Embed Size (px)
Citation preview
S5
Bulletin of the Seismological Society of America, Vol. 94, No. 6B, pp. S5–S22, December 2004
The Susitna Glacier Thrust Fault: Characteristics of Surface Ruptures on the
Fault that Initiated the 2002 Denali Fault Earthquake
by Anthony J. Crone, Stephen F. Personius, Patricia A. Craw, Peter J. Haeussler, andLauren A. Staft
Abstract The 3 November 2002 Mw 7.9 Denali fault earthquake sequence initi-ated on the newly discovered Susitna Glacier thrust fault and caused 48 km of surfacerupture. Rupture of the Susitna Glacier fault generated scarps on ice of the Susitnaand West Fork glaciers and on tundra and surficial deposits along the southern frontof the central Alaska Range. Based on detailed mapping, 27 topographic profiles,and field observations, we document the characteristics and slip distribution of the2002 ruptures and describe evidence of pre-2002 ruptures on the fault. The 2002surface faulting produced structures that range from simple folds on a single traceto complex thrust-fault ruptures and pressure ridges on multiple, sinuous strands. Thedeformation zone is locally more than 1 km wide. We measured a maximum verticaldisplacement of 5.4 m on the south-directed main thrust. North-directed backthrustshave more than 4 m of surface offset. We measured a well-constrained near-surfacefault dip of about 19� at one site, which is considerably less than seismologicallydetermined values of 35�–48�. Surface-rupture data yield an estimated magnitude ofMw 7.3 for the fault, which is similar to the seismological value of Mw 7.2. Com-parison of field and seismological data suggest that the Susitna Glacier fault is partof a large positive flower structure associated with northwest-directed transpressivedeformation on the Denali fault. Prehistoric scarps are evidence of previous ruptureof the Sustina Glacier fault, but additional work is needed to determine if past failuresof the Susitna Glacier fault have consistently induced rupture of the Denali fault.
Introduction
On 3 November 2002, the central Alaska Range wasstruck by one of the largest historical earthquakes in NorthAmerica. The Mw 7.9 Denali fault earthquake sequence rup-tured parts of the Susitna Glacier, Denali, and Totschundafaults (Fig. 1) and created a 354-km-long scar across thecentral Alaskan landscape, which is the longest on-land sur-face rupture in North America since the 1906 San Franciscoearthquake. Right-lateral offsets of nearly 9 m occurred onthe Denali fault about 189 km east of the epicenter (Haeus-sler et al., 2004). The earthquake also triggered thousandsof landslides near the rupture zone and caused liquefactionhundreds of kilometers away from the epicenter (Harp et al.,2003; Kayen et al., 2004).
On 23 October 2002, 11 days prior to the Denali faultearthquake, the Mw 6.7 Nenana Mountain earthquake oc-curred on the Denali fault about 22 km west of the main-shock epicenter (Ratchkovski et al., 2003), but it did notproduce any observed surface rupture. Aftershocks from theNenana Mountain foreshock extended mainly westwardalong the fault from the epicenter for about 30 km (Ratch-kovski et al., 2003) toward Cantwell, Alaska (Fig. 1). Mod-
els of Coulomb stress change indicate that right-lateral slipduring the Nenana Mountain earthquake transferred 30–50kPa of Coulomb stress to the hypocentral area of the Mw 7.9mainshock, which may have helped trigger the 3 Novemberevent (Anderson and Ji, 2003; Eberhart-Phillips et al., 2003).
The Mw 7.9 mainshock consisted of at least three sub-events (Ji et al., 2002; Eberhart-Phillips et al., 2003), whichwere widely spaced along the rupture zone (Fig. 1). Theinitial subevent, at a depth of about 4.2 km (Ratchkovski etal., 2003), was located near a 15�–20� bend in the Denalifault and produced primarily thrust faulting on an east-striking slip plane (82�) that dips about 48� N. (Alaska Earth-quake Information Center [AEIC], 2002). This thrust fault-ing, which initiated the Denali fault earthquake sequence,occurred on the previously unknown Susitna Glacier fault.
Strong-motion seismograms and modeling of InSARimages indicate that the initial thrust-faulting subevent hada magnitude (Mw) of 7.2 (Eberhart-Phillips et al., 2003; Luet al., 2003). About 8–10 sec after initiation, the thrust-faultmotion transitioned into right-lateral strike-slip motion as therupture propagated unilaterally eastward, first onto the Den-
S6 A. J. Crone, S. F. Personius, P. A. Craw, P. J. Haeussler, and L. A. Staft
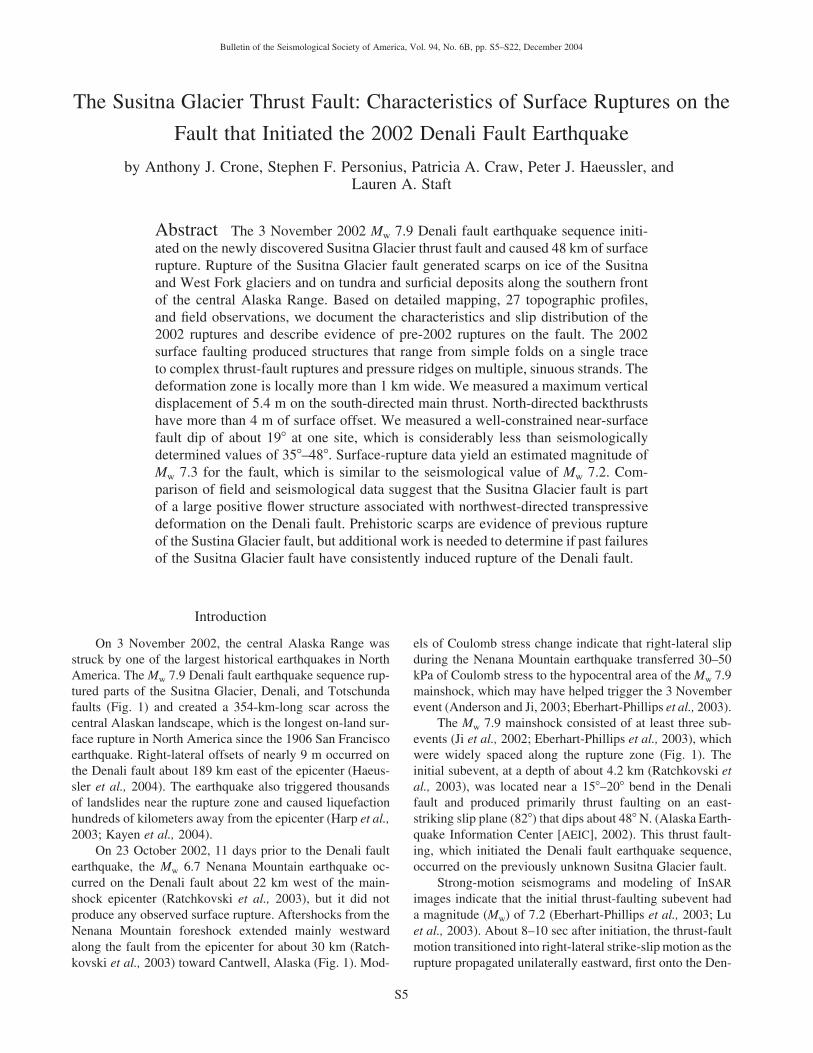
Figure 1. Location map and generalizedplate-tectonic setting of the 3 November 2002Denali fault earthquake. The collision betweenthe north-northwestward moving Pacific plate(PAC) and the North American plate (NAM) iscausing counterclockwise rotation (circular ar-row) of the Yakutat block (YAK) and is drivingright-lateral slip on the Denali fault. Open starsshow locations of the 23 October 2003, Mw 6.7Nenana Mountain foreshock and the Mw 7.9Denali fault earthquake. Focal mechanisms forthe three subevents of the Denali fault earth-quake are labeled SE1, SE2, and SE3. Boldsolid line shows the 2002 surface ruptures onthe Denali, Susitna Glacier (SGF), and Tot-schunda (TF) faults; gray lines are unrupturedfaults. Aftershocks from the Nenana Mountainearthquake extended mainly westward fromthe epicenter to near the town of Cantwell (C).Ruptures from the 3 November earthquakepropagated unilaterally to the east. Dashed lineshows route of the Trans-Alaska Pipeline(TAPS).
ali fault and later onto the Totschunda fault (Ji et al., 2002).The second subevent, which was located about 80 km eastof the mainshock epicenter near the Trans-Alaska Pipeline,involved right-lateral motion on the Denali fault (Eberhart-Phillips et al., 2003; Frankel, 2004). The third subevent,which was located about 190 km east of the epicenter, hadthe greatest moment release and caused right-lateral slip onthe Denali fault and on part of the Totschunda fault (Haeus-sler et al., 2004). Thus, failure of the Susitna Glacier faultinitiated the Mw 7.9 earthquake and induced rupture on partsof two interconnected faults. Eastward propagation of rup-ture on the Denali fault produced the largest displacementsand strongest shaking 175 km or more east of the epicenter.The Susitna Glacier fault played a critical role in this earth-quake sequence by initiating failure of the Denali fault.
In this report, we summarize geological observationsand field studies of the Susitna Glacier fault, which wereconducted in November 2002 and July 2003. In our studieswe concentrated on detailed mapping of the 2002 ruptures,both on the ground and by using aerial photographs, whichwere acquired less than two weeks after the earthquake. Herewe document the distribution of slip on the fault, character-ize the morphology of the ruptures, and describe the evi-dence of pre-2002 ruptures on the fault.
Geologic Setting of the Susitna Glacier Fault
Most of Alaska is composed of fault-bounded lithotec-tonic terrains, which were accreted onto the North Americancraton throughout Phanerozoic time (Plafker and Berg,1994). The Susitna Glacier fault lies in a structurally com-plex region, where slivers of small terrains are wedged be-
tween the Wrangellia composite terrain to the south and theYukon-Tanana terrain to the north (Fig. 2; Nokleberg et al.,1994). The Susitna Glacier fault lies adjacent to and withinthe Maclaren terrain, which is bounded by the BroxsonGulch fault on the south and the Denali fault on the north.
The Maclaren terrain is comprised of two major rockunits: the Maclaren Glacier metamorphic belt on the southand the East Susitna batholith on the north (Nokleberg etal., 1985, 1994). The eastern edge of the Maclaren terrainpinches out and is truncated where the Broxson Gulch faultconverges with the Denali fault (Fig. 2B). The correlativebut displaced portion of the Maclaren terrain that shouldexist on the opposite side of the Denali fault may correspondto the Kluane Lake–Ruby Range area in the southwesternYukon Territory (Fig. 2A; Division of Geological and Geo-physical Surveys [DGGS], 1973; Nokleberg et al., 1985). Ifthis correlation is correct, then the Maclaren terrain has beenlaterally offset at least 400 km by the Denali fault sinceCretaceous time. Csejtey et al. (1992) questioned this cor-relation and the evidence for large amounts of lateral offseton the Denali fault system.
Quaternary structures in the central Alaska Range arestrongly influenced by the motion on the Denali fault system,which is thought to have a Quaternary slip rate of 5–35 mm/yr (Richter and Matson, 1971; Stout et al., 1973; Hickmanet al., 1977; Plafker et al., 1977). The Denali fault (St.Amand, 1957; Grantz, 1966) has a history that extends backat least 85 Ma (Miller et al., 2002). The rate of late Cenozoicmovement on the western Denali fault is constrained by a38-Ma pluton that is offset 38 km (Reed and Lanphere,1974), which implies an average Cenozoic slip rate of ap-proximately 1 mm/yr.
Characteristics of Surface Ruptures on the Susitna Glacier Thrust Fault S7
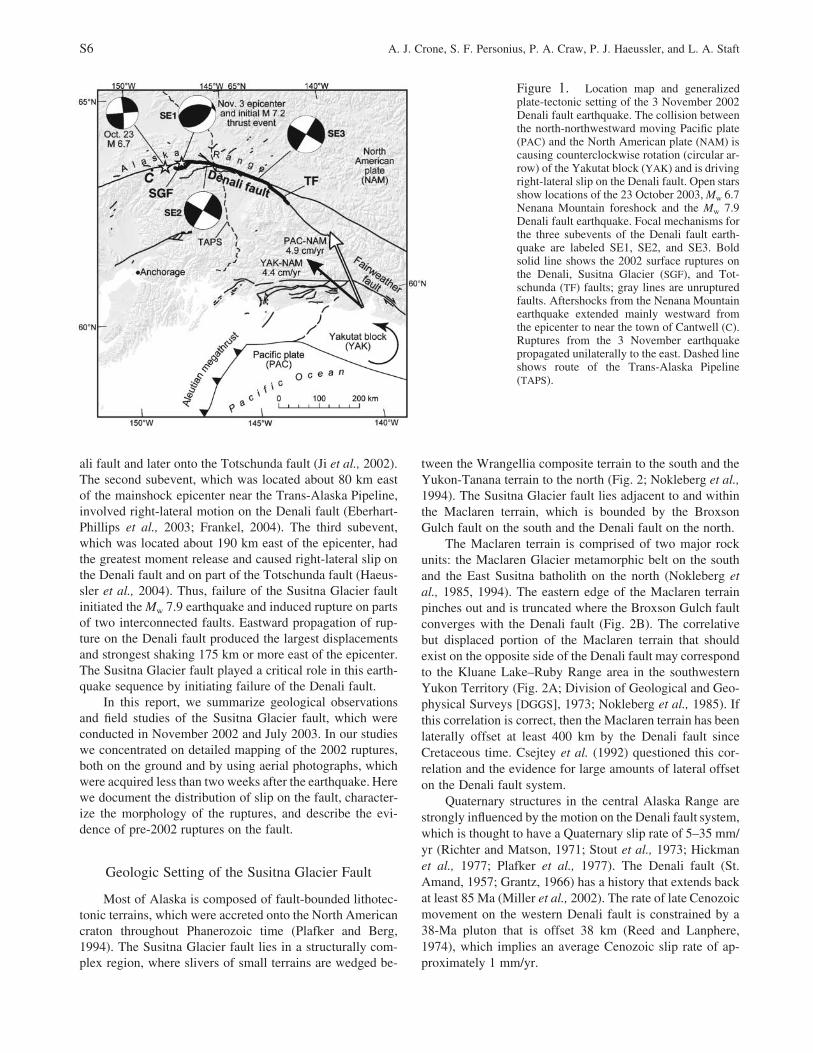
Figure 2. Regional (A) and local (B) maps showing selected lithotectonic terrainsand faults associated with the Denali fault system. If the Kluane schist in the YukonTerritory correlates with the Maclaren terrain, then more than 400 km of right-lateralslip has occurred on the Denali fault. Labeled faults are Broxson Gulch fault, BGF;Cross Creek fault, CCF; Donnelly Dome–Granite Mountain fault, DDGMF; McGinnisGlacier fault, MGF; McCallum-Slate Creek fault, MSCF; Rainy Creek fault, RCF; Tot-schunda fault, TF. Selected drainage valleys in (B) include Nenana River valley, NRV;Susitna River valley, SRV; West Fork valley, WFV. Unpatterned areas in (B) correspondto areas of undifferentiated bedrock. Dashed box in (A) shows approximate area of (B).Figures adapted from Brogan et al. (1975), Nokleberg et al. (1985, 1992, 1994), Plafkeret al. (1993), Ridgeway et al. (2002), and Stout and Chase (1980).
The regional strain that is driving Quaternary and lateCenozoic movement on the Denali fault has also inducedmovement on several nearby smaller reverse and normalfaults (Fig. 2B), including the Donnelly Dome-GraniteMountain fault (Hudson and Weber, 1977), the McCallum-Slate Creek fault (Weber and Turner, 1977), and the Mc-Ginnis Glacier fault (Brogan et al., 1975). The developmentand movement history of these faults are almost certainlyrelated to movement on the master Denali fault. The geo-metric relationship between the Susitna Glacier and Denalifaults, as well as the fact that failure of the Susitna Glacierfault induced failure on the Denali fault, is clear evidence ofan intimate structural relationship between these two faults.
The Susitna Glacier fault was not recognized prior toits surface rupture in 2002. T. E. Smith and colleagues ofthe Alaska Division of Geological and Geophysical Surveys(DGGS) mapped a northeast-trending fault extending up theSusitna Glacier and informally named the feature the “Sus-itna fault” (DGGS Staff, 1973), but their Susitna fault is notthe same as the Susitna Glacier fault, and their fault is notshown on subsequently published maps. The “Susitna fault”described by the DGGS Staff is a pronounced 180-km-longlineament that might correlate with the Kluane lineament,which is located in similar metamorphic rocks on the op-posite side of the Denali fault about 400 km to the southeastin western Canada (Fig. 2A).
It is not surprising that previous workers did not rec-ognize the Susitna Glacier fault because its prehistoric scarpsare not obvious or continuous, the fault does not juxtaposedistinctive bedrock units along much of its length, and it
does not coincide with any other mapped structure. How-ever, we observed subparallel bedrock faults in the hangingwall of the Susitna Glacier fault east of the West Fork Gla-cier, which indicates that older faults similar to the SusitnaGlacier fault are present in the region.
2002 Ruptures on the Susitna Glacier Fault
Discovery of the Susitna Glacier Fault
Shortly after the Mw 7.9 earthquake, seismologists re-ported that the initial earthquake motion was dominantlythrust faulting even though the net slip from the event wasright lateral (Kikuchi and Yamanaka, 2002). Immediatelyfollowing the Denali fault earthquake, two of us (P.J.H. andP.A.C.) discovered extensive rupture on the Denali and Tot-schunda faults from field reconnaissance on 4 and 5 Novem-ber. Additional field parties arrived within a few days tofurther map the surface ruptures on these faults. On 10 No-vember two of us (P.J.H. and P.A.C.) discovered surfacerupture on the lower part of the Susitna Glacier and tracedruptures in the glacial ice up-valley to the Denali fault. Wethen traced the ruptures down-valley to near the glacier’sterminus, where they curved westward along the southernfront of the Alaska Range (Fig. 3). We named the fault thatproduced these ruptures the Susitna Glacier fault (Craw etal., 2002). The location of this fault with respect to the main-shock epicenter, its dip direction and sense of motion, andthe length of the ruptures are all consistent with the seis-mological parameters for the first subevent (Eberhart-Phillips et al., 2003).
S8 A. J. Crone, S. F. Personius, P. A. Craw, P. J. Haeussler, and L. A. Staft
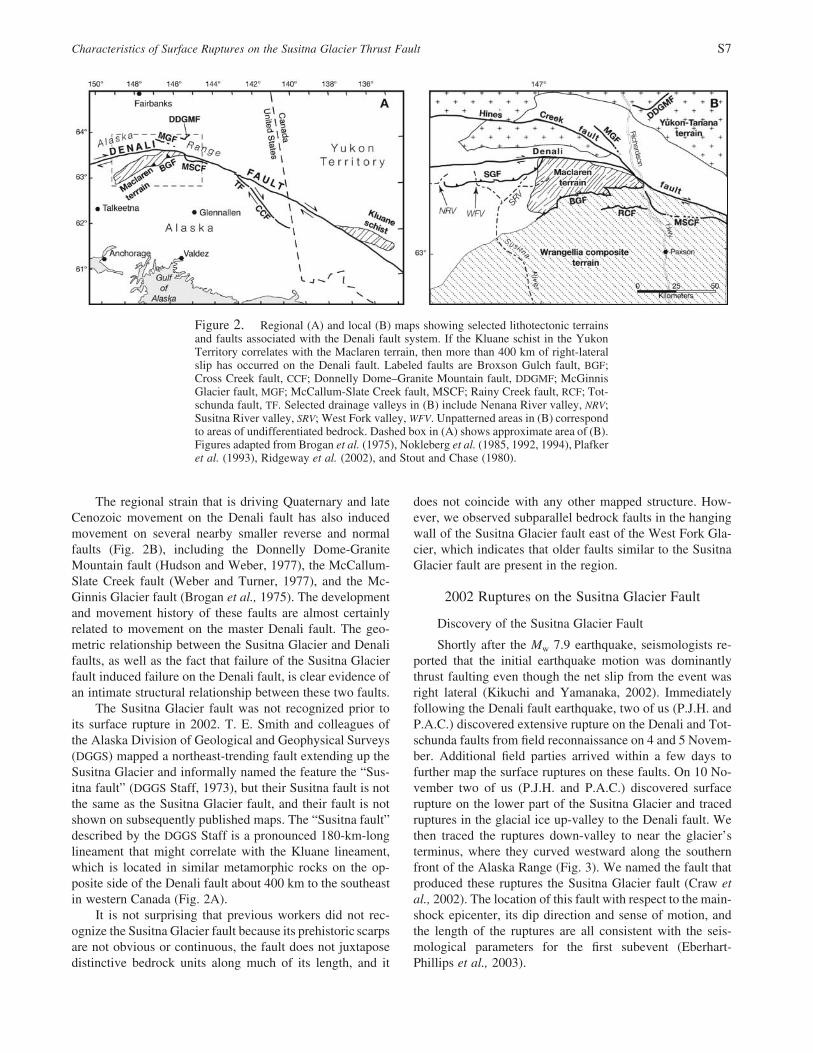
Figure 3. Simplified map of the 3 November 2002 ruptures on the Susitna Glacierfault. Teeth on Susitna Glacier fault are on hanging wall of fault, dashed where rupturesare discontinuous, dotted where concealed. Open star shows epicenter of Denali faultearthquake (subevent 1 in Fig. 1), which initiated on the Susitna Glacier fault. Denalifault, DF; West Fork valley, WFV; Nenana River valley, NRV; “Three-point Canyon,”TPC. Lake 3395 is an unnamed valley referred to in text as “Lake 3395” valley. AA�and BB� show end points of rupture displacement data presented in Figure 14. Tables1 and 2 summarize field measurements of the ruptures.
In November 2002, deformation associated with the sur-face faulting was locally expressed as brittle rupture in areascovered by a thin (typically 20–30 cm) but cohesive snow-pack, and by more plastic deformation in areas of unfrozenground and tundra. However, unstable weather and limitedfield time restricted our mapping and the number of slipmeasurements that we could make on the Susitna Glacierfault. In July 2003, four of us (P.A.C., A.J.C., S.F.P., L.A.S.)returned to map and study ruptures on the fault in greaterdetail. We discovered new strands of the fault, large back-thrust scarps, and tear zones that constitute a considerablymore complex rupture zone than we recognized in Novem-ber 2002.
Length of Ruptures
The southern front of the Alaska Range in the area ofthe Susitna Glacier fault is geomorphically dynamic. Surfi-cial and periglacial processes produce numerous escarp-ments and downhill-facing lobate features that are similar to
and difficult to distinguish from thrust-fault ruptures. As aresult, it is challenging to distinguish between tectonic faultscarps and scarps of nontectonic origin. Nontectonic scarpsinclude solifluction lobes and linear, scarplike medial andlateral moraines, which locally are parallel to the fault trace.Other nontectonic scarps result from gravitational processesand include scarps associated with landslides, sackungs, anddebris-flow levees. The abundance of these nontectonicscarps complicated mapping of ruptures on the fault. Distin-guishing between tectonic and nontectonic scarps was par-ticularly difficult along the westernmost 6–7 km of the rup-tures, where vertical offset on the 2002 ruptures is generallyless than 1 m. As a result, it was very difficult to map con-fidently the ruptures along this part of the fault.
To map most of the ruptures on the Susitna Glacier fault,we used vertical-incidence color aerial photographs at ap-proximately 1:6,000 scale (taken on 13 November 2002).Global Positioning System (GPS) data were collected whilephotographing, and the photography contractor considers theabsolute position of points on the photographs to be accurate
Characteristics of Surface Ruptures on the Susitna Glacier Thrust Fault S9
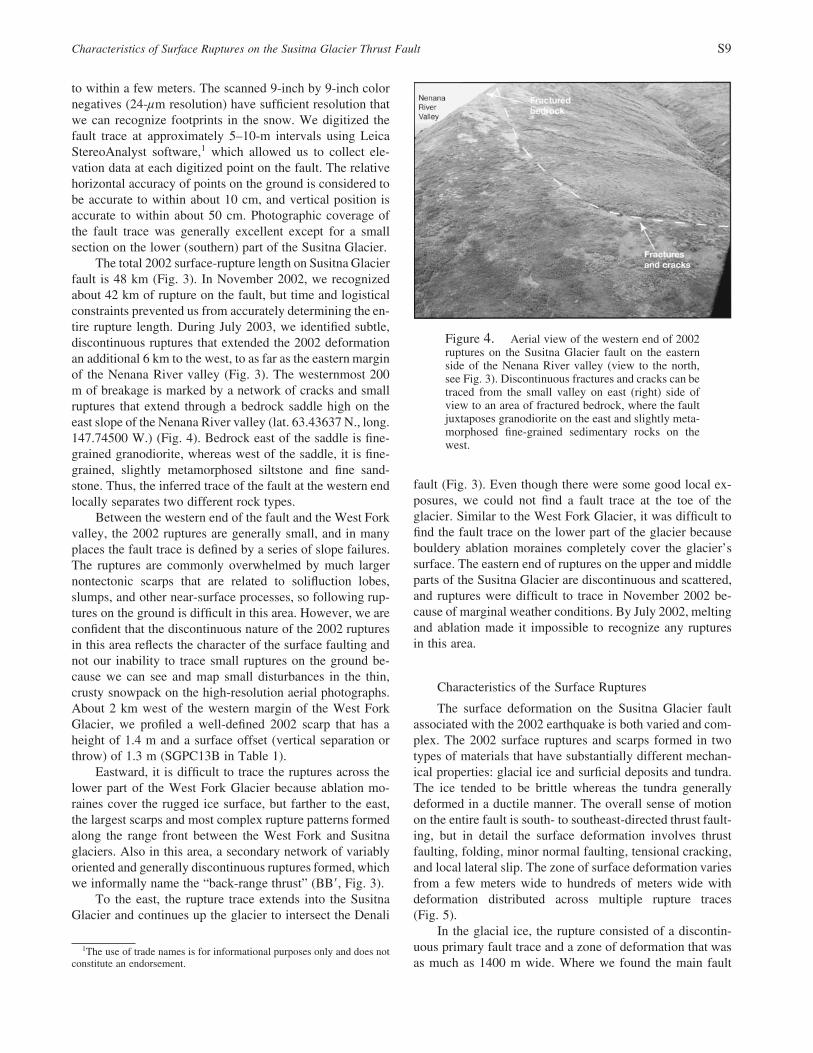
Figure 4. Aerial view of the western end of 2002ruptures on the Susitna Glacier fault on the easternside of the Nenana River valley (view to the north,see Fig. 3). Discontinuous fractures and cracks can betraced from the small valley on east (right) side ofview to an area of fractured bedrock, where the faultjuxtaposes granodiorite on the east and slightly meta-morphosed fine-grained sedimentary rocks on thewest.
to within a few meters. The scanned 9-inch by 9-inch colornegatives (24-lm resolution) have sufficient resolution thatwe can recognize footprints in the snow. We digitized thefault trace at approximately 5–10-m intervals using LeicaStereoAnalyst software,1 which allowed us to collect ele-vation data at each digitized point on the fault. The relativehorizontal accuracy of points on the ground is considered tobe accurate to within about 10 cm, and vertical position isaccurate to within about 50 cm. Photographic coverage ofthe fault trace was generally excellent except for a smallsection on the lower (southern) part of the Susitna Glacier.
The total 2002 surface-rupture length on Susitna Glacierfault is 48 km (Fig. 3). In November 2002, we recognizedabout 42 km of rupture on the fault, but time and logisticalconstraints prevented us from accurately determining the en-tire rupture length. During July 2003, we identified subtle,discontinuous ruptures that extended the 2002 deformationan additional 6 km to the west, to as far as the eastern marginof the Nenana River valley (Fig. 3). The westernmost 200m of breakage is marked by a network of cracks and smallruptures that extend through a bedrock saddle high on theeast slope of the Nenana River valley (lat. 63.43637 N., long.147.74500 W.) (Fig. 4). Bedrock east of the saddle is fine-grained granodiorite, whereas west of the saddle, it is fine-grained, slightly metamorphosed siltstone and fine sand-stone. Thus, the inferred trace of the fault at the western endlocally separates two different rock types.
Between the western end of the fault and the West Forkvalley, the 2002 ruptures are generally small, and in manyplaces the fault trace is defined by a series of slope failures.The ruptures are commonly overwhelmed by much largernontectonic scarps that are related to solifluction lobes,slumps, and other near-surface processes, so following rup-tures on the ground is difficult in this area. However, we areconfident that the discontinuous nature of the 2002 rupturesin this area reflects the character of the surface faulting andnot our inability to trace small ruptures on the ground be-cause we can see and map small disturbances in the thin,crusty snowpack on the high-resolution aerial photographs.About 2 km west of the western margin of the West ForkGlacier, we profiled a well-defined 2002 scarp that has aheight of 1.4 m and a surface offset (vertical separation orthrow) of 1.3 m (SGPC13B in Table 1).
Eastward, it is difficult to trace the ruptures across thelower part of the West Fork Glacier because ablation mo-raines cover the rugged ice surface, but farther to the east,the largest scarps and most complex rupture patterns formedalong the range front between the West Fork and Susitnaglaciers. Also in this area, a secondary network of variablyoriented and generally discontinuous ruptures formed, whichwe informally name the “back-range thrust” (BB�, Fig. 3).
To the east, the rupture trace extends into the SusitnaGlacier and continues up the glacier to intersect the Denali
1The use of trade names is for informational purposes only and does notconstitute an endorsement.
fault (Fig. 3). Even though there were some good local ex-posures, we could not find a fault trace at the toe of theglacier. Similar to the West Fork Glacier, it was difficult tofind the fault trace on the lower part of the glacier becausebouldery ablation moraines completely cover the glacier’ssurface. The eastern end of ruptures on the upper and middleparts of the Susitna Glacier are discontinuous and scattered,and ruptures were difficult to trace in November 2002 be-cause of marginal weather conditions. By July 2002, meltingand ablation made it impossible to recognize any rupturesin this area.
Characteristics of the Surface Ruptures
The surface deformation on the Susitna Glacier faultassociated with the 2002 earthquake is both varied and com-plex. The 2002 surface ruptures and scarps formed in twotypes of materials that have substantially different mechan-ical properties: glacial ice and surficial deposits and tundra.The ice tended to be brittle whereas the tundra generallydeformed in a ductile manner. The overall sense of motionon the entire fault is south- to southeast-directed thrust fault-ing, but in detail the surface deformation involves thrustfaulting, folding, minor normal faulting, tensional cracking,and local lateral slip. The zone of surface deformation variesfrom a few meters wide to hundreds of meters wide withdeformation distributed across multiple rupture traces(Fig. 5).
In the glacial ice, the rupture consisted of a discontin-uous primary fault trace and a zone of deformation that wasas much as 1400 m wide. Where we found the main fault
S10 A. J. Crone, S. F. Personius, P. A. Craw, P. J. Haeussler, and L. A. Staft
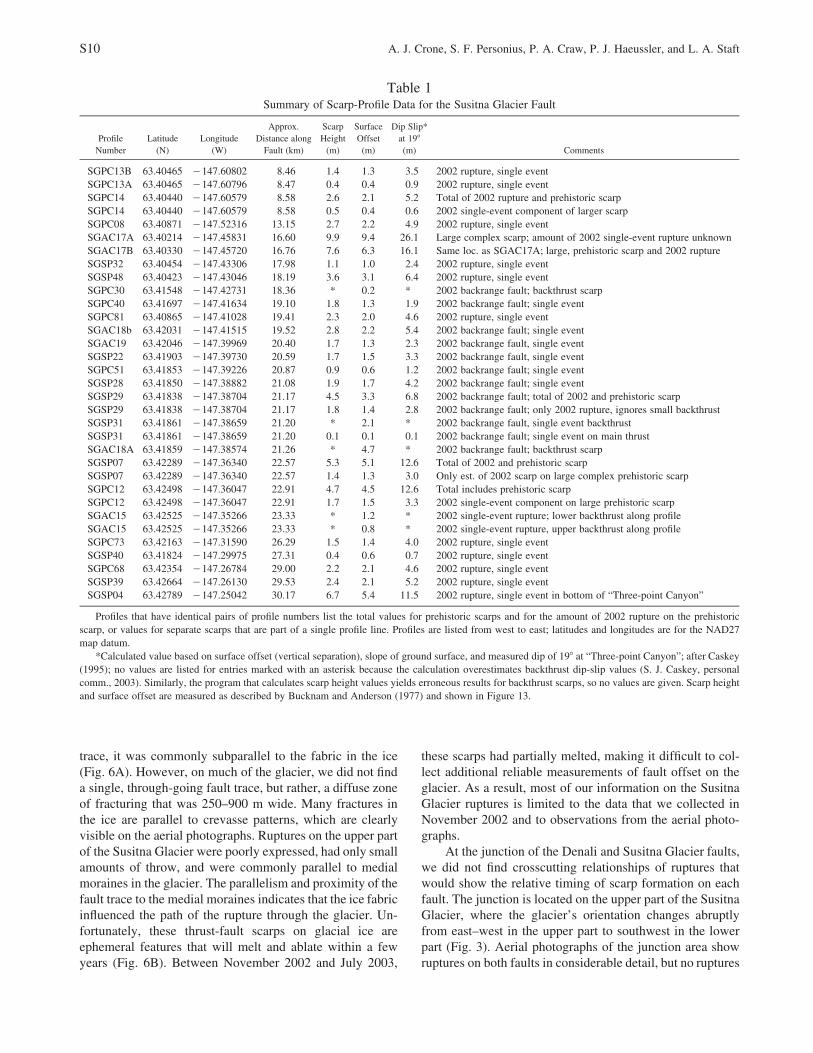
Table 1Summary of Scarp-Profile Data for the Susitna Glacier Fault
ProfileNumber
Latitude(N)
Longitude(W)
Approx.Distance along
Fault (km)
ScarpHeight
(m)
SurfaceOffset
(m)
Dip Slip*at 19�(m) Comments
SGPC13B 63.40465 �147.60802 8.46 1.4 1.3 3.5 2002 rupture, single eventSGPC13A 63.40465 �147.60796 8.47 0.4 0.4 0.9 2002 rupture, single eventSGPC14 63.40440 �147.60579 8.58 2.6 2.1 5.2 Total of 2002 rupture and prehistoric scarpSGPC14 63.40440 �147.60579 8.58 0.5 0.4 0.6 2002 single-event component of larger scarpSGPC08 63.40871 �147.52316 13.15 2.7 2.2 4.9 2002 rupture, single eventSGAC17A 63.40214 �147.45831 16.60 9.9 9.4 26.1 Large complex scarp; amount of 2002 single-event rupture unknownSGAC17B 63.40330 �147.45720 16.76 7.6 6.3 16.1 Same loc. as SGAC17A; large, prehistoric scarp and 2002 ruptureSGSP32 63.40454 �147.43306 17.98 1.1 1.0 2.4 2002 rupture, single eventSGSP48 63.40423 �147.43046 18.19 3.6 3.1 6.4 2002 rupture, single eventSGPC30 63.41548 �147.42731 18.36 * 0.2 * 2002 backrange fault; backthrust scarpSGPC40 63.41697 �147.41634 19.10 1.8 1.3 1.9 2002 backrange fault; single eventSGPC81 63.40865 �147.41028 19.41 2.3 2.0 4.6 2002 rupture, single eventSGAC18b 63.42031 �147.41515 19.52 2.8 2.2 5.4 2002 backrange fault; single eventSGAC19 63.42046 �147.39969 20.40 1.7 1.3 2.3 2002 backrange fault, single eventSGSP22 63.41903 �147.39730 20.59 1.7 1.5 3.3 2002 backrange fault, single eventSGPC51 63.41853 �147.39226 20.87 0.9 0.6 1.2 2002 backrange fault; single eventSGSP28 63.41850 �147.38882 21.08 1.9 1.7 4.2 2002 backrange fault; single eventSGSP29 63.41838 �147.38704 21.17 4.5 3.3 6.8 2002 backrange fault; total of 2002 and prehistoric scarpSGSP29 63.41838 �147.38704 21.17 1.8 1.4 2.8 2002 backrange fault; only 2002 rupture, ignores small backthrustSGSP31 63.41861 �147.38659 21.20 * 2.1 * 2002 backrange fault, single event backthrustSGSP31 63.41861 �147.38659 21.20 0.1 0.1 0.1 2002 backrange fault; single event on main thrustSGAC18A 63.41859 �147.38574 21.26 * 4.7 * 2002 backrange fault; backthrust scarpSGSP07 63.42289 �147.36340 22.57 5.3 5.1 12.6 Total of 2002 and prehistoric scarpSGSP07 63.42289 �147.36340 22.57 1.4 1.3 3.0 Only est. of 2002 scarp on large complex prehistoric scarpSGPC12 63.42498 �147.36047 22.91 4.7 4.5 12.6 Total includes prehistoric scarpSGPC12 63.42498 �147.36047 22.91 1.7 1.5 3.3 2002 single-event component on large prehistoric scarpSGAC15 63.42525 �147.35266 23.33 * 1.2 * 2002 single-event rupture; lower backthrust along profileSGAC15 63.42525 �147.35266 23.33 * 0.8 * 2002 single-event rupture, upper backthrust along profileSGPC73 63.42163 �147.31590 26.29 1.5 1.4 4.0 2002 rupture, single eventSGSP40 63.41824 �147.29975 27.31 0.4 0.6 0.7 2002 rupture, single eventSGPC68 63.42354 �147.26784 29.00 2.2 2.1 4.6 2002 rupture, single eventSGSP39 63.42664 �147.26130 29.53 2.4 2.1 5.2 2002 rupture, single eventSGSP04 63.42789 �147.25042 30.17 6.7 5.4 11.5 2002 rupture, single event in bottom of “Three-point Canyon”
Profiles that have identical pairs of profile numbers list the total values for prehistoric scarps and for the amount of 2002 rupture on the prehistoricscarp, or values for separate scarps that are part of a single profile line. Profiles are listed from west to east; latitudes and longitudes are for the NAD27map datum.
*Calculated value based on surface offset (vertical separation), slope of ground surface, and measured dip of 19� at “Three-point Canyon”; after Caskey(1995); no values are listed for entries marked with an asterisk because the calculation overestimates backthrust dip-slip values (S. J. Caskey, personalcomm., 2003). Similarly, the program that calculates scarp height values yields erroneous results for backthrust scarps, so no values are given. Scarp heightand surface offset are measured as described by Bucknam and Anderson (1977) and shown in Figure 13.
trace, it was commonly subparallel to the fabric in the ice(Fig. 6A). However, on much of the glacier, we did not finda single, through-going fault trace, but rather, a diffuse zoneof fracturing that was 250–900 m wide. Many fractures inthe ice are parallel to crevasse patterns, which are clearlyvisible on the aerial photographs. Ruptures on the upper partof the Susitna Glacier were poorly expressed, had only smallamounts of throw, and were commonly parallel to medialmoraines in the glacier. The parallelism and proximity of thefault trace to the medial moraines indicates that the ice fabricinfluenced the path of the rupture through the glacier. Un-fortunately, these thrust-fault scarps on glacial ice areephemeral features that will melt and ablate within a fewyears (Fig. 6B). Between November 2002 and July 2003,
these scarps had partially melted, making it difficult to col-lect additional reliable measurements of fault offset on theglacier. As a result, most of our information on the SusitnaGlacier ruptures is limited to the data that we collected inNovember 2002 and to observations from the aerial photo-graphs.
At the junction of the Denali and Susitna Glacier faults,we did not find crosscutting relationships of ruptures thatwould show the relative timing of scarp formation on eachfault. The junction is located on the upper part of the SusitnaGlacier, where the glacier’s orientation changes abruptlyfrom east–west in the upper part to southwest in the lowerpart (Fig. 3). Aerial photographs of the junction area showruptures on both faults in considerable detail, but no ruptures
Characteristics of Surface Ruptures on the Susitna Glacier Thrust Fault S11
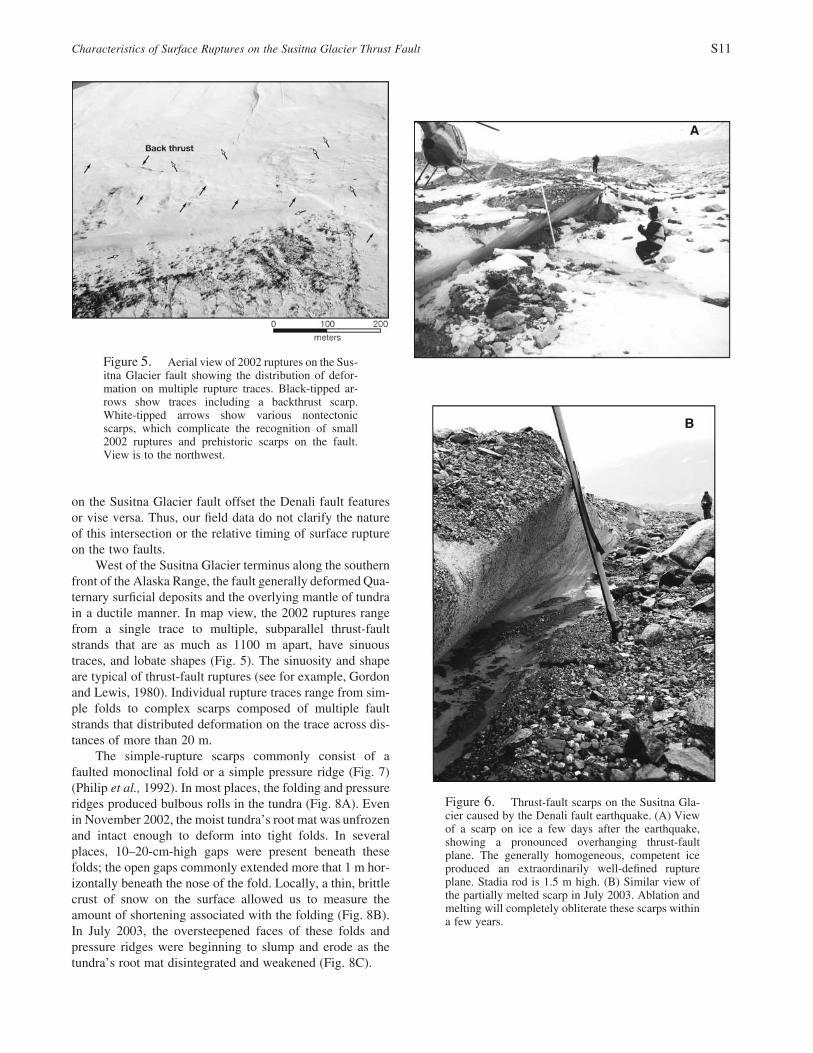
Figure 5. Aerial view of 2002 ruptures on the Sus-itna Glacier fault showing the distribution of defor-mation on multiple rupture traces. Black-tipped ar-rows show traces including a backthrust scarp.White-tipped arrows show various nontectonicscarps, which complicate the recognition of small2002 ruptures and prehistoric scarps on the fault.View is to the northwest.
Figure 6. Thrust-fault scarps on the Susitna Gla-cier caused by the Denali fault earthquake. (A) Viewof a scarp on ice a few days after the earthquake,showing a pronounced overhanging thrust-faultplane. The generally homogeneous, competent iceproduced an extraordinarily well-defined ruptureplane. Stadia rod is 1.5 m high. (B) Similar view ofthe partially melted scarp in July 2003. Ablation andmelting will completely obliterate these scarps withina few years.
on the Susitna Glacier fault offset the Denali fault featuresor vise versa. Thus, our field data do not clarify the natureof this intersection or the relative timing of surface ruptureon the two faults.
West of the Susitna Glacier terminus along the southernfront of the Alaska Range, the fault generally deformed Qua-ternary surficial deposits and the overlying mantle of tundrain a ductile manner. In map view, the 2002 ruptures rangefrom a single trace to multiple, subparallel thrust-faultstrands that are as much as 1100 m apart, have sinuoustraces, and lobate shapes (Fig. 5). The sinuosity and shapeare typical of thrust-fault ruptures (see for example, Gordonand Lewis, 1980). Individual rupture traces range from sim-ple folds to complex scarps composed of multiple faultstrands that distributed deformation on the trace across dis-tances of more than 20 m.
The simple-rupture scarps commonly consist of afaulted monoclinal fold or a simple pressure ridge (Fig. 7)(Philip et al., 1992). In most places, the folding and pressureridges produced bulbous rolls in the tundra (Fig. 8A). Evenin November 2002, the moist tundra’s root mat was unfrozenand intact enough to deform into tight folds. In severalplaces, 10–20-cm-high gaps were present beneath thesefolds; the open gaps commonly extended more that 1 m hor-izontally beneath the nose of the fold. Locally, a thin, brittlecrust of snow on the surface allowed us to measure theamount of shortening associated with the folding (Fig. 8B).In July 2003, the oversteepened faces of these folds andpressure ridges were beginning to slump and erode as thetundra’s root mat disintegrated and weakened (Fig. 8C).
S12 A. J. Crone, S. F. Personius, P. A. Craw, P. J. Haeussler, and L. A. Staft
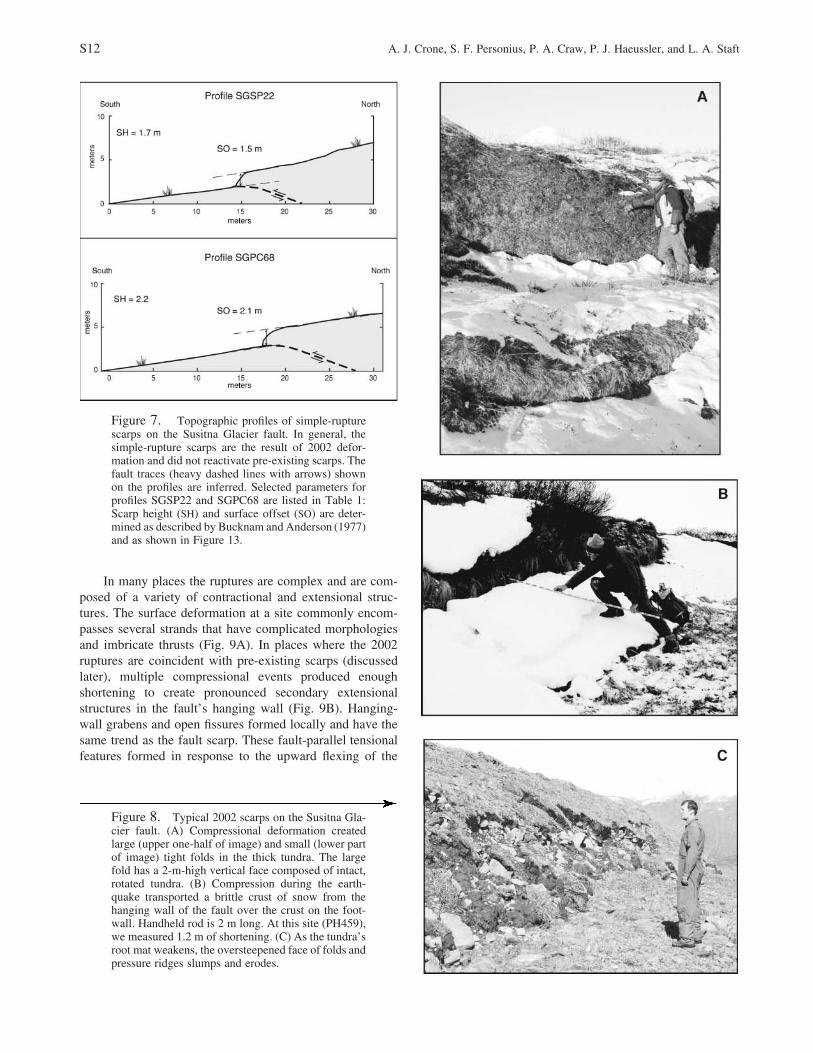
Figure 7. Topographic profiles of simple-rupturescarps on the Susitna Glacier fault. In general, thesimple-rupture scarps are the result of 2002 defor-mation and did not reactivate pre-existing scarps. Thefault traces (heavy dashed lines with arrows) shownon the profiles are inferred. Selected parameters forprofiles SGSP22 and SGPC68 are listed in Table 1:Scarp height (SH) and surface offset (SO) are deter-mined as described by Bucknam and Anderson (1977)and as shown in Figure 13.
Figure 8. Typical 2002 scarps on the Susitna Gla-cier fault. (A) Compressional deformation createdlarge (upper one-half of image) and small (lower partof image) tight folds in the thick tundra. The largefold has a 2-m-high vertical face composed of intact,rotated tundra. (B) Compression during the earth-quake transported a brittle crust of snow from thehanging wall of the fault over the crust on the foot-wall. Handheld rod is 2 m long. At this site (PH459),we measured 1.2 m of shortening. (C) As the tundra’sroot mat weakens, the oversteepened face of folds andpressure ridges slumps and erodes.
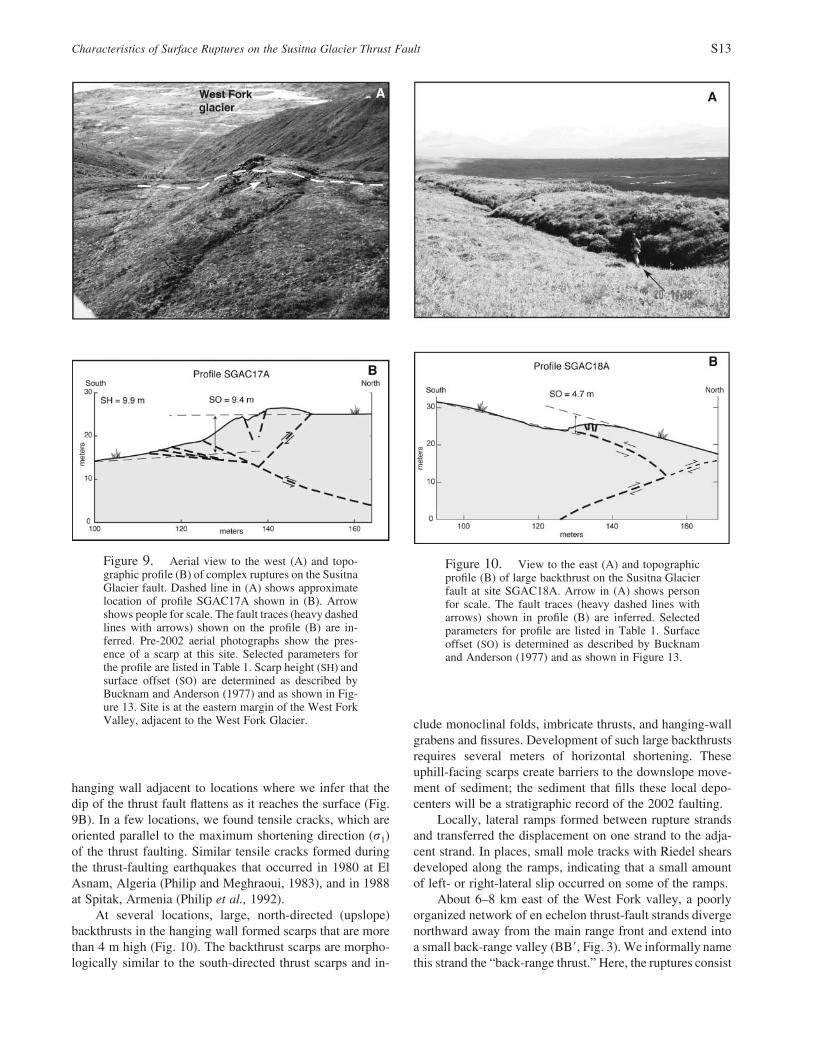
In many places the ruptures are complex and are com-posed of a variety of contractional and extensional struc-tures. The surface deformation at a site commonly encom-passes several strands that have complicated morphologiesand imbricate thrusts (Fig. 9A). In places where the 2002ruptures are coincident with pre-existing scarps (discussedlater), multiple compressional events produced enoughshortening to create pronounced secondary extensionalstructures in the fault’s hanging wall (Fig. 9B). Hanging-wall grabens and open fissures formed locally and have thesame trend as the fault scarp. These fault-parallel tensionalfeatures formed in response to the upward flexing of the
Characteristics of Surface Ruptures on the Susitna Glacier Thrust Fault S13
Figure 9. Aerial view to the west (A) and topo-graphic profile (B) of complex ruptures on the SusitnaGlacier fault. Dashed line in (A) shows approximatelocation of profile SGAC17A shown in (B). Arrowshows people for scale. The fault traces (heavy dashedlines with arrows) shown on the profile (B) are in-ferred. Pre-2002 aerial photographs show the pres-ence of a scarp at this site. Selected parameters forthe profile are listed in Table 1. Scarp height (SH) andsurface offset (SO) are determined as described byBucknam and Anderson (1977) and as shown in Fig-ure 13. Site is at the eastern margin of the West ForkValley, adjacent to the West Fork Glacier.
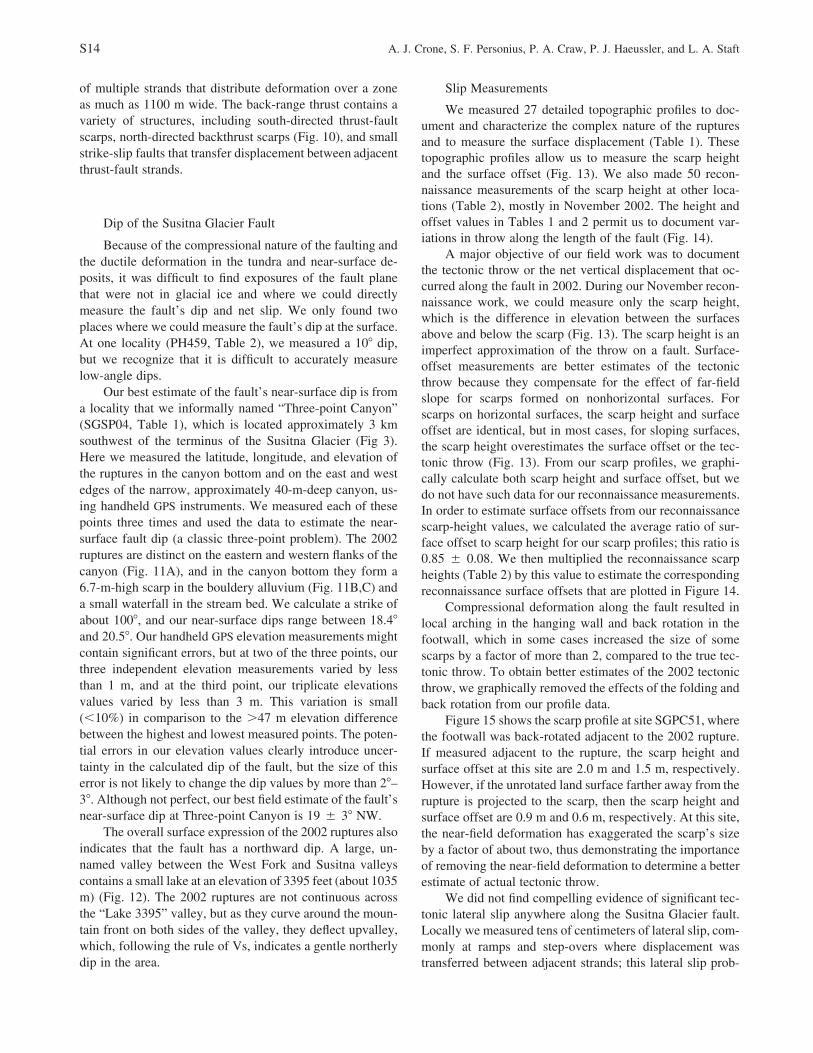
Figure 10. View to the east (A) and topographicprofile (B) of large backthrust on the Susitna Glacierfault at site SGAC18A. Arrow in (A) shows personfor scale. The fault traces (heavy dashed lines witharrows) shown in profile (B) are inferred. Selectedparameters for profile are listed in Table 1. Surfaceoffset (SO) is determined as described by Bucknamand Anderson (1977) and as shown in Figure 13.
hanging wall adjacent to locations where we infer that thedip of the thrust fault flattens as it reaches the surface (Fig.9B). In a few locations, we found tensile cracks, which areoriented parallel to the maximum shortening direction (r1)of the thrust faulting. Similar tensile cracks formed duringthe thrust-faulting earthquakes that occurred in 1980 at ElAsnam, Algeria (Philip and Meghraoui, 1983), and in 1988at Spitak, Armenia (Philip et al., 1992).
At several locations, large, north-directed (upslope)backthrusts in the hanging wall formed scarps that are morethan 4 m high (Fig. 10). The backthrust scarps are morpho-logically similar to the south-directed thrust scarps and in-
clude monoclinal folds, imbricate thrusts, and hanging-wallgrabens and fissures. Development of such large backthrustsrequires several meters of horizontal shortening. Theseuphill-facing scarps create barriers to the downslope move-ment of sediment; the sediment that fills these local depo-centers will be a stratigraphic record of the 2002 faulting.
Locally, lateral ramps formed between rupture strandsand transferred the displacement on one strand to the adja-cent strand. In places, small mole tracks with Riedel shearsdeveloped along the ramps, indicating that a small amountof left- or right-lateral slip occurred on some of the ramps.
About 6–8 km east of the West Fork valley, a poorlyorganized network of en echelon thrust-fault strands divergenorthward away from the main range front and extend intoa small back-range valley (BB�, Fig. 3). We informally namethis strand the “back-range thrust.” Here, the ruptures consist
S14 A. J. Crone, S. F. Personius, P. A. Craw, P. J. Haeussler, and L. A. Staft
of multiple strands that distribute deformation over a zoneas much as 1100 m wide. The back-range thrust contains avariety of structures, including south-directed thrust-faultscarps, north-directed backthrust scarps (Fig. 10), and smallstrike-slip faults that transfer displacement between adjacentthrust-fault strands.
Dip of the Susitna Glacier Fault
Because of the compressional nature of the faulting andthe ductile deformation in the tundra and near-surface de-posits, it was difficult to find exposures of the fault planethat were not in glacial ice and where we could directlymeasure the fault’s dip and net slip. We only found twoplaces where we could measure the fault’s dip at the surface.At one locality (PH459, Table 2), we measured a 10� dip,but we recognize that it is difficult to accurately measurelow-angle dips.
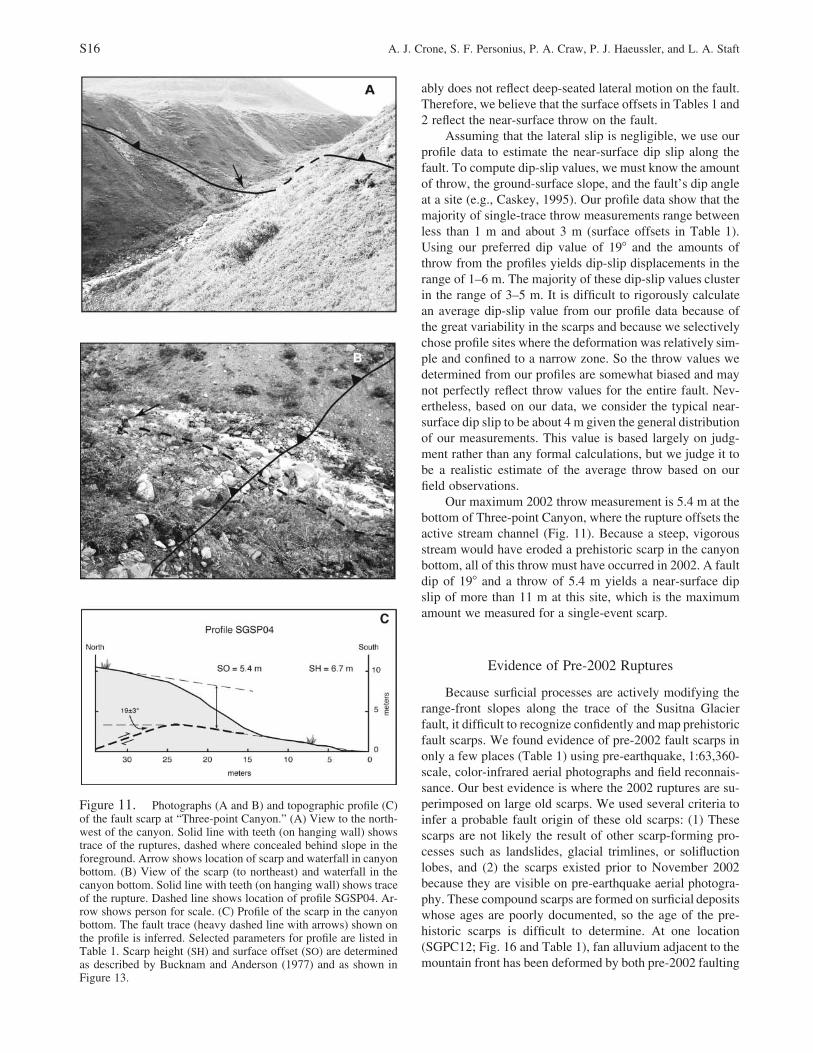
Our best estimate of the fault’s near-surface dip is froma locality that we informally named “Three-point Canyon”(SGSP04, Table 1), which is located approximately 3 kmsouthwest of the terminus of the Susitna Glacier (Fig 3).Here we measured the latitude, longitude, and elevation ofthe ruptures in the canyon bottom and on the east and westedges of the narrow, approximately 40-m-deep canyon, us-ing handheld GPS instruments. We measured each of thesepoints three times and used the data to estimate the near-surface fault dip (a classic three-point problem). The 2002ruptures are distinct on the eastern and western flanks of thecanyon (Fig. 11A), and in the canyon bottom they form a6.7-m-high scarp in the bouldery alluvium (Fig. 11B,C) anda small waterfall in the stream bed. We calculate a strike ofabout 100�, and our near-surface dips range between 18.4�and 20.5�. Our handheld GPS elevation measurements mightcontain significant errors, but at two of the three points, ourthree independent elevation measurements varied by lessthan 1 m, and at the third point, our triplicate elevationsvalues varied by less than 3 m. This variation is small(�10%) in comparison to the �47 m elevation differencebetween the highest and lowest measured points. The poten-tial errors in our elevation values clearly introduce uncer-tainty in the calculated dip of the fault, but the size of thiserror is not likely to change the dip values by more than 2�–3�. Although not perfect, our best field estimate of the fault’snear-surface dip at Three-point Canyon is 19 � 3� NW.
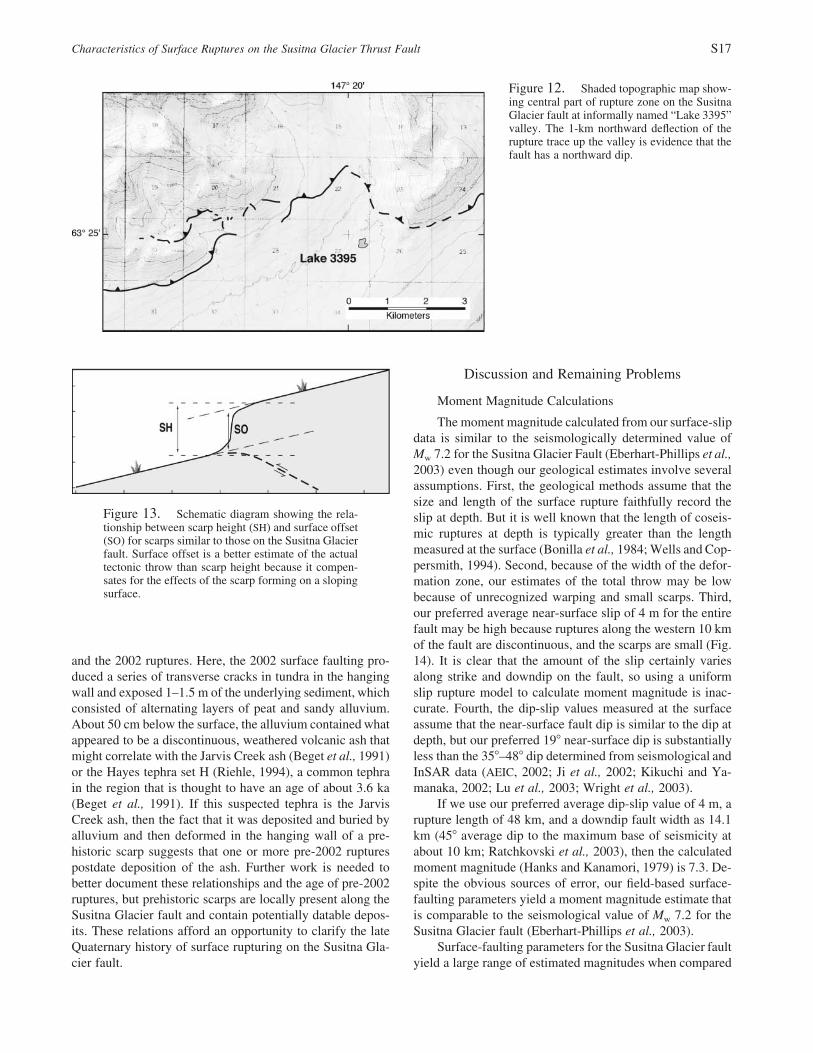
The overall surface expression of the 2002 ruptures alsoindicates that the fault has a northward dip. A large, un-named valley between the West Fork and Susitna valleyscontains a small lake at an elevation of 3395 feet (about 1035m) (Fig. 12). The 2002 ruptures are not continuous acrossthe “Lake 3395” valley, but as they curve around the moun-tain front on both sides of the valley, they deflect upvalley,which, following the rule of Vs, indicates a gentle northerlydip in the area.
Slip Measurements
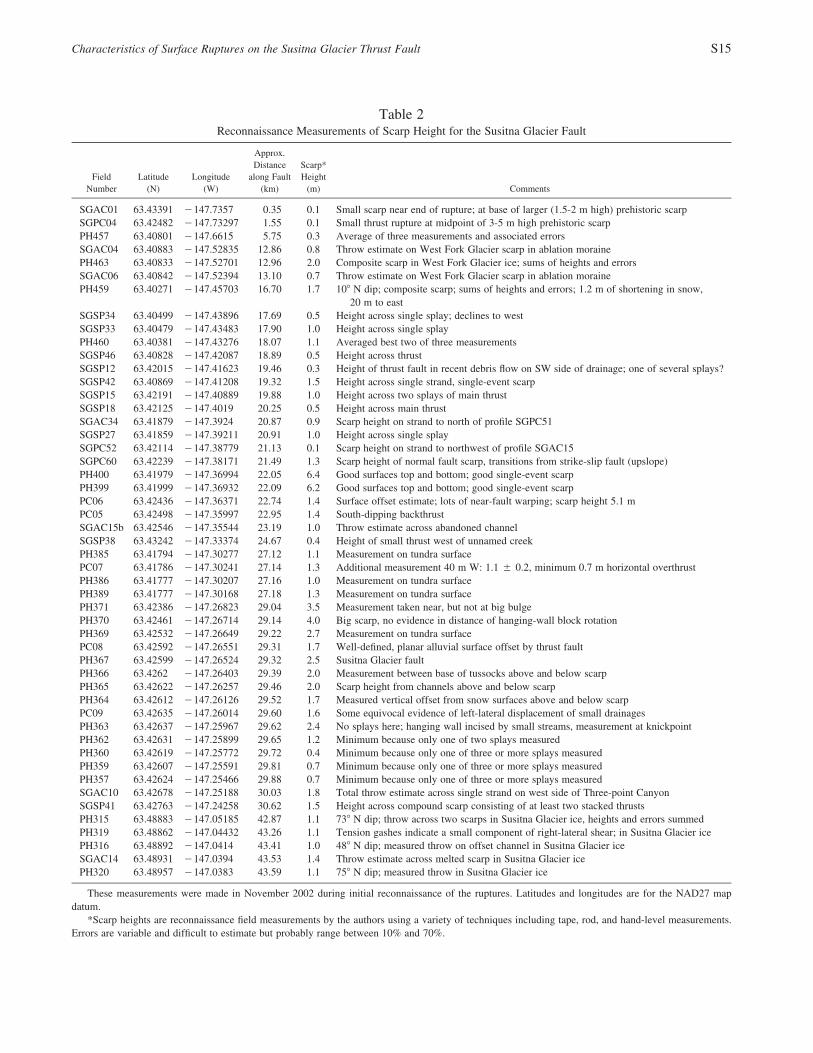
We measured 27 detailed topographic profiles to doc-ument and characterize the complex nature of the rupturesand to measure the surface displacement (Table 1). Thesetopographic profiles allow us to measure the scarp heightand the surface offset (Fig. 13). We also made 50 recon-naissance measurements of the scarp height at other loca-tions (Table 2), mostly in November 2002. The height andoffset values in Tables 1 and 2 permit us to document var-iations in throw along the length of the fault (Fig. 14).
A major objective of our field work was to documentthe tectonic throw or the net vertical displacement that oc-curred along the fault in 2002. During our November recon-naissance work, we could measure only the scarp height,which is the difference in elevation between the surfacesabove and below the scarp (Fig. 13). The scarp height is animperfect approximation of the throw on a fault. Surface-offset measurements are better estimates of the tectonicthrow because they compensate for the effect of far-fieldslope for scarps formed on nonhorizontal surfaces. Forscarps on horizontal surfaces, the scarp height and surfaceoffset are identical, but in most cases, for sloping surfaces,the scarp height overestimates the surface offset or the tec-tonic throw (Fig. 13). From our scarp profiles, we graphi-cally calculate both scarp height and surface offset, but wedo not have such data for our reconnaissance measurements.In order to estimate surface offsets from our reconnaissancescarp-height values, we calculated the average ratio of sur-face offset to scarp height for our scarp profiles; this ratio is0.85 � 0.08. We then multiplied the reconnaissance scarpheights (Table 2) by this value to estimate the correspondingreconnaissance surface offsets that are plotted in Figure 14.
Compressional deformation along the fault resulted inlocal arching in the hanging wall and back rotation in thefootwall, which in some cases increased the size of somescarps by a factor of more than 2, compared to the true tec-tonic throw. To obtain better estimates of the 2002 tectonicthrow, we graphically removed the effects of the folding andback rotation from our profile data.
Figure 15 shows the scarp profile at site SGPC51, wherethe footwall was back-rotated adjacent to the 2002 rupture.If measured adjacent to the rupture, the scarp height andsurface offset at this site are 2.0 m and 1.5 m, respectively.However, if the unrotated land surface farther away from therupture is projected to the scarp, then the scarp height andsurface offset are 0.9 m and 0.6 m, respectively. At this site,the near-field deformation has exaggerated the scarp’s sizeby a factor of about two, thus demonstrating the importanceof removing the near-field deformation to determine a betterestimate of actual tectonic throw.
We did not find compelling evidence of significant tec-tonic lateral slip anywhere along the Susitna Glacier fault.Locally we measured tens of centimeters of lateral slip, com-monly at ramps and step-overs where displacement wastransferred between adjacent strands; this lateral slip prob-
Characteristics of Surface Ruptures on the Susitna Glacier Thrust Fault S15
Table 2Reconnaissance Measurements of Scarp Height for the Susitna Glacier Fault
FieldNumber
Latitude(N)
Longitude(W)
Approx.Distance
along Fault(km)
Scarp*Height
(m) Comments
SGAC01 63.43391 �147.7357 0.35 0.1 Small scarp near end of rupture; at base of larger (1.5-2 m high) prehistoric scarpSGPC04 63.42482 �147.73297 1.55 0.1 Small thrust rupture at midpoint of 3-5 m high prehistoric scarpPH457 63.40801 �147.6615 5.75 0.3 Average of three measurements and associated errorsSGAC04 63.40883 �147.52835 12.86 0.8 Throw estimate on West Fork Glacier scarp in ablation morainePH463 63.40833 �147.52701 12.96 2.0 Composite scarp in West Fork Glacier ice; sums of heights and errorsSGAC06 63.40842 �147.52394 13.10 0.7 Throw estimate on West Fork Glacier scarp in ablation morainePH459 63.40271 �147.45703 16.70 1.7 10� N dip; composite scarp; sums of heights and errors; 1.2 m of shortening in snow,
20 m to eastSGSP34 63.40499 �147.43896 17.69 0.5 Height across single splay; declines to westSGSP33 63.40479 �147.43483 17.90 1.0 Height across single splayPH460 63.40381 �147.43276 18.07 1.1 Averaged best two of three measurementsSGSP46 63.40828 �147.42087 18.89 0.5 Height across thrustSGSP12 63.42015 �147.41623 19.46 0.3 Height of thrust fault in recent debris flow on SW side of drainage; one of several splays?SGSP42 63.40869 �147.41208 19.32 1.5 Height across single strand, single-event scarpSGSP15 63.42191 �147.40889 19.88 1.0 Height across two splays of main thrustSGSP18 63.42125 �147.4019 20.25 0.5 Height across main thrustSGAC34 63.41879 �147.3924 20.87 0.9 Scarp height on strand to north of profile SGPC51SGSP27 63.41859 �147.39211 20.91 1.0 Height across single splaySGPC52 63.42114 �147.38779 21.13 0.1 Scarp height on strand to northwest of profile SGAC15SGPC60 63.42239 �147.38171 21.49 1.3 Scarp height of normal fault scarp, transitions from strike-slip fault (upslope)PH400 63.41979 �147.36994 22.05 6.4 Good surfaces top and bottom; good single-event scarpPH399 63.41999 �147.36932 22.09 6.2 Good surfaces top and bottom; good single-event scarpPC06 63.42436 �147.36371 22.74 1.4 Surface offset estimate; lots of near-fault warping; scarp height 5.1 mPC05 63.42498 �147.35997 22.95 1.4 South-dipping backthrustSGAC15b 63.42546 �147.35544 23.19 1.0 Throw estimate across abandoned channelSGSP38 63.43242 �147.33374 24.67 0.4 Height of small thrust west of unnamed creekPH385 63.41794 �147.30277 27.12 1.1 Measurement on tundra surfacePC07 63.41786 �147.30241 27.14 1.3 Additional measurement 40 m W: 1.1 � 0.2, minimum 0.7 m horizontal overthrustPH386 63.41777 �147.30207 27.16 1.0 Measurement on tundra surfacePH389 63.41777 �147.30168 27.18 1.3 Measurement on tundra surfacePH371 63.42386 �147.26823 29.04 3.5 Measurement taken near, but not at big bulgePH370 63.42461 �147.26714 29.14 4.0 Big scarp, no evidence in distance of hanging-wall block rotationPH369 63.42532 �147.26649 29.22 2.7 Measurement on tundra surfacePC08 63.42592 �147.26551 29.31 1.7 Well-defined, planar alluvial surface offset by thrust faultPH367 63.42599 �147.26524 29.32 2.5 Susitna Glacier faultPH366 63.4262 �147.26403 29.39 2.0 Measurement between base of tussocks above and below scarpPH365 63.42622 �147.26257 29.46 2.0 Scarp height from channels above and below scarpPH364 63.42612 �147.26126 29.52 1.7 Measured vertical offset from snow surfaces above and below scarpPC09 63.42635 �147.26014 29.60 1.6 Some equivocal evidence of left-lateral displacement of small drainagesPH363 63.42637 �147.25967 29.62 2.4 No splays here; hanging wall incised by small streams, measurement at knickpointPH362 63.42631 �147.25899 29.65 1.2 Minimum because only one of two splays measuredPH360 63.42619 �147.25772 29.72 0.4 Minimum because only one of three or more splays measuredPH359 63.42607 �147.25591 29.81 0.7 Minimum because only one of three or more splays measuredPH357 63.42624 �147.25466 29.88 0.7 Minimum because only one of three or more splays measuredSGAC10 63.42678 �147.25188 30.03 1.8 Total throw estimate across single strand on west side of Three-point CanyonSGSP41 63.42763 �147.24258 30.62 1.5 Height across compound scarp consisting of at least two stacked thrustsPH315 63.48883 �147.05185 42.87 1.1 73� N dip; throw across two scarps in Susitna Glacier ice, heights and errors summedPH319 63.48862 �147.04432 43.26 1.1 Tension gashes indicate a small component of right-lateral shear; in Susitna Glacier icePH316 63.48892 �147.0414 43.41 1.0 48� N dip; measured throw on offset channel in Susitna Glacier iceSGAC14 63.48931 �147.0394 43.53 1.4 Throw estimate across melted scarp in Susitna Glacier icePH320 63.48957 �147.0383 43.59 1.1 75� N dip; measured throw in Susitna Glacier ice
These measurements were made in November 2002 during initial reconnaissance of the ruptures. Latitudes and longitudes are for the NAD27 mapdatum.
*Scarp heights are reconnaissance field measurements by the authors using a variety of techniques including tape, rod, and hand-level measurements.Errors are variable and difficult to estimate but probably range between 10% and 70%.
S16 A. J. Crone, S. F. Personius, P. A. Craw, P. J. Haeussler, and L. A. Staft
Figure 11. Photographs (A and B) and topographic profile (C)of the fault scarp at “Three-point Canyon.” (A) View to the north-west of the canyon. Solid line with teeth (on hanging wall) showstrace of the ruptures, dashed where concealed behind slope in theforeground. Arrow shows location of scarp and waterfall in canyonbottom. (B) View of the scarp (to northeast) and waterfall in thecanyon bottom. Solid line with teeth (on hanging wall) shows traceof the rupture. Dashed line shows location of profile SGSP04. Ar-row shows person for scale. (C) Profile of the scarp in the canyonbottom. The fault trace (heavy dashed line with arrows) shown onthe profile is inferred. Selected parameters for profile are listed inTable 1. Scarp height (SH) and surface offset (SO) are determinedas described by Bucknam and Anderson (1977) and as shown inFigure 13.
ably does not reflect deep-seated lateral motion on the fault.Therefore, we believe that the surface offsets in Tables 1 and2 reflect the near-surface throw on the fault.
Assuming that the lateral slip is negligible, we use ourprofile data to estimate the near-surface dip slip along thefault. To compute dip-slip values, we must know the amountof throw, the ground-surface slope, and the fault’s dip angleat a site (e.g., Caskey, 1995). Our profile data show that themajority of single-trace throw measurements range betweenless than 1 m and about 3 m (surface offsets in Table 1).Using our preferred dip value of 19� and the amounts ofthrow from the profiles yields dip-slip displacements in therange of 1–6 m. The majority of these dip-slip values clusterin the range of 3–5 m. It is difficult to rigorously calculatean average dip-slip value from our profile data because ofthe great variability in the scarps and because we selectivelychose profile sites where the deformation was relatively sim-ple and confined to a narrow zone. So the throw values wedetermined from our profiles are somewhat biased and maynot perfectly reflect throw values for the entire fault. Nev-ertheless, based on our data, we consider the typical near-surface dip slip to be about 4 m given the general distributionof our measurements. This value is based largely on judg-ment rather than any formal calculations, but we judge it tobe a realistic estimate of the average throw based on ourfield observations.
Our maximum 2002 throw measurement is 5.4 m at thebottom of Three-point Canyon, where the rupture offsets theactive stream channel (Fig. 11). Because a steep, vigorousstream would have eroded a prehistoric scarp in the canyonbottom, all of this throw must have occurred in 2002. A faultdip of 19� and a throw of 5.4 m yields a near-surface dipslip of more than 11 m at this site, which is the maximumamount we measured for a single-event scarp.
Evidence of Pre-2002 Ruptures
Because surficial processes are actively modifying therange-front slopes along the trace of the Susitna Glacierfault, it difficult to recognize confidently and map prehistoricfault scarps. We found evidence of pre-2002 fault scarps inonly a few places (Table 1) using pre-earthquake, 1:63,360-scale, color-infrared aerial photographs and field reconnais-sance. Our best evidence is where the 2002 ruptures are su-perimposed on large old scarps. We used several criteria toinfer a probable fault origin of these old scarps: (1) Thesescarps are not likely the result of other scarp-forming pro-cesses such as landslides, glacial trimlines, or solifluctionlobes, and (2) the scarps existed prior to November 2002because they are visible on pre-earthquake aerial photogra-phy. These compound scarps are formed on surficial depositswhose ages are poorly documented, so the age of the pre-historic scarps is difficult to determine. At one location(SGPC12; Fig. 16 and Table 1), fan alluvium adjacent to themountain front has been deformed by both pre-2002 faulting
Characteristics of Surface Ruptures on the Susitna Glacier Thrust Fault S17
Figure 12. Shaded topographic map show-ing central part of rupture zone on the SusitnaGlacier fault at informally named “Lake 3395”valley. The 1-km northward deflection of therupture trace up the valley is evidence that thefault has a northward dip.
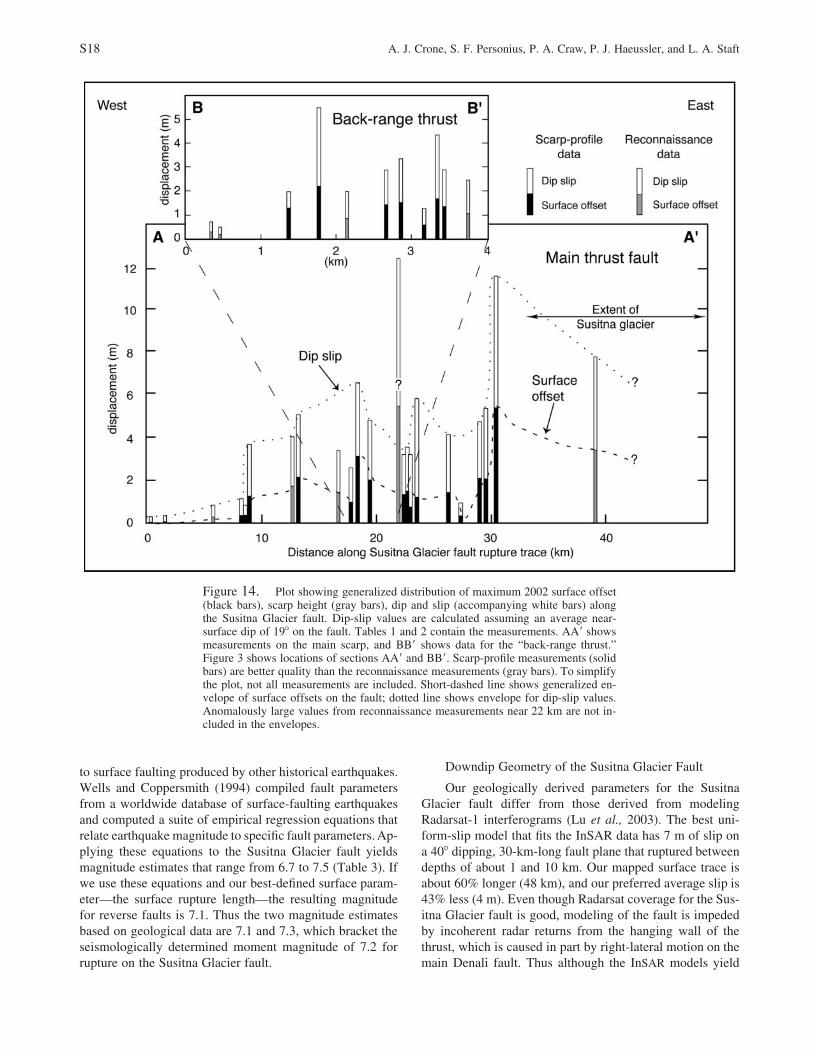
Figure 13. Schematic diagram showing the rela-tionship between scarp height (SH) and surface offset(SO) for scarps similar to those on the Susitna Glacierfault. Surface offset is a better estimate of the actualtectonic throw than scarp height because it compen-sates for the effects of the scarp forming on a slopingsurface.
and the 2002 ruptures. Here, the 2002 surface faulting pro-duced a series of transverse cracks in tundra in the hangingwall and exposed 1–1.5 m of the underlying sediment, whichconsisted of alternating layers of peat and sandy alluvium.About 50 cm below the surface, the alluvium contained whatappeared to be a discontinuous, weathered volcanic ash thatmight correlate with the Jarvis Creek ash (Beget et al., 1991)or the Hayes tephra set H (Riehle, 1994), a common tephrain the region that is thought to have an age of about 3.6 ka(Beget et al., 1991). If this suspected tephra is the JarvisCreek ash, then the fact that it was deposited and buried byalluvium and then deformed in the hanging wall of a pre-historic scarp suggests that one or more pre-2002 rupturespostdate deposition of the ash. Further work is needed tobetter document these relationships and the age of pre-2002ruptures, but prehistoric scarps are locally present along theSusitna Glacier fault and contain potentially datable depos-its. These relations afford an opportunity to clarify the lateQuaternary history of surface rupturing on the Susitna Gla-cier fault.
Discussion and Remaining Problems
Moment Magnitude Calculations
The moment magnitude calculated from our surface-slipdata is similar to the seismologically determined value ofMw 7.2 for the Susitna Glacier Fault (Eberhart-Phillips et al.,2003) even though our geological estimates involve severalassumptions. First, the geological methods assume that thesize and length of the surface rupture faithfully record theslip at depth. But it is well known that the length of coseis-mic ruptures at depth is typically greater than the lengthmeasured at the surface (Bonilla et al., 1984; Wells and Cop-persmith, 1994). Second, because of the width of the defor-mation zone, our estimates of the total throw may be lowbecause of unrecognized warping and small scarps. Third,our preferred average near-surface slip of 4 m for the entirefault may be high because ruptures along the western 10 kmof the fault are discontinuous, and the scarps are small (Fig.14). It is clear that the amount of the slip certainly variesalong strike and downdip on the fault, so using a uniformslip rupture model to calculate moment magnitude is inac-curate. Fourth, the dip-slip values measured at the surfaceassume that the near-surface fault dip is similar to the dip atdepth, but our preferred 19� near-surface dip is substantiallyless than the 35�–48� dip determined from seismological andInSAR data (AEIC, 2002; Ji et al., 2002; Kikuchi and Ya-manaka, 2002; Lu et al., 2003; Wright et al., 2003).
If we use our preferred average dip-slip value of 4 m, arupture length of 48 km, and a downdip fault width as 14.1km (45� average dip to the maximum base of seismicity atabout 10 km; Ratchkovski et al., 2003), then the calculatedmoment magnitude (Hanks and Kanamori, 1979) is 7.3. De-spite the obvious sources of error, our field-based surface-faulting parameters yield a moment magnitude estimate thatis comparable to the seismological value of Mw 7.2 for theSusitna Glacier fault (Eberhart-Phillips et al., 2003).
Surface-faulting parameters for the Susitna Glacier faultyield a large range of estimated magnitudes when compared
S18 A. J. Crone, S. F. Personius, P. A. Craw, P. J. Haeussler, and L. A. Staft
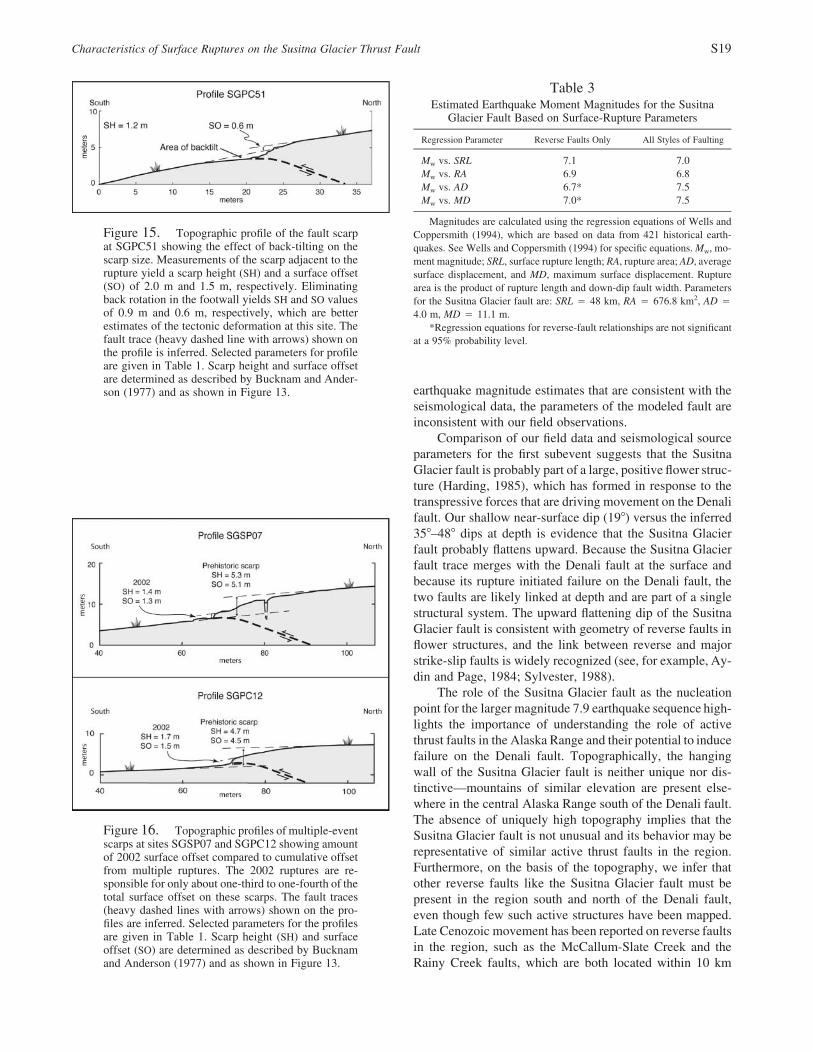
Figure 14. Plot showing generalized distribution of maximum 2002 surface offset(black bars), scarp height (gray bars), dip and slip (accompanying white bars) alongthe Susitna Glacier fault. Dip-slip values are calculated assuming an average near-surface dip of 19� on the fault. Tables 1 and 2 contain the measurements. AA� showsmeasurements on the main scarp, and BB� shows data for the “back-range thrust.”Figure 3 shows locations of sections AA� and BB�. Scarp-profile measurements (solidbars) are better quality than the reconnaissance measurements (gray bars). To simplifythe plot, not all measurements are included. Short-dashed line shows generalized en-velope of surface offsets on the fault; dotted line shows envelope for dip-slip values.Anomalously large values from reconnaissance measurements near 22 km are not in-cluded in the envelopes.
to surface faulting produced by other historical earthquakes.Wells and Coppersmith (1994) compiled fault parametersfrom a worldwide database of surface-faulting earthquakesand computed a suite of empirical regression equations thatrelate earthquake magnitude to specific fault parameters. Ap-plying these equations to the Susitna Glacier fault yieldsmagnitude estimates that range from 6.7 to 7.5 (Table 3). Ifwe use these equations and our best-defined surface param-eter—the surface rupture length—the resulting magnitudefor reverse faults is 7.1. Thus the two magnitude estimatesbased on geological data are 7.1 and 7.3, which bracket theseismologically determined moment magnitude of 7.2 forrupture on the Susitna Glacier fault.
Downdip Geometry of the Susitna Glacier Fault
Our geologically derived parameters for the SusitnaGlacier fault differ from those derived from modelingRadarsat-1 interferograms (Lu et al., 2003). The best uni-form-slip model that fits the InSAR data has 7 m of slip ona 40� dipping, 30-km-long fault plane that ruptured betweendepths of about 1 and 10 km. Our mapped surface trace isabout 60% longer (48 km), and our preferred average slip is43% less (4 m). Even though Radarsat coverage for the Sus-itna Glacier fault is good, modeling of the fault is impededby incoherent radar returns from the hanging wall of thethrust, which is caused in part by right-lateral motion on themain Denali fault. Thus although the InSAR models yield
Characteristics of Surface Ruptures on the Susitna Glacier Thrust Fault S19
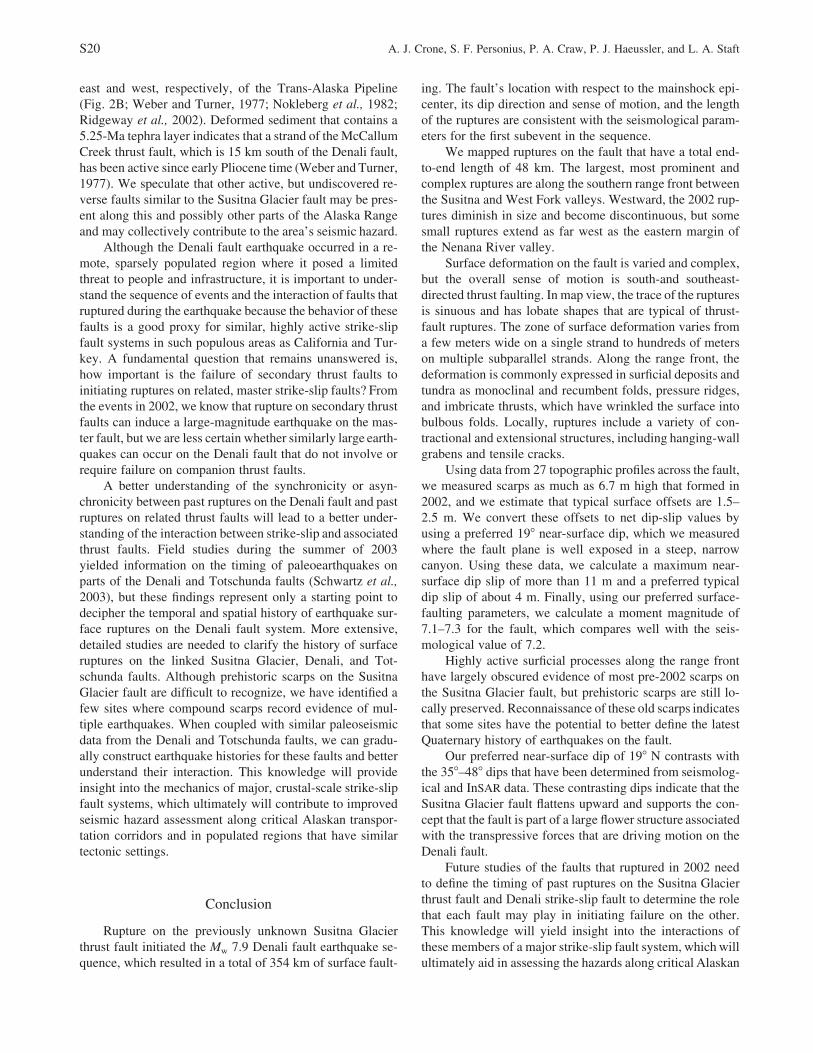
Figure 15. Topographic profile of the fault scarpat SGPC51 showing the effect of back-tilting on thescarp size. Measurements of the scarp adjacent to therupture yield a scarp height (SH) and a surface offset(SO) of 2.0 m and 1.5 m, respectively. Eliminatingback rotation in the footwall yields SH and SO valuesof 0.9 m and 0.6 m, respectively, which are betterestimates of the tectonic deformation at this site. Thefault trace (heavy dashed line with arrows) shown onthe profile is inferred. Selected parameters for profileare given in Table 1. Scarp height and surface offsetare determined as described by Bucknam and Ander-son (1977) and as shown in Figure 13.
Table 3Estimated Earthquake Moment Magnitudes for the Susitna
Glacier Fault Based on Surface-Rupture Parameters
Regression Parameter Reverse Faults Only All Styles of Faulting
Mw vs. SRL 7.1 7.0Mw vs. RA 6.9 6.8Mw vs. AD 6.7* 7.5Mw vs. MD 7.0* 7.5
Magnitudes are calculated using the regression equations of Wells andCoppersmith (1994), which are based on data from 421 historical earth-quakes. See Wells and Coppersmith (1994) for specific equations. Mw, mo-ment magnitude; SRL, surface rupture length; RA, rupture area; AD, averagesurface displacement, and MD, maximum surface displacement. Rupturearea is the product of rupture length and down-dip fault width. Parametersfor the Susitna Glacier fault are: SRL � 48 km, RA � 676.8 km2, AD �
4.0 m, MD � 11.1 m.*Regression equations for reverse-fault relationships are not significant
at a 95% probability level.
Figure 16. Topographic profiles of multiple-eventscarps at sites SGSP07 and SGPC12 showing amountof 2002 surface offset compared to cumulative offsetfrom multiple ruptures. The 2002 ruptures are re-sponsible for only about one-third to one-fourth of thetotal surface offset on these scarps. The fault traces(heavy dashed lines with arrows) shown on the pro-files are inferred. Selected parameters for the profilesare given in Table 1. Scarp height (SH) and surfaceoffset (SO) are determined as described by Bucknamand Anderson (1977) and as shown in Figure 13.
earthquake magnitude estimates that are consistent with theseismological data, the parameters of the modeled fault areinconsistent with our field observations.
Comparison of our field data and seismological sourceparameters for the first subevent suggests that the SusitnaGlacier fault is probably part of a large, positive flower struc-ture (Harding, 1985), which has formed in response to thetranspressive forces that are driving movement on the Denalifault. Our shallow near-surface dip (19�) versus the inferred35�–48� dips at depth is evidence that the Susitna Glacierfault probably flattens upward. Because the Susitna Glacierfault trace merges with the Denali fault at the surface andbecause its rupture initiated failure on the Denali fault, thetwo faults are likely linked at depth and are part of a singlestructural system. The upward flattening dip of the SusitnaGlacier fault is consistent with geometry of reverse faults inflower structures, and the link between reverse and majorstrike-slip faults is widely recognized (see, for example, Ay-din and Page, 1984; Sylvester, 1988).
The role of the Susitna Glacier fault as the nucleationpoint for the larger magnitude 7.9 earthquake sequence high-lights the importance of understanding the role of activethrust faults in the Alaska Range and their potential to inducefailure on the Denali fault. Topographically, the hangingwall of the Susitna Glacier fault is neither unique nor dis-tinctive—mountains of similar elevation are present else-where in the central Alaska Range south of the Denali fault.The absence of uniquely high topography implies that theSusitna Glacier fault is not unusual and its behavior may berepresentative of similar active thrust faults in the region.Furthermore, on the basis of the topography, we infer thatother reverse faults like the Susitna Glacier fault must bepresent in the region south and north of the Denali fault,even though few such active structures have been mapped.Late Cenozoic movement has been reported on reverse faultsin the region, such as the McCallum-Slate Creek and theRainy Creek faults, which are both located within 10 km
S20 A. J. Crone, S. F. Personius, P. A. Craw, P. J. Haeussler, and L. A. Staft
east and west, respectively, of the Trans-Alaska Pipeline(Fig. 2B; Weber and Turner, 1977; Nokleberg et al., 1982;Ridgeway et al., 2002). Deformed sediment that contains a5.25-Ma tephra layer indicates that a strand of the McCallumCreek thrust fault, which is 15 km south of the Denali fault,has been active since early Pliocene time (Weber and Turner,1977). We speculate that other active, but undiscovered re-verse faults similar to the Susitna Glacier fault may be pres-ent along this and possibly other parts of the Alaska Rangeand may collectively contribute to the area’s seismic hazard.
Although the Denali fault earthquake occurred in a re-mote, sparsely populated region where it posed a limitedthreat to people and infrastructure, it is important to under-stand the sequence of events and the interaction of faults thatruptured during the earthquake because the behavior of thesefaults is a good proxy for similar, highly active strike-slipfault systems in such populous areas as California and Tur-key. A fundamental question that remains unanswered is,how important is the failure of secondary thrust faults toinitiating ruptures on related, master strike-slip faults? Fromthe events in 2002, we know that rupture on secondary thrustfaults can induce a large-magnitude earthquake on the mas-ter fault, but we are less certain whether similarly large earth-quakes can occur on the Denali fault that do not involve orrequire failure on companion thrust faults.
A better understanding of the synchronicity or asyn-chronicity between past ruptures on the Denali fault and pastruptures on related thrust faults will lead to a better under-standing of the interaction between strike-slip and associatedthrust faults. Field studies during the summer of 2003yielded information on the timing of paleoearthquakes onparts of the Denali and Totschunda faults (Schwartz et al.,2003), but these findings represent only a starting point todecipher the temporal and spatial history of earthquake sur-face ruptures on the Denali fault system. More extensive,detailed studies are needed to clarify the history of surfaceruptures on the linked Susitna Glacier, Denali, and Tot-schunda faults. Although prehistoric scarps on the SusitnaGlacier fault are difficult to recognize, we have identified afew sites where compound scarps record evidence of mul-tiple earthquakes. When coupled with similar paleoseismicdata from the Denali and Totschunda faults, we can gradu-ally construct earthquake histories for these faults and betterunderstand their interaction. This knowledge will provideinsight into the mechanics of major, crustal-scale strike-slipfault systems, which ultimately will contribute to improvedseismic hazard assessment along critical Alaskan transpor-tation corridors and in populated regions that have similartectonic settings.
Conclusion
Rupture on the previously unknown Susitna Glacierthrust fault initiated the Mw 7.9 Denali fault earthquake se-quence, which resulted in a total of 354 km of surface fault-
ing. The fault’s location with respect to the mainshock epi-center, its dip direction and sense of motion, and the lengthof the ruptures are consistent with the seismological param-eters for the first subevent in the sequence.
We mapped ruptures on the fault that have a total end-to-end length of 48 km. The largest, most prominent andcomplex ruptures are along the southern range front betweenthe Susitna and West Fork valleys. Westward, the 2002 rup-tures diminish in size and become discontinuous, but somesmall ruptures extend as far west as the eastern margin ofthe Nenana River valley.
Surface deformation on the fault is varied and complex,but the overall sense of motion is south-and southeast-directed thrust faulting. In map view, the trace of the rupturesis sinuous and has lobate shapes that are typical of thrust-fault ruptures. The zone of surface deformation varies froma few meters wide on a single strand to hundreds of meterson multiple subparallel strands. Along the range front, thedeformation is commonly expressed in surficial deposits andtundra as monoclinal and recumbent folds, pressure ridges,and imbricate thrusts, which have wrinkled the surface intobulbous folds. Locally, ruptures include a variety of con-tractional and extensional structures, including hanging-wallgrabens and tensile cracks.
Using data from 27 topographic profiles across the fault,we measured scarps as much as 6.7 m high that formed in2002, and we estimate that typical surface offsets are 1.5–2.5 m. We convert these offsets to net dip-slip values byusing a preferred 19� near-surface dip, which we measuredwhere the fault plane is well exposed in a steep, narrowcanyon. Using these data, we calculate a maximum near-surface dip slip of more than 11 m and a preferred typicaldip slip of about 4 m. Finally, using our preferred surface-faulting parameters, we calculate a moment magnitude of7.1–7.3 for the fault, which compares well with the seis-mological value of 7.2.
Highly active surficial processes along the range fronthave largely obscured evidence of most pre-2002 scarps onthe Susitna Glacier fault, but prehistoric scarps are still lo-cally preserved. Reconnaissance of these old scarps indicatesthat some sites have the potential to better define the latestQuaternary history of earthquakes on the fault.
Our preferred near-surface dip of 19� N contrasts withthe 35�–48� dips that have been determined from seismolog-ical and InSAR data. These contrasting dips indicate that theSusitna Glacier fault flattens upward and supports the con-cept that the fault is part of a large flower structure associatedwith the transpressive forces that are driving motion on theDenali fault.
Future studies of the faults that ruptured in 2002 needto define the timing of past ruptures on the Susitna Glacierthrust fault and Denali strike-slip fault to determine the rolethat each fault may play in initiating failure on the other.This knowledge will yield insight into the interactions ofthese members of a major strike-slip fault system, which willultimately aid in assessing the hazards along critical Alaskan
Characteristics of Surface Ruptures on the Susitna Glacier Thrust Fault S21
transportation corridors and of similar fault systems in high-risk seismogenic regions of the world.
Acknowledgments
We wish to thank Jonathan Larivee and David Beard, pilots for PrismHelicopters, for their flying skills that allowed us track the surface rupturesunder difficult conditions in November 2002 and also pilot Jon Goodmanof Pathfinder Aviation for his flying skills and assistance in the field in2003. We thank Butch and Carol Gratias, proprietors of the GraciousHouse, Milepost 82, Denali Highway, for their enthusiastic support andassistance during our July 2003 fieldwork. Also, we thank Keith Labay forhis GIS programming skills. We wish to express our gratitude to our othercolleagues who formed in the Denali Earthquake Geologic Field Team inNovember 2002 for their enthusiasm and dedication under less than idealand sometimes harsh field conditions: T. E. Dawson, G. Plafker, C. M.Rubin, B. L. Sherrod, K. Sieh, and W. K. Wallace. We also thank Alan R.Nelson, Michael N. Machette, Michael J. Rymer, and an anonymous re-viewer for their beneficial and constructive comments that helped clarifyexplanations and identify problems.
References
Alaska Earthquake Information Center (AEIC) (2002). M 7.9 Denali faultearthquake of November 2, 2002: available from the AEIC atwww.giseis.alaska.edu/M7.9_quake_2002/M7.9_quake.html (last ac-cessed December 2004).
Anderson, G., and C. Ji (2003). Static stress transfer during the 2002 Nen-ana Mountain–Denali fault, Alaska, earthquake sequence, Geophys.Res. Lett. 30, no. 6, 1310, doi: 10.1029/2002GL016724.
Aydin, A., and B. M. Page (1984). Diverse Pliocene–Quaternary tectonicsin a transform environment, San Francisco Bay region, California,Geol. Soc. Am. Bull. 95, 1303–1317.
Beget, J. E., R. D. Reger, D. Pinney, T. Gillispie, and K. Campbell (1991).Correlation of the Holocene Jarvis Creek, Tangle Lakes, Cantwell,and Hayes tephras in south-central and central Alaska, Quat. Res. 35,174–189.
Bonilla, M. G., R. K. Mark, and J. J. Lienkaemper (1984). Statistical re-lations among earthquake magnitude, surface rupture length, and sur-face fault displacement, Bull. Seism. Soc. Am. 74, 2379–2411.
Brogan, G. E., L. S. Cluff, M. K. Korring, and D. B. Slemmons (1975).Active faults in Alaska, Tectonophysics 29, 73–85.
Bucknam, R. C., and R. E. Anderson (1977). Estimation of fault-scarp agesfrom a scarp-height–slope-angle relationship, Geology 7, 1–4.
Caskey, S. J. (1995). Geometric relations of dip slip to a faulted groundsurface—New nomograms for estimating components of fault dis-placement, J. Struct. Geol. 17, 1197–1202.
Craw, P., P. Haeussler, A. Crone, S. Personius, and W. Wallace (2002).Surface rupture on the Susitna Glacier fault associated with the M 7.9Denali fault earthquake, EOS 83, Abstract S72F-1336.
Csejtey, B., M. W. Mullen, D. P. Cox, and G. D. Stricker (1992). Geologyand geochronology of the Healy quadrangle, south-central Alaska:U.S. Geol. Surv. Misc. Invest. Map I-1961, scale 1:250,000.
Division of Geological and Geophysical Surveys (DGGS) Staff (1973). Stateof Alaska DGGS Annual Report 1973, 1–59 (link to download reportis available at http://www.dggs.dnr.state.ak.us/pubs/pubs.jsp, last ac-cessed December 2004).
Eberhart-Phillips, D., P. J. Haeussler, J. T. Freymueller, A. D. Frankel,C. M. Rubin, P. Craw, N. A. Ratchkovski, G. Anderson, G. A. Carver,A. J. Crone, T. E. Dawson, H. Fletcher, R. Hansen, E. L. Harp, R. A.Harris, D. P. Hill, S. Hreinsdottir, R. W. Jibson, L. M. Jones,R. Kayen, D. K. Keefer, C. F. Larsen, S. C. Moran, S. F. Personius,G. Plafker, B. Sherrod, K. Sieh, N. Sitar, and W. K. Wallace (2003).The 2002 Denali fault earthquake, Alaska—A large magnitude, slip-partitioned event, Science 300, 1113–1118.
Frankel, A. (2004). Rupture process of the M 7.9 Denali fault, Alaska,earthquake: Subevents, directivity and scaling of high-frequencyground motion, Bull. Seism. Soc. Am. 94, no. 6B, S234–S255.
Gordon, F. R., and J. D. Lewis (1980). The Meckering and Calingiri earth-quakes October 1968 and March 1970, Geol. Surv. West. Aust. Bull.126, 229 pp.
Grantz, A. (1966). Strike-slip faults in Alaska, U.S. Geol. Surv. Open-FileRept. 66-53, 156 pp.
Haeussler, P. J., D. P. Schwartz, T. E. Dawson, H. D. Stenner, J. J. Lien-kaemper, B. Sherrod, F. R. Cinti, P. Montone, P. Craw, A. J. Crone,and S. Personius. (2004). Surface rupture and slip distribution of theDenali and Totschunda faults in the 3 November 2002 M 7.9 earth-quake, Alaska, Bull. Seism. Soc. Am. 94, no. 6B, S23–S52.
Hanks, T. C., and H. Kanamori (1979). A moment magnitude scale, J.Geophys. Res. 84, 2348–2350.
Harding, T. P. (1985). Seismic characteristics and identification of negativeflower structures, positive flower structures, and positive structuralinversion, Am. Assoc. Pet. Geol. Bull. 69, 582–600.
Harp, E. L., R. W. Jibson, R. E. Kayen, D. K. Keefer, B. L. Sherrod, G. A.Carver, B. D. Collins, R. E. S. Moss, and N. Sitar (2003). Landslidesand liquefaction triggered by the M 7.9 Denali fault earthquake of 3November 2002, GSA Today 13, 4–10.
Hickman, R. G., C. Craddock, and K. W. Sherwood (1977). Structuralgeology of the Nenana River segment of the Denali fault system,central Alaska Range, Geol. Soc. Am. Bull. 88, 1217–1230.
Hudson, T., and F. R. Weber (1977). The Donnelly Dome and GraniteMountain faults, south-central Alaska, U.S. Geol. Surv. Circular 751-B, B64–B66.
Ji, C., D. Helmberger, and D. Wald (2002). Preliminary slip history of the2002 Denali earthquake, EOS 83, Abstract S72F-1344.
Kayen, R., E. Thompson, D. Minasian, R. E. S. Moss, B. D. Collins, N.Sitar, D. Dreger, and G. Carver (2004). Geotechnical reconnaissanceof the 2002 Denali fault, Alaska, earthquake, Earthquake Spectra 20,639–667.
Kikuchi, M., and Y. Yamanaka (2002). Source rupture processes for thecentral Alaska earthquake of Nov. 3, 2002, inferred from teleseismicbody wave (� the 10/23 M 6.7 event), EIC Seismological Note No.129, revised 5 November 2002. Available from the Earthquake In-formation Center, University of Tokyo at http://wwweic.eri.u-toyko-ac.jp/EIC/EIC_News/021103AL-e.html (last accessed December2004).
Lu, Z., T. Wright, and C. Wicks (2003). Deformation of the 2002 Denalifault earthquakes, mapped by Radarsat-1 interferometry, EOS 84,no. 425, 430–431.
Miller, M. L., D. C. Bradley, T. K. Bundtzen, and W. McClelland (2002).Late Cretaceous through Cenozoic strike-slip tectonics of southwest-ern Alaska, J. Geol. 110, 247–270.
Nokleberg, W. J., N. R. D. Albert, G. C. Bond, P. L. Herzon, R. Miyaoka,W. H. Nelson, D. H. Richter, T. P. Smith, J. H. Stout, W. Yeend, andR. E. Zehrner (1982). Geologic map of the southern part of the Mt.Hayes quadrangle, Alaska, U.S. Geol. Surv. Open-File Rept. 82-52,26 pp., scale 1:250,000.
Nokleberg, W. J., J. N. Aleinikoff, I. M. Lange, S. R. Silva, R. T. Miyaoka,C. E. Schwab, and R. E. Zehner (1992). Preliminary geologic map ofthe Mount Hayes quadrangle, eastern Alaska Range, Alaska, U.S.Geol. Surv. Open-File Rept. 92-594, 39 pp., scale 1:250,000.
Nokleberg, W. J., D. L. Jones, and N. J. Silberling (1985). Origin andtectonic evolution of the Maclaren and Wrangellia terrains, easternAlaska Range, Alaska, Geol. Soc. Am. Bull. 96, 1251–1270.
Nokleberg, W. J., G. Plafker, and F. H. Wilson (1994). Geology of south-central Alaska, in The Geology of Alaska, G. Plafker and H. C. Berg(Editors) The Geology of North America G1, Geological Society ofAmerica, Boulder, Colorado, 311–366.
Philip, H., and M. Meghraoui (1983). Structural analysis and interpretationof the surface deformations of the El Asnam earthquake of October10, 1980, Tectonics 2, 17–49.
Philip, H., E. Rogozhin, A. Cisternas, J. C. Bousquet, B. Borisov, and A.
S22 A. J. Crone, S. F. Personius, P. A. Craw, P. J. Haeussler, and L. A. Staft
Karakhanian (1992). The Armenian earthquake of 1988 December7—faulting and folding, neotectonics and paleoseismicity, Geophys.J. Int. 110, 141–158.
Plafker, G., and H. C. Berg (1994). Overview of the geology and tectonicevolution of Alaska, in The Geology of Alaska, G. Plafker and H. C.Berg (Editors), The Geology of North America G1, Boulder, Colo-rado, Geological Society of America, 989–1021.
Plafker, G., L. M. Gilpin, and J. C. Lahr (1993). Neotectonic map of Alaska,in The Geology of Alaska, G. Plafker and H. C. Berg, (Editors) theGeology of North America G1, Geological Society of America, Boul-der, Colorado, pl. 12, scale 1:2,500,000.
Plafker, G., T. Hudson, and D. H. Richter (1977). Preliminary observationson late Cenozoic displacements along the Totschunda and Denali faultsystems, U.S. Geol. Surv. Circular 751-B, B67–B69.
Ratchkovski, N. A., R. A. Hansen, J. C. Stanching, T. Cox, O. Fox, L. Rio,E. Clark, M. Lafevers, S. Estes, J. B. MacCormack, and T. Williams(2003). Aftershock sequence of the Mw 7.9 Denali fault, Alaska, earth-quake of 3 November 2002 from regional seismic network data,Seism. Res. Lett. 74, 743–752.
Reed, B. L., and M. A. Lanphere (1974). Offset plutons and history ofmovement along the McKinley segment of the Denali fault system,Alaska, Geol. Soc. Am. Bull. 85, 1883–1892.
Richter, D. H., and N. A. Matson (1971). Quaternary faulting in the easternAlaska Range, Geol. Soc. Am. Bull. 82, 1529–1540.
Ridgeway, K. D., J. M. Trop, W. J. Nokleberg, C. M. Davidson, and K. R.Eastham (2002). Mesozoic and Cenozoic tectonics of the eastern andcentral Alaska Range—Progressive basin development and defor-mation in a suture zone, Geol. Soc. Am. Bull. 114, 1480–1504.
Riehle, J. R. (1994). Heterogeneity, correlatives, and proposed stratigraphicnomenclature of Hayes tephra set H, Alaska, Quat. Res. 41, 285–288.
Schwartz, D. P. and the Denali Fault Earthquake Geology Working Group(2003). Paleoearthquakes on the Denali–Totschunda fault system—Preliminary observations of slip and timing, EOS 84, AbstractS11B-03.
St. Amand, P. (1957). Geological and geophysical synthesis of the tectonics
of portions of British Columbia, the Yukon Territory, and Alaska,Geol. Soc. Am. Bull. 68, 1343–1370.
Stout, J. H., and C. G. Chase (1980). Plate kinematics of the Denali faultsystem, Can. J. Earth Sci. 17, 1527–1537.
Stout, J. H., J. G. Brady, F. Weber, and R. A. Page (1973). Evidence forQuaternary movement on the McKinley strand of the Denali fault inthe Delta River area, Alaska, Geol. Soc. Am. Bull. 84, 939–948.
Sylvester, A. G. (1988). Strike-slip faults, Geol. Soc. Am. Bull. 100, 1666–1703.
Weber, F. R., and D. L. Turner (1977). A late Tertiary thrust fault in thecentral Alaska Range, U.S. Geol. Surv. Circular 751-B, B66–B67.
Wells, D. L., and K. J. Coppersmith (1994). New empirical relationshipsamong magnitude, rupture length, rupture width, rupture area, andsurface displacement, Bull. Seism. Soc. Am. 84, 974–1002.
Wright, T. J., Z. Lu, and C. Wicks (2003). Source models for the 2003Denali fault earthquakes from InSAR and GPS, EOS 84, AbstractS11H-04.
U.S. Geological SurveyMS 966, Box, 25046Denver, Colorado 80225-0046
(A.J.C., S.F.P.)
Alaska Division of Geological and Geophysical Surveys3354 College RoadFairbanks, Alaska 99709
(P.A.C., L.A.S.)
U.S. Geological Survey4200 University DriveAnchorage, Alaska 99508
(P.J.H.)
Manuscript received 13 February 2004.


