Embed Size (px)
Citation preview
The Theory of Planned Behavior: Some Measurement Issues Concerning Belief-Based Variables
CAMILLE GAGNE AND GASTON GODIN' Research Group on Psychosocial Aspects of Health-Related Behaviors
Laval Universip Sre. -Fay Canada
The theory of planned behavior presents clear operational definitions of attitudes, subjec- tive norm, perceived behavioral control, and each of their corresponding belief-based mea- sures. Theoretically, the direct and indirect measures of a given construct must be closely correlated. Empirical results, however, indicate that this is not always the case. In the present study, 2 of the factors that could be responsible for this situation-namely, the scaling of the variables defining each belief-based construct and the adequacy of using an expectancy-value model within the belief-based measures-were verified among a data set of 16 studies concerned with the application of the theory of planned behavior to the field of health. The results indicate that the scaling method used affected the correlation coefficients between indirect and direct measures. However, the face validity of these scal- ing methods must be demonstrated. The results also support the idea that, in most cases, using the expectancy-value model is no better than using only one arm of the belief-based measure.
According to the theory of planned behavior, intention is regarded as the immediate determinant of volitional behavior. Perceived behavioral control may also exert a direct influence on behavior, but only when performance of the behavior is not hlly under volitional control. Three variables define behavioral intention: attitude toward the act, subjective norm, and perceived behavioral con- trol. The attitude component (Aact) is defined as the personal evaluation of the behavior to be adopted. Subjective norm (SN) is regarded as the perceived social influence regarding adoption of the behavior. Finally, perceived behavioral con- trol (PBC) reflects personal beliefs of how easy or difficult performing the behavior is likely to be.
Specific kinds of salient beliefs underlie each of these three determinants of intention: behavioral beliefs, normative beliefs, and control beliefs. Modeled on the theory of reasoned action (Ajzen & Fishbein, 1980), the belief-based con- structs are defined by an expectancy-value model where salient beliefs are
'Correspondence concerning this article should be addressed to Gaston Godin, Faculty of Nurs- ing Sciences, Pavillon Paul Comtois, Laval University, Ste.-Foy, Quebec GI K 7P4, Canada.
2173
Journal of Applied Social Psychology, 2000, 30, 10, pp. 2173-2193. Copyright 0 2000 by V. H. Winston & Son, Inc. All rights reserved.
2174 GAGNE AND GODIN
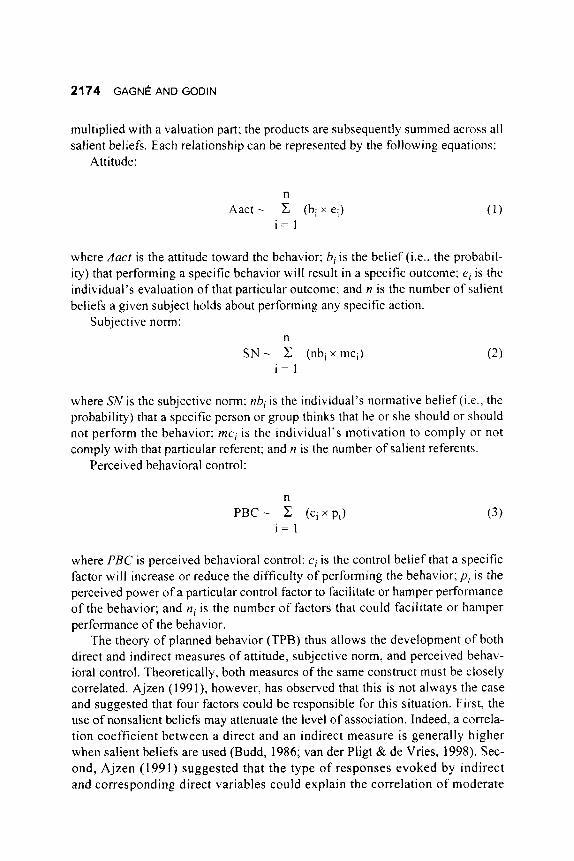
multiplied with a valuation part: the products are subsequently summed across all salient beliefs. Each relationship can be represented by the following equations:
Attitude:
n Aact - C (bi x ei)
i = 1
where Aact is the attitude toward the behavior; bi is the belief (i.e., the probabil- ity) that performing a specific behavior will result in a specific outcome; ei is the individual’s evaluation of that particular outcome; and n is the number of salient beliefs a given subject holds about performing any specific action.
Subjective norm: n
i = 1 S N - c (nbixmc,) (2)
where SN is the subjective norm: nbi is the individual’s normative belief ( i t . , the probability) that a specific person or group thinks that he or she should or should not perform the behavior; mci is the individual’s motivation to comply or not comply with that particular referent: and n is the number of salient referents.
Perceived behavioral control:
n
i = 1 PBC - C (ci x pi) (3)
where PBC is perceived behavioral control: ci is the control belief that a specific factor will increase or reduce the difficulty of performing the behavior; p , is the perceived power of a particular control factor to facilitate or hamper performance of the behavior; and ni is the number of factors that could facilitate or hamper performance of the behavior.
The theory of planned behavior (TPB) thus allows the development of both direct and indirect measures of attitude, subjective norm, and perceived behav- ioral control. Theoretically, both measures of the same construct must be closely correlated. Ajzen (1991), however. has observed that this is not always the case and suggested that four factors could be responsible for this situation. First, the use of nonsalient beliefs may attenuate the level of association. Indeed, a correla- tion coefficient between a direct and an indirect measure is generally higher when salient beliefs are used (Budd, 1986; van der Pligt & de Vries, 1998). Sec- ond, Ajzen (1991) suggested that the type of responses evoked by indirect and corresponding direct variables could explain the correlation of moderate
MEASUREMENT IN THE THEORY OF PLANNED BEHAVIOR 2175
magnitude between these two measures; that is, answering belief-based items requiring relatively reasoned responses compared to a direct measure that evokes a rather automatic reaction. However, no evidence related to this hypothesis was presented within the expectancy-value model.
Third, the scaling method of the variables defining the belief-based constructs was suggested as a factor explaining the relatively low correlation coefficient between a direct and a belief-based measure. In this regard, Schmidt (1973) has demonstrated that when variables in a multiplicative model are not measured on a ratio scale, as in the TPB, a change in the zero point can have marked effects on the magnitude of the correlation between the expectancy-value construct and another variable. Thus. the correlation coefficient was quite dependent on the scales used to measure the variables in the expectancy-value model. It should be mentioned that some approaches have been suggested to control the scaling prob- lem with multiplicative models. For instance, Thurstone and Jones (1957) sug- gested a method for constructing ratio scales. However, this approach is laborious (Schmidt, 1973), and few researchers have used it (Bagozzi, 1984).
According to Bagozzi (1984) and Schmidt (1973), other techniques of anal- yses, such as conjoint analysis and functional measurement, could be possible solutions for the scaling problem. These approaches, however, are cumbersome to apply. Others authors have suggested using hierarchical regression analysis to circumvent the scaling problem (e.g., Arnold & Evans, 1979; Evans, 1991). Arnold and Evans indicate that the amount of explained variance and the F ratio are invariant across the linear transformation of the original data (unipolar or bipolar scale). However, there is no agreement concerning the adequacy of this method (Birnaum, 1973, 1974; Busemeyer & Jones, 1983; Schmidt, 1973; Valois, Deshamais, Godin, Perron, & Lecomte, 1993).
One generally neglected aspect is that the scaling problem must be addressed before applying hierarchical regression. Indeed, in terms of influencing the find- ings of the items analysis (e.g., alpha coefficient, coefficient of correlation between product items associated with a construct), the scaling method can affect the items that will be retained or rejected for the final analysis. Finally, Holbrook (1977) suggested an optimal scaling method, which consists of finding the scal- ing method leading to the best correlation between a criterion and the sum of product terms not measured on a ratio scale. This method has also been criticized (Bagozzi, 1984; Evans, 1991). In sum, there is no agreement concerning the approach that should be adopted for the problem of scaling.
The last factor suggested by Ajzen (1991) to explain the relatively low corre- lation between the belief-based measures and the corresponding global constructs is the adequacy of using an expectancy-value model. Is it necessary to adopt such a model to define the belief-based constructs? The potential influence of the last two factors is the focus of the present paper; that is, the scoring method and the adequacy of the expectancy-value model.
2176 GAGNE AND GODIN
At least two scaling methods have been recommended for measurement of each of the belief-based measures o f the TPB. With regard to the attitude construct, two scaling methods were acknowledged: bb x eb and b, x eb (see equation 1). Fishbein and Ajzen (1975) and Ajzen (1991) referred to the defini- tion of the behavioral belief to justify a unipolar scoring for b: Considering that beliefs are to be regarded as subjective probability and that a probability cannot take negative values, unipolar scoring assigning positive scale values to responses should be used forb. However, the same authors also provided reasons for selecting a bipolar scoring method. For instance, in 1980, Ajzen and Fishbein suggested a bipolar scaling method for both b and e in order to ensure that dis- agreement that a behavior leads to a negative outcome would contribute posi- tively to the attitude toward the behavior.
Empirical findings indicate that the bipolar scaling (-3 to f3) for both b and e most often yields a higher correlation with the global attitude construct than does a bipolar scoring method (-3 to +3) for b and a unipolar scoring method ( f l to +7) fore. For instance, Ajzen (1991) observed that for leisure-time behaviors, the correlation between Aact and X(b x e) was stronger when a bipolar scale was used for both b and e, compared to using a unipolar scale for b. Sparks, Hedder- ley, and Shepherd (1991), in their review of different studies of eating behaviors, also noted that the correlation between both constructs was generally improved when bipolar scales were used, but not always. Sometimes it did not change or it improved the correlation when a unipolar scoring method was adopted forb. In contrast, Hewstone and Young (1988) observed that the b, x eb scoring method yielded a higher correlation coefficient with Aact than the bipolar scoring model bb x eb. Finally, Mellenbergh, Molendijk, de Haan, and ter Horst (1990) observed that different scaling methods may yield higher correlations with Aact, depend- ing on the scale values assigned to translate unipolar (0 to +6, +2 to +8, -6 to 0) and bipolar (-3 to +3, -8 to -2) scoring methods.
With respect to the belief-based construct of subjective norm, two scaling methods have been proposed: nbb x mcb and nbb x mc, (see equation 2). The bipolar scaling for both nb and mc was first suggested so that the belief that a given referent would not approve adoption of the behavior and a negative moti- vation to comply with that referent would contribute positively to the SN con- struct. As it is unlikely that people would not be motivated to comply with important referents (Fishbein, 1976), it was later recommended to opt for a uni- polar scaling for mc. This approach is largely supported in the literature (Budd, North, & Spencer, 1984; Fishbein & Ajzen, I98 1 ; Loken & Fishbein, 1980).
The data presented by Ajzen (1991) suggest that three scaling methods (i.e., Cb x Pb, c b x pu, and c, x p,; see equation 3) may yield the highest correlation with PBC, the best scoring method varying with the behavior under study. The author gave no theoretical justification to support the choice of either of the seal- ing methods. However, according to Valois et al. (1993), the perceived power
MEASUREMENT IN THE THEORY OF PLANNED BEHAVIOR 21 77
was unlikely to be negative, and they proposed using a cb x p, scaling method. They reported that the best correlation between PBC and C(c x p) was obtained when the belief-based construct was scored as Cb x p, instead of cb x Pb.
As we can see, the appropriate scoring method regarding the belief-based measure of perceived behavioral control has yet to be established. However, there is a trend to use the bb x eb and the nbb x mc, methods to produce higher correlations with the corresponding global attitude and global subjective norm, respectively. It should be emphasized, however, that it is difficult to establish the face validity of these scaling methods (or other scaling approaches) because the contribution of some patterns of responses to the overall construct measured is ambiguous. Consider, for instance, the disbelief in a negative outcome within the belief-based measure of attitude. According to Ajzen and Fishbein (1980) and Ryan and Bonfield (1975), such a pattern of responses translates into a positive attitude. In contrast, Valiquette, Valois, Desharnais, and Godin (1988) consider that it may lead to a meaningless score of attitude, whereas Bagozzi (1984) sug- gests that it implies a neutral attitude. In fact, when a disbelief is obtained (on b, nb, or c variables), the answer on the valence variable (e, mc, or p variables) may be irrelevant because it does not refer to the belief of the subject. Consequently, it is difficult to infer the influence of patterns of responses for disbeliefs.
The contribution of neutral scores (“neither”) is also ambiguous. Indeed, it is awkward that a neutral score on the expectancy or the valence arms of the belief- based construct does not have the same impact on the overall score when the scoring method is not bipolar for both arms. For instance, a neutral score on a bipolar e scale (0) results in a zero score for b x e, whereas a neutral score on a unipolar b scale (i.e., 4 on a 7-point scale) yields a positive, a neutral, or a nega- tive score for b x e, depending on the e response. More attention should be given to the meaning of a neutral response, especially when the questionnaire does not provide clear directives in this regard. The score that should be attributed to a given response option should vary according to its meaning (e.g., a neutral opin- ion, a nonopinion, the irrelevance of a question).
Rating the influence of a referent with whom the subject is not motivated to comply also requires additional attention. It is acceptable to postulate that in the decision to adopt or not to adopt a behavior, an individual will not consider refer- ents who are not important to him or her. Consequently, it is debatable whether to assign a positive or a negative score to translate the effect of that referent (as is the case with the nbbx mcb and the nbb x mc, methods). Assigning a neutral score for the rating of a referent with whom a respondent is not motivated to comply is cumbersome because the contribution to the global score of SN could be the same as a neutral score on nb, mc, or both.
Ajzen (199 1) suggested that the expectancy-value model could be inadequate to describe the relation between a belief-based measure and a more global measure of the same construct. Some empirical findings obtained within the
2178 GAGNE AND GODIN
framework of the theory of reasoned action tend to support this hypothesis. For instance, with respect to the attitude construct. Nakanishi and Bettman ( 1974) observed that I(bb x eb) and Cb explained virtually the same proportion of the variance of Aact. In the same perspective, Hom and Hulin (198 1 ) noted that the correlation with Aact was not different when c(bb x eb) or a unit-weighted Cb (that took into account the sign of e) was used. Lechner (1998) observed similar findings using intention instead of Aact as the criterion. She noted that, in most instances, b yielded similar or higher correlation with intention than did e orb, x eb. Furthermore, she observed that. most often, b, x eh could not explain any additional variance in intention over and above the b and e variables. It should be emphasized, however. that each of these studies has used only one of the scaling methods proposed for the belief-based measure of attitude. Different findings could have been obtained with other scaling approaches.
Few researchers have also verified if the correlation between SN and Cnb is equivalent to the correlation between SN and C(nb x mc). The findings of Hom and Hulin (198 1) indicate that when both nb and mc were scored on bipolar scales, the correlation between SN and Cnb was better than was the correlation between SN and C(nbb x mcb). The results, however, are more ambiguous when mc is treated as a unipolar variable. Indeed. Fishbein and Ajzen (198 1 ) showed that the correlation between SN and Znb was lower than the correlation between SN and C(nbb x mc,). In contrast, Budd et al. (1984) demonstrated that the corre- lation with SN was similar when Cnb instead of C(nbb x mc,) was used. The use of nonsalient beliefs in the data analyzed by Fishbein and Ajzen (1981) may, however, partially explain the low correlation between SN and Cnb. In the present paper, the effect of omitting the mc variable will be verified, but using salient beliefs as recommended by Ajzen and Fishbein (1980).
The effect of omitting mc was also tested using intention as a criterion instead of the global construct of SN. For instance, Ajzen and Fishbein (1969) and Grube, Morgan, and McGree (1986) observed that the inclusion of mc with nb decreased the correlation with intention. The scaling method used for C(nb x mc) was not specified in either study. However, Schlegel, Crawford, and Sanborn (1977) indicated that the inclusion of mc decreased the correlation with intention, regardless of the scaling method applied to mc. Moreover, some authors have observed that the predictive power of C(nb x mc) is not improved when a unipo- lar scoring method is used for mc (e.g., Budd, 1986; Saltzer, 1981). According to Miniard and Cohen (1981), the level ofspecificity at which mc is measured could influence the pooled simple correlation between x(nbb x mcb) and SN or inten- tion. However, Fishbein and Ajzen (198 1) reanalyzed the data of Miniard and Cohen and demonstrated that, with unadjusted correlations and a unipolar scor- ing for mc, the correlation with SN or intention was better when C(nbb x mc,) instead of Cnb was used. The findings were observed regardless of the level of measurement for mc.
MEASUREMENT IN THE THEORY OF PLANNED BEHAVIOR 2179
Regarding the belief-based measure of PBC, no study, to the best of our knowledge, has yet investigated if one of the arms of the indirect measure [C(c x p)] has a higher correlation with the corresponding direct measure (PBC). Our past studies conducted within the framework of TPB suggest, however, that Ep is more strongly related to PBC than is Cc. This is one of the avenues tested in the present paper.
In summary, key questions to be answered in the present study are as follows: (a) Which scoring method, among the methods proposed in the literature, gives the strongest correlation between direct and corresponding belief-based mea- sures? and (b) Are the correlations between Aact, SN, PBC, and their corre- sponding belief-based measures [C(b x e), C(nb x mc), C(c x p)] lower when only one arm of the expectancy-value model is used (i.e., Cb, Cnb, and Cp)?
Method
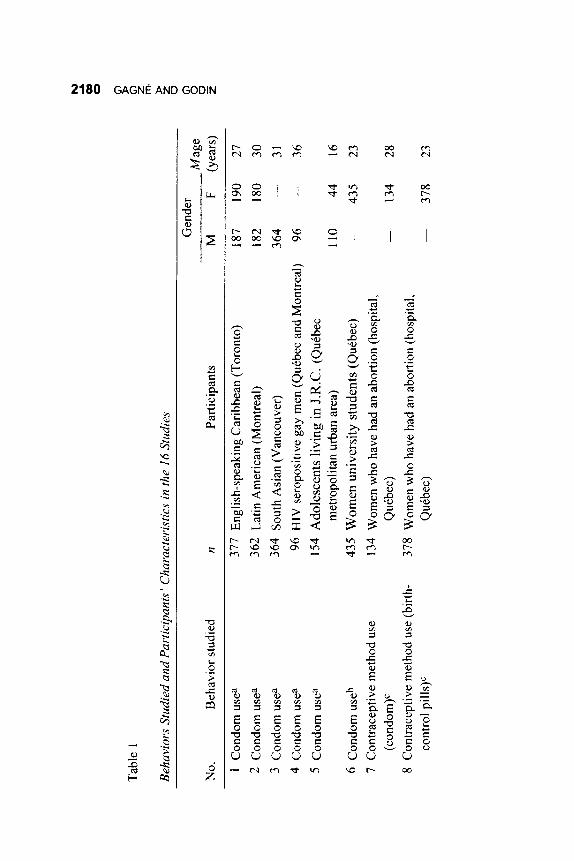
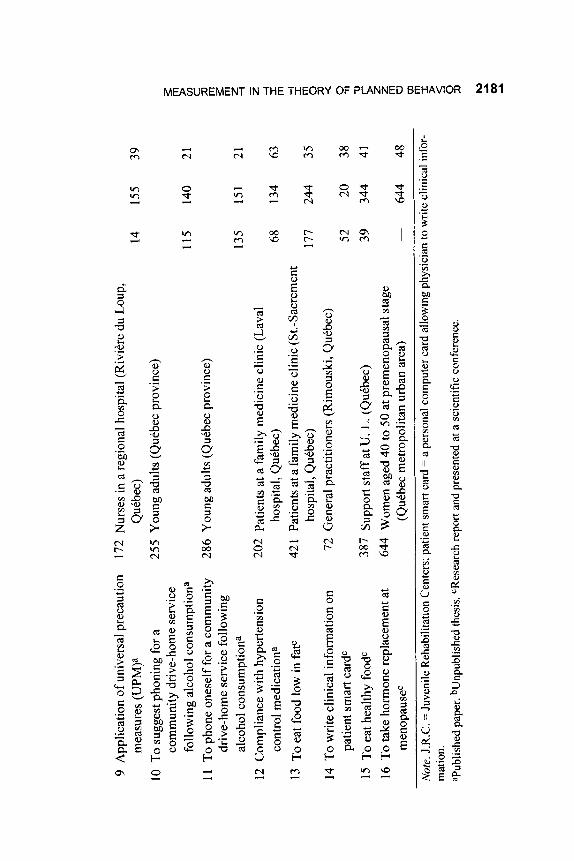
Sixteen studies conducted in recent years were used in this research. Each study concerned the adoption of a given behavior in the domain of health and was carried out among different segments of the population. The studies retained were those that included direct and indirect measures of the constructs of the TPB. A brief description of these studies is presented in Table 1.
In each of these studies, the information was obtained by means of a self- administered questionnaire. Also, each questionnaire was developed following Godin and Kok’s (1996) method and applying Ajzen and Fishbein’s (1980) recom- mendations. Essentially, salient beliefs were obtained from a preliminary study conducted with an independent sample of subjects selected from the target popula- tion. An open-ended eliciting questionnaire or focus groups were used to collect (a) the list of advantages and disadvantages in the adoption of the behavior studied; (b) the list of persons or groups of persons who would approve or disapprove of one’s performance of the behavior; and (c) the list of perceived factors that could facilitate or hamper performance of the behavior. The beliefs most often listed were selected for each construct. In most cases, 5- or 7-point scales were used.
Item Anulvsis
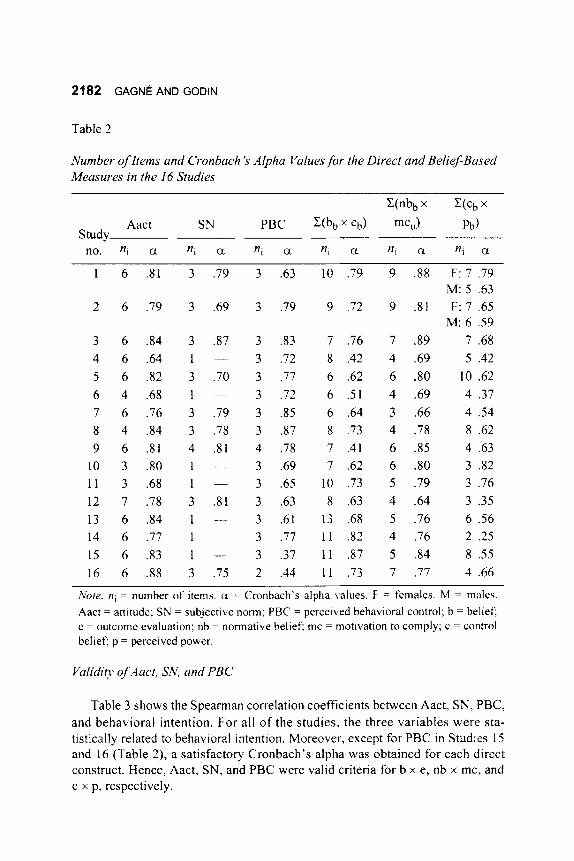
In order to secure the construct validity of the measures, data of a given sub- ject were retained only if he or she had answered at least 75% of the items of a given construct. Concerning the reliability of the measure, a Cronbach’s alpha value close to .65 was sought. Table 2 depicts the number of items and the Cron- bach’s alphas for direct and belief-based measures in the 16 studies, when con- structs were operationalized as currently recommended by Ajzen and Fishbein (1980) and Ajzen (1991); that is, bb x eb (Ajzen & Fishbein, 1980), nbb x mc, (Ajzen & Fishbein, 1980), and cb x Pb (Ajzen, 199 1).
Tabl
e 1
>
z 0
Beha
vior
s St
udie
d an
d Pa
rtic
ipan
ts ’
Cha
ract
eris
tics in
the
16 St
udie
s
No.
B
ehav
ior s
tudi
ed
n Pa
rtic
ipan
ts
Gen
der
0 s
Mag
e M
F
(yea
rs)
z
1 C
ondo
m u
se“
2 C
ondo
m u
se3
3 C
ondo
m u
se”
4 C
ondo
mus
ea
5 C
ondo
m u
se”
6 C
ondo
mus
eb
7 C
ontr
acep
tive
met
hod
use
8 C
ontr
acep
tive
met
hod
use
(birt
h-
377
Engl
ish-
spea
king
Car
ibbe
an (T
oron
to)
362
Latin
Am
eric
an (
Mon
trea
l)
364
Sout
h A
sian
(V
anco
uver
)
154
Ado
lesc
ents
livi
ng in
J.R
.C. (
Que
bec
435
Wom
en u
nive
rsity
stu
dent
s (Q
uebe
c)
134
Wom
en w
ho h
ave
had
an a
bort
ion
(hos
pita
l,
378
Wom
en w
ho h
ave
had
an a
bort
ion
(hos
pita
l,
96 H
IV s
erop
ositi
ve g
ay m
en (
Que
bec a
nd M
ontr
eal)
met
ropo
litan
urb
an a
rea)
(con
dom
)c
Que
bec)
cont
rol p
ills)
c Q
uebe
c)
187
190
27
182
180
30
364
-
31
96
-
36
110
44
16
-
435
23
-
134
28
-
378
23
9 A
pplic
atio
n of
uni
vers
al p
reca
utio
n m
easu
res
(UPM
)a
10 T
o su
gges
t pho
ning
for a
co
mm
unity
dri
ve-h
ome
serv
ice
follo
win
g al
coho
l con
sum
ptio
na
11 T
o ph
one
ones
elf f
or a
com
mun
ity
driv
e-ho
me
serv
ice
follo
win
g al
coho
l con
sum
ptio
na
12 C
ompl
ianc
e w
ith h
yper
tens
ion
cont
rol m
edic
atio
na
13 T
o ea
t foo
d lo
w in
fat?
14 T
o w
rite
clin
ical
inf
orm
atio
n on
pa
tient
sm
art c
ardc
15
To
eat h
ealth
y fo
odc
16 T
o ta
ke h
orm
one
repl
acem
ent a
t m
enop
ause
C
172
Nur
ses
in a
regi
onal
hos
pita
l (R
ivik
re d
u Lo
up,
255
You
ng a
dults
(Que
bec
prov
ince
) Q
uebe
c)
14
115
286
You
ng a
dults
(Q
uebe
c pr
ovin
ce)
135
202
Patie
nts
at a
fam
ily m
edic
ine
clin
ic (L
ava1
421
Patie
nts
at a
fam
ily m
edic
ine
clin
ic (S
t.-Sa
crem
ent
hosp
ital,
Que
bec)
68
hosp
ital,
Que
bec)
17
7 52
39
(Que
bec
met
ropo
litan
urb
an a
rea)
-
72 G
ener
al p
ract
ition
ers (
Rim
ousk
i, Q
uebe
c)
387
Supp
ort s
taff
at U
. L. (
Que
bec)
64
4 W
omen
age
d 40
to 5
0 at
pre
men
opau
sal
stag
e
155
140
151
134
244 20
34
4
644
39
21
21
63
35
38
41
48
Not
e. J.
R.C
. = Ju
veni
le R
ehab
ilita
tion
Cen
ters
; pat
ient
sm
art c
ard
= a
pers
onal
com
pute
r car
d al
low
ing
phys
icia
n to
writ
e cl
inic
al in
for-
mat
ion.
aP
ublis
hed
pape
r. bu
npub
lishe
d th
esis.
CRe
sear
ch re
port
and
pres
ente
d at
a sc
ient
ific c
onfe
renc
e.
2182 GAGNE AND GODIN
Table 2
Number of Items and Cronbach ’s Alpha Values for the Direct and Belief-Based Measures in the 16 Studies
C(nbbX C(CbX
Aact SN PBC x(bbx eb) mcu) Pb) Study
no. ni CL ni a ni a a Hi Q ni CL
1 6 .81 3 .79 3 .63 10 .79 9 .88 F: 7 .79 M: 5 .63
2 6 .79 3 .69 3 .79 9 .72 9 .81 F: 7 .65 M: 6 .59
3 6 .84 3 .87 3 .83 7 .76 7 .89 7 .68 4 6 .64 1 - 3 .72 8 .42 4 .69 5 .42 5 6 .82 3 .70 3 .77 6 .62 6 .80 10 .62 6 4 .68 1 - 3 .72 6 .51 4 .69 4 .37 7 6 .76 3 .79 3 .85 6 .64 3 .66 4 .54 8 4 .84 3 .78 3 .87 8 .73 4 .78 8 .62 9 6 .81 4 .81 4 .78 7 .41 6 .85 4 .63
10 3 .80 1 - 3 .69 7 .62 6 .80 3 .82 11 3 .68 1 ~ 3 .65 10 .73 5 .79 3 .76 12 7 .78 3 .81 3 .63 8 .63 4 .64 3 .35 13 6 .84 1 - 3 .61 13 .68 5 .76 6 .56 14 6 .77 1 - 3 .77 11 .82 4 .76 2 .25 15 6 .83 1 - 3 .37 11 .87 5 .84 8 .55 16 6 .88 3 .75 2 .44 11 .73 7 .77 4 .66
Note. ni = number of items. (x = Cronbach’s alpha values. F = females. M = males. Aact = attitude; SN = subjective norm; PBC = perceived behavioral control; b = belief; e = outcome evaluation; nb = normative belief: mc = motivation to comply; c = control belief; p = perceived power.
Validi<\* of Aact, SN, and PBC
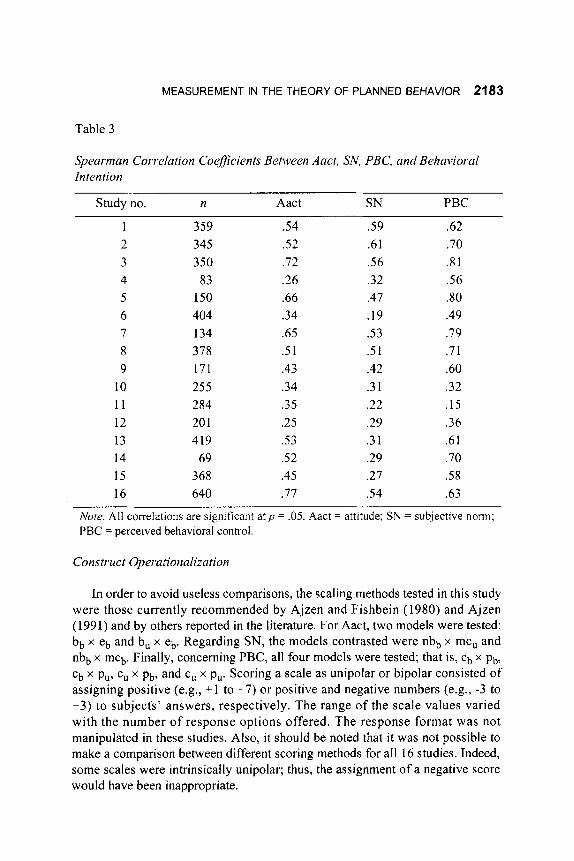
Table 3 shows the Spearman correlation coefficients between Aact, SN, PBC, and behavioral intention. For all of the studies. the three variables were sta- tistically related to behavioral intention. Moreover, except for PBC in Studies 15 and 16 (Table 2), a satisfactory Cronbach’s alpha was obtained for each direct construct. Hence, Aact, SN, and PBC were valid criteria fo rb x e, nb x mc, and c x p, respectively.
MEASUREMENT IN THE THEORY OF PLANNED BEHAVIOR 2183
Table 3
Spearman Correlation Coefficients Behveen Aact. SN, PBC, and Behavioral Intention
Study no. n Aact SN PBC
1 359 .54 .59 .62 2 345 .52 .6 1 .70 3 350 .72 .56 .8 1 4 83 .26 .32 .56 5 150 .66 .47 .80 6 404 .34 .19 .49 7 134 .65 .s3 .79 8 378 .5 1 .5 1 .7 1 9 171 .43 .42 .60
10 255 .34 .3 1 .32 1 1 284 .35 .22 .15 12 20 1 .25 .29 .36 13 419 .53 .3 1 .6 1 14 69 .52 .29 .70 15 368 .45 .27 .58 16 640 .77 .54 .63
Note. All correlations are significant a t p = .05. Aact = attitude; S N = subjective norm; PBC = perceived behavioral control.
Construct 0peru:ionalization
In order to avoid useless comparisons, the scaling methods tested in this study were those currently recommended by Ajzen and Fishbein (1980) and Ajzen (1991) and by others reported in the literature. For Aact, two models were tested: bb x eb and b, x eb. Regarding SN, the models contrasted were nbb x mc, and nbb x mcb. Finally, concerning PBC, all four models were tested; that is, Cb x Pb, Cb x p,, c, x Pb, and cu x p,. Scoring a scale as unipolar or bipolar consisted of assigning positive (e.g., +1 to +7) or positive and negative numbers (e.g., -3 to +3) to subjects’ answers, respectively. The range of the scale values varied with the number of response options offered. The response format was not manipulated in these studies. Also, it should be noted that it was not possible to make a comparison between different scoring methods for all 16 studies. Indeed, some scales were intrinsically unipolar; thus, the assignment of a negative score would have been inappropriate.
2184 GAGNE AND GODIN
Table 4
Spearman Correlation Coeficients Behveen 23, 22, Z(b x e), and Aact Using Different Scoring Methods
Study no.a n Cb Ce C(bb X eb) x ( b ~ eb)
4 94 .32 -.23 .27 .02 5 150 .56 .24 .50 .45 6 404 .58 .04 .47 .36 7 134 .58 .15 .62 .48 8 378 .55 .06 .54 .42 9 170 .28 .2 1 .24 .33
10 253 .30 .08 .28 .22 11 2 84 .32 .12 .38 .30 13 42 1 S O .03 .43 .29 14 70 .55 .39 .60 .53 15 3 80 .40 .35 .44 .43 16 636 .64 .05 .65 .44
Nore. b = behavioral belief; e = outcome evaluation; Aact = attitude. aStudies I , 2,3, and 12 are not included in this analysis.
Statistical Tests
Spearman correlation coefficients were computed between the appropriate direct and belief-based measures and between the direct measures and one arm of the expectancy-value model (i.e., Cb, Xnb, Cp). Moreover, the Friedman test or the Wilcoxon signed-rank test were computed in order to test the statistical sig- nificance of the overall difference between the correlation coefficients. With the Wilcoxon test, the difference between correlation coefficients was computed in a way that takes into account the sample size (n,,,p~e/ntota~) so that correlations based on larger samples receive greater weight than do those from smaller samples.
Results and Discussion
Scaling Method
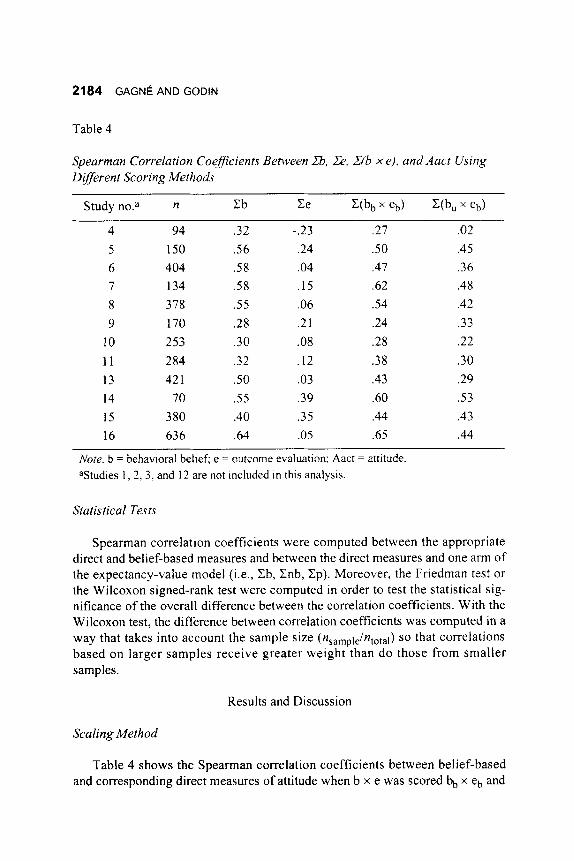
Table 4 shows the Spearman correlation coefficients between belief-based x eb and and corresponding direct measures of attitude when b x e was scored
MEASUREMENT IN THE THEORY OF PLANNED BEHAVIOR 2185
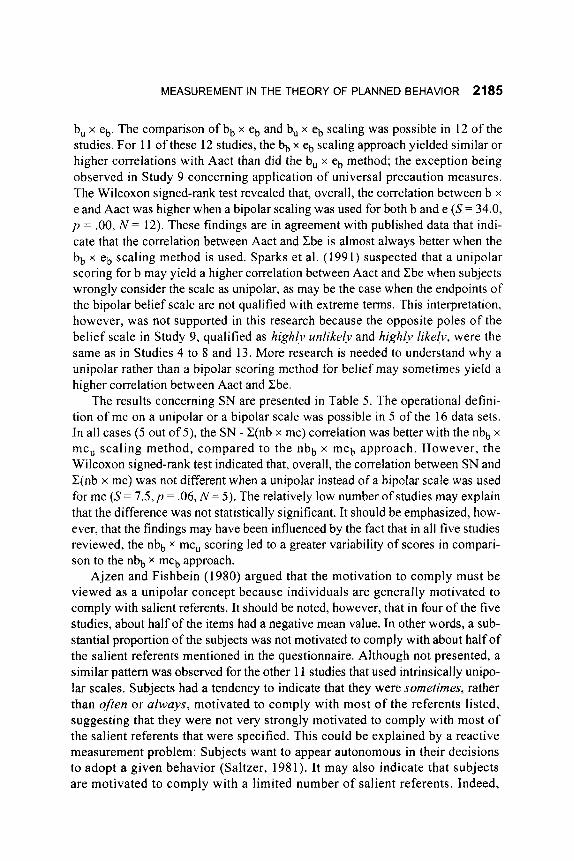
b, x eb. The comparison of bb x eb and b, x eb scaling was possible in 12 of the studies. For 11 of these 12 studies, the bb x eb scaling approach yielded similar or higher correlations with Aact than did the b, x eb method; the exception being observed in Study 9 concerning application of universal precaution measures. The Wilcoxon signed-rank test revealed that, overall, the correlation between b x e and Aact was higher when a bipolar scaling was used for both b and e (S = 34.0, p = .OO, N = 12). These findings are in agreement with published data that indi- cate that the correlation between Aact and Cbe is almost always better when the bb x eb scaling method is used. Sparks et al. (1991) suspected that a unipolar scoring forb may yield a higher correlation between Aact and Cbe when subjects wrongly consider the scale as unipolar, as may be the case when the endpoints of the bipolar belief scale are not qualified with extreme terms. This interpretation, however, was not supported in this research because the opposite poles of the belief scale in Study 9, qualified as high!)? unlikelv and highly likelv, were the same as in Studies 4 to 8 and 13. More research is needed to understand why a unipolar rather than a bipolar scoring method for belief may sometimes yield a higher correlation between Aact and Xbe.
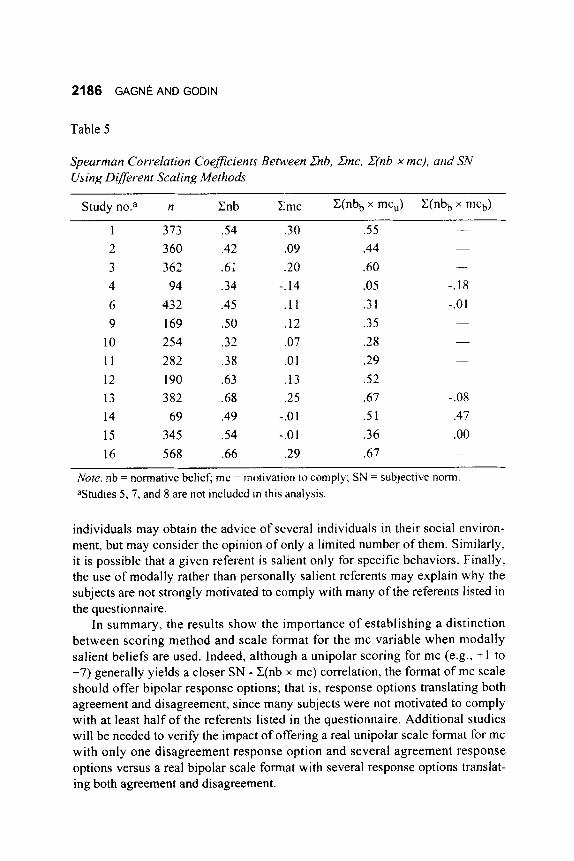
The results concerning SN are presented in Table 5. The operational defini- tion of mc on a unipolar or a bipolar scale was possible in 5 of the 16 data sets. In all cases (5 out of S ) , the SN - C(nb x mc) correlation was better with the nbb x
mc, scaling method, compared to the nbb x mcb approach. However, the Wilcoxon signed-rank test indicated that, overall, the correlation between SN and C(nb x rnc) was not different when a unipolar instead of a bipolar scale was used for mc (S= 7 . 5 , ~ = .06, N = 5). The relatively low number of studies may explain that the difference was not statistically significant. It should be emphasized, how- ever, that the findings may have been influenced by the fact that in all five studies reviewed, the nbb x mc, scoring led to a greater variability of scores in compari-
Ajzen and Fishbein (1980) argued that the motivation to comply must be viewed as a unipolar concept because individuals are generally motivated to comply with salient referents. It should be noted, however, that in four of the five studies, about half of the items had a negative mean value. In other words, a sub- stantial proportion of the subjects was not motivated to comply with about half of the salient referents mentioned in the questionnaire. Although not presented, a similar pattern was observed for the other 11 studies that used intrinsically unipo- lar scales. Subjects had a tendency to indicate that they were sometimes, rather than often or always, motivated to comply with most of the referents listed, suggesting that they were not very strongly motivated to comply with most of the salient referents that were specified. This could be explained by a reactive measurement problem: Subjects want to appear autonomous in their decisions to adopt a given behavior (Saltzer, 1981). It may also indicate that subjects are motivated to comply with a limited number of salient referents. Indeed,
son to the nbb X mCb approach.
2186 GAGNE AND GODIN
Table 5
Spearman Correlation Coeficcients Between Znb, zinc. C(nb x mc), and SN Using Different Scaling Methods
1 2 3 4 6 9
10 11 12 13 14 15 16
373 360 362
94 432 169 254 282 190 382
69 345 568
.54
.42
.61
.34
.45 S O .32 .38 .63 .68 .49 .54 .66
.30
.09
.20 -. 14 .11 .12 .07 .o 1 .13 .25
-.o 1 -.o 1 .29
.55
.44
.60
.05
.3 1
.35
.28
.29
.52
.67
.5 1
.36
.67
-
-. 18 -.01
-
-.08 .47 .oo
Note. nb = normative belief; mc = motivation to comply; SN = subjective norm aStudies 5 , 7, and 8 are not included in this analysis.
individuals may obtain the advice of several individuals in their social environ- ment, but may consider the opinion of only a limited number of them. Similarly, it is possible that a given referent is salient only for specific behaviors. Finally, the use of modally rather than personally salient referents may explain why the subjects are not strongly motivated to comply with many of the referents listed in the questionnaire.
In summary, the results show the importance of establishing a distinction between scoring method and scale format for the mc variable when modally salient beliefs are used. Indeed, although a unipolar scoring for mc (e.g., +1 to +7) generally yields a closer SN - C(nb x mc) correlation, the format of mc scale should offer bipolar response options; that is, response options translating both agreement and disagreement, since many subjects were not motivated to comply with at least half of the referents listed in the questionnaire. Additional studies will be needed to verify the impact of offering a real unipolar scale format for mc with only one disagreement response option and several agreement response options versus a real bipolar scale format with several response options translat- ing both agreement and disagreement.
MEASUREMENT IN THE THEORY OF PLANNED BEHAVIOR 2187
Table 6
Spearman Correlation Coe8cients Between 2, Zp, Z(c xp), and PBC Using Dgerent Scoring for cp
Study no. n Zc Zp c(cbx Pb) C(cbx Pu) C(cux Pb) C(cux Pu)
1
2
3 4 5 6 7 8 9
10 11 12 13 14 15 16
M: 184 F: 184
M: 178 F: 177
361 94
150 435 134 378 171 253 282 20 1 412
71 382 643
.60 .56 S 3 -67 .35 .58 .so .49 .45 .69 .07 S O .46 .74 S 3 .46 .44 .62 .51 .54 .41 .62 .22 .20 .25 . I 8 .19 .33 .35 .56 .39 .55 .35 .58 .56 .53
.60
.57
.47
.so
.67
.20
.49
.so
.5 1
.47
.so
.26
.25
.28
.45
.30
.19
.46
.63
.55
.42
.53
.60
.14
.53
.53
.52
.54
.46
.26
.26
.24
.44
.4 1
.29
.so
.6 1
.68
.59
.55
.72
.35
.68
.53
.60
.56
.6 1
.25
.24
.33
.57
.53
.57
.52
.64
.63
.55
.58
.72
.26
.70
.54
.59
.60
.55
.27
.25
.30
.54
.49
.49
.56
Note. M = males; F = females; c = central belief; p = perceived power; PBC = perceived behavioral control.
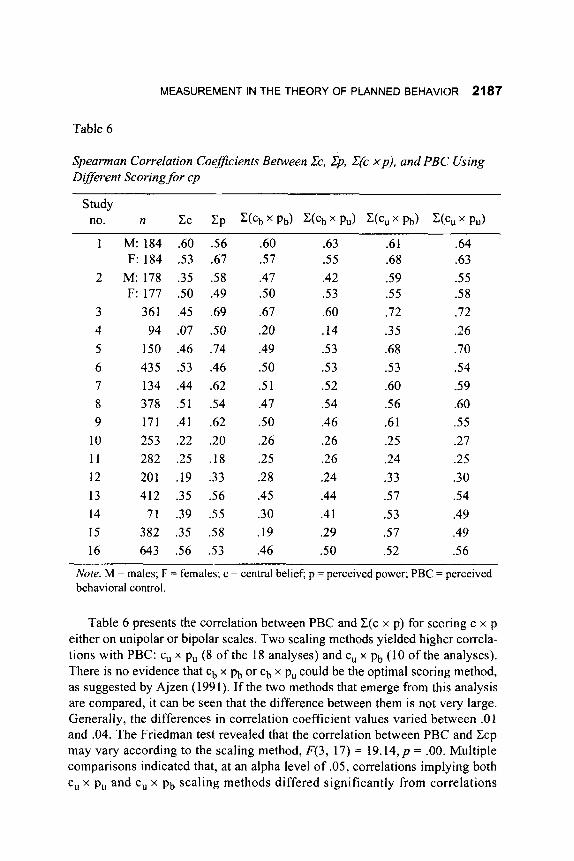
Table 6 presents the correlation between PBC and Z(c x p) for scoring c x p either on unipolar or bipolar scales. Two scaling methods yielded higher correla- tions with PBC: c, x p, (8 of the 18 analyses) and c, x Pb (10 of the analyses). There is no evidence that ch x Pb or Cb x p, could be the optimal scoring method, as suggested by Ajzen (1991). If the two methods that emerge from this analysis are compared, it can be seen that the difference between them is not very large. Generally, the differences in correlation coefficient values varied between .O 1 and .04. The Friedman test revealed that the correlation between PBC and Ccp may vary according to the scaling method, F(3, 17) = 1 9 . 1 4 , ~ = .OO. Multiple comparisons indicated that, at an alpha level of .05, correlations implying both c, x p, and c, x Pb scaling methods differed significantly from correlations
2188 GAGNE AND GODlN
implying Cb x Pb and C b x p, approaches. However, there was no difference between c, x p, and c, x Pb or between Cb x Pb and Cb x p,, The higher correlation between PBC and C(c x p), when c, x p, and c, x Pb scaling methods are used, may be partially explained by the fact that these latter methods led to a higher variability of scores than did cb x Pb and Cb x p, approaches.
The data in Table 6 were, however, those obtained when the item analysis was made on c x p, operationalized as Cb x Pb, as with Ajzen (1991). Reliability analysis with this scoring method resulted in the rejection of few items (in 1 1 out of 18 studies) in order to obtain satisfactory Cronbach’s alphas. It should be noted that more items would have been rejected with an items analysis performed on C(c x p) scored Cb x p,. To verify more carefblly the adequacy of the c, x p, and c, x Pb scaling approaches, the PBC - C(c x p) correlation coefficients were scrutinized again, but with an item analysis performed on the c x p construct operationalized the same way as the scaling method tested. This time, no item had to be rejected to obtain an appropriate alpha value. This was true for both the c, x p, and c, x Pb methods. The results also indicate that in 14 of the 18 anal- yses, scoring cp as c, x pb, compared to c, x p,, yielded slightly better Cron- bach’s alphas. In spite of this apparent better performance of the c, x Pb method, however, it must be noted that a satisfactory Cronbach’s alpha of .65 or more was obtained in 15 of the 18 analyses performed with the c, x p, method, in compari- son to 13 of the 18 analyses with the c, x Pb model. With respect to the correla- tion between PBC and C(c x p), the highest correlation was observed for c, x p, in 6 of the 18 analyses, whereas the c, x Pb was the best model in 9 of the anal- yses. The correlation coefficients were equivalent in 3 of 18 analyses. The Wilcoxon signed-rank test indicated that the correlation between PBC and C(c x p) was not statistically different according to the scaling method used (i.e., c, x
Thus, taken together, the results suggest that the c, x p, and c, x Pb scaling methods are particularly valuable. Finally, it should be emphasized that the sug- gestion to use the c, x p, or the c, x Pb method does not imply developing real unipolar scale formats that do not offer the possibility of taking into account opposing views. Indeed, the presence of c and p items with a negative mean value suggests that it is preferable to use a true bipolar scale format in order to secure the validity of the measure. What is suggested is to assign positive scores (e.g., +1 to +7) when a unipolar scoring method is adopted.
p, Or C, X pb; s = 23.5, p = .32, N = 18).
Adequacy of the Expectanc-v- Value Model
The results concerning the second research question, dealing with the effect of omitting one arm in the sum of products of b x e, nb x mc, and c x p are pre- sented in Tables 4, 5, and 6. The results concerning the b x e variable are dis- played in Table 4. Consistent with the observations of Hom and H u h (198 l), the
MEASUREMENT IN THE THEORY OF PLANNED BEHAVIOR 2189
results of the present research indicate that the correlation coefficients between Aact and Zb were often similar or better (in 8 out of 12 studies) than were the correlation coefficients between Aact and C(bb x eb). This conclusion was also true when the belief-based attitude variable was scored b, x eb (10 out of 12 stud- ies). The Wilcoxon signed-rank test indicates that the difference between Aact - Cb and Aact - C(b x e) correlations was statistically significant when a unipolar scoring was used forb (S = 1 1 . 0 , ~ = .42, N = 12), but not when a bipolar scoring was adopted forb (S = 3 2 . 0 , ~ = .01, N = 12).
A few authors (Lechner, 1998; Smith & Clark, 1973) have suggested that the low variance in the e variable may be responsible for its low influence on the cor- relation with Aact when it is combined with b. However, such an interpretation is not supported in this research since the mean variance of e was greater in studies where the correlation between Aact and Zb was stronger than in studies where the correlation between Aact and Z(b x e) was the best model. Thus, based on the present findings, the use of Cb provides as good a correlation coefficient with Aact as does the composite score of C(b x e).
In Table 5, it can be observed that for all of the studies, and whatever the scal- ing approach adopted, the inclusion of the mc variable suppressed or yielded sim- ilar correlation coefficients between SN and C(nb x mc). The difference between SN - Cnb and SN - C(nb x mc) correlations was statistically significant when mc was scored in a unipolar fashion (S = 3 0 . 5 , ~ = .03, N = 13), but not when bipolar scoring was adopted for mc (S= 7 . 5 , ~ = .06, N = 5) . This supports the idea that motivation to comply does not add to the predictive power of Cnb. This is in agreement with the observations of Budd et al. (1984) and Hom and Hulin (1981).
Three factors have generally been suggested to explain why mc suppresses the SN - C(nb x mc) correlation: the low variance of the mc variable (Ajzen & Fishbein, 1970; Miniard & Cohen, 1981); social desirability bias, which could lead the subject to indicate that he or she is not influenced by others concerning his or her behavior performance (Hom & Hulin, 1981; Saltzer, 1981); and the possibility that the SN formulation better translates the nb concept, compared to the mc dimension (Fishbein, 1976). The results of the present research, however, do not suggest that low variance is an explanatory factor. Indeed, the comparison of nb and mc items having the same number of response options-which is a pre- requisite because the variance of an item is influenced by the number of response options offered-indicated that the variance was sometimes greater for the Cmc, compared to the Cnb (in 3 out of 7 studies). Further research will be necessary to clarify the role of social desirability bias or the effect of SN formulation on the SN - C(nb x mc) correlation.
In Table 6, it can be seen that the p variable alone yielded similar or higher correlation with PBC in 14, 13, 12, or 10 of the 18 studies, depending on the scaling method for C(c x p). The Wilcoxon signed-rank test indicated that the
2190 GAGNE AND GODlN
differences between PBC - Cp and PBC - c(c x p) correlations were statistically significant when Z(c x p) was scored cb x pb ( S = 5 9 . 5 , ~ = .01, N = 18) and cb x p, ( S = 52.S,p= .02, N = 18), but not when the scaling methods used were c, x Pb ( S = - 3 1 . 5 , ~ = .18, N = 18) or c, x pu ( S = - 1 6 . 5 , ~ = .49, N = 18). Similar results were obtained when the items analysis was performed on c, x Pb ( S = 11.5, p = .63, N = 18) or c, x p, ( S = 9.5, p = .70, N = 18). At first glance, this result could not be explained by the low variance of the Cc variable. Indeed, for all of the scaling methods in Table 6, the mean variance of the Cc variable was higher in studies where the PBC - Cp correlation was better than in studies where the correlation between PBC and Ccp was the best model. One explanation could be the formulation of the p items. Indeed, the c items generally assess if an individ- ual anticipates bamers or obstacles to the adoption of a given behavior or if he or she foresees the presence of facilitating factors. In translating what the subject expects to do if the barriers or facilitating factors were present, the p items appear to capture more information on the individual’s perception of control. Finally, Cp corresponds to the concept of self-efficacy formulated by Bandura (1977). Thus, it is possible that this operational definition fully accounts for one’s perception of control or perceived self-efficacy in adopting a given behavior.
The results of this research suggest that, for most situations in the domain of health-related behavior, bb x eb, nbb x mc,, c, x Pb, or c, x p, yield higher corre- lation coefficients with the corresponding direct measures. However, the face validity of these scaling methods must be demonstrated. Moreover, the results of this research suggest that using only Xb, Cnb, and Cp, instead of C(b x e), C(nb x mc), and C(c x p) yields similar or higher coefficient correlations with their spe- cific direct measures. This latter conclusion holds, regardless of the scaling method adopted for defining the indirect constructs. Thus, this research tends to confirm, as suggested by Ajzen (1991). that the expectancy-value model may not be the best to describe the relationship between direct and indirect measures of constructs of the TPB.
It should be emphasized that using only one arm of the belief-based construct of attitude, SN, and PBC may result in a loss of information for differentiating subjects who have and those who do not have the intention to adopt a behavior. However, using only one arm, rather than the sum of the product variables, pre- sents a few advantages. It ensures that the scaling problem resulting from multi- plying two variables not measured on a ratio scale is avoided, and it also leads to a reduction in the number of items presented to subjects. Such a reduction in the number of items is apt to lower the administration time of the questionnaire and, consequently, to reduce subjects’ fatigue and boredom when answering redun- dant questions. Hence, more valid information may be obtained. However, assessing a given belief-based construct and deciding afterward to use only one arm may not be equivalent to assessing and analyzing only one component. Indeed, many studies have indicated that subjects who filled out questionnaires
MEASUREMENT IN THE THEORY OF PLANNED BEHAVIOR 2191
may be influenced by the order of questions, as well as by the information contained in the preceding questions (e.g., Schwarz, Strack, & Mai, 1991; Tourangeau, Rasinski, Bradburn, & D’Andrade, 1989a, 1989b). Consequently, additional studies comparing responses to a questionnaire with all of the vari- ables proposed by the theory with another omitting the e, mc, and c items will be necessary before a more definite conclusion can be reached.
References
Ajzen, I. (1 99 1). The theory of planned behavior. Organizational Behavior and Human Decision Processes, 50, 179-2 I 1.
Ajzen, I., & Fishbein, M. (1969). The prediction of behavioral intentions in a choice situation. Journal of Experimental Social Psycholog: 5,400-4 16.
Ajzen, I., & Fishbein, M. (1970). The prediction of behavior from attitudinal and normative variables. Journal of Experimental Social Psychology, 6,466-487.
Ajzen, I., & Fishbein, M. (1980). Understanding attitudes andpredicting social behavior. Englewood Cliffs, NJ: Prentice Hall.
Arnold, H. J. , & Evans, M. G. (1979). Testing multiplicative models does not require ratio scales. Organizational Behavior and Human Petformance, 24,
Bagozzi, R. P. (1984). Expectancy-value attitude models: An analysis of critical measurement issues. International Journal of Research in Marketing, 1, 295- 3 10.
Bandura, A. (1977). Self-efficacy: Toward a unifying theory of behavioral change. Psychological Review, 84, 191-215.
Birnaum, M. H. (1973). The devil rides again: Correlations as an index of fit. Psychologica f Bulletin, 79, 239-242.
Birnaum, M. H. (1974). Reply to the devil’s advocates: Don’t confound model testing with measurement. Psychological Bulletin, 81, 854-859.
Budd, R. J. (1986). Predicting cigarette use: The need to incorporate measures of salience in the theory of reasoned action. Journal of Applied Sociul Psychol-
Budd, R. J. , North, D., & Spencer, C. (1984). Understanding seatbelt use: A test of Bentler and Speckart’s extension of the theory of reasoned action. Euro- pean Journal of Social Psychology, 14,69-78.
Busemeyer, J. R., & Jones, L. E. (1983). Analysis of multiplicative combination rules when the causal variables are measured with error. Psychological Bulle- tin, 93,549-562.
Evans, M. G. (1991). The problem of analyzing multiplicative composites: Inter- actions revisited. American Psychologist, 46, 6- 15.
Fishbein, M. (1976). Extending the extended model: Some comments. Advances in Consumer Research, 3,49 1-497.
41-59.
OD, 16,663-685.
2192 GAGNE AND GODIN
Fishbein, M., & Ajzen, I. (1975). Belief; attitude, intention, and behavior.: An introduction to theoiy of research. Reading, MA: Addison-Wesley.
Fishbein, M., & Ajzen, I. (198 1). On construct validity: A critique of Miniard and Cohen’s paper. Journal of Expei*inzental and Social Psycholop, 17, 340-350.
Godin, G., & Kok, G. (1996). The theory of planned behavior: A review of its applications to health-related behaviors. American Journal of Health Promo- tion, 11, 87-98.
Grube, J. W., Morgan, M., & McGree, S. T. (1986). Attitudes and nonnative beliefs as predictors of smoking intentions and behaviours: A test of three models. British Journal of Social Psycholop, 25, 8 1-93.
Hewstone, M., & Young, L. (1988). Expectancy-value models of attitude: Mea- surement and combination of evaluations and beliefs. Journal of Applied Social Psycholog,, 18,958-971.
Holbrook, M. B. (1977). Comparing multiattribute attitude models by optimal scaling. Journal of Consumer Research, 4, 165- 17 1.
Horn, P. W., & Hulin, C. L. (1981). A competitive test of the prediction of reen- listment by several models. Journal ofApplied Psychology, 66.23-39.
Lechner, L. ( 1998). Social psychological determinants of health risk behaviors related to cancer and CVD. Applications and elaborations of the ASE models. Unpublished doctoral dissertation, University of Maastricht, The Nether- lands.
Loken, B., & Fishbein, M. (1980). An analysis of the effects of occupational variables on childbearing intentions. Journal of Applied Social Psychologv,
Mellenbergh, G. J., Molendijk, L., de Haan, W., & ter Horst, G. (1990). The sum- of-products variable reconsidered. Methodika, 4, 37-46.
Miniard, P. W., & Cohen, J. B. (198 1). An examination of the Fishbein behav- ioral intentions model’s concepts and measures. Journal of Experimental and Social Ps.vchologv, 17,309-329.
Nakanishi, M., & Bettman. J. R. (1974). Attitude models revisited: An individual level analysis. Journal of Consumer Research, 1, 16-2 1.
Ryan, M. J., & Bonfield, E. H. (1975). The Fishbein extended model and con- sumer behavior. Journal of Consumer Research, 2, 118- 136.
Saltzer, E. B. (1981). Cognitive moderators of the relationship between behav- ioral intentions and behavior. Journal of Personality and Social Psychology, 41, 260-27 1.
Schlegel, R. P., Crawford, C. A., & Sanborn, M. D. (1977). Correspondence and mediational properties of the Fishbein model: An application to adolescents’ alcohol use. Journal of Experimental Social Psychology, 13,42 1-430.
Schmidt, F. L. (1973). Implications of a measurement problem for expectancy theory research. Organizational Behavior and Human Performance, 10, 243- 251.
10,202-223.
MEASUREMENT IN THE THEORY OF PLANNED BEHAVIOR 2193
Schwarz, N., Strack, F., & Mai, H.-P. (1991). Assimilation and contrast effects in part-whole question sequences: A conversational logic analysis. Public Opinion Quarterly, 55,3-23.
Smith, A. J., & Clark, R. D., 111. (1973). The relationship between attitudes and beliefs. Journal of Personality and Social Psychology, 26,321-326.
Sparks, P., Hedderley, D., & Shepherd, R. (1991). Expectancy-value models of attitudes: A note on the relationship between theory and methodology. Euro- pean Journal ofsocial Psychology, 21,261-271.
Thurstone, L. L., & Jones, L. V. (1957). The rational origin for measuring sub- jective values. Journal of the American Statistical Association, 52,458-471.
Tourangeau, R., Rasinski, K. A., Bradburn, N., & D’Andrade, R. (1989a). Belief accessibility and context effects in attitude measurement. Journal of Experi- mental SociaI Psychology, 25,40 1-42 1.
Tourangeau, R., Rasinski, K. A., Bradburn, N., & D’Andrade, R. (1989b). Cany- over effects in attitude surveys. Public Opinion Quarterly, 53,495-524.
Valiquette, C. A. M., Valois, P., Desharnais, R., & Godin, G. (1988). An item analytic investigation of the Fishbein and Ajzen multiplicative scale: The problem of a simultaneous negative evaluation of belief and outcome. Ps,y- chological Reports, 63, 723-728.
Valois, P., Deshamais, R., Godin, G., Perron, J., & Lecomte, C. (1993). Psycho- metric properties of a perceived behavioral control multiplicative scale devel- oped according to Ajzen’s theory of planned behavior. Psychological Reports, 72, 1079-1083.
van der Pligt, J., & de Vries, N. K. (1998). Expectancy-value models of health behavior: The role of salience and anticipated affect. Psychology and Health, 13, 289-305.


