Embed Size (px)
Citation preview
THE USE OF FIBRE WALL THICKNESS DATA TO PREDICT HANDSHEET PROPERTIES OF EUCALYPT PULP FIBRES 1 Iiro Pulkkinen, Research Scientist 2 Ville Alopaeus, Professor, Helsinki University of Technology, Chemical Engineering, Department of Biotechnology and Chemical Technology, PO Box 6100, FI-02015, TKK, Finland. 3 Juha Fiskari, Development manager, Oy Metsä-Botnia Ab, Joutseno, FI-54120 Finland. 4 Olli Joutsimo, Development manager, Oy Metsä-Botnia Ab, Äänekoski, FI-44100, Finland.
SUMMARY With modern fibre analysers, such as the FiberLab®, the whole range of fibres in a pulp mix can be measured, providing distributions of fibre properties. Fibre dimension distributions and the calculated density of handsheets were used to find suitable parameters to characterise the effect of fibre morphology on paper technical properties. With these variables combined with the water retention value (WRV) data, both the effect of raw material morphology and that of the drying shrinkage behaviour can be characterised qualitatively. Fibre wall thickness distribution was found to be the major contributor of handsheet properties studied, such as tensile strength, sheet density and air resistance. Fiber length, and also surprisingly fiber width had no significant effect on measured properties. Scanning electron microscopy (SEM) was also used in order to investigate the potential of SEM in swelling studies of the fibres and handsheets. Keywords: FiberLab®, WRV, fibre wall thickness, morphology, distribution, drying shrinkage, SEM INTRODUCTION The relationship between pulp fibre morphology and paper properties has been extensively studied over the years (1-7). Fibre length and strength have been shown to be particularly important for tearing resistance (7-9). The thickness of the fibre wall has an important bearing on most paper properties, with thick-walled fibres forming bulky sheets of low tensile but with a high tearing strength (1, 4).
It has become increasingly important to identify key pulp parameters that can be used to predict ultimate papermaking performance on the paper machine. We have previously studied the correlations between fibre wall thickness distributions and paper technical properties of handsheets (10).
The network structure of paper depends on the collapsibility, conformability, and flexibility of wet fibres. These factors and the swelling of the fibres determine the densification of paper structure in wet pressing and drying. Fibre curl affects mostly the tensile strength and the bonding ability of fibres in a fibre network. The effect of fibre bonding has previously been studied by Retulainen (1997)(11) and Vainio (2007)(12). The high fibre curl e.g. according to Page et al. 1985(13) affects the tensile index so that a sheet formed with curled fibres has a low tensile index but can have a high tear strength. The low tensile index has also been explained by low fibre segment activation (14-16).
Fibre segment activation modifies originally curly or otherwise deformed fibre segments, unable to carry the load, into active components of the network (17-19). Activation of fibre network occurs during drying, when lateral shrinkage of fibres is transformed into axial shrinkage of neighbouring fibres in bonded areas. In restrained drying, the free fibre segments dry under stress and the slackness is therefore removed (17-19). Interfibre bonding and shrinkage of fibres are the requisites for activation. The amount of drying stress needed to activate fibre segments depends on the morphology of the fibres (11). In this paper we have investigated how fibre wall thickness can be linked to drying shrinkage, and therefore to the development of paper technical properties.
In this study, we have characterised this by a single parameter that uses the whole mass distribution of fibres. All fibre dimension measurements carried out in this study are made with a FiberLab® fibre analyser (20). In this paper, the effect of fibre dimension property distributions on handsheet properties was also examined. Previous studies have mostly concentrated on mean dimensions of fibres (21,22). In addition, SEM images were used to characterise the swelling behaviour of handsheets when subjected to varying humidity conditions. This further supported our suggestion to use apparent density as a basic parameter for characterising inter-fibre bonding and network activation. The combined use of dimension distribution measurements of fibre properties, calculated apparent density and WRV measurements provides an insight on the effect of fibre segment activation to sheet properties. A
EXPERIMENTAL Materials 20 Eucalyptus grandis clones (16 4-year-old and 4 8 -year-old) were used in this study. Kraft pulps were produced from chips representing the whole trees. Pulps were laboratory cooked to a Kappa number of 18 ± 2. Samples of the prepared pulps were beaten with a PFI refiner up to 2,500 revolutions according to standard ISO 5264-2. Handsheets were made according to the standard ISO 5269-1.
For SEM imaging, dynamic sheets of an E. grandis/E. dunnii commercial pulp were used. Dynamic sheets were made with a dynamic sheet former (23) developed by Paprican, which had been slightly altered. The wire speed was set to 1000 m/min. The jet speed was set to ~ 920 m/min (1.6 bar) and the feed concentration was 4 g/l. The grammage of dynamic sheets was ~60 g/m2. The sheets were wet- pressed according to ISO 5269-1. The laboratory sheets were dried in contact with a plate, which prevented shrinkage during drying. The drying was done in a climate control room (23 °C and relative humidity (RH) of 50%). After drying, the handsheets were tested according to the following standards and methods:
B
• apparent density EN ISO 534 • tensile properties EN ISO 1924-2 • water retention value (WRV) SCAN-C62 • air resistance EN ISO 5636-5:03
Absolute dry samples were dried overnight (16 hours) in an oven at 105°C. Handsheet conditioning to 90% RH was carried out with an OPTIDIM hygroexpansivity meter (24). Microfibril angle was measured with SilviScan 2 measurement apparatus (25). Samples were taken from breast height, as a bark free sample (12 mm core from bark to pith (1 radii). Measurements of fibre dimensions A FiberLab® measurement equipment consists of an analyser and a sample unit. Two CCD cameras capture fibre images. The direct results are the fibre length, fibre width and fibre wall thickness. The calculated values are the curl index, coarseness, cross-sectional area and volume index (20). Procedures of fibre and image processing to obtain fibre properties have been described in detail elsewhere (20).
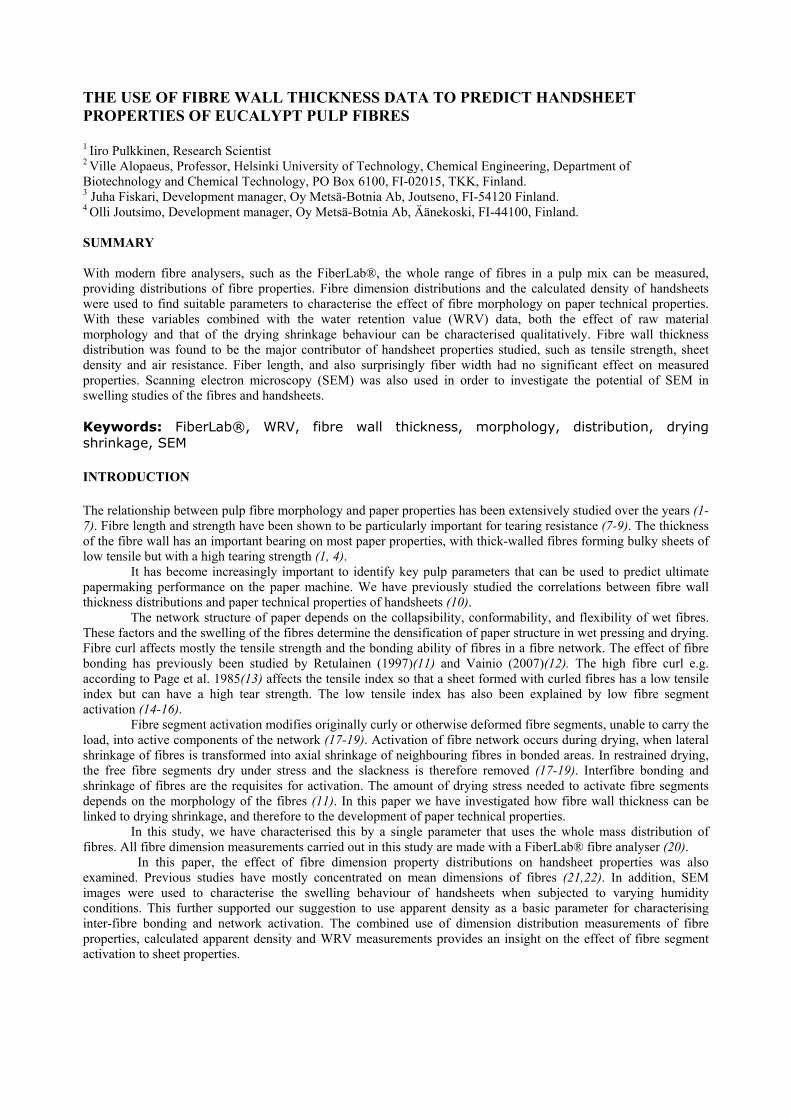
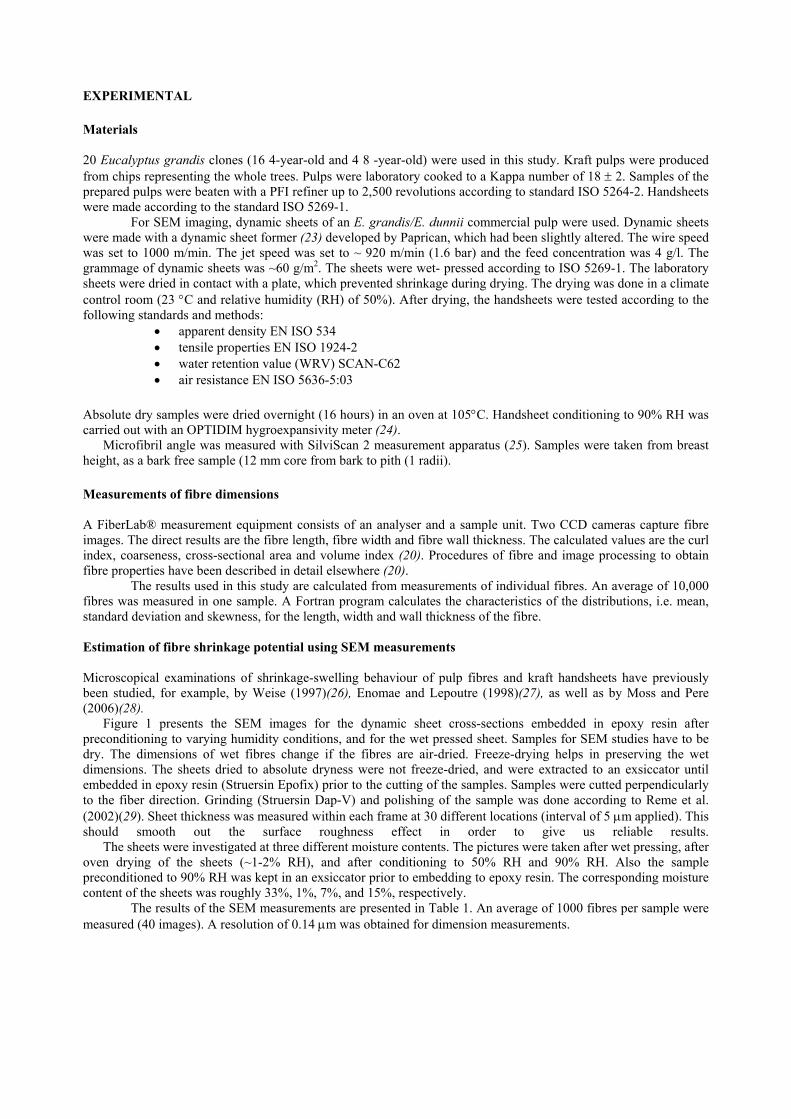
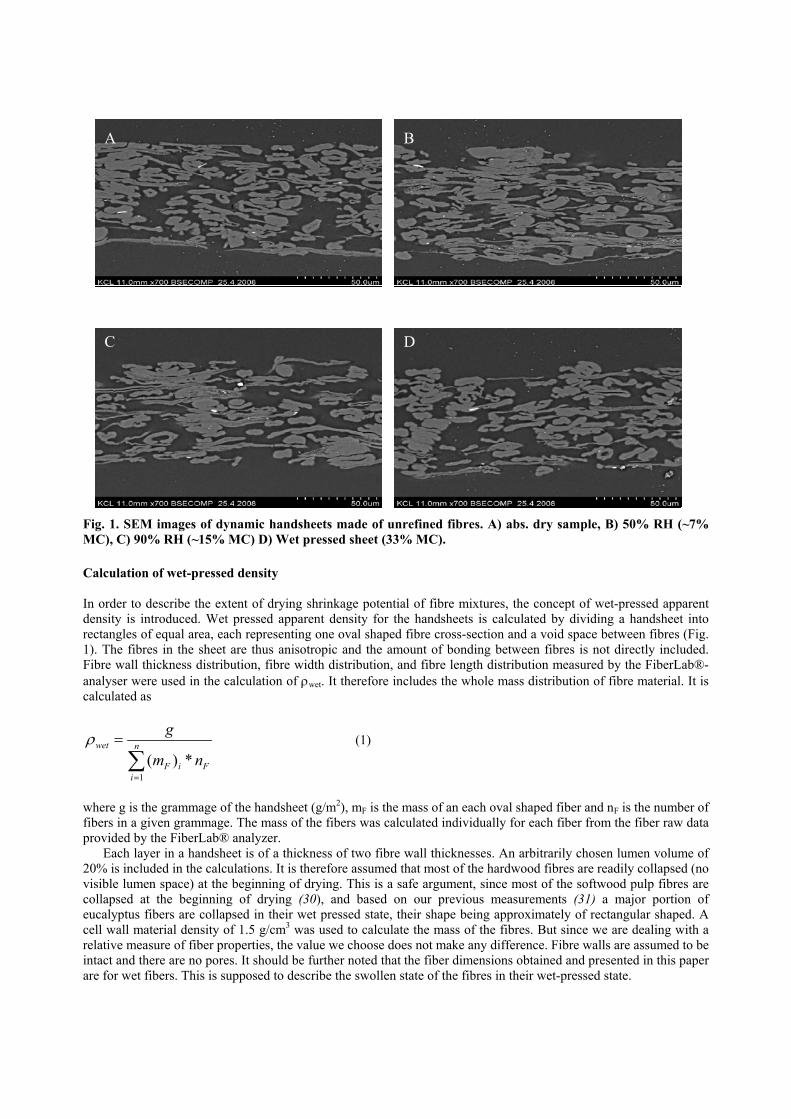
The results used in this study are calculated from measurements of individual fibres. An average of 10,000 fibres was measured in one sample. A Fortran program calculates the characteristics of the distributions, i.e. mean, standard deviation and skewness, for the length, width and wall thickness of the fibre. Estimation of fibre shrinkage potential using SEM measurements Microscopical examinations of shrinkage-swelling behaviour of pulp fibres and kraft handsheets have previously been studied, for example, by Weise (1997)(26), Enomae and Lepoutre (1998)(27), as well as by Moss and Pere (2006)(28). Figure 1 presents the SEM images for the dynamic sheet cross-sections embedded in epoxy resin after preconditioning to varying humidity conditions, and for the wet pressed sheet. Samples for SEM studies have to be dry. The dimensions of wet fibres change if the fibres are air-dried. Freeze-drying helps in preserving the wet dimensions. The sheets dried to absolute dryness were not freeze-dried, and were extracted to an exsiccator until embedded in epoxy resin (Struersin Epofix) prior to the cutting of the samples. Samples were cutted perpendicularly to the fiber direction. Grinding (Struersin Dap-V) and polishing of the sample was done according to Reme et al. (2002)(29). Sheet thickness was measured within each frame at 30 different locations (interval of 5 µm applied). This should smooth out the surface roughness effect in order to give us reliable results. The sheets were investigated at three different moisture contents. The pictures were taken after wet pressing, after oven drying of the sheets (~1-2% RH), and after conditioning to 50% RH and 90% RH. Also the sample preconditioned to 90% RH was kept in an exsiccator prior to embedding to epoxy resin. The corresponding moisture content of the sheets was roughly 33%, 1%, 7%, and 15%, respectively.
The results of the SEM measurements are presented in Table 1. An average of 1000 fibres per sample were measured (40 images). A resolution of 0.14 µm was obtained for dimension measurements.
C D
A B Fig. 1. SEM images of dynamic handsheets made of unrefined fibres. A) abs. dry sample, B) 50% RH (~7% MC), C) 90% RH (~15% MC) D) Wet pressed sheet (33% MC). Calculation of wet-pressed density In order to describe the extent of drying shrinkage potential of fibre mixtures, the concept of wet-pressed apparent density is introduced. Wet pressed apparent density for the handsheets is calculated by dividing a handsheet into rectangles of equal area, each representing one oval shaped fibre cross-section and a void space between fibres (Fig. 1). The fibres in the sheet are thus anisotropic and the amount of bonding between fibres is not directly included. Fibre wall thickness distribution, fibre width distribution, and fibre length distribution measured by the FiberLab®-analyser were used in the calculation of ρwet. It therefore includes the whole mass distribution of fibre material. It is calculated as
F
n
iiF
wet
nm
g
*)(1
∑=
=ρ (1)
where g is the grammage of the handsheet (g/m2), mF is the mass of an each oval shaped fiber and nF is the number of fibers in a given grammage. The mass of the fibers was calculated individually for each fiber from the fiber raw data provided by the FiberLab® analyzer. Each layer in a handsheet is of a thickness of two fibre wall thicknesses. An arbitrarily chosen lumen volume of 20% is included in the calculations. It is therefore assumed that most of the hardwood fibres are readily collapsed (no visible lumen space) at the beginning of drying. This is a safe argument, since most of the softwood pulp fibres are collapsed at the beginning of drying (30), and based on our previous measurements (31) a major portion of eucalyptus fibers are collapsed in their wet pressed state, their shape being approximately of rectangular shaped. A cell wall material density of 1.5 g/cm3 was used to calculate the mass of the fibres. But since we are dealing with a relative measure of fiber properties, the value we choose does not make any difference. Fibre walls are assumed to be intact and there are no pores. It should be further noted that the fiber dimensions obtained and presented in this paper are for wet fibers. This is supposed to describe the swollen state of the fibres in their wet-pressed state.
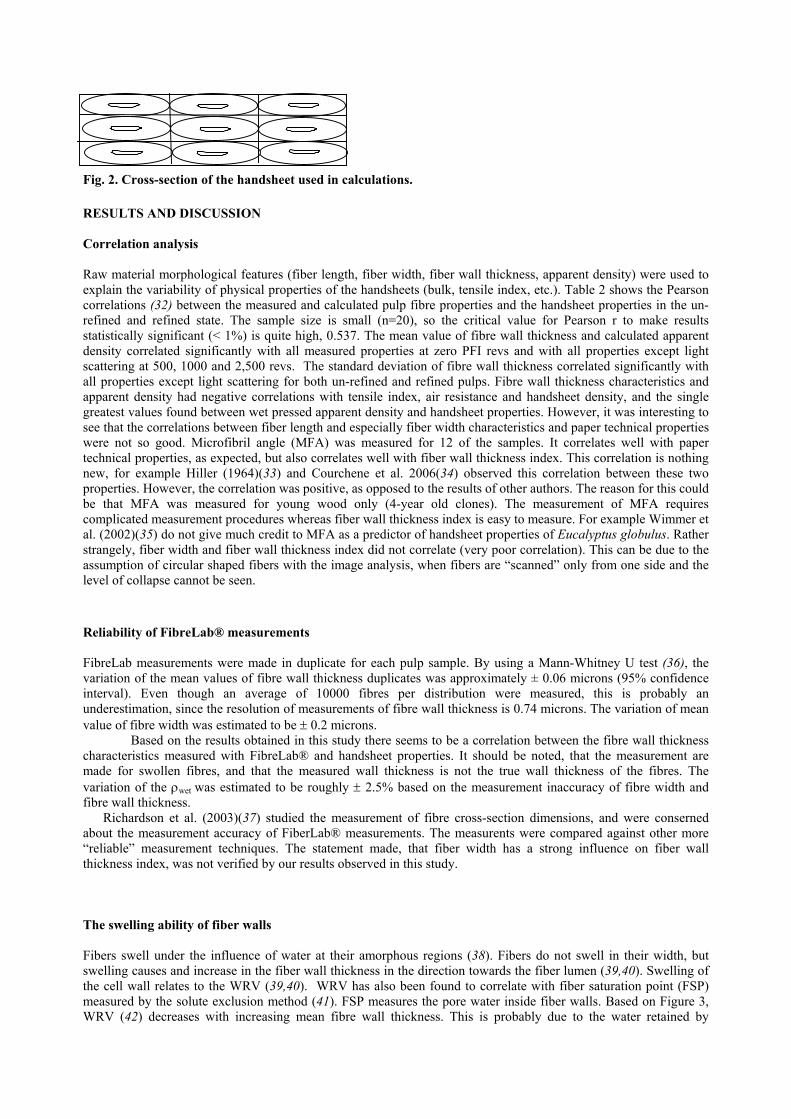
Fig. 2. Cross-section of the handsheet used in calculations. RESULTS AND DISCUSSION Correlation analysis Raw material morphological features (fiber length, fiber width, fiber wall thickness, apparent density) were used to explain the variability of physical properties of the handsheets (bulk, tensile index, etc.). Table 2 shows the Pearson correlations (32) between the measured and calculated pulp fibre properties and the handsheet properties in the un-refined and refined state. The sample size is small (n=20), so the critical value for Pearson r to make results statistically significant (< 1%) is quite high, 0.537. The mean value of fibre wall thickness and calculated apparent density correlated significantly with all measured properties at zero PFI revs and with all properties except light scattering at 500, 1000 and 2,500 revs. The standard deviation of fibre wall thickness correlated significantly with all properties except light scattering for both un-refined and refined pulps. Fibre wall thickness characteristics and apparent density had negative correlations with tensile index, air resistance and handsheet density, and the single greatest values found between wet pressed apparent density and handsheet properties. However, it was interesting to see that the correlations between fiber length and especially fiber width characteristics and paper technical properties were not so good. Microfibril angle (MFA) was measured for 12 of the samples. It correlates well with paper technical properties, as expected, but also correlates well with fiber wall thickness index. This correlation is nothing new, for example Hiller (1964)(33) and Courchene et al. 2006(34) observed this correlation between these two properties. However, the correlation was positive, as opposed to the results of other authors. The reason for this could be that MFA was measured for young wood only (4-year old clones). The measurement of MFA requires complicated measurement procedures whereas fiber wall thickness index is easy to measure. For example Wimmer et al. (2002)(35) do not give much credit to MFA as a predictor of handsheet properties of Eucalyptus globulus. Rather strangely, fiber width and fiber wall thickness index did not correlate (very poor correlation). This can be due to the assumption of circular shaped fibers with the image analysis, when fibers are “scanned” only from one side and the level of collapse cannot be seen.
Reliability of FibreLab® measurements FibreLab measurements were made in duplicate for each pulp sample. By using a Mann-Whitney U test (36), the variation of the mean values of fibre wall thickness duplicates was approximately ± 0.06 microns (95% confidence interval). Even though an average of 10000 fibres per distribution were measured, this is probably an underestimation, since the resolution of measurements of fibre wall thickness is 0.74 microns. The variation of mean value of fibre width was estimated to be ± 0.2 microns. Based on the results obtained in this study there seems to be a correlation between the fibre wall thickness characteristics measured with FibreLab® and handsheet properties. It should be noted, that the measurement are made for swollen fibres, and that the measured wall thickness is not the true wall thickness of the fibres. The variation of the ρwet was estimated to be roughly ± 2.5% based on the measurement inaccuracy of fibre width and fibre wall thickness. Richardson et al. (2003)(37) studied the measurement of fibre cross-section dimensions, and were conserned about the measurement accuracy of FiberLab® measurements. The measurents were compared against other more “reliable” measurement techniques. The statement made, that fiber width has a strong influence on fiber wall thickness index, was not verified by our results observed in this study. The swelling ability of fiber walls Fibers swell under the influence of water at their amorphous regions (38). Fibers do not swell in their width, but swelling causes and increase in the fiber wall thickness in the direction towards the fiber lumen (39,40). Swelling of the cell wall relates to the WRV (39,40). WRV has also been found to correlate with fiber saturation point (FSP) measured by the solute exclusion method (41). FSP measures the pore water inside fiber walls. Based on Figure 3, WRV (42) decreases with increasing mean fibre wall thickness. This is probably due to the water retained by
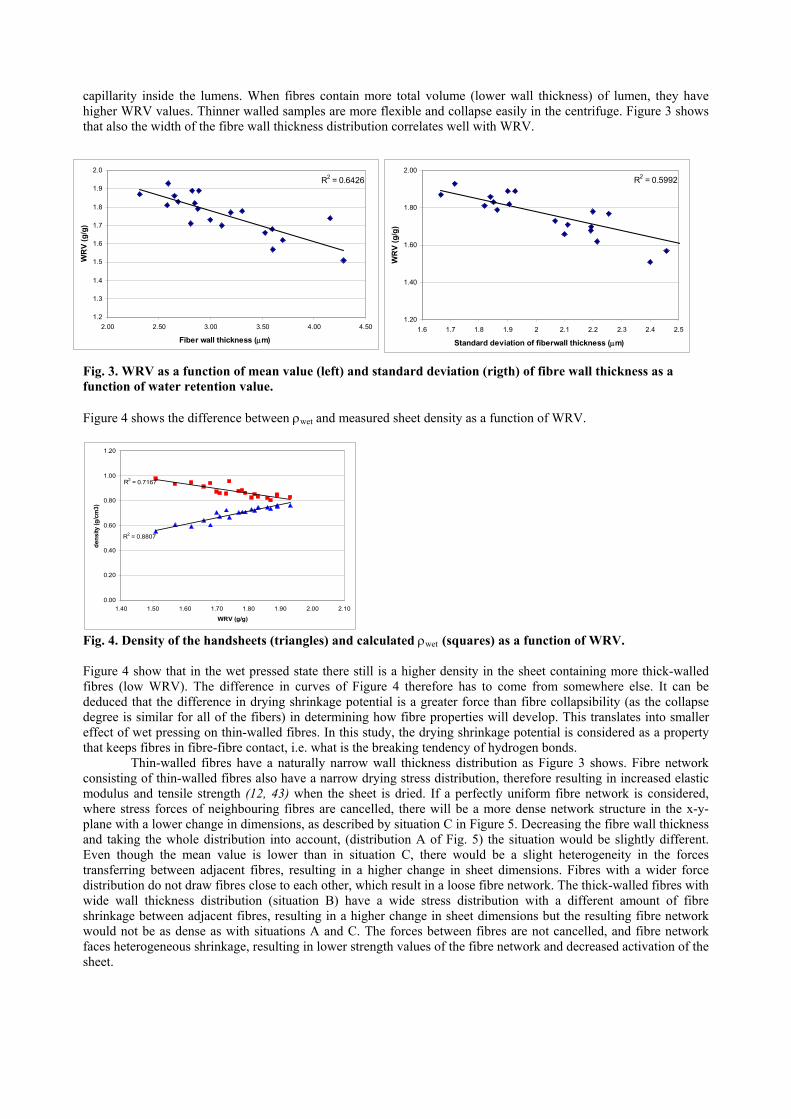
capillarity inside the lumens. When fibres contain more total volume (lower wall thickness) of lumen, they have higher WRV values. Thinner walled samples are more flexible and collapse easily in the centrifuge. Figure 3 shows that also the width of the fibre wall thickness distribution correlates well with WRV.
R2 = 0.6426
1.2
1.3
1.4
1.5
1.6
1.7
1.8
1.9
2.0
2.00 2.50 3.00 3.50 4.00 4.50
Fiber wall thickness (µm)
WR
V (g
/g)
R2 = 0.5992
1.20
1.40
1.60
1.80
2.00
1.6 1.7 1.8 1.9 2 2.1 2.2 2.3 2.4 2.5
Standard deviation of fiberwall thickness (µm)
WR
V (g
/g)
Fig. 3. WRV as a function of mean value (left) and standard deviation (rigth) of fibre wall thickness as a function of water retention value. Figure 4 shows the difference between ρwet and measured sheet density as a function of WRV.
R2 = 0.8807
R2 = 0.7167
0.00
0.20
0.40
0.60
0.80
1.00
1.20
1.40 1.50 1.60 1.70 1.80 1.90 2.00 2.10
WRV (g/g)
dens
ity (g
/cm
3)
Fig. 4. Density of the handsheets (triangles) and calculated ρwet (squares) as a function of WRV. Figure 4 show that in the wet pressed state there still is a higher density in the sheet containing more thick-walled fibres (low WRV). The difference in curves of Figure 4 therefore has to come from somewhere else. It can be deduced that the difference in drying shrinkage potential is a greater force than fibre collapsibility (as the collapse degree is similar for all of the fibers) in determining how fibre properties will develop. This translates into smaller effect of wet pressing on thin-walled fibres. In this study, the drying shrinkage potential is considered as a property that keeps fibres in fibre-fibre contact, i.e. what is the breaking tendency of hydrogen bonds.
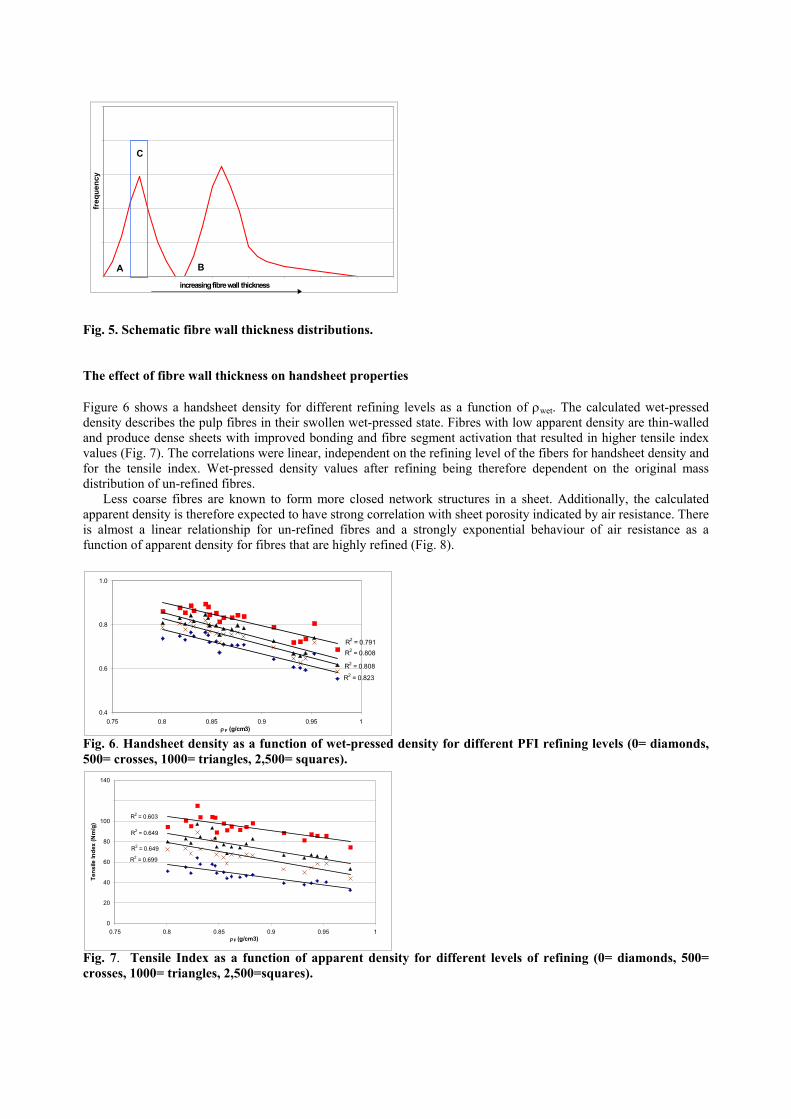
Thin-walled fibres have a naturally narrow wall thickness distribution as Figure 3 shows. Fibre network consisting of thin-walled fibres also have a narrow drying stress distribution, therefore resulting in increased elastic modulus and tensile strength (12, 43) when the sheet is dried. If a perfectly uniform fibre network is considered, where stress forces of neighbouring fibres are cancelled, there will be a more dense network structure in the x-y-plane with a lower change in dimensions, as described by situation C in Figure 5. Decreasing the fibre wall thickness and taking the whole distribution into account, (distribution A of Fig. 5) the situation would be slightly different. Even though the mean value is lower than in situation C, there would be a slight heterogeneity in the forces transferring between adjacent fibres, resulting in a higher change in sheet dimensions. Fibres with a wider force distribution do not draw fibres close to each other, which result in a loose fibre network. The thick-walled fibres with wide wall thickness distribution (situation B) have a wide stress distribution with a different amount of fibre shrinkage between adjacent fibres, resulting in a higher change in sheet dimensions but the resulting fibre network would not be as dense as with situations A and C. The forces between fibres are not cancelled, and fibre network faces heterogeneous shrinkage, resulting in lower strength values of the fibre network and decreased activation of the sheet.
increasing fibre wall thickness
freq
uenc
y
A B
C
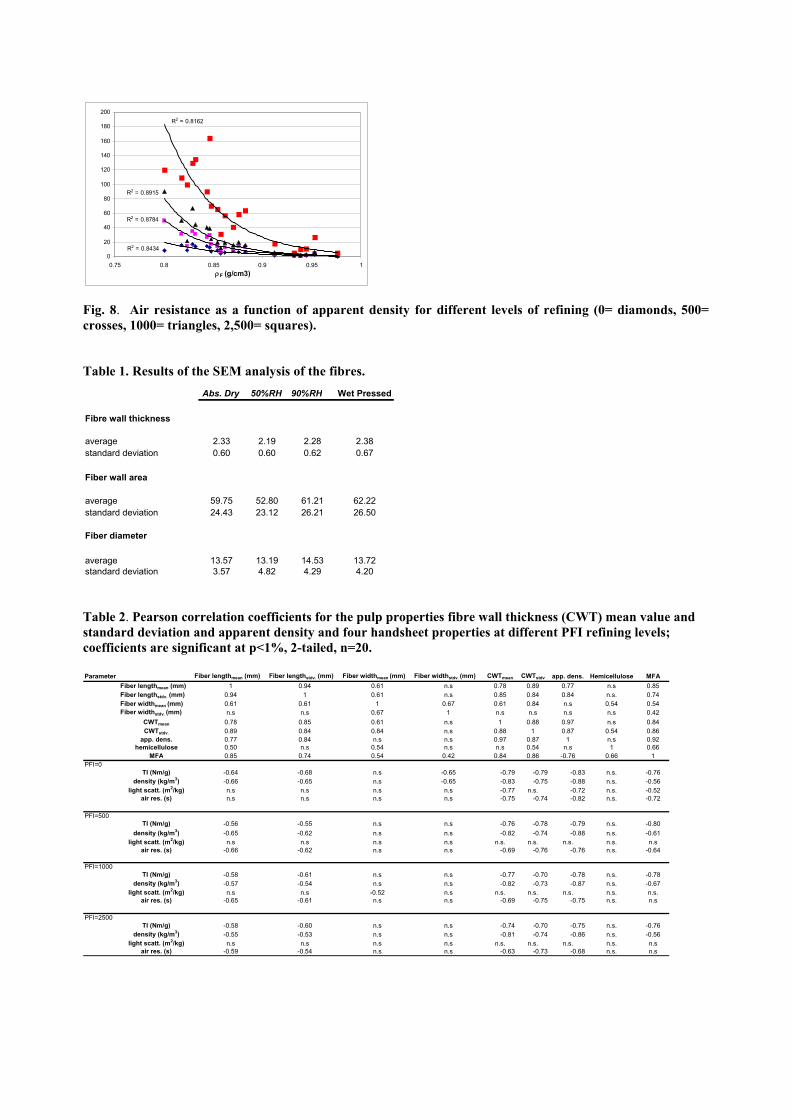
Fig. 5. Schematic fibre wall thickness distributions. The effect of fibre wall thickness on handsheet properties Figure 6 shows a handsheet density for different refining levels as a function of ρwet. The calculated wet-pressed density describes the pulp fibres in their swollen wet-pressed state. Fibres with low apparent density are thin-walled and produce dense sheets with improved bonding and fibre segment activation that resulted in higher tensile index values (Fig. 7). The correlations were linear, independent on the refining level of the fibers for handsheet density and for the tensile index. Wet-pressed density values after refining being therefore dependent on the original mass distribution of un-refined fibres. Less coarse fibres are known to form more closed network structures in a sheet. Additionally, the calculated apparent density is therefore expected to have strong correlation with sheet porosity indicated by air resistance. There is almost a linear relationship for un-refined fibres and a strongly exponential behaviour of air resistance as a function of apparent density for fibres that are highly refined (Fig. 8). /c
m3)
ity (g
den
s
heet
hans
R2 = 0.791R2 = 0.808
R2 = 0.808
R2 = 0.823
0.4
0.6
0.8
1.0
0.75 0.8 0.85 0.9 0.95 1ρ F (g/cm3)
Fig. 6. Handsheet density as a function of wet-pressed density for different PFI refining levels (0= diamonds, 500= crosses, 1000= triangles, 2,500= squares). 120
Fig. 7. Tensile Index as a function of apparent density for different levels of refining (0= diamonds, 500= crosses, 1000= triangles, 2,500=squares).
R2 = 0.603
R2 = 0.649
R2 = 0.649
R2 = 0.699
0
20
40
60
80
100
140
0.75 0.8 0.85 0.9 0.95 1ρF (g/cm3)
Tens
ile In
dex
(Nm
/g)
(s
)
ce
stan
ir re
si
A
R2 = 0.8162
R2 = 0.8915
R2 = 0.8784
R2 = 0.84340
20
40
60
80
100
120
140
160
180
200
0.75 0.8 0.85 0.9 0.95 1ρF (g/cm3)
Fig. 8. Air resistance as a function of apparent density for different levels of refining (0= diamonds, 500= crosses, 1000= triangles, 2,500= squares). Table 1. Results of the SEM analysis of the fibres.
Abs. Dry 50%RH 90%RH Wet Pressed
Fibre wall thickness
average 2.33 2.19 2.28 2.38standard deviation 0.60 0.60 0.62 0.67
Fiber wall area
average 59.75 52.80 61.21 62.22standard deviation 24.43 23.12 26.21 26.50
Fiber diameter
average 13.57 13.19 14.53 13.72standard deviation 3.57 4.82 4.29 4.20
Table 2. Pearson correlation coefficients for the pulp properties fibre wall thickness (CWT) mean value and standard deviation and apparent density and four handsheet properties at different PFI refining levels; coefficients are significant at p<1%, 2-tailed, n=20. Parameter Fiber lengthmean (mm) Fiber lengthstdv. (mm) Fiber widthmean (mm) Fiber widthstdv. (mm) CWTmean CWTstdv app. dens. Hemicellulose MFA
Fiber lengthmean (mm) 1 0.94 0.61 n.s 0.78 0.89 0.77 n.s 0.85Fiber lengthstdv. (mm) 0.94 1 0.61 n.s 0.85 0.84 0.84 n.s. 0.74Fiber widthmean (mm) 0.61 0.61 1 0.67 0.61 0.84 n.s 0.54 0.54Fiber widthstdv. (mm) n.s n.s 0.67 1 n.s n.s n.s n.s 0.42
CWTmean 0.78 0.85 0.61 n.s 1 0.88 0.97 n.s 0.84CWTstdv. 0.89 0.84 0.84 n.s 0.88 1 0.87 0.54 0.86
app. dens. 0.77 0.84 n.s n.s 0.97 0.87 1 n.s 0.92hemicellulose 0.50 n.s 0.54 n.s n.s 0.54 n.s 1 0.66
MFA 0.85 0.74 0.54 0.42 0.84 0.86 -0.76 0.66 1PFI=0
TI (Nm/g) -0.64 -0.68 n.s -0.65 -0.79 -0.79 -0.83 n.s. -0.76density (kg/m3) -0.66 -0.65 n.s -0.65 -0.83 -0.75 -0.88 n.s. -0.56
light scatt. (m2/kg) n.s n.s n.s n.s -0.77 n.s. -0.72 n.s. -0.52air res. (s) n.s n.s n.s n.s -0.75 -0.74 -0.82 n.s. -0.72
PFI=500TI (Nm/g) -0.56 -0.55 n.s n.s -0.76 -0.78 -0.79 n.s. -0.80
density (kg/m3) -0.65 -0.62 n.s n.s -0.82 -0.74 -0.88 n.s. -0.61light scatt. (m2/kg) n.s n.s n.s n.s n.s. n.s. n.s. n.s. n.s
air res. (s) -0.66 -0.62 n.s n.s -0.69 -0.76 -0.76 n.s. -0.64
PFI=1000TI (Nm/g) -0.58 -0.61 n.s n.s -0.77 -0.70 -0.78 n.s. -0.78
density (kg/m3) -0.57 -0.54 n.s n.s -0.82 -0.73 -0.87 n.s. -0.67light scatt. (m2/kg) n.s n.s -0.52 n.s n.s. n.s. n.s. n.s. n.s.
air res. (s) -0.65 -0.61 n.s n.s -0.69 -0.75 -0.75 n.s. n.s
PFI=2500TI (Nm/g) -0.58 -0.60 n.s n.s -0.74 -0.70 -0.75 n.s. -0.76
density (kg/m3) -0.55 -0.53 n.s n.s -0.81 -0.74 -0.86 n.s. -0.56light scatt. (m2/kg) n.s n.s n.s n.s n.s. n.s. n.s. n.s. n.s
air res. (s) -0.59 -0.54 n.s n.s -0.63 -0.73 -0.68 n.s. n.s
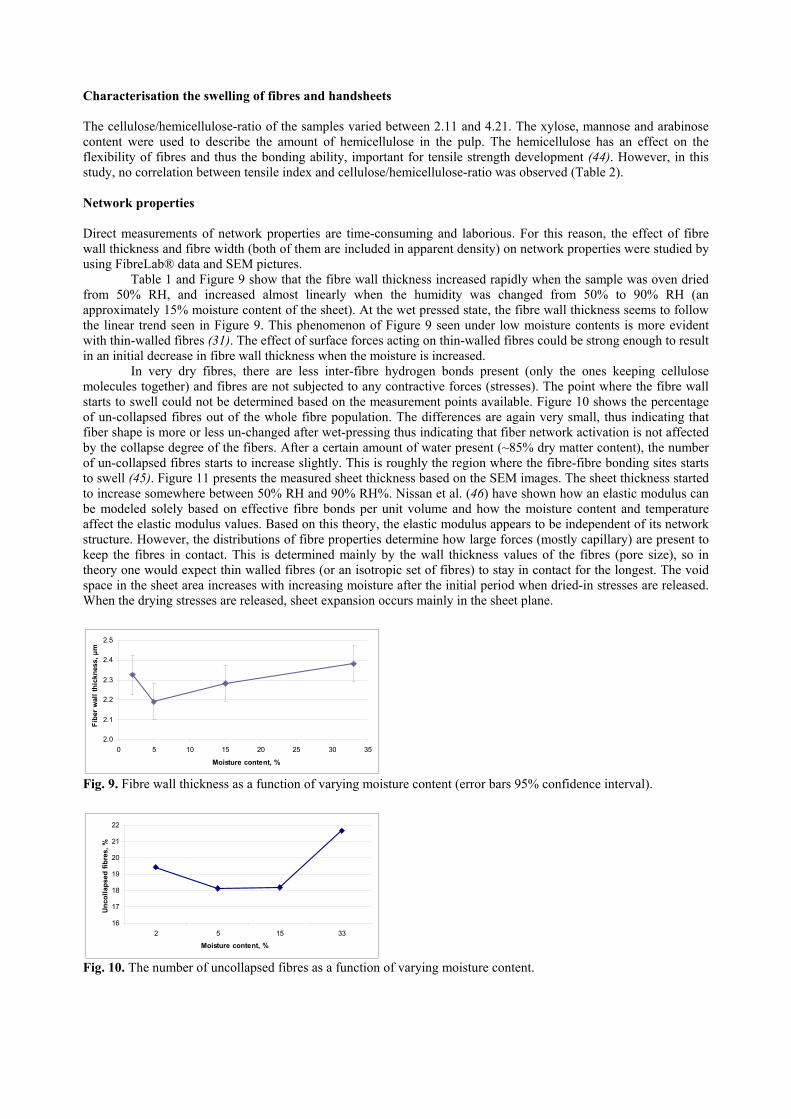
Characterisation the swelling of fibres and handsheets The cellulose/hemicellulose-ratio of the samples varied between 2.11 and 4.21. The xylose, mannose and arabinose content were used to describe the amount of hemicellulose in the pulp. The hemicellulose has an effect on the flexibility of fibres and thus the bonding ability, important for tensile strength development (44). However, in this study, no correlation between tensile index and cellulose/hemicellulose-ratio was observed (Table 2). Network properties Direct measurements of network properties are time-consuming and laborious. For this reason, the effect of fibre wall thickness and fibre width (both of them are included in apparent density) on network properties were studied by using FibreLab® data and SEM pictures. Table 1 and Figure 9 show that the fibre wall thickness increased rapidly when the sample was oven dried from 50% RH, and increased almost linearly when the humidity was changed from 50% to 90% RH (an approximately 15% moisture content of the sheet). At the wet pressed state, the fibre wall thickness seems to follow the linear trend seen in Figure 9. This phenomenon of Figure 9 seen under low moisture contents is more evident with thin-walled fibres (31). The effect of surface forces acting on thin-walled fibres could be strong enough to result in an initial decrease in fibre wall thickness when the moisture is increased.
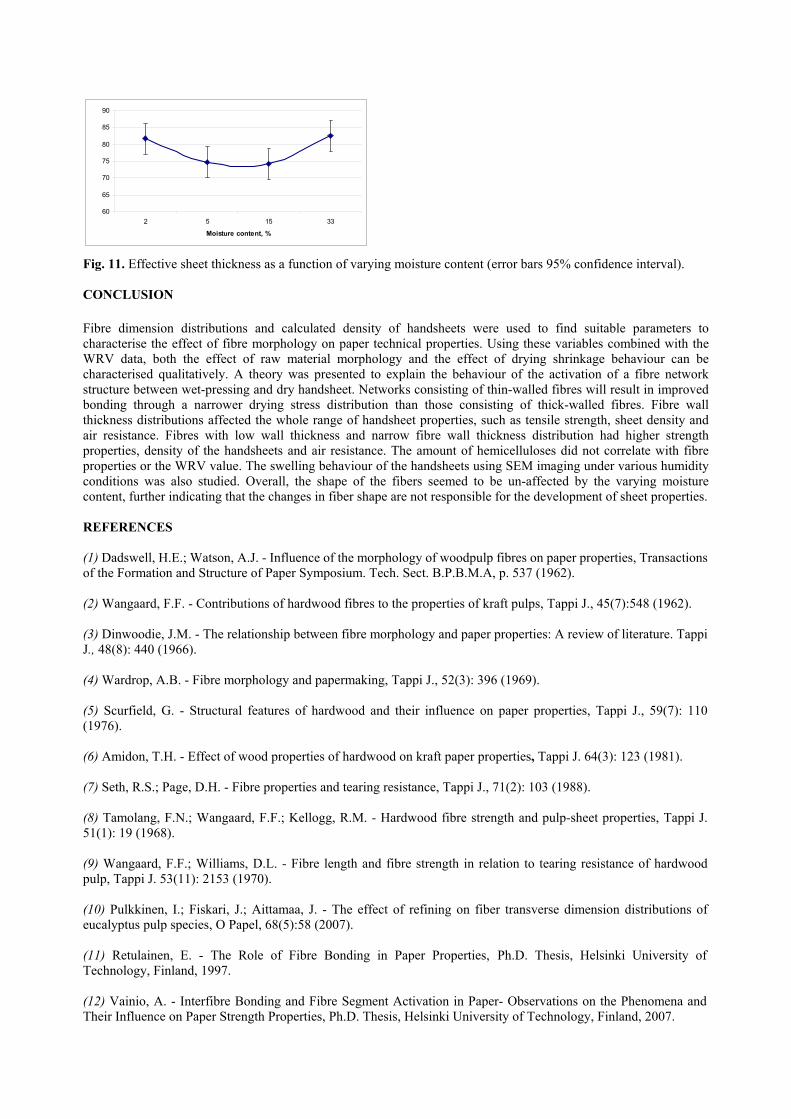
In very dry fibres, there are less inter-fibre hydrogen bonds present (only the ones keeping cellulose molecules together) and fibres are not subjected to any contractive forces (stresses). The point where the fibre wall starts to swell could not be determined based on the measurement points available. Figure 10 shows the percentage of un-collapsed fibres out of the whole fibre population. The differences are again very small, thus indicating that fiber shape is more or less un-changed after wet-pressing thus indicating that fiber network activation is not affected by the collapse degree of the fibers. After a certain amount of water present (~85% dry matter content), the number of un-collapsed fibres starts to increase slightly. This is roughly the region where the fibre-fibre bonding sites starts to swell (45). Figure 11 presents the measured sheet thickness based on the SEM images. The sheet thickness started to increase somewhere between 50% RH and 90% RH%. Nissan et al. (46) have shown how an elastic modulus can be modeled solely based on effective fibre bonds per unit volume and how the moisture content and temperature affect the elastic modulus values. Based on this theory, the elastic modulus appears to be independent of its network structure. However, the distributions of fibre properties determine how large forces (mostly capillary) are present to keep the fibres in contact. This is determined mainly by the wall thickness values of the fibres (pore size), so in theory one would expect thin walled fibres (or an isotropic set of fibres) to stay in contact for the longest. The void space in the sheet area increases with increasing moisture after the initial period when dried-in stresses are released. When the drying stresses are released, sheet expansion occurs mainly in the sheet plane.
2.0
2.1
2.2
2.3
2.4
2.5
0 5 10 15 20 25 30 35
Moisture content, %
Fibe
r w
all t
hick
ness
, µm
Fig. 9. Fibre wall thickness as a function of varying moisture content (error bars 95% confidence interval).
16
17
18
19
20
21
22
2 5 15 33
Moisture content, %
Unco
llaps
ed fi
bres
, %
Fig. 10. The number of uncollapsed fibres as a function of varying moisture content.
µ
m
ess,
hick
n
eet t
ve s
h
ffect
i
E
60
65
70
75
80
85
90
2 5 15 33
Moisture content, %
Fig. 11. Effective sheet thickness as a function of varying moisture content (error bars 95% confidence interval). CONCLUSION Fibre dimension distributions and calculated density of handsheets were used to find suitable parameters to characterise the effect of fibre morphology on paper technical properties. Using these variables combined with the WRV data, both the effect of raw material morphology and the effect of drying shrinkage behaviour can be characterised qualitatively. A theory was presented to explain the behaviour of the activation of a fibre network structure between wet-pressing and dry handsheet. Networks consisting of thin-walled fibres will result in improved bonding through a narrower drying stress distribution than those consisting of thick-walled fibres. Fibre wall thickness distributions affected the whole range of handsheet properties, such as tensile strength, sheet density and air resistance. Fibres with low wall thickness and narrow fibre wall thickness distribution had higher strength properties, density of the handsheets and air resistance. The amount of hemicelluloses did not correlate with fibre properties or the WRV value. The swelling behaviour of the handsheets using SEM imaging under various humidity conditions was also studied. Overall, the shape of the fibers seemed to be un-affected by the varying moisture content, further indicating that the changes in fiber shape are not responsible for the development of sheet properties. REFERENCES (1) Dadswell, H.E.; Watson, A.J. - Influence of the morphology of woodpulp fibres on paper properties, Transactions of the Formation and Structure of Paper Symposium. Tech. Sect. B.P.B.M.A, p. 537 (1962). (2) Wangaard, F.F. - Contributions of hardwood fibres to the properties of kraft pulps, Tappi J., 45(7):548 (1962). (3) Dinwoodie, J.M. - The relationship between fibre morphology and paper properties: A review of literature. Tappi J., 48(8): 440 (1966). (4) Wardrop, A.B. - Fibre morphology and papermaking, Tappi J., 52(3): 396 (1969). (5) Scurfield, G. - Structural features of hardwood and their influence on paper properties, Tappi J., 59(7): 110 (1976). (6) Amidon, T.H. - Effect of wood properties of hardwood on kraft paper properties, Tappi J. 64(3): 123 (1981). (7) Seth, R.S.; Page, D.H. - Fibre properties and tearing resistance, Tappi J., 71(2): 103 (1988). (8) Tamolang, F.N.; Wangaard, F.F.; Kellogg, R.M. - Hardwood fibre strength and pulp-sheet properties, Tappi J. 51(1): 19 (1968). (9) Wangaard, F.F.; Williams, D.L. - Fibre length and fibre strength in relation to tearing resistance of hardwood pulp, Tappi J. 53(11): 2153 (1970). (10) Pulkkinen, I.; Fiskari, J.; Aittamaa, J. - The effect of refining on fiber transverse dimension distributions of eucalyptus pulp species, O Papel, 68(5):58 (2007).
(11) Retulainen, E. - The Role of Fibre Bonding in Paper Properties, Ph.D. Thesis, Helsinki University of Technology, Finland, 1997. (12) Vainio, A. - Interfibre Bonding and Fibre Segment Activation in Paper- Observations on the Phenomena and Their Influence on Paper Strength Properties, Ph.D. Thesis, Helsinki University of Technology, Finland, 2007.
(13) Page, D.H.; Seth, R.S. Jordan, B.D., Barbe, M.C. - Curl, crimps, kinks and microcompressions in pulp fibres- their origin, measurements and significance. Paper making raw materials: their interactions with the production process and their effect on paper properties. Transactions of the 8th Fundamental Research Symposium held in Oxford September 1985, ed. V. Punton. Vol. 1, Mechanical Engineering Publications Limited, London, p. 183 (1985). (14) Pöhler, T.; Niskanen, K.;Wathen, R.- KCL Internal Report (2002). (15) Joutsimo, Olli; Wathen, Rolf; Tamminen, Tarja. - Effects of fibre deformations on pulp sheet properties and fibre strength, Paperi ja Puu, 87(6): 392 (2005). (16) Wathen, R. - Studies on fibre strength and its effect on paper properties, PhD. Thesis, Helsinki University of Technology, Finland, 2006. (17) Giertz, H.W. - Contribution to the theory of tensile strength, EUCEPA/European TAPPI Conference on Beating, Venice, Italy, Proceedings, EUCEPA, p.39 (1964). (18) Giertz, H.W., Rodland, G. - Elongation of segments- bonds in the secondary regime of the load/elongation curve, 1979 Int. Paper Physics Conf., Harrison Hot Springs, Canada. CPPA, Montreal, p.129 (1979). (19) Lobben, T.H. - The tensile stiffness of paper. Part 1. A model based on activation, Norsk Skogindustri, 29(12):311 (1975). (20) Metso Automation- FiberLabTM, Research-quality fiber measurement for mill process management, Leaflet, (2001). (21) Kerekes, R.J. - Characterizing refining action in PFI mills, Tappi J., 4(3): p.9 (2005). (22) Jang, H.F.; Seth, R.S. - Determining the mean values for fiber physical properties, NPPRJ, 19(3): p.372 (2004). (23) Uesaka, T. - Dimensional Stability and Environmental Effects on Paper Properties, In Handbook of physical testing of paper, Vol. 1, Dekker, New York, pp. 115-171 (2002). (24) Kajanto, I. and Niskanen, K. - Optical measurement of dimensional stability, Progress in Paper Physics- A seminar proceedings, Stockholm, Sweden, p.75 (1996). (25) Hatvani, Thomas S. G.; Evans, Robert; Kibblewhite, R. Paul; Parker, Ian H. Relationships between tracheid and kraft pulp fiber transverse dimensions. Appita Annual General Conference Proceedings (1999), 53rd (Vol. 1), pp. 87-94. (26) Weise, U. - Characterization and Mechanisms of Changes in Wood Pulp Fibres Caused by Water Removal, Ph.D., Helsinki University of Technology, Finland, 1997.
(27) Enomae, T.; Lepoutre, P. - Observation of the swelling behaviour of kraft fibres and sheets in the environmental scanning electron microscope, NPPRJ, 13(4):280 (1998).
(28) Moss, P.A.; Pere, J. - Microscopical study on the effects of partial removal of xylan on the swelling properties of birch kraft pulp fibres, NPPRJ, 21(1):8 (2006). (29) Reme, P.A.; Johnsen, P.O.; Helle, T. – Assessment of Fibre Transverse Dimensions using SEM and Image Analysis, JPPS, 28(4): 122 (2002). (30) Paavilainen, L. - Bonding potential of softwood sulphate pulp fibres, Paperi ja Puu, 76(3):162 (1994). (31) Pulkkinen, I., Fiskari, J., Alopaeus, V. - Observation of the swelling behaviour of fractionated kraft handsheets in the scanning electron microscope, Progress in Paper Physics Seminar- A seminar proceedings, Helsinki, Finland, p.251 (2008). (32) Milton, J.S., Arnold, J.C. - Introduction to probability and statistics, McGraw-Hill, New York, p. 811 (1995).
(33) Hiller, C.H. – Correlation of fibril angle with wall thickness of tracheids in summerwood of slash and loblolly pine. Tappi J., 47(2):125-128(1964). (34) Courchene, C.E.; Peter, G.F.; Litvay, J. - Cellulose Microfibril Angle as a Determinant of Paper Strength and Hygroexpansivity in Pinus Taeda L., Wood and Fiber Science, 38(1), 2006, pp. 112-120.
(35) Wimmer, R.; Downes, G.M.; Evans, R.; Rasmussen, G; French, J. – Direct Effects of Wood Characteristics on Pulp and Handsheet Properties on Eucalyptus globulus , Holzforschung, 56(3), 244-252(2002).
(36) Mann, H. B., & Whitney, D. R. - On a test of whether one of two random variables is stochastically larger than the other, Annals of Mathematical Statistics, 18, p. 50-60 (1947).
(37) Richardson, J.D.; Riddell, M.J.C.; Burnell, P. “Experience with the FiberLab™ V3.0 analyser for measuring fibre cross-section dimensions,” Proceedings of 57th Appita Annual Conference and Exhibition, Melbourne, Australia, 5-7 May, 2003, p.315-322. (38) Sisson, W.A. – Cellulose fibers, X-ray examination, In: E. Ott, editor, Cellulose and cellulose derivates, Chapter III-A (b), pages 256-266. Interscience Publisher, New York, 1943. (39) Lindström, T. – Der Einfluβ chemischer Faktoren auf Faserquellung und Papierfestigkeit. Das Papier, 34(12):561-568 (1980). (40) Lindström, T.; Carlsson, G. – The effect of carboxyl groups and their ionic form during drying on the hornification of cellulose fibers, Svensk Papperstidning, 85(15):R146-R151(1982). (41) Scallan, A.M.; Carles, J.E. – Correlation of the water retention value with the fiber saturation point, Svensk Papperstidning, 75(17):699-703 (1972). (42) Jayme, G., - Properties of Wood Celluloses. II. Determination and significance of Water Retention Value, Tappi J, 41(11):180A (1958). (43) Kärenlampi, P.- Effect of Distributions of Fibre Properties on Tensile Strength of Paper: A closed-Form Theory, JPPS, 21(4):J138 (1995). (44) Casey, P. - Pulp and Paper: Chemistry and Chemical Technology. Third Ed., Vol II, New York, p. 821-1446 (1980). (45) Nanko, H., Ohsawa, J., Okagawa, A. – How to see interfibre bonding in paper science, JPPS, 15(1):J17-J23 (1989). (46) Nissan, A.H. - Paper as an H-bond dominated solid in the elastic and plastic regimes, Tappi J., 68(9):118 (1985).


