Embed Size (px)
Citation preview
energies
Article
The Use of Well-Log Data in the GeomechanicalCharacterization of Middle Cambrian Tight SandstoneFormation: A Case Study from Eastern Pomerania, Poland
Małgorzata Słota-Valim * and Anita Lis-Sledziona
�����������������
Citation: Słota-Valim, M.;
Lis-Sledziona, A. The Use of Well-Log
Data in the Geomechanical
Characterization of Middle Cambrian
Tight Sandstone Formation: A Case
Study from Eastern Pomerania,
Poland. Energies 2021, 14, 6022.
https://doi.org/10.3390/en14196022
Academic Editor: Jadwiga A. Jarzyna
Received: 6 August 2021
Accepted: 17 September 2021
Published: 22 September 2021
Publisher’s Note: MDPI stays neutral
with regard to jurisdictional claims in
published maps and institutional affil-
iations.
Copyright: © 2021 by the authors.
Licensee MDPI, Basel, Switzerland.
This article is an open access article
distributed under the terms and
conditions of the Creative Commons
Attribution (CC BY) license (https://
creativecommons.org/licenses/by/
4.0/).
Oil and Gas Institute—NRI, Lubicz Street 25A, 31-503 Krakow, Poland; [email protected]* Correspondence: [email protected]; Tel.: +48-126177683
Abstract: Geomechanical characterization plays a key role in optimizing the stimulation treatment oftight reservoir formations. Petrophysical models help classify the reservoir rock as the conventionalor unconventional type and determine hydrocarbon-saturated zones. Geomechanical and petro-physical models are fundamentally based on well-log data that provide reliable and high-resolutioninformation, and are used to determine various relationships between measured borehole parametersand modeled physical rock properties in 3D space, with the support of seismic data. This paperpresents the geomechanical characterization of the Middle Cambrian (Cm2) sediments from EasternPomerania, north Poland. To achieve the aim of this study, 1D well-log-based and 3D models basedon seismic data of the rocks’ petrophysical, elastic, and strength properties, as well as numericalmethods, were used. The analysis of the Middle Cambrian deposits revealed vertical and horizontalheterogeneity in brittleness, the direction of horizontal stresses, and the fracturing pressure requiredto initiate hydraulic fractures. The most prone to fracturing is the gas-saturated tight sandstonesbelonging to the Paradoxides Paradoxissimus formation of Cm2, exhibiting the highest brittlenessand highest fracturing pressure necessary to stimulate this unconventional reservoir formation.
Keywords: tight sandstone reservoir; reservoir characterization; well-log data; geomechanicalmodeling; fracturing pressure; stress field
1. Introduction
In contrast to conventional sandstone reservoirs exhibiting good transport properties,including porosity and permeability, tight reservoir rocks are characterized by the presenceof smaller and disconnected pore space, resulting in very low permeability. When holdinghydrocarbons accumulations, these tight reservoirs need to be stimulated via hydraulicfracturing to achieve production at economical rates. As the effectiveness of the stimulationtreatment is strongly dependent on the mechanical state in the reservoir, a comprehensivegeomechanical study should be performed to determine the stress field in order to optimizewell placement and trajectory, as well as to determine the magnitude of pressure at whichhydraulic fractures will open with optimal geometry at the desired location [1–3].
In this study, we aimed to characterize tight Middle Cambrian sandstones from East-ern Pomerania, north Poland. The overlying shale formation of Lower Paleozoic in thestudy area was the subject of intensive exploration a few years ago regarding the potentialoccurrence of hydrocarbons in the unconventional shale formation [4–10]. The MiddleCambrian sandstones lying beneath were not explored to this extent, but some studieswere dedicated to the characterization of tectonics, lithostratigraphy, or hydrocarbonspotential [11–21]. The evaluated reservoir rock developed as fine- to medium-grainedquartzitic sandstones rarely interbedded with thin layers of claystones or mudstones, butthe dominant layers are sandstones with an admixture of pyrite [12]. These sandstones,with a maximum thickness reaching up to 80 m, are considered the main potential hydrocar-bons reservoir in the lower Paleozoic strata. Natural gases occurring in Middle Cambrian
Energies 2021, 14, 6022. https://doi.org/10.3390/en14196022 https://www.mdpi.com/journal/energies
Energies 2021, 14, 6022 2 of 25
sandstones in the onshore Polish Baltic region are related with oil accumulated in thereservoir rock of Middle Cambrian age and are originated from a source containing typeII kerogen [19]. The overlaying shales formed in the Upper Cambrian and Tremadocianages constitute a sealing layer for the Middle Cambrian sandstones and are considered thesource rocks of highest hydrocarbon potential in the Lower Paleozoic interval [21].
This paper provides the results of an investigation conducted in the Middle Cambriansandstones aiming to optimize the stimulation treatment of the tight sandstone reser-voir [13]. The reservoir was characterized using a wide variety of modern data, includingborehole data supported by 3D seismic data. The interpretation of this input data com-bination resulted in the development of geomechanical models and the use of numericalmethods to determine the stress field and areas suitable for stimulation treatment to ulti-mately optimize the well placement, trajectory, and technical parameters of stimulationtreatment of the Middle Cambrian tight sandstones in the study area.
Geological Setting
The study was conducted in Peribaltic Syneclise, in the onshore part of north Poland.The geological setting of the research area is dictated by the Teyseiere-Tornquist Zone(T-T Zone) separating the Precambrian platform (part of the East European Craton, EEC)from the Paleozoic epiCaledonian platform [22] (Figure 1). The deposits located in thenortheastern part of Poland can be considered a result of the development of the BalticBasin, which commenced in the late Vendian in the current area of northeast Poland,Kaliningrad region, the Peribaltic countries, and the southerly part of the present BalticSea. The main phase of basin development occurred in the Early Paleozoic in the westerlypart of the EEC craton, this being a basement [12,14,17,22].
In the study area, no significant tectonic deformations affecting the structure of an-alyzed sediments were documented. The deposits of Lower Palaeozoic are lying nearlyhorizontally on the crystalline basement. Within the Early Palaeozoic and Precambrianstrata, two major fault complexes were identified based on the 3D seismic data in the studyarea. The first fault system is composed of faults propagating through the uppermost partof the Precambrian, Cambrian, and Ordovician sediments. The second, subordinate faultcomplex, consists of faults occurring only in the top part of the Precambrian sediments,terminates in Cambrian and appears only as a flexure in Ordovician strata. The faultsidentified in Early Palaeozoic sediments generally are characterized by NE-SW and SE-NWdirection, wherein the second fault system appears to be subordinate and complementaryto the first. Most of the interpreted faults are reversed [23]. The identified fault system islikely the result of reactivation of the old fault system in the basement with NE-SW andWSW-ENE arrangement in response to prevailing stresses in Caledonian Orogeny, causedby Avalonia and Baltica collision [22].
The Middle Cambrian deposits evaluated in this study comprise the first and secondof four Lower Paleozoic depositional sequences distinguished in the northern part ofPoland and the Polish part of the Baltic Sea.
The bottom-most Middle Cambrian deposits are assigned to the first depositionalsequence, belonging to the Sarbsko formation with a total thickness exceeding 200 m. Thedeposits of the Sarbsko formation developed as black claystones, dark grey mudstones,and mudstone-sandstone with heterolytic structures in deposits assigned to the Acadopara-doxides Oelandicus and lower part of the Paradoxides Paradoxissimus zones [12]. TheSarbsko formation is overlain by the Debki formation, assigned to Paradoxides Paradoxis-simus and is represented by light-grey, fine- to medium- grained quartz sandstones, rarelyinterbedded with sandstone-mudstone deposits. The Debki formation being the mainfocus of this study, with a thickness reaching up to 80 m, is considered the hydrocarbonsreservoir with the most potential in the Lower Paleozoic strata [11,12,20,21,24].
Energies 2021, 14, 6022 3 of 25
Energies 2021, 14, x FOR PEER REVIEW 3 of 28
ing the main focus of this study, with a thickness reaching up to 80 m, is considered the
hydrocarbons reservoir with the most potential in the Lower Paleozoic strata
[11,12,20,21,24].
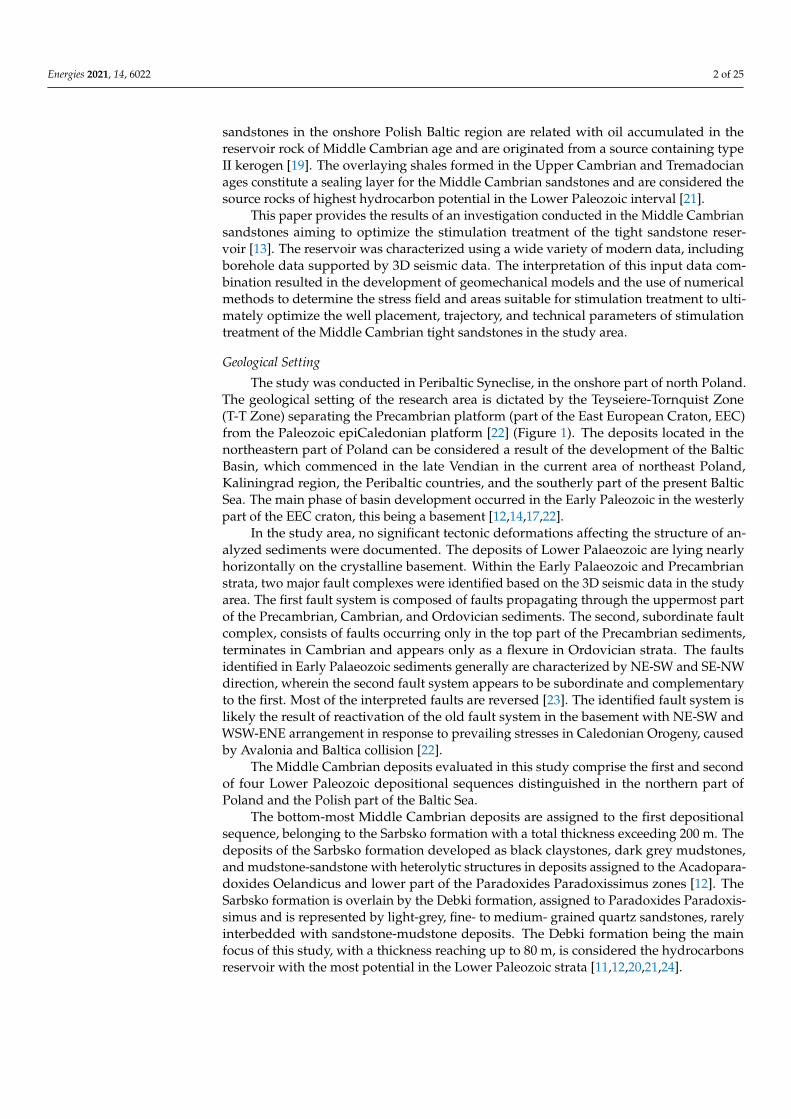
Figure 1. Location of the study area on a background paleothickness map of Middle Cambrian deposits (changed after12; [25]) (A), detailed thickness map constructed for the investigated Middle Cambrian deposits with the arrangementof occurring fault system marked with black lines and the location of analyzed boreholes W-1-4 (B), and the exemplarylithostratigraphic profile including Arenig (Oar), Upper Cambrian (Cm3) and Middle Cambrian sediments (Cm2) inborehole W-3 with the lithostratigraphical units description after 12 (C).
Energies 2021, 14, 6022 4 of 25
The overlaying mudstones and mudstone-sandstone heterolytic deposits, reachingup to 30 m, assigned to the Osiek formation, belong to the uppermost part of the MiddleCambrian Paradoxides Paradoxissimus Zone.
The second depositional sequence beginning with the Bialogora formation consistsof poorly sorted quartz sandstones with glauconite and frequently present phosphoriticclasts. These locally occurring sediments with a maximum thickness of 4 m belong tothe Paradoxides Forchhammeri zone. The upper-most Middle Cambrian sediments arerepresented by the Slowinski formation, developed as organic rich shales interbedded withthin dark limestones [12]. The overlaying bituminous shales of the Piasnica formation ofthe Upper Cambrian and Tremadocian age not only constitute a sealing layer for the MiddleCambrian sandstones but are also the best source rocks in Lower Paleozoic strata [21].
2. Methodology
In this study, the petrophysical and geomechanical properties of the Middle Cambriandeposits were evaluated primarily using well-log data. The well-log data were interpretedusing Techlog software (Schlumberger, Houston, TX, USA), where 1D models of the ge-omechanical and petrophysical parameters confirming the tight nature of the sandstonereservoir were developed. The interpretation results obtained were modeled in defined3D space, driven by 3D seismic data in Petrel software (Schlumberger). The constructed3D models of petrophysical properties include density and porosity, whereas the geome-chanical parameters include elastic properties (including Young modulus and Poisson’sratio) and strength properties (uniaxial compressive strength (UCS), tensile strength (T),and friction angle (FA)). Together with the determined direction and magnitude of tectonicstresses as boundary conditions, these models were used as an input for geomechanicalsimulations run with the Visage geomechanical simulator (Schlumberger). This simulationprovided the stress field, which, together with an estimated spatial distribution of elasticproperties, was essential in determining optimal borehole location, the trajectory of thehorizontal wells, and the technological parameters of stimulation treatment of the MiddleCambrian tight sandstones.
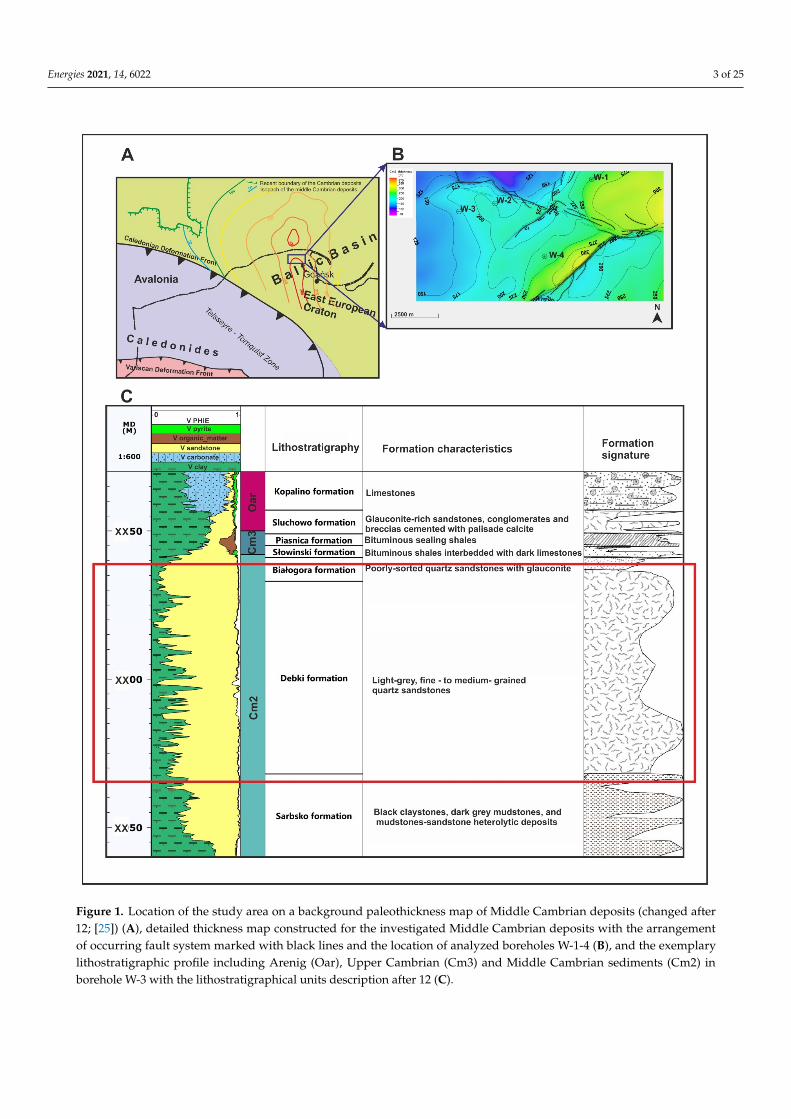
The schematic workflow of the study is depicted in Figure 2.Energies 2021, 14, x FOR PEER REVIEW 5 of 28
Figure 2. Schematic workflow for characterization of Middle Cambrian tight sandstones.
2.1. Relevant Input Data
The interpretation was conducted in four boreholes: W‐1, W‐2, W‐3, and W‐4, the
location of which is shown in Figure 1. The selected wells had a wide range of well logs
available to perform the petrophysical interpretation and build the geomechanical mod‐
el. The well‐log datasets in Figure 3 contain: gamma ray (GR), caliper (CALI), uranium
concentration (URAN), thorium concertation (THOR), potassium concentration (POTA),
bulk density (RHOB), neutron porosity (NPHI), compressional and shear slowness (DTP
and DTS, respectively), photoelectric factor (PE), and deep and shallow laterolog resis‐
tivity (LLD and LLS, respectively). A wide range of laboratory measurements of core
porosity, permeability, water saturation (NMR), and mineral content (X‐ray diffraction,
XRD) allowed us to calibrate the petrophysical properties calculated from well logs [26].
The shale volume was calculated based on the gamma ray and thorium concentration,
and calibrated with the results of XRD available from W‐2. XRD is a technique used for
the identification and quantitative analyses of rock mineral composition by determining
the crystallographic structure of mineral components of the rock. The powdered sample
is irradiated with incident X‐rays, and intensities and scattering angles of the X‐rays that
leave the material are measured. The mineral identification is possible as each mineral
has different atomic arrangements corresponding to different patterns with different in‐
tensities.
Figure 2. Schematic workflow for characterization of Middle Cambrian tight sandstones.
Energies 2021, 14, 6022 5 of 25
2.1. Relevant Input Data
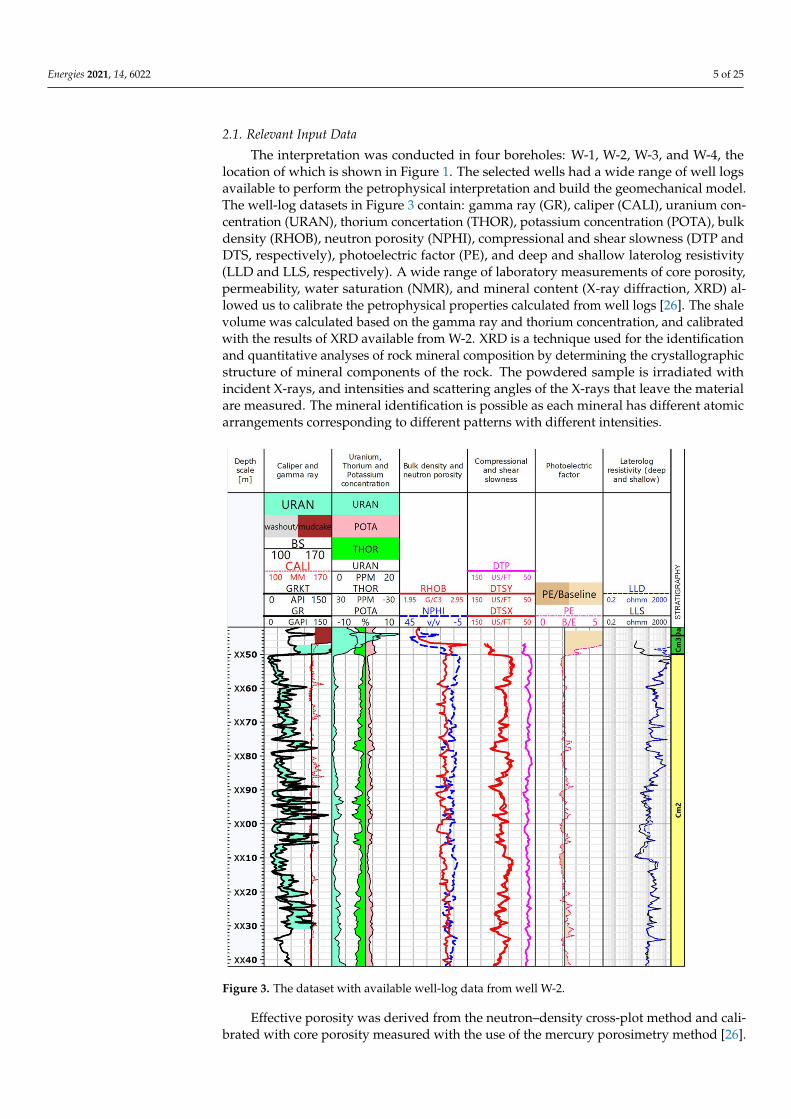
The interpretation was conducted in four boreholes: W-1, W-2, W-3, and W-4, thelocation of which is shown in Figure 1. The selected wells had a wide range of well logsavailable to perform the petrophysical interpretation and build the geomechanical model.The well-log datasets in Figure 3 contain: gamma ray (GR), caliper (CALI), uranium con-centration (URAN), thorium concertation (THOR), potassium concentration (POTA), bulkdensity (RHOB), neutron porosity (NPHI), compressional and shear slowness (DTP andDTS, respectively), photoelectric factor (PE), and deep and shallow laterolog resistivity(LLD and LLS, respectively). A wide range of laboratory measurements of core porosity,permeability, water saturation (NMR), and mineral content (X-ray diffraction, XRD) al-lowed us to calibrate the petrophysical properties calculated from well logs [26]. The shalevolume was calculated based on the gamma ray and thorium concentration, and calibratedwith the results of XRD available from W-2. XRD is a technique used for the identificationand quantitative analyses of rock mineral composition by determining the crystallographicstructure of mineral components of the rock. The powdered sample is irradiated withincident X-rays, and intensities and scattering angles of the X-rays that leave the materialare measured. The mineral identification is possible as each mineral has different atomicarrangements corresponding to different patterns with different intensities.
Energies 2021, 14, x FOR PEER REVIEW 6 of 28
Figure 3. The dataset with available well‐log data from well W‐2.
Effective porosity was derived from the neutron–density cross‐plot method and
calibrated with core porosity measured with the use of the mercury porosimetry method
[26]. In this method by forced injection of mercury into the pore space of the tested ma‐
terial, it is possible to calculate the critical diameter of the capillary into which mercury
can penetrate under a given injection pressure, as well as other parameters characteriz‐
ing the pore space, e.g., effective porosity and bulk density.
TOC content in the Cm2pp interval was obtained from the correlation between
uranium concertation and TOC content from laboratory Rock‐Eval measurements [26].
The TOC is measured during Rock‐Eval Pyrolysis, during which the organic content in
the rock sample is decomposed in oxygen absence, followed by combustion. The quan‐
tity of hydrocarbons and carbon dioxide released during this process allow for the de‐
termination of the richness and maturity of potential source rocks. The water saturation
of tight sandstone layers was calculated from well logs with the use of Archie equation.
Full‐wave sonic waveforms acquired by the Halliburton Wave Sonic Tool enabled
the calculation of the rocks’ dynamic elastic properties. Full‐wave acoustic logging is a
new‐generation tool that enables a better understanding of the wave propagation around
a borehole. The acoustic wavetrain is composed of compressional, shear, and Stoneley
waves. Table 1 presents the results of laboratory rock mechanical tests carried out on a
Figure 3. The dataset with available well-log data from well W-2.
Effective porosity was derived from the neutron–density cross-plot method and cali-brated with core porosity measured with the use of the mercury porosimetry method [26].
Energies 2021, 14, 6022 6 of 25
In this method by forced injection of mercury into the pore space of the tested material, it ispossible to calculate the critical diameter of the capillary into which mercury can penetrateunder a given injection pressure, as well as other parameters characterizing the pore space,e.g., effective porosity and bulk density.
TOC content in the Cm2pp interval was obtained from the correlation between ura-nium concertation and TOC content from laboratory Rock-Eval measurements [26]. TheTOC is measured during Rock-Eval Pyrolysis, during which the organic content in the rocksample is decomposed in oxygen absence, followed by combustion. The quantity of hydro-carbons and carbon dioxide released during this process allow for the determination of therichness and maturity of potential source rocks. The water saturation of tight sandstonelayers was calculated from well logs with the use of Archie equation.
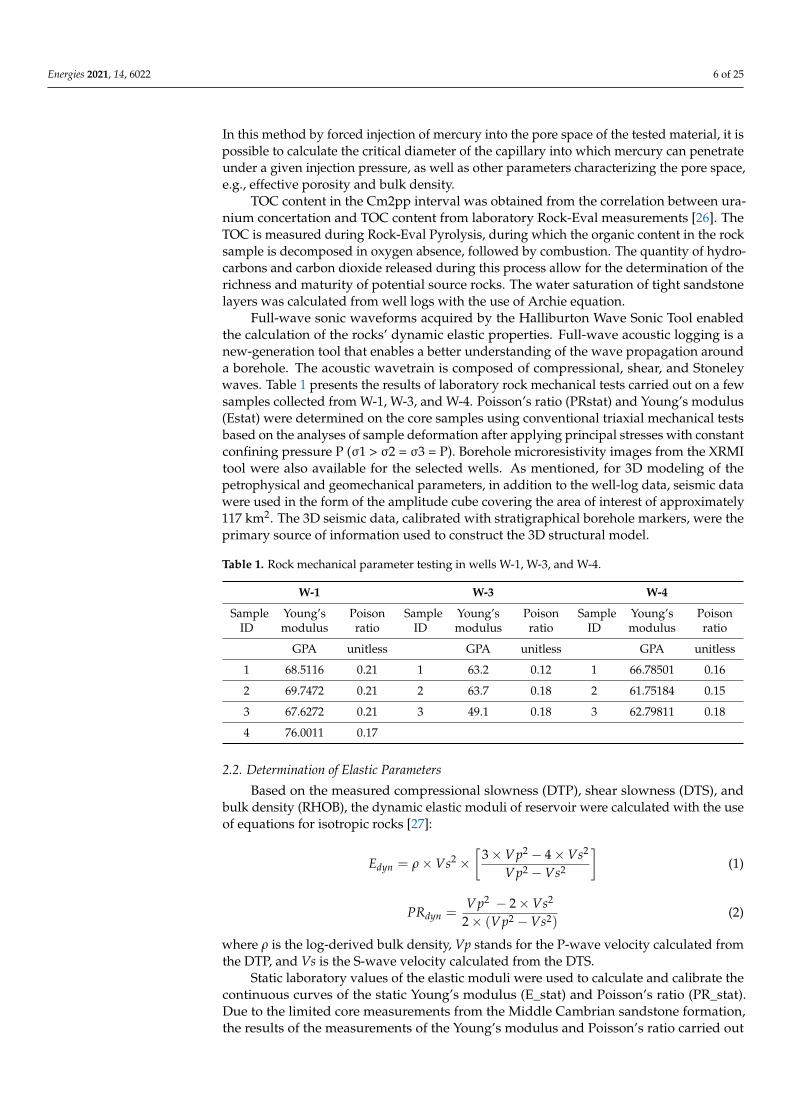
Full-wave sonic waveforms acquired by the Halliburton Wave Sonic Tool enabledthe calculation of the rocks’ dynamic elastic properties. Full-wave acoustic logging is anew-generation tool that enables a better understanding of the wave propagation arounda borehole. The acoustic wavetrain is composed of compressional, shear, and Stoneleywaves. Table 1 presents the results of laboratory rock mechanical tests carried out on a fewsamples collected from W-1, W-3, and W-4. Poisson’s ratio (PRstat) and Young’s modulus(Estat) were determined on the core samples using conventional triaxial mechanical testsbased on the analyses of sample deformation after applying principal stresses with constantconfining pressure P (σ1 > σ2 = σ3 = P). Borehole microresistivity images from the XRMItool were also available for the selected wells. As mentioned, for 3D modeling of thepetrophysical and geomechanical parameters, in addition to the well-log data, seismic datawere used in the form of the amplitude cube covering the area of interest of approximately117 km2. The 3D seismic data, calibrated with stratigraphical borehole markers, were theprimary source of information used to construct the 3D structural model.
Table 1. Rock mechanical parameter testing in wells W-1, W-3, and W-4.
W-1 W-3 W-4
SampleID
Young’smodulus
Poisonratio
SampleID
Young’smodulus
Poisonratio
SampleID
Young’smodulus
Poisonratio
GPA unitless GPA unitless GPA unitless
1 68.5116 0.21 1 63.2 0.12 1 66.78501 0.16
2 69.7472 0.21 2 63.7 0.18 2 61.75184 0.15
3 67.6272 0.21 3 49.1 0.18 3 62.79811 0.18
4 76.0011 0.17
2.2. Determination of Elastic Parameters
Based on the measured compressional slowness (DTP), shear slowness (DTS), andbulk density (RHOB), the dynamic elastic moduli of reservoir were calculated with the useof equations for isotropic rocks [27]:
Edyn = ρ × Vs2 ×[
3 × Vp2 − 4 × Vs2
Vp2 − Vs2
](1)
PRdyn =Vp2 − 2 × Vs2
2 × (Vp2 − Vs2)(2)
where ρ is the log-derived bulk density, Vp stands for the P-wave velocity calculated fromthe DTP, and Vs is the S-wave velocity calculated from the DTS.
Static laboratory values of the elastic moduli were used to calculate and calibrate thecontinuous curves of the static Young’s modulus (E_stat) and Poisson’s ratio (PR_stat).Due to the limited core measurements from the Middle Cambrian sandstone formation,the results of the measurements of the Young’s modulus and Poisson’s ratio carried out
Energies 2021, 14, 6022 7 of 25
on Ordovician and Silurian core samples were referenced to help determine a relationshipbetween the static and dynamic moduli. The Silurian and Ordovician shales lie directlyabove the Middle Cambrian rocks and might be source rocks for the underlying sandstones.
2.3. Calculation of the Brittleness Index (BI)
The brittleness index (BIlit) was calculated based on the lithology Javrie’s equation [28]and with the use of dynamic Young’s modulus and Poisson’s ratio values (BIe):
BI_lit =Vsand
Vsand + Vcl + Vker(3)
where Vsand is the quartz volume in the fraction, Vcl is the clay volume in the fraction,and Vker is the kerogen volume in the fraction.
BIe = E_dyn +PR_dyn
2(4)
where E_dyn is the dynamic values of the Young’s modulus calculated from well logs andPR_dyn is the dynamic values of Poisson’s ratio calculated from well logs.
The mechanical properties of tight sandstones play an important role in the identifica-tion of the intervals for hydraulic fracturing, which enables the exploration of hydrocarbonsfrom the zones of low porosity and permeability [13]. The brittleness is a function of min-eral composition, anisotropy, pressure, temperature, diagenesis and compaction processes,and the elastic properties of the rock. An increase in quartz or carbonates increases thebrittleness of the rock, whereas an increase in clay minerals increases the plasticity. How-ever, the intervals with high plasticity stabilize the borehole and prevent the wellbore fromcollapsing. Brittleness is one of the parameters that can be used to guide the selection offracturing targets in unconventional reservoirs such as shales or tight reservoirs.
2.4. Determination of the Stress Field
In unconventional reservoir characterization, the knowledge of the distribution ofprincipal stresses plays a critical role in stimulation treatment design, as the stress distribu-tion controls the geometry of the generated hydraulic fractures. To reconstruct the spatialdistributions of tectonic stresses, the boundary conditions were first determined and thenapplied in the geomechanical simulation.
The stress field within the 3D structural model was calculated using the finite ele-ment method implemented in the geomechanical simulator Visage (Schlumberger). Aseries of parametric models describing the mechanical behavior of the rock medium withdetermined boundary conditions was necessary to deploy the geomechanical simulatorand calculate the stress field. To estimate the orientation of the minimum and maximumhorizontal stresses in the borehole profiles, we analyzed the XRMI images, which capturethe borehole damage zones and identify the direction of the principal horizontal stresses.The magnitude of the stresses was established with the use of the results of a hydraulicfracturing test performed in one of the boreholes within the study area. The estimatedtectonic stresses were then used as boundary conditions in the geomechanical simulationto calculate stress field within the Middle Cambrian sandstones.
The analyses conducted on wellbore microresistivity images captured the drilling-induced damage zones in the borehole wall, e.g., breakouts occurring in the orientationparallel to the minimum horizontal stress and drilling-induced fractures (DIFFS), which inturn indicate the regional direction of maximum horizontal stress [29–32]. Breakouts anddrilling-induced fractures indicate that the borehole stresses exceed the rock strength incompression or tension, respectively [33–36]. The XRMI images were interpreted for fourwells. The main concern was to identify the borehole breakouts and drilling-induced frac-tures, providing valuable information about the horizontal stress directions. The breakoutsare recognized as high-conductivity or low-conductivity (in oil-base mud) enlargementsof the borehole walls [37]. They can also be interpreted based on the bulk density curve
Energies 2021, 14, 6022 8 of 25
as they lower the bulk density values and cause caliper enlargements on the oppositesite of the borehole. In turn, tensile fractures usually develop parallel to the maximumhorizontal stress [38], and they can be identified on XRMI images as conductive pairs ofnarrow features.
The magnitude of the minimum horizontal stress (σh) was estimated based on hy-draulic fracturing treatment, in which the analyses of the pressure drop trend from themoment the stimulation fluid is pumped out allowed for the determination of the closurepressure (Pc). The magnitude of Pc is equal to the pressure of the fluid in the fracture, bal-ancing the minimum horizontal stress value acting in the opposite direction to the fractureopening. Therefore, Pc provides an estimate of the value of the minimum horizontal stressσh [39].
Another fundamental element of the geomechanical model is pore pressure. Thepore pressure is the pressure imposed by the fluid filling the pore space at a given depth,counteracting the magnitude of the principal stresses [40,41]. The pore pressure in theborehole profiles was estimated in particular intervals with the Bowers method based onacoustics (slowness), as shown in Figure 3. The physical concept of the Bowers method iswell-known and described in many papers [42–44].
The calculated pore pressure curves were calibrated against pore pressure point dataestimated with the D-exponent method. This method uses the relationship between thecurrent formation pressure and drilling parameters such as rate of penetration, weight onbit, and rotation per minute [45].
The stress field was calculated during geomechanical simulation, which used thepreviously developed 3D models of the petrophysical and geomechanical parameters andthe determined boundary conditions. The simulation was run under an isotropic mediumassumption using Coulomb Mohr failure criteria and von Mises failure criteria for rock saltintervals occurring in the overburden. Finally, the results of the geomechanical simulationwere used to indicate the preferable horizontal well trajectory and calculate the injectionpressure in hydraulic fracturing treatment.
3. Characterization of Petrophysical and Elastic Properties
In this paper we show the results of the investigation conducted in the Middle Cam-brian sandstones from Eastern Pomerania, North Poland. The petrophysical propertieswere evaluated to determine the hydrocarbon potential and confirm the unconventionalcharacter of the reservoir, requiring the stimulation treatment. The spatial distributions ofgeomechanical properties of the analyzed reservoir rock, on the other hand, were necessaryto determine the areas prone to hydraulic fracturing and calculate the stress field, allowingthe horizontal well trajectory and stimulation treatment parameters to be optimized.
3.1. The Results of Petrophysical Interpretation
The reservoir rock developed as layers of clean sandstones interbedded with thinlayers of claystones or mudstones, but the dominant layer is sandstone with an admixtureof pyrite. The most prospective are sandstones with thin interlayers of sand-silt heteroliths.The porosity of sandstones is diverse and does not exceed 10%. The porosity and theinterconnection of pore space were mainly reduced as a result of the quartz cementationprocess. The other factors impacting the reservoir porosity include compaction, cementa-tion, and dissolution [17]. The interpretation of XRMI borehole images shows the presenceof natural and drilling-induced fractures. The cracks are filled with bitumen, quartz, orcarbonates. The fractures constitute additional potential paths for hydrocarbon migration,and their presence contributes to the reservoir’s dual porosity system. The sandstonesare hydrocarbon-saturated. The calculated average water saturation coefficient is low,approx. 40%. The perforation in the reservoir interval indicates the presence of gas andgasoline. The shale volume in sandstone intervals is low, below 10%. The overburdenorganic-rich Upper Cambrian shales that formed as claystones and mudstones with car-bonates are potential source rocks for hydrocarbon accumulation in the sandstones of the
Energies 2021, 14, 6022 9 of 25
Middle Cambrian age. The total organic carbon content in shales is as high as 10%. Totalorganic carbon was determined with the use of the Bowman method [46] and calibratedwith the Rock-Eval measurements of TOC content. The results of XRMI interpretationindicate the presence of high-resistivity carbonates among the low-resistivity claystones.The Rock-Eval analysis performed on cores derived from Middle Cambrian rocks in wellW-2 also indicates the presence of organic matter in mudstone and claystone intervals. TheTOC content does not exceed 1.3%.
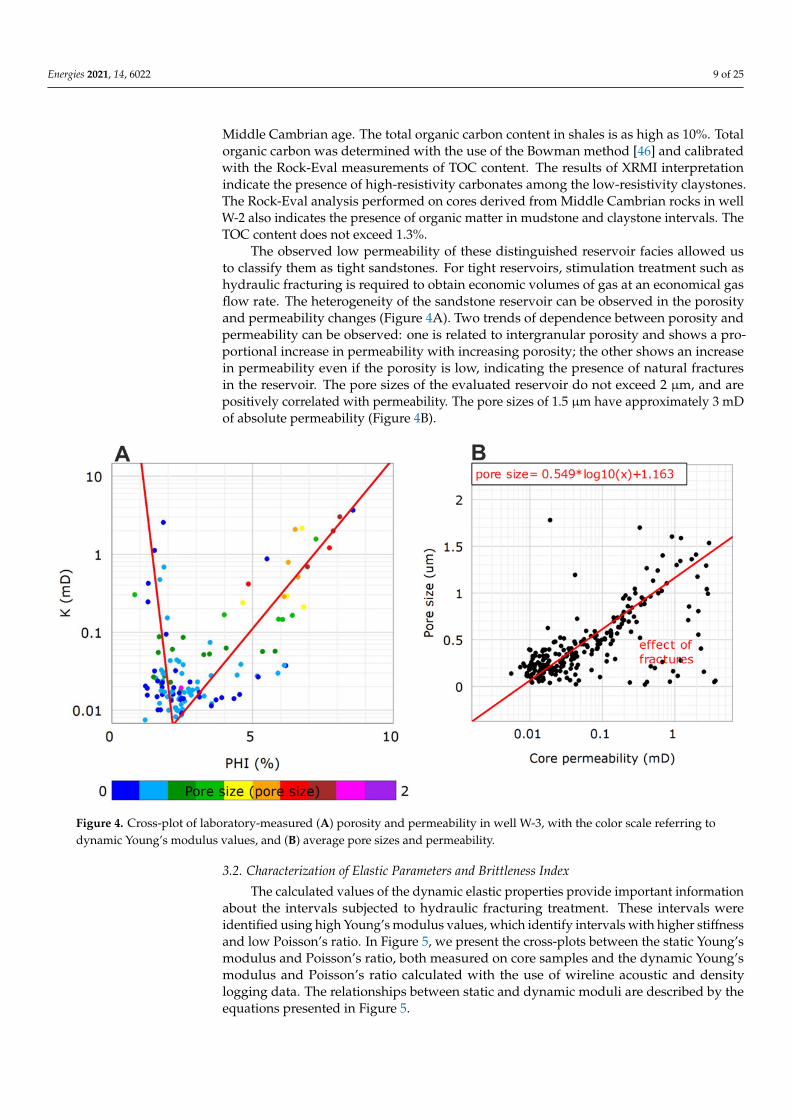
The observed low permeability of these distinguished reservoir facies allowed usto classify them as tight sandstones. For tight reservoirs, stimulation treatment such ashydraulic fracturing is required to obtain economic volumes of gas at an economical gasflow rate. The heterogeneity of the sandstone reservoir can be observed in the porosityand permeability changes (Figure 4A). Two trends of dependence between porosity andpermeability can be observed: one is related to intergranular porosity and shows a pro-portional increase in permeability with increasing porosity; the other shows an increasein permeability even if the porosity is low, indicating the presence of natural fracturesin the reservoir. The pore sizes of the evaluated reservoir do not exceed 2 µm, and arepositively correlated with permeability. The pore sizes of 1.5 µm have approximately 3 mDof absolute permeability (Figure 4B).
Energies 2021, 14, x FOR PEER REVIEW 10 of 28
permeability can be observed: one is related to intergranular porosity and shows a pro‐
portional increase in permeability with increasing porosity; the other shows an increase
in permeability even if the porosity is low, indicating the presence of natural fractures in
the reservoir. The pore sizes of the evaluated reservoir do not exceed 2 μm, and are posi‐
tively correlated with permeability. The pore sizes of 1.5 μm have approximately 3 mD of
absolute permeability (Figure 4B).
Figure 4. Cross‐plot of laboratory‐measured (A) porosity and permeability in well W‐3, with the color scale referring to
dynamic Young’s modulus values, and (B) average pore sizes and permeability.
3.2. Characterization of Elastic Parameters and Brittleness Index
The calculated values of the dynamic elastic properties provide important infor‐
mation about the intervals subjected to hydraulic fracturing treatment. These intervals
were identified using high Young’s modulus values, which identify intervals with higher
stiffness and low Poisson’s ratio. In Figure 5, we present the cross‐plots between the static
Young’s modulus and Poisson’s ratio, both measured on core samples and the dynamic
Young’s modulus and Poisson’s ratio calculated with the use of wireline acoustic and
density logging data. The relationships between static and dynamic moduli are described
by the equations presented in Figure 5.
The results in Figure 5 show higher values of Young modulus for Cambrian sand‐
stones than in Lower Paleozoic shale formation, while the values of Poison’s Ratio for
Cambrian sandstones have similar values for shales. The values of Poisson’s Ratio are
affected by the gas present in the pore space.
Figure 4. Cross-plot of laboratory-measured (A) porosity and permeability in well W-3, with the color scale referring todynamic Young’s modulus values, and (B) average pore sizes and permeability.
3.2. Characterization of Elastic Parameters and Brittleness Index
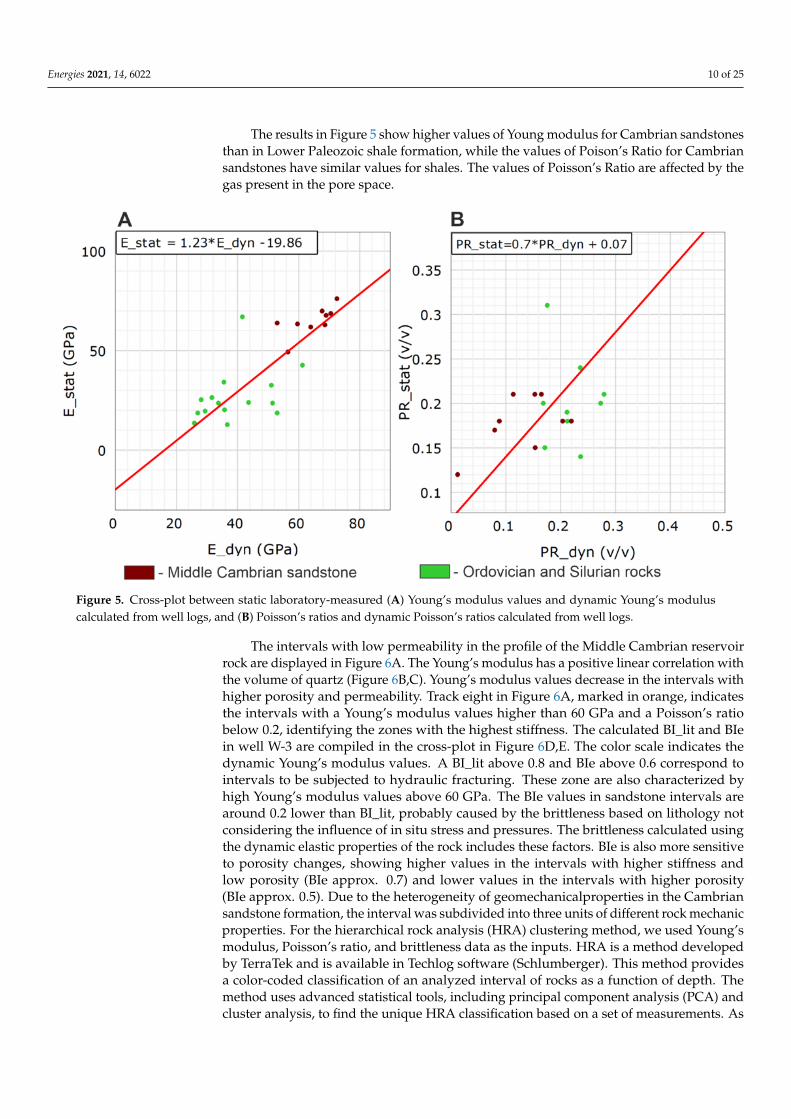
The calculated values of the dynamic elastic properties provide important informationabout the intervals subjected to hydraulic fracturing treatment. These intervals wereidentified using high Young’s modulus values, which identify intervals with higher stiffnessand low Poisson’s ratio. In Figure 5, we present the cross-plots between the static Young’smodulus and Poisson’s ratio, both measured on core samples and the dynamic Young’smodulus and Poisson’s ratio calculated with the use of wireline acoustic and densitylogging data. The relationships between static and dynamic moduli are described by theequations presented in Figure 5.
Energies 2021, 14, 6022 10 of 25
The results in Figure 5 show higher values of Young modulus for Cambrian sandstonesthan in Lower Paleozoic shale formation, while the values of Poison’s Ratio for Cambriansandstones have similar values for shales. The values of Poisson’s Ratio are affected by thegas present in the pore space.
Energies 2021, 14, x FOR PEER REVIEW 11 of 28
Figure 5. Cross‐plot between static laboratory‐measured (A) Young’s modulus values and dynamic Young’s modulus
calculated from well logs, and (B) Poisson’s ratios and dynamic Poisson’s ratios calculated from well logs.
The intervals with low permeability in the profile of the Middle Cambrian reservoir
rock are displayed in Figure 6A. The Young’s modulus has a positive linear correlation
with the volume of quartz (Figure 6B,C). Young’s modulus values decrease in the inter‐
vals with higher porosity and permeability. Track eight in Figure 6A, marked in orange,
indicates the intervals with a Young’s modulus values higher than 60 GPa and a Pois‐
son’s ratio below 0.2, identifying the zones with the highest stiffness. The calculated BI_lit
and BIe in well W‐3 are compiled in the cross‐plot in Figure 6D,E. The color scale indi‐
cates the dynamic Young’s modulus values. A BI_lit above 0.8 and BIe above 0.6 corre‐
spond to intervals to be subjected to hydraulic fracturing. These zone are also character‐
ized by high Young’s modulus values above 60 GPa. The BIe values in sandstone inter‐
vals are around 0.2 lower than BI_lit, probably caused by the brittleness based on lithol‐
ogy not considering the influence of in situ stress and pressures. The brittleness calcu‐
lated using the dynamic elastic properties of the rock includes these factors. BIe is also
more sensitive to porosity changes, showing higher values in the intervals with higher
stiffness and low porosity (BIe approx. 0.7) and lower values in the intervals with higher
porosity (BIe approx. 0.5). Due to the heterogeneity of geomechanicalproperties in the
Cambrian sandstone formation, the interval was subdivided into three units of different
rock mechanic properties. For the hierarchical rock analysis (HRA) clustering method,
we used Young’s modulus, Poisson’s ratio, and brittleness data as the inputs. HRA is a
method developed by TerraTek and is available in Techlog software (Schlumberger). This
method provides a color‐coded classification of an analyzed interval of rocks as a func‐
tion of depth. The method uses advanced statistical tools, including principal component
analysis (PCA) and cluster analysis, to find the unique HRA classification based on a set
of measurements. As a result, the average values of input data, clay volume, effective
porosity, permeability, and brittleness (BI_lit) were calculated for each group (Table 2).
Figure 5. Cross-plot between static laboratory-measured (A) Young’s modulus values and dynamic Young’s moduluscalculated from well logs, and (B) Poisson’s ratios and dynamic Poisson’s ratios calculated from well logs.
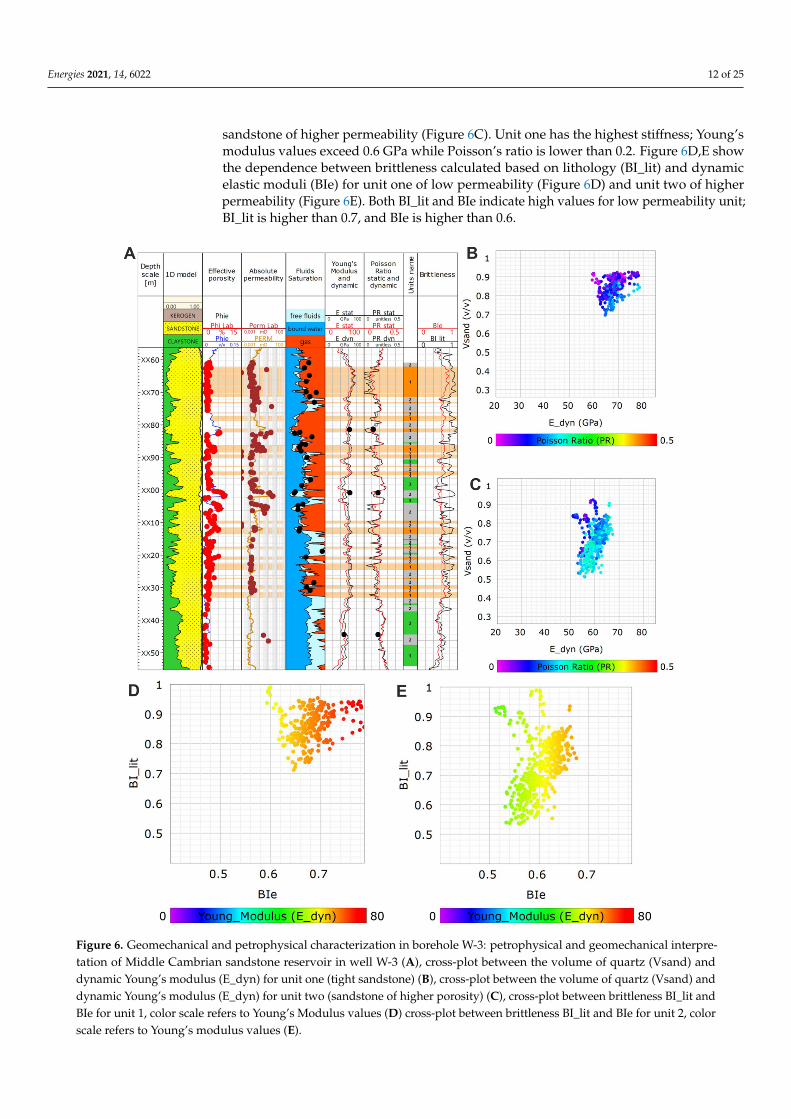
The intervals with low permeability in the profile of the Middle Cambrian reservoirrock are displayed in Figure 6A. The Young’s modulus has a positive linear correlation withthe volume of quartz (Figure 6B,C). Young’s modulus values decrease in the intervals withhigher porosity and permeability. Track eight in Figure 6A, marked in orange, indicatesthe intervals with a Young’s modulus values higher than 60 GPa and a Poisson’s ratiobelow 0.2, identifying the zones with the highest stiffness. The calculated BI_lit and BIein well W-3 are compiled in the cross-plot in Figure 6D,E. The color scale indicates thedynamic Young’s modulus values. A BI_lit above 0.8 and BIe above 0.6 correspond tointervals to be subjected to hydraulic fracturing. These zone are also characterized byhigh Young’s modulus values above 60 GPa. The BIe values in sandstone intervals arearound 0.2 lower than BI_lit, probably caused by the brittleness based on lithology notconsidering the influence of in situ stress and pressures. The brittleness calculated usingthe dynamic elastic properties of the rock includes these factors. BIe is also more sensitiveto porosity changes, showing higher values in the intervals with higher stiffness andlow porosity (BIe approx. 0.7) and lower values in the intervals with higher porosity(BIe approx. 0.5). Due to the heterogeneity of geomechanicalproperties in the Cambriansandstone formation, the interval was subdivided into three units of different rock mechanicproperties. For the hierarchical rock analysis (HRA) clustering method, we used Young’smodulus, Poisson’s ratio, and brittleness data as the inputs. HRA is a method developedby TerraTek and is available in Techlog software (Schlumberger). This method providesa color-coded classification of an analyzed interval of rocks as a function of depth. Themethod uses advanced statistical tools, including principal component analysis (PCA) andcluster analysis, to find the unique HRA classification based on a set of measurements. As
Energies 2021, 14, 6022 11 of 25
a result, the average values of input data, clay volume, effective porosity, permeability, andbrittleness (BI_lit) were calculated for each group (Table 2).
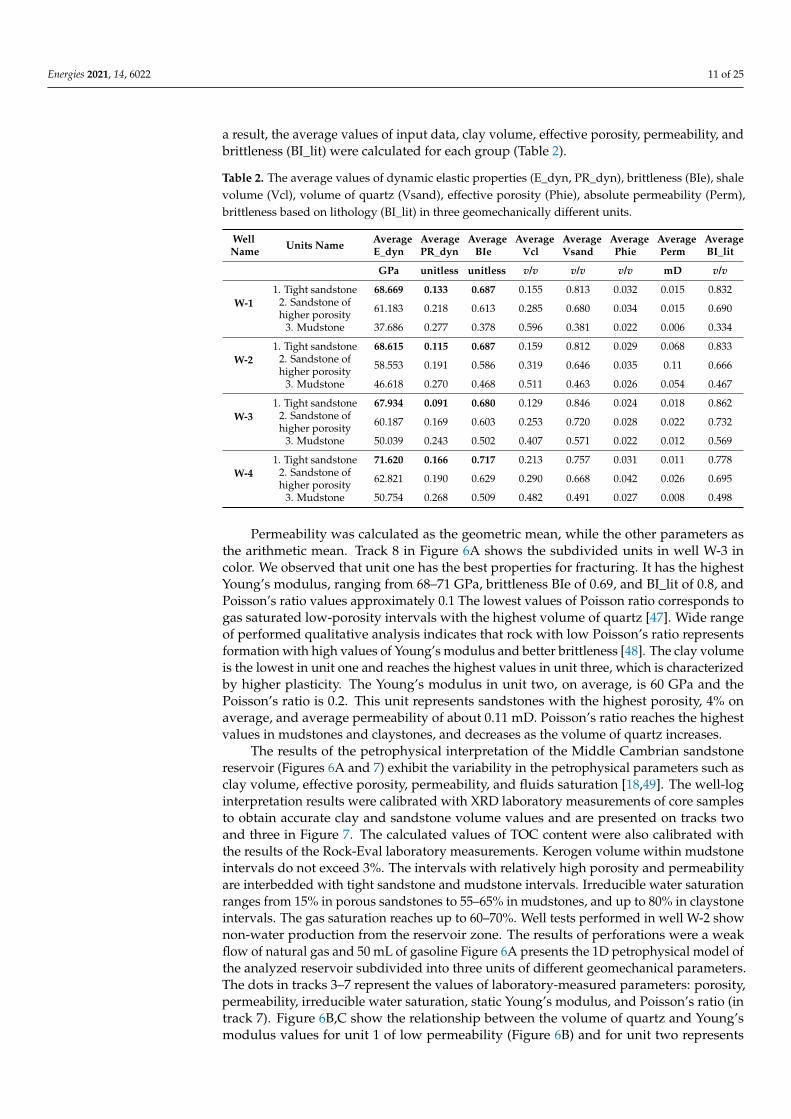
Table 2. The average values of dynamic elastic properties (E_dyn, PR_dyn), brittleness (BIe), shalevolume (Vcl), volume of quartz (Vsand), effective porosity (Phie), absolute permeability (Perm),brittleness based on lithology (BI_lit) in three geomechanically different units.
WellName Units Name Average
E_dynAveragePR_dyn
AverageBIe
AverageVcl
AverageVsand
AveragePhie
AveragePerm
AverageBI_lit
GPa unitless unitless v/v v/v v/v mD v/v
W-11. Tight sandstone 68.669 0.133 0.687 0.155 0.813 0.032 0.015 0.832
2. Sandstone ofhigher porosity 61.183 0.218 0.613 0.285 0.680 0.034 0.015 0.690
3. Mudstone 37.686 0.277 0.378 0.596 0.381 0.022 0.006 0.334
W-21. Tight sandstone 68.615 0.115 0.687 0.159 0.812 0.029 0.068 0.833
2. Sandstone ofhigher porosity 58.553 0.191 0.586 0.319 0.646 0.035 0.11 0.666
3. Mudstone 46.618 0.270 0.468 0.511 0.463 0.026 0.054 0.467
W-31. Tight sandstone 67.934 0.091 0.680 0.129 0.846 0.024 0.018 0.862
2. Sandstone ofhigher porosity 60.187 0.169 0.603 0.253 0.720 0.028 0.022 0.732
3. Mudstone 50.039 0.243 0.502 0.407 0.571 0.022 0.012 0.569
W-41. Tight sandstone 71.620 0.166 0.717 0.213 0.757 0.031 0.011 0.778
2. Sandstone ofhigher porosity 62.821 0.190 0.629 0.290 0.668 0.042 0.026 0.695
3. Mudstone 50.754 0.268 0.509 0.482 0.491 0.027 0.008 0.498
Permeability was calculated as the geometric mean, while the other parameters asthe arithmetic mean. Track 8 in Figure 6A shows the subdivided units in well W-3 incolor. We observed that unit one has the best properties for fracturing. It has the highestYoung’s modulus, ranging from 68–71 GPa, brittleness BIe of 0.69, and BI_lit of 0.8, andPoisson’s ratio values approximately 0.1 The lowest values of Poisson ratio corresponds togas saturated low-porosity intervals with the highest volume of quartz [47]. Wide rangeof performed qualitative analysis indicates that rock with low Poisson’s ratio representsformation with high values of Young’s modulus and better brittleness [48]. The clay volumeis the lowest in unit one and reaches the highest values in unit three, which is characterizedby higher plasticity. The Young’s modulus in unit two, on average, is 60 GPa and thePoisson’s ratio is 0.2. This unit represents sandstones with the highest porosity, 4% onaverage, and average permeability of about 0.11 mD. Poisson’s ratio reaches the highestvalues in mudstones and claystones, and decreases as the volume of quartz increases.
The results of the petrophysical interpretation of the Middle Cambrian sandstonereservoir (Figures 6A and 7) exhibit the variability in the petrophysical parameters such asclay volume, effective porosity, permeability, and fluids saturation [18,49]. The well-loginterpretation results were calibrated with XRD laboratory measurements of core samplesto obtain accurate clay and sandstone volume values and are presented on tracks twoand three in Figure 7. The calculated values of TOC content were also calibrated withthe results of the Rock-Eval laboratory measurements. Kerogen volume within mudstoneintervals do not exceed 3%. The intervals with relatively high porosity and permeabilityare interbedded with tight sandstone and mudstone intervals. Irreducible water saturationranges from 15% in porous sandstones to 55–65% in mudstones, and up to 80% in claystoneintervals. The gas saturation reaches up to 60–70%. Well tests performed in well W-2 shownon-water production from the reservoir zone. The results of perforations were a weakflow of natural gas and 50 mL of gasoline Figure 6A presents the 1D petrophysical model ofthe analyzed reservoir subdivided into three units of different geomechanical parameters.The dots in tracks 3–7 represent the values of laboratory-measured parameters: porosity,permeability, irreducible water saturation, static Young’s modulus, and Poisson’s ratio (intrack 7). Figure 6B,C show the relationship between the volume of quartz and Young’smodulus values for unit 1 of low permeability (Figure 6B) and for unit two represents
Energies 2021, 14, 6022 12 of 25
sandstone of higher permeability (Figure 6C). Unit one has the highest stiffness; Young’smodulus values exceed 0.6 GPa while Poisson’s ratio is lower than 0.2. Figure 6D,E showthe dependence between brittleness calculated based on lithology (BI_lit) and dynamicelastic moduli (BIe) for unit one of low permeability (Figure 6D) and unit two of higherpermeability (Figure 6E). Both BI_lit and BIe indicate high values for low permeability unit;BI_lit is higher than 0.7, and BIe is higher than 0.6.
Energies 2021, 14, x FOR PEER REVIEW 14 of 28
Figure 6. Geomechanical and petrophysical characterization in borehole W‐3: petrophysical and geomechanical inter‐
pretation of Middle Cambrian sandstone reservoir in well W‐3 (A), cross‐plot between the volume of quartz (Vsand) and
dynamic Young’s modulus (E_dyn) for unit one (tight sandstone) (B), cross‐plot between the volume of quartz (Vsand)
and dynamic Young’s modulus (E_dyn) for unit two (sandstone of higher porosity) (C), cross‐plot between brittleness
BI_lit and BIe for unit 1, color scale refers to Young’s Modulus values (D) cross‐plot between brittleness BI_lit and BIe for
unit 2, color scale refers to Young’s modulus values (E).
Figure 6. Geomechanical and petrophysical characterization in borehole W-3: petrophysical and geomechanical interpre-tation of Middle Cambrian sandstone reservoir in well W-3 (A), cross-plot between the volume of quartz (Vsand) anddynamic Young’s modulus (E_dyn) for unit one (tight sandstone) (B), cross-plot between the volume of quartz (Vsand) anddynamic Young’s modulus (E_dyn) for unit two (sandstone of higher porosity) (C), cross-plot between brittleness BI_lit andBIe for unit 1, color scale refers to Young’s Modulus values (D) cross-plot between brittleness BI_lit and BIe for unit 2, colorscale refers to Young’s modulus values (E).
Energies 2021, 14, 6022 13 of 25Energies 2021, 14, x FOR PEER REVIEW 15 of 28
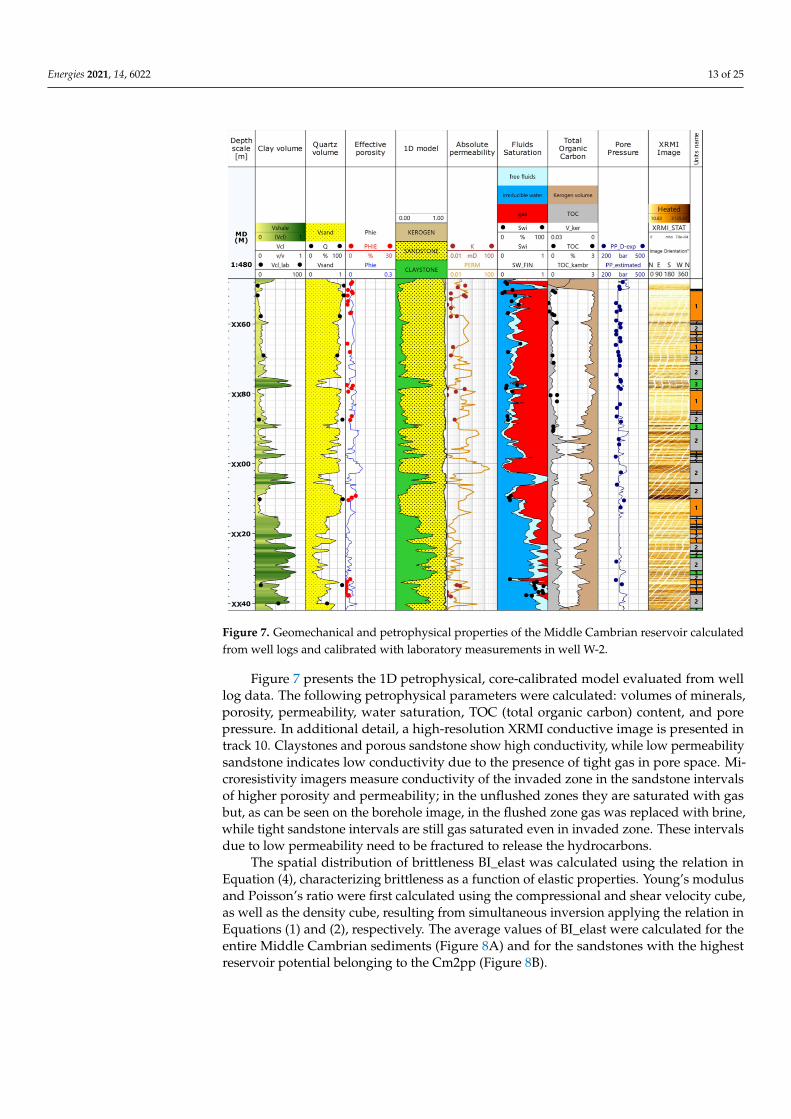
Figure 7. Geomechanical and petrophysical properties of the Middle Cambrian reservoir calculated
from well logs and calibrated with laboratory measurements in well W‐2.
Figure 7 presents the 1D petrophysical, core‐calibrated model evaluated from well
log data. The following petrophysical parameters were calculated: volumes of minerals,
porosity, permeability, water saturation, TOC (total organic carbon) content, and pore
pressure. In additional detail, a high‐resolution XRMI conductive image is presented in
track 10. Claystones and porous sandstone show high conductivity, while low permea‐
bility sandstone indicates low conductivity due to the presence of tight gas in pore space.
Microresistivity imagers measure conductivity of the invaded zone in the sandstone in‐
tervals of higher porosity and permeability; in the unflushed zones they are saturated
with gas but, as can be seen on the borehole image, in the flushed zone gas was replaced
with brine, while tight sandstone intervals are still gas saturated even in invaded zone.
These intervals due to low permeability need to be fractured to release the hydrocarbons.
The spatial distribution of brittleness BI_elast was calculated using the relation in
Equation (4), characterizing brittleness as a function of elastic properties. Young’s mod‐
ulus and Poisson’s ratio were first calculated using the compressional and shear velocity
cube, as well as the density cube, resulting from simultaneous inversion applying the
relation in Equations (1) and (2), respectively. The average values of BI_elast were cal‐
culated for the entire Middle Cambrian sediments (Figure 8A) and for the sandstones
with the highest reservoir potential belonging to the Cm2pp (Figure 8B).
Figure 7. Geomechanical and petrophysical properties of the Middle Cambrian reservoir calculatedfrom well logs and calibrated with laboratory measurements in well W-2.
Figure 7 presents the 1D petrophysical, core-calibrated model evaluated from welllog data. The following petrophysical parameters were calculated: volumes of minerals,porosity, permeability, water saturation, TOC (total organic carbon) content, and porepressure. In additional detail, a high-resolution XRMI conductive image is presented intrack 10. Claystones and porous sandstone show high conductivity, while low permeabilitysandstone indicates low conductivity due to the presence of tight gas in pore space. Mi-croresistivity imagers measure conductivity of the invaded zone in the sandstone intervalsof higher porosity and permeability; in the unflushed zones they are saturated with gasbut, as can be seen on the borehole image, in the flushed zone gas was replaced with brine,while tight sandstone intervals are still gas saturated even in invaded zone. These intervalsdue to low permeability need to be fractured to release the hydrocarbons.
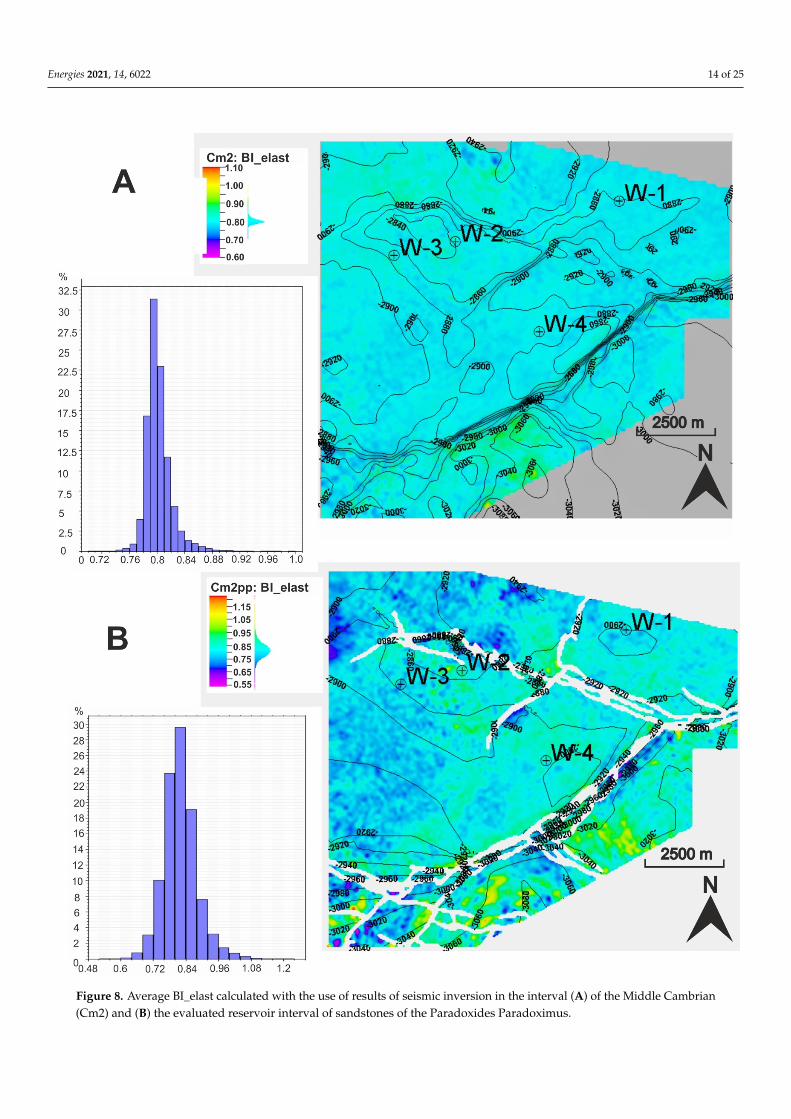
The spatial distribution of brittleness BI_elast was calculated using the relation inEquation (4), characterizing brittleness as a function of elastic properties. Young’s modulusand Poisson’s ratio were first calculated using the compressional and shear velocity cube,as well as the density cube, resulting from simultaneous inversion applying the relation inEquations (1) and (2), respectively. The average values of BI_elast were calculated for theentire Middle Cambrian sediments (Figure 8A) and for the sandstones with the highestreservoir potential belonging to the Cm2pp (Figure 8B).
Energies 2021, 14, 6022 14 of 25Energies 2021, 14, x FOR PEER REVIEW 16 of 28
Figure 8. Average BI_elast calculated with the use of results of seismic inversion in the interval (A) of the Middle Cam‐
brian (Cm2) and (B) the evaluated reservoir interval of sandstones of the Paradoxides Paradoximus. Figure 8. Average BI_elast calculated with the use of results of seismic inversion in the interval (A) of the Middle Cambrian(Cm2) and (B) the evaluated reservoir interval of sandstones of the Paradoxides Paradoximus.
Energies 2021, 14, 6022 15 of 25
Middle Cambrian sediments are characterized by a BI of approximately 0.8, with theoccurrence of more brittle areas in the central part and those located to the south of thefault zone, an area of deeper buried sediments. In the Paradoxides Paradoxissimus intervalof the Middle Cambrian age, the sediments are, on average, more brittle, with a BI_elastof approximately 0.85. The sandstones reveal a wider range of BI, with the least-brittlesandstones in the northern part and the highest brittleness in the deeper buried area locatedtoward the south of the dislocation zones.
The average brittleness of the Middle Cambrian sandstones is lowered by the contri-bution of less-brittle sediments located in the top-most and bottom part in the profile ofCm2, exhibiting an increased content of clay (Figures 6A and 7).
4. Characterization of the Stress Field
Based on the interpretation of XRMI images capturing the damage zones in the bore-hole wall, such as breakouts and drilling-induced fractures (Figure 9A,B), we determinedthe direction of present horizontal stresses.
4.1. Estimation of Horizontal Stress Direction (Based on XRMI Images)
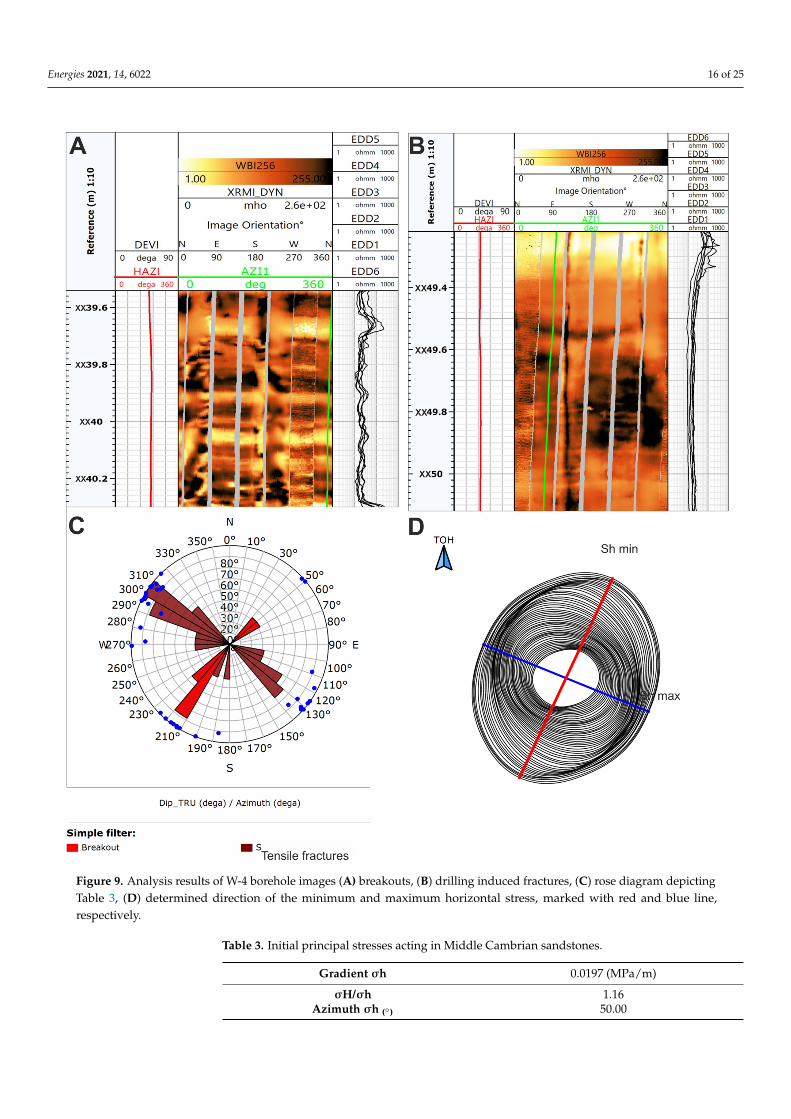
Although the breakouts and tensile fractures are mainly visible in the overlying LowerPaleozoic shale formation, it was also possible to identify these structures in the MiddleCambrian sandstones. They are particularly well-recognized in well W-4. The azimuthdirection of breakouts is around 50–70 NE and 190–230 SW (Figure 9C). In the directionperpendicular to the breakouts, some tensile fractures can be observed. They are mainlyvisible in Caradok in well W-2 and are identified in Cambrian sandstone in well W-4. Theazimuth direction of drilling-induced fractures ranges from 110–130 SE and 290–310 NW(Figure 9C). The borehole failure in the study wells was used to define the orientations ofthe maximum (Shmax) and minimum (Shmin) horizontal stress (Figure 9D). Accuratelydetermining the minimum and maximum horizontal stress directions allow the optimaldesign of the horizontal wells’ trajectories. To increase the effectiveness of the plannedreservoir rock stimulation treatment, they should be drilled in the direction of the minimumhorizontal stress [38]. Notably, most of the tensile fractures occur in the intervals definedas unit one, which has the highest stiffness, expressed by a higher Young’s modulus andbrittleness (BI_elast) predefined for fracturing treatment.
To assess the effective stresses, we determined the pore pressure in the borehole profilefirst. W-2 was used as the reference well due to its available dense calibration data set. Theestimated pore pressure in the Middle Cambrian sandstone formation is at approximately300 bars; however, there are clearly visible zones with elevated pore pressure, reaching upto 400 bars (track 9 in Figure 7). The zones with increased pore pressure are located at thevery top of the Middle Cambrian sediments, two zones in the middle of the profile, andtwo other zones localized closer to the bottom of the analyzed interval.
Determined from the reference W-2 borehole, fitting parameters were used in theremaining three boreholes, which had few or no calibration data. The obtained profileswere then used to interpolate the pore pressure in the 3D structural model.
Statistical analysis of the pore pressure profiles of the four boreholes allowed us todetermine the parameters controlling the interpolation process of the input data in the3D structural geological model. Spatial modeling was preceded by a stage of arithmeticaveraging of high-resolution pore pressure profiles with a resolution of 0.1 m, up to 3Dmodel resolution in the upscaling process. The estimated pore pressure was then used inthe geomechanical simulation.
Energies 2021, 14, 6022 16 of 25Energies 2021, 14, x FOR PEER REVIEW 18 of 28
Figure 9. Analysis results of W‐4 borehole images (A) breakouts, (B) drilling induced fractures, (C) rose diagram depict‐
ing Table 3, (D) determined direction of the minimum and maximum horizontal stress, marked with red and blue line,
respectively.
Figure 9. Analysis results of W-4 borehole images (A) breakouts, (B) drilling induced fractures, (C) rose diagram depictingTable 3, (D) determined direction of the minimum and maximum horizontal stress, marked with red and blue line,respectively.
Table 3. Initial principal stresses acting in Middle Cambrian sandstones.
Gradient σh 0.0197 (MPa/m)
σH/σh 1.16Azimuth σh (◦) 50.00
Energies 2021, 14, 6022 17 of 25
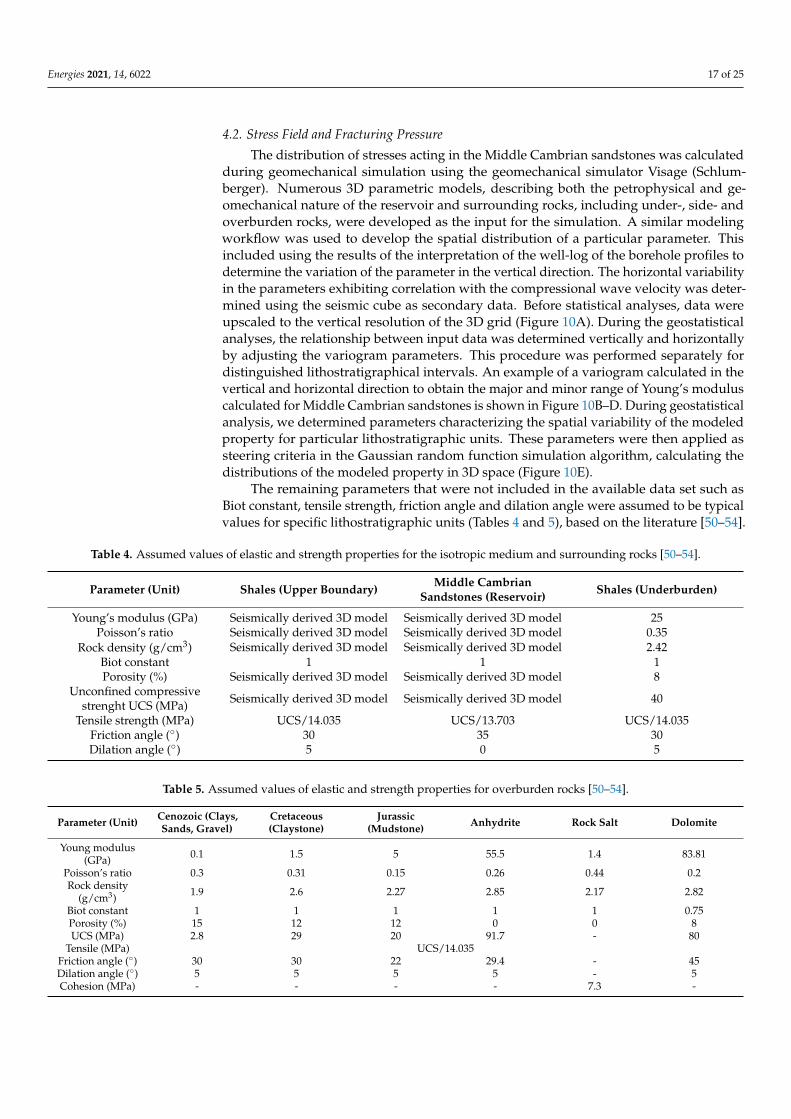
4.2. Stress Field and Fracturing Pressure
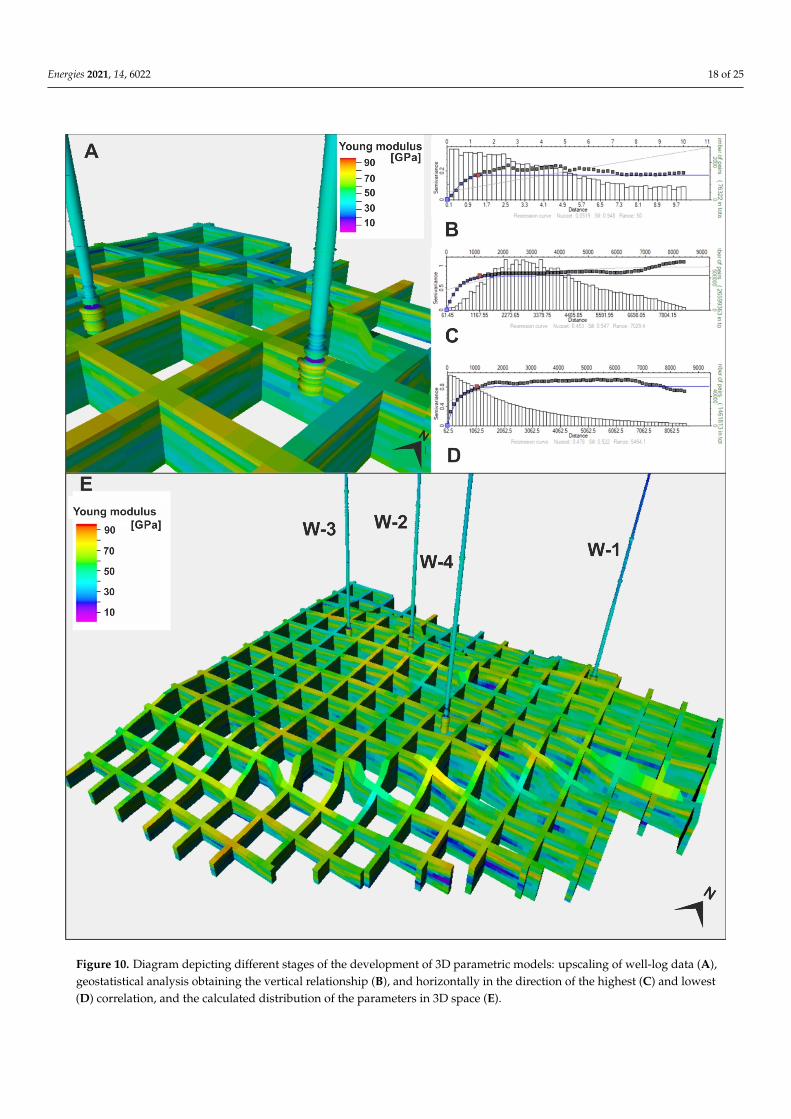
The distribution of stresses acting in the Middle Cambrian sandstones was calculatedduring geomechanical simulation using the geomechanical simulator Visage (Schlum-berger). Numerous 3D parametric models, describing both the petrophysical and ge-omechanical nature of the reservoir and surrounding rocks, including under-, side- andoverburden rocks, were developed as the input for the simulation. A similar modelingworkflow was used to develop the spatial distribution of a particular parameter. Thisincluded using the results of the interpretation of the well-log of the borehole profiles todetermine the variation of the parameter in the vertical direction. The horizontal variabilityin the parameters exhibiting correlation with the compressional wave velocity was deter-mined using the seismic cube as secondary data. Before statistical analyses, data wereupscaled to the vertical resolution of the 3D grid (Figure 10A). During the geostatisticalanalyses, the relationship between input data was determined vertically and horizontallyby adjusting the variogram parameters. This procedure was performed separately fordistinguished lithostratigraphical intervals. An example of a variogram calculated in thevertical and horizontal direction to obtain the major and minor range of Young’s moduluscalculated for Middle Cambrian sandstones is shown in Figure 10B–D. During geostatisticalanalysis, we determined parameters characterizing the spatial variability of the modeledproperty for particular lithostratigraphic units. These parameters were then applied assteering criteria in the Gaussian random function simulation algorithm, calculating thedistributions of the modeled property in 3D space (Figure 10E).
The remaining parameters that were not included in the available data set such asBiot constant, tensile strength, friction angle and dilation angle were assumed to be typicalvalues for specific lithostratigraphic units (Tables 4 and 5), based on the literature [50–54].
Table 4. Assumed values of elastic and strength properties for the isotropic medium and surrounding rocks [50–54].
Parameter (Unit) Shales (Upper Boundary) Middle CambrianSandstones (Reservoir) Shales (Underburden)
Young’s modulus (GPa) Seismically derived 3D model Seismically derived 3D model 25Poisson’s ratio Seismically derived 3D model Seismically derived 3D model 0.35
Rock density (g/cm3) Seismically derived 3D model Seismically derived 3D model 2.42Biot constant 1 1 1Porosity (%) Seismically derived 3D model Seismically derived 3D model 8
Unconfined compressivestrenght UCS (MPa) Seismically derived 3D model Seismically derived 3D model 40
Tensile strength (MPa) UCS/14.035 UCS/13.703 UCS/14.035Friction angle (◦) 30 35 30Dilation angle (◦) 5 0 5
Table 5. Assumed values of elastic and strength properties for overburden rocks [50–54].
Parameter (Unit) Cenozoic (Clays,Sands, Gravel)
Cretaceous(Claystone)
Jurassic(Mudstone) Anhydrite Rock Salt Dolomite
Young modulus(GPa) 0.1 1.5 5 55.5 1.4 83.81
Poisson’s ratio 0.3 0.31 0.15 0.26 0.44 0.2Rock density
(g/cm3) 1.9 2.6 2.27 2.85 2.17 2.82
Biot constant 1 1 1 1 1 0.75Porosity (%) 15 12 12 0 0 8UCS (MPa) 2.8 29 20 91.7 - 80
Tensile (MPa) UCS/14.035Friction angle (◦) 30 30 22 29.4 - 45Dilation angle (◦) 5 5 5 5 - 5Cohesion (MPa) - - - - 7.3 -
Energies 2021, 14, 6022 18 of 25Energies 2021, 14, x FOR PEER REVIEW 20 of 28
Figure 10. Diagram depicting different stages of the development of 3D parametric models: upscaling of well‐log data
(A), geostatistical analysis obtaining the vertical relationship (B), and horizontally in the direction of the highest (C) and
lowest (D) correlation, and the calculated distribution of the parameters in 3D space (E).
Figure 10. Diagram depicting different stages of the development of 3D parametric models: upscaling of well-log data (A),geostatistical analysis obtaining the vertical relationship (B), and horizontally in the direction of the highest (C) and lowest(D) correlation, and the calculated distribution of the parameters in 3D space (E).
Energies 2021, 14, 6022 19 of 25
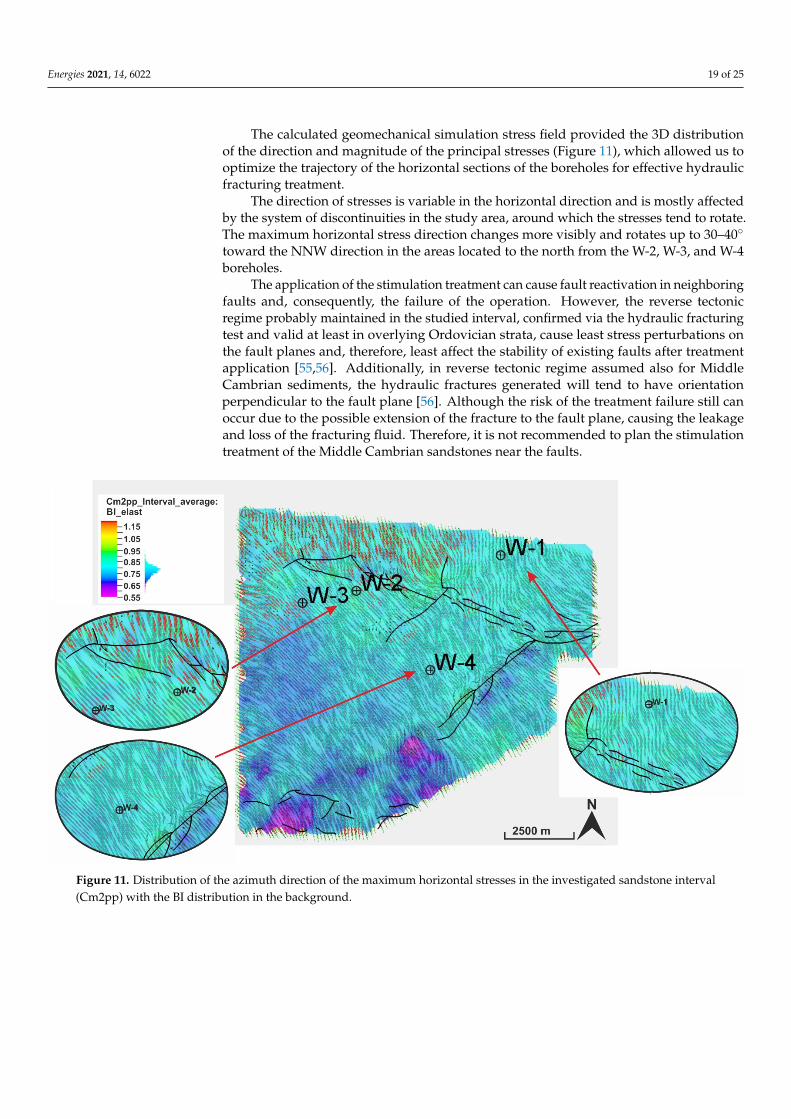
The calculated geomechanical simulation stress field provided the 3D distributionof the direction and magnitude of the principal stresses (Figure 11), which allowed us tooptimize the trajectory of the horizontal sections of the boreholes for effective hydraulicfracturing treatment.
The direction of stresses is variable in the horizontal direction and is mostly affectedby the system of discontinuities in the study area, around which the stresses tend to rotate.The maximum horizontal stress direction changes more visibly and rotates up to 30–40◦
toward the NNW direction in the areas located to the north from the W-2, W-3, and W-4boreholes.
The application of the stimulation treatment can cause fault reactivation in neighboringfaults and, consequently, the failure of the operation. However, the reverse tectonicregime probably maintained in the studied interval, confirmed via the hydraulic fracturingtest and valid at least in overlying Ordovician strata, cause least stress perturbations onthe fault planes and, therefore, least affect the stability of existing faults after treatmentapplication [55,56]. Additionally, in reverse tectonic regime assumed also for MiddleCambrian sediments, the hydraulic fractures generated will tend to have orientationperpendicular to the fault plane [56]. Although the risk of the treatment failure still canoccur due to the possible extension of the fracture to the fault plane, causing the leakageand loss of the fracturing fluid. Therefore, it is not recommended to plan the stimulationtreatment of the Middle Cambrian sandstones near the faults.
Energies 2021, 14, x FOR PEER REVIEW 22 of 28
the leakage and loss of the fracturing fluid. Therefore, it is not recommended to plan the
stimulation treatment of the Middle Cambrian sandstones near the faults.
Figure 11. Distribution of the azimuth direction of the maximum horizontal stresses in the investigated sandstone inter‐
val (Cm2pp) with the BI distribution in the background.
To achieve an effective stimulation treatment and apply hydraulic fracturing in an
unconventional reservoir formation, the horizontal well should be drilled along the di‐
rection of the minimum horizontal stress so that the potential fractures can open per‐
pendicular to the horizontal well section [38]. For the Cm2pp sandstone reservoir, the
optimal direction of the horizontal boreholes is perpendicular to the direction of the
maximum horizontal stress shown in Figure 11, which also indicates the direction of po‐
tentially generated hydraulic fractures. The variation in the horizontal stress direction
needs to be considered when planning new horizontal boreholes.
Fractures occur when the value of the minimum principal stress at the borehole
wall is below the tensile strength of the rock [57]. Using the calculated distributions of
the principal horizontal stresses with the developed 3D distributions of tensile strength
and pore pressure, it was possible to specify the fracturing pressure (Pfrac) by applying
the following relationship in Equation (5) [57]:
Pfrac = 3 σh − σH + T − Pp (5)
where σh and σH are the magnitude of the minimum and maximum horizontal stress,
respectively; T stands for the tensile strength; and Pp is the value of the pore pressure.
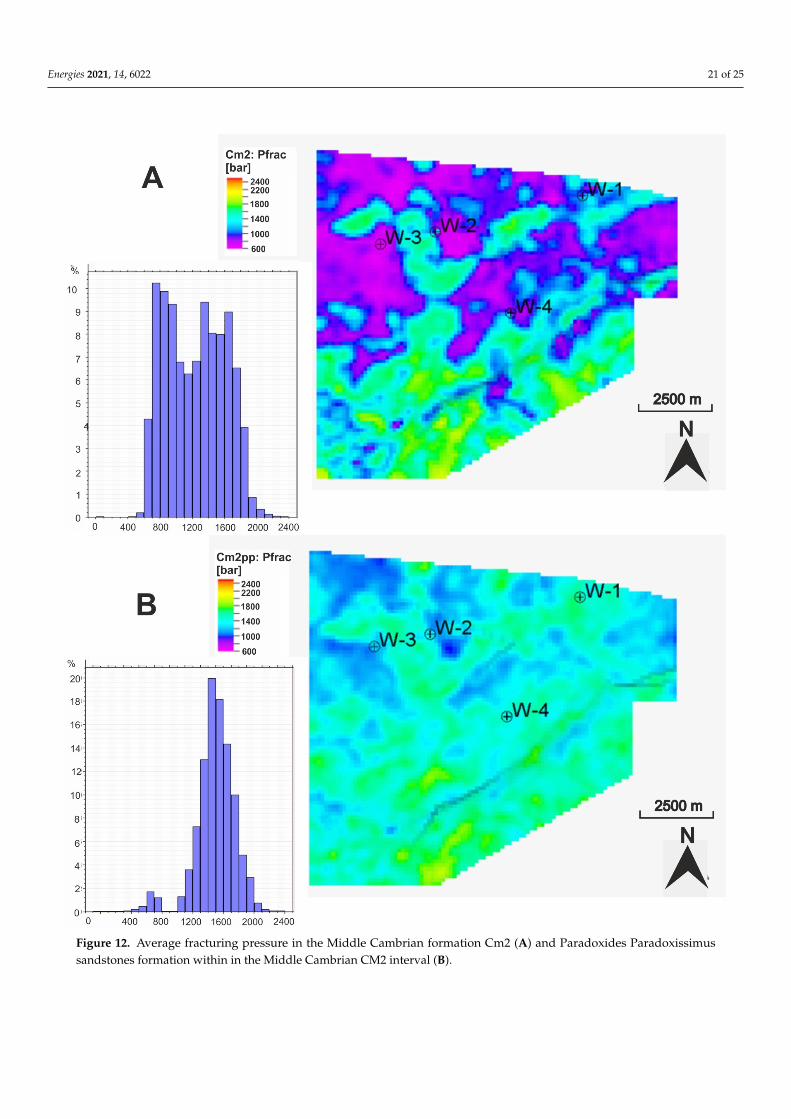
Comparing the average fracturing pressure values in the entire Cm2 interval to
those in the reservoir zone of Cm2pp, we observed that the entire Middle Cambrian in‐
terval exhibits bimodal distribution in terms of the magnitude of fracturing pressure. In
the northerly part of the study area, where boreholes W‐1‐4 are located, lower pressure
(800 bar, on average) is enough to initiate hydraulic fractures (Figure 12A). However, to
fracture the Middle Cambrian sediments in the southern part of the study area, higher
pressures are required, with an average level of 1600 bar, reaching up to 2200 bar (Figure
12B). This bimodal distribution of the fracturing pressures occurs due to the higher con‐
Figure 11. Distribution of the azimuth direction of the maximum horizontal stresses in the investigated sandstone interval(Cm2pp) with the BI distribution in the background.
Energies 2021, 14, 6022 20 of 25
To achieve an effective stimulation treatment and apply hydraulic fracturing in an un-conventional reservoir formation, the horizontal well should be drilled along the directionof the minimum horizontal stress so that the potential fractures can open perpendicular tothe horizontal well section [38]. For the Cm2pp sandstone reservoir, the optimal direction ofthe horizontal boreholes is perpendicular to the direction of the maximum horizontal stressshown in Figure 11, which also indicates the direction of potentially generated hydraulicfractures. The variation in the horizontal stress direction needs to be considered whenplanning new horizontal boreholes.
Fractures occur when the value of the minimum principal stress at the borehole wallis below the tensile strength of the rock [57]. Using the calculated distributions of theprincipal horizontal stresses with the developed 3D distributions of tensile strength andpore pressure, it was possible to specify the fracturing pressure (Pfrac) by applying thefollowing relationship in Equation (5) [57]:
Pfrac = 3 × σh − σH + T − Pp (5)
where σh and σH are the magnitude of the minimum and maximum horizontal stress,respectively; T stands for the tensile strength; and Pp is the value of the pore pressure.
Comparing the average fracturing pressure values in the entire Cm2 interval to thosein the reservoir zone of Cm2pp, we observed that the entire Middle Cambrian inter-val exhibits bimodal distribution in terms of the magnitude of fracturing pressure. Inthe northerly part of the study area, where boreholes W-1-4 are located, lower pressure(800 bar, on average) is enough to initiate hydraulic fractures (Figure 12A). However, to frac-ture the Middle Cambrian sediments in the southern part of the study area, higher pressuresare required, with an average level of 1600 bar, reaching up to 2200 bar(Figure 12B). This bimodal distribution of the fracturing pressures occurs due to the highercontribution of weaker clay minerals abundant in the profile, especially in the uppermostand bottom-most part of the Middle Cambrian interval Cm2, possibly belonging to theSarbsko and Osiek formations, respectively, developed as claystones, mudstones, andmudstone-sandstones.
Paradoxides Paradoxissimus sandstone formation requires much higher injectionfluid pressures of 1200 to 2200 bars to fracture (Figure 12B). This is due to the very highstrength of the quartzitic sandstones which for effective stimulation require high fracturingpressure levels.
Energies 2021, 14, 6022 21 of 25Energies 2021, 14, x FOR PEER REVIEW 24 of 28
Figure 12. Average fracturing pressure in the Middle Cambrian formation Cm2 (A) and Paradoxides Paradoxissimus
sandstones formation within in the Middle Cambrian CM2 interval (B).
Figure 12. Average fracturing pressure in the Middle Cambrian formation Cm2 (A) and Paradoxides Paradoxissimussandstones formation within in the Middle Cambrian CM2 interval (B).
Energies 2021, 14, 6022 22 of 25
5. Conclusions
In this paper, we demonstrated the importance and wide range of applications ofwell-log data in the geomechanical evaluation of unconventional reservoir rocks.
The use of well-log data is an indispensable step in the geomechanical characterizationof unconventional reservoir formations. Unconventional reservoir rock requires stimulationtreatment to produce hydrocarbons at an economic level. Geomechanical properties andstress distribution were proved to play a critical role in optimizing the drilling location,trajectories of the horizontal sections of boreholes, and designing hydraulic fracturingtreatments.
The petrophysical and geomechanical properties of the Middle Cambrian tight sand-stones formation in Eastern Pomerania (north Poland) were evaluated simultaneously. Thisapproach first determines the zones with prospective hydrocarbons saturation and helpcategorize the analyzed rock formation into the conventional or unconventional type. Forthe latter, stimulation treatment and geomechanical evaluation are also necessary.
In this study, based on laboratory, well-log, and seismic data, we developed 1D and3D models of both petrophysical (density, porosity, permeability, mineralogical model,and formation fluids saturation) and geomechanical (elastic and strength) properties todetermine the intervals that have the most potential in terms of hydrocarbons saturationand with favorable conditions for hydraulic fracturing.
The application of dipole sonic imaging, borehole microresistivity images, and conven-tional well logs help derive accurate and core-calibrated elastic and strength properties, thevalue of the vertical stress, and horizontal stress orientation. One of the essential elementsduring data preparation for geomechanical evaluation is the correct estimate of static elasticproperties, which will be further used in geomechanical simulations via calibration of theirdynamic equivalents calculated from the well-log data with the results of static laboratorymeasurements of these elastic properties.
The study of breakouts and drilling-induced fractures observed on high-resolutionimages of borehole walls allowed us to identify the horizontal stress direction, necessaryfor determining the boundary conditions used in geomechanical simulations.
The analysis of the petrophysical and geomechanical properties of the Middle Cam-brian tight sandstones from Eastern Pomerania, north Poland, allowed us to draw detailedconclusions specific for this reservoir formation:
- The highest gas saturation with low shale volume was found in the top and middleparts of the reservoir.
- The petrophysical properties of Middle Cambrian sandstones, such as effective poros-ity and permeability, show variability. Based on the interpreted porosity ranging from2–10%, and permeability that mostly has values of a few millidarcy, not exceeding100 mD, the analyzed reservoir is classified as tight sandstone requiring stimulationtreatment for economic hydrocarbons production.
- In the analyzed sandstone profile, within gas saturated zones, the best propertiesin terms of effective reservoir stimulation treatment are characterized by Young’smodulus valued ranging from 68–71 GPa, brittleness higher than BIe 0.69 and BI_it0.8, and Poisson’s ratio values lower than 0.1
- The sediments of the Paradoxides Paradoxissimus interval of the Middle Cambrianage comprising quartzitic sandstones are, on average, more brittle compared to theentire Middle Cambrian sediments, with an average BI_e of 0.85. Cm2pp sandstonesreveal a wide range of horizontal BI. The least-brittle sandstones are located in thenorthern part of the study area, while the sandstones with the highest brittleness arein the deeper buried area, located toward the south of the dislocation zones. Theaverage brittleness of Middle Cambrian sediments is lowered by the contribution ofless brittle component found especially in the top and bottom part in the profile ofCm2 sediments exhibiting an increased clay content.
- Determined relationships between static and dynamic elastic properties in the MiddleCambrian quarzitic sandstones are the following: E_stat = 1.23 × E_dyn − 19.86 and

Energies 2021, 14, 6022 23 of 25
PR_stat = 0.7 × PR_dyn + 0.07 for Young modulus and Poisson’s ratio, respectively.These relationships can be further used in the geomechanical analysis of sedimentswith similar lithology.
- The reverse tectonic regime in the study area affects the orientation of potentiallygenerated hydraulic fractures, which tend to be oriented perpendicularly to the planeof existing faults. The variable direction of horizontal stresses calculated in geome-chanical simulation should be considered when planning new horizontal boreholes.
- Comparing the average values of fracturing pressure in the entire Cm2 intervaland those in Cm2pp reservoir zone, it can be observed that the Paradoxides Para-doxissimus quartzitic sandstone formation, due to very high strength, requires theapplication of higher fracturing pressure (1200–2200 bars).
The Middle Cambrian tight sandstone formation in the research area is an interestingformation to study mainly due to its hydrocarbon potential. However, until the present,it has not been very well recognized. There are still many unanswered questions, e.g.,resulting from missing sedimentological and petrographical studies. Involving those infuture research, by analyzing the core material and combining it with the results of well logand seismic data interpretation, would help us better recognize the formation, especially indefining boundaries between particular lithostratigraphic units. All these would improveunderstanding of the spatial distribution of these units to identify the best candidate forstimulation treatment.
Author Contributions: Conceptualization, M.S.-V., A.L.-S.; methodology, M.S.-V. and A.L.-S.; soft-ware, M.S.-V. and A.L.-S.; validation, M.S.-V. and A.L.-S.; formal analysis, M.S.-V. and A.L.-S.;investigation, M.S.-V. and A.L.-S.; resources, M.S.-V. and A.L.-S.; data curation, M.S.-V. and A.L.-S.;writing—original draft preparation, M.S.-V. and A.L.-S.; writing—review and editing, M.S.-V.; visual-ization, M.S.-V. and A.L.-S.; supervision, M.S.-V.; project administration, M.S.-V. All authors haveread and agreed to the published version of the manuscript.
Funding: This research was funded by the Polish Ministry of Science and Higher Education, GrantNo. DK-4100-61/21. The authors would like to express their gratitude to the Polish Ministry ofScience and Higher Education for funding this research.
Data Availability Statement: The data supporting the findings of this research are available onreasonable request from the corresponding author.
Conflicts of Interest: The authors declare no conflict of interest.
References1. Huang, J.; Ma, X.; Safari, R.; Mutlu, U.; McClure, M. Hydraulic Fracture Design Optimization for Infill Wells: An Integrated
Geomechanics Workflow. In Proceedings of the 49th US Rock Mechanics/Geomechanics Symposium, San Francisco, CA, USA,28 June–1 July 2015.
2. Taghichian, A.; Hashemalhoseini, H.; Zaman, M.; Yang, Z.-Y. Geomechanical Optimization of Hydraulic Fracturing in Unconven-tional Reservoirs: A Semi-Analytical Approach. Int. J. Fract. 2018, 213, 107–138. [CrossRef]
3. Iferobia, C.C.; Ahmad, M. A Review on the Experimental Techniques and Applications in the Geomechanical Evaluation of ShaleGas Reservoirs. J. Nat. Gas Sci. Eng. 2020, 74, 103090. [CrossRef]
4. Podhalanska, T.; Waksmundzka, M.I.; Becker, A.; Roszkowska-Remin, J.; Dyrka, I.; Feldman-Olszewska, A.; Głuszynski, A.;Grotek, I.; Janas, M.; Karcz, P.; et al. Prospective Zones for Unconventional Hydrocarbon Resources in Cambrian, Ordovician,Silurian and Carboniferous Rocks of Poland: Integration of the Research Results. Przeglad Geologiczny 2016, 64, 1008–1021.
5. Such, P.; Lesniak, G.; Mroczkowska-Szerszen, M.; Dudek, L.; Cicha-Szot, R.; Spunda, K. Methodology of Pore Space Analysis inShale Rocks. Pract. Nauk. Inst. Naft. Gazu 2017, 214, 1–154.
6. Lesniak, G.; Sowizdzał, K.; Stadtmuller, M.; Lis-Sledziona AKaczmarczyk, W.; Słota-Valim, M.; Kasza, P. Wykonanie Niestandard-owych Kompleksowych Bada N Petrofizycznych I Geomechanicznych Na Próbkach I Danych Z Dolnopaleozoicznych Łupków; TechnicalReport, Shalemech No. 3; INiG–PIB: Kraków, Poland, 2017.
7. Jarzyna, J.; Bała, M.; Krakowska, P.; Puskarczyk, E.; Strzepowicz, A.; Wawrzyniak-Guz, K.; Wiecław, D.; Zietek, J. Shale Gasin Poland. In Advances in Natural Gas. Emerging Technologies; al Megren, H.A., Altamini, R.H., Eds.; BoD–Books on Demand:Norderstedt, Germany, 2017.
Energies 2021, 14, 6022 24 of 25
8. Sowizdzał, K.; Słoczynski, T.; Stadtmuller, M.; Kaczmarczyk, W. Lower Palaeozoic Petroleum Systems of the Baltic Basin inNorthern Poland: A 3D Basin Modeling Study of Selected Areas (onshore and offshore). Interpretation 2018, 6, SH117–SH132.[CrossRef]
9. Stadtmuller, M.; Lis-Sledziona, A.; Słota-Valim, M. Petrophysical and Geomechanical Analysis of the Lower Paleozoic ShaleFormation, North Poland. Interpretation 2018, 6, SH91–SH106. [CrossRef]
10. Wilczynski, P.; Domonik, A.; Lukaszewski, P. Anisotropy of Strength and Elastic Properties of Lower Paleozoic Shales from theBaltic Basin, Poland. Energies 2021, 14, 2995. [CrossRef]
11. Wiecław, D.; Kotarba, M.J.; Kosakowski, P.; Kowalski, A. Habitat and Hydrocarbon Potential of the Lower Palaeozoic SourceRocks of the Polish Sector of the Baltic Basin. Geol. Q. 2010, 54, 159–182.
12. Modlinski, Z.; Podhalanska, T. Outline of the Lithology and Depositional Features of the Lower Paleozoic Strata in the Polish Partof the Baltic Region. Geol. Q. 2010, 54, 109–121.
13. Bała, M. Charakterystyka parametrów sprezystych okreslonych Na Podstawie pomiarów Geofizyki Otworowej I ModelowanTeoretycznych W Wybranych Formacjach W Otworach Basenu bałtyckiego I Wierconych Na Szelfie. Nafta Gaz 2017, 73, 558–570.[CrossRef]
14. Dadlez, R. Phanerozoic Basinal Evolution Along the Teisseyre-Tornquist Zone. Kwartalnik Geologiczny 1987, 31, 263–278, (In Polishwith English Summary).
15. Dadlez, R. Tectonics of the Southern Baltic. Kwartalnik Geologiczny 1990, 34, 1–20, (In Polish with English Summary).16. Jaworowski, K. Transgresja Morza Kambryjskiego W północnej Polsce. Pr. Inst. Geol. 1979, 94, 5–80.17. Jaworowski, K. Warunki Sedymentacji osadów Prekambru I Kambru W północnej Polsce. Przeglad Geologiczny 1982, 30, 220–224.18. Jaworowski, K. Facies Variability in the Cambrian Deposits from the Koscierzyna and Gdansk Sections (Pomeranian Caledonides
Foreland, Northern Poland): A Comparative Study. Geol. Q. 2000, 44, 249–260.19. Kotarba, M.J.; Nagao, K. Molecular and Isotopic Compositions and Origin of Natural Gases from Cambrian and Carboniferous-
Lower Permian Reservoirs of the Onshore Polish Baltic Region. Acta Diabetol. 2014, 104, 241–261. [CrossRef]20. Kosakowski, P.; Wróbel, M.; Poprawa, P. Hydrocarbon Generation and Expulsion Modelling for the Lower Palaeozoic Source
Rocks in the Polish Part of the Baltic Region. Geol. Q. 2010, 54, 241–256.21. Kosakowski, P.; Kotarba, M.J.; Piestrzynski, A.; Shogenova, A.; Wiecław, D. Petroleum Source Rock Evaluation of the Alum and
Dictyonema Shales (Upper Cambrian-Lower Ordovician) in the Baltic Basin and Podlasie Depression (eastern Poland). Int. J.Earth Sci. 2016, 106, 743–761. [CrossRef]
22. Poprawa, P.; Šliaupa, S.; Stephenson, R.; Lazauskien, J. Late Vendian–Early Palæozoic Tectonic Evolution of the Baltic Basin:Regional Tectonic Implications from Subsidence Analysis. Tectonophysics 1999, 314, 219–239. [CrossRef]
23. Processing and interpretation of 3D seismic data from the study area. 2013; unpublished report.24. Schleicher, M.; Köster, J.; Kulke, H.; Weil, W. Reservoir and Source Rock Characterisation of the Early Palaeozoic in-Terval in the
Peribaltic Syneclise, Northern Poland. J. Petrol. Geol. 1998, 21, 33–56. [CrossRef]25. Golonka, J.; Porebski, S.J.; Barmuta, J.; Papiernik, B.; Bebenek, S.; Barmuta, M.; Botor, D.; Pietsch, K.; Słomka, T. Palaeozoic
Palaeogeography of the East European Craton (Poland) in the Framework of Global Plate Tectonics. Ann. Soc. Geol. Pol. 2019,87, 10. [CrossRef]
26. Lesniak, G.; Stadtm
Energies 2021, 14, x FOR PEER REVIEW 27 of 28
5. Such, P.; Leśniak, G.; Mroczkowska-Szerszeń, M.; Dudek, L.; Cicha-Szot, R.; Spunda, K. Methodology of Pore Space Analysis in Shale Rocks. Pract. Nauk. Inst. Naft. Gazu 2017, 214, 1–154.
6. Leśniak, G.; Sowiżdżał, K.; Stadtműller, M.; Lis-Śledziona AKaczmarczyk, W.; Słota-Valim, M.; Kasza, P. Wykonanie Niestandardowych Kompleksowych Bada N Petrofizycznych I Geomechanicznych Na Próbkach I Danych Z Dolnopaleozoicznych Łupków; Technical Report, Shalemech No. 3; INiG–PIB: Kraków, Poland, 2017.
7. Jarzyna, J.; Bała, M.; Krakowska, P.; Puskarczyk, E.; Strzępowicz, A.; Wawrzyniak-Guz, K.; Więcław, D.; Ziętek, J. Shale Gas in Poland. In Advances in Natural Gas. Emerging Technologies; al Megren, H.A., Altamini, R.H., Eds.; BoD–Books on Demand: Norderstedt, Germany, 2017.
8. Sowiżdżał, K.; Słoczyński, T.; Stadtműller, M.; Kaczmarczyk, W. Lower Palaeozoic Petroleum Systems of the Baltic Basin in Northern Poland: A 3D Basin Modeling Study of Selected Areas (onshore and offshore). Interpretation 2018, 6, SH117–SH132, doi:10.1190/int-2017-0194.1.
9. Stadtmuller, M.; Lis-Śledziona, A.; Słota-Valim, M. Petrophysical and Geomechanical Analysis of the Lower Paleozoic Shale Formation, North Poland. Interpretation 2018, 6, SH91–SH106, doi:10.1190/int-2017-0193.1.
10. Wilczynski, P.; Domonik, A.; Lukaszewski, P. Anisotropy of Strength and Elastic Properties of Lower Paleozoic Shales from the Baltic Basin, Poland. Energies 2021, 14, 2995, doi:10.3390/en14112995.
11. Więcław, D.; Kotarba, M.J.; Kosakowski, P.; Kowalski, A. Habitat and Hydrocarbon Potential of the Lower Palaeozoic Source Rocks of the Polish Sector of the Baltic Basin. Geol. Q. 2010, 54, 159–182.
12. Modliński, Z.; Podhalańska, T. Outline of the Lithology and Depositional Features of the Lower Paleozoic Strata in the Polish Part of the Baltic Region. Geol. Q. 2010, 54, 109–121.
13. Bała, M. Charakterystyka parametrów sprężystych określonych Na Podstawie pomiarów Geofizyki Otworowej I Modelowań Teoretycznych W Wybranych Formacjach W Otworach Basenu bałtyckiego I Wierconych Na Szelfie. Nafta Gaz 2017, 73, 558–570, doi:10.18668/NG.2017.08.03.
14. Dadlez, R. Phanerozoic Basinal Evolution Along the Teisseyre-Tornquist Zone. Kwartalnik Geologiczny 1987, 31, 263–278. (In Polish with English Summary)
15. Dadlez, R. Tectonics of the Southern Baltic. Kwartalnik Geologiczny 1990, 34, 1–20. (In Polish with English Summary) 16. Jaworowski, K. Transgresja Morza Kambryjskiego W północnej Polsce. Pr. Inst. Geol. 1979, 94, 5–80. 17. Jaworowski, K. Warunki Sedymentacji osadów Prekambru I Kambru W północnej Polsce. Przegląd Geologiczny 1982, 30, 220–
224. 18. Jaworowski, K. Facies Variability in the Cambrian Deposits from the Koscierzyna and Gdansk Sections (Pomeranian Caledo-
nides Foreland, Northern Poland): A Comparative Study. Geol. Q. 2000, 44, 249–260. 19. Kotarba, M.J.; Nagao, K. Molecular and Isotopic Compositions and Origin of Natural Gases from Cambrian and Carbonifer-
ous-Lower Permian Reservoirs of the Onshore Polish Baltic Region. Acta Diabetol. 2014, 104, 241–261, doi:10.1007/s00531-014-1063-0.
20. Kosakowski, P.; Wróbel, M.; Poprawa, P. Hydrocarbon Generation and Expulsion Modelling for the Lower Palaeozoic Source Rocks in the Polish Part of the Baltic Region. Geol. Q. 2010, 54, 241–256.
21. Kosakowski, P.; Kotarba, M.J.; Piestrzyński, A.; Shogenova, A.; Więcław, D. Petroleum Source Rock Evaluation of the Alum and Dictyonema Shales (Upper Cambrian-Lower Ordovician) in the Baltic Basin and Podlasie Depression (eastern Poland). Int. J. Earth Sci. 2016, 106, 743–761. DOI 10.1007/s00531-016-1328-x
22. Poprawa, P.; Šliaupa, S.; Stephenson, R.; Lazauskien, J. Late Vendian–Early Palæozoic Tectonic Evolution of the Baltic Basin: Regional Tectonic Implications from Subsidence Analysis. Tectonophysics 1999, 314, 219–239, doi:10.1016/s0040-1951(99)00245-0.
23. Processing and interpretation of 3D seismic data from the study area, 2013, unpublished report 24. Schleicher, M.; Köster, J.; Kulke, H.; Weil, W. Reservoir and Source Rock Characterisation of the Early Palaeozoic in-Terval in
the Peribaltic Syneclise, Northern Poland. J. Petrol. Geol. 1998, 21, 33–56. 25. Golonka, J.; Porębski, S.J.; Barmuta, J.; Papiernik, B.; Bębenek, S.; Barmuta, M.; Botor, D.; Pietsch, K.; Słomka, T. Palaeozoic
Palaeogeography of the East European Craton (Poland) in the Framework of Global Plate Tectonics. Ann. Soc. Geol. Pol. 2019, 87, 10, doi:10.14241/asgp.2019.16.
26. Leśniak, G., Stadtmϋller, M. Interpretation of the results of core material, cuttings and reservoir fluids (natural gas, crude oil) from W1, W-2, W-3 and W-4 boreholes in terms of hydrocarbons exploration in the Ordovician-Silurian shale formations. Unpublished report, 2012, Kraków.
27. Herwanger, J.; Koutsabeloulis, N. Rock Physics for Geomechanics. In: Seismic Geomechanics: How to Build and Calibrate Geome-chanical Models Using 3D and 4D Seismic Data; EAGE Publications: Houten, The Netherlands, 2011; pp. 181–182.
28. Jarvie, D.M.; Hil, R.J.; Ruble, T.E.; Pollastro, R.M. Unconventional Shale Gas System: The Mississippian Barnet Shale of North-Central Texas as One Model for Thermogenic Shale Gas Assessment. AAPG Bull. 2007, 91, 475–499.
29. Tingay, M.; Reinecker, J.; Birgit, M. Borehole Breakout and Drilling-Induced Fracture Analysis from Image Logs; World Stress Map Project– guidelines: Image Logs, Helmholtz Vent. Potsdam, GFZ.2008:pp. 1–18.
30. Li, H.; Tang, H.; Qin, Q.; Zhou, J.; Qin, Z.; Fan, C.; Su, P.; Wang, Q.; Zhong, C. Characteristics, Formation Periods and Genetic Mechanisms of Tectonic Fractures in the Tight Gas Sandstones Reservoir: A Case Study of Xujiahe Formation in YB Area, Si-chuan Basin. China J. Petrol. Sci. Eng. 2019, 178, 723–735.
ller, M. Interpretation of the results of core material, cuttings and reservoir fluids (natural gas, crude oil) fromW1, W-2, W-3 and W-4 boreholes in terms of hydrocarbons exploration in the Ordovician-Silurian shale formations. Unpublishedreport. 2012; Kraków.
27. Herwanger, J.; Koutsabeloulis, N. Rock Physics for Geomechanics. In Seismic Geomechanics: How to Build and Calibrate GeomechanicalModels Using 3D and 4D Seismic Data; EAGE Publications: Houten, The Netherlands, 2011; pp. 181–182.
28. Jarvie, D.M.; Hil, R.J.; Ruble, T.E.; Pollastro, R.M. Unconventional Shale Gas System: The Mississippian Barnet Shale of North-Central Texas as One Model for Thermogenic Shale Gas Assessment. AAPG Bull. 2007, 91, 475–499. [CrossRef]
29. Tingay, M.; Reinecker, J.; Birgit, M. Borehole Breakout and Drilling-Induced Fracture Analysis from Image Logs; World StressMap Project– guidelines: Image Logs, Helmholtz Vent. Potsdam, GFZ.2008:pp. 1–18.
30. Li, H.; Tang, H.; Qin, Q.; Zhou, J.; Qin, Z.; Fan, C.; Su, P.; Wang, Q.; Zhong, C. Characteristics, Formation Periods and GeneticMechanisms of Tectonic Fractures in the Tight Gas Sandstones Reservoir: A Case Study of Xujiahe Formation in YB Area, SichuanBasin. China J. Petrol. Sci. Eng. 2019, 178, 723–735. [CrossRef]
31. Dubinya, N.V. An Overview of Wellbore Methods of Investigating Stress State of the Upper Layers of the Earth’s Crust. IzvestiyaPhys. Solid Earth 2019, 55, 311–326. [CrossRef]
32. Sone, H.; Zoback, M.D. Viscous Relaxation Model for Predicting Least Principal Stress Magnitudes Insedimentary Rock. J. Petrol.Sci. Eng. 2014, 124, 416–431. [CrossRef]
33. Zoback, M.D.; Moos, D.; Mastin, L.G.; Anderson, R.N. Well Bore Breakouts and in Situ Stress. J. Geophys. Res. 1985, 90, 5523–5530.[CrossRef]
34. Bell, J.S. Investigating Stress Regimes in Sedimentary Basins Using Information from Oil Industry Wireline Logs and DrillingRecords. In Geological Applications of Wireline Logs; Hurst, A., Lovell, M., Morton, A., Eds.; Geological Society Special Publications:London, UK, 1990; Volume 48, pp. 305–325.
35. Moos, D. In Situ Stress Measurements in the NPR Hole, Volume I - Results and Interpretations. In Off. Sci. Tech. Inf. Tech. Rep;2001. Available online: https://www.osti.gov/servlets/purl/787831 (accessed on 5 August 2021). [CrossRef]
Energies 2021, 14, 6022 25 of 25
36. Zoback, M.D.; Healy, J.H. In Situ Stress Measurements to 3.5 Km Depth in the Cajon Pass Scientific Research Drill Hole:Implications for the Mechanics of Crustal Faulting. J. Geophys. 1992, 97, 5039–5057. [CrossRef]
37. Bell, J.S.; Gough, D.I. Northeast-Southwest Compressive Stress in Alberta: Evidence from Oil Wells. Earth Planet. Sci. Lett. 1979,45, 475–482. [CrossRef]
38. Zillur, R.; Adnan, A.A.-K.; Hamoud, A.A.-A.; Mahbub, S.A. Succesfull Drilling of Lateral Wells in Minimum Horizontal StressDirection for Optimal Fracture Placement. Oil Gas. J. 2012, 110, 74–83.
39. Wikel, K. Geomechanics: Bridging the Gap from Geophysics to Engineering in Unconventional Reservoirs. First Break 2011, 29,71–80. [CrossRef]
40. Terzaghi, K. Stress Conditions for the Failure of Saturated Concrete and Rock. In From Theory to Practice in Soil Mechanics; JohnWiley and Sons: Hoboken, NJ, USA, 1945; pp. 181–197.
41. Swabrick, R.E. Challenges of Porosity-Based Pore Pressure Prediction. CSEG Rec. 2002, 27, 75–77.42. Boer, L.; Sayers, C.; Nagy, Z.; Hooyman, P.J. Pore Pressure Prediction Using Well-Conditioned Seismic Velocities. First Break 2006,
24, 43–49.43. Bowers, G. Pore Pressure Estimation from Velocity Data: Accounting for Overpressure Mechanisms Besides Undercompaction.
SPE Drill. Complet. 1995, 10, 89–95. [CrossRef]44. Sayers, C.M.; Johnson, G.M.; Denyer, G. Predrill Pore-Pressure Prediction Using Seismic Data. Geophysics 2002, 67, 1286–1292.
[CrossRef]45. Bourgoyne, A.T.; Millheim, K.K.; Chenevert, M.E.; Young, F.S. Applied Drilling Engineering. Textbook Series; Society of Petroleum
Engineers: Richardson, TX, USA, 1986; Volume 2.46. Bowman, T. Direct Method for Determining Organic Shale Potential from Porosity and Resistivity Logs to Identify Possible
Resource Plays. In Proceedings of the AAPG Annual Convention & Exhibition, New Orleans, LA, USA, 11–14 April 2010.47. Li, M. Chapter 7—Prestack Seismic Inversion and Seismic Attribute Analysis. In Geophysical Exploration Technology; Li, M., Zhao,
Y., Eds.; Elsevier: Amsterdam, The Netherlands, 2014; pp. 199–219. ISBN 9780124104365. [CrossRef]48. Zou, C. Calculation of Brittleness Index for Rock Elastic Parameters. In Unconventional Petroleum Geology, 2nd ed.; Zou, C., Ed.;
Elsevier: Amsterdam, The Netherlands, 2017; ISBN 9780128122341. [CrossRef]49. Shogenov, K.; Shogenovaa, A.; Vizika-Kavvadiasb, O.; Nauroy, J.-F. Reservoir quality and petrophysical properties of Cambrian
sandstones and their changes during the experimental modelling of CO2 storage in the Baltic Basin. Estonian J. Earth Sci. 2015, 64,199–217. [CrossRef]
50. Handin, J.; Hager, R.V. Experimental Deformation of Sedimentary Rocks under Confining Pressure: Tests at Room Temperatureon Dry Samples. Bull. Am. Assoc. Pet. Geol. 1957, 41, 1–51.
51. Wines, D.; Lilly, P. Estimates of Rock Joint Shear Strength in Part of the Fimiston Open Pit Operation in Western Australia. Int. J.Rock Mech. Min. Sci. 2003, 40, 929–937. [CrossRef]
52. Smith, S.A.F.; Faulkner, D.R. Laboratory Measurements of the Frictional Properties of the Zuccale Low-Angle Normal Fault, ElbaIsland, Italy. J. Geophys. Res. Space Phys. 2010, 115, 115. [CrossRef]
53. Kwasniewski, M.; Rodriguez-Oitaben, P. Study on the Dilatancy Angle of Rocks in the Pre-Failure Domain. In Harmonizing RockEngineering and the Environment; Qian, Q., Zhou, Y., Eds.; Taylor and Francis Group: London, UK, 2012; pp. 681–686.
54. Pinazzi Da Silva Ribeiro, P.C.; Mello Oliveira, M.; Nelson, P. Correlation Between Uniaxial Compressive Strength and BrazilianTensile Strength Using Different Rock Types. In Proceedings of the ISRM VII Brazilian Symposium on Rock Mechanics, BeloHorizonte, MG, Brazil, 19–26 October 2016. Paper Number: ISRM-SBMR-2016-01.
55. Cheng, Y. Boundary Element Analysis of the Stress Distribution Around Multiple Fractures: Implications for the Spacing ofPerforation Clusters of Hydraulically Fractured Horizontal Wells. In Proceedings of the SPE Eastern Regional Meeting, Charleston,WV, USA, 23–25 September 2009. [CrossRef]
56. Gao, Q.; Cheng, Y.; Fathi, E.; Ameri, S. Analysis of Stress-Field Variations Expected on Subsurface Faults and Discontinuities inthe Vicinity of Hydraulic Fracturing. Spe Reserv. Eval. Eng. 2016, 19, 54–69.
57. Lavrov, A. Mechanisms and Diagnostics of Lost Circulation. In Lost Circulation; Elsevier BV: Amsterdam, The Netherlands, 2016;pp. 99–162. [CrossRef]


