Embed Size (px)
Citation preview
The value of pseudo 3D techniques
for the interpretation of analogue archaeological research
Geert OVERMARS | Raphaël PANHUYSEN
University of Amsterdam, the Netherlands
Abstract: The use of virtual 3D techniques as a research tool in the interpretation of analogue
archaeological data has gained little attention. The current paper will explore whether the use of 3D
techniques can help to understand data from old archaeological excavations. A method is presented which
facilitates the translation of analogue data into a pseudo 3D environment. One trench from the famous
excavations of the early medieval trading town of Dorestad serves as a case study. This trench was
excavated in 1970 and has never been published in detail. The trench contains a particularly large amount of
features and has a complex stratigraphy. This makes it hard to interpret the features in the trench by
traditional methods using two dimensions. In this paper it is argued that the creation of a pseudo 3D space of
old analogue excavation data offers archaeologists the possibility to experience and understand the data in a
way which is not possible when the data is experienced in only two dimensions. Experiencing old
archaeological data in three dimensions from different angles creates a spatial awareness of the features
which helps to comprehend and interpret the features and structures in the trench.
Keywords: Pseudo 3D, digital archaeology, analogue data, Dorestad, GIS
Introduction
Virtual 3D techniques are increasingly being used in archaeology. Often these techniques are applied to
create three dimensional models of ancient architecture in order to visualise old buildings for a large
audience without much academic purpose. Since a few years virtual and real 3D techniques have come into
use as a research tool in archaeological investigations. As a result of improvements and increasing
affordability of hardware and software the range of applications in archaeology has widened. At present 3D
applications in archaeology include techniques like laser scanning an ancient building or site (AKBOY 2010),
the use of photogrammetry to create point clouds of objects or landscapes or virtually model a building
literally stone by stone in order to understand the building's construction (LULOF et al. 2013).
Most of the applications of virtual 3D techniques in current research deal with ongoing archaeological
excavations and surveys or the virtual preservation of heritage. These techniques are valuable tools
welcomed in a discipline which on the whole becomes increasingly digitalised. However, the use of virtual 3D
techniques as a research tool in the interpretation of old or analogue archaeological data is largely uncharted
terrain. The current paper will explore whether virtual 3D techniques can be used to help understand data
from old excavations. The goal of this paper is to assess whether 3D techniques can contribute to the
process of interpretation of old archaeological research. Preparing analogue data sets for 3D analysis is
considered useful when with a reasonable investment in labour and money better information is generated
International Conference on Cultural Heritage and New Technologies | Vienna | 2013
2
from the data set. An important factor in this process is how the construction of a pseudo 3D image of the
excavation findings can be of use for the analysis of excavation data by researchers who analyse old
excavation data from 40 years ago and were not present in the field at the time of excavation.
To determine whether pseudo 3D reconstruction of excavation findings and data contributes to the analysis
of old excavation data we have used the analogue archaeological data of a trench from the well-known
excavations of Dorestad. Dorestad was an early medieval trading town located in the central part of the
Netherlands, near the present town Wijk bij Duurstede. This site was excavated from the late sixties onwards
and has become one of the largest excavations in the Netherlands (VAN ES 1990; WILLEMSEN and KIK
2010). The excavation archives consist of large numbers of field drawings, sketchy note books, black and
white pictures and other analogue data. The excavations at Dorestad were performed under considerable
time pressure and with limited means. Also for post excavational analysis insufficient resources were
available. As a result the basic analysis of finds and findings of large sections of the excavation have not yet
been carried out. Most work has been done on the excavations of sections of the harbour. These were
published by the original excavators van Es and Verwers in 1980 and 2009 (VAN ES and VERWERS 1980;
VAN ES and VERWERS 2009). Both authors are preparing a synthesizing volume on the central part of
Dorestad. Within the framework of the Odyssee archaeological backlog programme of the Netherlands
Organisation for Scientific Research (NWO) a project was initiated to analyse the cemeteries of Dorestad. As
a part of this project the features and finds of the trenches in which burials were found have been analysed.
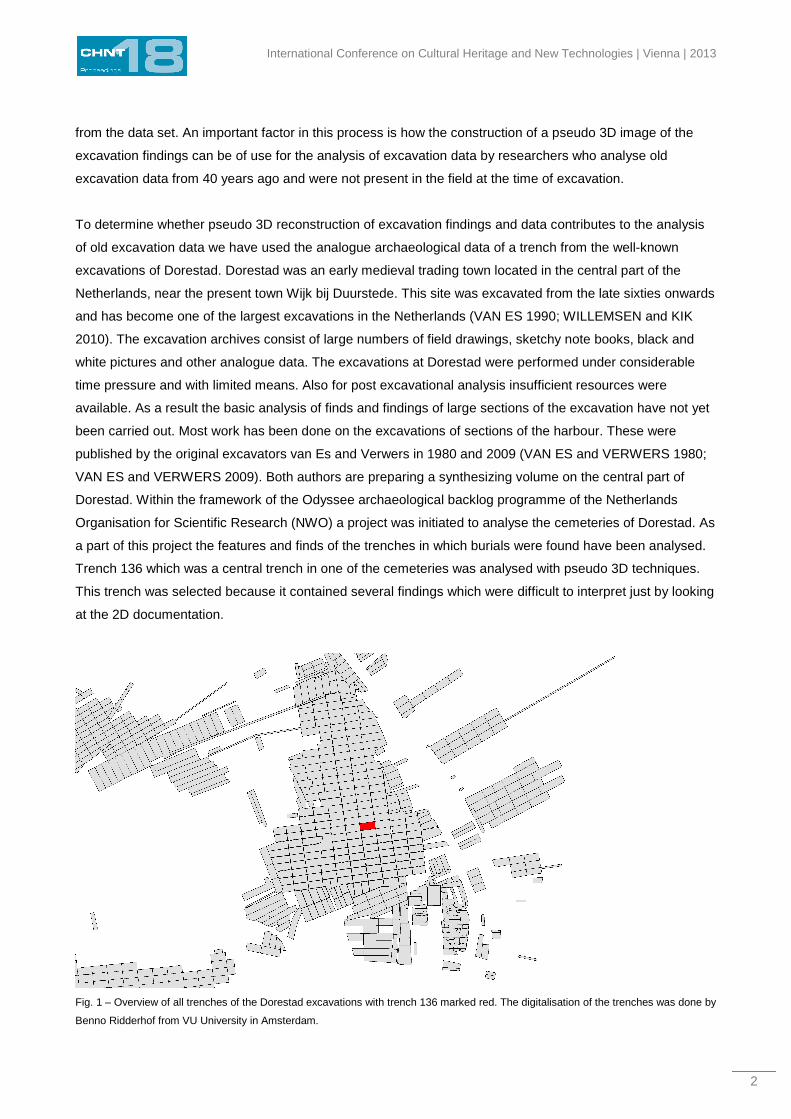
Trench 136 which was a central trench in one of the cemeteries was analysed with pseudo 3D techniques.
This trench was selected because it contained several findings which were difficult to interpret just by looking
at the 2D documentation.
Fig. 1 – Overview of all trenches of the Dorestad excavations with trench 136 marked red. The digitalisation of the trenches was done by
Benno Ridderhof from VU University in Amsterdam.
Overmars | Panhuysen – The value of pseudo 3D techniques
3
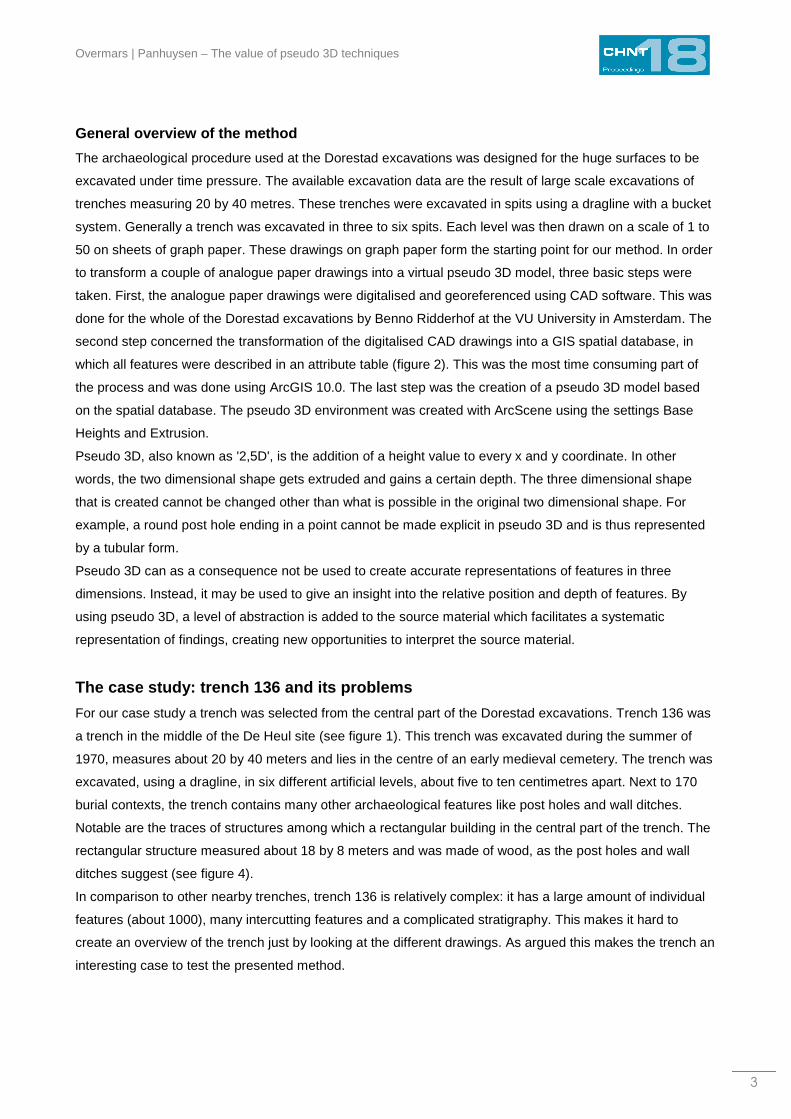
General overview of the method
The archaeological procedure used at the Dorestad excavations was designed for the huge surfaces to be
excavated under time pressure. The available excavation data are the result of large scale excavations of
trenches measuring 20 by 40 metres. These trenches were excavated in spits using a dragline with a bucket
system. Generally a trench was excavated in three to six spits. Each level was then drawn on a scale of 1 to
50 on sheets of graph paper. These drawings on graph paper form the starting point for our method. In order
to transform a couple of analogue paper drawings into a virtual pseudo 3D model, three basic steps were
taken. First, the analogue paper drawings were digitalised and georeferenced using CAD software. This was
done for the whole of the Dorestad excavations by Benno Ridderhof at the VU University in Amsterdam. The
second step concerned the transformation of the digitalised CAD drawings into a GIS spatial database, in
which all features were described in an attribute table (figure 2). This was the most time consuming part of
the process and was done using ArcGIS 10.0. The last step was the creation of a pseudo 3D model based
on the spatial database. The pseudo 3D environment was created with ArcScene using the settings Base
Heights and Extrusion.
Pseudo 3D, also known as '2,5D', is the addition of a height value to every x and y coordinate. In other
words, the two dimensional shape gets extruded and gains a certain depth. The three dimensional shape
that is created cannot be changed other than what is possible in the original two dimensional shape. For
example, a round post hole ending in a point cannot be made explicit in pseudo 3D and is thus represented
by a tubular form.
Pseudo 3D can as a consequence not be used to create accurate representations of features in three
dimensions. Instead, it may be used to give an insight into the relative position and depth of features. By
using pseudo 3D, a level of abstraction is added to the source material which facilitates a systematic
representation of findings, creating new opportunities to interpret the source material.
The case study: trench 136 and its problems
For our case study a trench was selected from the central part of the Dorestad excavations. Trench 136 was
a trench in the middle of the De Heul site (see figure 1). This trench was excavated during the summer of
1970, measures about 20 by 40 meters and lies in the centre of an early medieval cemetery. The trench was
excavated, using a dragline, in six different artificial levels, about five to ten centimetres apart. Next to 170
burial contexts, the trench contains many other archaeological features like post holes and wall ditches.
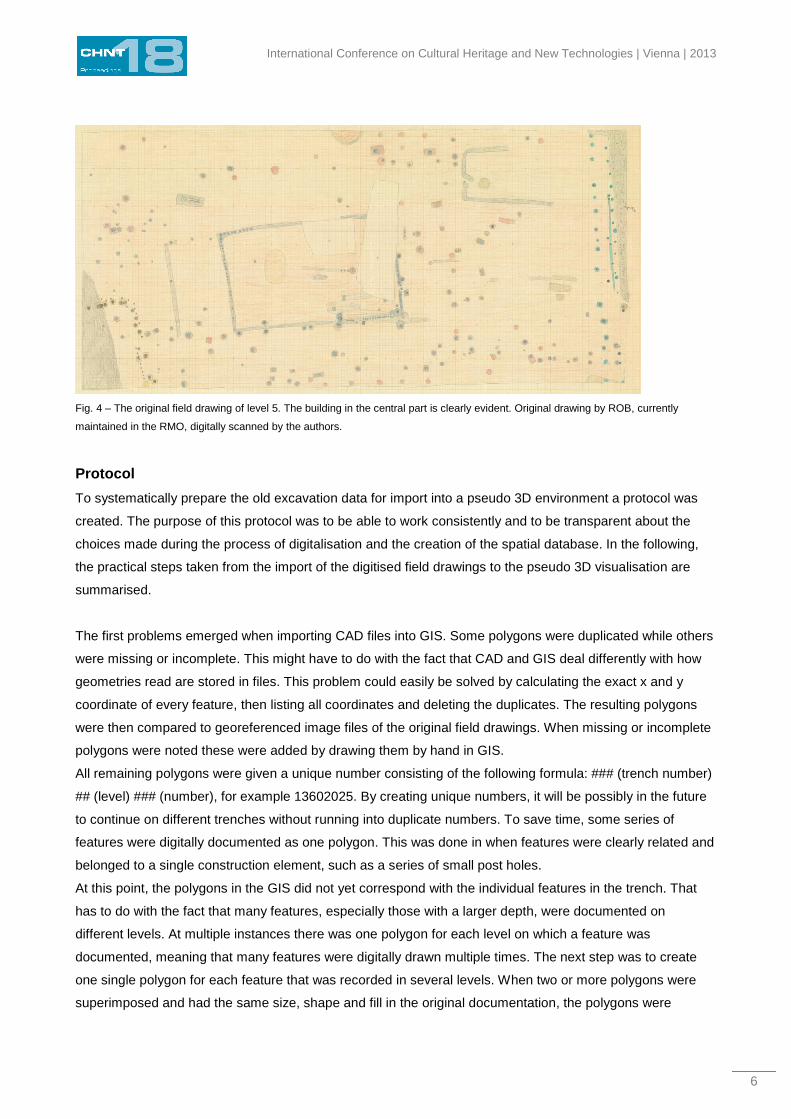
Notable are the traces of structures among which a rectangular building in the central part of the trench. The
rectangular structure measured about 18 by 8 meters and was made of wood, as the post holes and wall
ditches suggest (see figure 4).
In comparison to other nearby trenches, trench 136 is relatively complex: it has a large amount of individual
features (about 1000), many intercutting features and a complicated stratigraphy. This makes it hard to
create an overview of the trench just by looking at the different drawings. As argued this makes the trench an
interesting case to test the presented method.
International Conference on Cultural Heritage and New Technologies | Vienna | 2013
4
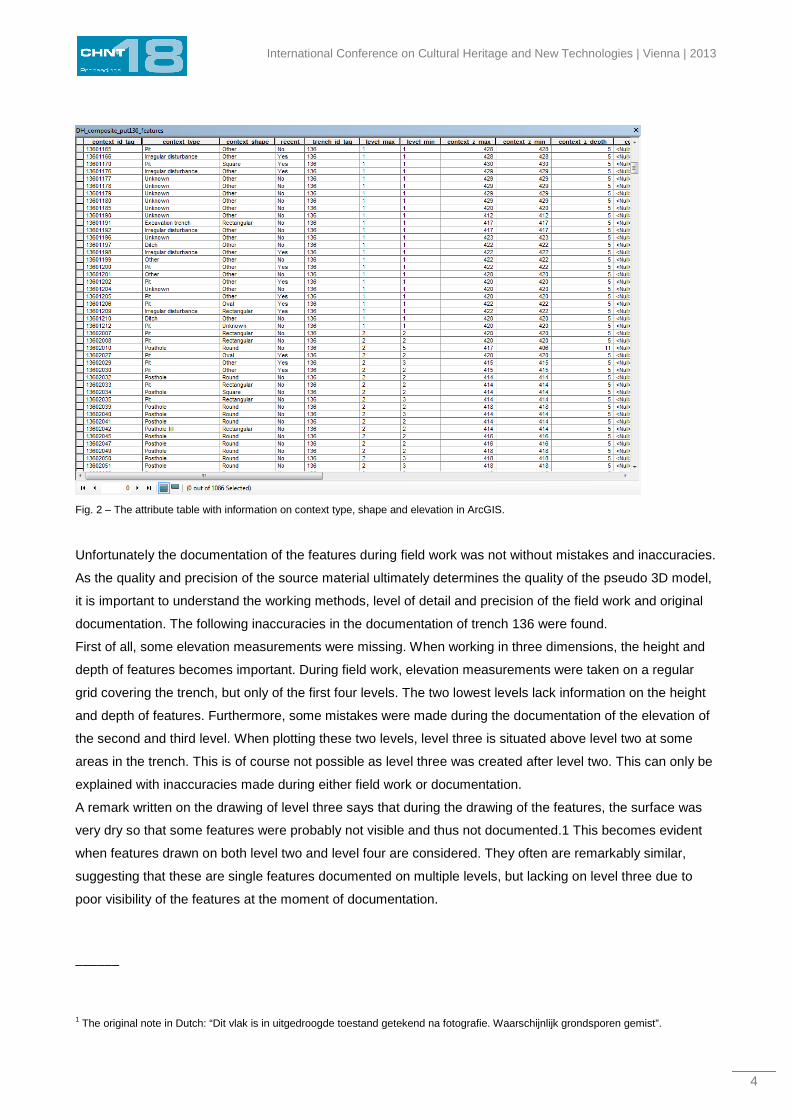
Fig. 2 – The attribute table with information on context type, shape and elevation in ArcGIS.
Unfortunately the documentation of the features during field work was not without mistakes and inaccuracies.
As the quality and precision of the source material ultimately determines the quality of the pseudo 3D model,
it is important to understand the working methods, level of detail and precision of the field work and original
documentation. The following inaccuracies in the documentation of trench 136 were found.
First of all, some elevation measurements were missing. When working in three dimensions, the height and
depth of features becomes important. During field work, elevation measurements were taken on a regular
grid covering the trench, but only of the first four levels. The two lowest levels lack information on the height
and depth of features. Furthermore, some mistakes were made during the documentation of the elevation of
the second and third level. When plotting these two levels, level three is situated above level two at some
areas in the trench. This is of course not possible as level three was created after level two. This can only be
explained with inaccuracies made during either field work or documentation.
A remark written on the drawing of level three says that during the drawing of the features, the surface was
very dry so that some features were probably not visible and thus not documented.1 This becomes evident
when features drawn on both level two and level four are considered. They often are remarkably similar,
suggesting that these are single features documented on multiple levels, but lacking on level three due to
poor visibility of the features at the moment of documentation.
______
1 The original note in Dutch: “Dit vlak is in uitgedroogde toestand getekend na fotografie. Waarschijnlijk grondsporen gemist”.
Overmars | Panhuysen – The value of pseudo 3D techniques
5
Except for human remains, very few artefacts were recovered in the trench. In fact, only the first two levels
have a couple of find numbers, the other four levels lack any find number. This is probably not due to a lack
of objects but due to a different approach in collecting finds. Recent excavations in Wijk bij Duurstede do not
show a similar absence of finds in the Dorestad layers (DIJKSTRA 2012). Because of the scarcity of finds
collected from the various features it is difficult to determine the chronological order of features.
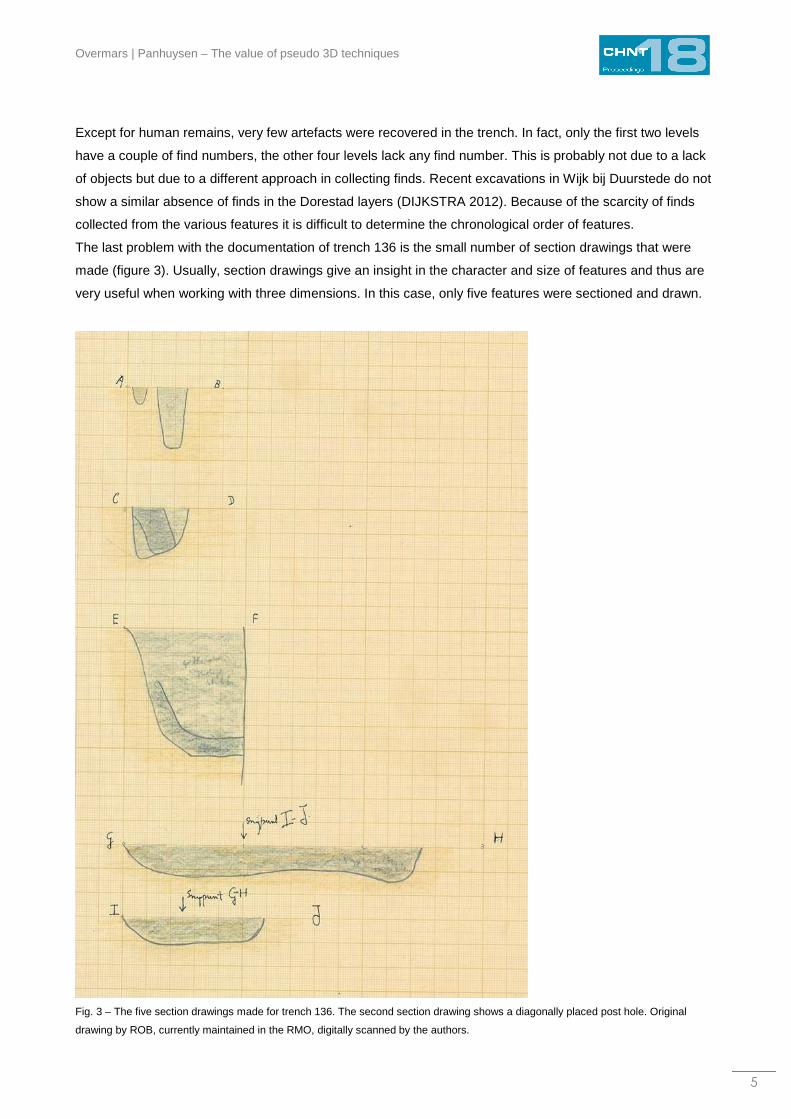
The last problem with the documentation of trench 136 is the small number of section drawings that were
made (figure 3). Usually, section drawings give an insight in the character and size of features and thus are
very useful when working with three dimensions. In this case, only five features were sectioned and drawn.
Fig. 3 – The five section drawings made for trench 136. The second section drawing shows a diagonally placed post hole. Original
drawing by ROB, currently maintained in the RMO, digitally scanned by the authors.
International Conference on Cultural Heritage and New Technologies | Vienna | 2013
6
Fig. 4 – The original field drawing of level 5. The building in the central part is clearly evident. Original drawing by ROB, currently
maintained in the RMO, digitally scanned by the authors.
Protocol
To systematically prepare the old excavation data for import into a pseudo 3D environment a protocol was
created. The purpose of this protocol was to be able to work consistently and to be transparent about the
choices made during the process of digitalisation and the creation of the spatial database. In the following,
the practical steps taken from the import of the digitised field drawings to the pseudo 3D visualisation are
summarised.
The first problems emerged when importing CAD files into GIS. Some polygons were duplicated while others
were missing or incomplete. This might have to do with the fact that CAD and GIS deal differently with how
geometries read are stored in files. This problem could easily be solved by calculating the exact x and y
coordinate of every feature, then listing all coordinates and deleting the duplicates. The resulting polygons
were then compared to georeferenced image files of the original field drawings. When missing or incomplete
polygons were noted these were added by drawing them by hand in GIS.
All remaining polygons were given a unique number consisting of the following formula: ### (trench number)
## (level) ### (number), for example 13602025. By creating unique numbers, it will be possibly in the future
to continue on different trenches without running into duplicate numbers. To save time, some series of
features were digitally documented as one polygon. This was done in when features were clearly related and
belonged to a single construction element, such as a series of small post holes.
At this point, the polygons in the GIS did not yet correspond with the individual features in the trench. That
has to do with the fact that many features, especially those with a larger depth, were documented on
different levels. At multiple instances there was one polygon for each level on which a feature was
documented, meaning that many features were digitally drawn multiple times. The next step was to create
one single polygon for each feature that was recorded in several levels. When two or more polygons were
superimposed and had the same size, shape and fill in the original documentation, the polygons were
Overmars | Panhuysen – The value of pseudo 3D techniques
7
considered to be one feature. The upper polygon was normally used to represent the feature as a whole,
while the other polygons were deleted.
Due to inaccuracies in the measurements taken during fieldwork, the polygons on different levels were often
not exactly lined vertically. Relative deviations up to 25 centimetres emerged. This was visible in particular
when groups of polygons showed the same deviations. When it could be argued on the contextual situation
that multiple features documented on different levels with such deviations are in fact representations of one
single feature, a composite polygon was created. The polygon containing the most information was chosen
to represent the feature while the other polygons were deleted. Information concerning the elevation and
depth of the feature was retained in the attribute table.
It is possible that the polygons with vertical deviations represent features which were placed diagonally in the
soil, such as posts of early medieval house constructions. It is however very hard to make that conclusion
when section drawings of the features are lacking. Often there was not enough proof to identify diagonal
features. Based on the local context, inaccuracies during fieldwork served often as a better explanation for
the vertical deviations.
Many features differed in size and shape on different levels. A post hole, for example, could very well end in
a small round shape while on a higher level the shape is much larger and square. However, due to the lack
of sufficient section drawings this could not often be proved with certainty. In some cases the size or shape
of superimposed features could differ while there were good arguments to believe it to be the same feature.
This may be explained by the drawing style of the different draughtsmen who worked on the different level
drawings (figure 5). It became clear that some draughtsmen used a standardized version of a post hole,
while other draughtsmen were more precise and drew the exact shape. This is particularly true for the
drawing of level 3, which contains the above mentioned note on how some features were not drawn due to a
dry and poorly visible surface. Many features on this level look very similar in both size and shape, as if the
features were sketched instead of measured. In such cases, the polygon that was created to represent the
feature was given the shape of the drawing with the most information.
As indicated the note on the level 3 drawing implies that some features were not documented at this level.
When there were arguments to believe that features documented on level 2 and 4 were in fact the same
feature, these features were brought together in composite features extending from level 2 to 4 even though
these were not documented on level 3.
International Conference on Cultural Heritage and New Technologies | Vienna | 2013
8
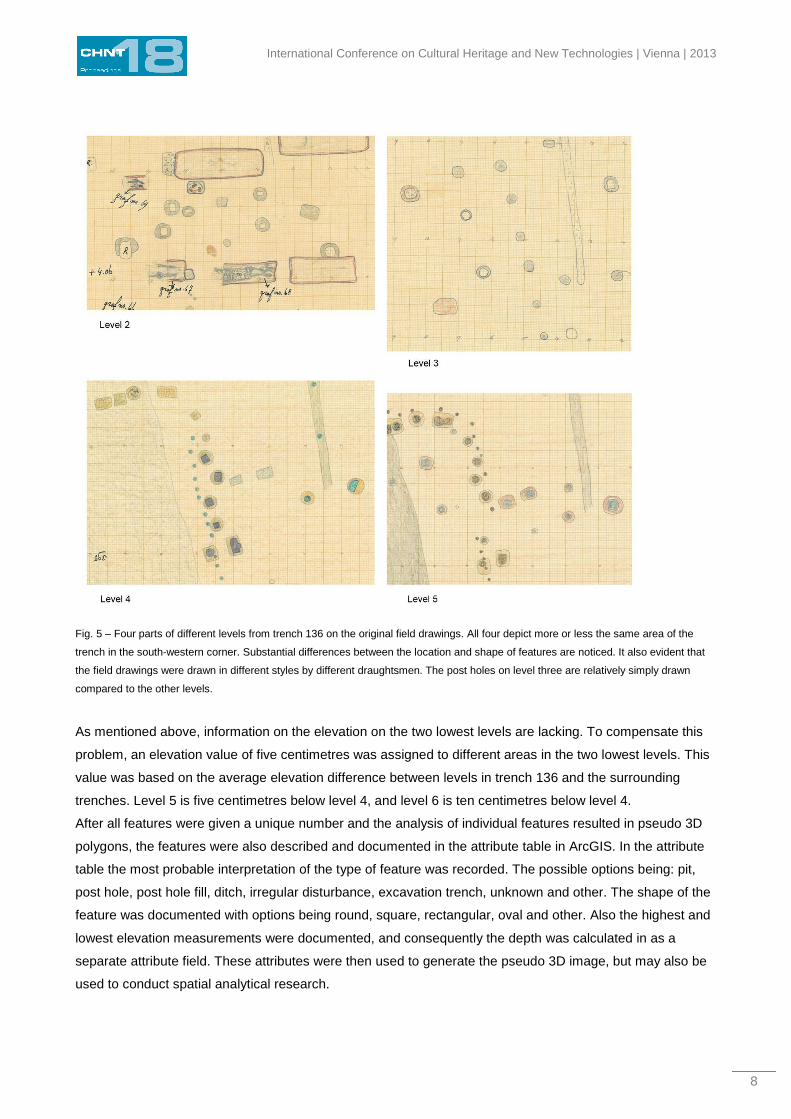
Fig. 5 – Four parts of different levels from trench 136 on the original field drawings. All four depict more or less the same area of the
trench in the south-western corner. Substantial differences between the location and shape of features are noticed. It also evident that
the field drawings were drawn in different styles by different draughtsmen. The post holes on level three are relatively simply drawn
compared to the other levels.
As mentioned above, information on the elevation on the two lowest levels are lacking. To compensate this
problem, an elevation value of five centimetres was assigned to different areas in the two lowest levels. This
value was based on the average elevation difference between levels in trench 136 and the surrounding
trenches. Level 5 is five centimetres below level 4, and level 6 is ten centimetres below level 4.
After all features were given a unique number and the analysis of individual features resulted in pseudo 3D
polygons, the features were also described and documented in the attribute table in ArcGIS. In the attribute
table the most probable interpretation of the type of feature was recorded. The possible options being: pit,
post hole, post hole fill, ditch, irregular disturbance, excavation trench, unknown and other. The shape of the
feature was documented with options being round, square, rectangular, oval and other. Also the highest and
lowest elevation measurements were documented, and consequently the depth was calculated in as a
separate attribute field. These attributes were then used to generate the pseudo 3D image, but may also be
used to conduct spatial analytical research.
Overmars | Panhuysen – The value of pseudo 3D techniques
9
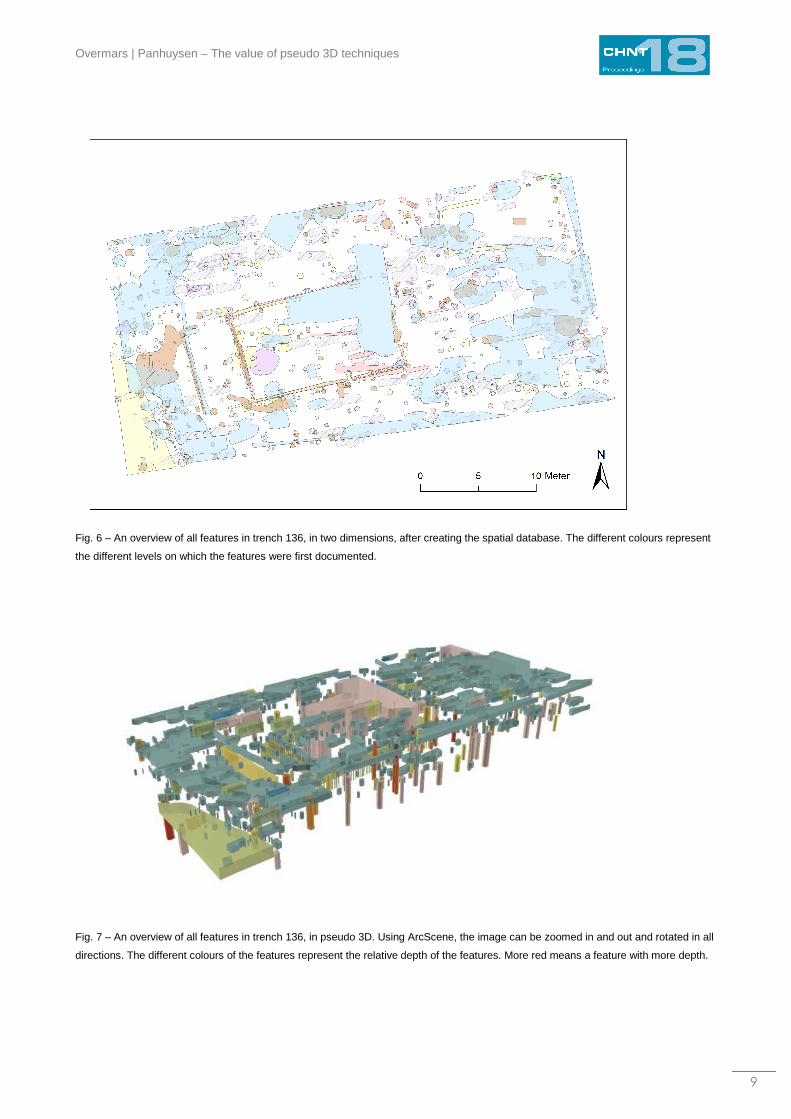
Fig. 6 – An overview of all features in trench 136, in two dimensions, after creating the spatial database. The different colours represent
the different levels on which the features were first documented.
Fig. 7 – An overview of all features in trench 136, in pseudo 3D. Using ArcScene, the image can be zoomed in and out and rotated in all
directions. The different colours of the features represent the relative depth of the features. More red means a feature with more depth.
International Conference on Cultural Heritage and New Technologies | Vienna | 2013
10
Result and discussion
The pseudo 3D image and the spatial data resulted in a visualisation of all features recorded at different
excavation levels. Marking the features with colours on the basis of attributes made it easier to interpret the
relation between the different features. This allowed us to group features belonging to the same structure
and it elucidated the diachronic sequence of features and structures.
A study to objectively establish the added value of a pseudo 3D reconstruction was not within the scope of
our project. Therefore the aspects presented here result more from personal, subjective observations rather
than objective observations. Both authors found the resulting pseudo 3D image of great help in creating a
spatial image of an excavation that was carried out 40 years earlier. An important factor seems to be the
ability to observe the pseudo 3D image from every desired angle. In part the image overcame the
disadvantages of the excavation method collecting information in artificial spits or excavation levels.
Creating the pseudo 3D image for the case study presented in this paper took about 80 hours of work.
However, this includes a phase of trial and error figuring out the best GIS method and the drafting of the
protocol. Now that the method and the protocol are completed, it is estimated that the whole procedure for a
similar trench would take about 40 hours of work. The authors do not believe that there is added value for
the application of this approach to trenches with few and uncomplicated features. However, we certainly
recommend creating a pseudo 3D reconstruction of trenches of a more complex nature.
The protocol is made to work with data that do not meet modern day criteria. It can only compensate for
missing information in a limited way. A detailed interpretation of the recorded features before creating the
composite features and the accompanying polygons remains necessary and is the most time consuming part
of the procedure.
Conclusion
In this paper a method was presented to use and analyse analogue data in a digital way. The goal was not to
use digital archaeology to just make an image of the source data. Rather, digital archaeology was used to
develop a research tool which could help to analyse findings that were recorded in the past and are now
studied by archaeologists who were not present at the time of excavation.
The process to create a pseudo 3D image from analogue field drawings consists of three steps:
digitalisation, describing and interpreting and finally the creation of a pseudo 3D image. In order to reach a
reliable and controllable result all features are interpreted and described following a protocol. With the
recording of all associated data of each feature in the attribute table of the GIS environment a spatial
database is created. This makes it possible to conduct different spatial analytical methods, such as visually
differentiating between round and square post holes or marking features with an exceptional depth. These
methods and other spatial analysis techniques can be used as a tool to further analyse the trench.
Using the elevation measurements on the height and depth of the different features in the trench, a pseudo
3D environment is created. The purpose of this pseudo 3D environment is to visualise the archaeological
data in a way which improves the understanding of a trench. The method is particularly useful for trenches
with a high amount of features and a complex stratigraphy and for series of features that belong to one or
more structures. The user gains a certain spatial awareness of the features in the trench by moving through
Overmars | Panhuysen – The value of pseudo 3D techniques
11
the pseudo 3D space. When looking at the trench in three dimensions and from different angles, the relative
position, size, shape and depth of features becomes clear. This spatial awareness allows the user to
comprehend and subsequently interpret the features and structures in a straightforward manner. It also
facilitates a better understanding of diachronic changes of the features and structures in the trench.
Acknowledgements
We would like to thank Benno Ridderhof at VU University, Amsterdam for his work on the digitalisation of the
original source material, to Menne Kosian at the National Heritage Agency of the Netherlands for his help on
the scanning of the original drawings and for providing an elevation map and to Jitte Waagen at the
University of Amsterdam for his technical assistance. We would also like to thank Annemarieke Willemsen at
the National Museum of Antiquities for providing the original source material, Annabelle de Gast at the
University of Amsterdam for her research on the finds in trench 136 and Maja d’Hollosy and Liesbeth Smits
at the University of Amsterdam for their support.
References AKBOY, S. (2010). “Archaeology: A Mediated Practice of Technology and Digital Tools. Three-dimensional Laser Scanning as a Case
Study Analysis,” CHNT 15 Proceedings: 397-408
DIJKSTRA, J. (ed.) (2012) “Het domein van de boer en de ambachtsman. Een opgraving op het terrein van de voormalige fruitveiling te
Wijk bij Duurstede: een deel van Dorestad en de villa Wijk archeologisch onderzocht, ” ADC Monografie 12
ES, W.A. van (1990). “Dorestad centred,” in Besteman, J.C. et al. (eds.) Medieval Archaeology in the Netherlands, 151-182
ES, W.A. van, VERWERS, W.J.H. (eds.) (1980) “Excavations at Dorestad 1, The Harbour: Hoogstraat I” Nederlandse Oudheden 9, ’s-
Gravenhage
ES, W.A. van, VERWERS, W.J.H. (eds.) (2009) “Excavations at Dorestad 3. Hoogstraat 0, II-IV” Nederlandse Oudheden 16, Amersfoort
KOSIAN, M., WEERTS, H., VAN LANEN, R., ABRAHAMSE, J.E. (2012) “The City and River. The early medieval Emporium (trade
centre) of Dorestad; integrating physical geography with archaeological data in changing environments,” CHNT 17 Proceedings
LULOF, P.S., OPGENHAFFEN, L., SEPERS, M.H. (2013) “The Art of Reconstruction. Documenting the process of 3D modeling: some
preliminary results” Digital Heritage: 333-336
WILLEMSEN, A., KIK, H. (eds.) (2010) “Dorestad in an international framework. New research on centres of trade and coinage in
Carolingian times,” Amsterdam
Abbreviations RCE Rijksdienst voor het Cultureel Erfgoed (Cultural Heritage Agency of the Netherlands), formely the ROB
RMO Rijksmuseum voor Oudheiden (National Museum of Antiquities)
ROB Rijksdienst voor het Oudheidkundig Bodemonderzoek, today known as RCE

International Conference on Cultural Heritage and New Technologies | Vienna | 2013
12
Imprint:
Proceedings of the 18th International Conference on Cultural Heritage and New Technologies 2013 (CHNT 18, 2013)
Vienna 2014
http://www.chnt.at/proceedings-chnt-18/
ISBN 978-3-200-03676-5
Editor/Publisher: Museen der Stadt Wien – Stadtarchäologie
Editorial Team: Wolfgang Börner, Susanne Uhlirz
The editor’s office is not responsible for the linguistic correctness of the manuscripts.
Authors are responsible for the contents and copyrights of the illustrations/photographs.