Embed Size (px)
Citation preview

1
Supplemental Information
Multisensory Context Portends Object Memory Antonia Thelen, Pawel J. Matusz, and Micah M. Murray
Supplemental Experimental Procedures Main Experiment Participants
Twelve healthy adults (3 women; mean age±SD = 27.1±3.4 years; 10 right-handed according to the Edinburgh handedness inventory [S1]) participated in the study. These individuals are the subset of participants from [S3] who partook in both the behavioural as well as the EEG acquisitions. The study was conducted in accordance with the Declaration of Helsinki, and all subjects provided written informed consent to participate in the study. The experimental procedures were approved by the Ethics Committee of the Vaudois University Hospital Centre and University of Lausanne. No subject had a history of a neurological or psychiatric illness, and all subjects had normal or corrected-to-normal vision as well as reported normal hearing. Task and Procedures
Subjects performed a continuous recognition task, which required the discrimination of initial (i.e., ‘new’) from repeated (i.e., ‘old’) presentations of line drawings that were pseudo-randomized within a block of trials. That is, on each trial a single image was presented (with or without a sound) that required a judgment regarding whether it was “new” or “old” (c.f., Figure 1 in [1]). Participants were instructed to perform as quickly and as accurately as possible. Each object (irrespective of whether it was initially presented in a unisensory or multisensory context) was repeated only once throughout the duration of the experiment. Furthermore, the pictures were subdivided into two groups: Initial presentations were either unisensory or multisensory. Repeated presentations were always unisensory. Thus, half of the repeated presentations were multisensory when initially encountered and the other half were unisensory when initially encountered (different and same contexts, respectively).
The line drawings were taken from a standardized set [S2] or obtained from an online library (dgl.microsoft.com) (see Appendix 1 in [S3] for a full list). The pictures were equally subdivided across experimental conditions and blocks. Images were controlled to equate spatial frequency spectra and luminance between image groups (AV vs. V), according to the procedures described in [S4]. They were black drawings presented centrally on a white background. On initial presentations, the visual stimuli could be presented simultaneously with a meaningless sound or displayed alone (each 50% of all trials). The sounds were generated using Adobe Audition 1.0 (16 bit stereo; 44100 Hz digitization; 500 ms duration; 10 ms rise/fall to avoid clicks), differed in their spectral composition (ranging from 100 Hz to 4700 Hz), and sometimes were modulated in terms of amplitude envelopes and/or waveform types (triangular and sinusoid).
Stimulus presentation was 500 ms, followed by a randomized inter-stimulus interval (ISI) ranging from 900 to 1500 ms. The mean (±SD) number of trials between the initial and the repeated presentation of the same image was 9±4 pictures for both presentation conditions (V and AV). Importantly, the distribution of old and new pictures throughout the length of the block was controlled. An equal probability of “new” objects across all quartiles within a block ensured that subjects could not determine the predictive probabilities of the upcoming stimuli. This, in turn, prevented the results from confounds

2
related to a response-decision bias, reflected, for example, by faster reaction times. Blocks consisted of 136 trials each, equally divided between V, AV, V−, and V+ conditions (i.e., 34 trials each). Notably, the same the block length was used in our prior studies [S3, S5, S6]. All participants completed 2 blocks of training.
The experiment took place in a sound-attenuated chamber, where subjects were seated centrally in front of a 20” LCD computer monitor that was located about 140 cm away from them to produce a visual angle of ~4°. The auditory stimuli were presented over insert earphones (Etymotic model: ER4S), and the volume was adjusted to a comfortable level (~62 dB). All stimuli were presented and controlled by E-Prime 2.0, and all behavioural data were recorded in conjunction with the serial response box (Psychology Software Tools, Inc.; www.pstnet.com). EEG acquisition and pre-processing
Continuous EEG was acquired from 160 scalp electrodes (sampling rate at 1024 Hz) using a Biosemi ActiveTwo system. Data pre-processing and analyses were performed using Cartool ([S7]; http://sites.google.com/site/fbmlab/cartool). Event-related potentials (ERPs) were calculated by averaging epochs from 100 ms pre-stimulus to 500ms post-stimulus onset for each of the four experimental conditions and each subject. In addition to a ±80 μV artefact rejection criterion, EEG epochs containing eye blinks or other noise transients were removed based on a trial-by-trial visual inspection of the data. Before group averaging, data from artefact electrodes of each subject were interpolated using 3-D splines [S8]. On average, 5 of the 160 channels were interpolated (range 2–12). The ERP data were baseline corrected using the pre-stimulus period, band-pass filtered (0.1–60 Hz including a notch filter at 50 Hz) and recalculated against the average reference. Electrical neuroimaging analyses
The ERP analyses were based on the hypothesis that a differential neural response would be found between individuals with memory performance that was improved by multisensory contexts and individuals whose memory performance was impaired by such multisensory contexts. The approach we employed here has been referred to as “electrical neuroimaging” and is based largely on the multivariate and reference-independent analysis of global features of the electrical field at the scalp that in turn informs the selection of time periods for analyses of source estimations [S9-S12]. These electrical neuroimaging analyses allowed us to differentiate the effects following from 1) modulations in the strength of brain responses within statistically indistinguishable brain generators, 2) alterations in the configuration of these generators (viz. the topography of the electric field at the scalp), as well as 3) latency shifts in brain processes across experimental conditions. Additionally, we applied the local auto-regressive average distributed linear inverse solution (LAURA [S13, S14]) to these ERP data to visualize and statistically contrast the likely underlying sources of the effects identified during the preceding steps of analysis of the surface-recorded ERPs.
The strength of the electric field across the whole scalp was quantified using Global Field Power (GFP; [S15]). This measure is equivalent to the standard deviation of the voltage potential values across the entire electrode montage at a given time point and represents a reference-independent measure of the ERP strength [S9]. The formula for GFP is:
, where u is the measured potential at the ith electrode among n electrodes. GFP was statistically contrasted using a millisecond-by-millisecond paired t-test, in conjunction with a >10 ms contiguous temporal criterion for significant effects that corrects for multiple contrasts [S16]. While this dependent measure provides an assay of ERP strength, it is inherently insensitive to spatial (i.e., topographic) variation in ERPs across conditions.
n
iiu u
nGFP
1
21

3
In order to test the ERP topography differences independently of strength differences, we used Global Dissimilarity (DISS [S15]). DISS is equivalent to the square root of the mean of the squared difference between the potentials measured at each electrode for different conditions, normalized by the instantaneous GFP. It is also directly related to the (spatial) correlation between two normalized vectors (cf., Appendix in [9]). We then performed a non-parametric randomization test (TANOVA, [9]): The DISS value at each time point is compared to an empirical distribution derived from permuting the condition label of the data from each subject. Because changes in topography forcibly follow from changes in the configuration of the underlying active sources [S17], this analysis can reveal at which points in time the experimental conditions activate distinct sets of brain networks. Because topographic differences were not observed in the current experiments, we do not discuss these analyses further here.
We estimated the sources underlying our GFP effects using a distributed linear inverse solution (minimum norm) together with the LAURA regularization approach ([S13, S14]; see also [S18] for review). LAURA selects the source configuration that better mimics the biophysical behavior of electric vector fields (i.e., according to electromagnetic laws, activity at one point depends on the activity at neighboring points). In our study, homogenous regression coefficients in all directions and within the whole solution space were used. LAURA uses a realistic head model, and the solution space included 4024 nodes, selected from a 6x6x6mm grid of 4024 nodes equally distributed within the gray matter of the Montreal Neurological Institute’s average brain (courtesy of R. Grave de Peralta and S. Gonzalez Andino; http://www.electrical-neuroimaging.ch/). Prior basic and clinical research by members of our group and others has documented and discussed in detail the spatial accuracy of the inverse solution model used here (e.g., [S14, S18-S21]). In general, the localization accuracy is considered to parallel the matrix grid size (here 6 mm). The results of the above GFP analysis defined the time periods for which the intracranial sources were subsequently estimated and statistically compared between conditions (here 270-316ms post-stimulus). Prior to calculation of the inverse solution, the ERP data were down-sampled and affine-transformed to a common 111-channel montage. Statistical analyses of source estimations were performed by first averaging the ERP data across time to generate a single data point for each participant and condition. This procedure increases the signal-to-noise ratio of the data from each participant. The inverse solution was then estimated for each of the 4024 nodes. These data were then submitted to an unpaired t-test. Here, we considered a difference reliable if it fulfilled a spatial extent criterion of at least 17 contiguous significant nodes (see also [S3, S22-S27]). This spatial criterion was determined using the AlphaSim program (available at http://afni.nimh.nih.gov) and assuming a spatial smoothing of 6mm full-width half maximum. The described criterion indicates that there is a 3.54% probability of presence of a cluster of at least 17 contiguous nodes, which gives an equivalent node-level p-value of p≤0.0002. The results of the source estimations were rendered on the Montreal Neurologic Institute’s averaged brain. Follow-up Experiment Participants
A new set of fifteen healthy adults (9 women; mean age±SD = 26±3.9 years; 13 right-handed according to the Edinburgh handedness inventory [S1]) participated in the follow-up study. The study was conducted in accordance with the Declaration of Helsinki, and all participants provided written informed consent to participate in the study. The experimental procedures were approved by the Ethics Committee of the Vaudois University Hospital Centre and University of Lausanne. No subject had a history of neurological or psychiatric illness, and all subjects had normal or corrected-to-normal vision as well as reported normal hearing. Task and Procedures

4
Participants performed a continuous recognition task with complex, meaningful sounds, rather than with images (as in the main experiment). Subjects heard a sound and were instructed to indicate as quickly and as accurately as possible (by right-hand keyboard button press) whether the sound was being heard for the first or second time within a given block of trials.
The sounds of 60 common objects were obtained from an online library (http://dgl.microsoft.com) or from prior experiments (e.g., [S28]) and modified with Adobe Audition to be 500 ms in duration (10 ms rise/fall to prevent clicks; 16 bit stereo, 44100 Hz digitization) and to have normalized mean volume. The average sound intensity during the experiment (comprised of stimuli and background noise between stimuli) was adjusted to 53.1 dB (s.e.m. ± 0.2 dB). These sounds were presented through stereo loud speakers (Logitech, Speaker System Z370) placed on both sides of the computer monitor that was located directly in front of the participants.
When presented for the first time, sounds could be presented alone (A), with a semantically congruent image (AVc) or with a meaningless, abstract image (AVm). Repeated sound presentations were always unisensory (auditory-only), and were labelled according to their past presentation context: previously presented alone (A-), previously presented with a congruent (A+c) or with a meaningless image (A+m). This yielded six experimental conditions in total. The present analyses focused exclusively on ERPs in response to the AVm and A conditions, based on the performance differences across the A+m and A- conditions.
For the AVc condition, visual stimuli consisted of line drawings of common objects obtained from a standardized set [S2] or from an online library (dgl.microsoft.com). For the AVm condition, visual stimuli were abstract drawings of lines and circles or scrambled versions of the line drawings (the latter of which were produced by dividing the images into 5 × 5 squares and randomizing pixels within these squares with a in-house MATLAB script (www.mathworks.com)
To familiarize participants with the sounds, subjects underwent a habituation block before the beginning of the experiment, in which all the sounds were coupled with their corresponding visual image (e.g., an image of a dog together with the sound of a barking dog) and presented twice. No responses were recorded for this block. All the remaining experimental procedures, such as the number of blocks or counterbalancing of the task-relevant stimuli within the block were similar to the procedures employed in the main experiment, with the obvious difference that now the task-relevant objects were auditory, while the irrelevant stimuli were visual in nature. EEG acquisition, pre-processing, and analyses
Continuous EEG was recorded at a sampling rate of 500 Hz with 63 scalp electrodes (EasyCap, BrainProducts), positioned according to the international 10-20 system. An electrode on the tip of the nose served as the online reference. The electrode-skin impedance was monitored throughout the experiment and averaged 4.5 kΩ across electrodes and individuals. Incorrect trials (erroneous responses and misses) were removed from the analysis. On average, less than one electrode was interpolated per participant (range 0-3). EEG data pre-processing steps and the ERP analyses followed the same procedures as described above. The source estimations were again based on LAURA, though in the present experiment data were down-sampled to a 61-channel montage. The array of 4024 solution points and the statistical analysis of the source estimations remained identical.

5
Supplemental Figures Figure S1. Paradigm and results from the follow-up study (A) A schematic depiction of the continuous recognition task, here involving the discrimination of sounds (initial vs. repeated). As in the main experiment, the context across the sound presentations remained the same or differed, such that the initial presentations were sometimes paired with a meaningless image. (B) The behavioral results from repeated sound presentations indicated that between the initial and repeated sound presentations that involved multisensory pairings some participants improved with different contexts and some participants were impaired by such context changes (red and black dots, respectively). (C) In order to determine the predictive value of multisensory contexts during encoding for later unisensory memory performance, ERP strength was quantified using Global Field Power triggered by initial sound encounters. Individuals that improved with context changes showed significantly stronger Global Field Power in response to multisensory stimuli than did individuals impaired by context changes (red versus black waveforms, respectively; mean±s.e.m. shown; p<0.05 for >10 ms contiguously indicated by shaded blue period). This difference was observed over the 160-190 ms post-stimulus period. No such differences were observed in response to unisensory auditory stimuli (see Figure S2). (D) The correlation between Global Field Power to multisensory stimuli and later differences in object discrimination accuracy as a function of time identified significant positive correlation over the 162-200ms interval. Thresholds for significant correlations (p<0.05) are indicated by the dotted lines. (E) Significant differences in distributed source estimations were observed within the inferior parietal sulcus bilaterally as well as within the right inferior occipital cortex, here displayed on a set of sagittal slices.
6
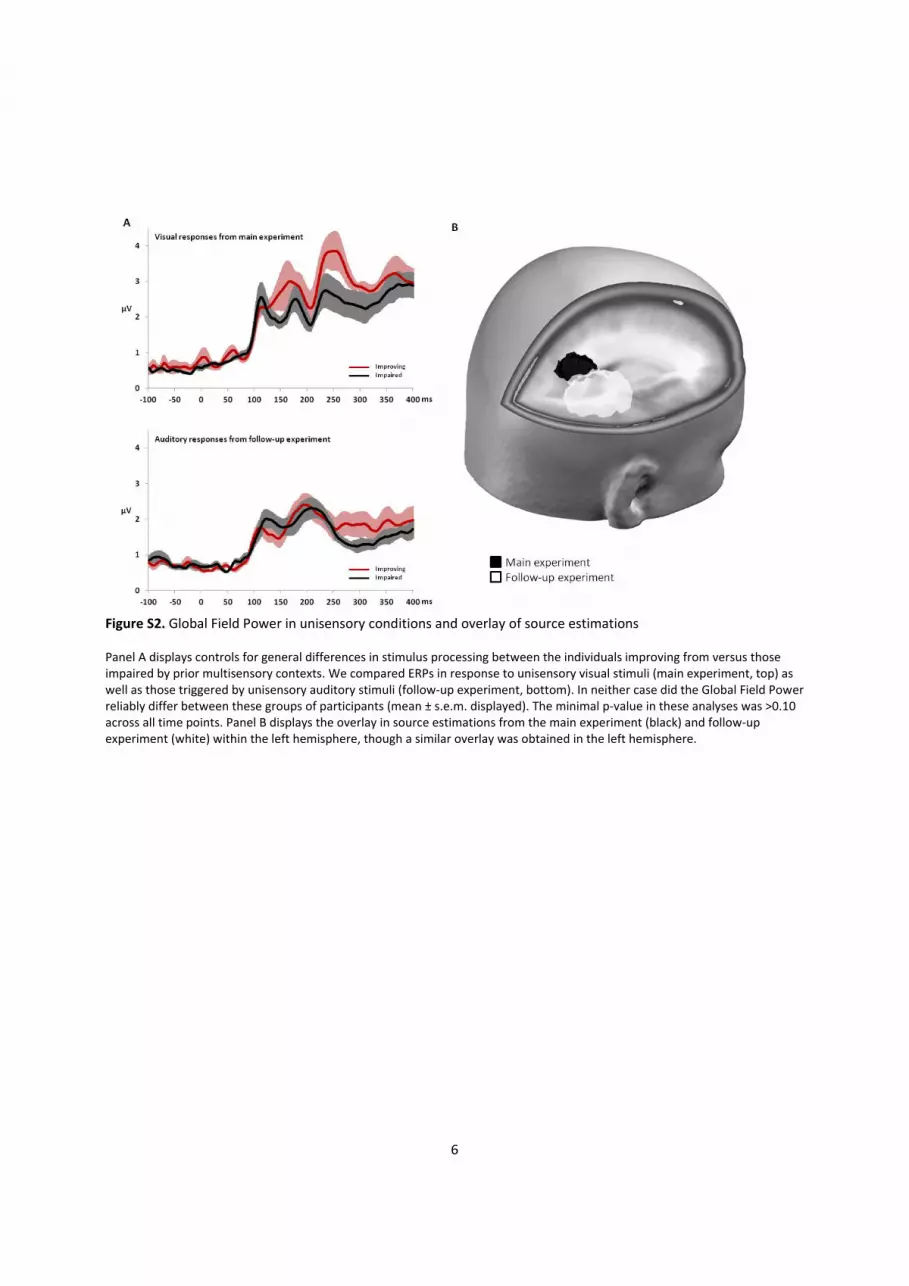
Figure S2. Global Field Power in unisensory conditions and overlay of source estimations Panel A displays controls for general differences in stimulus processing between the individuals improving from versus those impaired by prior multisensory contexts. We compared ERPs in response to unisensory visual stimuli (main experiment, top) as well as those triggered by unisensory auditory stimuli (follow-up experiment, bottom). In neither case did the Global Field Power reliably differ between these groups of participants (mean ± s.e.m. displayed). The minimal p-value in these analyses was >0.10 across all time points. Panel B displays the overlay in source estimations from the main experiment (black) and follow-up experiment (white) within the left hemisphere, though a similar overlay was obtained in the left hemisphere.

7
Supplemental Table Table S1. Accuracy rates across conditions and experiments as a function of whether an individual’s memory performance was improved by or impaired by multisensory contexts. There was no evidence for general performance differences across groups in either experiment.
Main Experiment
Improving Impaired Between groups t-test Initial presentation
Multisensory 91±1.5 86±4.8 t(10)=1.0; p=0.32 Visual 90±1.8 85±5.5 t(10)=0.8; p=0.45 Within-group t-test t(5)=0.2; p>0.83 t(5)=1.6; p>0.17
Repeated presentation
Had been multisensory 88±2.4 82±4.4 t(10)=-1.2; p=0.26 Had been unisensory 85±2.6 89±3.3 t(10)=1.2; p=0.27 Within-group t-test t(5)=6.3; p<0.002 t(5)=-3.9; p<0.02
ANOVA on initial presentations Main effect of context: F(1,10)=0.69; p>0.40 Main effect of group: F(1,10)=0.83; p>0.38 Group x context interaction: F(1,10)=0.17; p>0.68 ANOVA on repeated presentations Main effect of context: F(1,10)=1.98; p>0.19 Main effect of group: F(1,10)=0.01; p>0.9 Group x context interaction: F(1,10)=33.72; p<0.001; ηp
2=0.77
Follow-up Experiment
Improving Impaired Between groups t-test Initial presentation
Multisensory 72±4.5 78±4.7 t(13)= -0.9; p=0.38 Auditory 69±4.8 74±4.3 t(13)= -0.9; p=0.41 Within-group t-test t(7)=1.9; p>0.09 t(6)=1.2; p>0.26
Repeated presentation
Had been multisensory 79±4.9 66±8.3 t(13)= 1.4; p=0.13 Had been unisensory 74±5.0 71±6.3 t(13)= 0.4; p=0.69 Within-group t-test t(7)=7.7; p<0.001 t(6)=-2.5; p<0.05
ANOVA on initial presentations Main effect of context: F(1,13)=4.0; p>0.05 Main effect of group: F(1,13)=0.81; p>0.38 Group x context interaction: F(1,13)=0.01; p>0.85 ANOVA on repeated presentations Main effect of context: F(1,13)=0.06; p>0.8 Main effect of group: F(1,13)=0.01; p>0.9 Group x context interaction: F(1,13)=19.8; p<0.001; ηp
2=0.6
Supplemental Discussion
It is worthwhile to provide some considerations regarding the difference in the timing of effects across the two experiments. One possibility is that this timing difference may stem from the brain’s faster old/new discrimination of sounds of objects than images. For example, [S29] showed old/new effects with the same auditory stimuli as used in the present study at ~170-200 ms post-stimulus onset. By contrast, most studies of these processes involving images, typically line drawings, observed effects at ~250-300 ms (reviewed in [S30]). The qualitative features of the stimuli presented to each modality – e.g. naturalistic sounds vs. line drawings – may likewise constitute an important contributing factor.

8
Additional research is clearly required to provide a fuller account. Such notwithstanding, the timing differences should not detract the reader from the principal discovery; namely that brain activity in response to multisensory stimuli at one point in time is predictive of whether an individual’s later memory will benefit or be impaired.
Given the above, it is important to consider what precisely leads to an individual improving versus being impaired by prior multisensory contexts (at least in the case of the paradigm employed here). Inter-individual differences have been previously shown to impact multisensory interactions. For example, preferences at the level of perception and/or goal-based attention determine the impact of sounds on visual cortex excitability [S31, S32, see also S33 for influences of game-playing on top-down control mechanisms in vision or S34 for inter-individual differences in multisensory speech processing]. Other findings have linked variations in brain activity to susceptibility to multisensory influences on current perception/attention [4, S35]. The present results are consistent with these findings, but also extend them in an important, novel fashion to later memory function. The current observation of two distinct patterns of behaviour would suggest there to be contrasting mechanisms at play that were elicited in response to multisensory, but not unisensory, contexts across the two groups in our paradigm.
It is possible that those individuals who show less accurate performance with stimuli that had
been previously encountered in a multisensory vs. unisensory context are actually more adept at attending to task-relevant information. Had this been the case, however, a prediction would have been for a general difference across groups in the processing of information. We had no evidence in either experiment for differences in unisensory processing. However, this interpretation would assume that attending to multisensory stimuli can be likened to attending to visual stimuli, which has not been unequivocally established [S36, S37]. If our results can be construed as an enhancement of processing by individuals whose performance increases for stimuli that had been previously encountered in a multisensory vs. unisensory context, then it may likewise be the case that such individuals have a stronger tendency to integrate information across sensory modalities, even in contexts where some of this information is task-irrelevant. Consistent with this proposal is the specificity of our effects for multisensory conditions. Enhanced Global Field Power in response to multisensory stimuli, together with the localization of the effects in both experiments to regions of the parietal cortex that have previously been linked to perceptual benefits in multisensory object recognition [7], provide another line of support for the proposal that performance benefits may stem from enhanced multisensory processing rather than weaker top-down control mechanisms. One derivative hypothesis that is currently being investigated in our laboratory is that individuals improving with multisensory context also exhibit greater multisensory integration during other tasks, such as simple stimulus detection, where notably both visual and auditory stimuli are task-relevant. The hypothesis of enhanced tendency to integrate information across the senses in some individuals compared to others would be in line with recent evidence suggesting that multisensory processes scale across function levels [S38].
Supplemental References S1. Oldfield, R.C. (1971). The assessment and analysis of handedness: The Edinburgh
Inventory. Neuropsychologia 9, 97-113. S2. Snodgrass, J.G., and Vanderwart, M. (1980). A standardized set of 260 pictures: norms for name
agreement, image agreement, familiarity, and visual complexity. J. Exp. Psychol. Learn. 6, 174. S3. Thelen, A., Cappe, C., and Murray, M.M. (2012). Electrical neuroimaging of memory discrimination
based on single-trial multisensory learning. NeuroImage 62, 1478-1488.

9
S4. Knebel, J.F., Toepel, U., Hudry, J., le Coutre, J., and Murray, M.M. (2008). Generating controlled image sets in cognitive neuroscience research. Brain Topogr. 20, 284-289.
S5. Lehmann, S., and Murray, M.M. (2005). The role of multisensory memories in unisensory object discrimination. Cognitive Brain Res. 24, 326-334.
S6. Murray, M.M., Michel, C.M., Grave de Peralta, R., Ortigue, S., Brunet, D., Gonzalez Andino, S., and Schnider, A. (2004). Rapid discrimination of visual and multisensory memories revealed by electrical neuroimaging. Neuroimage 21, 125-135.
S7. Brunet, D., Murray, M.M., and Michel, C.M. (2011). Spatiotemporal analysis of multichannel EEG: CARTOOL. Comput. Intell. Neurosci. 2011, 2. S8. Perrin, F., Pernier, J., Bertnard, O., Giard, M.H., and Echallier, J.F. (1987). Mapping of scalp potentials
by surface spline interpolation. Electroen. Clin. Neuro. 66, 75-81. S9. Murray, M.M., Brunet, D., and Michel, C.M. (2008). Topographic ERP analyses: a step-by-step tutorial
review. Brain Topogr. 20, 249-264. S10. Michel, C.M., and Murray, M.M. (2012). Towards the utilization of EEG as a brain imaging tool. Neuroimage 61, 371-385. S11. Tzovara, A., Murray, M.M., Bourdaud, N., Chavarriaga, R., Millán, J.D.R., and De Lucia, M. (2012).
The timing of exploratory decision-making revealed by single-trial topographic EEG analyses. Neuroimage 60, 1959-1969.
S12. Koenig, T., Stein, M., Grieder, M., and Kottlow, M. (2014). A Tutorial on Data-Driven Methods for Statistically Assessing ERP Topographies. Brain. Topogr. 27, 72-83.
S13. Grave de Peralta Menendez, R.G., Andino, S.G., Lantz, G., Michel, C.M., and Landis, T. (2001). Noninvasive localization of electromagnetic epileptic activity. I. Method descriptions and simulations. Brain. Topogr. 14, 131-137.
S14. Grave de Peralta Menendez, R., Murray, M.M., Michel, C.M., Martuzzi, R., and Gonzalez Andino, S. L. (2004). Electrical neuroimaging based on biophysical constraints. Neuroimage 21, 527-539.
S15. Lehmann, D., and Skrandies, W. (1980). Reference-free identification of components of checkerboard-evoked multichannel potential fields. Electroen. Clin. Neuro. 48, 609-621.
S16. Guthrie, D., and Buchwald, J.S. (1991). Significance testing of difference potentials. Psychophysiology 28, 240-244.
S17. Lehmann, D. (1987). Mapping and analyzing maps of evoked potentials. Evok. Pot. 3, 91-99. S18. Michel, C.M., Murray, M.M., Lantz, G., Gonzalez, S., Spinelli, L., and Grave de Peralta, R. (2004). EEG
source imaging. Clin. Neurophys. 115, 2195-2222. S19. Gonzalez Andino, S.L., Michel, C.M., Thut, G., Landis, T., and Grave de Peralta, R. (2005). Prediction
of response speed by anticipatory high-frequency (gamma band) oscillations in the human brain. Hum. Brain Mapp. 24, 50-58.
S20. Martuzzi, R., Murray, M.M., Meuli, R.A., Thiran, J.P., Maeder, P.P., Michel, C.M., Grave de Peralta Menendez, R., and Gonzalez Andino, S.L. (2009). Methods for determining frequency-and region-dependent relatIonships between estimated LFPs and BOLD responses in humans. J. Neurophys. 101, 491-502.
S21. Akalin Acar, Z., and Makeig, S. (2013). Effects of forward model errors on EEG source localization. Brain Topogr. 26, 378-396.
S22. Toepel U., Knebel J.F., Hudry J., le Coutre J., and Murray M.M. (2009). The brain tracks the energetic value in food images. Neuroimage 44, 967-974.
S23. Cappe, C., Thut, G., Romei, V., and Murray, M.M. (2010). Auditory–visual multisensory interactions in humans: timing, topography, directionality, and sources. J. Neurosci. 30, 12572-12580.
S24. Cappe, C., Thelen, A., Romei, V., Thut, G., and Murray, M.M. (2012). Looming signals reveal synergistic principles of multisensory integration. J. Neurosci. 32, 1171-1182.
S25. De Lucia, M., Clarke, S., and Murray, M.M. (2010). A temporal hierarchy for conspecific vocalization discrimination in humans. J. Neurosci. 30, 11210-11221.

10
S26. Knebel, J.F., Javitt, D.C., and Murray, M.M. (2011). Impaired early visual response modulations to spatial information in chronic schizophrenia. Psychiat. Res.: Neuroimaging 193, 168-176.
S27. Knebel, J. F., and Murray, M. M. (2012). Towards a resolution of conflicting models of illusory contour processing in humans. Neuroimage 59, 2808-2817.
S28. Marcell, M. M., Borella, D., Greene, M., Kerr, E., and Rogers, S. (2000). Confrontation naming of environmental sounds. J. Clin. Exp. Neuropsyc. 22, 830-864. S29. Murray, M.M., Camen C., Spierer, L., and Clarke, S. (2008). Plasticity in representations of
environmental sounds revealed by electrical neuroimaging. Neuroimage 39, 847-856. S30. Grill-Spector, K., Henson, R., and Martin, A. (2006). Repetition and the brain: neural models of
stimulus-specific effects. Trends Cogn. Sci. 10, 14-23. S31. Romei, V., Murray, M.M., Cappe, C., and Thut, G. (2009). Preperceptual and stimulus-selective
enhancement of low-level human visual cortex excitability by sounds. Curr. Biol. 19, 1799-805. S32. Romei, V., Murray, M.M., Cappe, C., and Thut, G. (2013). The contributions of sensory dominance
and attentional bias to cross-modal enhancement of visual cortex excitability. J. Cogn. Neurosci. 25, 1122-1135.
S33. Krishnan, L., Kang, A., Sperling, G., and Srinivasan, R. (2013). Neural strategies for selective attention distinguish fast-action video game players. Brain Topogr. 26, 83-97.
S34. Stevenson, R.A., Bushmakin, M., Kim, S., Wallace, M.T., Puce, A., and James, T.W. (2012). Inverse effectiveness and multisensory interactions in visual event-related potentials with audiovisual speech. Brain Topogr. 25, 308-26.
S35. Romei, V., Gross, J., and Thut, G. (2012). Sounds reset rhythms of visual cortex and corresponding human visual perception. Curr. Biol. 22, 807-813.
S36. Matusz, P.J., and Eimer, M. (2013). Top-down control of audiovisual search by bimodal search templates. Psychophysiology 50, 996-1009.
S37. Matusz, P.J. and Eimer, M. (2013). Multisensory enhancement of attentional capture in visual search. Psychon. Bull. Rev. 18, 904-909.
S38. Stevenson, R.A., and Wallace, M.T. (2013). Multisensory temporal integration: task and stimulus dependencies. Exp. Brain Res. 227, 249-261.


