Embed Size (px)
Citation preview

Plant Biotechnology Journal (2003) 1, pp. 195–207
© 2003 Blackwell Publishing Ltd 195
Blackwell Publishing Ltd.
There is more to tomato fruit colour than candidate carotenoid genesYong-Sheng Liu1, Amit Gur1, Gil Ronen1,2, Mathilde Causse3, René Damidaux3, Michel Buret4, Joseph Hirschberg2 and Dani Zamir1,*1Department of Field and Vegetable Crops and The Otto Warburg Center for Biotechnology, Faculty of Agriculture, The Hebrew University of Jerusalem, PO Box
12, Rehovot 76100, Israel 2Department of Genetics, The Hebrew University of Jerusalem, Givat-Ram, Jerusalem 91904, Israel 3Station de Génétique et Amelioration des Fruits et Légumes, INRA, BP 94-84143 Montfavet-Cedex, France 4UMR Sécurité et Qualité des Produits d’Origine Végétale, INRA, Domaine St Paul, 84914 Avignon, Cedex 9, France
SummaryDetermining gene sequences responsible for complex phenotypes has remained a major
objective in modern biology. The candidate gene approach is attempting to link, through
mapping analysis, sequences that have a known functional role in the measured phenotype
with quantitative trait loci (QTL) that are responsible for the studied variation. To explore the
potential of the candidate approach for complex traits we conducted a mapping analysis of
QTL for the intensity of the red colour of the tomato fruit (mainly lycopene) and for probes
associated with the well-characterized carotenoid biosynthesis pathway. Seventy-five
tomato introgression lines (ILs), each containing a single homozygous RFLP-defined
chromosome segment from the green-fruited species Lycopersicon pennellii delimited 107
marker-defined mapping bins. Three of the bins resolved known qualitative colour
mutations for yellow (r) and orange (B and Del ) fruits resulting from variation in specific
carotenoid biosynthesis genes. Based on trials in different environments, 16 QTL that
modified the intensity of the red colour of ripe fruit were assigned to bins. Candidate
sequences associated with the carotenoid biosynthesis pathway were mapped to 23 loci.
Only five of the QTL co-segregated with the same bins that contained candidate genes – a
number that is expected by chance alone. Furthermore, similar map location of a QTL and
a candidate is far from a direct causative relationship between a gene and a phenotype. This
study highlights the wealth and complexity of the variation present in the genus
Lycopersicon that could be employed for basic research and genetic improvement of fruit
colour in tomato.
Received 28 January 2003;
revised 28 January 2003;
accepted 29 January 2003.
*Correspondence: Faculty of Agriculture, The
Hebrew University of Jerusalem, PO Box 12,
Rehovot 76100, Israel (fax +972 8 9468265;
e-mail [email protected])
Keywords: bin mapping, candidate
genes, carotenoid biosynthesis,
introgression lines (ILs), tomato, QTL.
Introduction
Genetic variation in nature usually takes the form of a
continuous phenotypic range rather than discrete classes. The
genetic variation underlying quantitative traits results from
the segregation of numerous interacting quantitative trait loci
(QTL) whose expression is modified by the environment.
Tomato has been the model system for the analysis of
complex genetic traits due to the development of a wide
range of introgressions of wild-species chromosome
segments in cultivated genetic background (Eshed and Zamir,
1995; Monforte and Tanksley, 2000). These interspecific
nearly isogenic or congenic populations offered a tool for
the identification of quantitative trait loci (QTL) that improve
yield (Eshed and Zamir, 1994) and for the map-based cloning
of two wild species QTL. Brix9-2-5 is a QTL that originates from
Lycopersicon pennellii and increases the glucose and fructose
content of the fruit. Brix9-2-5 was genetically delimited to
the third exon and intron of the tomato apoplastic invertase
gene, Lin5 (Fridman et al., 2000). This finding is consistent

196 Yong-Sheng Liu et al.
© Blackwell Publishing Ltd, Plant Biotechnology Journal (2003), 1, 195–207
with the sucrose cleaving function of the invertase enzyme –
and makes a good ‘candidate gene’ sense. On the other hand,
the QTL Fw2.2 that modifies fruit size turned out to be a
gene of unknown function that shares some motive similarity
with the human oncogene RAS (Frary et al., 2000). This gene
could not be identified through the candidate approach.
For genomes that have not yet been targeted for complete
sequence analysis, such as tomato, the framework for
associating gene sequences and phenotypes is a genetic
linkage-map. Our QTL mapping framework is based on an
introgression line (IL; Eshed and Zamir, 1995) population
composed of 75 L. esculentum (cv. M82) lines, each containing
a single RFLP-defined chromosome segment introgression
from the wild green-fruited species L. pennellii (LA 716)
(Pan et al., 2000). Each of the ILs is nearly isogenic to the
cultivated tomato variety and together the lines provide a
complete coverage of the tomato genome. The ILs partition
the tomato genome into 107 discrete marker defined mapping
bins with unique composition (average size 12 cM). The ILs
constitute a permanent seed and information resource for
associating complex phenotypes with specific bins that can
be tested in different environments and locations.
Carotenoids are one of the largest classes of pigments in
nature that play indispensable roles in photosynthesis as
accessory pigments for light-harvesting, and in preventing
photo-oxidative damage. Another important role of caroten-
oids in plants is the distinct pigmentation they provide to
flowers and fruits, which attract animals for pollination and
for seed dispersal. Most of the orange, yellow and red colours
found in the flowers, fruits and some other organs of many
higher plant species are due to the accumulation of caroten-
oids in the chromoplasts. The carotenoid biosynthesis path-
way was postulated over three decades ago by standard
biochemical analyses using labelled precursors, specific
inhibitors and mutant characterization. In recent years, genes
encoding nearly all of the enzymes in the carotenoid biosyn-
thesis pathway have been cloned from bacteria, fungi and
plants (reviewed in Hirschberg, 2001). The tomato fruit,
which mainly contains the red pigment lycopene, has been
a favourite model system for carotenoid research due to its
dramatic colour changes during ripening and the availability
of a range of colour mutants. The concentration of lycopene
in tomato fruit is an important feature for the processing and
fresh market industry; increasing lycopene content is there-
fore a main objective in tomato breeding. In this study, bin
map positions of QTL for internal fruit colour and carotenoid-
associated candidate sequences were compared, indicating
that a diverse network of processes control the intensity of
tomato fruit colour.
Results
Genetic variation for fruit colour phenotypes
The objective of this study was to identify genomic regions
that modify the intensity of the red colour of tomato fruits.
The L. pennellii IL population is an efficient resource for the
identification of fruit colour QTL for the following reasons:
(1) The donor wild species is green-fruited and therefore the
population is expected to carry a wide range of exotic genes
that modify fruit colour; (2) the genetic structure of the pop-
ulation ensures that each line is nearly isogenic to the original
L. esculentum variety (M82), and therefore a phenotypic
difference between an IL and M82 are associated with the
introgressed chromosome segment; (3) L. pennellii has an
exceptional drought tolerance allowing the evaluation of
fruit colour of ILs grown under normal and non-irrigated
conditions. We hypothesized that if certain colour QTL are
consistently identified under such extremely different environ-
ments they must represent genomic regions with a solid effect
on the measured phenotype.
The internal fruit colour of the 75 ILs was evaluated under
the irrigated and non-irrigated treatments, with a high
correlation between the two field environments (r = 0.81).
The frequency distribution of the mean internal colour rating
from the two irrigation regimes was continuous, except for
bins 3C, 6E and 12C, which were previously characterized
as harbouring the single gene mutations that alter carote-
noid composition: yellow-flesh (r; Fray and Grierson, 1993),
high Beta (B; Ronen et al. 2000) and high Delta (Del; Ronen
et al. 1999), respectively (Figure 1). The internal colour
frequency distribution clearly differentiated between the
three qualitative variants and the rest of the lines located in
the continuous distribution for quantitative differences in red
colour intensity. Fruit lycopene content was assayed on the
population grown in a third environment in France and
was continuous except for IL3-2 and IL12-2 (IL6-2 and IL6-3
harbouring B were not evaluated). Trait distributions for
carotene content and for the chromameter measurements
L*, a* and b* also indicated that the lines containing the
single gene mutations r and Del were outside the range of the
normal curve.
We detected significant genetic correlations among the 10
colour phenotypes analysed on the ILs, as detailed in Table 1.
External and internal colours were highly correlated both in
the wet and dry environments and so were the internal colour
ratings in the two irrigation treatments. The strong colour
rating correlations between the dry and wet treatments
prompted us to calculate the mean internal colour rating and

Tomato colour QTL and candidate genes 197
© Blackwell Publishing Ltd, Plant Biotechnology Journal (2003), 1, 195–207
Figure 1 Frequency distribution for fruit colour traits measured on the L. pennellii ILs. The %-value on the x-axis represents the value of the common control, M82, and the population means are indicated by black arrows.
Table 1 Significant (P < 0.001) correlations between colour related traits in the L. pennellii IL populations. The sign of the correlation coefficient indicates the direction of the correlation
EC-D EC-W IC-D IC-W IC-M lycopene carotene L* a* b*
EC-W 0.84
IC-D 0.81 0.74
IC-W 0.72 0.87 0.81
IC-M 0.80 0.85 0.94 0.96
lycopene 0.56 0.60 0.67 0.63 0.69
carotene −0.34 −0.31 −0.33 N.S. −0.31 N.S.
L* −0.68 −0.76 −0.64 −0.73 −0.73 −0.72 N.S.
a* 0.44 0.46 0.44 0.42 0.46 0.69 N.S. −0.74
b* −0.50 −0.61 −0.55 −0.62 −0.62 −0.57 N.S. 0.77 −0.48
EC = external colour, IC = internal colour, D = non-irrigated, W = irrigated, M = mean effect.

198 Yong-Sheng Liu et al.
© Blackwell Publishing Ltd, Plant Biotechnology Journal (2003), 1, 195–207
compare it to the fruit colour parameters measured for the
same lines, independently grown in France. The mean inten-
sity of the internal red colour of the fruits was highly positively
correlated to lycopene content (0.69) and showed a strong
negative correlation with L* (−0.73). These results also dem-
onstrate that the L. pennellii ILs provide a rich permanent
resource that permits a reproducible scoring of the colour
phenotypes in different locations.
Mapping of fruit colour QTL
Nineteen genomic regions were associated with modifica-
tions in the intensity of the red internal colour (Table 2). IL2-
1 and IL2-2, that had a lower colour rating than M82, defined
the QTL ic-2C (Figure 2). IL2-1 had a mean rating that was
27% lower than M82 in the wet treatment and 14% lower
(not significant) than the control in the dry treatment. The
IC %m82
Limits
(in cM)Locus ILs Dry Wet Mean QTL value
ic-2C IL2-1 −14 −27** −21** −22 3
IL2-2 −20** −24** −22**
ic-2K IL2-5 38** 5 21** 21 21
IL2-6 31** 27** 30**
ic-2L IL2-6-5 22** 14 19** 19 3
r (ic-3C ) IL3-2 −71** −75** −73** −73 28
ic-4F IL4-3-2 −18** −15* −16** −16 5
IL4-3 −12 9 1
ic-4H IL4-4 43** 16* 29** 29 20
ic-6A IL6-1 17* 11 15** 15 22
B (ic-6E) IL6-2 −28* −26** −27** −35 8
IL6-3 −59** −58** −42**
ic-7B IL7-4 −19* −28** −23** −23 7
IL7-4-1 −24** −33** −28**
IL7-5 −8 −35** −22**
IL7-5-5 N.T. −19* −19*
ic-7F IL7-2 0 23** 13** 13 19
IL7-3 8 16** 13**
ic-8C IL8-1 27** 25** 26** 26 2
ic-8E IL8-2-1 −16 −18** −17** −17 18
IL8-2 −9 0 −3
ic-8F IL8-3 8 22** 16** 16 20
ic-9G IL9-2 8 22** 16** 18 7
IL9-2-6 15 22** 19**
ic-10B IL10-1 29** 27** 28** 28 24
ic-10E IL10-2 −35** −32** −33** −34 19
IL10-2-2 −33** −36** −34**
ic-11B IL11-1 29** 7 18** 20 11
IL11-2 31** 11 21**
Del (ic-12C ) IL12-2 −65** −64** −65** −65 9
ic-12H IL12-4 −21** −31** −26** −26 6
Significant at *P < 0.05 level; significant at **P < 0.01 level.
Table 2 Fruit internal colour (IC) QTL identified in non-irrigated and irrigated fields (as percentage of M82). Mean QTL effect derived from the two enviromnents and QTL value (– indicates lower than M82) are delimited to their corresponding bin sizes
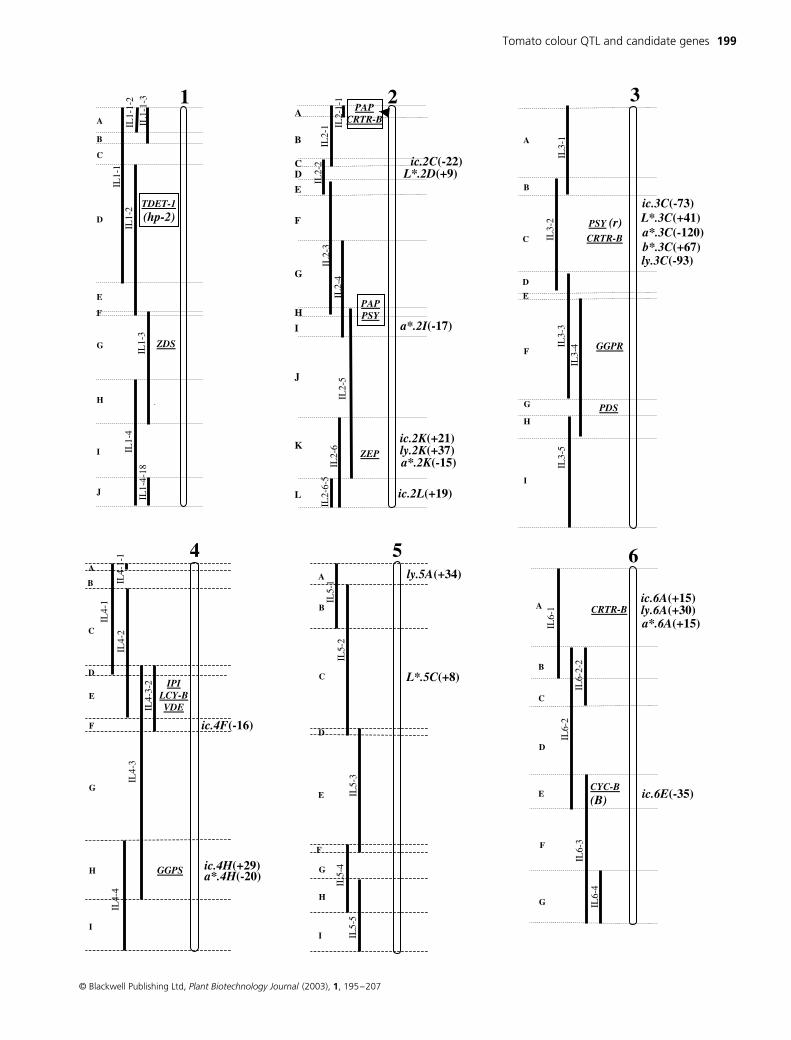
Figure 2 The L. pennellii IL bin map composed of 75 lines and 107 bins. The chromosomes are drawn as open bars and the L. pennellii introgressed segments appear as solid bars to the left of the chromosomes. The boundary markers of each introgressed segment and bins definition are detailed in the Solanaceae Genome Network <http://www.sgn.cornell.edu/>. All ILs are homozygous for the introgressed segment, except for part of IL8-1 (dashed line). The bins for each chromosome are designated by capital letters and indicate a unique area of IL overlap and singularity. The bin locations of the sequences associated with carotenoid biosynthesis (Table 3) are indicated (underlined) to the left of the chromosomes as well as cloned single-gene fruit colour mutations (in parenthesis). The bin location of the fruit colour QTL is indicated to the right of the chromosomes. QTL designations are: ic – internal colour, ly – lycopene, car – carotene, L* – lightness, a* – chromaticity and b* – chromaticity. QTL names include their chromosome bin position and the number in parentheses that follows the QTL indicates the percentage difference from the common control (M82) where a (+) designates a QTL that improves the colour phenotype.
Tomato colour QTL and candidate genes 199
© Blackwell Publishing Ltd, Plant Biotechnology Journal (2003), 1, 195–207

200 Yong-Sheng Liu et al.
© Blackwell Publishing Ltd, Plant Biotechnology Journal (2003), 1, 195–207
Figure 2 Continued.

Tomato colour QTL and candidate genes 201
© Blackwell Publishing Ltd, Plant Biotechnology Journal (2003), 1, 195–207
observation that IL2-2 had significantly lower ratings than the
control in both environments delimited the QTL to an approx-
imately 3 cM region overlapping between the two lines,
designated to bin-2C. A combined colour analysis in the two
environments showed a similar reduced rating for IL2-1 and
IL2-2, whose mean defined the phenotypic value of the QTL
ic-2C (22% lower than M82). The QTL ic-2K and ic-2L both
improved fruit colour relative to the control and were defined
by IL2-5, IL2-6 and IL2-6-5. IL2-6 had the largest effect in
improving fruit colour in both environments while IL2-5 and
IL2-6-5 only showed a significant increase in the dry treat-
ment. IL2-5 and IL2-6-5 have no overlapping introgression
and based on this result we assigned two QTL to the long arm
of chromosome 2. IL3-2, carrying the mutation yellow flesh
(r), defined a genomic region that dramatically reduced the
colour rating in the dry and wet fields. IL4-3-2 had signifi-
cantly lower colour under the two irrigation regimes and IL4-
4 showed the highest colour improvement in the population.
However, IL4-3, which partially overlaps the above two lines,
was neutral in its effect on colour. These results suggest that
at least two QTL reside on IL4-3, ic-4F with a negative effect
and ic-4H that improves colour. The next QTL mapped to the
short arm of chromosome 6 (ic-6A) where its effects were
only highly significant in the combined analysis. The reduc-
tion in the internal colour observed in IL6-2 and IL6-3 was due
to the gene Beta (B) that increases β-carotene in the fruit at
the expense of lycopene (Ronen et al., 2000). Four overlap-
ping lines defined the ic-7B that reduced colour, while ic-7F
was only effective in the wet environment. Three QTL were
defined to chromosome 8: ic-8C mapped to a small genetic
segment (2 cM) that can only be maintained in a hetero-
zygous condition in IL8-1. A resolution of the two linked QTL,
ic-8E and ic-8F, was based on a similar rationale as for the
linked loci on the long arm of chromosome 4. ic-9G had its
strongest effects in the wet environment, and on chromo-
some 10 two major QTL were defined; ic-10B improving
colour and ic-10E is the QTL with the largest reducing effect
on internal colour in the population. Ic-11B was mostly effec-
tive under dry conditions, while ic-12C (the mutation Delta;
Ronen et al. 1999) and ic-12H were detected under both
environments.
In summary, of the 19 genomic regions that affected fruit
colour, three were attributed to known single gene muta-
tions while the other 16 regions were defined as QTL that
affect the intensity of the red colour of the fruit. Of these QTL,
10 showed transgressive segregation where alleles from the
green-fruited species improved the intensity of the red colour
of the fruits (Figure 2). For six QTL we detected significant
effects on colour, both in the dry and wet treatments, while
nine additional QTL (ic-2C, ic-2K, ic-2L, ic-6A, ic-7B, ic-8E,
ic-8F, ic-9G, ic-11B) exhibited similar trends in the direction
of the QTL effect, although significance was only detected for
a single environment. One QTL, ic-7F, only seemed to affect
colour in one of the environments. For the colour parameters
measured in France, we identified five QTL that modified
lycopene content, two of which landed in the same bin as the
internal colour QTL. One QTL was mapped for β-carotene
content and located in a bin that modified internal fruit
colour. Six QTL were detected for L*, out of which four were
located to bins that affected internal colour. In accordance
with the negative relationship calculated for internal colour
and L* (Table 1), QTL that were found to improve the intensity
of the red colour were associated with reduced L* readings,
and vice versa. Ten QTL were mapped for a*, out of which seven
corresponded to loci that affected internal colour. Overall,
the internal colour scores of the ILs were consistent in the dry
and wet field environments and generally with the colour
measurements that were obtained in France. These results
provide a strong credibility to the subjective internal colour
scores and the QTL that modulate this phenotype.
Mapping the candidate carotenoid sequences
Genes associated with the carotenoid biosynthetic pathway
are obvious candidates for QTL that modify the intensity of
the red colour and lycopene content of the fruit. The carote-
noid biosynthesis pathway is presented in Figure 3 (reviewed
by Hirschberg, 2001) and the genes that encode the carote-
noid associated enzymes that were used as RFLP probes
are summarized in Table 3. Plant carotenoids are 40-carbon
isoprenoids that are built from the 5-carbon compound
isopentenyl diphosphate (IPP). IPP is produced in the ‘DOXP
pathway’ from pyruvate and glyceraldehyde-3-phosphate.
In plants, carotenoids are synthesized within the plastids by
enzymes that are nuclear encoded. The first part of the
isoprenoid pathway up to GGPP serves the biosynthesis of
numerous essential compounds. Three different enzymes
utilize DMAPP and IPP to produce geranyl diphosphate (GPP),
farnesyl diphosphate (FPP) and geranylgeranyl diphosphate
(GGPP), which is the substrate for carotenoids. Two phytoene
synthase enzymes, which carry out the first committed step
in carotenoid biosynthesis, exist in tomato, PSY2 is expressed
in green tissues and PSY1 is highly expressed exclusively in
flowers and fruits. The 40 carbon phytoene undergoes dehy-
drogenation by two enzymes, PDS and ZDS, to give lycopene,
which is the red carotenoid that accumulates in fruits. These
reactions involve an electron transfer that requires the plastid
terminal oxydase (PTOX). β-carotene and δ-carotene are

202 Yong-Sheng Liu et al.
© Blackwell Publishing Ltd, Plant Biotechnology Journal (2003), 1, 195–207
formed by cyclization reactions at the ends of the lycopene
molecules and the hydroxylation and epoxidation that follow
produce the various xanthophylls (Figure 3).
In an attempt to resolve as many loci as possible, we used
low stringency hybridization conditions as well as ortholo-
gous probes from Arabidopsis and pepper. For GGPS, ZDS,
ZEP and CCS (which is the orthologue of CYC-B) the probes
originating from pepper and Arabidopsis generated identical
results to the tomato clones. In addition to the carotenoid
biosynthesis pathway genes, four additional candidates were
mapped that may be associated with colour development:
(1) Farnesyl diphosphate synthase (FPS) operates early in the
isoprenoid pathway by catalysing the sequential condensation
of two molecules of IPP with one molecule of DMAPP to pro-
duce C15 farnesyl diphosphate. (2) Geranylgeranyl diphosphate
reductase (GGPR) converts GGPP to phytyl diphosphate in the
tocopherols biosynthesis pathway and may affect carotenoid
biosynthesis through competition with PSY for GGPP. (3) Plastid
Figure 3 The carotenoid biosynthesis pathway in tomato. Abbreviations of intermediates and enzymes: CCS, capsanthin-capsorubin synthase; CRTISO, carotenoid isomerase; CRTR-B, β-ring hydroxylase, CRTR-E, ε-ring hydroxylase; CYC-B, chromoplast-specific lycopene βcyclase; DMAPP, dimethylallyl diphosphate; FPP, farnesyl diphosphate; FPS, farnesyl diphosphate synthase; GA3P, Glyceraldehyde-3-phosphate; GPP, geranyl diphosphate; GGPP, geranylgeranyl diphosphate; GGPR, geranylgeranyl diphosphate reductase; GGPS, GGPP synthase; GPS, geranyl diphosphate synthase; IPI, IPP isomerase; IPP, isopentenyl diphosphate; LCY-B, lycopene β-cyclase; LCY-E, lycopene ε-cyclase; NXS, neoxanthin synthase; PDS, phytoene desaturase; PPP, phytyl diphosphate; PQ, plastoquinone; PSY, phytoene synthase; PTOX, plastid terminal oxydase; VDE, violaxanthin de-epoxidase; VNCED, 9-cis-epoxycarotenoid dioxygenase; ZDS, ζ-carotene desaturase; ZEP, zeaxanthin epoxidase. Mutations in tomato that alter carotenoid biosynthesis are indicated in parentheses: B, Beta; Del, Delta; og, old-gold; gh, ghost; r, yellow-flesh; t, tangerine; Y, yellow-fruit (in pepper).
Table 3 Mapped carotenoid associated cDNAs, their accession numbers and bin-map positions
Probed
gene Encoded enzyme
Accession
number
Bin location
and size (cM) Reference
CRTISO Carotenoid isomerase AF416727 10E (19) Issacson et al. (2002)
CRTR-B β-carotene hydroxylase Y14810 2A (2), 3C (28), 6A (22) Ronen et al. (in prep.)
CYC-B Lycopene β-cyclase, B (in chromoplasts) AF254793 6E (8) Ronen et al. (2000)
FPS Farnesyl diphosphate synthase AI485064 10A (12) Gaffe et al. (2000)
GGPR Geranylgeranyl diphosphate reductase AI484190 3F (32) van der Hoeven et al. (2002)
GGPS Geranylgeranyl diphosphate synthase BE432698 4H (20) van der Hoeven et al. (2002)
IPI Isopentenyl diphosphate isomerase AI488740 4E (15), 11D (15) van der Hoeven et al. (2002)
LCY-B Lycopene β-cyclase X86452 4E (15), 10E (19) Pecker et al. (1996)
LCY-E Lycopene ε-cyclase Y14387 12C (9) Ronen et al. (1999)
PAP Plastid-lipid-associated protein Y15490 2A (2), 2H (2) Pozueta-Romero et al. (1997)
PDS Phytoene desaturase X59948 3G (3) Pecker et al. (1992)
PSY Phytoene synthase Y00521 3C (28), 2H (2) Ray et al. (1992)
tDET-1 Phytochrome signalling pathway AJ222798 1D (48) Mustilli et al. (1999)
VDE Violaxanthin de-epoxidase AI483033 4E (15) van der Hoeven et al. (2002)
VNCED Xanthophyll cleavage enzyme Z97215 7F (19) Burbidge et al. (1999)
ZDS ζ-carotene desaturase AF195507 1G (24) Bramley, unpublished
ZEP Zeaxanthin epoxidase Z83835 2K (21) Burbidge et al. (1997)

Tomato colour QTL and candidate genes 203
© Blackwell Publishing Ltd, Plant Biotechnology Journal (2003), 1, 195–207
lipid-associated protein (PAP) is involved in carotenoid packaging
in the chromoplast and may play a role in colour development
in the fruit. (4) Tomato de-etiolated-1 (tDET1) functions in the
phytochrome signal transduction pathway and is responsible
for the high lycopene accumulating mutant high-pigment-2
(Mustilli et al., 1999).
Co-segregation of internal colour QTL and candidate
genes
To evaluate whole genome associations of QTL that modify
the intensity of the red colour and candidate genes we tested
the co-occurrence of the two groups in map intervals defined
by the 107 mapping bins (average size 12 cM). Qualitative
variation for internal fruit colour is evident from the frequency
distribution (Figure 1), where bins 3C, 6E and 12C carried
carotenoid biosynthesis genes that modified the carotenoid
composition of the fruit. These bins and the candidate loci
that map to them were excluded from the analysis since they
represent non-red phenotypes, while our focus has been
those QTL that modify the intensity of the red colour of
the fruit. The bin position of 16 QTL cover a total length of
208 cM, while the whole genome covers 104 bins that span
1155 cM of the 1200 cM of the tomato genetic map (r, B and
Del were excluded; Table 2; Figure 2). Nineteen candidate
carotenoid-associated loci were mapped to 14 independent
bins, of which five contained QTL for the intensity of the
red colour of the fruit (2K, 4H, 6A, 7F and 10E). Assuming
that the candidate genes are randomly distributed along the
tomato genome we would expect to find 0.016 candidates
per cM (19/1155) and for the 208 cM, to which the QTL were
mapped, the expectation is 3.4 candidates (208 × 0.016).
This number is very close to the observed value of five
co-segregating QTL and candidate genes (χ2 = 0.43, 1 d.f., P = 0.5)
indicating that the potential of the candidate genes to explain
the QTL variation is no more than would be expected by
chance alone.
Discussion
Fruit colour mutations in tomato
Ripe tomato fruits of the M82 variety are composed of
approximately 75% lycopene and the rest is mainly β-carotene
and phytoene (Fraser et al., 1994; Isaacson et al., 2002).
The recessive allele yellow flesh (r; bin 3C ) results from a loss-
of-function mutation in the phytoene synthase gene (PSY-1),
which catalyses the first committed step in carotenoid synthe-
sis, and as a result the fruits do not accumulate lycopene (Fray
and Grierson, 1993). The orange colour of the partially dom-
inant alleles of Del (high δ-carotene; bin 12C ) and B (high β-
carotene; bin 6E ) result from higher expression during fruit
ripening of the wild species alleles for lycopene ε-cyclase
(LCY-E) and lycopene β-cyclase (LCY-B) (Ronen et al., 1999,
2000). The distinctness of r, B and Del is evident from the
frequency distribution plots (Figure 1) where the appropriate
lines are located outside the normal distributions. The amino
acid sequence of the lycopene β-cyclase encoded by B (CYC-
B) is similar to the capsanthin-capsorubin synthase (CCS) in
pepper, which produces the red xanthophylls in the wild-type
fruits (Hugueney et al., 1995; Thorup et al., 2000). A reces-
sive mutation (y) in the CCS of pepper is responsible for the
yellow fruit phenotype (Lefebvre et al., 1998). These results
from tomato and pepper are consistent with the observation
that CCS, when expressed in E. coli, exhibits some activity of
lycopene β-cyclase (Hugueney et al., 1995). Cloning of the
tomato mutation tangerine, which accumulates the orange
pigment poly-cis lycopene (prolycopene), revealed a caroten-
oid isomerase essential for the production of β-carotene and
xanthophylls (Isaacson et al., 2002). The strong interaction of
carotenoid biosynthesis genes with fruit colour variation in the
tomato is further indicated by the transgenic over-expression
of enzymes in the pathway (Dharmapuri et al., 2002; Fraser
et al., 2002; Ronen et al., 2000; Rosati et al., 2000). The above
results support the strong candidate position of carotenoid
genes for qualitative variation in fruit colour phenotypes.
It is important to note that other genes, not directly
involved in the carotenoid pathway, can dramatically modify
the carotenoid content of the tomato fruit. Tomato de-
etiolated 1 (tDET-1; bin 1D) is the tomato homologue of Det1
from Arabidopsis, a gene that functions in the phytochrome
signal transduction pathway which regulates various
developmental processes, including those affecting plastids
(Mustilli et al., 1999). A mutation in tDet-1 is responsible for
the phenotype of high lycopene accumulation in the fruits of
high-pigment-2 (hp-2), probably due to an increase in the
number of plastids and their capacity to synthesize and store
carotenoids. Furthermore, fruit-localized phytochromes regulate
light-induced lycopene accumulation independently of
ethylene biosynthesis (Alba et al., 2000). Fruit ripening pro-
cesses can influence carotenoid content, as exemplified by the
ripening-inhibitor (rin) mutation in a MADS-box transcription
factor that regulates fruit maturation (Vrebalov et al., 2002).
Plants homozygous for the recessive mutation rin develop
very little of the red pigment lycopene. Other ripening related
mutations and transgenic plants were also shown to affect
colour development (Reviewed by Giovannoni, 2001). This
short list of genes that affect fruit colour in tomato establish

204 Yong-Sheng Liu et al.
© Blackwell Publishing Ltd, Plant Biotechnology Journal (2003), 1, 195–207
the links of the carotenoid pathway to a network of develop-
mental processes in the fruit.
Transgressive segregation of fruit colour QTL
Wild germplasm provides a rich resource for both qualitative
and quantitative variation in many important plant traits.
Marker and phenotypic analyses of segregating populations
involving crosses of the cultivated tomato with its wild
relatives revealed numerous QTL that modify fruit colour.
The small red-fruited species L. pimpinellifolium is rich in
lycopene, with values five-fold higher than in the cultivated
tomato. Eight QTL that modify lycopene content in the fruit,
including a major QTL accounting for 12% of the total phe-
notypic variation, were identified in a segregating population
involving L. pimpinellifolium (Chen et al., 1999). Advanced
backcross analysis involving a different accession of L.
pimpinellifolium identified five QTL that modify fruit colour
intensity (Tanksley et al., 1996). Of the 13 QTL identified in
the red-fruited species crosses, 10 had a significant effect on
improving colour. In a population derived from a cross with
a L. esculentum var. cerasiforme, Saliba-Colombani et al.
(2001) mapped three QTL for L*, a* and b* colour parame-
ters, two QTL for lycopene and three for carotene content.
The cherry tomato alleles improved the traits in all the cases.
Advanced backcross populations involving crosses with three
green-fruited species were scored for different fruit colour
parameters. In an L. hirsutum population (Bernacchi et al.,
1998), 15 QTL were identified, of which eight were associ-
ated with improved colour. In an L. peruvianum cross, 15 fruit
colour QTL were detected, three of which improved fruit
colour (Fulton et al., 1997). An L. parviflorum cross was analysed
for a range of fruit colour phenotypes and of the 42 QTL
identified, 18 improved the red pigmentation of the fruit
(Fulton et al., 2000). In summary, in the three crosses involving
tomato species that do not develop red fruits, QTL originated
in the wild parent were associated with improved colour.
These studies and the results presented in this paper highlight
the transgressive variation in wild germplasm and its potential
for tomato breeding and in basic research of fruit colour
development. The tomato IL ‘exotic library’ should encourage the
construction of similar populations for other crop plants as a
source of naturally selected phenotypic variations (Zamir, 2001).
Candidate genes and pleiotropic effects on fruit
colour QTL
In this study we employed IL bin-mapping to explore the rela-
tionship between genes involved in carotenoid biosynthesis
and QTL that regulate fruit colour. Based on the mapping
intervals, 19 genomic regions that affect the intensity of the
red colour of the fruit and 23 carotenoid-associated loci were
identified. After eliminating the three qualitative colour
mutants and their corresponding bins and candidates from
the analysis, we assayed for independence of segregation of
the 16 QTL that were within the range of the continuous
distribution presented for internal colour (Figure 1). The QTL
and candidates were largely independent, since the simultaneous
occurrence of the two in the same genetic interval does not
occur more often than is expected by chance. Furthermore,
11 QTL were located in bins with no mapped carotenoid-
related sequences. However in five intervals there was an
overlap for genomic segments that carry hundreds of genes
(Van der Hoeven et al., 2002) many of which may affect fruit
colour, either directly or indirectly. The QTL ic-4H is conserved
in nearly isogenic lines (NILs) derived from a number of
tomato wild species crosses (Monforte et al., 2001). The
chromosome 4 segment was associated with a range of
agronomic traits including yield, total soluble solids content
(Brix), fruit weight and epidermis reticulation (Eshed and Zamir,
1995). Fine mapping of the QTL using L. hirsutum NILs
delimited the internal colour effect to 2–3 cM interval (additive
effect a = 30%; Monforte et al., 2001). Substitution mapping
assisted in resolving the issue of linkage vs. pleiotropy by
separating the QTL in the region to single independent locus.
Ic-4H could represent a regulatory gene of the carotenoid
pathway or a potential variant in geranylgeranyl diphosphate
synthase (GGPS; bin 4H). This enzyme is a member of a closely
related family of prenyl transferases. It catalyses the sequen-
tial condensation of three molecules of IPP with one molecule
of DMADP to produce the C20 molecule geranylgeranyl
diphosphate (GGPP), which is the backbone of the caroten-
oid molecule. The 20% colour improvement associated with
ic-2K could result from a pleiotropic effect exerted by the fruit
weight allele of L. pennellii (fw2.2) that reduced fruit weight
in 20% (Frary et al., 2000). The strong negative correlation
observed between fruit weight and lycopene content (r =
−0.46, P < 0.01, data not shown; Chen et al., 1999; Saliba-
Colombani et al., 2001) suggests that the colour variation
could be partly due to the pleiotropic effects of fruit weight
QTL. Smaller fruits may produce the same amount of lyco-
pene as normal fruits, and as a result increase the parameter
of lycopene/fresh fruit weight (reflected by ly.2K; Figure 2).
The other candidate for ic-2k is ZEP, however, this enzyme
operates a few steps after lycopene production and is not
likely to control the amount of lycopene in fruits.
The candidate gene approach has been efficient for the
identification of sequences that regulate major fruit colour

Tomato colour QTL and candidate genes 205
© Blackwell Publishing Ltd, Plant Biotechnology Journal (2003), 1, 195–207
loci, but not for the quantitative variation of red colour and
the regulation of pigment accumulation. This paper presents
a genetic framework for further elucidation of fruit colour
development through physiological studies, map based
cloning and validation by genetic transformation. The results
of this and other studies (Byrne et al., 1996; Kliebenstein et al.,
2001; Pflieger et al., 2001) are consistent with the concept
that network relationships are an appropriate perspective
to approach the complex reality of QTL biology.
Experimental procedures
Plant material
The IL population is composed of 75 lines, each containing a
single introgression from L. pennellii (LA 716) in the genetic
background of the processing tomato variety M82 (Pan et al.,
2000; http://www.sgn.cornell.edu/ ). For colour analysis the
lines were planted in the field in Akko, Israel (2000), in a com-
pletely randomised design under two irrigation treatments.
Seven plants of each homozygous IL and 100 plants of M82
were transplanted under each irrigation treatment. IL8-1 is
the only line that could not be maintained in a homozygous
condition, and therefore plants heterozygous for the intro-
gression IL8-1 were selected using the RFLP marker TG16.
Seedlings (35 days old) were transplanted in the field with
50 cm between plants and 2 m between rows (1 m2 per plant).
All the plants were sprinkler-irrigated at the transplanting
day with 30 m3 of water for 1000 m2 of field area. For the
rest of the growing period, the wet treatment was drip-
irrigated with 250 m3 of water for 1000 m2, while no
water was applied to the dry treatment.
The IL population was planted in Sonito, Avignon (France)
during summer 2000, in a three-block trial under irrigated
conditions. Each block contained the 70 lines (6 plants per
plot) and four plots of M82 as a control (lines IL1-1-3, IL3-3,
IL6-2, IL6-2-2 and IL6-3 were not planted). Fully ripe fruits
were harvested and a total of 21 fruits per plot were used for
the colour analyses.
Colour phenotyping
In the Israeli trial, at the time of harvest, 10 ripe fruits from
each replicated genotype were randomly sampled. Five fruits
were sliced open transversely and another five longitudinally.
Internal fruit colour was visually evaluated using a scale of
one to five (1 = yellow, 2 = orange, 3 = light red, 4 = red, 5
= dark red). Higher scores indicate a more intense red colour.
In the French trial, external colour was measured by a
Minolta chromameter which resulted in three parameters:
lightness (L*), and the chromaticity coordinates a*, a green-
to-red scale, and b*, a blue to yellow scale (Arias et al.,
2000; Saliba-Colombani et al., 2001). The fruits were then cut,
frozen and powdered in liquid nitrogen, and lycopene and
carotene were extracted in acetone and petroleum benzene.
The amounts were then evaluated spectrophotometrically
according to Lime et al. (1957).
cDNA clones used for mapping
The tomato cDNA clones and their accession numbers are
listed in Table 3. For genes identified based on homology in
the tomato EST database <http://www.sgn.cornell.edu/> and
for which we did not have the corresponding cDNAs, we
designed primers for amplification of cDNA fragments by RT-
PCR (Ronen et al., 1999).
The primer sequences were: for FPS: CAAAAGGT-
TGGGATGATTGC (f) and CTCTGGGTCAGCAAAGCAG (r),
amplifying a 393 bp fragment; for GGPR: GGCCAACATA-
CAAGGTGCTT (f) and CATGAAATTCGATAAAAGGCATA
(r), amplifying a 326 bp fragment; for IPI: CTGGTGGATGA-
GAATGACCA (forward) and CCTCAGCAACTTCATCTGGA
(reverse), amplifying a 448 bp fragment; for PAP: CGAA-
GAACCCTAATCCAGCA (f ) and GTACCTGCAGTGTTCCAGCA
(r), amplifying a 604 bp fragment; for tDET-1: CCATTCA-
TTTCGCAAGTTCA (f ) and TTGTGGAAAACCCTTTCGTC
(r), amplifying 399 bp fragment; for VDE: AATTGAATAA-
TGGCGCTTGC (f) and TCAGCCTTTGAAGCAACTGA (r),
amplifying a 407 bp fragment; for VNCED: TCAATGCC-
ATCATCAAAGGA (f ) and TTGGGTATTTTTCCGGTGAC (r),
amplifying a 403 bp fragment; for ZEP: TTATTCGGACCCAG-
TGAAGC (f) and CATCAGAGGCATTCCCAAGT (r), amplifying
a 703 bp fragment.
Restriction fragment length polymorphism (RFLP)
analysis
The IL map was connected to the high-resolution F2 map
composed of 1500 markers (Tanksley et al., 1992) by probing
all of the specific chromosome lines with the RFLP markers
from the framework F2 map. A total of 614 markers were
probed, and the ends of the introgressions were mapped
with the resolution of the F2 map. The entire IL population
was probed with carotenoid genes and PCR products
(Table 3). Genomic DNA extraction, digestion and hybridiza-
tion were as previously described (Eshed and Zamir, 1995).
Low and high-stringency analysis was performed for all probes
according to the methods of Zamir and Tanksley (1988).

206 Yong-Sheng Liu et al.
© Blackwell Publishing Ltd, Plant Biotechnology Journal (2003), 1, 195–207
Statistical analyses and QTL mapping
Statistical analyses were performed using the JMP V.4
software package for Macintosh (SAS Institute, 2000). Mean
values for the parameters measured for the tested genotypes
were compared to the common control (M82) using the ‘Fit
Y by X’ function and ‘Compare with control’ with an α-level
of 0.05 (Dunnet). All calculations were performed with
the phenotypic values, while the results are presented as a
percentage difference from M82. The basic pre-requisite for
mapping a QTL to a specific bin was that all the ILs that
included this bin had a significant effect on the phenotype in
the same direction relative to the control.
Acknowledgements
Many thanks to R. Matthieu and M. Lensel for their technical
support, and to SONITO for the field trial in France. This work
was supported in part by The French–Israeli Association for
Scientific and Technological Research (AFIRST).
References
Alba, R., Cordonnier-Pratt, M.M. and Pratt, L.H. (2000) Fruit-localizedphytochromes regulate lycopene accumulation independently ofethylene production in tomato. Plant Physiol. 123, 363–370.
Arias, R., Tung-Ching, L., Logendra, L. and Janes, H. (2000) Corre-lation of lycopene measured by HPLC with the L*, a*, b* colourreadings of a hydroponic tomato and the relationship of maturitywith colour and lycopene content. J. Agric. Food Chem. 48,1697–1702.
Bernacchi, D., Beck-Bunn, T., Eshed, Y., Lopez, J., Petiard, V., Uhlig, J.,Zamir, D. and Tanksley, S. (1998) Advanced backcross QTLanalysis in tomato. I. Identification of QTL for traits of agronomicimportance from Lycopersicon hirsutum. Theor. Appl. Genet. 97,381–397.
Burbidge, A., Grieve, T.M., Jackson, A., Thompson, A., McCarty, D.R.and Taylor, I.B. (1999) Characterization of the ABA-deficienttomato mutant notabilis and its relationship with maize Vp14.Plant J. 17, 427–431.
Burbidge, A., Grieve, T., Terry, C., Corlett, J., Thompson, A. andTaylor, I. (1997) Structure and expression of a cDNA encodingzeaxanthin epoxidase, isolated from a wilt-related tomato (Lyco-persicon esculentum Mill.) library. J. Exp. Bot. 48, 1749–1750.
Byrne, P.F., McMullen, M.D., Snook, M.E., Musket, T.A., Theuri, J.M.,Widstrom, N.W., Wiseman, B.R. and Coe, E.H. (1996) Quantita-tive trait loci and metabolic pathways: genetic control of theconcentration of maysin, a corn earworm resistance factor, inmaize silks. Proc. Natl Acad. Sci. USA, 93, 8820–8825.
Chen, F.Q., Foolad, M.R., Hyman, J., St. Clair, D.A. and Beelaman, R.B.(1999) Mapping of QTLs for lycopene and other fruit traits ina Lycopersicon esculentum × L. pimpinellifolium cross andcomparison of QTLs across tomato species. Mol. Breed, 5, 283–299.
Dharmapuri, S., Rosati, C., Pallara, P., Aquilani, R., Bouvier, F.,Camara, B. and Giuliano, G. (2002) Metabolic engineering ofxanthophyll content in tomato fruits. FEBS Lett. 519, 30–34.
Eshed, Y. and Zamir, D. (1994) Introgressions from Lycopersiconpennellii can improve the soluble-solids yield of tomato hybrids.Theor. Appl. Genet. 88, 891–897.
Eshed, Y. and Zamir, D. (1995) An introgression line populationof Lycopersicon pennellii in the cultivated tomato enables theidentification and fine mapping of yield-associated QTL. Genetics,141, 1147–1162.
Frary, A., Nesbitt, T.C., Grandillo, S., van der Knaap, E., Cong, B.,Liu, J., Meller, J., Elber, R., Alpert, K. and Tanksley, S.D. (2000)Cloning and transgenic expression of fw2.2: a quantitativetrait locus key to the evolution of tomato fruit. Science, 289,85–87.
Fraser, P.D., Romer, S., Shipton, C.A., Mills, P.B., Kiano, J.W.,Misawa, N., Drake, R.G., Schuch, W. and Bramley, P.M. (2002)Evaluation of transgenic tomato plants expressing an additionalphytoene synthase in a fruit-specific manner. Proc. Natl Acad. Sci.USA, 99, 1092–1097.
Fraser, P.D., Truesdale, M.R., Bird, C.R., Schuch, W. and Bramley, P.M.(1994) Carotenoid biosynthesis during tomato fruit development.Plant Physiol. 105, 405–413.
Fray, R.G. and Grierson, D. (1993) Identification and genetic-analysisof normal and mutant phytoene synthase genes of tomato bysequencing, complementation and co-suppression. Plant Mol.Biol. 22, 589–602.
Fridman, E., Pleban, T. and Zamir, D. (2000) A recombinationhotspot delimits a wild species QTL for tomato sugar content to484-bp within an invertase gene. Proc. Natl Acad. Sci. USA, 97,4718–4723.
Fulton, T.M., Beck-Bunn, T., Emmatty, D., Eshed, Y., Lopez, J.,Uhlig, J., Zamir, D. and Tanksley, S.D. (1997) QTL analysis of anadvanced backcross of Lycopersicon peruvianum to the cultivatedtomato and comparison of QTLs found in other wild species.Theor. Appl. Genet. 95, 881–894.
Fulton, T.M., Grandillo, S., Beck-Bunn, T., Fridman, E., Frampton, A.,Lopez, J., Petiard, V., Uhlig, J., Zamir, D. and Tanksley, S.D. (2000)Advanced backcross analysis of Lycopersicon esculentum × L.parviflorum cross. Theor. Appl. Genet. 100, 1025–1042.
Gaffe, J., Bru, J.P., Causse, M., Vidal, A., Stamitti-Bert, L., Carde, J.P.and Gallusci., P. (2000) LeFPS1, a tomato farnesyl pyrophos-phatase gene highly expressed during early fruit development.Plant Physiol. 123, 1351–1362.
Giovannoni, J. (2001) Molecular biology of fruit maturation andripening. Annu. Rev. Plant. Physiol. Plant. Mol. Biol. 52, 725–749.
Hirschberg, J. (2001) Carotenoid biosynthesis in flowering plants.Curr. Opin. Plant Biol. 4, 210–218.
Hugueney, P., Badillo, A., Chen, H.C., Klein, A., Hirschberg, J.,Camara, B. and Kuntz, M. (1995) Metabolism of cyclic caroten-oids – a model for the alteration of this biosynthetic-pathway inCapsicum-annuum chromoplasts. Plant J. 8, 417–424.
Isaacson, T., Ronen, G., Zamir, D. and Hirschberg, J. (2002) Cloningof tangerine from tomato reveals a carotenoid isomerase essentialfor production of carotene and xanthophylls in plants. Plant Cell,14, 333–342.
Kliebenstein, D.J., Gershenzon, J. and Mitchell-Olds, T. (2001) Com-parative quantitative trait loci mapping of aliphatic, indolic andbenzylic glucosinolate production in Arabidopsis thaliana leavesand seeds. Genetics, 159, 359–370.

Tomato colour QTL and candidate genes 207
© Blackwell Publishing Ltd, Plant Biotechnology Journal (2003), 1, 195–207
Lefebvre, V., Kuntz, M., Camara, B. and Palloix, A. (1998) Thecapsanthin-capsorubin synthase gene: a candidate gene for the ylocus controlling the red fruit colour in pepper. Plant Mol. Biol. 36,785–789.
Lime, B.J., Griffiths, F.P., O’Connor, R.T., Heinzelman, D.C. andMcCall, E.R. (1957) Spectrophotometric methods for determiningpigmentation – Beta-carotene and lycopene. Ruby red grapefruit.J. Agri. Food Chem. 5, 941–944.
Monforte, A.J., Friedman, E., Zamir, D. and Tanksley, S.D. (2001)Comparison of a set of allelic QTL-NILs for chromosome 4 oftomato: Deductions about natural variation and implications forgermplasm utilization. Theor. Appl. Genet. 102, 572–590.
Monforte, A.J. and Tanksley, S.D. (2000) Development of a set ofnear isogenic and backcross recombinant inbred lines containingmost of the Lycopersicon hirsutum genome in a L. esculentumgenetic background: a tool for gene mapping and gene discovery.Genome, 43, 803–813.
Mustilli, A.C., Fenzi, F., Ciliento, R., Alfano, F. and Bowler, C. (1999)Phenotype of the tomato high pigment-2 mutant is caused by amutation in the tomato homolog of DEETIOLATED1. Plant Cell,11, 145–157.
Pan, Q., Liu, Y.S., Budai-Hadrian, O., Sela, M., Carmel-Goren, L.,Zamir, D. and Fluhr, R. (2000) Comparative genetics of NBS-LRRresistance gene homologues in the genomes of two dicotyledons:tomato and Arabidopsis. Genetics, 155, 309–322.
Pecker, I., Chamovitz, D., Linden, H., Sandmann, G. and Hirschberg, J.(1992) A single polypeptide catalyzing the conversion of phy-toene to zeta-carotene is transcriptionally regulated duringtomato fruit ripening. Proc. Natl Acad. Sci. USA, 89, 4962–4966.
Pecker, I., Gabbay, R., Cunningham, F.X. and Hirschberg, J. (1996)Cloning and characterization of the cDNA for lycopene beta-cyclase from tomato reveals decrease in its expression during fruitripening. Plant Mol. Biol. 30, 807–819.
Pflieger, S., Lefebvre, V. and Causse, M. (2001) The candidate geneapproach in plant genetics: a review. Mol. Breed, 7, 275–291.
Pozueta-Romero, J., Rafia, F., Houlne, G., Cheniclet, C., Carde, J.P.,Schantz, M.L. and Schantz, R. (1997) A ubiquitous plant house-keeping gene, PAP, encodes a major protein component of bellpepper chromoplasts. Plant Physiol. 115, 1185–1194.
Ray, J., Moureau, P., Bird, C., Bird, A., Grierson, D., Maunders, M.,Truesdale, M., Bramley, P. and Schuch, W. (1992) Cloning andcharacterization of a gene involved in phytoene synthesis fromtomato. Plant Mol. Biol. 19, 401–404.
Ronen, G., Carmel-Goren, L., Zamir, D. and Hirschberg, J. (2000) Analternative pathway to β-carotene formation in plant chromo-plasts discovered by map-based cloning of Beta (B) and old-gold
(og) colour mutations in tomato. Proc. Natl Acad. Sci. USA, 97,11102–11107.
Ronen, G., Cohen, M., Zamir, D. and Hirschberg, J. (1999) Regula-tion of carotenoid biosynthesis during tomato fruit development:Expression of the gene for lycopene epsilon- cyclase is down-reg-ulated during ripening and is elevated in the mutant Delta. PlantJ. 17, 341–351.
Rosati, C., Aquilani, R., Dharmapuri, S., Pallara, P., Marusic, C.,Tavazza, R., Bouvier, F., Camara, B. and Giuliano, G. (2000) Met-abolic engineering of beta-carotene and lycopene content intomato fruit. Plant J. 24, 413–420.
Saliba-Colombani, V., Causse, M., Langlois, D., Philouze, J. andBuret, M. (2001) Genetic analysis of organoleptic quality in freshmarket tomato. 1. Mapping QTLs for physical and chemical traits.Theor. Appl. Genet. 102, 259–272.
SAS Institute (2000) JMP Statistics and Graphics Guide: version 4.Cary, NC: SAS Institute, Inc.
Tanksley, S.D., Ganal, M.W., Prince, J.P., Devicente, M.C.,Bonierbale, M.W., Broun, P., Fulton, T.M., Giovannoni, J.J.,Grandillo, S., Martin, G.B., Messeguer, R., Miller, J.C., Miller, L.,Paterson, A.H., Pineda, O., Roder, M.S., Wing, R.A., Wu, W. andYoung, N.D. (1992) High-density molecular linkage maps of thetomato and potato genomes. Genetics, 132, 1141–1160.
Tanksley, S.D., Grandillo, S., Fulton, T.M., Zamir, D., Eshed, Y.,Petiard, V., Lopez, J. and BeckBunn, T. (1996) Advanced back-cross QTL analysis in a cross between an elite processing line oftomato and its wild relative L. pimpinellifolium. Theor. Appl.Genet. 92, 213–224.
Thorup, T.A., Tanyolac, B., Livingstone, K.D., Popovsky, S., Paran, I.and Jahn, M. (2000) Candidate gene analysis of organ pigmenta-tion loci in the Solanaceae. Proc. Natl Acad. Sci. USA, 97,11192–11197.
Van der Hoeven, R., Ronning, C., Giovannoni, J., Martin, G. andTanksley, S. (2002) Deductions about the number, organization,and evolution of genes in the tomato genome based on analysisof a large expressed sequence tag collection and selectivegenomic sequencing. Plant Cell, 14, 1441–1456.
Vrebalov, J., Ruezinsky, D., Padmanabhan, V., White, R., Medrano, D.,Drake, R., Schuch, W. and Giovannoni, J. (2002) A MADS-boxgene necessary for fruit ripening at the tomato ripening-inhibitor(rin) locus. Science, 12, 343–346.
Zamir, D. (2001) Improving plant breeding with exotic geneticlibraries. Nature Rev. Genet, 2, 983–989.
Zamir, D. and Tanksley, S.D. (1988) Tomato genome is comprisedlargely of fast evolving, low copy number sequences. Mol. Gen.Genet. 213, 254–261.