Embed Size (px)
Citation preview

Thermal and Hydraulic Aspects
of
Falling Film Evaporation
A thesis presented for the degree of
Doctor of Philosophy
in
Chemical and Process Engineering
at the
University of Canterbury
Christchurch, New Zealand
by
A. R. Mackereth
1995
VOLUME 2: APPENDICES A - S

ENGINEERING
TABLE OF CONTENTS
VOLUME 1 (abbreviated, full details at front of Volume 1)
SYMBOLS
PART I: 1. 2 3
PART II: 4. 5 6 7 8
INTRODUCTION EVAPORATION EVAPORATION OF MILK THIS WORK
APPARATUS & MATERIALS THE NZDRI RESEARCH EVAPORATOR INSTRUMENTATION PROCESS CONTROL AND DATA LOGGING NON CONDENSABLE GAS MEASUREMENT APPARATUS MATERIALS
PART III: HEAT TRANSFER 9 CONDENSATION THEORY 10 BOILING-SIDE THEORY 11 OVERALL HEAT TRANSFER THEORY 12 DATA ANALYSIS 13-22 WATER EXPERIMENTS 23-27 SUCROSE EXPERIMENTS 28-32 SKIM MILK EXPERIMENTS
PART IV: HEAT TRANSFER IN THE PRESENCE OF NON-CONDENSABLE GASES 33 CONDENSATION IN THE PRESENCE OF NON-CONDENSABLE
GASES 34 MODEL OF STEAM CONDENSATION IN THE PRESENCE OF
NON-CONDENSABLE GASES 35 NON-CONDENSABLE GAS EXPERIMENTAL DESIGN AND
PROCEDURE 36 NON-CONDENSABLE GAS EXPERIMENTAL RESULTS 37 NON-CONDENSABLE GAS DISCUSSION
PARTY: 38 39 40
OVERVIEW GENERAL DISCUSSION CONCLUSIONS RECOMMENDATIONS FOR FURTHER WORK
REFERENCES
1

11
VOLUME2
PART VI: APPENDICES APPENDIX A: INSIDE THE STAINLESS STEEL - AN INSIGHT INTO
EVAPORATION HEAT TRANSFER
APPENDIX B: CALIBRATION PROCEDURES BO Nomenclature . . . . . . . . . . . . . . . . . . . . . . . . . . . . . . . . B1 B1 Calibration of Temperature Probes . . . . . . . . . . . . . . . . . . . B2 B2 Calibration of Pressure Sensors . . . . . . . . . . . . . . . : . . . . . B2 B3 Calibration of Flow Rate Meters . . . . . . . . . . . . . . . . . . . . B4 B4 Calibration of Density Meters . . . . . . . . . . . . . . . . . . . . . . B 10 B5 Determination of Expected Accuracy of Calculated Overall Heat
Transfer Coefficients . . . . . . . . . . . . . . . . . . . . . . . . . . . B 14 B6 Calculating the Pressure Profile on the Steam Side of the Third
Evaporator . . . . . . . . . . . . . . . . . . . . . . . . . . . . . . . . . . B16
APPENDIX C: SC.~. .._'WATER QUALITY
APPENDIX D: RANGE OF OPERATING CONDITIONS IN COMMERCIAL MILK EVAPORATORS
APPENDIX E: DERIVATION OF W ASSNER' S FORM OF CONDENSATION NUSSELT EQUATIONS EO Nomenclature . . . . . . . . . . . . . . . . . . . . . . . . . . . . . . . . E1 E1 Derivation of Wassner Form of Nusselt Equation (Equation 9.6) . E1 E2 Derivation of W assner ~ ~rm of Zazuli' s Correction
(Equation 9. 7) . . . . . . . . . . . . . . . . . . . . . . . . . . . . . . . . E3 E3 Derivation of Wassner Form of Chun & Kim (1990) Correlation
(Equation 9. 8) . . . . . . . . . . . . . . . . . . . . . . . . . . . . . . . . E4 E4 References . . . . . . . . . . . . . . . . . . . . . . . . . . . . . . . . . . E5
APPENDIX F: WASSNER METHOD FOR CALCULATING OVERALL HEAT TRANSFER COEFFICIENTS
APPENDIX G: PHYSICAL PROPERTY CORRELATIONS G 1 Water Density . . . . . . . . . . . . . . . . . . . . . . . . . . . . . . . . G 1 G2 Water Thermal Conductivity . . . . . . . . . . . . . . . . . . . . . . . G2 G3 Water Specific Heat Capacity . . . . . . . . . . . . . . . . . . . . . . G3 G4 Water Dynamic Viscosity . . . . . . . . . . . . . . . . . . . . . . . . . G4 G5 Water Enthalpy . . . . . . . . . . . . . . . . . . . . . . . . . . . . . . . G5 G6 Saturated Steam Pressure . . . . . . . . . . . . . . . . . . . . . . . . . G6 G7 Steam Saturation Temperature . . . . . . . . . . . . . . . . . . . . . . G7 G8 Saturated Steam Density . . . . . . . . . . . . . . . . . . . . . . . . . G8 G9 Saturated Steam Dynamic Viscosity ................... G9 G 10 Steam Enthalpy . . . . . . . . . . . . . . . . . . . . . . . . . . . . . . . G 10 G 11 Latent Heat of Vaporization . . . . . . . . . . . . . . . . . . . . . . . G 11 G12 Sucrose Density at 20°C ......................... G12 G13 Sucrose Density ............................... G13 G14 Sucrose Density Temperature Correction Factor ........... G14

iii
G15 Sucrose Concentration . . . . . . . . . . . . . . . . . . . . . . . . . . . G15 G16 Sucrose Thermal Conductivity ...................... G16 G 17 Sucrose Dynamic Viscosity . . . . . . . . . . . . . . . . . . . . . . . . G 17 G18 Sucrose Enthalpy .............................. G20 G19 Sucrose Boiling Point Elevation . . . . . . . . . . . . . . . . . . . . . G21 G20 Skim Milk Density . . . . . . . . . . . . . . . . . . . . . . . . . . . . . G22 G21 Milk Thermal Conductivity ......................... G23 G22 Skim Milk Specific Heat Capacity . . . . . . . . . . . . . . . . . . . G24
. G23 Skim Milk Kinematic Viscosity . . . . . . . . . . . . . . . . . . . . . G25 G24 Skim Milk Concentration . . . . . . . . . . . . . . . . . . . . . . . . . G26 G25 Skim Milk Boiling Point Elevation . . . . . . . . . . . . . . . . . . . G27 G26 Thermal Conductivity of 316 Stainless Steel . . . . . . . . . . . . . G28 G27 References . . . . . . . . . . . . . . . . . . . . . . . . . . . . . . . . . . G29
APPENDIX H: INTEGRATION OF LOCAL NUSSELT NUMBER OVER TUBE LENGTH H1 Nomenclature . . . . . . . . . . . . . . . . . . . . . . . . . . . . . . . . H2 H2 Inputs . . . . . . . . . . . . . . . . . . . . . . . . . . . . . . . . . . . . . H3 H3 Constants . . . . . . . . . . . . . . . . . . . . . . . . . . . . . . . . . . . H3 H4 Initial Calculations . . . . . . . . . . . . . . . . . . . . . . . . . . . . . H3 H5 Iterative Calculations . . . . . . . . . . . . . . . . . . . . . . . . . . . H5 H6 References .................................. H15 Appendix HA: Calculation Procedure for Pipe Friction Factor . . . . . . H16
APPENDIX I: EXPERIMENTAL DATA I1 Data from Water Experiments . . . . . . . . . . . . . . . . . . . . . . . I1 I2 Data from Sucrose Experiments . . . . . . . . . . . . . . . . . . . . . . I57 I3 Data from Skim Milk Experiments .................... I81 I4 Data from Non-condensable Gas Experiments ............ 1103
APPENDIX J: EVALUATION OF METHODS OF MEASURING NONCONDENSABLE GASES IN EVAPORATOR PROCESS STREAMS J1 Abstract . . . . . . . . . . . . . . . . . . . . . . . . . . . . . . . . . . . . J1 J2 Nomenclature . . . . . . . . . . . . . . . . . . . . . . . . . . . . . . . . . J1 J3 Introduction . . . . . . . . . . . . . . . . . . . . . . . . . . . . . . . . . . J1 J4 Specification . . . . . . . . . . . . . . . . . . . . . . . . . . . . . . . . . . J4 J5 Possible Measurement Methods . ·. . . . . . . . . . . . . . . . . . . . . J5 J6 Recommendations .............................. Jl2 J7 Conclusions .................................. J13 J8 References ................................... J13 Appendix JA: Estimates of Air Leakage. . ................... J15
APPENDIX K: IN-LINE MEASUREMENT OF TEMPERATURE AND PRESSURE K1 Abstract . . . . . . . . . . . . . . . . . . . . . . . . . . . . . . . . . . . K1 K2 Nomenclature ...................... , . . . . . . . . . K2 K3 Introduction . . . . . . . . . . . . . . . . . . . . . . . . . . . . . . . . . K3 K4 Methods . . . . . . . . . . . . . . . . . . . . . . . . . . . . . . . . . . . K3 K5 Problem Definition . . . . . . . . . . . . . . . . . . . . . . . . . . . . . K5 K6 Temperature Measurement in Moving Fluids . . . . . . . . . . . . . K6 K7 Pressure Measurement in Moving Fluids ............... K15

IV
K8 Discussion .................................. K19 K9 Conclusions . . . . . . . . . . . . . . . . . . . . . . . . . . . . . . . . . K20 K10 Recommendations ............................. K20 K11 References . . . . . . . . · . . . . . . . . . . . . . . . . . . . . . . . . . . K20 Appendix KA: Estimation of Heat Loss From De-aeration Line Entry
Section . . . . . . . . . . . . . . . . . . . . . . . . . . . . . . . . . . . . K21 Appendix KB: Calculation of the Steam Flow Rate, and a Point Velocity
Upstream of a Sonic Orifice . . . . . . . . . . . . . . . . . . . . . . . K23 Appendix KC: Effect of Fluid Properties on the Thermometer Time
Constant . . . . . . . . . . . . . . . . . . . . . . . . . . . . . . . . . . . K26 Appendix KD: Calculation of static wall tap error . . . . . . . . . . . . . . K29
APPENDIX L: DIMENSIONAL ANALYSIS OF BOILING SIDE HEAT TRANSFER
APPENDIX M: SKIM MILK EXPERIMENT RUN SHEETS
APPENDIX N: LABORATORY ANALYSIS METHODS
APPENDIX 0: MODEL FOR STEAM CONDENSATION IN A CALANDRIA SHELL IN THE PRESENCE OF NON-CONDENSABLE GASES 01 Introduction . . . . . . . . . . . . . . . . . . . . . . . . . . . . . . . . . 01 02 Nomenclature . . . . . . . . . . . . . . . . . . . . . . . . . . . . . . . . 02 03 Model Assumptions . . . . . . . . . . . . . . . . . . . . . . . . . . . . 02 04 Conservation Equations for Liquid Layer . . . . . . . . . . . . . . . 03 05 Conservation Equations for Vapour Space . . . . . . . . . . . . . . . 03 06 Boundary Conditions . . . . . . . . . . . . . . . . . . . . . . . . . . . . 04 07 Derivatives involved in Equations . . . . . . . . . . . . . . . . . . . . 05 08 Vapour Phase Finite Difference Approximations at the Point j,k . 010 09 Finite Difference Approximations at the Inner Boundary . . . . . . 012 010 References . . . . . . . . . . . . . . . . . . . . . . . . . . . . . . . . . . 013
APPENDIX P: NUMERICAL MODEL PROCEDURE FOR TOP HALF OF CALANDRIA SHELL P1 Introduction . . . . . . . . . . . . . . . . . . . . . . . . . . . . . . . . . . P1 · P2 Model Assumptions for Version 4 . . . . . . . . . . . . . . . . . . . . P1 P3 Nomenclature . . . . . . . . . . . . . . . . . . . . . . . . . . . . . . . . . P2 P4 System Parameter Settings . . . . . . . . . ·. . . . . . . . . . . . . . . . P3 P5 Determining Conditions at j = 0 . . . . . . . . . . . . . . . . . . . . . . P3 P6 Determining Conditions at js = -1 . . . . . . . . . . . . . . . . . . . . P9 P7 Determining Conditions at j = 1 to J . . . . . . . . . . . . . . . . . P10
APPENDIX Q: PHYSICAL PROPERTY CORRELATIONS OF GASES, STEAM, WATER AND GAS-STEAM MIXTURES Q1 Properties of Gases (GAS.FOR) . . . . . . . . . . . . . . . . . . . . . Q2 Q2 Properties of Steam (STEAM.FOR) ................... Q7 Q3 Properties of Water (WATER.FOR) .................. Qll Q4 Properties of Gas-Steam Mixtures (MIX.FOR) ............ Q14
APPENDIX R: CALCULATIONS FOR NON-CONDENSABLE GAS EXPERIMENTS RO Nomenclature . . . . . . . . . . . . . . . . . . . . . . . . . . . . . . . . R1

v
Rl Volume of steam side of Third Evaporator . . . . . . . . . . . . . . Rl R2 Leakage rate calculations . . . . . . . . . . . . . . . . . . . . . . . . . R4 R3 De-aeration Rate Calculation . . . . . . . . . . . . . . . . . . . . . . . . R6 R4 Pressure Ratio Test Calculations . . . . . . . . . . . . . . . . . . . . . R8 R5 References . . . . . . . . . . . . . . . . . . . . . . . . . . . . . . . . . . . R9
APPENDIX S: NON-CONDENSABLE GAS APPARATUS COMMISSIONING PROCEDURE AND OBSERVATIONS SO Glossary . . . . . . . . . . . . . . . . . . . . . . . . . . . . . . . . . . . . Sl Sl Initial Test Comparing Dry. Ice and Liquid Nitrogen as the
Coolant . . . . . . . . . . . . . . . . . . . . . . . . . . . . . . . . . . . . . Sl S2 Comparison of Pressure Ratio Method Upon Condensation with
Gas Chromatography Measurements . . . . . . . . . . . . . . . . . . . S2 S3 Evaluation of Glycol as a Cooling Medium . . . . . . . . . . . . . . . S6 S4 Check of Purity of Balloon Gas helium . . . . . . . . . . . . . . . . . S7 S5 Bottom De-aeration Line Measurement . . . . . . . . . . . . . . . . . S7 S6 Non-condensable Gas Apparatus Leakage Rate Test . . . . . . . . . S8 S7 Measurement of Non-condensable Gases in Top De-aeration
Line ....................................... S8 S8 Non-condensable Gas Apparatus Leak Detection, Repair and
Testing ..................................... S9 S9 Measurements With and Without Deliberate Air Addition to
Calandria . . . . . . . . . . . . . . . . . . . . . . . . . . . . . . . . . . . S 10


Al
APPENDIX A: INSIDE THE STAINLESS STEEL - AN
INSIGHT INTO EVAPORATION HEAT TRANSFER
The following paper was presented to "Milk Powders for the Future", a symposium on Milk
Powder Research held in Palmerston North on July 2-3, 1992.

22 Milk Powders for the Future
Inside the Stainless Steel An Insight into Evaporation Heat Transfer
3
AR MACKERETH Milk Powders & Drying Section,
NZDRI, Palmerston North
The basis of falling film evaporation is heat transfer through the calandria tube wall. The process consists of film-wise condensation on the outer surface of the tube, convection heat transfer through the condensate film, heat conduction through the wall and convection heat transfer through the product film and surface evaporation. Factors which affect each step in the heat transfer process are presented. Experimental data and theory are presented to show the relative magnitude of each heat transfer resistance. Provided the plant is vacuum tight, the major resistance to heat transfer, in modern evaporators, is due to the properties of the product film. The application of these principles in modern evaporator design is discussed. The purpose of this presentation is to give insight into the factors which affect heat transfer in falling film evaporators.
Nomenclature
Roman
boilint. point ele:vOltion nun--condensable r ..... ~::S
A : he-At tr .tnsft:r <~rrll.. tn'
d : tube dlflmclt:r, m h c:onvcctiv~ hcod ll>tn,.;t"¢r ~:~ffie-icnt,
Wm·:K'' k : therm;.tJ eunductivity. W m'~ K"1
L h:n~,:th of tube, m m m:.tn flvw r'.tte. kt;h N number of tubes
q hat transJcrred, W ~ thickn~~ of layer, m ~T h::mprrfi,ture drivin& force:. K U overaU h~M.I H"'no,fcr cvetfk:it::nt. W ur1 K·'
Greek r tuhe lu"'dini:!. k~ m" .s:' 1
.I film m ll dyn:.ul\iJ; vi:~~<:uJ~-Hy, ~c m·' ,...,
MVR TVR
medumical vapour r~ompres:slun th~rmaJ v~pour
Subscripts condens.ilt: tihn condition produc: tilm condition proi..luct :.iU.: foutanl innt:r outer l"tt:"<1tn~ll'id.: $tale
U uv.:raU comlition w : v.·.aJI ccJndltivn 1.. condition 011 bottom of tube
Dimensionless Groups Re : R~ynolt.l~ numher
Inside the Stainless Steel 23
The basic principle of heat transfer through an evaporator tube is shown in 1. Steam condenses on the outside of the tube wall, forming condensate. The
heat released is conducted through the evaporator wall to the product film. The heat is released from the product stream by surface evaporation.
Figure 1: Sectional view through calandria wall showing process steam flows.
The amount of heat transferred is determined by the following equation:
(1) q UA/:iru
The overall heat transfer coefficient, U, takes account of all the properties of the wall, condensate and product streams. It can be either determined directly by experiment or calculated from the following equation1
:
(2)
(3)
l. • l. + :i_s + 3,... + :i_f + .1 U he ks kw kf he
The area available for heat transfer, A, in an evaporator calandria is:
A =N1td.L '
The steps in the temperature profile between the bulk steam and the bulk product steams are shown in stylised form in Figure 2. The overall temperature driving force, ll T u• is defined as the difference between the bulk steam saturation temperature

24 Milk Powders for the Future
and the saturation temperature of the boiled-off vapour. Each stage of the heat transfer process is governed by a number of factors, which are outlined below:
Wall
Foulont l Product film ~
•!•!•!•!•!•!•!•!•'.:0
BPE
Condensate
I Scale
\
I
Bulk Steam
I I
\ NCG rich bouf}dory Ioyer
Figure 2: Temperature profile across calandria tube wall.
STEAM PROPERTIES
Superheat
The presence of superheat in the steam has an insignificant effect on heat transfer rate (Minkowycz and Sparrow, 1966) for steam with a low (0.1 %w/w) noncondensible gas concentration. At the top of the tube, the condensate film coverage of the tube wall will be very thin and possibly incomplete. The presence of superheat in this region may cause localised hot spots which would lead to rapid product fouling of the tube. The superheated vapmir must be cooled down to saturation temperature before condensation will occur. The superheat should be subtracted from a measured temperature difference to give a true driving force for heat transfer. Thus the use of differential pressure measurement for process control is preferred where the presence of superheat is likely.
Mr.: onlry
liQJid dimibufor
k:l ~~~~
Steam
co~= ~-:~~~~~ =·
Air Ioden stoom
Top de-oeratCn
"""
Colondrb shell 100mm0
Air Ioden stoom
Slohtolon
Figure 3: Diagram of single tube calandria showing steam entry and de-aeration ports.
Inside the Stainless Steel 25
Presence of non-condensible gases, NCG
The amount of NCG present in the steam has a major effect on the heat transfer rate. The NCG are drawn to the tube surface along with the condensing steam but remain1 in the vapour phase. Experimental data obtained on a single tube calandria shown in Figure 3 with de-aeration rates of0.6-1.6 %w/w, indicates that the average concentration at the steam-condensate interface is approximately 10-15 times that in the incoming steam (see Figure4). The reasonable maximum NCG level is 0.1 %w/w. Commercial de-aeration rates are normally set at 1-1.5 %w/w of the steam condensed in an effect. The de-aeration rate determines the steam velocity at the top and at the bottom of the calandria. At low de-aeration rates, the average concentration of NCG at the interface will increase. In an extreme case where a de-aeration port becomes blocked, for example by condensate flooding, the heat transfer rate will slowly drop to approximately half the original rate (see Figure 5) due to the build up ofNCG in the unvented section of the calandria.

26 Milk Powders for the Future
5
2 Q) 4 !:! .!2 Ol c: ·:;;
3 ·c \)
Q)
'5 2 25. 2 E ~ <lJ
15 0 0 ~
0
~ lcR·=1
CR';5
cR·=10
cR·=15
CR'=20
o Experimenlal Ftinls
0.2 0.4 0.6
Percentage air in bulk steam (% v/v)
[ Mean conCeti1ta10n ot woJ ]
• Coocemtcnion Ro1to • Concentrmiort in bJk t~eom
8oJli"Q lde tempeto1ure we
Figure 4: Effect of NCG concentration on available temperature driving force.
"" 2000 -E
~ 1800 c .!!! g 1600 Ql 0 u Q;
1400
"E g 1200
8 1000 .J::
e "' 800
5 6 ' 2 3 4
Time since blockage occurred (hours)
Figure 5: Effect of complete blockage of a de-~er~tion line.
Inside the Stainless Steel 27
CONDENSATE FILM PROPERTillS
Condensation mechanisms
Steam can condense on the tube in one of two modes:
Film-wise condensation- where the steam condenses onto a film of condensate flowing down the tube.
Drop-wise condensation- where the steam condenses as droplets on the surface.
Drop-wise condensation has a much higher heat transfer coefficient because when the drops reach a certain size, they run off rapidly and thus the majority of the surface is free of liquid. Drop-wise condensation is difficult to achieve and especially to maintain. On clean surfaces, film-wise condensation will occur.
To achieve drop-wise condensation requires the application of a coating to the tube which inhibits wetting (Incropera and de Witt, 1990, p610). Silicones, Teflon, waxes and fatty acids have been used for this purpose. Jebson (1992) has suggested that milk fat carried over into the steam side coats the surface so that drop-wise condensation occurs. However, the author believes that the carry-over of caustic and acid solutions during evaporator cleaning is likely to prevent the build-up of a fat deposit. Only the worst case scenario, film condensation, is considered here.
Condensate flow regimes
TI1e flow regimes observed in a condensate film (Incroperaand de Witt, 1990, p616) are shown in Figure 6. At the top of the film the flow is laminar, then waves start appearing on the surface which introduce a small amount of mixing and also disturb the vapour boundary layer, and finally the film becomes turbulent. The Reynolds number is the ratio of the inertia and viscous forces, and for a condensing film it can be defined as:
Re,= 4re.~.
J.lc
Where the condensate liquid loading at the bottom of the tube is:
re.~.=~ N1td.
Now, the condensate film becomes turbulent when Re, reaches 1800. In commercial milk evaporators only laminar and wavy-laminar conditions are experienced, as Re, does not exceed 1000 (Mackereth, 1992). Under these conditions

28 Milk Powders for the Future
Laminar. wave-free
Rec ~ 30
Laminar. wavy
Rec = 1800
Turbulent
Figure 6: Flow regimes experienced by condensate film.
the thermal conductivity of the film is the primary factor for heat transfer. A secondary factor is the film viscosity, because the film thickness is weakly dependent on the viscosity. The dependence of the convective heat transfer rate on k. and 11. is:
ht "" k. "" J.L; ,,4
The thermal conductivity of water increases with increasing temperature, and the viscosity of water decreases with increasing temperature. Thus, the higher the temperature the higher the condensation heat transfer rate.
PROPERTIES OF SCALE FORMATION ON STEAM SIDE
The presence of rust and other contaminants in the steam supply, or product and/or cleaning solution components carried over from the preceding effect, may cause a layer of material to build up on the tube walL The scale acts as an extra wall layer that the heat has to pass through and the heat conduction rate is dependent on the thickness and thermal conductivity of the scale.
Inside the Stainless Steel 29
WALLPROPERTlES
The heat transfer through the wall is dependent on the thickness and thermal conductivity of the wall. Stainless steel has a relativity low thermal conductivity, 13.4 W m·1 K 1 , compared with 401 W m·1 K·1 for copper (Incropera and de Witt, 1990, A3-5). The roughness of the wall surfaces will affect the likelihood of the build up of scale or foulant. To minimise thermal resistance and fouling, smoothdrawn tubing with a wall thickness of 1 mm is used.
PROPERTIES OF FOULANT MATERIAL
Proteins and minerals present in the milk stream will form deposits on tt.e inner wall surfaces (Fergusson, 1 ~89). The deposited layer acts as an extra wall that the heat has to pass through. The thermal conductivity of the fouled material, typically 0.5-3 W m·2 K·1 (Wood, 1982, pp5:17-19), is much lower than that of stainless steel. Thus, even a very thin layer will dramatically reduce the overall heat transfer rate. The low~ Tu (3-5°C) used in modem evaporator designs has reduced fouling rates significantly. No significant change in the overall heat transfer coefficient was observed in a commercial MVR evaporator over a twenty hour period (Mackereth,
PROPERTIES OF PRODUCT FILM
Boiling regime
l11e nature ofboiling on the product side is dependent on the temperature difference between the wall and the product-vapour liquid interface, ~T. (see Figure 7). With no forced liquid flow at low temperature differences (up to about 5°C), free convection boiling occurs. Free convection boiling can be described as surface evaporation where the heat is conducted through the product film and then released by evaporation into the vapour phase. At atmospheric pressure, the nucleate boiling of water will commence at a ~T. of 5° C. Nucleate boiling involves the formation of bubbles on the wall which gmw and travel out to the film-vapour interface. Heat transfer coefficients for nucleate boiling in the absence of fouling are much higher than for free convection boiling. However, as nucleate boiling involves drying out the wall surface, there is a greater potential for fouling than with free convection boiling.
The temperature difference required for nucleate boiling increases when the is flowing over the surface and when the boiling temperature is reduced
(Miiller-Steinhagen, 19&9). When the product film trickles down a tube under gravity the ~T. required for nucleate boiling increases to about 7oC (Billet, 1989, pl39). Experimental data for the falling film evaporation of water at 50-74°C

30 Milk Powders for the Future
(Housova, !970) indicates that the change to nucleate boiling may not occur until f.. T > 1 o•c. Therefore, falling film evaporators in the dairy industry should operate sol~ly under the forced (or free) convection boiling regime. Thus, the heat transfer across the product film is by convection alone.
. Adapted from lncropera & De Will (1990)
IOOOOOr---~--.--.-----.-----.
'I E
~ 10000 " ..:::
2~
!! .... .£
~ ~ :r:
1000
1001
~ v ::;; -" ::> .1:0
:!]
······r~ NucleAte Boiling
-~-u-5 10 32
For water nt atmospheric pressure
120
..§ li:
1000
Excess temperature, Ll.T. ("C)
Figure 7: Pool boiling regimes.
Liquid Loading
The tube liquid loading, or wetting factor is defined as:
r, . .!!!..__ N1tdt
Commercially, minimum exit liquid loadings, rl' as a function of product type and concentration are set for design purposes to avoid excessive fouling (Anhydro, 1987). The tube liquid loading can be also described in terms of a Reynold's number:
Re::::: 4r ' -· tl,
Inside the Stainless Steel 31
The effect of Re, on the overall heat transfer coefficient for water boiling at 6o•c with a f..Tu of3•c is shown in Figure 8.
4500 ~ ~ i ~ I i ·~[ I -,
I
I
.. . .. ' ~:
: . 3750 L
j Psuedo-lominar Tr:1nsitional
L____----~--~----~-----500 1000 1500
. ----~
: R!!~urch E.vapor:a1,or : i E.~perimenu a·: ;
:'
:' Turbulent
~()()() 2500 3000
BoiJinc film Reynolds number, Rc::.
Figure 8: Effect of liquid loading on heat transfer rate.
In the pseudo-laminar zone h. drops with increasing flow rate due to increasing film thickness. In the transitional zone the presence of waves and the onset of turbulence tends to cancel out the effect of film thickness. The reason for the local maximum in this region is not understood at present. In the turbulent zone, h. increases with increasing flow rate as the heat transfer is no longer dependent on the film thickness but on the degree of turbulence. Apart from the first effect of a threeeffect direct steam evaporator (Re. - 1200), all milk evaporator effects operate in the laminar and/or transitional zone (Re. < = 500). In both these zones, the heat transferred is directly proportional to the liquid thermal conductivity.
Thermal conductivity
ThemJal conductivity data of water, skim, and whole milk from the literature (\V ood, 1982, p5: 1-8) is shown in Figure 9. The concentration of the whole milk and skim milk is not given. The data indicates that un-homogenised whole milk has a significantly lower thermal conductivity than skim, but that homogenisation significantly increases the thermal conductivity. The thermal conductivity of whole milk (see Figure 1 0) decreases with increasing concentration and increases with increasing temperature (Hall and Hedrick, I 966, p35). The fouling rate of heat

32 Milk Powders for the Future
transfer surfaces by precipitation of salts and proteins increases with temperature and concentration. 'Fergusson (1989) reports that the maximum boiling temperature for evaporation of a low concentration product is 70°C and for a high concentration product is 58-60°C.
0.70 ..--Water curve from Rogers & Mayhew
~ 0.65 1-:;..;
""e 0.60 ,_ /o 0
~ ~ ·;;:
[ @
•;::J u
"' 0.55 0 ., c 0 b. 0 0
~ 0 0 §
o.so o o a:P o oor·o.u;;rr;;;nwc;ocr{i98if--"' ~ Whole milk 0
0.45 r Homogenised wholemilk 0' Skim milk b.
0.40 0 20 40 60 80 100
Temperature c•q Figure 9: Thermal conductivity data for whole milk and skim milk.
Viscosity
The viscosity of milk is dependent on milk solids composition, temperature and concentration {Buckingham, 1976 and Bloore, 1.981). At high viscosities, a higher liquid loading is required to ensure complete tube wall coverage and thus prevent excessive fouling.
Boiling point. elevation, BPE
Aqueous solutions boil at a higher temperature than water. BPE data for skim milk (Mackereth, 1992) is plotted in Figure I 1 along with a theoretical line (Hall and Hedrick, 1966, p18). The BPE is an extra resistance to heat transfer and prevents the use of low Ll.Tu (< 6-7°C) for the final stages of milk concentration (- 40 to 50 %w/w).
lnsidt;J the Stainless Steel 33
0.70
0.65 .. ~
D.ata from Wood (I 982)) At 20 deg C •.) At 80 deg C l J ---~-~-~-·~·~···· ··~--
~ I 0 ·a 0.60
~ ~ 0 ·;: 0.55 f.. 0 ·;:; 0 ::;1 0 '0 c 0 u
0.50 ~
E 0
"' ~ 0.45 0
0.40 10 15 20 25 30 35
\\'hole milk conccnlration (%w/w)
Figure 10: Thermal conductivity data for whole milk concentrates.
0. 8 r-------r---.---,--.,------,,..--,---,----,
p 0.6
c:: 0
] "' .5 0.4 8. "" .9 '8 Cll
0? ,.
0.0 0
0 0
0
0
§
·---L. __ I ___ J _____ i_ ______ .l_. __ L. ____ L_.
5 10 15 20 25 30 35 Skim milk concentration (%w/w)
Figure 11: Boiling point elevation of skim milk.
40

34 Milk Powders for the Future
PROPERTIES OF VAPOUR
The pressure maintained on the boiling side fixes the boiling-side temperature. The steam-side pressure is determined by the boiling-side temperatu;e and the total resistance to heat transfer. The vapour velocity assists with spreading the liquid over the tube walls and can increase the liquid film velocity reducing both the film thickness and the chances of nucleate boiling. Extremely high vapour velocities may lead to the product film being stripped off the walls (Jebson and Iyer, 1991). The vapour flow also affects the boiling temperature profile over the length of the tube due to pressure drop, and, at high velocities, the dynamic pressure component.
RELATIVE EFFECT OF EACH RESISTANCE STEP
Using skim milk data obtained on a commercial MVR evaporator (Mackereth, 1990), the component .t.T values were calculated (see Table !) assuming there was negligible scale or foulant material on the tube walls. For a vacuum-tight plant, the main resistance to heat transfer is on the product side. When the overall temperature is fixed, the ratio, .6.T/ .6. T u rises from 0.4 96 (056 with BPE) at a skim concentration of 12% w/w to 0.626 (0.82 with BPE) at a skim concentration of 37% w/w.
APPLICATIONS
Consideration of the above factors can be seen in modem evaporator design.
Steam-side design
Hot condensate is sprayed into steam after the MVR fan, ther!l)a! vapour recompressor (TVR) or main steam control valve to remove superheat. Modern evaporator joints are welded rather than using rubber gasket~ to minimise vacuum leaks as modern low .6. T u evaporator designs have made NCG exclusion more critical. NCG present in the incoming milk are removed by direct heating and flashing during pre-heating. The de-aeration line from the first heating vessel and flash vessel now commonly goes directly to the condenser to prevent introducing the NCG into the steam-side of the calandrias. Laquilharre evaporators use external straight tube heaters to pre-heat the milk, rather than coils mounted in the calandria or separator bodies. The steam for the pre-heaters comes from the top de-aeration port on the adjacent calandria shell, thus ensuring that the ca!andria de-aeration rate is approximately double the norma11evel.
Evaporator configurations and boiling temperature profiles
The original falling film evaporators were heated directly using low pressure steam. This is still the preferred option where co-generation of steam and electricity provide
Inside the Stainless Steel 35
Table 1: Calculated components of AT0 based on skim milk data obtained on a commercial MVR evaporator
Skim Milk .C.Tu .t.T, .t.T_ AT, BPE
Concentration,
%w/w ·c ·c ·c ·c ·c
12 2.3 0.78 0.41 1.14 0.16
18 2.3 0.68 0.27 1.21 0.22
23 2.3 0.62 0.23 1.21 0.28 .
27 2.3 0.50 0.21 1.32 0.33
31 2.3 0.43 0.21 !.36 0.38
34 2.3 0.36 0.18 1.40 0.42
37 2.3 0.30 0.21 1.44 0.45
.t. T u was measured. AT c was calculated using Chun &. Kim{! 990) correlation and the measured q/ A, t. T. was determined from q/A and by assuming a 1 mm wall thickness. The boiling point elevation. BPE. was calculated from data supplied in Figure 8 of Hall & Hedrick (1966), and l. T, was determined by difference.
--·----·---------------·--~-
an abundance of low-pressure steam. In a three-effect direct steam evaporator (see Figure 12) an equal amount of evaporation occurs in each effect, so that a large amount of evaporation is carried out at low temperatures (40-45°C) where the product has a low thermal conductivity and a high viscosity. Thus, a large surface area was required, which led to low liquid loadings and high fouling rates. The partial re-circulation of product around the last effect, alleviated this problem, but had a detrimental effect on product quality. The introduction ofTVR reduced the percentage of evaporation which occurred at low temperatures (see Figure 13) and reduced the evaporation in the last effect which improved the final liquid loading. Traditionally, lO prevent thermal damage, the milk has passed through the effects in order of decreasing boiling temperature. However, this meant that the final concentration was done at40-45°C under conditions of very low thermal conductivity and high viscosity. On a four-effect evaporator, the concentrating milk can be sent to the last effect and then to the third effect (see Figure 13), thus ensuring that the final concentration is done at a higher temperature (50°C). The use of finishers or high concentrators with separate steam supply enables the final concentration to be earned out at a desired boiling temperature with an optimal liquid loading. Increasing

36 Milk Powders for the Future
Steam 267 kg/h
Figure 12: Three-effect direct steam evaporator.
Su::orn t~2 k~/h
Figure 13: Four-cfrect TVR evaporator.
Condenser
Cohdof'ISOf
the number of effects (up to 7 effects in New Zealand) reduced t.T u and reduced fouling rates. More area was required because of the lower t.Tu and tube lengths were increased to keep liquid loadings high. Multiple product passes were used to keep tube liquid loadings at acceptable levels. The introduction of MVR evaporators, reduced the t.Tu further. A MVR calandria can have 1500 tubes of 14-15 metres in length and 50 mm in diameter, split into 8 product passes. The direct steam and TVR evaporators are forced to operate over a boiling temperature
Inside the Stainless Steel 37
15 k:Qtn S'le:lm
Conoemer
Figure 14: MVR evaporator with TVR finisher.
range of 40-70°C, for economy reasons. The MVR evaporator does not have this constraint, and thus the first "effect" temperature has dropped to 60-65°C which has reduced both plant fouling and thermal damage of the product. The MVR evaporator with a direct steam or TVR finisher (see Figure 14), runs with a final concentrate temperature of 48-53°C, thus avoiding heat transfer at low boiling temperatures. The reason for the direct steam or TVR finisher is that a high t.Tu (6-1 0°C) is required for the final concentration from 38-42 %w/w to 50 %w/w and asingleMVRfan has a maximum .::lTuof about5°C.MKThave a total MVR evaporator design (see Figure 15), where the higher ATu required for final concentration is achieved by having two fans running in series. This evaporator runs with a final concentrate temperature of 56-60°C and has fewer product passes due to the lower product viscosity and higher thermal conductivity during the final concentration step.
The future for evaporator design
The available information on the properties of milk and milk concentrates is limited and in some cases conflicting. Research is required to obtain physical property information in terms of composition. This will enable the optimisation of evaporators both for the production of existing product and for new products such as milks with higher protein or high fat contents. The optimal temperature for final concentration of high-heat skim milk needs to be determined. Concentrate cooling, storage and heating need further study. The chemical reactions which occur during pre-heating are not well understood. Ongoing work at the NZDRI and elsewhere is providing

38 Milk Powders far the Future
a clearer picture but there is a long way to go. The modem pre-heat system designs are energy efficient but in general have a detrimental effect on concentrate viscosity. Novel pre-heat designs are required to improve product quality while maintaining or reducing energy consumption. The investment in existing evaporation plant is considerable, and it is expected that there will be a significant level of activity in the evaluation and modification of existing evaporators. Tools to enable measurement ofNCG levels, fouling levels, concentrate viscosity and product thermal damage need to be developed for plant troubleshooting, process optimisation and quality assurance.
Feed 1000 kg/h -----, @' 9% TS
First MVR unit
Figure 15: Total MVR evaporator design.
360kg/h @' 25% TS
62·c
640 kg/h
7 6 5 14
180 kg/h @' 50"1. TS
180 kg/h
Powder consumption - 10 kW
Inside the Stainless Steel 39
NOTES
The correction to account for the difference between the inner and outer surface area of the tubes has been omitted for simplicity.
2 The amount ofNCG which dissolve in condensate at its boiling temperature is insignificant (lvfackereth, 1992).
REFERENCES
AnhydroAJS (1987), Personal commuaicarion,Anhydro AJS, Copenhagen, Denmark. BilletR(l989), Evaporation technology-principles, applications, economics. VCH
Verlagsgeselj.schaft mbH, W einheim, Germany. Bloore C G (1981 ), A quality control system for the manufacture of spray dried milk
powders. PhD thesis, Massey University, Palmerston North. Buckingham J H (1976), Kinematic viscosities of native skim milk. Physics and
Engineering Laboratory Report No. 523, Department of Scientific and Industrial Research, New Zealand.
Fergusson PH (1989), Developments in the evaporation and drying of dairy products. Journal of the Society of Dairy Technology, 42 (4), pp. 94-101.
Hall C Wand Hedrick TI (1966), Drying of milk and milk products. A VI Publishing Company Inc., Westport Connecticut.
Hou'S'ovaJ (1970), Pr~tup tepla pri varu v Odparbich se stekajfcfm filmem. Prumysl Potravin, 21 (1), pp. 7-12.
Incropera FP and DeWitt D P (1990), Fundamentals of hear and mass transfer, 3rd edn. John Wiley and Sons, New York.
Jebson Rand Iyer M (1991), Performances of falling film evaporators. Journal of Dairy Research, 58, pp. 29-38.
Jebson R (1992), Personal communication, Food Technology, Massey University, Palmerston North.
Mackereth A R (1990), Unpublished data obtained on MVR evaporator at Inglewood. Mackereth AR ( 1992), Some thermal and hydraulic aspects offallingjilm evaporation,
PhD Thesis, University of Canterbury, Christchurch (in preparation). Minkowycz W J and Sparrow EM (1966), Condensation heattransferin the presence
of non-condensables, interfacial resistance, superheating, variable properties and diffusion. International Journal of Heat and Mass Transfer, 9, pp. 1125-1144.
MoHer-Steinhagen H ( 1989), Heat transfer and heat exchanger design, ContinuingEducation Seminar notes, Chemical and Materials Engineering Department, University of Auckland, Auckland.
Rogers G F C and Mayhew Y R (1982), Thennodynamic and transport properties of fluids (Sf units), 3rd edn. Basil Blackwell, Oxford.
Wood P W ( 1982), Physical properties of dairy products, Dairy Division Technic3.J Report T2182, Ministry of Agriculture and Fisheries, Wellington.

Bl
APPENDIX B: CALIBRATION PROCEDURES
The calibration philosophy was to calibrate the instruments in-situ where possible. The only
adjustments made was to the control program calibration constants. Therefore the instrument
span and zero adjustment were not altered except where the range was inadequate. This allowed
any drift in calibration to be observed. The calibration procedure, in general, consisted of:
setting the calibration constants in the operating program to 4 and 20 rnA,
getting computer readings at four or more known levels over the instrument's range while
measuring the required physical conditions at these levels,
calculating (where necessary) the actual levels from the measured physical conditions (for
example, the absolute pressure from temperature, barometer and manometer
measurements),
fitting a regression line to the actual level versus computer readings, and determining
fitted levels at each point and at 4 and 20 rnA,
determining the linearity of the instruments response by subtracting the actual levels from
the fitted levels, and,
adding the fitted values at 4 and 20 rnA to the calibration coefficient file in the operating
program.
BO Nomenclature
Roman AP absolute pressure (Pa)
DP
h
L
m T
u
Greek L).T
'A
p
differential pressure (Pa) enthalpy (J kg-1
)
length of tube (m) mass flow rate (kg s-1
)
temperature (°C)
overall heat transfer coefficient (W m-2 K1)
temperature difference (K)
latent heat of vaporization (J kg-1)
density (kg m-3)
cr uncertainty (various)
Subscripts boil boiling vapour condition
cone concentrate stream condition
e boiling film condition
f property of liquid
ID condition at inner diameter
max maximum value
min minimum value
MM Micromotion meter output
U in overall heat transfer coefficient
Superscripts mean value

B2
Bl Calibration of Temperature Probes
Temperature Calibration Methods
Three calibration methods were used for the temperature probes: the NZDRI standard
method, a surface probe method and in-line calibration.
NZDRI standard method
The transmitters, sensors and sheath (if applicable) were removed from the plant and
installed in the control room. The transmitters were wired into the computer through
their normal port so that only the length of the 4-20 rnA loop was different from the in
situ condition. The calibration was carried out by comparing the assembled probes with
a Guildline secondary standard digital reference thermometer in an ice bath and at three
temperatures (nominally 30, 60 and 90°C) in a water bath. A disadvantage of this
method was the need to immerse the surface temperature probes.
Surface probe calibration
The Degussa temperature probes could not be immersed and so were calibrated by
mounting them on a pipe through which water was circulated at constant temperature.
The Guildline temperature probe was mounted in-line. The resistance of the probes were
measured. A decade box was then used to simulate the probe response so that the
transmitter-to-computer circuit could be calibrated. The probe was then installed. This
method proved umeliable, probably due to the differences in connection resistance during
probe calibration, circuit calibration and final probe installation. The probes were also
prone to failure, so the critical temperature probes were replaced with Minco strip probes
in August 1991.
In-line method
The Guildline secondary standard was first checked in an ice bath and then mounted in
line (usually by inserting it into the pipe exit against the flow) near the instrument being
tested. Water was then pumped through the line at a reasonably high flow rate and pre
heated to the desired temperature prior to the instrument under test. Once stability was
achieved, readings were taken regularly over a period (nominally 2-4 min) and compared
with the computer readings for the same period.
Specific temperature probe calibration procedures
The specific calibration procedures for each temperature measurement are tabulated in
Table B1.
B2 Calibration of Pressure Sensors
Pressure calibration methods
Three calibration methods were used for the pressure sensors.
None
The factory calibration of the instruments was assumed to be correct.

B3
Table B1: Specific Calibration Procedures for Temperature Probes.
Measurement Point Calibration Date of Comments Method Calibration
Common to bQth Third and Fifth EyaporatQrs
Feed ex-balance tank In-line Early 1990
PHE water supply NZDRI std Early 1990
Feed ex PHE In-line Early 1990
Product Surface 18 Sep 1990 Maximum deviation from linearity 0.09°C. Replaced 27 August 1991.
NZDRI std 27 Aug 1991 Mounted normally on Third Evaporator but installed on Fifth Evaporator for Experiments Wa25-Wa32 and Su6-Su11. Maximum deviation from linearity 0.03°C,
Steam entry Surface 15 Sep 1990 Maximum deviation from linearity 0.13°C. Replaced 27 August 1991.
NZDRI std 27 Aug 1991 Mounted normally on Third Evaporator but installed on Fifth Evaporator for Experiments Wa25-Wa32 and Su6-Su11. Maximum deviation from linearity 0.1 °C.
Concentrate In-line Early 1990 During the density calibration, this was clearly reading 1 oc low. For viscosity calculations, the temperature was corrected to account for this.
Ambient at top 1 NZDRI std Early 1990 The ambient temperature probe measurements should be considered to be within 1 o C of actual.
Ambient at middle Surface 15 Sep 1990 As above
Ambient at bottom Surface 18 Sep 1990 As above
Third EvaporatQr oniJ::
Feed at 3m from top NZDRI std 27 Aug 1991 Maximum deviation from linearity 0.09°C,
Feed at 0.3m from top NZDRI std 27 Aug 1991 Maximum deviation from linearity 0.07°C.
Liquid distributor NZDRI std Early 1990
Condensate exit NZDRI std 27 Aug 1991 Maximum deviation from linearity 0.15°C.
Top de-aeration line NZDRI std 27 Aug 1991 Maximum deviation from linearity 0.12°C. entry
Bottom de-aeration line NZDRI std 27 Aug 1991 Maximum deviation from linearity 0.21 °C. entry
For Fifth EvaporatQr onlJ::
Feed temperature In-line 21 Feb 1992 Maximum deviation from linearity 0.01 oc. Used "Feed at 3 m from top" transmitter with different Minco probe.
Liquid distributor NZDRI std Early 1990 -23 mm tube
Liquid distributor NZDRI std Early 1990 -40 mm tube
Liquid distributor NZDRI std Early 1990 On 7 Feb 1992, this probe was repaired but not -48 mm tube calibrated.
1Top, middle and bottom refer to relationship to Third Evaporator calandria.

B4
Quick check
The factory calibration was assumed to be correct, and the range was checked in situ,
against a calibrated absolute pressure instrument, at one or two points.
Comprehensive
Where the range of the instrument had been changed and/ or the instrument had remote
sanitary sensors the instrument was calibrated in situ. The pressure readings obtained
at four levels were compared with readings from a water manometer (temperature of
water monitored) and a barometer (for absolute pressure sensors). A 0-7 kPa absolute
pressure sensor with a factory certified range was used as a cross check in August 1991.
Specific pressure sensor calibration procedures
The specific calibration procedures for each temperature measurement are tabulated in
Table B2.
B3 Calibration of Flow Rate Meters
Calibration method
All flow meters were calibrated in situ using a bucket and stop watch technique. The
water collected was.weighed. In August 1990, each meter was calibrated separately by
J C C Tan. The feed flow meter (F1) was calibrated using six levels (25, 135, 195, 325,
582 & 695 kg h-1). The third evaporator feed flow meter (F2) was calibrated using four
levels (15, 130, 165 & 235 kg h-1). The fifth evaporator feed flow meter (F3) was
calibrated using three levels (30, 135 & 240 kg h-1). The concentrate flow meter (F4)
was calibrated using four levels (25, 135, 195 & 275 kg h-1).
In August 1991, the feed, third evaporator feed and concentrate meters were calibrated
in series at five levels (30, 90, 150, 210 & 270 kg h-1). The calibration coefficients
obtained in 1990 and 1991 are shown in Table B3. The fifth evaporator flow meter was
not calibrated in August 1991.
The maximum deviation from linearity was 0.4 kg h-1 in August 1991. The accuracy of
the calibration procedure in August 1991 was calculated to be only slightly below the
stated accuracy of the flow meters (see Table B4).
The feed flow meter (F1) is the only feed flow meter for the fifth evaporator, which had
been recalibrated in 1991. So, initially the data from Experiments Wa25-Wa32 and Su6-
Sull were analyzed using F1 values. Unfortunately, due to it's larger range, F1 has a
poorer accuracy (see Table B4), and a computer resolution of 0.767 kg h-1 (compared
with 0.3 kg h-1 for the fifth evaporator feed flow meter).

B5
Table B2: Specific Calibration Procedures for Pressure Sensors.
Measurement Point Calibration Date of Comments Method Calibration
CommQn to bQth Third and Fifth EvaporatQrs
Feed balance tank level None Accuracy of level irrelevant.
Viscometer Comprehensive 11 Nov 1991 Ten point calibration. The deviation from linearity was less than 0.25 kPa for all points except the zero point (-0.53 kPa).
Concentrate tank level None Accuracy of level irrelevant.
Cooling water supply Factory settings 1989
Main steam supply Factory settings 1989
Condenser shell side Comprehensive Early 1990 Calibration allowed for vertical location of instrument (12m above basement).
16 Aug 1991 Instrument span was changed and instrument calibrated. Maximum deviation from linearity 0.05 kPa. No allowance was made for vertical allocation of instrument.
For Third Evaporator onl;i
Boiling side absolute Quick check 4 Sep 1990 Checked against condenser AP at three levels.
Comprehensive 16 Aug 1991 Instrument span was changed and instrument recalibrated. Maximum deviation from linearity 0.04 kPa. When the remote sensor was mounted on the Fifth Evaporator there was a slight increase in elevation (approximately 10-20 mm of silicon oil) so a small zero shift was expected.
Original DP Comprehensive 10 Aug 1990 Linearity and factory span setting confirmed. Computer coefficients adjusted to set zero point to account for remote sanitary seal elevation.
Steam entry DP Quick check 25 Sep 1991 Compared with boiling side AP at two levels and with original DP sensor (see Section B6). Confirmed factory settings were correct. No zero adjustment required as the legs were free draining.
Top de-aeration DP Quick check 25 Sep 1991 As above.
Bottom de-aeration DP Quick check 25 Sep 1991 As above.
Pump suction side level Factory settings 20 Sep 1991
For Fifth Evaporator onl;i
Boiling side absolute Quick check 7 Aug 1991 The instrument span was adjusted prior to this quick check and a comprehensive calibration was intended to be done later, but was not done. Comparison with rough check on Third Evaporator AP indicates that this instrument was reading approximately 0.4 kPa high.
Differential pressure Factory settings 1991 Same batch as Third Evaporator top, entry and bottom instruments.
For NCG measurement apparatus
0-7 kPa absolute Quick check 16 Aug 1991 Check confirmed factory settings.
0-114 kPa absolute Comprehensive 16 Aug 1991

B6
Table B3: Third Evaporator Calibration Coefficients.
Flow Meter Calibration Coefficient
Min/Max August 1990 August 1991
Feed Flow (D25) @4 rnA -1.06 -0.10
@20mA 766.99 767.64
Feed to Third Evaporator (Dl2) @4mA 0.40 -0.49
@20mA 301.79 302.08
Feed to Fifth Evaporator (D12) @4mA 0.13 -
@20mA 299.41 -
Concentrate Flow (D12) @4 rnA 0.54 0.42
@20mA 289.22 289.48
Table B4: Stated Accuracy of Micromotion Flow Meters.
Flow Meter Accuracy (kg h-1)
@ 30 kg h-1 @ 210 kg h-1
Feed Flow (D25) ± 0.54 ± 1.26
Feed to Third Evaporator (D12) ± 0.18 ± 0.9 Feed to Fifth Evaporator (D 12) and Concentrate Flow (Dl2)
The poor accuracy and resolution of F1 had a dramatic effect on the fifth evaporator
experimental results, because the evaporation rate was determined by subtracting the
concentrate flow rate from the feed flow rate. The comparison of the numerical
integration results with the experimental data from the Experiments Su6-Su11, is plotted
in Figure B1 based on both the F1 and F3 values. This shows that there is more scatter
in the F1 data. Many of the F1 results plotted as zero were actually negative, which
indicates that there was something wrong.
Comparison of the third effect flow meter (F2) and F1 using data from Experiment Wa21
(14-15 November 1991) showed a maximum difference of 0.6 kg h-1 (see Figure B2).
However, comparison of F2 and F1 for Experiment Sk2 (2-6 March 1992) showed a
maximum difference of 1.8 kg h-1 (see Figure B2). The large scatter shown in
Figure B1, when using the F1 values and the increasing lack of agreement between F1
and F2 between November 1991 ~nd March 1992, indicate that F1 was unstable. A
comparison of F3 and F1 using data from Experiments Wa25-Wa32 (22-26 February
1992) shows considerable scatter (see Figure B3), although the difference between the
mean values for each flow meter was only 0.5 kg h-1• Therefore, all results reported
in Chapters 21 and 26, were derived using the fifth evaporator feed flow meter (F3)
values.

B7
1400~----------------------------------------~
1200 .
..--.. 1000 B ~ __.
::> 0 t:S
~';~-Cb
.0 z 800 + .--. " 0
0 ~ <l 0 0 z z 0 N .__.. ::> f) t:S 600 0 + 0 0
0 ..__.. N ::> t:S
400 Feed flow meter
Fl 0 F3
200
0 200 400 600 800 1000 1200
Experimental overall heat transfer coefficient (W m-2 K 1)
Figure Bl: Comparison of feed flow meter (Fl) and .fifth evaporator feed flow meter (F3) using Chun & Seban 1S fit to the sucrose data (cf Figure 26.4).
1400

B8
3 ~~~~--~--~~~.~.~.--~~~~~~~--~~ "".. " ~ "" . ' l" . .:.." .... : .. " .:.. . ..1 " ... : . •." . . .. .I. ... ; . " .. "" ... ". . ....
..... ; .. ·< .. ' ....... j .... ) ......... : .... ) ..... j .... :. .. .. .. j ..... i ..... i .... i .. .
. ... ·: .... ·' .... -; .... ' .. ' ... j ..... ·:· .. ":·' .. · ............ j ..... ·•· ..... j .....•.. "" .... j. '' .. ,, .... '··· .. ~- .
"""' 2 -:.c=
. . . . .. . . . ... . . ..... . .. . . . . . ·:· ..... ; .... ·:· .... ; ..... +· ... :- .... ~ .... : .. < ... ·I ..... ; .... : ..... : .... . . . . . ' . ' . . ·:- :-·__;_·~·-t·~· : . . . t-·_.:_·~·-: . . . '
~ "-' ,......., -P-.!
g 1 00 1-; Q.) ....... s ~ 0
!:+::: 0 ~ Q.)
~ Q.)
,.0 Q.)
g Q.) 1-; -1 ~ ...... Q
.... : .... .: .. .: .... ; ..... , ...... : ...... : .... ; ...... : .... , ...... : ...... ;- ..... :.. 0 Nov 1991 ; .....
..... ~ ............ ; ..... :.. rO·[-- ... : "'":"'"'j'""T "'("'~ ... "' 0 Mar 1992
: ... ·::::··[:.··:_:::·L·::.<>::. :.·::..·::.;-·::.-:-:·.:r::.~:::.:::::r:: ........ i·····:······· .... : .. . ·-·-·-·:·-i ::-·:·-·:-·-r· : :-·~·-·:·-··
:::::t·. :· .[·:. :·· .. ::.:.:.::I YI. :::I:::::-.: ... :.: .. :: :r· .... : ... :: r··: ·::.· ::t. ·.:r::: .. :.·:.l::: :.1::: T : .. . . ' ... ; ' .... ~ ' .... ~ ..... : .. ''.I. . .; '' .. :. '' .. : .. ' ... : ... '. J'.' 6 ... : .... ; ... ';, .... ) ..... : ' .... j.' .. : .... : .... ' .... ; .... : ..... • ...... : ... ..~. ... ..:. ..... : ..... .: .... : ..... l ...... : .... o ... ; ... ; .. J .... L ... ; .... ~ ..... ; .... . . ~ _j_·-~-8: ,i_,8j _j__--+8' ·-g:·-i : ... Qt.~- l·-j· -~-·
..... > ... : .... ; .. ~.. "0" "0" .... "0"6"g' ... ~ ..... ; ..... ~ ..... > ... :·:: .. :·:.:[.·_·::?··: :··r··::I·:.?:::I::::I::::::::::?:::--··:::·:::i_:··r:.:8·:.9:::es··e:::.
. . . . . . ' . . . ' . . . ' ' . . ..... ; ..... ; .... -:.'... • .. 'I' .... : ...... ; ..... : ..... ·: .... 'l"' .• ' .. ·: ...... :. '"'t'.' 1' .... ~-' .. -~·' .. ~ ..... ~ .....
. . . . . . . ' ' . . . . ' '
·:·:·:·:·-r ·:-·7-·:·~·-T • -:-·:-·:·T .. :· .·-:·-:-· ""';"·";""': .. ' ""i' ' "j"'"'('"'(""('"'i' ""("'("'~'""("'( "("'("'("i""'
: : :.:::::: .. ;::::::: .. :••J ... •::J. 1. ; ;.i:::,:·.< :.:•:::~.:::::~.. ·...> ···:·····:······:····· ... . .... . . . . . . -2 ~----------+----· ______ ,_ __________ r-------· --·~
0 50 100 150 200
Third evaporator feed flow [F2] (kg h-1)
Figure B2: Comparison of Feed Flow Meter (Fl) and Third Evaporator Feed Flow Meter (F2) Outputs.

::2 -~ ,........, ,..... ~
('(")
~ ""--' Q.)
§ 1-;
~ ..... Q
2~--------. --.--.----------------~--~~~~
... .. . : I : : I .... J .... : .. ··· .. ··:·····: .. ··· .. : ....... :.::.::··:::·.Io.:--:··.I:.::.=:··:I:~:r:·::r ... ; .......... L .... : ................ : .. .
1
· · I · · I · I . . : = : = : . : =o· : : : : :
.. · ··~ · .... : ·· · · ·~· · · ··~ ·· ·· "i R ·:· · · · ·[·· · · ··[· · · ·· ·[· o·j· ·· · ·:· o~··· · ·i· ···· ]· · ·· · i"" · · ·i· · ·· ·i · · · ·· >·· t · ··· ·
···•·•· ·_.··.···•·.······~~·······.······_···.··· •J······Q··············.l•i Jj~-·~·
0
· ········ · ., .... · ...... g .. : ............. : ...... ~ ·i ... , ·: .... ~ .. ..) .... ,. 0. Feb 1992 , ..
.... -o·[· ... ; ... ·J9·: ... T" .. : ..... : \··· .. : .: ... ~ .... ; .... T ... :·· .. ·:·····: .. ··: .. ···
.•. [•••_•i••.••:•.••·········~f••-I•.·_ .••••• _ •..• ··:·~·--i .••.•• _.:•t•••:·····:J•••!•--•• .... p ..... ~ ....... .
••· •r••• .•••• :•• ·•••· i••••I••••r·•·•···•••}d••t g• ·•-•• ···-•-•1••••:•••:••••.· ·····•••-• ..... ; ..... ; ..... ~ ..... ; .... , .. ,,: '' .. ; ...... ~ ...... ~ .... ..1. ..... ~ ...... ; ...... ~. ···{· .... J ..... i ..... ~ ... , , ....
-1
: : : I : : : 0 I : : : : I : : : .... · ----:··· · ·:·· ···~··· ·J~ ··-:-· ··· -r· ·· ··r ····o· ·r ···· r ..... :··· r ... ·~· ... ·r· ... r ... ·:· .. ·· : ... ·· · · · · · : ·:·:·-y-: ·: ·: ·:·~·-~· : : ·:·r·~·--r-~·- -
. . . . . . . . . . ~ . . . . · · · · · · · · ·~ · · · · ·:· · · · · ·:· · · · · "~" · · · · ·:· · · · · ·:· · · · · ·:· · · · · ·:· · · · · r .. · · ·:· · ·· · ·: .. · · · : .. · · · :· · .. · r · .. · :· · · · ·: · · .. ·: · · · · · · · · · · .......... ;.: ... ~ ..... ~ ...... i ...... : ...... ; ..... [ ..... ~ ..... +- .. ··: .... ; .... ~ .. ). """i""""'>··~"'"'": ........ . · · · ·· · · .; · · · · .~ ··· · ·~ ··· ·Y· · · .:. · · · · .[. · · ·· ·~· · · ·· ·~· · ·· · i· ... Q ... ·~· · · ··~· · ···i···· · i· · · ·· j. · · · · ~ · · · · · j · · · · · · · · · ·
: : i : : : : l. : = : : I. : : • • • · • • • • · • · · • • 7 · • • • • :- • • • • • r · · · · ·:· · ... ·:· . . . ·:· .... ·:· .. ~ ....... -:·, ... -: ..... -: ..... :. . . . . . . . . . . .... : ..... : . . . . . ... . . . . . . . ' . . .
-24-~~~~~~~~~~~·--·~~· ~~--~~~~
0 50 100 150 200
Fifth Evaporator Flow (kg/h)
B9
Figure B3: Comparison of Feed Flow Meter (Fl) and Fifth Evaporator Feed Flow Meter (F3) Outputs.

B10
B4 Calibration of Density Meters
The Micromotion density meters had an in-built calibration procedure using air and
water. This procedure was done when installing the meters and again in 1990. The
4-20 rnA output range of the feed density meter was set at 900-1400 kg m-3 and the
concentrate density meter at 950-1400 kg m-3 just prior to the sucrose experiments.
There was no significant effect on the calibration when the 4-20 rnA output range was
adjusted.
The feed and concentrate density meters have a quoted accuracy of ± 2 kg m-3, and a
quoted repeatability of ± 1 kg m-3. The quoted short term stability is ± 4 kg m-3.
The effect of sensor temperature is ± 5 kg m-3 per 100°C. A calibration of the two
meters has done using both water and sucrose solutions (9, 17, 29, 40 & 49% w/w).
The results confirmed that the feed density meter range was correct. The effect of
temperature and flow t"ate on the density meters was evaluated using water and the
9% w/w sucrose solution.
The feed density meter output was not affected by flow rate, but was affected by
temperature (see Figure B4) although it met the temperature variation specification. The
following equation was fitted and used (see Chapter 12) to correct the feed density
readings.
PActual PMM - 0.0822 T[° CJ + 3.036 r = 0.96 (B1)
The concentrate density meter output was affected badly by both flow rate and by
temperature (see Figures B5 and B6). For this reason, the concentrate density results
were not used for calculation purposes.

Bll
1000 ~----~------~------~------~------~--.
Actual Feed meter D
995
,-...__ ":' .... c: CJ) ~ '---" >-. 990 ....... Cli
c 11)
Q
985 • 980 ~----~------~----~------~------~~
10 20 30 40 50 60
Temperature (°C)
Figure B4: Feed Density Meter Response to Water Temperature.

B12
1000 Temperature 18oC 0 4o•c ()
0
sg•c 0 0
995
0 ,--_
0 '7 0 0 E 0 0
0[)
0 0 0 ~ .............
0 990 rn
0 ...... t::
0 0 <) Q
0 0 ()
985 0
0 0 0
0
980 0 50 100 150 20Q 250 300
Flow rate (kg h·1)
Figure B5: Concentrate Density Meter Response to Water Flow Rate.

B13
1000
Actual Concentrate meter 0
0
995
0 .,.-.., ":'
f E ~ El ~ ...._., ;;:.., 990 ........ lZl .... 0 c 0 0 Cl 0
0 985
Cfd 0
980 10 20 30 40 50 60
Temperature (°C)
Figure B6: Concentrate Density Meter Response to Water Temperature.

B14
BS Detennination of Expected Accuracy of Calculated Overall Heat Transfer Coefficients
The overall heat transfer coefficient was calculated using the following equation:
U = (mfeed - mconc) A.e[AP] - mfeed (ht(1Jeed] - h![Tboil[APJ]) (B2)
1t diD L LlTu[AP,DP]
Assumptions Now assuming the following operating conditions:
Feed flow rate 110 kg h-1
Feed temperature 61.5°C
Concentrate flow rate
Boiling side absolute pressure
Differential pressure
90 kg h-1
20 kPa
3 kPa
There would be fixed errors introduced from the measurement of tube length and
diameter but these have been ignored here.
The quoted accuracy of the instruments used to measure the above operating conditions
is listed in Table B5.
Table B5: Accuracy Specifications for Instruments
Measurement Span Specified Accuracy Uncertainty at Assumed Level
Absolute pressure 0-110 kPa ± 0.25% of span 20 ± 0.275 kPa (± 1.375%)
Differential pressure 0-20 kPa ± 0.2% of span 3 ± 0.04 kPa (± 1.333%)
Feed flow rate 0-768 kg h-1 ± 0.4% of reading ± zero 110 ± 0.86 kg h-1 (± 0.782%) stability (0.42 kg h-1
)
Feed to Third 0-300 kg h-1 ± 0.4% of reading ± zero _110 ± 0.42 kg h-1 (± 0.382%) Evaporator stability (0.06 kg h-1
)
Concentrate flow rate 0-289 kg h-1 ± 0.4% of reading ± zero 90 ± 0.42 kg h-1 (± 0.467%) stability (0.06 kg h-1
)
Feed temperature 0-100°C ± 0.1 oc 61.5 ± 0.1 oc (± 0.163%)

B15
To determine the uncertainty for the measured overall heat transfer coefficients, the
component of uncertainty, cr, in overall HTC due to the variation in absolute pressure
alone was determined as follows:
-U=
aAP =
U [AP' DP, mfeed' m cone' Tfeed J U[(AP +APunc)' DP, mfeed' mconc' Tfeea]
U[(AP -APunc)' DP, mfeed' mconc' Tfeea]
( UAP max - UAP min)
2U
Likewise, the uncertainty due to the other variables was also determined. The results are
shown in Table B6. The uncertainty was then determined as follows:
a = u 2 2 2 2 2
a + a + aT + a AP + a DP mfeed m cone feed
For Experiments Wa1-Wa7 the feed flow meter was used so cr0 = 5.2%
(± 102 W m-2 K 1). For Experiments Wa9-Wa24, Su1-Su5 and Sk0-Sk2, the Third
Evaporator feed flow meter was used so cr0 = 3.8% (± 75 W m-2 K-1). For
Experiments W a25-Wa32 and Su6-Su11, the Fifth Evaporator feed flow meter was used
so cr0 = 3.8% (± 75 W m-2 K-1). The repeatability was a lot better than this, as is shown
by the replicated points in the experiments.
Table B6: Overall Heat Transfer Coefficient Uncertainty Analysis Results.
Measured Overall heat transfer coefficient (W m-2 K-1) Uncertainty
Variable Using minimum likely Using maximum
(%)
value likely value
Absolute 1946 20po 1.37 pressure
Differential 1998 1948 -1.26 pressure
Feed flow rate 1887 2059 4.35
Third evaporator 2023 1923 2.53 feed flow rate
Concentrate flow 2015 1931 -2.13 rate
Feed 1975 1971 -0.09 temperature

B16
B6 Calculating the Pressure Profile on the Steam Side of the Third Evaporator
When the new differential pressure sensors were installed, they were compared with the
existing Third Evaporator sanitary DP sensor (see Table B7).
Table B7: Comparison of Original and New Differential Pressure Sensors on Third Evaporator.
Differential Pressure Sensor Measurement Corrected (kPa) for altitude1
(kPa)
Original sanitary sensor2 6.22 6.22
New one mounted on top de-aeration line entry 6.33 6.11
New one mounted on steam entry section 6.42 6.31
N nounted on bottom de-aeration line 6.01 5.97 ei -1But not for dynamic velocity and friction loss effects. 2Connected to calandria shell at 1 m above bottom.
The high pressure tappings for the three new probes were not on the calandria shell of
the Third Evaporator, but were on either the steam entry line or a de-aeration line
(upstream of the de-aeration nozzle). The low pressure side leg of the transmitters was
common and tapped into the side of the duct between the calandria and the separator..
The average pressure readings obtained between 1300-1500 h on 27 September 1991
(when using 3.2 mm diameter de-aeration nozzles) were corrected for differences in
height of low pressure side tapping line, for frictional pressure drop between high
pressure tapping point and the calandria shell and for the dynamic pressure at the tapping
point. The results (see Table B8) demonstrated that there was no significant pressure
drop over the length of the calandria shell.
Table B8: Comparing the Three Differential Pressure Sensors
Instrument Location Reading Low Pressure Frictional Dynamic Corrected (kPa) Leg Head Pressure Drop pressure Shell
Adjustment Adjustment Adjustment Pressures (kPa) (kPa) (kPa) (kPa)
Steam entry 3.50 -0.12 -0.04 +0.03 3.37
Top de-aeration line 3.39 -0.19 +0.07 +0.1 3.37
Bottom de-aeration 3.09 -0.05 +0.18 +0.1 3.34 line

C1
APPENDIX C: SOFT WATER QUALITY
Four samples (A-D) of the soft water were taken from the feed balance tank during the period
18 October 1990 to 5 November 1990 for chemical analysis. Samples of the bulk soft water
supply were taken three times during the 1991192 dairy season for chemical analysis. The
analyses were carried out by the Palmerston North City Council (PNCC) Laboratory. The
results are shown in Table C1 and C2.
Table C1: Chemical Analysis Results for Feed Balance Tank Samples A-C.
Sample Tiine Taken PNCC Alkalinity Sodium
Number Lab Code (g m-3 CaC03) (g m-3)
A 1115h 1/477 108 61
18/10/90
B 1600 h 11478 109 61
30/10/90
c 2031 h 11479 108 61
01/11/90

C2
Table C2: Complete Chemical Analysis Results for Water Samples.
Sample I D Soft Water Main Supply Analysis
Time Taken 1045 h 5111190 18/09/91 02/12/91 12/03/92
PNCC Lab Code 1/480 2/268 2/610 2/1297
pH 7.9 8.4 8.3 8.2 Total hardness (g m-3 CaC03) <0.5 3 <1 0.5 Calcium hardness (g m·3 CaC03) <0.5 2 <1 <0.5 Magnesium hardness (g m·3 CaC03) <0.5 1 <1 <0.5 Total alkalinity (g m·3 CaC03) 109 108 105 108 Chloride (g m·3 Cl) 14.9 14.2 14 13.7 Sulphate (g m·3 S04) 7.3 7.5 7.6 7.6 Sodium (g m·3 Na) 61 65 68 61 Potassium (g m·3 K) 0.2 0.4 0.2 0.5 Iron (g m·3 Fe) <0.03 <0.04 0.03 <0.03 Manganese (g m-3 Mn) <0.015 <0.015 <0.02 <0.02 Nitrite Nitrogen (g m·3 NOrN) <0.005 <0.003 <0.005 0.02 Nitrate Nitrogen (g m·3 N03-N) <0.1 <0.1 <0.1 <0.1 Ammonia Nitrogen (g m·3 NH3-N) 0.005 <0.010 0.035 0.03 Filtrable reactive (g m·3 P04-P) 0.09 0.11 0.11 0.01
phosphorus Free C02 - estimated (g m·3 C02) 3 <1 1 1.5 Turbidity (NTU) 0.08 0.15 0.11 0.11 Colour (Hazel Units) <5 <5 <5 <5 Conductivity at 25°C (mS m·1) 26.6 23.7 26.6 26.4 Silica (g m·3 Si02) 44 43 43 46 Fluoride (g m·3) <0.1 0.14 <0.2 0.15 Aluminium (g m·3) <0.01 <0.01' <0.02 <0.01 Boron (g m·3) <0.2

D1
APPENDIX D: RANGE OF OPERATING CONDITIONS IN
COlVlMERCIAL MILK EVAPORATORS
To illustrate the range of operating conditions experienced in milk evaporators the following
examples have been chosen;
First pass of a three-effect direct steam expansion (DSE) evaporator (3D First),
Last pass of a three-effect DSE evaporator with recirculation (3D Last),
First pass of a MVR evaporator (MVR First), and,
Last pass of a TVR finisher (Finisher Last).
A range of operating parameters, for skim milk concentration, for each of the above are
presented in Table D1.. The feed flow, concentrations, temperatures and tube dimensions were
determined from information obtained for commercial plants. The physical properties were
calculated as described in Appendix G, except for the viscosity for concentrations greater than
40% w/w which were based on unpublished data of Trinh T K (personal communication, 1993)
for end-of-season skim milk. The calculated variables were determined using the methods
described in Chapter 12.
The above examples show the extremes in milk evaporation. Thus, for milk evaporators:
Maximum Rec < 800 (in three effect DSE plants)
< 400 (in modern evaporator plants)
Ree ranges from 5 to 1742
Pre ranges from 4.5 to 1463

D2
Table Dl: Examples of Milk Evaporator Operating Conditions
Example 3D First 3D Last MVR First Finisher Last
Feed flow rate per tube (kg h"1) 137.5 125.0 60.3 148.7
Feed temperature (0 C) 90 45 64.8 50
Feed total solids (% w/w) 9 39.9 9.2 46.7
Concentrate total solids (% w/w) 12.2 45.1 15.2 50.1
Tube inner diameter (mm) 40 40 48.8 40
Tube outer diameter (mm) 42 42 50.8 42
Tube length (m) 6 6 15 7
Temperature driving force (0 C) I 12 12 2.3 12
Boiling temperature (0 C) 70 45 62 50
oncentrate flow rate (kg h'1) ! 101.4 110.7 36.4 138.6
Total evaporation (kg h'1) 1 36.1 14.3 23.9 10.1
Flash on entry (kg h'1) 5.4 0 .3 0
Evaporation in tube (kg h'1) 30.7 14.3 23.6 10.1
Condensate exit flow rate (kg h'1) 31.1 14.5 23.7 10.2
Overall heat transfer coefficient (W m·2 K 1) 2195 1055 2915 633
Liquid loading at top (kg m·1 s·1) 0.304 0.276 0.109 0.329
Liquid loading at bottom (kg m·1 s·1) 0.214 0.233 0.063 0.292
Skitn milk feed viscosity (kg m·1 s·1) 6.98xl0-4 0.0186 7.08x10·4 0.07
Skitn milk concentrate viscosity (kg m·1 s·1) 8.64x10⁻⁴ 0.05 l.06x10·3 0.23
Condensate film Reynolds number at bottom 764 252 . 379 192
Boiling film Reynolds number at top 1742 59 617 19
Boiling film Reynolds number at bottom 989 19 240 5
Condensate Prandtl Number 2.14 3.12 2.76 2.87
Skim milk feed Prandtl number 4.5 125 4.6 453
Skim milk concentrate Prandtl number 5.6 330 7.0 1463
Exit vapour velocity (m s·1) i 40 47 25 33

El
APPENDIX E: DERIVATION OF WASSNER'S FORM OF
CONDENSATION NUSSELT EQUATIONS
EO Nomenclature
Roman A c g
k
L
q
Greek
surface area (m2)
specific heat of fluid (J kg-1 K-1)
acceleration due to gravity (m s-2)
fluid conductivity (W m-1 K 1)
length (m)
heat transferred (VV)
a heat transfer coefficient (VV m-2 K1)
r mass flow per unit tube perimeter (kg s-1 m-1)
~T temperature difference (K)
'A latent heat of vaporization (J kg-1)
p, dynamic viscosity (kg m-1 s-1)
v kinematic viscosity (m2 s-1)
Subscripts c condensate stream condition
p at constant pressure
l_ condition at bottom of tube
Superscripts mean value
Dimensionless groups Modified Nusselt number:
Nu = ~(~f Prandtl number:
c J.L Pr = _P_
k
Film Reynolds number:
4r Re =-J.L
El Derivation of Wassner Form of Nusselt Equation (Equation 9.6)
Now under Nusselt's conditions;
(El)

E2
Now Wassner(1981) has expressed this as;
Nu = ___ 0_.7_9 __ _ c
(E2)
Now
(E3)
(E4)
and
= (E5)
So substituting equations E3-E5 into equation El we get
(E6)
Now rearranging the right hand side of equation E6 we get
(E7)

E3
Substituting equation E7 into the left side of equation E6 we get
-1
(E8)
-=> Nuc = 0.94
Thus Wassner must have used a coefficient of 1.17 (instead of 1.47) in Equation E1 to
arrive at Equation E2.
E2 Derivation of Wassner Form of Zazuli's Correction (Equation 9.7)
Now Zazuli' s correction can be expressed as;
Nu = ~ ~ = __lQ!_ - ( 2)% c k g R o.22
c ec .1.
Substituting equations E3-E5 into equation E9 we get
Now rearranging the right hand side of equation E10 we get
1.014.545 llc
4 .,..7 4.545 ,lVUc
(E9)
(E10)
(Ell)

E4
Substituting equation Ell into the left side of equation ElO we get
.,.7 5.545 = lVUc =
C LilT Pc c
( v; lYa APr -c c g
-= Nuc = 0.785
= 0.262
-0.18
C L llT - 1 Pc c
( v; l% APr -c c g
E3 Derivation of Wassner Form of Chun & Kim (1990) Correlation (Equation 9.8)
Chun & Kim's correlation is:
- a ( V2cl% -1V:3 6 089 094 2
AT c 1 33 R + 9.56xlo- Re · Pr · + 8.22xlo-1VUc = kc g = . ecj_ cj_ c
Now by substituting equations E3-5 into equation El3 we get;
(E12)
(E13)
Now taking the right side of E14 and 'solving' for I' by substitution in first term only;
1.333 llc r = -----------------------------
cj_ 4 [ N~c - 9.56x10⁻⁶ Re~~89 Pr~'94 - 0.0822 y (E15)

E5
Substituting equation E15 into left hand side of equation E14 we get;
(E16)
CP L 11Tc [ Nuc - 9.56x10⁻⁶ Re~89 Pr~'94 - 0.0822 r Equation E16 and the right hand side of equation E13 need to be solved together by
iteration to determine Rec ..L and mean Nuc.
E4 References
Chun M H & Kim K T (1990). Assessment of the new and existing correlations for
laminar and turbulent flow film condensations on a vertical surface. International
Communications in Heat and Mass Transfer, 17, 431-441.
Wassner L (1981). Warmetechnische auslegung von fallfilmverdampfern; Theorie und
Anwendung. Forschung im ingenieurwesen, 47, 4, 125-130.


Fl
APPENDIX F: WASSNER lVIETHOD FOR CALCULATING
OVERALL HEAT TRANSFER COEFFICIENTS
Nomenclature
Roman
A surface area (m2)
C specific heat of fluid (J kg·' K')
g acceleration due to gravity (m s·2)
k fluid conductivity (W m·' K 1)
L length (m)
N q
s T u
~
number of tubes in effect (-)
heat flow (W)
tube wall thickness (m)
temperature (K)
overall heat· transfer coefficient (W m·2 K 1)
a heat transfer coefficient (W m·2 K')
ilT temperature difference (K)
A. latent heat of vaporization (J kg-1)
p. dynamic viscosity (kg m·1 s-1)
u kinematic viscosity (m2 s·')
Hebrew
D mass evaporation rate (kg s-1)
0 mass condensation rate (kg s-1)
Subscripts
c condensate stream condition
e evaporating film condition
ID condition at wall inner surface
m mean
OD condition at wall outer surface
p at constant pressure
steam bulk steam condition
u overall
w wall condition
Dimensionless groups
Modified Nusselt number:
Prandtl number:
c 1..1. Pr = _P_
k
Wa:ssner's material parameter:
X
Wassner's pipe wall parameter:
s y = ---
(;r Wassner' s condensation parameter
incorporating ilTc:
z =
Wassner' s condensation parameter
incorporating Ll T u:
LATu z * ::: _ _..::._ __ _
vr,( ;r

F2
Assumptions
Wassner (1981) proposed a simple method for calculating the overall heat transfer coefficient
using dimensionless parameters. The method is based on the following assumptions and
simplifications;
1. The thickness of the condensate film, is approximated by a mean film thickness.
2. The effect of ripples in the condensate film is ignored.
3. The condensing temperature is assumed to be constant.
4. The system is at steady state.
Thus, Tw_ID• Tw_OD• Tsteam• and Teare constant over the full length of the tube.
Calculations
Under the above assumptions, the following heat balance equations apply;
Heat flow from the condensation side to the evaporation side
Heat flow into the falling film
__!1_ =a (T - Te) N !1T e W ""'e e A ID ID
Heat flow into the condensate film
Heat flow through the wall
where Am
(Fl)
(F2)
(F3)
(F4)
F3
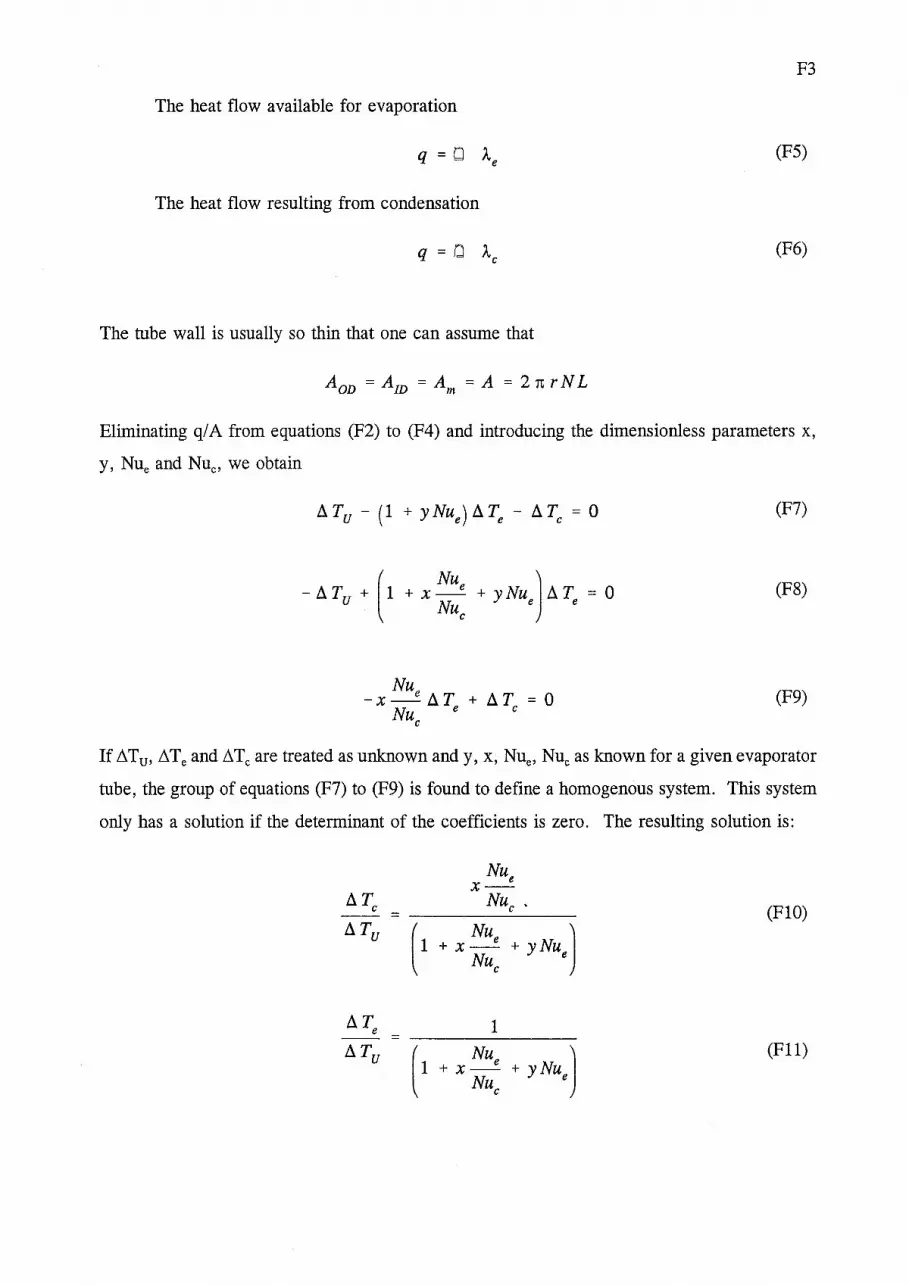
The heat flow available for evaporation
(F5)
The heat flow resulting from condensation
(F6)
The tube wall is usually so thin that one can assume that
A =A =A =A=2rr.rNL OD ID m
Eliminating q/A from equations (F2) to (F4) and introducing the dimensionless parameters x,
y, Nue and Nuc, we obtain
(F7)
(F8)
Nu -x-e ll.T + !::.T = 0
Nu e c c
(F9)
If ilTu, ilTe and ilTc are treated as unknown andy, x, Nue, Nuc as known for a given evaporator
tube, the group of equations (F7) to (F9) is found to define a homogenous system. This system
only has a solution if the determinant of the coefficients is zero. The resulting solution is:
Nue X-
!::.Tc Nuc. -- = (FlO) !::.Tu (1 Nu l + x-e + yNu
Nu e c
!::. Te 1 -- = !::.Tu (1 Nue
+ yNu, J +x-Nuc
(Fll)

F4
Now the Nusselt number of condensation for principally laminar flow can be expressed as
(Fl3)
The temperature difference Ll.Tc upon which Z is based can be eliminated using equation (FlO):
Nuc Z* = 0.79 1 + e Nuc 4 ( 1 + yNu l xNue
The above equation must be satisfied in addition to equations (FlO) to (Fll).
The Zazuli correction can be written as
Nu = 0.816 c 2 o.1s2s
(F14)
(F15)
So if the Zazuli correction (Chun & Seban, 1971) is to be used for Nuc the following equation
should solved instead of Equation F14:
( 1 + Y Nue l 0.264 1 + Nu
xNu c e
(F16)
References
ChunK R & Seban R A (1971). Heat transfer to evaporating liquid films. ASME Journal of
Heat Transfer, 93, 391-396.
Wassner L (1981). Warmetechnische auslegung von fallfilmverdampfem; Theorie und
Anwendung. Forschung im ingenieurwesen, 47, 4, 125-130.

G1
APPENDIX G: PHYSICAL PROPERTY CORRELATIONS
The correlations used for the physical properties of water, steam, sucrose solutions, skim milk
and stainless steel are given below in Framework III (Ashton Tate, Torrance, California, USA)
code format.
Gl Water Density
Description
Inputs
Functions Called
Output
Range of Applicability
Accuracy
Source
FW3 Code
Calculates the density of water given the temperature.
Temperature, oc
None
Density, kg m-3
For temperature range 0.01-100°C
Correlation coefficient, r = 100.0%. Maximum deviation
between calculated and base data was 0. 05%.
A regression equation fitted to 21 data points from Rogers
& Mayhew (1982, p10) using a stepwise multiple linear
regression package (Minitab Release 7.1, VAX/VMS
version, Minitab Inc., State College, Pennsylvania, USA).
;Called as @Water density (temperature)
@local (a, b, c, d, e, T, Tn, rho),
T @item1,
Tn (T-50.0)/50.0,
a -
b -
c -d -e -
rho -
@return (rho)
987.941,
-22.6324,
-8.0736,
1.7015,
-1.0838,
a+ b*Tn +c*TnA2 +d*TnA3 +e*TnA6,

G2
G2 Water Thennal Conductivity
Description
Inputs
Functions Called
Output
Range of Applicability
Accuracy
Source
FW3 Code
Calculates the thermal conductivity of water given the
temperature.
Temperature, oc
None
Thermal conductivity, W m-1 K 1
For temperature range 0.01-100°C.
Correlation coefficient, r2 = 100.0%. Maximum deviation
between calculated and base data was 0.12%.
A regression equation fitted to 21 data points from Rogers
& Mayhew (1982, p10) using a stepwise multiple linear
regression package (Mini tab Release 7.1, VAX/VMS
version, Minitab Inc., State College, Pennsylvania, USA).
;Called as @Water thennal cond (temperature)
@local (a, b, c, T, Tn, k),
T .- @item1,
Tn
a
b
c
k
-
----
(T -50.0)/50.0,
643.096,
55.6128,
-18.3148,
a+b*Tn+c*TnA2
@return (k/1000)

G3
G3 Water Specific Heat Capacity
Description
Inputs
Functions Called
Output
Range of Applicability
Accuracy
Source
FW3 Code
Calculates the specific heat capacity of water given the
temperature.
Temperature, oc
None
Specific heat capacity, J kg-1 K 1
For temperature range 0.01-100°C.
Correlation coefficient, r = 99.5%. Maximum deviation
between calculated and base data was 0.052%.
A regression equation fitted to 21 data points from Rogers
& Mayhew (1982, p10) using a stepwise multiple linear
regression package (Minitab Release 7.1, VAX/VMS
version, Minitab Inc., State College, Pennsylvania, USA).
;Called as @cp water (temperature)
@local (T, Tn, a, b, c, d, e, f, Cp 1),
T - @item1,
Tn - (T - 50.0)/50.0,
a - 4181.82,
b - 17.2038,
c - 11.900,
d - -13.1.82,
e - 40.47,
f - -19.414,
Cp _1 a +b*Tn+c*n~+d*Tn"3 +e*Tn"4+f*Tn"6,
@return(Cp 1)

G4
G4 Water Dynamic Viscosity
Description
Inputs
Functions Called
Output
Range of Applicability
Accuracy
Source
FW3 Code
Calculates the dynamic viscosity of water given the
temperature.
Temperature, oc
None
Dynamic viscosity, kg m-1 s-1
For temperature range 0.01-100°C.
Correlation coefficient, r2 = 100.0%. Maximum deviation
between calculated and base data was 0.1%.
A regression equation fitted to 21 data points from Rogers
& Mayhew (1982, p10) using a stepwise multiple linear
regression package (Minitab Release 7.1, VAX/VMS
version, Minitab Inc., State College, Pennsylvania, USA).
;Called as @water viscosity (temperature)
@local (a, b, c, d, e, f, g, T, Tn, mu _1),
T @item1,
Tn (T-50.0)/50,
a - 543.978,
b - -464.141,
c - 324.542,
d - -184.192,
e - 102.607,
f - -88.162,
g - 44.526,
mu 1 - a+b*Tn+c*TnA2+d*TnA3+e*TnA4
+ f*TnA5 + g*TnA6,
@return(mu _1*1e-6)

G5 Water Enthalpy
Description
Inputs
Functions Called
Output
Range of Applicability
Accuracy
Source
FW3 Code
G5
Calculates the enthalpy of water given the temperature.
Temperature, °C
None
Enthalpy, J kg-1
For temperature range 26.84-326.84°C.
Maximum deviation between calculated and base data
reported to be 0. 05 % .
Irvine & Liley (1984, p22).
;Called as @water hf (Temperature)
@local (a, e1, e2, e3, e4, e5, e6, e7, hfcr, tc, y),
a - 8.839230108e-1,
e1 - -2.67172935,
e2 - 6.22640035,
e3 - -1.31789573el,
e4 - -1.91322436,
e5 - 6.87937653el,
e6 - -1.24819906e2,
e7 - 7 .21435404el,
hfcr - 2.0993e3,
tc - (647,;3-(@item1 +273.16))/647.3,
y - a +el *tc+e2*tc*tc+e3*tc'''3 +e4*tc"4
+e5*tc" +e6*tc"6+e7*tc"7 '
@retum(y*hfcr)

G6
G6 Saturated Steam Pressure
Description
Inputs
Functions Called
Output
Range of Applicability
Accuracy
Source
FW3 Code
Calculates the (partial) pressure of saturated steam given
the temperature.
Temperature, oc
@exp {exponential function}
Pressure, bar absolute
For temperature range 0-374.14 °C.
Maximum deviation between calculated and base data
reported to be 0.1 % .
Irvine & Liley (1984, p21).
;Called as @steam sat press (temperature)
@ local(T ,aO ,a1, a2,a3 ,a4 ,a5, a6,a 7 ,a8 ,a9 ,a10 ,all),
T (@iteml +273.16),
aO - 0.104592e2,
a1 - -0.404897 e-2 *T,
a2 - -0.41752e-4*TA2,
a3 - 0.36851 e-6 *TA3,
a4 - -0.10152e-8*TA4,
a5 - 0. 8653le-12*TA5,
a6 - 0.903668e-15*TA6,
a7 - -0.19969e-17*TA7,
a8 - 0.779287e-21 ~'TA8,
a9 - 0.191482e-24*TA9,
a10 - -0.3 96806e4,
all - 0:395735e2,
@return(lO*@exp(aO+al +a2+a3 +a4+a5 +a6+a7 +aS
+a9+a10/(T-all)))
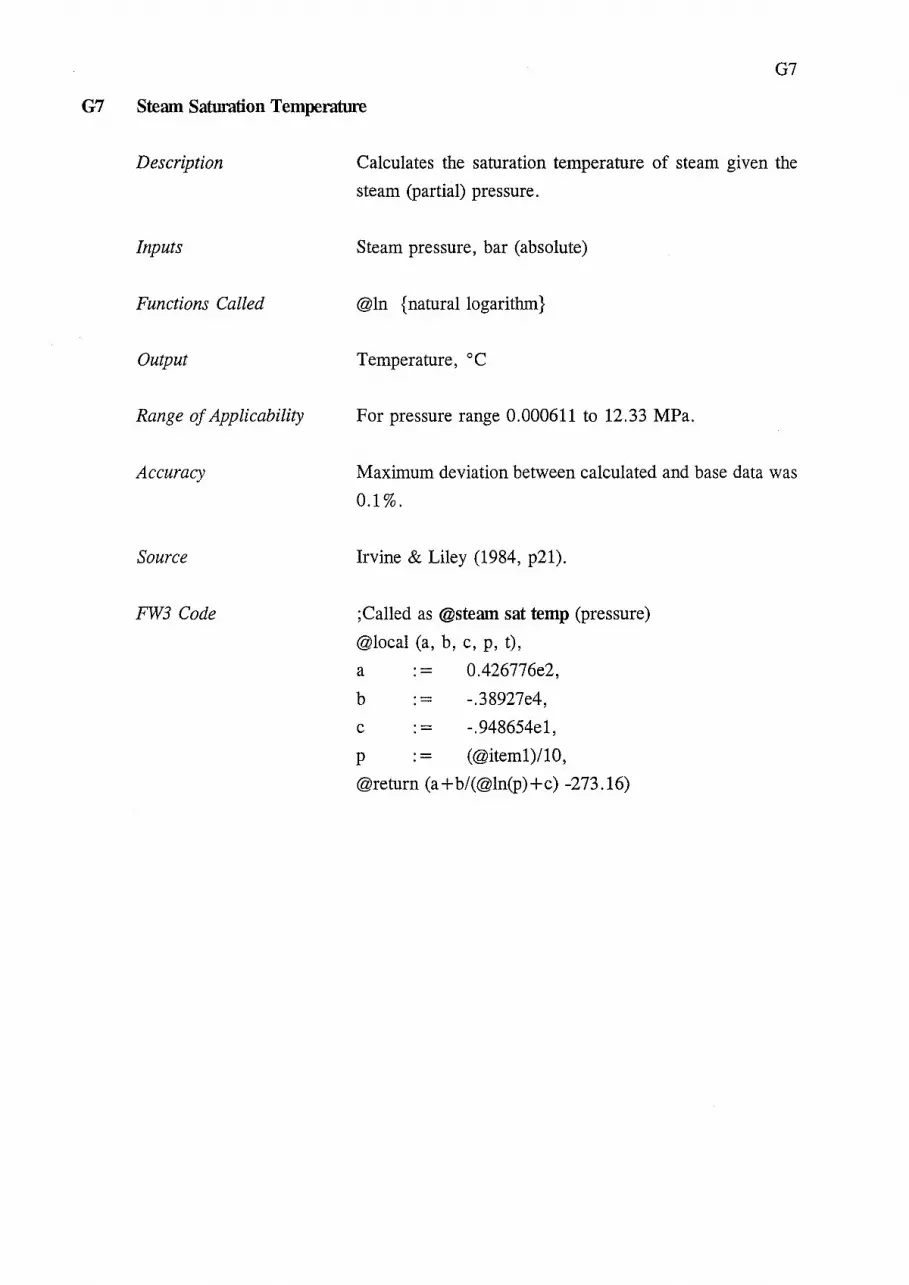
G7
G7 Steam Saturation Temperature
Description
Inputs
Functions Called
Output
Range of Applicability
Accuracy
Source
FW3 Code
Calculates the saturation temperature of steam given the
steam (partial) pressure.
Steam pressure, bar (absolute)
@ln {natural logarithm}
Temperature, oc
For pressure range 0.000611 to 12.33 MPa.
Maximum deviation between calculated and base data was
0.1%.
Irvine & Liley (1984, p21).
; Called as @steam sat temp (pressure)
@local (a, b, c, p, t),
a 0.426776e2,
b -.38927e4,
c -.948654e1,
p (@item1)/10,
@return (a+b/(@ln(p)+c) -273.16)

G8
G8 Saturated Steam Density
Description
Inputs
Functions Called
Output
Range of Applicability
Accuracy
Source
FW3 Code
Calculates the density of saturated steam given the
temperature.
Temperature, oc
@steam sat press(temperature) {steam pressure}
Density, kg m-3
For temperature range 0-374.14 oc.
Maximum deviation between calculated and base data was
0.1%.
Irvine & Liley (1984, p22).
;Called as @sat steam vap density (temperature)
@local (a, b, c, d, e1, e2, e3, e4, e5, vgcr, per, tc, y),
a 1.0,
b - 1,6351057'
c - 5 .2584599e1,
d - -4.4694653e1,
el - -8.9751114,
e2 - -4.384553e-1,
e3 - -1.9179576e1,
e4 - 3.6765319e1,
e5 - -1.9462437e1,
vgcr - 3.155e-3,
per - 2.2089e1,
tc - (647 .3-(@item1_ 273.16)/647 .3,
y - a+ b*tc"'(1/3) +c*tc"'(5/6) +d*tc"'(7 /8)
+el *tc+e2*tc"'2+e3*tc"'3+e4*tc"'4+e5*tc"'5
@return (@steam sat press(@item1)/10/y/pcr/vgcr)
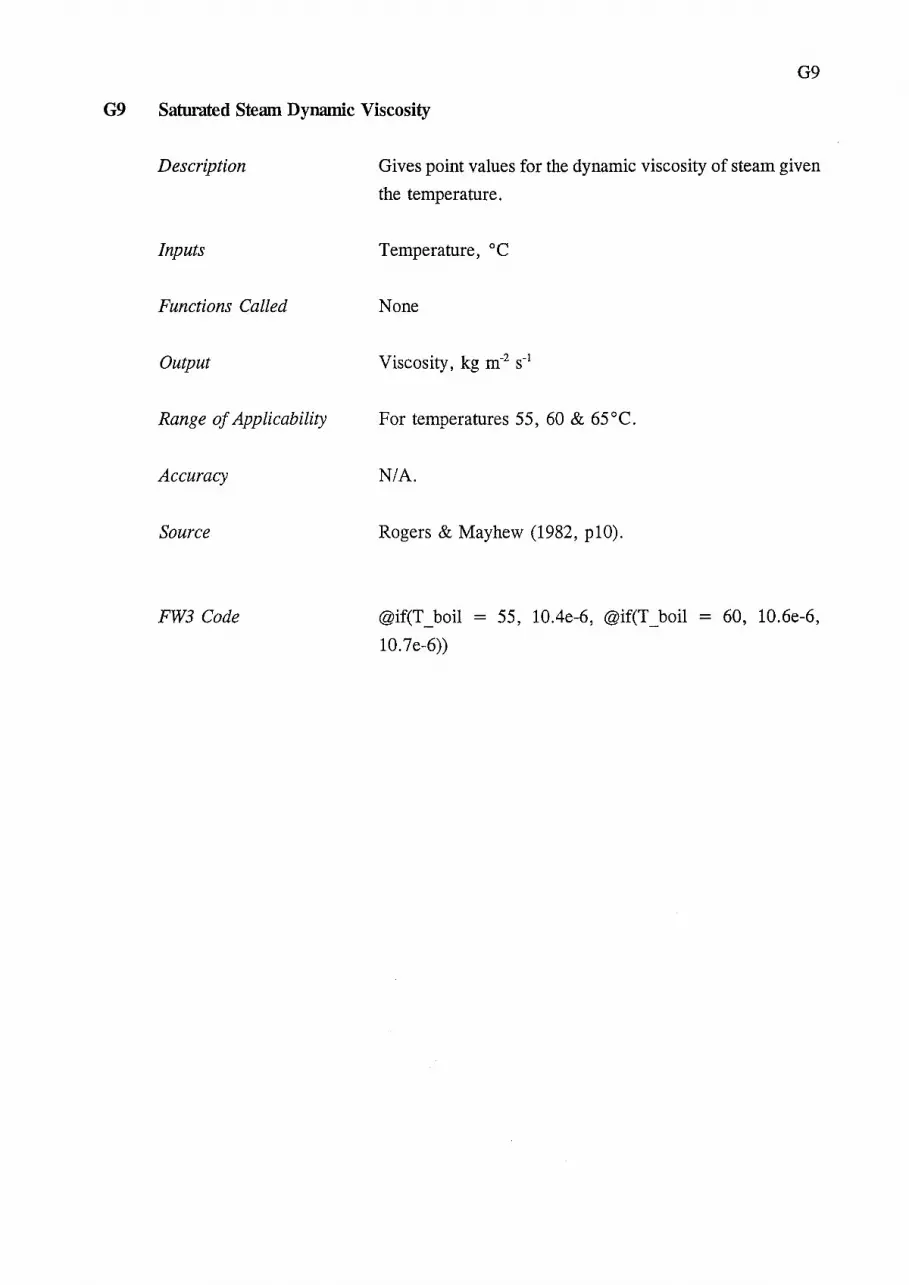
G9
G9 Saturated Steam Dynamic Viscosity
Description
Inputs
Functions Called
Output
Range of Applicability
Accuracy
Source
FW3 Code
Gives point values for the dynamic viscosity of steam given
the temperature.
Temperature, oc
None
Viscosity, kg m-2 s-1
For temperatures 55, 60 & 65°C.
N/A.
Rogers & Mayhew (1982, plO).
@if(T_boil = 55, 10.4e-6, @if(T_boil = 60, 10.6e-6,
10.7e-6))

GlO
GlO Steam Enthalpy
Description
Inputs
Functions Called
Output
Range of Applicability
Accuracy
Source
FW3 Code
Calculates the enthalpy of saturated steam given the
temperature.
Temperature, oc
None
Enthalpy, J kg-1
For temperature range 0-374.14°C.
Maximum deviation between calculated and base data was
0.05%.
Irvine & Liley (1984, p23).
;Called as @steam hg (temperature)
@local (a, b, c, d, e1, e2, e3, e4, e5, hgcr, tc, y),
a 1.0,
b - 4.57874342e-1,
c - 5.08441288,
d - -1.48513244,
e1 - -4.81351884,
e2 - 2.69411792,
e3 - -7.39064542,
e4 - 1.04961689e1,
e5 - -5.46840036,
hgcr - 2.0993e3,
tc - (647.3-(@item1 +273.16))/647.3,
y - a+ b*tc""(1/3)+c*tc""(5/6) +d*tc""(7 /8)
+e1 *tc+e2*tc""2+e3*tc""3 +e4*tc""4
+e5*tc""5,
@return (y*hgcr)

Gll Latent Heat of Vaporization
Description
Inputs
Functions Called
Output
Range of Applicability
Accuracy
Source
FW3 Code
Gll
Calculates the latent heat of vaporization of steam given the
temperature.
Temperature, oc
@steam hg(temperature), @water hf(temperature)
Latent heat of vaporization, J kg-1
For temperature range 26.84-362.84°C.
See Sections G2.4 & Gl.5.
See Sections G2.4 & Gl.5.
;Called as @steam hfg (temperature)
@return (@steam hg(@iteml)-@water hf (@iteml))

G12
G12 Sucrose Density at 20° C
Description
Inputs
Functions Called
Output
Range of Applicability
Accuracy
Source
FW3 Code
Calculates the density of sucrose solutions at 20°C given
the sucrose concentration.
Concentration, % w /w
None
Density, kg m-3
For sucrose concentration range 0-83 %w/w.
Maximum deviation between calculated and base data was
0.051%.
A regression equation fitted to 84 data points from
Pancoast & Junk (1980, p54-62) using a spreadsheet
package (Framework III, Ashton Tate, Torrance,
California, USA).
;Called as @sugar density20 (concentration)
@local (a, b, c, d, S, rho20),
S (@iteml-41.5)/41.5,
a 1183.20,
b
c
d
216.147,
30.9247,
0.27466,
rho20 a+b*S+c*S"2+d*S"3 . ' @return (rho20)
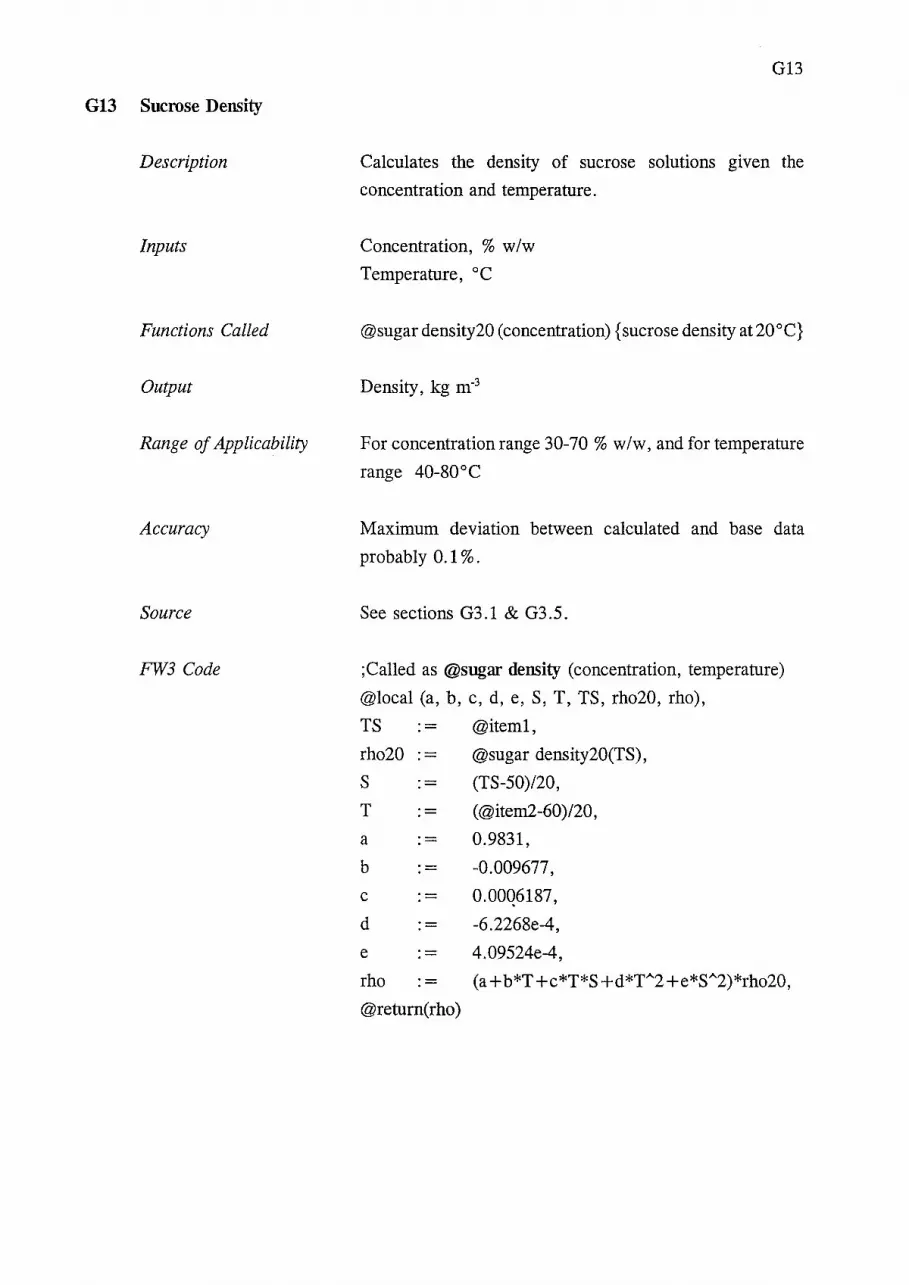
G13 Sucrose Density
Description
Inputs
Functions Called
Output
Range of Applicability
Accuracy
Source
FW3 Code
G13
Calculates the density of sucrose solutions given the
concentration and temperature.
Concentration, % w /w
Temperature, oc
@sugar density20 (concentration) {sucrose density at20°C}
Density, kg m-3
For concentration range 30-70 % w /w, and for temperature
range 40-80 a C
Maximum deviation between calculated and base data
probably 0.1%.
See sections G3.1 & G3.5.
; Called as @sugar density (concentration, temperature)
@local (a, b, c, d, e, S, T, TS, rho20, rho),
TS @iteml,
rho20 - @sugar density20(TS),
s - (TS-50)/20,
T - (@item2-60)/20,
a - 0.9831,
b - -0.009677,
c - O.OOQ6187,
d - -6.2268e-4,
e - 4.09524e-4,
rho - (a +b*T +c*T*S +d*TA2+e*SA2)*rho20,
@return( rho)

G14
G14 Sucrose Density Temperature Correction Factor
Description
Inputs
Functions Called
Output
Range of Applicability
Accuracy
Source
FW3 Code
Calculates the temperature correction factor for the density
of sucrose solutions given the concentration and
temperature. Used to determine the density at any given
temperature from the density at 20°C.
Concentration, % w /w
Temperature, oc
None
Temperature correction factor, {dimensionless}
For. concentration range 30-70 % w/w, and temperature
range 40-80 o C.
Maximum deviation between calculated and base data was
0.035%.
A regression equation fitted to 45 data points from
Pancoast & Junk (1980, p66) using a spreadsheet package
(Framework III, Aston Tate, Torrance, California, USA).
;Called as @sugar density temp corr (concentration,
temperature)
@local (a, b, c, d, e, S, T, rho_c),
s - (@item1-50)/:f0,
T - (@item2-60)/20,
a - 0.9831,
b - -0.009677,
c - 0.0006187,
d - -6.2268e-4,
e - 4.09524e-4,
rho c:= a+b*T+c*T*S+d*T .... 2+e*S'''2,
@return (rho_ c)

GIS Sucrose Concentration
Description
Inputs
Functions Called
Output
Range of Applicability
Accuracy
Source
FW3 Code
G15
Calculates the concentration of sucrose solutions given the
density and temperature.
Density, kg m-3
Temperature, oc
@sugar density temp corr (concentration, temperature)
Concentration, % w /w
For density range 1000-1430 kg m-3, and temperature range
40-80 oc
See Section G3 .2.
As per Section G3.1 & G3.5.
;Called as @sugar total solids (density, temperature)
@local(a,b,c,d,e,D,Den,rho_c,rho20,T,TS20,TS,TdegC),
a 43.464,
b - 41.386717,
c - -5.60709,
d - 1.02854,
e - -0.42607,
TS - 40,
TS20 - 50,
Den - @iterp.1,
TdegC : = @item2,
@while (@abs (TS-TS20) > 0.03,
TS TS20,
rho c @sugar density temp corr (TS, TdegC),
rho20 Denlrho_c,
D (rho20 - 1193.76)/433.53*2,
TS20 a+b*D+c*D"'2+d*D"'3 +e*D"'4),
@retum(TS)

G16
G16 Sucrose Thermal Conductivity
Description
Inputs
Functions Called
Output
Range of Applicability
Accuracy
Source
FW3 Code
Calculates the thermal conductivity of sucrose solutions
given the concentration and temperature.
Concentration, % w /w
Temperature, °C
None
Thermal conductivity, W m-1 K 1
For concentration range 40-60 %w/w {No data available
beyond 60 %w/w}, and temperature range 50-70°C.
Maximum deviation between calculated and base data was
0.5%.
A regression equation fitted to 9 data points from
Honig (1953, p27) using a spreadsheet package
(Framework III, Ashton Tate, Torrance, California, USA).
;Called as @sugar thermal conductivity (concentration,
temperature)
@local (Z,T,k, aO, a1, a2),
Z @item1,
T -aO -a1 -a2 -
@item2,
0.512, ; kcal/m.h.K
0.0008,
-0.0030,
k a0+a1 *T+a2*Z,
@return (k*4190/3600)

G17 Sucrose Dynamic Viscosity
Description
Inputs
Functions Called
Output
Range of Applicability
Accuracy
Source
FW3 Code
G17
Calculates the dynamic viscosity of sucrose solutions given
the concentration and temperature.
Concentration, % w /w Temperature, oc
@exp {exponential function}
Dynamic viscosity, kg m-1 s-1
For concentration range 35-75 % w/w, and temperature range 40-80 o C.
Maximum deviation between calculated and base data was
3. 9% . The base data is shown in Figure G 1 and the
percentage deviation in Figure G2.
A regression equation fitted to 81 data points from
Pancoast & Junk (1980, p46-47) using a spreadsheet and
plotting package (SigmaPlot 5.0, Jande! Scientific, USA).
;Called as @sugar viscosity (concentration, temperature)
@local (a, b, c, d, e, f, g, h, i, j, k, T, S, mu),
S @iteml,
T @item2,
a 4.38,
b - -0.2683,
c - 8.867e-3,
d - -1.076e-4,
e - 6.539-7,
f - -4.294e-2, g - 7.885e-5,
h - -1.17e-6,
1 - 7.398e-4,
j - 6.026e-6,
k - -2.131e-5,
mu - a+b*S+c*S"'2+d*S"'3+e*S"'4+f*T
+ g*T"'2 + h *T"'3 + i *T*S + j *T"'2 *S
+k*T*S"'2,
mu - @exp(mu)
@return (mu*1e-3)
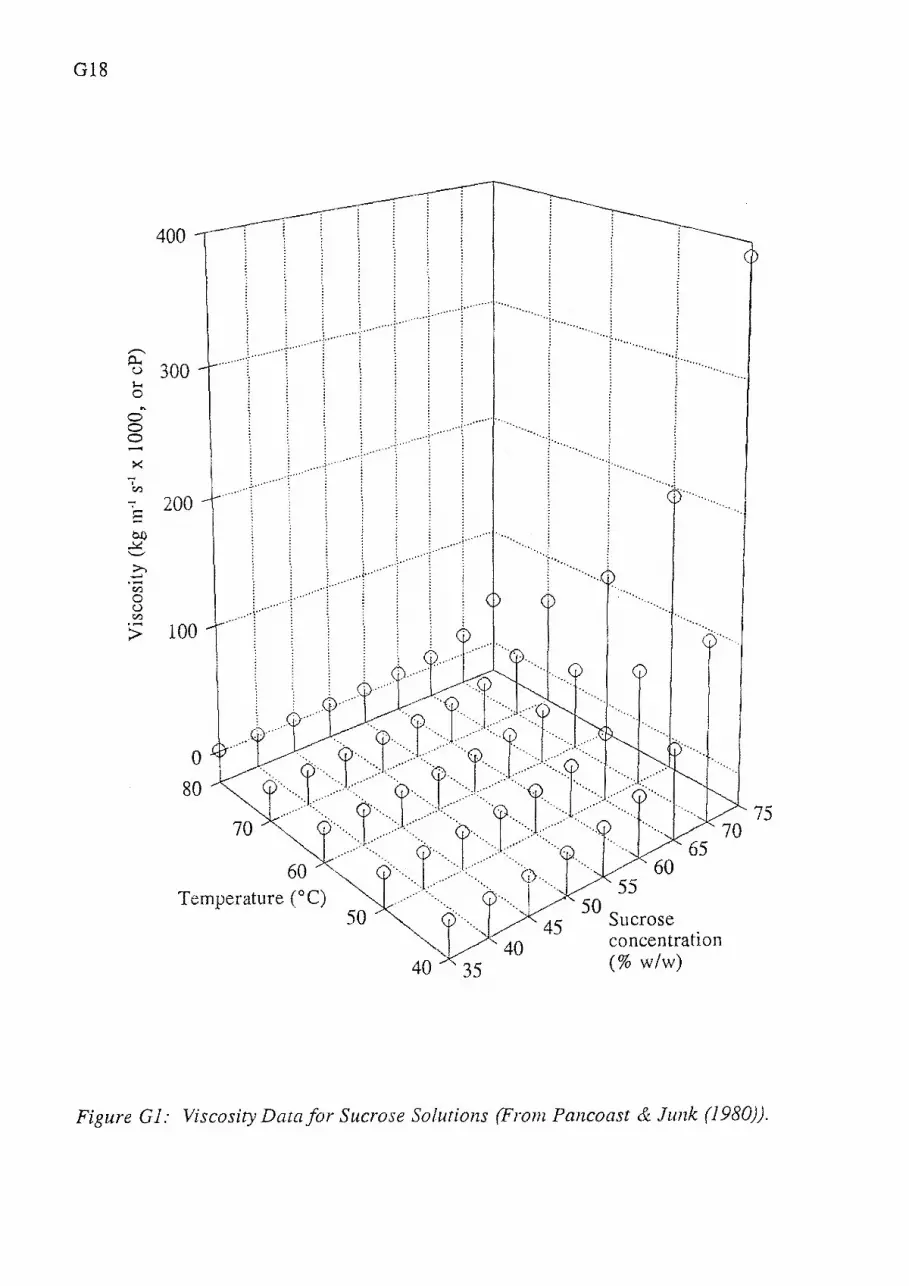
Gl8
400
-.. ~ 300 1-. 0
0 0 0
' 200 E ~ "--'
0 <Zl 0 u <Zl > 100
0
....... ···· ··... ······ .. .... ·· ··. . · ..
80 70. rr ..... <vll······ .. 60 ···· .... cp >:t··.... ···.... ··· ....
··· ... [ ...... ·· ·. ··... ·-... . Temperature CO C) .... · ..
50 concentration (% w/w)
75
Figure Gl: Viscosity Data for Sucrose Solutions (From Pancoast & Junk (1980)).

~ 4
2
0
·· ........ .
Temperature CO C) 50
'·· ...... . ::--::···
.. ::::. · .. ····· .... '•,
·· ...
... ······ '•,
. ..... :::
...
....
.. -::
·· ..
. . .. ·· ..
·······l····· ···:·······
········r···· ·········f···· ·········
Sucrose concentration
(% w/w)
Figure G2: Difference Between Fitted Regression Equation and Viscosity Data from Pancoast & Junk (1980).
Gl9

G20
G18 Sucrose Enthalpy
Description
Inputs
Functions Called
Output
Range of Applicability
Accuracy
Source
FW3 Code
Calculates the enthalpy of sucrose solutions given the
concentration and temperature.
Concentration, % w/w
Temperature, oc
None
Enthalpy, J kg-1
For concentration range 30-80 % w /w, and temperature
range 40-80 o C.
Maximum deviation between calculated and base data was
1.23%.
Adapted from specific heat capacity and heat of solution
data (Pancoast & Junk, 1980, p51) based on water enthalpy
being zero at triple point. The resulting enthalpy diagram
is shown in Figure 27 .1.
;Called as @sugar hf (concentration, temperature)
@local (a, b, c, d, e, f, g, S, T, H),
S @item1,
T -a -b -c -d -e -f -g -H -
@return (H)
@item2,
2.08091,
0.44692,
-0.00207
3.9247e-5,
4.05658,
0.00135,
-0.021046,
a+b*S+c*S"'2+d*s"'3+e*T+f*T"'2
+g*T*S,
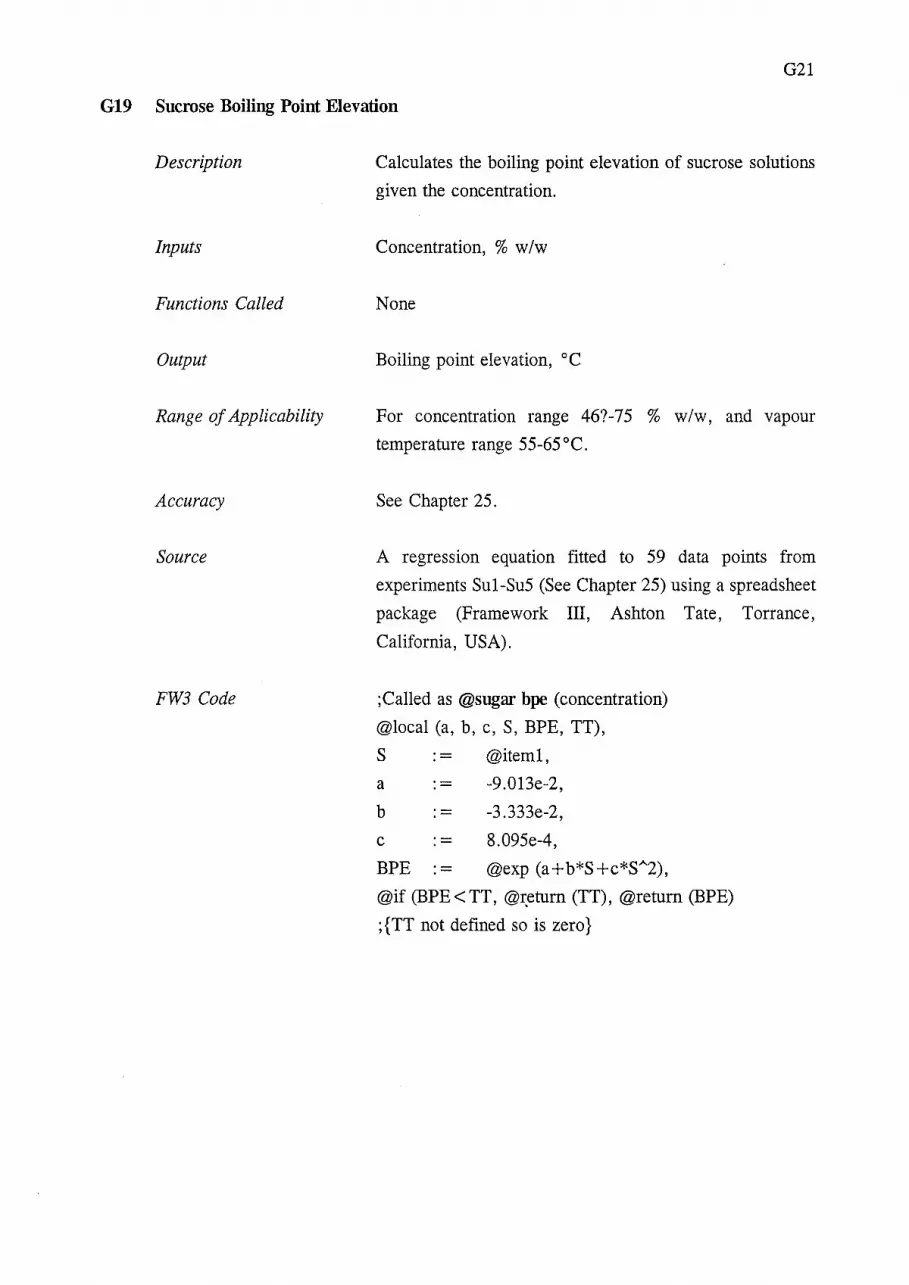
G21
G19 Sucrose Boiling Point Elevation
Description
Inputs
Functions Called
Output
Range of Applicability
Accuracy
Source
FW3 Code
Calculates the boiling point elevation of sucrose solutions
given the concentration.
Concentration, % w/w
None
Boiling point elevation, oc
For concentration range 46?-75 % w/w, and vapour
temperature range 55-65°C.
See Chapter 25.
A regression equation fitted to 59 data points from
experiments Sul-Su5 (See Chapter 25) using a spreadsheet
package (Framework III, Ashton Tate, Torrance,
California, USA).
;Called as @sugar bpe (concentration)
@local (a, b, c, S, BPE, TT),
S @iteml,
a - -9.013e-2,
b = -3.333e-2,
c = 8.095e-4,
BPE @exp (a+b*S+c*SA2),
@if (BPE < TT, @r:eturn (TT), @return (BPE)
; {TT not defined so is zero}

G22
G20 Skim Milk Density
Description
Inputs
Functions Called
Output
Range of Applicability
Accuracy
Source
FW3 Code
Calculates the density of skim milk concentrates given the
concentration and temperature.
Concentration, % w /w
Temperature, oc
None
Density, kg m-3
For concentration range, 9-50 % w/w.
Dependent on composition.
The formula was obtained by multiple linear regression
from the data of Hall & Hedrick (1966, p323) by NZDRI.
The intercept was adjusted slightly to improve the fit to
New Zealand milk.
;Called as @skim density (concentration, temperature)
@local (k1, k2, k3, k4, k5, k6, c, t),
k1 989,
k2 0.064,
k3 - 0.0024,
k4 - 0.0076,
k5 - 3.75,
k6 - 0.0166,
c @item1,
t @item2,
@return (((2*k6*c-(k4*t-k5))"2-(k4*t-k5)"2
+4*k6*(k1-t*(k2 + k3*t)))/4/k6)

G21 Milk Thennal Conductivity
Description
Inputs
Functions Called
Output
Range of Applicability
Accuracy
Source
FW3 Code
G23
Calculates the thermal conductivity of milk concentrates
given the solids concentration, fat concentration and
temperature.
Solids concentration, % w /w
Fat concentration on dry basis) % w fat I w solids
Temperature, oc
@water thermal cond (temperature)
Thermal conductivity, W m·1 K-1
Whole milk data concentration range 12-32 % w/w, Skim
milk at 9 % w/w. Data at 20 and 80°C.
Likely to be poor.
A regression equation fitted to 8 data points from Hall &
Hedrick (1971, p35) and the thermal conductivity of water
(Rogers & Mayhew, 1982, p10) using a spreadsheet
package (Framework III, Ashton Tate, Torrance,
California, USA).
;Called as @milk thermal cond (solids concentration,
temperature, fat concentration on dry basis)
@local (a, b, w, T, TS, Fat, k),
T @item2,
TS @item1,
Fat @item3/100,
@if(TS : = 0, Fat : = 0),
a 0.004,
b
w
k
@return (k)
0.04,
@water thermal cond(T),
w-a *TS-b*Fat,

G24
G22 Skim Milk Specific Heat Capacity
Description
Inputs
Functions Called
Output
Range of Applicability
Accuracy
Source
FW3 Code
Calculates the specific heat capacity of skim milk at 60°C
given the concentration.
Concentration, % w /w
None
Specific heat capacity, J kg-1 K 1
Concentration range 0-40 % w /w
Correlation coefficient, r = 99.90%.
A regression equation1 fitted to 3 data points from Wood
(1982, p3. 7) and the specific heat capacity of water
(Rogers & Mayhew, 1982, p10) using a spreadsheet
package (Framework III, Ashton Tate, Torrance,
California, USA).
; Called as @cp skim milk (concentration)
@local (a, b, c, Z, Cp),
a 4182,
b - -13.973,
c - -0.26653,
z - @item1,
Cp - a+b*Z+c*ZA2,
@return (Cp)
A first order correlation would actually be more appropriate here, but this second order equation is accurate
within the range stated. I recommend using Cp_milk(T) = Cp_water(T) * (l-0.6*S/100).

G25
G23 Skim Milk Kinematic Viscosity
Description
Inputs
Functions Called
Output
Range of Applicability
Accuracy
Source
FW3 Code
Calculates the kinematic viscosity of skim milk at 60°C
given the concentration.
Concentration, % w /w
@exp {exponential function}
Kinematic viscosity, m2 s
For concentration range 0-40 % w/w.
Maximum deviation between calculated and base data was
7%.
A regression equation fitted to 9 data points from Wood
(1982, p1.14) using a spreadsheet package (Framework III,
Ashton Tate, Torrance, California, USA).
; Called as @nu skim milk (concentration)
@local (a, b, c, d, e, Z, nu),
a -0.73839,
b 0.007136,
c - 0.005857,
d - -0.00026025'
e ·-' 4.1208e-6,
z - @iteml,
nu - @ex~ (a +b*Z+c*Z"'2+d*Z"'3 +e*Z"'4),
nu - nu*le-6,
@return (nu)
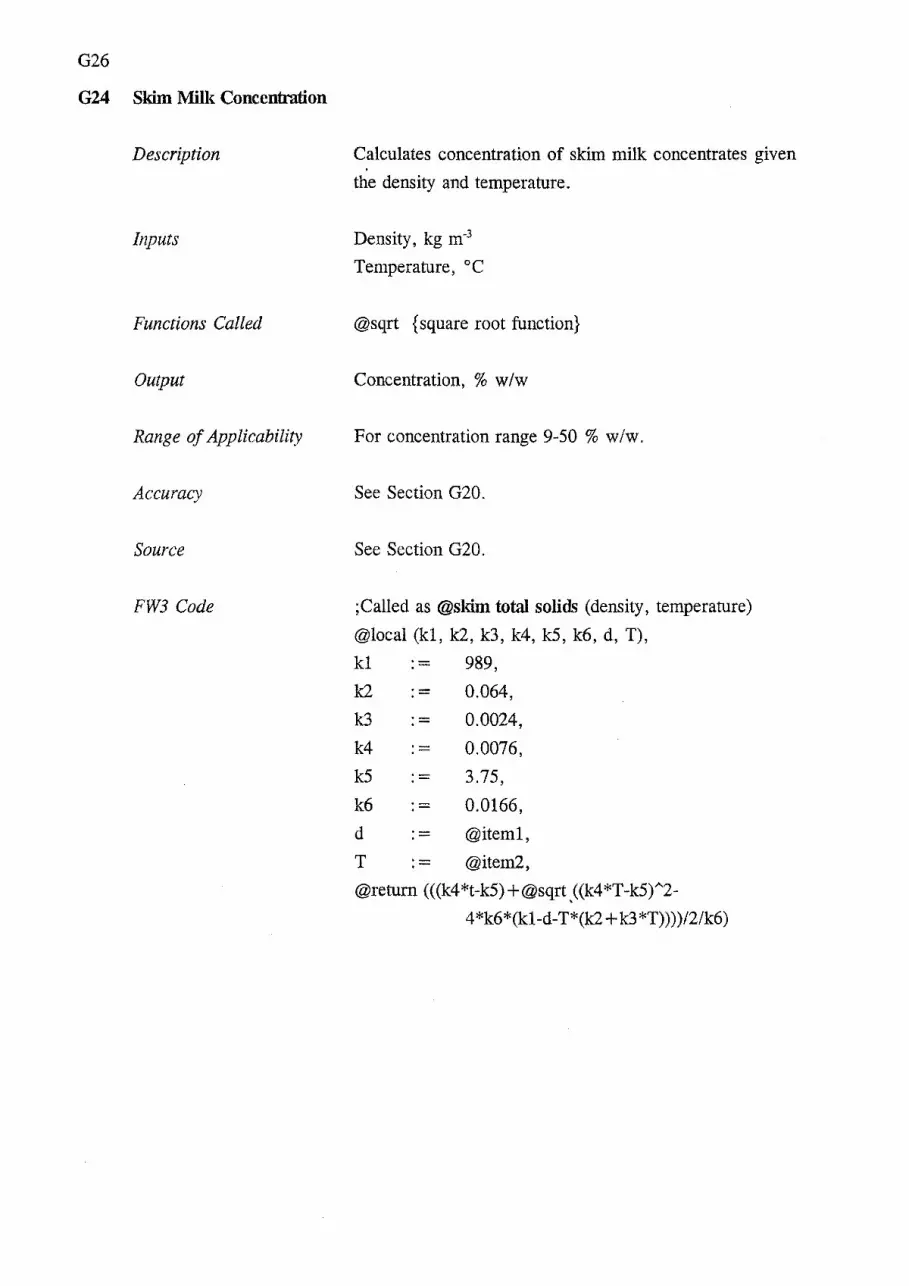
G26
G24 Skim Milk Concentration
Description
Inputs
Functions Called
Output
Range of Applicability
Accuracy
Source
FW3 Code
Calculates concentration of skim milk concentrates given
the density and temperature.
Density, kg m-3
Temperature, oc
@sqrt {square root function}
Concentration, % w /w
For concentration range 9-50 % w/w.
See Section G20.
See Section G20.
;Called as @skim total solids (density, temperature)
@local (kl, k2, k3, k4, k5, k6, d, T),
kl 989,
k2 0.064,
k3 - 0.0024,
k4 - 0.0076,
k5 - 3.75,
k6 - 0.0166,
d - @iteml,
T @item2,
@return (((k4*t-k5)+@sqrt .((k4*T-k5)A2-
4*k6*(kl-d-T*(k2 + k3*T))))/2/k6)

G27
G25 Skim Milk Boiling Point Elevation
Description
Inputs
Functions Called
Output
Range of Applicability
Accuracy
Source
FW3 Code
Calculates the boiling point elevation of skim milk
concentrates at 60°C.
Concentration, %w/w
None
Boiling point elevation, oc
18-48 % w/w total solids
See Chapter 31.
A regression equation fitted to 11 data points from
Experiment SU1 (see Chapter 31) using a spreadsheet
package (Framework III, Ashton Tate, Torrance,
California, USA).
; Called as @skim bpe (concentration)
@local (a, b, c, Z, BPE, TT),
Z @item1,
a
b
c
BPE
TT
-
---
-
-0.00465,
0.00278,
0.000294,
a+b*Z+c*ZA2,
0.001,
@if (BPE < 0. 0, ~return (TT), @return (BPE))

G28
G26 Thermal Conductivity of 316 Stainless Steel
Description
Inputs
Functions Called
Output
Range of Applicability
Accuracy
Source
FW3 Code
Calculates the thermal conductivity of ANSI 316 stainless
steel given the temperature.
Temperature, oc
None
Thermal conductivity, W m-1 K 1
For temperature range 26.85-726.85°C.
Correlation coefficient, r2 = 99.91%.
A regression equation fitted to 4 data points from Incropera
& DeWitt (1990, pA5) using a stepwise multiple linear
regression package (Mini tab Release 7.1, VAX/VMS
version, Minitab Inc., State College, Pennsylvania, USA).
;Called as @SS316 thermal cond (temperature)
@local (a, b, T, kw),
T @item1,
a 13.16,
b 0.01534,
kw a+b*T,
@return (kw)

G29
G27 References
Hall C W & Hedrick T I (1966). Drying of Milk and Milk Products. AVI Publishing Company
Inc. , Westport Connecticut.
Hall C W & Hedrick T I (1971). Drying of Milk and Milk Products, 2nd edn., A VI Publishing
Company Inc., Westport Connecticut.
Honig P (1953). Sugar Technology, Volume 1 - Properties of sugars and nonsugars, the
purification of juices. Elsevier Publishing Co, Amsterdam.
Incropera F P & DeWitt D P (1990). Fundamentals of Heat and Mass Transfer, 3rd edn., John
Wiley & Sons, New York.
Irvine T F & Liley P E (1984). Steam and Gas Tables with Computer Equations. Academic
Press, Orlando.
Pancoast, H M & Junk W R (1980). Handbook of Sugars. 2nd edn., AVI Publishing Co,
Westport, Connecticut.
Rogers G F C & Mayhew Y R (1982). Thermodynamic and Transport Properties of Fluids, SI
Units. 3rct edn., Basil Blackwell, Oxford.
Wood P W (1982). Physical Properties of Dairy Products. 2nd edn. Report T2/82, Ministry of
Agriculture and Fisheries, Wellington.


H1
APPENDIX H: INTEGRATION OF LOCAL NUSSELT
NUMBER OVER TUBE LENGTH
The integration was done using a spreadsheet package (Framework III, Version 1.1, Ashton-Tate
Corporation, Torrance, California, USA). Two integration spreadsheets were created, the first
uses Billet (1989) boiling side local Nusselt number correlations and the second uses Chun &
Seban (1971) boiling side local Nusselt number correlations. The calculation procedure for both
spreadsheets is given below. The steps that are only in one spreadsheet or are different are
noted by the inclusion of a B (for Billet) or CS (for Chun & Seban) after the step number. A
step size of 0.5 m for the 15m tube was found to be optimal and a step size of 0.33 m was used
for the 10m tube.
A similar spreadsheet was developed for water, in which Steps 8, 20 & 46 were omitted and
Steps 18, 28, 48 and 50 were modified to give the properties of water.
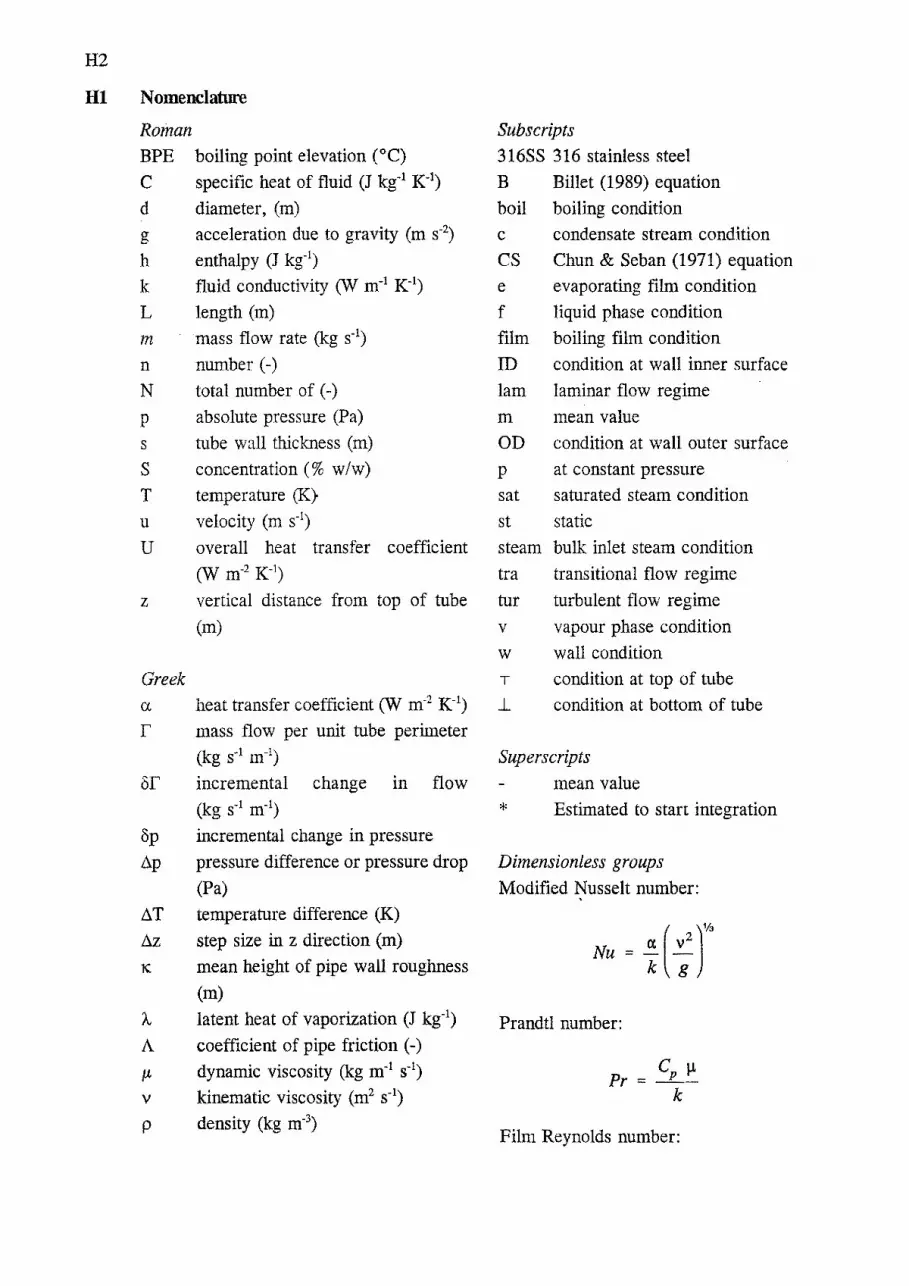
H2
Hl Nomenclature
Roman BPE boiling point elevation CC)
C specific heat of fluid (J kg·1 K-1)
d g
h k L m n
N p
s
s T u u
z
Greek
diameter, (m)
acceleration due to gravity (m s·2)
enthalpy (J kg-1)
fluid conductivity (J{ m·1 K·1)
length (m)
mass flow rate (kg s·1)
number(-)
total number of (-)
absolute pressure (Pa)
tube wall thickness (m)
concentration(% w/w)
temperature (K}
velocity (m s·1)
overall heat transfer coefficient 0N m-2 K-1)
vertical distance from top of tube
(m)
Subscripts 316SS 316 stainless steel
B Billet (1989) equation
boil boiling condition
c condensate stream condition
CS Chun & Seban (1971) equation
e evaporating film condition
f liquid phase condition
film boiling film condition
ID condition at wall inner surface
lam laminar flow regime
m mean value
OD condition at wall outer surface
p at constant pressure
sat saturated steam condition
st static
steam bulk inlet steam condition
tra transitional flow regime
tur turbulent flow regime
v vapour phase condition
w wall condition
T
heat transfer coefficient 0N m·2 K-1) ..L
condition at top of tube
condition at bottom of tube
r mass flow per unit tube perimeter
(kg s·1 m·1) Superscripts or
op Ap
AT
Az
p
incremental change in flow
(kg s-1 m·1)
incremental change in pressure
pressure difference or pressure drop
(Pa)
temperature difference (K)
step size in z direction (m)
mean height of pipe wall roughness
(m)
latent heat of vaporization (J kg-1)
coefficient of pipe friction (-)
dynamic viscosity (kg m·1 s·1)
kinematic viscosity (m2 s-1)
density (kg m-3)
mean value
* Estimated to start integration
Dimensionless groups Modified Nusselt number:
ex v2
( )
'Ia
Nu =kg
Prandtl number:
c IJ. Pr = _P_
k
Film Reynolds number:

H3
H2 Inputs Re 4r
(1) Temperature of vapour ex-tube, Tboil• !.1.
(2) Steam side saturation temperature, Tsat
steam•
(3) Tube internal diameter, dm,
(4) Separator entry duct diameter, dduct•
(5) Tube length, L,
(6) Feed mass flow rate, mreed•
(7) Flash mass flow rate, mnash•
(8) Sucrose Concentration after flash, ST,
(9) Assumed mean height of surface roughness, K.
H3 Constants
(10) Step size in z, !::.z,
(11) Tube wall thickness, sw
H4 Initial Calculations
(12) Number of steps in z, Na.z:
L· N ==-az Llz
(13) Tube outer diameter, d00 :
(14) Mean tube diameter, dm:

H4
(15) Condensate properties at Tsatsteam (assumes condensate temperature is the same as
the saturated steam temperature).
(16) Boiling side vapour properties calculated at Tboil (assumes vapour properties are
constant over the length of the tube).
(17) Wall heat transfer coefficient, hw:
(18) Boiling point elevation at top:
(19) Set distance from top of tube at zero:
z(O) = 0
(20) Set sucrose concentration at top:
S(O) = ST
(21) Set condensate flow at top:

H5
(22) Set condensate liquid loading at top:
(23) Set condensate Reynolds number at top:
(24) Chun & Seban (1971) laminar to turbulent point for condensate:
(25) Boiling side liquid mass flow rate at top:
(26) Boiling side vapour mass flow rate at top:
H5 Iterative Calculations
Steps 27 to 81 were iteratively calculated until the change in the mean values of Se, Tmm•
Ree, Pre, Nuc, Nue, U and the value of t1p was insignificant. i.e. The consecutive values
of the Nusselt numbers agreed to within 3 decimal places, and the other values agreed
to within 1 decimal place. Starred terms in an equation means that an assumed value was
used initially to start the iterative process.
At n = 0 (z = 0)
(27) Boiling side film mean temperature at top:
(28) Film properties at top:
Thermal conductivity

H6
Dynamic viscosity
Specific heat capacity
Density
(29) Boiling side liquid loading at top:
(30) Film Reynolds number at top:
4r (O) Re (0) = e
e j.Le(O)
(31) Film Prandtl number:
(32B) Billet (1989) transitional power term at top:
n (0) = 0.196 - 0·844
B Pre(O) + 2.95 (10.15)
(33B) Billet (1989) laminar to transition point at top:
(10.13)
(34B) Billet (1989) transitional to turbulent point at top:
ReI (0) = f(o.625 _ 3.21 l4n8 (0)]n8 (0)-0.231 e tra-tur l Pre(O) + 5.47
(10.14)

H7
(35CS) Chun & Seban (1971) laminar to turbulent point at top:
(10.9)
(36) Vapour core diameter at top:
(cf 10.1)
(37) Mean vapour velocity at top:
(38) Vapour Reynolds number at top:
(39) Pipe friction factor (see Appendix HA) at top:
(40) Incremental pressure drop at top:
(41) Total pressure at top (right hand side parameters determined in steps 79 & 81):
(42) Static pressure at top (from Benedict (1984, p338), assumes that the vapour is
incompressible):
If Rev(O) < 2300 then
Pst(O) == p(O)- Pv{uv(0))2
Else
Pst(O) :: p(O)-1~1 Pv{uv(0))2
End If

H8
(43) Local vapour static temperature at top:
For n = 1 toN&.
(44) Boiling side liquid mass flow rate at z(n):
(45) Condensate mass flow rate at z(n), ignoring sensible heating of boiling liquid due
to boiling point elevation:
(46) Sucrose concentration at z(n):
m (n -1) S(n) = S(n -1) _e --
me(n)
(47) Distance from top at z(n):
z ( n) = z ( n - 1 ) + llz
( 48) Boiling point elevation at z(n):
BPE(n) = BPEsugar(S(n))
(49) Boiling side film mean temperature at z(n):
(50) Film properties at n:
Thermal conductivity
Dynamic viscosity

H9
Specific heat capacity
Density
(51) Boiling side liquid loading at z(n):
(52) Film Reynolds number at z(n):
(53) Film Prandtl number at z(n):
(54) Condensate liquid loading at z(n):
(55) Condensate Reynolds number at z(n):
4 r (n) Re (0) = c
c llc
(56B) Billet (1989) transitional power term at z(n):
n (n) = 0.196 - 0·844 B Pre(n) + 2.95
(10.15)
(57B) Billet (1989) laminar to transition point at z(n):
1 (10.13)

H10
(58B) Billet (1989) transitional to turbulent point at z(n):
ReI (n) = [(0.625 _ 3.21 l4nB(n)]nB(n)-0231 e tra-tur Pre(n) + 5.47
1
(10.14)
(59CS) Chun & Seban (1971) laminar to turbulent point at z(n):
(10.9)
(60B) Determine whether Billet (1989) predicts that the boiling liquid flow is laminar,
transitional or turbulent for 11z between z(n-1) and z(n):
(Re (n-1) +Re (n)l (ReeiB (n-1) +ReeiB (n)) If e e < lam-tra Iam-tra then
2 2 Flow(n) = laminar
Else '
(Re (n-1) +Re (n)l (ReeiB (n-1) +ReeiB (n)) If e e < tra-tur tra-tur then
2 2 Flow ( n) = transitional
Else Flow( n) = turbulent
Endlf Endlf
(60CS) Determine whether Chun & Seban (1971) predicts that the boiling liquid
flow is laminar or turbulent for l1z between z(n-1) and z(n):
( Re ( n - 1 ) + Re ( n) l ( Re e I cs ( n - 1 ) + Re e I cs ( n) ) If e e < lam-tur lam-tur then
2 2 Flow(n) = laminar
Else Flow(n) = turbulent
Endlf

Hll
(61) Chun & Seban (1971)'s local Nusselt number for condensate film1 for liz between
z(n-1) and z(n):
(Re(n 1)+Re(n)l If c c < Reel then
2 cs~·~r
( l-022
Ren-1+Ren · Nuc(n) = 0.822 c( ; c( ) (10.5)
Else
(Re (n-1) +Re (n)l
0.4
Nuc(n) = 3.8 x 10⁻³ c 2
c Pr~·65 ( 10.6)
End If
(62B) Billet (1989)'s local Nusselt number for boiling film for !:.z between z(n-1) and
z(n):
. If Flow ( n) = laminar then
Ree(n -1) + Ree(n) l-Va Nue(n) 1.43 (10.10)
2 Else
If Flow( n) = transitional then
(
( Re,(n -1; + Re,(n) l]( nB(n-1~ +nB(n))
Nue(n) 0.176 4
(10.11)
Else ; {turbulent flow}
(Ree(n 1) +Ree(n)l0.231
Nue(n) = 2
x
(
0.110 °·565 l ( 10.12) ((Pr,(n l;+Pr,(n)l+S.4?l
Endlf Endlf
1 Chun & Seban's correlation was always used for the condensate side.

H12
(62CS) Chun & Seban (1971)'s local Nusselt number for boiling film for Ill.
between z(n-1) and z(n):
If Flow = laminar then
Re e( n - 1 ) + Re e ( n) . ( l-022
Nue(n) = 0.822 2
(10.5)
Else {Turbulent flow}
_3 (Ree(n-1) +Re (n)]0
'4
(Pre(n-1) +Pre(n)]0
'65
Nu (n) = 3.8 X 10 e e 2 2
(10.6)
Endlf
(63) Condensate HTC, ac for /1z between z(n-1) and z(n):
(64) Boiling side HTC, ae for 11z between z(n-1) and z(n):
(65) Overall HTC, U for 11z between z(n-1) and z(n):
T -( Tv(n-1) + Tv(n)*) -(BPE(n-1) +BPE(n)) 1 l sat.steam 2 2
U(n)= (diD)_1_+_1_+(diD)__!_ x T -(Tv(n-1)+Tv(n)*) d a (n) a (n) d h sat steam 2
OD c e m w
(66) Incremental evaporation for Ill. between z(n-1) and z(n):

H13
(67) Temperature drop across boiling film (excluding BPE) for /1z between z(n-1) and
z(n):
(68) Vapour flow rate at z(n):
m,.(n) = m,.(n-1) +(me(n-1) -me(n))
(69) Vapour core diameter at z(n):
d,(n) = d1D -2 x(3
3 ~,(n)r,(n)] (cf 10.1)
( P e(n ))2 g
(70) Mean vapour velocity at z(n):
u,.(n) = m,.(n)
P,.(: (d,.(n))2)
(71) Vapour Reynolds number at z(n):
Re,.(n) = P,. u,.(n) d,.(n)
1-Lv
(72) Pipe friction factor (see Appendix HA) at z(n):
A(n) = Pipe Friction(Re,.(n),d,.(n),K)
(73) Incremental pressure drop at z(n):
5 (n) = ( A(n) l!.z) (u,(n))2
P, Pv d,.(n) 2
(74) Total pressure at z(n):
p(n) = p(n-1) + ( op(n-1~ + op(n))

H14
(75) Static pressure (from Benedict (1984, p338), assuming that vapour 1s
incompressible) at z(n):
If Rev(n) < 2300 then
P8e(n) p(n)- Pv(uv(n))2
Else
Pse(n) p(n)- 1~1 Pv(uv(n)l
Endlf
(76) Local vapour static temperature at z(n):
Average Properties
(77) Average values· over the length of the tube for the following properties:
me, me, Se, z, BPEe, Tfilm' ke, lle' CP.' Pe' re, Ree, Pre, rc, Rec, Reel , Reel , Reel , mv, dv, uv, Rev, A, Tv
CS/am-tur B/am-tra Btra-tur
were calculated using the following equation:
I (N ) Nr.~-1 l x(O) + x t:.z + L x(n) 2 2 1
X
(78) Average values over the length of the tube for the following properties:
were calculated using the following equation:
Other properties
(79) Total pressure drop due to friction over the tube length:
o op(N ) Nr.z.-1 !J.p = p(O) + t:.z + L op(n)
2 2 1

H15
(80) Expansion pressure drop (McCabe & Smith, 1956, p75-76), holds approximately
for turbulent flow (Rev > 2000)) at bottom of tube:
ll. . = ( _ diD ]2
(uv(Nb.z)f P expansion 1 d 2 g
duct
(81) Total pressure at bottom of tube:
p and Re fior measured S range re e
To determine the error involved in determining mean film properties from end-point
values, Pr and ~ were determined by averaging the local values (obtained by e e
integration) over the measured concentration range. Where the measured S.L value
exceeded the predicted value (obtained using the local Nue correlations of Chun & Seban
(1971)), then the mean values were obtained by fitting a second order regression equation
to the mean values for ST-Sn (n = 1 to 30) and extrapolating to S.L.
H6 References
Benedict R P (1984). Fundamentals of temperature, pressure and flow measurements.
3rct edn., John Wiley & Sons, New York.
Billet R (1989). Evaporation Technology- Principles, Applications, Economics. VCH
Verlagsgescllschaft mbH, Weinheim, Germany.
ChunK R & Seban R A (1971). Heat transfer to evaporating liquid films. ASME
Journal of Heat Transfer, 93, 391-396.
McCabe W L & Smith J C (1956). Unit Operations of Chemical Engineering.
McGraw-Hill Book Co., New York.

H16
Appendix HA: Calculation Procedure for Pipe Friction Factor
The pipe friction factor calculation procedure is given below in Framework III (Aston
Tate, Torrance, California, USA) code format.
Description
Calculates the pipe friction factor given the Reynolds number, pipe internal diameter and
the mean height of the pipe wall surface roughness.
Inputs Reynolds number - Re
Pipe internal diameter - dm, m
Mean height of pipe wall roughness - K, m
Functions Called @abs {absolute value function}
@log {base 10 logarithm}
Output Pipe friction factor, {dimensionless}
Range of Applicability· N/A
Accuracy N/A
Source Korting (1986, p15).
FW3 Code ;Called as @pipe friction (Re, dm, K)
@local(D, k, Lam_g, Lambda, Re, tur),
Reference
Re
D
@item1,
@item2,
k @item3,
@if(Re < 2300, @return(64/Re)),
Lambda 0,
Lam g 1,
@while(@abs(Lambda- Lam g) > 0.0001,
Lambda
tur
@if(tur > 200,
Lam g,
Re*k/D*LambdaAO. 5,
Lam g : = (l/(2*@log(D/k)+ 1.14))A2,
Lam g : = (-11(2*@log(2.51/Re/(LambdaA0.5)+k/D/3.71))t2),
),
@return(Lambda)
Korting (1986). Korting Reference Data for Application of Jet Ejectors and Vacuum
Processing. Publication A1, Korting Hannover AG, Hannover.

I1
APPENDIX 1: EXPERil\1ENTAL DATA
For all experiments, the data was logged to disk. The mean values for each experimental run have been tabulated in this appendix along with an indication of the variation during each experimental run. A standard deviation level (SDL) has been included for each variable in the tables. Where the actual standard deviation exceeds this level, the data points have been marked. The marks used and the standard deviation range they represent are as follows:
{none}
* & #
SD ~ SDL SDL < SD ~ 2*SDL 2*SDL < SD ~ 4*SDL SD ~ 4*SDL
On occasion, an instrument may be off scale and thus the reading is erroneous. These readings have been marked with "OS".
For water and sucrose experiments, the start of the first run's steady state period is noted at the bottom of the tables. 'The average interval between consecutive runs is also given. Where there was a delay between consecutive runs, the start time of the run immediately after the delay is noted.
For the skim milk and NCG experiments, the time of each run can be found in Appendix M and Appendix S respectively.
ll Data from Water Experiments The raw data from Experiments Wal, Wa3-Wa7, Wa9-Wa14 and Wa16-Wa32 are presented in Tables 11-129.

------··· -----·- -··-·-----···-····· -----·-·-········ -···· --·- ---······ ----
~ Table Ila: Raw Data from Experiment Wal. (Tube length 15, Tube diameter 48, De-aeration nozzle diameter 3.2 mm, No air bleed)
Experimental run number SDL1 12 2 3 4 5 6 7 8 9 10 11 12 13 14
Third feed flow rate (kg h'1) 0.6 115.2 37.4 44.6 41.8 184.7 48.1 111.1 194.9 191.3 106.1 113.6 43.1 50.1 193.0
Concentrate flow rate (kg h'1) 2 90.5 18.3 17.6 17.9 161.9 18.1 86.8 162.0 162.8 90.0 89.6 18.0 18.2 162.2
Feed temperature ex-PHE (•C) 0.1 64.0' 71.5 71.5' 56.4' 56.5 56.5 64.0 71.5' 56.5 56.5 64.0 64.0 64.0 64.0
Feed temperature at 3m ("C) 0.1
Feed temperature at 0.3m ("C) 0.1
Vapour temperature (•c) 0.1 61.5 61.7 63.0 50.4 55.3 51.0 61.2 69.8 55.4 54.2 61.3 56.5 57.5 62.6
Product temperature c•c) 0.1 65.1"' 71.9' 72.3' 56.8 56.7 56.7 63.9' 71.3#· 56.3 56.2 63.7 63.7 63.7 63.8
Steam supply temperature ("C) OJ 70.0' 77.0 78.2' 61.8 61.9 63.4' 70.0 80.0 66.1' 60.7 70.0 70.0 12.11 71.81
Condensate temperature (°C) 0.1
Top de-aeration line temp c•q 0.1 64.2 70.6 71.6 57.1 57.0' 58.0 64.3 72.5 58.1 56.1 64.3 64.3 65.3 65.3
Bottom de-aeration line temp ("C) 0.1 65.8 72.1 73.0 58.4 58.4 59.3 65.6 73.8 59.2 57.3 65.5 65.5 66.4 66.4
Ambient temp at 15m tube top:c 0.1
Ambient temp at steam entry ("C) 0.1
Ambient temp at 15 m tube bottom, •c 0.1
Tube-side absolute pressure (kPa) 0.05 22.37 31.21 31.21 15.78 15.8 15.77 22.37 31.21 15.78 15.77' 22.38 22.38 22.37 22.38
Differential pressure (kPa) 0.03 3.241 2.802 4.281 2.410 2.411 3.278 3.240 5.810 3.281 1.569 3.241 3.240 4.403 4.402
Differential pressure - top (kPa) 0.03 . Differential pressure • bottom (k:Pa) 0.03
Main steam pressure (kPa gauge) 2
Steam header pressure (kPa gauge) l
Steam valve position (%) 0.1 89.6"' 86.2 93.11 86.8 85.7" 92.3 89.0 98.6" 91.0' 78.2' 88.8 89.6 95.7"' 94.6.
Vapour valve position(%) 0.1 81.2. 66.3 74.9' 89.3 88.5" 97.1. 80.7 80.6 95.5' 78.6' 80.5 81.4 88.2' 87.5
'Standard deviation level (see page 11). zRun started at 1648 h on 31 October 1990, subsequent runs at 60 min intervals.

-------
Table Ilb: Raw Data from Experiment Wal.
Experimental run number sou 15 16 17 18 19 20
Third feed flow rate (kg h"1) 0.6 105.8 119.7 51.7 179.2 118.3 112.9
Concentrate flow rate (kg h"1) 2 89.1 89.1 17.7 162.6 89.6 87.6
Feed temperature ex-PHE (°C) 0.1 64.0 64.0 71.5' 64.0 56.5 71.5'
Feed temperature at 3m (0 C) 0.1
Feed temperature at 0.3m (°C) 0.1
Vapour temperature (°C) 0.1 61.0 61.4 63.8 62.4 54.4 68.1
Product temperature (0 C) 0.1 63.7 63.7 71.3" 63.7 56.3"' 72.0'
Steam supply temperature (°C) 0.1 68.9 71.8' 80.8' 69.9' 64.18 79.38
Condensate temperature ("C) 0.1
Top de-aeration line temp (°C) 0.1 63.4 65.3 72.5 63.4' 58.1 71.6
Bottom de-aeration line temp (°C) 0.1 64.6 66.4 73.8 64.6 59.3 73.2
Ambient temp at 15 m tube top, oc 0.1
Ambient temp at steam entry (°C) 0.1
Ambient temp at 15m tube bottom, oc 0.1 . Tube-side absolute pressure (kPa) 0.05 22.38 22.38 31.21 22.37' 15.77 31.24
Differential pressure (kPa) 0.03 2.120 4.400 5.804 2.120' 3.280 4.279'
Differential pressure - top (kPa) 0.03
Differential pressure - bottom (kPa) 0.03
Main steam pressure (kPa gauge) 2
Steam header pressure (kPa gauge) I
Steam valve position (%) 0.1 81.6 94.6' 99.6' 81.2' 91.0' 91.8'
Vapour valve position(%) 0.1 71.5 87.2 81.0 71.71 95.5 74.8'
'Standard deviation level (see page Il).
21
125.0
103.6
64.0
61.6
69.7'
74.0'
67.8'
69.4'
26.65"'
3.240
87.5
99.9
(Tube length 15, Tube diameter 48, De-aeration nozzle diameter 3.2 mm, No air bleed)
22 24 25 26 27 28 29
197.0 105.6 186.9 35.6 124.0 178.8 35.8
175.4 87.7 161.3 17.5 90.7 162.3 18.4
64.0' i71.6' 71.5' 64.0 71.5' 56.5 56.5
.
62.6 67.5' 69.5' 55.7 68.7' 55.3 49.8
67.2' 70.8" 71.5" 64.4 72.0 57.2 57.4
73.4"' 77.1 78.2' 69.0" 80.9" 61.0' 60.9
67.4" 70.6 71.6' 63.4 72.6 56.2 56.2
68.9"' 72.3 73.2' 64.8 74.2 57.5 57.5
26.041 31.19' 31.18"' 22.37' 31.21 15.77 15.77
3.241 2.801 4.281 2.121' 5.812 1.567 1.570
88.0' 85.3'. 92.1"' 82.7' 98.8"' 78.9"' 79.7'
99.9 66.21 76.9' 72.9" 80.7 80.1' 80.7'
-w

----·--··--·---
Table Ilc: Raw data from Experiment Wa!. (Tube length 15, Tube diameter 48, De-aeration nozzle diameter 3.2 mm, No air bleed) ~
Experimental run number SOL' 30 31 21R2 22R 23R
Third feed flow rate (kg h'1) 0.6 180.1 113.1 115.0 186.6 113.0
Concentrate flow rate (kg h'1) 2 162.1 88.9 90.6 162.1 90.0
Feed temperature ex-PHE c•c) 0.1 71.5' 64.0 64.0 64.0 56.5
Feed temperature at 3m (•C) 0.1
Feed temperature at 0.3m c•c) 0.1
Vapour temperature ("C) 0.1 69.6' 61.2 61.2 62.5 54.4
Product temperature c•c) 0.1 72.9 64.9' 64.8' 64.3' 57.3'
Steam supply temperature (°C) 0.1 77.2 70.2' 69.9' 70.0 61.8
Condensate temperature c•c) 0.1
Top de-aeration line temp (•C) 0.1 70.6 64.3 69.7 69.9 61.9
Bottom de-aeration line temp (°C) 0.1 72.2 65.8 65.7 65.7 58.4
Ambient temp at 15m tube top, •c 0.1
Ambient temp at steam entry (°C) 0.1
Ambient temp at 15 m tube bottom, •c 0.1
Tube-side absolute pressure (kPa) 0.05 31.21 22.38' 22.38 22.37 15.78
Differential pressure (kPa) 0.03 2.801 3.239' 3.241 3.241 2.409
Differential pressure - top (kPa) 0.03 . Differential pressure - bottom (kPa) 0.03
Main steam pressure (kPa gauge) 2
Steam header pressure (kPa gauge) 1
Steam valve position(%) 0.1 85.1 88.81 89.6' 89.2' 85.5
Vapour valve position(%) 0.1 65.7' 80.7" 80.9 81.2 88.3'
'Standard deviation level (see pag7 It). 2Run started at 0916 h on 5 November 1990. subsequent runs at 60 min intervals.

Table 12a: Raw data from Experiment Wa3. (Tube length 15, Tube diameter 48, De-aeration nozzle diameter 3.2 mm, No air bleed)
Experimental run number SDL' 1' 2 3 4 5 6 7 8 9 10 11 12 13 14
Third feed flow rate (kg h"1) 0.6 114.5 36.7 42.3 41.0 186.0 53.0 114.7 195.4 189.1 106.6 114.1 44.5 53.2 192.9
Concentrate flow rate (kg h"1) 2 90.0 17.2 15.1 16.2 162.1 23.8 90.3 162.1 160.7 90.3 90.1 19.6 21.8 162.1
Feed temperature ex-PHE (°C) 0.1 66.3 81.2 79.3 66.8' 60.1 65.2 67.0 70.8 60.1 61.6 67.0 73.1 71.3 65.5
Feed temperature at 3m ( 0 C) 0.1 62.0 68.1 67.9 57.5 56.9 57.4 62.1 67.0 56.9 57.0 62.1 62.8 62.5 61.9 . Feed temperature at 0.3m CC) 0.1 61.6 66.7 66.6 56.5 56.7 56.6 61.7 66.7 56.7 56.7 61.7 61.7 61.6 61.7
Vapour temperature (0 C) 0.1 60.7 65.4 65.5 55.8 56.1 57.2 60.9 65.9 56.9 55.9 60.9 60.8 60.9 61.2
Product temperature CC) 0.1 59.6 64.4 64.5 54.7 54.8 55.9 59.6 64.6 55.6 54.8 59.7 59.6 59.7 59.8
Steam supply temperature ( 0 C) 0.1 71.0' 72.6 77.4' 71.6" 70.2" 73.9" 73.6" 76.4' 75.4" 63.8' 72.0 73.5' 78.3 77.4'
Condensate temperature (0 C) 0.1 62.0 66.1 66.9 57.1 57.1 58.9 62.0 67.6 58.5 56.2 62.0 61.9 62.6 '62.7
Top de-aeration line temp ( 0 C) 0.1 61.9 65.7 66.6 57.1 57.1 58.9 61.7 67.5 58.7 56.2 61.9 61.9 62.8 62.8
Bottom de-aeration line temp (°C) 0.1 63.1 67.1 68.0 58.3 58.2 60.2 63.1 69.1 59.8 57.3 63.1 63.1 64.1 64.1
Ambient temp at 15 m tube top, oc 0.1
Ambient temp at steam entry (°C) 0.1
Ambient temp at 15 m tube bottom, oc 0.1 . Tube-side absolute pressure (kPa) 0.05 19.92 25.00 25.00 15.78 15.77 16.70 19.92 25.01 16.33 15.77 19.92 19.93 19.93 19.92
Differential pressure (kPa) 0.03 2.931 2.341 3.570 2.412 2.411 3.280 2.932 4.851 3.282 1.571 2.933 2.931 3.990 3.992
Differential pressure - top (kPa) 0.03
Differential pressure - bottom (kPa) O.o3
Main steam pressure (kPa gauge) 2
Steam header pressure (kPa gauge) 1
Steam valve position(%) 0.1 83.3 79.0 86.4' 82.6 80.7 87.1 82.9' 91.1' 85.9 72.0' 82.3 83.4 89.3 88.2
Vapour valve position(%) 0.1 86.4' 74.1 82.6 95.9 94.1 99.9 86.1 88.4 99.9 82.7' 85.5 86.4 94.0' 93.2
'Standard deviation level (see page Il). 2Run started at 1527 h on 4 September 1991, subsequent runs at 60 min intervals.
tii

Table J2b; Raw Data from Experiment Wa3.
Experimental run number SDL' 15 16 17 18 19
TI1ird feed flow rate (kg h'1) 0.6 106.9 120.2 55.2 179.9 118.5
Concentrate flow rate (kg h'1) 2 90.3 90.3 22.1 162.0 90.2
Feed temperature ex-PHE (•C) 0.1 67.3 66.9 77.5 65.8 61.6
Feed temperature at 3m (•C) 0.1 62.1 62.1 67.7 61.9 57.0
Feed temperature at 0.3m ("C) 0.1 61.7 61.7 66.7 61.7 56.7
Vapour temperature ("C) 0.1 60.8 61.1 65.8 60.8 56.8
Product temperature (°C) 0.1 59.7 59.7 64.6 59.7 55.4
Steam supply temperature ("C) 0.1 68.2" 76.5'" 78.4"' 68.2 73.0
Condensate temperature c•c) 0.1 61.1 62.7 67.5 61.2 58.4
Top de-aeration line temp eC) 0.1 60.9 62.8 67.6 60.8 58.3
Bottom de-aeration line temp ( •c) 0.1 62.2 64.1 69.0 62.2 59.7
Ambient temp at 15 m tube top, •c 0.1
Ambient temp at steam entry (°C) 0.1
Ambient temp at 15 m tube bottom, •c 0.1
Tube--side absolute pressure (kPa) 0.05 19.92 19.92 25.01 19.93 16.16
Differential pressure (kPa) 0.03 1.921 3.991 4.853 1.919 3.280
Differential pressure - top (kPa) 0.03 . Differential pressure - bottom (kPa) 0.03
Main steam pressure {kPa gauge) 2
Steam header pressure (kPa gauge) I
Steam valve position (%) 0.1 74.3 88.0 91.5 74.6' 86.0
Vapour valve position(%) 0.1 76.9 92.4 87.9 77.7 99.9
'Standard deviation level {sec page II).
---
20 21
115.5 114.7
90.0 90.3
72.7& 66.3'
67.2 62.0
66.7 61.5
65.8 60.8
64.6 59.7
75.1 73.3"'
67.0 62.1
66.5 62.1
68.1 63.2
25.01 19.93
3.571 2.931
84.7 82.7
81.0 85.9
-----·······
(Tube length 15. Tube diameter 48, De-aeration nozzle diameter 3.2 mm, No air bleed)
22 23 24 25 26 27 28
187.1 113.5 108.8 188.7 37.0 123.2 179.7
162.4 90.3 90.0 162.5 18.3 90.2 162.4
64.7 60.5 71.9 70.3 73.6' 71.5 59.7
61.8 56.9 67.1 66.9 62.8 67.0 56.8
61.6 56.6 66.7 66.7 61.8 66.7 56.7
60.7 55.9' 65.5 65.6 60.5 65.7 55.8
59.7. 54.8 64.5 64.5 59.6 64.5 54.8
74.0 71.3' 72.1 76.9" 69.9* 80.8& 65.3'
62.1 57.1 66.2 67.0 61.2 67.6 56.4
62.1 57.4 65.9 66.8 61.1 67.8 56.5
63.2 5ll.3 67.1 68.1 62.2 69.1 57.3
19.93 15.77 25.01 25.01 19.92 25.02 15.77
2.930 2.411 2.339 3.572 1.919 4.851 1.569
82.8 80.6 77.4' 85.1' 76.6 90.9 73.0'
86.6 93.1 73.3 82.1 79.0 87.9 84.5
.
'
!--(
0\

Table 12c: Raw Data from E~periment Wa3. (Tube length 15, Tube diameter 48, De-aeration nozzle diameter 3.2 mm, No air bleed)
E~perimental run number SDL1 29 30 31
Third feed flow rate (kg h'1) 0.6 36.5 181.1 114.9
Concentrate flow rate (kg h'1) 2 18.6 162.0 90.3
Feed temperature ex-PHE ("C) 0.1 67.1 70.4 66.2
Feed temperature at 3m (°C) 0.1 57.7 66.9 62.0 . Feed temperature at 0.3m (•C) 0.1 56.7 66.7 61.7
Vapour temperature (°C) 0.1 55.6 65.5 60.7
Product temperature ( •C) 0.1 54.7 64.5 59.6
Steam supply temperature (•c) 0.1 65.8" 70.8 73.9'
Condensate temperature (•C) 0.1 56.3 66.2 62.0
Top de-aeration line temp ("C) 0.1 56.4 65.9 62.0
Bottom de-aeration line temp ("C) 0.1 57.3 67.1 63.2
Ambient temp at 15 m tube top, •c 0.1
Ambient temp at steam entry (°C) 0.1
Ambient temp at 15 m tube bottom, •c 0.1 . Tube-side absolute pressure (kPa) 0.05 15.76 25.00 19.92
Differential pressure (kPa) O.Q3 1.570 2.343 2.932
Differential pressure - top (kPa) 0.03
Differential pressure - bottom (kPa) 0.03
Main steam pressure (kPa gauge) 2
Steam header pressure (lcPa gauge) I
Steam valve position (%) 0.1 74.4' 77.5' 82.8
Vapour valve position(%) 0.1 84.7' 74.0 86.2
'Standard deviation level (see page 11).
:j

Oci Table 13a: Raw Data from Experiment Wa4. (Tube length 15, Tube diameter 48, De-aeration Nozzles Diameter 3.2 mm, No air bleed)
Experimental run number SDL p 2 3 4 5 6 7 8 9 10 ll 12 13 14
Third feed flow rate (kg h"1) 0.6 114.6 114.1 114.8 113.9 113.7 113.9 114.3 114.5 113.7 113.9 113.4 113.8 113.5 ll4.8 i
Concentrate flow rate (kg h"1) 2 90.3 90.3 90.4 90.5 90.3 90.3 90.1 90.3 90.4 90.2 90.0 90.2 90.1 90.1
Feed temperature e>t-PHE ( 0 C) O.l 65.1 63.4 66.8 60.1 61.8 65.2 68.6 70.3 65.3 67.1 63.7 65.6 62.3' 68.2'
Feed temperature at 3m (•C) 0.1 60.6 59.0 62.1 56.0 57.5 60.6 63.6 65.1 60.6 62.1 59.1 60.6 57.6 63.6 .
Feed temperature at 0.3m (°C) 0.1 60.2 58.6 61.7 55.7 57.2 60.2 63.2 64.7 60.2 61.7 58.7 60.2 57.2 63.2
Vapour temperature ( 0 C) 0.1 60.8 60.3 60.9 51.5 59.1 60.9 61.0 61.1 60.9 61.0 60.5 60.9 59.2 60.9 •
Product temperature (•C) 0.1 59.6 59.6 59.6 59.6 59.7 59;7 59.1 59.7· 59.7 59.7 59.7 59.7 59.7 59.7
Steam supply temperature (°C) 0.1 67.8' 74.0 73.7" 73.8' 73.5' 73.2" 71.4" 72.9' 72.8' 72.7' 72.4' 71.6"' 73.1 73.1"'
Condensate temperature (0 C) 0.1 61.9 61.9 61.9 61.9 62.0 62.0 62.1 62.1 62.1 62.1 62.1 62.2 62.2 62.2
Top de-aeration line temp ("C) 0.1 61.7 61.9 61.9 61.8 61.9 61.8 61.8 61.8 61.8 61.8 61.9 61.7 61.7 62.0
Bottom de-aeration line temp (•C) 0.1 63.1 63.1 63.1 63.1 63.1 63.1 63.1 63.1 63.1 63.1 63.1 63.1 63.1 63.2
Ambient temp at 15 m lUbe lOp, •c 0.1
Ambient temp at steam entry ( 0 C) 0.1
Ambient temp at 15 m tube bottom, •c 0.1
Tube-side absolute pressure (kPa) 0.05 19.92 19.92 19.93 19.92 19.93 19.92 19.92 19.92 19.92 19.93 19.93 19.91 19.93 19.91'
Differential pressure (kPa) 0.03 2.933 2.931 2.932 2.932 2.931 2.931 2.932 2.929 2.933 2.932 2.930 2.930 2.930 2.930
Differential pressure - top (kPa) 0.03 . Differential pressure • bottom (kPa) 0.03
Main steam pressure (kPa gauge) 2
Steam header pressure (kPa gauge) I
Steam valve position (%) 0.1 83.3' 83.1 82.9 82.9 82.8 82.5 82.4 82.2 82.4 82.4 82.5 82.8 83.0 83.0'
Vapour valve position(%) 0.1 85.9' 85.6 86.1 84.8 85.1 85.4 85.8 86.0 84.9' 85.2 84.5 85.1 84.7 86.2
'Standard deviation level (see page II). lRun started at 2113 h on 5 September 1991, subsequent runs at 50 min intervals.
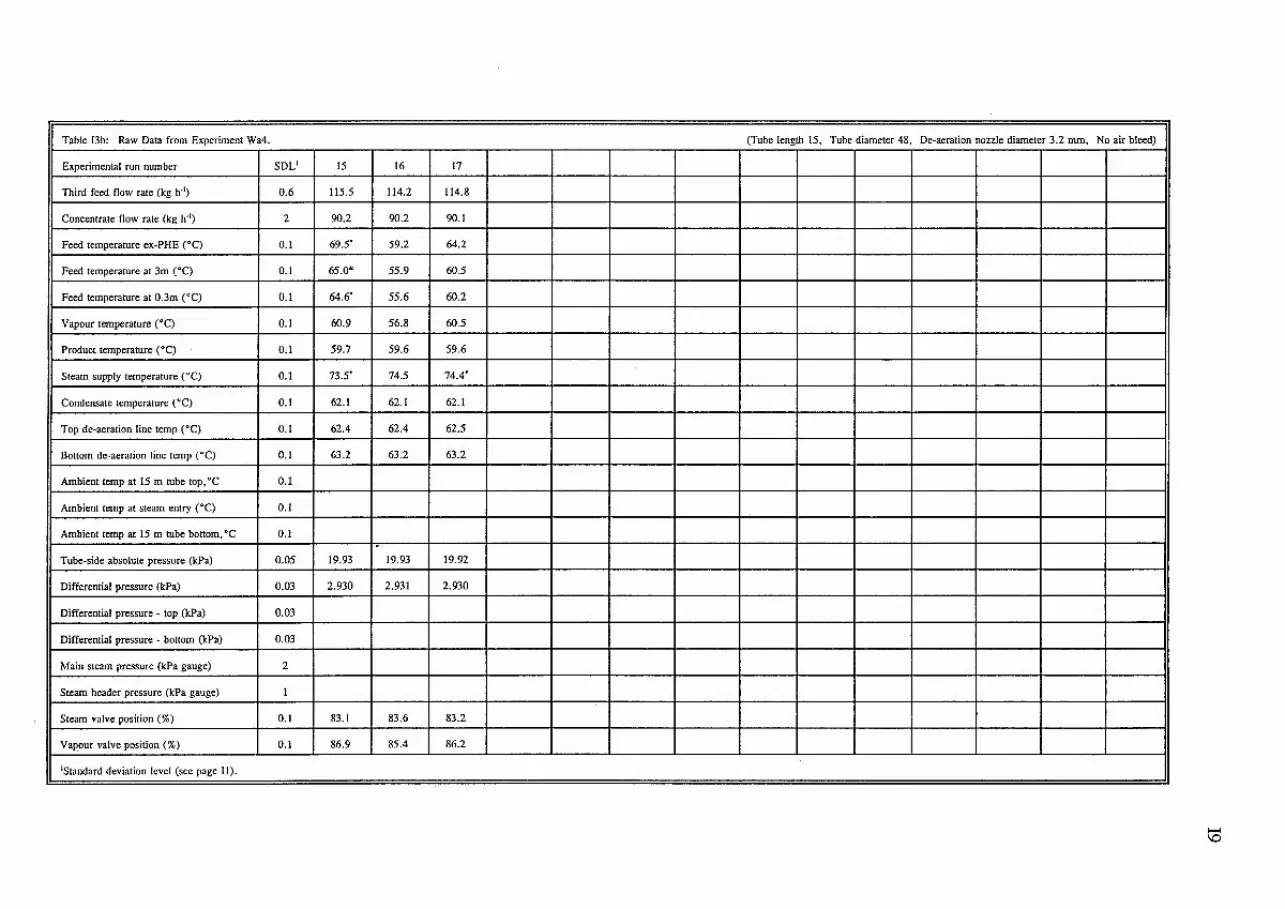
Table 13b: Raw Data from Experiment Wa4.
Experimental run number SDL'
Third feed flow rate (kg h"1) 0.6
Concentrate flow rate (kg h"1) 2
Feed temperature ex-PHE (°C) 0.1
Feed temperature at 3m c·c) 0.1
Feed temperature at 0.3m ("C) 0.1
Vapour temperature (•C) 0.1
Product temperature c•c) 0.1
Steam supply temperature c·c) 0.1
Condensate temperature c•q 0.1
Top de-aeration line temp (°C) 0.1
Bottom de-aeration line temp c•c) 0.1
Ambient temp at 15 m tube top, •c 0.1
Ambient temp at steam entry c•c) 0.1
Ambient temp at 15 m tube bottom, ·c 0.1
Tube-side absolute pressure (kPa) 0.05
Differential pressure (kPa) 0.03
Differential pressure - top (kPa) 0.03
Differential pressure - bottom (kPa) 0.03
Main steam pressure (kPa gauge) 2
Steam header pressure (kPa gauge) 1
Steam valve position(%) 0.1
Vapour valve position(%) 0.1
'Standard deviation level (see page II).
15
115.5
90.2
69.5.
65.0"
64.6·
60.9
59.7
73.5.
62.1
62.4
63.2
. 19.93
2.930
83.1
86.9
16
114.2
90.2
59.2
55.9
55.6
56.8
59.6
74.5
62.1
62.4
63.2
19.93
2.931
83.6
85.4
17
114.8
90.1
64.2
60.5
60.2
60.5
59.6
74.4.
62.1
62.5
63.2
19.92
2.930
83.2
86.2
(Tube length 15, Tube diameter 48, De-aeration nozzle diameter 3.2 mm, No air bleed)
~ 1.0

-
Table I4a: Raw Data from Experiment WaS.
Experimental run number SDL' 1' 2 3 4 5 6
Third feed flow rate (kg h'1) 0.6 111.4 101.3 120.7 104.2 110.2 104.3
Concentrate flow rate (kg h'1) 2 90.4 81.2 99.8 81.8 89.1 81.0
Feed temperature ex-PHE ("C) 0.1 65.2 56.5 64.9 74.6 65.3 79.2
Feed temperature at 3m ("C) 0.1 60.5 52.4 60.6 68.7 60.5 72.8
Feed temperature at 0.3m ("C) 0.1 60.2 52.1 60.3 68.3 60.2 72.3
Vapour temperature ("C) 0.1 60.9 53.5 60.9 61.2 60.9 61.4
Product temperature ("C) 0.1 59.9 59.9 59.9 59.9 59.9 60.0
Steam supply temperature ("C) 0.1 62.7 62.7 62.7 62.7 62.6 62.7
Condensate temperature ("C) 0.1 60.3 60.2 60.3 60.3 60.3 60.2
Top de-aeration line temp ("C) 0.1 61.4 61.4 61.4 61.4 61.4 61.4
Bottom de-aeration line temp ("C) 0.1 62.8 62.7 62.8 62.8 62.8 62.8
Ambient temp at 15 m tube top, •c 0.1
Ambient temp at steam entry ("C) 0.1
Ambient temp at 15 m tube bottom, •c 0.1
Tube-side absolute pressure (kPa) 0.05 19.93 19.92 19.93 19.92 19.92 19.93
Differential pressure • entry (kPa) 0.03 2.929 2.931 2.927 2.929 2.929 2.930
Differential pressure - top (icPa) 0.03 . Differential pressure - bottom (kPa) 0.03
Main steam pressure (kPa gauge) 2
Steam header pressure (kPa gauge) I
Steam valve position (%) 0.1 70.4 71.0 70.3 70.2 70.3 70.1
Vapour valve position(%) 0.1 82.6 81.6 82.3 83.9 82.5 84.6
'Standard deviation level (see page 11). 2Run started at 2143 h on 10 October 1991, subsequent runs at 45 min intervals.
7
122.4
99.7
73.8
68.6
68.2
61.3
60.0
62.7
60.3
61.5
62.8
19.93
2.932
70.1
84.3
(Tube length 15, Tube diameter 48, De-aeration nozzle diameter 3.2 mrn, No air bleed) •
8 9 10 11 12 13 14 I
111.5 100.5 100.2 120.9 120.2 122.8 104.4 _j
90.4 80.7 79.9 100.1 100.6 99.3 82.4
65.3 52.2 61.3 65.0' 51.6' 78.3' 69.9
60.5 48.4 56.6 60.6 48.4' 72.8 64.6
60.2 48.1 56.2 60.3 48.1' 72.4 64.2
60.9 49.5 57.6 60.9 49.5' 61.6 61.1
60.0• 60.0 60.0 60.0 60.0 60.0 60.0
62.7 62.7 62.7 62.7 62.7 62.7 62.7
60.3 60.3 60.3 60.4 60.5 60.5 60.5
61.3 61.4 61.4 61.5 61.5 61.5 61.5
62.8 62.8 62.8 62.8 62.8 62.8 62.8
19.92 19.93 19.93 19.92 19.93 19.93 19.93
2.930 2.932 2.932 2.929 2.931 2.932 2.929
70.4 71.4 70.5 70.3 71.6 69.9 70.5
82.4 81.1 81.7 82.2 80.7 84.9 83.3
-........ 0

Table I4b: Raw Data from Experiment Wa5.
Experimental run number SDL1 15 16 17
Third feed flow rate (kg h") 0.6 99.0 122.0 103.3
Concentrate flow rate (kg h'1) 2 78.9 99.8 81.7
Feed temperature ex-PHE (°C) 0.1 52.0' 69.2" 65.1
Feed temperature at 3m (•C) 0.1 48.4 64.6 60.6
Feed temperature at 0.3m (°C) 0.1 48.1 64.3 60.2
Vapour temperature (•C) 0.1 49.4' 61.3' 60.9
Product temperature (•C) 0.1 60.0 60.0 60.0
Steam supply temperature (•C) 0.1 62.7 62.8' 62.7
Condensate temperature ("C) 0.1 60.7 60.6 60.7
Top de-aeration line temp (°C) 0.1 61.5 61.5' 61.5
Bottom de-aeration line temp (•C) 0.1 62.8 62.8 62.8
Ambient temp at 15 m tube top, •c 0.1
Ambient temp at steam entry (•C) 0.1
Ambient temp at 15 m tube bottom, •c 0.1
Tube-side absolute pressure (k Pa) 0.05 19.93 19.92 19.92
Differential pressure - entry (kPa) 0.03 2.931 2.930 2.930
Differential pressure top (kPa) O.o3
Differential pressure - bottom (kPa) 0.03
Main steam pressure {kPa gauge) 2
Steam header pressure (kPa gauge) 1
Steam valve position (%) 0.1 71.7 70.5 70.7
Vapour valve position(%) 0.1 81.5 83.6 82.9
'Standard deviation level {see page 11).
18 19 20 21
1205 103.5 121.0 120.4
99.9 79.8 100.3 100.4
55.6 78.6' 59.9' 51.1'
52.4 72.8' 56.4' 48.3
52.2 72.4' 56.1 48.0
53.5 61.4 57.5' 49.4'
60.0 59.9 59.9 59.9
62.7 62.7 62.6 62.6
60.8 60.7 60.7 60.8
61.5 61.5 61.6 61.6
62.8 62.8 62.8 62.8
19.93 19.93 19.92 19.93
2.929 2.927 2.931 2.931
71.3 70.2 70.8 71.7
81.8 84.9 82.2 81.2
(Tube length 15, Tube diameter 48, De-aeration nozzle diameter 3.2 mm, No air bleed)
22 23 24
123.1 104.1 111.3
99.4 82.8 90.0
77.7' 64.7 64.5
72.7' 60.4 60.5 . 72.2' 60.0 60.0
61.6' 60.7' 60.8
59.9 59.9 59.9
62.7 62.7 62.7
60.6 60.6 60.7
61.6 61.5' 61.6
62.8 62.8 62.8
19.92 19.92 19.93
2.930 2.927 2.933
69.8 70.0 70.1
85.0 82.6 82.7
1-4 f-' f-'

Table I5a: Raw Data from Experiment Wa6. (Tube length 15, Tube diameter 48, De-aeration nozzle diameter 3.2 mm, No air bleed) ,
Experimental run number SDL' ,,
2 3 4 5 6 7 8 9 10 11 123 13 14
Third feed flow rate (kg h-1) 0.6 117.2 33.7 41.2 40.7 183.9 42.9 111.3 192.1 188.2 103.5 116.0 40.1 47.3 189.1
Concentrate flow rate (kg h'1) 2 96.1 18.0 17.6 20.5 164.1 15.9 90.5 162.1 162.3 91.5 95.1 18.3 18.4 160.8
Feed temperature ex-PHE (•C) 0.1 66.2 84.0 80.5' 67.5 59.8 67.0 66.7 70.4 59.8 61.4 66.7 74.6' 72.4 64.9
Feed temperature at 3m ("C) 0.1 62.0 68.5' 68.0' 57.6 56.8 57.7 62.1 66.9 56.8 57.0 62.1 63.0' 62.7 61.9
Feed temperature at 0.3m ("C) 0.1 61.6 66.7' 66.6' 56.5 56.7 56.6 61.7 66.8 56.7 56.7 61.7 61.8' 61.7 61.7
Vapour temperature ("C) 0.1 60.9 65.6 65.7 56.0 56.1 56.2 61.0 66.0 56.4 55.9 61.0 61.0 61.2 61.3
Product temperature ("C) 0.1 59.9 64.8 64.8 55.! 55.! 55.1 59.9 64.9. 55.1 55.1 60.0 59.9 59.9 60.0
Steam supply temperature ("C) 0.1 62.7 66.5 67.6 57.9 57.9 60.51 62.7 68.6 58.9 56.8 62.7 62.7 64.1 63.8 I
Condensate temperature ("C) 0.1 60.8 64.6 65.4 55.8 56.0 56.6 60.5 65.9 56.4 55.0 60.3 60.3 61.3"' 61.3
Top de-aeration line temp ("C) 0.1 61.5 65.3 66.3 56.7 56.8 57.7 61.5 67.2 57.7 55.8 61.5 61.3 62.4 62.4
Bottom de-aeration line temp ("C) 0.1 62.8 66.7 67.7 57.9 57.9 58.9 62.8 68.7 59.0 56.9 62.8 62.7 63.8 63.8
Ambient temp at 15m tube top:c 0.1
Ambient temp at steam entry ("C) 0.1
Ambient temp at 15 m tube bottom, •c 0.1
Tube-side absolute pressure (kPa) 0.05 19.93 25.01 25.01 15.78 15.77 15.77 19.92 25.00 15.78 15.77 19.92 19.92 19.93 19.93
Differential pressure - entry (kPa) 0.03 2.932 2.340 3.573 2.410 2.412 3.281 2.931 4.850 3.279 1.571 2.932 2.930 3.991 3.990
Differential pressure - top (kPa) 0.03 . Differential pressure - bottom (kPa) 0.03
Main steam pressure (I!:Pa gauge) 2
Steam header pressure (kPa gauge) I
Steam valve position (%) 0.1 70.0 64.8' 73.3 68.4 67.4 75.9' 70.4' 79.3 74.1 57.6' 70.4' 70.9' 77.3 76.1
Vapour valve position(%) 0.1 83.0 69.8 79.7 87.9 87.6 97.2 83.3 86.4 95.6' 76.6' 83.0 83.8' 91.5 91.1
'Standard deviation level (see page 11). 'Run started at 1738 h on II October 1991, subsequent runs at 50 min intervals. 'Run started at 1034 h on 12 October 1991, subsequent runs at 50 min intervals.
1-1 ....... N

Table 15b: Raw Data from Experiment Wa6.
Experimental run number SDL1 15 16 17 18 19
Third feed flow rate (kg h"1) 0.6 105.0 118.2 49.3 176.3 116.2
Concentrate flow rate (kg h"1) 2 91.7 90.4 18.3 162.3 90.1
Feed temperature ex-PHE (°C) 0.1 66.8 66.3 78.2 65.1 60.8
Feed temperature at 3m ( o C) 0.1 62.1 62.0 67.8 61.9 57.0
Feed temperature at 0.3m (°C) 0.1 61.7 61.7 66.6 61.7 56.6
Vapour temperature (°C) 0.1 60.8 61.1 65.9 60.8 55.5
Product temperature ( 0 C) 0.1 59.9 60.0 64.8 59.9 55.1
Steam supply temperature (°C) 0.1 61.8 63.7 68.9' 61.8 59.0
Condensate temperature (°C) 0.1 59.7 61.3 66.0 59.7 56.6
Top de-aeration line temp (°C) 0.1 60.5 62.4 67.2 60.5 57.7
Bottom de-aeration line temp (°C) 0.1 61.8 63.8 68.7 61.8 59.0
Ambient temp at 15 m tube top, oc 0.1
Ambient temp at steam entry (°C) 0.1
Ambient temp at 15 m tube bottom, oc 0.1 . Tube-side absolute pressure (kPa) 0.05 19.92 19.93 25.01 19.92 15.77
Differential pressure - entry (kPa) 0.03 1.924 3.993 4.853 1.917 3.381
Differential pressure - top (kPa) 0.03
Differential pressure - bottom (kPa) 0.03
Main steam pressure (kPa gauge) 2
Steam header pressure (kPa gauge) 1
Steam valve position(%) 0.1 60.1 76.1 79.9 60.4 74.0
Vapour valve position(%) 0.1 72.8 90.3 86.9 73.6 95.5
'Standard deviation level (see page 11).
20 21
113.2 111.8
90.7 91.0
72.1 66.5
67.1 62.0
66.7 61.6
65.8 61.1
64.8 60.0
67.6 62.7
65.1 60.3
66.2 61.5
67.7 62.8
25.01 19.93
3.571 2.933
72.2 69.8
79.1 83.0
(Tube lengtlt 15, Tube diameter 48, De-aeration nozzle diameter 3.2 mm, No air bleed)
22 23 24 25 26 27 28
183.3 112.9 109.3 185.0 32.5 120.0 175.1
162.0 93.5 94.5 161.9 18.4 90.0 162.3
65.1 61.0 72.5 70.6 78.5 72.2 60.1
61.9 57.0 67.2 67.0 63.4' 67.1 56.9 . 61.7 56.6 66.7 66.8 61.8' 66.7 56.7
61.2 56.2 65.8 65.9 61.0 66.0 56.1
60.0 55.1 64.8 64.9 59.9 64.9 55.1
62.8 57.9 66.6 67.7 61.7 68.7 57.0
60.3 55.7 64.3 65.0 59.6 65.9 55.0
61.5 56.7 65.3 66.2 60.4 67.2 55.8
62.8 58.0 66.7 67.7 61.8 68.7 57.0
19.92 15.77 25.01 25.01 19.92 25.01 15.78
2.929 2.409 2.338 3.572 1.919 4.850 1.570
69.8 67.3' 63.6' 72.5 61.5 79.0 57.6
83.5 87.1 69.3 79.6 73.4 85.9 77.4
I
>-I -Vl

Table 15c: Raw Data from Experiment Wa6.
Experimental run number SDU
Third feed flow rate (kg h'1) 0.6
Concentrate flow rate (kg h'1) 2
Feed temperature ex-PHE (•C) 0.1
Feed temperature at 3m (•q 0.1
Feed temperature at 0.3m c•c) 0.1
Vapour temperature (°C) 0.1
Product temperature (•C) 0.1
Steam supply temperature (•C) 0.1
Condensate temperature c•c) 0.1
Top de-aeration line temp eq 0.1
Bottom de-aeration line temp ("C) 0.1
Ambient temp at 15 m tube top, •c 0.1
Ambient temp at steam entry CC) 0.1
Ambient temp at 15 m tube bottom, •c 0.1
Tube-side absolute pressure (kPa) 0.05
Differential pressure - entry (kPa) 0.03
Differential pressure - top (kPa) 0.03
Differential pressure - bottom (kPa) 0.03
Main steam pressure (kPa gauge) 2
Steam header pressure (kPa gauge) 1
Steam valve position(%) 0.1
Vapour valve position(%) 0.1
'Standard deviation level (see page II).
29 30
30.2 !77.6
17.2 162.3
73.0' 70.9
58.4' 67.0
56.8' 66.8
56.1 65.8
55.! 64.9
56.9 66.6
54.9 64.3
55.7 65.3
57.0 66.7
15.78 25.00
1.569 2.341
58.7 63.8'
77.3 69.9
31
115.9
95.4
66.9
62.1
61.7
61.2
60.0
62.7
60.3
61.4
62.8
19.92
2.931
69.3
82.3
(Tube length 15, Tube diameter 48, De-aeration nozzle diameter 3.2 nun, No air bleed)
I
I
1-1 ...... .+:-
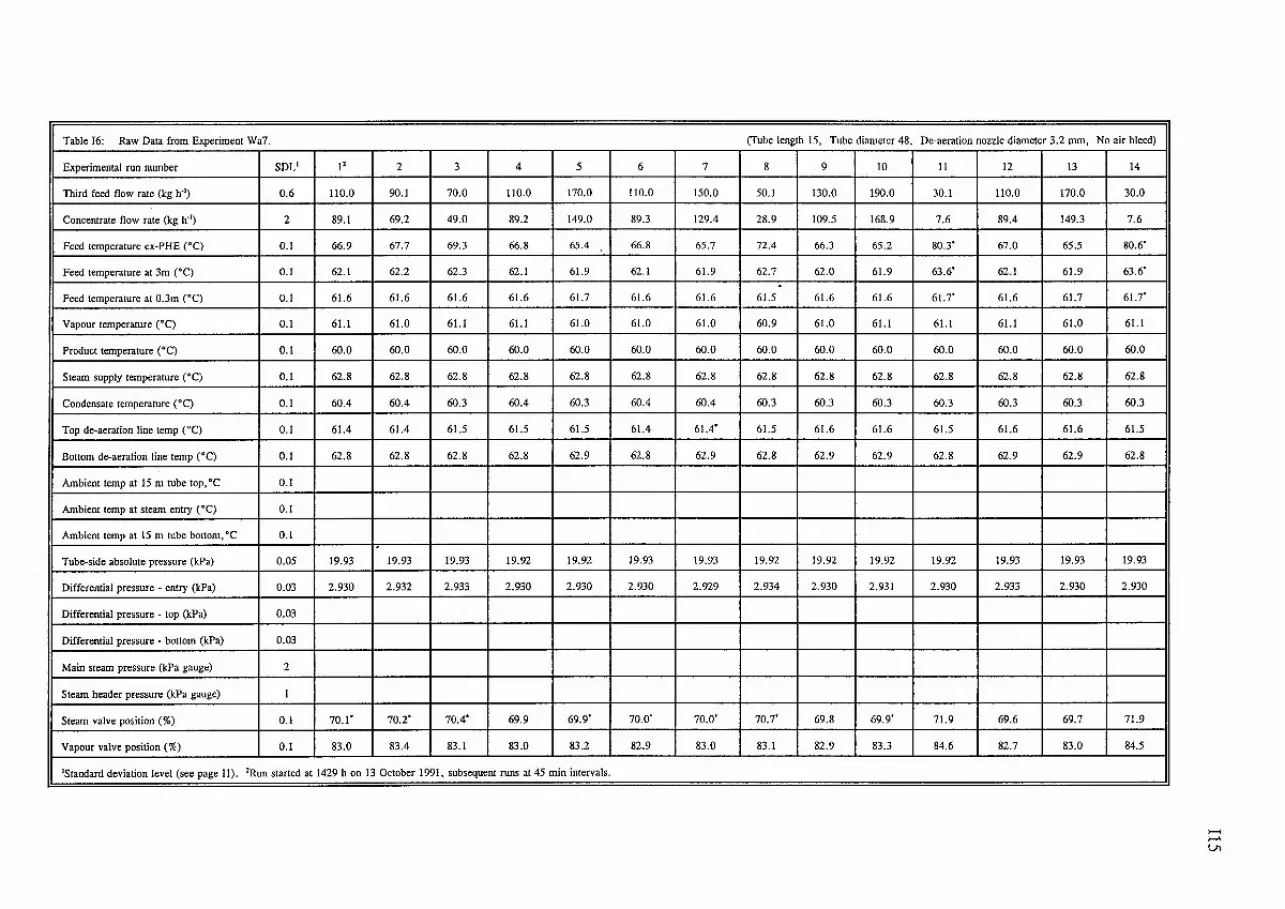
Table 16: Raw Data from Experiment Wa7.
Experimental run number SDL' 12 2 3 4 5 6
Third feed flow rate (kg h"1) 0.6 110.0 90.1 70.0 110.0 170.0 110.0
Concentrate flow rate (kg h"1) 2 89.1 69.2 49.0 89.2 149.0 89.3
Feed temperature ex-PHE (°C) 0.1 66.9 67.7 69.3 66.8 65.4 66.8
Feed temperature at 3m ("C) 0.1 62.1 62.2 62.3 62.1 61.9 62.1
Feed temperature at 0.3m (°C) 0.1 61.6 61.6 61.6 61.6 61.7 61.6
Vapour temperature ( • C) 0.1 61.1 61.0 61.1 61.1 61.0 61.0
Product temperature ("C) 0.1 60.0 60.0 60.0 60.0 60.0 60.0
Steam supply temperature (°C) 0.1 62.8 62.8 62.8 62.8 62.8 62.8
Condensate temperature (°C) 0.1 60.4 60.4 60.3 60.4 60.3 60.4
Top de-aeration line temp ("C) 0.1 61.4 61.4 61.5 61.5 61.5 61.4
Bottom de-aeration line temp ("C) 0.1 62.8 62.8 62.8 62.8 62.9 62.8
Ambient temp at 15 m tube top, •c 0.1
Ambient temp at steam entry (°C) 0.1
Ambient temp at 15m tube bottom, •c 0.1
Tube-side absolute pressure (kPa) 0.05 19.93 19.93 19.93 19.92 19.92 19.93
Differential pressure - entry (kPa) 0.03 2.930 2.932 2.933 2.930 2.930 2.930
Differential pressure - top (kPa) 0.03
Differential pressure - bottom (kPa) 0.03
Main steam pressure (kPa gauge) 2
Steam header pressure (kPa gauge) 1
Steam valve position(%) 0.1 70.1' 70.2' 70.4' 69.9 69.9' 70.0'
Vapour valve position(%) 0.1 83.0 83.4 83.1 83.0 83.2 82.9
'Standard deviation level (see page II). 2Run started at 1429 h on 13 October 1991, subsequent runs at 45 min intervals.
7
150.0
129.4
65.7
61.9
61.6
61.0
60.0
62.8
60.4
61.4'
62.9
19.93
2.929
70.0'
83.0
(Tube length 15, Tube diameter 48, De-aeration nozzle diameter 3.2 mm, No air bleed)
8 9 10 11 12 13 14
50.1 130.0 190.0 30.1 110.0 170.0 30.0
28.9 109.5 168.9 7.6 89.4 149.3 7.6
72.4 66.3 65.2 80.3' 67.0 65.5 80.6'
62.7 62.0 61.9 63.6' 62.1 61.9 63.6' . 61.5 61.6 61.6 61.7' 61.6 61.7 61.7'
60.9 61.0 61.1 61.1 61.1 61.0 61.1
60.0 60.0 60.0 60.0 60.0 60.0 60.0
62.8 62.8 62.8 62.8 62.8 62.8 62.8
60.3 60.3 60.3 60.3 60.3 60.3 60.3
61.5 61.6 61.6 61.5 61.6 61.6 61.5
62.8 62.9 62.9 62.8 62.9 62.9 62.8
19.92 19.92 19.92 19.92 19.93 19.93 19.93
2.934 2.930 2.931 2.930 2.933 2.930 2.930
70.7' 69.8 69.9' 71.9 69.6 69.7 71.9
83.1 82.9 83.3 84.6 82.7 83.0 84.5
I
1-1 1--' VI

Table 16b: Raw Data from Experiment Wa7.
Experimental run number SDL1 15 16
Third feed flow rate (kg h-1) 0.6 110.0 50.0
Concentrate flow rate (kg h-1) 2 89.6 29.3
Feed temperature ex-PHE ("C) 0.1 67.0 72.6·
Feed temperature at 3m ("C) 0.1 62.1 62.7
Feed temperature at 0.3m ("C) 0.1 61.6 61.6
Vapour temperature ("C) 0.1 61.0 61.0
Product temperature ("C) 0.1 60.0 60.0
Steam supply temperature ( •q 0.1 62.8 62.8
Condensate temperature (•C) 0.1 60.3 60.2
Top de-aeration line temp (•C) 0.1 61.6 61.6
Bottom de-aeration line temp (°C) 0.1 62.9 62.8
Ambient temp at 15 m tube top, •c 0.1
Ambient temp at steam entry ("C) 0.1
Ambient temp at 15 m tube bottom, •c 0.1
Tube-side absolute pressure (kPa) 0.05 19.92 19.92
Differential pressure - entry (kPa) 0.03 2.934 2.932
Differential pressure - top (kPa) 0.03 . Differential pressure - bottom (kPa) 0.03
Main steam pressure (kPa gauge) 2
Steam header pfessure (kPa gauge) 1
Steam valve position(%) 0.1 69.0 70.2
Vapour valve position(%) 0.1 82.5 82.7
'Standard deviation level (see page 11).
17 18 19
90.0 150.0 130.0
69.7 129.7 109.8
68.1 65.9 66.5
62.2 62.0 62.0
61.6 61.7 61.7
61.0 61.0 61.1
60.0 60.0 60.0
62.8 62.8 62.8
60.2 60.2 60.3
61.6 61.6 61.6
62.9 62.9 62.9
19.93 19.92 19.91
2.930 2.933 2.928
69.7 69.7 69.5.
82.6 82.7 82.5
20 21
70.0 190.0
49.6 169.0
69.7 65.2
62.4 61.9
61.7 61.7
61.1 6!.1
60.0 60.0
62.8 62.8
60.2 60.4
61.7 61.6
62.9 62.9
19.92 19.92
2.930 2.936
69.9' 69.8
82.5 83.2
(Tube length 15, Tube diameter 48, De-aeration nozzle diameter 3.2 mm, No air bleed)
22
110.0
89.6
67.0
62.1
61.7
6!.1
60.0·
62.8
60.4
61.6
62.9
19.93
2.932
69.7'
82.6
...... ,....... 0\

Table 17: Raw Data from Experiment Wa9.
Experimental run number SOL' 12 2 3 4
Third feed flow rate (kg h'1) 0.6 50.0 39.9' 45.1' 35.2
Concentrate flow rate (kg h'1) 2 26.3 16.0 21.3 10.5
Feed temperature ex-PHE c•q 0.1 71.2 73.6 72.2 75.7'
Feed temperature at 3m c•c) 0.1 62.6 62.8 62.6 63.0'
Feed temperature at 0.3m c•c) 0.1 61.5 61.5 61.4 61.5
Vapour temperature (•C) 0.1 60.8 60.7 60.7 60.7
Product temperature c•q 0.1 59.9 59.9 59.9 59.9
Steam supply temperature (°C) 0.1 62.6 62.5 62.5 62.6
Condensate temperature (•C) 0.1 60.7 60.7 60.7 60.7
Top de-aeration line temp c•c) 0.1 61.4 61.3 61.4 61.4
Bottom de-aeration line temp c•c) 0.1 62.8 62.8 62.8 62.7
Ambient temp at 15 m rube top, •c 0.5 25.1 24.9 24.6 24.6
Ambient temp at steam entry c•q 0.5 25.3 25.0 25.3 25.1
Ambient temp at 15 m tube bottom, •c 0.5 28.1 27.8 27.9 27.8 . Tube-side absolute pressure (kPa) 0.05 19.93 19.93 19.92 19.93
Differential pressure - entry (kPa) 0.03 2.928 2.931 2.934 2.930
Differential pressure - top (kPa) 0.03 2.840 2.842 2.847 2.840
Differential pressure - bottom (!cPa) 0.03 2.522 2.522 2.528 2.521
Main steam pressure (kPa gauge) 2 814.31 902.7" 912.4" 913.7
Steam pressure ex regulator (kPa gauge) 1 646.5" 645.1" 649.3 644.0
Steam valve position(%) 0.1 69.9' 70.2" 69.8 70.6
Vapour valve position(%) 0.1 84.6 85.1 84.8 85.4
'Standard deviation level (see page II). 2Run started at 1510 h on 15 October 1991, subsequent runs at 45 min intervals.
(Tube length 15, Tube diameter 48, De-aeration nozzle diameter 3.2 mm, No air bleed)
.
.....
....... -l

Table J8a: Raw Data from Experiment Wa10.
Experimental run number SDL' 12 2 3 4 5 6
Third feed flow rate (kg h"1) 0.6 50.0 40.1 45.1 35.1 55.0 35.2'
Concentrate flow rate (kg lf 1) 2 27.1 16.8 22.0 11.2 32.4 11.3
Feed temperature ex~PHE ("C) 0.1 71.4 73.9 72.5 75.9' 70.7 76.0'
Feed temperature at Jm (°C) 0.1 62.6 62.8 62.7 63.0 62.5 63.1'
Feed temperature at 0.3m ("C) 0.1 61.5 61.6 61.6 61.6 61.5 61.6
Vapour temperature ( • C) 0.1 60.8 60.8 60.8 60.8 60.9 60.8
Product temperature (•C) 0.1 59.9 59.9 59.9 59.9 59.9 59.9
Steam supply temperature c•c) 0.1 62.6 62.6 62.6 62.6 62.6 62.6
Condensate temperature ("C) 0.1 60.6 60.5 60.5 60.5 60.6 60.5
Top de~aeration line temp (°C) 0.1 61.3 61.4 61.4 61.4 61.3 61.4
Bottom de~aeration line temp (°C) 0.1 62.7 62.7 62.7 62.7 62.7 62.7
Ambient temp at IS m tube top, •c 0.5 24.7 23.9 23.9 23.9 23.7 23.8
Ambient temp at steam entry ( 0 C) 0.5 24.9 24.7 24.7 24.5 24.5 24.4
Ambient temp at 15m tube bottom, •c 0.5 26.6 26.5 26.3 26.1 26.0 25.9
Tube~side absolute pressure (kPa) 0.0.5 19.92 19.93 19.92 19.92 19.92 19.92
Differential pressure ~ entry (kPa) O.Q3 2.932 2.934 2.930 2.932 2.932 2.931
Differential pressure ~ top (kPa) O.Q3 2.842 • 2.842 2.840 2.842 2.845 2.839
Differential pressure • bottom (kPa) 0.03 2.523 2.526 2.522 2.523 2.527 2.523
Main steam pressure (kPa gauge) 2 915.6 915.3 915.2' 914.7 915.0 914.1
Steam pressure ex-regulator (kPa gauge) 1 647.9 644.4 646.6 644.1 649.1 644.3
Steam valve position(%) 0.1 69.7 70.1 69.9 70.7 69.6 70.6
Vapour valve position (%) 0.1 83.9 84.2 84.0 84.6 83.7 84.5
'Standard deviation level (see page II). 'Run started at 1836 h on 16 October 1991, subsequent runs at 45 min intervals.
7
40.0
16.9
74.0
62.8
61.6
60.8
59.9
62.6
60.5
61.4
62.7
23.6
24.3
25.7
19.93
2.929
2.840
2.524
914.9
647.0
70.1
84.2
------------·····-··-··
(Tube length 15, Tube diameter 48, De~ aeration nozzle diameter 3.2 mm, No air bleed)
8 9 10 11 12 13 14
55.5 45.0 50.0 45.0 55.2 35.!' 50.0
32.4 22.1 27.3 22.2 32.4 11.6 27.4
70.7 72.7 71.7' 72.9 70.9 76.3 71.8
62.5 62.7 62.6 62.7 62.5 63.1' 62.6
61.6 61.6 61.6 61.6 61.6 61.6 61.6
60.9 60.9 60.9 60.9 60.9 60.8 60.9
59.9• 59.9 59.9 59.9 59.9 59.9 59.9
62.6 62.6 62.6 62.6 62.6 62.6 62.6
60.6 60.5 60.5 60.4 60.4 60.4 60.4
61.4 61.4 61.4 61.4 61.4 61.4 61.4
62.7 62.7 62.7 62.7 62.7 62.7 62.8
23.4 23.2 23.3 23.2 23.3 23.1 23.3
24.1 24.0 23.9 23.9 23.9 23.8 23.7
25.4 25.1 25.0 24.8 24.6 24.6 24.4
19.93 19.92 19.93 19.93 19.92 19.93 19.93
2.932 2.927 2.936 2.930 2.931 2.929 2.933
2.844 2.839 2.843 2.840 2.842 2.838 2.843
2.529 2.524 2.529 2.526 2.528 2.522 2.526
914.9 914.4' 913.8 914.3 915.0' 913.7' 914.9
648.4 645.1 647.0 644.7 647.5 646.0' 647.1'
69.5 69.7 69.5 69.7 69.4 70.4 69.5
83.7 83.8 83.7 83.8 83.6 84.4 83.6
-......... 00

Table 18b: Raw Data from Experiment WaiO.
Experimental run number SOL'
Third feed flow rate (kg h"1) 0.6
Concentrate flow rate (kg h"1) 2
Feed temperature ex-PHE (0 C) 0.1
Feed temperature at 3m ("C) 0.1
Feed temperature at 0.3m ("C) 0.1
Vapour temperature (°C) 0.1
Product temperature (°C) 0.1
Steam supply temperature ("C) 0.1
Condensate temperature (°C) 0.1
Top de-aeration line temp (°C) 0.1
Bottom de-aeration line temp (°C) 0.1
Ambient temp at 15m tube top, •c 0.5
Ambient temp at steam entry (°C) 0.5
Ambient temp at 15 m tube bottom, •c 0.5
Tube-side absolute pressure (kPa) 0.05
Differential pressure - entry (kPa} 0.03
Differential pressure - top (kPa) 0.03
Differential pressure - bottom (kPa) 0.03
Main steam pressure (kPa gauge) 2
Steam pressure ex regulator (kPa gauge) 1
Steam valve position(%) 0.1
Vapour valve position (%) 0.1
'Standard deviation level (see page II).
15
39.7
16.9
74.3'
62.9
61.6
60.9
59.9
62.6
60.4
61.4
62.7
23.0
23.6
24.4
19.92
2.931
2.840
2.523
909.8'
645.7
69.9
83.9
-
.
(Tube length 15, Tube diameter 48, De-aeration nozzle diameter 3.2 mm, No air bleed)
.
.-I f-'

Table 19a: Raw Data from Experiment Wal I. (Tube length 15, Tube diameter 48, De-aeration nozzle diameter 0.99 mm, No air bleed) ~ Experimental run number SDL' jl 2 3 4 5 6 7 8 9 10 11 12 13 14
Third feed flow rate (kg h"1) 0.6 50.0 40.1 45.0 35.0 55.0 35.2 40.0 55.0 45.0 50.0 45.0 55.0 35.1 50.0
Concentrate flow rate (kg h"1) 2 27.7 17.4 22.7 11.8 32.9 12.1 17.5 33.1 22.9 28.1 23.0 33.2 12.2 28.1 i
Feed temperature ex-PHE ("C) 0.1 71.6' 74.2 72.7 75.9 70.8' 76.3' 74.5' 71.0 73.1 72.1 73.3 71.3 77.2 72.5
Feed temperature at 3m (°C) 0.1 62.6 62.9 62.7 63.1 62.5 63.1 62.9 62.5 62.7 62.6 62.8 62.5 63.2 62.7
Feed temperature at 0.3m (0 C) 0.1 61.6 61.6 61.6 61.7 61.6 61.7 61.7 61.7 61.7 61.7 61.7 61.6 61.7 61.7
Vapour temperature (°C) 0.1 61.2 61.3 61.4 61.3 61.3 61.3 61.4 61.4 61.4 61.4 61.5 61.5 61.5 61.5
Product temperature (°C) 0.1 60.3 60.3 60.4 60.4 60.4 60.4 60.4 60.4· 60.4 60.4 60.4 60.5 60.5 60.5
Steam supply temperature ( 0 C) 0.1 62.8 62.8 62.9 62.9 62.9 62.9 62.9 63.0 63.0 63.0 63.0 63.0 63.0 63.1
Condensate temperature (°C) 0.1 60.0 60.0 60.1 60.0 60.0 60.0 60.0 60.0 60.0 60.0 60.0 60.0 60.0 60.0
Top de-aeration line temp ( 0 C) 0.1 61.4 61.5 61.5 61.5 61.5 61.6 61.6 61.6 61.6 61.6 61.6 61.6 61.6 61.7
Bottom de-aeration line temp (°C) 0.1 62.9 62.9 62.9 62.9 63.0 63.0 63.0 63.0 63.0 63.0 63.1 63.1 63.1 63.1
Ambient temp at 15 m tube top, •c 0.5 23.8 23.6 23.7 23.7 23.8 23.7 23.7 23.3 23.5 23.1 22.7 22.4 22.1 21.9
Ambient temp at steam entry (•C) 0.5 24.2 24.1 24.1 24.2 24.0 23.8 23.8 23.7 23.6 23.3 23.1 22.8 22.3 22.1
Ambient temp at 15 m tube bottom, •c 0.5 25.1 25.0 25.0 24.9 24.8 24.5 24.1 23.9 23.7 23.3 23.1 22.8 22.5 22.1
Tube-side absolute pressure (kPa) 0.05 19.93 19.93 19.93 19.93 19.92 19.93 19.92 19.92 19.93 19.92 19.93 19.92 19.92 19.92
Differential pressure - entry (kPa) 0.03 2.935 2.931 2.933 2.934 2.932 2.929 2.927 2.930 2.930 2.929 2.933 2.932 2.929 2.929
Differential pressure - top (kPa) 0.03 2.924 • 2.923 2.923 2.921 2.922 2.917 2.916 2.919 2.920 2.918 2.921 2.922 2.918 2.922
Differential pressure • bottom (kPa) 0.03 2.883 2.883 2.883 2.882 2.883 2.878 2.878 2.879 2.880 2.879 2.882 2.883 2.877 2.881
Main steam pressure (kPa gauge) 2 862.6 862.3 862.4 862.6 862.5 862.6 862.9 862.9 862.9 862.8 862.0 861.8 861.4 861.2
Steam pressure ex regulator (kPa gauge) I 646.4"' 640.0" 640.9' 642.4" 647.5' 643.8" 644.0" 648.8" 645.5' 647.5' 643.8" 647.8' 646.31 650.2"
Steam valve position (%) 0.1 67.1' 67.5 67.1 67.8' 66.9' 67.8' 67.3 66.8 67.0 66.9 67.0 66.8 67.7' 66.8
Vapour valve position(%) 0.1 83.1 83.2 82.9 83.3 82.6' 83.3 82.9 82.4 82.5 82.4 82.3 82.2 82.8 82.1
'Standard deviation level (see page II). 2Run started at 1837 h on 18 October 1991, subsequent runs at 45 min intervals.
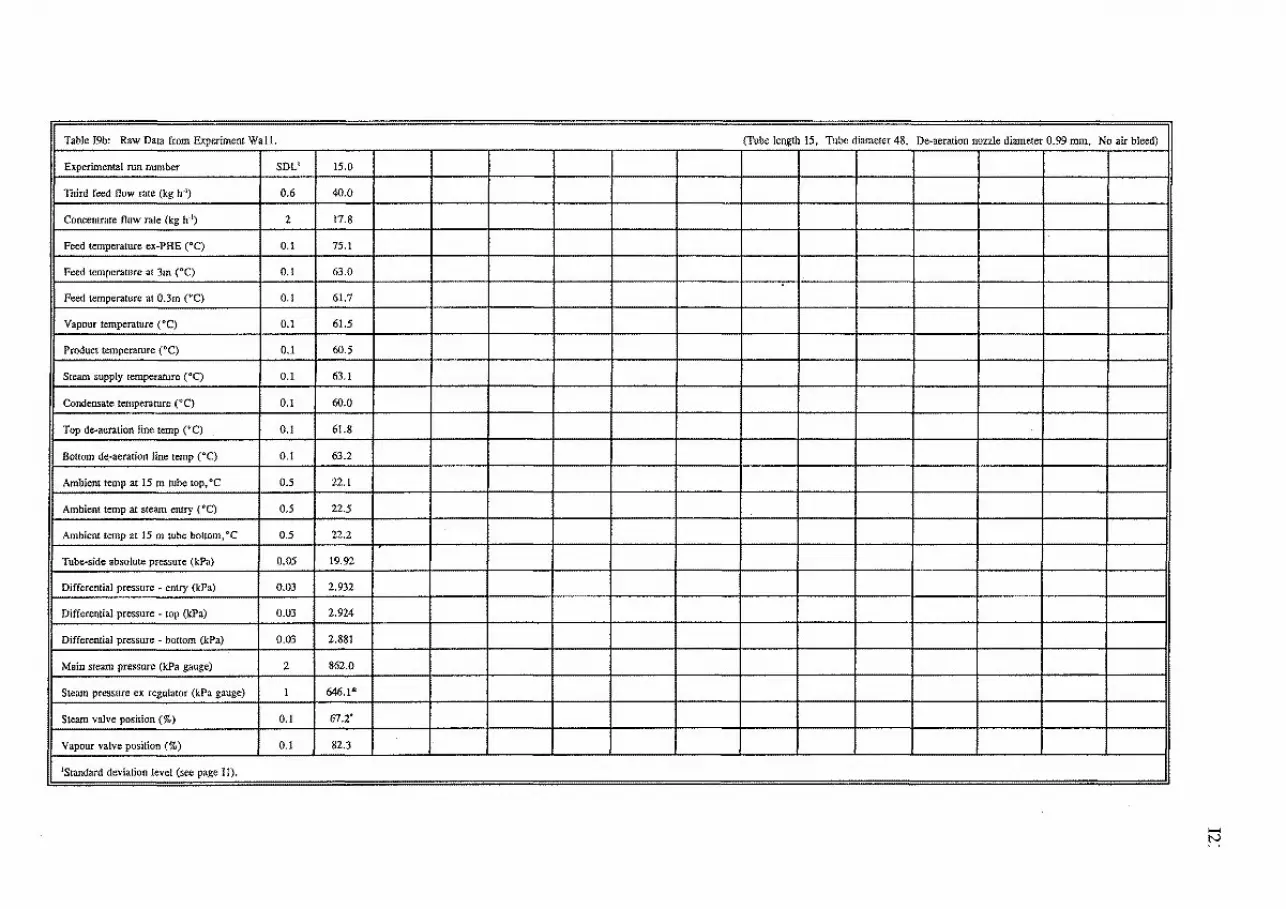
Table I9b: Raw Data from Experiment Wall. (fube length 15, Tube diameter 48, De-aeration nozzle diameter 0.99 mm, No air bleed)
Experimental run nwnber SDL' 15.0
Third feed flow rate (kg h-1) 0.6 40.0
Concentrate flow rate (kg h-1) 2 17.8
Feed temperature ex-PHE (°C) 0.1 75.1
Feed temperature at 3m ( 0 C) 0.1 63.0
Peed temperature at 0.3m ("C) 0.1 61.7
Vapour temperature (°C) 0.1 61.5
Product temperarure ("C) 0.1 60.5
Steam supply temperature ("C) 0.1 63.1
Condensate temperature (°C) 0.1 60.0
Top de-aeration line temp ("C) 0.1 61.8
Bottom de_-aeration line temp ("C) 0.1 63.2
Ambient temp at 15 m tube top, •c 0.5 22.1
Ambient temp at steam entry (°C) 0.5 22.5
Ambient temp at 15 m tube bottom, •c 0.5 22.2
Tube-side absolute pressure (kPa) 0.05 19.92
Differential pressure - entry (kPa) 0.03 2.932
Differential pressure - top (kPa) 0.03 2.924
Differential pressure - bottom (kPa) 0.03 2.881
Main steam pressure (kPa gauge) 2 862.0
Steam pressure ex regulator (kPa gauge) 1 646.1"
Steam valve position(%) 0.1 67.2'
Vapour valve position(%} 0.1 82.3
1Standard deviation level (see page II).
-N

Table IlOa: Raw Data from Experiment Wa12. (Tube length 15, Tube diameter 48, De-aeration nozzle diameter 0.99 mm, No air bleed) s Experimental run number SDL1 F 2 3 4 5 6 7 8 9 10 II 12 13 14
Third feed flow rate (kg lf1) 0.6 50.0 39.9' 45.0 35.0 55.0 35.1 40.1 55.0 45.1 50.0 45.0 55.0 35.0 50.1
Concentrate flow rate (kg h'1) 2 27.6 17.4 22.5 11.9 33.0 12.1 17.4 32.7 22.5 27.6 22.5 32.8 11.7 27.6
Feed temperature ex-PHE (•C) 0.1 69.6' 72.0' 7l.l' 75.6' 70.7' 76.1' 74.3 70.9' 73.0' 7!.9 73.0 71.1 76.7' 72.1
Feed temperature at 3m (•C) 0.1 62.4 62.6' 62.5 63.0 62.5 63.1' 62.9 62.5 62.7 62.6 62.7 62.5 63.1 62.6
Feed temperature at 0.3m (•C) 0.1 6!.6 61.6 61.6 6!.7 61.7 6!.7 61.7 61.7 61.7 61.7 61.7 61.7 61.7 61.7
Vapour temperature (•c) 0.1 615 6!.4 61.5 61.4 61.5 61.5 61.5 6!.5 61.7 6!.7 6!.7 61.7 61.5 61.7
Product temperature (°C) 0.1 60.5 60.5 60.5 60.5 60.5 60.5 60.5 60.5. 60.5 60.5 60.6 60.6 60.6 60.6
Steam supply temperature (°C) 0.1 63.2 63.2 63.2 63.2 63.2 63.2 63.3 63.2 63.2 63.2 63.2 63.2 63.2 63.2
Condensate temperature ( • C) 0.1 60.4 60.2 60.2 60.2 60.2 60.1 60.2 60.2 60.1 60.2 60.1 60.1 60.1 60.1
Top de-aeration line temp (•C) 0.1 62.2 62.2 62.2 62.0 62.0 62.0 62.0 62.0 62.1 62.0 62.0 62.0 61.9 62.0
Bouom de-aeration line temp ("C) 0.1 63.2 63.2 63.2 63.2 63.2 63.2 63.2 63.3 63.3 63.3 63.3 63.3 63.3 63.3
Ambient temp at 15 m tube top, •c 0.5 29.1 28.1 27.0 25.5 24.6 24.4 23.9 23.9 23.6 23.8 23.2 23.1 22.9 22.7
Ambient temp at steam entry ("C) 0.5 2&.4 27.4 26.6 25.7 25.3 25.1 24.7 24.5 24.6 24.4 24.2 24.0 23.7 23.6
Ambient temp at 15 m tube bottom, •c 0.5 27.6 26.9 26.2 25.5 24.9 24.6 24.3 24.1 24.0 23.8 23.7 23.4 23.2 23.0
Tube-side absolute pressure (kPa) 0.05 19.93 19.92 19.93 19.93 19.92 19.92 19.92 19.92 19.92 19.92 19.92 19.92 19.93 19.92
Differential pressure entry (kPa) 0.03 2.930 2.930 2.931 2.929 2.933 2.930 2.928 2.930 2.931 2.931 2.928 2.932 2.930 2.931
Differential pressure - top (kPa) 0.03 2.910 '2.909 2.913 2.911 2.918 2.915 2.913 2.917 2.919 2.920 2.917 2.921 2.917 2.922
Differential pressure - bottom (kPa) 0.03 2.882 2.880 2.883 2.877 2.881 2.878 2.876 2.881 2.882 2.883 2.879 2.883 2.878 2.882
Main steam pressure (kPa gauge) 2 868.3 868.0 867.1 863.1 863.5 862.9 863.4 864.1 864.0 864.0 863.3 863.4' 862.8 863.1'
Steam pressure ex regulator (kPa gauge) 1 640.5" 637.4" 637.')' 641.1"' 642.5"' 642.7" 640.3"' 645.0" 643.5"' 640.6" 641.6" 641.6" 641.0" 642.3"
Steam valve position(%) 0.1 68.8 69.1 68.8 69.6 68.7 69.6 69.2 68.8 69.0 69.0 69.0 68.9' 69.9 69.2'
Vapour valve position(%) 0.1 82.7 82.7 82.6 83.0 82.2 83.0 82.6 82.4 82.5 82.5 82.4 82.3 83.3 82.4
'Standard deviation level (sec page II). 'Run started at 1753 II on 21 October 199!, subsc<Jucnt rw1s at 45 min intervals.

Table IlOb: Raw Data from Experiment Wal2. (Tube length 15, Tube diameter 48, De-aeration nozzle diameter 0.99 mm, No air bleed) '
Experimental run number SDL1 15 !
Third feed flow rate (kg 11·') 0.6 40.1 •
Concentrate flow rate (kg 11·1) 2 17.2
Feed temperature ex-PHE ("C) 0.1 74.9
Feed temperature at 3m (°C) 0.1 62.9 .
Feed temperature at 0.3m (°C) 0.1 61.7
Vapour temperature (°C) 0.1 61.7
Product temperature (°C) 0.1 60.6
Steam supply temperature (°C) 0.1 63.2
Condensate temperature (°C) 0.1 60.1
Top de-aeration line temp (°C) 0.1 62.0
Bottom de-aeration line temp (°C) 0.1 63.3
Ambient temp at 15m tube top, oc 0.5 22.6
Ambient temp at steam entry (°C) 0.5 23.5
Ambient temp at 15 m tube bottom, oc 0.5 23.0 . Tube-side absolute pressure {kPa) 0.05 19.92
Differential pressure - entry (kPa) O.o3 2.929
Differential pressure - top (kPa) 0.03 2.920
Differential pressure - bottom (kPa) O.o3 2.879
Main steam pressure (kPa gauge) 2 863.0
Steam pressure ex regulator {kPa gauge) I 642.5'
Steam valve position (%) 0.1 69.5
Vapour valve position(%) 0.1 82.6
'Standard deviation level (see page 11).
t:::) w

Table II Ia: Raw Data from Experiment Wa13. (Tube length 15, Tube diameter 48, De-aeration nozzle diameter 0.99 mm, Air bleed nozzle diameter 0.2 mm) ~ Experimental run number SDL' 1' 2 3 4 5 6 7 8 9 10 11 12 13 14
Third feed flow rate (kg h'1) 0.6 50.0 40.0 45.0 35.0 55.0 35.0 40.0 55.0 45.0 50.0 45.0 55.0 35.0 50.0
Concentrate flow rate (kg lf1) 2 29.9 20.0 25.4 14.6 35.5 14.7 19.9 35.2 25.0 30.0 24.9 35.0 14.2 29.9
Feed temperature ex-PHE (•C) 0.1 70.8 73.78 72.9' 76.4' 71.0 76.6 74.6 71.1 73.3' 72.2 73.4 71.4 77.2' 71.9
Feed temperature at 3m ("C) 0.1 62.5 62.7" 62.7 63.1 62.5 63.1 62.9 62.5 62.8 62.6 62.8 62.5 63.2' 62.6
Feed temperature at 0.3m (•C) 0.1 61.6 61.6" 61.6 61.7 61.6 61.7 61.7 61.7 61.7 61.7 61.7 61.7 61.7 61.6
Vapour temperature c•q 0.1 61.5 61.5 61.5 61.6 61.6 61.5 6!.4 61.4 61.4 61.5 61.5 61.4 61.5 61.5
Product temperature (•C) 0.1 60.4 60.4 60.4 60.5 60.5 60.5 60.5 60.5. 60.5 60.5 60.5 60.5 60.5 60.5
Steam supply temperature ("C) 0.1 63.1 63.1 63.1 63.1 63.2 63.1 63.1 63.1 63.2 63.2 63.2 63.2 63.2 63.2
Condensate temperature (•C) 0.1 59.5 59.4 59.4 59.4 59.4 59.4 59.4 59.4 59.4 59.4 59.4 59.4 59.4 59.6
Top de-aeration line temp c•c) 0.1 60.8 60.7 60.9 60.8 60.8 60.8 60.9 60.8 60.9 60.9 60.8 60.8 60.8 60.8
Bottom de-aeration line temp ("C) 0.1 62.4 62.4 62.5 62.5 62.5 62.5 62.5 62.5 62.5 62.6 62.6 62.6 62.6 62.5
Ambient temp at 15m tube top,"C 0.5 25.0 24.5 24.3 23.9 23.6 23.6 23.3 23.3 22.9 22.7 22.6 22.4 22.0 22.1
Ambient temp at steam entry CCC) 0.5 25.7 25.4 25.0 24.6 24.3 24.4 24.2 24.0 23.6 23.2 23.2 23.0 22.8 23.0
Ambient temp at 15 m tube bottom, •c 0.5 25.7 25.2 24.9 24.7 24.4 24.3 24.1 24.0 23.8 23.5 23.4 23.3 23.1 24.0
Tube-side absolute pressure (kPa) 0.05 19.92 19.92 19.93 19.93 19.92 19.93 19.93 19.92 19.92 !9.92 19.92 19.92 19.92 19.92
Differential pressure • entry (kPa) 0.03 2.931 2.929 2.931 2.931 2.931 2.927 2.931 2.931 2.928 2.932 2.932 2.933 2.932 2.933
Differential pressure top (kPa) 0.03 2.924 • 2.922 2.923 2.924 2.925 2.921 2.924 2.925 2.923 2.926 2.927 2.929 2.928 2.930
Differential pressure • bottom (kPa) 0.03 3.445 3.350 3.281 3.305 3.333 3.353 3.380 3.401 3.424 3.446 3.291 3.255 3.272 3.219
Main steam pressure (kPa gauge) 2 863.8 864.0 863.8 863.8 863.2 863.1 863.6 864.0 863.4 862.6 862.5" 862.4 861.9 850.11
Steam pressure ex regulator (kPa gauge) 1 638.5'' 640.9" 639.4' 636.5'" 638.9" 637.2' 636.8' 638.51 637.11 638.0" 641.1" 633.0" 632.2' 640.0"
Steam valve position (%) 0.1 66.0' 65.9' 65.7' 66.3 65.6' 66.4' 66.2 66.o· 66.2' 66.2 66.3 66.2 67.0' 66.3'
Vapour valve position(%) 0.1 79.9 79.7 79.4 80.0 79.2 79.8' 79.8 79.7 79.7 79.7 79.8 79.7 80.4 79.9
'Standard deviation level (sec page II). 1Run started at 1956 h on 22 October 1991, subsequent runs at 45 min intervals.

Table Illb: Raw Data from Experiment Wa13.
Experimental run number SDL1
Third feed flow rate (kg h·') 0.6
Concentrate flow rate (kg h·') 2
Feed temperature ex-PHE (•C) 0.1
Feed temperature at 3m c•q 0.1
Feed temperature at 0.3m (°C) 0.1
Vapour temperature (•c) 0.1
Product temperature CO C) 0.1
Steam supply temperature c•c) 0.1
Condensate temperature (•c) 0.1
Top de-aeration line temp (°C) 0.1
Bottom de-aeration line temp c•c) 0.1
Ambient temp at 15 m tube top, •c 0.5
Ambient temp at steam entry (•C) 0.5
Ambient temp at 15m tube bottom, •c 0.5
Tube-side absolute pressure (kPa) 0.05
Differential pressure - entry (kPa) 0.03
Differential pressure - top (kPa) 0.03
Differential pressure - bottom (kPa) 0.03
Main steam pressure (kPa gauge) 2
Steam pressure ex regulator (kPa gauge) 1
Steam valve position (%) 0.1
Vapour valve position(%) 0.1
'Standard deviation level (see page 11).
15
40.5
19.5
74.7"'
63.0
61.6
61.6
60.5
63.2
59.7
60.7
62.5
23.6.
23.8
27.4.
19.92
2.929
2.928
3.076
936.7.
640.2"'
66.7
80.0
(Tube length 15, Tube diameter 48, De-aeration nozzle diameter 0.99 mm, Air bleed nozzle diameter 0.2 mm)
. ' I
!
•
~
N Ul

Table Il2a: Raw Data from Experiment Wa14. (Tube length 15, Tube diameter 48, De-aeration nozzle diameter 3.2 mm, No air bleed) t:3 0\
Experimental run number SDL' 12 2 3 4 5 6 7 8 9 10 11 12 13 14
Third feed flow rate (kg h-1) 0.6 110.0 llO.O 110.0 110.0 110.0 109.9 110.0 109.9 109.9 110.0 110.0 110.0 110.0 110.0
Concentrate flow rate (kg h-1) 2 77.2 90.1 72.2 83.7' 104.7' 96.5' 72.3 104.7' 96.8 89.5 83.3' 76.9 90.6 104.3'
Feed temperature ex-PHE (•q 0.1 66.4 66.4 66.5 66.6 66.8 66.9 66.9 67.0 67.1 67.1 67.2 67.2 67.2 67.2
Feed temperature at 3m (0 C) 0.1 62.0 62.0 62.0 62.1 62.1 62.1 62.1 62.1 62.1 62.1 62.1 62.1 62.1 62.1
Feed temperature at 0.3m (°C) 0.1 61.7 61.7 61.7 61.7 61.7 61.7 61.7 61.7 61.7 61.7 61.7 61.7 61.7 61.7
Vapour temperature (•C) 0.1 61.3 60.9 61.9 61.1 60.7 60.8 62.1 60.9 60.9 61.1 61.3 61.4 61.1 60.9
Product temperature (•q 0.1 60.0 59.9 60.6 60.0 59.9 59.9 60.7 59.9· 60.0 60.0 60.0 60.0 60.0 60.0
Steam supply temperature (•q 0.1 66.8 62.7 69.3 63.7 60.7 61.7 66.7 60.7 61.8 62.8 63.7 64.6 62.8 60.7
Condensate temperature (•C) 0.1 61.1 59.9 62.3 60.6 58.7 59.4 62.2 58.5 59.3 59.7 60.5 61.1 59.7 58.5
Top de-aeration line temp ("C) 0.1 63.3 61.5 64.7 62.4 59.6 60.6 64.7 59.6 60.6 61.5 62.4 63.3 61.5 59.5
Bottom de-aeration line temp (0 C) 0.1 64.6 62.7 66.0 63.7 60.8 61.8 66.1 60.8 61.8 62.8 63.8 64.7 62.8 60.8
Ambient temp at 15 m tube top, •c 0.5 25.1 24.8 24.9 24.6 23.6 23.1 23.0 22.3 22.0 22.0 21.8 21.5 21.4 21.5
Ambient temp at steam entry (•q 0.5 26.2 26.0 25.9 25.3 24.2 23.9 23.7 23.2 22.9 22.8 22.7 22.5 22.4 22.2
Ambient temp at 15m tube bottom, •c 0.5 26.8 26.6 25.9 25.3 24.6 23.9 23.4 23.0 22.7 22.4 22.3 22.2 22.0 21.9
Tube-side absolute pressure (kPa) 0.05 19.92 19.92 20.58 19.92 19.92 19.93 20.59 19.92 19.93 19.92 19.92 19.93 19.93 19.92
Differential pressure - entry (kPa) 0.03 4.999 3.003 6.000 4.000 1.002 1.999 5.999 0.997 2.003 3.002 4.001 5.001 3.000 1.002
Differential pressure - top (kPa) 0.03 4.949 • 2.986 5.933 3.971 1.005 1.999 5.940 1.006 2.003 2.992 3.979 4.959 2.993 1.013
Differential pressure - bottom (kPa) 0.03 4.915 2.955 5.895 3.937 0.972 1.962 5.898 0.968 1.965 2.951 3.938 4.916 2.951 0.973
Main steam pressure (kPa gauge) 2 863.7 867.6 865.2 865.2 865.8 865.0 862.7 864.6 864.1 863.0 862.5 863.0 863.3 864.4
Steam pressure ex regulator (kPa gauge) I 648.2 643.21 649.5 647.7 654.2 646.6" 646.4 652.1" 648.9' 645.9 646.4 643.11 643.31 640.8'
Steam valve position(%) 0.1 79.9 68.1 84.5 74.4 44.1' 58.9 84.9 44.3' 59.1 68.1 75.0 80.4 68.6 44.4'
Vapour valve position(%) 0.1 96.4 83.3 99.9 90.1 57.4' 73.9 99.9 57.3' 73.9 83.3 90.3 96.3 83.1 57.4'
'Standard deviation level (see page II). 1Run started at 1612 h on 24 October 1991, subsequent runs at 50 min intervals.

Table Il2b: Raw Data from Experiment Wa14. (Tube length 15, Tube diameter 48, De-aeration nozzle diameter 3.2 mm, No air bleed)
Experimental run number SDL1 15 16 17 18
Third feed flow rate (kg h'1) 0.6 110.0 110.0 110.0 109.9
Concentrate flow rate (kg h'1) 2 96.5 77.3' 82.7' 71.9'
Feed temperature ex-PHE (°C) 0.1 67.3 .67.3 67.1 67.1
Feed temperature at 3m (°C) 0.1 62.1 62.1 62.1 62.1 . Feed temperature at 0.3m ("C) 0.1 61.8 61.8 61.7 61.7
Vapour temperature (•C) 0.1 61.0 61.5 61.4 62.2
Product temperature (°C) 0.1 60.0 60.0 60.0 60.8
Steam supply temperature (•c) 0.1 61.8 64.6 63.7 69.1
Condensate temperature (°C) 0.1 59.2 61.1 60.6 62.5
Top de-aeration line temp (•q 0.1 60.5 63.4 62.5 64.7
Bottom de-aeration line temp (°C) 0.1 61.8 64.7 63.8 66.2
Ambient temp at 15 m tube top, •c 0.5 21.3 21.1 21.1 22.2
Ambient temp at steam entry ("C) 0.5 22.0 22.1 21.9 22.2
Ambient temp at 15 m tube bottom, •c 0.5 21.7 21.4 22.6 24.5" . Tube-side absolute pressure (kPa) 0.05 19.93 19.92 19.93 20.58
Differential pressure - entry (kPa) 0.03 2.000 4.998 4.002 6.001
Differential pressure - top (kPa) 0.03 2.002 4.957 3.981 5.945
Differential pressure - bottom (kPa) 0.03 1.963 4.913 3.941 5.902
Main steam pressure (kPa gauge) 2. 863.9 861.6 852.4' 887.9'
Steam pressure ex regulator (kPa gauge) 1 641.6' 644.5" 638.11 643.9'
Steam valve position (%) 0.1 59.3' 80.3' 74.9 85.1'
Vapour valve position(%) 0.1 74.0' 96.2 90.2 99.9
'Standard deviation level (see page 11).
8

Table 113a: Raw Data from Experiment Wa16. N
(Tube length 15, Tube diameter 48, De-aeration nozzle diameter 3.2 mm, No air bleed) 00
Experimental run number SDL1 1' 2 3 4 5 6 7 8 9 10 11 12 13 14
1l1ird feed flow rate (kg 11'1) 0.6 110.0 110.0 110.0 110.0 I 10.0 110.0 110.0 110.0 110.0 110.0 110.0 110.0 110.0 109.9
Concentrate flow rate (kg h-1) 2 87.5 86.7 85.9 85.7 88.0 87.2 87.6 86.6 87.8 87.4 87.4 87.9 86.8 88.5
Feed temperature ex-PHE c•q 0.1 64.4 68.9 73.4 75.6 61.2 66.8 63.4 70.1 62.3 65.7' 64.5 60.1 67.8 55.6
Feed temperature at 3m ("C) 0.1 60.5 64.5 68.6 70.6 57.4 62.5 59.5 65.5 58.5 61.5 60.5 56.4 63.5 52.4
Feed temperature at 0.3m (°C) 0.1 59.6 63.6 67.5 69.5 56.6 61.6 58.6 64.6 57.6 60.6 59.6 55.7 62.6 51.7
Vapour temperature (°C) 0.1 60,8 6U 61.2 61.3 58.5 61.1 60.4 61.2 59.5 6LI 60.9 57.5 61.1 53.4
Product temperature {°C) 0.1 59.9 60.0 60.0 60.0 60.0 60.0 60.0 60.0• 60.0 60.0 60.0 60.0 60.0 60.0
Steam supply temperature ("C) 0.1 62.6 62.6 62.6 62.6 62.6 62.7 62.6 62.7 62.7 62.7 62.7 62.7 62.7 62.7
Condensate temperature ("C) 0.1 60.6 60.6 60.5 60.6 60.5 60.6 60.6 60.6 60.6 60.6 60.6 60.7 60.6 60.7
Top de-aeration line temp ( 0 C) 0.1 61.7 61.7 61.7 61.7 61.8 61.7 61.7 61.7 61.7 61.7 61.7 61.8 61.8 61.7
Bottom de-aeration line temp (•C) 0.1 62.7 62.7 62.7 62.7 62.7 62.7 62.7 62.7 62.7 62.7 62.7 62.7 62.7 62.7
Ambient temp at 15 m lube lop, •c 0.5 24.4 24.0 23.6 23.4 23.2 23.1 23.0 23.1 23.2 23.2 23.3 23.4 23.6 23.7
Ambient temp at steam entry c•c) 05 25.7 25.2 24.9 24.8 24.6 24.6 24.5 24.7 24.8 24.8 24.9 25.2 25.4 25.5
Ambient temp at 15 m tube bottum, •c 05 25.0 24.5 24.1 23.9 23.7 23.5 23.4 23.4 23.3 23.3 23.4 24.3 24.9 24.8
Tube-side absolute pressure (kPa) 0.05 19.92 19.92 19.93 19.93 19.92 19.93 19.92 19.92 19.92 19.93 19.93 19.93 19.92 19.92
Differential pressure - entry (kPa) 0.03 2.931 2.933 2.931 2.930 2.930 2.931 2.931 2.932 2.932 2.929 2.929 2.930 2.931 2.929
Differential presSllre top (kPa) 0.03 2.842 • 2.846 2.847 2.846 2.846 2.848 2.849 2.849 2.850 2.846 2.847 2.846 2.850 2.845
Differential pressure - bottom (kPa) 0.03
Main steam pressure (kPa gauge) 2 837.8 836.5 836.5 835.0"' 835.0"' 836.4' 836.2 835.1' 834.5"' 837.0 837.7 835.1"' 837.6 838.7
Steam header pressure (kPa gauge) 1 292.4 291.3 290.5 289.8 292.1' 291.2 291.6 290.4 291.5 291.1 291.6 291.7 290.6 292.8
Steam valve position(%} 0.1 62.4 62.3 62.3 62.3 62.6 62.4 62.4 62.4 62.6 62.4 62.4 62.7 62.4 63.0
Vapour valve position(%) 0.1 83.2 83.7 84.5 84.9 82.7 83.3 82.9 83.8 82.8 83.1 82.9 82.5 83.5 82.0
'Standard deviation level (see page II). 'Run started at 2109 h on 8 November 1991, subsequent runs at 60 min intervals. ---~----

·······-·······--······- ·····-
Table ll3b: Raw Data from Experiment Wa16. (Tube length 15, Tube diameter 48, De-aeration nozzle diameter 3.2 mm, No air bleed)
Experimental run number SDL1 15 16 17
Third feed flow rate (kg h"1) 0.6 110.0 110.1 110.0
Concentrate flow rate (kg h"1) 2 86.3 88.1 85.1
Feed temperature ex-PHE ("C) 0.1 71.2 57.8 77.8
Feed temperature at 3m (•C) 0.1 66.6 54.4 72.6 . Feed temperature at 0.3m ("C) 0.1 65.5 53.7 71.5
Vapour temperature (•C) 0.1 61.1 55.5 61.4
Product temperature ("C) 0.1 60.0 60.0 60.0
Steam supply temperature ("C) 0.1 62.7 62.7 62.7
Condensate temperature ("C) 0.1 60.6 60.7 60.6
Top de-aeration line temp ("C) 0.1 61.8 61.8 61.8
Bottom de-aeration line temp ("C) 0.1 62.7 62.7 62.7
Ambient temp at 15 m tube top, •c 0.5 23.7 24.2 24.5
Ambient temp at steam entry (•C) 0.5 25.0 25.4 25.4
Ambient temp at 15 m tube bottom, •c 0.5 24.0 24.0 24.2 . Tube-side absolute pressure (kPa) 0.05 19.92 19.92 19.93
Differential pressure - entry (kPa) 0.03 2.931 2.932 2.930
Differential pressure - top (kPa) 0.03 2.849 2.846 2.846
Differential pressure - bottom (kPa) 0.03
Main steam pressure (kPa gauge) 2 834.5'" 837.9 837.8
Steam header pressure (kPa gauge) I 289.5 292.2 289.0
Steam valve position(%) 0.1 62.4 62.8 62.2
Vapour valve position (%) 0.1 84.0 82.1 85.3
'Standard deviation level (see page ll).
t::) \0

~ Table Il4a: Raw Data from Experiment Wal7. (Tube length 15, Tube diameter 48, De-aeration nozzle diameter 3.2 mm, No air bleed) 0
Experimental run number SOL' JZ 2 3 4 5 6 7 8 9 10 II 12 13 14
Third feed flow rate (kg h" 1) 0.6 110.0 1!0.0 110.0 1!0.0 110.1 110.0 110.0 110.0 110.0 110.0 110.0 110.0 110.0 110.0
Concentrate flow rate (kg 11" 1) 2 87.3 86.7 86.0 85.6 87.7 87.3 87.8 86.7 87.9 87.6 87.8 88.2 87.3 88.7
Feed temperature ex-PHE (•C) 0.1 64.8 69.2 73.7 76.0 61.6 67.3 63.9 70.6 62.8' 66.1 65.1 60.7 68.6 56.3
Feed temperature at 3m (•C) 0.1 60.5 64.6 68.6 70.6 57.5 62.6 59.5 65.6 58.5 61.5 60.5 56.5 63.6 52.5
Feed temperature at 0.3m ("C) 0.1 59.7 63.6 67.5 69.5 56.6 61.6 58.6 64.6 57.6 60.6 59.6 55.7 62.6 51.7
Vapour temperature (•C) 0.1 60.7 60.9 61.1 61.2 58.4 60.9 60.3 61.1 59.5 61.0 61.0 57.6 61.0 53.4
Product temperature ("C) 0.1 60.0 60.0 60.0 60.0 60.0 60.0 60.0 60.0· 60.0 60.0 60.0 60.0 60.0 60.0
Steam supply temperature (•C) 0.1 62.8 62.7 62.7 62.8 62.8 62.8 62.8 62.8 62.8 62.8 62.8 62.7 62.8 62.8
Condensate temperature ("C) 0.1 60.5 60.5 60.5 60.4 60.5 60.4 60.4 60.4 60.4 60.4 60.4 60.4 60.4 60.5
Top de-aeration line temp ("C) 0.1 61.7 61.7 61.6 61.7 61.6 61.6 61.6 61.6 61.6 61.6 61.6 61.6 61.7 61.6
Bottom de-aeration line temp ("C) 0.1 62.7 62.7 62.7 62.7 62.7 62.7 62.7 62.7 62.7 62.7 62.8 62.7 62.8 62.8
Ambient temp at 15 m tube top, •c 0.5 24.5 24.6 24.3 23.9 23.4 23.0 22.8 22.9 22.6 22.5 22.3 21.8 21.5 21.3
Ambient temp at steam entry (•C) 0.5 25.8 25.9 25.5 25.2 24.4 24.2 23.9 24.1 23.8 23.7 23.5 22.9 22.6 22.4
Ambient temp at 15 m tube bottom, •c 0.5 24.8 25.4 25.4 25.0 24.0 23.6 23.3 23.2 22.9 22.8 22.5 22.0 21.7 21.4
Tube-side absolute pressure (kPa) 0.05 19.92 19.92 19.93 19.92 19.92 19.93 19.92 19.92 19.92 19.92 19.92 19.93 19.93 19.92
Differential pressure - entry (kPa) 0.03 2.932 2.930 2.932 2.930 2.933 2.931 2.928 2.932 2.930 2.930 2.931 2.929 2.932 2.931
Differential pressure - top (kPa) 0.03 2.847 • 2.849 2.853 2.848 2.850 2.852 2.847 2.852 2.850 2.852 2.852 2.850 2.853 2.853
Differential pressure - bottom (kPa) 0.03
Main steam pressure (kPa gauge) 2 881.5 880.9 879.1 878.5 879.0 879.2 879.4' 878.4 879.2 878.6 878.9 878.2 877.8 877.9
Steam header pressure (kPa gauge) 1 180.2 180.1 180.3 180.6 180.7 180.6 180.8 181.1 180.4 179.9 180.1 179.6 179.7 179.6
Steam valve position(%) 0.1 72.7 72.5 72.4 72.3 72.7 72.4 72.3 72.1 72.4 72.4 72.3 72.6 72.2 73.0
Vapour valve position(%) 0.1 83.1 83.7 84.5 84.8 82.5 83.1 82.5 83.5 82.3 82.6 82.5 81.9 82.9 81.3
'Standard deviation level (see page 11). 'Run started at 1645 h on 9 November 1991, subsequent runs at 60 min intervals.

--
Table 114b: Raw Data from Experiment Wal7.
Experimental run number SDL1 15.0 16.0 17 18 19 20
Third feed flow rate (kg h-1) 0.6 110.0 110.0 110.0 110.0 110.0 110.0
Concentrate flow rate (kg h-1) 2 86.5 88.3 85.3 88.9 88.8 88.2
Feed temperature ex-PHE (0 C) 0.1 72.0 58.4 78.4 51.4" 53.7 59.3'
Feed temperature at 3m (°C) 0.1 66.7 54.5 72.7 48.31 50.4 55.5'
Feed temperature at 0.3m ( 0 C) 0.1 65.6 53.7 71.5 47.6" 49.7 54.7'
Vapour temperature (°C) 0.1 61.1 55.5 61.5 49.21 51.0 56.3'
Product temperature (0 C) 0.1 60.0 60.0 60.0 60.0 60.0 60.0
Steam supply temperature ("C) 0.1 62.8 62.8 62.8 62.7 62.7 62.8
Condensate temperature (°C) 0.1 60.4 60.5 60.5 60.7 60.7 60.6
Top de-aeration line temp ("C) 0.1 61.7 61.7 61.6 61.6 61.5 61.5
Bottom de-aeration line temp (°C) 0.1 62.8 62.8 62.8 62.8 62.7 62.8
Ambient temp at 15 m tube top, oc 0.5 21.2 22.3 23.7 23.8 23.6 23.8
Ambient temp at steam entry ( 0 C) 0.5 22.2 23.5 24.7 25.1' 24.8 24.8
Ambient temp at 15 m tube bottom, oc 0.5 21.3 22.5 24.3 24.8 24.2 24.3
Tube-side absolute pressure (kPa) 0.05 19.92 19.93 19.92 19.93 19.92 19.93
Differential pressure - entry (kPa) 0.03 2.930 2.931 2.929 2.932 2.930 2.930
Differential pressure - top (kPa) 0.03 2.853 2.853 2.855 2.850 2.849 2.851
Differential pressure - bottom (kPa) 0.03
Main steam pressure (kPa gauge) 2 877.3' 879.1 878.3 881.8 881.7 882.2
Steam header pressure (kPa gauge) 1 179.8 179.6 180.0 179.7 179.6 180.0
Steam valve position (%) 0.1 72.3 72.9 72.1 73.5 73.3 72.7'
Vapour valve position(%) 0.1 83.6 81.8 84.8 81.2 81.3 81.7
, 'Standard deviation level (see page II).
21
110.0
87.6
64.8
60.5
59.6
60.5
60.0
62.8
60.6
61.5
62.8
24.1
25.1
24.5
19.93
2.934
2.851
882.1
180.3
72.3
82.5
(Tube length 15, Tube diameter 48, De-aeration nozzle diameter 3.2 mm, No air bleed)
22 23 24 25 26 27 28
110.0 110.0 110.0 110.0 110.0 110.0 110.0
88.0 86.1 88.9 88.8 88.3 88.2 87.6
60.4 73.9 53.7 51.5 58.1 59.3 64.9'
56.5 68.6 50.4 48.4 54.4 55.5 60.5 . 55.7 67.6 49.7 47.8 53.7 54.7 59.6
57.2' 61.3 51.4 49.3 55.4 56.4 60.9
60.0 60.0 60.0 60.0 60.0 60.0 60.0
62.8 62.8 62.8 62.8 62.8 62.8 62.8
60.6 60.6 60.7 60.7 60.5 60.5 60.5
61.6' 61.7 61.6 61.7 61.7 61.7 61.7
62.7 62.7 62.7 62.7 62.7 62.7 62.7
23.9 23.8 23.4 23.7 24.0 23.6 23.2
24.9 25.0 24.5 25.1 25.2 25.0 24.5
24.3 24.3 23.7 24.2 24.8 24.6 24.5
19.92 19.93 19.93 19.93 19.92 19.92 19.92
2.932 2.929 2.927 2.931 2.929 2.930 2.931
2.852 2.849 2.846 2.843 2.845 2.846 2.850
882.1 880.3 881.2 880.6 880.0 878.8 878.2
180.3 180.6 179.9 180.7 181.5 181.4 181.2
72.6 72.1 73.2 73.6 72.8 72.8 72.5
82.1 84.1 81.3 81.4 82.0 82.1 82.7
I I
...... w 1--'

tj Table I14c: Raw Data from Experiment Wal7. (Tube length 15, Tube diameter 48, De-aeration nozzle diameter 3.2 mm, No air bleed) N
Experimental run number SDL' 29 30 31 32A 32B 32C 32D 32 32F 32G 32H 321 32J 32K
Third feed flow rate (kg h'1) 0.6 110.0 110.0 110.0 110.0 110.0 110.0 110.0 110.0 110.0 110.0 110.0 110.0 110.0 110.0
Concentrate flow rate (kg h'1) 2 87.1 88.4 86.8 85.7 85.9 85.8 85.8 85.8 85.9 85.9 85.9 85.8 85.9 85.8
Feed temperature ex-PHE ("C) 0.1 68.4 56.1 70.7 76.3' 76.3 76.3 76.4' 76.4 76.4' 76.4' 76.4' 76.4 76.4' 76.4'
Feed temperature at 3m ("C) 0.1 63.6 52.4 65.7 70.7 70.7 70.7 70.7 70.7 70.7 70.7 70.7 70.7 70.7 70.7
Feed temperature at 0.3m ("C) 0.1 62.6 51.7 64.6 69.5 69.5 69.5 69.5 69.5 69.5 69.5 69.5 69.5 69.5 69.5
Vapour temperature ("C) 0.1 61.1 53.5 61.2 61.4 61.4 61.4 6!.5 61.5 61.5 61.5 61.5 61.5 61.5 61.5
Product temperature ("C) 0.1 60.0 60.0 60.0 60.0 60.0 60.0 60.0 60.0· 60.0 60.0 60.0 60.0 60.0 60.0
Steam supply temperature ("C) 0.1 62.8 62.8 62.8 62.8 62.8 62.8 62.8 62.8 62.8 62.8 62.8 62.8 62.8 62.8
Condensate temperature ("C) 0.1 60.6 60.7 60.5 60.5 60.5 60.5 60.4 60.5 60.4 60.4 60.4 60.4 60.4 60.5
Top de-aeration line t~'1Tlp ("C) 0.1 61.7 61.7 61.6 61.6 61.7 61.7 61.7 61.6 61.6 61.6 61.6 61.7 61.7 61.7
Bottom de-aeration line temp ( • C) O.l 62.7 62.7 62.8 62.8 62.8 62.8 62.8 62.8 62.8 62.8 62.8 62.8 62.8 62.8
Ambient temp at 1 5 m tube top, •c 0.5 22.8 22.5 22.4 22.2 22.1 22.0 21.8 21.8 21.6 21.6 21.5 21.4 21.4 21.6
Ambient temp at steam entry ("C) 0.5 23.8 23.7 23.6 23.3 23.3 23.2 22.9 23.0 22.7 22.7 22.6 22.4 22.6 22.7
Ambient temp at 15 m tube bottom, •c 0.5 23.4 23.0 22.7 22.5 22.3 22.2 22.1 22.1 21.9 21.7 21.6 21.5 21.8 22.9
Tube-side absolute pressure (kPa) 0.05 19.93 19.92 19.92 19.92 19.92 19.92 19.92 19.92 19.92 19.92 19.92 19.93 19.92 19.92
Differernia1 pressure - entry (kPa) 0.03 2.934 2.927 2.930 2.928 2.930 2.931 2.931 2.931 2.929 2.928 2.930 2.932 2.931 2.932
Differential pressure - top (kPa) 0.03 2.854 • 2.845 2.851 2.851 2.851 2.853 2.854 2.856 2.855 2.854 2.856 2.856 2.856 2.855
Differential pressure - bottom (kPa) 0.03
Main steam pressure (kPa gauge) 2 876.8 877.8 876.4 876.3 876.1 876.3 876.0 876.0 876.3 875.8 876.2 875.7 871.5 871.7
Steam header pressure (kPa gauge) I 181.2 180.6 180.8 180.9 180.7 180.7 180.6 180.7 181.0 181.l 181.3 181.4 181.3 181.5
Steam valve position (%) 0.1 72.3 73.0 72.3 72.1 72.1 72.1 72.1 72.1 72.1 72.1 72.0 72.0 72.0 72.0
Vapour valve position (%) 0.1 83.2 81.8 83.5 84.4 84.4 84.4 84.5 84.5 84.5 84.5 84.5 84.5 84.5 84.5
'Standard deviation level (see page 11).

Table 114d: Raw Data from Experiment Wal7.
Experimental run number SDL1 32L 33 34 35
Third feed flow rate (kg h'1) 0.6 110.0 110.0 110.0 110.0
Concentrate flow rate (kg h'1) 2 85.8 87.4 87.9 88.1
Feed temperature ex-PHE ("C) 0.1 76.0' 67.5' 63.0 61.8
Feed temperature at 3m ("C) 0.1 70.7 62.6 58.5 57.5
Feed temperature at 0.3m ("C) 0.1 69.5 61.6 57.6 56.6
Vapour temperature ("C) 0.1 61.5 61.2' 59.7' 58.5
Product temperature ("C) 0.1 60.0 60.0 60.0 60.0
Steam supply temperature ("C) 0.1 62.8 62.8 62.8 62.8
Condensate temperature ("C) 0.1 60.6' 60.7' 60.7' 60.6
Top de-aeration line temp ("C) 0.1 61.7 61.8' 61.7' 61.6
Bottom de-aeration line temp (°C) 0.1 62.8 62.8 62.8 62.8
Ambient temp at 15 m tube top, •c 0.5 21.5 21.6 21.8 22.3
Ambient temp at steam entry ("C) 0.5 22.3 22.6 23.1 23.7
Ambient temp at 15 m tube bottom, •c 0.5 23.2 23.4 23.8 24.1 . Tube-side absolute pressure (kPa) 0.05 19.92 19.93 19.93 19.92
Differential pressure - entry (kPa) 0.03 2.932 2.932 2.931 2.931
Differential pressure - top (kPa) 0.03 2.857 2.855 2.857 2.857
Differential pressure - bottom (kPa) 0.03
Main steam pressure (kPa gauge) 2 871.2' 868.0" 862.9" 858.6"
Steam header pressure (kPa gauge) I 181.7 181.7 181.7 181.9
Steam valve position (%) 0.1 72.0 72.3 72.5 72.6
Vapour valve position(%) 0.1 84.4 83.1 82.4 82.3
'Standard deviation level (see page II).
36 37 38
110.0 110.0 110.0
85.4 86.4 87.4
78.6" 71.7' 66.0'
72.8' 66.6 61.5'
71.5' 65.5 60.5'
61.5'" 61.1 60.9'
60.0 60.0 60.0
62.8 62.7 62.7
60.7' 60.7 60.7'
61.8' 61.6 61.6'
62.8 62.8 62.8
23.0 23.3 23.5
24.3 24.6 24.6
24.6 24.8 24.9
19.92 19.92 19.92
2.931 2.931 2.931
2.858 2.856 2.855
848.8' 859.9" 863.2"
181.5 181.9 181.8
72.1 72.3 72.4
85.1 84.0 83.1
(Tube length 15, Tube diameter 48, De-aeration nozzle diameter 3.2 mm, No air bleed)
39 40 41
110.0 110.0 110.0
86.8 87.6 87.6
69.4' 63.7' 64.8'
64.6 59.5' 60.5 . 63.5' 58.6 59.6
61.0 60.2' 60.8'
60.0 60.0 60.0
62.7 62.8 62.7
60.8' 60.8' 60.9'
61.6 61.6 61.6
62.8 62.8 62.8
23.7 23.8 24.0
24.9 25.0 25.3
25.1 25.1 26.3
19.93 19.93 19.92
2.927 2.932 2.930
2.853 2.856 2.854
860.7" 866.2" 866.3"'
181.8 182.1 182.3
72.3 72.5 72.4
83.5 82.6 82.8
...... w w

·····-··-··-----
Table Il5a: Raw Data from Experiment Wa18.
Experimental run number SDL1 2' 3 4 5 6 7
Third feed flow rate (kg h'1) 0.6 110.0 110.0 110.0 110.0 110.0 110.0
Concentrate flow rate (kg h'1) 2 87.0 86.1 85.7 87.9 87.2 87.8
Feed temperature ex-PHE (°C) 0.1 69.3' 73.9' 76.1 61.5" 67.3' 63.9'
Feed temperature at 3m ("C) 0.1 64.6 68.6' 70.7 57.4 62.6' 59.5'
Feed temperature at 0.3m ("C) 0.1 63.6 67.5 69.5 56.6 61.7' 58.6'
Vapour temperature ("C) 0.1 60.9 61.0 61.1 58.3 60.8 60.3
Product temperature ("C) 0.1 60.0 60.0 60.0 60.0 60.0 60.0
Steam supply temperature ("C) 0.1 62.7 62.7 62.7 62.7 62.7 62.8
Condensate temperature (°C) 0.1 60.9' 60.9' 60.8' 60.9' 60.8' 60.9'
Top de-aeration line temp ("C) 0.1 61.6 61.6 61.6 61.6 61.6 61.7
Bonom de-aeration line temp (•C) 0.1 62.7 62.7 62.8 62.7 62.7 62.7
Ambient temp at 15m tube top, •c 0.5 24.1 23.9 23.8 23.5 23.0 22.8
Ambient temp at steam entry (•c) 0.5 25.3 24.9 24.8 24.5 24.2 24.0
Ambient temp at 15m tube bottom, •c 0.5 25.4 25.3 25.3 25.0 24.2 23.7
Tube-side absolute pressure (kPa) 0.05 19.93 19.92 19.93 19.92 19.93 19.92
Differential pressure - entry (kPa) 0.03 2.931 2.930 2.930 2.933 2.933 2.931
Differential pressure - top (kPa) O.Q3 2.852 • 2.853 2.854 2.857 2.854 2.852
Differential pressure - bottom (kPa) 0.03
Main steam pressure (kPa gauge) 2 877.8' 877.6 877.0' 877.9 876.8' 877.5
Steam header pressure (kPa gauge) 1 182.7 182.9 183.1 182.9 183.0 182.9
Steam valve position(%) 0.1 72.2 72.1 12.0 12.5 72.2 72.3
Vapour valve position (%) 0.1 83.4 84.3 84.6 82.4 83.0 82.6
'Standard deviation level (sec page II). 'Run started at 1712 h on II November 1991, subsequent runs at 45 min intervals.
8
110.0
86.7
70.7
65.6
64.6
61.1
60.0
62.8
61.0
61.8
62.8
22.7
23.9
23.4
19.93
2.930
2.850
876.4
183.0
72.1
83.5
(Tube length 15, Tube diameter 48, De-aeration nozzle diameter 3.2 mm, No air bleed) '
9 10 II 12 13 14 15
110.0 110.0 110.0 110.0 110.0 110.0 110.0
88.1 87.4 87.8 88.2 87.2 88.6 86.6
62.8' 66.2' 65.!' 60.6' 68.5' 56.2' 72.0'
58.5' 61.6 60.5' 56.5 63.6 52.4 66.7'
57.6' 60.6 59.6' 55.7 62.6 61.7 65.6'
59.4 60.9 60.8 57.4 61.0 53.4 61.1
60.0· 60.0 60.0 60.0 60.0 60.0 60.0
62.8 62.8 62.8 62.8 62.8 62.8 62.8
61.0 61.0 61.0 61.0 60.9 61.0 60.8
61.8 61.7 61.7 61.7 61.7 61.7 61.7
62.8 62.8 62.8 62.8 62.8 62.8 62.8
22.6 22.4 22.3 22.3 22.3 22.0 21.9
23.6 23.4 23.4 23.4 23.3 23.2 23.0
23.1 22.9 22.7 22.5 22.4 22.2 22.0
19.92 19.92 19.93 19.92 19.93 19.92 19.92
2.931 2.933 2.932 2.931 2.930 2.931 2.928
2.849 2.839 2.838 2.850 2.853 2.849 2.838
876.9 876.8 877.1 876.8. 876.2 876.4 874.9'
183.1 183.0 182.9 183.3 183.2 182.9 183.0
72.3 72.1 72.2 72.4 72.1 72.8 72.0
82.5 82.8 82.7 82.1 83.1 81.7 83.7
........ w .j::..

Table 115b: Raw Data from Experiment Wal8. (Tube length 15, Tube diameter 48, De-aeration nozzle diameter 3.2 mm, No air bleed)
Experimental run number SDL1 16 17 18 19 20 21
Third feed flow rate (kg h"') 0.6 110.0 !10.0 110.0 110.0 110.0 110.0
Concentrate flow rate (kg h"1) 2 88.4 85.4 89.0 89.0 88.3 87.4
Feed temperature ex-PHE ("C) 0.1 58.5' 78.8 51.8' 54.1 60.0' 65.0'
Feed temperature at 3m (•C) 0.1 54.4' 72.8 48.3 50.5 55.6 60.6
Feed temperature at 0.3m (°C) 0.1 53.7' 71.6 47.7 49.8 54.7 59.6
Vapour temperature c·c) 0.1 55.4' 61.4 49.3' 51.4 56.5' 60.9'
Product temperature (°C) 0.1 60.0 60.0 60.0 60.0 60.0 60.0
Steam supply temperature c•c) 0.1 62.8 62.8 62.8 62.7 62.7 62.7'
Condensate temperature ("C) 0.1 60.9 60.8' 60.9 60.9 60.9' 61.0'
Top de-aeration line temp c•c) 0.1 61.6 61.8 61.7 61.7 61.6 61.5
Bottom de-aeration line temp ("C) 0.1 62.8 62.8 62.8 62.8 62.8 62.8
Ambient temp at 15 m tube top, •c 0.5 21.5 21.4 21.2 21.4 23.5' 24.0
Ambient temp at steam entry (•C) 0.5 22.5 22.5 22.4 22.5 22.5 23.2
Ambient temp at 15 m tube bottom, •c 0.5 21.6 21.5 21.8 23.2 25.3 26.9 . Tube-side absolute pressure (kPa) 0.05 19.93 19.93 19.92 19.92 19.92 19.92
Differential pressure - entry (kPa) 0.03 2.931 2.931 2.931 2.932 2.930 2.931
Differential pressure - top (kPa) 0.03 2.852 2.853 2.848 2.854 2.852 2.855
Differential pressure- bottom (kPa) 0.03
Main steam pressure (kPa gauge) 2 876.1' 874.8' 863.7* 880.7 937.2' 935.8'
Steam header pressure (kPa gauge) l !83.0 183.0 182.8 183.0 182.9 183.2
Steam valve position (%) 0.1 72.6 71.9 73.4 73.2 72.6 72.3
Vapour valve position(%) 0.1 81.8 84.8 81.2 81.2 81.7 82.6
1Standard deviation level (see page II).
w Lll

Table Il6: Raw Data from Experiment Wa19.
Experimental run number SDL' 1' 2 3 4 5 6
Third feed flow rate (kg h'1) 0.6 110.0 42.5 150.0 40.0 140.0 45.0
Concentrate flow rate (kg h'1) 2 86.9 18.8 127.1 16.3 117.2 21.6
Feed temperature ex-PHE ("C) 0.1 66.7 73.5 65.7' 74.3' 65.9' 72.9
Feed temperature at 3m (•C) 0.1 62.1 62.8 62.0' 62.9' 62.0 62.7
Feed temperature at 0.3m ("C) 0.1 61.1 61.0 6l.l' 61.1 61.2 61.0
Vapour temperature ("C) 0.1 60.9 60.9 60.9 60.9 61.0 6l.l
Product temperature ("C) 0.1 59.9 59.9 59.9 59.9 59.9 59.9
Steam supply temperature ("C) 0.1 62.6 62.6 62.6 62.6 62.6 62.6
Condensate temperature (•C) 0.1 60.5 60.4 60.5 60.4 60.5 60.4
Top de-aeration line temp (•C) 0.1 61.6 61.6 61.8 61.7 61.8 61.7
Bottom de-aeration line temp (•C) 0.1 62.7 62.6 62.7 62.7 62.7 62.7
Ambient temp at 15 m tube top, •c 0.5 23.2 23.1 22.8 22.8 22.8 22.5
Ambient temp at steam entry (•C) 0.5 24.3 24.1 23.7 23.6 23.7 23.2
Ambient temp at 15 m tube bottom, •c 0.5 26.0 25.5 25.1 24.8 24.6 24.3
Tube-side absolute pressure (k:Pa) 0.05 19.92 19.94 19.92 19.93 19.92 19.93
Differential pressure • entry (kPa) 0.03 2.930 2.932 2.935 2.931 2.927 2.928
Differential pressure top (kPa) 0.03 2.852 • 2.851 2.855 2.851 2.850 2.848
Differential pressure • bottom (kPa) 0.03
Main steam pressure (kPa gauge) 2 875.1 874.2 875.3 874.7 875.3 874.8
Steam header pressure (kPa gauge) 1 185.3 185.2 185.3 185.2 185.2 185.1
Steam valve position (%) 0.1 72.5 73.5 72.5 73.6 72.4 73.2
Vapour valve position (%) 0.1 84.0 84.5 84.0 84.5 83.9 84.0
'Standard deviation level (see page ll). 1Run started at 2059 h on 12 November 1991, subsequem runs at 45 min intervals.
7
70.0
46.9
69.0
62.3
61.0
60.9
59.9
62.6
60.4
61.7
62.7
22.4
23.2
24.1
19.92
2.931
2.854
875.2
!85.0
72.9
83.8
(Tube length 15, Tube diameter 48, De-aeration nozzle diameter 3.2 mm, No air bleed)
8 9 10 11 12 13 14
180.0 37.5 170.0 120.0 160.0 80.0 130.0
156.7 13.6 146.9 97.2 137.0 57.2 107.2
65.2' 75.3 65.3' 66.4' 65.5' 68.3' 65.8'
61.9' 63.0 61.9' 62.0 61.9 62.2 62.0
61.2' 61.0 61.2' 61.2 61.2 61.1 61.2
61.0 60.9 61.0 61.0 61.0 60.9 60.9
60.0· 60.0 60.0 60.0 60.0 60.0 60.0
62.6 62.6 62.7 62.6 62.7 62.6 62.7
60.4 60.3 60.4 60.4 60.4 60.4 60.5
61.7 61.7 61.7 61.7 61.7 61.7 61.7
62.7 62.7 62.7 62.7 62.7 62.7 62.8
22.3 22.5 22.6 22.6 22.6 22.7 25.9
23.1 23.3 23.5 23.4 23.5 23.8 23.8
24.0 24.0 24.1 24.1 24.0 24.9 25.3
19.93 19.93 19.92 19.93 19.92 19.92 19.92
2.929 2.931 2.931 2.933 2.932 2.932 2.928
2.851 2.849 2.852 2.854 2.852 2.852 2.845
875.2 874.6 875.5 875.2 867.3' 884.41 935.4"'
185.1 185.3 185.4 185.4 185.3 185.4 185.6
72.5 73.6 72.3 72.3 72.3 72.6 72.3
84.0 84.4 83.9 83.5 83.7 83.4 83.5
-w 0\

Table Il7a: Raw Data from Experiment Wa20.
Experimental run number SDL' J2 2 3 4 5 6
Third feed flow rate (kg h"1) 0.6 110.0 42.5 150.0 40.0 140.0 45.0
Concentrate flow rate (kg h"1) 2 86.9 18.9 127.1 16.3 117.2 21.9
Feed temperature ex-PHE (°C) 0.1 66.3 72.8 65.5" 73.8 65.8' 72.6
Feed temperature at 3m (°C) 0.1 62.0 62.7 62.0 62.8 62.0 62.7'
Feed temperature at 0.3m (°C) 0.1 61.0 60.9 61.2' 60.9 61.2 60.9'
Vapour temperature (°C) 0.1 60.9 60.8 60.9 60.9 60.9 61.0
Product temperature (°C) 0.1 59.9 59.8 59.9 59.9 59.9 59.9
Steam supply temperature ("C) 0.1 62.6 62.5 62.6 62.5 62.6 62.6
Condensate temperature (•C) 0.1 60.6 60.5 60.5 60.4 60.5 60.4
Top de-aeration line temp ("C) 0.1 61.5 61.5 61.6 61.5 61.6 61.7
Bottom de-aeration line temp (°C) 0.1 62.8 62.7 62.8 62.7 62.8 62.8
Ambient temp at 15 m tube top, •c 0.5 25.9 25.1 24.6 24.2 23.8 23.2
Ambient temp at steam entry ("C) 0.5 25.9 25.4 25.0 24.9 24.9 24.2
Ambient temp at 15 m tube bottom, •c 0.5 29.3 28.6 27.9 27.3 26.7 25.8
Tube-side absolute pressure (kPa) 0.05 19.93 19.93 19.92 19.92 19.92 19.93
Differential pressure - entry (kPa) 0.03 2.933 2.930 2.931 2.930 2.932 2.930
Differential pressure - top (kPa) 0.03 2.852 2.850 2.852 2.850 2.857 2.853
Differential pressure - bottom {kPa) 0.03 2.611 2.606 2.642 2.660 2.715 2.717
Main steam pressure (kPa gauge) 2 868.2' 871.1 860.0 874.2& 875.3 873.4
Steam header pressure {kPa gauge) 1 188.4 188.3 188.5 188.3 188.4 188.6
Steam valve position(%) 0.1 71.9 72.8 71.8 72.9 71.7 72.4
Vapour valve position(%) 0.1 83.8 84.5 84.0 84.5 83.8' 83.9
'Standard deviation level (see page II). 2Run started at 1751 h on 13 November 1991, subsequent runs at 45 min intervals.
7
69.9
47.1
69.0
62.3
61.0
60.9
59.9
62.6
60.4
61.6
62.8
22.7
23.8
25.1
19.94
2.934
2.858
2.638
874.3
188.5
72.1
83.7
(Tube length 15, Tube diameter 48, De-aeration nozzle diameter 3.2 mm, No air bleed)
8 9 10 11 12 13 14
180.0 37.5 170.0 120.0 160.0 80.0 130.0
156.7 13.7 146.7 97.1 137.0 57.1 107.1
65.2 75.3 65.4' 66.4 65.5" 68.3 66.2
61.9 63.0' 62.0' 62.0 61.9 62.2 62.0 .
61.2 61.0 61.2 61.1 61.2 61.1 61.2
61.0 60.9 61.0 61.0 61.0 61.0 61.0
59.9 59.9 59.9 59.9 60.0 60.0 60.0
62.6 62.6 62.6 62.6 62.7 62.7 62.7
60.4 60.2 60.4 60.3 60.3 60.2 60.3
61.7 61.6 61.7 61.7 61.7 61.7 61.7
62.8 62.8 62.8 62.8 62.8 62.8 62.8
22.7 22.5 22.5 22.3 22.3 22.2 22.1
23.7 23.5 23.5 23.3 23.3 23.4 23.1
24.9 24.5 24.5 24.2 24.3 24.1 23.9
19.93 19.93 19.92 19.93 19.92 19.93 19.92
2.930 2.930 2.930 2.928 2.930 2.928 2.930
2.855 2.848 2.854 2.854 2.841 2.839 2.854
2.677 2.703 2.611 2.633 2.658 2.677 2.704
874.8 873.9 874.8 874.4 873.9 874.4 874.0
188.4 188.4 188.5 188.3 188.2 188.4 188.4
71.8 73.0 71.8 71.7 71.8 72.0 71.7
84.0 84.3 84.0 83.5 83.7 83.4 83.5
i
..... w -....l

Table I17b: Raw Data from Experiment Wa20.
Experimental run number SOL' 15 16 17
Feed flow rate (kg h-1) 0.6 110.0 35.0 50.0
Concentrate flow rate (kg h"1) 2 87.0 10.8 26.7
Feed temperature ex-PHE (°C) 0.1 66.8 76.7 71.8
Feed temperature at 3m {°C) 0.1 62.1 63.2 62.6
Feed temperature at 0.3m ("C) 0.1 61.1 61.0 61.0
Vapour temperature ("C) 0.1 61.0 61.0 61.1
Product temperature ("C) 0.1 60.0 60.0 60.0
Steam supply temperature ("C) 0.1 62.7 62.6 62.6
Condensate temperature ("C) 0.1 60.2 60.1 60.5
Top de-aeration line temp ("C) 0.1 61.7 61.7 61.7
Bottom de-aeration line temp ("C) 0.1 62.8 62.8 62.8
Ambient temp at 15m tube top, •c 0.5 21.9 21.8 22.3
Ambient temp at steam entry ("C) 0.5 22.8 22.7 23.1
Ambient temp at 15 m tube bottom, •c 0.5 23.7 23.3 24.3
Tube-side absolute pressure (kPa) 0.05 19.92 19.93 19.93
Differential pressure - entry {kPa} 0.03 2.930 2.932 2.929
Differential pressure - top {kPa) 0.03 2.856 '2.853 2.849
Differential pressure - bottom {kPa) 0.03 2.641 2.587 2.576
Main steam pressure (kPa gauge) 2 873.6 859.1! 868.6"'
Steam header pressure (kPa gauge) 1 188.3 188.5 188.5
Steam valve position(%) 0.1 71.8 73.3 72.4
Vapour valve position (%) 0.1 83.4 84.5 83.6
'Standard deviation level (sec page II).
18 19 20
190.0 100.0 60.0
166.3 76.9 36.8
65.1 67.2' 70.1
61.9 62.1 62.4
61.3 61.1 61.1
61.l 61.0 61.1
60.0 60.0 59.9
62.6 62.6 62.6
60.7 60.9 60.8
61.7 61.5 61.6
62.8 62.8 62.8
22.7 22.9 23.3
23.1 23.4 23.8
25.1 27.1 26.8
19.92 19.93 19.92
2.931 2.930 2.931
2.860 2.865 2.862
2.580 2.577 2.572
864.9"' 895.0' 912.4"'
188.8 188.7 188.8
72.0 72.0 72.3
84.2 83.5 83.6
21
90.0
66.8
67.4'
62.1
61.1
61.0
59.9
62.7
60.8'
61.6
62.8
23.5
24.9
27.1
19.93
2.934
2.864
2.574
905.8'
188.8
72.0
83.5
(Tube length 15, Tube diameter 48, De-aeration nozzle diameter 3.2 mm, No air bleed)
22
110.0
86.7
66.5
62.0
61.1
61.1"'
59.9.
62.7
61.0'
61.6
62.8
24.0
25.4
28.5
19.93
2.931
2.860
2.569
892.4'
188.8
71.9
83.6
1-4 w 00
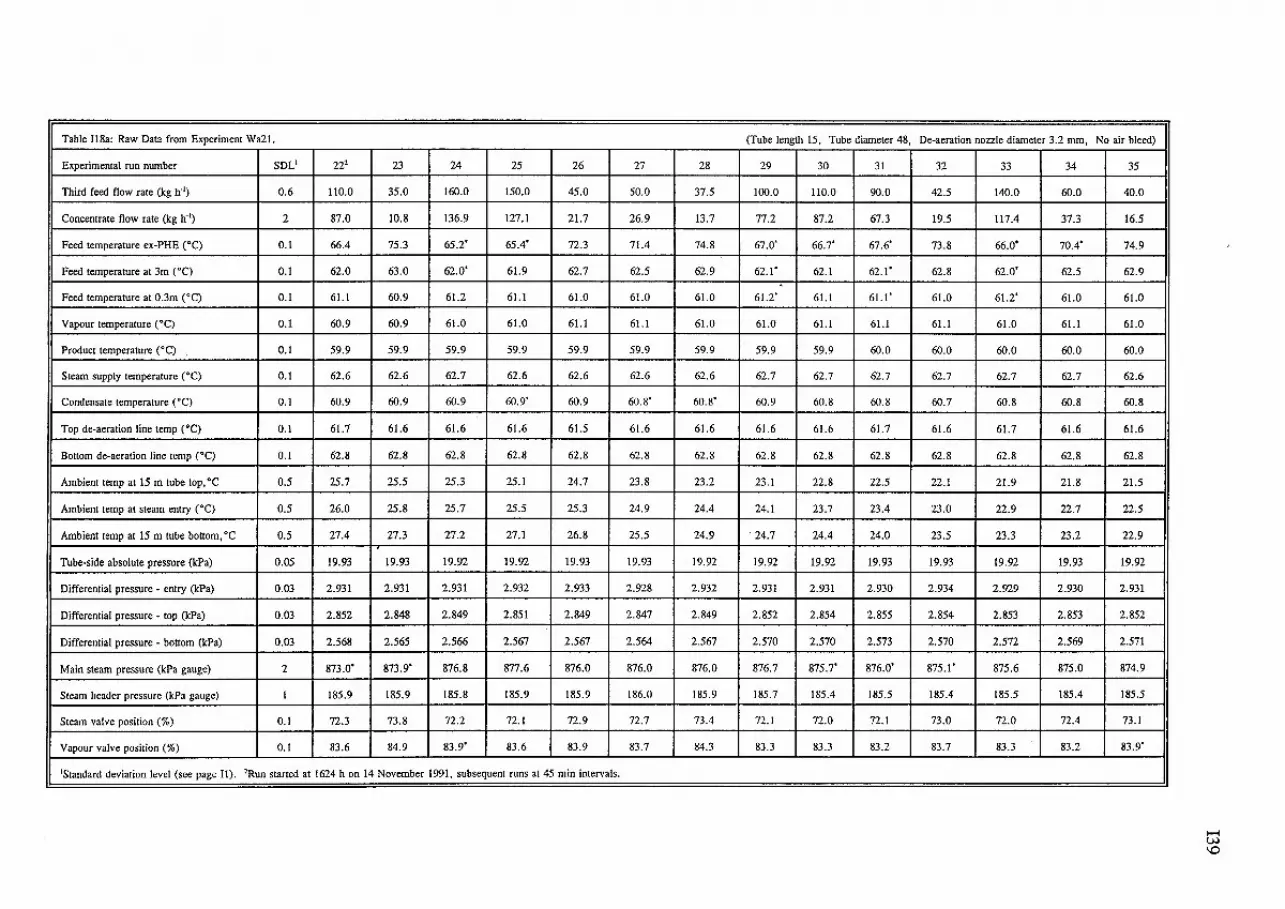
Table I18a: Raw Data from Experiment Wall.
Experimental run number SDL1 222 23 24 25 26 27
Third feed flow rate (kg 11"1) 0.6 110.0 35.0 160.0 150.0 45.0 50.0
Concentrate flow rate (kg h-1) 2 87.0 10.8 136.9 127.1 21.7 26.9
Feed temperature ex-PHE ( 0 C) 0.1 66.4 75.3 65.2' 65.4' 72.3 71.4
Feed temperature at 3m CC) 0.1 62.0 63.0 62.0' 61.9 62.7 62.5
Feed temperature at 0.3m ( 0 C) 0.1 61.1 60.9 61.2 61.1 61.0 61.0
Vapour temperature CC) 0.1 60.9 60.9 61.0 61.0 61.1 61.1
Product temperature (°C) 0.1 59.9 59.9 59.9 59.9 59.9 59.9
Steam supply temperature ( 0 C) 0.1 62.6 62.6 62.7 62.6 62.6 62.6
Condensate temperature (0 C) 0.1 60.9 60.9 60.9 60.9' 60.9 60.8'
Top de-aeration line temp (°C) 0.1 61.7 61.6 61.6 61.6 61.5 61.6
Bottom de-aeration line temp ( 0 C) 0.1 62.8 62.8 62.8 62.8 62.8 62.8
Ambient temp at 15 m tube top, •c 0.5 25.7 25.5 25.3 25.1 24.7 23.8
Ambient temp at steam entry (0 C) 0.5 26.0 25.8 25.7 25.5 25.3 24.9
Ambient temp at 15 m tube bottom, •c 0.5 27.4 27.3 27.2 27.1 26.8 25.5
Tube-side absolute pressure (kPa) 0.05 19.93 19.93 19.92 19.92 19.93 19.93
Differential pressure - entry (kPa) O.D3 2.931 2.931 2.931 2.932 2.933 2.928
Differential pressure - top (kPa) 0.03 2.852 2.848 2.849 2.851 2.849 2.847
Differential pressure - bottom (kPa) 0.03 2.568 2.565 2.566 2.567 2.567 2.564
Main steam pressure (kPa gauge) 2 873.0' 873.9' 876.8 877.6 876.0 876.0
Steam header pressure (kPa gauge) I 185.9 185.9 185.8 185.9 185.9 186.0
Steam valve position (%) 0.1 72.3 73.8 72.2 72.1 72.9 72.7
Vapour valve position(%) 0.1 83.6 84.9 83.9' 83.6 83.9 83.7
'Standard deviation level (see page 11). 2Run started at 1624 h on 14 November 1991, subsequent runs at 45 min intervals.
28
37.5
13.7
74.8
62.9
61.0
61.0
59.9
62.6
60.8'
61.6
62.8
23.2
24.4
24.9
19.92
2.932
2.849
2.567
876.0
185.9
73.4
84.3
(Tube length 15, Tube diameter 48, De-aeration nozzle diameter 3.2 mm, No air bleed)
29 30 31 32 33 34 35
100.0 110.0 90.0 42.5 140.0 60.0 40.0
77.2 87.2 67.3 19.5 117.4 37.3 16.5
67.0' 66.7' 67.6' 73.8 66.0' 70.4' 74.9
62.1' 62.1 62.1' 62.8 62.0' 62.5 62.9 . 61.2' 61.1 61.1' 61.0 61.2' 61.0 61.0
61.0 61.1 61.1 61.1 61.0 61.1 61.0
59.9 59.9 60.0 60.0 60.0 60.0 60.0
62.7 62.7 62.7 62.7 62.7 62.7 62.6
60.9 60.8 60.8 60.7 60.8 60.8 60.8
61.6 61.6 61.7 61.6 61.7 61.6 61.6
62.8 62.8 62.8 62.8 62.8 62.8 62.8
23.1 22.8 22.5 22.1 21.9 21.8 21.5
24.1 23.7 23.4 23.0 22.9 22.7 22.5
24.7 24.4 24.0 23.5 23.3 23.2 22.9
19.92 19.92 19.93 19.93 19.92 19.93 19.92
2.931 2.931 2.930 2.934 2.929 2.930 2.931
2.852 2.854 2.855 2.854 2.853 2.853 2.852
2.570 2.570 2.573 2.570 2.572 2.569 2.571
876.7 875.7' 876.0' 875.1' 875.6 875.0 874.9
185.7 185.4 185.5 185.4 185.5 185.4 185.5
72.1 72.0 72.1 73.0 72.0 72.4 73.1
83.3 83.3 83.2 83.7 83.3 83.2 83.9'
-w \0

$: Table Il8b: Raw Data from Experiment Wa21. (Tube length 15, Tube diameter 48, De-aeration nozzle diameter 3.2 mm, No air bleed) 0
Experimental run number SOL' 36 37 38 39 40 41 42
Third feed flow rate (kg h"1) 0.6 170.0 190.0 120.0 80.0 180.0 130.0 70.0
Concentrate flow rate (kg h"1) 2 146.7 166.5 97.1 57.2 156.4 106.8 46.4
Feed temperature ex-PHE ("C) 0.1 65.5" 65.2 66.7' 68.6' 65.3' 66.2' 69.2
Feed temperature at 3m ("C) 0.1 62.0' 61.9 62.0 62.3 62.0 62.0 62.4
Feed temperature at 0.3m (•C) 0.1 61.2' 61.2 61.1 6Ll 61.3 61.2 6Ll
Vapour temperature c•c) 0.1 61.1 61.1 61.1 61.1 61.1 61.0 61.1
Product temperature ("C) 0.1 60.0 60.0 60.0 60.0 60.0 60.0 60.0 . Steam supply temperature ("C) 0.1 62.7 62.7 62.7 62.7 62.7 62.6 62.6
Condensate temperature c•c) 0.1 60.9 60.8 60.8 60.8 60.9 61.1 61.1
Top de-aeration line temp (•C) 0.1 61.7 61.7 61.7 61.7 61.7 61.6 61.5
Bottom de-aeration line temp c·C) 0.1 62.9 62.9 62.9 62.9 62.9 62.9 62.8
Ambient temp at 15m tube top,OC 0.5 21.3 21.2 20.8 20.8 21.5 22.8 24.6
Ambient temp at steam entry c•c) 0.5 22.2 22.0 21.6 21.6 22.3 22.7 24.0
Ambient temp at 15 m tube bottom, •c 0.5 22.6 22.3 22.1 22.1 23.8 26.2 28.2
Tube-side absolute pressure (kPa) 0.05 19.92 19.92 19.92 19.92 19.92 19.92 19.93
Differential pressure - entry (kPa} 0.03 2.931 2.928 2.932 2.931 2.932 2.931 2.925
Differential pressure - top (kPa) 0.03 2.856 • 2.853 2.858 2.858 2.857 2.857 2.850
Differential pressure - bottom {kPa) 0.03 2.574 2.570 2.574 2.574 2.574 2.572 2.561
Main steam pressure {kPa gauge) 2 875.6 875.2 874.5 867.1' 886.0" 936.4"' 933.5'
Steam header pressure {kPa gauge) 1 185.8 185.8 185.8 185.9 186.1 186.3 186.7
Steam valve position(%) 0.1 72.3 72.3 72.2 72.5 72.4 72.4 72.6
Vapour valve position(%) 0.1 83.8 83.9 83.3 83.3 83.9 83.5 83.5
'Standard deviation level (see page II).

Table 119a: Raw Data from Experiment Wall. (Tube length 15, Tube diameter 48, De-aeration nozzle diameter 3.2 mm, No air bleed)
Experimental run number SDL' 12 3' 4 5 6 7 g 9 10 ll 12 13 14 15
Third feed flow rate (kg h'1) 0.6 110.0 150.1 40.0 140.0 45.0 70.0 180.0 37.5 170.0 120.0 160.0 80.0 130.0 110.0
Concentrate flow rate (kg h'1) 2 87.1 127.1 16.2 117.2 21.7 47.0 156.6 13.7 146.8 97.1 137.0 57.2 107.1 87.1
Feed temperature ex-PHE ("C) 0.1 66.7 65.7 74.7 66.0 73.4 69.4 65.4 76.3' 65.68 66.8 65.8 68.9 66.5 67.0'
Feed temperature at 3m (•C) 0,1 62.0 61.9 63.0 62.0 62.8 62.3 61.9 63.1 61.9 62.1 62.0 62.3 62.0 62.1 . Feed temperature at 0.3m ("C) 0.1 61.2 61.2 61.0 61.1 61.0 61.0 61.2 61.0' 61.2 61.1 61.2 61.1 61.2 61.2
Vapour temperature ("C) 0.1 61.0 61.1 61.1 61.1 61.1 61.1 61.1 61.0 61.1 61.2 61.1 61.1 61.1 61.1
Product temperature ("C) 0.1 59.9 59.9 59.9 60.0 59.9 60.0 60.0 60.0 60.0 60.0 60.0 60.0 60.0 60.0
Steam supply temperature (•C) 0.1 62.6 62.6 62.6 62.6 62.6 62.6 62.7 62.6 62.7 62.7 62.7 62.7 62.7 62.7
Condensate temperature ( 0 C) 0.1 60.4 60.4 60.3 60.3 60.2 60.2 60.3 60.2 60.3 60.2 60.2 60.2 60.3 60.2
Top de-aeration line temp ("C) O.l 61.5 61.6 61.6 61.6 61.6 61.6 61.6 61.5 6!.6 61.6 61.6 61.6 61.6 61.6
Bottom de-aeration line temp ("C) 0.1 62.8 62.8 62.8 62.8 62.8 62.8 62.8 62.8 62.8 62.8 62.9 62.9 62.9 62.9
Ambient temp at 15 m tube top, • C 0.5 23.3 22.3 21.9 21.6 21.3 21.0 20.9 20.8 20.5 20.3 20.1 20.0 20.6 21.4
Ambient temp at steam entry ("C) 0.5 24.3 23.3 22.8 22.5 22.1 21.8 21.6 21.5 21.2 21.0 20.8 20.6 21.3 22.4
Ambient temp at 15 m tube bottom, •c 0.5 26.4 24.9 24.3 23.6 23.2 22.8 22.5 22.2 22.2 21.9 21.7 21.5 21.6 22.1
Tube-side absolute pressure (kPa) 0.05 19.93 19.92 19.92 19.92 19.92 19.92 19.93 19.92 19.92 19.92 19.93 19.93 19.93 19.92
Differential pressure - entry (kPa) 0.03 2.931 2.931 2.930 2.931 2.934 2.934 2.934 2.930 2.932 2.929 2.929 2.933 2.932 2.931
Differential pressure • top (kPa) 0.03 2.780 2.812 2.814 2.849 2.859 2.846 2.863 2.844 2.860 2.860 2.858 2.863 2.862 2.859
Differential pressure - bottom (kPa) 0.03 2.569 2.569 2.567 2.573 2.573 2.573 2.575 2.569 2.575 2.575 2.572 2.575 2.574 2.574
Main steam pressure (kPa gauge) 2 876.0 875.7 873.7 874.4 873.1 872.9 873.6' 872.9 873.4' 872.9' 873.3 872.9 874.0. 875.7
Steam header pressure (kPa gauge) 1 187.7 187.3 187.3 187.2 187.3 187.2 187.2 187.2 186.9 187.0 187.2 187.2 187.2 187.4
Steam valve position(%) 0.1 72.1 72.2 73.4 72.2 73.1 72.7 72.3 73.5 72.3 72.2 72.2 72.4 72.1 72.1
Vapour valve position(%) 0.1 83.4 83.8 84.3 83.7 83.8 83.6 83.8 84.2 83.8 83.3 83.5 83.3 83.3 83.2
'Standard deviation level (see page 11). 'Run started at 2115 h on 15 November 1991. 'Run started at 2248 h on 15 November 1991, subsequent runs at 45 min intervals.
~ -

_.,. .. _
Table 119b: Raw Data from Experiment Wa22. (Tube length 15, Tube diameter 48, De-aeration nozzle diameter 3.2 mm, No air bleed) s Experimental run nwnber SDL' 16 17 18 19 20 21 22 23 24 25 26 27 28 29
.
Third feed flow rate (kg h"1) 0.6 34.9 50.0 190.0 100.0 60.0 90.0 110.0 35.0 160.0 150.0 45.0 50.0 37.5 100.0
Concentrate flow rate (kg h'1) 2 10.9 26.8 166.5 77.0 37.0 67.1 87.0 10.8 137.1 127.3 21.8 27.1 13.8 77.3 •
Feed temperature ex-PRE (•C) 0.1 16.5' 71.6 64.8' 66.9 69.8 67.1 66.2 75.3' 65.0' 65.1' 71.7' 70.6 73.8 66.4
' Feed temperature at 3m ( o C) 0.1 63.2 62.6 61.8 62.1 62.4 62.1 62.0 63.1 61.9 61.9 62.6' 62.5 62.8 62.0
Feed temperature at 0.3m (•C) 0.1 61.1 61.1 61.2 61.1 61.1 61.1 61.1 61.1' 61.1 61.1 61.0' 60.9 60.9' 61.0
Vapour temperature ( o C) 0.1 61.0 61.1 61.0 61.0 61.0 61.0 61.0 60.9 60.9 60.9 61.0 61.0 60.9 60.9
Product temperature ("C) 0.1 60.0 60.0 60.0 60.0 60.0 60.0 60.0 I
60.0• 60.0 60.0 59.9 59.9 59.9 59.9 '
Steam supply temperature (0 C) 0.1 62.7 62,7 62.7 62.7 62.7 62.7 62.7 62.7 62.7 62,7 62.7 62.7 62.7 62.7
Condensate temperature (•C) 0.1 60.2' 60.4 60.5 60.4 60.4 60.4 60.5 60.3' 60.5 60.6 60.5 60.5 60.4 60.4
Top de-aeration line temp c•c) 0.1 61.6 61.7 61.7 61.7 61.7 61.7 61.7 61.7 61.7 61.7 61.7 61.7 61.6 61.6
Boltom de-aeration line temp {°C) 0.1 62.8 62.8 62.9 62.8 62.8 62.9 62.8 62.8 62.9 62.9 62.8 62.8 62.8 62.8
Ambient temp at 15 m tube top, •c 0.5 22.6 23.5 24.1 24.0 24.5 25.5 25.2 25.9 26.0 26.4 26.4 26.5 26.4 26.0
Ambient temp at steam entry (0 C) 0.5 23.7 24.5 24.7 24.8 25.3 26.4 26.2 27.1 27.2 27.7 27.9 27.8 27.6 27.1
Ambient temp at 15 m tube bottom, oc 0.5 23.6 24.7 25.3 24.9 25.2 25.7 25.7 26.1 26.3 26.5 26.5 26.4 26.3 26.1
Tube-side absolute pressure (kPa) 0.05 19.94 19.92 19.93 19.93 19.92 19.92 19.93 19.92 19.92 19.92 19.93 19.92 19.92 19.92
Differential pressure - entry (kPa) 0.03 2.930 2.930 2.932 2.930 2.931 2.930 2.931 2.930 2.929 2.932 2.933 2.932 2.932 2.929
Differential pressure - top (kPa) 0.03 2.852 • 2.855 2.855 2.852 2.854 2.849 2.849 2.843 2.846 2.846 2.846 2.845 2.844 2.845
Differential pressure - bottom (kPa) 0.03 2.569 2.570 2.573 2.569 2.569 2.568 2.570 2.565 2.568 2.564 2.568 2.568 2.566 2.568
Main steam pressure (kPa gauge) 2 875.4' 877.8' 878.7 878.7 878.8 878.6 878.9 878.1 878.9 878.8 878.7 878.3 878.5 879.2
Steam header pressure (kPa gauge) 1 187.8 188.0 187.8 188.0 187.9 188.2 188.2 188.4 188.2 188.2 188.3 188.1 188.5 188.1
Steam valve position (%) 0.1 73.6 72.6 72.2 72.1 72.3 71.9 71.8 73.3 71.7 71.6 72.3 72.2 72.8 71.6
Vapour valve position(%) 0.1 84.4 83.6 83.8 83.3 83.4 83.2 83.2 84.5 83.6 83.4 83.4 83.4 84.1 83.1
1Staru:lard deviation level (see page 11).

Table I19c: Raw Data from Experiment Wall. (Tube length 15, Tube diameter 48, De-aeration nozzle diameter 3.2 mm, No air bleed)
Experimental run number SDL1 30 31 32 33 34 35 36 37 38 39 40 41 42 43
Third feed flow rate (kg h'1) 0.6 110.0 90.0 42.5 140.0 60.0 40.0 170.0 190.0 120.0 80.0 180.0 130.0 70.0 110.0
' Concentrate flow rate (kg h'1) 2 87.3 67.5 19.6 117.7 37.6 17.0 147.2 167.0 97.5 57.5 157.1 107.4 47.2 87.2 I
Feed temperature ex-PHE (°C) 0.1 66.2 67.2' 73.1 65.6' 70.1 74.5 65.2 65.0' 66.4' 68.4' 65.2' 66.2' 69.4 66.9
Feed temperature at 3m ( 0 C) 0.1 62.0 62.1 62.8 61.9 62.4 62.9 61.9 61.9' 62.0 62.3 61.9' 62.0 62.4 62.1 ! . Feed temperature at 0.3m ( 0 C) 0.1 61.0 61.0 60.9 60.9 60.9 60.9 61.0 61.0' 61.0 61.0 61.0' 61.0 60.9 61.0
Vapour temperature (°C) 0.1 60.9 60.9 61.0 61.0 61.0 61.0 6!.1 6LI 61.1 61.0 6!.1 61.1 61.0 6l.l
Product temperature (•C) 0.1 59.9 59.9 60.0 60.0 60.0 60.0 60.0 60.0 60.0 60.0 60.0 60.0 60.0 60.0
Steam supply temperature (0 C) 0.1 62.7 62.7 62.7 62.7 62.7 62.7 62.7 62.7 62.7 62.7 62.7 62.7 62.7 62.7
Condensate temperature ( •c) 0.1 60.4 60.4 60.3 60.3 60.3 60.2 60.3 60.3 60.3 60.2 60.3 60.2 60.2 60.2
Top de-aeration line temp (°C) 0.1 61.6 61.7 61.7 61.7 61.7 61.7 61.7 61.7 61.6 61.6 61.6 61.6 61.6 61.6
Bottom de-aeration line temp (°C) 0.1 62.8 62.8 62.8 62.8 62.8 62.8 62.9 62.9 62.9 62.9 62.9 62.9 62.9 62.9
Ambient temp at 15 m tube top, •c 0.5 25.4 24.6 24.1 23.6 23.2 22.8 22.6 22.3 22.0 21.8 21.7 21.5 21.3 21.1
Ambient temp at steam entry (•C) 0.5 26.3 25.5 25.0 24.6 24.1 23.6 23.6 23.3 22.8 22.6 22.5 22.4 22.2 22.0
I ! Ambient temp at 15 m tube bottom, •c 0.5 25.9 25.5 25.1 24.6 24.2 23.7 23.4 23.1 22.9 22.6 22.4 22.2 22.0 21.8
Tube-side absolute pressure (kPa) 0.05 !9.92 19.93 19.93 19.92 19.92 19.93 19.92 19.92 19.93 19.92 19.93 19.92 19.93 19.92
Differential pressure - entry (kPa) 0.03 2.931 2.933 2.933 2.933 2.934 2.932 2.932 2.930 2.932 2.930 2.932 2.931 2.930 2.932
Differential pressure - top (kPa) 0.03 2.847 2.849 2.850 2.852 2.855 2.851 2.853 2.854 2.856 2.855 2.857 2.858 2.856 2.856
Differential pressure - bottom (kPa} 0.03 2.569 2.569 2.567 2.571 2.572 2.569 2.573 2.571 2.572 2.569 2.574 2.574 2.573 2.573
Main steam pressure (kPa gauge) 2 879.3 877.8 877.1 877.1 876.2 876.0 876.3' 876.5 875.7 874.5' 875.3' 874.5 873.8 873.9
Steam header pressure (kPa gauge} 1 !88.2 188.2 188.2 188.4 188.3 188.2 188.0 188.2 188.1 188.0 188.0 187.9 188.0 188.1
Steam valve position(%) 0.1 71.6 71.7 72.4 71.4 . 71.8 72.4 71.6 71.7 71.6 71.9 7!.8 71.7 72.2 71.8
Vapour valve position (%) 0.1 83.0 82.9 83.4 82.9 82.9 83.3 83.3 83.3 82.9 83.0 83.4 83.0 83.1 83.0
1Standard deviation level (see page II).
~ w

------~~ ···········-·······- ······-····-·-··-·-- --····-·----·--- -·-·-·-·-·-
Table 120a: Raw Data from Experiment Wa23. (Tube length 15, Tube diameter 48, De-aeration nozzle diameter 3.2 mm, No air bleed) : ~ .j::..
Experimental run number SDL1 p 2 3 4 5 6 7 8 9 10 1! 12 13 14
Third feed flow rate (kg h'1) 0.6 110.0 110.0 110.0 110.0 110.0 110.0 110.0 I
110.1 109.9 110.0 110.0 110.0 110.0 tiO.O !
Concentrate flow rate (kg h"1) 2 71.4 94.4 105.5 97.8 86.8 77.3 101.6 74.3 80.3 90.2 83.4 69.0 74.2 77.4 I I
Feed temperature ex-PHE (°C) 0.1 66.1 66.2' 66.2' 66.3 66.5 66.5 66.5 66.5 66.5 66.3 66.2' 65.7' 65.6 65.7
Feed temperature at 3m c•q 0.1 62.0 62.0 62.0 62.0 62.0 62.0 62.0 62.0 62.1 62.0 62.0 62.0 61.9 62.0
Feed temperature at 0.3m c•q 0.1 61.0 61.0 61.0 61.0 61.0 61.0 61.0 61.0 61.0 61.1 61.2 61.1 61.1 61.0
Vapour temperature ("C) 0,1 61.4 60.8 60.8 60.7 61.0 61.2 60.8 61.4 61.2 61.0 61.0 62.1' 61.3' 61.2'
Product temperature ("C) 0.1 60.0 59.9 59.9 59.9 60.0 60.0 60.0 60.0. 60.0 60.0 59.9 60.8 59.9 59.9
Steam supply temperature (•C) 0.1 68.6 61.8 60.2 61.2 62.8 64.6 60.8 65.8 63.7 62.3 63.2 70.9' 67.5 66.1
Condensate temperature ("C) 0.1 62.5* 59.9 58.9 59.5 60.8' 61.3' 59.1 60.3 61.2 60.1 61.1 63.1 62.2 61.7
Top de-aeration line temp (•C) 0.1 64.0 60.7 59.3 60.3 61.8 63.2 59.8 63.6 62.7 61.2 62.0 65.0' 63.5' 63.0
Bottom de-aeration line temp (•C) 0.1 65.2 61.9 60.4 61.4 62.9 64.3 60.9 64.7 63.9 62.4 63.4 66.3 64.7 64.3
Ambient temp at 15 m tube top, •c 0.5 26.0 25.6 25.3 24.4 23.8 23.9 23.4 23.6 23.2 25.0 27.7 30.9 29.5 28.6
Ambient temp at steam entry ( 0 C) 0.5 27.1 26.6 26.4 25.5 24.7 24.7 24.3 24.4 24.2 24.9 27.2 30.3 29.7 29.2
Ambient temp at 15m tube bottom, •c 0.5 26.0 26.0 26.4 26.0 25.1 24.8 24.3 24.3 24.5 25.9 29.7 30.6 31.1 29.4
Tube-side absolute pressure (kPa) 0.05 19.92 19.93 19.93 19.93 19.92 19.92 19.92 19.93 19.92 19.92 19.92 20.76 19.93 19.92
Differential pressure- entry (kPa) 0.03 5.498 1.998 0.499 1.502 3.000 4.498 1.004 5.000 3.999 2.500 3.500 5.999 5.001 4.501
Differential pressure - top (kPa) 0.03 5.263 '1.927 0.447 1.436 2.917 4.390 0.945 4.824 3.902 2.428 3.404 5.842 4.865 4.383
Differential pressure - bottom (kPa) 0.03 5.085 1.641 0.156 1.149 2.635 4.116 0.656 4.447 3.621 2.143 3.123 5.581 4.587 4.103
Main steam pressure (kPa gauge) 2 877.6 879.5 880.1 878.1 876.4' 874.6 876.3 874.7 871.4" 860.21 938.6' 935.2" 937.3" 865.8"'
Steam header pressure (kPa gauge) 1 188.9 188.8 189.9 189.0 188.3 188.6 189.5 188.8 188.9 188.8 189.2 190.1 189.7 189.8
Steam valve position(%) 0.1 86.3 62.9 40.7 57.3' 72.2 81.1 50.2" 83.7 78.2 68.4 75.1 88.2 83.4 80.5
Vapour valve position(%) 0.1 98.4 72.8 40.1 67.6 83.4 93.3 58.7' 96.1 90.1 79.3 86.8 99.9 96.2 93.2
'Standard deviation level (see page ll). 'Run started at 1332 h on 17 November 1991, subsequent runs at 120 min intervals.

Table 120b: Raw Data from Experiment Wa23. (Tube length 15, Tube diameter 48, De-aeration nozzle diameter 3.2 mm, No air bleed)
Experimental run number SDL1 15 16 17 18 19 20 21 22 23 24 25 26 27 28
Third feed flow rate (kg h"1) 0.6 110.0 110.0 110.0 110.0 I 10.0 110.0 110.0 I 10.0 110.0 110.0 110.0 110.0 110.0 109.9
Concentrate flow rate (kg h"1) 2 80.7 94.3 83.8 90.5 71.7 106.0 101.5 69.1 86.9 98.0' 87.0 71.7 74.6 77.9
Feed temperature ex-PHE (0 C) 0.1 66.0 66.2 66.4 66.5 66.5 66.6' 66.4 66.0"" 65.9 66.61 65.5"" 65.1' 65.5 65.8
Feed temperature at 3m (•C) 0.1 62.0 62.0 62.0 62.0 62.0 62.0 62.0 62.0' 62.0 62.0' 62.0' 61.9 61.9 62.0 . Feed temperature at 0.3m ("C) 0.1 61.0 61.0 61.0 61.1 61.0 61.0 61.1 61.0' 60.9 61.0' 60.8' 60.8 60.9 61.0
Vapour temperature ( • C) 0.1 61.1 60.8 61.0 61.0 61.5 60.8 60.7 62.0' 61.2' 60.7' 61.0' 61.3 61.3 61.1 '
Product temperature (•C) 0.1 59.9 59.9 60.0 60.0 60.0 59.9 59.9 60.6 60.0 59.9' 59.9 60.0 60.0 60.0
Steam supply temperature (°C) 0.1 63.7 61.7 63.2 62.3 66.3' 60.3 60.7 70.5' 62.8 61.3' 62.8 67.2"" 67.1 65.6
Condensate temperature ( 0 C) 0.1 61.3 59.9 60.8' 60.1 60.6 58.8 59.2 61.2 60.4 58.6' 60.5 60.8 62.3 61.6
Top de-aeration line temp ( 0 C) 0.1 62.6 60.7 62.3 61.2 64.0 59.3 59.8 64.9' 61.9' 60.4 61.9 64.2 63.6 63.1
Bottom de-aeration line temp (°C) 0.1 63.8 61.9 63.4 62.4 65.2 60.4 60.9 66.1 62.9 61.4 62.9 65.1 64.7 64.3
Ambient temp at 15 m tube top, •c 0.5 27.2 25.2 24.6 24.0 23.8 23.5 24.4 25.6 25.8 27.0 31.9-" 35.7 29.5 27.4
Ambient temp at steam entry (0 C) 0.5 27.3 26.2 25.8 25.0 24.8 24.6 24.9 27.7 27.8 28.8 30.5 28.8 27.0 26.2
Ambient temp at 15 m tube bottom, •c 0.5 28.3 27.4 26.1 25.3 24.8 24.2 25.6 26.5 26.4 26.7 28.0 28.5 27.8 26.4 . Tube-side absolute pressure (kPa) 0.05 19.92 19.92 19.92 19.92 19.92 19.93 19.92 20.55 19.93 19.92"" 19.92 19.92 19.92 19.92
Differential pressure - entry (kPa) 0.03 4.003 2.002 3.501 2.501 5.498 0.497 1.002 6.001 3.002 1.504 2.997 5.499 5.000 4.498
Differential pressure - top (kPa) 0.03 3.897 1.922 3.401 2.422 5.318 0.429 0.943 5.836 2.912 1.427 2.906 5.340 4.864 4.374
Differential pressure - bottom (kPa) 0.03 3.610 1.635 3.120 2.135 4.939 0.146 0.648 5.285 2.627 1.143 2.622 5.061 4.584 4.100
Main steam pressure (kPa gauge) 2 872.5'" 874.6" 874.0 873.8 871.3"' 873.3' 867.0" 787.2' 898.41 912.21 892.3' 875.1' 875.7 875.5'
Steam header pressure (kPa gauge) 1 189.8 189.3 189.4 189.3 188.8 190.0 189.5 189.1 189.4 189.7 189.3 189.0 189.0 188.9
Steam valve position (%) 0.1 77.5 62.9 74.9 67.9 86.1 40.2' 50.1' 88.2' 71.7 56.8& 71.6 85.9 83.3 80.2
Vapour valve position(%) 0.1 89.9 73.6 86.5 79.0 98.7 37.0' 58.8' 99.9 83.2 66.9' 83.1 98.7 95.8 92.7
'Standard deviation level (see page II).
~ Ul

~ Table !20c: Raw Data from Experiment Wa23. (Tube length 15, Tube diameter 48, De-aeration nozzle diameter 3.2 mm, No air bleed) 0\
Experimental run number SDL' 29 30 31 32 33 34 35 36
Third feed flow rate (kg h"1) 0.6 110.0 110.0 110.0 110.0 110.0 l!O.O 110.0 110.0
Concentrate flow rate (kg h'1) 2 97.8 83.5 93.8 90.2 69.0 80.2 101.4 105.3
Feed temperature ex-PHE ("C) 0.1 66.5 66.6' 66.7' 66.8 66.7' 66.4' 65.5' 65.5'
Feed temperature at 3m (•C) 0.1 62.0 62.1 62.1 62.1 62.1 62.1 61.9 61.9
Feed temperature at 0.3m ("C) 0.1 61.2 61.2 61.2 61.2 61.2 61.2 61.(}" 61.0'
Vapour temperature (°C) 0.1 60.9 61.2 61.1 61.3 62.1 61.31 60.9' 60.8
Product temperature (<C) 0.1 59.9 60.0 60.0 60.0 60.6 60.0 59.9 59.9-
Steam supply temperature (°C) 0.1 61.2 63.2 61.8 62.3 70.2 63.8" 60.8' 60.2
Condensate temperamre ("C) 0.1 59.4 60.6' 59.7 60.0 61.3 61.3 59.2 58.9
Top de-aeration line temp ( 0 C) 0.1 60.2 62.2 60.7 61.1 64.8 62.6" 60.0 59.4
Bottom de-aeration line temp (°C) 0.1 61.4 63.4 61.9 62.4 66.1 63.9 60.9 60.3 I
Ambient temp at 15 m tube top, •c 0.5 25.7 25.1 24.0 23.4 24.0 25.7 27.7 29.9
Ambient temp at steam entry c•c) 0.5 25.2 25.0 24.3 23.7 24.3 25.5 28.4 30.6
Ambient temp at 15m tube bottom, •c 0.5 25.4 24.9 24.3 23.6 25.6 27.2 27.4 27.9
Tube-side absolute pressure (kPa) 0.05 19.92 19.92 19.92 19.92 20.46 19.93 19.93 19.93
Differential pressure - entry (kPa) 0.03 1.503 3.500 2.000 2.500 6.001 3.992 1.001 0.500
Differential pressure - top (kPa) 0.03 1.428 • 3.354 1.924 2.418 5.813 3.893 0.928 0.433
Differential pressure - bollom (kPa) 0.03 1.138 3.118 1.638 2.133 5.416 3.613 0.641 0.141
Main steam pressure (kPa gauge) 2 877.5 876.0 876.0 875.2' 871.9" 864.0" 789.5' 869.0'
Steam header pressure (kPa gauge) I 189.6 189. I 189.3 189.0 189.4 189.6 l9D.4 191.1
Steam valve position(%) 0.1 56.7' 75.0 63.3 68.1 88.3 77.8 49.6" 39.3"'
Vapour valve position(%) 0.1 67.2 86.8 73.9 79.1 99.9 90.1 58.7" 40.2"
1Standard deviation level (see page 11).

Table I21a: Raw Data from Experiment Wa24. (Tube length 15, Tube diameter 48, De-aeration nozzle diameter 3.2 mm, No air bleed)
Experimental run number SDL' 12 2 3 4 5 6 7 8 9 10 I 1 12 13 14
Third feed flow rate (kg h'1) 0.6 110.0 110.0 110.0 110.0 110.0 110.0 110.1 110.0 110.0 110.0 110.0 110.0 110.0 110.0
Concentrate flow rate (kg h"1) 2 87.1 87.6 89.8 88.3 89.1 86.2 91.5 86.0 90.8 91.7 87.7 89.1 89.9 86.9
Feed temperature ex-PHE ("C) 0.1 66.2 63.5 55.2 60.8 58.0 69.3 49.7 72.1 52.4 49.7 63.6 57.9 55.2 66.3
Feed temperature at 3m ("C) 0.1 62.0 59.5 51.9 57.0 54.4 64.6 46.8 67.1 49.3 46.8 59.5 54.4 51.9 62.0 . Feed temperature at 0.3m ("C) 0.1 61.0 58.5 51.0 56.0 53.6 63.5 46.1 66.0 48.5 46.0 58.5 53.4 51.0 6l.l
Vapour temperature ("C) 0.1 61.1 58.6 51.4 56.2 53.7 63.4 46.8 65.8 49.1 46.6 58.6 53.6 51.2 61.0'
Product temperature ("C) 0.1 60.0 57.5 50.3 55.1 52.7 62.5 45.6 64.9 48.0 45.6 57.6 52.7 50.3 60.0
Steam supply temperature ("C) 0.1 62.6 60.2 53.1 57.9 55.4 65.1 48.3 67.5 50.7 48.3 60.3 55.4 53.0 62.6
Condensate temperature ("C) 0.1 60.4 58.0 5l.l 55.2& 53.4 62.5& 46.4 65.0 49.2" 47.0 58.3' 53.5 51.2 60.6"'
Top de-aeration line temp ("C) 0.1 61.8 59.4 52.3 56.9 54.6 64.0 47.6 66.3 49.9 47.5 59.2 54.4 52.2 61.6
Bottom de-aeration line temp ("C) 0.1 62.9 60.4 53.2 58.0 55.6 65.3 48.4 67.8 50.8 48.4 60.4 55.6 53.2 62.9
Ambient temp at 15 m tube top, •c 0.5 24.3 23.8 23.3 23.4 23.1 23.2 22.4 23.4 22.4 21.7 22.8 22.3 22.5 23.2
Ambient temp at steam entry ("C) 0.5 25.3 25.1 24.8 24.8 24.4 24.1 23.9 24.1 24.2 24.3 24.6 24.8 24.5 25.0
Ambient temp at IS m tube bottom, •c 0.5 25.5 25.1 24.7 24.7 24.4 24.2 23.9 24.1 24.1 24.2 25.0 26.2 26.3 26.8 . Tube-side absolute pressure (kPa) 0.05 19.96 17.76 12.36 15.77 13.98 22.39 9.60 25.05 10.91 9.61 17.76 13.98 12.36 19.96
Differential pressure - entry (kPa) 0.03 2.941 2.661 1.960 2.413 2.182 3.241 1.580 3.560 1.759 1.581 2.661 2.178 1.959 2.940
Differential pressure - top (kPa) 0.03 2.696 2.576 1.882 2.318 2.099 3.123 1.509 3.315 1.682 1.510 2.575 2.105 1.887 2.815
Differential pressure - bottom (kPa) 0.03 2.546 2.258 1.507 1.993 1.745 3.379 1.418 4.474 1.435 1.357 2.353 1.738 1.505 3.078
Main steam pressure (kPa gauge) 2 875.2 875.4 876.5 876.2' 875.9 874.5 876.2 874.4 876.9 877.7 873.1"' 867.0 868.8"' 863.11
Steam header pressure (kPa gauge) 1 188.5 188.3 188.1 188.4 188.0 188.3 188.1 188.2 187.8 187.9 187.6 187.4 187.5 188.0
Steam valve position(%) 0.1 71.7 70.7 67.1 69.6 68.4 73.2 63.9 73.9 65.4 63.9 70.9 68.4' 67.1 72.1
Vapour valve position(%) 0.1 83.2 85.6 92.6 87.7 90.1 81.2 97.0 78.9 94.1 96.9 85.3 89.9 92.4 83.3
'Standard deviation level (see page Il). 2Run started at 2050 h on 20 November 1991, subsequent runs at 50 min intervals.
§

Table I21b: Raw Data from Experiment Wa24. (Tube length 15, Tube diameter 48, De-aeration nozzle diameter 3.2 rnm, No air bleed) ~ 00
Experimental run number SDL' 15.0 16.0 17 18 19 20 21 23 24 25 26 27
Third feed flow rate (kg h'1) 0.6 110.1 110.0 110.0 110.0 110.0 110.0 llO.O 109.9 110.0 110.0 110.0 110.0
Concentrate flow rate (leg h'1) 2 88.5 86.3 85.7 90.9 87.8 89.2 86.9 86.4 90.4 89.3 91.6 88.5
Feed temperature ex-PHE (°C) 0.1 60.5 68.8 71.6' 51.9 63.1' 57.5' 65.9 68.8' 52.0' 54.9 49.4 60.5
Feed temperature at 3m ("C) 0.1 56.9 64.5 67.1 49.3 59.5 54.4' 62.0 64.5 49.3 51.9 46.8 56.9
Feed temperature at 0.3m ("C) 0.1 56.0 63.5 66.0 48.5 .58.5' 53.5' 61.0 63.4 48.6 .51.1 46.1 56.1
Vapour temperature ("C) 0.1 56.1' 63.6" 66.0' 49.0 58.5 53.8' 61.0 63.3' 49.0' 51.3 46.5 56.1
Product temperature (•C) 0.1 55.1 62.4 64.9 47.9 57.5 52.7 60.0 62.4• 47.9 50.2 45.4 55.1
Steam supply temperature (•C) 0.1 57.8 64.1 67.6 50.7 60.3 55.5 62.7 65.1 50.6 53.0 48.2 57.8
Condensate temperature ("C) 0.1 55.9 63.0' 65.7 49.3' 58.0* 53.5 60.8' 63.5 49.0 51.1' 46.6 55.8
Top de-aeration line temp (•C) 0.1 57.0 64.1 66.5' 50.1 59.4 54.7 61.7 64.0 50.0' 52.3 47.6 56.9
Boltom de-aeration line temp c•c) 0.1 58.0 65.3 67.8 50.8 60.4 55.6 62.9 65.3 50.8 53.1 48.3 58.0
Ambient temp at 15 m tube top. •c 0.5 23.7 24.4 25.2 25.2 25.7 25.9 26.0 25.8 25.3 25.0 24.7 24.8
Ambient temp at steam entry c·c) 0.5 25.9 26.8 27.5 27.8 27.9 28.1 27.1 26.5 26.4 26.3 26.0 26.0
Ambient temp at 15 m tube bottom, •c 0.5 26.8 27.3 27.4 27.3 27.6 27.7 27.9 27.9 27.6 27.6 27.3 27.4
Tube-side absolute pressure (kPa) 0.05 15.77 22.38 25.05 10.90 17.76 13.99 19.97 22.38 10.92 12.37 9.60 15.11
Differential pressure - entry (kPa) 0.03 2.409 3.241 3.563 1.759 2.660 2.179 2.943 3.239 1.759 1.957 1.579 2.411
Differential pressure - top (kPa) 0.03 2.325 ' 3.077 3.378 1.678 2.522 2.094 2.814 3.146 1.678 1.877 1.503 2.323
Differential pressure - bottom (kPa) 0.03 1.986 3.542 3.840 1.590 2.125 1.736 3.148 3.229 1.590 1.505 1.375 2.713
Main steam pressure (lcPa gauge) 2 851.41 865.2'" 862.61 843.7' 199.41 864.0' 845.2' 868.2" 874.2' 876.7" 871.5 877.2
Steam header pressure (kPa gauge) 1 187.6 188.1 188.2 188.1 188.2 187.9 188.2 187.9 188.1 187.9 188.0 187.8
Steam valve position (%) 0.1 69.5 73.1 74.1 65.3 70.6 68.1 71.9 73.0 65.0 66.7 63.4 69.5 I
Vapour valve position(%) 0.1 87.7 81.3 79.0 94.6 85.4 90.1 83.2 81.2 94.4 92.1 97.0 87.8
1Stantlard deviation level (sec page II}.

Table 122: Raw Data from Experiment Wa25. (Tube length 10, Tube diameter 48, De-aeration orifice diameter 2.95 mm, No air bleed)
Experimental run number SDL1 Jl 2 3 4 5 6 7 8 9 10 II 12
Feed flow rate (kg h'1) 0.6 112.6. 114.3 112.8. 112.5 112.5 111.0 114.3 110.7 112.4 110.9 114.4 112.5
Fifth feed flow rate (kg h"1) 0.6 113.0 115.1 112.9 113.0 113.0 111.0 115.2 111.0 113.0 111.0 115.2 113.0
Concentrate flow rate (kg h"1) 2 79.1 79.1 93.0 79.4 67.4 68.0 92.8 79.7 79.4 93.0 67.1 80.0
Feed temperature at 0.3 m c·c) 0.1 75.0 85.0" 75.0 75.0 75.0 65.0 85.0" 65.0 75.0 65.0 85.0" 75.0 . Vapour temperature 23 mm tube c·q 0.1 59.6 59.6 59.5 59.4 59.4 59.4 59.4 59.3 59.4 59.2. 59.2 59.3
Vapour temperature 40 mm tube (°C) 0.1 60.1 60.0 60.1 60.0 60.0 60.0 60.0 60.0 60.0 60.0 60.0 60.0
Vapour temperature 48 mm tube ("C) 0.1 60.7 61.7 60.4 60.7 61.0 60.4 61.5 60.1 60.7 59.8 62.0 60.7
Product temperature (°C) 0.1 59.9 59.8 59.8 59.8 59.8 59.7 59.7 59.7 59.7 59.7 59.7 59.7
Steam supply temperature (•C) 0.1 73.4"' 73.7 62.8 73.4. 76.3. 76.4 62.8 73.4. 73.5 62.8 76.3 73.4
Condensate temperature c·c) 0.1
Top de-aeration line temp c•q 0.1
Bottom de-aeration line temp ("C) 0.1
Ambient temp at 15 m tube top, •c 0.5 23.8 23.6 23.3 23.5 23.6 23.4 23.7 23.6 23.7 24.3 24.3 24.4
Ambient temp at steam entry (°C) 0.5 28.1 28.0 27.9 27.9 27.9 27.8 27.6 27.6 27.7 27.7 27.5 27.3 . Ambient temp at 15 m tube bottom, •c 0.5 26.7 26.8 26.8 26.8 26.9 26.6 26.6 26.4 26.4 26.3 26.1 26.2
Tube-side absolute pressure (kPa) 0.05 20.00 20.0 2o.oo· 20.00 20.01 20.00 20.00 20.02 20.00 20.00 20.00 20.02
Tube-side absolute pressure (AP3) (kPa) 0.05 19.35 . 19.34 19.33 19.34 19.33 19.33 19.32 19.32 19.31 19.30 19.32 19.31
Differential pressure (kPa) 0.03 6.005 5.998 2.999 5.998 8.996 8.998. 3.002 5.999 5.998 3.004 9.001 5.999
Main steam pressure (kPa gauge) 2 896.2 895.4 897.9 895.7 895.5 896.0 896.5 896.9 896.3 898.1 894.6 896.0
Steam header pressure (kPa gauge) 1 187.1 187.7 188.0. 186.9 187.32 187.3 187.2 187.6 187.3. 188.5" 187.7 187.9
Steam valve position (%) 0.5 87.7 87.6 74.9 87.6 97.8 97.6 75.0 87.4 87.4 74.9 97.5 87.0
Vapour valve position(%) 0.5 73.3 75.8 55.9 73.4 88.5 83.2 58.3 70.8 73.0 53.4 92.2 70.4
'Standard deviation level (see page II). 2Run started at 0054 h on 22 February 1992, subsequent runs at 45 min intervals.
~ 1.0

t;: Table 123: Raw Data from Experiment Wa26. (Tube length 10, Tube diameter 23, De-aeration orifice diameter 2.95 mm, No air bleed) 0
Experimental run number SDV 12 2 3 4 5 6 7 8 9 10 11 12
Feed flow rate (kg h'1) 0.6 52.5 53.0 52.4 52.3 52.6 51.8 53.3 51.8 52.5 51.8 53.1 52.5
Fifth feed flow rate (kg h·') 0.6 53.0 53.0 53.0 53.0 53.0 52.1 54.0 52.0 53.0 52.0 54.0 53.0
Concentrate flow rate (kg h-1) 2 40.8 40.2 45.7 40.0 36.1 35.0' 45.6 39.5' 39.8 45.6 36.2 39.7'
Feed temperature at 0.3 m ("C) 0.1 75.0 85.0 75.0 75.0 75.0 65.0 85.0 64.9 75.0 65.0 85.1 75.0
Vapour temperature 23 mm tube ("C) 0.1 62.6 64.5 61.7 62.7 63.9 62.9 63.8 61.7 62.8 60.7 65.6 62.8
Vapour temperature 40 mm tube ("C) 0.1 60.1 60.1 60.1' 60.1 60.1 60.1 60.1 60.1 60.1 60.1' 60.1 60.1
Vapour temperature 48 mm tube (•q 0.1 58.3' 57.7' 57.0"' 56.5'' 55.6"' 55.0' 55.2" 54.6" 54.1" 53.4' 52.5' 5!.81
Product temperature ("C) 0.1 59.7 59.7 59.6' 59.6 59.6 59.6 59.6 59.6 59.6 59.6' 59.7 59.6
Steam supply temperature (•C) 0.1 65.4 65.4 62.6 65.4 67.9 67.9 62.7 65.4 65.4 62.6' 67.8 65.4
Condensate temperature ("C) O.l
Top de-aeration line temp ("C) 0.1
Bottom de-aeration line temp (•C) 0.1
Ambient temp at 15 m tube top, •c 0.5 26.7 27.3 27.5 27.8 28.1 28.3 28.2 27.9 27.2 26.4 25.7 25.1
Ambient temp at steam entry (°C) 0.5 30.6 31.1 31.1 31.5 31.9 31.7 31.6 31.2 30.3 29.1 28.6 28.1
Ambient temp at 15 m tube bottom, •c 0.5 27.2 27.5 27.5 27.6 27.8 27.5 27.8 27.4 27.1 26.6 26.8 26.5
Tube-side absolute pressure (kPa) 0.05 20.01' 20.01' 20.00" 20.01' 20.00 20.01' 20.02' 20.00' 20.00' 19.98' 20.01' 20.00'
Tube-side absolute pressure (AP3) (kPa) 0.05 19.29' • 19.28' 19.24" 19.28' !9.27' 19.27' 19.27' 19.26 19.27' 19.26' 19.28' 19.28'
Differential pressure (kPa) 0,03 6.000' 6.003' 3.004"' 5.995 9.000 9.001 3.004' 6.004 6.001 2.998' 8.999' 6.002
Main steam pressure (kPa gauge) 2 897.8 895.7 897.6 897.0 897.6 897.9 897.0 898.4 896.2 896.9 894.9 895.4
Steam header pressure (kPa gauge) 1 189.1' 188.9' 190.9' 189.7' 188.5' 189.3' 190.1' 189.6' 190.0' 189.1' 188.8' 189.3'
Steam valve position(%) 0.5 65.2 65.1 55.6 66.0 73.8 74.2 55.5 66.9 66.3 57.4 73.4 66.5
Vapour valve position(%) 0.5 40.4' 43.6' 27.8' 42.9 53.3 51.4 29.7' 41.2 42.9 26.2' 53.9 42.5
'Standard deviation level (see page 11). 2Run started at 1331 h on 22 February 1992, subsequent runs at 45 min intervals.

Table 124: Raw Data from Experiment Wa27. (Tube length 10, Tube diameter 40, De-aeration orifice diameter 2.95 mm, No air bleed)
Experimental run number SDU 12 2 3 4 5 6 7 8 9 10 ll 12
Feed flow rate (kg h'1) 0.6 92.8 94.3 92.7 92.8 92.8 91.5 94.2 91.4 92.8 91.5 94.2 92.7
Fifth feed flow rate (kg h"') 0.6 93.3 94.9 93.2 93.3 93.2 91.5 95.0 91.5 93.2 91.6 94.9 93.3
Concentrate flow rate (kg h'1) 2 66.5 66.0 16.6' 66.6 57.1 56.1' 77.4' 66.0' 65.4 77.9 57.6 65.1'
Feed temperature at 0.3 m ("C) _ 0.1 75.0 85.0"' 75.0 75.0 75.0 65.0 85.0' 65.0 75.0 65.0 85.0' 75.0 . Vapour temperature 23 nun tube ("C) 0.1 59.8 59.!! 59.!! 59.8 59.!! 59.!! 59.9 59.9 59.9 59.9 59.9 59.9
Vapour temperature 40 mm tube ("C) 0.1 61.2 62.0 60.9 61.3 61.7 61.3 61.7 60.8 61.3 60.5 62.5 61.3
Vapour temperature 48 mm tube CC) 0.1 58.9 58.6 58.3 57.8 57.4 56.9' 56.5' 56.08 55.6' 54.4" 54.1 .. 53.5"
Product temperature ("C) 0.1 59.7 59.7 59.7 59.7 59.7 59.7 59.7 59.7 59.7 59.7 59.7 59.1
Steam supply temperature ("C) 0.1 68.9' 68.4' 62.7 67.9 75.7' 75.7' 62.7 69.7 69.4' 62.8 75.8 69.6
Condensate temperature ("C) 0.1
Top de-aeration line temp ("C) 0.1 I
Bottom de-aeration line temp ("C) 0.1
Ambient temp at 15 m tube top, •c 0.5 23.8 23.6 23.2 23.0 23.0 22.9 22.6 22.4 22.2 22.1 22.8 23.5
Ambient temp at steam entry ("C) 0.5 26.7 26.4 26.1 25.8 25.9 25.9 25.7 25.5 25.3 25.2 26.0 26.8
Ambient temp at 15m tube bouom."C 0.5 25.2 24.5 24.2 24.1 24.0 23.8 23.7 23.3 23.2 23.0 23.5 24.1
Tube-side absolute pressure (kPa) 0.05 20.00' 20.00' 20.00' 20.00' 20.01 20.00 20.00' 20.00' 20.00' 20.00' 20.00' 20.01
Tube-side absolute pressure (AP3) (kPa) 0.05 19.27' 19.25' 19.25' 19.25 19.29' 19.28 19.27' 19.28 19.29' 19.28' 19.29 19.29
Differential pressure (ld'a) 0.03 6.000 5.995 3.001 6.001 9.001 8.999 2.996 6.000 6.003' 3.000 8.997 6.004
Main steam pressure (kPa gauge) 2 894.7 892.6 895.1 894.1 892.9' 893.9' 893.4 894.6 893.7' 894.7' 892.9 895.8
Steam header pressure (kPa gauge) I 191.5 190.7' 191.3' 192.9' 190.7' 191.7 192.5' 192.1' 192.9' 193.2' 192.6' 193.6'
Stearn valve position (%) 0.5 81.6 81.5 68.8 81.5 89.6 89.8 69.4 82.2 81.9 68.9 89.4 81.6
Vapour valve position(%) 0.5 65.4 67.0 49.8 64.9 76.2 72.9 51.8 63.5 65.1 45.8' 77.9 63.5
'Standard deviation level (see page II). 2Run started at 0102 h 23 February 1992, subsequent runs at 45 min intervals.
~ ~

Table 125: Raw Data from Experiment Wa28.
Experimental run number SDL' I' 2 3 4 5
Feed flow rate (kg h·') 0.6 112.6 114.3 112.6 112.5 112.6
Fifth feed flow rate (kg h'1) 0.6 113~1 115.2 113.1 113.0 113.0
Concentrate flow rate (kg h"1) 2 80.2 79.8 93.1' 80.0 68.5'
Feed temperature at 0.3m ("C) 0.1 75.0 85.0' 75.0 75.0 75.0
Vapour temperature 23 mm tube ("C) 0.1 59.8 59.8 59.7' 59.8 59.8
Vapour temperature 40 mm tube ("C) OJ 60.1 60.1 60.1' 60.1 60.1
Vapour temperature 48 mm tube ("C) 0.1 60.7 61.8 60.5 60.7 61.0
Product temperature (°C) 0.1 59.6 59.6 59.6' 59.6 59.6
Steam supply temperature ("C) 0.1 73.6' 73.7' 62.8 73.6"' 76.7
Condensate temperature ("C) 0.1
Top de-aeration line temp ("C) 0.1
Bouom de-aeration line temp (°C) 0.1
Ambient temp at 15 m tube top, •c 0.5 25.8 26.4 26.7 27.1 26.8
Ambient temp at steam entry ("C) 0.5 29.8 30.2 30.8 30.7 30.0
Ambient temp at 15 m tube bottom, •c 0.5 26.2 26.6 26.8 27.0 27.0
Tube-side absolute pressure (kPa) 0.05 20.00 20.01 20.00' 20.00' 20.01'
Tube-side absolute pressure (AP3) (kPa) 0.05 19.22 • 19.23 19.21k 19.26 19.26
Differential pressure (kPa) 0.03 5.996 6.000 3.000' 5.999 9.001
Main steam pressure (kPa gauge) 2 894.9 894.0' 895.4 895.6' 894.1'
Steam header pressure (kPa gauge) I 193.8 194.6' 193.8' 193.6 192.7
Steam valve position(%) 0.5 86.0 86.0 73.6 86.3 95.7
Vapour valve position (%) 0.5 72.9 75.5 55.9' 73.0 87.7
'Standard deviation level (see page 11). 1Run started at 1217 h 23 February 1992, subsequent runs at 45 min intervals.
6 7
110.8 114.5'
111.0 115.0
67.4' 92.8'
65.0 85.0
59.7 59.7
60.1 60.1
60.3 61.5
59.6 59.6
76.7 62.8
26.9 26.6
30.5 29.9
26.9 27.0
19.99 20.00'
19.26 19.24
9.000 2.999
895.2 895.3
193.3 194.2
95.6 73.4
82.5 57.6
(Tube length 10, Tube diameter 48, De-aeration orifice diameter 2.95 mm, No air bleed)
8 9 10
110.8 112.5 110.8
111.0 113.0 110.9
80.1' 78.9' 91.6'
65.0 75.0 65.0
59.8 59.7 59.8
60.1 60.1 60.1
60.0. 60.7 59.8
59.6 59.6 59.6
73.4 73.5" 62.8
26.7 26.7 26.4
30.2 30.3 29.8
26.8 27.0 26.6
20.00' 20.00 19.99'
19.26 19.26 19.24'
6.000 6.000 3.001
895.2' 895.2 897.8
194.7' 194.4' 194.0
86.1 86.1 73.4
70.4 n.? 52.7
-Vl N

Table 126: Raw Data from Experiment Wa29. (Tube length 10, Tube diameter 48, De-aeration orifice diameter 2.95 mm, No air bleed)
Experimental run number SOL' 12 2 3 4 5 6 7 8 9 10 11 12
Feed flow rate (kg li1} 0.6 112.5 114.3 112.5 112.6 112.6 111.0 114.4 110.8 112.6 ll0.8 114.5 112.8
Fifth feed flow rate (leg h'1) 0.6 113.0 1!5.1 113.0 113.0 113.1 111.0 115.2 111.0 113.0 111.0 115.3 113.0
Concentrate flow rate (leg h'1) 2 79.3 79.4 93.2 79.3 69.3 69.4 93.2 79.9 79.9 92.9 69.0 79.6
Feed temperature at 0.3m (•C) 0.1 75.0 85.0' 75.0 75.0 75,0 65.0 85.0" 66.0 75.0 65.0 85.0" 75.0 . Vapour temperature 23 mm tube ("C) 0.1 38.7 38.6 37.5 37.9 38.5 38.2 36.9 37.3 37.4 36.5 38.0 37.4
Vapour temperature 40 mm tube (°C) 0.1 37.2" 36.4 35.7' 35.8' 37.5 37.1 35.7 36.3' 36.4' 35.4 36.1 35.7
Vapour temperature 48 mm tube c•c) 0.1 60.6 61.7 60.4 60,6 60.9 60.2 61.5 60.0 60.7 59.8 61.9 60.7
Product temperature c• C) 0.1 59.5 59.5 59.5 59.5 59.5 59.5 59.5 59.6 59.5 59.6 59.5 59.5
Steam supply temperature (0 C) 0.1 68.9 68.9 62.8 67.4 70.6" 71.2 62.8 67.5 67.5 62.8 70.1 67.3'
Condensate temperature ("C) 0.1
Top de-aeration line temp ("C) 0.1
Bottom de-aeration line temp (°C) OJ
Ambient temp at 15 m tube top, •c 0.5 29.1 29.3 29.0 28.7 28.1 27.8 27.8 27.7 27.5 27.3 27.3 27.1
Ambient temp at steam emry ( • C) 0.5 31.8 31.7 31.4 31.4 31.0 30.8 30.7 30.3 30.4 30.1 30.3 30.3 . Ambient temp at 15m tube bottom.OC 0.5 30.0 30.1 29.8 29.6 29.1 28.7 28.6 28.4 28.4 28.2 28.2 27.8
Tube-side absolute pressure (kPa) 0.05 20.01 20.01 20.00' 20.00' 20.00 20.00' 20.00 20.00 20.01 20.00' 19.98 20.01
Tube-side absolute pressure (AP3) (lePa) 0.05 19.27 19.28 19.27' 19.28 19.27 19.28 19.26 19.27 19.27 19.25 19.24 19.25
Differential pressure (kPa) 0.03 6.000 5.996 3.002 6.000 8.586 8.583' 3.001 5.994 6.001 3.001 8.549 6.000
Main steam pressure (kPa gauge) 2 892.0' 887.31 891.6" 895.2 894.7 896.8 895.9 896.8 895.6 896.8' 894.0 894.8
Steam header pressure (kPa gauge) 1 192.7 192.5 193.9' 192.2 191.6 192.3 193.7 192.7 193.1 192.3 193.3' 192.4
Steam valve position(%) 0.5 87.6 87.6 76.4 88.1 99.9 99.9 76.4 88.1 88.0 76.6 99.9 87.9
Vapour valve position(%) 0.5 73.0 76.1 56.0 73.7 86.8 81.2 58.1 70.8 73.4 53.0 90.0' 70.9
'Standard deviation level (see page 11). 'Run started at 1845 h on 24 February 1992, subsequent runs at 45 min intervals.
~ w

----··-·---- ----·-··---·-··-
Table 127: Raw Data from Experiment Wa30. (rube length 10, Tube diameter 23, De-aeration orifice diameter 2.95 mm, No air bleed) ti: .j:::..
Experimental run number SDL' 1' 2 3 4 5 6 7 8 9 10 II 12
Feed flow rate (kg h "1) 0.6 52.5 53.1 52.3 52.5 52.3 51.7 53.2 51.7 52.6 51.7 53.1 52.4
Fifth feed flow rate (kg h'') 0.6 53.0 53.9 53.0 53.0 53.0 52.0 54.0 52.1 53.1 52.0 54.0 53.0
Concentrate flow rate (kg h"') 2 3&.3' 40.7' 44.5' 40.4' 35.2' 34.9' 45.0' 39.8 40.2' 43.8' 35.8 40.1'
Feed temperature at 0.3m (°C) 0.1 75.0 &4.9 75.0 75.0 75.0 65.0 &5.0 65.0 75.0 65.0 85.0 74.9
Vapour temperature 23 mm tube ("C) 0.1 62.9 64.7 61.8 62.8 64.0 62.9 63.8 61.7 62.8 60.6' 65.7 62.8
Vapour temperature 40 mm tube (°C) 0.1 37.0' 37.8 37.5 3&.3' 38.6"' 38.7 37.4' 38.1 37.8"' 36.6 37.1" 36.7'
Vapour temperature 48 mm tube ("C) 0.1 58.3 57.8 57.1' 56.8" 56.4' 56.0' 55.3"" 54.8"· 54.2"' 53.6 53.5"" 53.1
Product temperature (0 C) 0.1 59.5 59.5 59.5' 59.5 59.5 59.5 59.5 59.5 59.6 59.5' 59.5 59.5
Steam supply temperature (•C) 0.1 65.3 64.3 62.6' 65.4" 67.9" 68.21 62.5 65.51 65.51 62.5' 67.7 65.3
Condensate temperature (•C) 0.1
Top de-aeration line temp ("C) 0.1
Bottom de-aeration line temp (0 C) 0.1
Ambient temp at 15 m tube top, ·c 0.5 27.6 27.1 27.4 28.3 28.7 28.1 28.0 27.5 27.6 27.6 27.2 27.1
Ambient temp at steam entry (•C) 0.5 31.1 31.6 32.1 32.7 32.5 32.4 31.7 31.8 32.2 31.8 30.9 30.1
Ambient temp at 15 m tube bottom, •c 0.5 29.2 29.9 29.8 29.8 30.0 29.7 29.8 29.5 29.6 29.3 29.6 28.9
Tube-side absolute pressure (kPa) 0.05 20.01 20.01 20.00" 20.00' 20.00' 19.99' 20.01" 20.00" 20.00' 19.99' 20.01 20.01
Tube-side absolute pressure (AP3) (kPa) 0.05 19.23 • 19.22 19.23" 19.23" 19.23' 19.23" 19.22' 19.24" 19.24' 19.22"' 19.24 19.23
Differential pressure (kPa) 0.03 5.996 5.998 3.001' 5.998 9.000' 8.998 3.000' 6.004 5.998 2.993' 9.000 5.997
Main steam pressure (kPa gauge) 2 882.6' 881.2' 883.9 869.4' 873.6"' 882.7" 880.41 888.9 884.0' 892.9' 896.0" 897.2
Steam header pressure (kPa gauge) 1 193.5 193.8 194.9' 194.3 193.4' 191.4' 193.6' 194.9' 194.7 195.2' 193.4' 194.5
Steam valve position(%) 0.5 71.6 71.2 62.5 71.5 77.4 77.9 62.3 71.9 71.4 63.1 76.9 71.5
Vapour valve position (%) 0.5 43.5 45.6 28.7 43.0 53.8 52.1 30.1 41.6 43.3 26.5' 54.5 42.9
'Standard deviation level (see page 11). 2Run started at 1033 h on 25 February 1992, subsequent runs at 45 min intervals.
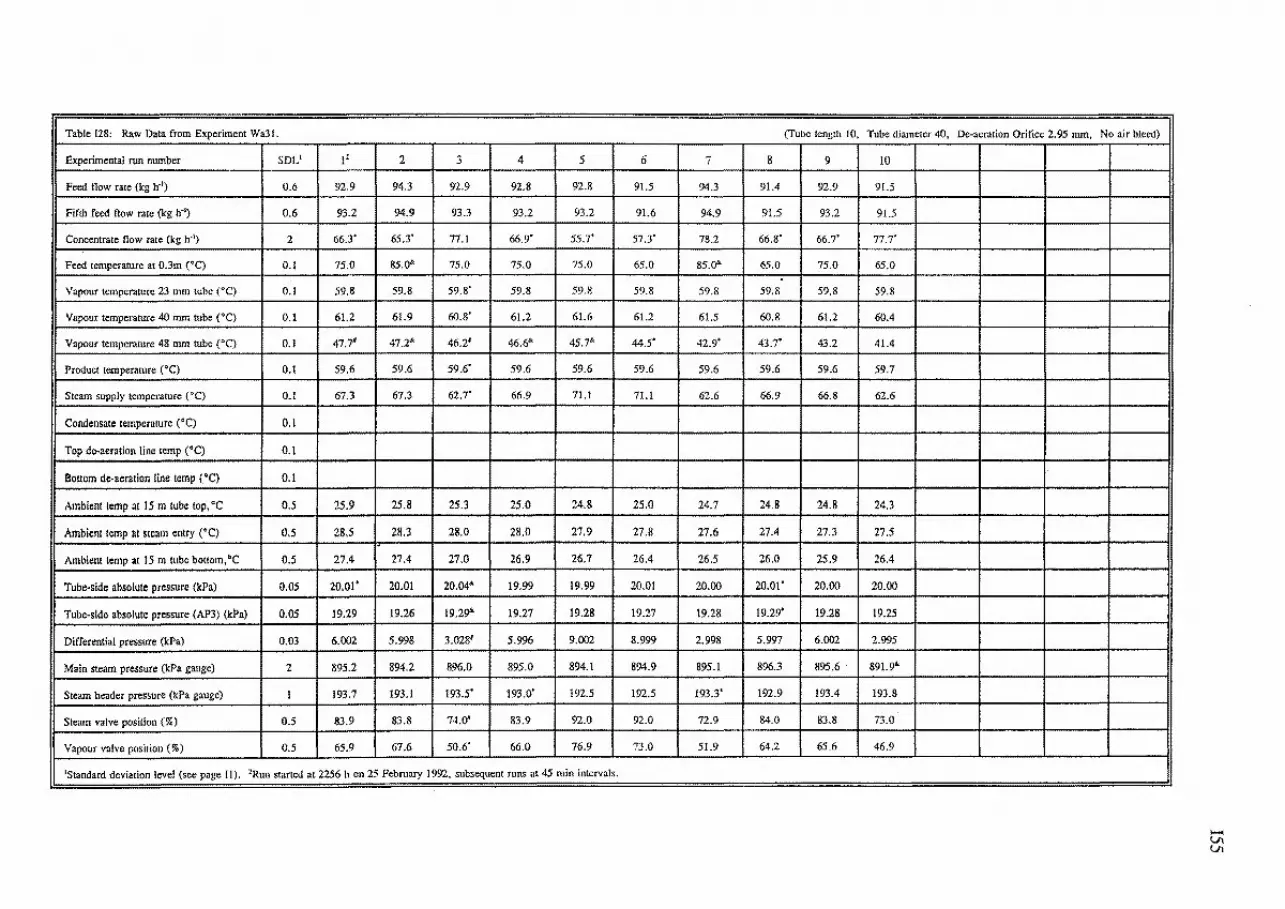
Table 128: Raw Data from Experiment Wa3L
Experimental run number SOL' 1' 2 3 4 5
Feed flow rate (kg h'1) 0.6 92.9 94.3 92.9 92.8 92.8
Fifth feed flow rate (kg h'1) 0.6 93.2 94.9 93.3 93.2 93.2
Concentrate flow rate (kg h'1) 2 66.3' 65.3' 77.1 66.9' 55.7'
Feed temperature at 0.3m (°C) 0.1 75.0 85.0" 75.0 75.0 75.0
Vapour temperature 23 mm tube (°C) 0.1 59.8 59.8 59.8' 59.8 59.8
Vapour temperature 40 rmn tube (°C) 0.1 61.2 61.9 60.8' 61.2 61.6
Vapour temperature 48 mm tube ("C) 0.1 47.71 47.2" 46.21 46.6"' 45.7"
Product temperature (•C) 0.1 59.6 59.6 59.6' 59.6 59.6
Steam supply temperature ("C) 0.1 67.3 67.3 62.7' 66.9 71.1
Condensate temperature c•c) 0.1
Top de-aeration line temp c•q 0.1
Bottom de-aeration line temp (•C) O.l
Ambient temp at 15 m tube top, •c 0.5 25.9 25.8 25.3 25.0 24.8
Ambient temp at steam entry (•C) o.s 28.5 28.3 28.0 28.0 27.9
Ambient temp at 15m tube bottom, •c 0.5 27.4 27.4 27.0 26.9 26.7
Tube-side absolute pressure (kPa) 0.05 20.01' 20.01 20.04" 19.99 19.99
Tube-side absolute pressure (AP3) (kPa) 0.05 19.29 19.26 19.29& 19.27 19.28
Differential pressure (kPa) 0,03 6.002 5.998 3.028' 5.996 9.002
Main steam pressure (kPa gauge) 2 895.2 894.2 896.0 895.0 894.1
Steam header pressure (kPa gauge) 1 193.7 193.1 193.5* 193.0' 192.5
Steam valve position(%) 0.5 83.9 83.8 74.0' 83.9 92.0
Vapour valve position (%) 0.5 65.9 67.6 50.6' 66.0 76.9
'Standard deviation level (see page II). 1Run started at 2256 h on 25 February 1992, subsequent runs at 45 min intervals.
6 7
91.5 94.3
91.6 94.9
57.3' 78.2
65.0 85.0"
59.8 59.8
61.2 61.5
44.5' 42.9'
59.6 59.6
7l.l 62.6
25.0 24.7
27.8 27.6
26.4 26.5
20,0! 20.00
19.27 19.28
8.999 2.998
894.9 895.1
192.5 193.3'
92.0 72.9
73.0 51.9
8
91.4
91.5
66.8'
65.0 . 59.8
60.8
43.7'
59.6
66.9
24.8
27.4
26.0
20.01'
19.29'
5.997
896.3
192.9
84.0
64.2
(Tube length 10, Tube diameter 40, De-aeration Orifice 2.95 mm, No air bleed)
9 10
92.9 91.5
93.2 91.5
66.7' 77.7'
75.0 65.0
59.8 59.8
61.2 60.4
43.2 41.4
59.6 59.7
66.8 62.6
24.8 24.3
27.3 27.5
25.9 26.4
20.00 20.00
19.28 19.25
6.002 2.995
895.6 891.9"'
193.4 193.8
83.8 73.0
65.6 46.9
"""" Vt Vt

c: Table 129: Raw Data from Experiment Wa32. (Tube length 10, Tube diameter 40, De-aeration orifice diameter 2.95 mm, No air bleed) 01
Experimental run number SDL' 12 2 3 4 5 6 7 8 9 10 11 12
Feed flow rate (kg h"1) 0.6 92.9 94.3 92.9 93.0 92.8 91.5 94.5 91.6 93.0 91.6 94.3 93.1
Fifth feed flow rate (kg h"1) 0.6 93.2 95.0 93.2 93.2 93.1 91.6 95.0 91.5 93.1 91.6 94.9 93.4
Concentrate flow rate (kg h"1) 2 66.0 65.9 77.2 66.0 56.0 56.6 76.6 65.5 65.9' 77.9 55.6' 66.2
Feed temperature at 0.3m (•C) 0.1 75.0 85.0" 75.0 75.0 75.0 65.0 85.0" 65.0 75.0 . 65.0 85.0" 75.0
Vapour temperarure 23 mm rube ( • C) 0.1 59.7 59.7 59.7 59.7 59.7 59.7 59.7 59.7 59.7 59.7 59.6 59.7
Vapour temperarure 40 mm tube (°C) 0.1 61.1 61.8 60.7 61.1 61.5 61.1 61.4 60.6 61.0 60.3 62.2 61.1
Vapour temperarure 48 mm tube (0 C) 0.1 48.1" 47.1" 45.7' 47.7' 49.4" 48.5'" 44.7' 45.7"> 45.1"' 43.4 48.4 45.8
Product temperature ("C) 0.1 59.6 59.5 59.5 59.5 59.5 59.5 59.5 59.6 59.6 59.5 59.5 59.6
Steam supply temperature (0 C) 0.1 67.4"' 67.3' 62.6 67.7 71.4"' 71.4" 62.7' 67.4' 67.4' 62.6 70.8 66.2
Condensate temperature ( 0 C) 0.1
Top de-aeration line temp (•C) 0.1
Bottom de-aeration line temp {"C) 0.1
Ambient temp at 15 m rube top, •c 0.5 27.1 27.9 27.7 28.6 29.1 28.5 28.7 28.1 27.5 27.4 27.4 27.7
Ambient temp at steam entry ("C) 0.5 32.1 31.4 31.5 32.0 32.1 31.5 31.7 31.2 31.4 31.2 31.1 30.7
Ambient temp at 15 ru tube bottom, •c 0.5 29.1 30.3 29.6 29.6 29.9 29.6 29.8 29.6 30.0 29.6 29.4 29.0
Tube-side absolute pressure (kPa) 0.05 20.01 20.00 20.01' 20.00 20.01 20.01 20.01 20.01 20.00 20.00' 20.00 20.00'
Tube·side absolute pressure (AP3) (kPa) 0.05 19.27 • 19.25 19.25 19.26 19.24 19.25 19.23 19.25 19.24' 19.23' 19.25 19.25
Differential pressure (kPa) 0.03 6.002 6.002 2.998 6.003 9.000 8.991 3.00.5 6.004 6.000 3.001 9.003 6.006 i
Main steam pressure (kPa gauge) 2 882.6" 886.7"' 888.1' 891.0' 891.1 882.0 886.2' 898.1"' 898.1 897.4' 89.5.4 897.3'
Steam header pressure (kPa gauge) 1 192.8 192.8 191.5' 192.0' 191.4 192.0 192.9 192.0 191.7 193.6' 191.8 192.8'
Steam valve position (%) 0.5 84.0 83.8 73.0 84.0 92.0 92.1 73.3 84.0 83.8 73.4 91.7 83.7
Vapour valve position(%) 0.5 65.9 67.8 50.4 66.0 77.4 73.5 52.5 64.2 65.9 47.6 79.0 63.8
1Standard deviation level (see page II). 2Run started at 1043 h on 27 February 1992, subsequent runs at 45 min intervals.

157
I2 Data from Sucrose Experiments
The feed total solids results are shown in Table 130 and the concentrate total solids results are found in Table 131. The logged data from Experiments Sul-Sull are presented in Tables 132-142.
Table 130: Sucrose Feed Total Solids Laboratory Results
MP&D Sample Description Uncorrected Feed Predicted Laboratory Sample Feed Temperature Concentration Total Code Density2 (oC) (% w/w) Solids
(kg m-3) (% w/w)
2X34 Taken from feed balance tank after 1282 47 61.7 60.85 (1) Experiment Su2.
2X34 Taken from feed balance tank during 1220 46 50.7 51.15 (2) Run 11 of Experiment Su3.
2X34 Taken from feed balance tank after 1216 50 50.3 50.67 (4) Experiment Su3.
2X34 Taken from feed balance tank after 1250 50.5 56.5 56.41 (6) Experiment Su4.
2X34 Taken from feed balance tank after 1162 49.5 39.9 39.73 (8) Experiment Su5.
2X74 Taken from feed balance tank at 1172 46.5 41.5 41.15 (1) beginning of Experiment Su6.
2X74 Taken from feed balance tank at end of 1170 46.3 41.1 40.01 (2) Experiment Su8.
2X74 Taken from feed balance tank at end of 1209 50 49.0 48.58 (3) Experiment SulO.
2X74 Taken from feed balance tank at end of 1213 47 49.5 49.25 (4) Experiment Sull.
Means 48.91 48.64

158
Table 131: Sucrose Concentrate Total Solids Laboratory Results
MP&D Sample Description Predicted Feed Concentration Ratio Predicted Laboratory Sample Concentration (feed flow/ cone flow) Exit Total Solids Code (from Table 130) Concentration (% w/w)
(% w/w) (% w/w)
2X34 (3) Taken from concentrate 50.7 110/89.6 62.2 63.98 line during Run 11 of Experiment Su3.
2X34 (5) Taken from concentrate 50.3 150/126.9 59.5 59.29 line after Run 12 of Experiment Su3.
2X34 (7) Taken from concentrate 56.5 150/131.1 64.6 65.54 line after Run 12 of Experiment Su4.
2X34 (9) Taken from concentrate 39.9 150/128.0 46.8 46.86 line after Run 12 of Experiment Su5.
Means 58.3 58.92

159
Table I32a: Raw Data from Experiment Su1. (Tube length 15, Tube diameter 48, De-aeration nozzle diameter 3 .2 mm, No air bleed)
Experimental run number SDV 12 2 3 4 5 6
Third feed flow rate (kg h"1) 0.6 150.0 190.0 150.0 150.0 150.0 190.0
Concentrate flow rate (kg h"1) 2 128.5 167.9 128.5 129.3 127.6 167.2
Feed temperature ex-PHE (°C) 0.1 69.5 68.9 69.8 75.4 64.4 63.7
Feed temperature at 3m (°C) 0.1 65.5 65.4 65.5 70.6 60.5 60.4
Feed temperature at 0.3m (0 C) 0.1 64.5 64.6 64.6 69.6 59.7 59.7
Vapour temperature ( 0 C) 0.1 61.9 62.4 62.1 66.8 57.5 57.9
Product temperature (°C) 0.1 61.0 61.0 61.0 65.9 56.1 56.1
Steam supply temperature (°C) 0.1 65.3 64.7 65.3 69.6 61.0 60.4
Condensate temperature (°C) 0.1 63.2 62.8 63.2 67.4 58.9 58.3
Top de-aeration line temp (°C) 0.1 64.5 63.9 64.4 68.7 60.2 59.5
Bottom de-aeration line temp (°C) 0.1 65.4 64.9 65.5 69.8 61.2 60.5
Ambient temp at 15 m tube top (°C) 0.5 27.1 26.6 25.5 25.6 25.1 24.8
Ambient temp at steam entry ( 0 C) 0.5 27.7 26.6 25.6 25.5 25.2 25.2
Ambient temp at 15 m tube bottom (°C) 0.5 27.4 26.7 26.1 25.9 25.7 25.6
Tube-side absolute pressure (kPa) 0.05 19.96 19.96 19.96 25.00 15.75 15.75
Differential pressure - entry (kPa) 0.03 5.798 5.133 5.820 6.354 5.395 4.740
Differential pressure - top (kPa) 0.03 5.720 5.047 5.732 6.212 5.319 4.661
Differential pressure - bottom (kPa) 0.03 5.580 4.868& 5.569 7.056 5.016 4.397
Main steam pressure (kPa gauge) 2 886.2 883.0& 882.5" 877.1 878.2 884.9&
Steam header pressure (kPa gauge) 1 189.7 189.8 189.7 189.6 189.6 189.5
Steam valve position(%) 0.1 70.0 70.0 70.0 70.0 70.0 70.0
Vapour valve position(%) 0.1 81.7 82.2 81.6 74.8 88.9 89.3
Temperature in feed density meter (°C) 0.1 49.9 51.7 49.5 52.7 46.3 48.1
Temperature in concentrate line ( o C) 0.1 58.3 58.8 58.2 62.5 53.9 54.2
Feed density3 (kg m·3) 0.5 1154.8 1153.7 1155.2 1154.4 1157.5 1155.8
Concentrate density3 (kg m"3) 2 1177.1 1169.4 1177.0 1173.4 1172.3" 1173.2
Viscometer differential pressure (kPa) 0.5 2.9 5.3 2.8 3.0 3.3 5.3
1Standard deviation level (see page 11). 2Run started at 1840 h on 19 December 1991, subsequent runs at 90 min intervals. 3Uncorrected figures (see Appendix B).

160
Table I32b: Raw Data from Experiment Sul. (Tube length 15, Tube diameter 48, De-aeration nozzle diameter 3.2 mm, No air bleed)
Experimental run number SDV 7 8 9 10 11 12
Third feed flow rate (kg h'1) 0.6 150.0 190.0 110.0 110.0 110.0 150.0
Concentrate flow rate (kg h'1) 2 128.6 168.7 89.3' 87.9 88.5 128.6
Feed temperature ex-PHE (0 C) 0.1 70.0 74.6 77.1' 65.7 7 .8
Feed temperature at 3m (°C) 0.1 1 65.5 70.5 70.7' 60.6 65.7 I 65.5
Feed temperature at 0.3m (0 C) 0.1 64.6 69.5 +69.5' 59.5 64.5 64.5
Vapour temperature (°C) 0.1 62.1 67.1 66.8' 57.3' 62.0"' 62.31
Product temperature (0 C) 0.1 61.1 65.9 66.0 56.3 61.2 61.1
Steam supply temperature ( 0 C) 0.1 65.3 69.1 70.1 61.4 65.7 65.4
Condensate temperature ("C) 0.1 63.2 67.0 67.9 59.4 63.8 63.3
Top de-aeration line temp ("C) 0.1 64.4 68.0 60.4 64.7 64.4
Bottom de-aeration line temp (°C) 65.5 69.3 61.5 5.5
Ambient temp at 15 m tube top (°C) 0.5 24.7 24.8 25.0 24.0 24.9 25.7
Ambient temp at steam entry (°C) 0.5 24.9 24.9 25.0 25.4 26.0 26.7
Ambient temp at 15 m tube bottom (°C) 0.5 25.5 25.5 26.0 26.1 26.7 27.1
Tube-side absolute pressure (kPa) 0.05 19.96 25.00 25.01 15.75 19.95 19.96
Differential pressure - entry (kPa) 0.03 1 s.969' 5.727"' 7.042"' 5.775 6.403' 5.851
Differential pressure top (kPa) 0.03 5.897' 5.571"" 6.905"' 5.710 6.339' 5.773
Differential pressure - bottom (kPa) 0.03 5.639 5.359' 6.831"' 5.382 6.085 5.675
Main steam pressure (kPa gauge) 2 879.5 ~884.7 870.8"' 870.0' 877.81
Steam header pressure (kPa gauge) 1 189.3 189.5 189.4 189.3 189.3 189.4
Steam valve position(%) 0.1 70.0 70.0 70.0 70.0 70.0 70.0
Vapour valve position(%) 0.1 81.5 H,., 88.1 81.0 81.4 . Temperature in feed density meter (°C) 49.3 49.2' .,,.~, 49.5
Temperature in concentrate line (0 C} 0.1 58.2 63.0 61.2 52.5 .7 58.2
Feed density2 (kg m-3) 0.5 1156.5 1153.6 1156.8 1160.1 1159.3 1156.7
Concentrate density2 (kg m'3) 2 1177.0 1167.7 1178.9"' 1186.2"' 1182.5"' 1172.6
Viscometer differential pressure (kPa) 0.5 3.0 5.2 1.6 2.0 1.8 3.1
1Standard deviation level (see page 11). •uncorrected figures (see Appendix B).

161
Table I33a: Raw Data from Experiment Su2. (Tube length 15, Tube diameter 48, De-aeration nozzle diameter 3.2 mm, No air bleed)
Experimental run number SDL' 12 2 3 4 5 6
Third feed flow rate (kg h'1) 0.6 150.1 190.0 150.1 150.0 150.0 190.0
Concentrate flow rate (kg h'1) 2 132.7 169.3& 132.8 133.4* 131.3& 168.8
Feed temperature ex-PHE (0 C) 0.1 71.2 70.4 71.5 77.7 66.3 65.6
Feed temperature at 3m ( 0 C) 0.1 65.7 65.6 65.7 70.8 60.7 60.6
Feed temperature at 0.3m (0 C) 0.1 65.8 65.7 66.0 71.4 61.2 61.1
Vapour temperature ( 0 C) 0.1 64.8* 64.3 64.8* 69.6& 60.4* 59.7
Product temperature ( 0 C) 0.1 65.2 64.1 65.1 70.1' 60.1 59.0
Steam supply temperature ( o C) 0.1 73.5 72.2· 73.5 77.8 69.3 67.8*
Condensate temperature ( 0 C) 0.1 70.8 69.4* 70.7 74.7* 66.4 64.9*
Top de-aeration line temp (0 C) 0.1 72.5 71.3* 72.6 76.6 68.3 66.8*
Bottom de-aeration line temp (0 C) 0.1 73.6 72.3* 73.6 77.8 69.3 67.9*
Ambient temp at 15 m tube top (°C) 0.5 30.6 30.8 29.6 28.7 27.1 26.1
Ambient temp at steam entry (0 C) 0.5 29.7 29.5 28.7 27.6 26.9 26.5
Ambient temp at 15 m tube bottom ( 0 C) 0.5 26.7 26.5 26.0 25.7 25.3 25.1
Tube-side absolute pressure (kPa) 0.05 19.97 19.97 19.97 25.00 15.75& 15.74
Differential pressure - entry (kPa) 0.03 17.039* 15.0201 17.056& 19.346 14.972& 13.0691
Differential pressure - top (kPa) 0.03 16.955* 14.9371 16.974& 19.189 14.892& 12.9941
Differential pressure - bottom (kPa) 0.03 16.677* 14.6551 16.694& 18.951 14.613& 12.7051
Main steam pressure (kPa gauge) 2 883.7 884.0 884.2 884.1 884.6 883.9&
Steam header pressure (kPa gauge) 1 189.8 190.1 189.8 189.9 190.0 189.7
Steam valve position(%) 0.1 70 70.0 70.0 70.0 70.0 70.0
Vapour valve position(%) 0.1 79.2 80.2 79.1 72.3 86.2 87.1 . Temperature in feed density meter (°C) 0.1 52.8 53.9" 52.7 55.8 49.0* 49.9*
Temperature in concentrate line ( o C) 0.1 59.7 59.6 59.6 63.5 55.4" 55.1
Feed density3 (kg m·3) 0.5 1282.5 1274.8* 1282.1 1280.8 1282.1" 1274.2&
Concentrate density3 (kg m·3) 2 1334.3 1314.6 1333.0 1329.1 1335.9 1316.3
Viscometer differential pressure (kPa) 0.5 23.7 19.9* 23.3* 18.0 29.3& 23.2*
1Standard deviation level (see page Il). 2Run started at 1631 h on 6 January 1992, subsequent runs at 90 min intervals. 3Uncorrected figures (see Appendix B).

162
Table I33b: Raw Data from Experiment Su2. (Tube length 15, Tube diameter 48, De-aeration nozzle diameter 3.2 mm, No air bleed)
Experimental run number SDL1 7 8 9 10 112
Third feed flow rate (kg h'1) 0.6 150.0 190.0 110.0 110.0 110.0
Concentrate flow rate (kg h"1) 2 132.7' 171.4 92.5' -;;:-;- 92.1
Feed temperature ex-PHE (•C) 0.1 72.5 77.3 80.5 68.1 74.1
Feed temperature at 3m (°C) 0.1 65.8 70.8 71.1 60.9 66.0
Feed temperature at 0.3m (°C) 0.1 66.4 71.6 71.8* 61.2 66.5
Vapour temperature (•C) 0.1 65.3' 69.2" 70.9' 61.5' 65.6'
Product temperature (•C) 0.1 65.1 69.3' 71.2& 62.3 I 67.4
Steam supply temperature (°C) 0.1 73.5 76.6 79.4' 71.1 75.5
Condensate temperature ("C) 0.1 70.7 73.7 76.5' 68.7 73.0
Top de-aeration line temp (°C) 0.1 72.4 75.5 78.1' 70.0 74.3
Bottom de-aeration line temp (°C) 0.1 73.6 76.8 79.5& 71.3 75.6
Ambient temp at 15m tube top (•C) 0.5 25.5 25.2 24.9 24.4 24.9
Ambient temp at steam entry ( 0 C) 0.5 26.2 25.7 25.7 25.4 25.9
Ambient temp at 15 m tube bottom (°C) 0.5 .0 24.9 24.9 25.3 25.8
Tube-side absolute pressure (kPa) 0.05 19.97 25.01' 25.01 15.74 19.96
Differential pressure · entry (kPa) 0.03 17.162"' 17.6941 20.006°5 17.694& 20.006°5
Differential pressure - top (kPa) 0.03 16.994& 17.5391 20.006°s 17.619"' 20.006°5
Differential pressure • bottom (kPa) 0,03 16.807"' 17.2981 20.006°5 17.334& 20.006°5
Main steam pressure (kPa gauge) 2 884.4 883.3 876.8 878.7 878.3
Steam header pressure (kPa gauge) 1 189.6 189.5 189.2 188.9 189.3
Steam valve position(%) 0.1 70.0 70.0 70.0 70.0 70.0
Vapour valve position(%) 0.1 79.0 73.0 71.2 85.0 77.8 . Temperature in feed density meter ("C) 0.1 52.3 57.4 52.3& 46.8' 49.4&
Temperature in concentrate line (°C) 0.1 59.3 63.4 63.2 55.8 59.9
Feed densitf (kg m·3) 0.5 1282.2 1278.2 1284.4 1284.3 1285.0
Concentrate density' (kg m·') 2 1333.8 1317.5 1353.1 1358.3 1357.7
Viscometer differential pressure (kPa) 1 o.5 22.8 17.7 23.2"' 42.0' 30.0
1Standard deviation level (see page Il). 2Run started at 0735 h on 7 January 1992, 20 min earlier than scheduled. 'Uncorrected figures (see Appendix B).

163
Table I34a: Raw Data from Experiment Su3. (Tube length 15, Tube diameter 48, De-aeration nozzle diameter 3.2 mm, No air bleed)
Experimental run number SDV 12 2 3 4 5 6
Third feed flow rate (kg h'1) 0.6 150.0 190.0 150.0 150.0 150.0 190.0
Concentrate flow rate (kg h'1) 2 127.8 167.2 127.8 128.0 127.7 166.2
Feed temperature ex-PHE (°C) 0.1 70.4 68.8 70.6 75.9 65.2 64.0
Feed temperature at 3m (°C) 0.1 65.6 65.4 65.6 70.6 60.6 60.4
Feed temperature at 0.3m (°C) 0.1 65.2 64.6 65.1 69.9 60.2 59.8
Vapour temperature (°C) 0.1 62.9 63.1 63.0 67.4 58.1 58.3
Product temperature (°C) 0.1 62.2 62.1 62.2 67.0 57.2 57.1
Steam supply temperature (°C) 0.1 68.6 68.2 68.4 72.4 64.1 63.6
Condensate temperature ( o C) 0.1 66.4 65.9 66.1 70.2 61.8 61.4
Top de-aeration line temp (°C) 0.1 67.8 67.2 67.4 71.4 63.2 62.7
Bottom de-aeration line temp (°C) 0.1 68.7 68.4 68.6 72.6 64.2 63.7
Ambient temp at 15 m tube top (°C) 0.5 28.7 28.3 27.7 26.3 25.6 25.3
Ambient temp at steam entry (0 C) 0.5 29.5 28.8 27.9 27.1 26.8 26.6
Ambient temp at 15 m tube bottom (°C) 0.5 28.5 28.0 27.8 27.3 27.0 26.8
Tube-side absolute pressure (kPa) 0.05 19.96 19.97 19.96 25.00 15.75 15.75
Differential pressure - entry (kPa) 0.03 9.947 9.425. 9.771 10.456. 8.617 8.069
Differential pressure - top (kPa) 0.03 9.855 9.335. 9.679 10.364. 8.551 8.003
Differential pressure - bottom (kPa) 0.03 9.588 9.062. 9.409 10.111. 8.252 7.703
Main steam pressure (kPa gauge) 2 884.67 885.6 885.2 883.1 883.9 884.6
Steam header pressure (kPa gauge) 1 190.1 189.8 190.0 189.9 190.1 190.1
Steam valve position(%) 0.1 70.0 70.0 70.0 70.0 70.0 70.0
Vapour valve position(%) 0.1 81.3 81.4 81.2 74.4 88.3 88.7
Temperature in feed density meter (°C) 0.1 50.4 52.4 50.0 52.8 46.8. 48.4
Temperature in concentrate line ( o C) 0.1 58.0 58.6 57.9 62.0 53.8 54.2
Feed density3 (kg m·3) 0.5 1226.6 1223.1 1224.3 1222.8 1223.9 1220.9
Concentrate density3 (kg m'3) 2 1267.5 1253.7 1265.0 1260.9 1265.7 1252.0
Viscometer differential pressure (kPa) 0.5 6.9 7.9 6.5 5.6 7.4 8.4
1Standard deviation level (see page 11). 2Run started at 1710 h on 7 January 1992, subsequent runs at 90 min intervals. 3Uncorrected figures (see Appendix B).

164
Table 134b: Raw Data from Experiment Su3. (Tube length 15, Tube diameter 48, De-aeration nozzle diameter 3.2 mm, No air bleed)
Experimental run number SDV l 8 9 10 11 12
Third feed flow rate (kg h'1) 0.6 1~;o 190.0 110.0 110.0 110.0 150.0
Concentrate flow rate (kg h'1) 2 l.~l,.3 168.5 90.2 89.5 89.6 126.9
Feed temperature ex-PHE ("C) 0.1 ~,f) 74.4 78.4 67.2 72.3 70.5"
Feed temperature at 3m ("C) 0.1 ~,'6 70.5 70.9 60.8 65.8 65.6'
Feed temperature at 0.3m ("C) 0.1 ~-'4 69.7 70.6 61.0 65.2 65.2' . Vapour temperature ("C) 0.1 ~~7 67.4 67.2 57.9 62.4 62.4
Product temperature ("C) 0.1 ~,\ 66.9 67.2 57.6 62.5 62.1 '"
Steam supply temperature ("C) 0.1 ~l 71.7 72.7 64.3 68.5 68.0
Condensate temperature (°C) 0.1 ~,:g 69.5 70.4 62.2 66.4 65.9 .. Top de-aeration line temp (°C) 0.1 Qil'.;z 70.7 71.7 63.4 67.4 67.0 .. Bottom de-aeration line temp ("C) 0.1 ~.:J 71.9 72.9 64.5 68.7 68.2
Ambient temp at 15m tube top ("C) 0.5 ~~·-l 25.0 25.0 25.2 26.1 26.4
Ambient temp at steam entry (°C) 0.5 4%:~ 26.1 26.2 26.4 27.1 28.2
1 Ambient temp at 15 m tube bottom ["C) 0.5 ~:17 26.6 26.6 27.3 27.5 28.1 . Tube-side absolute pressure (kPa) 0.05 l,Ql.'96 25.01 25.00 15.74 19.96 19.96
Differential pressure entry (kPa) 0.03 9<~~4 9.354' 10.812 8.958 9.862' 9.194'
Differential pressure · top (kPa) 0.03 9\.\'94 9.232' 10.694 8.888 9.789' 9.125'
Differential pressure · bottom (kPa) O.o3 8 .. ~ 9.009' 10.471 8.590 9.510' 8.842'
Main steam pressure (kPa gauge) 2 8841.;'5 884.8 881.6 882.6 881.1& 874.2'
Steam header pressure (kPa gauge) 1 1,~ . .3 189.9 190.2 190.1 190.2 190.0
Steam valve position (%) 0.1 7(0~ 70.0 70.0 70.0 70.0 70.0
Vapour valve position(%) 0.1 fS!L~ 74.6 73.9 . 88.0 80.6 81.2
Temperature in feed density meter (•C) 0.1 ~$ 55.1 49.2 44.2 46.5 50.6 .. Temperature in concentrate line (°C) 0.1 51;;:.7 62.7 60.4 53.0 56.8 57.9
Feed density2 (kg m·3) 0.5 12.4:4.4 1217.1 1220.6 1221.6 1220.3 1216.5
Concentrate density2 (kg m·3) 2 lz:tbl;O 1245.5 1277.4 1284.0 1280.0 1256.5
Viscometer differential pressure (kPa) 0.5 6;)t 6.6 4.6 I 6.7 5.3 5.7 II 1Standard deviation level (see page 11). 2Uncorrected figures (see Appendix B).

165
Table I35a: Raw Data from Experiment Su4. (Tube length 15, Tube diameter 48, De-aeration nozzle diameter 3.2 mm, No air bleed)
Experimental run number SDU 12 2 3 4 5 6
Third feed flow rate (kg h"1) 0.6 150.0 190.0 150.0 150.0 150.0 190.0
Concentrate flow rate (kg h"1) 2 131.0& 168.7 131.2' 131.3& 130.6 168.8
Feed temperature ex-PHE (0 C) 0.1 71.2 & 69.2 70.8 76.1 65.8 64.8
Feed temperature at 3m (0 C) 0.1 65.7' 65.4 65.6 70.6' 60.6 60.5'
Feed temperature at 0.3m (0 C) 0.1 65.8' 64.8 65.6 70.0 60.7 60.3
Vapour temperature ( 0 C) 0.1 63.4' 63.2' 63.2' 68.0 58.7' 58.6
Product temperature (0 C) 0.1 63.3 62.9 63.3 68.1 58.4 58.0
Steam supply temperature (0 C) 0.1 70.6 70.0 70.5 74.6 66.4 65.8
Condensate temperature (0 C) 0.1 68.1 67.7 68.2 72.2 64.0 63.4
Top de-aeration line temp (0 C) 0.1 69.6 69.2' 69.6 73.6 65.4 64.8
Bottom de-aeration line temp (0 C) 0.1 70.7 70.1 70.6 74.8 66.5 65.9
Ambient temp at 15 m tube top (0 C) 0.5 33.5& 33.1 32.0 31.1 29.2 27.9
Ambient temp at steam entry (°C) 0.5 32.2 32.1 31.6 30.7 29.0 28.2
Ambient temp at 15 m tube bottom (0 C) 0.5 30.3 30.5 30.4 29.4 28.7 28.29
Tube-side absolute pressure (kPa) 0.05 19.96 19.97 19.97 25.00' 15.74 15.74
Differential pressure - entry (kPa) 0.03 12.621& 11.850' 12.614' 13.9981 11.361 10.656'
Differential pressure - top (kPa) O.D3 12.542& 11.767' 12.536' 13.907' 11.281 10.580'
Differential pressure - bottom (kPa) 0.03 12.273& 11.500' 12.263' 13.637' 10.993 10.287'
Main steam pressure (kPa gauge) 2 879.3& 883.0& 884.6 884.5 885.1 885.5
Steam header pressure (kPa gauge) 1 190.6 191.0 190.7 190.6 190.5 190.6
Steam valve position(%) 0.1 70.0 70.0 70.0 70.0 70.0 70.0
Vapour valve position(%) 0.1 80.6 80.9 80.5 73.6 87.8 88.1
Temperature in feed density meter ( o C) 0.1 52.0 53.7 52.1 54.7 48.5 49.8
Temperature in concentrate line (0 C) 0.1 58.9' 59.2 59.0 62.5 54.6 54.6
Feed density3 (kg m·3) 0.5 1252.2' 1250.2' 1252.1 1251.9' 1252.9 1251.1
Concentrate density3 (kg m·3) 2 1300.3 1287.2 1299.1 1297.4 1303.6 1291.4
Viscometer differential pressure (kPa) 0.5 12.0' 12.6' 11.9 9.9' 14.3 14.7
'Standard deviation level (see page Il). 2Run started at 1435 h on 8 January 1992, subsequent runs at 90 min intervals. 3Uncorrected figures (see Appendix B).
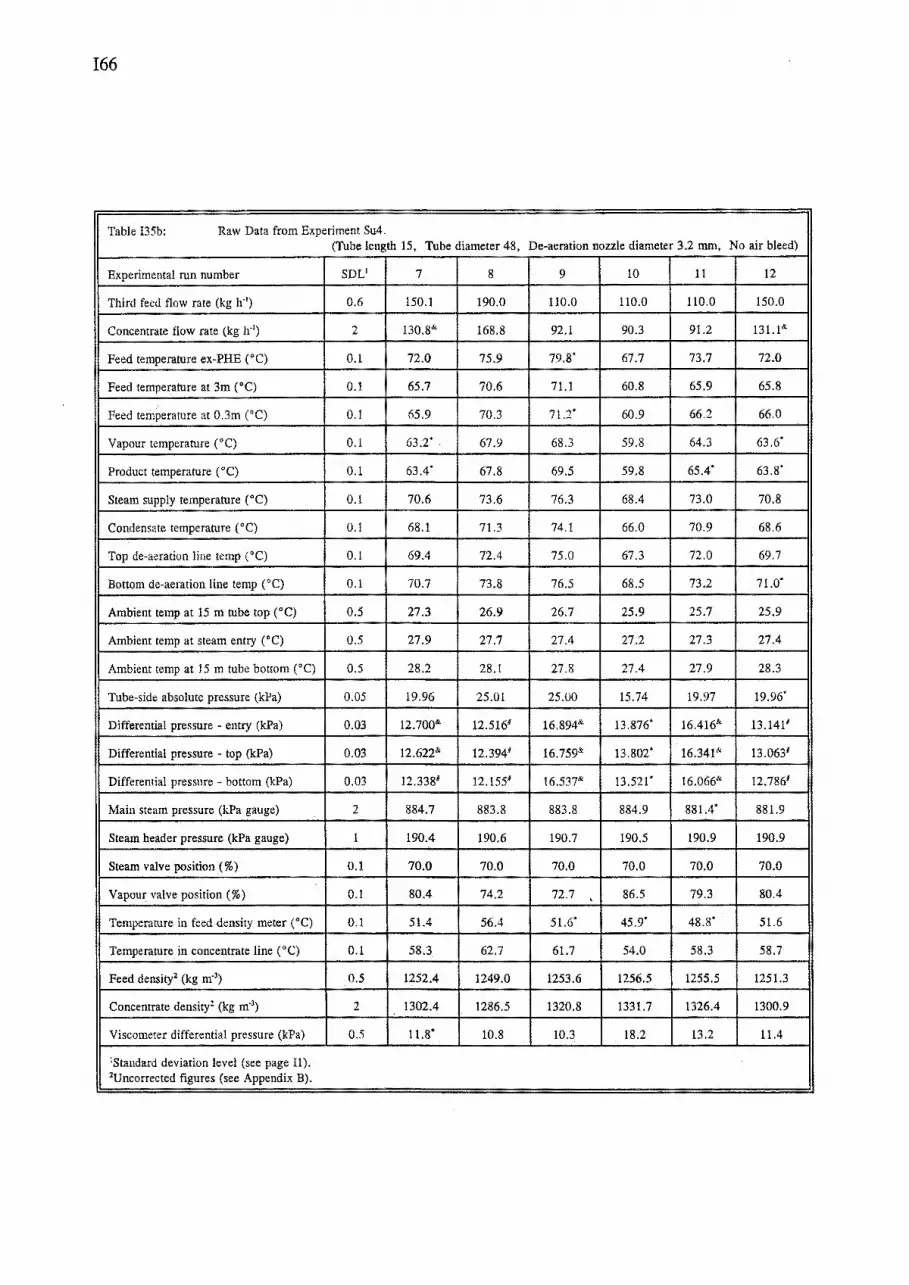
I66
Table I35b: Raw Data from Experiment Su4. (Tube length 15, Tube diameter 48, De-aeration nozzle diameter 3.2 mm, No air bleed)
Experimental run number SDU 7 8 9 10 11 12
Third feed flow rate (kg h'1) 0.6 150.1 190.0 110.0 110.0 110.0 150.0
Concentrate flow rate (kg h'1) 2 130.8& 168.8 92.1 90.3 91.2 131.1&
Feed temperature ex-PHE (°C) 0.1 I 72.0 75.9 1 79.8' 67.7 73.7 72.0
Feed temperature at 3m c•q ili' 70.6 1 71.1 60.8 65.9 65.8
Feed temperature at 0.3m (•C) 5.9 70.3 71.2' 60.9 66.2 66.0
Vapour temperature (°C) 0.1 63.2' . 67.9 68.3 59.8 64.3 63.6'
Product temperature (°C) 0.1 63.4' 67.8 69.5 59.8 65.4' 63.8'
Steam supply temperature (°C) 0.1 70.6 73.6 76.3 68.4 73.0 70.8
Condensate temperature (°C) H~· 71.3 74.1 66.0 70.9 68.6
Top de-aeration line temp (0 C) 69.4 72.4 75.0 67.3 72.0 69.7
Bottom de-aeration line temp ( • C) 0.1 ! 70.7 73.8 76.5 68.5 73.2 71.0'
Ambient temp at 15m tube top c•q 0.5 27.3 26.9 26.7 25.9 25.7 25.9
Ambient temp at steam entry (°C) 0.5 27.9 27.7 27.4 27.2 27.3 27.4
Ambient temp at 15m tube bottom (0 C) 0.5 28.2 28.1 27.8 27.4 27.9 28.3
Tube-side absolute pressure (kPa) 0.05 19.96 25.01 25.00 15.74 19.97 19.96'
Differential pressure - entry (kPa) ~700' 12.5161 16.894& 13.876' 16.416& 13.1411
Differential pressure top (kPa) .622& 12.3941 16.759& 13.802' 13.0631
Differential pressure - bottom (kPa) 0.03 12.338' 12.1551 16.537& 13.521' 16.066"' 12.7861
Main steam pressure (kPa gauge) 2 884.7 883.8 883.8 884.9 881.4' 881.9
Steam header pressure (kPa gauge) 1 190.4 190.6 190.7 190.5 190.9 190.9
Steam valve position(%) 0.1 70.0 70.0 70.0 70.0 70.0 70.0
Vapour valve position(%) 0.1 80.4 74.2 72.7 . 86.5 79.3 80.4
Temperature in feed density meter (°C) 0.1 51.4 56.4 51.6' 45.9' 1 48.s' 51.6
Temperature in concentrate line (•C) 0.1 58.3 62.7 61.7 54.0 I 58.3 58.7
Feed density2 (kg m·3) 0.5 1252.4 12~ 1253.6 1256.5 1255.5 1251.3
Concentrate density2 (kg m·3) 2 1302.4 1286.5 1320.8 1331.7 1326.4 1300.9
Viscometer differential pressure (kPa) 0.5 11.8* 10.8 10.3 18.2 13.2 11.4
1Standard deviation level (see page I1 ). 2Uncorrected figures (see Appendix B).

167
Table 136a: Raw Data from Experiment SuS. (Tube length 15, Tube diameter 48, De-aeration nozzle diameter 3.2 mm, No air bleed)
Experimental run number SDV IN·3 2A 1B 2B 3 4 5
Third feed flow rate (kg h'1) I
0.6 150.0 190.0 150.0 190.0 150.0 150.0 150.0
Concentrate flow rate (kg h'1) 2 128.1 167.5 128.1 167.7 128.2 128.9 127.2
Feed temperature ex-PHE (°C) 0.1 68.6' 68.1 68.5 67.8 68.6 74.2 63.5
Feed temperature at 3m ("C) 0.1 65.4 65.4 65.4 65.3 65.4 70.4 60.4
Feed temperature at 0.3m ("C) 0.1 64.4 64.5 64.4 64.4 64.4 69.4 59.6
Vapour temperature (0 C) 0.1 62.3 62.6' 62.1' 62.3"' 62.1 66.9 57.3
Product temperature (0 C) 0.1 61.2 61.1 61.1 I 61.1 61.1 66.0 56.2
Steam supply temperature (•C) 0.1 65.5 64.9 66.2 65.5 65.9 70.2 61.6
Condensate temperature ("C) 0.1 63.6 63.0 64.1 63.4 63.9 68.0 59.5
Top de-aeration line temp (•C) I o.1 64.8 64.2 65.5' 64.9' 65.3 69.4 61.0
Bottom de-aeration line temp ("C) 0.1 65.6 65.0 66.2 65.7 66.1 70.4 61.7
Ambient temp at 15 m tube top (•C) 0.5 33.1' 31.3 36.4 34.2 32.3 31.1 29.4
Ambient temp at steam entry (0 C) 0.5 30.6 30.6 32.4 3t.6 1 31.0 30.9~ Ambient temp at 15 m tube bottom (°C)
I 0.5 29.9 29.6 32.2 31.2 30.3 29.6 29.1
Tube-side absolute pressure (kPa) 0.05 19.97 19.96 19.96 19.96 19.97 25.00 15.75
Differential pressure - entry (kPa) 0.03 6.099' 5.3816 6.792 6.140 6.641 7.169 5.992
Differential pressure - top (kPa) O.Q3 6.006' 5.2856 6.704 6.041 6.540 7.037 5.903
Differential pressure - bottom (kPa) 0.03 5.728' 5.0011 6.422 5.76o 1 6.261 6.808 ~~.594 Main steam pressure (kPa gauge) 2 882.0' 883.8 875.6& 884.7 887.2 886.7 887.9
Steam header pressure (kPa gauge) 1 191.3 191.3 191.7 191.3 191.0 191.8 191.5
Steam valve position (%) 0.1 70.0 70.0 70.0 70.0 70.0 70.0 70.0
Vapour valve position (%) 0.1 81.9 82.5 81.8 82.3 81.8 75.4 89.2 . Temperature in feed density meter ("C) 0.1 51.6' 53.4' 51.2' 52.9 51.3 54.3 47.7
Temperature in concentrate line (°C) 0.1 58.7 59.4 58.8 59.4 59.0 63.1 54.2
Feed density4 (kg m'3) 0.5 1169.0' 1167.2' 1165.3 1164.4 1164.8 ll64.0 1165.7
Concentrate density4 (kg m·3) 2 1201.5 1192.4 1195.9 1187.8 1195.2 1192.4 1198.3
Viscometer differential pressure (kPa) 0.5
1Standard deviation level (see page Il). 2The Ultra-Turrix was not used for Runs lA and 2A. 3Run started at 1631 h on 6 January 1992, subsequent runs at 90 min intervals. •uncorrected figures (see Appendix B).
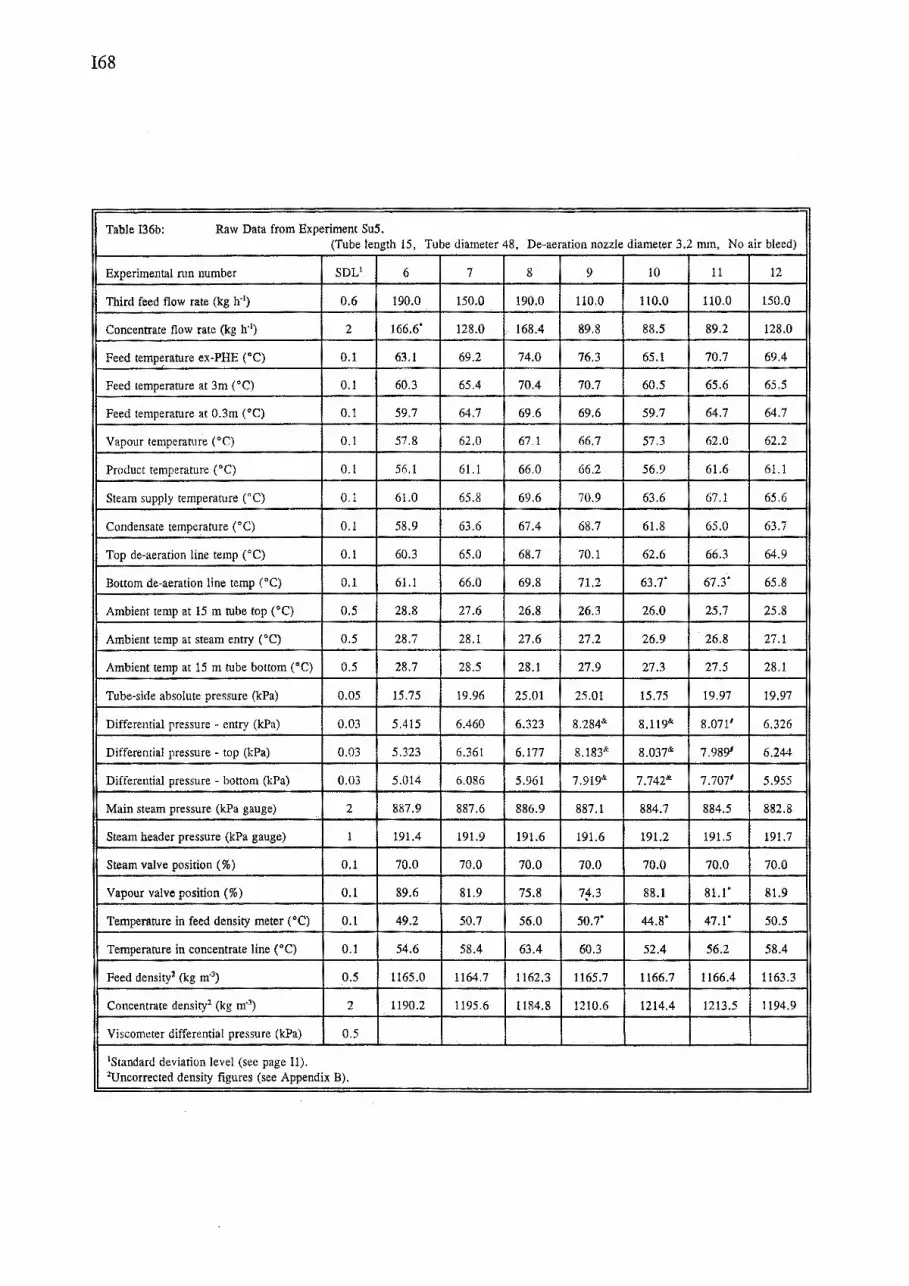
168
Table I36b: Raw Data from Experiment Su5. (Tube length 15, Tube diameter 48, De-aeration nozzle diameter 3.2 mm, No air bleed}
I Experimental run number SDV 6 7 8 9 10 11 12
Third feed flow rate (kg h'1} 0.6 190.0 150.0 190.0 110.0 110.0 110.0 150.0
Concentrate flow rate (kg h'1) 2 166.6' 128.0 168.4 89.8 88.5 89.2 128.0
Feed temperature ex-PHE (°C) 0.1 63.1 69.2 74.0 76.3 65.1 70.7 69.4
Feed temperature at 3m (°C) 0.1 60.3 65.4 70.4 70.7 60.5 65.6 65.5
Feed temperature at 0.3m c•c) 0.1 59.7 64.7 69.6 1 69.6 ---r-;.7 1 64.7 64.7
Vapour temperature ( 0 C) 0.1 57.8 62.0 67.1 66.7 57.3 62.0 62.2
Product temperature (•C) 0.1 56.1 61.1 66.0 66.2 56.9 61.6 I 61.1
Steam supply temperature (°C) 0.1 61.0 65.8 69.6 70.9 63.6 67.1 65.6
Condensate temperature c•c) 0.1 58.9 63.6 67.4 68.7 61.8 1 65.o 63.7
Top de-aeration line temp (°C) 0.1 60.3 65.0 68.7 70.1 62.6 66.3 64.9
Bottom de-aeration line temp (°C) 0.1 61.1 66.0 69.8 71.2 63.7' 67.3' 65.8
Ambient temp at 15 m tube top (°C} 0.5 28.8 27.6 26.8 26.3 26.0 25.7 25.8
Ambient temp at steam entry (°C) 0.5 28.7 28.1 27.6 27.2 26.9 26.8 27.1
Ambient temp at 15m tube bottom (°C) 0.5 28.7 28.5 28.1 27.9 27.3 27.5 28.1
Tube-side absolute pressure (kPa) 0.05 15.75 19.96 25.01 25.01 15.75 19.97 19.97
Differential pressure - entry (kPa) 0.03 5.415 6.460 1 6.323 8.284& 8.ll9& 8.0711 6.326
Differential pressure - top (kPa) 0.03 5.323 6.361 6.177 8.183& 8.037& 7.989' 6.244
Differential pressure - bottom (kPa) 0.03 5.014 6.086 5.961 7.919& 7.742& 7.7071 5.955
Main steam pressure (kPa gauge) 2 887.9 887.6 886.9 887.1 884.7 884.5 882.8
Steam header pressure (kPa gauge) 1 191.4 191.9 191.6 191.6 191.2 191.5 191.7
I Steam valve position (%) 0.1 70.0 70.0 70.0 70.0 70.0 70.0 70.0
Vapour valve position(%) 0.1 89.6 81.9 75.8 7~.3 88.1 81.1' 81.9
Temperature in feed density meter ("C) 0.1 I 49.2 50.7 56.0 50.7. I 44.8' 47.1* 50.5
Temperature in concentrate line ( • C) 0.1 54.6 58.4 63.4 60.3 52.4 56.2 58.4
Feed density1 (kg m·1) 0.5 1165.0 1164.7 1162.3 1165.7 1166.7 1166.4 1163.3
Concentrate density2 (kg m·3) 2 1190.2 1195.6 1184.8 1210.6 1214.4 1213.5 1194.9
Viscometer differential pressure (kPa) 0.5
1Standard deviation level (see page 11). 2Uncorrecred density figures (see Appendix B).

169
Table I37a: Raw Data from Experiment Su6. (Tube length 10, Tube diameter 23, De-aeration nozzle diameter 2.95 mm, No air bleed)
Experimental run number SDU 12 2 3 4 5 6
Feed flow rate (kg h'1) 0.6 50.4 51.1 50.2 50.2' 50.4 49.6
Fifth feed flow rate (kg h·') 0.6 52.9 53.9 53.0 53.0 53.0 52.0
Concentrate flow rate (kg h'1) 2 46.4 46.7 49.7 46.2 43.1 42.6
Feed temperature at 0.3m (0 C) 0.1 75.0' 84.8 74.9' 75.0' 75.0' 64.9'
Vapour temperature 23 mm tube (0 C) 0.1 62.4 63.2 62.0 62.5 63.4 62.6
Vapour temperature 40 mm tube (0 C) 0.1 60.1 60.1 60.1 60.2 60.2 60.2
Vapour temperature 48 mm tube ( 0 C) 0.1 59.1 58.9 58.6 58.3' 58.0' 57.7
Product temperature (0 C) 0.1 60.8 60.8 60.6 60.8 61.0 61.0
Steam supply temperature (0 C) 0.1 65.2 65.2 62.5 65.2 67.7 67.7
Condensate temperature (0 C) 0.1
Top de-aeration line temp (0 C) 0.1
Bottom de-aeration line temp (0 C) 0.1
Ambient temp at 15 m tube top ( 0 C) 0.5 26.8 26.1 25.2 24.5 23.9 23.4
Ambient temp at steam entry (0 C) 0.5 28.5 28.2 27.5 26.9 26.6 26.1
Ambient temp at 15 m tube bottom (0 C) 0.5 27.3 26.9 26.2 25.2 24.5 24.1
Tube-side absolute pressure (kPa) 0.05 20.00' 20.00' 20.01' 20.00' 20.00 20.01
Tube-side absolute pressure (AP3) (kPa) 0.05 19.3' 19.2' 19.3' 19.3' 19.3 19.3
Differential pressure (kPa) 0.03 5.993' 5.998 3.006 5.993' 8.995 9.ooo·
Main steam pressure (kPa gauge) 2 902.8 901.8 902.9 902.6 902.2' 903.2
Steam header pressure (kPa gauge) I 193.9' 195.1' 193.4' 194.3' 194.0' 194.5'
Steam valve position(%) 0.5 61.6 61.0 53.9 61.3 67.8 68.6
Vapour valve position(%) 0.5 24.2 25.8 15.3' 24.5 33.8 32.2
Temperature in feed density meter (0 C) 0.1 46.5' 45.4 45.6 45.1 43.7' 42.6
Temperature in concentrate line (0 C) 0.1 55.8 55.8 56.0 55.8 55.6 55.5
Feed density3 (kg m·3) 0.5 1171.6 1171.7 1172.4 1172.3 1172.3 1173.1
Concentrate density3 (kg m·3) 2 1194.9 1195.8 1178.7 1194.1 1213.4 1213.0
Viscometer differential pressure (kPa) 0.5 0.4 0.4 0.3 0.4 0.5 0.5
'Standard deviation level (see page II). 2Run started at 1850 h on 28 February 1992, subsequent runs at 45 min intervals. 3Uncorrected figures (see Appendix B).

I70
Table 137b: Raw Data from Experiment Su6. (Tube length 10, Tube diameter 23, De·aeration orifice diameter 2.95 mm, No air bleed)
Experimental run number SDV 7 8 9 10 11 12
Feed flow rate (kg h'1) 0.6 51.4 49.6' 50.0 49.1 51.4 50.2
Fifth feed flow rate (kg h'1) o.6 1 53.9 52.1 53.0 52.1 54.0 52.9
Concentrate flow rate (kg h'1) 2 50.3 45.7 1 46.7 49.4 44.5 46.7
Feed temperature at 0.3m (0 C) 0.1 83.8 64.9' 75.0"' 64,9' 83.4 75.0'
Vapour temperature 23 mm tube (°C) 0.1 62.8 62.0 62.5' 61.3' 63.6 62.6
Vapour temperature 40 mm tube (0 C) 0.1 60.2' 60.2 60.2' 60.2' 60.3 60.3
Vapour temperature 48 mm tube (°C) 0.1 57.4' 57.1' 56.7& 56.31 56.3' 55.9'
Product temperature c•c) 0.1 60.7' 60.9 60.9 60.7' 61.0 60.9
Steam supply temperature c·c) 0.1 62.5' 65.2 65.2 62.5' 67.6 65.2
Condensate temperature ("C) 0.1
Top de·aeration line temp ( 0 C) 0.1
Bottom de·aeration line temp (°C) 0.1
Ambient temp at 15 m tube top c•c) 0.5 22.9 22.4 22.0 21.6 21.4 21.1
Ambient temp at steam entry (°C) 0.5 25.8 25.5 25.0 24.6 24.4 24.1
Ambient temp at 15 m tube bottom (°C) 0.5 23.6 23.4 22.9 22.5 22.2 21.9
Tube·side absolute pressure (kPa) 0.05 20.00' 20.00 19.99' 19.98& 19.99 20.00
Tube-side absolute pressure (AP3) (kPa) 0.05 19.3' 19.2' 19.2 & 19.3 19.3
Differential pressure (kPa) 0.03 3.002& 5.998' 5.994' 2.998 9.000' 5.995
Main steam pressure (kPa gauge) 2 Go1.5' 902.4 901.2' 903.1 900.9 900.7'
Steam header pressure (kPa gauge) 1 193.9' 194.0' 195.1' 195.4' 194.3' 195.5'
Steam valve position (%) 0.5 53.7' 62.7 61.4 54.9. 66.5 61.5
Vapour valve position(%) 0.5 16.4' 24.5 23.7' 14.0"' 33.0 23.9
Temperature in feed density meter c•c) 0.1 44.6 44.1 44.1 44.6 43.8 43.4
Temperature in concentrate line CC) 0.1 55.9 55.7 55.7 55.7 55.5 55.7
Feed density1 (kg m·3) 0.5 1172.7 1172.9 1172.7 1173,3 1 t172.3 1173.1
Concentrate density2 (kg m·3) 2 F'o' 1194.8 1193.7 1177.3 1209.4 1193.9
Viscometer differential pressure (kPa) 0.5 0.4 0.3 0.3 0.3 0.5 0.3
1Standard deviation level (see page 11). 2Uncorrected density figures (see Appendix B).

171
Table 138a: Raw Data from Experiment Su7. (Tube length 10, Tube diameter 40, De-aeration orifice diameter 2.95 mm, No air bleed)
Experimental run number SDU 12 2 3 4 5 6
Feed flow rate (kg h"1) 0.6 91.1' 91.9 90.4 90.9 91.2 89.3
Fifth feed flow rate (kg h"1) 0.6 93.1 94.9 93.2 93.2 93.2 91.6
Concentrate flow rate (kg h"1) 2 81.2 82.2 87.2 81.1 75.6 72.6
Feed temperature at 0.3m (°C) 0.1 75.0 85.0 75.0 75.0 75.0 65.0
Vapour temperature 23 mm tube (0 C) 0.1 45.3' 47.1* 46.8& 48.4& 49.1& 48.6'
Vapour temperature 40 mm tube (°C) 0.1 61.7 62.2 61.5' 61.7 61.9' 62.0
Vapour temperature 48 mm tube (0 C) 0.1 49.91 49.1& 48.0' 49.7& 49.7' 49.3
Product temperature CO C) 0.1 61.0 61.0 60.7' 61.0 61.2' 61.3
Steam supply temperature (0 C} 0.1 65.4 65.4 62.6 65.4 67.8 67.9
Condensate temperature ( o C) 0.1
Top de-aeration line temp ( o C) 0.1
Bottom de-aeration line temp (°C) 0.1
Ambient temp at 15m tube top (0 C} 0.5 24.2 25.4 26.0 26.2 26.5 26.7
Ambient temp at steam entry (0 C} 0.5 24.9 26.5 26.0 26.4 26.7 27.0
Ambient temp at 15 m tube bottom (0 C) 0.5 21.8 22.5 22.9 23.3 23.5 23.7
Tube-side absolute pressure (kPa) 0.05 20.00' 20.01' 19.99' 20.02 20.00' 20.01'
Tube-side absolute pressure (AP3) (kPa) 0.05 19.25' 19.24' 19.21& 19.24 19.23& 19.25'
Differential pressure (kPa) 0.03 5.999 6.000' 2.998' 6.000 9.004' 9.003'
Main steam pressure (kPa gauge) 2 902.7' 901.5 903.3 902.3 902.0' 903.3'
Steam header pressure (kPa gauge) 1 195.1' 195.3' 195.2' 195.1' 194.4' 194.4'
Steam valve position(%) 0.5 69.7 68.2 58.3 69.6 77.6 80.0
Vapour valve position(%) 0.5 40.2 42.4 23.2' 41.3 55.5 57.4
Temperature in feed density meter (0 C} 0.1 46.6 46.9 48.5 47.6' 45.7 44.5
Temperature in concentrate line (0 C) 0.1 56.4 56.6 57.1 56.7 56.5 56.5
Feed density3 (kg m·3) 0.5 1170.4 1169.9 1169.9 1169.6 1169.6 1170.1
Concentrate density3 (kg m·3) 2 1193.1 1193.7 1175.3 1192.3 1212.8 1218.9
Viscometer differential pressure (kPa) 0.5 1.2 1.3 1.2 1.2 1.3 1.4
'Standard deviation level (see page 11). 2Run started at 0954 h on 29 February 1992, subsequent runs at 45 min intervals. 3Uncorrected figures (see Appendix B).
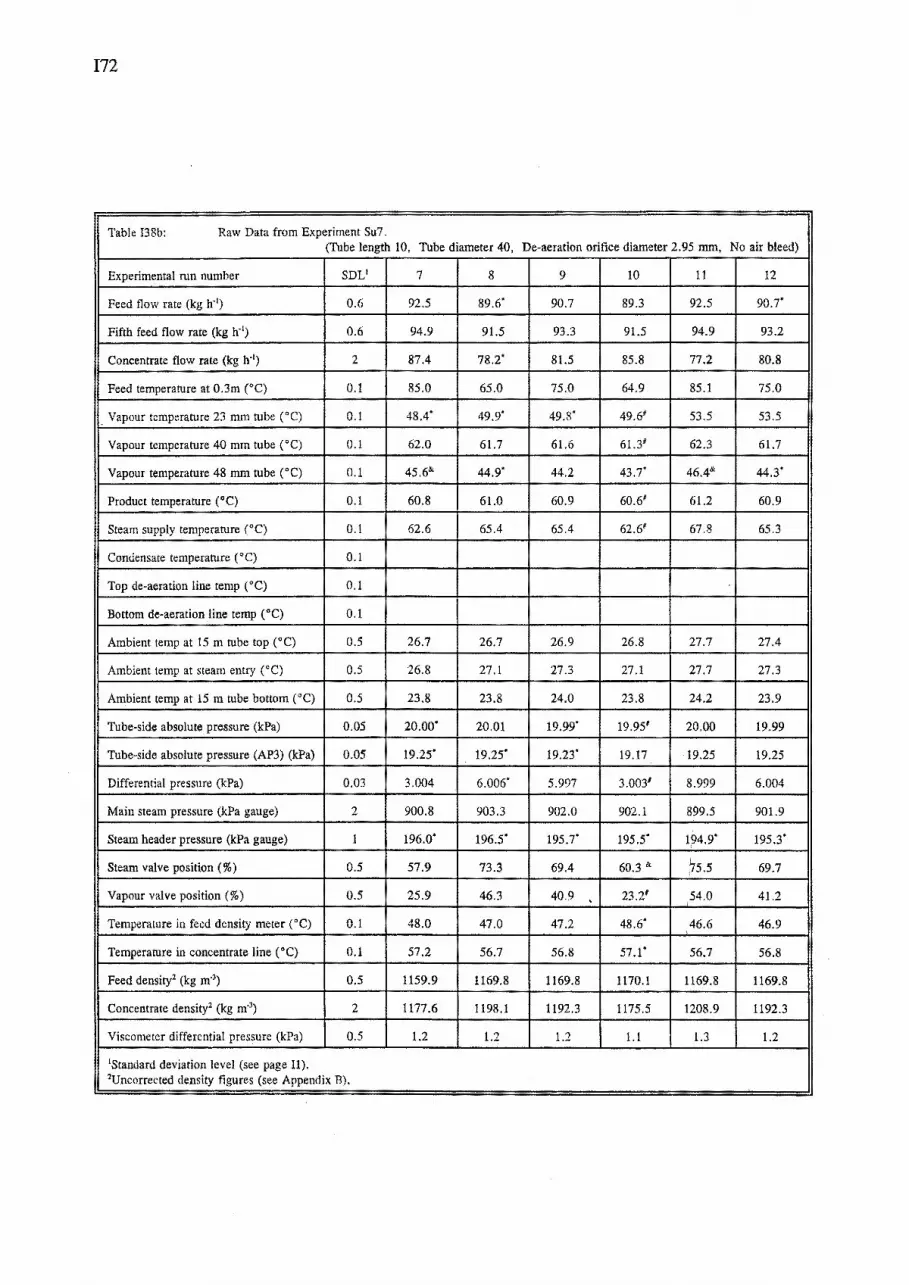
I72
Table I38b: Raw Data from Experiment Su7. (Tube length 10, Tube diameter 40, De-aeration orifice diameter 2.95 mm, No air bleed)
Experimental run number SDU 7 8 9 10 11 12
Feed flow rate (kg h'1) 0.6 92.5 89.6' 90.7 89.3 92.5 90.7'
Fifth feed flow rate (kg h'1) 0.6 94.9 91.5 93.3 91.5 94.9 93.2
Concentrate flow rate (kg h'1) 2 87.4 78.2' 81.5 85.8
~··· Feed temperature at 0.3m (°C) 0.1 85.0 65.0 75.0 64.9 75.0
. Vapour temperature 23 mm tube (°C) 0.1 48.4' 49.9' 49.8' 49.61 53.5
Vapour temperature 40 mm tube ("C) 0.1 62.0 61.7 61.6 61.31 62.3 61.7
Vapour temperature 48 mm tube (°C) 0.1 45.6"' 44.9' 44.2 43.7' 46.4"' 44.3'
Product temperature (°C) 0.1 60.8 61.0 60.9 60.61 61.2 60.9
Steam supply temperature (°C) 62.6 65.4 65.4 62.e 67.8 1 65.3
Condensate temperature (0 C) 0.1
Top de-aeration line temp (0 C) 0.1
Bottom de-aeration line temp (0 C) 0.1
Ambient temp at 15 m tube top (°C) 0.5 26.7 26.7 26.9 26.8 27.7 1 27.4
Ambient temp at steam entry (°C) 0.5 26.8 27.1 27.3 27.1 27.7 27.3
Ambient temp at 15 m tube bottom (0 C) 0.5 23.8 23.8 24.0 23.8 24.2 23.9
Tube-side absolute pressure (kPa) 0.05 20.00' 20.01 1 19.99' 19.951 20.00 19.99
TUb~<ldo ''""'"" P"""re (AP3) (kPo) ~19.25' 19.25' 19.23' 19.17 19.25 19.25
Differential pressure (kPa) 3 3.004 6.006' 5.997 3.0031 8.999 6.004
Main steam pressure (kPa gauge) 2 900.8 903.3 902.0 902.1 899.5 901.9
Steam header pressure (kPa gauge) 1 196.0' 196.5' 195.7' 195.5' 194.9' 195.3'
Steam valve position(%) 57.9 73.3 69.4 60.3 & 75.5 69.7
Vapour valve position(%) 25.9 40.9 . 23.21 54.0 41.2
Temperature in feed density meter (°C) 0.1 48.0 I
47.2 48.6' 46.6 46.9
Temperature in concentrate line (°C) 0.1 57.2 56.7 56.8 57.1* r,;; 56.8
Feed density2 (kg m·3) 0.5 1159.9 1169.8 1169.8 1170.1 1169.8 1169.8
Concentrate density2 (kg m·3) 2 1177.6 1198.1 1192.3 1175.5 1208.9 1192.3
Viscometer differential pressure (kPa) 0.5 1.2 1.2 1.2 1.1 1.3 1.2
1Standard deviation level (see page Il). 2Uncorrected density figures (see Appendix B).

I73
Table I39a: Raw Data from Experiment Su8. (Tube length 10, Tube diameter 48, De-aeration orifice diameter 2.95 mm, No air bleed)
Experimental run number SDL1 12 2 3 4 5 6
Feed flow rate (kg h'1) 0.6 111.0' 112.5 110.7* 110.4" 110.5' 109.2
Fifth feed flow rate (kg h'1) 0.6 112.9 115.2 113.0 113.0 113.0 111.0
Concentrate flow rate (kg h'1) 2 97.4 98.8 104.1 97.8 89.9 85.2
Feed temperature at 0.3m (°C) 0.1 75.0 85.0& 75.0 75.0 75.0 65.0
Vapour temperature 23 mm tube (°C) 0.1 56.0 56.1 56.0* 56.2 56.1' 56.1*
Vapour temperature 40 mm tube (°C) 0.1 47.0' 47.21 47.11 47.11 48.11 48.1&
Vapour temperature 48 mm tube (°C) 0.1 61.3 62.1 61.3 61.4 61.5 61.5
Product temperature (°C) 0.1 60.9 60.9 60.8 60.9 61.2 61.4
Steam supply temperature (0 C} 0.1 65.4 65.4 62.6 65.4 68.0 69.6
Condensate temperature ( o C) 0.1
Top de-aeration line temp (0 C) 0.1
Bonom de-aeration line temp (0 C) 0.1
Ambient temp at 15 m tube top ("C) 0.5 22.6 22.4 22.0 21.8 21.5 21.4
Ambient temp at steam entry (0 C) 0.5 24.8 24.6 24.3 23.9 23.8 23.6
Ambient temp at 15 m tube bottom (°C) 0.5 22.3 22.1 21.8 21.6 21.3 21.1
Tube-side absolute pressure (kPa) 0.05 20.01* 20.01 20.01* 20.00 20.01 20.01
Tube-side absolute pressure (AP3) (kPa) 0.05 19.24 19.23 19.24' 19.25 19.25 19.25'
Differential pressure (kPa) 0.03 6.000 6.003 3.000 6.000 8.990' 9.000
Main steam pressure (kPa gauge) 2 900.8 899.4 900.8 900.1 899.2 899.3
Steam header pressure (kPa gauge) 1 195.2' 195.8' 195.7* 194.7* 194.2" 194.0'
Steam valve position(%) 0.5 73.9 72.1 61.0 74.1 81.7 85.6
Vapour valve position(%) 0.5 49.8 51.0 27.9 50.8 61.6 64.3
Temperature in feed density meter (°C) 0.1 47.3 47.5 49.2* 47.7' 45.4* 43.7
Temperature in concentrate line (°C) 0.1 57.1 57.2 57.8 57.1 56.7 46.5
Feed density3 (kg m·3) 0.5 1168.4 1168.1 1168.4 1168.2 1168.7 1169.2
Concentrate density3 (kg m·3) 2 1191.9 1191.8 1173.2 1192.0 1212.8 1225.1
Viscometer differential pressure (kPa) 0.5 1.7 1.8 1.7 1.7 1.8 1.9
'Standard deviation level (see page 11). 2Run staned at 2255 h on 29 February 1992, subsequent runs at 45 min intervals. 3Uncorrected figures (see Appendix B).

I74
Table I39b: Raw Data from Experiment Su8. (Tube length 10, Tube diameter 48, De-aeration orifice diameter 2.95 mm, No air bleed)
Experimental run number SDV 7 8 9 10 11 12
Feed flow rate (kg h'1) 0.6 112.6 108.9' 110.4 108.8 112.0 110.1
Fifth feed flow rate (kg h'1) 0.6 115.2 110.9 113.0 111.0 115.1 113.0
Concentrate flow rate (kg h'1) 2 105.9' 92.2 97.2 102.4 91.9' 97.8
Feed temperature at 0.3m (°C) 0.1 85.0 66.0 75.0 65.0 85.0 75.0
Vapour temperature 23 mm tube c•c) 0.1 56.1' 56.9' 56.8 56.8"' 58.2* 58.2
r temperature 40 mm tube (0 C) 0.1 47.31 47.8' 41.01 49.41 47.71
Vapour temperature 48 mm tube (°C) 0.1 62.1 61.2 61.5 60.9' 62.3 61.4
Product temperature {0 C) 0.1 60.8 61.1 61.0 60.8' 61.2 61.0
Steam supply temperature c•c) 0.1 62.6 65.4 65.4 62.6 67.8 65.3
Condensate temperature (°C) 0.1
Top de-aeration line temp c•q 0.1
Bottom de-aeration line temp ( • C) 0.1
Ambient temp at 15 m tube top {0 C) 0.5 20.8 20.6 20.5 20.1 20.2 20.0
Ambient temp at steam entry (°C) 0.5 23.2 23.0 22.8 22.5 22.5 22.3
Ambient temp at 15m tube bottom (•C) 0.5 20.9 20.5 20.5 20.0 20.0 20.0
Tube-side absolute pressure (kPa) 0.05 20.00' 20.01* 20.00 19.99"' 20.00' 20.00'
Tube-side absolute pressure (AP3) (kPa) 0.05 19.24' 19.25' 19.24' 19.21& 19.25' 19.24
Differential pressure {kPa) 0.03 3.004 6.003' 6.003 3.009' 8.997' 5.996
Main steam pressure (kPa gauge) 2 899.5 900.6 900.4 901.0 899.0 900.4'
Steam header pressure (kPa gauge) 1 196.4' 195.6' 195.5" 195.3' 194.2* 195.1"
Steam valve position{%) 0.5 60.2 78.5 74.0 64.8 80.3 74.3
Vapour valve position (%) 0.5 30.7' 56.0 48.9 29.9"' 61.4 48.9
Temperature in feed density meter ("C) 0.1 48.2' 46.4' 46.7 1 48.3' 45.7' 46.3
Temperature in concentrate line (°C) 0.1 57.6 56.7 56.9 57.3' 56.5 56.8
Feed density2 (kg m'3) 0.5 1168.7 1169.1 1169.1 1169.4 1168.7 1169.5
Concentrate density2 (kg m·3) 2 1176.2 1201.3 1193.0 1177.0 1212.2 1193.4
Viscometer differential pressure (kPa) 0.5 1.8 1.7 1.7 1.6 1.9 1.7
1Standard deviation level (see page 11). 2Uncorrected density figures (see Appendix B).

175
Table I40a: Raw Data from Experiment Su9. (Tube length 10, Tube diameter 40, De-aeration orifice diameter 2.95 mm, No air bleed)
Experimental run number SDU 12 2 3 4 5 6
Feed flow rate (kg h'1) 0.6 91.3' 92.3 90.7 91.2' 91.1 89.6
Fifth feed flow rate (kg h'1) 0.6 93.2 95.0 93.2 93.3 93.2 91.5
Concentrate flow rate (kg h'1) 2 84.1 85.4 89.4 84.3 80.3 78.0
Feed temperature at 0.3m (•C) 0.1 75.0' 85.0 75.0& 75.0& 75.0' I
64.9
Vapour temperature 23 mm tube c•c) 0.1 44.7 44.8 45.11 52.6' 52.6' 52.8
Vapour temperature 40 mm tube (•C) 0.1 62.0 62.5 62.1& 62.0 62.2 62.0
Vapour temperature 48 mm tube c•c) 0.1 47.2' 48.9"' 48.91 56.5& 56.7&: 56.6'
Product temperature c•q 0.1 61.5 61.5 61.2& 61.4 62.0 62.0
Steam supply temperature ( 0 C) 0.1 65.4 65.4 62.8& 65.4 67.9 67.9
Condensate temperature ("C) 0.1
Top de-aeration line temp c•c) 0.1
Bottom de-aeration line temp ( • C) 0.1
Ambient temp at 15 m tube top (°C) 0.5 30.2 30.6 31.0 31.0 30.4 29.2
Ambient temp at steam entry ( 0 C) 0.5 28.7 28.6 28.9 28.8 28.6 27.9
Ambient temp at 15m tube bottom (°C) 0.5 24.6 24.7 24.8 24.8 24.5 24.0
Tube-side absolute pressure (kPa) 0.05 20.Q2' 20.00' 20.111 19.99" 20.01' 20.02
Tube-side absolute pressure (AP3) (kPa) 0.05 19.23' 19.21 19.301 19.20' 19.22' 19.23
Differential pressure (kPa) 0.03 6.004 6.002' 3.012' 6.002' 8.998' 9.003
! Main steam pressure (kPa gauge) 2 902.9' 902.9 903.3 902.3 900.6 !
902.2
Steam header pressure (kPa gauge) 1 194.6"' 194.8' 193.2' 194.6' 193.3 192.7'
Steam valve position(%) 0.5 65.0 64.4 54.6' 65.1 72.4 75.0
Vapour valve position (%) 0.5 32.0' 33.9 28.31 32.0 44.4 47.1
Temperature in feed density meter (°C) 0.1 49.7 49.8 50.9 50.0 48.7' 47.7
Temperature in concentrate line ( • C) 0.1 56.8 57.0 57.2 57.0 57.0 56.9
Feed density3 (kg m·3) 0.5 1209.2 1209.2 1210.5' 1209.6 1209.8 1210.5
Concentrate density3 (kg m.J) 2 1229.5 1231.9 1214.9 1229.9 1245.4 1249.9
Viscometer differential pressure (kPa) 0.5 2.0 2.1 1.9 2.0 2.4 2.5
1Standard deviation level (see page Il). 2Run started at 1542 h on 1 March 1992, subsequent runs at 45 min intervals. 3Uncorrected figures (see Appendix B).

I76
Table I40b: Raw Data from Experiment Su9. (Tube length 10, Tube diameter 40, De-aeration orifice diameter 2.95 mm, No air bleed)
Experimental run number SDV 7 8 9 10 11 12
Feed flow rate (kg h'1) 0.6 92.2 89.5 91.1 89.6 92.0 90.6
Fifth feed flow rate (kg h'1) 0.6 95.0 91.6 93.2 91.5 94.9 93.3
Concentrate flow rate (kg h'1) 2 89.5 82.3 84.4 89.1' 82.5 84.7'
Feed temperature at 0.3m (•C) 0.1 85.0 64.9 75.0' 65.0 1 85.2' 75.0'
Vapour temperarure 23 mm tube ( 0 C) 0.1 52.7' 53.1' 53.2' 53.71 54.4"' 54.4'
Vapour temperature 40 mm tube (•C) 0.1 62.5 61.9 62.1 61.9' 62.7' 62.1
Vapour temperature 48 mm tube ( 0 C) 0.1 56.1"' 55.9' 55.4"' 55.0' 55Y· 54.4"'
Product temperature (0 C) 0.1 61.2' 61.6 61.5 61.2' 62.2' 61.6
Steam supply temperature (°C) 0.1 62.6' 65.3 65.3 62.61 67.7 65.3
Condensate temperature (0 C) 0.1
Top de-aeration line temp (°C) 0.1
Bottom de·aeration line temp (•C) 0.1
Ambient temp at 15 m tube top (°C) 0.5 27.7 26.3 25.2 24.3 23.6 23.1
Ambient temp at steam entry ( 0 C) 0.5 27.2 I
26.5 25.9 25.5 25.3 24.9
Ambient temp at 15 m tube bottom (0 C) 0.5 23.8 23.2 22.9 22.5 22.4 22.1
Tube-side absolute pressure (kPa) 0.05 20.00' 20.01' 20.00' 20.11' 20.02' 20.01'
Tube-side absolute pressure (AP3) (kPa) 0.05 19.22"" 19.22' 19.23' 19.326 19.25"" 19.24'
Differential pressure (kPa) 0,03 3.008' 5.993' 5.999' 2.9541 8.980"" 5.995'
Main steam pressure (kPa gauge) 2 901.4 901.1 901.2' 901.5 899.6 900.6
Steam header pressure (kPa gauge) 1 193.2' 192.8' 193.4 192.3' 192.4 192.2
Steam valve position (%) 0.5 54.9' 68.0 65.2 56.61 70.3' 65.4
Vapour valve position(%) 0.5 21.2 33.6 30.5 . 15.71 43.3"' 31.1'
Temperature in feed density meter (0 C) 0.1 50.2"" 49.4 49.4 50.5 48.81 48.8
Temperature in concentrate line ( 0 C) 0.1 56.9 56.8 56.8 56.81 56.8 56.7
Feed density2 (kg m·3) 0.5 1212.3"" 1211.6 1211.6 1213.2' 1213.41 1211.9
Concentrate density2 (kg m'3) 2 1218.9 1233.5 1231.4 1214.7' 1248.7' 1231.0'
Viscometer differential pressure (kPa) 0.5 2.0 2.1 2.1 1.9 2.7 2.2
1Standard deviation level (see page Il). 2Uncorrected density figures (see Appendix B).

!77
Table I41a: Raw Data from Experiment Su10. (Tube length 10, Tube diameter 48, De-aeration orifice diameter 2.95 mm, No air bleed)
Experimental run number SDU 12 2 3 4 5 6
Feed flow rate (kg h'1) 0.6 110.8 112.3 110.8' 110.2' 110.8' 108.6*
Fifth feed flow rate (kg h'1) 0.6 113.1 115.2 113.1 112.7 113.0 111.0
Concentrate flow rate (kg h'1) 2 100.8 102.0 107.3 103.9 95.0 90.5
Feed temperature at 0.3m ( 0 C) 0.1 75.0 85.0& 74.9 75.2& 75.0 65.0
Vapour temperature 23 mm tube (°C) 0.1 57.4 57.3* 57.2* 57.2' 56.9' 56.9&
' Vapour temperature 40 mm tube (0 C) 0.1 43.1& 43.2& 41.8& 43.5& 44.6& 45.2'
Vapour temperature 48 mm tube (0 C) 0.1 61.6 62.3 61.6 62.2' 61.7' 61.5*
Product temperature (°C) 0.1 61.5 61.5 61.1 62.1' 61.9 61.9
Steam supply temperature (0 C) 0.1 65.2 65.2 62.5' 65.3' 68.0' 67.8
Condensate temperature (0 C) 0.1
Top de-aeration line temp (0 C) 0.1
Bottom de-aeration line temp ( 0 C) 0.1
Ambient temp at 15 m tube top (0 C) 0.5 22.7 22.9 23.9 25.4 26.3 26.7
Ambient temp at steam entry (0 C) 0.5 26.6 26.9 27.3 28.4 29.1 29.8
Ambient temp at 15 m tube bottom (°C) 0.5 25.4 25.8 26.7 27.9 28.5 28.7
Tube-side absolute pressure (kPa) 0.05 19.99* 20.00* 19.97' 20.10' 20.00' 19.99*
Tube-side absolute pressure (AP3) (kPa) 0.05 19.18* 19.21* 19.16' 19.28' 19.19 19.17*
Differential pressure (kPa) 0.03 5.998* 6.000 3.013* 5.974' 8.996* 9.002*
Main steam pressure (kPa gauge) 2 922.5& 885.11 845.5' 932.3* 935.2& 934.2*
Steam header pressure (kPa gauge) 1 192.8* 195.1* 193.9' 193.6' 193.1 193.0
Steam valve position(%) 0.5 69.2 66.6 55.7 64.2& 77.4 80.6
Vapour valve position(%) 0.5 40.2* 41.2 20.0& 33.11 55.6 58.0
Temperature in feed density meter (°C) 0.1 49.9* 50.7 52.8& 53.0' 49.0 48.3
Temperature in concentrate line (0 C) 0.1 57.1 57.2 57.4 57.7 57.5 57.6
Feed density3 (kg m·3) 0.5 1209.0 1208.6 1215.6& 1234.71 1208.5 1209.0
Concentrate density3 (kg m·3) 2 1233.2 1232.2 1220.3 1257.2& 1249.2 1259.7
Viscometer differential pressure (kPa) 0.5 2.8 2.9 2.7 4.4 3.5 3.9
1Standard deviation level (see page 11). 2Run started at 1041 h on 2 March 1992, subsequent runs at 45 min intervals. 3Uncorrected figures (see Appendix B).

178
Table 141b: Raw Data from Experiment SulO. (Tube length 10, Tube diameter 48, De-aeration orifice diameter 2.95 mm, No air bleed)
Experimental run number SDL' 7 8 9 10 11 12
Feed flow rate (kg h'1) 0.6 112.3 108.5 110.8' 109.0 112.1 111.0
Fifth feed flow rate (kg h'1) 0.6 115.2 110.8 113.0 111.0 114.9 113.0
Concentrate flow rate (kg h'1) 2 107.2 100.1' 100.1 105.5' 100.4 100.6
Feed temperature at 0.3m (°C) 0.1 85.0& 65.0 75.0 65.0 85.2& 75.0
Vapour temperature 23 mm tube (°C) 0.1 56.8' 57.31 57.3 57.11 58.4 58.4
Vapour temperature 40 mm tube (°C) 0.1 42.5' 45.31 44.3& 44.01 46.1& 44.4'
Vapour temperature 48 mm tube (°C) 0.1 62.2' 61.8& 61.5 61.3' 62.6' 61.5
Product temperature ( o C) 0.1 61.1 62.1& 61.5 61.2' 62.6' 61.5
Steam supply temperature (°C) 0.1 62.71 65.3& 65.3 62.5' 67.7 65.3
Condensate temperature (°C) 0.1
Top de-aeration line temp ( o C) 0.1
Bottom de-aeration line temp ( 0 C) 0.1
Ambient temp at 15 m tube top (0 C) 0.5 27.0 26.7 26.2 25.8 25.8 25.6
Ambient temp at steam entry (°C) 0.5 29.9 29.2 29.0 28.7 28.6 28.2
Ambient temp at 15 m tube bottom (°C) 0.5 28.8 28.1 28.0 27.7 27.6 26.9
Tube-side absolute pressure (kPa) 0.05 19.98 20.13' 20.00' 19.94' 20.05' 19.99
Tube-side absolute pressure (AP3) (kPa) 0.05 19.17' 19.30' 19.18' 19.141 19.26' 19.20
Differential pressure (kPa) 0.03 3.011 5.9701 5.999 3.0171 8.966' 6.002
Main steam pressure (kPa gauge) 2 878.01 892.7 895.8 898.6 897.1 897.7
Steam header pressure (kPa gauge) 1 194.2' 193.7' 193.4 194.1' 193.0' 193.1
Steam valve position (%) 0.5 55.1 70.0& 69.5 57.5& 71.6' 69.9
Vapour valve position(%) 0.5 23.1 39.61 43.2' . 20.21 49.1& 43.0
Temperature in feed density meter ("C) 0.1 52.7' 52.21 50.0' 53.3 50.8 49.9'
Temperature in concentrate line (°C) 0.1 57.6 57.9& 57.5 57.5 57.8 57.5
Feed density2 (kg m·3) 0.5 1216.4' 1235.71 1209.4 1224.61 1228.21 1209.2
Concentrate density2 (kg m·3) 2 1222.4' 1266.0& 1233.0' 1227.5' 1265.1& 1232.7'
Viscometer differential pressure (kPa) 0.5 2.8 4.8 3.0 3.0 4.8 3.0
1Standard deviation level (see page Il). 2Uncorrected density figures (see Appendix B).

179
Table I42a: Raw Data from Experiment Sull. (Tube length 10, Tube diameter 23, De-aeration orifice diameter 2.95 mm, No air bleed)
Experimental run number SDV 12 2 3 4 5 6
Feed flow rate (kg h"1) 0.6 50.5 51.5 50.7 50.1 50.7 49.7'
Fifth feed flow rate (kg h"1) 0.6 52.9 54.0 53.0 53.0 52.9 52.1
Concentrate flow rate (kg h"1) 2 49.3 50.0 50.8 49.2 46.5 46.1
Feed temperature at 0.3m (0 C) 0.1 75.0' 81.3 75.0' 75.0' 75.0' 65.0
Vapour temperature 23 mm tube (°C) 0.1 62.6' 63.3 62.5' 62.8 63.0& 62.4'
Vapour temperature 40 mm tube (°C) 0.1 45.71 45.61 43.78 44.3' 45.1 1 44.88
Vapour temperature 48 mm tube (°C) 0.1 48.2' 47.71 46.41 46.98 48.71 50.21
Product temperature ( o C) 0.1 61.3' 61.3 61.0' 61.6' 61.7& 61.9'
Steam supply temperature (°C) 0.1 65.2' 65.2 62.4' 65.2 67.6& 67.6'
Condensate temperature (°C) 0.1
Top de-aeration line temp (°C) 0.1
Bottom de-aeration line temp (0 C) 0.1
Ambient temp at 15 m tube top (°C) 0.5 23.6 23.3 23.0 23.3 23.6 23.6
Ambient temp at steam entry (°C) 0.5 27.2 27.1 26.9 27.0 27.1 27.0
Ambient temp at 15m tube bottom (°C) 0.5 25.8 25.9 25.6 25.5 25.1 24.7
Tube-side absolute pressure (kPa) 0.05 19.98& 20.00' 20.01& 20.01' 19.99' 20.01"'
Tube-side absolute pressure (AP3) (kPa) 0.05 19.19"' 19.21' 19.22& 19.22"' 19.211 19.22"'
Differential pressure (kPa) 0.03 6.0171 6.00& 3.003& 6.006"' 9.0021 9.007"'
Main steam pressure (kPa gauge) 2 897.6 897.5 898.0 897.5 897.7' 898.5'
Steam header pressure (kPa gauge) 1 194.7' 194.0& 195 .1' 194.7' 194.9' 194.4&
Steam valve position(%) 0.5 56.7' 55.4' 49.9& 55.8' 61.6"' 63.3'
Vapour valve position(%) 0.5 17.3"' 16.5' 11.4' 15.5& 22.7"' 24.2"'
Temperature in feed density meter ( o C) 0.1 47.1 47.4 47.7' 48.2' 46.3 45.8
Temperature in concentrate line (0 C) 0.1 56.2' 56.2' 56.2' 56.2' 56.0& 55.9*
Feed density3 (kg m"3) 0.5 1214.1& 1214.2' 1215.2' 1225.6& 1213.0 1213.3
Concentrate density3 (kg m·3) 2 1226.2& 1225.4& 1215.6& 1237.5& 1236.1 & 1239.4"'
Viscometer differential pressure (kPa) 0.5 1.0 0.95 0.8 1.2 1.1 1.1
1Standard deviation level (see page 11). 2Run started at 2319 h on 2 March 1992, subsequent runs at 45 min intervals. 3Uncorrected figures (see Appendix B).

ISO
Table I42b: Raw Data from Experiment Sull. (Tube length 10, Tube diameter 23, De-aeration orifice diameter 2.95 mm, No air bleed)
Experimental run number SDL1 7 8 9 10 11 12
Feed flow rate (kg h'1) 0.6 51.4 50.1 50.3 49.9 51.7 50.6
Fifth feed flow rate (kg h'1) 0.6 I 54.0 52.0 52.9 52.0 54.0 53.0
Concentrate flow rate (kg h'1) 2 51.2 48.6 48.5 50.2 47.9 48.7
Feed temperature at 0.3m (°C) 0.1 81.2 64.9 75.0 65.0 81.4 75.0
Vapour temperature 23 mm tube (°C) 0.1 63.1' 62.2 62.8' 61.7' 63.4&. 62.7'
Vapour temperature 40 mm tube ( 0 C) 0.1 43.31 43.5"' 43.81 43.2&. 45.51 44.4"'
Vapour temperature 48 mm tube (•C) 0.1 49.71 49.71 49.51 49.21 52.91 53.61
Product temperature (•C) 0.1 61.1' 61.7 61.4&. 61.0' 61.5&. 61.4'
Steam supply temperature ( 0 C) 0.1 625' 65.2 65.2' 62.5' 67.5" 65.1'
Condensate temperature ( • C) 0.1
Top de-aeration line temp (°C) 0.1
Bottom de-aeration line temp (°C) 0.1
I Ambient temp at 15 m tube top ("C) 0.5 23.8 24.0 1 23.9 23.5 23.7 23.7
Ambient temp at steam entry (°C) 0.5 26.9 26.7 26.6 26.7 27.2 27.3
Ambient temp at 15 m tube bottom (°C) 0.5 24.8 24.5 24.6 25.8 27.3 27.5
Tube-side absolute pressure (kPa) 0.05 19.9~ 19.99' 19.9~ 20.01&. 19.951 19.9~
Tube-side absolute pressure (AP3) (kPa) 0.05 19.22& 19.21& 19.201 19.21& 19.151 19.20"'
Differential pressure (kPa) 0.03 3.008& 5.995"' 6.0161 3.000"' 8.9841 6.007"
Main steam pressure (kPa gauge) 2 898.7 900.1 898.9 906.31 937.1' 934.9'
Steam header pressure (kPa gauge) 1 194.7' 195.3"' 195.6' 195.8& 194.5' 194.3'
Steam valve position(%) 0.5 49.7' 58.0' 57.3& 51.5" 59.5& 57.4'
Vapour valve position(%) 0.5 12.7' 16.9 18.7& 10.7& 21.51 18.8"'
Temperature in feed density meter (0 C) 0.1 47.2' 47.6 r;;- 47.4 47.1 47.0
Temperature in concentrate line (0 C} 0.1 55.9' 55.8' 55.8' 56.0 55.9& 56.1'
Feed density2 (kg m'3) 0.5 1214.4' 1227.6& 1213.3 1216.2 1213.4' 1213.1
Concentrate density2 (kg m·3) 2 1216.6"' 1240.1' 1229.8& 1219.8' 1235.0"' 1227.~"
Viscometer differential pressure (kPa) 0.5 0.9 1.2 0.9 0.8 1.0 1.0
1Standard deviation level (see page Il). 2Uncorrected density figures (see Appendix B).

13 Data from Skim Milk Experiments
Data collected by data logger
181
The mean values for Experiments Sk1 and Sk2 runs are tabulated in Tables 143 and 144.
The mean values for the water checks after rinsing and after C1P are shown in Tables 145
and 146.
Physical and Chemical Analysis
The gross composition results for Experiments SkO, Sk1 and Sk2 are listed in Table 147.
Experiment SkO (MP Lab Code 2X40)
The skim milk had a total solids of 9. 0% w /w, a WPN1 of 8. 04 mg/ g and a
titratable acidity of 0.162% w/v as lactic acid. After pre-heating and
concentration in the Wiegand evaporator the average concentrate total solids was
45.3% w /w for Run 1. The concentrate was diluted to a final feed total solids
of 28.4% w/w. The WPN1 of the final feed was 0.94 mg/g. A sample of
concentrate taken at 0826 h, 15 January 1992 from Run 1 had a total solids of
42.1% w/w and a WPN1 of 0.62 mg/g.
Experiment Sk1 (MP Lab Code 2X47)
The skim milk had a total solids of 8. 96% w /w, a WPN1 of 7.4 mg/ g and a
titratable acidity of 0.175% w/v as lactic acid. The laboratory analysis results
of the Wiegand evaporator concentrate samples are tabulated in Table 148. The
total solids of the feed stocks fed to the Research evaporator and the total solids
and WPN1 of the concentrates are given in Table 149.
Experiment Sk2 (MP Lab Code 2X71)
The skim milk had a total solids of 8. 86% w /w and a WPN1 of 7. 9 mg/ g. No
titratable acidity result was obtained for this experiment. The laboratory analysis
results of the Wiegand evaporator concentrate samples are tabulated in Table 150.
The total solids of the feed stocks fed to the Research Evaporator and the total
solids and WPNI of the concentrates are tabulated in Table 151.
Microbiological Analysis
The microbiological analysis results have been tabulated for Experiment SkO, Run 1 are
(see Table 152), Experiment Sk1 (see Tables 153 and !54) and Experiment Sk2 (see
Tables 155 and 156).

182
Table 143a: Raw Data from Experiment Skl. (Tube length 15, Tube diameter 48, De-aeration nozzle diameter 3.2 mm, No air bleed)
Experimental run number SDV A B c D E F
Third feed flow rate (kg h'1) 0.6 110.0 110.0 110.0 109.9' 109.9 110.0
Concentrate flow rate (kg h'1) 2 86.8 89.6 88.9 86.4 86.4' 86.8
Feed temperature ex-PHE (•C) 0.1 77.4 82.4 79.6 78.0& 77.8' 78.6'
Feed temperature at 3m (°C) 0.1 72.6 73.1 72.7' 72.7' 72.6' 72.7'
Feed temperature at 0.3m ("C) 0.1 71. 3.7 71.6' .7' 71.5' 71.5
Vapour temperature (•C) 0.1 64.2 .9 66.6 64.9 64.3 64.2
Product temperature ( • C) 0.1 60.3 60.7 60.5 60.5 60.3 60.3
Steam supply temperature (•C) 0.1 63.5 65.3 64.3 I 64.1 63.7 63.5
Condensate temperature (°C) 0.1 61.7 63.2 62.1 62.3 61.9 61.7
Top de-aeration line temp c•q 0.1 63.1 64.8 63.8 63.6 63.3 63.0
Bottom de-aeration line temp ( • C) 0.1 63.6 65.5 64.5 64.3 63.8 63.6
Ambient temp at 15 m tube top ("C) 0.5 29.5 25.7 25.3 29.3 30.0 26.7
Ambient temp at steam entry ("C) 0.5 28.7 25.9 25.4 30.5 30.9 27.0
Ambient temp at 15 m tube bottom (•C) 0.5 27.9 25.4 26.0 28.3 28.9 26.9
Tube-side absolute pressure (kPa) 0.05 20.00 20.01 20.00' 20.01 20.00 20.00
Differential pressure - entry (kPa) 0.03 3.859 5.863' 4.733' 4.471' 4.000 3.824
Differential pressure - top (kPa) 0.03 3.777 5.712' 4.563 4.396' 3.920 3.739
Differential pressure bottom (kPa) 0.03 3.483 5.493' 4.359' 4.090' 3.618 3.449
Main steam pressure (kPa gauge) 2 917 .1' 885.2 881.2 931.3& 891.9 890.5
Steam header pressure (kPa gauge) 1 191.6' 190.0' 190.2' 192.4' 193.3' 189.6'
Steam valve position (%) 0.1 70.0 70.0 70.0 70.0 70.0 70.0
Vapour valve position (%) 0.1 83.6 83.2 83.0' 83.8 84.6 83.2'
Temperature in feed densicy meter (0 C) 0.1 18.3' 16.8' 14.0 16.9 15.9' 13.8
Temperature in concentrate line ("C) 0.1 56.7 55.4 55.2 56.0 56.8 56.4
Feed density2 (kg m'3) 0.5 1080.2' 1158.4 1110.5' 1110.61 G7 1083.5
Concentrate density2 (kg m·3) 2 1085.7 1164.3 1123.6 1082.6' 1086.2 1086.5'
Viscometer differential pressure (kPa) 0.5
1Standard deviation level (see page 11). 2Uncorrected density figures (see Appendix B).

183
Table I43b: Raw Data from Experiment Skl. (Tube length 15, Tube diameter 48, De-aeration nozzle diameter 3.2 mrn, No air bleed)
Experimental run number SDU G H I J K L
Third feed flow rate (kg h'1) 0.6 109.9 110.0 109.9 110.0 110.0 110.0
Concentrate flow rate (kg h'1) 2 35.Y 86.5 86.5 86.9 87.2. 87.6&
Feed temperature ex-PHE (0 C) 0.1 78.7 77.2& 76.6. 77.4 77.6& 77.5&
Feed temperature at 3m (0 C) 0.1 72.7 72.6 72.5· 72.6 72.6· 72.6·
Feed temperature at 0.3m (0 C) 0.1 71.5 71.5' 71.3. 71.5 71.5' 71.3.
Vapour temperature ( 0 C) 0.1 64.7& 64.1' 64.3 66.2 64.7. 64.5
Product temperature (0 C) 0.1 60.5 60.3 60.1 60.2 60.2 60.3
Steam supply temperature (0 C) 0.1 63.7. 63.7 63.3 63.8 63.2 63.5
Condensate temperature ( o C) 0.1 61.9. 61.9 61.6 61.7 61.6 61.9
Top de-aeration line temp (0 C) 0.1 63.2. 63.2" 63.0 63.4 62.8 63.1
Bottom de-aeration line temp (0 C) 0.1 63.9. 63.8 63.4 64.0 63.5 63.7
Ambient temp at 15m tube top (0 C) 0.5 25.5 32.3 33.2 27.6 26.2 28.3
Ambient temp at steam entry (0 C) 0.5 25.8 33.8 33.1 29.3 28.2 30.3
Ambient temp at 15 m tube bottom (0 C) 0.5 26.4 30.8 30.6 28.5 28.6 30.0
Tube-side absolute pressure (kPa) 0.05 20.06' 20.00 20.01 20.01 20.00 19.99
Differential pressure - entry (kPa) 0.03 3.960& 3.895 3.616 4.182 3.557 3.827
Differential pressure - top (kPa) 0.03 3.889& 3.788 3.530 4.098 3.498 3.792
Differential pressure - bottom (kPa) 0.03 3.581 & 3.517 3.251 3.844 3.240 3.538
Main steam pressure (kPa gauge) 2 885.6 884.71 891.1 891.1 888.7 886:2&
Steam header pressure (kPa gauge) 1 192.1 193.2 193.0 192.2 192.2 191.8.
Steam valve position(%) 0.1 70.0 70.0 70.0 70.0 70.0 70.0
Vapour valve position(%) 0.1 85.71 83.4 83.4 83.2 83.2 83.0
Temperature in feed density meter (0 C) 0.1 14.6. 17.1& 16.5' 15.3. 14.3. 15.3
Temperature in concentrate line (°C) 0.1 43.91 58.3 58.8 58.7 58.6 58.2
Feed density2 (kg m'3) 0.5 1078.9 1079.8" 1053.3 1050.7 1053.9 1080.4
Concentrate density2 (kg m·3) 2 1065.21 1084.3 1049.4 1046.3 1049.9 1084.2
Viscometer differential pressure (kPa) 0.5
'Standard deviation level (see page II). 2Uncorrected density figures (see Appendix B).

184
Table 144a: Raw Data from Experiment Slc2. (Tube length 15, Tube diameter 48, De-aeration nozzle diameter 3.2 mm, No air bleed)
Experimental run number SDL' AI A2 A3 B1 B2 B3 Cl C2
Third feed flow rate (kg h'1) 0.6 55.0 110.0 110.0 55.1" 110.0 110.0 109.9 55.0
Concentrate flow rate (kg h'1) 2 76.5 86.8' 32.9" 87.11 77.1 77.4 35.5
Feed temperature ex-PHE ('C) 0.1 .9" 77.0' 86.0" 79.2 79.3 78.3 86.8"
Feed temperature at 3m ('C) 0.1 73.2' 12.5" 72.5' 73.5" 72.8' 72.8 72.7 73.6'
Feed temperature at 0.3m COC) 0.1 72.7' 71.3& 71.3' 73.5" 72.1 72.1 71.5 73.2'
Vapour temperature ('C) 0.1 65.2' 67.6 67.2 65.4' 67.1 68.0 68.2' 65.8'
Product temperature ('C) 0.1 60.9 60.9 60.9 61.3 61.3 61.4 61.5 61.3
Steam supply temperature ('C) 0.1 64.7' 66.4 65.1 65.3' 65.6 67.2 67.4 77.5'
Condensate temperature ('C) 0.1 62.9 63.8 62.4 62.8 62.7 64.4 64.4 69.1'
Top de-aeration line temp ('C) 0.1 63.1' 65.0 63.6 63.7' 64.1 66.0 66.1 75.3'
Bottom de-aeration line temp (°C) 0.1 64.2 66.0 64,6 64.7 65.0 66.8 16.<J'
Ambient temp at 15 m tube top ('C) 0.5 28.8 29.1 28.2 24.0 23.5 23.3 22.1 22.0
Ambient temp at steam entry ('C) 0.5 30.0 29.9 28.9 26.0 25.6 25.2 23.1 23.2
Ambient temp at 15 m tube bottom ('C) 0.5 29.5 29.0 27.7 25.1 24.8 24.2 21.5 22.4
Tube-side absolute pressure (kPa) 0.05 20.00 20.00 20,00 20.00 20.01 20.00 20.00'
Differential pressure • entry (kPa) 0.03 4.15Q& 6.168 4.598 4.64Q& 4.876' 6.949' 7.079 19.64
Differential pressure top (kPa} 0.03 4.079" 6.070 4.528 4.575" 4.813' 6.859' 6.993 19.62"
Differential pressure - bottom (kPa) 0.03
Main steam pressure (kPa gauge) 2 938.5 .. 885.3' 896.3 894.3 895.0 893.7 893.0 892.6
Steam header pressure (kPa gauge) I 195.2 194.2 194.3 196.3' 197.6' 193.6 195.2' 197 .9"
Steam valve position (%) 0.1 70.0 80.0 70.0 70.0 70.0 80.0 80.0 70.0
Vapour valve position (%) 94.0' 83.3 81.4" 82.8" 93.2' 92.9' 77.6"
. Temperature in feed density meter ('C) 0.1 17.3' 14.5' 14.4' 17.6' 14.5" 14.5' 10.4" 13.1
Temperature in concentrate line ('C) 0.1 54.0 56.4 57.6' 54.3" 56.1 55.9 53.6'
Feed density2 (kg m·~) 0.5 1076.4" 1079.6 1079.7 1101.6' 1106.7" .3" ll07.0'
Concentrate density2 (kg m·') 2 1125.5' 1104.1 1086.2 1164.8" 1119.5' ll41.3 1140.6 1150.8
Viscometer differential pressure (kPa) 0.5
'Standard deviation level (see page Il). 2Uncorrected density figures (see Appendix B).

185
Table I44b: Raw Data from Experiment Sk2.
• (Tube length 15, Tube diameter 48, De-aeration nozzle diameter 3.2 mm, No air bleed)
Experimental run number SDL1 C3 D1 D2 D3 E1 E2 E3 F1
Third feed flow rate (kg h'1) 0.6 110.0 109.9 110.0 55.0 110.0 55.0 110.0 110.0
Concentrate flow rate (kg h'1) 2 90.3" 77.2 87.8' 37.7' 77.0" 33.0 87.7" 76.9"
Feed temperature ex-PHE (°C) 0.1 78.3 77.2 77.1 84.1 76.6 82.7 76.7 77.4
Feed temperature at 3m (°C) 0.1 72.7 72.6 72.6 73.3 72.5 73.2 72.5 72.6
Feed temperature at 0.3m ( 0 C) 0.1 71.5 71.5 71.6 72.9 71.5 72.3' 71.5 71.7
Vapour temperature (0 C) 0.1 68.2 68.2" 67.3' 65.4' 67.9' 65.2 67.0 68.0'
Product temperature (°C) 0.1 61.4 61.4 61.2 61.2 61.0 61.0 60.9 61.0
Steam supply temperature (°C) 0.1 76.8 67.8' 66.0 73.5' 67.1' 65.2 65.6 67.1
Condensate temperature (°C) 0.1 68.5' 64.0 62.5 67.5' 63.6 62.3 62.1 63.4
Top de-aeration line temp ("C) 0.1 74.9 65.9 64.1' 71.21 65.5" 63.6 63.9 65.1
Bottom de-aeration line temp (°C) 0.1 76.2" 66.9 65.2 72.71 66.5 64.6 64.9 66.3
Ambient temp at 15 m tube top (°C) 0.5 22.0 28.6 29.7 30.0 30.8 30.7 30.3 26.1
Ambient temp at steam entry (°C) 0.5 23.6 30.3' 30.2 31.3 31.3 31.5 30.9 27.1
Ambient temp at 15 m tube bottom ("C) 0.5 23.2 26.8 27.7 28.2 29.2 29.2 28.1 25.9
Tube-side absolute pressure (kPa) 0.05 20.00 20.01 20.01 20.00 20.00 20.02 20.00 20.00'
Differential pressure - entry (kPa) 0.03 20.01 7.298' 5.273' 15.39' 6.747 4.598 4.938 6.634
Differential pressure - top (kPa) 0.03 19.98' 7.204' 5.202' 15.311 6.653 4.528 4.867 6.539
Differential pressure - bottom (kPa) 0.03
Main steam pressure (kPa gauge) 2 893.7 894.21 909.6 I 919.41 874.3' 898.5 899.7 898.0
Steam header pressure (kPa gauge) 1 198.1' 194.9 197.9' 198.8' 195.6' 196.2' 196.9' 195.2
Steam valve position(%) 0.1 70.0 80.0 70.0 70.0 80.0 70.0 70.0 80.0
Vapour valve position (%) 0.1 79.7' 92.8' 82.5 79.5' 93.4' 82.0 83.1 93.3'
Temperature in feed density meter (°C) 0.1 10.8' 13.7" 14.0" 17.1" 13.7' 17.5" 14.1 11.9'
Temperature in concentrate line (°C) 0.1 56.1 56.5 56.8' 54.3' 57.3' 55.8 58.1' 57.0'
Feed density2 (kg m'3) 0.5 1108.4' 1107.0" 1107.7' 1107.1' 1078.5 1077.8 1078.8 1075.5
Concentrate density2 (kg m·') 2 1116.3' 1141.4' 1120.8' 1162.9" 1098.1' 1124.4' 1082.3' 1093.4'
Viscometer differential pressure (kPa) 0.5
'Standard deviation level (see page !1). 2Uncorrected density figures (see Appendix B).

186
Table 144c: Raw Data from Experiment Sk2. (Tube length 15, Tube diameter 48, De-aeration nozzle diameter 3.2 mm, No air bleed)
Experimental run number SDL' F2 F3 01 02 03 HI H2 H3
Third feed flow rate (kg h'1) 0.6 55.0 110.0 110.0 110.0 55.0 109.9 55.0 110.0
Concentrate flow rate (kg h'1) 2 33.7' 86.7' 76.5' 88.8" 33.2" 75.8' 33.6 85.6"
Feed temperature ex-PHE ('C) 0.1 84.8 77.7 78.1 78.1 85.6' 76.9 83.2' 76.7
Feed temperature at 3m ('C) 0.1 73.4 72.6 72.7 72.7 73.5 72.5 73.2 72.5
Feed temperature at 0.3m ('C) 0.1 72.7 71.6 71.7 71.7 72.7 71.6 72.7 71.6
Vapour temperature ('C) 0.1 65.4 67.5 68.2 67.3 65.5 68.0" 65.2 67.1
Product temperature ('C) 0.1 61.0 61.0 61.1 61.1 61.1 61.1 61.1 61.0
Steam supply temperature ('C) 0.1 65.3 65.7 67.3 65.7 65.4 67.4 65.4 65.8
Condensate temperature ('C) 0.1 62.1 62.1 63.8 62.2 62.3 63.6 62.4 62.2
Top de-aeration line temp ('C) 0.1 63.3 63.8 65.3 63.8 63.5 65.5 63.6 64.0
Bottom de-aeration line temp ('C) 0.1 64.6 64.9 66.5 65.0 64.7 66.5 64.7 65.0
Ambient temp at 15 m tube top ('C) 0.5 25.1 24.4 22.4 22.0 21.9 28.6 29.9 30.3
Ambient temp at steam entry ('C) 0.5 26.5 26.0 24.5 24.3 24.6 30.0' 30.6 31.3
Ambient temp at 15 m tube bottom ('C) 0.5 25.0 24.3 22.7 24.1 24.7 27.1 28.2 28.6
Tube-side absolute pressure (kPa) 0.05 20.00 20.01 20.00 20.00 20.00 20.01' 20.00 20.01
Differential pressure - entry (kPa) 0.03 4.572 4.936' 6.793' 4.956' 4.630 6.803 4.678 5.025
Differential pressure - top (kPa) 0.03 4.506 4.873' 6.707' 4.897 4.572 6.706 4.602 4.953
Differential pressure - bottom (kPa) 0.03
Main steam pressure (kPa gauge) 2 897.8 898.0 897.2 898.0 896.7 886.8" 894.7' 901.8"
Steam header pressure (kPa gauge) I 196.4' 196.3' 195.4' 197.7' 197.1' 197.3' 198.1' 198.0.
Steam valve position (%) 0.1 70.0 70.0 80.0 70.0 70.0 80.0 70.0 70.0
Vapour valve position (%) 0.1 81.7' 82.7 92.8' 82.4' 81.4' 93.4' 81.9 83.1
Temperature in feed density meter ('C) 0.1 14.8' 12.0 10.2" 10.4' 13.8" 12.7' 16.0' 13.7'
Temperature in concentrate line ('C) 0.1 54.4' 58.1' 56.3 56.8 54.0 57.2 55.3 58.6'
Feed density2 (kg m·') 0.5 1074.9 1075.7 1086.1 1086.3 1085.1 1080.0 1079.1 1079.9
Concentrate density2 (kg m·') 2 1113.3' 1077.7 1110.9 1094.1' 1134.7' 1102.8' 1128.8' 1085.0
Viscometer differential pressure (kPa) 0.5
1Standard deviation level (see page II). 'Uncorrected density figures (see Appendix B).

187
Table 144<1: Raw Data from Experiment Sk2. (Tube length 15, Tube diameter 48, De-aeration nozzle diameter 3.2 mm, No air bleed)
Experimental run number SDL1 11 12 13 J1 J2 J3 K1 K2
Third feed flow rate (kg h'1) 0.6 55.0 110.0 110.0 55.0 110.0 110.0 110.0 55.0
Concentrate flow rate (kg h'1) 2 33.3 76.7 87.6 33.2 87.7 77.2 76.0' 33.7
Feed temperature ex-PHE ('C) 0.1 80.9' 76.6 76.8& 82.4 77.3 77.4 77.3' 82.5'
Feed temperature at 3m ('C) 0.1 73.0 72.5 72.5 .. 73.1 72.6 72.6 72.6' 73.1'
Feed temperature at 0.3m ('C) 0.1 71.5 71.5 71.6& 71.8 71.7 71.8 71.7' 71.8
Vapour temperature ('C) 0.1 64.7 67.6 66.7 65.0 67.1 67.8 67.7 64.8
Product temperature ('C) 0.1 60.9 60.9 60.8 60.9 60.8 60.9 60.9 60.9
Steam supply temperature ('C) 0.1 64.4 66.4 65.1 64.6 65.3 66.5 66.6 64.6
Condensate temperature ('C) 0.1 62.3 64.1 62.3 62.6 62.2 63.7' 63.4 62.0
Top de-aeration line temp ('C) 0.1 63.1 65.1 63.6 63.2 63.8 65.0 65.0 63.0
Bottom de-aeration line temp ('C) 0.1 64.0 65.9 64.6 64.1 64.7 66.0 66.1 64.1
Ambient temp at 15 m tube top ('C) 0.5 31.9 31.3 31.0 27.5 27.2 27.0 26.7 26.5
Ambient temp at steam entry ('C) 0.5 32.8 31.8 30.6 28.9 28.8 28.7 29.7 29.8
Ambient temp at 15m tube bottom ('C) 0.5 29.5 28.2 27.7 26.8 26.7 26.5 28.0 28.4
Tube-side absolute pressure (kPa) 0.05 20.00 20.01 20.01 20.01 20.01 20.01 20.00 20.00
Differential pressure - entry (kPa) 0.03 3.787' 5.964 4.447 3.834 4.554 6.030 6.107 3.933
Differential pressure - top (kPa) 0.03 3.665' 5.844 4.374 3.768 4.487 5.940 6.011 3.866
Differential pressure - bottom (kPa) 0,03
Main steam pressure (kPa gauge) 2 898.0' 897.2 897.6 897.1 897.6 897.2 897.6 897.6
Steam header pressure (kPa gauge) 1 197.9 195.8' 196.4' 199.0' 198.5' 194.9 196.0' 195.8'
Steam valve position (%) 0.1 70.0 80.0 70.0 70.0 70.0 80.0 80.0 70.0
Vapour valve position (%) 0.1 80.9' 93.1' 82.6 81.0 82.2 93.1 93.1' 81.3'
Temperature in feed density meter ('C) 0.1 17.71 13.8 14.1 14.3"· 10.4 11.1' 12.8' 16.2"
Temperature in concentrate line ('C) 0.1 54.2' 57.8 58.4 54.1 58.1 58.1 58.2 55.5
Feed density' (kg m·') 0.5 1053.5' 1054.8 1054.9 1053.0 1053.7 1053.8 1052.9 1052.4
Concentrate density' (kg m·') 2 1084.2" 1065.6 1053.3 1085.3 1052.5 1062.5 1062.8 1081.2
Viscometer differential pressure (kPa) 0.5
'Standard deviation level (see page 11). 'Uncorrected density figures (see Appendix B).
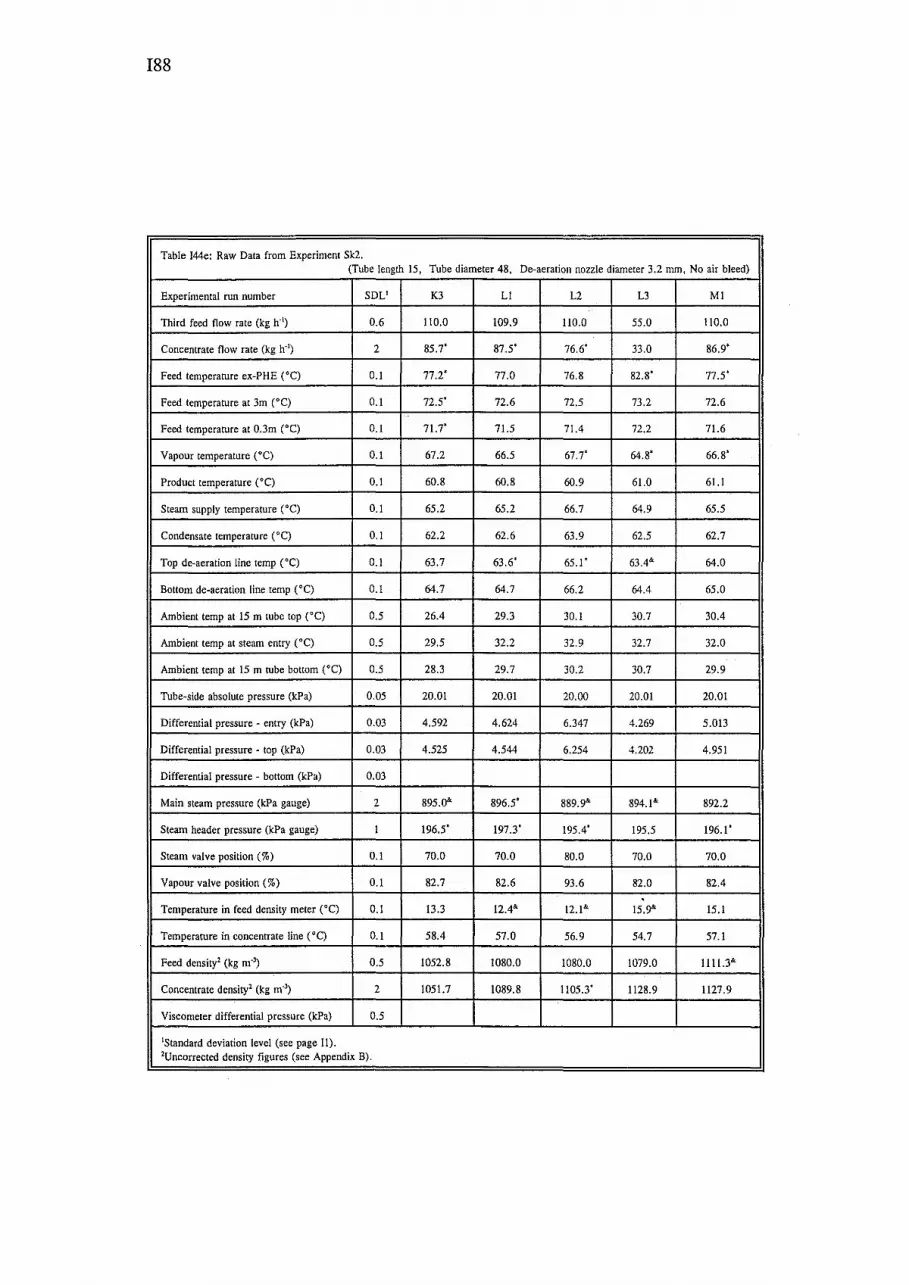
I88
Table 144e: Raw Data from Experiment Sk2. (Tube length 15, Tube diameter 48, De-aeration nozzle diameter 3.2 mm, No air bleed)
Experimental run number SDL' K3 LI L2 L3 M1
Third feed flow rate (kg h'1) 0.6 110.0 109.9 110.0 55.0 110.0
Concentrate flow rate (kg h'1) 2 85.7' 87.5' 76.6' 33.0 86.9'
Feed temperature ex-PHE ('C) 0.1 77.2' 77.0 76.8 82.8' 77.5'
Feed temperature at 3m ('C) 0.1 72.5' 72.6 72.5 73.2 72.6
Feed temperature at 0.3m ('C) 0.1 71.7' 71.5 71.4 72.2 71.6
Vapour temperature ('C) 0.1 67.2 66.5 67.7' 64.8' 66.8'
Product temperature ('C) 0.1 60.8 60.8 60.9 61.0 61.1
Steam supply temperature ('C) 0.1 65.2 65.2 66.7 64.9 65.5
Condensate temperature ('C) 0.1 62.2 62.6 63.9 62.5 62.7
Top de-aeration line temp ('C) 0.1 63.7 63.6' 65.1' 63.4" 64.0
Bottom de-aeration line temp ('C) 0.1 64.7 64.7 66.2 64.4 65.0
Ambient temp at 15 m tube top ('C) 0.5 26.4 29.3 30.1 30.7 30.4
Ambient temp at steam entry ('C) 0.5 29.5 32.2 32.9 32.7 32.0
Ambient temp at 15 m tube bottom ('C) 0.5 28.3 29.7 30.2 30.7 29.9
Tube-side absolute pressure (kPa) 0.05 20.01 20.01 20.00 20.01 20.01
Differential pressure - entry (kPa) 0.03 4.592 4.624 6.347 4.269 5.013
Differential pressure - top (kPa) 0.03 4.525 4.544 6.254 4.202 4.951
Differential pressure - bottom (kPa) 0.03
Main steam pressure (kPa gauge) 2 895.0" 896.5' 889.9" 894.1" 892.2
Steam header pressure (kPa gauge) 1 196.5' 197.3' 195.4' 195.5 196.1'
Steam valve position(%) 0.1 70.0 70.0 80.0 70.0 70.0
Vapour valve position (%) 0.1 82.7 82.6 93.6 82.0 82.4
Temperature in feed density meter ('C) 0.1 13.3 12.4" 12.1" 15.9" 15.1
Temperature in concentrate line ('C) 0.1 58.4 57.0 56.9 54.7 57.1
Feed density2 (kg m'') 0.5 1052.8 1080.0 1080.0 1079.0 1111.3"
Concentrate density' (kg m·') 2 1051.7 1089.8 1105.3' 1128.9 1127.9
Viscometer differential pressure (kPa) 0.5
'Standard deviation level (see page 11). 'Uncorrected density figures (see Appendix B).

189
Table I45a: Raw Data from Experiment Ski Cleaning Checks. (Tube length 15, Tube diameter 48, De-aeration nozzle diameter 3.2 mm, No air bleed)
Experimental run number SDL' ARIN ACIP BRIN BCIP CCIP ORIN DCIP ERIN ECIP
Third feed flow rate (kg h'1) 0.6 250.1 248.7 250.1 250.1 250.1 250.1 250.1 250.1 249.9
Concentrate flow rate (kg h'1) 2 223.3 221.1 223.7 223.1 222.7 221.6' 222.4 222.9 222.9
Feed temperature ex-PHE ('C) 0.1 74.7 76.4 75.4 75.4 75.1 74.7 74.8 75.0 75.3
Feed temperature at 3m ('C) 0.1 72.3 73.4 72.4 72.4 72.3 72.3 72.3 72.3 72.3
Feed temperature at 0.3m ('C) 0.1 71.4 72.7 71.6 71.6 71.6 71.6 71.6 71.5 71.5
Vapour temperature ('C) 0.1 63.2 63.7 63.6 63.4 63.4' 63.2 63.2 63.3 63.3
Product temperature ('C) 0.1 60.0 60.1 60.0 60.0 60.0 60.0 60.0 60.0 60.0
Steam supply temperature ('C) 0.1 62.6 62.6 63.0 62.6 62.8' 62.8 62.7 62.8 62.5
Condensate temperature ('C) 0.1 60.8 60.9 61.1 60.8 60.9 61.0 61.0 60.9 60.8
Top de-aeration line temp ('C) 0.1 62.2 62.2 62.3 62.0 62.2" 62.4 62.4 62.3 62.1
Bottom de-aeration line temp ('C) 0.1 62.7 62.7 63.1 62.7 62.7 62.9 62.8 62.8 62.6
Ambient temp at 15 m tube top ('C) 0.5 28.5 26.2 25.6 24.9 28.8 31.6 31.2 28.9 27.4
Ambient temp at steam entry ('C) 0. 27.5 26.4 25.7 25.2 29.5 32.8 32.4 29.8 27.7
Ambient temp at 15 m rube bottom ('C) 0.5 27.0 25.7 25.4 25.5 28.0 29.6 30.1 28.4 27.6
Tube-side absolute pressure (kPa) 0.05 20.00 20.01 20.00 20.00 20.01 19.99 19.99 20.03 20.00
Differential pressure - entry (kPa) 0.03 2.828' 2.810" 3.151' 2.783 2.752' 2.948 2.859 2.910 2.702
Differential pressure - top (kPa) 0.03 2.750' 2.692' 3.090' 2.669 2.675' 2.855 2.770 2.824 2.505
Differential pressure - bottom (kPa) O.o3 2.445' 2.427" 2.771' 2.397 2.363' 2.547 2.458 2.518 2.306
Main steam pressure (kPa gauge) 2 884.7 886.0 885.2' 881.7' 928.0" 887.6' 891.7 891.9 891.2
Steam header pressure (kPa gauge) 1 191.4' 192.1' 189.1 192.2 192.4' 193.2' 192.7' 191.7' 190.5'
Steam valve position (%) 0.1 70.0 70.0 70.0 70.0 70.0 70.0 70.0 70.0 70.0
Vapour valve position (%) 0.1 87.7' 87.6" 87.3 87.1 87.8' 88.8 88.7 88.7 87.1
Temperature in feed density meter ('C) 0.1 20.2 27.8 20.0' 20.0 20.4 20.9 21.3 20.9 21.2'
Temperarure in concentrate line ('C) 0.1 58.6 58.6 58.3 58.6 58.6 58.7 58.8 58.7 58.6
Feed density' (kg m·') 0.5 996.0 992.8' 996.4 996.3 995.8 995.5 995.3 995.8 995.3
Concentrate density' (kg m·') 2 982.5 983.9 982.9 982.8 982.0 981.7 981.5 981.8 982.5
Viscometer differential pressure (kPa) 0.5
'Standard deviation level (see page II). 'Uncorrected density figures (see Appendix B).

190
Table I45b: Raw Data from Experiment Ski Cleaning Cheeks. (Tube length 15, Tube diameter 48, De-aeration nozzle diameter 3.2 mm, No air bleed)
Experimental run number SDL1 FRIN FCIP GCIP HRIN HCIP IRIN ICIP JRIN JCIP
Third feed flow rate (kg h'1) 0.6 250.1 250.0 250.0 250.1 250.0 250.1 250.1 250.1 250.0
Concentrate flow rate (kg h'1) 2 215.9' 223.8 222~0' 222.9 .8 222.8 222.6 223.4
Feed temperature eli:·PHE ("C) 0.1 75.3 75.4 74.8 74.3 74.2 74.6 74.7 74.8 75.0
Feed temperature at 3m (°C) 0.1 72.3 72.3 72.3 72.2 72.2 72.3 72.3 72.3 72.3
Feed temperature at 0.3m (•C) 0.1 71.5 71.5 71.6 71.4 71.3 71.4 71.5 71.5 71.5
Vapour temperature (•C) 0.1 63.5 63.9 63.1' 63.1 62.9 63.1 63.2 63.3 63.4
Product temperature (°C) 0.1 60.1 60.7 60.0 60.0 60.0 60.0 60.0 60.0 60.0
Steam supply temperature (•C) 0.1 62.7 63.2 62.6 62.8 62.6 62.6 62.5 62.5
Condensate temperature ("C) 0.1 60.9 61.5 60.9 61.2 61.0 60.9 60.9 61.0 61.0
Top de-aeration line temp (°C) 0.1 62.3 62.7 62.1 62.5 62.3 62.4' 62.0 62.2 62.1
Bottom de-aeration line temp ( •c) 0.1 62.8 63.4 62.7 62.9 62.7 62.7 62.7 62.7 62.7
lr::bient temp at 15 m tube top (°C) 0.5 26.1 25.3 31.1 33.1 33.5 30.2 28.1 27.1 26.2
Ambient temp at steam entry ('C) 0.5 26.6 25.7 32.6 34.0 34.1 30.6 29.7 28.8 28.3
Ambient temp at 15 m tube bottom (•C) 0.5 26.7 26.1 29.9 31.1 31.5 29.3 28.9 28.0 28.2
Tube-side absolute pressure (kPa) 0.05 20.03 20.61" 20.02 19.99 20.01 20.01 19.99 20.00 20.01
Differential pressure entry (kPa) 0.03 2.832 2.872 2.747 2.971' 2.800 2.816 2.776 2.789 2.728
Differential pressure top (kPa) O.D3 2.752 2.796 2.572 2.880' 2.714 2.735 2.698 2.719 2.666
Differential pressure · bottom (kPa) 0.03 2.448 2.503 2.361 2.594' 2.426 2.457 2.426 2.458 2.401
Main steam pressure (kPa gauge) 2 890.7 885.8 888.5' 889.2' 891.3 891.0 891.0 891.7 888.8
Steam header pressure (kPa gauge) I 192.5' 192.3 192.5' t-;;-f 193" 192.9 192.2 192.5' 192.2
Steam valve position(%) 0.1 70.0 70.0 70.0 70.0 70.0 70.0 70.0 70.0
I Vapour valve position(%) 0.1 88.11 99.9 87.6 89.1" 87.7 87.5 87.6 87.6 87.4
Temperature in feed density meter (0 C) 0.1 20.2' 19.9 20.8 20.8 21.7 21.3 21.3 20.7 20.8
Temperature in concentrate line (°C) 0.1 58.3' 30.5' 58.5 58.3 58.9 58.8 58.8 58.8 58.8
Feed density2 (kg m·') 0.5 996.1 996.6' 995.6 995.3 995.2 995.5 995.5 995.9 995.7
Concentrate density' (kg m'3) 2 982.5 986.9 982.8 98!.2 98!.2 98!.8 981.9 982.1 982.2
Viscometer differential pressure (kPa) 0.5
'Standard deviation level (see page 11). 'Uncorrected density figures (see Appendix B).

191
Table l45c: Raw Data from Experiment Sk1 Cleaning Checks. (Tube length 15, Tube diameter 48, De-aeration nozzle diameter 3.2 mm, No air bleed)
Experimental run number SDL' KR!N KCIP LRIN I
Third feed flow rate (kg h'1) 0.6 250.1 250.0 250.1
Concentrate flow rate (kg h'1) 2 222.5 223.1 235.4
Feed temperature ex-PHE ("C) 0.1 74.9 74.9 74.8
Feed temperature at 3m ('C) 0.1 72.3 72.3 72.3
Feed temperature at 0.3m ("C) 0.1 71.6 71.4 71.4
Vapour temperature {'C) 0.1 63.2 63.3' 69.4 T Product temperature ('C) 0.1 60.0 60.0 60.0
Steam supply temperature ('C) 0.1 62.5 62.5 64.3
Condensate temperature (•C) 0.1 61.0 61.0 61.9
Top de-aeration line temp (•C) 0.1 62.1 62.0' 63.7
Bottom de-aeration line temp ("C) 0.1 62.7 62.7 64.5
Ambient temp at 15 m tube top ("C) 0. .9 27.2 28.7
Ambient temp at steam entry (•C) 0.5 28.3 29.8 30.7
Ambient temp at 15 m tube bottom ("C) 0.5 28.9 30.1 30.2 l
Tube-side absolute pressure (kPa) 0.05 20.00 20.01 20.01
Differential pressure - entry (kPa) 0.03 2.720 2.711 4.610
Differential pressure - top (kPa) 0.03 2.669 2.673 4.550
Differential pressure - bottom (kPa) 0.03 2.409 2.410 4.323
Main steam pressure (kPa gauge) 2 889.0 883.9' 885.5
H Steam header pressure (kPa gauge) 1 191.3' 192.4' 191.3'
Steam valve position{%) 0.1 70.0 70.0 70.0
~~alve position(%) 0.1 87.4 87.5 86.9 . ture in feed density meter (•C) 0.1 20.4' 20.3' 21.9
Temperarure in concentrate line (•q 0.1 S8.8 58.8 59.0
Feed densityl (kg m'') 0.5 995.8 995.5 995.9
Concentrate density2 (kg m'3) 2 892.1 982.2 982.4
Viscometer differential pressure (kPa) 0.5
'Standard deviation level (see page II). 'Uncorrected density figures (see Appendix B).

192
Table 146a: Raw Data from Experiment Sk2 Cleaning Checks. (Tube length 15, Tube diameter 48, De-aeration nozzle diameter 3.2 mm, No air bleed)
Experimental run number SDL1 ARIN ACIP BRIN BCIP CRIN CCIP ORIN DCIP ERIN
Third feed flow rate (kg h'1) 0.6 250.0 250.0 250.1 250.1 250.0 250.1 249.8 250.1 250.0
Concentrate flow rate (kg h'1) 2 223.6 223.0 213.7 213.1 224.5 223.4 223.0 223.5 223.9'
Feed temperature ex-PHE (°C) 0.1 74.3 74.5 74.6 74.7 74.7 74.3 74.1 74.0 74.2
Feed temperature at 3m ( 0 C) 0.1 72.3 72.3 72.3 72.3 72.3 72.3 72.2 72.2 72.2
Feed temperature at 0.3m ( 0 C) 0.1 71.4 71.5 71.5 71.5 71.6 71.5 71.5 71.5 71.7
Vapour temperature (°C) 0.1 64.6 63.7 65.3 64.0 67.7 63.6 64.2' 63.5 64.4
Product temperature (•c) 0.1 61.0 60.7 61.2 61.0 61.2 60.9 60.9 60.6 60.9
Steam supply temperature (0 C) 0.1 64.0 63.6 65.7 65.3 66.1' 64.0 64.7 64.0 64.6
Condensate temperature (0 C) 0.1 62.2 61.5 63.3 62.7 62.9' 61.5 62.2 61.6 62.0
Top de-aeration line temp ("C) 0.1 62.5 62.0 64.2 63.8 64.4' 62.0 63.0& 62.3 62.7
Bottom de-aeration line temp (°C) 0.1 63.5 63.1 65.3 64.9 65.7' 63.4 64.1 63.4 63.9
Ambient temp at 15 m tube top (0 C) 0.5 26.3 24.7 22.7 22.4 22.5 26.5 30.1 30.3 29.6
Ambient temp at steam entry ("C) 0.5 27.3 26.4 24.1 23.5 24.1 28.1 30.8 31.1 29.3
Ambient temp at 15 m tube bottom (•c) 0.5 26.4 25.9 22.9 21.7 23.8 26.4 28.9 29.2 27.5
Tube-side absolute pressure (kPa) 0.05 20.00 20.00 20.00 20.00 20.00 20.00 20.00 20.00 20.00
Differential pressure - entry (kPa) 0.03 3.514& 2.799 5.153' 4.559 5.482' 3.10' 5.57& 3.19' 5.06"
Differential pressure - top (kPa) 0.03 3.440& 2.728 5.055' 4.459 5.424' 3.03' 5.50 .. 3.12' 4.98"
Differential pressure - bottom (kPa) 0.03
Main steam pressure (kPa gauge) 2 897.0 896.1 893.7 893.4 901.4' 914"' 932.4"' 905.1' 900.7
Steam header pressure (kPa gauge) I 194.1* 194.7 193.9' 194.5 195.9"' 196' 195.2' 196.5' 196.9
Steam valve position (%) 0.1 70.0 70.0 80.0 80.0 70.0 70.0 70.0 70.0 70.0
Vapour valve position(%) 0.1 86.5 86.8 96.4 96.5 85.7' 86.0 85.8 86.3 86.1 . Temperature in feed density meter (•C) 0.1 53.7' 19.9 51.7' 19.2 54.6 19.1' 55.41 20.5 55.0'
Temperature in concentrate line ( 0 C) 0.1 59.5 58.9 59.3 58.9 59.3 59.1 59.7 59.3 59.7
Feed density' (kg m·') 0.5 1004"' 996.2 1004.9"' 996.9 1005' 996.5 1001.7' 995.4 1002'
Concentrate density' (kg m·') 2 999.0 983.0 999.8 982.8 1001.0 983.0 996.9 982.0 997.3
Viscometer differential pressure (kPa) 0.5
'Standard deviation level (see page 11). 'Uncorrected density figures (see Appendix B).
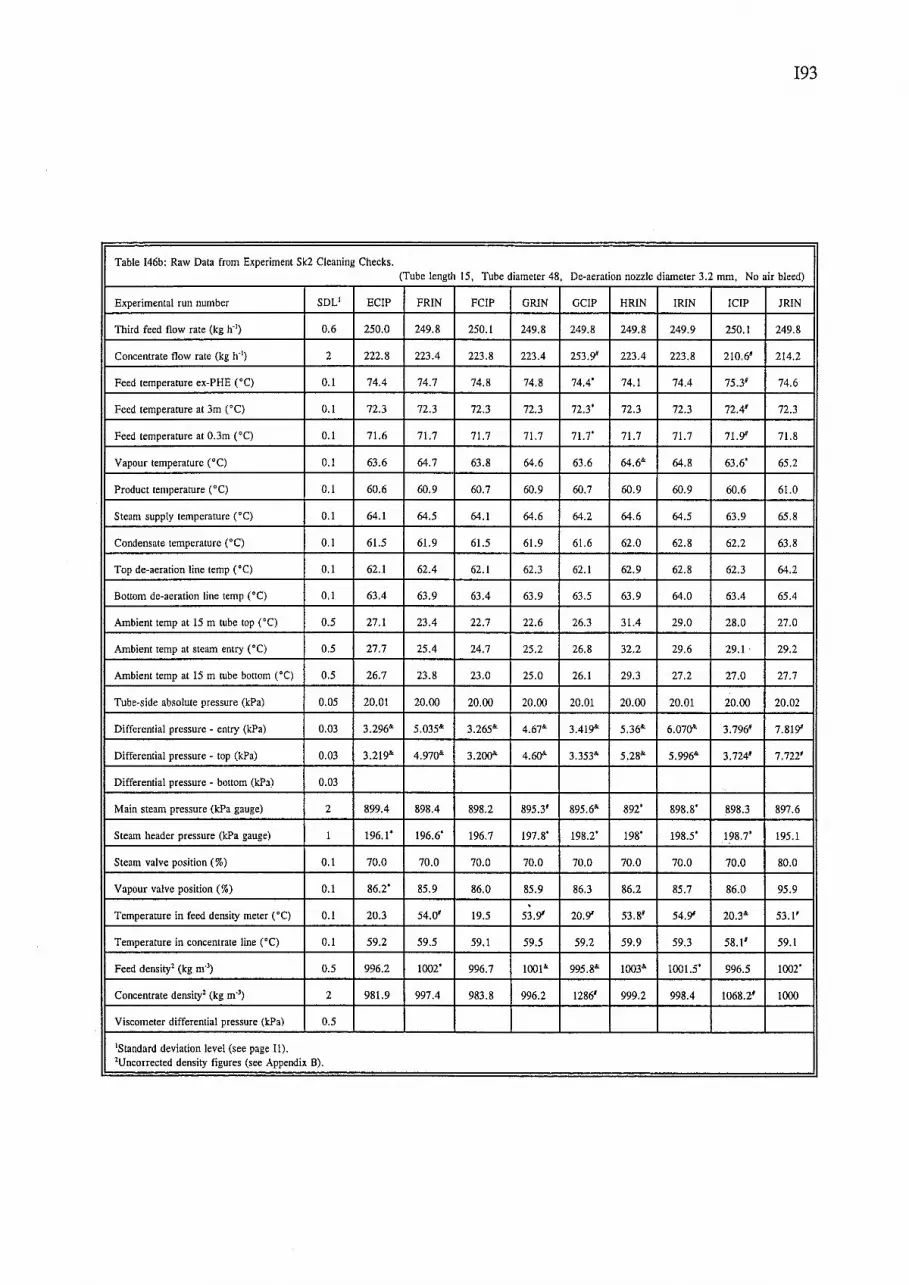
I93
Table I46b: Raw Data from Experiment Sk2 Cleaning Checks. (Tube length 15, Tube diameter 48, De-aeration nozzle diameter 3.2 mm, No air bleed)
Experimental run number SDL1 ECIP FRIN FCIP GRIN GCIP HRIN IRIN ICIP JRIN
Third feed flow rate (kg h'1) 0.6 250.0 249.8 250.1 249.8 249.8 249.8 249.9 250.1 249.8
Concentrate flow rate (kg h'1) 2 222.8 223.4 223.8 223.4 253.9' 223.4 223.8 210.6' 214.2
Feed temperature ex-PHE CC) 0.1 74.4 74.7 74.8 74.8 74.4' 74.1 74.4 75.3' 74.6
Feed temperature at 3m ('C) 0.1 72.3 72.3 72.3 72.3 72.3' 72.3 72.3 72.4' 72.3
Feed temperature at 0.3m ('C) 0.1 71.6 71.7 71.7 71.7 71.7' 71.7 71.7 71.9' 71.8
Vapour temperature ('C) 0.1 63.6 64.7 63.8 64.6 63.6 64.6" 64.8 63.6' 65.2
Product temperature ('C) 0.1 60.6 60.9 60.7 60.9 60.7 60.9 60.9 60.6 61.0
Steam supply temperature ('C) 0.1 64.1 64.5 64.1 64.6 64.2 64.6 64.5 63.9 65.8
Condensate temperature ('C) 0.1 61.5 61.9 61.5 61.9 61.6 62.0 62.8 62.2 63.8
Top de-aeration line temp ('C) 0.1 62.1 62.4 62.1 62.3 62.1 62.9 62.8 62.3 64.2
Bottom de-aeration line temp ('C) 0.1 63.4 63.9 63.4 63.9 63.5 63.9 64.0 63.4 65.4
Ambient temp at 15 m tube top ('C) 0.5 27.1 23.4 22.7 22.6 26.3 31.4 29.0 28.0 27.0
Ambient temp at steam entry ('C) 0.5 27.7 25.4 24.7 25.2 26.8 32.2 29.6 29.1. 29.2
Ambient temp at 15m tube bottom ('C) 0.5 26.7 23.8 23.0 25.0 26.1 29.3 27.2 27.0 27.7
Tube-side absolute pressure (kPa) 0.05 20.01 20.00 20.00 20.00 20.01 20.00 20.01 20.00 20.02
Differential pressure - entry (kPa) 0,03 3.296'" 5.035" 3.265" 4.67" 3.419" 5.36" 6.070" 3.796' 7.819'
Differential pressure - top (kPa) 0,03 3.219" 4.970" 3.200" 4.60" 3.353" 5.28" 5.996 .. 3.724' 7.722'
Differential pressure - bottom (kPa) 0,03
Main steam pressure (kPa gauge) 2 899.4 898.4 898.2 895.3' 895.6'" 892' 898.8' 898.3 897.6
Steam header pressure (kPa gauge) I 196.1' 196.6' 196.7 197.8' 198.2' 198' 198.5' 198.7' 195.1
Steam valve position (%) 0.1 70.0 70.0 70.0 70.0 70.0 70.0 70.0 70.0 80.0
Vapour valve position(%) 0.1 86.2' 85.9 86.0 85.9 86.3 86.2 85.7 86.0 95.9
Temperature in feed density meter ('C) 0.1 20.3 54.0' 19.5 53.9' 20.9' 53.81 54.9' 20.3" 53.1'
Temperature in concentrate line ('C) 0.1 59.2 59.5 59.1 59.5 59.2 59.9 59.3 58.1' 59.1
Feed density2 {kg m·') 0.5 996.2 1002' 996.7 1001 .. 995.8 .. 1003" 1001.5' 996.5 1002'
Concentrate density2 (kg m·') 2 981.9 997.4 983.8 996.2 1286' 999.2 998.4 1068.21 1000
Viscometer differential pressure (kPa) 0.5
'Standard deviation level (see page II). 2Uncorrected density figures (see Appendix B).

194
Table l46c: Raw Data from Experiment Sk2 Cleaning Checks. (Tube length 15, Tube diameter 48, De-aeration nozzle diameter 3.2 mm, No air bleed)
Experimental run number KRIN KCIP ~ LCIP
Third feed flow rate (kg h'1) 250.0 250.1"' 254.11 250.2"
Concentrate flow rate (kg h'1) 221.0 214.1' 149.0' 239.9
Feed temperature ex-PHE ("C) 74.5 74.6 74.1' 74.1'
Feed temperature at 3m ("C) 0.1 72.3"' 72.3 72.3 72.3 72.3'
Feed temperature at 0.3m ("C) 0.1 71.8" 71.7 71.8 71.5 71.5'
Vapour temperature (°C) 0.1 63.8 64.7& 63.2' 63.9' G Product temperature (•c) 0.1 60.7 60.8 60.4 60.6'
Steam supply temperature ("C) 0.1 65.4 64,3 63.5 64.0 .. 1 63.6
Condensate temperature c•q 0.1 62.6 62.1 61.7 62.2" 61.6
Top de-aeration line temp (°C) 0.1 63.7 62.8* 62.0' 62.9' 62.1'
Bottom de-aeration line temp ("C) 0.1 64.9 I 63.s 63.1 63.6" 63.1
Ambient temp at 15 m tube top (0 C) 0.5 26.8 26,9 28.3 30.9 31.0
Ambient temp at steam entry ('C) 0.5 29.4 30J) 31.8 32.8 32.4
Ambient temp at 15 m tube bottom (°C) 0.5 28.0 29.1 29.9 30.8 30.1
Tube-side absolute pressure (kPa) 0.05 20.01 20J)0 20.01 19.95" 19.99'
Differential pressure - entry (kPa) 0.03 4.892' 6.082. 7.5371 3.130"
Differential pressure - top (kPa) 0.03 4.787' 6.012' 7.444' 3.311' 1 3.064"
Differential pressure - bottom (kPa) 0.03
Main steam pressure (kPa gauge) 2 897.9 783.lt 889.4 893.4 896.0"
Steam header pressure (kPa gauge) 1 195.5 196.9' 195.6" 196.0' 195.5
Steam valve position (%) 0.1 80.0 70.() 70.0 70.0 70.0
Vapour valve position (%) 0.1 96.1' 86J) 86.6' 93.2' 86.8"
feed density meter ("C) 0.1 20.6 53.8*' 22.4' 20.6"' 22.0'
Temperature in concentrate line ("C) 0.1 51.8' 59.0 57.9 57.2' 58.5
Feed density1 (kg m·') 0.5 996.1 lOOt' 995.9" 99~ ity1 (kg m·') 2 1130' 999.$ 995.61 982.9 986.3
~~ - '"''' p<=m• '"'' 0.5
tandard deviation level (see page 11). ncorrected density figures (see Appendix B).

I95
I Table I47: Skim Milk Gross Composition Analysis Results.
Analysis Experiment SkO Experiment Sk1 Experiment Sk2
Powder Sample Milk ex-Silo Milk ex Silo
MP&D Analysis Code 2X40 2X47 2X71
Ash(% w/w) 8.1 0.77 0.71
Lactose(% w/w) 52.3 4.94 4.78
Total Protein(% w/w) 37.6 3.49 3.62
[TN** 6.38]
Casein(% w/w) - 2.67 2.79
[(TN-NCN&) * 6.38]
Whey Protein(% w/w) - 0.68 0.67
[(NCN-NPNu) * 6.38]
Fat(% w/w) 0.76 0.10 0.08
Moisture (% w/w) 3.6 - -
Total Solids (% w/w) - 8.95 -
*Total Nitrogen, &Non Casein Nitrogen, #Non Protein Nitrogen
Table I48 Wiegand Evaporator Concentrate Analysis Results for Experiment Sk1. . (MP Lab Code 2X47)
Sample Code Preheat Treatment Total Solids WPNI (% w/w) (mg/g)
1 95°C for 20 s 43.1 4.6
2 95°C for 20 s 47.4 4.6
3 l20°C for 180 s 45.9 1.2
4 100°C for 1 s 45.7 5.9

196
Table 149: Research Evaporator Feed and Concentrate Analysis Results for Experiment Sk1. (MP Lab Code 2X47)
Run Code Pre-heat Feed Total Concentrate Treatment Solids
Total solids WPNI (% w/w) (% w/w) (mg/g)
A 95°C for 20 s 21.0 26.9 4.0
B l20°C for 180 s 37.8 48.2 -
c 95°C for 20 s 27.9 - -
D 100°C for 1 s 27.9 35.9 -
E 95°C for 20 s 21.3 27.5 -
F 100°C for 1 s 21.7 27.9 -
G l20°C for 180 s 20.8 23.5 -
H 95°C for 20 s 21.1 27.0 -
I l20°C for 120 s 14.8 19.1 -
J 95°C for 20 s 14.3 17.9 4.2
K 100°C for 1 s 14.8 19.0 5.2
L 95°C for 20 s 21.2 27.1 -
Table 150: Wiegand Evaporator Concentrate Analysis Results for Experiment Sk2. (MP Lab Code 2X71)
Sample Code Preheat Treatment Total Solids WPNI (% w/w) (mg/g)
1 95°C for 20 s 46.0 4.7
2 95°C for 20 s 46.6 8.6?
3 l20°C for 180 s 44.5 0.7
4 100°C for 1 s 44.6 6.7

197
Table I51: Research Evaporator Feed and Concentrate Analysis Results for
Experiment Sk2. (MP Lab Code 2X71)
Run Pre-heat Treatment Feed Concentrate
Code Total
Solids Total solids WPNI
(% w/w) (mg/g)
(% w/w) 1* 2 3 1
A 95°C for 20 s 20.8 34.7 30.3 26.3 2.6
B l20°C for 180 s 27.0 43.5 34.3 38.5 0.5
c 95°C for 20 s 27.3 37.9 40.5 33.1 4.4
1.7
D l00°C for 1 s 27.5 39.7 26.7 43.4 6.3
E 95°C for 20 s 20.9 29.7 34.9 26.2 -
F l00°C for 1 s 19.9 28.3 32.9 25.0 6.1
G l20°C for 180 s 21.9 31.3 27.9 37.1 -
H 95°C for 20 s 20.4 30.2 35.3 26.8 -
I l20°C for 120 s 15.0 24.9 21.7 19.0 -
J 95°C for 20 s 14.7 24.4 . 18.6 21.0 2.7
K l00°C for 1 s 14.6 21.2 24.4 18.5 5.8
L 95°C for 20 s 20.0 26.6 30.3 35.2 -
M 95°C for 20 s 28.3 35.7 - - -
*These numbers refer to the operating condition order (see Table 30.3).

Table I52: Microbiological Results for Run 1 of SkO Experiment.
Sample Point Time Taken Standard Coliforms Yeasts & (No.) Plate Mould
Count (ml-1) (ml-1) (ml-1)
Skim silo (1) pm 4.8xl03 <1 67 13 January 92
Wiegand am 3.2xl03 <1 <1 BIT (2) 14 January 92
Wiegand am 1.6xl03 3 12 Cone (3) 14 January 92
RE feed BIT 1630 h 1.2xl03 - 51 (4) 14 January 92
0830 h 1.7xl03 - 38 15 January 92
RE cone line 1630 h 27 - <1 (5) 14 January 92
0830 h 310 - <1 15 January 92
Mesophillic Thermophillic Spore formers Spore formers
(ml-1) (mi-1)
3 <1
3 6
3 <1
- -
- -
- -
- -
(SM Lab Codes FC87-FC95)
Sulphite Thermophiles Reducing Clostridia
(ml-1) (ml-1)
<1 -
<1 -
<1 -
- <1
- <1
- <1
- 140
-\0 00

199
Table 153: Microbiological Analysis Results for Sk1 Experiment Feed Preparation and Storage. (SM Lab Codes FC165-179, FC192-203, FC219-243, FC242-243)
Sample Point Time SPC Coliforms Yeast & Thermophiles Mould
(ml-1) (ml-1) (mt-1) (ml-1)
Skim silo 1000 h 2x10⁴ 1 1 -21 January 92
Wiegand feed 1030 h 1.4x10³ <1 2 100-1000 BIT 21 January 92
Tank 2 pm 930 520 <1 100-1000 21 January 92
Medium Heat Centre Point 0615 h
22 January 92 1.7x10³ 420 6 100-1000
0700 h 2.3x10³ 510 8 4 23 January 92
0600 h 8x10³ 5x10³ 340 <1 24 January 92
Tank 3 pm 4 <1 <1 <1 High Heat 21 January 92
0615 h 9x10³ <1 1 30 22 January 92
0700 h 128 <1 2 <1 23 January 92
Tank 3 0600 h 336 9 100 <1 Low Heat 24 January 92
Tank4 pm 17 <1 <1 30 21 January 92
Low Heat 0615 h 17 1 2 100-1000
22 January 92
0700 h 430 4 . 410 10-100 23 January 92
0600 h - - - -24 January 92
Tank 5 pm 20 <1 <1 5 21 January 92
Medium Heat 0615 h 14 <1 <1 100
22 January 92
0700 h > 105 1.2x10S 5x10³ 100-1000 23 January 92
0600 h 3x10⁴ 1.9x10⁴ 2.4x10³ 9 24 January 92
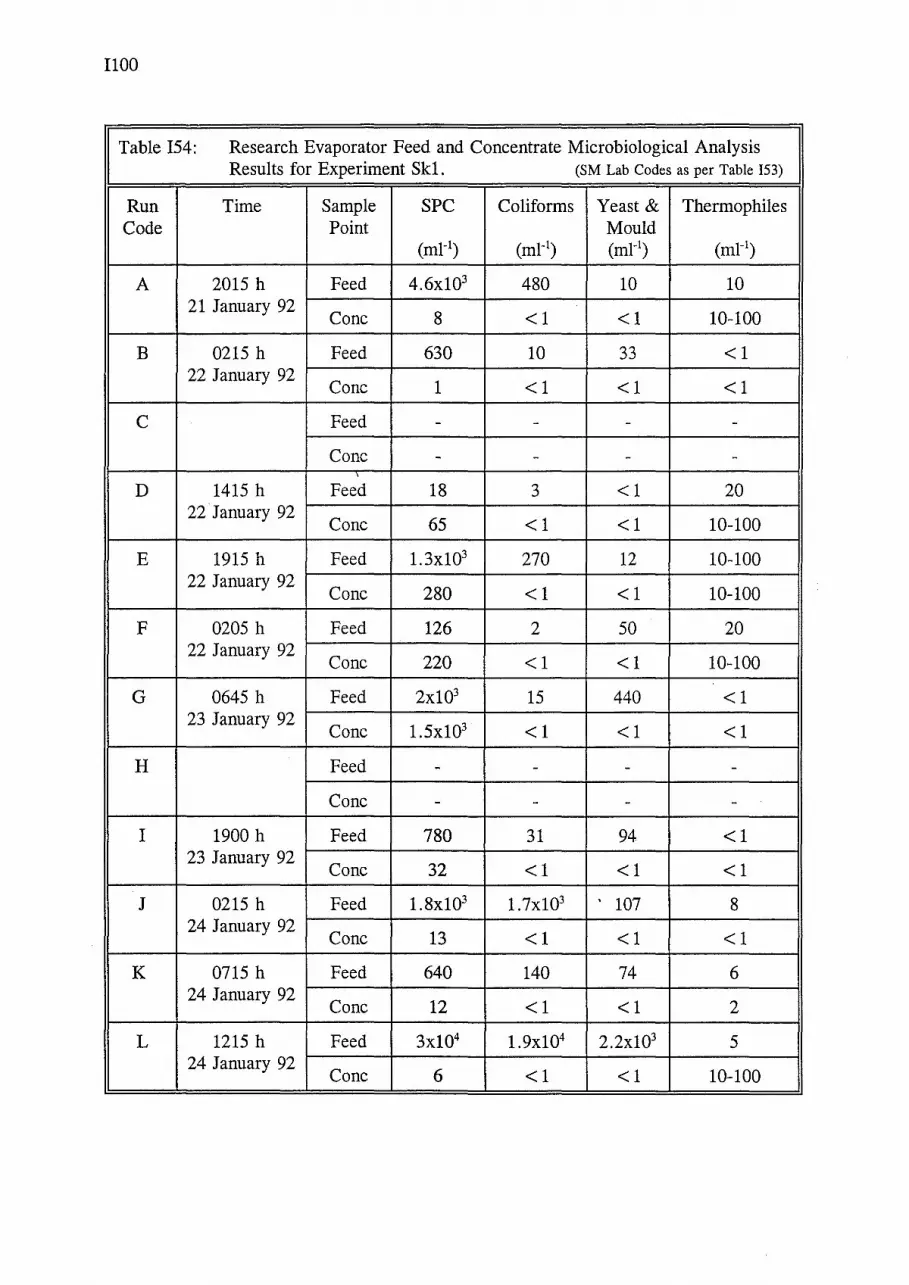
noo
Table 154: Research Evaporator Feed and Concentrate Microbiological Analysis Results for Experiment Sk1. (SM Lab Codes as per Table !53)
Run Time Sample SPC Coliforms Yeast & Thermophiles Code Point Mould
(ml-1) (ml-1) (ml-1) (ml-1)
A 2015 h Feed 4.6x10³ 480 10 10 21 January 92
Cone 8 <1 <1 10-100
B 0215 h Feed 630 10 33 <1 22 January 92
Cone 1 <1 <1 <1
c Feed - - - -
Cone - - - -
D 1415 h Feed 18 3 <1 20 22 January 92
Cone 65 <1 <1 10-100
E 1915 h Feed 1.3x10³ 270 12 10-100 22 January 92
Cone 280 <1 <1 10-100
F 0205 h Feed 126 2 50 20 22 January 92
Cone 220 <1 <1 10-100
G 0645 h Feed 2x10³ 15 440 <1 23 January 92
Cone 1.5x10³ <1 <1 <1
H Feed - - - -
Cone - - - -
I 1900 h Feed 780 31 94 <1 23 January 92
Cone 32 <1 <1 <1
J 0215 h Feed 1.8x10³ 1.7x10³ 107 8 24 January 92
Cone 13 <1 <1 <1
K 0715 h Feed 640 140 74 6 24 January 92
Cone 12 <1 <1 2
L 1215 h Feed 3x10⁴ 1.9x10⁴ 2.2x10³ 5 24 January 92
Cone 6 <1 <1 10-100

!101
Table 155: Feed Preparation and Storage Microbiological Analysis Results for Experiment Sk2. (SM Lab Codes HC43-56, HC74-85, HC112-121, HC129-131)
Sample Point Time SPC Coliforms Yeast & Thermophiles Mould
(ml-1) (ml-1) (ml-1) (ml-1)
Skim Silo 2 March 92 5.2x10³ <1 <1 <1
Wiegand feed 0700 h 3 March 92 1.1x10³ 11 <1 3 BIT
Tank 2 0405 h 4 March 92 4.5x10⁴ 7.6x10³ 690 3
Medium Heat 0400 h 5 March 92 > 105 <1 > 105 <1
Centre Point 0500 h 6 March 92 > 105 7.6x10⁴ <1 <1
Tank 3 0405 h 4 March 92 60 <1 <1 <1
High heat 0400 h 5 March 92 >105 3.5x10³ 1.9x10³ <1
0500 h 6 March 92 105 7.6x10⁴ <1 <1
Tank4 0405 h 4 March 92 1.1x10⁴ 1.4x10⁴ 280 <1
Low Heat 0400 h 5 March 92 4.6x10⁴ 104 280 <1
Tank 5 0405 h 4 March 92 1.8x10⁴ .<1 2 3
Medium Heat 0400 h 5 March 92 > 105 6 28 <1

!102
Table 156: Research Evaporator Feed and Concentrate Microbiological Analysis Results for Experiment Sk2. (SM Lab Codes as per Table ISS)
Run Time Sample SPC Coliforms Yeast & Thermophiles Code Point Mould
(ml-1) (ml-1) (ml-1) (ml-1)
A 1645 h Feed 4.8x10³ 2 35 <1 4 March 92
Cone > 106 <1 <1 <1
B 2245 h Feed 200 3 37 <1 4 March 92
Cone 1.6x10⁴ <1 1.4x10⁴ <1
c 0445 h Feed 140 <1 9 <1 4 March 92
Cone 10 <1 <1 <1
D 1045 h Feed 200 6 35 <1 4 March 92
Cone 30 <1 <1 <1
E 1645 h Feed 2.8x10⁴ 6 58 <1 4 March 92
Cone 122 <1 <1 <1
F 2245 h Feed 2.5x10⁴ 18 39 <1 4 March 92
Cone 8 <1 <1 <1
G 0445 h Feed 860 100 180 <1 5 March 92
Cone 41 <1 <1 <1
H 1045 h Feed 1.2x10³ 220 260 <1 5 March 92
Cone 40 <1 <1 <1
I 1745 h Feed 490 170 18 <1 5 March 92
Cone 80 <1 <1 <1
J 2345 h Feed 6xl03 370 50 <10 5 March 92
Cone <10 <1 <1 <10
K 0545 h Feed 1.4x10³ 46 45 <10 6 March 92
Cone 20 <1 <1 <10
L 1145 h Feed 9.3x10⁵ 1.3x10³ <1 <10 6 March 92
Cone 30 <1 <1 <10

1103
14 Data from Non-condensable Gas Experiments
The mean operating conditions for Experiment Nc2 are tabulated in Table 157. The
operating conditions immediately before and during sampling of the de-aeration lines for
each of the NCG level measurements in Experiment Nc4 are tabulated in Table 158.

--Table 157a: Raw Data from Experiment Nc2. (Tube Length 15, Tube diameter 48, De-aeration nozzle diameter 0.99 mm) ~ Experimental run number SDL' I 3 4 5 6 7 8A 8B 10 11 12 13 14 16
Feed now rate (kg lr1) 0.6 110.0 110.0 109.8 109.9 109.9 110.0 109.9 110.0 110.1 110.1 110.0 110.2 110.0 109.9
Concentrate flow rate (kg h-t) 2 88.5 72.9 88.8 88.7 93.2 84.0 84.1 85.1 84.4 69.3 88.3 88.1 104.2 87.8
Feed temperature ex-PHE ("C) 0.1 66.5 66.4 66.4' 66.4 66.3 66.3 66.2 66.2 65.9 65.6' 65.6 65.5' 65.5 65.4'
Feed temperature at 3m ("C) 0.1 62.0 62.1 62.0 62.1 62.0 62.0 62.0 62.0 62.1' 62.0 61.9 62.0 62.0 61.9
Feed temperature at 0.3m ("C) 0.1 61.7 61.7 61.7' 61.8 61.8 61.8 61.8 61.8 61.8 61.6 61.6 61.7 61.6 61.6
Vapour temperature ("C) 0.1 61.8 62.1 61.6 61.6 61.6' 61.6 61.6 61.6 61.7 62.0 61.6 61.6 61.3' 61.5
Product temperature (•C) 0.1 60.7 60.7 60.6 60.7 60.6 60.6 60.6 60.6· 60.6 60.7 60.5 60.5 60.5 60.5
Steam supply temperature ("C) 0.1 65.5 65.6 63.4 63.9 63.5' 63.9 68.3 68.2 69.0 69.1' 63.3 69.8 65.5 63.2
Condensate temperature (•C) 0.1 58.8 62.0 60.6 59.5 59.2 60.9 58.8 58.8 58.9 62.4 60.6 58.7 58.6 60.6
Top de-aeration line temp ("C) 0.1 57.9 64.2 62.1 60.4 60.0' 62.7 57.3 57.0"' 57.1 64.8 62.2 57.2 56.4' 62.2
Bottom de-aeration line temp ("C) 0.1 59.8 65.6 63.4 62.4 61.7 63.9 59.3 59.3 59.3 66.1 63.4 59.2 59.1 63.3
Ambient temp at 15 m tube lop ( 0 C) 0.5 24.1 25.4 25.4 25.3 25.8 25.7 25.6 26.1 26.5 27.6 27.8 28.3 28.7 29.2
Ambient temp at steam entrY ("C) 0.5 24.8 25.5 25.7 25.9 26.4 26.4 26.7 26.8 27.7 29.1 29.4 30.1 29.9 29.8
Ambient temp at 15 m tube bottom ("C) 0.5 24.6 25.3 25.6 25.8 26.0 25.9 26.3 26.3 26.9 27.6 27.9 28.1 28.3 28.4
Tube-side absolute pressure (kPa) 0.05 19.93 19.91 19.91 19.92 19.92 19.91 19.94 19.92 19.93 19.97 19.90 19.92 19.92 19.92
Differential pressure - entry (!cPa) 0.03 5.409 5.409 2.935 3.559 2.930 . 3.566 8.819 8.651 9.753 5.992 2.937 11.016"' 5.901"' 2.929
Differential pressure- top (kPa) 0.03 5.405 • 5.359 2.919 3.548 2.924 3.539 8.813 8.643 9.745 5.923 2.918 11.018"' 5.910" 2.909
Differential pressure - bottom (!cPa) 0.03 5,365 5.325 2.885 3.512 2.884 3.503 8.769 8.605' 9.696 5.887 2.890 10.977"' 5.882" 2.880
Main steam pressure (kPa gauge) 2 863.2 850.0 856.5' 855.7' 856.6"' 856.3' 859.4"' 858.8"' 863.3' 830.81 854.41 855.5'" 862.6"' 859.0"'
Steam header pressure (!cPa gauge) 1 645.4 640.7"' 639.0" 641.1' 642.5 642.5 636.5' 632.9" 645.9"' 638.61 642.7" 642.2' 650.9' 641.1'
Steam valve position(%) 0.1 66.0 82.5' 67.8' 67.6 61.0' 71.9' 72.0 72.0 72.0 85.2' 67.3 67.6 39.2 68.2
Vapour valve position (%) 0.1 81.3 96.8 81.0 80.8' 74.8' 85.4 85.7 85.3' 85.8 99.9 81.4' 81.3 46.6 82.0
Air bleed nozzle nominal diameter (mm) - 0.51 - - 0.20 0.20 - 0.30 0.30 0.30 - - 0.25 0.25 -1Staodard deviation level (see page II).

Table I57b: Raw Data from Experiment Nc2.
Experimental run number SOL' 17 18 19 20 21 22
Peed flow rate (kg h'1) 0.6 110.0 109.9 110.0 110.0 109.9 110.0
Concentrate flow rate (kg h'1) 2 87.7 90.1 87.9 87.3 92.0 84.7
Feed temperature ex-PHE (°C) 0.1 65.4 65.4 65.4 65.4 65.4 65.4
Feed temperature at 3m ("C) 0.1 61.9 61.9 61.9 61.9 61.9 61.9
Feed temperature at 0.3m c·c) 0.1 61.6 61.6 61.5 61.5 61.6 61.5
Vapour temperature c•c) 0.1 61.6' 61.5 61.5' 61.5 61.4 61.6
Product temperature c•c) 0.1 60.5 60.5 60.5 60.5 60.5 60.5
Steam supply temperature c•c) 0.1 63.5 63.2 63.2 63.6 63.2 63.7
Condensate temperature c•c) 0.1 59.9 59.7 60.5 59.7 59.4 60.7
Top de-aeration l~e temp ("C) 0.1 61.3 61.0 62.3 60.7 60.2 62.7 -"' - -
Bottom de-aeration line temp ('C) 0.1 62.9 62.S 63.3 62.5 62.0 63.7
Ambient temp at 15 m tube top ("C) 0.5 29.2 29.3 29.3 29.6 29.4 29.4
Ambient temp at steam entry (°C) 0.5 29.7 29.6 29.5 29.3 29.1 29.0
Ambient temp at IS m tube bottom (•C) 0.5 28.3 28.1 28.2 28.1 28.0 27.9
Tube-side absolute pressure (kPa) 0.05 19.95 19.91 19.91 19.94 19.91 19.94
Differential pressure - entry (kPa) 0.03 3.290 2.936 2.928 3.443 2.938 3.423
Differential pressure - top (kPa) 0.03 3.273 2.925 2.912 3.427 2.928 3.406
Differential pressure - bottom (kPa) 0.03 3.244 2.894 2.877 3.396 2.892 3.375
Main steam pressure (kPa gauge) 2 855.61 859.5' 864.1"' 864.5 868.9' 869.5
Steam header pressure (kPa gauge) 1 636.81 638.0' 636.0"' 641.2' 638.6 644.8'
Steam valve position (%) 0.1 68.4 65.6 68.3 68.2 63.8' 71.6
Vapour valve position(%) 0.1 82.2 79.6' 81.8 82.0 77.8' 85.3'
Air bleed nozzle nominal diameter (mm) - 0.20 0.20 - 0.25 0.25 -'Standard deviation level (see page II).
23 24
110.0 110.0
88.0 87.7
65.8 65.8
62.0 61.9 . 61.5' 61.5
61.4 61.6"'
60.5 60.5
63.2 64.2
60.6 59.4
62,1 59.6'
63.3 61.8
26.4 26.4
27.7 28.2
27.8 27.8
19.92 19.92
2.927 4.001
2.921 3.993
2.883 3.951
904.8" 9Q4,g&
645.2 644.9'
68.6 68.6
82.0 82.2
- 0.34
(Tube Length 15, Tube diameter 48, De-aeration nozzle diameter 0.99 mm)
25 26 27 28 30
110.0 110.0 110.0 110.0 110.0
96.5 8!.1 88.0 88.3 69.5
65.8 65.8 65.7 65.6 65.5
61.9 62.0 62.0 61.9 61.9
61.4 61.5 61.5 61.4' 61.4
61.1 61.5 61.3 61.4 62.1
60.5 60.5 60.5 60.5 60.7
63.1 64.2 63.2 66.8 66.8'
58.9 61.3 60.5 58.8 61.5'
58.5 63,0 62.2 57,1' 64.9 -
60,5 64.3 63.3 59.5 66.0
26.5 26.8 26.9 27.3 27.9
28.6 28.8 28.3 30.0 30.4
27.9 28.1 28.2 28.2 28.1
19.92 19.92 19.92 19.93 20.08'
2.933 3.999 2.934 7.049' 6.006
2.939 3.980 2.920 7.044 5.945
2.902 3.940 2.886 7.006 5.2681
920.1"' 912.6' 896.2"' 846.2' 938.1"'
647.8 648.2 649.1 645.3"' 650.4'
56.0" 75.2 68.2 67.9 85.1'
69.8' 89.3 82.1 81.6 99.9
0.34 - - 0.51 -
I
!
~ ....... ~

·-····-········ - -·-··- --···--·-·--·-
Table 158: Raw Data from Experiment Nc4.
NCG measurement number SDL' 1 2 3 4 5
Feed flow rate (kg h·') 0.6 115.0 114.9 110.0 109.8 50.0
Concentrate flow rate (kg h'1) 2 90.2 89.6 87.2 87.3 27.0
Feed temperature ex-PHE (•C) 0.1 60.1 60.0 66.5 66.5 70.8
Feed temperature at 0.3m (°C) 0.1 61.5 61.5 61.4
Vapour temperature (0 C} 0.1 61.2 61.2' 61.1 60.9 60.9'
Product temperature ("C) 0.1 59.7 59.7 59.9 59.9 59.8
Steam supply temperature ( •q 0.1 75.6' 15.9' 62.7 62.6 62.6
Condensate temperature ( 0 C) 0.1 60.6 60.6 60.6
Top de-aeration line temp ( •c) 0.1 60.5 60.5 61.5 61.4 61.4
Bottom de-aeration line temp (•C) 0.1 63.7" 65.2' 62.8 62.8 62.7
Ambient temp at 15m tube top (•C) 0.5 24.7 24.9 26.1
Ambient temp at steam entry ("C) 0.5 24.5 24.7 26.8
Ambient temp at 15 m tube bottom (•C) 0.5 27.4 27.7 28.5
Tube-side absolute pressure (kPa) 0.05 19.93 19.92 19.93 19.92 19.93
Differential pressure - entry (kPa) 0.03 3.495' 5.365 2.930 2.929 2.931
Differential pressure - top (kPa) 0.03 2.843 2.844 2.839
Differential pressure - bottom (kPa) 0.03 2.792" 2.790' 2.5111
Main steam pressure (kPa gauge) 2 913.5" 921.3" 922.9'
Steam header pressure (kPa gauge) I
Steam valve position(%) 0.1 82.5 82.5 64.1' 64.6' 69.7"
Vapour valve position (%) 0.1 85.9" 86.3 83.4 83.4 84.0'
De-aeration nozzle nominal diameter (mm) - 3.21 3.21 3.2 3.2 3.2
Air bleed nozzle nominal diameter (mm) - - - - -
'Standard deviation level (see page II). 'Value prior to sampling. 1Top de-aeration vent closed.
6 7 8 9
40.1 110.0 110.0 110.0
15.8 85.7 85.6 85.8
73.1 76.5 76.4 72.0
61.1' 71.5 71.5 67.2
60.7 .. 61.9 61.9 61.6
59.9 60.6 60.6 60.5
62.6 65.3 66.9' 65.6
60.9 66.6 63.9' 69.3'
61.3' 43.3' 44.6' 40.7'
62.7 64.9 64.7' 65.1
27.9" 29.2 31.3 27.1
29.7 29.7 30.8 29.0
31.9 27.1 27.8 27.1
19.92 20.00 20.00 20.01
2.930 4.784' 8.6571 5.116'
2.807" 4.803' 8.681' 5.148'
2.519 4.401' 8.2881 s.on"
936.4" 898.3" 939.0" 891.7 ..
196.7 196.5 197.4
70.3"' 70.0 70.0 70.0
84.7' 83.4" 83.6' 83.5"
3.2 3.2T 3.21 0.99T
- 0.51 -
10 II
110.0 110.0
85.5 84.5
72.0 76.5
67.3 71.5
61.9 61.8
60.5 60.4
74.41 74.6'
66.3 64.0'
37.6 40.5'
58.0' 58.9
28.5 34.1'
30.1 29.9
27.9 29.2
20.01 19.99
17.778' 18.258'
17.839' 18.282'
17.798' 18.278'
941.3" 935.2'
197.1' 196.6
70.0 70.0
83.8' 84.7'
0.99T 0.99T
0.51 0.51
(Tube Length 15, Tube diameter 48)
12
110.0
84.3
73.(/
69.0
61.5
60.4
68.5'
64.2'
59.0
59.2
37.4
32.6
31.2
20.00
9.360"
9.676'
9.372'
936.5'
197.4
70.0
84.7"
0.99
0.51
-1-' 0 0\

J1
APPENDIX J: EVALUATION OF :METHODS OF
:MEASURING NON-CONDENSABLE GASES IN
EVAPORATOR PROCESS STREAMS
Jl Abstract
J2
Ways of determining the amount and composition of non-condensable gases in the steam,
milk and condensate streams in an evaporator are discussed. A preliminary set of
methods is recommended for evaluation as a tool both for research and for commercial
plant troubleshooting.
Nomenclature
Roman Subscripts
d tube diameter (m) ID condition at wall inner surface
D shell diameter (m) leak leak stream condition
L length of tube(m) NCG non-condensable gases
m mass flow rate (kg s-1) OD condition at wall outer surface
MM molecular weight (kg moi-1) steam bulk steam condition
N mole fraction (-) vent venting stream condition
v volume (m3)
J3 Introduction
Objective
To provide a means of determining the amount of non-condensable gases (NCG) present
in evaporator process streams. The method (or methods) developed should be suitable for
both research and plant troubleshooting purposes.
Background
Falling film evaporators utilize the heat from vacuum steam condensing on the outside
of vertical tubes to evaporate water.
The performance of surface condensers for condensing steam is affected by the presence
of NCG. Lyle (1947) proposed that the NCG form a stagnant film between the bulk

J2
steam and the condensate film thus providing an extra resistance to heat transfer.
When operating under vacuum, air ingress is a problem and care has to be taken to
ensure all possible air entry points are sealed effectively.
NCG will also enter the evaporator with the feed. Ling (1963) reported that the
equilibrium dissolved gas content of milk in a commercial plant reservoir is;
Oxygen
Nitrogen
Carbon dioxide
Total
0.47%
1.29%
4.45%
6.21 % v/v
Ling (1963) states that by the application of a combination of heat and vacuum, the
amount of dissolved oxygen is reduced to negligible proportions. Presumably, the
dissolved concentration of nitrogen and carbon dioxide would be affected in a similar
manner. Thus, almost all the gases entering the evaporator with the milk will leave the
first effect in the vapour stream.
The incoming steam will include small amounts of NCG. Steam has been reported to
contain carbon dioxide and ammonia (Whirl & Lower, 1941) and air (Anon, 1943).
Patchett (1989) stated that a modem steam plant should not produce ammonia but that
carbon dioxide could be present.
Sim (1925) gives the following rule of thumb for the amount of air and vapour to be
removed to maintain a given vacuum.
Where
mvent = 0.0005 msteam + 1.3 kg h"1 (3 lb }1"1)
mvent = mass of air laden steam to be extracted in kg h-1
msteam = mass of steam condensed in kg h"1
(Jl)
This covers both the NCG in the incoming steam and air leaks. Sim claims that actual
rates can be less than 50% of the above rate. From this it appears that the amount of
NCG in the incoming steam could be as low as 0.025% w/w.
Air will be present in the calandria bodies before a vacuum is pulled. Once a vacuum is
drawn, air will be drawn in through leaks. Commercially available tight vacuum systems

J3
operating at 1 kPa (absolute) generally have the following leakage rate (Korting, 1986);
mteak = 0.4 y2t3 (12)
where m1eak is the leakage rate (kg h-1) and Vis the vessel volume (m3).
Jackson (1948) produced a table of 'estimated average air leakage' figures for various
types of fittings. Khan (1972) reports a design rate of 0.2 lb h-1/1000 ft3 of evaporator
volume for sea water evaporators.
In Appendix JA, the leakage rates are calculated using the NZDRI research evaporator's
third effect as a basis. Jackson's method gives far too high an estimate. Using
equation J2 gives a value of 0.13% mol/mol. At this rate, leakage would be the
predominant source of NCG.
Using Khan's figure gives a value of 0.00012% mol/mol. At this rate NCG from milk
and steam sources would predominate.
Air and carbon dioxide are both heavier than steam and therefore would be expected to
sink to the bottom of the calandria. However macro-effects such as turbulent eddies and
local velocities cause the steam and NCG to mix. The highest concentrations of NCG are
then found in areas where the vapour velocity is low.
The NCG should be mixed with saturated steam and thus high concentrations of air can
only occur where the local temperature is lower than the bulk temperature.
In commercial evaporators, small amounts of vapours are vented from the shell side of
each calandria to remove the non-condensable vapours. When the steam enters about half
way up the calandria, vents are placed at the top a.nd bottom of the calandria shell. When
the steam is added at the bottom, there may be only a single vent at the top. When a
single vent is used the venting rate is higher and the steam drawn off is passed through
a milk tubular pre-heater to recover the heat. Commercial venting rates for milk
evaporators are usually between 1 - 1.5% mol/mol of the steam (or milk vapour) entering
the calandria shell.
The area around where the vent lines leave the calandria is usually un-insulated. This
may be done deliberately to provide a cold spot, which would give rise to a localized
high concentration of NCG around the vent exit.
Ultra-sonic detectors are available commercially to detect small leaks but require the

J4
plant to be shutdown to ensure reliable results. Hydraulic testing is another way of
testing plant tightness but this requires extensive plant down-time.
This report proposes a means of allowing real time measurement of NCG in evaporator
process streams. Thus, both the static and dynamic aspects of the effect of NCG on the
evaporator performance can be determined.
J4 Specification
Information required to enable a complete mass balance for NCG to be obtained
The following information needs to be obtained from the method(s) developed.
(1) The mole fraction of NCG in the steam entering the calandria body .
(2) The mole fraction of NCG leaving a calandria through de-aeration lines.
(3) The local concentration of NCG at various points in the calandria shell.
(4) The mole fraction of NCG leaving in the condensate as dissolved gases (e.g.
carbon dioxide).
(5) The amount of NCG present in the milk entering the evaporator.
(6) The steam flow rate into the calandria.
(7) The condensate flow rate out of the calandria.
(8) The flow rate through the de-aeration lines.
(9) The composition of the NCG in all streams in order to establish the source(s) of
the NCG and to enable mass flow rates to be determined.
Environmental factors
To enable use for commercial plant troubleshooting, the apparatus should meet the
following requirements;
(a) The apparatus should be portable by car and preferably by air.
(b) It should be possible to check the calibration of all instruments on-site.
(c) The apparatus should not contain any substances such as mercury or glass which
are considered undesirable in a dairy processing plant environment.
(d) The apparatus should be easy to clean and sanitize so as to minimize the
possibility of carrying micro-organisms from one factory to another.
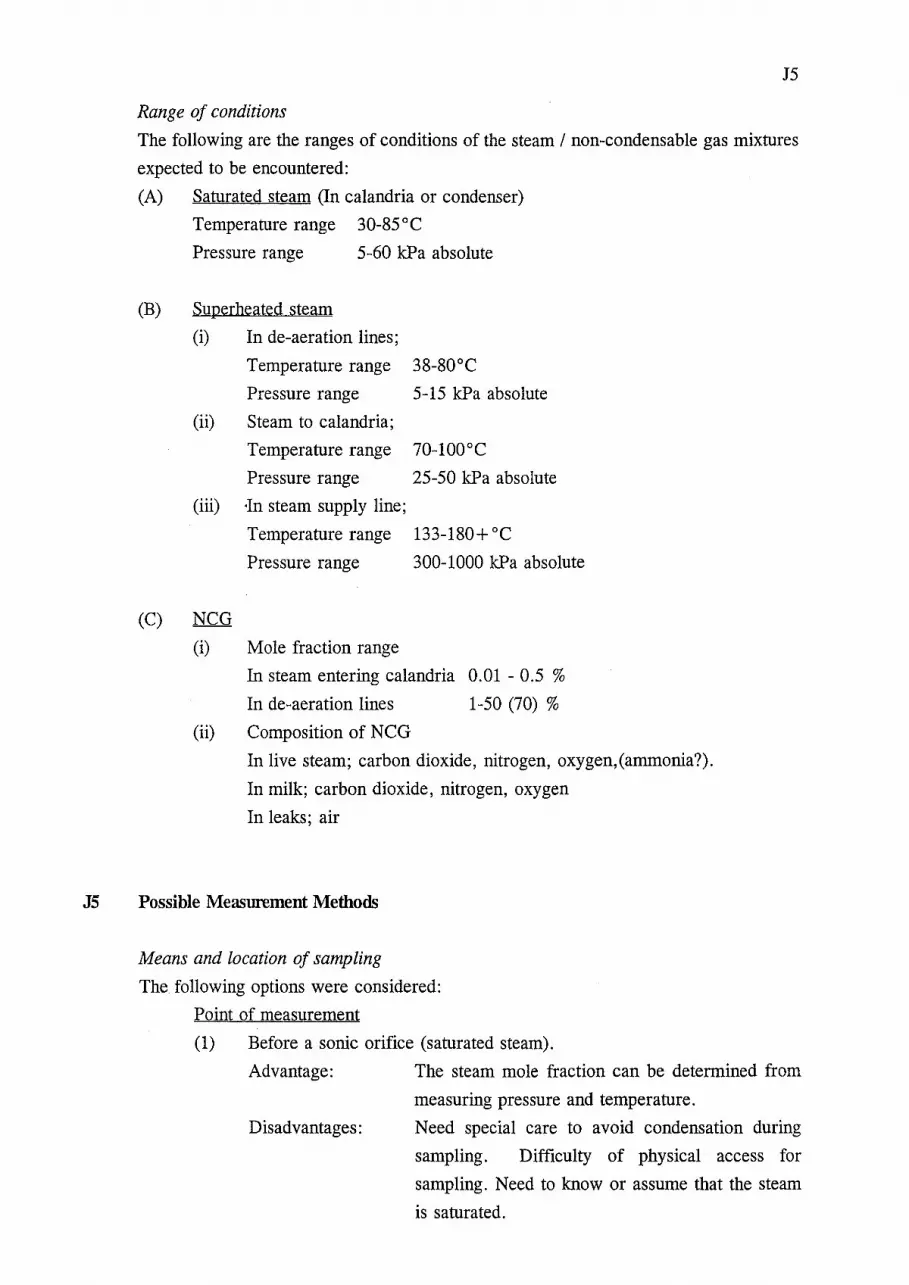
J5
Range of conditions
The following are the ranges of conditions of the steam I non-condensable gas mixtures
expected to be encountered:
(A) Saturated steam (In calandria or condenser)
Temperature range 30-85°C
Pressure range 5-60 kPa absolute
(B) Superheated steam
(i) In de-aeration lines;
Temperature range 38-80°C
Pressure range 5-15 kPa absolute
(ii) Steam to calandria;
Temperature range 70-100°C
Pressure range 25-50 kPa absolute
(iii) ·In steam supply line;
Temperature range 133-180+ oc Pressure range 300-1000 kPa absolute
(C) NCG
(i) Mole fraction range
In steam entering calandria 0.01 - 0.5 %
In de-aeration lines 1-50 (70) %
(ii) Composition of NCG
In live steam; carbon dioxide, nitrogen, oxygen,(ammonia?).
In milk; carbon dioxide, nitrogen, oxygen
In leaks; air
J5 Possible Measurement Methods
Means and location of sampling
The following options were considered:
Point of measurement
(1) Before a sonic orifice (saturated steam).
Advantage: The steam mole fraction can be determined from
measuring pressure and temperature.
Disadvantages: Need special care to avoid condensation during
sampling. Difficulty of physical access for
sampling. Need to know or assume that the steam
is saturated.

J6
(2) After a sonic orifice (superheated steam).
Advantages: Condensation during sampling is unlikely. The
mixture of steam and NCG at low pressures can be
assumed to obey the ideal gas laws. Ease of access
for sampling.
Disadvantages:
Sampling options
(1) In-line measurement.
Advantages:
Disadvantages:
Need to measure dew-point and pressure to
determine water vapour mole fraction. Low
pressures make extraction more difficult.
No sample extraction system is required.
Only a limit range of fluid properties can be
measured in line without disturbing the process.
(2) Batch sample extraction.
Advantages: Once the sample is extracted, a large number of
analyses can be done.
Disadvantages: There are difficulties involved in obtaining and
preserving a representative sample of a low
pressure steam I non-condensable gas mixture.
There would be a time delay before analysis results
are available.
(3) Continuous sample extraction.
Advantages: A number of analyses can be done on-line giving a
quick response time.
Disadvantages:
Mole fraction of NCG in steam
There are difficulties involved in analysing a stream
of a low pressure &team I non-condensable gas
mixture.
The mole fraction of NCG or conversely the mole fraction of water vapour could be
determined by a wide variety of techniques. However, only techniques which would be
suitable in a commercial plant setting are presented here.
Pressure and temperature of saturated steam
A saturated steam I non-condensable gas mixture at low pressure can be assumed
to obey Dalton's law. Thus, the partial pressure (and thence the mole fraction)

J7
of water vapour can be determined by measuring the temperature and pressure.
Using steam tables, the measured temperature can be converted to the saturation
pressure, which is the partial pressure of water vapour. Thence the mole fraction
of water vapour is determined by dividing the saturation pressure by the total
pressure.
The accuracy of this method depends on three factors;
(a) The degree to which the mixture of gases obeys Dalton's law. In practice,
at pressures less than 50 kPa (absolute) the only component present which
is likely to exhibit non-ideality is water vapour and this factor is taken into
account by use of steam tables.
(b) ·The degree to which the assumption of dry saturated steam holds. This
needs to be checked by experimentation, but it should be a reasonable
assumption for steam entering the de-aeration line.
(c) The accuracy of the pressure and temperature measurements. The
relationship between saturation temperature and saturation pressure of
steam is non-linear. The accuracy of the mole fraction determination using
pressure and temperature measurements is dependent therefore on both the
mole fraction of water and the system pressure.
The accuracy decreases as the mole fraction of water increases. Thus the method
becomes inappropriate at low levels of NCG. The accuracy decreases with
decreasing total pressure.
Temperature can be measured to ± 0,1 oc and pressure to ± 0.125 kPa
(0 - 50 kPa absolute span) using reasonably priced industrial quality instruments
(Morison, 1989).
The effect of total pressure and water mole fraction on the accuracy is shown in
Table Jl.
This method can be used in-line and could also be used to measure local
concentrations in the calandria body.

J8
Pressure and dew-point of superheated steam
A superheated steam I non-condensable gas mixture at low pressure will obey ' Dalton's law. Thus, the mole fraction of water vapour can be determined by the
same method as outlined above for saturated steam with the exception that instead
of measuring the dry bulb temperature, the dew-point temperature must be
measured.
The accuracy is this method is based on the same assumptions as that for the
temperature I pressure method for saturated steam. However the dew-point
temperature can only be measured to ± 0.3 oc and is a more expensive
measurement (Carr-Brion, 1986).
The effect of total pressure and water mole fraction on the accuracy of the
dew-point I pressure method for superheated steam is shown in Table J2.
This method could be used in a continuous extraction system.
Partial pressure measurement
Abdulhadi (1987) reported a method for measuring the amount of NCG in steam.
A sample of the steam was extracted into a previously evacuated container. The
container was trace heated to prevent condensation. The pressure and temperature
of the sampled stream were known. The sample container was then isolated from
the process and placed in a cold trap.
The partial pressure of the NCG was then measured using a McLeod vacuum
gauge. This device could measure air traces of 480- 39100 ppm. With the use
of a diaphragm type pressure sensor, a much higher level of NCG could be
measured.
A variant of this method shows great promise in two areas;
(1) To measure low concentrations of NCG where the pressure I temperature
measurement method is inaccurate.
(2) To use it as a standard method for checking the suitability of the pressure
I temperature method.

19
Table 11: Steam mole fraction determination accuracy using temperature and pressure
measurements for saturated steam.
Steam Mole Total Saturation Accuracy1 (mole %) Percent Pressure Temperature
(%) (kPa) (oC) +% -% Range %
100 40 . 75.90 0.93 1 0.53 1.46
90 40 73.38 0.81 0.51 1.33
75 40 69.12 0.65 0.47 1.12
50 40 60.05 0.39 0.38 0.77
25 40 45.76 0.17 0.24 0.41
100 . 30 69.12 0.97 0.73 1.71
90 30 L.t:. .71 0.85 0.69 1.55
75 30 62.63 0.68 0.62 1.31
50 30 53.94 0.42 0.48 0.90
25 30 40.23 0.19 0.29 0.47
100 20 .05 1.10 1.08 2.17
90 20 57.78 0.97 1.00 1.97
75 20 53.94 0.78 0.88 1.66
50 20 45.76 0.49 0.64 1.13
25 20 32.81 0.24 0.35 0.59
. 100 10 45.76 1.6:.! 1 RQ
90 10 43.71 1.45 1.73 ,...
75 10 40.23 1.20 1.47 2.67
50 10 32.91 0.79 1.01 1.81
25 10 21.02 0.42 0.51 0.93
1Assumes accuracy of saruration tempera1Ure measurement is ± 0.1 oc and accuracy of pressure measurement is
± 0.125 k:Pa.

no
Table J2: Steam mole fraction determination accuracy using temperature and pressure
measurements for superheated steam.
Steam Mole Total Saturation Accuracy1 (mole %)
Percent Pressure Temperature
(%) (kPa) (oC) +% -% Range%
100 40 75.90 1.77 1.36 3.13
90 40 73.38 1.58 1.27 2.85
75 40 69.12 1.31 1.12 2.43
50 40 60.05 0.86 0.84 1.70
25 40 45.76 0.42 0.50 0.92
100 30 69.12 1.85 1.59 3.45
90 30 66.71 1.66 1.48 3.14
75 30 62.63 1.37 1.30 2.67
50 30 53.94 0.90 0.96 1.86
25 30 40.23 0.46 0.55 1.00
100 20 60.05 2.03 1.99 4.02
90 20 57.78 1.83 1.83 3.66
75 20 53.94 1.52 1.59 3.11
50 20 45.76 1.01 1.15 2.15
25 20 32.81 0.52 0.63 1.15
100 10 45.76 2.67 2.89 5.56
90 10 43.71 2.40 2.64 5.04
75 10 40.23 2.01 2.25 4.26
50 10 32.91 1.37 1.56 2.93
25 10 21.02 0.73 0.81 1.54
'Assumes accuracy of dew point temperature measurement is ± 0.3°C and accuracy of pressure measurement is
± 0.125 kPa.

Jll
Mole fraction of NCG in liquid streams
No method has been fully considered for either condensate or milk at present, but it is
thought that perhaps a variant of the partial pressure method described above could be
used.
Composition of NCG
The composition of the NCG can not be determined in-line. A batch sample taken and
compressed up to atmospheric pressure can be run through a gas chromatograph (GC),
but this would mean that the samples could only be analyzed back at base. The Milk
Powders and Drying Section of the New Zealand Dairy Research Institute has a GC with
a column designed for measuring gases.
The vacuum pump would have to be leak-free and oil-free. A quadruple diaphragm pump
would be able to extract samples from a minimum pressure of 5 kPa (absolute) for a
reasonable price. This minimum pressure may well be too high as a cold trap would be
required before the pump. Leak proof, evaluated sample containers would be required.
The use of a train of instruments mounted on a continuous extraction line is also
possible. After measuring the dew-point, temperature, pressure of the stream, the water
vapour could be removed by a cold trap.
The NCG could then be passed through a paramagnetic device to determine the oxygen
content and through a infra-red device to determine the carbon dioxide content. Other
possible instruments which could have conceivably been used include an on-line gas
chromatograph and a mass spectrometer.
None of these devices could be purchased with the sum of money available at present.
Therefore, it is recommended that the batch sample method is pursued.
Flow rate measurement
Flow through a sonic orifice
Given the upstream pressure, the composition of the gas and the orifice diameter,
the flow through a sonic orifice can be calculated. Grace & Lapple (1951)
demonstrated that the profile of the orifice edge affected the rate of flow.
Calculations for determining the theoretical flow of steam through a sonic orifice
have been published by Murdock (1980). Johnson (1964) allowed for the real gas
properties of gases such as air on the flow through an orifice. No work has been
found on the combined flow of steam and a non-condensable gas through a sonic
orifice.

J12
Heat and mass balance
The steam flow rate into a calandria and the condensate flow rate out of a
calandria is best determined by heat and balance. This requires the following
measurements to be obtained;
Milk feed rate
Milk feed total solids
Total solids of milk entering effect
Total solids of milk leaving effect
Boiling and Condensing Temperatures
When using the research evaporator, the heat and mass balance can be done using
the mass flow rate measurements in and out of the effect.
J6 Recommendations
Measurement of temperature and pressure
A pressure transducer and a temperature probe which meet the following specifications
should be procured.
Pressure
Temperature
Span 0- 50 kPa (absolute).
Accuracy ± 0.25% of span.
Display resolution 0.1% of span.
Portable.
Span 0- 100°C
Accuracy ± 0.1% of span
Display resolution 0.1% of span.
A special fitting is required to house the temperature probe and the pressure high
pressure hose end. This fitting should be designed to allow it to be quickly connected
into a sealed fitting mounted permanently either on the calandria vent line immediately
prior to the orifice plate or on the calandria shell. The fitting should be adjustable to
allow the temperature probe end to be located in the centre of the vent line, or at an
appropriate distance from a condensing tube wall.
Measurement of partial pressure of extracted batch sample
A batch sampling system needs to be developed. It is envisaged that it would consist of
an aluminium sample container complete with electrical heat tracing, shut off valves, cold

113
trap, and a pressure transducer (Span 0 - 10 kPa). This would be connected to the
process using a double sealed Quick-Connect fitting. A vacuum pump or equivalent
would be required for container evacuation to 0.1 kPa (absolute) or better.
This method would be used for measuring the non-condensable gas mole fraction of the
steam or vapour entering the calandria as well as the amount leaving through the vent
lines.
Analysis of NCG using gas chromatograph (GC)
The GC in the Milk Powders and Drying Section would need to be set up again to
measure the gases of interest.
A set of air-tight sample containers would be required. A vacuum pump, which does not
add either oil or air, would be required to extract samples from a pressure of
5 kPa (absolute). A cold trap will be required prior to the vacuum pump to prevent
condensation <9ccurring during compression. Condensation may damage the pump and
would also contaminate the extracted sample. The use of a cold trap may reduce the
pump suction pressure below 5 kPa.
J7 Conclusions
The recommended set of apparati should provide all the information specified in
Section H3, with the possible exception of the mole fraction of dissolved gases in the
liquid streams.
J8 References
Abdulhadi M (1987). Estimation of air trace.s in steam-air mixtures subjected to
dropwise condensation. International Journal of Heat & Mass Transfer, 14,
347-351.
Anon (1943). Air in steam heated equipment. Power and Works Engineer, 38,
No. 440, 31-32.
Carr-Brion K (1986). Moisture sensors in process control. Elsevier Applied Science
Publ, London.

114
Grace H P & Lapple C E (1951). Discharge coefficients of small-diameter orifices and
flow nozzles. Transactions of the American Society of Mechanical Engineers, 73,
639-647.
Jackson D H (1948). Selection and use of ejectors. Chemical Engineering Progress, 44,
5, 347-352.
Johnson R C (1964). Calculations of real-gas effects in flow through critical-flow
nozzles. Journal of Basic Engineering, Trans. ASME Series D, 86, 519-526.
Khan R A (1972). Effect of noncondensables in sea water evaporators. Chemical
Engineering Progress, 68, 7, 79-80.
Korting (1986). Korting Reference Data for Application of Jet Ejectors and Vacuum
Processing. Publication A1, Korting Hannover AG, Hannover.
Ling E R (1963). A Text-Book of Dairy Chemistry Vol. 1 - Theoretical, 3rct edn.,
Chapman & Hall, London, 64-65.
Lyle 0 (1947). The Efficient Use of Steam. His Majesty's Stationery Office, London,
276-286.
Morison K R (1989). Personal communication. Engineering Services Section, New
Zealand Dairy Research Institute, Palmerston North.
Murdock J W (1980). Calculation of the Theoretical Critical Flow Rate of Saturated
Steam. Paper I American Society of Mechanical Engineers, Power Test Codes
Div. No. 80-WA/PTC-3.
Patchett R J (1989). Personal communication. Engineering Services Section, New
Zealand Dairy Research Institute, Palmerston North.
Sim J (1925). Steam Condensing Plant. Blackie & Son, London, 37.
WhirlS F & Lower W A (1941). Experimental methods for determining conductivity
corrections for dissolved gases in steam condensate. Proceeding of the American
Society of Testing Materials, 1277-1284.

115
Appendix JA: Estimates of Air Leakage.
Basis:
Calandria: 15 m long, 1 x 50 mm ~ tube in 100 mm ~ shell.
Has one valve, three small screwed fittings, one flanged fitting,
one sight glass and one relief valve.
Steam flow rate:
Vent rate (total):
36 kg/h [U = 2000 W m-2 K 1]
1 mole percent of incoming steam flow
rate.
(1) Using Korting (1986) equation (Equation J2):
mleak = 0.4 y%
0.4 [:(vi, d~n) r = 0.4 [: {0.12
_ 0.052) r
= 0.0794 kg h -l
Mole fraction of NCG, Ng(1)
m MMH.o N (1);::: ~X 2
8 msteam MMair
0.0794 18 ::::: x-36 29
r::: 0.0014 = 0.14% molfmol
(2) Using table of leakage rates (Jackson, 1948) for each
fittings listed above;
Total leakage = .5 + 3 * .1 + .5 + 1 + 2 = 4.3 lb h-1
= 2 kg h-1
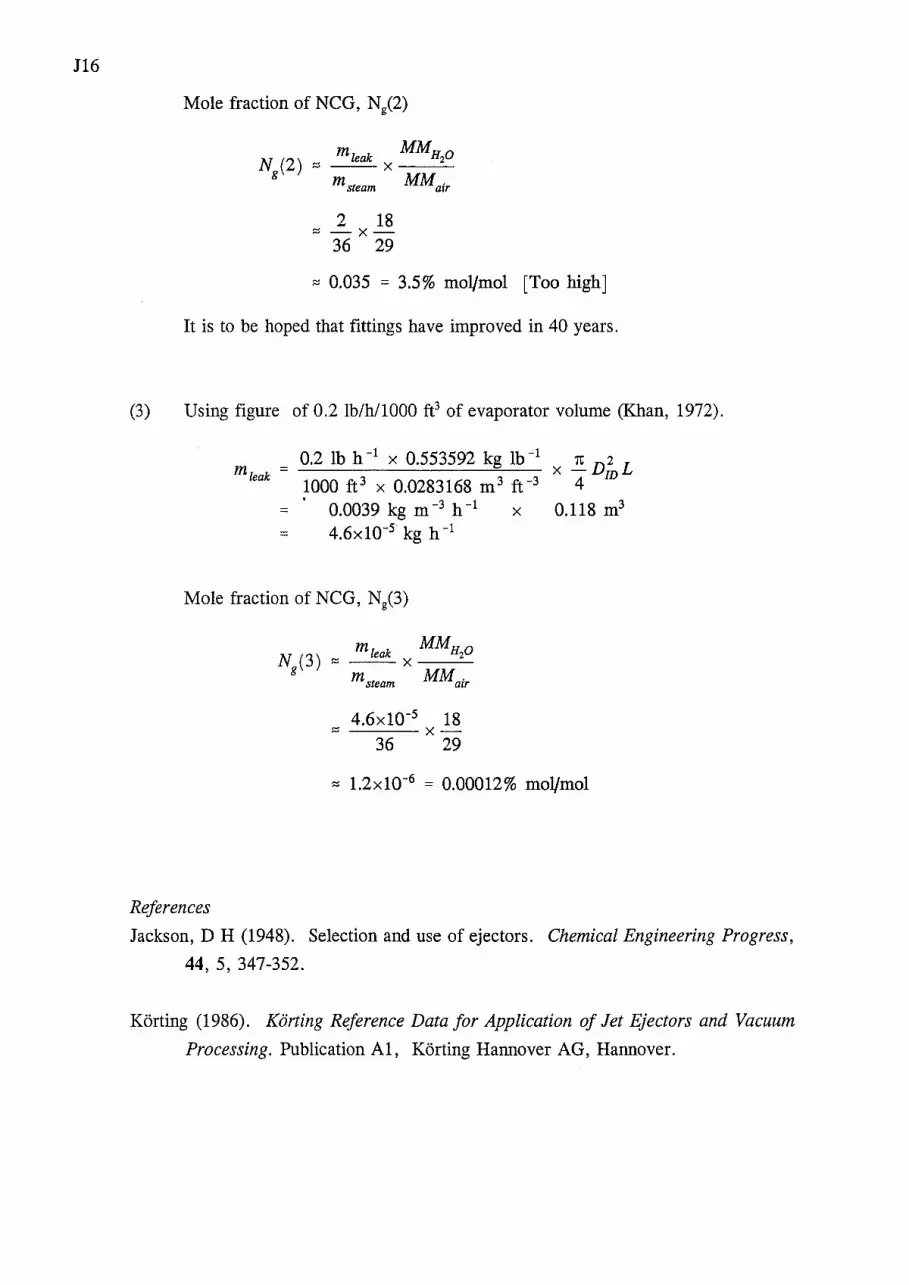
116
Mole fraction of NCG, Ng(2)
MM mleak HzO
::::--x---m steam MM air
2 18 :::::-x-
36 29
::::: 0.035 = 3.5% molfmol [Too high]
It is to be hoped that fittings have improved in 40 years.
(3) Using figure of 0.2 lb/h/1000 fe of evaporator volume (Khan, 1972).
mleak = 0.2 lb h -1 X 0.553592 kg lb -1
1000 ft 3 x 0.0283168 m 3 ft -3
= · 0.0039 kg m -3 h -1 x = 4.6x10⁻⁵ kg h -1
Mole fraction of NCG, Ng(3)
mleak MMHo ::::--X 2
m steam MM air
4.6x10⁻⁵ 18 x-
36 29
1t 2 X -DIDL
4
0.118 m3
::::: 1.2x10-6 = 0.00012% molfmol
References
Jackson, D H (1948). Selection and use of ejectors. Chemical Engineering Progress,
44, 5, 347-352.
Korting (1986). Korting Reference Data for Application of Jet Ejectors and Vacuum
Processing. Publication A1, Korting Hannover AG, Hannover.

Kl
APPENDIX K: IN-LINE MEASUREMENT OF
TEMPERATURE AND PRESSURE
K1 Abstract The use of in-line pressure and temperature measurements for the determining the
mole fraction of non-condensable gases in steam flowing through an evaporator
de-aeration line was critically evaluated. Calculations were carried out to determine
the likely degree of error in the temperature and pressure measurements. The results
obtained indicate that the technique was suitable for use on the NZDRl Research
Evaporator. The method is unsuitable for commercial evaporators due to high de
aeration line velocities.
This appendix was prepared as an NZDRl internal report. The nomenclature used
in this appendix is different from that used in the rest of this work.

K2
K2 Nomenclature
Roman a A Bi c
cpitot
<fulffi d D g Gr h k ko L Lo Ln M n
p Pr q r ReF R Reng
Re. Re0
t T u v
Greek 6 13
y 8p 8T 8
f.t v p 't
$
sonic velocity (m s·1)
probe surface area (m2)
Biot number function of Reynolds number defined in Equation KCl pitot coefficient probe diameter (mm) probe diameter (m) tube diameter (m) acceleration due to gravity (m s·2)
Grashof number film heat transfer coefficient (W m·2 K 1
)
probe conductivity (W m·1 K 1)
constant defined in equation Kl probe length (m) characteristic length of probe (m) tube length (m) Mach number function of Reynolds number defined in Equation KCl absolute pressure (Pa) Prandtl number heat flow (W) probe radius (m) recovery correction factor resistance (W m-4 K 1
)
engineering gas constant (J kg-1 K 1)
probe Reynolds number tube Reynolds number time (s) temperature (K) velocity (m s·1)
probe volume (m3)
inverse of absolute temperature (K1)
ratio of orifice diameter to tube diameter adiabatic exponent decrease in static pressure (Pa) temperature difference (K) emissivity of probe dynamic viscosity (kg m·1 s·1
)
kinematic viscosity (m2 s·1)
density (kg m·3)
time constant of probe (s) factor defined in equation K4
Subscripts 0 position in calandria shell near
1
latm lD 2 3
de-aeration line entry (see Figure Kl) position in the de-aeration line upstream of the orifice (see Figure Kl) At atmospheric pressure one dimensional within the orifice (see Figure Kl) position in the de-aeration line downstream of the orifice (see Figure Kl) bulk gas condition
a ambient condition comp compressible conv convection D tube e error component eff effective f condition in liquid (film) fg change of phase at constant pressure g gas condition i initial condition I indicated ID internal m measured OD external rad radiation s system condition st static component sen sensor t total (sum of static and dynamic) v dynamic or velocity component w wall condition
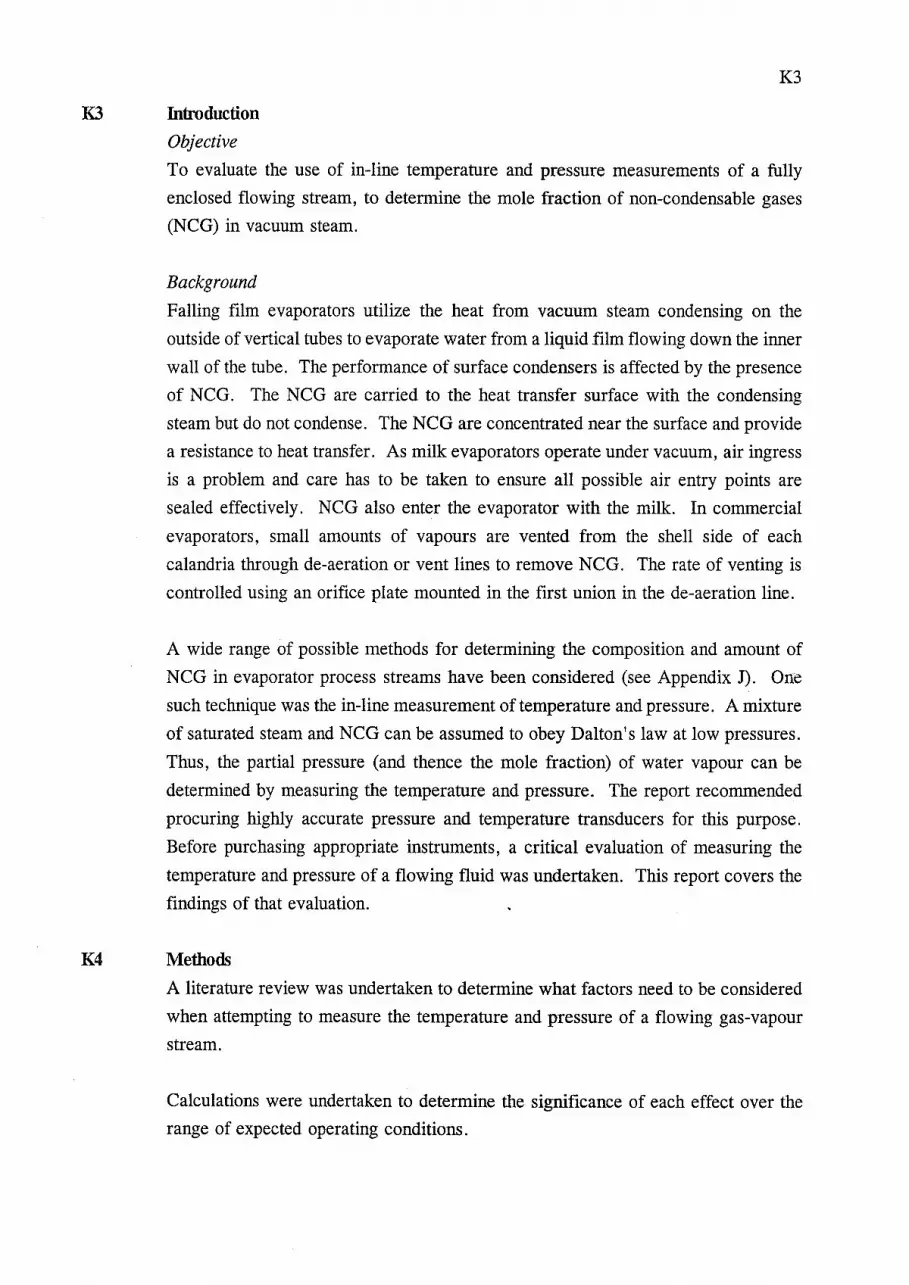
K3
K3 Introduction Objective
To evaluate the use of in-line temperature and pressure measurements of a fully
enclosed flowing stream, to determine the mole fraction of non-condensable gases
(NCG) in vacuum steam.
Background
Falling film evaporators utilize the heat from vacuum steam condensing on the
outside of vertical tubes to evaporate water from a liquid film flowing down the inner
wall of the tube. The performance of surface condensers is affected by the presence
of NCG. The NCG are carried to the heat transfer surface with the condensing
steam but do not condense. The NCG are concentrated near the surface and provide
a resistance to heat transfer. As milk evaporators operate under vacuum, air ingress
is a problem and care has to be taken to ensure all possible air entry points are
sealed effectively. NCG also enter the evaporator with the milk. In commercial
evaporators, small amounts of vapours are vented from the shell side of each
calandria through de-aeration or vent lines to remove NCG. The rate of venting is
controlled using an orifice plate mounted in the first union in the de-aeration line.
A wide range of possible methods for determining the composition and amount of
NCG in evaporator process streams have been considered (see Appendix J). One
such technique was the in-line measurement of temperature and pressure. A mixture
of saturated steam and NCG can be assumed to obey Dalton's law at low pressures.
Thus, the partial pressure (and thence the mole fraction) of water vapour can be
determined by measuring the temperature and pressure. The report recommended
procuring highly accurate pressure and temperature transducers for this purpose.
Before purchasing appropriate instruments, a critical evaluation of measuring the
temperature and pressure of a flowing fluid was undertaken. This report covers the
findings of that evaluation.
K4 Methods
A literature review was undertaken to determine what factors need to be considered
when attempting to measure the temperature and pressure of a flowing gas-vapour
stream.
Calculations were undertaken to determine the significance of each effect over the
range of expected operating conditions.

Calandria shell
(Point 0) I I I I I •
Saturated steam at P0, T0 u0~ 0
I Lo ~ .,
(Point 1 J (Point 2) (Point 3) I \ I I \ · I I \ d I 1 \\ orifice 1
DID • ~_L/ I p T "" -:1I_ • st3' 3
~ pst1' pt1' Tst1' Tt1' u1 PSt2' pt2' TSt2' Tt2' u2 A,=~ ID,~ ~ (d.,,,,.}'
\
, ( Orifice1 plate
De-aeration line
Figure Kl: De-aeration Line Entry Section (Graphics by Maria Wind, NZDRI).
~

K5
K5 Problem Definition
Specific process variable requirements
To determine the mole fraction of NCG using Dalton's law, the saturation
temperature and pressure of the gas-vapour mixture is required to be measured at one
specific point.
In Appendix J it was recommended that in order to obtain the mole fraction of NCG
with a reasonable degree of accuracy, the accuracy limits for the two measurements
should be;
Saturation temperature;
Saturation pressure;
± 0.1 oc (Range 0 - 100°C)
± 0.125 kPa (Range 0- 50 kPa (absolute))
The confidence limits for the accuracy figures were not given but should be greater
than 99% ..
Description of de-aeration line entry section
Physical description
The detail of the de-aeration line entry section is shown in Figure K1. For the
purposes of evaluation, a line diameter, Dm, of 22 mm and an entry section length,
LD, of 50 nun (between the calandria shell and the orifice plate) were chosen. These
dimensions are those of the de-aeration lines on the NZDRI Research Evaporator and
are approximately the same as the de-aeration lines on the W aitoa Powder
Development Centre Evaporator.
Range of operating conditions
The ratio of the orifice diameter over the tube diameter, ~ can vary between 0. 09
and 1. That is, for a 22 mm diameter tube, the orifice diameter can vary between
2 and 22 nun. This covers the range of~ us~d on the NZDRI Research Evaporator
and on the Waitoa Powder Development Centre Evaporator. It should be noted that
in commercial plants, ~ will be usually between 0.4 and 1.
The effect of orifice size on the upstream velocity is shown later in Table K2. The
calandria shell-side absolute pressure, p0 can vary between 0.12 and 0.6 kPa. The
static absolute pressure downstream of orifice, Pst3 can vary between 0.07 and
0.15 kPa. The ratio of the orifice downstream static pressure, Pst3 over the calandria
shell-side pressure, p0 can vary between 0.12 and 0.6. As the critical pressure ratio
for sonic flow of steam is approximately 0.58 (for y = 1.129) the sonic flow
equations will not hold for all possible operating conditions.

K6
Surface condensation rate
The heat loss from the surfaces of the tube upstream of the orifice have been
estimated (see Appendix KA). The amount of condensation occurring is negligible
and therefore the composition of the gas-vapour mixture can be considered to remain
constant throughout the length of the de-aeration line entry section.
K6 Temperature Measurement in Moving Fluids
Temperature definitions
The following gas temperature definitions come from Benedict (1984, p203).
"1. Static temperature, Tst' This is the actual temperature of the gas
at all times (in motion or at rest). It has been considered as a
measure of the average random translational kinetic energy of the
molecules. The static temperature will be sensed by an adiabatic
probe in thermal equilibrium and at rest with respect to the gas.
2. Dynamic temperature, Tv. The thermal equivalent of the directed
kinetic energy of the continuum is known as the dynamic
temperature.
3. Total temperature, Tt. This temperature is made up of the static
temperature plus the dynamic temperature of the gas. The total
temperature will be sensed by an idealized probe, at rest with
respect to the system boundaries, when it stagnates an idealized
gas."
Factors which affect temperature measurement
In practice the temperature of a real gas has to be mea_sured using a real probe. The
factors which affect temperature measurement are: thermometer heat capacity, probe
stem losses, velocity effects, radiation errors, thermal lag and the type of
thermometer
These are now considered in more detail with regard to the measurement of
temperature in a de-aeration line entry section.
Effect of probe heat capacity on system temperature
When a temperature probe is inserted into a closed system, the probe will either pick
up or lose heat until the probe and the system are at the same temperature.
Obviously for a closed system where no heat is added or removed, the insertion of

K7
a temperature probe will change the system temperature. The amount the
temperature changes depends on the relative heat capacity of the probe and the
system. The de-aeration line entry section is not a closed system as fresh steam is
being continuously supplied from the calandria. Thus, the probe's heat capacity will
not affect the temperature measurement in the manner described above.
Probe stem losses
Where the system is warmer than the surroundings, there will be a continuous flow
of heat along the stem of an inserted probe to the surroundings. Nicholas & White
(1982, p136) derived the following equation for determining whether the immersion
depth is sufficient.
Where:
(K1)
is the temperature error,
Ts is the system temperature,
Ta is the ambient temperature,
ko is a constantl always less than 1,
L0 is a constant called the characteristic length of the probe
(usually approximately equal to the diameter of the probe),
and,
L is the length of the probe.
The maxmmm temperature error for various values of L/L0 calculated using
Equation Kl is tabulated in Table K1. To ensure that the effect of stem losses is
insignificant when a temperature measurement accuracy of± 0.1 oc is required, the
probe length must be at least 8 times the probe diameter.
~is actually dependent on the conductivity of the probe, and the heat transfer rate between the system and the probe and between the probe and ambient.

K8
Table K1: Maximum temperature
errors due to stem losses.
L/L0 Maximum Temperature
Error (°C)
1 -23.91
2 -8.80
3 -3.24
4 -1.19
5 -0.44
6 -0.16
7 -0.06
8 -0.02
9 -0.01
10 -0.003
Basis: T, = 85°C, T. = zooc, ko = 1
Effect of fluid velocity
Nicholas & White (1982, p146) give the following equation for calculating the
dynamic temperature.
u2 T =-
v 2 c Pt
(K2)
Where u is the fluid velocity (m s-1) and Cpr is the fluid heat capacity (J kg-1 K-1).
The dynamic temperature for a number of different gas-vapour flow rates is shown
in Table K2. The NZDRI Research Evaporator will have low ~values ( < 0.13) and
therefore Tv will be insignificant. For commercial plants (see Section K5), however,
~ values will be in the range 0. 4-1 and Tv must be allowed for.
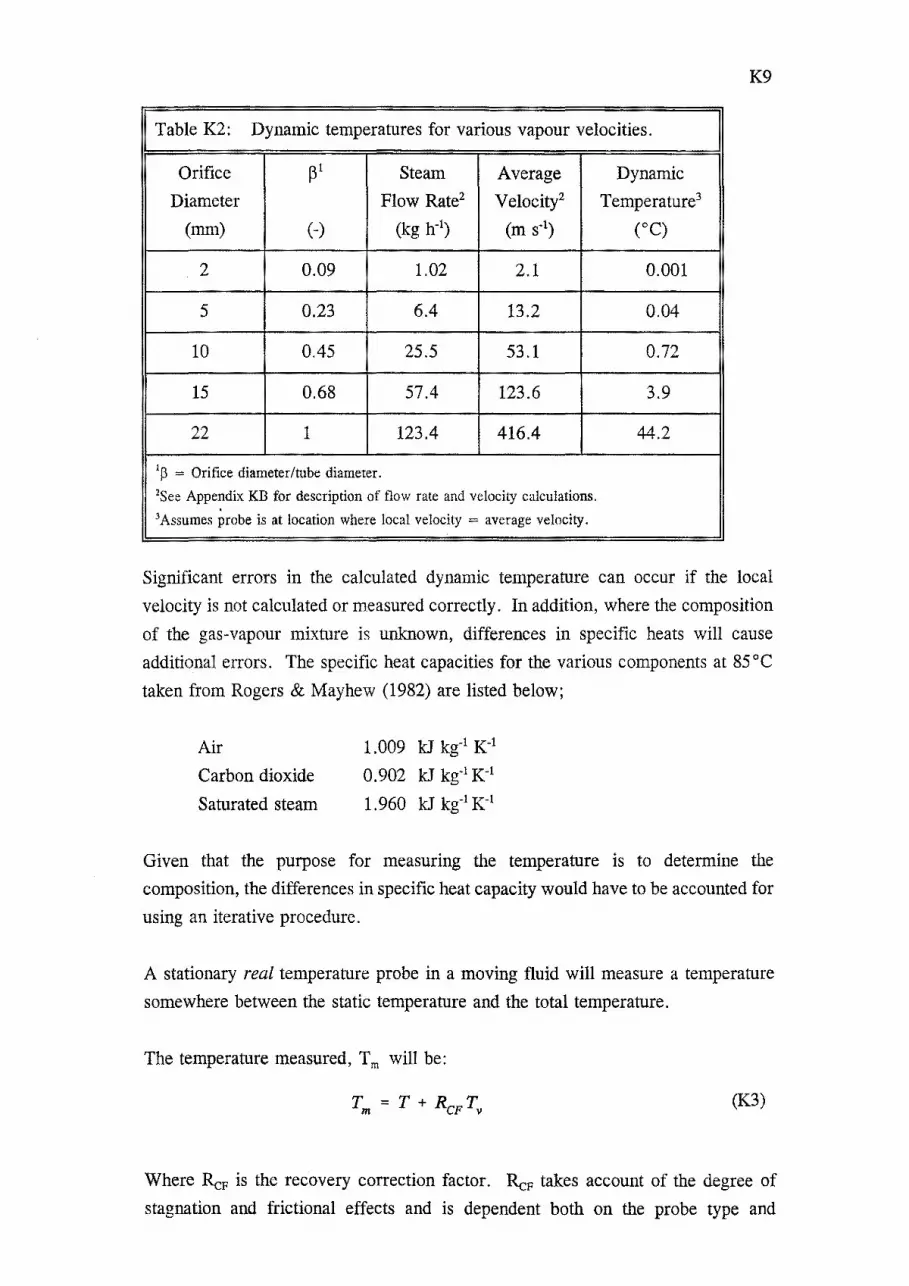
K9
Table K2: Dynamic temperatures for various vapour velocities.
Orifice pl Steam Average Dynamic
Diameter Flow Rate2 Velocity2 Temperature3
(mm) (-) (kg h-1) (m s-1) (oC)
2 0.09 1.02 2.1 0.001
5 0.23 6.4 13.2 0.04
10 0.45 25.5 53.1 0.72
15 0.68 57.4 123.6 3.9
22 1 123.4 416.4 44.2
1p = Orifice diameter/tube diameter. 2See Appendix KB for description of flow rate and velocity calculations. 3 Assumes probe is at location where local velocity average velocity.
Significant errors in the calculated dynamic temperature can occur if the local
velocity is not calculated or measured correctly. In addition, where the composition
of the gas-vapour mixture is unknown, differences in specific heats will cause
additional errors. The specific heat capacities for the various components at 85°C
taken from Rogers & Mayhew (1982) are listed below;
Air
Carbon dioxide
Saturated steam
1.009 kJ kg-1 K 1
0.902 kJ kg-1 K 1
1.960 kJ kg-1 K 1
Given that the purpose for measuring the temperature is to determine the
composition, the differences in specific heat capacity would have to be accounted for
using an iterative procedure.
A stationary real temperature probe in a moving fluid will measure a temperature
somewhere between the static temperature and the total temperature.
The temperature measured, Tm will be:
(K3)
Where ReF is the recovery correction factor. ReF takes account of the degree of
stagnation and frictional effects and is dependent both on the probe type and

KlO
geometry and on gas properties. Values of ReF can range between 0.6 and 0.99
(Nicholas & White, 1982, p147). So for probes measuring temperature in medium
to high velocity gas streams, it would be essential to determine ReF experimentally.
Another problem would be estimating the true local velocity accurately. A small
error in velocity would cause a large error in Tv.
Thennal radiation losses
Nicholas & White (1982, p144) give the following equation for estimating the
maximum temperature error due to radiation:
e<f>dmm T = - (T T )
e 1 + eA.d g w 'V mm
where T e is the temperature error,
e is the emissivity of the probe,
dmm is the probe diameter (in mm),
Tg is the gas temperature,
Tw is the tube wall temperature, and,
~ is a factor (dependent on the gas velocity, the probe diameter
and the wall temperature).
(K4)
The temperature error due to radiation for various levels of gas velocity is shown in
Table K3. For a 3 mm diameter probe the error is insignificant for gas velocities
above 10m s-1•
Table K3: Maximum temperature error due to radiation.
Average Vdmma ~b Radiation
Velocity Temperature Error
(m s-1) (oC)
2.1 6.30 4.00e-3 -0.031
13.2 39.6 l.OOe-3 -0.008
53.1 159.3 7.00e-4 -0.005
123.6 370.8 5.00e4 -0.004
416.4 1248.9 l.OOe-4 -0.0008
Basis: T, 85°C, Tw = 50°C, dmm = 3 mm, s = 0.074 (Polished Stainless Steel)
•Assumes probe is at location where local velocity = average velocity
bFrom Figure 8.10 of Nicholas & White (1982).
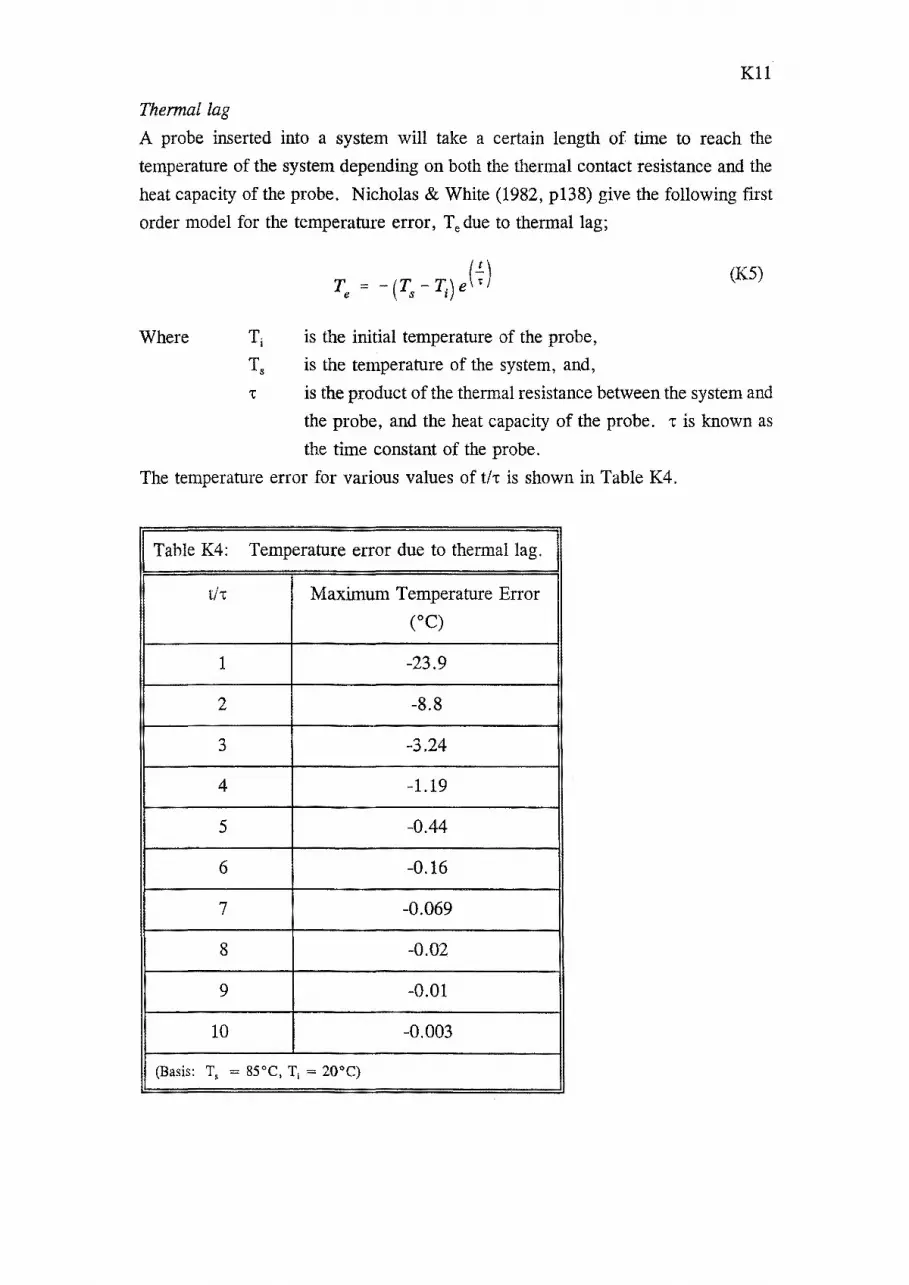
Kll
Thermal lag
A probe inserted into a system will take a certain length of time to reach the
temperature of the system depending on both the thermal contact resistance and the
heat capacity of the probe. Nicholas & White (1982, p138) give the following first
order model for the temperature error, Te due to thermal lag;
Where
T = - (T - T.) e ( ~) e s 1
(K5)
is the initial temperature of the probe,
Ts is the temperature of the system, and,
-c is the product of the thermal resistance between the system and
the probe, and the heat capacity of the probe. -r is known as
the time constant of the probe.
The temperature error for various values of t/'t is shown in Table K4.
K4: Temperature error due to thermal lag.
t/'t Maximum Temperature Error
(oC)
1 -23.9
2 -8.8
3 -3.24
4 -1.19
5 -0.44
6 -0.16
7 -0.069
8 -0.02
9 -0.01
10 -0.003
(Basis: T, = ssoc, T1 2QOC)

K12
The ideal model for the time constant, 1: is;
Pw "(;ideal h = A
(K6)
Where h is the film heat transfer coefficient,
V is the probe volume,
A is the probe surface area,
Pw is the probe wall density, and,
Cpw is the probe heat capacity.
The above equation is based on the following assumptions (Benedict, 1984, p265).
1. All the resistance to heat transfer is in the surface film.
2. All the thermal capacitance is in the probe.
3. All the heat received through convection is stored in the probe.
4. The heat transfer is one dimensional.
The Biot number, Bi is used to determine the relative magnitude of the film
resistance to the sensor resistance.
(K7)
Where: r is the probe radius,
kw is the probe conductivity, and,
h is the film heat transfer coefficient.
For Bi < 0.2 the above model for 't is reasonable (Benedict, 1984, p267), but for
Bi > > 0.2 the conductivity of the probe should be taken into account.
By assuming the probe is a hollow cylinder (containing a temperature sensing
element) Benedict (1984, p268) determined the following overall heat transfer
coefficient which he called the effective film coefficient, ~rr
1 1 h + RsenAsen
(k8)
Where
(K9)
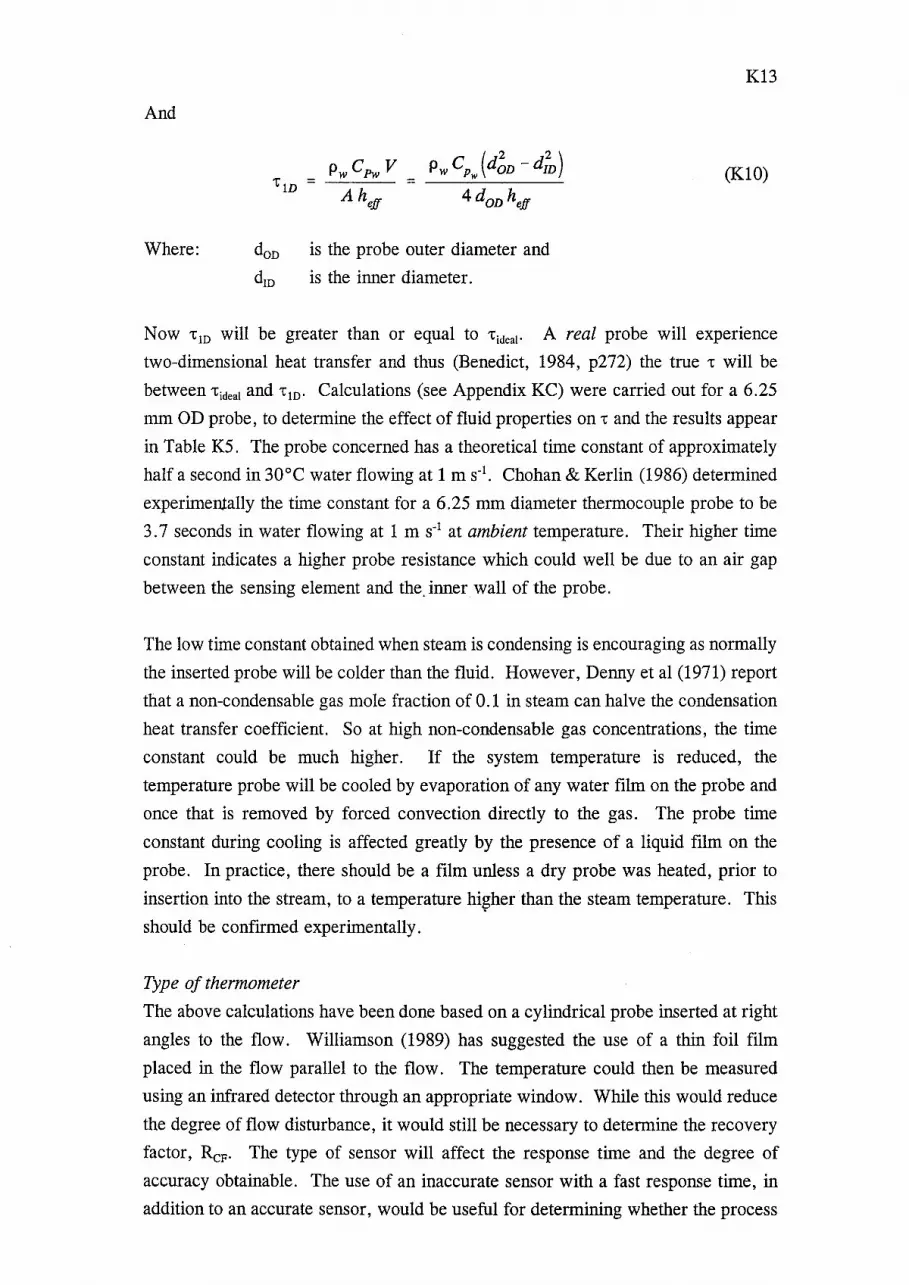
And
Where:
't'lD =
is the probe outer diameter and
is the inner diameter.
K13
(KlO)
Now 'tm will be greater than or equal to 'tideat· A real probe will experience
two-dimensional heat transfer and thus (Benedict, 1984, p272) the true 't will be
between 'tideat and 'tm. Calculations (see Appendix KC) were carried out for a 6.25
mm OD probe, to determine the effect of fluid properties on 't and the results appear
in Table K5. The probe concerned has a theoretical time constant of approximately
half a second in 30°C water flowing at 1 m s-1• Chohan & Kerlin (1986) determined
experimentally the time constant for a 6.25 mm diameter thermocouple probe to be
3.7 seconds in water flowing at 1m s-1 at ambient temperature. Their higher time
constant indicates a higher probe resistance which could well be due to an air gap
between the sensing element and the. inner wall of the probe.
The low time constant obtained when steam is condensing is encouraging as normally
the inserted probe will be colder than the fluid. However, Denny et al (1971) report
that a non-condensable gas mole fraction of 0.1 in steam can halve the condensation
heat transfer coefficient. So at high non-condensable gas concentrations, the time
constant could be much higher. If the system temperature is reduced, the
temperature probe will be cooled by evaporation of any water film on the probe and
once that is removed by forced convection directly to the gas. The probe time
constant during cooling is affected greatly by the presence of a liquid fllm on the
probe. In practice, there should be a film unless a dry probe was heated, prior to
insertion into the stream, to a temperature hi~her than the steam temperature. This
should be confirmed experimentally.
Type of thermometer
The above calculations have been done based on a cylindrical probe inserted at right
angles to the flow. Williamson (1989) has suggested the use of a thin foil film
placed in the flow parallel to the flow. The temperature could then be measured
using an infrared detector through an appropriate window. While this would reduce
the degree of flow disturbance, it would still be necessary to determine the recovery
factor, ReF· The type of sensor will affect the response time and the degree of
accuracy obtainable. The use of an inaccurate sensor with a fast response time, in
addition to an accurate sensor, would be useful for determining whether the process

K14
was operating at a steady-state condition.
Table K5: Effect of fluid properties on the time constant.
Fluid Properties h ~ff · 'tideal 'tm
(W' m-2Kl) (W' m-2K-t) (s) (s)
Water 30°C 1 m s-1 8513 4925 0.39 0.67
Saturated steam condensing @ 85 oc 20383 7426 0.16 0.45
Water film boiling at 85°C 1464 1301 2.3 2.5
Air 50°C 30 m s-1 234 - 14 (14)
Air 50°C 2 m s-1 58 - 147 (147)
Cooling of dry probe using saturated
steam@ 85°C at: (a) 2m s-1 40 - 213 (213)
(b) 30m s-1 151 - 56
Summary of temperature measurement errors
Each of the above factors has been considered in determining the overall error in
temperature measurement in the following situations:
On NZDRI Research Eyaporatm:
During the work on the NZDRI Research Evaporator, two orifice diameters were
used (0.99 & 3.2 mm). Under these conditions with a permanently mounted probe,
the effect of probe heat capacity, fluid velocity and thermal lag are insignificant or
irrelevant. If a 3 mm diameter probe had been inserted into the entry section say 15
mm then the stem loss error would have been -0.44°C. This could have been
reduced to -0.003 oc by modifying the entry section Fo allow a probe length of 30
mm. However, an insulated surface probe was used to minimise flow disturbances
and plant modifications and the expected error in measurement was less than 0.1 °C.
In commercial plants
In commercial plants the velocity in the de-aeration line entry section is considerably
higher (see Section K5) and thus the dynamic temperature is significant. To avoid
problems with measuring the dynamic temperature, the static temperature (or surface
temperature) should be measured. This can be measured to within 0.1 o C.
(56)

K7 Pressure Measurement in Moving Fluids
Pressure definitions
The following pressure definitions are taken from Benedict (1984, p335).
1. "Static (or stream) pressure, Pst is the actual pressure of the fluid
whether in motion or at rest. In principle, it can be sensed by a small
hole drilled perpendicular to and flush with the flow boundaries so
that it does not disturb the fluid in any way. "
2. "Dynamic (or velocity) pressure, Pv is the pressure equivalent of the
directed kinetic energy of the fluid when the fluid is considered as a
continuum. "
3. "Total (stagnation, impact, or pitot) pressure, Pt is the sum of the
static and the dynamic pressures. It'can be sensed by a probe that is
at rest with respect to the system boundaries when it locally stagnates
the fluid isentropically (i.e., without losses and without heat
transfer)."
Dynamic pressure measurement
K15
For a perfect gas undergoing an isentropic process, where y is the ratio of specific
heats:
( Pt _ Pst l = (_I_=._!) u
2
Pt Pst Y 2 comp
(Kll)
By introducing the Mach number (u(yRTt'h) this can be approximated using a
binomial series.
(K12)
Values of y for saturated steam are tabulated in Table K6.
Dynamic pressures for steam which was saturated at 85 oc prior to entering the
de-aeration line over the subsonic velocity range are tabulated in Table K7. Now,
if a differential pressure transducer with an accuracy of ± 0.2% (of full scale) was
used with a full scale of 0- 4 k:Pa, then the accuracy would be ± 0.008 k:Pa. The
measurement accuracy in percentage of reading are also presented in Table K7.
Now since u ex.: --./pv, the percentage error in u is half that in Pv·

K16
Table K6: y values for saturated steam (from Murdock, 1980)
Saturation Temperature Saturation Pressure y (oC) (kPa) (-)
39 7 1.113
53 14 1.118
61 21 1.121
72 34 1.126
80 48 1.128
87 62 1.129
90 70 1.130
99.6 100 1.134
Table K7: Dynamic pressure of saturated steam (at 85°C).
Velocity Dynamic Pressure1 Measurement Accuracy2
(m s-1) (kPa) ( ± % of reading)
2.1 0.0008 1000.0%
13.2 0.03 26.7%
53.1 0.5 1.6%
123.6 2.6 0.3%
416.4 24.3 0.03%
1Calculated from data tabulated in Table Bl, Appendix KB. 2Using instrument with accuracy of ± 0.2 % of a full scale of 0 - 4 kPa.
Static pressure measurement using a wall tap
Provided the tap is installed free of burrs and the recommended geometry constraints
are met, the extent of the likely measurement error can be estimated (Benedict,
1984). The static tap error as a percentage of the dynamic pressure has been
determined (see Appendix KD) for a 3 mm diameter probe. The maximum static tap
error is only 1.4% of dynamic pressure, and if the static pressure is measured to an
accuracy of ± 0.25 kPa, the static tap error is only significant at velocities over

K17
Static tube measurements (effect of tube blockage)
Given that a probe is constructed correctly with two or more taps (Benedict, 1984,
p349-358) and positioned within ± 30° of the normal to the flow, the only likely
significant source of error would be due to the localized increase in velocity due to
probe blockage, i.e. decrease in the free area of the duct due to the presence of the
probe.
For a probe inserted halfway into the tube, the decrease in static pressure, op can
be determined from the following equation (Benedict, 1984, p357):
op = 2 [1.15+0.75(M-0.2)]( 2d) Pv 1 M2 2 1t D
(K13)
where Pv is the dynamic pressure, and M is the Mach number which is defined as:
where u is the velocity and
a is the sonic velocity.
M = u a
(K14)
The sonic velocity for saturated steam initially at 85°C (see Appendix KB) is
416.4 m s·1• The Mach number and op are tabulated in Table K8. At 0.5 tube
diameters upstream of the probe entry point the tube blockage effect is only 40% of
op. So by mounting the static taps at least 11 mm from the base of the pitot probe,
the tube blockage effect will only be significant at velocities above 100m s·1•
I Table K8: Effect of tube blockage. I Velocity Mach op/pv Dynamic op
(m s·1) Number (%) Pressure (kPa)
(-) (kPa)
2.1 .005 -8.71 0.0008 -0.0001
13.2 0.031 -8.89 0.03 -0.003
53.1 0.124 -9.63 0.5 -0.05
123.6 0.288 -11.50 2.6 -0.3
416.4 1.000 -112349.9 24.4 -27.40

K18
Total pressure measurement
Benedict (1984, p360) states "The total pressure is remarkably easy to measure over
wide variations in Reynolds number, Mach number, probe geometry and alignment
with flow direction. Thus the Pitot coefficient:
(K15)
where Ptr is the indicated total pressure, is essentially equal to 1 under usual flow
conditions." Factors which do affect Cpitot are probe geometry - flow alignment
interactions, viscosity effects at low Reynolds numbers, and transverse pressure
gradients. By good design, the effect of flow misalignment can be kept under 1 %
of Pv over ± 25°. Viscous effects are insignificant at Re* > 50. The Reynolds
number is defined as:
(K16)
where r is the probe radius.
For saturated steam at 85°C, Re* > 50 for velocities above 1m s-1 and for saturated
steam at 45°C, Re* > 50 for velocities above 5.62 m s-1. As theRe* is reduced
below 50, the Cpitot rises and reaches 1.4 at a Re* of 5. Given that the dynamic
pressure at low velocities (see Table K8) is insignificant, in practice, the viscous
effect can be ignored.
Transient pressure measurement
Rosemount Instruments Ltd quote a 0.4 s maximum time constant for their
Model 1151 Alphaline pressure transducers. Benedict (1984, p386-9) shows that the
99% pressure recovery time for a 20 ft long, 1A " diameter transmission line to be
13 s when filled with air and 0. 008 s when filled· with water. Therefore, the
pressure measurement response time will not be a limiting factor.
Summary of pressure measurement errors
Each of the above factors has been considered in determining the overall error in
pressure measurement in the following situations.
On NZDRI Research Evaporator
During the work on the NZDRI Research Evaporator, two orifice diameters were
used (0.99 & 3.2 mm). Under these conditions with a static tap fitting there was no
significant error in pressure measurement.

K19
In commercial plants
In commercial plants the velocity in the de-aeration line entry section is considerably
higher (see Section K5) and thus the static tap error can be significant. However
the static tap would still provide the least intrusive and lowest error means of
determining static pressure.
K8 Discussion
Effect of measurement on process The insertion of a temperature probe into the de-aeration line can have a dramatic
effect on the process. Firstly, it introduces a flow disturbance, which may affect the
flow rate through the orifice and could also affect static flow measurements due to
turbulence. Secondly, it increases the surface area available for condensation,
particularly if a thermo-well is required to reduce stern losses.
The flow disturbance will be severe at high fluid velocities and, therefore, it will be
necessary to use a different means of measurement when high velocities are
expected.
A pressure tap and leg will also affect the process, as it provides additional surface
area for condensation. However, by ensuring the pressure leg is full of water, the
effect on the process should be minimised.
Measurement options The actual pressure required to determine the flow through a sonic orifice is the total
pressure, so a static pressure measurement is only of value where the dynamic
pressure is insignificant or can be accurately determined.
Therefore, the use of a static pressure measurement and an inserted temperature
probe could be used for the NZDRI Research Evaporator where the velocities are
low. For commercial evaporators, the use of a static pressure measurement and a
surface temperature measurement would provide information on composition but
would not give the total pressure which is required to determine the flow rate.
For commercial evaporators, it may be necessary to measure the pressure and
temperature prior to the de-aeration entry where low velocities would be expected.
The non-condensable gas concentration may vary considerably over a small distance,
particularly in the area surrounding the de-aeration line entry. This means that the
probe location could have a dramatic effect on the temperature measurement.
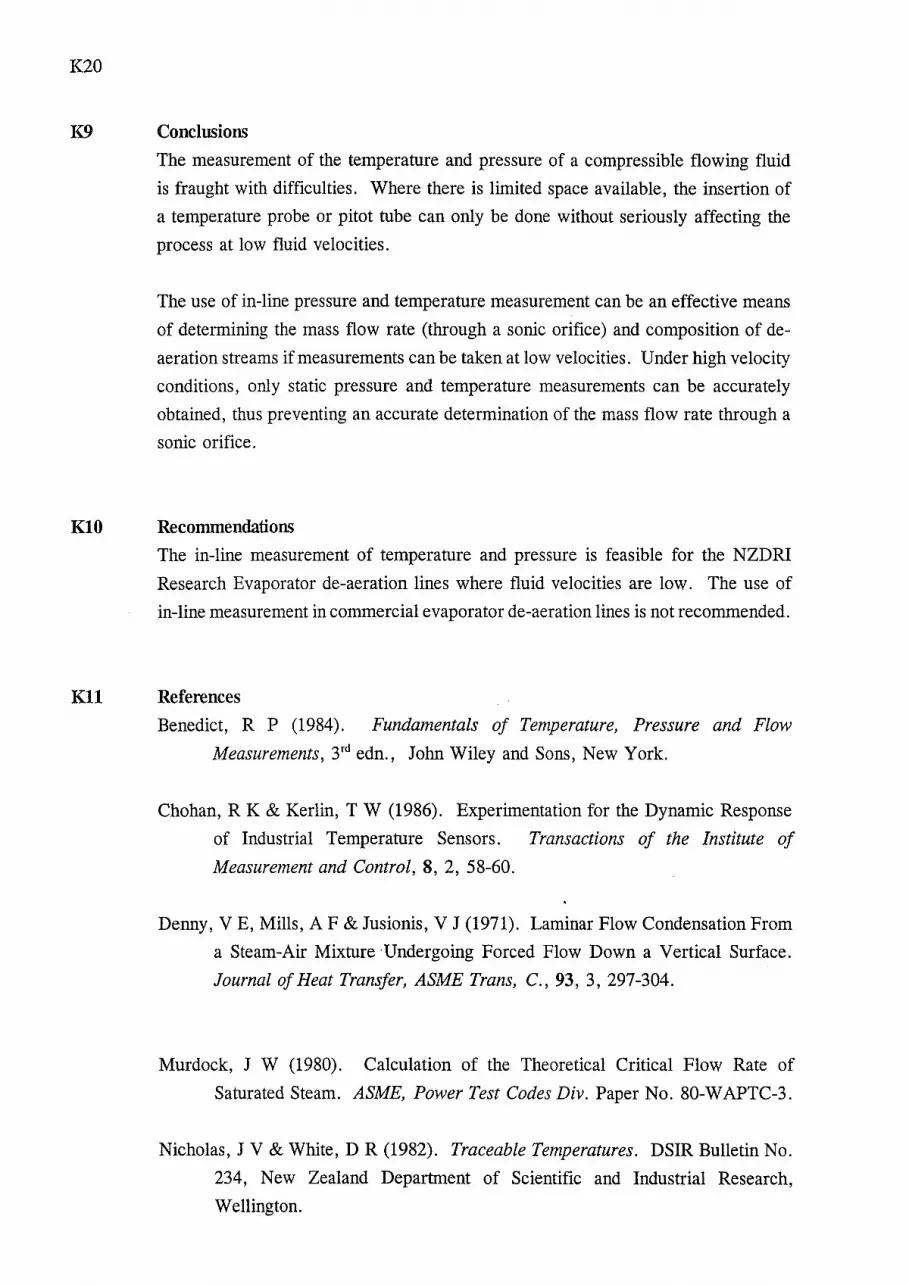
K20
K9 Conclusions
The measurement of the temperature and pressure of a compressible flowing fluid
is fraught with difficulties. Where there is limited space available, the insertion of
a temperature probe or pitot tube can only be done without seriously affecting the
process at low fluid velocities.
The use of in-line pressure and temperature measurement can be an effective means
of determining the mass flow rate (through a sonic orifice) and composition of de
aeration streams if measurements can be taken at low velocities. Under high velocity
conditions, only static pressure and temperature measurements can be accurately
obtained, thus preventing an accurate determination of the mass flow rate through a
sonic orifice.
KlO Recommendations
The in-line measurement of temperature and pressure is feasible for the NZDRI
Research Evaporator de-aeration lines where fluid velocities are low. The use of
in-line measurement in commercial evaporator de-aeration lines is not recommended.
Kll References
Benedict, R P (1984). Fundamentals of Temperature, Pressure and Flow
Measurements, 3rd edn., John Wiley and Sons, New York.
Chohan, R K & Kerlin, T W (1986). Experimentation for the Dynamic Response
of Industrial Temperature Sensors. Transactions of the Institute of
Measurement and Control, 8, 2, 58-60.
Denny, V E, Mills, A F & Jusionis, V J (1971). Laminar Flow Condensation From
a Steam-Air Mixture ·Undergoing Forced Flow Down a Vertical Surface.
Journal of Heat Transfer, ASME Trans, C., 93, 3, 297-304.
Murdock, J W (1980). Calculation of the Theoretical Critical Flow Rate of
Saturated Steam. ASME, Power Test Codes Div. Paper No. 80-W APTC-3.
Nicholas, J V & White, DR (1982). Traceable Temperatures. DSIR Bulletin No.
234, New Zealand Department of Scientific and Industrial Research,
Wellington.

K21
Rogers, G F C & Mayhew, Y R (1982). Thermodynamic and Transport Properties
of Fluids, SI Units. 3rd edn., Basil Blackwell, Oxford.
Vernard, J K & Street, R L (1976). Elementary Fluid Mechanics, 51h edn., SI
Version. John Wiley & Sons, New York.
Williamson, A G (1989). Personal Communication, University of Canterbury.
Appendix KA: Estimation of Heat Loss From De-aeration Line Entry Section
Convection heat loss
Calculating maximum likely heat loss assuming natural convection conditions apply;
Data:
Tw = 80°C
T~ = 20°C
Tt = (Tw + Too)/2 = 50°C
6(Tt) = 1/(Tr + 273.15) = 0.003095 K-1
v(Tr) = 1.807e-5 m2 s-1
Pr(Tc) = 0.701
g = 9.81 m s-2
Tube outer diameter, D00 = 0.025 m
Tube length, Lo = 0. 05 m
Minimum steam flow rate ~ 1 kg h"1
(2 mm diameter orifice)
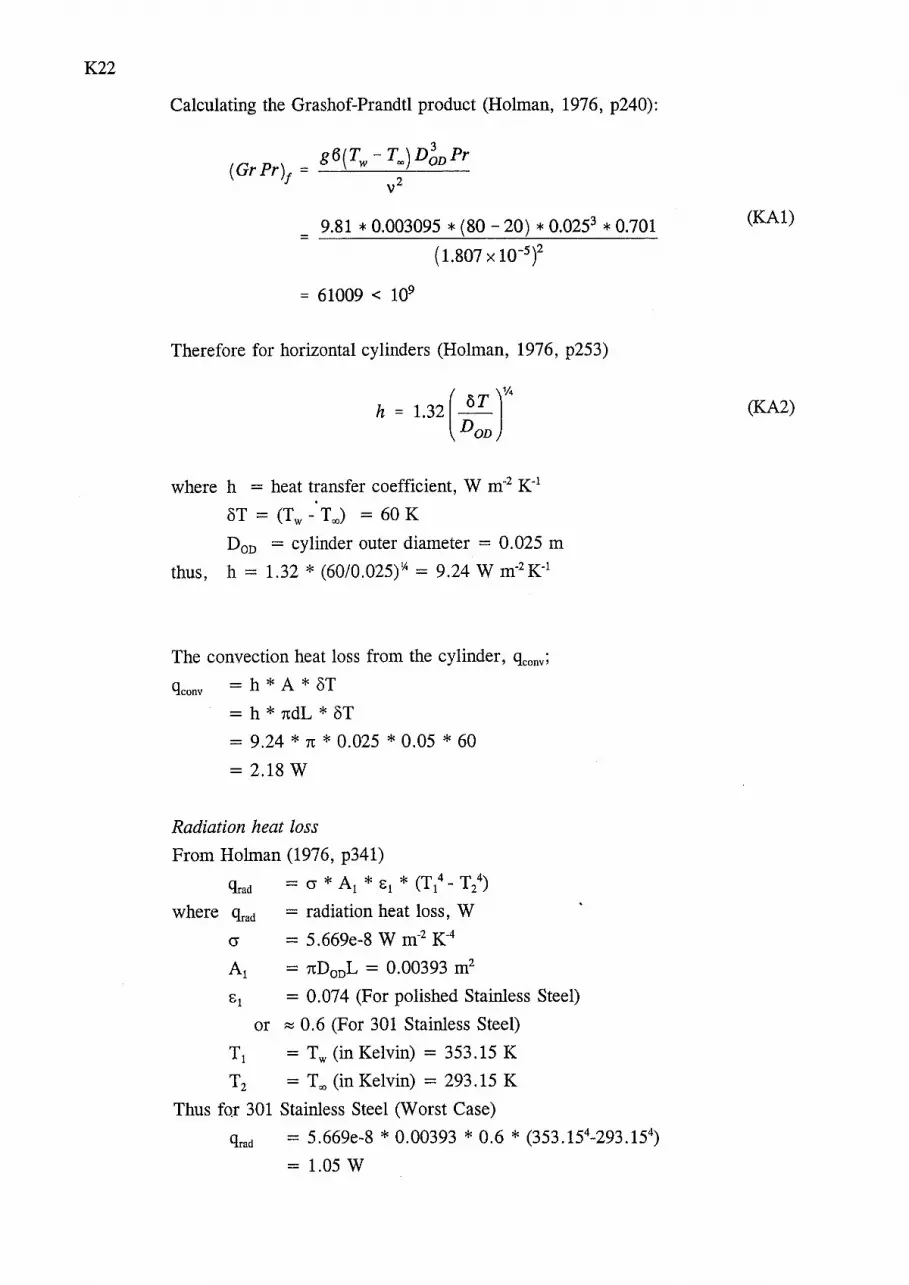
K22
Calculating the Grashof-Prandtl product (Holman, 1976, p240):
= 9.81 * 0.003095 * (80- 20) * 0.0253 * 0.701
( 1.807 x w-5 )2
= 61009 < 109
Therefore for horizontal cylinders (Holman, 1976, p253)
( )
114
h = 1.32 or DOD
where h = heat transfer coefficient, W m-2 K-1
8T = (Tw- Teo) = 60 K
D00 = cylinder outer diameter = 0.025 m
thus, h = 1.32 * (60/0.025)\4 = 9.24 W m-2 K-1
The convection heat loss from the cylinder, qconv;
qconv = h * A * 8T
= h * ndL * 8T
= 9.24 * 1t * 0.025 * 0.05 * 60
= 2.18 w
Radiation heat loss
From Holman (1976, p341)
~act = cr * A1 * 81 * (T14_ T24)
where qrad = radiation heat loss, W
cr = 5. 669e-8 W m-2 K-4
A1 = nD00L = 0.00393 m2
8 1 = 0.074 (For polished Stainless Steel)
or :::::: 0.6 (For 301 Stainless Steel)
T1 = Tw (in Kelvin) = 353.15 K
T2 = Teo (in Kelvin) = 293.15 K
Thus for 301 Stainless Steel (Worst Case)
qrad = 5.669e-8 * 0.00393 * 0.6 * (353.154-293.154)
= 1.05 w
(KA1)
(KA2)

K23
Total heat loss
Assuming conduction heat loss negligible
= = 2.18 + 1.05
= 3.23 w
Amount of steam condensed
If the heat loss comes solely from condensation of saturated steam at say 85°C, and
hrg = 2295.6 kJ kg-1 (Rogers & Mayhew, 1982) then;·
Steam condensed in de-aeration line entry section
= qtota/hfg(@85°C}
= 3.23 W I 2295600 J kg-1 * 3600 s h-1
= 0.0051 kg h-1
Which corresponds to 0.51% of the minimum likely gas-vapour flow. For a 1 mole
percent mixture of NCG in steam, the condensation would change the mole
percentage to 1.005 %. Thus, as the highest temperatures will correspond to
gas-vapour mixtures consisting mainly of steam, this condensation can be neglected.
Appendix KB: Calculation of the Steam Flow Rate, and a Point Velocity Upstream
of a Sonic Orifice
For the purposes of giving an idea of the conditions at the measurement point 1 (see
Figure K1) the theoretical mass flow rate and upstream velocities for an ideal orifice
have been calculated. The equations used below assume one dimensional flow and
an absence of viscous effects. The actual flow rate of steam/non-condensable gas
mixtures through orifice plates will be the subject of another report.
Vernard & Street (1976, p206) give the following equations:

K24
For the mass flow rate through a sonic nozzle from a region where the fluid
is at rest;
AzPo m- -- _1_ (-2 )(~ :~) Reng Y + 1
And for pressure ratios (pip0) above the critical;
and
m=A 2 2 Y p p [(Pst2l~ _ (Pst2l~l ( Y - 1)
0 0 Po Po
(KB1)
(KB2)
(KB3)
The sonic or critical velocity, a of a perfect gas (Vernard & Street, 1976, p13) is;
a = ~ Y P,a . Pz
or
Benedict (1984, p417) gives the following equation for an ideal gas;
Pstl -p = p - y ( ll
1 o Po
And the tube Reynolds number is;
Re = p uD D IJ.
Basis: Assume 100% saturated steam in calandria,
Uo ~ 0 m s-1,
T0 = 85°C = 358.15 K,
D1 = 22 mm.
(KB4)
(KB5)
(KB6)
(KB7)

K25
From Rogers & Mayhew (1982);
Po = 57800 Pa,
Pg0 = 0.3536 kg m·3
Reng = 461.5 J kg-1 K"1
From Table K6;
y = 1.129
Calculation Method
1 Using equation [KB1], m was calculated for orifice diameters; 2, 5, 10, 15
& 22 mm).
2 Equation [KB3] was solved iteratively to determine Pstt/p0, for each orifice
diameter except 22 mm.
3 Using Equation [KB2] the velocity at point 1 (see Figure K1) was determined
for each orifice diameter except 22 mm. The sonic velocity was calculated for
the 22 mm diameter orifice using equation KB4.
Results
The results of the calculations are tabulated in Table KBl.
Table KBl: Steam flow rate and average velocity at Point 1.
Orifice Mass Pressure Velocity
Diameter Flow rate Ratio at Point 1
(mm) (kg h-1) PsufPo (m s·1)
2 1.0 0.9999865 2.1
5 6.4 0.999464 13.2
10 25.5 0.991400 53.1
15 57.4 0.954200 123.6
22 123.4 0.578660 416.4
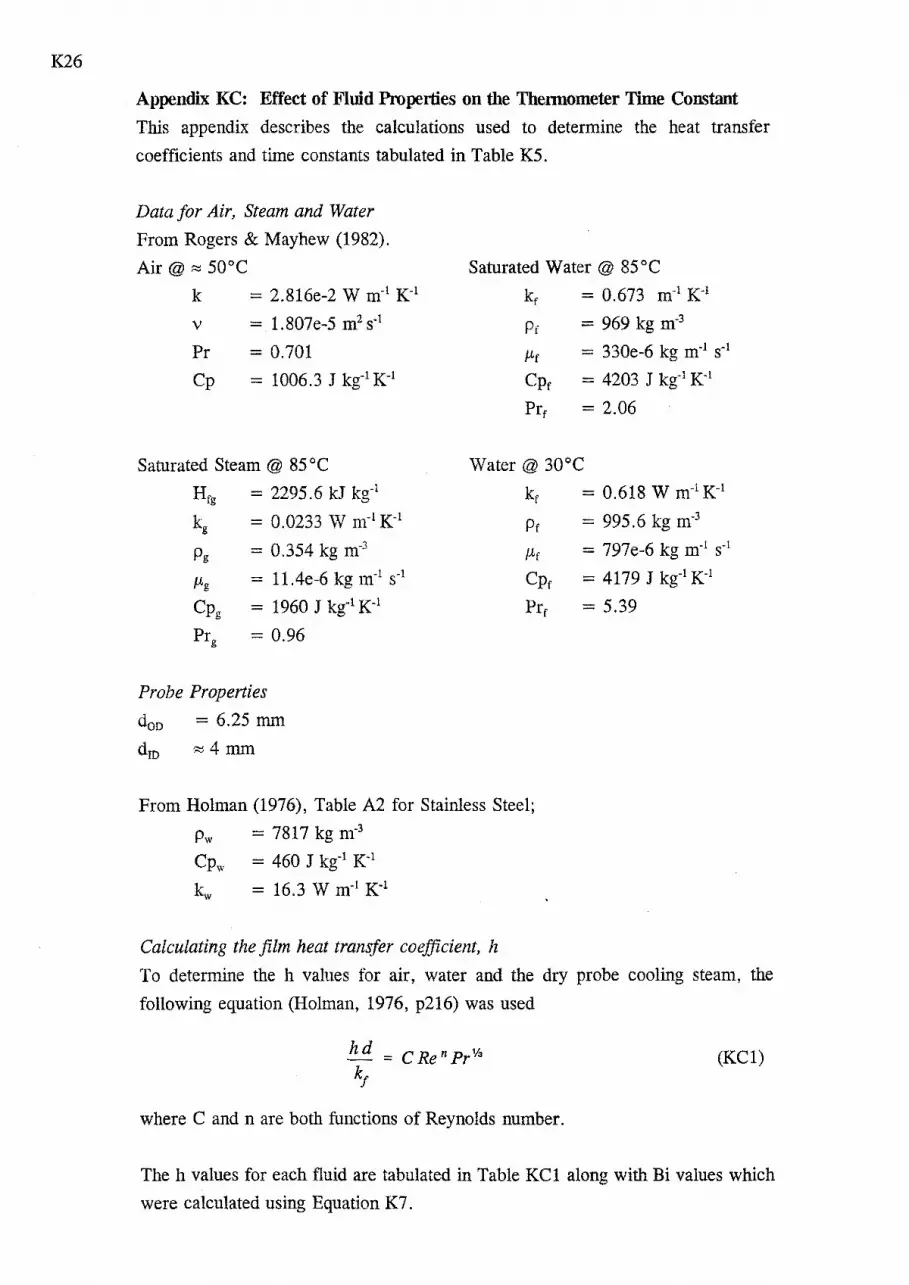
K26
Appendix KC: Effect of Fluid Properties on the Thermometer Time Constant
This appendix describes the calculations used to determine the heat transfer
coefficients and time constants tabulated in Table K5.
Data for Air, Steam and Water
From Rogers & Mayhew (1982).
Air@;::; 50°C
k = 2.816e-2 W m·1 K·1
v = 1.807e-5 m2 s·1
Saturated Water @ 85 oc kr = 0.673 m·1 K·1
Pr = 969 kg m·3
Pr
Cp
= 0.701 P.r = 330e-6 kg m·1 s·1
= 1006.3 J kg·1 K·1 Cpr = 4203 J kg-1 K 1
Prr = 2.06
Saturated Steam@ 85°C Water@ 30°C
Hrg = 2295.6 kJ kg·1 kr = 0.618 W m·1 K-1
kg = 0.0233 W m·1 K·1 Pr = 995.6 kg m·3
pg = 0.354 kg m·3 /1-r = 797e-6 kg m·1 s·1
/hg = 11.4e-6 kg m·1 s·1
Cpg = 1960 J kg-1 K-1
Prg = 0.96
Probe Properties
d00 = 6.25 mm
dm ;::; 4 mm
Cpr = 4179 J kg-1 K 1
Prr = 5.39
From Holman (1976), Table A2 for Stainless Steel;
Pw = 7817 kg m·3
Cpw = 460 J kg-1 K 1
kw = 16.3 W m·1 K-1
Calculating the film heat transfer coefficient, h
To determine the h values for air, water and the dry probe cooling steam, the
following equation (Holman, 1976, p216) was used
C Ren PrVa (KC1)
where C and n are both functions of Reynolds number.
The h values for each fluid are tabulated in Table KCl along with Bi values which
were calculated using Equation K7.

K27
Table KC1: h and Bi values for air, water and dry steam.
Fluid Re C# n# h Bi
Air, 2m s-1 692 0.683 0.466 58 0.01
Air, 30m s-1 10376 0.193 0.618 234 0.04
Steam, 2 m s-1 388 0.683 0.466 40 0.01
Steam, 30 m s-1 5822 0.193 0.618 151 0.03
Water (30°C), 1 m s-1 7807 0.193 0.618 8513 1.63
8The values for C and n come from Table 6.1 of Holman (1976, p216).
For steam condensing on the probe, Nusselt's equation for steam condensing on a
horizontal.tube (Holman, 1976, p358) was used;
(KC2)
Where Tg is the system temperature, and Tw is the probe wall temperature.
Using a value of soc for Ts-Tw.
[
6 3lv. h = 0.725 969 * (969 - 0.354) * 9.81 * 2.295 X 10 * 0.673
3.3 x w-4 * o.oo625 * 5) = 20383 Wm-2 K-1
For a water film boiling off in steam, the following equations from Holman (1976,
p376-7) were used;
( ]
0.4
h = hlatm _I!_ Platm
h1 atm = 1042 o T"h for ! < 16000 W m -2
Where h1atm is the boiling heat transfer coefficient at 1 atm,
p is the system pressure (0.578 bar),
p1atm is the atmospheric pressure (1.0133 bar),
(KC3)
(KC4)
and 8T is the temperature difference between the bulk fluid and the wall.

K28
If a value of 5 oc is used for oT
h = 1042 * (5)'13 latm
Check q/A < 16000 W m-2
q/A = hoT = 1833 * 5 = 9165 so Ok.
Therefore h = 1833 * (0.5780/1.0133)0.4
= 1464 W m-2 K 1
Calculating the theoretical time constants for the probe
For water @ 30°C and 1 m s-1
'tideal = Pw Cpw V f A/h .... (K6)
= Pw Cpw (d002-dm2)/4/d00/h (for hollow cylinder cf Equation KlO)
= 7817 * 460 * [(6.25e-3)2 - (4e-3i]/4/6.25e-3/8513
= 3317/8513 0.39 seconds.
Check Bi: Bi = 1.63 > 0.2 so calculate 1 10
= ln(d00/dm) d00/2/k = ln(6.25/4)*6.25e-3/2/16.3 .... (K9)
= 8.56e-5 K m2 w-1
herr = 1/[(11h) + RsenAsenJ
= 11[(118513 + 8.56e-5]
= 4925 W m-2 K-1
= Pw Cpw (doo2-dm2)/4/dool~rr = 3317/4925
= 0.67 s.
For condensing steam
Bi = 3.908 > 0.2 so
~ff = 11[(1/20383 + 8.56e-5]
= 7426 W m-2 K-1
= Pw Cpw (doo2-dm2)/4/dool~rr
= 331717426
= 0.45 s.
.... (K8)
.... (KlO)
.... (K10)

For film boiling
Bi = 0.28 > 0.2 so
1\rr = 11[(1/1464 + 8.56e-5]
= 1301 W m·2 K-1
'tm = Pw Cpw (don2-dm2)/4/donlheff
= 3317/1301
= 2.5 s.
Appendix KD: Calculation of static wall tap error
K29
.... (K10)
There a number of numerical methods for estimating the static wall tap error. One
of these is a plot of static tap error (as a percentage of the dynamic pressure) in
terms of the tube Reynolds number and the probe to tube diameter ratio (Figure
17.8, Benedict, 1984).
To use this method, the tube Reynolds number has to be calculated first;
Re = D (ID1)
When using the same basis as Appendix KB, the only additional information required
is the density and viscosity at Point l.
Now, from Rogers & Mayhew (1982);
/-Lg ~ 11e-6 kg m·1 s·1 (for 36000 < p < 57800 Pa)
The densities calculated using equation [KB6] and the tube Reynolds numbers
calculated using equation KD1 are tabulated in Table KDl. Using a 3 mm probe,
the static tap errors were drawn from Fig 17.8 of Benedict (1984) and tabulated in
Table KDl.

K30
Table KD1: Tube Reynolds numbers and static tap errors.
Conditions at Point 1 Orifice Static Tap
Diameter (mm) Velocity Density Reynolds Error
(m s-1) (kg m-3) Number (% of Pv)
2 2.1 0.3536 1486 0.1%
5 13.2 0.3534 9358 0.2%
10 53.1 0.3509 37284 0.7%
15 123.6 0.3392 83879 1.3%
22 416.4 0.2178 181381 1.4%

Ll
APPENDIX L: Dll\1ENSIONAL ANALYSIS OF BOILING
SIDE HEAT TRANSFER
Nomenclature
Roman
C specific heat capacity (J kg-1 K 1)
d tube diameter (m)
g acceleration due to gravity (m s-2)
k thermal conductivity (W m-1 K 1)
L length of tube(m)
Greek
a heat transfer coefficient (W m-2 K 1)
r mass flow per unit tube perimeter
(kg s-1 m-1)
L1 T temperature difference (K)
A, latent heat of vaporization (J kg-1)
J.l dynamic viscosity (kg m-1 s-1)
p density (kg m-3)
Subscripts
c condensate stream condition
e evaporating film condition
ID condition at wall inner surface
p at constant pressure
v boiling vapour phase condition
Dimensionless groups
Jacob number:
Modified Nusselt number:
a v2 ( l'h
Nu =kg
Tube aspect ratio:
Vapour/liquid loading ratio:
Prandtl number:
c l.l Pr = _P_ k
Film Reynolds number:
4r Re--

L2
Description of system
Dependent variable, ae
Properties of liquid film
/he ke cpe Pe Ae
Conditions of test
le ly .L1Te L dm g
Determination of dimensionless groups
The dimensions of each variable in terms of mass (M), length (L), time (t), temperature (T) and
heat (H) are shown in Table L1. The effect of eliminating His shown in Table L2. Likewise,
the elimination ofT, t, L and·M is shown in Tables L3-L6.
Table L1: Dimensions of significant variables
No. Symbol M L t T H
1 ae 0 -2 -1 -1 1
2 !he 1 -1 -1 0 0
3 Pe 1 -3 0 0 0
4 ke 0 -1 -1 -1 1
5 Cpe -1 0 0 -1 1
6 Ae -1 0 0 0 1
7 le 1 -1 -1 0 0
8 ly 1 -1 -1 0 0
9 .L1Te 0 0 0 1 0
10 L 0 1 0 0 0
11 dm 0 1 0 0 0
12 g 0 1 -2 0 0

L3
Table L2: Elimination of H dimension
No. Symbol M L t T H
1/4 ae/ke 0 -1 0 0 0
2 fte 1 -1 -1 0 0
3 Pe 1 -3 0 0 0
5/4 Cpefke -1 1 1 0 0
516 CpiAe 0 0 0 -1 0
7 re 1 -1 -1 0 0
8 rv I 1 -1 -1 0 0
9 ATe 0 0 0 1 0
10 L 0 1 0 0 0 . 11 diD 0 1 0 0 0
12 g 0 1 -2 0 0
I Table L3: Elimination of T dimension I No. Symbol M L t T H
1/4 aefkc 0 -1 0 0 0
2 fte 1 -1 -1 0 0
3 Pe 1 -3 0 0 0
5/4 Cpefke -1 1 1 0 0
9*5/6 Ja = ATe Cpe/Ae 0 I 0 0 0 0
7 re 1 -1 -1 0 0 . 8 rv 1 -1 I -1 0 0
10 L 0 1 0 0 0
11 diD 0 1 0 0 0
12 g 0 1 -2 0 0

L4
Table L4: Elimination of t dimension
1 No. Symbol M L t T H
1/4 aefke 0 -1 0 0 0
2*5/4 Pr = Jl.e *Cp/ke 0 0 0 0 0
3 Pe 1 -3 0 0 0
9*516 Ja = ilTe Cpif•·e 0 0 0 0 0
7/2 Ree = I)p,e 0 0 0 0 0
817 = !Jf'e
0 0 0 0 0 N rvtr.
10 L 0 1 0 0 0
11 dm 0 1 0 0 0
II 22/12 p,/lg 2 -3 0 0 0
Table L5: Elimination of L dimension
No~ Symbol ~ t T H
(1/4)3 (a)kiiPe -1 0 0 0 0
2*5/4 Pr = p,/Cp/ke 0 0 0 0 0
9*5/6 Ja = ATe Cp/A.e 0 0 0 0 0
7/2 Ree = [' / Jl.e 0 v 0 0 0
817 = !Jf'e
0 0 0 0 0 N rvtr. .
10/~ Nud = L/dm 0 0 0 0 0
22112/3 p,/fg/pe 1 0 0 0 0

L5
I Table L6: Elimination of M dimension I No. Symbol M L t T H
(114)3/3*22/12/3 Nu3 = (a)~)3/pe *p,/lg/pe 0 0 0 0 0
2*5/4 Pr = f.l-e *Cpe/~ 0 0 0 0 0
9*5/6 Ja = ~Te Cpi"-e 0 0 0 0 0
7/2 Ree = rif.l-e 0 0 0 0 0
8/7 0 0 0 0 0 N = rv~re rvtre
10/11 Nud = L/dm 0 0 0 0 0
Therefore, the system can be described by the following equation:
(Ll)
provided entry effects are insignificant (in which case surface tension should be considered) and
the solvent is water. A Prv term should perhaps be included when comparing different solvents.


Ml
APPENDIX M: SKIM MILK EXPERIMENT RUN SHEETS
The run sheets for Experiments SkO, Skl and Sk2 have been included here. The run sheets have been edited to reflect actual timing and observations made during the experiments have been included in italics.
~
MILK POWDERS AND DRYING PROCESS DETAILS for
EXPERIMENT SkO Copies to: Robbie Buwalda, Control room, Floor, Paul Webby, Garvin Filby, Sally Miller,
Tony Mackereth.
Date: 14/01/92 Project: MPDR067 R.O: Tony Mackereth
Product:
Objective:
:MILK: Quantity: Source: Date in: Treatment:
PLANT:
Skim milk concentrate, and skim milk powder
To produce a 30% w/w skim concentrate, plus powder, from the same milk supply. The powder will be recombined to 30% w/w and both concentrates run through the Research Evaporator, RE (1 effect only, 20 h run) to determine the difference between fresh and reconstituted skim on evaporation.
20,000 I whole milk Tui 13/01 Separate and pasteurize
Plant: Wiegand, Delaval No. Runs: Evaporator; 2 Drier; 1 Drier config: DCD Fines Return; Nozzle
EXPERilVIENT SkO RUN DETAILS
Monday: Chill down two tanks of water ( < 4 oq overnight (Tanks 3 & 5) Set up conveying line from end of VFB to top of tank.
Use portable blow-thru rotary valve, portable blower and plastic hose. Suspend portable cyclone in top of tank (above 3000 I Mark, and opposite side to top product entry line.
Tuesday: Runt Evaporate skim to 48% w /w Require 1600 kg ( -1400 I) minimum Chill Through IFB Crepaco and send to MP tank (2 or 4)

M2
Refrigeration on When there is enough concentrate, send sample to Lab forTS analysis. When result comes through, calculate amount of water required to dilute to 30% w /w. Add chilled water. Pump to Silo 5.
Tony will start feeding to RE when we are finished and he is organised (20 h run)
Rnn2 Concentrate skim milk to 48% w/w in Wiegand evaporator Feed to De laval Drier, fines return to nozzle Fill tank with - 1200 l cold or tepid water Start water circulating, Agitation on. Convey powder from end of VFB to tank. Regularly check:
level in tank TS (Refractometer) how well powder is recombining. froth
When refractometer reading reaches 30% (@ -1700 l), top up tank with a bit more water (say -200 - 300 l) Repeat last 2 steps until the tank has -2500 l of concentrate at 32-33% w/w (Refractometer)
Note: If powder is not recombining well, go as far as is possible with this system then bag remaining powder and add via pump and funnel. Take care not to add too much water to tank to avoid ending up with too dilute a mix when the powder runs out (no more than 1730 l water total).
At end, circulate through Crepaco, to chill to < 10°C Refrigeration on Hold overnight.
Wednesday: Sample of concentrate from Run 2 to Lab for TS analysis When results come back, calculate amount of chilled water to add to dilute to 30% w /w Add chilled water Tony should finish run 1 (am) Rinse silo 5 Pump out reconstituted concentrate from tank to Silo 5 Tony will CIP RE and start on Run 2 (20 h run) This was not done because the recombining step was not successful
Tony's used concentrate from Tuesday onwards will need to be diluted to -20% w/w, cooled and held in a refrigerated tank. This can then be emptied to a pig-tank daily.

MILKPOWDE for
EXPERIMENT Skl
M3
Copies to: Robbie Buwalda, Control room, Floor, Paul Webby, Garvin Filby, Sally Miller, Tony Mackereth.
Date: 2111192 Project: MPDR067 R.O: Tony Mackereth
Product: Skim milk concentrate
Objective: -To produce skim milk concentrate using the Wiegand evaporator, for use in theRE. - To determine the effect of preheat treatment and feed concentration on evaporation heat transfer rate.
MUK: Quantity: 15,000 skim milk Source: Tui (pasteurized skim)
21 Date in: Treaiment: To silo 3
PLANT: Plant: Wiegand only No. Runs: Evaporator; 3
EXPERIMENT Skl.RUN DETAILS
Milk Requirements Type: Skim milk (Tui supply). Quality: 15,000 l (require 10,000 l of skim milk equivalent ex evaporator) Quality: Check TA is Ok on arrival Time Required: Put in Silo 3 by 1000 h Tuesday 21/1192.
Silo chilling. to be set at 4 °C.
Wiegand Runl:
Run2:
Pre-heat: 95°C for 20 s Concentrate: 45% w/w Chill and dilute with chilled water to obtain the following;
1200 kg@ 22.5% w/w in Tank 2 450 kg@ 30% w/w in Tank 5
Pre-heat: l20°C for 180 s Concentrate: 45% w/w Chill and store in Tank 3 at < 10°C. Dilute with chilled water to get 30% w /w. Require 675 kg @ 30% w/w
I

M4
R1ll13: Pre-heat: 100°C for 1 s Concentrate 45% w/w on Wiegand Chill and store in Tank 4 at < l0°C. Dilute with chilled water to obtain a final concentration of 30% w /w. Require 675 kg@ 30% w/w.
I Experiment Skl Research Evaporator Details "
Concentrate for Removal (from Research Evaporator) The concentrate will be diluted to approximately 20% w/w and stored in Silo 3? with chilling on.
Services Requirements Steam is required 24 hours per day from Tuesday 21-1-92 to Saturday 25-01-92.
Equipment Requirements Require a small dosing pump to add a solution of antifoam to the third effect separator.
Lecithin pump will need to be checked and cleaned, moved into position , and set up.
I
Set up a small line with a valve, to bleed antifoam into the separator vapour exhaust duct. The antifoam was drawn in by pressure difference alone. Require a flexible line to run the concentrate from Tank 1 to the feed valve mounted on the RE Balance Tank.
Research Evaporator Roo Information The following 12 runs will be put through theRE. (Batch size 300 kg).
Rllll A: MH at 22.5% w/w Ex Tank 2 Rllll B: HH at 30% w/w Ex Tank 3
Rllll C:
Rllll D:
Rllll E: Rllll F:
Rllll G:
Rllll H: Rllll 1: Rllll J: Rllll K: Rllll L:
Dilute Silo 3 to 22.5% w/w with chilled water
MH at 30% w/w. Dilute Silo 5 to 15% w/w
LH at 30% w/w Dilute Silo 4 to 22.5% w /w
MH at 22.5% w/w LH at 22.5% w/w
Dilute Silo 4 to 15% w/w
HH at 22.5% w/w Dilute Silo 3 to 15% w/w
MH at 22.5% w/w HH at 15% w/w MH at 15% w/w LH at 15% w/w MH at 22.5% w/w
Ex Tank 5
Ex Tank 4
Ex Tank 2 Ex Tank 4
Ex Tank 3
Ex Tank 2 Ex Tank 3 Ex Tank 5 Ex Tank 4 Ex Tank 2
NB: Will transfer 300 kg of appropriate concentrate to Tank 1 and gravity feed from there, to ensure no more than 300 kg is used on any one run.

M5
I %.
Experiment Skl Procedure I 1000 h Tuesday 21M01-92 1. 15,000 l of pasteurised skim milk is obtained from Town Milk and stored in Silo 3 by 1000 h.
Silo chilling set at 4 °C. 2. Check acidity of milk {0.175 %wlv} 3. Take samples of Skim milk for Micro [1], MP lab [1] and Chern lab [0]. {8.96% wlw} 1030 h {1025 h) 4. Evaporate skim milk to 45% w/w on Wiegand using a medium pre-heat treatment (95°C for
20 s). Chill concentrate and store in Tank 2. 4a. Take balance tank micro sample. 1110 h After collecting 100 l of low TS concentrate, stopped to unblock condensate line (after second
effect (protein deposit). 1233 h Sending concentrate to Tank 2 again. 1230 h {? h} 5. When Tank 2 has 550 l (652 kg [52 kg excess]) in it, switch concentrate flow to Tank 5. 6. When Tank 2 is deemed mixed, take sample [2] for TS and WPNI. Submit for Urgent TS
Analysis- Result required by 1400 h. {43.13% wlw} 7. Start RE and settle at operating conditions on water. 1315 h Put some iodophor through theRE. 1340 h REstarted on full CIP because plant was found to be dirty. 1346 h Put iodophor through the silo feed line. 1330 h {1530 h} 8. When Tank 5 has 320 l (350 kg [50 kg excess]) in it, stop adding concentrate, put Wiegand
evaporator on \Vater and change pre-heat holding to 180 s. 9. When Tank 5 is deemed mixed, take sample [3] for TS and submit for Urgent Analysis - Result
required by 1630 h. {47.4% wlw}
1400 h {1540 h} 10. Concentrate skim milk on Wiegand evaporator to 45% w/w using high heat pre-heat treatment
of l20°C for 180 s. Chill concentrate and put in Tank 3. 11. When Tank 2 initial total solids result [2] known, determine and add amount of chilled water
(from outside silo) required to dilute to a concentration of22.5% w/w. {Added 700 l of chilled water}
1555 h Bled RE differential pressure low pressure lines. 1605 h Wiegand preheat temperature probe failed, so had to run DSI on manual for remainder of this
experiment. hand held temperature probe reads l18°C}. A small amount of the skim milk processed only received a preheat treatment of 73°C/180 s.
1644 h Hand held temperature probe reads 116.5°C, Rinsed line from silo toRE.
1$20 h {1715 h} 12. When Tank 3 has 420 l (500 kg [50 kg excess]) in it, stop adding concentrate to Tank 3, put
Wiegand on water and change pre-heat holding to 1 s. 13. When Tank 3 is deemed mixed, take sample [4] for TS and WPNI. Submit for Urgent TS
Analysis- Result required by 1630 h. {45.88% wlw}
1600 h {1725 h} 14. Evaporate skim on Wiegand to 45% w/w using low heat pre-heat treatment of 100°C for 1 s.
Chill concentrate and put in Tank 4. 14a. Take Wiegand concentrate BIT micro sample 163() h {1641 h) 15. When Tank 5 initial total solids result [3] known, determine and add amount of chilled water
required to drop total solids to 30%. {Added 225 l of chilled water} 16. When Tank 3 initial total solids result [4] known, determine and add amount of chilled water
required to drop total solids to 30%. {Added 265 l of chilled water} 1720 h {1846 h} 17. When Tank 4 has 420 l (500 kg [50 kg excess]) in it, stop adding concentrate to Tank 4,

M6
18.
1730 h
CIP Wiegand evaporator. When Tank 4 is deemed mixed, take sample [5] for TS and WPNI. Submit for Urgent TS Analysis- Result required by 0900 h on Wednesday. {45. 71% w!w}
19. Put 280 kg of medium heat concentrate from Tank 2 in Tank 1. Take sample for TS [Feed A] {21.01% w!w}
1800 h 20. Put RE on milk, drawing it from Tank 1. Run A. Medimn heat@ 22.5% w/w 21. Add AntiFoam to Separator at regular intervals, Add AntiFoam to Tanks 2,3,4,5. 1800 h Added slug of antifoam to separator. 1815 h Concentrate pump suction-side level unstable. 1849 h Concentrate flow stopped - low level due to foam, so added some antifoam to balance tank.
Added 30-40 ppm antifoam to Tanks 1, 2, 3, 4 and 5. 2015 h 23. Take feed and concentrate Micro samples and concentrate sample for TS and WPNI. [Cone A] 2030 h 24.
25.
Run A ends. Plant automatically starts CIP sequence. Disconnect flexible line from Feed valve on REbalance tank and drain out remaining concentrate, flush Tank 1 and line with water and iodophor, rinse and add 280 kg of concentrate from Tank 3. Take sample forTS. TS analysis result required by 1200 h Wednesday. [Feed B]
0000 h Wednesday 22-01-92 26. RE goes on milk, drawing it from Tank 1. Run B. High heat@ 30% w/w
Gravity feed not sufficient, so had to bucket feed down to balance tank. This was because the concentration was actually 37% w!w, due to poor mixing in Tank 3 of the chilled water with the concentrate. Tank 3 was the only one where the chilled water was added to the top of the tank, and unfortunately Tank 3 had poor agitation.
0054 h Tank temperatures Tank 1 l2°C Tank 2 5°C Tank 3 3°C Tank 4 SOC Tank 5 4°C
0215 h 27. Take feed and concentrate Micro samples and concentrate sample for TS. [Cone B] 0230 h 28. Run B ends. Plant automatically starts CIP sequence. Disconnect flexible line from Feed valve
on RE balance tank and drain out remaining concentrate, flush Tank 1 and line with water and iodophor, rinse and add 280 kg of concentrate from Tank 5.
29. Take sample for TS. TS analysis result required by 1200 h Wednesday. [Feed C] 0600 h 30. RE goes on milk, drawing it from Tank 1. Run C. Medimn heat@ 30% w/w 30a. Take Micro samples from each of tanks 2,3,4,5 0725 h RE shut down due to low suction side level for 10 minutes. 0820 h Plant was started up again and put on CIP. 0815 h {0930 h) 31. Take feed and concentrate Micro samples and concentrate sample for TS and WPNI. [Cone C] 32. When Tank 4 initial total solids result known, determine and add amount of chilled water
required to drop total solids to 30%. Added 250 l of water. 0830 h 33. Run C ends. Plant automatically starts CIP sequence. Disconnect flexible line from Feed valve
on REbalance tank and drain out remaining concentrate, flush Tank 1 and line with water and iodophor, rinse and add 280 kg of concentrate from Tank 4.
34. Take sample forTS. TS analysis result required by 1200 h Wednesday. [Feed D] 1155 h Bled differential pressure instrument low pressure lines. 1200 h 35. RE goes on milk, drawing it from Tank 1. Run D. Low heat@ 30% w/w 1212 h Added antifoam to balance tank and Tank 1. Took another sample from Tank 3 forTS analysis. 1300 h
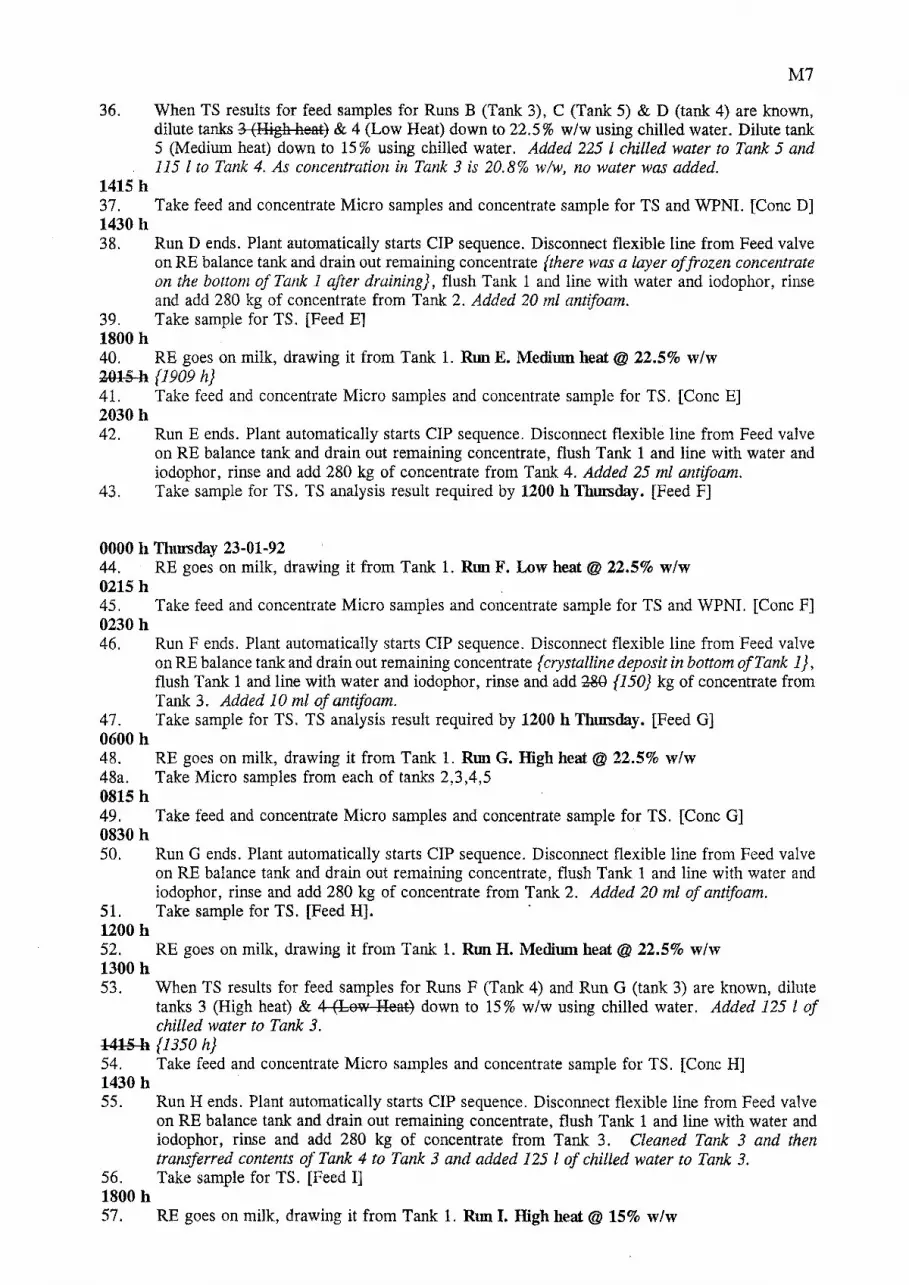
36.
1415 h
M7
When TS results for feed samples for Runs B (Tank 3), C (Tank 5) & D (tank 4) are known, dilute tanks 3 (High heat) & 4 (Low Heat) down to 22.5% w/w using chilled water. Dilute tank 5 (Medium heat) down to 15% using chilled water. Added 225 l chilled water to Tank 5 and 115 l to Tank 4. As concentration in Tank 3 is 20.8% w/w, no water was added.
37. Take feed and concentrate Micro samples and concentrate sample forTS and WPNI. [ConeD] 1430 h 38. Run D ends. Plant automatically starts CIP sequence. Disconnect flexible line from Feed valve
on RE balance tank and drain out remaining concentrate {there was a layer of frozen concentrate on the bottom of Tank 1 after draining}, flush Tank 1 and line with water and iodophor, rinse and add 280 kg of concentrate from Tank 2. Added 20 ml antifoam.
39. Take sample forTS. [Feed E] 1800 h 40. RE goes on milk, drawing it from Tank 1. Rnn E. Medimn heat@ 22.5% w/w 2015 h {1909 h) 41. Take feed and concentrate Micro samples and concentrate sample forTS. [Cone E] 2030 h 42.
43.
RunE ends. Plant automatically starts CIP sequence. Disconnect flexible line from Feed valve on REbalance tank and drain out remaining concentrate, flush Tank 1 and line with water and iodophor, rinse and add 280 kg of concentrate from Tank 4. Added 25 ml antifoam. Take sample forTS. TS analysis result required by 1200 h Thursday. [Feed F]
0000 h Thursday 23-01-92 44. RE goes on milk, drawing it from Tank 1. Rnn F. Low heat@ 22.5% w/w 0215 h 45. Take feed and concentrate Micro samples and concentrate sample for TS and WPNI. [Cone F] 0230 h 46. Run Fends. Plant automatically starts CIP sequence. Disconnect flexible line from Feed valve
on REbalance tank and drain out remaining concentrate {crystalline deposit in bottom of Tank 1}, flush Tank 1 and line with water and iodophor, rinse and add~ {150} kg of concentrate from Tank 3. Added 10 ml of antifoam.
47. Take sample forTS. TS analysis result required by 1200 h Thursday. [Feed G] 0600h 48. RE goes on milk, drawing it from Tank 1. Rnn G. High heat @ 22.5% w/w 48a. Take Micro samples from each of tanks 2,3,4,5 0815 h 49. Take feed and concentrate Micro samples and concentrate sample forTS. [Cone G] 0830 h 50. RunG ends. Plant automatically starts CIP sequence. Disconnect flexible line from Feed valve
on RE balance tank and drain out remaining concentrate, flush Tank 1 and line with water and iodophor, rinse and add 280 kg of concentrate from Tank 2. Added 20 ml of antifoam.
51. Take sample for TS. [Feed H]. · 1200h 52. RE goes on milk, drawing it from Tank 1. Rnn H. Medimn heat @ 22.5% w/w 1300h 53. When TS results for feed samples for Runs F (Tank 4) and RunG (tank 3) are known, dilute
tanks 3 (High heat) & 4 (Low Heat) down to 15% w/w using chilled water. Added 125 l of chilled water to Tank 3.
1415 h {1350 h} 54. Take feed and concentrate Micro samples and concentrate sample forTS. [Cone H] 1430 h 55. Run H ends. Plant automatically starts CIP sequence. Disconnect flexible line from Feed valve
on RE balance tank and drain out remaining concentrate, flush Tank 1 and line with water and iodophor, rinse and add 280 kg of concentrate from Tank 3. Cleaned Tank 3 and then transferred contents of Tank 4 to Tank 3 and added 125 l of chilled water to Tank 3.
56. Take sample forTS. [Feed I] 1800 h 57. RE goes on milk, drawing it from Tank 1. Rnn I. High heat @ 15% w /w

M8
2015 h {1900 h) 58. Take feed and concentrate Micro samples and concentrate sample forTS. [Cone I] 2030 h Run ended at 1930 h, CIP started at 2030 h. 59. Run I ends. Plant automatically starts CIP sequence. Disconnect flexible line from Feed valve
on RE balance tank and drain out remaining concentrate, flush Tank 1 and line with water and iodophor, rinse and add 280 kg of concentrate from Tanlc 5 {connected line to Tank 5}.
60. Take sample forTS. [Feed J]
0000 h Friday 24~01 ~92 61. RE goes on milk, drawing it from Tank ±-{5}. Run J. Medimn heat@ 15% w/w 0215 h 62. Take feed and concentrate Micro samples and concentrate sample forTS and WPNI. [Cone J] 0230h 63. Run J ends. Plant automatically starts CIP sequence. Disconnect flexible line from Feed valve
on REbalance tank and drain out remaining concentrate, flush Tank± {5} and line with water and iodophor, rinse and add 280 kg of concentrate from Tank 4 {connected line to Tank 3}.
64. Take sample forTS. [Feed K] 0600 h 65. RE goes on milk, drawing it from Tank± {3}. Run K. Low heat@ 15% w/w 65a. Take Micro samples from each of tanks 2,3,4,5 0815 h {0715 h} 66. Take feed and concentrate Micro samples and concentrate sample forTS and WPNI. [Cone K] 0830 h {0730 h} 67. Run K ends. Plant automatically starts CIP sequence. Disconnect flexible line from Feed valve
on RE balance tank and drain out remaining concentrate, flush Tank ± {3} and line with water and iodophor, rinse and add 280 kg of concentrate from Tank 2 connect to Tank 2.
68. Take sample forTS. [Feed l]. WO-h {1100 h) 69. RE goes on milk, drawing it from Tank± {2}. Run L. Medimn heat@ 22.5% w/w 1415 h {1230 h) 70. Take feed and concentrate Micro samples and concentrate sample forTS. [Cone L] 1430 h {1230 h) 71. Run L ends. Plant automatically starts CIP sequence. Disconnect flexible line from Feed valve
on REbalance tank and drain out remaining concentrate, flush Tank± {2} and line with water and iodophor, rinse.
1800 h {1600 h) 72. Evaporator CIP completed, Shut down Evaporator.

~K POWDERS & DRYING PROCESSING for
EXPERIMENT Sk2
M9
Copies to: Robbie Buwalda, John Grant, Jason Flynn, Colin Knight, Paul Webby, Garvin Filby, Sally Miller, Tony Mackereth, Pat Jordan (CU).
Date: 25 February 1995 Project: MPDR067 R.O: Tony Mackereth
Product: Skim concentrate
Objective: To produce skim milk concentrate using the Wiegand evaporator, for use in theRE.
To determine the effect of preheat treatment and feed concentrate on evaporation heat transfer rate at two levels of feed flow rate and two levels of temperature driving force.
MILK: Quantity: Source: Date in: Treatment:
PLANT:
17,500 l whole milk (15,000 1 skim milk required) Tui 2 March 1992 Separate, pasteurize and put skim in Silo 3
Plant: Wiegand only No. Runs: Evaporator; 3
EXPERIMENT Sk2 RUN DETAILS
Milk Requirements Type: Skim Milk (Tui supply). Quantity: 15,000 l (require 11,500 l of skim milk equivalent ex Wiegand evaporator) Quality: Check TA is Ok on arrival Time Required: Put in Silo 3 by 1400 h Monday 2/3/92.
Silo chilling to be set at 4 °C.
Wiegand Rnnl: Pre-heat: 95°C for 20 s
Concentrate: 45% w/w [1150 kg@ 45% w/w] Chill and dilute with chilled water to obtain the following;
1500 kg @ 22.5% w/w in Tank 2 600 kg@ 30% w/w in Tank 5
Rnn 2: Pre-heat: l20°C for 180 s Concentrate: 45% w/w [570 kg@ 45% w/w] Chill and store in Tank 3 at <woe. Dilute with chilled water to get 30% w /w. Require 850 kg @ 30% w /w
Rnn3: Pre-heat: 100°C for 1 s Concentrate 45% w/w [570 kg @ 45% w/w] Chill and store in Tank 4 at < W°C. Dilute with chilled water to obtain a final concentration of 30% w /w. Require 850 kg @ 30% w /w.
I

MlO
Experiment Sk2 Research Evaporator Details
Concentrate for Removal (from Research Evaporator) The concentrate will be diluted to approximately 20% w/w and stored in Silo 3 with chilling on.
Services Requirements Steam is required 24 hours per day from Tuesday 3-3-92 to Friday 6-3-92.
Equipment Requirements Require a flexible line to run the concentrate from Tank 1 to the feed valve mounted on the RE Balance Tank. Require a line from the Pig Pump to Silo No 3, complete with non-return valve.
Research Evaporator Run Information The following 12 nms will be put through the RE. (Batch size 330 kg).
Run A: RunB:
MH at 22.5% w/w HH at 30% w/w
Ex Tank 2 Ex Tank 3
Dilute Silo 3 to 22.5% w/w with chilled water
RunC: MH at 30% w/w.
Dilute Silo 5 to 15% w/w
RunD: LH at 30% w/w
Dilute Silo 4 to 22.5% w/w
RunE: RunF:
MH at 22.5% w/w LH at 22.5% w/w
Dilute Silo 4 to 15% w/w
RunG: HH at 22.5% w/w
Dilute Silo 3 to 15% w/w
RunH: Run I: RunJ: RunK:
. RunL:
MH at 22.5% w/w HH at 15% w/w MH at 15% w/w LH at 15% w/w MH at 22.5% w/w
Ex Tank 5
Ex Tank 4
Ex Tank 2 Ex Tank 4
Ex Tank 3
Ex Tank 2 Ex Tank 3 Ex Tank 5 Ex Tank 4 Ex Tank 2
NB: Will transfer 330 kg of appropriate concentrate to Tank 1 and gravity feed from there, to ensure no more than 300 kg is used on any one run. Each run involves three hours processing. Three different operating conditions will be applied ( 1 hour each) in random order.

Mll
Experiment Sk2 Procedure 1400 h Monday 2 March 1992 1. 15,000 l of pasteurised skim milk is stored in Silo 3 by 1400 h.
Silo chilling set at 4 °C. {5 oc} 2. Take samples of Skim milk for Micro [1], MP lab [1] and Chern lab [0]. {8.86% wlw} 0700 h Tuesday 3. Evaporate skim milk to 45% w/w on Wiegand using a medium pre-heat treatment (95°C for
4. 915 h 5. 6.
20 s). Chill concentrate and store in Tank 2. Take balance tank micro sample
When Tank 2 has 640 l (750 kg) in it, switch concentrate flow to Tank 5. When Tank 2 is deemed mixed, take sample [2] for TS and WPNI. Submit for Urgent TS Analysis- Result required by 1400 h. {46% w!w}
7. Start RE and settle at operating conditions on water. 1030 h 8.
9.
1100 h
When Tank 5 has 340 l (400 kg) in it, stop adding concentrate, put Wiegand evaporator on water and change pre-heat holding to 180 s. When Tank 5 is deemed mixed, take sample [3] forTS and submit for Urgent Analysis- Result required by 1630 h. {46.63% w!w}
10. Evaporate skim on Wiegand to 45% w/w using high heat pre-heat treatment of l20°C for 180 s.
11.
1245 h
Chill concentrate and put in Tank 3. When Tank 2 initial total solids result [2] known, determine and add amount of chilled water (from outside silo) required to drop total solids to 22.5%. {Total in Tank 2 = 1450 l}
12. When Tank 3 has~ {500} l (570 kg) in it, stop adding concentrate to Tank 3, put Wiegand on
13.
1315 h 14.
water and change pre-heat holding to 1 s. When Tank 3 is deemed mixed, take sample [4] for TS and WPNI. Submit for Urgent TS Analysis- Result required by 1630 h. {44.47% w!w}
Evaporate skim on Wiegand to 45% w/w using low heat pre-heat treatment of 100°C for 1 s. Chill concentrate and put in Tank 4.
15. Take Wiegand concentrate BIT micro sample. 1400 h 16.
17.
1500 h
When Tank 5 initial total solids result [3] known, determine and add amount of chilled water required to drop total solids to 30%. Stir tank to mix in water. {Total in Tank 5 = 550 l} When Tank 3 initial total solids result [4] known, determine and add amount of chilled water required to drop total solids to 30%. Stir tank to mix in water. {Total in Tank 3 = 790 l}
18. When Tank 4 has~ {500} l (570 kg) in it, stop adding concentrate to Tank 4,
19.
1530 h 20.
CIP Wiegand evaporator. When Tank 4 is deemed mixed, take sample [5] forTS and WPNI. Submit for Urgent TS Analysis -Result required by 1630 h on Tuesday. {44.64% wlw}
Put 350 kg (322 1) of medium heat concentrate from Tank 2 in Tank 1. Take sample for TS [Feed A] Left 1128 lin Tank 2.
1600 h {Prior to this, the evaporator was hydraulically tested, and a leak was found in the union between the third effect calandria and the vapour duct. The union was inspected and reassembled, and a subsequent hydraulic test revealed that the leak was still present but much reduced. Due to lack of time, the plant had to be run with the leak.
The differential pressure low pressure lines were bled at 1546 h) 21. Put RE on milk, drawing it from Tank 1. Run A. Medium heat @ 22.5% w/w 1630 h 22.
1645 h 23.
When Tank 4 initial total solids result known, determine and add amount of chilled water required to drop total solids to 30% . Check water is mixed in by agitator. {Total in Tank 4 = 790 l}
Take feed and concentrate Micro samples and concentrate sample forTS and WPNI. [Cone A1]

M12
1745 h 24. Take concentrate sample forTS [Cone A2] 1845 h 25. Take concentrate sample for TS [Cone A3] 1900 h 26. Run A ends. Plant automatically starts CIP sequence. Disconnect flexible line from Feed valve
on REbalance tank and drain out remaining concentrate, flush Tank 1 and line with water and iodophor, rinse and add 350 kg (313 l) of concentrate from Tank 3. Left 4771 in Tank 3.
27. Take sample forTS. TS analysis result required by 1000 h Wednesday. [Feed B] 2200 h 28. RE goes on milk, drawing it from Tank 1. Run B. High heat@ 30% w/w 2245 h 29. Take feed and concentrate Micro samples and concentrate sample forTS. [Cone B1] 2345 h 30. Take concentrate sample for TS [Cone B2] 0045 h Wednesday 4th 31. Take concentrate sample for TS [Cone B3] 0100 h 32. Run B ends. Plant automatically starts CIP sequence. Disconnect flexible line from Feed valve
on RE balance tank and drain out remaining concentrate, flush Tank 1 and line with water and iodophor, rinse and add 350 kg (313 l) of concentrate from Tank 5.
33. Take sample forTS. TS analysis result required by 1000 h Wednesday. [Feed C] 0400 h 34. RE goes on milk, drawing it from Tank 1. Run C. Medimn heat @ 30% w/w 35. Take Micro samples from each of tanks 2,3,4,5. 0445 h 36. Take feed and concentrate Micro samples and concentrate sample forTS and WPNI. [Cone C1] 0540 h Differential pressures all over 20 kPa from now to end of run, indicated that severe fouling had
occurred. Kept 100 l of feed to run through evaporator as Run M on Friday. 0545 h 37. Take concentrate sample for TS [Cone C2] 0645 h 38. Take concentrate sample forTS [Cone C3] 0700 h 39. Run C ends. Plant automatically starts CIP sequence. Disconnect flexible line from Feed valve
on RE balance tank and drain out remaining concentrate, flush Tank 1 and line with water and iodophor, rinse and add 350 kg (313 l) of concentrate from Tank 4.
40. Take sample forTS. TS analysis result required by 1000 h Wednesday. [Feed D] 1000 h 41. 42.
1045 h
RE goes on milk, drawing it from Tank 1. Run D. Low heat@ 30% w/w When TS results for feed samples for Runs B (Tank 3), C (Tank 5) & D (tank 4) are known, dilute tanks 3 (High heat) & 4 (Low Heat) down to 22.5% w/w using chilled water. Dilute tank 5 (Medium heat) down to 15% using chilled water. At 1330 h Tank 3 filled to 575 l, Tank 4 filled to 625 l, Tank 5 filled to 316 l after taking out 95 l to store in cream cans for Run M.
43. Take feed and concentrate Micro samples and concentrate sample forTS and WPNI. [Cone Dl] 1145 h 44. Take concentrate sample forTS [Cone D2] 1245 h 45. Take concentrate sample for TS [Cone D3] 1300 h 46. Run D ends. Plant automatically starts CIP sequence. Disconnect flexible line from Feed valve
on RE balance tank and drain out remaining concentrate, flush Tank 1 and line with water and iodophor, rinse and add 350 kg (322 l) of concentrate from Tank 2.
47. Take sample forTS. [Feed E] 1600 h 48. RE goes on milk, drawing it from Tank 1. Run E. Medimn heat@ 22.5% w/w 1645 h 49. Take feed and concentrate Micro samples and concentrate sample forTS. [Cone E1]

1745 h 50. Take concentrate sample forTS [Cone E2] 1845 h 51. Take concentrate sample forTS [Cone E3]
M13
1900 h 52. RunE ends. Plant automatically starts CIP sequence. Disconnect flexible line from Feed valve
on RE balance tank and drain out remaining concentrate, flush Tank 1 and line with water and iodophor, rinse and add 350 kg (322 l) of concentrate from Tank 4.
53. Take sample forTS. TS analysis result required by 1000 h Thursday. [Feed F] 2200 h 54. RE goes on milk, drawing it from Tank 1. RWI F. Low heat@ 22.5% w/w 2245 h 55. Take feed and concentrate Micro samples and concentrate sample forTS and WPNL [Cone F1] 2345 h 56. Take concentrate sample forTS [Cone F2] 0045 h Thursday 5th 57. Take concentrate sample for TS [Cone F3] 0100 h 58. Run F ends. Plant automatically starts CIP sequence. Disconnect flexible line from Feed valve
on RE balance tank and drain out remaining concentrate, flush Tank 1 and line with water and iodophor, rinse and add 350 kg (322 l) of concentrate from Tank 3.
59. Take sample forTS. TS analysis result required by 1000 h Thursday. [Feed G] 0400 h 60. RE goes on milk, drawing it from Tank 1. RWI G. Ingh heat@ 22.5% w/w 61. Take Micro samples from each of tanks 2,3,4,5 0445 h 62. Take feed and concentrate Micro samples and concentrate sample forTS. [Cone Gl] 0545 h 63. Take concentrate sample for TS [Cone G2] 0645h 64. Take concentrate sample for TS [Cone G3] 0700h 65. RunG ends. Plant automatically starts CIP sequence. Disconnect flexible line from Feed valve
on RE balance tank and drain out remaining concentrate, flush Tank 1 and line with water and iodophor, rinse and add 350 kg (322 l) of concentrate from Tank 2.
66. Take sample for TS. [Feed H]. 0945 h High concentrate density alarm, so blew out concentrate flow meter with compressed air. 1000 h 67. RE goes on milk, drawing it from Tank 1. RWI H. Medimn heat @ 22.5% w/w 1045 h 68. 69.
Take feed and concentrate Micro samples and concentrate sample forTS. [Cone H1] When TS results for feed samples for Runs F (Tank 4) and RunG (tank 3) are known, dilute tanks 3 (High heat) & 4 (Low Heat) down to 15% w/w using chilled water. Tank 3 filled to 420 l, Tank 4 filled to 390 l.
1145 h 70. Take concentrate sample for TS [Cone H2] 1245 h 71. Take concentrate sample for TS [Cone H3] 1300 h 72. Run H ends. Plant automatically starts CIP sequence. Disconnect flexible line from Feed valve
on REbalance tank and drain out remaining concentrate, flush Tank 1 and line with water and iodophor, rinse and add 350 kg (330 l) of concentrate from Tank 3.
73. Take sample forTS. [Feed I] 1900 h {1700 h due to operator interface failure, had to restart plant} 74. RE goes on milk, drawing it from Tank 1. RWI I. Ingh heat@ 15% w/w 1945 h {1745 h) 75. Take feed and concentrate Micro samples and concentrate sample forTS. [Cone Il] 1745 h {1845 h} 76. Take concentrate sample forTS [Cone 12]

M14
1845 h {1945 h} 77. Take concentrate sample for TS [Cone 13] 1900 h {2000 h} 78. Run I ends. Plant automatically starts CIP sequence. Disconnect flexible line from Feed valve
on REbalance tank and drain out remaining concentrate, flush Tank 1 and line with water and iodophor, rinse and add 350 kg (330 l) of concentrate from Tank 5.
79. Take sample for TS. [Feed J] 2233 h High concentrate density alarm, blew out concentrate density meter with compressed air. 2200 h {2300 h} 80. RE goes on milk, drawing it from Tank 1. Rllll J. Medimn heat@ 15% w/w 2245 h {2345 h} 81. Take feed and concentrate Micro samples and concentrate sample for TS and WPNI. [Cone Jl] 2345 h {0045 h Friday 61h) 82. Take concentrate sample for TS [Cone J2] 0045 h {0145 h} 83. Take concentrate sample for TS [Cone J3] 0100 h {0200 h) 84. Run J ends. Plant automatically starts CIP sequence. Disconnect flexible line from Feed valve
on REbalance tank and drain out remaining concentrate, flush Tank 1 and line with water and iodophor, rinse and add 350 kg (330 l) of concentrate from Tank 4.
85. Take sample for TS. [Feed K] 0400 h {0500 h} 86. RE goes on milk, drawing it from Tank 1. Rllll K. Low heat@ 15% w/w 87. Take Micro samples from each of tanks 2,3,4,5 0445 h {0545 h} 88. Take feed and concentrate Micro samples and concentrate sample forTS and WPNI. [Cone K1] 0545 h {0545 h} 89. Take concentrate sample for TS [Cone K2] 0645 h {0645 h} 90. Take concentrate sample forTS [Cone K3] 0700 h {0800 h} 91. Run K ends. Plant automatically starts CIP sequence. Disconnect flexible line from Feed valve
on REbalance tank and drain out remaining concentrate, flush Tank 1 and line with water and iodophor, rinse and add 350 kg (322 l) of concentrate from Tank 2.
92. Take sample forTS. [Feed L]. 0945 h Plant shut down due to high steam temperature. Restarted and C!Ped. Bled differential pressure
low pressure lines. 1000 h {1100 h} 86. RE goes on milk, drawing it from Tank 1. Rllll L. Medimn heat@ 22.5% w/w 87. Take Micro samples from each of tanks 2,3,4,5. 1045 h {1145 h} 88. Take feed and concentrate Micro samples and concentrate sample forTS and WPNI. [Cone K1] 1145 h {1245 h} 89. Take concentrate sample for TS [Cone K2] 1245 h {1345 h} 90. Take concentrate sample forTS [Cone K3] 1300 h {1300 h) 91. Run Lends. Plant automatically starts CIP sequence. Disconnect flexible line from Feed valve
on REbalance tank and drain out remaining concentrate, flush Tank 1 and line with water and iodophor, rinse and add 95 l of concentrate stored since Run C. The CIP sequence was shortened to speed up process.
1544h 93. RE goes on milk, drawing it from Tank 1. Run M. (Repeat of Run C) 1615 h 94. Take feed and concentrate Micro samples and concentrate sample for TS. [Cone L] 1640h 95. Run M ends. Plant put onto CIP sequence. Disconnect flexible line from Feed valve on RE
balance tank and drain out remaining concentrate, flush Tank 1 and line with water and iodophor, rinse.

N1
APPENDIX N: LABORATORY ANALYSIS METHODS
The methods used for analysis were as follows:
Analysed at the NZDRI by the Milk Powders & Drying laboratory
The total solids of the milk and concentrate samples was determined using a vacuum oven
method (Mojonnier & Troy, 1925).
The titratable acidity (TA) of the milk was determined by titration with NaOH (MAFQM, 1986,
Method 2.2.1a).
The moisture content of the powders was determined using the standard toluene extraction
method (MAFQM, 1981, Method 2.9.1).
Analysed at the NZDRI by the Analytical Chemistry laboratory
The fat content of the powders was determined using the Rose-Gottlieb reference test for milk
powders (International Dairy Federation, 1987).
The lactose content was determined on an autoanalyser (Chern Laboratory Instruments Ltd,
Hornchurch, England). Yell ow ferricyanide was reduced by lactose to give colourless
ferrocyanide which was measured colorimetrically at 420 nm (Technicon, 1973).
The protein content was determined by measuring total nitrogen (TN). The sample was digested
and automatically titrated on a Kjel-Foss automatic 16200 (A/S N. Foss Electric, Hillerod,
Denmark) to determine total nitrogen. Protein content was obtained by multiplying the TN by
6.38.
To determine the non-casein nitrogen (NCN), samples were prepared by the method of Roland
(1938). The sample was dissolved and the pH adjusted to 4.6 to precipitate the casein. The
filtrate was tested by Kjel-foss as for total nitrogen. The casein content was determined by
subtracting NPN from TN and multiplying by 6.38.
To determine the non-protein nitrogen (NPN), samples were prepared by the method of Rowland
(1938). The sample was dissolved and the protein precipitated by 12% trichloroacetic acid.
The filtrate (NPN soluble in 12% TCA) was tested by Kjel-foss as for total nitrogen. The whey
protein content was determined by subtracting NPN from NCN and multiplying by 6.38.
The ash content was determined by heating a sample overnight at 550°C (British Standards
Institution, 1968).

N2
Analysed at NZDRI by the Starters and Microbiology Section
The samples taken for microbiology analysis were analysed using the procedures laid out in
MAFDD (1978 revised 1982, 1985). The actual tests done and the appropriate section of the
manual are listed below:
References
Coliforms
Standard Plate Count
Spore Formers1
Mesophillic
Thermophillic
Sulphite Reducing Clostridia
Thermophiles
Yeast and Mould
(Section 44, May 1985)
(Section 41.1, Aug 1978)
(Section 52.2, May 1985)
(Section 52.1, May 1985)
(Section 52.3, May 1985)
(Section 42, Aug 1978)
(Section 43, Dec 1982)
British Standard Institution (1968). Methods for the chemical analysis of dried milk. British
Standard 1743, British Standards Institution, London.
International Dairy Federation (1987). Determination of fat content (Rose-Gottlieb reference
method). IDF Standard 9C, International Dairy Federation, Brussels.
MAFDD (1978, revised 1982, 1985). Manual 3 Microbiological Standard Laboratory
Methods. Dairy Division of Ministry of Agriculture and Fisheries, Wellington, New
Zealand.
MAFQM (1981, revised in 1983 and 1986). Manual 4 Chemistry: Standard Laboratory
Methods. Ministry of Agriculture and Fisheries Quality Management, Wellington.
Mojonnier T & Troy H C (1925). Technical Control of Milk Products, 2nd edn., Mojonnier
Bros. Co. , Chicago, Illinois. , 122.
RowlandS J (1938). The determination of the nitrogen distribution in milk. Journal of Dairy
Research, 9, 42-46.
Technicon (1973). Technicon Method 120-71A. Technicon Industrial Systems, Tarrytown, New
York.
1The heat treatment used for all three spore former tests was 80°C for 30 min.
01
APPENDIX 0: MODEL FOR STEAM CONDENSATION IN
A CALANDRIA SHELL IN
NON-CONDENSABLE GASES
01 futroduction
THE PRESENCE OF
The model description presented here has been adapted from the model for a vertical
plate (Denny et al, 1971). The gas phase equations presented here are based on the
forms in Bird et al (1960) with the last two terms in the energy equation (Equation 05)
being taken from Denny et al. This model attempts to describe the condensation of
steam on the internal surface of a vertical annulus. The assumptions made are covered
in Section 03. The conservation equations for the liquid layer (Section 04), the
conservation equations for the vapour space (Section 05) and the boundary conditions
(Section 06) are presented. The derivatives in the vapour phase equations were
determined by expansion and the derivatives at the boundaries were also listed
(Section 07). Finite difference approximations of the vapour phase conservation
equations (Section 08), and of the inner boundary conditions (Section 09) were
determined to be solved by a forward marching parabolic technique. The parabolic
technique can not be applied to situations where there is reverse flow in the forward
marching direction (see Chapter 34). Thus, the attempted application (see Appendix P)
of the description presented here to the top half the calandria was not successful because
the upward vapour flow is opposed by the downward condensate flow.

02
02 Nomenclature
Roman
Cp
D
g
k
L
p
q
r
R
T
u
w z
Greek
8
Ll
'A
p,
p
Hebrew
specific heat of fluid (J kg-1 K 1)
diffusivity (m2 s-1)
acceleration due to gravity (m s-2) [ +!.]
fluid conductivity (W m-1 K 1)
length of top section (m) [ + t] absolute pressure (Pa)
heat flow (W) [ ~ +]
radius (m) [ +~]
specific gas constant (J kg-1 K 1)
temperature (K)
velocity (m s-1) [ + t]
mass fraction (-)
vertical distance from bottom of region
(m) [ + t]
liquid film thickness (m) [ +~]
step size (m)
latent heat of vaporization (J kg-1)
dynamic viscosity (kg m-1 s-1)
density (kg m-3)
shear stress (kg m-1 s-2)
0 mass condensation rate (kg s-1) [ ~ +]
03 Model Assumptions
1. Negligible tangential velocities.
Subscripts
1
2
cond
e
j
k
r
sat
steam
v
vent
w
z
Superscripts
water vapour
non-condensible gas
condensate stream condition
bulk gas condition
condition at liquid/vapour interface
step in z direction [ + t] step in r direction [ +~]
liquid phase condition
r direction component [ + ~] saturated steam condition
bulk inlet steam condition
vapour phase condition
venting stream condition
wall condition
z direction component [ + t]
mean value
Sign convention
+ t vertically upwards is positive
+.!. vertically downwards is positive
+~ outwards is positive
inwards is positive
2. Both vapour and liquid phases are Newtonian fluids.
3. Kinetic energy terms insignificant.
4. Viscous dissipation insignificant.
5. No friction loss
6. No superheat (Further work)
7. No surface heat loss from outer shell (Further work)
8. Liquid film assumed to be in one plane (that is, no cylindrical effects allowed for.)

03
04 Conservation Equations for Liquid Layer
Assuming radial effect is insignificant (that is; 8 < < rw)
i. Momentum
(01)
ii. Energy
&T 0 ~- (02)
OS Conservation Equations for Vapour Space
i. Mass
1 a a --(P ru ) + -(p u ) = 0 r ar v r az v z (03)
11. Momentum
[ au, au, auz auz] pu-+u-+u-+u-=
v r ar z az r ar z az _ap _ ap
ar az
[ a ( 1 a ) 1 a ( auzj] + j.l. - --(ru) +-- r-v ar r ar r r ar ar (04)
[&u, &uz] +j.t-+--
v az 2 az 2
+ Pvgz

04
iii. Energy
iv. Species
06 Bomulary Conditions
At inner wall,
At outer wall,
At interface,
( 1 a ( awl) &wtl pD --r- +--
v 12 r ar ar az 2
r = rw, Uz = 0, Tw = constant
assumes vapour and liquid phase velocities are equal
assumes vapour and liquid phases are at same temperature
auz J.L-
l ar 'l I,
= 1: i
assumes shear of liquid and vapour phases is equal
(05)
(06)
(07)
(08)
(09)
(010)
(011)

z+~z [ D aw l = J 2n p v 12
-1 (r + o) dz
(1 - w1) ar . w Z I,V
Change in condensate flow rate Diffusion of water vapour to surface
0 ). +
Conduction of heat through liquid latent heat + conduction through vapour
In addition assuming ideal gas conditions in vapour phase
p = PvRT where R = f(w1)
and assuming thermodynamic equilibrium
Heat Balance on Film
z+~z rw+6
2x [ r k1 ~~ dz l,.,w " 2x f. p 1ru, [A + Cp1(T1- T) Jdrl, rw+6
- 2n J plruz[A. +Cpl(Ti-T)]d1z+~z
z+~z · + 21t I r kv ar 1 dz ar .
Z I,V
07 Derivatives involved in Equations
Equation 3 has the following derivatives;
05
(012)
(014)
(015)
(016)

06
Now can expand the first derivative as follows;
And the second derivative as follows;
Therefore the expanded form of equation 03 is;
ap + U r-v
r ar
1 ( au; apvl apv auz - p r- + p u + ru - + u - + p -r v ar v r r ar z az v az
Equation 04 has the following derivatives;
au, ar '
&u, a~ ,
The antepenultimate derivative above expands as follows;
0
(03E)

07
The penultimate derivative above expands as follows;
l_ ~(r auzl = l_ (ar auz + r &uzl r ar ar r ar ar ar 2
1 auz &uz --- + --
r ar ar2
Therefore the expanded form of equation 04 is;
[ auT auT auz auz]
p u-+u-+u-+u- = v T ar z az T ar z az
(04E)
Equation 05 has the following derivatives;
aT aT ~(r k aT) ~(k aT) ar ' az ' ar v ar ' az v az ' awl aT --, ar ar
aT aincp ar ar
The third derivative above expands as follows;
~(rk aT) = r ~(k aT) + k aT ar ar v ar ar v ar v ar ar akv aT .ffT aT
= r-- + rk - + k -ar ar v ar 2 v ar
The fourth derivative above expands as follows;

08
Therefore the expanded form of Equation 05 is;
Equation 06 has the following derivatives;
The third derivative above expands as follows;
Therefore the expanded form of Equation 06 is;
&wl + r--
8r2
( aw1 aw1l ( 1 awl + &wl + &wll p u- + u- = p D --v r ar z az v 12 r ar ar2 az2
·At the boundaries, there are the following derivatives;
In Equation 011
auz auz - ,-ar.l ar. I, l,V
(05E)
(06E)

In Equation 012
In Equation 013
In Equation 016
awl ar i,v
BTl BTl ar w ' ar i,v
09

010
08 Vapour Phase Finite Difference Approximations at the Point j,k
t z
j+1 I
I I I
I ! _l !
I I I
!
I I I I
J
j-1
0
I I
L I ----
1
i
i
01 i !
1- k~1 k' k+l r~
Figure 01: Grid used for finite difference approximations.
For equation 03
I (u,lj,k+1- u,lj,k-1] + (PvUrl + ul (Pvlj,k+l- Pvlj,k-ll Pv j,k 21:1r r . k r j,k 21:1r
], (03N)
+ p I (uzlj+l,k - uzlj-1,kl + u I ( Pvlj+1,k - Pvlj-l,k l = O v j,k 21:1z z j,k 21:1z
For equation 04 the left hand side is;
I u I ( u,lj,k+ 1 - u,lj,k-1] + I u I ( u,lj+ 1,k - u,lj-1,kl Pvj,k 'j,k 21:1r Pv j,k Zj,k 21:1z
+ I u I (uzlj,k+l - uzlj,k-1] + p I u I (uzlj+1,k - uzlj-1,kl' Pv '.i,k r j,k 21:1r v j,k z j,k 21:1z
(04N_L)
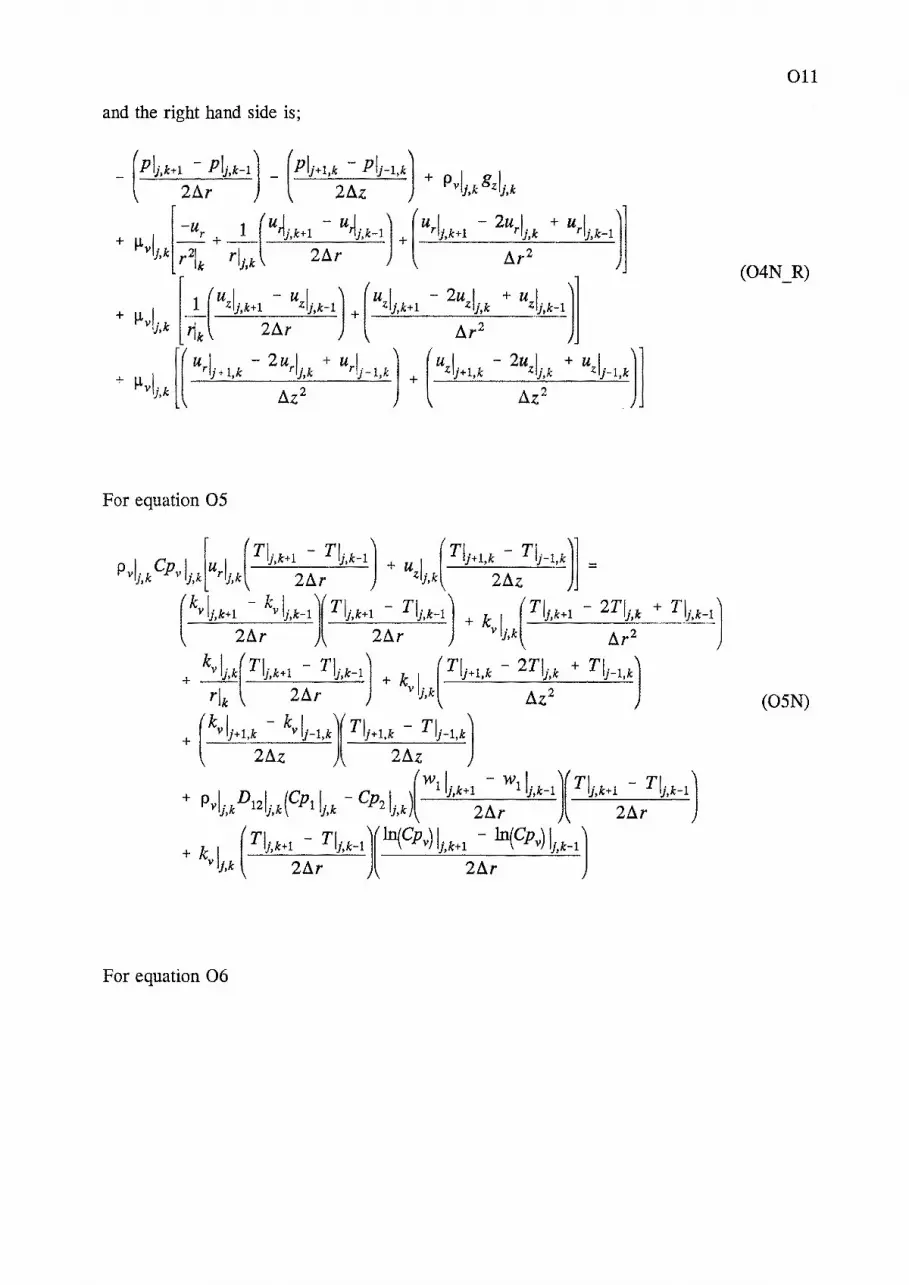
and the right hand side is;
For equation 05
Pvl· Cpvl· [uri· (TIJ,k+l- TIJ,k-1] + "zl· (TjJ+l,k T~-l,kll:::: J.k ;,k ;,k 2/l.r ;,k 2/l.z
(kvlj,k+l - kvlj,k-l](T~,k+l - TJj,k-ll + k I (Tlj,k+l - 2Tlj,k + Tlj,k-1]
2/l.r 2/l.r v J,k ll.rz
011
(04N_R)
+ kvl1,k(Tl1,k+l - Tl1,k-1] + k 1
(Tij+l,k - 2TIJ,k + Tu-1,k] rjk 2/l.r v J,k ll.zz (OSN)
+ (kvlj+l,k - kvlj-l,k](Tjj+l,k Tlj-l,kl 2/l.z 2/l.z
+ Pvl· Dlzl. (CPll· Cpzl. )(wl~,k+l- wliJ,k-ll(TIJ,k+l- TIJ,k-1] ;,k ;,k J,k J,k 2/l.r 2/l.r
+ k 1
( Tij,k+l TJj,k-ll(ln{Cpv) lj,k+l ln{CPv) lj,k-ll v J,k 2/l.r 2/l.r
For equation 06

012
09 Finite Difference Approximations at the Inner Boundary
For equation 011
a ( - 3a 1 + 4u 1 - u 1 l 1: I· = -.5_ = I z j,O z j,l z j,2 J llt ar . llv j,O 2tJ..r
l,l
For equation 012
awl where-
ar i,v
For equation 013
(06N)
(OllN)
(012N)
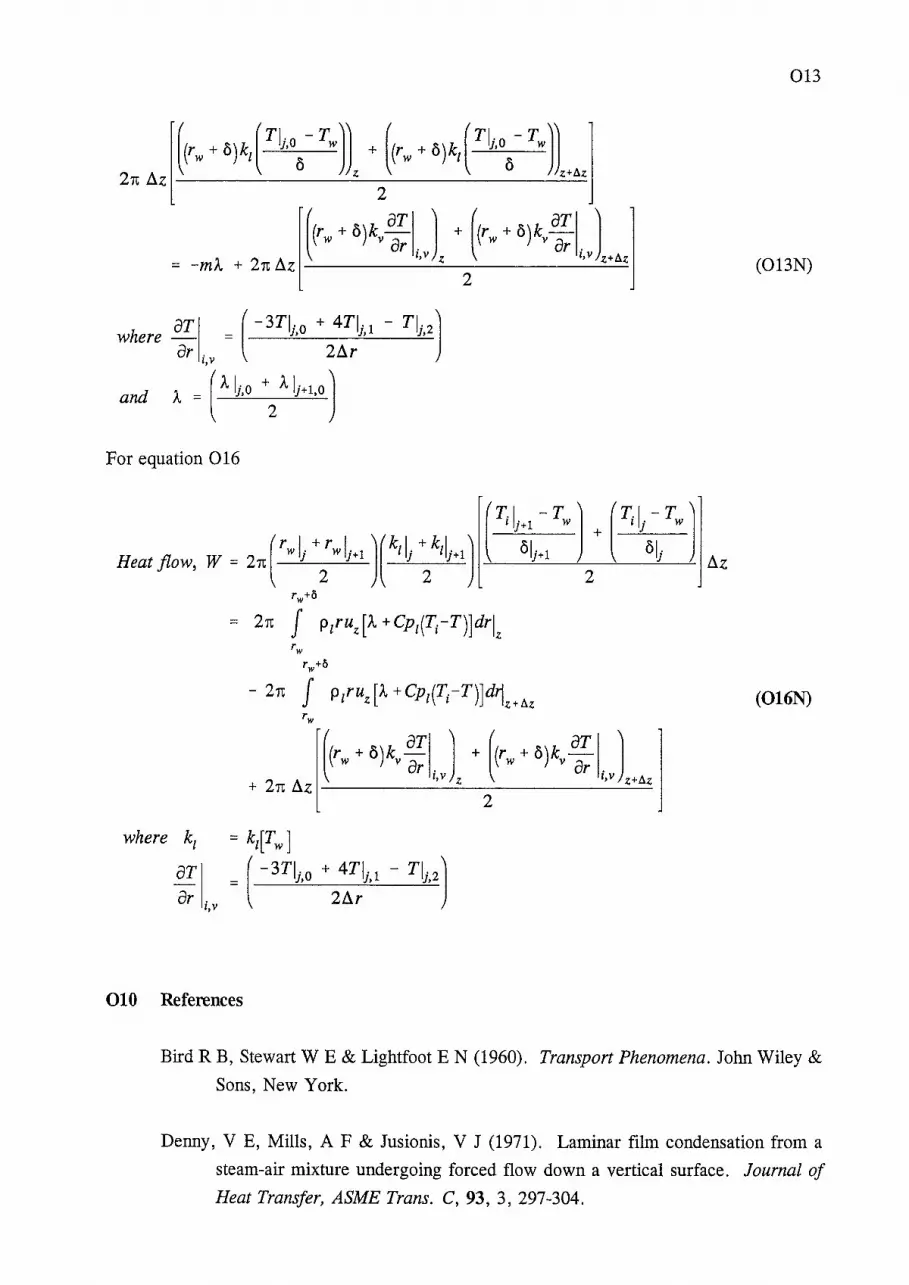
2
aT I ( -3TI,· o + 4TI,· 1 - Tl,· 2] where- = ' ' ' ar . 2f:J.r
I,V
and A = (A V.o +2 A lj•l,O l For equation 016
where k1
~~~iv ,
010 References
'w rw+li
- 2n J Pzruz [A.+ Cpz(Ti-T)]d1z+Az 'w
((r w + 0) kv ~~I. l + ((r w + 0) kv ~ I. l 2 A I,V z I,V z+Az
+ 1t uZ --------------2
013
(013N)
(016N)
Bird R B, Stewart WE & Lightfoot EN (1960). Transport Phenomena. John Wiley &
Sons, New York.
Denny, V E, Mills, A F & Jusionis, V J (1971). Laminar film condensation from a
steam-air mixture undergoing forced flow down a vertical surface. Journal of
Heat Transfer, ASME Trans. C, 93, 3, 297-304.

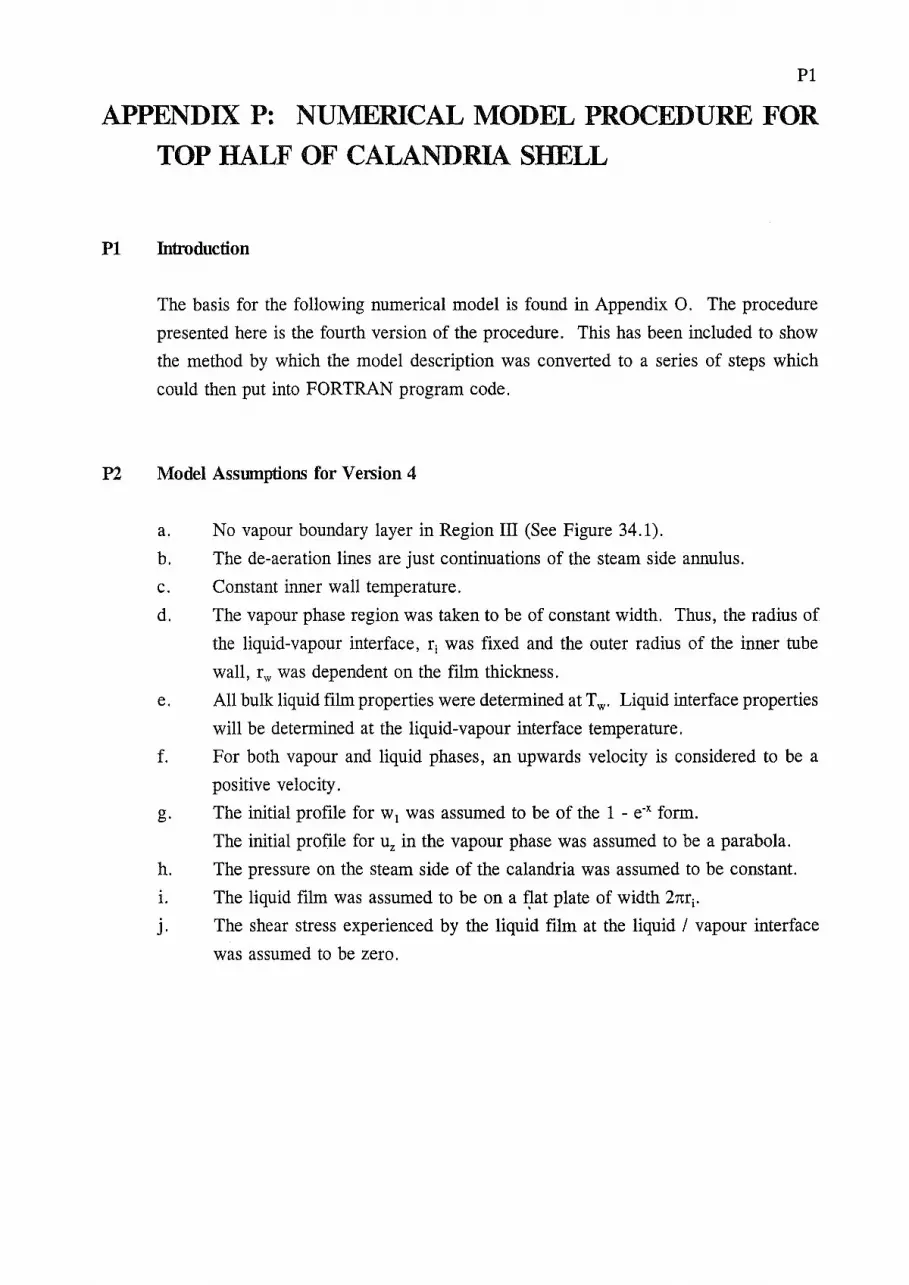
P1
APPENDIX P: NUl\1ERICAL MODEL PROCEDURE FOR
TOP HALF OF CALANDRIA SHELL
Pl Introduction
The basis for the following numerical model is found in Appendix 0. The procedure
presented here is the fourth version of the procedure. This has been included to show
the method by which the model description was converted to a series of steps which
could then put into FORTRAN program code.
P2 Model Assmnptions for Version 4
a. No vapour boundary layer in Region III (See Figure 34.1).
b. The de-aeration lines are just continuations of the steam side annulus.
c. Constant inner wall temperature.
d. The vapour phase region was taken to be of constant width. Thus, the radius of
the liquid-vapour interface, ri was fixed and the outer radius of the inner tube
wall, rw was dependent on the film thickness.
e. All bulk liquid film properties were determined at Tw. Liquid interface properties
will be determined at the liquid-vapour interface temperature.
f. For both vapour and liquid phases, an upwards velocity is considered to be a
positive velocity.
g. The initial profile for w1 was assumed to be of the 1 -e-x form.
The initial profile for uz in the vapour phase was assumed to be a parabola.
h. The pressure on the steam side of the calandria was assumed to be constant.
1. The liquid film was assumed to be on a f!at plate of width 2mi.
J . The shear stress experienced by the liquid film at the liquid I vapour interface
was assumed to be zero.

P2
P3 Nomenclature
Roman
a
A
A a
b
B
c D
g
k
L
LHS
m
Iter 1
Iter 2
N
coefficient for z velocity profile at j =0 (-)
defmed in Step 38
defmed in Step 38
coefficient for w 1 profile at j = 0 (-)
defmed in Step 38
specific heat of fluid (J kg·1 K"1)
diffusivity (m2 s·1)
acceleration due to gravity (m s·2) [ +J,]
fluid conductivity (W m·1 K-1)
length of top section (m) [ + t] left hand side (of equation)
mass flow rate (kg s·') [ + t] maximum number of iterations for simple
iterations (-)
maximum number of iterations for complex
iterations (-)
number of large steps (-)
n number of sub-steps in first step (-)
NCGcype type of non-condensible gas (-)
p absolute pressure (Pa)
q heat flow (W) [+-+]
r radius (m) [ +-+]
R specific gas constant (J kg·1 K 1)
RHS right hand side (of equation)
T temperature (0 C)
TermAv defmed in Step 19
Tol tolerance level for iteration (-)
u velocity (m s·1) [ + t, +-+]
w
X
z
mass fraction (-)
function of w 1 defined in Step 28 (-)
vertical distance from bottom of region I (m)
[ +-+]
ZeroCinK zero oc inK (K)
Greek
0 ,1
liquid fllm thickness (m) [ +-+]
step size (m) [ + t, +-+]
'A latent heat of vaporization (J kg-1)
11- dynamic viscosity (kg m·' s·')
p density (kg m·3)
1: shear stress (kg m·' s·2)
Hebrew
1 percentage of steam inlet flow vented
through top vent
mass condensation rate (kg s·') [+-+]
Subscripts
1 water vapour
2 non-condensible gas
cond condensate stream condition
e bulk gas condition
condition at liquid/vapour interface
j step in z direction [ + t] jb standard sized step in z direction [ + t] j 5 small sub-step in z direction (within first jb
step) [ + t] k step in r direction [ +-+]
kb standard sized step in r direction [ +-+]
k. small sub-step in r direction (within first ~
step) [ +-+]
liquid phase condition
max maximum value
p at constant pressure
r r direction component [ +-+]
sat saturated steam condition
steam bulk inlet steam condition
v vapour phase condition
vent venting stream condition
w wall condition
z z direction component [ + t]
Superscripts
mean vruue
Sign convention
+ t vertically upwards is positive
+J, vertically downwards is positive
+-+ outwards is positive
+-+ inwards is positive

P4 System Parameter Settings
Step 1. Specify Numerical Solution Conditions
Step 2. Specify Steam-side Dimensions
Step 3. Specify Operating Conditions
Step 4. Calculate liquid film properties at T w
Step 5. Estimate steam latent heat at j = 0 using T w
Step 6. Specify Inlet Steam Properties at j =0
msteam {to top half only}, Tsteam, w1,steam, NCGtype
PS Detennining Conditions at j = 0
Step 7.
Step 8.
Calculate mvent
Calculate mcond
l m xsteam 100
m cond ::::: m vent - m steam
P3

P4
Step 9.
Step 10.
Step 11.
Step 12.
Step 13.
Step 14.
Step 15.
Calculate Psteam
p Psat[Tsteam] steam W I
1 steam
(N.B. It is assumed that ap
ar
Calculate Rsteam
Calculate Pv steam
Psteam
= o ap ' az
Rsteam (Tsteam + ZeroCinK)
Calculate oj=o (Estimate using Nusselt Conditions)
Calculate rw at j =0
r I r,. - ol,·=o Wj=O
Calculate Ti at j =0
Calculate w1 i at j =0
= Psat[To,o]
Psteam

P5
Step 16. Calculate Ri at j = 0
Step 17. Calculate Pv,i at j =0
p 1
= Psteam
v o,o Rlo,o (Tlo,o + ZeroCinK)
Step 18. Calculate Jl-v at interface
IJ.llo,o = IJ.l[Tlo,o 'NCGtype' wllo,o J
IJ.zlo,o = IJ.z [Tio,o 'NCG type' wllo,o J
IJ.vlo,o = IJ.v[Tlo,o ' 1J.1Io,o ' IJ.zlo,o 'wllo,o 'NCGtype]
Step 19. Calculate 'rv at j = 0
- TermA v
-r I = P I v j=O v steam
IJ.v lo,o
Step 20. Calculate Uz,i,l at j = 0
u I = - _s__(P - p ) o2 z l,O 2j.Ll l steam

P6
Step 21.
Step 22.
Step 23.
Step 24.
Step 25.
Step 26.
flr flr = - 0
s
Calculate rkb and rks for kb = 1 to K-1, ks = 1 to 11r-1
rlkb = ri + kb flrb
rjk ri + ks flrs 3
Calculate liz for ~ = 1 to K-1, ks = 0 to nr-1 at j =0
1 2 -Ark 4 v
1 2 +-A r 4 v 0
1: vI where B =
0'0
v P I v steam
Select set of bkb values; Initially will use
Calculate b0 at j = 0
Calculate maximum w1 at j=O
w 1 w 1 {Temporary Solution} 1 O,max 1 steam

P7
Step 27. Calculate bks forks = 1 to nr-1
-ln(l-wdo,o) ln(1 - W 1 I steam )
1 _ exp -(x)x.::•) k,)]
W1 1steam
Step 28. Calculate w1 at j =0 for kb = 1 to K, ks = 1 to nr-1
Step 29. Calculate Tat j =0 for kb = 1 to K, ks = 1 to nr-1
Step 30. Calculate R at j =0 for kb = 1 to K, ks = 1 to nr-1
Step 31. Calculate Pv at j =0 for kb = 1 to K, ks = 1 to nr-1
p I = Psteam
v o,k Rlo,k (Tio,k + ZeroCinK)
Step 32. Calculate ur,i at j = 0
3mcond ' uj -----r 0,0 8 L j 1t ri Pv
0,0
Step 33. Calculate ur at j =0 for kb = 1 to K, ks = 1 to 11r-1
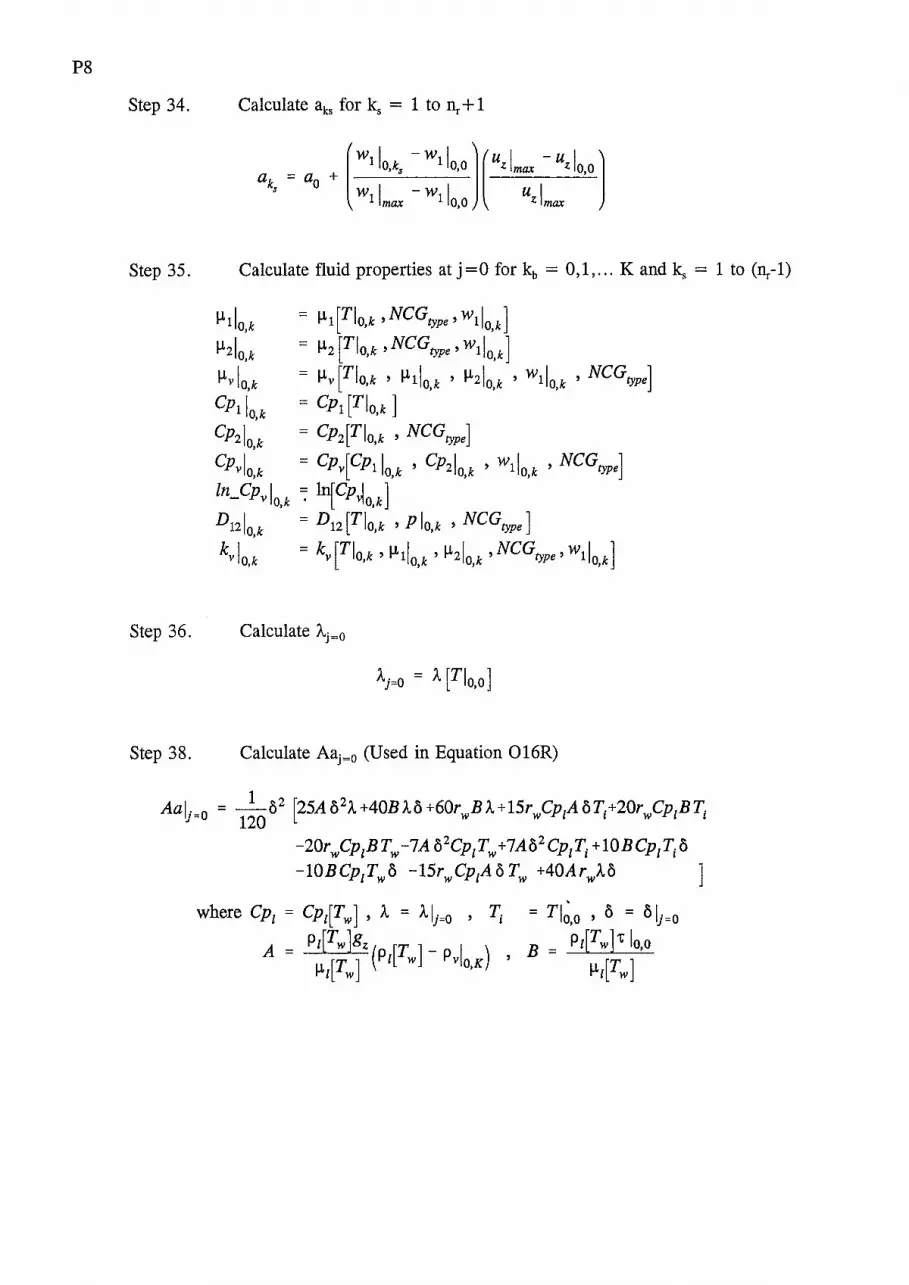
P8
Step 34. Calculate aks for ks = 1 to nr + 1
(w11o,k3 - w11o,o] ( uz lmax - uz lo 0 l
a =a + • ks o w I -w I u I
1 max 1 0,0 z max
Step 35. Calculate fluid properties at j = 0 for kb = 0, 1, ... K and ks = 1 to (~ -1)
~11o,k = ~1[Tio,k 'NCGtype 'w11o,k]
~21o,k = ~2 [Tio,k 'NCG type' wdo,k J
~vlo,k = ~v[Tio,k ' ~11o,k ' ~21o,k 'wllo,k 'NCGtype]
Cp1l0 k = Cpl [Tio,k ] . Cp21o,k = Cp2[Tio,k ' NCGtype]
Cpvlo,k = Cpv[CPllo,k ' Cp21o,k ' wllo,k ' NCGtype]
ln_Cpvlo,k ~ ln[Cp~o.k] D12lo,k = D12 [Tio,k 'P io,k ' NCGtype]
kvlo,k = kv[Tio,k '~llo,k '~21o,k ,NCGtype' wllo,k]
Step 36. Calculate \=o
Step 38. Calculate Aaj=o (Used in Equation 016R)
Aai·-o = - 1-o2 (25Ao2A.+40BA.o+60r BA.+15rwCp1AoT.+20r Cp1BT. ')- 120 W I W 1
-20rwCp1BTw -7A o2Cp1Tw +1Ao2Cp1Ti +10BCp1Tio -10BCp1Two -15rwCp1AoTw +40ArwA.o
= Tl~.o ' o = o li=O B = Pl[Tw]'t' lo,o
~l[Tw]

P9
P6 Detennining Conditions at js = -1
Step 39. Calculate Uz at js = -1 for kb = 0 to K, ks = 1 to nr-1
-, -, mvent u = u --z J Zlj=O m
steam
rr u 1 > o then u 1 = u 1 - [U.l1 -Lu;~-•] ~J.z Zj=O,k Zlj
8=-l,k Zlj=O,k
0 then uzl; =-1 k JS '
If uzi;=Ok < 0 then uzl; =-1 k J ' Js '
Step 40. Calculate Ur at js = -1 for kb = 0 to K, ks = 1 to nr-1
au Assuming _r ~ 0 then
az j=O
u I - u I rj,=-1,k ro,k
Step 41. Calculate w 1 at js = -1 for~ = 0 to K, ks = 1 to nr-1
aw Assuming --1 ~ 0 then
az :i=O
w I - w I 1 j3
= -l,k - 1 O,k
Step 42. Calculate T at j 5 = -1 for ~ = 0 .to K, ks = 1 to fic-1

P10
Step 43. Calculate Pv at js = -1 for kb = 0 to K, ~ = 1 to nr-1
ap Assuming _v ~ 0 then
az j=O
Pvl1· =-1k = Pvlok s ' '
Step 44.
IJ.11,· =-1k s '
IJ.21,· =-1 k s '
kvl,. =-1 k s '
P7 Detennining Condition's at j = 1 to J
For js = 0 to 11z-1 do
For~ = 1 to (nr- 1) and kb = 1 to K-1 do
Steps 45 to 51 below
End Do
End Do
For jb = 1 to J-1 do
For~ = 1 to (nr- 1) and kb = 1 to K-1 do
Steps 45 to 51 below
End Do
End Do
If o1 not equal to zero then adjust msteam and return to Step 6.

P11
Vapour Phase Equations
For partial derivatives with respect tor the following numerical equations were used in
the vapour phase;
Fork = nr
aF 1 (3Fi.k - 4FI·k-1 + Fl·k-2] = j, j, j,
ar ij,k 211rs
&F = (
3Tr l., - 4T, IJ,H + T, l.k-2] ar2 . k 2/:irs
j,
Fork + nr
aF I = (Fij,k+l - Flj,k-1] ar . k 2/:ir
j,
&F = (Fij,k+l - Fij,k + Fij,k-ll ar2 11r2
where F is any fluid property
Step 45. Solve Equation 06 for w1•
w I = 1 j+ l,k (06)
Step 46. Solve Equation 015 forT.
(015)
Step 47. Solve Equation 014 for Pv·
Rij+l,k = R[Tij+l,k ' wllj+l,k ' NCGtype J I _ Psteam
Pv j+l,k - Rij+l,k (Tij+l,k-+ ZeroCinK)
(014)

P12
Step 48. Solve Equation 03 for uz.
Step 49. Solve Equation 04 for ur.
If uzlj,k = 0 then set Flag
Else
u,lj+l,k = u I r j-l,k 2D.z
+ pI U I [Pvlj,kgz vj,k Zj,k
( -u, 1 au, &u, 1 auz &uz l
+ .1-Lvlj,k r2ik + rJk a, + ar2 + r lk ar + ar2
+ 1-Lvl· ( uzlj+l,k - 2uzlj,k + uzlj-l,k]- Pvl· u~. au, J,k D.z2 J,k J,k ar
auz (uzlj+lk- uzlj-lkl - Pvlj,k u,lj,k ar - Pvlj,k uzlj,k • 2Az •
If Flag set then
[ul (r-r )+ul (r -r )] U = r j+l,k-2 k k-1 r j+l,k k-1 k-2
rlj+l,k-1 (r - r ) k k-2
Set Flag to False End If
End If
Step 50. Determine unknown fluid properties at point j + 1 ,k
ll-1 = ll-1 [TJj+l,k] ll-2 = ll-2 (TJj+l,k ' NCGtype]
1-Lv~+l,k = 1-Lv[ll-1 ' ll-2 ' TJj+l,k ' Wllj+l,k 'NCGtype]
Cpllj+l,k = Cpl [TJj+l,k J
Cp21j+l,k = Cp2[TJj+l,k ' NCGtype]
Cpvlj+l,k = Cpv[CPllj+l,k ' Cp21j+l,k ' wllj+l,k ' NCGtype]
ln_Cpv lj+l,k = ln[Cp~j+l,k] D121j+l,k = Dl2 [TJj+l,k 'Psteam ' NCGtype]
kvlj+l,k = [1-Lp ll-2' TJj+l,k' Wllj+l,k' NCGtype J
Step 51. Check 05-LHS = 05-RHS
(04)
l

P13
Outer Boundary Conditions
Step 52. Calculate conditions at j + 1, K
u1 =0 u1 =0 Z j+l,K r j+l,K ar [ 4Tij+l,K-1 - Tlj+l,K-2 - = 0 :. Tlj+ l,K = ----=------'------''--'--
ar j+l,O 3 (08)
W I = Psat(Tij+l,K) 1 j+l,K p steam
Step 53. Calculate fluid properties at j + 1, K
I-L1 = I-L1 [Tij+l,K]
I-L2 = I-L2 (Tij+l,K ' NCGtype]
1-Lvlj+l,K = 1-Lv[1-L1 ' I-L2' Tlj+1,K 'W11j+l,K 'NCGtype]
Cpllj+l,K = Cpt[Tij+1,K]
Cp21j+1,K = Cp2[Tij+1,K ' NCGtype]
Cpvlj+l,K = Cpv[Cp1 ~+l,K ' Cp21j+1,K ' W11j+1,K ' NCGtype]
ln_Cpvlj+l,K = ln[Cp~j+l,K] Dl21j+1,K = D12 [Tij+l,K 'Psteam ' NCGtype]
kvlj+l,K = kv [1-L1 ' j.L2 ' Tlj+1,K ' W11j+l,K ' NCGtype]
Liquid-Gas Interface Conditions
Step 54. Set w 1 and 't' based on upstream values
ar j+l,O ar ·o J,
:. w1l ~+1,0
4 1 4 1 = w I - -w I + -w I + -w I - -w I
1 ~.o 3 1 j, 1 3 1 j,2 • 3 1 J+ 1,1 3 1 J+ 1,2

P14
Step 55. Determine T, Pv and Rgas
Rlj+l,O = R [Tij+l,O ' Wllj+l,O ' NCGtype]
I _ Psteam
Pv j+l,O - Rlj+l,O (Tij+l,O + ZeroCinK)
Step 56. Determine D12
Step 60. Determine 0 from Equation 012
(1-wl) ar . (1-wl) ar ( p'v Dl2 awl l + ( Pv Dl2 _awl l
l,v z i,v z+A.z 'J j+l = 2nri~z --------
2--------
Step 57.
Step 58.
P I D I ( -3w I + 4w I - w I l v j+l,O 12 j+l,O 1 j+l,O 1 j+l,l l j+l,l
(1 - w1 1 ) 2/lr j+l,O s
Determine 8 from Equation 012
= 3
Aj o] - c j+l
Aj+l where
2rt rigz Pt Aj = - 3~-tt[Tw J (Pt(Tw J - Pvlj,K)
Determine r _ w(j + 1)
(012)
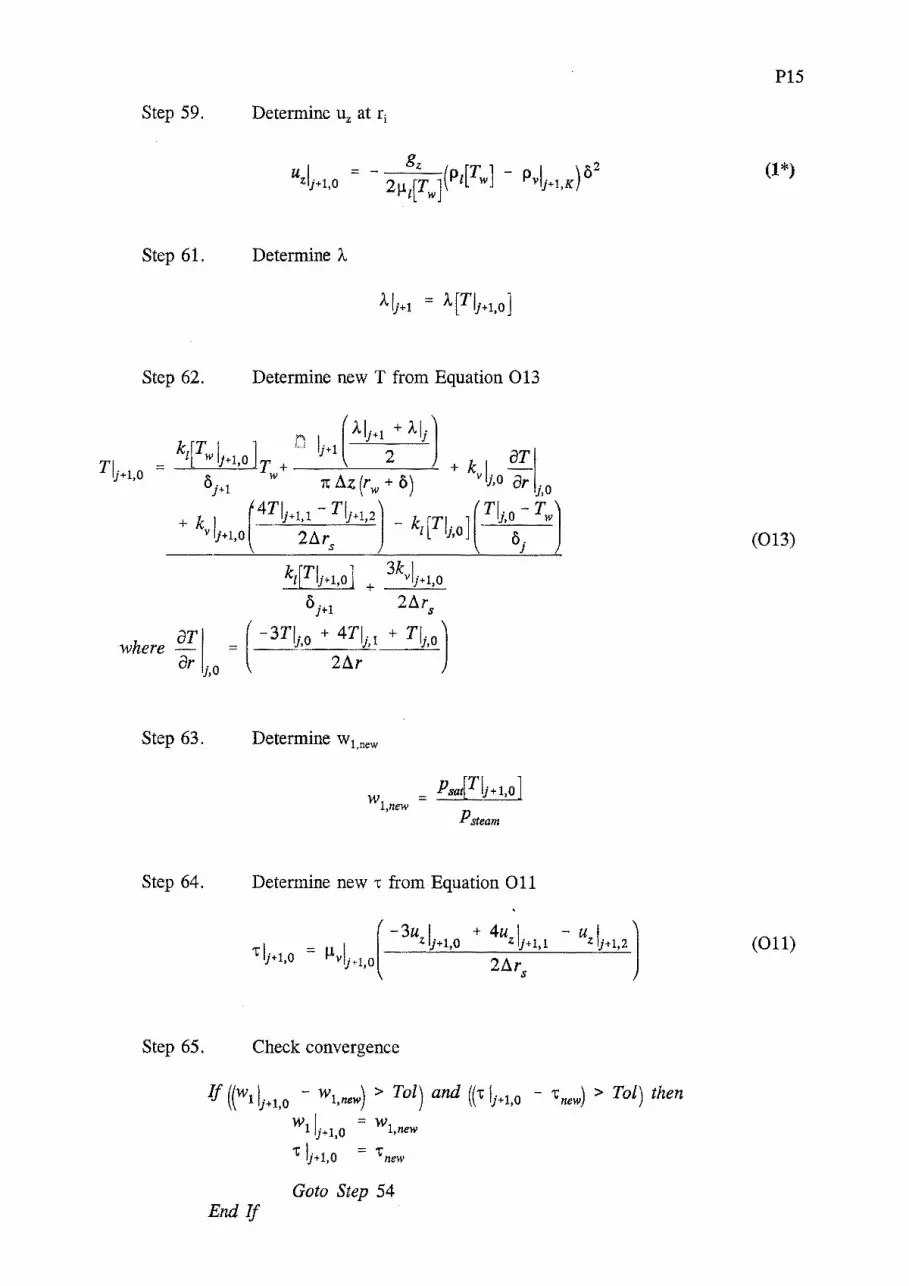
P15
Step 59. Determine uz at ri
u I = z j+l,O (1 *)
Step 61. Determine 'A
Step 62. Determine new T from Equation 013
(1..1. 1 + 1..1·]
k[T 1 ] a I r ' Tlj+l,o = l w J+l,o T + -= j+l 2 + k I ar I
Oj+l w 1tAz(rw+o) vj,O Brj,O
+ k I (4T[j+l,l- Tlj+l,2l- k [Tf. J(T[j,O Twl v J+l,o 2/lr l ,,o o.
s 1 (013)
Step 63. Determine w 1 new . w = PsaJTfJ+l,o]
l,new p steam
Step 64. Determine new t from Equation 011
(011)
Step 65. Check convergence
If ((w1jj+l,O - wl,new) > Tol) and ((t lj+l,O - 't'new) > Tol) then
w 1 = w 1 j+ 1,0 l,new t lj+l,O 1 new
Goto Step 54 End If

P16
Step 66. Check if Equation 016 LHS = RHS
(016L)
(016R)
1 Aaii+l =
120 o2 [25Ao 2A.+40BA.o+60rwBA.+15rwCp1AoTi+20rwCp1BTi
-20r WCpzBTW -7A o2CplTw +7Ao2 CplTi + 10BCplTio -10BCp1Two -15rwCp1AoTw +40ArwA.o

Ql
APPENDIX Q: PHYSICAL PROPERTY CORRELATIONS OF GASES, STEAM, WATER AND GAS-STEAM MIXTURES
Included here is the FORTRAN code (FORTRAN for VAX/VMS Version 5.8) for all the
physical property information required for the non-condensable gas model (see Appendix J).
The source of the data and/ or the correlation fitted to the data is included in the code. Each
physical property is the subject of one FORTRAN subroutine, although several properties call
additional subroutines.
The code has been split into the following files:
GAS.FOR
STEAM.FOR
WATER.FOR
MIX.FOR
Contains subroutines to calculate the thermal conductivity,
dynamic viscosity and specific heat capacity of air, argon, carbon
dioxide, helium, nitrogen and oxygen given the temperature.
Contains subroutines to calculate the latent heat of vaporization,
saturation pressure, thermal conductivity, dynamic viscosity and
specific heat capacity of steam given the temperature. A
subroutine was also included to determine the saturation
temperature given the absolute pressure.
Contains subroutines to calculate the density, thermal
conductivity, dynamic viscosity and specific heat capacity
of water given the temperature.
Contains subroutines to calculate the thermal conductivity,
dynamic viscosity, specific heat capacity specific gas
constant and diffusion coefficient of mixtures of steam and
one of the following gases: argon, carbon dioxide, helium,
nitrogen and oxygen. The known properties required
varies for each physical property.

Q2
Ql Properties of Gases (GAS.FOR)
Real*8 Function Gas thermal cond(T, NCGtype) Called by; Thermai_cond_mix Inputs:
Output:
T is temperature in degrees C NCGtype is the gas type 1-6
Thermal conductivity of the gas in units of W/m K
Code written by A R Mackereth Equation Source: Irvine T F & Liley P E (1984); "Steam and Gas
Tables with Computer Equations", Academic Press , Orlando.
Implicit None Integer NCGtype Integer Nn Logical First/.True./ Real*8 A array Real*8 Max Temp Real*8 Min-Temp Real*8 Running sum Real*8 T -Real*8 T K Real*8 Zero C in ~ Dimension A-array(0:6,6) Parameter (Max Temp = 500) !K Parameter (Min-Temp = 250) !K Parameter (Zero_C_in_K = 273.15) !0 degrees C
If (First .eq .. True.) then First = .False. For Air A array(0,1) A-array(1,1) A-array(2,1) A-array(3,1) A-array(4,1) = A-array(5,1) Aarray(6,1) For Argon
-2.276501d-3 1.2598485d-4
-1.4815235d-7 1.73550646d-10
-1.066657d-13 2.47663035d-17 0.0
A array(0,2) -5.2839462d-4 A-array(1,2) 7.60706705d-5 A-array(2,2) -6.4749393d-8 A-array(3,2) 5.41874502d-11 A-array(4,2) -3.22024235d-14 A-array(5,2) 1.17962552d-17 A-array(6,2) -1.86231745d-21 For carbon Dioxide A array(0,3) 2.971488d-3 A-array(1,3) -1.33471677d-5 A-array(2,3) 3.14443715d-7 A-array(3,3) -4.75106178d-10 A-array(4,3) 2.68500151d-13 A-array(5,3) 0.0 A-array(6,3) 0.0
273.15 K
For Helium ! (Note not accurate below 300 K) A array(0,4) -7.761491d-3 A-array(1,4) 8.66192033d-4 A-array (2, 4) -1. 5559338d-6 A-array(3,4) 1.40150565d-9 A-array(4,4) 0.0 A-array(5,4) 0.0 A-array(6,4) 0.0 For Nitrogen A array (0, 5) A-array(1,5) A-array(2,5) A-array(3,5) A-array(4,5) A=:array(5,5)
-1.5231785d-3 1.18879965d-4
-1.2092845d-7 1.15567802d-10
-6.36537349d-14 1.47167023d-17

End If
A_array(6,5) For Oxygen A array(0,6) A-array(1,6) A-array(2,6) A-array(3,6) A-array(4,6) A-array(5,6) A=array(6,6)
0.0
-7.6727798d-4 1.03560076d-4
-4.62034365d-8 1.51980292d-ll 0.0 0.0 0.0
If ((NCGtype .gt. 0) .and. (NCGtype .lt. 7}) then Running sum = 0.0 T_K = T-+ Zero_C_in_K ! {convert from deg C to K} If ( (T K .ge. Min temp) .and. (T K .le. Max temp)) then
Do-Nn = 0, 6 - - -Running_sum Running sum +
c A_array(Nn, NCGtype)*T_K**Nn
Else
End If Return
End Do Gas thermal cond
Else Write(10,100) T Gas thermal cond
End If
Write(10,200) NCGtype
Running_ sum
0.02
Gas~thermal cond = 0.02 !NCG unknown
100 Format(1x, 'Illegal Temperature of ',E12.4,' in Gas Thermal Cond') 200 Format(1x, 'Illegal NCGtype ',I6,' in Gas_Thermal_Cond') -
End
Real*B Function Gas viscosity(T, NCGtype) Called byi Initial~ Outer_bounds, Vapour_Phase Inputs:
T is temperature in degrees C NCGtype is the gas type 1-6
Output: dynamic viscosity of the gas in units of kg/m s
Code written by A R Mackereth Equation Source: Irvine T F & Liley P E (1984) i "Steam and Gas
Tables with Computer Equations", Academic Press , Orlando.
Implicit None Integer NCGtype, Nn Logical First/.True./ Real*B A array Real*B Max Temp Real*B Min-Temp Real*B Running sum Real*B T -Real*B T K Real*B Zero C in K Dimension A-array(0:6,6) Parameter (Max Temp = 500.0) !K Parameter (Min-Temp = 250.0) !K Parameter (Zero_C_in_K = 273.15) !0 degrees c
If (First .eq .. True.) then First = .False. For Air A array(0,1) A-array(1,1) A-array(2,1) A-array(3,1) A-array(4,1) A-array(5,1) A=array(6,1) For Argon A_array(0,2)
-9.8601d-1 9.080125d-2
-1.1763557d-4 1.2349703d-7
-5.7971299d-ll 0.0 0.0
1.22573
273.15 K
Q3

Q4
c
End If
A array(l,2} 5.945696d-2 A-array(2,2} = 1.897011d-4 A-array{3,2} = -8.171242d-7 A-array(4,2) = 1.2939183d-9 A-array(S,2) -7.5027442d-13 A-array(6,2) = 0.0 For Carbon Dioxide A array(0,3) = -8.09519ld-1 A-array(1,3) 6.0395329d-2 A-array(2,3) -2.824853d-5 A-array(3,3) = 9.843776d-9 A-array(4,3) -1.47315277d-12 A-array(S,3) 0.0 A=array(6,3) = 0.0 For Helium A array(0,4) A-array(l,4) A-array(2,4) A-array(3,4) A-array(4,4) A-array(5,4) A-array(6,4) For Nitrogen A array(O,S) = A-array(l,S) JCarray(2,, 5) A array(3,5) A-array(4,5) = A-array(5,5) A=array(6,5) = For Oxygen A array(0,6) A-array(1,6) A-array(2,6) = A-array(3,6) = A-array(4,6) A-array(5,6) = A=array(6,6)
3.9414d-1 1.7213335d-1
-1.38733d-3 8.020045d-6
-2.4278655d-8 3.641644d-11
-2 .14117d-14
2.5465d-2 7.5336535d-2
-6.51566245d-5 4.34945d-8
-1.5622457d-11 2. 249666d-15 0.0
-3.97863d-1 8.7605894d-2
-7.064J.24d-5 4.6287d-8
-1.690435d-11 2.534147d-15 0.0
If ((NCGtype .gt. 0) .and. {NCGtype .lt. 7)) then Running sum = 0.0 T K = T-+ Zero C in K ! {Convert Temp. from degrees C to K} If { (T K .ge. Min temp) .and. (T_K .le. Max_temp)) then
Else
End If Return
Do-Nn = 0, 6 -Running_sum = Running sum +
A_array(Nn, NCGtype)*T_K**Nn End Do Gas viscosity Running_sum * l.Od-6
Else -Write(lO,lOO) T Gas viscosity l.Od-5
End If -
Write(10,200) NCGtype Gas_viscosity = l.Od-5 !NCG unknown
100 Format(1x, 'Illegal Temperature of ',E12.4,' in Gas Viscosity') 200 Format(1x, 'Illegal NCGtype ',I6,' in Gas_Viscosity1 )
End
Real*S Function Gas_specific_heat(T, NCGtype) Called by; Initial, Outer bounds, Vapour phase Inputs: - -
Output:
T is temperature in degrees C NCGtype is the gas type 1-6
Specific heat capacity of the gas in units of J/kg K
Code written by A R Mackereth Equation Source: Irvine T F & Liley P E {1984); "Steam and Gas
Tables with Computer Equations", Academic Press

c
, Orlando.
Implicit None Integer NCGtype Integer Nn Logical First/.True./ Real*8 A array Real*8 Max Temp Real*8 Min-Temp Real*8 Running sum Real*8 T -Real*8 T K Real*8 Zero C in K Real*8 Air_specific_heat Dimension A array(0:6,2:6) Parameter (Max Temp = 590) !K Parameter (Min-Temp = 280) !K Parameter (Zero_C_in_K = 273.15) !0 degrees c
If (First .eq .. True.) then First = .False.
End If
For Argon A array(0,2) 0.52034 A-array(1,2) 0.0 A-array(2,2) 0.0 A-array(3,2) 0.0 A~array(4,2) 0.0 A-array(5,2) 0.0 A-array(6,2) 0.0 For Carbon Dioxide A array(0,3) 4.5386462d-1 A-array(1,3) l.5334795d-3 A-array(2,3) -4.195556d-7 A-array(3,3) -l.871946d-9 A-array(4,3) 2.862388d-12 A-array(5,3) -1.6962d-15 A-array(6,3) 3.717285d-19 For Helium A array(0,4) A-array(1,4) A-array(2,4) A-array(3,4) A-array(4,4) A-array(5,4) A:=array(6,4) For Nitrogen A array(O,S) A-array(1,5) A-array(2,5) A-array(3,5) A-array(4,5) A-array(S,S) A:=array(6,5) For Oxygen A array(0,6) A-array(1,6) A-array(2,6) A-array(3,6) A-array(4,6) A-array(5,6) A:=array(6,6)
5.1931 0.0 0.0 0.0 0.0 0.0 0.0
1.088047 -3.55968d-4 7.2907605d-7
-2.8861556d-10 0.0 0.0 0.0
9.29247d-1 -3.220603d-4 1.166523d-6
-7.1157865d-10 0.0 0.0 0.0
Q5
273.15 K
If ((NCGtype .gt. 1) .and. (NCGtype .lt. 7)) then Running sum= 0.0 T_K = T-+ Zero_C_in_K ! {Convert Temp. from degrees C to K}
If ((T_K .ge. Min_temp) .and. (T_K .le. Max_temp)} then Do Nn = o, 6
Running_ sum
End Do Gas specific heat
Else - -
Running sum + A_array(Nn, NCGtype)*T_K**Nn
Running_sum * 1000.0

Q6
Write(10 1 100) T Gas specific heat 1000.0
End If - -Else If (NCGtype .eq. 1) then !Air
Gas_specific_heat = Air_specific_heat(T 1 NCGtype) Else
Write(10 1 200) NCGtype Gas_specific_heat = 1000.0 !NCG unknown
End If Return
100 Format(' Illegal Temperature of ' 1 E12.4 1 ' in Gas Specific heat') 200 Format(1x 1 'Illegal NCGtype ' 1 I6 1 ' in Gas_Specific_heat') -
End
Real*8 Function Air specific heat(T 1 NCGtype) called by; Gas_specific_heat Inputs:
T is temperature in degrees C NCGtype is the gas type 1-6
Output: Specific heat capacity of air in units of J/kg K
Code written by A R Mackereth ·Equation Source: Irvine T F & Liley P E (1984); "Steam and Gas
. Tables with Computer Equations" 1 Academic Press 1 Orlando.
Implicit None Integer NCGtype Integer NCG_type Integer Nn Logical First/.True./ Real*8 Argon wt Real*8 A array Real*8 Cp Real*8 Cp Argon Real*8 Max Temp Real*8 Min-Temp Real*8 Nitrogen wt Real*8 Oxygen wt Real*8 Running sum Real*8 T -Real*8 T K Real*8 Zero C in K Dimension A-array(0:3 1 5:6) 1 Cp(5:6) Parameter (Argon wt 0.0128) !weight fraction Parameter (Cp Argon = .52034) ! kJ/kg K Parameter (Max Temp = 590) !K Parameter (Nitrogen wt = 0.7557) !weight fraction Parameter (Oxygen wt = 0.2315) ! " " Parameter (Min Temp = 280) !K Parameter (Zero_C_in_K = 273.15) !0 degrees C 273.15 K
If (First .eq .. True.) then First = .False.
End If
For Nitrogen A array(0 1 5) A-array(1 1 5) A-array(2 1 5) A::::array(3 1 5) For Oxygen A array(0 1 6) A-array(1 1 6) A-array(2 1 6) A::::array(3 1 6)
1.088047 -3.55968d-4
7.2907605d-7 -2.8861556d-10
9.29247d-1 -3.220603d-4 1.166523d-6
-7.1157865d-10
If (NCGtype .eq. 1) then T_K = T + Zero_C_in_K ! {convert Temp. from degrees C to K} If ((T_K .ge. Min_temp) .and. (T_K .le. Max_temp)) then
Do NCG type = 5 1 6 Ruilning_sum = 0.0

Q7
Do Nn = 0, 3 Running_sum = Running sum +
c A_array(Nn, NCG_type)*T_K**Nn End Do Cp(NCG_type) = Running_Sum
End Do Air_specific_heat (Cp(S)*Nitrogen wt + Cp(6)*0xygen wt
+Cp_Argon*Argon_wt)*1000.0 -c Else
Write(10,100) T Air specific heat = 1000.0
End If - -Else
Write{10,200) NCGtype Air_specific_heat = 1000.0 !NCG is not air
End If Return
100 Format(' Illegal Temperature of ',E12.4, 1 in Air Specific Heat'} 200 Format(1x, 'Illegal NCGtype ',I6,' in Air_Specific_Heat') -
End
Q2 Properties of Steam (STEAM.FOR)
c
Real*8 Function Steam Latent heat(T) Called by; Initial, Inner_bounds Inputs:
T is the temperature in degrees C Output:
Latent heat of steam in units of J/kg Code written by A R Mackereth Equation Source: Irvine T F & Liley P E (1984); 11 Steam and Gas
Tables with Computer Equations", Academic Press , Orlando.
A, B, C, D, E Real*B H fg critical Real*B Max Temp Real*8 Min=Temp Real*B T Real*B T critical Real*8 T K Real*B Zero c in K Real*8 Y s Dimension E(1:7) Parameter (H fg critical = 2.5009e6} !J/kg Parameter (Min Temp = 273.16) !K Parameter (T critical = 647.3) !K Parameter (Max Temp = T critical) !K Parameter (Zero c inK~ 273.15) !0 deg C = 273.15 K
T_K = T + Zero_C_in_K !Convert Temp. from degrees C to K If ((T K .ge. Min temp) .and. (T K .le. Max_temp}) then
A- 0.0 - -
Else
End If Return
B 7.79221d-1 c = 4.62668 D = -1.07931 E (1} = -3.87446 E(2) 2.94553 E(3) = -8.06395 E(4) 1.15633dl E(S) 6.02884 E(6) 0.0 E(7) 0.0 Steam Latent heat
Write(lO,lOO) T Steam Latent heat
Y s(A,B 1 C,D,E 1 T K) * - -H_fg_critical
2.2d6

Q8
100 Format(' Illegal Temperature of ',E12.4,' in Steam_Latent_heat') End
Real*8 Function Steam sat press(T) Called by; Initial, Vapour_phase Inputs:
Output: T is the temperature in degrees C
Partial Pressure of the steam in units of Pa
Code written by A R Mackereth Equation Source: Irvine T F & Liley P E (1984); "Steam and Gas
Tables with Computer Equations", Academic Press , Orlando.
Implicit None Integer Nn Real*8 A array Real* 8 Log T K Real*8 Max-Temp Real*8 Min-Temp Real*8 P MPa Real*8 Running sum Real*8 T -Real*8 T critical Real*8 T K Real*8 zero c in K Dimension A-array(0:11) Parameter (Min Temp = 273.16) Parameter (T critical= 647.3) Parameter (Max Temp = T critical) Parameter (Zero_C_in_K ~ 273.15)
A array(O) 0.104592d2 A-array (1) -0. 404897d-2 A-array(2) -0.417520d-4 A-array (3) 0. 368510d-6 A-array(4) -0.101520d-8 A-array (5) 0. 865310d-12 A-array (6) 0. 903668d-15 A-array (7) -0 .199690d-17 A-array ( 8) 0. 779287d-21 A-array(9) 0.191482d-24
!K !K !K !0 degrees c 273.15 K
A-array(10) -0.396806d4 A-array(ll) 0.395735d2 Running sum o.o T K = T-+ Zero c in K ! {Convert Temp. from degrees C to K} If ((T K .ge. Min temp) .and. (T_K .le. Max_temp)) then
Log T K = Dlog(T K) Do Nn-= 0, 9 -
Running sum= Running sum +A array(Nn) * Dexp(Log T K*Nn) End Do - - - . - -P MPa = Exp(Running sum+ A array(10)/(T K- A_array(11))) Steam sat press P-MPa * 1~0d6 -
Else - -Write(l0,100) T Steam_sat_press 1.0d5
End If Return
100 Format(' Illegal Temperature of ',E12.4,' in Steam_sat_press') End
Real*8 Function Steam sat temp(p) Called by; Initial - -Inputs:
Output: p is the steam partial pressure in Pa
Saturation temperature of the steam in degrees c
Code written by A R Mackereth Equation Source: Irvine T F & Liley P E (1984); "Steam and Gas
Tables with Computer Equations", Academic Press

Implicit None Real*B A, B, C Real*B p Real*B p MPa Real*B T-K Real*B zero c in K
, Orlando.
Parameter (Zero_C_in_K = 273.15) !0 degrees c = 273.15 K
p_Mpa = p I 1.0d6 !Converts p from Pa to MPa If ((p Mpa .ge. 0.000611) .and. (p MPa .le. 22.1)) then
-If (p MPa .lt. 12.33) then--A 0.426776d2
Else
End If Return
Else
End If
B = -0.389270d4 c = -0.948654d1
A -0. 387592d3 B -0.125875d5
c = -0.152578d2
T K = A+ B I (Dlog(p MPa) + C) Steam sat_temp T K ~ Zero C in K
Write(10,100) Ste,am_sat_temp 100.0
100 Format(1x, 'Illegal Pressure of ',F12.0,' in Steam_sat_temp') End
Real*8 Function Steam sat viscosity(T) Called by; Initial, Outer bounds, Vapour phase Inputs: - -
Output: T is the temperature in degrees C
Dynamic viscosity of the steam in units of kglm s
Code written by A R Mackereth Equation Source: Minitab multiple linear regression equation
fitted to data from;
Q9
Rogers G F C & Mayhew Y R (1981); "Thermodynamic and Transport Properties of Fluids, SI units", 3ed, Basil Blackwell, Oxford.
Implicit None Real*B A, B Real*B Min Temp Real*B Max-Temp Real*B T -Parameter (A= 8.48, B = 0.03485) Parameter (Max Temp = 100.0) !deg C Parameter (Min=Temp = 0.01) !deg C
If ((T .ge. Min temp) .and. (T .le. Max temp)) then Steam_sat_viscosity = (A + B*T)*1.0d-6
Else
End If Return
Write(10,100) T Steam_sat_viscosity l. Od-5
100 Format(' Illegal Temperature of ',E12.4,' in Steam_sat_viscosity' c )
End

QlO
Real*8 Function Steam specific heat(T) Called by; Initial, Outer_bounds, Vapour_phase Inputs: T is the temperature in degrees C Output: Specific heat capacity of the steam
in units of J/kg K Code written by A R Mackereth Equation Source: Minitab multiple linear regression equation
fitted to data from; Rogers G F C & Mayhew Y R (1981); "Thermodynamic and
Transport Properties of Fluids, SI units", 3ed, Basil Blackwell, Oxford.
Implicit None Real*8 A, B, C, D Real*8 Min_Temp Real*8 Max_ Temp Real*8 T Real*8 TT Real*8 TTsq Real*8 TTcubed Real*8 Tm Parameter (Min Temp = 0.01) !deg C Parameter (Max-Temp = 100.0) !deg c Parameter (Tm ~ 50.0) Parameter (A= 1898, B = 58.2, c = 34.5, D = 16.8)
If ((T .ge. Min temp) .and. (T .le. Max_temp)) then TT = (T-- Tm)/Tm
Else
End If Return
TTsq = TT * TT TTcubed = TTsq * TT Steam_specific_heat A + B*TT + C*TTsq + D*TTcubed
Write(10,100) T Steam_specific_heat 2000.0
100 Format(' Illegal Temperature of ',E12.4,' in Steam_specific_heat C I)
End
Real*8 Function Steam thermal cond(T) Called by; Thermal cond mix -Inputs: T is the temperature in degrees c Output: Thermal conductivity of the steam
in units of W/m K Code written by A R Mackereth Equation Source: Minitab multiple linear regression equation
fitted to data from;
Implicit None Real*8 A, B, E Real*8 Max Temp Real*8 Min-Temp Real*8 T -Real*8 Tm Real*8 TT Real*8 TTquad
Rogers G F C & Mayhew Y R (1981); "Thermodynamic and Transport Properties of Fluids, SI units", 3ed, Basil Blackwell, Oxford.
Parameter (A= 20.4, B = 4.20, E = 0.197) Parameter (Max Temp = 100.0) !deg C Parameter (Min-Temp = 0.01) !deg C Parameter (Tm ~ 50.0)
If ((T .ge. Min temp) .and. (T .le. Max_temp)) then TT = (T-- Tm)/Tm
Else
TTquad = TT * TT * TT * TT Steam thermal cond = (A+ B*TT + E*TTquad)*1.0e-3
Write(10,100) T Steam thermal cond 0.02

End If Return
100 Format(' Illegal Temperature of ',El2.4,' in Steam thermal cond' c )
End
Real*8 Function Y s(A, B, C, D, E, T_K) Called by Steam_Latent_Heat Inputs: A-E are constants
T K is the temperature in Kelvin Output: Y s Code written by A R Mackereth Equation Source: Irvine T F & Liley P E (1984); "Steam and Gas
Tables with Computer Equations", Academic Press , Orlando.
Implicit None Integer Nn Real*8 A, B, C, D Real*8 E(1:7) Real*8 Fivesixths Real*8 Log T c Real*8 Onethird Real*8 Running sum Real*8 Seveneights Real*8 T c Real*8 T-c~itical Real*8 T-K Parameter (T_critical = 647.3) !K
T c = (T critical - T K) I T critical If (T c ~gt. 1.0e-5) then !Trap to prevent division by zero
-Running sum= 0.0 Log_T_c- = Dlog(T_c) Do Nn = 1, 7
Running sum= Running sum+ E(Nn) * Dexp(Log T c*Nn) End Do - - - -Onethird = Dexp(Log T c/3.0) Fivesixths = Dexp(Log-T c*S.0/6.0) Seveneights = Dexp(Log T c*7.0/8.0) Y s Running sum + A + B * Onethird + C *
c Fivesixths + D * Seveneights Else
Y s A End If
Return End
Q3 Properties of Water (W A TER.FOR)
Real*8 Function Water density(T) Called by; Initial -Inputs:
T is the temperature in degrees C Output:
Density of water in units of kg/m3 Code written by A R Mackereth Equation Source: Minitab multiple linear regression equation
fitted to data from;
Qll
Rogers G F C & Mayhew Y R (1981) ; "Thermodynamic and Transport Properties of Fluids, SI units",
Implicit None Real*8 A, B, C, D, G Real*8 Max_Temp Real*8 Min_Temp Real*8 T Real*8 Tm Real*8 TT Real*8 TTcubed
3ed, Basil Blackwell, Oxford.

Q12
Real*8 TTsix Real*8 TTsq Parameter (A= 987.9, B = -22.63, c Parameter (G = -1.084) Parameter (Max Temp = 100.0) !deg C Parameter (Min-Temp = 0.01) !deg C Parameter (Tm ~ 50.0)
-8.074, D 1. 702)
If ((T .ge. Min temp) .and. (T .le. Max_temp)) then TT = (T-- Tm)/Tm
Else
End If Return
TTsq = TT * TT TTcubed = TTsq * TT TTsix = TTcubed * TTcubed Water_density A + B*TT + C*TTsq + D*TTcubed + G*TTsix
Write(10,100) T Water_density 1000.0
100 Format(1x, 'Illegal Temperature of ',E12.4,' in Water_Density') End
Real*8 Function Water specific heat(T) Called by; Initial, Vapour_phase Inputs:
T is the, temperature in degrees C Output:
Specific heat capacity of water in units of J/kg K Code written by A R Mackereth Equation Source: Minitab multiple linear regression equation
fitted to data from; Rogers G F C & Mayhew Y R (1981); "Thermodynamic and
Transport Properties of Fluids, SI units", 3ed, Basil Blackwell, Oxford.
Implicit None Real*8 A, B, C, D, E, G Real*8 Min Temp Real*8 Max-Temp Real*8 T -Real*8 Tm Real*8 TT Real*8 TTcubed Real*8 TTquad Real*8 TTsix Real*8 TTsq Parameter (A= 4182, B = 17.20, C 11.9, D Parameter (G = -19.41) Parameter (Max Temp = 100.0) !deg C Parameter (Min-Temp = 0.01) !deg C Parameter (Tm ~ 50.0)
-13.18, E = 40.47)
If ((T .ge. Min temp) .and. (T .le. Max_temp)) then TT = (T-- Tm)/Tm TTsq = TT * TT TTcubed = TTsq * TT TTquad = TTcubed*TT TTsix = TTcubed * TTcubed Water_specific_heat = A + B*TT + C*TTsq + D*TTcubed
c + E*TTquad + G*TTsix Else
End If Return
Write(10,100) T Water_specific_heat 4200.0
100 Format(' Illegal Temperature of ',E12.4,' in Water_specific_heat C I)
End
Real*8 Function Water thermal cond(T) Called by; Initial - -Inputs:

T is the temperature in degrees C Output:
Thermal conductivity of water in units of W/m K Code written by A R Mackereth Equation Source: Minitab multiple linear regression equation
fitted to data from;
Q13
Rogers G F C & Mayhew Y R (1981); "Thermodynamic and Transport Properties of Fluids, SI units", 3ed, Basil Blackwell, Oxford.
Implicit None Real*8 A, B, C Real*8 Max Temp Real*8 Min=Temp Real*8 T Real*8 Tm Real*8 TT Real*8 TTsq Parameter (A= 643.1, B = 55.61, C = -18.31) Parameter (Max Temp = 100.0) !deg C Parameter (Min-Temp= 0.01) !deg C Parameter (Tm ~ 50.0)
If ((T .ge. Min temp) .and. (T .le. Max_temp)) then TT = (T-- Tm)/Tm
Else
End If Return
TTsq = TT * TT Water thermal cond (A+ B*TT + C*TTsq)*1.0d-3
Write(10,100) T Water thermal cond 0.650
100 Format(' Illegal Temperature of ',E12.4,' in Water_thermal_cond') End
Real*8 Function Water viscosity(T) Called by; Initial -Inputs:
T is the temperature in degrees C Output:
Dynamic viscosity of water in units of kg/m s Code written by A R Mackereth Equation Source: Minitab multiple linear regression equation
fitted to data from; Rogers G F C & Mayhew Y R (1981) ; "Thermodynamic and
Transport Properties of Fluids, SI units", 3ed, Basil Blackwell, Oxford.
Implicit None Real*8 A, B, C, D, E, F, G Real*8 Max Temp Real*8 Min-Temp Real*8 T -Real*8 Tm Real*8 TT Real*8 TTcubed Real*8 TTquad Real*8 TTquin Real*8 TTsix Real*8 TTsq Parameter(A = 544, B = -464.1, c = 324.5, D Parameter(F = -88.16, G = 44.53) Parameter (Max Temp= 100.0) !deg C Parameter (Min-Temp = 0.01) !deg C Parameter (Tm ~ 50.0)
-184.2, E
If ((T .ge. Min temp) .and. (T .le. Max_temp)) then TT = (T-- Tm)/Tm TTsq = TT * TT TTcubed = TTsq * TT TTquad TTcubed*TT TTquin = TTquad*TT
102.6)

Q14
c Else
End If Return
TTsix = TTquin * TT Water_viscosity = (A + B*TT + C*TTsq + D*TTcubed
Write(10,100) T Water_ viscosity
+ E*TTquad + F*TTquin + G*TTsix)*1.0d-6
5. Od-4
100 Format(' Illegal Temperature of ',E12.4,' in Water_Viscosity') End
Q4 Properties of Gas-Steam Mixtures (MIX.FOR)
Real*B Function CpMix(Cp1, Cp2, w 1) Called by; Initial, Outer_bounds~ Vapour_Phase Inputs:
Cp1 is the specific heat capacity of steam, J/kg K Cp2 is the specific heat capacity of gas, J/kg K
w 1 is the mass fraction of steam Output:
Specific heat capacity of the gas-steam mixture in units of W/m K
Code written by A R Mackereth
Implicit None Real*B Cp1 Real*B Cp2 Real*B w 1 Real*B w-2
If ( (w_1 .lt. 0.0) .or. (w_1 .gt. 1.0)) then Write(10,100) w 1 w 1 1.0
End If w 2 = 1.0 - w 1 CpMix = w_1*Cp1 + w_2*Cp2 Return
100 Format(1x, 'w 1 of ',E12.4,' in CpMix') End -
Real*B Function Diffusion(p, T, NCGtype) Called by; Initial, Inner bounds, Outer bounds, Vapour_phase Inputs: - -
Output:
p is absolute pressure in Pa T is temperature in degrees C NCGtype is the gas type 1-6
Diffusion coefficient of the gas-steam mixture in units of m2/s
Code written by A R Mackereth Equation Source: Sherwood T K, Pigford R L &'Wilke C R (1975);
"Mass Transfer", McGraw-Hill, Kogakusha, p19
Implicit None Integer NCGtype Logical First/.True./ Real*B Constant Real*B EK Real*B EK12 Real*B KTE Real*B Max Temp Real*B Min=Temp Real*B MM Real*B Omega Real*B OneAtm in Pa Real*B P Real*B P atm Real*B S Real*B S12sq Real*B T Real*B Temp

Real*8 T K Real*8 Zero C in K Real*8 OmegaFunc Dimension EK(0:6), MM(0:6), 8(0:6) Parameter (Constant = 0.001858/100.0**2) Parameter (Max Temp = 500.0) !K Parameter (Min-Temp = 250.0) !K Parameter (OneAtm in Pa 1.01325d5) !Pa Parameter (Zero_C=in=K 273.15) !0 degrees c
If (First .eq .. True.) then First = .False. MM(O) 18.015 MM(1) 28.966 MM(2) 39.948 MM(3) 44.01 MM(4) 4.003 MM(5) = 28.013 MM (6) 31.999 EK(O) 809.1 EK (1) 78.6 EK (2) 93.3 EK(3) 195.2 EK(4) 10.22 EK (5) = 71.4 EK (6) 106.7 8(o) 2.641 8(1) 3.711 8(2) 3.542 8(3) 3.941 8(4) 2.551 8(5) 3.798 8(6) 3.467
End If
!Water !Air !Argon !Carbon dioxide !Helium !Nitrogen !Oxygen
!Water !Air !Argon !Carbon dioxide !Helium !Nitrogen !Oxygen !Water !Air !Argon !Carbon dioxide !Helium !Nitrogen !Oxygen
If ((NCGtype 0) .and. (NCGtype .lt. 7)) then
273.15 K
= T + Zero_C_in_K ! {Convert Temp. from C to K}
Else
End If Return
((T K .ge. Min temp) .and. (T K .le. Max temp)) then EK12 = Dsqrt(EK(O)*EK(NCGtype)) -
Else
S12sq (0.5*(8(0) + S(NCGtype)))**2 KTE = T K / EK12 Omega= OmegaFunc(KTE) P atm = P I OneAtm in Pa Temp= DSqrt(1.0/MM(O)+ 1.0/MM(NCGtype))*T K**(1.5) Diffusion Constant*Temp/P_atm/S12sq/Omega
Write(10,100) T Diffusion = l.Od-5 End If
Write(10,200) NCGtype Diffusion = 1.0d-5 !Gas unknown
100 Format(1x, 'Illegal Temperature of ',E12.4, • in Diffusion') 200 Format(1x, 'Illegal NCGtype ',I6,' in Diffusion')
End
Real*8 Function OmegaFunc(KTE) Called by Diffusion Function Inputs:
KTE is kT/e Output:
Collision integral, Omega D Code written by A R Mackereth. -Equation Source: Equation was obtained by fitting a curve to
data tabulated in Table 2.2 of Sherwood T K, Pigford R L & Wilke C R (1975) ; "Mass Transfer", McGraw-Hill, Kogakusha, p19 using Minitab.
Q15

Q16
Integer Nn Logical First/.True./ Real*8 A Real*8 KTE Real*8 Running sum Dimension A(O:S)
If (First .eq .. True.) then First .False. A(O) 1.63907 A(1) -0.526468 A(2) 0.263214 A(3) -0.120770 A(4) 0.076192 A(5) -0.035739
End If If ( (KTE .ge. 0.30) .and. (KTE .le. 1.25)) then
Running_sum = 0.0 DoNn= 0,5
Running_sum = Running_sum + A(Nn)*KTE**Nn End Do OmegaFunc Running_ sum
Else OmegaFunc 9.9 !Dummy Error Trap
End If Return End
Real*8 Function SpecGasConst (w 1, NCGtype) Called by; Initial, Vapour_Phase Inputs:
w 1 is the mass fraction of steam NCGtype is the gas type 1-6
Output: Engineering gas constant of the gas-steam mixture in units of J/kg K
Code written by A R Mackereth Data Source: Irvine T F & Liley P E (1984); "Steam and Gas
Tables with Computer Equations", Academic Press Orlando.
Implicit None Integer NCGtype Logical First/.True./ Real*8 R gas Real*8 w-1 Real*8 w-2 Dimension R_gas(0:6)
If (First .eq .. True.) then First = .False.
End If
R gas (0) R-gas (1) R-gas (2) R-gas(3) R-gas(4) R-gas (5) R=gas(6)
461.5 287.040 208.129 188.919 2077.022 296.798 259.832
!Water J/kg K . !Air !Argon !Carbon dioxide !Helium !Nitrogen !Oxygen
If ((NCGtype .gt. 0) .and. (NCGtype .lt. 7) .and. (w_1 .gt. c - 0 . 0 1) . and . ( w _1 . 1 t . 1 . 01) ) then
w 2 = 1 - w 1 SpecGasConst = w 1*R gas(O) + w_2*R_gas(NCGtype)
Else - -Write(10,100) NCGtype, w 1 SpecGasConst = 460
End If Return
100 Format(1x, 'Illegal NCGtype ',I6,' or Illegal w 1 ',E12.4, c in SpecGasConst')
End

Real*B Function Thermal Cond Mix(mu1, mu2, T, w 1, NCGtype) Called byi Initial, Inner_bounds, Outer_bounds~ Vapour_phase Inputs:
mu1 mu2 T w 1
NCGtype Output:
is the steam viscosity in kg/m s is the gas viscosity in kg/m s is the temperature in degrees c is the steam mass fraction
is the gas type 1-6
Thermal conductivity of the gas-steam mixture in units of W/m K
Code written by A R Mackereth using the "Lindsey and Bromley Modification".
Equation Source: Reid R c, Prausnitz J M & Sherwood T K (19{??}} i "The Properties of Gases & Liquids", 3edi McGraw-Hill, New York, p 509.
Integer NCGtype Logical First/.True./ Real*B A 12 Real*B A-21 Real*B kv1 Real*S kv2 Real*S Max Temp Real*B Min-Temp Real*B MM-Real*S mul Real*B mu2 Real*B S Real*8 S 12 Real*8 T-Real*B Temp Real*S TS12 Real*B TS21 Real*S TS 12 Real*S TS12 1 Real*8 TS12 2 Real*8 T K Real*B TS 1 Real*S TS 2 Real*S w 1 Real*B y 1 Real*B y-2 Real*B Zero c in K Real*B Gas Thermal cond Real*B Steam thermal cond Dimension MM(0:6), S(0:6} Parameter (Max Temp = 500.0) !K Parameter (Min-Temp = 250.0) !K Parameter (Zero_C_in_K = 273.15) !0 degrees c
End If
.eq .. First = .False. MM{O) = 18.015 MM{1) 28.966 MM(2) 39.948 MM(3) 44.01 MM(4) 4.003 MM(5) 28.013 MM {6) 31.999 S(O) 559.7 s (1) 81 S(2) 87.45 S(3) 194.55 s {4) 79 S{5) 77.35 S{6) 90.2
!Water !Air !Argon !Carbon dioxide !Helium !Nitrogen !Oxygen !Water !Air !Argon !Carbon dioxide !Helium !Nitrogen !Oxygen
273.15 K
If {{NCGtype .gt. 0) .and. {NCGtype .lt. 7) .and. {w_1 .gt. c -0.01) .and. {w 1 .lt. 1.01)) then
T K = T + Zero c in K ! {convert Temp. from c to K}
Q17

Q18
c
c
c
Else
End If Return
If ((T_K .ge. Min temp) .and. (T K .le. Max temp)) then y 1 w 1*MM(NCGtype)/(MM(O)- w 1* -
- (MM(O) - MM(NCGtype))) y_2 1.0 - y 1 S 12 0.73*Dsqrt(S(O)*S(NCGtype)) TS 1 T K + S(O) TS 2 T-K +S(NCGtype) TSl2 TS 1/TS 2 TS21 TS=2/Ts::) TS 12 = T K + S 12 TSl2 1 = TS 12/TS 1 TS12-2 = TS-12/TS-2 A 12 .25*(1.0+Dsqrt(mu1/mu2*(MM(NCGtype)/
MM(0))**(.75)*TS12))**2 * TS12 1 A 21 .25*(1.0+Dsqrt(mu2/mu1*(MM(O)/
MM(NCGtype))**(.75)*TS21))**2 * TS12 2 kv1 Steam thermal cond(T) kv2 Gas thermal cond(T, NCGtype) Temp y 1*kv1/(y 1 + y 2*A 12) Thermal Cond Mix~ Temp-+ y-2*kv2/(y 2 + y_1*A_21)
Else - - - -Write(10,100) T Thermal Cond Mix = 0.02
End If
Write,(10 ,200) NCGtype, w_1 Thermal Cond Mix = 0.02 !Gas unknown
100 Format(1x, 'Illegal Temperature of ',E12.4,' in Thermal Cond Mix• c )
200 Format(1x, 'Illegal NCGtype ',I6,' or Illegal w 1 ',E12.4,
l
c in Thermal_Cond_Mix') End
Real*S Function Viscosity Mix(mu1, mu2, T, w 1, NCGtype) Called byi Initial, Inner_bounds, Outer_bounds, Vapour_phase Inputs:
mu1 is the steam viscosity in kg/m s mu2 is the gas viscosity in kg/m s T is the temperature in degrees c w 1 is the steam mass fraction NCGtype is the gas type 1-6
Output: Dynamic viscosity of the gas-steam mixture in units of kg/m s
Code written by A R Mackereth using the "Reichenberg Method" Equation Source: Reid R C, Prausnitz J M & Poling B E (1987) i
"The Properties of Gases & Liquids", 4edi McGraw-Hill, New York, p 404-6
Implicit None Integer NCGtype Logical First/.True./ Real*S Const32 Real*B C 1, C 2 Real*B Dipole-DTen7 Real*B GasVis-Real*B H 12 Real*B K=1, K_2 Real*B Max_Temp, Min_Temp Real*B MM Real*B mu1, mu2 Real*B T Real*B Tcritical Real*B Temp Real*S T K Real*B T_R_gas, T R mix Real*B T R wat, T R wat35 Real*B U=1~ U_2 Real*B WatVis Real*B w 1
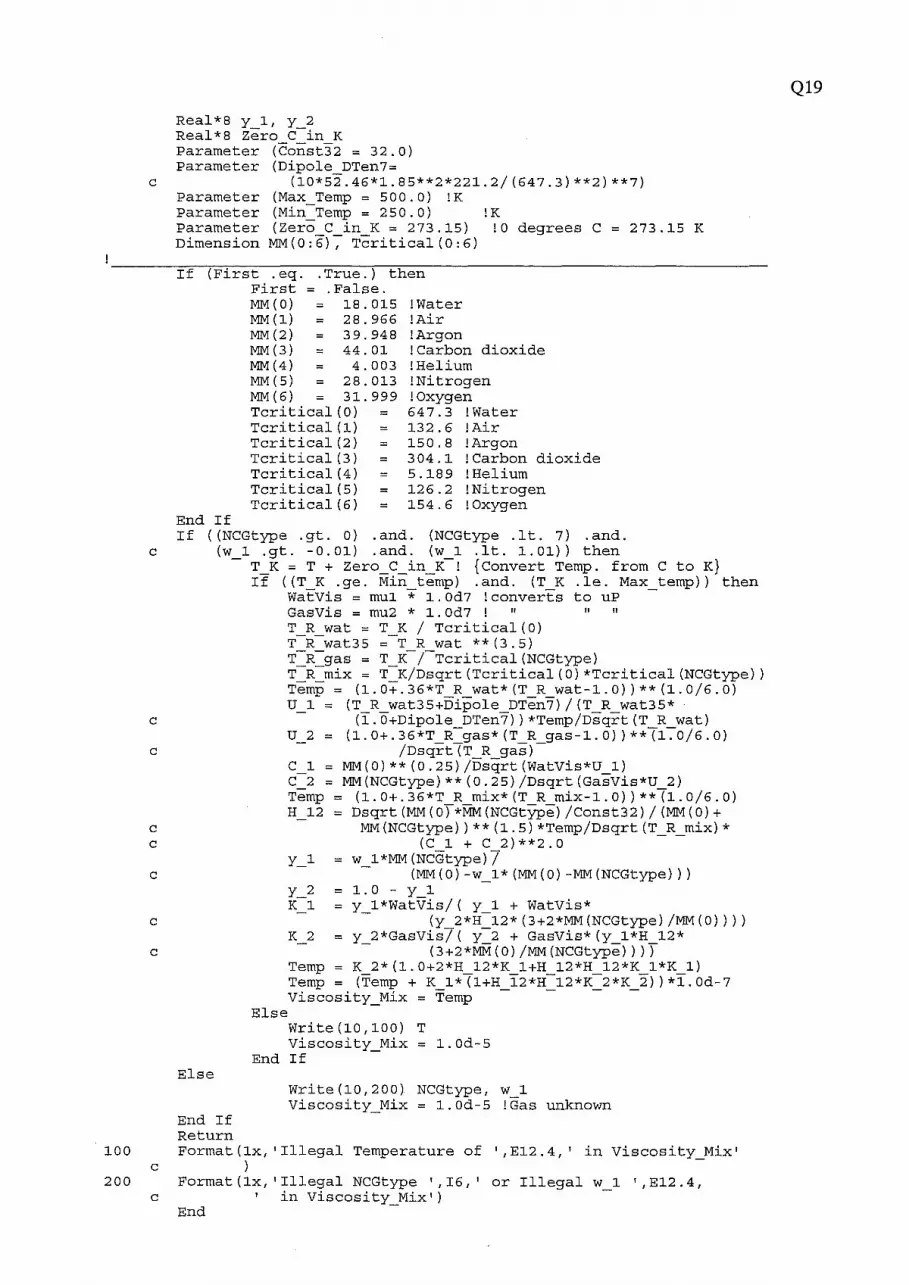
Real*8 y 1, y 2 Real*8 zero c-in K Parameter (Const32 = 32.0) Parameter (Dipole DTen7=
c (10*52.46*1.85**2*221.2/(647.3)**2)**7) Parameter (Max Temp= 500.0) !K Parameter (Min-Temp = 250.0) !K Parameter (Zero C inK= 273.15) !0 degrees c 273.15 K Dimension MM(0:6)~ Tcritical(0:6)
If (First .eq .. True.) then First = .False.
End If
MM(O) 18.015 MM(1) 28.966 MM (2) 39.948 MM(3) 44.01 MM(4) 4.003 MM(5) 28.013 MM(6) 31.999 Tcritical(O) Tcritical(1) Tcritical (2) Tcritical(3) Tcritical(4) Tcritical{5) Tcritical(6)
!Water !Air !Argon !Carbon dioxide !Helium !Nitrogen !Oxygen 647.3 !Water l32. 6 !Air 150.8 !Argon 304.1 !Carbon dioxide 5.189 !Helium 126.2 !Nitrogen 154.6 !Oxygen
If ((NCGtype .gt. 0) .and. (NCGtype .lt. 7) .and. c ( w 1 . gt . - 0 . 01) . and . ( w 1 . 1 t . 1. 01) ) then
- T_K = T + Zero_C_in_K-! {Convert Temp. from C to K} If ((T K .ge. Min temp) .and. (T K .le. Max_temp)) then
WatVis = mu1 * 1.0d7 !converts to uP GasVis = mu2 * 1.0d7 ! 11 11 11
T R wat = T K I Tcritical(O) T-R-wat35 =-T R wat **(3.5) T-R-gas = T K-/-Tcritical(NCGtype) T-R-mix = T-K/Dsqrt(Tcritical(O)*Tcritical(NCGtype)) Temp= (1.o+.36*T R wat*(T R wat-1.0))**(1.0/6.0) u 1 (T R wat35+Dipole DTen7)/(T R wat35*
c (l.O+Dipole DTen7))*Temp/Dsqrt(T R wat) U 2 (1.0+.36*T R-gas*(T R gas-1.0))**(1~0/6.0)
c /Dsqrt(T R gas)-c 1 MM(0)**(0.25)/Dsqrt(WatVis*U 1) C-2 MM(NCGtype)**(0.25)/Dsqrt(GasVis*U 2) Temp (1.0+.36*T R mix*(T R mix-1.0))**(1.0/6.0) H 12 Dsqrt(MM(O)*MM(NCGtype)/Const32)/{MM(O)+
c MM(NCGtype))**(1.5)*Temp/Dsqrt(T R mix)* c (C 1 + C 2)**2.0 --
y_1 w 1*MM(NCGtype)7 c - (MM(O)-w_1*(MM(O)-MM(NCGtype)))
y_2 1.0 - y 1 K 1 y 1*WatVis/( y 1 + WatVis*
c - (y 2*H-12*(3+2*MM(NCGtype)/MM(O)))) K 2 y 2*GasVis7( y-2 + GasVis*(y 1*H 12*
c - (3+2*MM(O)/MM(NCGtype))))
Else
End If Return
Else
Temp K 2*(1.0+2*H 12*K 1+H 12*H 12*K 1*K 1) Temp (Temp+ K 1*(1+H l2*H-12*K-2*K 2))*l.Od-7 Viscosity_Mix Temp - - - -
Write(10,100) T Viscosity Mix 1.0d-5
End If -
Write(10,200) NCGtype, w 1 Viscosity_Mix = 1.0d-5 !Gas unknown
100 Format(1x, 'Illegal Temperature of ',E12.4,' in Viscosity_Mix' c )
200 Format(1x, 'Illegal NCGtype ',I6,' or Illegal w 1 ',E12.4, c in Viscosity_Mix')
End
Ql9


R1
APPENDIX R: CALCULATIONS FOR NON-CONDENSABLE GAS EXPERIMENTS
RO Nomenclature
Roman Greek A cross-sectional area (m2
) y adiabatic exponent (-)
d diameter, (m) <p nozzle coefficient (-)
H height (m) ~AP change in absolute pressure (Pa)
L length (m) ~DP change in differential pressure (Pa)
m mass flow rate (kg s-1) ~p change in pressure (Pa)
N number of ~SP change in steam pressure (Pa)
P1 upstream absolute pressure (Pa) ~t time increment (s)
R specific gas constant (J kg-1 K-1)
T temperature (K) Subscripts v volume (m3) A condition after cooling
w width (m) B condition before cooling
cond condensate film condition
Hebrew cor value corrected for volume change
l percent de-aeration evap evaporation
ID condition at wall inner surface
OD condition at wall outer surface
vent de-aeration line condition
R1 Vohnne of steam side of Third Evaporator
The steam side consisted of the calandria shell annulus, a sight glass, the condensate line
entry section, two de-aeration line entry sections, de-aeration lines, differential pressure
transmitter connection lines and the steam supply line.
Calandria shell components
1. Shell annulus
Shell length = 14.98 m
Shell inner diameter = 98.8 mm
Tube outer diameter = 50.12 mm
V - 1t (d2 - d 2
) L 1 - 4 she/liD tube0v
= ~(0.09882 - 0.050142) X 14.98
4 = 0.08527 m 3

R2
2. Sight glass
Length = 70 nun
Inner diameter = 48.8 nun
3. De-aeration line entries
Number= 2 Length = 75 nun
Inner diameter = 22.8 nun
4. Condensate line entry
Length = 60 nun
Inner diameter = 15 nun
5. Steam entry to flange
Length= 150 mm
Inner diameter = 63 nun
Steam supply 6. Separator cylinder
Length = 0.35 m
Inner diameter = 97 nun
7. Separator entry section
Length varies from 50 nun to 100 nun
(along 50 nun radius arc)
Width= 35 nun Height = 150 mm
1t 2 V2 = - diDL
4
= ~ X 0.04882 X 0.07
4 = 0.00013 m 3
1t 2 V3 = - diDLN
4
= ~ X 0.02282 X 0.075 X 2
4 = 0.00006 m 3
1t 2 v4 = 4 diDL
= ~ X 0.0152 X 0.06
4 = 0.00001 m 3
1t 2 V5 = - diDL
4
= ~X 0.0632 X 0.15
4 = 0.00047 m 3
1t 2 V6 = - diDL
4
= ~ X 0.0972 X 0.35
4 = 0.00259 m 3
1t 2 V7 = HWLmax-- diDH
16
= 0.15 X 0.035 X 0.1 - _2:.. X 0.052 X 0.15
16 = 0.00045 m 3

8. Separator transition section
Length = 200 mm Changes from a 63 mm circular section
to a 35 mm wide by 150 mm high rectangular section.
9. Leg to steam trap
Length= 0.33 m
Inner diameter = 16 mm
10. Duct to calandria steam flange
Length = 0.4 m
Inner diameter = 60 mm
11. Steam pipe from valve
Length = 2.6 m
Inner diameter = 63 mm
De-aeration and differential pressure lines 12. Lines
Length= 10m
Inner diameter = 10 mm
Total volume
[: div +HWl
V8 :::: L 2
[ : x 0.0632
+ 0.15 x0.035l :::: x0.2
2 :::: 0.00084 m 3
1t 2 V9 =- dmL 4
= ~ X 0.0162 X 0.33 4
= 0.00007 m 3
1t 2 V = -d1DL
10 4
= ~ X 0.062 X 0.4
4 = 0.00113 m 3
1t 2 V11 = - dmL
4
= ~ X 0.0632 X 2.6
4 = 0.00810 m 3
1t 2 = -dmL
4
= ~ x0.012 x 10 4
= 0.00079 m 3
Therefore, the steam side volume is 0. 09991 m3
R3

R4
R2 Leakage rate calculations
The rate of steam-side pressure (tube side absolute pressure plus differential pressure) rise for each run was determined from the slopes of the tube side absolute pressure and
differential pressure lines on the real-time plot of differential pressure (see Table R1).
The diameter of the nozzles were measured using a back-lit microscope (Projecting A.G., Heerbrugg, Switzerland) with a 10 times magnification display with grid and a 7 times
magnification lens (N5512b). Four measurements were taken at 45° apart around the
nozzle circumference and averaged (see Table R2).
The leak mass flow rate (see Table R3) was then determined using the following
equation:
( ~p) v mleak = ~t x RT
(R1)
where T is the temperature inK, R is the specific gas constant = 286.7 J kg-1 K-1 for air
and V is the volume = 0. 09991 m3.
The mean leakage rate without deliberate air addition for the period 23-24 October 1991
was higher than for the period 30 October- 1 November 1991. Therefore, to determine
the leakage rate through the nozzles for Runs 3-5, the mean leakage for Runs 1-2 was
subtracted from the total leakage. Likewise for Runs 6, 8, 10 and 11 the mean leakage
for Runs 7, 9 and 12 was subtracted from the total leakage.
The theoretical flow through a sonic nozzle is:
2 2
- 1t d2 2 y ( 2 ) y - 1 m - <p- P - -- --4 1 RTy+1 y+1
(R2)
where p1 was assumed to be 101.33 kPa andy for air is 1.4. The above equation was
rearranged and solved for the nozzle coefficient using both· the nominal and the measured
nozzle diameters (see Table R3). The results obtained for the smallest nozzle based on
the measured diameter were lower than for the others. The nozzle profile was essentially
that of an orifice, so coefficients of 0.6-0.8 could be expected (Grace & Lapple, 1951).
For the purposes of calculating leakage rates for Experiments N c2 and W a 13, all nozzles
were assumed to have a coefficient of 0.75 based on the nominal diameter.

R5
Table R1: Pressure Rise Test (Experiment Nc2) Raw Data.
Run Time/Date Leak Nozzle AAP"/At ADPb/At ASP"/At Air
No. Nominal Temperature Diameterd (OC)
(mm) (kPa h'1) (kPa h'1) (kPa h'1)
1 1330 h 23 October 91 None 0 16.4 16.4 27
2 1430 h 23 October 91 None 1.4 14.4 15.8 27
3 1545 h 23 October 91 0.20 0 33 33 26
4 0850 h 24 October 91 0.34 0 74.3 74.3 22
5 1015 h 24 October 91 0.51 0 130.5 130.5 23
6 1050 h 30 October 91 0.51 0 117.4 117.4 22
7 1200 h 30 Qctober 91 None 0 7.91 7.91 23
8 1500 h 30 October 91 0.20 0 25.8 25.8 24
9 1100 h 31 October 91 None 0 12.6 12.6 24
10 1346 h 31 October 91 0.51 0 123.2 123.2 24
11 1430 h 31 October 91 0.20 0 29.7 29.7 25
12 1010 h 01 November 91 None 0 8.2 8.2 24
'Tube side absolute pressure, bDifferential pressure, 'Steam side pressure, d As specified by Spraying Systems
Table R2: Measurement of Mean Diameters of Spraying Systems Nozzles.
Nozzle No. Nominal Nozzle Grid Measurements Measured Mean
Diameter (mm) (1/7 mm) Diameter (mm)
000009 0.20 1.6, 1.6, 1.6, 1.6 0.229
000012 0.25 1.85, 1.85, 1.85, 1.82 0.264
000019 0.30 2.35, 2.35, 2.3, 2.25 0.330
000021 0.34 2.55, 2.55, 2.6, 2.5 0.364
000050 0.51 3.65, 3.62, 3.6, 3.62 0.517

R6
Table R3: Calculated Nozzle Coefficients for Air Bleed Nozzles.
Nozzle Run No Total Leakage Actual Nozzle Nozzle Coefficient based on
Nominal (kg h-1) Flow Rate
Diameter (kg h-1) Nominal Measured (mm) Diameter Diameter
None 1 0.0190 - - -
II 2 0.0183 - - ---------r--------------- -------------- --------------- --------------- f-·
II Mean of 1, 2 0.0187 - - -
II 7 0.00931 - - -
II 9 0.0148 - - -
II 12 0.00962 - - ----------- --------------- --------------- --------------- --------------- --
II Mean of 7,9,12 0.01124 - - -
0.20 3 0.0384 0.0197 0.74 0.56
" 8 0.0303 0.0190 0.71 0.54
II 11 0.0347 0.0235 0.87 0.67 ---- --------------- ------------ ------------- --------------- f---·---
II Mean of 3,8,11 0.0345 0.0207 0.77 0.59
I 0.34 I 4 I 0.0877 I 0.0690 I 0.89 I 0.77 I 0.51 5 0.154 0.135 0.77 0.75
II 6 0.139 0.127 0.73 0.71
II 10 0.144 0.133 0.76 0.74 --------- --------------- --------------- --------------- ------------
II Mean of 5,6,10 0.147 0.132 0.75 0.73
R3 De-aeration Rate Calculation
The measurement of the sonic flow of steam/ air mixtures through a nozzle has not been
reported in the literature. For this work, it was assumed that the saturated steam and air
do not interact and that both behave as ideal gases at low pressures. Thus the air can be
considered to be flowing only through part of the nozzle cross-sectional area proportional
to its volumetric fraction. Other assumptions made include:
the nozzle coefficient is 0.75 (see Section R2),
steady state conditions apply,
saturated steam on both steam and boiling sides,
all air leaves through de-aeration lines,
the sensible heat component in condensation is negligible,
the adiabatic exponent for saturated steam = 1. 3.

Now known parameters include:
nozzle or orifice diameter,
steam side pressure,
boiling side pressure,
air flow entering the shell,
condensation rate (from evaporation rate).
R7
The temperature of the steam I air mixture entering the de-aeration lines was solved by
iteration with the bulk steam temperature being used as the initial guess in the following '
calculations.
The area required to vent the air can be calculated:
mair
2 2
2 Yair ( 2 ]ra~,-1 Rair T Yair + 1 Yair + 1
and the area available for steam is:
The steam flow through the de-aeration lines is:
m steam out
2 2
2 Ysteam ( 2 JYsteam-1 ~eam T Y steam + 1 Y steam + 1
Therefore the percentage of air in the de-aeration lines is:
mair %Airout = ----- X 100
m +m. steamout alt:
The condensation rate is:
So the percentage of air in the incoming steam is:
%Air. = m mair
-------X 100 m +m. +m cond mr steam out

R8
The de-aeration rate is:
m = m. +m vent arr steamout
and the percentage de-aeration is:
l __ m_ve_n_t - X 100
R4 Pressure Ratio Test Calculations
This section outlines the calculations required to determine the volumetric air fraction in
the de-aeration line stream, from the pressure ratio test measurements. As the
temperature inside the pottle was not measured, the temperature after cooling, TAwas
assumed to be ooc for the measurements done using a dry-ice/water or a glycol/dry ice
mixture as the coolant, except for Run 2 where the coolant was water containing a little
dry ice at soc. A temperature inside the bottle of -sooc was assumed for the
measurements made using liquid nitrogen.
The temperature of the sample before condensation, T B was assumed to be the steam
saturation temperature at the measured pressure initially. The temperature was then
adjusted by iteration of the following calculations.
The water vapour pressure at T A was then subtracted from the PA to obtain the air partial
pressure at T A-
p = p - p (T) Aalr Acor vap A
The water vapour pressures used were:
At S°C; 0.8719 kPa, at 0°C; 0.61 kPa (Rogers & Mayhew, 1982).
At -S0°C; 0.004 kPa (Weast & Astle, 1980, D19S).
If the MEA valve (the valve between the bottle and the pressure sensors) was kept closed
until after cooling the bottle, the residual pressure was adjusted to account for the change
in volume:
Otherwise

p = p X ( Vbottle + Vlines l Acor Aair V
bottle
( 0.45 + 0.0725 ) =p X
Aair 0.45
= 1.161 PA. mr
The air partial pressure at T8 was then determined:
(
TB + 273.15) p = p
Bair Acor TA + 273.15
Therefore the air volume fraction was:
R5 References
Air 1 fr . Pn.
vo ume act10n = ~ Pn
R9
Grace H P & Lapple C E (1951). Discharge coefficients of small-diameter orifices and
flow nozzles. Trans. ASME,73, 639-647.
Rogers G F C & Mayhew Y R (1982). Thennodynamic and Transport Properties of
Fluids- SI Units, 3rct edn., Basil Blackwell, Oxford.
Weast R C & Astle M J- Eds. (1980). CRC Handbook of Chemistry and Physics, 60th edn., CRC Press Inc., Boca Raton, Florida.
n~ •.t~~nY ' ilBURY


Sl
APPENDIX S: NON-CONDENSABLE GAS APPARATUS
COMMISSIONING PROCEDURE AND
OBSERVATIONS
This is the record of the NCG Apparatus commissioning trials in chronological order. The
apparatus set up is shown in Figure 7.1-7. 3.
so Glossary
0-114AP
0-7AP
AP3
bypass valve
DP3
DP3B
DP3T
GC
IN
MEA
Absolute pressure sensor with range 0-114 k.Pa mounted on NCG
apparatus.
Absolute pressure sensor with range 0-7 k.Pa mounted on NCG apparatus.
Third Evaporator absolute pressure.
'valve on line containing the de-aeration nozzle used when not going
through the NCG apparatus.
Third Evaporator differential pressure.
Third Evaporator differential pressure measured in bottom de-aeration
line.
Third Evaporator differential pressure measured in top de-aeration line.
Gas chromatograph
Valve on bottle through which the steam-air mixture enters the bottle.
Valve on bottle through which the bottle is connected to the absolute
pressure sensors (0-7AP and 0-114AP), the helium bottle and the vacuum
pump.
plant valves Valves on de-aeration lines to NCG apparatus which isolate the quick
connect fittings from the plant when NCG apparatus is not present or
assembled.
OUT Valve on bottle through which the' steam-air mixture leaves the bottle on
its way to the condenser.
SP Steam pressure in de-aeration line determined from AP3 and either DP3,
DP3B or DP3T as appropriate.
Sl Initial Test Comparing Dry Ice and Liquid Nitrogen as the Coolant
9 September 1991
1335 h Apparatus installed to measure NCG concentration in bottom de-aeration
line. Drained bottle, blew out water from lines, put bottle heater on, and
started pulling vacuum to dry out apparatus.
1349 h Closed top de-aeration line valve so all air comes through bottom
de-aeration line. Differential pressure increased to 3.46 k.Pa from

S2
2.9 kPa.
1409 h Pressure in NCG apparatus still dropping, 0-7AP now 2.24 kPa absolute.
N c4 Measurement 1
1412 h Closed MEA valve, opened plant valves and IN/OUT valves, closed
bypass, left vacuum pump running.
1416:30 h
1420:44 h
1428 h
1432 h
1505 h
1518 h
1520 h
1525 h
1526 h
1528 h
1532 h
1535 h
1538:30 h
0-7AP now reads 1.72 kPa.
0-7AP now reads 1.35 kPa.
Closed valve to vacuum pump, opened MEA valve, closed IN valve,
closed OUT valve, 0-114AP reads 15.1 kPa.
Removed heater and put dry ice around bottle and poured a little water on
neck of bottle and onto dry ice.
0-7AP dropped to 1.3 kPa and rose again to 1.8 kPa.
0-7AP now steady at 1.37 kPa absolute.
Removed dry ice, pressure rose.
Put liqui:d nitrogen around bottle.
0-7AP reads 1.4 kPa
0-7AP reads 1.1 kPa
0-7AP reads 1.0 kPa, was just about stable, and dropped away again.
0-7AP now reads 0.79 kPa
0-7AP now reads 0.80 kPa. The minimum pressure between 1535 hand
1538:30 h was 0.78 kPa.
S2 Comparison of Pressure Ratio Method Upon Condensation with Gas Chromatography
Measurements
10 September 1991
1330 h Apparatus still connected to bottom de-aeration line. Top de-aeration line
valve is closed. Drained water out of bottle. Blew water out of lines
with helium. Then reassembled, turned heater and vacuum pump on to
dry out apparatus.
Nc4 Measurement 2
1352 h Closed MEA valve (0-7AP reads 2.5 kPa).
1352:30 h
1352:40 h
1356 h
1358 h
1400:30 h
1401 h
1402 h
1406 h
Opened IN valve and then OUT valve.
Closed bypass valve. Differential pressure dropped from 5.5 kPa to
5. 0 kPa and then started rising again.
DP3 now 5.24 kPa, 0-7AP reads 2.3 kPa.
0-7 AP reads 2.2 kPa.
Closed valve to vacuum pump, opened MEA valve.
Closed OUT then IN valves (0-144AP reads 26.1 kPa).
Removed heater from bottle.
Put dry ice around bottle and filled dry ice container with water. Only

S3
half the bottle is covered with the water/dry ice mixture. Temperature of
water 5°C.
1412 h 0-7AP reads 4.83 kPa and dropping.
1416 h Opened bypass valve.
1421 h Put bottle in liquid nitrogen.
1427 h Pressure steady at 2.28 kPa (0-7AP).
1433 h Pressure steady at 2.28 kPa (0-7AP).
1434 h 0-7AP rising again. Level of liquid nitrogen has dropped.
1435:30 h Closed MEA valve.
1435:50 h Opened valve to vacuum pump (pump still on), opened valves to helium
bottle and set helium bottle regulator at 1 psig.
1437:40 h Bleed helium through to vacuum pump.
1438:30 h Closed valve to vacuum pump, opened valve on cold trap to atmosphere
and turned vacuum pump off.
1439:30 h ·Filled bottle with helium, pressure reached -5 psig (say 136 kPa
absolute).
1440:30 h Closed MEA valve, took bottle off and carried it to the GC for analysis
with a tiny amount of liquid nitrogen surrounding the bottle to kept the
water frozen.
GC Sample 1
1630 h Put a test gas (15.3% C02, 0 2, balance N2) through the GC. A 0.5 ml
sample was injected into the GC column. The composition of the gas was
15.099% C02 , 2.893% 0 2, 82.008% N2 , with a nitrogen peak area of
1,150,475.
GC Sample 2
1640 h A 0. 5 ml sample was extracted from the chilled bottle and put into the GC
column. The composition of the gas was 0.739% C02 , 20.221% 0 2 ,
79.04% N2, with a nitrogen peak height of 75,885.
GC Sample 3
1645 h A 0.5 ml sample of atmospheric air was put into the GC column and the
composition obtained was 0.197% C02 , 20.633% 0 2 , 79.17% N2 , with
a nitrogen peak height of 1,167,543.
(1) Assuming that peak area is proportional to concentration, the amount of
non-helium gases in the sample from the chilled bottle (GC Sample 2)
was:
( 75885) 0.7904 X 100 = 6.S%
(1167543) 1 0.7917

S4
when compared with atmospheric air (GC Sample 3) or 6.8% when
compared with the test gas (GC Sample 1).
11 September 1991 ·
GC Sample 4
0818 h
GC Sample 5
Injected 0.5 ml of test gas into GC column. The composition of the gas
was 15.339% C02 , 2.617% 0 2, 82.044% N2 , with a nitrogen peak height
of 1,076,655.
Extraction of a sample from the chilled bottle proved impossible due to an
inadequate needle and a damaged septum.
0840 h A 0.4 ml sample was taken through one of the valves on the bottle and
injected on the column. The composition of the gas was 0.094% C02 ,
20.194% 0 2 , 79.712% N2 , with a nitrogen peak height of 64364.
(2)
1146 h
GC Sample 6
1217 h
GC Sample 7
1228 h
(3)
GC Sample 8
The amount of non-helium gases in the sample from the chilled bottle
valve (GC Sample 5) was 7. 7% when compared with the test gas (GC
Sample 4) result.
The sample bottle was drained, and connected to the NCG apparatus. The
vacuum pump was switched on to reduce the pressure (to 2.5 kPa) and the
heater was placed around the bottle to boil off any water. The bottle was
then filled with helium (to 1 psig) and then the pressure was reduced to
5 kPa. This step was repeated twice before filling the bottle with helium
to 113.8 kPa.
A 0.5 m1 sample of the test gas was put into the GC. The composition of
the gas was 15.25% C02 , 2.608% 0 2 , 82.142% N2 , with a nitrogen peak
height of 1,079,752.
A 0.5 ml sample was taken from the bottle and injected into the GC
column (helium blank). The composition of the gas was 0.438% C02 ,
20.631% 0 2, 78.931% N2, with a nitrogen peak height of 55,436.
The amount of non-helium gases in the helium blank bottle (GC Sample 7)
was 5.3% when compared with the test gas (GC Sample 4) result.
1255 h A 0.5 ml sample1 of helium was extracted from the end of the flexible
helium supply line, after a 30 s bleed, using the syringe, and injected into
1 For all samples taken from the Helium line, a 1 ml sample was taken initially and after carrying the sample back to the GC, the sample was reduced to 0.5 ml.

(4)
S5
the GC column (located 400 m away). The composition of the gas was
0.794% C02 , 20.79% 0 2 , 78.416% N2, with a nitrogen peak height of
54,896.
The amount of non-helium gases ex-flexible helium blank line after 30 s
bleed (GC Sample 8) was 5.3% when compared with the test gas
(GC Sample 4) result.
GC Sample 9
1336 h A 0.5 ml sample of helium was extracted from the end of the flexible
supply line after a 16 min bleed and put into the GC column. The
composition of the gas was 0.729% C02, 20.744% 0 2 , 78.527% N2 , with
a nitrogen peak height of 38,779.
(5) The amount of non-helium gases ex-flexible helium blank line after
16 min bleed (GC Sample 9) was 3.7% when compared with the test gas
(GC Sample 4) result.
GC Sample 10
1352 h A 0.5 ml sample of the test gas was injected into the GC column. The
composition of the gas was 15.071% C02 , 2.734% 0 2 , 82.195% N2 , with
a nitrogen peak height of 1,086,404.
GC Sample 11
1413 h A 0.5 ml sample of helium was taken from directly after the low pressure
shut-off valve on the helium gas bottle. The valve unfortunately had a
very small orifice in an 6 mm diameter outlet pipe, so back mixing could
have occurred. The composition of the gas was 0.992% C02 ,
20.851% 0 2 , 78.157% N2 , with a nitrogen peak height of 47,448.
(6) The amount of non-helium gases ex-helium shut-off valve (GC Sample 11)
was 4.6% when compared with the test gas (GC Sample 4) result.
In summary, the GC results were as follows:
(1) Nc4 Measurement 2 (ex septum) 6.5%.
(2) Nc4 Measurement 2 (ex valve) 7.7%
(3) Bottle blank sample 5.3%
(4) Ex helium line (30 s bleed) 5.3%
(5) Ex helium line (16 min bleed) 3.5%
(6) Ex helium shut-off valve 4.6%
Comparing (1) and (2) the true non-condensable gas concentration could have been 1.2%
which compares well with the 1.68% predicted from the pressure ratio method. The
supposedly 99.9% helium (Balloon Gas Grade) appeared to be contaminated. Two
unidentified peaks occurred on the GC trace for all samples which contained helium from
that bottle.
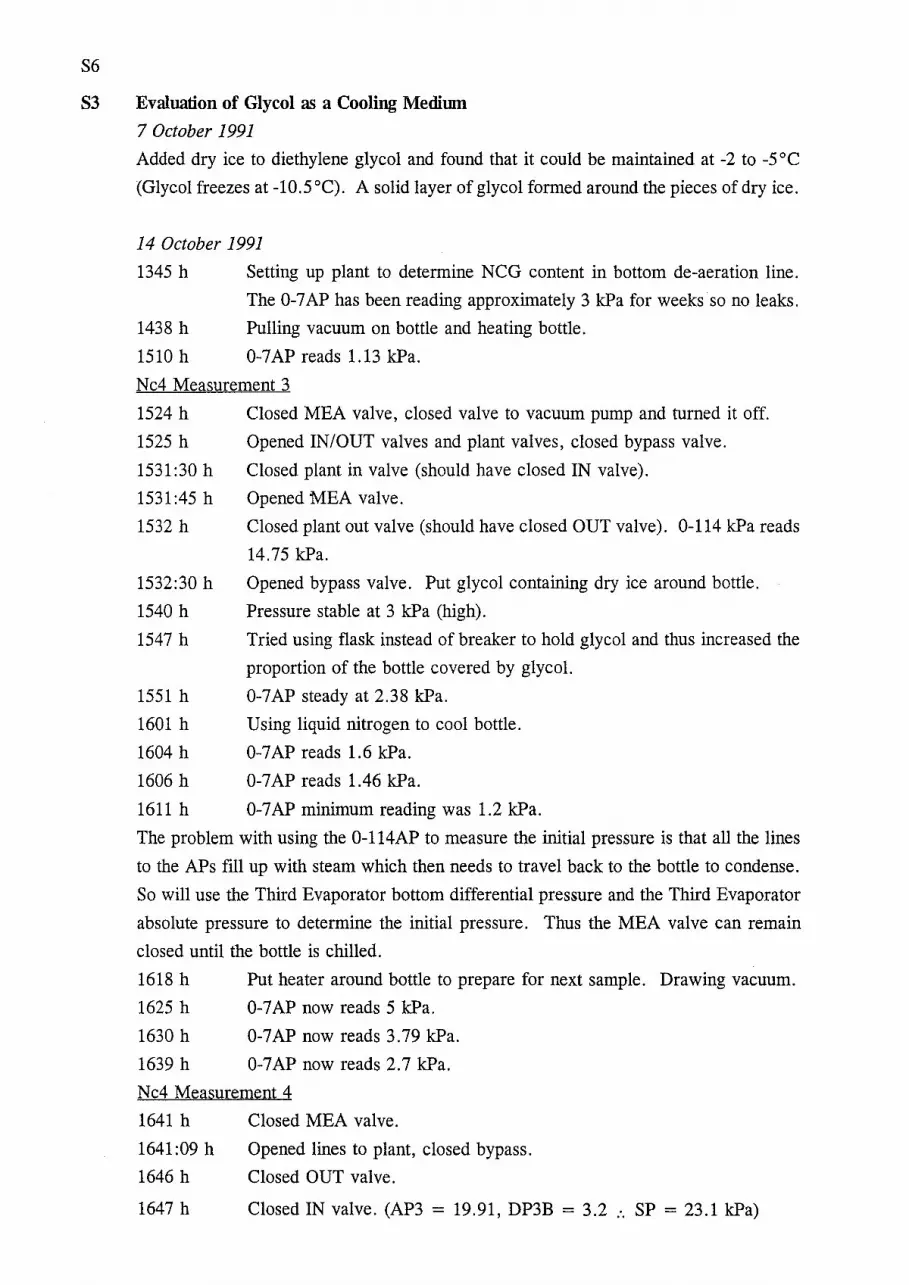
S6
S3 Evaluation of Glycol as a Cooling Medimn
7 October 1991
Added dry ice to diethylene glycol and found that it could be maintained at -2 to -5°C
(Glycol freezes at -10.5 °C). A solid layer of glycol formed around the pieces of dry ice.
14 October 1991
1345 h Setting up plant to determine NCG content in bottom de-aeration line.
1438 h
1510 h
The 0-7 AP has been reading approximately 3 kPa for weeks so no leaks.
Pulling vacuum on bottle and heating bottle.
0-7 AP reads 1.13 kPa.
N c4 Measurement 3
1524 h Closed MEA valve, closed valve to vacuum pump and turned it off.
1525 h Opened IN/OUT valves and plant valves, closed bypass valve.
1531:30 h
1531:45 h
1532 h
1532:30 h
1540 h
1547 h
1551 h
1601 h
1604 h
1606 h
1611 h
Closed plant in valve (should have closed IN valve).
Opened MEA valve.
Closed plant out valve (should have closed OUT valve). 0-114 kPa reads
14.75 kPa.
Opened bypass valve. Put glycol containing dry ice around bottle.
Pressure stable at 3 kPa (high).
Tried using flask instead of breaker to hold glycol and thus increased the
proportion of the bottle covered by glycol.
0-7AP steady at 2.38 kPa.
Using liquid nitrogen to cool bottle.
0-7AP reads 1.6 kPa.
0-7 AP reads 1.46 kPa.
0-7AP minimum reading was 1.2 kPa.
The problem with using the 0-114AP to measure the initial pressure is that all the lines
to the APs fill up with steam which then needs to travel back to the bottle to condense.
So will use the Third Evaporator bottom differential pressure and the Third Evaporator
absolute pressure to determine the initial pressure. Thus the MEA valve can remain
closed until the bottle is chilled.
1618 h
1625 h
1630 h
1639 h
Put heater around bottle to prepare for next sample. Drawing vacuum.
0-7 AP now reads 5 kPa.
0-7AP now reads 3.79 kPa.
0-7AP now reads 2.7 kPa.
N c4 Measurement 4
1641 h Closed MEA valve.
1641:09 h
1646 h
1647 h
Opened lines to plant, closed bypass.
Closed OUT valve.
Closed IN valve. (AP3 = 19.91, DP3B = 3.2 :. SP = 23.1 kPa)

1653 h
1654 h
1705 h
1711 h
1713 h
1717h
1718 h
Put glycol containing dry ice around bottle.
Isolated and switched off vacuum pump. 0-7AP reads 2.4 kPa.
Opened MEA valve, 0-7AP dropped to 2.15 kPa.
0-7AP reads 1.54 kPa (need to compensate for AP line volume).
0-7AP reads 1.47 kPa.
Removed glycol and put liquid nitrogen around bottle.
0-7AP reads 0.95 kPa.
0-7AP reads 0.92 kPa. 0-7AP body temperature is above 0°C.
S4 Check of Purity of Balloon Gas helimn
15-16 October 1991
S7
The helium bottle was taken to the GC and samples were taken from the flexible line
(which was held under pressure between samples). The results indicated that the bottle
did contain 1-2% non-helium gases so another small bottle of helium was ordered (it did
not arrive until after March 1992).
SS Bottom De-aeration Line Measurement
16 October 1991
1327 h Pulling vacuum on NCG apparatus (still warm since yesterday, pressure
was 50 kPa having risen 7 kPa in 2 hours).
0-7AP drops to 0.81 kPa.
1349 h 0-7AP reads 1.0 kPa.
Nc4 Measurement 5
1351:00 h
1351:10 h
1351:20 h
1355 h
1401:00 h
1402:00 h
1402:08 h
1407:00 h
1407:15 h
1410 h
1417 h
1421 h
1423 h
1424 h
1426 h
Closed MEA valve.
Opened both plant valves (IN/OUT valves were already open).
Closed bypass valve.
Isolated and turned vacuum pump off.
Closed OUT valve,
DP3B = 2.93 kPa, AP3 = 19.91·kPa, .. SP = 22.84 kPa.
Closed IN valve.
Opened bypass valve, put bottle in glycol (with dry ice).
0-7 AP now 4 kPa so there must be a leak.
Opened MEA valve, 0-7AP dropped to 2 kPa.
Minimum 0-7AP reading 1.9 kPa.
0-7AP reading risen to 2.2 kPa. Found that glycol no longer bubbling.
Added some dry ice and poured some liquid nitrogen on bottle stem.
0-7 AP now 1. 66 kPa and dropping.
0-7 AP steady at 1. 62 kPa.
Added some more dry ice to glycol.
0-7AP steady at 1.61 kPa.

S8
1429 h
1432 h
1436 h
1441 h
1445 h
1513 h
1514 h
1517 h
1521 h
1524 h
1527 h
1528 h
1538 h
Put bottle in liquid nitrogen.
Pressure steady at 0.83 kPa.
Put bottle back in glycol, 0-7AP to 1.65 kPa.
Glycol freezes on bottle.
Pressure rising steadily, 0-7AP now 1,84 kPa. Glycol not bubbling now
due to so much frozen glycol.
0-7AP now 1.98 kPa.
0-7 AP now 3 kPa.
Took off frozen glycol and added fresh glycol with dry ice.
0-7AP now 3.18 kPa.
0-7 AP now 3.22 kPa.
Put bottle in liquid nitrogen.
0-7 AP steady at 1. 88 kPa so air has been leaking in.
0-7AP now 1.86 kPa.
Boiling (')ff water, drying out apparatus (heat plus vacuum).
S6 Non-condensable Gas Apparatus Leakage Rate Test
16 October 1991
1630 h Drew vacuum, closed all valves and left overnight (pressure approximately
1.8 kPa).
17 October 1991
1100 h 0-7AP reads 2.7 kPa.
1110:50 h Opened 1,4 11 valve on line to bottle, 0-114AP to 24 kPa.
1113 h Pulled vacuum on AP side up to MEA valve.
1114 h Isolated vacuum pump, 0-7AP to 2.3 kPa.
1115 h Opened MEA valve to bottle, 0-7AP to 1.62 kPa.
1117 h 0-7AP reads 1.7 kPa.
1118 h Opened OUT valve on bottle, 0-AP to 4.2.kPa.
1119 h Opened IN valve on bottle, 0-7AP reading changes from 4.27 to
4.17 kPa.
1121 h 0-7AP reads 4.24 kPa.
So there is a leak between the 1,4 11 valve and the MEA valve on the line between the APs
and the bottle and a leak in the nozzle assembly.
S7 Measurement of Non-condensable Gases in Top De-aeration Line
1122 h Took apparatus to top of tower to do NCG measurement on top de
aeration line. Wired in 0-7AP only. Nozzles SS0020, 3.2 mm in
diameter.
1210 h Draining out condensate from top de-aeration lines - three times from 11 in 11

1220 h
1310h
plant line and once from "out" plant line.
Drying out bottle with heat and vacuum.
0-7AP reads 2.25 kPa with all (appropriate) valves open.
Nc4 Measurement 6
1310 h Closed MEA valve.
1310:30 h Opened plant in valve (IN and OUT valves already open).
1311:30 h Opened plant out valve.
1311: 31 h Closed bypass valve.
1319:30 h Closed OUT valve on bottle.
1320:31 h Closed IN valve on bottle, opened bypass
AP3 = 19.91 kPa, DP3T = 2.95 kPa, :. SP = 22.86 kPa.
Cooled bottle with liquid nitrogen.
1324:38 h 0-7AP read 1.05 kPa, opened MEA valve, 0-7AP to 0.07 kPa.
S9
Removed liquid nitrogen and warmed bottle with glycol, had to scrap off
'frozen glycol from bottle.
1342 h
1345 h
1355 h
1418 h
1430 h
Added fresh glycol and dry ice.
Minimum pressure (0-7 AP) = 0. 83 kPa.
0-7 AP reads 0. 993 kPa and steadily rising.
Putting more dry ice in glycol, 0-7AP reading dropped from 1.55 kPa to
1.3 kPa.
Disconnected bottle and weighed it (2 .40 kg).
18 October 1991
1100 h Drained bottle and weighed it (2.37 kg) so approximately 30 ml of water
condensed in bottle. Filled bottle with water, closed valves and weighed
it (2.82 kg).
Changed de-aeration nozzles to SS0002 (0. 99 mm diameter)
SS Non-condensable Gas Apparatus Leak Detection; Repair and Testing
25 October 1991
Measuring air leakage rates. Found leak in fitting. Organised repair.
18 December 1991
Pulled vacuum on NCG apparatus, left overnight.
19 December 1991
Found leak in nozzle assembly.
13 January 1992
Tightened fittings around nozzle assembly, and drew vacuum.

S10
23 January 1992
0-7 AP reached full scale this morning.
16 March 1992
1105 h Pulled vacuum on NCG apparatus and then closed all valves.
23 March 1992
1519 h 0-7AP reading 1.4 kPa, opened !A" valve to bottle, no change in pressure.
1523 h Opened MEA valve, 0-7AP to 1.207 kPa.
1535 h
1538 h
1546 h
1610 h
1650 h
Opened IN valve, 0-7AP to 1.267 kPa.
Opened OUT valve, 0-7AP to 5.5 kPa. So leak still present, but should
be OK due to location.
Pulled vacuum on NCG apparatus and left all internal valves open, initial
pressure (0-7AP) 0.6 kPa.
0-7AP reads 0.73 kPa.
0-7AP reads 0.82 kPa.
24 March 1992
0948 h 0-7AP reads 1.557 kPa. Rose only 0.8 kPa in 18 hours and it could be
due to the water vapour/temperature effect.
S9 Measurements With and Without Deliberate Air Addition to Calandria
25 March 1992
0807 h 0-7AP reads 2.7 kPa.
1300 h
1311h
1314 h
1319 h
1324 h
Will measure air content in bottom de-aeration line with top de-aeration
line closed and no air bleed. Note computer time 14:08:00, watch time
13:06:43.
Started pulling vacuum on NCG apparatus and started heating bottle using
a taller container so some of the neck of the bottle is in the glycol.
0-7AP reads 0.5 kPa.
0-7AP rising to 0.6 kPa.
Bottle hot but neck cold.
Nc4 Measurement 7
1326 h
1327:00 h
1327:15 h
1332:17 h
Closed valve to vacuum pump, and MEA valve.
Opened inlet and outlet plant valves (IN and OUT already open).
Closed bypass valve.
Closed OUT valve on bottle,
DP3B = 4.9 kPa, AP3 = 20.1 kPa :. SP = 25 kPa.
1332:47 h Closed IN valve on bottle.
1333:06 h Opened bypass. Removed heating block and put glycol around bottle and

1342 h
1344:45 h
1350:32 h
1351:50 h
1354 h
1356 h
1411 h
1418 h
1419 h
1425 h
added dry ice.
Glycol temperature 4.9°C. Cooled neck with cold glycol.
Opened valves to APs, temperature of glycol now 1.6°C.
0-7AP now reads 0.76 kPa.
Temperature of glycol -0.2 °C, neck warm.
Temperature of glycol -0.1 °C.
0-7AP 0.77 kPa (minimum value 0.76 kPa at 1353 h)
S11
Installed 0.51 mm diameter nozzle (SS000050) in air bleed and turned on.
Heating bottle, pulling vacuum.
Disconnected bottle and drained out excess water.
Connected bottle to apparatus and put heating block around bottle. Started
pulling vacuum. Put dry ice around glass cold trap on line to vacuum
pump.
Nc4 Measurement 8
1535 h ·Isolated APs (closed MEA valve) and vacuum pump, turned off vacuum
1535:35 h
1544:00 h
1544:30 h
1550 h
1551:30 h
1552:40 h
1605 h
pump.
Neck hot, opened bottle valves to process, closed bypass.
Closed OUT valve,
dP3B = 11 kPa, AP3 = 19.8 (20.4?) kPa, :. SP = 30.8 kPa.
Closed IN valve, opened bypass. Put bottle in glycol/dry ice mixture,
temperature to 7°C. Poured glycol at 4°C over stem of bottle.
Temperature 3.3°C.
Temperature -1.5°C
Opened valve to AP's. Temperature -3.4°C. AP rose from 1.38 to
1.531 kPa.
0-7AP now stable at 1.506 kPa.
Dried out apparatus, replaced 0020 de-aeration nozzles (3. 2 mm diameter)
with 0002 nozzles (0.99 mm diameter). Opened both top & bottom
de-aeration lines and ran overnight with no air bleed.
26 March 1992
0818 h Started heating bottle and pulling vacuum.
0820 h
0825 h
1119h
1121 h
1305 h
Closed top de-aeration line.
Closed NCG drain valve and opened valve to vacuum pump.
0-7AP reads 0.42 kPa. Evaporator still not stable.
Isolated vacuum pump and turned it off. Closed IN and OUT bottle
valves and opened plant valves.
Started vacuum pump again, dP3 has been stable for last hour.
Nc4 Measurement 9
1337:00 h Closed MEA valve and valve to vacuum pump, turned vacuum pump off.

S12
1337:22 h
1352:00 h
1352:30 h
1400 h
1402 h
1403 h
1405 h
1409:45 h
1431 h
1437 h
1521 h
Opened valves to process, closed bypass.
Closed OUT valve on bottle,
DP3B = 5.2 kPa, AP3= 20 kPa, :. SP = 25.2 kPa.
Closed IN valve on bottle, opened bypass.
Cooling bottle, need to keep glycol cold prior to use.
Temperature 6.5°C
Temperature 1.9°C
Temperature -1.4 oc
Temperature -2 oc
Opened line to AP's, 0-7AP went from 1.18 kPa to 0.925 kPa.
Temperature -2°C.
Opened 000050 bleed nozzle.
Temperature around bottle still 0.5°C. Removed glycol and put in fridge.
Removed bottle and drained a reasonable quantity of water and heated.
Pulling vacuum and heating bottle.
Closed valve to vacuum pump, turned pump off.
0-7AP reads 2.68 kPa.
N c4 Measurement 10
1522 h dP3 still rising but nearly stable.
Bottom de-aeration temperature 58.8rc
Steam temperature 74.75°C
Steam pressure = 20+17.7 = 37.7 kPa (Sat temp 74.6°C). Therefore
percentage steam at outlet = p(58°C)/p(75°C) = 0.18/0.377 = 47.7%
Thus, %air = 52.3%.
1530:00 h MEA valve is closed. Opened IN and OUT valves.
1530:08 h Closed bypass.
1531:20 h Pulling vacuum on AP's.
dP3B and DP3T dropping to 14.5 kPa
1536:40 h Closed OUT valve.
1537:10 h Closed IN valve,
DP3B = 16.5 kPa, AP3 = 19.8 :. SP = 36.3 kPa.
1542:30 h Closed valve to vacuum pump, vacuum pump off.
1543 h Removed heating unit, put glycol at 1.6°C around bottle. Added dry ice,
1547 h
1538:00 h
1555 h
1559 h
1601 h
poured -2 oc glycol over bottle stem.
Glycol temperature -0.6°C.
Opened valve to AP's, 0-7AP off scale,
0-114AP reads 23 kPa (rose from 0.75 kPa).
0-114 AP reads 22.85 kPa.
Temperature still -2.7°C.
Put glycol in fridge, put heating unit around bottle, drained bottle but no
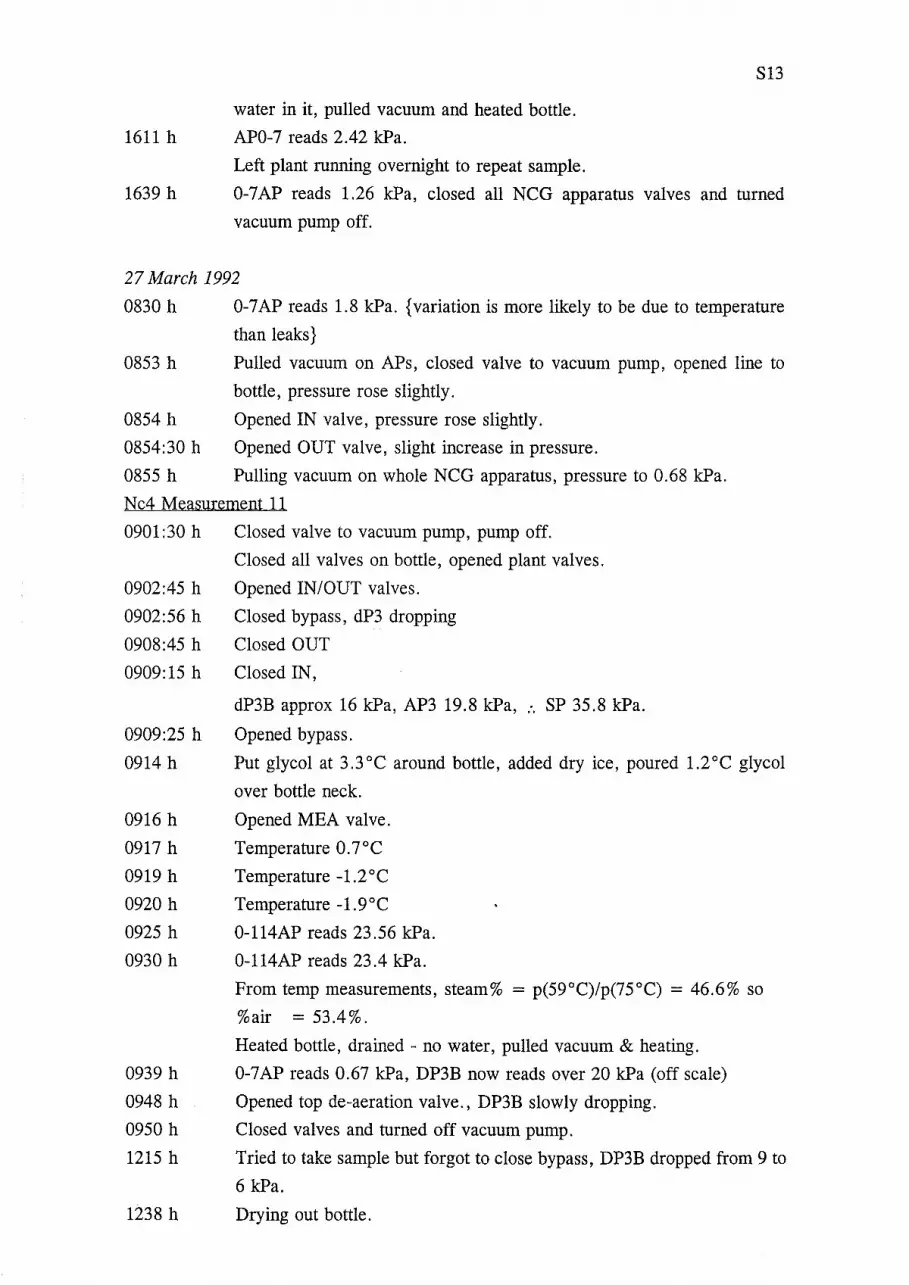
1611 h
water in it, pulled vacuum and heated bottle.
AP0-7 reads 2.42 kPa.
Left plant running overnight to repeat sample.
S13
1639 h 0-7 AP reads 1.26 kPa, closed all NCG apparatus valves and turned
vacuum pump off.
27 March 1992
0830 h 0-7AP reads 1.8 kPa. {variation is more likely to be due to temperature
than leaks}
0853 h Pulled vacuum on APs, closed valve to vacuum pump, opened line to
bottle, pressure rose slightly.
0854 h Opened IN valve, pressure rose slightly.
0854:30 h Opened OUT valve, slight increase in pressure.
0855 h Pulling vacuum on whole NCG apparatus, pressure to 0.68 kPa.
N c4 Measurement 11
0901:30 h Closed valve to vacuum pump, pump off.
Closed all valves on bottle, opened plant valves.
0902:45 h Opened IN/OUT valves.
0902:56 h Closed bypass, dP3 dropping
0908:45 h Closed OUT
0909:15 h Closed IN,
dP3B approx 16 kPa, AP3 19.8 kPa, :. SP 35.8 kPa.
0909:25 h Opened bypass.
0914 h Put glycol at 3.3°C around bottle, added dry ice, poured 1.2°C glycol
over bottle neck.
0916 h
0917 h
0919 h
0920 h
0925 h
0930 h
0939 h
0948 h
0950 h
1215 h
1238 h
Opened MEA valve.
Temperature 0.7°C
Temperature -1.2 oc Temperature -1.9°C
0-114AP reads 23.56 kPa.
0-114AP reads 23.4 kPa.
From temp measurements, steam% = p(59°C)/p(75°C) = 46.6% so
%air = 53.4%.
Heated bottle, drained- no water, pulled vacuum & heating.
0-7AP reads 0.67 kPa, DP3B now reads over 20 kPa (off scale)
Opened top de-aeration valve., DP3B slowly dropping.
Closed valves and turned off vacuum pump.
Tried to take sample but forgot to close bypass, DP3B dropped from 9 to
6 kPa.
Drying out bottle.
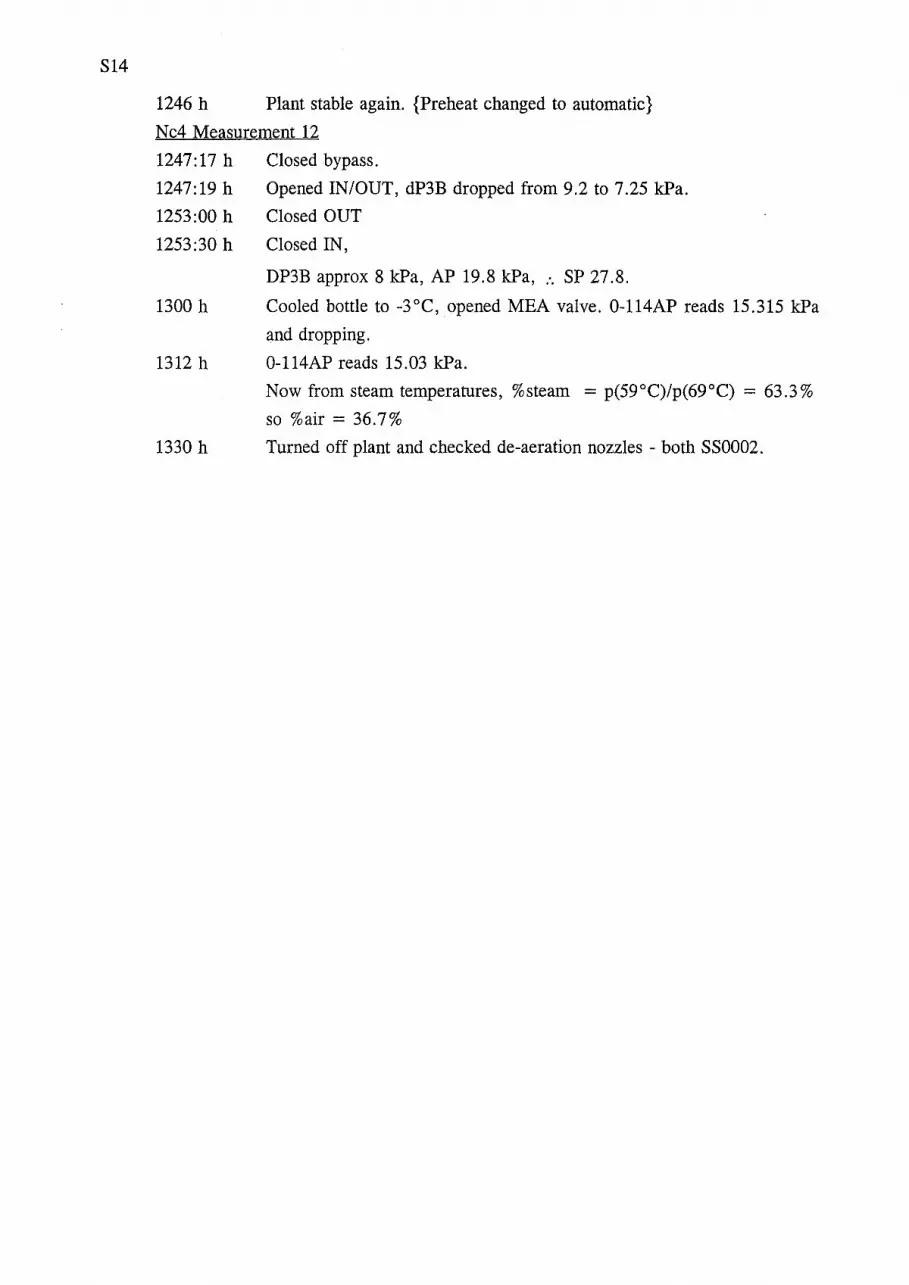
S14
1246 h Plant stable again. {Preheat changed to automatic}
N c4 Measurement 12
1247:17 h Closed bypass.
1247:19 h Opened IN/OUT, dP3B dropped from 9.2 to 7.25 k:Pa.
1253:00 h
1253:30 h
1300 h
1312 h
1330 h
Closed OUT
Closed IN,
DP3B approx 8 k:Pa, AP 19.8 k:Pa, :. SP 27.8.
Cooled bottle to -3°C, opened MEA valve. 0-114AP reads 15.315 k:Pa
and dropping.
0-114AP reads 15.03 k:Pa.
Now from steam temperatures, %steam = p(59°C)/p(69°C) = 63.3%
so %air = 36.7%
Turned off plant and checked de-aeration nozzles - both SS0002.


