Embed Size (px)
Citation preview
THIRD WAYNew Approach to Global
WarmingPresentation 5-22-14
ICLAHE.org Nashville, TN
Dr. Robert W Reuschlein “Dr. Peace”
Real Economy Institute www.realeconomy.com
Global Warming• Two Extremes in Global Warming:• 99% of all scientists agree
Michael Mann’s Hockey Stick• Don’t Worry, It’s Natural
Fossil Fuel Industry DenialJames Burke Australia
• But there are other ways to look at significant change in climate
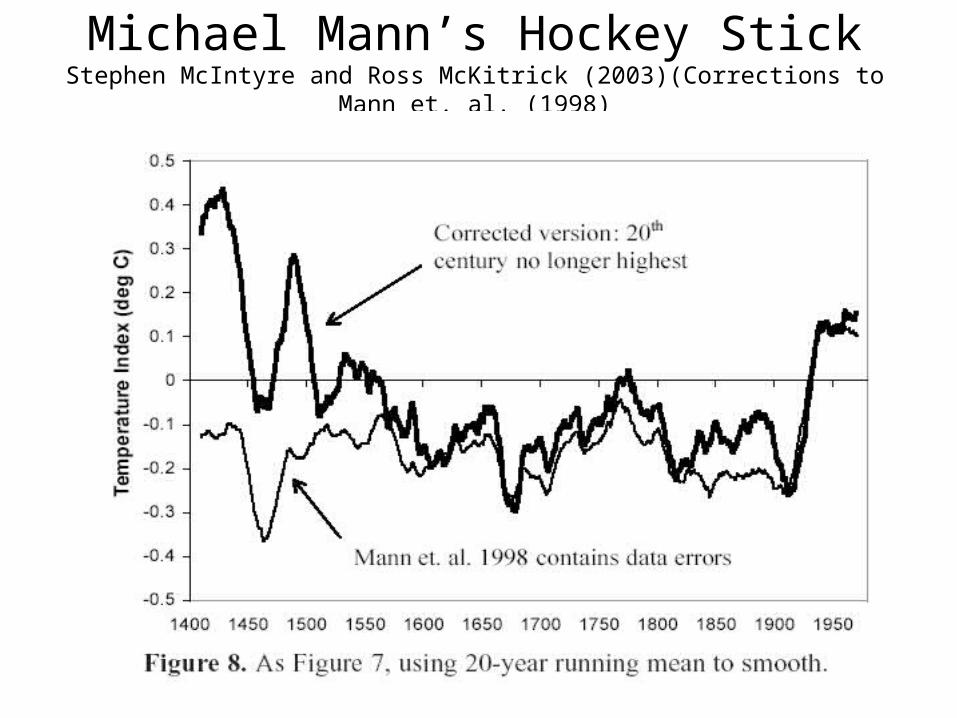
Michael Mann’s Hockey StickStephen McIntyre and Ross McKitrick (2003)(Corrections to
Mann et. al. (1998)
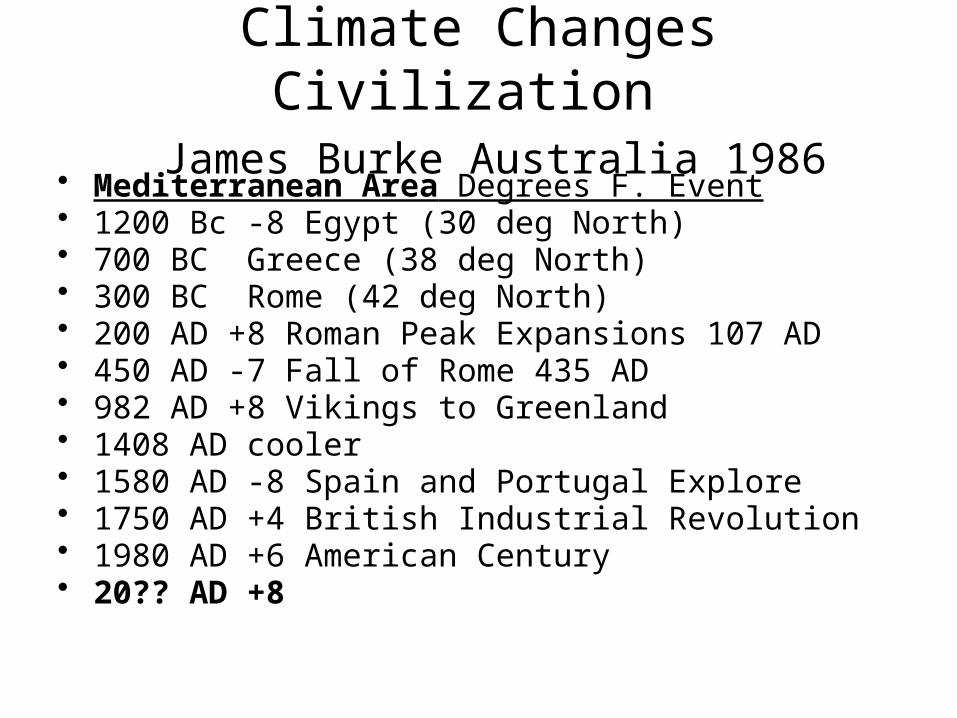
Climate Changes Civilization
James Burke Australia 1986• Mediterranean Area Degrees F. Event• 1200 Bc -8 Egypt (30 deg North)• 700 BC Greece (38 deg North)• 300 BC Rome (42 deg North)• 200 AD +8 Roman Peak Expansions 107 AD• 450 AD -7 Fall of Rome 435 AD• 982 AD +8 Vikings to Greenland• 1408 AD cooler• 1580 AD -8 Spain and Portugal Explore• 1750 AD +4 British Industrial Revolution• 1980 AD +6 American Century• 20?? AD +8
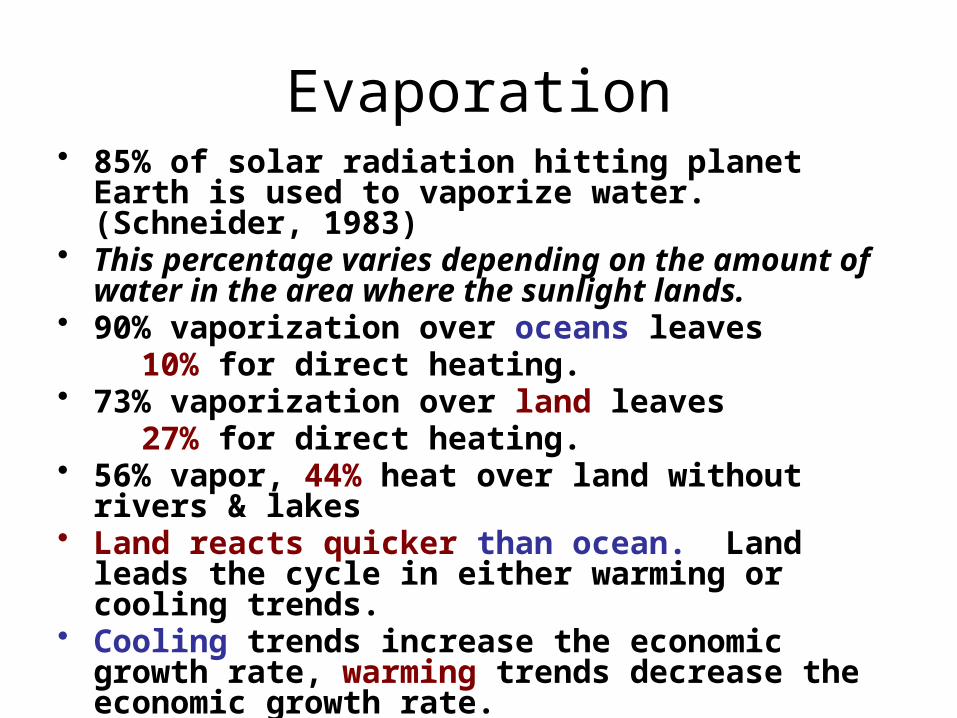
Evaporation• 85% of solar radiation hitting planet Earth is used to vaporize water. (Schneider, 1983)
• This percentage varies depending on the amount of water in the area where the sunlight lands.
• 90% vaporization over oceans leaves 10% for direct heating.
• 73% vaporization over land leaves 27% for direct heating.
• 56% vapor, 44% heat over land without rivers & lakes
• Land reacts quicker than ocean. Land leads the cycle in either warming or cooling trends.
• Cooling trends increase the economic growth rate, warming trends decrease the economic growth rate.
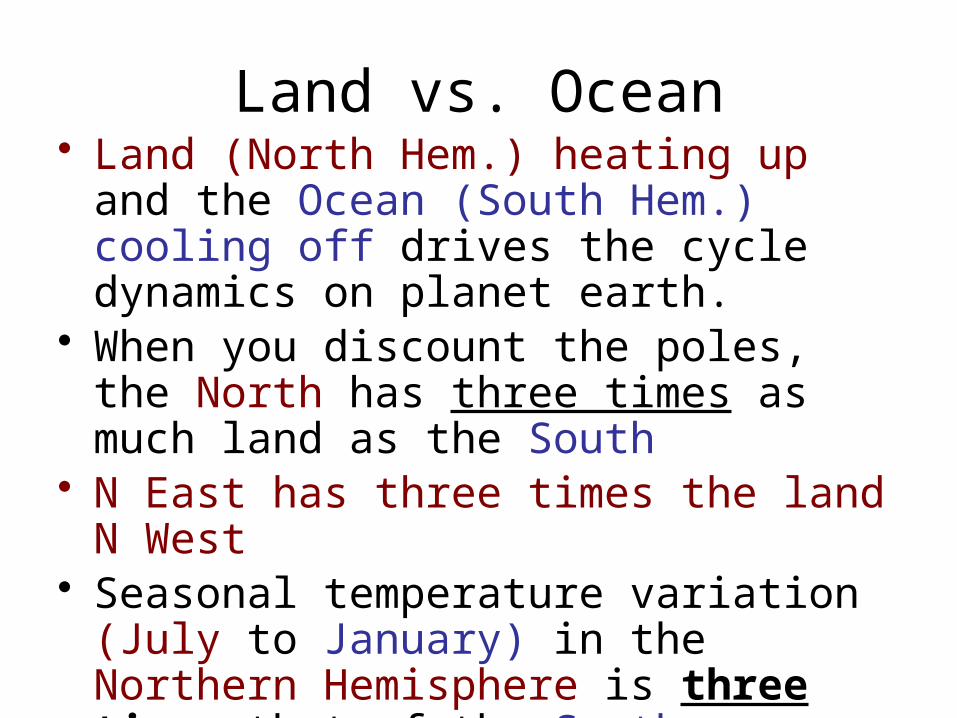
Land vs. Ocean• Land (North Hem.) heating up and the Ocean (South Hem.) cooling off drives the cycle dynamics on planet earth.
• When you discount the poles, the North has three times as much land as the South
• N East has three times the land N West
• Seasonal temperature variation (July to January) in the Northern Hemisphere is three times that of the Southern Hemisphere: (27 f. to 9 f.)
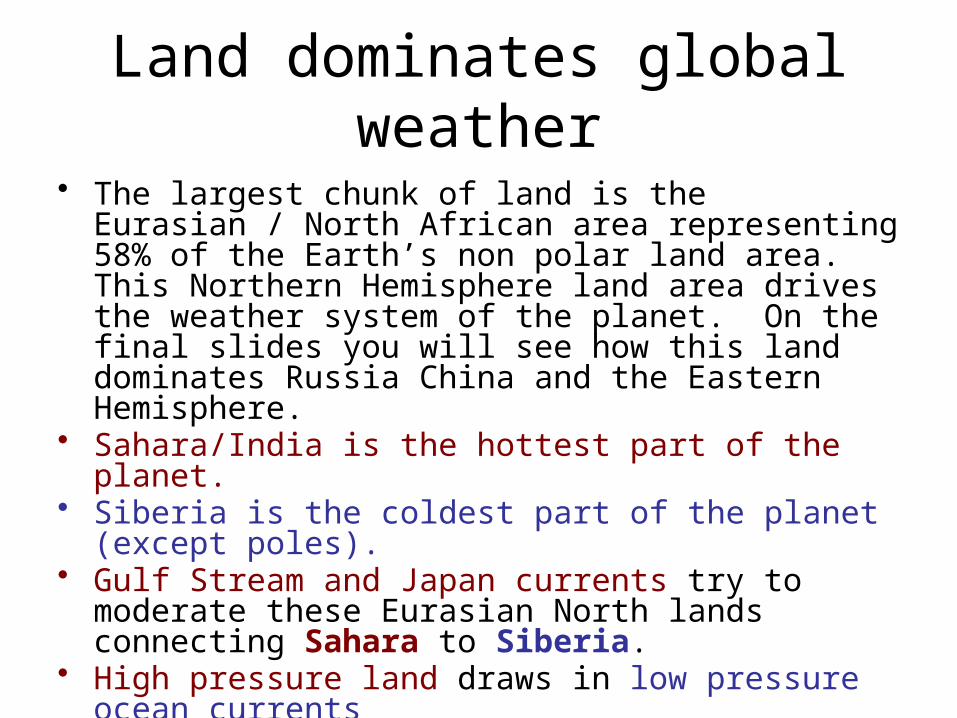
Land dominates global weather
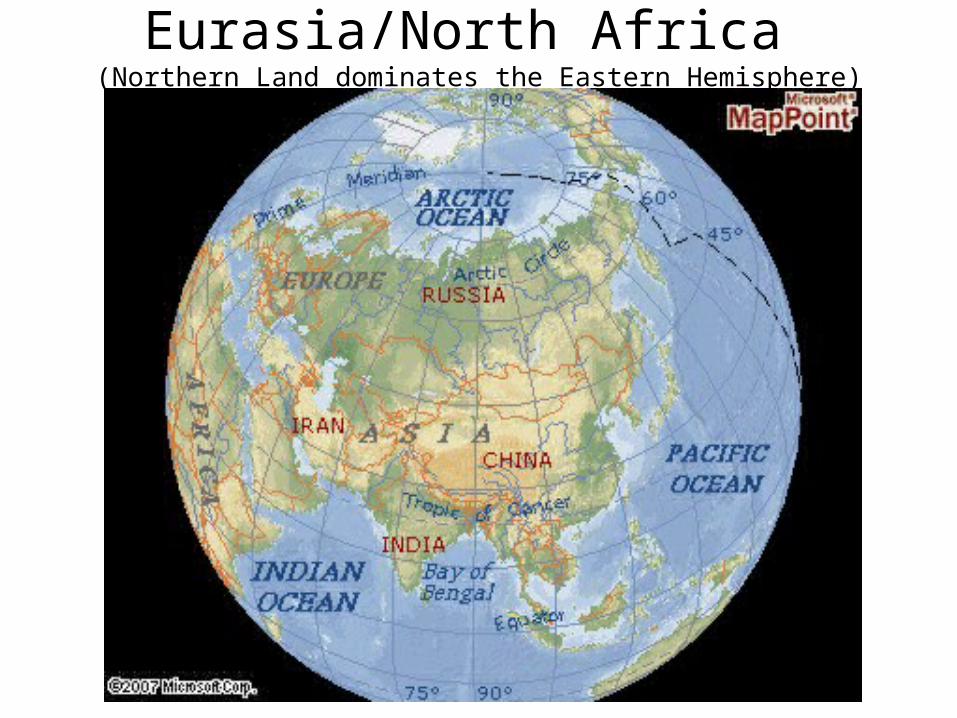
• The largest chunk of land is the Eurasian / North African area representing 58% of the Earth’s non polar land area. This Northern Hemisphere land area drives the weather system of the planet. On the final slides you will see how this land dominates Russia China and the Eastern Hemisphere.
• Sahara/India is the hottest part of the planet.
• Siberia is the coldest part of the planet (except poles).
• Gulf Stream and Japan currents try to moderate these Eurasian North lands connecting Sahara to Siberia.
• High pressure land draws in low pressure ocean currents
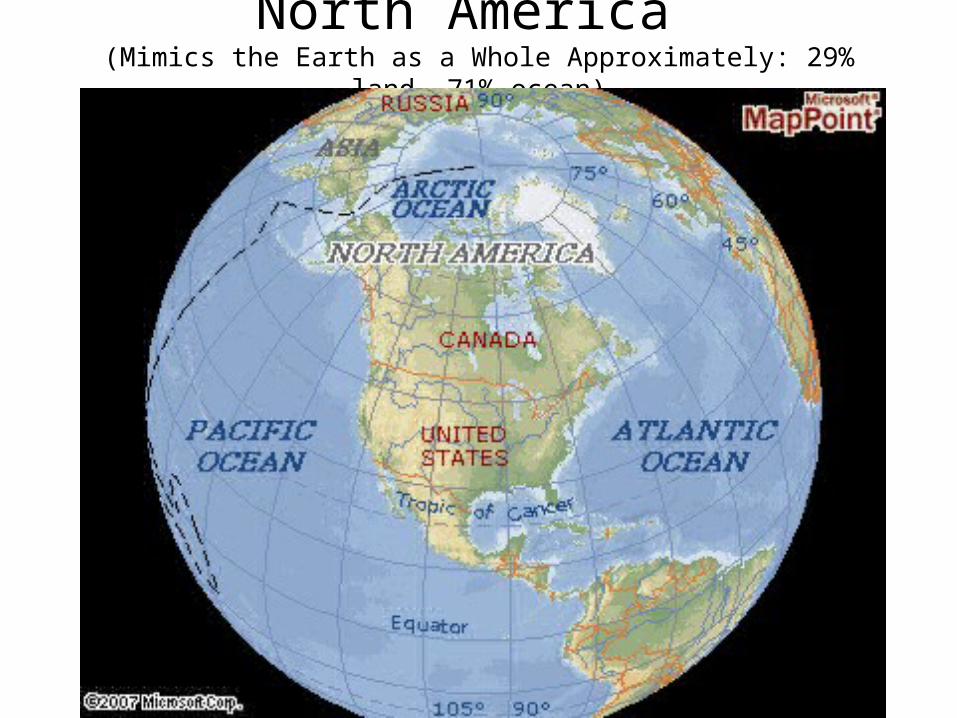
• The Labrador and California “back currents” cool North America into the strongest winters of any major developed area. North America mimics Earth (land 29% ocean 71%) as Western Hemisphere slide shows.
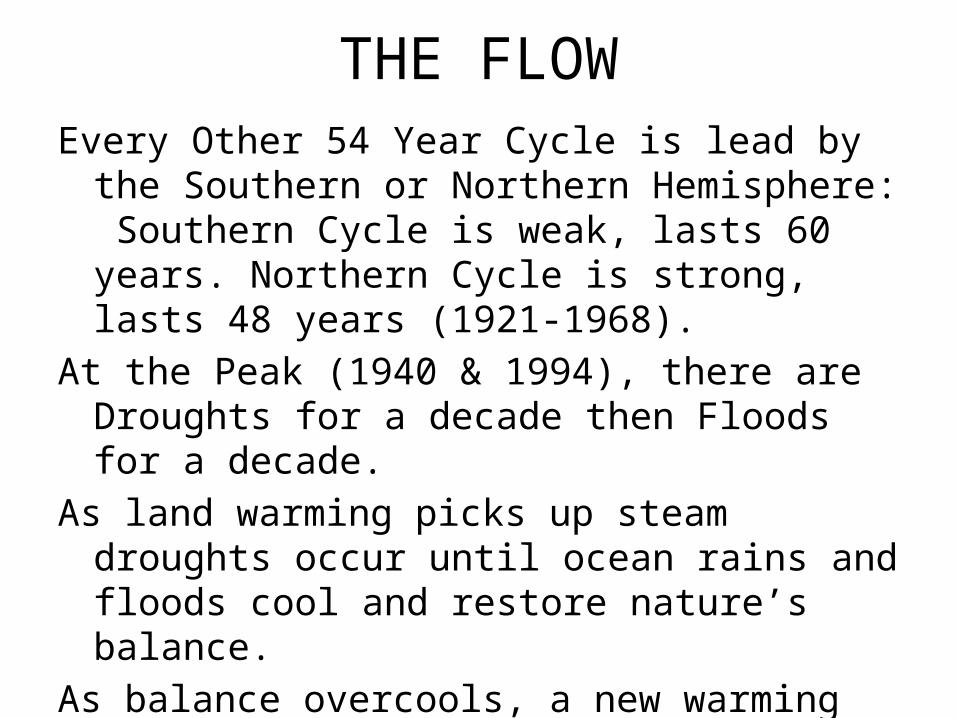
THE FLOWEvery Other 54 Year Cycle is lead by the Southern or Northern Hemisphere: Southern Cycle is weak, lasts 60 years. Northern Cycle is strong, lasts 48 years (1921-1968).
At the Peak (1940 & 1994), there are Droughts for a decade then Floods for a decade.
As land warming picks up steam droughts occur until ocean rains and floods cool and restore nature’s balance.
As balance overcools, a new warming begins.
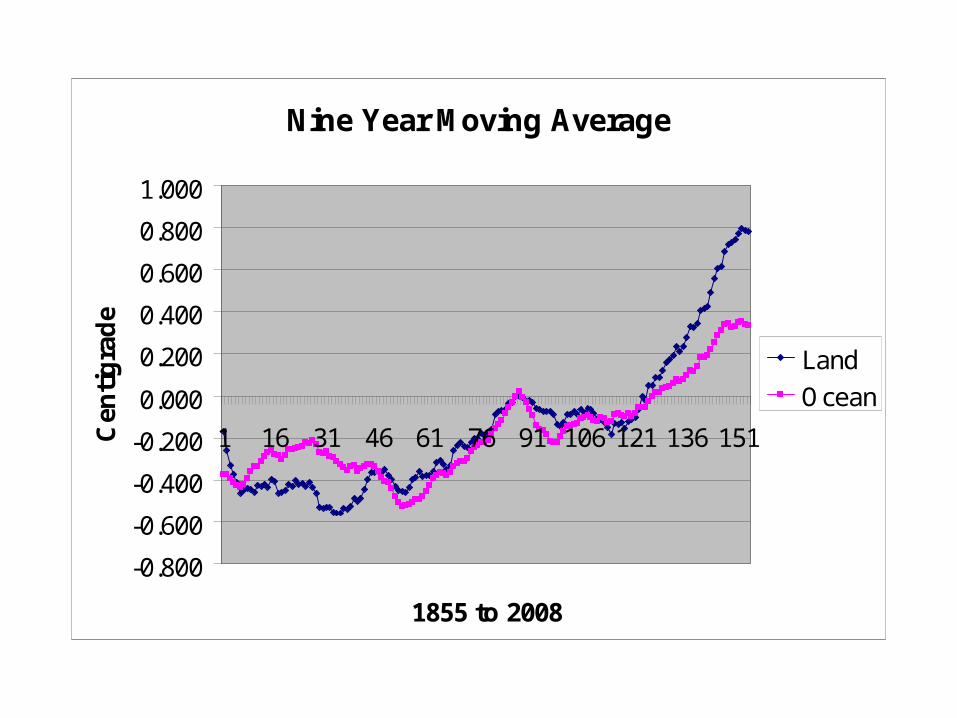
Nine Year M oving Average
-0.800-0.600-0.400-0.2000.0000.2000.4000.6000.8001.000
1 16 31 46 61 76 91 106 121 136 151
1855 to 2008
Centigrade
LandOcean
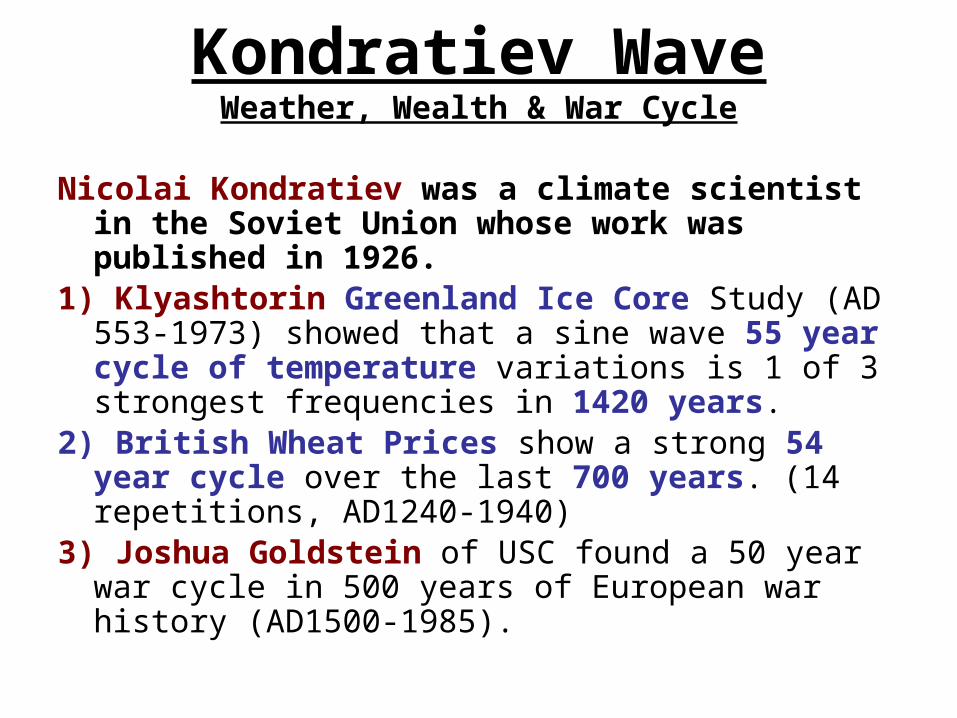
Kondratiev WaveWeather, Wealth & War Cycle
Nicolai Kondratiev was a climate scientist in the Soviet Union whose work was published in 1926.
1) Klyashtorin Greenland Ice Core Study (AD 553-1973) showed that a sine wave 55 year cycle of temperature variations is 1 of 3 strongest frequencies in 1420 years.
2) British Wheat Prices show a strong 54 year cycle over the last 700 years. (14 repetitions, AD1240-1940)
3) Joshua Goldstein of USC found a 50 year war cycle in 500 years of European war history (AD1500-1985).
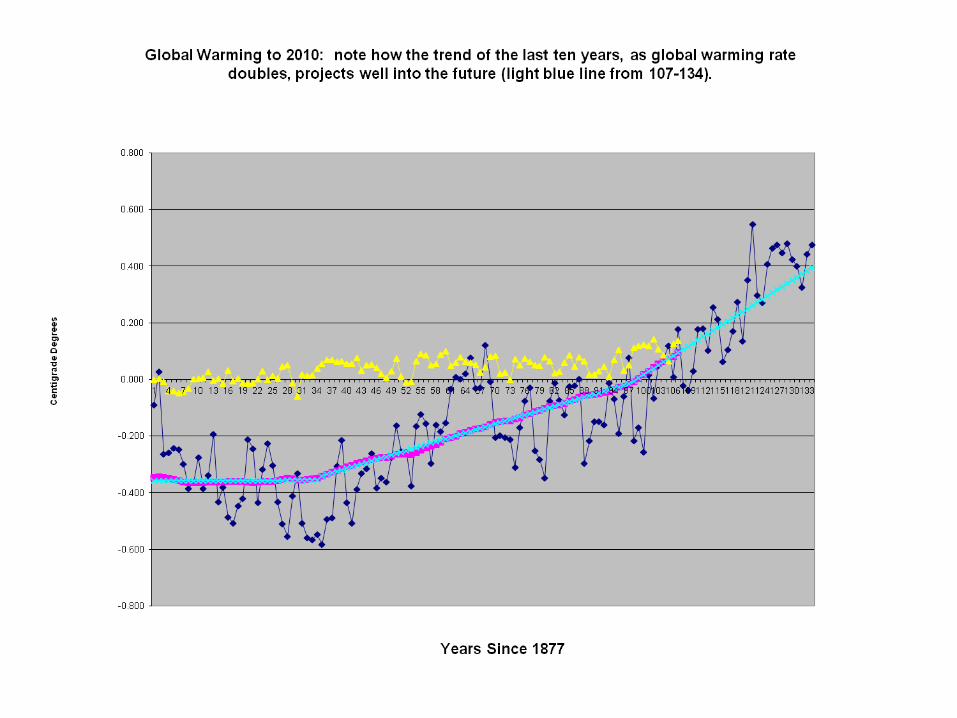
Next Chart Shows:• Proof of the long cycle and global warming:
• The 55 year moving average removes the cycle from the temperature plot producing a 64 year straight line, warming at a 0.95 f. rate / century.
• This first line correlates at .998. • The rate of global warming doubles to 2.0 f. per century in the last ten years of the moving average. (end years 2001-2010)
• This second line correlates at .997.
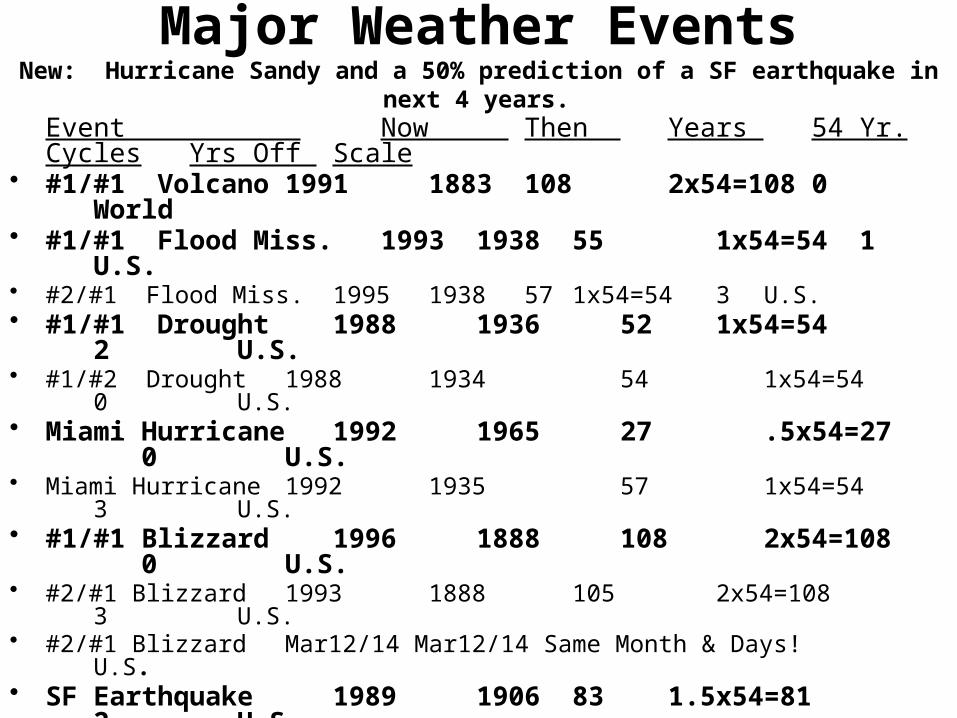
Major Weather EventsNew: Hurricane Sandy and a 50% prediction of a SF earthquake in
next 4 years.Event Now Then Years 54 Yr. Cycles Yrs Off Scale
• #1/#1 Volcano 1991 1883 108 2x54=108 0 World
• #1/#1 Flood Miss. 1993 1938 55 1x54=54 1 U.S.
• #2/#1 Flood Miss. 1995 1938 57 1x54=54 3 U.S.• #1/#1 Drought 1988 1936 52 1x54=54
2 U.S.• #1/#2 Drought 1988 1934 54 1x54=54
0 U.S.• Miami Hurricane 1992 1965 27 .5x54=27
0 U.S.• Miami Hurricane 1992 1935 57 1x54=54
3 U.S.• #1/#1 Blizzard 1996 1888 108 2x54=108
0 U.S.• #2/#1 Blizzard 1993 1888 105 2x54=108
3 U.S.• #2/#1 Blizzard Mar12/14 Mar12/14 Same Month & Days!
U.S.• SF Earthquake 1989 1906 83 1.5x54=81
2 U.S.• 4 top El Ninos 1998 1941 57 1x54=54 3
World• 4 top El Ninos 1983 1926 57 1x54=54 3
World• NY Sandy Hurr. 2012 1960 52 1x54=54 2 U.S.• SF Earthquake 2014? 1906 108 2x54=108
U.S.
Secondary Average (6) 2.50 Prime Average (Bold 7) 1.00
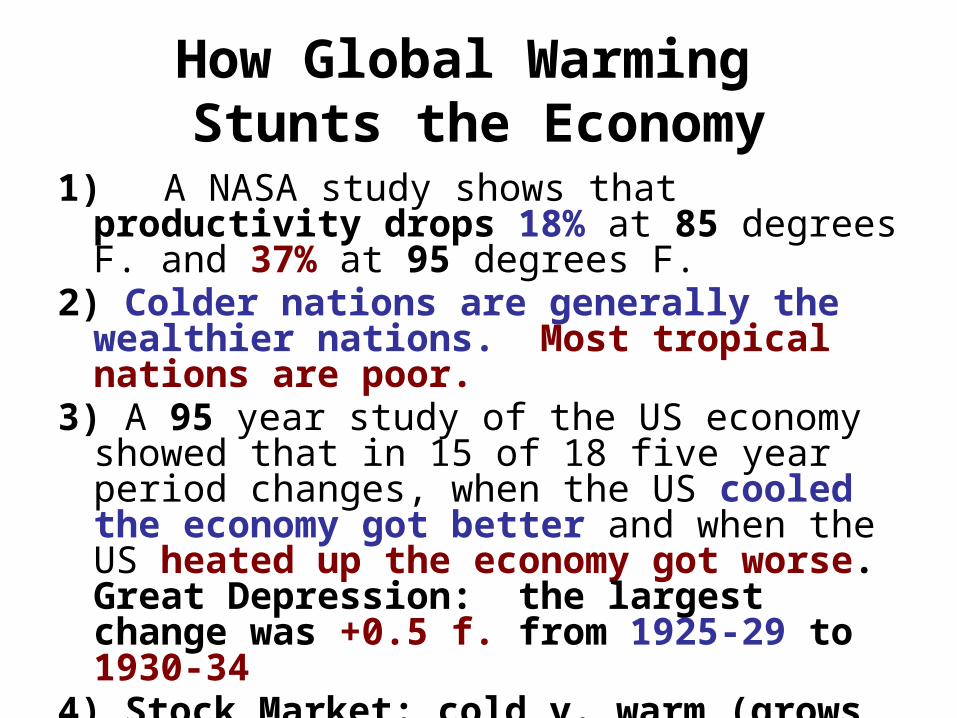
How Global Warming Stunts the Economy
1) A NASA study shows that productivity drops 18% at 85 degrees F. and 37% at 95 degrees F.
2) Colder nations are generally the wealthier nations. Most tropical nations are poor.
3) A 95 year study of the US economy showed that in 15 of 18 five year period changes, when the US cooled the economy got better and when the US heated up the economy got worse. Great Depression: the largest change was +0.5 f. from 1925-29 to 1930-34
4) Stock Market: cold v. warm (grows 6% more Nov-Apr than May-Oct)
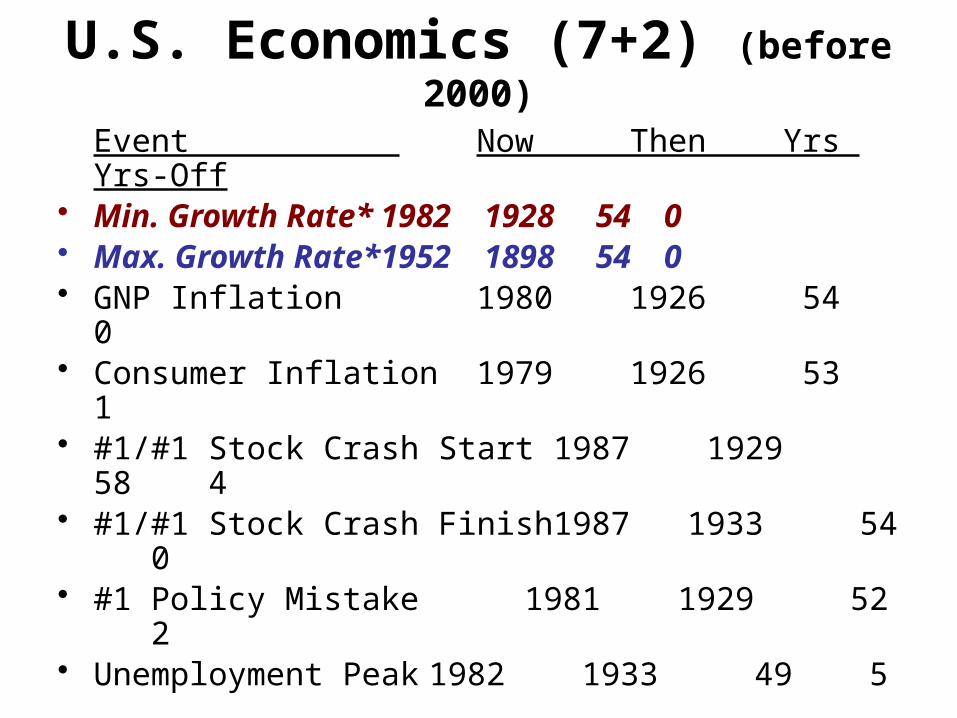
U.S. Economics (7+2) (before 2000)
Event Now Then Yrs Yrs-Off
• Min. Growth Rate* 1982 1928 54 0 • Max. Growth Rate*1952 1898 54 0 • GNP Inflation 1980 1926 54 0
• Consumer Inflation 1979 1926 53 1
• #1/#1 Stock Crash Start 1987 1929 58 4
• #1/#1 Stock Crash Finish1987 1933 54 0
• #1 Policy Mistake 1981 1929 52 2
• Unemployment Peak 1982 1933 49 5
• #2/#2 Unemployment 1992 1938 54 0
Average (9) 1.33 Events Only Average (7) 1.71*Measured by multi-year averages around extremes.
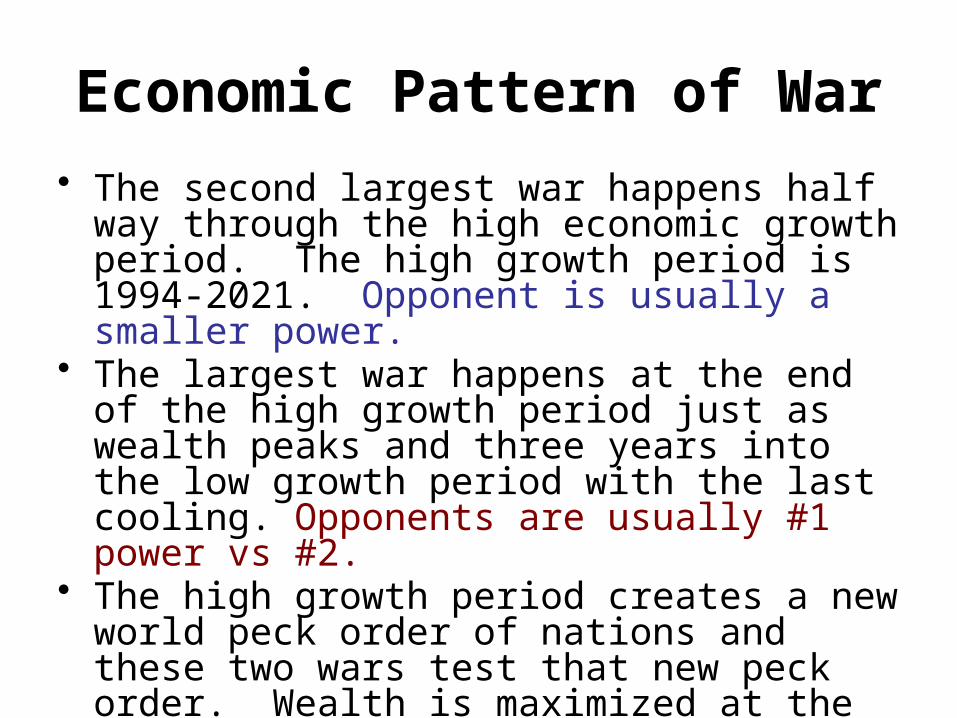
Economic Pattern of War• The second largest war happens half way through the high economic growth period. The high growth period is 1994-2021. Opponent is usually a smaller power.
• The largest war happens at the end of the high growth period just as wealth peaks and three years into the low growth period with the last cooling. Opponents are usually #1 power vs #2.
• The high growth period creates a new world peck order of nations and these two wars test that new peck order. Wealth is maximized at the end of the period, when the major war occurs.
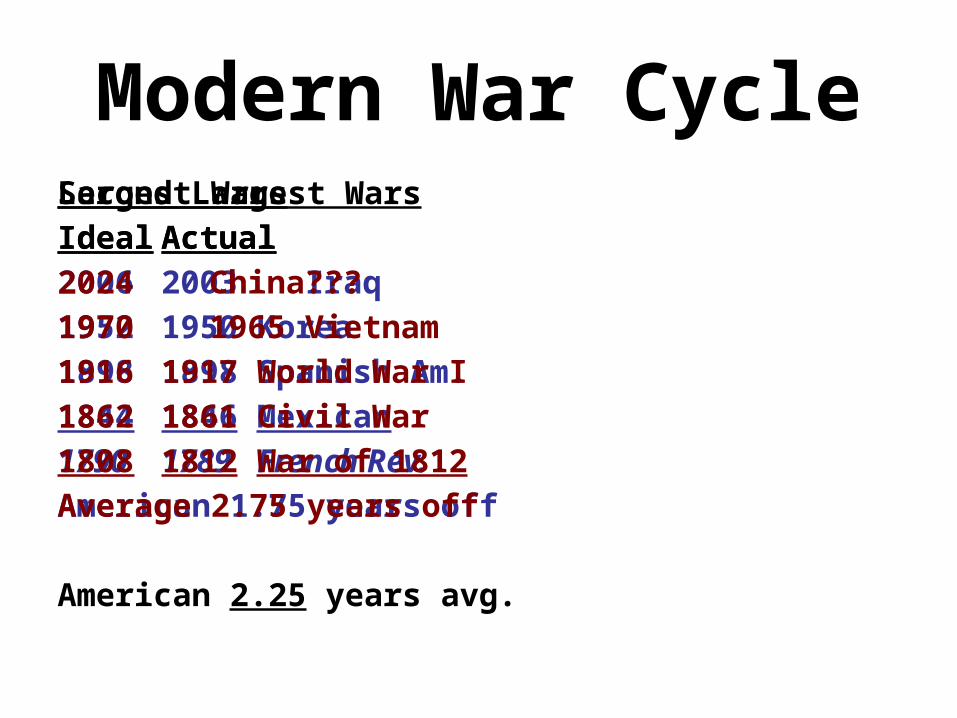
Modern War CycleSecond Largest WarsIdeal Actual2006 2003 Iraq1952 1950 Korea1898 1898 Spanish Am.1844 1846 Mexican1790 1789 French Rev.American 1.75 years off
American 2.25 years avg.
Largest WarsIdeal Actual2024 China???1970 1965 Vietnam1916 1917 World War I1862 1861 Civil War1808 1812 War of 1812Average 2.75 years off
Evaporation Land Ocean Cycle
• Many Cyclic Events Can’t Be Explained by the Greenhouse Effect
• Climate Models Help Explain Craziness
• Climate Models Show Earth Stabilizing in Second Century From Now
• 15 Year Warming Pause Will Last Another Decade.
Eurasia/North Africa (Northern Land dominates the Eastern Hemisphere)
North America (Mimics the Earth as a Whole Approximately: 29%
land, 71% ocean)


