Embed Size (px)
Citation preview

Glyndŵr UniversityGlyndŵr University Research Online
Centre for Applied Internet Research Computer Science
10-1-2002
Three-dimensional space-borne synthetic apertureradar (SAR) imaging with multiple pass processingZhishun SheGlyndwr University zsheglyndwracuk
D A Gray
R E Bogner
J Homer
I D Longstaff
Reproduced by permission of the publisher copy 2002 Taylor and Francis This is an electronic versionof an article published in She Z Gray D A Bogner R E Homer J amp Longstaff I D(2002)lsquoThree-dimensional space-borne synthetic aperture radar (SAR) imaging with multiple passprocessingrsquo International Journal Remote Sensing 23(20) 4357ndash4382 The final version of thearticle as published in the print edition of the International Journal of Remote Sensing by Taylor andFrancis is available online at httpwwwinformaworldcom
This Article is brought to you for free and open access by the Computer Science at Glyndŵr University Research Online It has been accepted forinclusion in Centre for Applied Internet Research by an authorized administrator of Glyndŵr University Research Online For more informationplease contact djepsonglyndwracuk
Recommended CitationShe Z Gray D A Bogner R E Homer J amp Longstaff I D (2002)lsquoThree-dimensional space-borne synthetic aperture radar(SAR) imaging with multiple pass processingrsquo International Journal Remote Sensing 23(20) 4357ndash4382
int j remote sensing 2002 vol 23 no 20 4357ndash4382
Three-dimensional space-borne synthetic aperture radar (SAR)imaging with multiple pass processing
Z SHE
School of Informatics University of Wales Bangor Gwynedd LL57 1UTWales UK
D A GRAY R E BOGNER
Cooperative Research Centre for Sensor Signal and Information Processing(CSSIP) and Department of Electrical and Electronic EngineeringThe University of Adelaide Adelaide SA 5005 Australia
J HOMER and I D LONGSTAFF
CSSIP and Department of Computer Science and Electrical EngineeringThe University of Queensland Brisbane QLD 4072 Australia
(Received 28 June 2000 in nal form 2 April 2002)
Abstract Three-dimensional (3D) synthetic aperture radar (SAR) imaging viamultiple-pass processing is an extension of interferometric SAR imaging Itexploits more than two ight passes to achieve a desired resolution in elevationIn this paper a novel approach is developed to reconstruct a 3D space-borneSAR image with multiple-pass processing It involves image registration phasecorrection and elevational imaging An image model matching is developed formultiple image registration an eigenvector method is proposed for the phasecorrection and the elevational imaging is conducted using a Fourier transform ora super-resolution method for enhancement of elevational resolution 3D SARimages are obtained by processing simulated data and real data from the rstEuropean Remote Sensing satellite (ERS-1) with the proposed approaches
1 IntroductionSynthetic aperture radar (SAR) is a high-resolution coherent radar It is usually
carried on an aircraft or a satellite to map terrain in range and azimuthal directionswhich results in a two-dimensional (2D) high-resolution image (Wehner 1995) Awide-band signal is transmitted to achieve high range resolution and a large antennaaperture synthesized by motion of the radar provides high azimuthal resolutionSince its origins in the 1950s SAR has been extensively developed and its all-weatherhigh-resolution imaging capability has been used for civilian and surveillanceapplications
Interferometric SAR (InSAR) is a technique to extract elevational informationabout the mapped terrain from two complex SAR images (Graham 1974 Zebker
Corresponding author e-mail zsheseesbangoracuk
International Journal of Remote SensingISSN 0143-1161 printISSN 1366-5901 online copy 2002 Taylor amp Francis Ltd
httpwwwtandfcoukjournalsDOI 10108001431160210153075
Z She et al4358
and Goldstein 1986 Gabriel and Goldstein 1988 Goldstein et al 1988) The InSAR
processing rst registers two complex SAR images and secondly forms an interferog-
ram by multiplying one registered image with the conjugate of the other It thenunwraps the principal phase value of the interferogram and nally reconstructs a
digital elevation model (DEM) of terrain However the 2D phase unwrapping is
restricted by SAR image decorrelation (Zebker and Villasenor 1992) the generationof DEM is dependent on precise baseline estimation (Ru no et al 1998) and the
re ectivity of the terrain is unknownMultiple-pass SAR (MPSAR) is a natural extension of typical InSAR It makes
use of more than two SAR imaging ight passes to synthesize an aperture in elevation
resulting in improved elevational resolving power (Pasquali et al 1995 Homer et al
1996 1997 She et al 1999 Reigber et al 2000) The elevational imaging combined
with single-pass SAR imagery in the range and azimuthal directions constructs a
three-dimensional (3D) SAR image This image provides information about both theelevational variation and the re ectivity of terrain which is important for terrain
mapping analysis and classi cation
The principle of 3D SAR imaging originated from 3D holographic processing
(Wolf 1969) The basic idea of 3D SAR imaging was described in the literature
(Walker 1980 Chan and Farhat 1981 Ausherman et al 1984 Farhat 1984) Since
then some investigations have been conducted However most of them were carried
out with simulated data (Li et al 1997) or under ideal experimental conditions(Fortuny and Sieber 1999) Recently 3D SAR imaging has been reported for airborne
SAR processing (Reigber et al 2000) In the study the position of each ight path
needed to be known or to be measured precisely with inertial navigation systems
(INS) and global position systems (GPS) Nevertheless in practical applications the
positions of ight paths are unknown and the size of ight path array is limited
Sometimes the accuracy of measurement cannot meet the requirement (a fraction of
radar wavelength) for 3D SAR imaging and the enlarged array aperture is requested
for high elevational resolution Meanwhile sensor array processing techniques havebeen extensively developed in the past two decades (Krim and Viberg 1996) The
multiple ight paths form a synthesized array in the elevational direction and this
synthesized array can be solved from the perspective of array processing The
contributions of this paper are to investigate multiple SAR image registration apply
the array calibration technique (Rockah and Schuitheiss 1987) to estimate the shape
of unknown ight path array and extend the physical limitation of this array by
super-resolution processing (Kay and Marple 1981) in the case of space-borne SARprocessing
2 Mathematical model
The geometry of 3D SAR imaging is shown in gure 1 where x y and z represent
range azimuth and elevation respectively and Pii=1 N denotes ith ight path
They are assumed to be parallel and equi-spaced in elevation Consider a terrainpatch whose centre is taken as the origin The patch is supposed to be a rigid body
with a nite number of point scatterers spread on its surface each having its own
elevation The slant ranges from the closest point B of approach for each ight path
to the patch centre o and scene point A with coordinate (x y z) are denoted by R0and R respectively
3D space-borne SAR imaging 4359
Figure 1 3D SAR imaging geometry
For a transmitted signal u(t) the received signal sr(t R0 ) from point scatterer
A is (Skolink 1990)
sr(t R0 )=s(x y z)uAt shy
2R(x y z)c B (1)
where s(x y z) is the re ectivity of A which is assumed to be independent offrequency and aspect angle and c the propagation speed of light The total of thereceived signals from all scatterers of the distributed object is
sr(t R0 )=P
V
s(x y z)uAt shy2R(x y z)
c Bdxdydz (2)
where s(x y z) is the re ectivity density which includes propagation eVects andvarious system gains for convenience The integration is carried out over a terrainvolume V If we take the Fourier transform of equation (2) with respect to t we obtain
Sr( f R0 )=U( f )P
Vs(x y z)exp[shy j 4p fR(x y z)c]dxdydz (3)
where U( f ) is the complex Fourier spectrum of the transmitted signal The outputof a lter S
ref( f R0 )=U( f )exp( j4p fR0c) matched to a re ection of the transmitted
wavefront from an ideal scatterer at the origin o for focusing is given by
So( f R0 )=|U( f ) |2P
V
s(x y z)exp shy j4p f [R(x y z)shy R0]cdxdydz (4)
Z She et al4360
If the range of the terrain is large compared with the size of the terrain patch thatis R amp r we have an approximation
R(x y z) $ R0 shyr(x y z) acuteR0
R0
(5)
where r(x y z) and R0
are the corresponding range vectors as shown in gure 1De ne a vector q of the reference point as
q=2 f R0cR0
(6)
For a speci c frequency q lies on the surface of a sphere as R0
is varied For variousfrequencies q is mapped into a vector in a 3D data space (q
x q
y q
z) Thus we have
So(q )=|U( f ) |2P
V
s(x y z)exp j 2pq acuter(x y z)dxdydz (7)
This implies that except for the factor |U( f ) |2 the output of focusing is a niteinverse 3D Fourier transform of the terrain re ectivity function s(x y z) This modelis consistent with the results in Ausherman et al (1984) and Marechal (1995)
The support region of q can be shown in the data domain (Walker 1980) Eachpulse is corresponding to a radial line as shown in gure 2(a) A single ight pathresults in a shaded section region as shown in gure 2(a) Multiple-pass processingproduces a volume in a 3D data space V
fwhich is composed of slices of 2D data
recorded for individual ight paths as shown in gure 2(b) Letting q=(qx q
y q
z)
and r=(x y z) then s(x y z) can be estimated by the 3D Fourier transform of
So(q
x q
y q
z)|U( f ) |2 over a limited support region V
f that is
s(x y z)=PqxPqyPqz
So(q
x q
y q
z)
|U( f ) |2exp shy j2p(xq
x+yq
y+zq
z)dq
xdq
ydq
z(8)
as shown in gure 2(c)Equation (8) indicates that the 3D re ectivity function s(x y z) can be estimated
by three one-dimensional (1D) Fourier transforms which are realized by widebandpulse compression in x direction azimuthal processing in y direction and elevational
Figure 2 3D data and image space
3D space-borne SAR imaging 4361
processing in z direction If the complex image of each ight path is availableequation (8) can be changed into
s(x y z)=Pqz
G ecirc (x y qz)exp shy j2pzq
zdq
z(9)
where
G ecirc (x y qz)=P
qxPqy
So(q
x q
y q
z)|U ( f ) |2exp shy j2p(xq
x+yq
y)dq
ydq
x
represents a SAR complex image of a single ight pass after focusing Equation (9)shows that with multiple-pass processing of SAR s(x y z) the 3D image can beestimated by doing a 1D Fourier transform in each pixel cell of the multiple SARcomplex image set In practice we only have discrete ight passes Thus we have
s(x y z)= aeligN
i= 1G frac34
i(x y)exp shy j2pzq
i (10)
where G frac34i(x y) denotes the complex SAR image of ith ight path after phase correction
and qi
is determined by the position of ith ight path In general equation (10)represents an N-point discrete Fourier transform (DFT) If the ight paths areequi-spaced in elevation equation (10) can be implemented with an N-point fastFourier transform (FFT)
Based on theory of spectral analysis the spacing of adjacent ight path d deter-mines the maximal elevational distance zmax that can be unambiguously estimatedvia the relationship
zmax=lR02d
(11)
where l denotes radar wavelength The elevational resolution rz
depends on theaperture length D=(N shy 1)d in the elevational direction by
rz=
lR02D
(12)
For a given number of ight paths a small baseline d will reduce the ambiguityproblem However this will also reduce the elevational resolution There is a com-promise between elevational ambiguity and resolution The baseline distributionneeds to be designed for speci c requirement
3 3D SAR imaging approachEach ight pass performs conventional SAR processing including complex I Q
data collection range compression quadratic phase correction and azimuthal com-pression which results in multiple complex SAR images However rather thanforming absolute value of the complex image at the last step 3D SAR imaging useseach SAR image in its complex form Clearly the N complex SAR images G
i(x y)
have diVerent phases for diVerent values of i which contain the information aboutthe re ectivity distribution along the elevational direction The main function of 3DSAR imaging is to extract the re ectivity distribution in the elevation from the N
Z She et al4362
complex SAR images In its simplest form the elevational imaging involves a straight-forward Fourier transform of N points along the i-axis of G frac34
i(x y) as shown in
equation (10)In the analysis of sect2 the motion of the SAR platform is assumed to be known
so that focusing is conducted precisely However in practical applications the ightpath is unknown or not known precisely causing individual complex SAR imagesto be misaligned in range and azimuth directions This uncertainty of the ight pathinduces an unknown phase factor and thus each complex SAR image G
i(x y) needs
to be calibrated or corrected in phase prior to elevational imaging namely
s(x y z)= aeligN
i= 1G
i(x y)exp jw
iexp shy j 2pzq
i (13)
where wi
is the phase for correction caused by the uncertainty of each ight pathBased on the above analysis a novel approach to 3D SAR imaging via multiple-
pass processing is developed The block diagram as shown in gure 3 includes thefollowing steps
1 It carries out conventional SAR imaging for each ight path2 It registers multiple complex SAR images which aligns the returns resulted
from the common terrain in the multiple images into the same image pixel cell3 It corrects the registered SAR images in phase which multiplies each image
by a phase factor to make the phases of the multiple complex images cohereat the reference point of the terrain
4 It re-samples the unequal spacing ight paths and then performs an N-pointFFT across the equi-spaced ight paths This operation is the core of 3D SARimaging where FFT acts as an elevational lter with the output of each FFTbin giving the re ectivity whose elevation is within a particular range
Essentially three orthogonal axes (range azimuth and elevation) out of the3D SAR image eld may be visualized by three 2D images in the rangendashazimuth(top view) rangendashelevation (front view) and azimuthndashelevation (side view) planesThe elevation resolution can be illustrated in the rangendashelevation and azimuthndashelevation images
Figure 3 Block diagram of 3D SAR imaging
3D space-borne SAR imaging 4363
In sect2 a reference function is applied to a patch of image rather than each pixelin order to reduce computational complexity of focusing However the size of patchis limited by the phase error tolerance of SAR system and needs to be determinedWhen the image registration is accomplished the multiple SAR images are realignedin range and azimuth directions so that the signal returns from multiple ight pathsresulting from the same terrain will be located in the same image pixel cell Afterphase correction the focused beam in elevation is formed and it points to thereference point of the terrain patch Using the DFT applies a linear phase acrossthe synthesized elevational aperture to steer beam away from the reference pointThis introduces a phase error due to the linear approximation for R in equation (5)The appropriate size of terrain patch can be determined by limiting the phase errorAccording to gure 1 we have
R=(R20+r2 shy 2R0 middot r)12 (14)
The residual error DR in equation (5) is less than r2(2R0 ) that is
DRltr2(2R0 ) (15)
If we restrain DR to be less than l8 we have
R0gt4r2l (16)
Thus the size of terrain patch rmax can be determined by
rmax=(R0
l)122 (17)
As an example of ERS-1 system we have a satellite altitude of 785km an incidenceangle of 23deg and a wavelength of 567 cm thus rmax=110 m
Although the developed proposed approach is suitable for a small area it canbe extended to 3D SAR imaging of a large area by use of subpatch processing Firsta large area which breaks the limitation of equation (17) is divided into many smallpatches that satisfy equation (17) Then the 3D SAR imaging is conducted by theapproach described above for each divided patch Finally the 3D SAR image of thelarge area can be generated by mosaicking the reconstructed 3D images of smallpatches
4 Multiple image registrationThe geometrical transformations between SAR images of repeated passes are
identi ed as local translations in range and azimuth (Li and Goldstein 1990Jakowatz et al 1996) In order to correct the local translational distortion imageregistration for SAR images is usually accomplished in four steps First the SARimage is divided into many subimages Secondly measurements are made of thelocal misregistrations from one image to another in all subimages Thirdly themisregistrations are then used to calculate a warping function which maps a locationin one image to the corresponding location in the other Finally the rst image isresampled so that it overlays the second precisely
The crux of the registration process is to determine the spatial misregistrationsbetween one subimage and another The existing methods to estimate misregistrationare applicable to image pairs Multiple images are registered by a process of repeatingthe operation until all the images are registered However the registration result isdependent on the order of the images and it suVers from image drift error resultingfrom the error accumulation of correlation and image variation error caused by
Z She et al4364
decorrelation of SAR images In order to reduce these errors the correlation of allthe images in one step rather than the correlation of image pairs should be used Inthis section a minimal distance approach is rstly proposed and then an imagemodel matching approach is developed to improve computational eYciency
41 Minimal distance approachDe ne a distance measure D[G
i(x y) G
l(x y)] between two images G
i(x y) and
Gl(x y) satisfying
D[Gi(x y) G
l(x y)]gt0 YG
i(x y) euml G
l(x y)
D[Gi(x y) G
i(x y)]=0
D[Gi(x y) G
l(x y)]=D[G
l(x y) G
i(x y)]
D[Gi(x y) G
l(x y)+G
k(x y)]ltD[G
i(x y) G
l(x y)]+D[G
i(x y) G
k(x y)] (18)
Let Dxi
and Dyi
i=1 N be the misregistrations of the ith image Gi(x y) in the
range and azimuthal directions respectively Multiple image registration depends ona cost function
C1(Dx
1 Dy
1 Dx
N Dy
N)= aelig
N
i= 1
aeligN
l= i+ 1D[G
i(x+Dx
i y+Dy
i) G
l(x+Dx
l y+Dy
l)]
(19)
where Gi(x+Dx
i y+Dy
i) is the image of G
i(x y) with shifts Dx
iand Dy
iin range
and azimuthal directions respectively The misregistrations of multiple images canbe determined by minimizing equation (19) with respect to all the Dx
i Dy
i that is
(Dx01 Dy0
1 Dx0
N Dy0
N)=Argmin(C1 (Dx1 Dy1 Dx
N Dy
N)) (20)
which is called the minimal distance methodThe minimal distance method considers the correlation of multiple images to be
processed rather than the correlation of image pairs It is less aVected by the SARimage decorrelation than the conventional method for image pairs Moreover asthe method calculates the correlation as a whole instead of computing the multiplecorrelations between two images it avoids the problem of error accumulation incorrelation estimation and the eVect of image order However the computationalload of the minimal distance method is very expensive because it requires theoptimization of multiple variables Although it is a good method for multiple imageregistration it is impractical especially when the number of images is large
42 Image model matching approachA new algorithm for multiple image registration named image model matching
is developed for practical applications It is assumed that each image is derived froma reference image M(x y) by the addition of noise The new cost function of multipleimage registration is expressed as
C2 (Dx1 Dy1 DxN
DyN
)= aeligN
i= 1D[G
i(x+Dx
i y+Dy
i) M(x y)] (21)
3D space-borne SAR imaging 4365
Minimizing equation (21) is equivalent to minimizing the distance of each image tothe reference image that is
min[C2 (Dx1 Dy1 DxN
DyN
)]= aeligN
i= 1minD[G
i(x+Dx
i y+Dy
i) M(x y)]
(22)
The misregistrations can be estimated by
(Dx01 Dy0
1 Dx0
N Dy0
N)=Argmin(C2 (Dx1 Dy1 Dx
N Dy
N)) (23)
It is noted that the optimization of 2N variables in equation (20) is simpli edinto the N optimizations of two variables in equation (22) Since the dimension ofoptimization space is changed from 2N into 2 the computational burden of theimage model matching approach is greatly reduced compared with the minimaldistance approach
The image model matching method matches each image to the reference imagerather than each other image so that the eVects of image order and image drift areeliminated and the eVect of image variation is reduced The critical step of imagemodel matching method is how to estimate the reference image We rst measurethe N(N shy 1)2 distances between all image pairs to determine the misregistrationsand distances The initial reference image M1 (x y) is formed by summing tworegistered images with the minimal distance ie
M1 (x y)=sum[Gk(x+Dx
k y+Dy
k) G
l(x+Dx
l y+Dy
l)] (24)
where k l=Argmin[D(Gi(x+Dx
l y+Dy
i) G
m(x+Dx
m y+Dy
m))] Y i euml m i m=1
N When signal-to-noise ratio (SNR) is high the two images can be accumulatedcoherently after removing the interferometric phase If SNR is low they are addedincoherently
Then the remaining images are reordered as Gi(x y) i=1 N shy 2 and are
matched to M1(x y) to determine the misregistrations and distances The reference
image M2 (x y) is produced by summing M1 (x y) with one registered image whichhas a minimal distance with M1 (x y) namely
M2 (x y)=sum[M1 (x y) Gk(x+Dx
k y+Dy
k)] (25)
where k=Argmin[D(Gi(x+Dx
i y+Dy
i) M
1(x y))] Y i=1 N shy 2 The above
procedure is repeated N shy 2 times until the reference image MNOtilde 1 (x y) is produced
and images Gi(x y) i=1 N have been registered
We can further elaborate the reference image to increase the accuracy of multipleimage registration by iterating the match of the reference image to each image G
i(x y)
until the misregistrations Dxi Dy
ii=1 N remain constant
5 Phase correctionIn sect2 it is assumed that the multiple ight paths are parallel and equi-spaced in
elevation and thus the beam output formed by summing the registered imagesenhances a plane wavefront signal incident on the ight path array from the broadsidedirection of elevation However in practice the ight paths are uncertain and deviatefrom their nominal position and the propagation medium of signals in ionosphereand troposphere may be inhomogeneous (Zebker et al 1997) These defects maydestroy the above capability of coherent summation In order to correct the uncer-tainty of ight paths and compensate for anomalies in the propagation medium a
Z She et al4366
phase shift is required to be attached to each ight path to form a focused beam inthe elevation The phase correction is dependent upon precise information on ightpaths propagation medium and terrain slope (Gatelli et al 1994) In this sectionan approach to phase correction is developed based on array self-calibration whichdoes not need the information about ight paths propagation medium and terrainslope
The subimage after image registration can be modelled by (Li and Goldstein1990 Gatelli et al 1994)
G2 (x y)=G1 (x y)exp shy jQ21 (x y) (26)
where G1 (x y) and G2 (x y) are the subimages of the rst and the second ight pathrespectively Q21 (x y) the unknown phase variation caused by diVerent ight pathspropagation medium and terrain slope For the complex image of the ith ightpath equation (26) generalizes to
Gi(x y)=G
i Otilde 1 (x y)exp shy jQii Otilde 1 (x y)=G1 (x y)exp shy jw
i(x y) (27)
where
wi(x y)= aelig
i
n= 2Q
nn Otilde 1 (x y)
De ning a pixel vector V (x y)=[G1 (x y) GN
(x y)]T and considering the SARsystem noise equation (27) has the form for each pixel
V (x y)=G1 (x y) D(x y)+W (x y) (28)
where D(x y)=[1 exp shy jw2 (x y) expshy jwN
(x y)]T and W (x y)=[w1 (x y) w
N(x y)]T w
i(x y) is assumed to be independent identically distributed complex
Gaussian noise components with zero mean and variance s2w
The tasks of phasecorrection are to rst estimate the complex signal vector D(x y) and then tocompensate the multiple complex SAR images by conjugating with D(x y)
The covariance matrix of V (x y) is
CV
(x y)=EV (x y)V H (x y)=|G1 (x y) |2D(x y)DH (x y)+s2w
I (29)
where I is the identity matrix E the ensemble average and H the complex conjugatetranspose It can be veri ed that the largest eigenvalue of C
v(x y) is
l1=|G1 (x y) |2 N+s2
w(30)
and its corresponding normalized eigenvector is
u1=D(x y)N (31)
and all the other eigenvalues are equal to s2w
Equation (31) shows that the eigen-vector corresponding to the largest eigenvalue of C
v(x y) being proportional to
D(x y) can be used for phase correctionThis eigenvector approach also realizes the maximum likelihood (ML) estimation
of D(x y) as follows The joint probability density function of a single observation is
p(V (x y) D(x y))=p Otilde N |CV
(x y) | Otilde 1expshy V H (x y)C Otilde 1V
(x y)V (x y) (32)
It is assumed that the individual pixel vectors in the subimage are independentand have the same covariance matrix Thus the joint probability density function of
3D space-borne SAR imaging 4367
V=[V (x1 y1 ) V (xKL
yKL
)] is the product of probability density function forindividual pixel vectors and is given by
p(V D(x y))=p Otilde NKL |CV
(x y) | Otilde KLexp shy KL Tr(C Otilde 1V
(x y)CAtildeV
(x y)) (33)
where
CAtildeV
(x y)=1
KLaeligKL
i= 1V (x
i y
i)VH (x
i y
i)
Tr( ) the trace of matrix K and L are the dimensions of the SAR subimage in rangeand azimuth respectively Maximizing the log joint probability density function withrespect to the unknown parameter D(x y) results in the following equation in theappendix (Gray et al 1989)
CAtildeV
(x y)DML(x y)=l
maxD
ML(x y) (34)
where lmax
is the maximal eigenvalue of CAtildeV
(x y) DML
(x y) is the correspondingeigenvector and the ML estimation of D(x y) Equation (34) shows that the eigenvec-tor corresponding to the maximal eigenvalue of CAtilde
V(x y) is the ML phase estimation
of D(x y)
6 Elevational imagingThree-dimensional SAR imaging is able to produce a radar image as a function
of range azimuth and elevation High-range resolution is achieved by pulse compres-sion of the transmitted wideband signals Azimuthal and elevational resolutions relyon the synthesized apertures in azimuth and elevation respectively In this sectionphased array beamforming techniques based on frequency domain beamforming areused to obtain the elevational resolution by forming many receiving beams in theelevational direction Super-resolution processing is used to enhance the elevationalresolution
61 Elevational processingAfter phase correction and resampling all the ight paths are equi-spaced and
an elevational beam is formed in the broadside direction of the ight path arrayThus the signal from this direction is enhanced However signals from other direc-tions are not in phase and are not reinforced To form an image in these directionsthe complex image of each ight path is required to be shifted in phase to compensatethe diVerence of propagation path in order to sum them coherently Due to the factthat the variation of azimuthal aspect angle within a subimage is negligible thediVerence of propagation path for ith ight path with respect to the rst ight pathas shown in gure 4 is
Dril=(i shy 1)dsinh
l(35)
where d is the baseline between adjacent ight paths and hl
the elevational signaldirection Thus the corresponding phase shift is expressed as
gil=4p(i shy 1)dsinh
ll (36)
due to two-way propagation The frequency-domain beamforming approach steerselevational receiving beam by varying g
ilas shown in gure 4 Two groups of phase
shifters are illustrated The rst group conducts the phase correction to compensatefor the unknown array aperture as discussed in sect5 The second group applies a linear
Z She et al4368
Figure 4 Focusing and scanning of elevational beam
phase across the equi-spaced ight path array to scan the focused beam electronicallyin the elevational direction
For an equi-spaced ight path array the steering phase factor isexp shy j 4p(ishy 1)dsinh
ll By use of relation sinh
l zR0
the output of the elevationalbeamformer is
sAtilde (x y z)= aeligN
i= 1G frac34
i(x y)exp shy j4p(ishy 1)dz(lR0 ) (37)
where G frac34i(x y)=G
i(x y)exp( jw
i) denotes the complex image after phase correction
and resampling Equation (37) can be computed eYciently using an N-point FFTUse of an N-point FFT produces multiple receiving beams at elevational height zgiven by
z=llR0(2dN ) | l |ltN2 (38)
The shading weight coeYcients bii=1 N are generally applied to the individual
phase corrected and resampled images to control the mainlobe width and sidelobelevels of elevational beams In order to increase the number of elevational beamssteered the windowed phase-corrected and resampled images b
iG frac34
i(x y) i=1 N
need to be appended with zeros prior to FFT of the extended data (Kay andMarple 1981)
62 Super-resolution processingSuper-resolution has been extensively applied to 2D SAR imaging (DeGraaf
1998) In this section it is extended to 3D SAR imaging Whilst zero-paddingincreases the number of steered elevational beams the elevational resolution remainsunchanged because zero-padding does not increase the array aperture The eleva-tional resolution is determined by the aperture length in elevation which is knownas Rayleigh resolution The Rayleigh resolution can only be enhanced by increasingthe eVective aperture length which is impractical for multiple-pass space-borne SARprocessing Super-resolution processing of multiple-pass SAR allows the Rayleigh
3D space-borne SAR imaging 4369
resolution to be overcome and consequently to be preferred as it reduces the numberof ight paths for a speci ed elevational resolution and thus saves the experimentalexpense and time and mitigates the decorrelation of SAR images
The model of multiple complex sinusoids in equation (37) allows modern spectralestimation to be used successfully to increase the spectral resolution beyond theRayleigh resolution Such techniques (Stoica and Moses 1997) include maximalentropy (ME) auto-regressive (AR) moving average (MA) auto-regressive movingaverage (ARMA) multiple signal classi cation (MUSIC) and estimation of signalparameters via rotational invariance techniques (ESPRIT) We applied the MUSICalgorithm to elevational imaging (She et al 1999) However it requires that thenumber of signals be estimated a priori so that the accurate separation of signal andnoise subspaces of the covariance matrix can be realized (Schmidt 1986) and theestimation of the covariance matrix with spatial smoothing usually reduces theresolution of 3D image in range and azimuthal directions (Williams et al 1988)
In this section a super-resolution approach which is robust to signal modelselection is used to enhance the elevational resolution The block diagram of eleva-tional super-resolution is shown in gure 5 After image registration phase correctionand ight path resampling the data across multiple SAR images with the same pixelposition that is the output of ight path array at this pixel form a pixel seriesInstead of DFT processing maximal entropy data extrapolation is applied to eachpixel series to enhance the elevational resolution
The philosophy of maximal entropy spectral estimation is that all extrapolationsof the measured data should be consistent with the available data and should makeminimal assumption regarding unavailable data For a 1D stationary Gaussianprocess maximal entropy is equivalent to the AR process and there are two mainways to estimate the AR spectrum The rst approach is to estimate the predictioncoeYcients and to calculate the spectrum using the estimated prediction coeYcientsThe second approach also estimates the prediction coeYcients but then extrapolatesthe observed data in both directions with the estimated prediction coeYcients and nally applies a Fourier transform to the extrapolated data Since both approaches
Figure 5 Elevational super-resolution processing
Z She et al4370
use the same prediction coeYcients they should provide essentially the same spectralestimation However the rst approach only estimates the power spectrum andignores the phase spectrum The second approach despite being more computation-intensive produces both the power and phase spectra and this is sometimes usefulfor radar and sonar applications (Swingler and Walker 1989 Wu 1995) Moreoverthis data extrapolation approach is insensitive to the order of model Thus the secondapproach is employed
The proposed super-resolution includes three steps First the Burg algorithmis applied to the pixel series G frac34
i(x y) at pixel (x y) to estimate the prediction coeY-
cients hQ
(x y k) k=1 Q where Q is the AR model order Then the pixel seriesis extrapolated forward and backward to the length NF where F is a factor ofextrapolation The forward extrapolation of data is given by
G frac34N+ i
(x y)= aeligQ
k=1hQ
(x y k)G frac34N+ i Otilde k
(x y) igt0 (39)
and the backward extrapolation of data is done by
G frac34Otilde i
(x y)= aeligQ
k= 1hQ
(x y k)G frac34k Otilde i
(x y) igt0 (40)
Finally the extrapolated pixel series is Fourier transformed to produce the super-resolution
The selection of model order is a critical step If the model is too low thespectrum has all the peaks smoothed On the other hand if the order is too largethe spectrum may contain spurious peaks Many criteria such as Akaike InformationCriterion (AIC) and Minimum Description Length (MDL) have been proposed toestimate the model order (Stoica and Moses 1997) An eVective approach to deter-mine the model order Q of AR for the short data in radar application is (Wu 1995)
Q=N3~N2 (41)
and the extrapolation factor is selected as
F=2~4 (42)
7 Experimental results71 Simulated data
The computer simulations were conducted based on the system parameters ofERS-1 where the satellite operated at an altitude of 785 km The radar transmitteda linear-frequency-modulated (LFM) signal with a bandwidth of 1555MHz and anominal wavelength of 567 cm A point scatterer was located in a at terrainSeventeen ight passes spaced 100 m apart vertically as shown in gure 6 weresimulated The distribution of ight passes provided an elevational aperture of1600m which is similar to that of ERS-1 real data
At rst a matched lter was applied to obtain the SAR complex image of each ight path Then 17 SAR images were registered with image model matchingcorrected in phase by the eigenvector method and resolved in the elevationaldirection with a 32-point FFT Figure 7 shows the 3D image of the scatterer illustrat-ing the 2D point-spread-functions (PSF) with (a) in the rangendashelevation plane (b) inthe azimuthndashelevation plane and (c) in the rangendashazimuth plane The 3D image is32times32times32 pixels Each pixel has a size of 938 m 1379 m and 690m in the rangeazimuthal and elevational directions The theoretical resolutions in the range
3D space-borne SAR imaging 4371
Figure 6 Simulation of 3D SAR imaging
Figure 7 3D image of simulated data
Z She et al4372
azimuth and elevation are 938 m 1379 m and 1379 m respectively The maximalunambiguous distance in the elevation is 22255m
Resolution and noise are two important performance measures for an imagingsystem since both impact the capability to perform image reconstruction They arecharacterized by the PSF of the imaging system Resolution is characterized by the3 dB width of the main lobe of the PSF while noise is characterized by the heightof the sidelobes The 1D PSFs in range azimuth and elevation are given in gure 7(d )which show that the MPSAR processing is able to provide the focused resolutionsin range azimuth and elevation the measured resolutions (3 dB width of PSF) inrange azimuthal and elevational directions are consistent with the theoreticalresolutions and the peak sidelobes have a level of shy 24 dB shy 23 dB and shy 15 dB inrange azimuth and elevation directions
In order to con rm the validity of the proposed approaches to natural scatteringa volume area having a size of 128mtimes128 m and a random normal distribution ofre ectivity in the rangendashelevation plane was simulated and is shown in gure 8(a)The other parameters were the same as those of a point scatterer described aboveThe imaging result after image registration phase correction resampling and eleva-tional processing is given in gure 8(b) It is seen that although some distortionsexist between gure 8(a) and (b) (Mitchell 1974) gure 8(b) has a correspondence tothe scatterer distribution in gure 8(a) and the scatterers in gure 8(b) are not wellresolved in the elevational direction as the elevational resolution is limited Then thesuper-resolution processing was applied to the same data in gure 8(b) The data ineach range cell were extrapolated forward and backward from 17 to 32 The orderof AR model was chosen as N3$ 5 The super-resolution image is shown in gure 8(c) The enhancement of elevational resolution is obvious
72 ERS-1 real dataThe multiple image registration the phase correction and the elevational imaging
were tested using nine SAR image datasets acquired by the ERS-1 satellite overa small area in the south-west of the city of Bonn Germany during the period2ndash29 March 1992 The nine ight paths were parallel and their elevational positionsare shown in gure 9 where the four digit numbers located in the right above each ight path point are the ERS-1 orbit numbers The nine ight paths provided asynthesized aperture length of 1686m An array of 19 corner re ectors was deployedby the Institute of Navigation University of Stuttgart in the terrain for calibration
An experimental study was carried out to measure the performances of the image
Figure 8 Simulation of random scattering
3D space-borne SAR imaging 4373
Figure 9 Relative elevational positions of ERS-1 ight paths
model matching approach using multiple SAR subimages of the same terrain Thesimilarity of multiple SAR images is determined by the signal-to-noise ratio (SNR)of SAR image the baseline of ight path and the time interval of ight path (Zebkerand Villasenor 1992) It increases with an increase of SNR or a decrease of baselineand time interval The amplitude correlation method being a standard method wasused as a comparison The experiment included 162 pairs of SAR image datasets bychoosing subregions with a size of 50times50 pixels The translational oVset of twoimages within each pair was known to within a pixel by the use of ground controlpoints For each oVset a window size of 32times32 was selected in the calculation ofthe registration measure This allowed for oVsets of up to plusmn9 pixel positions ineach direction The distance measure between image pairs G
i(x y) and G
l(x y) was
chosen as
D[Gi(x y) G
l(x y)]=aelig
xaeligy
[|Gi(x y) |shy |G
l(x y) |]2 (43)
The reference image was updated by the incoherent summation that is
sum[M(x y) G(x y)]=|M(x y) |+c |G(x y) | (44)
where c is the normalized correlation coeYcient between |M(x y) | and |G(x y) |Figure 10 gives the correct probability of images registration using the image modelmatching approach (solid line) and the amplitude correlation (dashed line) It shows
Z She et al4374
Figure 10 Registration accuracy versus image similarity
that both provide correct registration if image similarity is greater than 06 for theimage model matching approach and 07 for the amplitude correlation Howeverthe image model matching degrades more slowly as the correlation coeYcientdecreases The thresholds of registration accuracy 80 for the image model matchingand the amplitude correlation are 037 and 046 respectively
In gure 11 the dashed line denotes the correlation coeYcient histogram of imagepairs and the solid line is the correlation coeYcient histogram between the referenceimage and each image It is seen that the reference image has a better correlationwith multiple images and so the image model approach can increase the accuracyof multiple image registration
An image patch containing a corner re ector with 32times32 pixels was used for3D SAR processing Three-dimensional image was formed by registering nine SARimages with the image model matching correcting them in phase by the eigenvectormethod to remove the derivation of ight path and elevational imaging where theunequal spaced ight paths were interpolated into equi-spaced ight paths and thenthe FFT was conducted Figure 12 gives the 2D slices of 3D image of terrain The3D image is 32times32times16 pixels Each pixel has a size of 790m 400m and 673m inthe range azimuthal and elevational directions The resolutions in the range azimuthand elevation are 938m 600 m and 1345 m respectively The focused resolution ofthe MPSAR processing in the elevation is illustrated in gure 12 In order to displaythe weak scattering the display range of 3D image is selected from shy 30 dB to 0 dB
The eVects of image registration and phase correction were investigated Figure 13gives the 3D image formed with elevational imaging and without image registrationand phase correction It indicates that pro les in rangendashelevation and azimuthndashelevation planes are out of focus in the elevational direction and signals resulting
3D space-borne SAR imaging 4375
Figure 11 Histogram of correlation coeYcients
Figure 12 3D image of ERS-1 data
from the corner re ector are distributed in several rangendashazimuth cells in rangendashazimuth plane The 3D image formed with image registration and elevational imagingand without phase correction is given in gure 14 It is seen that signals correspondingto the corner re ector are located in the same rangendashazimuth cells However theyare still unfocused and scattered over the elevational direction Figures 12 13 and
Z She et al4376
Figure 13 3D image of ERS-1 data without image registration and phase correction
Figure 14 3D image of ERS-1 data without phase correction
14 illustrate that image registration phase correction and elevational imaging arethe essential processing steps for 3D SAR imaging
Instead of elevational imaging with FFT the 3D image formed by the super-resolution method for elevational resolution enhancement is shown in gure 15 Thepixel vectors were extrapolated forward and backward from 9 to 32 The AR modelorder was selected as N3=3 The enhancement of elevational resolution is obvious
A large patch of terrain with a size of 256times256 pixels was chosen for 3D SARimaging The 2D SAR image in the rangendashazimuth plane is shown in gure 16 Itinvolves the natural scattering from trees and buildings This large image was divided
3D space-borne SAR imaging 4377
Figure 15 3D image of ERS-1 data with elevational super-resolution
Figure 16 2D SAR image of large area with a marked pro le
into subimages with a size of 32times32 pixels After the 3D image for each subimagewas computed the 3D image of the large area was reconstructed by mosaicking the3D images of the subimages Pro les of the large 3D image in the azimuthndashelevation
Z She et al4378
plane are shown in gure 17 where (a) is the Fourier processing and (b) is the super-resolution imaging As the position of the pro le is marked in gure 16 a cornerre ector on the top of the building is in the middle two small trees on a grasslandare located in the right and a forest of tall trees is in the left Locations of thebuilding the corner re ector the forest and the small trees are plotted and super-imposed over the SAR image in gure 17(b) By comparing gure 17(b) with (a) theimprovement of elevational resolution is impressive But a small slope of forest andbuilding roof exists in gure 17(a) and (b) It is the inherent geometrical distortionin space-borne SAR imagery (Curlander 1984) which is caused by the SAR imaginggeometry and the Earth rotation Despite this inherent defect gure 17(a) and (b)have a correspondence to the scene By use of equation (38) the height diVerencebetween the forest and the small trees is about 11 m which has an agreement withmanual measurement
In order to measure the 3D image quality of ERS-1 data quantitatively threeelevational pro les of the corner re ector in gure 17 without calibration withcalibration and with super-resolution are presented in gure 18 They are character-ized by 3 dB bandwidth (BW) peak sidelobe level (PSLR) and integrated sidelobelevel (ISLR) BW determines the measured elevational resolution PSLR is the ratioof the highest sidelobe value to the mainlobe value The smaller the PSLR thesmaller the sidelobe level ISLR is de ned as the ratio of the integrated sidelobeenergy to the mainlobe energy The smaller the ISLR the smaller the sidelobes andthe better the resolution capability BW PSLR and ISLR of these three pro les were
(a)
(b)
Figure 17 Pro les of 3D SAR image in the azimuthndashelevation plane
3D space-borne SAR imaging 4379
Figure 18 Elevational pro les of corner re ector
calculated and are listed in table 1 It indicates that calibration obtains a gain of19 dB for PSLR and 14 dB for ISLR and super-resolution provides an improvedfactor of larger than three for elevational resolution and a gain of 6 dB for PSLRand 9 dB for ISLR
8 ConclusionsIn this paper a novel approach for 3D space-borne SAR imaging via multiple-
pass processing is developed based on the mathematical model of 3D SAR imagingIt calibrates the uncertainty of ight path with the image registration and the phasecorrection and images in the elevation with multiple focused beams The imagemodel matching is proposed for multiple image registration the eigenvector methodis applied for the phase correction and the super-resolution method is utilized forenhancement of elevational resolution Super-resolution is preferable to reduce the
Table 1 Parameters of elevational pro les of corner re ector
Elevational pro les BW (m) PSLR (dB) ISLR (dB)
No calibration 20 shy 2 1164Calibration 20 shy 21 shy 252Super-resolution 6 shy 27 shy 1155
Z She et al4380
number of ight paths of the SAR system and thus mitigate the decorrelation ofSAR images Three-dimensional images of the simulated and real ERS-1 data areproduced with the proposed approaches The processing results of ERS-1 dataindicate that the improved factor of elevational super-resolution is larger than threePSLR and ISLR are reduced signi cantly by the calibration of ight path and theyare further enhanced by use of the super-resolution processing The generated3D images demonstrate the promise of developed approaches for applications intopography surveying forest and crops monitoring and concealed target detection
AcknowledgmentsThe authors would like to thank the anonymous referees and editor Dr S Tanaka
for their constructive comments to improve the quality of this paper We would alsolike to thank Dr Thiel from Insitut fur Navigation University of Stuttgart as wellas the European Space Agency for providing the ERS-1 data used in the experimentalstudy The rst author would like to acknowledge the scholarships from theAustralian Research Council the University of Adelaide and CSSIP for his PhDstudy at the University of Adelaide
Appendix Derivation of (34)The joint probability density function is
p(V D(x y))=p Otilde NKL|CV
(x y) | Otilde KLexp shy KL Tr(C Otilde 1V
(x y)CAtildeV
(x y)) (A1)
where
CAtildeV
(x y)=1
KLaeligKL
i=1V (x
i y
i) V H (x
i y
i)
is an estimator of covariance matrix CV
(x y) Maximizing the logarithm jointprobability density function with respect to D(x y) leads to minimization of
l=KL ln |Cv(x y) |+KL Tr(C Otilde 1
v(x y)CAtilde
v(x y)) (A2)
By use of relations (Stoica and Moses 1997)
ccedil |Cv(x y) |
ccedil D(x y)=|C
v(x y) | TrAccedil C
v(x y)
ccedil D(x y)C Otilde 1
v(x y)B (A3)
and
ccedil C Otilde 1v
(x y)ccedil D(x y)
=shy C Otilde 1v
(x y)ccedil C
v(x y)
ccedil D(x y)C Otilde 1
v(x y) (A4)
we have
ccedil lccedil D(x y)
=KL TrG ccedil Cv(x y)
ccedil D(x y)[C Otilde 1
v(x y)shy C Otilde 1
v(x y)CAtilde
v(x y)C Otilde 1
v(x y)]H (A5)
Based on equation (29) we get
ccedil Cv(x y)
ccedil DH (x y)=|G1 (x y) |2 D(x y) (A6)
that is
ccedil Cv(x y)
ccedil (D(x y))n=|G1 (x y) |2 D(x y)dT
n(A7)
3D space-borne SAR imaging 4381
where dn=(0 0 0 1 0 0)T n=1 N Setting
ccedil lccedil (D(x y))
n=0
the maximum likelihood estimation DML (x y) satis es
Tr[|G1 (x y) |2 DML(x y)dT
n(C Otilde 1
v(x y)shy C Otilde 1
v(x y)CAtilde
v(x y)C Otilde 1
v(x y))]=0 n=1 N
(A8)
Equation (A8) can be changed into
dTn
C Otilde 1v
(x y)DML (x y) shy dTn
C Otilde 1v
(x y)CAtildev(x y)C Otilde 1
v(x y)DML (x y)=0 n=1 N
(A9)
which is equivalent to
CAtildev(x y)C Otilde 1
v(x y)DML (x y)=DML (x y) (A10)
By use of the matrix inverse
C Otilde 1v
(x y)=s Otilde 2w CI shy
|G1 (x y) |2 D(x y)DH (x y)s2w
+|G1 (x y) |2 N Dwe have
CAtildev(x y)DML (x y)=lmaxDML (x y) (A11)
where lmax is the maximal eigenvalue of CAtildev(x y)
References
Ausherman D A Kozma A Walker J L Jones H M and Poggio E C 1984Developments in radar imaging IEEE T ransactions on Aerospace and ElectronicSystems 20 363ndash398
Chan C K and Farhat N H 1981 Frequency swept tomographic imaging of three-dimensional perfectly conducting objects IEEE T ransactions on Antenna Propagation29 312ndash319
Curlander J C 1984 Utilization of spaceborne SAR data for mapping IEEE T ransactionson Geoscience and Remote Sensing 24 106ndash112
DeGraaf S R 1998 SAR imaging via modern 2D spectral estimation methods IEEET ransactions on Image Processing 7 729ndash761
Farhat N H 1984 Prospects for three-dimensional projective and tomographic imagingradar networks Radio Science 19 1347ndash1355
Fortuny J and Sieber A J 1999 Three-dimensional synthetic aperture radar imaging ofa r tree rst results IEEE T ransactions on Geoscience and Remote Sensing 371006ndash1014
Gabriel A K and Goldstein R 1988 Crossed orbit interferometry theory and experi-mental results from SIR-B International Journal of Remote Sensing 9 857ndash872
Gatelli F Guarnieri A M Parizzi F Pasquali P Prati C and Rocca F 1994The wavenumber shift in SAR interferometry IEEE T ransactions on Geoscience andRemote Sensing 32 855ndash865
Goldstein R M Zebker H A and Werner C L 1988 Satellite radar interferometrytwo-dimensional phase unwrapping Radio Science 23 713ndash720
Graham L C 1974 Synthetic interferometer radar for topographic mapping Proceedings ofIEEE 62 763ndash768
Gray D A Wolfe W O and Riley J L 1989 An eigenvector method for estimatingthe positions of the elements of an array of receivers Proceedings of the AustralianSymposium on Signal Processing Application Adelaide Australia (Adelaide IEEE)pp 391ndash393
3D space-borne SAR imaging4382
Homer J Longstaff I D and Callaghan G 1996 High resolution 3D SAR via multi-baseline interferometry Proceedings of IGARSS L incoln NE 27ndash31 May 1996(Noordwijk ESA) pp 796ndash798
Homer J Longstaff I D and Zhishun She 1997 Improved digital elevation models viamulti-baseline interferometric SAR Proceedings of IGARSS Singapore 3ndash8 August1997 (Noordwijk ESA) pp 1579ndash1581
Jakowatz C V Wahl D E Eichel P H Ghiglia D C and Thompson P A 1996Spotlight-mode Synthetic Aperture Radar A Signal Processing Approach (BostonKluwer)
Kay S M and Marple S L 1981 Spectrum analysismdasha modern perspective Proceedingsof IEEE 69 1380ndash1419
Krim H and Viberg M 1996 Two decades of array signal processing research theparametric approach IEEE Signal Processing Magazine 13 67ndash94
Li F K and Goldstein R M 1990 Studies of multibaseline spaceborne interferometricsynthetic aperture radars IEEE T ransactions on Geoscience and Remote Sensing28 88ndash97
Li J Bi Z Liu Z and Knaell K 1997 Use of curvilinear SAR for three-dimensionaltarget feature extractionIEE ProceedingsmdashRadar Sonar and Navigation 144 275ndash283
Marechal N 1995 Tomographic formulation of interferometric SAR for terrain elevationmapping IEEE T ransactions on Geoscience and Remote Sensing 33 726ndash739
Mitchell R L 1974Models of extended targets and their coherent radar images Proceedingsof IEEE 62 754ndash758
Pasquali P Prati C Rocca F Seymour M Fortuny J Phimer E and Sieber A J1995 A 3D SAR experiment with EMSL data Proceedings of IGARSS Florence10ndash14 July 1995 (Noordwijk ESA) pp 784ndash786
Reigber A Moreira A and Papathanassiou K P 2000 First demonstration of airborneSAR tomography using multibaseline L-band data IEEE T ransactions on Geoscienceand Remote Sensing 38 2142ndash2152
Rockah Y and Schuitheiss P M 1987 Array shape calibration using sources in unknownlocationsmdashpart I far- eld sources IEEE T ransactions on Acoustics Speech and SignalProcessing 35 724ndash735
Rufino G Moccia A and Esposito S 1998 DEM generation by means of ERS tandemdata IEEE T ransactions on Geoscience and Remote Sensing 36 1905ndash1912
Schmidt R O 1986 Multiple emitter location and signal parameter estimation IEEET ransactions on Antenna and Propagation 34 276ndash280
She Z Gray D A Bogner R E and Homer J 1999 Three-dimensional syntheticaperture radar (SAR) imaging via multiple pass processing Proceedings of IGARSSHamburg 28 Junendash2 July 1999 (Noordwijk ESA) pp 2389ndash2391
Skolink M I 1990 Radar Handbook (New York McGraw-Hill)Stoica P and Moses R L 1997 Introduction to Spectral Analysis (Upper Saddle River NJ
Prentice-Hall)Swingler D N and Walker R S 1989 Line-array beamforming using linear prediction
for aperture interpolation and extrapolation IEEE T ransactions on Acoustics Speechand Signal Processing 37 16ndash30
Walker J L 1980 Range-Doppler imaging of rotating objects IEEE T ransactions onAerospace and Electronic Systems 16 23ndash52
Wehner D R 1995 High Resolution Radar (Norwood MA Artech House)Williams R T Prasad S Mahalanabis A K and Sibnl L H 1988 An improved
spatial smoothing technique for bearing estimation in a multipath environment IEEET ransactions on Acoustics Speech and Signal Processing 36 425ndash432
Wolf E 1969 Three-dimensional structure determination of semi-transparent objects fromholographic data Optics Communications 1 153ndash156
Wu P 1995 A criterion for radar resolution enhancement with Burg algorithm IEEET ransactions on Aerospace and Electronic Systems 31 897ndash915
Zebker H A and Goldstein R M 1986 Topographic mapping from interferometrysynthetic aperture radar observation Journal of Geophysical Research 91 4993ndash4999
Zebker H A and Villasenor J 1992 Decorrelation in interferometric radar echoes IEEET ransactions on Geoscience and Remote Sensing 30 950ndash959
Zebker H A Rosen P A and Hensley S 1997 Atmospheric eVects in interferometricsynthetic aperture radar surface deformation and topographic maps Journal ofGeophysical Research 102 7547ndash7563
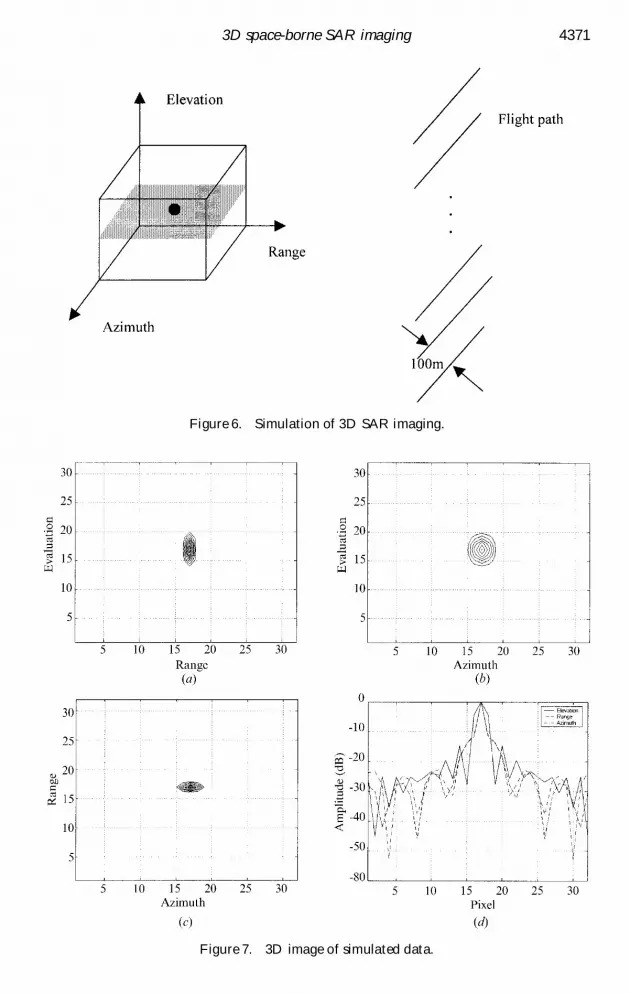
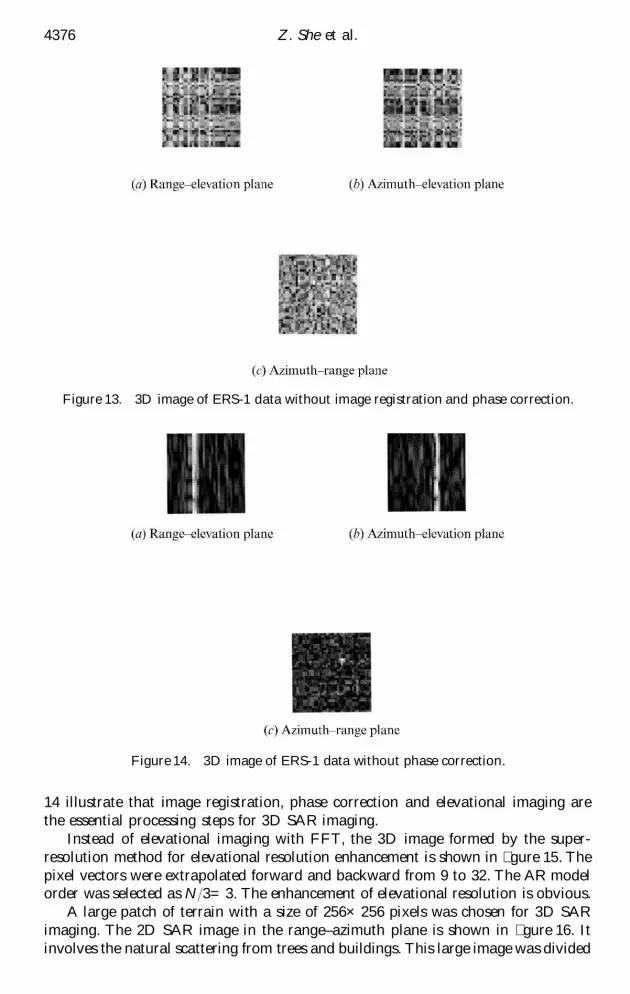


