Embed Size (px)
Citation preview
lable at ScienceDirect
Acta Oecologica 52 (2013) 29e37
Contents lists avai
Acta Oecologica
journal homepage: www.elsevier .com/locate/actoec
Original article
Thriving at the limit: Differential reproductive performance inrange-edge populations of a Mediterranean sclerophyll(Olea europaea)
Carlos Granado-Yela a,*, Luis Balaguer a, Carlos García-Verdugo b, Katty Carrillo a,Marcos Méndez c
aDepartamento de Biología Vegetal I, Universidad Complutense de Madrid, Madrid 28040, Spainb Jardín Botánico Viera y Clavijo, Las Palmas de Gran Canaria 35017, SpaincÁrea de Biodiversidad y Conservación, Universidad Rey Juan Carlos, Madrid 28933, Spain
a r t i c l e i n f o
Article history:Received 9 October 2012Accepted 11 July 2013Available online
Keywords:Flowering intensityFruit setMarginal habitatsRange limitsWild olive
* Corresponding author.E-mail addresses: [email protected], carlosgy@
1146-609X/$ e see front matter � 2013 Elsevier Mashttp://dx.doi.org/10.1016/j.actao.2013.07.002
a b s t r a c t
Peripheral populations are often lumped together on the assumption of thriving in marginal habitatswhere reproductive performance is compromised. We have tested this hypothesis in peripheral pop-ulations of wild olive tree (Olea europaea L.) presumably limited by different factors at the westernmostlimit of the species range. Additionally, we hypothesized that differences in reproductive outcome amongpopulations are better explained by site-specific environmental conditions (PAR, soil water, soil nutri-ents, air humidity and air temperature) than by differences in phenotypic traits (tree size and leaf traits).To test these hypotheses, we assessed the number of flowering trees, the flowering intensity, fruit set andseed viability in eight populations for three consecutive years. Our findings provided sufficient evidenceto reject the first hypothesis. Peripheral populations that occur under oceanic conditions, resembling theTertiary subtropical climate, consistently presented higher values for all components of reproductiveperformance than those at the thermal and rainfall tolerance limits. In support of our second hypothesis,the variation in reproductive performance among populations was primarily accounted for by localenvironmental conditions. Leaf traits, however, also explained reproductive variation but to a lesserextent. Finally, we found that small changes in tree size may cause large differences in reproductiveperformance. This close relationship between tree size and reproductive performance suggests that anyimpact on population size structure would likely jeopardize persistence and expansion at the range edge.Our results suggest that reproductive performance of wild olive trees was not shaped by the populationgeographic position within the species range, but by the interaction between local environment, as themain driver, and individual phenotypic traits.
� 2013 Elsevier Masson SAS. All rights reserved.
1. Introduction
Reproductive performance of peripheral populations is a keytopic in the ecology and evolution of range limits (Sexton et al.,2009), climate change ecology (Hampe and Petit, 2005) and con-servation of relict populations (Lesica and Allendorf, 1995). Pe-ripheral populations are assumed to thrive in ecologically marginalhabitats where abiotic or biotic stressful conditions compromisereproductive performance and survival (Vucetich and Waite, 2003;Kawecki, 2008). Stressful conditions can influence reproductiveperformance directly or indirectly. For example, nutrient deficiencymay directly affect plant reproduction by preventing or arresting
gmail.com (C. Granado-Yela).
son SAS. All rights reserved.
the development of flowers, fruits and seeds (Ne’eman et al., 2006)or indirectly through alteration of floral rewards (Muñoz et al.,2005) or pollen quality and quantity (Lau and Stephenson, 1994).Moreover, in stressful environments, increased maintenance costsat the expense of vegetative growth reduce plant size, and indi-vidual size is strongly related to reproductive performance (e.g.Samson and Werk, 1986; Weiner et al., 2009; García-Verdugo,2011); hence larger plants are expected to reproduce more oftenand have higher seed set than smaller plants (Kato and Hiura,1999). Individuals of equivalent sizes, however, may show differ-ential reproductive performance depending on habitat conditions(Parra-Tabla and Bullock, 2003; Méndez and Karlsson, 2004;Hampe, 2005). In addition to plant size, interactions among leafphenotypic traits are expected to influence resource uptake andutilization, nutrient and biomass allocation, individual growth, and,
C. Granado-Yela et al. / Acta Oecologica 52 (2013) 29e3730
ultimately, reproductive performance (Ackerly et al., 2000; Geberand Griffen, 2003). Thus, leaf traits are used as proxies ofresource availability. For instance, plants experiencing stress con-ditions, such as drought and high irradiance levels, build smaller,thicker and steeper leaves than their counterparts growing undermilder conditions (Gratani and Bombelli, 1999).
Although several studies have documented lower reproductiveperformance of peripheral populations, compared to central ones,some exceptions exist (Sagarin and Gaines, 2002; Sexton et al.,2009). We highlight three potential causes for these inconsistentresults. First, peripheral populations can hardly be assigned tohomogeneous comparison groups (Gaston, 1990; Hampe and Petit,2005). For example, northern and southern range limits are ex-pected to differ in relation to the importance of biotic and abioticlimiting factors (Gaston, 2009) and are expected to responddifferently to environmental modifications (Hampe and Petit,2005). Second, the assumption that all core populations share acommon reproductive behaviour is also an unrealistic over-simplification, since they are usually spread throughout a large areaand may occur under contrasted environmental conditions. Third,poor reproductive performance can result from reductions in oneor several reproductive components, such as flowering frequencyor intensity (Levin and Clay, 1984; Morin et al., 2007), fecundity(Dorken and Eckert, 2001; Angert and Schemske, 2005), seedviability or germination rates (García et al., 2000; Jump andWoodward, 2003; Sugiyama, 2003). These components, however,should not be considered in isolation. Final reproductive perfor-mance results from the combination of all these components and adecrease in one component may be mitigated by increases inanother (Angert, 2006). Indeed, peripheral populations can alsoshow particular adaptations to stressful conditions involving suchreproductive compensations (Sexton et al., 2009).
The aim of the present study was to test whether peripheralpopulations share a reduced reproductive output. Peripheral pop-ulations of the Mediterranean wild olive tree (namely two subspe-cies of Olea europaea L.: O.e. europaea and O.e. guachica) at thewesternmost limit of its distribution provides an excellent scenarioto investigate the reproductive performance of populations at therange edge occurring under contrasted environmental situations.First, some peripheral populations occur at the thermal tolerancelimit imposed by minimal winter temperatures (Vargas andKadereit, 2001; Rubio de Casas et al., 2002), while others occur atthe lower rainfall limit of the species (Pansiot and Rebour, 1961).Second, the study subspecies of wild olive constitute a prominentelement of the present day Mediterranean Flora. Phylogeographic
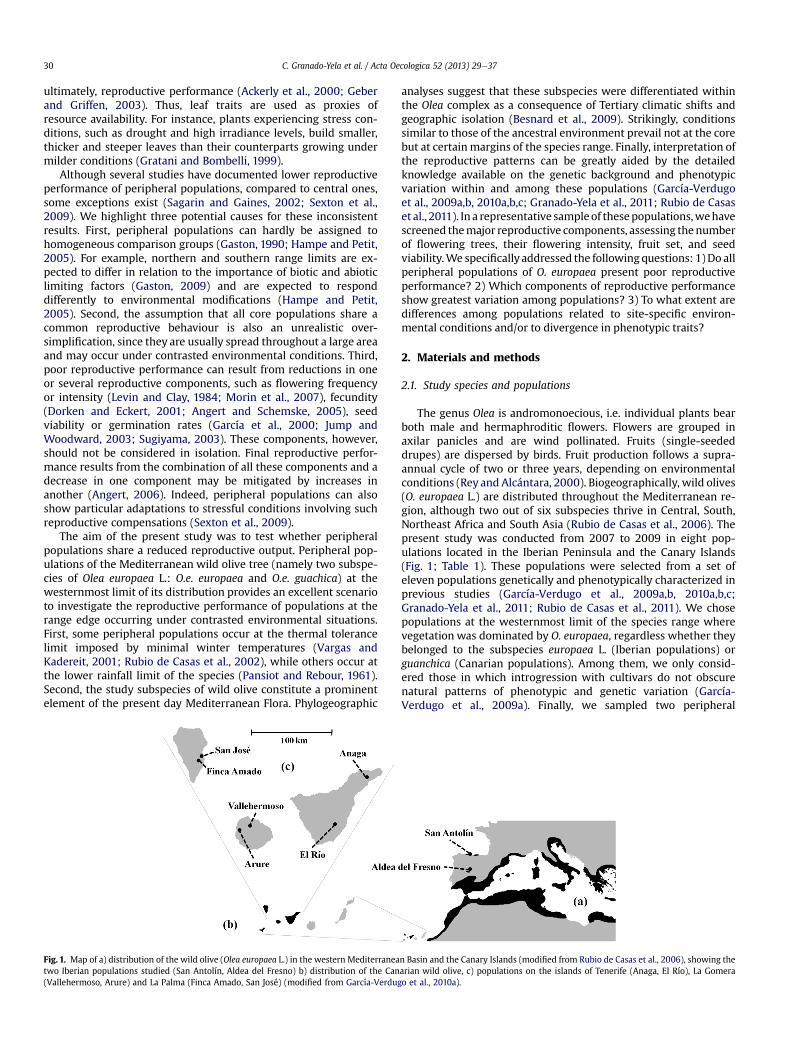
Fig. 1. Map of a) distribution of the wild olive (Olea europaea L.) in the western Mediterraneatwo Iberian populations studied (San Antolín, Aldea del Fresno) b) distribution of the Can(Vallehermoso, Arure) and La Palma (Finca Amado, San José) (modified from García-Verdug
analyses suggest that these subspecies were differentiated withinthe Olea complex as a consequence of Tertiary climatic shifts andgeographic isolation (Besnard et al., 2009). Strikingly, conditionssimilar to those of the ancestral environment prevail not at the corebut at certainmargins of the species range. Finally, interpretation ofthe reproductive patterns can be greatly aided by the detailedknowledge available on the genetic background and phenotypicvariation within and among these populations (García-Verdugoet al., 2009a,b, 2010a,b,c; Granado-Yela et al., 2011; Rubio de Casaset al., 2011). In a representative sampleof thesepopulations,wehavescreened themajor reproductive components, assessing thenumberof flowering trees, their flowering intensity, fruit set, and seedviability.We specifically addressed the followingquestions: 1) Do allperipheral populations of O. europaea present poor reproductiveperformance? 2) Which components of reproductive performanceshow greatest variation among populations? 3) To what extent aredifferences among populations related to site-specific environ-mental conditions and/or to divergence in phenotypic traits?
2. Materials and methods
2.1. Study species and populations
The genus Olea is andromonoecious, i.e. individual plants bearboth male and hermaphroditic flowers. Flowers are grouped inaxilar panicles and are wind pollinated. Fruits (single-seededdrupes) are dispersed by birds. Fruit production follows a supra-annual cycle of two or three years, depending on environmentalconditions (Rey and Alcántara, 2000). Biogeographically, wild olives(O. europaea L.) are distributed throughout the Mediterranean re-gion, although two out of six subspecies thrive in Central, South,Northeast Africa and South Asia (Rubio de Casas et al., 2006). Thepresent study was conducted from 2007 to 2009 in eight pop-ulations located in the Iberian Peninsula and the Canary Islands(Fig. 1; Table 1). These populations were selected from a set ofeleven populations genetically and phenotypically characterized inprevious studies (García-Verdugo et al., 2009a,b, 2010a,b,c;Granado-Yela et al., 2011; Rubio de Casas et al., 2011). We chosepopulations at the westernmost limit of the species range wherevegetation was dominated by O. europaea, regardless whether theybelonged to the subspecies europaea L. (Iberian populations) orguanchica (Canarian populations). Among them, we only consid-ered those in which introgression with cultivars do not obscurenatural patterns of phenotypic and genetic variation (García-Verdugo et al., 2009a). Finally, we sampled two peripheral
n Basin and the Canary Islands (modified from Rubio de Casas et al., 2006), showing thearian wild olive, c) populations on the islands of Tenerife (Anaga, El Río), La Gomerao et al., 2010a).
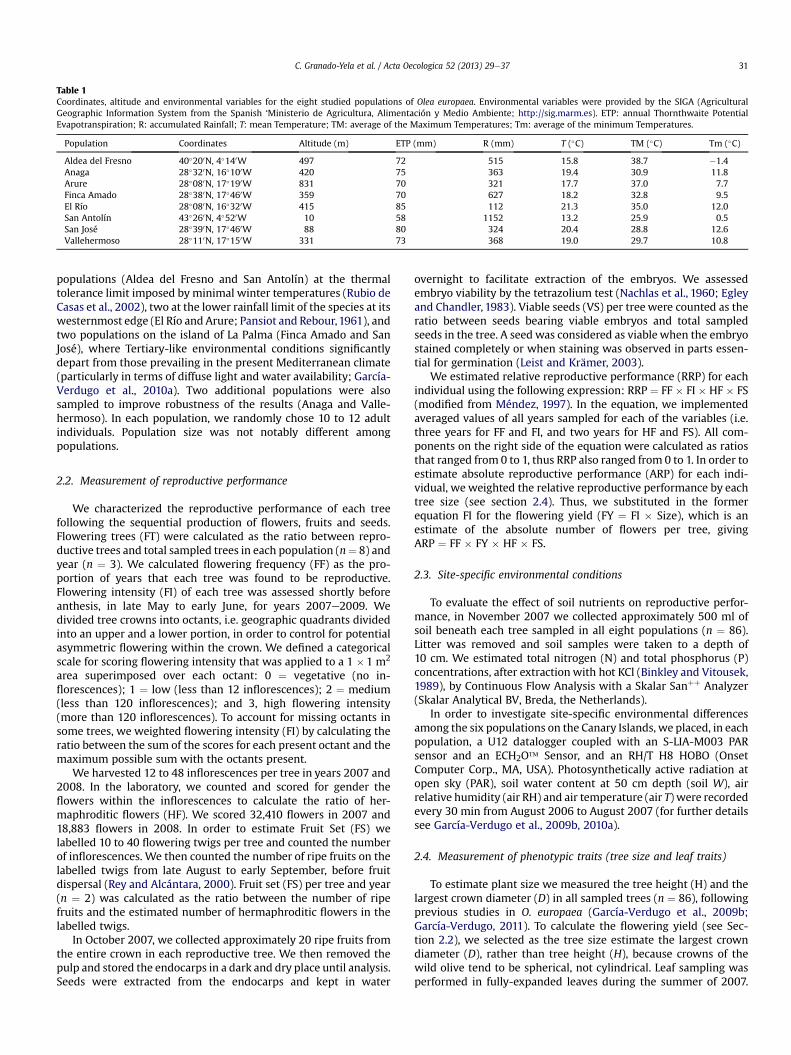
Table 1Coordinates, altitude and environmental variables for the eight studied populations of Olea europaea. Environmental variables were provided by the SIGA (AgriculturalGeographic Information System from the Spanish ‘Ministerio de Agricultura, Alimentación y Medio Ambiente; http://sig.marm.es). ETP: annual Thornthwaite PotentialEvapotranspiration; R: accumulated Rainfall; T: mean Temperature; TM: average of the Maximum Temperatures; Tm: average of the minimum Temperatures.
Population Coordinates Altitude (m) ETP (mm) R (mm) T (�C) TM (�C) Tm (�C)
Aldea del Fresno 40�200N, 4�140W 497 72 515 15.8 38.7 �1.4Anaga 28�320N, 16�100W 420 75 363 19.4 30.9 11.8Arure 28�080N, 17�190W 831 70 321 17.7 37.0 7.7Finca Amado 28�380N, 17�460W 359 70 627 18.2 32.8 9.5El Río 28�080N, 16�320W 415 85 112 21.3 35.0 12.0San Antolín 43�260N, 4�520W 10 58 1152 13.2 25.9 0.5San José 28�390N, 17�460W 88 80 324 20.4 28.8 12.6Vallehermoso 28�110N, 17�150W 331 73 368 19.0 29.7 10.8
C. Granado-Yela et al. / Acta Oecologica 52 (2013) 29e37 31
populations (Aldea del Fresno and San Antolín) at the thermaltolerance limit imposed by minimal winter temperatures (Rubio deCasas et al., 2002), two at the lower rainfall limit of the species at itswesternmost edge (El Río and Arure; Pansiot and Rebour,1961), andtwo populations on the island of La Palma (Finca Amado and SanJosé), where Tertiary-like environmental conditions significantlydepart from those prevailing in the present Mediterranean climate(particularly in terms of diffuse light and water availability; García-Verdugo et al., 2010a). Two additional populations were alsosampled to improve robustness of the results (Anaga and Valle-hermoso). In each population, we randomly chose 10 to 12 adultindividuals. Population size was not notably different amongpopulations.
2.2. Measurement of reproductive performance
We characterized the reproductive performance of each treefollowing the sequential production of flowers, fruits and seeds.Flowering trees (FT) were calculated as the ratio between repro-ductive trees and total sampled trees in each population (n¼ 8) andyear (n ¼ 3). We calculated flowering frequency (FF) as the pro-portion of years that each tree was found to be reproductive.Flowering intensity (FI) of each tree was assessed shortly beforeanthesis, in late May to early June, for years 2007e2009. Wedivided tree crowns into octants, i.e. geographic quadrants dividedinto an upper and a lower portion, in order to control for potentialasymmetric flowering within the crown. We defined a categoricalscale for scoring flowering intensity that was applied to a 1 �1 m2
area superimposed over each octant: 0 ¼ vegetative (no in-florescences); 1 ¼ low (less than 12 inflorescences); 2 ¼ medium(less than 120 inflorescences); and 3, high flowering intensity(more than 120 inflorescences). To account for missing octants insome trees, we weighted flowering intensity (FI) by calculating theratio between the sum of the scores for each present octant and themaximum possible sum with the octants present.
We harvested 12 to 48 inflorescences per tree in years 2007 and2008. In the laboratory, we counted and scored for gender theflowers within the inflorescences to calculate the ratio of her-maphroditic flowers (HF). We scored 32,410 flowers in 2007 and18,883 flowers in 2008. In order to estimate Fruit Set (FS) welabelled 10 to 40 flowering twigs per tree and counted the numberof inflorescences. We then counted the number of ripe fruits on thelabelled twigs from late August to early September, before fruitdispersal (Rey and Alcántara, 2000). Fruit set (FS) per tree and year(n ¼ 2) was calculated as the ratio between the number of ripefruits and the estimated number of hermaphroditic flowers in thelabelled twigs.
In October 2007, we collected approximately 20 ripe fruits fromthe entire crown in each reproductive tree. We then removed thepulp and stored the endocarps in a dark and dry place until analysis.Seeds were extracted from the endocarps and kept in water
overnight to facilitate extraction of the embryos. We assessedembryo viability by the tetrazolium test (Nachlas et al., 1960; Egleyand Chandler, 1983). Viable seeds (VS) per tree were counted as theratio between seeds bearing viable embryos and total sampledseeds in the tree. A seed was considered as viable when the embryostained completely or when staining was observed in parts essen-tial for germination (Leist and Krämer, 2003).
We estimated relative reproductive performance (RRP) for eachindividual using the following expression: RRP ¼ FF � FI � HF � FS(modified from Méndez, 1997). In the equation, we implementedaveraged values of all years sampled for each of the variables (i.e.three years for FF and FI, and two years for HF and FS). All com-ponents on the right side of the equation were calculated as ratiosthat ranged from 0 to 1, thus RRP also ranged from 0 to 1. In order toestimate absolute reproductive performance (ARP) for each indi-vidual, we weighted the relative reproductive performance by eachtree size (see section 2.4). Thus, we substituted in the formerequation FI for the flowering yield (FY ¼ FI � Size), which is anestimate of the absolute number of flowers per tree, givingARP ¼ FF � FY � HF � FS.
2.3. Site-specific environmental conditions
To evaluate the effect of soil nutrients on reproductive perfor-mance, in November 2007 we collected approximately 500 ml ofsoil beneath each tree sampled in all eight populations (n ¼ 86).Litter was removed and soil samples were taken to a depth of10 cm. We estimated total nitrogen (N) and total phosphorus (P)concentrations, after extractionwith hot KCl (Binkley and Vitousek,1989), by Continuous Flow Analysis with a Skalar Sanþþ Analyzer(Skalar Analytical BV, Breda, the Netherlands).
In order to investigate site-specific environmental differencesamong the six populations on the Canary Islands, we placed, in eachpopulation, a U12 datalogger coupled with an S-LIA-M003 PARsensor and an ECH2O� Sensor, and an RH/T H8 HOBO (OnsetComputer Corp., MA, USA). Photosynthetically active radiation atopen sky (PAR), soil water content at 50 cm depth (soil W), airrelative humidity (air RH) and air temperature (air T) were recordedevery 30 min from August 2006 to August 2007 (for further detailssee García-Verdugo et al., 2009b, 2010a).
2.4. Measurement of phenotypic traits (tree size and leaf traits)
To estimate plant size we measured the tree height (H) and thelargest crown diameter (D) in all sampled trees (n ¼ 86), followingprevious studies in O. europaea (García-Verdugo et al., 2009b;García-Verdugo, 2011). To calculate the flowering yield (see Sec-tion 2.2), we selected as the tree size estimate the largest crowndiameter (D), rather than tree height (H), because crowns of thewild olive tend to be spherical, not cylindrical. Leaf sampling wasperformed in fully-expanded leaves during the summer of 2007.
C. Granado-Yela et al. / Acta Oecologica 52 (2013) 29e3732
We sought to examine resource-use strategies of the study pop-ulations through three key functional traits. First, wemeasured leafangle to the horizontal (Ang) on 10 leaves per tree using a pro-tractor. Then, we randomly took 30 leaves per tree and scannedthem in the laboratory. Scanned leaves were analysed with ScionImage software (Scion Corp., MD, USA) to calculate leaf area (LA).Finally, these leaves were oven-dried (65 �C for 48 h) and weighedwith a precision balance (Mettler Toledo, Greifensee, Switzerland)to estimate dry mass. Specific leaf area (SLA) was calculated as theratio between LA and dry mass.
2.5. Data analyses
We performed three analyses at the population level. First, weinvestigated differences in the components of reproductive per-formance among the study populations. We included all eightpopulations for these analyses, although the likelihood of type IIerror (i.e. failing to find differences in reproductive componentsamong populations when they actually exist) would increase sincethe Canarian populations are not truly independent. Second, weexamined the contribution of each component to overall repro-ductive performance in each population. Finally, we investigatedthe effect of site-specific environmental conditions on reproductiveperformance across Canary Island populations. At the individuallevel, we analysed the relationship between reproductive perfor-mance and plant phenotypic traits (tree size and leaf traits) andbetween reproductive performance and soil properties.
2.5.1. Population level analysesWe tested for differences in FT among populations and years
using a Friedman test. In addition, we tested for within-populationdifferences in FT by means of G-tests (Sokal and Rohlf, 1995).Because not every tree produced flowers every year in some pop-ulations, a joint analysis was not feasible. Thus, we compared FIamong populations in a given year using one-way ANOVA, aftertesting for normality with ShapiroeWilks test, and homogeneity ofvariances with Levene’s test. In addition, we performed a repeated-measures ANOVA with year as a within-subject factor for eachpopulation. Populations with a low number of flowering trees wereexcluded from the analysis (see Results). FI was rank-transformedto meet the assumptions of the analysis. We tested between-yearvariation in FS within each population using a t-test for pairedsamples, after confirming the normality in the distribution of fruitset values (Zar, 1999). Since average population for FS values werehighly correlated between years across populations (see Results),and population Vallehermoso had only one flowering tree in 2008,we tested for significant differences in FS among populations onlyin 2007 by means of the BrowneForsythe test. Differences amongpopulations in FS were detected with the post-hoc GameseHowelltest for multiple comparisons.We compared VS among populationsusing G-tests.
The influence of environmental variables on reproductivecomponents in the Canarian populations was assessed by means ofpartial least squares regressions in SPSS 16.0 (SPSS Inc., IL, USA).Wetested the influence of four site-specific environmental variables(PAR, soil W, T and air RH) on key phenological stages for thereproductive components during 2007. According to Sanz-Cortéset al. (2002), emergence/development of reproductive buds, inflo-rescence development and flowering occurs approximately fromDecember toMay, fruit development fromMay to October, and fruitripening from September to December. Averages of each site-specific environmental variable for each time interval were usedas predictors of FI, FS and VS, respectively.
The relative importance of each reproductive componentcontributing to ARP in each population was analysed following the
procedures detailed in Mott (1966). The variance of each compo-nent and the covariance between each pair of components wereobtained on log-transformed data. Variances and covariances werestandardised by expressing them as percentage of variance in log(ARP). The magnitude of standardised variance and covariance foreach component estimates its contribution to between-plant vari-ation in ARP in each population.
2.5.2. Individual level analysesWe used multiple ordinal regressions to test the effect of tree
size, leaf traits and soil nutrients on FF. We created an ordinalvariable with four categories (0e3) that summarized FF (i.e. flow-ering events in each tree along the three study years). Predictorsvariables included in the model were soil nutrients (N and P),crown features (H, D and Ang) and leaf traits (LA and SLA). Aparallelism test was performed to test the null hypothesis of similarslope coefficients across response categories.
We studied the effect of tree size, leaf traits and soil nutrients onreproductive components by means of redundancy analysis inCANOCO 4.5 for Windows (ter Braak and Smilauer, 2002). Redun-dancy analysis is an ordination method which summarises overallvariation in one set of variables (independent variables) in a fewordination axes which are linear combinations another set of var-iables (dependent variables). The dependent variables consideredwere FI, FS and VS of each year. The independent variables includedwere crown features (H, D and Ang), leaf traits (LA and SLA) and soilnutrients (N and P). The statistical significance of the resultingordination was tested by means of a Monte Carlo permutation testwith 9999 permutations.
We investigated the relationship between tree size and RRP bymeans of regression models in GraphPad Prism 5 (GraphPad Soft-ware, CA, USA). We applied an information-theoretic approachbased on Akaike’s information criteria (AIC; Burnham andAnderson, 2002) in order to check whether the relationship be-tween tree size and RRP followed a linear or a nonlinear model. Thenonlinear models included were exponential, quadratic andsegmental linear with breakpoint.
3. Results
3.1. Variation in reproductive performance at the population level
We found significant differences in all components of the repro-ductive performance (except for the flowering intensity) among theeight studypopulations. The ratio offlowering trees (FT) ranged from0.083 to 1 among populations and years (Table 2). FT significantlydiffered among populations ðc27 ¼ 14:474; p ¼ 0:043Þ, but notamong years ðc22 ¼ 2:154; p ¼ 0:341Þ. The only population forwhich all monitored individuals consistently flowered throughoutthe three study years was Finca Amado, located on the island of LaPalma. Populations San Antolín, at the thermal limit under oceanicconditions, and Finca Amado presented the highest ratios of FT,whereas populations El Río, at the rainfall limit, and Vallehermososhowed the lowest. Within populations, FT significantly differedbetween years in Anaga (G2 ¼ 8.331, p ¼ 0.008), Aldea del Fresno(G2 ¼ 5.841, p ¼ 0.046) and San José (G2 ¼ 5.633, p ¼ 0.043).
Flowering intensity ranged from 0.250 to 0.933 (Table 2) and didnot differ among populations or years. Within populations, FI var-ied significantly only in population San Jose (F1, 3 ¼ 16.667,p ¼ 0.027).
Fruit set (FS) ranged from 0 to 0.107 (Table 2). Average popula-tion FS values were highly correlated between years across pop-ulations (r ¼ 0.933, n ¼ 8, p < 0.001). The FS significantly differedamong populations in 2007 (BrowneForsythe statistics: 12.197,df ¼ 7, 11.385, p < 0.001). One of the populations on La Palma (San
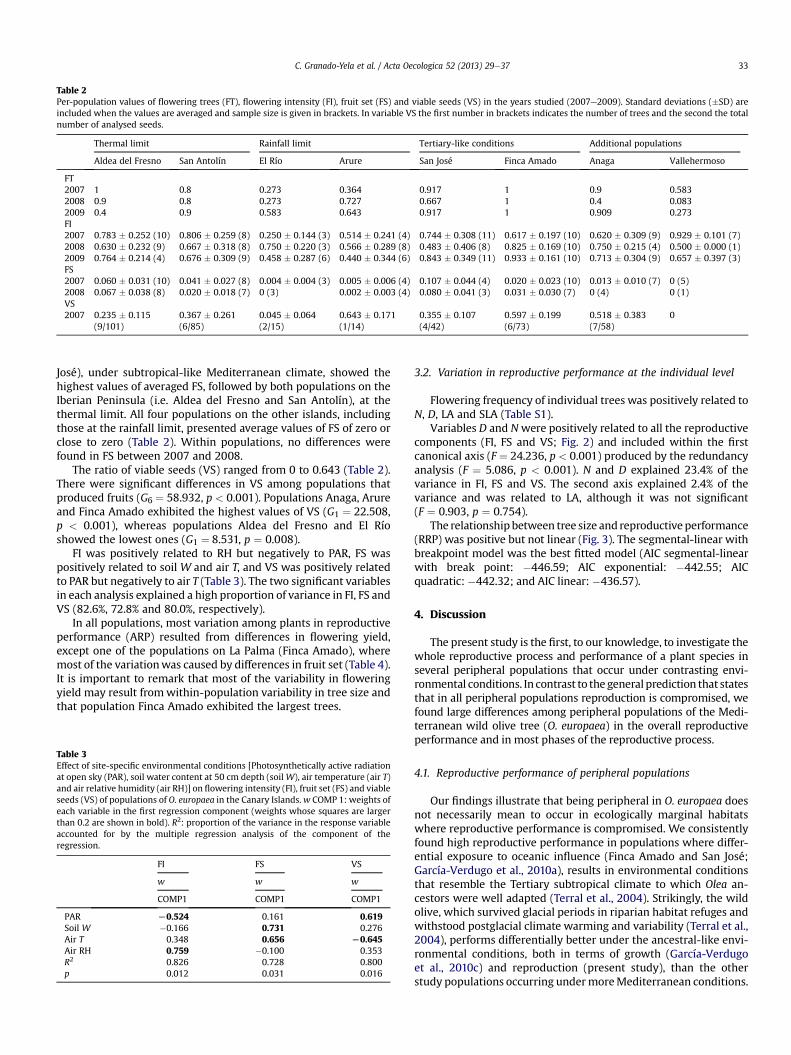
Table 2Per-population values of flowering trees (FT), flowering intensity (FI), fruit set (FS) and viable seeds (VS) in the years studied (2007e2009). Standard deviations (�SD) areincluded when the values are averaged and sample size is given in brackets. In variable VS the first number in brackets indicates the number of trees and the second the totalnumber of analysed seeds.
Thermal limit Rainfall limit Tertiary-like conditions Additional populations
Aldea del Fresno San Antolín El Río Arure San José Finca Amado Anaga Vallehermoso
FT2007 1 0.8 0.273 0.364 0.917 1 0.9 0.5832008 0.9 0.8 0.273 0.727 0.667 1 0.4 0.0832009 0.4 0.9 0.583 0.643 0.917 1 0.909 0.273FI2007 0.783 � 0.252 (10) 0.806 � 0.259 (8) 0.250 � 0.144 (3) 0.514 � 0.241 (4) 0.744 � 0.308 (11) 0.617 � 0.197 (10) 0.620 � 0.309 (9) 0.929 � 0.101 (7)2008 0.630 � 0.232 (9) 0.667 � 0.318 (8) 0.750 � 0.220 (3) 0.566 � 0.289 (8) 0.483 � 0.406 (8) 0.825 � 0.169 (10) 0.750 � 0.215 (4) 0.500 � 0.000 (1)2009 0.764 � 0.214 (4) 0.676 � 0.309 (9) 0.458 � 0.287 (6) 0.440 � 0.344 (6) 0.843 � 0.349 (11) 0.933 � 0.161 (10) 0.713 � 0.304 (9) 0.657 � 0.397 (3)FS2007 0.060 � 0.031 (10) 0.041 � 0.027 (8) 0.004 � 0.004 (3) 0.005 � 0.006 (4) 0.107 � 0.044 (4) 0.020 � 0.023 (10) 0.013 � 0.010 (7) 0 (5)2008 0.067 � 0.038 (8) 0.020 � 0.018 (7) 0 (3) 0.002 � 0.003 (4) 0.080 � 0.041 (3) 0.031 � 0.030 (7) 0 (4) 0 (1)VS2007 0.235 � 0.115
(9/101)0.367 � 0.261(6/85)
0.045 � 0.064(2/15)
0.643 � 0.171(1/14)
0.355 � 0.107(4/42)
0.597 � 0.199(6/73)
0.518 � 0.383(7/58)
0
C. Granado-Yela et al. / Acta Oecologica 52 (2013) 29e37 33
José), under subtropical-like Mediterranean climate, showed thehighest values of averaged FS, followed by both populations on theIberian Peninsula (i.e. Aldea del Fresno and San Antolín), at thethermal limit. All four populations on the other islands, includingthose at the rainfall limit, presented average values of FS of zero orclose to zero (Table 2). Within populations, no differences werefound in FS between 2007 and 2008.
The ratio of viable seeds (VS) ranged from 0 to 0.643 (Table 2).There were significant differences in VS among populations thatproduced fruits (G6 ¼ 58.932, p < 0.001). Populations Anaga, Arureand Finca Amado exhibited the highest values of VS (G1 ¼ 22.508,p < 0.001), whereas populations Aldea del Fresno and El Ríoshowed the lowest ones (G1 ¼ 8.531, p ¼ 0.008).
FI was positively related to RH but negatively to PAR, FS waspositively related to soil W and air T, and VS was positively relatedto PAR but negatively to air T (Table 3). The two significant variablesin each analysis explained a high proportion of variance in FI, FS andVS (82.6%, 72.8% and 80.0%, respectively).
In all populations, most variation among plants in reproductiveperformance (ARP) resulted from differences in flowering yield,except one of the populations on La Palma (Finca Amado), wheremost of the variationwas caused by differences in fruit set (Table 4).It is important to remark that most of the variability in floweringyield may result fromwithin-population variability in tree size andthat population Finca Amado exhibited the largest trees.
Table 3Effect of site-specific environmental conditions [Photosynthetically active radiationat open sky (PAR), soil water content at 50 cm depth (soilW), air temperature (air T)and air relative humidity (air RH)] on flowering intensity (FI), fruit set (FS) and viableseeds (VS) of populations of O. europaea in the Canary Islands.w COMP 1: weights ofeach variable in the first regression component (weights whose squares are largerthan 0.2 are shown in bold). R2: proportion of the variance in the response variableaccounted for by the multiple regression analysis of the component of theregression.
FI FS VS
w w w
COMP1 COMP1 COMP1
PAR L0.524 0.161 0.619Soil W �0.166 0.731 0.276Air T 0.348 0.656 L0.645Air RH 0.759 �0.100 0.353R2 0.826 0.728 0.800p 0.012 0.031 0.016
3.2. Variation in reproductive performance at the individual level
Flowering frequency of individual trees was positively related toN, D, LA and SLA (Table S1).
Variables D and Nwere positively related to all the reproductivecomponents (FI, FS and VS; Fig. 2) and included within the firstcanonical axis (F ¼ 24.236, p < 0.001) produced by the redundancyanalysis (F ¼ 5.086, p < 0.001). N and D explained 23.4% of thevariance in FI, FS and VS. The second axis explained 2.4% of thevariance and was related to LA, although it was not significant(F ¼ 0.903, p ¼ 0.754).
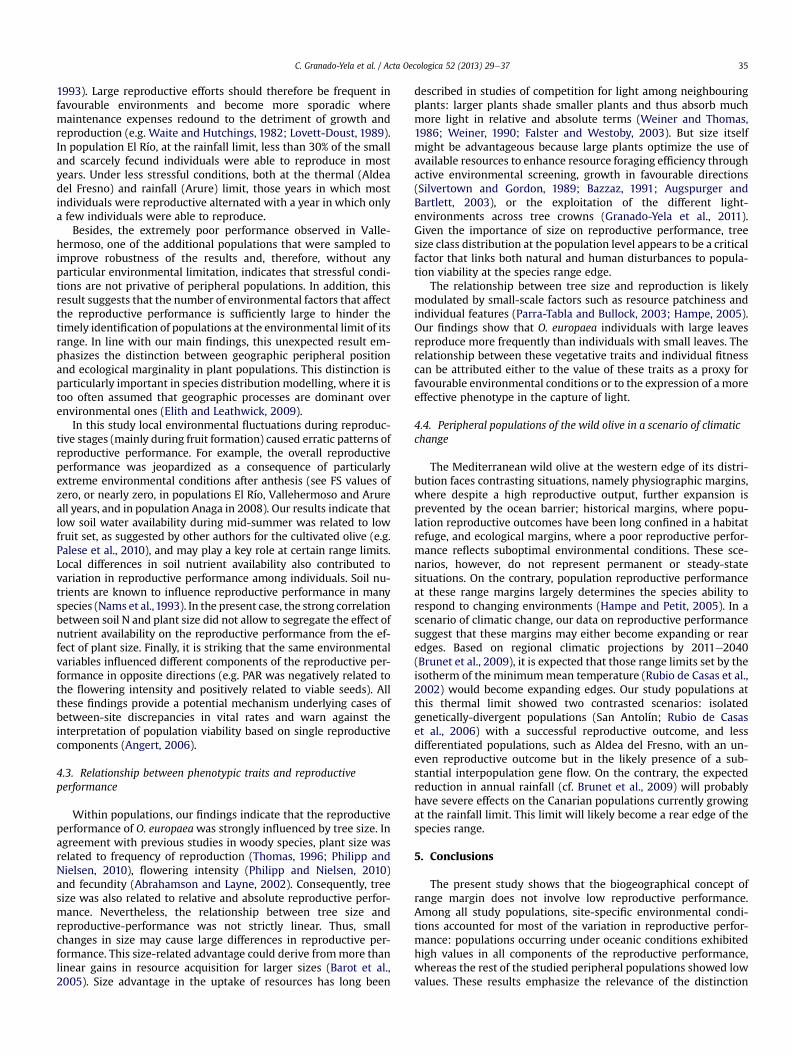
The relationshipbetween tree size and reproductive performance(RRP) was positive but not linear (Fig. 3). The segmental-linear withbreakpoint model was the best fitted model (AIC segmental-linearwith break point: �446.59; AIC exponential: �442.55; AICquadratic: �442.32; and AIC linear: �436.57).
4. Discussion
The present study is the first, to our knowledge, to investigate thewhole reproductive process and performance of a plant species inseveral peripheral populations that occur under contrasting envi-ronmental conditions. In contrast to the general prediction that statesthat in all peripheral populations reproduction is compromised, wefound large differences among peripheral populations of the Medi-terranean wild olive tree (O. europaea) in the overall reproductiveperformance and in most phases of the reproductive process.
4.1. Reproductive performance of peripheral populations
Our findings illustrate that being peripheral in O. europaea doesnot necessarily mean to occur in ecologically marginal habitatswhere reproductive performance is compromised. We consistentlyfound high reproductive performance in populations where differ-ential exposure to oceanic influence (Finca Amado and San José;García-Verdugo et al., 2010a), results in environmental conditionsthat resemble the Tertiary subtropical climate to which Olea an-cestors were well adapted (Terral et al., 2004). Strikingly, the wildolive, which survived glacial periods in riparian habitat refuges andwithstood postglacial climate warming and variability (Terral et al.,2004), performs differentially better under the ancestral-like envi-ronmental conditions, both in terms of growth (García-Verdugoet al., 2010c) and reproduction (present study), than the otherstudy populations occurring undermoreMediterranean conditions.
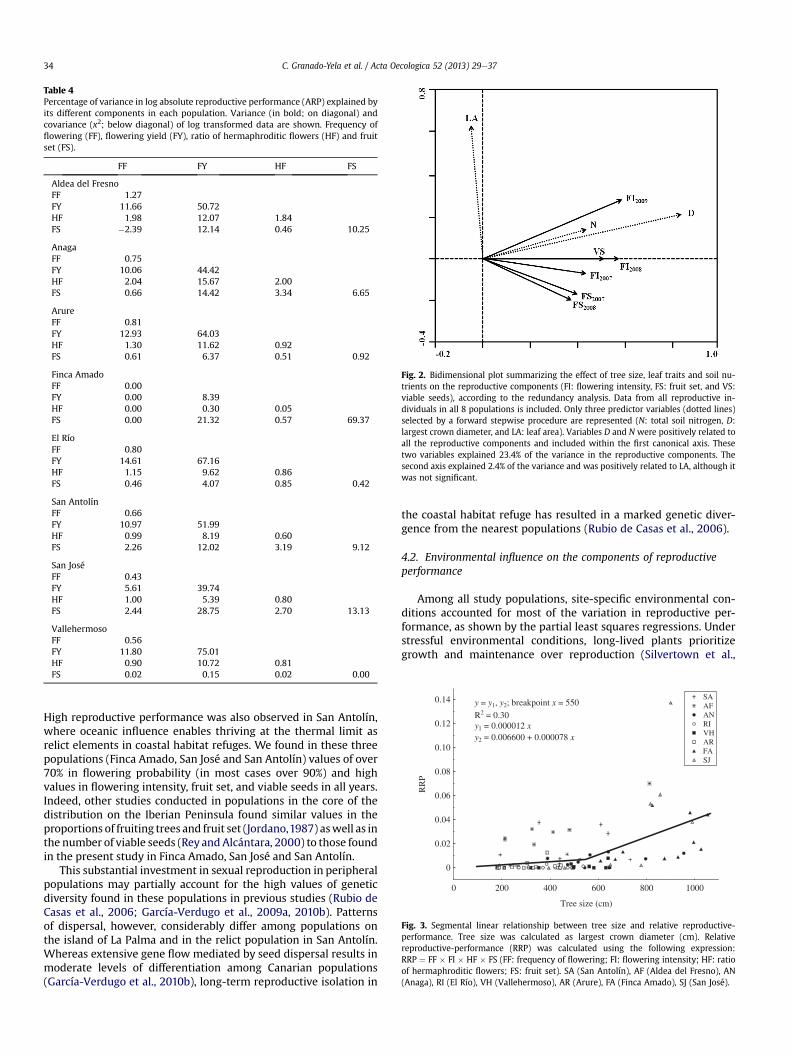
Table 4Percentage of variance in log absolute reproductive performance (ARP) explained byits different components in each population. Variance (in bold; on diagonal) andcovariance (x2; below diagonal) of log transformed data are shown. Frequency offlowering (FF), flowering yield (FY), ratio of hermaphroditic flowers (HF) and fruitset (FS).
FF FY HF FS
Aldea del FresnoFF 1.27FY 11.66 50.72HF 1.98 12.07 1.84FS �2.39 12.14 0.46 10.25
AnagaFF 0.75FY 10.06 44.42HF 2.04 15.67 2.00FS 0.66 14.42 3.34 6.65
ArureFF 0.81FY 12.93 64.03HF 1.30 11.62 0.92FS 0.61 6.37 0.51 0.92
Finca AmadoFF 0.00FY 0.00 8.39HF 0.00 0.30 0.05FS 0.00 21.32 0.57 69.37
El RíoFF 0.80FY 14.61 67.16HF 1.15 9.62 0.86FS 0.46 4.07 0.85 0.42
San AntolínFF 0.66FY 10.97 51.99HF 0.99 8.19 0.60FS 2.26 12.02 3.19 9.12
San JoséFF 0.43FY 5.61 39.74HF 1.00 5.39 0.80FS 2.44 28.75 2.70 13.13
VallehermosoFF 0.56FY 11.80 75.01HF 0.90 10.72 0.81FS 0.02 0.15 0.02 0.00
Fig. 2. Bidimensional plot summarizing the effect of tree size, leaf traits and soil nu-trients on the reproductive components (FI: flowering intensity, FS: fruit set, and VS:viable seeds), according to the redundancy analysis. Data from all reproductive in-dividuals in all 8 populations is included. Only three predictor variables (dotted lines)selected by a forward stepwise procedure are represented (N: total soil nitrogen, D:largest crown diameter, and LA: leaf area). Variables D and N were positively related toall the reproductive components and included within the first canonical axis. Thesetwo variables explained 23.4% of the variance in the reproductive components. Thesecond axis explained 2.4% of the variance and was positively related to LA, although itwas not significant.
0 200 400 600 800 1000
Tree size (cm)
0
0.02
0.04
0.06
0.08
0.10
0.12
0.14
RR
P
SA AF AN RI VH AR FA SJ
y = y1, y2; breakpoint x = 550
R2 = 0.30y1 = 0.000012 xy2 = 0.006600 + 0.000078 x
Fig. 3. Segmental linear relationship between tree size and relative reproductive-performance. Tree size was calculated as largest crown diameter (cm). Relativereproductive-performance (RRP) was calculated using the following expression:RRP ¼ FF � FI � HF � FS (FF: frequency of flowering; FI: flowering intensity; HF: ratioof hermaphroditic flowers; FS: fruit set). SA (San Antolín), AF (Aldea del Fresno), AN(Anaga), RI (El Río), VH (Vallehermoso), AR (Arure), FA (Finca Amado), SJ (San José).
C. Granado-Yela et al. / Acta Oecologica 52 (2013) 29e3734
High reproductive performance was also observed in San Antolín,where oceanic influence enables thriving at the thermal limit asrelict elements in coastal habitat refuges. We found in these threepopulations (Finca Amado, San José and San Antolín) values of over70% in flowering probability (in most cases over 90%) and highvalues in flowering intensity, fruit set, and viable seeds in all years.Indeed, other studies conducted in populations in the core of thedistribution on the Iberian Peninsula found similar values in theproportions of fruiting trees and fruit set (Jordano,1987) aswell as inthe number of viable seeds (Rey and Alcántara, 2000) to those foundin the present study in Finca Amado, San José and San Antolín.
This substantial investment in sexual reproduction in peripheralpopulations may partially account for the high values of geneticdiversity found in these populations in previous studies (Rubio deCasas et al., 2006; García-Verdugo et al., 2009a, 2010b). Patternsof dispersal, however, considerably differ among populations onthe island of La Palma and in the relict population in San Antolín.Whereas extensive gene flow mediated by seed dispersal results inmoderate levels of differentiation among Canarian populations(García-Verdugo et al., 2010b), long-term reproductive isolation in
the coastal habitat refuge has resulted in a marked genetic diver-gence from the nearest populations (Rubio de Casas et al., 2006).
4.2. Environmental influence on the components of reproductiveperformance
Among all study populations, site-specific environmental con-ditions accounted for most of the variation in reproductive per-formance, as shown by the partial least squares regressions. Understressful environmental conditions, long-lived plants prioritizegrowth and maintenance over reproduction (Silvertown et al.,
C. Granado-Yela et al. / Acta Oecologica 52 (2013) 29e37 35
1993). Large reproductive efforts should therefore be frequent infavourable environments and become more sporadic wheremaintenance expenses redound to the detriment of growth andreproduction (e.g. Waite and Hutchings, 1982; Lovett-Doust, 1989).In population El Río, at the rainfall limit, less than 30% of the smalland scarcely fecund individuals were able to reproduce in mostyears. Under less stressful conditions, both at the thermal (Aldeadel Fresno) and rainfall (Arure) limit, those years in which mostindividuals were reproductive alternated with a year in which onlya few individuals were able to reproduce.
Besides, the extremely poor performance observed in Valle-hermoso, one of the additional populations that were sampled toimprove robustness of the results and, therefore, without anyparticular environmental limitation, indicates that stressful condi-tions are not privative of peripheral populations. In addition, thisresult suggests that the number of environmental factors that affectthe reproductive performance is sufficiently large to hinder thetimely identification of populations at the environmental limit of itsrange. In line with our main findings, this unexpected result em-phasizes the distinction between geographic peripheral positionand ecological marginality in plant populations. This distinction isparticularly important in species distribution modelling, where it istoo often assumed that geographic processes are dominant overenvironmental ones (Elith and Leathwick, 2009).
In this study local environmental fluctuations during reproduc-tive stages (mainly during fruit formation) caused erratic patterns ofreproductive performance. For example, the overall reproductiveperformance was jeopardized as a consequence of particularlyextreme environmental conditions after anthesis (see FS values ofzero, or nearly zero, in populations El Río, Vallehermoso and Arureall years, and in population Anaga in 2008). Our results indicate thatlow soil water availability during mid-summer was related to lowfruit set, as suggested by other authors for the cultivated olive (e.g.Palese et al., 2010), and may play a key role at certain range limits.Local differences in soil nutrient availability also contributed tovariation in reproductive performance among individuals. Soil nu-trients are known to influence reproductive performance in manyspecies (Nams et al.,1993). In the present case, the strong correlationbetween soil N and plant size did not allow to segregate the effect ofnutrient availability on the reproductive performance from the ef-fect of plant size. Finally, it is striking that the same environmentalvariables influenced different components of the reproductive per-formance in opposite directions (e.g. PAR was negatively related tothe flowering intensity and positively related to viable seeds). Allthese findings provide a potential mechanism underlying cases ofbetween-site discrepancies in vital rates and warn against theinterpretation of population viability based on single reproductivecomponents (Angert, 2006).
4.3. Relationship between phenotypic traits and reproductiveperformance
Within populations, our findings indicate that the reproductiveperformance of O. europaeawas strongly influenced by tree size. Inagreement with previous studies in woody species, plant size wasrelated to frequency of reproduction (Thomas, 1996; Philipp andNielsen, 2010), flowering intensity (Philipp and Nielsen, 2010)and fecundity (Abrahamson and Layne, 2002). Consequently, treesize was also related to relative and absolute reproductive perfor-mance. Nevertheless, the relationship between tree size andreproductive-performance was not strictly linear. Thus, smallchanges in size may cause large differences in reproductive per-formance. This size-related advantage could derive frommore thanlinear gains in resource acquisition for larger sizes (Barot et al.,2005). Size advantage in the uptake of resources has long been
described in studies of competition for light among neighbouringplants: larger plants shade smaller plants and thus absorb muchmore light in relative and absolute terms (Weiner and Thomas,1986; Weiner, 1990; Falster and Westoby, 2003). But size itselfmight be advantageous because large plants optimize the use ofavailable resources to enhance resource foraging efficiency throughactive environmental screening, growth in favourable directions(Silvertown and Gordon, 1989; Bazzaz, 1991; Augspurger andBartlett, 2003), or the exploitation of the different light-environments across tree crowns (Granado-Yela et al., 2011).Given the importance of size on reproductive performance, treesize class distribution at the population level appears to be a criticalfactor that links both natural and human disturbances to popula-tion viability at the species range edge.
The relationship between tree size and reproduction is likelymodulated by small-scale factors such as resource patchiness andindividual features (Parra-Tabla and Bullock, 2003; Hampe, 2005).Our findings show that O. europaea individuals with large leavesreproduce more frequently than individuals with small leaves. Therelationship between these vegetative traits and individual fitnesscan be attributed either to the value of these traits as a proxy forfavourable environmental conditions or to the expression of a moreeffective phenotype in the capture of light.
4.4. Peripheral populations of the wild olive in a scenario of climaticchange
The Mediterranean wild olive at the western edge of its distri-bution faces contrasting situations, namely physiographic margins,where despite a high reproductive output, further expansion isprevented by the ocean barrier; historical margins, where popu-lation reproductive outcomes have been long confined in a habitatrefuge, and ecological margins, where a poor reproductive perfor-mance reflects suboptimal environmental conditions. These sce-narios, however, do not represent permanent or steady-statesituations. On the contrary, population reproductive performanceat these range margins largely determines the species ability torespond to changing environments (Hampe and Petit, 2005). In ascenario of climatic change, our data on reproductive performancesuggest that these margins may either become expanding or rearedges. Based on regional climatic projections by 2011e2040(Brunet et al., 2009), it is expected that those range limits set by theisotherm of the minimummean temperature (Rubio de Casas et al.,2002) would become expanding edges. Our study populations atthis thermal limit showed two contrasted scenarios: isolatedgenetically-divergent populations (San Antolín; Rubio de Casaset al., 2006) with a successful reproductive outcome, and lessdifferentiated populations, such as Aldea del Fresno, with an un-even reproductive outcome but in the likely presence of a sub-stantial interpopulation gene flow. On the contrary, the expectedreduction in annual rainfall (cf. Brunet et al., 2009) will probablyhave severe effects on the Canarian populations currently growingat the rainfall limit. This limit will likely become a rear edge of thespecies range.
5. Conclusions
The present study shows that the biogeographical concept ofrange margin does not involve low reproductive performance.Among all study populations, site-specific environmental condi-tions accounted for most of the variation in reproductive perfor-mance: populations occurring under oceanic conditions exhibitedhigh values in all components of the reproductive performance,whereas the rest of the studied peripheral populations showed lowvalues. These results emphasize the relevance of the distinction
C. Granado-Yela et al. / Acta Oecologica 52 (2013) 29e3736
between geographic peripheral position and ecological marginalityin plant populations. Due to the close relationship between plantsize and fecundity, natural or human disturbances on populationsize structure will likely have major effects on the possibilities ofpersistence and expansion at the range edges. Our study helps toovercome simplistic assumptions of population performance acrossranges. Ad hoc studies are needed to further understand theecological and evolutionary consequences of differential repro-ductive performance of peripheral populations, and to support themanagement of plant populations under current global warmingscenarios.
Acknowledgements
We wish to thank E. Manrique, A. Vázquez, S. Santamaría, O.García-Bodelón and E. Torres for field and laboratory assistance.Special thanks to Mr. Cormac de Brun for the linguistic corrections.We sincerely acknowledge the numerous comments of two anon-ymous reviewers that significantly improved the manuscript. Thisresearch was funded by the Spanish Ministry of Science andInnovation (project CGL2009-10392/BOS), by a MEC-Fulbrightfellowship to C G-V (FU2009-0068) and by an FPU grant to C. G-Y(AP2006-02283). We are also indebted to the Madrid RegionalGovt. (project REMEDINAL-2, S2009/AMB-1783).
Appendix A. Supplementary data
Supplementary data related to this article can be found at http://dx.doi.org/10.1016/j.actao.2013.07.002.
References
Abrahamson, W.G., Layne, J.N., 2002. Relation of ramet size to acorn production infive oak species of xeric upland habitats in south-central Florida. Am. J. Bot. 89,124e131.
Ackerly, D.D., Dudley, S.A., Sultan, S.A., Schmitt, J., Coleman, J.S., Linder, C.R.,Sandquist, D.R., Geber, M.A., Evans, A.S., Dawson, T.E., Lechowicz, M.J., 2000. Theevolution of plant ecophysiological traits: recent advances and future di-rections. BioScience 50, 979e995.
Angert, A.L., 2006. Demography of central and marginal populations of monkey-flowers (Mimulus cardinalis and M-lewisii). Ecology 87, 2014e2025.
Angert, A.L., Schemske, D.W., 2005. The evolution of species’ distributions: recip-rocal transplants across the elevation ranges of Mimulus cardinalis andM. lewisii. Evolution 59, 1671e1684.
Augspurger, C.K., Bartlett, E.A., 2003. Differences in leaf phenology between juve-nile and adult trees in a temperate deciduous forest. Tree Physiol. 23, 517e525.
Barot, S., Mitja, D., Miranda, I., Meija, G.D., Grimaldi, M., 2005. Reproductive plas-ticity in an Amazonian palm. Evol. Ecol. Res. 7, 1051e1065.
Bazzaz, F.A., 1991. Habitat selection in plants. Am. Nat. 137, S116eS130.Besnard, G., De Casas, R.R., Christin, P.A., Vargas, P., 2009. Phylogenetics of Olea
(Oleaceae) based on plastid and nuclear ribosomal DNA sequences: tertiaryclimatic shifts and lineage differentiation times. Ann. Bot. 104, 143e160.
Binkley, D., Vitousek, P., 1989. Soil nutrient availability. In: Pearcy, R.W.,Ehleringer, J.R., Mooney, H.A., Rundel, P.W. (Eds.), Plant Physiological Ecology:Field Methods and Instrumentation. Chapman & Hall, London, UK, pp. 75e96.
Brunet, M., Casado, M., Castro, M., Galán, P., López, J., Martín, J., Pastor, A., Petisco, E.,Ramos, P., Ribalaygua, J., Rodríguez, E., Sanz, I., Torres, L., 2009. Generación deescenarios regionalizados de cambio climático para España. Agencia Estatal deMeteorología, Madrid, Spain.
Burnham, K.P., Anderson, D.R., 2002. Model Selection and Multi-model Inference: apractical information-theoretic approach, second ed. Springer-Verlag, NewYork, USA.
Dorken, M.E., Eckert, C.G., 2001. Severely reduced sexual reproduction innorthern populations of a clonal plant, Decodon verticillatus (Lythraceae).J. Ecol. 89, 339e350.
Egley, G.H., Chandler, J.M., 1983. Longevity of weed seeds after 5.5 years in thestoneville 50-year buried-seed study. Weed Sci. 31, 264e270.
Elith, J., Leathwick, J.R., 2009. Species distribution models: ecological explanationand prediction across space and time. Annu. Rev. Ecol. Evol. Syst. 40, 677e697.
Falster, D.S., Westoby, M., 2003. Plant height and evolutionary games. Trends Ecol.Evol. 18, 337e343.
García, D., Zamora, R., Gómez, J.M., Jordano, P., Hodar, J.A., 2000. Geographicalvariation in seed production, predation and abortion in Juniperus communisthroughout its range in Europe. J. Ecol. 88, 436e446.
García-Verdugo, C., 2011. Intracanopy plasticity under strong wind conditions in thewild olive tree (Olea europaea L.): a conserved response between closely relatedtaxa? Trees-Struct. Funct. 25, 509e518.
García-Verdugo, C., Fay, M.F., Granado-Yela, C., Casas, R.R., Balaguer, L., Besnard, G.,Vargas, P., 2009a. Genetic diversity and differentiation processes in the ploidyseries of Olea europaea L.: a multiscale approach from subspecies to insularpopulations. Mol. Ecol. 18, 454e467.
García-Verdugo, C., Granado-Yela, C., Manrique, E., De Casas, R.R., Balaguer, L.,2009b. Phenotypic plasticity and integration across the canopy of Olea europaeasubsp. guanchica (Oleaceae) in populations with different wind exposures. Am.J. Bot. 96, 1454e1461.
García-Verdugo, C., Méndez, M., Velázquez-Rosas, N., Balaguer, L., 2010a. Con-trasting patterns of morphological and physiological differentiation acrossinsular environments: phenotypic variation and heritability of light-relatedtraits in Olea europaea. Oecologia 164, 647e655.
García-Verdugo, C., Forrest, A.D., Fay, M.F., Vargas, P., 2010b. The relevance of geneflow in metapopulation dynamics of an oceanic island endemic, Olea europaeasubsp. guanchica. Evolution 64, 3525e3536.
García-Verdugo, C., Forrest, A.D., Balaguer, L., Fay, M.F., Vargas, P., 2010c. Parallelevolution of insular Olea europaea subspecies based on geographical structuringof plastid DNA variation and phenotypic similarity in leaf traits. Bot. J. Linn. Soc.162, 54e63.
Gaston, K.J., 1990. Patterns in the geographical ranges of species. Biol. Rev. Camb.Philos. Soc. 65, 105e129.
Gaston, K.J., 2009. Geographic range limits: achieving synthesis. P. Roy. Soc. B-Biol.Sci. 276, 1395e1406.
Geber, M.A., Griffen, L.R., 2003. Inheritance and natural selection on functionaltraits. Int. J. Plant Sci. 164, S21eS42.
Granado-Yela, C., García-Verdugo, C., Carrillo, K., Rubio de Casas, R.,Kleczkowski, L.A., Balaguer, L., 2011. Temporal matching among diurnalphotosynthetic patterns within the crown of the evergreen sclerophyll Oleaeuropaea L. Plant Cell Environ. 34, 800e810.
Gratani, L., Bombelli, A., 1999. Leaf anatomy, inclination, and gas exchange re-lationships in evergreen sclerophyllous and drought semideciduous shrubspecies. Photosynthetica 37, 573e585.
Hampe, A., 2005. Fecundity limits in Frangula alnus (Rhamnaceae) relict pop-ulations at the species’ southern range margin. Oecologia 143, 377e386.
Hampe, A., Petit, R.J., 2005. Conserving biodiversity under climate change: the rearedge matters. Ecol. Lett. 8, 461e467.
Jordano, P., 1987. Avian fruit removal: effects of fruit variation, crop size, and insectdamage. Ecology 68, 1711e1723.
Jump, A.S., Woodward, F.I., 2003. Seed production and population densitydecline approaching the range-edge of Cirsium species. New Phytol. 160,349e358.
Kato, E., Hiura, T., 1999. Fruit set in Styrax obassia (Styracaceae): the effect of lightavailability, display size, and local floral density. Am. J. Bot. 86, 495e501.
Kawecki, T.J., 2008. Adaptation to marginal habitats. Annu. Rev. Ecol. Evol. Syst. 39,321e342.
Lau, T.C., Stephenson, A.G., 1994. Effects of soil-phosphorus on pollen production,pollen size, pollen phosphorus-content, and the ability to sire seeds in Cucurbitapepo (Cucurbitaceae). Sex. Plant Reprod. 7, 215e220.
Leist, N., Krämer, S., 2003. ISTAWorking Sheets on Tetrazolium Testing. ISTA, Zurich,Switzerland.
Lesica, P., Allendorf, F.W., 1995. When are peripheral populations valuable forconservation? Conserv. Biol. 9, 753e760.
Levin, D.A., Clay, K., 1984. Dynamics of synthetic Phlox drummondii populations atthe species margin. Am. J. Bot. 71, 1040e1050.
Lovett-Doust, J., 1989. Plant reproductive strategies and resource-allocation. TrendsEcol. Evol. 4, 230e234.
Méndez, M., 1997. Sources of variation in seed mass in Arum italicum. Int. J. PlantSci. 158, 298e305.
Méndez, M., Karlsson, P.S., 2004. Between-population variation in size-dependentreproduction and reproductive allocation in Pinguicula vulgaris (Lentibular-iaceae) and its environmental correlates. Oikos 104, 59e70.
Mott, D.G., 1966. The analysis of determination in population systems. In:Watt, K.E.F. (Ed.), Systems Analysis in Ecology. Academic Press, New York, USA,pp. 179e194.
Morin, X., Augspurger, C., Chuine, I., 2007. Process-based modeling of species’ dis-tributions: what limits temperate tree species’ range boundaries? Ecology 88,2280e2291.
Muñoz, A., Celedon-Neghme, C., Cavieres, L.A., Arroyo, M.T.K., 2005. Bottom-upeffects of nutrient availability on flower production, pollinator visitation, andseed output in a high-Andean shrub. Oecologia 143, 126e135.
Nachlas, M.M., Margulies, S.I., Seligman, A.M., 1960. Sites of electron transfer totetrazolium salts in the succinoxidase system. J. Biol. Chem. 235, 2739e2743.
Nams, V.O., Folkard, N.F.G., Smith, J.N.M., 1993. Effects of nitrogen-fertilization onseveral woody and nonwoody boreal forest species. Can. J. Bot. 71, 93e97.
Ne’eman, G., Ne’eman, R., Ellison, A.M., 2006. Limits to reproductive success ofSarracenia purpurea (Sarraceniaceae). Am. J. Bot. 93, 1660e1666.
Palese, A.M., Nuzzo, V., Favati, F., Pietrafesa, A., Celano, G., Xiloyannis, C., 2010. Ef-fects of water deficit on the vegetative response, yield and oil quality of olivetrees (Olea europaea L., cv Coratina) grown under intensive cultivation. Sci.Hortic. 125, 222e229.
Pansiot, F.P., Rebour, H., 1961. Improvement in Olive Cultivation. FAO AgriculturalStudies, Rome, Italy.
C. Granado-Yela et al. / Acta Oecologica 52 (2013) 29e37 37
Parra-Tabla, V., Bullock, S.H., 2003. Exploring the limiting causes of fruit productionin the tropical tree Ipomoea wolcottiana Rose (Convolvulaceae). Plant Ecol. 166,107e115.
Philipp, M., Nielsen, L.R., 2010. Reproductive ecology of Scalesia cordata (Aster-aceae), an endangered species from the Galapagos Islands. Bot. J. Linn. Soc. 162,496e503.
Rey, P.J., Alcántara, J.M., 2000. Recruitment dynamics of a fleshy-fruited plant (Oleaeuropaea): connecting patterns of seed dispersal to seedling establishment.J. Ecol. 88, 622e633.
Rubio de Casas, R., Balaguer, L., Manrique, E., Pérez, M.E., Vargas, P., 2002. On thehistorical presence of the wild olive [Olea europaea L. var. sylvestris (Miller) Lehr.(Oleaceae)] in the Eurosiberian region of the Iberian Peninsula. Anales Jard. Bot.Madrid 59, 342e344.
Rubio de Casas, R., Besnard, G., Schonswetter, P., Balaguer, L., Vargas, P., 2006.Extensive gene flow blurs phylogeographic but not phylogenetic signal Oleaeuropaea L. Theor. App. Genet. 113, 575e583.
Rubio de Casas, R., Vargas, P., Pérez, M.E., Manrique, E., García-Verdugo, C.,Balaguer, L., 2011. Sun and shade leaves of Olea europaea respond differently toplant size, light availability and genetic variation. Funct. Ecol. 25, 802e812.
Sagarin, R.D., Gaines, S.D., 2002. The ’abundant centre’ distribution: to what extentis it a biogeographical rule? Ecol. Lett. 5, 137e147.
Samson, D.A., Werk, K.S., 1986. Size-dependent effects in the analysis of repro-ductive effort in plants. Am. Nat. 127, 667e680.
Sanz-Cortés, F., Martínez-Calvo, J., Badenes, M.L., Bleiholder, H., Hack, H., Llacer, G.,Meier, U., 2002. Phenological growth stages of olive trees (Olea europaea). Ann.Appl. Biol. 140, 151e157.
Sexton, J.P., Mcintyre, P.J., Angert, A.L., Rice, K.J., 2009. Evolution and ecology ofspecies range limits. Annu. Rev. Ecol. Evol. Syst. 40, 415e436.
Silvertown, J., Gordon, D.M., 1989. A framework for plant behavior. Annu. Rev. Ecol.Syst. 20, 349e366.
Silvertown, J., Franco, M., Pisanty, I., Mendoza, A., 1993. Comparative plantdemography e relative importance of life-cycle components to the finite rate ofincrease in woody and herbaceous perennials. J. Ecol. 81, 465e476.
Sokal, R.R., Rohlf, F.J., 1995. Biometry: The Principles and Practice of Statistics inBiological Research, third ed. W. H. Freeman and Co., New York, USA.
Sugiyama, S., 2003. Geographical distribution and phenotypic differentiation inpopulations of Dactylis glomerata L. in Japan. Plant Ecol. 169, 295e305.
ter Braak, C.J.F., Smilauer, P., 2002. CANOCO Reference Manual and CanoDraw forWindows User’s Guide: Software for Canonical Ordination, Version 4.5.Microcomputer Power, Ithaca, New York, USA.
Terral, J.F., Badal, E., Heinz, C., Roiron, P., Thiebault, S., Figueiral, I., 2004. A hydraulicconductivity model points to post-Neogene survival of the Mediterranean olive.Ecology 85, 3158e3165.
Thomas, S.C., 1996. Relative size at onset of maturity in rain forest trees: acomparative analysis of 37 Malaysian species. Oikos 76, 145e154.
Vargas, P., Kadereit, J.W., 2001. Molecular fingerprinting evidence (ISSR, Inter-Simple Sequence Repeats) for a wild status of Olea europaea L. (Oleaceae) inthe Eurosiberian North of the Iberian Peninsula. Flora 196, 142e152.
Vucetich, J.A., Waite, T.A., 2003. Spatial patterns of demography and genetic pro-cesses across the species’ range: null hypotheses for landscape conservationgenetics. Conserv. Genet. 4, 639e645.
Waite, S., Hutchings, M.J., 1982. Plastic energy allocation patterns in Plantagocoronopus. Oikos 38, 333e342.
Weiner, J., 1990. Asymmetric competition in plant populations. Trends Ecol. Evol. 5,360e364.
Weiner, J., Thomas, S.C., 1986. Size variability and competition in plant mono-cultures. Oikos 47, 211e222.
Weiner, J., Campbell, L.G., Pino, J., Echarte, L., 2009. The allometry of reproductionwithin plant populations. J. Ecol. 97, 1220e1233.
Zar, J.H., 1999. Biostatistical Analysis, fourth ed. Prentice Hall, New Jersey, USA.


