Embed Size (px)
Citation preview

Tidal and non-tidal sea level variability along the coastalNova Scotia from satellite altimetry
GUOQI HAN*†, JOHN LODER‡ and BRIAN PETRIE‡
†Northwest Atlantic Fisheries Centre, Fisheries and Oceans Canada,
St John’s, NL, Canada
‡Bedford Institute of Oceanography, Fisheries and Oceans Canada,
Dartmouth, NS, Canada
TOPEX/Poseidon (T/P) sea level data are used to investigate tidal and non-tidal
sea level variability over the Scotian Shelf. Eight major diurnal and semi-diurnal
tidal constituents are derived from the September 1992 to December 2001 T/P
data. The present altimetric tides agree generally with in situ observations and
show an error reduction of over 30� in phase over Han et al.’s [Han, G., Ikeda, M.
and Smith, P.C., 1996, Oceanic tides on the Newfoundland and Scotian Shelves
from TOPEX/POSEIDON altimetry. Atmosphere–Ocean, 34, pp. 589–604] results
for the diurnal tides. De-tided T/P sea level data are used to provide geo-referenced
seasonal-mean sea surface topography during the period September 1992 to July
2002. The T/P data are explored to estimate seasonal-mean sea level along the
Nova Scotia coast. Comparisons with sea level measurements from coastal tide
gauges are carried out to evaluate the potential of altimetry data for coastal sea
level monitoring. Seasonally the sea level is highest along the coast in late autumn/
early winter (associated with the peak of the Nova Scotian Current), and over the
Scotian Slope in summer. On the interannual scale it was low in the early 1990s,
high in the mid 1990s, and close to normal in the late 1990s and early 2000s.
1. Introduction
The Scotian Shelf off Nova Scotia (figure 1) is subject to strong downstream influ-
ences of the Labrador Current from the north and the outflow of the Gulf of St
Lawrence. The influence of the Labrador Current of Arctic origin can continue
equatorward along the upper continental slope and can intrude onto the Scotian
Shelf through cross-shelf channels (Petrie and Drinkwater 1993, Petrie 2007). The
intruding water is a mixture of the Labrador Slope Water and the warmer and more
saline Warm Slope Water offshore (Sutcliffe et al. 1976). Offshore over the ScotianSlope, the sea level and circulation are subject to influences of the Gulf Stream
meanders and rings (e.g. Han 2007).
Earlier studies using water level and hydrographic data suggest that local and non-
local forcings play significant roles in sea level variability on the Scotian Shelf and
Slope. Thompson (1986) examined sea level data off northeast America for the period
from 1950 to 1975 and found that wind stresses and air pressure were only small
contributors to the interannual changes of the coastal sea level. Umoh and Thompson
(1994) showed that interannual temperature variability on the Scotian Shelf could notbe accounted for by the atmospheric heat flux variability. The Nova Scotian Current
*Corresponding author. Email: [email protected]
International Journal of Remote SensingISSN 0143-1161 print/ISSN 1366-5901 online # 2010 Government of Canada Crown Copyright
http://www.tandf.co.uk/journalsDOI: 10.1080/01431161.2010.485152
International Journal of Remote Sensing
Vol. 31, Nos. 17–18, September 2010, 4791–4806
Dow
nloa
ded
by [
Fish
erie
s an
d O
cean
s C
anad
a] a
t 08:
48 2
2 Ja
nuar
y 20
14

is usually strong in winter (Anderson and Smith 1989), associated with the large
onshore sea surface slope. The dominant alongshore wind in summer results in coastal
upwelling (Petrie et al. 1987). Steric height variability over the Scotian Shelf was
studied based on the temperature and salinity climatology (e.g. Loder et al. 1997),showing general seasonal increases of 5–10 cm from winter to summer, with an
exception that the winter steric height is higher on the inner Scotian Shelf. Tidal
information was mainly from scattered tide-gauge data (Godin 1980) and hydrody-
namic models (de Margerie and Lank 1986, Han and Loder 2003).
Satellite altimetry has been widely used for studying oceanic tides and mesoscale
ocean circulation in the deep ocean (e.g. Fu and Cazenave 2001). Its synoptic mea-
surements with near global coverage of the world’s ocean make it an essential tool in
ocean and climate research and monitoring. Satellite altimetry provides reliablemeasurements of offshore sea level variations off Atlantic Canada, particularly for
those with large amplitudes such as tides (Han et al. 1996), major ocean currents
(Hakkinen and Rhines 2004), and mesoscale eddies (Han 2004).
Until recently the majority of oceanographic applications of satellite altimetry have
simply excluded coastal and shelf regions. Estimation of associated sea level varia-
tions at coastal sites from altimetry is more challenging and the results may be subject
to larger uncertainty, generally related to data degradation, sparsity, and errors in
various environmental corrections near land. Appropriate re-tracking methods mustbe implemented and evaluated to ensure accuracy. Environmental corrections such as
water vapour need to be improved. Accurate coastal tide models and methods to
integrate them with the global deep ocean tide models for de-tiding are required.
−68 −66 −64 −62 −60 −5841
42
43
44
45
46
47
012
050088
12607
1
10903
3037
020
Longitude°W
Latit
ude°
N
Nova Scotia
Halifax
Scotian Shelf SEC
GeorgesBank
SIB
LCNorth Sydney
YarmouthLunenburg
Canso Harbour
Lockeport
Murphy’s Coveo
o
o
o
o
o
o
Figure 1. Map showing the Scotian Shelf and adjacent oceans. The numerical labelled lines(thin dashed) are the selected T/P ground tracks on which the analysis is performed. The 200-,1000-, 2000-, 3000- and 4000-m isobaths (grey lines) are also shown. LC: Laurentian Channel;SIB: Sable Island Bank; SEC: Shelf-edge current.
4792 G. Han et al.
Dow
nloa
ded
by [
Fish
erie
s an
d O
cean
s C
anad
a] a
t 08:
48 2
2 Ja
nuar
y 20
14

There are only three (figure 1) long-term tide gauges along the nearly 1000-km
coastline of Nova Scotia and less than a dozen along the approximately 10 000-km
Atlantic (including the Gulf of St Lawrence) coastline of Canada. Therefore, there is
high potential that satellite altimetry can contribute to coastal sea level monitoring,
particularly in remote areas and ones with spatially-varying sea level changes. Thealtimetric data available since the 1990s allow for the extraction of important seasonal
and interannual sea level variations which are of significance to coastline variability,
climate and other societal issues in Atlantic Canada.
In this study we used TOPEX/Poseidon (T/P) altimetry data for the period from
1992 to 2002 to study tidal and non-tidal sea level variability over the Scotian Shelf.
Our objectives are: (1) to provide improved observational estimates of the tidal
variations in sea surface topography over the Scotian Shelf; (2) to provide geo-
referenced seasonal-mean sea surface topography over the Scotian Shelf and adjacentregions by season and year; and (3) to compare seasonal and interannual variations in
coastal sea level from T/P altimetry with those from coastal tide gauges along Nova
Scotia, in order to evaluate the potential of satellite altimetry for coastal sea level
monitoring.
This paper consists of five sections. Section 2 briefly describes the datasets, proces-
sing techniques, and methods for tidal and non-tidal analyses. Tidal results are
presented in section 3. Section 4 discusses non-tidal results including seasonal and
interannual variations. A summary is given in section 5.
2. Methodology
2.1 T/P data processing and analyses
T/P sea-surface height data were obtained from the NASA Pathfinder Project. The
satellite has a nominal repeat cycle of 10 days, and ideally there are 360 observations
at each location. There are ascending (SW–NE) and descending (NW–SE) tracks with
spacing of about 200 km on the Scotian Shelf (figure 1). The along-track resolution is
about 6 km. The data were corrected based primarily on the principles in Benada
(1997) for various atmospheric and oceanographic effects, including:
1. wet troposphere delay measured by the T/P microwave radiometer;2. dry troposphere delay determined from the European Centre for Medium-
Range Weather Forecasts surface pressure model;
3. ionosphere delay based on the dual frequency altimeter measurement;
4. electromagnetic bias (due to ocean wave influences) using 2% of the significant
wave height;
5. solid Earth tide; and
6. inverse barometric effect.
The standard NASA GSFC (Goddard Space Flight Center) precise orbit based on the
Joint Gravity Model-3 (JGM-3) was used to produce the sea surface height data
relative to the T/P reference ellipsoid with equatorial radius of 6378.1363 km and a
flattening coefficient of 1/298.257.
2.1.1 Analysis for tides. The T/P data used for tidal analysis are for the period from
August 1992 to December 2001. They are not corrected for ocean, load, or pole tides
henceforth called the tide-in T/P data. The 10-year T/P data are sufficient to resolve
PORSEC 2008 4793
Dow
nloa
ded
by [
Fish
erie
s an
d O
cean
s C
anad
a] a
t 08:
48 2
2 Ja
nuar
y 20
14

the eight major semi-diurnal (M2, S2, N2, K2) and diurnal (K1, O1, P1, Q1) tidal
constituents well. Little improvement can be achieved with a longer dataset.
A modified response analysis method (Han et al. 1996) was used to extract eight
major tide constituents from the tide-in T/P data. The orthogonal response analysis
method to retrieve tides from satellite altimetry was described and discussed in greatdetail by Cartwright and Ray (1990). In essence, the time-varying portion of the tide-
generating potential for each species is expressed as a sequence of nearly orthogonal
functions. A least squares regression is performed to determine the convolution
coefficients from the observed data. These coefficients are used to calculate the
admittance to the tide-generating potential at a frequency for each species. We also
included the annual cycle in the least squares analysis. As a result, the regression has a
14-parameter description, with two sets of six parameters for the semi-diurnal and
diurnal species and two (cosine and sine) remaining parameters for the annual cycle.The tidal admittance is used to calculate the amplitude and Greenwich phase lag for
each constituent.
2.1.2 Analysis for seasonal-mean anomalies. T/P sea-surface height data forseasonal-mean anomalies are for the period from mid 1992 to May 2002. Ocean,
load and pole tides were all corrected.
An along-track digital filter with a filter width of about 36 km (seven points) is
applied to the altimetric sea surface height data. The results presented are based on the
smoothed height data unless indicated otherwise. A time-mean sea surface was con-
structed from the T/P data. We then calculate the sea surface height anomalies relative
to the mean sea surface. Both the marine geoid and mean oceanic topography are
removed by this procedure.
2.2 Tide-gauge data and processing
Water level data at three permanent tide-gauge sites along the Nova Scotia coast
(North Sydney, Halifax and Yarmouth; see figure 1) were obtained from Marine
Environmental Data Service (MEDS) of Fisheries and Oceans Canada. One-hour
water level records from 1992 to 2002 are quality controlled, and then analysed by a
harmonic analysis method (Foreman and Henry 1989) to extract major tidal consti-tuents. The 2002 data from North Sydney were suspect and not included in this
analysis. The 2002 data for the two other sites received no or only minimal quality
control by MEDS but appeared to be of good quality.
A linear trend was removed from the tide-gauge data, to approximately account for
the effect of the ground motion, mainly due to post-glacial rebound. Note that any
long-term sea level trend is also removed by the de-trending. This approximation is
reasonable since the tidal and non-tidal variabilities of interest in this paper have
much shorter timescales than those of the Glacial Isostatic Adjustment (Peltier 2004).The detided sea level data are filtered using the Godin 25_24_24 filter (a boxcar
filter with 24, 24 and 25 h windows successively applied; Godin 1972) and averaged to
produce monthly mean sea levels. The inverse barometer effect is corrected using local
atmospheric pressure data at nearby meteorological stations of Environment Canada.
Tidal harmonic constituents at other coastal tide gauge stations and bottom
pressure gauge sites (see figure 2) are also used for evaluating the altimetric tides.
The in situ data are obtained from Han et al. (1996).
4794 G. Han et al.
Dow
nloa
ded
by [
Fish
erie
s an
d O
cean
s C
anad
a] a
t 08:
48 2
2 Ja
nuar
y 20
14

3. Major tidal constituents
We have derived eight major semi-diurnal (M2, S2, N2, K2) and diurnal (K1, O1, P1,
Q1) tidal constituents from the tide-in T/P data using the modified response analysis
method outlined in section 2.1.1. The major features are consistent with previous
results (e.g. Godin 1980, Han et al. 1996). For example, the semidiurnal has small
amplitude and phase change from the east to west, except for the southwestern
Scotian Shelf. The diurnal features amphidromic points near the eastern Scotian
Shelf. See Han et al. (1996) for the general patterns of semi-diurnal (M2, S2, N2)
and diurnal (K1, O1) co-tidal charts.We have compared the present altimetry estimates with in situ observations from
coastal tide gauges at the three permanent tide-gauge stations (table 1). For Halifax
and North Sydney, the altimetric tides on the ascending and descending tracks are
interpolated/extrapolated onto the tide-gauge site using an optimal linear interpola-
tion method with a correlation scale of 3� and 3� in the longitudinal and latitudinal
directions. For Yarmouth, a linear extrapolation scheme is used, with the altimetric
tidal data on Track 033 only.
There is good agreement between tide-gauge data and T/P estimates at Yarmouth.The largest amplitude (phase) difference is 0.023 m for K2, the smallest semi-diurnal
constituent (36� for Q1, the smallest diurnal constituent) with root mean square
(RMS) differences over eight constituents of 0.012 m (9�). This suggests the T/P
altimetry is able to provide accurate information for coastal tides.
−68 −66 −64 −62 −60 −5841
42
43
44
45
46
47
012
050088
126
071
10903
3
037
020
Longitude°W
Latit
ude°
N oooo
oo
o
oo
o
o
ooo
o
o
oo
Figure 2. Locations of coastal tide gauges and pelagic bottom pressure gauges where T/Pestimates are compared with in situ observations and with Han et al.’s (1996) results (seetable 2). Dashed lines are satellite ground tracks.
PORSEC 2008 4795
Dow
nloa
ded
by [
Fish
erie
s an
d O
cean
s C
anad
a] a
t 08:
48 2
2 Ja
nuar
y 20
14

At Halifax, the altimetric M2 amplitude is lower than the tide-gauge result by about
0.05 m, while the S2 and N2 amplitude differences are within 0.001 m. The altimetric
K1 and O1 amplitudes underestimate by about 0.01 and 0.02 m, respectively. The
overall RMS amplitude difference for all eight constituents is 0.021 m. There is
generally good agreement in phase between altimetric and tide-gauge data for the
semi-diurnal constituents, K1 and P1; however, the phases for O1 and Q1 differsubstantially (by 33 and 153�).
At North Sydney, the altimetric tide amplitude is significantly higher than the tide-
gauge magnitude by 0.14 m for M2, lower by 0.03 m for S2 and N2 and higher by 0.04
and 0.05 m for K1 and O1. The overall RMS amplitude difference for all eight
constituents is 0.06 m. There are also larger phase differences at this site than at
Yarmouth or Halifax. As we can see, the nearest altimetric data points are far away
from North Sydney (figure 1). For the diurnals, the presence of nearby amphidromic
points further limits the accuracy of extrapolation of altimetric tides to the coastalsite. A dynamic approach that assimilates along-track altimetric tides into a coastal
tidal model may be useful (e.g. Han et al. 2000, Egbert and Erofeeva 2002).
It is usually more difficult to observe weak constituents such as K2, P1, and Q1 due
to low signal-to-noise ratio, which were excluded in Han et al. (1996). The present
results from longer altimetric time series show approximate agreement with tide-
gauge estimates, except for Q1 at Halifax (table 1). Nevertheless, it is not surprising
to see large discrepancy for the Q1 phase, since the Q1 amplitude is nearly zero.
The altimetric tidal results are further evaluated against other coastal tide-gaugedata and pelagic bottom pressure gauge measurements (see figure 2 for location) off
Nova Scotia for the five major constituents. A comparison of the present altimetric
tide solutions with Han et al.’s (1996) altimetric estimates indicates overall improve-
ment for the diurnal tides (table 2), with an error reduction of over 30� in phase. The
nearly doubled record length is now sufficient to get the aliased K1 tide (which has an
aliasing period of 172.3 days) separated from the semi-annual cycle, which improves
the estimation of the tidal admittance at each frequency of the diurnal species.
The comparison also indicates little improvement for the semi-diurnal constituents.
Table 1. Harmonic constants from T/P estimates and tide-gauge observations (in parentheses)for eight major semi-diurnal and diurnal constituents at North Sydney, Halifax and Yarmouth.
Amplitudes are in metres and Greenwich phase lags are in degrees.
Yarmouth Halifax North Sydney
Amplitude Phase Amplitude Phase Amplitude Phase(m) (�) (m) (�) (m) (�)
M2 1.658 (1.652) 62 (61) 0.584 (0.633) 349 (351) 0.510 (0.368) 353 (349)S2 0.272 (0.287) 96 (89) 0.139 (0.139) 17 (23) 0.109 (0.143) 37 (24)N2 0.351 (0.336) 34 (35) 0.139 (0.14) 333 (327) 0.076 (0.106) 330 (320)K2 0.082 (0.059) 98 (90) 0.035 (0.039) 19 (16) 0.03 (0.035) 32 (27)K1 0.14 (0.137) 183 (183) 0.088 (0.109) 123 (123) 0.077 (0.043) 325 (27)O1 0.108 (0.124) 165 (169) 0.018 (0.04) 127 (94) 0.082 (0.029) 287 (332)P1 0.048 (0.050) 182 (183) 0.024 (0.032) 122 (124) 0.026 (0.015) 315 (29)Q1 0.016 (0.019) 160 (124) 0.014 (0.006) 128 (335) 0.011 (0.012) 250 (286)
4796 G. Han et al.
Dow
nloa
ded
by [
Fish
erie
s an
d O
cean
s C
anad
a] a
t 08:
48 2
2 Ja
nuar
y 20
14

4. Non-tidal sea levels
4.1 Altimetric mean surface topography
Mean sea levels at T/P track locations were calculated over the period from 1992 to
2002 relative to the T/P ellipsoid. We also bi-linearly interpolated the 20 by 20 GSFC00
mean surface topography (Wang 2001) onto the track locations. The differencesbetween the T/P and GSFC00 mean sea levels (the former minus the latter) were
computed location by location. We then mapped the differences onto a 0.2� by 0.2�
grid using an optimal linear interpolation method with correlation scales of 3� and 3�
in the longitudinal and latitudinal directions. The mapped differences were added
onto the GSFC00 mean sea surface. As expected, the T/P mean sea surface topogra-
phy (figure 3) is predominated by the spatial pattern in the marine geoid.
Interpretation for mean sea surface topography due to ocean dynamics are subject
Figure 3. Mean sea surface height (colour band, m) relative to the T/P ellipsoid from the T/Pdata for the period from August 1992 to June 2002. The 200-m isobath (grey lines) and T/Ptracks (white lines) are also displayed.
Table 2. The RMS differences between the altimetric tides and in situ observations. The valuesin parentheses are from Han et al.’s (1996) solutions. See figure 2 for observation locations.
Coastal Pelagic
Amplitude Phase Amplitude Phase(m) (�) (m) (�)
M2 0.031 (0.040) 11 (7) 0.012 (0.008) 4 (4)S2 0.017 (0.031) 13 (15) 0.015 (0.016) 10 (9)N2 0.014 (0.015) 17 (17) 0.012 (0.009) 8 (8)K1 0.014 (0.017) 15 (48) 0.013 (0.014) 10 (17)O1 0.019 (0.031) 29 (69) 0.018 (0.017) 21 (28)
PORSEC 2008 4797
Dow
nloa
ded
by [
Fish
erie
s an
d O
cean
s C
anad
a] a
t 08:
48 2
2 Ja
nuar
y 20
14

to uncertainty in the geoid. For coastal and shelf oceans, this is true even with recent
state-of-the-art mean dynamic topography (Foreman et al. 2008). The geoid from
GOCE (Gravity field and steady-state Ocean Circulation Explorer Mission)
(Drinkwater et al. 2007) is expected to significantly enhance the mean dynamical
topography on the shelf scale.
4.2 Anomalies of altimetric seasonal-mean sea-surface topography
Long-term, seasonal-mean, sea-surface height anomalies averaged from 1992 to 2002
were constructed using the optimal linear interpolation method with correlation
scales of 3� and 3� in the longitudinal and latitudinal directions (figure 4). We can
see the coastal sea level west of Halifax is highest in autumn and lowest in spring,
which can be well accounted for by the steric height variability. Over the open shelf,the sea level is higher in summer and autumn and lower in spring and winter, mainly in
response to seasonal atmospheric heating and cooling (Han et al. 2002). The seasonal
variability is enhanced over the continental slope, associated with shifting and/or
meandering of the Gulf Stream and rings pinched off from it. The annual sea level
range varies from 10 cm near the coast to 20 cm over the lower slope. Relatively low
sea level nearshore in summer could be associated with coastal upwelling under
alongshore wind forcing (Petrie et al. 1987) and relatively high sea level off the
southwestern Nova Scotia in winter could be associated with the passage of thepeak Nova Scotian Current (Anderson and Smith 1989, Han et al. 1997).
Figure 4. Long-term seasonal-mean sea surface height anomalies (colour band, m) from T/Pdata. The 200-m isobath (grey lines) and T/P tracks (white lines) are also displayed.
4798 G. Han et al.
Dow
nloa
ded
by [
Fish
erie
s an
d O
cean
s C
anad
a] a
t 08:
48 2
2 Ja
nuar
y 20
14

Using the optimal linear interpolation method, we also constructed seasonal-
mean sea-surface topography anomalies by season for selected years to show inter-
annual variability (figure 5). The sea level over the Scotian Shelf was low in 1994,
high in 1997, and in between in 2000, consistent with Han’s (2002) earlier analysis
from the descending-track data only. Overall, the interannual variability over theScotian Slope is nearly out of phase with that along the coast and over the Scotian
Shelf. Han (2007) showed that the mean sea level profile was lowest near the 3000-m
isobath, rising towards the Scotian Shelf and coast associated with the southwest-
ward shelf edge current and the Nova Scotian Current and towards offshore
associated with the northeastward slope current and the Gulf Stream. They illu-
strated that a southward shift of the Gulf Stream position would result in a sea level
rise near the coast and a sea level fall over the lower continental slope, and vice versa.
Gulf Stream rings can also be seen over the Scotian Slope, e.g. in spring and autumnof 1994 (figure 5(a)).
4.3 Seasonal and interannual sea level anomalies at tide-gauge stations and offshore
An important aspect of this paper is to evaluate accuracy of altimetric estimates of
coastal sea levels. Seasonal-mean sea level estimates at selected tide-gauge sites along
the Nova Scotia coast, extrapolated from the altimetry data using the aforementionedoptimal linear interpolation method, indicate significant interannual variations at all
the sites (figure 6). In general, the sea level was low in the early 1990s, high in mid
1990s and close to normal in the late 1990s and early 2000s. The range is about 10 cm.
Altimetric estimates are compared with tide-gauge measurements at the three
permanent tide-gauge sites (North Sydney, Halifax and Yarmouth) (figure 7). The
correlation coefficients are 0.53–0.64. The RMS sea level differences between records
are 3.5–4.5 cm, comparable to the RMS values of individual records. The removal of
the annual and semiannual cycles substantially enhances the agreement at Halifax(the RMS difference: 1.5 cm), and but not at the other two sites (the RMS difference:
2.3, 1.9 cm) (figure 8). At all three sites, the satellite sensor data appear to lag the
coastal tide gauge data for the period 1992–1997. Furthermore, at North Sydney,
there also appears to be some systematic difference between the tide gauge and
satellite observations, i.e. for the first half of the record the difference (satellite
minus gauge) is generally negative, and for the second half mostly positive. The lowest
correlation and largest RMS difference at this location are presumably associated
with the poorest T/P coverage. A dynamic approach that assimilates altimetricobservations into a coastal circulation model would be useful for improving the fit.
To provide further information on the along-shelf and cross-shelf structure of sea
level anomalies, four along-track bands were selected based on bathymetry: (i) coast to
mid-shelf, (ii) mid-shelf to 200 m, (iii) 200–2000 m and (iv) 2000–4000 m. For Tracks
050, 088 and 126, we average sea level anomalies band by band every cycle, to produce
band-averaged time series of sea level anomalies. To derive the annual cycle from the
sea level anomalies, we fit an annual harmonic to the data using least squares.
Over the inner shelf, the amplitude of the annual cycle is about 5 cm off central NovaScotia, decreasing towards both the northeastern and southwestern ends of the Scotian
Shelf (table 3). The phase pattern shows a ,2 month lag from east to west, suggesting a
southwestward propagation of the sea level signal at a rate of about 6 cm s-1.
The amplitude of the annual cycle is larger over the continental slope. The sea level is
PORSEC 2008 4799
Dow
nloa
ded
by [
Fish
erie
s an
d O
cean
s C
anad
a] a
t 08:
48 2
2 Ja
nuar
y 20
14

Figure 5. Seasonal-mean sea surface height anomalies (colour band, m) for (a) 1994, (b) 1997,and (c) 2000. The 200-m isobath (grey lines) and T/P tracks (white lines) are also displayed.
4800 G. Han et al.
Dow
nloa
ded
by [
Fish
erie
s an
d O
cean
s C
anad
a] a
t 08:
48 2
2 Ja
nuar
y 20
14
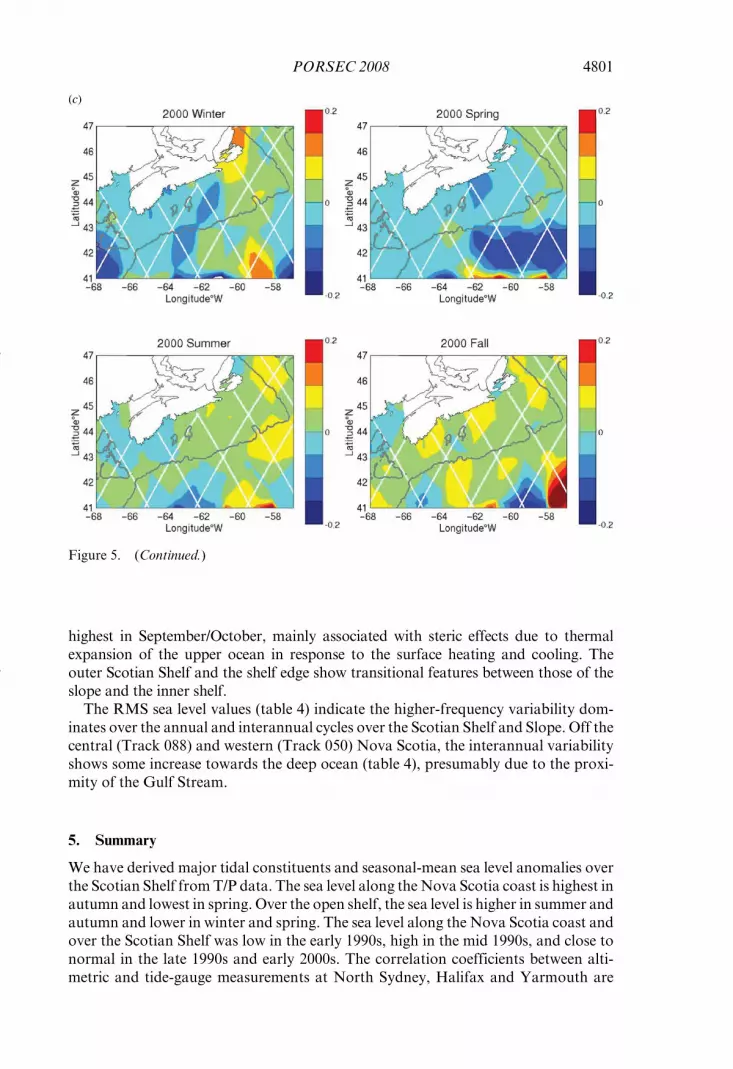
highest in September/October, mainly associated with steric effects due to thermal
expansion of the upper ocean in response to the surface heating and cooling. The
outer Scotian Shelf and the shelf edge show transitional features between those of the
slope and the inner shelf.The RMS sea level values (table 4) indicate the higher-frequency variability dom-
inates over the annual and interannual cycles over the Scotian Shelf and Slope. Off the
central (Track 088) and western (Track 050) Nova Scotia, the interannual variability
shows some increase towards the deep ocean (table 4), presumably due to the proxi-
mity of the Gulf Stream.
5. Summary
We have derived major tidal constituents and seasonal-mean sea level anomalies over
the Scotian Shelf from T/P data. The sea level along the Nova Scotia coast is highest in
autumn and lowest in spring. Over the open shelf, the sea level is higher in summer and
autumn and lower in winter and spring. The sea level along the Nova Scotia coast and
over the Scotian Shelf was low in the early 1990s, high in the mid 1990s, and close to
normal in the late 1990s and early 2000s. The correlation coefficients between alti-
metric and tide-gauge measurements at North Sydney, Halifax and Yarmouth are
Figure 5. (Continued.)
PORSEC 2008 4801
Dow
nloa
ded
by [
Fish
erie
s an
d O
cean
s C
anad
a] a
t 08:
48 2
2 Ja
nuar
y 20
14

0.53 (0.48), 0.64 (0.82), and 0.63 (0.62), respectively, without (with) the seasonal cycle
being removed. The correlation analysis indicates fair agreement at the seasonal and
interannual scales, except at Halifax where there is good agreement at the interannual
scale.
Eight major semi-diurnal and diurnal constituents are derived from the tide-in T/Pdata. Comparisons with tide-gauge data and bottom pressure gauge data indicate
overall good agreement. The present tidal solutions are in better agreement with
0
North Sydney
Canso Harbour
Murphy’s Cove
SS
H A
nom
aly
(m)
Halifax
Lunenburg
Lockeport
−0.06
0.06
−0.06
0
0.06
−0.06
0
0.06
−0.06
0
0.06
−0.06
0
0.06
−0.06
0
0.06
−0.06
0
0.06
1992 1993 1994 1995 1996 1997 1998 1999 2000 2001 2002Year
Yarmouth
Figure 6. Seasonal-mean sea level anomalies (solid lines) at sites along the Nova Scotia coastestimated from T/P data. The dashed lines are the results with the annual and semi-annualcycles removed and subsequently smoothed with a five-point moving filter. SSH, sea surfaceheight.
4802 G. Han et al.
Dow
nloa
ded
by [
Fish
erie
s an
d O
cean
s C
anad
a] a
t 08:
48 2
2 Ja
nuar
y 20
14

tide-gauge data than Han et al.’s (1996) for the K1 and O1 tides with an improvement
of 30� in phase, but nearly the same for M2, S2 and N2. Detailed comparisons for thethree permanent tide-gauge stations indicate good agreement at Yarmouth and
Halifax, but with notable discrepancies at North Sydney. The RMS amplitude
differences for all eight tidal constituents are 0.012, 0.021 and 0.06 m at Yarmouth,
Halifax and North Sydney, respectively.
For estimating coastal sea levels (both tidal and non-tidal) from satellite altimetry,
higher spatial resolution is demanded. It is apparent that the close agreement between
altimetric estimates and tide-gauge measurements at Yarmouth and Halifax can be
−0.20
−0.10
0.00
0.10
0.20
1992 1993 1994 1995 1996 1997 1998 1999 2000 2001 2002
1992 1993 1994 1995 1996 1997 1998 1999 2000 2001 2002
1992 1993 1994 1995 1996 1997 1998 1999 2000 2001 2002
SS
H A
nom
aly
(m)
North Sydney
RMSD = 4.47 cm
Corr. = 0.53
T/P RMS = 4.49 cm Tide−gauge RMS = 4.75 cm
−0.20
−0.10
0.00
0.10
0.20
SS
H A
nom
aly
(m)
Halifax
RMSD = 3.58 cm
Corr. = 0.64
T/P RMS= 4.59 cm Tide−gauge RMS= 3.62 cm
−0.20
−0.10
0.00
0.10
0.20
SS
H A
nom
aly
(m)
Year
Yarmouth
RMSD = 3.49 cm
Corr. = 0.63
T/P RMS= 4.43 cm Tide−gauge RMS= 3.32 cm
Figure 7. Comparison of T/P estimates and tide-gauge observations of seasonal-mean seasurface height (SSH) anomalies.
PORSEC 2008 4803
Dow
nloa
ded
by [
Fish
erie
s an
d O
cean
s C
anad
a] a
t 08:
48 2
2 Ja
nuar
y 20
14

−0.08
−0.04
0.00
0.04
0.08
1992 1993 1994 1995 1996 1997 1998 1999 2000 2001 2002
1992 1993 1994 1995 1996 1997 1998 1999 2000 2001 2002
1992 1993 1994 1995 1996 1997 1998 1999 2000 2001 2002
SS
H A
nom
aly
(m)
North Sydney
RMSD = 2.28 cm
Corr. = 0.48
T/P RMS = 2.48 cm Tide−gauge RMS = 1.94 cm
−0.08
−0.04
0.00
0.04
0.08
SS
H A
nom
aly
(m)
Halifax
RMSD = 1.47 cm
Corr. = 0.82
T/P RMS = 2.51 cm Tide−gauge RMS = 2.23 cm
−0.08
−0.04
0.00
0.04
0.08
SS
H A
nom
aly
(m)
Year
Yarmouth
RMSD = 1.89 cm
Corr. = 0.62
T/P RMS = 2.08 cm Tide−gauge RMS = 2.26 cm
Figure 8. Same as figure 7, except for annual and semi-annual cycles being removed andsubsequently being smoothed with a five-point moving filter.
Table 3. Annual cycles of sea level derived from the segment-averaged T/P data. Amplitudesare in metres and phases indicate the year day of the maximum sea level.
050 088 126
Amplitude Amplitude AmplitudeSegment (m) Phase (m) Phase (m) Phase
Shore to mid-shelf 0.037 8 0.049 314 0.035 290Mid-shelf to 200 m 0.013 343 0.052 300 0.050 297200–2000 m 0.046 252 0.055 272 0.048 2802000–4000 m 0.052 266 0.063 275 0.071 264
4804 G. Han et al.
Dow
nloa
ded
by [
Fish
erie
s an
d O
cean
s C
anad
a] a
t 08:
48 2
2 Ja
nuar
y 20
14

partly attributed to better data coverage near the site. It is therefore expected that the
coastal sea levels can be improved using the data from the concurrent multi-mission
satellite altimetry missions. The improvement may also be achieved by a dynamic
approach which assimilates altimetric observations into a coastal ocean model.
Acknowledgements
We thank J. Li and M. Newhook for assistance in data processing and analysis.
Helpful comments and suggestions were received from the two anonymous reviewers.The project was funded by the Canadian Space Agency, the Climate Change Impacts
on the Energy Sector (CCIES) subprogram of the federal Program on Energy,
Research and Development (PERD), and Fisheries and Oceans Canada. The T/P
altimeter data were obtained from the NASA Pathfinder Project.
References
ANDERSON, C. and SMITH, P.C., 1989, Oceanographic observations on the Scotian Shelf during
CASP. Atmosphere–Ocean, 27, pp. 130–156.
BENADA, R., 1997, Merged GDR (TOPEX/Poseidon) User Handbook. JPL D-11007,
(Pasadena, CA: Jet Propulsion Laboratory).
EGBERT, G.D. and EROFEEVA, S., 2002, Efficient inverse modeling of barotropic ocean tides.
Journal of Atmospheric and Oceanic Technology, 19, pp. 183–204.
CARTWRIGHT, D.E. and RAY, R.D., 1990, Oceanic tides from Geosat altimetry. Journal of
Geophysical Research, 95, pp. 3069–3090.
DE MARGERIE, S. and LANK K., 1986, Tidal circulation of the Scotian Shelf and Grand Banks.
Technical report, Contract Report 08SC.FD901-5-X515, Department of Fisheries and
Oceans, Ottawa, Ontario, Canada.
DRINKWATER, M.R., HAAGMANS, R., MUZI, D., POPESCU, A., FLOBERGHAGEN, R., KERN, M. and
FEHRINGER, M., 2007, The GOCE gravity mission: ESA’s first core earth explorer. In
Proceedings of 3rd International GOCE User Workshop, 6–8 November 2006, Frascati,
Italy, ESA SP-627 (Noordwijk, The Netherlands: ESA), pp. 1–8.
FOREMAN, M.G.G., CRAWFORD, W.R., CHERNIAWSKY, J.Y. and GALBRAITH, J., 2008, Dynamic
ocean topography for the northeast Pacific and its continental margins, Geophysical
Research Letters, 35, L22606, doi: 10.1029/2008GL035152.
FOREMAN, M.C.G. and HENRY, R.F., 1989, The harmonic analysis of tidal model time series.
Advances in Water Resources, 12, pp. 109–120.
Fu, L.L. and Cazenave, A. (Eds), 2001, Satellite Altimetry and Earth Sciences, A Handbook of
Technique and Applications (London: Academic Press).
GODIN, G. 1972, The Analysis of Tides, p. xxi (Toronto: University of Toronto Press).
Table 4. The RMS values (m) of (a) the raw 10-day sea level data, (b) with the annual cycleremoved, and (c) with an additional 37-point moving filter applied.
RMS values (m)
050 088 126
(a) (b) (c) (a) (b) (c) (a) (b) (c)
Shore to mid-shelf 0.118 0.115 0.022 0.116 0.110 0.028 0.108 0.104 0.030Mid-shelf to 200 m 0.097 0.097 0.014 0.107 0.100 0.021 0.113 0.106 0.032200–2000 m 0.107 0.101 0.019 0.114 0.107 0.027 0.109 0.104 0.0292000–3000 m 0.125 0.119 0.040 0.127 0.118 0.037 0.117 0.105 0.024
PORSEC 2008 4805
Dow
nloa
ded
by [
Fish
erie
s an
d O
cean
s C
anad
a] a
t 08:
48 2
2 Ja
nuar
y 20
14

GODIN, G. 1980, Cotidal charts for Canada. Marine Science Directorate, Manuscript Report
Series, 55, 93 pp., Department of Fisheries and Oceans, Ottawa, Ontario, Canada.
HAKKINEN, S. and RHINES, P.B., 2004, Decline of subpolar North Atlantic circulation during the
1990s. Science, 304, pp. 555–559.
HAN, G., 2002, Interannual sea level variations in the Scotia–Maine region in the 1990s.
Canadian Journal of Remote Sensing, 28, pp. 581–587.
HAN, G., 2004, Scotian Slope circulation and eddy variability from TOPEX/Poseidon and
frontal analysis data. Journal of Geophysical Research, 109, C03028, doi: 10.1029/
2003JC002046.
HAN, G., 2007, Satellite observations of seasonal and interannual changes of sea level and
currents over the Scotian Slope. Journal of Physical Oceanography, 37, pp. 1051–1065.
HAN, G. and LODER, J.W., 2003, Three-dimensional seasonal-mean circulation and hydrogra-
phy over the eastern Scotian Shelf. Journal of Geophysical Research, 108, pp. 3136, doi:
10.1029/2002JC001463.
HAN, G., IKEDA, M. and SMITH, P.C., 1996, Oceanic tides on the Newfoundland and Scotian
Shelves from TOPEX/POSEIDON altimetry. Atmosphere–Ocean, 34, pp. 589–604.
HAN, G., HANNAH, C.G., SMITH, P.C. and LODER, J.W., 1997, Seasonal variation of the three-
dimensional circulation over the Scotian Shelf. Journal of Geophysical Research, 102,
pp. 1011–1025.
HAN, G., HENDRY, R. and IKEDA, M., 2000, Assimilating TOPEX/POSEIDON derived tides in
a primitive equation model over the Newfoundland Shelf. Continental Shelf Research,
20, pp. 84–108.
HAN, G., TANG, C.L. and SMITH, P.C., 2002, Annual variations of sea surface elevations and
currents over the Scotian Shelf and Slope. Journal of Physical Oceanography, 32,
pp. 1794–1810.
LODER, J.W., HAN, G., HANNAH, C.G., GREENBERG, D.A. and SMITH, P.C., 1997, Hydrography
and baroclinic circulation in the Scotian Shelf region: winter vs summer. Canadian
Journal of Fisheries and Aquatic Sciences, 54 (suppl. 1), pp. 40–56.
PELTIER, W.R., 2004, Global glacial isostasy and the surface of the Ice-Age Earth: the ICE-
5G(VM2) model and GRACE. Annual Review of Earth and Planetary Sciences, 32,
pp. 111–149.
PETRIE, B., 2007, Does the North Atlantic Oscillation affect hydrographic properties on the
Canadian Atlantic Continental Shelf? Atmosphere–Ocean, 45, pp. 141–151.
PETRIE, B.D. and DRINKWATER, K., 1993, Temperature and salinity variability on the Scotian
Shelf and in the Gulf of Maine 1945–1990. Journal of Geophysical Research, 98, pp.
20 079–20 089.
PETRIE, B., TOPLISS, B.J. and WRIGHT, D.G., 1987, Coastal upwelling and eddy development off
Nova Scotia. Journal of Geophysical Research, 92, pp. 12 979–12 991.
SUTCLIFFE, W.H., LOUCKS, R.H. and DRINKWATER, K.F., 1976, Coastal circulation and physical
oceanography of the Scotian Shelf and Gulf of Maine. Journal of the Fisheries Research
Board of Canada, 33, pp. 98–115.
THOMPSON, K.R., 1986, North Atlantic sea-level and circulation. Geophysical Journal of the
Royal Astronomical Society, 87, pp. 15–32.
UMOH, J.U. and THOMPSON K.R., 1994, Surface heat flux, horizontal advection, and the
seasonal evolution of water temperature on the Scotian Shelf. Journal of Geophysical
Research, 99, pp. 20 403–20 416.
WANG, Y.M., 2001, GSFC00 mean sea surface, gravity anomaly, and vertical gravity gradient
from satellite altimeter data. Journal of Geophysical Research, 106, pp. 31 167–31 174.
4806 G. Han et al.
Dow
nloa
ded
by [
Fish
erie
s an
d O
cean
s C
anad
a] a
t 08:
48 2
2 Ja
nuar
y 20
14


