Embed Size (px)
Citation preview

Tidal geomorphology affects phytoplankton at the transitionfrom forested streams to tidal rivers
SCOTT H. ENSIGN*, MARTIN W. DOYLE †, 1 AND MICHAEL F. PIEHLER ‡
*Curriculum for the Environment and Ecology, University of North Carolina at Chapel Hill, Chapel Hill, NC, U.S.A.†Department of Geography, University of North Carolina at Chapel Hill, Chapel Hill, NC, U.S.A.‡Institute of Marine Sciences, University of North Carolina at Chapel Hill, Morehead City, NC, U.S.A.
SUMMARY
1. Coastal rivers can have long tidally influenced reaches that are affected by tides but do not
contain saline water. These tidal freshwater reaches have steep geomorphic gradients where the
river transitions from narrow, heavily shaded streams to wide, unshaded channels. The influence
of these gradients on river ecosystem production is poorly understood.
2. We characterised gradients in irradiance, geomorphology, water clarity and chlorophyll a along
9- to 16-km tidal freshwater reaches of the Newport and White Oak Rivers in North Carolina,
USA, and examined the effect of nutrient enrichment on phytoplankton growth in the Newport
River. Underwater irradiance was modelled at 2–4 week intervals along both rivers using
measurements of the above-canopy irradiance, canopy cover, water column light attenuation (Kd)
and water depth. Suspended material (TSS), dissolved organic carbon (DOC) and chlorophyll a
were sampled at 2-week interval at five sites on the Newport River and on four dates at four sites
on the White Oak River over the course of one year.
3. Phytoplankton nutrient limitation was assessed at three locations along the tidal gradient. River
water was collected during March, April, June and October, and incubated in 10-L plastic outdoor
containers under ambient water temperature and sunlight. Additions of inorganic nitrogen and
phosphorus served as treatments; growth rate during the 4 days of incubation was calculated from
the change in chlorophyll a concentration over time.
4. Canopy cover decreased from more than 90% to <10% over the length of both tidal freshwater
rivers. Water column irradiance and phytoplankton biomass increased as tree canopy cover
decreased and channel width increased. Channel width exceeded predictions for non-tidal rivers
by threefold because of tidal influence. TSS and DOC decreased significantly along the length of
the Newport River, but no significant gradients were observed in the White Oak River. Kd did not
vary along the tidal gradient of either river.
5. Mesocosm experiments indicated that inorganic nitrogen and phosphorus enhanced the
growth of phytoplankton advected from the non-tidal river into the tidal freshwater river during
spring and summer. Phytoplankton in the tidal freshwater reach were generally not nutrient
limited.
6. Tidal hydrology (in the absence of saltwater) directly affected the morphology of the channel
and indirectly affected biological growth and production. The significant increase in river width,
irradiance and phytoplankton biomass distinguished these tidal freshwater ecosystems from their
upstream (non-tidal fluvial) counterparts, while the strong influence of riparian shading
distinguished them from the saline estuaries downstream. Future development of ecosystem and
biogeochemical models for tidal freshwater rivers will benefit from the linkages between
geomorphology and biological processes identified here.
Correspondence: Scott H. Ensign, USGS National Research Program, 12201 Sunrise Valley Dr, Mail Stop 430, Reston VA 20190, U.S.A. E-mail:
[email protected] address: Martin W. Doyle, Nicholas School of the Environment, Duke University, Box 90328, Durham, NC 27708, U.S.A.
Freshwater Biology (2012) doi:10.1111/j.1365-2427.2012.02856.x
Published 2012. This article is a U.S. Government work and is in the public domain in the USA 1

Keywords: fluvial geomorphology, hydraulic geometry, irradiance, phytoplankton, tidal freshwater river
Introduction
Along low-gradient coastal plains world-wide, there is a
transition zone between rivers and estuaries in which
water flow is affected by tides but not saltwater. This tidal
freshwater zone extends hundreds of kilometres inland in
large rivers such as the Amazon (644 km, Wheeler, 1893),
Mississippi (370 km, Galler & Allison, 2008) and Gambia
(276 km, Amphlett & Brabben, 1991), and encompasses up
to half the length of smaller coastal plain rivers (Ander-
son, 1986). Across the US coastal plain, a vast network of
tidal freshwater rivers sustains 192 873 ha of tidal fresh-
water wetlands (Field et al., 1991). Tidal freshwater rivers
around the globe constitute a unique ecosystem along the
riverine-estuarine gradient (Van Damme et al., 2009).
Primary production within the tidal freshwater zone is
governed by a combination of riverine and estuarine
factors (Schuchardt, Haesloop & Schirmer, 1993; Van
Damme et al., 2009). Tides from downstream and catch-
ment runoff from upstream affect spatial patterns in
channel morphology (Langbein, 1963) and hydrology
(Dalrymple & Choi, 2007), subsequently affecting the
accumulation of phytoplankton biomass within the tidal
freshwater zone (Lucas, Thompson & Brown, 2009).
Gradients in environmental variables such as irradiance,
water clarity and nutrients are also affected by tides and
affect phytoplankton growth (Bukaveckas et al., 2011).
These spatial gradients in geomorphology and environ-
mental factors underlie a gradient in riparian forest
shading that occurs between coastal plain rivers and
estuaries (Vahatalo, Wetzel & Paerl, 2005). However, this
gradient in tree canopy shading and resultant patterns in
irradiance and phytoplankton growth in tidal freshwater
rivers have not been characterised at the transition from
river to estuary. Consequently, knowledge of the factors
affecting primary production in tidal freshwater rivers is
incomplete.
The percentage of above-canopy irradiance that reaches
a river is a function of topographic shading, forest canopy
shading and the width of the channel (Julian, Doyle &
Stanley, 2008a). In coastal plain environments with low-
relief topography, shading from surrounding hill slopes is
minimal but tree canopy shading can block 99% of the
incoming irradiance (Vahatalo et al., 2005). The width of
the channel also affects how much the tree canopy shades
the river. Even when bordered by a dense riparian forest
canopy, a wide channel will receive more irradiance per
unit of channel width than a narrow channel. Therefore,
the tendency for tidal rivers to widen rapidly in the
downstream direction (Leopold, Wolman & Miller, 1964)
may play an important role in affecting irradiance and
phytoplankton growth along a gradient of tidal influence.
Once light reaches the river water surface, the average
irradiance within the water column is affected by channel
depth and water clarity. The increase in channel depth
along the tidal freshwater zone reduces average water
column irradiance. Water clarity declines along the tidal
freshwater zone because of increased suspended particu-
late matter entrained by tidally enhanced flow velocity
(Chen et al., 2005; Lionard et al., 2005). Dissolved organic
carbon (DOC) also attenuates irradiance, particularly in
blackwater rivers where DOC concentrations are high
(Meyer, 1990). Spatial gradients in DOC may develop
along the tidal freshwater zone because of photo-oxida-
tion (Wiegner & Seitzinger, 2001) and bacterial metabo-
lism (Edwards & Meyer, 1987; Sabater, Meyer & Edwards,
1993; Moran, Sheldon & Sheldon, 1999). It is unknown
what the combined effect of gradients in depth, particu-
late matter and DOC is on light attenuation in tidal
freshwater rivers.
In addition to irradiance, nutrient concentrations can
limit phytoplankton growth in tidal freshwater rivers.
Longitudinal gradients in nitrogen and phosphorus
related to tidal mixing and biogeochemical processes
were found to influence phytoplankton growth and
nutrient limitation in the St Johns River in Florida,
U.S.A., although irradiance was the primary factor limit-
ing phytoplankton growth (Phlips et al., 2000). Nitrogen
and phosphorus both limited phytoplankton growth in
two blackwater, tidal freshwater rivers in North Carolina
during spring and summer (Mallin et al., 2001). However,
in the turbid Neuse River, North Carolina, immediately
upstream from the tidal freshwater zone nutrients limited
phytoplankton growth only under light-saturated condi-
tions (Whalen & Benson, 2007). These studies indicate that
nutrient limitation of phytoplankton growth in tidal
freshwater rivers is likely to be closely associated with
spatial and temporal trends in light availability along the
tidal gradient.
Riparian shading, geomorphic gradients and water
characteristics affect irradiance in tidal freshwater rivers,
but the combined influence of these factors on reach-scale
patterns in irradiance and phytoplankton growth has not
been examined. This study addressed this knowledge gap
2 S. H. Ensign et al.
Published 2012. This article is a U.S. Government work and is in the public domain in the USA, Freshwater Biology, doi:10.1111/j.1365-2427.2012.02856.x
with observational and manipulative studies of how these
patterns are affected by tidal influence. The first objective
was to determine the spatial and temporal patterns in
irradiance and relate these to patterns in tree canopy
shading, channel morphology and water clarity. The
second objective was to quantify how tide-affected chan-
nel width and depth along the tidal freshwater zone, since
these factors directly and indirectly affect irradiance to the
river and subsequent phytoplankton growth. The third
objective was to examine the spatial and temporal
patterns in inorganic nitrogen and phosphorus concen-
tration and determine their influence on phytoplankton
growth along this gradient. Intensive water sampling was
performed on one river over a year, and the general
patterns found there were corroborated with less-inten-
sive sampling on an adjoining tidal freshwater river. Both
rivers have relatively short fluvial–estuarine transition
zones (9–16 km between the head of tide and oligohaline
estuary), which we expected to create steep gradients in
geomorphic and ecological conditions and facilitate the
detection of spatial trends.
Methods
Study sites and channel morphology
The Newport (34.8�N 76.8�W) and White Oak (34.8�N
77.2�W) Rivers in North Carolina are blackwater rivers
with relatively small drainage areas (150 and 200 km2,
respectively) and tidal freshwater reaches of nine and 23
river km, respectively. General characteristics of these
coastal plain blackwater rivers include low-gradient,
extensive forested riparian zones, and highly coloured
water because of dissolved organic matter. Tidal range is
c. 1 m at the downstream end of each study reach and
diminishes to zero at the upstream end of each study
reach (Ensign et al., 2012). Tertiary-treated waste-water
effluent from the town of Newport enters the Newport
River c. 5 km downstream from the head of tide.
Sampling of physicochemical parameters and chloro-
phyll a was conducted at five sampling sites (A through E)
on the Newport River, located 3 km upstream from the
head of tide, and at 2, 4, 5.5 and 9 km downstream from
the head of tide. Morphology and riparian characteristics
of the Newport River are similar between the non-tidal
site A and head of tide, so we assume that physicochem-
ical parameters change little between site A and the head
of tide 3 km downstream. Therefore, we present data
from site A as distance 0 km from the head of tide. On the
White Oak River, four sites (A through D) were sampled
for physicochemical parameters and chlorophyll a and
were located 4, 5, 9 and 16 km from the head of tide,
respectively. On the Newport River, sites A through D
were bordered by hardwood forests composed of cypress
(Taxodium spp.), red maple (Acer rubrum L) and tupelo
(Nyssa spp.), while the riparian zone at site E was a
transitional cypress swamp-oligohaline marsh. Sites A
through C on the White Oak were bordered by cypress-
maple-tupelo forest, while site D was bordered by a
transitional cypress-oligohaline marsh.
Channel width and depth were measured along these
tidal gradients between the vegetated banks of the river at
500-m interval on the Newport River and 1000-m interval
on the White Oak River. On the Newport River, a line was
strung across the river, and channel depth was measured
at 2-m interval from a boat. This same procedure was
used on the White Oak in the upper half of the tidal
freshwater zone, but was not logistically possible in the
wider portions of the White Oak River. In the lower
portion of the White Oak River channel, therefore, width
was measured from aerial photographs from the US
Geological Survey using Google Earth (Google, 2012), and
channel depth was measured mid-channel using an SM-5
Depthmate portable sounder (Speedtech Instruments,
Great Falls, VA, U.S.A.).
An important part of our analysis was to identify how
channel morphology departed from its upstream, non-
tidal condition along the tidal freshwater reach. To do
this, we predicted channel width and depth along the
tidal freshwater reach using hydraulic geometry equa-
tions developed for non-tidal coastal plain rivers in North
Carolina by Sweet & Geratz (2003). The relationship
between catchment area (Aw, mi2) and bankfull channel
width (Wbkf, ft) was Wbkf = 9.64(Aw)0.38, with an R2 of 0.95;
the relationship between Aw and bank full channel depth
was Dbkf = 0.98(Aw)0.36, with an R2 of 0.92. The 95%
confidence interval of the predicted values on the New-
port and White Oak Rivers was also computed, and all
predictions were converted to metre. Catchment area at
five locations on the Newport River was determined with
elevation-based flow modelling in a GIS (Ensign, Piehler
& Doyle, 2008). Catchment area at three locations on the
White Oak River was determined from the Watershed
Boundary Dataset (http://datagateway.nrcs.usda.gov).
Irradiance modelling
Solar irradiance at the river water surface was modelled
over a 1-year period that encompassed the period of water
sampling on both rivers. Water surface irradiance was
calculated as a function of above-canopy irradiance, tree
canopy shading and orientation of the channel using the
Tides and river ecosystems 3
Published 2012. This article is a U.S. Government work and is in the public domain in the USA, Freshwater Biology, doi:10.1111/j.1365-2427.2012.02856.x

solar simulator software included with Gap Light Ana-
lyzer (Frazer, Canham & Lertzman, 1999). Average daily
solar irradiances for the study area were obtained from
the North Carolina State Climate Office (http://www.nc-
climate.ncsu.edu/) at three sites near the study area, and
solar irradiance was converted to photosynthetically
active radiation (PAR) using a conversion factor of 2.04
(Meek et al., 1984). Canopy interception of irradiance was
calculated from hemispherical photographs of the tree
canopy taken with a Nikon Coolpix 4500 (Nikon Inc.,
Melville, NY, U.S.A) camera with fisheye lens at 500 m
(Newport River) and 1000 m (White Oak River) intervals
during leaf-on (June in the Newport River, May in the
White Oak River) and leaf-off periods (January–February
in both rivers). The colour photographs were digitised to
black and white using automatic threshold detection
algorithms in SideLook 1.1.01 software (Nobis & Hunz-
iker, 2005), and the per cent canopy cover was determined
using Gap Light Analyzer software (Frazer et al., 1999).
Average daily irradiance to the river’s surface was
modelled with Gap Light Analyzer software. Leaf-on
canopy cover data were used for May–October period,
leaf-off photos were used for December–March, and an
average of leaf-on and leaf-off values were used for April
and November. Topographic shading by the surrounding
coastal plain landscape was assumed to be negligible and
was not parameterised in the model. Average water
column irradiance was calculated using the formula:
Ix = I0 · [1 ) exp()k · z)] ⁄ k · z, where Ix is the average
water column irradiance, I0 is the modelled water surface
irradiance, k is the water column attenuation coefficient
and z is average channel depth at mid-tide.
Water sampling
Water sampling was conducted on the Newport River
every 2 weeks between May 2006 and May 2007. The
White Oak River was sampled on four dates in 2009.
Sampling of the White Oak River was focused around the
period of maximum phytoplankton biomass observed in
the Newport River. On both rivers, we attempted to take
all samples during the ebb tide, although this was not
always possible at all sites during each sampling trip.
During each sampling, water column attenuation of PAR
was measured using a 4-pi irradiance sensor and LI1400
display ⁄ logger (Li-Cor Environmental, Lincoln, NB,
U.S.A.) at 0.25-m interval. A YSI 6800 multiparameter
water quality sonde and 650 display (Yellow Springs
Instruments, Yellow Springs, OH, U.S.A.) were used to
measure salinity and turbidity. Salinity was measured to
provide an indication of the freshwater–saltwater bound-
ary, and turbidity was measured as an indicator of
suspended matter.
Surface water samples (2 L) were collected and
returned to the UNC Chapel Hill Institute of Marine
Science for analysis of chlorophyll a, dissolved organic
carbon (DOC), nitrogen, phosphorus and total suspended
solids (TSS). Fifty to 100 mL aliquots was filtered through
0.7-lm glass fibre filters, and chlorophyll a captured on
the filter was extracted in 90% acetone and analysed on a
Turner Trilogy fluorometer (Turner Designs, Inc., Sunny-
vale, CA, U.S.A.). The filtrate was analysed for DOC on a
Shimadzu 5000TOC analyzer (Shimadzu, Columbia, MD,
U.S.A.). DOC concentration was used as an indicator of
how much attenuation of irradiance was attributed to
dissolved material. Nitrate plus nitrite (referred to here-
after as just NO�3 ), ammonium (NHþ4 ) and dissolved
reactive phosphorus (referred to hereafter as just PO�34 )
were measured using a Lachat Quikchem 8000 autoana-
lyzer (Lachat Instruments, Milwaukee, WI, U.S.A.). TSS
was measured by filtering up to 1 L of water through a
2.7-lm pre-combusted glass fibre filter (Whatman GF ⁄D)
and drying at 105 �C until a constant weight was
achieved. TSS was not measured in the White Oak River,
so we relied on turbidity as an indicator of suspended
material in this river.
We tested for spatial trends in TSS, turbidity, DOC and
Kd which would indicate an effect of tidal influence along
the gradient. For each of these parameters (excluding TSS
in the White Oak River), a mixed-effect linear model was
developed using distance from the head of tide (km) and
river as fixed effects and the date of sampling as a random
effect. This modelling framework accounted for the
correlation between measurements during each sampling
date and tested the null hypothesis of zero slope in each
regression model. All statistical analyses were performed
using R (R Development Core Team, 2012).
Mesocosm experiments
Mesocosm experiments were conducted to determine how
changes in nutrient concentration along the tidal gradient
affect phytoplankton growth. Experiments were per-
formed in April, June and October 2006 and March 2007
using river water from Sites A (non-tidal), C (tidal
freshwater) and E (oligohaline) on the Newport River.
River water (5 L) was incubated in 10-L polyethylene
cubitainers (Hedwin Corp., Baltimore, MD, U.S.A.) in an
outdoor pond at the nearby UNC Institute of Marine
Sciences in Morehead City, North Carolina. A control and
a nutrient treatment were applied in 4 replicates; the
nutrient treatment was comprised of +140 lg N-NO�3 L)1,
4 S. H. Ensign et al.
Published 2012. This article is a U.S. Government work and is in the public domain in the USA, Freshwater Biology, doi:10.1111/j.1365-2427.2012.02856.x

+140 lg N-NHþ4 L)1 and +155 lg P-PO�34 L)1 (expressed
as the concentration increase over background). Initial
and final concentrations of NO�3 , NHþ4 and PO�34 are
provided in Table 4. Since the purpose of the experiments
was to measure the effects of nutrient enrichment when
irradiance was not limiting, irradiance was reduced to
66% of ambient conditions using black plastic window
screen. This design allowed phytoplankton much more
irradiance than they receive in the river but was not high
enough to cause photo-inhibition. Irradiance and temper-
ature were equivalent for all mesocosms during each
study. Phytoplankton growth rate was determined from
the slope of mixed-effects linear regression models
developed from log(chlorophyll a) values on days 1, 2
and 4 of each experiment, with fixed effects for site and
nutrient treatment and random effects for each cubitainer
over the course of the experiment. Model simplification
was performed using likelihood ratio tests with ANOVAANOVA
(a = 0.05).
Identifying the factors that affect phytoplankton com-
munities is a critical step in understanding and managing
aquatic systems. Nutrient bioassays have been used
extensively to try to provide this information (Paerl &
Bowles, 1987). Results from nutrient addition bioassays
reveal the response of the native phytoplankton to
identifiable changes in nutrient conditions, but generali-
sations from the experiments must be drawn with caution
(Hecky & Kilham, 1988). Nutrient addition bioassays are
often conducted on small scales and always include a
containment effect. Some have argued that their results
have little relationship to the overall ecology of the system
in which they are conducted (Carpenter, 1996). However,
our experiments were a direct assessment of the role of
nutrients and provide data to inform future experiments
and modelling. We interpreted our data within the
context of knowledge of the overall system and an
understanding that the experiments were not a perfect
tool.
Results
Channel morphology, canopy cover, irradiance and
phytoplankton biomass
The width of both rivers was within the predicted range
of non-tidal rivers in the upper third of the tidal
freshwater zone, but width exceeded the range of non-
tidal rivers by up to threefold in the lower tidal freshwater
zone (Figs 1 and 2). The depth of the Newport was within
the range of predicted non-tidal rivers in the upper half
but greater than predictions in the lower half of the tidal
freshwater zone (Fig. 1). The White Oak River depth was
within the range of non-tidal predictions throughout the
tidal freshwater zone (Fig. 2).
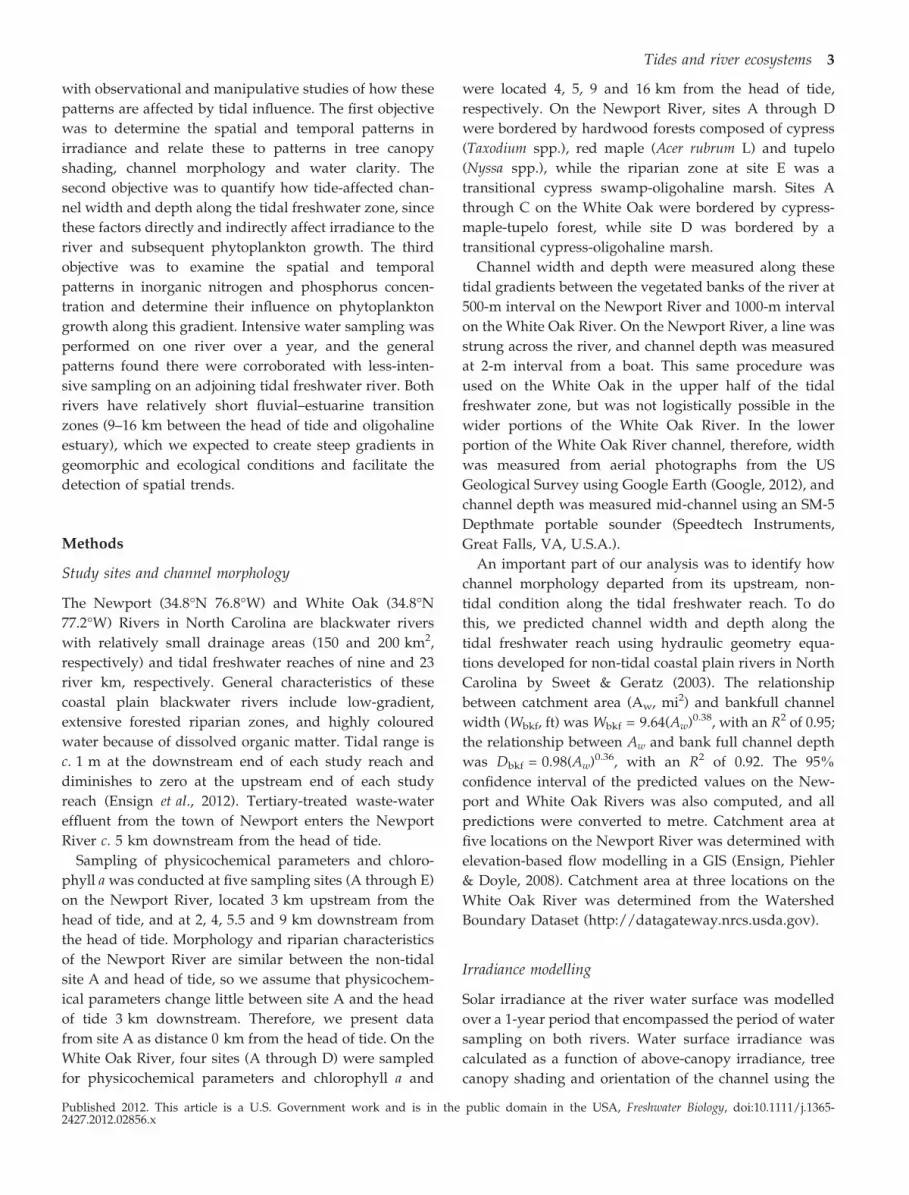
Canopy cover on both rivers was higher during
summer than winter, ranging from more than 80% in
summer at the upstream end to <10% at the downstream
end during winter (Fig. 3a,b). In the Newport River, a
Distance from head-of-tide (km)
Cha
nnel
wid
th (
m)
0 41 2 3 5 6 7 8 9
0
5
10
15
20
25
30
35
Observation at high tideBankfull prediction for a non−tidal river
0.0
0.5
1.0
1.5
2.0
2.5
3.0
Cha
nnel
dep
th (
m)
Fig. 1 Observed and predicted bankfull channel width along the
tidal freshwater Newport River. Vertical bars on bankfull predictions
indicate the 95% confidence interval of the predicted value.
0 2 4 6 8 10 12 14 16
0102030405060708090
Cha
nnel
wid
th (
m)
Observation at mean tide
Bankfull prediction for anon-tidal river
0.00.51.01.52.02.53.03.54.04.5
Cha
nnel
dep
th (
m)
Distance from head-of-tide (km)
Fig. 2 Observed and predicted channel width and depth on the tidal
freshwater White Oak River. Vertical bars on bankfull predictions
indicate the 95% confidence interval of the predicted value. Only a
single mid-channel depth was measured in the White Oak River, so
the average cross-channel depth was estimated by multiplying mid-
channel depth measurement by the ratio of mean depth ⁄ maximum
depth found in the Newport River. The grey-shaded area shows the
estimated mean cross-channel depth in the White Oak River using
the minimum and maximum of the Newport River ratio.
Tides and river ecosystems 5
Published 2012. This article is a U.S. Government work and is in the public domain in the USA, Freshwater Biology, doi:10.1111/j.1365-2427.2012.02856.x
considerable decrease in canopy cover began to occur
3 km downstream from the head of tide during the
summer period (Fig. 3a), which is approximately the same
location where channel width increased markedly (Fig. 1).
The decrease in canopy cover on the White Oak was most
dramatic c. 4 km downstream (Fig. 3b), although the
(a) (b)
(c) (d)
(e) (f)
(g) (h)
Fig. 3 Per cent tree canopy during summer and winter on the Newport (a) and White Oak (b) Rivers; irradiance at the water surface on the
Newport (c) and White Oak (d) Rivers; average water column irradiance on the Newport (e) and White Oak (f) Rivers; chlorophyll a on
the Newport (g) and White Oak (h) Rivers. The data for January to early April are from 2007, while the data for late April to December are
from 2006; data were plotted by month as opposed to chronological order. Chlorophyll a in the Newport River was linearly interpolated
between the five sampling locations at each sampling date.
6 S. H. Ensign et al.
Published 2012. This article is a U.S. Government work and is in the public domain in the USA, Freshwater Biology, doi:10.1111/j.1365-2427.2012.02856.x

channel did not begin to widen significantly until 6 km
downstream (Fig. 2). These locations where canopy cover
decreased closely correspond with increased water sur-
face irradiance (Fig. 3c,d). The highest water surface
irradiance occurred in the lower tidal region of both
rivers during April when above-canopy irradiance was
highest (Fig. 4). Water surface irradiance was always
greater downstream than upstream, but this contrast was
greater during summer due in part to the more foliated
tree canopy during leaf-on conditions. Average water
column irradiance followed the general temporal patterns
in water surface irradiance, with deviations because of
the longitudinal patterns in depth and water clarity
(Fig. 3e,f).
Chlorophyll a peaked during April and May in the
Newport River and June and July in the White Oak River
(Fig. 2g,h). In the Newport River, the peak chlorophyll a
occurred around 5 km downstream from the head of tide
(Fig. 3g). Chlorophyll a was high at both 5 km and 15 km
downstream in the White Oak River (Fig. 3H). These
locations and periods of high chlorophyll a coincided with
high water column irradiance.
Water characteristics and clarity
Sites A to D on the Newport River were fresh throughout
the study period (salinity <0.5), and site E was oligohaline,
with salinity ranging from 0.04 to 2.6 (Table 1). Sites A
0
200
400
600
800
µmol
esP
AR
m–2
s–1
Jan Mar May Jul Sep Nov
Newport RiverWhite Oak River
Fig. 4 Average hourly solar irradiance above the tree canopy
during the annual period of irradiance modelling in the Newport and
White Oak Rivers.
Table 1 Summary statistics of salinity (psu), total suspended solids (TSS mg L)1), turbidity (NTU), dissolved organic carbon (DOC) (mg L)1)
and Kd (m)1) on the Newport and White Oak Rivers; values are means ± standard deviations, minimum-maximum and sample size
River Site Salinity TSS Turbidity DOC Kd
Newport River A 0.04 ± 0.02 2.7 ± 3.3 0.2 ± 1.2 36.4 ± 6.7 6.9 ± 1.1
0.02–0.12 0–11 0–6 22.7–50.0 5.2–10.8
28 23 27 25 25
B 0.05 ± 0.02 2.7 ± 3.3 1.3 ± 1.9 28.6 ± 6.0 6.9 ± 1.6
0.03–0.11 0.0–11 0–7 16.1–39.9 5.0–10.6
23 23 23 21 10
C 0.06 ± 0.03 4.6 ± 5.5 3.6 ± 4.6 26.7 ± 5.4 6.9 ± 0.9
0.03–0.14 0–23 0–18 16.3–36.0 5.4–9.4
28 25 27 24 22
D 0.07 ± 0.04 5.9 ± 5.5 5 ± 5.1 26.5 ± 6.3 6.8 ± 1.1
0.03–0.20 0–20 0–18 15.4–40.2 4.1–8.6
23 23 23 20 21
E 0.25 ± 0.54 13.3 ± 11.8 9.6 ± 8.9 23.7–5.5 7.3 ± 1.4
0.04–2.60 1.0–46.0 0–36 14.8–35.7 4.9–10.6
28 25 27 25 25
White Oak River A 0.14 ± 0.04 no data 5.0 ± 2.0 no data 4.3 ± 1.2
0.10–0.19 3.2–7.7 3.2–5.9
4 4 4
B 0.12 ± 0.03 no data 4.6 ± 2.1 22.3 ± 5.1 4.0 ± 0.5
0.10–0.16 3.4–7.7 16.4–27.4 3.5–4.6
4 4 4 4
C 0.26 ± 0.32 no data 2.4 ± 2.0 22.3 ± 3.3 4.0 ± 0.3
0.1–0.75 0.4–5.1 18.5–26.5 3.5–4.3
4 4 4 4
D 1.62 ± 2.88 no data 5.6 ± 4.2 21.6 ± 3.5 3.6 ± 0.8
0.13–5.95 1.5–10.9 19.5–26.7 2.8–4.5
4 4 4 4
Tides and river ecosystems 7
Published 2012. This article is a U.S. Government work and is in the public domain in the USA, Freshwater Biology, doi:10.1111/j.1365-2427.2012.02856.x

and B on the White Oak River were fresh while sites C and
D were oligohaline, ranging from 0.1 to 0.75 psu and from
0.13 to 5.95 psu. TSS on the Newport River increased from
a mean of 2.7–13.3 mg L)1 along the tidal gradient
(Table 1). There was a significant linear trend in TSS
of 1.3 ± 0.28 mg L)1 km)1 along the Newport River
(Table 2). Turbidity increased along the Newport River
from a mean of 0.2–9.6 NTU, with a significant linear
trend of 1.1 ± 0.2 NTU km)1. Turbidity on the White Oak
River was lowest at the oligohaline Station C with a
mean of 2.4 NTU; the regression between turbidity
and distance on the White Oak was not significantly
different from zero (0.02 ± 0.8 NTU km)1). DOC on the
Newport River decreased from a mean of 36.5 at Station A
to 23.7 at Station E, with a regression coefficient of
)1.3 ± 0.1 mg L)1 km)1. DOC decreased more modestly
in the White Oak River from 22.3 at Station B to 21.6 at
Station D; the regression coefficient was not significantly
different from zero ()0.09 ± 0.4 mg L)1 km)1). The mean
Kd on the Newport River ranged from of 6.9 m)1 at Station
A to 7.3 m)1 at Station E, and 4.3 m)1 at Station A to
3.6 m)1 at Station D on the White Oak River. Kd did not
change significantly along the tidal gradient of either river
(regression slope estimates were not distinguishable from
zero; Table 2).
Nutrient concentrations and their relationship with
chlorophyll a
NO�3 concentration increased by 22 lg N L)1 km)1 in the
Newport River, but did not change with distance down-
stream in the White Oak River (Tables 2 and 3). Highest
mean NO�3 in the Newport River was found at Station C
(218 lg N L)1), while highest NO�3 in the White Oak was
much lower (96 lg N L)1 at Station A) (Table 3). The
change in NHþ4 with distance along the Newport River
was 1.2 lg N L)1 km)1, but was not distinguishable from
zero in the White Oak River. The mean NHþ4 at all sites
was similar between rivers, except that the maximum in
the Newport River (102 lg N L)1 at Station E) was greater
than the maximum in the White Oak River (52 lg N L)1 at
Station C). Mean PO�34 was greater at all stations on the
White Oak River than the Newport River. PO4) increased
by 1.8 lg P L)1 km)1 in the Newport River, but no
statistically significant relationship existed in the White
Oak River.
High chlorophyll a generally corresponded with high
ambient nitrogen and phosphorus concentrations in the
Newport River, although this was not the case in the
White Oak River (Fig. 5). In the Newport River, variation
in chlorophyll a increased dramatically when nitrogen
Table 2 Summary of mixed-effect modelling results
Model River Estimate Standard error d.f. P value
TSS � distance Newport Intercept = 0.65 0.71 95 0.361
Slope = 1.29 0.28 95 0.000
Turbidity � distance · river Newport Intercept = )0.26 0.30 110 0.400
Slope = 1.06 0.18 110 0.000
White Oak Intercept = 4.27 1.11 29 0.000
Slope = 0.02 0.80 110 0.043
Dissolved organic
carbon � distance · river
Newport Intercept = 32.4 1.3 105 0.000
Slope = )1.3 0.1 105 0.000
White Oak Intercept = 22.4 5.1 31 0.014
Slope = )0.09 0.4 105 0.000
Kd � distance · river Newport Intercept = 6.9 0.19 87 0.000
Slope = 0.03 0.03 87 0.381
White Oak Intercept = 4.2 0.67 27 0.000
Slope = )0.04 0.12 87 0.325
NO�3 � distance · river Newport Intercept = 30 12 101 0.015
Slope = 22 3.0 101 0.000
White Oak Intercept = 87 50 29 0.148
Slope = )3.5 11 101 0.003
NHþ4 � distance · river Newport Intercept = 38 2.4 101 0.000
Slope = 1.2 0.36 101 0.001
White Oak Intercept = 44 9.2 29 0.404
Slope = )1.2 1.4 101 0.018
PO�34 � distance + river Newport Intercept = 9.3 1.4 101 0.000
Slope = 1.8 0.26 101 0.000
White Oak Intercept = 28 5.8 29 0.000
Slope = 1.1 1.1 101 0.331
8 S. H. Ensign et al.
Published 2012. This article is a U.S. Government work and is in the public domain in the USA, Freshwater Biology, doi:10.1111/j.1365-2427.2012.02856.x

and phosphorus were greater than about 150 lg N L)1
and about 10 lg P L)1, respectively. In contrast, chloro-
phyll a in the White Oak River spanned nearly the entire
range of the Newport River’s chlorophyll a, even when
nitrogen was <200 lg N L)1. In summary, high nitrogen
and phosphorus concentrations were not always associ-
ated with high chlorophyll a, and high chlorophyll a was
not always associated with high nutrient concentrations.
Mesocosm growth experiments
Nutrients did not limit the growth of phytoplankton in
mesocosms from any location of the river during April
2006 (Fig. 6a,b). While the nutrient-enriched mesocosms
for site C showed a lower growth rate than the controls
(estimated at the 50% confidence interval), this estimated
growth rate was probably an artefact of abnormally low
chlorophyll a concentrations after 1 day of incubation
(Fig. 6a). In June 2006, growth at all sites was greater in
the nutrient-enriched mesocosms, although only at the
50% confidence interval at site E (Fig. 6c,d). June growth
rates in the controls for sites A and C were similar, as
were the controls at sites C and E (Fig. 6d). In October
2006, no differences in growth rate were observed
(Fig. 6e,f), and mixed-effects modelling showed the nutri-
ent term to not be significant (therefore separate slopes
for the nutrient treatment are not shown in Fig. 6f). In
March 2007, phytoplankton growth differed significantly
between the non-tidal and tidal mesocosms, but those
differences were alleviated by the addition of nutrients to
the non-tidal mesocosms (Fig. 6g,h).
Nutrient additions to site A’s mesocosms increased the
combined NO�3 and NHþ4 as well as PO�34 concentrations
above ambient concentrations at sites C and E (Table 4),
thereby allowing the evaluation of how increased nutrient
concentration would affect phytoplankton advected from
the non-tidal river into the tidal freshwater zone. In June
and March, higher nutrient concentrations in the tidal
freshwater zone enhanced the growth of phytoplankton
from the non-tidal river. Thus, the gradients in nutrients
we observed (Table 2) probably contributed to the peak in
phytoplankton biomass (Fig. 3g) during spring and sum-
mer in the upper tidal freshwater zone.
Nitrogen additions raised the concentration well above
the 200 lg L)1 threshold necessary for nutrient stimula-
tion of phytoplankton growth in blackwater rivers (Mallin
et al., 2004). Combined NO�3 and NHþ4 concentrations
<200 lg L)1 at the conclusion of the experiments in April
and June indicate that phytoplankton growth may have
become nutrient limited over the course of the experi-
ments. Ambient water chemistry in the Newport River
Table 3 Summary statistics of NO�3 ; NHþ4 , total dissolved nitrogen
(TDN) and PO�34 in the Newport and the White Oak Rivers
River Site NO�3 NHþ4 PO�34
Newport
River
A 14 ± 10 35 ± 10 8 ± 3
3–59 18–54 4–17
26 26 26
B 53 ± 23 46 ± 20 11 ± 4
5–120 16–81 6–20
22 22 22
C 218 ± 154 43 ± 16 26 ± 14
20–582 9–70 6–54
22 22 22
D 119 ± 107 45 ± 18 17 ± 14
4–452 13–81 3–60
26 26 26
E 216 ± 107 49 ± 22 25 ± 10
26–493 8–102 10–42
26 26 26
White Oak
River
A no data no data no data
B 96 ± 30 49 ± 3 28 ± 9
55–125 45–52 19–39
4 4 4
C 58 ± 12 29 ± 8 34 ± 10
47–72 20–40 21–44
4 4 4
D 63 ± 22 37 ± 10 37 ± 7
33–86 26–50 29–45
4 4 4
Data are means ± standard deviations, minimum–maximum and
sample size. All values are lg N L)1 or lg P L)1.
0
5
10
15
20
25 ABCDE
0
5
10
15
20
25
NO3−1 + NH4
−1 (µg L−1)
Whi
te O
ak c
hlor
ophy
ll a
(µg)
l/por
t Riv
er c
hlor
ophy
ll a
(µg)
0 200 400 600
BCD
PO4−3 (µg L−1)
0 20 40 60
(a) (c)
(b) (d)
Fig. 5 Chlorophyll a and dissolved inorganic nitrogen concentrations
in the Newport (a) and White Oak River (b), and chlorophyll a and
PO�34 concentration in the Newport (c) and White Oak River (d).
Tides and river ecosystems 9
Published 2012. This article is a U.S. Government work and is in the public domain in the USA, Freshwater Biology, doi:10.1111/j.1365-2427.2012.02856.x

during these experiments was not affected by salinity or
exchange of sea water from the estuary ⁄salinity was
<0.1 psu at all sites (except the lower tidal site in April
2006 when salinity was 0.23 psu). The mesocosm results
therefore represent the growth dynamics of a freshwater
riverine, not estuarine, phytoplankton community.
Discussion
Effects of canopy cover and water clarity on irradiance and
phytoplankton
The first objective of this study was to explore the spatial
and temporal patterns in irradiance and phytoplankton at
the transition from a forested coastal plain river to an
oligohaline tidal river. In both rivers we studied, the
spatial and temporal patterns in water surface irradiance
closely corresponded with seasonal and longitudinal
changes in tree canopy shading. A large increase in
irradiance occurred at the same location that tree canopy
shading decreased. Reduction in water surface irradiance
to 1% of the above-canopy irradiance has also been
documented in other coastal plain rivers (Vahatalo et al.,
2005). There are a range of factors that affect tree canopy
shading in addition to channel width and leaf area,
including vegetation type, channel orientation (Julian,
Stanley & Doyle, 2008b) and riparian timber removal
(Ensign & Mallin, 2001), but the significant effect of tidal
morphology on riparian shading found in this study has
not previously been documented.
While water surface irradiance was related to tree
canopy cover, the water column irradiance was greatly
reduced by particulate and dissolved material. In the
Newport River, TSS increased while DOC decreased
along the tidal gradient, with each factor negating the
other’s effect on light attenuation. Because of these
opposing trends in TSS and DOC, no longitudinal trends
in the light attenuation were found in the Newport River.
No longitudinal trends in light attenuation or DOC were
found in the White Oak River, either. Increases in
suspended matter with proximity to the oligohaline
estuary are common in tidal freshwater rivers (Chen
et al., 2005), reducing light availability for phytoplankton
growth (Lionard et al., 2005; Muylaert, Tackx & Vyver-
man, 2005b; Muylaert et al., 2000; Bukaveckas et al., 2011).
Coastal plain blackwater rivers have low concentrations of
0.10.51.05.0
10.050.0
100.0
Chl
orop
hyll
a (µ
g L–1
)
Log
(bio
mas
s gr
owth
rat
e) (
day–
1 )
−0.5
0.0
0.5
1.0
1.5
0.10.51.05.0
10.050.0
100.0
0.0
0.5
1.0
1.5
0.10.2
0.51.02.0
0.0
0.5
Bioassay incubation time (days)
Biomass accumulation Biomass growth rate
0 1 2 3 40.10.20.51.02.05.0
10.020.0
0.0
0.5
A(non-tidal)
E(lower tidal)
Site
(a) (b)
(c) (d)
(e) (f)
(g) (h)
Fig. 6 Chlorophyll a response in mesocosm experiments in the Newport River during April (a), June (c), October (e), and March (g), and
the corresponding rate of growth determined using linear, mixed-effects regression modelling (b, d, f, h). Colour of lines on the left-hand panels
corresponds with x axis labels in the right-hand panels; solid lines indicate control mesocosms, and dashed lines indicate nutrient additions.
In the right-hand panels, the darker, thicker bars represent the 50% confidence interval of the slope estimate, and the lighter, longer bars
represent the 95% confidence interval of the slope estimate; filled circles indicate controls and open triangles indicate nutrient treatments.
10 S. H. Ensign et al.
Published 2012. This article is a U.S. Government work and is in the public domain in the USA, Freshwater Biology, doi:10.1111/j.1365-2427.2012.02856.x

suspended material (Meyer, 1990; Hupp, 2000), although
the tidal freshwater portion can have significantly higher
suspended material (as demonstrated by the fourfold
increase in TSS in the Newport River). The effect of tidal
hydraulics on river flow is a significant factor affecting
suspended matter and consequently irradiance in tidal
freshwater rivers, and further research is needed on how
the fluvial energy regime is altered by tidal flow.
The highly chromophoric, humic material that com-
prises the majority of DOC in blackwater rivers (Sabater
et al., 1993) has a major effect on light attenuation (Phlips
et al., 2000). Concentrations of DOC in blackwater tidal
rivers (>20 mg L)1) are much higher than those draining
piedmont catchments into tidal freshwater zones
(<10 mg L)1 in the Schelde estuary, Muylaert et al.,
2005a,b), making DOC dynamics particularly important
to ecosystem processes. The decrease in DOC observed
along the tidal freshwater Newport River was presumably
attributed to a combination of photooxidation and
bacterial respiration. Photooxidation can have a major
influence on DOC concentration (reviewed by Wiegner &
Seitzinger, 2001), especially given the longer residence
time in the tidal freshwater zone than in the river
upstream (Lucas et al., 2009). Bacterial respiration in
blackwater rivers also reduces DOC concentration, and
this utilisation can be enhanced by photooxidation (Moran
et al., 1999; Wiegner & Seitzinger, 2001).
Phytoplankton biomass peaked in the same region of
the Newport River that water column irradiance peaked,
and at roughly the same time of year. While fewer
observations of phytoplankton biomass were made on the
White Oak River, a similar correspondence was observed
between phytoplankton and irradiance. While the spatial
and temporal relationships between irradiance and phy-
toplankton were not surprising given that irradiance is
often the primary limiting factor for phytoplankton
growth, it was particularly interesting that the increase
in irradiance and phytoplankton occurred in the same
location where channel width deviated from its non-tidal
pattern. The significance of this tidal influence on channel
morphology and subsequent effects on phytoplankton are
discussed below.
Finally, it should be noted that long water residence
times in tidal freshwater rivers can contribute to increased
phytoplankton biomass, especially when river discharge
is low (e.g. Bennett, Woodward & Shultz, 1986; Schuc-
hardt & Schirmer, 1991). This factor probably played a
role in the development of phytoplankton communities in
the Newport and White Oak Rivers: lowest discharge
during the study period occurred from April–July 2006,
Table 4 Nitrogen and phosphorus concentrations in phytoplankton growth mesocosms
Month Site Treatment
Initial (day 0) Final (day 4)
NO�3 NHþ4 PO�34 NO�3 NHþ4 PO�3
4
April 2006 Non-tidal Control 3 49 17 11 38 8
Nutrients 143 189 172 150 128 162
Upper tidal Control 175 81 44 39 9 11
Nutrients 315 221 199 274 11 115
Lower tidal Control 226 92 32 4 7 7
Nutrients 366 232 187 24 18 78
June 2006 Non-tidal Control 15 37 8 12 26 8
Nutrients 209 185 163 78 31 40
Upper tidal Control 69 45 14 11 13 7
Nutrients 209 185 169 91 23 50
Lower tidal Control 188 50 36 6 18 10
Nutrients 328 190 191 9 22 27
October 2006 Non-tidal Control 17 24 6 14 22 4
Nutrients 157 164 161 153 129 181
Upper tidal Control 5 18 4 43 11 2
Nutrients 145 158 159 213 93 121
Lower tidal Control 174 20 12 157 12 8
Nutrients 314 160 167 324 97 127
March 2007 Non-tidal Control 6 34 7 6 26 2
Nutrients 146 174 162 133 108 123
Upper tidal Control 170 70 20 141 18 46
Nutrients 310 210 175 302 105 141
Lower tidal Control 207 47 19 158 14 11
Nutrients 347 187 174 341 99 135
All values are lg N L)1 or lg P L)1.
Tides and river ecosystems 11
Published 2012. This article is a U.S. Government work and is in the public domain in the USA, Freshwater Biology, doi:10.1111/j.1365-2427.2012.02856.x

and March–April 2007 in the Newport River (Ensign et al.,
2007). Water residence time in the tidal freshwater
Newport River ranged from 3.5 to 6.5 days when calcu-
lated with the modified tidal prism method of Dyer (1997)
(Ensign et al., 2007). The approximate travel time based on
a continuous downstream flow velocity similar to that
measured above tidal influence is less than 1 day,
indicating that tidal hydrology allowed an additional
2–5 days for phytoplankton biomass to accumulate in the
tidal freshwater reach.
Tidal influence on channel morphology
The second objective of this study was to quantify how
tide-affected channel width and depth along the tidal
freshwater zone. Channel width increased along the tidal
freshwater zone of both rivers more rapidly than would
be expected in a non-tidal river of similar size. An obvious
deviation from predicted, non-tidal width did not occur
until one-third of the way downstream through the tidal
freshwater zone of both rivers. Depth also increased more
rapidly than would be expected in a non-tidal river,
although this effect of tide was more pronounced in the
Newport than White Oak River. These tidally affected
trends in channel width and depth strongly influenced
irradiance in opposing ways: the trend in width increased
surface water irradiance while the trend in depth
decreased the average water column irradiance.
In the studies of larger tidal freshwater rivers, where
riparian shading is not significant, changes in channel
depth significantly affect irradiance and subsequent
phytoplankton growth. In the St. Johns River tidal
freshwater zone, increases in channel depth decreased
the light availability downstream (Phlips et al., 2000). In
contrast, channel depth in the James River, Virginia,
U.S.A., decreased as width increased in the tidal fresh-
water zone and resulted in increased average water
column irradiances that enhanced phytoplankton growth
in this region (Bukaveckas et al., 2011). The James River
enters the tidal freshwater zone as a large piedmont river,
and therefore, the gradient in channel depth may differ
from coastal plain rivers such as the Newport and White
Oak Rivers.
Tidal channels exhibit a more rapid increase in width
and depth with distance downstream than do non-tidal
rivers (Langbein, 1963; Leopold, Wolman & Miller, 1964).
Since the tidal freshwater zone spans a disciplinary divide
between fluvial and estuarine geomorphology, the models
of channel morphology are fundamentally different on
either side of this zone. In rivers, channel morphology is
modelled as a function of catchment size and river
discharge (e.g. the hydraulic geometry models of Sweet
& Geratz, 2003 used in this study, which are based on
earlier research by Leopold & Maddock, 1953). In contrast,
estuarine morphology models are based on tidal prism
(D’Alpaos et al., 2010) and distance from the river mouth
(Davies & Woodroffe, 2010). In the relatively small coastal
plain rivers we studied, channel morphology diverged
from predictions made using a fluvial model at roughly
one-third of the way through the tidal freshwater zone.
We have also computed the relationship between tidal
prism and channel area and found that it differs signif-
icantly from the estuarine channels investigated by
D’Alpaos et al. (2010) (S. H. Ensign, unpublished data).
It is not unexpected that both fluvial and estuarine models
would fail to accurately predict channel morphology at
the transition between these two geomorphic regimes.
Further research is needed to develop empirical models of
channel morphology in the tidal freshwater transition
zone.
Nutrients gradients and their influence on phytoplankton
growth
The third objective of this study was to examine the
spatial and temporal patterns in inorganic nitrogen and
phosphorus concentrations and determine their influ-
ence on phytoplankton growth in this transition zone.
Inorganic nitrogen and phosphorus increased signifi-
cantly through the Newport River tidal freshwater zone,
but not in the White Oak River. In the Newport River,
this pattern was partly a function of treated waste-water
effluent that entered the river between sites C and D
(Ensign et al., 2007). Interestingly, the average NO�3 and
PO�34 concentrations were lower at site D (nearest the
effluent) than site C upstream and site E downstream.
Spatial gradients in nutrient concentration could also be
related to photomineralisation of dissolved and sus-
pended matter that produces inorganic nitrogen and
phosphorus (Southwell et al., 2009), particularly
given the increase in particulate matter, residence time
and surface irradiance in the lower tidal freshwater
river.
Mesocosm experiments showed that in March and
June the growth rate of the phytoplankton community
advected from upstream into the tidal freshwater reach
would increase when exposed to the higher nutrient
concentrations found in the upper tidal zone. Under
these nutrient-enriched conditions, during spring and
summer, the growth rate of the phytoplankton commu-
nity from the non-tidal river was equal to or greater
than the resident community in the tidal zone. The
12 S. H. Ensign et al.
Published 2012. This article is a U.S. Government work and is in the public domain in the USA, Freshwater Biology, doi:10.1111/j.1365-2427.2012.02856.x

mesocosm results indicate that the high phytoplankton
growth observed in the middle portion of the Newport
River tidal freshwater zone is partly a result of
gradients in nutrient concentration. However, a lack of
significant response in the bioassay experiment in April
and October, combined with the relatively high phyto-
plankton biomass (i.e. >10 lg L)1) observed at relatively
low nitrogen (<200 lg N L)1) and phosphorus
(<20 lg P L)1) concentrations in both rivers, indicate
that phytoplankton growth is not always limited by
nutrients in the tidal freshwater zone. Previous studies
of nutrient limitation in coastal plain tidal freshwater
rivers have also reported nutrient limitation of phyto-
plankton growth (Mallin et al., 2004). In summary,
phytoplankton growth in the tidal freshwater zone
was sometimes enhanced by nutrient enrichment, but
ambient nutrient concentrations are often adequate to
support considerable phytoplankton growth when other
factors (e.g. irradiance and grazing) are not limiting.
In conclusion, small coastal plain rivers undergo dra-
matic changes in morphology as they become influenced
by tides. Increased channel width drives a significant
increase in irradiance reaching the river surface, even
while hardwood forests border the channel. Increased
primary production within this zone is attributed to
increased irradiance, but the mechanism responsible for
increased irradiance, namely a tidally driven increase in
width and decrease in canopy shading, is unique among
both fluvial and estuarine ecosystems. In the rivers we
studied, there was a zone between one-third and one-half
of the way through the tidal freshwater reach where
channel morphology, irradiance and nutrients were opti-
mal for phytoplankton growth. While additional studies
are needed in a wider variety of coastal plain tidal
freshwater rivers, our data suggest that it may be possible
to develop a geomorphic framework for predicting where
this growth-optimising zone occurs in coastal plain tidal
freshwater rivers. Prediction of where and when phyto-
plankton growth occurs in tidal freshwater rivers based
on geomorphic attributes would help integrate tidal
freshwater river ecosystems with geomorphically based
conceptual models of river (e.g. Vannote et al., 1980;
Thorp, Thoms & Delong, 2006) and estuarine ecosystems.
Acknowledgments
We thank J. Muehlbauer, K. Siporin, A. Smyth, L.
Stevenson, S. Thompson, B. VonKorff and Dr. J. Weiss
for field and laboratory help, statistical support and
reviews. H. Godwin and D. Wilke provided access to field
sites on their property. This project was funded by NSF
REU # 0441504 (M. W. D.), EPA STAR Graduate Fellow-
ship #FP-91686901-0 (S. H. E.), NSF EAR-0815627 (M. F.
P.) and the NOAA Ecological Effects of Sea Level Rise
Program (M.F.P.). The research described in this paper
has been funded in part by the US EPA under the STAR
Graduate Fellowship Program. EPA has not officially
endorsed this publication, and the views expressed herein
may not reflect the views of the EPA.
References
Amphlett M.B. & Brabben T.E. (1991) Measuring fresh water
flows in large tidal rivers. in: Water management of the
Amazon Basin (Eds B.P.F. Braga & C.A. Fernandez-
Jauregui), pp. 179–190. Manaus, 5–9 August 1990. UNE-
SCO Montevideo.
Anderson G.F. (1986) Silica, diatoms and a freshwater
productivity maximum in Atlantic coastal plain estuaries.
Chesapeake Bay: Estuarine, Coastal and Shelf Science, 22,
183–197.
Bennett J., Woodward J. & Shultz D. (1986) Effect of discharge
on the chlorophyll a distribution in the tidally-influenced
Potomac River. Estuaries and Coasts, 9, 250–260.
Bukaveckas P., Barry L., Beckwith M., David V. & Lederer
B. (2011) Factors determining the location of the chloro-
phyll maximum and the fate of algal production within
the tidal freshwater James River. Estuaries and Coasts, 34,
569–582.
Carpenter S.R. (1996) Microcosm experiments have limited
relevance for community and ecosystem ecology. Ecology,
77, 677–680.
Chen M.S., Wartel S., Eck B.V. & Maldegem D.V. (2005)
Suspended matter in the Scheldt estuary. Hydrobiologia,
540, 79–104.
D’Alpaos A., Lanzoni S., Marani M. & Rinaldo A. (2010) On
the tidal prism–channel area relations. Journal of Geophysical
Research, 115, F01003.
Dalrymple R.W. & Choi K. (2007) Morphologic and facies
trends through the fluvial-marine transition in tide-dom-
inated depositional systems: a schematic framework for
environmental and sequence-stratigraphic interpretation.
Earth-Science Reviews, 81, 135–174.
Davies G. & Woodroffe C.D. (2010) Tidal estuary width
convergence: theory and form in North Australian estuar-
ies. Earth Surface Processes and Landforms, 35, 737–749.
Dyer K.R. (1997) Estuaries: A Physical Introduction. John Wiley
and Sons, New York.
Edwards R.T. & Meyer J.L. (1987) Metabolism of a sub-
tropical low gradient black water river. Freshwater Biology,
17, 251–263.
Ensign S., Siporin K., Piehler M., Doyle M. & Leonard L.
(2012) Hydrologic versus biogeochemical controls of deni-
trification in tidal freshwater wetlands. Estuaries and Coasts,
doi: 10.1007/s12237-012-9491-1.
Tides and river ecosystems 13
Published 2012. This article is a U.S. Government work and is in the public domain in the USA, Freshwater Biology, doi:10.1111/j.1365-2427.2012.02856.x

Ensign S.H. & Mallin M.A. (2001) Stream water quality
changes following timber harvest in a coastal plain swamp
forest. Water Research, 35, 3381–3390.
Ensign S.H., Piehler M.F. & Doyle M.W. (2008) Riparian zone
denitrification affects nitrogen flux through a tidal fresh-
water river. Biogeochemistry, 91, 133–150.
Ensign S.H., Piehler M.F., Doyle M.W. & Smyth A.R. (2007)
Effects of Tidal Flow on Riparian Zone Hydraulics and Nitrogen
Dynamics: Implications for Nutrient Management in Coastal
Creeks. Water Resources Research Institute of the Univer-
sity of North Carolina Report 383, Raleigh, NC.
Field D.W., Refer A.J., Genovese P.V. & Shearer B.D. (1991)
Coastal Wetlands of the United States: An Accounting of a
Valuable National Resource. National Oceanic and Atmo-
spheric Administration and United States Fish and Wild-
life Service, Department of Commerce, Washington, D.C.
Frazer G.W., Canham C.D. & Lertzman K.P. (1999) Gap Light
Analyzer (GLA), Version 2.0: Imaging Software to Extract
Canopy Structure and Gap Light Transmission Indices from
True-color Fisheye Photographs, Users Manual and Program
Documentation, Version 2.0. Simon Fraser University and the
Institute of Ecosystem Studies, Burnaby, British Columbia,
Canada, and Millbrook, New York, USA.
Galler J.J. & Allison M.A. (2008) Estuarine controls on fine-
grained sediment storage in the lower Mississippi and
Atchafalaya Rivers. Geological Society of America Bulletin,
120, 386–398.
Hecky R.E. & Kilham P. (1988) Nutrient limitation of
phytoplankton in freshwater and marine environments: a
review of recent evidence on the effects of enrichment.
Limnology and Oceanography, 33, 796–822.
Hupp C.R. (2000) Hydrology, geomorphology and vegetation
of Coastal Plain rivers in the south-eastern USA. Hydrolog-
ical Processes, 14, 2991–3010.
Julian J.P., Doyle M.W. & Stanley E.H. (2008a) Empirical
modeling of light availability in rivers. Journal of Geophys-
ical Research, 113, G03022.
Julian J.P., Stanley E.H. & Doyle M.W. (2008b) Basin-scale
consequences of agricultural land use on benthic light
availability and primary production along a sixth-order
temperate river. Ecosystems, 11, 1091–1105.
Langbein W.B. (1963) The hydraulic geometry of a shallow
estuary. International Association of Scientific Hydrology
Bulletin, 8, 84–94.
Leopold L.B. & Maddock T. (1953) The hydraulic geometry of
stream channels and some physiographic implications.
U.S. Geological Survey Professional Paper 252. U.S. Govern-
ment Printing Office, Washington, D.C.
Leopold L.B., Wolman M.G. & Miller J.P. (1964) Fluvial
Processes in Geomorphology. Freeman, San Francisco.
Lionard M., Muylaert K., Gansbeke D.V. & Vyverman W.
(2005) Influence of changes in salinity and light intensity on
growth of phytoplankton communities from the Schelde
river and estuary (Belgium ⁄The Netherlands). Hydrobiolo-
gia, 540, 105–115.
Lucas L.V., Thompson J.K. & Brown L.R. (2009) Why are
diverse relationships observed between phytoplankton
biomass and transport time? Limnology and Oceanography,
54, 381–390.
Mallin M., Cahoon L.B., Parsons D. & Ensign S. (2001) Effect
of nitrogen and phosphorus loading on plankton in Coastal
Plain blackwater streams. Journal of Freshwater Ecology, 16,
455–466.
Mallin M.A., McIver M.R., Ensign S.H. & Cahoon L.B. (2004)
Photosynthetic and heterotrophic impacts of nutrient
loading to blackwater streams. Ecological Applications, 14,
823–838.
Meek D.W., Hatfield J.L., Howell T.A., Idso S.B. & Reginato
R.J. (1984) A generalized relationship between photosyn-
thetically active radiation and solar radiation. Agronomy
Journal, 76, 939–945.
Meyer J.L. (1990) A blackwater perspective on riverine
ecosystems. BioScience, 40, 643–651.
Moran M., Sheldon W. & Sheldon J. (1999) Biodegradation of
riverine dissolved organic carbon in five estuaries of the
southeastern United States. Estuaries and Coasts, 22, 55–64.
Muylaert K., Dasseville R., De Brabandere L., Dehairs F. &
Vyverman W. (2005a) Dissolved organic carbon in the
freshwater tidal reaches of the Schelde estuary. Estuarine,
Coastal and Shelf Science, 64, 591–600.
Muylaert K., Sabbe K. & Vyverman W. (2000) Spatial and
temporal dynamics of phytoplankton communities in a
freshwater tidal estuary (Schelde, Belgium). Estuarine,
Coastal and Shelf Science, 50, 673–687.
Muylaert K., Tackx M. & Vyverman W. (2005b) Phytoplank-
ton growth rates in the freshwater tidal reaches of the
Schelde estuary (Belgium) estimated using a simple light-
limited primary production model. Hydrobiologia, 540, 127–
140.
Nobis M. & Hunziker U. (2005) Automatic thresholding for
hemispherical canopy-photographs based on edge detec-
tion. Agricultural and Forest Meteorology, 128, 243–250.
Paerl H.W. & Bowles N.D. (1987) Dilution bioassays: their
application to assessments of nutrient limitation in hype-
reutrophic waters. Hydrobiologia, 146, 265–273.
Phlips E.J., Cichra M., Aldridge F.J., Jembeck J., Hendrickson
J. & Brody R. (2000) Light availability and variations in
phytoplankton standing crops in a nutrient-rich blackwater
river. Limnology and Oceanography, 45, 916–929.
R Development Core Team. (2012) R: A Language and
Environment for Statistical Computing. R Foundation for
Statistical Computing, Vienna, Austria. ISBN 3-900051-
07-0.
Sabater F., Meyer J. & Edwards R. (1993) Longitudinal
patterns of dissolved organic carbon concentration and
suspended bacterial density along a blackwater river.
Biogeochemistry, 21, 73–93.
Schuchardt B., Haesloop U. & Schirmer M. (1993) The tidal
freshwater reach of the Weser estuary: Riverine or estua-
rine? Aquatic Ecology, 27, 215–226.
14 S. H. Ensign et al.
Published 2012. This article is a U.S. Government work and is in the public domain in the USA, Freshwater Biology, doi:10.1111/j.1365-2427.2012.02856.x

Schuchardt B. & Schirmer M. (1991) Phytoplankton maxima
in the tidal freshwater reaches of two coastal plain
estuaries. Estuarine, Coastal and Shelf Science, 32, 187–
206.
Southwell M.W., Kieber R.J., Mead R.N., Brooks A.G. &
Skrabal S.A. (2009) Effects of sunlight on the production of
dissolved organic and inorganic nutrients from resus-
pended sediments. Biogeochemistry, 98, 115–126.
Sweet W.V. & Geratz J.W. (2003) Bankfull hydraulic geom-
etry relationships and recurrence intervals for North
Carolina’s coastal plain. Journal of the American Water
Resources Association, 39, 861–871.
Thorp J.H., Thoms M.C. & Delong M.D. (2006) The riverine
ecosystem synthesis: biocomplexity in river networks
across space and time. River Research and Applications, 22,
123–147.
Vahatalo A.V., Wetzel R.G. & Paerl H.W. (2005) Light
absorption by phytoplankton and chromophoric dissolved
organic matter in the drainage basin and estuary of the
Neuse River, North Carolina (U.S.A.). Freshwater Biology,
50, 477–493.
Van Damme S., Struyf E., Maris T., Cox T. & Meire P. (2009)
Characteristic aspects of the tidal freshwater zone that
affect aquatic primary production. In: Tidal Freshwater
Wetlands (Eds A. Barendregt, D.F. Whigham & A.H.
Baldwin), pp. 123–136. Backhuys, Netherlands.
Vannote R.L., Minshall G.W., Cummins K.W., Sedell J.R. &
Cushing C.E. (1980) The river continuum concept. Canadian
Journal of Fisheries and Aquatic Sciences, 37, 130–137.
Whalen S.C. & Benson P.M. (2007) Influence of nutrient
reduction, light and light-nutrient interactions on phyto-
plankton biomass, primary production and community
composition in the Neuse River, USA. Fundamental and
Applied Limnology ⁄Archiv fur Hydrobiologie, 168, 257–270.
Wheeler W.H. (1893) Tidal Rivers. Longmans, Green, and Co.,
London.
Wiegner T.N. & Seitzinger S.P. (2001) Photochemical and
microbial degradation of external dissolved organic matter
inputs to rivers. Aquatic Microbial Ecology, 24, 27–40.
(Manuscript accepted 24 June 2012)
Tides and river ecosystems 15
Published 2012. This article is a U.S. Government work and is in the public domain in the USA, Freshwater Biology, doi:10.1111/j.1365-2427.2012.02856.x


