Embed Size (px)
Citation preview

Physica C 420 (2005) 1–10
www.elsevier.com/locate/physc
Time evolution of quenched state and correlationto glassy effects
K. Kilic a, A. Kilic a,*, A. Altinkok a, H. Yetis� a, O. Cetin a, Y. Durust b
a Department of Physics, Turgut Gulez Research Laboratory, Abant Izzet Baysal University, 14280 Bolu, Turkeyb Department of Chemistry, Abant Izzet Baysal University, 14280 Bolu, Turkey
Received 25 October 2004; accepted 1 December 2004
Abstract
In this work, dynamic changes generated by the driving current were studied in superconducting bulk polycrystalline
YBCO sample via transport relaxation measurements (V–t curves). The evolution of nonlinear V–t curves was inter-
preted in terms of the formation of resistive and nonresistive flow channels and the spatial reorganization of the trans-
port current in a multiply connected network of weak-link structure. The dynamic re-organization of driving current
could cause an enhancement or suppression in the superconducting order parameter due to the magnitude of the driving
current and coupling strength of weak-link structure along with the chemical and anisotropic states of the sample as the
time proceeds. A nonzero voltage decaying with time, correlated to the quenched state, was recorded when the magni-
tude of initial driving current is reduced to a finite value. It was found that, after sufficiently long waiting time, the evo-
lution of the quenched state could result in a superconducting state, depending on the magnitude of the driving current
and temperature. We showed that the decays in voltage over time are consistent with an exponential time dependence
which is related to the glassy state. Further, the effect of doping of organic material Bis dimethyl-glyoximato Copper
(II) to YBCO could be monitored apparently via the comparison of the V–t curves corresponding to doped and
undoped YBCO samples.
� 2005 Elsevier B.V. All rights reserved.
PACS: 74.72.Bk; 74.25.Qt
0921-4534/$ - see front matter � 2005 Elsevier B.V. All rights reserv
doi:10.1016/j.physc.2004.12.014
* Corresponding author. Fax: +90 374 253 4642.
E-mail address: [email protected] (A. Kilic).
1. Introduction
The dissipation induced by the motion of the
flux lines in a type-II superconductor depends
strongly on distribution and type of the pinningcenters. The main mechanism which governs the
ed.

2 K. Kilic et al. / Physica C 420 (2005) 1–10
dissipation is attributed to the competition
between pinning and depinning, provided that
thermal fluctuations are negligible compared to
pinning [1–9]. In one hand, depinning which favors
spatially the ordering of the vortices, in the otherhand, pinning which arises from inhomogeneities
and defects inside the sample promotes disorder
by decreasing the vortex–vortex interactions and,
thus, destroy the long-range order of the flux line
lattice [6,7,10]. This competition evolving between
pinning and depinning can be observed in details
by magnetic and transport measurements via the
response of the moving entity to the applied cur-rent and external magnetic field [6,11–15]. Experi-
mental observations show that the competition
between pinning and depinning causes several
unusual and interesting phenomena, such as low-
frequency noise [3,16], slow voltage oscillations
[17], history dependent dynamic response [18],
memory effect etc. [6,19], which deserve further
investigations.It is well known that one of the remarkable
features of high temperature superconductors
(HTSCs) is the presence of large flux creep effect
[20]. Although the phenomenological flux creep
theory could explain many magnetic and transport
properties of HTSCs, there are some difficulties to
describe the reorganization of vortices evolving to
a state with vanishingly small voltage values, sothat this case may sometimes result in a true super-
conducting state [11,18,21]. In the description of
this physical case, the flux creep picture and the
other theories cannot solely explain some magnetic
or transport data without invoking current/field
induced glassy state. Indeed, the experimental
observations on both low Tc superconductors
LTSCs [11,18] and HTSCs [21–25] supportstrongly the presence of a glassy state which
reminds classic spin glasses [26]. After the work
of Muller et al. [22], not only the magnetic data,
but also the transport measurements were inter-
preted in terms of the glassy state effect [21]. For
instance, the exponential time decay of the voltage
in bulk polycrystalline superconducting YBCO
sample was explained by this effect [21]. Recently,the fast transport measurements performed by
Henderson et al. [11] and Xiao et al. [6] have con-
firmed such a glassy relaxation in single crystal
samples of 2H–NbSe2 and Fe-doped 2H–NbSe2,
respectively.
In the glassy state relaxation, it is assumed that
there are several energy states for the moving enti-
ties with a hierarchy of barriers. Within thisdescription, it is assumed that the energy difference
between the neighboring barriers is small, while
the difference between the more distant barriers
is higher [21]. It can be assumed that such an en-
ergy landscape (associated with the frustrated
superconducting domains coupled by weak links)
leads to the concept of the superconducting glass
model. Due to the external force or thermal activa-tion, the vortices in an inhomogeneous distribu-
tion of the energy landscape can easily overcome
the neighboring barriers, but may fall in a deeper
barrier. Thus, bundle of vortices remaining at the
bottom of deeper barriers can not overcome the
barriers and give no contribution to the measured
voltage.
Recent studies reveal that the time evolution ofthe sample voltage (i.e., V–t curves) is one of the
best methods to monitor preciously the dynamic
variables which are sensitive to the external forces
[6,8,9,11,16–18]. Both fast and slow transport mea-
surements associated with these studies can pro-
vide an accurate way to determine the metastable
states, motional reorganization, dynamic transi-
tions, and dynamics of driven vortices etc.[6,8,9,11,16–18]. The aim of this study is to inves-
tigate the time effects induced by the transport cur-
rent via the time evolution of the sample voltage
(i.e., V–t curves) measured in an undoped poly-
crystalline bulk superconducting Y1Ba2Cu3O7�d
(YBCO) material and the doped one by organic
material Bis dimethyl-glyoximato Copper (II),
respectively. For this purpose, slow transportrelaxation measurements were performed as a
function of driving current (I), and temperature
(T). It was observed that, when the transport cur-
rent is interrupted, the voltage response becomes
abruptly zero within the time constant of the
experimental set-up. However, it was found that
the reduction of initial current to finite value re-
sults in only smooth exponential voltage decaysor the voltage decays with transitions evolving to
lower voltage values. The transitions result in a
true superconducting state depending on the mag-
K. Kilic et al. / Physica C 420 (2005) 1–10 3
nitude of transport current or the temperature
range considered. Furthermore, the effect of the
organic material introduced to YBCO material
could be observed apparently by means of the
V–t curves. Thus, the difference between dopedand undoped YBCO samples could be distin-
guished separately. The experimental results were
discussed mainly in terms of the suppression or
enhancement of the superconducting order param-
eter in a multiply connected network of the weak
link structure and also by the glassy state relaxa-
tion in an inhomogeneous energy landscape.
2. Experimental
The YBCO sample was prepared from the high
purity powders of Y2O3, BaCO3 and CuO by using
the conventional solid state reaction [8,9]. In order
to eliminate possible heating effect which will oc-
cur at current leads due to the high currents, thesample for the transport measurements was
shaped carefully in the dimensions of length
l � 4 mm, width w � 0.1 mm, and thickness
d � 0.2 mm. The four conductive pads were placed
onto the sample by using silver paint and annealed
�1 to 2 h at 150 �C under O2 atmosphere. The
pure copper wires were attached by silver paint.
The measured contact resistance by using thethree-point method was of order of �10�3 X below
Tc and �10�2 X at room temperature. In this case,
the power dissipated at the current contacts would
be �9 · 10�7 W for a current of I = 30 mA, and,
the power generated at the current leads is negligi-
ble and will not affect the evolution of the V–t
curves. The transport measurements were carried
out using standard four-point method, and per-formed in a closed cycle He-refrigerator (Oxford
Instruments (OI) CCC1104). In the experiments,
Keithley-182 with a resolution 1 nV and Keith-
ley-220 were used in measuring the sample voltage
and supplying the current, respectively. The mea-
sured voltage is the average value of five readings
for each data point. After the current is applied,
just at this time, we start to measure the develop-ing voltage across the sample as a function of time.
Thus, monitoring of all details of the time evolu-
tion including the transient effects becomes avail-
able. In the experiments, to create a glassy state,
the dc current was interrupted or reduced to a
finite value. The temperature was recorded by a
calibrated 27 X Rhodium–Iron thermocouple (OI
Calibration number 31202), and a temperaturestability better than 10 mK was maintained dur-
ing the experiments (OI, ITC-503 temperature
controller).
The undoped YBCO sample used in this study
has zero resistance at �92 K with a transition
width DTc of about 3 K at zero field and zero mag-
netic field critical current density of �25 A/cm2
at T = 88 K determined by using the 1 lV/cmcriterion.
3. Experimental results
One of the best ways to observe the time effects
induced by the transport current is to record the
sample voltage continuously as a function of time,i.e., to measure the V–t curves. Thus, all dynamic
changes including the transient effects can be mon-
itored. During the time evolution of the sample
voltage, the transport current (I1) can be inter-
rupted or reduced to a finite value (I2) so that a
quenched state which is reminiscent of the glassy
state can be obtained. Indeed, to create such a
state, one of the requirements is to interrupt thepower supply which generates the transport cur-
rent (or the external magnetic field) or to reduce
the transport current (or the external magnetic
field) to a lower value. For this purpose, in our
measurements, a dc driving current I1 was applied
to the sample and maintained for sometime (i.e.,
53 s) to achieve a steady state. Then, the current
was reduced from I1 to a lower value I2 duringcourse of the measurement, and this value kept
at rest of the relaxation process, (i.e., up to
120 s). In the mean time, the sample voltage was
recorded continuously.
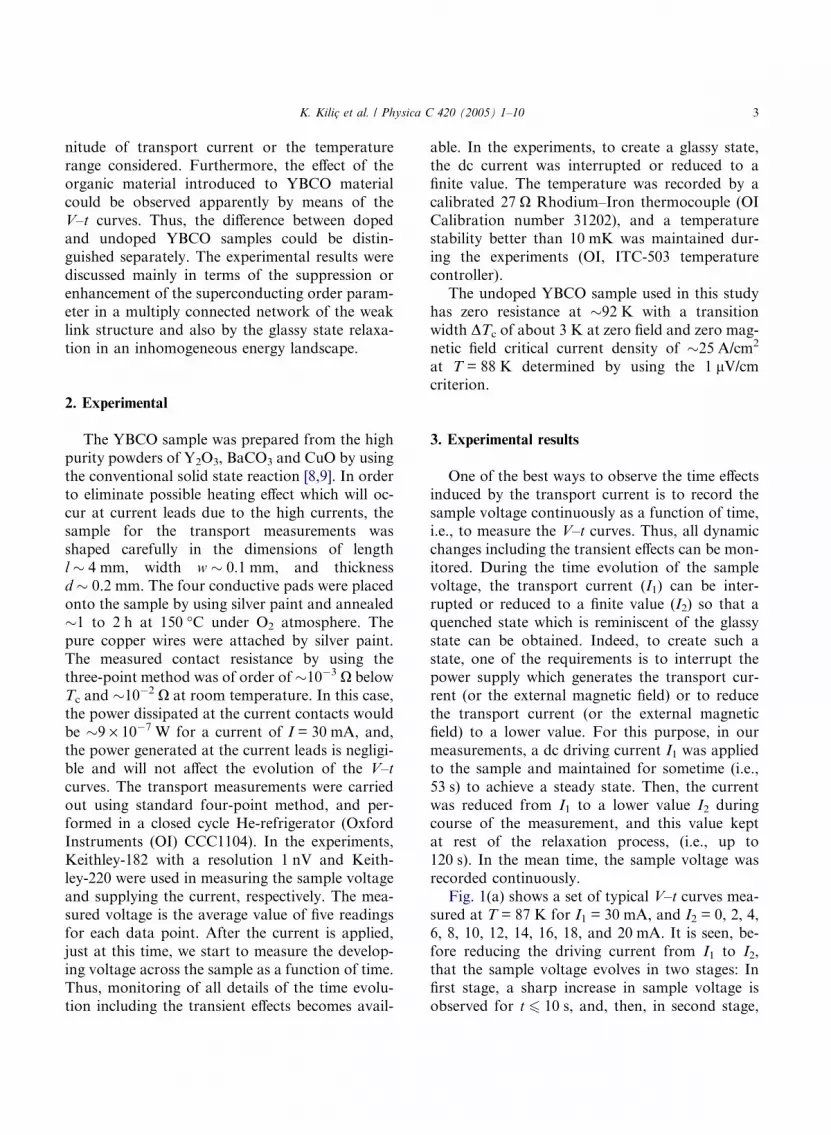
Fig. 1(a) shows a set of typical V–t curves mea-
sured at T = 87 K for I1 = 30 mA, and I2 = 0, 2, 4,
6, 8, 10, 12, 14, 16, 18, and 20 mA. It is seen, be-
fore reducing the driving current from I1 to I2,that the sample voltage evolves in two stages: In
first stage, a sharp increase in sample voltage is
observed for t 6 10 s, and, then, in second stage,
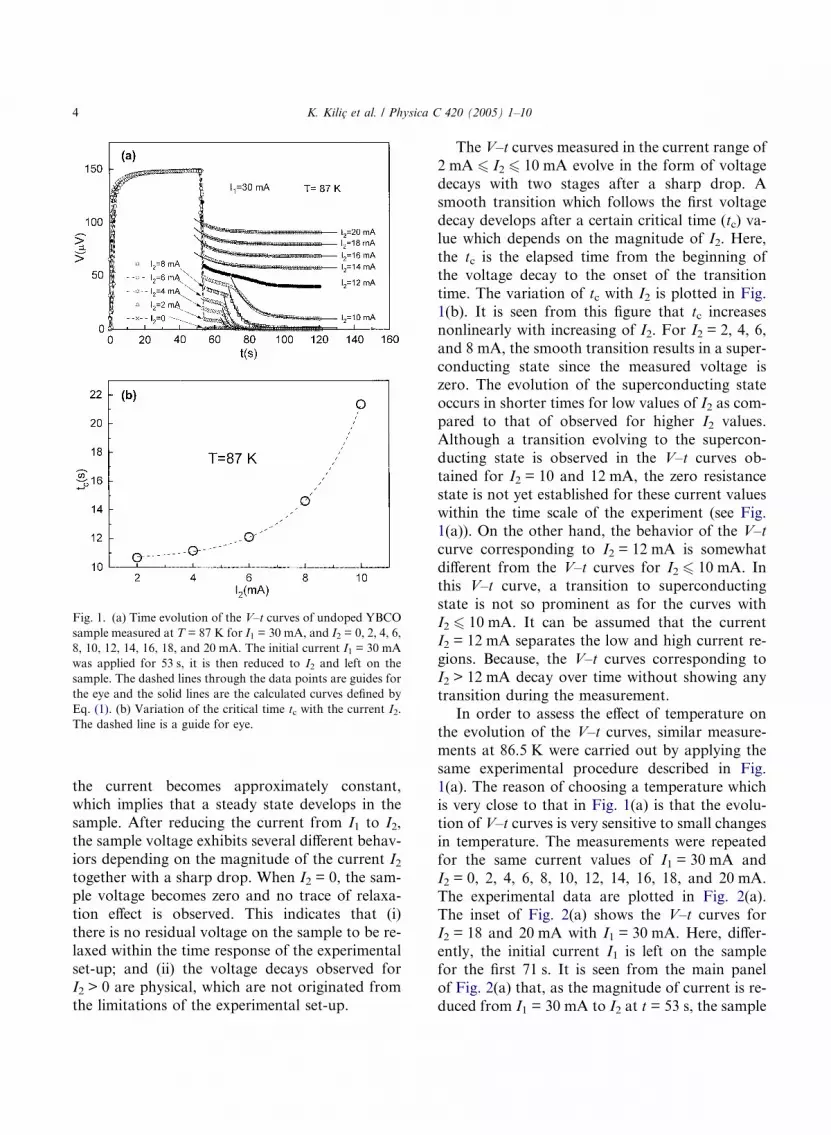
Fig. 1. (a) Time evolution of the V–t curves of undoped YBCO
sample measured at T = 87 K for I1 = 30 mA, and I2 = 0, 2, 4, 6,
8, 10, 12, 14, 16, 18, and 20 mA. The initial current I1 = 30 mA
was applied for 53 s, it is then reduced to I2 and left on the
sample. The dashed lines through the data points are guides for
the eye and the solid lines are the calculated curves defined by
Eq. (1). (b) Variation of the critical time tc with the current I2.
The dashed line is a guide for eye.
4 K. Kilic et al. / Physica C 420 (2005) 1–10
the current becomes approximately constant,
which implies that a steady state develops in the
sample. After reducing the current from I1 to I2,the sample voltage exhibits several different behav-
iors depending on the magnitude of the current I2together with a sharp drop. When I2 = 0, the sam-
ple voltage becomes zero and no trace of relaxa-
tion effect is observed. This indicates that (i)
there is no residual voltage on the sample to be re-
laxed within the time response of the experimental
set-up; and (ii) the voltage decays observed forI2 > 0 are physical, which are not originated from
the limitations of the experimental set-up.
The V–t curves measured in the current range of
2 mA 6 I2 6 10 mA evolve in the form of voltage
decays with two stages after a sharp drop. A
smooth transition which follows the first voltage
decay develops after a certain critical time (tc) va-lue which depends on the magnitude of I2. Here,
the tc is the elapsed time from the beginning of
the voltage decay to the onset of the transition
time. The variation of tc with I2 is plotted in Fig.
1(b). It is seen from this figure that tc increases
nonlinearly with increasing of I2. For I2 = 2, 4, 6,
and 8 mA, the smooth transition results in a super-
conducting state since the measured voltage iszero. The evolution of the superconducting state
occurs in shorter times for low values of I2 as com-
pared to that of observed for higher I2 values.
Although a transition evolving to the supercon-
ducting state is observed in the V–t curves ob-
tained for I2 = 10 and 12 mA, the zero resistance
state is not yet established for these current values
within the time scale of the experiment (see Fig.1(a)). On the other hand, the behavior of the V–t
curve corresponding to I2 = 12 mA is somewhat
different from the V–t curves for I2 6 10 mA. In
this V–t curve, a transition to superconducting
state is not so prominent as for the curves with
I2 6 10 mA. It can be assumed that the current
I2 = 12 mA separates the low and high current re-
gions. Because, the V–t curves corresponding toI2 > 12 mA decay over time without showing any
transition during the measurement.
In order to assess the effect of temperature on
the evolution of the V–t curves, similar measure-
ments at 86.5 K were carried out by applying the
same experimental procedure described in Fig.
1(a). The reason of choosing a temperature which
is very close to that in Fig. 1(a) is that the evolu-tion of V–t curves is very sensitive to small changes
in temperature. The measurements were repeated
for the same current values of I1 = 30 mA and
I2 = 0, 2, 4, 6, 8, 10, 12, 14, 16, 18, and 20 mA.
The experimental data are plotted in Fig. 2(a).
The inset of Fig. 2(a) shows the V–t curves for
I2 = 18 and 20 mA with I1 = 30 mA. Here, differ-
ently, the initial current I1 is left on the samplefor the first 71 s. It is seen from the main panel
of Fig. 2(a) that, as the magnitude of current is re-
duced from I1 = 30 mA to I2 at t = 53 s, the sample

Fig. 2. (a) Time evolution of the V–t curves of undoped YBCO
sample measured at T = 86.5 K for I1 = 30 mA, and I2 = 0, 2, 4,
6, 8, 10, 12, 14, 16, 18, and 20 mA. The initial current
I1 = 30 mA was applied on the sample for 53 s, it is then
reduced to I2 and left on the sample. The inset shows the V–t
curves measured at the current values I2 = 18 and 20 mA,
respectively. The reduction from I1 to I2 was carried out at
t = 71 s of the time evolution. The dashed lines are a guide for
the eye and the solid lines are the calculated curves defined by
Eq. (1). (b) Variation of the critical time tc with current I2. The
dashed line is a guide for eye.
Fig. 3. Time evolution of the V–t curves of undoped YBCO
sample measured at T = 87 K for I1 = 20 mA, and I2 = 0, 2, 4, 6,
8, and 10 mA. The initial current I1 = 20 mA was applied for
53 s, it is then reduced to I2 and left on the sample. The inset
shows the variation of the critical time tc with the current I2.
The dashed lines through the data points are guides for the eye
and the solid lines are the calculated curves defined by Eq. (1).
K. Kilic et al. / Physica C 420 (2005) 1–10 5
voltage drops abruptly, and, then, decays nonlin-early up to a certain time tc (the critical time)
which depends on the magnitude of I2. The varia-
tion of critical time tc with I2 extracted from Fig.
2(a) is illustrated in Fig. 2(b). For t > tc a transi-
tion follows the initial smooth decay evolving to
lower voltage values. For the current values of
I2 = 2, 4, 6, 8, 10, and 12 mA, the transition results
in a superconducting state, whereas, for I2 = 14and 16 mA, the smooth voltage decays together
with transitions do not result in a superconducting
state in the time scale of the experimental set-up.
A comparison between Fig. 1(a) and Fig. 2(a)
shows that, in addition to similarities, there are
also some differences. For instance, the transition
at I2 = 12 mA in Fig. 2(a) results in a supercon-
ducting state, whereas, for the same current valuein Fig. 1(a), such a behavior evolving to zero resis-
tance state is not seen. This behavior is due to the
change of temperature. On the other hand, the
dependence of tc on the current I2 (Fig. 1(b) and
Fig. 2(b)) demonstrates these differences well and
reveals the effect of the temperature on the evolu-
tion of the V–t curves. The comparison of tc values
obtained at different temperatures shows that boththe evolution of voltage decays and the width of
the transitions depend strongly on the tempera-
ture, which implies the lower the temperature the
lower the critical time. As can be seen from the in-
set of Fig. 2(a), at the higher current values of 18
and 20 mA, only voltage decays without a transi-
tion to superconducting state are observed.
To investigate the influence of the magnitude ofdriving current I1 on the evolution of the V–t
curves, the current I1 was reduced from 30 to
20 mA and the V–t curve measurements were re-
peated for I2 = 0, 2, 4, 6, 8, and 10 mA at
T = 87 K. The data are represented in Fig. 3. A
comparison of Fig. 1(a) and Fig. 3 shows that
there is a similarity between the corresponding
V–t curves. The response of the sample to the

6 K. Kilic et al. / Physica C 420 (2005) 1–10
reduction of I1 = 20 mA to I2 shows nearly the
same behavior as compared to that of observed
in Fig. 1(a), i.e., the time evolution of the sample
voltage occurs in two stages. However, a careful
examination reveals that there are remarkable dif-ferences between the V–t curves presented in Fig.
1(a) and Fig. 3. First of all, just after the current
I1 is reduced to I2, the sample voltage decays and
evolves to superconducting state within shorter
times. This can be easily understood from the inset
of Fig. 3 which shows shorter critical time values
as compared to those Fig. 1(b). For instance, the
tc values corresponding to I2 = 8 mA in Fig. 1(a)and Fig. 3 are 15 and 9 s, respectively. This empha-
sizes that, at low values of the initial current I1, the
smooth transitions are observed within shorter
times.
4. Discussion
We now discuss on the V–t data presented in
Fig. 1(a), Fig. 2(a) and Fig. 3, which evolve in
two stages over time for a current value of I1.
We suggest that, in such V–t curves with two
stages, at the beginning, the transport current tries
to distribute itself and meanders along the nonre-
sistive flow channels for a while. As the time pro-
ceeds, the internal energy of the superconductingmaterial may increase due to the presence of the
transport current so that the effective supercon-
ducting order parameter cannot keep its previous
spatial configuration and can decrease in time.
Thus, an increase in sample voltage may be ob-
served. This means that the transport current pen-
etrates the weak-link network where the weak
superconducting regions exist and disrupt themgradually [27]. As a result, an enhancement in dis-
sipation together with a dynamic process triggered
by the current can appear. The nonlinear increase
in sample voltage observed in this stage can be
evaluated as an indication of the coexistence of
the disruption and reconstruction of the weak-link
structure by the transport current. However, the
voltage response shows that the competition be-tween these two physical mechanisms develops
mostly in favor of disruption in time. Finally, at
second stage, the transport current nearly com-
pletes the redistribution process depending on its
magnitude and a steady process is established
within the time scale of the experiment.
On the other hand, as shown in Fig. 1(a), Fig.
2(a), and Fig. 3, when the transport current isinterrupted, the sample voltage becomes immedi-
ately zero. It can be suggested that the weak links
form a coherent state and the resistive flow chan-
nels disappear within a very short time, at least,
within the time constant of our experimental
set-up. Thus, the effective order parameter should
increase after the interruption of the transport cur-
rent. We note that these experiments can also beconsidered as a test of whether the thermal relaxa-
tion due to the Joule heating at current contacts
[28,29] or hot spot effect [28,30–32] exists or not.
Our data demonstrate that the observation of zero
voltage for I = 0 (just after the dc current was
turned off) rules out the thermal relaxation associ-
ated with such mechanisms.
The decrease of transport current from I1 to asmaller value of I2, however, causes the appear-
ance of a different voltage response. Following this
procedure, the effective superconducting order
parameter suppressed by I1 is enhanced rapidly,
and a quenched state associated with the distribu-
tion of the transport current is developed. Depend-
ing on the magnitude of the currents I1 and I2, and
the temperature range of measurements, thequenched state reorganizes itself over time and
evolves to low dissipation levels. The decay in sam-
ple voltage can be considered as a measure of this
reorganization process in which the structural dis-
order, chemical and anisotropic states of the sam-
ple play a central role. At relatively low currents,
the effective size of dissipative nonsuperconducting
flow channels begins to decrease gradually withtime and this process leads to an enhancement in
the effective order parameter. At low enough cur-
rents, these channels are closed completely within
a very short time, so that the response is voltage
decay with transition to superconducting state. It
can be suggested that the phase of the order
parameter in a multiply connected superconduct-
ing disordered grains network becomes locked.We also correlate the voltage decays without
transition and the smooth transitions appearing
in V–t curves to the glassy state relaxation

Fig. 4. Variation of the characteristic time s0 with current I2:
(a) extracted from Fig. 3; (b) extracted from Fig. 1(a); (c)
extracted from Fig. 2(a) and its inset. The dashed lines are a
guide for eye.
K. Kilic et al. / Physica C 420 (2005) 1–10 7
(GSR), as in the case of spin glasses [21,22]. It
should be noted that the physical case appearing
in V–t curve cannot be explained alone by the
usual phenomenological theories such as flux creep
theory [33], collective creep model [34] etc., sincethese theories do not explain sufficiently the transi-
tion process evolving from resistive state to true
superconducting state. It has already been shown
[21,22] that such type of relaxation can be ex-
plained by glassy state relaxation (GSR). One of
the requirements of GSR is that the sample voltage
must decrease exponentially in time [21,22]:
V ðtÞ � V ðt ¼ 0Þ ¼ expð�t=s0Þ: ð1ÞHere, V is the sample voltage, s0 is a characteristic
time and depends on the external magnetic field,transport current, and temperature. Eq. (1) estab-
lishes that the sample voltage evolves to lower val-
ues for any time of the relaxation process.
Physically, the decrease in sample voltage can be
considered as a measure of degree of disordered
of the moving entity. For instance, as the time pro-
gresses, some of the vortices can pass locally into a
state of minimum energy within the correspondingenergy landscape and such a physical process can
evolve in the other regions of the sample in time
by enhancing gradually the superconducting order
parameter over the whole sample, which leads to a
decrease in the sample voltage. Therefore, Eq. (1)
gives quite reasonable insight on about the decay
of sample voltage below Tc [21,22]. In addition,
we emphasize that another important requirementto get a glassy state is to switch off the power sup-
ply which generates the transport current (or mag-
netic field), or reduce it to a given finite value.
Thus, it becomes possible to create a quenched
state which is unstable in time, and the measurable
time independent parameters of the system become
remarkably time dependent.
The solid lines through experimental datapoints in Fig. 1(a), Fig. 2(a) and Fig. 3 are calcu-
lated by using Eq. (1). The reasonable agreement
between the calculated curves and the experimen-
tal data suggests that the time evolution of the
quenched state is closely related to GSR relaxa-
tion. The characteristic time s0 values found from
the fitting of Eq. (1) to the experimental V–t curves
given in Fig. 1(a), Fig. 2(a) and Fig. 3 are plotted
as a function of the driving current I2 in Fig. 4.
The characteristic time s0 tends to increase with
current, because the transitions at low currents
are more faster than that at higher currents. In
addition, we note that there is no marked changein values of s0 as the temperature is reduced or
the current I1 is increased (see Fig. 4).
It is also observed that the reduction in the ini-
tial transport current I1 (see Fig. 1(a) and also Fig.
3) or the decrease in sample temperature (see Fig.
1(a) and Fig. 2(a)) do the same physical impact. It
can be suggested that there should be a correlation
between the transport current and the temperature[13]. Such a correlation has been treated theoreti-
cally and numerically by Koshelev and Vinokur

Fig. 5. (a)–(d) Time evolution of the V–t curves of YBCO
sample doped with an organic material Bis dimethyl-glyoxi-
mato Copper (II) measured at T = 87 K for I1 = 30 mA, and
I2 = 0, 15, 20, and 25 mA, respectively. The solid lines are the
calculated curves defined by Eq. (1).
8 K. Kilic et al. / Physica C 420 (2005) 1–10
[35]. These authors have shown that the random
pinning potential can induce measurable addi-
tional fluctuations on the moving vortices which
resemble the fluctuations associated with the ther-
mal Langevin force. In addition, we note that thiscorrelation can be naturally expected since the
superconducting order parameter strongly de-
pends on both the temperature and transport cur-
rent. The transport current serves here as an
‘‘effective temperature’’ in the sense defined in
the statistical mechanics, and anneals dynamically
the corresponding states during the relaxation pro-
cess [8,9,13,36]. Further, the magnitude of thetransport current determines mainly the annealing
kinetics.
In what follows, it is shown that the V–t curves
can be used to observe any microscopic structural
variation, i.e., deviation from the nominal compo-
sition, doping of any organic or inorganic material
into the superconducting matrix etc. We now
investigate this effect on the evolution of the V–tcurves and also on the evolution of the quenched
state. For this purpose, an organic material Bis di-
methyl-glyoximato Copper (II) was mixed with
sintered YBCO powder in the amount of 0.01%
of the weight of nominal composition of YBCO.
A similar sample preparation route such as mixing,
pelletization and sintering, was applied as like in
undoped YBCO sample whose the experimentalresults are presented above. In addition, in order
to remove the size effects and to make a correct
comparison between doped and undoped YBCO
samples, the doped-YBCO was shaped in the same
dimensions, i.e., length l � 4 mm, width w � 0.1
mm, and thickness d � 0.2 mm, as in the case of
undoped YBCO. The resistivity vs temperature
measurement showed that the addition of Bisdimethyl-glyoximato Copper (II) does not change
of the critical temperature of YBCO. However,
we obtained a small variation in the critical current
density Jc of doped YBCO, i.e., Jc = �30 A/cm2 at
T = 88 K. The higher Jc than that of undoped
YBCO can be attributed to the introducing of
the new pinning centers by addition of the organic
material.The effect of the addition of the organic mate-
rial into YBCO can be observed directly by means
of the V–t curves. Fig. 5 shows the V–t curves mea-
sured for such a YBCO sample at T = 87 K for
I1 = 30 mA, and I2 = 0, 10, 20 and 25 mA. The
evolution of the V–t curves for I1 in Fig. 5 repre-
sents three distinct stages: At first stage, it is seen
that there is no measurable voltage response upto the time value of �5 s. After t > �5 s, several
current carrying regions which connecting the
sample edges from one to another form: The dissi-
pation grows up nonlinearly and levels off at a cer-
tain voltage value at second and third stages,
respectively. As is also seen from Fig. 5(a), on
the other hand, interruption of the current gives
no measurable voltage and also no relaxationeffects to be recorded, as in the other V–t curves

K. Kilic et al. / Physica C 420 (2005) 1–10 9
given in Fig. 1(a), Fig. 2(a) and Fig. 3 for undoped
sample. However, when the current I1 is reduced to
I2, more smooth decrease rather than a sharp drop
in sample voltage is observed. The solid lines be-
long to this part of the measurement in Fig. 5 rep-resent the best fits of Eq. (1) to the data points. It is
seen that there is a reasonable agreement between
the calculated curves and experimental data. We
found from the fitting procedure that the charac-
teristic time, s0 values are 1.6, 4.3, and 6.3 s for
the current values of 15, 20, and 25 mA, respec-
tively. Consequently, we conclude that, for
I2 5 0, the voltage response is in the shape of anexponential decay without exhibiting any interme-
diate transition, which results in a superconducting
state up to the current values of 20 mA. For
I2 P 20 mA, it is observed that the exponential
decay does not result in superconducting state
within the time scale of the experiment. However,
we note that the V–t curves taken for undoped
YBCO in Fig. 1(a) reveal a voltage decay for awhile after a sharp drop, and, for the current (I2)
values low enough, evolve with a smooth exponen-
tial transition following the voltage decrease,
which may result in a superconducting state
depending on the magnitude of the current I2. At
higher currents (I2 P 12 mA) only the exponential
decays which do not show any trace of entering
into the superconducting state are observed withinthe time scale of the experiment. We would like to
note that, in doped YBCO, the superconducting
state still can be observed at the higher values of
I2 as compared to that of the undoped YBCO.
These differences between the V–t curves for doped
(Fig. 5) and undoped YBCO sample (Fig. 1(a)) can
be attributed to the effect caused by the organic
material in the superconducting matrix. Further-more, it can be suggested that the V–t curves intro-
duce a way to observe such a structural change
done with respect to a reference material which is
chosen.
Finally, one of the important points what we
wish to emphasize here is that the time evolution
of the V–t curves given in Fig. 1(a), Fig. 2(a),
Fig. 3 and Fig. 5 also should depict the timedependence of the order parameter, that is, the
relaxation of the order parameter over time.
According to the Ginzburg–Landau (GL) theory
[37] and time-dependent GL theory [38,39], the
superconducting order parameter depends explic-
itly on time, temperature, current density, and
external magnetic field. We suggest that the exper-
imental procedure used in the acquisition of V–tcurves presented in Fig. 1(a), Fig. 2(a), Fig. 3
and Fig. 5 provides a useful way to monitor the
time variation of order parameter, in details. All
these facts underline the importance of the V–t
curve and show that, in addition to the usual
transport measurements, this experimental method
introduced here is a candidate to be one of the
powerful tools to characterize the superconductingmaterials.
5. Conclusion
In this paper, nonlinear transport phenomena
was investigated in bulk polycrystalline supercon-
ducting Y1Ba2Cu3O7�d sample via slow transportrelaxation measurements [i.e., voltage–time, (V–t)
curves] as a function of driving current and tem-
perature. A quenched state was created by inter-
rupting the initial driving current or reducing to
a finite value. As the time progresses, it was found
that the time evolution of the quenched state rep-
resents several interesting properties. The voltage
response results in decay or decay with smoothtransitions evolving to lower voltage levels. In
addition, when the driving current was inter-
rupted, it was observed that the measured voltage
becomes zero. This finding indicated that there is
no residual voltage in the sample to be relaxed.
It was shown that the voltage response decays
exponentially in time and this interesting behavior
was interpreted in terms of glassy state relaxationin an inhomogeneous energy landscape. Further,
the effect of doping of an organic material Bis
dimethyl-glyoximato Copper (II) to YBCO could
be monitored apparently via the comparison of
the V–t curves corresponding to doped and
undoped YBCO samples. The experimental results
were discussed mainly by considering the spatial
reorganization of the driving current and suppres-sion or enhancement of the superconducting order
parameter in a multiply connected network of the
weak link structure.

10 K. Kilic et al. / Physica C 420 (2005) 1–10
Acknowledgments
This work was supported by TUBITAK/TBAG
2037. The authors would like to thank Prof. Dr.
M. Cankurtaran at Hacettepe University for valu-able discussions.
References
[1] G. Blatter, M.V. Feigel�man, V.B. Geshkenbein, A.I.
Larkin, V.M. Vinokur, Rev. Mod. Phys. 66 (4) (1994)
1125.
[2] E.H. Brandt, Rep. Prog. Phys. 58 (1995) 1465.
[3] G. D�Anna, P.L. Gammel, H. Safar, G.B. Alers, D.J.
Bishop, Phys. Rev. Lett. 75 (1995) 3521.
[4] W. Henderson, E.Y. Andrei, M.J. Higgins, S. Bhattach-
arya, Phys. Rev. Lett. 80 (1998) 381.
[5] T. Tsuboi, T. Hanaguri, A. Maeda, Phys. Rev. Lett. 80
(1998) 4550.
[6] W. Henderson, E.Y. Andrei, M.J. Higgins, Phys. Rev.
Lett. 81 (1998) 2532.
[7] S.R. Park, S.M. Choi, D.C. Dender, J.W. Lynn, X.S.
Ling, Phys. Rev. Lett. 91 (2003) 167003.
[8] K. Kilic, A. Kilic, H. Yetis�, O. Cetin, Phys. Rev. B 68
(2003) 144513;
Virt. J. Appl. Supercond. 5 (8) (2003).
[9] K. Kilic, A. Kilic, H. Yetis�, O. Cetin, J. Appl. Phys. 95
(2004) 1924.
[10] A.I. Larkin, Sov. Phys. JETP 31 (1970) 784.
[11] Z.L. Xiao, E.Y. Andrei, M.J. Higgins, Phys. Rev. Lett. 83
(1999) 1664.
[12] U. Yaron et al, Phys. Rev. Lett. 73 (1994) 2748.
[13] Z.L. Xiao, E.Y. Andrei, P. Shuk, M. Greenblatt, Phys.
Rev. Lett. 85 (2000) 3265.
[14] S.S. Banarjee et al, Appl. Phys. Lett. 74 (1999) 126.
[15] S.S. Banarjee et al, Phys. Rev. B 59 (1999) 6043.
[16] W.K. Kwok, G.W. Craptree, J.A. Fendrich, L.M. Paulius,
Physica C 293 (1997) 111.
[17] S.N. Gordeev, P.A.J. de Groot, M. Oussena, A.V.
Volkozup, S. Pinfold, R. Langan, R. Gagnon, L. Taillefer,
Nature 385 (1997) 324.
[18] W. Henderson, E.Y. Andrei, M.J. Higgins, S. Bhattach-
arya, Phys. Rev. Lett. 77 (1996) 2077.
[19] S.O. Valenzula, V. Bekeris, Phys. Rev. Lett. 84 (2000)
4000.
[20] Y. Yeshurun, A.P. Malozemoff, Phys. Rev. Lett. 60 (1988)
2202.
[21] Yu.S. Karimov, A.D. Kikin, Physica C 169 (1990) 50.
[22] K.A. Muller, M. Takashiga, J.G. Bednorz, Phys. Rev.
Lett. 58 (1987) 1143.
[23] I. Morgernstern, K.A. Muller, J.G. Bednorz, Z. Phys. B 69
(1987) 33.
[24] C. Rossel, Y. Maeno, I. Morgenstern, Phys. Rev. Lett. 62
(1989) 681.
[25] A.P. Malozemoff, L. Krusin-Elbaum, D.C. Cronomeyer,
Y. Yeshurun, F. Holtzberg, Phys. Rev. B 38 (1988)
6440.
[26] C. Ebner, D. Stroud, Phys. Rev. B 31 (1985) 165.
[27] A. Kilic, K. Kilic, O. Cetin, J. Appl. Phys. 93 (2003) 1;
Virt. J. Appl. Supercond. 4 (1) (2003).
[28] A. Kilic, K. Kilic, O. Cetin, Physica C 384 (2003) 321.
[29] Z.L. Xiao, E.Y. Andrei, P. Shuk, M. Greenblatt, Phys.
Rev. B 64 (2001) 094511.
[30] A.V. Gurevich, R.G. Mints, Rev. Mod. Phys. 59 (1987)
941.
[31] Z.L. Xiao, P. Voss-de Haan, G. Jakop, Th. Kluge, P.
Haibach, H. Adrian, E.Y. Andrei, Phys. Rev. B 59 (1999)
1481.
[32] Z.L. Xiao, E.Y. Andrei, P. Zeimann, Phys. Rev. B 58
(1998) 11185.
[33] P.W. Anderson, Phys. Rev. Lett. 9 (1962) 309;
P.W. Anderson, Y.B. Kim, Rev. Mod. Phys. 36 (1964) 39.
[34] M.V. Feigel�man, V.M. Geshkeinbein, A.I. Larkin, V.M.
Vinokur, Phys. Rev. Lett. 63 (1989) 2303.
[35] A.E. Koshelev, V.M. Vinokur, Phys. Rev. Lett. 73 (1994)
3580.
[36] Y. Paltiel, E. Zeldov, Y.N. Myasoedov, H. Shtrikman, S.
Bhattacharya, M.J. Higgins, Z.L. Xiao, P.L. Gammel,
D.J. Bishop, Nature 403 (2000) 398.
[37] V.L. Ginzburg, L.D. Landau, Zh. Eksperim. Theor. Fiz.
20 (1950) 1064.
[38] M. Thinkham, Introduction to Superconductivity, second
ed., McGraw-Hill, New York, 1996, p. 319.
[39] A.A. Abrikosov, Fundamentals of the Theory of Metals,
Elsevier/North-Holland, Amsterdam, 1988.


