Embed Size (px)
Citation preview

Water Resources Perspectives: Evaluation, Management and Policy. Edited by A.S. Alsharhan and W.W. Wood. Published in 2003 by Elsevier Science, Amsterdam, The Netherlands, p. 295-312.
Timing of Recharge, and the Origin, Evolution and Distribution of Solutes in a Hyperarid Aquifer System WARREN W. WOOD U. S. Geological Survey, MS 430, 12201 Sunrise Valley Drive, Reston, VA 20192, USA. E-mail: [email protected] and School of Geography and the Environment University of Oxford, Mansfield Road, Oxford OX1 3TB UK. ZEIN S. RIZK
Institute of Environment and Water, Ajman University of Science & Technology, P. O. Box 346, Ajman, United Arab Emirates. E-mail: [email protected] ABDULRAHMAN S. ALSHARHAN Faculty of Science, United Arab Emirates University, P. O. Box 17551, Al Ain, United Arab Emirates. E-mail: [email protected] ABSTRACT: Examination of an aquifer system in the Liwa Crescent/ Bu Hasa area of the Emirate of Abu Dhabi on the southeastern edge of the Rub al Khali, Arabian sub-continent, provides insight into the timing of ground-water recharge and the origin and evolution of solutes in a representative hyperarid area. Ground-water flow in the aquifer system is radially outward from the center of two ground-water mounds, corresponding to two 110 m-thick sand deposits. The isotopic data from ancient ground waters from the Liwa Oasis with its unusual “d” (deuterium excess) of approximately -15 indicate that Holocene moisture derived from previously evaporated water on the surface of the Indian Ocean rather than from the Mediterranean/Arabian Gulf. Such a source is consistent with a summer monsoonal circulation. Hydraulic heads in underlying aquifers are lower than those of the Liwa/ Bu Hasa aquifer; thus, there is no advective water or solute input from these lower units. Solute diffusion from underlying aquifers provides a small solute flux, but it is inadequate to account for the observed solute mass, nor is the ionic ratio consistent with this source. There are no laterally adjacent aquifers; thus, there is no influx of solutes from these sources. Dissolution of the aquifer framework provides for only a minor fraction of most of the observed solutes. Most solutes in this aquifer system are derived from atmospheric precipitation. Salts contained in rain were stored on the surface and in the unsaturated zone during the hyperarid time interval between the ends of the Pleistocene recharge event (26,000 years BP) and the beginning of the Holocene recharge (9000 years BP). During the Holocene recharge era (9000 to 6000 years BP), these stored salts were mobilized and transported to the ground water. The initial solute distribution has been slightly modified as the solutes and water were transported along the flow path. As ground water moves away from the apex of the mound, it encounters a series of interdunal sabkhat. Water is evaporated from the sabkhat leaving soluble chloride and nitrate minerals on the surface and retrograde carbonate and sulfate minerals in the unsaturated zone. When recharge occurs through the interdunal sabkhat, which are the only areas of recharge in the aquifer, soluble salts on the surface, modern 14C, and tritium are added to the aquifer. There is vertical mixing within the aquifer because the density of the recharged water is greater than the density of the ground water in this nearly homogeneous and isotropic aquifer. Relatively insoluble carbonate and sulfate minerals are retained in the unsaturated zone of the interdunal sabkhat, causing a change in the solute ratios downgradient. Only the portion of the aquifer not associated with interdunal sabkhat retains the original solute composition determined by mobilization of stored salts. These findings, although specific to this aquifer, provide a useful model by which to evaluate other aquifer systems in hyperarid environments. INTRODUCTION Arid areas occupy 25 percent of the continental surface, excluding polar regions (Thompson and Turk, 1999). As world population is predicted to increase from 6 to 9 billion in the next 50 years (Lutz et al., 2001), these previously marginal areas will undergo water-resource development. Most of
this development in arid areas will be ground water; thus, knowledge of the origin, distribution, and evolution of solutes and source and timing of recharge is essential for the implementation of appropriate water-management practices (Gleick, 2002). Our experimental design consisted of selecting an aquifer system in a hyperarid environment with

W. W. WOOD, Z. S. RIZK and A. S. ALSHARHAN
296
well-defined chemical and flow properties that minimized the number of potential solute and water sources. Our site-selection criteria were met in an area north and northwest of the apex of the Liwa Crescent on the northeastern edge of the Ar Rub al Khali, or "Empty Quarter," approximately 150 km southwest of the city of Abu Dhabi (Figure 1). The aquifer in this area is essentially homogeneous and isotropic with respect to flow; has a well-defined flow system; is mineralogically homogeneous; experiences low rainfall flux; receives no water or solutes from underlying or adjacent aquifers; lacks vegetation; and is not contaminated on a regional scale by human activity. Furthermore, the aquifer contained wells for sampling solute chemistry, isotopes, and hydraulic head; and cooperative landowners assured access by motor vehicle. Hydrogeology
High sand dunes (130 - 150 m above mean sea
level) with relief up to 50 m dominate the topography of the area. Nearly flat (typically less than 1 m of relief) valley floors (interdunal sabkhat) separate the dunes over much of the area (Figure 2). The surface elevations of these sabkhat are controlled by a dynamic equilibrium between the water table and eolian processes (Wood and Imes, 1995). That is, as the water table drops over geologic time, the sabkhat surfaces are lowered by wind erosion. As water level rises, sediment is trapped, and the sabkhat surfaces rise.
Dunes forming the Liwa aquifer are Quaternary as dated by Optically Stimulated Luminescence (OSL) (Table 1). Dunes are deposited on thin, less than 30 m, essentially flat-lying clastics of Miocene age (Alsharhan et al., 2001), the top of which is near (± 10 m) sea level. These clastics have lower hydraulic conductivity than the Liwa aquifer and contain brackish water. The top of these clastics forms the base of the active flow system of the Liwa aquifer. Below the clastics is a Tertiary and pre-Tertiary sequence of carbonate and evaporite formations with low hydraulic conductivity, containing brines with greater than 50,000 mg/L TDS (Table 2).
The Liwa aquifer is composed largely of quartz, equal amounts of calcite and dolomite, and minor amounts of anhydrite, feldspar, and opaque and heavy minerals (Ahmed et al., 1998; Hadley et al., 1998). Porosity of fine eolian sand typically varies between 35 to 40% (Driscoll, 1986), and laboratory evaluation of three samples averaged 38% with little variance. Grain-size analyses (Figure 3, Table 3) show a high degree of uniformity, similar to the
dunes in other areas of the Emirates (Ahmed et al., 1998). Specific yield of this aquifer is assumed to be 0.2, based on analysis of a similar aquifer on a coastal sabkha of the Arabian Gulf (Sanford and Wood 2001). Aquifer hydraulic conductivity is approximately 1.1 m/d (meters/day), based on the arithmetic average of seven regionally distributed aquifer tests in the Liwa area (Wood and Imes, 1995), and on similar tests in eolian sediments near the coast (Sanford and Wood, 2001). Hydraulic conductivities calculated from grain-size analyses (Taylor, 1948) are consistent with these values and range between 0.52 and 1.67 m/d (Table 4). Because of the uniform grain size, the eolian origin, and the general lack of cementation, the hydraulic properties are assumed to be homogeneous and isotropic.
The Quaternary aquifer has a maximum saturated thickness of approximately 110 m that thins away from the center of the dune complex (Figure 4). The ground-water surface forms two mounds reflecting the topography of the area: one approximately 20 km north of the apex of the Liwa Crescent, and one near Bu Hassa, approximately 90 km northwest of the apex (Figure 4). The water table at the top of both of the mounds is approximately 110 m above MSL (mean sea level), and ground-water flow is radially away from the mounds (Figure 4). A north/south-generalized cross section through the Liwa ground-water mound illustrates probable flow patterns (Figure 5). Heads in underling formations are approximately 70 m below those in the Liwa aquifer; thus, there is no advective transport of water or solutes to the Liwa aquifer from this source. The altitude of the paleo-ground-water table at the center was 128 m above MSL at approximately 28,000 years BP and again at 6000 years BP (Wood and Imes, 1995).
Historical records of annual rainfall in the Liwa Crescent area are limited but document extreme rainfall variability averaging 40 mm/y (millimeters/year) (National Atlas, U.A.E., 1993). Potential pan evaporation exceeds 3.5 m/y (National Atlas, U. A. E. 1993). Wood and Imes (1995) and Wood and Imes (this volume) showed that paleo-rainfall between 32,000 and 26,000 years BP and again between 9000 and 6000 years BP was approximately 200 ± 50 mm/y. Rainfall in the intervening hyperarid interval is believed to be approximately 40 mm/y, similar to the present. Estimates of wet and dry intervals are consistent with other findings in the area (McClure 1976; Clarke and Fontes, 1990; Burns et al., 1998; Burns et al., 2001; Neff et al., 2001; and Stokes et al., this volume).

Timing of Recharge, and the Origin, Evolution, and Distribution of Solutes in a Hyperarid Aquifer System
297
Figure 1. Map of the study areas showing roads, cities, and locations of wells sampled. Present study ( PS), Ground Water Project ( GWP), Water and Electricity Department ( LWS), and water quality monitoring ( LQ).
OM
AN
Al Ain
Fujairah
Gul
f of
Om
an
O M A N
U N I T E D A R A B E M I R A T E S
ABU DHABI
DubaiSharjah
Ajman
Ras Al Khaimah
Umm Al Qaiwin
A r a b i a n G u l f
50 km
N
Bu Hassa
Liwa
MadinatZayad
Asab
Shah
Sahil
SAUDI ARABIA
52o 53o 54o 55o 56o
25o
24o
23o
52o 53o 54o55o 56o
Scale
25o
24o
23o
N
33o
30`
33o
00`
53o 30` 54o 030` 54o 30`
20 km
Habshan
Bu Hasa
HamimArdah
Shah
Asab
Madinat Zayed
53o 30` 54o 030` 54o 30`
33o
30`
33o
00`
Sahil
8
BU181
BTDF
BU405WW16
WW6
CH5
CH3
BU336
BU121
BU104
BU360
9
10
11
12
13
30
29
1817
1615 14
2019
2122
2324
25 2627
28
SH9SH8
SH1SH10SH11SH4
SH2
SH8SH5
SH6 SH7
AS18
AS11
AS8
AS12AS1 AS16
AS4
AS6
AS10
AS9AS13
SA2
SA13SA5
SA5
SA10
SA9SA3
SA8SA7
SA4
SA11
Mizairaa
Liwa
GWP96
GWP98
GWP97
GWP95
GWP102
GWP140
GWP104
GWP94
GWP100
GWP143
GWP139
GWP105
GWP101
GWP138
GWP106
GWP103
GWP99
PsGWPLWSLQMain Town
SAUDI ARABIA
Bu Hasa

W. W. WOOD, Z. S. RIZK and A. S. ALSHARHAN
298
Table 1. Dates in thousands of years (ka) from OSL (Optically Stimulated Luminescence). “Wet” assumes that sample was at or below water table since deposition, “dry” assumes the sample was above
water table since deposition. Analyses by A.G. Wintle and G.A.T. Duller, University of Wales, UK.
Dry Burial Wet Burial
Sample ID LAB No.
Location UTM Zone 39
Measured % Water Content
K%Bulk Th (ppm) U (ppm) Equivalent
Dose (Gy) Dose Rate (Gy/ka)
Age (ka)
Dose Rate (Gy/ka)
Age (ka)
Description
LM-2 (.5-.6m) 124 746340E 2534641N Zone 39 4.01 1.37 2.06 ± 0.38 1.04 ± 0.12 323.5 ± 28.1 2.40 ± 0.152 134 ± 14 2.023 ± 0.135 160 ± 8 Paleo interdunal sabkha
LM-4 Road Cut (240-257 cm) 125 751528E 2545266N Zone 39 0.41 1.16 1.61 ± 0.33 0.44 ± 0.10 320.2 ± 39.2 1.950 ± 0.106 164 ± 22 1.640 ± 0.098 195 ± 27 Paleo interdunal sabkha
LM-6 near surface 126 219156E 2547039N Zone 40 1.95 1.10 1.28 ± 0.32 0.87 ± 0.10 112.4 ± 8.6 2.063 ± 0.119 54 ± 5 1.749 ± 0.109 64 ± 6 Paleo interdunal sabkha
LM-7 near surface 127 223630E 2537931N Zone 40 2.15 1.22 1.46 ± 0.32 0.70 ± 0.10 87.7 ± 2.1 1.947 ± 0.116 45 ± 3 1.623 ± 0.104 54 ± 4 Paleo interdunal sabkha
190193-4 130 783757E 2579561N Zone 39 2.51 1.19 0.64 ± 0.18 0.68 ± 0.06 102.9 ± 9.0 2.031 ± 0.118 51 ± 5 1.720 ± 0.108 60 ± 6 Cemented forest dune
210193-2 131 798176E 2545448N Zone 39 0.21 1.24 0.94 ± 0.24 0.69 ± 0.08 126.6 ± 3.1 2.113 ± 0.132 60 ± 4 1.785 ± 0.118 71 ± 5 Cemented forest dune
210193-4 192 766152E 2618558N Zone 39 3.73 1.22 1.26 ± 0.33 1.42 ± 0.11 243.8 ± 30.2 2.164 ± 0.122 113 ± 15 1.802 ± 0.109 135 ± 19 Cemented forest dune
Near Liwa Hotel 202 781787E 2558287N Zone 39 1.16 1.36 1.37 ± 0.25 0.81 ± 0.08 7.7 ± 0.4 2.395 ± 0.140 3.2 ± 0.3 2.012 ± 0.127 3.8 ± 0.3 Holocene dune
Table 2. Analyses in mg/L for brine underlying the Liwa and Bu Hasa aquifer.
Source Name Depth
in meters
UTM
east
UTM
north
UTM
zone
Date
sampled Ca Mg Na K Sr SiO2
Alk as
HCO3 Cl SO4 Br NO3
Dissolved
Solids
Density
at 20oC pH δ34S δ2H δ18O
Tertiary GWP-287A 121 600,328 2,647,191 39 Jan-98 4,800 2,600 35,000 1,300 85 30 109 69,500 2,850 140 1,625 117,857 1.0798 7.9 17.73 -12.6 3.36
Tertiary GWP-287B 127 600,329 2,647,220 39 Jan-98 4,500 2,500 34,000 1,300 85 25 73 67,600 2,950 140 1,500 114,505 1.0749 7.9 18.24 -14.2 2.95
Tertiary GWP-288A 89 687,801 2,666,649 39 Jan-98 1,450 950 10,500 300 25 36 55 19,700 4,050 11 33 37,078 1.0258 8.0 19.80 -6.2 2.37
Tertiary GWP-289 119 777,587 2,655,712 39 Jan-98 1,150 675 5,600 120 23 15 49 10,300 4,000 5 8 21,922 1.0146 7.8 19.84 0.7 2.92
Tertiary GWP-290A 88 210,989 2,655,365 40 Feb-98 1,500 950 15,500 450 27 20 50 25,000 6,750 15 22 50,251 1.0369 7.4 17.72 5.9 4.09
Tertiary GWP-291A 142 205,481 2,670,574 40 Feb-98 2,200 1,350 31,500 950 40 18 39 55,100 4,650 20 35 95,867 1.0686 7.8 18.42 5.0 4.64
Tertiary GWP-292 119 236,909 2,671,579 40 Feb-98 3,600 2,400 48,000 1,500 62 23 34 87,300 3,300 6 33 146,239 1.0971 7.4 17.82 7.5 5.19
Tertiary GWP-306A 137 208,465 2,668,318 40 Mar-99 2,750 1,250 34,500 1,100 50 64 62,500 4,800 12 50 107,040 1.0820 7.7 - - -
Pre Tertiary Bu Hassa oil field >1000 - - - Nov. 95 16,400 4,900 60,500 2,100 725 50 180 131,500 500 310 650 217,437 1.1415 6.4 - -2.8 3.19
Pre Tertiary Ramaitha oil field >1000 - - - April-96 14,200 1,600 57,900 1,350 1.000 22 210 110,000 350 620 1 186,553 1.0289 6.2 30.82 -5.3 6.47
Pre Tertiary Ham Yaphour oil field >1000 - - - April-96 9,700 1,200 40,000 600 200 20 142 62,000 200 345 0 114,008 1.0291 6.6 30.15 7.1 7.12
W. W
. WO
OD
, Z. S. RIZKand A. S. ALSH
ARHAN
298

Timing of Recharge, and the Origin, Evolution, and Distribution of Solutes in a Hyperarid Aquifer System
299
Table 3. The results of grain size analysis of six sediment samples from boreholes (depth ≈ 30 m) and sand dunes in the Liwa area. Sample locations are shown on Figure 1.
Sample GWP-95 GWP-96 GWP-100 Sieve Size
(mm) Weight
(gm) Weight
(%)
Cumulative weight
(%)
Finer by weight
(%)
Weight (gm)
Weight (%)
Cumulative weight
(%)
Finer by weight
(%)
Weight (gm)
Weight (%)
Cumulative weight
(%)
Finer by weight (%)
1.17 0.00 0.00 0.00 100.00 0.00 0.00 0.00 100.00 0.00 0.00 0.00 100.000.85 0.26 0.89 0.89 99.11 0.27 0.95 0.95 99.05 0.50 1.20 1.20 98.80 0.60 0.09 0.31 1.20 98.80 0.56 1.96 2.91 97.09 0.38 0.92 2.12 97.88 0.43 0.23 0.79 1.99 98.01 1.44 5.05 7.96 92.04 0.81 1.95 4.07 95.93 0.30 1.38 4.74 6.74 93.26 1.92 6.73 14.69 85.31 3.09 7.44 11.52 88.48 0.21 6.37 21.90 28.64 71.36 7.98 27.98 42.67 57.33 8.61 20.74 32.26 67.74 0.15 9.24 31.76 60.40 39.60 10.30 36.12 78.79 21.21 12.87 31.00 63.26 36.74 0.06 11.52 39.60 100.00 0.00 6.05 21.21 100.00 0.00 15.25 36.74 100.00 0.00
Sample GWP-102 GWP-105 Sand Dune
Sieve Size (mm)
Weight (gm)
Weight (%)
Cumulative weight
(%)
Finer by weight
(%)
Weight (gm)
Weight (%)
Cumulative weight
(%)
Finer by weight
(%)
Weight (gm)
Weight (%)
Cumulative weight
(%)
Finer by weight (%)
1.17 0.00 0.00 0.00 100.00 0.00 0.00 0.00 100.00 0.03 0.02 0.02 99.98 0.85 0.12 0.80 0.80 99.20 0.84 3.36 3.36 96.64 0.42 0.21 0.23 99.77 0.60 0.06 0.40 1.19 98.81 2.09 8.36 11.72 88.28 19.59 10.01 10.24 89.76 0.43 0.40 2.65 3.85 96.15 3.47 13.87 25.59 74.41 19.27 9.84 20.08 79.92 0.30 0.72 4.78 8.63 91.37 3.14 12.55 38.14 61.86 18.89 9.65 29.73 70.27 0.21 3.02 20.04 28.67 71.33 4.42 17.67 55.82 44.18 29.05 14.84 44.57 55.43 0.15 5.57 36.96 65.63 34.37 4.76 19.03 74.85 25.15 78.50 40.10 84.67 15.33 0.06 5.18 34.37 100.00 0.00 6.29 25.15 100.00 0.00 30.00 15.33 100.00 0.00 Table 4. Calculated uniformity coefficient (Cu) and hydraulic conductivity (K) of six sediment samples from the Quaternary Liwa aquifer in the Liwa area.
Map No. d10 d50 d60 Uniformity coefficient KHazen (m/d) GWP-95 0.078 0.17 0.19 2.44 0.52 GWP-96 0.100 0.19 0.23 2.30 0.85 GWP-100 0.080 0.18 0.20 2.50 0.54 GWP-102 0.085 0.18 0.19 2.24 0.61 GWP-105 0.090 0.24 0.30 3.33 0.70 Sand Dune 0.140 0.20 0.23 1.64 1.67 d10 = grain size that is 10% fine by weight (mm). d50 = grain size that is 50% fine by weight (mm). d60 = grain size that is 60% fine by weight (mm). KHazen = hydraulic conductivity calculated by Hazen method (m/day).
Figure 2. Photograph of dunes and interdunal sabkha near Liwa Crescent, Emirate of Abu Dhabi, United Arab Emirates.
Figure 3. Grain-size analyses of six samples collected from the Quaternary Liwa aquifer.
0.01 0.10 1.00 10.0
100
80
60
40
20
0
Fin
e by
wei
ght
G r a i n s i z e (m m)
GWP#95GWP#96GWP#100GWP#102GWP#105Sand Dune
W. W. WOOD, Z. S. RIZK and A. S. ALSHARHAN
300
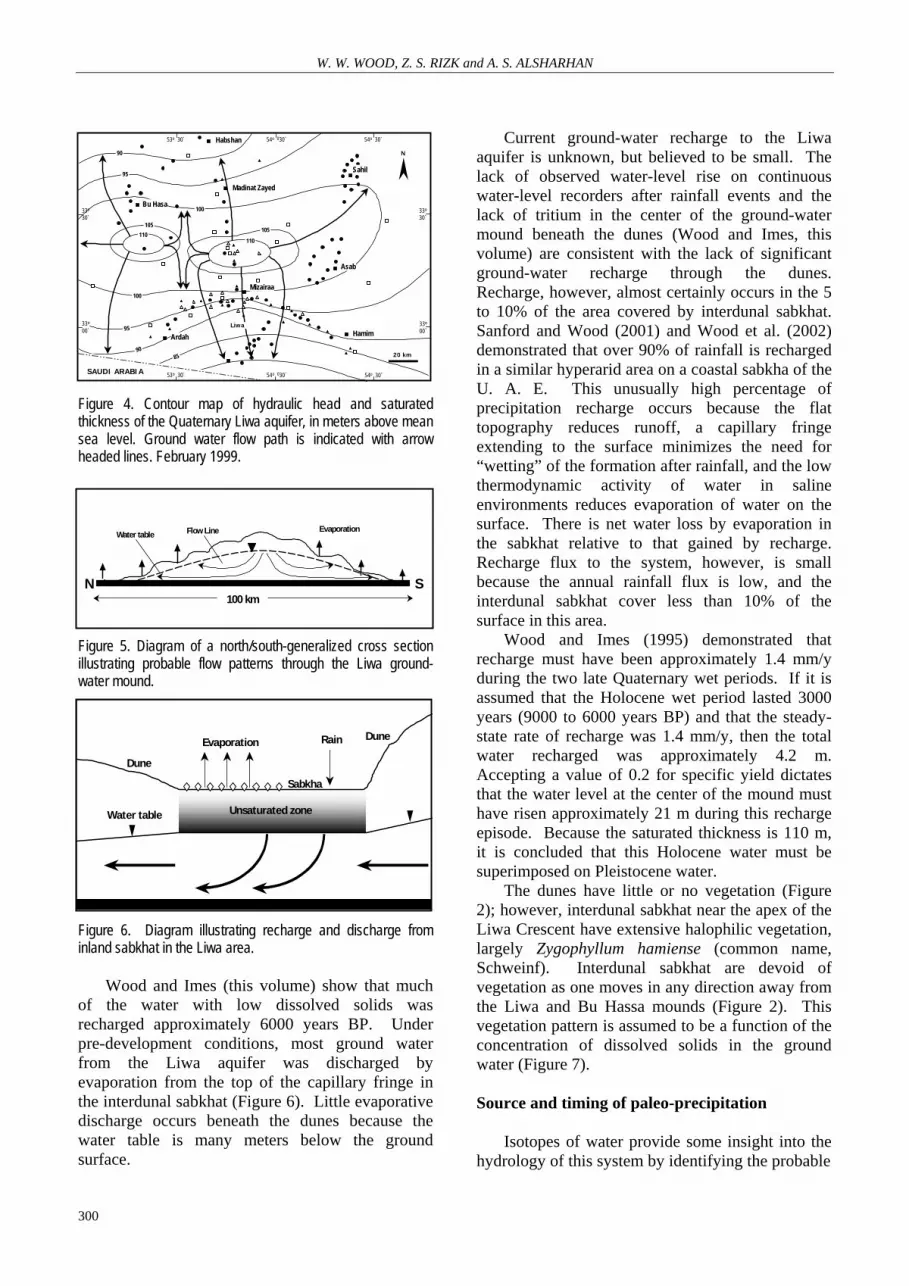
Figure 4. Contour map of hydraulic head and saturated thickness of the Quaternary Liwa aquifer, in meters above mean sea level. Ground water flow path is indicated with arrow headed lines. February 1999. Figure 5. Diagram of a north/south-generalized cross section illustrating probable flow patterns through the Liwa ground-water mound. Figure 6. Diagram illustrating recharge and discharge from inland sabkhat in the Liwa area.
Wood and Imes (this volume) show that much of the water with low dissolved solids was recharged approximately 6000 years BP. Under pre-development conditions, most ground water from the Liwa aquifer was discharged by evaporation from the top of the capillary fringe in the interdunal sabkhat (Figure 6). Little evaporative discharge occurs beneath the dunes because the water table is many meters below the ground surface.
Current ground-water recharge to the Liwa aquifer is unknown, but believed to be small. The lack of observed water-level rise on continuous water-level recorders after rainfall events and the lack of tritium in the center of the ground-water mound beneath the dunes (Wood and Imes, this volume) are consistent with the lack of significant ground-water recharge through the dunes. Recharge, however, almost certainly occurs in the 5 to 10% of the area covered by interdunal sabkhat. Sanford and Wood (2001) and Wood et al. (2002) demonstrated that over 90% of rainfall is recharged in a similar hyperarid area on a coastal sabkha of the U. A. E. This unusually high percentage of precipitation recharge occurs because the flat topography reduces runoff, a capillary fringe extending to the surface minimizes the need for “wetting” of the formation after rainfall, and the low thermodynamic activity of water in saline environments reduces evaporation of water on the surface. There is net water loss by evaporation in the sabkhat relative to that gained by recharge. Recharge flux to the system, however, is small because the annual rainfall flux is low, and the interdunal sabkhat cover less than 10% of the surface in this area.
Wood and Imes (1995) demonstrated that recharge must have been approximately 1.4 mm/y during the two late Quaternary wet periods. If it is assumed that the Holocene wet period lasted 3000 years (9000 to 6000 years BP) and that the steady-state rate of recharge was 1.4 mm/y, then the total water recharged was approximately 4.2 m. Accepting a value of 0.2 for specific yield dictates that the water level at the center of the mound must have risen approximately 21 m during this recharge episode. Because the saturated thickness is 110 m, it is concluded that this Holocene water must be superimposed on Pleistocene water.
The dunes have little or no vegetation (Figure 2); however, interdunal sabkhat near the apex of the Liwa Crescent have extensive halophilic vegetation, largely Zygophyllum hamiense (common name, Schweinf). Interdunal sabkhat are devoid of vegetation as one moves in any direction away from the Liwa and Bu Hassa mounds (Figure 2). This vegetation pattern is assumed to be a function of the concentration of dissolved solids in the ground water (Figure 7). Source and timing of paleo-precipitation
Isotopes of water provide some insight into the
hydrology of this system by identifying the probable
90
95
100
105
110
105110
100
95
9085
N
33o
30`
33o
00`
53o 30` 54o 030` 54o 30`
20 km
53o 30` 54o 030` 54o 30`
33o
30`
33o
00`Liwa
SAUDI ARABIA
Habshan
Bu Hasa
HamimArdah
Asab
Madinat Zayed
Sahil
Mizairaa
100 km
Water table Flow Line Evaporation
SN
Rain
Sabkha
DuneEvaporation
Dune
Water table Unsaturated zone

Timing of Recharge, and the Origin, Evolution, and Distribution of Solutes in a Hyperarid Aquifer System
301
source and timing of precipitation. Analysis of carbonates in speleothems, travertines, and lacustrine and capillary-zone deposits indicates that the current hyperaridity prevalent across much of the Arabian Peninsula has been punctuated by past episodes of increased rainfall. Absolute dating of these and other climate-sensitive deposits documents episodes of increased precipitation during the late Pleistocene (32-26 ka) and Holocene
(9-6 ka) (McClure, 1976; Clarke and Fontes, 1990; Wood and Imes, 1995; Burns et al., 1998; Burns et al., 2001; Neff et al., 2001; and Wood and Imes, this volume). Although the age of these deposits and water is well established, the source of the moisture and seasonal timing of the precipitation remains elusive.
Summer monsoon-associated precipitation during the mid-Holocene in southern Arabia is thought to be the result of northward extension of the ITCZ (intertropical convergence zone) (McClure, 1976; Clarke and Fontes, 1990; and Burns et al., 1998) with moisture derived from the Indian Ocean during the summer. This contrasts with intensification of the present “shamals,” or northern rain, which has an Arabian Gulf moisture source and winter precipitation. The monsoon hypothesis is consistent with other sectors of the Old World paleomonsoon belt (deMenocal et al., 2002; Zhisheng et al., 2000). Ground water from Liwa exhibits an unusual “d” (deuterium excess) of approximately -15 relative to the +10 of the GMWL (Global Meteoric Water Line) and the +22 of typical Eastern Mediterranean precipitation (Figure 8, Table 5). Deuterium excess is expressed as d = δ2H – 8 δ18O, (1)
and δ is: [(Rx/Rs)-1] 1000. Rx is the isotopic ratio of the sample, and Rs is the isotopic ratio of Vienna Standard Mean Ocean Water (VSMOW) in parts per thousand (permil, ‰). Deuterium excess is controlled by the temperature-dependent equilibrium of water vapor with the water source and relative humidity (Merlivat and Jouzel 1979). The Global Meteoric Water Line is expressed as
δ2H = 8.17 δ18O +10.35. (2)
Table 5. The stable isotopes 2H and 18O per mil, in groundwater samples from the Quaternary Liwa and Bu Hasa aquifer. Analyses were made at International Atomic Energy Agency (IAEA) Central Laboratories in Vienna, Austria and referenced to VSMOW (Vienna Standard Mean Ocean Water).
Liwa Bu Hasa
Map No.
18O (‰)
2H (‰)
Map No.
18O (‰)
2H (‰)
8 2.53 -16.7 WW-02 - - 9 1.96 -2.7 WW-06 2.86 1.3
10 1.85 -3.1 WW-07 - - 11 1.92 -2.1 WW-11 2.65 -1.4 12 1.94 -1.8 WW-15 - - 13 2.03 -2.4 WW-16 - - 14 2.62 0.1 WW-17 - - *15 10.51 43.1 WW-18 - - 16 2.70 -0.4 WW-19 - - 17 2.70 1.0 WW-20 - - 18 2.88 2.6 WW-21 - - 19 2.92 1.7 CH-03 2.44 -3.6 20 2.71 -2.6 CH-05 2.11 -2.7 21 2.78 6.3 CH-06 - - 22 2.64 3.5 CH-07 - - 23 2.73 3.3 BU-104 4.27 8.7 24 2.89 4.0 BU-116 - - 25 2.93 4.7 BU-121 2.31 -0.1 26 2.90 0.2 BU-173 1.73 -4.1 27 2.47 1.4 BU-177 1.89 -3.3 28 2.81 2.8 BU-181 2.31 -1.8 29 2.52 5.2 BU-360 6 8.5 30 2.86 6.2 BU-465 2.26 0
*15 is a water sample collected from an interdunal sabkha.
It is extremely improbable that stable isotopes from the Liwa ground waters are representative of evaporation of the winter shamals because the delta deuterium values are isotopically much more negative than those that would occur by evaporation of the current “shamals” sampled at Bahrain (Figure 8) (International Atomic Energy Agency, 1992). It is not likely that the water was derived from eastern Mediterranean precipitation because of the large positive value of “d” in this source. Nor is it likely that evaporation of the current Oman monsoons (Clarke et al., 1987) could produce the observed
40003000
2000
4000
6000
8000
10000
1500020000
3000040000
50000
2000
1000
20004000 6000
8000
10000
20000
15000
N
33o
30`
33o
00`
53o 30` 54o 030` 54o 30`
20 km
53o 30` 54o 030` 54o 30`
33o
30`
33o
00`Liwa
SAUDI ARABIA
Habshan
Bu Hasa
HamimArdah
Asab
Madinat Zayed
Sahil
Mizairaa
Figure 7. Contour map of total dissolved solids, in milligrams per liter, in the Quaternary Liwa aquifer, February 1999.

W. W. WOOD, Z. S. RIZK and A. S. ALSHARHAN
302
distribution because the slope of Liwa isotope data is greater than (8.2), not less than, these data (5.6) (Figure 8). Physics dictates that the most likely explanation for the large negative “d” value is that the precipitation was derived from a previously evaporated water source (Merlivat and Jouzel, 1979).
With increased precipitation, significant relatively fresh water would have been discharging from the Red Sea to the Indian Ocean. This input could account for the observed isotopic anomaly because it would have been both less dense (due to the freshwater component) and isotopically enriched in 2H and 18O due to evaporation. This water would have floated over cold, upwelling Indian Ocean water and been driven northeastward along the coast of Oman under monsoonal influence, becoming the moisture source for precipitation in southern Arabia during the late mid-Holocene and presumably earlier episodes of monsoonal intensification. The amount of water discharging from the Red Sea would have been greater than at present and dominated the isotopic signature of the surface of the Indian Ocean in this area. The surface-water circulation and stable water isotopes of the Red Sea
therefore have been linked by feedback processes to precipitation in the catchment area. An example of negative “d” precipitation can be seen in the shaded area of Figure 8 that represents the first day of precipitation of the new monsoon. That is, this precipitation is derived from surface waters that are presently discharged from the Red Sea or Oman coast. Because there is little current discharge, the volume is small, and the effects are eliminated after the first day or two of monsoonal activity. The remainder of the annual precipitation is derived from upwelling water once the surface water has been swept eastward. The isotopic data from ancient ground waters from the Liwa Oasis indicate that Holocene moisture sources derived from the Indian Ocean rather than the Mediterranean/Arabian Gulf. Such a source is consistent with a proposed summer monsoonal circulation (McClure, 1976). This information provides important deterministic constraints on the paleoclimatic and paleoenvironmental dynamism of the Arabian Peninsula.
Solute Geochemistry
Solutes in aquifer systems generally originate
from reaction of water with the solid framework of the aquifer, from advective or diffusive transport from underlying or adjacent aquifers, or from atmospheric precipitation. In vegetation-free areas, solutes are removed from aquifer systems by water discharge to the surface, by discharge to adjacent or underlying formations, and by precipitation of solid phases. The Liwa aquifer system was selected because there is no upward or lateral advective flow into the aquifer. Natural solutes in the Liwa aquifer, therefore, must originate by dissolution of the solid aquifer framework, from diffusion from underlying formations, or from atmospheric precipitation.
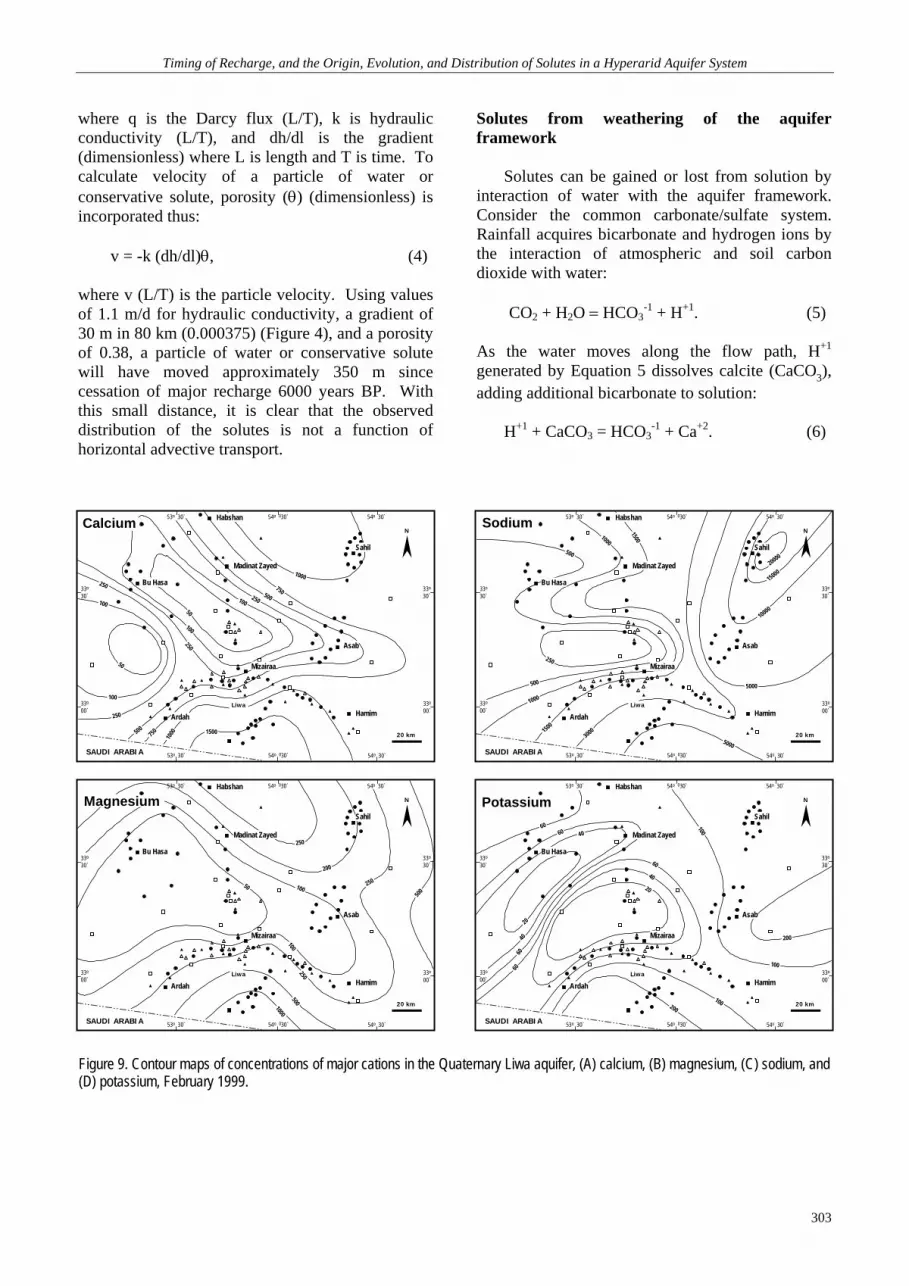
The distribution of dissolved solutes clearly shows increasing concentration away from the core of the ground-water mound along the direction of flow (Figure 7). Individual ions (Figures 9, 10, and 11; Tables 6, 7, and 8), with the exception of bicarbonate (Figure 10c), follow the same general pattern (see below). Any model for the origin of these solutes and water must address this distribution. Because of the nearly homogeneous and isotropic nature of the aquifer, the solute transport in this system can be estimated by modification of Darcy’s Law:
q =-k (dh/dl), (3)
Figure 8. Graph of 18O and 2H ‰ values relative to VSMOW from the Liwa ground water, GMWL (Global Meteoric Water Line), current eastern Mediterranean line, weekly averages of shamal precipitation from Bahrain (International Atomic Energy Agency, 1992), and July, 1987 Oman monsoon (Clarke et al., 1987). The shaded data, collected the first and second days of a new Oman monsoon season, are consistent with the proposed isotope model of previously evaporated water as the source of ancient ground water in the Liwa area.
EasternMediterranean
Shamals (Bahrain)
LiwaPaleowaterOman monsoonGMWL
δ2 H
VSM
OW
δ18O VSMOW
25
20
15
10
5
0
-5
-10-2 -1 0 1 2 3
Timing of Recharge, and the Origin, Evolution, and Distribution of Solutes in a Hyperarid Aquifer System
303
where q is the Darcy flux (L/T), k is hydraulic conductivity (L/T), and dh/dl is the gradient (dimensionless) where L is length and T is time. To calculate velocity of a particle of water or conservative solute, porosity (θ) (dimensionless) is incorporated thus:
v = -k (dh/dl)θ, (4) where v (L/T) is the particle velocity. Using values of 1.1 m/d for hydraulic conductivity, a gradient of 30 m in 80 km (0.000375) (Figure 4), and a porosity of 0.38, a particle of water or conservative solute will have moved approximately 350 m since cessation of major recharge 6000 years BP. With this small distance, it is clear that the observed distribution of the solutes is not a function of horizontal advective transport.
Solutes from weathering of the aquifer framework
Solutes can be gained or lost from solution by
interaction of water with the aquifer framework. Consider the common carbonate/sulfate system. Rainfall acquires bicarbonate and hydrogen ions by the interaction of atmospheric and soil carbon dioxide with water:
CO2 + H2O = HCO3
-1 + H+1. (5)
As the water moves along the flow path, H+1 generated by Equation 5 dissolves calcite (CaCO3), adding additional bicarbonate to solution:
H+1 + CaCO3 = HCO3
-1 + Ca+2. (6)
Figure 9. Contour maps of concentrations of major cations in the Quaternary Liwa aquifer, (A) calcium, (B) magnesium, (C) sodium, and (D) potassium, February 1999.
Potassium
Calcium
1000750500250100
100
250
50
100
250
500
750 1000 1500
250
10050
Sodium
500
1000
1500
5000
10000
20000
15000
250
500
1000
1500
30005000
250
200
250
500
10050
100250
5001000
Magnesium60
60 40
20
4060
60
60
40
20
100
200
100
100200
N
33o
30`
33o
00`
53o 30` 54o 030` 54o 30`
20 km
53o 30` 54o 030` 54o 30`
33o
30`
33o
00`Liwa
SAUDI ARABIA
Habshan
Bu Hasa
HamimArdah
Asab
Madinat Zayed
Sahil
Mizairaa
N
33o
30`
33o
00`
53o 30` 54o 030` 54o 30`
20 km
53o 30` 54o 030` 54o 30`
33o
30`
33o
00`Liwa
SAUDI ARABIA
Habshan
Bu Hasa
HamimArdah
Asab
Madinat Zayed
Sahil
Mizairaa
N
33o
30`
33o
00`
53o 30` 54o 030` 54o 30`
20 km
53o 30` 54o 030` 54o 30`
33o
30`
33o
00`Liwa
SAUDI ARABIA
Habshan
Bu Hasa
HamimArdah
Asab
Madinat Zayed
Sahil
Mizairaa
N
33o
30`
33o
00`
53o 30` 54o 030` 54o 30`
20 km
53o 30` 54o 030` 54o 30`
33o
30`
33o
00`Liwa
SAUDI ARABIA
Habshan
Bu Hasa
HamimArdah
Asab
Madinat Zayed
Sahil
Mizairaa

W. W. WOOD, Z. S. RIZK and A. S. ALSHARHAN
304
The dissolution of gypsum (CaSO4.2H2O) adds
calcium and sulfate ions to the solution:
CaSO4.2H2O +H2O = Ca+2 + SO4-2 + 3H2O. (7)
The addition of calcium (Equation 7) forces thermodynamic supersaturation of the solution with respect to calcite, a mineral of lower solubility, and calcite precipitates. This combined reaction is:
CaSO4.2H2O + HCO3
-1= CaCO3↓ + H+1 + SO4
-2 + 2H2O. (8)
The net result is that bicarbonate is removed, and the solution becomes more acidic (addition of H+ ions) in a downgradient direction. Because the concentration of bicarbonate is small, the mass of calcium removed by calcite precipitation is small, and the calcium concentration continues to increase with the increasing gypsum dissolution.
The thermodynamic saturation index (SI), (ratio of the logarithm of equilibrium ion activity product Kiap to the equilibrium constant Keq) is used to assess the potential for solubility or precipitation of a mineral (Plummer et al., 1988). The SI of gypsum changes from a negative value (undersaturated) toward 0.0 (equilibrium) as the water moves away from the center of the ground-water mound (Wood and Imes, this volume), consistent with the addition of Ca+2 and/or SO4
-2 ions. Calcite is essentially at equilibrium in all the samples evaluated, suggesting that equilibrium is obtained before the water has moved far. Thus, relatively little calcite is dissolved.
Trace elements are likely derived from weathering of the aquifer framework. The abduction of the oceanic mantle in the formation of the Oman Mountains provides a likely source of Cr-rich pyroxene (Lippard et al., 1986). Chromium in solution (Cr+6 or hexavalent) (Figure 11c, Table 8) almost certainly represents weathering of pyroxene
Figure 10. Contour maps of concentrations of major anions in the Quaternary Liwa aquifer, (A) chloride, (B) sulfate, (C) bicarbonate, and (D) nitrate, February 1999.
Sulfate
1000
1500
2000
2500
2500
2000
1500
1000
1500
2000
2500
2500 10
000
20000
10000
3000 35004000
450
4000
3500
30002500
Chloride
100 150
200
300
100
200 50
0
100
50
100
100
50
50
Bicarbonate
N
33o
30`
33o
00`
53o 30` 54o 030` 54o 30`
20 km
53o 30` 54o 030` 54o 30`
33o
30`
33o
00`Liwa
SAUDI ARABIA
Habshan
Bu Hasa
HamimArdah
Asab
Madinat Zayed
Sahil
Mizairaa
35003000
20001000
1000
2000
2500
3000
1000
500
400300
1000500400
300200
100
400500 1000
1000
1500 15
Nitrate
2030
40
5050
4030
20
200
150
100
5040
3020
300
200
100
N
33o
30`
33o
00`
53o 30` 54o 030` 54o 30`
20 km
53o 30` 54o 030` 54o 30`
33o
30`
33o
00`Liwa
SAUDI ARABIA
Habshan
Bu Hasa
HamimArdah
Asab
Madinat Zayed
Sahil
Mizairaa
N
33o
30`
33o
00`
53o 30` 54o 030` 54o 30`
20 km
53o 30` 54o 030` 54o 30`
33o
30`
33o
00`Liwa
SAUDI ARABIA
Habshan
Bu Hasa
HamimArdah
Asab
Madinat Zayed
Sahil
Mizairaa
N
33o
30`
33o
00`
53o 30` 54o 030` 54o 30`
20 km
53o 30` 54o 030` 54o 30`
33o
30`
33o
00`Liwa
SAUDI ARABIA
Habshan
Bu Hasa
HamimArdah
Asab
Madinat Zayed
Sahil
Mizairaa

Timing of Recharge, and the Origin, Evolution, and Distribution of Solutes in a Hyperarid Aquifer System
305
incorporated in the opaque fraction of the sand. Pyroxene from the ophiolites contains a significant amount of chromium in the +3 valence state, substituting for iron in the crystal lattice. As the pyroxene weathers rapidly in this environment, Cr+3 becomes available and is likely oxidized from +3 to +6 by the reduction of manganese. In the hexavalent state, chromium is mobile and moves with water by advective transport. Chromite, although present in significant quantities in the opaque fraction of the Liwa aquifer, is chemically stable in this environment and not likely to dissolve and provide chromium in solution.
Dissolved zinc is probably derived from weathering of the mineral sphalerite [ZnS] in the heavy mineral fraction of the sands. Fluoride likely is derived from the weathering of the mineral fluorapatite [Ca5(PO4)3F] in the heavy mineral fraction. Other trace elements are undoubtedly added to the solute mass by weathering of the
framework. While weathering provides a rationale for increasing concentration of some elements downgradient, the mass added is small. Nor does weathering address the origin of the large mass of sodium, magnesium, chloride, and nitrate, because there are no minerals in the aquifer framework to provide these elements.
Diffusion
Large concentrations of calcium, sodium,
magnesium, and chloride exist in the brines in the underlying formations (Table 2); thus, diffusion of the solutes will occur from these brines to the lower TDS waters of the Liwa aquifer. The basic equation controlling the diffusion into geologic material under one-dimensional, steady-state conditions is given in Fick's First Law: q = -D (∆C/∆X), (9)
Figure 11. Contour maps of concentrations of selected trace elements in the Quaternary Liwa aquifer, (A) fluoride, (B) boron, (C) chromium, and (D) zinc, February 1999.
Fluoride
ZincBoron
1.50
1.25
1.25
1.25
3.5
3.75
3.753.00
1.25
1.25
500
0.01
0.02
0.05
0.1
N
33o
30`
33o
00`
53o 30` 54o 030` 54o 30`
20 km
53o 30` 54o 030` 54o 30`
33o
30`
33o
00`Liwa
SAUDI ARABIA
Habshan
Bu Hasa
HamimArdah
Asab
Madinat Zayed
Sahil
Mizairaa
N
33o
30`
33o
00`
53o 30` 54o 030` 54o 30`
20 km
53o 30` 54o 030` 54o 30`
33o
30`
33o
00`Liwa
SAUDI ARABIA
Habshan
Bu Hasa
HamimArdah
Asab
Madinat Zayed
Sahil
Mizairaa
0.03
0.05
0.10
0.10 0.1
5
N
33o
30`
33o
00`
53o 30` 54o 030` 54o 30`
20 km
53o 30` 54o 030` 54o 30`
33o
30`
33o
00`Liwa
SAUDI ARABIA
Habshan
Bu Hasa
HamimArdah
Asab
Madinat Zayed
Sahil
Mizairaa
3.0
1.5
3.0
3.01.5
N
33o
30`
33o
00`
53o 30` 54o 030` 54o 30`
20 km
53o 30` 54o 030` 54o 30`
33o
30`
33o
00`Liwa
SAUDI ARABIA
Habshan
Bu Hasa
HamimArdah
Asab
Madinat Zayed
Sahil
Mizairaa
Chromium

W. W. WOOD, Z. S. RIZK and A. S. ALSHARHAN
306
Table 6a. Chemical analyses of ground water collected from the Quaternary Liwa aquifer during 1999. Electrical conductance (EC in µS/cm), total dissolved solids (TDS in mg/l), and major ions (mg/l).
No. pH EC TDS Ca++ Mg++ Na+ K+ HCO3- Cl- SO4
- NO3-
8 7.6 18,100 13,600 760 290 2900 93 98 5300 1700 380 9 7.4 10,200 7700 590 160 1600 58 49 2600 1300 160
10 7.4 9300 7000 420 100 1500 55 49 2400 1000 160 11 7.6 8200 5800 170 83 1500 40 85 2300 2500 - 12 7.4 5600 3600 62 35 1100 33 307 1400 1300 - 13 7.5 2300 1500 72 10 440 16 92 480 570 55 14 7.6 9100 6600 290 100 1700 35 92 2200 2200 220 15 7.6 56,700 50,700 480 720 15900 400 171 19800 12000 210 16 7.4 11,500 8600 580 150 2100 100 165 2600 1700 180 17 7.7 9400 6900 590 180 1400 85 159 1800 1900 590 18 7.5 8900 6300 590 170 1400 83 63 1700 2000 - 19 7.7 15,300 11,500 730 260 2800 95 140 4000 2000 320 20 7.4 12,300 9200 620 190 2200 68 123 3200 1500 480 21 7.3 7400 5100 550 200 1000 45 79 1300 1500 22 22 7.5 11,800 8800 710 240 2000 68 73 2800 2000 358 23 7.4 9000 6400 710 190 1500 35 55 2100 1700 - 24 7.6 11,800 8800 780 220 2500 53 123 2800 2100 400 25 7.6 13,100 9900 740 230 2900 65 57 3400 2100 270 26 7.3 13,900 10,400 630 280 2400 55 85 3500 2500 260 27 7.5 6800 4500 270 100 1600 38 110 1700 1200 260 28 7.4 12,400 9300 600 160 2000 80 49 2900 2200 230 29 7.3 3000 1900 140 41 580 21 58 500 870 220 30 7.8 1300 810 21 7 330 13 104 210 190 65
Table 6b. Chemical analyses of ground water collected from the Quaternary Liwa aquifer during February 1999. Electrical conductance (EC in µS/cm), total dissolved solids (TDS in mg/l), and major ions (mg/l).
Map No. pH TDS Ca++ Mg++ Na+ K+ HCO3
- Cl- SO4- NO3
- WW-02 7.3 3700 140 65 990 45 150 1600 640 7 WW-06 7.4 2000 71 31 540 23 180 820 320 9 WW-07 7.5 3300 73 54 920 38 240 1500 440 10 WW-11 7.6 5000 240 96 1110 49 91 2500 900 12 WW-15 7.1 2200 63 30 490 15 110 1000 420 9 WW-16 7.4 2900 120 47 640 25 110 1400 550 13 WW-17 6.9 2000 59 25 450 17 110 900 390 17 WW-18 7.6 3800 160 67 990 42 120 1600 730 13 WW-19 7.4 2200 75 27 600 20 130 890 390 14 WW-20 7.5 2500 90 40 540 21 140 1200 470 15 WW-21 7.7 2800 87 37 810 26 110 1100 590 13 WW-22 7.5 2100 43 16 480 12 110 670 400 12 WW-23 7.2 1900 49 20 440 16 130 870 340 10 CH-03 7.6 5400 190 77 850 35 84 2700 1500 13 CH-05 7.6 2400 67 27 490 15 110 1100 550 19 CH-06 7.8 6200 250 102 1200 50 89 2900 1500 12 CH-07 7.5 2600 74 29 650 20 110 1200 520 18 BU-104 - 5800 110 73 1700 50 83 3800 18 - BU-116 - 1800 21 10 540 15 32 1200 8 3 BU-121 - 1800 4000 5 440 8 160 1000 100 - BU-173 - 1900 6 3 590 10 160 1100 7 - BU-177 - 2319 7 0.2 660 10 84 1500 30 - BU-181 - 4258 137 60 960 35 100 2000 940 15 BU-185 - 1348 10 2 340 9 81 760 130 - BU-329 - 3135 214 60 590 45 - 1500 580 7 BU-360 - 2829 1 0.1 800 10 310 1500 160 - BU-377 - 1939 11 7 510 8 77 1100 270 - BU-465 - 2692 79 33 700 21 120 1200 490 9 AL DHAFRA - 2770 114 47 650 34 97 1300 550 17 BIN THANI - 3398 1298 490 770 34 100 1600 650 16

Timing of Recharge, and the Origin, Evolution, and Distribution of Solutes in a Hyperarid Aquifer System
307
Table 7. Chemical analyses, (in mg/l), of ground water from the Quaternary Liwa aquifer.
A. Chemical analysis of groundwater samples from Groundwater Project wells in the Liwa area.
Map No. Location pH TDS Ca2+ Mg2+ Na+ K+ HCO3- Cl- SO4
- NO3-
GWP-94 Lagain 7.5 16,800 700 350 4200 150 60 7900 3500 83 GWP-95 Mizairaa 7.5 990 65 16 250 12 110 230 350 20 GWP-96 Hameem 7.3 16,200 850 350 4600 83 220 7600 2700 75 GWP-98 Al Hamra 7.7 12,800 720 270 3600 220 510 5600 2500 53 GWP-99 Al Zafrah 7.2 15,100 1100 350 4100 98 1500 5600 3800 130
GWP-100 Huwaila 7.2 1400 62 12 430 33 82 460 330 44 GWP-101 Asab Northwest 7.0 9700 600 200 2700 98 18 3800 2300 53 GWP-102 Bousadeen 7.3 3400 88 54 1100 25 390 1250 670 57 GWP-103 Qafah 7.7 910 9 3.0 330 7 130 300 180 35 GWP-104 Qafah 7.7 1100 120 20 220 17 51 170 540 6 GWP-105 Heea 7.6 3000 87 32 990 44 82 1400 450 41 GWP-138 Jarub - 3300 85 3.0 850 30 110 1100 500 - GWP-139 Mussama 7.6 1800 20 5.0 600 19 140 500 300 - GWP-140 Khurais 7.6 1100 30 6.0 230 13 93 200 200 35 GWP-142 Huwaila West 7.8 2000 75 30 450 26 85 650 300 18 GWP-143 Bu Hasa South 7.4 1300 15 5.0 350 12 120 350 200 -
B. Chemical analysis of ground water from the Asab oil field. Map No. pH TDS Ca++ Mg++ Na+ HCO3
- Cl- SO4-
AS-1 7.5 6500 600 160 1400 61 2100 2100 AS-4 8.2 9500 500 200 2500 68 3200 2800 AS-6 8.1 9000 330 90 2800 81 3700 1900 AS-8 7.9 4300 240 75 1200 85 1500 920 AS-9 8.0 6900 330 110 1800 84 2600 1500 AS-10 8.0 9000 370 120 2400 61 3100 2200 AS-11 7.9 6900 250 69 1900 110 2400 1500 AS-12 7.8 6400 290 71 1700 76 2200 1600 AS-13 7.6 9900 360 130 2700 220 3200 2600 AS-15 7.7 18,900 1000 420 5200 41 9000 2800 AS-16 8.2 22,800 1100 450 6600 450 11,300 2600
C. Chemical analysis of ground water from the Sahil oil field. Map No. pH TDS Ca++ Mg++ Na+ HCO3
- Cl- SO4-
SA-1 7.6 6000 450 94 1500 85 2100 1600 SA-2 7.4 13,200 770 250 3600 73 5400 3000 SA-3 7.6 14,200 920 280 3700 73 5700 3300 SA-4 7.7 15,500 1200 100 4300 61 6700 3000 SA-5 7.8 16,700 1400 92 4500 61 7400 3100 SA-6 6.8 18,000 930 290 5000 81 7600 3500 SA-7 6.9 27,500 1000 220 8900 61 13,500 3700 SA-8 6.6 13,200 910 300 3300 73 5200 3300 SA-9 6.7 13,200 900 310 3300 73 5200 3200 SA-10 7.2 15,100 1100 350 4100 51 5600 3800 SA-11 7.6 6000 450 94 1500 85 2100 1600
D. Chemical analysis of ground water from the Shah oil field. Map No. TDS Ca++ Mg++ Na+ HCO3
- Cl- SO4-
SH-1 53,500 1600 1000 9800 44 18,800 2800 SH-2 36,300 1500 920 9600 61 18,100 2700 SH-3 33,100 1300 840 9900 49 17,400 3600 SH-4 47,700 1600 1200 14,800 53 25,900 4200 SH-5 51,000 1800 1200 15,700 42 28,000 4200 SH-6 40,100 1600 880 11,900 40 21,600 2800 SH-7 28,800 1100 150 9500 63 14,600 3300 SH-8 27,200 1300 570 8100 57 18,900 3250 SH-9 40,800 1800 880 1100 49 20,700 2900 SH-10 47,600 2300 1500 13,500 57 26,000 4300 SH-11 26,300 1100 620 7900 55 13,800 2900
W. W. WOOD, Z. S. RIZK and A. S. ALSHARHAN
308
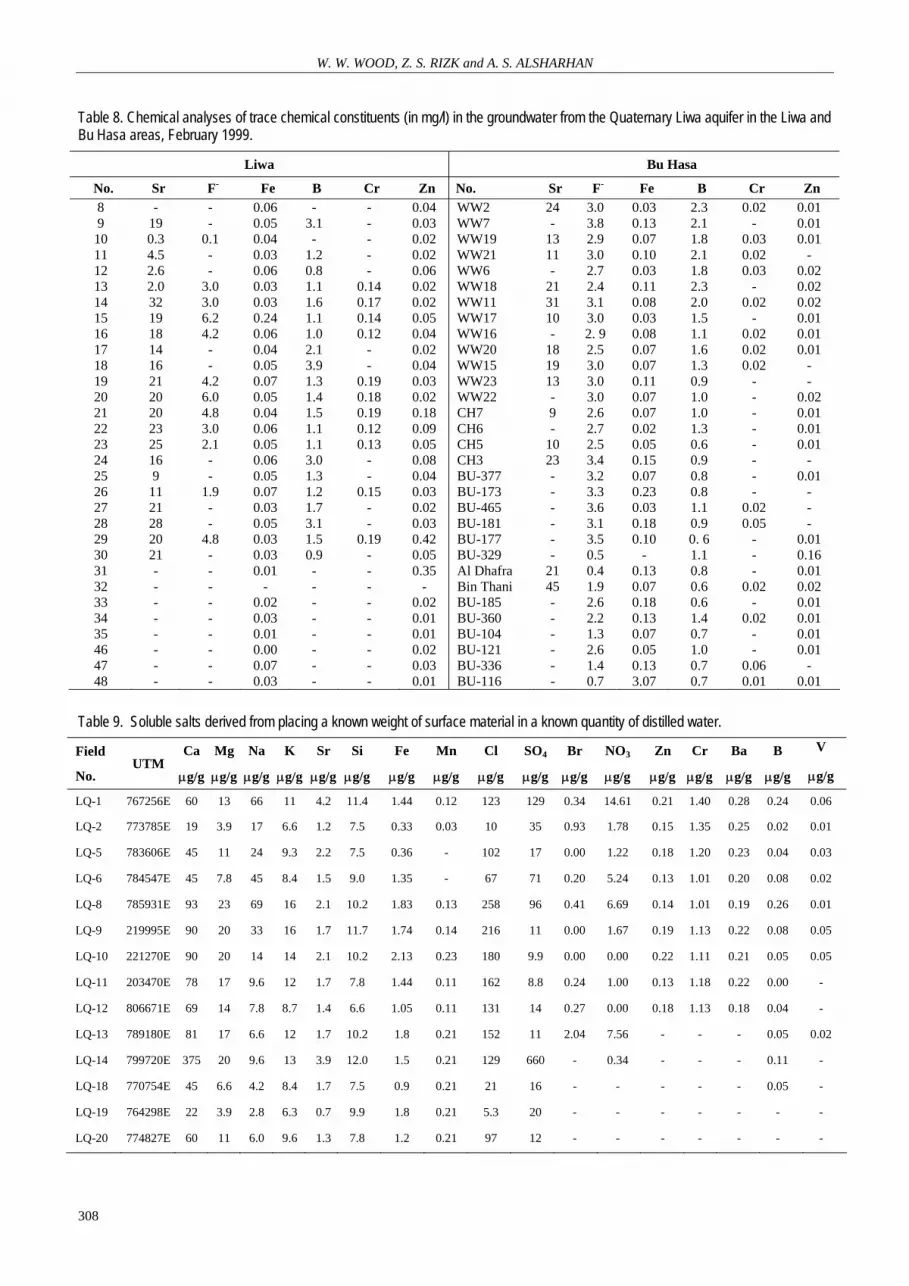
Table 8. Chemical analyses of trace chemical constituents (in mg/l) in the groundwater from the Quaternary Liwa aquifer in the Liwa and Bu Hasa areas, February 1999.
Liwa Bu Hasa
No. Sr F- Fe B Cr Zn No. Sr F- Fe B Cr Zn 8 - - 0.06 - - 0.04 WW2 24 3.0 0.03 2.3 0.02 0.01 9 19 - 0.05 3.1 - 0.03 WW7 - 3.8 0.13 2.1 - 0.01 10 0.3 0.1 0.04 - - 0.02 WW19 13 2.9 0.07 1.8 0.03 0.01 11 4.5 - 0.03 1.2 - 0.02 WW21 11 3.0 0.10 2.1 0.02 - 12 2.6 - 0.06 0.8 - 0.06 WW6 - 2.7 0.03 1.8 0.03 0.02 13 2.0 3.0 0.03 1.1 0.14 0.02 WW18 21 2.4 0.11 2.3 - 0.02 14 32 3.0 0.03 1.6 0.17 0.02 WW11 31 3.1 0.08 2.0 0.02 0.02 15 19 6.2 0.24 1.1 0.14 0.05 WW17 10 3.0 0.03 1.5 - 0.01 16 18 4.2 0.06 1.0 0.12 0.04 WW16 - 2. 9 0.08 1.1 0.02 0.01 17 14 - 0.04 2.1 - 0.02 WW20 18 2.5 0.07 1.6 0.02 0.01 18 16 - 0.05 3.9 - 0.04 WW15 19 3.0 0.07 1.3 0.02 - 19 21 4.2 0.07 1.3 0.19 0.03 WW23 13 3.0 0.11 0.9 - - 20 20 6.0 0.05 1.4 0.18 0.02 WW22 - 3.0 0.07 1.0 - 0.02 21 20 4.8 0.04 1.5 0.19 0.18 CH7 9 2.6 0.07 1.0 - 0.01 22 23 3.0 0.06 1.1 0.12 0.09 CH6 - 2.7 0.02 1.3 - 0.01 23 25 2.1 0.05 1.1 0.13 0.05 CH5 10 2.5 0.05 0.6 - 0.01 24 16 - 0.06 3.0 - 0.08 CH3 23 3.4 0.15 0.9 - - 25 9 - 0.05 1.3 - 0.04 BU-377 - 3.2 0.07 0.8 - 0.01 26 11 1.9 0.07 1.2 0.15 0.03 BU-173 - 3.3 0.23 0.8 - - 27 21 - 0.03 1.7 - 0.02 BU-465 - 3.6 0.03 1.1 0.02 - 28 28 - 0.05 3.1 - 0.03 BU-181 - 3.1 0.18 0.9 0.05 - 29 20 4.8 0.03 1.5 0.19 0.42 BU-177 - 3.5 0.10 0. 6 - 0.01 30 21 - 0.03 0.9 - 0.05 BU-329 - 0.5 - 1.1 - 0.16 31 - - 0.01 - - 0.35 Al Dhafra 21 0.4 0.13 0.8 - 0.01 32 - - - - - - Bin Thani 45 1.9 0.07 0.6 0.02 0.02 33 - - 0.02 - - 0.02 BU-185 - 2.6 0.18 0.6 - 0.01 34 - - 0.03 - - 0.01 BU-360 - 2.2 0.13 1.4 0.02 0.01 35 - - 0.01 - - 0.01 BU-104 - 1.3 0.07 0.7 - 0.01 46 - - 0.00 - - 0.02 BU-121 - 2.6 0.05 1.0 - 0.01 47 - - 0.07 - - 0.03 BU-336 - 1.4 0.13 0.7 0.06 - 48 - - 0.03 - - 0.01 BU-116 - 0.7 3.07 0.7 0.01 0.01
Table 9. Soluble salts derived from placing a known weight of surface material in a known quantity of distilled water.
Field
No. UTM
Ca
µg/g
Mg
µg/g
Na
µg/g
K
µg/g
Sr
µg/g
Si
µg/g
Fe
µg/g
Mn
µg/g
Cl
µg/g
SO4
µg/g
Br
µg/g
NO3
µg/g
Zn
µg/g
Cr
µg/g
Ba
µg/g
B
µg/g
V
µg/g
LQ-1 767256E 60 13 66 11 4.2 11.4 1.44 0.12 123 129 0.34 14.61 0.21 1.40 0.28 0.24 0.06
LQ-2 773785E 19 3.9 17 6.6 1.2 7.5 0.33 0.03 10 35 0.93 1.78 0.15 1.35 0.25 0.02 0.01
LQ-5 783606E 45 11 24 9.3 2.2 7.5 0.36 - 102 17 0.00 1.22 0.18 1.20 0.23 0.04 0.03
LQ-6 784547E 45 7.8 45 8.4 1.5 9.0 1.35 - 67 71 0.20 5.24 0.13 1.01 0.20 0.08 0.02
LQ-8 785931E 93 23 69 16 2.1 10.2 1.83 0.13 258 96 0.41 6.69 0.14 1.01 0.19 0.26 0.01
LQ-9 219995E 90 20 33 16 1.7 11.7 1.74 0.14 216 11 0.00 1.67 0.19 1.13 0.22 0.08 0.05
LQ-10 221270E 90 20 14 14 2.1 10.2 2.13 0.23 180 9.9 0.00 0.00 0.22 1.11 0.21 0.05 0.05
LQ-11 203470E 78 17 9.6 12 1.7 7.8 1.44 0.11 162 8.8 0.24 1.00 0.13 1.18 0.22 0.00 -
LQ-12 806671E 69 14 7.8 8.7 1.4 6.6 1.05 0.11 131 14 0.27 0.00 0.18 1.13 0.18 0.04 -
LQ-13 789180E 81 17 6.6 12 1.7 10.2 1.8 0.21 152 11 2.04 7.56 - - - 0.05 0.02
LQ-14 799720E 375 20 9.6 13 3.9 12.0 1.5 0.21 129 660 - 0.34 - - - 0.11 -
LQ-18 770754E 45 6.6 4.2 8.4 1.7 7.5 0.9 0.21 21 16 - - - - - 0.05 -
LQ-19 764298E 22 3.9 2.8 6.3 0.7 9.9 1.8 0.21 5.3 20 - - - - - - -
LQ-20 774827E 60 11 6.0 9.6 1.3 7.8 1.2 0.21 97 12 - - - - - - -

Timing of Recharge, and the Origin, Evolution, and Distribution of Solutes in a Hyperarid Aquifer System
309
where q is solute flux (M/L2)/T), D is the diffusion coefficient (L2/T), C is concentration (M/L3), and M is mass (L and T were defined previously). This equation can be used to estimate the maximum effect of mass transport by diffusion. Consider the following initial conditions using two horizontal, porous slabs one meter on a side: the lower one is infinite in thickness and contains a solute with a constant concentration of 26,000 mg/L; the upper slab is 100 m thick and contains a constant concentration of 1000 mg/L. Both slabs are homogeneous and isotropic with a porosity of 38%. Using representative values of D = 1x10-11 m2/s, a concentration difference of 25 g/m3 over a distance of 100 m would result in a steady-state mass flux to the upper slab of 0.25 x 10⁻¹¹g/m2/s. Because there are 2.83 x 10¹¹ seconds in the 9000 years since Holocene recharge started, the total mass flux to this water over that time period would be approximately 0.9 g/m2 or 900 mg/m2. Because the upper slab is 100 m thick and has a porosity of 38%, the total pore volume of the upper slab would be 38 m3 or 38,000 L. The average mass contribution by diffusion would thus be approximately 0.024 mg/L, an insignificant amount relative to the total concentration. In the above analysis, the horizontal velocity in the upper slab is assumed to be zero. Although that is not strictly true, the velocity is very low, and the assumption would have little impact on the transport of solutes.
Although there is a low concentration of NO3 in the underlying aquifer, the concentration of NO3 in the upper aquifer is high. The conservative chloride/bromide ratio is different in the upper and lower aquifers (Tables 2 and 9). Thus, the chemical data are also inconsistent with the underlying aquifers provide a significant source of solutes. Atmospheric precipitation as a source of solutes
Based on the above analysis, most of the solutes in this aquifer system must be derived from atmospheric precipitation. Eolian transport of sea aerosols in precipitation on the continents is well established (Junge and Werby, 1958; Mandel and Shiftean, 1981; and Hingston and Gailitis, 1976), as are the effects of these aerosols on surface waters and soils (Person and Fisher, 1971; Dethier, 1979; Eisenreich, 1980; Wiman and Agren, 1985; and Wiman et al., 1990). Accumulation of solutes over geologic time has been shown to be the major source of solutes in the arid areas of Australia (Wiman et al., 1990). Because of the infrequent nature of
rainfall, we were unable to collect rainfall samples during the duration of this study; however, based on data from other arid areas, the input TDS is generally believed to be approximately 10 mg/L (Junge and Werby, 1958). Soluble salts on the surface of the dunes, however, were collected (Table 9) and are believed to represent the ionic ratio, but not concentration, of those salts stored between the Pleistocene and Holocene recharge events. In an arid area, salt input from adjacent sabkhat would significantly increase the load (Wood and Sanford 1995).
The following conceptual model accounts for the observed solute concentrations and distribution in the ground water of the Liwa aquifer. Between approximately 26,000 years BP (the end of the late Pleistocene recharge event) and approximately 9000 years BP (beginning of the Holocene recharge event), salts from precipitation accumulated on the surface and in the unsaturated zone. That is, rainfall was insufficient to transport them to the water table. In this 17,000 year interval, each square meter received 10 mg/L TDS in rainfall with an average annual flux of 40 mm/y, resulting in an accumulation of 6.8x10⁶ mg/m2. When precipitation increased between 9000 and 6000 years BP, recharge occurred, and these stored salts were mobilized and transported to the ground water.
The solute distribution in the Holocene water is believed to be largely a function of the thickness of the unsaturated zone before recharge. That is, with a thick unsaturated zone associated with the topographic apex of the aquifer, storage is large, and sufficient recharge water flushes through the system to remove most of the stored soluble salts. When the unsaturated zone is thin, as on the flanks of the aquifer, storage is small, and only a small portion of the recharge enters the aquifer. The rest is rejected and is evaporated. Furthermore, because the water table is shallow, significant evaporation can occur, which increases the solute concentration. Thus, the solute concentration is greater on the flanks of the sand mound than near the apex because it has not been diluted. The observed “halo” solute distribution surrounding the mound is a function of the pre-recharge thickness of the unsaturated zone. That is, it is assumed that rainfall and salts stored on the surface would have been relatively uniform on this topographically low-lying aquifer system. Controls on solute distribution during the Pleistocene recharge event where probably similar to those during the Holocene recharge event. The present concentration distribution has not reached a steady state.

W. W. WOOD, Z. S. RIZK and A. S. ALSHARHAN
310
If it were assumed that recharge during the 3000 year wet interval of the Holocene was approximately 1.4 mm/y (Wood and Imes, 1995), 4.2 m of total recharge would have occurred. If all the stored salts from the previous 17,000 years (6.8x10⁶ mg/m2) were mobilized, one would expect to observe concentrations of approximately 1620 mg/L in the core of the aquifer. This expectation is confirmed within the limit of error and thus consistent with the proposed model (Figure 7, Tables 6 and 7).
High concentrations of Mg+2, Na+1, Cl-1, and NO3
-1 are also consistent with an atmospheric source (Junge and Werby, 1958) because there are no significant mineral sources for these elements in the aquifer framework (Ahmed et al., 1998; Hadley et al., 1998). Nitrate (NO3
-1) is formed by the oxidation of ammonia (NH4
+1) formed in the atmosphere by the action of lightening on atmospheric N2. Because of a lack of vegetation in this system, there is little nitrogen take-up, and it accumulates by evaporative concentration, like other solutes. There is significant nitrate that has accumulated on the surface since the end of the Holocene recharge interval (Table 9). The presence of the ubiquitous sabkhat increases the potential mass of salts on the surface (Wood and Sanford, 1995).
The initial solute distribution is modified by the presence of interdunal sabkhat. Capillary forces bring water and solutes to the surfaces of these sabkhat; water is evaporated, and soluble chlorides and nitrate salts are deposited on the surface. The relatively insoluble calcite, gypsum, and anhydrite that exhibit retrograde solubility are precipitated in the unsaturated zone as a function of increasing temperature toward the surface. When recharge occurs, the soluble salts are returned to the ground water while the relatively insoluble carbonates and sulfates remain in the unsaturated zone. There is a net loss of water by evaporation relative to recharge; thus, the concentrations of the solutes increase beneath the sabkhat. The ground water and solutes move downgradient toward the next interdunal sabkha, where the solutes are further concentrated by this process. Vertical mixing is promoted by the high density of recharging water relative to the density of water in the aquifer, and by the nearly isotropic hydraulic conductivity of the aquifer. This downgradient transport is coupled with the removal of some calcium, sulfate, and carbon, reflecting precipitation of relatively insoluble sulfates and carbonates in the unsaturated zone (Figure 6).
Summary and Conclusions
A Quaternary sand aquifer near the Liwa Crescent on the northeastern edge of the Ar Rub al Khali, United Arab Emirates, was selected to test several hypotheses on the seasonal timing of ground-water recharge, and on the origin, evolution, and distribution of solutes in a hyperarid area. Examination of this aquifer system provides insight into the timing of ground-water recharge and the origin and evolution of solutes in a representative hyperarid area. Ground-water flow in the aquifer system is outward in all directions from the center of two ground-water mounds, corresponding to two thick sand deposits. Hydraulic heads in underlying aquifers are lower than those of the Liwa/ Bu Hasa aquifer; thus, there is no advective water or solute input from this source. Solute diffusion from underlying aquifers provides a small solute flux, but it is inadequate to account for the observed solute mass; nor is the ionic ratio consistent with this source. There are no laterally adjacent aquifers; thus, there is no influx of solutes from these sources. Dissolution of the aquifer framework provides only for a minor fraction of most of the observed solutes. Therefore, most solutes in this aquifer system are almost certainly derived from atmospheric precipitation. Salts contained in rain were stored on the surface and in the unsaturated zone during the hyperarid time interval between the end of the Pleistocene recharge event (26,000 years BP) and the beginning of the Holocene recharge event (9000 years BP). During the Holocene recharge era (9000 to 6000 years BP), these stored salts were mobilized and transported to the ground water.
Initial solute distribution was controlled by the thickness of the pre-recharge unsaturated zone. With a thick unsaturated zone, aquifer storage is large, and recharge water flushes through the system, removing most of the stored soluble salts. Where the unsaturated zone is thin, the aquifer storage space is small, and only a small portion of the recharge enters the aquifer. The rest is rejected and lost to evaporation. Thus, the solute concentration is greater on the flanks than at the center because it has not been diluted by recharge.
The initial solute distribution has been modified as the solutes and water are transported along the flow path. Calcium and sulfate have been added by the dissolution of gypsum, as have certain trace elements, and bicarbonate has been reduced by precipitation of calcite. As ground water moves away from the apex of the mound, it encounters a series of interdunal sabkhat. Water is evaporated

Timing of Recharge, and the Origin, Evolution, and Distribution of Solutes in a Hyperarid Aquifer System
311
from the sabkhat, leaving soluble chloride and nitrate minerals on the surfaces and retrograde carbonate and sulfate minerals in the unsaturated zone. When recharge occurs through the interdunal sabkhat, soluble salts on the surfaces, modern 14C, and tritium are added to the aquifer. There is vertical mixing within the aquifer because the density of the recharged water is greater than the density of water. This mixed water is then carried downgradient toward the next interdunal sabkha. Relatively insoluble carbonate and sulfate minerals are retained in the unsaturated zone of the interdunal sabkhat, causing a change in the solute ratios in a downgradient. The portion of the aquifer near the center of the mound which is not affected by interdunal sabkhat retains the original solute composition determined by mobilization of stored salts. It should be noted, however, that the water and solute movement is very slow, and much of the solute distribution is controlled by the initial thickness of the unsaturated zone rather than by ground-water transport.
Controls on solute distribution during the Pleistocene recharge event where probably similar to those during the Holocene recharge event. The system is not at steady state with respect to solute distribution. The isotopic data from ancient ground waters from the Liwa Oasis with its unusual “d” (deuterium excess) of approximately -15 indicate that Holocene moisture derived from previously evaporated water on the surface of the Indian Ocean rather than from the Mediterranean/Arabian Gulf. Such a source is consistent with a summer monsoonal circulation first proposed by McClure (1976). These findings, although specific to this aquifer, provide a useful model by which to evaluate other aquifer systems in hyperarid environments.
ACKNOWLEDGMENTS
We thank the International Atomic Energy
Agency for isotope analyses and the United Arab Emirates University for support for this study. We thank Jeffery Imes and Ward Sanford for reviews that enhanced both the clarity of thought and the presentation. The authors, however, assume all responsibility for any errors. REFERENCES Ahmed, E. A., Soliman, M. A., Alsharhan, A. S., and
Tamer, S., 1998. Mineralogical characteristics of the Quaternary sand dunes in the eastern province of Abu Dhabi, United Arab Emirates. In: Quaternary
Deserts and Climatic Change: A. S. Alsharhan, K. W. Glennie, G. L. Whittle, and C. G. St. C. Kendall, (editors), A. A. Balkema, Rotterdam, 85-90.
Alsharhan, A. S., Rizk, Z. A., Nairn, A. E., Bakhit, D. W., and Alhajari, S. A., 2001. Hydrogeology of an Arid Region - The Arabian Gulf and Adjoining Areas: Elsevier, 331p.
Burns, S. J., Matter, A, Frank, N., and Mangini, A., 1998. Speleothem-based paleoclimate record from northern Oman. Geology 26(6): 499-502.
Burns, S. J., Fleitmann, D., Matter, A., Neff, U., and Mangini, A., 2001. Speleothem evidence from Oman for continental pluvial events during interglacial periods. Geology 29(7): 623-626.
Clarke, I. D., Fritz, P., Quinn, O. P., Rippon, P. W., Nash, H., and bin Ghalib al Said, B., 1987. Modern and fossil groundwater in an arid environment, a look at the hydrogeology of Southern Oman, in Use of Isotopes in Water Resources: International Atomic Energy Agency, Symposium 299, Vienna, p. 167-187.
Clarke, I. D., and Fontes, J. C., 1990. Paleoclimactic reconstruction in Northern Oman based on carbonates from hyperalkaline ground waters. Quaternary Research 33: 320-336.
deMenocal, P., Ortiz, J., Guilderson, T., Adkins, J, Sarnthein, M., Baker, L., and Yarusinsky, M., 2002. Abrupt onset and termination of the African humid period - Rapid climate responses to gradual insolation forcing. Quaternary Science Reviews 19: 347-361.
Dethier, D. P., 1979. Atmospheric contributions to stream-water chemistry in the North Cascade Range, Washington. Water Resources Research 15:787-794.
Driscoll F. G., 1986. Groundwater and Wells: Johnson Filtration Systems, Inc., St. Paul, 1089p.
Eisenreich, S. J., 1980. Atmospheric input of trace metals to Lake Michigan. Water, Air, Soil Pollution 13: 287-301.
Gleick, P., 2002. The world’s water - The biennial report on freshwater resources: Island Press, Washington, DC, 334p.
Hadley, D. G., Brouwers, E. M., and Bown, T. M., 1998. Quaternary paleodunes, Arabian Gulf coast, Abu Dhabi Emirate - Age and paleoenvironmental evolution. In: Quaternary Deserts and Climatic Change: A. S. Alsharhan, K. W. Glennie, G. L. Whittle, and C. G. St. C. Kendall, eds., A.A. Balkema, Rotterdam, 123-140.
Hingston, F. J., and Gailitis, V., 1976. The geographic variation of salt precipitation over Western Australia. Australian Journal of Soil Research 14: 319-335.
International Atomic Energy Agency, 1992. Statistical treatment of data on environmental isotopes in precipitation, Technical Report Series No. 331: International Atomic Energy Agency, Vienna, 781p.
Junge, C. E., and Werby, R. T., 1958. The concentration of chloride, sodium, potassium, calcium and sulfate in rainwater over the United States. Journal of Meteorology 15(5): 417-425.

W. W. WOOD, Z. S. RIZK and A. S. ALSHARHAN
312
Lippard, S. J., Shelton, A. W., and Gass, I. G., 1986. The ophiolite of Northern Oman: The Geol. Society Memoir # 11, Blackwell Scientific. Pub., Oxford, UK, 178p.
Lutz, W., Sanderson, W., and Scherbov, S., 2001. The end of world population growth. Nature 412: 543-545.
Mandel, S., and Shiftean, Z. L., 1981. Groundwater Resources: Academic Press, New York, 269p.
McClure, H. A., 1976. Radiocarbon chronology of late Quaternary lakes in the Arabian desert. Nature 263: 755-756.
Merlivat, L., and Jouzel, J. J., 1979. Global climatic interpretations of the deuterium-oxygen 18 relationship for precipitation. Journal of Geophysical Research. 84: 5029-5033.
National Atlas of the United Arab Emirates, 1993. United Arab Emirates University, 164p.
Neff, U., Burns, S. J., Mangini, A., Fleitmann, D., and Matter, A., 2001. Strong coherence between solar variability and monsoon in Oman between 9 and 6 kyr ago. Nature 411: 190-293.
Person, F. J. Jr., and Fisher, D. W., 1971. Chemical composition of atmospheric precipitation in the northeastern United States: U.S. Geological Survey Water Supply Paper 1535-P, p.1-23.
Plummer, L. N., Parkhurst, D. L., Fleming, G. W., and Dunkle, S. A., 1988. A computer program incorporating Pitzer's equations for calculation of geochemical reactions in brines: U. S. Geological Survey Water-Resources Investigation Report 88-4153, 310p.
Sanford, W. E., and Wood, W. W., 2001. Hydrology of the coastal sabkhat of Abu Dhabi, United Arab Emirates. Hydrogeology Journal 9(4): 338-366.
Stokes, S., Bray, H., Wood, W. W., and Goudie, A. S., (this volume), Later Quaternary paleorecharge events in the Arabian Peninsula. In: A.S. Alsharhan & W.W. Wood (editors). Water Resources Perspectives: Evaluation, Management and Policy. Elsevier Science, The Netherlands.
Taylor, D. W., 1948. Fundamentals of soil mechanics: John Wiley and Sons, New York.
Thompson, G. R., and Turk, J., 1999. Earth Science and the Environment - 2nd Ed.: Harcourt College Publisher, Fort Worth, TX, 589p.
Wiman, B. L. B., and Agren, G. L., 1985. Aerosol depletion and deposition in forests - A model analysis. Atmospheric Environment 19: 335-347.
Wiman, B. L. B., Unsworth, M. H., Lindberg, S. E., Bergkvist, B., Jaenicke, R., and Hanson, H. C., 1990. Perspectives on aerosol deposition to natural surfaces-Interactions between aerosol residence times, removal processes, the biosphere and global environmental change. Journal of Aerosol Science 21: 313-338.
Wood, W. W., and Imes, J. L., 1995. How wet is wet? Constraints on late Quaternary climate in southern Arabian Peninsula. Journal of Hydrology 164: 263-268.
Wood, W. W., and Imes J. L. (this volume), Dating of Holocene ground-water recharge in the Rub al Khali of Abu Dhabi - Constraints on global climate-change models. In: A.S. Alsharhan & W.W. Wood (editors). Water Resources Perspectives: Evaluation, Management and Policy. Elsevier Science, The Netherlands.
Wood, W. W., and Sanford, W. E., 1995. Eolian transport, saline lake basins, and groundwater solutes. Water Resources Research 31: 3121-3129.
Wood, W. W., Sanford, W. E., and Al Habschi, A. R. S., 2002. The source of solutes in the coastal sabkha of Abu Dhabi. Bulletin of the Geological Society of America 114(3): 259-268.
Zhisheng, A., Porter, S. C., Kutzbach, J. E., Xihao, W., Suming, W., Xiaodand, L., Xiaoqiang, L., and Weijian, Z., 2000. Asynchronous Holocene optimum of the East Asian monsoon. Quaternary Science Review 19: 743-762.


