Embed Size (px)
Citation preview

Losses in the Fluorescent Tracer used in Hydrodynamic Modeling of Constructed Wetlands studied by Laser Induced Fluorescence
Lucero Plazasa, Edison Roseroa, Efraín Solartea, Jhon Sandovalb, and Miguel Peñab
aGrupo de Óptica Cuántica, Universidad del Valle, A.A. 25360, Cali, Colombia; bFundación CINARA, Facultad de Ingeniería, Universidad del Valle, Cali, Colombia
ABSTRACT
Fluorescent tracer trials are performed to obtain useful information for hydrodynamic modeling. Particularly they have been used in constructed wetlands, aimed for residual water treatment, in order to find residence time distribution for particles entering the system and, in general, to know the flux pattern. Nevertheless, it has been reported that some tracers, as Rhodamine WT, exhibit adsorption phenomena over the substrate. This situation has to be considered in the analysis of residence time distribution curves, taking into account advection-dispersion processes which are given by the diffusion modified equation. Laser Induced Fluorescence (LIF) with a Nd:YAG laser (532 nm; 35mW), was used to determine Rhodamine WT accumulated concentration. Through adsorption coefficients obtained experimentally, an advection – dispersion model for solute transport in a subsurface flow constructed wetland was evaluated. Including this phenomenon allows to optimize the model, and another important condition is added in the behavior prediction of these complex ecosystems.
Keywords: Fluorescent Tracers, Constructed Wetlands, Rhodamine WT, Adsorption, Laser Induced Fluorescence.
1. INTRODUCTION Wetlands are transition zones between the terrestrial and the aquatic environment. Human activities have created various types of wetlands, which provide cycling of nutrients and buffers sites for organic and inorganic pollutants. This ability is the mechanism used in constructed wetlands, which simulate a natural wetland for quality water improvement [1].
The effectiveness of a wetland depends mainly on microbial dynamics and hydrodynamics. Microbial processes are significant in the removal of some nutrients that can be eliminated from wastewater in the wetlands. In addition, the hydrodynamics of a constructed wetland is the most important factor in performance. It is necessary to know both, the pollutants residence time distribution inside the wetland, and the time-space concentration distribution, to estimate the system capacity to remove contaminant material. Even though, there are many alternatives for wastewater treatment, the use of constructed wetlands is studied in detail because of their advantages as low operational cost, environmentally friendly and usefulness for removing diverse types of pollutants. In this way, modeling the wetland system’s behavior, allows to obtain significant data that can be applied to a real situation, in order to implement constructed wetlands for treatment various kinds of wastewater.
The subsurface flow constructed wetlands are areas formed by a porous subsurface (usually gravel) that let wastewater flows through this substrate. In order to know the flow pattern, a tracer is used. This is a compound of easy detection, conservative and inert, which behaves in the same way that the particles passing through the wetland [2]. Since only few compounds meet the above characteristics, the choice of a tracer is difficult, especially because some tracers can be adsorbed on porous media, besides to other effects, such as absorption and recirculation that must be considered.
To generate reliable hydrodynamic data, the recovery percentage of tracer should be at less as 90 %, or more [3]. In this study it has took into consideration the constructed wetlands at Ginebra town (Valle del Cauca-Colombia), they are facilities where the tests, using fluorescent dye tracer, were carried out in order to measure the travel time of solutes. Rhodamine WT, (RWT), was used as fluorescent tracer, and it showed recovery percentages between 50 % and 80%. So, it was necessary to investigate the main loss mechanisms of the fluorescent tracer, taking into account the physical and chemical properties of the tracer and its environmental interactions, the results could be then used to model the hydrodynamic behavior of the real system.
Ultraviolet and Visible Ground- and Space-based Measurements, Trace Gases, Aerosols and Effects VI, edited by Jay R. Herman, Wei Gao, Proc. of SPIE Vol. 7462, 74620L · © 2009 SPIE
CCC code: 0277-786X/09/$18 · doi: 10.1117/12.826726
Proc. of SPIE Vol. 7462 74620L-1

Therefore, the aim of this study is to determine the effectiveness of RWT for tracer studies and to find the adsorption characteristics of this tracer, when it flows through the substrate gravel. The calculated partition coefficient Kd, makes it possible to include a new parameter, which improves the advection-dispersion model and allows a better fit of the experimental data.
2. THEORETICAL CONSIDERATIONS 2.1 The diffusion equation and partition coefficient
The travel of a pollutant through the environment depends on two important factors; the chemical reactions in which it can participate, and the transport velocity of the contaminants in the environment. There are two main processes responsible for mass transport in wetlands systems: advection and dispersion. Transport by advection is due to the natural movement of water, whereas the dispersion transport concerns to fluid mixing caused by the substrate. It is supposed that the tracer movement in the wetland system follows the same transport laws as the pollutants do. So, the 1D partial differential equation, that represents the transport of pollutants, including the effects of advection and diffusion-dispersion, and taking into account sink or source terms, can be written as:
2
2 xC C r CD v
x x n t∂ ∂ ∂
− ± =∂ ∂ ∂
(1)
Where C(x,t) represents the tracer concentration, n is the effective porosity, D is the bulk diffusion coefficient, vx is the water flow velocity and r is taken as the mass produced or consumed per unit volume and per unit time. It is assumed that the adsorbed quantity is directly proportional to the pollutants concentration in water, and that it happens instantaneously. The exchange rate of tracer on the surface can be expressed as r=∂C*/∂t. For a porous rock as gravel, the exchange rate of mass sorption per unit volume of porous medium can be defined as: ∂C*/∂t = ρb∂S/∂t , where S is the mass quantity adsorbed on the surface, which depends on the tracer amount distributed into the wetland, and ρb is the bulk density, given by: ρb = ρS(1-n), where ρS is the rock’s mass density. By assuming proportionality in the form:
d
S CKt t
∂ ∂=
∂ ∂ (2)
Where Kd is the partition or distribution coefficient, which can be calculated from an equilibrium adsorption isotherm. By substitution of equation (2) into (1), the advection-dispersion differential equation, that includes a retardation factor, Rf , can be found in the form:
2
2x
f f
vD C C CR x R x t
∂ ∂ ∂− =
∂ ∂ ∂ (3)
This retardation factor can be written as [4]:
11f S dnR K
nρ−⎛ ⎞= + ⎜ ⎟
⎝ ⎠ (4)
Equation (3), with the retardation factor, is more consistent with the experimental results.
2.2 Laser Induced Fluorescence
The concentration of RWT can be determined by laser induced fluorescence spectroscopy (LIFS). In this work, a solid-state diode pumped Nd-YAG laser @532 nm, with an effective power output of 50mW, was used as excitation source. The relation between the total measured fluorescence spectral intensity, F, and the concentration, C, of fluorescent molecules, is described by the following relation:
0fF k p xCφ= (5)
Proc. of SPIE Vol. 7462 74620L-2

Where φf is the fluorescence quantum yield of RWT (0.98), k is the fraction of photons emitted by the excited molecules of RWT that are detected, p0 is the incident excitation power, and x is the optical path length of the sample. A typical RWT fluorescence spectrum is shown in Fig. 1. The fluorescence emission peak is at 580 nm, whereas the total fluorescence light spans from 550 to 690 nm; the excitation laser light, scattered by the sample, can be seen on the Fig. 1.
Fig. 1. Experimental RWT fluorescence spectrum, the excitation laser line at 532 nm can be observed because of the light
scattering due to the sample.
3. EXPERIMENTAL METHODS 3.1 Wetland model experimental setup
In order to study the degree of adsorption as a function of the Rhodamine WT (RWT) concentration in aqueous solution; an experimental setup, to simulate on a small scale a constructed wetland, was been designed and built. It consists of a set of closed polyethylene bottles, each with a central tube through its top; this tube has a line of small holes on its wall, and a narrow hose to take samples, as is shown on Fig. 2.
Special concentrations of RWT solutions were prepared for the test batch, using 175, 200, 250 and 300 μg / L of RWT in water, as they were typical values for RWT solutions in the tracer tests carried out at the Ginebra wetlands facility. Each bottle was added with 1 liter of RWT solution and 1 kg of rock (ρs = 3.007 ± 0.005 g / mL, effective porosity n = 47%). To study the behavior of the RWT equilibrium concentration on the gravel, as a function of the RWT equilibrium concentration in the solution at constant temperature and pH, samples were taken along 7 days, and the temperature and system pH were continuously evaluated to keep them constant. In this assay set, the model wetlands bottles were kept in rest. Additionally, the same system was used to perform a test in which the solution’s bottles were shaken to simulate the water movement; the used setup is shown in Fig. 2. In this case, RWT concentrations in water of: 175, 200, 275 and 300 μg / L were used; and the samples were taken along 59 hours, but the samples were left to stay for a day. For both tests the samples were taken at defined time intervals. To study the desorption process, the original remained fluid were removed from the bottles and replaced by distillated water, samples were taken along 3 hours. In all the cases, the samples were put in a disposable UV grade, fluorometer cells to carry LIF measurements out.
Proc. of SPIE Vol. 7462 74620L-3
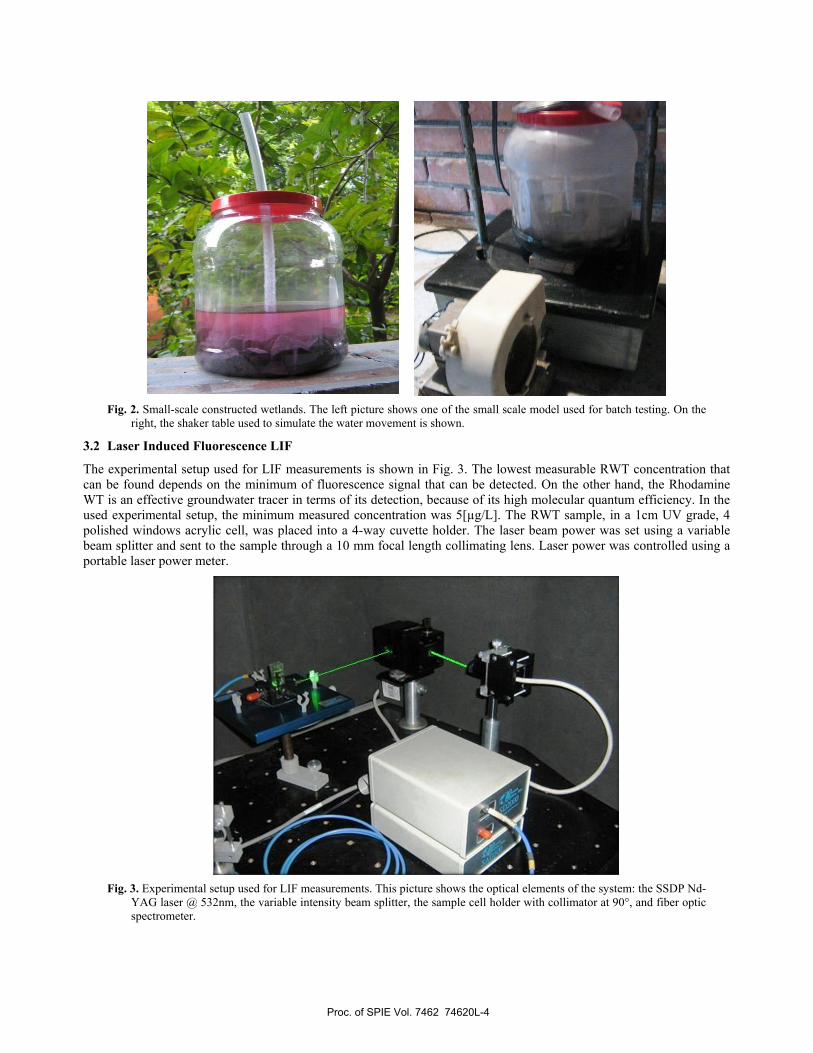
Fig. 2. Small-scale constructed wetlands. The left picture shows one of the small scale model used for batch testing. On the
right, the shaker table used to simulate the water movement is shown.
3.2 Laser Induced Fluorescence LIF
The experimental setup used for LIF measurements is shown in Fig. 3. The lowest measurable RWT concentration that can be found depends on the minimum of fluorescence signal that can be detected. On the other hand, the Rhodamine WT is an effective groundwater tracer in terms of its detection, because of its high molecular quantum efficiency. In the used experimental setup, the minimum measured concentration was 5[µg/L]. The RWT sample, in a 1cm UV grade, 4 polished windows acrylic cell, was placed into a 4-way cuvette holder. The laser beam power was set using a variable beam splitter and sent to the sample through a 10 mm focal length collimating lens. Laser power was controlled using a portable laser power meter.
Fig. 3. Experimental setup used for LIF measurements. This picture shows the optical elements of the system: the SSDP Nd-
YAG laser @ 532nm, the variable intensity beam splitter, the sample cell holder with collimator at 90°, and fiber optic spectrometer.
Proc. of SPIE Vol. 7462 74620L-4

The RWT emitted fluorescence was collected and focused by a 10 mm focal length lens into a 200µm diameter optical fiber, 90 degrees from the excitation laser beam direction, and sent to the spectrophotometer (SD2000 Ocean Optics Inc). Collected spectral data were recorded in the range of Rhodamine fluorescence emission, stored using the spectrometer own program, and processed using the Origin7.0 software. From the area of the RWT fluorescence emission spectrum the molecular concentration in the solution can be calculated using a calibration curve for the total fluorescence intensity as a function of the fluorescent tracer concentration. To observe the adsorption kinetics, RWT concentration in the residual (model wetland) fluid was measured for different initial concentrations of the batch solution, and as a function of the solution stay time in the model wetland, determined equilibrium concentrations [5].
4. RESULTS AND DISCUSION 4.1 Kinetic uptake experiments without shaking
Typical obtained data for the remaining RWT concentrations as a function of the time are shown in Fig. 4, for different initial concentrations, in bath test without shake the bottles. The observed behavior reveals Rhodamine WT adsorption on the gravel. From these curves, it is to see that the processes reach the equilibrium in about 60 hours at low initial concentrations, but increases up to 140 hours or more for concentrations larger than 250 µg/L.
0 20 40 60 80 100
140
150
160
170
180
Concentration (175 μg/L)
Con
cent
ratio
n (μ
g/L)
Time (Hour)0 20 40 60 80 100
140
150
160
170
180
190
Concentration (200 μg/L)
Con
cent
ratio
n (μ
g/L)
Time (Hour)
0 20 40 60 80 100 120 140 160 180180
200
220
240
260
280
Concentration (250 mg/L)
Con
cent
ratio
n (μ
g/L)
Time (Hour)0 50 100 150 200 250 300
240
260
280
300
320Concentration (300 μg/L)
Con
cent
ratio
n ( μ
g/L)
Time (Hour) Fig. 4. Experimental adsorption kinetics data for different concentrations of Rhodamine WT tracer (175, 200, 250 and 300
µg/L) obtained in batch test without shake solutions. Adsorption of RWT onto rock tends to equilibrium in about 60 hours at low initial concentrations, but goes over 140 hours for larger concentrations.
Proc. of SPIE Vol. 7462 74620L-5

4.2 Kinetic uptake experiments with shaking and desorption kinetics
Experimental data, simulating the water movement by shaking, were taken along 59 hours; the results were essentially the same as those in the non shaking case. The experimental results for the 300 µg/L are shown in left side of Figure 5. In the case of movement, the adsorption equilibrium appears very quickly, even for larger concentrations, values between 1.7 and 5 hours were obtained. Desorption experiment results are shown in the right side of Fig. 5, from this graph the irreversibility of the adsorption process can be concluded. From these data it can be calculated that only about 11% of the adsorbed RWT is desorbed from the rocks.
0 100 200 300 400 500
240
250
260
270
280
290
300
310
320
Concentration 300 (μ g / L)
Con
cent
ratio
n (μ
g/L)
Time (min)
0 5 10 15 20 25 30 35 40
3,76
3,78
3,80
3,82
3,84
3,86
3,88
3,90
Con
cent
ratio
n (μ
g/L)
Time (min)
Fig. 5. Experimental adsorption kinetics data for the maximum RWT concentration (300 µg/L) used in the shaking experiment. The curve tends to equilibrium in about 2 hours. On the right, a typical desorption curve of RWT from the rocks are presented. Desorption equilibrium is reach in about 15 minutes, but only 11% of adsorbed RWT is recuperated.
4.3 Adsorption isothermals
From the equilibrium concentrations, it is possible to calculate the adsorption isotherm. The left side of the Fig. 6 shows the respective adsorption isotherm for the different concentrations used in the batch experiment. Data fitting provide the distribution coefficient, Kd = (0.33± 0.03) ×10-3 [L/g], which is the ratio between the amounts adsorbed per unit mass of Rhodamine WT. Substitution of Kd value into the equation 4, allows determine the value of Rf = 2,01± 0.23.On the right side, the adsorption isotherm, corresponding to the shaking data is displayed. In this case, data fitting provide the value of distribution coefficient: Kd = (0.48± 0.08) ×10-3 [L/g]., which is the ratio between the amounts adsorbed per unit mass of Rhodamine WT. Substitution of Kd value into the equation 4, allows determine the value of Rf = 2,63 ± 0,33. The retardation effect, caused by tracer adsorption, can now be taken into account by including this parameter in the model.
Proc. of SPIE Vol. 7462 74620L-6

120 140 160 180 200 220 240 260
0,01
0,02
0,03
0,04
0,05
120 140 160 180 200 220 240 260
0,01
0,02
0,03
0,04
0,05
μg o
f RW
T ad
sorb
ed p
er g
of g
rave
l (ro
ck)
Equilibrium concentration (μg/L)
R2 = 0,993
140 160 180 200 220 240
0,02
0,03
0,04
0,05
0,06
0,07
140 160 180 200 220 240
0,02
0,03
0,04
0,05
0,06
0,07
R2 = 0,984
μ g
of R
WT
adso
rbed
per
g o
f gra
vel (
rock
)
Equilibrium concentration (μg/L) Fig. 6. Adsorption isotherms for the batch (left) and the shaking (right) experiments, the values were calculated using the Langmuir
method.
5. CONCLUSION The results show that the Rhodamine WT adsorption on rock is strongly dependent on the initial RWT concentration and on the time on the rock surface. Therefore, we can say qualitatively that the Rhodamine WT as a tracer for use in wetlands with short residence times [6]. Although Rhodamine WT is considered one of the most conservative tracers, this work shows that it is necessary to study its interaction with the elements which constitute the wetland substrate.
REFERENCES
[1] J.D. Luise, [A Handbook of Constructed Wetlands], EPA publications, (1993). [2] F.A. Kilpatrick., J.F., Wilson., [Application of Hydraulics] , USGS Publications , Chapter A9, (1982). [3] J.F. Wilson., E.D., Cobb., F.A., Kilpatrick., [Application of Hydraulics], USGS Publications, Chapter A12, (1982). [4] P. A. Domenico., F. W. Schwartz., [Physical and Chemical Hydrogeology], Jhon Wiley & Sons, (1990). [5] C.J. Everts et al, “Evaluation of Rhodamine WT as an adsorbed tracer in an agricultural soil”, Journal of Hidrology
153, (1994). [6] Lin A, et al, “Comparison of Rhodamine WT and bromide in the determination of hydraulic characteristics of
constructed wetlands”. Ecological Engineering 20 ,75-88, (2003).
Proc. of SPIE Vol. 7462 74620L-7


