Embed Size (px)
Citation preview
ANNUAL REPORT 2021
TOGETHER SHAPING TOMORROW’S WORLD

2
CONTENTS
WHY AND WHO WE ARE
HOW WE SHAPE THE WORLD
3
ANNUAL REPORT
STATEMENT OF NON-FINANCIAL INFORMATION
FINANCIAL STATEMENTS
Pursuant to the Belgian Royal Decree of 14 November 2007 concerning the obligations of issuers of financial instruments listed for trading on a regulated market, Compagnie d’Entreprises CFE is required to make its annual financial report available to its share-holders. This report includes:• the combined statutory and consolidated
annual report of the Board of Directors, drawn up in accordance with Article 3:32§1, last paragraph, of the Code of Companies and Associations,
• a condensed version of the statutory financial statements, drawn up in ac-cordance with Article 3:17 of the Code of Companies and Associations, and
• the full version of the consolidated fi-nancial statements.
The complete statutory financial state-ments, the annual report of the Board of Directors and the auditor’s report are filed with the National Bank of Belgium in ac-cordance with Articles 3:10 and 3:12 of the Code of Companies and Associations. The statutory auditor has issued an unqualified opinion on the statutory and consolidated financial statements. Pursuant to Article 12, §2, 3° of the Royal Decree of 14 November 2007, Piet De-jonghe, Managing Director, and MSQ SRL, represented by Fabien De Jonge, Chief Financial Officer, certify that, to their knowledge:a. the financial statements, prepared in
accordance with the applicable ac-counting standards, give a true and fair view of the assets, financial position and results of Compagnie d’Entrepris-es CFE and of the companies included in its scope of consolidation,
b. the directors’ report contains a true and fair presentation of the business, results and position of Compagnie d’Entreprises CFE and of the compa-nies included in its scope of consoli-dation, along with a description of the main risks and uncertainties to which they are exposed.
The annual report, the full versions of the statutory and consolidated financial state-ments, as well as the statutory auditor’s report regarding these financial statements are available on the website (www.cfe.be) or can be obtained free of charge and on request at this address: Avenue Herrmann-Debroux 42 – 1160 Brussels (Belgium) – Tel. +32 2 661 18 15 - [email protected].
SHAREHOLDER INFORMATION
PROPOSED DIVIDENDThe partial demerger of CFE will automat-ically lead to a transfer of a substantial part of CFE’s equity and distributable reserves to DEME Group. The Board of Direc-tors considers that CFE’s equity must be strengthened and therefore proposes not to distribute a dividend for the 2021 financial year.
CFE will distribute a dividend as from 2023.
INVESTOR RELATIONS Additional information is available on our website (www.cfe.be), such as: • the annual and half-yearly reports, as
well as the quarterly trading updates;• other press releases;• presentations for analysts and investors;
• on-line subscription to receive investor information (notices of publications, press releases, etc.).
FINANCIAL CALENDAR 5 May 2022: Ordinary General Meeting19 May 2022: Quarterly information at
31 March 2022 Summer 2022: Extraordinary General Meeting31 August 2022: Half-year results 2022 23 November 2022: Quarterly information at
30 September 2022
ANNUAL REPORT 2021
20214
CONTENTS
WHY AND WHO WE ARE
HOW WE SHAPE THE WORLD
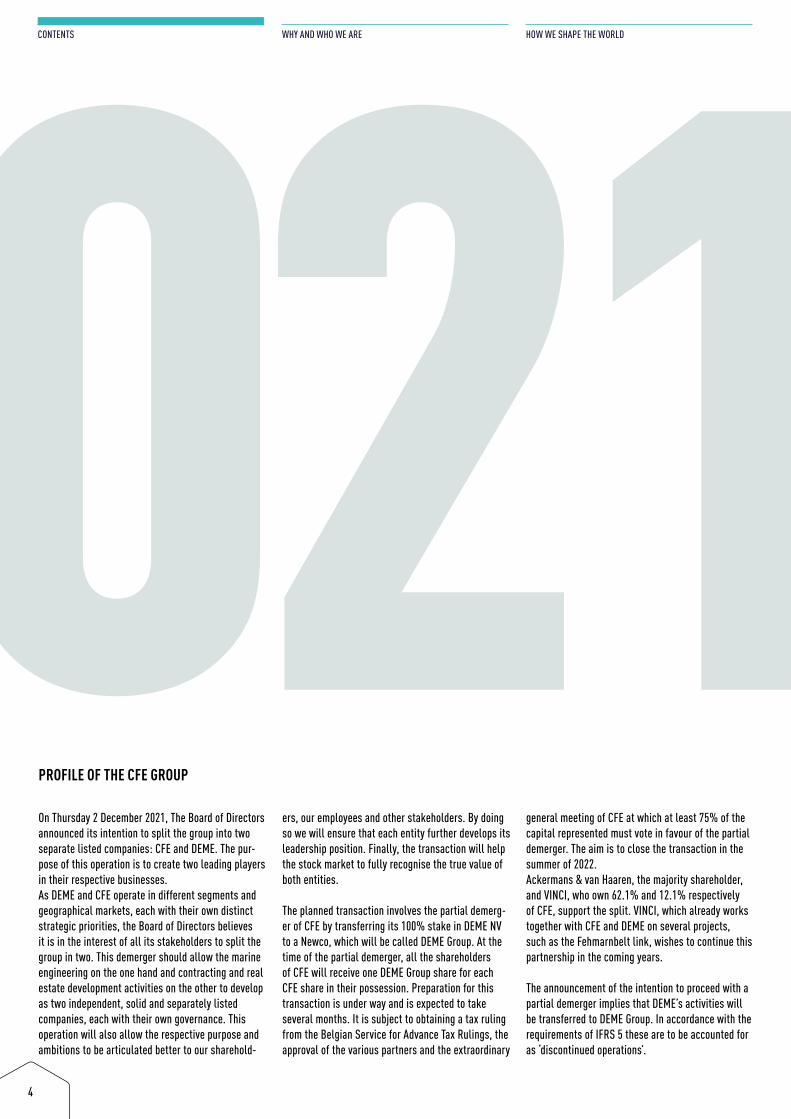
On Thursday 2 December 2021, The Board of Directors announced its intention to split the group into two separate listed companies: CFE and DEME. The pur-pose of this operation is to create two leading players in their respective businesses.As DEME and CFE operate in different segments and geographical markets, each with their own distinct strategic priorities, the Board of Directors believes it is in the interest of all its stakeholders to split the group in two. This demerger should allow the marine engineering on the one hand and contracting and real estate development activities on the other to develop as two independent, solid and separately listed companies, each with their own governance. This operation will also allow the respective purpose and ambitions to be articulated better to our sharehold-
ers, our employees and other stakeholders. By doing so we will ensure that each entity further develops its leadership position. Finally, the transaction will help the stock market to fully recognise the true value of both entities.
The planned transaction involves the partial demerg-er of CFE by transferring its 100% stake in DEME NV to a Newco, which will be called DEME Group. At the time of the partial demerger, all the shareholders of CFE will receive one DEME Group share for each CFE share in their possession. Preparation for this transaction is under way and is expected to take several months. It is subject to obtaining a tax ruling from the Belgian Service for Advance Tax Rulings, the approval of the various partners and the extraordinary
general meeting of CFE at which at least 75% of the capital represented must vote in favour of the partial demerger. The aim is to close the transaction in the summer of 2022.Ackermans & van Haaren, the majority shareholder, and VINCI, who own 62.1% and 12.1% respectively of CFE, support the split. VINCI, which already works together with CFE and DEME on several projects, such as the Fehmarnbelt link, wishes to continue this partnership in the coming years.
The announcement of the intention to proceed with a partial demerger implies that DEME’s activities will be transferred to DEME Group. In accordance with the requirements of IFRS 5 these are to be accounted for as ‘discontinued operations’.
PROFILE OF THE CFE GROUP
20215
ANNUAL REPORT
STATEMENT OF NON-FINANCIAL INFORMATION
FINANCIAL STATEMENTS
Why and who we are
Our Mission 006
Profile of the CFE Group 008
CEO’s message 010
Key figures and highlights of the year 016
How we shape the world
Our value creation model 024
How we are building the future 026
How we are a great place to work 030
How we offer innovative solutions 034
How we move towards climate neutrality 038
How we are a partner for change 042
Annual report
Annual report of the Board of Directors 046
I. Statutory financial statements 050
II. Consolidated financial statements 052
III. Corporate governance statement 071
IV. Remuneration report 087
Statement of non-financial information
Brief description of the group’s activities 094
Policies applied in terms of ESG 095
Main risks related to ESG 099
Outcomes of those policies 110
Non-financial key performance indicators (KPIs) 120
European taxonomy 130
Financial statements
I. Consolidated financial statements 138
II. Notes on the consolidated financial statements 142
III. Statutory financial statements 212
General information 214
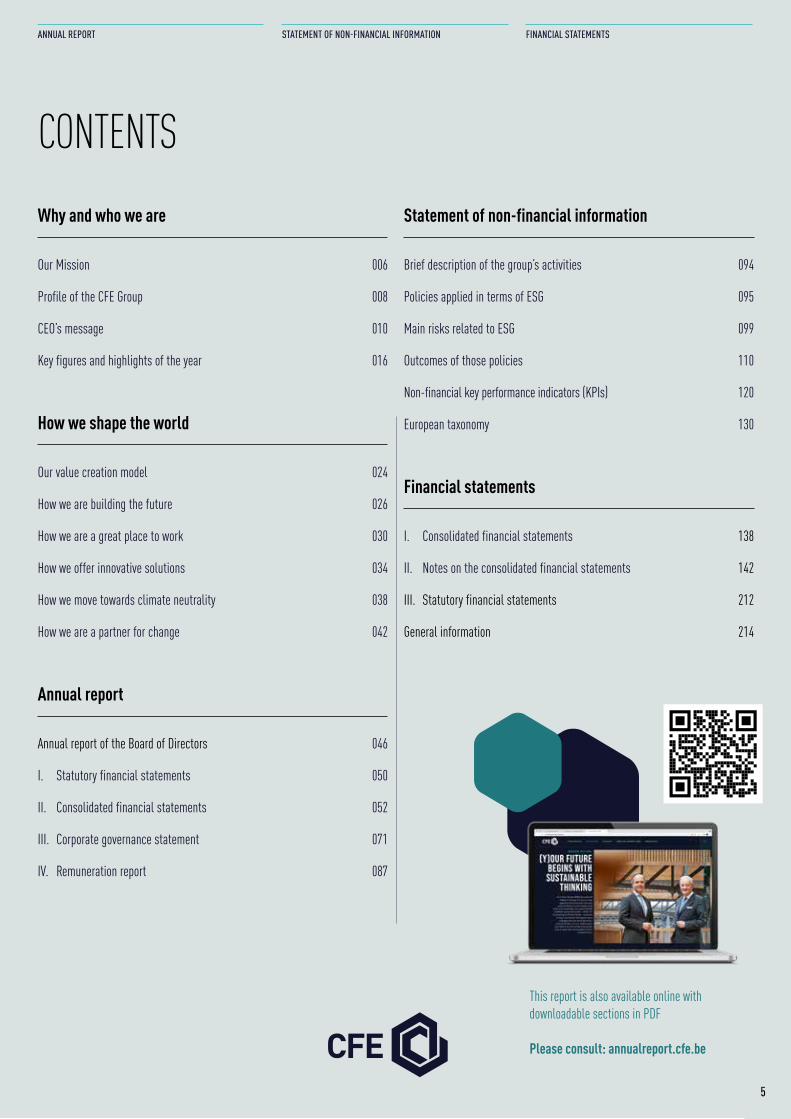
This report is also available online withdownloadable sections in PDF
Please consult: annualreport.cfe.be
CONTENTS

6
CONTENTS
WHY AND WHO WE ARE
HOW WE SHAPE THE WORLD
WELCOMETO (Y)OURWORLD
7
ANNUAL REPORT
STATEMENT OF NON-FINANCIAL INFORMATION
FINANCIAL STATEMENTS
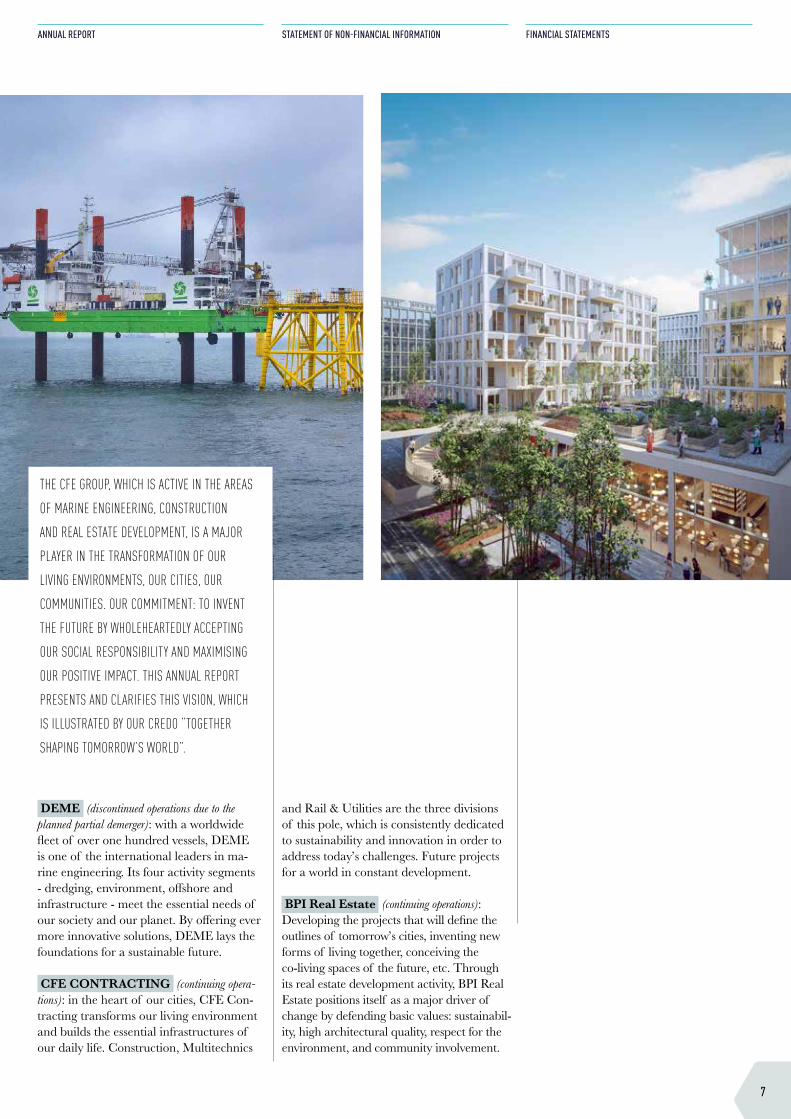
THE CFE GROUP, WHICH IS ACTIVE IN THE AREAS
OF MARINE ENGINEERING, CONSTRUCTION
AND REAL ESTATE DEVELOPMENT, IS A MAJOR
PLAYER IN THE TRANSFORMATION OF OUR
LIVING ENVIRONMENTS, OUR CITIES, OUR
COMMUNITIES. OUR COMMITMENT: TO INVENT
THE FUTURE BY WHOLEHEARTEDLY ACCEPTING
OUR SOCIAL RESPONSIBILITY AND MAXIMISING
OUR POSITIVE IMPACT. THIS ANNUAL REPORT
PRESENTS AND CLARIFIES THIS VISION, WHICH
IS ILLUSTRATED BY OUR CREDO “TOGETHER
SHAPING TOMORROW’S WORLD”.
and Rail & Utilities are the three divisions of this pole, which is consistently dedicated to sustainability and innovation in order to address today’s challenges. Future projects for a world in constant development.
BPI Real Estate (continuing operations): Developing the projects that will define the outlines of tomorrow’s cities, inventing new forms of living together, conceiving the co-living spaces of the future, etc. Through its real estate development activity, BPI Real Estate positions itself as a major driver of change by defending basic values: sustainabil-ity, high architectural quality, respect for the environment, and community involvement.
DEME (discontinued operations due to the planned partial demerger): with a worldwide fleet of over one hundred vessels, DEME is one of the international leaders in ma-rine engineering. Its four activity segments - dredging, environment, offshore and infrastructure - meet the essential needs of our society and our planet. By offering ever more innovative solutions, DEME lays the foundations for a sustainable future.
CFE CONTRACTING (continuing opera-tions): in the heart of our cities, CFE Con-tracting transforms our living environment and builds the essential infrastructures of our daily life. Construction, Multitechnics
2021March 2022
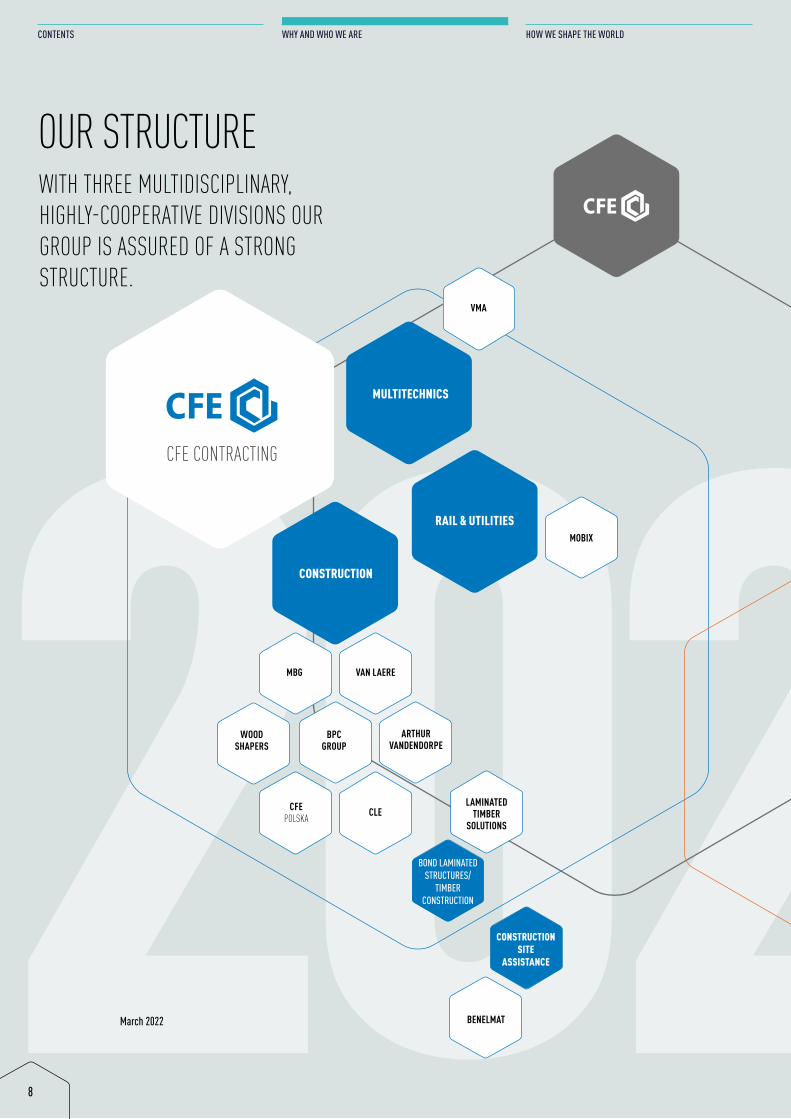
CFE CONTRACTING
MBG VAN LAERE
CONSTRUCTION
CFE POLSKA CLE
BOND LAMINATEDSTRUCTURES/
TIMBERCONSTRUCTION
LAMINATEDTIMBER
SOLUTIONS
CONSTRUCTIONSITE
ASSISTANCE
BENELMAT
BPC GROUP
MULTITECHNICS
MOBIX
ARTHUR VANDENDORPE
VMA
RAIL & UTILITIES
WOODSHAPERS
8
CONTENTS
WHY AND WHO WE ARE
HOW WE SHAPE THE WORLD
WITH THREE MULTIDISCIPLINARY, HIGHLY-COOPERATIVE DIVISIONS OUR GROUP IS ASSURED OF A STRONG STRUCTURE.
OUR STRUCTURE
2021BPILUXEMBOURG
BPIPOLSKA
BPIBELGIUM
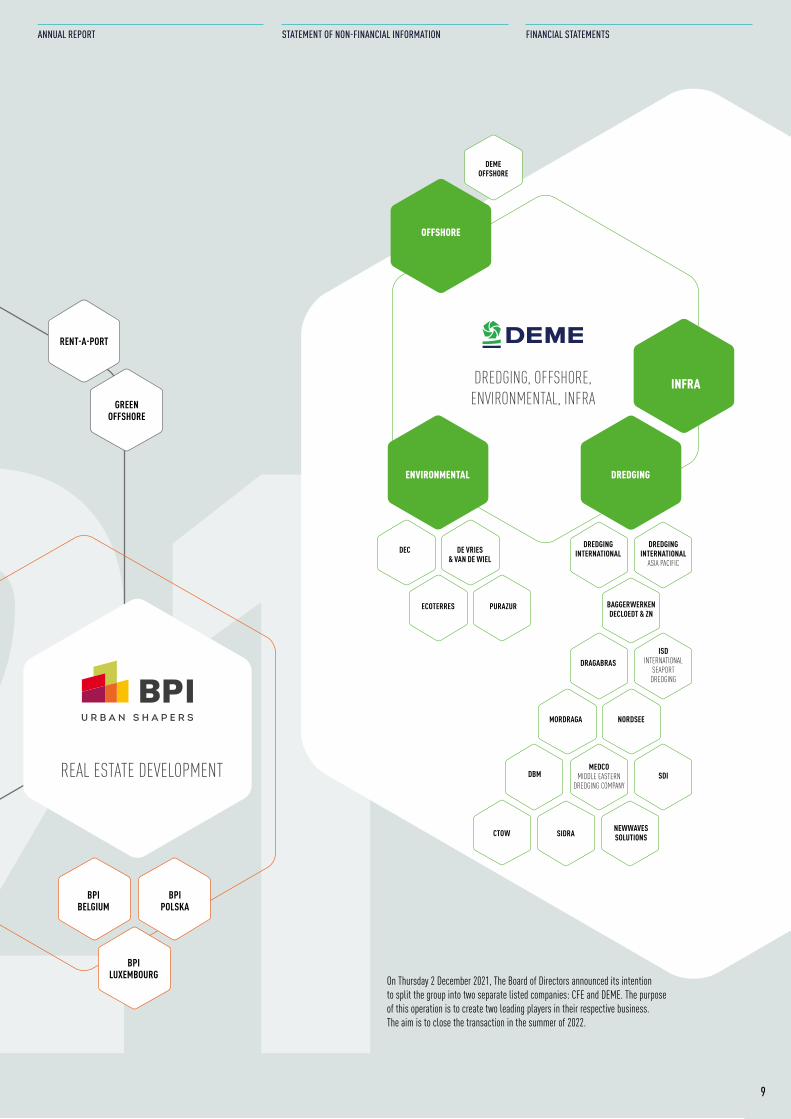
REAL ESTATE DEVELOPMENT
DREDGING
BAGGERWERKENDECLOEDT & ZN
DREDGINGINTERNATIONAL
ASIA PACIFIC
DREDGINGINTERNATIONAL
DRAGABRASISD
INTERNATIONALSEAPORT
DREDGING
MORDRAGA NORDSEE
MEDCOMIDDLE EASTERN
DREDGING COMPANYSDI
SIDRA NEWWAVESSOLUTIONS
ENVIRONMENTAL
DE VRIES& VAN DE WIEL
DEC
PURAZURECOTERRES
OFFSHORE
DEMEOFFSHORE
DREDGING, OFFSHORE, ENVIRONMENTAL, INFRA
CTOW
DBM
INFRA
RENT-A-PORT
GREENOFFSHORE
9
ANNUAL REPORT
STATEMENT OF NON-FINANCIAL INFORMATION
FINANCIAL STATEMENTS
On Thursday 2 December 2021, The Board of Directors announced its intention to split the group into two separate listed companies: CFE and DEME. The purpose of this operation is to create two leading players in their respective business.The aim is to close the transaction in the summer of 2022.
10
CONTENTS
WHY AND WHO WE ARE
HOW WE SHAPE THE WORLD
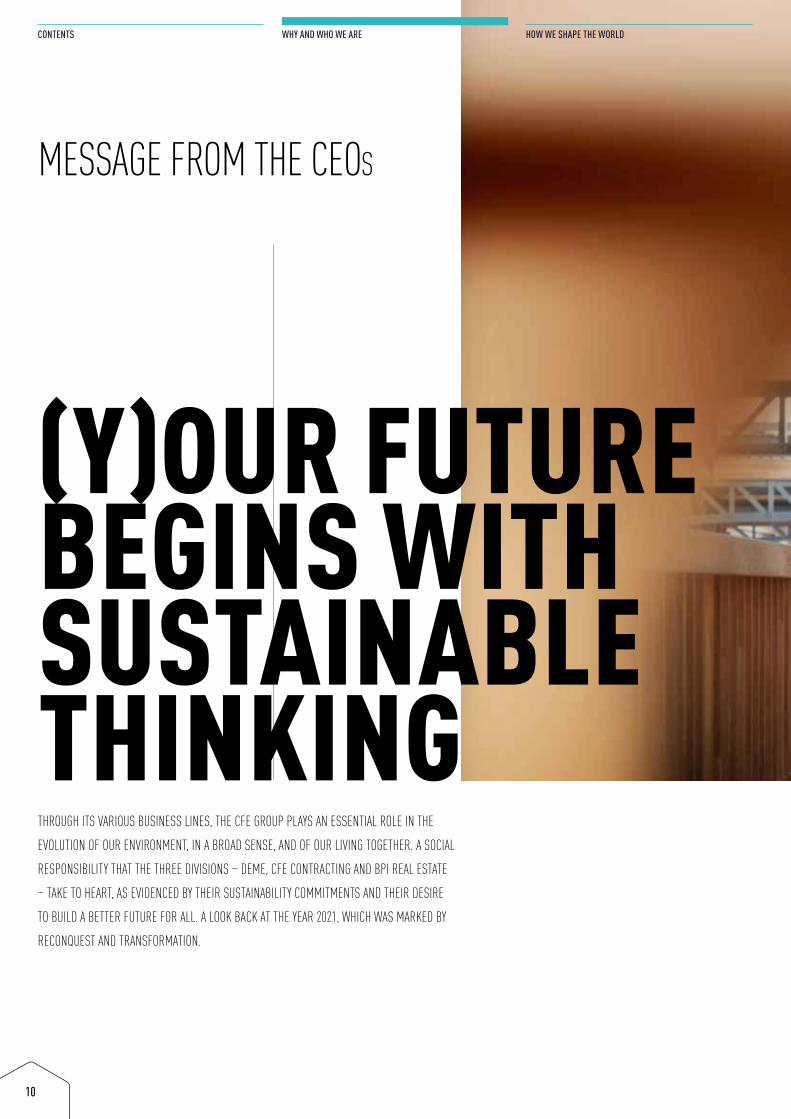
THROUGH ITS VARIOUS BUSINESS LINES, THE CFE GROUP PLAYS AN ESSENTIAL ROLE IN THE
EVOLUTION OF OUR ENVIRONMENT, IN A BROAD SENSE, AND OF OUR LIVING TOGETHER. A SOCIAL
RESPONSIBILITY THAT THE THREE DIVISIONS – DEME, CFE CONTRACTING AND BPI REAL ESTATE
– TAKE TO HEART, AS EVIDENCED BY THEIR SUSTAINABILITY COMMITMENTS AND THEIR DESIRE
TO BUILD A BETTER FUTURE FOR ALL. A LOOK BACK AT THE YEAR 2021, WHICH WAS MARKED BY
RECONQUEST AND TRANSFORMATION.
(Y)OUR FUTURE BEGINS WITH SUSTAINABLE THINKING
MESSAGE FROM THE CEOs
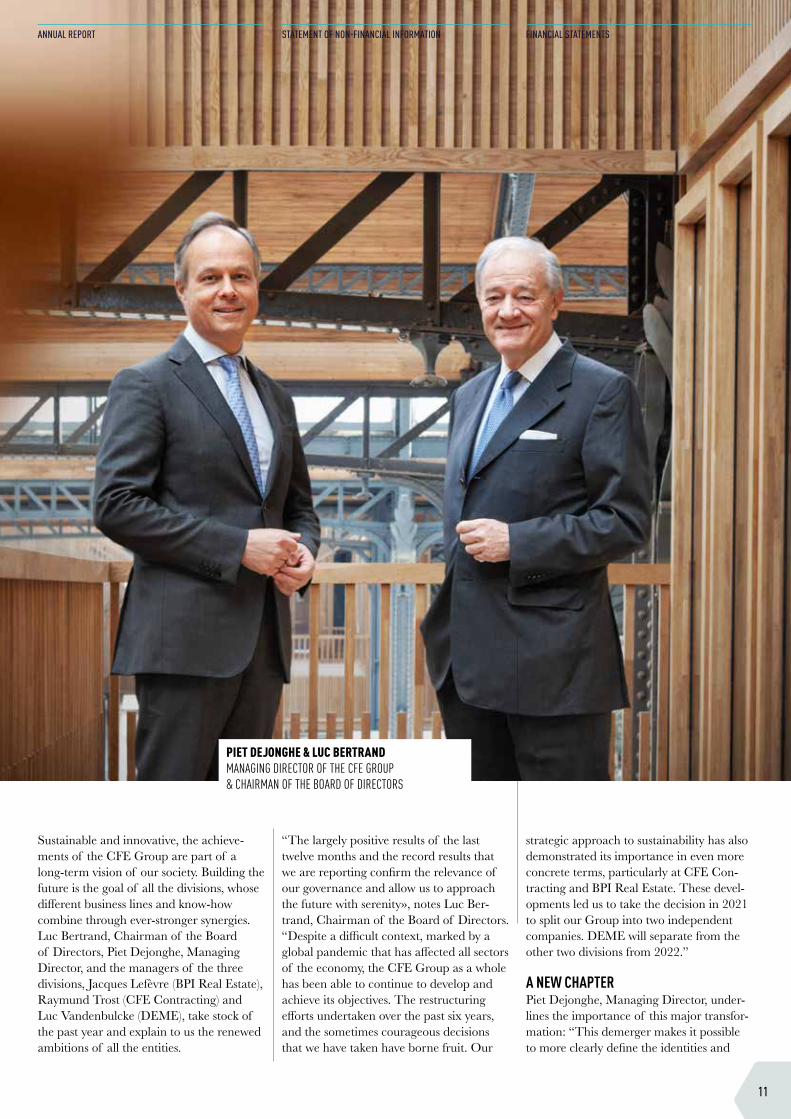
PIET DEJONGHE & LUC BERTRAND MANAGING DIRECTOR OF THE CFE GROUP& CHAIRMAN OF THE BOARD OF DIRECTORS
11
ANNUAL REPORT
STATEMENT OF NON-FINANCIAL INFORMATION
FINANCIAL STATEMENTS
Sustainable and innovative, the achieve-ments of the CFE Group are part of a long-term vision of our society. Building the future is the goal of all the divisions, whose different business lines and know-how combine through ever-stronger synergies. Luc Bertrand, Chairman of the Board of Directors, Piet Dejonghe, Managing Director, and the managers of the three divisions, Jacques Lefèvre (BPI Real Estate), Raymund Trost (CFE Contracting) and Luc Vandenbulcke (DEME), take stock of the past year and explain to us the renewed ambitions of all the entities.
“The largely positive results of the last twelve months and the record results that we are reporting confirm the relevance of our governance and allow us to approach the future with serenity», notes Luc Ber-trand, Chairman of the Board of Directors. “Despite a difficult context, marked by a global pandemic that has affected all sectors of the economy, the CFE Group as a whole has been able to continue to develop and achieve its objectives. The restructuring efforts undertaken over the past six years, and the sometimes courageous decisions that we have taken have borne fruit. Our
strategic approach to sustainability has also demonstrated its importance in even more concrete terms, particularly at CFE Con-tracting and BPI Real Estate. These devel-opments led us to take the decision in 2021 to split our Group into two independent companies. DEME will separate from the other two divisions from 2022.”
A NEW CHAPTERPiet Dejonghe, Managing Director, under-lines the importance of this major transfor-mation: “This demerger makes it possible to more clearly define the identities and
MESSAGE FROM THE CEOs
12
CONTENTS
WHY AND WHO WE ARE
HOW WE SHAPE THE WORLD
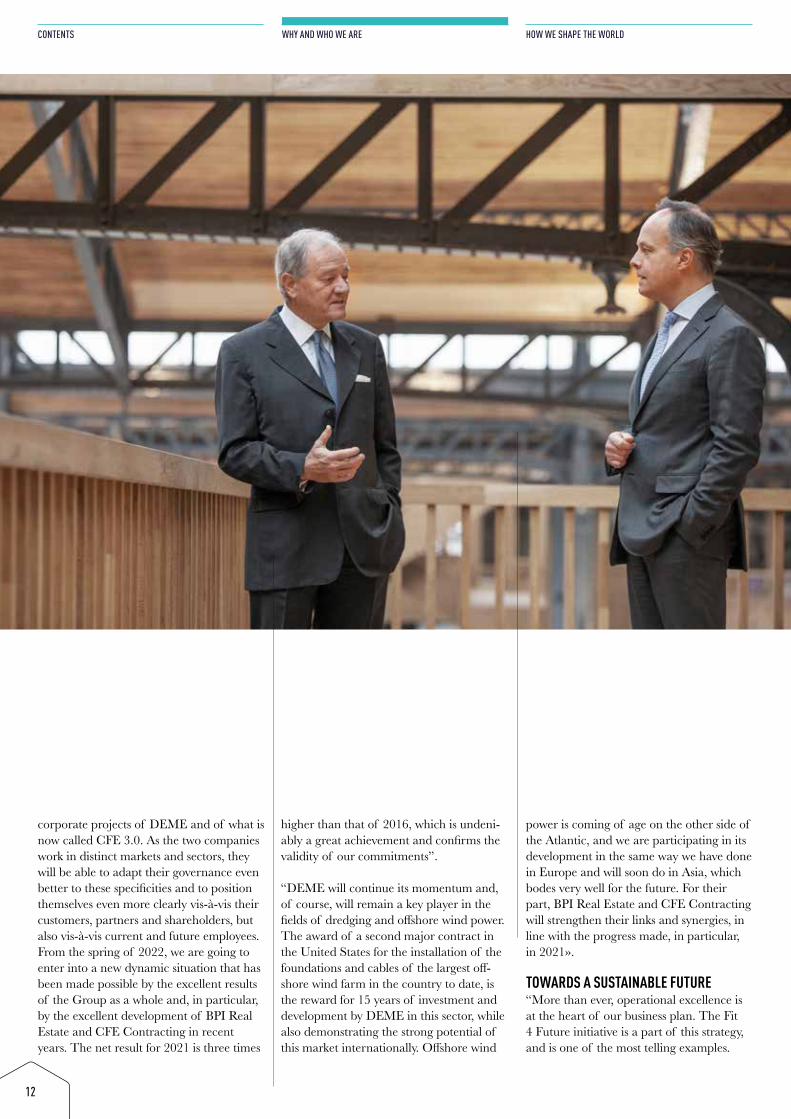
corporate projects of DEME and of what is now called CFE 3.0. As the two companies work in distinct markets and sectors, they will be able to adapt their governance even better to these specificities and to position themselves even more clearly vis-à-vis their customers, partners and shareholders, but also vis-à-vis current and future employees. From the spring of 2022, we are going to enter into a new dynamic situation that has been made possible by the excellent results of the Group as a whole and, in particular, by the excellent development of BPI Real Estate and CFE Contracting in recent years. The net result for 2021 is three times
higher than that of 2016, which is undeni-ably a great achievement and confirms the validity of our commitments”.
“DEME will continue its momentum and, of course, will remain a key player in the fields of dredging and offshore wind power. The award of a second major contract in the United States for the installation of the foundations and cables of the largest off-shore wind farm in the country to date, is the reward for 15 years of investment and development by DEME in this sector, while also demonstrating the strong potential of this market internationally. Offshore wind
power is coming of age on the other side of the Atlantic, and we are participating in its development in the same way we have done in Europe and will soon do in Asia, which bodes very well for the future. For their part, BPI Real Estate and CFE Contracting will strengthen their links and synergies, in line with the progress made, in particular, in 2021».
TOWARDS A SUSTAINABLE FUTURE“More than ever, operational excellence is at the heart of our business plan. The Fit 4 Future initiative is a part of this strategy, and is one of the most telling examples.
13
ANNUAL REPORT
STATEMENT OF NON-FINANCIAL INFORMATION
FINANCIAL STATEMENTS
Despite a difficult context, marked by a global pandemic that has affected all sectors of the economy, the CFE Group as a whole has been able to continue to develop and achieve its objectives.
LUC BERTRAND
This approach to analysing our processes has the objective of structurally improving our results, by making them more stable and more predictable. All the Belgian enti-ties of the construction segment are taking part in this large-scale project, through working groups bringing together teams from Van Laere, BPC Group and MBG. This has already enabled us to develop new working methods and, in particular, to implement a new integrated management software package (PGI), in addition to a whole series of common digital tools. Here, we are laying the solid foundations of what CFE 3.0 will be, with an efficient develop-ment platform that will allow us to work on all our assignments and all our projects in a fully integrated manner.”
These developments are also based on a sustainability policy that is still anchored in the DNA of the Group: “Putting sus-tainability at the heart of our work is not a matter of opportunism but the result of careful thought. It is a strategy that drives out waste and non-quality, promotes inno-vation, opens up business opportunities for us, strengthens our growth, and permits us to assume our social responsibility to the full. The work of identifying the elements that best match the nature of our activities
- among the 17 sustainable development goals (SDGs) defined by the United Nations Organisation - resulted in the formulation of key performance indicators (KPIs) by which we can clearly measure the progress made. 2021 marked the concrete imple-mentation of a whole series of measures in the various entities of CFE Contracting and at BPI Real Estate, as well as the appoint-ment of new sustainability officers. The stronger integration that will result from the split of the Group in 2022 will allow the various sustainability initiatives to be aligned even better.”
A GLOBAL VISIONIn 2021, BPI Real Estate confirmed its driving role in the construction of the ur-ban spaces of the future, and reaffirmed its long-term vision, as explained by its CEO Jacques Lefèvre: “We anticipate the devel-opments in the market by relying, in par-ticular, on innovation. This means that we conceive our projects as real estate activities that must offer real services that allow us to adapt over time to the needs of our clients and to urban transformations.The approach, which is linked to the Sustainable Development Goals, is now anchored in our procedures and allows us to analyse and determine the precise
structuring criteria for the selection and the design of each project. This includes, in particular, two essential aspects, namely the carbon footprint and the rational use of resources. There is a great demand in the market for buildings that integrate these issues throughout their life cycle, and BPI Real Estate is a pioneer here. We have been obtaining BREEAM certificates on all our developments for several years now, and are systematically aiming for even higher levels.”
« BPI Real Estate’s ability to focus on long cycles allows the Group to provide real answers to the crucial questions of housing and the evolution of the urbanisation of cities. Our experience in the field of rede-velopment – and I’m thinking in particular of the Grand Poste project in Liège – or in the field of wooden construction – for which the new headquarters of CFE, BPI Real Estate, BPC Group and Wood Shapers in Brussels will be the showcase – are real assets in a market that is increasingly de-manding innovation and sustainability. The synergies with the other entities, which will be reinforced in the new structure resulting from the split with DEME, are essential in this sense. The sharing of experiences, a flowing coordination, a methodology and a
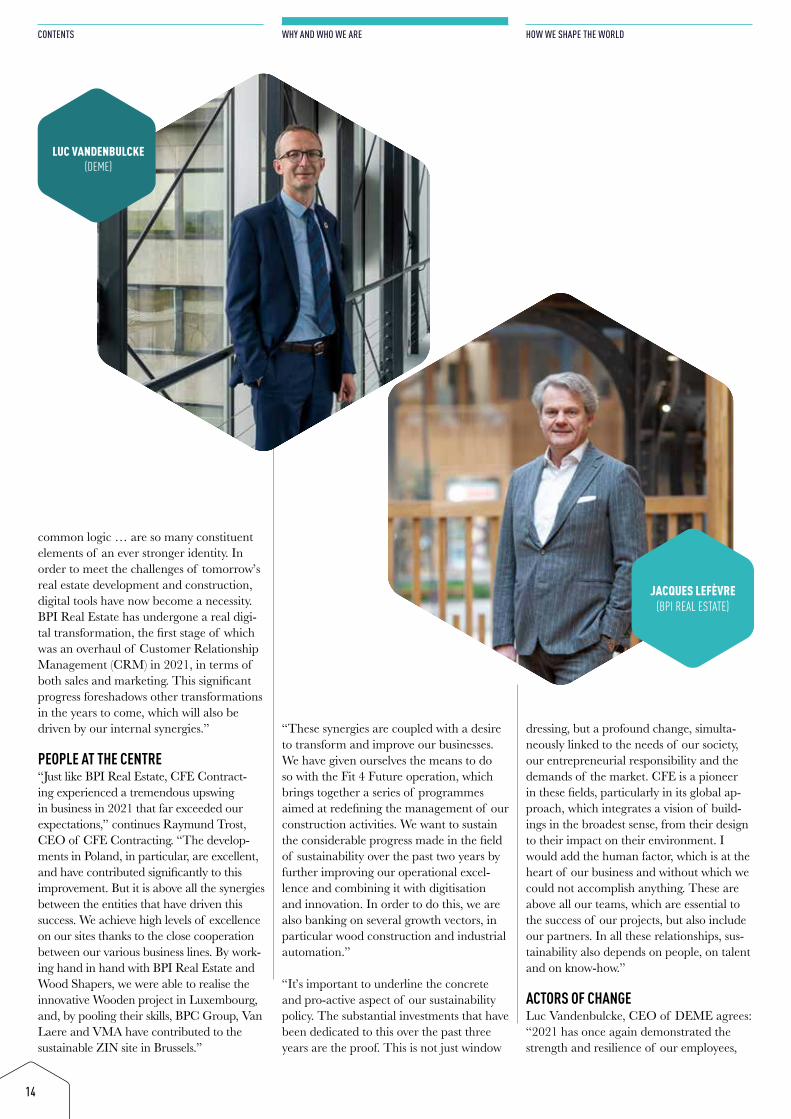
LUC VANDENBULCKE (DEME)
JACQUES LEFÈVRE(BPI REAL ESTATE)
14
CONTENTS
WHY AND WHO WE ARE
HOW WE SHAPE THE WORLD
common logic … are so many constituent elements of an ever stronger identity. In order to meet the challenges of tomorrow’s real estate development and construction, digital tools have now become a necessity. BPI Real Estate has undergone a real digi-tal transformation, the first stage of which was an overhaul of Customer Relationship Management (CRM) in 2021, in terms of both sales and marketing. This significant progress foreshadows other transformations in the years to come, which will also be driven by our internal synergies.”
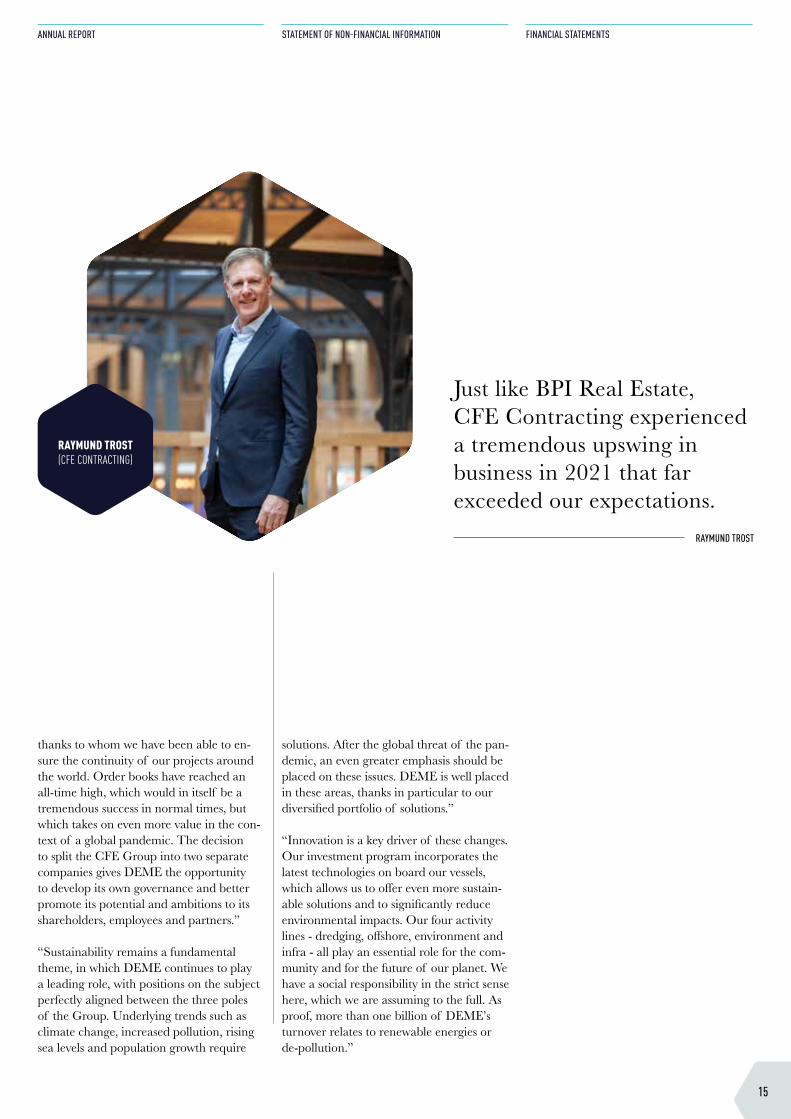
PEOPLE AT THE CENTRE“Just like BPI Real Estate, CFE Contract-ing experienced a tremendous upswing in business in 2021 that far exceeded our expectations,” continues Raymund Trost, CEO of CFE Contracting. “The develop-ments in Poland, in particular, are excellent, and have contributed significantly to this improvement. But it is above all the synergies between the entities that have driven this success. We achieve high levels of excellence on our sites thanks to the close cooperation between our various business lines. By work-ing hand in hand with BPI Real Estate and Wood Shapers, we were able to realise the innovative Wooden project in Luxembourg, and, by pooling their skills, BPC Group, Van Laere and VMA have contributed to the sustainable ZIN site in Brussels.”
“These synergies are coupled with a desire to transform and improve our businesses. We have given ourselves the means to do so with the Fit 4 Future operation, which brings together a series of programmes aimed at redefining the management of our construction activities. We want to sustain the considerable progress made in the field of sustainability over the past two years by further improving our operational excel-lence and combining it with digitisation and innovation. In order to do this, we are also banking on several growth vectors, in particular wood construction and industrial automation.”
“It’s important to underline the concrete and pro-active aspect of our sustainability policy. The substantial investments that have been dedicated to this over the past three years are the proof. This is not just window
dressing, but a profound change, simulta-neously linked to the needs of our society, our entrepreneurial responsibility and the demands of the market. CFE is a pioneer in these fields, particularly in its global ap-proach, which integrates a vision of build-ings in the broadest sense, from their design to their impact on their environment. I would add the human factor, which is at the heart of our business and without which we could not accomplish anything. These are above all our teams, which are essential to the success of our projects, but also include our partners. In all these relationships, sus-tainability also depends on people, on talent and on know-how.”
ACTORS OF CHANGELuc Vandenbulcke, CEO of DEME agrees: “2021 has once again demonstrated the strength and resilience of our employees,
RAYMUND TROST (CFE CONTRACTING)
RAYMUND TROST
15
ANNUAL REPORT
STATEMENT OF NON-FINANCIAL INFORMATION
FINANCIAL STATEMENTS
thanks to whom we have been able to en-sure the continuity of our projects around the world. Order books have reached an all-time high, which would in itself be a tremendous success in normal times, but which takes on even more value in the con-text of a global pandemic. The decision to split the CFE Group into two separate companies gives DEME the opportunity to develop its own governance and better promote its potential and ambitions to its shareholders, employees and partners.”
“Sustainability remains a fundamental theme, in which DEME continues to play a leading role, with positions on the subject perfectly aligned between the three poles of the Group. Underlying trends such as climate change, increased pollution, rising sea levels and population growth require
solutions. After the global threat of the pan-demic, an even greater emphasis should be placed on these issues. DEME is well placed in these areas, thanks in particular to our diversified portfolio of solutions.”
“Innovation is a key driver of these changes. Our investment program incorporates the latest technologies on board our vessels, which allows us to offer even more sustain-able solutions and to significantly reduce environmental impacts. Our four activity lines - dredging, offshore, environment and infra - all play an essential role for the com-munity and for the future of our planet. We have a social responsibility in the strict sense here, which we are assuming to the full. As proof, more than one billion of DEME’s turnover relates to renewable energies or de-pollution.”
Just like BPI Real Estate, CFE Contracting experienced a tremendous upswing in busi ness in 2021 that far exceeded our expec tations.
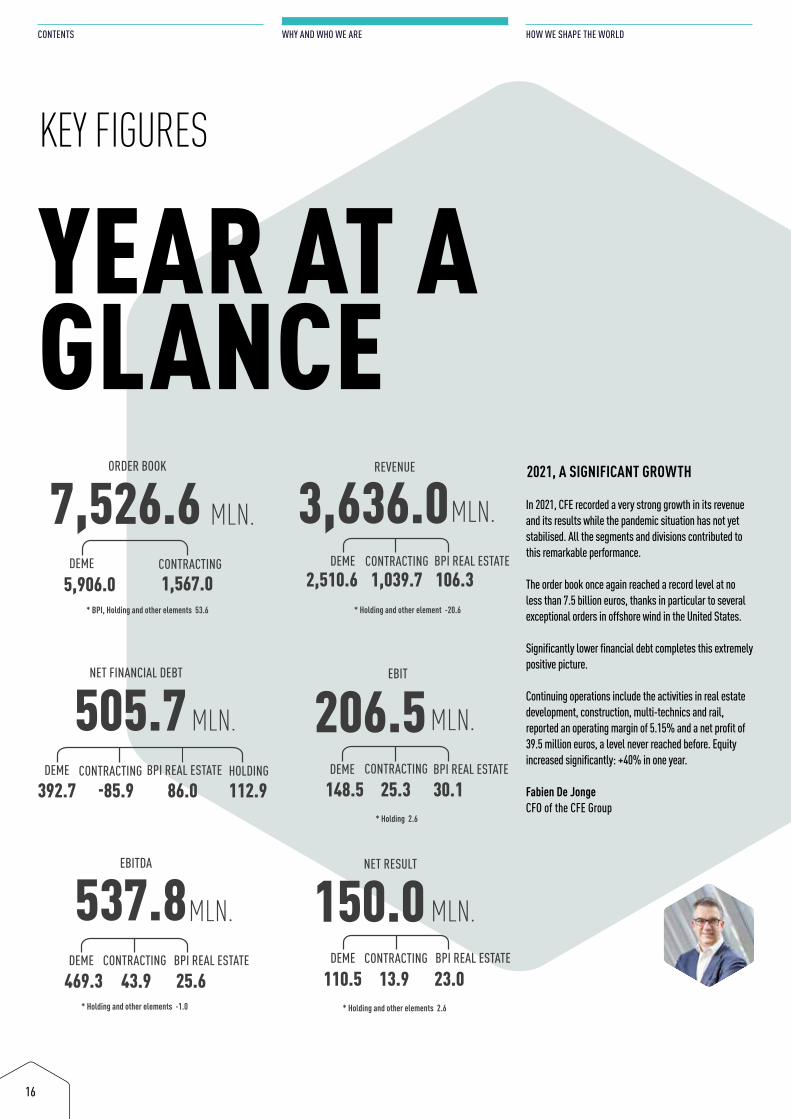
505.7NET FINANCIAL DEBT
DEME BPI REAL ESTATE392.7 -85.9 86.0
HOLDING112.9
MLN.CONTRACTING
537.8MLN.
EBITDA
DEME BPI REAL ESTATE469.3 43.9 25.6
* Holding and other elements -1.0
CONTRACTING
7,526.6ORDER BOOK
DEME
5,906.0 1,567.0
MLN.
* BPI, Holding and other elements 53.6
CONTRACTING
3,636.0MLN.
REVENUE
DEME BPI REAL ESTATE2,510.6 1,039.7 106.3
* Holding and other element -20.6
CONTRACTING
206.5EBIT
DEME BPI REAL ESTATE148.5 25.3 30.1
MLN.
* Holding 2.6
CONTRACTING
150.0NET RESULT
DEME BPI REAL ESTATE
110.5 13.9 23.0
MLN.
* Holding and other elements 2.6
CONTRACTING
16
CONTENTS
WHY AND WHO WE ARE
HOW WE SHAPE THE WORLD
KEY FIGURES
In 2021, CFE recorded a very strong growth in its revenue and its results while the pandemic situation has not yet stabilised. All the segments and divisions contributed to this remarkable performance.
The order book once again reached a record level at no less than 7.5 billion euros, thanks in particular to several exceptional orders in offshore wind in the United States.
Significantly lower financial debt completes this extremely positive picture.
Continuing operations include the activities in real estate development, construction, multi-technics and rail, reported an operating margin of 5.15% and a net profit of 39.5 million euros, a level never reached before. Equity increased significantly: +40% in one year.
Fabien De JongeCFO of the CFE Group
2021, A SIGNIFICANT GROWTH
YEAR AT AGLANCE
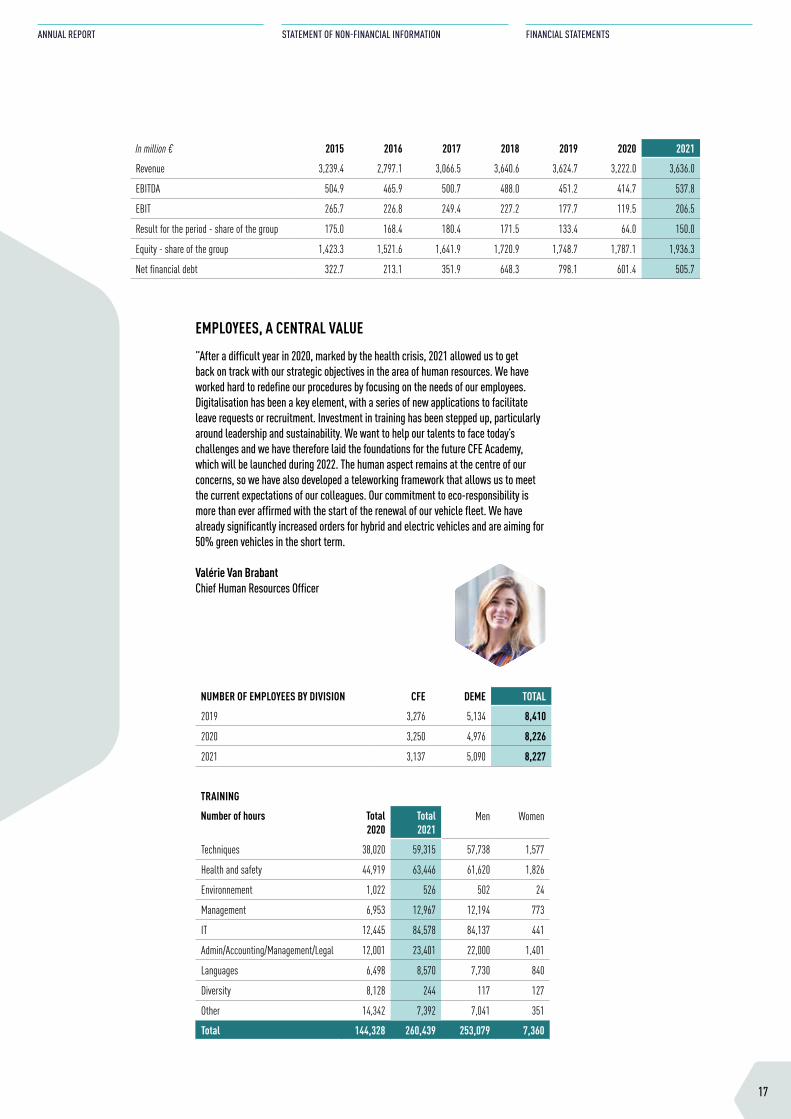
In million € 2015 2016 2017 2018 2019 2020 2021
Revenue 3,239.4 2,797.1 3,066.5 3,640.6 3,624.7 3,222.0 3,636.0
EBITDA 504.9 465.9 500.7 488.0 451.2 414.7 537.8
EBIT 265.7 226.8 249.4 227.2 177.7 119.5 206.5
Result for the period - share of the group 175.0 168.4 180.4 171.5 133.4 64.0 150.0
Equity - share of the group 1,423.3 1,521.6 1,641.9 1,720.9 1,748.7 1,787.1 1,936.3
Net financial debt 322.7 213.1 351.9 648.3 798.1 601.4 505.7
NUMBER OF EMPLOYEES BY DIVISION CFE DEME TOTAL
2019 3,276 5,134 8,410
2020 3,250 4,976 8,226
2021 3,137 5,090 8,227
TRAINING
Number of hours Total2020
Total2021
Men Women
Techniques 38,020 59,315 57,738 1,577
Health and safety 44,919 63,446 61,620 1,826
Environnement 1,022 526 502 24
Management 6,953 12,967 12,194 773
IT 12,445 84,578 84,137 441
Admin/Accounting/Management/Legal 12,001 23,401 22,000 1,401
Languages 6,498 8,570 7,730 840
Diversity 8,128 244 117 127
Other 14,342 7,392 7,041 351
Total 144,328 260,439 253,079 7,360
17
ANNUAL REPORT
STATEMENT OF NON-FINANCIAL INFORMATION
FINANCIAL STATEMENTS
”After a difficult year in 2020, marked by the health crisis, 2021 allowed us to get back on track with our strategic objectives in the area of human resources. We have worked hard to redefine our procedures by focusing on the needs of our employees. Digitalisation has been a key element, with a series of new applications to facilitate leave requests or recruitment. Investment in training has been stepped up, particularly around leadership and sustainability. We want to help our talents to face today’s challenges and we have therefore laid the foundations for the future CFE Academy, which will be launched during 2022. The human aspect remains at the centre of our concerns, so we have also developed a teleworking framework that allows us to meet the current expectations of our colleagues. Our commitment to eco-responsibility is more than ever affirmed with the start of the renewal of our vehicle fleet. We have already significantly increased orders for hybrid and electric vehicles and are aiming for 50% green vehicles in the short term.
Valérie Van Brabant Chief Human Resources Officer
EMPLOYEES, A CENTRAL VALUE
18
CONTENTS WHY AND WHO WE ARE HOW WE SHAPE THE WORLD
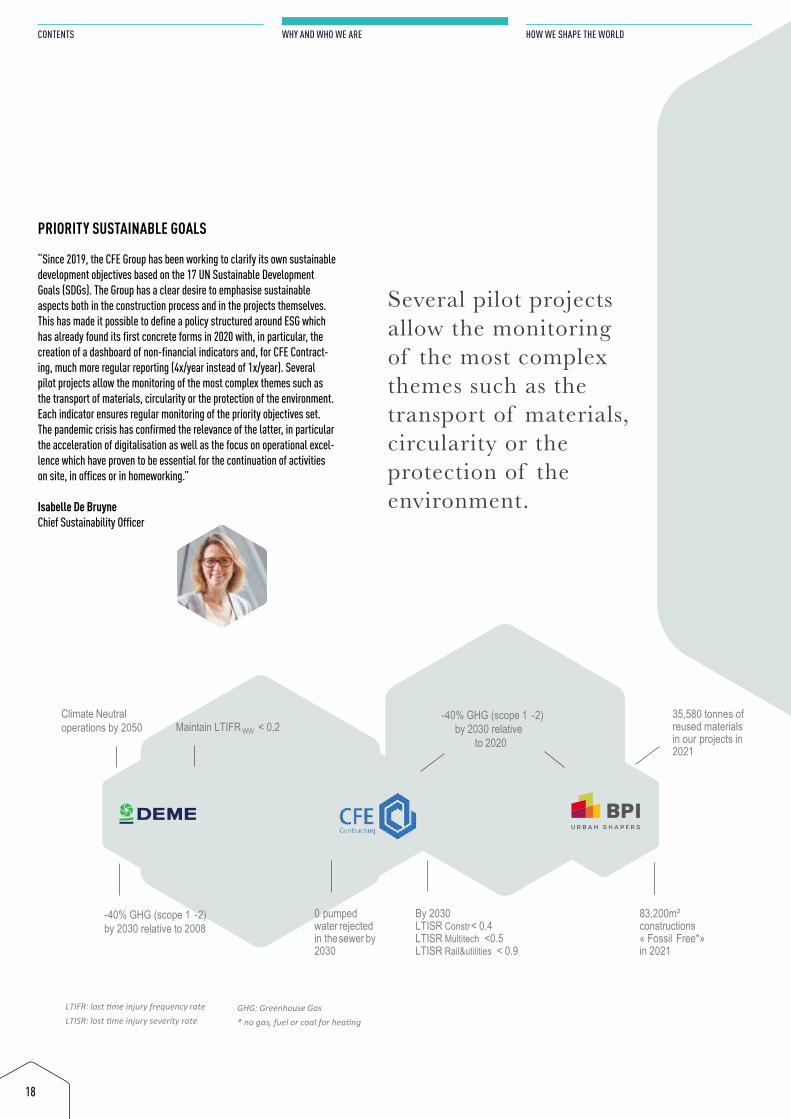
Climate Neutral operations by 2050
-40% GHG (scope 1 -2) by 2030 relative to 2008
-40% GHG (scope 1 -2) by 2030 relative
to 2020Maintain LTIFR WW < 0,2
By 2030LTISR Constr< 0.4 LTISR Multitech <0.5LTISR Rail&utilities < 0.9
83,200m² constructions « Fossil Free*» in 2021
35,580 tonnes of reused materialsin our projects in 2021
0 pumpedwater rejectedin the sewer by 2030
LTIFR: lost time injury frequency rateLTISR: lost time injury severity rate
GHG: Greenhouse Gas* no gas, fuel or coal for heating
PRIORITY SUSTAINABLE GOALS
“Since 2019, the CFE Group has been working to clarify its own sustainable development objectives based on the 17 UN Sustainable Development Goals (SDGs). The Group has a clear desire to emphasise sustainable aspects both in the construction process and in the projects themselves. This has made it possible to define a policy structured around ESG which has already found its first concrete forms in 2020 with, in particular, the creation of a dashboard of non-financial indicators and, for CFE Contract-ing, much more regular reporting (4x/year instead of 1x/year). Several pilot projects allow the monitoring of the most complex themes such as the transport of materials, circularity or the protection of the environment. Each indicator ensures regular monitoring of the priority objectives set. The pandemic crisis has confirmed the relevance of the latter, in particular the acceleration of digitalisation as well as the focus on operational excel-lence which have proven to be essential for the continuation of activities on site, in offices or in homeworking.”
Isabelle De Bruyne Chief Sustainability Officer
Several pilot projects allow the monitoring of the most complex themes such as the transport of materials, circularity or the protection of the environment.
2.00
1.60
1.20
0.80
0.40
0.00
2.00
1.60
1.20
0.80
0.40
0.00
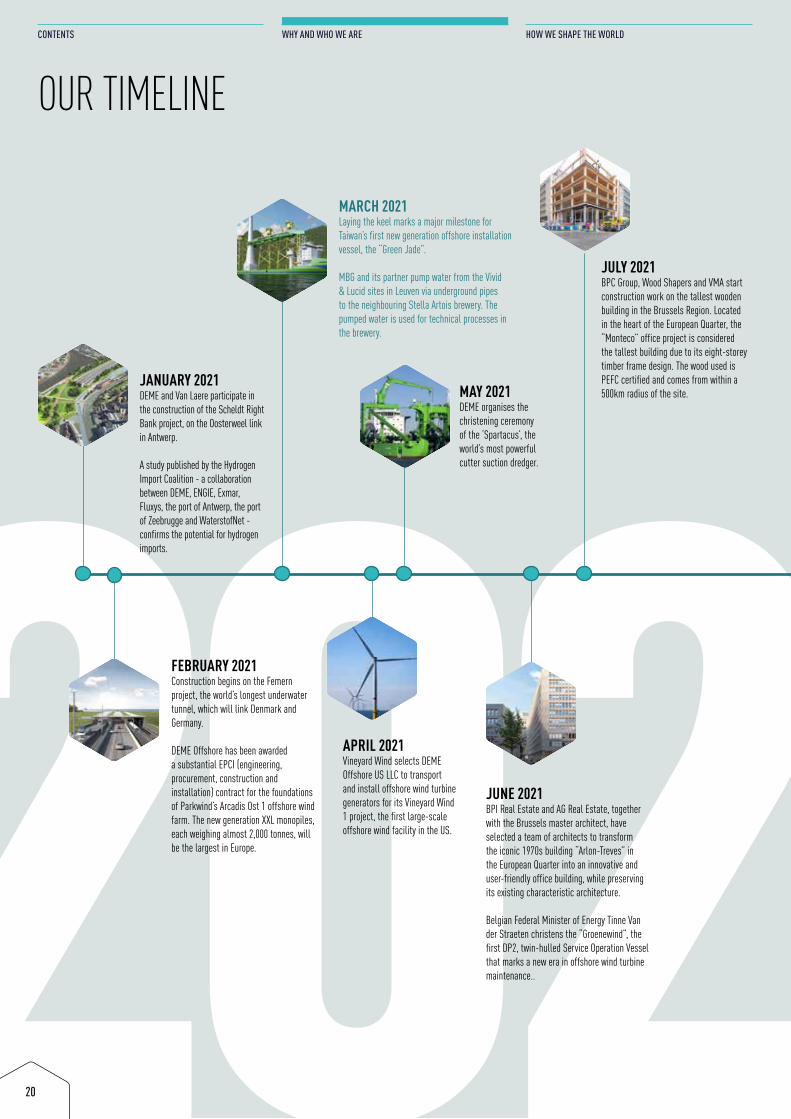
0,07 0,69
CFE CONTRACTINGDEME
DEME Seriousness rate
CFE Contracting Seriousness rate
19
ANNUAL REPORT
STATEMENT OF NON-FINANCIAL INFORMATION
FINANCIAL STATEMENTS
Climate Neutral operations by 2050
-40% GHG (scope 1 -2) by 2030 relative to 2008
-40% GHG (scope 1 -2) by 2030 relative
to 2020Maintain LTIFR WW < 0,2
By 2030LTISR Constr< 0.4 LTISR Multitech <0.5LTISR Rail&utilities < 0.9
83,200m² constructions « Fossil Free*» in 2021
35,580 tonnes of reused materialsin our projects in 2021
0 pumpedwater rejectedin the sewer by 2030
LTIFR: lost time injury frequency rateLTISR: lost time injury severity rate
GHG: Greenhouse Gas* no gas, fuel or coal for heating
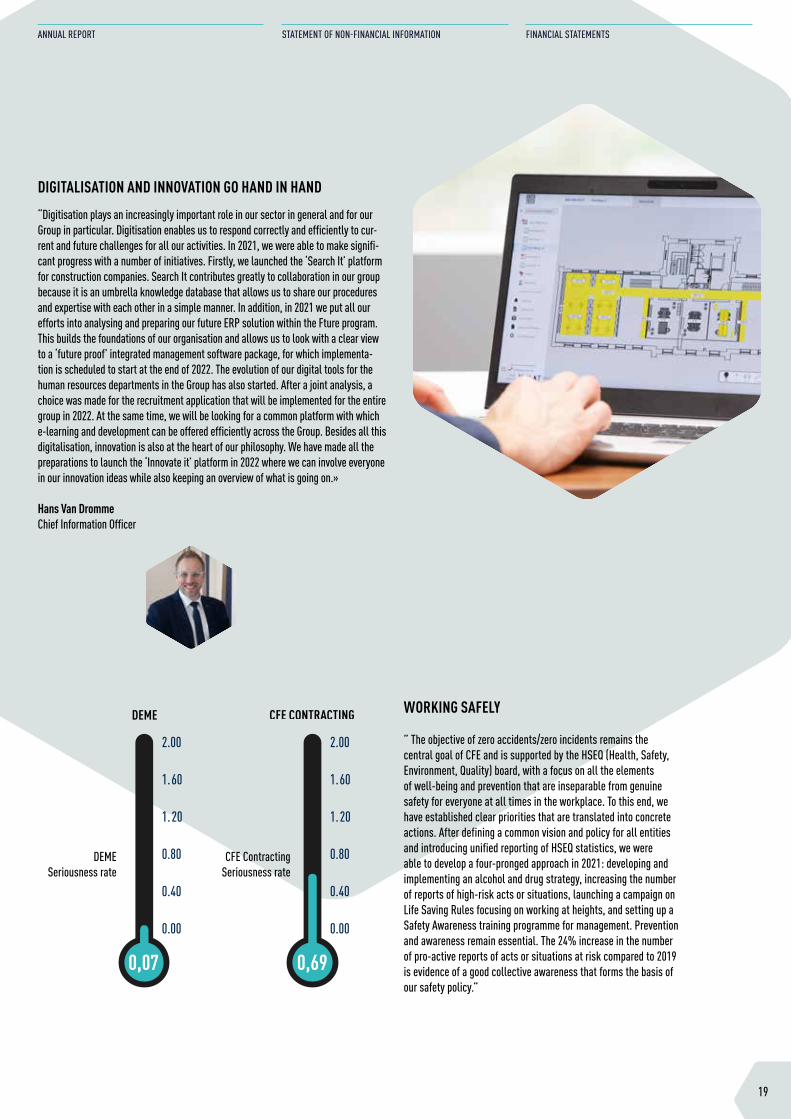
“Digitisation plays an increasingly important role in our sector in general and for our Group in particular. Digitisation enables us to respond correctly and efficiently to cur-rent and future challenges for all our activities. In 2021, we were able to make signifi-cant progress with a number of initiatives. Firstly, we launched the ‘Search It’ platform for construction companies. Search It contributes greatly to collaboration in our group because it is an umbrella knowledge database that allows us to share our procedures and expertise with each other in a simple manner. In addition, in 2021 we put all our efforts into analysing and preparing our future ERP solution within the Fture program. This builds the foundations of our organisation and allows us to look with a clear view to a ‘future proof’ integrated management software package, for which implementa-tion is scheduled to start at the end of 2022. The evolution of our digital tools for the human resources departments in the Group has also started. After a joint analysis, a choice was made for the recruitment application that will be implemented for the entire group in 2022. At the same time, we will be looking for a common platform with which e-learning and development can be offered efficiently across the Group. Besides all this digitalisation, innovation is also at the heart of our philosophy. We have made all the preparations to launch the ‘Innovate it’ platform in 2022 where we can involve everyone in our innovation ideas while also keeping an overview of what is going on.»
Hans Van Dromme Chief Information Officer
DIGITALISATION AND INNOVATION GO HAND IN HAND
” The objective of zero accidents/zero incidents remains the central goal of CFE and is supported by the HSEQ (Health, Safety, Environment, Quality) board, with a focus on all the elements of well-being and prevention that are inseparable from genuine safety for everyone at all times in the workplace. To this end, we have established clear priorities that are translated into concrete actions. After defining a common vision and policy for all entities and introducing unified reporting of HSEQ statistics, we were able to develop a four-pronged approach in 2021: developing and implementing an alcohol and drug strategy, increasing the number of reports of high-risk acts or situations, launching a campaign on Life Saving Rules focusing on working at heights, and setting up a Safety Awareness training programme for management. Prevention and awareness remain essential. The 24% increase in the number of pro-active reports of acts or situations at risk compared to 2019 is evidence of a good collective awareness that forms the basis of our safety policy.”
WORKING SAFELY
202120
CONTENTS
WHY AND WHO WE ARE
HOW WE SHAPE THE WORLD
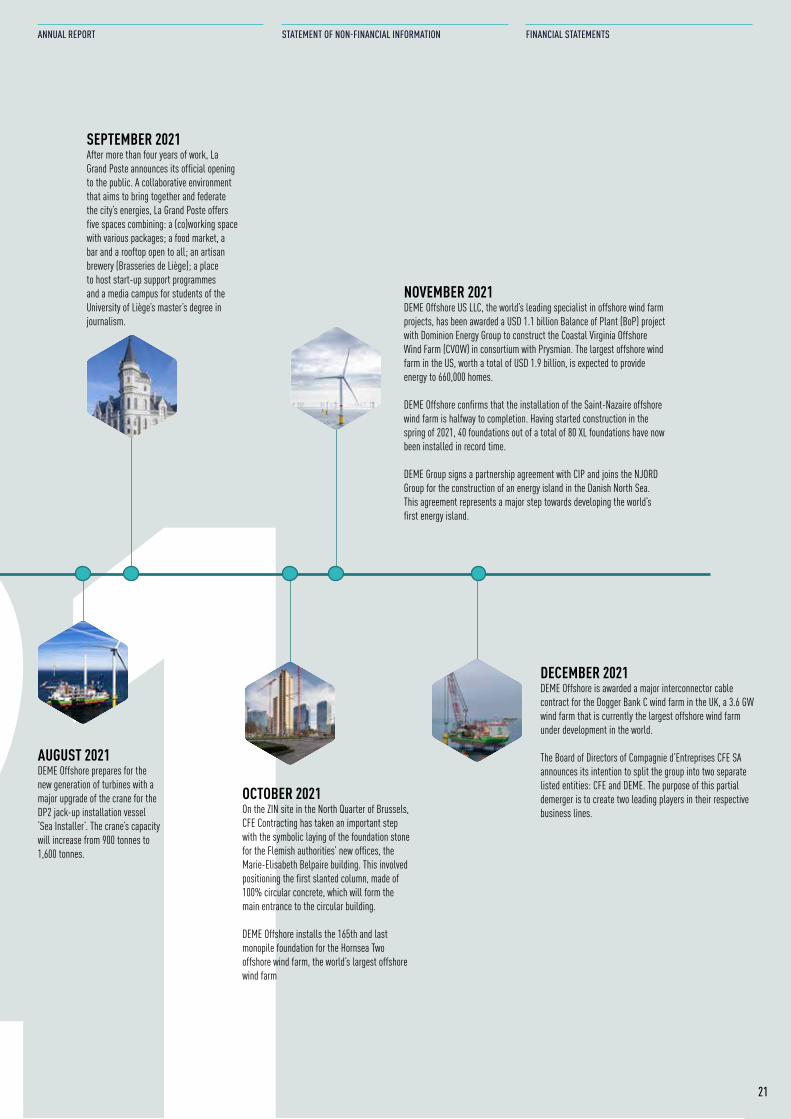
JANUARY 2021 DEME and Van Laere participate in the construction of the Scheldt Right Bank project, on the Oosterweel link in Antwerp.
A study published by the Hydrogen Import Coalition - a collaboration between DEME, ENGIE, Exmar, Fluxys, the port of Antwerp, the port of Zeebrugge and WaterstofNet - confirms the potential for hydrogen imports.
MARCH 2021Laying the keel marks a major milestone for Taiwan’s first new generation offshore installation vessel, the “Green Jade”.
MBG and its partner pump water from the Vivid & Lucid sites in Leuven via underground pipes to the neighbouring Stella Artois brewery. The pumped water is used for technical processes in the brewery.
FEBRUARY 2021Construction begins on the Femern project, the world’s longest underwater tunnel, which will link Denmark and Germany.
DEME Offshore has been awarded a substantial EPCI (engineering, procurement, construction and installation) contract for the foundations of Parkwind’s Arcadis Ost 1 offshore wind farm. The new generation XXL monopiles, each weighing almost 2,000 tonnes, will be the largest in Europe.
APRIL 2021Vineyard Wind selects DEME Offshore US LLC to transport and install offshore wind turbine generators for its Vineyard Wind 1 project, the first large-scale offshore wind facility in the US.
MAY 2021 DEME organises the christening ceremony of the ‘Spartacus’, the world’s most powerful cutter suction dredger.
OUR TIMELINE
JUNE 2021 BPI Real Estate and AG Real Estate, together with the Brussels master architect, have selected a team of architects to transform the iconic 1970s building “Arlon-Treves” in the European Quarter into an innovative and user-friendly office building, while preserving its existing characteristic architecture.
Belgian Federal Minister of Energy Tinne Van der Straeten christens the “Groenewind”, the first DP2, twin-hulled Service Operation Vessel that marks a new era in offshore wind turbine maintenance..
JULY 2021BPC Group, Wood Shapers and VMA start construction work on the tallest wooden building in the Brussels Region. Located in the heart of the European Quarter, the “Monteco” office project is considered the tallest building due to its eight-storey timber frame design. The wood used is PEFC certified and comes from within a 500km radius of the site.
2021 21
ANNUAL REPORT
STATEMENT OF NON-FINANCIAL INFORMATION
FINANCIAL STATEMENTS
AUGUST 2021 DEME Offshore prepares for the new generation of turbines with a major upgrade of the crane for the DP2 jack-up installation vessel ‘Sea Installer’. The crane’s capacity will increase from 900 tonnes to 1,600 tonnes.
SEPTEMBER 2021After more than four years of work, La Grand Poste announces its official opening to the public. A collaborative environment that aims to bring together and federate the city’s energies, La Grand Poste offers five spaces combining: a (co)working space with various packages; a food market, a bar and a rooftop open to all; an artisan brewery (Brasseries de Liège); a place to host start-up support programmes and a media campus for students of the University of Liège’s master’s degree in journalism.
OCTOBER 2021 On the ZIN site in the North Quarter of Brussels, CFE Contracting has taken an important step with the symbolic laying of the foundation stone for the Flemish authorities’ new offices, the Marie-Elisabeth Belpaire building. This involved positioning the first slanted column, made of 100% circular concrete, which will form the main entrance to the circular building.
DEME Offshore installs the 165th and last monopile foundation for the Hornsea Two offshore wind farm, the world’s largest offshore wind farm
NOVEMBER 2021DEME Offshore US LLC, the world’s leading specialist in offshore wind farm projects, has been awarded a USD 1.1 billion Balance of Plant (BoP) project with Dominion Energy Group to construct the Coastal Virginia Offshore Wind Farm (CVOW) in consortium with Prysmian. The largest offshore wind farm in the US, worth a total of USD 1.9 billion, is expected to provide energy to 660,000 homes.
DEME Offshore confirms that the installation of the Saint-Nazaire offshore wind farm is halfway to completion. Having started construction in the spring of 2021, 40 foundations out of a total of 80 XL foundations have now been installed in record time.
DEME Group signs a partnership agreement with CIP and joins the NJORD Group for the construction of an energy island in the Danish North Sea. This agreement represents a major step towards developing the world’s first energy island.
DECEMBER 2021 DEME Offshore is awarded a major interconnector cable contract for the Dogger Bank C wind farm in the UK, a 3.6 GW wind farm that is currently the largest offshore wind farm under development in the world.
The Board of Directors of Compagnie d’Entreprises CFE SA announces its intention to split the group into two separate listed entities: CFE and DEME. The purpose of this partial demerger is to create two leading players in their respective business lines.
CONTENTS
WHY AND WHO WE ARE
HOW WE SHAPE THE WORLD
202122
HOW WE SHAPE THE WORLD
ANNUAL REPORT
STATEMENT OF NON-FINANCIAL INFORMATION
FINANCIAL STATEMENTS
202123
CONTRACTING URBAN SHAPERS
MARINE ENGINEERING
HOW WECREATE VALUE
INPUT
EMPLOYEES MATERIALS & SUPPLIERS KNOWLEDGE & EXPERTISE DIGITAL TECHNOLOGIES EQUIPMENT & CAPITAL
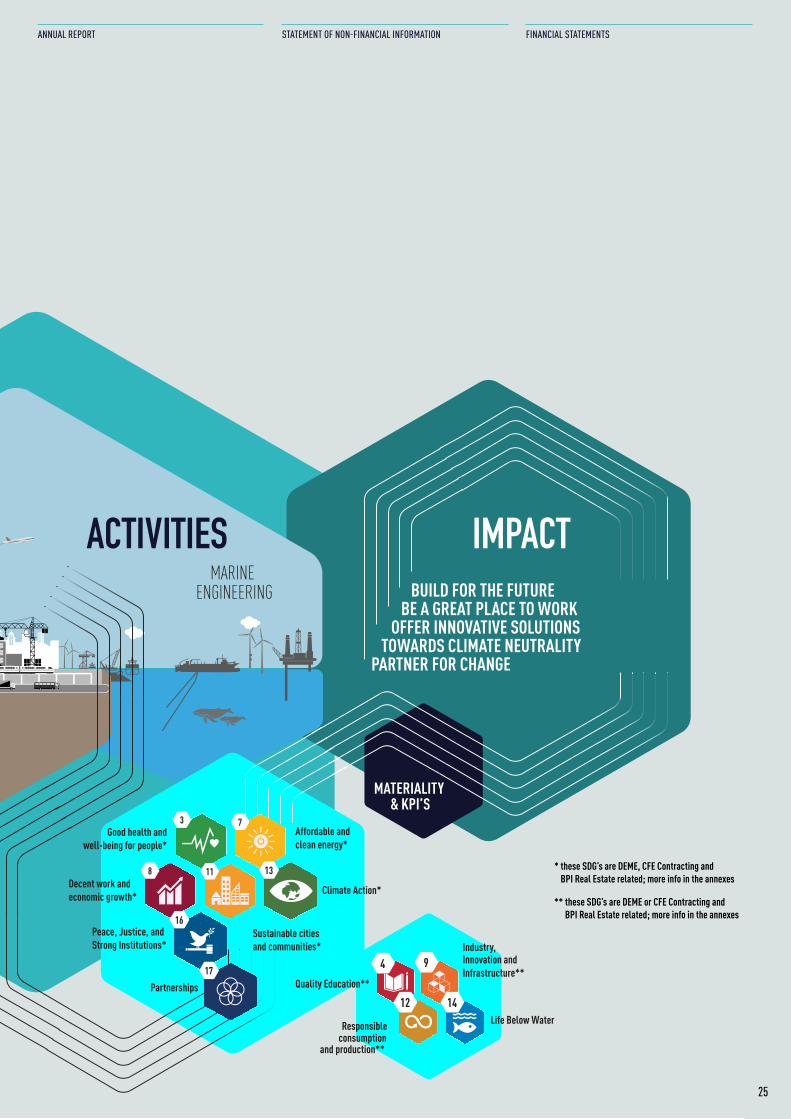
ACTIVITIES BUILD FOR THE FUTURE BE A GREAT PLACE TO WORK OFFER INNOVATIVE SOLUTIONS TOWARDS CLIMATE NEUTRALITYPARTNER FOR CHANGE
IMPACT
MATERIALITY & KPI’S
73
8 1311
16
1794
12 14
Good health andwell-being for people*
Affordable andclean energy*
Sustainable citiesand communities*
Decent work andeconomic growth*
Peace, Justice, andStrong Institutions*
Partnerships
Climate Action*
Industry, Innovation and Infrastructure**
Quality Education**
Responsible consumption
and production**
Life Below Water
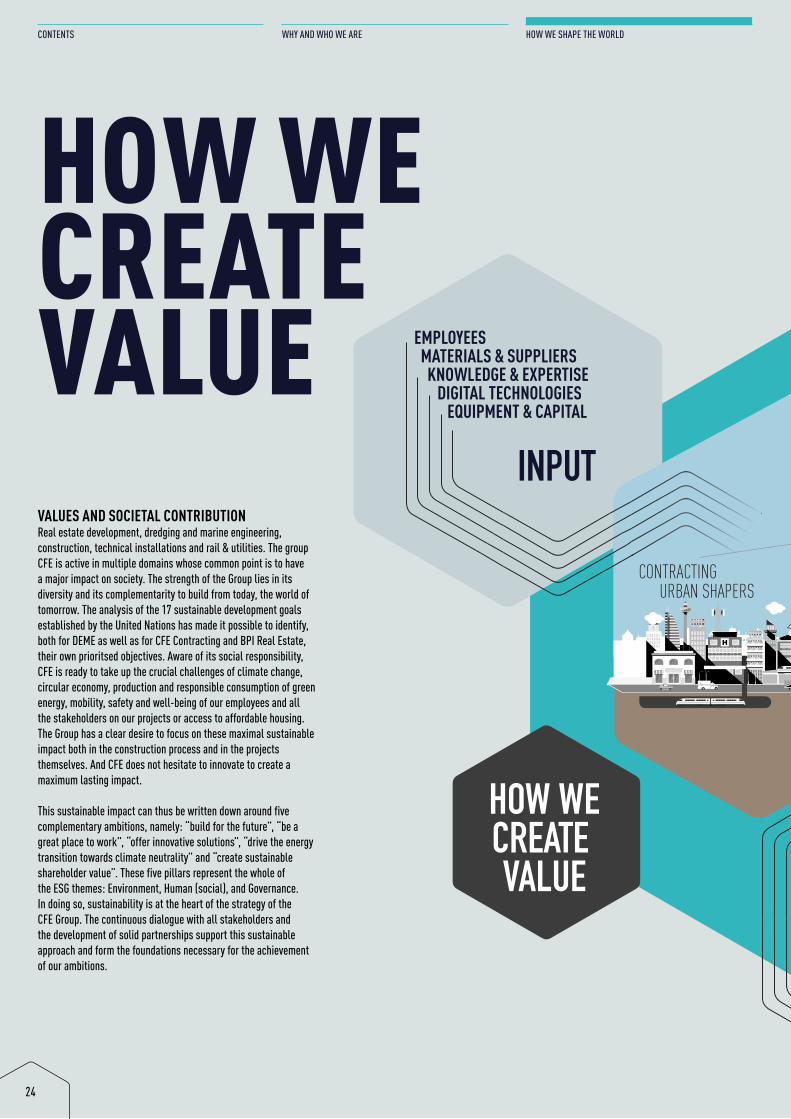
VALUES AND SOCIETAL CONTRIBUTIONReal estate development, dredging and marine engineering, construction, technical installations and rail & utilities. The group CFE is active in multiple domains whose common point is to have a major impact on society. The strength of the Group lies in its diversity and its complementarity to build from today, the world of tomorrow. The analysis of the 17 sustainable development goals established by the United Nations has made it possible to identify, both for DEME as well as for CFE Contracting and BPI Real Estate, their own prioritsed objectives. Aware of its social responsibility, CFE is ready to take up the crucial challenges of climate change, circular economy, production and responsible consumption of green energy, mobility, safety and well-being of our employees and all the stakeholders on our projects or access to affordable housing. The Group has a clear desire to focus on these maximal sustainable impact both in the construction process and in the projects themselves. And CFE does not hesitate to innovate to create a maximum lasting impact.
This sustainable impact can thus be written down around five complementary ambitions, namely: “build for the future”, “be a great place to work”, “offer innovative solutions”, “drive the energy transition towards climate neutrality” and “create sustainable shareholder value”. These five pillars represent the whole of the ESG themes: Environment, Human (social), and Governance. In doing so, sustainability is at the heart of the strategy of the CFE Group. The continuous dialogue with all stakeholders and the development of solid partnerships support this sustainable approach and form the foundations necessary for the achievement of our ambitions.
24
CONTENTS
WHY AND WHO WE ARE
HOW WE SHAPE THE WORLD
HOW WE CREATE VALUE
CONTRACTING URBAN SHAPERS
MARINE ENGINEERING
HOW WECREATE VALUE
INPUT
EMPLOYEES MATERIALS & SUPPLIERS KNOWLEDGE & EXPERTISE DIGITAL TECHNOLOGIES EQUIPMENT & CAPITAL
ACTIVITIES BUILD FOR THE FUTURE BE A GREAT PLACE TO WORK OFFER INNOVATIVE SOLUTIONS TOWARDS CLIMATE NEUTRALITYPARTNER FOR CHANGE
IMPACT
MATERIALITY & KPI’S
73
8 1311
16
1794
12 14
Good health andwell-being for people*
Affordable andclean energy*
Sustainable citiesand communities*
Decent work andeconomic growth*
Peace, Justice, andStrong Institutions*
Partnerships
Climate Action*
Industry, Innovation and Infrastructure**
Quality Education**
Responsible consumption
and production**
Life Below Water
* these SDG’s are DEME, CFE Contracting and BPI Real Estate related; more info in the annexes
** these SDG’s are DEME or CFE Contracting and BPI Real Estate related; more info in the annexes
25
ANNUAL REPORT
STATEMENT OF NON-FINANCIAL INFORMATION
FINANCIAL STATEMENTS
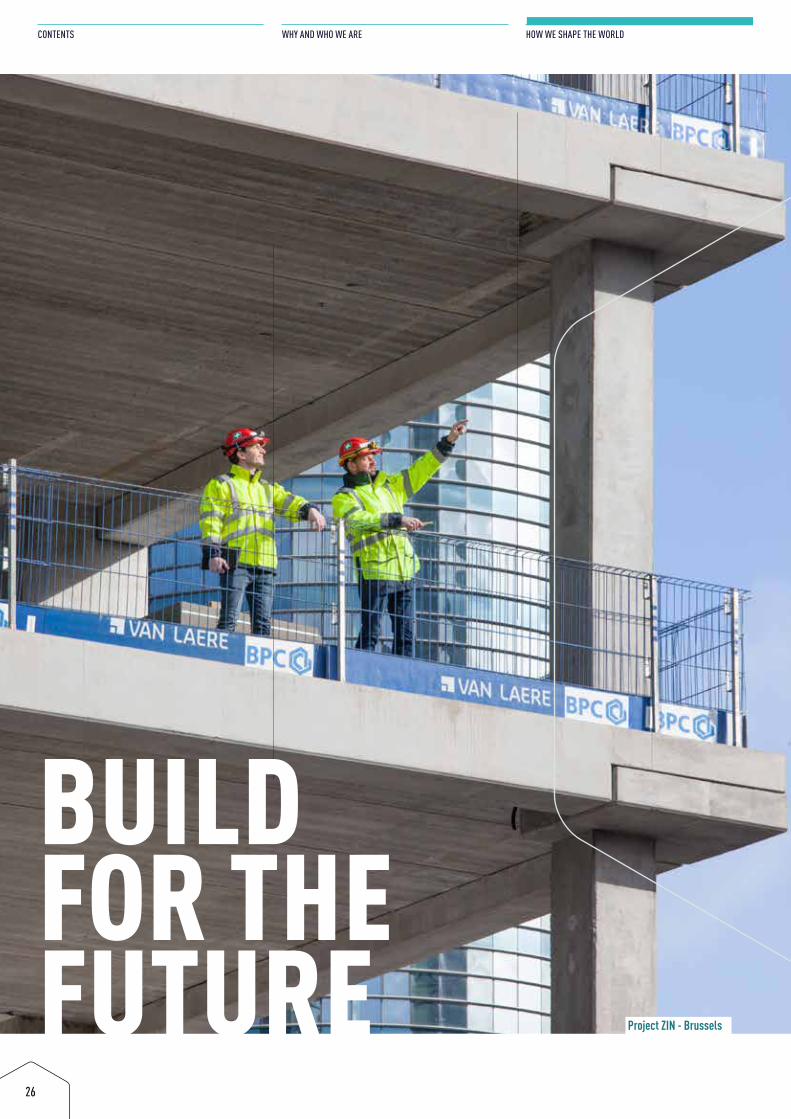
Project ZIN - Brussels
26
CONTENTS
WHY AND WHO WE ARE
HOW WE SHAPE THE WORLD
BUILD FOR THE FUTURE
Project ZIN - Brussels
27
ANNUAL REPORT
STATEMENT OF NON-FINANCIAL INFORMATION
FINANCIAL STATEMENTS
Given that the nature of its activities is di-rectly linked to renewable energies, DEME has integrated environmental, social and governance (ESG) criteria into all of its processes for several years now. CFE Con-tracting and BPI Real Estate have in turn embarked on a new proactive policy in this area from 2019. This took off in 2020, with the introduction of clear and relevant key performance indicators (KPIs). The year 2021 was marked by a global awareness within all entities, at all levels of responsibil-ity, and by the appointment of several sus-tainability officers in the various structures of the group. Through regular meetings, the synergies and work groups have led to the emergence of many initiatives. Each business unit has been allowed a great deal of freedom of reflection, in order to stimu-late the collective intelligence without upset-ting the specificities of each business unit. The foundation for an even more coherent common line is already in place, and will allow the CFE Group to define even more ambitious objectives from 2022.
The first fruits of this vision are already clearly visible, as evidenced by the remark-able results obtained during the analysis exercise carried out by the Sustainalytics rating agency. With a score of 27.8 (Me-
dium Risk), the CFE Group is one of the best companies in its sector in the field of ESG risk management. This is not only about applying the principles of the circular economy in the operating processes of con-struction sites, but also about enlightened governance and resolute investment in innovative construction methods in terms of sustainability. CFE Contracting and BPI Real Estate have thereby combined their know-how to create Wood Shapers. After the iconic Wooden project in Luxembourg, Wood Shapers this time teamed up with BPC Group for the Monteco project, the tallest wooden building in the Brussels Region.
PRESERVING NATURAL ENVIRONMENTSAs a pioneer in the ESG approach, DEME is also improving the analysis of its energy data through the development of control panels for the greenhouse gas emissions and energy consumption for all its business units. Given the nature of the operations of the CFE Group’s maritime hub, the protec-tion of biodiversity and respect for marine balances are at the heart of its concerns. To guarantee those principles in a general and consistent manner, a QHSE (Quality, Health, Safety and Environment) risk man-agement system is implemented at all sites
and in all operations. A KPI is linked to the system. According to its index, this initiates responses in the form of ‘green initiatives’, namely one or several modifications to pro-cesses, equipment or installations with the aim of reducing the environmental impact of the project, in particular by limiting any waste and unnecessary discharges. The KPIs raise the awareness of the involved team members in a very specific way. They are better able to identify the environmen-tal impacts and to formulate creative ways to reduce these effects. A recent initiative was to replace the oil and grease used on the hydraulic and lubrication systems of the floating equipment with biodegradable alternatives.
ANTICIPATING THE FUTUREImagining the buildings and living spaces of the future is the credo of BPI Real Estate. Beyond the construction process, the con-cepts of living together linked to the types of buildings are today already determining the contours of our future. A long-term vi-sion that anticipates the needs of tomorrow, with results today. In 2021, BPI Real Estate projects under design or execution repre-sent 83.200 m2 of ‘fossil free’ constructions, 50.360 m2 of wooden constructions and 206.870 m2 of ‘eco friendly’ constructions.
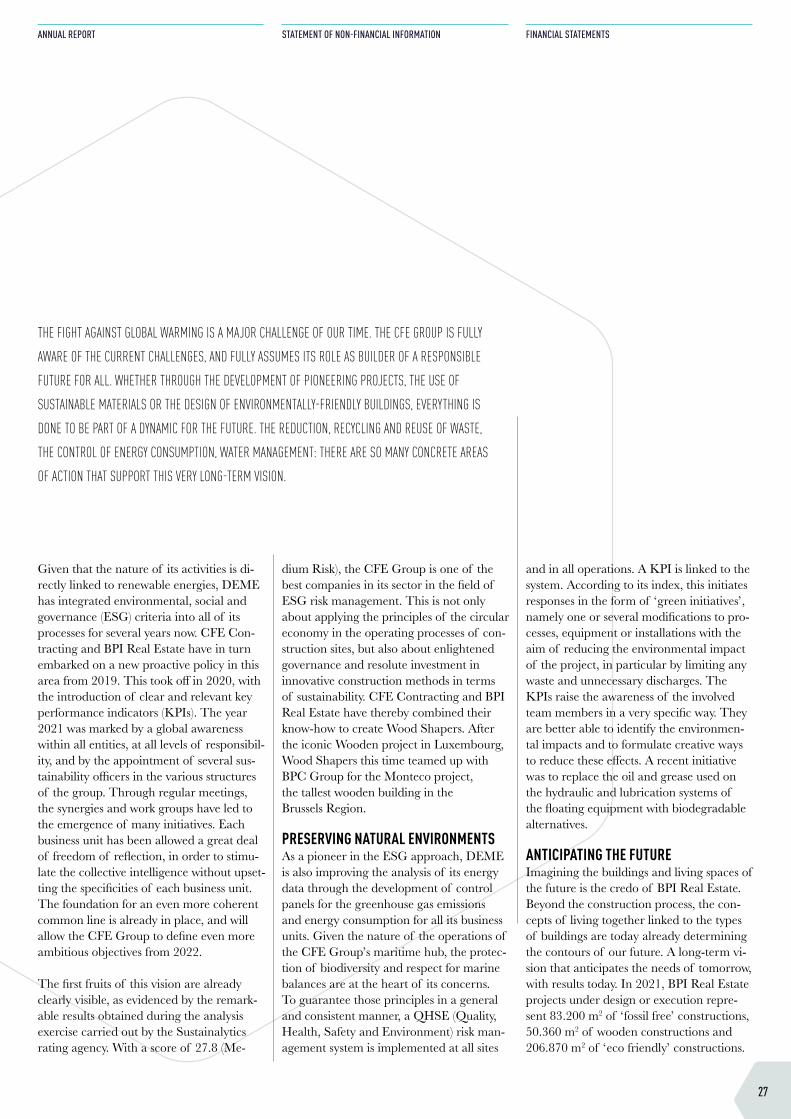
THE FIGHT AGAINST GLOBAL WARMING IS A MAJOR CHALLENGE OF OUR TIME. THE CFE GROUP IS FULLY
AWARE OF THE CURRENT CHALLENGES, AND FULLY ASSUMES ITS ROLE AS BUILDER OF A RESPONSIBLE
FUTURE FOR ALL. WHETHER THROUGH THE DEVELOPMENT OF PIONEERING PROJECTS, THE USE OF
SUSTAINABLE MATERIALS OR THE DESIGN OF ENVIRONMENTALLY-FRIENDLY BUILDINGS, EVERYTHING IS
DONE TO BE PART OF A DYNAMIC FOR THE FUTURE. THE REDUCTION, RECYCLING AND REUSE OF WASTE,
THE CONTROL OF ENERGY CONSUMPTION, WATER MANAGEMENT: THERE ARE SO MANY CONCRETE AREAS
OF ACTION THAT SUPPORT THIS VERY LONG-TERM VISION.
With projects such as BrouckR in Brussels, a multifunctional realisation which for the residential part and offices is entirely heated and cooled by means of open geothermal energy, without any fossil energy, and which will accommodate housing, a hotel, offices and shops in the very centre of the Belgian capital, these are the foundations that have been laid for a new way of living in the city.
RECYCLE, IMAGINE, INNOVATEBPC Group and Van Laere have paved the way for the use of recycled concrete on the
ZIN site in Brussels. This is an ap-proach that is still experimental and will require standardisation in the years to come, but which promises real progress. The principle consists of reducing part of the materials resulting from the demolition in the form of aggregates, and then adding them to the new concrete. A virtuous cycle with an extremely positive impact on the reduction of CO2 emissions at all levels. In general, the awareness of the need for recy-cling is now part of the DNA of the CFE Group.
The management of energy sources is at the heart of all reflections on the future of our planet. VMA has developed a tool that makes it possible to combine SMART and sustainability. It is called VMANAGER. This intelligent energy management solu-tion for buildings marks a major technolog-ical advance. It interconnects independent systems from several suppliers and manu-facturers, regardless of the technical field (lighting, heating, cooling, ventilation, fire detection, access control, geothermal ener-gy, management of charging stations, etc.)
28
CONTENTS
WHY AND WHO WE ARE
HOW WE SHAPE THE WORLD
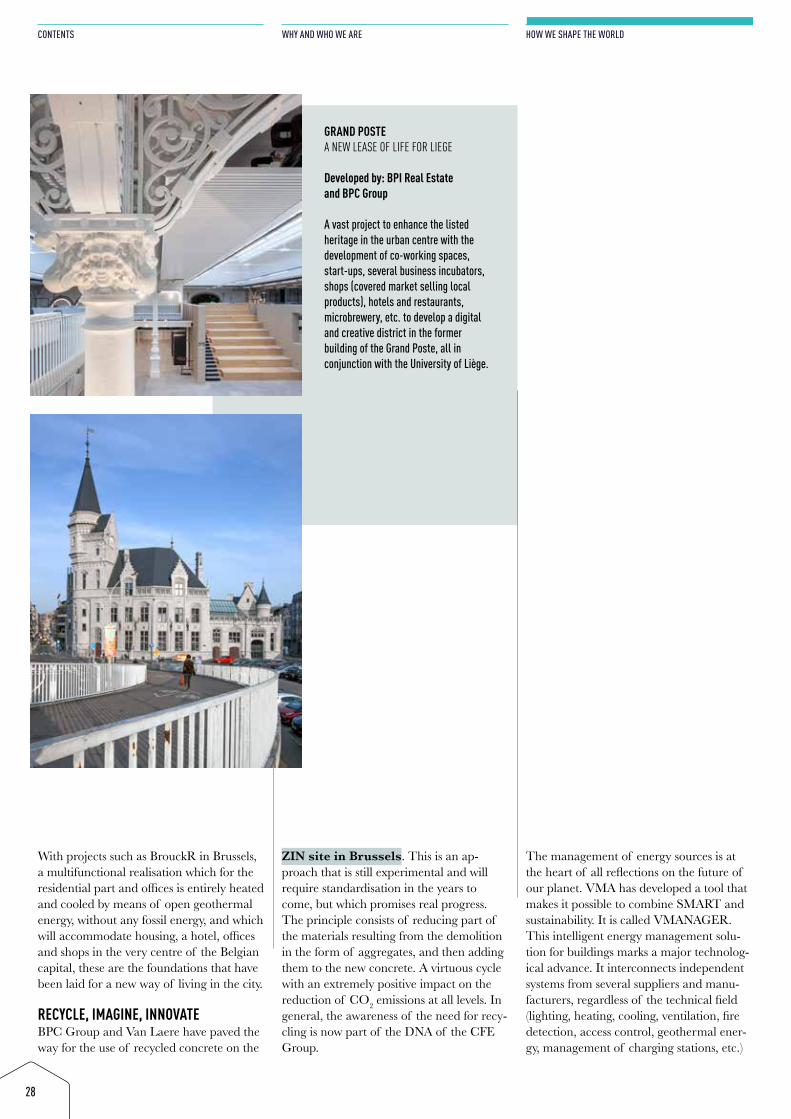
GRAND POSTE A NEW LEASE OF LIFE FOR LIEGE
Developed by: BPI Real Estate and BPC Group A vast project to enhance the listed heritage in the urban centre with the development of co-working spaces, start-ups, several business incubators, shops (covered market selling local products), hotels and restaurants, microbrewery, etc. to develop a digital and creative district in the former building of the Grand Poste, all in conjunction with the University of Liège.
and gives an accurate view of the operation of the building, while providing the tools for its efficient maintenance. Combined with an optimisation of consumption based on guaranteed results, VMANAGER is a truly comprehensive energy management tool for buildings. Although intended for buildings under construction or renovation, the intel-ligence of VMANAGER is now also used internally on the construction sites, with very tangible successes. The 24/24 moni-toring makes it possible to optimise the elec-trical consumption of site installations and has also made it possible, for example, to identify a water leak on sanitary equipment on a site in the middle of the weekend and to stop it, thereby saving some 12,000 litres of water in a day.
Mobility, which is central to the resolution of environmental issues, is not left behind. This is demonstrated by the participation of MOBIX in the LuWa consortium, which is modernising the lighting equip-ment of the Walloon road network and laying the foundations for the first connect-ed motorways.
The construction site of the Oosterweel link in Antwerp, thanks to which the major port city will have a complete ring road and the necessary bypass to absorb international traffic, is another example of this. DEME and Van Laere are partners in this, demon-strating once again how the Group’s entities complement each other and their ability to provide real solutions for the future.
29
ANNUAL REPORT
STATEMENT OF NON-FINANCIAL INFORMATION
FINANCIAL STATEMENTS
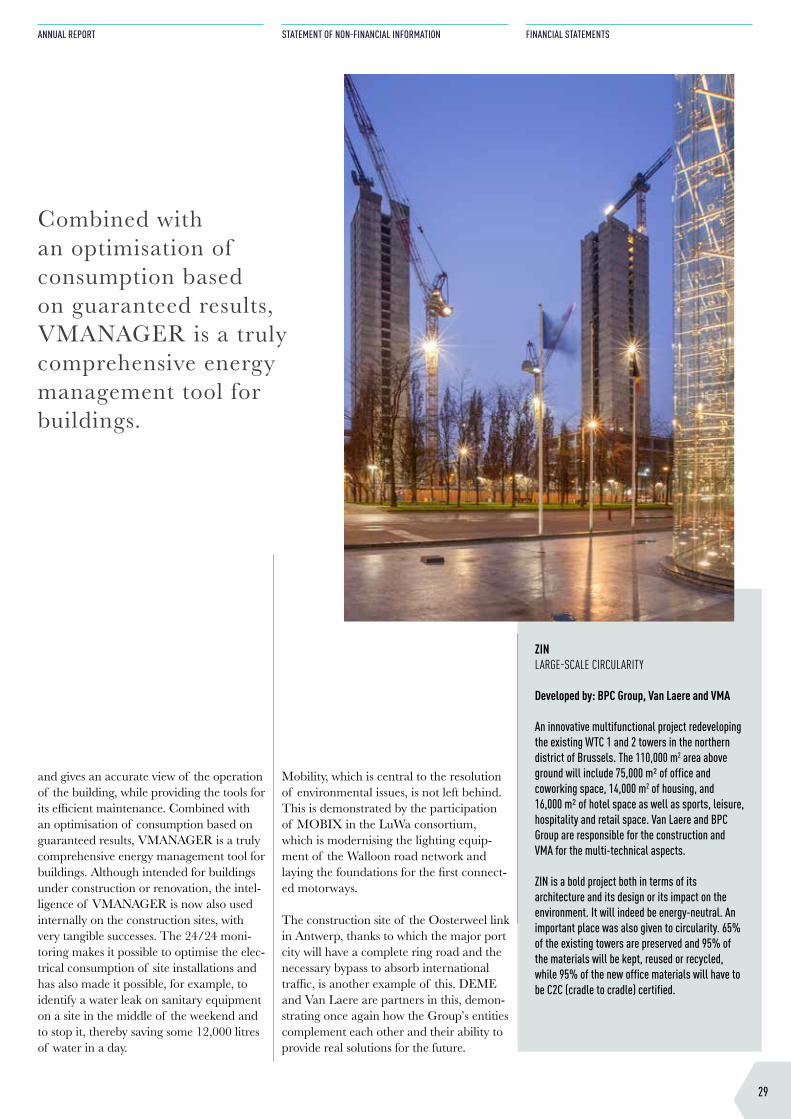
Combined with an optimisation of consumption based on guaranteed results, VMANAGER is a truly comprehensive energy management tool for buildings.
ZIN LARGE-SCALE CIRCULARITY
Developed by: BPC Group, Van Laere and VMA An innovative multifunctional project redeveloping the existing WTC 1 and 2 towers in the northern district of Brussels. The 110,000 m2 area above ground will include 75,000 m² of office and coworking space, 14,000 m2 of housing, and 16,000 m² of hotel space as well as sports, leisure, hospitality and retail space. Van Laere and BPC Group are responsible for the construction and VMA for the multi-technical aspects.
ZIN is a bold project both in terms of its architecture and its design or its impact on the environment. It will indeed be energy-neutral. An important place was also given to circularity. 65% of the existing towers are preserved and 95% of the materials will be kept, reused or recycled, while 95% of the new office materials will have to be C2C (cradle to cradle) certified.
30
CONTENTS
WHY AND WHO WE ARE
HOW WE SHAPE THE WORLD
31
ANNUAL REPORT
STATEMENT OF NON-FINANCIAL INFORMATION
FINANCIAL STATEMENTS
Safety is both a right and a duty at all times and on all construction sites of the CFE Group. Ensuring a safe work environment for employees is absolutely fundamental at all levels and in all entities, regardless of their activity. In this context, Benelmat has completely revised the risk analyses of jobs and tasks, with a new framework and quantified evaluations. A 5-year glob-al prevention plan and an annual action plan with concrete objectives have been launched, as well as a specific health and safety plan integrating the different possible interventions on site and the specific risks or situations. The synergy with BPC Group in
terms of the Quality-Safety-Environment standards has been further strengthened and improved.
VMA has extended the actions of its ‘VMA VCA’ project, through which all the health and safety advisers joined forces in order to implement a VCA system in all VMA units by the beginning of 2022, coupled with a safety strategy adapted to each sector of the entity. MBG, which has confirmed its ISO-9001, VCA and VCA-P certifications, has also stepped up its awareness-raising policy by including a welcome video covering safe-ty on all sites, following which people wish-
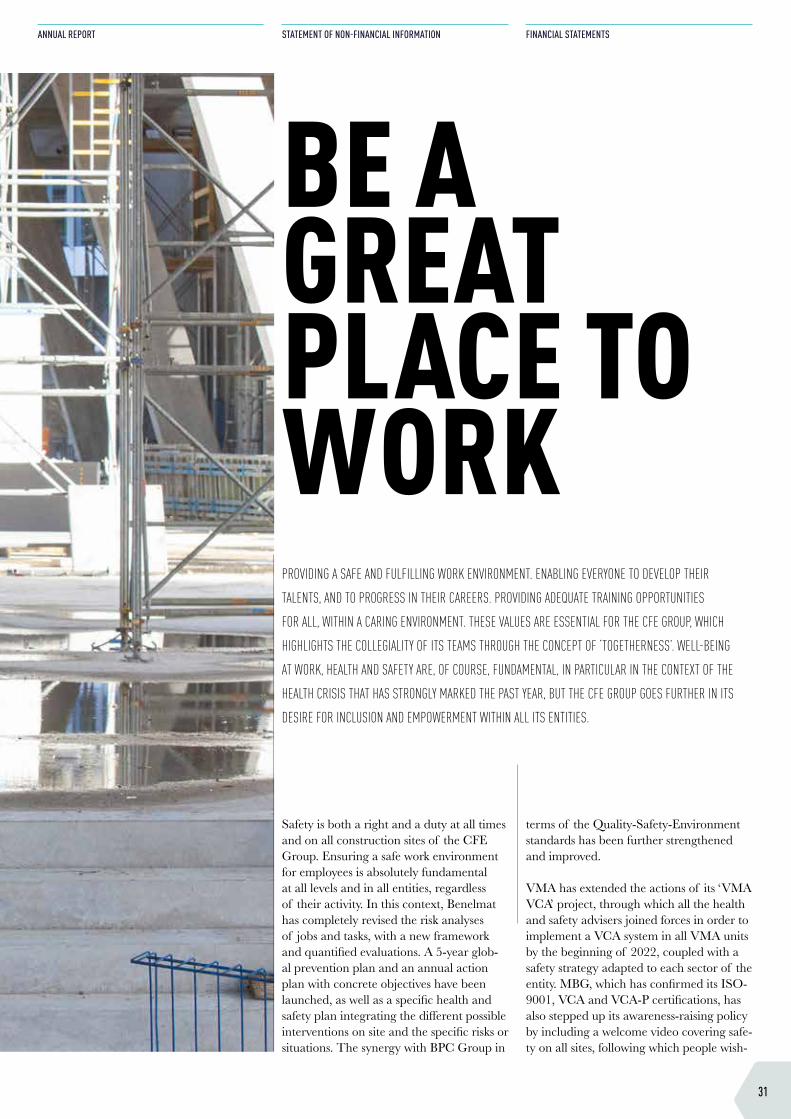
PROVIDING A SAFE AND FULFILLING WORK ENVIRONMENT. ENABLING EVERYONE TO DEVELOP THEIR
TALENTS, AND TO PROGRESS IN THEIR CAREERS. PROVIDING ADEQUATE TRAINING OPPORTUNITIES
FOR ALL, WITHIN A CARING ENVIRONMENT. THESE VALUES ARE ESSENTIAL FOR THE CFE GROUP, WHICH
HIGHLIGHTS THE COLLEGIALITY OF ITS TEAMS THROUGH THE CONCEPT OF ‘TOGETHERNESS’. WELL-BEING
AT WORK, HEALTH AND SAFETY ARE, OF COURSE, FUNDAMENTAL, IN PARTICULAR IN THE CONTEXT OF THE
HEALTH CRISIS THAT HAS STRONGLY MARKED THE PAST YEAR, BUT THE CFE GROUP GOES FURTHER IN ITS
DESIRE FOR INCLUSION AND EMPOWERMENT WITHIN ALL ITS ENTITIES.
BE A GREAT PLACE TO WORK
ing to access the site must answer a series of questions before access is authorised. At MOBIX, all the board members and managers have attended a Safety Awareness training programme, and the functionality of the safety app has been extended to in-clude site inspections and the reporting of incidents and accidents at work.
SAFETY AND WELL-BEING, WITHOUT RESPITEThe complete revision of the Safety Aware-ness training programme in 2021, which is now tailored to reflect the seniority and position of each participant, has been en-hanced by a series of concrete action plans aimed at reducing the number of incidents in the very short term. Specific attention is paid to working at height, as well as to the Life Saving Rules common to all the entities of CFE Contracting.
In order to measure and improve the well-being, as well as the motivation and performance of its teams, MBG and VMA have jointly introduced a site barometer on the Tweewaters project in Leuven. On this table, which shows a series of points related to the work on the site, employees can indicate how they feel about each sub-ject, using a colour code: green, orange or red. The possibility for everyone to express themselves, and the decision to put people at the centre of considerations, have led to concrete improvements in the working con-ditions, for the benefit of all.
As pioneers in many fields, the DEME teams are often required to work under complex conditions or environments. Safe-ty and well-being are equally essential on vessels, on construction sites and in offices. In addition to constant monitoring through
32
CONTENTS
WHY AND WHO WE ARE
HOW WE SHAPE THE WORLD
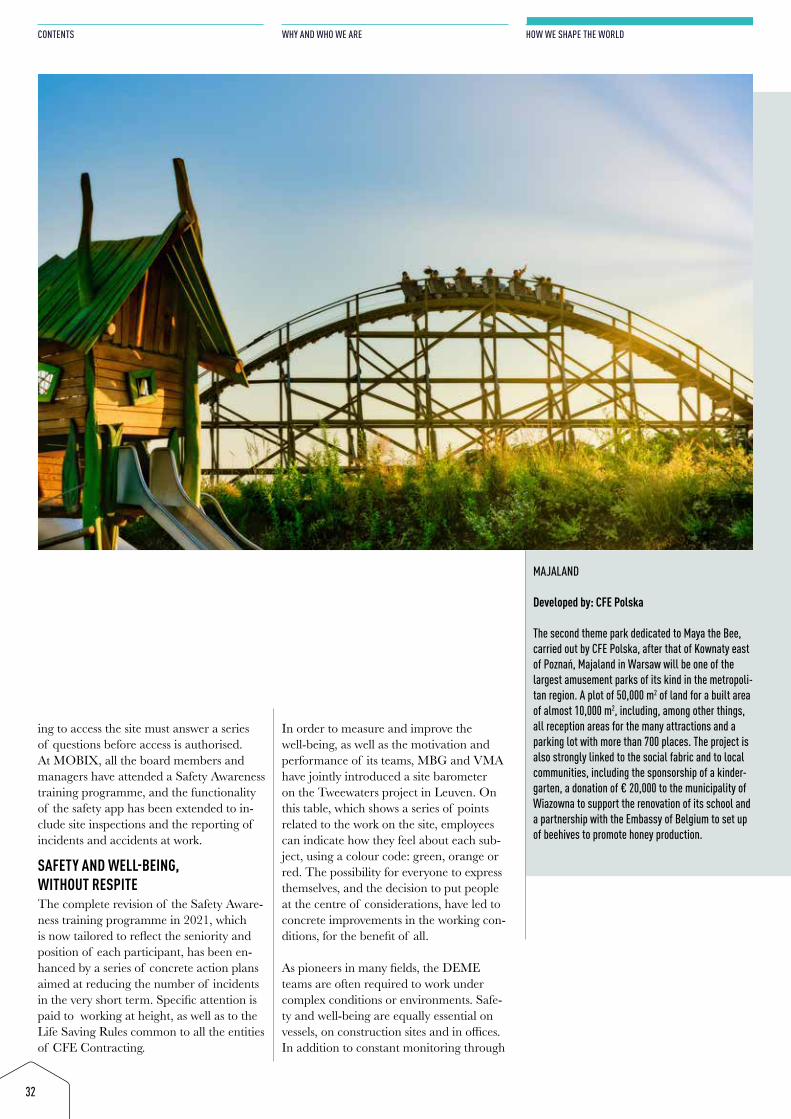
MAJALAND
Developed by: CFE Polska
The second theme park dedicated to Maya the Bee, carried out by CFE Polska, after that of Kownaty east of Poznań, Majaland in Warsaw will be one of the largest amusement parks of its kind in the metropoli-tan region. A plot of 50,000 m2 of land for a built area of almost 10,000 m2, including, among other things, all reception areas for the many attractions and a parking lot with more than 700 places. The project is also strongly linked to the social fabric and to local communities, including the sponsorship of a kinder-garten, a donation of € 20,000 to the municipality of Wiazowna to support the renovation of its school and a partnership with the Embassy of Belgium to set up of beehives to promote honey production.
strict KPIs, DEME developed several actions in 2021, in particular the Safety Stand Down and the Safety Moment Day, during which 214 success stories in the area of safety were shared. The ‘Resilience and well-being at DEME’ prevention pro-gramme was the main tool that allowed the teams to continue to work and to maintain the projects in complete safety, despite the pandemic.
LONG-TERM TRAININGThe focus within several entities of the CFE Group was placed in particular on skill de-velopment in 2021. This was especially the case at Van Laere through the implemen-tation of the Van Laere Academy, which provides a wide range of global training modules that are accessible to everyone, supplemented by more specific training programmes aimed at specialised technical activities. The latter programmes also call upon the support of the most experienced staff members, who pass on their know-how and knowledge in this way. The approach is largely the same at MBG, through the ‘mentor’ training projects, and at MOBIX, where project managers can take advantage of projects adapted to their position over a period of nine months. CFE also launched its “Trainership for Young Project Leaders”
programme in 2021. This is a compre-hensive training programme covering not only project management and construction site planning, but also sustainability and finance, with all this incorporated in inter-active modules led by experts and comple-mented by field visits.
ATTRACTING TALENTAt Group level, the foundations of the fu-ture CFE Academy, which will be launched in 2022, have been laid. It will support the career development of all employees and will also make it possible to attract outside talent even better. The recruitment of new qualified employees remains one of the major challenges of the CFE Group, like all players in the construction world. The digitalisation of many human resources departments also improves everyone’s work-ing comfort and strengthens the team spirit present in all entities. A community with strong ties which expressed its values of sol-idarity at all levels, both in Poland with the social actions around the Majaland project or in Belgium with the aid for victims of the floods of 2021. A collection in favour of the Cross -Rouge thus made it possible to collect nearly 15,000 euros, an amount doubled by CFE which made it possible to pay the NGO no less than 30,000 euros.
33
ANNUAL REPORT
STATEMENT OF NON-FINANCIAL INFORMATION
FINANCIAL STATEMENTS
The focus within several entities of the CFE Group was placed in particular on skill de velopment in 2021.
RED CROSS CFE SOLIDARITY
After the terrible floods in eastern Belgium in 2021, funds were raised among employees to make a donation to the Red Cross. CFE then doubled the amount collected - € 14,890 - paying a total of € 30,000 to the NGO helping the victims. Not to mention the many volunteer colleagues who came to help in the field in their spare time.
34
CONTENTS
WHY AND WHO WE ARE
HOW WE SHAPE THE WORLD
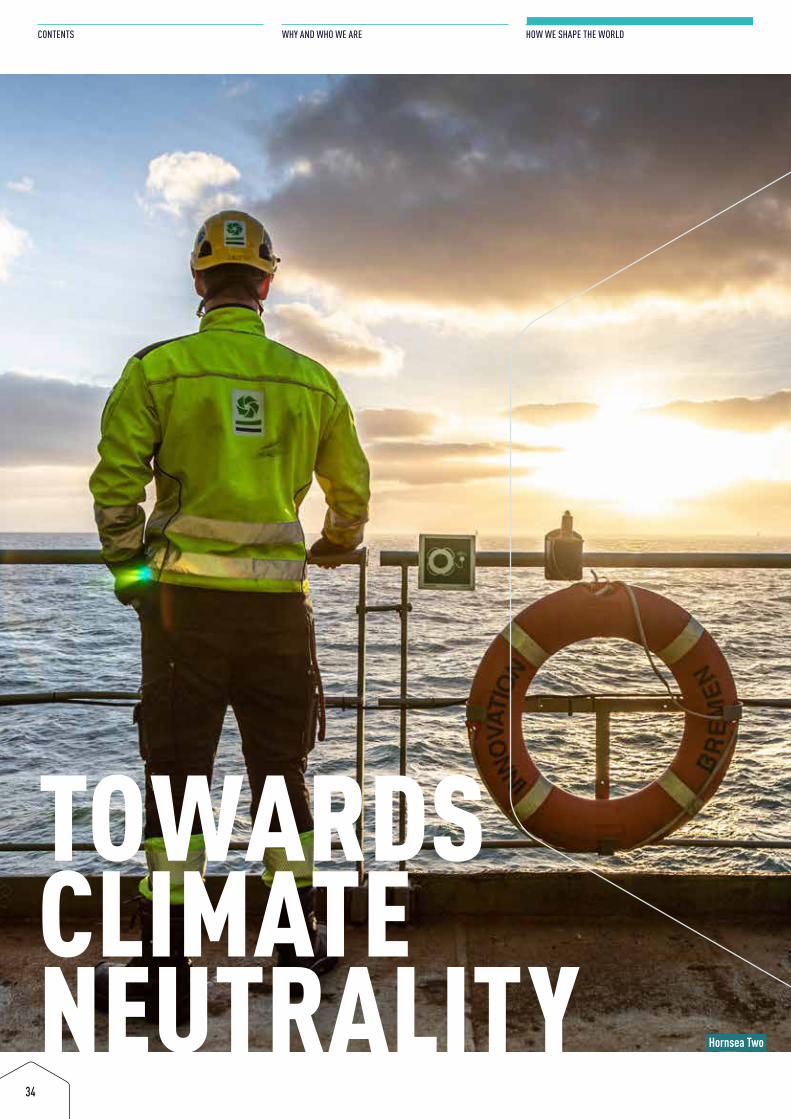
TOWARDS CLIMATE NEUTRALITY Hornsea Two
35
ANNUAL REPORT
STATEMENT OF NON-FINANCIAL INFORMATION
FINANCIAL STATEMENTS
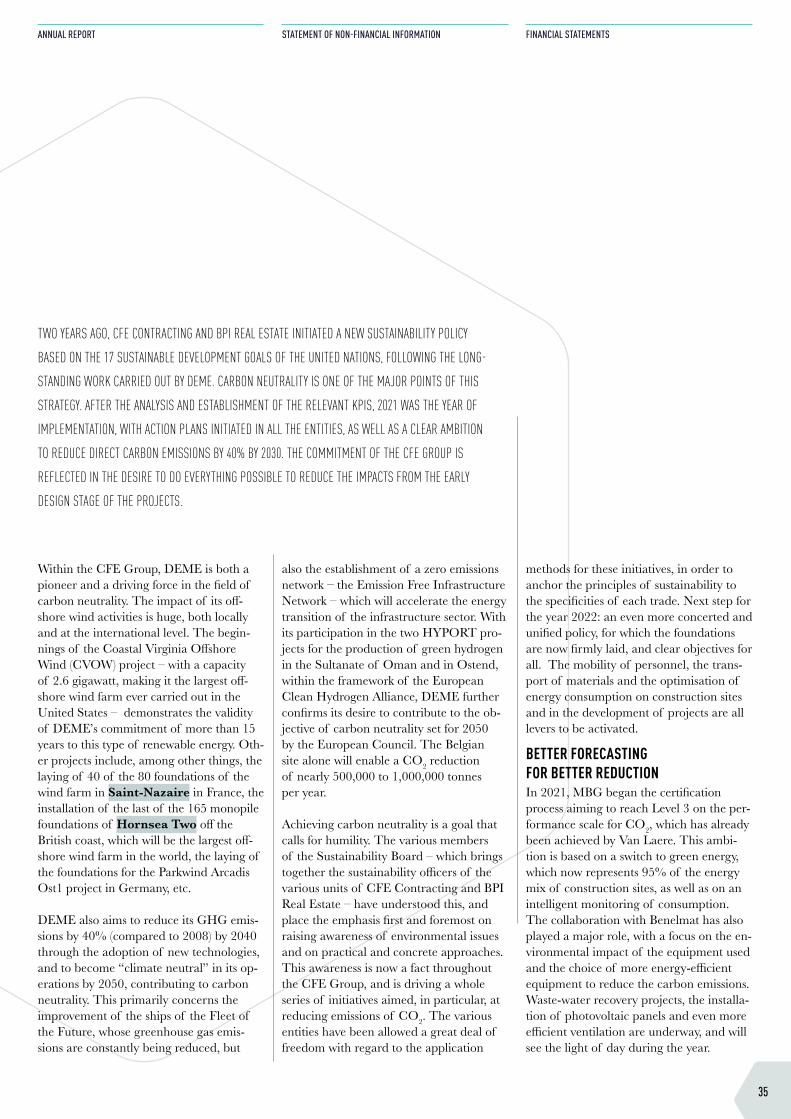
Within the CFE Group, DEME is both a pioneer and a driving force in the field of carbon neutrality. The impact of its off-shore wind activities is huge, both locally and at the international level. The begin-nings of the Coastal Virginia Offshore Wind (CVOW) project – with a capacity of 2.6 gigawatt, making it the largest off-shore wind farm ever carried out in the United States – demonstrates the validity of DEME’s commitment of more than 15 years to this type of renewable energy. Oth-er projects include, among other things, the laying of 40 of the 80 foundations of the wind farm in Saint-Nazaire in France, the installation of the last of the 165 monopile foundations of Hornsea Two off the British coast, which will be the largest off-shore wind farm in the world, the laying of the foundations for the Parkwind Arcadis Ost1 project in Germany, etc.
DEME also aims to reduce its GHG emis-sions by 40% (compared to 2008) by 2040 through the adoption of new technologies, and to become “climate neutral” in its op-erations by 2050, contributing to carbon neutrality. This primarily concerns the improvement of the ships of the Fleet of the Future, whose greenhouse gas emis-sions are constantly being reduced, but
also the establishment of a zero emissions network – the Emission Free Infrastructure Network – which will accelerate the energy transition of the infrastructure sector. With its participation in the two HYPORT pro-jects for the production of green hydrogen in the Sultanate of Oman and in Ostend, within the framework of the European Clean Hydrogen Alliance, DEME further confirms its desire to contribute to the ob-jective of carbon neutrality set for 2050 by the European Council. The Belgian site alone will enable a CO2 reduction of nearly 500,000 to 1,000,000 tonnes per year.
Achieving carbon neutrality is a goal that calls for humility. The various members of the Sustainability Board – which brings together the sustainability officers of the various units of CFE Contracting and BPI Real Estate – have understood this, and place the emphasis first and foremost on raising awareness of environmental issues and on practical and concrete approaches. This awareness is now a fact throughout the CFE Group, and is driving a whole series of initiatives aimed, in particular, at reducing emissions of CO2. The various entities have been allowed a great deal of freedom with regard to the application
methods for these initiatives, in order to anchor the principles of sustainability to the specificities of each trade. Next step for the year 2022: an even more concerted and unified policy, for which the foundations are now firmly laid, and clear objectives for all. The mobility of personnel, the trans-port of materials and the optimisation of energy consumption on construction sites and in the development of projects are all levers to be activated.
BETTER FORECASTING FOR BETTER REDUCTIONIn 2021, MBG began the certification process aiming to reach Level 3 on the per-formance scale for CO2, which has already been achieved by Van Laere. This ambi-tion is based on a switch to green energy, which now represents 95% of the energy mix of construction sites, as well as on an intelligent monitoring of consumption. The collaboration with Benelmat has also played a major role, with a focus on the en-vironmental impact of the equipment used and the choice of more energy-efficient equipment to reduce the carbon emissions. Waste-water recovery projects, the installa-tion of photovoltaic panels and even more efficient ventilation are underway, and will see the light of day during the year.
TWO YEARS AGO, CFE CONTRACTING AND BPI REAL ESTATE INITIATED A NEW SUSTAINABILITY POLICY
BASED ON THE 17 SUSTAINABLE DEVELOPMENT GOALS OF THE UNITED NATIONS, FOLLOWING THE LONG-
STANDING WORK CARRIED OUT BY DEME. CARBON NEUTRALITY IS ONE OF THE MAJOR POINTS OF THIS
STRATEGY. AFTER THE ANALYSIS AND ESTABLISHMENT OF THE RELEVANT KPIS, 2021 WAS THE YEAR OF
IMPLEMENTATION, WITH ACTION PLANS INITIATED IN ALL THE ENTITIES, AS WELL AS A CLEAR AMBITION
TO REDUCE DIRECT CARBON EMISSIONS BY 40% BY 2030. THE COMMITMENT OF THE CFE GROUP IS
REFLECTED IN THE DESIRE TO DO EVERYTHING POSSIBLE TO REDUCE THE IMPACTS FROM THE EARLY
DESIGN STAGE OF THE PROJECTS.
Hornsea Two
36
CONTENTS
WHY AND WHO WE ARE
HOW WE SHAPE THE WORLD
In the case of BPC Group, monitoring con-sumption on site was also the cornerstone in reducing emissions. A network of sensors and alarms, installed, among other places, in offices, workers’ premises and on cranes, makes it possible to analyse consumption in order to improve energy performance on the one hand, and to immediately alert the teams in the event of an incident, for example a water leak, on the other. The Construction Consolidation Centre (CCC) pilot project – a logistics system where de-livery flows are regulated according to the needs of the site – inspired by the one used by CLE on the Aurea site, has contributed to greatly reducing the environmental im-pacts linked to deliveries and to the routing of materials, while simplifying storage as a whole.
The CCC is used in particular on ZIN, an-other exemplary site on which BPC Group, Van Laere and VMA jointly demonstrate the merits of circular construction. De-signed to be almost energy neutral, the redevelopment project of the WTC 1 and 2 towers in Brussels is carried out by retain-ing, reusing or recycling 95% of the weight of the pre-existing buildings. The new materials used are 95% Cradle to Cradle (C2C) certified. An approach that dramat-ically reduces the carbon footprint of the works, as well as that of the final buildings over their entire lifespan.
LOCAL ACTIONS FOR THE FUTUREOn certain crucial aspects of the overall environmental report of Belux, the specific technical skills of the CFE Group have
made it possible to make a significant differ-ence. One example among many others is Procool, a specialist in industrial refrigera-tion and air conditioning within the VMA multi-technical cluster, which replaces old harmful cooling gases with sustainable gases such as ammonia and carbon dioxide. As a pioneer in this field, Procool is not only happy to offer these solutions to its cus-tomers – including many players in food distribution – but also participates in the training of technicians in partnership with the schools.
BPI Real Estate believes that climate am-bition begins at the source, from the design of projects, by systematically taking into account the ecological impact of each construction, and by integrating a focus on possible sustainable solutions at each stage
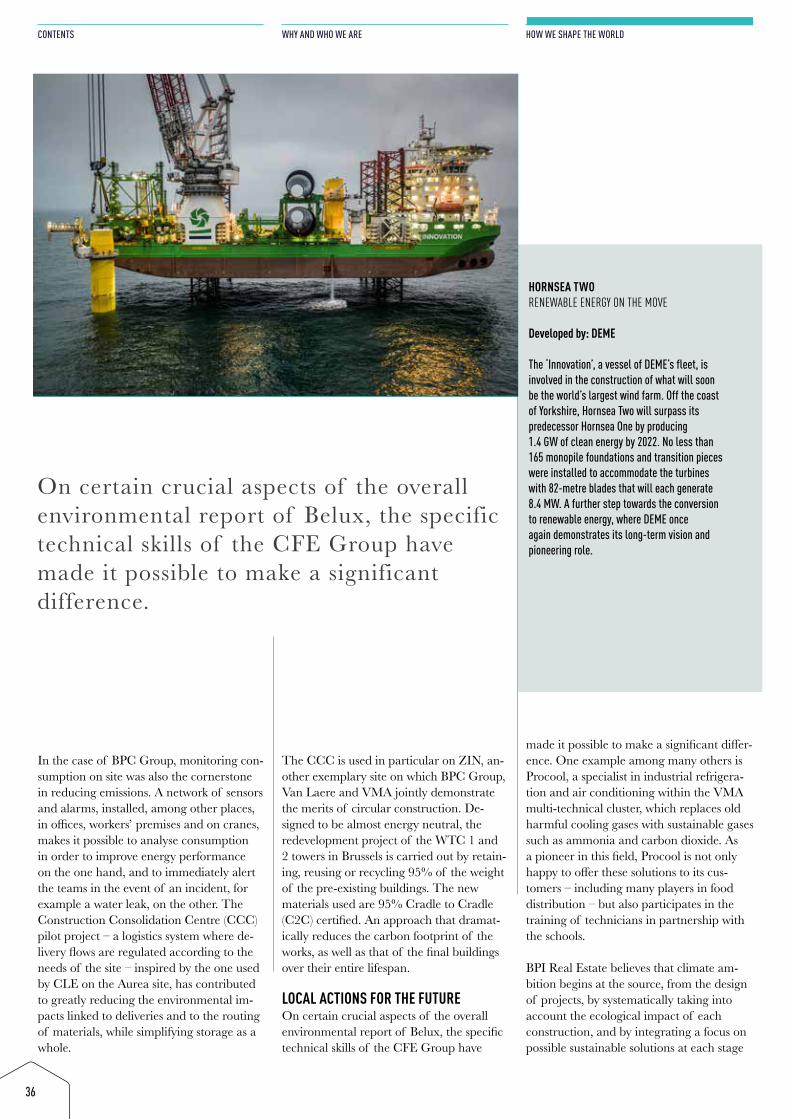
HORNSEA TWO RENEWABLE ENERGY ON THE MOVE
Developed by: DEME The ‘Innovation’, a vessel of DEME’s fleet, is involved in the construction of what will soon be the world’s largest wind farm. Off the coast of Yorkshire, Hornsea Two will surpass its predecessor Hornsea One by producing 1.4 GW of clean energy by 2022. No less than 165 monopile foundations and transition pieces were installed to accommodate the turbines with 82-metre blades that will each generate 8.4 MW. A further step towards the conversion to renewable energy, where DEME once again demonstrates its long-term vision and pioneering role.
On certain crucial aspects of the overall environmental report of Belux, the specific technical skills of the CFE Group have made it possible to make a significant differ ence.
37
ANNUAL REPORT
STATEMENT OF NON-FINANCIAL INFORMATION
FINANCIAL STATEMENTS
of the development. This approach has given rise to projects that partially or totally dispense with fossil fuels, being based on geothermal energy – such as BrouckR and Serenity in Brussels – or on biomass and pellets, such as Gravity in Luxembourg. One of the strengths of the CFE Group, specific to real estate development, is this ability to position itself over the long term and to take global issues into account.
Whether through reuse – 35,580 tonnes of materials reused over the last 12 months – through the integration of mobility elements, through the choice of upgrad-ing – 60,160 m2 to be renovated or under renovation during the past year – or by the use of sustainable technologies – resulting in 206,870 m2 of ‘CO2 friendly’ buildings in 2021 – BPI Real Estate is paving the way for our carbon-free future.
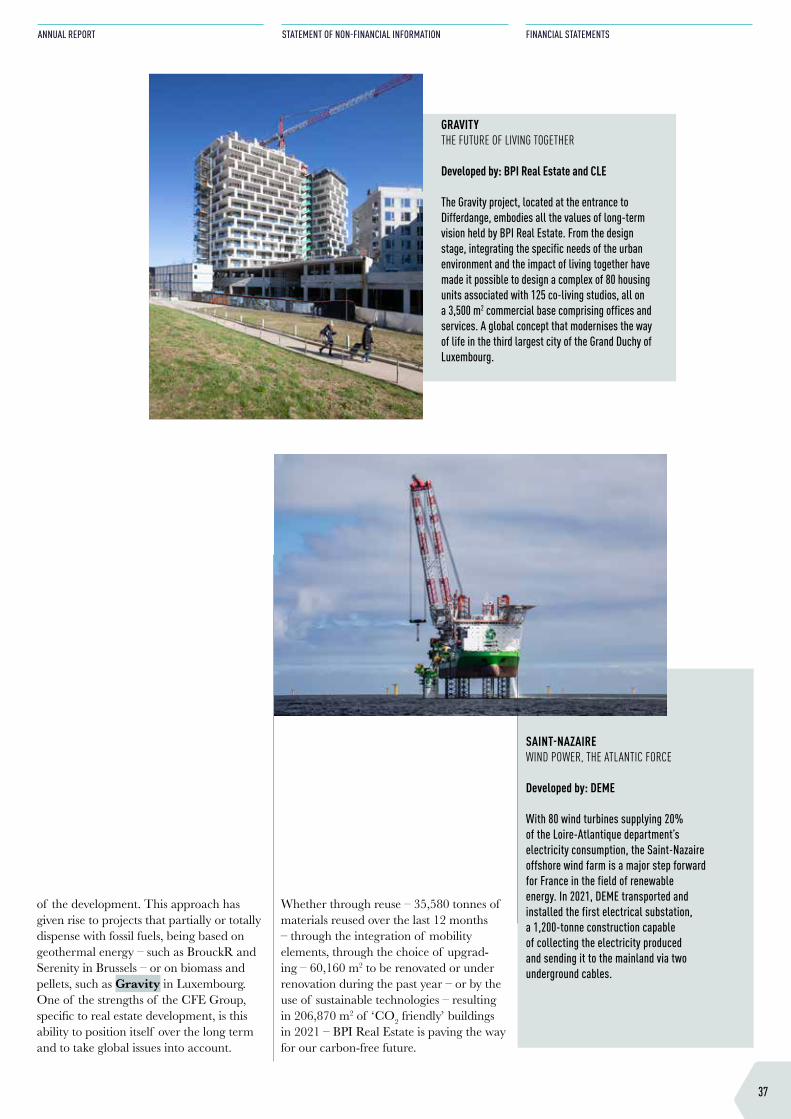
SAINT-NAZAIRE WIND POWER, THE ATLANTIC FORCE
Developed by: DEME With 80 wind turbines supplying 20% of the Loire-Atlantique department’s electricity consumption, the Saint-Nazaire offshore wind farm is a major step forward for France in the field of renewable energy. In 2021, DEME transported and installed the first electrical substation, a 1,200-tonne construction capable of collecting the electricity produced and sending it to the mainland via two underground cables.
GRAVITY THE FUTURE OF LIVING TOGETHER Developed by: BPI Real Estate and CLE
The Gravity project, located at the entrance to Differdange, embodies all the values of long-term vision held by BPI Real Estate. From the design stage, integrating the specific needs of the urban environment and the impact of living together have made it possible to design a complex of 80 housing units associated with 125 co-living studios, all on a 3,500 m2 commercial base comprising offices and services. A global concept that modernises the way of life in the third largest city of the Grand Duchy of Luxembourg.
38
CONTENTS
WHY AND WHO WE ARE
HOW WE SHAPE THE WORLD
39
ANNUAL REPORT
STATEMENT OF NON-FINANCIAL INFORMATION
FINANCIAL STATEMENTS
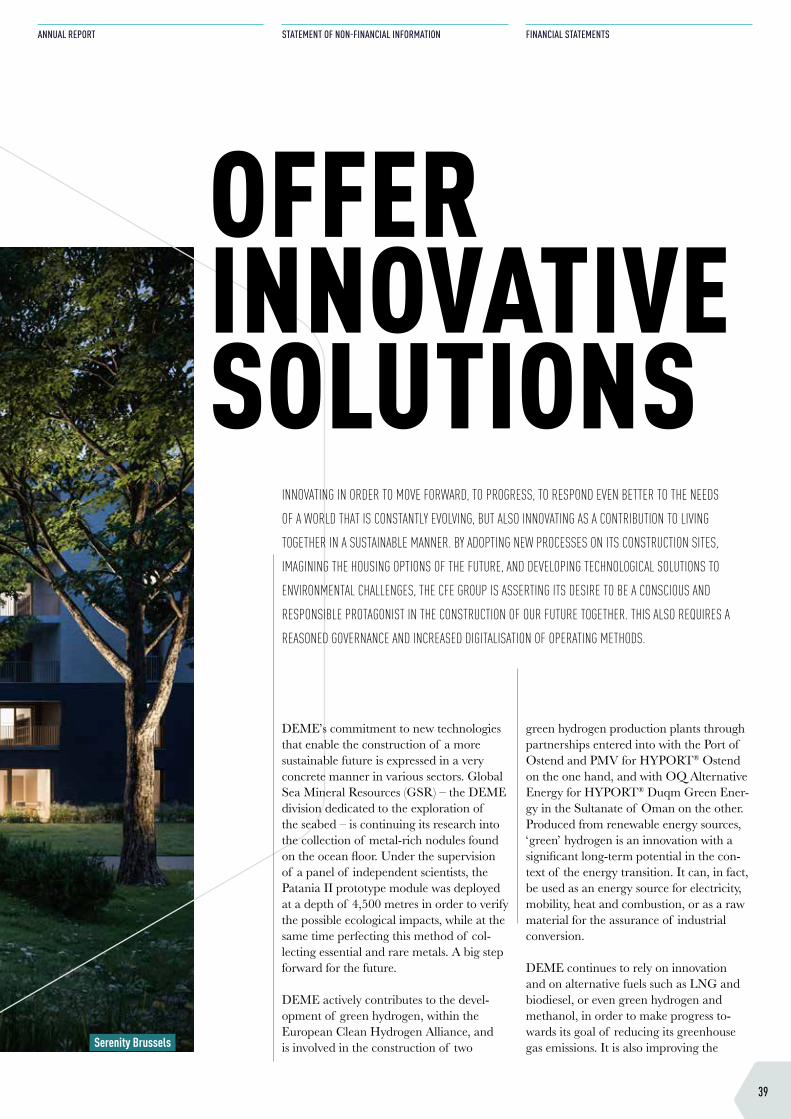
DEME’s commitment to new technologies that enable the construction of a more sustainable future is expressed in a very concrete manner in various sectors. Global Sea Mineral Resources (GSR) – the DEME division dedicated to the exploration of the seabed – is continuing its research into the collection of metal-rich nodules found on the ocean floor. Under the supervision of a panel of independent scientists, the Patania II prototype module was deployed at a depth of 4,500 metres in order to verify the possible ecological impacts, while at the same time perfecting this method of col-lecting essential and rare metals. A big step forward for the future.
DEME actively contributes to the devel-opment of green hydrogen, within the European Clean Hydrogen Alliance, and is involved in the construction of two
green hydrogen production plants through partnerships entered into with the Port of Ostend and PMV for HYPORT® Ostend on the one hand, and with OQ Alternative Energy for HYPORT® Duqm Green Ener-gy in the Sultanate of Oman on the other. Produced from renewable energy sources, ‘green’ hydrogen is an innovation with a significant long-term potential in the con-text of the energy transition. It can, in fact, be used as an energy source for electricity, mobility, heat and combustion, or as a raw material for the assurance of industrial conversion.
DEME continues to rely on innovation and on alternative fuels such as LNG and biodiesel, or even green hydrogen and methanol, in order to make progress to-wards its goal of reducing its greenhouse gas emissions. It is also improving the
INNOVATING IN ORDER TO MOVE FORWARD, TO PROGRESS, TO RESPOND EVEN BETTER TO THE NEEDS
OF A WORLD THAT IS CONSTANTLY EVOLVING, BUT ALSO INNOVATING AS A CONTRIBUTION TO LIVING
TOGETHER IN A SUSTAINABLE MANNER. BY ADOPTING NEW PROCESSES ON ITS CONSTRUCTION SITES,
IMAGINING THE HOUSING OPTIONS OF THE FUTURE, AND DEVELOPING TECHNOLOGICAL SOLUTIONS TO
ENVIRONMENTAL CHALLENGES, THE CFE GROUP IS ASSERTING ITS DESIRE TO BE A CONSCIOUS AND
RESPONSIBLE PROTAGONIST IN THE CONSTRUCTION OF OUR FUTURE TOGETHER. THIS ALSO REQUIRES A
REASONED GOVERNANCE AND INCREASED DIGITALISATION OF OPERATING METHODS.
OFFER INNOVATIVE SOLUTIONS
Serenity Brussels
40
CONTENTS
WHY AND WHO WE ARE
HOW WE SHAPE THE WORLD
energy efficiency of its entire fleet thanks to technological advances, using waste gas heat recovery systems for electrical energy and by implementing tools for tracking and monitoring energy data.
COLLECTIVE INTELLIGENCEThe sharing of best practices and techno-logical solutions between the various entities of the CFE Group plays an important role in the concrete implementation of innova-tions in the field. Meetings focusing on sus-tainable development issues have enabled BPC Group and Benelmat to optimise the electrical equipment on construction sites, using batteries capable of absorbing con-sumption peaks and enabling a reduction in power – and therefore the carbon footprint – of conventional generators. The coopera-tion between Benelmat, VMA, BPC Group and MBG for the installation of smart me-ters and for the continuous, accurate and remote monitoring of energy consumption is another interesting example.
The development of Building Information Modelling (BIM) is now a priority at the construction sites. This method of digital modelling of construction information profoundly changes the work of the teams, both upstream and during field operations, and clarifies all the processes from property development to final completion, while reducing the risk of errors at every stage. The Arlon-Trèves project in Brussels, an ambitious renovation project covering 18,000 m2 of buildings that were earmarked for demolition but have been transformed into offices, provides a perfect illustration of this.
In general, digitalisation is becoming the rule for a growing number of administra-tive formalities, including the electronic signature in 2021. The development of IT tools has made it possible to reduce or even virtually eliminate paper archives. This ‘paperless’ operation is beneficial from an environmental point of view, and has now
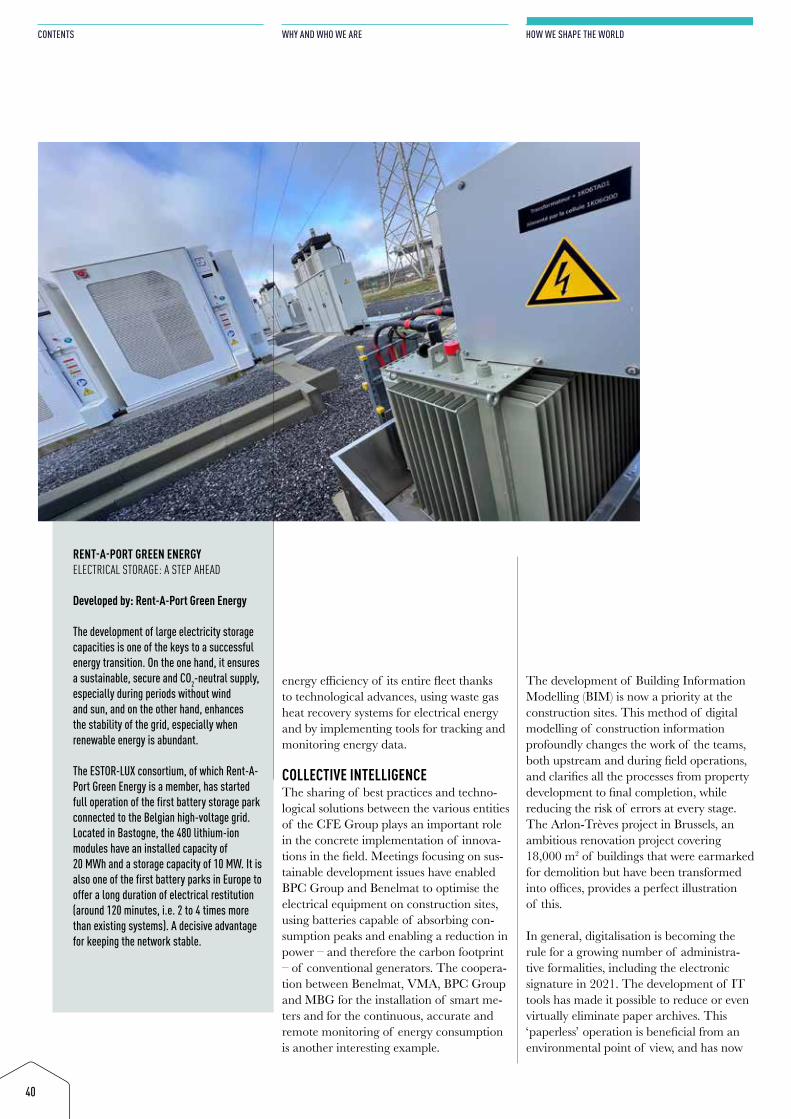
RENT-A-PORT GREEN ENERGY ELECTRICAL STORAGE: A STEP AHEAD Developed by: Rent-A-Port Green Energy The development of large electricity storage capacities is one of the keys to a successful energy transition. On the one hand, it ensures a sustainable, secure and CO2-neutral supply, especially during periods without wind and sun, and on the other hand, enhances the stability of the grid, especially when renewable energy is abundant.
The ESTOR-LUX consortium, of which Rent-A-Port Green Energy is a member, has started full operation of the first battery storage park connected to the Belgian high-voltage grid. Located in Bastogne, the 480 lithium-ion modules have an installed capacity of 20 MWh and a storage capacity of 10 MW. It is also one of the first battery parks in Europe to offer a long duration of electrical restitution (around 120 minutes, i.e. 2 to 4 times more than existing systems). A decisive advantage for keeping the network stable.
41
ANNUAL REPORT
STATEMENT OF NON-FINANCIAL INFORMATION
FINANCIAL STATEMENTS
been adopted by BPC Group, among other entities. In all entities, the simplification and digitisation of documents, reports and tech-nical data sheets are laying the foundations for the interconnected construction of the future, with a focus on improved rationalisa-tion and greater efficiency.
ENTERING THE WORLD OF TOMORROWAt the same time, BPI is strengthening its skills in the area of smart buildings. The PURE project in Auderghem offers apart-ments connected to the Internet of Things (IoT), whereby several aspects can be man-aged remotely. This type of housing antici-
pates our daily life in the future, as does the choice to increasingly invest in geothermal energy, a sustainable and efficient techno-logical solution that increases user comfort while limiting carbon emissions. In Brussels, Serenity, an exemplary mixed housing-office project, which can be dismantled at the end of its life, will be heated and cooled using geothermal energy and cogeneration, with no fossil fuels for the office part. In view of its location on a metro station, it will also of-fer Smart Office and Smart Parking systems. The innovation in the CFE group is largely supported by the principles of sustainability, as illustrated by the Rent-A-Port project
for electrical storage - and of circular econ-omy. Wooden, the most recent achievement of Wood Shapers, the Group entity that is entirely dedicated to timber construction, is proof of this. Another example is the site of the Aurea tower in Luxembourg, which is managed by CLE. The innovative Hydro Circal 75R system used for the composition of the aluminium of the exterior body has, in fact, enabled a reduction of the carbon footprint by a factor of eight. A third inter-esting example is the ZIN project in Brussels, an ambitious redevelopment of the WTC 1 & 2 buildings.
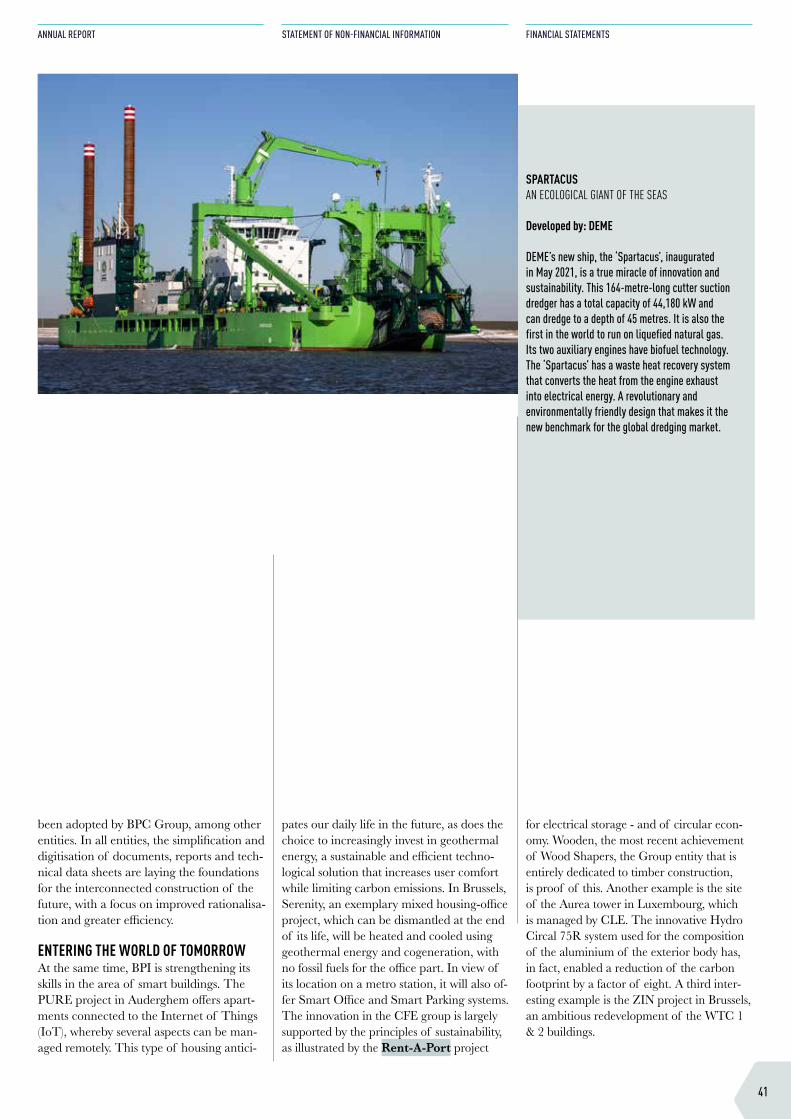
SPARTACUS AN ECOLOGICAL GIANT OF THE SEAS
Developed by: DEME DEME’s new ship, the ‘Spartacus’, inaugurated in May 2021, is a true miracle of innovation and sustainability. This 164-metre-long cutter suction dredger has a total capacity of 44,180 kW and can dredge to a depth of 45 metres. It is also the first in the world to run on liquefied natural gas. Its two auxiliary engines have biofuel technology. The ‘Spartacus’ has a waste heat recovery system that converts the heat from the engine exhaust into electrical energy. A revolutionary and environmentally friendly design that makes it the new benchmark for the global dredging market.
42
CONTENTS
WHY AND WHO WE ARE
HOW WE SHAPE THE WORLD
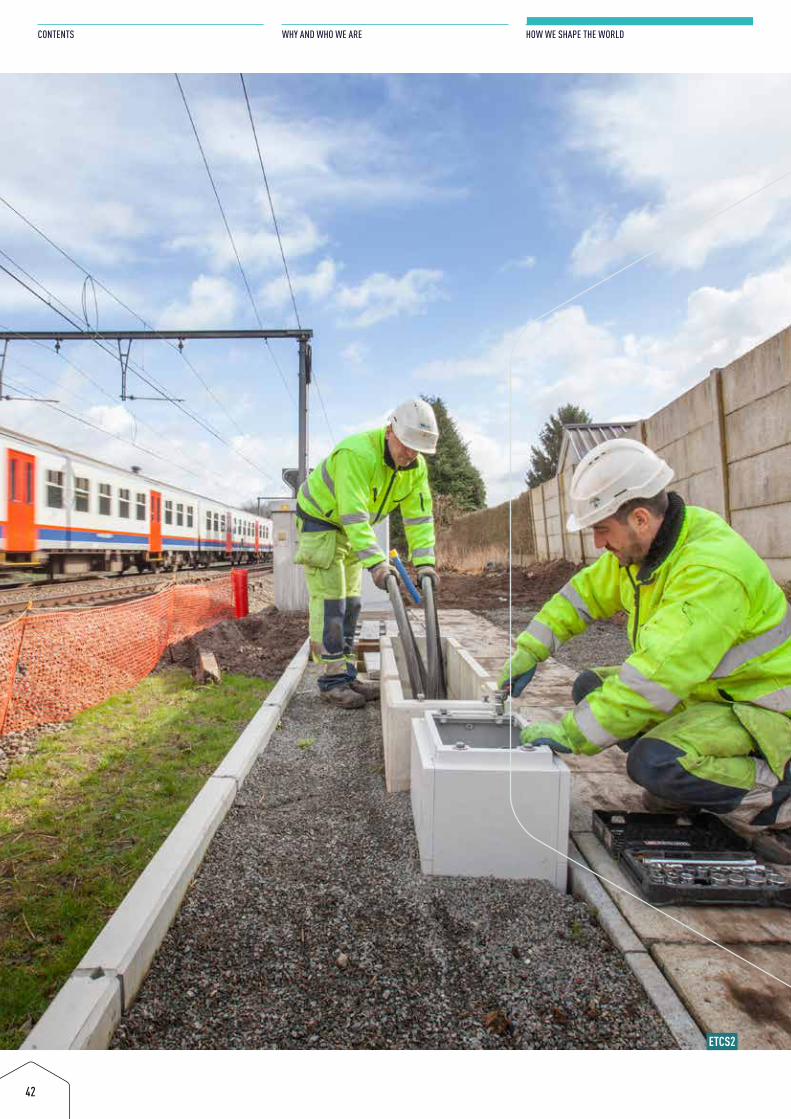
ETCS2
43
ANNUAL REPORT
STATEMENT OF NON-FINANCIAL INFORMATION
FINANCIAL STATEMENTS
The positive impact of the CFE Group on our society is particularly visible through the contribution of DEME to infrastructure projects such as the Oosterweel Link in Antwerp. The latter will provide this ma-jor port city with a ring road link that will improve traffic flow, as well as the quality of life of all the residents of the region. Continuing in the same spirit, the start of the works on the Fehmarnbelt Fixed Link, the world’s longest immersed tunnel linking Denmark and Germany, to which DEME is contributing all its technical expertise, marks the start of a new era of mobility in northern Europe.
It is equally relevant to underline the importance of the multiple cooperations and synergies between the entities, which
foreshadows the consolidation of the CFE Group – bringing together contracting and real estate development – separate from DEME. A change that will become effective in 2022. The close exchanges of know-how and joint projects between MBG, BPC Group, VMA and, of course, Benelmat, with regard, among others, to the reduction targets for CO2, is the best evidence of this.
INTERNAL AND EXTERNAL LINKSIn the same spirit of cooperation and taking advantage of technical advances, CFE Con-tracting and BPI Real Estate have pooled their know-how to create Wood Shapers. This entity, which is entirely dedicated to timber and modular construction, perfect-ly embodies the Group’s thinking on the
mastery of materials and the optimisation of construction methods. The sustainable approach of Wood Shapers and its integrat-ed vision of construction sites have already been applied on numerous construction sites in Belgium and Luxembourg. The highlight in 2021 will be the Monteco project, which, with its eight floors, will be the highest wooden office building in the Brussels-Capital region.
Following a survey among 80 suppliers, MBG was able to analyse the overwhelm-ingly positive responses and expectations of its partners, and could identify areas for im-provement to make these relationships even more sustainable. The measures adopted made it possible to refine certain processes, strengthen the bonds of trust, and improve
THE CFE GROUP SYSTEMATICALLY SEEKS TO PUT ITSELF AT THE SERVICE OF THE COMMUNITY, AND TO
USE THE KNOW-HOW AND THE SKILLS OF ITS TEAMS TO FURTHER IMPROVE OUR LIVING TOGETHER.
THE STRENGTHENING OF SOCIAL LINKS, THE CONSIDERATION OF ENVIRONMENTAL ISSUES AND THE
INTEGRATION OF NEW TECHNOLOGIES ARE ALL ELEMENTS PRESENT IN EACH PROJECT, WITH THE GOAL OF
TRANSFORMING OUR LIVING ENVIRONMENT IN A POSITIVE MANNER. THE INFRASTRUCTURES CREATED BY
THE DIFFERENT ENTITIES LITERALLY SHAPE OUR DAILY LIVES. THE CFE GROUP IS POSITIONING ITSELF AS A
PARTNER OF CHANGE, IN BOTH THE SHORT AND THE LONG TERM.
PARTNER FOR CHANGE
ETCS2
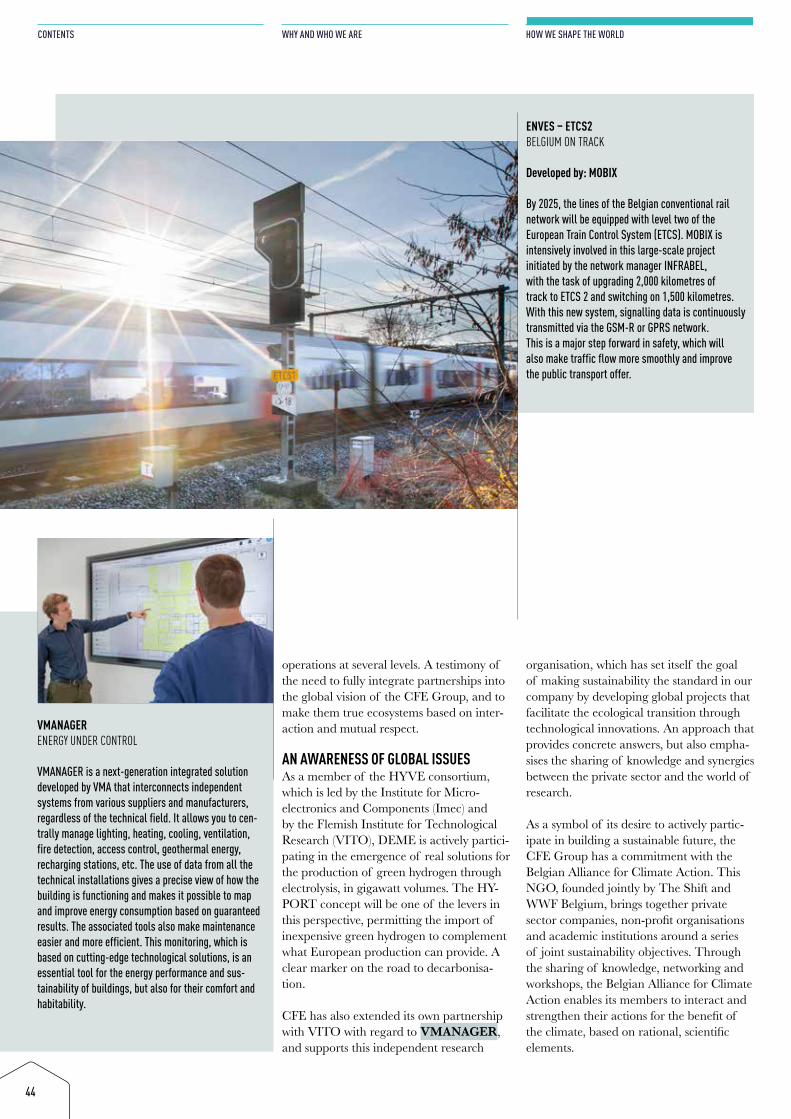
44
CONTENTS
WHY AND WHO WE ARE
HOW WE SHAPE THE WORLD
operations at several levels. A testimony of the need to fully integrate partnerships into the global vision of the CFE Group, and to make them true ecosystems based on inter-action and mutual respect.
AN AWARENESS OF GLOBAL ISSUESAs a member of the HYVE consortium, which is led by the Institute for Micro-electronics and Components (Imec) and by the Flemish Institute for Technological Research (VITO), DEME is actively partici-pating in the emergence of real solutions for the production of green hydrogen through electrolysis, in gigawatt volumes. The HY-PORT concept will be one of the levers in this perspective, permitting the import of inexpensive green hydrogen to complement what European production can provide. A clear marker on the road to decarbonisa-tion.
CFE has also extended its own partnership with VITO with regard to VMANAGER, and supports this independent research
organisation, which has set itself the goal of making sustainability the standard in our company by developing global projects that facilitate the ecological transition through technological innovations. An approach that provides concrete answers, but also empha-sises the sharing of knowledge and synergies between the private sector and the world of research.
As a symbol of its desire to actively partic-ipate in building a sustainable future, the CFE Group has a commitment with the Belgian Alliance for Climate Action. This NGO, founded jointly by The Shift and WWF Belgium, brings together private sector companies, non-profit organisations and academic institutions around a series of joint sustainability objectives. Through the sharing of knowledge, networking and workshops, the Belgian Alliance for Climate Action enables its members to interact and strengthen their actions for the benefit of the climate, based on rational, scientific elements.
ENVES – ETCS2 BELGIUM ON TRACK
Developed by: MOBIX By 2025, the lines of the Belgian conventional rail network will be equipped with level two of the European Train Control System (ETCS). MOBIX is intensively involved in this large-scale project initiated by the network manager INFRABEL, with the task of upgrading 2,000 kilometres of track to ETCS 2 and switching on 1,500 kilometres. With this new system, signalling data is continuously transmitted via the GSM-R or GPRS network. This is a major step forward in safety, which will also make traffic flow more smoothly and improve the public transport offer.
VMANAGER ENERGY UNDER CONTROL VMANAGER is a next-generation integrated solution developed by VMA that interconnects independent systems from various suppliers and manufacturers, regardless of the technical field. It allows you to cen-trally manage lighting, heating, cooling, ventilation, fire detection, access control, geothermal energy, recharging stations, etc. The use of data from all the technical installations gives a precise view of how the building is functioning and makes it possible to map and improve energy consumption based on guaranteed results. The associated tools also make maintenance easier and more efficient. This monitoring, which is based on cutting-edge technological solutions, is an essential tool for the energy performance and sus-tainability of buildings, but also for their comfort and habitability.
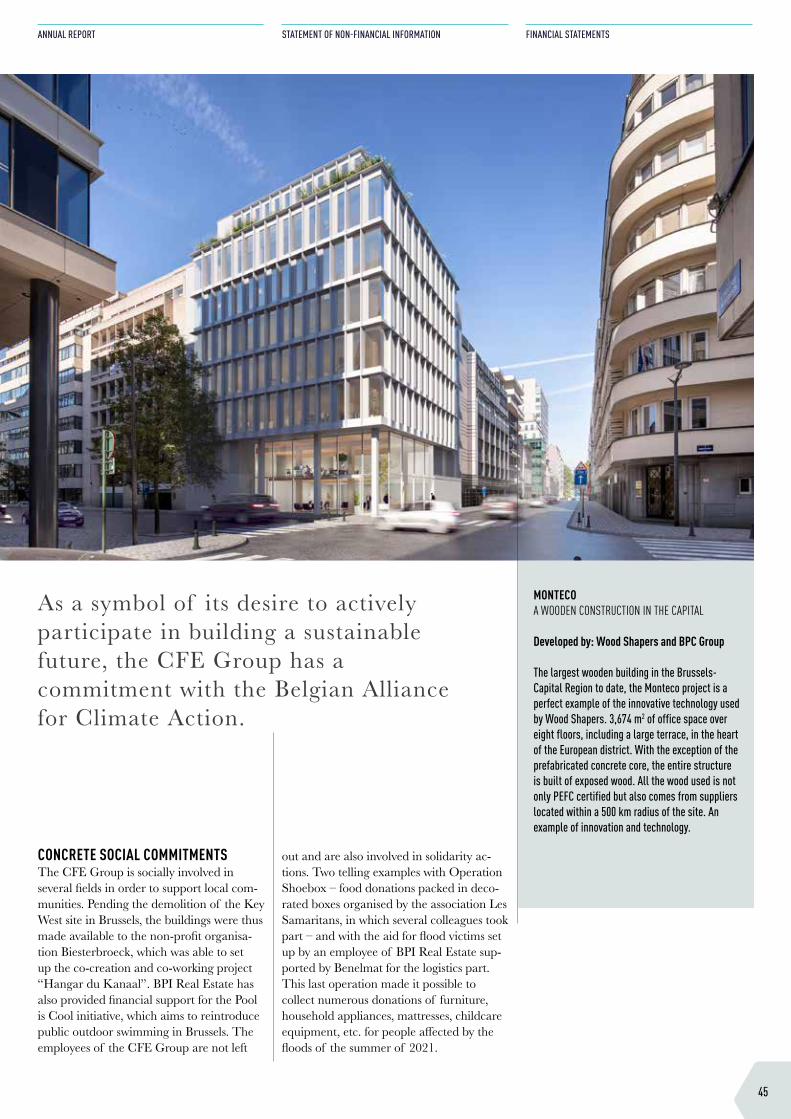
45
ANNUAL REPORT
STATEMENT OF NON-FINANCIAL INFORMATION
FINANCIAL STATEMENTS
CONCRETE SOCIAL COMMITMENTSThe CFE Group is socially involved in several fields in order to support local com-munities. Pending the demolition of the Key West site in Brussels, the buildings were thus made available to the non-profit organisa-tion Biesterbroeck, which was able to set up the co-creation and co-working project “Hangar du Kanaal”. BPI Real Estate has also provided financial support for the Pool is Cool initiative, which aims to reintroduce public outdoor swimming in Brussels. The employees of the CFE Group are not left
out and are also involved in solidarity ac-tions. Two telling examples with Operation Shoebox – food donations packed in deco-rated boxes organised by the association Les Samaritans, in which several colleagues took part – and with the aid for flood victims set up by an employee of BPI Real Estate sup-ported by Benelmat for the logistics part.This last operation made it possible to collect numerous donations of furniture, household appliances, mattresses, childcare equipment, etc. for people affected by the floods of the summer of 2021.
As a symbol of its desire to actively partic ipate in building a sustainable future, the CFE Group has a commitment with the Belgian Alliance for Climate Action.
MONTECO A WOODEN CONSTRUCTION IN THE CAPITAL Developed by: Wood Shapers and BPC Group The largest wooden building in the Brussels-Capital Region to date, the Monteco project is a perfect example of the innovative technology used by Wood Shapers. 3,674 m2 of office space over eight floors, including a large terrace, in the heart of the European district. With the exception of the prefabricated concrete core, the entire structure is built of exposed wood. All the wood used is not only PEFC certified but also comes from suppliers located within a 500 km radius of the site. An example of innovation and technology.
202146
CONTENTS
WHY AND WHO WE ARE
HOW WE SHAPE THE WORLD
202147
ANNUAL REPORT
STATEMENT OF NON-FINANCIAL INFORMATION
FINANCIAL STATEMENTS
ANNUAL REPORT
48
CONTENTS
WHY AND WHO WE ARE
HOW WE SHAPE THE WORLD
CONTENTS
I. STATUTORY FINANCIAL STATEMENTS 501. EQUITY AND SHAREHOLDER BASE 502. COMMENTS ON THE STATUTORY FINANCIAL STATEMENTS 502.1. Financial position at 31/12/2021 502.2. Appropriation of profit 512.3. Outlook 2022 512.4. Main risks and uncertainties 512.5. Major events after the closing of the financial year 512.6. Financial instruments 512.7. Notices 51
II. CONSOLIDATED FINANCIAL STATEMENTS 521. COMMENTS ON THE CONSOLIDATED FINANCIAL STATEMENTS 521.1. Financial position at 31/12/2021 521.2. Main risks 641.3. Major events after the closing of the financial year 701.4. Research and development 701.5. Financial instruments 701.6. Outlook 2022 701.7. Outlook 2022 discontinued activities 70
III. CORPORATE GOVERNANCE STATEMENT 711. REFERENCE CODE 712. BOARD OF DIRECTORS 712.1. Composition 722.2. Independent directors 772.3. Other directors 772.4. Mode of operation 782.5. Code of conduct regarding conflicts of interest 782.6. Financial transactions 783. AUDIT COMMITTEE AND RISK MANAGEMENT 793.1. Composition 793.2. Mode of operation and activity report 794. APPOINTMENTS AND REMUNERATION COMMITTEE 804.1. Composition 804.2. Mode of operation and activity report 805. DIVERSITY POLICY 816. SYSTEMS OF EXTERNAL AND INTERNAL CONTROL AND RISK MANAGEMENT 816.1. External control 816.2. Internal control and risk management 816.3. Internal control and risk management systems in the divisions 837. SHAREHOLDER BASE 868. DEROGATIONS FROM THE 2020 CODE 87
49
ANNUAL REPORT
STATEMENT OF NON-FINANCIAL INFORMATION
FINANCIAL STATEMENTS
IV. REMUNERATION REPORT 871. REMUNERATION POLICY 871.1. Governance - Procedure 871.2. Remuneration policy for non-executive directors 871.3. Remuneration policy with regard to the Managing Director 881.4. Directorships in the subsidiaries 881.5. Changes since the last remuneration policy 881.6. Possibility of deviating from the remuneration policy 882. REMUNERATION REPORT 892.1. Remuneration of non-executive directors 892.2. Remuneration of the Managing Director 892.3. Annual evolution of the ratio between remuneration and salary 90
V. STATEMENT OF NON-FINANCIAL INFORMATION 941. INTRODUCTION 942. BRIEF DESCRIPTION OF THE GROUP’S ACTIVITIES 942.1. Dredging, Environment, Offshore and Infra 942.2. Contracting 952.3. Real estate development 953. POLICIES IN THE AREA OF ESG 953.1. Rules common to the three divisions 953.2. DEME’s ESG Policy 963.3. CFE Contracting and BPI Real Estate’s ESG policy 974. MAIN RISKS RELATED TO ESG 994.1. Introduction 994.2. Main ESG risks and opportunities at DEME 994.3. Main ESG risks and opportunities at CFE Contracting and BPI Real Estate 1035. OUTCOMES OF THOSE POLICIES 1105.1. The results of these policies at DEME 1105.2. The results of these policies at CFE Contracting and BPI Real Estate 1156. NON-FINANCIAL KEY PERFORMANCE INDICATORS (KPIS) 1206.1. Key figures & sustainable ambition 1206.2. HR indicators for the CFE Group 1216.3. Key Performance Indicators for DEME 1226.4. Key performance indicators for CFE Contracting and BPI Real Estate 1267. EUROPEAN TAXONOMY 1307.1. Introduction 1307.2. Consolidated results: eligibility 1317.3. Methodology 131
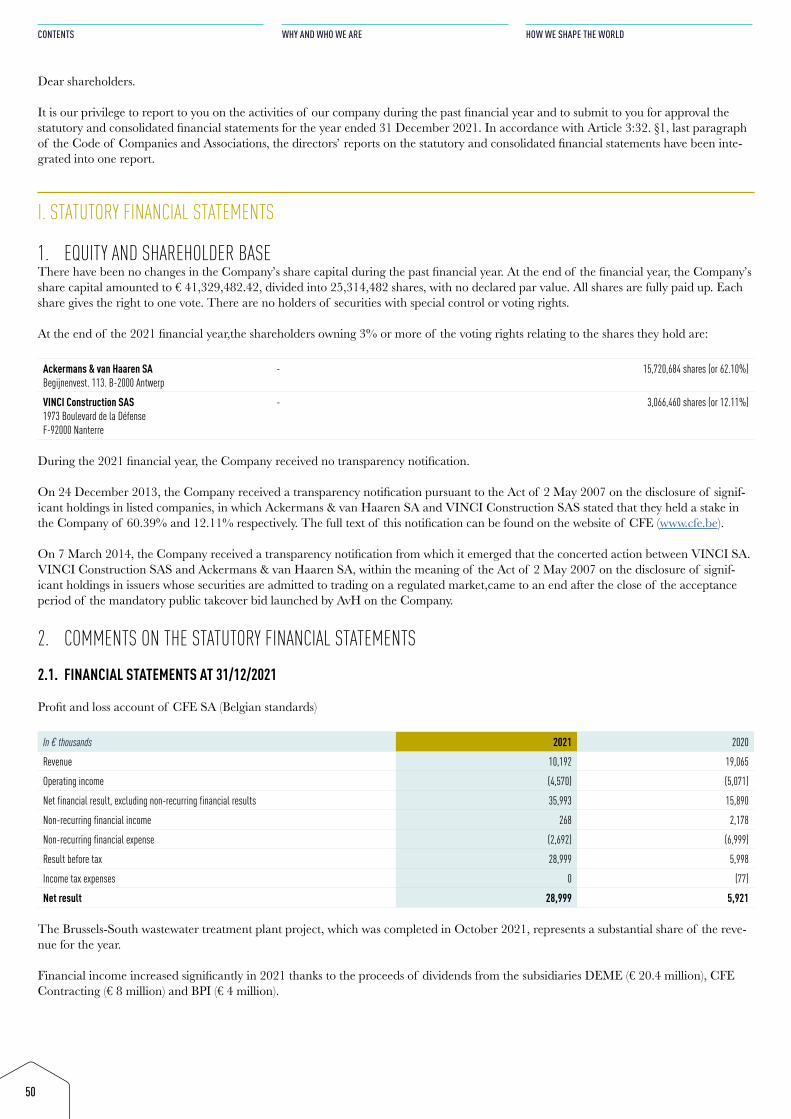
50
CONTENTS
WHY AND WHO WE ARE
HOW WE SHAPE THE WORLD
Dear shareholders.
It is our privilege to report to you on the activities of our company during the past financial year and to submit to you for approval the statutory and consolidated financial statements for the year ended 31 December 2021. In accordance with Article 3:32. §1, last paragraph of the Code of Companies and Associations, the directors’ reports on the statutory and consolidated financial statements have been inte-grated into one report.
I. STATUTORY FINANCIAL STATEMENTS
1. EQUITY AND SHAREHOLDER BASEThere have been no changes in the Company’s share capital during the past financial year. At the end of the financial year, the Company’s share capital amounted to € 41,329,482.42, divided into 25,314,482 shares, with no declared par value. All shares are fully paid up. Each share gives the right to one vote. There are no holders of securities with special control or voting rights.
At the end of the 2021 financial year,the shareholders owning 3% or more of the voting rights relating to the shares they hold are:
Ackermans & van Haaren SABegijnenvest. 113. B-2000 Antwerp
- 15,720,684 shares (or 62.10%)
VINCI Construction SAS1973 Boulevard de la DéfenseF-92000 Nanterre
- 3,066,460 shares (or 12.11%)
During the 2021 financial year, the Company received no transparency notification.
On 24 December 2013, the Company received a transparency notification pursuant to the Act of 2 May 2007 on the disclosure of signif-icant holdings in listed companies, in which Ackermans & van Haaren SA and VINCI Construction SAS stated that they held a stake in the Company of 60.39% and 12.11% respectively. The full text of this notification can be found on the website of CFE (www.cfe.be).
On 7 March 2014, the Company received a transparency notification from which it emerged that the concerted action between VINCI SA. VINCI Construction SAS and Ackermans & van Haaren SA, within the meaning of the Act of 2 May 2007 on the disclosure of signif-icant holdings in issuers whose securities are admitted to trading on a regulated market,came to an end after the close of the acceptance period of the mandatory public takeover bid launched by AvH on the Company.
2. COMMENTS ON THE STATUTORY FINANCIAL STATEMENTS
2.1. FINANCIAL STATEMENTS AT 31/12/2021
Profit and loss account of CFE SA (Belgian standards)
In € thousands 2021 2020
Revenue 10,192 19,065
Operating income (4,570) (5,071)
Net financial result, excluding non-recurring financial results 35,993 15,890
Non-recurring financial income 268 2,178
Non-recurring financial expense (2,692) (6,999)
Result before tax 28,999 5,998
Income tax expenses 0 (77)
Net result 28,999 5,921
The Brussels-South wastewater treatment plant project, which was completed in October 2021, represents a substantial share of the reve-nue for the year.
Financial income increased significantly in 2021 thanks to the proceeds of dividends from the subsidiaries DEME (€ 20.4 million), CFE Contracting (€ 8 million) and BPI (€ 4 million).
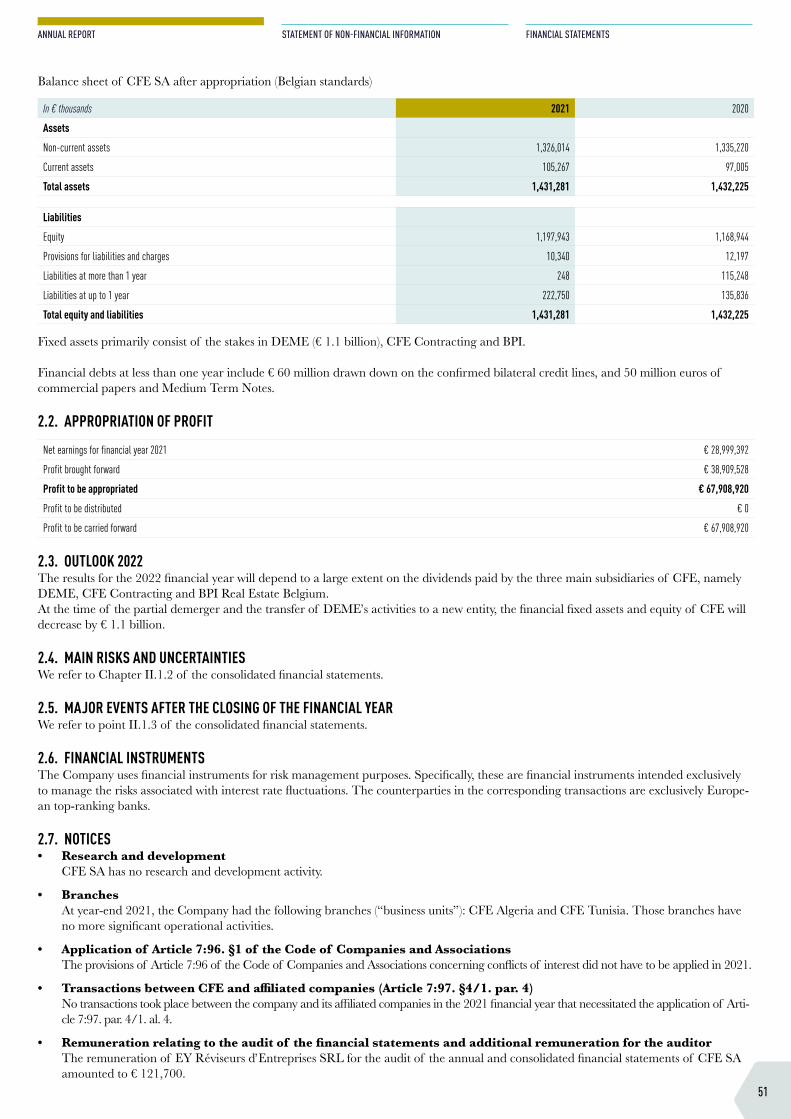
51
ANNUAL REPORT
STATEMENT OF NON-FINANCIAL INFORMATION
FINANCIAL STATEMENTS
Balance sheet of CFE SA after appropriation (Belgian standards)
In € thousands 2021 2020
Assets
Non-current assets 1,326,014 1,335,220
Current assets 105,267 97,005
Total assets 1,431,281 1,432,225
Liabilities
Equity 1,197,943 1,168,944
Provisions for liabilities and charges 10,340 12,197
Liabilities at more than 1 year 248 115,248
Liabilities at up to 1 year 222,750 135,836
Total equity and liabilities 1,431,281 1,432,225
Fixed assets primarily consist of the stakes in DEME (€ 1.1 billion), CFE Contracting and BPI.
Financial debts at less than one year include € 60 million drawn down on the confirmed bilateral credit lines, and 50 million euros of commercial papers and Medium Term Notes.
2.2. APPROPRIATION OF PROFIT
Net earnings for financial year 2021 € 28,999,392
Profit brought forward € 38,909,528
Profit to be appropriated € 67,908,920
Profit to be distributed € 0
Profit to be carried forward € 67,908,920
2.3. OUTLOOK 2022The results for the 2022 financial year will depend to a large extent on the dividends paid by the three main subsidiaries of CFE, namely DEME, CFE Contracting and BPI Real Estate Belgium.At the time of the partial demerger and the transfer of DEME’s activities to a new entity, the financial fixed assets and equity of CFE will decrease by € 1.1 billion.
2.4. MAIN RISKS AND UNCERTAINTIES We refer to Chapter II.1.2 of the consolidated financial statements.
2.5. MAJOR EVENTS AFTER THE CLOSING OF THE FINANCIAL YEAR We refer to point II.1.3 of the consolidated financial statements.
2.6. FINANCIAL INSTRUMENTSThe Company uses financial instruments for risk management purposes. Specifically, these are financial instruments intended exclusively to manage the risks associated with interest rate fluctuations. The counterparties in the corresponding transactions are exclusively Europe-an top-ranking banks.
2.7. NOTICES • Research and development
CFE SA has no research and development activity.
• Branches At year-end 2021, the Company had the following branches (“business units”): CFE Algeria and CFE Tunisia. Those branches have no more significant operational activities.
• Application of Article 7:96. §1 of the Code of Companies and Associations The provisions of Article 7:96 of the Code of Companies and Associations concerning conflicts of interest did not have to be applied in 2021.
• Transactions between CFE and affiliated companies (Article 7:97. §4/1. par. 4) No transactions took place between the company and its affiliated companies in the 2021 financial year that necessitated the application of Arti-cle 7:97. par. 4/1. al. 4.
• Remuneration relating to the audit of the financial statements and additional remuneration for the auditor The remuneration of EY Réviseurs d’Entreprises SRL for the audit of the annual and consolidated financial statements of CFE SA amounted to € 121,700.
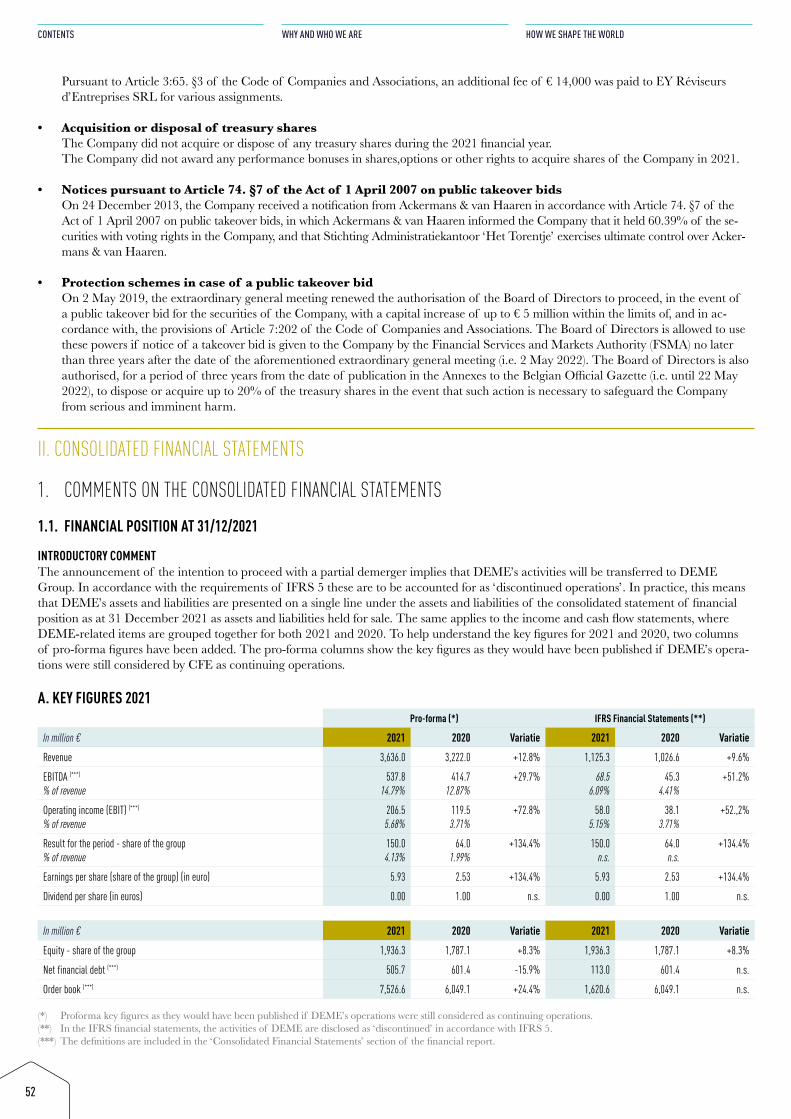
52
CONTENTS
WHY AND WHO WE ARE
HOW WE SHAPE THE WORLD
Pursuant to Article 3:65. §3 of the Code of Companies and Associations, an additional fee of € 14,000 was paid to EY Réviseurs d’Entreprises SRL for various assignments.
• Acquisition or disposal of treasury shares The Company did not acquire or dispose of any treasury shares during the 2021 financial year. The Company did not award any performance bonuses in shares,options or other rights to acquire shares of the Company in 2021.
• Notices pursuant to Article 74. §7 of the Act of 1 April 2007 on public takeover bids On 24 December 2013, the Company received a notification from Ackermans & van Haaren in accordance with Article 74. §7 of the Act of 1 April 2007 on public takeover bids, in which Ackermans & van Haaren informed the Company that it held 60.39% of the se-curities with voting rights in the Company, and that Stichting Administratiekantoor ‘Het Torentje’ exercises ultimate control over Acker-mans & van Haaren.
• Protection schemes in case of a public takeover bid On 2 May 2019, the extraordinary general meeting renewed the authorisation of the Board of Directors to proceed, in the event of a public takeover bid for the securities of the Company, with a capital increase of up to € 5 million within the limits of, and in ac-cordance with, the provisions of Article 7:202 of the Code of Companies and Associations. The Board of Directors is allowed to use these powers if notice of a takeover bid is given to the Company by the Financial Services and Markets Authority (FSMA) no later than three years after the date of the aforementioned extraordinary general meeting (i.e. 2 May 2022). The Board of Directors is also authorised, for a period of three years from the date of publication in the Annexes to the Belgian Official Gazette (i.e. until 22 May 2022), to dispose or acquire up to 20% of the treasury shares in the event that such action is necessary to safeguard the Company from serious and imminent harm.
II. CONSOLIDATED FINANCIAL STATEMENTS
1. COMMENTS ON THE CONSOLIDATED FINANCIAL STATEMENTS
1.1. FINANCIAL POSITION AT 31/12/2021
INTRODUCTORY COMMENTThe announcement of the intention to proceed with a partial demerger implies that DEME’s activities will be transferred to DEME Group. In accordance with the requirements of IFRS 5 these are to be accounted for as ‘discontinued operations’. In practice, this means that DEME’s assets and liabilities are presented on a single line under the assets and liabilities of the consolidated statement of financial position as at 31 December 2021 as assets and liabilities held for sale. The same applies to the income and cash flow statements, where DEME-related items are grouped together for both 2021 and 2020. To help understand the key figures for 2021 and 2020, two columns of pro-forma figures have been added. The pro-forma columns show the key figures as they would have been published if DEME’s opera-tions were still considered by CFE as continuing operations.
A. KEY FIGURES 2021Pro-forma (*) IFRS Financial Statements (**)
In million € 2021 2020 Variatie 2021 2020 Variatie
Revenue 3,636.0 3,222.0 +12.8% 1,125.3 1,026.6 +9.6%
EBITDA (***)
% of revenue537.8
14.79%414.7
12.87%+29.7% 68.5
6.09%45.3
4.41%+51.2%
Operating income (EBIT) (***)
% of revenue206.55.68%
119.53.71%
+72.8% 58.05.15%
38.13.71%
+52.,2%
Result for the period - share of the group % of revenue
150.04.13%
64.01.99%
+134.4% 150.0n.s.
64.0n.s.
+134.4%
Earnings per share (share of the group) (in euro) 5.93 2.53 +134.4% 5.93 2.53 +134.4%
Dividend per share (in euros) 0.00 1.00 n.s. 0.00 1.00 n.s.
In million € 2021 2020 Variatie 2021 2020 Variatie
Equity - share of the group 1,936.3 1,787.1 +8.3% 1,936.3 1,787.1 +8.3%
Net financial debt (***) 505.7 601.4 -15.9% 113.0 601.4 n.s.
Order book (***) 7,526.6 6,049.1 +24.4% 1,620.6 6,049.1 n.s.
(*) Proforma key figures as they would have been published if DEME’s operations were still considered as continuing operations.(**) In the IFRS financial statements, the activities of DEME are disclosed as ‘discontinued’ in accordance with IFRS 5.(***) The definitions are included in the ‘Consolidated Financial Statements’ section of the financial report.
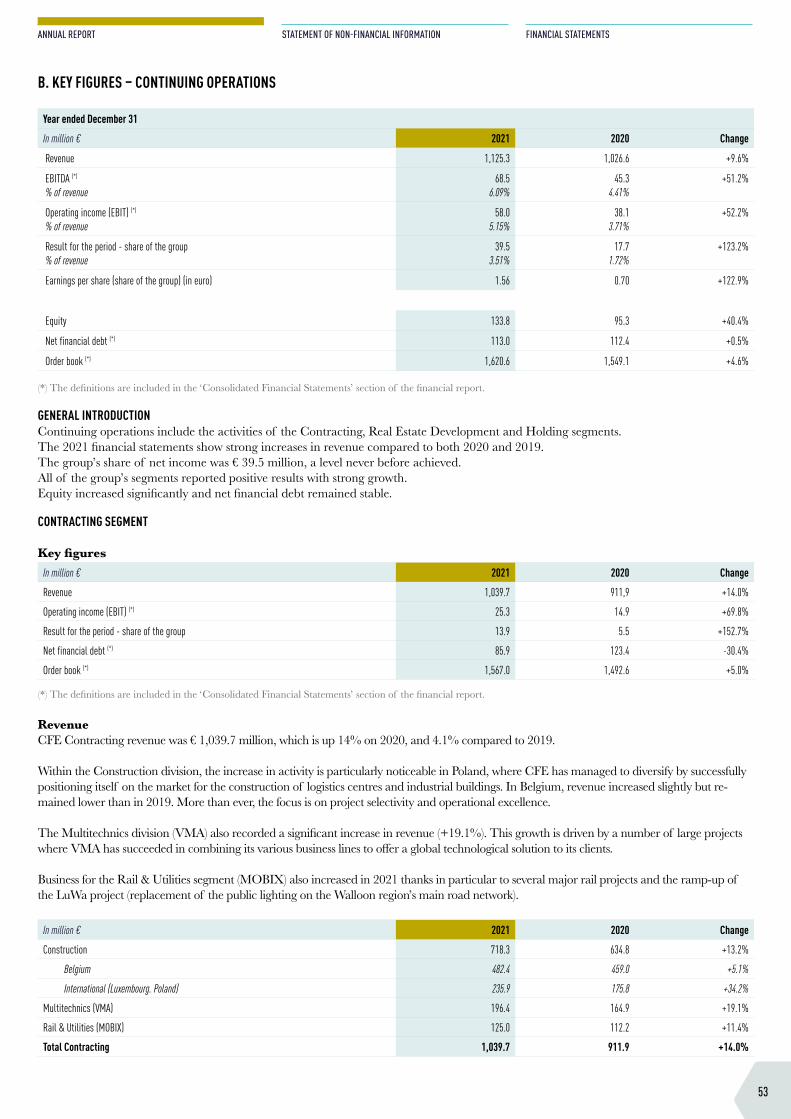
53
ANNUAL REPORT
STATEMENT OF NON-FINANCIAL INFORMATION
FINANCIAL STATEMENTS
B. KEY FIGURES – CONTINUING OPERATIONS
Year ended December 31
In million € 2021 2020 Change
Revenue 1,125.3 1,026.6 +9.6%
EBITDA (*)
% of revenue68.5
6.09%45.3
4.41%+51.2%
Operating income (EBIT) (*)
% of revenue58.0
5.15%38.1
3.71%+52.2%
Result for the period - share of the group % of revenue
39.53.51%
17.71.72%
+123.2%
Earnings per share (share of the group) (in euro) 1.56 0.70 +122.9%
Equity 133.8 95.3 +40.4%
Net financial debt (*) 113.0 112.4 +0.5%
Order book (*) 1,620.6 1,549.1 +4.6%
(*) The definitions are included in the ‘Consolidated Financial Statements’ section of the financial report.
GENERAL INTRODUCTIONContinuing operations include the activities of the Contracting, Real Estate Development and Holding segments.The 2021 financial statements show strong increases in revenue compared to both 2020 and 2019.The group’s share of net income was € 39.5 million, a level never before achieved.All of the group’s segments reported positive results with strong growth.Equity increased significantly and net financial debt remained stable.
CONTRACTING SEGMENT
Key figuresIn million € 2021 2020 Change
Revenue 1,039.7 911,9 +14.0%
Operating income (EBIT) (*) 25.3 14.9 +69.8%
Result for the period - share of the group 13.9 5.5 +152.7%
Net financial debt (*) 85.9 123.4 -30.4%
Order book (*) 1,567.0 1,492.6 +5.0%
(*) The definitions are included in the ‘Consolidated Financial Statements’ section of the financial report.
RevenueCFE Contracting revenue was € 1,039.7 million, which is up 14% on 2020, and 4.1% compared to 2019.
Within the Construction division, the increase in activity is particularly noticeable in Poland, where CFE has managed to diversify by successfully positioning itself on the market for the construction of logistics centres and industrial buildings. In Belgium, revenue increased slightly but re-mained lower than in 2019. More than ever, the focus is on project selectivity and operational excellence.
The Multitechnics division (VMA) also recorded a significant increase in revenue (+19.1%). This growth is driven by a number of large projects where VMA has succeeded in combining its various business lines to offer a global technological solution to its clients.
Business for the Rail & Utilities segment (MOBIX) also increased in 2021 thanks in particular to several major rail projects and the ramp-up of the LuWa project (replacement of the public lighting on the Walloon region’s main road network).
In million € 2021 2020 Change
Construction 718.3 634.8 +13.2%
Belgium 482.4 459.0 +5.1%
International (Luxembourg. Poland) 235.9 175.8 +34.2%
Multitechnics (VMA) 196.4 164.9 +19.1%
Rail & Utilities (MOBIX) 125.0 112.2 +11.4%
Total Contracting 1,039.7 911.9 +14.0%
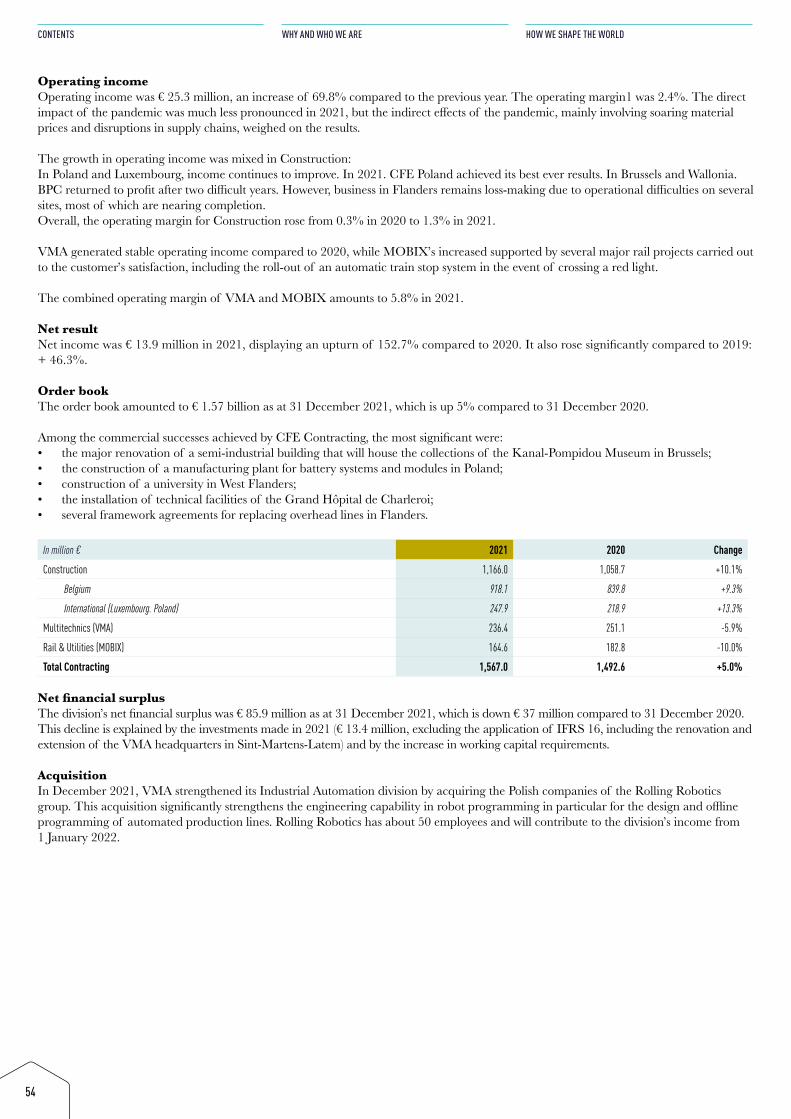
54
CONTENTS
WHY AND WHO WE ARE
HOW WE SHAPE THE WORLD
Operating incomeOperating income was € 25.3 million, an increase of 69.8% compared to the previous year. The operating margin1 was 2.4%. The direct impact of the pandemic was much less pronounced in 2021, but the indirect effects of the pandemic, mainly involving soaring material prices and disruptions in supply chains, weighed on the results.
The growth in operating income was mixed in Construction:In Poland and Luxembourg, income continues to improve. In 2021. CFE Poland achieved its best ever results. In Brussels and Wallonia. BPC returned to profit after two difficult years. However, business in Flanders remains loss-making due to operational difficulties on several sites, most of which are nearing completion.Overall, the operating margin for Construction rose from 0.3% in 2020 to 1.3% in 2021.
VMA generated stable operating income compared to 2020, while MOBIX’s increased supported by several major rail projects carried out to the customer’s satisfaction, including the roll-out of an automatic train stop system in the event of crossing a red light.
The combined operating margin of VMA and MOBIX amounts to 5.8% in 2021.
Net resultNet income was € 13.9 million in 2021, displaying an upturn of 152.7% compared to 2020. It also rose significantly compared to 2019: + 46.3%.
Order bookThe order book amounted to € 1.57 billion as at 31 December 2021, which is up 5% compared to 31 December 2020.
Among the commercial successes achieved by CFE Contracting, the most significant were:• the major renovation of a semi-industrial building that will house the collections of the Kanal-Pompidou Museum in Brussels;• the construction of a manufacturing plant for battery systems and modules in Poland;• construction of a university in West Flanders;• the installation of technical facilities of the Grand Hôpital de Charleroi;• several framework agreements for replacing overhead lines in Flanders.
In million € 2021 2020 Change
Construction 1,166.0 1,058.7 +10.1%
Belgium 918.1 839.8 +9.3%
International (Luxembourg. Poland) 247.9 218.9 +13.3%
Multitechnics (VMA) 236.4 251.1 -5.9%
Rail & Utilities (MOBIX) 164.6 182.8 -10.0%
Total Contracting 1,567.0 1,492.6 +5.0%
Net financial surplusThe division’s net financial surplus was € 85.9 million as at 31 December 2021, which is down € 37 million compared to 31 December 2020. This decline is explained by the investments made in 2021 (€ 13.4 million, excluding the application of IFRS 16, including the renovation and extension of the VMA headquarters in Sint-Martens-Latem) and by the increase in working capital requirements.
AcquisitionIn December 2021, VMA strengthened its Industrial Automation division by acquiring the Polish companies of the Rolling Robotics group. This acquisition significantly strengthens the engineering capability in robot programming in particular for the design and offline programming of automated production lines. Rolling Robotics has about 50 employees and will contribute to the division’s income from 1 January 2022.
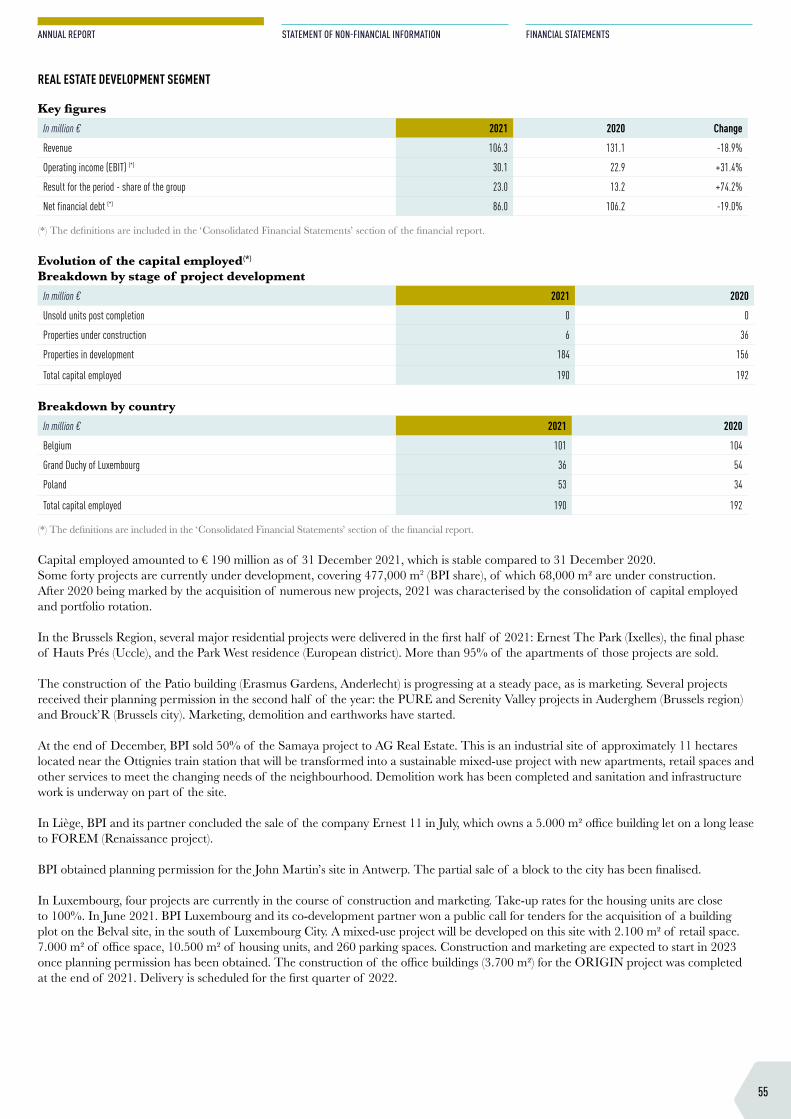
55
ANNUAL REPORT
STATEMENT OF NON-FINANCIAL INFORMATION
FINANCIAL STATEMENTS
REAL ESTATE DEVELOPMENT SEGMENT
Key figuresIn million € 2021 2020 Change
Revenue 106.3 131.1 -18.9%
Operating income (EBIT) (*) 30.1 22.9 +31.4%
Result for the period - share of the group 23.0 13.2 +74.2%
Net financial debt (*) 86.0 106.2 -19.0%
(*) The definitions are included in the ‘Consolidated Financial Statements’ section of the financial report.
Evolution of the capital employed(*)
Breakdown by stage of project developmentIn million € 2021 2020
Unsold units post completion 0 0
Properties under construction 6 36
Properties in development 184 156
Total capital employed 190 192
Breakdown by countryIn million € 2021 2020
Belgium 101 104
Grand Duchy of Luxembourg 36 54
Poland 53 34
Total capital employed 190 192
(*) The definitions are included in the ‘Consolidated Financial Statements’ section of the financial report.
Capital employed amounted to € 190 million as of 31 December 2021, which is stable compared to 31 December 2020. Some forty projects are currently under development, covering 477,000 m2 (BPI share), of which 68,000 m² are under construction.After 2020 being marked by the acquisition of numerous new projects, 2021 was characterised by the consolidation of capital employed and portfolio rotation.
In the Brussels Region, several major residential projects were delivered in the first half of 2021: Ernest The Park (Ixelles), the final phase of Hauts Prés (Uccle), and the Park West residence (European district). More than 95% of the apartments of those projects are sold.
The construction of the Patio building (Erasmus Gardens, Anderlecht) is progressing at a steady pace, as is marketing. Several projects received their planning permission in the second half of the year: the PURE and Serenity Valley projects in Auderghem (Brussels region) and Brouck’R (Brussels city). Marketing, demolition and earthworks have started.
At the end of December, BPI sold 50% of the Samaya project to AG Real Estate. This is an industrial site of approximately 11 hectares located near the Ottignies train station that will be transformed into a sustainable mixed-use project with new apartments, retail spaces and other services to meet the changing needs of the neighbourhood. Demolition work has been completed and sanitation and infrastructure work is underway on part of the site.
In Liège, BPI and its partner concluded the sale of the company Ernest 11 in July, which owns a 5.000 m² office building let on a long lease to FOREM (Renaissance project).
BPI obtained planning permission for the John Martin’s site in Antwerp. The partial sale of a block to the city has been finalised.
In Luxembourg, four projects are currently in the course of construction and marketing. Take-up rates for the housing units are close to 100%. In June 2021. BPI Luxembourg and its co-development partner won a public call for tenders for the acquisition of a building plot on the Belval site, in the south of Luxembourg City. A mixed-use project will be developed on this site with 2.100 m² of retail space. 7.000 m² of office space, 10.500 m² of housing units, and 260 parking spaces. Construction and marketing are expected to start in 2023 once planning permission has been obtained. The construction of the office buildings (3.700 m²) for the ORIGIN project was completed at the end of 2021. Delivery is scheduled for the first quarter of 2022.
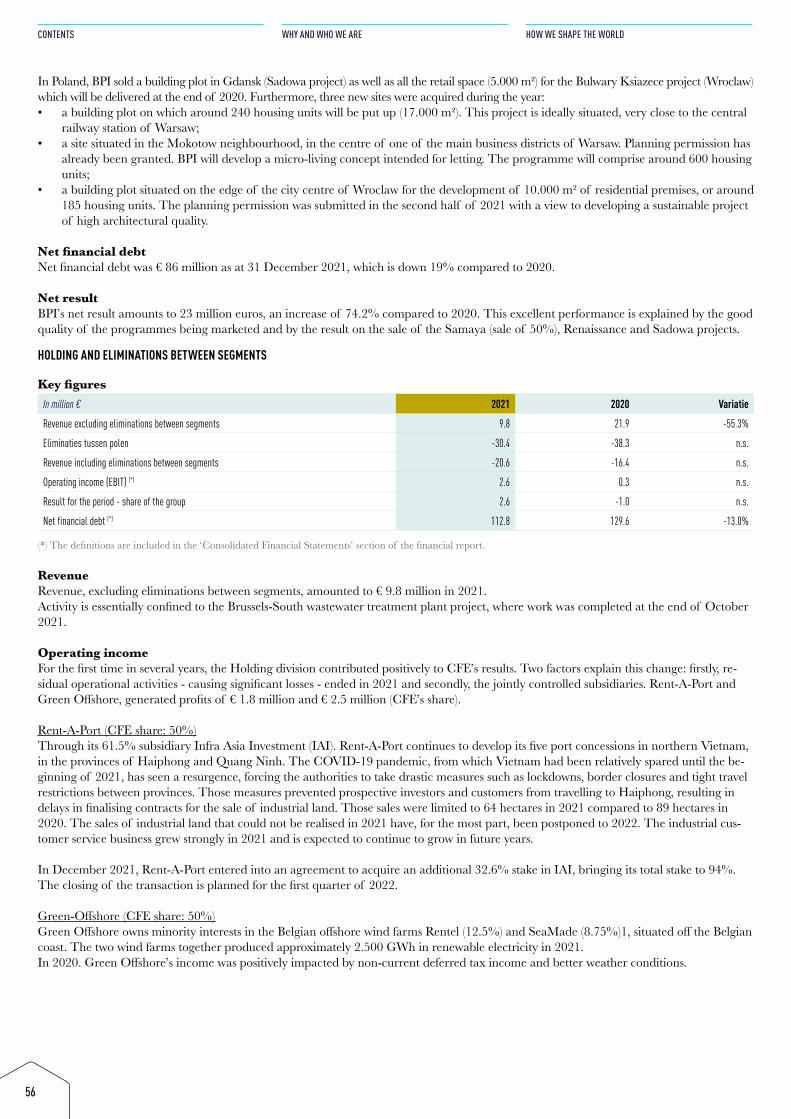
56
CONTENTS
WHY AND WHO WE ARE
HOW WE SHAPE THE WORLD
In Poland, BPI sold a building plot in Gdansk (Sadowa project) as well as all the retail space (5.000 m²) for the Bulwary Ksiazece project (Wroclaw) which will be delivered at the end of 2020. Furthermore, three new sites were acquired during the year:• a building plot on which around 240 housing units will be put up (17.000 m²). This project is ideally situated, very close to the central
railway station of Warsaw;• a site situated in the Mokotow neighbourhood, in the centre of one of the main business districts of Warsaw. Planning permission has
already been granted. BPI will develop a micro-living concept intended for letting. The programme will comprise around 600 housing units;
• a building plot situated on the edge of the city centre of Wroclaw for the development of 10.000 m² of residential premises, or around 185 housing units. The planning permission was submitted in the second half of 2021 with a view to developing a sustainable project of high architectural quality.
Net financial debtNet financial debt was € 86 million as at 31 December 2021, which is down 19% compared to 2020.
Net resultBPI’s net result amounts to 23 million euros, an increase of 74.2% compared to 2020. This excellent performance is explained by the good quality of the programmes being marketed and by the result on the sale of the Samaya (sale of 50%), Renaissance and Sadowa projects.
HOLDING AND ELIMINATIONS BETWEEN SEGMENTS
Key figuresIn million € 2021 2020 Variatie
Revenue excluding eliminations between segments 9.8 21.9 -55.3%
Eliminaties tussen polen -30.4 -38.3 n.s.
Revenue including eliminations between segments -20.6 -16.4 n.s.
Operating income (EBIT) (*) 2.6 0.3 n.s.
Result for the period - share of the group 2.6 -1.0 n.s.
Net financial debt (*) 112.8 129.6 -13.0%
(*) The definitions are included in the ‘Consolidated Financial Statements’ section of the financial report.
RevenueRevenue, excluding eliminations between segments, amounted to € 9.8 million in 2021.Activity is essentially confined to the Brussels-South wastewater treatment plant project, where work was completed at the end of October 2021.
Operating incomeFor the first time in several years, the Holding division contributed positively to CFE’s results. Two factors explain this change: firstly, re-sidual operational activities - causing significant losses - ended in 2021 and secondly, the jointly controlled subsidiaries. Rent-A-Port and Green Offshore, generated profits of € 1.8 million and € 2.5 million (CFE’s share).
Rent-A-Port (CFE share: 50%)Through its 61.5% subsidiary Infra Asia Investment (IAI). Rent-A-Port continues to develop its five port concessions in northern Vietnam, in the provinces of Haiphong and Quang Ninh. The COVID-19 pandemic, from which Vietnam had been relatively spared until the be-ginning of 2021, has seen a resurgence, forcing the authorities to take drastic measures such as lockdowns, border closures and tight travel restrictions between provinces. Those measures prevented prospective investors and customers from travelling to Haiphong, resulting in delays in finalising contracts for the sale of industrial land. Those sales were limited to 64 hectares in 2021 compared to 89 hectares in 2020. The sales of industrial land that could not be realised in 2021 have, for the most part, been postponed to 2022. The industrial cus-tomer service business grew strongly in 2021 and is expected to continue to grow in future years.
In December 2021, Rent-A-Port entered into an agreement to acquire an additional 32.6% stake in IAI, bringing its total stake to 94%. The closing of the transaction is planned for the first quarter of 2022.
Green-Offshore (CFE share: 50%)Green Offshore owns minority interests in the Belgian offshore wind farms Rentel (12.5%) and SeaMade (8.75%)1, situated off the Belgian coast. The two wind farms together produced approximately 2.500 GWh in renewable electricity in 2021. In 2020. Green Offshore’s income was positively impacted by non-current deferred tax income and better weather conditions.
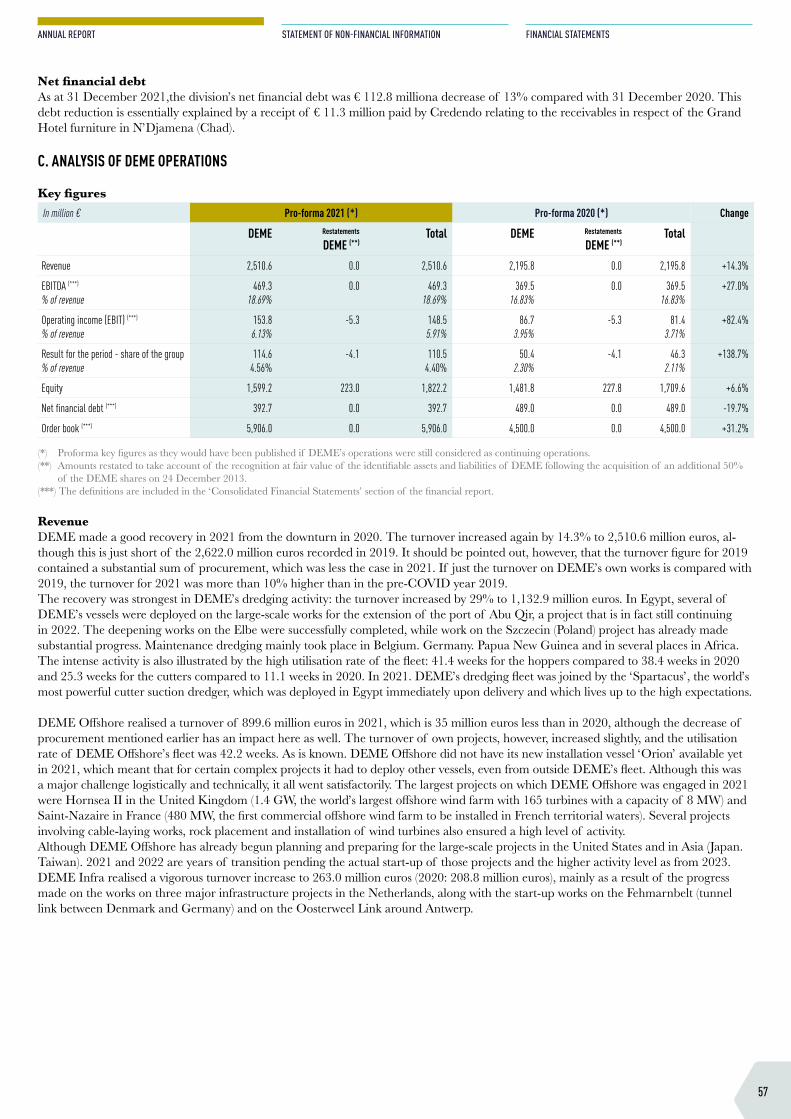
57
ANNUAL REPORT
STATEMENT OF NON-FINANCIAL INFORMATION
FINANCIAL STATEMENTS
Net financial debtAs at 31 December 2021,the division’s net financial debt was € 112.8 milliona decrease of 13% compared with 31 December 2020. This debt reduction is essentially explained by a receipt of € 11.3 million paid by Credendo relating to the receivables in respect of the Grand Hotel furniture in N’Djamena (Chad).
C. ANALYSIS OF DEME OPERATIONS
Key figuresIn million € Pro-forma 2021 (*) Pro-forma 2020 (*) Change
DEME Restatements
DEME (**) Total DEME Restatements
DEME (**) Total
Revenue 2,510.6 0.0 2,510.6 2,195.8 0.0 2,195.8 +14.3%
EBITDA (***)
% of revenue469.3
18.69%0.0 469.3
18.69%369.5
16.83%0.0 369.5
16.83%+27.0%
Operating income (EBIT) (***)
% of revenue153.86.13%
-5.3 148.55.91%
86.73.95%
-5.3 81.43.71%
+82.4%
Result for the period - share of the group % of revenue
114.64.56%
-4.1 110.54.40%
50.42.30%
-4.1 46.32.11%
+138.7%
Equity 1,599.2 223.0 1,822.2 1,481.8 227.8 1,709.6 +6.6%
Net financial debt (***) 392.7 0.0 392.7 489.0 0.0 489.0 -19.7%
Order book (***) 5,906.0 0.0 5,906.0 4,500.0 0.0 4,500.0 +31.2%
(*) Proforma key figures as they would have been published if DEME’s operations were still considered as continuing operations.(**) Amounts restated to take account of the recognition at fair value of the identifiable assets and liabilities of DEME following the acquisition of an additional 50%
of the DEME shares on 24 December 2013.(***) The definitions are included in the ‘Consolidated Financial Statements’ section of the financial report.
RevenueDEME made a good recovery in 2021 from the downturn in 2020. The turnover increased again by 14.3% to 2,510.6 million euros, al-though this is just short of the 2,622.0 million euros recorded in 2019. It should be pointed out, however, that the turnover figure for 2019 contained a substantial sum of procurement, which was less the case in 2021. If just the turnover on DEME’s own works is compared with 2019, the turnover for 2021 was more than 10% higher than in the pre-COVID year 2019. The recovery was strongest in DEME’s dredging activity: the turnover increased by 29% to 1,132.9 million euros. In Egypt, several of DEME’s vessels were deployed on the large-scale works for the extension of the port of Abu Qir, a project that is in fact still continuing in 2022. The deepening works on the Elbe were successfully completed, while work on the Szczecin (Poland) project has already made substantial progress. Maintenance dredging mainly took place in Belgium. Germany. Papua New Guinea and in several places in Africa. The intense activity is also illustrated by the high utilisation rate of the fleet: 41.4 weeks for the hoppers compared to 38.4 weeks in 2020 and 25.3 weeks for the cutters compared to 11.1 weeks in 2020. In 2021. DEME’s dredging fleet was joined by the ‘Spartacus’, the world’s most powerful cutter suction dredger, which was deployed in Egypt immediately upon delivery and which lives up to the high expectations.
DEME Offshore realised a turnover of 899.6 million euros in 2021, which is 35 million euros less than in 2020, although the decrease of procurement mentioned earlier has an impact here as well. The turnover of own projects, however, increased slightly, and the utilisation rate of DEME Offshore’s fleet was 42.2 weeks. As is known. DEME Offshore did not have its new installation vessel ‘Orion’ available yet in 2021, which meant that for certain complex projects it had to deploy other vessels, even from outside DEME’s fleet. Although this was a major challenge logistically and technically, it all went satisfactorily. The largest projects on which DEME Offshore was engaged in 2021 were Hornsea II in the United Kingdom (1.4 GW, the world’s largest offshore wind farm with 165 turbines with a capacity of 8 MW) and Saint-Nazaire in France (480 MW, the first commercial offshore wind farm to be installed in French territorial waters). Several projects involving cable-laying works, rock placement and installation of wind turbines also ensured a high level of activity.Although DEME Offshore has already begun planning and preparing for the large-scale projects in the United States and in Asia (Japan. Taiwan). 2021 and 2022 are years of transition pending the actual start-up of those projects and the higher activity level as from 2023. DEME Infra realised a vigorous turnover increase to 263.0 million euros (2020: 208.8 million euros), mainly as a result of the progress made on the works on three major infrastructure projects in the Netherlands, along with the start-up works on the Fehmarnbelt (tunnel link between Denmark and Germany) and on the Oosterweel Link around Antwerp.
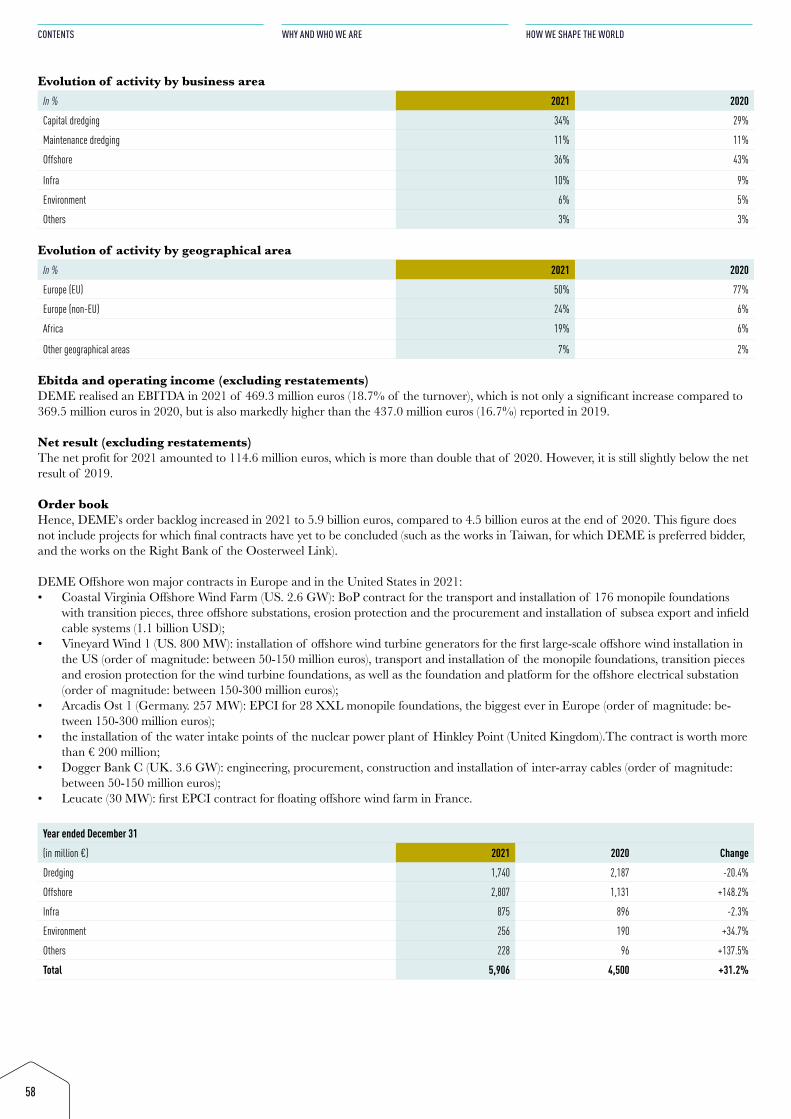
58
CONTENTS
WHY AND WHO WE ARE
HOW WE SHAPE THE WORLD
Evolution of activity by business areaIn % 2021 2020
Capital dredging 34% 29%
Maintenance dredging 11% 11%
Offshore 36% 43%
Infra 10% 9%
Environment 6% 5%
Others 3% 3%
Evolution of activity by geographical areaIn % 2021 2020
Europe (EU) 50% 77%
Europe (non-EU) 24% 6%
Africa 19% 6%
Other geographical areas 7% 2%
Ebitda and operating income (excluding restatements)DEME realised an EBITDA in 2021 of 469.3 million euros (18.7% of the turnover), which is not only a significant increase compared to 369.5 million euros in 2020, but is also markedly higher than the 437.0 million euros (16.7%) reported in 2019.
Net result (excluding restatements)The net profit for 2021 amounted to 114.6 million euros, which is more than double that of 2020. However, it is still slightly below the net result of 2019.
Order bookHence, DEME’s order backlog increased in 2021 to 5.9 billion euros, compared to 4.5 billion euros at the end of 2020. This figure does not include projects for which final contracts have yet to be concluded (such as the works in Taiwan, for which DEME is preferred bidder, and the works on the Right Bank of the Oosterweel Link).
DEME Offshore won major contracts in Europe and in the United States in 2021:• Coastal Virginia Offshore Wind Farm (US. 2.6 GW): BoP contract for the transport and installation of 176 monopile foundations
with transition pieces, three offshore substations, erosion protection and the procurement and installation of subsea export and infield cable systems (1.1 billion USD);
• Vineyard Wind 1 (US. 800 MW): installation of offshore wind turbine generators for the first large-scale offshore wind installation in the US (order of magnitude: between 50-150 million euros), transport and installation of the monopile foundations, transition pieces and erosion protection for the wind turbine foundations, as well as the foundation and platform for the offshore electrical substation (order of magnitude: between 150-300 million euros);
• Arcadis Ost 1 (Germany. 257 MW): EPCI for 28 XXL monopile foundations, the biggest ever in Europe (order of magnitude: be-tween 150-300 million euros);
• the installation of the water intake points of the nuclear power plant of Hinkley Point (United Kingdom).The contract is worth more than € 200 million;
• Dogger Bank C (UK. 3.6 GW): engineering, procurement, construction and installation of inter-array cables (order of magnitude: between 50-150 million euros);
• Leucate (30 MW): first EPCI contract for floating offshore wind farm in France.
Year ended December 31
(in million €) 2021 2020 Change
Dredging 1,740 2,187 -20.4%
Offshore 2,807 1,131 +148.2%
Infra 875 896 -2.3%
Environment 256 190 +34.7%
Others 228 96 +137.5%
Total 5,906 4,500 +31.2%
59
ANNUAL REPORT
STATEMENT OF NON-FINANCIAL INFORMATION
FINANCIAL STATEMENTS
InvestmentsIn 2021, DEME invested 282.0 million euros in the renewal and expansion of its fleet (excluding the application of IFRS 16). At the beginning of August, DEME took delivery of the ‘Spartacus’, the world’s most powerful and innovative cutter suction dredger. The ‘Groenewind’ (a service operation vessel for the maintenance of Belgian wind farms) was launched at the end of June. This vessel is being deployed on the Rentel and SeaMade offshore wind farms. The ‘Orion’ and the ‘Green Jade’ are still under construction, and delivery is expected in 2022 and 2023 respectively.
Moreover, the ‘Sea Installer’ and the ‘Sea Challenger’, DP2 jack-up installation vessels of DEME Offshore, will get a major crane upgrade. The hoisting capacity will be increased from 900 tonnes to 1,600 tonnes, which will enable the ship to install next-generation wind turbines and DEME Offshore to maintain the leadership position in the installation of wind turbines.
Net financial debtNotwithstanding the markedly higher level of activity at DEME and the sustained investments, DEME nevertheless succeeded in reducing its net financial debt by 96.3 million euros to 392.7 million euros at year-end 2021.
DEME concessionsIn July, Hyport Coordination Company LLC, a 50% subsidiary of DEME Concessions located in Oman, signed a cooperation agreement with German energy giant Uniper. In its first phase, it will develop a green hydrogen plant of 500 MW (HYPORT Duqm) on that site. The green hydrogen produced from electricity from solar panels and on-shore wind turbines will then be converted into green ammonia and transported to Europe.
DEME Concessions continues to invest in deep-sea mineral mining through its subsidiary Global Sea Mineral Resources (GSR). In April, the ‘Patania II’, GSR’s deep-sea robot, successfully demonstrated that it can ride on the seabed and collect polymetallic nodules at a depth of 4,500 metres. As in previous periods, all costs relating to GSR were charged to profit and loss, which for DEME means a negative im-pact on the result (before tax) of 16 million euros in 2021.
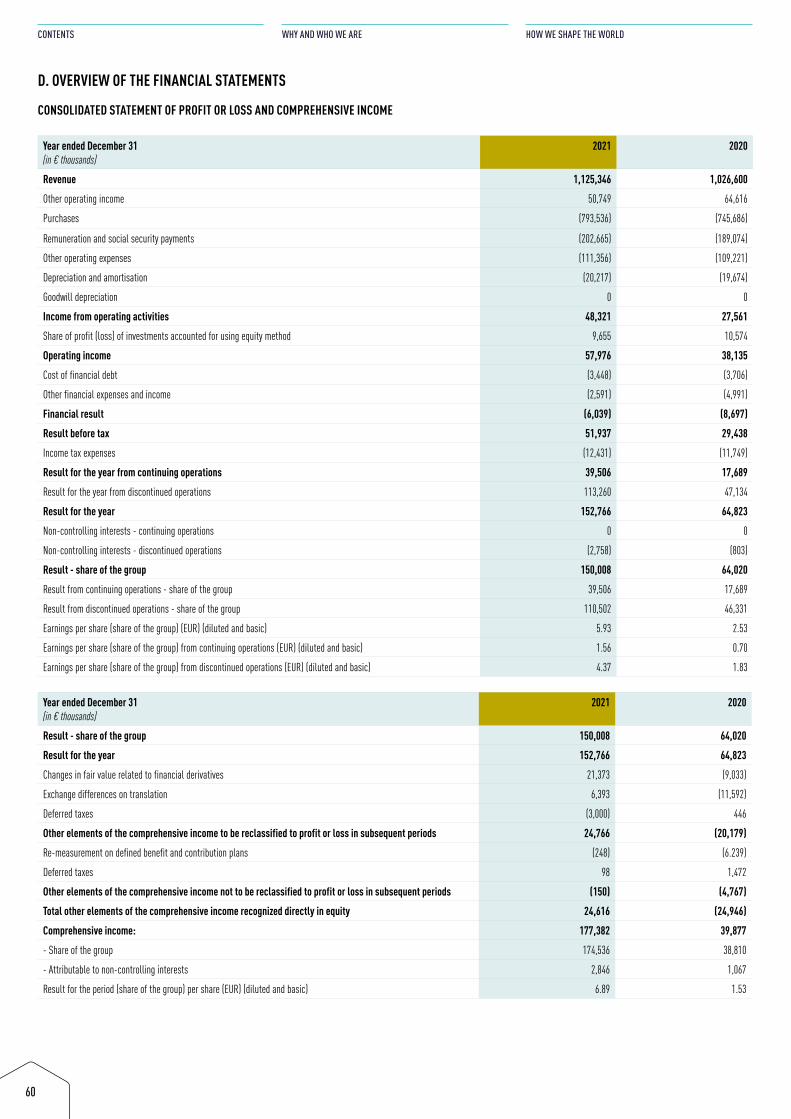
60
CONTENTS
WHY AND WHO WE ARE
HOW WE SHAPE THE WORLD
D. OVERVIEW OF THE FINANCIAL STATEMENTS
CONSOLIDATED STATEMENT OF PROFIT OR LOSS AND COMPREHENSIVE INCOME
Year ended December 31(in € thousands)
2021 2020
Revenue 1,125,346 1,026,600
Other operating income 50,749 64,616
Purchases (793,536) (745,686)
Remuneration and social security payments (202,665) (189,074)
Other operating expenses (111,356) (109,221)
Depreciation and amortisation (20,217) (19,674)
Goodwill depreciation 0 0
Income from operating activities 48,321 27,561
Share of profit (loss) of investments accounted for using equity method 9,655 10,574
Operating income 57,976 38,135
Cost of financial debt (3,448) (3,706)
Other financial expenses and income (2,591) (4,991)
Financial result (6,039) (8,697)
Result before tax 51,937 29,438
Income tax expenses (12,431) (11,749)
Result for the year from continuing operations 39,506 17,689
Result for the year from discontinued operations 113,260 47,134
Result for the year 152,766 64,823
Non-controlling interests - continuing operations 0 0
Non-controlling interests - discontinued operations (2,758) (803)
Result - share of the group 150,008 64,020
Result from continuing operations - share of the group 39,506 17,689
Result from discontinued operations - share of the group 110,502 46,331
Earnings per share (share of the group) (EUR) (diluted and basic) 5.93 2.53
Earnings per share (share of the group) from continuing operations (EUR) (diluted and basic) 1.56 0.70
Earnings per share (share of the group) from discontinued operations (EUR) (diluted and basic) 4.37 1.83
Year ended December 31(in € thousands)
2021 2020
Result - share of the group 150,008 64,020
Result for the year 152,766 64,823
Changes in fair value related to financial derivatives 21,373 (9,033)
Exchange differences on translation 6,393 (11,592)
Deferred taxes (3,000) 446
Other elements of the comprehensive income to be reclassified to profit or loss in subsequent periods 24,766 (20,179)
Re-measurement on defined benefit and contribution plans (248) (6.239)
Deferred taxes 98 1,472
Other elements of the comprehensive income not to be reclassified to profit or loss in subsequent periods (150) (4,767)
Total other elements of the comprehensive income recognized directly in equity 24,616 (24,946)
Comprehensive income: 177,382 39,877
- Share of the group 174,536 38,810
- Attributable to non-controlling interests 2,846 1,067
Result for the period (share of the group) per share (EUR) (diluted and basic) 6.89 1.53
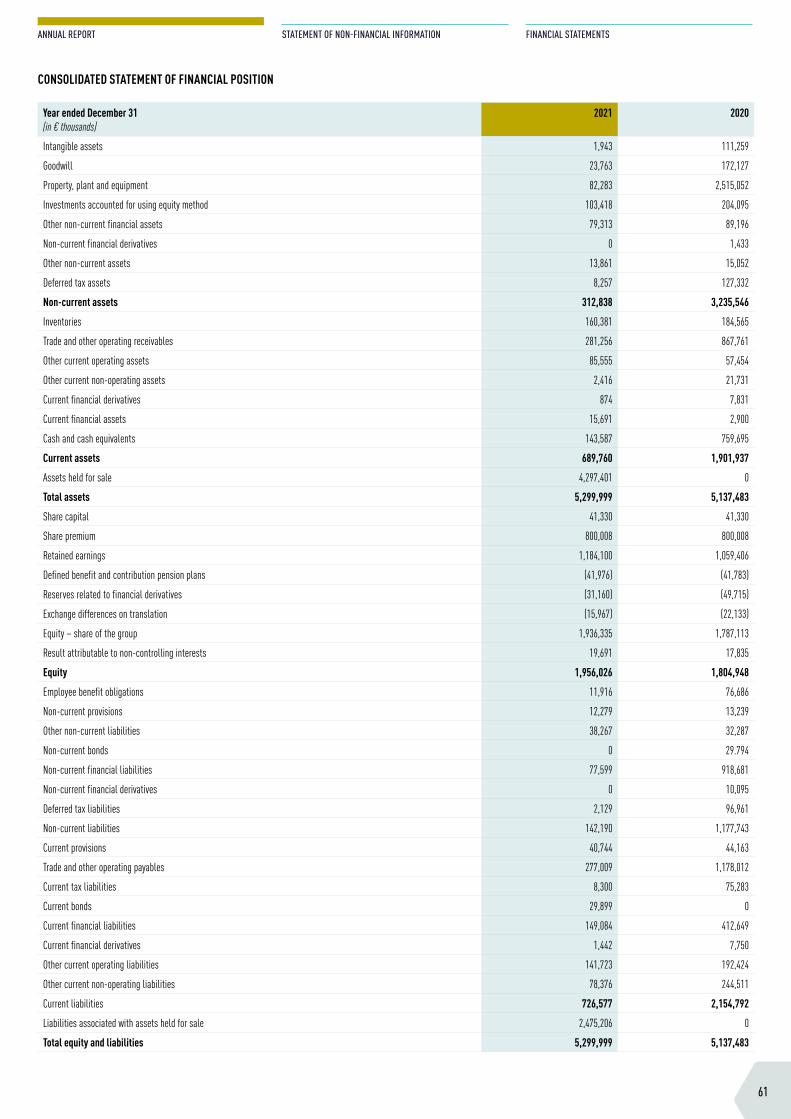
61
ANNUAL REPORT
STATEMENT OF NON-FINANCIAL INFORMATION
FINANCIAL STATEMENTS
CONSOLIDATED STATEMENT OF FINANCIAL POSITION
Year ended December 31(in € thousands)
2021 2020
Intangible assets 1,943 111,259
Goodwill 23,763 172,127
Property, plant and equipment 82,283 2,515,052
Investments accounted for using equity method 103,418 204,095
Other non-current financial assets 79,313 89,196
Non-current financial derivatives 0 1,433
Other non-current assets 13,861 15,052
Deferred tax assets 8,257 127,332
Non-current assets 312,838 3,235,546
Inventories 160,381 184,565
Trade and other operating receivables 281,256 867,761
Other current operating assets 85,555 57,454
Other current non-operating assets 2,416 21,731
Current financial derivatives 874 7,831
Current financial assets 15,691 2,900
Cash and cash equivalents 143,587 759,695
Current assets 689,760 1,901,937
Assets held for sale 4,297,401 0
Total assets 5,299,999 5,137,483
Share capital 41,330 41,330
Share premium 800,008 800,008
Retained earnings 1,184,100 1,059,406
Defined benefit and contribution pension plans (41,976) (41,783)
Reserves related to financial derivatives (31,160) (49,715)
Exchange differences on translation (15,967) (22,133)
Equity – share of the group 1,936,335 1,787,113
Result attributable to non-controlling interests 19,691 17,835
Equity 1,956,026 1,804,948
Employee benefit obligations 11,916 76,686
Non-current provisions 12,279 13,239
Other non-current liabilities 38,267 32,287
Non-current bonds 0 29.794
Non-current financial liabilities 77,599 918,681
Non-current financial derivatives 0 10,095
Deferred tax liabilities 2,129 96,961
Non-current liabilities 142,190 1,177,743
Current provisions 40,744 44,163
Trade and other operating payables 277,009 1,178,012
Current tax liabilities 8,300 75,283
Current bonds 29,899 0
Current financial liabilities 149,084 412,649
Current financial derivatives 1,442 7,750
Other current operating liabilities 141,723 192,424
Other current non-operating liabilities 78,376 244,511
Current liabilities 726,577 2,154,792
Liabilities associated with assets held for sale 2,475,206 0
Total equity and liabilities 5,299,999 5,137,483
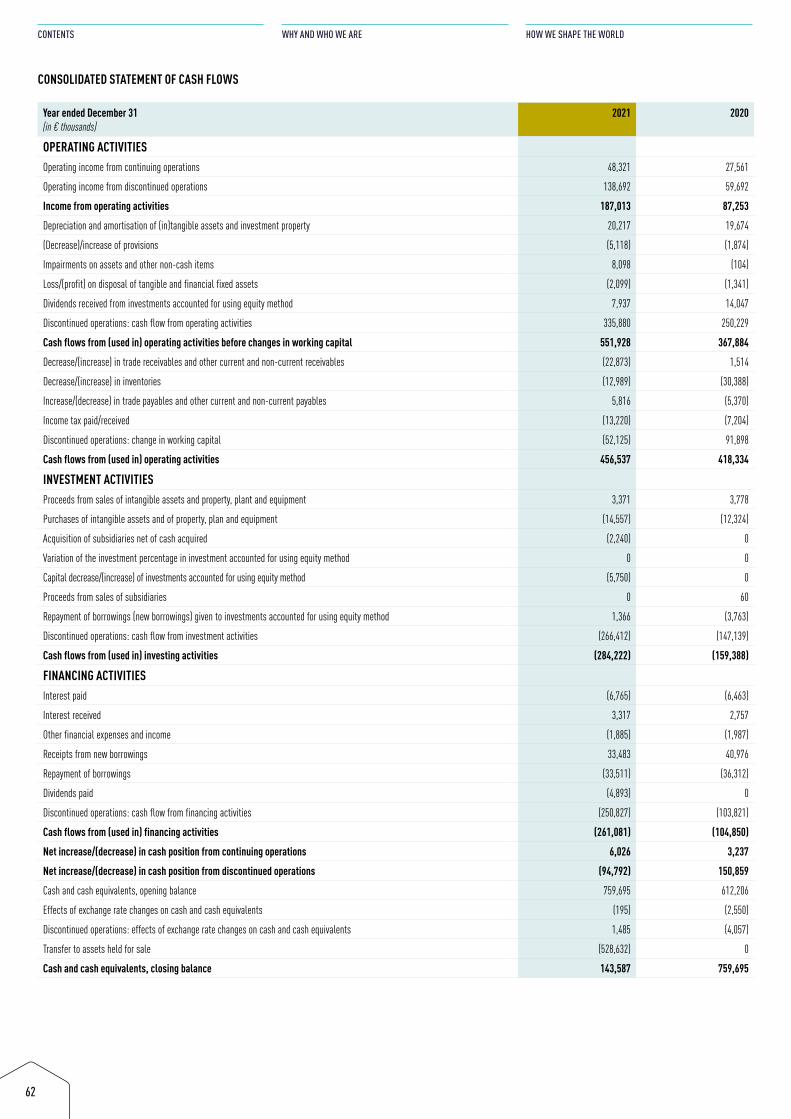
62
CONTENTS
WHY AND WHO WE ARE
HOW WE SHAPE THE WORLD
CONSOLIDATED STATEMENT OF CASH FLOWS
Year ended December 31(in € thousands)
2021 2020
OPERATING ACTIVITIESOperating income from continuing operations 48,321 27,561
Operating income from discontinued operations 138,692 59,692
Income from operating activities 187,013 87,253
Depreciation and amortisation of (in)tangible assets and investment property 20,217 19,674
(Decrease)/increase of provisions (5,118) (1,874)
Impairments on assets and other non-cash items 8,098 (104)
Loss/(profit) on disposal of tangible and financial fixed assets (2,099) (1,341)
Dividends received from investments accounted for using equity method 7,937 14,047
Discontinued operations: cash flow from operating activities 335,880 250,229
Cash flows from (used in) operating activities before changes in working capital 551,928 367,884
Decrease/(increase) in trade receivables and other current and non-current receivables (22,873) 1,514
Decrease/(increase) in inventories (12,989) (30,388)
Increase/(decrease) in trade payables and other current and non-current payables 5,816 (5,370)
Income tax paid/received (13,220) (7,204)
Discontinued operations: change in working capital (52,125) 91,898
Cash flows from (used in) operating activities 456,537 418,334
INVESTMENT ACTIVITIESProceeds from sales of intangible assets and property, plant and equipment 3,371 3,778
Purchases of intangible assets and of property, plan and equipment (14,557) (12,324)
Acquisition of subsidiaries net of cash acquired (2,240) 0
Variation of the investment percentage in investment accounted for using equity method 0 0
Capital decrease/(increase) of investments accounted for using equity method (5,750) 0
Proceeds from sales of subsidiaries 0 60
Repayment of borrowings (new borrowings) given to investments accounted for using equity method 1,366 (3,763)
Discontinued operations: cash flow from investment activities (266,412) (147,139)
Cash flows from (used in) investing activities (284,222) (159,388)
FINANCING ACTIVITIESInterest paid (6,765) (6,463)
Interest received 3,317 2,757
Other financial expenses and income (1,885) (1,987)
Receipts from new borrowings 33,483 40,976
Repayment of borrowings (33,511) (36,312)
Dividends paid (4,893) 0
Discontinued operations: cash flow from financing activities (250,827) (103,821)
Cash flows from (used in) financing activities (261,081) (104,850)
Net increase/(decrease) in cash position from continuing operations 6,026 3,237
Net increase/(decrease) in cash position from discontinued operations (94,792) 150,859
Cash and cash equivalents, opening balance 759,695 612,206
Effects of exchange rate changes on cash and cash equivalents (195) (2,550)
Discontinued operations: effects of exchange rate changes on cash and cash equivalents 1,485 (4,057)
Transfer to assets held for sale (528,632) 0
Cash and cash equivalents, closing balance 143,587 759,695
63
ANNUAL REPORT
STATEMENT OF NON-FINANCIAL INFORMATION
FINANCIAL STATEMENTS
NOTES TO THE CONSOLIDATED FINANCIAL STATEMENTS
Introductory commentAs indicated in the introduction, the announcement of the intention to proceed with a partial demerger implies that DEME’s activities have to be accounted for as discontinued operations in accordance with the requirements of IFRS 5 – Assets held for sale and discontinued operations.
The impacts on the presentation of the financial statements can be summarised as follows:In terms of the consolidated income statement, the amounts relating to DEME are grouped and presented on three separate lines: profit or loss from discontinued operations, non-controlling interests - discontinued operations and profit or loss from discontinued operations, group share. This presentation applies to both 2021 and 2020, resulting in a restatement of the 2020 consolidated income statement.
In terms of the consolidated statement of financial position, and only for 2021, the asset items relating to DEME are grouped on one line (assets held for sale) and debt and provision items are also grouped on one line (liabilities associated with assets held for sale). It should be noted that i) DEME’s equity remains part of CFE’s consolidated equity until the effective date of the partial demerger and ii) the consoli-dated statement of financial position of 2020 is not restated.
In terms of the consolidated cash flow statement, the amounts related to DEME are aggregated and presented on eight separate lines: op-erating income from discontinued operations, discontinued operations: cash flow from operating activities, discontinued operations: change in working capital, discontinued operations: cash flow from investing activities, discontinued operations: cash flow from financing activities, net increase (decrease) in cash and cash equivalents from discontinued operations, discontinued operations: effect of exchange rate changes on cash and cash equivalents and transfer to assets held for sale. This presentation applies to both 2021 and 2020, which involves a restate-ment of the 2020 consolidated cash flow statement.
Comments on consolidated statement of financial position as of 31 December 2021Excluding assets held for sale, the statement of financial position total was € 1 billion.
Fixed assets consist mainly of the net book values of the head offices of several Belgian subsidiaries of the group, machinery, equipment and vehicles.Equity-accounted investments and other financial assets mainly include the shareholdings and shareholder loans towards Rent-A-Port, Green Offshore and the jointly controlled real estate development project companies.
Inventories consist mainly of property projects developed by BPI and its fully consolidated subsidiaries.The cash position includes € 72.8 million available at CFE SA. The balance of the cash position is broken down between joint ventures and foreign entities not included in the cash pooling.
Equity is broken down into 1,822.2 million for discontinued operations (DEME) and 133.8 million for continuing operations (CFE exclud-ing DEME). Non-controlling interests amounting to € 19.7 million relate exclusively to discontinued operations.
Financial debts and bonds totalled € 256.6 million.
The financial covenants of the parent company and its subsidiaries are fully met.
As at 31 December 2021, CFE SA had € 174 million in unused confirmed credit lines.
64
CONTENTS
WHY AND WHO WE ARE
HOW WE SHAPE THE WORLD
1.2. MAIN RISKSThe Managing Director of CFE is responsible for the preparation of a framework for internal control and risk management, which is submitted to the Board of Directors for approval. The Board of Directors is responsible for assessing the implementation of this frame-work, taking the recommendations of the Audit Committee into account. At least once a year, the Audit Committee evaluates the internal control systems that the Managing Director has set up, in order to ascertain that the main risks have been properly identified, reported and managed. The subsidiaries of CFE are responsible for the management of their own operational and financial risks. These risks, which vary according to the sector, are not centrally managed by CFE. The management teams of the subsidiaries in question report to their Board of Directors on their risk management.
This section describes, in general terms, the risks facing CFE as a holding company on the one hand, and the operational and financial risks associated with the various segments in which it is active (either directly or indirectly) through its subsidiaries on the other.
1.2.1. RISKS AT THE LEVEL OF CFE
Liquidity riskCFE ensures that it always has sufficient financial resources to meet its obligations towards its creditors. Its confirmed credit lines amount to € 234 million. 60 million of which has been drawn down as of 31 December 2021. In addition. CFE has € 72.8 million available in cash.
CFE complied with all of its financial covenants at 31 December 2021.
The confirmed credit lines will be either amended or replaced by new credit lines and, where appropriate, other forms of financing that will be put in place before the partial demerger planned in the summer of 2022.
Interest rate riskCFE is exposed to the effect of interest rate fluctuations on its variable rate financial debt. This risk is partly mitigated by the implementation of ‘Interest Rate Swap’ (IRS) type interest rate hedges. The notional amount of the IRS amounted to € 50 million as at 31 December 2021.
Exchange rate riskApart from a minor residual exposure to the Tunisian dinar. CFE is no longer exposed to exchange rate risks.
Counterparty riskCFE has no significant exposure to the counterparty risk.
As regards the operational risks of the non-transferred activities of CFE other than those described above, we refer to 1.2.2 below.
1.2.2. RISKS AT THE SUBSIDIARY LEVEL A distinction should be made between the risks common to the three divisions and those specific to each division.
RISKS COMMON TO THE THREE DIVISIONS
Preliminary remarkAll risks relating to DEME’s activities will no longer affect CFE from the day of the partial demerger.
Risks related to project executionThe main characteristic of the businesses of the CFE Group is the commitment made when submitting a proposal (or selling a property) to perform a task that is by its nature unique, for a price with predetermined terms and within an agreed time schedule.
The risk factors therefore relate to:• the price of the task to be performed and in the event of divergence between the anticipated price and the actual price as a result of
variations in the unit prices and/or quantities stated in the tender;• the possibility (or not) of obtaining coverage for additional costs and price increases;• design, if this is the contractor’s responsibility;• performance of the contract;• control of the elements included in the cost price;• project time schedule and deadlines, internal and external factors that may influence the delivery time;• performance obligations (quality, deadlines) and the related direct and indirect consequences;• warranty obligations (10-year guarantee, maintenance);• compliance with safety and other workforce-related obligations that are also extended to service providers.
65
ANNUAL REPORT
STATEMENT OF NON-FINANCIAL INFORMATION
FINANCIAL STATEMENTS
The procedures for managing the aforementioned risks are:• In the early stages, during the study phase:
- preliminary analysis; - review of projects that exceed a certain threshold by the Risk Committee, prior to tendering; - assessment of the right size of the teams involved; - incorporation of feedback in the study phase.
• In the later stages, during the execution phase: - organisation of the preparation of the construction sites; - setting up specific and appropriate management systems; - application of price revision formulas; - transfer of risk to subcontractors and suppliers; - prior choice of technical solutions or equipment; - dialogue with the customer and the project owner; - drafting of contractual clauses containing reciprocal commitments; - provision of payment guarantees; - arranging insurance policies
Economic risksThe different divisions of CFE are, by their very nature, subject to strong cyclical fluctuations. Nevertheless, this observation must be qualified for each segment or sub-segment of activity, since the key factors can vary between them.
For example:• dredging and marine civil engineering activities are sensitive to the international economic climate, trends in world trade and gov-
ernment investment policy as concerns major infrastructure and sustainable development works. Slower growth in one or more of DEME’s markets may adversely affect its business levels and earnings;
• construction activities and real-estate development activities related to the office property market move in line with the traditional economic cycle, while the residential business depends more directly on general economic conditions, consumer confidence and inter-est rates.
Risks related to the management and workforceCFE Contracting suffers from a chronic shortage of qualified supervisory staff and workers. The success of projects, in the study, prepara-tion and execution phases, depends both on employees’ qualifications and skills and on their availability in the labour market.
On the talent market. DEME must be able to attract, motivate and retain highly qualified staff to manage projects abroad..
Market risks Interest rate riskDEME and BPI make major investments extending over long periods of time. In this context and in terms of the availability of long-term credit, project finance or major capital expenditure, those entities apply a policy of interest rate hedging where necessary. Nevertheless, interest-rate risk cannot be entirely eliminated.
Change riskGiven the international nature of its activities and the fact that some contracts are performed in foreign currencies, the different divi-sions of the group are exposed to exchange-rate risk. For the Contracting and Real Estate Development divisions, this is limited to the Polish Zloty (PLN). To mitigate this risk, they engage in exchange-rate hedging and forward foreign exchange contracts. Nevertheless, ex-change-rate risk cannot be entirely eliminated.
Credit riskTo reduce underlying solvency risk, DEME and CFE Contracting check the solvency of their customers when submitting quotations, reg-ularly monitor accounts receivable, and adjust their positions with them where necessary. For customers presenting a material credit risk, down payments and/or bank guarantees are required before the work starts. In markets outside Europe, if a country is eligible and the risk can be covered by credit insurance. DEME obtains coverage from organisa-tions specialising in this area, such as Credendo Group. Nevertheless, credit risk cannot be entirely eliminated.
Liquidity riskIn order to limit the liquidity risk, the entities of the CFE Group increased their sources of financing, of which there are four:• a bond of € 30 million issued by BPI (maturing in 2022);• confirmed medium-term bilateral credit lines available to DEME and BPI;• ‘project-finance’ loans or leasing contracts, as used by DEME to finance some of its vessels and set up by BPI to fund its real estate
projects;• bank loans or treasury notes to cover short and medium-term cash requirements.
DEME, CFE Contracting and BPI complied with all of their financial covenants at 31 December 2021.
66
CONTENTS
WHY AND WHO WE ARE
HOW WE SHAPE THE WORLD
Price risk of commodities, equipment and subcontractorsDEME and CFE Contracting are potentially exposed to increases in the prices of certain raw materials, equipment and work done by sub-contractors. Such increases are liable to have a negative impact on the profitability of the projects. It is also worth noting that DEME hedges against rising diesel prices for contracts that do not contain price revision mechanisms.
Risk of dependency on customers or suppliersGiven the Group’s activities and its organisational structure, which reflects the local nature of its markets. CFE considers that, overall, it is not dependent on a small number of customers, suppliers or subcontractors.
Environmental risksLike any company involved in dredging and marine activities. DEME pays particular attention to environmental risks, which fall into two categories:• disruption to flora and/or fauna or accidental pollution, which can never be totally ruled out despite the very strict prevention meas-
ures that the company takes in performing its dredging work;• DEME subsidiaries operating in the environmental field have to decontaminate highly polluted soil, the extent and exact composition
of which is not always easy to establish before the contract starts. In addition, the innovative technologies that DEME uses to remedi-ate soils also carry a degree of risk
In view of the type of work it is asked to do, CFE Contracting may be involved in handling hazardous materials. CFE Contracting takes all possible safety and health precautions for its workers and takes particular care regarding this point, although this risk cannot be entirely eliminated.
Respect for the environment is one of the fundamental values upheld by the different divisions of CFE, which make every effort to limit the negative environmental impact of their activities.
Legal risksGiven the diversity of their activities and geographical locations, DEME, CFE Contracting and BPI are exposed to a complex regulatory environment as concerns the places where services are performed and the fields of activity involved. In particular, they are subject to the rules relating to administrative contracts, public and private works contracts, civil liability, and to the regulations in the area of social and labour law.
Political risksDEME is exposed to political risks, which may take different forms: political instability, wars (including civil wars), armed conflicts, terror-ism, hostage-taking, extortion and sabotage.
They represent potential threats to the security of staff and property. As a result, these risks are monitored closely and, if necessary, a pro-ject may be stopped if basic security conditions are no longer met. In this case, staff and equipment are transferred to a safer location.
DEME has appointed an Enterprise Security Officer to:• provide regular updates on potential threats to the security of staff and property;• help to set up security procedures;• verify compliance with those procedures;• coordinate emergency situations when necessary.
Risks relating to the protection of intellectual property and know-howDEME has developed specific know-how and innovative technologies in various areas.
To protect its trade secrets and intellectual property relating to its innovations. DEME has filed numerous patent applications covering over 100 specific applications.
Risks related to special-purpose companiesDEME and BPI participate in carrying out some of their real estate, public-private partnerships or concession activities, and will continue to participate in special-purpose companies (SPVs) that provide real guarantees in support of their credit facilities. The risk, in the event of the failure of this type of company and exercise of the guarantees, is that the proceeds from such exercise are not sufficient to cover some or all of the amount of shareholders’ equity or equivalent used as collateral for setting up the credit facilit
Risks related to Covid-19In order to protect everyone’s health, the management of the different poles and divisions has taken the necessary measures in response to the COVID-19 pandemic, in particular travel restrictions, teleworking, strict adherence to social distance rules and holding virtual meetings. The Group is committed to limiting the adverse effects of the pandemic. Nevertheless, they still had a negative impact on the results of the group in 2021, albeit to a far lesser extent than in 2020. The pandemic caused:• productivity losses and delays on some construction sites due to lockdown and quarantine measures and major disruptions in the sup-
ply chain;• quarantining of certain vessels following the detection of positive COVID-19 cases;
67
ANNUAL REPORT
STATEMENT OF NON-FINANCIAL INFORMATION
FINANCIAL STATEMENTS
• at the time of writing this report, the consequences of COVID-19 on the operation of the group’s entities based in Europe are tend-ing to fade. However, it cannot be excluded that a new variant of the virus may appear.
IT security risksIn the digital and teleworking era, IT risks increasingly constitute threats that are liable to slow down the activities of CFE’s subsidiaries, or that could harm their most valuable resources and data.
The main IT risks are viruses and malware, fraudulent emails, hacking (cyber attacks), loss of confidential information, operating errors, risk of physical loss or theft, and misappropriation.
As and when they are identified, a series of specific measures are taken for each type of risk in order to minimise the occurrence of those risks and, where appropriate, the consequences that could arise.
For example:• a professional antivirus software has been installed on all workstations, with regular updates.• regular training and awareness-building sessions in social engineering are organised for all the staff, focusing on human and technical
detection tools. • a professional service has been added to Outlook to report and analyse “phishing” e-mails.• a strategy of complex passwords and a well-configured and up-to-date multi-factor authentication system have been put in place. • the Group hires external service providers to carry out a penetration test.• the Group calls in external service providers to analyse the systems, and to alert the company with regard to incidents that could have
a negative impact.• the Group works with the Chief Information Security Officers to carry out audits regarding the implementation of our security policies.• access to confidential and sensitive records is restricted according to the user profiles, and records and resources are partitioned by
department, with authentication required. • an efficient backup system has been put in place. • the employees are systematically trained in the use of applications and software.
The financial year 2021 was characterised by numerous interventions by dedicated IT teams, without any significant consequences for the subsidiaries concerned.
OPERATIONAL RISKS SPECIFIC TO THE DREDGING. ENVIRONMENT. OFFSHORE AND INFRA DIVISION
Operational risks relating to dredging and offshore worksIn its dredging, wind farm installation, subsea cable-laying and civil engineering projects, DEME faces various specific operational risks related to:• determining the type and composition of the soil;• climatic and weather conditions, including extreme events such as storms, tsunamis and earthquakes;• wear and tear affecting equipment;• technical incidents and breakdowns that may affect the performance of vessels;• default of subcontractors or suppliers, particularly in the context of EPCI type contracts;• project design and engineering;• changes in the regulatory framework during the contract• relations with subcontractors, suppliers and partners.
Operational risks related to the development of concessionsDEME has for several years been developing a concessions and public-private partnership business. In this business. DEME faces specific risks related to:• the evolution of electricity prices (offshore wind farm concessions);• the evolution of maritime traffic (port concessions);• maintenance and servicing activities;• the ability to finance these large projects.
Risks related to fleet investmentsDEME is primarily engaged in maritime activities, which are characterised by their capital-intensive nature, due to the need for regular investment in new vessels in order to keep the fleet at the cutting edge of technology. For this reason, DEME is faced with complex invest-ment decisions and specific operational risks relating to:• technical design of the investment (type of vessel, capacity, power, etc.) and expertise in new technologies;• time between the investment decision and commissioning of the vessel, and anticipating future market developments;• control over construction by the shipyard once the investment decision has been made (cost, performance, conformity, etc.);• utilisation of the fleet and scheduling of activities;• financing.
68
CONTENTS
WHY AND WHO WE ARE
HOW WE SHAPE THE WORLD
DEME has qualified staff with the capacity to design new vessels and design and execute large-scale projects. Given the very nature of the activity and the many external factors to be taken into account, the risks inherent in this business cannot be completely eliminated.
Fraud and integrity risksDEME closely follows its procedures for the avoidance of fraud and integrity risks. A centralisation at the headquarters of the global fi-nancial payments in the DEME group is being worked out. The framework of the internal audit function was also centralised, and a new internal audit manager was appointed.
Sabetta case fileAs publicly known, the Public Prosecutor’s office started an investigation in 2016 into the circumstances under which a contract was awarded in April 2014 in the context of a private tender to Mordraga, a Russian joint venture company of the DEME group, for the execution of dredging works in the port of Sabetta (Russia). The works were carried out in the summer months of 2014 and 2015. The contract was completed in 2016.
The investigation was initiated after a complaint was filed by a competitor who was not awarded the contract in question, and is based exclusively on selective information provided by this competitor.
The Public Prosecutor summoned certain companies and (former) staff members of the DEME group at the end of December 2020 to appear before the Council Chamber. The Council Chamber decided on February 21, 2022 to refer the case to the competent court. An appeal will be lodged against the decision of the Council Chamber. It should be emphasised that the Council Chamber does not pronounce any judgment on the merits of the case, but merely rules on the question whether or not there are sufficient incriminating elements to have a case judged on its merits by the competent court.
DEME remains confident about the further development of the procedure.
In light of the foregoing, DEME cannot for the time being make a reliable assessment of the possible financial impact of the pending in-vestigation. Therefore, no provision has been recorded as of 31 December 2021, in accordance with the requirements of IAS 37.
OPERATIONAL RISKS SPECIFIC TO THE CONTRACTING DIVISION
Contractual risks related to public-private partnershipsThe legal and contractual risks facing the Contracting division are even greater in a public-private partnership contract (e.g. Design. Build. Fi-nance and Maintain (DBFM) contract, concession contract), which may vary in duration from a few years to several decades. The risks are as-sessed before bid submission during the study phase, which is generally much longer than for a conventional construction contract. The main risks connected with the operation of assets given in concession relate to maintaining the viability of the asset in view of the maintenance and repair objectives defined in the concession contract. For any infrastructure that is operated under a public-private partnership contract, the equipment renewal cost and the cost of the work must be provided for on the basis of a forecast plan for major maintenance.
The measures to manage the risks related to partnership contracts include: • discussion in Risk Committee prior to tendering;• setting up the operation in a special purpose vehicle with financing that is for the most part provided through debt without recourse or
with limited recourse against the shareholders;• involvement of the lenders in the early stages of the projects;• seeking advice from external consultants.
Legal risks related to social and labour lawSocial risksThe social risks facing CFE Contracting are situated in the context of the cross-border subcontracting chain mainly in the construction sector. The main risks identified for the construction sites in Belgium are: the re-qualification of top-tier subcontracting contracts, the employ-ment and the absence of the checkin@work declaration.Any breach of social law is likely to constitute a risk at both the legal and the reputational level..
Risk management measuresIn order to prevent the occurrence of such risks, subcontractor policies, as well as training programmes, are provided within CFE Contracting, and are applicable in all its entities. Their implementation at the level of the Contracting divisions is ensured by the management of the subsidiaries. In addition to those structural procedures aimed at strengthening the effectiveness of the prevention mechanism, social audits with regard to subcontractors have been carried out on the construction sites from 2018 onwards. During those audits, special attention was paid to compliance with social security obligations. Social risks are analysed every six months, and action plans are drawn up.
LitigationBPC SA, a subsidiary of CFE Contracting SA was convicted on May 19, 2020, for alleged violations of employment law allegedly com-mitted by one of its subcontractors in 2017. BPC SA strongly refuted the allegations made against it in the decision at firstand appealed against this decision.
69
ANNUAL REPORT
STATEMENT OF NON-FINANCIAL INFORMATION
FINANCIAL STATEMENTS
OPERATIONAL RISKS SPECIFIC TO THE REAL ESTATE DEVELOPMENT DIVISION
Risks related to the economic environment The division is exposed to local, regional, national and international economic conditions and to other events that affect the markets on which BPI operates. The division’s projects are currently situated exclusively in Belgium. Luxembourg and Poland.
A change in the principal macroeconomic indicators, the geopolitical environment or the economic cycle in general may impact the confi-dence of households, investors and private and public entities, and may bring about (i) a fall in demand for housing and retail properties, as well as other categories of real estate, (ii) lower sale prices and lower returns on which those sale prices may be calculated, and (iii) a higher risk of default by service providers, building contractors and other stakeholders.
Variations in mortgage rates may affect the ability of households and private investors to acquire residential properties and, consequently, diminish the demand for such class of assets.On the office market, variations in long-term interest rates may also affect the return on which the price of office properties is calculated. Such variations may also have a significant impact on the division’s ability to sell residential or office properties.
Risks related to real estate investmentsBefore acquiring land for building. BPI examines the financial, technical and town planning feasibility of the real estate project. Those feasibil-ity studies are carried out by external experts or consultants and are based on assumptions concerning economic, market and other conditions (including estimates of potential sale prices). Despite BPI’s diligent approach, it is possible that it does not take account of, or does not know, all the relevant factors to make an informed decision.The systematic review of all real estate acquisitions by the company’s Investment Committee diminishes this risk.
Risks related to real estate developmentAll projects are dependent on planning, building and environmental permits being granted. Consequently, any project may be affected by (i) the division being unable to obtain, maintain or renew the necessary permits or (ii) any delay in obtaining, maintaining or renewing those permits, as well as (iii) BPI being unable to comply with the conditions of those permits.Furthermore, changes made by the competent authorities to the legal framework and the administrative procedures surrounding the filing for, delivery or validity of, such permits may have a negative impact on the financial result of a project.
Project delivery may be delayed or compromised by various factors, such as weather conditions, building site accidents, natural disasters, industrial disputes, shortage of equipment or building materials, accidents or other unforeseen difficulties. BPI may also incur additional project construction and development costs that exceed the initial estimates.
Additional costs and penalties may be incurred if a project cannot be developed in a timely manner or in accordance with the agreed terms and conditions.This risk is mitigated by the fact that BPI almost systematically entrusts the construction of its projects to one of the companies of CFE Contracting (lump-sum contracts) and arranges appropriate insurance coveraget.
Liquidity and financing risksThe development of projects involves substantial investments that are primarily financed by equity and external financing sources.
BPI is unable to renew the existing finance agreements or attract new financing on commercially favourable terms.
However and in view of the increase in capital employed over the past few years, BPI pursued its policy of diversifying its sources of fi-nancing by increasing its confirmed credit lines, using its treasury notes and medium-term promissory notes programme, and by setting up new project financing in Belgium and Luxembourg on terms that are virtually equivalent to those in effect before the health crisis. On 31 December 2021, BPI has € 50 million of unused confirmed bilateral credit lines.
Risks related to the ability to sell projectsBPI’s activity, financial position, results and prospects are almost entirely dependent on the sale of its projects.Investments in real estate projects for which no planning permission has been obtained yet are relatively illiquid. BPI is unable to find a suita-ble buyer for this type of asset if it needs cash. Moreover, market conditions may force BPI to sell its projects at lower prices than planned.The division’s inability to generate positive cash flow from project sales can adversely affect its capacity to repay its debts.Nevertheless, this risk is mitigated by a careful market survey prior to any investment and in the course of its development, as well as by the elasticity of demand on the residential market. The take-up rate of real estate projects in progress remains at a very satisfactory level in 2021.
Risk of portfolio concentrationThe division tries to constitute a diversified project portfolio. Nevertheless, more than 50% of its projects are situated in Belgium and are acquired on the residential market. Consequently, any slowdown or regulatory changes in Belgium or any market changes affecting the residential market may have a considerable negative impact on the division’s results and operations. Nevertheless. BPI’s policy is to diversi-fy its portfolio.
70
CONTENTS
WHY AND WHO WE ARE
HOW WE SHAPE THE WORLD
Risks related to stakeholdersThe division maintains contractual relations with several parties, such as partners, investors, tenants, entrepreneurs, financial institutions and architects. Those stakeholders may experience disruptions in their operations or be confronted with financial difficulties that may cause a delay or total inability to meet their contractual obligations.Although contractual agreements usually contain guarantees, default or bankruptcy of a stakeholder could render the guarantees entirely or partially inapplicable.
As was mentioned above, the risk is largely mitigated by the fact that BPI almost systematically entrusts the construction of its projects to the companies of CFE Contracting.
Risks related to competitionThe division faces competition from other property developers on the markets where it is active. This competition can affect the division’s abil-ity to sell and rent projects at attractive rates and prices and can therefore have an adverse impact on the division’s activity, financial situation, results and prospects.
This activity is also characterised by long operating cycles, which means that operators need to anticipate decisions and make long-term com-mitments.
1.3. MAJOR EVENTS AFTER THE CLOSING OF THE FINANCIAL YEAR
1.3.1. CONTINUING OPERATIONSThe Ukrainian crisis has no direct impact on CFE’s continued operation as CFE has no presence in these two countries. However, this conflict has major indirect consequences: the sharp rise in most materials prices and disruption to supply chains will affect CFE’s continued operation in 2022. However, as the duration and extent of the crisis are not known, it is not possible to quantify the impact at this stage.
1.3.2. DISCONTINUED OPERATIONSThe Russia-Ukraine crisis, which destabilised both countries and global financial markets, will put further pressure on our global economy, which has already been weakened by inflation, rising energy prices, the ongoing pandemic and a constrained supply chain. At the date of this report, we assess that this crisis and the restrictive measures taken by Europe and the US against Russia do not have a substantial direct impact on the activities of DEME. The indirect impact is difficult to predict at the moment.
1.4. RESEARCH AND DEVELOPMENTDEME carries out ongoing research to increase the efficiency of its fleet. In addition, in partnership with universities and the Flemish re-gion of Belgium, it carries out research into the production of sustainable marine energy. In partnership with private-sector companies, it also carries out research into techniques to harvest polymetallic nodules.
1.5. FINANCIAL INSTRUMENTSThe CFE Group has implemented a system of investment limits to manage the counterparty risk. This system determines maximum amounts eligible for investment by a counterparty defined according to their credit ratings published by Standard & Poor’s and Moody’s. These limits are regularly monitored and updated.
1.6. OUTLOOK 2022 - CONTINUING OPERATIONSExcluding exceptional items, CFE expects moderate growth in revenue and to maintain a high level of net profit for its continuing operations.
With a full order book, CFE Contracting should report further growth in its activity and continue to improve its operational performance.BPI’s net result should remain at a high level, albeit lower than in 2021.
Barring a worsening of the health situation, the Holding division should benefit from the recovery of business in Vietnam and increase its contribution to the group’s net income.
1.7. OUTLOOK 2022 - DISCONTINUED ACTIVITIES Based on its order backlog and the present market conditions, DEME expects a further increase of turnover, EBITDA and net result for 2022. As a result of the delivery of the long-awaited and groundbreaking installation vessel ‘Orion’ in the first half of the year, the acqui-sition of the cable installation vessel ‘Viking Neptun’ by year-end 2022, and the planned dry-docking of several vessels. DEME projects an investment budget of approx. 500 million euros for 2022.
71
ANNUAL REPORT
STATEMENT OF NON-FINANCIAL INFORMATION
FINANCIAL STATEMENTS
III. CORPORATE GOVERNANCE STATEMENT
1. REFERENCE CODEThe Company uses the 2020 Belgian Corporate Governance Code (“2020 Code”) as reference code. The 2020 Code may be consulted on the website of the Corporate Governance Committee (www.corporategovernancecommittee.be).
The Board of Directors of Compagnie d’Entreprises CFE adopted the initial version of the Corporate Governance Charter (the “Charter”) on 9 December 2005.
The Charter is regularly updated according to developments in corporate governance policy and changes made to the applicable regu-lations.
The main amendments made to the Charter are discussed in the corporate governance statement, which constitutes a special section in the directors’ report pursuant to Article 3:6. §2 of the Code of Companies and Associations (the “Statement”).
Since 9 December 2005, the Board of Directors has adopted the following amendments to the Charter:• 7 May 2009: amendment of the Charter following the revision of the Belgian Corporate Governance Code;• 8 December 2011: amendment of the Charter to bring it into conformity with the Act of 6 April 2010 on the enhancement of cor-
porate governance for listed companies and the Act of 20 December 2010 on the exercise of certain rights of shareholders in listed companies;
• 24 December 2013: amendment of the Charter following the change of control over the Company in 2013;• 26 February 2015: amendment of the Charter to bring it into conformity with European Regulation (EU) no. 596/2014 of 16 April
2014 on market abuse;• 24 February 2016: introduction in the Charter of the age limit for directors;• 25 February 2017: amendment of the Charter regarding the daily management of the Company;• 26 March 2019: amendment of the Charter to bring it into conformity with the law on the organisation of the profession and the
public supervision of auditors, and relaxation of the rule concerning the age limit for directors;• 26 March 2020: amendment of the Charter to bring it into conformity with the 2020 Belgian Corporate Governance Code, enacted
by the Royal Decree of 12 May 2019 laying down the corporate governance code to be complied with by listed companies.
The Charter is available in two languages (Dutch and French) on the Company’s website (www.cfe.be). This chapter (“Corporate Govern-ance Statement”) contains the information referred to in Articles 3:6. §2 and 3:32. §1. second paragraph. 7° of the Code of Companies and Associations. This chapter focuses more specifically on factual information relating to corporate governance matters and explains the derogations from certain provisions of the 2020 Code during the past financial year, according to the “comply or explain” principle.
2. BOARD OF DIRECTORSThe Board of Directors determines the Company’s direction and values, its strategy and its key policies. It examines and approves related significant operations, ensures that they are properly executed and defines any measures needed to carry out its policies. It decides on the level of risk the Company is prepared to take.
The Board of Directors:• approves the general internal control and risk management system and checks that this system is correctly implemented;• takes all measures needed to ensure the integrity of the financial statements;• supervises the activities of the Statutory Auditor;• reviews the performance of the managing director;• ensures that the special committees of the Board of Directors function properly and efficiently.
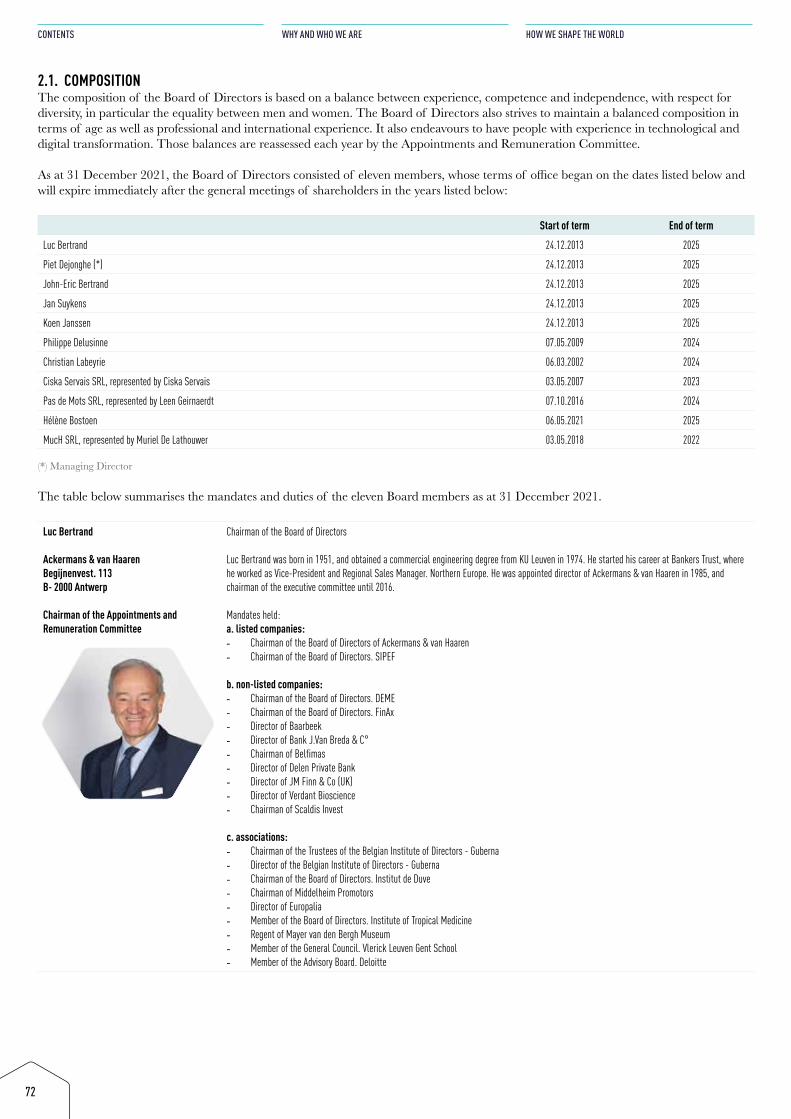
72
CONTENTS
WHY AND WHO WE ARE
HOW WE SHAPE THE WORLD
2.1. COMPOSITIONThe composition of the Board of Directors is based on a balance between experience, competence and independence, with respect for diversity, in particular the equality between men and women. The Board of Directors also strives to maintain a balanced composition in terms of age as well as professional and international experience. It also endeavours to have people with experience in technological and digital transformation. Those balances are reassessed each year by the Appointments and Remuneration Committee.
As at 31 December 2021, the Board of Directors consisted of eleven members, whose terms of office began on the dates listed below and will expire immediately after the general meetings of shareholders in the years listed below:
Start of term End of term
Luc Bertrand 24.12.2013 2025
Piet Dejonghe (*) 24.12.2013 2025
John-Eric Bertrand 24.12.2013 2025
Jan Suykens 24.12.2013 2025
Koen Janssen 24.12.2013 2025
Philippe Delusinne 07.05.2009 2024
Christian Labeyrie 06.03.2002 2024
Ciska Servais SRL, represented by Ciska Servais 03.05.2007 2023
Pas de Mots SRL, represented by Leen Geirnaerdt 07.10.2016 2024
Hélène Bostoen 06.05.2021 2025
MucH SRL, represented by Muriel De Lathouwer 03.05.2018 2022
(*) Managing Director
The table below summarises the mandates and duties of the eleven Board members as at 31 December 2021.
Luc Bertrand
Ackermans & van HaarenBegijnenvest. 113B- 2000 Antwerp
Chairman of the Appointments and Remuneration Committee
Chairman of the Board of Directors
Luc Bertrand was born in 1951, and obtained a commercial engineering degree from KU Leuven in 1974. He started his career at Bankers Trust, where he worked as Vice-President and Regional Sales Manager. Northern Europe. He was appointed director of Ackermans & van Haaren in 1985, and chairman of the executive committee until 2016.
Mandates held:a. listed companies: - Chairman of the Board of Directors of Ackermans & van Haaren - Chairman of the Board of Directors. SIPEF
b. non-listed companies: - Chairman of the Board of Directors. DEME - Chairman of the Board of Directors. FinAx - Director of Baarbeek - Director of Bank J.Van Breda & C° - Chairman of Belfimas - Director of Delen Private Bank - Director of JM Finn & Co (UK) - Director of Verdant Bioscience - Chairman of Scaldis Invest
c. associations: - Chairman of the Trustees of the Belgian Institute of Directors - Guberna - Director of the Belgian Institute of Directors - Guberna - Chairman of the Board of Directors. Institut de Duve - Chairman of Middelheim Promotors - Director of Europalia - Member of the Board of Directors. Institute of Tropical Medicine - Regent of Mayer van den Bergh Museum - Member of the General Council. Vlerick Leuven Gent School - Member of the Advisory Board. Deloitte
73
ANNUAL REPORT
STATEMENT OF NON-FINANCIAL INFORMATION
FINANCIAL STATEMENTS
Piet Dejonghe
Ackermans & van HaarenBegijnenvest. 113B- 2000 Antwerp
Managing Director
Piet Dejonghe was born in 1966, and has a degree in law (KU Leuven. 1989), a postgraduate degree in management (KU Leuven. 1990) and an MBA from INSEAD (1993). Before joining Ackermans & van Haaren in 1995, he worked as a lawyer attached to the law firm Loeff Claeys Verbeke, and as a consultant at the Boston Consulting Group.
Mandates held:a. listed companies: - Member of the Executive Committee. Ackermans & van Haaren - Director of Nextensa
b. non-listed companies: - Director of Baloise Belgium - Director of Bank J.Van Breda & C° - Director of Delen Private Bank - Director of Delen Private Bank Luxembourg - Director of DEME - Director of FinAx - Director of Profimolux - Director of AvH Growth Capital - Director of BPI Real Estate Belgium - Director of BPI Real Estate Luxembourg - Director of MBG - Director of BPC Group - Director of BPC Wallonia - Director of CFE Contracting - Director of Mobix Engema - Director of Mobix Stevens - Director of CLE - Director of Extensa Group - Director of Green Offshore - Director of Van Laere - Director of Bio Cap Invest - Director of HDP Charleroi
c. associations: - Member of the Board of Directors of SOS-Villages d’Enfants Belgique
74
CONTENTS
WHY AND WHO WE ARE
HOW WE SHAPE THE WORLD
John-Eric Bertrand
Ackermans & van HaarenBegijnenvest. 113B- 2000 Antwerp
Chairman of the Audit Committee
Director
John-Eric Bertrand was born in 1977, and has a degree in commercial engineering (UCL 2001,magna cum laude), a Master’s degree in International Ma-nagement (CEMS. 2002), and an MBA from INSEAD (2006). Before joining Ackermans & van Haaren in 2008 as investment manager. John-Eric Bertrand worked as a senior auditor at Deloitte and as a senior consultant at Roland Berger Strategy Consultants. He has been on the Executive Committee of AvH since 1 July 2015.
Mandates held:a. listed companies: - Member of the Executive Committee. Ackermans & van Haaren - Director of Sagar Cements
b. non-listed companies: - Chairman of the Board of Directors. Agidens - Chairman of the Board of Directors. Telemond Holding - Chairman of the Board of Directors. Baarbeek Immo - Director of DEME - Director of AvH Growth Capital - Director of Manuchar - Director of Axe Investments - Director of VMA - Director of VMA Druart - Director of VMA Nizet - Director of Profimolux - Director of Finasucre - Director of AvH Resources India - Director of AvH Singapore - Director of Venturi Partners - Member of the Investment Committee of Venturi - Member of the Investment Committee of Healthquad
c.associations: - Director of Belgian Finance Club
Jan Suykens
Ackermans & van HaarenBegijnenvest. 113B- 2000 Antwerp
Director
Jan Suykens was born in 1960, and has a degree in applied economics (UFSIA. 1982) and an MBA from Columbia University (1984). He worked for several years in corporate and investment banking at Générale de Banque before joining Ackermans & van Haaren in 1990.
Mandates held:a. listed companies: - Chairman of the Executive Committee. Ackermans & van Haaren - Chairman of the Board of Directors. Nextensa
b. non-listed companies: - Chairman of the Board of Directors. Anima - Chairman of the Board of Directors. Bank J.Van Breda & C° - Vice-Chairman of the Board of Directors. Delen Private Bank - Director of Anfima - Director of BPI Real Estate Belgium - Director of Delen Private Bank Luxembourg - Director of DEME - Director of Extensa Group - Director of FinAx - Director of Grossfeld PAP - Director of JM Finn & Co (UK) - Director of Mediacore - Director of Mediahuis - Director of Mediahuis Partners - Director of Profimolux - Director of Rent-A-Port - Director of AvH Growth Capital
c. associations : - Director of Antwerp Management School - Director of De Vrienden van het Rubenshuis - Member of the Advisory Board. ING Antwerp Branch - Chairman of the Executive Committee. Antwerp Support Council for the King Baudouin Foundation
75
ANNUAL REPORT
STATEMENT OF NON-FINANCIAL INFORMATION
FINANCIAL STATEMENTS
Koen Janssen
Ackermans & van HaarenBegijnenvest. 113B- 2000 Antwerp
Director
Koen Janssen was born in 1970, and has a degree in civil engineering and electromechanics (KU Leuven. 1993), along with an MBA from IEFSI (France. 1994). He worked for Recticel. ING Investment Banking and ING Private Equity before joining Ackermans & van Haaren in 2001.
Mandates held:a. listed companies: - Member of the Executive Committee. Ackermans & van Haaren
b. non-listed companies: - Director of Bedrijvencentrum Regio Mechelen - Director of DEME - Director of NMC International - Director of Rent-A-Port - Director of Infra Asia Investment - Director of RAP Green Energy - Director of Biolectric Group - Director of Green Offshore - Director of Sofinim Lux - Director of AvH Growth Capital - Director of LTS - Director of Otary RS - Director of Otary Bis - Director of Rentel - Director of Seamade - Director of North Sea Wave - Director of Estor-Lux - Director of Stichting Continuïteit IHC - Director of Finance Continuïteit IHC - Independent director of NMC International
c. associations: - Director of Belgian Offshore Platform (BOP) vzw, permanent representative for Green Offshore
Philippe Delusinne
RTL BelgiumAvenue Jacques Georgin 2B-1030 Brussels
Director
Philippe Delusinne was born in 1957, and holds a diploma in Marketing & Distribution from ISEC Brussels and a Short MBA from the Sterling Institute of Harvard University.He began his career as an account executive at Ted Bates, and subsequently held the positions of account manager at Publicis, client services director at Impact FCB, deputy general manager at McCann Erikson, and Chief Executive Officer of Young & Rubicam in 1993. He has been Chief Executive Officer of RTL Belgium since March 2002.
Mandates held: a. listed companies: - Member of the Supervisory Board of Métropole Télévision - M6
b. non-listed companies: - Managing Director of RTL Belgium and Radio H - Permanent representative of CLT-UFA. Managing Director of Cobelfra and Inadi - CEO of RTL Belux & Cie SECS and Managing Director of RTL Belux - Managing Director and Chairman of the Board of Directors of IP Belgium - Permanent representative of CLT-UFA. Managing Director and President of New Contact - Director of CLT-UFA - Director of Agence Télégraphique Belge de Presse - Representative of INADI SA. Director of MaRadio.be - Director of the Belgian Association for Self-Regulation of Journalistic Ethics - Permanent representative of RTL BELGIUM. Director of the AISBL Business Club Belgium Luxembourg - Chairman of the Théâtre Royal de La Monnaie - Chairman of Les Amis des Musées Royaux des Beaux-Arts de Belgique (Friends of the Royal Museums of Fine Arts of Belgium) - Vice-Chairman of B19 Business Club
76
CONTENTS
WHY AND WHO WE ARE
HOW WE SHAPE THE WORLD
Christian Labeyrie
VINCI1973 Boulevard de la DéfenseF-92000 Nanterre
Member of the Audit Committee
Director
Born in 1956. Christian Labeyrie is Executive Vice-President and Chief Financial Officer of the VINCI group, and a member of its Executive Committee. Before joining VINCI in 1990, he held various positions in the Rhône-Poulenc and Schlumberger groups. He began his career in the banking industry. Christian Labeyrie is a graduate of HEC, the Escuela Superior de Administración de Empresas (Barcelona) and McGill University (Canada), and holds a DECS diploma (advanced accounting degree). He is a Chevalier of the Légion d’Honneur and a Chevalier of the Ordre National du Mérite.
Mandates held:a. listed companies: - Member of the Executive Committee of the VINCI Group
b. non-listed companies: - Director of VINCI Deutschland - Director of Arcour - Director of the Stade de France consortium - Director of VFI - Director of SMABTP - Member of the Board of Directors. Lima Expesa (Limex) - Manager of SCCV CESAIRE-LES GROUES - Manager of SCCV HEBERT-LES GROUES - Permanent Representative of VINCI Innovation on the Board of Directors of ASF - Chairman of VINCI Re
Ciska Servais SRL, represented by Ciska Servais
Boerenlegerstraat. 204B-2650 Edegem
Director
Ciska Servais is a partner in law firm Astrea. She is active in the field of administrative law, focusing in particular on environmental and town planning law, real estate law and construction law. She has extensive experience as a consultant in judicial proceedings and negotiations; she teaches universi-ty courses and is a regular speaker at seminars.She graduated with a Bachelor’s degree in law from the University of Antwerp (1989), and obtained a Master’s degree (LL.M) in international legal cooperation from the Free University of Brussels (VUB) (1990). She also obtained a special degree in ecology from the University of Antwerp (1991).She started her internship in 1990 at law firm Van Passel & Greeve. She became a partner at Lexeco in 1994 and, subsequently, at Lawfort in 2004. She co-founded the law firm Astrea in 2006.Ciska Servais mainly publishes on the subject of environmental law, such as on the wastewater treatment decree, environmental liability and regulati-ons regarding the movement of soil. She is a member of the Antwerp Bar Association.
Mandates held:b. non-listed companies: - Astrea CVBA - SYMBIOSIS SON
Pas de Mots SRL, represented by Leen Geirnaerdt
Anne Frankstraat 1B-9150 Kruibeke
Member of the Audit Committee
Independent Director
After studying applied economic science at Antwerp University. Leen Geirnaerdt began her professional career at PricewaterhouseCoopers (PwC), where she worked for six years in auditing. She then moved on to Solvus Resource Group, a Belgian listed company where she held the position of corporate controller. After Solvus Resource Group was taken over by Dutch listed company USG People NV. Leen Geirnaerdt was appointed director of the Belgian Shared Services Center, and subsequently in 2010 as Chief Financial Officer in the Netherlands. Following the takeover by Japanese group Recruit, she was appointed global CFO of Recruit Global Staffing in 2016. From May 2019 until October 2021. Leen Geirnaerdt was CFO at bpost.
Mandates held: b. non-listed companies: - Director and Chair of the Audit Committee of H. Essers NV
77
ANNUAL REPORT
STATEMENT OF NON-FINANCIAL INFORMATION
FINANCIAL STATEMENTS
MucH SRL,represented by Muriel De Lathouwer
Jacques Pasturlaan 128B-1180 Ukkel
Member of the Audit Committee Member of the Appointments and Remuneration Committee
Independent Director
Muriel De Lathouwer holds an engineering degree in nuclear physics (ULB. Brussels) and an MBA from INSEAD. Paris.She started her career as an IT consultant at Accenture, followed by seven years at McKinsey in Brussels where she was Associate Principal and advised major telecom and cable TV operators, as well as media and high tech companies around the world. She subsequently became Chief Marketing Officer and a member of the Executive Committee of mobile telecom operator BASE, after which she became CEO of EVS from 2014 to 2018 where she oversaw the digital transformation of the company. Muriel De Lathouwer is a director of several international companies and is active in the W.I.N.G. fund (Digital Wallonia) as a member of the operating team and the Deep Tech investment committee.
Mandates held: a. listed companies: - Member of the Board of Directors. Remuneration Committee and Audit Committee of Shurgard
b. non-listed companies: - Member of the Board of Directors and of the Appointments and Remuneration Committee. Etex - Member of the Board of Directors. Chair of the Appointments and Remuneration Committee, and member of the Governance and Investment
Committees of the Olympia investment fund - Member of the Board of Directors, CPH bank
c. associations: - Vice-Chair. Coderdojo Belgium - Chair of the Board of Directors, ULB dev
Hélène Bostoen
Burgemeestersstraat 22B-1050 Elsene
Member of the Audit Committee Member of the Appointments and Remuneration Committee
Independent Director
Hélène Bostoen is a management engineer (Solvay Business School, ULB, Brussels) and holds an MBA from INSEAD. Singapore and Fontainebleau.She began her career at Merrill Lynch in New York where she developed portfolio analysis services and tools for international UHNW clients, in close collaboration with Riskmetrics. After her MBA, she set up It’za Foods (now Mexma Food), which makes flour tortillas for the European market. In 2007 she took over the management of the family business and launched residential development activities in Belgium and Poland.
Mandates held: a. listed companies: - Member of the Board of Directors of Home Invest Belgium, member of the Investment Committee and the Project Committee
b. non-listed companies: - Member of the Board of Directors and Managing Director, Flanders-Immo JB SA - Member of the Board of Directors and Managing Director, Fenixco SA - Member of the Board of Directors and Manager. FBC SPRL - Member of the Board of Directors, District I SPRL - Member of the Board of Directors, Eko Development sp.z o O. - Member of the Board of Directors, Abattoir NV
c.associations: - Co-chair of the Committee of Residential Property Developers of UPSI-BVS, Association of Real Estate Professionals
2.2. INDEPENDENT DIRECTORSAs at 31 December 2021, the directors who meet the independence criteria defined in Article 3.5 of the 2020 Code are: • Pas de Mots SRL, represented by Leen Geirnaerdt• Hélène Bostoen• MucH SRL, represented by Muriel De Lathouwer
2.3. OTHER DIRECTORS• Luc Bertrand • Piet Dejonghe• Jan Suykens• Koen Janssen• John-Eric Bertrand• Christian Labeyrie• Ciska Servais SRL, represented by Ciska Servais• Philippe Delusinne
78
CONTENTS
WHY AND WHO WE ARE
HOW WE SHAPE THE WORLD
2.4. MODE OF OPERATIONThe Board of Directors is organised so as to ensure that decisions are taken in the interest of the Company and that work is executed efficiently. Meetings of the Board of DirectorsThe Board of Directors meets regularly and with sufficient frequency to perform its obligations effectively. It also meets whenever required in the interest of the Company.
In 2021, the Board of Directors considered all major issues concerning CFE. It met six times.In particular, the Board of Directors:• approved the financial statements for 2020 as well as the financial statements for the first half of 2021;• examined the 2021 budget and the updates to that budget;• examined the 2022 budget;• reviewed matters that were presented at Risk Committee meetings and the evolution of the safety indicators;• examined the financial situation of CFE, changes in its debt levels and its working capital requirement;• reviewed the strategic analysis of the Construction in Belgium and Multitechnics (VMA) segments;• examined the evolution of real estate projects and approved the acquisition and sale of several real estate projects worth more than
ten million euros;• decided on the remuneration and bonus arrangements for the managing director and the executives, at the proposal of the Appoint-
ments and Remuneration Committee;• decided on the preparation of the partial demerger of CFE which will be submitted for approval to the Extraordinary General Meeting.
With regard to the active participation of directors in board meetings, the table below indicates the individual attendance rate of directors at Board meetings in 2021.
Directors Attendance/Total number of meetings
Luc Bertrand 6/6
Piet Dejonghe 6/6
Jan Suykens 6/6
Koen Janssen 6/6
John-Eric Bertrand 6/6
Christian Labeyrie 6/6
Philippe Delusinne 6/6
Ciska Servais SRL, represented by Ciska Servais 6/6
Pas de Mots SRL, represented by Leen Geirnaerdt 6/6
Much SRL, represented by Muriel De Lathouwer 6/6
Hélène Bostoen 4/4
Euro-Investment Management SA, represented by Martine Van den Poel 2/2
In accordance with Article 2.7 of the Charter, periodic evaluation procedures are organized within the Board of Directors. These take place on the initiative and under the lead of the chairman. The annual assessment of the relationship between the Board of Directors and the Chief Executive Officer took place on 23 February 2020. The non-executive directors expressed their general satisfaction with the good cooperation between the Board of Directors and the Chief Executive Officer and made some suggestions to this effect. The next triennial evaluation will take place in 2022.
2.5. CODE OF CONDUCT REGARDING CONFLICTS OF INTERESTIn the Charter (Article II.6.3), he Board of Directors published its policy regarding transactions between the Company or an affiliated company on the one hand, and members of the Board of Directors (or their close relatives) on the other, which may give rise to a conflict of interest (within the meaning of the Code of Companies and Associations) and, in certain cases, the application of a procedure provided for this purpose. To the Company’s knowledge, no decisions were made in 2021 giving rise to the application of this procedure.
2.6. FINANCIAL TRANSACTIONSThe Board of Directors published its policy on the prevention of market abuse in the Charter (Section V.3). At the meeting of 26 February 2015, the Charter was amended to align it to Regulation (EU) no. 596/2014 of the European Parliament and of the Council of 16 April 2014 on market abuse.
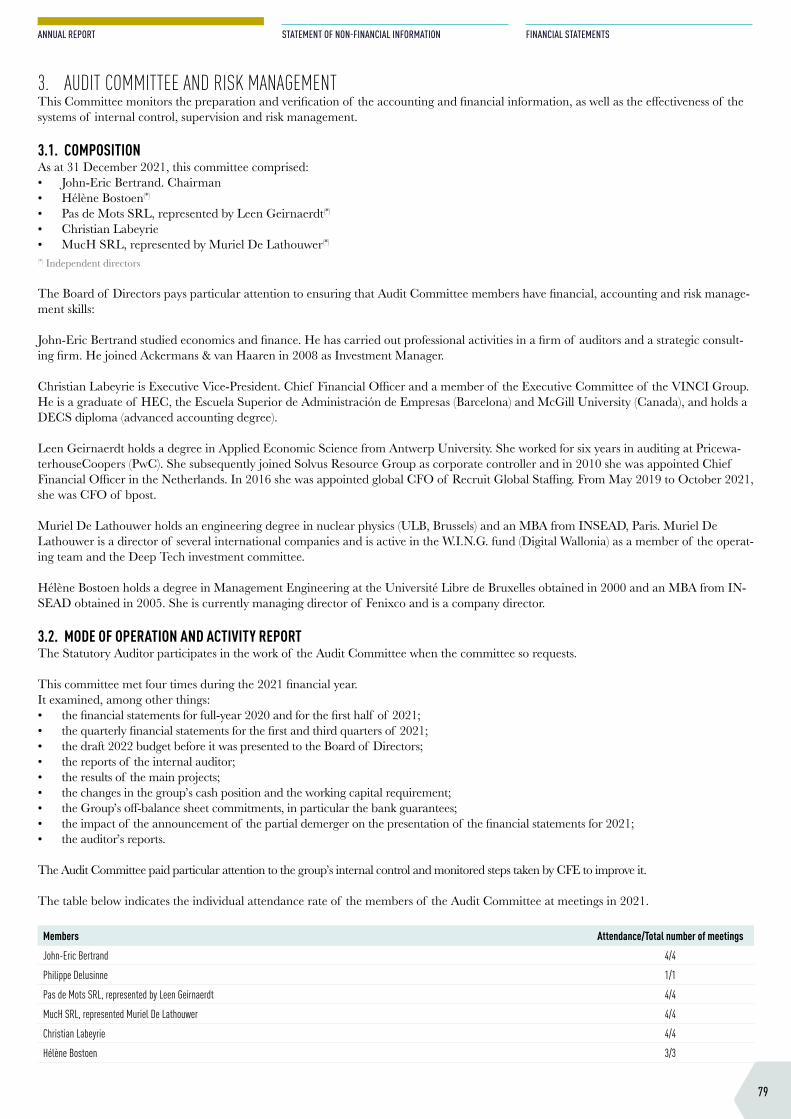
79
ANNUAL REPORT
STATEMENT OF NON-FINANCIAL INFORMATION
FINANCIAL STATEMENTS
3. AUDIT COMMITTEE AND RISK MANAGEMENTThis Committee monitors the preparation and verification of the accounting and financial information, as well as the effectiveness of the systems of internal control, supervision and risk management.
3.1. COMPOSITIONAs at 31 December 2021, this committee comprised:• John-Eric Bertrand. Chairman • Hélène Bostoen(*)
• Pas de Mots SRL, represented by Leen Geirnaerdt(*)
• Christian Labeyrie• MucH SRL, represented by Muriel De Lathouwer(*)
(*) Independent directors
The Board of Directors pays particular attention to ensuring that Audit Committee members have financial, accounting and risk manage-ment skills:
John-Eric Bertrand studied economics and finance. He has carried out professional activities in a firm of auditors and a strategic consult-ing firm. He joined Ackermans & van Haaren in 2008 as Investment Manager.
Christian Labeyrie is Executive Vice-President. Chief Financial Officer and a member of the Executive Committee of the VINCI Group. He is a graduate of HEC, the Escuela Superior de Administración de Empresas (Barcelona) and McGill University (Canada), and holds a DECS diploma (advanced accounting degree).
Leen Geirnaerdt holds a degree in Applied Economic Science from Antwerp University. She worked for six years in auditing at Pricewa-terhouseCoopers (PwC). She subsequently joined Solvus Resource Group as corporate controller and in 2010 she was appointed Chief Financial Officer in the Netherlands. In 2016 she was appointed global CFO of Recruit Global Staffing. From May 2019 to October 2021, she was CFO of bpost.
Muriel De Lathouwer holds an engineering degree in nuclear physics (ULB, Brussels) and an MBA from INSEAD, Paris. Muriel De Lathouwer is a director of several international companies and is active in the W.I.N.G. fund (Digital Wallonia) as a member of the operat-ing team and the Deep Tech investment committee.
Hélène Bostoen holds a degree in Management Engineering at the Université Libre de Bruxelles obtained in 2000 and an MBA from IN-SEAD obtained in 2005. She is currently managing director of Fenixco and is a company director.
3.2. MODE OF OPERATION AND ACTIVITY REPORTThe Statutory Auditor participates in the work of the Audit Committee when the committee so requests.
This committee met four times during the 2021 financial year.It examined, among other things:• the financial statements for full-year 2020 and for the first half of 2021;• the quarterly financial statements for the first and third quarters of 2021;• the draft 2022 budget before it was presented to the Board of Directors;• the reports of the internal auditor;• the results of the main projects;• the changes in the group’s cash position and the working capital requirement;• the Group’s off-balance sheet commitments, in particular the bank guarantees;• the impact of the announcement of the partial demerger on the presentation of the financial statements for 2021;• the auditor’s reports.
The Audit Committee paid particular attention to the group’s internal control and monitored steps taken by CFE to improve it.
The table below indicates the individual attendance rate of the members of the Audit Committee at meetings in 2021.
Members Attendance/Total number of meetings
John-Eric Bertrand 4/4
Philippe Delusinne 1/1
Pas de Mots SRL, represented by Leen Geirnaerdt 4/4
MucH SRL, represented Muriel De Lathouwer 4/4
Christian Labeyrie 4/4
Hélène Bostoen 3/3
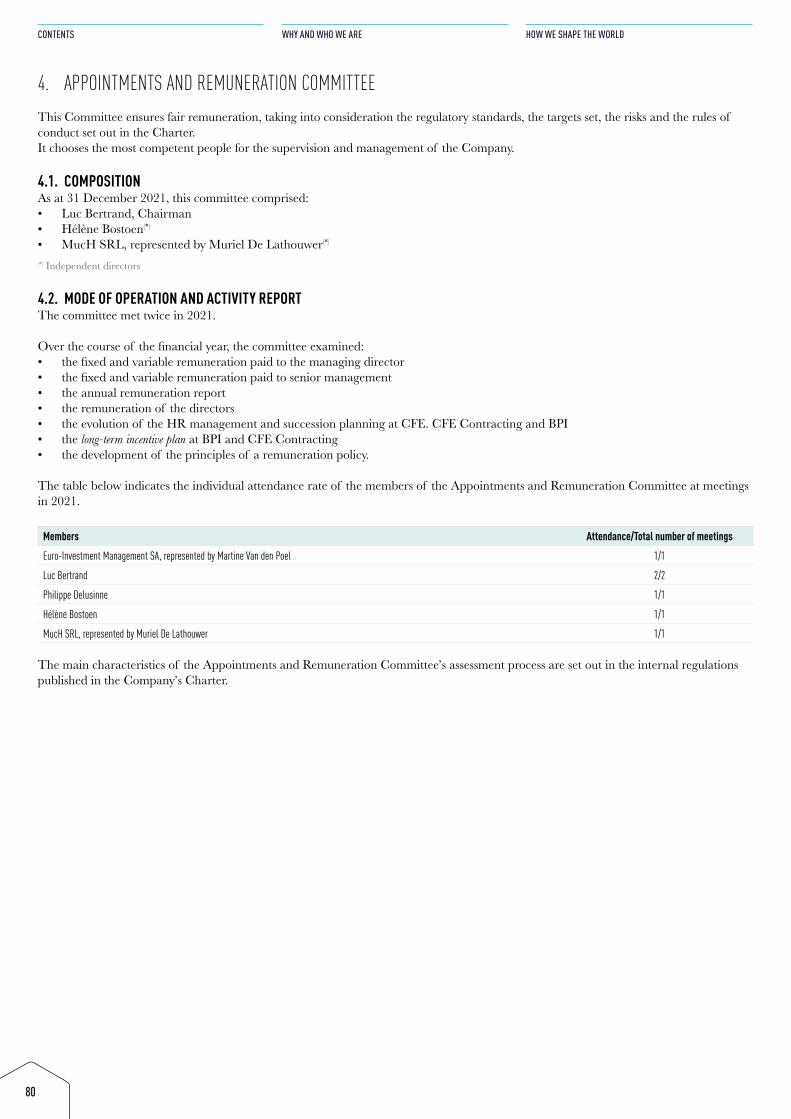
80
CONTENTS
WHY AND WHO WE ARE
HOW WE SHAPE THE WORLD
4. APPOINTMENTS AND REMUNERATION COMMITTEEThis Committee ensures fair remuneration, taking into consideration the regulatory standards, the targets set, the risks and the rules of conduct set out in the Charter.It chooses the most competent people for the supervision and management of the Company.
4.1. COMPOSITIONAs at 31 December 2021, this committee comprised:• Luc Bertrand, Chairman• Hélène Bostoen(*)
• MucH SRL, represented by Muriel De Lathouwer(*)
(*) Independent directors
4.2. MODE OF OPERATION AND ACTIVITY REPORTThe committee met twice in 2021.
Over the course of the financial year, the committee examined:• the fixed and variable remuneration paid to the managing director• the fixed and variable remuneration paid to senior management• the annual remuneration report• the remuneration of the directors• the evolution of the HR management and succession planning at CFE. CFE Contracting and BPI• the long-term incentive plan at BPI and CFE Contracting• the development of the principles of a remuneration policy.
The table below indicates the individual attendance rate of the members of the Appointments and Remuneration Committee at meetings in 2021.
Members Attendance/Total number of meetings
Euro-Investment Management SA, represented by Martine Van den Poel 1/1
Luc Bertrand 2/2
Philippe Delusinne 1/1
Hélène Bostoen 1/1
MucH SRL, represented by Muriel De Lathouwer 1/1
The main characteristics of the Appointments and Remuneration Committee’s assessment process are set out in the internal regulations published in the Company’s Charter.
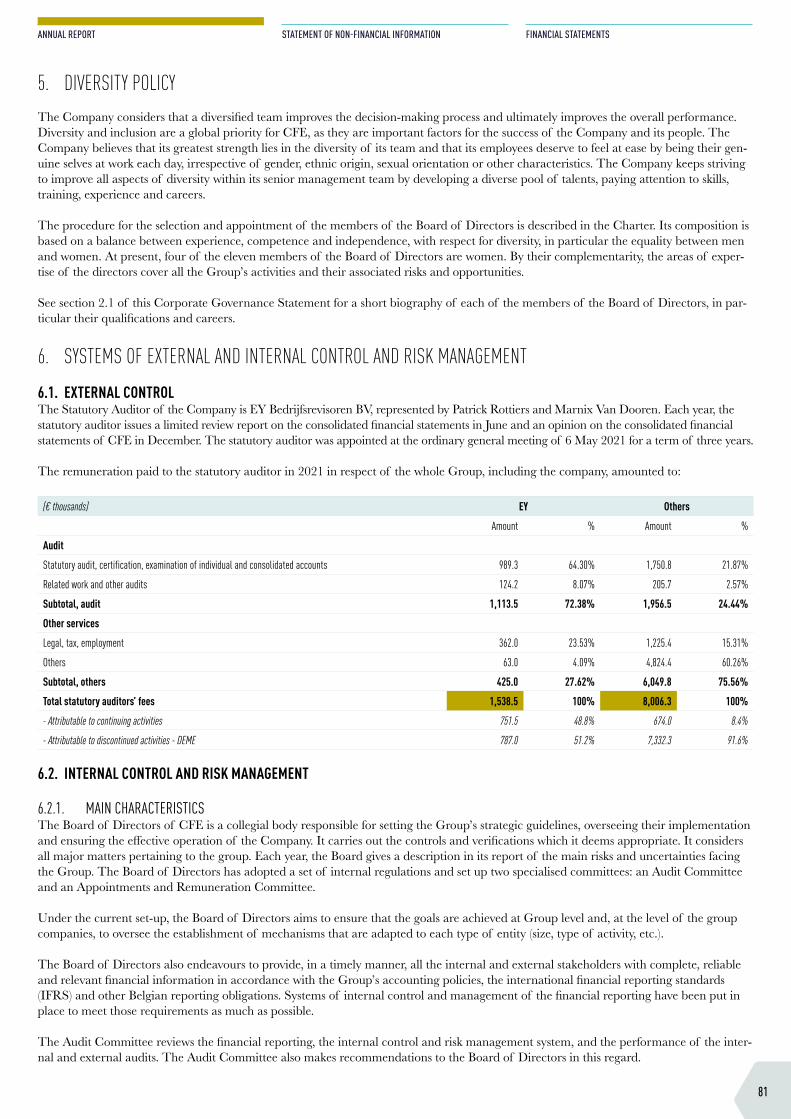
81
ANNUAL REPORT
STATEMENT OF NON-FINANCIAL INFORMATION
FINANCIAL STATEMENTS
5. DIVERSITY POLICYThe Company considers that a diversified team improves the decision-making process and ultimately improves the overall performance. Diversity and inclusion are a global priority for CFE, as they are important factors for the success of the Company and its people. The Company believes that its greatest strength lies in the diversity of its team and that its employees deserve to feel at ease by being their gen-uine selves at work each day, irrespective of gender, ethnic origin, sexual orientation or other characteristics. The Company keeps striving to improve all aspects of diversity within its senior management team by developing a diverse pool of talents, paying attention to skills, training, experience and careers.
The procedure for the selection and appointment of the members of the Board of Directors is described in the Charter. Its composition is based on a balance between experience, competence and independence, with respect for diversity, in particular the equality between men and women. At present, four of the eleven members of the Board of Directors are women. By their complementarity, the areas of exper-tise of the directors cover all the Group’s activities and their associated risks and opportunities.
See section 2.1 of this Corporate Governance Statement for a short biography of each of the members of the Board of Directors, in par-ticular their qualifications and careers.
6. SYSTEMS OF EXTERNAL AND INTERNAL CONTROL AND RISK MANAGEMENT
6.1. EXTERNAL CONTROLThe Statutory Auditor of the Company is EY Bedrijfsrevisoren BV, represented by Patrick Rottiers and Marnix Van Dooren. Each year, the statutory auditor issues a limited review report on the consolidated financial statements in June and an opinion on the consolidated financial statements of CFE in December. The statutory auditor was appointed at the ordinary general meeting of 6 May 2021 for a term of three years.
The remuneration paid to the statutory auditor in 2021 in respect of the whole Group, including the company, amounted to:
(€ thousands) EY Others
Amount % Amount %
Audit
Statutory audit, certification, examination of individual and consolidated accounts 989.3 64.30% 1,750.8 21.87%
Related work and other audits 124.2 8.07% 205.7 2.57%
Subtotal, audit 1,113.5 72.38% 1,956.5 24.44%
Other services
Legal, tax, employment 362.0 23.53% 1,225.4 15.31%
Others 63.0 4.09% 4,824.4 60.26%
Subtotal, others 425.0 27.62% 6,049.8 75.56%
Total statutory auditors’ fees 1,538.5 100% 8,006.3 100%
- Attributable to continuing activities 751.5 48.8% 674.0 8.4%
- Attributable to discontinued activities - DEME 787.0 51.2% 7,332.3 91.6%
6.2. INTERNAL CONTROL AND RISK MANAGEMENT
6.2.1. MAIN CHARACTERISTICSThe Board of Directors of CFE is a collegial body responsible for setting the Group’s strategic guidelines, overseeing their implementation and ensuring the effective operation of the Company. It carries out the controls and verifications which it deems appropriate. It considers all major matters pertaining to the group. Each year, the Board gives a description in its report of the main risks and uncertainties facing the Group. The Board of Directors has adopted a set of internal regulations and set up two specialised committees: an Audit Committee and an Appointments and Remuneration Committee.
Under the current set-up, the Board of Directors aims to ensure that the goals are achieved at Group level and, at the level of the group companies, to oversee the establishment of mechanisms that are adapted to each type of entity (size, type of activity, etc.).
The Board of Directors also endeavours to provide, in a timely manner, all the internal and external stakeholders with complete, reliable and relevant financial information in accordance with the Group’s accounting policies, the international financial reporting standards (IFRS) and other Belgian reporting obligations. Systems of internal control and management of the financial reporting have been put in place to meet those requirements as much as possible.
The Audit Committee reviews the financial reporting, the internal control and risk management system, and the performance of the inter-nal and external audits. The Audit Committee also makes recommendations to the Board of Directors in this regard.
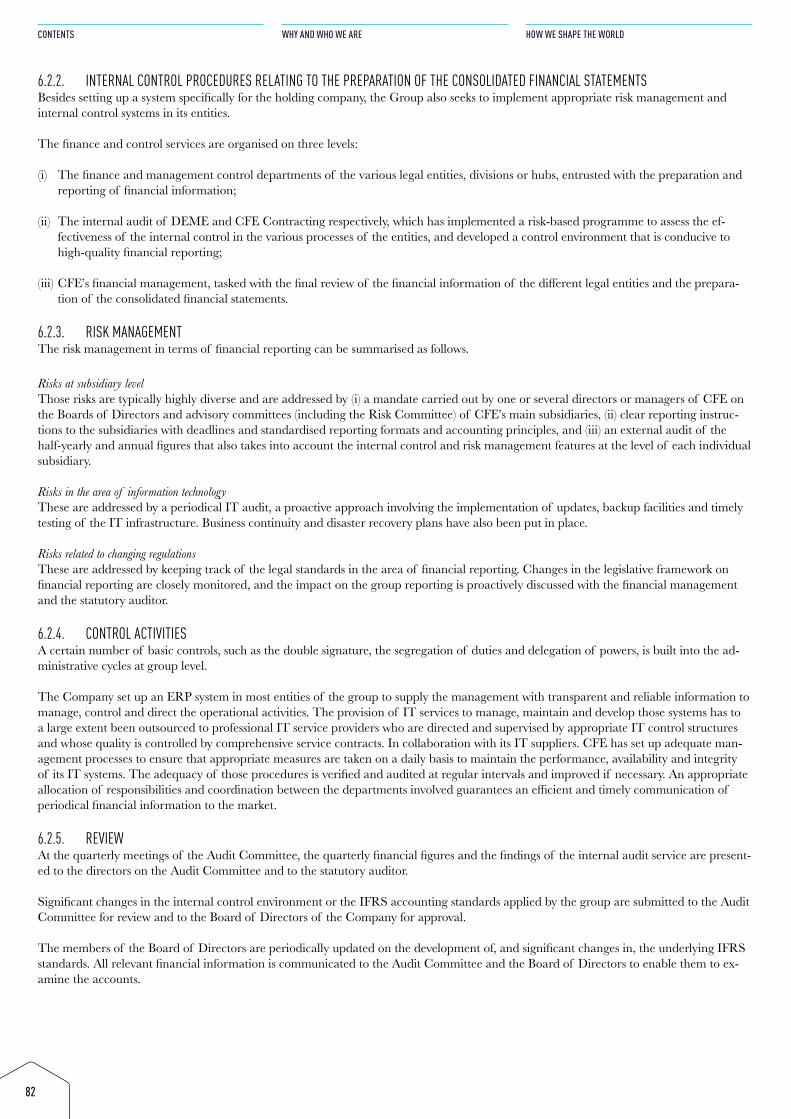
82
CONTENTS
WHY AND WHO WE ARE
HOW WE SHAPE THE WORLD
6.2.2. INTERNAL CONTROL PROCEDURES RELATING TO THE PREPARATION OF THE CONSOLIDATED FINANCIAL STATEMENTSBesides setting up a system specifically for the holding company, the Group also seeks to implement appropriate risk management and internal control systems in its entities.
The finance and control services are organised on three levels:
(i) The finance and management control departments of the various legal entities, divisions or hubs, entrusted with the preparation and reporting of financial information;
(ii) The internal audit of DEME and CFE Contracting respectively, which has implemented a risk-based programme to assess the ef-fectiveness of the internal control in the various processes of the entities, and developed a control environment that is conducive to high-quality financial reporting;
(iii) CFE’s financial management, tasked with the final review of the financial information of the different legal entities and the prepara-tion of the consolidated financial statements.
6.2.3. RISK MANAGEMENTThe risk management in terms of financial reporting can be summarised as follows.
Risks at subsidiary levelThose risks are typically highly diverse and are addressed by (i) a mandate carried out by one or several directors or managers of CFE on the Boards of Directors and advisory committees (including the Risk Committee) of CFE’s main subsidiaries, (ii) clear reporting instruc-tions to the subsidiaries with deadlines and standardised reporting formats and accounting principles, and (iii) an external audit of the half-yearly and annual figures that also takes into account the internal control and risk management features at the level of each individual subsidiary.
Risks in the area of information technologyThese are addressed by a periodical IT audit, a proactive approach involving the implementation of updates, backup facilities and timely testing of the IT infrastructure. Business continuity and disaster recovery plans have also been put in place.
Risks related to changing regulationsThese are addressed by keeping track of the legal standards in the area of financial reporting. Changes in the legislative framework on financial reporting are closely monitored, and the impact on the group reporting is proactively discussed with the financial management and the statutory auditor.
6.2.4. CONTROL ACTIVITIESA certain number of basic controls, such as the double signature, the segregation of duties and delegation of powers, is built into the ad-ministrative cycles at group level.
The Company set up an ERP system in most entities of the group to supply the management with transparent and reliable information to manage, control and direct the operational activities. The provision of IT services to manage, maintain and develop those systems has to a large extent been outsourced to professional IT service providers who are directed and supervised by appropriate IT control structures and whose quality is controlled by comprehensive service contracts. In collaboration with its IT suppliers. CFE has set up adequate man-agement processes to ensure that appropriate measures are taken on a daily basis to maintain the performance, availability and integrity of its IT systems. The adequacy of those procedures is verified and audited at regular intervals and improved if necessary. An appropriate allocation of responsibilities and coordination between the departments involved guarantees an efficient and timely communication of periodical financial information to the market.
6.2.5. REVIEWAt the quarterly meetings of the Audit Committee, the quarterly financial figures and the findings of the internal audit service are present-ed to the directors on the Audit Committee and to the statutory auditor.
Significant changes in the internal control environment or the IFRS accounting standards applied by the group are submitted to the Audit Committee for review and to the Board of Directors of the Company for approval.
The members of the Board of Directors are periodically updated on the development of, and significant changes in, the underlying IFRS standards. All relevant financial information is communicated to the Audit Committee and the Board of Directors to enable them to ex-amine the accounts.
83
ANNUAL REPORT
STATEMENT OF NON-FINANCIAL INFORMATION
FINANCIAL STATEMENTS
6.3. INTERNAL CONTROL AND RISK MANAGEMENT SYSTEMS IN THE DIVISIONSTo enable each entity manager to take the appropriate operating decisions rapidly, a decentralised organisation has been set up in the Dredging, Environment, Offshore and Infra. Contracting and Real Estate Development divisions.The divisions have their own operations control systems suited to the specific features of their activity.
Nevertheless, CFE maintains regular oversight through the presence of directors and/or representatives of CFE on the Boards of Direc-tors and advisory committees of its subsidiaries.
6.3.1. DEMECFE controls its subsidiary DEME at five different levels:• The Board of Directors. This is composed of seven directors, including five directors from CFE and the CFO of CFE. The Board of
Directors monitors the management of the Executive Committee, adopts the half-yearly and annual financial statements, and, among other things, approves the strategy and investment policy of DEME. The Board of Directors met eight times in 2021.
• The Technical Committee. This is composed of a CFE director, as well as the members of the Executive Committee. This committee monitors the main projects and pending lawsuits. It also prepares investment proposals.
• The Risk Committee. This consists of a CFE Director, as well as the CEO, the SOD, the CFO and the representatives of the Execu-tive Committee of the respective division. The Risk Committee analyses and approves all binding offers relating to EPC and Design & Build contracts and all contracts involving an amount of over €100 million (dredging works) or €25 million (non-dredging works).
• The Audit Committee. This consists of three representatives of CFE (a director, the CFO, and the Director of Finance & Con-trolling). The Audit Committee reviews the financial statements of DEME, the evolution of the results of the various projects, and the budget updates at each quarterly closing. It may also be convened to deal with specific financial matters. It met eight times in 2021.
• The Steering Committee. Set up in 2018 by the Board of Directors. Its mission is to monitor the implementation of the internal compliance procedures and to ensure their strict application within the Group. This Committee is composed of four members, two of whom are directors of CFE, and a representative of CFE.
• The internal control system of DEME is implemented by its Executive Committee and by the SOD of DEME, with the support of the Management Team and under the responsibility of the Board of Directors.
In this respect. DEME has taken several initiatives to strengthen internal control over its activities. These included:
• Most of DEME’s entities use the same ERP, namely Microsoft Dynamics. This system is centrally driven and designed for all master data and for all integrated controls, ensuring the uniform processing of all data within the group. In the area of digitisation, DEME forges ahead with automatic data recognition and e-invoicing.
• The reporting system, a tailor-made multidimensional database, is fully integrated in the transaction systems and is fed live. The con-solidated financial statements and the management reports are also automatically linked, allowing perfect consistency between the different reports. Uniformity of reporting is a priority for DEME.
• The agreements relating to bank guarantees and loans have been harmonised.
• For all projects executed by DEME. Opportunity and Risk Management (ORM) covers three stages: - a proactive identification of opportunities and risks; - a tighter focus on the management of opportunities and actions to be implemented; - a transparent and timely sharing - through a common database that can be accessed by the staff - of experience and knowledge
of ORM with all departments concerned, both during tendering and during execution.
• By means of detailed and interactive ORM dashboards, all the opportunities and risks are continuously monitored so that decisions and necessary actions can be taken.
• With the help of an external consultant, new cash management systems have been chosen. The implementation of a cash manage-ment system was finalised at the end of 2019, and has been generally used as of 2020. In order to keep improving the efficiency of payments in all the countries where DEME is active, the process of setting up a payment factory was rolled out further across the group in 2021 and the first half of 2022.
• DEME has formulated a clear policy that allows it to carry out all its activities with integrity and zero tolerance with regard to cor-ruption. In addition to its Code of Ethics and Integrity, DEME has set up a comprehensive corporate compliance programme that includes, among other things, a detailed anti-corruption policy. This anti-corruption policy is an integral part of the annual awareness programme for all employees. The procedures to implement this policy were further optimised in 2020. In particular, the selection process of third parties was fine-tuned on the basis of a new risk analysis. The digitisation of this process was worked out in 2021. Thanks to the payment factory set up by the Finance Department, allowing the payments of the different entities - if technically and legally possible - to pass through one single channel (SWIFT), additional checks are now carried out on outgoing payments using a screening tool based on a list of sanctions (sanction screening) before the payments are sent to the different banks via SWIFT, thereby preventing payments being made to beneficiaries that are subject to sanctions.
84
CONTENTS
WHY AND WHO WE ARE
HOW WE SHAPE THE WORLD
• In 2019, DEME created an Internal Audit department. This third line of defence will audit the second line of defence. Where no second line of defence exists, it will audit the first line of defence. The Internal Audit department operates independently and reports to the Audit Committee. The purpose of this department is to review the risk management and internal control processes of DEME, and to provide advice to the management on how to strengthen the overall level of control.
• The annual audit plan is supplemented with further audit assignments requested by the Audit Committee and/or the Executive Committee of DEME. The main results are presented each year to the members of the Audit Committee, as well as to the members of the Executive Committee and the Management of DEME. The Internal Audit Department is also responsible for monitoring the progress of the action plans.
6.3.2. CFE CONTRACTINGCFE controls its CFE Contracting subsidiary at four different levels:• The Board of Directors. This is composed of four directors, including the Managing Director of CFE, the CEO of CFE Contracting, the
CFO of CFE, and a representative of the controlling shareholder of CFE. The Board of Directors controls the Executive Committee, adopts the half-yearly and annual financial statements, and defines the division’s strategy.
• The Executive Committee. This is chaired by the CEO of CFE Contracting, and is composed of the Managing Director of CFE, the CFO of CFE, the Human Resources Director of CFE Contracting, the Executive Chairman of the Multitechnics divisions (VMA) and Rail & Utilities (MOBIX), the Managing Director of BPC and BPC Wallonia, and the CEO of Van Laere, who is also the Exec-utive Chairman of MBG. The Executive Committee is in charge of the daily management of the division and the implementation of the strategy defined by the Board of Directors.
• The Risk Committee. This is composed of the Managing Director of CFE, the CFO of CFE, a director representing the controlling shareholder of CFE, the CEO of CFE Contracting, the Chairman of the Risk Committee of CFE Contracting, a member of the Executive Committee in charge of the subsidiary, and the operational or functional representatives of the entity concerned. Projects with a high risk profile, construction projects worth more than € 50 million, and Multitechnics or Rail & Utilities projects exceeding a value of € 10 million are required to be approved by the Risk Committee before tendering. The Committee reviews the technical, commercial, contractual and financial risks of the projects that are submitted to its scrutiny.
• Quarterly budget review meetings. These meetings are attended by the Managing Director, the CFO and the Director of Finance & Controlling of CFE, in addition to the Chairman of the Executive Committee, the CFO of CFE Contracting, the CEO of the divi-sion concerned, the Managing Director or General Manager of the subsidiary concerned, as well as its COO and CFO.
• The topics discussed include: - the budgets (and their quarterly updates); - the volume of business for the current financial year and the detail of the order book; - the latest financial statements that were communicated (balance sheet and income statement); - the projected result of the profit centre, with details of profit margins per project; - analysis of the entity’s balance sheet; - the analysis of current risks including a presentation of legal disputes; - the status of guarantees given; - investment or divestment requirements; - the cash position and projected changes in the next 12 months.
The Internal Audit department of CFE Contracting is entrusted with the review of the internal controls and procedures at its entities. Its independence is assured since the internal auditor reports directly to the Audit Committee.
The Internal Audit department carries out the following duties:• Internal control: this encompasses monitoring of the general rules of the Contracting division as defined in the Charter, the Internal
Procedures Manual, and the Anti-corruption Code. Those general rules of conduct, which can be found on the Intranet site, essentially relate to the following policies: - acceptance of new business; - project monitoring; - participation in joint ventures and in the capital of companies; - purchases and subcontracting; - investment; - accounting and financial management; - Human Resources management; - legal affairs, tax and insurance management; - internal and external communication; - integrity; - information security; - personal data processing.
85
ANNUAL REPORT
STATEMENT OF NON-FINANCIAL INFORMATION
FINANCIAL STATEMENTS
• Update of the risk identification mapping for the main subsidiaries of the Contracting division. This mapping is reviewed every two years. It involves: - listing the main sources of identifiable internal and external risks that prevent reaching the division’s goals and may have finan-
cial, human or reputation consequences; - assessing, on a qualitative scale, the criticality of the risks based on their potential impact, probability of occurrence, and the
degree of control for the various events constituting those risks; - defining appropriate ways to address those risks. Based on the risk mapping prepared by the main entities, risk matrices specific to
each line of business allow a uniform presentation and assessment of events that are liable to affect the projects examined by the competent bodies of the entities.
Eight audit assignments were carried out during the 2021 financial year. They did not reveal any malfunctions that are likely to have a materi-al impact on the business and financial statements of the Group. These audits included: • the application of the principles of good project management as defined by the Executive Committee;• compliance with the General Data Protection Regulations (“GDPR”);• the functioning of the Risk Committee and the Selection Committee;• the application of the IT security policy; • risk management of subcontractors;• management of the accounts;• Checkin@Work;• simulation of cyber-attacks..
The results of the audits that were carried out are presented to the members of CFE’s Audit Committee and to the Executive Committee of CFE Contracting in order to agree with the latter on the corrective actions to be taken.
Various actions were taken during the 2021 financial year to strengthen CFE Contracting’s internal control, including the launch of the Fit4Future programme, which aims to improve performance in the three construction entities in Belgium. This programme comprises 9 components, the objectives of which are outlined below.
• Selective Bidding: improve the governance and selection process for tenders in order to increase the profitability of projects;• Lean Organisation: optimisation of the overhead structure;• Lean Site: maximising operational excellence on the site;• Procurement Excellence: economies of scale in the procurement;• Risk management: improving existing opportunity and risk management (ORM) systems;• Management of change orders: strengthening the management of contractual changes;• Future-proof workforce: optimising the workforce on-site;• Transparency and performance management: improved reporting of relevant information on the sites;• Capabilities and culture: developing the culture and capabilities the organisation needs to reach and maintain its full potential.
The first results will be visible in 2022.
In 2021. CFE Contracting launched a project to implement a new ERP system for the construction entities in a first phase, and for the multitechnics activities in a second phase. The objectives are (i) to promote the digitisation and operational efficiency of the activities. (ii) to increase the control of the activities and (iii) to ensure transparent reporting integrated with the transaction systems.
The first phase of the analysis of the current situation in each entity was completed in 2021. The choice of a new ERP for construction will be determined in 2022.
6.3.3. BPICFE controls its subsidiary BPI at two different levels:• The Board of Directors. This is composed of six directors, among whom are two directors of CFE (including the Managing Direc-
tor), the CFO of CFE, as well as the Managing Director of BPI, and an external director. The Board of Directors controls the man-agement of the Management Team, adopts the half-yearly and annual financial statements, and approves, among other things, the strategy and investment policy of BPI. The Board of Directors alone is authorised to approve, on the basis of a favourable opinion from the Board of Directors of CFE. (i) investments involving a (beneficial) amount of over € 10 million, and (ii) the setting up of any partnership relating to a project involv-ing a (beneficial) amount of over € 10 million.
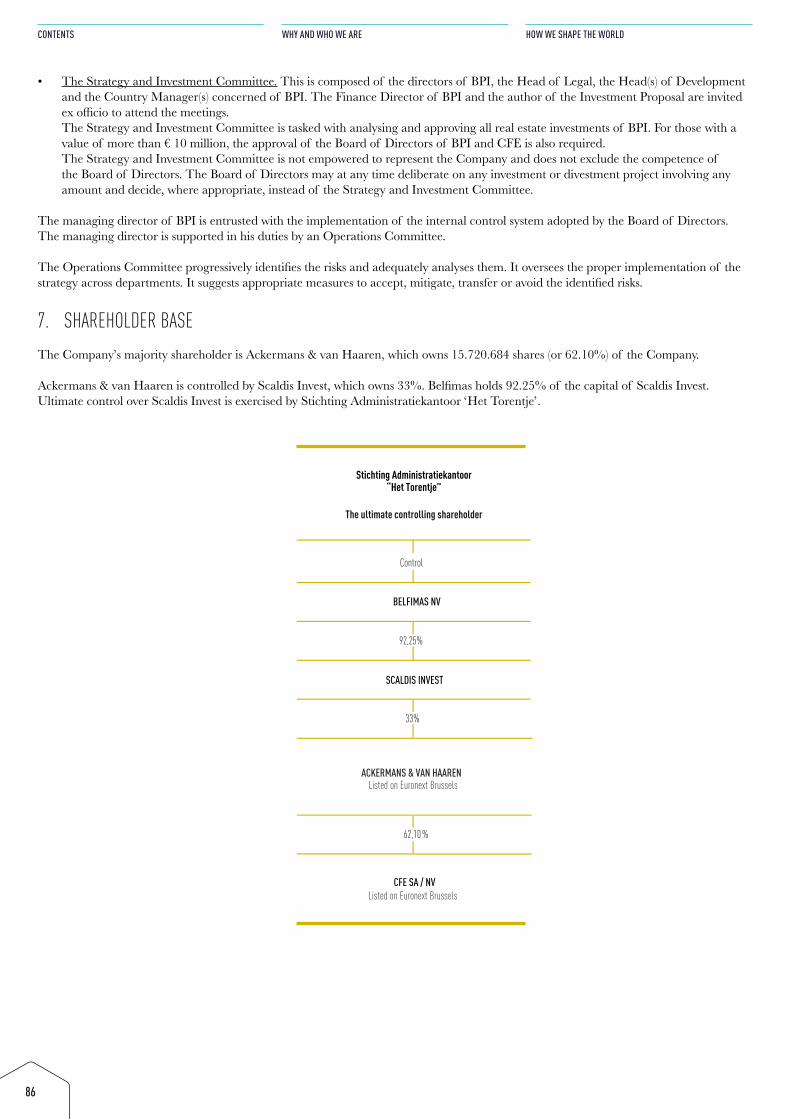
86
CONTENTS
WHY AND WHO WE ARE
HOW WE SHAPE THE WORLD
• The Strategy and Investment Committee. This is composed of the directors of BPI, the Head of Legal, the Head(s) of Development and the Country Manager(s) concerned of BPI. The Finance Director of BPI and the author of the Investment Proposal are invited ex officio to attend the meetings. The Strategy and Investment Committee is tasked with analysing and approving all real estate investments of BPI. For those with a value of more than € 10 million, the approval of the Board of Directors of BPI and CFE is also required. The Strategy and Investment Committee is not empowered to represent the Company and does not exclude the competence of the Board of Directors. The Board of Directors may at any time deliberate on any investment or divestment project involving any amount and decide, where appropriate, instead of the Strategy and Investment Committee.
The managing director of BPI is entrusted with the implementation of the internal control system adopted by the Board of Directors. The managing director is supported in his duties by an Operations Committee.
The Operations Committee progressively identifies the risks and adequately analyses them. It oversees the proper implementation of the strategy across departments. It suggests appropriate measures to accept, mitigate, transfer or avoid the identified risks.
7. SHAREHOLDER BASEThe Company’s majority shareholder is Ackermans & van Haaren, which owns 15.720.684 shares (or 62.10%) of the Company.
Ackermans & van Haaren is controlled by Scaldis Invest, which owns 33%. Belfimas holds 92.25% of the capital of Scaldis Invest. Ultimate control over Scaldis Invest is exercised by Stichting Administratiekantoor ‘Het Torentje’.
Control
BELFIMAS NV
92,25%
SCALDIS INVEST
33%
62,10 %
CFE SA / NV
Listed on Euronext Brussels
Stichting Administratiekantoor“Het Torentje”
The ultimate controlling shareholder
ACKERMANS & VAN HAAREN
Listed on Euronext Brussels
87
ANNUAL REPORT
STATEMENT OF NON-FINANCIAL INFORMATION
FINANCIAL STATEMENTS
8. DEROGATIONS FROM THE 2020 CODEThe derogations from the 2020 Code relate exclusively to the remuneration of non-executive directors and the managing director, and in particular to principles 7.6 to 7.9 of the 2020 Code. The justified reasons for this exemption are set out in the remuneration policy set out in point IV.1 below.
IV. REMUNERATION REPORT
1. REMUNERATION POLICYThe company’s remuneration policy has been established within the framework of Article 7:89/1 of the Code of Companies and Associa-tions, and the 2020 Belgian Corporate Governance Code.
The remuneration policy is aimed at non-executive directors and the managing director. There is no Executive Committee, or a similar body, within the company.It applies as of 1 January 2021 approved by the ordinary general meeting held on May 6. 2021. It remains applicable until 2025, unless a significant change takes place.
The remuneration policy is intended to support the performance culture and the long-term value creation of the company. It aims to at-tract and retain directors with a wide variety of skills in the various fields necessary for the expansion of the company’s activities.
1.1. GOVERNANCE - PROCEDUREThe remuneration policy is established by the Board of Directors, on the recommendation of the Appointments and Remuneration Com-mittee. As mentioned above, it is then submitted to the approval of the General Meeting.
The individual remuneration of the non-executive directors is approved by the General Meeting and, where applicable, the individual remuneration of the Managing Director is approved by the Board of Directors of the company. In every case, this remuneration is deter-mined on the basis of the remuneration policy, on the advice of the Appointments and Remuneration Committee.
In order to prevent the emergence of conflicts of interest, the Managing Director is not invited to take part in the discussions of the Ap-pointments and Remuneration Committee and the Board of Directors relating to his own remuneration. In addition, the regulations of the Code of Companies and Associations with regard to conflicts of interest will be applied whenever this is required.
1.2. REMUNERATION POLICY FOR NON-EXECUTIVE DIRECTORSThe remuneration is composed of:• a fixed annual amount; and• attendance fees: these are awarded to the non-executive directors for their presence at the meetings of the Board of Directors, and, where
appropriate, for their presence at the meetings of the Appointments and Remuneration Committee. Attendance fees are also awarded to the directors entrusted with specific assignments by the Board of Directors.
Where applicable, non-executive directors are also entitled to an additional fixed remuneration for the provision of specific services such as chairing the Board of Directors or one of the committees.
In addition, non-executive directors are also reimbursed for expenses incurred during the execution of their duties, according to conditions specified by the Board of Directors.
Non-executive directors do not receive a variable remuneration, such as a bonus or stock options. They also do not receive any benefits in kind or benefits linked to a pension scheme.
Directors are invited but are not required to own shares in the company. This derivation from principle 7.6 of the 2020 Belgian Corporate Governance Code is justified by the fact that the policies of the company adequately promote a long-term perspective. Moreover, as part of the positions they hold within Ackermans & van Haaren (‘AvH’), several directors are already exposed to changes in the value of the company, taking into account the number of shares they hold in AvH, whose value is partly dependent on the value of the company.
Non-executive directors may serve as directors in the subsidiaries of the company. Any remunerations received for exercising these man-dates are included in the remuneration report of the company.
Non-executive directors carry out their duties as self-employed individuals, and they can be dismissed ‘ad nutum’ (at any time and without cause), without compensation.
88
CONTENTS
WHY AND WHO WE ARE
HOW WE SHAPE THE WORLD
1.3. REMUNERATION POLICY WITH REGARD TO THE MANAGING DIRECTOR
1.3.1. REMUNERATION STRUCTURE The remuneration of the Managing Director only includes the following elements:• a fixed annual remuneration at the same level as that of the non-executive directors; and• remuneration granted in the context of a directorship held in certain subsidiaries of the CFE Group, these amounts being linked to
the active participation of the Managing Director within these subsidiaries.
The Managing Director does not benefit from a variable remuneration or from a stock option plan. He is also not required to hold a mini-mum number of shares in the company.
These derivations from principles 7.7 to 7.9 of the 2020 Belgian Corporate Governance Code are justified by the fact that the Managing Director already receives a remuneration from AvH in his capacity of member of the Executive Committee of this company. The remu-neration of the Managing Director in the context of the positions he holds in AvH is therefore partially linked to his performance in the context of his duties as Managing Director within the company. This makes it possible to align the interests of the Managing Director of the company with the creation of value within the AvH Group, of which the company is a part. In addition, the entire remuneration of the Managing Director (i.e. his fixed remuneration) has been reassigned by him to AvH under a binding agreement.
The Board of Directors and the Appointments and Remuneration Committee therefore consider that the provision of a variable remuner-ation within the company and requiring the Managing Director to hold shares in the company is not necessary due to his position within the AvH Group, and the structure of the remuneration granted to him within it.
The Managing Director does not receive benefits in kind, such as pension schemes, insurances or a company car.
1.3.2. CONTRACTUAL CONDITIONS OF THE MANAGING DIRECTORThe Managing Director is not bound to the company by any specific contract. No severance pay will be paid out at the termination of the mandate, whether this termination is voluntary, forced, early or at the normal end of the term.
1.4. DIRECTORSHIPS IN THE SUBSIDIARIESThe Managing Director may exercise the mandate of executive or non-executive director within the subsidiaries of the company. The remu-nerations paid for serving these mandates are included in the remuneration report of the company. As a reminder: these remunerations are also fixed and reassigned to AvH under a binding agreement between the Managing Director and AvH.
As the subsidiaries of the company are not listed, they do not fall within the scope of the regulations of the Code of Companies and Associa-tions when it comes to the remuneration policy and the remuneration report.
In any case, the company ensures that a sound and effective remuneration policy is applied within the different subsidiaries. In this context, and in order to highlight the creation of value in the short and the long term, the company ensures that a remuneration based on individual performance and on the performance of the company is adopted within the subsidiaries. Moreover, it should be emphasised that the contracts of the executive officers in the subsidiaries (with the exception of the position of Managing Director of the company, however) provide for the recuperation of the variable remuneration that would have been granted them on the basis of incorrect financial information.
Unless otherwise agreed between the parties, the termination of the relationship between the company and the Managing Director will also result in the termination of the mandates held within the subsidiaries of the company.
1.5. CHANGES SINCE THE LAST REMUNERATION POLICY There is no significant change between what is set out in this remuneration policy and what has been set out in the remuneration report published in 2020 (regarding the remuneration policy).
1.6. POSSIBILITY OF DEVIATING FROM THE REMUNERATION POLICYIn the case of exceptional circumstances that necessitate a deviation from the remuneration policy in order to serve the long-term interests and the viability of the company as a whole, or to assure its viability, the Board of Directors, on the recommendation of the Appointments and Remuneration Committee, is empowered to temporarily modify the remuneration of the members, the non-executive directors or the Managing Director. This modification may relate to any element of the remuneration, in line with the respective powers of the Board of Directors and the General Meeting.
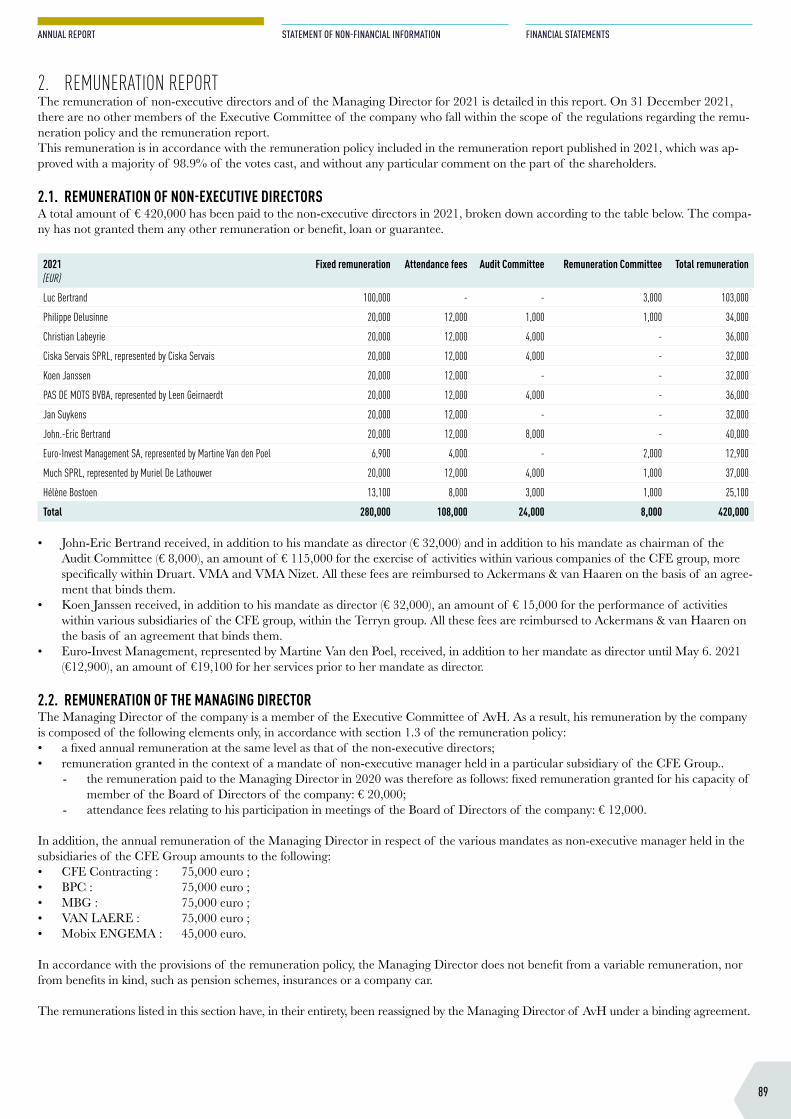
89
ANNUAL REPORT
STATEMENT OF NON-FINANCIAL INFORMATION
FINANCIAL STATEMENTS
2. REMUNERATION REPORTThe remuneration of non-executive directors and of the Managing Director for 2021 is detailed in this report. On 31 December 2021, there are no other members of the Executive Committee of the company who fall within the scope of the regulations regarding the remu-neration policy and the remuneration report.This remuneration is in accordance with the remuneration policy included in the remuneration report published in 2021, which was ap-proved with a majority of 98.9% of the votes cast, and without any particular comment on the part of the shareholders.
2.1. REMUNERATION OF NON-EXECUTIVE DIRECTORSA total amount of € 420,000 has been paid to the non-executive directors in 2021, broken down according to the table below. The compa-ny has not granted them any other remuneration or benefit, loan or guarantee.
2021(EUR)
Fixed remuneration Attendance fees Audit Committee Remuneration Committee Total remuneration
Luc Bertrand 100,000 - - 3,000 103,000
Philippe Delusinne 20,000 12,000 1,000 1,000 34,000
Christian Labeyrie 20,000 12,000 4,000 - 36,000
Ciska Servais SPRL, represented by Ciska Servais 20,000 12,000 4,000 - 32,000
Koen Janssen 20,000 12,000 - - 32,000
PAS DE MOTS BVBA, represented by Leen Geirnaerdt 20,000 12,000 4,000 - 36,000
Jan Suykens 20,000 12,000 - - 32,000
John.-Eric Bertrand 20,000 12,000 8,000 - 40,000
Euro-Invest Management SA, represented by Martine Van den Poel 6,900 4,000 - 2,000 12,900
Much SPRL, represented by Muriel De Lathouwer 20,000 12,000 4,000 1,000 37,000
Hélène Bostoen 13,100 8,000 3,000 1,000 25,100
Total 280,000 108,000 24,000 8,000 420,000
• John-Eric Bertrand received, in addition to his mandate as director (€ 32,000) and in addition to his mandate as chairman of the Audit Committee (€ 8,000), an amount of € 115,000 for the exercise of activities within various companies of the CFE group, more specifically within Druart. VMA and VMA Nizet. All these fees are reimbursed to Ackermans & van Haaren on the basis of an agree-ment that binds them.
• Koen Janssen received, in addition to his mandate as director (€ 32,000), an amount of € 15,000 for the performance of activities within various subsidiaries of the CFE group, within the Terryn group. All these fees are reimbursed to Ackermans & van Haaren on the basis of an agreement that binds them.
• Euro-Invest Management, represented by Martine Van den Poel, received, in addition to her mandate as director until May 6. 2021 (€12,900), an amount of €19,100 for her services prior to her mandate as director.
2.2. REMUNERATION OF THE MANAGING DIRECTORThe Managing Director of the company is a member of the Executive Committee of AvH. As a result, his remuneration by the company is composed of the following elements only, in accordance with section 1.3 of the remuneration policy:• a fixed annual remuneration at the same level as that of the non-executive directors;• remuneration granted in the context of a mandate of non-executive manager held in a particular subsidiary of the CFE Group..
- the remuneration paid to the Managing Director in 2020 was therefore as follows: fixed remuneration granted for his capacity of member of the Board of Directors of the company: € 20,000;
- attendance fees relating to his participation in meetings of the Board of Directors of the company: € 12,000.
In addition, the annual remuneration of the Managing Director in respect of the various mandates as non-executive manager held in the subsidiaries of the CFE Group amounts to the following:• CFE Contracting : 75,000 euro ;• BPC : 75,000 euro ;• MBG : 75,000 euro ;• VAN LAERE : 75,000 euro ;• Mobix ENGEMA : 45,000 euro.
In accordance with the provisions of the remuneration policy, the Managing Director does not benefit from a variable remuneration, nor from benefits in kind, such as pension schemes, insurances or a company car.
The remunerations listed in this section have, in their entirety, been reassigned by the Managing Director of AvH under a binding agreement.
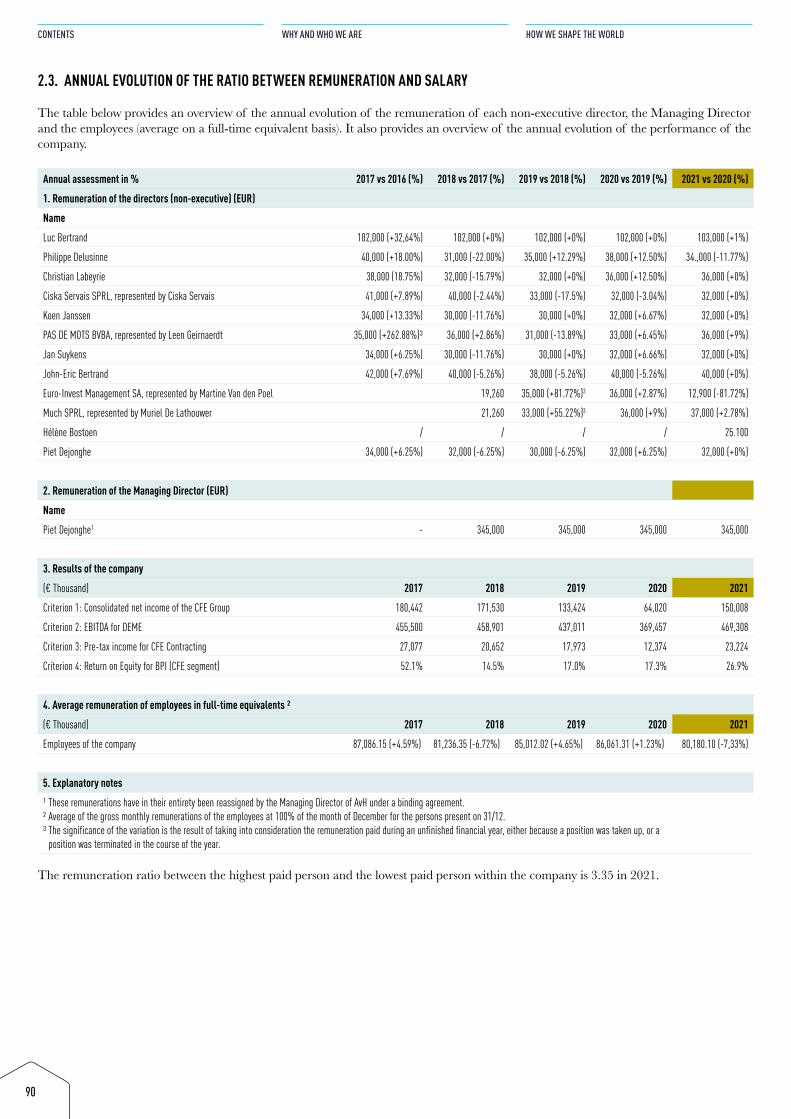
90
CONTENTS
WHY AND WHO WE ARE
HOW WE SHAPE THE WORLD
2.3. ANNUAL EVOLUTION OF THE RATIO BETWEEN REMUNERATION AND SALARY
The table below provides an overview of the annual evolution of the remuneration of each non-executive director, the Managing Director and the employees (average on a full-time equivalent basis). It also provides an overview of the annual evolution of the performance of the company.
Annual assessment in % 2017 vs 2016 (%) 2018 vs 2017 (%) 2019 vs 2018 (%) 2020 vs 2019 (%) 2021 vs 2020 (%)
1. Remuneration of the directors (non-executive) (EUR)
Name
Luc Bertrand 102,000 (+32,64%) 102,000 (+0%) 102,000 (+0%) 102,000 (+0%) 103,000 (+1%)
Philippe Delusinne 40,000 (+18.00%) 31,000 (-22.00%) 35,000 (+12.29%) 38,000 (+12.50%) 34.,000 (-11.77%)
Christian Labeyrie 38,000 (18.75%) 32,000 (-15.79%) 32,000 (+0%) 36,000 (+12.50%) 36,000 (+0%)
Ciska Servais SPRL, represented by Ciska Servais 41,000 (+7.89%) 40,000 (-2.44%) 33,000 (-17.5%) 32,000 (-3.04%) 32,000 (+0%)
Koen Janssen 34,000 (+13.33%) 30,000 (-11.76%) 30,000 (+0%) 32,000 (+6.67%) 32,000 (+0%)
PAS DE MOTS BVBA, represented by Leen Geirnaerdt 35,000 (+262.88%)3 36,000 (+2.86%) 31,000 (-13.89%) 33,000 (+6.45%) 36,000 (+9%)
Jan Suykens 34,000 (+6.25%) 30,000 (-11.76%) 30,000 (+0%) 32,000 (+6.66%) 32,000 (+0%)
John-Eric Bertrand 42,000 (+7.69%) 40,000 (-5.26%) 38,000 (-5.26%) 40,000 (-5.26%) 40,000 (+0%)
Euro-Invest Management SA, represented by Martine Van den Poel 19,260 35,000 (+81.72%)3 36,000 (+2.87%) 12,900 (-81.72%)
Much SPRL, represented by Muriel De Lathouwer 21,260 33,000 (+55.22%)3 36,000 (+9%) 37,000 (+2.78%)
Hélène Bostoen / / / / 25.100
Piet Dejonghe 34,000 (+6.25%) 32,000 (-6.25%) 30,000 (-6.25%) 32,000 (+6.25%) 32,000 (+0%)
2. Remuneration of the Managing Director (EUR)
Name
Piet Dejonghe1 - 345,000 345,000 345,000 345,000
3. Results of the company
(€ Thousand) 2017 2018 2019 2020 2021
Criterion 1: Consolidated net income of the CFE Group 180,442 171,530 133,424 64,020 150,008
Criterion 2: EBITDA for DEME 455,500 458,901 437,011 369,457 469,308
Criterion 3: Pre-tax income for CFE Contracting 27,077 20,652 17,973 12,374 23,224
Criterion 4: Return on Equity for BPI (CFE segment) 52.1% 14.5% 17.0% 17.3% 26.9%
4. Average remuneration of employees in full-time equivalents 2
(€ Thousand) 2017 2018 2019 2020 2021
Employees of the company 87,086.15 (+4.59%) 81,236.35 (-6.72%) 85,012.02 (+4.65%) 86,061.31 (+1.23%) 80,180.10 (-7,33%)
5. Explanatory notes
1 These remunerations have in their entirety been reassigned by the Managing Director of AvH under a binding agreement.2 Average of the gross monthly remunerations of the employees at 100% of the month of December for the persons present on 31/12. 3 The significance of the variation is the result of taking into consideration the remuneration paid during an unfinished financial year, either because a position was taken up, or a
position was terminated in the course of the year.
The remuneration ratio between the highest paid person and the lowest paid person within the company is 3.35 in 2021.

91
ANNUAL REPORT
STATEMENT OF NON-FINANCIAL INFORMATION
FINANCIAL STATEMENTS
202192
CONTENTS
WHY AND WHO WE ARE
HOW WE SHAPE THE WORLD
STATEMENT OF NON-FINANCIAL INFORMATION

202193
ANNUAL REPORT
STATEMENT OF NON-FINANCIAL INFORMATION
FINANCIAL STATEMENTS
STATEMENT OF NON-FINANCIAL INFORMATION
94
CONTENTS
WHY AND WHO WE ARE
HOW WE SHAPE THE WORLD
V. STATEMENT OF NON-FINANCIAL INFORMATIONPursuant to Article 3:32, §2 of the Code of Companies and Associations, the annual report must include a Statement of Non-financial Information. This statement is contained in the next section of this annual report, of which it forms an integral part.
On behalf of the Board of Directors, March, 2022.
Luc BERTRANDChairman of the Board of Directors
This statement of non-financial information (the ‘Statement’) was prepared in accordance with Article 3:32 of the Code of Companies and Associations and relates to the financial year ended 31 December 2021.
1. INTRODUCTIONDue to the fact that CFE and its subsidiaries are included in the management report regarding the consolidated financial statements prepared by Ackermans & van Haaren (AvH), it is in principle exempt from the obligation to draw up a statement of non-financial information.
Nevertheless, bearing in mind the importance that CFE and its entities attach to sustainability, we have decided not to avail ourselves of this legal exemption and to prepare a statement of non-financial information to complement AvH’s statement of non-financial informa-tion, and to inform CFE’s shareholders in more detail about the policies applied in the area of ESG (Environmental, Social, Governance) throughout the CFE Group, the actions taken in this respect, and the outcomes of those actions. As far as DEME is concerned, we also refer to the ESG report contained in DEME’s annual report.
Climate, energy, the re-use of materials and the limitation of waste production are all global issues to which DEME, CFE Contracting and BPI Real Estate can provide sustainable solutions. A relevant materiality analysis has enabled the three divisions to define the ESG themes for which they can have a real impact. Combined with clear policies and ambitions, this analysis enables the group's various subsidiaries to be real players in sustainable change.
2. BRIEF DESCRIPTION OF THE GROUP’S ACTIVITIES
2.1. DREDGING, ENVIRONMENT, OFFSHORE AND INFRAThe DEME Group is active in four different segments.
DREDGING DEME is involved in complex dredging projects all over the world, and offers its customers state-of-the-art solutions. The DEME Group carries out major marine engineering infrastructure works, such as the development of new ports, waterways, airports, artificial islands, residential and recreational areas, industrial areas, etc., on all continents. DEME has a subsidiary specialising in the extraction, processing (washing, grinding, calibration) and supply of marine aggregates for the European construction industry. The aggregates originate from the marine sand and gravel concessions of the DEME Group and licences of third parties.
OFFSHOREFor customers active in renewable energies, the DEME Group provides flexible solutions regarding the transportation and installation of foundations and turbines, cable installation, maintenance operations and activities, up to overall EPCI-type contracts (engineering, pro-curement, construction and installation). For oil and gas companies, as well as other offshore customers, services include offshore civil en-gineering works, rock placement, heavy haulage, subsea construction, umbilical cable laying and the installation and decommissioning of offshore platforms.
ENVIRONMENTThe DEME Group has specialist environmental companies with more than 20 years’ experience in the rehabilitation of polluted sites. Those companies adopt a proactive approach to the remediation of brownfield sites alongside their real estate development partners. Their activities include soil decontamination, treatment of polluted soils and dredged sediments, as well as the treatment of groundwater and polluted soils using innovative techniques. The activities of this division are carried out by Ecoterres Holding and its subsidiaries.
MARINE CIVIL ENGINEERINGThe DEME Group is also active in marine infrastructure and civil engineering works that complement and reinforce the Group’s activities. These include the design and construction of hydraulic and marine works such as jetties, port terminals, locks and weirs, infrastructural works such as bored, immersed and cut & cover tunnels, foundation and marine works for bridges and offshore structures, civil engineering works for port infrastructures, dams and sea defences, canals, quay walls and port and shore protection works.
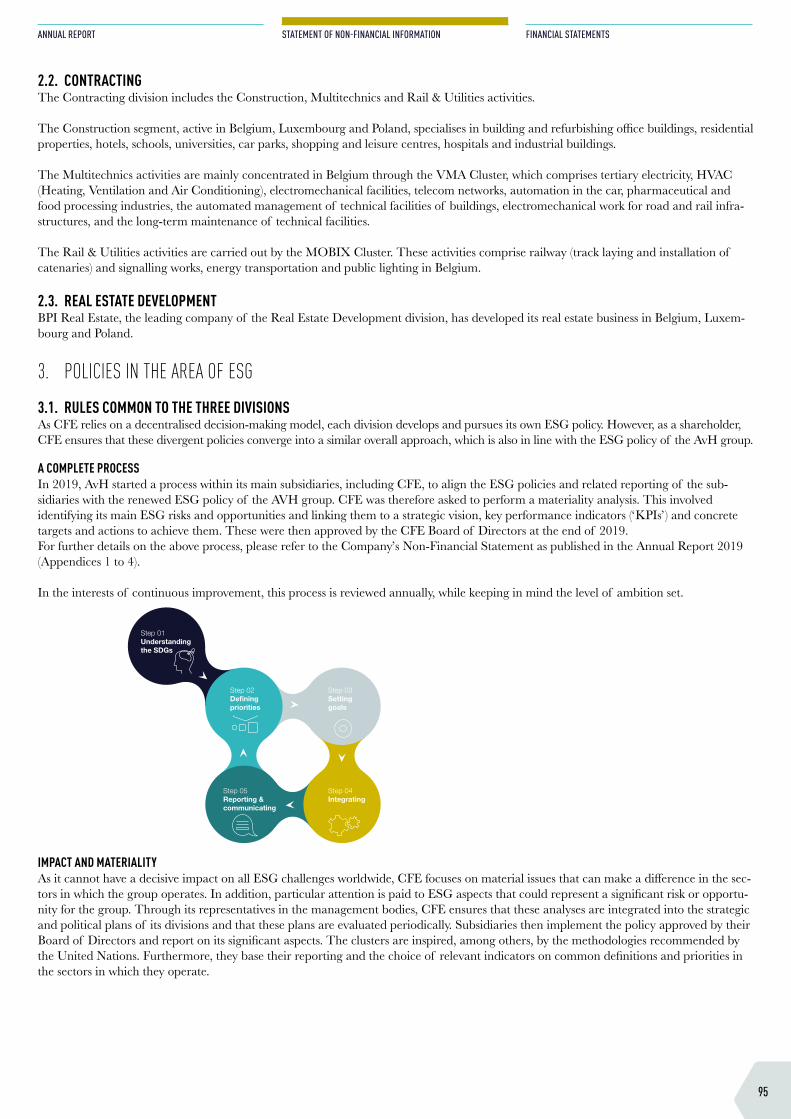
95
ANNUAL REPORT
STATEMENT OF NON-FINANCIAL INFORMATION
FINANCIAL STATEMENTS
2.2. CONTRACTINGThe Contracting division includes the Construction, Multitechnics and Rail & Utilities activities.
The Construction segment, active in Belgium, Luxembourg and Poland, specialises in building and refurbishing office buildings, residential properties, hotels, schools, universities, car parks, shopping and leisure centres, hospitals and industrial buildings.
The Multitechnics activities are mainly concentrated in Belgium through the VMA Cluster, which comprises tertiary electricity, HVAC (Heating, Ventilation and Air Conditioning), electromechanical facilities, telecom networks, automation in the car, pharmaceutical and food processing industries, the automated management of technical facilities of buildings, electromechanical work for road and rail infra-structures, and the long-term maintenance of technical facilities.
The Rail & Utilities activities are carried out by the MOBIX Cluster. These activities comprise railway (track laying and installation of catenaries) and signalling works, energy transportation and public lighting in Belgium.
2.3. REAL ESTATE DEVELOPMENTBPI Real Estate, the leading company of the Real Estate Development division, has developed its real estate business in Belgium, Luxem-bourg and Poland.
3. POLICIES IN THE AREA OF ESG
3.1. RULES COMMON TO THE THREE DIVISIONSAs CFE relies on a decentralised decision-making model, each division develops and pursues its own ESG policy. However, as a shareholder, CFE ensures that these divergent policies converge into a similar overall approach, which is also in line with the ESG policy of the AvH group.
A COMPLETE PROCESSIn 2019, AvH started a process within its main subsidiaries, including CFE, to align the ESG policies and related reporting of the sub- sidiaries with the renewed ESG policy of the AVH group. CFE was therefore asked to perform a materiality analysis. This involved identifying its main ESG risks and opportunities and linking them to a strategic vision, key performance indicators (‘KPIs’) and concrete targets and actions to achieve them. These were then approved by the CFE Board of Directors at the end of 2019. For further details on the above process, please refer to the Company’s Non-Financial Statement as published in the Annual Report 2019 (Appendices 1 to 4).
In the interests of continuous improvement, this process is reviewed annually, while keeping in mind the level of ambition set.
IMPACT AND MATERIALITYAs it cannot have a decisive impact on all ESG challenges worldwide, CFE focuses on material issues that can make a difference in the sec-tors in which the group operates. In addition, particular attention is paid to ESG aspects that could represent a significant risk or opportu-nity for the group. Through its representatives in the management bodies, CFE ensures that these analyses are integrated into the strategic and political plans of its divisions and that these plans are evaluated periodically. Subsidiaries then implement the policy approved by their Board of Directors and report on its significant aspects. The clusters are inspired, among others, by the methodologies recommended by the United Nations. Furthermore, they base their reporting and the choice of relevant indicators on common definitions and priorities in the sectors in which they operate.
96
CONTENTS
WHY AND WHO WE ARE
HOW WE SHAPE THE WORLD
CONTRIBUTION TO THE 17 SDGSThe three divisions are committed to aligning their sustainability approach to the seventeen Sustainable Development Goals (SDGs) of the United Nations. The CFE Group as a whole believes it is the responsibility of every individual, and of every business, to help meet the great challenges facing the world today. The CFE group endorses the UN Agenda 2030 and the accompanying SDG methodology and uses it as an international framework for its policy.
Choosing the SDGs also makes it possible to draw inspiration from the GRI (Global Reporting Initiative) methodology, given the existing correspondence tables.
CONTINUOUS IMPROVEMENT AND OPPORTUNITIESThis sustainable approach consists of both the desire to continuously improve operations and to minimise the negative impacts of opera-tions. It also provides opportunities to continually seek to create new sustainable values and to explore and develop new markets.
EUROPEAN TAXONOMYThe aim of the European Taxonomy is to create a classification system for what is considered ‘sustainable’ from an environmental and social point of view. It creates a framework and principles for assessing economic activities in relation to six environmental objectives: these include ‘Climate change mitigation’, ‘Climate change adaptation’, ‘The sustainable use and protection of water and marine resources’, ‘The transition to a circular economy’, ‘Pollution prevention and control’ and ‘The protection and restoration of biodiversity and ecosys-tems’.It works as follows: an activity can be considered ‘sustainable’ if it contributes substantially to one of the six environmental objectives, without causing significant harm to any of the other five objectives. An activity must also meet basic social criteria to be considered ‘sus-tainable’.The analysis of CFE activities is included in chapter 7.
PARTNERSHIP FOR CHANGEFinally, and above all, the CFE Group also believes that this approach can only work with the cooperation of all the different parties in-volved in our activities: employees, suppliers, subcontractors, public authorities, customers, etc. Partnership for change is key to the success of a sustainable strategy. SDG 17 shows the path to follow in this respect. With this in mind, the CFE Group has from the outset involved different stakeholders (both internal and external) in its thinking about sustainability.
3.2. DEME’S ESG POLICYDEME, which has actively implemented the SDGs since 2017, has developed a number of themes and actions through its sustainability approach with which it contributes to the seventeen SDGs. All these themes and actions are explained in detail in DEME’s 2021 sustaina-bility report.
At DEME, our ambition is to make a major contribution to finding sustainable solutions to the environmental, societal and economic challenges facing the world today. Every day, we are involved in a wide range of large-scale and complex projects around the world, from dredging and land reclamation to marine infrastructure and offshore environmental and energy work. All these projects have a potential impact - positive or negative, minor or substantial - on communities, local economies and the general climate. We are always striving to improve the sustainability of our own operations.An intense process of internal cooperation has taken place across our business, resulting in a two-dimensional strategy for sustainable per-formance.
01 EXPLORING SUSTAINABLE BUSINESS SOLUTIONS by continually challenging ourselves to expand our portfolio of sustainable activities and to align our business decisions with the sustainability goals where DEME can have the most impact.
02 EXCELLING IN OUR OPERATIONS by maintaining and enhancing sustainable performance in our daily operations. Thanks to an innovative approach, the ‘Excel’ programme makes it possible to find the best possible uses for scientific research and existing technologies. The EXCEL dimension therefore aims to ensure that its projects are implemented not only efficiently and cost-effectively, but also sustainably.
This strategy will help us to create sustainable value for our customers, DEME and society.
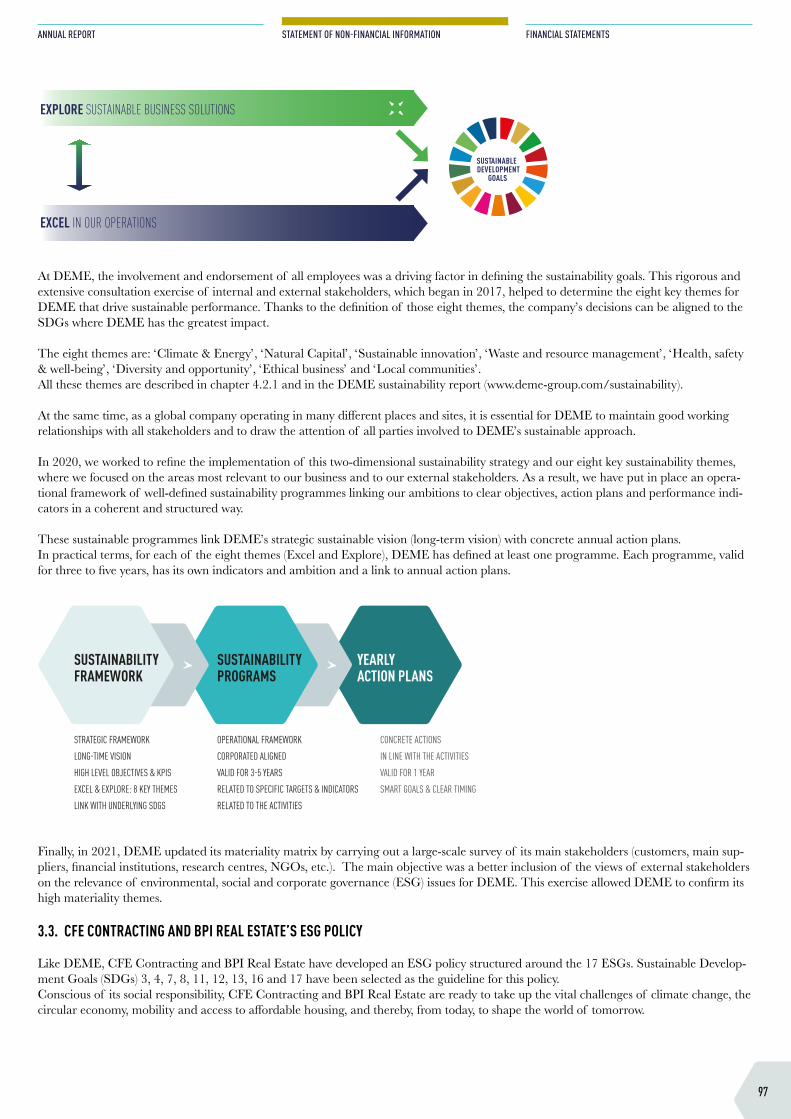
97
ANNUAL REPORT
STATEMENT OF NON-FINANCIAL INFORMATION
FINANCIAL STATEMENTS
EXPLORE SUSTAINABLE BUSINESS SOLUTIONS
EXCEL IN OUR OPERATIONS
SUSTAINABLE
DEVELOPMENT
GOALS
At DEME, the involvement and endorsement of all employees was a driving factor in defining the sustainability goals. This rigorous and extensive consultation exercise of internal and external stakeholders, which began in 2017, helped to determine the eight key themes for DEME that drive sustainable performance. Thanks to the definition of those eight themes, the company’s decisions can be aligned to the SDGs where DEME has the greatest impact.
The eight themes are: ‘Climate & Energy’, ‘Natural Capital’, ‘Sustainable innovation’, ‘Waste and resource management’, ‘Health, safety & well-being’, ‘Diversity and opportunity’, ‘Ethical business’ and ‘Local communities’. All these themes are described in chapter 4.2.1 and in the DEME sustainability report (www.deme-group.com/sustainability).
At the same time, as a global company operating in many different places and sites, it is essential for DEME to maintain good working relationships with all stakeholders and to draw the attention of all parties involved to DEME’s sustainable approach. In 2020, we worked to refine the implementation of this two-dimensional sustainability strategy and our eight key sustainability themes, where we focused on the areas most relevant to our business and to our external stakeholders. As a result, we have put in place an opera-tional framework of well-defined sustainability programmes linking our ambitions to clear objectives, action plans and performance indi-cators in a coherent and structured way.
These sustainable programmes link DEME’s strategic sustainable vision (long-term vision) with concrete annual action plans. In practical terms, for each of the eight themes (Excel and Explore), DEME has defined at least one programme. Each programme, valid for three to five years, has its own indicators and ambition and a link to annual action plans.
OPERATIONAL FRAMEWORKCORPORATED ALIGNEDVALID FOR 3-5 YEARS RELATED TO SPECIFIC TARGETS & INDICATORSRELATED TO THE ACTIVITIES
CONCRETE ACTIONSIN LINE WITH THE ACTIVITIESVALID FOR 1 YEARSMART GOALS & CLEAR TIMING
STRATEGIC FRAMEWORKLONG-TIME VISIONHIGH LEVEL OBJECTIVES & KPISEXCEL & EXPLORE: 8 KEY THEMESLINK WITH UNDERLYING SDGS
SUSTAINABILITY FRAMEWORK
SUSTAINABILITY PROGRAMS
YEARLY ACTION PLANS
Finally, in 2021, DEME updated its materiality matrix by carrying out a large-scale survey of its main stakeholders (customers, main sup-pliers, financial institutions, research centres, NGOs, etc.). The main objective was a better inclusion of the views of external stakeholders on the relevance of environmental, social and corporate governance (ESG) issues for DEME. This exercise allowed DEME to confirm its high materiality themes.
3.3. CFE CONTRACTING AND BPI REAL ESTATE’S ESG POLICY
Like DEME, CFE Contracting and BPI Real Estate have developed an ESG policy structured around the 17 ESGs. Sustainable Develop-ment Goals (SDGs) 3, 4, 7, 8, 11, 12, 13, 16 and 17 have been selected as the guideline for this policy. Conscious of its social responsibility, CFE Contracting and BPI Real Estate are ready to take up the vital challenges of climate change, the circular economy, mobility and access to affordable housing, and thereby, from today, to shape the world of tomorrow.
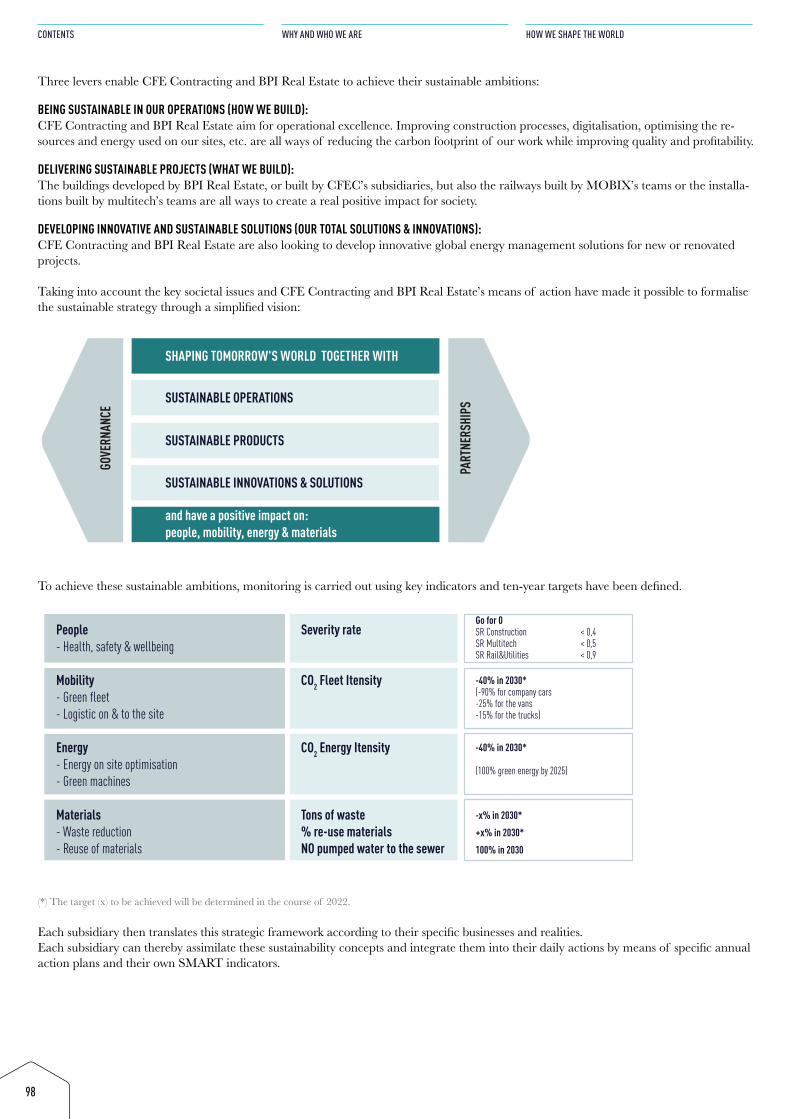
98
CONTENTS
WHY AND WHO WE ARE
HOW WE SHAPE THE WORLD
Three levers enable CFE Contracting and BPI Real Estate to achieve their sustainable ambitions:
BEING SUSTAINABLE IN OUR OPERATIONS (HOW WE BUILD):CFE Contracting and BPI Real Estate aim for operational excellence. Improving construction processes, digitalisation, optimising the re-sources and energy used on our sites, etc. are all ways of reducing the carbon footprint of our work while improving quality and profitability.
DELIVERING SUSTAINABLE PROJECTS (WHAT WE BUILD): The buildings developed by BPI Real Estate, or built by CFEC’s subsidiaries, but also the railways built by MOBIX’s teams or the installa-tions built by multitech’s teams are all ways to create a real positive impact for society.
DEVELOPING INNOVATIVE AND SUSTAINABLE SOLUTIONS (OUR TOTAL SOLUTIONS & INNOVATIONS): CFE Contracting and BPI Real Estate are also looking to develop innovative global energy management solutions for new or renovated projects.
Taking into account the key societal issues and CFE Contracting and BPI Real Estate’s means of action have made it possible to formalise the sustainable strategy through a simplified vision:
SUSTAINABLE OPERATIONS
SUSTAINABLE PRODUCTS
SUSTAINABLE INNOVATIONS & SOLUTIONS
SHAPING TOMORROW'S WORLD TOGETHER WITH
and have a positive impact on: people, mobility, energy & materials
GOVE
RNAN
CE
PART
NERS
HIPS
People- Health, safety & wellbeing
Mobility- Green fleet- Logistic on & to the site
Energy- Energy on site optimisation- Green machines
Materials- Waste reduction- Reuse of materials
Severity rate
CO2 Fleet Itensity
CO2 Energy Itensity
Tons of waste% re-use materialsNO pumped water to the sewer
Go for 0SR Construction < 0,4SR Multitech < 0,5SR Rail&Utilities < 0,9
-40% in 2030*(-90% for company cars-25% for the vans-15% for the trucks)
-40% in 2030*
(100% green energy by 2025)
-x% in 2030*+x% in 2030*100% in 2030
To achieve these sustainable ambitions, monitoring is carried out using key indicators and ten-year targets have been defined.
SUSTAINABLE OPERATIONS
SUSTAINABLE PRODUCTS
SUSTAINABLE INNOVATIONS & SOLUTIONS
SHAPING TOMORROW'S WORLD TOGETHER WITH
and have a positive impact on: people, mobility, energy & materials
GOVE
RNAN
CE
PART
NERS
HIPS
People- Health, safety & wellbeing
Mobility- Green fleet- Logistic on & to the site
Energy- Energy on site optimisation- Green machines
Materials- Waste reduction- Reuse of materials
Severity rate
CO2 Fleet Itensity
CO2 Energy Itensity
Tons of waste% re-use materialsNO pumped water to the sewer
Go for 0SR Construction < 0,4SR Multitech < 0,5SR Rail&Utilities < 0,9
-40% in 2030*(-90% for company cars-25% for the vans-15% for the trucks)
-40% in 2030*
(100% green energy by 2025)
-x% in 2030*+x% in 2030*100% in 2030
(*) The target (x) to be achieved will be determined in the course of 2022.
Each subsidiary then translates this strategic framework according to their specific businesses and realities.Each subsidiary can thereby assimilate these sustainability concepts and integrate them into their daily actions by means of specific annual action plans and their own SMART indicators.
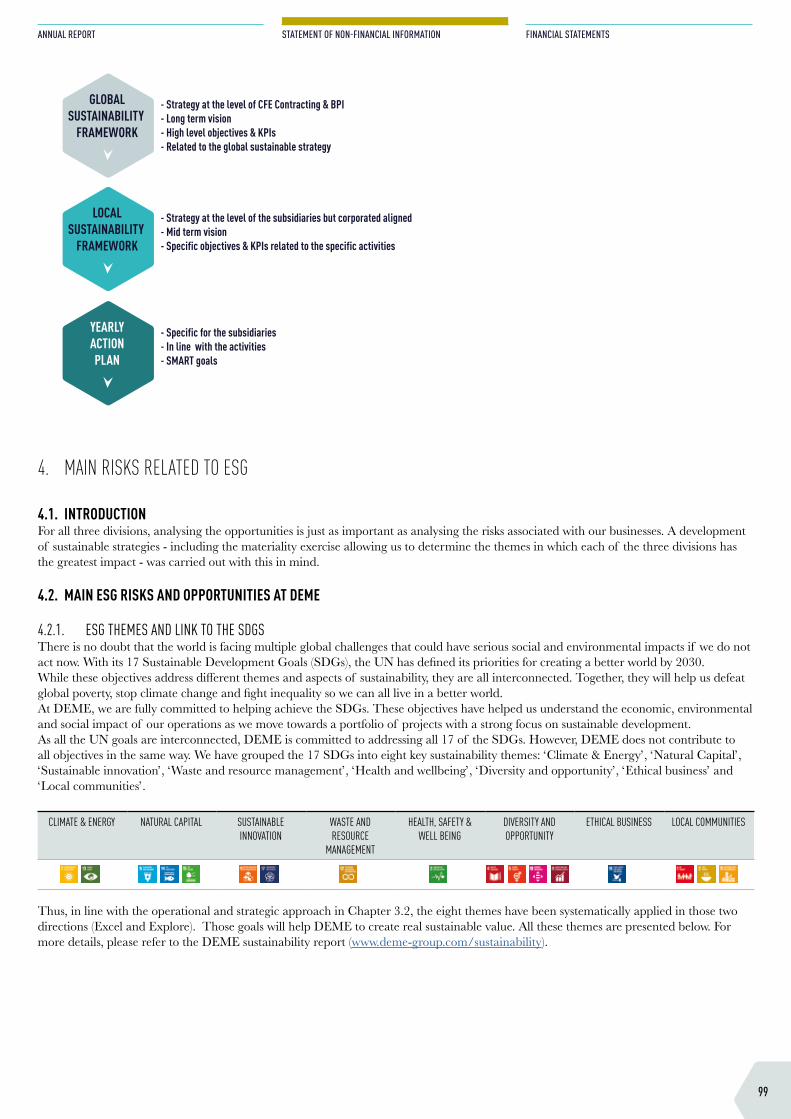
99
ANNUAL REPORT
STATEMENT OF NON-FINANCIAL INFORMATION
FINANCIAL STATEMENTS
- Strategy at the level of CFE Contracting & BPI- Long term vision- High level objectives & KPIs- Related to the global sustainable strategy
- Strategy at the level of the subsidiaries but corporated aligned- Mid term vision- Specific objectives & KPIs related to the specific activities
- Specific for the subsidiaries- In line with the activities- SMART goals
GLOBALSUSTAINABILITY
FRAMEWORK
LOCALSUSTAINABILITY
FRAMEWORK
YEARLYACTIONPLAN
4. MAIN RISKS RELATED TO ESG
4.1. INTRODUCTIONFor all three divisions, analysing the opportunities is just as important as analysing the risks associated with our businesses. A development of sustainable strategies - including the materiality exercise allowing us to determine the themes in which each of the three divisions has the greatest impact - was carried out with this in mind.
4.2. MAIN ESG RISKS AND OPPORTUNITIES AT DEME
4.2.1. ESG THEMES AND LINK TO THE SDGSThere is no doubt that the world is facing multiple global challenges that could have serious social and environmental impacts if we do not act now. With its 17 Sustainable Development Goals (SDGs), the UN has defined its priorities for creating a better world by 2030. While these objectives address different themes and aspects of sustainability, they are all interconnected. Together, they will help us defeat global poverty, stop climate change and fight inequality so we can all live in a better world. At DEME, we are fully committed to helping achieve the SDGs. These objectives have helped us understand the economic, environmental and social impact of our operations as we move towards a portfolio of projects with a strong focus on sustainable development.As all the UN goals are interconnected, DEME is committed to addressing all 17 of the SDGs. However, DEME does not contribute to all objectives in the same way. We have grouped the 17 SDGs into eight key sustainability themes: ‘Climate & Energy’, ‘Natural Capital’, ‘Sustainable innovation’, ‘Waste and resource management’, ‘Health and wellbeing’, ‘Diversity and opportunity’, ‘Ethical business’ and ‘Local communities’.
CLIMATE & ENERGY NATURAL CAPITAL SUSTAINABLE INNOVATION
WASTE AND RESOURCE
MANAGEMENT
HEALTH, SAFETY & WELL BEING
DIVERSITY AND OPPORTUNITY
ETHICAL BUSINESS LOCAL COMMUNITIES
Thus, in line with the operational and strategic approach in Chapter 3.2, the eight themes have been systematically applied in those two directions (Excel and Explore). Those goals will help DEME to create real sustainable value. All these themes are presented below. For more details, please refer to the DEME sustainability report (www.deme-group.com/sustainability).
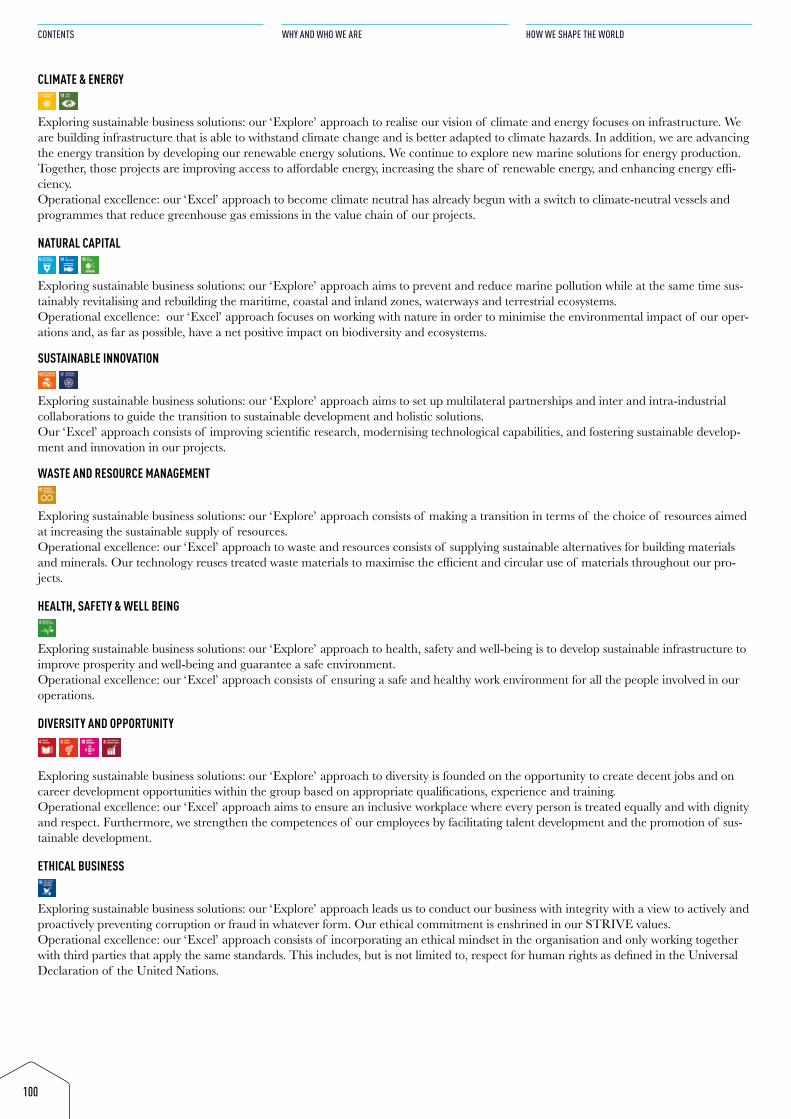
100
CONTENTS
WHY AND WHO WE ARE
HOW WE SHAPE THE WORLD
CLIMATE & ENERGY
Exploring sustainable business solutions: our ‘Explore’ approach to realise our vision of climate and energy focuses on infrastructure. We are building infrastructure that is able to withstand climate change and is better adapted to climate hazards. In addition, we are advancing the energy transition by developing our renewable energy solutions. We continue to explore new marine solutions for energy production. Together, those projects are improving access to affordable energy, increasing the share of renewable energy, and enhancing energy effi-ciency. Operational excellence: our ‘Excel’ approach to become climate neutral has already begun with a switch to climate-neutral vessels and programmes that reduce greenhouse gas emissions in the value chain of our projects.
NATURAL CAPITAL
Exploring sustainable business solutions: our ‘Explore’ approach aims to prevent and reduce marine pollution while at the same time sus-tainably revitalising and rebuilding the maritime, coastal and inland zones, waterways and terrestrial ecosystems. Operational excellence: our ‘Excel’ approach focuses on working with nature in order to minimise the environmental impact of our oper-ations and, as far as possible, have a net positive impact on biodiversity and ecosystems.
SUSTAINABLE INNOVATION
Exploring sustainable business solutions: our ‘Explore’ approach aims to set up multilateral partnerships and inter and intra-industrial collaborations to guide the transition to sustainable development and holistic solutions. Our ‘Excel’ approach consists of improving scientific research, modernising technological capabilities, and fostering sustainable develop-ment and innovation in our projects.
WASTE AND RESOURCE MANAGEMENT
Exploring sustainable business solutions: our ‘Explore’ approach consists of making a transition in terms of the choice of resources aimed at increasing the sustainable supply of resources. Operational excellence: our ‘Excel’ approach to waste and resources consists of supplying sustainable alternatives for building materials and minerals. Our technology reuses treated waste materials to maximise the efficient and circular use of materials throughout our pro-jects.
HEALTH, SAFETY & WELL BEING
Exploring sustainable business solutions: our ‘Explore’ approach to health, safety and well-being is to develop sustainable infrastructure to improve prosperity and well-being and guarantee a safe environment. Operational excellence: our ‘Excel’ approach consists of ensuring a safe and healthy work environment for all the people involved in our operations.
DIVERSITY AND OPPORTUNITY
Exploring sustainable business solutions: our ‘Explore’ approach to diversity is founded on the opportunity to create decent jobs and on career development opportunities within the group based on appropriate qualifications, experience and training. Operational excellence: our ‘Excel’ approach aims to ensure an inclusive workplace where every person is treated equally and with dignity and respect. Furthermore, we strengthen the competences of our employees by facilitating talent development and the promotion of sus-tainable development.
ETHICAL BUSINESS
Exploring sustainable business solutions: our ‘Explore’ approach leads us to conduct our business with integrity with a view to actively and proactively preventing corruption or fraud in whatever form. Our ethical commitment is enshrined in our STRIVE values. Operational excellence: our ‘Excel’ approach consists of incorporating an ethical mindset in the organisation and only working together with third parties that apply the same standards. This includes, but is not limited to, respect for human rights as defined in the Universal Declaration of the United Nations.
101
ANNUAL REPORT
STATEMENT OF NON-FINANCIAL INFORMATION
FINANCIAL STATEMENTS
LOCAL COMMUNITIES
Exploring sustainable business solutions: our ‘Explore’ approach aims to increase the resilience of communities so that they are able to meet the economic, environmental and social challenges. Operational excellence: our ‘Excel’ approach consists of establishing collaborative relations with the local communities through consulta-tion, commitment and participation.
4.2.2. MATERIALITY MATRIX
MATERIALITY PRINCIPLEThe materiality analysis carried out by DEME aims to define the key issues for DEME. These are the themes where DEME has a strong impact, both in commercial terms and in terms of importance for the different stakeholders. This analysis needs to be reviewed regularly to ensure it is in line with the realities of the ever-changing external world. The materiality exercise covers environmental, social and cor-porate governance (ESG) issues. The materiality assessment enabled DEME to define its sustainability strategy, resulting in eight priority sustainability themes that drive its sustainable performance.
METHODOLOGYTo understand the key sustainability goals and themes where DEME has the most impact, extensive consultations with stakeholders (in-ternal and external) were conducted in 2017 and 2018. Based on the eight key themes (as described in chapter 4.2.1), DEME has defined a series of ESG issues. The assessment of DEME’s impact on these ESG issues led to the establishment of an initial materiality matrix, which served as a reference for aligning DEME’s sustainable ambitions.
In the course of 2021, DEME updated this materiality matrix. The main objective was a better inclusion of the views external stakehold-ers on the relevance of environmental, social and corporate governance (ESG) issues for DEME. To do this, we have: • Reviewed the ESG and sustainability issues in DEME’s existing 2018 materiality matrix and compared them in our sector with some
of our peers and with relevant ESG issues used by risk rating agencies; • Sent an anonymous online survey to more than 200 of our closest external stakeholders (customers, suppliers, financial institutions,
research partners, NGOs and shareholders) asking them to rate the relevance of the ESG and sustainability issues identified in the previous step, based on their expectations of DEME and its industry;
• Compiled the results of the review and the online survey into the renewed 2021 materiality matrix and validated these results through our governance model.
The renewed DEME 2021 materiality matrix thereby helps us to better identify and understand the relative importance of specific ESG and sustainability issues for external stakeholders and align our business decisions with the sustainability objectives where DEME can cre-ate the most impact.
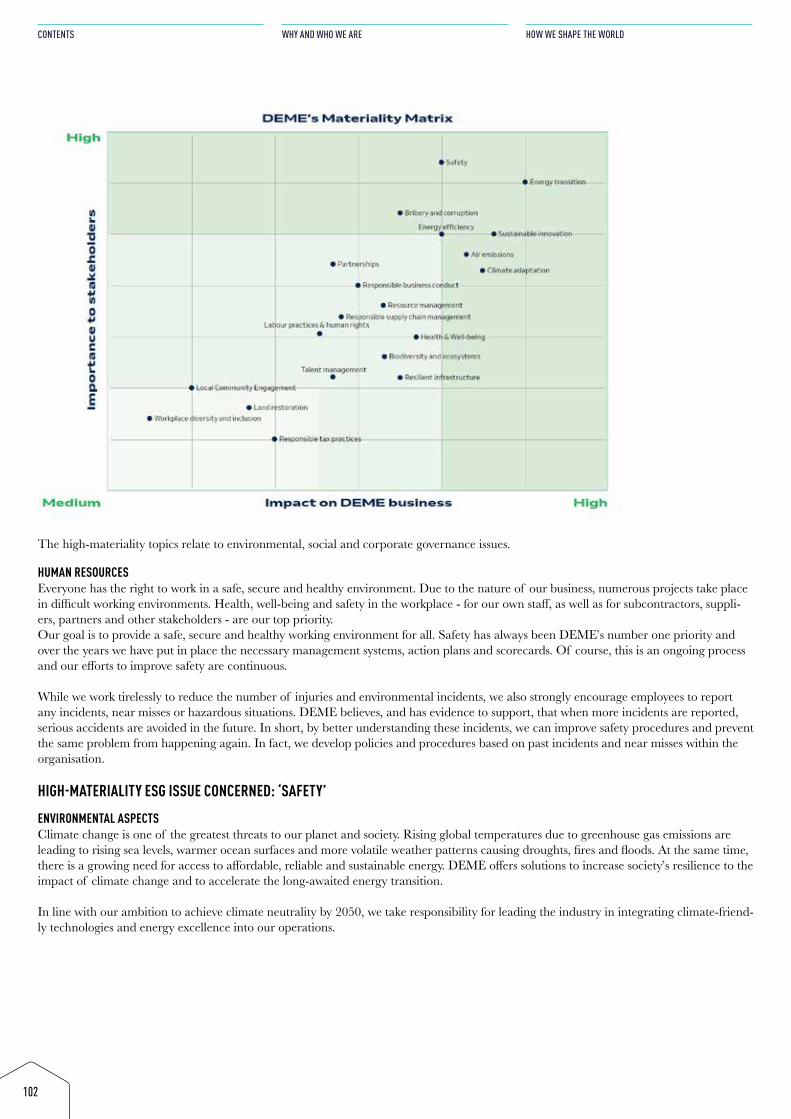
102
CONTENTS
WHY AND WHO WE ARE
HOW WE SHAPE THE WORLD
The high-materiality topics relate to environmental, social and corporate governance issues.
HUMAN RESOURCESEveryone has the right to work in a safe, secure and healthy environment. Due to the nature of our business, numerous projects take place in difficult working environments. Health, well-being and safety in the workplace - for our own staff, as well as for subcontractors, suppli-ers, partners and other stakeholders - are our top priority.Our goal is to provide a safe, secure and healthy working environment for all. Safety has always been DEME’s number one priority and over the years we have put in place the necessary management systems, action plans and scorecards. Of course, this is an ongoing process and our efforts to improve safety are continuous.
While we work tirelessly to reduce the number of injuries and environmental incidents, we also strongly encourage employees to report any incidents, near misses or hazardous situations. DEME believes, and has evidence to support, that when more incidents are reported, serious accidents are avoided in the future. In short, by better understanding these incidents, we can improve safety procedures and prevent the same problem from happening again. In fact, we develop policies and procedures based on past incidents and near misses within the organisation.
HIGH-MATERIALITY ESG ISSUE CONCERNED: ‘SAFETY’ENVIRONMENTAL ASPECTSClimate change is one of the greatest threats to our planet and society. Rising global temperatures due to greenhouse gas emissions are leading to rising sea levels, warmer ocean surfaces and more volatile weather patterns causing droughts, fires and floods. At the same time, there is a growing need for access to affordable, reliable and sustainable energy. DEME offers solutions to increase society’s resilience to the impact of climate change and to accelerate the long-awaited energy transition.
In line with our ambition to achieve climate neutrality by 2050, we take responsibility for leading the industry in integrating climate-friend-ly technologies and energy excellence into our operations.
103
ANNUAL REPORT
STATEMENT OF NON-FINANCIAL INFORMATION
FINANCIAL STATEMENTS
HIGH-MATERIALITY ESG ISSUE CONCERNED: ‘ENERGY TRANSITION’, ‘ENERGY EFFICIENCY’, ‘AIR EMISSIONS’ AND ‘CLIMATE ADAPTATION’
CORPORATE GOVERNANCEIn our day-to-day activities, we work closely with civil servants and third parties, such as joint venture partners, subcontractors and recruit-ment agencies. In addition, we often operate in countries with a higher risk profile for unethical practices (e.g. a low ranking in Trans- parency International’s Corruption Perceptions Index). Because of these factors, we must be highly vigilant in ensuring that our ethical standards are met at all times.
In line with our ambitions to create a long-term sustainable business, we aim to conduct our business with integrity and to actively and proactively prevent corruption or bribery in all its forms. We respect and protect workers’ rights in our operations. Above all, an ethical mindset is embedded in our organisation and we attach great importance to transparent communications on our ethical performance.
RELEVANT ESG ISSUE WITH HIGH MATERIALITY: INNOVATIONInnovation is the cornerstone of our projects. We are constantly pushing our limits by developing new services and value-added solutions.
HIGH-MATERIALITY ESG ISSUE CONCERNED: ‘SUSTAINABLE INNOVATION’
HIGH MATERIALITY ESG ISSUES AND SUSTAINABLE STRATEGYThe high-materiality issues are therefore well prioritised in the DEME strategy and have been grouped into the four DEME high-material-ity themes:- Climate & Energy- Sustainable innovation- Ethical business- Health, safety & wellbeing
The four other themes:- Natural capital- Waste & resource management- Diversity & opportunity - Local communitiesare therefore considered to be medium materiality themes..
The 2021 materiality exercise confirms the high materiality of the previously selected priority themes.
4.3. MAIN ESG RISKS AND OPPORTUNITIES AT CFE CONTRACTING AND BPI REAL ESTATE
4.3.1. ESG THEMES AND LINK TO THE SDGSThe main risk trends specific to the construction and real estate sector that are currently emerging are: • ‘Safety’: there are numerous risks on construction sites. They are incurred both by employees and by third parties. Accidents at work
can be serious and have serious consequences. This is why applying safety rules on construction sites is essential.
• ‘The talent war’: people are, more than ever, at the heart of our business. Nevertheless, it remains difficult to recruit and retain qual-ified people for a job in the construction industry on account of the problems of image and working conditions that may seem less appealing such as night and weekend work, outdoor activity and sites. Moreover, young starters often lack sufficient qualifications and need additional training.
• ‘Complex collaborations’: the construction industry is both fascinating and complex, particularly in terms of the number of parties involved (architects, engineering firms, institutions, customers, suppliers, etc.) and the relations between them throughout the design and execution process.
• ‘Lack of long-term vision’: at the moment, it is still very difficult for the construction division to convince the parties involved to have a long-term and global view of ‘life cycle costs’. The sometimes too short-term view of some project designers inhibits innovation, tech-nological optimisation and the use of more environmentally friendly materials. Fortunately, BPI Real Estate has made sustainability its priority in the development of its projects, which greatly facilitates the joint innovative approach between the two poles.
• ‘Scarcity of resources and Managing the production of waste’: managing resources and waste, either by limiting waste or reusing and recycling it, is a crucial issue. More than ever, circularity is a major challenge for our businesses.
• ‘Complex legislation’: the various stringent European, national and regional regulations often overcomplicate our activities and restrict opportunities for innovation.
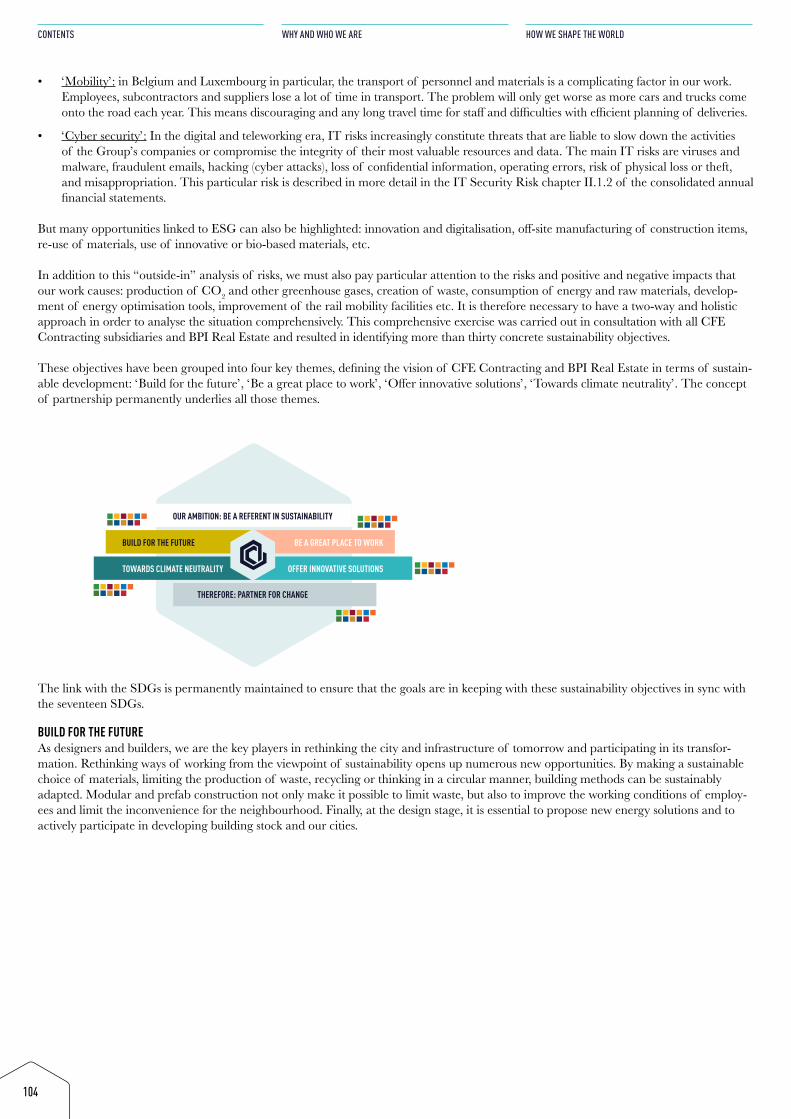
104
CONTENTS
WHY AND WHO WE ARE
HOW WE SHAPE THE WORLD
• ‘Mobility’: in Belgium and Luxembourg in particular, the transport of personnel and materials is a complicating factor in our work. Employees, subcontractors and suppliers lose a lot of time in transport. The problem will only get worse as more cars and trucks come onto the road each year. This means discouraging and any long travel time for staff and difficulties with efficient planning of deliveries.
• ‘Cyber security’: In the digital and teleworking era, IT risks increasingly constitute threats that are liable to slow down the activities of the Group’s companies or compromise the integrity of their most valuable resources and data. The main IT risks are viruses and malware, fraudulent emails, hacking (cyber attacks), loss of confidential information, operating errors, risk of physical loss or theft, and misappropriation. This particular risk is described in more detail in the IT Security Risk chapter II.1.2 of the consolidated annual financial statements.
But many opportunities linked to ESG can also be highlighted: innovation and digitalisation, off-site manufacturing of construction items, re-use of materials, use of innovative or bio-based materials, etc.
In addition to this “outside-in” analysis of risks, we must also pay particular attention to the risks and positive and negative impacts that our work causes: production of CO2 and other greenhouse gases, creation of waste, consumption of energy and raw materials, develop-ment of energy optimisation tools, improvement of the rail mobility facilities etc. It is therefore necessary to have a two-way and holistic approach in order to analyse the situation comprehensively. This comprehensive exercise was carried out in consultation with all CFE Contracting subsidiaries and BPI Real Estate and resulted in identifying more than thirty concrete sustainability objectives.
These objectives have been grouped into four key themes, defining the vision of CFE Contracting and BPI Real Estate in terms of sustain-able development: ‘Build for the future’, ‘Be a great place to work’, ‘Offer innovative solutions’, ‘Towards climate neutrality’. The concept of partnership permanently underlies all those themes.
OUR AMBITION: BE A REFERENT IN SUSTAINABILITY
THEREFORE: PARTNER FOR CHANGE
BUILD FOR THE FUTURE
TOWARDS CLIMATE NEUTRALITY
BE A GREAT PLACE TO WORK
OFFER INNOVATIVE SOLUTIONS
The link with the SDGs is permanently maintained to ensure that the goals are in keeping with these sustainability objectives in sync with the seventeen SDGs.
BUILD FOR THE FUTURE As designers and builders, we are the key players in rethinking the city and infrastructure of tomorrow and participating in its transfor-mation. Rethinking ways of working from the viewpoint of sustainability opens up numerous new opportunities. By making a sustainable choice of materials, limiting the production of waste, recycling or thinking in a circular manner, building methods can be sustainably adapted. Modular and prefab construction not only make it possible to limit waste, but also to improve the working conditions of employ-ees and limit the inconvenience for the neighbourhood. Finally, at the design stage, it is essential to propose new energy solutions and to actively participate in developing building stock and our cities.
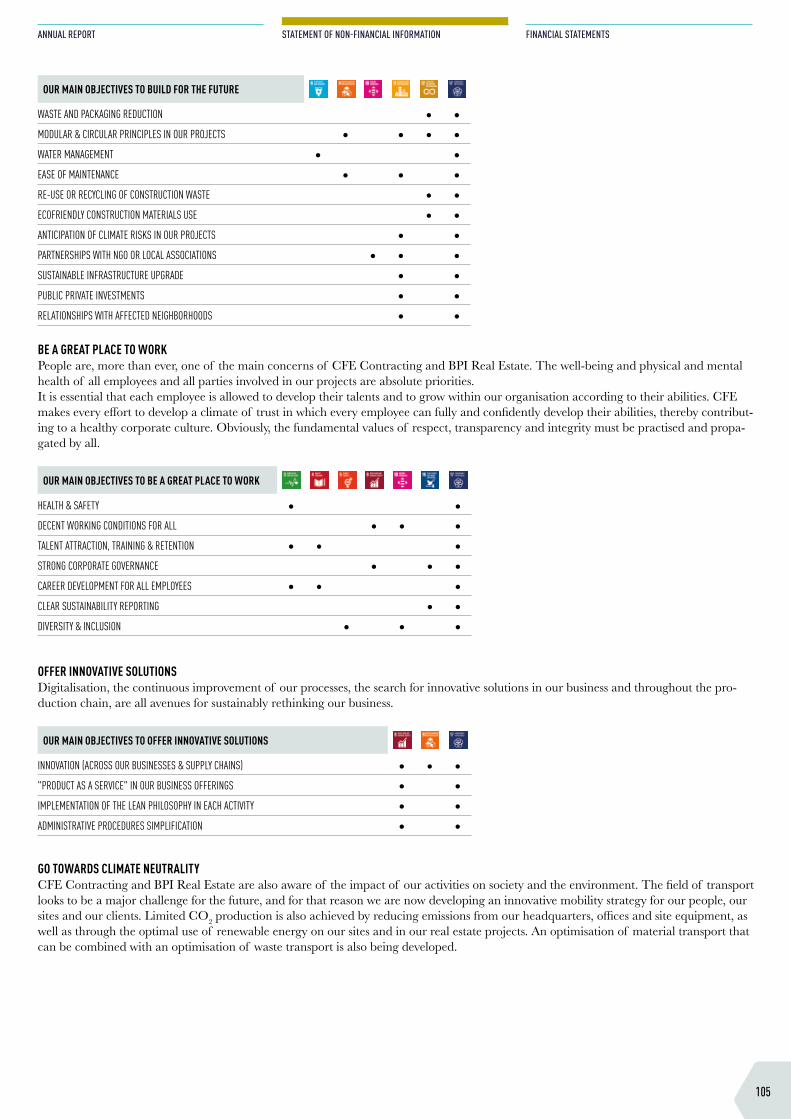
105
ANNUAL REPORT
STATEMENT OF NON-FINANCIAL INFORMATION
FINANCIAL STATEMENTS
OUR MAIN OBJECTIVES TO BUILD FOR THE FUTURE
WASTE AND PACKAGING REDUCTION ∙ ∙MODULAR & CIRCULAR PRINCIPLES IN OUR PROJECTS ∙ ∙ ∙ ∙WATER MANAGEMENT ∙ ∙EASE OF MAINTENANCE ∙ ∙ ∙RE-USE OR RECYCLING OF CONSTRUCTION WASTE ∙ ∙ECOFRIENDLY CONSTRUCTION MATERIALS USE ∙ ∙ANTICIPATION OF CLIMATE RISKS IN OUR PROJECTS ∙ ∙PARTNERSHIPS WITH NGO OR LOCAL ASSOCIATIONS ∙ ∙ ∙SUSTAINABLE INFRASTRUCTURE UPGRADE ∙ ∙PUBLIC PRIVATE INVESTMENTS ∙ ∙RELATIONSHIPS WITH AFFECTED NEIGHBORHOODS ∙ ∙
BE A GREAT PLACE TO WORK People are, more than ever, one of the main concerns of CFE Contracting and BPI Real Estate. The well-being and physical and mental health of all employees and all parties involved in our projects are absolute priorities. It is essential that each employee is allowed to develop their talents and to grow within our organisation according to their abilities. CFE makes every effort to develop a climate of trust in which every employee can fully and confidently develop their abilities, thereby contribut-ing to a healthy corporate culture. Obviously, the fundamental values of respect, transparency and integrity must be practised and propa-gated by all.
OUR MAIN OBJECTIVES TO BE A GREAT PLACE TO WORK
HEALTH & SAFETY ∙ ∙DECENT WORKING CONDITIONS FOR ALL ∙ ∙ ∙TALENT ATTRACTION, TRAINING & RETENTION ∙ ∙ ∙STRONG CORPORATE GOVERNANCE ∙ ∙ ∙CAREER DEVELOPMENT FOR ALL EMPLOYEES ∙ ∙ ∙CLEAR SUSTAINABILITY REPORTING ∙ ∙DIVERSITY & INCLUSION ∙ ∙ ∙
OFFER INNOVATIVE SOLUTIONS Digitalisation, the continuous improvement of our processes, the search for innovative solutions in our business and throughout the pro-duction chain, are all avenues for sustainably rethinking our business.
OUR MAIN OBJECTIVES TO OFFER INNOVATIVE SOLUTIONS
INNOVATION (ACROSS OUR BUSINESSES & SUPPLY CHAINS) ∙ ∙ ∙"PRODUCT AS A SERVICE" IN OUR BUSINESS OFFERINGS ∙ ∙IMPLEMENTATION OF THE LEAN PHILOSOPHY IN EACH ACTIVITY ∙ ∙ADMINISTRATIVE PROCEDURES SIMPLIFICATION ∙ ∙
GO TOWARDS CLIMATE NEUTRALITYCFE Contracting and BPI Real Estate are also aware of the impact of our activities on society and the environment. The field of transport looks to be a major challenge for the future, and for that reason we are now developing an innovative mobility strategy for our people, our sites and our clients. Limited CO2 production is also achieved by reducing emissions from our headquarters, offices and site equipment, as well as through the optimal use of renewable energy on our sites and in our real estate projects. An optimisation of material transport that can be combined with an optimisation of waste transport is also being developed.
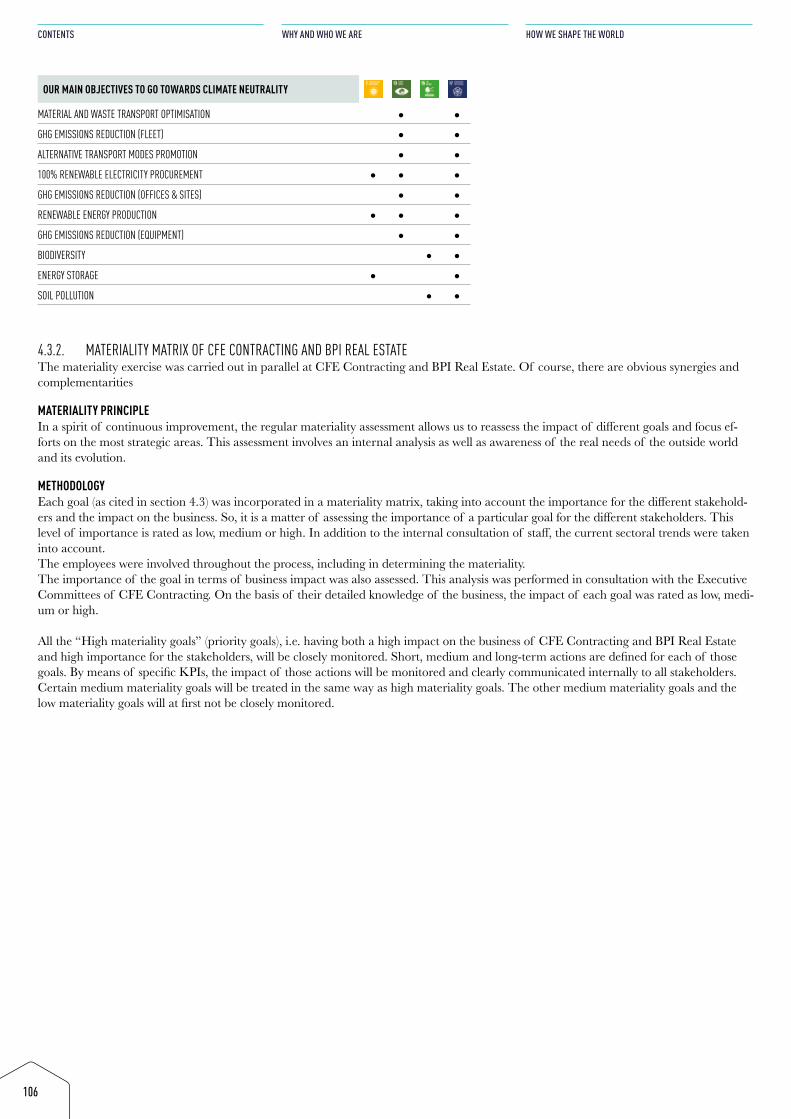
106
CONTENTS
WHY AND WHO WE ARE
HOW WE SHAPE THE WORLD
OUR MAIN OBJECTIVES TO GO TOWARDS CLIMATE NEUTRALITY
MATERIAL AND WASTE TRANSPORT OPTIMISATION ∙ ∙GHG EMISSIONS REDUCTION (FLEET) ∙ ∙ALTERNATIVE TRANSPORT MODES PROMOTION ∙ ∙100% RENEWABLE ELECTRICITY PROCUREMENT ∙ ∙ ∙GHG EMISSIONS REDUCTION (OFFICES & SITES) ∙ ∙RENEWABLE ENERGY PRODUCTION ∙ ∙ ∙GHG EMISSIONS REDUCTION (EQUIPMENT) ∙ ∙BIODIVERSITY ∙ ∙ENERGY STORAGE ∙ ∙SOIL POLLUTION ∙ ∙
4.3.2. MATERIALITY MATRIX OF CFE CONTRACTING AND BPI REAL ESTATEThe materiality exercise was carried out in parallel at CFE Contracting and BPI Real Estate. Of course, there are obvious synergies and complementarities
MATERIALITY PRINCIPLE In a spirit of continuous improvement, the regular materiality assessment allows us to reassess the impact of different goals and focus ef-forts on the most strategic areas. This assessment involves an internal analysis as well as awareness of the real needs of the outside world and its evolution.
METHODOLOGY Each goal (as cited in section 4.3) was incorporated in a materiality matrix, taking into account the importance for the different stakehold-ers and the impact on the business. So, it is a matter of assessing the importance of a particular goal for the different stakeholders. This level of importance is rated as low, medium or high. In addition to the internal consultation of staff, the current sectoral trends were taken into account. The employees were involved throughout the process, including in determining the materiality. The importance of the goal in terms of business impact was also assessed. This analysis was performed in consultation with the Executive Committees of CFE Contracting. On the basis of their detailed knowledge of the business, the impact of each goal was rated as low, medi-um or high.
All the “High materiality goals” (priority goals), i.e. having both a high impact on the business of CFE Contracting and BPI Real Estate and high importance for the stakeholders, will be closely monitored. Short, medium and long-term actions are defined for each of those goals. By means of specific KPIs, the impact of those actions will be monitored and clearly communicated internally to all stakeholders. Certain medium materiality goals will be treated in the same way as high materiality goals. The other medium materiality goals and the low materiality goals will at first not be closely monitored.
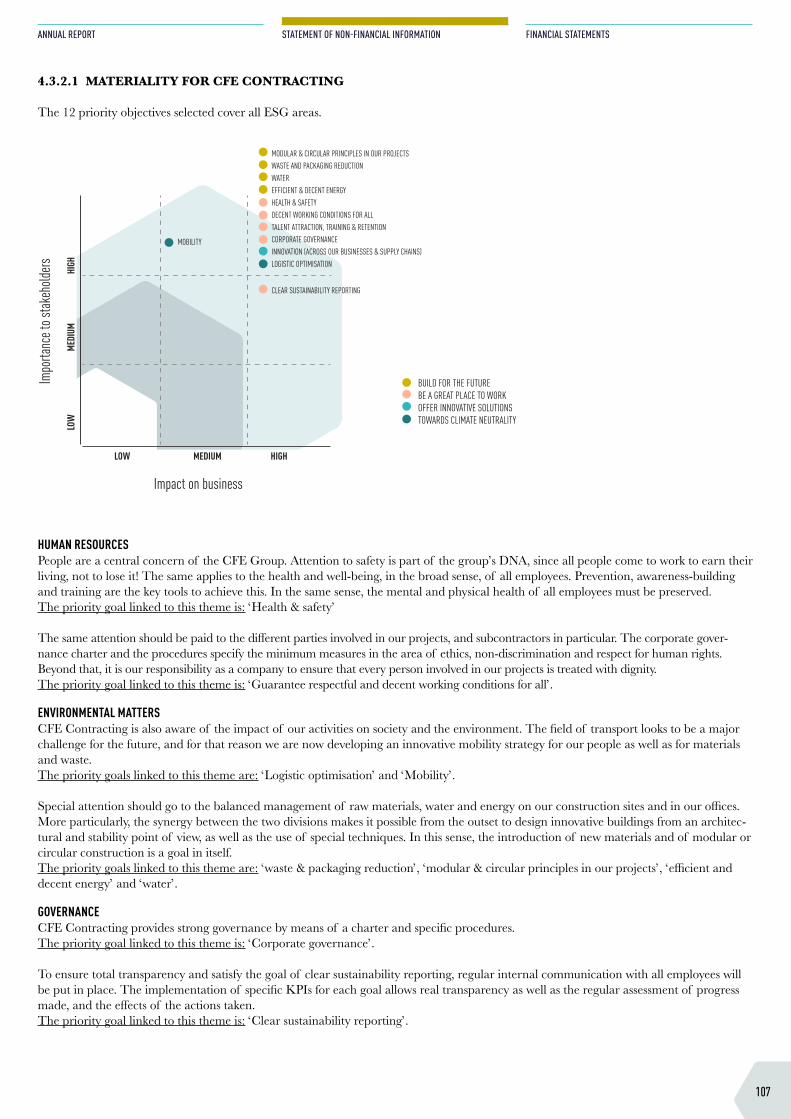
107
ANNUAL REPORT
STATEMENT OF NON-FINANCIAL INFORMATION
FINANCIAL STATEMENTS
4.3.2.1 MATERIALITY FOR CFE CONTRACTING
The 12 priority objectives selected cover all ESG areas.
BUILD FOR THE FUTURE
TOWARDS CLIMATE NEUTRALITY
BE A GREAT PLACE TO WORKOFFER INNOVATIVE SOLUTIONS
LOW MEDIUM HIGH
LOW
MEDI
UMHI
GH
Impo
rtanc
e to s
takeh
olders
Impact on business
MOBILITY
MODULAR & CIRCULAR PRINCIPLES IN OUR PROJECTS WASTE AND PACKAGING REDUCTIONWATEREFFICIENT & DECENT ENERGY HEALTH & SAFETYDECENT WORKING CONDITIONS FOR ALLTALENT ATTRACTION, TRAINING & RETENTIONCORPORATE GOVERNANCEINNOVATION (ACROSS OUR BUSINESSES & SUPPLY CHAINS)LOGISTIC OPTIMISATION
CLEAR SUSTAINABILITY REPORTING
HUMAN RESOURCES People are a central concern of the CFE Group. Attention to safety is part of the group’s DNA, since all people come to work to earn their living, not to lose it! The same applies to the health and well-being, in the broad sense, of all employees. Prevention, awareness-building and training are the key tools to achieve this. In the same sense, the mental and physical health of all employees must be preserved. The priority goal linked to this theme is: ‘Health & safety’
The same attention should be paid to the different parties involved in our projects, and subcontractors in particular. The corporate gover- nance charter and the procedures specify the minimum measures in the area of ethics, non-discrimination and respect for human rights. Beyond that, it is our responsibility as a company to ensure that every person involved in our projects is treated with dignity. The priority goal linked to this theme is: ‘Guarantee respectful and decent working conditions for all’.
ENVIRONMENTAL MATTERSCFE Contracting is also aware of the impact of our activities on society and the environment. The field of transport looks to be a major challenge for the future, and for that reason we are now developing an innovative mobility strategy for our people as well as for materials and waste. The priority goals linked to this theme are: ‘Logistic optimisation’ and ‘Mobility’.
Special attention should go to the balanced management of raw materials, water and energy on our construction sites and in our offices.More particularly, the synergy between the two divisions makes it possible from the outset to design innovative buildings from an architec-tural and stability point of view, as well as the use of special techniques. In this sense, the introduction of new materials and of modular or circular construction is a goal in itself. The priority goals linked to this theme are: ‘waste & packaging reduction’, ‘modular & circular principles in our projects’, ‘efficient and decent energy’ and ‘water’.
GOVERNANCECFE Contracting provides strong governance by means of a charter and specific procedures. The priority goal linked to this theme is: ‘Corporate governance’.
To ensure total transparency and satisfy the goal of clear sustainability reporting, regular internal communication with all employees will be put in place. The implementation of specific KPIs for each goal allows real transparency as well as the regular assessment of progress made, and the effects of the actions taken. The priority goal linked to this theme is: ‘Clear sustainability reporting’.
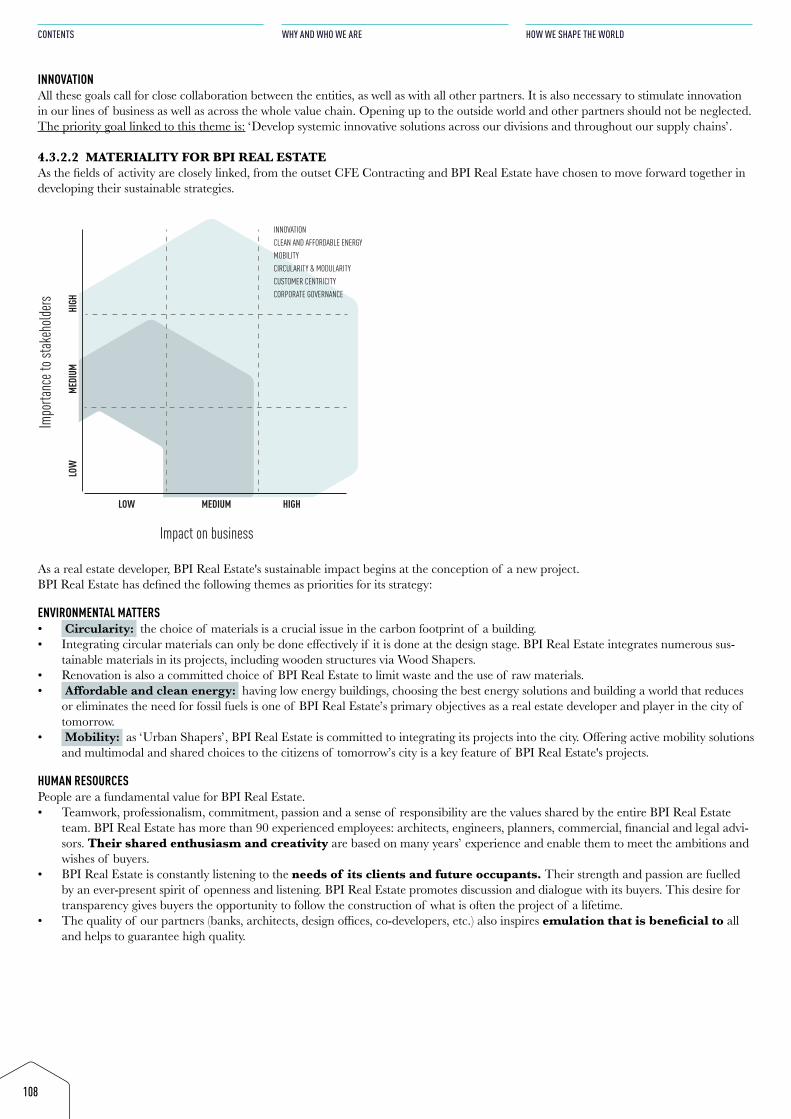
108
CONTENTS
WHY AND WHO WE ARE
HOW WE SHAPE THE WORLD
INNOVATION All these goals call for close collaboration between the entities, as well as with all other partners. It is also necessary to stimulate innovation in our lines of business as well as across the whole value chain. Opening up to the outside world and other partners should not be neglected.The priority goal linked to this theme is: ‘Develop systemic innovative solutions across our divisions and throughout our supply chains’.
4.3.2.2 MATERIALITY FOR BPI REAL ESTATEAs the fields of activity are closely linked, from the outset CFE Contracting and BPI Real Estate have chosen to move forward together in developing their sustainable strategies.
LOW MEDIUM HIGH
LOW
MEDI
UMHI
GH
Impo
rtanc
e to s
takeh
olders
Impact on business
INNOVATIONCLEAN AND AFFORDABLE ENERGYMOBILITYCIRCULARITY & MODULARITYCUSTOMER CENTRICITYCORPORATE GOVERNANCE
As a real estate developer, BPI Real Estate's sustainable impact begins at the conception of a new project. BPI Real Estate has defined the following themes as priorities for its strategy:
ENVIRONMENTAL MATTERS • Circularity: the choice of materials is a crucial issue in the carbon footprint of a building. • Integrating circular materials can only be done effectively if it is done at the design stage. BPI Real Estate integrates numerous sus-
tainable materials in its projects, including wooden structures via Wood Shapers. • Renovation is also a committed choice of BPI Real Estate to limit waste and the use of raw materials.• Affordable and clean energy: having low energy buildings, choosing the best energy solutions and building a world that reduces
or eliminates the need for fossil fuels is one of BPI Real Estate’s primary objectives as a real estate developer and player in the city of tomorrow.
• Mobility: as ‘Urban Shapers’, BPI Real Estate is committed to integrating its projects into the city. Offering active mobility solutions and multimodal and shared choices to the citizens of tomorrow’s city is a key feature of BPI Real Estate's projects.
HUMAN RESOURCESPeople are a fundamental value for BPI Real Estate. • Teamwork, professionalism, commitment, passion and a sense of responsibility are the values shared by the entire BPI Real Estate
team. BPI Real Estate has more than 90 experienced employees: architects, engineers, planners, commercial, financial and legal advi-sors. Their shared enthusiasm and creativity are based on many years’ experience and enable them to meet the ambitions and wishes of buyers.
• BPI Real Estate is constantly listening to the needs of its clients and future occupants. Their strength and passion are fuelled by an ever-present spirit of openness and listening. BPI Real Estate promotes discussion and dialogue with its buyers. This desire for transparency gives buyers the opportunity to follow the construction of what is often the project of a lifetime.
• The quality of our partners (banks, architects, design offices, co-developers, etc.) also inspires emulation that is beneficial to all and helps to guarantee high quality.
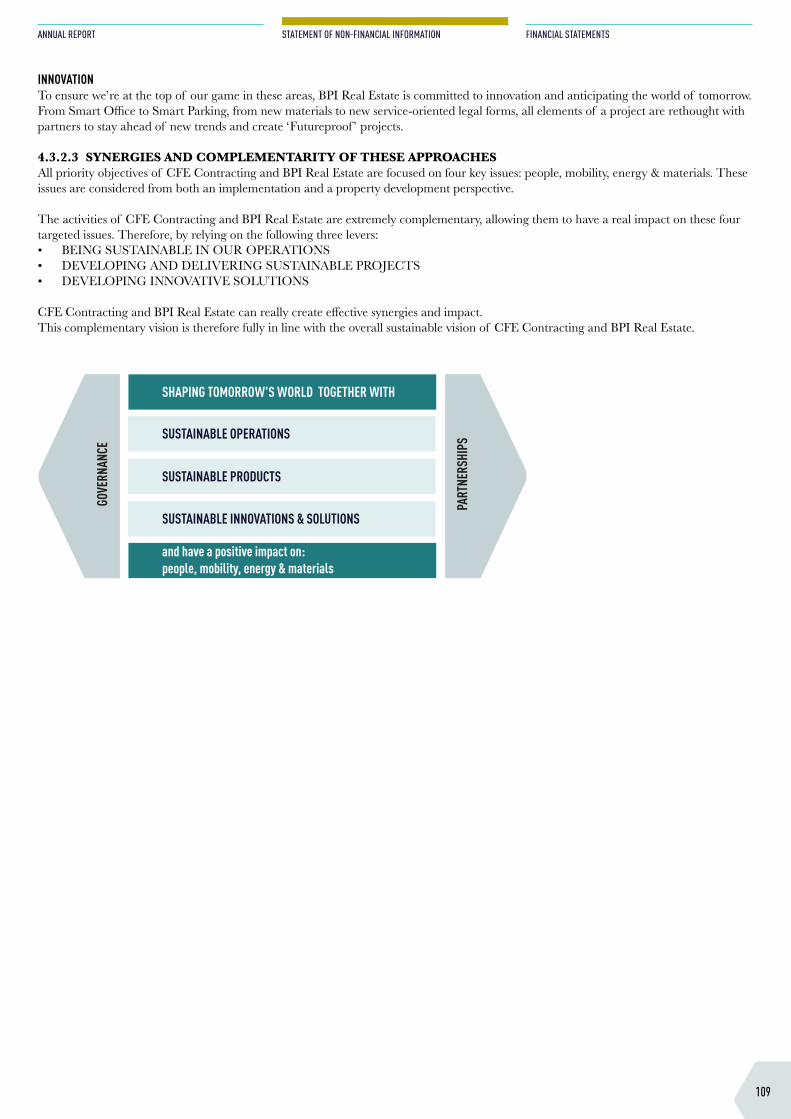
109
ANNUAL REPORT
STATEMENT OF NON-FINANCIAL INFORMATION
FINANCIAL STATEMENTS
INNOVATIONTo ensure we’re at the top of our game in these areas, BPI Real Estate is committed to innovation and anticipating the world of tomorrow. From Smart Office to Smart Parking, from new materials to new service-oriented legal forms, all elements of a project are rethought with partners to stay ahead of new trends and create ‘Futureproof ’ projects.
4.3.2.3 SYNERGIES AND COMPLEMENTARITY OF THESE APPROACHESAll priority objectives of CFE Contracting and BPI Real Estate are focused on four key issues: people, mobility, energy & materials. These issues are considered from both an implementation and a property development perspective.
The activities of CFE Contracting and BPI Real Estate are extremely complementary, allowing them to have a real impact on these four targeted issues. Therefore, by relying on the following three levers:• BEING SUSTAINABLE IN OUR OPERATIONS• DEVELOPING AND DELIVERING SUSTAINABLE PROJECTS• DEVELOPING INNOVATIVE SOLUTIONS
CFE Contracting and BPI Real Estate can really create effective synergies and impact. This complementary vision is therefore fully in line with the overall sustainable vision of CFE Contracting and BPI Real Estate.
SUSTAINABLE OPERATIONS
SUSTAINABLE PRODUCTS
SUSTAINABLE INNOVATIONS & SOLUTIONS
SHAPING TOMORROW'S WORLD TOGETHER WITH
and have a positive impact on: people, mobility, energy & materials
GOVE
RNAN
CE
PART
NERS
HIPS
People- Health, safety & wellbeing
Mobility- Green fleet- Logistic on & to the site
Energy- Energy on site optimisation- Green machines
Materials- Waste reduction- Reuse of materials
Severity rate
CO2 Fleet Itensity
CO2 Energy Itensity
Tons of waste% re-use materialsNO pumped water to the sewer
Go for 0SR Construction < 0,4SR Multitech < 0,5SR Rail&Utilities < 0,9
-40% in 2030*(-90% for company cars-25% for the vans-15% for the trucks)
-40% in 2030*
(100% green energy by 2025)
-x% in 2030*+x% in 2030*100% in 2030
110
CONTENTS
WHY AND WHO WE ARE
HOW WE SHAPE THE WORLD
5. OUTCOMES OF THOSE POLICIESPROOF BY EXAMPLE The examples and projects shown on pages [15] highlight the impact of the ESG policies for the three divisions. Once again this year, whether through actions on our construction sites or through carrying out sustainable projects in itself, the CFE group is asserting its sus-tainability ambitions.
CERTIFICATIONS TO CONFIRM THIS COMMITMENT TO SUSTAINABILITY This sustainable approach and effective ESG risk management enabled the CFE Group to achieve remarkable results in the ESG risk anal-ysis exercise carried out by rating agency Sustainalytics. On a global scale, with a score of 27.8 (Medium Risk), the CFE Group is among the frontrunners in its sector. This result stems from a detailed analysis of the various ESG policies and procedures of the CFE group and its numerous key indicators.
In October 2021, DEME also officially received the international ‘SDG Pioneer’ certificate from the United Nations, the United Nations Institute for Training and Research (UNITAR) and the Flemish Chamber of Commerce and Industry (VOKA).
THE EUROPEAN TAXONOMYDEME's commitment to sustainable sectors is directly reflected in the results of the analysis of its activities according to the European taxonomy. Indeed, DEME’s offshore wind farm activity will, on the basis of the current interpretation of the rules, be considered both ‘eligible’ and largely “aligned” with the EU taxonomy. 28% of total revenue is ‘eligible’ and 24% is ‘aligned’ based on current definitions. CFE Contracting and BPI Real Estate’s revenue is, on the other hand, largely (more than 95%) "eligible" for the EU taxonomy. CFE Con-tracting and BPI Real Estate actively analyse the technical alignment criteria and ensure that these criteria are taken into account in ongo-ing projects and developments. The details of this analysis can be found on pages [130-132].
MEASURING THE EFFECT OF ACTIONSFor the group’s three divisions, closely monitoring clear KPIs and concrete actions is a priority. Indeed, this monitoring makes it possible to evaluate the effect of the actions undertaken as soon as possible and to take any appropriate measures. This data collection goes hand in hand with aligning actions by division in the different entities to ensure it has a significant impact. Quan-tified objectives and structured actions are put in place.
At BPI Real Estate, two tools are in development, on the one hand, to measure the CO2 impact of each project developed and, on the other hand, the impact on the SDGs in the broader sense. The aim of these tools is not only to measure the current portfolio, but also and above all to design and challenge the projects under development. The objective of the tools developed is to be as “agile” as possible to take into account ESG criteria that could evolve over time and thereby remain in line with social developments.
A QUESTION OF MINDSETFinally, all three divisions are committed to embedding sustainability in the mindset of all employees and making it a real corporate cul-ture. To this end, the targeted actions will concern large-scale projects and small, simple everyday gestures. However simple, these will help to raise awareness among all employees. Secondly, it is also fundamental to integrate all the links in the production chain in this approach and to create real sustainable partnerships. In all three divisions, dedicated sustainability and innovation teams monitor ESG policies, the progress of KPIs against targets and the specific action plans put in place.
5.1. THE RESULTS OF THESE POLICIES AT DEMEIn October 2021, DEME was named a United Nations ‘Pioneer of the Millennium Development Goals’ by the United Nations itself and the United Nations Institute for Training and Research (UNITAR) in recognition of its efforts to create a more sustainable planet. DEME has been officially awarded an international certificate. This award is the result of three consecutive years of successful participation in the VOKA Charter Sustainable Entrepreneurship (VOKA Charter Duurzaam Ondernemen). By carrying out a series of actions within the framework of the Charter, DEME has made a positive contribution to each of the 17 sustainable development goals. DEME is particularly proud to have achieved this result, as it underlines the considerable efforts of all its enthusiastic employees who have been committed from the outset and participate every day in realising this ambitious vision of a sustainable future.
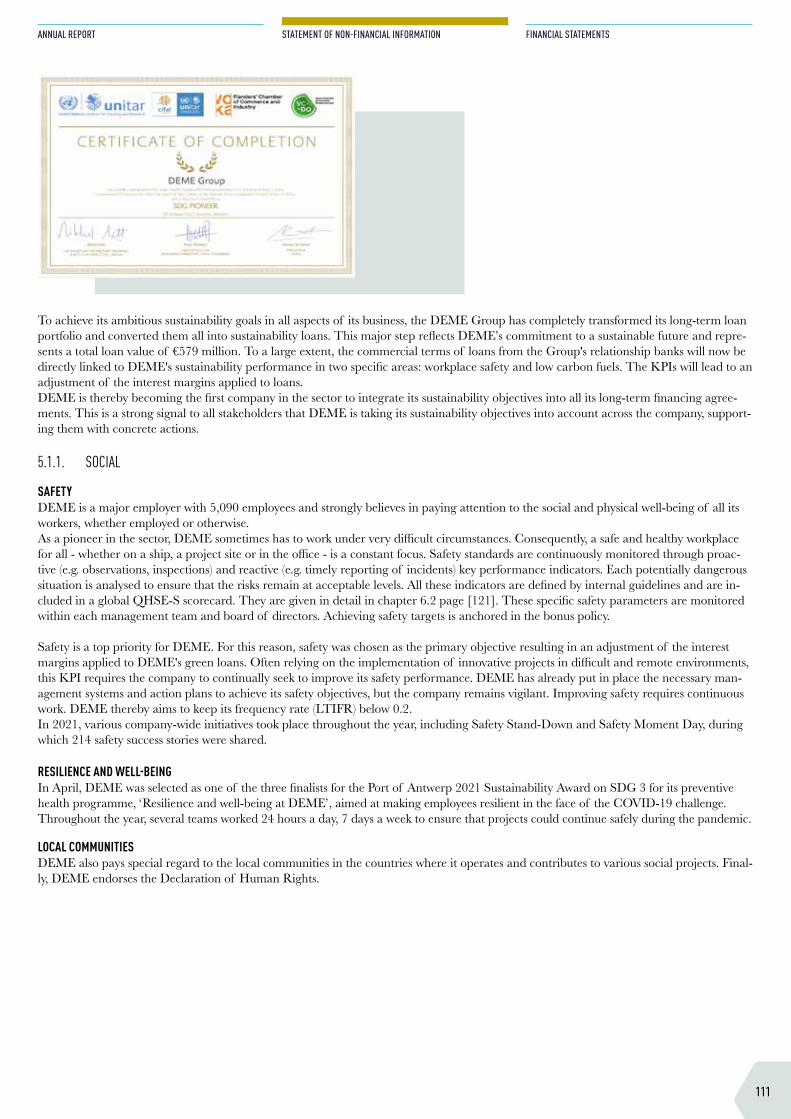
111
ANNUAL REPORT
STATEMENT OF NON-FINANCIAL INFORMATION
FINANCIAL STATEMENTS
To achieve its ambitious sustainability goals in all aspects of its business, the DEME Group has completely transformed its long-term loan portfolio and converted them all into sustainability loans. This major step reflects DEME’s commitment to a sustainable future and repre-sents a total loan value of €579 million. To a large extent, the commercial terms of loans from the Group's relationship banks will now be directly linked to DEME's sustainability performance in two specific areas: workplace safety and low carbon fuels. The KPIs will lead to an adjustment of the interest margins applied to loans.DEME is thereby becoming the first company in the sector to integrate its sustainability objectives into all its long-term financing agree-ments. This is a strong signal to all stakeholders that DEME is taking its sustainability objectives into account across the company, support-ing them with concrete actions.
5.1.1. SOCIAL
SAFETYDEME is a major employer with 5,090 employees and strongly believes in paying attention to the social and physical well-being of all its workers, whether employed or otherwise. As a pioneer in the sector, DEME sometimes has to work under very difficult circumstances. Consequently, a safe and healthy workplace for all - whether on a ship, a project site or in the office - is a constant focus. Safety standards are continuously monitored through proac-tive (e.g. observations, inspections) and reactive (e.g. timely reporting of incidents) key performance indicators. Each potentially dangerous situation is analysed to ensure that the risks remain at acceptable levels. All these indicators are defined by internal guidelines and are in-cluded in a global QHSE-S scorecard. They are given in detail in chapter 6.2 page [121]. These specific safety parameters are monitored within each management team and board of directors. Achieving safety targets is anchored in the bonus policy.
Safety is a top priority for DEME. For this reason, safety was chosen as the primary objective resulting in an adjustment of the interest margins applied to DEME's green loans. Often relying on the implementation of innovative projects in difficult and remote environments, this KPI requires the company to continually seek to improve its safety performance. DEME has already put in place the necessary man-agement systems and action plans to achieve its safety objectives, but the company remains vigilant. Improving safety requires continuous work. DEME thereby aims to keep its frequency rate (LTIFR) below 0.2.In 2021, various company-wide initiatives took place throughout the year, including Safety Stand-Down and Safety Moment Day, during which 214 safety success stories were shared.
RESILIENCE AND WELL-BEINGIn April, DEME was selected as one of the three finalists for the Port of Antwerp 2021 Sustainability Award on SDG 3 for its preventive health programme, ‘Resilience and well-being at DEME’, aimed at making employees resilient in the face of the COVID-19 challenge. Throughout the year, several teams worked 24 hours a day, 7 days a week to ensure that projects could continue safely during the pandemic.
LOCAL COMMUNITIESDEME also pays special regard to the local communities in the countries where it operates and contributes to various social projects. Final-ly, DEME endorses the Declaration of Human Rights.
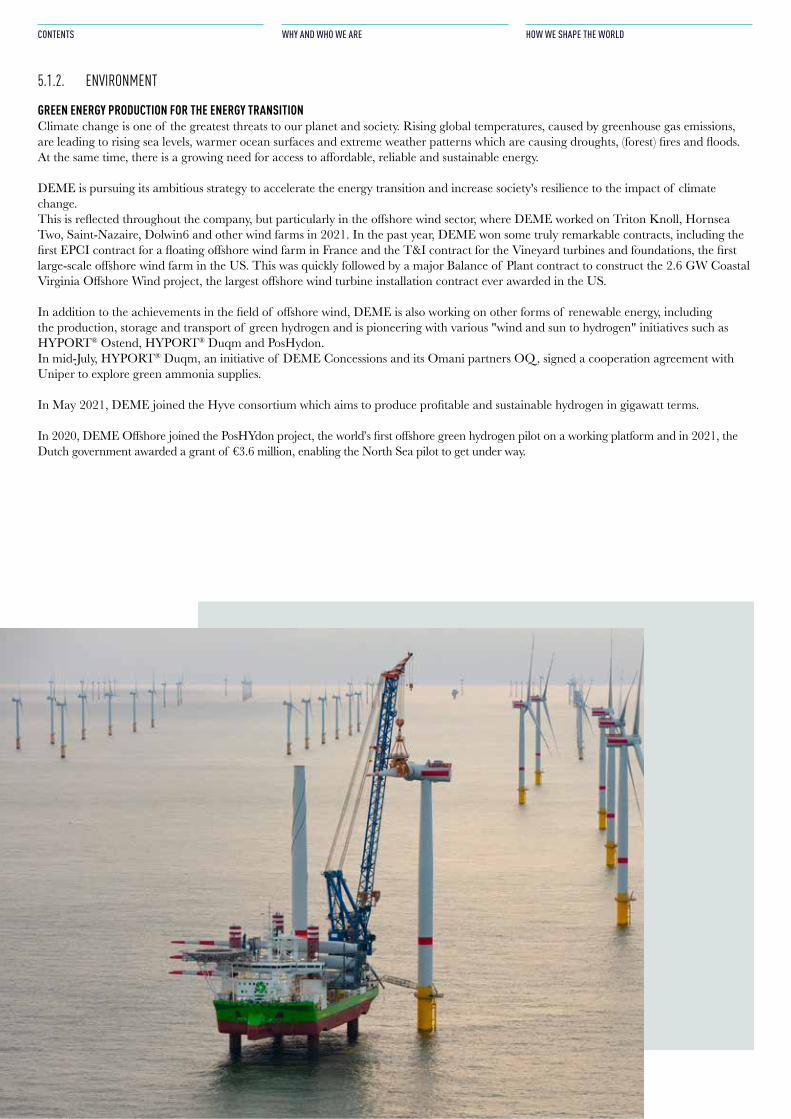
112
CONTENTS
WHY AND WHO WE ARE
HOW WE SHAPE THE WORLD
5.1.2. ENVIRONMENT
GREEN ENERGY PRODUCTION FOR THE ENERGY TRANSITIONClimate change is one of the greatest threats to our planet and society. Rising global temperatures, caused by greenhouse gas emissions, are leading to rising sea levels, warmer ocean surfaces and extreme weather patterns which are causing droughts, (forest) fires and floods. At the same time, there is a growing need for access to affordable, reliable and sustainable energy.
DEME is pursuing its ambitious strategy to accelerate the energy transition and increase society's resilience to the impact of climate change. This is reflected throughout the company, but particularly in the offshore wind sector, where DEME worked on Triton Knoll, Hornsea Two, Saint-Nazaire, Dolwin6 and other wind farms in 2021. In the past year, DEME won some truly remarkable contracts, including the first EPCI contract for a floating offshore wind farm in France and the T&I contract for the Vineyard turbines and foundations, the first large-scale offshore wind farm in the US. This was quickly followed by a major Balance of Plant contract to construct the 2.6 GW Coastal Virginia Offshore Wind project, the largest offshore wind turbine installation contract ever awarded in the US.
In addition to the achievements in the field of offshore wind, DEME is also working on other forms of renewable energy, including the production, storage and transport of green hydrogen and is pioneering with various "wind and sun to hydrogen" initiatives such as HYPORT® Ostend, HYPORT® Duqm and PosHydon.In mid-July, HYPORT® Duqm, an initiative of DEME Concessions and its Omani partners OQ, signed a cooperation agreement with Uniper to explore green ammonia supplies.
In May 2021, DEME joined the Hyve consortium which aims to produce profitable and sustainable hydrogen in gigawatt terms.
In 2020, DEME Offshore joined the PosHYdon project, the world’s first offshore green hydrogen pilot on a working platform and in 2021, the Dutch government awarded a grant of €3.6 million, enabling the North Sea pilot to get under way.
113
ANNUAL REPORT
STATEMENT OF NON-FINANCIAL INFORMATION
FINANCIAL STATEMENTS
ON THE ROAD TO CLIMATE NEUTRALITY
DEME wants to work towards a 40% reduction in greenhouse gases by 2030 compared to the 2008 reference year set by the International Maritime Organisation (IMO). DEME wants to become a climate neutral company by 2050.
Because more than 90% of greenhouse gas emissions can be attributed to the fuel consumption of ships, DEME is pursuing a multi-an-nual investment plan to this end, through which it is providing its new fleet with the most advanced fuel-saving technology and the use of low-emission fuels such as LNG, biodiesel and future green fuels containing hydrogen, such as green methanol or green hydrogen. In addi-tion, DEME is constantly working to further increase the energy efficiency of the entire fleet with technological measures such as waste gas heat recovery systems in electrical energy. There is also a constant focus on process optimisation and improving productivity.For this reason, increasing the percentage of low-carbon fuels consumed by the company was chosen as a second objective, resulting in an adjustment of the interest margins applied to the green loans taken out by DEME.DEME is therefore continuing to build its future-proof fleet. The “Spartacus” mega cutter - the most powerful in the world - has become operational. The vessel is capable of running on LNG and has several energy saving features. The “Groenewind”, a vessel specially de-signed for offshore wind farm maintenance, and which saves up to 50% fuel, also joined the fleet. Furthermore, DEME has improvement programmes to further reduce the environmental impact during project implementation. For ex-ample, specific emission reduction programmes aim to further reduce emissions of greenhouse gases that contribute to climate change, as well as other pollutants that contribute to poor local air quality.
DEME’s total CO2 emissions (scope 1 and 2) amounted to 833 kt CO2-eq. in 2021, compared to 660 kt CO2-eq. in 2020. The increase in emissions can mainly be attributed to increased use of ships in 2021. The use of hopper and cutter vessels increased by about 15% com-pared to the previous year. This is mainly due to its activities in large projects such as the Abu Qir I and II port projects in Egypt.
ENVIRONMENTAL CERTIFICATIONSIn 2021, for the first time, DEME obtained the ISO 50001 certificate for the management and continuous improvement of its energy per-formance. It also allows DEME to integrate energy management and related CO2 emissions.
In the Benelux, DEME is certified according to the requirements of the CO2 performance scale, which encourages companies to map and reduce their CO2 emissions. Since 2012, LRQA (an independent accredited party) has been regularly auditing our processes and results. In 2018, DEME passed the renewal audit with the highest qualification (level 5). The CO2 Performance Ladder is a widely used tool to help organisations reduce their carbon emissions, both in projects and in their business activities. The principle of the scale is that efforts regarding CO2 are rewarded economically, i.e. the higher the score on the scale, the better the company’s evaluation in tenders.The CO2 performance scale is owned and managed by the Foundation for Climate Friendly Procurement and Business (SKAO).
INNOVATIONS ADAPTED TO CLIMATE-RELATED RISKSAs it has done for decades, DEME provides solutions for building infrastructure that is better adapted to climate-related risks, such as ded-icated flood protection. In addition to pioneering projects such as Coastbusters, which focuses on nature-inspired designs, the Bankbusters project has also started. Together with its partners, DEME will study and design an artificial marsh.
5.1.3. GOVERNANCEDEME is often active in countries with a higher risk profile in terms of business ethics. The aim is always to conduct business with in- tegrity and to proactively prevent corruption and bribery. The company is also actively committed to respecting and protecting human and labour rights, as reflected in its ‘Code of Business Ethics and Integrity’ and ‘Code of Ethics for Business Partners’.This code reflects the core values of DEME, expressed in the acronym ‘STRIVE’, which stands for Safety, Technical Leadership, Respect & Integrity, Innovation, Value Creation and Environment. Besides compliance with the law, which is a condition sine qua non, respect and in-tegrity are paramount for all of DEME’s employees, and anyone who wishes to work together with DEME must uphold the same standards.
114
CONTENTS
WHY AND WHO WE ARE
HOW WE SHAPE THE WORLD
SAFETY
INNOVATION
TECHNICAL LEADERSHIP
VALUE CREATION
RESPECT & INTEGRITY
ENVIRONMENT
SAFETY
INNOVATION
TECHNICAL LEADERSHIP
VALUE CREATION
RESPECT & INTEGRITY
ENVIRONMENT
All staff members of DEME are treated fairly, with dignity and respect, regardless of their personal traits, beliefs or their national or ethnic origin, cultural background, religion, age, gender and sexual orientation, political convictions, and their mental or physical abilities. DEME creates a workplace where all employees are treated fairly and without discrimination.
RESPECT FOR HUMAN RIGHTSDEME respects and protects human rights in general and the fundamental rights and freedoms as defined in the United Nations Universal Declaration of Human Rights. The group will never tolerate slavery, child labour, forced or compulsory labour, or trafficking in human beings. The implementation of the policies ensures that all the partners are aware of the importance of respect for human rights and know when and where to report any breaches. DEME is often active in countries with a higher risk profile for unethical practices. The specifics of its activities require great vigilance to ensure that ethical standards are respected at all times. The ambition is to always do business with integrity and to proactively prevent cor-ruption and bribery in any form. DEME is actively committed to respecting and protecting labour and human rights in its activities. To this end, DEME has a corporate ‘Code of Ethics and Integrity’ in addition to various specific policies (‘Compliance Policy and Practices’, ‘Human Rights Policy’ and ‘Whistleblowing Policy and Procedures’). This corporate code of ethics and integrity is combined with mandatory annual training, which achieved a 99% pass rate in 2021 (all staff except crew members). A tailored approach to COVID-19 has been developed for crew mem-bers.
A careful selection of firms, agencies and other third parties is a precondition before doing business with them and before entering into a partnership. DEME’s policy is always clearly contractually defined in the matter of respect in general and respect for human rights in particular. A procedure developed for those firms and agencies in the pre-recruitment and post-recruitment phases clearly highlights our standards and how they must be observed.
Regular audits and inspections of the firms, agencies and other third parties employing staff on our sites guarantee that our standards are respected and effective.
FIGHT AGAINST FRAUD AND CORRUPTIONDEME has a clear policy to carry out all its activities with integrity and to fight against any form of corruption. In addition to the cor-porate Code of Ethics and Integrity, DEME has implemented a fully-fledged corporate compliance programme which also defines an-ti-corruption policies. In the context of this compliance programme, those anti-corruption policies also form part of the annual employee awareness programme. In addition, this policy is in turn accompanied by specific procedures to guarantee its day-to-day effectiveness. The third-party due diligence policy, the policy on the integrity of outgoing payments, the supply-to-payment policy for key third parties, and a training programme for staff members involved in this kind of procedure constitute an effective instrument in the fight against fraud and corruption. The activities are deployed worldwide and therefore also in countries that have a higher score in the perception of corruption index. Potential situations of corruption are a risk to the group’s reputation. For that reason, DEME has set up a due diligence procedure, not only for those high-risk countries, but also for all situations where there appears to be a high risk of fraud and corruption. First of all, DEME advises against using sponsors or agents. If there is no way to do otherwise, those parties must first be screened; this screening will be more or less extensive depending on the level of risk. The group also monitors the third parties it does business with. Specific clauses are included in the contracts, under which the parties agree to always act in accordance with the standard of conformity required by DEME. Finally, DEME ensures that those parties effectively comply with the policies and procedures in the area of corruption. Moreover, DEME reduces those risks as much as possible through policies and procedures that are well known to everybody and implemented throughout the organisation.
115
ANNUAL REPORT
STATEMENT OF NON-FINANCIAL INFORMATION
FINANCIAL STATEMENTS
5.1.4. INNOVATIONIn terms of innovation, DEME focuses on joint value creation through multi-stakeholder partnerships in addition to a strong focus on in-ternal entrepreneurship. In the course of the year, several notable innovations were achieved. DEME is a member of the innovation cluster ‘The Blue Cluster’, which focuses on sustainable growth at sea. MPVAqua won the Blue Innovation Swell Award 2021. The partners in this collaboration are committed to developing large-scale offshore solar farms.The "Bankbusters" project has also been launched. Together with its partners, DEME will study and design an artificial marsh. Its innova-tiveness lies in the integration of biological and technological aspects for the protection of natural erosive banks of tidal rivers. The basic knowledge acquired is applied to the creation of DRECOs (Dredged Ecological Compartment - conceptual building blocks). In these, new techniques and procedures are applied to the treatment, installation and dewatering of soft dredged material. These DRECOs provide a basis for applying nature-based solutions (NbS), reusing and stabilising soft sediments and creating sustainable bank erosion protection. In addition, appropriate measuring instruments and an approach for monitoring erosion protection are being developed.DEME also continues to invest in sustainable deep-sea mining through its subsidiary GSR. In April, GSR’s deep-seabed mining robot ‘Patania II’ successfully demonstrated that it could travel on the seabed and collect polymetallic nodules at a depth of 4.5 km.DEME has a strong focus on international cooperation, for example, by engaging with the European Clean Hydrogen Alliance, the Sus-tainable Ocean Business Action Platform and the World Economic Forum’s Global Plastic Action Partnership. To support internal entrepreneurship, different innovation programmes are set up to capture new ideas on the one hand and reward the initiatives carried out on the other. Sustainability is included in the evaluation criteria throughout the innovation process.
5.2. THE RESULTS OF THESE POLICIES AT CFE CONTRACTING AND BPI REAL ESTATE
A JOINT AND MULTIDISCIPLINARY APPROACHThe real impact on the major ESG themes of People, Energy, Mobility and Materials is ensured by the joint and multidisciplinary ap-proach of CFE Contracting and BPI Real Estate’s different entities. Sustainability is therefore taken into account from the design stage by BPI Real Estate and Wood Shapers, but is also central to the completion of projects by the various CFE Contracting entities. Innovation and joint actions by the different entities reinforce this impact.
PILOT PROJECTS TO MONITOR MORE COMPLEX ISSUESSeveral pilot projects are allowing us to monitor the most complex issues such as material transport or the circular economy. Thus, the very successful experience in Belgium and Luxembourg of optimising site logistics through the use of consolidation centres is being extended to new projects.
AMBITIOUS GOALS WITH SBTCFE Contracting has joined the Belgian Alliance for Climate Action. In doing so, it undertook to subscribe to the Science Based Targets (SBT) initiative. This course of action will allow it to attain sustainable goals that meet the ambitions of the Paris agreements.In 2021, CFE Contracting was able to confirm its calculation of greenhouse gas emissions for scopes 1 and 2 and carried out a complete mapping of its scope 3 emissions. CFE Contracting has validated its concrete objectives for scope 1 and 2 in line with the SBT and is committed to reducing the intensity of its direct CO2 emissions (scope 1 and 2) by 40% by 2030, compared to 2020. Greening its vehicle fleet, optimising logistics on construction sites, monitoring and optimising energy consumption, using 100% green energy on sites and rational management of water on its projects and raw materials are all tactics for achieving these objectives.
5.2.1. SOCIALPeople are at the heart of CFE’s construction process. CFE contributes to significant direct employment (3,155 employees), as well as indi-rectly through its various subcontractors and suppliers. In 2020, CFE Contracting launched an employer branding campaign highlighting the ‘Framily’ (family & friends) that characterises it. The modest size of the subsidiaries and the soundness of the group, as well as the nu-merous synergies are what make CFE strong and unique. Attracting new talent is a major challenge for the group.
HEALTH & SAFETYCFE wants to pay full attention to safe and healthy workplaces. The severity and frequency of accidents at work are given priority atten-tion by each board of directors. CFE performs better in this area than the sector average in Belgium. This does not prevent CFE Contract-ing from improving its score every year. A policy of awareness-raising, training and prevention are important tools in this respect. Its choice of lean methodology also contributes to this. Regular site visits are carried out to check compliance with procedures. To take into account the specificity and level of risk of the CFE Contracting teams’ various activities, specific objectives have been set. CFE Contracting has chosen to use the severity rate (LTIGR) as an indicator to monitor the effect of safety actions. CFE Contracting aims for a severity rate of less than 0.4 for construction activities, a severity rate of less than 0.5 for multi-technical activ-ities and a severity rate of less than 0.9 for rail & utilities activities. It aims to achieve this by 2030. To do so, proactive approaches are favoured. A monthly dashboard is used to measure the actions undertaken on our sites and the effect of these actions on the frequency and severity of accidents. Safety is the responsibility of every employee and proactive and constructive interventions are strongly encouraged.
The objectives of the HSEQ (Health, Safety, Environment, Quality) board are multiple. It seeks above all to translate the strategic objec-tives of the CFE Group into concrete actions and clear priority plans. The principle of 'think global, act local' governs these decisions, with a view to ensuring safety for all at all times. To achieve zero accidents/zero incidents, the board relies on continuous process improvement
116
CONTENTS
WHY AND WHO WE ARE
HOW WE SHAPE THE WORLD
and the sharing of best practices through constructive consultations, with sustainability as a common thread. In 2020, the Board defined a common vision and policy for all entities and implemented unified reporting of HSEQ statistics. This enabled it to develop a multi-layered strategy in 2021, including the long-term Awareness training project, which will strengthen the safety skills of managers, but also aware-ness-raising on Life Saving Rules and a prevention campaign on alcohol and drug use.Well-being on the construction sites is also measured in a concrete way. A pilot project has been set up at MBG’s Tweewaters site where a well-being barometer allows employees to indicate how they feel.
DECENT WORKING CONDITIONS FOR ALLRespect for people applies not only to our own employees, but also to those involved with subcontractors and suppliers. This philosophy is contained in a code of integrity that includes respect for human rights. For example, procedures for selecting and interacting with subcon-tractors are written for this purpose. In 2021, no human rights violations were reported. All safety rules naturally apply to our own staff as well as to the various subcontractors and other stakeholders on our sites. The same vig-ilance is therefore applied to compliance with safety instructions and working conditions. The monthly safety scorecards also include inci-dents and accidents involving our subcontractors and temporary workers.
BESPOKE TRAININGThis year again, more than 40,000 hours of training were delivered to CFE Contracting employees. These training courses are highly varied and cover technical, management and safety related themes as well as languages and IT, for example.By 2030, CFE Contracting and BPI Real Estate aim to triple the number of hours of training provided to five days of training per person.Targeted actions were also launched in 2021. This year, for example, Van Laere launched the Van Laere Academy, a comprehensive pro-gramme specially designed to complement the training of young project managers.
5.2.2. ENVIRONMENTEnergy, mobility and materials are key issues for CFE Contracting and BPI Real Estate. The joint actions of the different entities on sites but also, and above all, from the project design stage, allow CFE to have a very significant positive impact on these different issues.New innovative approaches to our business and new technological solutions reinforce this ambition.
RETHINKING MOBILITY Transporting people and materials has a considerable effect on direct CO2 emissions. Almost 65% of direct CO2 emissions (scope 1 and 2) are in fact due to employee transport alone. For this reason, a new policy related to greening the vehicle fleet of the different entities has been put in place. Electric vehicles, alternative transport solutions (bicycle, public transport etc.), occupancy rate of vans, renewing the fleet of heavy vehicles are some of the solutions being implemented. To facilitate this transition, electrical charging terminals are being installed on the various construction sites. CFE Contracting and BPI Real Estate's objective is to reduce its fleet-related carbon intensity by 40% by 2030.
Reconsidering the need to transport materials and waste can also help to reduce this impact. The Lean construction processes used at the various sites also contribute to this.Since 2020, several construction sites in Belgium and Luxembourg have rethought their site logistics by using consolidation centres. These logistics hubs make it possible to considerably limit the number of lorries supplying the sites, thereby making delivery schedules more re-liable. In Brussels, alternative delivery methods such as waterborne deliveries are also used. The impact on CO2 emissions is immediate. Extensive studies carried out on the Auréa site in Luxembourg have shown that the use of logistics hubs has made it possible to reduce CO2 production linked to the transport of materials by up to 46%. The success of these pilot projects has led to repeating the experiment on new projects in Belgium and Luxembourg. In the Luxembourg projects, the experience is even being complemented by optimising the return journey of lorries to remove construction waste, thereby optimising its sorting, treatment and recycling.By their very nature, the projects developed by BPI Real Estate, as an Urban Shaper, are located in the heart of cities and each integrate multimodal mobility. In addition to site logistics and employee mobility, BPI Real Estate is also working towards low-carbon mobility for its clients and urban partners.The MOBIX teams continue to renovate the Belgian railways and are therefore playing a major role in soft mobility in Belgium. These large-scale works are made possible by MOBIX’s great expertise, but also by its ability to offer total solutions: track repairs, electrification, and signalling repairs.
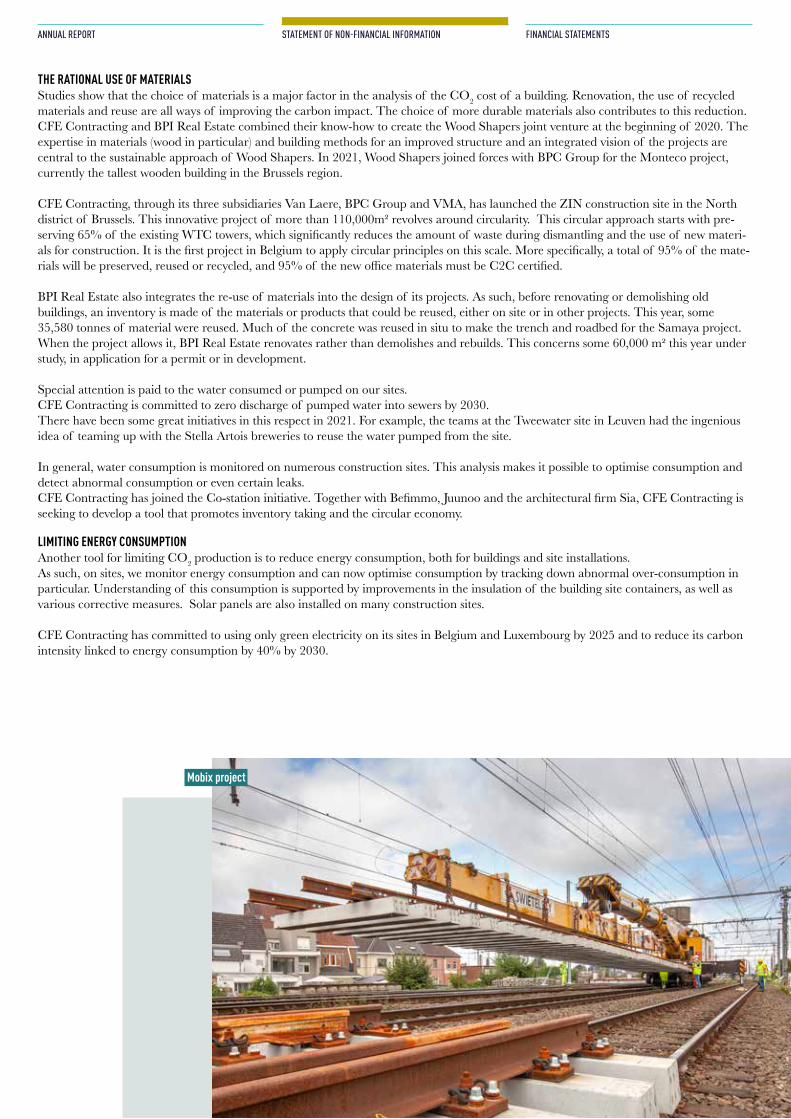
ANNUAL REPORT
STATEMENT OF NON-FINANCIAL INFORMATION
FINANCIAL STATEMENTS
THE RATIONAL USE OF MATERIALSStudies show that the choice of materials is a major factor in the analysis of the CO2 cost of a building. Renovation, the use of recycled materials and reuse are all ways of improving the carbon impact. The choice of more durable materials also contributes to this reduction.CFE Contracting and BPI Real Estate combined their know-how to create the Wood Shapers joint venture at the beginning of 2020. The expertise in materials (wood in particular) and building methods for an improved structure and an integrated vision of the projects are central to the sustainable approach of Wood Shapers. In 2021, Wood Shapers joined forces with BPC Group for the Monteco project, currently the tallest wooden building in the Brussels region.
CFE Contracting, through its three subsidiaries Van Laere, BPC Group and VMA, has launched the ZIN construction site in the North district of Brussels. This innovative project of more than 110,000m² revolves around circularity. This circular approach starts with pre-serving 65% of the existing WTC towers, which significantly reduces the amount of waste during dismantling and the use of new materi-als for construction. It is the first project in Belgium to apply circular principles on this scale. More specifically, a total of 95% of the mate-rials will be preserved, reused or recycled, and 95% of the new office materials must be C2C certified.
BPI Real Estate also integrates the re-use of materials into the design of its projects. As such, before renovating or demolishing old buildings, an inventory is made of the materials or products that could be reused, either on site or in other projects. This year, some 35,580 tonnes of material were reused. Much of the concrete was reused in situ to make the trench and roadbed for the Samaya project.When the project allows it, BPI Real Estate renovates rather than demolishes and rebuilds. This concerns some 60,000 m² this year under study, in application for a permit or in development.
Special attention is paid to the water consumed or pumped on our sites. CFE Contracting is committed to zero discharge of pumped water into sewers by 2030.There have been some great initiatives in this respect in 2021. For example, the teams at the Tweewater site in Leuven had the ingenious idea of teaming up with the Stella Artois breweries to reuse the water pumped from the site.
In general, water consumption is monitored on numerous construction sites. This analysis makes it possible to optimise consumption and detect abnormal consumption or even certain leaks.CFE Contracting has joined the Co-station initiative. Together with Befimmo, Juunoo and the architectural firm Sia, CFE Contracting is seeking to develop a tool that promotes inventory taking and the circular economy.
LIMITING ENERGY CONSUMPTIONAnother tool for limiting CO2 production is to reduce energy consumption, both for buildings and site installations. As such, on sites, we monitor energy consumption and can now optimise consumption by tracking down abnormal over-consumption in particular. Understanding of this consumption is supported by improvements in the insulation of the building site containers, as well as various corrective measures. Solar panels are also installed on many construction sites.
CFE Contracting has committed to using only green electricity on its sites in Belgium and Luxembourg by 2025 and to reduce its carbon intensity linked to energy consumption by 40% by 2030.
Mobix project
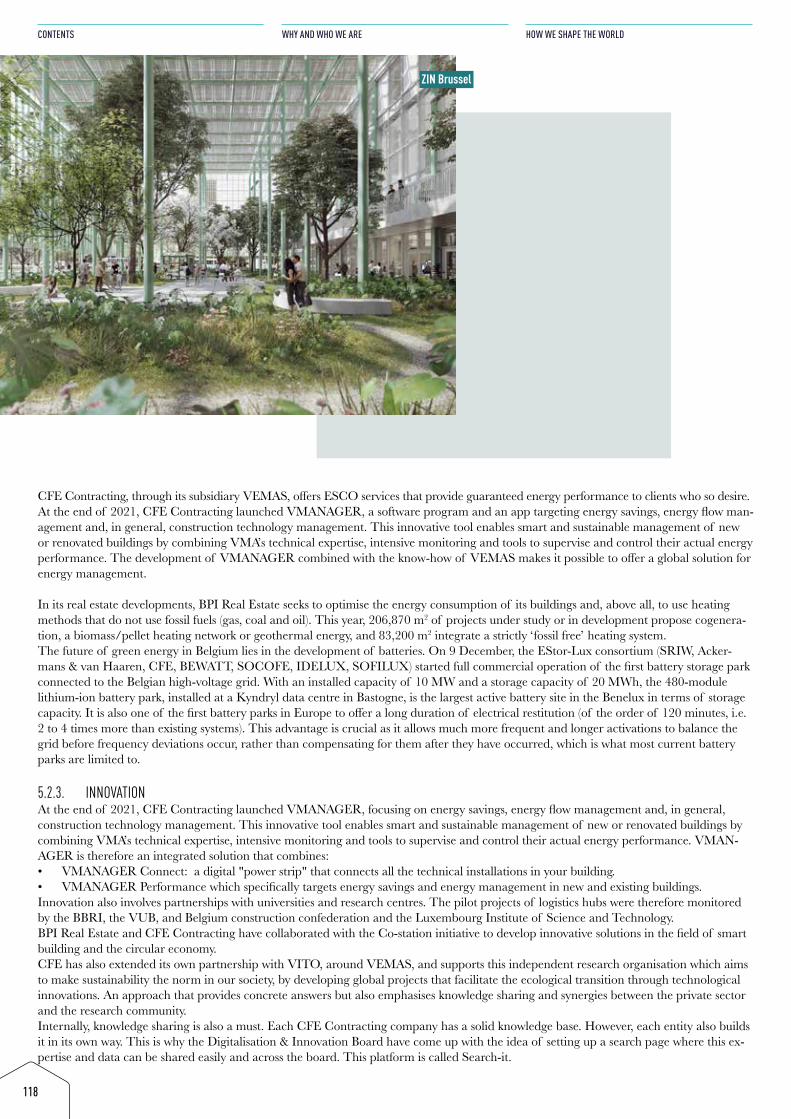
118
CONTENTS
WHY AND WHO WE ARE
HOW WE SHAPE THE WORLD
CFE Contracting, through its subsidiary VEMAS, offers ESCO services that provide guaranteed energy performance to clients who so desire. At the end of 2021, CFE Contracting launched VMANAGER, a software program and an app targeting energy savings, energy flow man-agement and, in general, construction technology management. This innovative tool enables smart and sustainable management of new or renovated buildings by combining VMA’s technical expertise, intensive monitoring and tools to supervise and control their actual energy performance. The development of VMANAGER combined with the know-how of VEMAS makes it possible to offer a global solution for energy management.
In its real estate developments, BPI Real Estate seeks to optimise the energy consumption of its buildings and, above all, to use heating methods that do not use fossil fuels (gas, coal and oil). This year, 206,870 m2 of projects under study or in development propose cogenera-tion, a biomass/pellet heating network or geothermal energy, and 83,200 m2 integrate a strictly ‘fossil free’ heating system. The future of green energy in Belgium lies in the development of batteries. On 9 December, the EStor-Lux consortium (SRIW, Acker-mans & van Haaren, CFE, BEWATT, SOCOFE, IDELUX, SOFILUX) started full commercial operation of the first battery storage park connected to the Belgian high-voltage grid. With an installed capacity of 10 MW and a storage capacity of 20 MWh, the 480-module lithium-ion battery park, installed at a Kyndryl data centre in Bastogne, is the largest active battery site in the Benelux in terms of storage capacity. It is also one of the first battery parks in Europe to offer a long duration of electrical restitution (of the order of 120 minutes, i.e. 2 to 4 times more than existing systems). This advantage is crucial as it allows much more frequent and longer activations to balance the grid before frequency deviations occur, rather than compensating for them after they have occurred, which is what most current battery parks are limited to.
5.2.3. INNOVATIONAt the end of 2021, CFE Contracting launched VMANAGER, focusing on energy savings, energy flow management and, in general, construction technology management. This innovative tool enables smart and sustainable management of new or renovated buildings by combining VMA’s technical expertise, intensive monitoring and tools to supervise and control their actual energy performance. VMAN-AGER is therefore an integrated solution that combines:• VMANAGER Connect: a digital "power strip" that connects all the technical installations in your building. • VMANAGER Performance which specifically targets energy savings and energy management in new and existing buildings.Innovation also involves partnerships with universities and research centres. The pilot projects of logistics hubs were therefore monitored by the BBRI, the VUB, and Belgium construction confederation and the Luxembourg Institute of Science and Technology. BPI Real Estate and CFE Contracting have collaborated with the Co-station initiative to develop innovative solutions in the field of smart building and the circular economy.CFE has also extended its own partnership with VITO, around VEMAS, and supports this independent research organisation which aims to make sustainability the norm in our society, by developing global projects that facilitate the ecological transition through technological innovations. An approach that provides concrete answers but also emphasises knowledge sharing and synergies between the private sector and the research community.Internally, knowledge sharing is also a must. Each CFE Contracting company has a solid knowledge base. However, each entity also builds it in its own way. This is why the Digitalisation & Innovation Board have come up with the idea of setting up a search page where this ex-pertise and data can be shared easily and across the board. This platform is called Search-it.
ZIN Brussel
119
ANNUAL REPORT
STATEMENT OF NON-FINANCIAL INFORMATION
FINANCIAL STATEMENTS
5.2.4. GOVERNANCEA corporate governance charter with concrete and comprehensible procedures should ensure the greatest possible impact of the actions un-dertaken. In 2021, the corporate governance charter and all key policies and procedures were updated by both CFE and CFE Contracting. This charter defines the structure of CFE Contracting and BPI Real Estate, the roles and responsibilities of the different boards and com-mittees, as well as the minimum applicable procedures, and breaks downs into several internal policies.
Specific policies include respect for human rights and the fight against fraud and corruption.
RESPECT FOR HUMAN RIGHTS Respect for human rights is one of the core values on which the general policy of the Contracting and Real Estate Development divisions is based. This respect is embodied in a formulated policy with a specific code of conduct focused on the integrity of employees which con-stitutes the general framework of which the implementation is ensured by individual reports and internal audits.
Any discrimination - whether in hiring, day-to-day labour relations or training opportunities - based on criteria related to gender, age, na-tionality, ethnic origin, beliefs or disability is strictly prohibited. The group’s general policy also encompasses compliance with staff privacy laws, which is reflected in ICT-related measures at the subsidiaries to protect the security of the personal data of employees.
This general policy is also reflected in the contractual clauses of our agreements with suppliers, in which we require compliance with the current laws on human rights. In the selection of foreign suppliers, the necessary audits are carried out, for example with regard to social security and minimum pay conditions.
So far, no violation of our human rights policy has been reported in the Contracting and Real Estate Development divisions.
FIGHT AGAINST FRAUD AND CORRUPTIONThe anti-corruption code drawn up by CFE and updated in 2021 is addressed to all staff members, regardless of their position. It clearly states that all forms of corruption or influence peddling, direct or indirect, by companies and individuals is prohibited. In order to ensure the effectiveness and proper understanding of the ethical rules that have been issued, the code gives specific details of customary business practices, such as benefits, gifts, privileges and tokens of hospitality: it specifies what is permitted and what is not, the limits to be observed etc., taking into account the national (of Belgium and/or the foreign country concerned) and international rules. The commitment of the subsidiaries and their staff, a sense of propriety and a willingness to work in a spirit of cooperation and trust, and the establishment of a set of internal procedures aimed at limiting the risk of fraud and corruption, are all elements that have guaranteed proper compliance with the anti-fraud and anti-corruption rules. CFE Contracting has redoubled its efforts in 2020 and 2021 to train its operational staff in know-ing and understanding social legislation. To ensure a good understanding of the regulations in force concerning contracts and social laws, a training course entitled ‘Best practices: contract management & social law’ was given to more than 450 operational employees of the various CFE Contracting subsidiaries.
INTERNAL AUDITEach entity regularly undergoes an analysis of risks and procedures by the internal audit unit. Internal audit is an independent function, and its main task is to support management and help it improve the management of risks.
Internal audit reports functionally to the Audit Committee of CFE by submitting the annual audit plan and presenting the main findings of the audits carried out and a follow-up of the action plans. If necessary, additional audit assignments may be carried out at the request of the Audit Committee or of the Executive Committee of CFE Contracting.
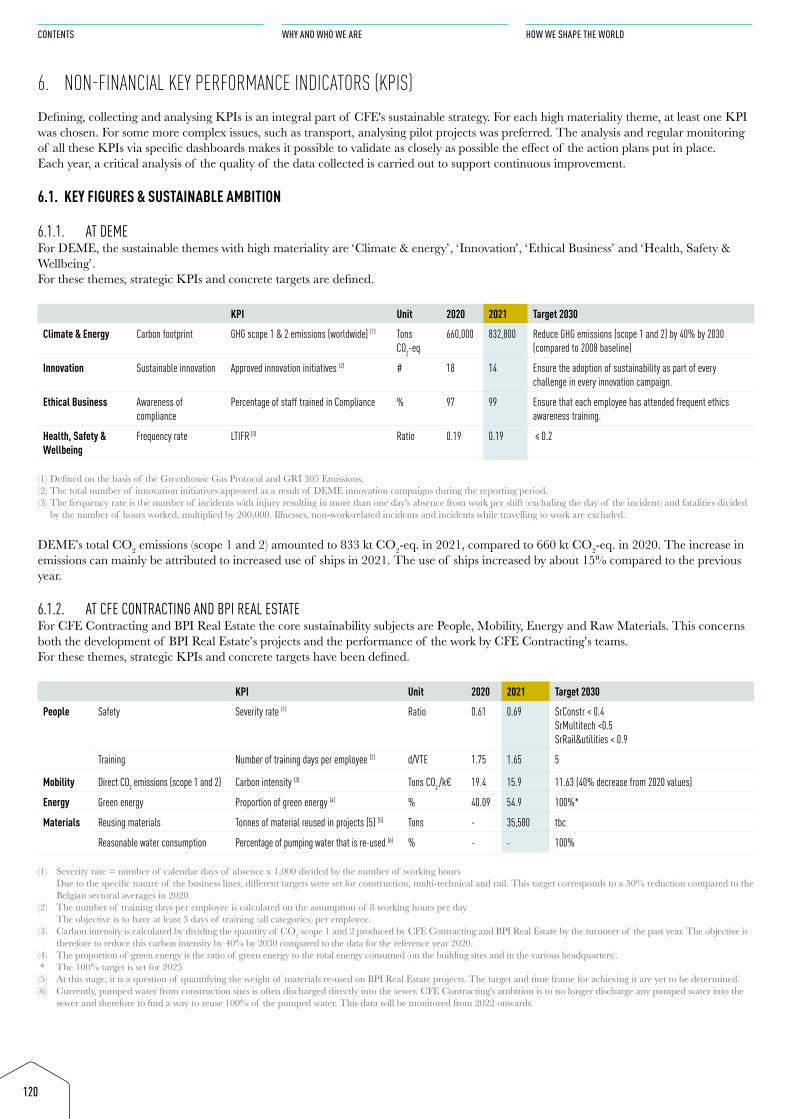
120
CONTENTS
WHY AND WHO WE ARE
HOW WE SHAPE THE WORLD
6. NON-FINANCIAL KEY PERFORMANCE INDICATORS (KPIS)Defining, collecting and analysing KPIs is an integral part of CFE's sustainable strategy. For each high materiality theme, at least one KPI was chosen. For some more complex issues, such as transport, analysing pilot projects was preferred. The analysis and regular monitoring of all these KPIs via specific dashboards makes it possible to validate as closely as possible the effect of the action plans put in place. Each year, a critical analysis of the quality of the data collected is carried out to support continuous improvement.
6.1. KEY FIGURES & SUSTAINABLE AMBITION
6.1.1. AT DEMEFor DEME, the sustainable themes with high materiality are ‘Climate & energy’, ‘Innovation’, ‘Ethical Business’ and ‘Health, Safety & Wellbeing’.For these themes, strategic KPIs and concrete targets are defined.
KPI Unit 2020 2021 Target 2030
Climate & Energy Carbon footprint GHG scope 1 & 2 emissions (worldwide) (1) Tons CO2-eq
660,000 832,800 Reduce GHG emissions (scope 1 and 2) by 40% by 2030 (compared to 2008 baseline)
Innovation Sustainable innovation Approved innovation initiatives (2) # 18 14 Ensure the adoption of sustainability as part of every challenge in every innovation campaign.
Ethical Business Awareness of compliance
Percentage of staff trained in Compliance % 97 99 Ensure that each employee has attended frequent ethics awareness training.
Health, Safety & Wellbeing
Frequency rate LTIFR (3) Ratio 0.19 0.19 ≤ 0.2
(1) Defined on the basis of the Greenhouse Gas Protocol and GRI 305 Emissions.(2) The total number of innovation initiatives approved as a result of DEME innovation campaigns during the reporting period.(3) The frequency rate is the number of incidents with injury resulting in more than one day's absence from work per shift (excluding the day of the incident) and fatalities divided
by the number of hours worked, multiplied by 200,000. Illnesses, non-work-related incidents and incidents while travelling to work are excluded.
DEME’s total CO2 emissions (scope 1 and 2) amounted to 833 kt CO2-eq. in 2021, compared to 660 kt CO2-eq. in 2020. The increase in emissions can mainly be attributed to increased use of ships in 2021. The use of ships increased by about 15% compared to the previous year.
6.1.2. AT CFE CONTRACTING AND BPI REAL ESTATEFor CFE Contracting and BPI Real Estate the core sustainability subjects are People, Mobility, Energy and Raw Materials. This concerns both the development of BPI Real Estate’s projects and the performance of the work by CFE Contracting’s teams.For these themes, strategic KPIs and concrete targets have been defined.
KPI Unit 2020 2021 Target 2030
People Safety Severity rate (1) Ratio 0.61 0.69 SrConstr < 0.4 SrMultitech <0.5SrRail&utilities < 0.9
Training Number of training days per employee (2) d/VTE 1.75 1.65 5
Mobility Direct CO2 emissions (scope 1 and 2) Carbon intensity (3) Tons CO2 /k€ 19.4 15.9 11.63 (40% decrease from 2020 values)
Energy Green energy Proportion of green energy (4) % 40.09 54.9 100%*
Materials Reusing materials Tonnes of material reused in projects (5) (5) Tons - 35,580 tbc
Reasonable water consumption Percentage of pumping water that is re-used (6) % - - 100%
(1) Severity rate = number of calendar days of absence x 1,000 divided by the number of working hours Due to the specific nature of the business lines, different targets were set for construction, multi-technical and rail. This target corresponds to a 50% reduction compared to the Belgian sectoral averages in 2020.
(2) The number of training days per employee is calculated on the assumption of 8 working hours per day. The objective is to have at least 5 days of training (all categories) per employee.
(3) Carbon intensity is calculated by dividing the quantity of CO2 scope 1 and 2 produced by CFE Contracting and BPI Real Estate by the turnover of the past year. The objective is therefore to reduce this carbon intensity by 40% by 2030 compared to the data for the reference year 2020.
(4) The proportion of green energy is the ratio of green energy to the total energy consumed (on the building sites and in the various headquarters). * The 100% target is set for 2025(5) At this stage, it is a question of quantifying the weight of materials re-used on BPI Real Estate projects. The target and time frame for achieving it are yet to be determined.(6) Currently, pumped water from construction sites is often discharged directly into the sewer. CFE Contracting's ambition is to no longer discharge any pumped water into the
sewer and therefore to find a way to reuse 100% of the pumped water. This data will be monitored from 2022 onwards.
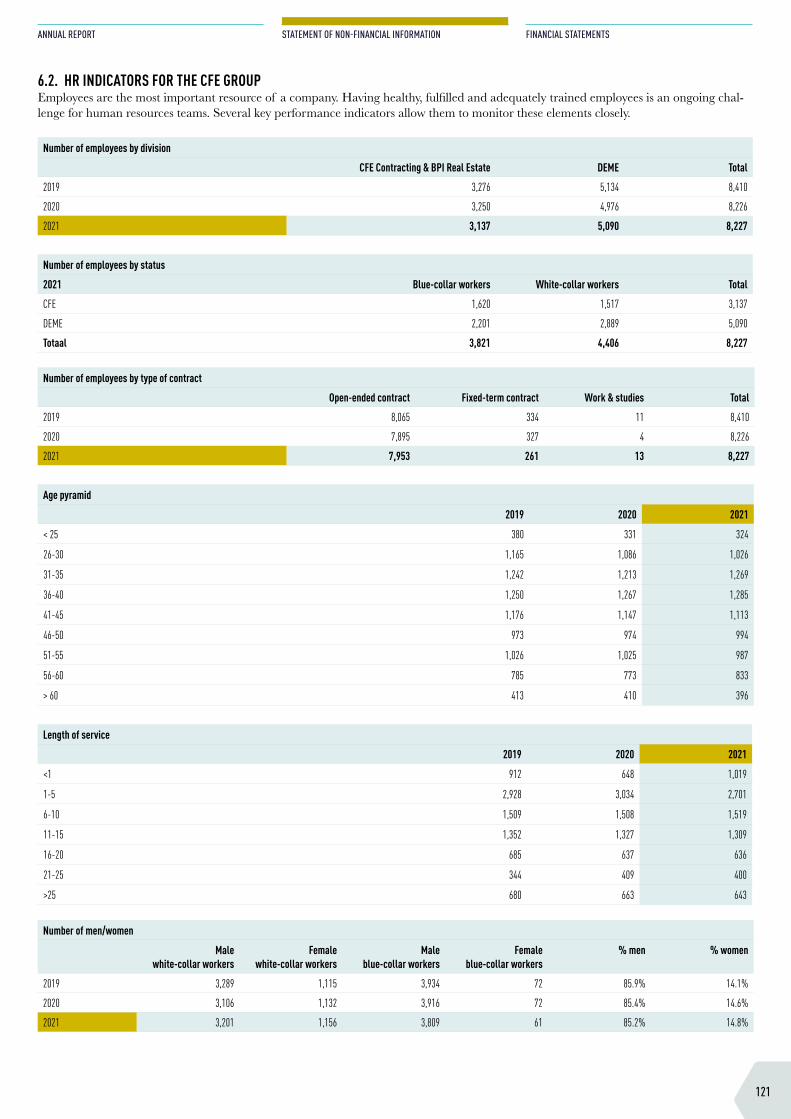
121
ANNUAL REPORT
STATEMENT OF NON-FINANCIAL INFORMATION
FINANCIAL STATEMENTS
6.2. HR INDICATORS FOR THE CFE GROUPEmployees are the most important resource of a company. Having healthy, fulfilled and adequately trained employees is an ongoing chal-lenge for human resources teams. Several key performance indicators allow them to monitor these elements closely.
Number of employees by division
CFE Contracting & BPI Real Estate DEME Total
2019 3,276 5,134 8,410
2020 3,250 4,976 8,226
2021 3,137 5,090 8,227
Number of employees by status
2021 Blue-collar workers White-collar workers Total
CFE 1,620 1,517 3,137
DEME 2,201 2,889 5,090
Totaal 3,821 4,406 8,227
Number of employees by type of contract
Open-ended contract Fixed-term contract Work & studies Total
2019 8,065 334 11 8,410
2020 7,895 327 4 8,226
2021 7,953 261 13 8,227
Age pyramid
2019 2020 2021
< 25 380 331 324
26-30 1,165 1,086 1,026
31-35 1,242 1,213 1,269
36-40 1,250 1,267 1,285
41-45 1,176 1,147 1,113
46-50 973 974 994
51-55 1,026 1,025 987
56-60 785 773 833
> 60 413 410 396
Length of service
2019 2020 2021
<1 912 648 1,019
1-5 2,928 3,034 2,701
6-10 1,509 1,508 1,519
11-15 1,352 1,327 1,309
16-20 685 637 636
21-25 344 409 400
>25 680 663 643
Number of men/women
Male white-collar workers
Female white-collar workers
Male blue-collar workers
Female blue-collar workers
% men % women
2019 3,289 1,115 3,934 72 85.9% 14.1%
2020 3,106 1,132 3,916 72 85.4% 14.6%
2021 3,201 1,156 3,809 61 85.2% 14.8%
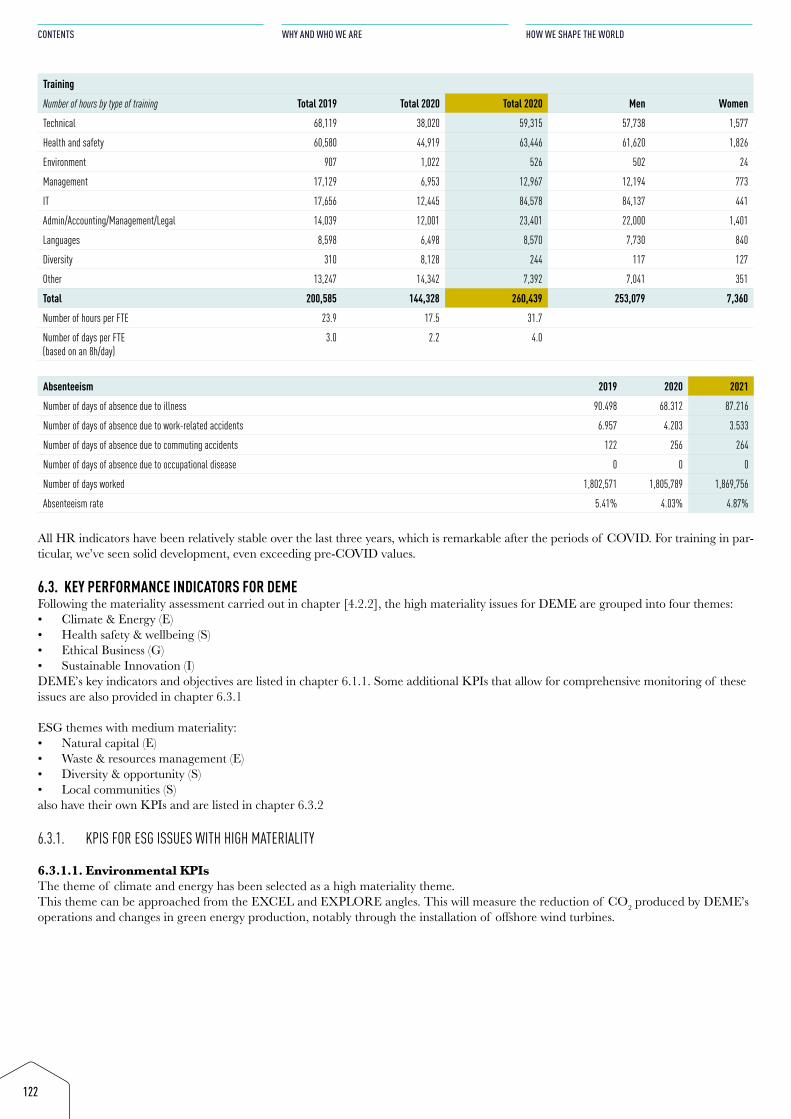
122
CONTENTS
WHY AND WHO WE ARE
HOW WE SHAPE THE WORLD
Training
Number of hours by type of training Total 2019 Total 2020 Total 2020 Men Women
Technical 68,119 38,020 59,315 57,738 1,577
Health and safety 60,580 44,919 63,446 61,620 1,826
Environment 907 1,022 526 502 24
Management 17,129 6,953 12,967 12,194 773
IT 17,656 12,445 84,578 84,137 441
Admin/Accounting/Management/Legal 14,039 12,001 23,401 22,000 1,401
Languages 8,598 6,498 8,570 7,730 840
Diversity 310 8,128 244 117 127
Other 13,247 14,342 7,392 7,041 351
Total 200,585 144,328 260,439 253,079 7,360
Number of hours per FTE 23.9 17.5 31.7
Number of days per FTE(based on an 8h/day)
3.0 2.2 4.0
Absenteeism 2019 2020 2021
Number of days of absence due to illness 90.498 68.312 87.216
Number of days of absence due to work-related accidents 6.957 4.203 3.533
Number of days of absence due to commuting accidents 122 256 264
Number of days of absence due to occupational disease 0 0 0
Number of days worked 1,802,571 1,805,789 1,869,756
Absenteeism rate 5.41% 4.03% 4.87%
All HR indicators have been relatively stable over the last three years, which is remarkable after the periods of COVID. For training in par-ticular, we’ve seen solid development, even exceeding pre-COVID values.
6.3. KEY PERFORMANCE INDICATORS FOR DEMEFollowing the materiality assessment carried out in chapter [4.2.2], the high materiality issues for DEME are grouped into four themes:• Climate & Energy (E)• Health safety & wellbeing (S)• Ethical Business (G)• Sustainable Innovation (I)DEME’s key indicators and objectives are listed in chapter 6.1.1. Some additional KPIs that allow for comprehensive monitoring of these issues are also provided in chapter 6.3.1
ESG themes with medium materiality:• Natural capital (E)• Waste & resources management (E)• Diversity & opportunity (S)• Local communities (S) also have their own KPIs and are listed in chapter 6.3.2
6.3.1. KPIS FOR ESG ISSUES WITH HIGH MATERIALITY
6.3.1.1. Environmental KPIsThe theme of climate and energy has been selected as a high materiality theme. This theme can be approached from the EXCEL and EXPLORE angles. This will measure the reduction of CO2 produced by DEME’s operations and changes in green energy production, notably through the installation of offshore wind turbines.
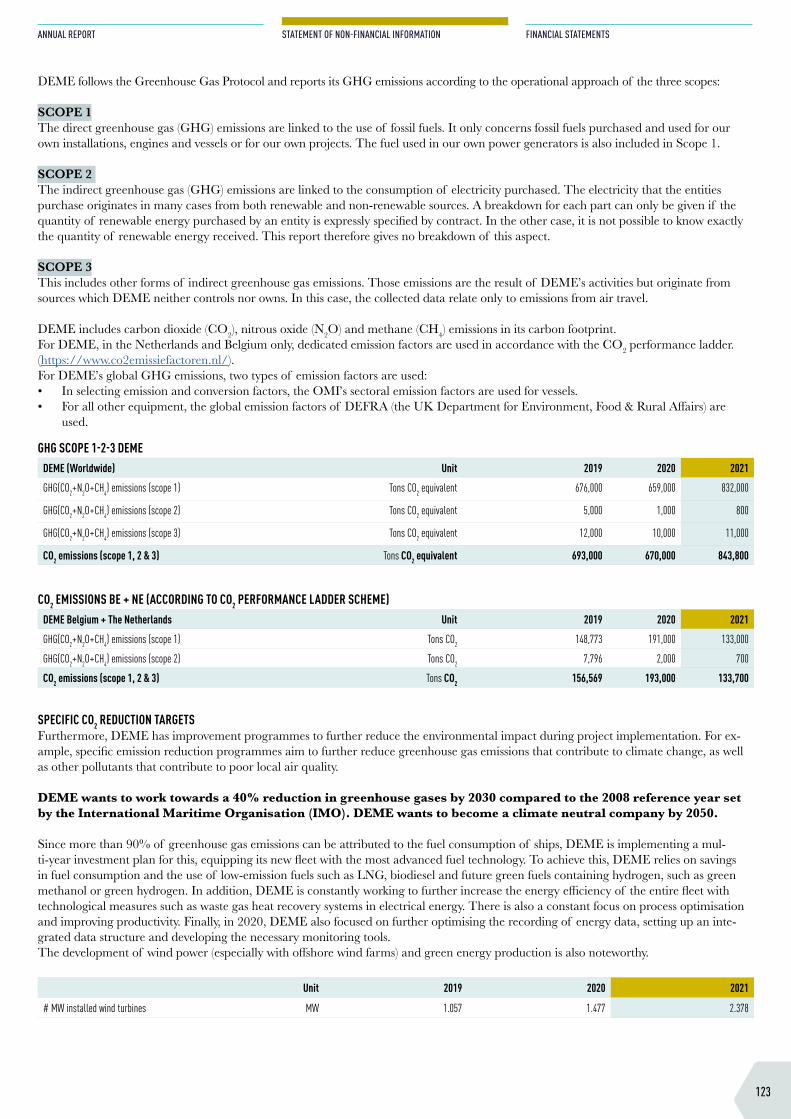
123
ANNUAL REPORT
STATEMENT OF NON-FINANCIAL INFORMATION
FINANCIAL STATEMENTS
DEME follows the Greenhouse Gas Protocol and reports its GHG emissions according to the operational approach of the three scopes:
SCOPE 1The direct greenhouse gas (GHG) emissions are linked to the use of fossil fuels. It only concerns fossil fuels purchased and used for our own installations, engines and vessels or for our own projects. The fuel used in our own power generators is also included in Scope 1.
SCOPE 2 The indirect greenhouse gas (GHG) emissions are linked to the consumption of electricity purchased. The electricity that the entities purchase originates in many cases from both renewable and non-renewable sources. A breakdown for each part can only be given if the quantity of renewable energy purchased by an entity is expressly specified by contract. In the other case, it is not possible to know exactly the quantity of renewable energy received. This report therefore gives no breakdown of this aspect.
SCOPE 3This includes other forms of indirect greenhouse gas emissions. Those emissions are the result of DEME’s activities but originate from sources which DEME neither controls nor owns. In this case, the collected data relate only to emissions from air travel.
DEME includes carbon dioxide (CO2), nitrous oxide (N2O) and methane (CH4) emissions in its carbon footprint. For DEME, in the Netherlands and Belgium only, dedicated emission factors are used in accordance with the CO2 performance ladder. (https://www.co2emissiefactoren.nl/). For DEME’s global GHG emissions, two types of emission factors are used: • In selecting emission and conversion factors, the OMI’s sectoral emission factors are used for vessels. • For all other equipment, the global emission factors of DEFRA (the UK Department for Environment, Food & Rural Affairs) are
used.
GHG SCOPE 1-2-3 DEMEDEME (Worldwide) Unit 2019 2020 2021
GHG(CO2+N2O+CH4) emissions (scope 1) Tons CO2 equivalent 676,000 659,000 832,000
GHG(CO2+N2O+CH4) emissions (scope 2) Tons CO2 equivalent 5,000 1,000 800
GHG(CO2+N2O+CH4) emissions (scope 3) Tons CO2 equivalent 12,000 10,000 11,000
CO2 emissions (scope 1, 2 & 3) Tons CO2 equivalent 693,000 670,000 843,800
CO2 EMISSIONS BE + NE (ACCORDING TO CO2 PERFORMANCE LADDER SCHEME)DEME Belgium + The Netherlands Unit 2019 2020 2021
GHG(CO2+N2O+CH4) emissions (scope 1) Tons CO2 148,773 191,000 133,000
GHG(CO2+N2O+CH4) emissions (scope 2) Tons CO2 7,796 2,000 700
CO2 emissions (scope 1, 2 & 3) Tons CO2 156,569 193,000 133,700
SPECIFIC CO2 REDUCTION TARGETSFurthermore, DEME has improvement programmes to further reduce the environmental impact during project implementation. For ex-ample, specific emission reduction programmes aim to further reduce greenhouse gas emissions that contribute to climate change, as well as other pollutants that contribute to poor local air quality.
DEME wants to work towards a 40% reduction in greenhouse gases by 2030 compared to the 2008 reference year set by the International Maritime Organisation (IMO). DEME wants to become a climate neutral company by 2050.
Since more than 90% of greenhouse gas emissions can be attributed to the fuel consumption of ships, DEME is implementing a mul-ti-year investment plan for this, equipping its new fleet with the most advanced fuel technology. To achieve this, DEME relies on savings in fuel consumption and the use of low-emission fuels such as LNG, biodiesel and future green fuels containing hydrogen, such as green methanol or green hydrogen. In addition, DEME is constantly working to further increase the energy efficiency of the entire fleet with technological measures such as waste gas heat recovery systems in electrical energy. There is also a constant focus on process optimisation and improving productivity. Finally, in 2020, DEME also focused on further optimising the recording of energy data, setting up an inte-grated data structure and developing the necessary monitoring tools. The development of wind power (especially with offshore wind farms) and green energy production is also noteworthy.
Unit 2019 2020 2021
# MW installed wind turbines MW 1.057 1.477 2.378
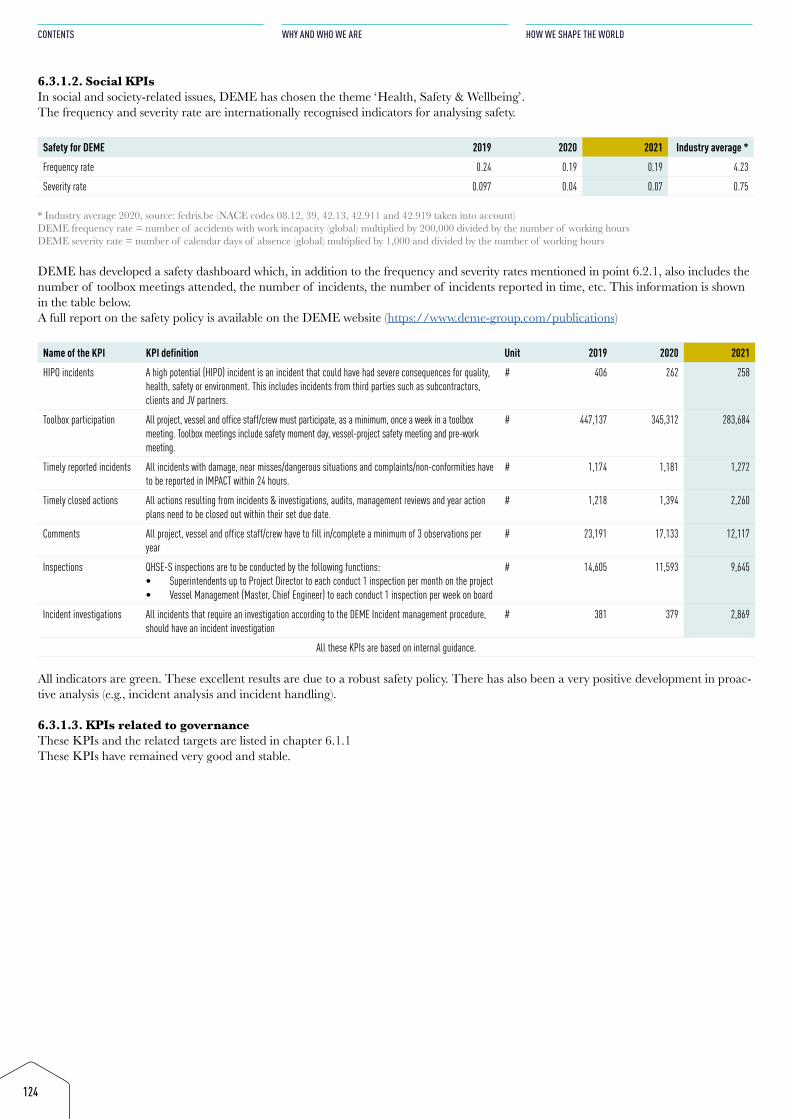
124
CONTENTS
WHY AND WHO WE ARE
HOW WE SHAPE THE WORLD
6.3.1.2. Social KPIsIn social and society-related issues, DEME has chosen the theme ‘Health, Safety & Wellbeing’. The frequency and severity rate are internationally recognised indicators for analysing safety.
Safety for DEME 2019 2020 2021 Industry average *
Frequency rate 0.24 0.19 0.19 4.23
Severity rate 0.097 0.04 0.07 0.75 * Industry average 2020, source: fedris.be (NACE codes 08.12, 39, 42.13, 42.911 and 42.919 taken into account)DEME frequency rate = number of accidents with work incapacity (global) multiplied by 200,000 divided by the number of working hoursDEME severity rate = number of calendar days of absence (global) multiplied by 1,000 and divided by the number of working hours
DEME has developed a safety dashboard which, in addition to the frequency and severity rates mentioned in point 6.2.1, also includes the number of toolbox meetings attended, the number of incidents, the number of incidents reported in time, etc. This information is shown in the table below.A full report on the safety policy is available on the DEME website (https://www.deme-group.com/publications)
Name of the KPI KPI definition Unit 2019 2020 2021
HIPO incidents A high potential (HIPO) incident is an incident that could have had severe consequences for quality, health, safety or environment. This includes incidents from third parties such as subcontractors, clients and JV partners.
# 406 262 258
Toolbox participation All project, vessel and office staff/crew must participate, as a minimum, once a week in a toolbox meeting. Toolbox meetings include safety moment day, vessel-project safety meeting and pre-work meeting.
# 447,137 345,312 283,684
Timely reported incidents All incidents with damage, near misses/dangerous situations and complaints/non-conformities have to be reported in IMPACT within 24 hours.
# 1,174 1,181 1,272
Timely closed actions All actions resulting from incidents & investigations, audits, management reviews and year action plans need to be closed out within their set due date.
# 1,218 1,394 2,260
Comments All project, vessel and office staff/crew have to fill in/complete a minimum of 3 observations per year
# 23,191 17,133 12,117
Inspections QHSE-S inspections are to be conducted by the following functions:• Superintendents up to Project Director to each conduct 1 inspection per month on the project• Vessel Management (Master, Chief Engineer) to each conduct 1 inspection per week on board
# 14,605 11,593 9,645
Incident investigations All incidents that require an investigation according to the DEME Incident management procedure, should have an incident investigation
# 381 379 2,869
All these KPIs are based on internal guidance.
All indicators are green. These excellent results are due to a robust safety policy. There has also been a very positive development in proac-tive analysis (e.g., incident analysis and incident handling).
6.3.1.3. KPIs related to governance These KPIs and the related targets are listed in chapter 6.1.1These KPIs have remained very good and stable.
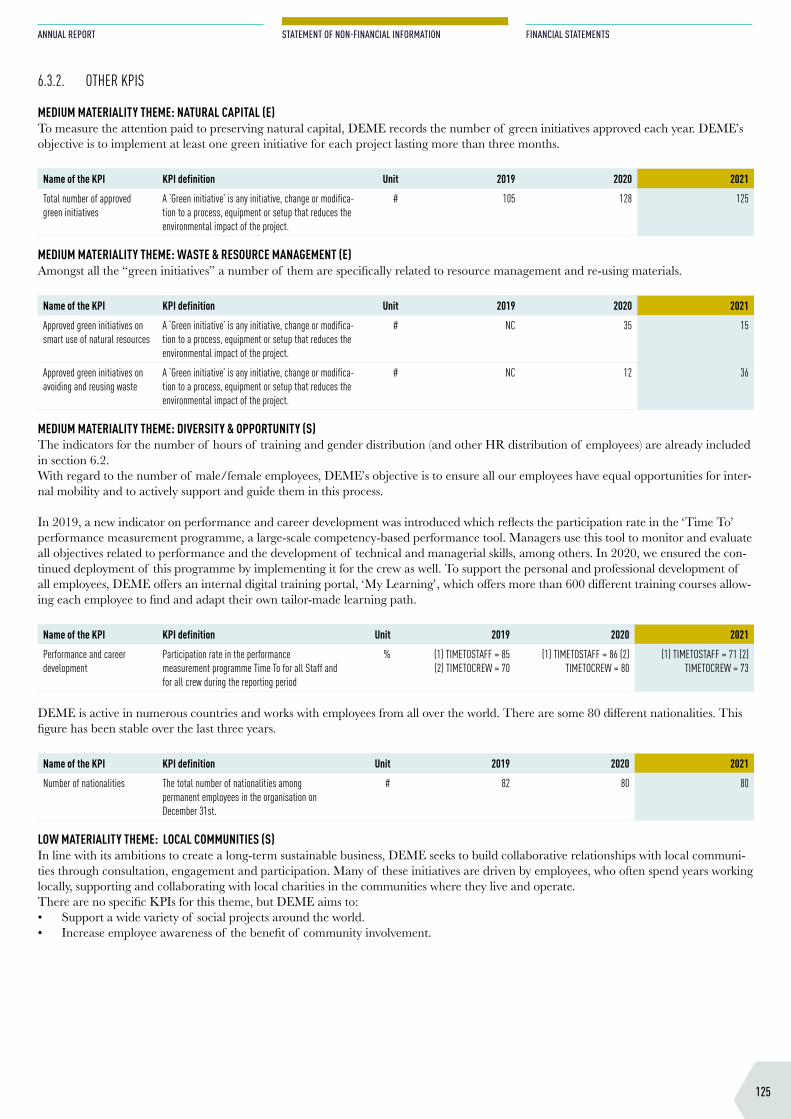
125
ANNUAL REPORT
STATEMENT OF NON-FINANCIAL INFORMATION
FINANCIAL STATEMENTS
6.3.2. OTHER KPIS
MEDIUM MATERIALITY THEME: NATURAL CAPITAL (E)To measure the attention paid to preserving natural capital, DEME records the number of green initiatives approved each year. DEME’s objective is to implement at least one green initiative for each project lasting more than three months.
Name of the KPI KPI definition Unit 2019 2020 2021
Total number of approved green initiatives
A ‘Green initiative’ is any initiative, change or modifica-tion to a process, equipment or setup that reduces the environmental impact of the project.
# 105 128 125
MEDIUM MATERIALITY THEME: WASTE & RESOURCE MANAGEMENT (E)Amongst all the “green initiatives” a number of them are specifically related to resource management and re-using materials.
Name of the KPI KPI definition Unit 2019 2020 2021
Approved green initiatives on smart use of natural resources
A ‘Green initiative’ is any initiative, change or modifica-tion to a process, equipment or setup that reduces the environmental impact of the project.
# NC 35 15
Approved green initiatives on avoiding and reusing waste
A ‘Green initiative’ is any initiative, change or modifica-tion to a process, equipment or setup that reduces the environmental impact of the project.
# NC 12 36
MEDIUM MATERIALITY THEME: DIVERSITY & OPPORTUNITY (S)The indicators for the number of hours of training and gender distribution (and other HR distribution of employees) are already included in section 6.2.With regard to the number of male/female employees, DEME’s objective is to ensure all our employees have equal opportunities for inter-nal mobility and to actively support and guide them in this process.
In 2019, a new indicator on performance and career development was introduced which reflects the participation rate in the ‘Time To’ performance measurement programme, a large-scale competency-based performance tool. Managers use this tool to monitor and evaluate all objectives related to performance and the development of technical and managerial skills, among others. In 2020, we ensured the con-tinued deployment of this programme by implementing it for the crew as well. To support the personal and professional development of all employees, DEME offers an internal digital training portal, ‘My Learning’, which offers more than 600 different training courses allow-ing each employee to find and adapt their own tailor-made learning path.
Name of the KPI KPI definition Unit 2019 2020 2021
Performance and career development
Participation rate in the performance measurement programme Time To for all Staff and for all crew during the reporting period
% (1) TIMETOSTAFF = 85(2) TIMETOCREW = 70
(1) TIMETOSTAFF = 86 (2) TIMETOCREW = 80
(1) TIMETOSTAFF = 71 (2) TIMETOCREW = 73
DEME is active in numerous countries and works with employees from all over the world. There are some 80 different nationalities. This figure has been stable over the last three years.
Name of the KPI KPI definition Unit 2019 2020 2021
Number of nationalities The total number of nationalities among permanent employees in the organisation on December 31st.
# 82 80 80
LOW MATERIALITY THEME: LOCAL COMMUNITIES (S) In line with its ambitions to create a long-term sustainable business, DEME seeks to build collaborative relationships with local communi-ties through consultation, engagement and participation. Many of these initiatives are driven by employees, who often spend years working locally, supporting and collaborating with local charities in the communities where they live and operate.There are no specific KPIs for this theme, but DEME aims to:• Support a wide variety of social projects around the world.• Increase employee awareness of the benefit of community involvement.
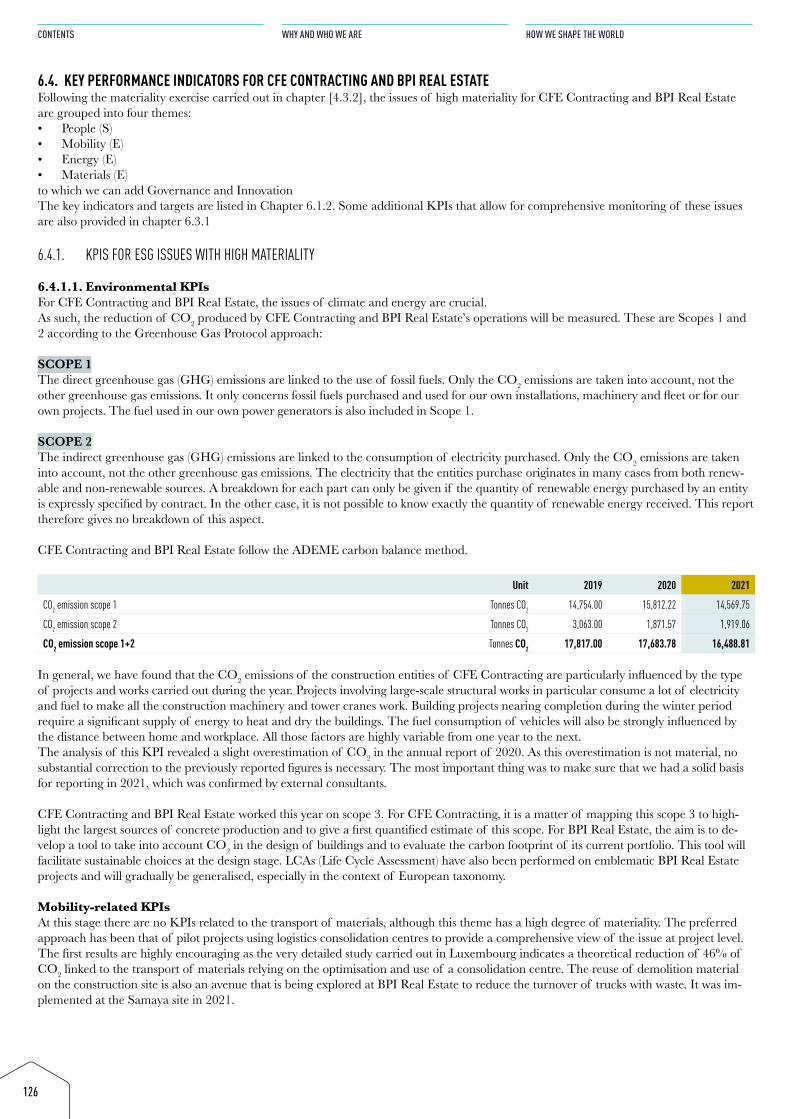
126
CONTENTS
WHY AND WHO WE ARE
HOW WE SHAPE THE WORLD
6.4. KEY PERFORMANCE INDICATORS FOR CFE CONTRACTING AND BPI REAL ESTATEFollowing the materiality exercise carried out in chapter [4.3.2], the issues of high materiality for CFE Contracting and BPI Real Estate are grouped into four themes:• People (S)• Mobility (E)• Energy (E)• Materials (E)to which we can add Governance and Innovation The key indicators and targets are listed in Chapter 6.1.2. Some additional KPIs that allow for comprehensive monitoring of these issues are also provided in chapter 6.3.1
6.4.1. KPIS FOR ESG ISSUES WITH HIGH MATERIALITY
6.4.1.1. Environmental KPIsFor CFE Contracting and BPI Real Estate, the issues of climate and energy are crucial. As such, the reduction of CO2 produced by CFE Contracting and BPI Real Estate’s operations will be measured. These are Scopes 1 and 2 according to the Greenhouse Gas Protocol approach:
SCOPE 1The direct greenhouse gas (GHG) emissions are linked to the use of fossil fuels. Only the CO2 emissions are taken into account, not the other greenhouse gas emissions. It only concerns fossil fuels purchased and used for our own installations, machinery and fleet or for our own projects. The fuel used in our own power generators is also included in Scope 1.
SCOPE 2 The indirect greenhouse gas (GHG) emissions are linked to the consumption of electricity purchased. Only the CO2 emissions are taken into account, not the other greenhouse gas emissions. The electricity that the entities purchase originates in many cases from both renew-able and non-renewable sources. A breakdown for each part can only be given if the quantity of renewable energy purchased by an entity is expressly specified by contract. In the other case, it is not possible to know exactly the quantity of renewable energy received. This report therefore gives no breakdown of this aspect.
CFE Contracting and BPI Real Estate follow the ADEME carbon balance method.
Unit 2019 2020 2021
CO2 emission scope 1 Tonnes CO2 14,754.00 15,812.22 14,569.75
CO2 emission scope 2 Tonnes CO2 3,063.00 1,871.57 1,919.06
CO2 emission scope 1+2 Tonnes CO2 17,817.00 17,683.78 16,488.81
In general, we have found that the CO2 emissions of the construction entities of CFE Contracting are particularly influenced by the type of projects and works carried out during the year. Projects involving large-scale structural works in particular consume a lot of electricity and fuel to make all the construction machinery and tower cranes work. Building projects nearing completion during the winter period require a significant supply of energy to heat and dry the buildings. The fuel consumption of vehicles will also be strongly influenced by the distance between home and workplace. All those factors are highly variable from one year to the next.The analysis of this KPI revealed a slight overestimation of CO2 in the annual report of 2020. As this overestimation is not material, no substantial correction to the previously reported figures is necessary. The most important thing was to make sure that we had a solid basis for reporting in 2021, which was confirmed by external consultants.
CFE Contracting and BPI Real Estate worked this year on scope 3. For CFE Contracting, it is a matter of mapping this scope 3 to high-light the largest sources of concrete production and to give a first quantified estimate of this scope. For BPI Real Estate, the aim is to de-velop a tool to take into account CO2 in the design of buildings and to evaluate the carbon footprint of its current portfolio. This tool will facilitate sustainable choices at the design stage. LCAs (Life Cycle Assessment) have also been performed on emblematic BPI Real Estate projects and will gradually be generalised, especially in the context of European taxonomy.
Mobility-related KPIs At this stage there are no KPIs related to the transport of materials, although this theme has a high degree of materiality. The preferred approach has been that of pilot projects using logistics consolidation centres to provide a comprehensive view of the issue at project level. The first results are highly encouraging as the very detailed study carried out in Luxembourg indicates a theoretical reduction of 46% of CO2 linked to the transport of materials relying on the optimisation and use of a consolidation centre. The reuse of demolition material on the construction site is also an avenue that is being explored at BPI Real Estate to reduce the turnover of trucks with waste. It was im-plemented at the Samaya site in 2021.
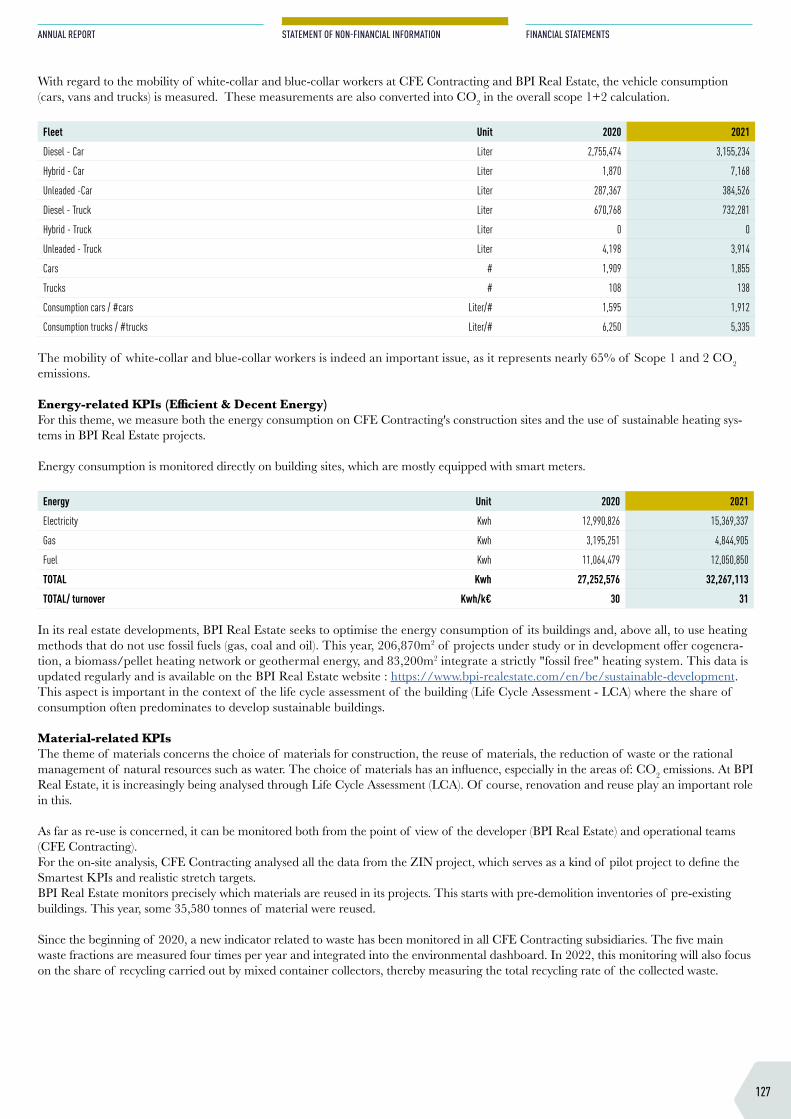
127
ANNUAL REPORT
STATEMENT OF NON-FINANCIAL INFORMATION
FINANCIAL STATEMENTS
With regard to the mobility of white-collar and blue-collar workers at CFE Contracting and BPI Real Estate, the vehicle consumption (cars, vans and trucks) is measured. These measurements are also converted into CO2 in the overall scope 1+2 calculation.
Fleet Unit 2020 2021
Diesel - Car Liter 2,755,474 3,155,234
Hybrid - Car Liter 1,870 7,168
Unleaded -Car Liter 287,367 384,526
Diesel - Truck Liter 670,768 732,281
Hybrid - Truck Liter 0 0
Unleaded - Truck Liter 4,198 3,914
Cars # 1,909 1,855
Trucks # 108 138
Consumption cars / #cars Liter/# 1,595 1,912
Consumption trucks / #trucks Liter/# 6,250 5,335
The mobility of white-collar and blue-collar workers is indeed an important issue, as it represents nearly 65% of Scope 1 and 2 CO2 emissions.
Energy-related KPIs (Efficient & Decent Energy)For this theme, we measure both the energy consumption on CFE Contracting's construction sites and the use of sustainable heating sys-tems in BPI Real Estate projects.
Energy consumption is monitored directly on building sites, which are mostly equipped with smart meters.
Energy Unit 2020 2021
Electricity Kwh 12,990,826 15,369,337
Gas Kwh 3,195,251 4,844,905
Fuel Kwh 11,064,479 12,050,850
TOTAL Kwh 27,252,576 32,267,113
TOTAL/ turnover Kwh/k€ 30 31
In its real estate developments, BPI Real Estate seeks to optimise the energy consumption of its buildings and, above all, to use heating methods that do not use fossil fuels (gas, coal and oil). This year, 206,870m2 of projects under study or in development offer cogenera-tion, a biomass/pellet heating network or geothermal energy, and 83,200m2 integrate a strictly "fossil free" heating system. This data is updated regularly and is available on the BPI Real Estate website : https://www.bpi-realestate.com/en/be/sustainable-development.This aspect is important in the context of the life cycle assessment of the building (Life Cycle Assessment - LCA) where the share of consumption often predominates to develop sustainable buildings.
Material-related KPIs The theme of materials concerns the choice of materials for construction, the reuse of materials, the reduction of waste or the rational management of natural resources such as water. The choice of materials has an influence, especially in the areas of: CO2 emissions. At BPI Real Estate, it is increasingly being analysed through Life Cycle Assessment (LCA). Of course, renovation and reuse play an important role in this.
As far as re-use is concerned, it can be monitored both from the point of view of the developer (BPI Real Estate) and operational teams (CFE Contracting).For the on-site analysis, CFE Contracting analysed all the data from the ZIN project, which serves as a kind of pilot project to define the Smartest KPIs and realistic stretch targets.BPI Real Estate monitors precisely which materials are reused in its projects. This starts with pre-demolition inventories of pre-existing buildings. This year, some 35,580 tonnes of material were reused.
Since the beginning of 2020, a new indicator related to waste has been monitored in all CFE Contracting subsidiaries. The five main waste fractions are measured four times per year and integrated into the environmental dashboard. In 2022, this monitoring will also focus on the share of recycling carried out by mixed container collectors, thereby measuring the total recycling rate of the collected waste.
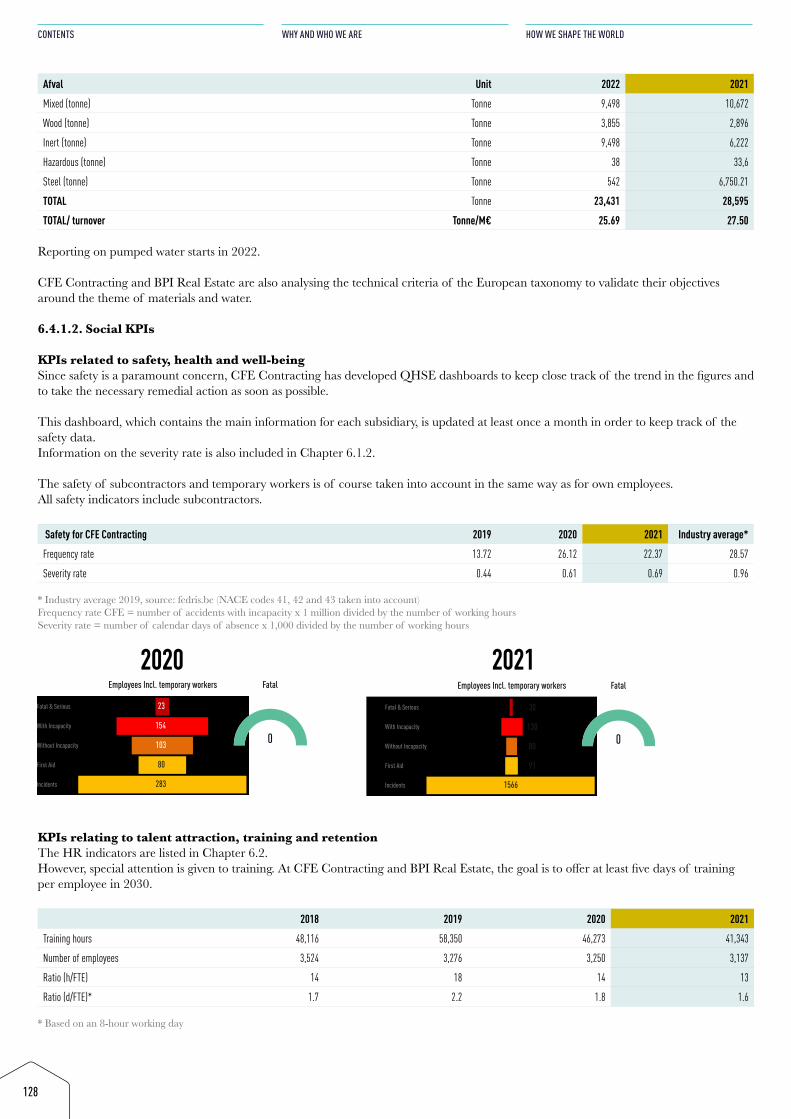
128
CONTENTS
WHY AND WHO WE ARE
HOW WE SHAPE THE WORLD
Afval Unit 2022 2021
Mixed (tonne) Tonne 9,498 10,672
Wood (tonne) Tonne 3,855 2,896
Inert (tonne) Tonne 9,498 6,222
Hazardous (tonne) Tonne 38 33,6
Steel (tonne) Tonne 542 6,750.21
TOTAL Tonne 23,431 28,595
TOTAL/ turnover Tonne/M€ 25.69 27.50
Reporting on pumped water starts in 2022.
CFE Contracting and BPI Real Estate are also analysing the technical criteria of the European taxonomy to validate their objectives around the theme of materials and water.
6.4.1.2. Social KPIs
KPIs related to safety, health and well-beingSince safety is a paramount concern, CFE Contracting has developed QHSE dashboards to keep close track of the trend in the figures and to take the necessary remedial action as soon as possible.
This dashboard, which contains the main information for each subsidiary, is updated at least once a month in order to keep track of the safety data.Information on the severity rate is also included in Chapter 6.1.2.
The safety of subcontractors and temporary workers is of course taken into account in the same way as for own employees.All safety indicators include subcontractors.
Safety for CFE Contracting 2019 2020 2021 Industry average*
Frequency rate 13.72 26.12 22.37 28.57
Severity rate 0.44 0.61 0.69 0.96
* Industry average 2019, source: fedris.be (NACE codes 41, 42 and 43 taken into account)Frequency rate CFE = number of accidents with incapacity x 1 million divided by the number of working hoursSeverity rate = number of calendar days of absence x 1,000 divided by the number of working hours
Fatal & Serious
With Incapacity
Without Incapacity
First Aid
Incidents
23
154
103
80
283
0
Employees Incl. temporary workers Fatal
2020Fatal & Serious
With Incapacity
Without Incapacity
First Aid
Incidents
30
130
80
91
1566
0
Employees Incl. temporary workers Fatal
2021
KPIs relating to talent attraction, training and retentionThe HR indicators are listed in Chapter 6.2. However, special attention is given to training. At CFE Contracting and BPI Real Estate, the goal is to offer at least five days of training per employee in 2030.
2018 2019 2020 2021
Training hours 48,116 58,350 46,273 41,343
Number of employees 3,524 3,276 3,250 3,137
Ratio (h/FTE) 14 18 14 13
Ratio (d/FTE)* 1.7 2.2 1.8 1.6
* Based on an 8-hour working day
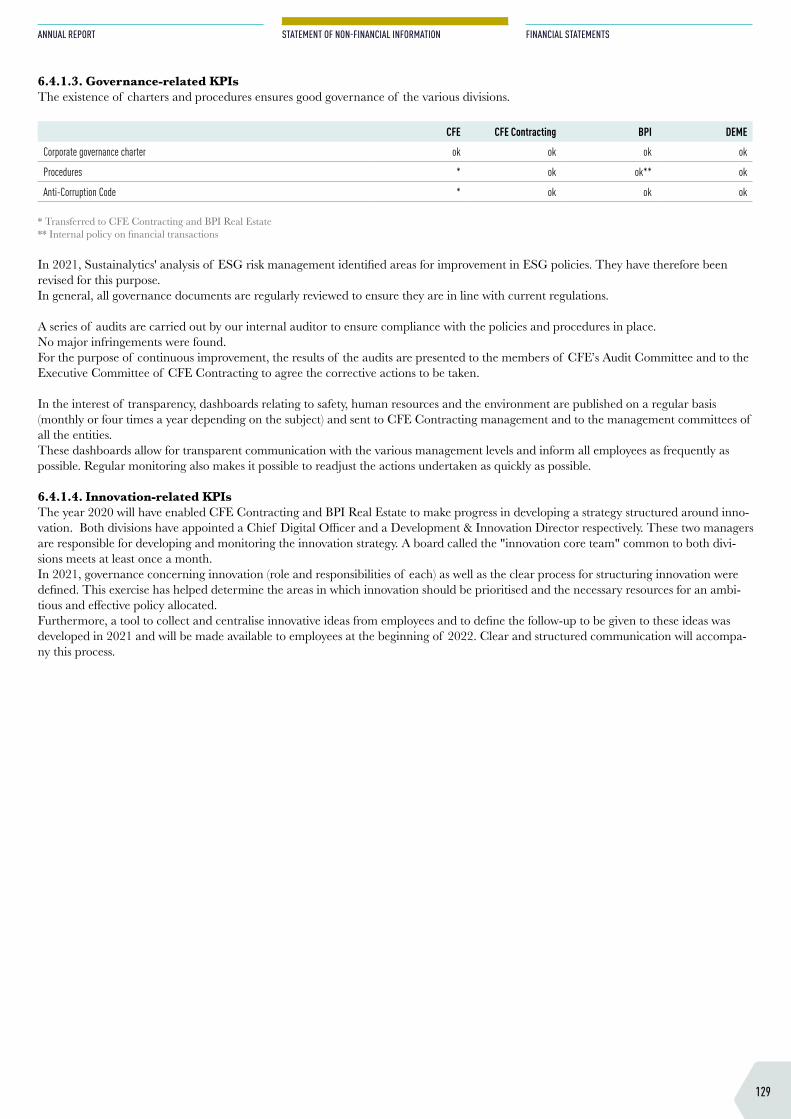
129
ANNUAL REPORT
STATEMENT OF NON-FINANCIAL INFORMATION
FINANCIAL STATEMENTS
6.4.1.3. Governance-related KPIs The existence of charters and procedures ensures good governance of the various divisions.
CFE CFE Contracting BPI DEME
Corporate governance charter ok ok ok ok
Procedures * ok ok** ok
Anti-Corruption Code * ok ok ok * Transferred to CFE Contracting and BPI Real Estate ** Internal policy on financial transactions
In 2021, Sustainalytics' analysis of ESG risk management identified areas for improvement in ESG policies. They have therefore been revised for this purpose. In general, all governance documents are regularly reviewed to ensure they are in line with current regulations.
A series of audits are carried out by our internal auditor to ensure compliance with the policies and procedures in place.No major infringements were found.For the purpose of continuous improvement, the results of the audits are presented to the members of CFE’s Audit Committee and to the Executive Committee of CFE Contracting to agree the corrective actions to be taken.
In the interest of transparency, dashboards relating to safety, human resources and the environment are published on a regular basis (monthly or four times a year depending on the subject) and sent to CFE Contracting management and to the management committees of all the entities. These dashboards allow for transparent communication with the various management levels and inform all employees as frequently as possible. Regular monitoring also makes it possible to readjust the actions undertaken as quickly as possible.
6.4.1.4. Innovation-related KPIsThe year 2020 will have enabled CFE Contracting and BPI Real Estate to make progress in developing a strategy structured around inno-vation. Both divisions have appointed a Chief Digital Officer and a Development & Innovation Director respectively. These two managers are responsible for developing and monitoring the innovation strategy. A board called the "innovation core team" common to both divi-sions meets at least once a month. In 2021, governance concerning innovation (role and responsibilities of each) as well as the clear process for structuring innovation were defined. This exercise has helped determine the areas in which innovation should be prioritised and the necessary resources for an ambi-tious and effective policy allocated.Furthermore, a tool to collect and centralise innovative ideas from employees and to define the follow-up to be given to these ideas was developed in 2021 and will be made available to employees at the beginning of 2022. Clear and structured communication will accompa-ny this process.
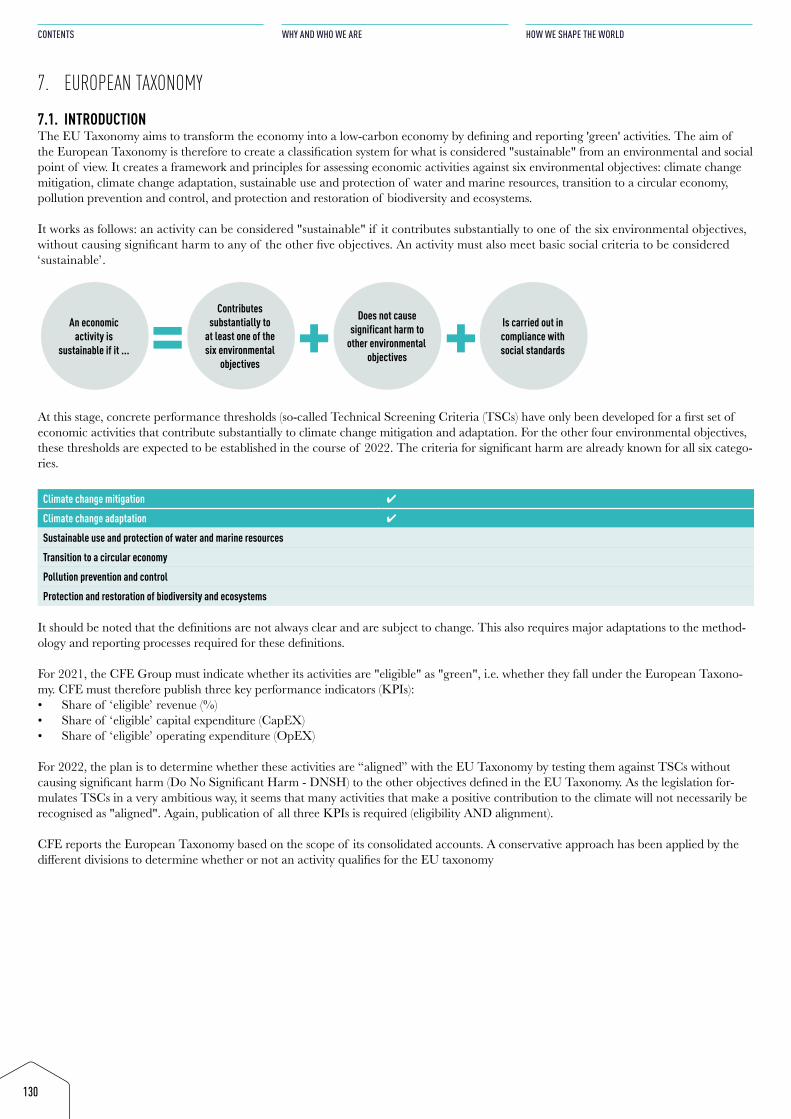
130
CONTENTS
WHY AND WHO WE ARE
HOW WE SHAPE THE WORLD
7. EUROPEAN TAXONOMY
7.1. INTRODUCTIONThe EU Taxonomy aims to transform the economy into a low-carbon economy by defining and reporting 'green' activities. The aim of the European Taxonomy is therefore to create a classification system for what is considered "sustainable" from an environmental and social point of view. It creates a framework and principles for assessing economic activities against six environmental objectives: climate change mitigation, climate change adaptation, sustainable use and protection of water and marine resources, transition to a circular economy, pollution prevention and control, and protection and restoration of biodiversity and ecosystems.
It works as follows: an activity can be considered "sustainable" if it contributes substantially to one of the six environmental objectives, without causing significant harm to any of the other five objectives. An activity must also meet basic social criteria to be considered ‘sustainable’.
Contributes substantially to
at least one of the six environmental
objectives
Does not cause significant harm to
other environmental objectives
Is carried out in compliance with social standards
An economic activity is
sustainable if it ... + +=At this stage, concrete performance thresholds (so-called Technical Screening Criteria (TSCs) have only been developed for a first set of economic activities that contribute substantially to climate change mitigation and adaptation. For the other four environmental objectives, these thresholds are expected to be established in the course of 2022. The criteria for significant harm are already known for all six catego-ries.
Climate change mitigation
Climate change adaptation
Sustainable use and protection of water and marine resources
Transition to a circular economy
Pollution prevention and control
Protection and restoration of biodiversity and ecosystems
It should be noted that the definitions are not always clear and are subject to change. This also requires major adaptations to the method-ology and reporting processes required for these definitions.
For 2021, the CFE Group must indicate whether its activities are "eligible" as "green", i.e. whether they fall under the European Taxono-my. CFE must therefore publish three key performance indicators (KPIs): • Share of ‘eligible’ revenue (%) • Share of ‘eligible’ capital expenditure (CapEX)• Share of ‘eligible’ operating expenditure (OpEX)
For 2022, the plan is to determine whether these activities are “aligned” with the EU Taxonomy by testing them against TSCs without causing significant harm (Do No Significant Harm - DNSH) to the other objectives defined in the EU Taxonomy. As the legislation for-mulates TSCs in a very ambitious way, it seems that many activities that make a positive contribution to the climate will not necessarily be recognised as "aligned". Again, publication of all three KPIs is required (eligibility AND alignment).
CFE reports the European Taxonomy based on the scope of its consolidated accounts. A conservative approach has been applied by the different divisions to determine whether or not an activity qualifies for the EU taxonomy
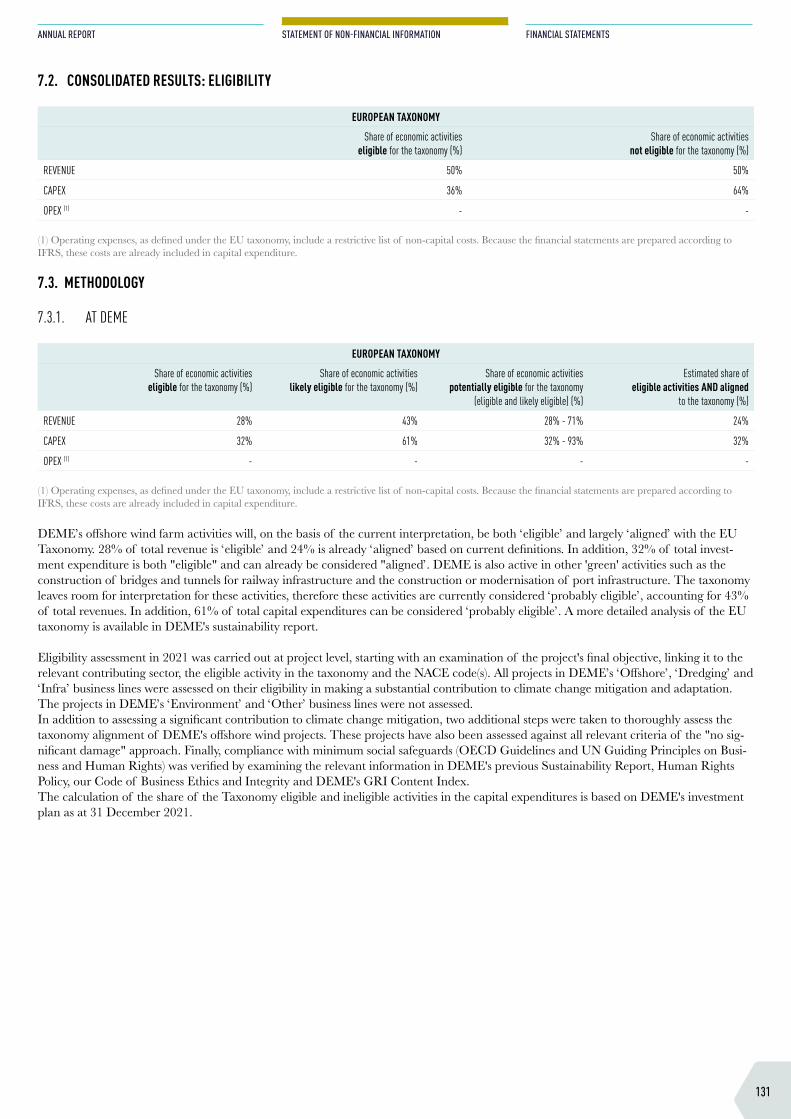
131
ANNUAL REPORT
STATEMENT OF NON-FINANCIAL INFORMATION
FINANCIAL STATEMENTS
7.2. CONSOLIDATED RESULTS: ELIGIBILITY
EUROPEAN TAXONOMY
Share of economic activities eligible for the taxonomy (%)
Share of economic activities not eligible for the taxonomy (%)
REVENUE 50% 50%
CAPEX 36% 64%
OPEX (1) - -
(1) Operating expenses, as defined under the EU taxonomy, include a restrictive list of non-capital costs. Because the financial statements are prepared according to IFRS, these costs are already included in capital expenditure.
7.3. METHODOLOGY
7.3.1. AT DEME
EUROPEAN TAXONOMY
Share of economic activities eligible for the taxonomy (%)
Share of economic activities likely eligible for the taxonomy (%)
Share of economic activities potentially eligible for the taxonomy
(eligible and likely eligible) (%)
Estimated share of eligible activities AND aligned
to the taxonomy (%)
REVENUE 28% 43% 28% - 71% 24%
CAPEX 32% 61% 32% - 93% 32%
OPEX (1) - - - -
(1) Operating expenses, as defined under the EU taxonomy, include a restrictive list of non-capital costs. Because the financial statements are prepared according to IFRS, these costs are already included in capital expenditure.
DEME’s offshore wind farm activities will, on the basis of the current interpretation, be both ‘eligible’ and largely ‘aligned’ with the EU Taxonomy. 28% of total revenue is ‘eligible’ and 24% is already ‘aligned’ based on current definitions. In addition, 32% of total invest-ment expenditure is both "eligible" and can already be considered "aligned’. DEME is also active in other 'green' activities such as the construction of bridges and tunnels for railway infrastructure and the construction or modernisation of port infrastructure. The taxonomy leaves room for interpretation for these activities, therefore these activities are currently considered ‘probably eligible’, accounting for 43% of total revenues. In addition, 61% of total capital expenditures can be considered ‘probably eligible’. A more detailed analysis of the EU taxonomy is available in DEME's sustainability report.
Eligibility assessment in 2021 was carried out at project level, starting with an examination of the project's final objective, linking it to the relevant contributing sector, the eligible activity in the taxonomy and the NACE code(s). All projects in DEME’s ‘Offshore’, ‘Dredging’ and ‘Infra’ business lines were assessed on their eligibility in making a substantial contribution to climate change mitigation and adaptation. The projects in DEME’s ‘Environment’ and ‘Other’ business lines were not assessed.In addition to assessing a significant contribution to climate change mitigation, two additional steps were taken to thoroughly assess the taxonomy alignment of DEME's offshore wind projects. These projects have also been assessed against all relevant criteria of the "no sig-nificant damage" approach. Finally, compliance with minimum social safeguards (OECD Guidelines and UN Guiding Principles on Busi-ness and Human Rights) was verified by examining the relevant information in DEME's previous Sustainability Report, Human Rights Policy, our Code of Business Ethics and Integrity and DEME's GRI Content Index.The calculation of the share of the Taxonomy eligible and ineligible activities in the capital expenditures is based on DEME's investment plan as at 31 December 2021.
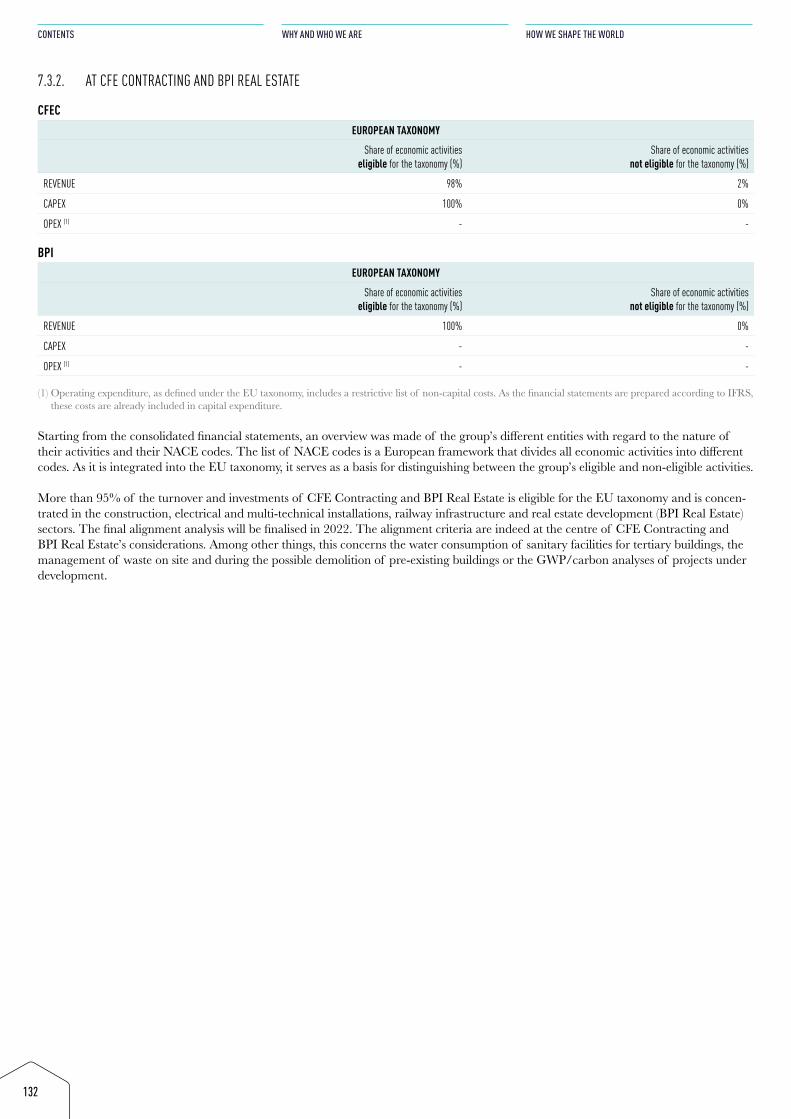
132
CONTENTS
WHY AND WHO WE ARE
HOW WE SHAPE THE WORLD
7.3.2. AT CFE CONTRACTING AND BPI REAL ESTATE
CFECEUROPEAN TAXONOMY
Share of economic activities eligible for the taxonomy (%)
Share of economic activities not eligible for the taxonomy (%)
REVENUE 98% 2%
CAPEX 100% 0%
OPEX (1) - -
BPIEUROPEAN TAXONOMY
Share of economic activities eligible for the taxonomy (%)
Share of economic activities not eligible for the taxonomy (%)
REVENUE 100% 0%
CAPEX - -
OPEX (1) - -
(1) Operating expenditure, as defined under the EU taxonomy, includes a restrictive list of non-capital costs. As the financial statements are prepared according to IFRS, these costs are already included in capital expenditure.
Starting from the consolidated financial statements, an overview was made of the group’s different entities with regard to the nature of their activities and their NACE codes. The list of NACE codes is a European framework that divides all economic activities into different codes. As it is integrated into the EU taxonomy, it serves as a basis for distinguishing between the group’s eligible and non-eligible activities.
More than 95% of the turnover and investments of CFE Contracting and BPI Real Estate is eligible for the EU taxonomy and is concen-trated in the construction, electrical and multi-technical installations, railway infrastructure and real estate development (BPI Real Estate) sectors. The final alignment analysis will be finalised in 2022. The alignment criteria are indeed at the centre of CFE Contracting and BPI Real Estate’s considerations. Among other things, this concerns the water consumption of sanitary facilities for tertiary buildings, the management of waste on site and during the possible demolition of pre-existing buildings or the GWP/carbon analyses of projects under development.

133
ANNUAL REPORT
STATEMENT OF NON-FINANCIAL INFORMATION
FINANCIAL STATEMENTS
2021134
HOW WE SHAPE THE WORLD
WHY AND WHO WE ARE
CONTENTS
ANNUAL REPORT 2021 CFE GROUP
2021135
FINANCIAL STATEMENTS
STATEMENT OF NON-FINANCIAL INFORMATION
ANNUAL REPORT
FINANCIALSTATEMENTS
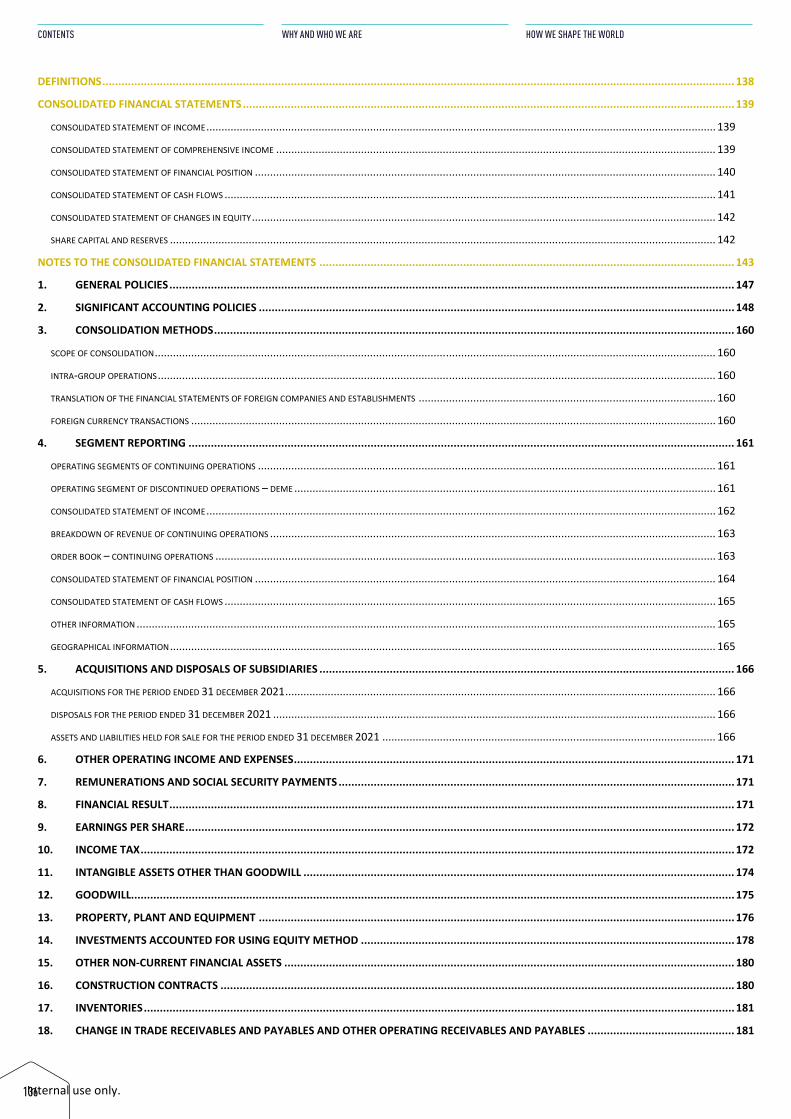
Internal use only.
DEFINITIONS ...................................................................................................................................................................................................... 138
CONSOLIDATED FINANCIAL STATEMENTS .......................................................................................................................................................... 139
CONSOLIDATED STATEMENT OF INCOME ........................................................................................................................................................................ 139
CONSOLIDATED STATEMENT OF COMPREHENSIVE INCOME ................................................................................................................................................. 139
CONSOLIDATED STATEMENT OF FINANCIAL POSITION ........................................................................................................................................................ 140
CONSOLIDATED STATEMENT OF CASH FLOWS .................................................................................................................................................................. 141
CONSOLIDATED STATEMENT OF CHANGES IN EQUITY ......................................................................................................................................................... 142
SHARE CAPITAL AND RESERVES .................................................................................................................................................................................... 142
NOTES TO THE CONSOLIDATED FINANCIAL STATEMENTS .................................................................................................................................. 143
1. GENERAL POLICIES ................................................................................................................................................................................. 147
2. SIGNIFICANT ACCOUNTING POLICIES ..................................................................................................................................................... 148
3. CONSOLIDATION METHODS ................................................................................................................................................................... 160
SCOPE OF CONSOLIDATION ......................................................................................................................................................................................... 160
INTRA-GROUP OPERATIONS ........................................................................................................................................................................................ 160
TRANSLATION OF THE FINANCIAL STATEMENTS OF FOREIGN COMPANIES AND ESTABLISHMENTS .................................................................................................. 160
FOREIGN CURRENCY TRANSACTIONS ............................................................................................................................................................................. 160
4. SEGMENT REPORTING ........................................................................................................................................................................... 161
OPERATING SEGMENTS OF CONTINUING OPERATIONS ....................................................................................................................................................... 161
OPERATING SEGMENT OF DISCONTINUED OPERATIONS – DEME ........................................................................................................................................... 161
CONSOLIDATED STATEMENT OF INCOME ........................................................................................................................................................................ 162
BREAKDOWN OF REVENUE OF CONTINUING OPERATIONS ................................................................................................................................................... 163
ORDER BOOK – CONTINUING OPERATIONS ..................................................................................................................................................................... 163
CONSOLIDATED STATEMENT OF FINANCIAL POSITION ........................................................................................................................................................ 164
CONSOLIDATED STATEMENT OF CASH FLOWS .................................................................................................................................................................. 165
OTHER INFORMATION ............................................................................................................................................................................................... 165
GEOGRAPHICAL INFORMATION .................................................................................................................................................................................... 165
5. ACQUISITIONS AND DISPOSALS OF SUBSIDIARIES .................................................................................................................................. 166
ACQUISITIONS FOR THE PERIOD ENDED 31 DECEMBER 2021 .............................................................................................................................................. 166
DISPOSALS FOR THE PERIOD ENDED 31 DECEMBER 2021 .................................................................................................................................................. 166
ASSETS AND LIABILITIES HELD FOR SALE FOR THE PERIOD ENDED 31 DECEMBER 2021 .............................................................................................................. 166
6. OTHER OPERATING INCOME AND EXPENSES .......................................................................................................................................... 171
7. REMUNERATIONS AND SOCIAL SECURITY PAYMENTS ............................................................................................................................ 171
8. FINANCIAL RESULT ................................................................................................................................................................................. 171
9. EARNINGS PER SHARE ............................................................................................................................................................................ 172
10. INCOME TAX .......................................................................................................................................................................................... 172
11. INTANGIBLE ASSETS OTHER THAN GOODWILL ....................................................................................................................................... 174
12. GOODWILL............................................................................................................................................................................................. 175
13. PROPERTY, PLANT AND EQUIPMENT ..................................................................................................................................................... 176
14. INVESTMENTS ACCOUNTED FOR USING EQUITY METHOD ..................................................................................................................... 178
15. OTHER NON-CURRENT FINANCIAL ASSETS ............................................................................................................................................. 180
16. CONSTRUCTION CONTRACTS ................................................................................................................................................................. 180
17. INVENTORIES ......................................................................................................................................................................................... 181
18. CHANGE IN TRADE RECEIVABLES AND PAYABLES AND OTHER OPERATING RECEIVABLES AND PAYABLES .............................................. 181
136
CONTENTS
WHY AND WHO WE ARE
HOW WE SHAPE THE WORLD
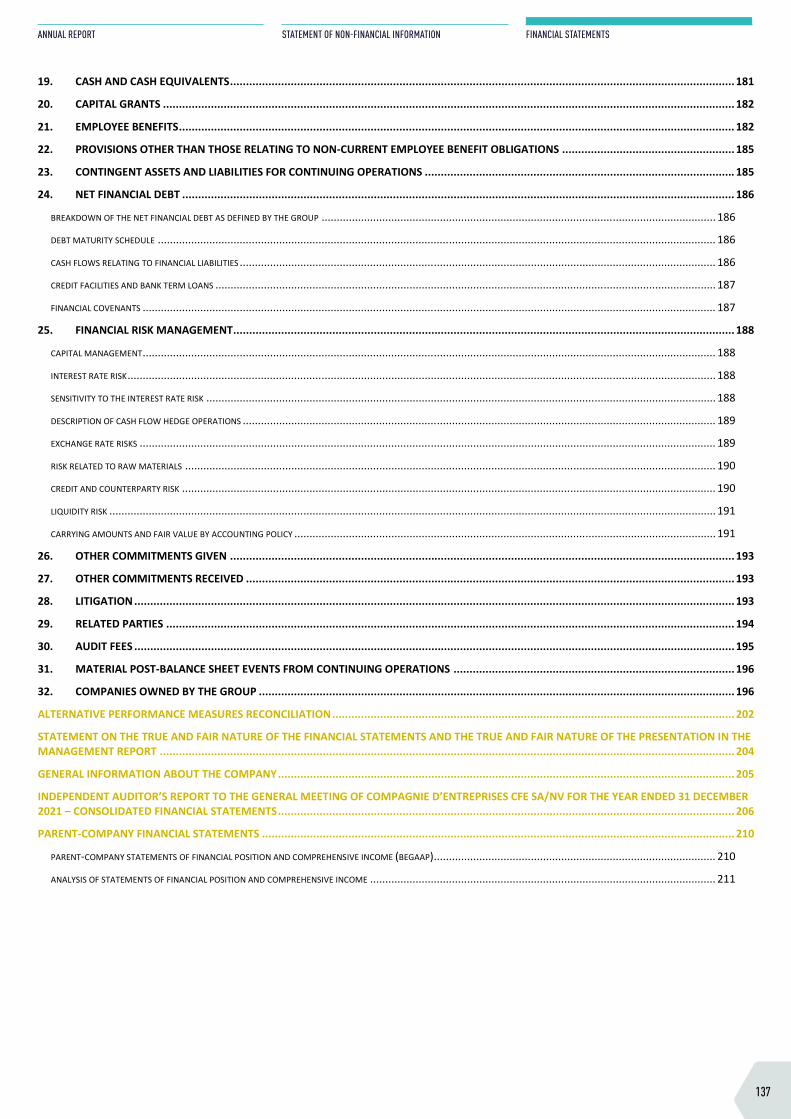
Internal use only.
DEFINITIONS ...................................................................................................................................................................................................... 138
CONSOLIDATED FINANCIAL STATEMENTS .......................................................................................................................................................... 139
CONSOLIDATED STATEMENT OF INCOME ........................................................................................................................................................................ 139
CONSOLIDATED STATEMENT OF COMPREHENSIVE INCOME ................................................................................................................................................. 139
CONSOLIDATED STATEMENT OF FINANCIAL POSITION ........................................................................................................................................................ 140
CONSOLIDATED STATEMENT OF CASH FLOWS .................................................................................................................................................................. 141
CONSOLIDATED STATEMENT OF CHANGES IN EQUITY ......................................................................................................................................................... 142
SHARE CAPITAL AND RESERVES .................................................................................................................................................................................... 142
NOTES TO THE CONSOLIDATED FINANCIAL STATEMENTS .................................................................................................................................. 143
1. GENERAL POLICIES ................................................................................................................................................................................. 147
2. SIGNIFICANT ACCOUNTING POLICIES ..................................................................................................................................................... 148
3. CONSOLIDATION METHODS ................................................................................................................................................................... 160
SCOPE OF CONSOLIDATION ......................................................................................................................................................................................... 160
INTRA-GROUP OPERATIONS ........................................................................................................................................................................................ 160
TRANSLATION OF THE FINANCIAL STATEMENTS OF FOREIGN COMPANIES AND ESTABLISHMENTS .................................................................................................. 160
FOREIGN CURRENCY TRANSACTIONS ............................................................................................................................................................................. 160
4. SEGMENT REPORTING ........................................................................................................................................................................... 161
OPERATING SEGMENTS OF CONTINUING OPERATIONS ....................................................................................................................................................... 161
OPERATING SEGMENT OF DISCONTINUED OPERATIONS – DEME ........................................................................................................................................... 161
CONSOLIDATED STATEMENT OF INCOME ........................................................................................................................................................................ 162
BREAKDOWN OF REVENUE OF CONTINUING OPERATIONS ................................................................................................................................................... 163
ORDER BOOK – CONTINUING OPERATIONS ..................................................................................................................................................................... 163
CONSOLIDATED STATEMENT OF FINANCIAL POSITION ........................................................................................................................................................ 164
CONSOLIDATED STATEMENT OF CASH FLOWS .................................................................................................................................................................. 165
OTHER INFORMATION ............................................................................................................................................................................................... 165
GEOGRAPHICAL INFORMATION .................................................................................................................................................................................... 165
5. ACQUISITIONS AND DISPOSALS OF SUBSIDIARIES .................................................................................................................................. 166
ACQUISITIONS FOR THE PERIOD ENDED 31 DECEMBER 2021 .............................................................................................................................................. 166
DISPOSALS FOR THE PERIOD ENDED 31 DECEMBER 2021 .................................................................................................................................................. 166
ASSETS AND LIABILITIES HELD FOR SALE FOR THE PERIOD ENDED 31 DECEMBER 2021 .............................................................................................................. 166
6. OTHER OPERATING INCOME AND EXPENSES .......................................................................................................................................... 171
7. REMUNERATIONS AND SOCIAL SECURITY PAYMENTS ............................................................................................................................ 171
8. FINANCIAL RESULT ................................................................................................................................................................................. 171
9. EARNINGS PER SHARE ............................................................................................................................................................................ 172
10. INCOME TAX .......................................................................................................................................................................................... 172
11. INTANGIBLE ASSETS OTHER THAN GOODWILL ....................................................................................................................................... 174
12. GOODWILL............................................................................................................................................................................................. 175
13. PROPERTY, PLANT AND EQUIPMENT ..................................................................................................................................................... 176
14. INVESTMENTS ACCOUNTED FOR USING EQUITY METHOD ..................................................................................................................... 178
15. OTHER NON-CURRENT FINANCIAL ASSETS ............................................................................................................................................. 180
16. CONSTRUCTION CONTRACTS ................................................................................................................................................................. 180
17. INVENTORIES ......................................................................................................................................................................................... 181
18. CHANGE IN TRADE RECEIVABLES AND PAYABLES AND OTHER OPERATING RECEIVABLES AND PAYABLES .............................................. 181
19. CASH AND CASH EQUIVALENTS .............................................................................................................................................................. 181
20. CAPITAL GRANTS ................................................................................................................................................................................... 182
21. EMPLOYEE BENEFITS .............................................................................................................................................................................. 182
22. PROVISIONS OTHER THAN THOSE RELATING TO NON-CURRENT EMPLOYEE BENEFIT OBLIGATIONS ...................................................... 185
23. CONTINGENT ASSETS AND LIABILITIES FOR CONTINUING OPERATIONS ................................................................................................. 185
24. NET FINANCIAL DEBT ............................................................................................................................................................................. 186
BREAKDOWN OF THE NET FINANCIAL DEBT AS DEFINED BY THE GROUP .................................................................................................................................. 186
DEBT MATURITY SCHEDULE ........................................................................................................................................................................................ 186
CASH FLOWS RELATING TO FINANCIAL LIABILITIES ............................................................................................................................................................. 186
CREDIT FACILITIES AND BANK TERM LOANS ..................................................................................................................................................................... 187
FINANCIAL COVENANTS ............................................................................................................................................................................................. 187
25. FINANCIAL RISK MANAGEMENT ............................................................................................................................................................. 188
CAPITAL MANAGEMENT ............................................................................................................................................................................................. 188
INTEREST RATE RISK .................................................................................................................................................................................................. 188
SENSITIVITY TO THE INTEREST RATE RISK ........................................................................................................................................................................ 188
DESCRIPTION OF CASH FLOW HEDGE OPERATIONS ............................................................................................................................................................ 189
EXCHANGE RATE RISKS .............................................................................................................................................................................................. 189
RISK RELATED TO RAW MATERIALS ............................................................................................................................................................................... 190
CREDIT AND COUNTERPARTY RISK ................................................................................................................................................................................ 190
LIQUIDITY RISK ........................................................................................................................................................................................................ 191
CARRYING AMOUNTS AND FAIR VALUE BY ACCOUNTING POLICY ........................................................................................................................................... 191
26. OTHER COMMITMENTS GIVEN .............................................................................................................................................................. 193
27. OTHER COMMITMENTS RECEIVED ......................................................................................................................................................... 193
28. LITIGATION ............................................................................................................................................................................................ 193
29. RELATED PARTIES .................................................................................................................................................................................. 194
30. AUDIT FEES ............................................................................................................................................................................................ 195
31. MATERIAL POST-BALANCE SHEET EVENTS FROM CONTINUING OPERATIONS ........................................................................................ 196
32. COMPANIES OWNED BY THE GROUP ..................................................................................................................................................... 196
ALTERNATIVE PERFORMANCE MEASURES RECONCILIATION .............................................................................................................................. 202
STATEMENT ON THE TRUE AND FAIR NATURE OF THE FINANCIAL STATEMENTS AND THE TRUE AND FAIR NATURE OF THE PRESENTATION IN THE MANAGEMENT REPORT .................................................................................................................................................................................... 204
GENERAL INFORMATION ABOUT THE COMPANY ............................................................................................................................................... 205
INDEPENDENT AUDITOR’S REPORT TO THE GENERAL MEETING OF COMPAGNIE D’ENTREPRISES CFE SA/NV FOR THE YEAR ENDED 31 DECEMBER 2021 – CONSOLIDATED FINANCIAL STATEMENTS ............................................................................................................................................... 206
PARENT-COMPANY FINANCIAL STATEMENTS .................................................................................................................................................... 210
PARENT-COMPANY STATEMENTS OF FINANCIAL POSITION AND COMPREHENSIVE INCOME (BEGAAP) ............................................................................................. 210
ANALYSIS OF STATEMENTS OF FINANCIAL POSITION AND COMPREHENSIVE INCOME .................................................................................................................. 211
137
ANNUAL REPORT
STATEMENT OF NON-FINANCIAL INFORMATION
FINANCIAL STATEMENTS
DEFINITIONS WWoorrkkiinngg ccaappiittaall rreeqquuiirreemmeenntt Inventories + trade receivables and other operating receivables + other current assets - trade payables and other
operating liabilities - tax payables - other current liabilities
CCaappiittaall eemmppllooyyeedd Equity of real estate segment + net financial debt of real estate segment
NNeett ffiinnaanncciiaall ddeebbtt ((NNFFDD)) Non-current bonds + non-current financial liabilities + current bonds + current financial liabilities - cash and cash equivalents
IInnccoommee ffrroomm ooppeerraattiinngg aaccttiivviittiieess Turnover + other operating income + purchases + remunerations and social security payments + other operating expenses + depreciation and goodwill depreciation
OOppeerraattiinngg IInnccoommee ((EEBBIITT)) Income from operating activities + share of profit (loss) of investments accounted for under the equity method
EEBBIITTDDAA Income from operating activities + amortisation and depreciation of (in)tangible assets and goodwill.
RReettuurrnn oonn eeqquuiittyy ((RROOEE)) Net income, share of the group / equity, share of the group
OOrrddeerr bbooookk Revenue to be generated by the projects for which the contract has been signed and has come into effect (after notice to proceed has been given or conditions precedent have been fulfilled) and for which project financing is in place.
138
CONTENTS
WHY AND WHO WE ARE
HOW WE SHAPE THE WORLD
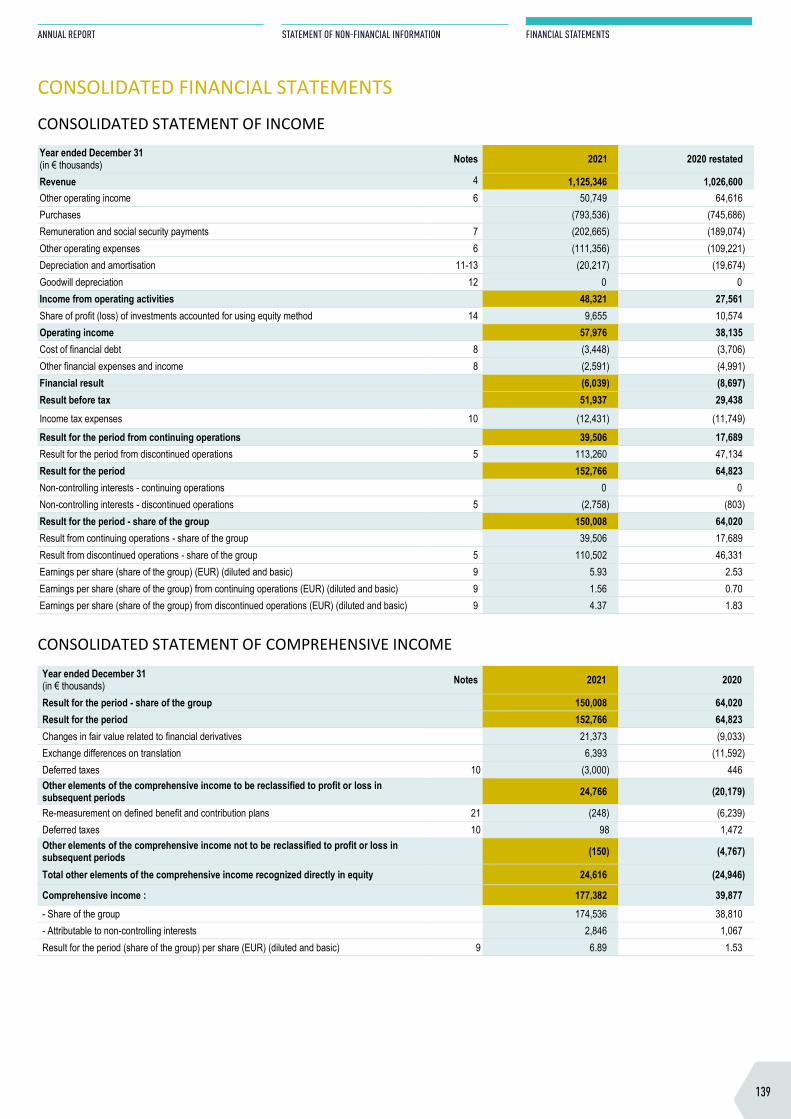
DEFINITIONS WWoorrkkiinngg ccaappiittaall rreeqquuiirreemmeenntt Inventories + trade receivables and other operating receivables + other current assets - trade payables and other
operating liabilities - tax payables - other current liabilities
CCaappiittaall eemmppllooyyeedd Equity of real estate segment + net financial debt of real estate segment
NNeett ffiinnaanncciiaall ddeebbtt ((NNFFDD)) Non-current bonds + non-current financial liabilities + current bonds + current financial liabilities - cash and cash equivalents
IInnccoommee ffrroomm ooppeerraattiinngg aaccttiivviittiieess Turnover + other operating income + purchases + remunerations and social security payments + other operating expenses + depreciation and goodwill depreciation
OOppeerraattiinngg IInnccoommee ((EEBBIITT)) Income from operating activities + share of profit (loss) of investments accounted for under the equity method
EEBBIITTDDAA Income from operating activities + amortisation and depreciation of (in)tangible assets and goodwill.
RReettuurrnn oonn eeqquuiittyy ((RROOEE)) Net income, share of the group / equity, share of the group
OOrrddeerr bbooookk Revenue to be generated by the projects for which the contract has been signed and has come into effect (after notice to proceed has been given or conditions precedent have been fulfilled) and for which project financing is in place.
CONSOLIDATED FINANCIAL STATEMENTS CONSOLIDATED STATEMENT OF INCOME Year ended December 31 (in € thousands) Notes 2021 2020 restated
Revenue 4 1,125,346 1,026,600 Other operating income 6 50,749 64,616 Purchases (793,536) (745,686) Remuneration and social security payments 7 (202,665) (189,074) Other operating expenses 6 (111,356) (109,221) Depreciation and amortisation 11-13 (20,217) (19,674) Goodwill depreciation 12 0 0 Income from operating activities 48,321 27,561 Share of profit (loss) of investments accounted for using equity method 14 9,655 10,574 Operating income 57,976 38,135 Cost of financial debt 8 (3,448) (3,706) Other financial expenses and income 8 (2,591) (4,991) Financial result (6,039) (8,697) Result before tax 51,937 29,438 Income tax expenses 10 (12,431) (11,749)
Result for the period from continuing operations 39,506 17,689 Result for the period from discontinued operations 5 113,260 47,134 Result for the period 152,766 64,823 Non-controlling interests - continuing operations 0 0 Non-controlling interests - discontinued operations 5 (2,758) (803) Result for the period - share of the group 150,008 64,020 Result from continuing operations - share of the group 39,506 17,689 Result from discontinued operations - share of the group 5 110,502 46,331 Earnings per share (share of the group) (EUR) (diluted and basic) 9 5.93 2.53 Earnings per share (share of the group) from continuing operations (EUR) (diluted and basic) 9 1.56 0.70 Earnings per share (share of the group) from discontinued operations (EUR) (diluted and basic) 9 4.37 1.83
CONSOLIDATED STATEMENT OF COMPREHENSIVE INCOME Year ended December 31 (in € thousands) Notes 2021 2020
Result for the period - share of the group 150,008 64,020 Result for the period 152,766 64,823 Changes in fair value related to financial derivatives 21,373 (9,033) Exchange differences on translation 6,393 (11,592) Deferred taxes 10 (3,000) 446 Other elements of the comprehensive income to be reclassified to profit or loss in subsequent periods 24,766 (20,179)
Re-measurement on defined benefit and contribution plans 21 (248) (6,239) Deferred taxes 10 98 1,472 Other elements of the comprehensive income not to be reclassified to profit or loss in subsequent periods (150) (4,767)
Total other elements of the comprehensive income recognized directly in equity 24,616 (24,946)
Comprehensive income : 177,382 39,877 - Share of the group 174,536 38,810 - Attributable to non-controlling interests 2,846 1,067 Result for the period (share of the group) per share (EUR) (diluted and basic) 9 6.89 1.53
139
ANNUAL REPORT
STATEMENT OF NON-FINANCIAL INFORMATION
FINANCIAL STATEMENTS
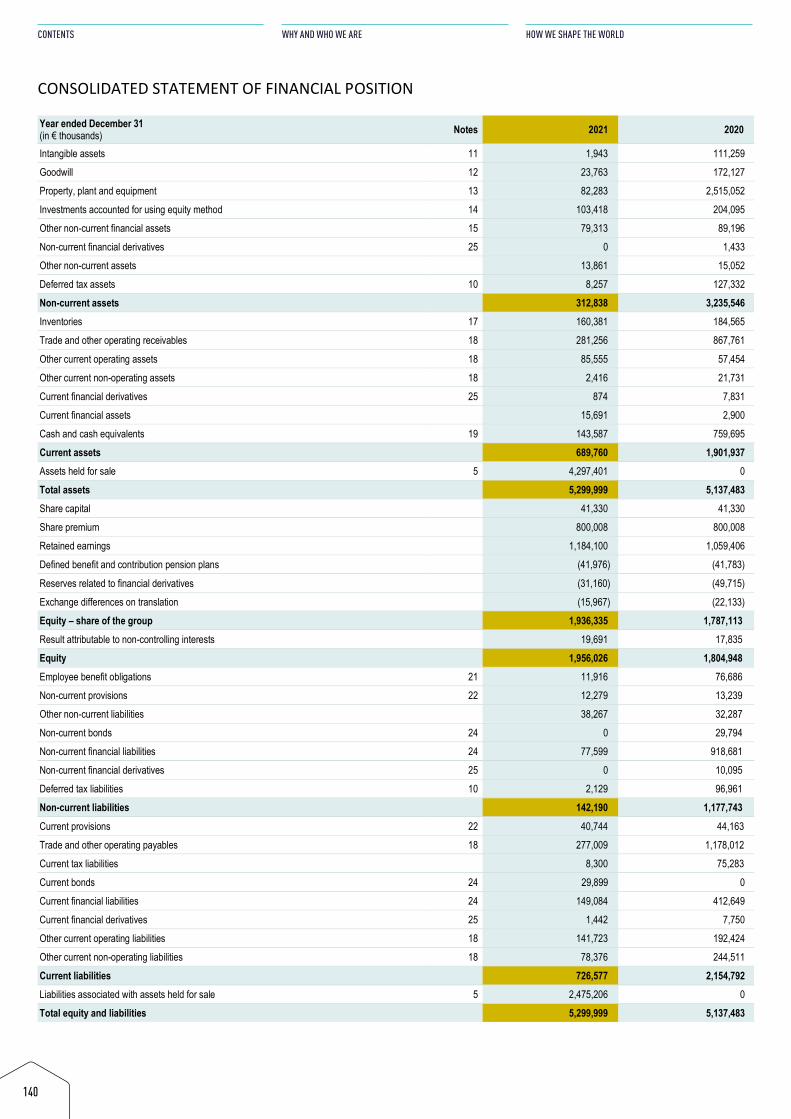
CONSOLIDATED STATEMENT OF FINANCIAL POSITION Year ended December 31 (in € thousands) Notes 2021 2020
Intangible assets 11 1,943 111,259
Goodwill 12 23,763 172,127
Property, plant and equipment 13 82,283 2,515,052
Investments accounted for using equity method 14 103,418 204,095
Other non-current financial assets 15 79,313 89,196
Non-current financial derivatives 25 0 1,433
Other non-current assets 13,861 15,052
Deferred tax assets 10 8,257 127,332
Non-current assets 312,838 3,235,546 Inventories 17 160,381 184,565
Trade and other operating receivables 18 281,256 867,761
Other current operating assets 18 85,555 57,454
Other current non-operating assets 18 2,416 21,731
Current financial derivatives 25 874 7,831
Current financial assets 15,691 2,900
Cash and cash equivalents 19 143,587 759,695
Current assets 689,760 1,901,937 Assets held for sale 5 4,297,401 0
Total assets 5,299,999 5,137,483 Share capital 41,330 41,330
Share premium 800,008 800,008
Retained earnings 1,184,100 1,059,406
Defined benefit and contribution pension plans (41,976) (41,783)
Reserves related to financial derivatives (31,160) (49,715)
Exchange differences on translation (15,967) (22,133)
Equity – share of the group 1,936,335 1,787,113 Result attributable to non-controlling interests 19,691 17,835
Equity 1,956,026 1,804,948 Employee benefit obligations 21 11,916 76,686
Non-current provisions 22 12,279 13,239
Other non-current liabilities 38,267 32,287
Non-current bonds 24 0 29,794
Non-current financial liabilities 24 77,599 918,681
Non-current financial derivatives 25 0 10,095
Deferred tax liabilities 10 2,129 96,961
Non-current liabilities 142,190 1,177,743 Current provisions 22 40,744 44,163
Trade and other operating payables 18 277,009 1,178,012
Current tax liabilities 8,300 75,283
Current bonds 24 29,899 0
Current financial liabilities 24 149,084 412,649
Current financial derivatives 25 1,442 7,750
Other current operating liabilities 18 141,723 192,424
Other current non-operating liabilities 18 78,376 244,511
Current liabilities 726,577 2,154,792 Liabilities associated with assets held for sale 5 2,475,206 0
Total equity and liabilities 5,299,999 5,137,483
140
CONTENTS
WHY AND WHO WE ARE
HOW WE SHAPE THE WORLD
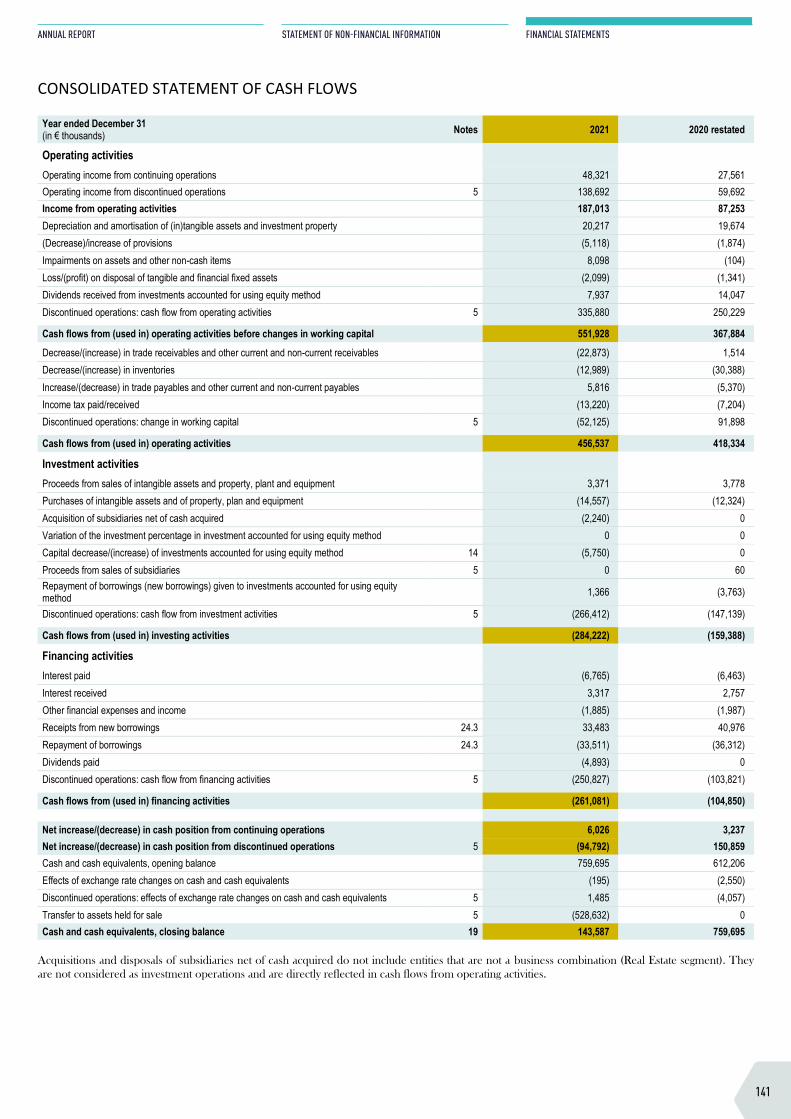
CONSOLIDATED STATEMENT OF FINANCIAL POSITION Year ended December 31 (in € thousands) Notes 2021 2020
Intangible assets 11 1,943 111,259
Goodwill 12 23,763 172,127
Property, plant and equipment 13 82,283 2,515,052
Investments accounted for using equity method 14 103,418 204,095
Other non-current financial assets 15 79,313 89,196
Non-current financial derivatives 25 0 1,433
Other non-current assets 13,861 15,052
Deferred tax assets 10 8,257 127,332
Non-current assets 312,838 3,235,546 Inventories 17 160,381 184,565
Trade and other operating receivables 18 281,256 867,761
Other current operating assets 18 85,555 57,454
Other current non-operating assets 18 2,416 21,731
Current financial derivatives 25 874 7,831
Current financial assets 15,691 2,900
Cash and cash equivalents 19 143,587 759,695
Current assets 689,760 1,901,937 Assets held for sale 5 4,297,401 0
Total assets 5,299,999 5,137,483 Share capital 41,330 41,330
Share premium 800,008 800,008
Retained earnings 1,184,100 1,059,406
Defined benefit and contribution pension plans (41,976) (41,783)
Reserves related to financial derivatives (31,160) (49,715)
Exchange differences on translation (15,967) (22,133)
Equity – share of the group 1,936,335 1,787,113 Result attributable to non-controlling interests 19,691 17,835
Equity 1,956,026 1,804,948 Employee benefit obligations 21 11,916 76,686
Non-current provisions 22 12,279 13,239
Other non-current liabilities 38,267 32,287
Non-current bonds 24 0 29,794
Non-current financial liabilities 24 77,599 918,681
Non-current financial derivatives 25 0 10,095
Deferred tax liabilities 10 2,129 96,961
Non-current liabilities 142,190 1,177,743 Current provisions 22 40,744 44,163
Trade and other operating payables 18 277,009 1,178,012
Current tax liabilities 8,300 75,283
Current bonds 24 29,899 0
Current financial liabilities 24 149,084 412,649
Current financial derivatives 25 1,442 7,750
Other current operating liabilities 18 141,723 192,424
Other current non-operating liabilities 18 78,376 244,511
Current liabilities 726,577 2,154,792 Liabilities associated with assets held for sale 5 2,475,206 0
Total equity and liabilities 5,299,999 5,137,483
CONSOLIDATED STATEMENT OF CASH FLOWS
Year ended December 31 (in € thousands) Notes 2021 2020 restated
Operating activities
Operating income from continuing operations 48,321 27,561 Operating income from discontinued operations 5 138,692 59,692 Income from operating activities 187,013 87,253 Depreciation and amortisation of (in)tangible assets and investment property 20,217 19,674 (Decrease)/increase of provisions (5,118) (1,874) Impairments on assets and other non-cash items 8,098 (104) Loss/(profit) on disposal of tangible and financial fixed assets (2,099) (1,341) Dividends received from investments accounted for using equity method 7,937 14,047 Discontinued operations: cash flow from operating activities 5 335,880 250,229
Cash flows from (used in) operating activities before changes in working capital 551,928 367,884
Decrease/(increase) in trade receivables and other current and non-current receivables (22,873) 1,514 Decrease/(increase) in inventories (12,989) (30,388) Increase/(decrease) in trade payables and other current and non-current payables 5,816 (5,370) Income tax paid/received (13,220) (7,204) Discontinued operations: change in working capital 5 (52,125) 91,898
Cash flows from (used in) operating activities 456,537 418,334
Investment activities
Proceeds from sales of intangible assets and property, plant and equipment 3,371 3,778 Purchases of intangible assets and of property, plan and equipment (14,557) (12,324) Acquisition of subsidiaries net of cash acquired (2,240) 0 Variation of the investment percentage in investment accounted for using equity method 0 0 Capital decrease/(increase) of investments accounted for using equity method 14 (5,750) 0 Proceeds from sales of subsidiaries 5 0 60 Repayment of borrowings (new borrowings) given to investments accounted for using equity method 1,366 (3,763)
Discontinued operations: cash flow from investment activities 5 (266,412) (147,139)
Cash flows from (used in) investing activities (284,222) (159,388)
Financing activities
Interest paid (6,765) (6,463) Interest received 3,317 2,757 Other financial expenses and income (1,885) (1,987) Receipts from new borrowings 24.3 33,483 40,976 Repayment of borrowings 24.3 (33,511) (36,312) Dividends paid (4,893) 0 Discontinued operations: cash flow from financing activities 5 (250,827) (103,821)
Cash flows from (used in) financing activities (261,081) (104,850)
Net increase/(decrease) in cash position from continuing operations 6,026 3,237 Net increase/(decrease) in cash position from discontinued operations 5 (94,792) 150,859 Cash and cash equivalents, opening balance 759,695 612,206 Effects of exchange rate changes on cash and cash equivalents (195) (2,550) Discontinued operations: effects of exchange rate changes on cash and cash equivalents 5 1,485 (4,057) Transfer to assets held for sale 5 (528,632) 0 Cash and cash equivalents, closing balance 19 143,587 759,695
Acquisitions and disposals of subsidiaries net of cash acquired do not include entities that are not a business combination (Real Estate segment). They are not considered as investment operations and are directly reflected in cash flows from operating activities.
141
ANNUAL REPORT
STATEMENT OF NON-FINANCIAL INFORMATION
FINANCIAL STATEMENTS
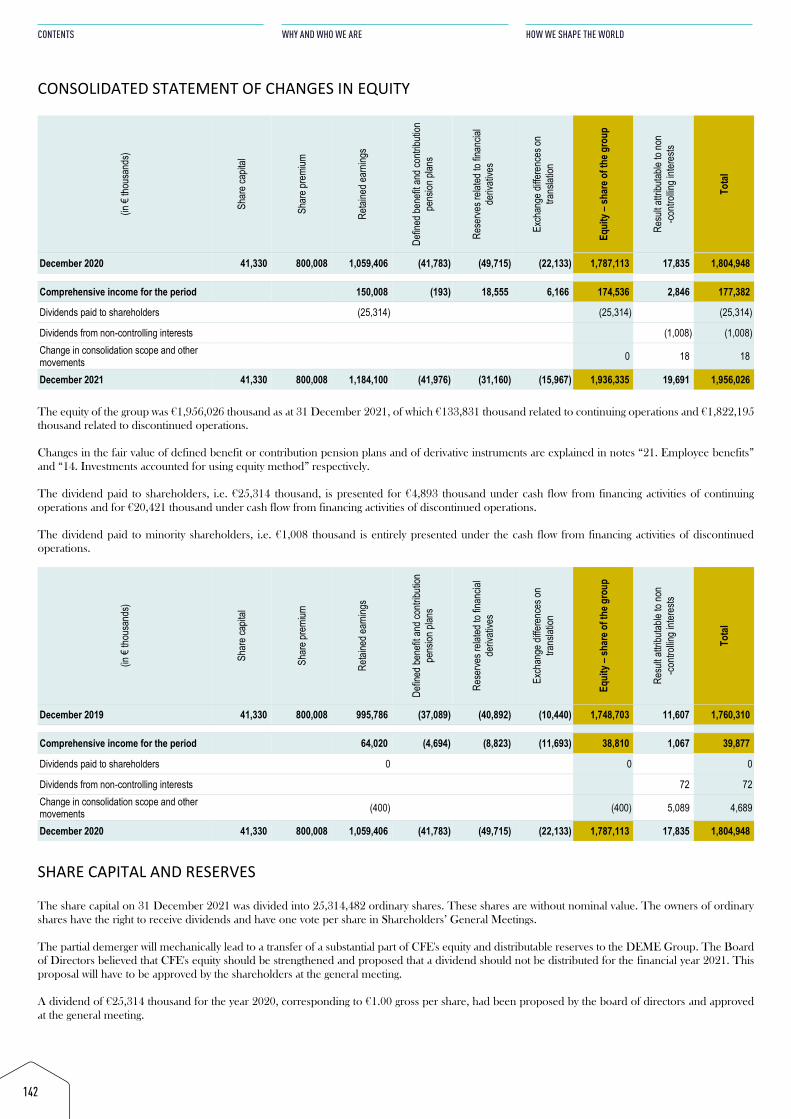
CONSOLIDATED STATEMENT OF CHANGES IN EQUITY
(in €
thous
ands
)
Shar
e cap
ital
Shar
e pre
mium
Retai
ned e
arnin
gs
Defin
ed be
nefit
and c
ontrib
ution
pe
nsion
plan
s
Rese
rves r
elated
to fin
ancia
l de
rivati
ves
Exch
ange
diffe
renc
es on
tra
nslat
ion
Equi
ty –
shar
e of t
he g
roup
Resu
lt attr
ibutab
le to
non
-contr
olling
inter
ests
Tota
l
December 2020 41,330 800,008 1,059,406 (41,783) (49,715) (22,133) 1,787,113 17,835 1,804,948
Comprehensive income for the period 150,008 (193) 18,555 6,166 174,536 2,846 177,382
Dividends paid to shareholders (25,314) (25,314) (25,314)
Dividends from non-controlling interests (1,008) (1,008) Change in consolidation scope and other movements 0 18 18
December 2021 41,330 800,008 1,184,100 (41,976) (31,160) (15,967) 1,936,335 19,691 1,956,026
The equity of the group was €1,956,026 thousand as at 31 December 2021, of which €133,831 thousand related to continuing operations and €1,822,195 thousand related to discontinued operations.
Changes in the fair value of defined benefit or contribution pension plans and of derivative instruments are explained in notes “21. Employee benefits” and “14. Investments accounted for using equity method” respectively.
The dividend paid to shareholders, i.e. €25,314 thousand, is presented for €4,893 thousand under cash flow from financing activities of continuing operations and for €20,421 thousand under cash flow from financing activities of discontinued operations.
The dividend paid to minority shareholders, i.e. €1,008 thousand is entirely presented under the cash flow from financing activities of discontinued operations.
(in €
thous
ands
)
Shar
e cap
ital
Shar
e pre
mium
Retai
ned e
arnin
gs
Defin
ed be
nefit
and c
ontrib
ution
pe
nsion
plan
s
Rese
rves r
elated
to fin
ancia
l de
rivati
ves
Exch
ange
diffe
renc
es on
tra
nslat
ion
Equi
ty –
shar
e of t
he g
roup
Resu
lt attr
ibutab
le to
non
-contr
olling
inter
ests
Tota
l December 2019 41,330 800,008 995,786 (37,089) (40,892) (10,440) 1,748,703 11,607 1,760,310
Comprehensive income for the period 64,020 (4,694) (8,823) (11,693) 38,810 1,067 39,877
Dividends paid to shareholders 0 0 0
Dividends from non-controlling interests 72 72 Change in consolidation scope and other movements (400) (400) 5,089 4,689
December 2020 41,330 800,008 1,059,406 (41,783) (49,715) (22,133) 1,787,113 17,835 1,804,948
SHARE CAPITAL AND RESERVES The share capital on 31 December 2021 was divided into 25,314,482 ordinary shares. These shares are without nominal value. The owners of ordinary shares have the right to receive dividends and have one vote per share in Shareholders’ General Meetings.
The partial demerger will mechanically lead to a transfer of a substantial part of CFE's equity and distributable reserves to the DEME Group. The Board of Directors believed that CFE's equity should be strengthened and proposed that a dividend should not be distributed for the financial year 2021. This proposal will have to be approved by the shareholders at the general meeting.
A dividend of €25,314 thousand for the year 2020, corresponding to €1.00 gross per share, had been proposed by the board of directors and approved at the general meeting.
142
CONTENTS
WHY AND WHO WE ARE
HOW WE SHAPE THE WORLD
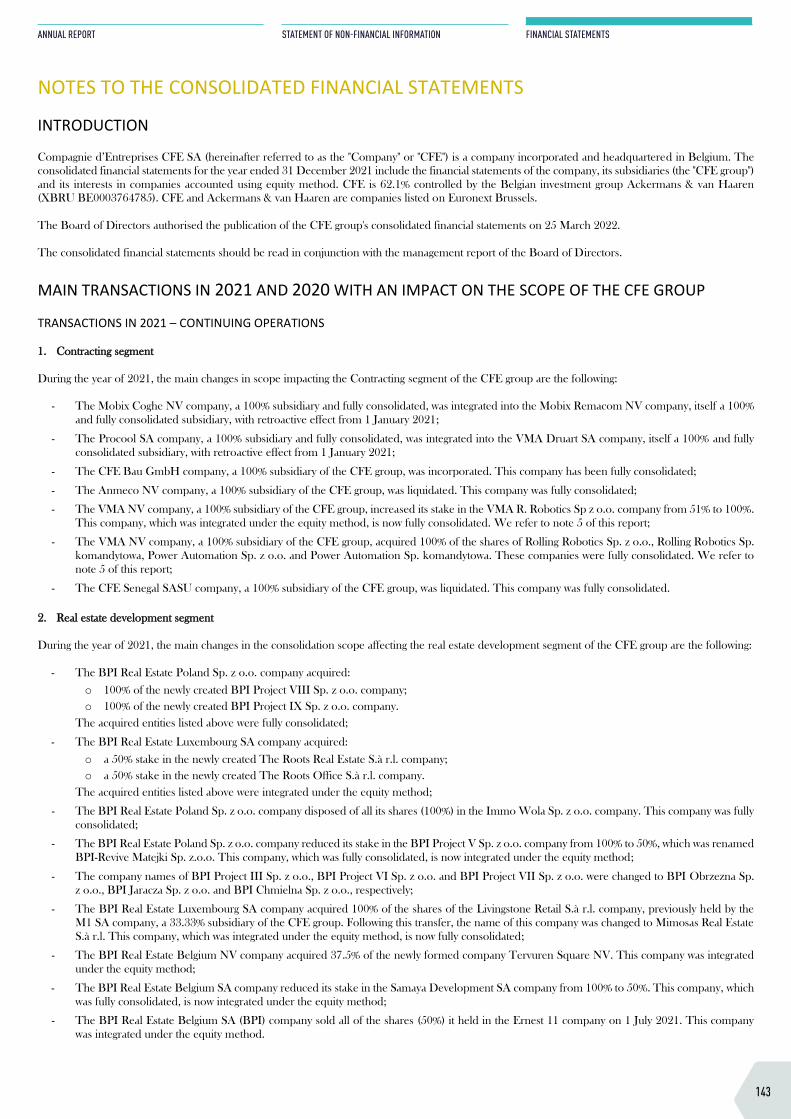
CONSOLIDATED STATEMENT OF CHANGES IN EQUITY
(in €
thous
ands
)
Shar
e cap
ital
Shar
e pre
mium
Retai
ned e
arnin
gs
Defin
ed be
nefit
and c
ontrib
ution
pe
nsion
plan
s
Rese
rves r
elated
to fin
ancia
l de
rivati
ves
Exch
ange
diffe
renc
es on
tra
nslat
ion
Equi
ty –
shar
e of t
he g
roup
Resu
lt attr
ibutab
le to
non
-contr
olling
inter
ests
Tota
l
December 2020 41,330 800,008 1,059,406 (41,783) (49,715) (22,133) 1,787,113 17,835 1,804,948
Comprehensive income for the period 150,008 (193) 18,555 6,166 174,536 2,846 177,382
Dividends paid to shareholders (25,314) (25,314) (25,314)
Dividends from non-controlling interests (1,008) (1,008) Change in consolidation scope and other movements 0 18 18
December 2021 41,330 800,008 1,184,100 (41,976) (31,160) (15,967) 1,936,335 19,691 1,956,026
The equity of the group was €1,956,026 thousand as at 31 December 2021, of which €133,831 thousand related to continuing operations and €1,822,195 thousand related to discontinued operations.
Changes in the fair value of defined benefit or contribution pension plans and of derivative instruments are explained in notes “21. Employee benefits” and “14. Investments accounted for using equity method” respectively.
The dividend paid to shareholders, i.e. €25,314 thousand, is presented for €4,893 thousand under cash flow from financing activities of continuing operations and for €20,421 thousand under cash flow from financing activities of discontinued operations.
The dividend paid to minority shareholders, i.e. €1,008 thousand is entirely presented under the cash flow from financing activities of discontinued operations.
(in €
thous
ands
)
Shar
e cap
ital
Shar
e pre
mium
Retai
ned e
arnin
gs
Defin
ed be
nefit
and c
ontrib
ution
pe
nsion
plan
s
Rese
rves r
elated
to fin
ancia
l de
rivati
ves
Exch
ange
diffe
renc
es on
tra
nslat
ion
Equi
ty –
shar
e of t
he g
roup
Resu
lt attr
ibutab
le to
non
-contr
olling
inter
ests
Tota
l
December 2019 41,330 800,008 995,786 (37,089) (40,892) (10,440) 1,748,703 11,607 1,760,310
Comprehensive income for the period 64,020 (4,694) (8,823) (11,693) 38,810 1,067 39,877
Dividends paid to shareholders 0 0 0
Dividends from non-controlling interests 72 72 Change in consolidation scope and other movements (400) (400) 5,089 4,689
December 2020 41,330 800,008 1,059,406 (41,783) (49,715) (22,133) 1,787,113 17,835 1,804,948
SHARE CAPITAL AND RESERVES The share capital on 31 December 2021 was divided into 25,314,482 ordinary shares. These shares are without nominal value. The owners of ordinary shares have the right to receive dividends and have one vote per share in Shareholders’ General Meetings.
The partial demerger will mechanically lead to a transfer of a substantial part of CFE's equity and distributable reserves to the DEME Group. The Board of Directors believed that CFE's equity should be strengthened and proposed that a dividend should not be distributed for the financial year 2021. This proposal will have to be approved by the shareholders at the general meeting.
A dividend of €25,314 thousand for the year 2020, corresponding to €1.00 gross per share, had been proposed by the board of directors and approved at the general meeting.
NOTES TO THE CONSOLIDATED FINANCIAL STATEMENTS
INTRODUCTION Compagnie d’Entreprises CFE SA (hereinafter referred to as the "Company" or "CFE") is a company incorporated and headquartered in Belgium. The consolidated financial statements for the year ended 31 December 2021 include the financial statements of the company, its subsidiaries (the "CFE group") and its interests in companies accounted using equity method. CFE is 62.1% controlled by the Belgian investment group Ackermans & van Haaren (XBRU BE0003764785). CFE and Ackermans & van Haaren are companies listed on Euronext Brussels.
The Board of Directors authorised the publication of the CFE group's consolidated financial statements on 25 March 2022.
The consolidated financial statements should be read in conjunction with the management report of the Board of Directors.
MAIN TRANSACTIONS IN 2021 AND 2020 WITH AN IMPACT ON THE SCOPE OF THE CFE GROUP TRANSACTIONS IN 2021 – CONTINUING OPERATIONS
11.. CCoonnttrraaccttiinngg sseeggmmeenntt
During the year of 2021, the main changes in scope impacting the Contracting segment of the CFE group are the following:
- The Mobix Coghe NV company, a 100% subsidiary and fully consolidated, was integrated into the Mobix Remacom NV company, itself a 100%and fully consolidated subsidiary, with retroactive effect from 1 January 2021;
- The Procool SA company, a 100% subsidiary and fully consolidated, was integrated into the VMA Druart SA company, itself a 100% and fullyconsolidated subsidiary, with retroactive effect from 1 January 2021;
- The CFE Bau GmbH company, a 100% subsidiary of the CFE group, was incorporated. This company has been fully consolidated;
- The Anmeco NV company, a 100% subsidiary of the CFE group, was liquidated. This company was fully consolidated;
- The VMA NV company, a 100% subsidiary of the CFE group, increased its stake in the VMA R. Robotics Sp z o.o. company from 51% to 100%.This company, which was integrated under the equity method, is now fully consolidated. We refer to note 5 of this report;
- The VMA NV company, a 100% subsidiary of the CFE group, acquired 100% of the shares of Rolling Robotics Sp. z o.o., Rolling Robotics Sp.komandytowa, Power Automation Sp. z o.o. and Power Automation Sp. komandytowa. These companies were fully consolidated. We refer tonote 5 of this report;
- The CFE Senegal SASU company, a 100% subsidiary of the CFE group, was liquidated. This company was fully consolidated.
22.. RReeaall eessttaattee ddeevveellooppmmeenntt sseeggmmeenntt
During the year of 2021, the main changes in the consolidation scope affecting the real estate development segment of the CFE group are the following:
- The BPI Real Estate Poland Sp. z o.o. company acquired:
o 100% of the newly created BPI Project VIII Sp. z o.o. company;o 100% of the newly created BPI Project IX Sp. z o.o. company.
The acquired entities listed above were fully consolidated;
- The BPI Real Estate Luxembourg SA company acquired:
o a 50% stake in the newly created The Roots Real Estate S.à r.l. company;o a 50% stake in the newly created The Roots Office S.à r.l. company.
The acquired entities listed above were integrated under the equity method;
- The BPI Real Estate Poland Sp. z o.o. company disposed of all its shares (100%) in the Immo Wola Sp. z o.o. company. This company was fullyconsolidated;
- The BPI Real Estate Poland Sp. z o.o. company reduced its stake in the BPI Project V Sp. z o.o. company from 100% to 50%, which was renamedBPI-Revive Matejki Sp. z.o.o. This company, which was fully consolidated, is now integrated under the equity method;
- The company names of BPI Project III Sp. z o.o., BPI Project VI Sp. z o.o. and BPI Project VII Sp. z o.o. were changed to BPI Obrzezna Sp.z o.o., BPI Jaracza Sp. z o.o. and BPI Chmielna Sp. z o.o., respectively;
- The BPI Real Estate Luxembourg SA company acquired 100% of the shares of the Livingstone Retail S.à r.l. company, previously held by theM1 SA company, a 33.33% subsidiary of the CFE group. Following this transfer, the name of this company was changed to Mimosas Real EstateS.à r.l. This company, which was integrated under the equity method, is now fully consolidated;
- The BPI Real Estate Belgium NV company acquired 37.5% of the newly formed company Tervuren Square NV. This company was integratedunder the equity method;
- The BPI Real Estate Belgium SA company reduced its stake in the Samaya Development SA company from 100% to 50%. This company, whichwas fully consolidated, is now integrated under the equity method;
- The BPI Real Estate Belgium SA (BPI) company sold all of the shares (50%) it held in the Ernest 11 company on 1 July 2021. This companywas integrated under the equity method.
143
ANNUAL REPORT
STATEMENT OF NON-FINANCIAL INFORMATION
FINANCIAL STATEMENTS
33.. WWoooodd SShhaappeerrss –– PPaarrttnneerrsshhiipp bbeettwweeeenn tthhee CCoonnttrraaccttiinngg sseeggmmeenntt aanndd tthhee RReeaall EEssttaattee DDeevveellooppmmeenntt sseeggmmeenntt
During the year of 2021, the Wood Shapers SA company has acquired a 50% stake in the newly created Wood Gardens SA company. This company was integrated under the equity method.
44.. HHoollddiinngg sseeggmmeenntt
During the year of 2021, the main changes in the consolidation scope affecting the Holding segment of the CFE group are the following :
- The CFE Tchad SA company, a 100% subsidiary of the CFE group, was sold. This company was fully consolidated;
- The Franco-Belge de Constructions Internationales SAS company, a 100% subsidiary of the CFE group, wa liquidated. This company was fullyconsolidated.
TRANSACTIONS IN 2021 – DISCONTINUED OPERATIONS (DEME)
During the year of 2021, the main changes in the consolidation scope affecting the DEME segment are the following :
- DEME acquired:
o a 100% stake in the newly created company Thistle Wind Partners Ltd;
o a 70% stake in the newly created company Hyport Oostende Holdco NV.
The acquired entities listed above have been fully consolidated;
o a 46.6% stake in the company Nou Vela SA, as well as a 23.77% stake in its subsidiary Port La Nouvelle SEMOP;
o a 37.45% stake in the newly created company Wérisol SA;
o a 16.67% stake in the consortium Hyve BV;
o a 28% stake in the company Rhama Port Hub SRL;
o a 50% stake in the company Hyport Coordination Company LLC;
o a 14.7% stake in the company Asyad Terminals DUQM LLC;
o a 26% stake in the company DUQM Logistic Land Investments Company LLC;
o a 20% stake in the company Zeeboerderij Westdiep BV;
o a 49% stake in the company Japan Offshore Marine Ltd;
o a 49.99% stake in the company CDWE Green Jade Shipowner Ltd.
The acquired entities listed above were integrated under the equity method;
- DEME increased its stake in the G-Tec Offshore SA, G-Tec SAS, G-Tec NV and G-Tec BV companies from 72.5% to 100%. These companiesremain fully consolidated;
- DEME increased its stake in the Hydrogeo SARL company, 60% owned by G-tec, from 43.5% to 60%. This company, which was integratedunder the equity method, is now fully consolidated;
- DEME increased its stake in the PT Dredging International Indonesia company from 60% to 95%. This company remains fully consolidated;
- DEME increased its stake in the High Wind NV company from 99.1% to 100%. This company remains fully consolidated;
- DEME liquidated all its shares (100%) in DEME Concessions Infrastructure NV, Mascarenes Dredging & Management Ltd, DEME ShippingCompany Ltd, Middle East Marine Contracting Ltd and Dredging International Services Middle East DMCEST. These companies remain fullyconsolidated;
- DEME changed the percentage of ownership in the DIAP Thailand Co LTD company from 98% to 48.9%. This company, which was fullyconsolidated, is now integrated under the equity method;
- The Agroviro NV and Purazur NV companies, which were 74.9% subsidiaries and fully consolidated, were integrated into the DEMEEnvironmental Contractors NV company, itself a 74.9% and fully consolidated subsidiary. As a result of this merger, the name of the absorbingcompany was changed to DEME Environmental NV;
- The Dredging International Luxembourg SA and Société de Dragage Luxembourg SA companies, which were 100% DEME subsidiaries and fully consolidated, were integrated into the Safindi SA company, itself a 100% and fully consolidated subsidiary. As a result of this merger, thename of the absorbing company was changed to DEME Luxembourg SA;
- The company name of Maritime Services & Solutions SA was changed to Spartacus Shipping SA.
144
CONTENTS
WHY AND WHO WE ARE
HOW WE SHAPE THE WORLD
33.. WWoooodd SShhaappeerrss –– PPaarrttnneerrsshhiipp bbeettwweeeenn tthhee CCoonnttrraaccttiinngg sseeggmmeenntt aanndd tthhee RReeaall EEssttaattee DDeevveellooppmmeenntt sseeggmmeenntt
During the year of 2021, the Wood Shapers SA company has acquired a 50% stake in the newly created Wood Gardens SA company. This company was integrated under the equity method.
44.. HHoollddiinngg sseeggmmeenntt
During the year of 2021, the main changes in the consolidation scope affecting the Holding segment of the CFE group are the following :
- The CFE Tchad SA company, a 100% subsidiary of the CFE group, was sold. This company was fully consolidated;
- The Franco-Belge de Constructions Internationales SAS company, a 100% subsidiary of the CFE group, wa liquidated. This company was fullyconsolidated.
TRANSACTIONS IN 2021 – DISCONTINUED OPERATIONS (DEME)
During the year of 2021, the main changes in the consolidation scope affecting the DEME segment are the following :
- DEME acquired:
o a 100% stake in the newly created company Thistle Wind Partners Ltd;
o a 70% stake in the newly created company Hyport Oostende Holdco NV.
The acquired entities listed above have been fully consolidated;
o a 46.6% stake in the company Nou Vela SA, as well as a 23.77% stake in its subsidiary Port La Nouvelle SEMOP;
o a 37.45% stake in the newly created company Wérisol SA;
o a 16.67% stake in the consortium Hyve BV;
o a 28% stake in the company Rhama Port Hub SRL;
o a 50% stake in the company Hyport Coordination Company LLC;
o a 14.7% stake in the company Asyad Terminals DUQM LLC;
o a 26% stake in the company DUQM Logistic Land Investments Company LLC;
o a 20% stake in the company Zeeboerderij Westdiep BV;
o a 49% stake in the company Japan Offshore Marine Ltd;
o a 49.99% stake in the company CDWE Green Jade Shipowner Ltd.
The acquired entities listed above were integrated under the equity method;
- DEME increased its stake in the G-Tec Offshore SA, G-Tec SAS, G-Tec NV and G-Tec BV companies from 72.5% to 100%. These companiesremain fully consolidated;
- DEME increased its stake in the Hydrogeo SARL company, 60% owned by G-tec, from 43.5% to 60%. This company, which was integratedunder the equity method, is now fully consolidated;
- DEME increased its stake in the PT Dredging International Indonesia company from 60% to 95%. This company remains fully consolidated;
- DEME increased its stake in the High Wind NV company from 99.1% to 100%. This company remains fully consolidated;
- DEME liquidated all its shares (100%) in DEME Concessions Infrastructure NV, Mascarenes Dredging & Management Ltd, DEME ShippingCompany Ltd, Middle East Marine Contracting Ltd and Dredging International Services Middle East DMCEST. These companies remain fullyconsolidated;
- DEME changed the percentage of ownership in the DIAP Thailand Co LTD company from 98% to 48.9%. This company, which was fullyconsolidated, is now integrated under the equity method;
- The Agroviro NV and Purazur NV companies, which were 74.9% subsidiaries and fully consolidated, were integrated into the DEMEEnvironmental Contractors NV company, itself a 74.9% and fully consolidated subsidiary. As a result of this merger, the name of the absorbingcompany was changed to DEME Environmental NV;
- The Dredging International Luxembourg SA and Société de Dragage Luxembourg SA companies, which were 100% DEME subsidiaries and fully consolidated, were integrated into the Safindi SA company, itself a 100% and fully consolidated subsidiary. As a result of this merger, thename of the absorbing company was changed to DEME Luxembourg SA;
- The company name of Maritime Services & Solutions SA was changed to Spartacus Shipping SA.
TRANSACTIONS IN 2020 – CONTINUING OPERATIONS
11.. CCoonnttrraaccttiinngg sseeggmmeenntt
During the year of 2020, the main changes in the consolidation scope affecting the Contracting segment of the CFE group are the following:
- The company VMA Vanderhoydoncks NV was absorbed by VMA NV, a 100% subsidiary of CFE Contracting, with retroactive effect to 1 January2020;
- The company Bâtiments et Ponts Construction SA (BPC SA), a 100% subsidiary of CFE Contracting, transferred its business lines BPC Hainaut,BPC Liège and BPC Namur to the company Thiran SA, also a 100% subsidiary of CFE Contracting, with retroactive effect to 1 January 2020.Following this partial demerger without the demerged company being wound up, the company Thiran SA was renamed BPC Wallonie SA;
- The company Algemeen Bouw-en Betonbedrijf NV (ABEB NV), a 100% subsidiary of CFE Contracting, was liquidated. This company wasconsolidated according to the equity method;
- The Spanbo NV company, a 100% subsidiary of CFE Contracting, was renamed Groep Terryn Construct NV.
22.. RReeaall eessttaattee ddeevveellooppmmeenntt sseeggmmeenntt
During the year of 2020, the main changes affecting the consolidation scope of the real estate development segment of the CFE group are the following :
- The company BPI Real Estate Belgium SA (BPI) acquired:
o a 100% stake in the newly created company BPI Serenity Valley SA;
o a 100% stake in the newly created company Samaya Development SA.
The acquired entities listed above have been fully consolidated;
o a 50% stake in the newly created company Arlon 53 SA;
o a 50% stake in the company Mobius I SA, which was partially demerged through the establishment of two companies, Debrouckère OfficeSA and Debrouckère Leisure SA, without dissolution of the demerged company, which has, moreover, been renamed Debrouckère LandSA. These two new companies are 50% owned.
The acquired entities listed above have been integrated under the equity method;
- The company BPI Real Estate Poland Sp. z o.o., a 100% subsidiary, has increased its stake in the company ACE 14 Sp. z o.o. from 90% to 100%,which has been renamed BPI Wolare Sp. z o.o. This company remains fully consolidated;
- The company BPI Project VII Sp. z o.o. has been established. This company is 100% owned by BPI Real Estate Poland Sp. z o.o., and has beenfully consolidated;
- The companies BPI Project I Sp. z o.o. and BPI Project IV Sp. z o.o., both 100% owned by BPI Real Estate Poland Sp. z o.o., have beenrenamed BPI Bernadowo Sp. z o.o. and BPI Wagrowska Sp. z o.o., respectively;
- The company BPI Real Estate Luxembourg SA, a 100% subsidiary, acquired:
o a 100% stake in the Herrenberg SA company;
o a 100% stake in the newly created Central Parc S.à r.l. company.
The acquired entities above have been fully consolidated;
o a 50% stake in the newly created Immo Marial S.à r.l. company;
o a 50% stake in the newly created Wooden SA company.
The acquired entities listed above have been integrated under the equity method;
- The company Prince Henri S.à r.l. was created. This company is 100% owned by Central Parc S.à.r.l. This company has been fully consolidated;
- The company Livingstone Retail S.à r.l. was created. This company is 100% owned by M1 SA, a 33.33% subsidiary of BPI Real EstateLuxembourg SA. This company was integrated under the equity method;
- The company Pourpelt SA was created. This company is 100% owned by BPI Real Estate Luxembourg SA. This company was fully consolidated.
- The company BPI Real Estate Luxembourg SA reduced its stake in the company Gravity SA from 100% to 50%. This company, which was fullyconsolidated, is now integrated under the equity method;
- The companies Bedford Finance SRL and Bayside Finance SRL, 40% subsidiaries of BPI, liquidated their stakes in the companies VM PropertyI SA and VM Property II SA. These companies were integrated under the equity method;
- BPI Real Estate Luxembourg SA has sold all its shares (100%) in the Arlon 23 SA company. This company was fully consolidated;
- The Van Maerlant SA company, a 100% subsidiary of BPI Real Estate Belgium SA, has been renamed BPI Pure SA.
33.. HHoollddiinngg sseeggmmeenntt
During the year of 2020, the main change affecting the consolidation scope of the Holding segment of the CFE group is the following :
- the CFE Middle East Co WLL company, a 100% subsidiary of the CFE group, has been deconsolidated. This company was fully consolidated.
145
ANNUAL REPORT
STATEMENT OF NON-FINANCIAL INFORMATION
FINANCIAL STATEMENTS
TRANSACTIONS IN 2020 – DISCONTINUED OPERATIONS (DEME)
During the year 2020, the main changes affecting the consolidation scope in the DEME segment are the following:
- DEME has acquired:o a 100% stake in the newly created company Dredging International Argentina SA;
o a 100% stake in the newly created company Deeptech NV;
o a 100% stake in the newly created company Meuse River Shipping SA;
o a 95% stake in the newly created company Dredging International Bahrain WLL;
o a 100% stake in the newly created company Delta River Shipping SA;
o 100% of the companies SPT Offshore Holding BV, Seatec Holding BV, Seatec Subsea Systems BV, SPT Equipment BV, SPT OffshoreBV, SPT Offshore UK Ltd and SPT Offshore SDN BHD, which constitute the SPT Offshore group.
These companies were fully consolidated;
o a 37.45% stake in the Blue Site SA company;
o a 19.47% stake in the Feluy M2M SA company;
o a 37.68% stake in the Combined Marine Terminal Operations Marafi LLC company.
These companies have been integrated under the equity method;
- DEME increased its stake in the company CBD SAS from 50% to 100%. This company, which was integrated under the equity method, is nowfully consolidated. This company was subsequently absorbed by the company “Société de Dragage International” (SDI), itself a 100% subsidiaryand fully consolidated;
- DEME increased its stake in the company International Seaport Dredging PVT LTD from 89.61% to 93.64%. This company remains fullyintegrated;
- DEME has increased its shareholding percentage in the company DIAP Thailand Co LTD from 48.90% to 98% after having signed ashareholders’ agreement through which 98% of the economic interest is granted by the local partner. This company, which was integrated underthe equity method, is now fully consolidated;
- DEME increased its stake in the High Wind NV company from 50.4% to 99.1%. This company, which was integrated under the equity method,is now fully consolidated;
- DEME decreased its stake in the company Terranova NV from 43.73% to 24.96%. This company remains integrated under the equity method;
- DEME decreased its stake in the DUQM Industrial Land Company LLC from 34.90% to 27.55%. This company remains integrated under theequity method;
- DEME disposed of its entire stake (12.5%) in the company Merkur Offshore GmbH. This company was shown as an asset held for sale at 31December 2019;
- DEME has liquidated the Thor Crewing Luxembourg SA company, of which it held all the shares. This company was fully integrated;
- DEME has liquidated the DEME Environmental Contractors UK LTD company, of which it held 74.9% of the shares. This company was fullyintegrated;
- The companies Innovation Holding BV and Innovation Shipowner BV, 100% subsidiaries and fully consolidated, have been absorbed by theDEME Offshore Shipping BV company, itself a 100% subsidiary and fully consolidated;
- The Innovation Shipping BV company, a 100% subsidiary and fully consolidated, has been absorbed by the DEME Offshore NL BV company,itself a 100% subsidiary and fully consolidated;
- The Paes Maritiem BV company, a 100% subsidiary and fully consolidated, has been absorbed by the DBM NL BV company, itself a 100%subsidiary and fully consolidated.
146
CONTENTS
WHY AND WHO WE ARE
HOW WE SHAPE THE WORLD
TRANSACTIONS IN 2020 – DISCONTINUED OPERATIONS (DEME)
During the year 2020, the main changes affecting the consolidation scope in the DEME segment are the following:
- DEME has acquired:o a 100% stake in the newly created company Dredging International Argentina SA;
o a 100% stake in the newly created company Deeptech NV;
o a 100% stake in the newly created company Meuse River Shipping SA;
o a 95% stake in the newly created company Dredging International Bahrain WLL;
o a 100% stake in the newly created company Delta River Shipping SA;
o 100% of the companies SPT Offshore Holding BV, Seatec Holding BV, Seatec Subsea Systems BV, SPT Equipment BV, SPT OffshoreBV, SPT Offshore UK Ltd and SPT Offshore SDN BHD, which constitute the SPT Offshore group.
These companies were fully consolidated;
o a 37.45% stake in the Blue Site SA company;
o a 19.47% stake in the Feluy M2M SA company;
o a 37.68% stake in the Combined Marine Terminal Operations Marafi LLC company.
These companies have been integrated under the equity method;
- DEME increased its stake in the company CBD SAS from 50% to 100%. This company, which was integrated under the equity method, is nowfully consolidated. This company was subsequently absorbed by the company “Société de Dragage International” (SDI), itself a 100% subsidiaryand fully consolidated;
- DEME increased its stake in the company International Seaport Dredging PVT LTD from 89.61% to 93.64%. This company remains fullyintegrated;
- DEME has increased its shareholding percentage in the company DIAP Thailand Co LTD from 48.90% to 98% after having signed ashareholders’ agreement through which 98% of the economic interest is granted by the local partner. This company, which was integrated underthe equity method, is now fully consolidated;
- DEME increased its stake in the High Wind NV company from 50.4% to 99.1%. This company, which was integrated under the equity method,is now fully consolidated;
- DEME decreased its stake in the company Terranova NV from 43.73% to 24.96%. This company remains integrated under the equity method;
- DEME decreased its stake in the DUQM Industrial Land Company LLC from 34.90% to 27.55%. This company remains integrated under theequity method;
- DEME disposed of its entire stake (12.5%) in the company Merkur Offshore GmbH. This company was shown as an asset held for sale at 31December 2019;
- DEME has liquidated the Thor Crewing Luxembourg SA company, of which it held all the shares. This company was fully integrated;
- DEME has liquidated the DEME Environmental Contractors UK LTD company, of which it held 74.9% of the shares. This company was fullyintegrated;
- The companies Innovation Holding BV and Innovation Shipowner BV, 100% subsidiaries and fully consolidated, have been absorbed by theDEME Offshore Shipping BV company, itself a 100% subsidiary and fully consolidated;
- The Innovation Shipping BV company, a 100% subsidiary and fully consolidated, has been absorbed by the DEME Offshore NL BV company,itself a 100% subsidiary and fully consolidated;
- The Paes Maritiem BV company, a 100% subsidiary and fully consolidated, has been absorbed by the DBM NL BV company, itself a 100%subsidiary and fully consolidated.
1. GENERAL POLICIESIFRS AS ENDORSED BY THE EUROPEAN UNION
The accounting principles used for the preparation and presentation of the consolidated financial statements of CFE at 31 December 2021 comply with the IFRS standards and interpretations as endorsed in the European Union on 31 December 2021.
The accounting principles used at 31 December 2021 are the same as those used for the consolidated financial statements at 31 December 2020, except for the standards and/or amendments to standards described below as endorsed in the European Union, mandatorily applicable as of 1 January 2021.
STANDARDS AND INTERPRETATIONS APPLICABLE FOR THE ANNUAL PERIOD BEGINNING ON OR AFTER 1 JANUARY 2021
- Amendments to IFRS 9, IAS 39, IFRS 7, IFRS 4 and IFRS 16 Interest Rate benchmark Reform – Phase 2 (applicable for annual periods beginningon or after 1 January 2021)
- Amendment to IFRS 16 Leases : COVID 19-Related Rent Concessions beyond 30 June 2021(applicable for annual periods beginning on or after1 April 2021)
- Extension of the temporary exemption from the application of IFRS 9 until 1 January 2023 (applicable for annual periods beginning on or after 1January 2021)
The application of these standards and interpretations had no material impact on the consolidated financial statements of CFE.
STANDARDS AND INTERPRETATIONS PUBLISHED, BUT NOT YET APPLICABLE FOR THE ANNUAL PERIOD BEGINNING ON 1 JANUARY 2021 The Group did not apply early any of the following new standards and interpretations, application of which was not mandatory at 31 December 2021.
- Amendments to IAS 16 Property, Plant and Equipment: proceeds before Intended Use (applicable for annual periods beginning on or after 1January 2022)
- Amendments to IAS 37 Provisions, Contingent Liabilities and Contingent Assets: Onerous Contracts – Cost of fulfilling a Contract (applicable forannual periods beginning on or after 1 January 2022)
- Amendments to IFRS 3 Business Combinations: Reference to the Conceptual Framework (applicable for annual periods beginning on or after 1January 2022)
- Annual Improvements to IFRS Standards 2018-2020 (applicable for annual periods beginning on or after 1 January 2022)
- Amendments to IFRS 17 Insurance contracts : Initial Application of IFRS 17 and IFRS 9 (applicable for annual periods beginning on or after 1January 2023)
- Amendments to IAS 1 Presentation of Financial Statements: Classification of Liabilities as Current or Non-Current (applicable for annual periodsbeginning on or after 1 January 2023, but not yet endorsed in the EU)
- Amendments to IAS 1 Presentation of Financial Statements and IFRS Practice Statement 2 : Disclosure of accounting policies (applicable forannual periods beginning on or after 1 January 2023, but not yet endorsed in the EU)
- Amendments to IAS 8 Accounting Policies, Changes in Accounting Estimates and Errors: Definitions of Accounting Estimates (applicable forannual periods beginning on or after 1 January 2023, but not yet endorsed in the EU)
- Amendments to IAS 12 Income taxes: Deferred tax related to assets and liabilities arising from a single transaction (applicable for annual periodsbeginning on or after 1 January 2023, but not yet endorsed in the EU)
147
ANNUAL REPORT
STATEMENT OF NON-FINANCIAL INFORMATION
FINANCIAL STATEMENTS
2. SIGNIFICANT ACCOUNTING POLICIES(A) STATEMENT OF COMPLIANCEThe consolidated financial statements have been prepared in accordance with the International Financial Reporting Standards (IFRS) approved by the European Union.
(B) BASIS OF PRESENTATIONThe financial statements are stated in thousands of euros, rounded to the nearest thousand.
Equity instruments and equity derivatives are stated at cost where they do not have a quoted market price in an active market and where other methods of reasonably estimating fair value are clearly inappropriate and/or inapplicable.
Accounting policies are applied consistently.
The financial statements are presented before the appropriation of parent-company income proposed to the Shareholders' General Meeting.
(C) MAIN JUDGEMENTS AND ASSUMPTIONSThe preparation of financial statements according to the IFRS standards requires the use of estimates, as well as the formulation of judgments and assumptions that affect the amounts shown in those financial statements, particularly with regard to the following items:
- the period over which non-current assets are depreciated or amortized;- the measurement of provisions and post-employment obligations;- the measurement of income or losses on construction contracts using the percentage of completion method;- estimates used in impairment tests;- estimates used regarding uncertain tax positions and income tax estimates;- the valuation of financial instruments at fair value;- the assessment of control;- the qualification of the nature of the transaction as a business combination or an acquisition of assets when a company is acquired; and,- the assumptions used to determine the financial liabilities in accordance with the IFRS 16 standard.
These estimates assume the operation is a going concern and are made on the basis of the information available at the time they were established. Estimates may be revised if the circumstances on which they were based alter or if new information becomes available. Actual results may be different from these estimates.
(D) CONSOLIDATION PRINCIPLESThe consolidated financial statements include the financial statements of the CFE group and the financial statements of its subsidiaries and the entities over which it has control. The CFE group controls an entity if:
- it has power over the entity,- it is exposed to, or entitled to, variable returns from the controlled entity,- it has the ability to exert power over the entity in order to influence the returns obtained.
If the CFE group does not have the majority of voting rights in an entity, it is presumed to have enough rights to exert power over the entity if it has the ability to manage the core businesses of the entity on its own. The CFE group takes into account all facts and circumstances when it assess whether the voting rights held are sufficient to give the power to manage the entity, including the following:
- the voting rights held by the CFE group compared to the voting rights held by the other partners and how there are spread among them,- the potential voting rights held by the CFE group and by other stakeholders or other parties,- the rights arising from other agreements,- other facts and circumstances, if any, that prove that the CFE group has the ability (or otherwise) to manage the entity’s core businesses when
decisions have to be taken, including voting trends at previous shareholder meetings.
The CFE group consolidates the subsidiary from the date on which it obtains control, and ceases to consolidate it when the group no longer controls the entity. In particular, the income and expenses of a subsidiary acquired or sold during the financial year are included in the consolidated statement of income and in other elements of the comprehensive income from the date the CFE group acquires control of the subsidiary until the date on which it ceases to control it.
If necessary, adjustments are made to statutory accounts of subsidiaries in order to align their accounting methods with those used by the group. All assets and liabilities, equity, revenues, expenses and cash flows related to transactions between group companies are eliminated in the consolidated financial statements.
Changes to the group’s interest in a subsidiary that do not result in a loss of control are recognized as equity transactions. The carrying amounts of the
148
CONTENTS
WHY AND WHO WE ARE
HOW WE SHAPE THE WORLD
2. SIGNIFICANT ACCOUNTING POLICIES(A) STATEMENT OF COMPLIANCEThe consolidated financial statements have been prepared in accordance with the International Financial Reporting Standards (IFRS) approved by the European Union.
(B) BASIS OF PRESENTATIONThe financial statements are stated in thousands of euros, rounded to the nearest thousand.
Equity instruments and equity derivatives are stated at cost where they do not have a quoted market price in an active market and where other methods of reasonably estimating fair value are clearly inappropriate and/or inapplicable.
Accounting policies are applied consistently.
The financial statements are presented before the appropriation of parent-company income proposed to the Shareholders' General Meeting.
(C) MAIN JUDGEMENTS AND ASSUMPTIONSThe preparation of financial statements according to the IFRS standards requires the use of estimates, as well as the formulation of judgments and assumptions that affect the amounts shown in those financial statements, particularly with regard to the following items:
- the period over which non-current assets are depreciated or amortized;- the measurement of provisions and post-employment obligations;- the measurement of income or losses on construction contracts using the percentage of completion method;- estimates used in impairment tests;- estimates used regarding uncertain tax positions and income tax estimates;- the valuation of financial instruments at fair value;- the assessment of control;- the qualification of the nature of the transaction as a business combination or an acquisition of assets when a company is acquired; and,- the assumptions used to determine the financial liabilities in accordance with the IFRS 16 standard.
These estimates assume the operation is a going concern and are made on the basis of the information available at the time they were established. Estimates may be revised if the circumstances on which they were based alter or if new information becomes available. Actual results may be different from these estimates.
(D) CONSOLIDATION PRINCIPLESThe consolidated financial statements include the financial statements of the CFE group and the financial statements of its subsidiaries and the entities over which it has control. The CFE group controls an entity if:
- it has power over the entity,- it is exposed to, or entitled to, variable returns from the controlled entity,- it has the ability to exert power over the entity in order to influence the returns obtained.
If the CFE group does not have the majority of voting rights in an entity, it is presumed to have enough rights to exert power over the entity if it has the ability to manage the core businesses of the entity on its own. The CFE group takes into account all facts and circumstances when it assess whether the voting rights held are sufficient to give the power to manage the entity, including the following:
- the voting rights held by the CFE group compared to the voting rights held by the other partners and how there are spread among them,- the potential voting rights held by the CFE group and by other stakeholders or other parties,- the rights arising from other agreements,- other facts and circumstances, if any, that prove that the CFE group has the ability (or otherwise) to manage the entity’s core businesses when
decisions have to be taken, including voting trends at previous shareholder meetings.
The CFE group consolidates the subsidiary from the date on which it obtains control, and ceases to consolidate it when the group no longer controls the entity. In particular, the income and expenses of a subsidiary acquired or sold during the financial year are included in the consolidated statement of income and in other elements of the comprehensive income from the date the CFE group acquires control of the subsidiary until the date on which it ceases to control it.
If necessary, adjustments are made to statutory accounts of subsidiaries in order to align their accounting methods with those used by the group. All assets and liabilities, equity, revenues, expenses and cash flows related to transactions between group companies are eliminated in the consolidated financial statements.
Changes to the group’s interest in a subsidiary that do not result in a loss of control are recognized as equity transactions. The carrying amounts of the
group’s interests and non-controlling interests are adjusted to reflect changes in their relative interests in the subsidiary. Any difference between the amount by which the non-controlling interests are adjusted and the fair value of the consideration paid or received is recognized directly in equity.
When the CFE group grants an option to sell to the non-controlling interests of a subsidiary (i.e. where the non-controlling interests have a "put"), the related financial liability is initially deducted from non-controlling interests in equity.
Associated companies are entities in which the CFE group exercises a significant influence. Significant influence is the power to take part in financial and operating policy decisions of a company without, however, exercising control or joint control over these policies.
A joint venture is an arrangement whereby the parties having joint control over the entity have rights to the entity’s net assets. A joint control is the sharing of the control over an entity among different parties based on legal agreements and where all decisions related to core businesses require the agreement of all parties.
Assets, liabilities, revenues and expenses from associates and joint ventures are accounted for using the equity method in the consolidated financial statements unless the interest in the associate is, partly or fully, classified as held-for-sale. In that case, it is accounted for in accordance with IFRS 5. Under the equity method, an investment in an associate or joint venture is first recorded at cost in the consolidated financial statement and then adjusted to record the share of the group in the net result and in the comprehensive income of the associate or joint venture. If the group’s share in the losses of an associate or joint venture is greater than its participation, the CFE group ceases to recognise its share in the future losses. Additional losses are recognized only to the extent that the CFE group has entered into a legal or implicit obligation, or has made payments on behalf of the associate or joint venture.
A participation in an associate or a joint venture is recognized under the equity method from the date when the entity becomes an associate a joint venture. When acquiring the participation in an associate or a joint venture, any surplus of the cost of the participation over the share of the net fair value of the identifiable assets and liabilities of the entity is recognized as goodwill, which is included in the carrying amount of the participation. Any surplus of the group’s share of the net fair value of the identifiable assets and liabilities over the cost of the participation, after revaluation, is immediately recognized in the income statement of the financial year in which the participation was acquired.
A joint operation is a partnership in which the parties who exercise joint control over the company have rights to the assets and obligations with respect to the entity’s liabilities. Joint control is the contractually agreed sharing of control over an entity, which only exists if decisions with regard to the relevant activities require the unanimous consent of the parties sharing control. When an entity of the CFE group entity starts its activities in the context of a joint operation, the CFE group, as a co-participant, recognises the following items in respect to its interests in the joint operation:
- its assets, including its share of any assets held jointly;- its liabilities, including its share of any liabilities incurred jointly;- its revenue from the sale of its share of the output arising from the joint operation;- its share of the revenue from the sale of its share of the output by the joint operation;- its expenses, including its share of any expenses incurred jointly.
(E) FOREIGN CURRENCIES(1) TRANSACTIONS IN FOREIGN CURRENCIES
Transactions in currencies other than the euro are recognized at the exchange rate on the transaction date. Monetary assets and liabilities denominated in foreign currencies are converted at the closing rate. Gains and losses resulting from these transactions, as well as the conversion of monetary assets and liabilities denominated in foreign currencies, are recognized in the income statement.
Non-monetary assets and liabilities denominated in foreign currencies are converted at the foreign exchange rate on the transaction date.
(2) FINANCIAL STATEMENTS OF FOREIGN ENTITIES
The assets and liabilities of the companies of the CFE group whose functional currencies are other than the euro are converted into euros at the exchange rate on the balance sheet date. The income statements of foreign entities, excluding foreign entities in hyperinflationary economies, are converted into euros at an average exchange rate for the year (approximating the foreign exchange rates prevailing at the dates of the transactions).
Components of shareholders’ equity are converted at historical rates.
The conversion differences arising from this conversion are recognized in the other elements of the comprehensive income, and are accumulated in a separate equity reserve, i.e., ‘exchange differences on translation’. These differences are recognized in the income statement of the financial year during which the entity is sold or liquidated.
149
ANNUAL REPORT
STATEMENT OF NON-FINANCIAL INFORMATION
FINANCIAL STATEMENTS
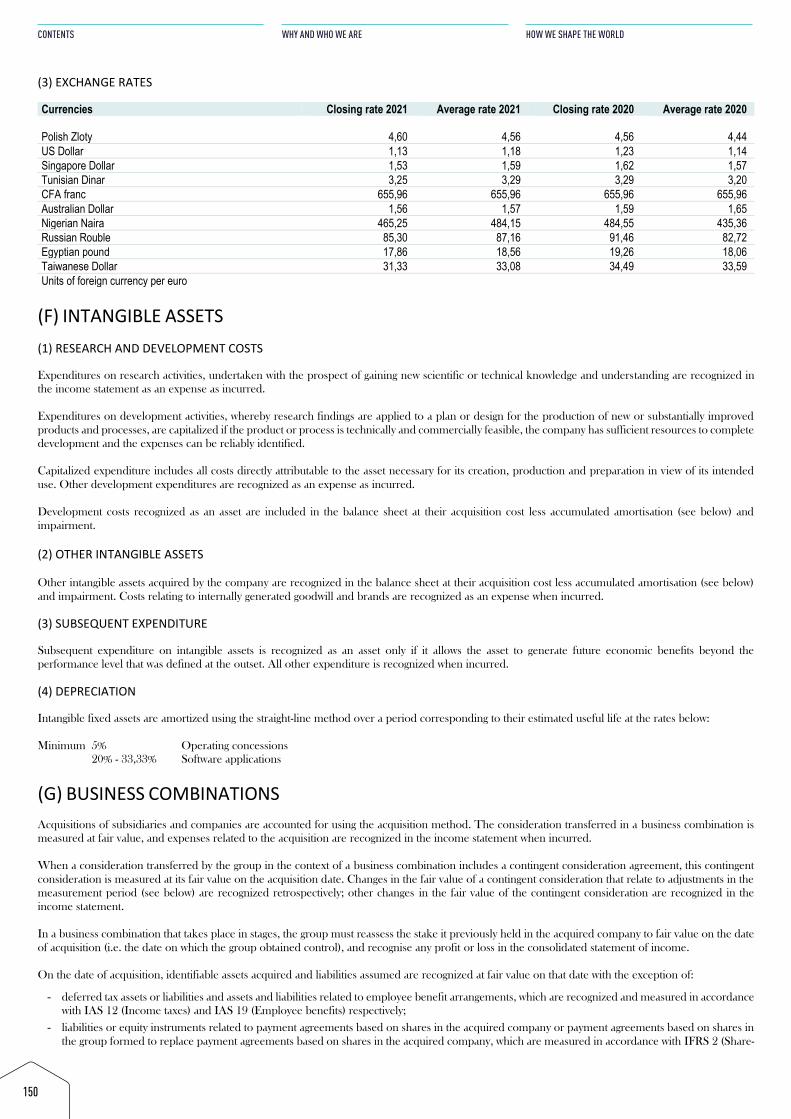
(3) EXCHANGE RATES
Currencies Closing rate 2021 Average rate 2021 Closing rate 2020 Average rate 2020
Polish Zloty 4,60 4,56 4,56 4,44 US Dollar 1,13 1,18 1,23 1,14 Singapore Dollar 1,53 1,59 1,62 1,57 Tunisian Dinar 3,25 3,29 3,29 3,20 CFA franc 655,96 655,96 655,96 655,96 Australian Dollar 1,56 1,57 1,59 1,65 Nigerian Naira 465,25 484,15 484,55 435,36 Russian Rouble 85,30 87,16 91,46 82,72 Egyptian pound 17,86 18,56 19,26 18,06 Taiwanese Dollar 31,33 33,08 34,49 33,59 Units of foreign currency per euro
(F) INTANGIBLE ASSETS(1) RESEARCH AND DEVELOPMENT COSTS
Expenditures on research activities, undertaken with the prospect of gaining new scientific or technical knowledge and understanding are recognized in the income statement as an expense as incurred.
Expenditures on development activities, whereby research findings are applied to a plan or design for the production of new or substantially improved products and processes, are capitalized if the product or process is technically and commercially feasible, the company has sufficient resources to complete development and the expenses can be reliably identified.
Capitalized expenditure includes all costs directly attributable to the asset necessary for its creation, production and preparation in view of its intended use. Other development expenditures are recognized as an expense as incurred.
Development costs recognized as an asset are included in the balance sheet at their acquisition cost less accumulated amortisation (see below) and impairment.
(2) OTHER INTANGIBLE ASSETS
Other intangible assets acquired by the company are recognized in the balance sheet at their acquisition cost less accumulated amortisation (see below) and impairment. Costs relating to internally generated goodwill and brands are recognized as an expense when incurred.
(3) SUBSEQUENT EXPENDITURE
Subsequent expenditure on intangible assets is recognized as an asset only if it allows the asset to generate future economic benefits beyond the performance level that was defined at the outset. All other expenditure is recognized when incurred.
(4) DEPRECIATION
Intangible fixed assets are amortized using the straight-line method over a period corresponding to their estimated useful life at the rates below:
Minimum 5% Operating concessions 20% - 33,33% Software applications
(G) BUSINESS COMBINATIONSAcquisitions of subsidiaries and companies are accounted for using the acquisition method. The consideration transferred in a business combination is measured at fair value, and expenses related to the acquisition are recognized in the income statement when incurred.
When a consideration transferred by the group in the context of a business combination includes a contingent consideration agreement, this contingent consideration is measured at its fair value on the acquisition date. Changes in the fair value of a contingent consideration that relate to adjustments in the measurement period (see below) are recognized retrospectively; other changes in the fair value of the contingent consideration are recognized in the income statement.
In a business combination that takes place in stages, the group must reassess the stake it previously held in the acquired company to fair value on the date of acquisition (i.e. the date on which the group obtained control), and recognise any profit or loss in the consolidated statement of income.
On the date of acquisition, identifiable assets acquired and liabilities assumed are recognized at fair value on that date with the exception of:
- deferred tax assets or liabilities and assets and liabilities related to employee benefit arrangements, which are recognized and measured in accordancewith IAS 12 (Income taxes) and IAS 19 (Employee benefits) respectively;
- liabilities or equity instruments related to payment agreements based on shares in the acquired company or payment agreements based on shares inthe group formed to replace payment agreements based on shares in the acquired company, which are measured in accordance with IFRS 2 (Share-
150
CONTENTS
WHY AND WHO WE ARE
HOW WE SHAPE THE WORLD
(3) EXCHANGE RATES
Currencies Closing rate 2021 Average rate 2021 Closing rate 2020 Average rate 2020
Polish Zloty 4,60 4,56 4,56 4,44 US Dollar 1,13 1,18 1,23 1,14 Singapore Dollar 1,53 1,59 1,62 1,57 Tunisian Dinar 3,25 3,29 3,29 3,20 CFA franc 655,96 655,96 655,96 655,96 Australian Dollar 1,56 1,57 1,59 1,65 Nigerian Naira 465,25 484,15 484,55 435,36 Russian Rouble 85,30 87,16 91,46 82,72 Egyptian pound 17,86 18,56 19,26 18,06 Taiwanese Dollar 31,33 33,08 34,49 33,59 Units of foreign currency per euro
(F) INTANGIBLE ASSETS(1) RESEARCH AND DEVELOPMENT COSTS
Expenditures on research activities, undertaken with the prospect of gaining new scientific or technical knowledge and understanding are recognized in the income statement as an expense as incurred.
Expenditures on development activities, whereby research findings are applied to a plan or design for the production of new or substantially improved products and processes, are capitalized if the product or process is technically and commercially feasible, the company has sufficient resources to complete development and the expenses can be reliably identified.
Capitalized expenditure includes all costs directly attributable to the asset necessary for its creation, production and preparation in view of its intended use. Other development expenditures are recognized as an expense as incurred.
Development costs recognized as an asset are included in the balance sheet at their acquisition cost less accumulated amortisation (see below) and impairment.
(2) OTHER INTANGIBLE ASSETS
Other intangible assets acquired by the company are recognized in the balance sheet at their acquisition cost less accumulated amortisation (see below) and impairment. Costs relating to internally generated goodwill and brands are recognized as an expense when incurred.
(3) SUBSEQUENT EXPENDITURE
Subsequent expenditure on intangible assets is recognized as an asset only if it allows the asset to generate future economic benefits beyond the performance level that was defined at the outset. All other expenditure is recognized when incurred.
(4) DEPRECIATION
Intangible fixed assets are amortized using the straight-line method over a period corresponding to their estimated useful life at the rates below:
Minimum 5% Operating concessions 20% - 33,33% Software applications
(G) BUSINESS COMBINATIONSAcquisitions of subsidiaries and companies are accounted for using the acquisition method. The consideration transferred in a business combination is measured at fair value, and expenses related to the acquisition are recognized in the income statement when incurred.
When a consideration transferred by the group in the context of a business combination includes a contingent consideration agreement, this contingent consideration is measured at its fair value on the acquisition date. Changes in the fair value of a contingent consideration that relate to adjustments in the measurement period (see below) are recognized retrospectively; other changes in the fair value of the contingent consideration are recognized in the income statement.
In a business combination that takes place in stages, the group must reassess the stake it previously held in the acquired company to fair value on the date of acquisition (i.e. the date on which the group obtained control), and recognise any profit or loss in the consolidated statement of income.
On the date of acquisition, identifiable assets acquired and liabilities assumed are recognized at fair value on that date with the exception of:
- deferred tax assets or liabilities and assets and liabilities related to employee benefit arrangements, which are recognized and measured in accordancewith IAS 12 (Income taxes) and IAS 19 (Employee benefits) respectively;
- liabilities or equity instruments related to payment agreements based on shares in the acquired company or payment agreements based on shares inthe group formed to replace payment agreements based on shares in the acquired company, which are measured in accordance with IFRS 2 (Share-
based payment) on the date of acquisition; - assets (or groups intended to be sold) classified as held-for-sale under IFRS 5 (Non-current assets held for sale and discontinued operations), which
are measured in accordance with this standard.
If the initial recognition of a business combination is unfinished at the end of the financial reporting period during which the business combination occurs, the group must present provisional amounts relating to the items for which recognition is unfinished. These provisional amounts are adjusted during the measurement period (see below), or the additional assets or liabilities are recognized to take into account new information obtained about the facts and circumstances prevailing at the acquisition date and which, if they had been known, would have had an impact on the amounts recognized at that date. Adjustments in the measurement period are a consequence of additional information about the facts and circumstances prevailing at the date of acquisition obtained during the “measurement period” (up to one year from the acquisition date).
(1) POSITIVE GOODWILL
Goodwill arising from a business combination is recognized as an asset on the date on which control was obtained (the acquisition date). Goodwill is measured as the excess of the sum of the consideration transferred, the number of non-controlling interests in the acquired company and the fair value of the stake previously owned by the group in the acquired company (if any) on the net balance of the amounts of identifiable assets acquired and liabilities assumed on the acquisition date.
Non-controlling interests are initially measured either at fair value or at the share of the non-controlling participation in the identifiable net assets recognized of the acquired company. The basis of measurement is selected on a transaction-by-transaction basis.
Goodwill is not amortized, but is subject to impairment tests that take place annually or more frequently if there is an indication that the cash-generating unit to which it is allocated (generally a subsidiary) could have suffered a drop in value. Goodwill is expressed in the currency of the subsidiary to which it relates. If the recoverable amount of the cash-generating unit is less than its carrying amount, the loss of value is first charged against any goodwill allocated to this unit, and then to any other assets of the unit in proportion to the carrying amount of each of the assets included in the unit. Goodwill is stated on the balance sheet at cost less impairment. Impairment of goodwill is not reversed in future periods. When a subsidiary is divested from the group, the resulting goodwill and other comprehensive income relating to the subsidiary are taken into account in determining the net gain or loss on disposal.
For companies accounted for by the equity method, the carrying amount of goodwill is included in the carrying amount of this participation.
(2) BADWILL
If, at the acquisition date, the net balance of identifiable assets acquired and liabilities assumed is higher than the sum of the consideration transferred, the non-controlling interests in the acquired company and the fair value of the stake in the acquired company previously owned by the group (if any), the surplus is recognized immediately in the income statement as a profit on an acquisition under favourable conditions.
(H) PROPERTY, PLANT AND EQUIPMENT(1) RECOGNITION AND MEASUREMENT
All property, plant and equipment are only recorded as assets if it is probable that the entity will benefit from future economic benefits, and if their cost can be measured reliably. These criteria are applicable at initial recognition and in relation to subsequent expenditure.
All property, plant and equipment are included in the balance sheet at their historical acquisition cost less accumulated depreciation and impairment losses.
Historical cost includes the original purchase price, borrowing costs incurred during the construction period, and related direct costs (e.g. non recoverable taxes and transport costs). The cost of assets produced by the company includes the cost of materials, direct labour costs and an appropriate proportion of overheads.
(2) SUBSEQUENT EXPENDITURE
Subsequent expenditure is only recorded as assets if it increases the future economic benefits generated by property, plant and equipment. Repairs and maintenance costs, which do not increase the future economic benefits of the asset to which they relate, are recognized as costs when incurred.
151
ANNUAL REPORT
STATEMENT OF NON-FINANCIAL INFORMATION
FINANCIAL STATEMENTS
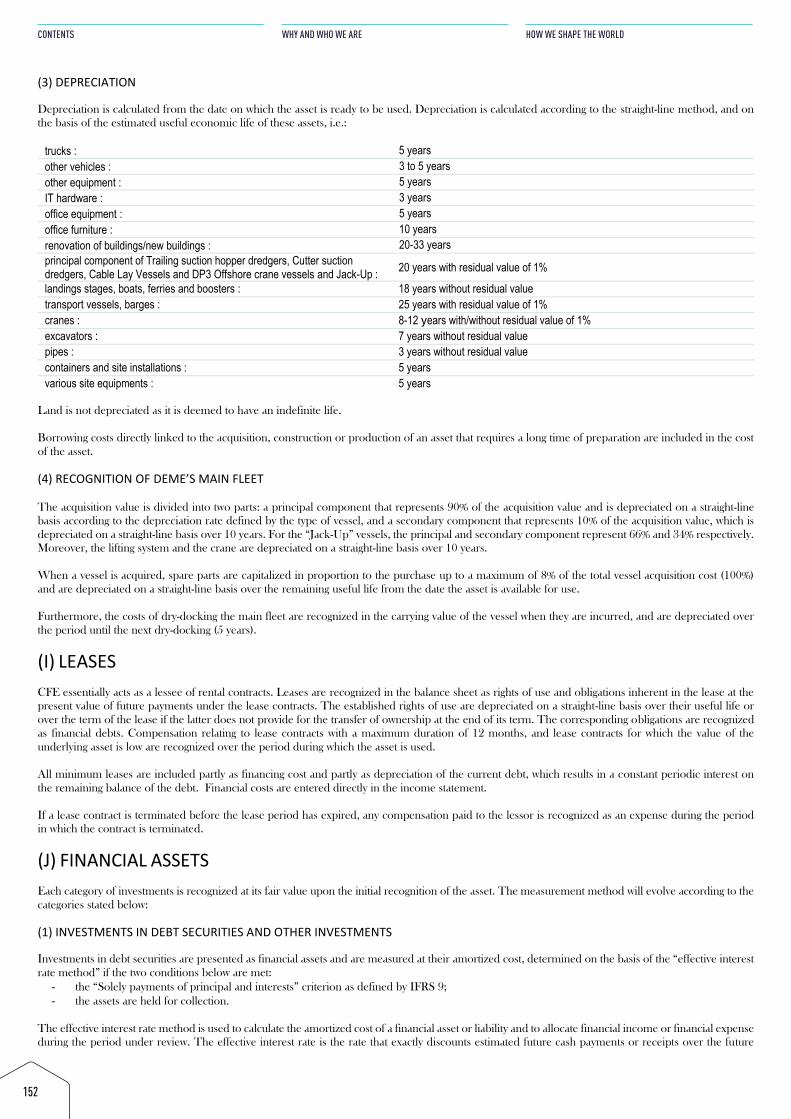
(3) DEPRECIATION
Depreciation is calculated from the date on which the asset is ready to be used. Depreciation is calculated according to the straight-line method, and on the basis of the estimated useful economic life of these assets, i.e.:
trucks : 5 years other vehicles : 3 to 5 years other equipment : 5 years IT hardware : 3 years office equipment : 5 years office furniture : 10 years renovation of buildings/new buildings : 20-33 yearsprincipal component of Trailing suction hopper dredgers, Cutter suction dredgers, Cable Lay Vessels and DP3 Offshore crane vessels and Jack-Up : 20 years with residual value of 1%
landings stages, boats, ferries and boosters : 18 years without residual value transport vessels, barges : 25 years with residual value of 1% cranes : 8-12 years with/without residual value of 1%excavators : 7 years without residual value pipes : 3 years without residual value containers and site installations : 5 years various site equipments : 5 years
Land is not depreciated as it is deemed to have an indefinite life.
Borrowing costs directly linked to the acquisition, construction or production of an asset that requires a long time of preparation are included in the cost of the asset.
(4) RECOGNITION OF DEME’S MAIN FLEET
The acquisition value is divided into two parts: a principal component that represents 90% of the acquisition value and is depreciated on a straight-line basis according to the depreciation rate defined by the type of vessel, and a secondary component that represents 10% of the acquisition value, which is depreciated on a straight-line basis over 10 years. For the “Jack-Up” vessels, the principal and secondary component represent 66% and 34% respectively. Moreover, the lifting system and the crane are depreciated on a straight-line basis over 10 years.
When a vessel is acquired, spare parts are capitalized in proportion to the purchase up to a maximum of 8% of the total vessel acquisition cost (100%) and are depreciated on a straight-line basis over the remaining useful life from the date the asset is available for use.
Furthermore, the costs of dry-docking the main fleet are recognized in the carrying value of the vessel when they are incurred, and are depreciated over the period until the next dry-docking (5 years).
(I) LEASESCFE essentially acts as a lessee of rental contracts. Leases are recognized in the balance sheet as rights of use and obligations inherent in the lease at the present value of future payments under the lease contracts. The established rights of use are depreciated on a straight-line basis over their useful life or over the term of the lease if the latter does not provide for the transfer of ownership at the end of its term. The corresponding obligations are recognized as financial debts. Compensation relating to lease contracts with a maximum duration of 12 months, and lease contracts for which the value of the underlying asset is low are recognized over the period during which the asset is used.
All minimum leases are included partly as financing cost and partly as depreciation of the current debt, which results in a constant periodic interest on the remaining balance of the debt. Financial costs are entered directly in the income statement.
If a lease contract is terminated before the lease period has expired, any compensation paid to the lessor is recognized as an expense during the period in which the contract is terminated.
(J) FINANCIAL ASSETSEach category of investments is recognized at its fair value upon the initial recognition of the asset. The measurement method will evolve according to the categories stated below:
(1) INVESTMENTS IN DEBT SECURITIES AND OTHER INVESTMENTS
Investments in debt securities are presented as financial assets and are measured at their amortized cost, determined on the basis of the “effective interest rate method” if the two conditions below are met:
- the “Solely payments of principal and interests” criterion as defined by IFRS 9;- the assets are held for collection.
The effective interest rate method is used to calculate the amortized cost of a financial asset or liability and to allocate financial income or financial expense during the period under review. The effective interest rate is the rate that exactly discounts estimated future cash payments or receipts over the future
152
CONTENTS
WHY AND WHO WE ARE
HOW WE SHAPE THE WORLD
(3) DEPRECIATION
Depreciation is calculated from the date on which the asset is ready to be used. Depreciation is calculated according to the straight-line method, and on the basis of the estimated useful economic life of these assets, i.e.:
trucks : 5 years other vehicles : 3 to 5 years other equipment : 5 years IT hardware : 3 years office equipment : 5 years office furniture : 10 years renovation of buildings/new buildings : 20-33 yearsprincipal component of Trailing suction hopper dredgers, Cutter suction dredgers, Cable Lay Vessels and DP3 Offshore crane vessels and Jack-Up : 20 years with residual value of 1%
landings stages, boats, ferries and boosters : 18 years without residual value transport vessels, barges : 25 years with residual value of 1% cranes : 8-12 years with/without residual value of 1%excavators : 7 years without residual value pipes : 3 years without residual value containers and site installations : 5 years various site equipments : 5 years
Land is not depreciated as it is deemed to have an indefinite life.
Borrowing costs directly linked to the acquisition, construction or production of an asset that requires a long time of preparation are included in the cost of the asset.
(4) RECOGNITION OF DEME’S MAIN FLEET
The acquisition value is divided into two parts: a principal component that represents 90% of the acquisition value and is depreciated on a straight-line basis according to the depreciation rate defined by the type of vessel, and a secondary component that represents 10% of the acquisition value, which is depreciated on a straight-line basis over 10 years. For the “Jack-Up” vessels, the principal and secondary component represent 66% and 34% respectively. Moreover, the lifting system and the crane are depreciated on a straight-line basis over 10 years.
When a vessel is acquired, spare parts are capitalized in proportion to the purchase up to a maximum of 8% of the total vessel acquisition cost (100%) and are depreciated on a straight-line basis over the remaining useful life from the date the asset is available for use.
Furthermore, the costs of dry-docking the main fleet are recognized in the carrying value of the vessel when they are incurred, and are depreciated over the period until the next dry-docking (5 years).
(I) LEASESCFE essentially acts as a lessee of rental contracts. Leases are recognized in the balance sheet as rights of use and obligations inherent in the lease at the present value of future payments under the lease contracts. The established rights of use are depreciated on a straight-line basis over their useful life or over the term of the lease if the latter does not provide for the transfer of ownership at the end of its term. The corresponding obligations are recognized as financial debts. Compensation relating to lease contracts with a maximum duration of 12 months, and lease contracts for which the value of the underlying asset is low are recognized over the period during which the asset is used.
All minimum leases are included partly as financing cost and partly as depreciation of the current debt, which results in a constant periodic interest on the remaining balance of the debt. Financial costs are entered directly in the income statement.
If a lease contract is terminated before the lease period has expired, any compensation paid to the lessor is recognized as an expense during the period in which the contract is terminated.
(J) FINANCIAL ASSETSEach category of investments is recognized at its fair value upon the initial recognition of the asset. The measurement method will evolve according to the categories stated below:
(1) INVESTMENTS IN DEBT SECURITIES AND OTHER INVESTMENTS
Investments in debt securities are presented as financial assets and are measured at their amortized cost, determined on the basis of the “effective interest rate method” if the two conditions below are met:
- the “Solely payments of principal and interests” criterion as defined by IFRS 9;- the assets are held for collection.
The effective interest rate method is used to calculate the amortized cost of a financial asset or liability and to allocate financial income or financial expense during the period under review. The effective interest rate is the rate that exactly discounts estimated future cash payments or receipts over the future
expected life of the financial instrument or, where appropriate, over a shorter period, in order to obtain the net book value of the financial asset or liability. Profit or loss is recognized in the income statement. Impairment losses are recognized in the income statement.
(2) TRADE RECEIVABLES
We refer to paragraph (L).
(3) FINANCIAL ASSETS DESIGNATED AT FAIR VALUE THROUGH PROFIT AND LOSS
Derivative instruments are recognized at fair value through the income statement, unless there is documentation of hedge accounting (see paragraph X).
(K) INVENTORIESInventories are measured at weighted average cost or at net realisable value, if the latter is lower.
The cost of finished products and work in progress comprises raw materials, other production materials, direct labour, other direct costs, borrowing costs incurred where the product requires a long period of construction, and an allocation of fixed and variable production overheads based on the normal capacity of production facilities.
The net realisable value is the estimated selling price in the normal course of business, less estimated completion costs and costs necessary to complete the sale.
(L) TRADE RECEIVABLESCurrent trade receivables are measured at amortized cost, which is generally identical to their nominal value less any impairment losses. The measurement of financial assets is made on the basis of the estimated loss model, which requires taking the discounted value of the estimated losses into account if the debtor proves to be in default. The estimated losses are calculated on the basis of the weighted average of the losses to be incurred according to several occurrence scenarios. This analysis is carried out on a case-by-case basis for project.
(M) CASH AND CASH EQUIVALENTSCash and cash equivalents include cash and term deposits with an original maturity date of less than three months.
(N) IMPAIRMENT OF NON-FINANCIAL ASSETSThe carrying amounts of non-current assets (with the exception of financial assets that fall within the scope of IFRS 9, deferred taxes and non-current assets held for sale) are reviewed at each closing date to determine whether there is any indication that an asset has lost value. If any such indication exists, the asset’s recoverable amount is estimated. For intangible assets with an indefinite useful life and goodwill, the recoverable amount is estimated at each closing date. An impairment loss is recognized whenever the carrying amount of an asset or its cash-generating unit exceeds its recoverable amount. Impairment losses are recognized in the income statement.
(1) ESTIMATES OF RECOVERABLE AMOUNTS
The recoverable amount of non-financial assets is the greater of the fair value less costs for selling the asset and its value in use. Value in use is the present value of estimated future cash flows.
In order to determine the value in use, estimated future cash flows are discounted using a pre-tax interest rate that reflects both current market interest rates and risks specific to the asset.
For assets that do not generate cash flows themselves, the recoverable amount is determined for the cash-generating unit to which the assets belong.
(2) REVERSAL OF IMPAIRMENT
With the exception of goodwill for which impairment losses are never reversed, impairments on non-financial assets are only reversed if there has been a change in the estimates used to determine the recoverable amount.
An asset impairment can only be reversed to the extent that the asset’s carrying amount, which has increased after the reversal of an impairment loss, does not exceed the net carrying amount of the amortisation that would have been determined, if no amortisation would have been recognized for this asset.
153
ANNUAL REPORT
STATEMENT OF NON-FINANCIAL INFORMATION
FINANCIAL STATEMENTS
(O) SHARE CAPITALPURCHASE OF OWN SHARES
If CFE shares are bought back by the company or a company of the CFE group, the amount paid, including costs directly attributable to their acquisition, is recognized as a deduction from equity. The proceeds from the sale of shares are directly included in total equity, with no impact on the income statement.
(P) PROVISIONSProvisions are made if the company has a legal or an implicit obligation as a result of events that have occurred in the past, if it is probable that an outflow of resources generating economic benefits will be required to settle the obligation, and if the amount of the obligation can be reliably estimated.
The amount recorded as provision corresponds to the best estimate of the necessary expenditure to settle the current obligation at the balance sheet date. This estimate is obtained by using a pre-tax interest rate that reflects both the current market assessments and the specific debt risks.
Provisions for restructuring are made if the company has approved a detailed and formal restructuring plan, and the restructuring has either started or has been announced publicly. Provisions are not set aside for costs that relate to the company's normal activities.
Current provisions are provisions directly linked to each business line’s own operating cycle, whatever the expected time of settlement of the obligation.
Provisions for after-sales service cover the obligations of the entities of the CFE group within the framework of the statutory guarantees relating to completed projects. They are estimated statistically on the basis of expenses incurred in previous years or individually on the basis of specifically identified problems. Provisions for after-sales services are provided from the start of the work.
A provision for onerous contracts is made if the expected economic benefits from a contract are lower than the inevitable costs of meeting the obligations of the contract.
Provisions for litigation with regard to activities mainly relate to disputes with customers, subcontractors, co-contractors or suppliers. Other provisions for current risks mainly consist of provisions for delay penalties and other risks related to operations.
Non-current provisions correspond to provisions not directly linked to the operating cycle and whose maturity generally exceeds one year.
(Q) EMPLOYEE BENEFITS(1) POST-EMPLOYMENT BENEFITS
Post-employment benefits include pension plans and life insurance.
The company operates a number of defined-benefit and defined-contribution pension plans throughout the world.
In Belgium, some pension schemes based on defined contribution plans are subject to a minimum guaranteed return by the employer and are therefore qualified as defined benefit plans.
The assets of these plans are generally held by separate institutions and are generally financed through contributions from the subsidiaries concerned and from employees. These contributions are determined on the basis of recommendations from independent actuaries.
Post-employment benefits are either funded or non-funded.
aa)) DDeeffiinneedd ccoonnttrriibbuuttiioonnss ppllaannss
Contributions to these pension plans are recognized as an expense in the income statement when incurred.
bb)) DDeeffiinneedd bbeenneeffiittss ppllaannss
For these pension plans, costs are estimated separately for each plan using the projected unit credit method. The projected unit credit method considers each period of service as giving rise to an additional unit of benefit entitlement and measures each unit separately.
Under this method, the cost of providing pensions is charged to the income statement so as to spread the cost evenly over the remaining careers of employees covered by the plan, in accordance with the advice of actuaries who carry out a full assessment of these plans every year. The amounts charged to the income statement consist of current service cost, interest cost, the expected return on plan assets and past service cost.
The pension obligations recognized on the balance sheet are measured as the present value of the estimated future cash outflows, discounted at a rate corresponding to the yield on high-quality corporate bonds with a maturity similar to that of the pension obligations, less any unrecognized past service costs and the fair value of plan assets.
Actuarial gains and losses are calculated separately for each defined-benefit plan. Actuarial gains and losses comprise the effects of differences between actuarial assumptions and actual figures, and the effects of changes in actuarial assumptions. Actuarial gains and losses on commitments or assets related to post-employment benefits and resulting from adjustments based on experience and/or
154
CONTENTS
WHY AND WHO WE ARE
HOW WE SHAPE THE WORLD
(O) SHARE CAPITALPURCHASE OF OWN SHARES
If CFE shares are bought back by the company or a company of the CFE group, the amount paid, including costs directly attributable to their acquisition, is recognized as a deduction from equity. The proceeds from the sale of shares are directly included in total equity, with no impact on the income statement.
(P) PROVISIONSProvisions are made if the company has a legal or an implicit obligation as a result of events that have occurred in the past, if it is probable that an outflow of resources generating economic benefits will be required to settle the obligation, and if the amount of the obligation can be reliably estimated.
The amount recorded as provision corresponds to the best estimate of the necessary expenditure to settle the current obligation at the balance sheet date. This estimate is obtained by using a pre-tax interest rate that reflects both the current market assessments and the specific debt risks.
Provisions for restructuring are made if the company has approved a detailed and formal restructuring plan, and the restructuring has either started or has been announced publicly. Provisions are not set aside for costs that relate to the company's normal activities.
Current provisions are provisions directly linked to each business line’s own operating cycle, whatever the expected time of settlement of the obligation.
Provisions for after-sales service cover the obligations of the entities of the CFE group within the framework of the statutory guarantees relating to completed projects. They are estimated statistically on the basis of expenses incurred in previous years or individually on the basis of specifically identified problems. Provisions for after-sales services are provided from the start of the work.
A provision for onerous contracts is made if the expected economic benefits from a contract are lower than the inevitable costs of meeting the obligations of the contract.
Provisions for litigation with regard to activities mainly relate to disputes with customers, subcontractors, co-contractors or suppliers. Other provisions for current risks mainly consist of provisions for delay penalties and other risks related to operations.
Non-current provisions correspond to provisions not directly linked to the operating cycle and whose maturity generally exceeds one year.
(Q) EMPLOYEE BENEFITS(1) POST-EMPLOYMENT BENEFITS
Post-employment benefits include pension plans and life insurance.
The company operates a number of defined-benefit and defined-contribution pension plans throughout the world.
In Belgium, some pension schemes based on defined contribution plans are subject to a minimum guaranteed return by the employer and are therefore qualified as defined benefit plans.
The assets of these plans are generally held by separate institutions and are generally financed through contributions from the subsidiaries concerned and from employees. These contributions are determined on the basis of recommendations from independent actuaries.
Post-employment benefits are either funded or non-funded.
aa)) DDeeffiinneedd ccoonnttrriibbuuttiioonnss ppllaannss
Contributions to these pension plans are recognized as an expense in the income statement when incurred.
bb)) DDeeffiinneedd bbeenneeffiittss ppllaannss
For these pension plans, costs are estimated separately for each plan using the projected unit credit method. The projected unit credit method considers each period of service as giving rise to an additional unit of benefit entitlement and measures each unit separately.
Under this method, the cost of providing pensions is charged to the income statement so as to spread the cost evenly over the remaining careers of employees covered by the plan, in accordance with the advice of actuaries who carry out a full assessment of these plans every year. The amounts charged to the income statement consist of current service cost, interest cost, the expected return on plan assets and past service cost.
The pension obligations recognized on the balance sheet are measured as the present value of the estimated future cash outflows, discounted at a rate corresponding to the yield on high-quality corporate bonds with a maturity similar to that of the pension obligations, less any unrecognized past service costs and the fair value of plan assets.
Actuarial gains and losses are calculated separately for each defined-benefit plan. Actuarial gains and losses comprise the effects of differences between actuarial assumptions and actual figures, and the effects of changes in actuarial assumptions. Actuarial gains and losses on commitments or assets related to post-employment benefits and resulting from adjustments based on experience and/or
changes in actuarial assumptions are recognized in ‘other items’ of the comprehensive income statement in the period in which they arise, and are the object of a separate reserve in equity. These differences and the changes in the recognized asset limit are presented in the comprehensive statement of income.
Interest expenses resulting from the accretion effect relating to pension obligations and similar liabilities, and financial income resulting from the expected return on plan assets, are recognized in the income statement under financial items.
The introduction of or changes to a new post-employment benefit plan or other long-term plans may increase the present value of the obligation with respect to defined-benefit plans for services rendered in previous periods, i.e. the past service cost. The past service cost related to post-employment benefit plans is recognized in income on a straight-line basis over the average period until the related benefits are received by employees. Benefits received after the adoption of or changes to a post-employment benefit plan, and past service costs relating to other long-term benefits, are immediately taken to income.
Actuarial calculations related to post-employment obligations and other long-term benefits are carried out by independent actuaries.
(2) BONUS
Bonuses granted to company employees and senior executives are based on targets relating to key financial indicators. The estimated amount of bonuses is recognized as an expense in the year to which they relate.
(R) FINANCIAL LIABILITIES(1) LIABILITIES AT AMORTIZED COST
Interest-bearing borrowings are recognized at their fair amount less attributable transaction costs. Any difference between this net amount (after transaction costs) and repayment value is recognized in the income statement over the life of the loan, using the effective interest-rate method. See paragraph J (2) for the definition of this method.
(2) FINANCIAL LIABILITIES DESIGNATED AT FAIR VALUE THROUGH PROFIT AND LOSS
Derivative instruments are recognized at fair value through the income statement, unless there is documentation of hedge accounting (see paragraph X).
(S) TRADE AND OTHER PAYABLESTrade and other current payables are recognized at amortized cost.
(T) INCOME TAXESIncome tax for the financial year comprises current and deferred tax. Income tax is recognized in the income statement, except to the extent that it relates to items recognized directly in equity or in other items of the comprehensive income. In this case, deferred tax is also recognized in these items.
Current tax is the expected tax payable on the taxable income for the past year, as well as any adjustment to taxes paid or payable with regard to previous years. It is calculated using the valid tax rates at the balance sheet date.
Deferred tax is calculated using the liability method for all temporary differences arising between the tax bases of assets and liabilities and their carrying amounts. The applicable tax rates at the closing date are used to calculate deferred tax assets and liabilities.
Under this method, the company is required to make a provision for deferred taxes for the difference between the fair value of the net assets acquired and their tax base, in the event of a business combination.
The following temporary differences are not taken into account: non-deductible goodwill, the initial recognition of assets or liabilities that do not affect accounting profit or taxable profit, and differences relating to participations in subsidiaries to the extent that they will probably not reverse in the foreseeable future.
A deferred tax asset is only recognized to the extent that it is probable that future taxable profit will be available to offset the tax advantage. A deferred tax asset is reduced to the extent that it is no longer likely that the related tax benefit will be realised.
IFRIC 23, which became effective on 1 January 2019, clarifies how to apply recognition and measurement requirements for income taxes when there is uncertainty about the tax treatment for current or deferred taxes. Whether or not a particular tax treatment in tax law is acceptable may not be known until the competent tax authority or a court makes a decision in the future. In assessing whether and how uncertain tax treatment affects how taxable income is determined, the Group assumes that a tax authority will review the amounts it is entitled to review and that it has full knowledge of all related information in conducting such reviews. If the Group concludes that it is likely that the tax authority will accept uncertain tax treatment, it determines the taxable income based on the tax treatment used or expected to be used in its tax returns. If the Group concludes that it is not likely that a tax authority will accept uncertain tax treatment, it reflects the effect of the uncertainty in determining its accounting tax position. If the possible outcomes are binary or concentrated on a single value, the uncertain tax position is measured using the most likely amount. If there is a range of possible outcomes that are neither binary nor concentrated on a single value, the sum of the weighted amounts within a range of possible outcomes may better predict the resolution of the uncertainty.
155
ANNUAL REPORT
STATEMENT OF NON-FINANCIAL INFORMATION
FINANCIAL STATEMENTS
(U) REVENUE FROM CONSTRUCTION AND SERVICE CONTRACTSIf the profit and loss that result from a construction contract can be estimated reliably, contract revenue and expenses, including borrowing costs incurred if the contract exceeds the accounting period, are recognized in the income statement over time, in proportion to the contract's percentage of completion at the closing date. The percentage of completion is calculated as the proportion between the contract costs at the closing date and the total estimated contract costs. Most of the income is gradually recognized if one of the following criteria is met:
- the customer simultaneously receives and consumes the benefits generated by the service provided by the company as it is implemented;
- the service provided by the company creates or enhances an asset over which the customer obtains control progressively as it is being created orenhanced;
- the service provided by the company creates an asset without possible alternative use by the company, and the latter has an enforceable right topayment for the service completed to date.
(1) CONTRACT COSTS
Contract costs are recognized as an expense in the income statement for the financial year in which the services to which they relate are provided, and the incurred costs that relate to future contract activities are capitalized if the entity is expecting to recover them. A correction will be made for the cost of equipment that has been purchased but not yet manufactured, or that is being manufactured, at the reporting date. In the event that the forecast at the completion of the construction work shows a deficit, the expected loss on completion is immediately recognized as an expense.
(2) CONTRACT REVENUE
Revenue from a construction contract includes the revenue initially defined in the contract, as well as any modifications to the work specified in the contract, claims and performance bonuses to the extent that it is highly probable that there will be no significant reversal in the cumulative recognized revenue when the uncertainty associated with the variable components is subsequently resolved. If the outcome of a construction contract cannot be reliably estimated, contract revenue is recognized to the extent that the contract costs incurred are likely to be recovered.
The transaction price is determined as the fair value of the consideration that the company is expecting to receive, and it is allocated to the performance obligation based on stand-alone selling prices. Stand-alone selling prices are estimated according to the estimated costs.
A modification to the contract may lead to an increase or decrease in the transaction price. It relates to an instruction from the customer with regard to the scope of the work defined by the contract. In applying this principle, performance bonuses and claims are generally considered to be included in the transaction price only if an agreement has been made with the customer. The most common variable components, such as the steel price, fuel consumption or modifications in the design price should only be included in the transaction price if it is highly probable that there will be no subsequent significant downward adjustment to the recognized revenues.
Performance bonuses constitute a part of the contract revenue if the contract's percentage of completion indicates that the specified performance level will actually be reached or exceeded, and the amount of the performance bonus can be reliably determined.
(3) CONTRACT BALANCES
A contract asset is the entity's right to a consideration in exchange for the transfer of the goods or services to a customer. If the entity provides goods or services to a customer before the customer has paid for the consideration, or before the consideration is due, a contract asset is recognized for the contingent consideration acquired.
A contract liability is the entity's obligation to transfer goods or services to a customer, for which the group has received a consideration prior to the transfer of goods or services to that customer. A contract liability is recognized when the consideration is received in advance, or when the payment is due (whichever is earlier). Contract liabilities are recognized as revenue when the entity has completed the contract.
(4) COSTS TO WIN OR IMPLEMENT A CONTRACT
CFE has assessed that the cost of winning a contract (e.g. commissions paid), as well as the related costs of completion that are not covered by a specific IFRS standard (e.g. mobilisation costs), which should normally be capitalized as defined in IFRS 15 if they meet certain specific criteria, have no significant impact on the recognition of revenues and margins of projects. As such, these costs of winning or implementing a contract are not recognized separately in accordance with IFRS 15, but are included in the recognition of the project and therefore recognized when they are incurred.
(5) SPECIFIC CONSIDERATIONS RELATING TO REVENUE BY SEGMENT
aa)) RReevveennuuee ooff DDEEMMEE ((ddiissccoonnttiinnuueedd ooppeerraattiioonnss))
DEME’s activities include dredging, land reclamation, maritime civil engineering, services to offshore oil and gas companies, and activities in renewable energies. The revenue generated by most of the construction and service contracts is recognized as a single performance obligation, the realisation of which is progressive. The group has assessed that revenues from construction and service contracts should be recognized according to the percentage of completion, using a cost-based method. As such, the model provides for the recognition of revenues according to the percentage of completion of the performance obligation, which corresponds to the transfer of control of the goods or services to a customer.
Costs and revenues are recognized according to the percentage of completion of the contract to be realised at the end of the period, measured as the committed share of the contract costs for the realisation of the contract to date, taking into account the total estimated costs, except in the case where this would not be representative of the percentage of completion. A correction will be made for the cost of equipment that has been purchased but not yet manufactured, or that is being manufactured, at the reporting date.
156
CONTENTS
WHY AND WHO WE ARE
HOW WE SHAPE THE WORLD
(U) REVENUE FROM CONSTRUCTION AND SERVICE CONTRACTSIf the profit and loss that result from a construction contract can be estimated reliably, contract revenue and expenses, including borrowing costs incurred if the contract exceeds the accounting period, are recognized in the income statement over time, in proportion to the contract's percentage of completion at the closing date. The percentage of completion is calculated as the proportion between the contract costs at the closing date and the total estimated contract costs. Most of the income is gradually recognized if one of the following criteria is met:
- the customer simultaneously receives and consumes the benefits generated by the service provided by the company as it is implemented;
- the service provided by the company creates or enhances an asset over which the customer obtains control progressively as it is being created orenhanced;
- the service provided by the company creates an asset without possible alternative use by the company, and the latter has an enforceable right topayment for the service completed to date.
(1) CONTRACT COSTS
Contract costs are recognized as an expense in the income statement for the financial year in which the services to which they relate are provided, and the incurred costs that relate to future contract activities are capitalized if the entity is expecting to recover them. A correction will be made for the cost of equipment that has been purchased but not yet manufactured, or that is being manufactured, at the reporting date. In the event that the forecast at the completion of the construction work shows a deficit, the expected loss on completion is immediately recognized as an expense.
(2) CONTRACT REVENUE
Revenue from a construction contract includes the revenue initially defined in the contract, as well as any modifications to the work specified in the contract, claims and performance bonuses to the extent that it is highly probable that there will be no significant reversal in the cumulative recognized revenue when the uncertainty associated with the variable components is subsequently resolved. If the outcome of a construction contract cannot be reliably estimated, contract revenue is recognized to the extent that the contract costs incurred are likely to be recovered.
The transaction price is determined as the fair value of the consideration that the company is expecting to receive, and it is allocated to the performance obligation based on stand-alone selling prices. Stand-alone selling prices are estimated according to the estimated costs.
A modification to the contract may lead to an increase or decrease in the transaction price. It relates to an instruction from the customer with regard to the scope of the work defined by the contract. In applying this principle, performance bonuses and claims are generally considered to be included in the transaction price only if an agreement has been made with the customer. The most common variable components, such as the steel price, fuel consumption or modifications in the design price should only be included in the transaction price if it is highly probable that there will be no subsequent significant downward adjustment to the recognized revenues.
Performance bonuses constitute a part of the contract revenue if the contract's percentage of completion indicates that the specified performance level will actually be reached or exceeded, and the amount of the performance bonus can be reliably determined.
(3) CONTRACT BALANCES
A contract asset is the entity's right to a consideration in exchange for the transfer of the goods or services to a customer. If the entity provides goods or services to a customer before the customer has paid for the consideration, or before the consideration is due, a contract asset is recognized for the contingent consideration acquired.
A contract liability is the entity's obligation to transfer goods or services to a customer, for which the group has received a consideration prior to the transfer of goods or services to that customer. A contract liability is recognized when the consideration is received in advance, or when the payment is due (whichever is earlier). Contract liabilities are recognized as revenue when the entity has completed the contract.
(4) COSTS TO WIN OR IMPLEMENT A CONTRACT
CFE has assessed that the cost of winning a contract (e.g. commissions paid), as well as the related costs of completion that are not covered by a specific IFRS standard (e.g. mobilisation costs), which should normally be capitalized as defined in IFRS 15 if they meet certain specific criteria, have no significant impact on the recognition of revenues and margins of projects. As such, these costs of winning or implementing a contract are not recognized separately in accordance with IFRS 15, but are included in the recognition of the project and therefore recognized when they are incurred.
(5) SPECIFIC CONSIDERATIONS RELATING TO REVENUE BY SEGMENT
aa)) RReevveennuuee ooff DDEEMMEE ((ddiissccoonnttiinnuueedd ooppeerraattiioonnss))
DEME’s activities include dredging, land reclamation, maritime civil engineering, services to offshore oil and gas companies, and activities in renewable energies. The revenue generated by most of the construction and service contracts is recognized as a single performance obligation, the realisation of which is progressive. The group has assessed that revenues from construction and service contracts should be recognized according to the percentage of completion, using a cost-based method. As such, the model provides for the recognition of revenues according to the percentage of completion of the performance obligation, which corresponds to the transfer of control of the goods or services to a customer.
Costs and revenues are recognized according to the percentage of completion of the contract to be realised at the end of the period, measured as the committed share of the contract costs for the realisation of the contract to date, taking into account the total estimated costs, except in the case where this would not be representative of the percentage of completion. A correction will be made for the cost of equipment that has been purchased but not yet manufactured, or that is being manufactured, at the reporting date.
In the event that the contract includes several distinct performance obligations, the group allocates the overall price of the contract to each performance obligation in accordance with the provisions of IFRS 15. For a limited number of EPCI contracts in the DEME division (offshore wind farms), multiple performance obligations have been identified. Those performance obligations relate to procurement activities and transport and installation activities.
bb)) RReevveennuuee ffrroomm ccoonnssttrruuccttiioonn ccoonnttrraaccttss
CFE is responsible for the overall management of a project in which various goods and services are included, such as demolition, earthworks, soil remediation, foundation work, procurement of materials, construction of the shell and facades, installation of technical facilities (electricity, HVAC, etc.), and the finishing works. The performance obligations aimed at transferring goods and services are not treated separately in the context of the contract, as the entity provides a significant service of integrating goods and services (the inputs) into the building (the combined output) for which the customer has concluded a contract. This is why the goods and services are not treated separately. The entity recognises all the goods and services under the contract as one and the same performance obligation. Revenues from construction contracts are recognized according to the percentage of completion using the cost-based method, i.e., according to the share of the contract costs incurred for its completion to date relative to the total estimated costs. To the extent that the contract explicitly identifies each unit individually, and the customer can benefit from each unit individually, the construction of each unit should be considered as a separate performance obligation, and revenues are recognized separately for each performance obligation. For some contracts, mainly in the multitechnics division, the installation and execution works cover a very short period of time. For such contracts, revenue is recognized at the exact moment that the work is completed.
cc)) DDeevveellooppmmeenntt ooff rreessiiddeennttiiaall bbuuiillddiinnggss
CFE is responsible for the overall management of real estate projects in which several building blocks under construction (or to be constructed) are sold to the customers. Taking into account the local regulator that governs the transfer of ownership to the end customer, the performance obligation is satisfied progressively or at a specific point in time. Revenue is recognized when the material risks and rewards of ownership have been substantially transferred to the buyer, and no uncertainty remains regarding the recovery of the amounts due, the associated costs or the possible return of goods.
In so-called mixed projects, and in particular real estate developments including residential, office and/or retail units, they will be subdivided in one or more performance obligations, depending on whether the different units that are developed are separate or not within the meaning of the IFRS 15 standard. Moreover, depending on the contractual framework, the development of the project and the monitoring of its construction will be considered as either a single performance obligation or as two separate obligations.
The income is recognized when each performance obligation, taken individually, is satisfied, i.e.:
- if the local regulator makes the ownership of the construction gradually transferable throughout the execution of the construction work, and if thegroup is contractually restricted from redirecting the properties to other customers, and has an enforceable right to payment for the work carriedout, the revenue from the construction of these residential properties will therefore be gradually recognized according to the cost-based method,i.e. based on the share of contract costs incurred for its realisation to date relative to the estimated total costs, and according to the degree ofownership transferred at the closing date;
- if the legislator provides that the transfer of risks and benefits, as well as the right to enforceable payment, is only established when the residentialunit is fully built and delivered, revenue is only recognized at a specific time, i.e. upon the signing of the notarial deed or the transfer protocolbetween CFE and the end customer.
If the development of a project and the monitoring of its construction are considered as two separate obligations, the income relating to the development of the project will generally be recognized at a specific time when it is sold, and the income relating to the monitoring of the construction will be recognized as a percentage of completion, as previously explained.
(V) OTHER REVENUES(1) RENTAL INCOME AND FEES
Rental income and costs are recognized on a straight-line basis over the term of the lease.
(2) PUBLIC GRANTS
An income-related grant is initially recognized as deferred income in the consolidated statement of financial position if there is a strong assumption that the income will be received and that the company will comply with the conditions attached to it. These grants are systematically recognized as other income from operational activities in the income statement over the same period during which these expenses are covered by the grant.
Capital grants that compensate the company for the cost of an asset are systematically recognized as a deduction in the cost of these fixed assets. They are recognized at their expected value on the date of initial recognition in the consolidated statement of financial position, and as a deduction from the depreciation cost of the underlying asset over its useful life in the income statement.
157
ANNUAL REPORT
STATEMENT OF NON-FINANCIAL INFORMATION
FINANCIAL STATEMENTS
(W) EXPENSES(1) FINANCIAL EXPENSES
Financial expenses comprise interest payable on borrowings, foreign exchange losses, and losses on hedging instruments that are recognized in the income statement.
All interest and other costs incurred in connection with borrowings, except those that were eligible for capitalisation, are recognized in the income statement as financial expenses. Interest costs relating to lease contracts are recognized in the income statement using the effective interest rate method.
(2) COSTS FOR RESEARCH AND DEVELOPMENT, ADVERTISING AND PROMOTIONAL COSTS AND COSTS RELATING TO THEDEVELOPMENT OF IT SYSTEMS
Research, advertising and promotional costs are recognized in the income statement of the financial year in which they were incurred. Development costs and development costs for IT systems are recognized as an expense when they are incurred if they do not meet the criteria for intangible assets.
(X) HEDGE ACCOUNTINGThe company uses derivative financial instruments primarily to reduce exposure to adverse fluctuations in interest rates, foreign exchange rates, commodity prices and other market risks. The company’s policy prohibits the use of such instruments for speculation purposes.
The company does not hold or issue financial instruments for trading purposes. Derivatives that do not qualify as hedging instruments under the IFRS 9 standard, however, are presented as instruments held for trading.
Derivative financial instruments are initially measured at their fair value. Subsequent to initial recognition, derivative financial instruments are measured at their fair value. Recognition of any resulting unrealised gain or loss depends on the nature of the derivative and the effectiveness of the hedge.
The fair value of interest rate swaps is the estimated value that the company would receive or pay when exercising the swap at the closing date, taking current interest rate curves and the solvency of the counterparty of the swap into account. The fair value of a forward exchange contract is the quoted value at the closing date, i.e. the current value of the quoted forward price.
Hedge accounting is applicable if the conditions of the IFRS 9 standard are met: - the hedging relationship must be clearly designated and documented on the date the hedging instrument is put in place;- the economic link between the hedged item and the hedging instrument must be documented, as well as the potential sources of inefficiency;- the retrospective ineffectiveness must be measured at each closing;- the hedging relationship consists only of eligible hedging instruments and eligible hedged items;- the hedge ratio of the hedging relationship is consistent with that resulting from the quantity of the hedged item that is actually hedged by the entity,
and the quantity of the hedging instrument that the entity actually uses to hedge that quantity of the hedged item.
Changes in the fair value from one period to another are recognized differently depending on the accounting qualification of the instrument.
(1) CASH-FLOW HEDGES
Where a derivative financial instrument hedges variations in the cash flow of a recognized liability, a firm commitment or an expected transaction of the company, the effective part of any profit or loss resulting from the derivative financial instrument is recognized directly in other items of the comprehensive income statement and is the object of a reserve that is separate from equity.
If the firm commitment or the expected future transaction leads to the recognition of a non-financial asset or liability, the cumulative profits or losses are extracted from the ‘equity’ heading and are included in the initial assessment of the value of the asset or liability.
Otherwise, the cumulative profits or losses are extracted from the ‘equity’ heading and recognized in the income statement at the same time as the hedged transaction.
The non-effective portion of the profit or loss on the financial instrument is recognized in the income statement. Profits or losses arising from the temporary value of the financial derivative instrument are recognized in the income statement.
If a hedging instrument or a hedging relationship has expired, but the hedged transaction has yet to take place, the cumulative unrealised profit or loss at that time remains under the ‘equity’ heading and is recognized according to the principle explained above at the time the transaction takes place.
If the hedged transaction is not expected to take place, the cumulative unrealised profit or loss recognized under ‘equity’ is immediately recognized in the income statement.
(2) FAIR VALUE HEDGES
For any derivative financial instrument hedging variations in the fair value of a recognized receivable or debt, any profit or loss resulting from the remeasurement of the hedging instrument is recognized in the income statement. The value of the hedged item is also measured at the fair value attributable to the hedged risk. The related loss or profit is recognized in the income statement.
158
CONTENTS
WHY AND WHO WE ARE
HOW WE SHAPE THE WORLD
(W) EXPENSES(1) FINANCIAL EXPENSES
Financial expenses comprise interest payable on borrowings, foreign exchange losses, and losses on hedging instruments that are recognized in the income statement.
All interest and other costs incurred in connection with borrowings, except those that were eligible for capitalisation, are recognized in the income statement as financial expenses. Interest costs relating to lease contracts are recognized in the income statement using the effective interest rate method.
(2) COSTS FOR RESEARCH AND DEVELOPMENT, ADVERTISING AND PROMOTIONAL COSTS AND COSTS RELATING TO THEDEVELOPMENT OF IT SYSTEMS
Research, advertising and promotional costs are recognized in the income statement of the financial year in which they were incurred. Development costs and development costs for IT systems are recognized as an expense when they are incurred if they do not meet the criteria for intangible assets.
(X) HEDGE ACCOUNTINGThe company uses derivative financial instruments primarily to reduce exposure to adverse fluctuations in interest rates, foreign exchange rates, commodity prices and other market risks. The company’s policy prohibits the use of such instruments for speculation purposes.
The company does not hold or issue financial instruments for trading purposes. Derivatives that do not qualify as hedging instruments under the IFRS 9 standard, however, are presented as instruments held for trading.
Derivative financial instruments are initially measured at their fair value. Subsequent to initial recognition, derivative financial instruments are measured at their fair value. Recognition of any resulting unrealised gain or loss depends on the nature of the derivative and the effectiveness of the hedge.
The fair value of interest rate swaps is the estimated value that the company would receive or pay when exercising the swap at the closing date, taking current interest rate curves and the solvency of the counterparty of the swap into account. The fair value of a forward exchange contract is the quoted value at the closing date, i.e. the current value of the quoted forward price.
Hedge accounting is applicable if the conditions of the IFRS 9 standard are met: - the hedging relationship must be clearly designated and documented on the date the hedging instrument is put in place;- the economic link between the hedged item and the hedging instrument must be documented, as well as the potential sources of inefficiency;- the retrospective ineffectiveness must be measured at each closing;- the hedging relationship consists only of eligible hedging instruments and eligible hedged items;- the hedge ratio of the hedging relationship is consistent with that resulting from the quantity of the hedged item that is actually hedged by the entity,
and the quantity of the hedging instrument that the entity actually uses to hedge that quantity of the hedged item.
Changes in the fair value from one period to another are recognized differently depending on the accounting qualification of the instrument.
(1) CASH-FLOW HEDGES
Where a derivative financial instrument hedges variations in the cash flow of a recognized liability, a firm commitment or an expected transaction of the company, the effective part of any profit or loss resulting from the derivative financial instrument is recognized directly in other items of the comprehensive income statement and is the object of a reserve that is separate from equity.
If the firm commitment or the expected future transaction leads to the recognition of a non-financial asset or liability, the cumulative profits or losses are extracted from the ‘equity’ heading and are included in the initial assessment of the value of the asset or liability.
Otherwise, the cumulative profits or losses are extracted from the ‘equity’ heading and recognized in the income statement at the same time as the hedged transaction.
The non-effective portion of the profit or loss on the financial instrument is recognized in the income statement. Profits or losses arising from the temporary value of the financial derivative instrument are recognized in the income statement.
If a hedging instrument or a hedging relationship has expired, but the hedged transaction has yet to take place, the cumulative unrealised profit or loss at that time remains under the ‘equity’ heading and is recognized according to the principle explained above at the time the transaction takes place.
If the hedged transaction is not expected to take place, the cumulative unrealised profit or loss recognized under ‘equity’ is immediately recognized in the income statement.
(2) FAIR VALUE HEDGES
For any derivative financial instrument hedging variations in the fair value of a recognized receivable or debt, any profit or loss resulting from the remeasurement of the hedging instrument is recognized in the income statement. The value of the hedged item is also measured at the fair value attributable to the hedged risk. The related loss or profit is recognized in the income statement.
The fair value of the hedged items, in respect of the hedged risk, is their carrying amount on the closing date converted into euros at the exchange rate in effect on the closing date.
(3) HEDGE OF AN INVESTMENT IN A FOREIGN COUNTRY
If a foreign currency debt hedges a net investment in a foreign entity, conversion differences arising from the conversion of the debt into euros are recognized directly as “exchange differences on translation” under other items in the comprehensive income statement.
If a derivative financial instrument hedges a net investment relating to foreign operations, the effective portion of the profit or loss on the hedging instrument is recognized directly in “exchange differences on translation” under other items in the comprehensive income statement, and the ineffective portion is recognized in the income statement.
(4) INSTRUMENTS RELATED TO CONSTRUCTION CONTRACTS
If a derivative financial instrument hedges exposure to variations in the cash flow of a recognized obligation, a firm commitment or a planned transaction of the company in the context of a construction contract (mainly forward purchases of raw materials, or forward purchases or sales of foreign currencies), this instrument will not be the object of cash flow hedging documentation as described in point (1) above. Any profit or loss resulting from the derivative financial instrument is recognized in the income statement as a financial income or financial expense.
Any profit or loss realised on the derivative financial instrument is considered to be a cost under the construction contract (see section (U) above). This element is, however, not considered for determining the percentage of completion of the construction contract.
(Y) ASSETS HELD FOR SALE AND DISCONTINUED OPERATIONSFixed assets and groups of assets that are disposed of are classified as held for sale if their carrying amount will be realised on disposal and not through continued use. This condition is only considered to be met if the disposal of these assets, by sale or otherwise, is highly probable and the asset or group of assets disposed of is immediately available for sale in its present condition. Management must be committed to completing the sale within one year of the classification date.
Assets held for sale are valued at the lower of carrying amount and fair value less selling costs. They are presented separately with their associated liabilities in the consolidated statement of financial position. Net result for the period and cash flows from discontinued operations are presented separately in the consolidated income statement and the consolidated cash flow statement respectively. Non-current assets classified as held for sale are no longer amortized or impaired.
As at 31 December 2021, these are the DEME division’s operations. On 2 December 2021, the Board of Directors announced its intention to split the group into two separate listed companies: CFE and DEME. The purpose of this demerger is to create two leading players in their respective business lines.
(Z) SEGMENT REPORTINGA segment is a distinguishable component of the CFE group that generates revenues and incurs expenses and whose operating income and losses are regularly reviewed by management in order to take decisions or determine its performance. The CFE group’s continuing operations consist of three operating divisions: Contracting, Real Estate Development, and Holding.
Discontinued operations consist exclusively of the DEME group’s operations.
159
ANNUAL REPORT
STATEMENT OF NON-FINANCIAL INFORMATION
FINANCIAL STATEMENTS
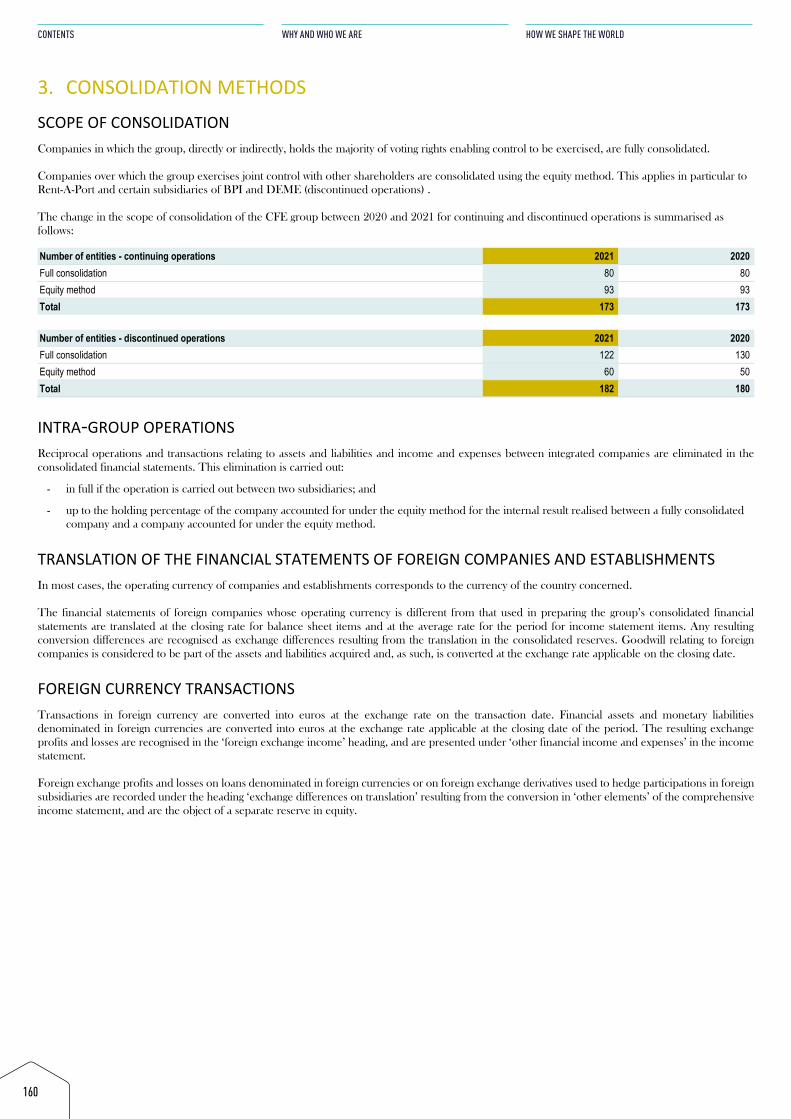
3. CONSOLIDATION METHODSSCOPE OF CONSOLIDATION Companies in which the group, directly or indirectly, holds the majority of voting rights enabling control to be exercised, are fully consolidated.
Companies over which the group exercises joint control with other shareholders are consolidated using the equity method. This applies in particular to Rent-A-Port and certain subsidiaries of BPI and DEME (discontinued operations) .
The change in the scope of consolidation of the CFE group between 2020 and 2021 for continuing and discontinued operations is summarised as follows:
Number of entities - continuing operations 2021 2020 Full consolidation 80 80 Equity method 93 93 Total 173 173
Number of entities - discontinued operations 2021 2020 Full consolidation 122 130 Equity method 60 50 Total 182 180
INTRA-GROUP OPERATIONS Reciprocal operations and transactions relating to assets and liabilities and income and expenses between integrated companies are eliminated in the consolidated financial statements. This elimination is carried out:
- in full if the operation is carried out between two subsidiaries; and
- up to the holding percentage of the company accounted for under the equity method for the internal result realised between a fully consolidatedcompany and a company accounted for under the equity method.
TRANSLATION OF THE FINANCIAL STATEMENTS OF FOREIGN COMPANIES AND ESTABLISHMENTS In most cases, the operating currency of companies and establishments corresponds to the currency of the country concerned.
The financial statements of foreign companies whose operating currency is different from that used in preparing the group’s consolidated financial statements are translated at the closing rate for balance sheet items and at the average rate for the period for income statement items. Any resulting conversion differences are recognised as exchange differences resulting from the translation in the consolidated reserves. Goodwill relating to foreign companies is considered to be part of the assets and liabilities acquired and, as such, is converted at the exchange rate applicable on the closing date.
FOREIGN CURRENCY TRANSACTIONS Transactions in foreign currency are converted into euros at the exchange rate on the transaction date. Financial assets and monetary liabilities denominated in foreign currencies are converted into euros at the exchange rate applicable at the closing date of the period. The resulting exchange profits and losses are recognised in the ‘foreign exchange income’ heading, and are presented under ‘other financial income and expenses’ in the income statement.
Foreign exchange profits and losses on loans denominated in foreign currencies or on foreign exchange derivatives used to hedge participations in foreign subsidiaries are recorded under the heading ‘exchange differences on translation’ resulting from the conversion in ‘other elements’ of the comprehensive income statement, and are the object of a separate reserve in equity.
160
CONTENTS
WHY AND WHO WE ARE
HOW WE SHAPE THE WORLD
3. CONSOLIDATION METHODSSCOPE OF CONSOLIDATION Companies in which the group, directly or indirectly, holds the majority of voting rights enabling control to be exercised, are fully consolidated.
Companies over which the group exercises joint control with other shareholders are consolidated using the equity method. This applies in particular to Rent-A-Port and certain subsidiaries of BPI and DEME (discontinued operations) .
The change in the scope of consolidation of the CFE group between 2020 and 2021 for continuing and discontinued operations is summarised as follows:
Number of entities - continuing operations 2021 2020 Full consolidation 80 80 Equity method 93 93 Total 173 173
Number of entities - discontinued operations 2021 2020 Full consolidation 122 130 Equity method 60 50 Total 182 180
INTRA-GROUP OPERATIONS Reciprocal operations and transactions relating to assets and liabilities and income and expenses between integrated companies are eliminated in the consolidated financial statements. This elimination is carried out:
- in full if the operation is carried out between two subsidiaries; and
- up to the holding percentage of the company accounted for under the equity method for the internal result realised between a fully consolidatedcompany and a company accounted for under the equity method.
TRANSLATION OF THE FINANCIAL STATEMENTS OF FOREIGN COMPANIES AND ESTABLISHMENTS In most cases, the operating currency of companies and establishments corresponds to the currency of the country concerned.
The financial statements of foreign companies whose operating currency is different from that used in preparing the group’s consolidated financial statements are translated at the closing rate for balance sheet items and at the average rate for the period for income statement items. Any resulting conversion differences are recognised as exchange differences resulting from the translation in the consolidated reserves. Goodwill relating to foreign companies is considered to be part of the assets and liabilities acquired and, as such, is converted at the exchange rate applicable on the closing date.
FOREIGN CURRENCY TRANSACTIONS Transactions in foreign currency are converted into euros at the exchange rate on the transaction date. Financial assets and monetary liabilities denominated in foreign currencies are converted into euros at the exchange rate applicable at the closing date of the period. The resulting exchange profits and losses are recognised in the ‘foreign exchange income’ heading, and are presented under ‘other financial income and expenses’ in the income statement.
Foreign exchange profits and losses on loans denominated in foreign currencies or on foreign exchange derivatives used to hedge participations in foreign subsidiaries are recorded under the heading ‘exchange differences on translation’ resulting from the conversion in ‘other elements’ of the comprehensive income statement, and are the object of a separate reserve in equity.
4. SEGMENT REPORTINGOPERATING SEGMENTS OF CONTINUING OPERATIONS Segment reporting is presented in respect of the group's operating segments. Segment results and assets and liabilities include items that can be directly attributed to a segment or allocated on a logical basis.
The CFE group’s continuing operations consist of three operating segments:
CCoonnttrraaccttiinngg The Contracting segment encompasses the construction, multitechnics and rail & utilities activities.
The construction activity is concentrated in Belgium, Luxembourg and Poland. CFE Contracting specializes in building and refurbishing office buildings, residential properties, hotels, schools, universities, car parks, shopping and leisure centres, hospitals and industrial buildings.
The Multitechnics, Rail & Utilities segments operate mainly in Belgium through two clusters:
- the VMA cluster comprising tertiary electricity, HVAC (heating, ventilation and air conditioning), electromechanical facilities, telecom networks,automation in the automobile, pharmaceutical and agri-food industries, the automated management of technical facilities of buildings,electromechanical work for road and rail infrastructures (tunnels, etc.), and the long-term maintenance of technical facilities and ESCO (energyperformance improvement of buildings) type projects;
- the MOBIX cluster comprising railway (track laying and installation of catenaries) and signalling works, energy transportation and public lighting.
RReeaall eessttaattee ddeevveellooppmmeenntt The Real Estate Development segment develops real estate projects in Belgium, Luxembourg and Poland.
HHoollddiinngg Besides the usual holding activities, this segment includes:
- participations in Rent-A-Port, Green Offshore and in two Design Build Finance and Maintenance contracts in Belgium;
- contracting activities not transferred to CFE Contracting SA including several civil engineering projects in Belgium and building projects in Africa(except Tunisia) and in Central Europe (except Poland).
OPERATING SEGMENT OF DISCONTINUED OPERATIONS – DEME DEME’s activities include dredging (investment dredging and maintenance dredging), the installation of offshore wind turbines, the laying of submarine cables, the protection of offshore pipelines, the treatment of polluted soil and sludge as well as maritime civil engineering.
161
ANNUAL REPORT
STATEMENT OF NON-FINANCIAL INFORMATION
FINANCIAL STATEMENTS
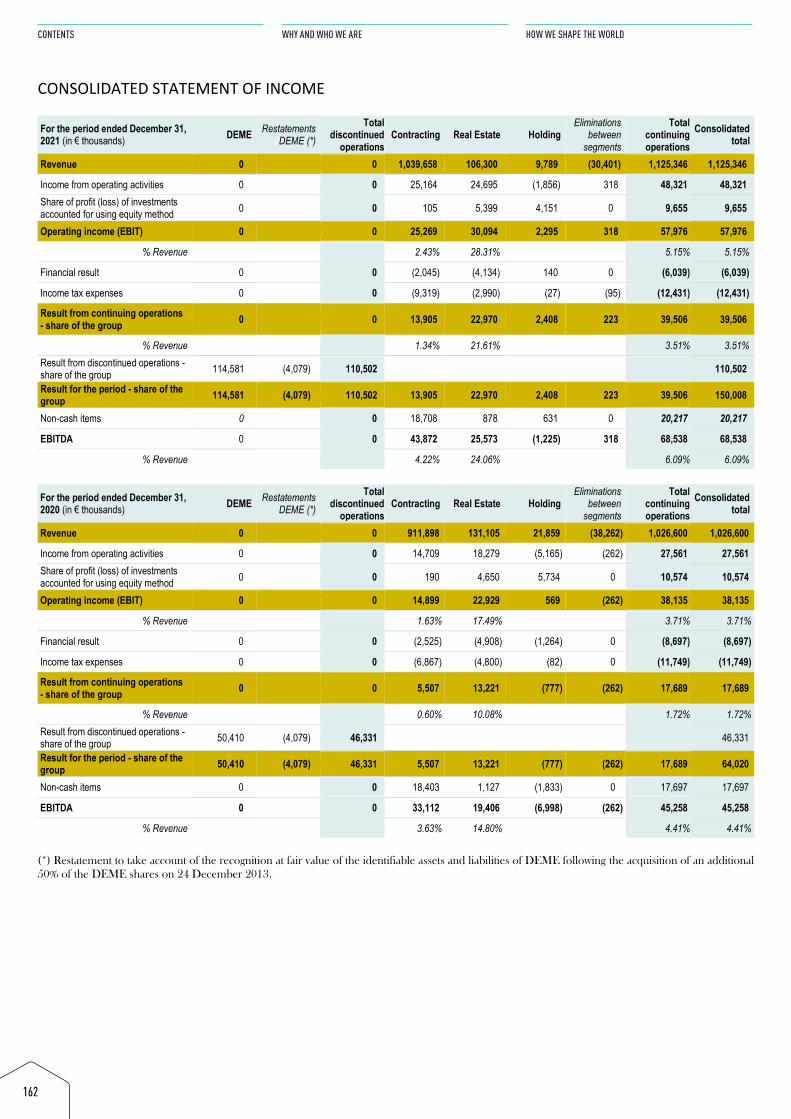
CONSOLIDATED STATEMENT OF INCOME
For the period ended December 31, 2021 (in € thousands) DEME Restatements
DEME (*)
Total discontinued
operations Contracting Real Estate Holding
Eliminations between
segments
Total continuing operations
Consolidated total
Revenue 0 0 1,039,658 106,300 9,789 (30,401) 1,125,346 1,125,346
Income from operating activities 0 0 25,164 24,695 (1,856) 318 48,321 48,321 Share of profit (loss) of investments accounted for using equity method 0 0 105 5,399 4,151 0 9,655 9,655
Operating income (EBIT) 0 0 25,269 30,094 2,295 318 57,976 57,976
% Revenue 2.43% 28.31% 5.15% 5.15%
Financial result 0 0 (2,045) (4,134) 140 0 (6,039) (6,039)
Income tax expenses 0 0 (9,319) (2,990) (27) (95) (12,431) (12,431)
Result from continuing operations - share of the group 0 0 13,905 22,970 2,408 223 39,506 39,506
% Revenue 1.34% 21.61% 3.51% 3.51% Result from discontinued operations - share of the group 114,581 (4,079) 110,502 110,502
Result for the period - share of the group 114,581 (4,079) 110,502 13,905 22,970 2,408 223 39,506 150,008
Non-cash items 0 0 18,708 878 631 0 20,217 20,217
EBITDA 0 0 43,872 25,573 (1,225) 318 68,538 68,538
% Revenue 4.22% 24.06% 6.09% 6.09%
For the period ended December 31, 2020 (in € thousands) DEME Restatements
DEME (*)
Total discontinued
operations Contracting Real Estate Holding
Eliminations between
segments
Total continuing operations
Consolidated total
Revenue 0 0 911,898 131,105 21,859 (38,262) 1,026,600 1,026,600
Income from operating activities 0 0 14,709 18,279 (5,165) (262) 27,561 27,561 Share of profit (loss) of investments accounted for using equity method 0 0 190 4,650 5,734 0 10,574 10,574
Operating income (EBIT) 0 0 14,899 22,929 569 (262) 38,135 38,135
% Revenue 1.63% 17.49% 3.71% 3.71%
Financial result 0 0 (2,525) (4,908) (1,264) 0 (8,697) (8,697)
Income tax expenses 0 0 (6,867) (4,800) (82) 0 (11,749) (11,749)
Result from continuing operations - share of the group 0 0 5,507 13,221 (777) (262) 17,689 17,689
% Revenue 0.60% 10.08% 1.72% 1.72% Result from discontinued operations - share of the group 50,410 (4,079) 46,331 46,331
Result for the period - share of the group 50,410 (4,079) 46,331 5,507 13,221 (777) (262) 17,689 64,020
Non-cash items 0 0 18,403 1,127 (1,833) 0 17,697 17,697
EBITDA 0 0 33,112 19,406 (6,998) (262) 45,258 45,258
% Revenue 3.63% 14.80% 4.41% 4.41%
(*) Restatement to take account of the recognition at fair value of the identifiable assets and liabilities of DEME following the acquisition of an additional 50% of the DEME shares on 24 December 2013.
162
CONTENTS
WHY AND WHO WE ARE
HOW WE SHAPE THE WORLD
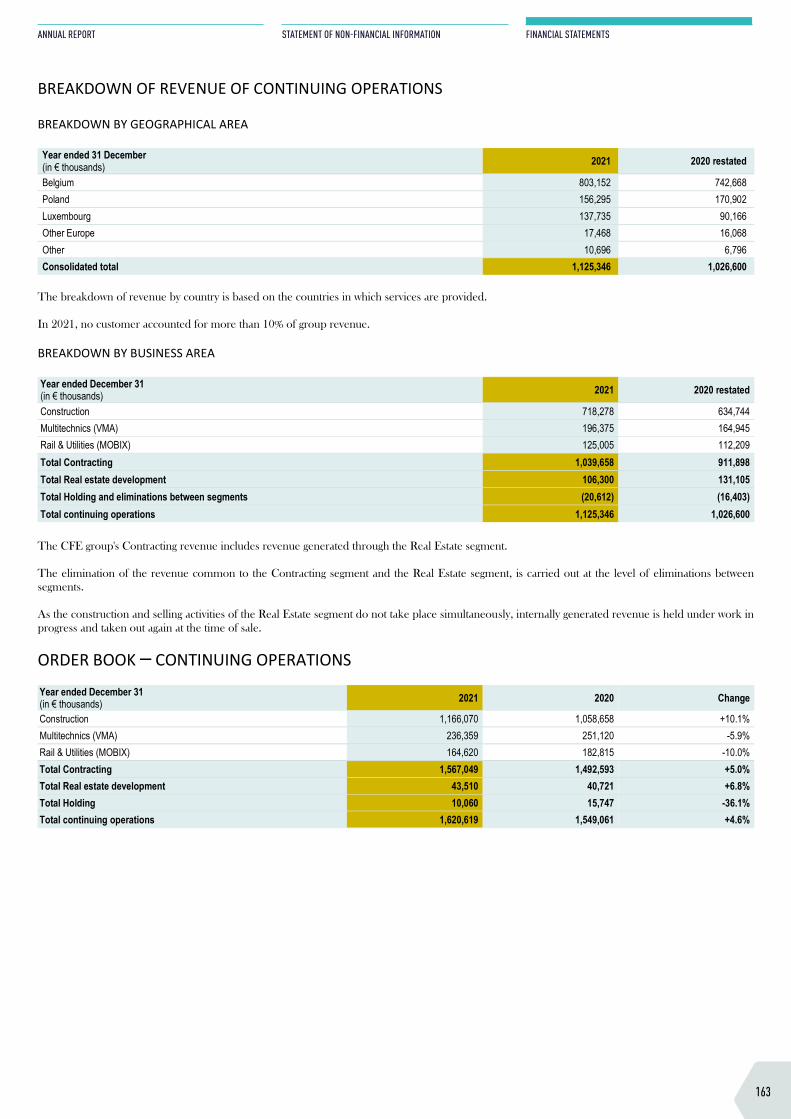
CONSOLIDATED STATEMENT OF INCOME
For the period ended December 31, 2021 (in € thousands) DEME Restatements
DEME (*)
Total discontinued
operations Contracting Real Estate Holding
Eliminations between
segments
Total continuing operations
Consolidated total
Revenue 0 0 1,039,658 106,300 9,789 (30,401) 1,125,346 1,125,346
Income from operating activities 0 0 25,164 24,695 (1,856) 318 48,321 48,321 Share of profit (loss) of investments accounted for using equity method 0 0 105 5,399 4,151 0 9,655 9,655
Operating income (EBIT) 0 0 25,269 30,094 2,295 318 57,976 57,976
% Revenue 2.43% 28.31% 5.15% 5.15%
Financial result 0 0 (2,045) (4,134) 140 0 (6,039) (6,039)
Income tax expenses 0 0 (9,319) (2,990) (27) (95) (12,431) (12,431)
Result from continuing operations - share of the group 0 0 13,905 22,970 2,408 223 39,506 39,506
% Revenue 1.34% 21.61% 3.51% 3.51% Result from discontinued operations - share of the group 114,581 (4,079) 110,502 110,502
Result for the period - share of the group 114,581 (4,079) 110,502 13,905 22,970 2,408 223 39,506 150,008
Non-cash items 0 0 18,708 878 631 0 20,217 20,217
EBITDA 0 0 43,872 25,573 (1,225) 318 68,538 68,538
% Revenue 4.22% 24.06% 6.09% 6.09%
For the period ended December 31, 2020 (in € thousands) DEME Restatements
DEME (*)
Total discontinued
operations Contracting Real Estate Holding
Eliminations between
segments
Total continuing operations
Consolidated total
Revenue 0 0 911,898 131,105 21,859 (38,262) 1,026,600 1,026,600
Income from operating activities 0 0 14,709 18,279 (5,165) (262) 27,561 27,561 Share of profit (loss) of investments accounted for using equity method 0 0 190 4,650 5,734 0 10,574 10,574
Operating income (EBIT) 0 0 14,899 22,929 569 (262) 38,135 38,135
% Revenue 1.63% 17.49% 3.71% 3.71%
Financial result 0 0 (2,525) (4,908) (1,264) 0 (8,697) (8,697)
Income tax expenses 0 0 (6,867) (4,800) (82) 0 (11,749) (11,749)
Result from continuing operations - share of the group 0 0 5,507 13,221 (777) (262) 17,689 17,689
% Revenue 0.60% 10.08% 1.72% 1.72% Result from discontinued operations - share of the group 50,410 (4,079) 46,331 46,331
Result for the period - share of the group 50,410 (4,079) 46,331 5,507 13,221 (777) (262) 17,689 64,020
Non-cash items 0 0 18,403 1,127 (1,833) 0 17,697 17,697
EBITDA 0 0 33,112 19,406 (6,998) (262) 45,258 45,258
% Revenue 3.63% 14.80% 4.41% 4.41%
(*) Restatement to take account of the recognition at fair value of the identifiable assets and liabilities of DEME following the acquisition of an additional 50% of the DEME shares on 24 December 2013.
BREAKDOWN OF REVENUE OF CONTINUING OPERATIONS BREAKDOWN BY GEOGRAPHICAL AREA
Year ended 31 December (in € thousands) 2021 2020 restated
Belgium 803,152 742,668 Poland 156,295 170,902 Luxembourg 137,735 90,166 Other Europe 17,468 16,068 Other 10,696 6,796 Consolidated total 1,125,346 1,026,600
The breakdown of revenue by country is based on the countries in which services are provided.
In 2021, no customer accounted for more than 10% of group revenue.
BREAKDOWN BY BUSINESS AREA
Year ended December 31 (in € thousands) 2021 2020 restated
Construction 718,278 634,744 Multitechnics (VMA) 196,375 164,945 Rail & Utilities (MOBIX) 125,005 112,209 Total Contracting 1,039,658 911,898 Total Real estate development 106,300 131,105 Total Holding and eliminations between segments (20,612) (16,403) Total continuing operations 1,125,346 1,026,600
The CFE group's Contracting revenue includes revenue generated through the Real Estate segment.
The elimination of the revenue common to the Contracting segment and the Real Estate segment, is carried out at the level of eliminations between segments.
As the construction and selling activities of the Real Estate segment do not take place simultaneously, internally generated revenue is held under work in progress and taken out again at the time of sale.
ORDER BOOK – CONTINUING OPERATIONS Year ended December 31 (in € thousands) 2021 2020 Change
Construction 1,166,070 1,058,658 +10.1% Multitechnics (VMA) 236,359 251,120 -5.9% Rail & Utilities (MOBIX) 164,620 182,815 -10.0% Total Contracting 1,567,049 1,492,593 +5.0% Total Real estate development 43,510 40,721 +6.8% Total Holding 10,060 15,747 -36.1% Total continuing operations 1,620,619 1,549,061 +4.6%
163
ANNUAL REPORT
STATEMENT OF NON-FINANCIAL INFORMATION
FINANCIAL STATEMENTS
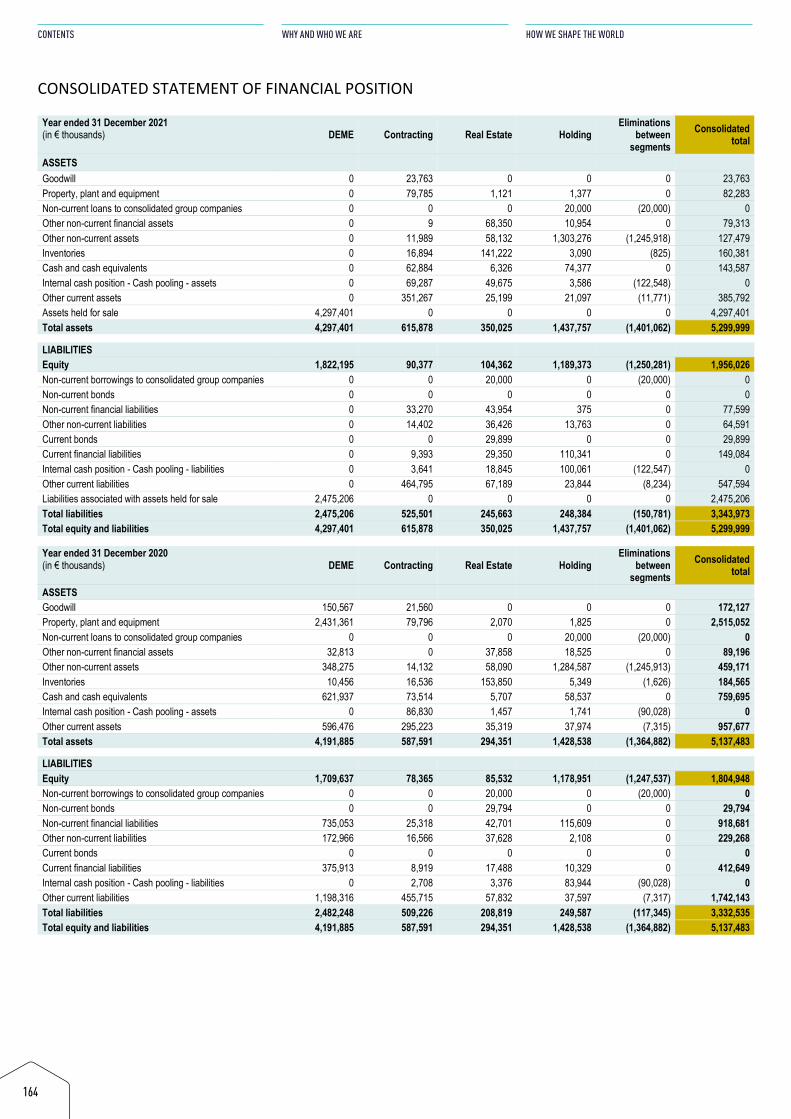
CONSOLIDATED STATEMENT OF FINANCIAL POSITION Year ended 31 December 2021 (in € thousands) DEME Contracting Real Estate Holding
Eliminations between
segments Consolidated
total
ASSETS Goodwill 0 23,763 0 0 0 23,763 Property, plant and equipment 0 79,785 1,121 1,377 0 82,283 Non-current loans to consolidated group companies 0 0 0 20,000 (20,000) 0 Other non-current financial assets 0 9 68,350 10,954 0 79,313 Other non-current assets 0 11,989 58,132 1,303,276 (1,245,918) 127,479 Inventories 0 16,894 141,222 3,090 (825) 160,381 Cash and cash equivalents 0 62,884 6,326 74,377 0 143,587 Internal cash position - Cash pooling - assets 0 69,287 49,675 3,586 (122,548) 0 Other current assets 0 351,267 25,199 21,097 (11,771) 385,792 Assets held for sale 4,297,401 0 0 0 0 4,297,401 Total assets 4,297,401 615,878 350,025 1,437,757 (1,401,062) 5,299,999
LIABILITIES Equity 1,822,195 90,377 104,362 1,189,373 (1,250,281) 1,956,026 Non-current borrowings to consolidated group companies 0 0 20,000 0 (20,000) 0 Non-current bonds 0 0 0 0 0 0 Non-current financial liabilities 0 33,270 43,954 375 0 77,599 Other non-current liabilities 0 14,402 36,426 13,763 0 64,591 Current bonds 0 0 29,899 0 0 29,899 Current financial liabilities 0 9,393 29,350 110,341 0 149,084 Internal cash position - Cash pooling - liabilities 0 3,641 18,845 100,061 (122,547) 0 Other current liabilities 0 464,795 67,189 23,844 (8,234) 547,594 Liabilities associated with assets held for sale 2,475,206 0 0 0 0 2,475,206 Total liabilities 2,475,206 525,501 245,663 248,384 (150,781) 3,343,973 Total equity and liabilities 4,297,401 615,878 350,025 1,437,757 (1,401,062) 5,299,999
Year ended 31 December 2020 (in € thousands) DEME Contracting Real Estate Holding
Eliminations between
segments Consolidated
total
ASSETS Goodwill 150,567 21,560 0 0 0 172,127 Property, plant and equipment 2,431,361 79,796 2,070 1,825 0 2,515,052 Non-current loans to consolidated group companies 0 0 0 20,000 (20,000) 0 Other non-current financial assets 32,813 0 37,858 18,525 0 89,196 Other non-current assets 348,275 14,132 58,090 1,284,587 (1,245,913) 459,171 Inventories 10,456 16,536 153,850 5,349 (1,626) 184,565 Cash and cash equivalents 621,937 73,514 5,707 58,537 0 759,695 Internal cash position - Cash pooling - assets 0 86,830 1,457 1,741 (90,028) 0 Other current assets 596,476 295,223 35,319 37,974 (7,315) 957,677 Total assets 4,191,885 587,591 294,351 1,428,538 (1,364,882) 5,137,483
LIABILITIES Equity 1,709,637 78,365 85,532 1,178,951 (1,247,537) 1,804,948 Non-current borrowings to consolidated group companies 0 0 20,000 0 (20,000) 0 Non-current bonds 0 0 29,794 0 0 29,794 Non-current financial liabilities 735,053 25,318 42,701 115,609 0 918,681 Other non-current liabilities 172,966 16,566 37,628 2,108 0 229,268 Current bonds 0 0 0 0 0 0 Current financial liabilities 375,913 8,919 17,488 10,329 0 412,649 Internal cash position - Cash pooling - liabilities 0 2,708 3,376 83,944 (90,028) 0 Other current liabilities 1,198,316 455,715 57,832 37,597 (7,317) 1,742,143 Total liabilities 2,482,248 509,226 208,819 249,587 (117,345) 3,332,535 Total equity and liabilities 4,191,885 587,591 294,351 1,428,538 (1,364,882) 5,137,483
164
CONTENTS
WHY AND WHO WE ARE
HOW WE SHAPE THE WORLD
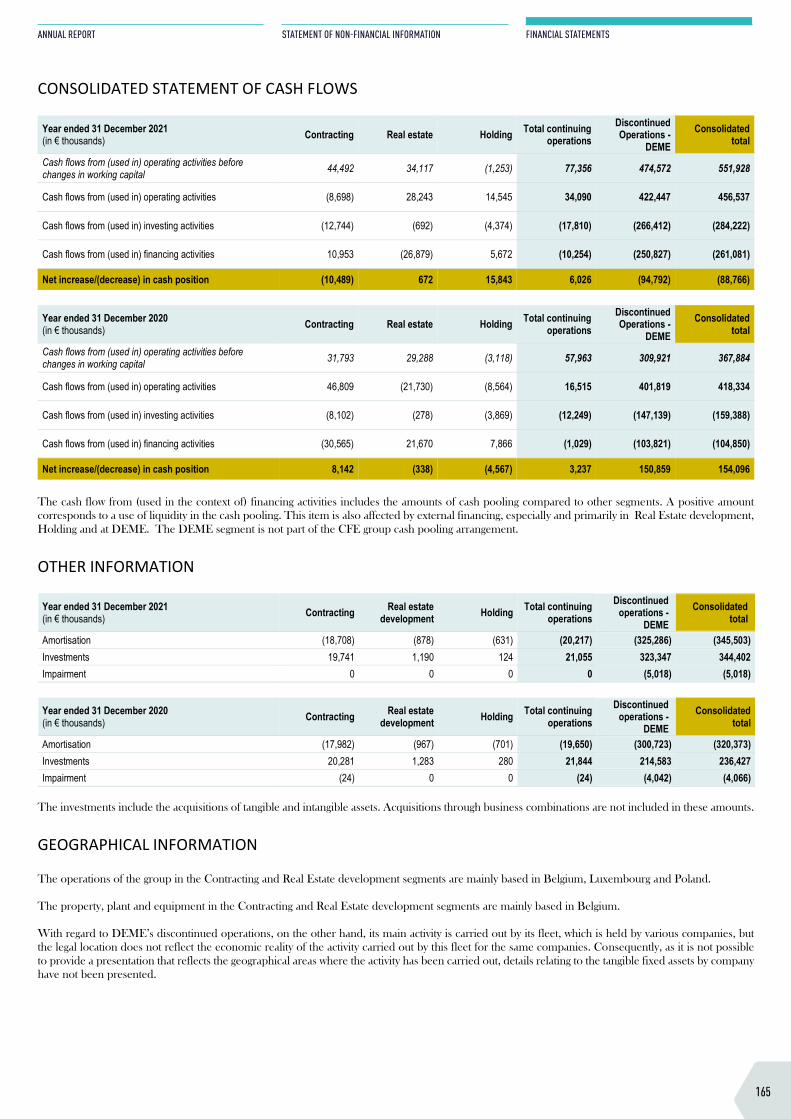
CONSOLIDATED STATEMENT OF FINANCIAL POSITION Year ended 31 December 2021 (in € thousands) DEME Contracting Real Estate Holding
Eliminations between
segments Consolidated
total
ASSETS Goodwill 0 23,763 0 0 0 23,763 Property, plant and equipment 0 79,785 1,121 1,377 0 82,283 Non-current loans to consolidated group companies 0 0 0 20,000 (20,000) 0 Other non-current financial assets 0 9 68,350 10,954 0 79,313 Other non-current assets 0 11,989 58,132 1,303,276 (1,245,918) 127,479 Inventories 0 16,894 141,222 3,090 (825) 160,381 Cash and cash equivalents 0 62,884 6,326 74,377 0 143,587 Internal cash position - Cash pooling - assets 0 69,287 49,675 3,586 (122,548) 0 Other current assets 0 351,267 25,199 21,097 (11,771) 385,792 Assets held for sale 4,297,401 0 0 0 0 4,297,401 Total assets 4,297,401 615,878 350,025 1,437,757 (1,401,062) 5,299,999
LIABILITIES Equity 1,822,195 90,377 104,362 1,189,373 (1,250,281) 1,956,026 Non-current borrowings to consolidated group companies 0 0 20,000 0 (20,000) 0 Non-current bonds 0 0 0 0 0 0 Non-current financial liabilities 0 33,270 43,954 375 0 77,599 Other non-current liabilities 0 14,402 36,426 13,763 0 64,591 Current bonds 0 0 29,899 0 0 29,899 Current financial liabilities 0 9,393 29,350 110,341 0 149,084 Internal cash position - Cash pooling - liabilities 0 3,641 18,845 100,061 (122,547) 0 Other current liabilities 0 464,795 67,189 23,844 (8,234) 547,594 Liabilities associated with assets held for sale 2,475,206 0 0 0 0 2,475,206 Total liabilities 2,475,206 525,501 245,663 248,384 (150,781) 3,343,973 Total equity and liabilities 4,297,401 615,878 350,025 1,437,757 (1,401,062) 5,299,999
Year ended 31 December 2020 (in € thousands) DEME Contracting Real Estate Holding
Eliminations between
segments Consolidated
total
ASSETS Goodwill 150,567 21,560 0 0 0 172,127 Property, plant and equipment 2,431,361 79,796 2,070 1,825 0 2,515,052 Non-current loans to consolidated group companies 0 0 0 20,000 (20,000) 0 Other non-current financial assets 32,813 0 37,858 18,525 0 89,196 Other non-current assets 348,275 14,132 58,090 1,284,587 (1,245,913) 459,171 Inventories 10,456 16,536 153,850 5,349 (1,626) 184,565 Cash and cash equivalents 621,937 73,514 5,707 58,537 0 759,695 Internal cash position - Cash pooling - assets 0 86,830 1,457 1,741 (90,028) 0 Other current assets 596,476 295,223 35,319 37,974 (7,315) 957,677 Total assets 4,191,885 587,591 294,351 1,428,538 (1,364,882) 5,137,483
LIABILITIES Equity 1,709,637 78,365 85,532 1,178,951 (1,247,537) 1,804,948 Non-current borrowings to consolidated group companies 0 0 20,000 0 (20,000) 0 Non-current bonds 0 0 29,794 0 0 29,794 Non-current financial liabilities 735,053 25,318 42,701 115,609 0 918,681 Other non-current liabilities 172,966 16,566 37,628 2,108 0 229,268 Current bonds 0 0 0 0 0 0 Current financial liabilities 375,913 8,919 17,488 10,329 0 412,649 Internal cash position - Cash pooling - liabilities 0 2,708 3,376 83,944 (90,028) 0 Other current liabilities 1,198,316 455,715 57,832 37,597 (7,317) 1,742,143 Total liabilities 2,482,248 509,226 208,819 249,587 (117,345) 3,332,535 Total equity and liabilities 4,191,885 587,591 294,351 1,428,538 (1,364,882) 5,137,483
CONSOLIDATED STATEMENT OF CASH FLOWS
Year ended 31 December 2021 (in € thousands) Contracting Real estate Holding Total continuing
operations Discontinued Operations -
DEME Consolidated
total
Cash flows from (used in) operating activities before changes in working capital 44,492 34,117 (1,253) 77,356 474,572 551,928
Cash flows from (used in) operating activities (8,698) 28,243 14,545 34,090 422,447 456,537
Cash flows from (used in) investing activities (12,744) (692) (4,374) (17,810) (266,412) (284,222)
Cash flows from (used in) financing activities 10,953 (26,879) 5,672 (10,254) (250,827) (261,081)
Net increase/(decrease) in cash position (10,489) 672 15,843 6,026 (94,792) (88,766)
Year ended 31 December 2020 (in € thousands) Contracting Real estate Holding Total continuing
operations Discontinued Operations -
DEME Consolidated
total
Cash flows from (used in) operating activities before changes in working capital 31,793 29,288 (3,118) 57,963 309,921 367,884
Cash flows from (used in) operating activities 46,809 (21,730) (8,564) 16,515 401,819 418,334
Cash flows from (used in) investing activities (8,102) (278) (3,869) (12,249) (147,139) (159,388)
Cash flows from (used in) financing activities (30,565) 21,670 7,866 (1,029) (103,821) (104,850)
Net increase/(decrease) in cash position 8,142 (338) (4,567) 3,237 150,859 154,096
The cash flow from (used in the context of) financing activities includes the amounts of cash pooling compared to other segments. A positive amount corresponds to a use of liquidity in the cash pooling. This item is also affected by external financing, especially and primarily in Real Estate development, Holding and at DEME. The DEME segment is not part of the CFE group cash pooling arrangement.
OTHER INFORMATION
Year ended 31 December 2021 (in € thousands) Contracting Real estate
development Holding Total continuing operations
Discontinued operations -
DEME Consolidated
total
Amortisation (18,708) (878) (631) (20,217) (325,286) (345,503) Investments 19,741 1,190 124 21,055 323,347 344,402 Impairment 0 0 0 0 (5,018) (5,018)
Year ended 31 December 2020 (in € thousands) Contracting Real estate
development Holding Total continuing operations
Discontinued operations -
DEME Consolidated
total
Amortisation (17,982) (967) (701) (19,650) (300,723) (320,373) Investments 20,281 1,283 280 21,844 214,583 236,427 Impairment (24) 0 0 (24) (4,042) (4,066)
The investments include the acquisitions of tangible and intangible assets. Acquisitions through business combinations are not included in these amounts.
GEOGRAPHICAL INFORMATION The operations of the group in the Contracting and Real Estate development segments are mainly based in Belgium, Luxembourg and Poland.
The property, plant and equipment in the Contracting and Real Estate development segments are mainly based in Belgium.
With regard to DEME’s discontinued operations, on the other hand, its main activity is carried out by its fleet, which is held by various companies, but the legal location does not reflect the economic reality of the activity carried out by this fleet for the same companies. Consequently, as it is not possible to provide a presentation that reflects the geographical areas where the activity has been carried out, details relating to the tangible fixed assets by company have not been presented.
165
ANNUAL REPORT
STATEMENT OF NON-FINANCIAL INFORMATION
FINANCIAL STATEMENTS
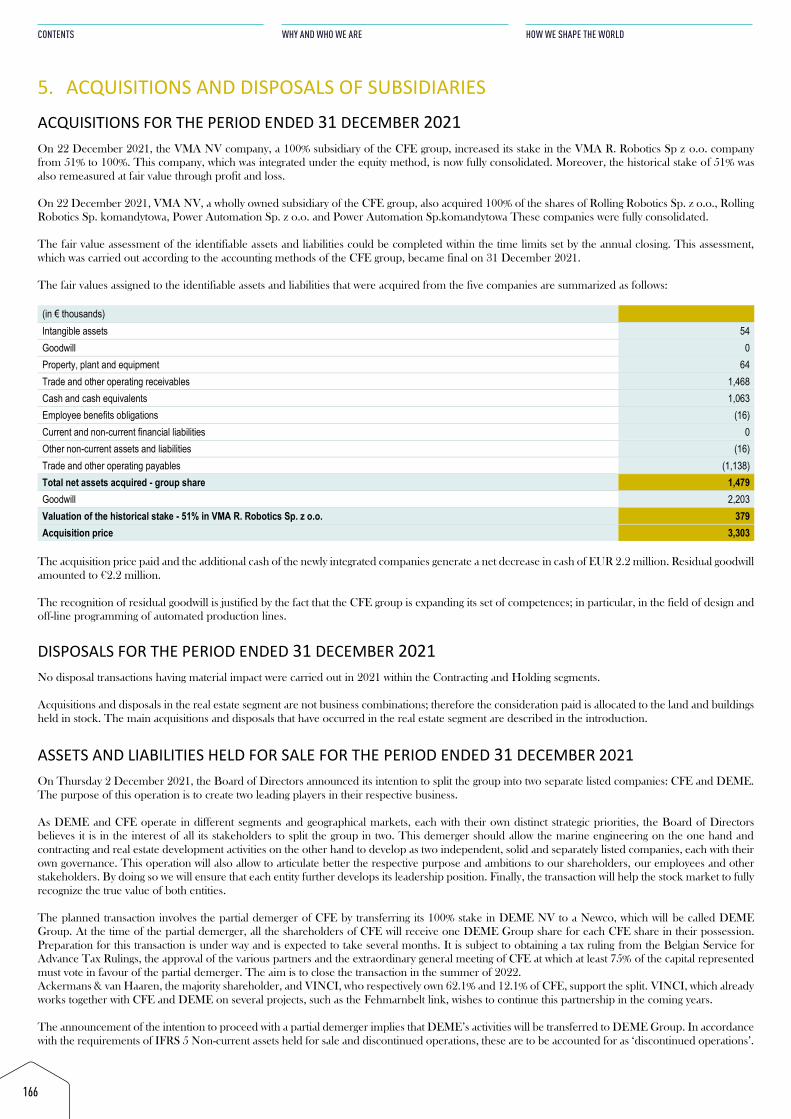
5. ACQUISITIONS AND DISPOSALS OF SUBSIDIARIESACQUISITIONS FOR THE PERIOD ENDED 31 DECEMBER 2021 On 22 December 2021, the VMA NV company, a 100% subsidiary of the CFE group, increased its stake in the VMA R. Robotics Sp z o.o. company from 51% to 100%. This company, which was integrated under the equity method, is now fully consolidated. Moreover, the historical stake of 51% was also remeasured at fair value through profit and loss.
On 22 December 2021, VMA NV, a wholly owned subsidiary of the CFE group, also acquired 100% of the shares of Rolling Robotics Sp. z o.o., Rolling Robotics Sp. komandytowa, Power Automation Sp. z o.o. and Power Automation Sp.komandytowa These companies were fully consolidated.
The fair value assessment of the identifiable assets and liabilities could be completed within the time limits set by the annual closing. This assessment, which was carried out according to the accounting methods of the CFE group, became final on 31 December 2021.
The fair values assigned to the identifiable assets and liabilities that were acquired from the five companies are summarized as follows:
(in € thousands) Intangible assets 54 Goodwill 0 Property, plant and equipment 64 Trade and other operating receivables 1,468 Cash and cash equivalents 1,063 Employee benefits obligations (16) Current and non-current financial liabilities 0 Other non-current assets and liabilities (16) Trade and other operating payables (1,138) Total net assets acquired - group share 1,479 Goodwill 2,203 Valuation of the historical stake - 51% in VMA R. Robotics Sp. z o.o. 379 Acquisition price 3,303
The acquisition price paid and the additional cash of the newly integrated companies generate a net decrease in cash of EUR 2.2 million. Residual goodwill amounted to €2.2 million.
The recognition of residual goodwill is justified by the fact that the CFE group is expanding its set of competences; in particular, in the field of design and off-line programming of automated production lines.
DISPOSALS FOR THE PERIOD ENDED 31 DECEMBER 2021 No disposal transactions having material impact were carried out in 2021 within the Contracting and Holding segments.
Acquisitions and disposals in the real estate segment are not business combinations; therefore the consideration paid is allocated to the land and buildings held in stock. The main acquisitions and disposals that have occurred in the real estate segment are described in the introduction.
ASSETS AND LIABILITIES HELD FOR SALE FOR THE PERIOD ENDED 31 DECEMBER 2021 On Thursday 2 December 2021, the Board of Directors announced its intention to split the group into two separate listed companies: CFE and DEME. The purpose of this operation is to create two leading players in their respective business.
As DEME and CFE operate in different segments and geographical markets, each with their own distinct strategic priorities, the Board of Directors believes it is in the interest of all its stakeholders to split the group in two. This demerger should allow the marine engineering on the one hand and contracting and real estate development activities on the other hand to develop as two independent, solid and separately listed companies, each with their own governance. This operation will also allow to articulate better the respective purpose and ambitions to our shareholders, our employees and other stakeholders. By doing so we will ensure that each entity further develops its leadership position. Finally, the transaction will help the stock market to fully recognize the true value of both entities.
The planned transaction involves the partial demerger of CFE by transferring its 100% stake in DEME NV to a Newco, which will be called DEME Group. At the time of the partial demerger, all the shareholders of CFE will receive one DEME Group share for each CFE share in their possession. Preparation for this transaction is under way and is expected to take several months. It is subject to obtaining a tax ruling from the Belgian Service for Advance Tax Rulings, the approval of the various partners and the extraordinary general meeting of CFE at which at least 75% of the capital represented must vote in favour of the partial demerger. The aim is to close the transaction in the summer of 2022. Ackermans & van Haaren, the majority shareholder, and VINCI, who respectively own 62.1% and 12.1% of CFE, support the split. VINCI, which already works together with CFE and DEME on several projects, such as the Fehmarnbelt link, wishes to continue this partnership in the coming years.
The announcement of the intention to proceed with a partial demerger implies that DEME’s activities will be transferred to DEME Group. In accordance with the requirements of IFRS 5 Non-current assets held for sale and discontinued operations, these are to be accounted for as ‘discontinued operations’.
166
CONTENTS
WHY AND WHO WE ARE
HOW WE SHAPE THE WORLD
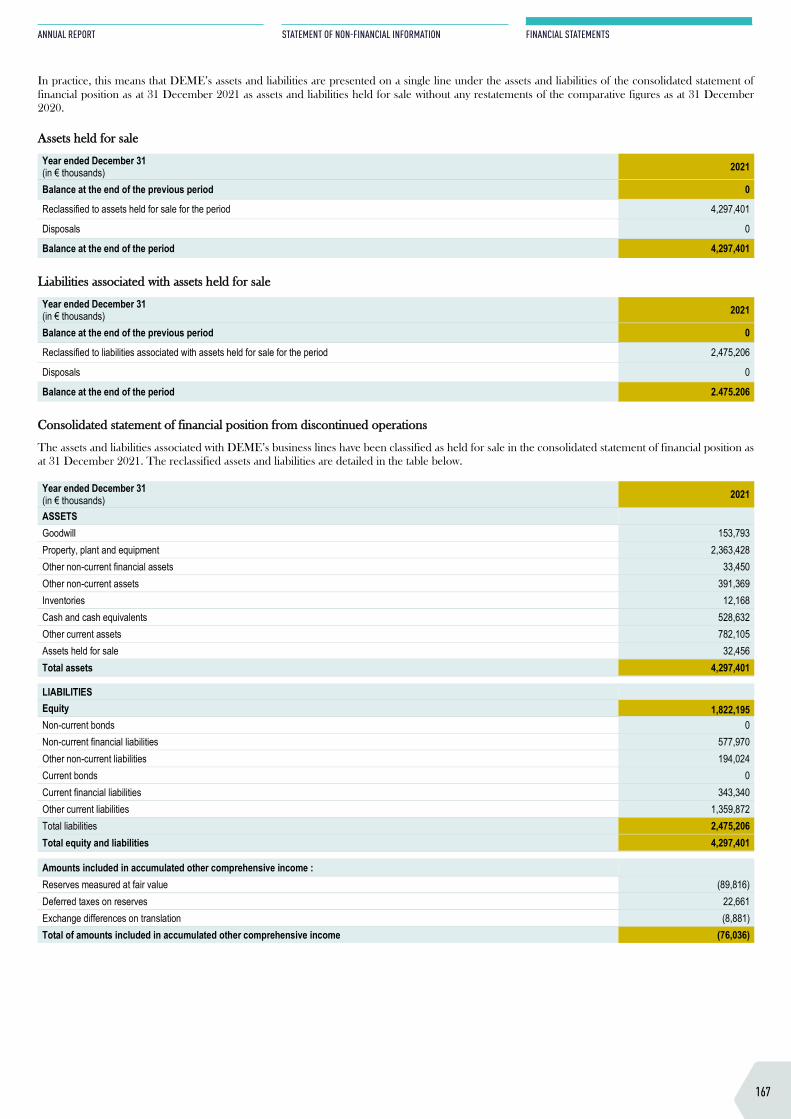
5. ACQUISITIONS AND DISPOSALS OF SUBSIDIARIESACQUISITIONS FOR THE PERIOD ENDED 31 DECEMBER 2021 On 22 December 2021, the VMA NV company, a 100% subsidiary of the CFE group, increased its stake in the VMA R. Robotics Sp z o.o. company from 51% to 100%. This company, which was integrated under the equity method, is now fully consolidated. Moreover, the historical stake of 51% was also remeasured at fair value through profit and loss.
On 22 December 2021, VMA NV, a wholly owned subsidiary of the CFE group, also acquired 100% of the shares of Rolling Robotics Sp. z o.o., Rolling Robotics Sp. komandytowa, Power Automation Sp. z o.o. and Power Automation Sp.komandytowa These companies were fully consolidated.
The fair value assessment of the identifiable assets and liabilities could be completed within the time limits set by the annual closing. This assessment, which was carried out according to the accounting methods of the CFE group, became final on 31 December 2021.
The fair values assigned to the identifiable assets and liabilities that were acquired from the five companies are summarized as follows:
(in € thousands) Intangible assets 54 Goodwill 0 Property, plant and equipment 64 Trade and other operating receivables 1,468 Cash and cash equivalents 1,063 Employee benefits obligations (16) Current and non-current financial liabilities 0 Other non-current assets and liabilities (16) Trade and other operating payables (1,138) Total net assets acquired - group share 1,479 Goodwill 2,203 Valuation of the historical stake - 51% in VMA R. Robotics Sp. z o.o. 379 Acquisition price 3,303
The acquisition price paid and the additional cash of the newly integrated companies generate a net decrease in cash of EUR 2.2 million. Residual goodwill amounted to €2.2 million.
The recognition of residual goodwill is justified by the fact that the CFE group is expanding its set of competences; in particular, in the field of design and off-line programming of automated production lines.
DISPOSALS FOR THE PERIOD ENDED 31 DECEMBER 2021 No disposal transactions having material impact were carried out in 2021 within the Contracting and Holding segments.
Acquisitions and disposals in the real estate segment are not business combinations; therefore the consideration paid is allocated to the land and buildings held in stock. The main acquisitions and disposals that have occurred in the real estate segment are described in the introduction.
ASSETS AND LIABILITIES HELD FOR SALE FOR THE PERIOD ENDED 31 DECEMBER 2021 On Thursday 2 December 2021, the Board of Directors announced its intention to split the group into two separate listed companies: CFE and DEME. The purpose of this operation is to create two leading players in their respective business.
As DEME and CFE operate in different segments and geographical markets, each with their own distinct strategic priorities, the Board of Directors believes it is in the interest of all its stakeholders to split the group in two. This demerger should allow the marine engineering on the one hand and contracting and real estate development activities on the other hand to develop as two independent, solid and separately listed companies, each with their own governance. This operation will also allow to articulate better the respective purpose and ambitions to our shareholders, our employees and other stakeholders. By doing so we will ensure that each entity further develops its leadership position. Finally, the transaction will help the stock market to fully recognize the true value of both entities.
The planned transaction involves the partial demerger of CFE by transferring its 100% stake in DEME NV to a Newco, which will be called DEME Group. At the time of the partial demerger, all the shareholders of CFE will receive one DEME Group share for each CFE share in their possession. Preparation for this transaction is under way and is expected to take several months. It is subject to obtaining a tax ruling from the Belgian Service for Advance Tax Rulings, the approval of the various partners and the extraordinary general meeting of CFE at which at least 75% of the capital represented must vote in favour of the partial demerger. The aim is to close the transaction in the summer of 2022. Ackermans & van Haaren, the majority shareholder, and VINCI, who respectively own 62.1% and 12.1% of CFE, support the split. VINCI, which already works together with CFE and DEME on several projects, such as the Fehmarnbelt link, wishes to continue this partnership in the coming years.
The announcement of the intention to proceed with a partial demerger implies that DEME’s activities will be transferred to DEME Group. In accordance with the requirements of IFRS 5 Non-current assets held for sale and discontinued operations, these are to be accounted for as ‘discontinued operations’.
In practice, this means that DEME’s assets and liabilities are presented on a single line under the assets and liabilities of the consolidated statement of financial position as at 31 December 2021 as assets and liabilities held for sale without any restatements of the comparative figures as at 31 December 2020.
AAsssseettss hheelldd ffoorr ssaallee
Year ended December 31 (in € thousands) 2021
Balance at the end of the previous period 0
Reclassified to assets held for sale for the period 4,297,401
Disposals 0
Balance at the end of the period 4,297,401
LLiiaabbiilliittiieess aassssoocciiaatteedd wwiitthh aasssseettss hheelldd ffoorr ssaallee
Year ended December 31 (in € thousands) 2021
Balance at the end of the previous period 0
Reclassified to liabilities associated with assets held for sale for the period 2,475,206
Disposals 0
Balance at the end of the period 2.475.206
CCoonnssoolliiddaatteedd ssttaatteemmeenntt ooff ffiinnaanncciiaall ppoossiittiioonn ffrroomm ddiissccoonnttiinnuueedd ooppeerraattiioonnss
The assets and liabilities associated with DEME’s business lines have been classified as held for sale in the consolidated statement of financial position as at 31 December 2021. The reclassified assets and liabilities are detailed in the table below.
Year ended December 31 (in € thousands) 2021
ASSETS Goodwill 153,793 Property, plant and equipment 2,363,428 Other non-current financial assets 33,450 Other non-current assets 391,369 Inventories 12,168 Cash and cash equivalents 528,632 Other current assets 782,105 Assets held for sale 32,456 Total assets 4,297,401
LIABILITIES Equity 1,822,195 Non-current bonds 0 Non-current financial liabilities 577,970 Other non-current liabilities 194,024 Current bonds 0 Current financial liabilities 343,340 Other current liabilities 1,359,872 Total liabilities 2,475,206 Total equity and liabilities 4,297,401
Amounts included in accumulated other comprehensive income : Reserves measured at fair value (89,816) Deferred taxes on reserves 22,661 Exchange differences on translation (8,881) Total of amounts included in accumulated other comprehensive income (76,036)
167
ANNUAL REPORT
STATEMENT OF NON-FINANCIAL INFORMATION
FINANCIAL STATEMENTS
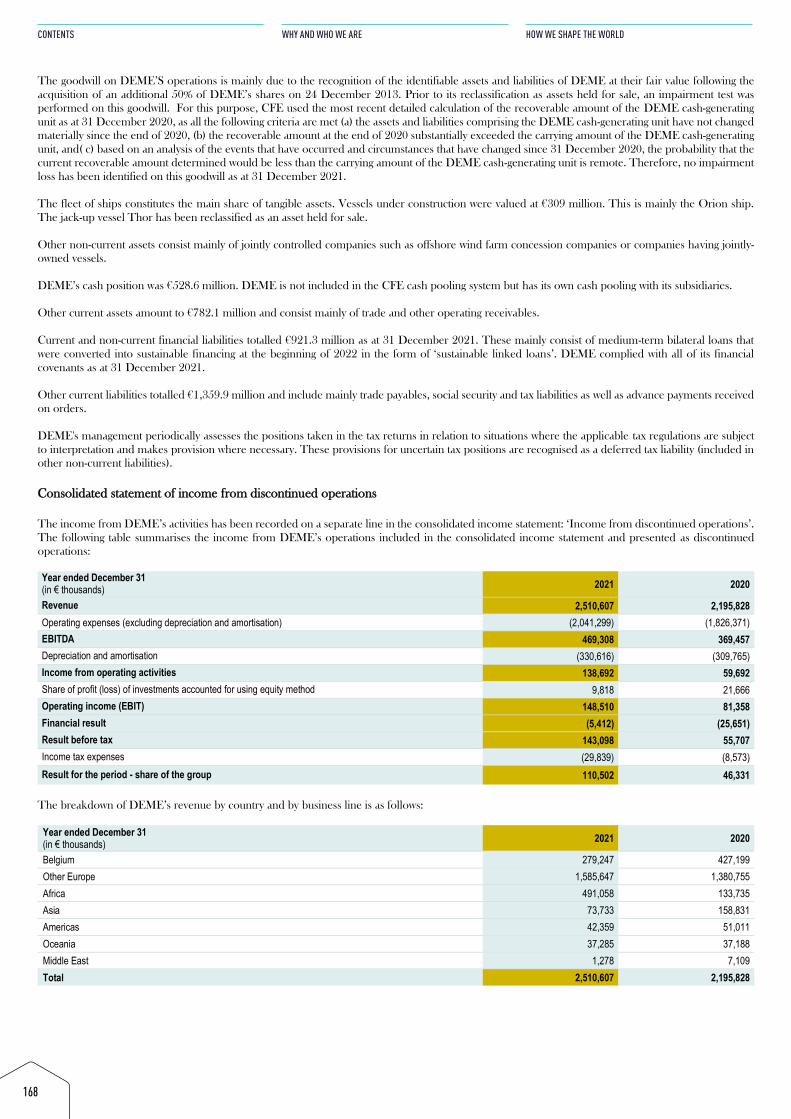
The goodwill on DEME’S operations is mainly due to the recognition of the identifiable assets and liabilities of DEME at their fair value following the acquisition of an additional 50% of DEME’s shares on 24 December 2013. Prior to its reclassification as assets held for sale, an impairment test was performed on this goodwill. For this purpose, CFE used the most recent detailed calculation of the recoverable amount of the DEME cash-generating unit as at 31 December 2020, as all the following criteria are met (a) the assets and liabilities comprising the DEME cash-generating unit have not changed materially since the end of 2020, (b) the recoverable amount at the end of 2020 substantially exceeded the carrying amount of the DEME cash-generating unit, and( c) based on an analysis of the events that have occurred and circumstances that have changed since 31 December 2020, the probability that the current recoverable amount determined would be less than the carrying amount of the DEME cash-generating unit is remote. Therefore, no impairment loss has been identified on this goodwill as at 31 December 2021.
The fleet of ships constitutes the main share of tangible assets. Vessels under construction were valued at €309 million. This is mainly the Orion ship. The jack-up vessel Thor has been reclassified as an asset held for sale.
Other non-current assets consist mainly of jointly controlled companies such as offshore wind farm concession companies or companies having jointly-owned vessels.
DEME’s cash position was €528.6 million. DEME is not included in the CFE cash pooling system but has its own cash pooling with its subsidiaries.
Other current assets amount to €782.1 million and consist mainly of trade and other operating receivables.
Current and non-current financial liabilities totalled €921.3 million as at 31 December 2021. These mainly consist of medium-term bilateral loans that were converted into sustainable financing at the beginning of 2022 in the form of ‘sustainable linked loans’. DEME complied with all of its financial covenants as at 31 December 2021.
Other current liabilities totalled €1,359.9 million and include mainly trade payables, social security and tax liabilities as well as advance payments received on orders.
DEME's management periodically assesses the positions taken in the tax returns in relation to situations where the applicable tax regulations are subject to interpretation and makes provision where necessary. These provisions for uncertain tax positions are recognised as a deferred tax liability (included in other non-current liabilities).
CCoonnssoolliiddaatteedd ssttaatteemmeenntt ooff iinnccoommee ffrroomm ddiissccoonnttiinnuueedd ooppeerraattiioonnss
The income from DEME’s activities has been recorded on a separate line in the consolidated income statement: ‘Income from discontinued operations’. The following table summarises the income from DEME’s operations included in the consolidated income statement and presented as discontinued operations:
Year ended December 31 (in € thousands) 2021 2020
Revenue 2,510,607 2,195,828 Operating expenses (excluding depreciation and amortisation) (2,041,299) (1,826,371) EBITDA 469,308 369,457 Depreciation and amortisation (330,616) (309,765) Income from operating activities 138,692 59,692 Share of profit (loss) of investments accounted for using equity method 9,818 21,666 Operating income (EBIT) 148,510 81,358 Financial result (5,412) (25,651) Result before tax 143,098 55,707 Income tax expenses (29,839) (8,573) Result for the period - share of the group 110,502 46,331
The breakdown of DEME’s revenue by country and by business line is as follows:
Year ended December 31 (in € thousands) 2021 2020
Belgium 279,247 427,199 Other Europe 1,585,647 1,380,755 Africa 491,058 133,735 Asia 73,733 158,831 Americas 42,359 51,011 Oceania 37,285 37,188 Middle East 1,278 7,109 Total 2,510,607 2,195,828
168
CONTENTS
WHY AND WHO WE ARE
HOW WE SHAPE THE WORLD
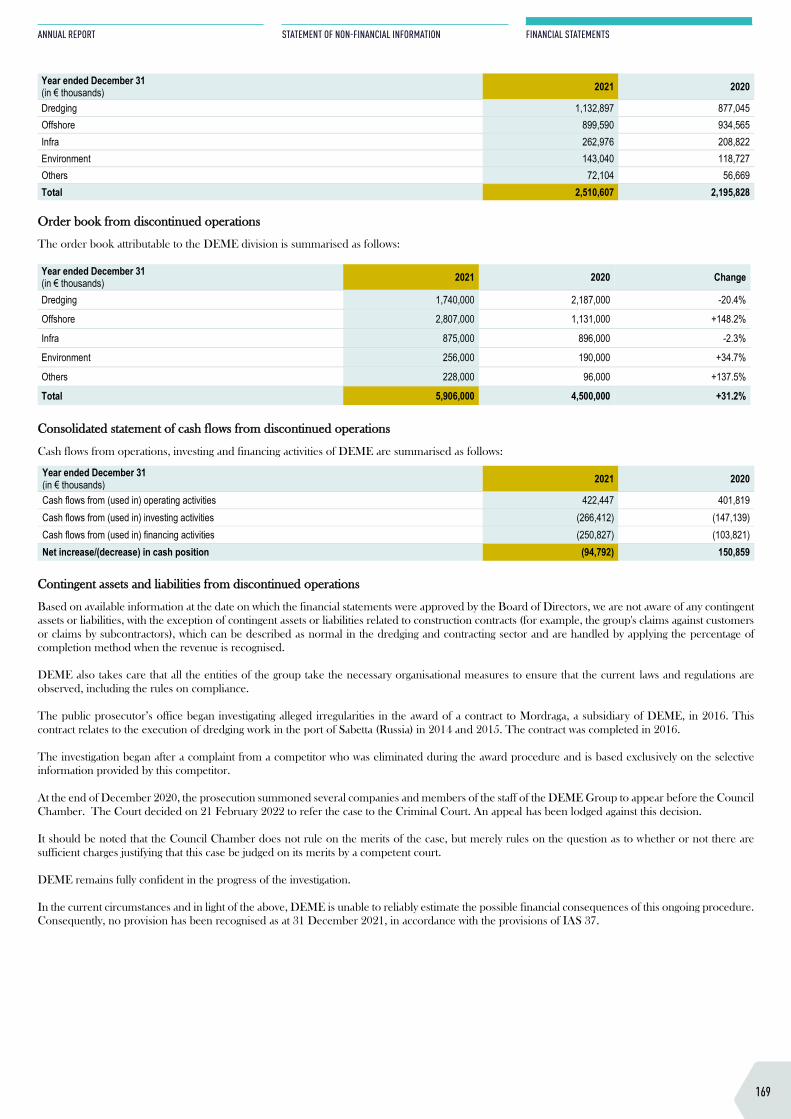
The goodwill on DEME’S operations is mainly due to the recognition of the identifiable assets and liabilities of DEME at their fair value following the acquisition of an additional 50% of DEME’s shares on 24 December 2013. Prior to its reclassification as assets held for sale, an impairment test was performed on this goodwill. For this purpose, CFE used the most recent detailed calculation of the recoverable amount of the DEME cash-generating unit as at 31 December 2020, as all the following criteria are met (a) the assets and liabilities comprising the DEME cash-generating unit have not changed materially since the end of 2020, (b) the recoverable amount at the end of 2020 substantially exceeded the carrying amount of the DEME cash-generating unit, and( c) based on an analysis of the events that have occurred and circumstances that have changed since 31 December 2020, the probability that the current recoverable amount determined would be less than the carrying amount of the DEME cash-generating unit is remote. Therefore, no impairment loss has been identified on this goodwill as at 31 December 2021.
The fleet of ships constitutes the main share of tangible assets. Vessels under construction were valued at €309 million. This is mainly the Orion ship. The jack-up vessel Thor has been reclassified as an asset held for sale.
Other non-current assets consist mainly of jointly controlled companies such as offshore wind farm concession companies or companies having jointly-owned vessels.
DEME’s cash position was €528.6 million. DEME is not included in the CFE cash pooling system but has its own cash pooling with its subsidiaries.
Other current assets amount to €782.1 million and consist mainly of trade and other operating receivables.
Current and non-current financial liabilities totalled €921.3 million as at 31 December 2021. These mainly consist of medium-term bilateral loans that were converted into sustainable financing at the beginning of 2022 in the form of ‘sustainable linked loans’. DEME complied with all of its financial covenants as at 31 December 2021.
Other current liabilities totalled €1,359.9 million and include mainly trade payables, social security and tax liabilities as well as advance payments received on orders.
DEME's management periodically assesses the positions taken in the tax returns in relation to situations where the applicable tax regulations are subject to interpretation and makes provision where necessary. These provisions for uncertain tax positions are recognised as a deferred tax liability (included in other non-current liabilities).
CCoonnssoolliiddaatteedd ssttaatteemmeenntt ooff iinnccoommee ffrroomm ddiissccoonnttiinnuueedd ooppeerraattiioonnss
The income from DEME’s activities has been recorded on a separate line in the consolidated income statement: ‘Income from discontinued operations’. The following table summarises the income from DEME’s operations included in the consolidated income statement and presented as discontinued operations:
Year ended December 31 (in € thousands) 2021 2020
Revenue 2,510,607 2,195,828 Operating expenses (excluding depreciation and amortisation) (2,041,299) (1,826,371) EBITDA 469,308 369,457 Depreciation and amortisation (330,616) (309,765) Income from operating activities 138,692 59,692 Share of profit (loss) of investments accounted for using equity method 9,818 21,666 Operating income (EBIT) 148,510 81,358 Financial result (5,412) (25,651) Result before tax 143,098 55,707 Income tax expenses (29,839) (8,573) Result for the period - share of the group 110,502 46,331
The breakdown of DEME’s revenue by country and by business line is as follows:
Year ended December 31 (in € thousands) 2021 2020
Belgium 279,247 427,199 Other Europe 1,585,647 1,380,755 Africa 491,058 133,735 Asia 73,733 158,831 Americas 42,359 51,011 Oceania 37,285 37,188 Middle East 1,278 7,109 Total 2,510,607 2,195,828
Year ended December 31 (in € thousands) 2021 2020
Dredging 1,132,897 877,045 Offshore 899,590 934,565 Infra 262,976 208,822 Environment 143,040 118,727 Others 72,104 56,669 Total 2,510,607 2,195,828
OOrrddeerr bbooookk ffrroomm ddiissccoonnttiinnuueedd ooppeerraattiioonnss
The order book attributable to the DEME division is summarised as follows:
Year ended December 31 (in € thousands) 2021 2020 Change
Dredging 1,740,000 2,187,000 -20.4%
Offshore 2,807,000 1,131,000 +148.2%
Infra 875,000 896,000 -2.3%
Environment 256,000 190,000 +34.7%
Others 228,000 96,000 +137.5%
Total 5,906,000 4,500,000 +31.2%
CCoonnssoolliiddaatteedd ssttaatteemmeenntt ooff ccaasshh fflloowwss ffrroomm ddiissccoonnttiinnuueedd ooppeerraattiioonnss
Cash flows from operations, investing and financing activities of DEME are summarised as follows:
Year ended December 31 (in € thousands) 2021 2020
Cash flows from (used in) operating activities 422,447 401,819 Cash flows from (used in) investing activities (266,412) (147,139) Cash flows from (used in) financing activities (250,827) (103,821) Net increase/(decrease) in cash position (94,792) 150,859
CCoonnttiinnggeenntt aasssseettss aanndd lliiaabbiilliittiieess ffrroomm ddiissccoonnttiinnuueedd ooppeerraattiioonnss
Based on available information at the date on which the financial statements were approved by the Board of Directors, we are not aware of any contingent assets or liabilities, with the exception of contingent assets or liabilities related to construction contracts (for example, the group's claims against customers or claims by subcontractors), which can be described as normal in the dredging and contracting sector and are handled by applying the percentage of completion method when the revenue is recognised.
DEME also takes care that all the entities of the group take the necessary organisational measures to ensure that the current laws and regulations are observed, including the rules on compliance.
The public prosecutor’s office began investigating alleged irregularities in the award of a contract to Mordraga, a subsidiary of DEME, in 2016. This contract relates to the execution of dredging work in the port of Sabetta (Russia) in 2014 and 2015. The contract was completed in 2016.
The investigation began after a complaint from a competitor who was eliminated during the award procedure and is based exclusively on the selective information provided by this competitor.
At the end of December 2020, the prosecution summoned several companies and members of the staff of the DEME Group to appear before the Council Chamber. The Court decided on 21 February 2022 to refer the case to the Criminal Court. An appeal has been lodged against this decision.
It should be noted that the Council Chamber does not rule on the merits of the case, but merely rules on the question as to whether or not there are sufficient charges justifying that this case be judged on its merits by a competent court.
DEME remains fully confident in the progress of the investigation.
In the current circumstances and in light of the above, DEME is unable to reliably estimate the possible financial consequences of this ongoing procedure. Consequently, no provision has been recognised as at 31 December 2021, in accordance with the provisions of IAS 37.
169
ANNUAL REPORT
STATEMENT OF NON-FINANCIAL INFORMATION
FINANCIAL STATEMENTS
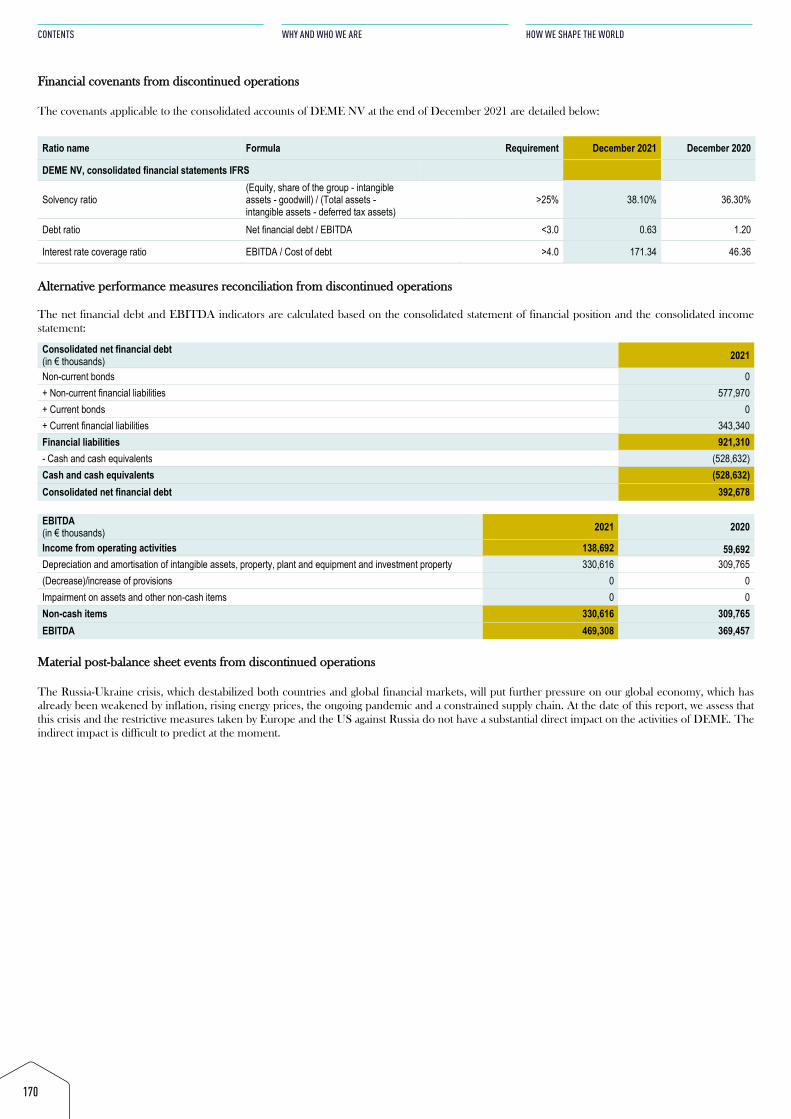
FFiinnaanncciiaall ccoovveennaannttss ffrroomm ddiissccoonnttiinnuueedd ooppeerraattiioonnss
The covenants applicable to the consolidated accounts of DEME NV at the end of December 2021 are detailed below:
Ratio name Formula Requirement December 2021 December 2020
DEME NV, consolidated financial statements IFRS
Solvency ratio (Equity, share of the group - intangible assets - goodwill) / (Total assets - intangible assets - deferred tax assets)
>25% 38.10% 36.30%
Debt ratio Net financial debt / EBITDA <3.0 0.63 1.20
Interest rate coverage ratio EBITDA / Cost of debt >4.0 171.34 46.36
AAlltteerrnnaattiivvee ppeerrffoorrmmaannccee mmeeaassuurreess rreeccoonncciilliiaattiioonn ffrroomm ddiissccoonnttiinnuueedd ooppeerraattiioonnss
The net financial debt and EBITDA indicators are calculated based on the consolidated statement of financial position and the consolidated income statement:
Consolidated net financial debt (in € thousands) 2021
Non-current bonds 0 + Non-current financial liabilities 577,970 + Current bonds 0 + Current financial liabilities 343,340 Financial liabilities 921,310 - Cash and cash equivalents (528,632) Cash and cash equivalents (528,632) Consolidated net financial debt 392,678
EBITDA (in € thousands) 2021 2020
Income from operating activities 138,692 59,692 Depreciation and amortisation of intangible assets, property, plant and equipment and investment property 330,616 309,765 (Decrease)/increase of provisions 0 0 Impairment on assets and other non-cash items 0 0 Non-cash items 330,616 309,765 EBITDA 469,308 369,457
MMaatteerriiaall ppoosstt--bbaallaannccee sshheeeett eevveennttss ffrroomm ddiissccoonnttiinnuueedd ooppeerraattiioonnss
The Russia-Ukraine crisis, which destabilized both countries and global financial markets, will put further pressure on our global economy, which has already been weakened by inflation, rising energy prices, the ongoing pandemic and a constrained supply chain. At the date of this report, we assess that this crisis and the restrictive measures taken by Europe and the US against Russia do not have a substantial direct impact on the activities of DEME. The indirect impact is difficult to predict at the moment.
170
CONTENTS
WHY AND WHO WE ARE
HOW WE SHAPE THE WORLD
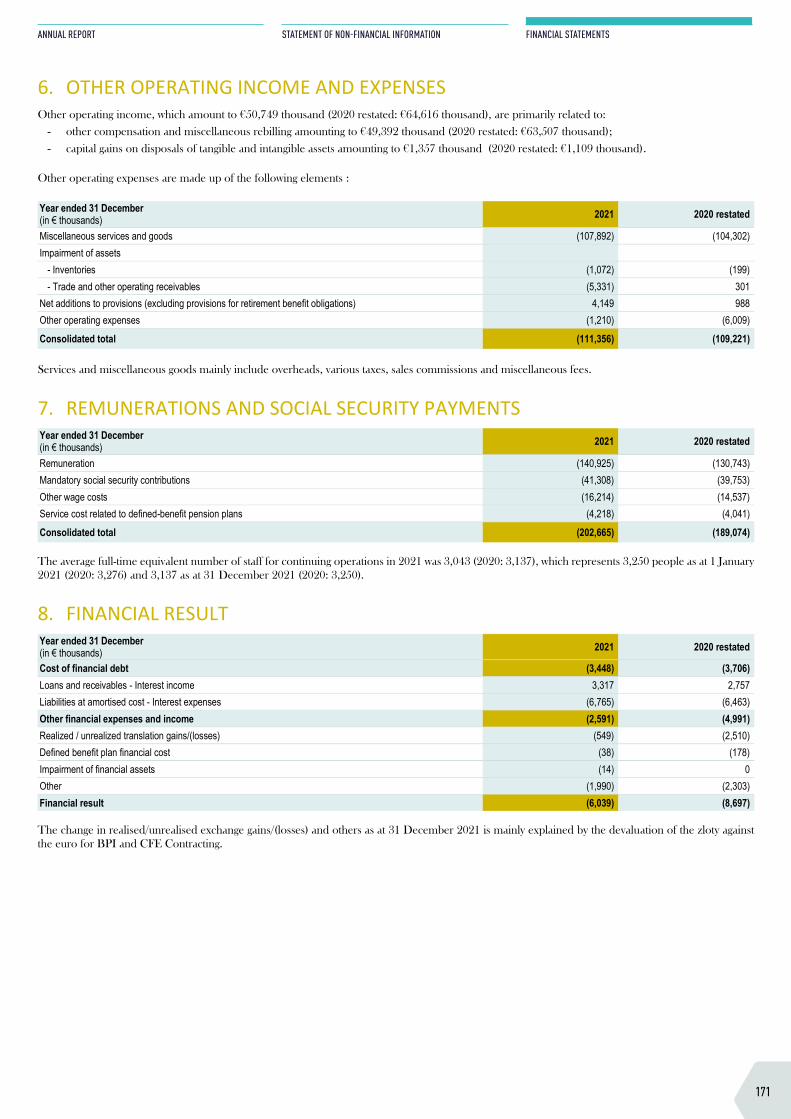
FFiinnaanncciiaall ccoovveennaannttss ffrroomm ddiissccoonnttiinnuueedd ooppeerraattiioonnss
The covenants applicable to the consolidated accounts of DEME NV at the end of December 2021 are detailed below:
Ratio name Formula Requirement December 2021 December 2020
DEME NV, consolidated financial statements IFRS
Solvency ratio (Equity, share of the group - intangible assets - goodwill) / (Total assets - intangible assets - deferred tax assets)
>25% 38.10% 36.30%
Debt ratio Net financial debt / EBITDA <3.0 0.63 1.20
Interest rate coverage ratio EBITDA / Cost of debt >4.0 171.34 46.36
AAlltteerrnnaattiivvee ppeerrffoorrmmaannccee mmeeaassuurreess rreeccoonncciilliiaattiioonn ffrroomm ddiissccoonnttiinnuueedd ooppeerraattiioonnss
The net financial debt and EBITDA indicators are calculated based on the consolidated statement of financial position and the consolidated income statement:
Consolidated net financial debt (in € thousands) 2021
Non-current bonds 0 + Non-current financial liabilities 577,970 + Current bonds 0 + Current financial liabilities 343,340 Financial liabilities 921,310 - Cash and cash equivalents (528,632) Cash and cash equivalents (528,632) Consolidated net financial debt 392,678
EBITDA (in € thousands) 2021 2020
Income from operating activities 138,692 59,692 Depreciation and amortisation of intangible assets, property, plant and equipment and investment property 330,616 309,765 (Decrease)/increase of provisions 0 0 Impairment on assets and other non-cash items 0 0 Non-cash items 330,616 309,765 EBITDA 469,308 369,457
MMaatteerriiaall ppoosstt--bbaallaannccee sshheeeett eevveennttss ffrroomm ddiissccoonnttiinnuueedd ooppeerraattiioonnss
The Russia-Ukraine crisis, which destabilized both countries and global financial markets, will put further pressure on our global economy, which has already been weakened by inflation, rising energy prices, the ongoing pandemic and a constrained supply chain. At the date of this report, we assess that this crisis and the restrictive measures taken by Europe and the US against Russia do not have a substantial direct impact on the activities of DEME. The indirect impact is difficult to predict at the moment.
6. OTHER OPERATING INCOME AND EXPENSESOther operating income, which amount to €50,749 thousand (2020 restated: €64,616 thousand), are primarily related to:
- other compensation and miscellaneous rebilling amounting to €49,392 thousand (2020 restated: €63,507 thousand);- capital gains on disposals of tangible and intangible assets amounting to €1,357 thousand (2020 restated: €1,109 thousand).
Other operating expenses are made up of the following elements :
Year ended 31 December (in € thousands) 2021 2020 restated
Miscellaneous services and goods (107,892) (104,302) Impairment of assets
- Inventories (1,072) (199) - Trade and other operating receivables (5,331) 301
Net additions to provisions (excluding provisions for retirement benefit obligations) 4,149 988 Other operating expenses (1,210) (6,009)
Consolidated total (111,356) (109,221)
Services and miscellaneous goods mainly include overheads, various taxes, sales commissions and miscellaneous fees.
7. REMUNERATIONS AND SOCIAL SECURITY PAYMENTSYear ended 31 December (in € thousands) 2021 2020 restated
Remuneration (140,925) (130,743) Mandatory social security contributions (41,308) (39,753) Other wage costs (16,214) (14,537) Service cost related to defined-benefit pension plans (4,218) (4,041)
Consolidated total (202,665) (189,074)
The average full-time equivalent number of staff for continuing operations in 2021 was 3,043 (2020: 3,137), which represents 3,250 people as at 1 January 2021 (2020: 3,276) and 3,137 as at 31 December 2021 (2020: 3,250).
8. FINANCIAL RESULTYear ended 31 December (in € thousands) 2021 2020 restated
Cost of financial debt (3,448) (3,706) Loans and receivables - Interest income 3,317 2,757 Liabilities at amortised cost - Interest expenses (6,765) (6,463) Other financial expenses and income (2,591) (4,991) Realized / unrealized translation gains/(losses) (549) (2,510) Defined benefit plan financial cost (38) (178) Impairment of financial assets (14) 0 Other (1,990) (2,303) Financial result (6,039) (8,697)
The change in realised/unrealised exchange gains/(losses) and others as at 31 December 2021 is mainly explained by the devaluation of the zloty against the euro for BPI and CFE Contracting.
171
ANNUAL REPORT
STATEMENT OF NON-FINANCIAL INFORMATION
FINANCIAL STATEMENTS
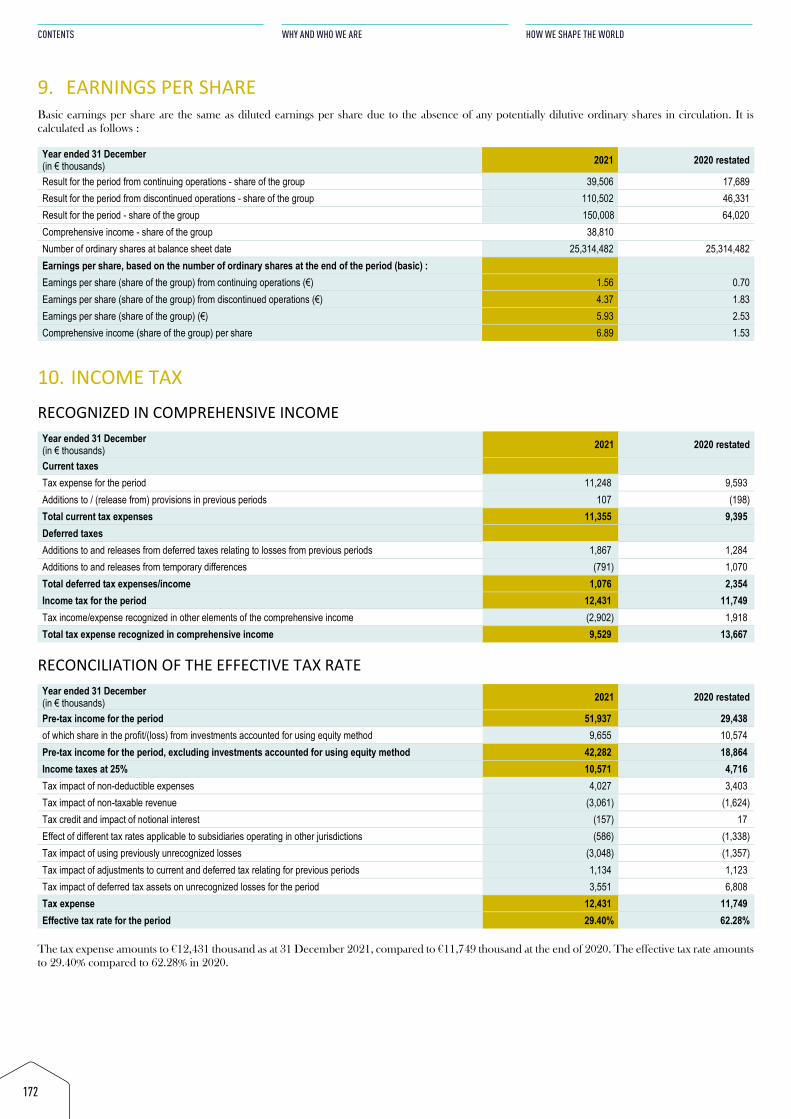
9. EARNINGS PER SHAREBasic earnings per share are the same as diluted earnings per share due to the absence of any potentially dilutive ordinary shares in circulation. It is calculated as follows :
Year ended 31 December (in € thousands) 2021 2020 restated
Result for the period from continuing operations - share of the group 39,506 17,689 Result for the period from discontinued operations - share of the group 110,502 46,331 Result for the period - share of the group 150,008 64,020 Comprehensive income - share of the group 38,810 Number of ordinary shares at balance sheet date 25,314,482 25,314,482 Earnings per share, based on the number of ordinary shares at the end of the period (basic) : Earnings per share (share of the group) from continuing operations (€) 1.56 0.70 Earnings per share (share of the group) from discontinued operations (€) 4.37 1.83 Earnings per share (share of the group) (€) 5.93 2.53 Comprehensive income (share of the group) per share 6.89 1.53
10. INCOME TAXRECOGNIZED IN COMPREHENSIVE INCOME Year ended 31 December (in € thousands) 2021 2020 restated
Current taxes Tax expense for the period 11,248 9,593 Additions to / (release from) provisions in previous periods 107 (198) Total current tax expenses 11,355 9,395 Deferred taxes Additions to and releases from deferred taxes relating to losses from previous periods 1,867 1,284 Additions to and releases from temporary differences (791) 1,070 Total deferred tax expenses/income 1,076 2,354 Income tax for the period 12,431 11,749 Tax income/expense recognized in other elements of the comprehensive income (2,902) 1,918 Total tax expense recognized in comprehensive income 9,529 13,667
RECONCILIATION OF THE EFFECTIVE TAX RATE Year ended 31 December (in € thousands) 2021 2020 restated
Pre-tax income for the period 51,937 29,438 of which share in the profit/(loss) from investments accounted for using equity method 9,655 10,574 Pre-tax income for the period, excluding investments accounted for using equity method 42,282 18,864 Income taxes at 25% 10,571 4,716 Tax impact of non-deductible expenses 4,027 3,403 Tax impact of non-taxable revenue (3,061) (1,624) Tax credit and impact of notional interest (157) 17 Effect of different tax rates applicable to subsidiaries operating in other jurisdictions (586) (1,338) Tax impact of using previously unrecognized losses (3,048) (1,357) Tax impact of adjustments to current and deferred tax relating for previous periods 1,134 1,123 Tax impact of deferred tax assets on unrecognized losses for the period 3,551 6,808 Tax expense 12,431 11,749 Effective tax rate for the period 29.40% 62.28%
The tax expense amounts to €12,431 thousand as at 31 December 2021, compared to €11,749 thousand at the end of 2020. The effective tax rate amounts to 29.40% compared to 62.28% in 2020.
172
CONTENTS
WHY AND WHO WE ARE
HOW WE SHAPE THE WORLD
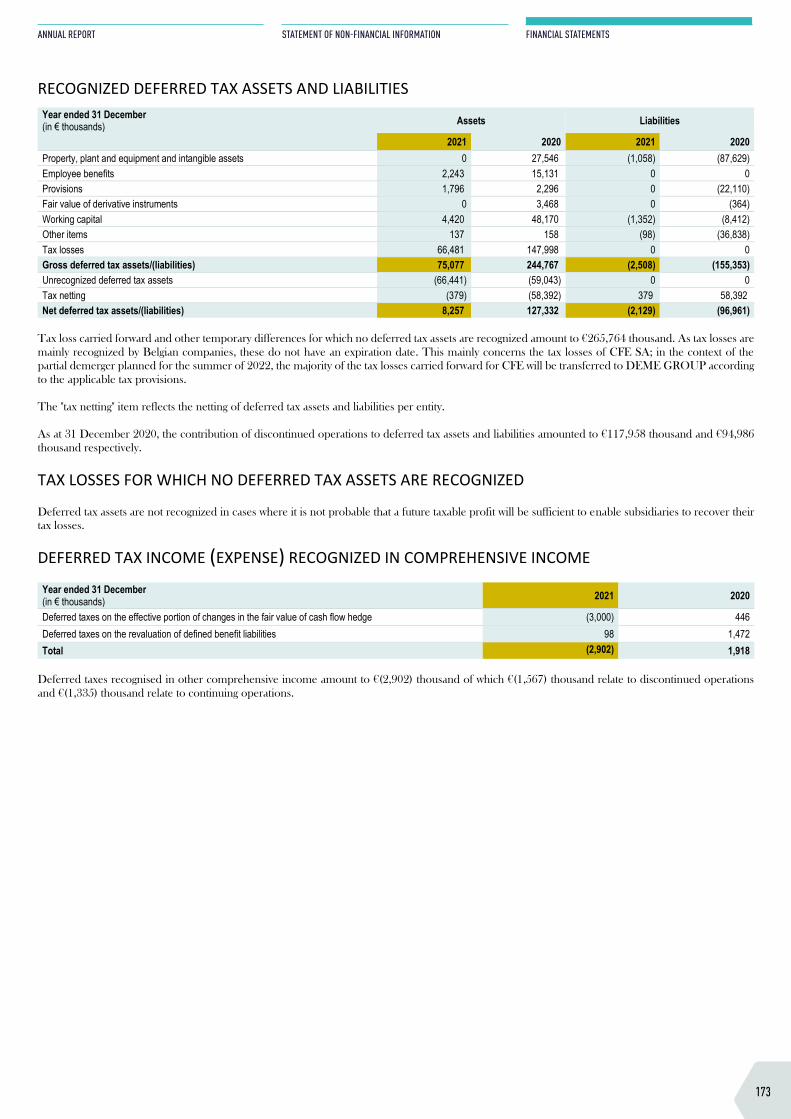
9. EARNINGS PER SHAREBasic earnings per share are the same as diluted earnings per share due to the absence of any potentially dilutive ordinary shares in circulation. It is calculated as follows :
Year ended 31 December (in € thousands) 2021 2020 restated
Result for the period from continuing operations - share of the group 39,506 17,689 Result for the period from discontinued operations - share of the group 110,502 46,331 Result for the period - share of the group 150,008 64,020 Comprehensive income - share of the group 38,810 Number of ordinary shares at balance sheet date 25,314,482 25,314,482 Earnings per share, based on the number of ordinary shares at the end of the period (basic) : Earnings per share (share of the group) from continuing operations (€) 1.56 0.70 Earnings per share (share of the group) from discontinued operations (€) 4.37 1.83 Earnings per share (share of the group) (€) 5.93 2.53 Comprehensive income (share of the group) per share 6.89 1.53
10. INCOME TAXRECOGNIZED IN COMPREHENSIVE INCOME Year ended 31 December (in € thousands) 2021 2020 restated
Current taxes Tax expense for the period 11,248 9,593 Additions to / (release from) provisions in previous periods 107 (198) Total current tax expenses 11,355 9,395 Deferred taxes Additions to and releases from deferred taxes relating to losses from previous periods 1,867 1,284 Additions to and releases from temporary differences (791) 1,070 Total deferred tax expenses/income 1,076 2,354 Income tax for the period 12,431 11,749 Tax income/expense recognized in other elements of the comprehensive income (2,902) 1,918 Total tax expense recognized in comprehensive income 9,529 13,667
RECONCILIATION OF THE EFFECTIVE TAX RATE Year ended 31 December (in € thousands) 2021 2020 restated
Pre-tax income for the period 51,937 29,438 of which share in the profit/(loss) from investments accounted for using equity method 9,655 10,574 Pre-tax income for the period, excluding investments accounted for using equity method 42,282 18,864 Income taxes at 25% 10,571 4,716 Tax impact of non-deductible expenses 4,027 3,403 Tax impact of non-taxable revenue (3,061) (1,624) Tax credit and impact of notional interest (157) 17 Effect of different tax rates applicable to subsidiaries operating in other jurisdictions (586) (1,338) Tax impact of using previously unrecognized losses (3,048) (1,357) Tax impact of adjustments to current and deferred tax relating for previous periods 1,134 1,123 Tax impact of deferred tax assets on unrecognized losses for the period 3,551 6,808 Tax expense 12,431 11,749 Effective tax rate for the period 29.40% 62.28%
The tax expense amounts to €12,431 thousand as at 31 December 2021, compared to €11,749 thousand at the end of 2020. The effective tax rate amounts to 29.40% compared to 62.28% in 2020.
RECOGNIZED DEFERRED TAX ASSETS AND LIABILITIES Year ended 31 December (in € thousands) Assets Liabilities
2021 2020 2021 2020 Property, plant and equipment and intangible assets 0 27,546 (1,058) (87,629) Employee benefits 2,243 15,131 0 0 Provisions 1,796 2,296 0 (22,110) Fair value of derivative instruments 0 3,468 0 (364) Working capital 4,420 48,170 (1,352) (8,412) Other items 137 158 (98) (36,838) Tax losses 66,481 147,998 0 0 Gross deferred tax assets/(liabilities) 75,077 244,767 (2,508) (155,353) Unrecognized deferred tax assets (66,441) (59,043) 0 0 Tax netting (379) (58,392) 379 58,392 Net deferred tax assets/(liabilities) 8,257 127,332 (2,129) (96,961)
Tax loss carried forward and other temporary differences for which no deferred tax assets are recognized amount to €265,764 thousand. As tax losses are mainly recognized by Belgian companies, these do not have an expiration date. This mainly concerns the tax losses of CFE SA; in the context of the partial demerger planned for the summer of 2022, the majority of the tax losses carried forward for CFE will be transferred to DEME GROUP according to the applicable tax provisions.
The "tax netting" item reflects the netting of deferred tax assets and liabilities per entity.
As at 31 December 2020, the contribution of discontinued operations to deferred tax assets and liabilities amounted to €117,958 thousand and €94,986 thousand respectively.
TAX LOSSES FOR WHICH NO DEFERRED TAX ASSETS ARE RECOGNIZED Deferred tax assets are not recognized in cases where it is not probable that a future taxable profit will be sufficient to enable subsidiaries to recover their tax losses.
DEFERRED TAX INCOME (EXPENSE) RECOGNIZED IN COMPREHENSIVE INCOME Year ended 31 December (in € thousands) 2021 2020
Deferred taxes on the effective portion of changes in the fair value of cash flow hedge (3,000) 446 Deferred taxes on the revaluation of defined benefit liabilities 98 1,472 Total (2,902) 1,918
Deferred taxes recognised in other comprehensive income amount to €(2,902) thousand of which €(1,567) thousand relate to discontinued operations and €(1,335) thousand relate to continuing operations.
173
ANNUAL REPORT
STATEMENT OF NON-FINANCIAL INFORMATION
FINANCIAL STATEMENTS
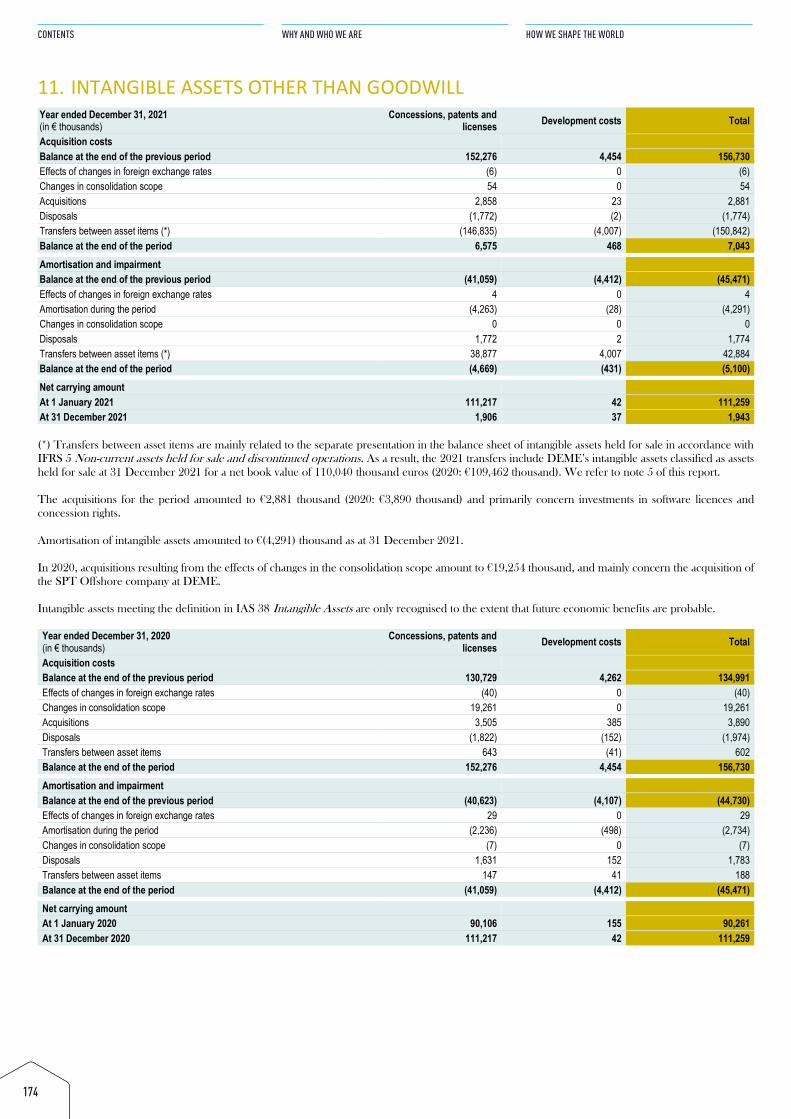
11. INTANGIBLE ASSETS OTHER THAN GOODWILLYear ended December 31, 2021 (in € thousands)
Concessions, patents and licenses Development costs Total
Acquisition costs Balance at the end of the previous period 152,276 4,454 156,730 Effects of changes in foreign exchange rates (6) 0 (6) Changes in consolidation scope 54 0 54 Acquisitions 2,858 23 2,881 Disposals (1,772) (2) (1,774) Transfers between asset items (*) (146,835) (4,007) (150,842) Balance at the end of the period 6,575 468 7,043 Amortisation and impairment Balance at the end of the previous period (41,059) (4,412) (45,471) Effects of changes in foreign exchange rates 4 0 4 Amortisation during the period (4,263) (28) (4,291) Changes in consolidation scope 0 0 0 Disposals 1,772 2 1,774 Transfers between asset items (*) 38,877 4,007 42,884 Balance at the end of the period (4,669) (431) (5,100) Net carrying amount At 1 January 2021 111,217 42 111,259 At 31 December 2021 1,906 37 1,943
(*) Transfers between asset items are mainly related to the separate presentation in the balance sheet of intangible assets held for sale in accordance with IFRS 5 Non-current assets held for sale and discontinued operations. As a result, the 2021 transfers include DEME’s intangible assets classified as assets held for sale at 31 December 2021 for a net book value of 110,040 thousand euros (2020: €109,462 thousand). We refer to note 5 of this report.
The acquisitions for the period amounted to €2,881 thousand (2020: €3,890 thousand) and primarily concern investments in software licences and concession rights.
Amortisation of intangible assets amounted to €(4,291) thousand as at 31 December 2021.
In 2020, acquisitions resulting from the effects of changes in the consolidation scope amount to €19,254 thousand, and mainly concern the acquisition of the SPT Offshore company at DEME.
Intangible assets meeting the definition in IAS 38 Intangible Assets are only recognised to the extent that future economic benefits are probable.
Year ended December 31, 2020 (in € thousands)
Concessions, patents and licenses Development costs Total
Acquisition costs Balance at the end of the previous period 130,729 4,262 134,991 Effects of changes in foreign exchange rates (40) 0 (40) Changes in consolidation scope 19,261 0 19,261 Acquisitions 3,505 385 3,890 Disposals (1,822) (152) (1,974) Transfers between asset items 643 (41) 602 Balance at the end of the period 152,276 4,454 156,730 Amortisation and impairment Balance at the end of the previous period (40,623) (4,107) (44,730) Effects of changes in foreign exchange rates 29 0 29 Amortisation during the period (2,236) (498) (2,734) Changes in consolidation scope (7) 0 (7) Disposals 1,631 152 1,783 Transfers between asset items 147 41 188 Balance at the end of the period (41,059) (4,412) (45,471) Net carrying amount At 1 January 2020 90,106 155 90,261 At 31 December 2020 111,217 42 111,259
174
CONTENTS
WHY AND WHO WE ARE
HOW WE SHAPE THE WORLD
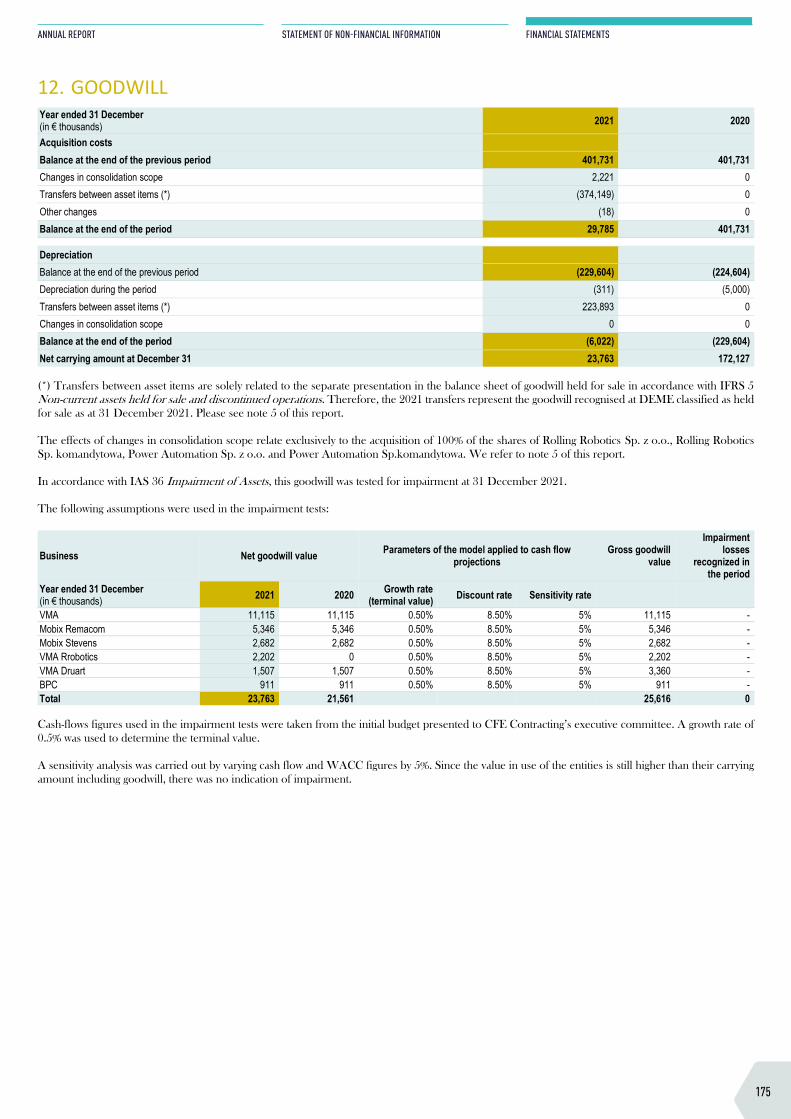
11. INTANGIBLE ASSETS OTHER THAN GOODWILLYear ended December 31, 2021 (in € thousands)
Concessions, patents and licenses Development costs Total
Acquisition costs Balance at the end of the previous period 152,276 4,454 156,730 Effects of changes in foreign exchange rates (6) 0 (6) Changes in consolidation scope 54 0 54 Acquisitions 2,858 23 2,881 Disposals (1,772) (2) (1,774) Transfers between asset items (*) (146,835) (4,007) (150,842) Balance at the end of the period 6,575 468 7,043 Amortisation and impairment Balance at the end of the previous period (41,059) (4,412) (45,471) Effects of changes in foreign exchange rates 4 0 4 Amortisation during the period (4,263) (28) (4,291) Changes in consolidation scope 0 0 0 Disposals 1,772 2 1,774 Transfers between asset items (*) 38,877 4,007 42,884 Balance at the end of the period (4,669) (431) (5,100) Net carrying amount At 1 January 2021 111,217 42 111,259 At 31 December 2021 1,906 37 1,943
(*) Transfers between asset items are mainly related to the separate presentation in the balance sheet of intangible assets held for sale in accordance with IFRS 5 Non-current assets held for sale and discontinued operations. As a result, the 2021 transfers include DEME’s intangible assets classified as assets held for sale at 31 December 2021 for a net book value of 110,040 thousand euros (2020: €109,462 thousand). We refer to note 5 of this report.
The acquisitions for the period amounted to €2,881 thousand (2020: €3,890 thousand) and primarily concern investments in software licences and concession rights.
Amortisation of intangible assets amounted to €(4,291) thousand as at 31 December 2021.
In 2020, acquisitions resulting from the effects of changes in the consolidation scope amount to €19,254 thousand, and mainly concern the acquisition of the SPT Offshore company at DEME.
Intangible assets meeting the definition in IAS 38 Intangible Assets are only recognised to the extent that future economic benefits are probable.
Year ended December 31, 2020 (in € thousands)
Concessions, patents and licenses Development costs Total
Acquisition costs Balance at the end of the previous period 130,729 4,262 134,991 Effects of changes in foreign exchange rates (40) 0 (40) Changes in consolidation scope 19,261 0 19,261 Acquisitions 3,505 385 3,890 Disposals (1,822) (152) (1,974) Transfers between asset items 643 (41) 602 Balance at the end of the period 152,276 4,454 156,730 Amortisation and impairment Balance at the end of the previous period (40,623) (4,107) (44,730) Effects of changes in foreign exchange rates 29 0 29 Amortisation during the period (2,236) (498) (2,734) Changes in consolidation scope (7) 0 (7) Disposals 1,631 152 1,783 Transfers between asset items 147 41 188 Balance at the end of the period (41,059) (4,412) (45,471) Net carrying amount At 1 January 2020 90,106 155 90,261 At 31 December 2020 111,217 42 111,259
12. GOODWILLYear ended 31 December (in € thousands) 2021 2020
Acquisition costs Balance at the end of the previous period 401,731 401,731 Changes in consolidation scope 2,221 0 Transfers between asset items (*) (374,149) 0 Other changes (18) 0 Balance at the end of the period 29,785 401,731
Depreciation Balance at the end of the previous period (229,604) (224,604) Depreciation during the period (311) (5,000) Transfers between asset items (*) 223,893 0 Changes in consolidation scope 0 0 Balance at the end of the period (6,022) (229,604) Net carrying amount at December 31 23,763 172,127
(*) Transfers between asset items are solely related to the separate presentation in the balance sheet of goodwill held for sale in accordance with IFRS 5 Non-current assets held for sale and discontinued operations. Therefore, the 2021 transfers represent the goodwill recognised at DEME classified as held for sale as at 31 December 2021. Please see note 5 of this report.
The effects of changes in consolidation scope relate exclusively to the acquisition of 100% of the shares of Rolling Robotics Sp. z o.o., Rolling Robotics Sp. komandytowa, Power Automation Sp. z o.o. and Power Automation Sp.komandytowa. We refer to note 5 of this report.
In accordance with IAS 36 Impairment of Assets, this goodwill was tested for impairment at 31 December 2021.
The following assumptions were used in the impairment tests:
Business Net goodwill value Parameters of the model applied to cash flow projections
Gross goodwill value
Impairment losses
recognized in the period
Year ended 31 December (in € thousands) 2021 2020 Growth rate
(terminal value) Discount rate Sensitivity rate
VMA 11,115 11,115 0.50% 8.50% 5% 11,115 - Mobix Remacom 5,346 5,346 0.50% 8.50% 5% 5,346 - Mobix Stevens 2,682 2,682 0.50% 8.50% 5% 2,682 - VMA Rrobotics 2,202 0 0.50% 8.50% 5% 2,202 - VMA Druart 1,507 1,507 0.50% 8.50% 5% 3,360 - BPC 911 911 0.50% 8.50% 5% 911 - Total 23,763 21,561 25,616 0
Cash-flows figures used in the impairment tests were taken from the initial budget presented to CFE Contracting’s executive committee. A growth rate of 0.5% was used to determine the terminal value.
A sensitivity analysis was carried out by varying cash flow and WACC figures by 5%. Since the value in use of the entities is still higher than their carrying amount including goodwill, there was no indication of impairment.
175
ANNUAL REPORT
STATEMENT OF NON-FINANCIAL INFORMATION
FINANCIAL STATEMENTS
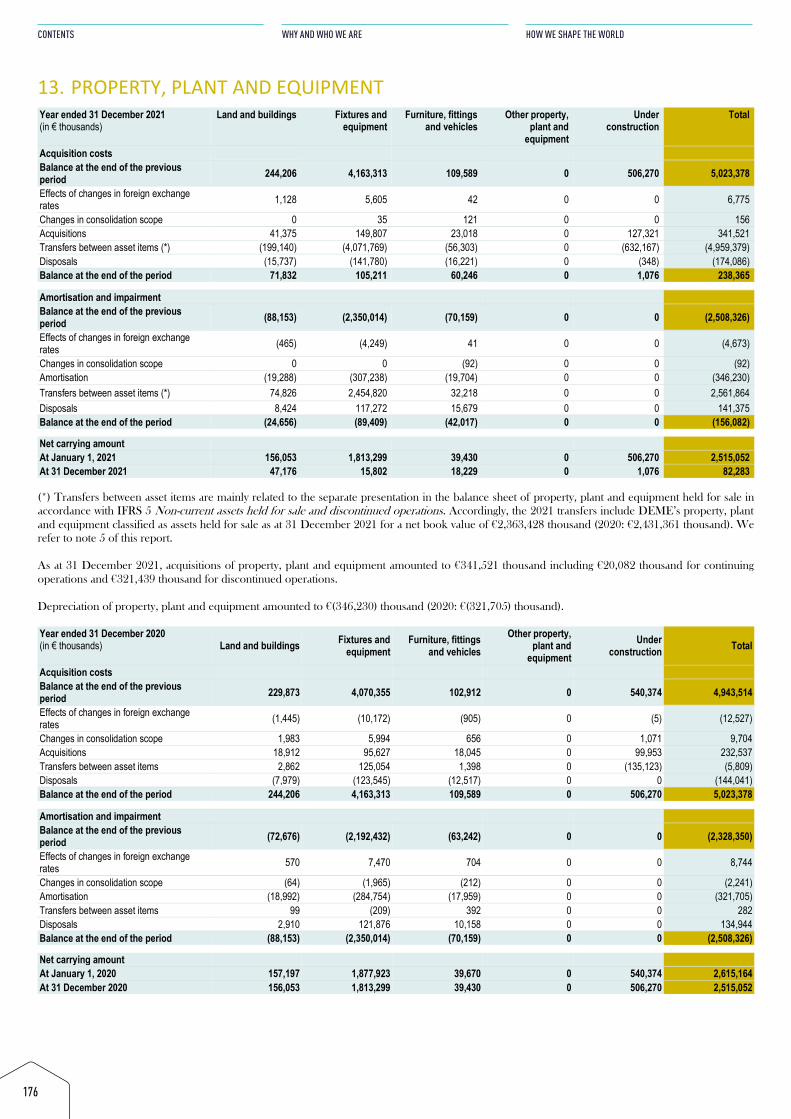
13. PROPERTY, PLANT AND EQUIPMENTYear ended 31 December 2021 (in € thousands)
Land and buildings Fixtures and equipment
Furniture, fittings and vehicles
Other property, plant and
equipment
Under construction
Total
Acquisition costs Balance at the end of the previous period 244,206 4,163,313 109,589 0 506,270 5,023,378
Effects of changes in foreign exchange rates 1,128 5,605 42 0 0 6,775
Changes in consolidation scope 0 35 121 0 0 156 Acquisitions 41,375 149,807 23,018 0 127,321 341,521 Transfers between asset items (*) (199,140) (4,071,769) (56,303) 0 (632,167) (4,959,379) Disposals (15,737) (141,780) (16,221) 0 (348) (174,086) Balance at the end of the period 71,832 105,211 60,246 0 1,076 238,365
Amortisation and impairment Balance at the end of the previous period (88,153) (2,350,014) (70,159) 0 0 (2,508,326)
Effects of changes in foreign exchange rates (465) (4,249) 41 0 0 (4,673)
Changes in consolidation scope 0 0 (92) 0 0 (92) Amortisation (19,288) (307,238) (19,704) 0 0 (346,230) Transfers between asset items (*) 74,826 2,454,820 32,218 0 0 2,561,864 Disposals 8,424 117,272 15,679 0 0 141,375 Balance at the end of the period (24,656) (89,409) (42,017) 0 0 (156,082)
Net carrying amount At January 1, 2021 156,053 1,813,299 39,430 0 506,270 2,515,052 At 31 December 2021 47,176 15,802 18,229 0 1,076 82,283
(*) Transfers between asset items are mainly related to the separate presentation in the balance sheet of property, plant and equipment held for sale in accordance with IFRS 5 Non-current assets held for sale and discontinued operations. Accordingly, the 2021 transfers include DEME’s property, plant and equipment classified as assets held for sale as at 31 December 2021 for a net book value of €2,363,428 thousand (2020: €2,431,361 thousand). We refer to note 5 of this report.
As at 31 December 2021, acquisitions of property, plant and equipment amounted to €341,521 thousand including €20,082 thousand for continuing operations and €321,439 thousand for discontinued operations.
Depreciation of property, plant and equipment amounted to €(346,230) thousand (2020: €(321,705) thousand).
Year ended 31 December 2020 (in € thousands) Land and buildings Fixtures and
equipment Furniture, fittings
and vehicles Other property,
plant and equipment
Under construction Total
Acquisition costs Balance at the end of the previous period 229,873 4,070,355 102,912 0 540,374 4,943,514
Effects of changes in foreign exchange rates (1,445) (10,172) (905) 0 (5) (12,527)
Changes in consolidation scope 1,983 5,994 656 0 1,071 9,704 Acquisitions 18,912 95,627 18,045 0 99,953 232,537 Transfers between asset items 2,862 125,054 1,398 0 (135,123) (5,809) Disposals (7,979) (123,545) (12,517) 0 0 (144,041) Balance at the end of the period 244,206 4,163,313 109,589 0 506,270 5,023,378
Amortisation and impairment Balance at the end of the previous period (72,676) (2,192,432) (63,242) 0 0 (2,328,350)
Effects of changes in foreign exchange rates 570 7,470 704 0 0 8,744
Changes in consolidation scope (64) (1,965) (212) 0 0 (2,241) Amortisation (18,992) (284,754) (17,959) 0 0 (321,705) Transfers between asset items 99 (209) 392 0 0 282 Disposals 2,910 121,876 10,158 0 0 134,944 Balance at the end of the period (88,153) (2,350,014) (70,159) 0 0 (2,508,326)
Net carrying amount At January 1, 2020 157,197 1,877,923 39,670 0 540,374 2,615,164 At 31 December 2020 156,053 1,813,299 39,430 0 506,270 2,515,052
176
CONTENTS
WHY AND WHO WE ARE
HOW WE SHAPE THE WORLD
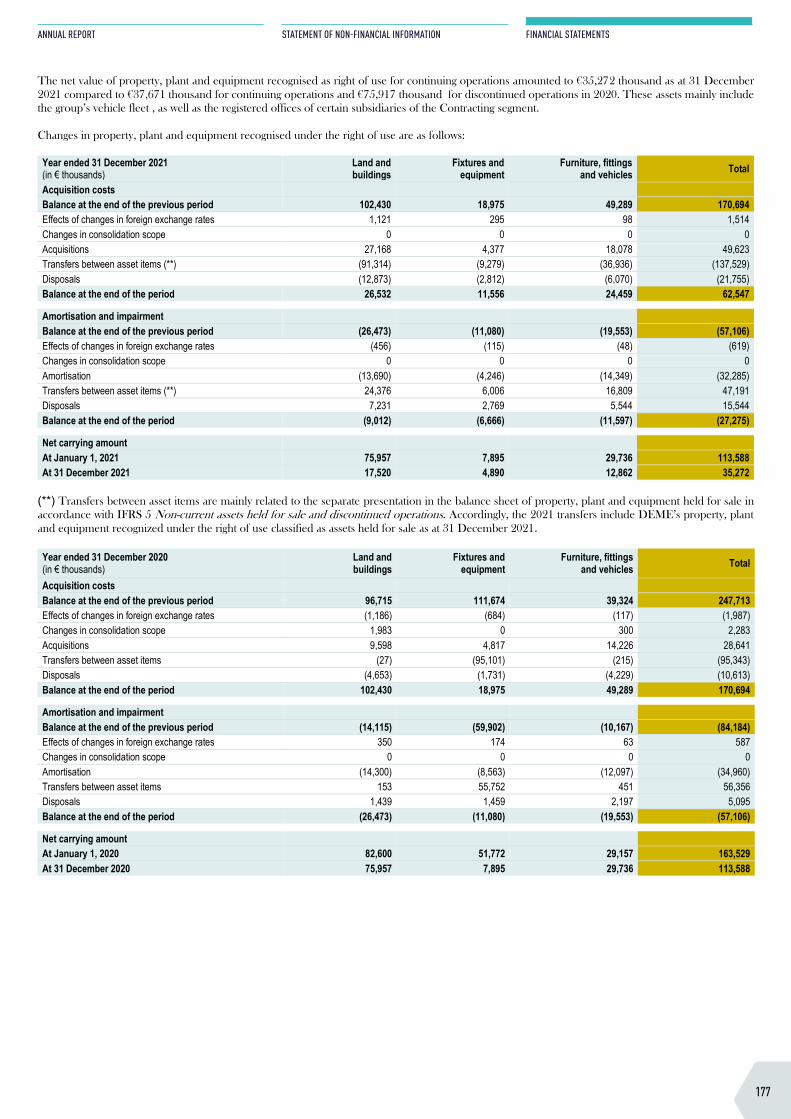
13. PROPERTY, PLANT AND EQUIPMENTYear ended 31 December 2021 (in € thousands)
Land and buildings Fixtures and equipment
Furniture, fittings and vehicles
Other property, plant and
equipment
Under construction
Total
Acquisition costs Balance at the end of the previous period 244,206 4,163,313 109,589 0 506,270 5,023,378
Effects of changes in foreign exchange rates 1,128 5,605 42 0 0 6,775
Changes in consolidation scope 0 35 121 0 0 156 Acquisitions 41,375 149,807 23,018 0 127,321 341,521 Transfers between asset items (*) (199,140) (4,071,769) (56,303) 0 (632,167) (4,959,379) Disposals (15,737) (141,780) (16,221) 0 (348) (174,086) Balance at the end of the period 71,832 105,211 60,246 0 1,076 238,365
Amortisation and impairment Balance at the end of the previous period (88,153) (2,350,014) (70,159) 0 0 (2,508,326)
Effects of changes in foreign exchange rates (465) (4,249) 41 0 0 (4,673)
Changes in consolidation scope 0 0 (92) 0 0 (92) Amortisation (19,288) (307,238) (19,704) 0 0 (346,230) Transfers between asset items (*) 74,826 2,454,820 32,218 0 0 2,561,864 Disposals 8,424 117,272 15,679 0 0 141,375 Balance at the end of the period (24,656) (89,409) (42,017) 0 0 (156,082)
Net carrying amount At January 1, 2021 156,053 1,813,299 39,430 0 506,270 2,515,052 At 31 December 2021 47,176 15,802 18,229 0 1,076 82,283
(*) Transfers between asset items are mainly related to the separate presentation in the balance sheet of property, plant and equipment held for sale in accordance with IFRS 5 Non-current assets held for sale and discontinued operations. Accordingly, the 2021 transfers include DEME’s property, plant and equipment classified as assets held for sale as at 31 December 2021 for a net book value of €2,363,428 thousand (2020: €2,431,361 thousand). We refer to note 5 of this report.
As at 31 December 2021, acquisitions of property, plant and equipment amounted to €341,521 thousand including €20,082 thousand for continuing operations and €321,439 thousand for discontinued operations.
Depreciation of property, plant and equipment amounted to €(346,230) thousand (2020: €(321,705) thousand).
Year ended 31 December 2020 (in € thousands) Land and buildings Fixtures and
equipment Furniture, fittings
and vehicles Other property,
plant and equipment
Under construction Total
Acquisition costs Balance at the end of the previous period 229,873 4,070,355 102,912 0 540,374 4,943,514
Effects of changes in foreign exchange rates (1,445) (10,172) (905) 0 (5) (12,527)
Changes in consolidation scope 1,983 5,994 656 0 1,071 9,704 Acquisitions 18,912 95,627 18,045 0 99,953 232,537 Transfers between asset items 2,862 125,054 1,398 0 (135,123) (5,809) Disposals (7,979) (123,545) (12,517) 0 0 (144,041) Balance at the end of the period 244,206 4,163,313 109,589 0 506,270 5,023,378
Amortisation and impairment Balance at the end of the previous period (72,676) (2,192,432) (63,242) 0 0 (2,328,350)
Effects of changes in foreign exchange rates 570 7,470 704 0 0 8,744
Changes in consolidation scope (64) (1,965) (212) 0 0 (2,241) Amortisation (18,992) (284,754) (17,959) 0 0 (321,705) Transfers between asset items 99 (209) 392 0 0 282 Disposals 2,910 121,876 10,158 0 0 134,944 Balance at the end of the period (88,153) (2,350,014) (70,159) 0 0 (2,508,326)
Net carrying amount At January 1, 2020 157,197 1,877,923 39,670 0 540,374 2,615,164 At 31 December 2020 156,053 1,813,299 39,430 0 506,270 2,515,052
The net value of property, plant and equipment recognised as right of use for continuing operations amounted to €35,272 thousand as at 31 December 2021 compared to €37,671 thousand for continuing operations and €75,917 thousand for discontinued operations in 2020. These assets mainly include the group’s vehicle fleet , as well as the registered offices of certain subsidiaries of the Contracting segment.
Changes in property, plant and equipment recognised under the right of use are as follows:
Year ended 31 December 2021 (in € thousands)
Land and buildings
Fixtures and equipment
Furniture, fittings and vehicles Total
Acquisition costs Balance at the end of the previous period 102,430 18,975 49,289 170,694 Effects of changes in foreign exchange rates 1,121 295 98 1,514 Changes in consolidation scope 0 0 0 0 Acquisitions 27,168 4,377 18,078 49,623 Transfers between asset items (**) (91,314) (9,279) (36,936) (137,529) Disposals (12,873) (2,812) (6,070) (21,755) Balance at the end of the period 26,532 11,556 24,459 62,547
Amortisation and impairment Balance at the end of the previous period (26,473) (11,080) (19,553) (57,106) Effects of changes in foreign exchange rates (456) (115) (48) (619) Changes in consolidation scope 0 0 0 0 Amortisation (13,690) (4,246) (14,349) (32,285) Transfers between asset items (**) 24,376 6,006 16,809 47,191 Disposals 7,231 2,769 5,544 15,544 Balance at the end of the period (9,012) (6,666) (11,597) (27,275)
Net carrying amount At January 1, 2021 75,957 7,895 29,736 113,588 At 31 December 2021 17,520 4,890 12,862 35,272
(**) Transfers between asset items are mainly related to the separate presentation in the balance sheet of property, plant and equipment held for sale in accordance with IFRS 5 Non-current assets held for sale and discontinued operations. Accordingly, the 2021 transfers include DEME’s property, plant and equipment recognized under the right of use classified as assets held for sale as at 31 December 2021.
Year ended 31 December 2020 (in € thousands)
Land and buildings
Fixtures and equipment
Furniture, fittings and vehicles Total
Acquisition costs Balance at the end of the previous period 96,715 111,674 39,324 247,713 Effects of changes in foreign exchange rates (1,186) (684) (117) (1,987) Changes in consolidation scope 1,983 0 300 2,283 Acquisitions 9,598 4,817 14,226 28,641 Transfers between asset items (27) (95,101) (215) (95,343) Disposals (4,653) (1,731) (4,229) (10,613) Balance at the end of the period 102,430 18,975 49,289 170,694
Amortisation and impairment Balance at the end of the previous period (14,115) (59,902) (10,167) (84,184) Effects of changes in foreign exchange rates 350 174 63 587 Changes in consolidation scope 0 0 0 0 Amortisation (14,300) (8,563) (12,097) (34,960) Transfers between asset items 153 55,752 451 56,356 Disposals 1,439 1,459 2,197 5,095 Balance at the end of the period (26,473) (11,080) (19,553) (57,106)
Net carrying amount At January 1, 2020 82,600 51,772 29,157 163,529 At 31 December 2020 75,957 7,895 29,736 113,588
177
ANNUAL REPORT
STATEMENT OF NON-FINANCIAL INFORMATION
FINANCIAL STATEMENTS
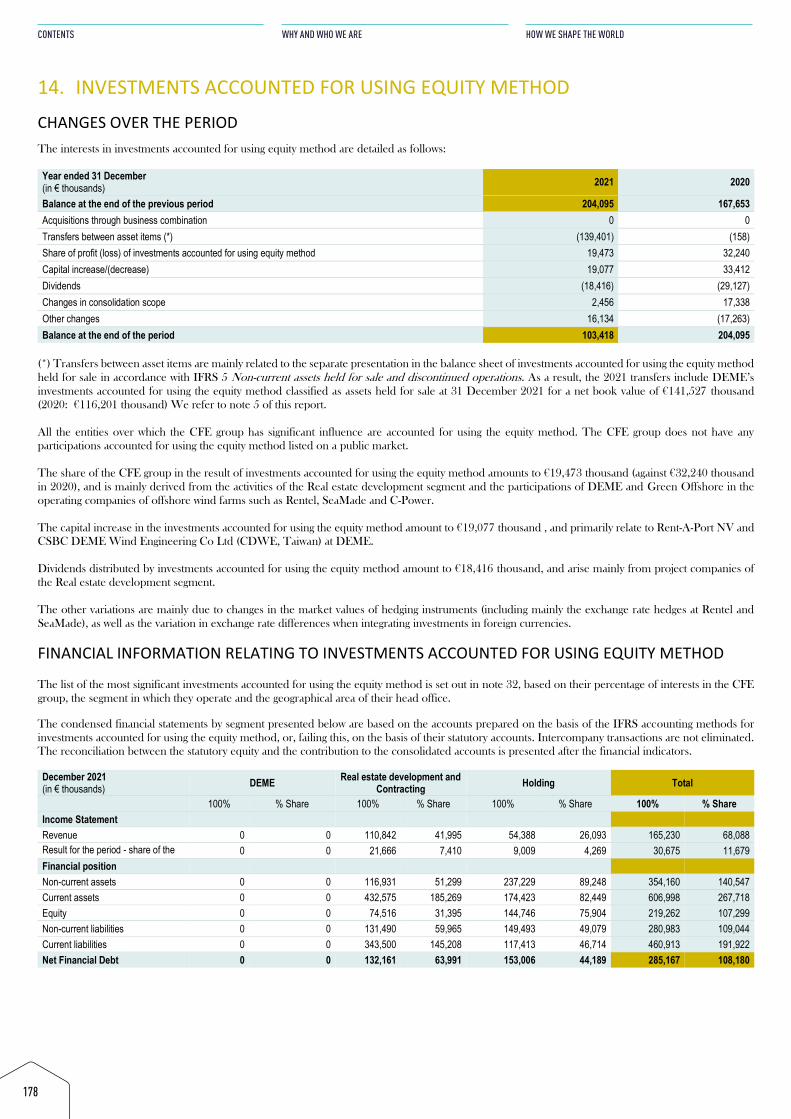
14. INVESTMENTS ACCOUNTED FOR USING EQUITY METHODCHANGES OVER THE PERIOD The interests in investments accounted for using equity method are detailed as follows:
Year ended 31 December (in € thousands) 2021 2020
Balance at the end of the previous period 204,095 167,653 Acquisitions through business combination 0 0 Transfers between asset items (*) (139,401) (158) Share of profit (loss) of investments accounted for using equity method 19,473 32,240 Capital increase/(decrease) 19,077 33,412 Dividends (18,416) (29,127) Changes in consolidation scope 2,456 17,338 Other changes 16,134 (17,263) Balance at the end of the period 103,418 204,095
(*) Transfers between asset items are mainly related to the separate presentation in the balance sheet of investments accounted for using the equity method held for sale in accordance with IFRS 5 Non-current assets held for sale and discontinued operations. As a result, the 2021 transfers include DEME’s investments accounted for using the equity method classified as assets held for sale at 31 December 2021 for a net book value of €141,527 thousand (2020: €116,201 thousand) We refer to note 5 of this report.
All the entities over which the CFE group has significant influence are accounted for using the equity method. The CFE group does not have any participations accounted for using the equity method listed on a public market.
The share of the CFE group in the result of investments accounted for using the equity method amounts to €19,473 thousand (against €32,240 thousand in 2020), and is mainly derived from the activities of the Real estate development segment and the participations of DEME and Green Offshore in the operating companies of offshore wind farms such as Rentel, SeaMade and C-Power.
The capital increase in the investments accounted for using the equity method amount to €19,077 thousand , and primarily relate to Rent-A-Port NV and CSBC DEME Wind Engineering Co Ltd (CDWE, Taiwan) at DEME.
Dividends distributed by investments accounted for using the equity method amount to €18,416 thousand, and arise mainly from project companies of the Real estate development segment.
The other variations are mainly due to changes in the market values of hedging instruments (including mainly the exchange rate hedges at Rentel and SeaMade), as well as the variation in exchange rate differences when integrating investments in foreign currencies.
FINANCIAL INFORMATION RELATING TO INVESTMENTS ACCOUNTED FOR USING EQUITY METHOD The list of the most significant investments accounted for using the equity method is set out in note 32, based on their percentage of interests in the CFE group, the segment in which they operate and the geographical area of their head office.
The condensed financial statements by segment presented below are based on the accounts prepared on the basis of the IFRS accounting methods for investments accounted for using the equity method, or, failing this, on the basis of their statutory accounts. Intercompany transactions are not eliminated. The reconciliation between the statutory equity and the contribution to the consolidated accounts is presented after the financial indicators.
December 2021 (in € thousands) DEME Real estate development and
Contracting Holding Total
100% % Share 100% % Share 100% % Share 100% % Share Income Statement Revenue 0 0 110,842 41,995 54,388 26,093 165,230 68,088 Result for the period - share of the group
0 0 21,666 7,410 9,009 4,269 30,675 11,679 Financial position Non-current assets 0 0 116,931 51,299 237,229 89,248 354,160 140,547 Current assets 0 0 432,575 185,269 174,423 82,449 606,998 267,718 Equity 0 0 74,516 31,395 144,746 75,904 219,262 107,299 Non-current liabilities 0 0 131,490 59,965 149,493 49,079 280,983 109,044 Current liabilities 0 0 343,500 145,208 117,413 46,714 460,913 191,922 Net Financial Debt 0 0 132,161 63,991 153,006 44,189 285,167 108,180
178
CONTENTS
WHY AND WHO WE ARE
HOW WE SHAPE THE WORLD
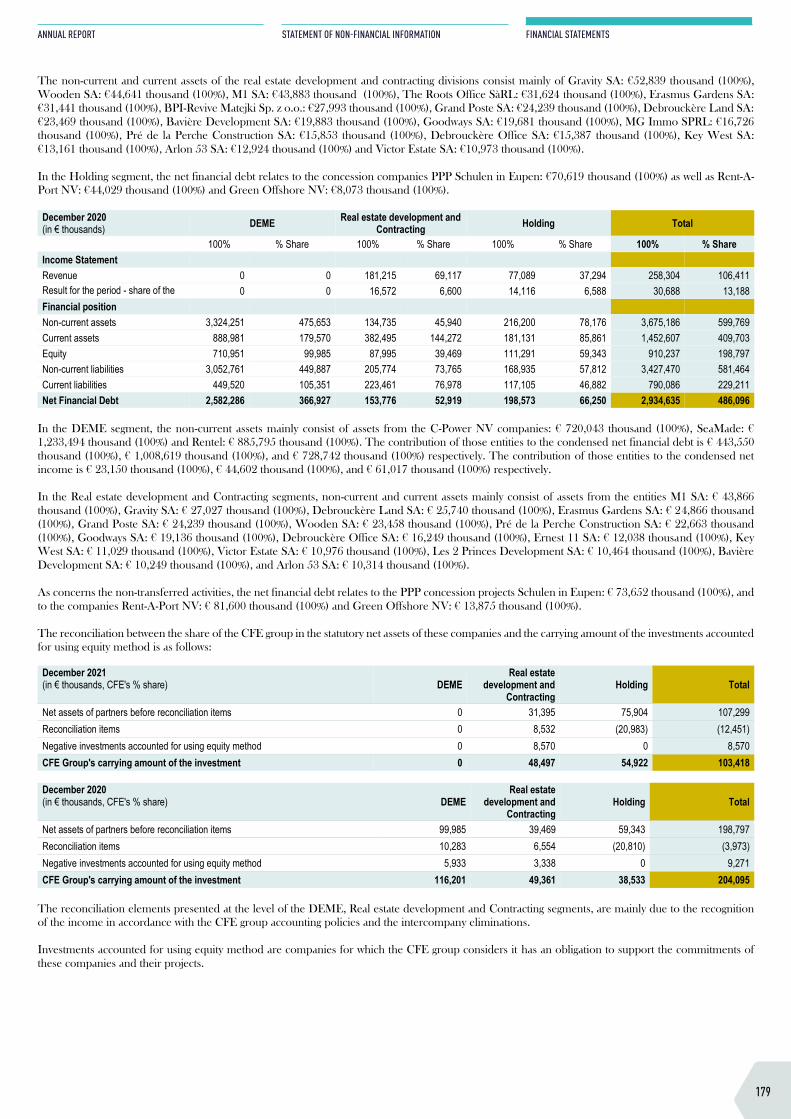
14. INVESTMENTS ACCOUNTED FOR USING EQUITY METHODCHANGES OVER THE PERIOD The interests in investments accounted for using equity method are detailed as follows:
Year ended 31 December (in € thousands) 2021 2020
Balance at the end of the previous period 204,095 167,653 Acquisitions through business combination 0 0 Transfers between asset items (*) (139,401) (158) Share of profit (loss) of investments accounted for using equity method 19,473 32,240 Capital increase/(decrease) 19,077 33,412 Dividends (18,416) (29,127) Changes in consolidation scope 2,456 17,338 Other changes 16,134 (17,263) Balance at the end of the period 103,418 204,095
(*) Transfers between asset items are mainly related to the separate presentation in the balance sheet of investments accounted for using the equity method held for sale in accordance with IFRS 5 Non-current assets held for sale and discontinued operations. As a result, the 2021 transfers include DEME’s investments accounted for using the equity method classified as assets held for sale at 31 December 2021 for a net book value of €141,527 thousand (2020: €116,201 thousand) We refer to note 5 of this report.
All the entities over which the CFE group has significant influence are accounted for using the equity method. The CFE group does not have any participations accounted for using the equity method listed on a public market.
The share of the CFE group in the result of investments accounted for using the equity method amounts to €19,473 thousand (against €32,240 thousand in 2020), and is mainly derived from the activities of the Real estate development segment and the participations of DEME and Green Offshore in the operating companies of offshore wind farms such as Rentel, SeaMade and C-Power.
The capital increase in the investments accounted for using the equity method amount to €19,077 thousand , and primarily relate to Rent-A-Port NV and CSBC DEME Wind Engineering Co Ltd (CDWE, Taiwan) at DEME.
Dividends distributed by investments accounted for using the equity method amount to €18,416 thousand, and arise mainly from project companies of the Real estate development segment.
The other variations are mainly due to changes in the market values of hedging instruments (including mainly the exchange rate hedges at Rentel and SeaMade), as well as the variation in exchange rate differences when integrating investments in foreign currencies.
FINANCIAL INFORMATION RELATING TO INVESTMENTS ACCOUNTED FOR USING EQUITY METHOD The list of the most significant investments accounted for using the equity method is set out in note 32, based on their percentage of interests in the CFE group, the segment in which they operate and the geographical area of their head office.
The condensed financial statements by segment presented below are based on the accounts prepared on the basis of the IFRS accounting methods for investments accounted for using the equity method, or, failing this, on the basis of their statutory accounts. Intercompany transactions are not eliminated. The reconciliation between the statutory equity and the contribution to the consolidated accounts is presented after the financial indicators.
December 2021 (in € thousands) DEME Real estate development and
Contracting Holding Total
100% % Share 100% % Share 100% % Share 100% % Share Income Statement Revenue 0 0 110,842 41,995 54,388 26,093 165,230 68,088 Result for the period - share of the group
0 0 21,666 7,410 9,009 4,269 30,675 11,679 Financial position Non-current assets 0 0 116,931 51,299 237,229 89,248 354,160 140,547 Current assets 0 0 432,575 185,269 174,423 82,449 606,998 267,718 Equity 0 0 74,516 31,395 144,746 75,904 219,262 107,299 Non-current liabilities 0 0 131,490 59,965 149,493 49,079 280,983 109,044 Current liabilities 0 0 343,500 145,208 117,413 46,714 460,913 191,922 Net Financial Debt 0 0 132,161 63,991 153,006 44,189 285,167 108,180
The non-current and current assets of the real estate development and contracting divisions consist mainly of Gravity SA: €52,839 thousand (100%), Wooden SA: €44,641 thousand (100%), M1 SA: €43,883 thousand (100%), The Roots Office SàRL: €31,624 thousand (100%), Erasmus Gardens SA: €31,441 thousand (100%), BPI-Revive Matejki Sp. z o.o.: €27,993 thousand (100%), Grand Poste SA: €24,239 thousand (100%), Debrouckère Land SA: €23,469 thousand (100%), Bavière Development SA: €19,883 thousand (100%), Goodways SA: €19,681 thousand (100%), MG Immo SPRL: €16,726 thousand (100%), Pré de la Perche Construction SA: €15,853 thousand (100%), Debrouckère Office SA: €15,387 thousand (100%), Key West SA: €13,161 thousand (100%), Arlon 53 SA: €12,924 thousand (100%) and Victor Estate SA: €10,973 thousand (100%).
In the Holding segment, the net financial debt relates to the concession companies PPP Schulen in Eupen: €70,619 thousand (100%) as well as Rent-A-Port NV: €44,029 thousand (100%) and Green Offshore NV: €8,073 thousand (100%).
December 2020 (in € thousands) DEME Real estate development and
Contracting Holding Total
100% % Share 100% % Share 100% % Share 100% % Share Income Statement Revenue 0 0 181,215 69,117 77,089 37,294 258,304 106,411 Result for the period - share of the group
0 0 16,572 6,600 14,116 6,588 30,688 13,188 Financial position Non-current assets 3,324,251 475,653 134,735 45,940 216,200 78,176 3,675,186 599,769 Current assets 888,981 179,570 382,495 144,272 181,131 85,861 1,452,607 409,703 Equity 710,951 99,985 87,995 39,469 111,291 59,343 910,237 198,797 Non-current liabilities 3,052,761 449,887 205,774 73,765 168,935 57,812 3,427,470 581,464 Current liabilities 449,520 105,351 223,461 76,978 117,105 46,882 790,086 229,211 Net Financial Debt 2,582,286 366,927 153,776 52,919 198,573 66,250 2,934,635 486,096
In the DEME segment, the non-current assets mainly consist of assets from the C-Power NV companies: € 720,043 thousand (100%), SeaMade: € 1,233,494 thousand (100%) and Rentel: € 885,795 thousand (100%). The contribution of those entities to the condensed net financial debt is € 443,550 thousand (100%), € 1,008,619 thousand (100%), and € 728,742 thousand (100%) respectively. The contribution of those entities to the condensed net income is € 23,150 thousand (100%), € 44,602 thousand (100%), and € 61,017 thousand (100%) respectively.
In the Real estate development and Contracting segments, non-current and current assets mainly consist of assets from the entities M1 SA: € 43,866 thousand (100%), Gravity SA: € 27,027 thousand (100%), Debrouckère Land SA: € 25,740 thousand (100%), Erasmus Gardens SA: € 24,866 thousand (100%), Grand Poste SA: € 24,239 thousand (100%), Wooden SA: € 23,458 thousand (100%), Pré de la Perche Construction SA: € 22,663 thousand (100%), Goodways SA: € 19,136 thousand (100%), Debrouckère Office SA: € 16,249 thousand (100%), Ernest 11 SA: € 12,038 thousand (100%), Key West SA: € 11,029 thousand (100%), Victor Estate SA: € 10,976 thousand (100%), Les 2 Princes Development SA: € 10,464 thousand (100%), Bavière Development SA: € 10,249 thousand (100%), and Arlon 53 SA: € 10,314 thousand (100%).
As concerns the non-transferred activities, the net financial debt relates to the PPP concession projects Schulen in Eupen: € 73,652 thousand (100%), and to the companies Rent-A-Port NV: € 81,600 thousand (100%) and Green Offshore NV: € 13,875 thousand (100%).
The reconciliation between the share of the CFE group in the statutory net assets of these companies and the carrying amount of the investments accounted for using equity method is as follows:
December 2021 (in € thousands, CFE's % share) DEME
Real estate development and
Contracting Holding Total
Net assets of partners before reconciliation items 0 31,395 75,904 107,299 Reconciliation items 0 8,532 (20,983) (12,451) Negative investments accounted for using equity method 0 8,570 0 8,570 CFE Group's carrying amount of the investment 0 48,497 54,922 103,418
December 2020 (in € thousands, CFE's % share) DEME
Real estate development and
Contracting Holding Total
Net assets of partners before reconciliation items 99,985 39,469 59,343 198,797 Reconciliation items 10,283 6,554 (20,810) (3,973) Negative investments accounted for using equity method 5,933 3,338 0 9,271 CFE Group's carrying amount of the investment 116,201 49,361 38,533 204,095
The reconciliation elements presented at the level of the DEME, Real estate development and Contracting segments, are mainly due to the recognition of the income in accordance with the CFE group accounting policies and the intercompany eliminations.
Investments accounted for using equity method are companies for which the CFE group considers it has an obligation to support the commitments of these companies and their projects.
179
ANNUAL REPORT
STATEMENT OF NON-FINANCIAL INFORMATION
FINANCIAL STATEMENTS
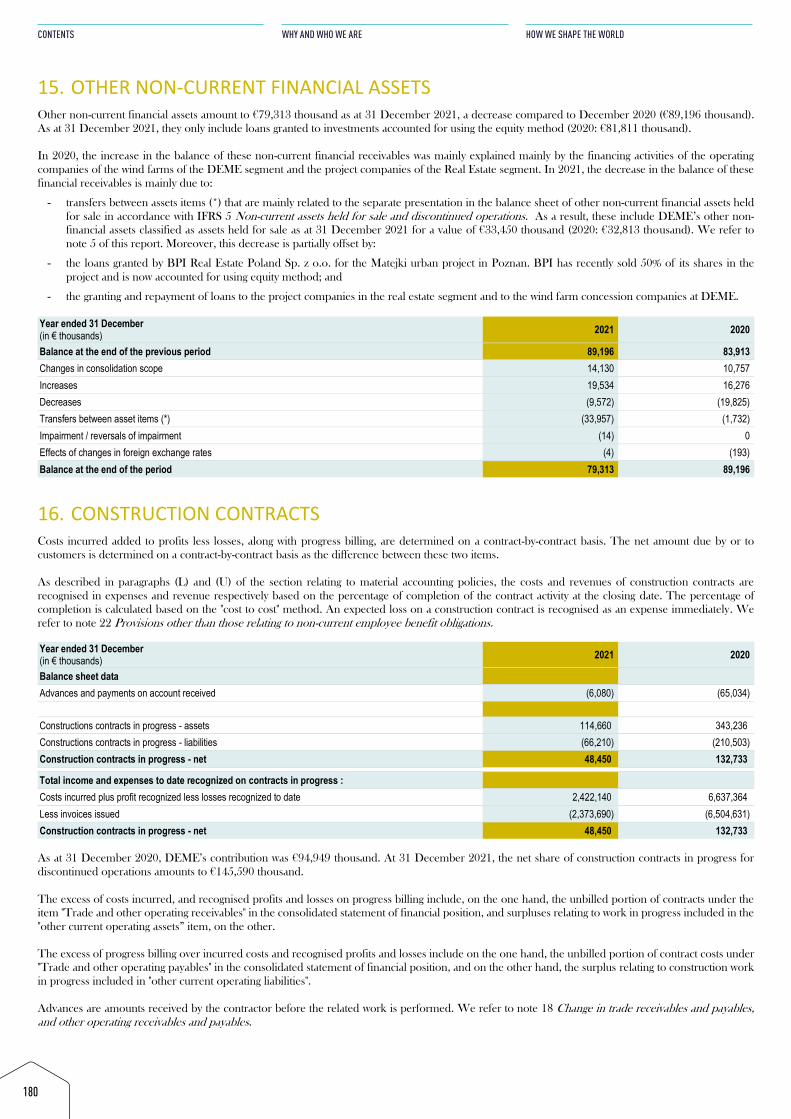
15. OTHER NON-CURRENT FINANCIAL ASSETSOther non-current financial assets amount to €79,313 thousand as at 31 December 2021, a decrease compared to December 2020 (€89,196 thousand). As at 31 December 2021, they only include loans granted to investments accounted for using the equity method (2020: €81,811 thousand).
In 2020, the increase in the balance of these non-current financial receivables was mainly explained mainly by the financing activities of the operating companies of the wind farms of the DEME segment and the project companies of the Real Estate segment. In 2021, the decrease in the balance of these financial receivables is mainly due to:
- transfers between assets items (*) that are mainly related to the separate presentation in the balance sheet of other non-current financial assets heldfor sale in accordance with IFRS 5 Non-current assets held for sale and discontinued operations. As a result, these include DEME’s other non-financial assets classified as assets held for sale as at 31 December 2021 for a value of €33,450 thousand (2020: €32,813 thousand). We refer tonote 5 of this report. Moreover, this decrease is partially offset by:
- the loans granted by BPI Real Estate Poland Sp. z o.o. for the Matejki urban project in Poznan. BPI has recently sold 50% of its shares in theproject and is now accounted for using equity method; and
- the granting and repayment of loans to the project companies in the real estate segment and to the wind farm concession companies at DEME.
Year ended 31 December (in € thousands) 2021 2020
Balance at the end of the previous period 89,196 83,913 Changes in consolidation scope 14,130 10,757 Increases 19,534 16,276 Decreases (9,572) (19,825) Transfers between asset items (*) (33,957) (1,732) Impairment / reversals of impairment (14) 0 Effects of changes in foreign exchange rates (4) (193) Balance at the end of the period 79,313 89,196
16. CONSTRUCTION CONTRACTSCosts incurred added to profits less losses, along with progress billing, are determined on a contract-by-contract basis. The net amount due by or to customers is determined on a contract-by-contract basis as the difference between these two items.
As described in paragraphs (L) and (U) of the section relating to material accounting policies, the costs and revenues of construction contracts are recognised in expenses and revenue respectively based on the percentage of completion of the contract activity at the closing date. The percentage of completion is calculated based on the "cost to cost" method. An expected loss on a construction contract is recognised as an expense immediately. We refer to note 22 Provisions other than those relating to non-current employee benefit obligations.
Year ended 31 December (in € thousands) 2021 2020
Balance sheet data Advances and payments on account received (6,080) (65,034)
Constructions contracts in progress - assets 114,660 343,236 Constructions contracts in progress - liabilities (66,210) (210,503) Construction contracts in progress - net 48,450 132,733
Total income and expenses to date recognized on contracts in progress : Costs incurred plus profit recognized less losses recognized to date 2,422,140 6,637,364 Less invoices issued (2,373,690) (6,504,631) Construction contracts in progress - net 48,450 132,733
As at 31 December 2020, DEME’s contribution was €94,949 thousand. At 31 December 2021, the net share of construction contracts in progress for discontinued operations amounts to €145,590 thousand.
The excess of costs incurred, and recognised profits and losses on progress billing include, on the one hand, the unbilled portion of contracts under the item "Trade and other operating receivables" in the consolidated statement of financial position, and surpluses relating to work in progress included in the "other current operating assets” item, on the other.
The excess of progress billing over incurred costs and recognised profits and losses include on the one hand, the unbilled portion of contract costs under "Trade and other operating payables" in the consolidated statement of financial position, and on the other hand, the surplus relating to construction work in progress included in "other current operating liabilities".
Advances are amounts received by the contractor before the related work is performed. We refer to note 18 Change in trade receivables and payables, and other operating receivables and payables.
180
CONTENTS
WHY AND WHO WE ARE
HOW WE SHAPE THE WORLD
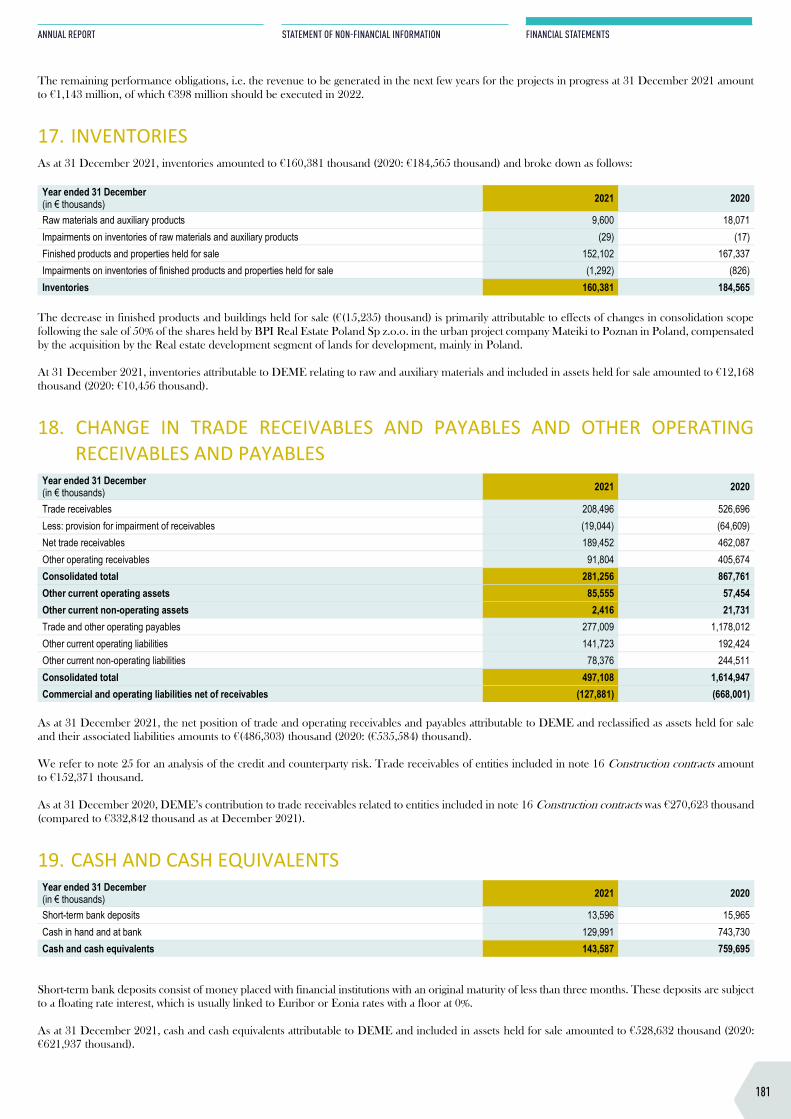
15. OTHER NON-CURRENT FINANCIAL ASSETSOther non-current financial assets amount to €79,313 thousand as at 31 December 2021, a decrease compared to December 2020 (€89,196 thousand). As at 31 December 2021, they only include loans granted to investments accounted for using the equity method (2020: €81,811 thousand).
In 2020, the increase in the balance of these non-current financial receivables was mainly explained mainly by the financing activities of the operating companies of the wind farms of the DEME segment and the project companies of the Real Estate segment. In 2021, the decrease in the balance of these financial receivables is mainly due to:
- transfers between assets items (*) that are mainly related to the separate presentation in the balance sheet of other non-current financial assets heldfor sale in accordance with IFRS 5 Non-current assets held for sale and discontinued operations. As a result, these include DEME’s other non-financial assets classified as assets held for sale as at 31 December 2021 for a value of €33,450 thousand (2020: €32,813 thousand). We refer tonote 5 of this report. Moreover, this decrease is partially offset by:
- the loans granted by BPI Real Estate Poland Sp. z o.o. for the Matejki urban project in Poznan. BPI has recently sold 50% of its shares in theproject and is now accounted for using equity method; and
- the granting and repayment of loans to the project companies in the real estate segment and to the wind farm concession companies at DEME.
Year ended 31 December (in € thousands) 2021 2020
Balance at the end of the previous period 89,196 83,913 Changes in consolidation scope 14,130 10,757 Increases 19,534 16,276 Decreases (9,572) (19,825) Transfers between asset items (*) (33,957) (1,732) Impairment / reversals of impairment (14) 0 Effects of changes in foreign exchange rates (4) (193) Balance at the end of the period 79,313 89,196
16. CONSTRUCTION CONTRACTSCosts incurred added to profits less losses, along with progress billing, are determined on a contract-by-contract basis. The net amount due by or to customers is determined on a contract-by-contract basis as the difference between these two items.
As described in paragraphs (L) and (U) of the section relating to material accounting policies, the costs and revenues of construction contracts are recognised in expenses and revenue respectively based on the percentage of completion of the contract activity at the closing date. The percentage of completion is calculated based on the "cost to cost" method. An expected loss on a construction contract is recognised as an expense immediately. We refer to note 22 Provisions other than those relating to non-current employee benefit obligations.
Year ended 31 December (in € thousands) 2021 2020
Balance sheet data Advances and payments on account received (6,080) (65,034)
Constructions contracts in progress - assets 114,660 343,236 Constructions contracts in progress - liabilities (66,210) (210,503) Construction contracts in progress - net 48,450 132,733
Total income and expenses to date recognized on contracts in progress : Costs incurred plus profit recognized less losses recognized to date 2,422,140 6,637,364 Less invoices issued (2,373,690) (6,504,631) Construction contracts in progress - net 48,450 132,733
As at 31 December 2020, DEME’s contribution was €94,949 thousand. At 31 December 2021, the net share of construction contracts in progress for discontinued operations amounts to €145,590 thousand.
The excess of costs incurred, and recognised profits and losses on progress billing include, on the one hand, the unbilled portion of contracts under the item "Trade and other operating receivables" in the consolidated statement of financial position, and surpluses relating to work in progress included in the "other current operating assets” item, on the other.
The excess of progress billing over incurred costs and recognised profits and losses include on the one hand, the unbilled portion of contract costs under "Trade and other operating payables" in the consolidated statement of financial position, and on the other hand, the surplus relating to construction work in progress included in "other current operating liabilities".
Advances are amounts received by the contractor before the related work is performed. We refer to note 18 Change in trade receivables and payables, and other operating receivables and payables.
The remaining performance obligations, i.e. the revenue to be generated in the next few years for the projects in progress at 31 December 2021 amount to €1,143 million, of which €398 million should be executed in 2022.
17. INVENTORIESAs at 31 December 2021, inventories amounted to €160,381 thousand (2020: €184,565 thousand) and broke down as follows:
Year ended 31 December (in € thousands) 2021 2020
Raw materials and auxiliary products 9,600 18,071 Impairments on inventories of raw materials and auxiliary products (29) (17) Finished products and properties held for sale 152,102 167,337 Impairments on inventories of finished products and properties held for sale (1,292) (826) Inventories 160,381 184,565
The decrease in finished products and buildings held for sale (€(15,235) thousand) is primarily attributable to effects of changes in consolidation scope following the sale of 50% of the shares held by BPI Real Estate Poland Sp z.o.o. in the urban project company Mateiki to Poznan in Poland, compensated by the acquisition by the Real estate development segment of lands for development, mainly in Poland.
At 31 December 2021, inventories attributable to DEME relating to raw and auxiliary materials and included in assets held for sale amounted to €12,168 thousand (2020: €10,456 thousand).
18. CHANGE IN TRADE RECEIVABLES AND PAYABLES AND OTHER OPERATINGRECEIVABLES AND PAYABLES
Year ended 31 December (in € thousands) 2021 2020
Trade receivables 208,496 526,696 Less: provision for impairment of receivables (19,044) (64,609) Net trade receivables 189,452 462,087 Other operating receivables 91,804 405,674 Consolidated total 281,256 867,761 Other current operating assets 85,555 57,454 Other current non-operating assets 2,416 21,731 Trade and other operating payables 277,009 1,178,012 Other current operating liabilities 141,723 192,424 Other current non-operating liabilities 78,376 244,511 Consolidated total 497,108 1,614,947 Commercial and operating liabilities net of receivables (127,881) (668,001)
As at 31 December 2021, the net position of trade and operating receivables and payables attributable to DEME and reclassified as assets held for sale and their associated liabilities amounts to €(486,303) thousand (2020: (€535,584) thousand).
We refer to note 25 for an analysis of the credit and counterparty risk. Trade receivables of entities included in note 16 Construction contracts amount to €152,371 thousand.
As at 31 December 2020, DEME’s contribution to trade receivables related to entities included in note 16 Construction contracts was €270,623 thousand (compared to €332,842 thousand as at December 2021).
19. CASH AND CASH EQUIVALENTSYear ended 31 December (in € thousands) 2021 2020
Short-term bank deposits 13,596 15,965 Cash in hand and at bank 129,991 743,730 Cash and cash equivalents 143,587 759,695
Short-term bank deposits consist of money placed with financial institutions with an original maturity of less than three months. These deposits are subject to a floating rate interest, which is usually linked to Euribor or Eonia rates with a floor at 0%.
As at 31 December 2021, cash and cash equivalents attributable to DEME and included in assets held for sale amounted to €528,632 thousand (2020: €621,937 thousand).
181
ANNUAL REPORT
STATEMENT OF NON-FINANCIAL INFORMATION
FINANCIAL STATEMENTS
20. CAPITAL GRANTSThe CFE group did not receive any significant capital grants in 2021.
21. EMPLOYEE BENEFITSThe CFE group contributes to pension and early retirement plans in several of the countries in which it operates. These benefits are recognised in accordance with IAS 19 and are regarded as "post-employment" and "long-term benefit plans".
At 31 December 2021, the CFE group's net liability relating to obligations for ‘post-employment’ benefits for pensions and early-retirement amounted to €11,916 thousand (2020: €76,686 thousand). These amounts are included in the item "Retirement commitments and employee benefits". This item also includes provisions for other employee benefits for €154 thousand (2020: € 2,950 thousand), mainly relating to the DEME group in 2020.
MAIN CHARACTERISTICS OF THE CFE GROUP’S POST-EMPLOYMENT BENEFIT PLANS Post-employment benefit plans are classified either as defined-contribution or defined-benefit plans.
DEFINED-CONTRIBUTION PLANS
Defined-contribution pension plans are those under which the company makes certain contributions to an entity or separate fund in accordance with the plan arrangements. Where contributions have been made, the company has no additional obligation.
DEFINED-BENEFIT PLANS
All plans that are not defined-contribution plans are presumed to be defined-benefit plans. These plans are either funded externally through pension funds or insurance companies ("funded plans") or funded within the CFE group ("unfunded plans"). For the main plans, an actuarial valuation is carried out every year by independent actuaries.
Post-employment benefit plans in which the CFE group takes part confer benefits to staff on retirement and death. All plans are funded externally through an insurance company unrelated to the CFE group. Obligations under defined-benefit plans for continuing operations are exclusively in Belgium.
Belgian post-employment benefit plans are "Class 21" type plans, which implies that the insurer guarantees a minimum interest rate on the contributions paid.
All plans comply with local regulations and minimum funding requirements.
Most of the CFE group's post-employment benefit plans are defined-benefit.
MAIN CHARACTERISTICS OF DEFINED-BENEFIT PLANS BELGIAN RETIREMENT PLANS “CLASS 21” TYPE
A number of staff members are covered by a "Class 21" type insurance-funded defined-contribution plan. Belgian law requires the employer to guarantee for defined-contribution plans a minimum return of 3.25% on employer contributions and a minimum return of 3.75% on employee contributions paid prior to 1 January 2016, and a minimum return of 1.75% on contributions paid after 1 January 2016. As a result of the modification of this law at the end of 2015, these pension schemes have been accounted for as defined-benefit plans.
Construction workers are covered by the defined-contribution pension plan funded by the "fbz-fse Constructiv" multi-employer pension fund. This pension plan is also governed by Belgian law, requiring a minimum return as mentioned above.
RISKS RELATING TO DEFINED-BENEFIT PLANS
Defined-benefit plans generally expose the employer to actuarial risks such as changes in interest rates, wages and inflation. The potential impact of these risks is illustrated by a sensitivity analysis, details of which are set out below.
The risk arising from benefits being spread over time is limited, since most plans involve a lump-sum payment. However, there is an option to pay annuities. If this option is used, the payment of annuities is handled through an insurance policy that converts the lump sum into an annuity. The risk of death in service is entirely covered through insurance. The risk of insurance companies becoming insolvent can be regarded as negligible.
GOVERNANCE OF DEFINED-BENEFIT PLANS
The administration and governance of insured plans are handled by the insurance company. CFE ensures that insurance companies comply with all retirement laws.
DEFINED-BENEFIT PLAN ASSETS
Plan assets invested with an insurance company are not subject to market fluctuations. The fair value of the insurance policies corresponds to the capitalised value of contributions paid, taking into account the return contractually agreed with the insurance company (Belgium). Plan assets do not include the CFE group's own financial instruments or any building used by the CFE group.
182
CONTENTS
WHY AND WHO WE ARE
HOW WE SHAPE THE WORLD
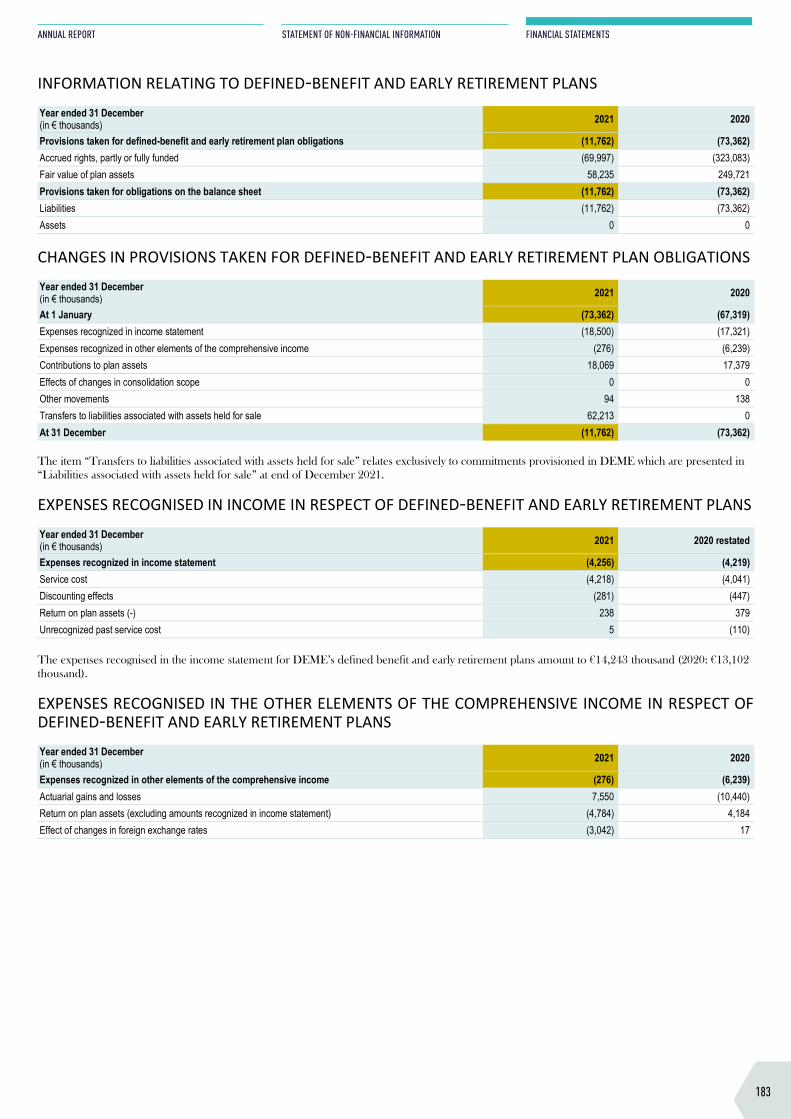
20. CAPITAL GRANTSThe CFE group did not receive any significant capital grants in 2021.
21. EMPLOYEE BENEFITSThe CFE group contributes to pension and early retirement plans in several of the countries in which it operates. These benefits are recognised in accordance with IAS 19 and are regarded as "post-employment" and "long-term benefit plans".
At 31 December 2021, the CFE group's net liability relating to obligations for ‘post-employment’ benefits for pensions and early-retirement amounted to €11,916 thousand (2020: €76,686 thousand). These amounts are included in the item "Retirement commitments and employee benefits". This item also includes provisions for other employee benefits for €154 thousand (2020: € 2,950 thousand), mainly relating to the DEME group in 2020.
MAIN CHARACTERISTICS OF THE CFE GROUP’S POST-EMPLOYMENT BENEFIT PLANS Post-employment benefit plans are classified either as defined-contribution or defined-benefit plans.
DEFINED-CONTRIBUTION PLANS
Defined-contribution pension plans are those under which the company makes certain contributions to an entity or separate fund in accordance with the plan arrangements. Where contributions have been made, the company has no additional obligation.
DEFINED-BENEFIT PLANS
All plans that are not defined-contribution plans are presumed to be defined-benefit plans. These plans are either funded externally through pension funds or insurance companies ("funded plans") or funded within the CFE group ("unfunded plans"). For the main plans, an actuarial valuation is carried out every year by independent actuaries.
Post-employment benefit plans in which the CFE group takes part confer benefits to staff on retirement and death. All plans are funded externally through an insurance company unrelated to the CFE group. Obligations under defined-benefit plans for continuing operations are exclusively in Belgium.
Belgian post-employment benefit plans are "Class 21" type plans, which implies that the insurer guarantees a minimum interest rate on the contributions paid.
All plans comply with local regulations and minimum funding requirements.
Most of the CFE group's post-employment benefit plans are defined-benefit.
MAIN CHARACTERISTICS OF DEFINED-BENEFIT PLANS BELGIAN RETIREMENT PLANS “CLASS 21” TYPE
A number of staff members are covered by a "Class 21" type insurance-funded defined-contribution plan. Belgian law requires the employer to guarantee for defined-contribution plans a minimum return of 3.25% on employer contributions and a minimum return of 3.75% on employee contributions paid prior to 1 January 2016, and a minimum return of 1.75% on contributions paid after 1 January 2016. As a result of the modification of this law at the end of 2015, these pension schemes have been accounted for as defined-benefit plans.
Construction workers are covered by the defined-contribution pension plan funded by the "fbz-fse Constructiv" multi-employer pension fund. This pension plan is also governed by Belgian law, requiring a minimum return as mentioned above.
RISKS RELATING TO DEFINED-BENEFIT PLANS
Defined-benefit plans generally expose the employer to actuarial risks such as changes in interest rates, wages and inflation. The potential impact of these risks is illustrated by a sensitivity analysis, details of which are set out below.
The risk arising from benefits being spread over time is limited, since most plans involve a lump-sum payment. However, there is an option to pay annuities. If this option is used, the payment of annuities is handled through an insurance policy that converts the lump sum into an annuity. The risk of death in service is entirely covered through insurance. The risk of insurance companies becoming insolvent can be regarded as negligible.
GOVERNANCE OF DEFINED-BENEFIT PLANS
The administration and governance of insured plans are handled by the insurance company. CFE ensures that insurance companies comply with all retirement laws.
DEFINED-BENEFIT PLAN ASSETS
Plan assets invested with an insurance company are not subject to market fluctuations. The fair value of the insurance policies corresponds to the capitalised value of contributions paid, taking into account the return contractually agreed with the insurance company (Belgium). Plan assets do not include the CFE group's own financial instruments or any building used by the CFE group.
INFORMATION RELATING TO DEFINED-BENEFIT AND EARLY RETIREMENT PLANS Year ended 31 December (in € thousands) 2021 2020
Provisions taken for defined-benefit and early retirement plan obligations (11,762) (73,362) Accrued rights, partly or fully funded (69,997) (323,083) Fair value of plan assets 58,235 249,721 Provisions taken for obligations on the balance sheet (11,762) (73,362) Liabilities (11,762) (73,362) Assets 0 0
CHANGES IN PROVISIONS TAKEN FOR DEFINED-BENEFIT AND EARLY RETIREMENT PLAN OBLIGATIONS Year ended 31 December (in € thousands) 2021 2020
At 1 January (73,362) (67,319) Expenses recognized in income statement (18,500) (17,321) Expenses recognized in other elements of the comprehensive income (276) (6,239) Contributions to plan assets 18,069 17,379 Effects of changes in consolidation scope 0 0 Other movements 94 138 Transfers to liabilities associated with assets held for sale 62,213 0 At 31 December (11,762) (73,362)
The item “Transfers to liabilities associated with assets held for sale” relates exclusively to commitments provisioned in DEME which are presented in “Liabilities associated with assets held for sale” at end of December 2021.
EXPENSES RECOGNISED IN INCOME IN RESPECT OF DEFINED-BENEFIT AND EARLY RETIREMENT PLANS Year ended 31 December (in € thousands) 2021 2020 restated
Expenses recognized in income statement (4,256) (4,219) Service cost (4,218) (4,041) Discounting effects (281) (447) Return on plan assets (-) 238 379 Unrecognized past service cost 5 (110)
The expenses recognised in the income statement for DEME’s defined benefit and early retirement plans amount to €14,243 thousand (2020: €13,102 thousand).
EXPENSES RECOGNISED IN THE OTHER ELEMENTS OF THE COMPREHENSIVE INCOME IN RESPECT OF DEFINED-BENEFIT AND EARLY RETIREMENT PLANS Year ended 31 December (in € thousands) 2021 2020
Expenses recognized in other elements of the comprehensive income (276) (6,239) Actuarial gains and losses 7,550 (10,440) Return on plan assets (excluding amounts recognized in income statement) (4,784) 4,184 Effect of changes in foreign exchange rates (3,042) 17
183
ANNUAL REPORT
STATEMENT OF NON-FINANCIAL INFORMATION
FINANCIAL STATEMENTS
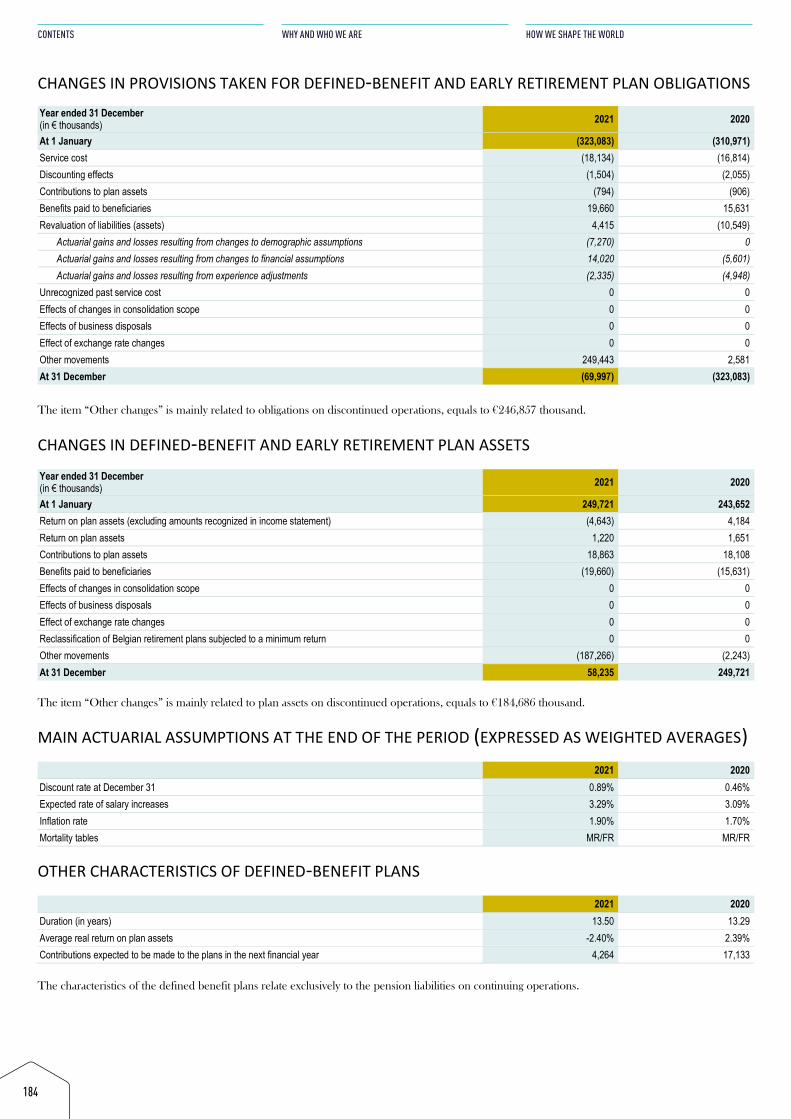
CHANGES IN PROVISIONS TAKEN FOR DEFINED-BENEFIT AND EARLY RETIREMENT PLAN OBLIGATIONS Year ended 31 December (in € thousands) 2021 2020
At 1 January (323,083) (310,971) Service cost (18,134) (16,814) Discounting effects (1,504) (2,055) Contributions to plan assets (794) (906) Benefits paid to beneficiaries 19,660 15,631 Revaluation of liabilities (assets) 4,415 (10,549)
Actuarial gains and losses resulting from changes to demographic assumptions (7,270) 0 Actuarial gains and losses resulting from changes to financial assumptions 14,020 (5,601) Actuarial gains and losses resulting from experience adjustments (2,335) (4,948)
Unrecognized past service cost 0 0 Effects of changes in consolidation scope 0 0 Effects of business disposals 0 0 Effect of exchange rate changes 0 0 Other movements 249,443 2,581 At 31 December (69,997) (323,083)
The item “Other changes” is mainly related to obligations on discontinued operations, equals to €246,857 thousand.
CHANGES IN DEFINED-BENEFIT AND EARLY RETIREMENT PLAN ASSETS Year ended 31 December (in € thousands) 2021 2020
At 1 January 249,721 243,652 Return on plan assets (excluding amounts recognized in income statement) (4,643) 4,184 Return on plan assets 1,220 1,651 Contributions to plan assets 18,863 18,108 Benefits paid to beneficiaries (19,660) (15,631) Effects of changes in consolidation scope 0 0 Effects of business disposals 0 0 Effect of exchange rate changes 0 0 Reclassification of Belgian retirement plans subjected to a minimum return 0 0 Other movements (187,266) (2,243) At 31 December 58,235 249,721
The item “Other changes” is mainly related to plan assets on discontinued operations, equals to €184,686 thousand.
MAIN ACTUARIAL ASSUMPTIONS AT THE END OF THE PERIOD (EXPRESSED AS WEIGHTED AVERAGES) 2021 2020
Discount rate at December 31 0.89% 0.46% Expected rate of salary increases 3.29% 3.09% Inflation rate 1.90% 1.70% Mortality tables MR/FR MR/FR
OTHER CHARACTERISTICS OF DEFINED-BENEFIT PLANS 2021 2020
Duration (in years) 13.50 13.29 Average real return on plan assets -2.40% 2.39% Contributions expected to be made to the plans in the next financial year 4,264 17,133
The characteristics of the defined benefit plans relate exclusively to the pension liabilities on continuing operations.
184
CONTENTS
WHY AND WHO WE ARE
HOW WE SHAPE THE WORLD
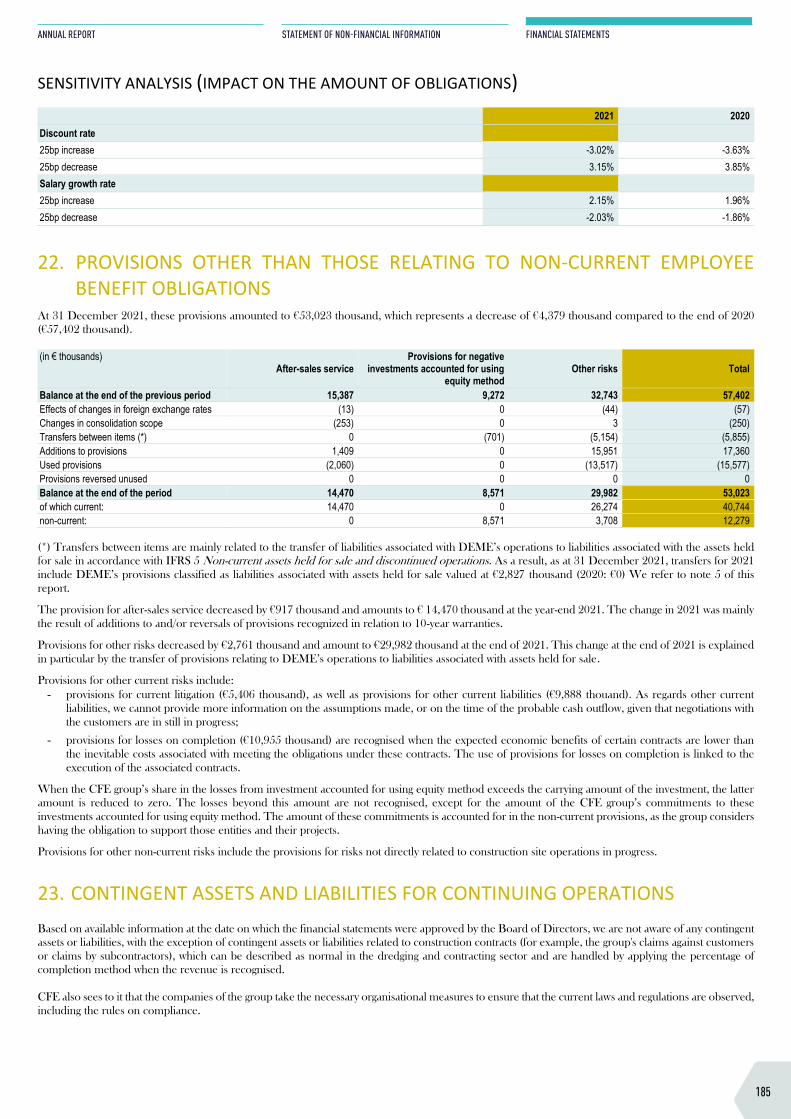
CHANGES IN PROVISIONS TAKEN FOR DEFINED-BENEFIT AND EARLY RETIREMENT PLAN OBLIGATIONS Year ended 31 December (in € thousands) 2021 2020
At 1 January (323,083) (310,971) Service cost (18,134) (16,814) Discounting effects (1,504) (2,055) Contributions to plan assets (794) (906) Benefits paid to beneficiaries 19,660 15,631 Revaluation of liabilities (assets) 4,415 (10,549)
Actuarial gains and losses resulting from changes to demographic assumptions (7,270) 0 Actuarial gains and losses resulting from changes to financial assumptions 14,020 (5,601) Actuarial gains and losses resulting from experience adjustments (2,335) (4,948)
Unrecognized past service cost 0 0 Effects of changes in consolidation scope 0 0 Effects of business disposals 0 0 Effect of exchange rate changes 0 0 Other movements 249,443 2,581 At 31 December (69,997) (323,083)
The item “Other changes” is mainly related to obligations on discontinued operations, equals to €246,857 thousand.
CHANGES IN DEFINED-BENEFIT AND EARLY RETIREMENT PLAN ASSETS Year ended 31 December (in € thousands) 2021 2020
At 1 January 249,721 243,652 Return on plan assets (excluding amounts recognized in income statement) (4,643) 4,184 Return on plan assets 1,220 1,651 Contributions to plan assets 18,863 18,108 Benefits paid to beneficiaries (19,660) (15,631) Effects of changes in consolidation scope 0 0 Effects of business disposals 0 0 Effect of exchange rate changes 0 0 Reclassification of Belgian retirement plans subjected to a minimum return 0 0 Other movements (187,266) (2,243) At 31 December 58,235 249,721
The item “Other changes” is mainly related to plan assets on discontinued operations, equals to €184,686 thousand.
MAIN ACTUARIAL ASSUMPTIONS AT THE END OF THE PERIOD (EXPRESSED AS WEIGHTED AVERAGES) 2021 2020
Discount rate at December 31 0.89% 0.46% Expected rate of salary increases 3.29% 3.09% Inflation rate 1.90% 1.70% Mortality tables MR/FR MR/FR
OTHER CHARACTERISTICS OF DEFINED-BENEFIT PLANS 2021 2020
Duration (in years) 13.50 13.29 Average real return on plan assets -2.40% 2.39% Contributions expected to be made to the plans in the next financial year 4,264 17,133
The characteristics of the defined benefit plans relate exclusively to the pension liabilities on continuing operations.
SENSITIVITY ANALYSIS (IMPACT ON THE AMOUNT OF OBLIGATIONS) 2021 2020
Discount rate 25bp increase -3.02% -3.63% 25bp decrease 3.15% 3.85% Salary growth rate 25bp increase 2.15% 1.96% 25bp decrease -2.03% -1.86%
22. PROVISIONS OTHER THAN THOSE RELATING TO NON-CURRENT EMPLOYEEBENEFIT OBLIGATIONS
At 31 December 2021, these provisions amounted to €53,023 thousand, which represents a decrease of €4,379 thousand compared to the end of 2020 (€57,402 thousand).
(in € thousands) After-sales service
Provisions for negative investments accounted for using
equity method Other risks Total
Balance at the end of the previous period 15,387 9,272 32,743 57,402 Effects of changes in foreign exchange rates (13) 0 (44) (57) Changes in consolidation scope (253) 0 3 (250) Transfers between items (*) 0 (701) (5,154) (5,855) Additions to provisions 1,409 0 15,951 17,360 Used provisions (2,060) 0 (13,517) (15,577) Provisions reversed unused 0 0 0 0 Balance at the end of the period 14,470 8,571 29,982 53,023 of which current: 14,470 0 26,274 40,744 non-current: 0 8,571 3,708 12,279
(*) Transfers between items are mainly related to the transfer of liabilities associated with DEME’s operations to liabilities associated with the assets held for sale in accordance with IFRS 5 Non-current assets held for sale and discontinued operations. As a result, as at 31 December 2021, transfers for 2021 include DEME’s provisions classified as liabilities associated with assets held for sale valued at €2,827 thousand (2020: €0) We refer to note 5 of this report.
The provision for after-sales service decreased by €917 thousand and amounts to € 14,470 thousand at the year-end 2021. The change in 2021 was mainly the result of additions to and/or reversals of provisions recognized in relation to 10-year warranties.
Provisions for other risks decreased by €2,761 thousand and amount to €29,982 thousand at the end of 2021. This change at the end of 2021 is explained in particular by the transfer of provisions relating to DEME’s operations to liabilities associated with assets held for sale.
Provisions for other current risks include: - provisions for current litigation (€5,406 thousand), as well as provisions for other current liabilities (€9,888 thouand). As regards other current
liabilities, we cannot provide more information on the assumptions made, or on the time of the probable cash outflow, given that negotiations withthe customers are in still in progress;
- provisions for losses on completion (€10,955 thousand) are recognised when the expected economic benefits of certain contracts are lower thanthe inevitable costs associated with meeting the obligations under these contracts. The use of provisions for losses on completion is linked to theexecution of the associated contracts.
When the CFE group’s share in the losses from investment accounted for using equity method exceeds the carrying amount of the investment, the latter amount is reduced to zero. The losses beyond this amount are not recognised, except for the amount of the CFE group’s commitments to these investments accounted for using equity method. The amount of these commitments is accounted for in the non-current provisions, as the group considers having the obligation to support those entities and their projects.
Provisions for other non-current risks include the provisions for risks not directly related to construction site operations in progress.
23. CONTINGENT ASSETS AND LIABILITIES FOR CONTINUING OPERATIONSBased on available information at the date on which the financial statements were approved by the Board of Directors, we are not aware of any contingent assets or liabilities, with the exception of contingent assets or liabilities related to construction contracts (for example, the group's claims against customers or claims by subcontractors), which can be described as normal in the dredging and contracting sector and are handled by applying the percentage of completion method when the revenue is recognised.
CFE also sees to it that the companies of the group take the necessary organisational measures to ensure that the current laws and regulations are observed, including the rules on compliance.
185
ANNUAL REPORT
STATEMENT OF NON-FINANCIAL INFORMATION
FINANCIAL STATEMENTS
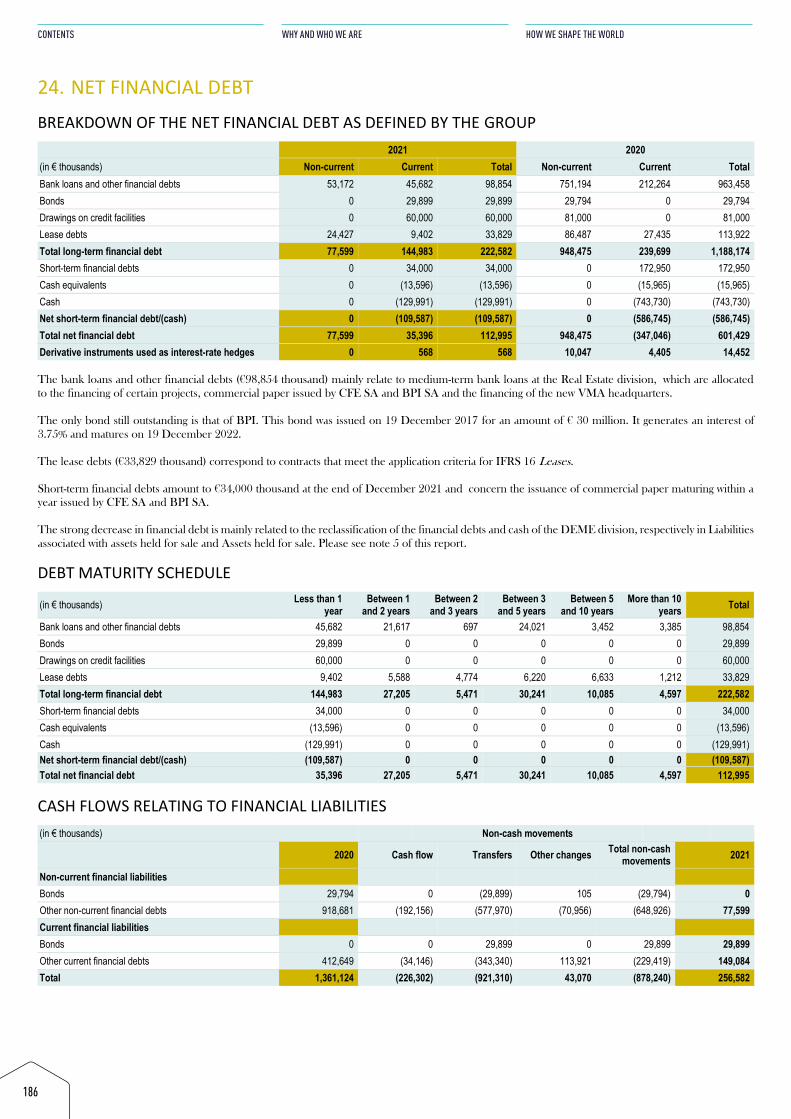
24. NET FINANCIAL DEBTBREAKDOWN OF THE NET FINANCIAL DEBT AS DEFINED BY THE GROUP
2021 2020 (in € thousands) Non-current Current Total Non-current Current Total Bank loans and other financial debts 53,172 45,682 98,854 751,194 212,264 963,458 Bonds 0 29,899 29,899 29,794 0 29,794 Drawings on credit facilities 0 60,000 60,000 81,000 0 81,000 Lease debts 24,427 9,402 33,829 86,487 27,435 113,922 Total long-term financial debt 77,599 144,983 222,582 948,475 239,699 1,188,174 Short-term financial debts 0 34,000 34,000 0 172,950 172,950 Cash equivalents 0 (13,596) (13,596) 0 (15,965) (15,965) Cash 0 (129,991) (129,991) 0 (743,730) (743,730) Net short-term financial debt/(cash) 0 (109,587) (109,587) 0 (586,745) (586,745) Total net financial debt 77,599 35,396 112,995 948,475 (347,046) 601,429 Derivative instruments used as interest-rate hedges 0 568 568 10,047 4,405 14,452
The bank loans and other financial debts (€98,854 thousand) mainly relate to medium-term bank loans at the Real Estate division, which are allocated to the financing of certain projects, commercial paper issued by CFE SA and BPI SA and the financing of the new VMA headquarters.
The only bond still outstanding is that of BPI. This bond was issued on 19 December 2017 for an amount of € 30 million. It generates an interest of 3.75% and matures on 19 December 2022.
The lease debts (€33,829 thousand) correspond to contracts that meet the application criteria for IFRS 16 Leases.
Short-term financial debts amount to €34,000 thousand at the end of December 2021 and concern the issuance of commercial paper maturing within a year issued by CFE SA and BPI SA.
The strong decrease in financial debt is mainly related to the reclassification of the financial debts and cash of the DEME division, respectively in Liabilities associated with assets held for sale and Assets held for sale. Please see note 5 of this report.
DEBT MATURITY SCHEDULE (in € thousands) Less than 1
year Between 1
and 2 years Between 2
and 3 years Between 3
and 5 years Between 5
and 10 years More than 10
years Total
Bank loans and other financial debts 45,682 21,617 697 24,021 3,452 3,385 98,854 Bonds 29,899 0 0 0 0 0 29,899 Drawings on credit facilities 60,000 0 0 0 0 0 60,000 Lease debts 9,402 5,588 4,774 6,220 6,633 1,212 33,829 Total long-term financial debt 144,983 27,205 5,471 30,241 10,085 4,597 222,582 Short-term financial debts 34,000 0 0 0 0 0 34,000 Cash equivalents (13,596) 0 0 0 0 0 (13,596) Cash (129,991) 0 0 0 0 0 (129,991) Net short-term financial debt/(cash) (109,587) 0 0 0 0 0 (109,587) Total net financial debt 35,396 27,205 5,471 30,241 10,085 4,597 112,995
CASH FLOWS RELATING TO FINANCIAL LIABILITIES (in € thousands) Non-cash movements
2020 Cash flow Transfers Other changes Total non-cash movements 2021
Non-current financial liabilities Bonds 29,794 0 (29,899) 105 (29,794) 0 Other non-current financial debts 918,681 (192,156) (577,970) (70,956) (648,926) 77,599 Current financial liabilities Bonds 0 0 29,899 0 29,899 29,899 Other current financial debts 412,649 (34,146) (343,340) 113,921 (229,419) 149,084 Total 1,361,124 (226,302) (921,310) 43,070 (878,240) 256,582
186
CONTENTS
WHY AND WHO WE ARE
HOW WE SHAPE THE WORLD
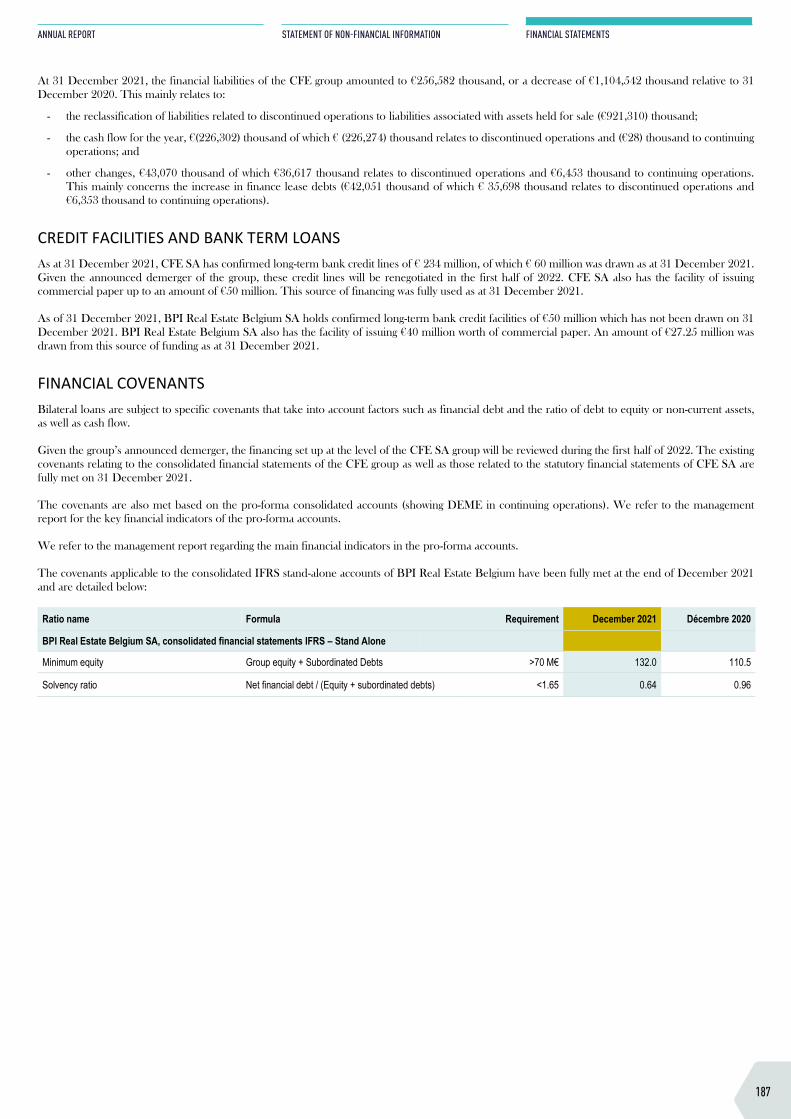
24. NET FINANCIAL DEBTBREAKDOWN OF THE NET FINANCIAL DEBT AS DEFINED BY THE GROUP
2021 2020 (in € thousands) Non-current Current Total Non-current Current Total Bank loans and other financial debts 53,172 45,682 98,854 751,194 212,264 963,458 Bonds 0 29,899 29,899 29,794 0 29,794 Drawings on credit facilities 0 60,000 60,000 81,000 0 81,000 Lease debts 24,427 9,402 33,829 86,487 27,435 113,922 Total long-term financial debt 77,599 144,983 222,582 948,475 239,699 1,188,174 Short-term financial debts 0 34,000 34,000 0 172,950 172,950 Cash equivalents 0 (13,596) (13,596) 0 (15,965) (15,965) Cash 0 (129,991) (129,991) 0 (743,730) (743,730) Net short-term financial debt/(cash) 0 (109,587) (109,587) 0 (586,745) (586,745) Total net financial debt 77,599 35,396 112,995 948,475 (347,046) 601,429 Derivative instruments used as interest-rate hedges 0 568 568 10,047 4,405 14,452
The bank loans and other financial debts (€98,854 thousand) mainly relate to medium-term bank loans at the Real Estate division, which are allocated to the financing of certain projects, commercial paper issued by CFE SA and BPI SA and the financing of the new VMA headquarters.
The only bond still outstanding is that of BPI. This bond was issued on 19 December 2017 for an amount of € 30 million. It generates an interest of 3.75% and matures on 19 December 2022.
The lease debts (€33,829 thousand) correspond to contracts that meet the application criteria for IFRS 16 Leases.
Short-term financial debts amount to €34,000 thousand at the end of December 2021 and concern the issuance of commercial paper maturing within a year issued by CFE SA and BPI SA.
The strong decrease in financial debt is mainly related to the reclassification of the financial debts and cash of the DEME division, respectively in Liabilities associated with assets held for sale and Assets held for sale. Please see note 5 of this report.
DEBT MATURITY SCHEDULE (in € thousands) Less than 1
year Between 1
and 2 years Between 2
and 3 years Between 3
and 5 years Between 5
and 10 years More than 10
years Total
Bank loans and other financial debts 45,682 21,617 697 24,021 3,452 3,385 98,854 Bonds 29,899 0 0 0 0 0 29,899 Drawings on credit facilities 60,000 0 0 0 0 0 60,000 Lease debts 9,402 5,588 4,774 6,220 6,633 1,212 33,829 Total long-term financial debt 144,983 27,205 5,471 30,241 10,085 4,597 222,582 Short-term financial debts 34,000 0 0 0 0 0 34,000 Cash equivalents (13,596) 0 0 0 0 0 (13,596) Cash (129,991) 0 0 0 0 0 (129,991) Net short-term financial debt/(cash) (109,587) 0 0 0 0 0 (109,587) Total net financial debt 35,396 27,205 5,471 30,241 10,085 4,597 112,995
CASH FLOWS RELATING TO FINANCIAL LIABILITIES (in € thousands) Non-cash movements
2020 Cash flow Transfers Other changes Total non-cash movements 2021
Non-current financial liabilities Bonds 29,794 0 (29,899) 105 (29,794) 0 Other non-current financial debts 918,681 (192,156) (577,970) (70,956) (648,926) 77,599 Current financial liabilities Bonds 0 0 29,899 0 29,899 29,899 Other current financial debts 412,649 (34,146) (343,340) 113,921 (229,419) 149,084 Total 1,361,124 (226,302) (921,310) 43,070 (878,240) 256,582
At 31 December 2021, the financial liabilities of the CFE group amounted to €256,582 thousand, or a decrease of €1,104,542 thousand relative to 31 December 2020. This mainly relates to:
- the reclassification of liabilities related to discontinued operations to liabilities associated with assets held for sale (€921,310) thousand;
- the cash flow for the year, €(226,302) thousand of which € (226,274) thousand relates to discontinued operations and (€28) thousand to continuing operations; and
- other changes, €43,070 thousand of which €36,617 thousand relates to discontinued operations and €6,453 thousand to continuing operations. This mainly concerns the increase in finance lease debts (€42,051 thousand of which € 35,698 thousand relates to discontinued operations and €6,353 thousand to continuing operations).
CREDIT FACILITIES AND BANK TERM LOANS As at 31 December 2021, CFE SA has confirmed long-term bank credit lines of € 234 million, of which € 60 million was drawn as at 31 December 2021. Given the announced demerger of the group, these credit lines will be renegotiated in the first half of 2022. CFE SA also has the facility of issuing commercial paper up to an amount of €50 million. This source of financing was fully used as at 31 December 2021. As of 31 December 2021, BPI Real Estate Belgium SA holds confirmed long-term bank credit facilities of €50 million which has not been drawn on 31 December 2021. BPI Real Estate Belgium SA also has the facility of issuing €40 million worth of commercial paper. An amount of €27.25 million was drawn from this source of funding as at 31 December 2021.
FINANCIAL COVENANTS Bilateral loans are subject to specific covenants that take into account factors such as financial debt and the ratio of debt to equity or non-current assets, as well as cash flow. Given the group’s announced demerger, the financing set up at the level of the CFE SA group will be reviewed during the first half of 2022. The existing covenants relating to the consolidated financial statements of the CFE group as well as those related to the statutory financial statements of CFE SA are fully met on 31 December 2021. The covenants are also met based on the pro-forma consolidated accounts (showing DEME in continuing operations). We refer to the management report for the key financial indicators of the pro-forma accounts. We refer to the management report regarding the main financial indicators in the pro-forma accounts. The covenants applicable to the consolidated IFRS stand-alone accounts of BPI Real Estate Belgium have been fully met at the end of December 2021 and are detailed below: Ratio name Formula Requirement December 2021 Décembre 2020
BPI Real Estate Belgium SA, consolidated financial statements IFRS – Stand Alone
Minimum equity Group equity + Subordinated Debts >70 M€ 132.0 110.5
Solvency ratio Net financial debt / (Equity + subordinated debts) <1.65 0.64 0.96
187
ANNUAL REPORT
STATEMENT OF NON-FINANCIAL INFORMATION
FINANCIAL STATEMENTS
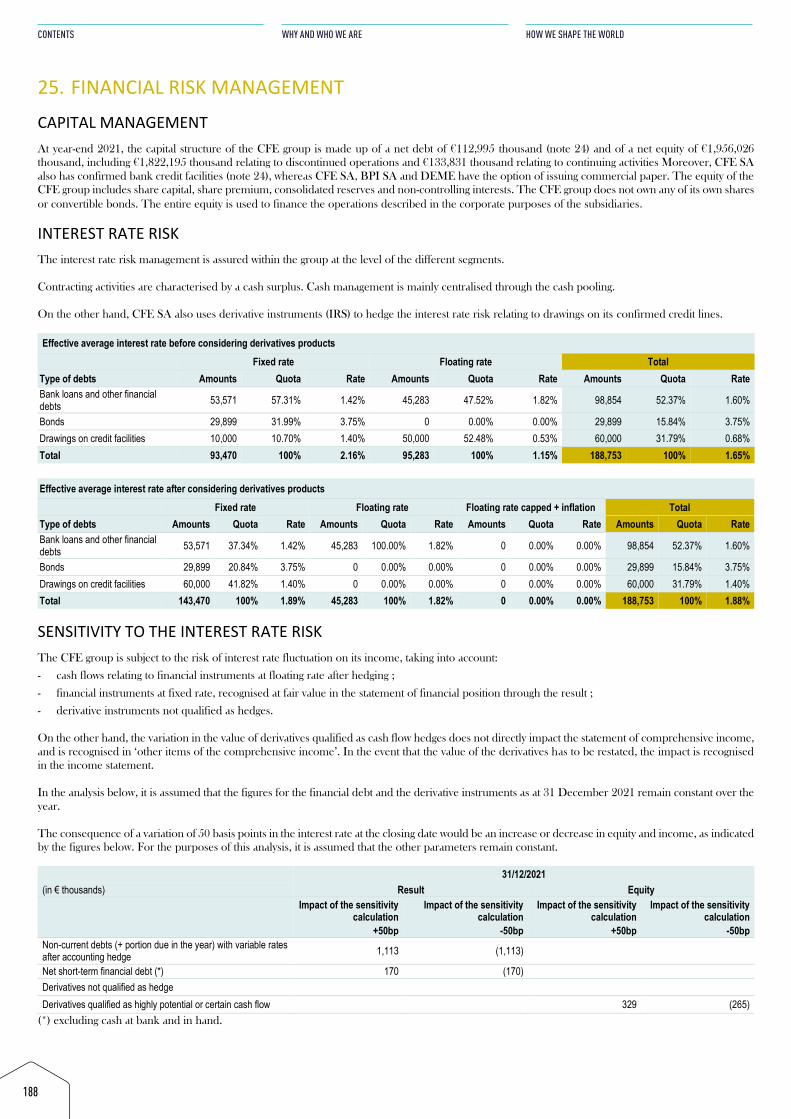
25. FINANCIAL RISK MANAGEMENT CAPITAL MANAGEMENT At year-end 2021, the capital structure of the CFE group is made up of a net debt of €112,995 thousand (note 24) and of a net equity of €1,956,026 thousand, including €1,822,195 thousand relating to discontinued operations and €133,831 thousand relating to continuing activities Moreover, CFE SA also has confirmed bank credit facilities (note 24), whereas CFE SA, BPI SA and DEME have the option of issuing commercial paper. The equity of the CFE group includes share capital, share premium, consolidated reserves and non-controlling interests. The CFE group does not own any of its own shares or convertible bonds. The entire equity is used to finance the operations described in the corporate purposes of the subsidiaries.
INTEREST RATE RISK The interest rate risk management is assured within the group at the level of the different segments. Contracting activities are characterised by a cash surplus. Cash management is mainly centralised through the cash pooling. On the other hand, CFE SA also uses derivative instruments (IRS) to hedge the interest rate risk relating to drawings on its confirmed credit lines. Effective average interest rate before considering derivatives products Fixed rate Floating rate Total
Type of debts Amounts Quota Rate Amounts Quota Rate Amounts Quota Rate Bank loans and other financial debts 53,571 57.31% 1.42% 45,283 47.52% 1.82% 98,854 52.37% 1.60%
Bonds 29,899 31.99% 3.75% 0 0.00% 0.00% 29,899 15.84% 3.75% Drawings on credit facilities 10,000 10.70% 1.40% 50,000 52.48% 0.53% 60,000 31.79% 0.68% Total 93,470 100% 2.16% 95,283 100% 1.15% 188,753 100% 1.65% Effective average interest rate after considering derivatives products
Fixed rate Floating rate Floating rate capped + inflation Total Type of debts Amounts Quota Rate Amounts Quota Rate Amounts Quota Rate Amounts Quota Rate Bank loans and other financial debts 53,571 37.34% 1.42% 45,283 100.00% 1.82% 0 0.00% 0.00% 98,854 52.37% 1.60%
Bonds 29,899 20.84% 3.75% 0 0.00% 0.00% 0 0.00% 0.00% 29,899 15.84% 3.75% Drawings on credit facilities 60,000 41.82% 1.40% 0 0.00% 0.00% 0 0.00% 0.00% 60,000 31.79% 1.40% Total 143,470 100% 1.89% 45,283 100% 1.82% 0 0.00% 0.00% 188,753 100% 1.88%
SENSITIVITY TO THE INTEREST RATE RISK The CFE group is subject to the risk of interest rate fluctuation on its income, taking into account:
- cash flows relating to financial instruments at floating rate after hedging ;
- financial instruments at fixed rate, recognised at fair value in the statement of financial position through the result ;
- derivative instruments not qualified as hedges. On the other hand, the variation in the value of derivatives qualified as cash flow hedges does not directly impact the statement of comprehensive income, and is recognised in ‘other items of the comprehensive income’. In the event that the value of the derivatives has to be restated, the impact is recognised in the income statement. In the analysis below, it is assumed that the figures for the financial debt and the derivative instruments as at 31 December 2021 remain constant over the year. The consequence of a variation of 50 basis points in the interest rate at the closing date would be an increase or decrease in equity and income, as indicated by the figures below. For the purposes of this analysis, it is assumed that the other parameters remain constant.
31/12/2021 (in € thousands) Result Equity
Impact of the sensitivity calculation
Impact of the sensitivity calculation
Impact of the sensitivity calculation
Impact of the sensitivity calculation
+50bp -50bp +50bp -50bp Non-current debts (+ portion due in the year) with variable rates after accounting hedge 1,113 (1,113)
Net short-term financial debt (*) 170 (170)
Derivatives not qualified as hedge Derivatives qualified as highly potential or certain cash flow 329 (265)
(*) excluding cash at bank and in hand.
188
CONTENTS
WHY AND WHO WE ARE
HOW WE SHAPE THE WORLD
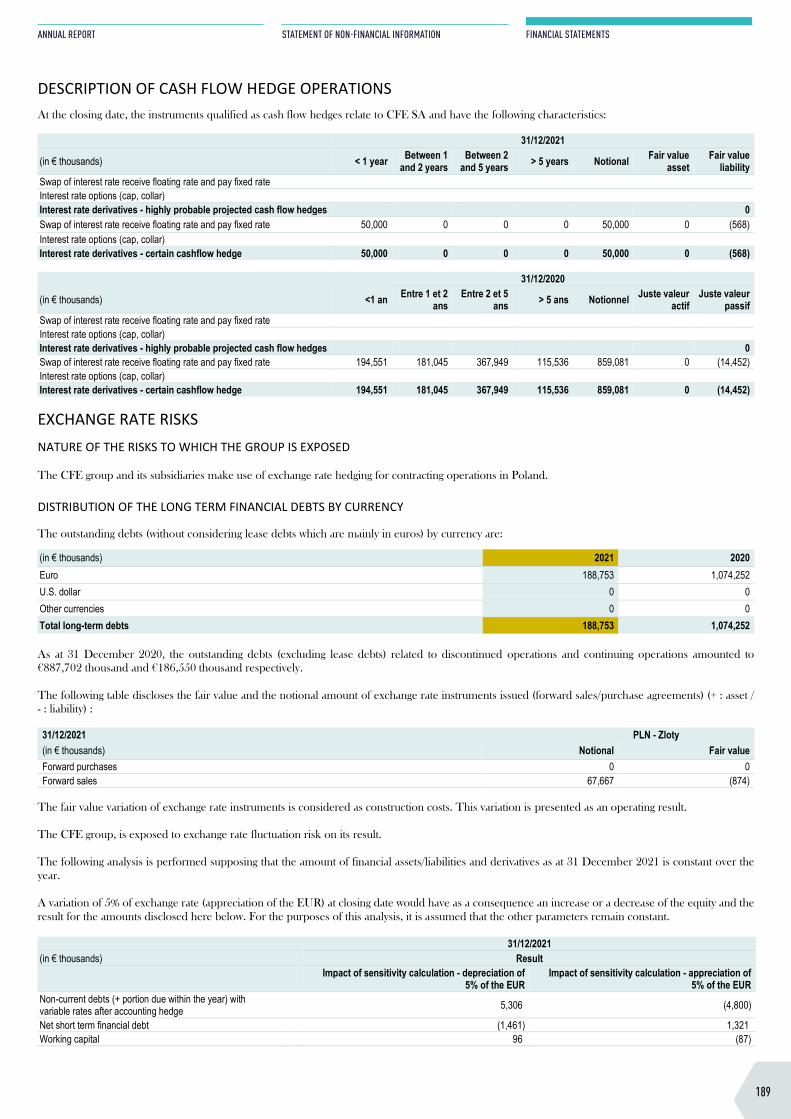
25. FINANCIAL RISK MANAGEMENT CAPITAL MANAGEMENT At year-end 2021, the capital structure of the CFE group is made up of a net debt of €112,995 thousand (note 24) and of a net equity of €1,956,026 thousand, including €1,822,195 thousand relating to discontinued operations and €133,831 thousand relating to continuing activities Moreover, CFE SA also has confirmed bank credit facilities (note 24), whereas CFE SA, BPI SA and DEME have the option of issuing commercial paper. The equity of the CFE group includes share capital, share premium, consolidated reserves and non-controlling interests. The CFE group does not own any of its own shares or convertible bonds. The entire equity is used to finance the operations described in the corporate purposes of the subsidiaries.
INTEREST RATE RISK The interest rate risk management is assured within the group at the level of the different segments. Contracting activities are characterised by a cash surplus. Cash management is mainly centralised through the cash pooling. On the other hand, CFE SA also uses derivative instruments (IRS) to hedge the interest rate risk relating to drawings on its confirmed credit lines. Effective average interest rate before considering derivatives products Fixed rate Floating rate Total
Type of debts Amounts Quota Rate Amounts Quota Rate Amounts Quota Rate Bank loans and other financial debts 53,571 57.31% 1.42% 45,283 47.52% 1.82% 98,854 52.37% 1.60%
Bonds 29,899 31.99% 3.75% 0 0.00% 0.00% 29,899 15.84% 3.75% Drawings on credit facilities 10,000 10.70% 1.40% 50,000 52.48% 0.53% 60,000 31.79% 0.68% Total 93,470 100% 2.16% 95,283 100% 1.15% 188,753 100% 1.65% Effective average interest rate after considering derivatives products
Fixed rate Floating rate Floating rate capped + inflation Total Type of debts Amounts Quota Rate Amounts Quota Rate Amounts Quota Rate Amounts Quota Rate Bank loans and other financial debts 53,571 37.34% 1.42% 45,283 100.00% 1.82% 0 0.00% 0.00% 98,854 52.37% 1.60%
Bonds 29,899 20.84% 3.75% 0 0.00% 0.00% 0 0.00% 0.00% 29,899 15.84% 3.75% Drawings on credit facilities 60,000 41.82% 1.40% 0 0.00% 0.00% 0 0.00% 0.00% 60,000 31.79% 1.40% Total 143,470 100% 1.89% 45,283 100% 1.82% 0 0.00% 0.00% 188,753 100% 1.88%
SENSITIVITY TO THE INTEREST RATE RISK The CFE group is subject to the risk of interest rate fluctuation on its income, taking into account:
- cash flows relating to financial instruments at floating rate after hedging ;
- financial instruments at fixed rate, recognised at fair value in the statement of financial position through the result ;
- derivative instruments not qualified as hedges. On the other hand, the variation in the value of derivatives qualified as cash flow hedges does not directly impact the statement of comprehensive income, and is recognised in ‘other items of the comprehensive income’. In the event that the value of the derivatives has to be restated, the impact is recognised in the income statement. In the analysis below, it is assumed that the figures for the financial debt and the derivative instruments as at 31 December 2021 remain constant over the year. The consequence of a variation of 50 basis points in the interest rate at the closing date would be an increase or decrease in equity and income, as indicated by the figures below. For the purposes of this analysis, it is assumed that the other parameters remain constant.
31/12/2021 (in € thousands) Result Equity
Impact of the sensitivity calculation
Impact of the sensitivity calculation
Impact of the sensitivity calculation
Impact of the sensitivity calculation
+50bp -50bp +50bp -50bp Non-current debts (+ portion due in the year) with variable rates after accounting hedge 1,113 (1,113)
Net short-term financial debt (*) 170 (170)
Derivatives not qualified as hedge Derivatives qualified as highly potential or certain cash flow 329 (265)
(*) excluding cash at bank and in hand.
DESCRIPTION OF CASH FLOW HEDGE OPERATIONS At the closing date, the instruments qualified as cash flow hedges relate to CFE SA and have the following characteristics: 31/12/2021
(in € thousands) < 1 year Between 1 and 2 years
Between 2 and 5 years > 5 years Notional Fair value
asset Fair value
liability Swap of interest rate receive floating rate and pay fixed rate Interest rate options (cap, collar) Interest rate derivatives - highly probable projected cash flow hedges 0 Swap of interest rate receive floating rate and pay fixed rate 50,000 0 0 0 50,000 0 (568) Interest rate options (cap, collar) Interest rate derivatives - certain cashflow hedge 50,000 0 0 0 50,000 0 (568) 31/12/2020
(in € thousands) <1 an Entre 1 et 2 ans
Entre 2 et 5 ans > 5 ans Notionnel Juste valeur
actif Juste valeur
passif Swap of interest rate receive floating rate and pay fixed rate Interest rate options (cap, collar) Interest rate derivatives - highly probable projected cash flow hedges 0 Swap of interest rate receive floating rate and pay fixed rate 194,551 181,045 367,949 115,536 859,081 0 (14,452) Interest rate options (cap, collar) Interest rate derivatives - certain cashflow hedge 194,551 181,045 367,949 115,536 859,081 0 (14,452)
EXCHANGE RATE RISKS NATURE OF THE RISKS TO WHICH THE GROUP IS EXPOSED The CFE group and its subsidiaries make use of exchange rate hedging for contracting operations in Poland. DISTRIBUTION OF THE LONG TERM FINANCIAL DEBTS BY CURRENCY The outstanding debts (without considering lease debts which are mainly in euros) by currency are:
(in € thousands) 2021 2020 Euro 188,753 1,074,252 U.S. dollar 0 0 Other currencies 0 0 Total long-term debts 188,753 1,074,252 As at 31 December 2020, the outstanding debts (excluding lease debts) related to discontinued operations and continuing operations amounted to €887,702 thousand and €186,550 thousand respectively. The following table discloses the fair value and the notional amount of exchange rate instruments issued (forward sales/purchase agreements) (+ : asset / - : liability) : 31/12/2021 PLN - Zloty (in € thousands) Notional Fair value Forward purchases 0 0 Forward sales 67,667 (874)
The fair value variation of exchange rate instruments is considered as construction costs. This variation is presented as an operating result. The CFE group, is exposed to exchange rate fluctuation risk on its result. The following analysis is performed supposing that the amount of financial assets/liabilities and derivatives as at 31 December 2021 is constant over the year. A variation of 5% of exchange rate (appreciation of the EUR) at closing date would have as a consequence an increase or a decrease of the equity and the result for the amounts disclosed here below. For the purposes of this analysis, it is assumed that the other parameters remain constant.
31/12/2021
(in € thousands) Result Impact of sensitivity calculation - depreciation of
5% of the EUR Impact of sensitivity calculation - appreciation of
5% of the EUR Non-current debts (+ portion due within the year) with variable rates after accounting hedge
5,306 (4,800)
Net short term financial debt (1,461) 1,321 Working capital 96 (87)
189
ANNUAL REPORT
STATEMENT OF NON-FINANCIAL INFORMATION
FINANCIAL STATEMENTS
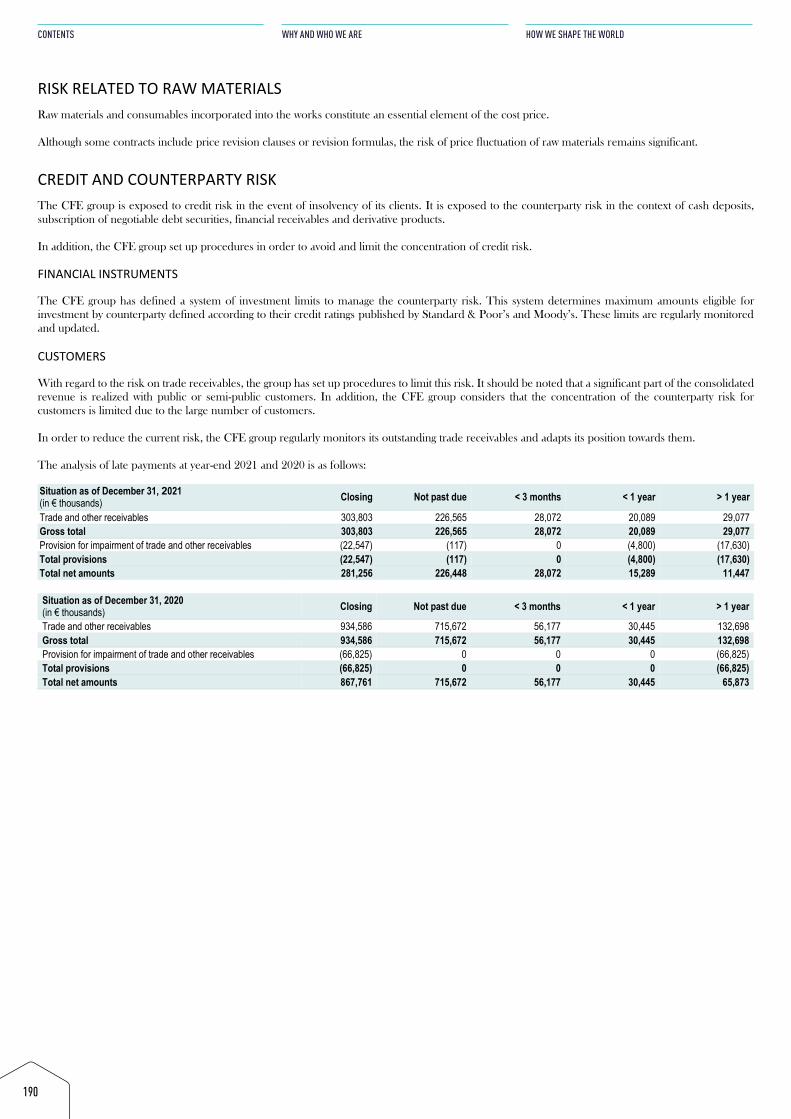
RISK RELATED TO RAW MATERIALS Raw materials and consumables incorporated into the works constitute an essential element of the cost price. Although some contracts include price revision clauses or revision formulas, the risk of price fluctuation of raw materials remains significant.
CREDIT AND COUNTERPARTY RISK The CFE group is exposed to credit risk in the event of insolvency of its clients. It is exposed to the counterparty risk in the context of cash deposits, subscription of negotiable debt securities, financial receivables and derivative products. In addition, the CFE group set up procedures in order to avoid and limit the concentration of credit risk. FINANCIAL INSTRUMENTS The CFE group has defined a system of investment limits to manage the counterparty risk. This system determines maximum amounts eligible for investment by counterparty defined according to their credit ratings published by Standard & Poor’s and Moody’s. These limits are regularly monitored and updated. CUSTOMERS With regard to the risk on trade receivables, the group has set up procedures to limit this risk. It should be noted that a significant part of the consolidated revenue is realized with public or semi-public customers. In addition, the CFE group considers that the concentration of the counterparty risk for customers is limited due to the large number of customers. In order to reduce the current risk, the CFE group regularly monitors its outstanding trade receivables and adapts its position towards them. The analysis of late payments at year-end 2021 and 2020 is as follows: Situation as of December 31, 2021 (in € thousands) Closing Not past due < 3 months < 1 year > 1 year
Trade and other receivables 303,803 226,565 28,072 20,089 29,077 Gross total 303,803 226,565 28,072 20,089 29,077 Provision for impairment of trade and other receivables (22,547) (117) 0 (4,800) (17,630) Total provisions (22,547) (117) 0 (4,800) (17,630) Total net amounts 281,256 226,448 28,072 15,289 11,447 Situation as of December 31, 2020 (in € thousands) Closing Not past due < 3 months < 1 year > 1 year
Trade and other receivables 934,586 715,672 56,177 30,445 132,698 Gross total 934,586 715,672 56,177 30,445 132,698 Provision for impairment of trade and other receivables (66,825) 0 0 0 (66,825) Total provisions (66,825) 0 0 0 (66,825) Total net amounts 867,761 715,672 56,177 30,445 65,873
190
CONTENTS
WHY AND WHO WE ARE
HOW WE SHAPE THE WORLD
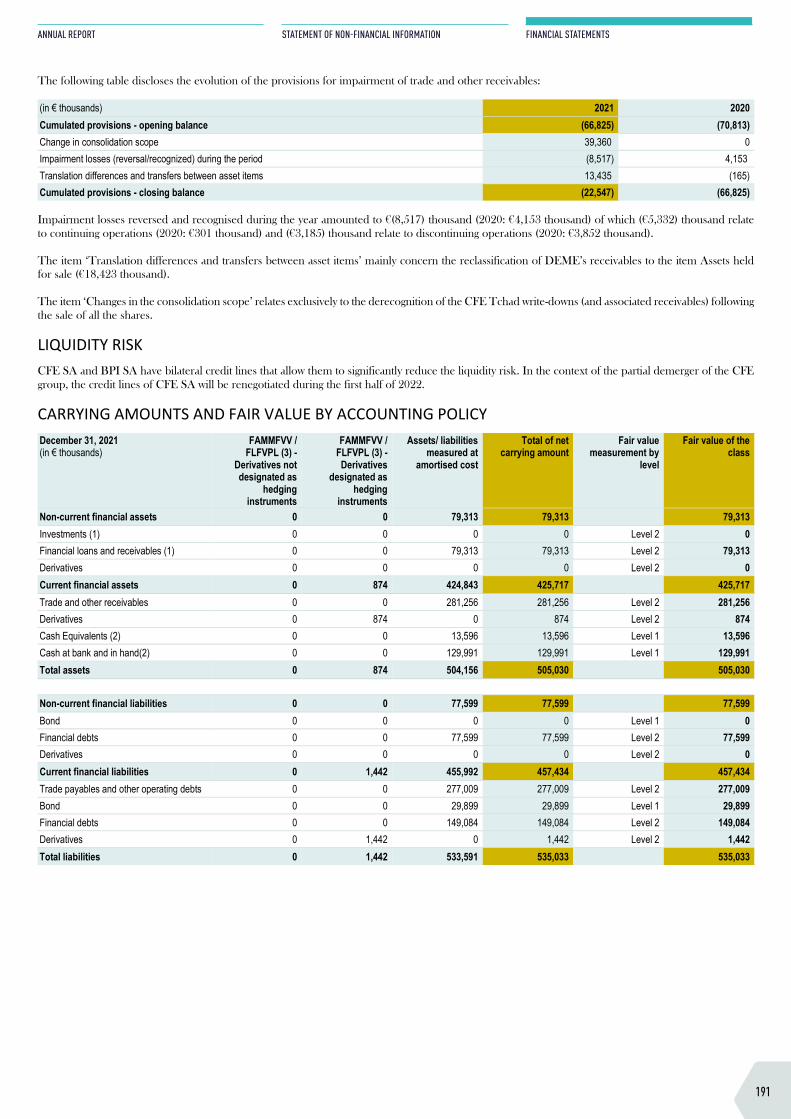
RISK RELATED TO RAW MATERIALS Raw materials and consumables incorporated into the works constitute an essential element of the cost price. Although some contracts include price revision clauses or revision formulas, the risk of price fluctuation of raw materials remains significant.
CREDIT AND COUNTERPARTY RISK The CFE group is exposed to credit risk in the event of insolvency of its clients. It is exposed to the counterparty risk in the context of cash deposits, subscription of negotiable debt securities, financial receivables and derivative products. In addition, the CFE group set up procedures in order to avoid and limit the concentration of credit risk. FINANCIAL INSTRUMENTS The CFE group has defined a system of investment limits to manage the counterparty risk. This system determines maximum amounts eligible for investment by counterparty defined according to their credit ratings published by Standard & Poor’s and Moody’s. These limits are regularly monitored and updated. CUSTOMERS With regard to the risk on trade receivables, the group has set up procedures to limit this risk. It should be noted that a significant part of the consolidated revenue is realized with public or semi-public customers. In addition, the CFE group considers that the concentration of the counterparty risk for customers is limited due to the large number of customers. In order to reduce the current risk, the CFE group regularly monitors its outstanding trade receivables and adapts its position towards them. The analysis of late payments at year-end 2021 and 2020 is as follows: Situation as of December 31, 2021 (in € thousands) Closing Not past due < 3 months < 1 year > 1 year
Trade and other receivables 303,803 226,565 28,072 20,089 29,077 Gross total 303,803 226,565 28,072 20,089 29,077 Provision for impairment of trade and other receivables (22,547) (117) 0 (4,800) (17,630) Total provisions (22,547) (117) 0 (4,800) (17,630) Total net amounts 281,256 226,448 28,072 15,289 11,447 Situation as of December 31, 2020 (in € thousands) Closing Not past due < 3 months < 1 year > 1 year
Trade and other receivables 934,586 715,672 56,177 30,445 132,698 Gross total 934,586 715,672 56,177 30,445 132,698 Provision for impairment of trade and other receivables (66,825) 0 0 0 (66,825) Total provisions (66,825) 0 0 0 (66,825) Total net amounts 867,761 715,672 56,177 30,445 65,873
The following table discloses the evolution of the provisions for impairment of trade and other receivables: (in € thousands) 2021 2020 Cumulated provisions - opening balance (66,825) (70,813) Change in consolidation scope 39,360 0 Impairment losses (reversal/recognized) during the period (8,517) 4,153 Translation differences and transfers between asset items 13,435 (165) Cumulated provisions - closing balance (22,547) (66,825) Impairment losses reversed and recognised during the year amounted to €(8,517) thousand (2020: €4,153 thousand) of which (€5,332) thousand relate to continuing operations (2020: €301 thousand) and (€3,185) thousand relate to discontinuing operations (2020: €3,852 thousand). The item ‘Translation differences and transfers between asset items’ mainly concern the reclassification of DEME’s receivables to the item Assets held for sale (€18,423 thousand). The item ‘Changes in the consolidation scope’ relates exclusively to the derecognition of the CFE Tchad write-downs (and associated receivables) following the sale of all the shares.
LIQUIDITY RISK CFE SA and BPI SA have bilateral credit lines that allow them to significantly reduce the liquidity risk. In the context of the partial demerger of the CFE group, the credit lines of CFE SA will be renegotiated during the first half of 2022.
CARRYING AMOUNTS AND FAIR VALUE BY ACCOUNTING POLICY December 31, 2021 (in € thousands)
FAMMFVV / FLFVPL (3) -
Derivatives not designated as
hedging instruments
FAMMFVV / FLFVPL (3) - Derivatives
designated as hedging
instruments
Assets/ liabilities measured at
amortised cost
Total of net carrying amount
Fair value measurement by
level
Fair value of the class
Non-current financial assets 0 0 79,313 79,313 79,313 Investments (1) 0 0 0 0 Level 2 0 Financial loans and receivables (1) 0 0 79,313 79,313 Level 2 79,313 Derivatives 0 0 0 0 Level 2 0 Current financial assets 0 874 424,843 425,717 425,717 Trade and other receivables 0 0 281,256 281,256 Level 2 281,256 Derivatives 0 874 0 874 Level 2 874 Cash Equivalents (2) 0 0 13,596 13,596 Level 1 13,596 Cash at bank and in hand(2) 0 0 129,991 129,991 Level 1 129,991 Total assets 0 874 504,156 505,030 505,030
Non-current financial liabilities 0 0 77,599 77,599 77,599 Bond 0 0 0 0 Level 1 0 Financial debts 0 0 77,599 77,599 Level 2 77,599 Derivatives 0 0 0 0 Level 2 0 Current financial liabilities 0 1,442 455,992 457,434 457,434 Trade payables and other operating debts 0 0 277,009 277,009 Level 2 277,009 Bond 0 0 29,899 29,899 Level 1 29,899 Financial debts 0 0 149,084 149,084 Level 2 149,084 Derivatives 0 1,442 0 1,442 Level 2 1,442 Total liabilities 0 1,442 533,591 535,033 535,033
191
ANNUAL REPORT
STATEMENT OF NON-FINANCIAL INFORMATION
FINANCIAL STATEMENTS
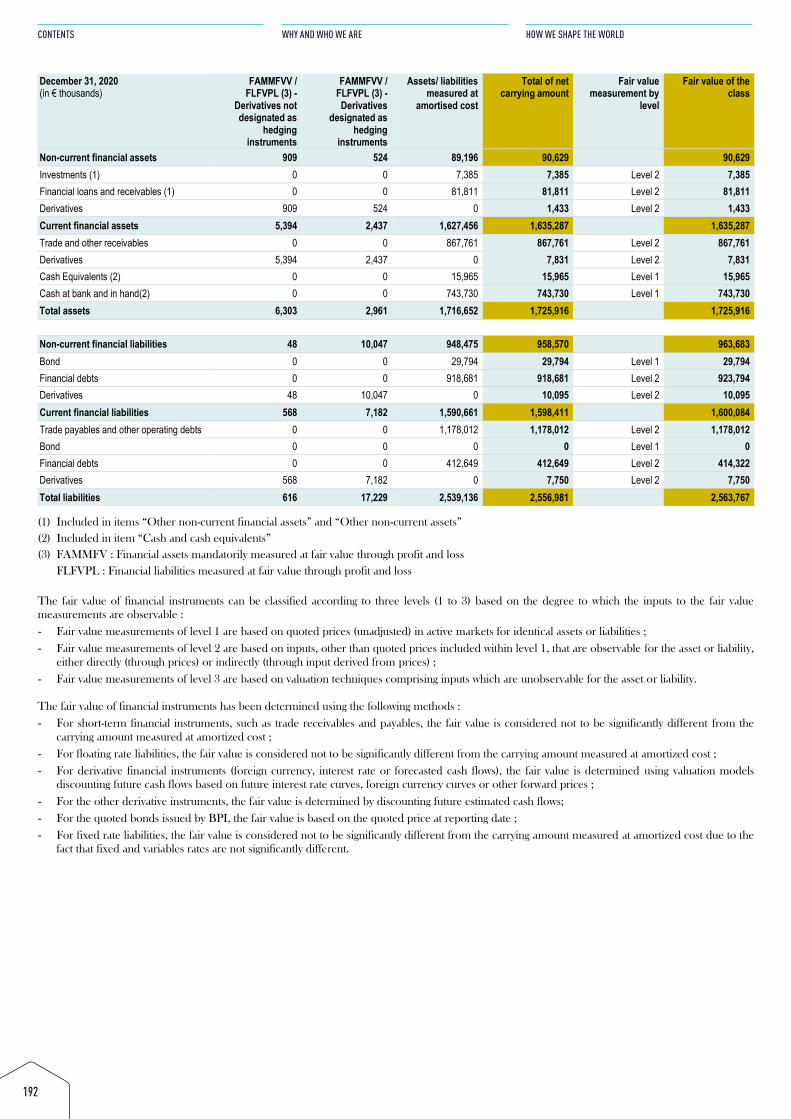
December 31, 2020 (in € thousands)
FAMMFVV / FLFVPL (3) -
Derivatives not designated as
hedging instruments
FAMMFVV / FLFVPL (3) - Derivatives
designated as hedging
instruments
Assets/ liabilities measured at
amortised cost
Total of net carrying amount
Fair value measurement by
level
Fair value of the class
Non-current financial assets 909 524 89,196 90,629 90,629 Investments (1) 0 0 7,385 7,385 Level 2 7,385 Financial loans and receivables (1) 0 0 81,811 81,811 Level 2 81,811 Derivatives 909 524 0 1,433 Level 2 1,433 Current financial assets 5,394 2,437 1,627,456 1,635,287 1,635,287 Trade and other receivables 0 0 867,761 867,761 Level 2 867,761 Derivatives 5,394 2,437 0 7,831 Level 2 7,831 Cash Equivalents (2) 0 0 15,965 15,965 Level 1 15,965 Cash at bank and in hand(2) 0 0 743,730 743,730 Level 1 743,730 Total assets 6,303 2,961 1,716,652 1,725,916 1,725,916
Non-current financial liabilities 48 10,047 948,475 958,570 963,683 Bond 0 0 29,794 29,794 Level 1 29,794 Financial debts 0 0 918,681 918,681 Level 2 923,794 Derivatives 48 10,047 0 10,095 Level 2 10,095 Current financial liabilities 568 7,182 1,590,661 1,598,411 1,600,084 Trade payables and other operating debts 0 0 1,178,012 1,178,012 Level 2 1,178,012 Bond 0 0 0 0 Level 1 0 Financial debts 0 0 412,649 412,649 Level 2 414,322 Derivatives 568 7,182 0 7,750 Level 2 7,750 Total liabilities 616 17,229 2,539,136 2,556,981 2,563,767 (1) Included in items “Other non-current financial assets” and “Other non-current assets” (2) Included in item “Cash and cash equivalents” (3) FAMMFV : Financial assets mandatorily measured at fair value through profit and loss FLFVPL : Financial liabilities measured at fair value through profit and loss The fair value of financial instruments can be classified according to three levels (1 to 3) based on the degree to which the inputs to the fair value measurements are observable : - Fair value measurements of level 1 are based on quoted prices (unadjusted) in active markets for identical assets or liabilities ; - Fair value measurements of level 2 are based on inputs, other than quoted prices included within level 1, that are observable for the asset or liability,
either directly (through prices) or indirectly (through input derived from prices) ; - Fair value measurements of level 3 are based on valuation techniques comprising inputs which are unobservable for the asset or liability. The fair value of financial instruments has been determined using the following methods : - For short-term financial instruments, such as trade receivables and payables, the fair value is considered not to be significantly different from the
carrying amount measured at amortized cost ; - For floating rate liabilities, the fair value is considered not to be significantly different from the carrying amount measured at amortized cost ; - For derivative financial instruments (foreign currency, interest rate or forecasted cash flows), the fair value is determined using valuation models
discounting future cash flows based on future interest rate curves, foreign currency curves or other forward prices ; - For the other derivative instruments, the fair value is determined by discounting future estimated cash flows; - For the quoted bonds issued by BPI, the fair value is based on the quoted price at reporting date ; - For fixed rate liabilities, the fair value is considered not to be significantly different from the carrying amount measured at amortized cost due to the
fact that fixed and variables rates are not significantly different.
192
CONTENTS
WHY AND WHO WE ARE
HOW WE SHAPE THE WORLD
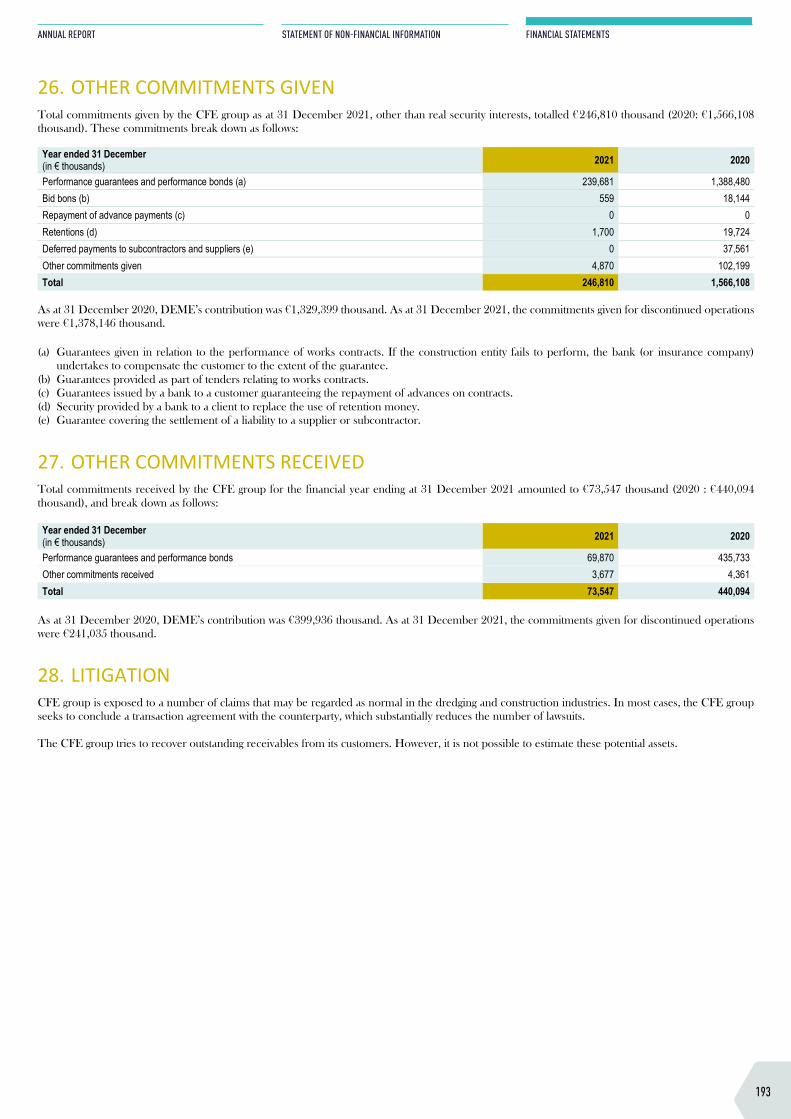
December 31, 2020 (in € thousands)
FAMMFVV / FLFVPL (3) -
Derivatives not designated as
hedging instruments
FAMMFVV / FLFVPL (3) - Derivatives
designated as hedging
instruments
Assets/ liabilities measured at
amortised cost
Total of net carrying amount
Fair value measurement by
level
Fair value of the class
Non-current financial assets 909 524 89,196 90,629 90,629 Investments (1) 0 0 7,385 7,385 Level 2 7,385 Financial loans and receivables (1) 0 0 81,811 81,811 Level 2 81,811 Derivatives 909 524 0 1,433 Level 2 1,433 Current financial assets 5,394 2,437 1,627,456 1,635,287 1,635,287 Trade and other receivables 0 0 867,761 867,761 Level 2 867,761 Derivatives 5,394 2,437 0 7,831 Level 2 7,831 Cash Equivalents (2) 0 0 15,965 15,965 Level 1 15,965 Cash at bank and in hand(2) 0 0 743,730 743,730 Level 1 743,730 Total assets 6,303 2,961 1,716,652 1,725,916 1,725,916
Non-current financial liabilities 48 10,047 948,475 958,570 963,683 Bond 0 0 29,794 29,794 Level 1 29,794 Financial debts 0 0 918,681 918,681 Level 2 923,794 Derivatives 48 10,047 0 10,095 Level 2 10,095 Current financial liabilities 568 7,182 1,590,661 1,598,411 1,600,084 Trade payables and other operating debts 0 0 1,178,012 1,178,012 Level 2 1,178,012 Bond 0 0 0 0 Level 1 0 Financial debts 0 0 412,649 412,649 Level 2 414,322 Derivatives 568 7,182 0 7,750 Level 2 7,750 Total liabilities 616 17,229 2,539,136 2,556,981 2,563,767 (1) Included in items “Other non-current financial assets” and “Other non-current assets” (2) Included in item “Cash and cash equivalents” (3) FAMMFV : Financial assets mandatorily measured at fair value through profit and loss FLFVPL : Financial liabilities measured at fair value through profit and loss The fair value of financial instruments can be classified according to three levels (1 to 3) based on the degree to which the inputs to the fair value measurements are observable : - Fair value measurements of level 1 are based on quoted prices (unadjusted) in active markets for identical assets or liabilities ; - Fair value measurements of level 2 are based on inputs, other than quoted prices included within level 1, that are observable for the asset or liability,
either directly (through prices) or indirectly (through input derived from prices) ; - Fair value measurements of level 3 are based on valuation techniques comprising inputs which are unobservable for the asset or liability. The fair value of financial instruments has been determined using the following methods : - For short-term financial instruments, such as trade receivables and payables, the fair value is considered not to be significantly different from the
carrying amount measured at amortized cost ; - For floating rate liabilities, the fair value is considered not to be significantly different from the carrying amount measured at amortized cost ; - For derivative financial instruments (foreign currency, interest rate or forecasted cash flows), the fair value is determined using valuation models
discounting future cash flows based on future interest rate curves, foreign currency curves or other forward prices ; - For the other derivative instruments, the fair value is determined by discounting future estimated cash flows; - For the quoted bonds issued by BPI, the fair value is based on the quoted price at reporting date ; - For fixed rate liabilities, the fair value is considered not to be significantly different from the carrying amount measured at amortized cost due to the
fact that fixed and variables rates are not significantly different.
26. OTHER COMMITMENTS GIVEN Total commitments given by the CFE group as at 31 December 2021, other than real security interests, totalled €246,810 thousand (2020: €1,566,108 thousand). These commitments break down as follows: Year ended 31 December (in € thousands) 2021 2020
Performance guarantees and performance bonds (a) 239,681 1,388,480 Bid bons (b) 559 18,144 Repayment of advance payments (c) 0 0 Retentions (d) 1,700 19,724 Deferred payments to subcontractors and suppliers (e) 0 37,561 Other commitments given 4,870 102,199 Total 246,810 1,566,108
As at 31 December 2020, DEME’s contribution was €1,329,399 thousand. As at 31 December 2021, the commitments given for discontinued operations were €1,378,146 thousand. (a) Guarantees given in relation to the performance of works contracts. If the construction entity fails to perform, the bank (or insurance company)
undertakes to compensate the customer to the extent of the guarantee. (b) Guarantees provided as part of tenders relating to works contracts. (c) Guarantees issued by a bank to a customer guaranteeing the repayment of advances on contracts. (d) Security provided by a bank to a client to replace the use of retention money. (e) Guarantee covering the settlement of a liability to a supplier or subcontractor.
27. OTHER COMMITMENTS RECEIVED Total commitments received by the CFE group for the financial year ending at 31 December 2021 amounted to €73,547 thousand (2020 : €440,094 thousand), and break down as follows: Year ended 31 December (in € thousands) 2021 2020
Performance guarantees and performance bonds 69,870 435,733 Other commitments received 3,677 4,361 Total 73,547 440,094
As at 31 December 2020, DEME’s contribution was €399,936 thousand. As at 31 December 2021, the commitments given for discontinued operations were €241,035 thousand.
28. LITIGATION CFE group is exposed to a number of claims that may be regarded as normal in the dredging and construction industries. In most cases, the CFE group seeks to conclude a transaction agreement with the counterparty, which substantially reduces the number of lawsuits. The CFE group tries to recover outstanding receivables from its customers. However, it is not possible to estimate these potential assets.
193
ANNUAL REPORT
STATEMENT OF NON-FINANCIAL INFORMATION
FINANCIAL STATEMENTS
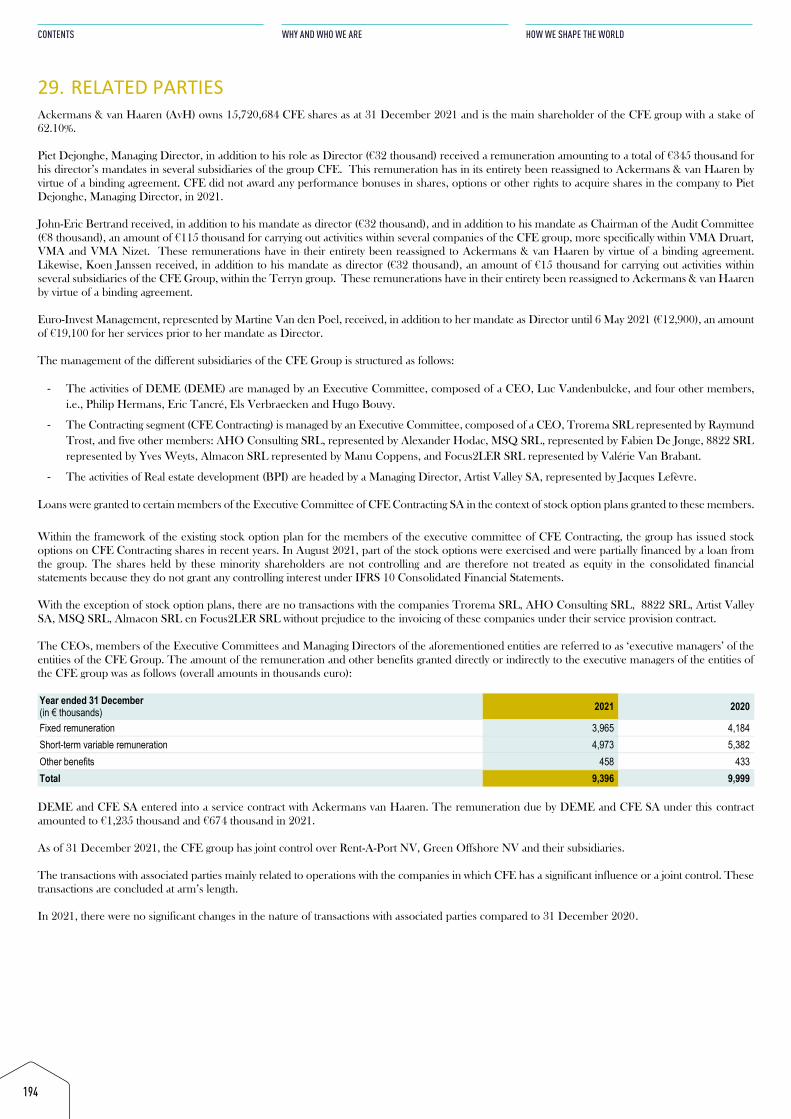
29. RELATED PARTIES Ackermans & van Haaren (AvH) owns 15,720,684 CFE shares as at 31 December 2021 and is the main shareholder of the CFE group with a stake of 62.10%. Piet Dejonghe, Managing Director, in addition to his role as Director (€32 thousand) received a remuneration amounting to a total of €345 thousand for his director’s mandates in several subsidiaries of the group CFE. This remuneration has in its entirety been reassigned to Ackermans & van Haaren by virtue of a binding agreement. CFE did not award any performance bonuses in shares, options or other rights to acquire shares in the company to Piet Dejonghe, Managing Director, in 2021. John-Eric Bertrand received, in addition to his mandate as director (€32 thousand), and in addition to his mandate as Chairman of the Audit Committee (€8 thousand), an amount of €115 thousand for carrying out activities within several companies of the CFE group, more specifically within VMA Druart, VMA and VMA Nizet. These remunerations have in their entirety been reassigned to Ackermans & van Haaren by virtue of a binding agreement. Likewise, Koen Janssen received, in addition to his mandate as director (€32 thousand), an amount of €15 thousand for carrying out activities within several subsidiaries of the CFE Group, within the Terryn group. These remunerations have in their entirety been reassigned to Ackermans & van Haaren by virtue of a binding agreement. Euro-Invest Management, represented by Martine Van den Poel, received, in addition to her mandate as Director until 6 May 2021 (€12,900), an amount of €19,100 for her services prior to her mandate as Director. The management of the different subsidiaries of the CFE Group is structured as follows:
- The activities of DEME (DEME) are managed by an Executive Committee, composed of a CEO, Luc Vandenbulcke, and four other members, i.e., Philip Hermans, Eric Tancré, Els Verbraecken and Hugo Bouvy.
- The Contracting segment (CFE Contracting) is managed by an Executive Committee, composed of a CEO, Trorema SRL represented by Raymund Trost, and five other members: AHO Consulting SRL, represented by Alexander Hodac, MSQ SRL, represented by Fabien De Jonge, 8822 SRL represented by Yves Weyts, Almacon SRL represented by Manu Coppens, and Focus2LER SRL represented by Valérie Van Brabant.
- The activities of Real estate development (BPI) are headed by a Managing Director, Artist Valley SA, represented by Jacques Lefèvre. Loans were granted to certain members of the Executive Committee of CFE Contracting SA in the context of stock option plans granted to these members. Within the framework of the existing stock option plan for the members of the executive committee of CFE Contracting, the group has issued stock options on CFE Contracting shares in recent years. In August 2021, part of the stock options were exercised and were partially financed by a loan from the group. The shares held by these minority shareholders are not controlling and are therefore not treated as equity in the consolidated financial statements because they do not grant any controlling interest under IFRS 10 Consolidated Financial Statements. With the exception of stock option plans, there are no transactions with the companies Trorema SRL, AHO Consulting SRL, 8822 SRL, Artist Valley SA, MSQ SRL, Almacon SRL en Focus2LER SRL without prejudice to the invoicing of these companies under their service provision contract. The CEOs, members of the Executive Committees and Managing Directors of the aforementioned entities are referred to as ‘executive managers’ of the entities of the CFE Group. The amount of the remuneration and other benefits granted directly or indirectly to the executive managers of the entities of the CFE group was as follows (overall amounts in thousands euro): Year ended 31 December (in € thousands) 2021 2020
Fixed remuneration 3,965 4,184 Short-term variable remuneration 4,973 5,382 Other benefits 458 433 Total 9,396 9,999
DEME and CFE SA entered into a service contract with Ackermans van Haaren. The remuneration due by DEME and CFE SA under this contract amounted to €1,235 thousand and €674 thousand in 2021. As of 31 December 2021, the CFE group has joint control over Rent-A-Port NV, Green Offshore NV and their subsidiaries. The transactions with associated parties mainly related to operations with the companies in which CFE has a significant influence or a joint control. These transactions are concluded at arm’s length. In 2021, there were no significant changes in the nature of transactions with associated parties compared to 31 December 2020.
194
CONTENTS
WHY AND WHO WE ARE
HOW WE SHAPE THE WORLD
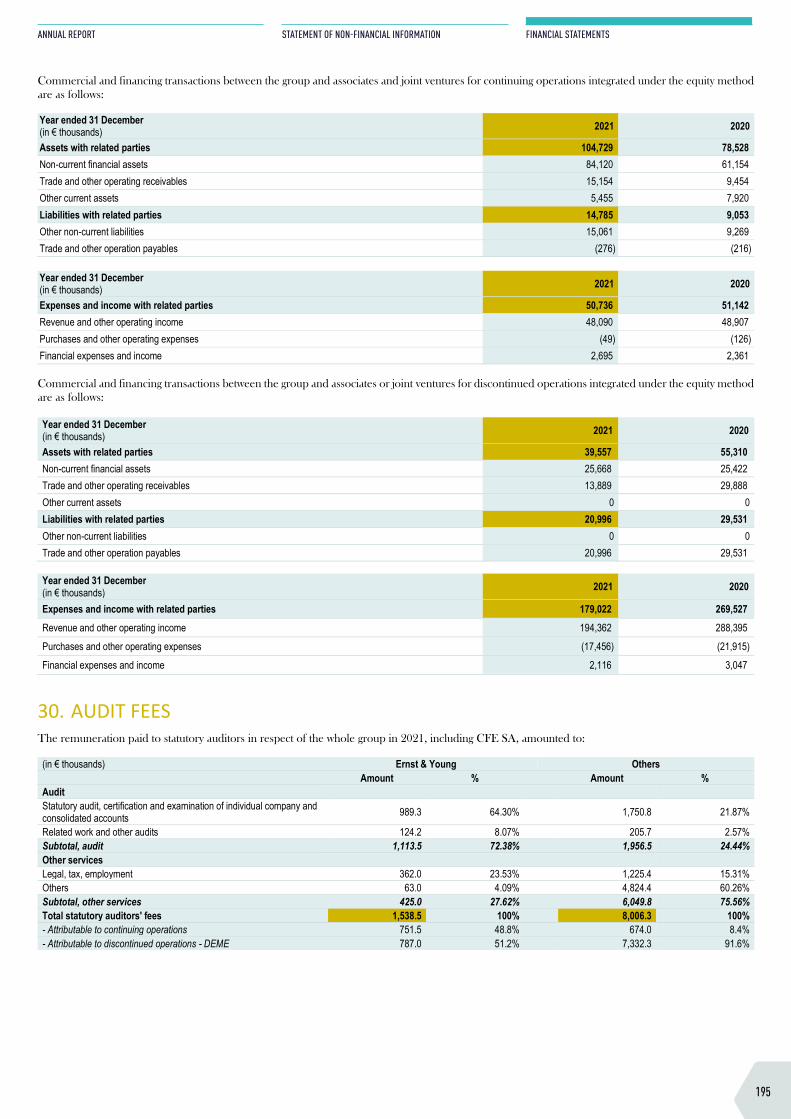
29. RELATED PARTIES Ackermans & van Haaren (AvH) owns 15,720,684 CFE shares as at 31 December 2021 and is the main shareholder of the CFE group with a stake of 62.10%. Piet Dejonghe, Managing Director, in addition to his role as Director (€32 thousand) received a remuneration amounting to a total of €345 thousand for his director’s mandates in several subsidiaries of the group CFE. This remuneration has in its entirety been reassigned to Ackermans & van Haaren by virtue of a binding agreement. CFE did not award any performance bonuses in shares, options or other rights to acquire shares in the company to Piet Dejonghe, Managing Director, in 2021. John-Eric Bertrand received, in addition to his mandate as director (€32 thousand), and in addition to his mandate as Chairman of the Audit Committee (€8 thousand), an amount of €115 thousand for carrying out activities within several companies of the CFE group, more specifically within VMA Druart, VMA and VMA Nizet. These remunerations have in their entirety been reassigned to Ackermans & van Haaren by virtue of a binding agreement. Likewise, Koen Janssen received, in addition to his mandate as director (€32 thousand), an amount of €15 thousand for carrying out activities within several subsidiaries of the CFE Group, within the Terryn group. These remunerations have in their entirety been reassigned to Ackermans & van Haaren by virtue of a binding agreement. Euro-Invest Management, represented by Martine Van den Poel, received, in addition to her mandate as Director until 6 May 2021 (€12,900), an amount of €19,100 for her services prior to her mandate as Director. The management of the different subsidiaries of the CFE Group is structured as follows:
- The activities of DEME (DEME) are managed by an Executive Committee, composed of a CEO, Luc Vandenbulcke, and four other members, i.e., Philip Hermans, Eric Tancré, Els Verbraecken and Hugo Bouvy.
- The Contracting segment (CFE Contracting) is managed by an Executive Committee, composed of a CEO, Trorema SRL represented by Raymund Trost, and five other members: AHO Consulting SRL, represented by Alexander Hodac, MSQ SRL, represented by Fabien De Jonge, 8822 SRL represented by Yves Weyts, Almacon SRL represented by Manu Coppens, and Focus2LER SRL represented by Valérie Van Brabant.
- The activities of Real estate development (BPI) are headed by a Managing Director, Artist Valley SA, represented by Jacques Lefèvre. Loans were granted to certain members of the Executive Committee of CFE Contracting SA in the context of stock option plans granted to these members. Within the framework of the existing stock option plan for the members of the executive committee of CFE Contracting, the group has issued stock options on CFE Contracting shares in recent years. In August 2021, part of the stock options were exercised and were partially financed by a loan from the group. The shares held by these minority shareholders are not controlling and are therefore not treated as equity in the consolidated financial statements because they do not grant any controlling interest under IFRS 10 Consolidated Financial Statements. With the exception of stock option plans, there are no transactions with the companies Trorema SRL, AHO Consulting SRL, 8822 SRL, Artist Valley SA, MSQ SRL, Almacon SRL en Focus2LER SRL without prejudice to the invoicing of these companies under their service provision contract. The CEOs, members of the Executive Committees and Managing Directors of the aforementioned entities are referred to as ‘executive managers’ of the entities of the CFE Group. The amount of the remuneration and other benefits granted directly or indirectly to the executive managers of the entities of the CFE group was as follows (overall amounts in thousands euro): Year ended 31 December (in € thousands) 2021 2020
Fixed remuneration 3,965 4,184 Short-term variable remuneration 4,973 5,382 Other benefits 458 433 Total 9,396 9,999
DEME and CFE SA entered into a service contract with Ackermans van Haaren. The remuneration due by DEME and CFE SA under this contract amounted to €1,235 thousand and €674 thousand in 2021. As of 31 December 2021, the CFE group has joint control over Rent-A-Port NV, Green Offshore NV and their subsidiaries. The transactions with associated parties mainly related to operations with the companies in which CFE has a significant influence or a joint control. These transactions are concluded at arm’s length. In 2021, there were no significant changes in the nature of transactions with associated parties compared to 31 December 2020.
Commercial and financing transactions between the group and associates and joint ventures for continuing operations integrated under the equity method are as follows: Year ended 31 December (in € thousands) 2021 2020
Assets with related parties 104,729 78,528 Non-current financial assets 84,120 61,154 Trade and other operating receivables 15,154 9,454 Other current assets 5,455 7,920 Liabilities with related parties 14,785 9,053 Other non-current liabilities 15,061 9,269 Trade and other operation payables (276) (216) Year ended 31 December (in € thousands) 2021 2020
Expenses and income with related parties 50,736 51,142 Revenue and other operating income 48,090 48,907 Purchases and other operating expenses (49) (126) Financial expenses and income 2,695 2,361 Commercial and financing transactions between the group and associates or joint ventures for discontinued operations integrated under the equity method are as follows: Year ended 31 December (in € thousands) 2021 2020
Assets with related parties 39,557 55,310 Non-current financial assets 25,668 25,422 Trade and other operating receivables 13,889 29,888 Other current assets 0 0 Liabilities with related parties 20,996 29,531 Other non-current liabilities 0 0 Trade and other operation payables 20,996 29,531
Year ended 31 December (in € thousands) 2021 2020
Expenses and income with related parties 179,022 269,527 Revenue and other operating income 194,362 288,395
Purchases and other operating expenses (17,456) (21,915)
Financial expenses and income 2,116 3,047
30. AUDIT FEES The remuneration paid to statutory auditors in respect of the whole group in 2021, including CFE SA, amounted to: (in € thousands) Ernst & Young Others Amount % Amount % Audit Statutory audit, certification and examination of individual company and consolidated accounts 989.3 64.30% 1,750.8 21.87%
Related work and other audits 124.2 8.07% 205.7 2.57% Subtotal, audit 1,113.5 72.38% 1,956.5 24.44% Other services Legal, tax, employment 362.0 23.53% 1,225.4 15.31% Others 63.0 4.09% 4,824.4 60.26% Subtotal, other services 425.0 27.62% 6,049.8 75.56% Total statutory auditors' fees 1,538.5 100% 8,006.3 100% - Attributable to continuing operations 751.5 48.8% 674.0 8.4% - Attributable to discontinued operations - DEME 787.0 51.2% 7,332.3 91.6%
195
ANNUAL REPORT
STATEMENT OF NON-FINANCIAL INFORMATION
FINANCIAL STATEMENTS
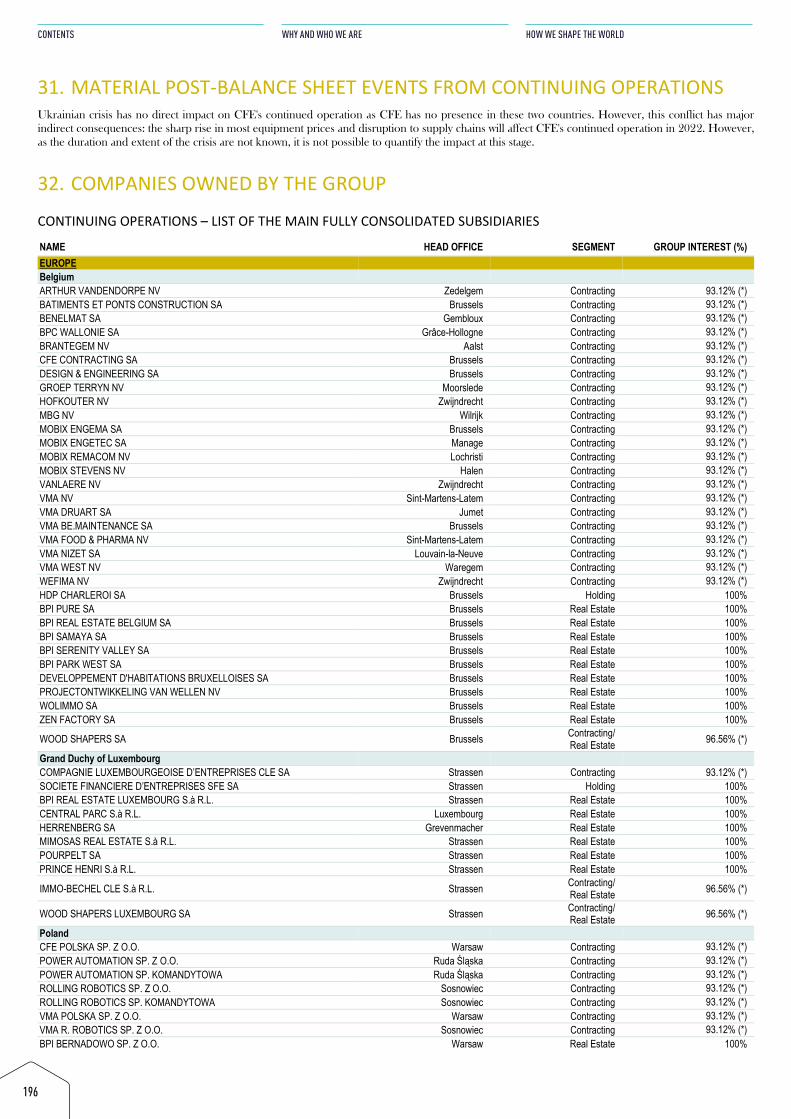
31. MATERIAL POST-BALANCE SHEET EVENTS FROM CONTINUING OPERATIONS Ukrainian crisis has no direct impact on CFE's continued operation as CFE has no presence in these two countries. However, this conflict has major indirect consequences: the sharp rise in most equipment prices and disruption to supply chains will affect CFE's continued operation in 2022. However, as the duration and extent of the crisis are not known, it is not possible to quantify the impact at this stage.
32. COMPANIES OWNED BY THE GROUP
CONTINUING OPERATIONS – LIST OF THE MAIN FULLY CONSOLIDATED SUBSIDIARIES
NAME HEAD OFFICE SEGMENT GROUP INTEREST (%) EUROPE Belgium ARTHUR VANDENDORPE NV Zedelgem Contracting 93.12% (*) BATIMENTS ET PONTS CONSTRUCTION SA Brussels Contracting 93.12% (*) BENELMAT SA Gembloux Contracting 93.12% (*) BPC WALLONIE SA Grâce-Hollogne Contracting 93.12% (*) BRANTEGEM NV Aalst Contracting 93.12% (*) CFE CONTRACTING SA Brussels Contracting 93.12% (*) DESIGN & ENGINEERING SA Brussels Contracting 93.12% (*) GROEP TERRYN NV Moorslede Contracting 93.12% (*) HOFKOUTER NV Zwijndrecht Contracting 93.12% (*) MBG NV Wilrijk Contracting 93.12% (*) MOBIX ENGEMA SA Brussels Contracting 93.12% (*) MOBIX ENGETEC SA Manage Contracting 93.12% (*) MOBIX REMACOM NV Lochristi Contracting 93.12% (*) MOBIX STEVENS NV Halen Contracting 93.12% (*) VANLAERE NV Zwijndrecht Contracting 93.12% (*) VMA NV Sint-Martens-Latem Contracting 93.12% (*) VMA DRUART SA Jumet Contracting 93.12% (*) VMA BE.MAINTENANCE SA Brussels Contracting 93.12% (*) VMA FOOD & PHARMA NV Sint-Martens-Latem Contracting 93.12% (*) VMA NIZET SA Louvain-la-Neuve Contracting 93.12% (*) VMA WEST NV Waregem Contracting 93.12% (*) WEFIMA NV Zwijndrecht Contracting 93.12% (*) HDP CHARLEROI SA Brussels Holding 100% BPI PURE SA Brussels Real Estate 100% BPI REAL ESTATE BELGIUM SA Brussels Real Estate 100% BPI SAMAYA SA Brussels Real Estate 100% BPI SERENITY VALLEY SA Brussels Real Estate 100% BPI PARK WEST SA Brussels Real Estate 100% DEVELOPPEMENT D'HABITATIONS BRUXELLOISES SA Brussels Real Estate 100% PROJECTONTWIKKELING VAN WELLEN NV Brussels Real Estate 100% WOLIMMO SA Brussels Real Estate 100% ZEN FACTORY SA Brussels Real Estate 100%
WOOD SHAPERS SA Brussels Contracting/ Real Estate 96.56% (*)
Grand Duchy of Luxembourg COMPAGNIE LUXEMBOURGEOISE D’ENTREPRISES CLE SA Strassen Contracting 93.12% (*) SOCIETE FINANCIERE D’ENTREPRISES SFE SA Strassen Holding 100% BPI REAL ESTATE LUXEMBOURG S.à R.L. Strassen Real Estate 100% CENTRAL PARC S.à R.L. Luxembourg Real Estate 100% HERRENBERG SA Grevenmacher Real Estate 100% MIMOSAS REAL ESTATE S.à R.L. Strassen Real Estate 100% POURPELT SA Strassen Real Estate 100% PRINCE HENRI S.à R.L. Strassen Real Estate 100%
IMMO-BECHEL CLE S.à R.L. Strassen Contracting/ Real Estate 96.56% (*)
WOOD SHAPERS LUXEMBOURG SA Strassen Contracting/ Real Estate 96.56% (*)
Poland CFE POLSKA SP. Z O.O. Warsaw Contracting 93.12% (*) POWER AUTOMATION SP. Z O.O. Ruda Śląska Contracting 93.12% (*) POWER AUTOMATION SP. KOMANDYTOWA Ruda Śląska Contracting 93.12% (*) ROLLING ROBOTICS SP. Z O.O. Sosnowiec Contracting 93.12% (*) ROLLING ROBOTICS SP. KOMANDYTOWA Sosnowiec Contracting 93.12% (*) VMA POLSKA SP. Z O.O. Warsaw Contracting 93.12% (*) VMA R. ROBOTICS SP. Z O.O. Sosnowiec Contracting 93.12% (*) BPI BERNADOWO SP. Z O.O. Warsaw Real Estate 100%
196
CONTENTS
WHY AND WHO WE ARE
HOW WE SHAPE THE WORLD
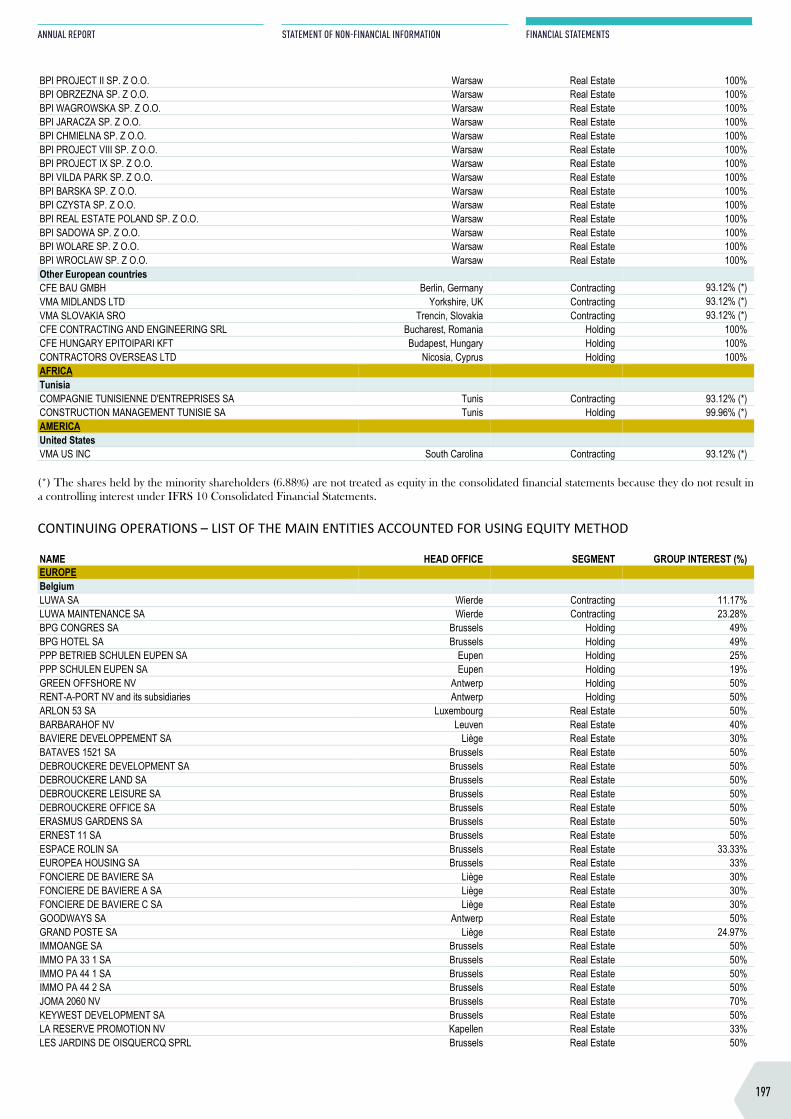
31. MATERIAL POST-BALANCE SHEET EVENTS FROM CONTINUING OPERATIONS Ukrainian crisis has no direct impact on CFE's continued operation as CFE has no presence in these two countries. However, this conflict has major indirect consequences: the sharp rise in most equipment prices and disruption to supply chains will affect CFE's continued operation in 2022. However, as the duration and extent of the crisis are not known, it is not possible to quantify the impact at this stage.
32. COMPANIES OWNED BY THE GROUP
CONTINUING OPERATIONS – LIST OF THE MAIN FULLY CONSOLIDATED SUBSIDIARIES
NAME HEAD OFFICE SEGMENT GROUP INTEREST (%) EUROPE Belgium ARTHUR VANDENDORPE NV Zedelgem Contracting 93.12% (*) BATIMENTS ET PONTS CONSTRUCTION SA Brussels Contracting 93.12% (*) BENELMAT SA Gembloux Contracting 93.12% (*) BPC WALLONIE SA Grâce-Hollogne Contracting 93.12% (*) BRANTEGEM NV Aalst Contracting 93.12% (*) CFE CONTRACTING SA Brussels Contracting 93.12% (*) DESIGN & ENGINEERING SA Brussels Contracting 93.12% (*) GROEP TERRYN NV Moorslede Contracting 93.12% (*) HOFKOUTER NV Zwijndrecht Contracting 93.12% (*) MBG NV Wilrijk Contracting 93.12% (*) MOBIX ENGEMA SA Brussels Contracting 93.12% (*) MOBIX ENGETEC SA Manage Contracting 93.12% (*) MOBIX REMACOM NV Lochristi Contracting 93.12% (*) MOBIX STEVENS NV Halen Contracting 93.12% (*) VANLAERE NV Zwijndrecht Contracting 93.12% (*) VMA NV Sint-Martens-Latem Contracting 93.12% (*) VMA DRUART SA Jumet Contracting 93.12% (*) VMA BE.MAINTENANCE SA Brussels Contracting 93.12% (*) VMA FOOD & PHARMA NV Sint-Martens-Latem Contracting 93.12% (*) VMA NIZET SA Louvain-la-Neuve Contracting 93.12% (*) VMA WEST NV Waregem Contracting 93.12% (*) WEFIMA NV Zwijndrecht Contracting 93.12% (*) HDP CHARLEROI SA Brussels Holding 100% BPI PURE SA Brussels Real Estate 100% BPI REAL ESTATE BELGIUM SA Brussels Real Estate 100% BPI SAMAYA SA Brussels Real Estate 100% BPI SERENITY VALLEY SA Brussels Real Estate 100% BPI PARK WEST SA Brussels Real Estate 100% DEVELOPPEMENT D'HABITATIONS BRUXELLOISES SA Brussels Real Estate 100% PROJECTONTWIKKELING VAN WELLEN NV Brussels Real Estate 100% WOLIMMO SA Brussels Real Estate 100% ZEN FACTORY SA Brussels Real Estate 100%
WOOD SHAPERS SA Brussels Contracting/ Real Estate 96.56% (*)
Grand Duchy of Luxembourg COMPAGNIE LUXEMBOURGEOISE D’ENTREPRISES CLE SA Strassen Contracting 93.12% (*) SOCIETE FINANCIERE D’ENTREPRISES SFE SA Strassen Holding 100% BPI REAL ESTATE LUXEMBOURG S.à R.L. Strassen Real Estate 100% CENTRAL PARC S.à R.L. Luxembourg Real Estate 100% HERRENBERG SA Grevenmacher Real Estate 100% MIMOSAS REAL ESTATE S.à R.L. Strassen Real Estate 100% POURPELT SA Strassen Real Estate 100% PRINCE HENRI S.à R.L. Strassen Real Estate 100%
IMMO-BECHEL CLE S.à R.L. Strassen Contracting/ Real Estate 96.56% (*)
WOOD SHAPERS LUXEMBOURG SA Strassen Contracting/ Real Estate 96.56% (*)
Poland CFE POLSKA SP. Z O.O. Warsaw Contracting 93.12% (*) POWER AUTOMATION SP. Z O.O. Ruda Śląska Contracting 93.12% (*) POWER AUTOMATION SP. KOMANDYTOWA Ruda Śląska Contracting 93.12% (*) ROLLING ROBOTICS SP. Z O.O. Sosnowiec Contracting 93.12% (*) ROLLING ROBOTICS SP. KOMANDYTOWA Sosnowiec Contracting 93.12% (*) VMA POLSKA SP. Z O.O. Warsaw Contracting 93.12% (*) VMA R. ROBOTICS SP. Z O.O. Sosnowiec Contracting 93.12% (*) BPI BERNADOWO SP. Z O.O. Warsaw Real Estate 100%
BPI PROJECT II SP. Z O.O. Warsaw Real Estate 100% BPI OBRZEZNA SP. Z O.O. Warsaw Real Estate 100% BPI WAGROWSKA SP. Z O.O. Warsaw Real Estate 100% BPI JARACZA SP. Z O.O. Warsaw Real Estate 100% BPI CHMIELNA SP. Z O.O. Warsaw Real Estate 100% BPI PROJECT VIII SP. Z O.O. Warsaw Real Estate 100% BPI PROJECT IX SP. Z O.O. Warsaw Real Estate 100% BPI VILDA PARK SP. Z O.O. Warsaw Real Estate 100% BPI BARSKA SP. Z O.O. Warsaw Real Estate 100% BPI CZYSTA SP. Z O.O. Warsaw Real Estate 100% BPI REAL ESTATE POLAND SP. Z O.O. Warsaw Real Estate 100% BPI SADOWA SP. Z O.O. Warsaw Real Estate 100% BPI WOLARE SP. Z O.O. Warsaw Real Estate 100% BPI WROCLAW SP. Z O.O. Warsaw Real Estate 100% Other European countries CFE BAU GMBH Berlin, Germany Contracting 93.12% (*) VMA MIDLANDS LTD Yorkshire, UK Contracting 93.12% (*) VMA SLOVAKIA SRO Trencin, Slovakia Contracting 93.12% (*) CFE CONTRACTING AND ENGINEERING SRL Bucharest, Romania Holding 100% CFE HUNGARY EPITOIPARI KFT Budapest, Hungary Holding 100% CONTRACTORS OVERSEAS LTD Nicosia, Cyprus Holding 100% AFRICA Tunisia COMPAGNIE TUNISIENNE D'ENTREPRISES SA Tunis Contracting 93.12% (*) CONSTRUCTION MANAGEMENT TUNISIE SA Tunis Holding 99.96% (*) AMERICA United States VMA US INC South Carolina Contracting 93.12% (*) (*) The shares held by the minority shareholders (6.88%) are not treated as equity in the consolidated financial statements because they do not result in a controlling interest under IFRS 10 Consolidated Financial Statements.
CONTINUING OPERATIONS – LIST OF THE MAIN ENTITIES ACCOUNTED FOR USING EQUITY METHOD
NAME HEAD OFFICE SEGMENT GROUP INTEREST (%) EUROPE Belgium LUWA SA Wierde Contracting 11.17% LUWA MAINTENANCE SA Wierde Contracting 23.28% BPG CONGRES SA Brussels Holding 49% BPG HOTEL SA Brussels Holding 49% PPP BETRIEB SCHULEN EUPEN SA Eupen Holding 25% PPP SCHULEN EUPEN SA Eupen Holding 19% GREEN OFFSHORE NV Antwerp Holding 50% RENT-A-PORT NV and its subsidiaries Antwerp Holding 50% ARLON 53 SA Luxembourg Real Estate 50% BARBARAHOF NV Leuven Real Estate 40% BAVIERE DEVELOPPEMENT SA Liège Real Estate 30% BATAVES 1521 SA Brussels Real Estate 50% DEBROUCKERE DEVELOPMENT SA Brussels Real Estate 50% DEBROUCKERE LAND SA Brussels Real Estate 50% DEBROUCKERE LEISURE SA Brussels Real Estate 50% DEBROUCKERE OFFICE SA Brussels Real Estate 50% ERASMUS GARDENS SA Brussels Real Estate 50% ERNEST 11 SA Brussels Real Estate 50% ESPACE ROLIN SA Brussels Real Estate 33.33% EUROPEA HOUSING SA Brussels Real Estate 33% FONCIERE DE BAVIERE SA Liège Real Estate 30% FONCIERE DE BAVIERE A SA Liège Real Estate 30% FONCIERE DE BAVIERE C SA Liège Real Estate 30% GOODWAYS SA Antwerp Real Estate 50% GRAND POSTE SA Liège Real Estate 24.97% IMMOANGE SA Brussels Real Estate 50% IMMO PA 33 1 SA Brussels Real Estate 50% IMMO PA 44 1 SA Brussels Real Estate 50% IMMO PA 44 2 SA Brussels Real Estate 50% JOMA 2060 NV Brussels Real Estate 70% KEYWEST DEVELOPMENT SA Brussels Real Estate 50% LA RESERVE PROMOTION NV Kapellen Real Estate 33% LES JARDINS DE OISQUERCQ SPRL Brussels Real Estate 50%
197
ANNUAL REPORT
STATEMENT OF NON-FINANCIAL INFORMATION
FINANCIAL STATEMENTS
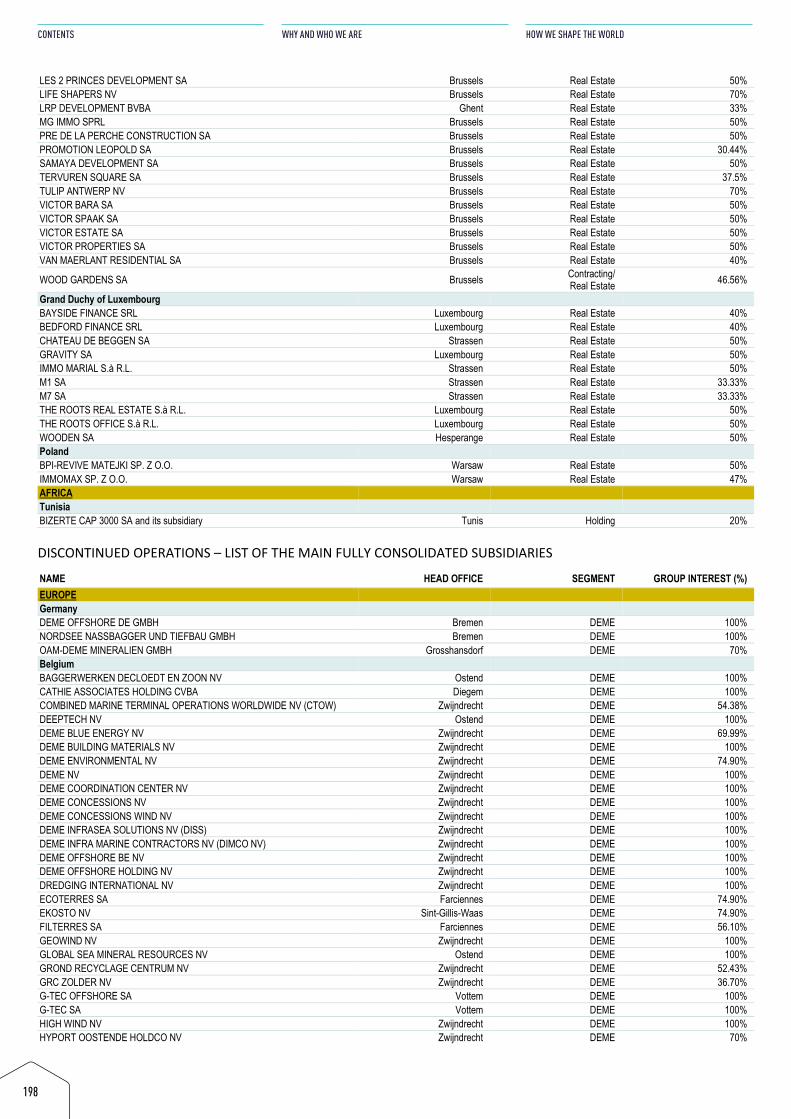
LES 2 PRINCES DEVELOPMENT SA Brussels Real Estate 50% LIFE SHAPERS NV Brussels Real Estate 70% LRP DEVELOPMENT BVBA Ghent Real Estate 33% MG IMMO SPRL Brussels Real Estate 50% PRE DE LA PERCHE CONSTRUCTION SA Brussels Real Estate 50% PROMOTION LEOPOLD SA Brussels Real Estate 30.44% SAMAYA DEVELOPMENT SA Brussels Real Estate 50% TERVUREN SQUARE SA Brussels Real Estate 37.5% TULIP ANTWERP NV Brussels Real Estate 70% VICTOR BARA SA Brussels Real Estate 50% VICTOR SPAAK SA Brussels Real Estate 50% VICTOR ESTATE SA Brussels Real Estate 50% VICTOR PROPERTIES SA Brussels Real Estate 50% VAN MAERLANT RESIDENTIAL SA Brussels Real Estate 40%
WOOD GARDENS SA Brussels Contracting/ Real Estate 46.56%
Grand Duchy of Luxembourg BAYSIDE FINANCE SRL Luxembourg Real Estate 40% BEDFORD FINANCE SRL Luxembourg Real Estate 40% CHATEAU DE BEGGEN SA Strassen Real Estate 50% GRAVITY SA Luxembourg Real Estate 50% IMMO MARIAL S.à R.L. Strassen Real Estate 50% M1 SA Strassen Real Estate 33.33% M7 SA Strassen Real Estate 33.33% THE ROOTS REAL ESTATE S.à R.L. Luxembourg Real Estate 50% THE ROOTS OFFICE S.à R.L. Luxembourg Real Estate 50% WOODEN SA Hesperange Real Estate 50% Poland BPI-REVIVE MATEJKI SP. Z O.O. Warsaw Real Estate 50% IMMOMAX SP. Z O.O. Warsaw Real Estate 47% AFRICA Tunisia BIZERTE CAP 3000 SA and its subsidiary Tunis Holding 20%
DISCONTINUED OPERATIONS – LIST OF THE MAIN FULLY CONSOLIDATED SUBSIDIARIES
NAME HEAD OFFICE SEGMENT GROUP INTEREST (%) EUROPE Germany DEME OFFSHORE DE GMBH Bremen DEME 100% NORDSEE NASSBAGGER UND TIEFBAU GMBH Bremen DEME 100% OAM-DEME MINERALIEN GMBH Grosshansdorf DEME 70% Belgium BAGGERWERKEN DECLOEDT EN ZOON NV Ostend DEME 100% CATHIE ASSOCIATES HOLDING CVBA Diegem DEME 100% COMBINED MARINE TERMINAL OPERATIONS WORLDWIDE NV (CTOW) Zwijndrecht DEME 54.38% DEEPTECH NV Ostend DEME 100% DEME BLUE ENERGY NV Zwijndrecht DEME 69.99% DEME BUILDING MATERIALS NV Zwijndrecht DEME 100% DEME ENVIRONMENTAL NV Zwijndrecht DEME 74.90% DEME NV Zwijndrecht DEME 100% DEME COORDINATION CENTER NV Zwijndrecht DEME 100% DEME CONCESSIONS NV Zwijndrecht DEME 100% DEME CONCESSIONS WIND NV Zwijndrecht DEME 100% DEME INFRASEA SOLUTIONS NV (DISS) Zwijndrecht DEME 100% DEME INFRA MARINE CONTRACTORS NV (DIMCO NV) Zwijndrecht DEME 100% DEME OFFSHORE BE NV Zwijndrecht DEME 100% DEME OFFSHORE HOLDING NV Zwijndrecht DEME 100% DREDGING INTERNATIONAL NV Zwijndrecht DEME 100% ECOTERRES SA Farciennes DEME 74.90% EKOSTO NV Sint-Gillis-Waas DEME 74.90% FILTERRES SA Farciennes DEME 56.10% GEOWIND NV Zwijndrecht DEME 100% GLOBAL SEA MINERAL RESOURCES NV Ostend DEME 100% GROND RECYCLAGE CENTRUM NV Zwijndrecht DEME 52.43% GRC ZOLDER NV Zwijndrecht DEME 36.70% G-TEC OFFSHORE SA Vottem DEME 100% G-TEC SA Vottem DEME 100% HIGH WIND NV Zwijndrecht DEME 100% HYPORT OOSTENDE HOLDCO NV Zwijndrecht DEME 70%
198
CONTENTS
WHY AND WHO WE ARE
HOW WE SHAPE THE WORLD
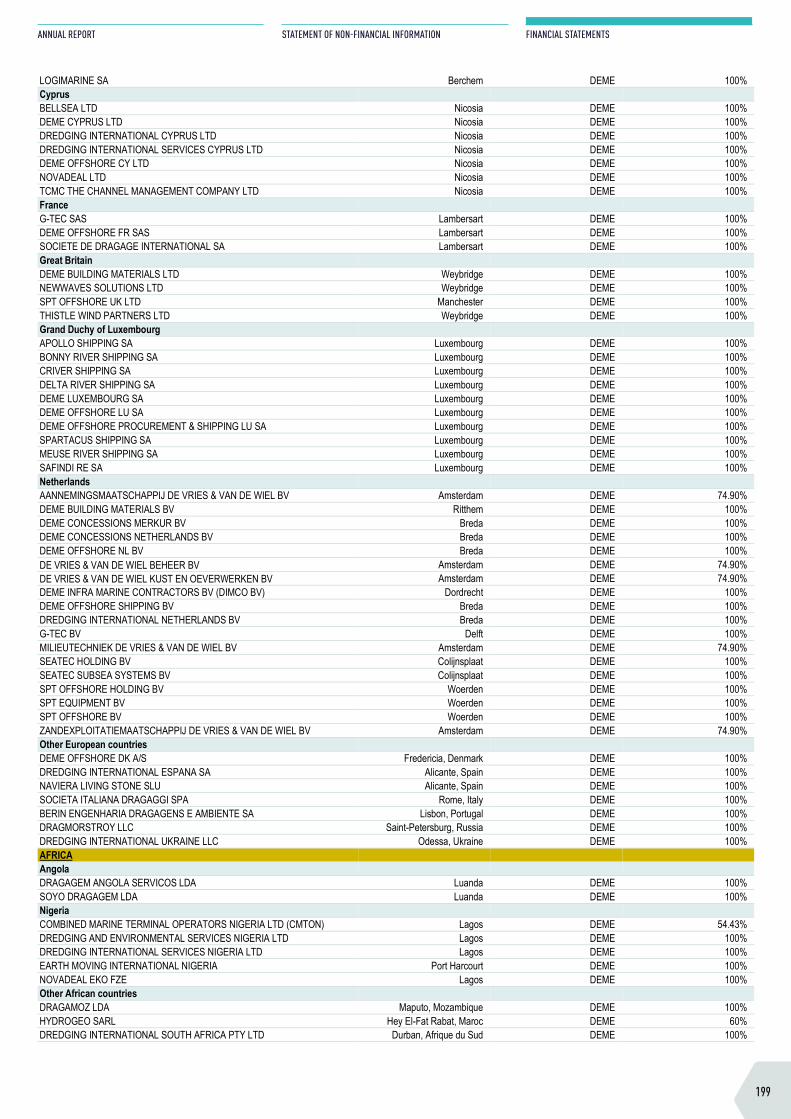
LES 2 PRINCES DEVELOPMENT SA Brussels Real Estate 50% LIFE SHAPERS NV Brussels Real Estate 70% LRP DEVELOPMENT BVBA Ghent Real Estate 33% MG IMMO SPRL Brussels Real Estate 50% PRE DE LA PERCHE CONSTRUCTION SA Brussels Real Estate 50% PROMOTION LEOPOLD SA Brussels Real Estate 30.44% SAMAYA DEVELOPMENT SA Brussels Real Estate 50% TERVUREN SQUARE SA Brussels Real Estate 37.5% TULIP ANTWERP NV Brussels Real Estate 70% VICTOR BARA SA Brussels Real Estate 50% VICTOR SPAAK SA Brussels Real Estate 50% VICTOR ESTATE SA Brussels Real Estate 50% VICTOR PROPERTIES SA Brussels Real Estate 50% VAN MAERLANT RESIDENTIAL SA Brussels Real Estate 40%
WOOD GARDENS SA Brussels Contracting/ Real Estate 46.56%
Grand Duchy of Luxembourg BAYSIDE FINANCE SRL Luxembourg Real Estate 40% BEDFORD FINANCE SRL Luxembourg Real Estate 40% CHATEAU DE BEGGEN SA Strassen Real Estate 50% GRAVITY SA Luxembourg Real Estate 50% IMMO MARIAL S.à R.L. Strassen Real Estate 50% M1 SA Strassen Real Estate 33.33% M7 SA Strassen Real Estate 33.33% THE ROOTS REAL ESTATE S.à R.L. Luxembourg Real Estate 50% THE ROOTS OFFICE S.à R.L. Luxembourg Real Estate 50% WOODEN SA Hesperange Real Estate 50% Poland BPI-REVIVE MATEJKI SP. Z O.O. Warsaw Real Estate 50% IMMOMAX SP. Z O.O. Warsaw Real Estate 47% AFRICA Tunisia BIZERTE CAP 3000 SA and its subsidiary Tunis Holding 20%
DISCONTINUED OPERATIONS – LIST OF THE MAIN FULLY CONSOLIDATED SUBSIDIARIES
NAME HEAD OFFICE SEGMENT GROUP INTEREST (%) EUROPE Germany DEME OFFSHORE DE GMBH Bremen DEME 100% NORDSEE NASSBAGGER UND TIEFBAU GMBH Bremen DEME 100% OAM-DEME MINERALIEN GMBH Grosshansdorf DEME 70% Belgium BAGGERWERKEN DECLOEDT EN ZOON NV Ostend DEME 100% CATHIE ASSOCIATES HOLDING CVBA Diegem DEME 100% COMBINED MARINE TERMINAL OPERATIONS WORLDWIDE NV (CTOW) Zwijndrecht DEME 54.38% DEEPTECH NV Ostend DEME 100% DEME BLUE ENERGY NV Zwijndrecht DEME 69.99% DEME BUILDING MATERIALS NV Zwijndrecht DEME 100% DEME ENVIRONMENTAL NV Zwijndrecht DEME 74.90% DEME NV Zwijndrecht DEME 100% DEME COORDINATION CENTER NV Zwijndrecht DEME 100% DEME CONCESSIONS NV Zwijndrecht DEME 100% DEME CONCESSIONS WIND NV Zwijndrecht DEME 100% DEME INFRASEA SOLUTIONS NV (DISS) Zwijndrecht DEME 100% DEME INFRA MARINE CONTRACTORS NV (DIMCO NV) Zwijndrecht DEME 100% DEME OFFSHORE BE NV Zwijndrecht DEME 100% DEME OFFSHORE HOLDING NV Zwijndrecht DEME 100% DREDGING INTERNATIONAL NV Zwijndrecht DEME 100% ECOTERRES SA Farciennes DEME 74.90% EKOSTO NV Sint-Gillis-Waas DEME 74.90% FILTERRES SA Farciennes DEME 56.10% GEOWIND NV Zwijndrecht DEME 100% GLOBAL SEA MINERAL RESOURCES NV Ostend DEME 100% GROND RECYCLAGE CENTRUM NV Zwijndrecht DEME 52.43% GRC ZOLDER NV Zwijndrecht DEME 36.70% G-TEC OFFSHORE SA Vottem DEME 100% G-TEC SA Vottem DEME 100% HIGH WIND NV Zwijndrecht DEME 100% HYPORT OOSTENDE HOLDCO NV Zwijndrecht DEME 70%
LOGIMARINE SA Berchem DEME 100% Cyprus BELLSEA LTD Nicosia DEME 100% DEME CYPRUS LTD Nicosia DEME 100% DREDGING INTERNATIONAL CYPRUS LTD Nicosia DEME 100% DREDGING INTERNATIONAL SERVICES CYPRUS LTD Nicosia DEME 100% DEME OFFSHORE CY LTD Nicosia DEME 100% NOVADEAL LTD Nicosia DEME 100% TCMC THE CHANNEL MANAGEMENT COMPANY LTD Nicosia DEME 100% France G-TEC SAS Lambersart DEME 100% DEME OFFSHORE FR SAS Lambersart DEME 100% SOCIETE DE DRAGAGE INTERNATIONAL SA Lambersart DEME 100% Great Britain DEME BUILDING MATERIALS LTD Weybridge DEME 100% NEWWAVES SOLUTIONS LTD Weybridge DEME 100% SPT OFFSHORE UK LTD Manchester DEME 100% THISTLE WIND PARTNERS LTD Weybridge DEME 100% Grand Duchy of Luxembourg APOLLO SHIPPING SA Luxembourg DEME 100% BONNY RIVER SHIPPING SA Luxembourg DEME 100% CRIVER SHIPPING SA Luxembourg DEME 100% DELTA RIVER SHIPPING SA Luxembourg DEME 100% DEME LUXEMBOURG SA Luxembourg DEME 100% DEME OFFSHORE LU SA Luxembourg DEME 100% DEME OFFSHORE PROCUREMENT & SHIPPING LU SA Luxembourg DEME 100% SPARTACUS SHIPPING SA Luxembourg DEME 100% MEUSE RIVER SHIPPING SA Luxembourg DEME 100% SAFINDI RE SA Luxembourg DEME 100% Netherlands AANNEMINGSMAATSCHAPPIJ DE VRIES & VAN DE WIEL BV Amsterdam DEME 74.90% DEME BUILDING MATERIALS BV Ritthem DEME 100% DEME CONCESSIONS MERKUR BV Breda DEME 100% DEME CONCESSIONS NETHERLANDS BV Breda DEME 100% DEME OFFSHORE NL BV Breda DEME 100% DE VRIES & VAN DE WIEL BEHEER BV Amsterdam DEME 74.90% DE VRIES & VAN DE WIEL KUST EN OEVERWERKEN BV Amsterdam DEME 74.90% DEME INFRA MARINE CONTRACTORS BV (DIMCO BV) Dordrecht DEME 100% DEME OFFSHORE SHIPPING BV Breda DEME 100% DREDGING INTERNATIONAL NETHERLANDS BV Breda DEME 100% G-TEC BV Delft DEME 100% MILIEUTECHNIEK DE VRIES & VAN DE WIEL BV Amsterdam DEME 74.90% SEATEC HOLDING BV Colijnsplaat DEME 100% SEATEC SUBSEA SYSTEMS BV Colijnsplaat DEME 100% SPT OFFSHORE HOLDING BV Woerden DEME 100% SPT EQUIPMENT BV Woerden DEME 100% SPT OFFSHORE BV Woerden DEME 100% ZANDEXPLOITATIEMAATSCHAPPIJ DE VRIES & VAN DE WIEL BV Amsterdam DEME 74.90% Other European countries DEME OFFSHORE DK A/S Fredericia, Denmark DEME 100% DREDGING INTERNATIONAL ESPANA SA Alicante, Spain DEME 100% NAVIERA LIVING STONE SLU Alicante, Spain DEME 100% SOCIETA ITALIANA DRAGAGGI SPA Rome, Italy DEME 100% BERIN ENGENHARIA DRAGAGENS E AMBIENTE SA Lisbon, Portugal DEME 100% DRAGMORSTROY LLC Saint-Petersburg, Russia DEME 100% DREDGING INTERNATIONAL UKRAINE LLC Odessa, Ukraine DEME 100% AFRICA Angola DRAGAGEM ANGOLA SERVICOS LDA Luanda DEME 100% SOYO DRAGAGEM LDA Luanda DEME 100% Nigeria COMBINED MARINE TERMINAL OPERATORS NIGERIA LTD (CMTON) Lagos DEME 54.43% DREDGING AND ENVIRONMENTAL SERVICES NIGERIA LTD Lagos DEME 100% DREDGING INTERNATIONAL SERVICES NIGERIA LTD Lagos DEME 100% EARTH MOVING INTERNATIONAL NIGERIA Port Harcourt DEME 100% NOVADEAL EKO FZE Lagos DEME 100% Other African countries DRAGAMOZ LDA Maputo, Mozambique DEME 100% HYDROGEO SARL Hey El-Fat Rabat, Maroc DEME 60% DREDGING INTERNATIONAL SOUTH AFRICA PTY LTD Durban, Afrique du Sud DEME 100%
199
ANNUAL REPORT
STATEMENT OF NON-FINANCIAL INFORMATION
FINANCIAL STATEMENTS
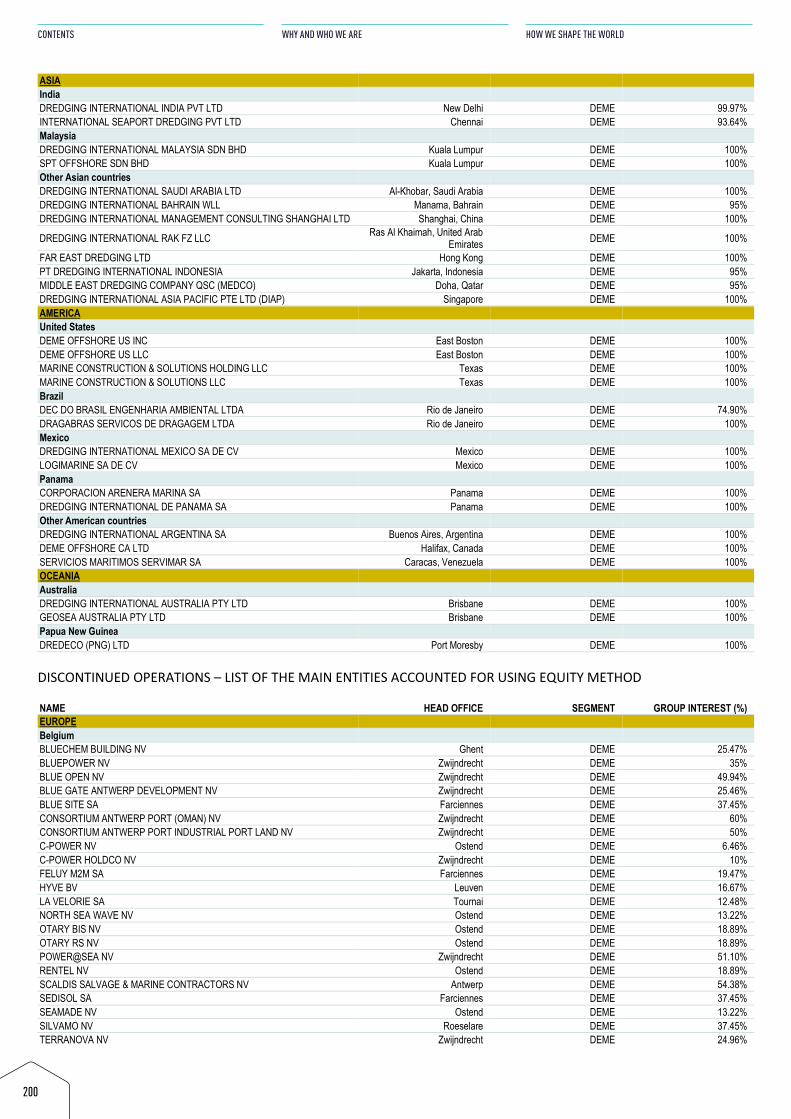
ASIA India DREDGING INTERNATIONAL INDIA PVT LTD New Delhi DEME 99.97% INTERNATIONAL SEAPORT DREDGING PVT LTD Chennai DEME 93.64% Malaysia DREDGING INTERNATIONAL MALAYSIA SDN BHD Kuala Lumpur DEME 100% SPT OFFSHORE SDN BHD Kuala Lumpur DEME 100% Other Asian countries DREDGING INTERNATIONAL SAUDI ARABIA LTD Al-Khobar, Saudi Arabia DEME 100% DREDGING INTERNATIONAL BAHRAIN WLL Manama, Bahrain DEME 95% DREDGING INTERNATIONAL MANAGEMENT CONSULTING SHANGHAI LTD Shanghai, China DEME 100%
DREDGING INTERNATIONAL RAK FZ LLC Ras Al Khaimah, United Arab Emirates DEME 100%
FAR EAST DREDGING LTD Hong Kong DEME 100% PT DREDGING INTERNATIONAL INDONESIA Jakarta, Indonesia DEME 95% MIDDLE EAST DREDGING COMPANY QSC (MEDCO) Doha, Qatar DEME 95% DREDGING INTERNATIONAL ASIA PACIFIC PTE LTD (DIAP) Singapore DEME 100% AMERICA United States DEME OFFSHORE US INC East Boston DEME 100% DEME OFFSHORE US LLC East Boston DEME 100% MARINE CONSTRUCTION & SOLUTIONS HOLDING LLC Texas DEME 100% MARINE CONSTRUCTION & SOLUTIONS LLC Texas DEME 100% Brazil DEC DO BRASIL ENGENHARIA AMBIENTAL LTDA Rio de Janeiro DEME 74.90% DRAGABRAS SERVICOS DE DRAGAGEM LTDA Rio de Janeiro DEME 100% Mexico DREDGING INTERNATIONAL MEXICO SA DE CV Mexico DEME 100% LOGIMARINE SA DE CV Mexico DEME 100% Panama CORPORACION ARENERA MARINA SA Panama DEME 100% DREDGING INTERNATIONAL DE PANAMA SA Panama DEME 100% Other American countries DREDGING INTERNATIONAL ARGENTINA SA Buenos Aires, Argentina DEME 100% DEME OFFSHORE CA LTD Halifax, Canada DEME 100% SERVICIOS MARITIMOS SERVIMAR SA Caracas, Venezuela DEME 100% OCEANIA Australia DREDGING INTERNATIONAL AUSTRALIA PTY LTD Brisbane DEME 100% GEOSEA AUSTRALIA PTY LTD Brisbane DEME 100% Papua New Guinea DREDECO (PNG) LTD Port Moresby DEME 100%
DISCONTINUED OPERATIONS – LIST OF THE MAIN ENTITIES ACCOUNTED FOR USING EQUITY METHOD
NAME HEAD OFFICE SEGMENT GROUP INTEREST (%) EUROPE Belgium BLUECHEM BUILDING NV Ghent DEME 25.47% BLUEPOWER NV Zwijndrecht DEME 35% BLUE OPEN NV Zwijndrecht DEME 49.94% BLUE GATE ANTWERP DEVELOPMENT NV Zwijndrecht DEME 25.46% BLUE SITE SA Farciennes DEME 37.45% CONSORTIUM ANTWERP PORT (OMAN) NV Zwijndrecht DEME 60% CONSORTIUM ANTWERP PORT INDUSTRIAL PORT LAND NV Zwijndrecht DEME 50% C-POWER NV Ostend DEME 6.46% C-POWER HOLDCO NV Zwijndrecht DEME 10% FELUY M2M SA Farciennes DEME 19.47% HYVE BV Leuven DEME 16.67% LA VELORIE SA Tournai DEME 12.48% NORTH SEA WAVE NV Ostend DEME 13.22% OTARY BIS NV Ostend DEME 18.89% OTARY RS NV Ostend DEME 18.89% POWER@SEA NV Zwijndrecht DEME 51.10% RENTEL NV Ostend DEME 18.89% SCALDIS SALVAGE & MARINE CONTRACTORS NV Antwerp DEME 54.38% SEDISOL SA Farciennes DEME 37.45% SEAMADE NV Ostend DEME 13.22% SILVAMO NV Roeselare DEME 37.45% TERRANOVA NV Zwijndrecht DEME 24.96%
200
CONTENTS
WHY AND WHO WE ARE
HOW WE SHAPE THE WORLD
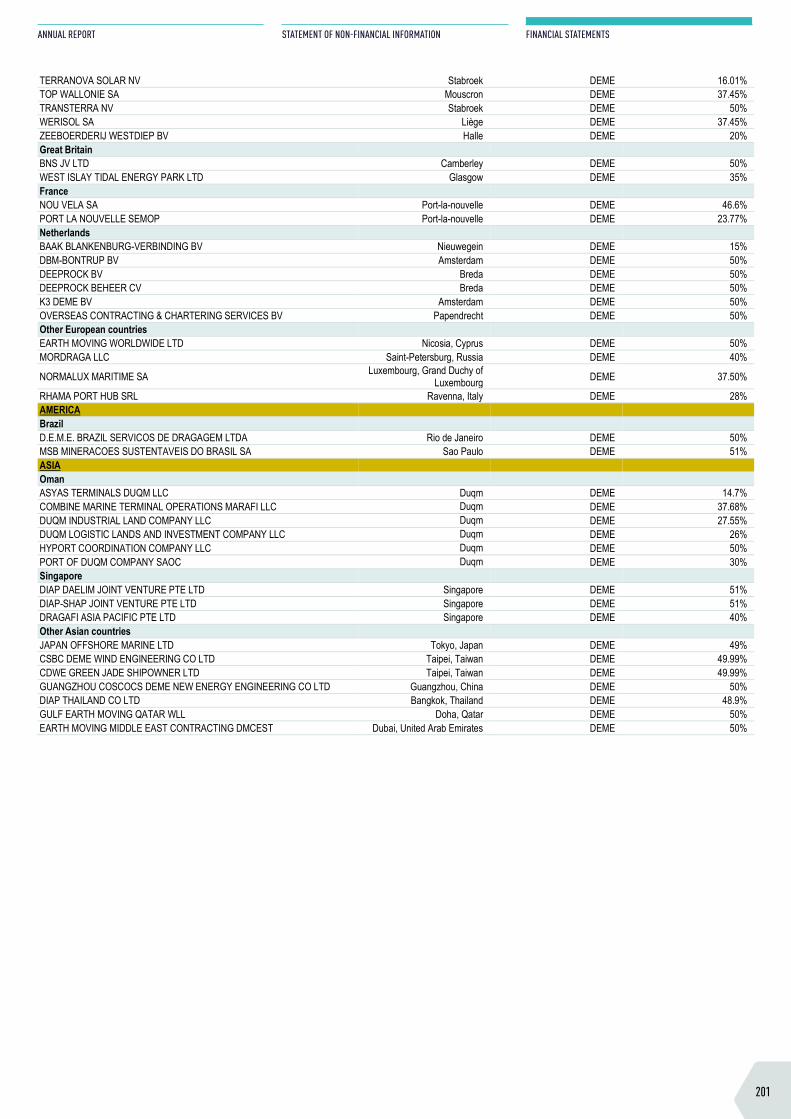
ASIA India DREDGING INTERNATIONAL INDIA PVT LTD New Delhi DEME 99.97% INTERNATIONAL SEAPORT DREDGING PVT LTD Chennai DEME 93.64% Malaysia DREDGING INTERNATIONAL MALAYSIA SDN BHD Kuala Lumpur DEME 100% SPT OFFSHORE SDN BHD Kuala Lumpur DEME 100% Other Asian countries DREDGING INTERNATIONAL SAUDI ARABIA LTD Al-Khobar, Saudi Arabia DEME 100% DREDGING INTERNATIONAL BAHRAIN WLL Manama, Bahrain DEME 95% DREDGING INTERNATIONAL MANAGEMENT CONSULTING SHANGHAI LTD Shanghai, China DEME 100%
DREDGING INTERNATIONAL RAK FZ LLC Ras Al Khaimah, United Arab Emirates DEME 100%
FAR EAST DREDGING LTD Hong Kong DEME 100% PT DREDGING INTERNATIONAL INDONESIA Jakarta, Indonesia DEME 95% MIDDLE EAST DREDGING COMPANY QSC (MEDCO) Doha, Qatar DEME 95% DREDGING INTERNATIONAL ASIA PACIFIC PTE LTD (DIAP) Singapore DEME 100% AMERICA United States DEME OFFSHORE US INC East Boston DEME 100% DEME OFFSHORE US LLC East Boston DEME 100% MARINE CONSTRUCTION & SOLUTIONS HOLDING LLC Texas DEME 100% MARINE CONSTRUCTION & SOLUTIONS LLC Texas DEME 100% Brazil DEC DO BRASIL ENGENHARIA AMBIENTAL LTDA Rio de Janeiro DEME 74.90% DRAGABRAS SERVICOS DE DRAGAGEM LTDA Rio de Janeiro DEME 100% Mexico DREDGING INTERNATIONAL MEXICO SA DE CV Mexico DEME 100% LOGIMARINE SA DE CV Mexico DEME 100% Panama CORPORACION ARENERA MARINA SA Panama DEME 100% DREDGING INTERNATIONAL DE PANAMA SA Panama DEME 100% Other American countries DREDGING INTERNATIONAL ARGENTINA SA Buenos Aires, Argentina DEME 100% DEME OFFSHORE CA LTD Halifax, Canada DEME 100% SERVICIOS MARITIMOS SERVIMAR SA Caracas, Venezuela DEME 100% OCEANIA Australia DREDGING INTERNATIONAL AUSTRALIA PTY LTD Brisbane DEME 100% GEOSEA AUSTRALIA PTY LTD Brisbane DEME 100% Papua New Guinea DREDECO (PNG) LTD Port Moresby DEME 100%
DISCONTINUED OPERATIONS – LIST OF THE MAIN ENTITIES ACCOUNTED FOR USING EQUITY METHOD
NAME HEAD OFFICE SEGMENT GROUP INTEREST (%) EUROPE Belgium BLUECHEM BUILDING NV Ghent DEME 25.47% BLUEPOWER NV Zwijndrecht DEME 35% BLUE OPEN NV Zwijndrecht DEME 49.94% BLUE GATE ANTWERP DEVELOPMENT NV Zwijndrecht DEME 25.46% BLUE SITE SA Farciennes DEME 37.45% CONSORTIUM ANTWERP PORT (OMAN) NV Zwijndrecht DEME 60% CONSORTIUM ANTWERP PORT INDUSTRIAL PORT LAND NV Zwijndrecht DEME 50% C-POWER NV Ostend DEME 6.46% C-POWER HOLDCO NV Zwijndrecht DEME 10% FELUY M2M SA Farciennes DEME 19.47% HYVE BV Leuven DEME 16.67% LA VELORIE SA Tournai DEME 12.48% NORTH SEA WAVE NV Ostend DEME 13.22% OTARY BIS NV Ostend DEME 18.89% OTARY RS NV Ostend DEME 18.89% POWER@SEA NV Zwijndrecht DEME 51.10% RENTEL NV Ostend DEME 18.89% SCALDIS SALVAGE & MARINE CONTRACTORS NV Antwerp DEME 54.38% SEDISOL SA Farciennes DEME 37.45% SEAMADE NV Ostend DEME 13.22% SILVAMO NV Roeselare DEME 37.45% TERRANOVA NV Zwijndrecht DEME 24.96%
TERRANOVA SOLAR NV Stabroek DEME 16.01% TOP WALLONIE SA Mouscron DEME 37.45% TRANSTERRA NV Stabroek DEME 50% WERISOL SA Liège DEME 37.45% ZEEBOERDERIJ WESTDIEP BV Halle DEME 20% Great Britain BNS JV LTD Camberley DEME 50% WEST ISLAY TIDAL ENERGY PARK LTD Glasgow DEME 35% France NOU VELA SA Port-la-nouvelle DEME 46.6% PORT LA NOUVELLE SEMOP Port-la-nouvelle DEME 23.77% Netherlands BAAK BLANKENBURG-VERBINDING BV Nieuwegein DEME 15% DBM-BONTRUP BV Amsterdam DEME 50% DEEPROCK BV Breda DEME 50% DEEPROCK BEHEER CV Breda DEME 50% K3 DEME BV Amsterdam DEME 50% OVERSEAS CONTRACTING & CHARTERING SERVICES BV Papendrecht DEME 50% Other European countries EARTH MOVING WORLDWIDE LTD Nicosia, Cyprus DEME 50% MORDRAGA LLC Saint-Petersburg, Russia DEME 40%
NORMALUX MARITIME SA Luxembourg, Grand Duchy of Luxembourg DEME 37.50%
RHAMA PORT HUB SRL Ravenna, Italy DEME 28% AMERICA Brazil D.E.M.E. BRAZIL SERVICOS DE DRAGAGEM LTDA Rio de Janeiro DEME 50% MSB MINERACOES SUSTENTAVEIS DO BRASIL SA Sao Paulo DEME 51% ASIA Oman ASYAS TERMINALS DUQM LLC Duqm DEME 14.7% COMBINE MARINE TERMINAL OPERATIONS MARAFI LLC Duqm DEME 37.68% DUQM INDUSTRIAL LAND COMPANY LLC Duqm DEME 27.55% DUQM LOGISTIC LANDS AND INVESTMENT COMPANY LLC Duqm DEME 26% HYPORT COORDINATION COMPANY LLC Duqm DEME 50% PORT OF DUQM COMPANY SAOC Duqm DEME 30% Singapore DIAP DAELIM JOINT VENTURE PTE LTD Singapore DEME 51% DIAP-SHAP JOINT VENTURE PTE LTD Singapore DEME 51% DRAGAFI ASIA PACIFIC PTE LTD Singapore DEME 40% Other Asian countries JAPAN OFFSHORE MARINE LTD Tokyo, Japan DEME 49% CSBC DEME WIND ENGINEERING CO LTD Taipei, Taiwan DEME 49.99% CDWE GREEN JADE SHIPOWNER LTD Taipei, Taiwan DEME 49.99% GUANGZHOU COSCOCS DEME NEW ENERGY ENGINEERING CO LTD Guangzhou, China DEME 50% DIAP THAILAND CO LTD Bangkok, Thailand DEME 48.9% GULF EARTH MOVING QATAR WLL Doha, Qatar DEME 50% EARTH MOVING MIDDLE EAST CONTRACTING DMCEST Dubai, United Arab Emirates DEME 50%
201
ANNUAL REPORT
STATEMENT OF NON-FINANCIAL INFORMATION
FINANCIAL STATEMENTS
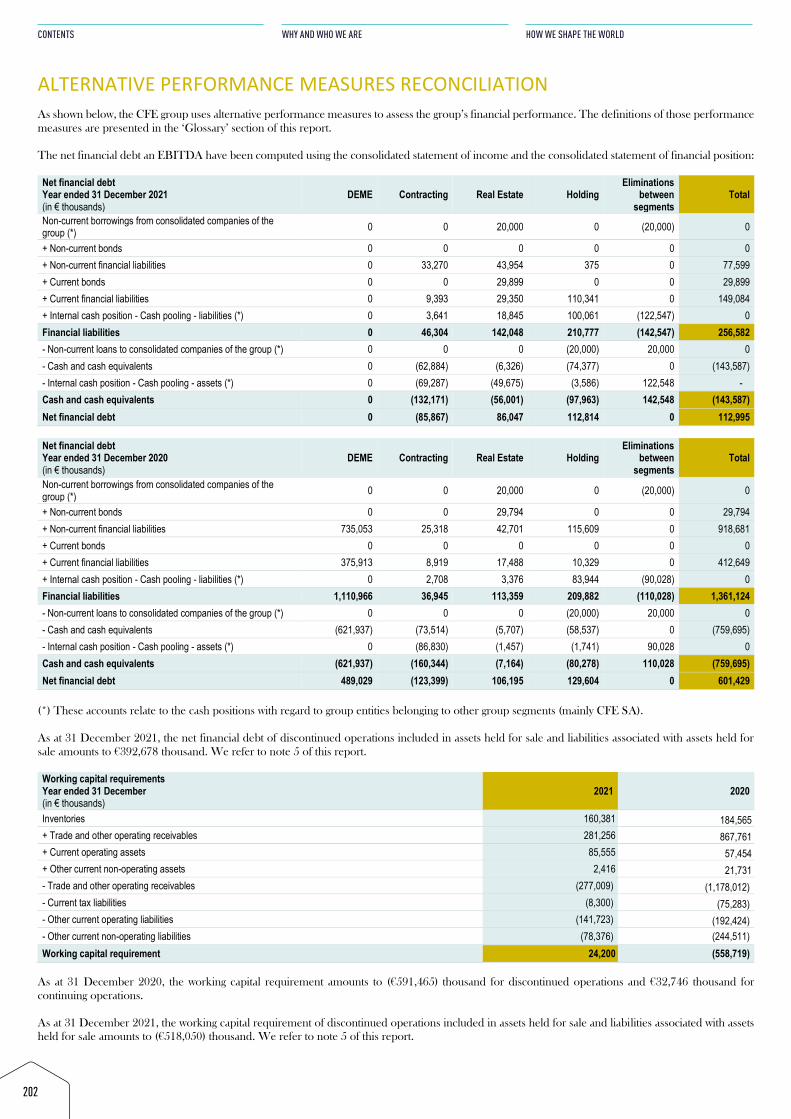
ALTERNATIVE PERFORMANCE MEASURES RECONCILIATION As shown below, the CFE group uses alternative performance measures to assess the group’s financial performance. The definitions of those performance measures are presented in the ‘Glossary’ section of this report. The net financial debt an EBITDA have been computed using the consolidated statement of income and the consolidated statement of financial position: Net financial debt Year ended 31 December 2021 (in € thousands)
DEME Contracting Real Estate Holding Eliminations
between segments
Total
Non-current borrowings from consolidated companies of the group (*) 0 0 20,000 0 (20,000) 0
+ Non-current bonds 0 0 0 0 0 0 + Non-current financial liabilities 0 33,270 43,954 375 0 77,599 + Current bonds 0 0 29,899 0 0 29,899 + Current financial liabilities 0 9,393 29,350 110,341 0 149,084 + Internal cash position - Cash pooling - liabilities (*) 0 3,641 18,845 100,061 (122,547) 0 Financial liabilities 0 46,304 142,048 210,777 (142,547) 256,582 - Non-current loans to consolidated companies of the group (*) 0 0 0 (20,000) 20,000 0 - Cash and cash equivalents 0 (62,884) (6,326) (74,377) 0 (143,587) - Internal cash position - Cash pooling - assets (*) 0 (69,287) (49,675) (3,586) 122,548 - Cash and cash equivalents 0 (132,171) (56,001) (97,963) 142,548 (143,587) Net financial debt 0 (85,867) 86,047 112,814 0 112,995
Net financial debt Year ended 31 December 2020 (in € thousands)
DEME Contracting Real Estate Holding Eliminations
between segments
Total
Non-current borrowings from consolidated companies of the group (*) 0 0 20,000 0 (20,000) 0
+ Non-current bonds 0 0 29,794 0 0 29,794 + Non-current financial liabilities 735,053 25,318 42,701 115,609 0 918,681 + Current bonds 0 0 0 0 0 0 + Current financial liabilities 375,913 8,919 17,488 10,329 0 412,649 + Internal cash position - Cash pooling - liabilities (*) 0 2,708 3,376 83,944 (90,028) 0 Financial liabilities 1,110,966 36,945 113,359 209,882 (110,028) 1,361,124 - Non-current loans to consolidated companies of the group (*) 0 0 0 (20,000) 20,000 0 - Cash and cash equivalents (621,937) (73,514) (5,707) (58,537) 0 (759,695) - Internal cash position - Cash pooling - assets (*) 0 (86,830) (1,457) (1,741) 90,028 0 Cash and cash equivalents (621,937) (160,344) (7,164) (80,278) 110,028 (759,695) Net financial debt 489,029 (123,399) 106,195 129,604 0 601,429
(*) These accounts relate to the cash positions with regard to group entities belonging to other group segments (mainly CFE SA). As at 31 December 2021, the net financial debt of discontinued operations included in assets held for sale and liabilities associated with assets held for sale amounts to €392,678 thousand. We refer to note 5 of this report. Working capital requirements Year ended 31 December (in € thousands)
2021 2020
Inventories 160,381 184,565 + Trade and other operating receivables 281,256 867,761 + Current operating assets 85,555 57,454 + Other current non-operating assets 2,416 21,731 - Trade and other operating receivables (277,009) (1,178,012) - Current tax liabilities (8,300) (75,283) - Other current operating liabilities (141,723) (192,424) - Other current non-operating liabilities (78,376) (244,511) Working capital requirement 24,200 (558,719)
As at 31 December 2020, the working capital requirement amounts to (€591,465) thousand for discontinued operations and €32,746 thousand for continuing operations. As at 31 December 2021, the working capital requirement of discontinued operations included in assets held for sale and liabilities associated with assets held for sale amounts to (€518,050) thousand. We refer to note 5 of this report.
202
CONTENTS
WHY AND WHO WE ARE
HOW WE SHAPE THE WORLD
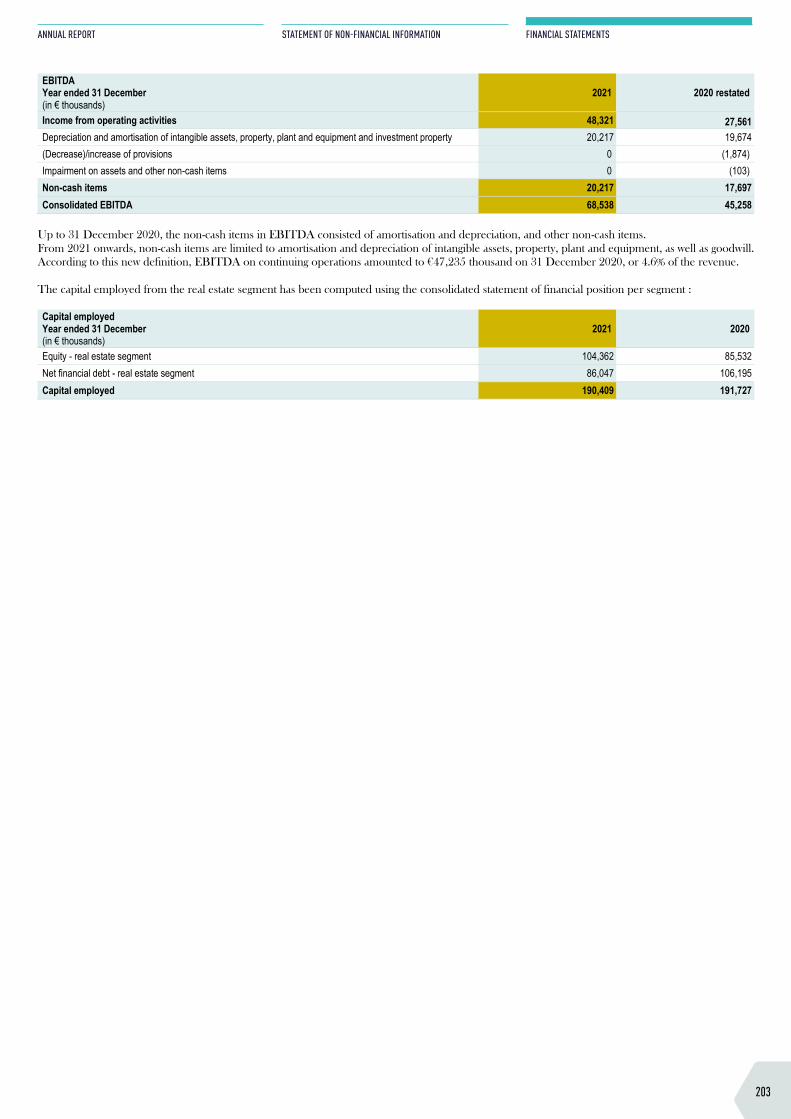
ALTERNATIVE PERFORMANCE MEASURES RECONCILIATION As shown below, the CFE group uses alternative performance measures to assess the group’s financial performance. The definitions of those performance measures are presented in the ‘Glossary’ section of this report. The net financial debt an EBITDA have been computed using the consolidated statement of income and the consolidated statement of financial position: Net financial debt Year ended 31 December 2021 (in € thousands)
DEME Contracting Real Estate Holding Eliminations
between segments
Total
Non-current borrowings from consolidated companies of the group (*) 0 0 20,000 0 (20,000) 0
+ Non-current bonds 0 0 0 0 0 0 + Non-current financial liabilities 0 33,270 43,954 375 0 77,599 + Current bonds 0 0 29,899 0 0 29,899 + Current financial liabilities 0 9,393 29,350 110,341 0 149,084 + Internal cash position - Cash pooling - liabilities (*) 0 3,641 18,845 100,061 (122,547) 0 Financial liabilities 0 46,304 142,048 210,777 (142,547) 256,582 - Non-current loans to consolidated companies of the group (*) 0 0 0 (20,000) 20,000 0 - Cash and cash equivalents 0 (62,884) (6,326) (74,377) 0 (143,587) - Internal cash position - Cash pooling - assets (*) 0 (69,287) (49,675) (3,586) 122,548 - Cash and cash equivalents 0 (132,171) (56,001) (97,963) 142,548 (143,587) Net financial debt 0 (85,867) 86,047 112,814 0 112,995
Net financial debt Year ended 31 December 2020 (in € thousands)
DEME Contracting Real Estate Holding Eliminations
between segments
Total
Non-current borrowings from consolidated companies of the group (*) 0 0 20,000 0 (20,000) 0
+ Non-current bonds 0 0 29,794 0 0 29,794 + Non-current financial liabilities 735,053 25,318 42,701 115,609 0 918,681 + Current bonds 0 0 0 0 0 0 + Current financial liabilities 375,913 8,919 17,488 10,329 0 412,649 + Internal cash position - Cash pooling - liabilities (*) 0 2,708 3,376 83,944 (90,028) 0 Financial liabilities 1,110,966 36,945 113,359 209,882 (110,028) 1,361,124 - Non-current loans to consolidated companies of the group (*) 0 0 0 (20,000) 20,000 0 - Cash and cash equivalents (621,937) (73,514) (5,707) (58,537) 0 (759,695) - Internal cash position - Cash pooling - assets (*) 0 (86,830) (1,457) (1,741) 90,028 0 Cash and cash equivalents (621,937) (160,344) (7,164) (80,278) 110,028 (759,695) Net financial debt 489,029 (123,399) 106,195 129,604 0 601,429
(*) These accounts relate to the cash positions with regard to group entities belonging to other group segments (mainly CFE SA). As at 31 December 2021, the net financial debt of discontinued operations included in assets held for sale and liabilities associated with assets held for sale amounts to €392,678 thousand. We refer to note 5 of this report. Working capital requirements Year ended 31 December (in € thousands)
2021 2020
Inventories 160,381 184,565 + Trade and other operating receivables 281,256 867,761 + Current operating assets 85,555 57,454 + Other current non-operating assets 2,416 21,731 - Trade and other operating receivables (277,009) (1,178,012) - Current tax liabilities (8,300) (75,283) - Other current operating liabilities (141,723) (192,424) - Other current non-operating liabilities (78,376) (244,511) Working capital requirement 24,200 (558,719)
As at 31 December 2020, the working capital requirement amounts to (€591,465) thousand for discontinued operations and €32,746 thousand for continuing operations. As at 31 December 2021, the working capital requirement of discontinued operations included in assets held for sale and liabilities associated with assets held for sale amounts to (€518,050) thousand. We refer to note 5 of this report.
EBITDA Year ended 31 December (in € thousands)
2021 2020 restated
Income from operating activities 48,321 27,561 Depreciation and amortisation of intangible assets, property, plant and equipment and investment property 20,217 19,674 (Decrease)/increase of provisions 0 (1,874) Impairment on assets and other non-cash items 0 (103) Non-cash items 20,217 17,697 Consolidated EBITDA 68,538 45,258
Up to 31 December 2020, the non-cash items in EBITDA consisted of amortisation and depreciation, and other non-cash items. From 2021 onwards, non-cash items are limited to amortisation and depreciation of intangible assets, property, plant and equipment, as well as goodwill. According to this new definition, EBITDA on continuing operations amounted to €47,235 thousand on 31 December 2020, or 4.6% of the revenue. The capital employed from the real estate segment has been computed using the consolidated statement of financial position per segment : Capital employed Year ended 31 December (in € thousands)
2021 2020
Equity - real estate segment 104,362 85,532 Net financial debt - real estate segment 86,047 106,195 Capital employed 190,409 191,727
203
ANNUAL REPORT
STATEMENT OF NON-FINANCIAL INFORMATION
FINANCIAL STATEMENTS

STATEMENT ON THE TRUE AND FAIR NATURE OF THE FINANCIAL STATEMENTS AND THE TRUE AND FAIR NATURE OF THE PRESENTATION IN THE MANAGEMENT REPORT (Article 12, paragraph 2, 3° of the Royal Decree of 14.11.2007 on the obligations of issuers of financial instruments admitted to trading on a regulated market) We certify, in the name and on behalf of Compagnie d’Entreprises CFE SA and on that company's responsibility, that, to our knowledge, 1. the financial statements, prepared in accordance with the applicable accounting standards, give a true and fair view of the assets, financial position
and results of Compagnie d’Entreprises CFE SA and of the companies included in its scope of consolidation; 2. the management report contains a true and fair presentation of the business, results and position of Compagnie d’Entreprises CFE SA and of the
companies included in its scope of consolidation, along with a description of the main risks and uncertainties to which they are exposed. SSIIGGNNAATTUURREESS Name: Fabien De Jonge Piet Dejonghe Function: Chief Financial Officer. Chief Executive Officer. Date : 25 March 2022
204
CONTENTS
WHY AND WHO WE ARE
HOW WE SHAPE THE WORLD
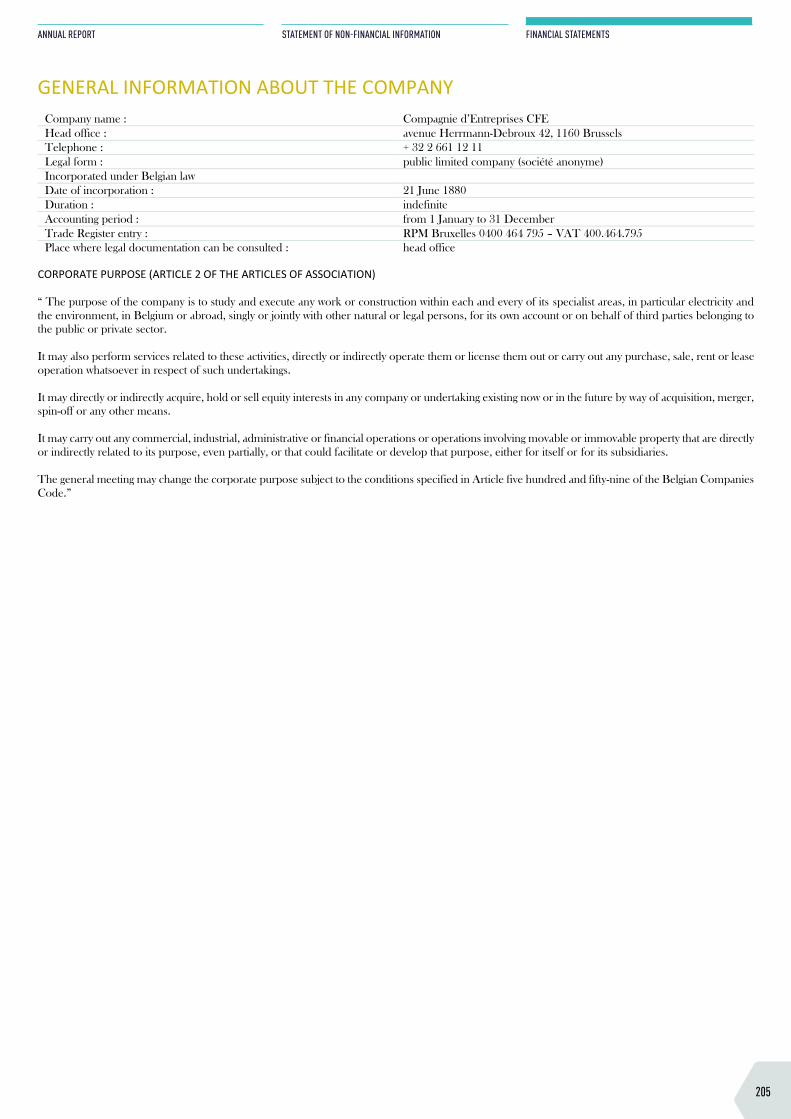
STATEMENT ON THE TRUE AND FAIR NATURE OF THE FINANCIAL STATEMENTS AND THE TRUE AND FAIR NATURE OF THE PRESENTATION IN THE MANAGEMENT REPORT (Article 12, paragraph 2, 3° of the Royal Decree of 14.11.2007 on the obligations of issuers of financial instruments admitted to trading on a regulated market) We certify, in the name and on behalf of Compagnie d’Entreprises CFE SA and on that company's responsibility, that, to our knowledge, 1. the financial statements, prepared in accordance with the applicable accounting standards, give a true and fair view of the assets, financial position
and results of Compagnie d’Entreprises CFE SA and of the companies included in its scope of consolidation; 2. the management report contains a true and fair presentation of the business, results and position of Compagnie d’Entreprises CFE SA and of the
companies included in its scope of consolidation, along with a description of the main risks and uncertainties to which they are exposed. SSIIGGNNAATTUURREESS Name: Fabien De Jonge Piet Dejonghe Function: Chief Financial Officer. Chief Executive Officer. Date : 25 March 2022
GENERAL INFORMATION ABOUT THE COMPANY
Company name : Compagnie d’Entreprises CFE Head office : avenue Herrmann-Debroux 42, 1160 Brussels Telephone : + 32 2 661 12 11 Legal form : public limited company (société anonyme) Incorporated under Belgian law Date of incorporation : 21 June 1880 Duration : indefinite Accounting period : from 1 January to 31 December Trade Register entry : RPM Bruxelles 0400 464 795 – VAT 400.464.795 Place where legal documentation can be consulted : head office
CORPORATE PURPOSE (ARTICLE 2 OF THE ARTICLES OF ASSOCIATION) “ The purpose of the company is to study and execute any work or construction within each and every of its specialist areas, in particular electricity and the environment, in Belgium or abroad, singly or jointly with other natural or legal persons, for its own account or on behalf of third parties belonging to the public or private sector. It may also perform services related to these activities, directly or indirectly operate them or license them out or carry out any purchase, sale, rent or lease operation whatsoever in respect of such undertakings. It may directly or indirectly acquire, hold or sell equity interests in any company or undertaking existing now or in the future by way of acquisition, merger, spin-off or any other means. It may carry out any commercial, industrial, administrative or financial operations or operations involving movable or immovable property that are directly or indirectly related to its purpose, even partially, or that could facilitate or develop that purpose, either for itself or for its subsidiaries. The general meeting may change the corporate purpose subject to the conditions specified in Article five hundred and fifty-nine of the Belgian Companies Code.”
205
ANNUAL REPORT
STATEMENT OF NON-FINANCIAL INFORMATION
FINANCIAL STATEMENTS
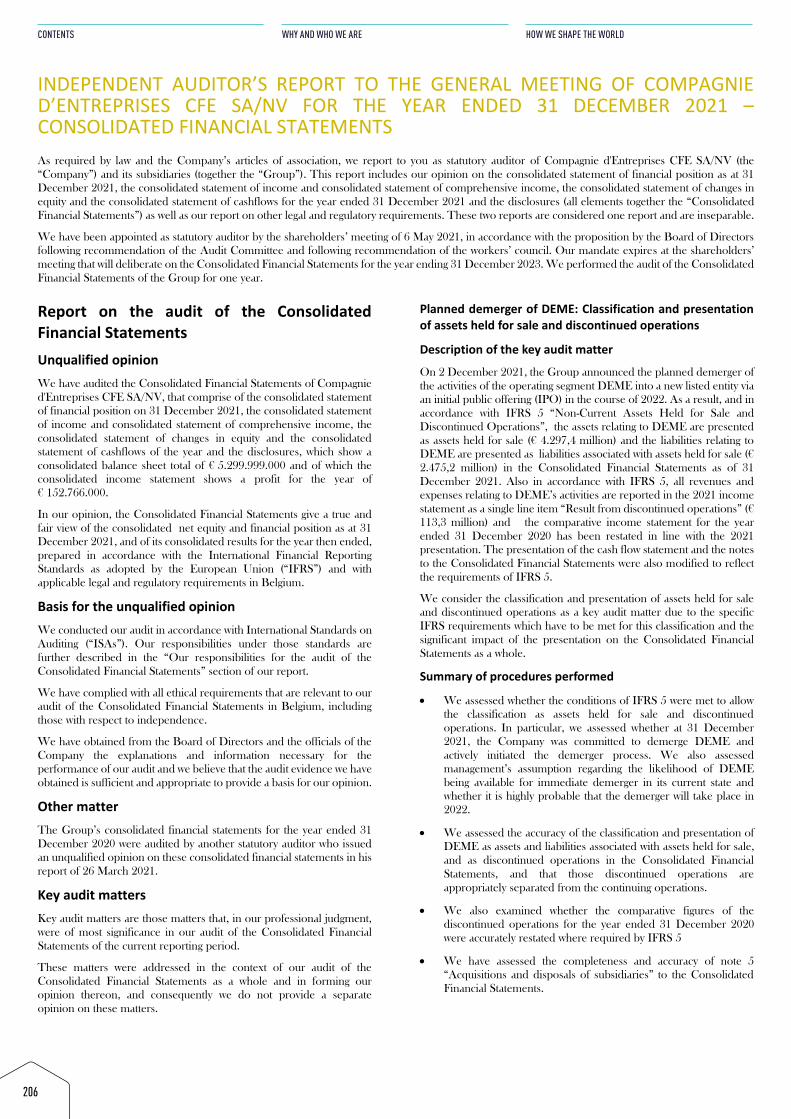
INDEPENDENT AUDITOR’S REPORT TO THE GENERAL MEETING OF COMPAGNIE D’ENTREPRISES CFE SA/NV FOR THE YEAR ENDED 31 DECEMBER 2021 – CONSOLIDATED FINANCIAL STATEMENTS As required by law and the Company’s articles of association, we report to you as statutory auditor of Compagnie d'Entreprises CFE SA/NV (the “Company”) and its subsidiaries (together the “Group”). This report includes our opinion on the consolidated statement of financial position as at 31 December 2021, the consolidated statement of income and consolidated statement of comprehensive income, the consolidated statement of changes in equity and the consolidated statement of cashflows for the year ended 31 December 2021 and the disclosures (all elements together the “Consolidated Financial Statements”) as well as our report on other legal and regulatory requirements. These two reports are considered one report and are inseparable.
We have been appointed as statutory auditor by the shareholders’ meeting of 6 May 2021, in accordance with the proposition by the Board of Directors following recommendation of the Audit Committee and following recommendation of the workers’ council. Our mandate expires at the shareholders’ meeting that will deliberate on the Consolidated Financial Statements for the year ending 31 December 2023. We performed the audit of the Consolidated Financial Statements of the Group for one year.
Report on the audit of the Consolidated Financial Statements Unqualified opinion We have audited the Consolidated Financial Statements of Compagnie d'Entreprises CFE SA/NV, that comprise of the consolidated statement of financial position on 31 December 2021, the consolidated statement of income and consolidated statement of comprehensive income, the consolidated statement of changes in equity and the consolidated statement of cashflows of the year and the disclosures, which show a consolidated balance sheet total of € 5.299.999.000 and of which the consolidated income statement shows a profit for the year of € 152.766.000.
In our opinion, the Consolidated Financial Statements give a true and fair view of the consolidated net equity and financial position as at 31 December 2021, and of its consolidated results for the year then ended, prepared in accordance with the International Financial Reporting Standards as adopted by the European Union (“IFRS”) and with applicable legal and regulatory requirements in Belgium.
Basis for the unqualified opinion We conducted our audit in accordance with International Standards on Auditing (“ISAs”). Our responsibilities under those standards are further described in the “Our responsibilities for the audit of the Consolidated Financial Statements” section of our report.
We have complied with all ethical requirements that are relevant to our audit of the Consolidated Financial Statements in Belgium, including those with respect to independence.
We have obtained from the Board of Directors and the officials of the Company the explanations and information necessary for the performance of our audit and we believe that the audit evidence we have obtained is sufficient and appropriate to provide a basis for our opinion.
Other matter The Group’s consolidated financial statements for the year ended 31 December 2020 were audited by another statutory auditor who issued an unqualified opinion on these consolidated financial statements in his report of 26 March 2021.
Key audit matters Key audit matters are those matters that, in our professional judgment, were of most significance in our audit of the Consolidated Financial Statements of the current reporting period.
These matters were addressed in the context of our audit of the Consolidated Financial Statements as a whole and in forming our opinion thereon, and consequently we do not provide a separate opinion on these matters.
Planned demerger of DEME: Classification and presentation of assets held for sale and discontinued operations
Description of the key audit matter On 2 December 2021, the Group announced the planned demerger of the activities of the operating segment DEME into a new listed entity via an initial public offering (IPO) in the course of 2022. As a result, and in accordance with IFRS 5 “Non-Current Assets Held for Sale and Discontinued Operations”, the assets relating to DEME are presented as assets held for sale (€ 4.297,4 million) and the liabilities relating to DEME are presented as liabilities associated with assets held for sale (€ 2.475,2 million) in the Consolidated Financial Statements as of 31 December 2021. Also in accordance with IFRS 5, all revenues and expenses relating to DEME’s activities are reported in the 2021 income statement as a single line item “Result from discontinued operations” (€ 113,3 million) and the comparative income statement for the year ended 31 December 2020 has been restated in line with the 2021 presentation. The presentation of the cash flow statement and the notes to the Consolidated Financial Statements were also modified to reflect the requirements of IFRS 5.
We consider the classification and presentation of assets held for sale and discontinued operations as a key audit matter due to the specific IFRS requirements which have to be met for this classification and the significant impact of the presentation on the Consolidated Financial Statements as a whole.
Summary of procedures performed
• We assessed whether the conditions of IFRS 5 were met to allow the classification as assets held for sale and discontinued operations. In particular, we assessed whether at 31 December 2021, the Company was committed to demerge DEME and actively initiated the demerger process. We also assessed management’s assumption regarding the likelihood of DEME being available for immediate demerger in its current state and whether it is highly probable that the demerger will take place in 2022.
• We assessed the accuracy of the classification and presentation of DEME as assets and liabilities associated with assets held for sale, and as discontinued operations in the Consolidated Financial Statements, and that those discontinued operations are appropriately separated from the continuing operations.
• We also examined whether the comparative figures of the discontinued operations for the year ended 31 December 2020 were accurately restated where required by IFRS 5
• We have assessed the completeness and accuracy of note 5 “Acquisitions and disposals of subsidiaries” to the Consolidated Financial Statements.
206
CONTENTS
WHY AND WHO WE ARE
HOW WE SHAPE THE WORLD
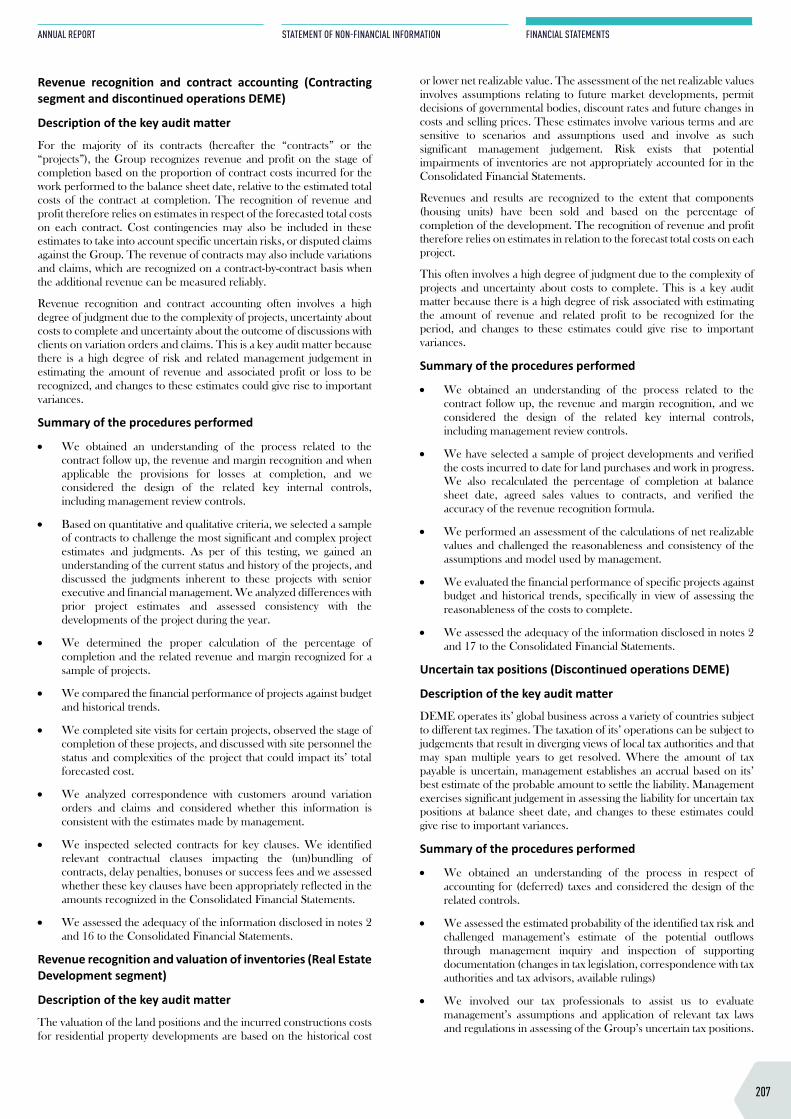
INDEPENDENT AUDITOR’S REPORT TO THE GENERAL MEETING OF COMPAGNIE D’ENTREPRISES CFE SA/NV FOR THE YEAR ENDED 31 DECEMBER 2021 – CONSOLIDATED FINANCIAL STATEMENTS As required by law and the Company’s articles of association, we report to you as statutory auditor of Compagnie d'Entreprises CFE SA/NV (the “Company”) and its subsidiaries (together the “Group”). This report includes our opinion on the consolidated statement of financial position as at 31 December 2021, the consolidated statement of income and consolidated statement of comprehensive income, the consolidated statement of changes in equity and the consolidated statement of cashflows for the year ended 31 December 2021 and the disclosures (all elements together the “Consolidated Financial Statements”) as well as our report on other legal and regulatory requirements. These two reports are considered one report and are inseparable.
We have been appointed as statutory auditor by the shareholders’ meeting of 6 May 2021, in accordance with the proposition by the Board of Directors following recommendation of the Audit Committee and following recommendation of the workers’ council. Our mandate expires at the shareholders’ meeting that will deliberate on the Consolidated Financial Statements for the year ending 31 December 2023. We performed the audit of the Consolidated Financial Statements of the Group for one year.
Report on the audit of the Consolidated Financial Statements Unqualified opinion We have audited the Consolidated Financial Statements of Compagnie d'Entreprises CFE SA/NV, that comprise of the consolidated statement of financial position on 31 December 2021, the consolidated statement of income and consolidated statement of comprehensive income, the consolidated statement of changes in equity and the consolidated statement of cashflows of the year and the disclosures, which show a consolidated balance sheet total of € 5.299.999.000 and of which the consolidated income statement shows a profit for the year of € 152.766.000.
In our opinion, the Consolidated Financial Statements give a true and fair view of the consolidated net equity and financial position as at 31 December 2021, and of its consolidated results for the year then ended, prepared in accordance with the International Financial Reporting Standards as adopted by the European Union (“IFRS”) and with applicable legal and regulatory requirements in Belgium.
Basis for the unqualified opinion We conducted our audit in accordance with International Standards on Auditing (“ISAs”). Our responsibilities under those standards are further described in the “Our responsibilities for the audit of the Consolidated Financial Statements” section of our report.
We have complied with all ethical requirements that are relevant to our audit of the Consolidated Financial Statements in Belgium, including those with respect to independence.
We have obtained from the Board of Directors and the officials of the Company the explanations and information necessary for the performance of our audit and we believe that the audit evidence we have obtained is sufficient and appropriate to provide a basis for our opinion.
Other matter The Group’s consolidated financial statements for the year ended 31 December 2020 were audited by another statutory auditor who issued an unqualified opinion on these consolidated financial statements in his report of 26 March 2021.
Key audit matters Key audit matters are those matters that, in our professional judgment, were of most significance in our audit of the Consolidated Financial Statements of the current reporting period.
These matters were addressed in the context of our audit of the Consolidated Financial Statements as a whole and in forming our opinion thereon, and consequently we do not provide a separate opinion on these matters.
Planned demerger of DEME: Classification and presentation of assets held for sale and discontinued operations
Description of the key audit matter On 2 December 2021, the Group announced the planned demerger of the activities of the operating segment DEME into a new listed entity via an initial public offering (IPO) in the course of 2022. As a result, and in accordance with IFRS 5 “Non-Current Assets Held for Sale and Discontinued Operations”, the assets relating to DEME are presented as assets held for sale (€ 4.297,4 million) and the liabilities relating to DEME are presented as liabilities associated with assets held for sale (€ 2.475,2 million) in the Consolidated Financial Statements as of 31 December 2021. Also in accordance with IFRS 5, all revenues and expenses relating to DEME’s activities are reported in the 2021 income statement as a single line item “Result from discontinued operations” (€ 113,3 million) and the comparative income statement for the year ended 31 December 2020 has been restated in line with the 2021 presentation. The presentation of the cash flow statement and the notes to the Consolidated Financial Statements were also modified to reflect the requirements of IFRS 5.
We consider the classification and presentation of assets held for sale and discontinued operations as a key audit matter due to the specific IFRS requirements which have to be met for this classification and the significant impact of the presentation on the Consolidated Financial Statements as a whole.
Summary of procedures performed
• We assessed whether the conditions of IFRS 5 were met to allow the classification as assets held for sale and discontinued operations. In particular, we assessed whether at 31 December 2021, the Company was committed to demerge DEME and actively initiated the demerger process. We also assessed management’s assumption regarding the likelihood of DEME being available for immediate demerger in its current state and whether it is highly probable that the demerger will take place in 2022.
• We assessed the accuracy of the classification and presentation of DEME as assets and liabilities associated with assets held for sale, and as discontinued operations in the Consolidated Financial Statements, and that those discontinued operations are appropriately separated from the continuing operations.
• We also examined whether the comparative figures of the discontinued operations for the year ended 31 December 2020 were accurately restated where required by IFRS 5
• We have assessed the completeness and accuracy of note 5 “Acquisitions and disposals of subsidiaries” to the Consolidated Financial Statements.
Revenue recognition and contract accounting (Contracting segment and discontinued operations DEME)
Description of the key audit matter For the majority of its contracts (hereafter the “contracts” or the “projects”), the Group recognizes revenue and profit on the stage of completion based on the proportion of contract costs incurred for the work performed to the balance sheet date, relative to the estimated total costs of the contract at completion. The recognition of revenue and profit therefore relies on estimates in respect of the forecasted total costs on each contract. Cost contingencies may also be included in these estimates to take into account specific uncertain risks, or disputed claims against the Group. The revenue of contracts may also include variations and claims, which are recognized on a contract-by-contract basis when the additional revenue can be measured reliably.
Revenue recognition and contract accounting often involves a high degree of judgment due to the complexity of projects, uncertainty about costs to complete and uncertainty about the outcome of discussions with clients on variation orders and claims. This is a key audit matter because there is a high degree of risk and related management judgement in estimating the amount of revenue and associated profit or loss to be recognized, and changes to these estimates could give rise to important variances.
Summary of the procedures performed
• We obtained an understanding of the process related to the contract follow up, the revenue and margin recognition and when applicable the provisions for losses at completion, and we considered the design of the related key internal controls, including management review controls.
• Based on quantitative and qualitative criteria, we selected a sample of contracts to challenge the most significant and complex project estimates and judgments. As per of this testing, we gained an understanding of the current status and history of the projects, and discussed the judgments inherent to these projects with senior executive and financial management. We analyzed differences with prior project estimates and assessed consistency with the developments of the project during the year.
• We determined the proper calculation of the percentage of completion and the related revenue and margin recognized for a sample of projects.
• We compared the financial performance of projects against budget and historical trends.
• We completed site visits for certain projects, observed the stage of completion of these projects, and discussed with site personnel the status and complexities of the project that could impact its’ total forecasted cost.
• We analyzed correspondence with customers around variation orders and claims and considered whether this information is consistent with the estimates made by management.
• We inspected selected contracts for key clauses. We identified relevant contractual clauses impacting the (un)bundling of contracts, delay penalties, bonuses or success fees and we assessed whether these key clauses have been appropriately reflected in the amounts recognized in the Consolidated Financial Statements.
• We assessed the adequacy of the information disclosed in notes 2 and 16 to the Consolidated Financial Statements.
Revenue recognition and valuation of inventories (Real Estate Development segment)
Description of the key audit matter The valuation of the land positions and the incurred constructions costs for residential property developments are based on the historical cost
or lower net realizable value. The assessment of the net realizable values involves assumptions relating to future market developments, permit decisions of governmental bodies, discount rates and future changes in costs and selling prices. These estimates involve various terms and are sensitive to scenarios and assumptions used and involve as such significant management judgement. Risk exists that potential impairments of inventories are not appropriately accounted for in the Consolidated Financial Statements.
Revenues and results are recognized to the extent that components (housing units) have been sold and based on the percentage of completion of the development. The recognition of revenue and profit therefore relies on estimates in relation to the forecast total costs on each project.
This often involves a high degree of judgment due to the complexity of projects and uncertainty about costs to complete. This is a key audit matter because there is a high degree of risk associated with estimating the amount of revenue and related profit to be recognized for the period, and changes to these estimates could give rise to important variances.
Summary of the procedures performed
• We obtained an understanding of the process related to the contract follow up, the revenue and margin recognition, and we considered the design of the related key internal controls, including management review controls.
• We have selected a sample of project developments and verified the costs incurred to date for land purchases and work in progress. We also recalculated the percentage of completion at balance sheet date, agreed sales values to contracts, and verified the accuracy of the revenue recognition formula.
• We performed an assessment of the calculations of net realizable values and challenged the reasonableness and consistency of the assumptions and model used by management.
• We evaluated the financial performance of specific projects against budget and historical trends, specifically in view of assessing the reasonableness of the costs to complete.
• We assessed the adequacy of the information disclosed in notes 2 and 17 to the Consolidated Financial Statements.
Uncertain tax positions (Discontinued operations DEME)
Description of the key audit matter DEME operates its’ global business across a variety of countries subject to different tax regimes. The taxation of its’ operations can be subject to judgements that result in diverging views of local tax authorities and that may span multiple years to get resolved. Where the amount of tax payable is uncertain, management establishes an accrual based on its’ best estimate of the probable amount to settle the liability. Management exercises significant judgement in assessing the liability for uncertain tax positions at balance sheet date, and changes to these estimates could give rise to important variances.
Summary of the procedures performed
• We obtained an understanding of the process in respect of accounting for (deferred) taxes and considered the design of the related controls.
• We assessed the estimated probability of the identified tax risk and challenged management’s estimate of the potential outflows through management inquiry and inspection of supporting documentation (changes in tax legislation, correspondence with tax authorities and tax advisors, available rulings)
• We involved our tax professionals to assist us to evaluate management’s assumptions and application of relevant tax laws and regulations in assessing of the Group’s uncertain tax positions.
207
ANNUAL REPORT
STATEMENT OF NON-FINANCIAL INFORMATION
FINANCIAL STATEMENTS
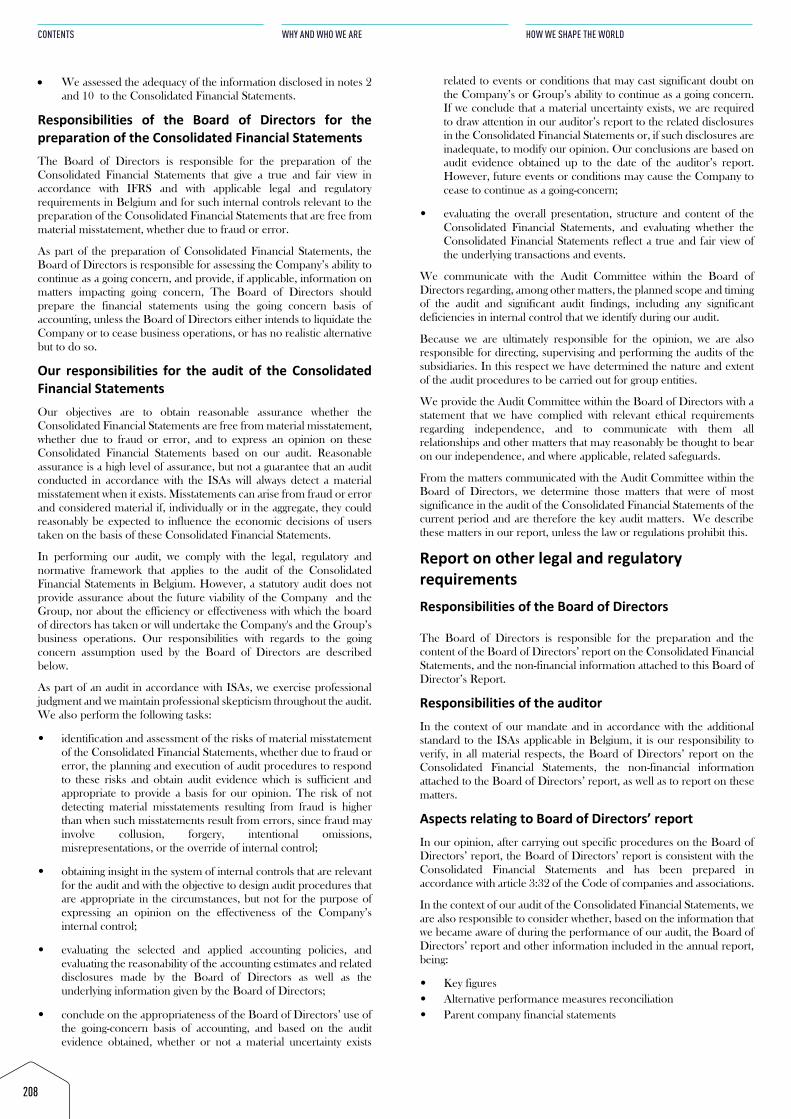
• We assessed the adequacy of the information disclosed in notes 2 and 10 to the Consolidated Financial Statements.
Responsibilities of the Board of Directors for the preparation of the Consolidated Financial Statements The Board of Directors is responsible for the preparation of the Consolidated Financial Statements that give a true and fair view in accordance with IFRS and with applicable legal and regulatory requirements in Belgium and for such internal controls relevant to the preparation of the Consolidated Financial Statements that are free from material misstatement, whether due to fraud or error.
As part of the preparation of Consolidated Financial Statements, the Board of Directors is responsible for assessing the Company’s ability to continue as a going concern, and provide, if applicable, information on matters impacting going concern, The Board of Directors should prepare the financial statements using the going concern basis of accounting, unless the Board of Directors either intends to liquidate the Company or to cease business operations, or has no realistic alternative but to do so.
Our responsibilities for the audit of the Consolidated Financial Statements Our objectives are to obtain reasonable assurance whether the Consolidated Financial Statements are free from material misstatement, whether due to fraud or error, and to express an opinion on these Consolidated Financial Statements based on our audit. Reasonable assurance is a high level of assurance, but not a guarantee that an audit conducted in accordance with the ISAs will always detect a material misstatement when it exists. Misstatements can arise from fraud or error and considered material if, individually or in the aggregate, they could reasonably be expected to influence the economic decisions of users taken on the basis of these Consolidated Financial Statements.
In performing our audit, we comply with the legal, regulatory and normative framework that applies to the audit of the Consolidated Financial Statements in Belgium. However, a statutory audit does not provide assurance about the future viability of the Company and the Group, nor about the efficiency or effectiveness with which the board of directors has taken or will undertake the Company's and the Group’s business operations. Our responsibilities with regards to the going concern assumption used by the Board of Directors are described below.
As part of an audit in accordance with ISAs, we exercise professional judgment and we maintain professional skepticism throughout the audit. We also perform the following tasks:
• identification and assessment of the risks of material misstatement of the Consolidated Financial Statements, whether due to fraud or error, the planning and execution of audit procedures to respond to these risks and obtain audit evidence which is sufficient and appropriate to provide a basis for our opinion. The risk of not detecting material misstatements resulting from fraud is higher than when such misstatements result from errors, since fraud may involve collusion, forgery, intentional omissions, misrepresentations, or the override of internal control;
• obtaining insight in the system of internal controls that are relevant for the audit and with the objective to design audit procedures that are appropriate in the circumstances, but not for the purpose of expressing an opinion on the effectiveness of the Company’s internal control;
• evaluating the selected and applied accounting policies, and evaluating the reasonability of the accounting estimates and related disclosures made by the Board of Directors as well as the underlying information given by the Board of Directors;
• conclude on the appropriateness of the Board of Directors’ use of the going-concern basis of accounting, and based on the audit evidence obtained, whether or not a material uncertainty exists
related to events or conditions that may cast significant doubt on the Company’s or Group’s ability to continue as a going concern. If we conclude that a material uncertainty exists, we are required to draw attention in our auditor’s report to the related disclosures in the Consolidated Financial Statements or, if such disclosures are inadequate, to modify our opinion. Our conclusions are based on audit evidence obtained up to the date of the auditor’s report. However, future events or conditions may cause the Company to cease to continue as a going-concern;
• evaluating the overall presentation, structure and content of the Consolidated Financial Statements, and evaluating whether the Consolidated Financial Statements reflect a true and fair view of the underlying transactions and events.
We communicate with the Audit Committee within the Board of Directors regarding, among other matters, the planned scope and timing of the audit and significant audit findings, including any significant deficiencies in internal control that we identify during our audit.
Because we are ultimately responsible for the opinion, we are also responsible for directing, supervising and performing the audits of the subsidiaries. In this respect we have determined the nature and extent of the audit procedures to be carried out for group entities.
We provide the Audit Committee within the Board of Directors with a statement that we have complied with relevant ethical requirements regarding independence, and to communicate with them all relationships and other matters that may reasonably be thought to bear on our independence, and where applicable, related safeguards.
From the matters communicated with the Audit Committee within the Board of Directors, we determine those matters that were of most significance in the audit of the Consolidated Financial Statements of the current period and are therefore the key audit matters. We describe these matters in our report, unless the law or regulations prohibit this.
Report on other legal and regulatory requirements Responsibilities of the Board of Directors
The Board of Directors is responsible for the preparation and the content of the Board of Directors’ report on the Consolidated Financial Statements, and the non-financial information attached to this Board of Director’s Report.
Responsibilities of the auditor In the context of our mandate and in accordance with the additional standard to the ISAs applicable in Belgium, it is our responsibility to verify, in all material respects, the Board of Directors’ report on the Consolidated Financial Statements, the non-financial information attached to the Board of Directors’ report, as well as to report on these matters.
Aspects relating to Board of Directors’ report In our opinion, after carrying out specific procedures on the Board of Directors’ report, the Board of Directors’ report is consistent with the Consolidated Financial Statements and has been prepared in accordance with article 3:32 of the Code of companies and associations.
In the context of our audit of the Consolidated Financial Statements, we are also responsible to consider whether, based on the information that we became aware of during the performance of our audit, the Board of Directors’ report and other information included in the annual report, being:
• Key figures • Alternative performance measures reconciliation • Parent company financial statements
208
CONTENTS
WHY AND WHO WE ARE
HOW WE SHAPE THE WORLD
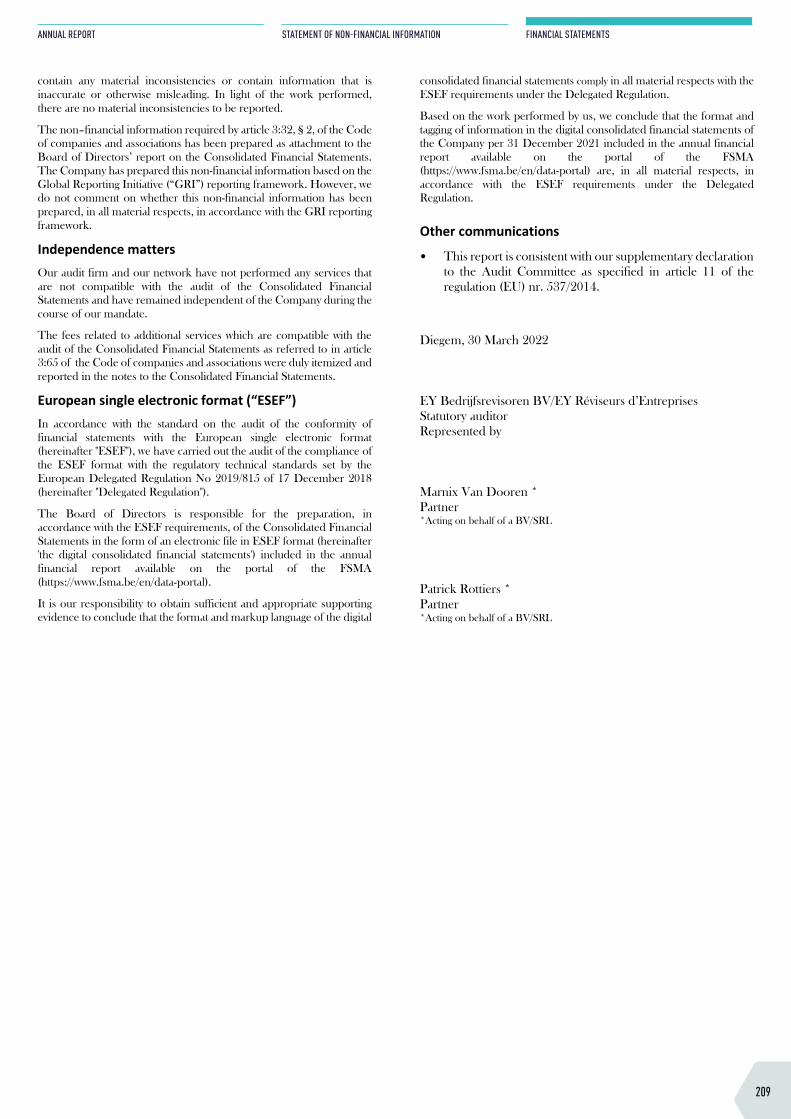
• We assessed the adequacy of the information disclosed in notes 2 and 10 to the Consolidated Financial Statements.
Responsibilities of the Board of Directors for the preparation of the Consolidated Financial Statements The Board of Directors is responsible for the preparation of the Consolidated Financial Statements that give a true and fair view in accordance with IFRS and with applicable legal and regulatory requirements in Belgium and for such internal controls relevant to the preparation of the Consolidated Financial Statements that are free from material misstatement, whether due to fraud or error.
As part of the preparation of Consolidated Financial Statements, the Board of Directors is responsible for assessing the Company’s ability to continue as a going concern, and provide, if applicable, information on matters impacting going concern, The Board of Directors should prepare the financial statements using the going concern basis of accounting, unless the Board of Directors either intends to liquidate the Company or to cease business operations, or has no realistic alternative but to do so.
Our responsibilities for the audit of the Consolidated Financial Statements Our objectives are to obtain reasonable assurance whether the Consolidated Financial Statements are free from material misstatement, whether due to fraud or error, and to express an opinion on these Consolidated Financial Statements based on our audit. Reasonable assurance is a high level of assurance, but not a guarantee that an audit conducted in accordance with the ISAs will always detect a material misstatement when it exists. Misstatements can arise from fraud or error and considered material if, individually or in the aggregate, they could reasonably be expected to influence the economic decisions of users taken on the basis of these Consolidated Financial Statements.
In performing our audit, we comply with the legal, regulatory and normative framework that applies to the audit of the Consolidated Financial Statements in Belgium. However, a statutory audit does not provide assurance about the future viability of the Company and the Group, nor about the efficiency or effectiveness with which the board of directors has taken or will undertake the Company's and the Group’s business operations. Our responsibilities with regards to the going concern assumption used by the Board of Directors are described below.
As part of an audit in accordance with ISAs, we exercise professional judgment and we maintain professional skepticism throughout the audit. We also perform the following tasks:
• identification and assessment of the risks of material misstatement of the Consolidated Financial Statements, whether due to fraud or error, the planning and execution of audit procedures to respond to these risks and obtain audit evidence which is sufficient and appropriate to provide a basis for our opinion. The risk of not detecting material misstatements resulting from fraud is higher than when such misstatements result from errors, since fraud may involve collusion, forgery, intentional omissions, misrepresentations, or the override of internal control;
• obtaining insight in the system of internal controls that are relevant for the audit and with the objective to design audit procedures that are appropriate in the circumstances, but not for the purpose of expressing an opinion on the effectiveness of the Company’s internal control;
• evaluating the selected and applied accounting policies, and evaluating the reasonability of the accounting estimates and related disclosures made by the Board of Directors as well as the underlying information given by the Board of Directors;
• conclude on the appropriateness of the Board of Directors’ use of the going-concern basis of accounting, and based on the audit evidence obtained, whether or not a material uncertainty exists
related to events or conditions that may cast significant doubt on the Company’s or Group’s ability to continue as a going concern. If we conclude that a material uncertainty exists, we are required to draw attention in our auditor’s report to the related disclosures in the Consolidated Financial Statements or, if such disclosures are inadequate, to modify our opinion. Our conclusions are based on audit evidence obtained up to the date of the auditor’s report. However, future events or conditions may cause the Company to cease to continue as a going-concern;
• evaluating the overall presentation, structure and content of the Consolidated Financial Statements, and evaluating whether the Consolidated Financial Statements reflect a true and fair view of the underlying transactions and events.
We communicate with the Audit Committee within the Board of Directors regarding, among other matters, the planned scope and timing of the audit and significant audit findings, including any significant deficiencies in internal control that we identify during our audit.
Because we are ultimately responsible for the opinion, we are also responsible for directing, supervising and performing the audits of the subsidiaries. In this respect we have determined the nature and extent of the audit procedures to be carried out for group entities.
We provide the Audit Committee within the Board of Directors with a statement that we have complied with relevant ethical requirements regarding independence, and to communicate with them all relationships and other matters that may reasonably be thought to bear on our independence, and where applicable, related safeguards.
From the matters communicated with the Audit Committee within the Board of Directors, we determine those matters that were of most significance in the audit of the Consolidated Financial Statements of the current period and are therefore the key audit matters. We describe these matters in our report, unless the law or regulations prohibit this.
Report on other legal and regulatory requirements Responsibilities of the Board of Directors
The Board of Directors is responsible for the preparation and the content of the Board of Directors’ report on the Consolidated Financial Statements, and the non-financial information attached to this Board of Director’s Report.
Responsibilities of the auditor In the context of our mandate and in accordance with the additional standard to the ISAs applicable in Belgium, it is our responsibility to verify, in all material respects, the Board of Directors’ report on the Consolidated Financial Statements, the non-financial information attached to the Board of Directors’ report, as well as to report on these matters.
Aspects relating to Board of Directors’ report In our opinion, after carrying out specific procedures on the Board of Directors’ report, the Board of Directors’ report is consistent with the Consolidated Financial Statements and has been prepared in accordance with article 3:32 of the Code of companies and associations.
In the context of our audit of the Consolidated Financial Statements, we are also responsible to consider whether, based on the information that we became aware of during the performance of our audit, the Board of Directors’ report and other information included in the annual report, being:
• Key figures • Alternative performance measures reconciliation • Parent company financial statements
contain any material inconsistencies or contain information that is inaccurate or otherwise misleading. In light of the work performed, there are no material inconsistencies to be reported.
The non–financial information required by article 3:32, § 2, of the Code of companies and associations has been prepared as attachment to the Board of Directors’ report on the Consolidated Financial Statements. The Company has prepared this non-financial information based on the Global Reporting Initiative (“GRI”) reporting framework. However, we do not comment on whether this non-financial information has been prepared, in all material respects, in accordance with the GRI reporting framework.
Independence matters Our audit firm and our network have not performed any services that are not compatible with the audit of the Consolidated Financial Statements and have remained independent of the Company during the course of our mandate.
The fees related to additional services which are compatible with the audit of the Consolidated Financial Statements as referred to in article 3:65 of the Code of companies and associations were duly itemized and reported in the notes to the Consolidated Financial Statements.
European single electronic format (“ESEF”) In accordance with the standard on the audit of the conformity of financial statements with the European single electronic format (hereinafter "ESEF"), we have carried out the audit of the compliance of the ESEF format with the regulatory technical standards set by the European Delegated Regulation No 2019/815 of 17 December 2018 (hereinafter "Delegated Regulation").
The Board of Directors is responsible for the preparation, in accordance with the ESEF requirements, of the Consolidated Financial Statements in the form of an electronic file in ESEF format (hereinafter 'the digital consolidated financial statements') included in the annual financial report available on the portal of the FSMA (https://www.fsma.be/en/data-portal).
It is our responsibility to obtain sufficient and appropriate supporting evidence to conclude that the format and markup language of the digital
consolidated financial statements comply in all material respects with the ESEF requirements under the Delegated Regulation.
Based on the work performed by us, we conclude that the format and tagging of information in the digital consolidated financial statements of the Company per 31 December 2021 included in the annual financial report available on the portal of the FSMA (https://www.fsma.be/en/data-portal) are, in all material respects, in accordance with the ESEF requirements under the Delegated Regulation. Other communications
• This report is consistent with our supplementary declaration to the Audit Committee as specified in article 11 of the regulation (EU) nr. 537/2014.
Diegem, 30 March 2022 EY Bedrijfsrevisoren BV/EY Réviseurs d’Entreprises Statutory auditor Represented by Marnix Van Dooren * Partner *Acting on behalf of a BV/SRL
Patrick Rottiers * Partner *Acting on behalf of a BV/SRL
209
ANNUAL REPORT
STATEMENT OF NON-FINANCIAL INFORMATION
FINANCIAL STATEMENTS
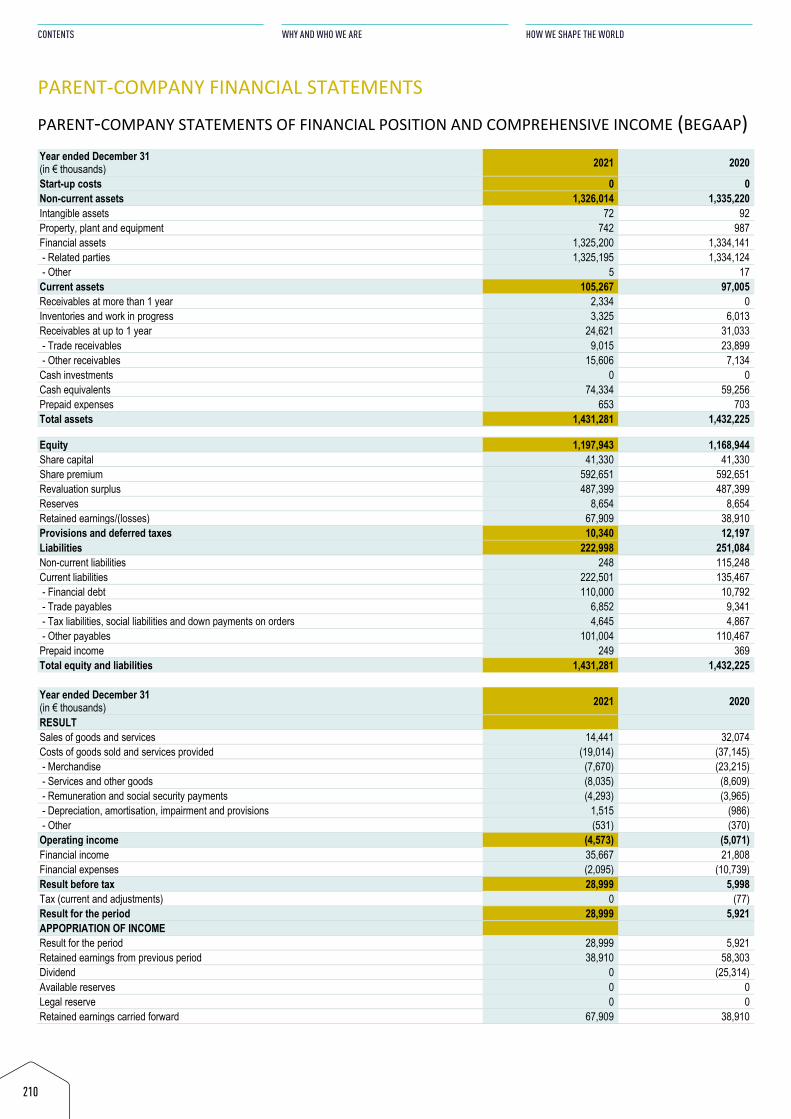
PARENT-COMPANY FINANCIAL STATEMENTS PARENT-COMPANY STATEMENTS OF FINANCIAL POSITION AND COMPREHENSIVE INCOME (BEGAAP) Year ended December 31 (in € thousands) 2021 2020
Start-up costs 0 0 Non-current assets 1,326,014 1,335,220 Intangible assets 72 92 Property, plant and equipment 742 987 Financial assets 1,325,200 1,334,141 - Related parties 1,325,195 1,334,124 - Other 5 17
Current assets 105,267 97,005 Receivables at more than 1 year 2,334 0 Inventories and work in progress 3,325 6,013 Receivables at up to 1 year 24,621 31,033 - Trade receivables 9,015 23,899 - Other receivables 15,606 7,134
Cash investments 0 0 Cash equivalents 74,334 59,256 Prepaid expenses 653 703 Total assets 1,431,281 1,432,225 Equity 1,197,943 1,168,944 Share capital 41,330 41,330 Share premium 592,651 592,651 Revaluation surplus 487,399 487,399 Reserves 8,654 8,654 Retained earnings/(losses) 67,909 38,910 Provisions and deferred taxes 10,340 12,197 Liabilities 222,998 251,084 Non-current liabilities 248 115,248 Current liabilities 222,501 135,467 - Financial debt 110,000 10,792 - Trade payables 6,852 9,341 - Tax liabilities, social liabilities and down payments on orders 4,645 4,867 - Other payables 101,004 110,467
Prepaid income 249 369 Total equity and liabilities 1,431,281 1,432,225 Year ended December 31 (in € thousands) 2021 2020
RESULT Sales of goods and services 14,441 32,074 Costs of goods sold and services provided (19,014) (37,145) - Merchandise (7,670) (23,215) - Services and other goods (8,035) (8,609) - Remuneration and social security payments (4,293) (3,965) - Depreciation, amortisation, impairment and provisions 1,515 (986) - Other (531) (370)
Operating income (4,573) (5,071) Financial income 35,667 21,808 Financial expenses (2,095) (10,739) Result before tax 28,999 5,998 Tax (current and adjustments) 0 (77) Result for the period 28,999 5,921 APPOPRIATION OF INCOME Result for the period 28,999 5,921 Retained earnings from previous period 38,910 58,303 Dividend 0 (25,314) Available reserves 0 0 Legal reserve 0 0 Retained earnings carried forward 67,909 38,910
210
CONTENTS
WHY AND WHO WE ARE
HOW WE SHAPE THE WORLD
PARENT-COMPANY FINANCIAL STATEMENTS PARENT-COMPANY STATEMENTS OF FINANCIAL POSITION AND COMPREHENSIVE INCOME (BEGAAP) Year ended December 31 (in € thousands) 2021 2020
Start-up costs 0 0 Non-current assets 1,326,014 1,335,220 Intangible assets 72 92 Property, plant and equipment 742 987 Financial assets 1,325,200 1,334,141 - Related parties 1,325,195 1,334,124 - Other 5 17
Current assets 105,267 97,005 Receivables at more than 1 year 2,334 0 Inventories and work in progress 3,325 6,013 Receivables at up to 1 year 24,621 31,033 - Trade receivables 9,015 23,899 - Other receivables 15,606 7,134
Cash investments 0 0 Cash equivalents 74,334 59,256 Prepaid expenses 653 703 Total assets 1,431,281 1,432,225 Equity 1,197,943 1,168,944 Share capital 41,330 41,330 Share premium 592,651 592,651 Revaluation surplus 487,399 487,399 Reserves 8,654 8,654 Retained earnings/(losses) 67,909 38,910 Provisions and deferred taxes 10,340 12,197 Liabilities 222,998 251,084 Non-current liabilities 248 115,248 Current liabilities 222,501 135,467 - Financial debt 110,000 10,792 - Trade payables 6,852 9,341 - Tax liabilities, social liabilities and down payments on orders 4,645 4,867 - Other payables 101,004 110,467
Prepaid income 249 369 Total equity and liabilities 1,431,281 1,432,225 Year ended December 31 (in € thousands) 2021 2020
RESULT Sales of goods and services 14,441 32,074 Costs of goods sold and services provided (19,014) (37,145) - Merchandise (7,670) (23,215) - Services and other goods (8,035) (8,609) - Remuneration and social security payments (4,293) (3,965) - Depreciation, amortisation, impairment and provisions 1,515 (986) - Other (531) (370)
Operating income (4,573) (5,071) Financial income 35,667 21,808 Financial expenses (2,095) (10,739) Result before tax 28,999 5,998 Tax (current and adjustments) 0 (77) Result for the period 28,999 5,921 APPOPRIATION OF INCOME Result for the period 28,999 5,921 Retained earnings from previous period 38,910 58,303 Dividend 0 (25,314) Available reserves 0 0 Legal reserve 0 0 Retained earnings carried forward 67,909 38,910
ANALYSIS OF STATEMENTS OF FINANCIAL POSITION AND COMPREHENSIVE INCOME Fixed assets primarily consist of the stakes in DEME (€ 1.1 billion), CFE Contracting and BPI. Financial debts at less than one year include € 60 million drawn down on the confirmed bilateral credit lines, and 50 million euros of commercial papers. The Brussels-South wastewater treatment plant project which was completed in October 2021 represents a substantial share of the revenue for the year. Financial income increased significantly in 2021 thanks to the proceeds of dividends from the subsidiaries DEME (€ 20.4 million), CFE Contracting (€ 8 million) and BPI (€ 4 million).
211
ANNUAL REPORT
STATEMENT OF NON-FINANCIAL INFORMATION
FINANCIAL STATEMENTS

212
CONTENTS
WHY AND WHO WE ARE
HOW WE SHAPE THE WORLD
214
CONTENTS
WHY AND WHO WE ARE
HOW WE SHAPE THE WORLD
GENERAL INFORMATION ABOUT THE COMPANY
1. REGISTERED OFFICE: Avenue Herrmann-Debroux 42, 1160 Brussels RLP Brussels n° 0400.464.795 Email address: [email protected] Website: https://www.cfe.be
2. DATE OF INCORPORATION, LATEST AMENDMENTS TO THE ARTICLES OF ASSOCIATION The Company was incorporated by notarial deed of 24 June 1880, published in the annexes to the Belgian Official Journal of 27 June 1880 under number 911, of which the articles of association have been amended several times, most recently by notarial deed of 2 May 2019, published in extracts in the annexes to the to the Belgian Official Journal of 22 May 2019, under number 19068846.
3. DURATION OF THE COMPANY Indefinite
4. COMPANY FORM - APPLICABLE LAW Public Limited Company incorporated under Belgian law
5. PURPOSE OF THE COMPANY The purpose of the company is to study and execute any work or construction within each and every of its specialist areas, in particular electricity and the environment, in Belgium or abroad, singly or jointly with other natural or legal persons, for its own account or on be-half of third parties belonging to the public or private sector. It may also perform services related to these activities, directly or indirectly operate them or license them out or carry out any purchase, sale, rent or lease operation whatsoever in respect of such undertakings. It may directly or indirectly acquire, hold or sell equity interests in any company or undertaking existing now or in the future by way of acquisition, merger, spin-off or any other means. It may carry out any commercial, industrial, administrative or financial operations or operations involving movable or immovable property that are directly or indirectly related to its purpose, even partially, or that could facilitate or develop that purpose, either for itself or for its subsidiaries.
6. SHARE CAPITAL ISSUED CAPITAL At the end of the financial year, the Company’s share capital amounted to €41,329,482.42, divided into 25,314,482 shares, with no de-clared par value. All shares are fully paid up. CAPITAL INCREASE The capital was last increased on 24 December 2013 following the contribution in kind of the public limited company Dredging, Environ-mental & Marine Engineering by the public limited company Ackermans & van Haaren. AUTHORISED CAPITAL Pursuant to the decision of the extraordinary general meeting of shareholders of 2 May 2019, the Board of Directors is authorised, in the five-year period starting on 22 May 2019, to increase the Company’s capital – in one or more operations – by up to € 5,000,000, with or without the issue of new shares or by the issue of convertible bonds, subordinated or not, or of warrants or other securities, whether or not linked to other securities of the Company. The Board of Directors may also make use of the authorised capital, in the event of a public bid for the shares issued by the Company, on the conditions and within the limits of Article 7:202 of the Code of Companies and Associations. The Board of Directors is allowed to use these powers if the notice of a takeover bid is given to the Company by the Financial Services and Markets Authority (FSMA) not later than three years after the date of the aforementioned extraordinary general meeting (i.e. 2 May 2022). This authorisation also encompasses the power to: • increase the capital or issue convertible bonds or subscription rights while cancelling or limiting the preferential subscription right of
shareholders;
ANNUAL REPORT 2021 CFE GROUP 215
ANNUAL REPORT
STATEMENT OF NON-FINANCIAL INFORMATION
FINANCIAL STATEMENTS
• increase the capital or issue convertible bonds while cancelling or limiting the preferential subscription right of shareholders in favour of one or more specific persons other than staff members of the company or its subsidiaries; and
• to increase the capital by the incorporation of reserves.
7. TYPE OF SHARES The Company’s shares are fully paid up and are registered or in electronic form. Any holder of shares may, at any time and at his own ex-pense, request the conversion of his fully paid-up shares into another form, or suspend ownership, usufruct or bare ownership, within the limits of the law. The co-owners, usufructuaries and bare owners are required to have be themselves represented by a common representa-tive, and to notify the Company thereof. In the case of usufruct, the bare owner of the share shall be represented vis-à-vis the Company by the usufructuary, unless the parties agree otherwise.
8. PLACE WHERE THE COMPANY’S DOCUMENTS MAY BE CONSULTED The statutory and consolidated financial statements of the Company are filed with the National Bank of Belgium. The coordinated ver-sion of the Company’s articles of association can be consulted at the office of the Commercial Court of Brussels, Brussels division. The annual financial report is sent to the registered shareholders and any person who so requests. The coordinated version of the articles of association and the annual financial report are also available on the website (www.cfe.be).
COLOFON
COPYRIGHT OF PHOTOS AND EDITS, IN ALFABETIC ORDER:
Archi2000ArtBuild ArchitectsDEMEEstor-LuxPhilippe van GeloovenPlopsa Kownaty - Studio 100Tom D’Haenens
CONCEPT, DESIGN AND REALISATION: Brandelicious/Anne Thys - [email protected]/Paul Thomas – www.makecontact.nl
Dit jaarverslag is verkrijgbaar in het Nederlands, Frans en Engels.In geval van verschillen primeert de Franse versie.


