Embed Size (px)
Citation preview

Fusion Engineering and Design 43 (1998) 37–58
Real time current profile control at JET
J.A. Romero a,*, J.M. de la Cruz b, T. Dobbing a, J. Ellis a, B. Fisher a, Q.A. King a,F. Soldner a, N. Zornig a
a JET Joint Undertaking, Abingdon, Oxon OX14 3EA, UKb Uni6ersidad Complutense de Madrid, A6da Complutense S/N, Madrid, Spain
Received 30 September 1997; received in revised form 5 February 1998
Abstract
A plasma current profile control system has been designed and tested at Joint European Torus (JET). The systemuses the one turn loop voltage for lower hybrid current drive (LHCD) control, and the normalised second currentmoment of the plasma current distribution for off-axis current control. These provide relatively simple measurementsand calculations suitable for real time operation. Models for the response of the loop voltage and second currentmoment to Lower Hybrid power input are derived and validated against JET data. Based on these models, thecomponents of the second current moment and loop voltage control systems are designed to suit prescribedperformance. Loop voltage has been controlled in 2.5 MA discharges at 66% reduction, providing the means forLHCD regulation. Second current moment control during the current rise phase has contributed to 60% improvementof the neutron yield performance of shear optimisation discharges at JET. © 1998 Elsevier Science S.A. All rightsreserved.
Keywords: Current profile control; Lower hybrid current drive control; Magneto hydro dynamic
1. Introduction
The shape of the plasma current profile is oneof the most important factors determining theplasma magneto hydro dynamic (MHD) stabilityand confinement in Tokamaks. For this reason,plasma current profile control has received con-siderable attention in recent years.
One of the tools for plasma current profilecontrol at Joint European Torus (JET) [1] is thelower hybrid current drive system (LHCD) [2,3].
Current profile control experiments with lowerhybrid waves at JET are usually conducted inopen loop, by careful pre-programming of theLHCD heating power waveforms. However, thistype of operation is affected considerably bychanging properties of the plasma, and the desiredtarget current profiles are not always obtained.
Feedback control tools and techniques providea solution to this problem [4]. This paper de-scribes a current profile feedback control systemthat has been developed for the LHCD system atJET which provides the capability for steady statescenarios, and eliminates the need for re-adjust-ments on the power waveforms. With this control* Corresponding author.
0920-3796/98/$ - see front matter © 1998 Elsevier Science S.A. All rights reserved.
PII S0920-3796(98)00261-0

J.A. Romero et al. / Fusion Engineering and Design 43 (1998) 37–5838
Fig. 1. Schematics of the current profile control system for the LHCD system at JET. The diagnostics for feedback are currentlythe loop voltage and the normalised second current moment.
system, it is now possible to control the non-in-ductive current generated by the LHCD systemand the relative peaking of the current profile.
The control system uses the loop voltage fornon-inductive control, and a dimensionless quan-tity derived from the second moment of the cur-rent profile for off-axis current control.
The philosophy of the control system designhas been to develop the simplest possible mathe-matical model for the plasma response, namely anon-linear state space model [5] for the loopvoltage, and a transfer function [5] model for thesecond current moment. These models will bepresented and validated against data from JETdischarges.
This initial development has improved the oper-ation of current profile control experiments withlower hybrid, and it has contributed to an im-provement on fusion yield performance in shearoptimization experiments at JET. This illustratesthe potential benefits of current profile feedbackcontrol systems for future devices such as ITER,where confinement and stability are crucial.
2. General description of the system
The control system has been implemented in afront end computer working with sample dataknown at JET as the real time power controlsystem (RTPC) [6]. The control system consists ofthree main parts (Fig. 1):
(1) The real time signal server (RTSS) collects asignal from numerous plasma diagnostics and per-forms simple processing such as calibration andfiltering.
(2) The real time central controller (RTCC)reads from a common memory area, shared withRTSS, the relevant diagnostics selected for feed-back. It then executes a network of interconnectedalgorithms prescribed by the user. These are typi-cally waveform generation of requested feedfor-ward powers, references for feedback, feedbacktiming, filtering and proportional integral deriva-tive (PID) control algorithms. The network out-put is calculated every 10 ms. The profile controlalgorithm is implemented in this area. The resultof the processing is a power or phase demand sentthrough an Ethernet connection to the lower hy-brid local manager (LHLM).
(3) The LHLM reads the power and phase re-quested by the RTCC and performs local feed-back control of the power generated by the LHplant. Independent control of power and phase ispossible for the 6 power modules that constitutethe plant [3].
Initially, while establishing the engineering ba-sis of this new control concept, loop voltage andsecond current moment feedback loops have beenimplemented. Future current profile diagnosticdevelopments at JET may allow control of thecurrent profile in the central region of the plasma,such as the central value of the safety factor (q0)[7,8].

J.A. Romero et al. / Fusion Engineering and Design 43 (1998) 37–58 39
Fig. 2. Simplified schematic of a Tokamak and the loop voltage measurement.
3. Lower hybrid current drive control
Tokamak operation is limited by the amount ofmagnetic flux available in the transformer pri-mary. To allow continuous operation, there areseveral non inductive current drive methods. Oneof the most interesting ones is the LHCD. TheLHCD system at JET generates microwave powerat 3.7 GHz. This system has achieved full currentdrive in X-point configurations in the range 0.7–3MA and line average electron density, ne, in therange 0.7–2.0×10¹⁹ m−3, with current drive effi-ciency, hCD, increasing with electron temperatureup to 0.3×10²⁰ AW−1 m−2. However, in somecases, variations in the plasma conditions maylead to uncontrolled excursions of the non-induc-tive current generated by the LH system. In orderto obtain steady state scenarios, a non-inductivecurrent control system with LH waves has beendeveloped and tested. This section presents thedesign of the LHCD control system and the ex-perimental results.
3.1. Loop 6oltage
The loop voltage is the voltage created in acircular loop concentric with the plasma columnas a result of the variation of the poloidal mag-netic flux linked through it (Fig. 2). By extensionof this concept, the loop voltage in an arbitrary
flux surface is minus the time derivative of thepoloidal magnetic flux relative to that surface. AtJET, a real time system [9] computes the poloidalflux function outside the plasma every 2 ms. Thisgives the loop voltage at the plasma boundary,where it is otherwise impossible to obtain a directmeasurement. There are two more loops takingdirect measurements of the loop voltage in realtime; one placed slightly above the mid-plane ofthe plasma and inside the vacuum vessel, andanother placed below the plasma and outside thevacuum vessel. By simple inspection of Fig. 2, it isclear that any change in the magnetic flux throughthe loop will generate a voltage, according toLenz’s law. The change in the flux can be pro-duced by a variation in the plasma current orprimary transformer flux. Plasma and transformercircuits are inductively coupled, and for this rea-son the loop voltage measurement contains mixedinformation regarding non-inductive currentdrive, plasma resistance and plasma inductancechanges. In order to obtain exact expressions forthe Tokamak equivalent parameters and its rela-tionship with the loop voltage, the Tokamakequivalent circuit is presented in the Section 3.2.
3.2. Tokamak equi6alent circuit
A Tokamak can be described as a distributed-parameter electric network (Fig. 3). Energy stor-
J.A. Romero et al. / Fusion Engineering and Design 43 (1998) 37–5840
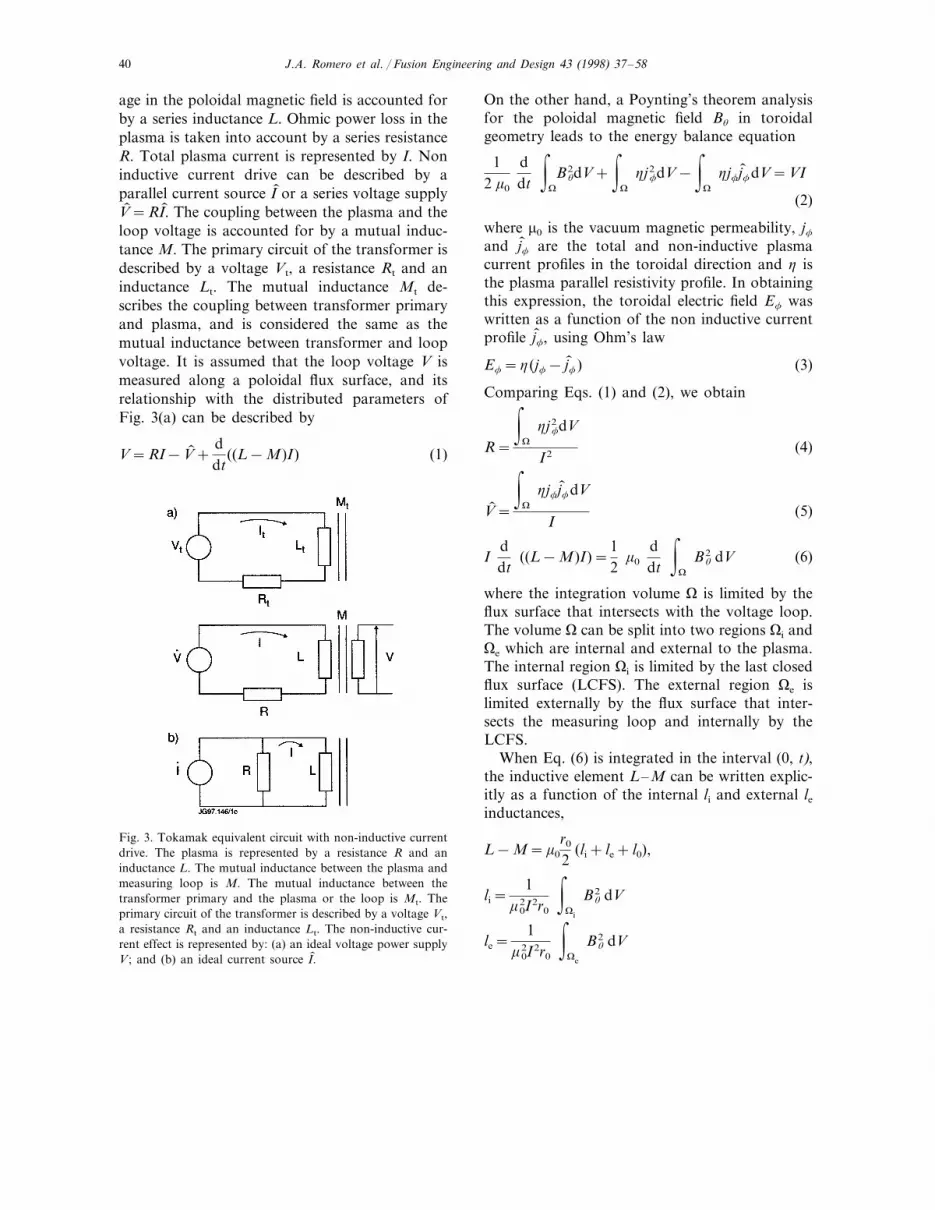
age in the poloidal magnetic field is accounted forby a series inductance L. Ohmic power loss in theplasma is taken into account by a series resistanceR. Total plasma current is represented by I. Noninductive current drive can be described by aparallel current source I. or a series voltage supplyV. =RI. . The coupling between the plasma and theloop voltage is accounted for by a mutual induc-tance M. The primary circuit of the transformer isdescribed by a voltage Vt, a resistance Rt and aninductance Lt. The mutual inductance Mt de-scribes the coupling between transformer primaryand plasma, and is considered the same as themutual inductance between transformer and loopvoltage. It is assumed that the loop voltage V ismeasured along a poloidal flux surface, and itsrelationship with the distributed parameters ofFig. 3(a) can be described by
V=RI−V. + ddt
((L−M)I) (1)
On the other hand, a Poynting’s theorem analysisfor the poloidal magnetic field Bu in toroidalgeometry leads to the energy balance equation
12 m0
ddt
&V
Bu2dV+
&V
hjf2 dV−
&V
hjfj. fdV=VI
(2)
where m0 is the vacuum magnetic permeability, jfand j. f are the total and non-inductive plasmacurrent profiles in the toroidal direction and h isthe plasma parallel resistivity profile. In obtainingthis expression, the toroidal electric field Ef waswritten as a function of the non inductive currentprofile j. f, using Ohm’s law
Ef=h(jf− j. f) (3)
Comparing Eqs. (1) and (2), we obtain
R=
&V
hjf2 dV
I2 (4)
V. =
&V
hjfj. fdV
I(5)
Iddt
((L−M)I)=12
m0
ddt
&V
Bu2 dV (6)
where the integration volume V is limited by theflux surface that intersects with the voltage loop.The volume V can be split into two regions Vi andVe which are internal and external to the plasma.The internal region Vi is limited by the last closedflux surface (LCFS). The external region Ve islimited externally by the flux surface that inter-sects the measuring loop and internally by theLCFS.
When Eq. (6) is integrated in the interval (0, t),the inductive element L–M can be written explic-itly as a function of the internal li and external leinductances,
L−M=m0
r0
2(li+ le+ l0),
li=1
m02I2r0
&Vi
Bu2 dV
le=1
m02I2r0
&Ve
Bu2 dV
Fig. 3. Tokamak equivalent circuit with non-inductive currentdrive. The plasma is represented by a resistance R and aninductance L. The mutual inductance between the plasma andmeasuring loop is M. The mutual inductance between thetransformer primary and the plasma or the loop is Mt. Theprimary circuit of the transformer is described by a voltage Vt,a resistance Rt and an inductance Lt. The non-inductive cur-rent effect is represented by: (a) an ideal voltage power supplyV ; and (b) an ideal current source I. .

J.A. Romero et al. / Fusion Engineering and Design 43 (1998) 37–58 41
Fig. 4. Loop voltage model internal states vs. experimental data. Top: Lower hybrid power. Middle: First state simulation (solid)compared with actual values (dot-dash). Bottom: Internal inductance simulation (solid) compared with actual values (dot-dash).
l0=1I& t
0
(li+ le)dIdt
dt#1I& tr
0
(li+ le)dIdt
dt (7)
where the major plasma radius is represented byr0 to avoid confusion with the plasma resistanceR. The time integrated inductance l0 is constantafter the initial current rise phase (0, tr), since theplasma current is usually kept constant during thesteady state phase of the discharge.
It must be emphasized that Eqs. (4) and (5) andEq. (7) are the only definitions for the Tokamakparameters that are consistent with loop voltagemeasurements.
The internal inductance can also be written as afunction of the fluxes at the plasma boundary cb
and plasma centre c0
li=2p(c0−cb)
m0r0I
:1−
&Vi
cn jfdA
I
;, (8)
where
cn=(c−c0)(cb−c0)
(9)
is the normalised flux function and dA is a differ-ential element of plasma cross-section. In obtain-ing Eq. (8), we have made use of the identity&
Bu2dV=
7(Af×Bu) · dS+m0
&Af · jfdV
(10)
together with the choice for the potential vector
Af=c−c0
ruf (11)
where uf is a unitary vector in the toroidaldirection.
Similarly, the external inductance can be writ-ten as a function of the flux at the loop locationci and at the plasma boundary cb,
le=2p(cb−cl)
m0r0I(12)

J.A. Romero et al. / Fusion Engineering and Design 43 (1998) 37–5842
Fig. 5. Comparison of the boundary loop voltage (dot-dash) and the loop voltage model output (solid).
Using the new definitions given by Eq. (7), Eq. (1)can be written as
V=RI−V. +m0
r0
2ddt
(li+ le)+m0r0(li+ le)dIdt
(13)
When the loop voltage measurement in Eq. (1) iscalculated at the LCFS, le=0, and Eq. (1) iswritten as
Vb=RI−V. +m0
r0
2I
dlidt
+m0r0lidIdt
(14)
where in this case, Vb is the loop voltage at theplasma boundary. Due to there being no currentsin the region external to the plasma, the parame-ters R and V. are still given by the Eqs. (4) and (5).
If the measuring loop is placed just below theplasma, the external inductance depends solely ongeometrical factors and is given by
le= lnba
(15)
where a is a characteristic dimension for the mi-nor plasma radius and b is the distance betweenthe plasma current center (r0, z0) and the measur-ing loop. For the JET parameters a=1.2, b=2.3,we obtain le$0.65. As long as the plasma shapeand the position are kept constant, the externalinductance can be considered constant, and theloop measurement Eq. (1) is reduced again to Eq.(14).
Alternatively, as shown in Fig. 3(b), the effectof the non-inductive current can be introduced asan ideal current source not subject to resistivelosses I. . In this case, the circuit equation is
Vb=R(I−I. )+m0
r0I2
dlidt
+m0r0lidIdt
(16)
where the equivalent non inductive current I. isdefined as
I. =V.R
=I ·
&hjfj. fadV&hj2
fdV(17)

J.A. Romero et al. / Fusion Engineering and Design 43 (1998) 37–58 43
For most Tokamaks, the total plasma current Iis kept constant by an external feedback mecha-nism that links the plasma current I to thetransformer voltage Vt. If the total plasma cur-rent is kept constant, the ratio of the loopvoltage before and after a non-inductive currentis driven in the plasma (once stationary condi-tions are reached) is given by
DVDV0
#DRR0
−I.I
(18)
The relative reduction of the loop voltage there-fore gives an indication of the relative change inthe plasma resistance and non-inductive currentdrive [2].
In stationary conditions V=R(I−I. ), a re-duction of the plasma resistance alone cannotlead to zero loop voltage, as this would implyzero plasma resistance. Only a non-inductivecurrent can reduce the loop voltage to zerowhen all the current is driven non-inductively,I. =I. In a intermediate situation, the reductionof the loop voltage is due to both effects, non-inductive current drive and plasma resistance re-duction.
In an overdrive situation, the non-inductivecurrent can exceed the set value for the totalplasma current, in which case the transformerwill counteract it. This situation is referred astransformer recharging. During recharging theloop voltage can be negative.
The loop voltage is most suitable for non-in-ductive current control when full current drivewithout transformer recharging is desired. Inany other case the effects of both plasma heat-ing and current drive can produce a reductionof the loop voltage, and they cannot be distin-guished.
3.3. Loop 6oltage state space model
The relationship between the loop voltageoutput and the lower hybrid power input is bestdescribed by a system of first-order differentialequations using an auxiliary vector X= (x1, x2,x3)T, where the variables x1, x2, x3 are chosento correspond with physical meaningful quanti-
ties such as plasma resistance, internal induc-tance and ohmic current.
x1=�Te−3/2�
x2= li
x3=I−I. (19)
The first state is assumed to be proportional tothe plasma resistance (Eq. 4), and is defined as
�Te−3/2�=
A2pr0
&Te
−3/2jf2 dV
I2 (20)
where A is the area of the plasma cross-section.This type of description is known as state
space description, and the auxiliary variables xi
are known as internal states. This description isparticularly useful for our purpose, as it allowsphysical mechanisms in the plasma to be incor-porated in the model.
Using the state space description, the loopvoltage measurement equation for constantplasma current V=R(I−I. )+I(dL/dt) can bewritten as a non-linear output equation depend-ing on the internal states x1, x2, x3
y=c1x1x3+c2x; 2 (21)
The physical parameters are summarized in themodel parameters through the expressions
c1=2p · 10−4 r0
A· ln L x(Zeff),
c2=m0
r0
2I (22)
where the dependence with the effective ioniccharge is given by
x(Zeff)=Zeff�
0.29+0.457
1.077+Zeff
�(23)
and the Coulomb logarithm ln Lis obtainedfrom
L=1.09 · 1014 Te
Zeffne
(24)
The numerical factors in c1 are valid for anSpitzer resistivity model [10], with Te in eV, h
in ohms per metre, and ne in electrons per cubic

J.A. Romero et al. / Fusion Engineering and Design 43 (1998) 37–5844
metre. A proportionality factor c1 can still beassumed when neoclassical [11] and/or Fisch [12]corrections are introduced.
Physically,
c1x1x3=R(I−I. ) and c2x; 2=m0
r0
2I
ddt
(li),
therefore, the output equation is simply the rela-tionship (Eq. 16) for constant plasma current.
Using the Akaike’s information criterion [13], afirst order lag is found to be the best approxima-tion for the internal states xi dynamics at JET[14]. Based on this, a first order model will beparametrized using system identification tech-niques. The system equations describing the dy-namics of the plasma resistance ($x1),inductance (x2) and ohmic current (x3) can bewritten as
x; i= −1ti
(xi− xi)+ki
ti
u, (25)
where first order linear approximations for theinternal state’s (xi) dynamics around a certainoperating point xi have been made. ki and ti aregains and time constants corresponding to xi
The internal states xi must be coupled to someextent, as they all depend on the current profile(Eqs. 4, 17 and 8). As a first approximation, thiscoupling will be ignored.
The input vector to the system is the lowerhybrid power delayed by td,
u(t)=PLH(t− td) (26)
The gains ki can be estimated from the change inthe states xi once stationary conditions arereached
ki=Dxi
PLH
=xi�t��−xi�t=0
PLH
(27)
The gain k1 at JET is always negative, as thelower hybrid power input always raises the elec-tron temperature, and as a result, lowers Te
−3/2.The time constant t1 depends on combined heattransport and current diffusion mechanisms in theplasma, and can range from a tenth of a second toa few seconds.
The gain k2 depends on the difference betweenthe power deposition profile and the plasma cur-
rent profile. When these profiles are different, theplasma current will diffuse in order to achieve aconstant electric field across the plasma [15]. Forinstance, an initially peaked plasma currentprofile will be broadened by off-axis lower hybridpower deposition. Current profile broadeningcauses a reduction in the internal inductance (x2),and corresponds with k2 being negative. The timeconstant t2 is basically the skin time ts, anddepends strongly on the plasma temperature. Fora cylindrical plasma of minor radius a and con-stant plasma resistivity h
ts=m0a2
hl12 (28)
where l1$3.831 is the first zero of the J1 Besselfunction. For JET plasmas with typical electrontemperatures between 1 and l0 KeV, the skin timevaries between 0.5 and 5 s. The skin time dependson the plasma resistivity, and must therefore becorrelated with the plasma resistance ($xl). Thishas not been considered in the model, and aneffective time constant t2 is adopted to encompassthese effects.
The amount of non-inductive current drive ILH
produced when lower hybrid power PLH is in-jected into the plasma can be characterized bymeans of the current drive efficiency hCD, definedas
hCD=�he�r0
ILH
PLH
(29)
where �he�is the volume-averaged electron den-sity. Due to the total plasma current being keptconstant by a feedback mechanism, the ohmiccurrent gain k3 is the same (in absolute value) asthe non-inductive current drive gain, and can beexpressed as a function of the non-inductive cur-rent drive efficiency hCD,
k3= −hCD
r0he
(30)
The time constant t3 describes how quickly theohmic part of the plasma current (x3) decayswhen a non inductive current is created in theplasma. This should occur as a result of theplasma current feedback mechanism. For con-stant plasma current, inductance and resistance,the following relationship must hold

J.A. Romero et al. / Fusion Engineering and Design 43 (1998) 37–58 45
I−I. =−
MT
Rs
LT
RT
s+1VT (31)
Since LT#180×10−3 H, RT#30×10−6 V, thetime constant of the transformer current in theprimary winding is extremely slow, LT/RT#6000 s, and Eq. (31) can be simplified to
I−I.#−MT
RRT
LT
VT (32)
Therefore, for constant plasma current, induc-tance and resistance, the time constant involved inthe ohmic current decay is the same as theflywheel generator output voltage VT responsetime. For the flywheel generator at JET, this is�0.15 s [16].
There are many discharges in which stationaryconditions are not attained, and it is thereforedifficult to obtain the model parameters using Eq.(27). In these cases, the model parameters ki, ti
can be estimated from the measured time tracesx1, x2, y by minimizing the loss function
o(ki, ti)=o(ki, ti)= �y− y �+ %i=1, 2
�xi− xi�,(33)
with respect to ki, ti. The model output y andinternal states xi are calculated from Eq. (21) andEq. (25). This parameter estimation technique isknown in the literature as the output errormethod (OE) [5].
Figs. 4 and 5 demonstrate a fitting example forthe states xi and the resulting loop voltage com-pared with the actual data. The third state (ohmiccurrent) is not shown due to it being directlyrelated to the lower hybrid power input, with afixed time constant t3=0.15 s. The parametersobtained were
k1= −3.2×10⁻¹² eV−3/2 W−1,
k2= −0.024×10⁻⁶ W−1,
hCD=1.18×10¹⁹ m−2 A W−1,
t1=0.04 s,
t2=0.05 s. (34)
The physical parameters of the discharge were
r0=2.96 m,
I=2.5 · 106 A,
Zeff=2.5,
ne=2 · 1019 m−3. (35)
One of the most important parameters in thismodel is the current drive efficiency. The experi-mentally determined current drive efficiency at JETincreases with the electron temperature [17], there-fore, in principle, the gain k3 must also be corre-lated with x1. This has not been taken into accountin the state space model, and the effective steadystate gain k3 is assumed to combine these effects.
3.3.1. Noise and perturbationsThe output equation (Eq. 21) was obtained
from the loop voltage measurement equation as-suming constant plasma current. However, ac-cording to Eq. (13), small oscillations of theplasma current around its equilibrium value intro-duce an additive perturbation w in the loopvoltage given by
w=m0r0(li+ le)dIdt
(36)
This perturbation can be seen in Fig. 5 as a smalloscillation of the loop voltage signal that is notreproduced in the simulation.
The loop voltage also has a component due tothe plasma movement. If c is the flux relative tothe flux surface corresponding with the measuringloop, and u is the velocity of this flux surfacerelative to the location of the measuring loop,then the convective time derivative gives the mea-sured loop voltage as:
Vl= −2pdc
dt= −2p
�(c(t
+ (u · 9)c�
(37)
To distribute the power load in the divertor tiles,the x-point is sometimes made to oscillate. This isachieved by modulating the current in the divertorcoils with a frequency of 4 Hz. This produces amovement of the flux surfaces relative to themeasuring loop. As a consequence of this move-ment, a low frequency noise appears in the loopvoltage and indeed in almost all magnetic diag-

J.A. Romero et al. / Fusion Engineering and Design 43 (1998) 37–5846
Fig. 6. Loop voltage feedback loop.
nostics. The solution to this consists of strongfiltering of the loop voltage signal with a 1 Hzcutoff low pass filter, whose equivalent transferfunction is
F(s)=38
s2+9s+38, (38)
where s is the Laplace operator. The divertor hasbeen replaced recently by the Mark II divertor[18], with better power handling that makes thedivertor sweep unnecessary.
3.4. Loop 6oltage transfer function
The former non-linear state space model can beapproximated by a linear transfer function withthe same frequency response at low frequencies, inthe form
G(s)=V(s)
PLH(s)#F(s)
�kres+skder
ts
�e− tds (39)
where it has been considered that t1#t2#ts,t3#0. The resistive loop voltage gain kres is
Fig. 7. Simulation of the loop voltage control system step response for three proportional gain values.

J.A. Romero et al. / Fusion Engineering and Design 43 (1998) 37–58 47
Fig. 8. Loop voltage control with kp= −3.
kres=c1(x3�t=0k1+ x1�t=0k3)
=V res�t=0� D�Te
−3/2��Te
−3/2�t=0DPLH
−hCD
r0heI�
(40)
where the resistive loop voltage initial valueV res�t=0 is calculated just before lower hybridpower is applied,
V res)t=0=V �t=0−
(
(t(LI)�t=0, (41)
and the gain kder accounts for the derivative con-tribution to the loop voltage,
kder=c2k2+c1tsx1)t=0k3
=m0
r0
2I
DliDPLH
−V res)t=0
hCD
r0heIts (42)
The term D�Te−3/2�/�Te
−3/2�t=0DPLH representsthe relative reduction in the plasma resistance perunit of lower hybrid power, and Dli is the internalinductance reduction when DPLH lower hybridpower is applied.
3.5. Loop 6oltage control
The objective of loop voltage control is toregulate the non-inductive current drive in theplasma. The experimental conditions for the firstcontrol experiments are chosen to generateenough non-inductive current in the plasma toobtain a substantial loop voltage reduction. Themaximum lower hybrid power to be used in theexperiments is limited to 5 MW. Considering anaverage electron temperature �Te�=1.5×10³ eV, the current drive efficiency is hCD=1.6×10¹⁹ A m−2 W−1 [17]. In order to obtain 50% ofthe plasma current driven non-inductively in adischarge with I=2.5 · 106 A and Pmax=5 MW,a density lower than heB2 · 1019 m−3 is neces-sary (Eq. 29). The averaged plasma density vol-ume is therefore chosen as
�he�=2 · 1019 m−3
When a residual (ohmic) electric field is presentin the plasma, the fast electrons can be acceleratedtowards higher energies by the slide-away effect.

J.A. Romero et al. / Fusion Engineering and Design 43 (1998) 37–5848
In contrast with the runaway situation, the elec-trons are not accelerated indefinitely, however, anupper energy limit exists determined by the Parail-Pogutse instability [19]. This effect can alter thedynamics of the fast electrons and potentiallyperturb the experimental conditions. To avoid theslide-away effect, the residual electric field respon-sible for the acceleration of the fast electrons mustbe reduced. This can be achieved by choosing asignificant reduction of the loop voltage, ideallyV=0, which guarantees full non inductive currentdrive and avoids transformer recharging.
The loop voltage controller design will be basedon the following experimental conditions
I=2.5 · 106 A
ne=2 · 1019 m−3
�Te�#1.5 · 103 eV (43)
3.5.1. Controller designIn this section, the design for the loop voltage Vl
controller is presented. As seen in the previoussection, the model for Vl does not have a pureintegrator. Therefore, a proportional integral (PI)controller is the minimum requirement in order toachieve control without steady state error. The PIcontroller designed in this section will serve as astarting point for the first control experiments.
The transfer function between the loop voltageand the lower hybrid power demand is obtainedfrom Eq. (39)
G(s)= (1−Rc)F(s)�kres+skder
tss+1�
e− tds (44)
where Rc is the reflection coefficient, e.g. thefraction of lower hybrid power reflected back fromthe plasma. Rc is an exponential function of thedistance between the LH antenna and the plasmaboundary, and is subject to uncertainties andperturbations. For this reason, Rc is usually feed-back controlled at 3% (Rc=0.03) by movement ofthe LH launcher around an equilibrium distancefrom the plasma [20].
The controller is to be used in a semi-stationarysituation where the plasma current is kept con-stant and the plasma current profile is not chang-ing. At the initial state before the feedback loop is
closed, the derivative contribution is negligible andthe initial value of the loop voltage is only resis-tive. Taking V0
res=V0=0.2 V, and evaluating theparameters kres, kder (Eqs. 40 and 42) with theexperimental conditions (Eq. 43), the transferfunction parameters (Eq. 39) are obtained as
kres= −0.05×10⁻⁶ V W−1,
kder= −0.04×10⁻⁶ V W−1
ts=1 s,
td=0.12 s (45)
and the transfer function used for the design is
G(s)#−10−6F(s)�0.04 s+0.05
s+1�
e−0.12 s (46)
The control system structure is shown in Fig. 6.The loop voltage is obtained from the loop placedon the bottom of the machine and outside thevessel.
A PI (proportional integral) controller is usedfor the design. The equivalent transfer function ofthe PI controller in the continuous time domain is
C(s)=kp�
1+1
sTi
�(47)
The proportional gain kp and integral term Ti areselected to obtain the maximum phase and gainmargins for the closed loop system without mak-ing it too slow [21]. The integral term set toTi=0.2 s. Using the discrete equivalent systemwith T=50 ms, a critical gain of kc= −24 iscalculated. If kpBkc, the closed system will beunstable. Fig. 7 shows the step response of theclosed loop system for several values of the pro-portional gain kp\kc. The response correspond-ing with kp= −8 lies within 5% of the referencevalue in �1.5 s. The phase Pm and amplitude Gm
margins of the closed loop system correspondingwith kp= −8 are
Gm=9.5 dB
Pm=62° (48)
3.5.2. Experimental resultsIn order to adjust the gain in the feedback loop,
three control experiments were performed. To
J.A. Romero et al. / Fusion Engineering and Design 43 (1998) 37–58 49
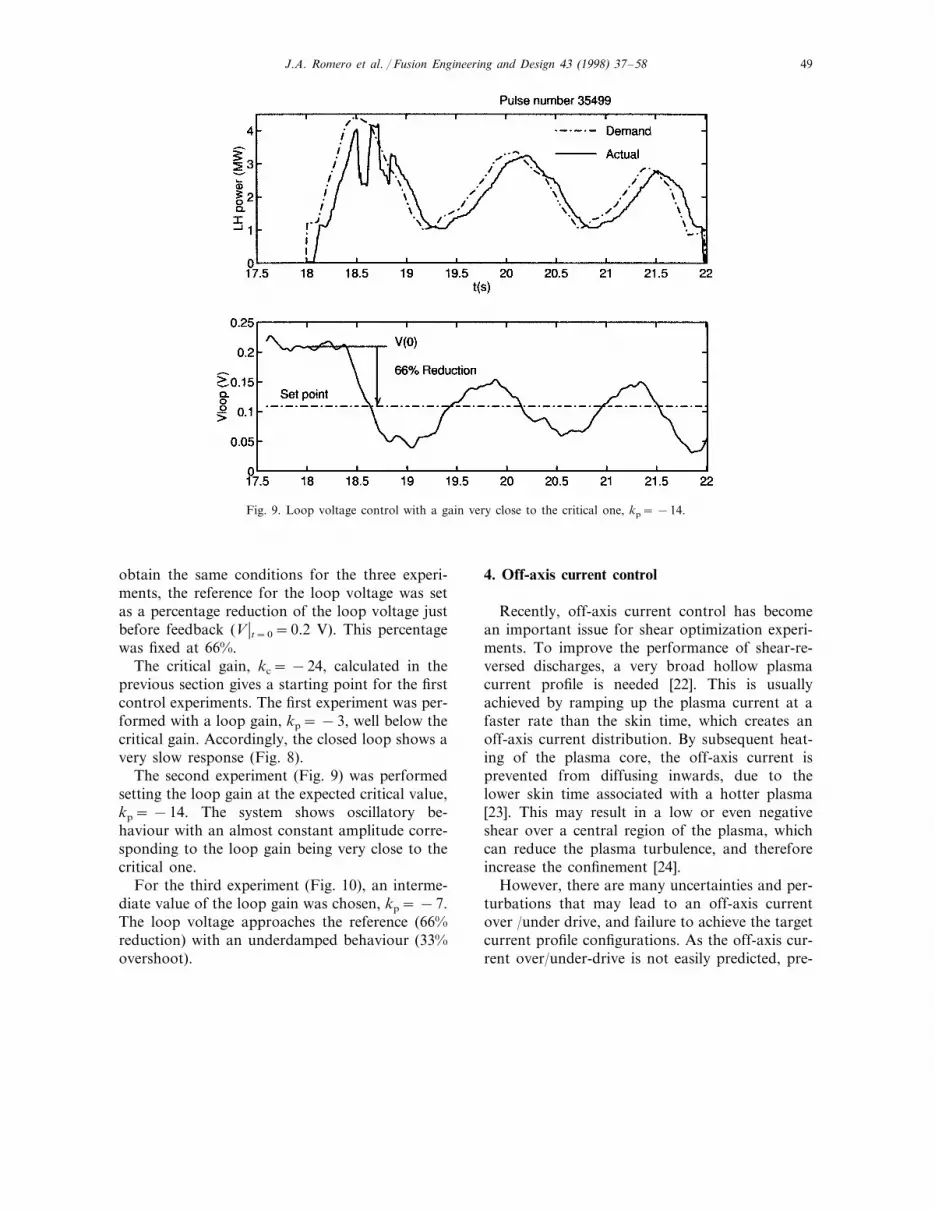
Fig. 9. Loop voltage control with a gain very close to the critical one, kp= −14.
obtain the same conditions for the three experi-ments, the reference for the loop voltage was setas a percentage reduction of the loop voltage justbefore feedback (V �t=0=0.2 V). This percentagewas fixed at 66%.
The critical gain, kc= −24, calculated in theprevious section gives a starting point for the firstcontrol experiments. The first experiment was per-formed with a loop gain, kp= −3, well below thecritical gain. Accordingly, the closed loop shows avery slow response (Fig. 8).
The second experiment (Fig. 9) was performedsetting the loop gain at the expected critical value,kp= −14. The system shows oscillatory be-haviour with an almost constant amplitude corre-sponding to the loop gain being very close to thecritical one.
For the third experiment (Fig. 10), an interme-diate value of the loop gain was chosen, kp= −7.The loop voltage approaches the reference (66%reduction) with an underdamped behaviour (33%overshoot).
4. Off-axis current control
Recently, off-axis current control has becomean important issue for shear optimization experi-ments. To improve the performance of shear-re-versed discharges, a very broad hollow plasmacurrent profile is needed [22]. This is usuallyachieved by ramping up the plasma current at afaster rate than the skin time, which creates anoff-axis current distribution. By subsequent heat-ing of the plasma core, the off-axis current isprevented from diffusing inwards, due to thelower skin time associated with a hotter plasma[23]. This may result in a low or even negativeshear over a central region of the plasma, whichcan reduce the plasma turbulence, and thereforeincrease the confinement [24].
However, there are many uncertainties and per-turbations that may lead to an off-axis currentover /under drive, and failure to achieve the targetcurrent profile configurations. As the off-axis cur-rent over/under-drive is not easily predicted, pre-

J.A. Romero et al. / Fusion Engineering and Design 43 (1998) 37–5850
Fig. 10. Loop voltage control with kp= −7.
programming of the ramp rate to control theoff-axis current is cumbersome, and numerousdischarges are required for commissioning.
An improved approach is to control the off-axisplasma current being generated directly, so thatinstead of imposing waveforms for the currentramps, reference waveforms are imposed in thedesired off-axis current.
The second moment of the plasma current dis-tribution contains information about the off-axiscurrent profile distribution, and feedback controlof the second current moment can be used foroff-axis current regulation.
Lower hybrid waves can also be used to helpbroaden the profile during the current raise phase.In this section, the design stages and experimentalresults of the second current moment Y2 controlusing lower hybrid waves are presented.
4.1. Second current moment definition
Traditionally, low order current moments ofthe plasma current distribution have been used to
obtain global plasma parameters such as the totalplasma current I (zero order moment) or thecoordinates (r0, z0) of the plasma current centroid(first current moment).
The second current moment of a current distri-bution is defined as
y2=
&V
jff2dA
I(49)
In our case, the integration region V is theplasma section bounded by the LCFS. I is thetotal plasma current, and f2 is a weighting onthe current density profile. The weighting f2 ischosen to satisfy the homogeneous Shafranovequation
D*f2=0
and is given by
f2=�r−r0
2r0
+1�2
(r−r0)2−�r−r0
r0
+1�2
(z−z0)2
(50)

J.A. Romero et al. / Fusion Engineering and Design 43 (1998) 37–58 51
The weighting function f2 increases in value withthe distance from the plasma current centroid,resulting in a higher weighting for the off-axisregion of the current distribution. If the integra-tion region is bounded by the plasma boundary,the integral (Eq. 49) can be expressed as a lineintegral of the poloidal magnetic field Bu alongthe plasma boundary G
y2=
7G f2Budl
m0l(51)
Due to the asymmetry in the z and r componentsin the weighting f2, (Fig. 11), the integral in Eq.(49) is sensitive to the plasma elongation. Thiswas first realized by Zakharov and Shafranov[25], who proposed the second current momentfor plasma elongation determination. However,since the weighting f2 increases with the distanceto the plasma current centroid, the plasma currentdensity profile jf has a higher weighting in theoff-axis region, and the integral (Eq. 49) alsocontains information regarding the off-axis cur-
rent profile distribution. The integral (Eq. 49) issensitive to both plasma elongation and off axiscurrent, and the relative influence of each contri-bution is left undetermined. A straightforwardsolution to this problem is to normalize Eq. (49).The normalized second current moment is thendefined as
Y2=
&V
jf f2dA
I
&V
dA&V
f2dA(52)
The normalization factor
Y2=
&V
jf f2dA
I
&V
dA&V
f2dA.
is introduced to obtain a dimensionless quantitythat is independent of the plasma shape. This typeof calculation is only possible in equilibrium re-construction codes, as direct magnetic field mea-surements are not possible at the plasmaboundary. In the following text, the second cur-rent moment refers to the normalized second cur-rent moment Y2.
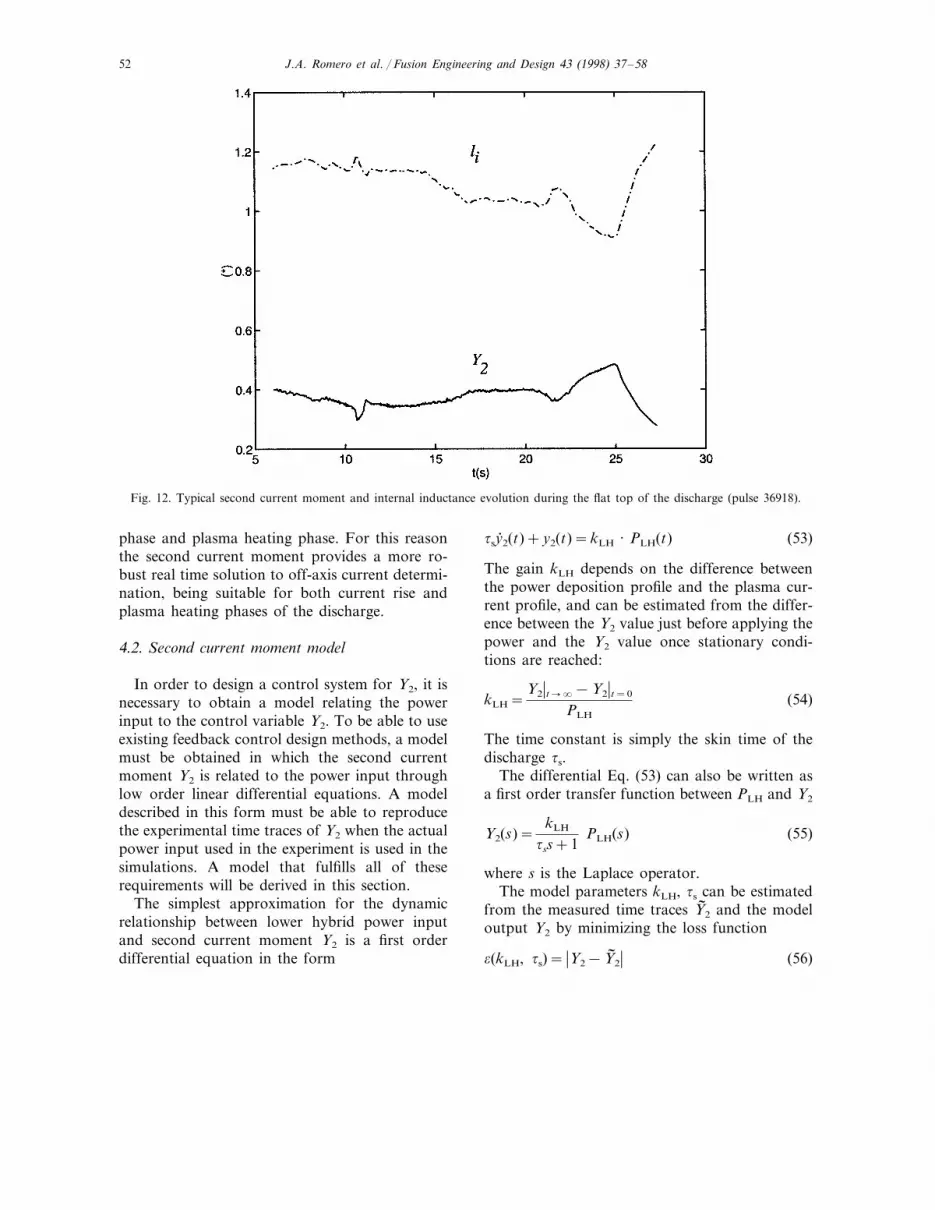
At JET, the second current moment is availablein real time from a fast equilibrium reconstructionsystem [26]. This allows use of the second currentmoment for real time off-axis current control. Fig.12 shows the typical evolution of the secondcurrent moment and internal inductance. Whenthe off-axis current increases the internal induc-tance decreases and the second current momentincreases. During the flat top of the discharge,second current moment and internal inductancecontain similar information about the off-axiscurrent profile.
However, the real time determination of theinternal inductance at JET is very sensitive toerrors on the plasma boundary reconstructionduring the initial current rise phase of the dis-charge. Plasma pressure anisotropy can also leadto errors on the diamagnetic beta, b calculationduring the high power heating phase [27]. Theseerrors in b are additive to the li calculation [28]
In contrast, the second current moment calcula-tion is very reliable both in the plasma current rise
Fig. 11. Contour plot for the weighting function f2 with r0=3m, z0=0.
J.A. Romero et al. / Fusion Engineering and Design 43 (1998) 37–5852
Fig. 12. Typical second current moment and internal inductance evolution during the flat top of the discharge (pulse 36918).
phase and plasma heating phase. For this reasonthe second current moment provides a more ro-bust real time solution to off-axis current determi-nation, being suitable for both current rise andplasma heating phases of the discharge.
4.2. Second current moment model
In order to design a control system for Y2, it isnecessary to obtain a model relating the powerinput to the control variable Y2. To be able to useexisting feedback control design methods, a modelmust be obtained in which the second currentmoment Y2 is related to the power input throughlow order linear differential equations. A modeldescribed in this form must be able to reproducethe experimental time traces of Y2 when the actualpower input used in the experiment is used in thesimulations. A model that fulfills all of theserequirements will be derived in this section.
The simplest approximation for the dynamicrelationship between lower hybrid power inputand second current moment Y2 is a first orderdifferential equation in the form
tsy; 2(t)+y2(t)=kLH · PLH(t) (53)
The gain kLH depends on the difference betweenthe power deposition profile and the plasma cur-rent profile, and can be estimated from the differ-ence between the Y2 value just before applying thepower and the Y2 value once stationary condi-tions are reached:
kLH=Y2�t��−Y2�t=0
PLH
(54)
The time constant is simply the skin time of thedischarge ts.
The differential Eq. (53) can also be written asa first order transfer function between PLH and Y2
Y2(s)=kLH
tss+1PLH(s) (55)
where s is the Laplace operator.The model parameters kLH, ts can be estimated
from the measured time traces Y0 2 and the modeloutput Y2 by minimizing the loss function
o(kLH, ts)= �Y2−Y0 2� (56)

J.A. Romero et al. / Fusion Engineering and Design 43 (1998) 37–58 53
Fig. 13. Second current moment simulation with a first order differential equation. Time constant is 1.15 s.
with respect to kLH, ts. The model output Y2 iscalculated from
Y: 2= −1ts
(Y2−Y0 2�t=0)+kLH
ts
PLH (57)
where the operation point Y0 2�t=0 is chosen as theinitial value of the second current moment justbefore lower hybrid power is applied. Fig. 13shows a fitting example for shot 33151. Theparameters obtained were kLH=0.034 MW−1
and ts=1.15 s. As seen from this example, thesecond current moment evolution due to thelower hybrid power is easily modelled by a first
order differential equation with just two parame-ters, a gain kLH and a time constant ts.
The model parameters have been found for twosets of experimental conditions of interest. Theseinclude:
(1) The initial plasma current raise phase justafter the x-point formation of shear optimizationexperiments.
(2) The steady state phase of 3 MA dischargeswith volume averaged density �he�$ (2×10¹⁹)and temperature (Te)$ (1−2.5) KeV.
The parameters kLH, ts obtained for these twoscenarios are summarised in the table below:
�ne�I (MA) �Te� kLH ts (s)(KeV) (W−1)
0.0353 2×l019 0.5–31–2.5×10⁻⁶
0.50.06010.5�2 1×l019
×10−6Fig. 14. Overview of the second current moment controlsystem using lower hybrid waves.
J.A. Romero et al. / Fusion Engineering and Design 43 (1998) 37–5854
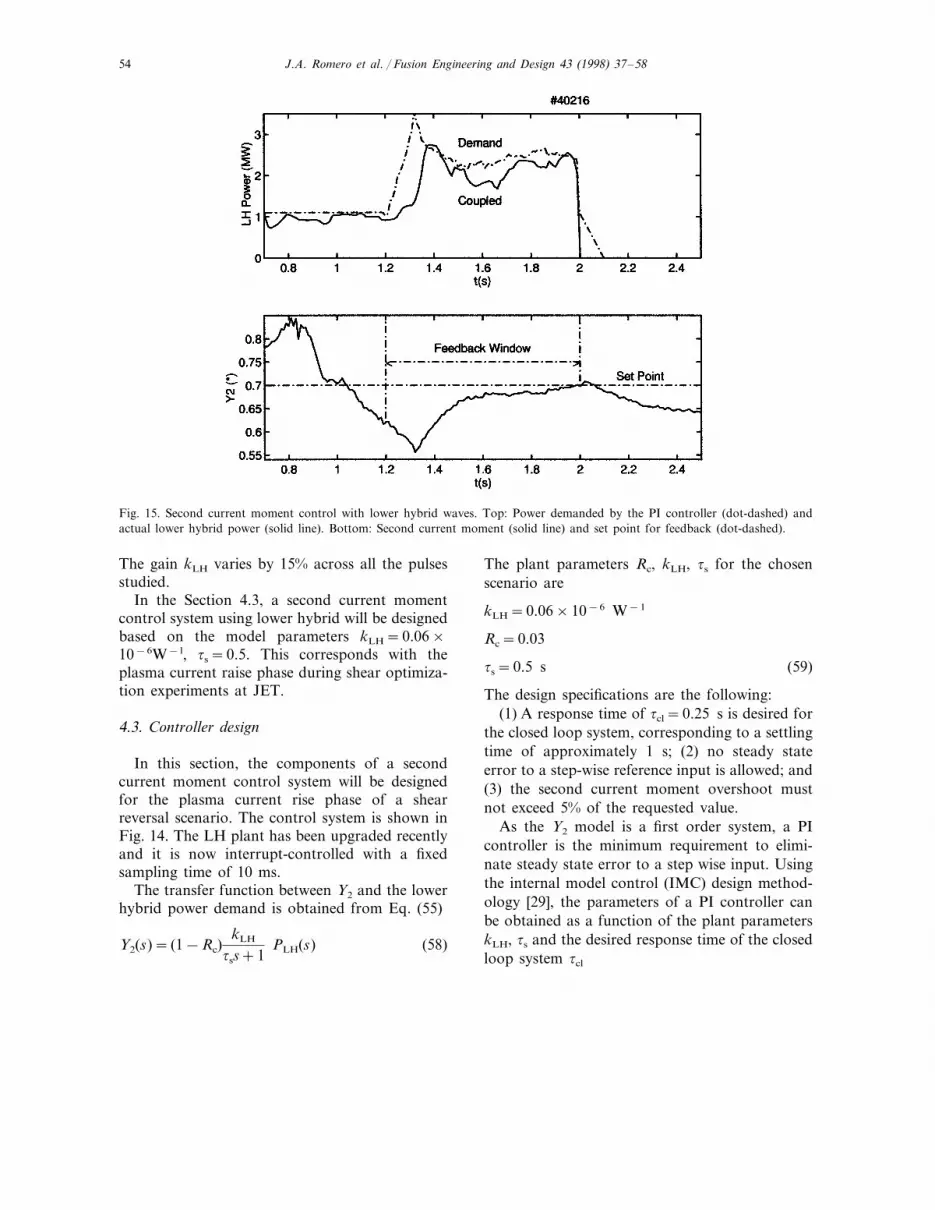
Fig. 15. Second current moment control with lower hybrid waves. Top: Power demanded by the PI controller (dot-dashed) andactual lower hybrid power (solid line). Bottom: Second current moment (solid line) and set point for feedback (dot-dashed).
The gain kLH varies by 15% across all the pulsesstudied.
In the Section 4.3, a second current momentcontrol system using lower hybrid will be designedbased on the model parameters kLH=0.06×10⁻⁶W− l, ts=0.5. This corresponds with theplasma current raise phase during shear optimiza-tion experiments at JET.
4.3. Controller design
In this section, the components of a secondcurrent moment control system will be designedfor the plasma current rise phase of a shearreversal scenario. The control system is shown inFig. 14. The LH plant has been upgraded recentlyand it is now interrupt-controlled with a fixedsampling time of 10 ms.
The transfer function between Y2 and the lowerhybrid power demand is obtained from Eq. (55)
Y2(s)= (1−Rc)kLH
tss+1PLH(s) (58)
The plant parameters Rc, kLH, ts for the chosenscenario are
kLH=0.06×10⁻⁶ W−1
Rc=0.03
ts=0.5 s (59)
The design specifications are the following:(1) A response time of tcl=0.25 s is desired for
the closed loop system, corresponding to a settlingtime of approximately 1 s; (2) no steady stateerror to a step-wise reference input is allowed; and(3) the second current moment overshoot mustnot exceed 5% of the requested value.
As the Y2 model is a first order system, a PIcontroller is the minimum requirement to elimi-nate steady state error to a step wise input. Usingthe internal model control (IMC) design method-ology [29], the parameters of a PI controller canbe obtained as a function of the plant parameterskLH, ts and the desired response time of the closedloop system tcl

J.A. Romero et al. / Fusion Engineering and Design 43 (1998) 37–58 55
Fig. 16. Current rise phase of three consecutive shear optimisation discharges. Top: Lower hybrid power. Bottom: Second currentmoment Y2. Increasingly higher values of Y2 correspond with a progressive broadening of the plasma current profile.
Ti=ts,
kp=1
(1−Rc)kLH
ts
tcl
(60)
For the plant parameters (Eq. 59) and tcl=0.5 s,this gives
Ti=0.5 s,
kp=33×106 W (61)
4.4. Second current moment control experiments
As discussed earlier, the second moment of theplasma current distribution contains informationregarding the off-axis current profile distribution,and feedback control of the second current mo-ment can be used for off-axis current regulation inshear optimization experiments.
The second current moment feedback controlexperiment is shown in Fig. 15. The aim of theexperiment was to broaden the current profile atan early stage of the discharge. To achieve this, 1MW of lower hybrid power was used in the initial
phase to provide central heating and to slowdown the current diffusion during the ramp-up.The feedback starts at t=1.2 s, �100 ms beforethe x-point formation. After the x-point forma-tion at t$1.3 s, the lower hybrid deposition shiftsoff-axis, providing off-axis current drive/heating.This helps to broaden the profile further, and att=2 s the second current moment set point forfeedback (0.7) is reached. The end of the LH pulsewas also scheduled at t=2 s to avoid a possibleplasma disruption triggered by an excess of LHcurrent drive in the off-axis region.
Three consecutive discharges with increasinglyhigher values of the second current moment areshown in Fig. 16. These correspond with a pro-gressive broadening of the plasma current profileduring the current rise phase. The correspondingdeuterium–deuterium nuclear reaction rates (Rdd)achieved during the neutral beam (NB) heatingphase are shown in Fig. 17. These experimentshave shown that there is a strong correlationbetween the second current moment values justafter the LH pulse and the maximum reaction

J.A. Romero et al. / Fusion Engineering and Design 43 (1998) 37–5856
Fig. 17. High power heating phase of three shear optimisation discharges. Top: Neutral beam power. Bottom: Neutron yield Rdd.The maximum Rdd values during the NB heating phase are correlated with the Y2 values just after the LH pulse (Fig. 16).
rates Rdd achieved during the high power NBheating phase. The discharge (40216) has a reac-tion rate Rdd that is 60% higher than the preced-ing one (40214), as shown in Fig. 17. Thisincrement can not be explained by a higher levelof NB power as the NB power for both shots isroughly the same. The increment in Rdd is theresult of an improvement of the energy confi-nement in the plasma induced by the broadeningof the current profile during the current risephase. This is a general result observed duringshear optimization discharges with lower hybridat JET.
5. Conclusions
A current profile control system has been devel-oped and tested at JET. Two separate controlloops have been implemented for the LHCD sys-tem, non-inductive current control and off-axiscurrent control.
For current profile control at JET, only mag-netic diagnostics are available. From these, theloop voltage has been selected for non-inductivecurrent control and the normalised second currentmoment has been selected for off-axis currentcontrol. These provide relatively simple measure-ments and calculations suitable for real timeoperation.
A Poynting’s theorem energy balance of theTokamak has been performed and exact expres-sions for the Tokamak circuit elements R, L−M, I. have been obtained in a way that isconsistent with loop voltage measurements.
When the evolution of R, L−M, I. in time isrelated to lower hybrid power input, the loopvoltage is best described by a state space model inwhich the internal states are related to these cir-cuit elements. Based on this, a state space modelof a Tokamak for loop voltage control purposeshas been presented and validated against JETdata. Similarly, a transfer function model betweenthe lower hybrid coupled power and the nor-

J.A. Romero et al. / Fusion Engineering and Design 43 (1998) 37–58 57
malised second current moment has been ob-tained. These models have proved to be veryuseful for the design of the loop voltage andsecond current moment control systems.
The first experimental results with the systemhave been presented. Loop voltage has been con-trolled at 66% reduction in 2.5 MA discharges.Second current moment control has been used inthe initial current raise phase of shear optimiza-tion experiments to broaden the current profile,and has contributed to a 60% improvement of thefusion yield performance. This illustrates the po-tential benefits of current profile feedback controlsystems for future devices such as ITER [30]where confinement and stability are crucial.
Acknowledgements
This paper is part of the work carried out bythe first author in fulfillment of the requirementsfor obtaining a Doctorate degree (UniversidadNacional de Educacion a Distancia, Madrid,Spain). The work described in this paper has beenperformed in the framework of an EuropeanCommission research training program.
References
[1] JET-Team, Design, construction, and first operationalexperience with the Joint European Torus (JET). FusionTechnol. 11 (l) (1987) 13–281.
[2] N.J. Fish, Theory of current drive in plasmas, Reviewsof Modern Physics, January 1987, pp. 175–234.
[3] M. Pain, H. Brinkschulte, G. Bosia, M. Brusati, J.A.Dobbing, A. Ekedahl, M. Gammelin, C. Gormezano, C.Idelon, J. Jacquinot, Gl Tessop, A. Kaye, M. Lenholm,J. Plancoulaine, Ph. Schild, A. Sibley, T. Wade, C.Walker, R. Walton, G. Wilson. The 15 MW microwavegenerator and launcher of the lower hybrid current driveexperiment on JET, Proc. IEEE 13th Symposium onFusion Engineering, Knoxville 2, 1989, pp. 1083–1088.
[4] J.M. Maciejowsky, Multivariable feedback design. Ad-dison-Wesley, Reading, MA, 1989.
[5] L. Ljung, System Identification, Prentice-Hall, Engle-wood Cliffs, NJ, 1987.
[6] N.H. Zornig, H.E.O. Brelen, A. Browne, M.L. Browne,T. Dobbing, C. Gormezano, J. How, F.A. Jesen, T.T.Jones, F.B. Marcus, Q.A. King, F. Rimini, J.A.
Romero, A.G.H. Sibley, F. Soldner, B.J.D. Tubbing.Experimental results using the JET Real Time PowerControl system, Proceedings 19th Symposium on FusionTechnology (SOFT-19), Lisboa, Portugal, September1996.
[7] B.W. Rice, D.G. Nilson, Wroblewski, Motional Starkeffect upgrades on DIII-D. Rev. Sci Instrum. 66 (1995)373–375.
[8] N.C. Hawkes, Design Study of a Motional Stark EffectDiagnostic for JET. JET-R (96)10.
[9] D.P. O’Brien, J.J. Ellis, J. Lingertat, Local expansionmethod for fast plasma boundary identification in JET,Nucl. Fusion 33 (3) (1993) 467-474.
[10] L. Spitzer, Physics of fully ionized gases. IntersciencePublishers, 1956.
[11] S.P. Hirsman, R.J. Hawryluk, B. Birge, Neoclasical con-ductivity of a Tokamak plasma, Nucl. Fusion 17 (3)(1977) 611-614.
[12] N.J. Fisch, Conductivity of RF-heated plasma, Phys.Fluids 28 (1) (1985) 245-247.
[13] H. Akaike, Information theory and an extension of themaximum likelihood principle. Proc. 2nd Int. Symp. In-formation Theory Supp. to Problems of Control andInformation Theory, 1972, pp. 267�281.
[14] J.A. Romero, Analisis, modelado y utilizacion de diag-nosticos magneticos en el control del perfil de corrienteen el Tokamak JET, PhD thesis, Universidad Nacionalde Educacion a Distancia (UNED), Madrid, Spain,November 1997.
[15] C. Litwin, Current diffusion and toroidal electric fieldresponse to a non-ohmic current drive, Phys. Plasmas 2(12) (1995) 4542-4550.
[16] M. Huart, Modelling and computer simulation of largeflywheel-generator-diode convertor for fusion experimentpulse load, Proc. 10th Symposium on Fusion Technol-ogy, Padova, Italy, September 1978, pp. 377�382.
[17] A. Ekedahl, Y. Baranov, J. Dobbing, B. Fisher, C.Gormezano, M. Lennholm, V. Pericolini-Ridolfini, F.Rimini, J.A. Romero, P. Shild, F. Soldner. Profile Con-trol in JET with Off-Axis Lower Hybrid Current Drive,Proc. 23rd EPS conference on Plasma Physics and Con-trolled Fusion, Kiev, Ukraine, 24�28 June, 1996.
[18] H. Altmann, E.B. Deksnis, J. Fanthome, C. Froger, C.Lowry, R. Mohanti, M. Nilsen, A. Peacock, M.A. Pick,D. Spencer, R.B. Tivey, G. Vlases. Design of the MKIIDivertor with large carbon-fibre composite (CFC) tiles,Proc. 18th Symposium on Fusion Technology, Karl-sruhe, Germany, August 1994, Vol. 1 pp. 275�278.
[19] V.V. Parail, O.P. Pogutse, Diffusion of runaway elec-trons in a Tokamak, Nucl. Fusion 18 (10) (1978) 1357-1362.
[20] M. Lennholm, Y. Baranov, J.A. Dobbing, A. Ekendahl,P. Finburg, B. Fischer, C. Gormezano, C. Gowers, A.Kaye, J. Plancoulanie, F.G. Rimmi, J.A. Romero, P.Schild, A. Sips, F. Smits, F.X, Soldner. Operation of the3.7 GHz LHCD System in JET, 16th Symposium ofFusion Engineering (SOFE), Champaign, USA, 1995.

J.A. Romero et al. / Fusion Engineering and Design 43 (1998) 37–5858
[21] K.Ogata, Discrete Time Control Systems. Prentice-Hall,Englewood Cliffs, NJ, 1987.
[22] B.W. Rice, Demonstration of high performance negativecentral magnetic shear discharges in the DIII-D Toka-mak, Phys. Plasmas 3 (5) (1996) 1983�1991.
[23] The JET Team, Optimisation of JET plasmas with cur-rent profile control, JET contributions to the 16th IAEAconference, Montreal, Canada, October 1996.
[24] E.J. Strait, Enhanced Confinement and Stability in DIII-D Discharges with Reversed Magnetic Shear, Phys. Rev.Lett. 75 (24) (1995) 4421-4424.
[25] L.E. Zakharov, V.D. Shafranov, Equilibrium of atoroidal plasma with non circular cross-section. Sov.Phys. Tech. Phys. 18 (2) (1973) 151�155.
[26] J. Ellis, The rapid determination of plasma equilibriumparameters at JET from external magnetic measurements,IAEA Technical Committe Meeting on Magnetica Diag-nosticos for fusion plasmas, Kharkov, Ukranine, October1994.
[27] A.J. Wooton, W.A. Copper, bp Analysis for TokamakPlasma With Anisotropic Pressure and Mass Flow,Plasma Phys. 24 (1982) 1183–1185.
[28] V.D. Shafranov, Determination of the parameters, b andli in a Tokamak for arbitrary shape of plasma pinch crosssection, Plasma Phys. 13 (1970) 757-762.
[29] M. Morari, Robust Process Control, Prentice-Hall, En-glewood Cliffs, NJ, 1989.
[30] P.H.. Rebut, ITER: The first experimental fusion reactor,Fusion Eng. Des. 30 (1995) 85-118.
.


