Embed Size (px)
Citation preview
N080-630 ERIC REPORT RESUME
ED 010 081 10-06-66 24 (REV)Al EXPERIMENTAL STUDY IN THE USE OF PROGRAMED MATERIALS FORSEVENTH -GRAPE OPEN-ENDED LABORATORY EXPERIENCES.CARIES, PHYLLIS E.FDX17906 UNIVERSITY OF GEORGIA, ATHENSBR-5-8088
- -66ED RS PRICE MF-S0.36 HC-$8.48 227P.
*GENERAL SCIENCE/ *PROGRAMED INSTRUCTION, *SCIENCE LABORATORY,*PROBLEM SOLVING, *EFFECTIVE TEACHING, INSTRUCTIONAL TECHNOLOGY,SEVENTH GRADE, EDUCATIONAL EXPERIENCES, ATHENS, GEORGIA
A NONPROGRAMED METHOD FOR TEACHING SEVENTH-GRADE GENERAL SCIENCE WASSTUDIED, USING A PROBLEM-SOLVING APPROACH THROUGH SELECTED,OPEN-ENDED, LABORATORY EXPERIENCES. PARTICULAR REFERENCE WAS GIVENTO ANY STUDENT CHANGES IN (1) FACTUAL GAINS, (2) SUBJECT-MATTERCOMPETENCY, (3) COMPREHENSION OF SCIENTIFIC CONCEPTS, PRINCIPLES,AND GENERALIZATIONS, AND (4) SCIENTIFIC INTERESTS. THE STUDENTSAMPLE WAS ASSIGNED TO FOUR ACADEMIC TEAMS OF FOUR TEACHERS EACH INTHE RESPECTIVE AREAS OF ENGLISH, MATHEMATICS, HISTORY, AND SCIENCE.THIS TEAM-STUDENT POPULATION WAS DIVIDED INTO 4 SECTIONS, WITH EACHSECTION HAVING APPROXIMATELY 30 STUDENTS, rim PROVIDING 2EXPERIMENTAL AND 2 CONTROL STUDY GROUPS. THF PROGRAM DEVELOPED FORTHE STUDY CONTAINED IN ITS FINAL VERSION 6 LESSONS OF ANINTERDISCIPLINARY NATURE TOTALING 590 LINEAR FRAMES. DATA WEREOBTAINED FROM THE FOLLOWING SOURCES (1) ACADEMIC AND GUIDANCERECORDS, (2) RESULTS FROM A GENERAL INTEREST' SURVEY AND UNIT PRE-ANDPOST-TESTS, (3) 'RESULTS FROM AN EVALUATIVE QUESTIONNAIRE, AND t4)RECORDS OF NUMBER OF FRAMES MISSED IN EACH PROGRAMED LESSON. THEOPEN-ENDED, PROBLEM-SOLVING ASPECT OF THE PROGRAM WAS USED WITH BOTHEXPERIMENTAL AND CONTROL GROUPS. ONLY THE EXPERIMENTAL GROUPS,HOWEVER, RECEIVED PROGRAMED INSTRUCTION. IN THE END THE ACHIEVEMENTOF THE CONTROL GROUPS, AS MEASURED BY THE FACTUAL, CONCEPTUAL, ANDTOTAL MT-TEST SCORES, WAS SIGNIFICANTLY HIGHER THAN THAT OF THEEXPERIMENTAL GROUPS. THUS, THE NONPROGRAMED METHOD APPEARED THFBETTER FOR INSTRUCTIONAL PURPOSES. A NUMBER OF OTHER AREAS WERESUGGESTED FOR ADDITIONAL RESEARCH IN THE FIELDS OF GENERAL SCIENCEAND PROGRAMED INSTRUCTION BASED UPON THE RESULTS. (JH)
U. S. 0:Pf..7:11.:".:7.-1 D'":."1:1::-1 AIM ViELFAvri..i . %,
This docurmrsa 1.4 11 rnt2.1:Cd from I -eperzon ;c. ;' . opinio sstated do not ncl.c.s3.,IV Oliice of Educationposition or policy.
AN EXPERIMENTAL STUDY IN THE USE OF PROGRAMMED MATERIALS
FOR SEVENTH-GRADE OPEN-ENDED LABORATORY EIPERIENCES
by
PHYLLIS EILEEN CARNES
University of Georgia
Athens, Georgia 30601
1966
The research reported herein was supported by the
Cooperative Research grogram of the Office of Education,
U.S. Department of Health, Education, and Welfare.
0 lb
TABLE OF CONTENTS
Chaptsr Page
I. THE PROBLEM AND DEFINITION OF TERMS 1
Statement of the Problem 1Objectives 1Hypotheses 2Definition of Terms 3Basic Assumptions 7Significance of the Study 7Limitations of the Study 9Organization of the Remainder of the Study..., 10
II. REVIEW OF RELATED LITERATURE 12
The Development of Programmed Instruction 12Research Related to Programmed Material 18Research Related to Programmed Science Material 20Research Related to Programmed Laboratory Experiences 21
III. PROCEDURE 27
Experimental Design 27Subjects 27The Program 29Description of the Treatments 33Administration and Duration of Experiment 34Sources and rpes of Data 36Description of the Tests 39Treatment of Data from Evaluation Questionnaire 45Treatment of Data from Programmed Materials 48Statistical Analysis 49
IV. RESULTS 51
Achievement as Measured by the Posttest FactualScores 51
Achievement as Measured by the Posttest ConceptualScores 53
Achievement as Measured by the Posttest Total Scores 55Results of Adjusted Means for Factual, Conceptual,
and Total Posttests 55Results of Testing Means of the Population of
Differences 59Multiple AMlySis of Kuder General Interest
Survey (Form E) 61
iv
ChapterPage
V. DISCUSSION AND CONCLUSIONS 63
Main Effects 63Interaction of Main Effects 67Covariates
68Ruder General Interest Sulam (Form E) 69Conclusions 69
VI. SUMMARY AND IMPLICATIONS 71
Summary71
Implications for Further Research 82
BIBLIOGRAPHY
FOOTNOTE88
APPENDICES 89
A. THE PROGRAM AND SCIENCE WORKSHEETS 89
B. UNIT TEST AND EVALUATION QUESTIONNAM 189
C. DATA TABLES 201
D. EXPERIMENTAL SCHEDULE AND STUDENTS' COMMENTS AND
REACTIONS 210
LIST OF TABLES
Table
1 Research nesign
Page
28
2 -Indices of Item Difficulty, and Proportion ChoosingFour Options for Pretest
201
3 Indices of "item Difficulty, and Proportion ChoosingFour Options for posttest
203
4 Indices of Item Difficulty, Item Standard Deviation,and Item-Total Correlation for Pretest 205
5 Indices of Item Difficulty, Item Standard Deviation,and Item -Total Correlation for Posttest
6 Unadjusted Means, Standard Deviation, So..11Skewness, Apo , Kurtosis, and Sow for Pre- andPosttests
207
44
7 A Comparison of the Favorable, Indifferent andUnfavorable Responses to the Evaluation
Questionnaire ....v 47
8 Correlation Matrix for Programmed Lessons
9 Multiple Analysis of Variance and Covariance forPosttest Factual Scores
10 Multiple Analysis of Variance and Covariance forPosttest Conceptual Scores
11 Multiple Analysis of Variance and Covariance forPosttest Total Scores
209
52
54
56
12 Adjusted Means for Factual, Conceptual, and TotalPosttests
57
13 Unadjusted Corrected Means, Variances, Differences,Standard Errors of Differences, Correlations, andt Ratios for Control and Experimental Groups....
14 Multiple Analysis of Variance and Covariance forScientific Scales of Kuder General InterestSurvez (Form E)
vi
60
62
CHAPTER I
THE PROBLEM AND DEFINITION OF TEEMS
Statement of the Problem
The purpose of this study was to ascertain the effectiveness
of a non-programmed, problem-solving method of teaching seventh-grade
general science and that of a programmed, problem-solving approach
through selected, open-ended, laboratory experiences.
An environment for personal inquiry is being seen as a funda-
mental characteristic of the science program at all 16vels. Inquiry
is broadly defined as a search for truth, information, or knowledge.
Teaching science as inquiry should show students how knowledge arises
from the interpretation of data, that the interpretation of data
proceeds on the basis of concepts and assumptions that change as our
knowledge grows. Because these principles and concepts change,
knowledge changes also inasmuch as we know more, and better, than we
did before. The student should build up his store of knowledge in
connection with the laboratory experience, rather than go through
the laboratory experience merely to illustrate and clarify the
knowledge which he has acquired elsewhere.
Objectives
The specific objectives are listed below:
1. To compare the data for any significant gains in factual,
subject- matter competency as measured by the factual-
oriented posttest.
2. To compare the ds'a for any significant gain in the
comprehension of scientific concepts, principles, and
generalizations as measured by the conceptual-oriented
posttest.
3. To determine the difference between the mean achievement
of students using programmed materials and the mean
achievement of students using the non-programmed approach
as measured by the total posttest.
4. To ascertain if there are differences between the effects
of the two approaches concerning development of interest
in science as measured by the Kuder General Interest
Survey (Form E).
Hypotheses
This experiment was based upon the substantive hypothesis
that desirable change is brought about by the experimental treatment.
Therefore, the substantive or research hypothesis that the experimental
treatment will yield significant gain differences for the experimental
groups, as measured by the posttest, is stated. In order to test a
substantive hypothesis, however, it is necessary to present an opera-
tional hypothesis or hypotheses in quantitative and statistical terms.
The following operational hypotheses were tested in the null form:
1. There is no significant difference in factual, science
subject-matter competency between the control groups and
3
experimental groups as measured by the factual-oriented
posttest.
2. There is no significant difference in the comprehension
of scientific concepts, principles, and generalizations
for students taught by the programmed, laboratory approach
as compared with the gain for students taught by the
non-programmed technique as measured by the conceptual-
oriented posttest.
3. There is no significant difference between the mean achieve-
ment of students using programmed general science materials,
and the mean achievement of students using the non-
programmed approach as measured by the total unit posttest.
4. There is no significant difference concerning development
of interest in science for the students in the experimental
group as compared with students taught by the non-programmed
method as measured by the Kuder General Interest sum/
(Form 1:).
Definition of Terms
For the purpose of this study, the terms listed below have
the following meanings:
Conceit --an idea including many separate percepts; a mental
image of an event, a quality, or a quantity.
Generalization --the application of a general concept to a
relatively new object or situation; process whereby
11.0111m.
111111111110Mirose;iik-
4
one reaches a judgment applicable to a whole class
often on the basis of experience with a limited
number of the class.
Interest --an individualts preference for an activity in
reference to his degree of liking for alternate
activities as measured by a standardized inventory
such as the Kuder General Interest Survey (Form E).
Scientific Interest when capitalized, refers to the Scientific
scale of the Kuder General Interest Survey (Form E)
or the studentls score on this scale.
Science achievement the number of correct responses on a test
designed to assess the subjectls understanding of
the science subject matter, and the concepts,
principles, and generalizations relevant to the
respective curriculum pertaining to this study.
..Intellimaa Quotient --the deviation I.Q. taken from published
norms of the California Short-Form Test of Mental
Maturity, Junior Level.
Reading ll-raw score values for both reading vocabulary
and reading comprehension as assessed by the
California Achievement Tests, Junior High Level.
Science average --a value derived by assigning number values
to the five-letter grading scale as follows: A = 4;
B = 3; C = 2; D = 1; F = 0. For this study the science
average was obtained from the two quarters of the
5
seventh grade of the current academic year, 1965-1966.
Low abllitz. level --the I.Q. range from 75-89 of the population
under study as measured by the California Short-Fon,
Test of Mental Maturity, Junior 'lull Level.
Low average abilit level --the I.Q. range from 90-104 of the
population under study as measured by the California
Short-Form Test of Mental Maturity, Junior High Level.
High average ability level the I.Q. range from 105-119 of
the population under study as measured by the
California Short Form Test of Mental Maturity, Junior
High Level.
High abilit level --the I.Q. range from 120 up of the population
under study as measured by the California Short-Form
Test of Mental Maturity, Junior High Leval.
Stimulus statement, rule, principle, or example presented in
a manner designed to evoke a specific response from
a subject.
Response - -reply or reaction by a subject to a stimulus.
Frame --a unit in a programmed sequence arranged in a particular
pattern of stimulus, response,'and reinforcement.
Programmed instruction--- learning content arranged in frames
and presented in a sequence designed to elicit
specific responses, followed by immediate reinforcement.
Linear alsral--program in which learning content is divided
into small increments so arranged that there is
WIMP%
alkoliamallargirs..0.4
6
minimal possibility of subject errors.
Problem-solving autraclan orderly method of applying
inductive and deductive methods of reasoning to
perplexing, open-ended, laboratory experiences.
2plen -ended experiences --the open -endedness and inquiry value
of these experiences appear mainly in the form of
the questions that are asked in the body of the
directions. These questions lie at four levels:
(a) those which can be answered from the experience
at hand, (b) those which can be answered only after
considerable investigation and thinking, (c) those
which cannot be answered with certainty by the student
or anyone else, (d) those which probably cannot be
ahswered at all with our present state of knowledge.
Also under further investigations suggested at the end
of each of the programmed lessons, the experience is
open-ended in that the student may apply, indefinitely,
the principles learned to extensions of the same idea.
Non -2roza.nrned methoda method whereby students are taught
by a problem-solving, lecture-demonstration technique.
programmed methoda method whereby students are instructed by
means of a programmed, problem-solving, open-ended,
laboratory approach.
Treatment administration of the programmed sequence or the
nonprogrammed instructional procedures.
AAAsa....1,MFAA
7
Factual-criented test--a test with items designed for recall
of facts.
Conceptual-oriented test test items designed for measuring
a student's knowledge of certain concepts, and their
ability to apply concepts to a relatively new situation.
Total unit test --the combined factual-oriented and conceptual-
oriented test items.
Basic Assumptions
This study is dependent upon the following basic assumptions:
1. That the California Short-Form Test of Mental Maturity,
Junior High Level provides reasonably valid measures of
the student's language ability and non-language ability.
2. That the personal information provided by the student's
permanent record folder is correct.
3. That student responses to an evaluative questionnaire
are valid indications of their likes and dislikes
concerning programmed materials.
That the students' science teachers' assessment of their
performance, in the former quarters of the seventh grade,
is a valid indication of their performance level in science.
Significance of the Study
In teaching science, a continuing area of concern to educators
has been the problem of integrating laboratory experimentation with
S
scientific theory. The need to individualize course content for
students is also recognized. Programmed instruction may offer one
solution to both these difficulties. If the science curriculum can'
be programmed so that individual rates of learning can be dealt with
more effectively, and if laboratory materials can be developed which
enable students to conduct experiments efficiently on an individual-
ized basis, laboratory experimentation will be integrated more
satisfactorily into the typical science course. What is generally
considered an advantage of programmed instruptioa is the systematic,
controlled, and sequential fashion in which content is presented to
the learner. In programmed instruction provision can be made for
differentiating instruction to accommodate individual differences
(Fry, 1959; Stolurow, 1961; Travers, 1945). It is the consensus of
science educators that laboratory exercises must be incorporated into
the programmed sequence in order to receive full benefit of time
advantages in science courses.
A survey of the subject areas in which programmed instruction
has been used reveals that those areas which require laboratory-like
'activities are rare (Hanson, 1963). To the writer's knowledge, this
investigation should be unique in that no programmed, open-ended,
laboratory experiments on the junior high level have been developed
and tested previously. The conclusions from this study should aid in
evaluating the future program of seventh-grade science instruction,
and; concomitantly, should demonstrate what programmed, problem-solving,
open-ended, laboratory experiences could contribute, if any contribution,
9
to the whole spectrum of science disciplines.
A student's laboratory exercises should constitute experiences
which serve to help him discover and explore the principles being
studied. This study seeks to obtain evidence relevant to this problem
by investigating the results of using instructional materials which
were designed to be an exploratory experience dealing with problems
real to students.
The results of studies of programmed materials in general
are somewhat contradictory, The findings of this study will provide
additional insight into the effectiveness of programmed materials
as an instructional method.
The results of this study should be of value to educators
who are concerned with individualized instruction for upper elementary
and/or junior high school students.
Limitations of the Study
Some limitations of this study are:
1. The subjects included in the study were limited to those
students drawn from the seventh-grade population of the
Clarke County School System, Athens, Georgia, for the
academic year, 1965-1966.
2. The,study was limited to a total population of 221 students.
The four sections of experimental groups numbered 106.
The four sections of control groups numbered 115.
3. Due to the absences of the subjects on testing days,
10
incomplete data from cumulative records, or a studentts
failing to finish the experimental lessons, some students
were of necessity dropped from the study.
For administrative reasons, intact classes of seventh
graders had to be used for this study with the result
that groups could not be matched or randomly assigned at
the beginning of the study. However, the statistical
model wed compensated for original differences in the
groups in achievement and intelligence.
5. As has been cited by many investigators employing the
experimental group-control, group design in research, the
Hawthorne effect was potentially a contaminating factor.
The achievement of students who were in an experimental
group was affected by the mere fact that they were members
of an experimental group. It was also likely that members
of the control groups were aware of the experimental
nature of the study. The exact effects of these realiza-
tions can not be isolated, but the existence of these
effects must be recognized.
6. The only measure of student understanding of science in
this study was the posttest instrument designed by the
investigator.
Organization of the Remainder
of the Study
This chapter has presented a statement of the problem, its
11
objectives, hypotheses, definitions of terms, basic assumptions, and
limitations.
The second chapter presents a review of related research,
which includes a review of the development of programmed instruction,
studies dealing with programmed material, reviews of programmed
science materials, and research dealing with programmed laboratory
experiences. The third chapter gives descriptions of the subjects,
the experimental design, the program, description of the treatments,
administration and duration of the experiment, sources and types of
data, a description of the testing instruments, and the types of
statistical analyses used.
The fourth chapter presents results of the study; the fifth
chapter includes a discussion of findings and conclusions. A summary
and implications for further research are contained in the sixth
chapter.
CHAPTER II
REVIEW OF RELATED LITERATURE
Shortly after this century passed the half-way mark, followers
of educational research and industrial training began to observe the
emergence of a new method of learning. Actually, it was not new; it
had its beginning even in the days of Plato and Socrates--and perhaps
before. Attention as being drawn by the novelty of this method
inasmuch as it was diametrically opposed to the group lecture method
monopolizing the classroom of the twentieth century. This method was
programmed learning, regarded as a recent development because its
practical application to education has become apparent only in the
past few years.
Because of its recency in entering the educational stage, the
literature related to the development of programming is herein reviewed
as a general background for this study, as uell as its implementation,
developments concerning instruction in the sciences, and research
related to programmed laboratory experiences. The first section
presents a summary of the development of programming. The second
section presents n review of rerwarch of programmed inntruction as
an educational medium. The third section consists of reviews of
programmed science materials; the fourth encompasses the available
literature related to programmed laboratory experiences.
The Development of Programmed Instruction
One of the earliest programmers was Socrates, who developed a
13
program for geometry, which was recorded by Plato in the dialogue,
Meno. It was Socrates' method to guide his followers to knowledge
by conducting them conversationally along a path from fact to fact
and insight to insight. His method could merit being termed floral
programming" which Banks (1963) has employed at the United States
Air Force Academy in a course in aerodynamics using closed-circuit
television. Each student has a switch which he uses to indicate his
answer to key questions asked by the instructor throughout the lecture.
The instructor has a device which records the number of correct
answers and allows him to gauge the class's understanding of each
important point. A workbook of programmed exercises follows each
television presentation to reinforce the lecture.
Closer to our own times has come the tutorial method. This
was perfected by the colleges of the great English universities and
taken up by many of this country's colleges in one form or another.
The continuous exchange of questions and answers between the tutor
and his student, the unfolding of information and explanations, and
the constant selection of new materials on the basis of the student's
mastery of what has gone before is indeed a forerunner of programmed
instruction.
The antecedents of current programming practices are many;
however, the method as it is now employed may be considered to derive
from dynamic efforts begun in the 1920's (Lysaught and 'Williams, 1963).
In 1926 Sidney L. Pressey, an Ohio State University psychol-
ogist, made public his pioneer studies on the first recognized
14
teaching machine (pressey, 1926). His model originally was conceived
as a testing machine that presented a series of questions to a student
and informed him immediately whether his reply was right or wrong:
The machine was essentially a box containing a revolving drum; the
program was exposed through a slot in the box and the student indicated
his response by pressing one of four buttons. The correct button
released the drum and permitted the student to move on to the next
question; an incorrect response did not release the mechanism.
Pressey thought this principle to be useful; the student always found
the correct answer, and as the correct answer was always the last
answer given, it made the strongest impression on the student. By
a simple adjustment, the machine could be used for testing; it merely
progressed to the next question without regard to the student's
response (Fry, 1963).
Even though Pressey's devices initially emphasized the automa-
tion of testing rather than of instruction, it was evident that they
incorporated principles of learning enunciated by psychologists the
major emphases being on active participation, immediate confirmation,
and individual progression adapted to the capabilities of individual
learners (Bilgard, 1964).
Despite the promise of Pressey's experimental results and
his interest, along with others, in encouraging further research,
the movement in behalf of such devices lost its impetus. There are
perhaps at least two explanations for this loss of impetus. First, no
provision was made for systematic programming of materials to be used
15
in these machines, and second, the onset of the depression and its
impact on social conditions and education apparently offered an
unfavorable environment for such a revolution in the nationts schools.
By 1954, however, conditions in the world'had changed. Greater
knowledge in classroom behavior, especially about the analysis of
learning behavior, and a demand for education on an unprecedented
scale, created a vastly different set of circumstances. In this
fresh climate, two Harvard psychologists, B. F. Skinner and James G.
Holland, devised auto-instructional methods which have served the
current generation as the bases for its own excursions into pro-
grammed learning.
Skinner proposes that reinforcement is one of the essential
processes in an instructional program. There is acknowledgment or
reward of some kind to show that an organ:sm has performed to
satisfaction. Reinforcement theories have sprung from laboratory
observation and analysis of the learning behaviors of lower organisms.
However, a projection of their conclusions to human beings provides
new insight into the educational problems of teachers and psycholo-
gists alike.
Considerations of Skinner supplied the ingredient missing
from Pressey's experiments. It provided the idea of programming
instructional materials that Presseyls machines needed. This theory
has the further merit of complementing a body of educational beliefs
long utilized in classroom teaching. The idea of reinforcement
provides a rationale for believing that a complex body of learning
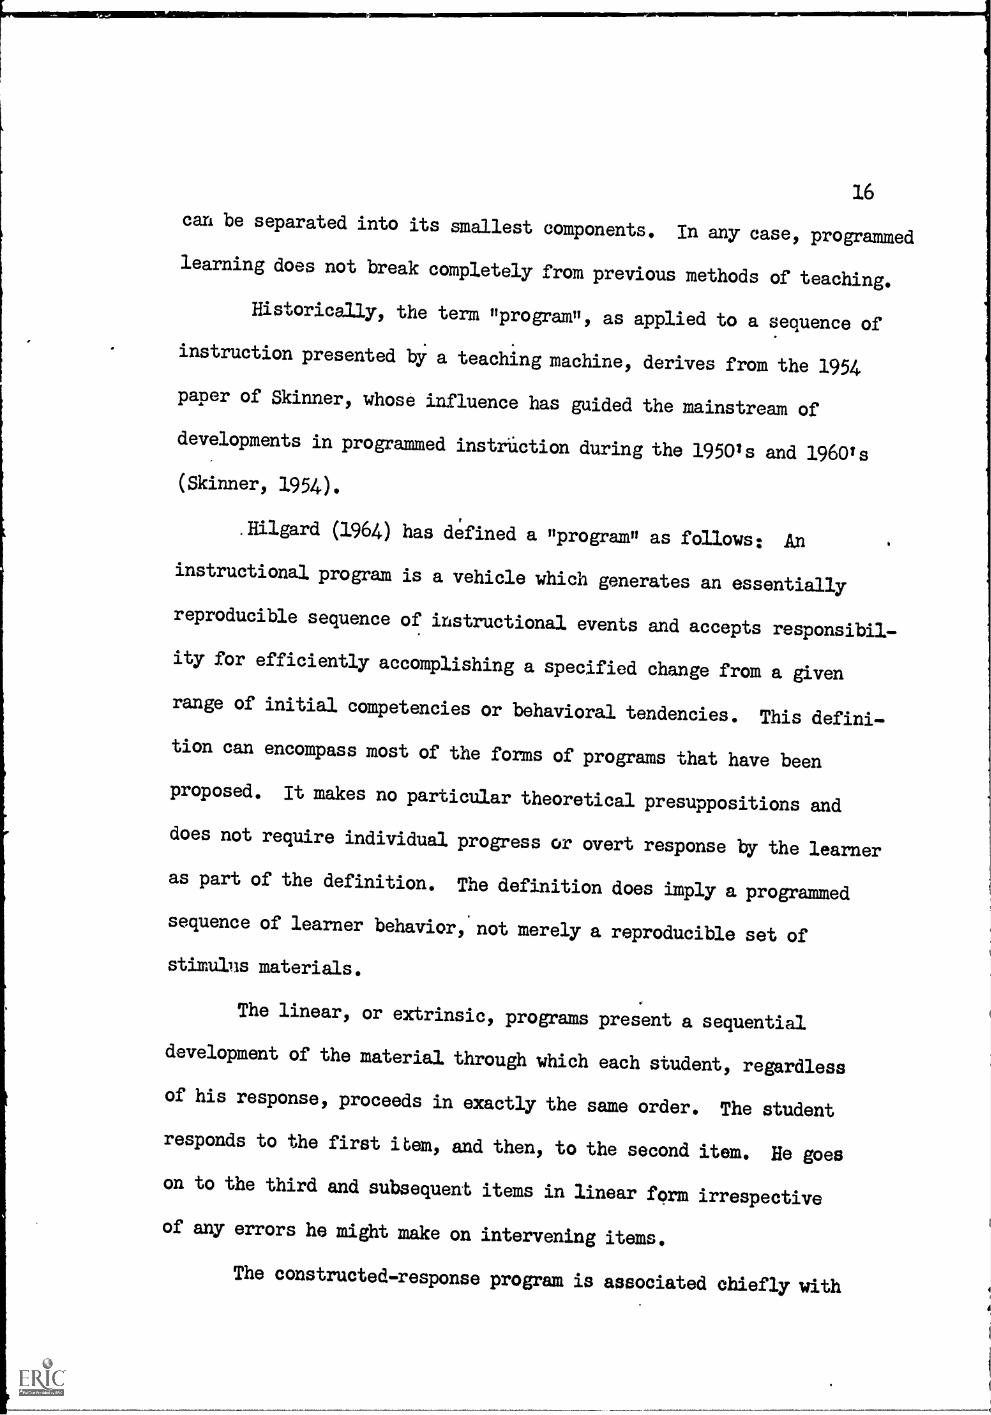
16
can be separated into its smallest components. In any case, programmed
learning does not break completely from previous methods of teaching.
Historically, the term nprogramP, as applied to a sequence of
instruction presented by a teaching machine, derives from the 1954
paper of Skinner, whose influence has guided the mainstream of
developments in programmed instruction during the 19501s and 1960's
(Skinner, 1954).
Bilgard (1964) has defined a "program" as follows: An
instructional program is a vehicle which generates an essentially
reproducible sequence of instructional events and accepts responsibil-
ity for efficiently accomplishing a specified change from a given
range of initial competencies or behavioral tendencies. This defini-
tion can encompass most of the forms of programs that have been
proposed. It makes no particular theoretical presuppositions and
does not require individual progress or overt response by the learner
as part of the definition. The definition does imply a programmed
sequence of learner behavior, not merely a reproducible set of
stimulus materials.
The linear, or extrinsic, programs present a sequential
development of the material through which each student, regardless
of his response, proceeds in exactly the same order. The student
responds to the first item, and then, to the second item. He goes
on to the third and subsequent items in linear form irrespective
of any errors he might make on intervening items.
The constructed-response program is associated chiefly with
17
the work of psychologist B. F. Skinner and his associates, including
James Holland. They believe that the absence of errors contributes
to more efficient learning, as a correct answer is in effect a
"reward" or "reinforcement" for the student; that is, knowledge
that he has answered correctly is stimulating and rewarding to the
student, and an incentive to greater effort or continued effort.
The second basic type of program is the so-called branching
or intrinsic program developed by Crowder (1959). In the branching
program, the student is presented with a problem and with several
alternative answers, one of which is correct. Uhen the student
chooses an answer he is instructed to move to a specified frame.
This frame then tells him if his answer was incorrect and explains
why it was incorrect. The frame then may return the student to the
original item which he had answered incorrectly for another trial,
or it -lay direct him through a subprogram--further instructing him
in the basic knowledge presumed to be necessary for the item he had
answered incorrectly. In either case, the student is eventually
returned to the missed item which he then, presumably, answers
correctly. If he again chooses an incorrect alternative, a similar
process is followed. Ultimately, he is returned to the missed item
and answers it correctly. He is then directed to the next frame in
the program where the same process may be repeated should he answer
that item incorrectly.
Branching programs are published in the form of scrambled
textbooks when the publication is in the form of a book. The scrambled
18
textbook arranges the frames and alternative answers to frames in
such a way that the student is directed to search through the book to
proceed to the next step. It does not move sequentially, page by
page, as does the linear program (Green, 1963).
Research Related to programmed Material
Literature referred to in this section is representative of
investigations related to programmed material.
Coulson and Si] erman (1960) gave branching and linear programs
to junior college students and found the linear, constructed-response
group had a higher mean score on the constructed-response section of
the test, but there was no difference on the multiple-choice test.
Fry (1960) used a linear program with either multiple-choice
or constructed responses to teach Spanish words and phrases to ninth-
grade pupils. The criterion test consisted of both types of items.
The conclusion reached from the data was that the constructed-
response method was superior for recall.
Larkin (1964) experimented with sixty children aged fourteen
years in using programs. No significant difference was found between
linear and branching methods of an immediate posttest consisting of
both composed and recognition items. Separate analyses of each section
of the test found neither program superior for recall or for recog-
nition. In addition there were no siglificant differences between
ability levels on either part of the test even though average
I.Q.s for the extreme groups differed by twenty points. Sixteen
19
weeks later the same test was administered again. Analysis of the
full test scores showed no advantage to either method of programming;
ability levels, were, however, significantly different on this
occasion.
In a second study, Larkin and Keith (1964), experimented to
ascertain whether younger pupils learn better from a linear,
constructed-response program or from a branching, multiple-choice
program. It was predicted that less mature pupils would learn and
retain more after using the constructed-response program. This
hypothesis was confirmed. Analysis of variance indicated that the
methods were significantly different. The significant ability-by-
method interaction showed that the branching program is less
effective with the lower ability groups.
Analyses of the scores on the constructed-response and also
on the multiple-choice items wera carried out. Thus the conclusions
of Fry, Coulson, and Silberman, referred to earlier, that a constructed-
response method results in higher scores on a constructed-response test
than does a multiple-choice method were confirmed.
Keislar (1959) investigated the relationship between intelli-
gence and programmed materials, correlating mental age with student
achievement in a linear program. The course content was based on
elementary concepts concerning rectangles. Fourteen experimental
subjects were selected from fifth and sixth grades and matched for
intelligence, sex, reading ability, and pretest scores. The rank
order correlation coefficient among the variables was reported as
20
modest.
Shay (1961) examined tne relationship of intelligence, in
respect to the probability of obtaining a correct response, to achieve-
ment. Ninety subjects were selected from the fourth grade on the
basis of scores on a group intelligence test and assigned to three
groups: above average, average, and below average. The programmed
content was a fourth-grade unit in Roman numerals. The results of
Shay's study indicate that differences in achievement occurred
consistently among the three intelligence groups, with the above
average group achieving at the higher level and the below average
group achieving at the lowest level.
McNeil and Keislar (1961) examined the relationships of sex
and intelligence on achievement in programmed instruction. Sex
differences were reported in favor of boys. The correlations of
intelligence and achievement ranged from 0.40 to 0.89.
A positive relationship between intelligence and mathematics
achievement was reported by Andrews (1.963) utilizing programmed
instruction with elementary school age subjects. Andrews found that
girls consistently exceeded boys in achievement during programmed
instruction.
Research Related to Programmed Science Material
Pollard (1964) using a card deck unit in biology in his
general science classes, reported that when two groups of students,
one using the card deck and the other exposed to conventional methods,
21
were tested, there was a significant difference in favor of the
experimental group. Scores showed a difference of 11.5 points, with
the experimental group having a mean 15.8 percent higher than the
mean of the control group.
Wong (1964), on the secondary level, described the processes
in producing three units in a biology class, but no data were
reported as to their implementation.
On the college level, Lawson (1960) presented data on a one-
week, scrambled-book, genetics unit. The sample consisted of ten
sections of students registered for a natural science course. Half
the sections were used as an experimental group and the other half
as a control. A, thirty-item objective test was administered which
was designed to measure the transfer of reasoning analysis and
application. The means and standard deviations of the scores were
determined for each group with t-test treatment. Results indicated
the difference in performance- was significant beyond the 0.01 level
in favor of the experimental group.
Reush and Cornell (1963) tested an edition of a program on
molecular equilibrium. The program was finished in a time range of
from three to twelve hours, with an average of six hours, by 300
college chemistry students in a general college chemistry course.
The investigators reported an increase in grade average as a result
of the programmed materials.
Research Related to Programmed Laboratorz Experiences
Wash (1964) conducted an experiment in the use of programmed
22
materials in teaching high school chemistry. Investigation relative
to difference in chemistry achievement between the control and
experimental group, the variability in time spent in the instructional
program, and the administrative feasibility of secondary students to
conduct individual experiments as a regular part of ,he programmed
sequence was performed. The investigator reported that students can
achieve at significantly higher levels through the use of a
programmed chemistry sequence which includes laboratory exercises,
and that there is a positive relationship between time in the
programmed sequence and achievement. Also concluded was that the
use of programmed instruction in laboratory science courses is
feasible and presents no unusual administrative problems.
A three-phase study has been completed and reported by Hedges
and MacDougall (1965) regarding the teaching of fourth-grade science
by means of programmed science materials with laboratory experiences.
In the first phase of the investigation, a pilot study, the achieve-
ment of those students using programmed materials during the investi-
gation was significantly higher at the 0.05 probability level than
the achievement of those who were taught by more conventional methods.
The primary purpose of Phase II was to write and refine through
field testing and analysis, a complete course of science study for
the fourth grade, using Skinner's small-step approach. A year-long
use of these programmed mate.dals revealed no significant differences
in achievement.
The efficacy of the programmed learning approach was investi-
23
gated in a more controlled situation, described by Phase III. Nineteen
fourth-grade classes were randomly assigned to each of three treatment
groups. The first group of six classes of students studied science
for one semester using the programmed materials with each child doing
the experiments. The second group of six classes of students studied
science for one semester by means of the programmed materials coupled
with the students only reading about the experiments; the third group
of seven classes of students studied by means of the programmed
materials rewritten in textbook form with fixed assignments by the
teacher and teacher-demonstration of the experiments in the emulation
of the sonventional approach to science teaching. The three groups
were compared on the instructional effectiveness of the method of
science instruction, where instructional effectiveness was defined
as (a) achievement, (b) interest and attitude, (c) value of laboratory
experiences, and (d) retention. The results of the post-experimental
testing revealed no significant mean differences were found among the
three treatments in initial intelligence and science achievement,
final measures of science achievement, level of interest in science,
and measures of retention.
A bulletin has been published by the Michigan Department of
Public Instruction (Michigan, 1965) presenting open-ended, laboratory-
centered, science experiences for grades seven, eight, and nine, but
the literature reveals no published research involving the use of
these experiences. The Committee on Science responsible for these
laboratory-experience outlines believe that it is possible to select
24
ideas or understandings of an interdisciplinary nature, which can be
introduced at the junior high school level or lower, and which will
continue to be valid in progressively more sophisticated fashion at
each succeeding level to graduate school and beyond.
A subcommittee, chaired by Professor W. C. Van Deventer,
Professor of Biology, Western Michigan University, is responsible for
having implemented a few ideas of the type indicated. The work is
an on-going project; presently over twenty laboratory-experience
outlines have been completed.
There is reported in the literature, research completed
under the auspices of the Department of Defense, U.S. Air Force,
certain laboratory-like activities. Some American industries have
had under study, programming of certain mechanical procedures.
Cohen and Fetterolf (1963) developed an adaptation of programmed
instruction for a laboratory course in qualitative analysis. Theory
is given in lecture but the twenty-four laboratory hours are structured
so that after necessary experimentation, confirmation of the students'
answers is given by a programmed guide. No attempt has been made to
evaluate results by statistical analysis.
No other reported researches in the area of programmed
laboratory instruction were discovered by the investigator.
This chapter has summarized the development of programming,
research related to developments of programmed instruction in the
sciences, and research relevant to programmed laboratory experiences.
The development of programming dates back to the teaching
25
method used by Socrates. The continuous exchange of questions and
answers under the tutorial method is a forerunner of programmed
instruction. Efforts by S. L. Pressy in the 1920's were probably
the beginning of the method of programming as it is now employed.
B. F. Skinner and J. C. Holland devised auto-instructional methods
which have served the current generation as to the bases for its
excursions into programmed learning. Linear and branching techniques
are the two basic types of programming.
In the studies cited the linear or constructed-response
technique was superior for recall with the exception of the study
by Larkin (1964) in which it was reported that neither the linear
nor the branching method was superior. Intelligence was found to
be related to achievement in programmed instruction. The findings
concerning the relationship of sex to achievement in programmed
instruction tend to favor the boys. Data reported for studies which
were related to programmed science material showed significant
achievement differences in favor of the experimental groups.
Few research projects involving programmed laboratory science
experiences were found. Among those cited, only two reported data
.1
analyses. One investigation revealed a significant difference in
achievement favoring the experimental group. The other study reported
no significant differences were found in achievement or level of
interest in science.
In the following chapter the procedure for implementing the
research project is discussed. Descriptions are given of the

26
experimental design, the subjects, the program, the treatments, the
sources and types of data, the testing instruments, and the types
of statistical analyses used.
CHAPTER. III
PROCEDURE
Experimental Design
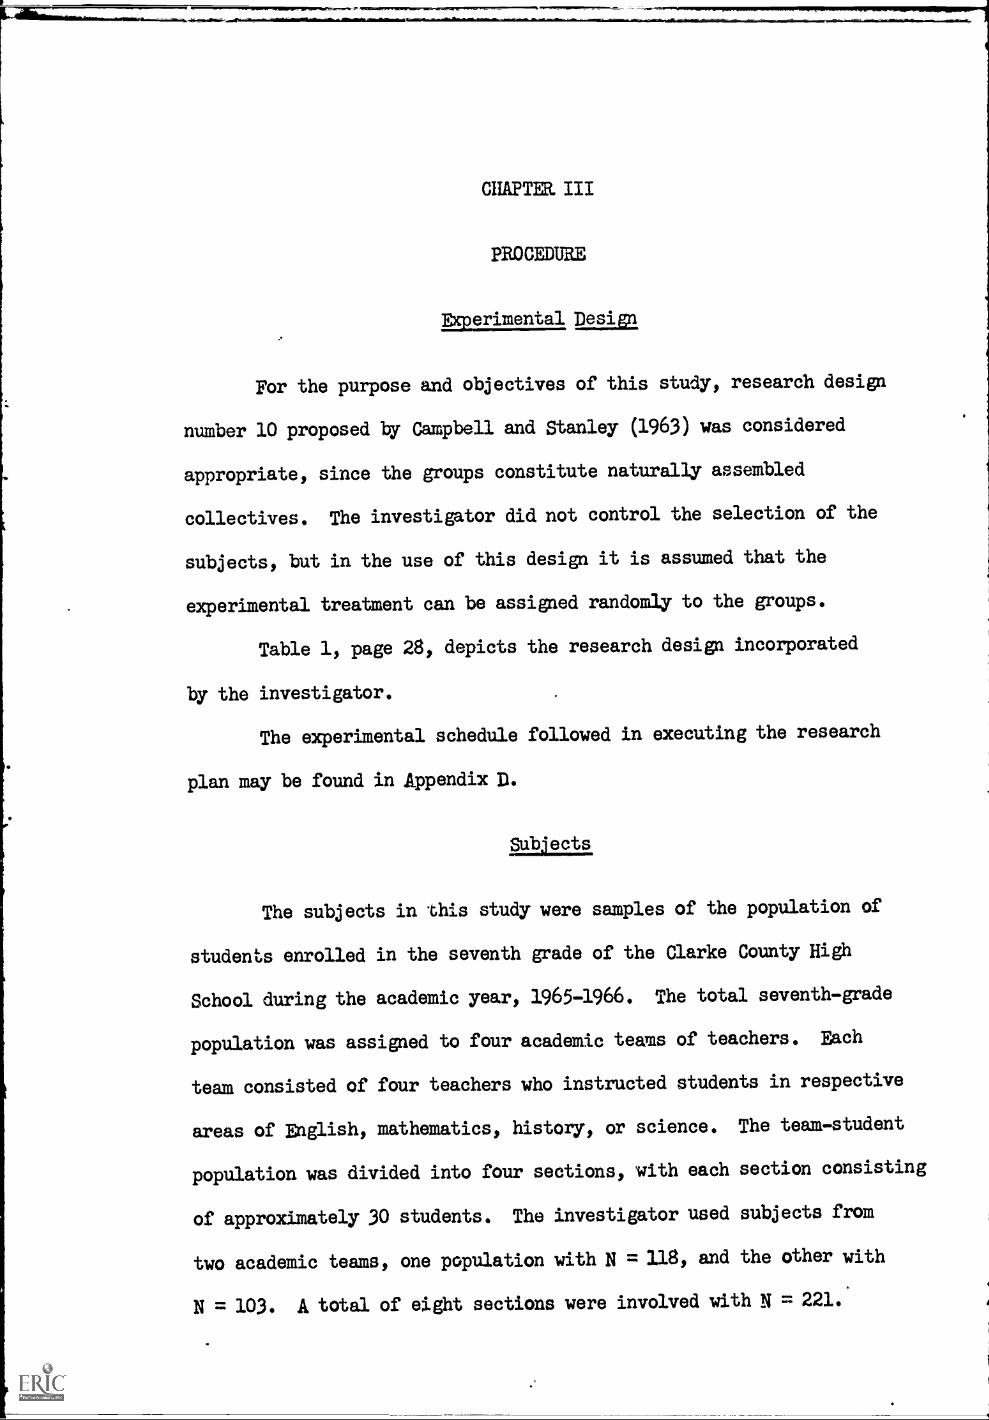
For the purpose and objectives of this study, research design
number 10 proposed by Campbell and Stanley (1963) was considered
appropriate, since the groups constitute naturally assembled
collectives. The investigator did not control the selection of the
subjects, but in the use of this design it is assumed that the
experimental treatment can be assigned randomly to the groups.
Table 1, page 28, depicts the research design incorporated
by the investigator.
The experimental schedule followed in executing the research
plan may be found in Appendix D.
Subjects
The subjects in this study were samples of the population of
students enrolled in the seventh grade of the Clarke County High
School during the academic year, 1965-1966. The total seventh-grade
population was assigned to four academic teams of teachers. Each
team consisted of four teachers who instructed students in respective
areas of English, mathematics, history, or science. The team-student
population was divided into four sections, with each section consisting
of approximately 30 students. The investigator used subjects from
two academic teams, one population with N = 118, and the other with
N = 103. A total of eight sections were involved with N = 221.
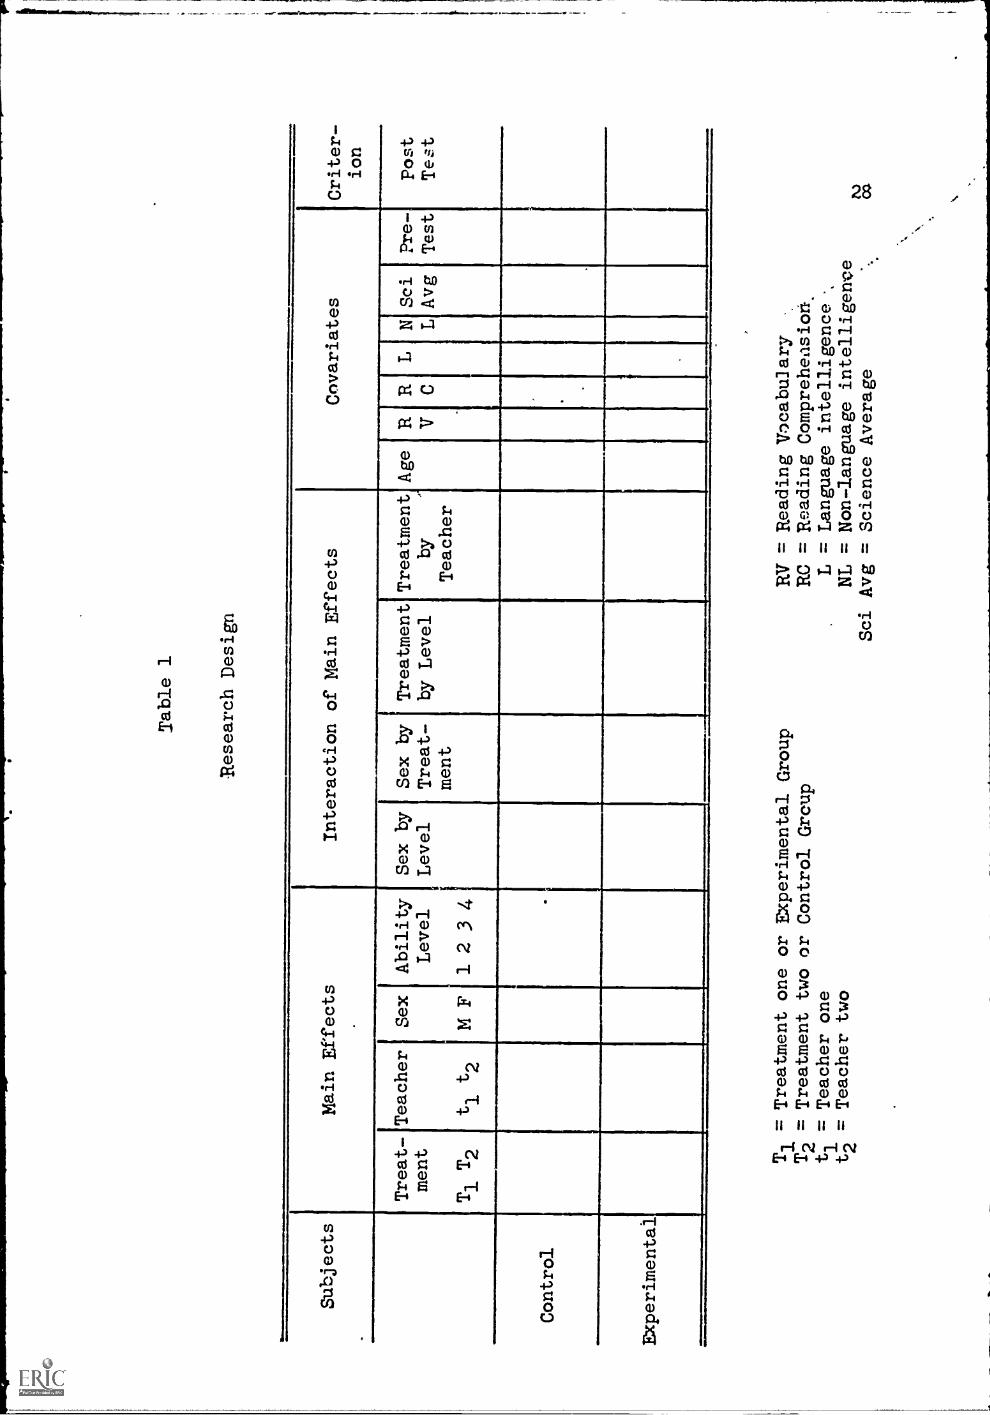
Research Design
,
Subjects
Main Effects
Interaction of Main Effects
Covariates
Criter-
ion
Treat-
ment
T1
T2
Teacher
tlt2
Sex
M F
Ability
Level
1 2 3 4
Sex by
Level
Sex by
Treat-
ment
Treatment
by Level
Treatment
by
Teacher
AgeRRLNSci
VC
LAvg
Pre-
Test
Post
Test
Control
Experimental
Ti = Treatment one
or Experimental Group
T2
= Treatment two or Control Group
t1
= Teacher one
t2
= Teacher two
RV = Reading Vocabulary
RC = Reading Compreheasiori.
L = Language intelligence %
NL = Non-language intelligence
Sci Avg = Science Average
29
Two science teachers from two academic teams participated in'
this study. Both cooperating teachers instructed two experimental
and two control groups.
The proz.ni
A programmed unit in seventh-grade science of an inter-
disciplinary nature was developed by the investigator. The investi-
gator secured perthission from Professor Van Deventer, chairman of
the Michigan Subcommittee on Science which published a bulletin of
open-ended, laboratory experience-outlines referred to earlier
(Michigan, 1965), to use a selected number of the outlines. These
outlines served as the framework for the programmed sequence of
instructional material. Six outlines were selected under three
main ideas. Listed below are the three main ideas and the titles
of the six laboratory-experience outlines:
1. The idea of gradients: there are no sharp boundarylines in nature.
a. A Gradient: The Effect of pH on Yeast Activity.
b. A Gradient for the Separation of Chemical Substances:Paper Chromatography.
2. The idea of normal curves: related phenomena tend tovary in pattern fashion around a norm.
a. Normal Distribution Curves Describe Variationin Nature.
b. The Use of Normal Curves in Distinguishing Species.
3. The idea of measurement as an expression of relationship.
a. A Study in Measurement.
30
b. Measurement as an Expression of Relationship:A Simple Balance.
The programmed unit of instruction, covering the six lessons,
each having the respective laboratory experiment es the core learning
experience, consisted of 590 modified linear frames. A copy of
these six lessons comprising the unit of instruction may be found
in Appendix A. This unit of six lessons was used as the sole
instructional device with the experimental group.
The linear mode of programming was modified so as to allow
certain frames to become open-ended. This procedure allows students,
through a series of inquiries, to gather data, interpret observations,
and arrive at conclusions based on such data and observations.
The combination of laboratory instruction and a programmed
sequence poses some special problems. Particularly, the concept of
an immediate reinforcement becomes difficult if laboratory experiences
are to be meaningful. When laboratory exercises consist of small
sequential steps with frequent responses, followed by immediate feed-
back to the pupil, it becomes difficult to allow the student to
gather evidence so that conclusions will represent insights he has
reached for himself. The frames containing the laboratory exercises,
while guiding the student to draw an independent conclusion, attempt
to assure his reaching a reasonable conclusion based on experimental
evidence.
The content of the program involved those items of information
necessary to an understanding of the idea of a gradient as demonstrated
in varying pH environments of yeast, or in paper chromatography; the
31
idea of normal curves and sampling as evidenced by variety in nature
or in the overlapping characteristics of related species of elm leaves;
and the idea of measurement as an expression of relationship as
demonstrated by a study in measurement from a microscopic quantity
to a quantity such as a portion of the school grounds, or by a simple
balance which called for the studentls establishing his own system of
measurement. The desirability for this information was identified
through pilot studies as the program was being written.
The programmed sequence was developed during the period from
June, 1965 to December, 1965. During this time the individual lessons
in the unit were tried with students from a selected sixth grade in
Clarke County, Georgia. It was felt that the problem of difficulty
level of the respective frames could be assessed more confidently if
students one grade level lower than the experimental population
were not handicapped in performing the laboratory experiences.
Sixth-grade students of differing ability levels were used. Each of
the six lessons was revised after feedback from the students
involved in the pilot study.
Before the six programmed lessons were tried on the sixth-
grade students, all of them were submitted to a program specialist,
science educator, and a specialist in each of the six fields (e.g.,
a microbiologist, a chromatographer, etc.) for editing. Any
suggestions for revision were followed prior to their submission to
the sixth-grade students. Professor Van Deventer assisted the
investigator in editing all of the six programmed lessons, the
32
testing instruments, and all of the materials involved in this
experimentation.
After the individual pilot trials were completed, a final
field trial was conducted from January 3, to January 26, 1966, at
Pattie Hilsman Junior High School in Clarke County, Georgia. To
eliminate possible contamination of the seventh-grade population,
this school was selected because of its geographic separation from
the selected school cooperating in the formal experimentation. The
investigator taught an experimental group with N = 31, and a control
group with N = 31 selected from the seventh grade population of
Pattie Hilsman Junior High School. The pretest instru.nent was admin-
istered to both control and experimental subjects at the beginning
of the field trial. At the end of this period, the posttest was
given to both groups; an evaluation questionnaire was administered
only to the experimental groups. A copy of this evaluation
questionnaire may be found in Appendix B.
The purpose of this final field trial was to identify the
frames in which students consistently made errors or could not supply
correct responses. Also, the investigator evaluated each question
posed by the students to detect any faulty frames in the preface
frames or in the procedural directions given for the performance of
the experiment. Four of the six lessons were revised as a result
of this final field trial. Other invaluable information was gleaned
from this experience which contributed to a much smoother operation
once the formal experimentation was begun.
33
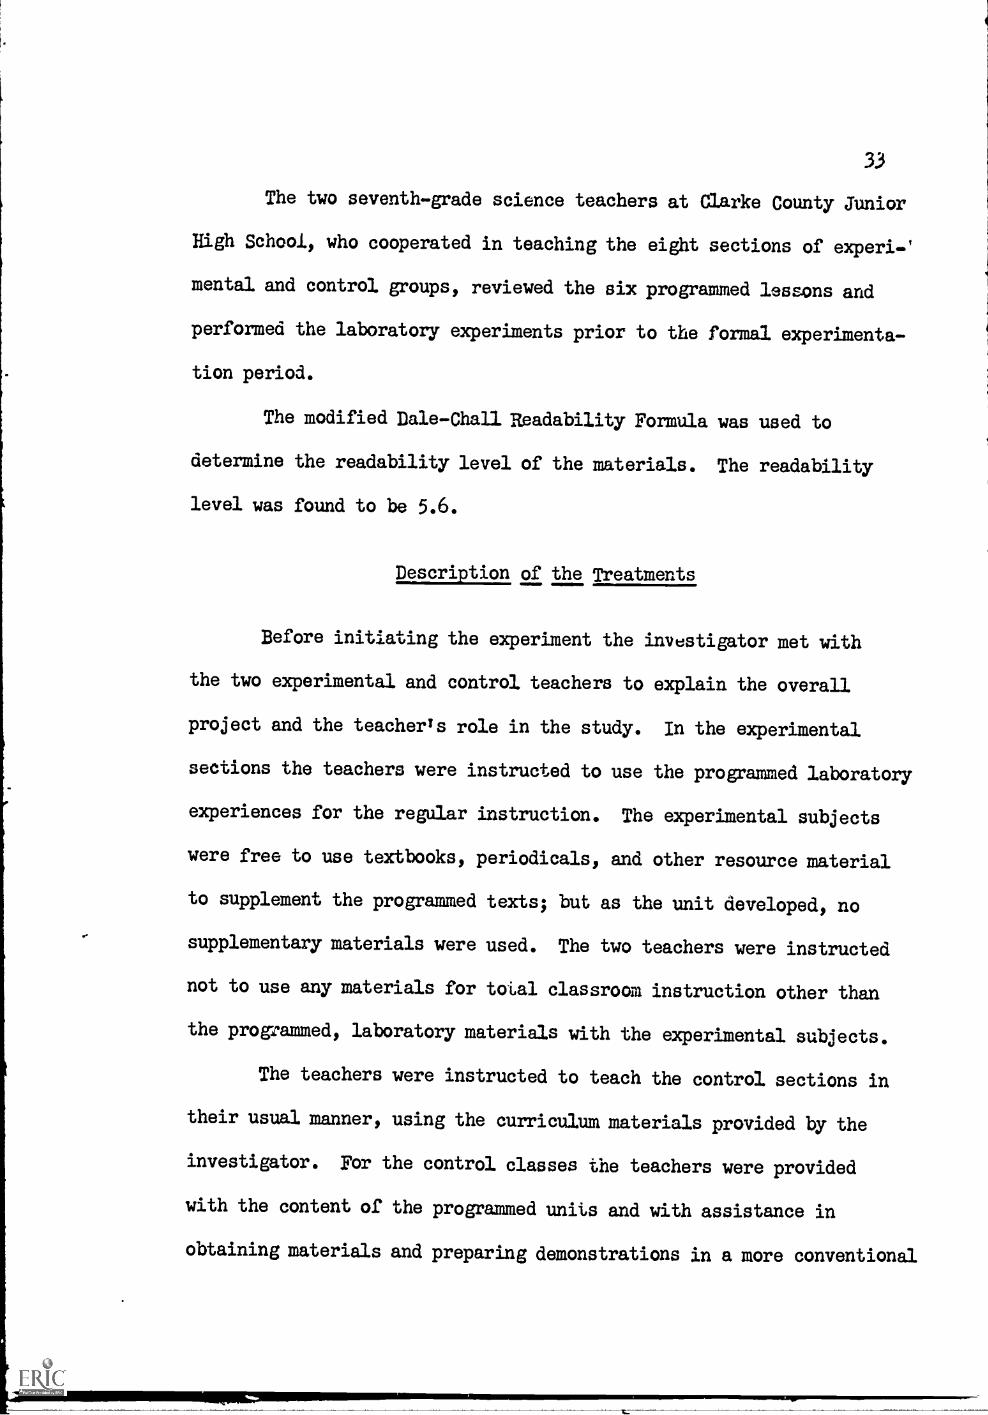
The two seventh-grade science teachers at Clarke County Junior
High School, who cooperated in teaching the eight sections of experi-'
mental and control groups, reviewed the six programmed lessons and
performed the laboratory experiments prior to the formal experimenta-
tion period.
The modified Dale-Chan Readability Formula was used to
determine the readability level of the materials. The readability
level was found to be 5.6.
Description of the Treatments
Before initiating the experiment the investigator met with
the two experimental and control teachers to explain the overall
project and the teacher's role in the study. In the experimental
sections the teachers were instructed to use the programmed laboratory
experiences for the regular instruction. The experimental subjects
were free to use textbooks, periodicals, and other resource material
to supplement the programmed texts; but as the unit developed, no
supplementary materials were used. The two teachers were instructed
not to use any materials for total classroom instruction other than
the programmed, laboratory materials with the experimental subjects.
The teachers were instructed to teach the control sections in
their usual manner, using the curriculum materials provided by the
investigator. For the control classes the teachers were provided
with the content of the programmed units and with assistance in
obtaining materials and preparing demonstrations in a more conventional
34
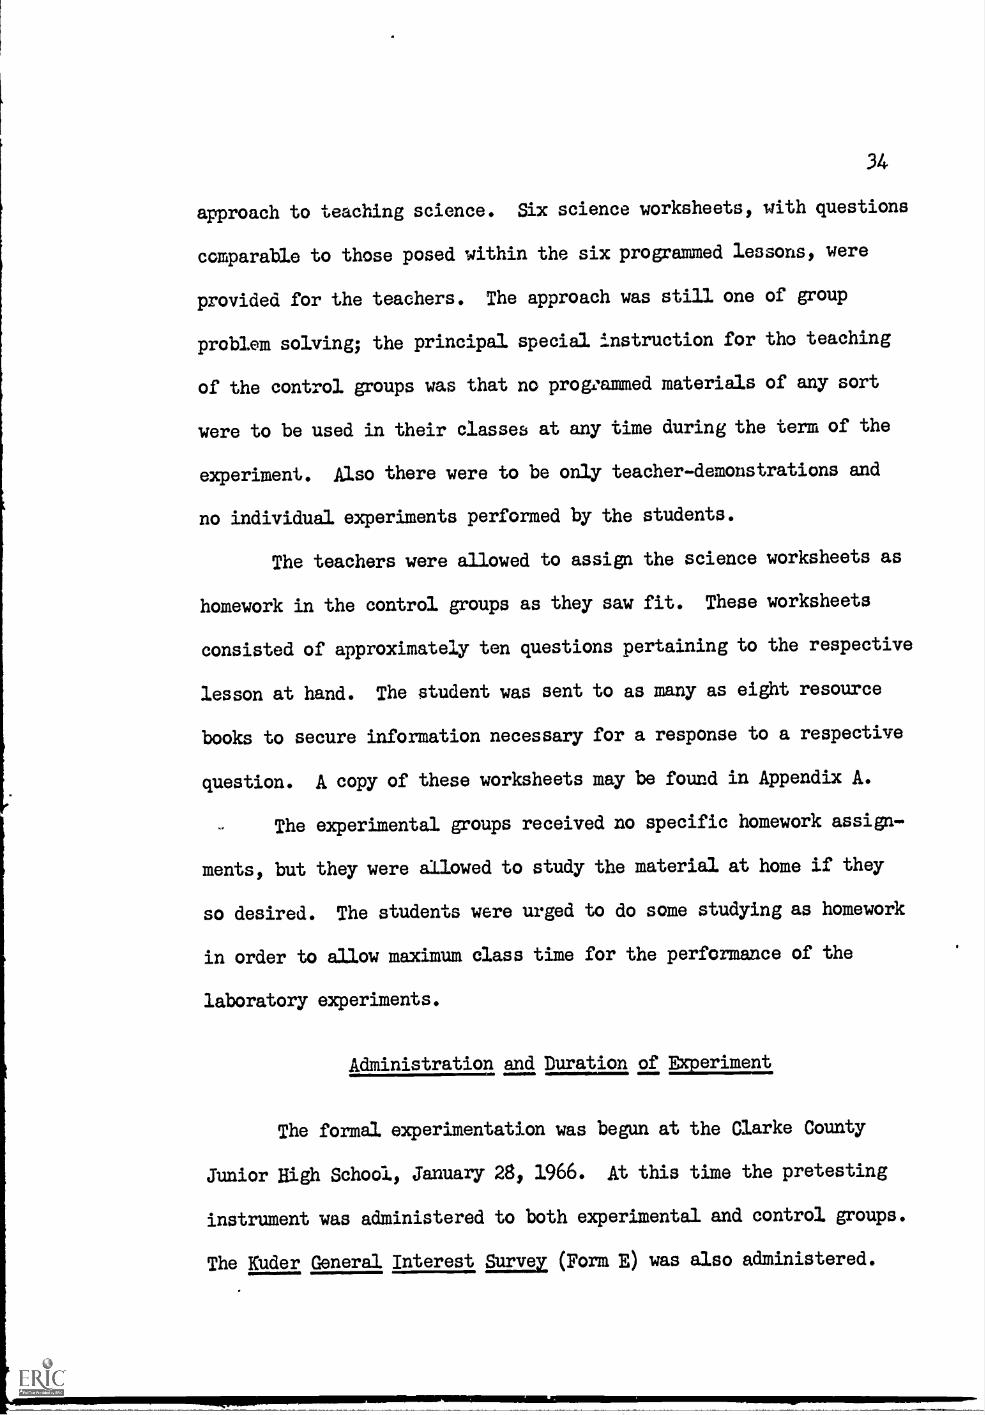
approach to teaching science. Six science worksheets, with questions
comparable to those posed within the six programmed lessons, were
provided for the teachers. The approach was still one of group
problem solving; the principal special instruction for the teaching
of the control groups was that no provammed materials of any sort
were to be used in their classes at any time during the term of the
experiment. Also there were to be only teacher-demonstrations and
no individual experiments performed by the students.
The teachers were allowed to assign the science worksheets as
homework in the control groups as they saw fit. These worksheets
consisted of approximately ten questions pertaining to the respective
lesson at hand. The student was sent to as many as eight resource
books to secure information necessary for a response to a respective
question. A copy of these worksheets may be found in Appendix A.
The experimental groups received no specific homework assign-
ments, but they were allowed to study the material at home if they
so desired. The students were urged to do some studying as homework
in order to allow maximum class time for the performance of the
laboratory experiments.
Administration and Duration of Experiment
The formal experimentation was begun at the Clarke County
Junior High School, January 28, 1966. At this time the pretesting
instrument was administered to both experimental and control groups.
The Kuder General Interest SurytE (Form E) was also administered.
35
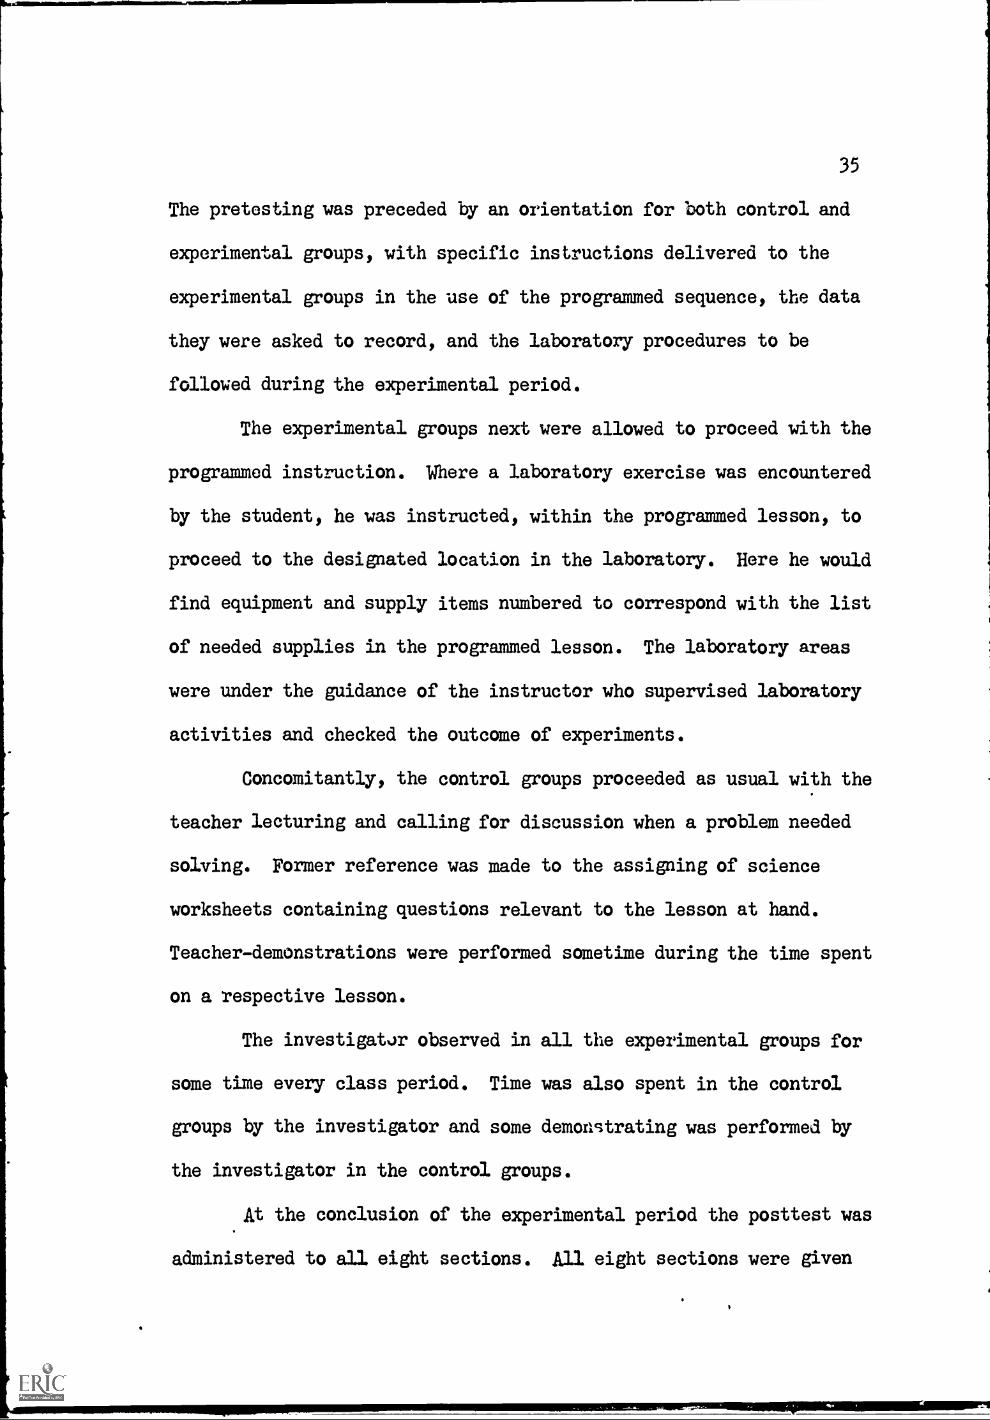
The pretesting was preceded by an orientation for both control and
experimental groups, with specific instructions delivered to the
experimental groups in the use of the programmed sequence, the data
they were asked to record, and the laboratory procedures to be
followed during the experimental period.
The experimental groups next were allowed to proceed with the
programmed instruction. Where a laboratory exercise was encountered
by the student, he was instructed, within the programmed lesson, to
proceed to the designated location in the laboratory. Here he would
find equipment and supply items numbered to correspond with the list
of needed supplies in the programmed lesson. The laboratory areas
were under the guidance of the instructor who supervised laboratory
activities and checked the outcome of experiments.
Concomitantly, the control groups proceeded as usual with the
teacher lecturing and calling for discussion when a problem needed
solving. Former reference was made to the assigning of science
worksheets containing questions relevant to the lesson at hand.
Teacher-demonstrations were performed sometime during the time spent
on a respective lesson.
The investigator observed in all the experimental groups for
some time every class period. Time was also spent in the control
groups by the investigator and some demonstrating was performed by
the investigator in the control groups.
At the conclusion of the experimental period the posttest was
administered to all eight sections. All eight sections were given
36
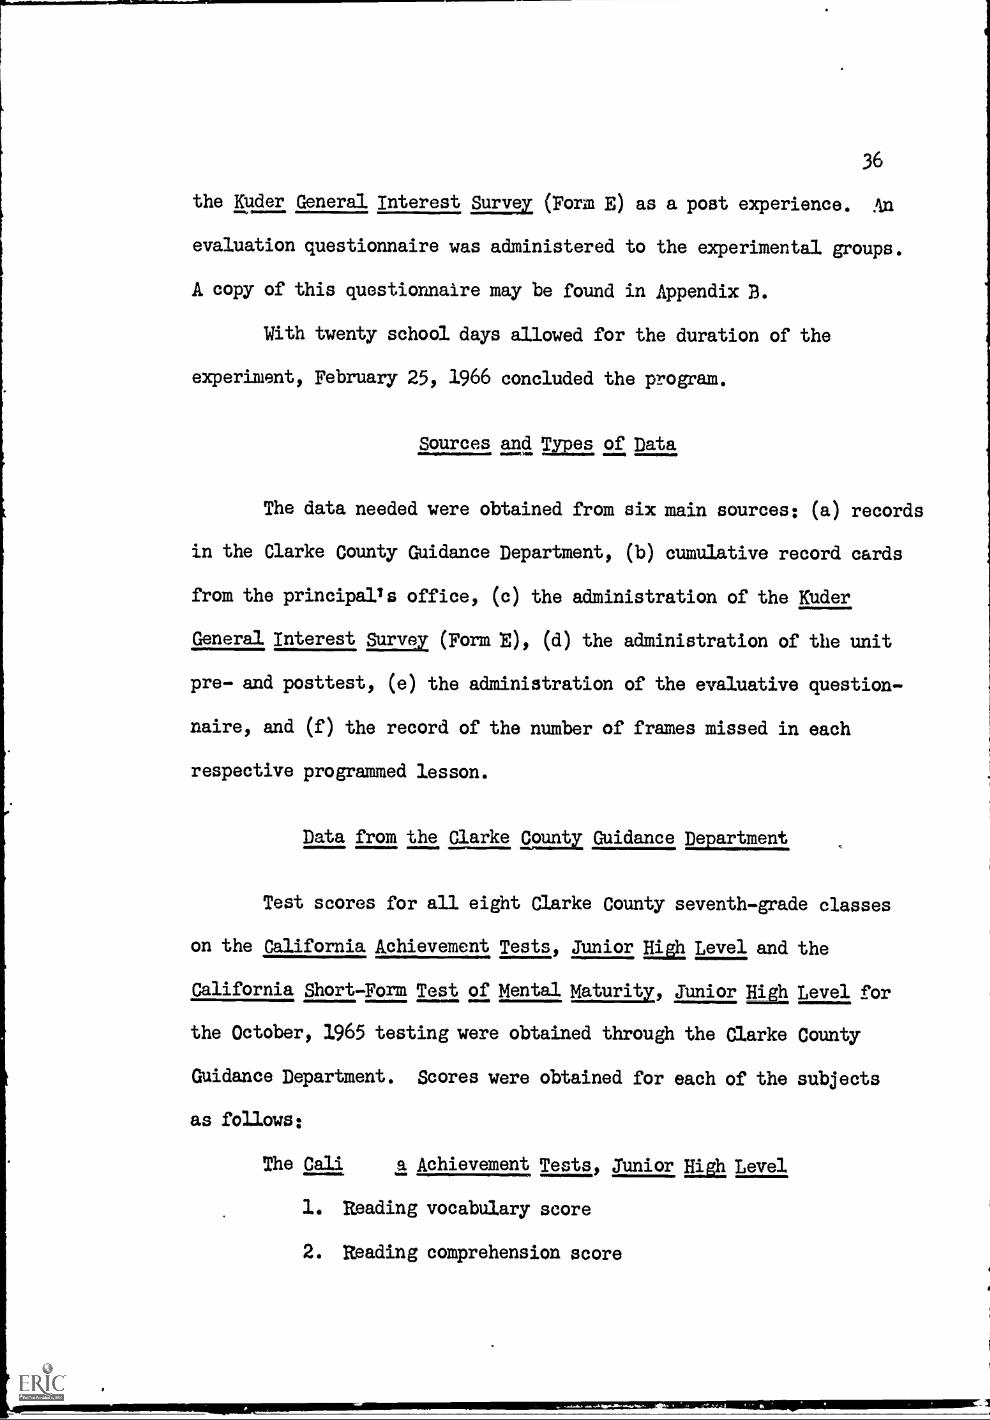
the Kuder General Interest Stixsvez (Form E) as a post experience. An
evaluation questionnaire was administered to the experimental groups.
A copy of this questionnaire may be found in Appendix B.
With twenty school days allowed for the duration of the
experiment, February 25, 1966 concluded the program.
Sources and aus of Data
The data needed were obtained from six main sources: (a) records
in the Clarke County Guidance Department, (b) cumulative record cards
from the principalts office, (c) the administration of the Kuder
Gen_ eral Interest Survey (Form E)1 (d) the administration of the unit
pre- and posttest, (e) the administration of the evaluative question-
naire, and (f) the record of the number of frames missed in each
respective programmed lesson.
Data from the Clarke County Guidance Department
Test scores for all eight Clarke County seventh-grade classes
on the California Achievement Tests, Junior High Level and the
California Short-Form Test of Mental Maturity, Junior High Level for
the October, 1965 testing were obtained through the Clarke County
Guidance Department. Scores were obtained for each of the subjects
as follows:
The Cali a Achievement Tests, Junior High Level
1. Reading vocabulary score
2. Reading comprehension score
-,M1111111.1111111111,
,000mmommmoommommommwmommummilm..
37
The California Short-Form Test of Mental Maturity, Junior
High Level
1. Language intelligence score
2. Non-language intelligence score
Data from Cumulative Record Cards
Age, sex, grade level, and average of previous science
grades were obtained from cumulative record cards.
Administration of the Kuder General Interest Survey (Form E)
In order to document any change in scientific interest as a
result of the experimental project, the Kuder General Interest Survey
(Form E) was administered at the beginning of the research project
and at the conclusion. Scientific Interest scores were analyzed from
this inventory on the subjects.
Administration of the Unit Pre- and Posttest
A specially-prepared test was administered before the beginning
of the experimental period to determine students' prior knowledge of
the respective curriculum content of the experimental instructional
materials. The test consisted of 50 multiple-choice items. A copy
of this test may be found in Appendix B.
Both the pretest and posttest were administrations of the same
test prepared by the investigator. No standardized achievement measure
was available which contained a sufficient range and number of items
38
concerning the six selected, laboratory experiences chosen for the
experimental curriculum.
Administration of an Evaluative Questionnaire
At the close of the study the classroom teachers administered
an evaluative questionnaire to the experimental subjects. This
questionnaire was given to attempt to evaluate the students? reactions
to the programmed texts. The questionnaire was devised by the invest-
igator after having reviewed several questionnaires used for similar
purposes in other studies. The students were encouraged by the
teachers and the investigator to give their honest opinions.
The two teachers were also asked to evaluate the experiment.
Strengths and weaknesses of the materials were pointed out. The
reactions of the teachers were comparable with the general reaction
of their individual classes.
Record of Number of Frames Missed
Each student in the experimental groups was given a mimeographed
form, asking for the recording of the number of each frame missed
within each of the six programmed lessons. The teachers and the
investigator stressed that this record in no way counted as a mark
against t1 student, but rather that the student was furnishing the
investigator with helpful evidence as to the reliability of a
particular frame.
39
Description of the Tests
California Achievement Tests, Junior High Level
The new edition was re-standardized in 1963 to take account
of faults in the 1957 norms. A sample of 341 schools in 48 states
was carefully selected to insure obtaining an unbiased sample. For
the junior high level, grades seven through nine, the reliability
coefficients for the various tests range from 0.83 to 0.95 with a
reliability coefficient for the total battery of 0.98. These
coefficients were computed using the Kuder Richardson formula 21.
The standard error of measurement for the raw score is 9.4 points:
for grade placement, 0.2 months.
The item discrimination data are indicative of the efficient
functioning of nearly all items. A high degree of concurrent validity
is reflected in the high correlation of scores on the new edition and
other standardized achievement tests (California Manual, 1963).
California Short-Form Test of Mental Maturity, Junior High Level
This test yields three mental age scores language, non-
language, and total. The scores are also interpretable in the form
of deviation I.Q. scores.
Coefficients of reliability computed by the split halves method
and corrected by the Spearman-Brown formula are 0.93 for language,
0.89 for non-language, and 0.95 for total. Standard errors of measure-
ment for mental ages are 7.7, 9.1, and 6.3 months, respectively
(California Manual, 1963).
40
The validity claims of the publishers are based primarily on
the original design of the test which evolved from a comprehensive
analysis of the Stanford-Binet, and the testis high correlation with
the individual Stanford-Binet and other intelligence tests.
Kuder General Interest Survey (Form E)
The Kuder General Interest Survey (1964 Edition) was developed
in response to a need for such an instrument for use with younger
people, particularly at the junior high level. It consists of ten
scales, surveying interests in a wide range of activities. Among
these ten interest areas is a Scientific Interest Scale.
Normative data for the Survey were developed in the spring of
1963, when the Survey was administered on a nationwide basis to a
stratified sample of 6,950 boys and 6,565 girls in grades 6 through
12 from public elementary and secondary schools in the United States.
Approximately six weeks after administration of the Survey
to the standardization sample, a randomly selected stratified sub-
sample, consisting of 287 boys and 433 girls in grades 6-8 and 471
boys and 691 girls in grades 9-12, took the Survey a second time.
Means, standard deviations, and test-retest correlations were
calculated. Correlations were mainly in the 0.70s and 0.80s.
The Kuder -Richardson formula 20 was employed to check the
internal consistency of the scales. Intercorrelations of the scales,
for girls in the standardization sample, ranged froth -.30 to +.37;
for boys, from -.37 to 1-.35. Most of the correlations were close to
zero,(Kuder Manual, 1964).
41
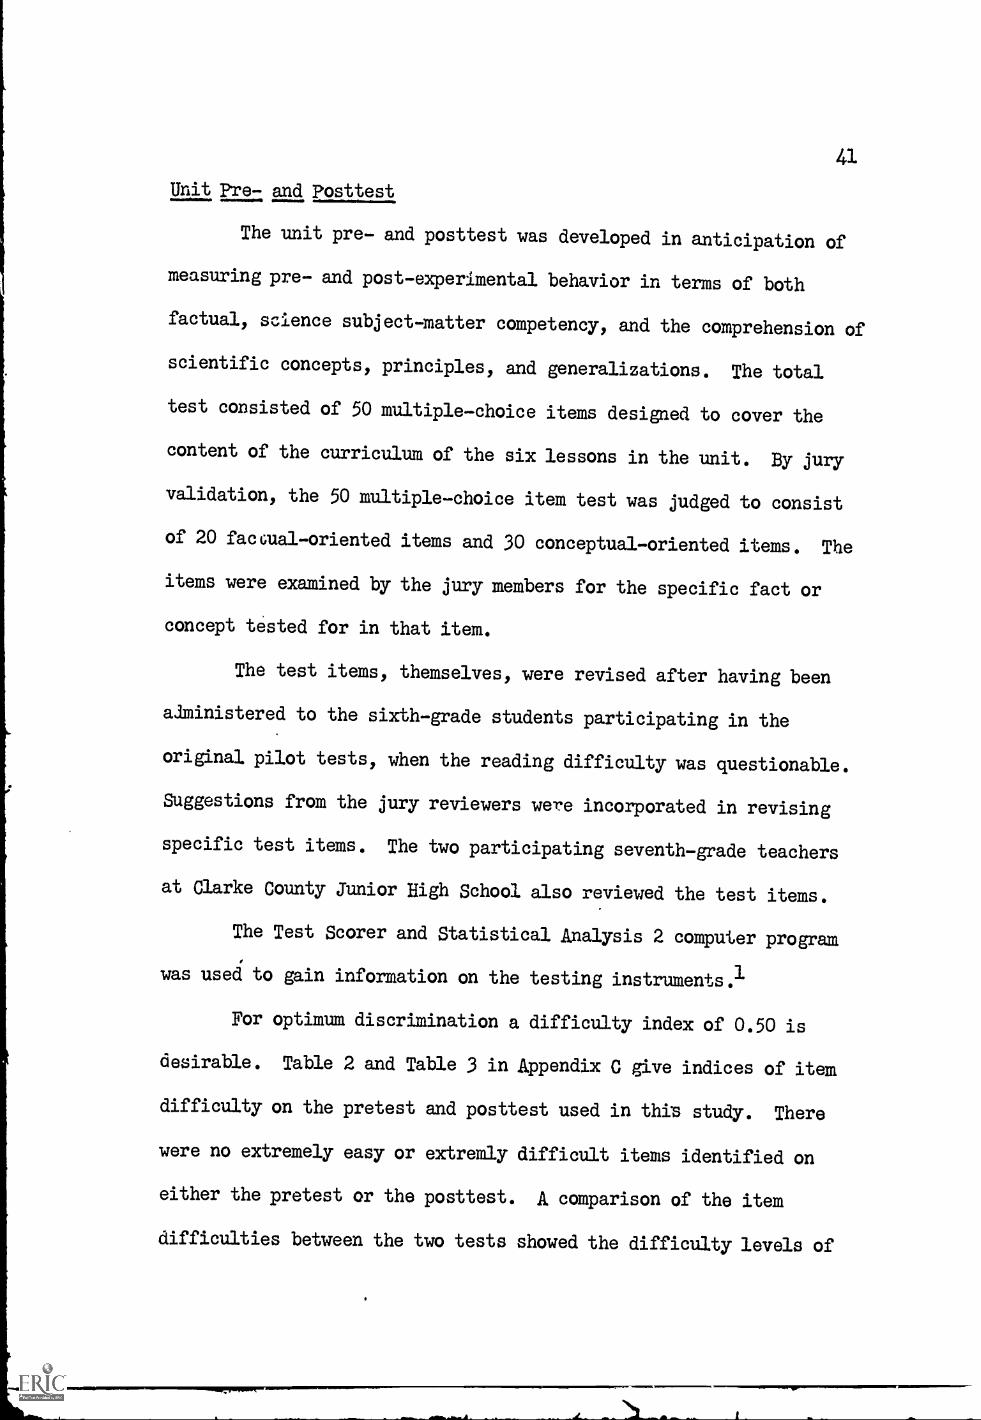
Unit Pre- and Posttest
The unit pre- and posttest was developed in anticipation of
measuring pre- and post-experimental behavior in terms of both
factual, science subject-matter competency, and the comprehension of
scientific concepts, principles, and generalizations. The total
test consisted of 50 multiple-choice items designed to cover the
content of the curriculum of the six lessons in the unit. By jury
validation, the 50 multiple-choice item test was judged to consist
of 20 factual- oriented items and 30 conceptual-oriented items. The
items were examined by the jury members for the specific fact or
concept tested for in that item.
The test items, themselves, were revised after having been
administered to the sixth-grade students participating in the
original pilot tests, when the reading difficulty was questionable.
Suggestions from the jury reviewers were incorporated in revising
specific test items. The two participating seventh-grade teachers
at Clarke County Junior High School also reviewed the test items.
The Test Scorer and Statistical Analysis 2 computer program
was used to gain information on the testing instruments.1
For optimum discrimination a difficulty index of 0.50 is
desirable. Table 2 and Table 3 in Appendix C give indices of item
difficulty on the pretest and posttest used in this study. There
were no extremely easy or extremly difficult items identified on
either the pretest or the posttest. A comparison of the item
difficulties between the two tests showed the difficulty levels of
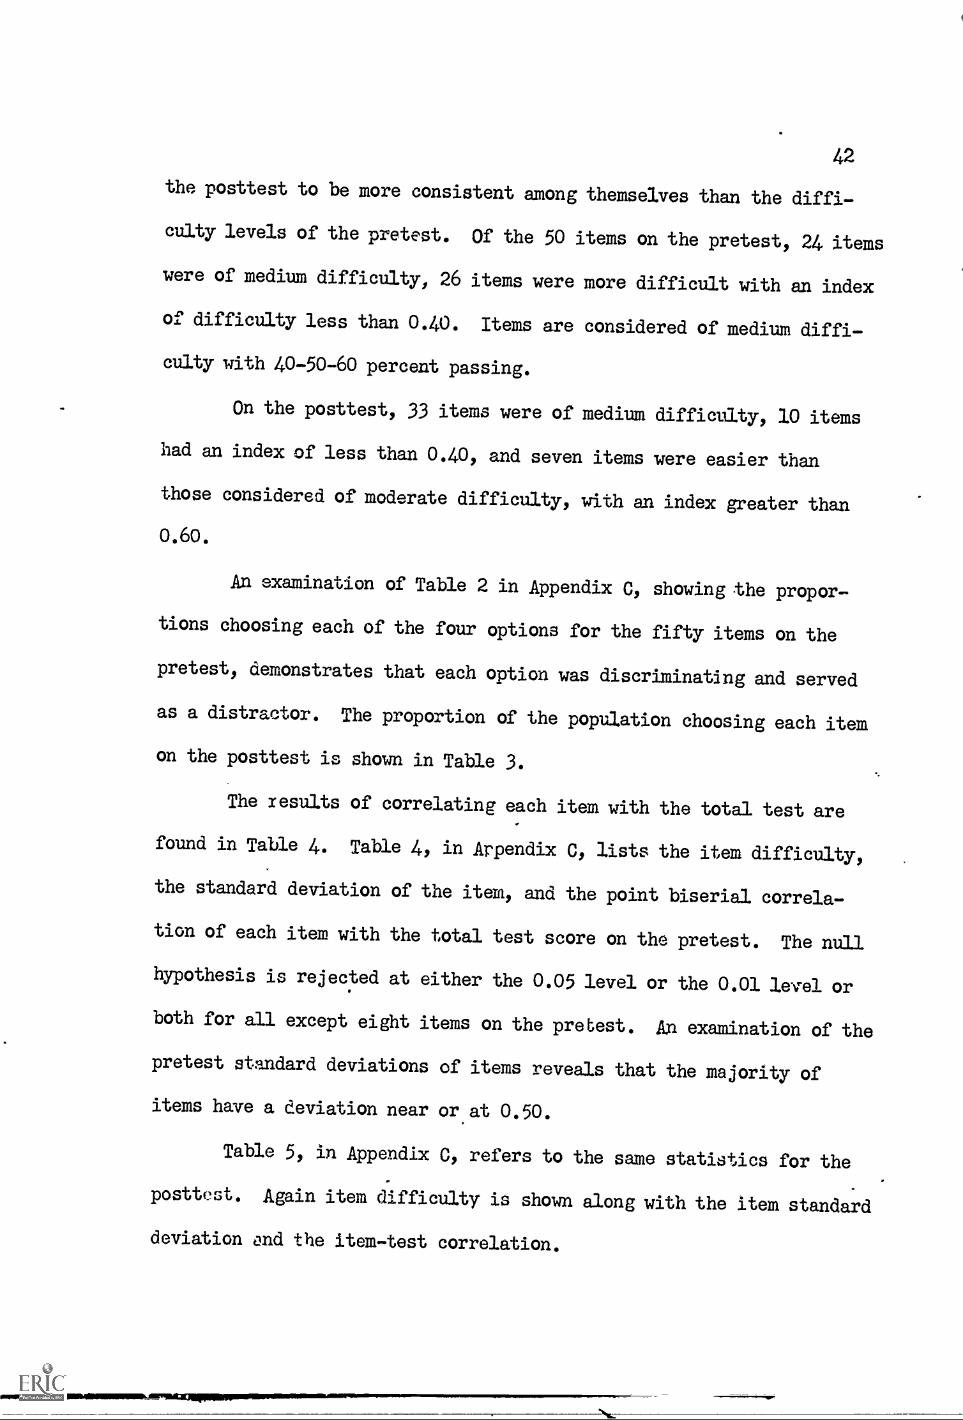
42
the posttest to be more consistent among themselves than the diffi-
culty levels of the pretest. Of the 50 items on the pretest, 24 items
were of medium difficulty, 26 items were more difficult with an index
of difficulty less than 0.40. Items are considered of medium diffi-
culty with 40-50-60 percent passing.
On the posttest, 33 items were of medium difficulty, 10 items
had an index of less than 0.40, and seven items were easier than
those considered of moderate difficulty, with an index greater than
0.60.
An examination of Table 2 in Appendix C, showing the propor-
tions choosing each of the four options for the fifty items on the
pretest, demonstrates that each option was discriminating and served
as a distractor. The proportion of the population choosing each item
on the posttest is shown in Table 3.
The xesults of correlating each item with the total test are
found in Table 4. Table 4, in Appendix C, lists the item difficulty,
the standard deviation of the item, and the point biserial correla-
tion of each item with the total test score on the pretest. The null
hypothesis is rejected at either the 0.05 level or the 0.01 level or
both for all except eight items on the pretest. An examination of the
pretest standard deviations of items reveals that the majority of
items have a deviation near or at 0.50.
Table 5, in Appendix C, refers to the same statistics for the
posttest. Again item difficulty is shown along with the item standard
deviation and the item-test correlation.
43
The null hypothesis is rejected at the 0.01 level of signifi-
cance for all test items with the exception of item number 31 being
significant at the 0.05 level, and items 11, 14, and 34 being
nonsignificant. A total of 47 items out of 50 or 94 percent of the
test items were significantly related to the total test score. Thus,
94 percent of the items apparently made a contribution to the total
variance of the test.
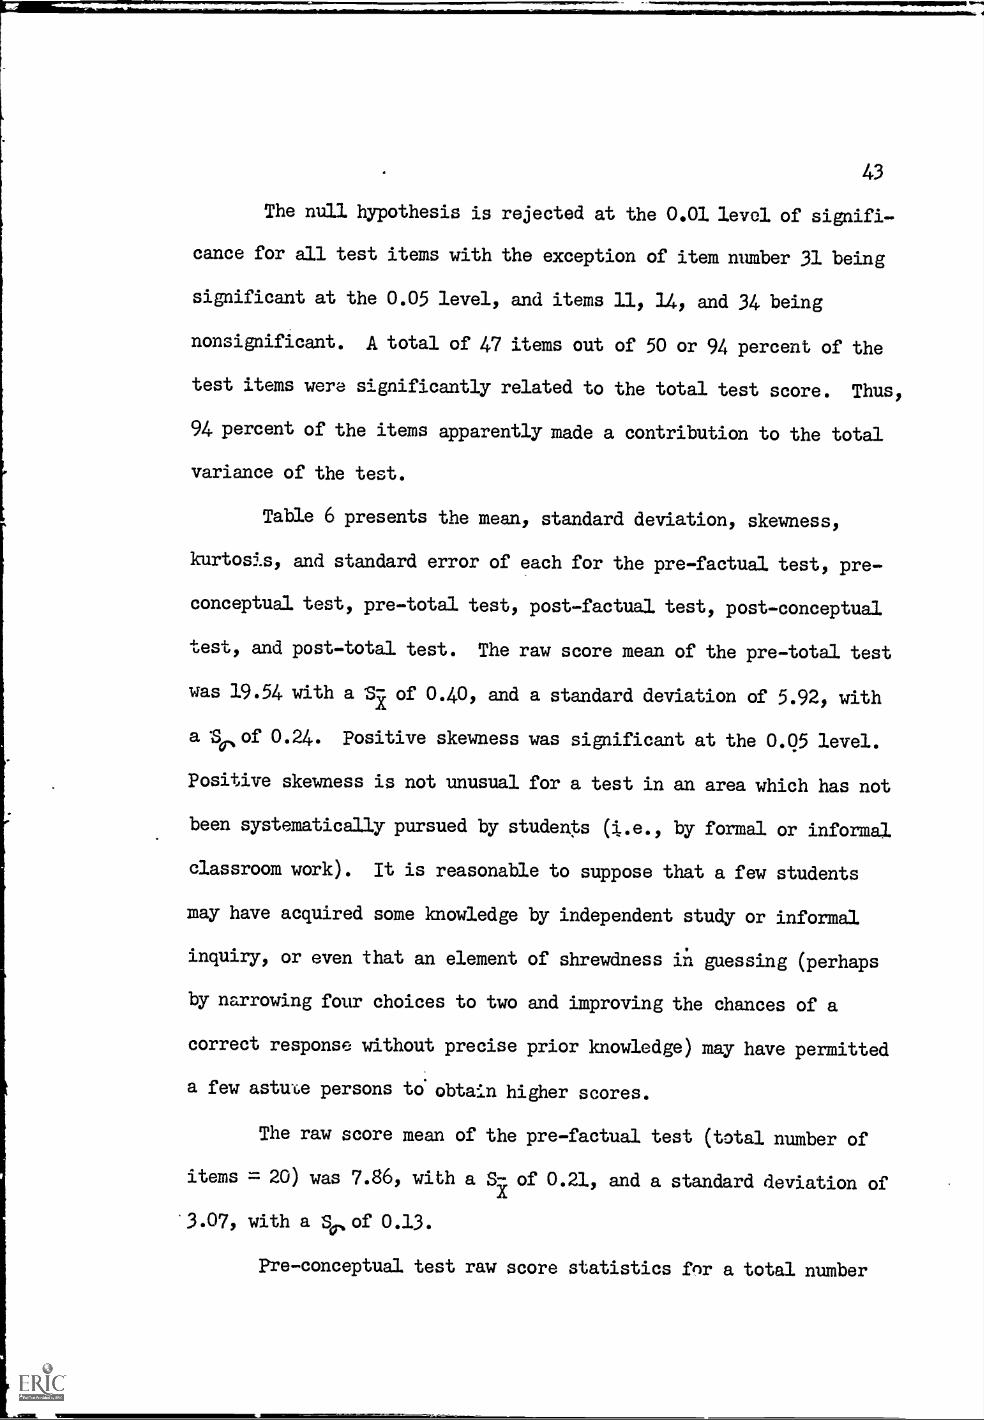
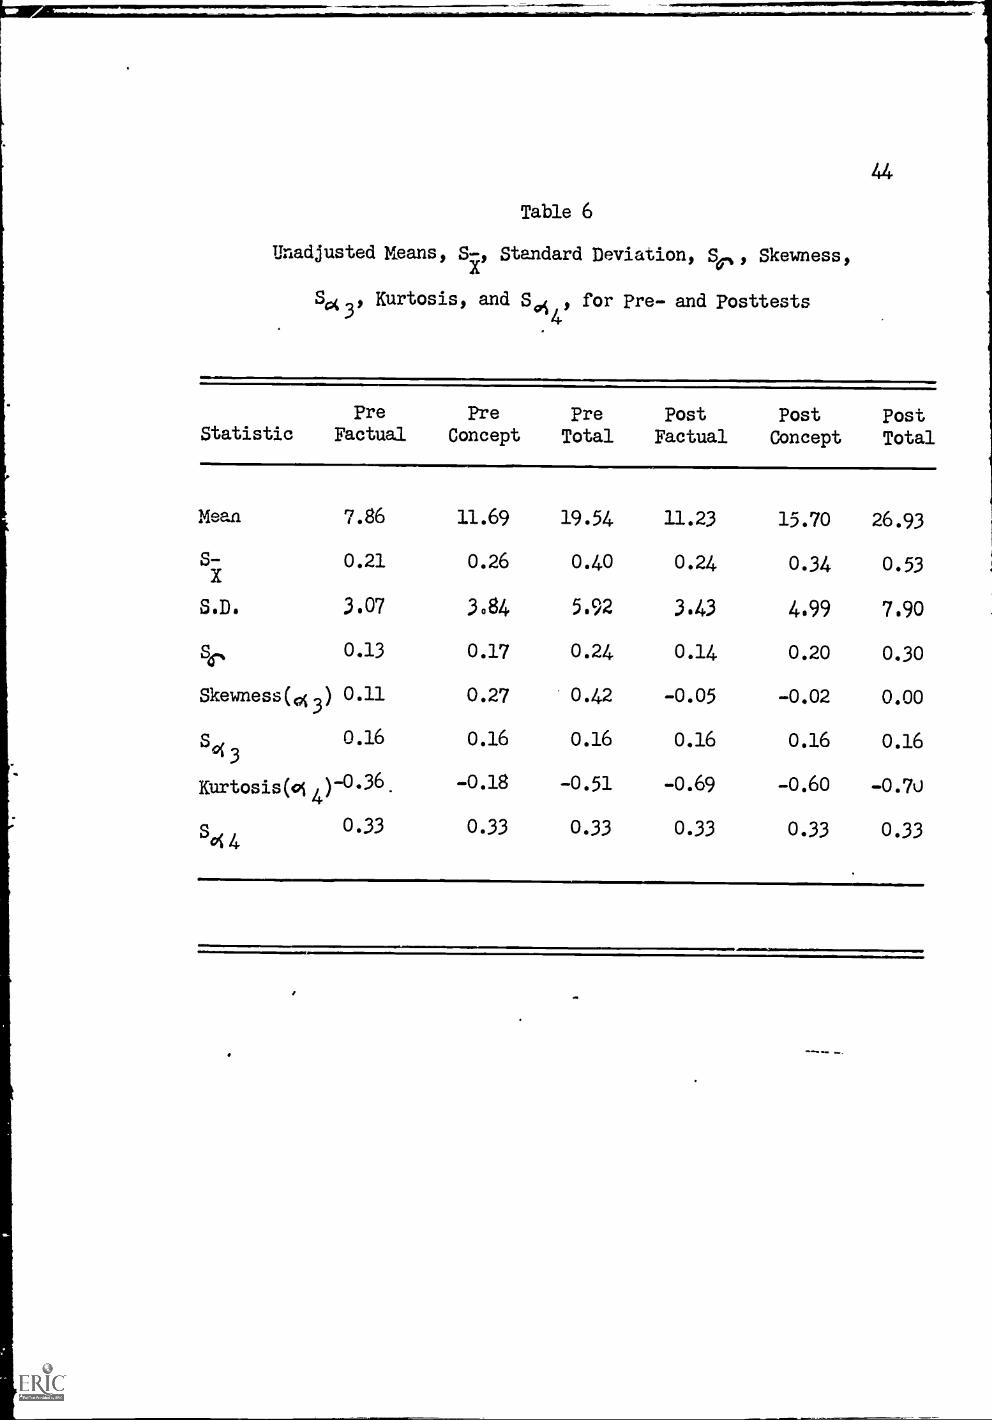
Table 6 presents the mean, standard deviation, skewness,
kurtosis, and standard error of each for the pre-factual test, pre-
conceptual test, pre-total test, post-factual test, post-conceptual
test, and post-total test. The raw score mean of the pre-total test
was 19.54 with a Sr-X of 0.40, and a standard deviation of 5.92, with
a So.,,of 0.24. positive skewness was significant at the 0.05 level.
Positive skewness is not unusual for a test in an area which has not
been systematically pursued by students (i.e., by formal or informal
classroom work). It is reasonable to suppose that a few students
may have acquired some knowledge by independent study or informal
inquiry, or even that an element of shrewdness ii guessing (perhaps
by narrowing four choices to two and improving the chances of a
correct response without precise prior knowledge) may have permitted
a few astu-ue persons to obtain higher scores.
The raw score mean of the pre-factual test (total number of
items = 20) was 7.86, with a Si of 0.21, and a standard deviation of
3.07, with a Sr, of 0.13.
Pre-conceptual test raw score statistics for a total number
44
Table 6
Unadjusted Means, S-X, Standard Deviation, Sp, Skewness,
So(3
, Kurtosis, and S,4 , for Pre- and posttests
PreStatistic Factual
Mean 7.86
S-x 0.21
S.D. 3.07
S6, 0.13
Skewness(00 0.11
So3
0.16
Kurtosis(oi 4)-0.36.
S014 0.33
PreConcept
PreTotal
Post
FactualPostConcept
PostTotal
11.69 19.54 11.23 15.70 26.93
0.26 0.40 0.24 0.34 0.53
3084 5.92 3.43 4.99 7.90
0.17 0.24 0.14 0.20 0.30
0.27 0.42 -0.05 -0.02 0.00
0.16 0.16 0.16 0.16 0.16
-0.18 -0.51 -0.69 -0.60 -0.70
0.33 0.33 0.33 0.33 0.33
45
of 30 items yielded a mean of 11.69 with a S -of 0.26, and a standard
deviation of 3.84, with a Sir, of 0.17.
Results for the total posttest revealed a raw score mean of
26.93, with .1 S- of 0.53, and a standard deviation of 7.90, with a
Srof 0.30. Kurtosis was significantly negative at the 0.05 level,
indicating a relatively platykurtic curve.
Examination of post-factual test statistics disclosed a raw
score mean of 11.23, with a S- of 0.24, and a standard deviation of
3.54, with a Iriof 0.14. Kurtosis was again significantly negative
at the 0.05 level, describing a platykurtic curve.
Inspection of the post-conceptual test showed a mean of 15.70,
with a sR of 0.34, and a standard deviation of 4.99, with a so, of 0.20.
Test reliability was computed by the Kuder-Richardson formula
20. The reliability coefficient for the total pretest was 0.70.
Treatment of data from the pre-factual-oriented subtest yielded a
reliability coe2ficient of 0.58. The pre-conceptual-oriented subtest
had a reliability coefficient of 0.57.
The reliability coefficient obtained for the total posttest
was 0.84. Post-factual-oriented test reliability was 0.68; the post-
conceptual-oriented subtest had a Kuder-Richardson coefficient of
0.74. A copy of the total test may be found in Appendix B.
Treatment of Data from Evaluation Questionnaire
In order to determine the students' reactions to the program-
ming method, chi-square values were calculated from the responses to
46
the Evaluation Questionnaire.
The first ten questions provided three to five cells for the
student's optional choice. The last two items on the questionnaire
asked for a discussion of least-liked and most-liked features of
the programmed laboratory materials. Representative comments from
answers to items 11 and 12 are reported in Appendix D.
The questionnaire is included in Appendix B, and referred to
by question number on Table 7, which summarizes the results of the
analysis of the first ten questions of the questionnaire. For
purposes of analysis the first two and the last two response
categories are combined. The combined first two categories are
referred to as the favorable category in all questions except number
three, number six, and number eight in which the combined last two
categories are referred to as the favorable category. The combined
last two categories are referred to as the unfavorable category in
all questions except aumbers three, six, and eight in which the
combined first two categories are referred to as the unfavorable
category.
The hypothesis of independence of the response categories and
classes was tested by computing chi-square for each of the ten questions
on the questionnaire. If the hypothesis of independence is true, then
the proportions of response in each of the three categories will be
the same regardless of the class involved.
An examination of Table 7 which compares the favorable, indif-
ferent, and unfavorable response categories, reveals that only question
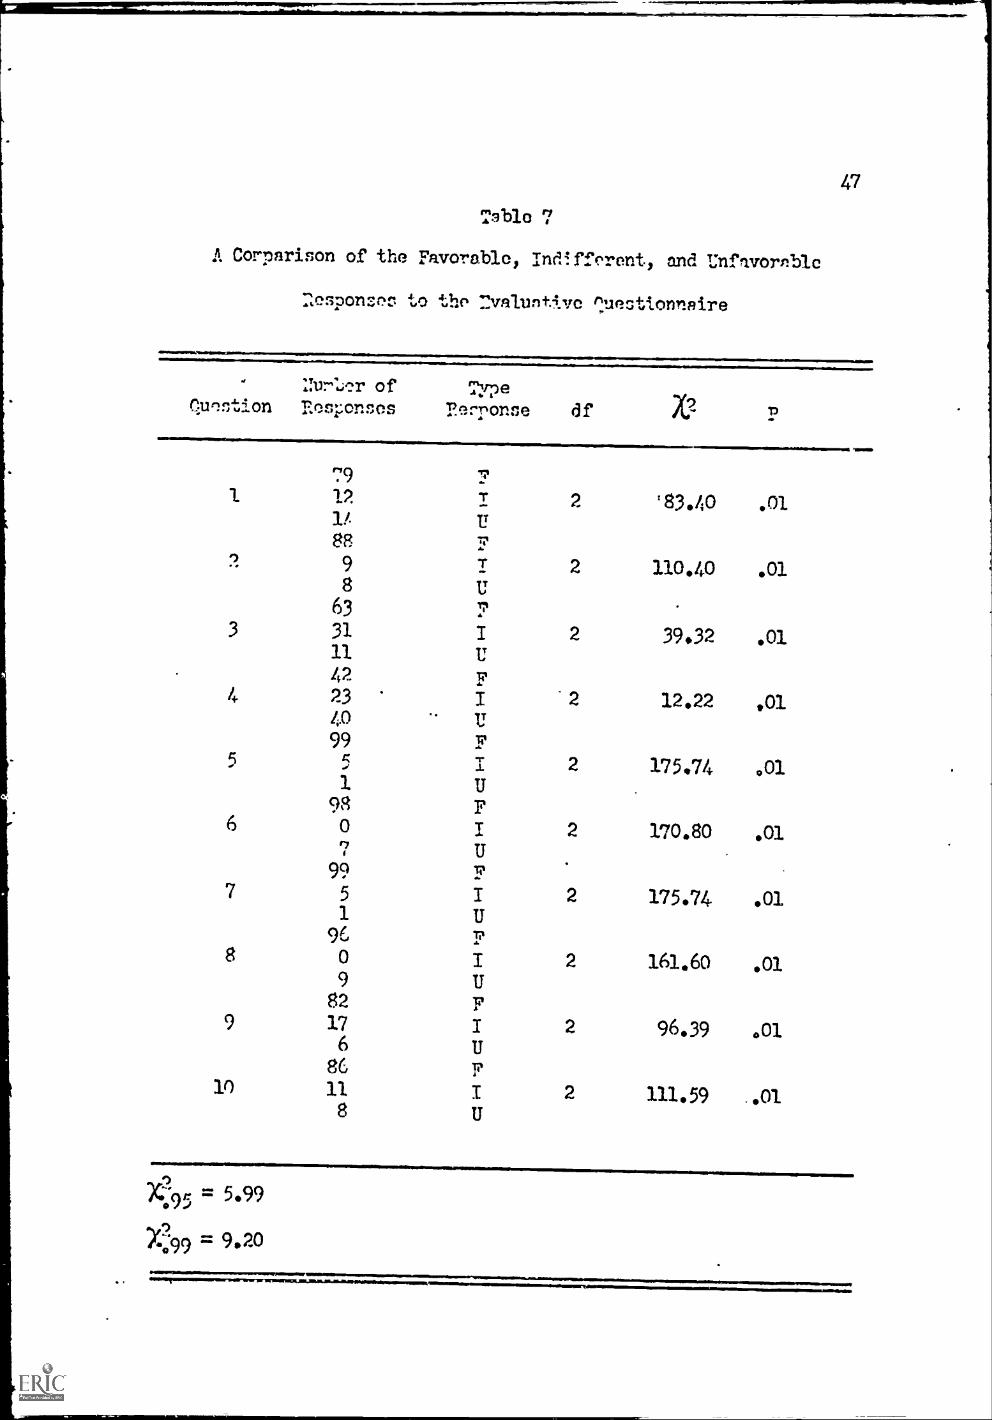
Table 7
A Corparison of the Favorable, Indifferent, and Unfavornble
esponses to thp 7valuntl.ve fluestionnaire
41111111.011111.11.141..1.11111CIMMill
47
1T.urr of TineQuIntion Responses Re:Tonne df X.2 n_
791 12
lt
88
2 98
63
3 31
11
42
T 2 '83.40 .01U-4,
T 2 110.40 .01UTi%
I 2 39.32 .01U
F4 23 I 2 12.22 .01
40 U99 F
5 5 1 2 175.74 0011
698
UF
0 I 2 170.80 .01ry U,
99 F7 5 I 2 175.74 .01
1 U96 F
8 0 I 2 161.60 .019 U82 F
9 17 I 2 96.39 0016 U
86 p,
10 11 I 2 111.59 ..018 U
X:95 = 5.99
X:99 = 9.20
48
four has an equivalence of response. The preponderant favorable
responses, to nine out of the ten objective questions on the
evaluative questionnaire, were highly significant at the 0.01 level
of significance.
Treatment of Data from Programmed Materials
Each of the six programmed, laboratory-experience lessons was
checkeu to identify specific frames which elicited an incorrect
response from the experimental subjects. A mean number of correct
responses was computed for each of the six lessons, as well as the
standard deviation. Lesson 1, HA. Gradient: The Effect of pH on Yeast
Activity", had a total of 77 frames with a mean number correctly
answered of 71.38, and a standard deviation of 8.86.
For a total of 67 frames in Lesson 2, "A GradiEnt for the
Separation of Chemical Substances: Paper Chromatography", a mean of
63.04 was obtained with a standard deviation of 7.07.
A mean of 98.62 resulted from the analysis of the frames answered
correctly in Lesson 3, "Normal Curves and Warping Factors ". The.total
possible number was 104 frames. The standard deviation was 10.75.
Lesson 4, "The Use of Normal Curves in Distinguishing Species",
had a total of 89 frames with a mean number correct of 84.61, and a
standard deviation of 9.44.
"A Study in Measurement", Lesson 5, was 182 frames in length.
Comparatively, Lesson 5 was approximately twice the length of -the
other five lessons. Inasmuch as the use of the microscope was
49
necessary in this exercise, abundant illustrations and instructive
frames were included in Lesson 5, along with the laboratory experiment
itself. The mean number of correct frame responses was 175.53, with
a standard deviation of 17.86.
For a total of 73 frames in Lesson 6, "Measurement as an
Expression of Relationship: A Simple Balance", the mean correct
was 70.22, with a standard deviation of 7.25.
Table 8, a correlation matrix for the six programmed,
laboratory lessons, can be found in Appendix C, page 209.
Statistical Analysis
Analyses of variance and covariance were used to analyze the
data. Because of disproportionate numbers in the groups being
considered, a least-squares method of fitting constants was employed
(Winer, 1961). Scores on reading vocabulary, reading comprehension,
language intelligence, non-language intelligence, science average,
Kuder General Interest Survey (Form E), the Unit Pretest, teacher,
and sex were evaluated as to their effect on posttest scores with
regard to factual and conceptual competencies in science. The
categorized ability levels poixted out earlier were also covariates.
This is a treatment-by-levels statistical model in which the
levels of the variables sex, ability, and achievement are not
randomly selected. Use of the analysis of covariance technique allowed
control over predicted differences between the experimental and control
groups on the dependent variables.. By adjusting for pretest differences,

50
this technique had the effect of controlling the students
statistically.
CHAPTER. IV
RESULTS
The least-squares analyses indicate the relationships between
achievement as measured by the factual-oriented posttest, the
conceptual-oriented posttest, and the total posttest scores, and
the subject variables considered. They also indicate the relation-
ship of scientific interest and the subject variables considered in
the study. The 0.05 probability level was the criterion for
rejecting the null hypothesis. By use of F tables, it was determined
that for 200 degrees of freedom, an "F" ratio of 3.89 and 6.76 are
significant at the 0.05 and 0.01 levels of significance, respectively.
Achievement as Measured la the Posttest Factual Scores (Table 9)
1. Evidence obtained from the analysis of the posttest factualscores of the experimental group and the control groupindicates that the control group achieved at a significantlyhigher level than the experimental group (F = 9.33; p 0.01).
2. Although the teacher variable did not prove to affect,significantly, the achievement of students, the inter-action effects of treatment by teacher proved to besignificant in favor of teacher one with the controlgroup and teacher two with the experimental group(F = 4.68; p 4 0.05).
3. Scores earned on the pre-factual test proved to be relatedpositively to achievement on the post-factual test(F 5.37; p 4 0.05).
4. The relationship of science grades assigned by theseventh-grade science teachers for the first two quartersof the academic year, 1965-1966, proved to be significant(F = 12.86; p 0.01).
5. Reading comprehension scores were positively related toachievement in the experimental program (F = 7.28;p < 0.01).
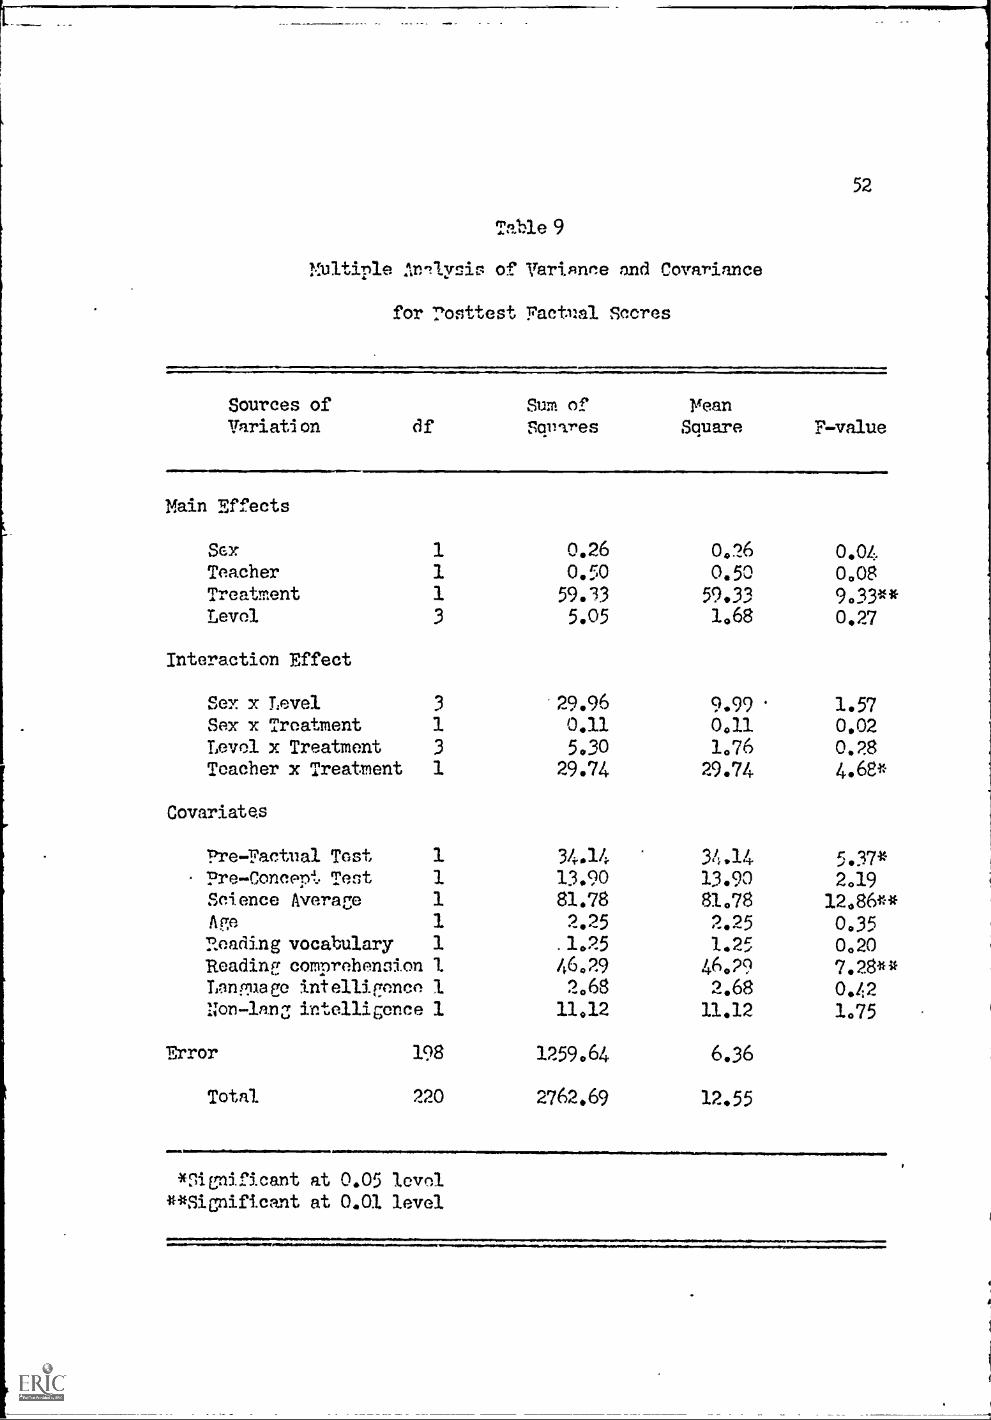
52
Table 9
Multiple Anilris of Varinnne and Covariance
for rosttest Factual Scores
Sources of
Variation dfSum of Yeansqulres Square F-value
Main Effects
Sex 1 0.26 0,26 0.04Teacher 1 0,50 0.50 0.08Treatment 1 59.33 59.33 9,33 **Level 3 5.05 1,68 0.27
Interaction Effect
Sex x Level 3 29.96 9.99 1.57Sex x Treatment 1 0.11 0,11 0.02Level x Treatment 3 5030 1,76 0.28Teacher x Treatment 1 29.74 29.74 4.68*
Covariates
Pre-Factual Test 1 34.14Pre-Concept Test 1 13.90Science Average 1 81.78Age 1 2.25
Reading vocabulary 1 .1.25Reading comprehension 1. 46.29TAInp.pae intelligence 1 2.68Non-lan3 intelligence 1 11,12
Error 198 1259,64
Total 220 2762.69
*Significant at 0.05 level**Significant at 0.01 level
34.14 5.37*13.90 2.1981.78 12.86**2.25 0.351.25 0.20
46,29 7.28**2.68 0.4211.12 1.75
6.36
12.55
amaIi...181.milmllawMPININOWINIIIMNIIINMNIA
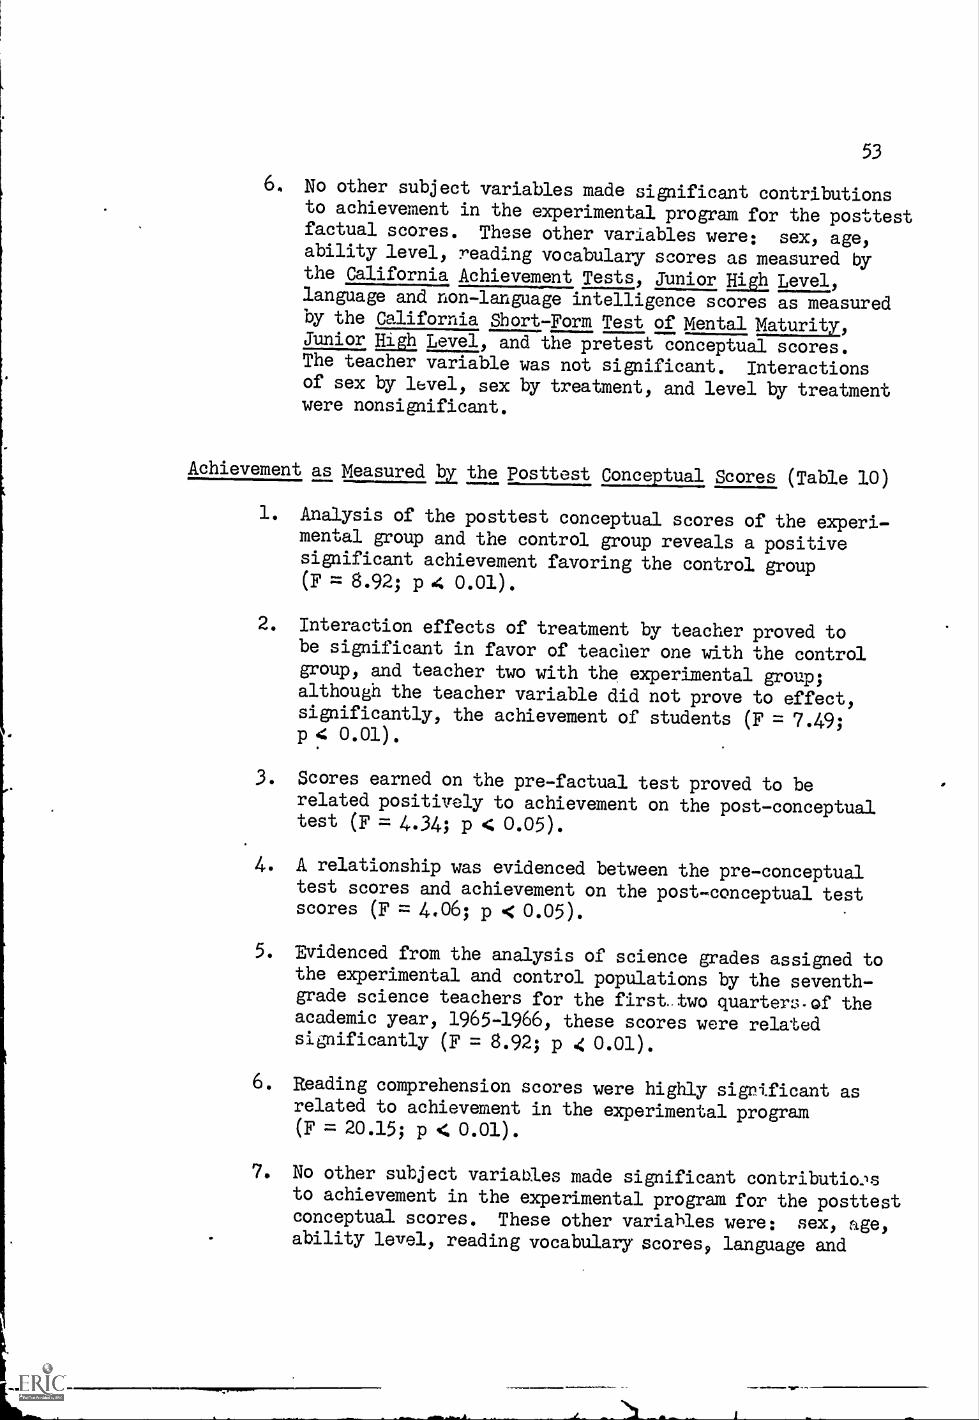
53
6. No other subject variables made significant contributionsto achievement in the experimental program for the posttestfactual scores. These other variables were: sex, age,ability level, reading vocabulary scores as measured bythe California Achievement Tests, Junior High Level,language and non-language intelligence scores as measuredby the California Short-Form Test of Mental Maturity,Junior High Level, and the pretest conceptual scores.The teacher variable was not significant. Interactionsof sex by level, sex by treatment, and level by treatmentwere nonsignificant.
Achievement as Measured la the Posttest Conceptual Scores (Table 10)
1. Analysis of the posttest conceptual scores of the experi-mental group and the control group reveals a positivesignificant achievement favoring the control group(F = 8.92; p 4 0.01).
2. Interaction effects of treatment by teacher proved tobe significant in favor of teacher one with the controlgroup, and teacher two with the experimental group;although the teacher variable did not prove to effect,significantly, the achievement of students (F = 7.49;p 4 0.01).
3. Scores earned on the pre-factual test proved to berelated positively to achievement on the post-conceptualtest (F = 4.34; p < 0.05).
4. A relationship was evidenced between the pre-conceptualtest scores and achievement on the post-conceptual testscores (F = 4.06; p < 0.05).
5. Evidenced from the analysis of science grades assigned tothe experimental and control populations by the seventh-grade science teachers for the first. two quarters.of theacademic year, 1965-1966, these scores were relatedsignificantly (F = 8.92; p 4 0.01).
6. Reading comprehension scores were highly sigrificant asrelated to achievement in the experimental program(F = 20.15; p < 0.01).
7. No other subject variables made significant contributionsto achievement in the experimental program for the posttestconceptual scores. These other variables were: sex, age,ability level, reading vocabulary scores, language and
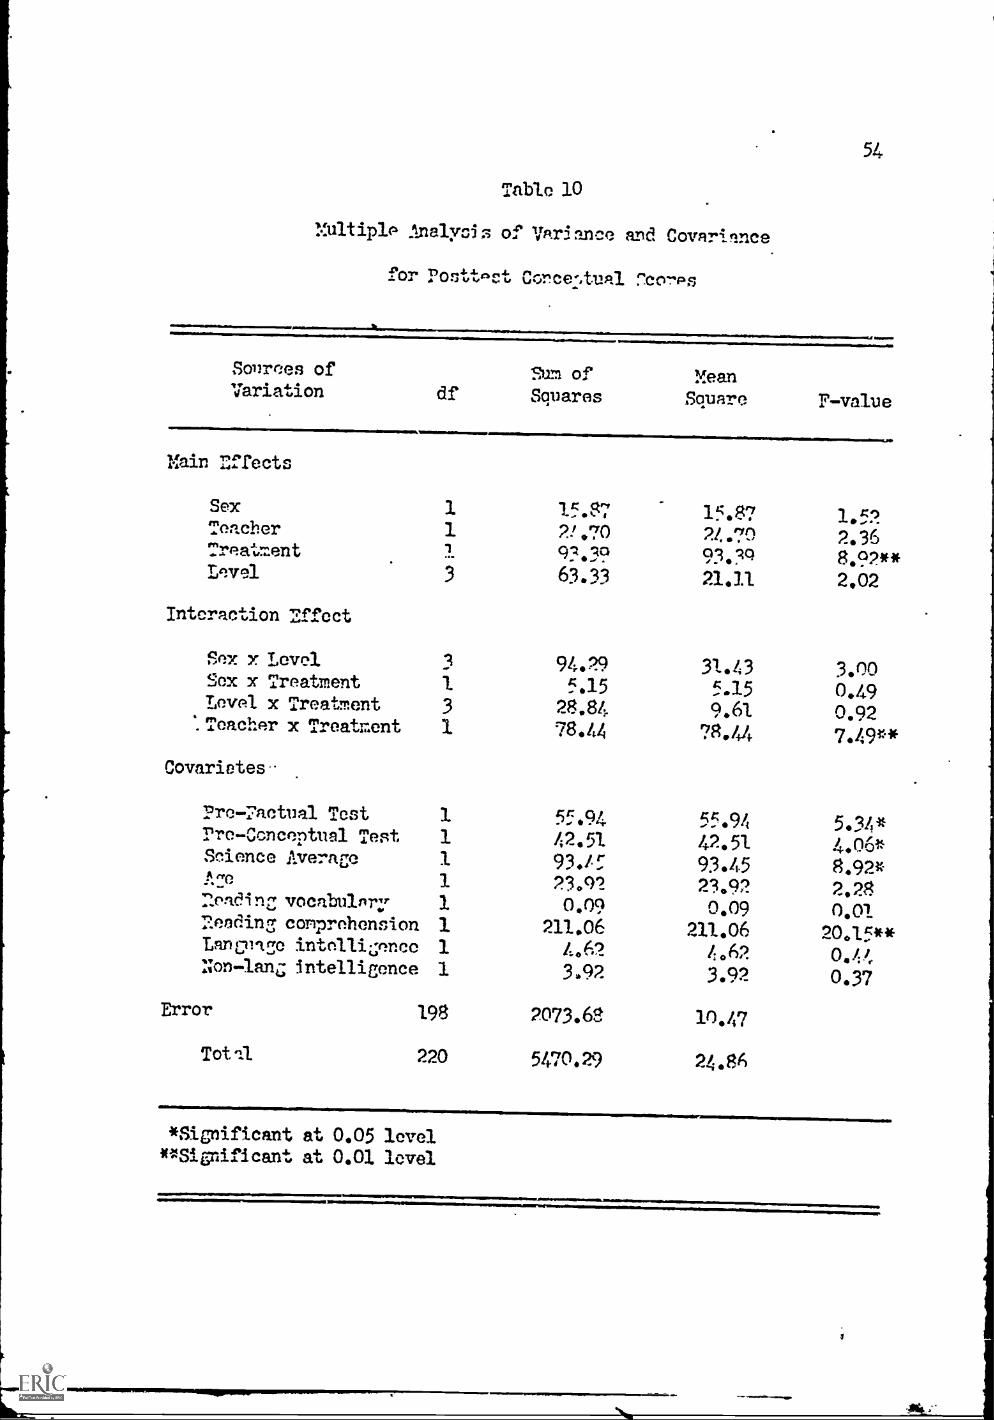
54
Table 10
Multiple Analysis of Vnrinnee and Covnrinnce
for Posttoct Corce:,tunl 7.corps
Sonrees of
Variation df.Sum of
SquaresMeanSquare
Main affects
Sex 1 15.87 15.87Teacher 1 2!.70 24.70Treatment 1 9?.39 93.qqLevel 3 63.33 21.11
Interaction Effect
Sex x Level 3 94.29 31.43Sex x Treatment 1 5.15 5.15Level x Treatment 3 28.84 9.61
'.Teacher x Treatment 1 78.44 78.44
Covarietes
pre-T,actual Test 1 55.94 55.94Pre-Conceptual Test 1 42.51 42.51Science Average 1 93./. 93.45f, .,-,,p 1 23.92 23.92:leaclingvocabuinrzr 1 0.09 0.09nencling comprehension 1 211.06 211.06Langrnge intellionce 1 4.62 4.62Non-lanz intelligence 1 3.92 3.92
Error 198 2073.68 10.47
Tot :1 220 5470.29 24.86
malswimaMMEr
F -value
1.522.36892**2.02
3.000.490.92
7 49**
5.34*4.06*8.92*2.280.01
20.15**0.410.37
*Significant at 0.05 level**significant at 0.01 level
AM.
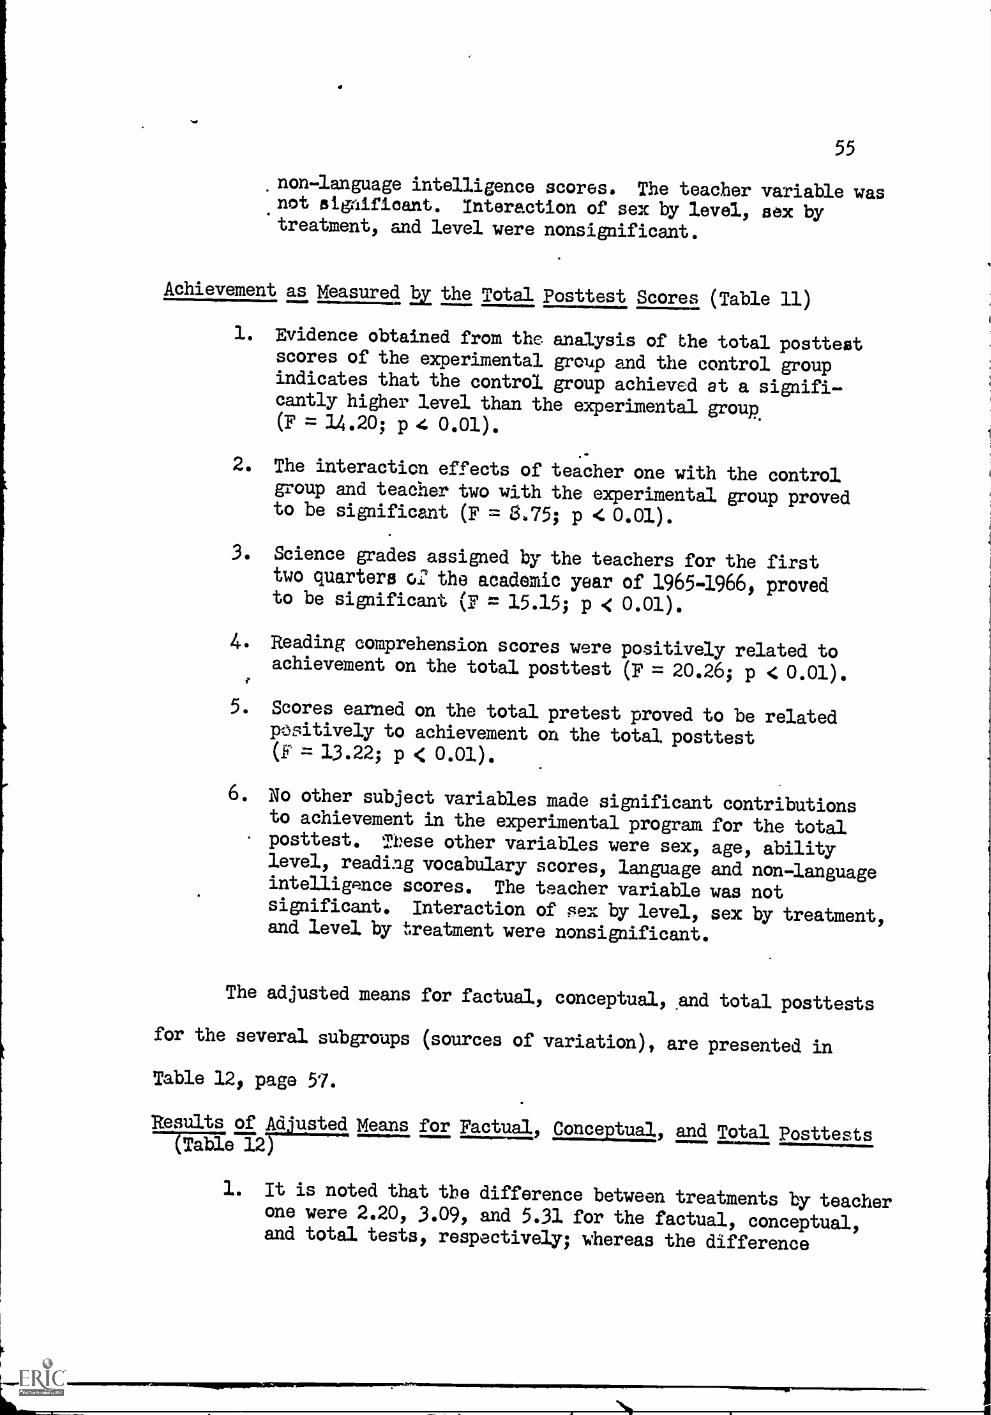
55
non-- language intelligence scores. The teacher variable wasnot significant. Interaction of sex by level, sex bytreatment, and level were nonsignificant.
Achievement as Measured by the Total Posttest Scores (Table 11)
1. Evidence obtained from the analysis of the total posttestscores of the experimental group and the control groupindicates that the control group achieved at a significantly higher level than the experimental group.(F = 14.20; p < 0.01).
2. The interaction effects of teacher one with the controlgroup and teacher two with the experimental group provedto be significant (F = 8.75; p 4:0.01).
3. Science grades assigned by the teachers for the firsttwo quarters o2 the academic year of 1965-1966, provedto be significant (F = 15.15; p < 0.01).
4. Reading comprehension scores were positively related toachievement on the total posttest (F = 20.26; p < 0.01).
5. Scores earned on the total pretest proved to be relatedpositively to achievement on the total posttest(F = 13.22; p < 0.01).
6. No other subject variables made significant contributionsto achievement in the experimental program for the totalposttest. Ttese other variables were sex, age, abilitylevel, readiag vocabulary scores, language and non languageintelligence scores. The teacher variable was notsignificant. Interaction of sex by level, sex by treatment,and level by treatment were nonsignificant.
The adjusted means for factual, conceptual, wand total posttests
for the several subgroups (sources of variation), are presented in
Table 12, page 57.
Results of Ad'usted Means for Factual, Conceptual" and Total Posttests---(Table 12
1. It is noted that the difference between treatments by teacherone were 2.20, 3.09, and 5.31 for the factual, conceptual,and total tests, respectively; whereas the difference
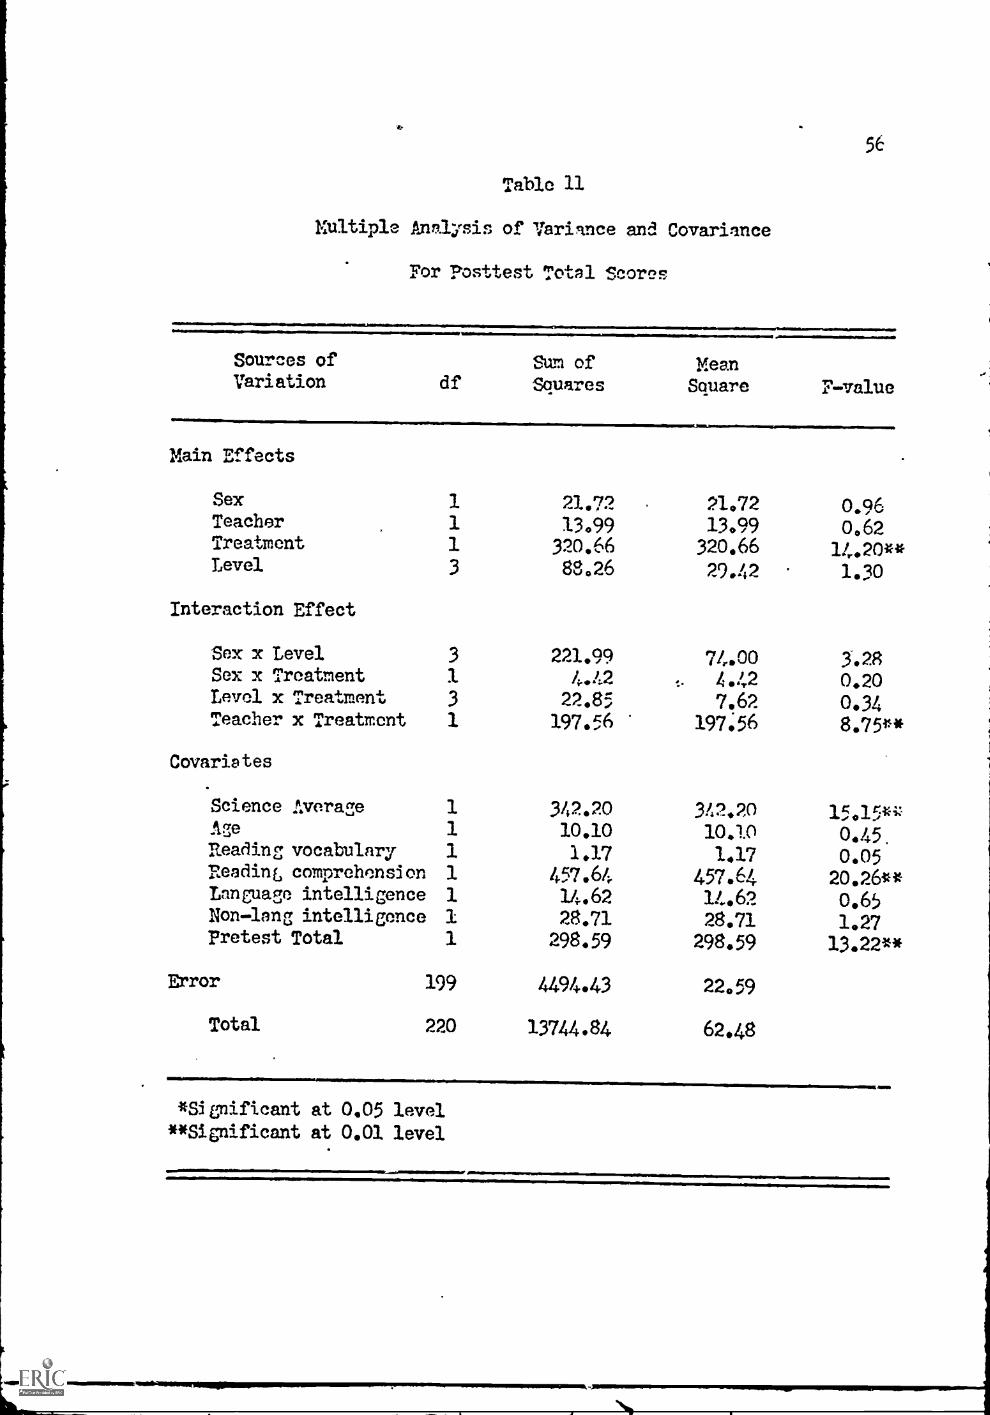
56
Table 11
Eultiple Analysis of Variance and Covariance
For Posttest Total Scores
Sources ofVariation df
Sum ofSquares
Main Effects
Sex 1 21.72Teacher 1 13.99Treatment 1 320.66Level 3 88.26
Interaction Effect
Sex x Level 3 221.99Sex x Treatment 1 4.42Level x Treatment 3 22.85Teacher x Treatment 1 197.56
Covaristes
MeanSquare F-value
21.72 0.9613.99 0.62
320.66 14.20**29.42 1.30
74.00 5.28t. 4.42 0.20
7.62 0.34
197.56 8.75**
Science Average 1 342.20 32.20 15015*Age 1 10.10 10.10 0.45.:Reading vocabulary 1 1.17 1.17 0.05Readinf, comprehension 1 457.64 457.64 20.26**language intelligence 1 14.62 14.62 0.65Non-lang intelligence 1 28.71 28.71 1.27Pretest Total 1 298.59 298.59 13.22**
Error 199 4494.43 22.59
Total 220 13744.84 62.48
*Siolificant at 0.05 level
**Significant at 0.01 level
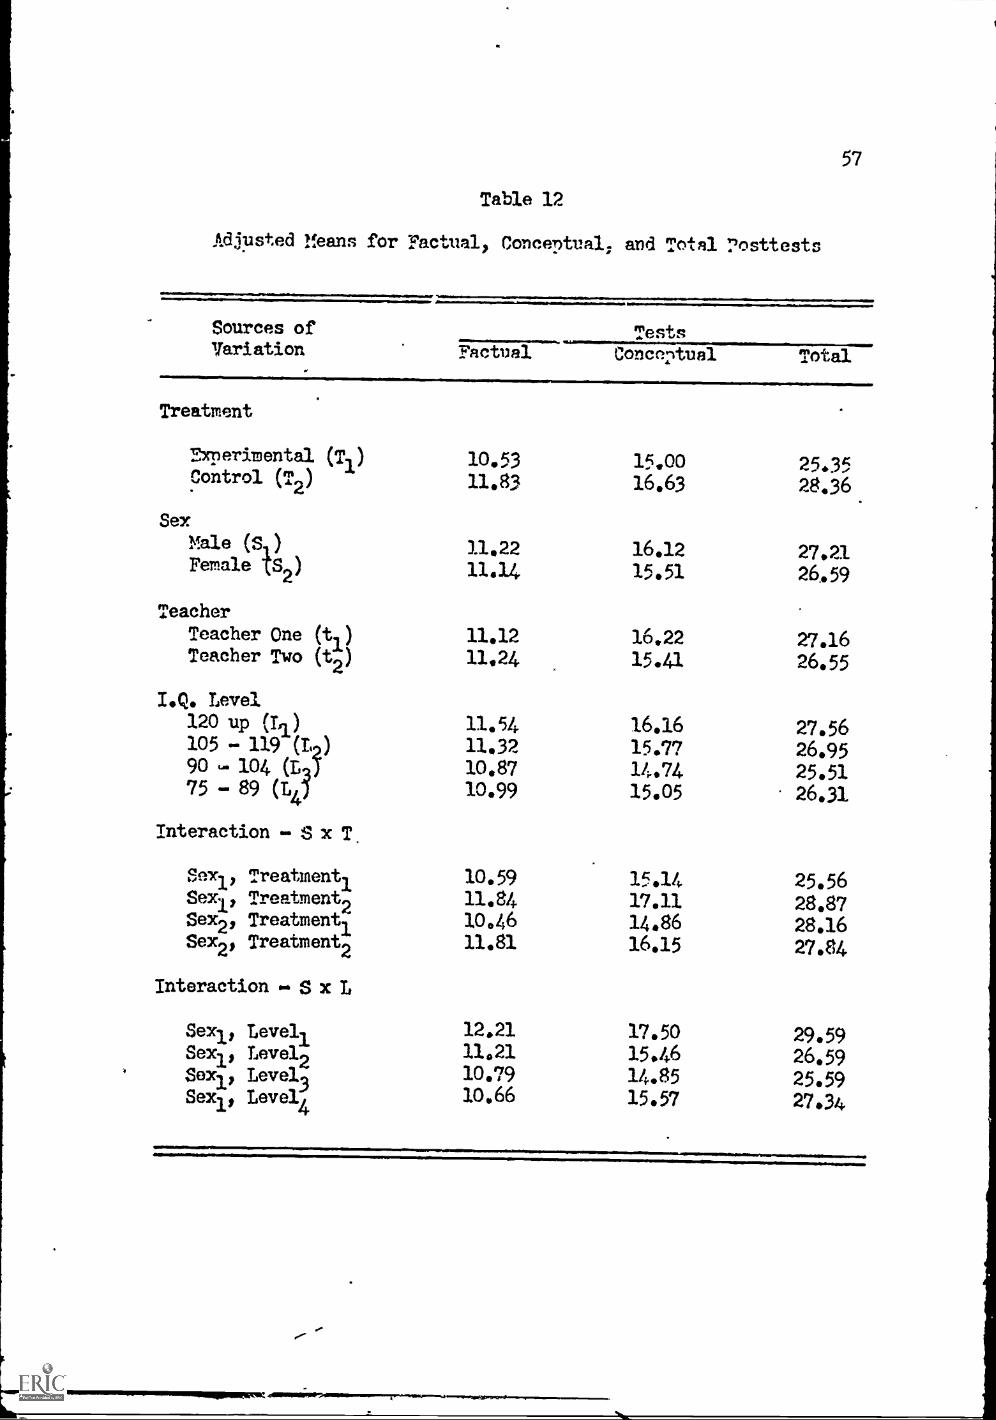
Table 12
Adjusted !leans for Factual, Conceptual; and Total rosttests
Sources ofVariation
Treatment
vxperimental (T1)Control (T2)
SexMale (Si)Female TS2)
Teacher
Teacher One (t1)Teacher Two (t2)
I.Q. Level120 up (L1)
105 - 119 (L)90 - 104 CEO'75 - 89 (L41
Interaction - S x T.
Sexil Treatment].
Sexl, Treatment2Sex2, Treatment].
Sex2, Treatment2
Interaction S x L
Sen., Level].
Sexl, Level2Sex', Level3Sen., Level4
57
11
TestsFactual ConcnIltual Total
10.53 15.00 25.3511.83 16.63 28.36
11.22 16.12 27.2111.14 15.51 26.59
11.12 16.22 27.1611.24 15.41 26.55
11.54 16.16 27.5611.32 15.77 26.9510.87 14.74 25.5110.99 15.05 26.31
10.59 15.14 25.5611.84 17.11 28.8710.46 14.86 28.1611.81 16.15 27.84
12.21 17.50 29.5911.21 15.46 26.5910.79 14.85 25.5910.66 15.57 27.34
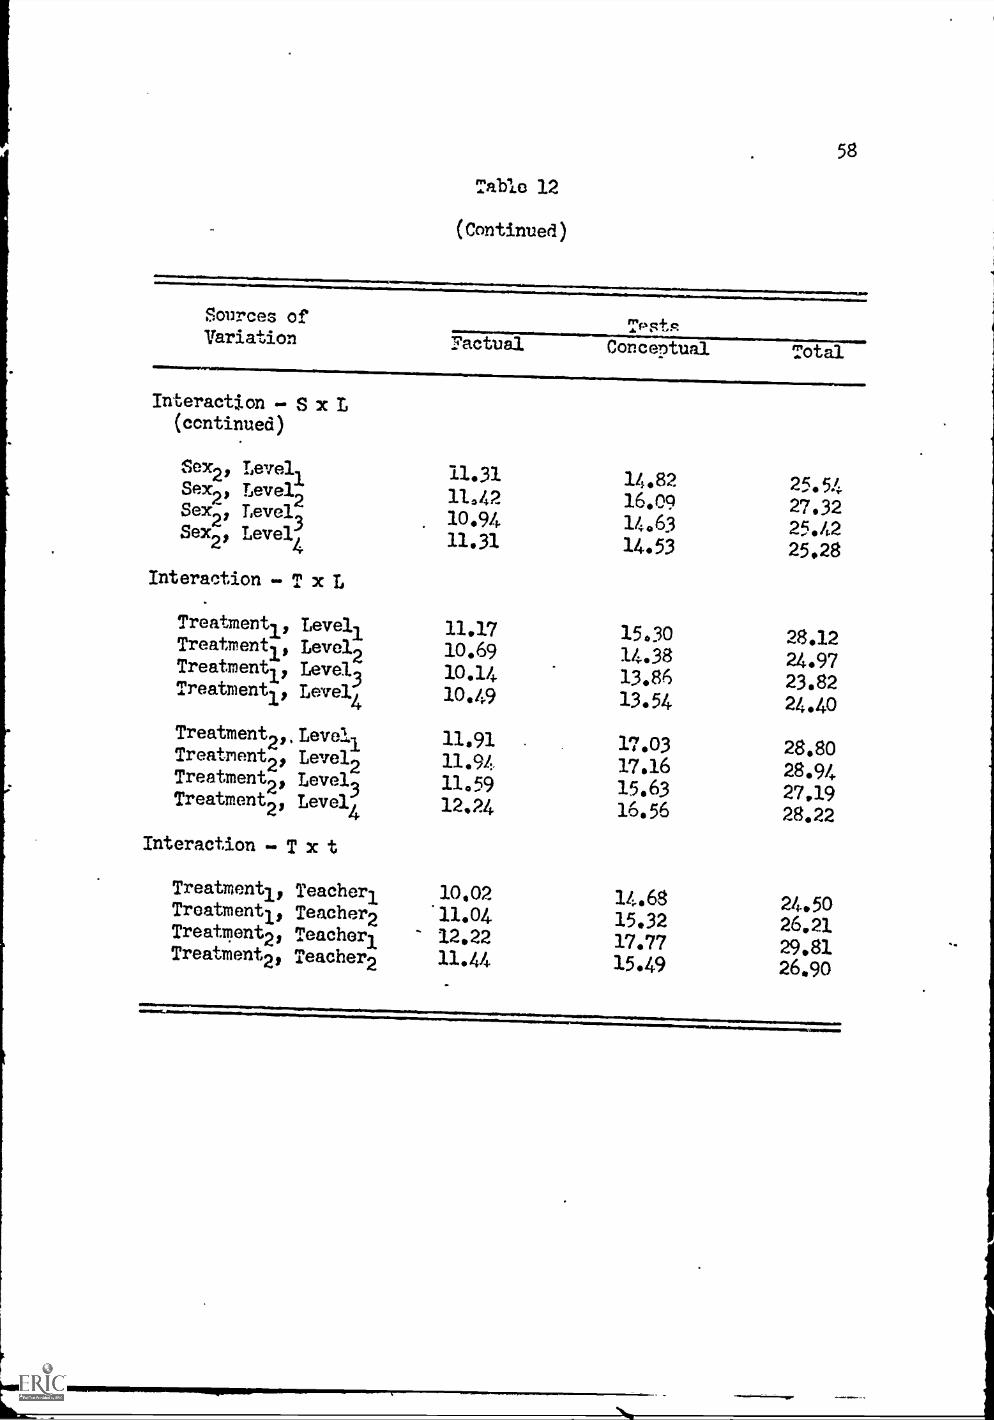
58
Table 12
(Continued)
Sources of
Variation
Interaction -SxL(continued)
Sex2, Level].evel
1Sex2, Level2
2Sex2'
Level3Sex2, Level4
Interaction -TxL
Treatment12Treatmenti,Treatment
1$Treatment
11
Treatment22
Treatnent2$
Treatment21
Treatment2'
Level1Level
2Level3
Level4
Level/Level2Level
3Level
4
Interaction -Txt
Treatmenti,Treatmenti,Treatment2,
Treatment2,
Teacher].
Teacher2Teacher].
Teacher2
TpstsFactual Conceptual Total
10
11.31 14.82 25.5411.42 16.09 27.3210.94 14.63 25.4211.31 14.53 25.28
11.17 15.30 28.1210.69 14.38 24.9710.14 13.86 23.8210.49 13.54 24.40
11.91 17.03 28.8011.94 17.16 28.9411.59 15.63 27,1912.24 16.56 28.22
10.02 14.68 24.50.11.04 15.32 26.2112.22 17.77 29.8111.44 15.49 26.90
between the treatments for t4Acher(.40, .17, and .69, respectively),significant interaction.
59
two were much smallerthus accounting for the
2. Most noteworthy was that the adjusted means for the severalI.Q. level groups were not only nonsignificant, but thedifference between the highest and lowest groups wereremarkably similar.
To analyze the differences in achievement gain for the control
group and experimental group on all three tests, factual, conceptual,
and total, a t test was performed. This test was performed on the
raw scores corrected for chance by the formula rights minus one-third
wrong, but did not take into account adjustments for covariates. The
one-tailed test was used because it seemed most unlikely that the
groups would lose proficiency as a result of systematic study. The
one-tailed test is a more powerful test in this situation. A t ratio
uith 120 degrees of freedom, for a one-tailed test, has a value of
2,36 at the 0.01 level of significance.
Results of Testii.n Means of the Population of Differences (Table 13)
1. Evidence obtained from the analysis of means of differencesfor the factual test of the experimental and control groups,indicates that both groups had highly significant gainsin achievement 5= 11.03 (Control); t = 10.03 (Experimental);p 4 0.017.
2. Analysis of means of differences for the conceptual testof the experimental group and control group, reveals thatboth groups gained in achievement significantly = 11.23(Control); t = 7.76 (Experimental); p< 0.017.
3. Data for the means of differences for the total test ofthe experimental and control groups demonstrated that bothgroups had highly significant achievement gains 5 = 13.06(Control); t = 10.39 (Experimental); p< 0.017.
The fourth hypothesis listed in Chapter I stated there would
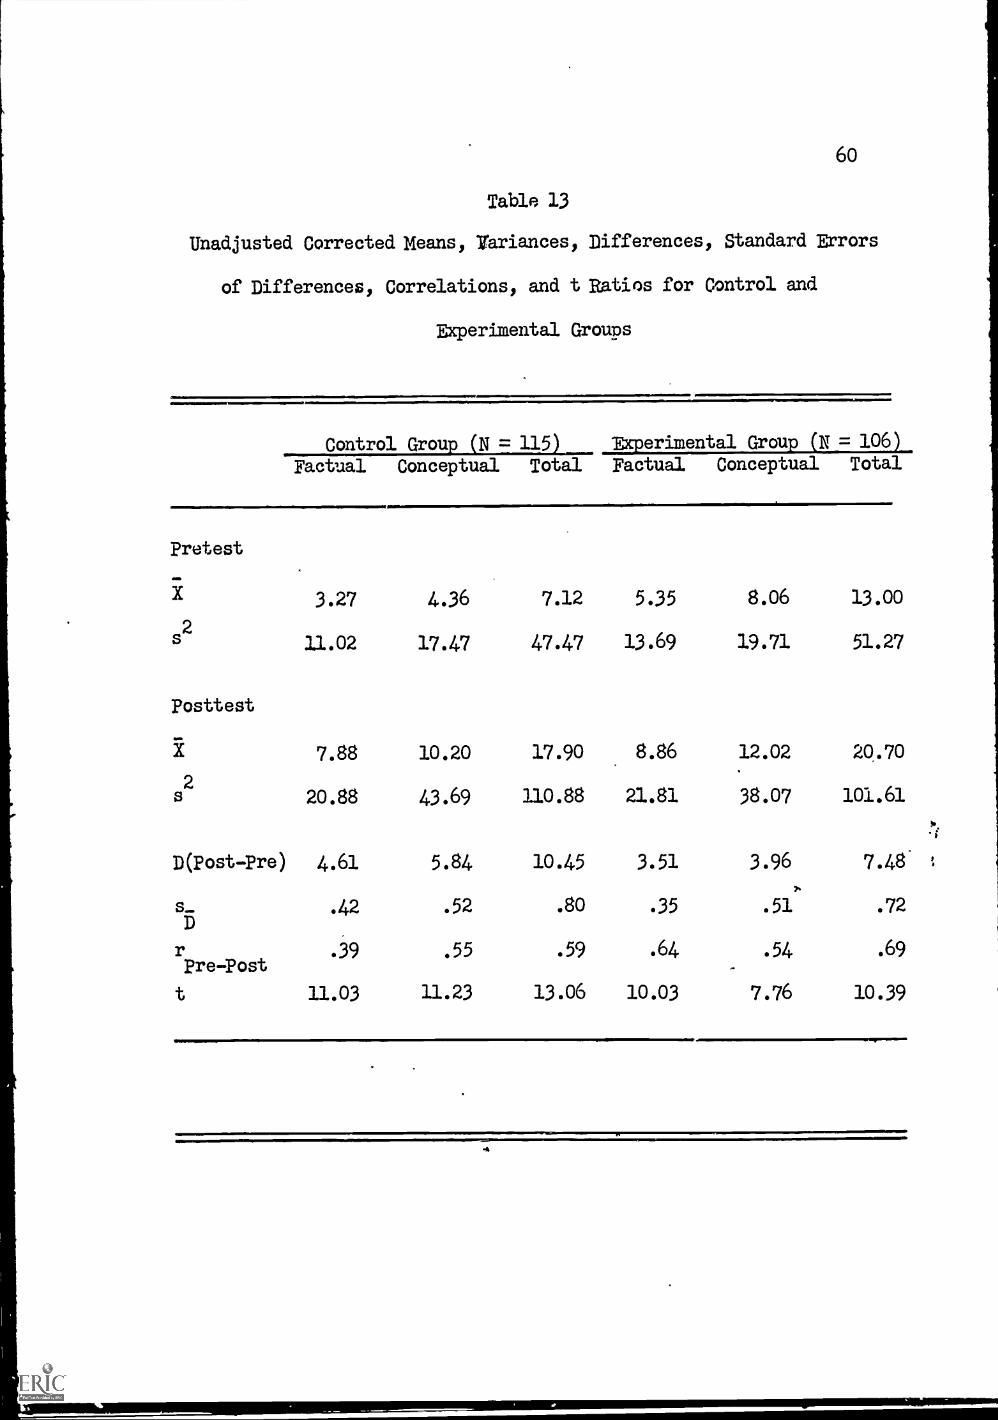
60
Table 13
Unadjusted Corrected Means, variances, Differences, Standard Errors
of Differences, Correlations, and t Ratios for Control and
Experimental Groups
Control Group_SN = 1151___ TXperimental Group (N = 106)
Factual Conceptual Total Factual Conceptual Total
Pretest
X 3.27 4.36 7.12
s2
11.02 17.47 47.47
Posttest
X 7.88 10.20 17.90
s2
20.88 43.69 110.88
D(Post-Pre) 4.61 5.84 10.45
s_D
.42 .52 .80
pre-Post.39 .55 .59
t 11.03 11.23 13.06
5.35 8.06 13.00
13.69 19.71 51.27
8.86 12.02 20.70
21.81 38.07 101.61
,..
3.51 3.96 7.48'
7.
.35 .51 .72
.64 .54 .69
10.03 7.76 10.39
-14
61
be no significant scientific interest change between the experimental
and control groups. This hypothesis was tested by the least-squares
multiple analysis of variance. Results of the treatment of the data
are listed below.
Multiple Analysis of Kuder General Interest Survey (Form E) (Table 14)
1. Differences attributable to sex were significant at the
0.01 level of significance (F = 13.47; p Z 0.01).
2. Differences attributable to teacher were significant at
the 0.01 level of significance (F = 33.55; p 4 0.01).
3. The pretest scores from the Kuder General Interest Survey,
were significant predictors for performance on the post-
administration of the Kuder General Interest Survey
(F = 41.45; p < 0.01).
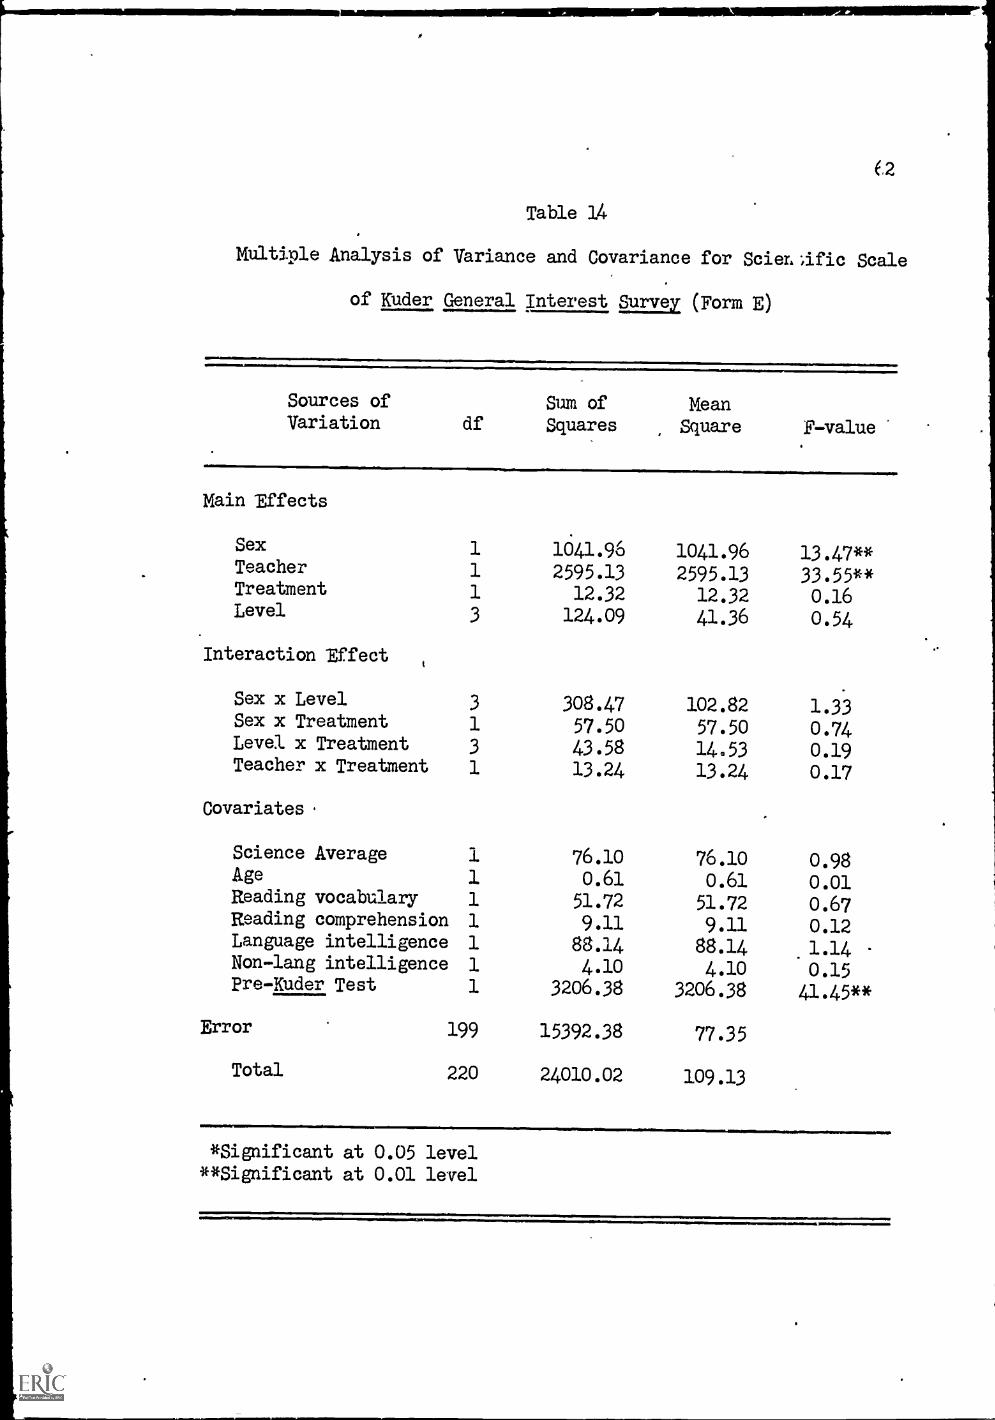
(2
Table 14
MultLple Analysis of Variance and Covariance for ScieLdfic Scale
of Kuder General Interest Lam (Form E)
Sources of Sum of MeanVariation df Squares Square F-value
Main Effects
Sex 1 1041.96 1041.96 13.47**Teacher 1 2595.13 2595.13 33.55**Treatment 1 12.32 12.32 0.16Level 3 124.09 41.36 0.54
Interaction Effect
Sex x Level 3 308.47 102.82 1.33Sex x Treatment 1 57.50 57.50 0.74Level x Treatment 3 43.58 14 53 0.19Teacher x Treatment 1 13.24 13.24 0.17
Covariates
Science Average 1 76.10 76.10 0.98Age 1 0.61 0.61 0.01Reading vocabulary 1 51.72 51.72 0.67Reading comprehension 1 9.11 9.11 0.12Language intelligence 1 88.14 88.14 1.14Non-lang intelligence 1 4.10 4.10 0.15pre-Kuder Test 1 3206.38 3206.38 41.45**
Error 199 15392.38 77.35
Total 220 24010.02 109.13
*Significant at 0.05 level**Significant at 0.01 level
CHAPTER V
DISCUSSION AND CONCLUSIONS
The first three hypotheses are closely related, and the findings
concerning them are consistent. Discussion related to them will be on
a collective basis.
Those students pursuing the program of instruction employing
the non-programmed, problem-solving approach achieved at a significantly
higher level than was achieved by members of the experimental group.
However, evidence clearly suggests that those students having the
ability to, pursue, adequately, a problem-solving, general science unit
did so in both the experimental and the control group. "The results of
testing means of the population of differences revealed highly signif-
icant t ratios beyona the 0.01 level for both the experimental and
control groups for all three tests, factual, conceptual, and total.
This means that not only were definite gains made in science, factual
knowledge; but, also, definite gains in ability to use concepts,
generalizations, and principles as measured by the pre- and post-
conceptual test, were evident for both groups. Thus, the open-ended,
problem-solving aspect of the experimental program appeared to be
successful for both experimental and control groups.
As revealed in Table 13, page 60, the relative gain for the
control group was greater. The raw score mean for the experimental
group was higher, but after adjustmert, which takes into account all
covariates, the adjusted means were reversed for the groups. On the
factual pretest, the control group mean was 3.27, that of the
64
experimental 5.35. Factual posttest means for the control
experimental were 7.88 and 8.86, respectively. The difference score
for the control group was 4.61, for the experimental 3.51, Thus, the
relative gain was higher for the control group.
This is demonstrated also from treatment of the data for the
conceptual pre- and posttest. The raw score means for the control
were 4.36 and 1(3.201 for the experimental, 8.06 and 12.02. Differences
were 5.84 and 3.96, respectively, for the control and experimental groups.
Differences for the total pre- and posttest were 10.45 for the
control, and 7.48 for the experimental. Raw score means were 7.12 and
17.90 for the control, and 13.00 and 20.70 for the experimental.
Thus, the control group started at a relative disadvantage as
compared with the experimental group, but made a significantly greater
gain. In spite of the relatively greater gain of the control group
for all criteria, the experimental raw means were still superior at
the'end of the experiment.
To look at some contributions of the programmed approach, the
teachers of the experimental groups and the investigator, by observa-
tion, noted a change in the general, work patterns of the members of
the experimental group. The program seemed to be highly motivating
to the students. Generally, they reported promptly to the classroom,
started to work immediately, and continued to work during the entire
class period. The principal and one of the cooperating teachers both
commented on the wonder of seeing some apathetic students participating
in any project for the first time. One of the teachers commented that
Apr
65
several of the lower ability students, by proceeding at their own pace,
were finally able to succeed at something, and to gain satisfaction
from their accomplishment. Another student, contributed one teacher,
talked more during the first week of experimentation than he had all
year; he wanted to discuss his research findings about which he was
apparently intrigued. Some students mentioned they were really
understanding the metric system for the first time, inasmuch as they
were actually working with metric units of measurement in the collec-
tion of their data.
The reaction to the programmed sequence ranged from enthusiasm
to mere acceptance. Most of the students reactions were highly
enthusiastic as demonstrated by the results of the evaluative question-
naire discussed in Chapter III.
There appeared to be no unusually difficult administrative
problems surrounding the individual performances of laboratory
ewperiments by these seventh-grade students. Breakage or destruction
of supplies and equipment was surprisingly minor. Generally students
developed laboratory skills rapidly.
The experimental group had the advantage in that those students
who were absent from class could, upon their return, enter the program
at the point they had left before the absence. There was no loss of
instructional time due to the absence. The student could take his
programmed material home during his absence also. As a result, all
members of the experimental group were exposed to precisely the same
content. This was not true in the control group where, because of
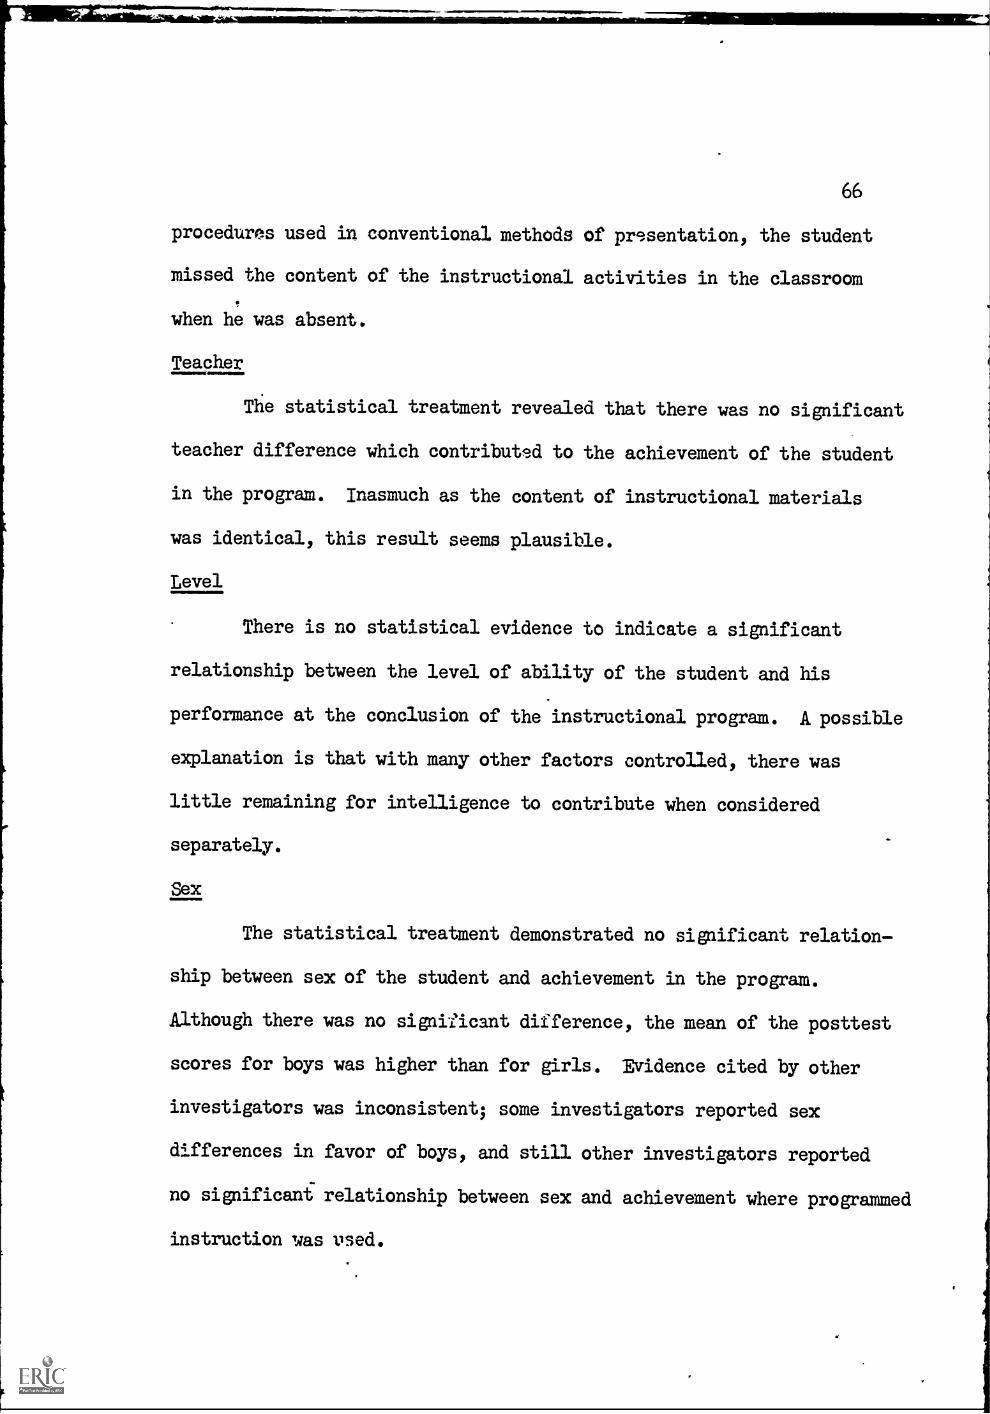
66
procedures used in conventional methods of presentation, the student
missed the content of the instructional activities in the classroom
when he was absent.
Teacher
The statistical treatment revealed that there was no significant
teacher difference which contributed to the achievement of the student
in the program. Inasmuch as the content of instructional materials
was identical, this result seems plausible.
Level
There is no statistical evidence to indicate a significant
relationship between the level of ability of the student and his
performance at the conclusion of the instructional program. A possible
explanation is that with many other factors controlled, there was
little remaining for intelligence to contribute when considered
separately.
Sex
The statistical treatment demonstrated no significant relation
ship between sex of the student and achievement in the program.
Although there was no significant difference, the mean of the posttest
scores for boys was higher than for girls. Evidence cited by other
investigators was inconsistent; some investigators reported sex
differences in favor of boys, and still other investigators reported
no significant relationship between sex and achievement where programmed
instruction was vsed.
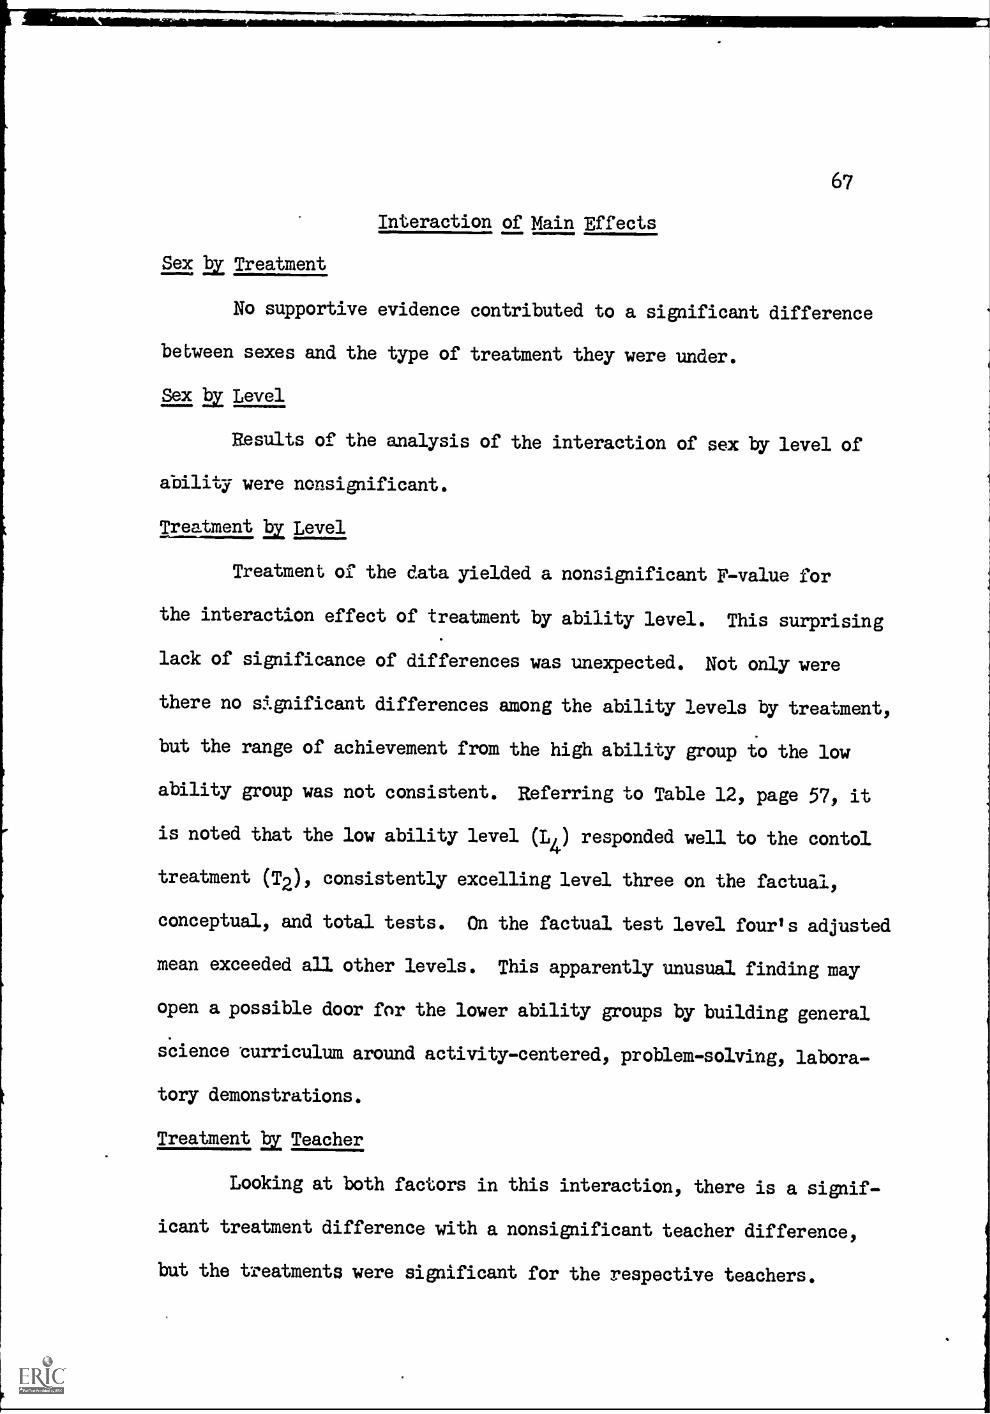
Interaction of Main Effects
67
Sex hy Treatment
No supportive evidence contributed to a significant difference
between sexes and the type of treatment they were under.
Sex Level
Results of the analysis of the interaction of sex by level of
ability were nonsignificant.
Treatment 12:Level
Treatment of the data yielded a nonsignificant F-value for
the interaction effect of treatment by ability level. This surprising
lack of significance of differences was unexpected. Not only were
there no significant differences among the ability levels by treatment,
but the range of achievement from the high ability group to the low
ability group was not consistent. Referring to Table 12, page 57, it
is noted that the low ability level (L4) responded well to the contol
treatment (T2), consistently excelling level three on the factual,
conceptual, and total tests. On the factual test level four's adjusted
mean exceeded all other levels. This apparently unusual finding may
open a possible door for the lower ability groups by building general
science curriculum around activity-centered, problem-solving, labora-
tory demonstrations.
Treatment Teacher
Looking at both factors in this interaction, there is a signif-
icant treatment difference with a nonsignificant teacher difference,
but the treatments were significant for the respective teachers.
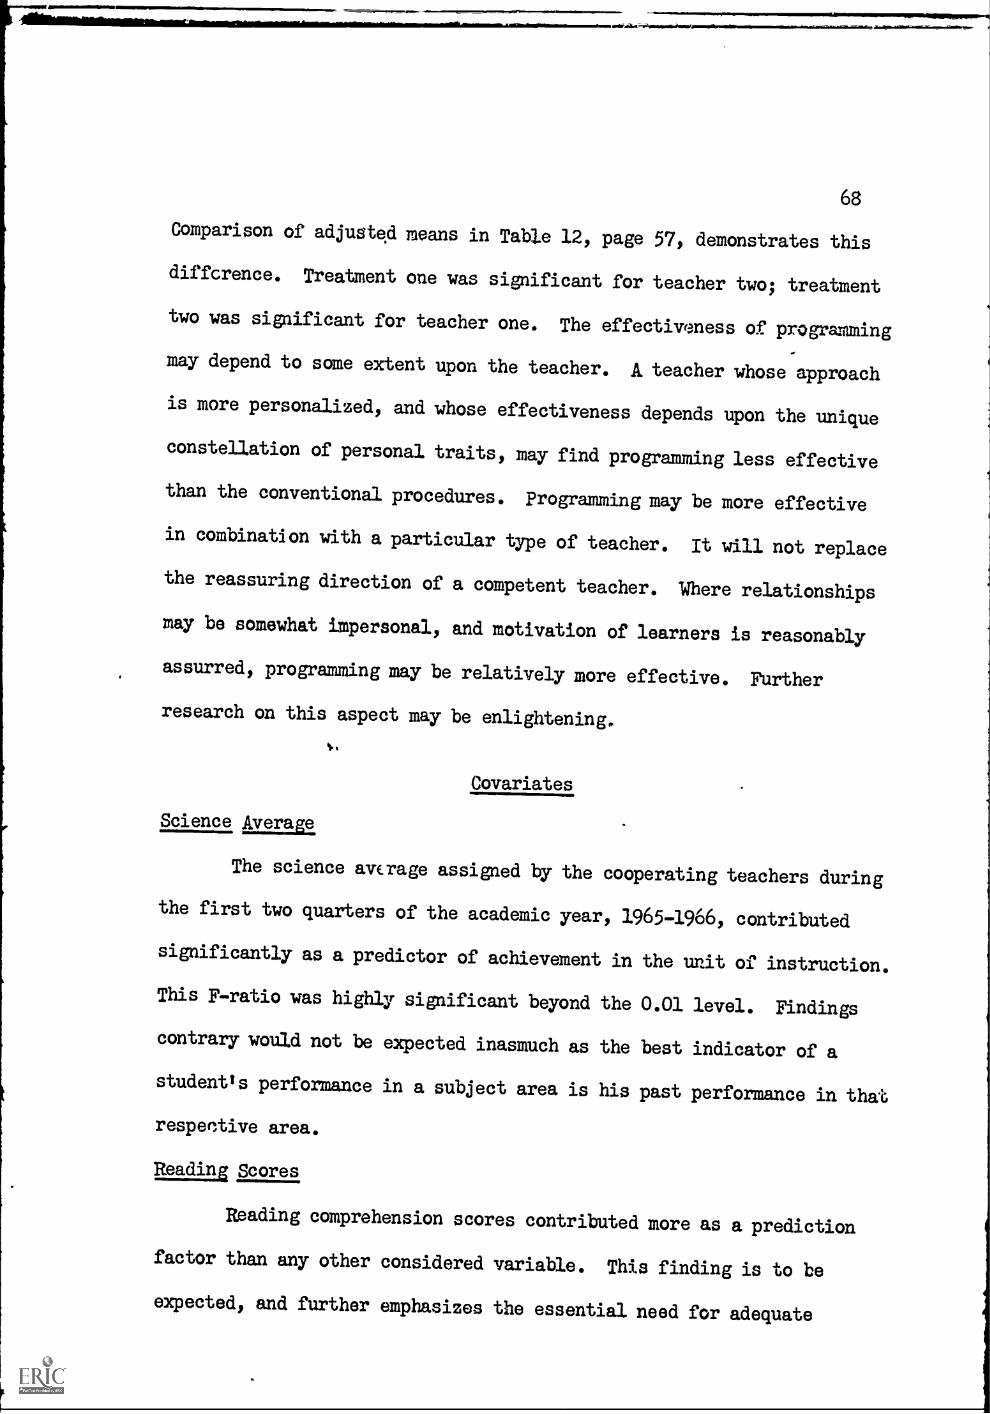
68
Comparison of adjusted means in Table 12, page 57, demonstrates this
diffcrence. Treatment one was significant for teacher two; treatment
two was significant for teacher one. The effectiveness of programming
may depend to some extent upon the teacher. A teacher whose approach
is more personalized, and whose effectiveness depends upon the unique
constellation of personal traits, may find programming less effective
than the conventional procedures. Programming may be more effective
in combination with a particular type of teacher. It will not replace
the reassuring direction of a competent teacher. Where relationships
may be somewhat impersonal, and motivation of learners is reasonably
assurred, programming may be relatively more effective. Further
research on this aspect may be enlightening.
Covariates
Science Average
The science avcrage assigned by the cooperating teachers during
the first two quarters of the academic year, 1965-1966, contributed
significantly as a predictor of achievement in the unit of instruction.
This F-ratio was highly significant beyond the 0.01 level. Findings
contrary would not be expected inasmuch as the best indicator of a
student's performance in a subject area is his past performance in that
respective area.
Reading Scores
Reading comprehension scores contributed more as a prediction
factor than any other considered variable. This finding is to be
expected, and further emphasizes the essential need for adequate
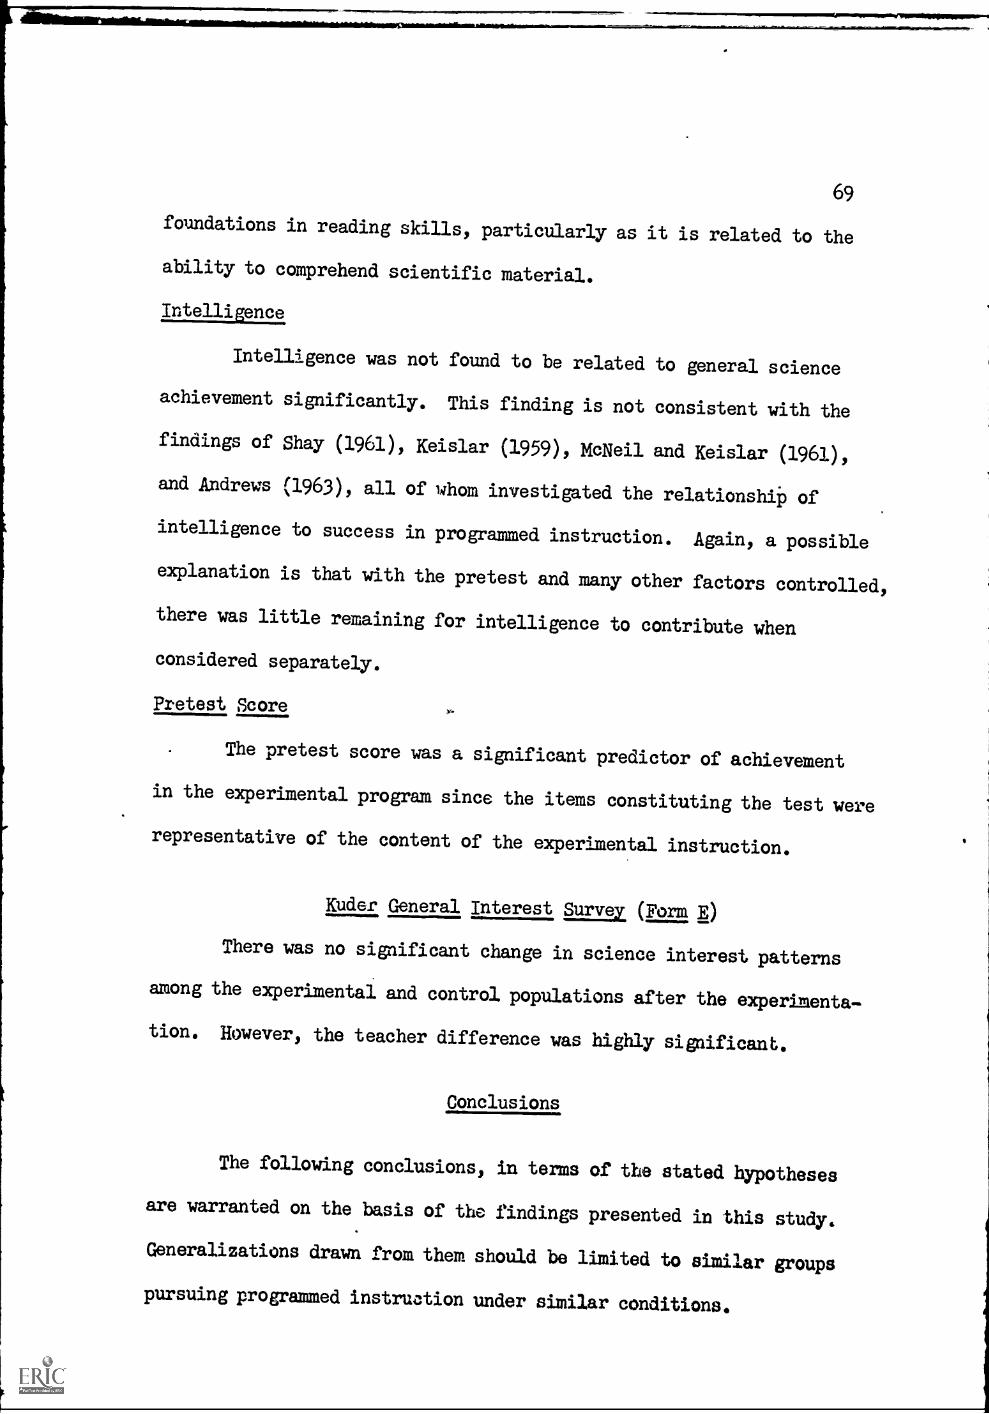
69
foundations in reading skills, particularly as it is related to the
ability to comprehend scientific material.
Intelligence
Intelligence was not found to be related to general science
achievement significantly. This finding is not consistent with the
findings of Shay (1961), Keislar (1959), McNeil and Keislar (1961),
and Andrews (1963), all of whom investigated the relationship of
intelligence to success in programmed instruction. Again, a possible
explanation is that with the pretest and many other factors controlled,
there was little remaining for intelligence to contribute when
considered separately.
Pretest Score
The pretest score was a significant predictor of achievement
in the experimental program since the items constituting the test were
representative of the content of the experimental instruction.
Kuder General Interest Survey (Form E)
There was no significant change in science interest patterns
among the experimental and control populations after the experimenta-
tion. However, the teacher difference was highly significant.
Conclusions
The following conclusions, in terms of the stated hypotheses
are warranted on the basis of the findings presented in this study.
Generalizations drawn from them should be limited to similar groups
pursuing programmed instruction under similar conditions.
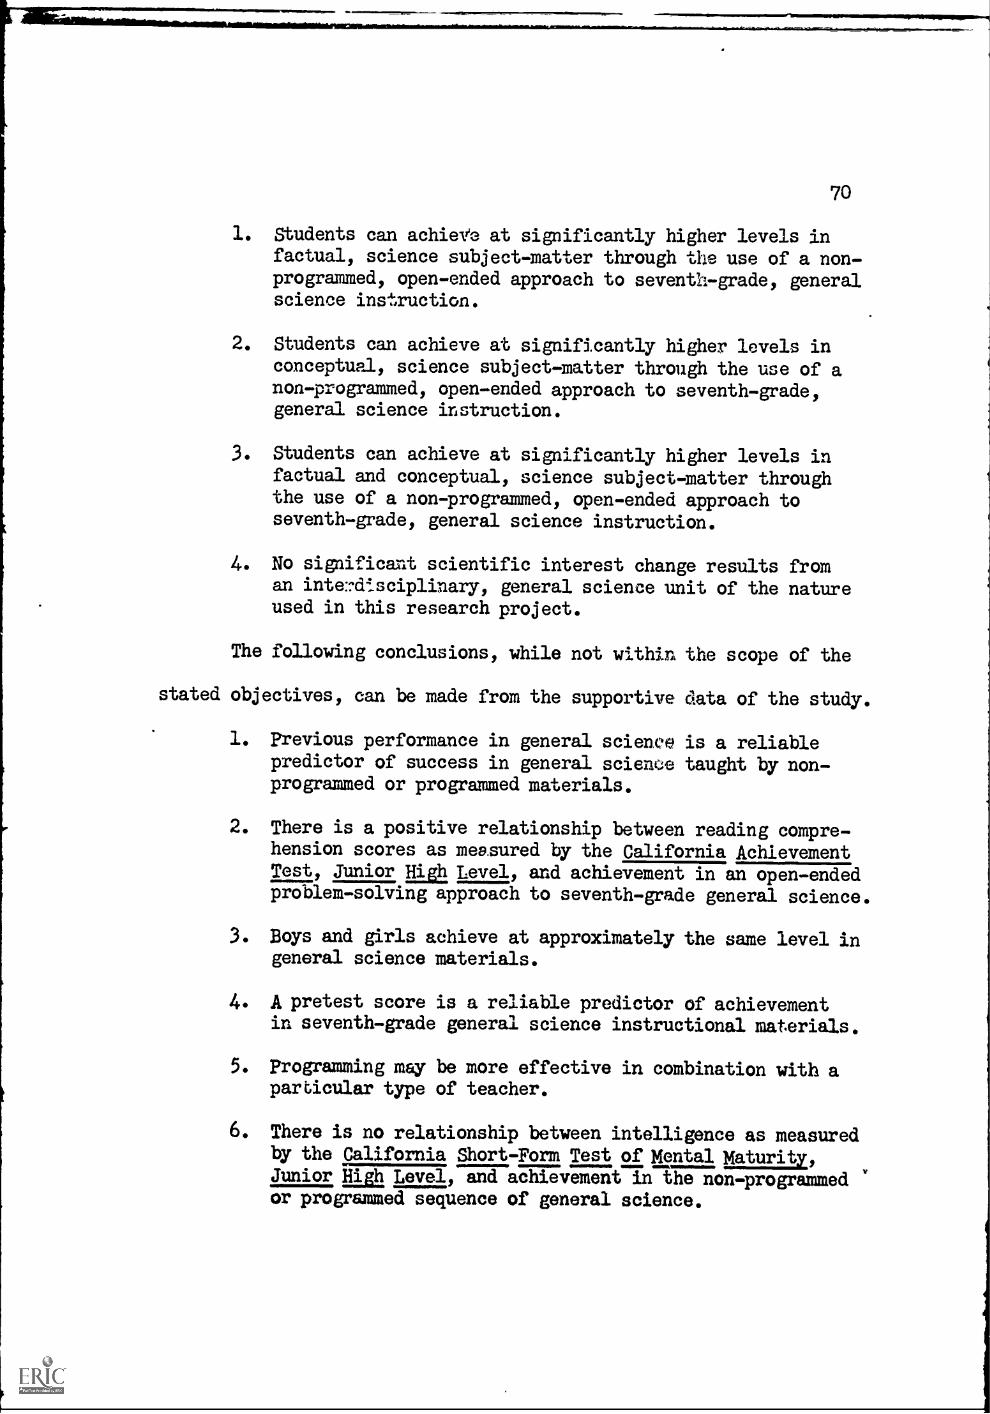
70
1. Students can achieve at significantly higher levels infactual, science subject-matter through the use of a non-programmed, open-ended approach to seventh-grade, generalscience instruction.
2. Students can achieve at significantly higher levels inconceptual, science subject-matter through the use of anon-programmed, open-ended approach to seventh-grade,general science instruction.
3. Students can achieve at significantly higher levels infactual and conceptual, science subject-matter throughthe use of a non-programmed, open-ended approach toseventh-grade, general science instruction.
4. No significant scientific interest change results froman interdisciplinary, general science unit of the natureused in this research project.
The following conclusions, while not within the scope of the
stated objectives, can be made from the supportive data of the study.
1. Previous performance in general science is a reliablepredictor of success in general scienGe taught by non-programmed or programmed materials.
2. There is a positive relationship between reading compre-hension scores as measured by the California AchievementTest, Junior High Level, and achievement in an open-endedproblem-solving approach to seventh-grade general science.
3. Boys and girls achieve at approximately the same level ingeneral science materials.
4. A pretest score is a reliable predictor of achievementin seventh-grade general science instructional materials.
5. Programming may be more effective in combination with aparticular type of teacher.
6. There is no relationship between intelligence as measuredby the California Short-Form Test of Mental Maturity,Junior High Level, and achievement in the non-programmedor programmed sequence of general science.
CHAPTER. VI
SUMMARY AND IWLICATIONS
Purposes and Objectives of problem
The purpose of this udy was to ascertain the effectiveness
of a non-programmed, problem-solving method of teaching se,.-mth-grade
general science, and that of a problem-solving approach through
selected, open-ended, laboratory experiences. Particular reference
was given to any significant change in factual, science, subject-matter
competency, comprehension of scientific concepts, principles, and
generalizations, and in scientific interest.
The specific objectives are listed below.
1. To compare the data for any significant gains in factual,
subject-matter competency as measured by the factual-
oriented posttest.
2. To compare the data for any significant gain in the
comprehension of scientific concepts, principles, and
generalizations as measured by the conceptual-oriented
posttest.
3. To determine the difference between the mean achievement
of students using programmed materials and the mean
achievement of students using the non-programmed approach
as measured by the total posttest.
4. To ascertain if there are differences between the effects
of the two approaches concerning development of interest
72
in science as measured by the Kuder General Interest
Survey (Form E).
Significance of Problem
In teaching science, a continuing area of concern to educators
has been the problem of integrating laboratory experimentation with
scientific theory. The need to individualize course content for
students is also recognized. Programmed instruction may offer one
solution to both these difficulties. If the science curriculum can
be programmed so that individual rates of learning can be dealt with
more effectively, and if laboratory materials can be developed which
enable students to conduct experiments efficiently on an individual
basis, laboratory experimentation will be integrated more satisfactorily
into the typical science course.
Related Research
The research reviewed was limited to a summary of the develop-
ment of programmed instruction, studies dealing with programmed
instruction, reviews of programmed science materials, and research
related to programmed laboratory experiences.
Among representative research dealing with programmed instruc-
tion, Coulson and Silberman (1960), Fry (1960), and Larkin and Keith
(1964), reported the constructed-response or linear method to be super-
ior for recall. Studies of the relationships amoiig intelligence, sox,
and achievement during programmed instruction were reported by Shay
73
(1961), Keislar (1959), McNeil and Keislar (1961), and Andrews (1963).
All reported a positive relationship between intelligence and achieve-
ment, but findings were inconsistent in regard to sex differences. A
positive relationship between intelligence and mathematics achievement
was reported by Andrews (1963).
Data reported for studies which were related to programmed,
science material showed significant achievement differences in favor
of the experimental groups. Pollard (1964) found a significant
difference in favor of the experimental group using a card deck unit
in biology. Lawson (1960) using a one-week, scrambled-book, genetics
unit reported significance beyond the 0.01 level in favor of the
programmed approach. Reush and Cornell (1963) tested an edition of
a program on molecular equilibrium, and reported an increase in grade
average as a result of the programmed material.
Few research projects involving programmed, laboratory, science
experiences were found. Among those cited, only two reported data
analyses. Wash (1964) conducted an experiment in the use of programmed
materials in teachirig high, school chemistry, reporting that students
can achieve at significantly higher leifels through the use of labora-
tory exercises with a programmed chemistry sequence. A year-long use
of programmed science materials with laboratory experiences on the
fourth-grade level, as reported by Hedges and MacDougall (1965),
revealed no significant differences in achievement. However, the groups
using programmed, laboratory experiences enjoyed their method of
learning considerably better.
74
Experimental. Design
To obtain data relevant to the objectives of this study,
research design number 10 proposed by Campbell and Stanley (1963)0as
considered appropriate. The four main effect variables, the inter-
action effect variables, and the covariates of the research design
are listed below.
Main effects:
1. Treatment2. Teacher
3. Sex
4. Ability level
Interaction effects:
1. Sex by level2. Sex by treatment3. Treatment by level
4. Treatment by teacher
Covariates:
1. Age2. Reading vocabulary3. Reading comprehension
4. Language intelligence5. Non-language intelligence6. Science average7. Unit pretest
Sampling procedure
The subjects in this study were samples of the population of
students enrolled in the seventh grade of the Clarke County High
School during the academic year, 1965-1966. The total seventh-grade
population was assigned to four academic teams of teachers. Each
team consisted of four teachers who instructed students in respective
75
areas of English, mathematics, history, or science. The team-student
population was divided into four sections, with each section consis: ng
of approximately 30 students. The investigator used subjects from
two academic teams, one population with N = 118, and the other with
N = 103. A total of eight sections were involved with N = 221.
Two science teachers from two academic teams participated in
this study. Both cooperating teachers instructed two experimental
and two control groups.
The Program
A programmed sequence was developed for use in this study from
June, 1965 to December, 1965, by the investigator. Pilot studies were
conducted for the purpose of revising the program, and laboratory
exercises were tested. The final version of the program contained
six lessons of an interdisciplinary nature totalling 590 modified
linear frames.
Description of the Treatments
In the experimental sections the teachers were instructed not
to use any materials for total classroom instruction other than the
programmed, laboratory materials. Using the non-programmed materials
provided by the investigator, the teachers instructed the control
sections in their usual manner. The principal, special instruction
for the teaching of the control groups was that no programmed materials
were to be used in their classes. Also there wore to be only teacher-
76
demonstrations, and no individual experiments. The approach was one
of problem-solving in both experimental and control groups.
Initially, students in the experimental group and control group
were administered a pretest. At the conclusion of the instructional
period, the posttest was administered to both the control and experi-
mental groups. The Kuder General Interest Survey (Form E) was also
administered to both the control and experimental groups. The evalua-
tion questionnaire, designed to elicit a student, subjective response
toward the method of programming laboratory experiences, was ad nis-
tered to the experimentals at the end of the instructional period.
Sources and Types of Data
The data were obtained from six main sources: (a) records in
the Clarke County Guidance Department, (b) cumulative record cards
from the principalts office, (c) the administration of the Kuder General
Interest Survey (Form E) (d) the administration of the unit pre- and
posttest, (e) the administration of the evaluative questionnaire, and
(f) the record of the number of frames missed in each respective
programmed lesson.
Testing Instrument for Unit Pre- and Posttest
The unit pre- and posttest was developed in anticipation of
measuring pre- and post-experimental behavior in terms of both factual,
science subject-matter competency, and the comprehension of scientific
concepts, principles, and generalizations. The total test consisted
77
of 50 multiple-choice items designed to cover the content of the
curriculum of the six lessons in the unit. By jury validation, the
50 multiple-choice item test was judged to consist of 20 factual-
oriented items and 30 conceptual-oriented items. The items were
examined by the jury members for the specific fact or concept tested
for in that item.
The test items, themselves, were revised after having been
administered to the sixth-grade students participating in the
original pilot tests, when the reading difficulty was questionable.
Suggestions from the jury reviewers were incorporated in revising
specific test items. The two participating seventh-grade teachers
at Clarke County Junior High School also reviewed the test items.
Test reliability was computed by the Euder4achardson formula
20. The reliability coefficient for the total pretest was 0.70.
Treatment of data from the pre-factual-oriented test yielded a
reliability coefficient of 0.58. The pre-conceptual-oriented test
had a reliability coefficient of 0.57.
The reliability coefficient obtained for the total posttest
was 0.84. post - factual- oriented test reliability was 0.68; the post-
conceptual-oriented test had a Kuder- Richardson coefficient!of 0.74.
Treatment of Data from Evaluation Questionnaire
In order to determine the studentst reactions to the program-
ming method, chi-square values were calculated from the responses to
the Evaluation Questionnaire, and the hypothesis of independence of
the response categories and classes was tested. Examination of -Lie
78
data revealed that nine out of the ten objective questions on the
evaluative questionnaire had preponderant favorable responses, highly
significant at the 0.01 level. Representative comments from responses
to items 11 and 12 are reported in Appendix D.
Treatment of Data from programmed Materials
Mean numbers of correct responses computed on each of the six
programmed lessons were satisfactory. An average of 4.5 incorrect
frames was reported out of an average length of 100 frames per lesson.
Statistical Procedure
Analyses of variance and covariance were used to analyze the
data. Because of disproportionate numbers in the groups being
considered, a least-squares method of fitting constants was employed.
Scores on reading vocabulary, reading comprehension, language intel-
ligence, non-language intelligence, science average, Ku_ der General
Interest Survey (Form E), the Unit Pretest, teacher, and sex were
evaluated as to their effect on posttest scores with regard to factual
and conceptual competencies in science. The categorized ability levels
wore also covariates. The 0.05 probability level was used as the
criterion for rejecting the null hypothesis.
Results and Discussion of the Study
Data obtained from the experimental and statistical procedures
described previously revealed the following relationships pursuant.to
79
the objectives of the study. The achievement of the members of the
control group, as measured by the factual, conceptual, and total
posttest scores, was significantly higher than the achievement of the
experimental group. However, evidence clearly suggests that those
students having the ability to pursue, adequately, a problem-solving,
general science unit did so in both the experimental and the control
group. The results of testing means of the population of differences
revealed highly significant t ratios beyond the 0.01 level for both
the experimental and control groups for all three tests, factual,
conceptual, and total. This means that not only were definite gains
made in science, factual knowledge; but, also definite gains in ability
to use concepts, generalizations, and principles as measured by the
pre- and post-conceptual test, were evident for both groups. Thus,
the open-ended, problem-solving aspect of the experimental program
appeared to be successful for both experimental and control groups.
Significant differences found among the sources of variation
in the analysis of the Kuder General Interest Survey (Form E) data
related to sex, teachers, and pre-Kuder scores. Differences attrib-
utable to sex, teacher, and pre-Kuder scores were significant at the
0.01 level of significance.
Positive contributions of the programmed approach were seen in
the work habits of the students, their increasing ability to work
independently, their enthusiasm in conducting laboratory experiments
individually, and their development of laboratory skills called for
within the programmed sequence. The experimental group had an advantage
80
in that those students who were absent from class, could, upon their
return, enter the program at the point they had left. The student
could also take his programmed materials home.
Scores on the pretest proved to be related positively to
achievement on the posttest. The relationship of science grades
assigned by the seventh-grade science teachers for the first two
quarters of the academic year, 1965-1966, proved to be significant.
Reading comprehension scores were positively related to achievement
in the experimental program. No other subject variables made signif-
icant contributions to achievement in the experimental program for
the posttest scores.
Interaction effects of sex by treatment, sex by level, and
treatment by level were nonsignificant. The surprising lack of
significance for the interaction of treatment by level was unexpected.
Not only were there no significant differences among the ability levels
by treatment, but the range of achievement from the high ability group
to the low ability group was not consistent. The lowest ability level
consistently excelled level three on the factual, conceptual, and
total tests. On the factual test, level fourts adjusted mean exceeded
all other levels. This apparently unusual finding may open a possible
door for the lower ability groups by building general science curric-
ulum around activity-centered, problem-solving, laboratory demonstrations.
The interaction effect of treatment by teacher was significant.
Treatment one was significant for teacher two; treatment two was
significant for teacher one. The effectiveness of programming may
81
depend to some extent upon the teacher. A teacher whose approach is
more personalized may find programming less efffectivc than the
conventional procedures.
Conclusions
The following conclusions, in terms of the stated hypotheses
are warranted on the basis of the findings presented in this etudy.
Generalizations drawn from them should be limited to similar groups
pursuing programmed instruction under similar conditions.
1. Students can achieve at significantly higher levels infactual, science subject-matter through the use of a non -programmed, open-ended approach to seventh-grade, generalscience instruction.
2. Students can achieve at significantly higher levels inconceptual, science subject-matter through the use of anon-programmed, open-ended approach to seventh-grade,general science instruction.
3. Students can achieve at significantly higher levels infactual and conceptual, science subject matter throughthe use of a non-programmed, open-ended approach toseventh-grade, general science instruction.
4. No significant scientific interest change results froman interdisciplinary, general science unit of the natureused in this research project.
The following conclusions, while not within the scope of the
stated objectives, can be made from the supportive data of the study,.
1. Previous performance in general science is a reliablepredictor of success in general science taught by non-programmed or programmed materials.
2. There is a positive relationship between reading compre-hension scores as measured by the California AchievementTest, Junior gia Level, and achievement in an open-endedproblem-solving approach to seventh-grade general science.
82
3. Boys and girls achieve at approximately the same level ingeneral science materials.
4. A pretest score is a reliable predictor of achievementin seventh-grade general science instructional materials.
5. Programming may be more effective in combination with aparticular type of teacher.
6. There is no relationship between intelligence as measuredby the California Short-Form Test of Mental Maturity,Junior High Level, and achievement in the non-programmedor programmed sequence of general science.
Implications for Further Research
As is true with most studies, the investigation reported here
has yielded answers to the problem under study, and, concomitantly,
has suggested other areas for research in the fields of general science
and programmed instruction. Problems suggested for further study are:
1. Investigation into the personality traits of the student,such as maturity, emotional stability, ability, egostrength, curiosity, and sufficiency to determine therelationship of a student's success with programming tothese traits.
2. Investigation into the personality traits of the teacherin more depth to determine the extent to which effectivenessof programming depends upon the instructor.
3. A more extensive experiment employing programmed materialscontaining laboratory experiences is needed to determinethe long-term effects of such an instructional procedure.
4. The study of reading and reading problems and theirimplications for programmed instruction in terms ofachievement and instructional time necessary for maximumlearning.
5. Investigation into the instructional time requirementsfor programmed materials of this nature for maximum benefitto the students.
6. Development of.a research plan to use the investigator's
83
programmed materials with other grade levels to determinethe readiness of other grade levels for self-instruction.
7. Modification of the investigatorfs research plan to includeadequate discussion sessions at the end of each programmedlesson to clarify faulty concept6.
8. Development of programmed laboratory experiences incorpor-ating more concepts other than the three main' ideas usedby the investigator.
9. Development of activity-centered general science curriculumfor lower ability groups.
BIBLIOGRAPHY
Alter, M. Retention as a function of length of retention interval,intelligence, and training time. Journal of aogramed instruction,1963, 2, 7 -17.
Andrews, Mary M. Programed instruction.in elementary school: astudy of variables associated with mathematics achievement.Unpublished doctoral dissertation. University of Georgia, 1963.
Arnstine, D. G. Programmed instruction and unit teaching, HighSchool Journal, 1964, 47, 194-200.
California Manual. California achievement tests. Los Angeles:California Test Bureau, 1963, p. 8.
California Manual. California short-form test of mental maturity.Los Angeles: California Test Bureau, 1957, p.3.
Campbell, D. T., & Stanley, J. C. Experimental and quasiexperimentaldesigns for research on teaching. In N. L. Gage (Ed.) Handbook ofResearch on Teaching. New York: Rand-McNally, 1963.
Cohen, I. & Fetterolf, R. Programmed instruction in qualitative.analysis laboratory. Journal of Chemical Education, 1963, 40,25-26.
Coulson, J. E. & Silberman, H. F. Effects of three variables on ateaching machine. Journal of Educational Psychology, 51, 1960,135-143.
Crowder, N. Automatic tutoring by means of intrinic programming.In E. H. Galanter (Ed.), Automatic teaching: the state of the art.New York: John Wiley and Sons, 1959.
Englemann, M. D. Construction and evaluation of programmed materialsin biology classroom use. American Biology Teacher, 1963, 25,212-213.
Das, R. C. TA 'roblem development method: an experimental try-outin the teacu g of science in secondary schools. Science Education,1964, 48, 485-488.
Fry, E. B. Teaching machines: an investigation of constructed versusmultiple-choice methods of response. In A. A. Lumsdaine & R. Glaser(Ed.), Teaching machines and programmed learning. Washington, D.C.:National Education Association, 1960.
Fry, L. B. Teaching machines: the coming automation. Phi DeltaMan) 1959.
85
Geller, M. S. Pupils' attitudes toward programed learning. ScienceTeacher, 1963, 30, 41-42.
Gilbert, T. F. On the relevance of laboratory investigation oflearning to self-instructional programming. In A. A. Lumsdaine& R. Glaser (Eds.), Teaching machines and programmed learning.Washington, D.C.: National Education Association, 1960, 517-539.
Goldberg, M. H. Comparison of programmed and conventional instructionmethods. Journal of Applied Psycholoa, 1964, 48, 110-114.
Green, E. J. The learning process and mrgrammed instruction.New York: Holt, Rinehart and Winston, Inc., 1963.
Hanson, L. T. Schools using programed materials. AudiovisualInstruction, 1963, 8, 101-103.
Hedges, W. D., &MacDougall, M. A. Teaching fourth grade science bymeans of programmed science materials with laboratory experiences.Science Education, 1964, 48, 64-76.
Hedges, W. D., & MacDougall, M. A. Teaching fourth grade science bymeans of programmed science materials with laboratory experiences,phase III. Science Education; 1965, 49, 348-358.
Hilgard, E. R. Theories of learning and instruction. The sixty-thirdyearbook of the national society for the study of education, PartI, 1964.
Hughes, J. L. Programed instruction for schools and industry.""Chicago: Science Research Associates, Inc., 1907
Humphreys, A. H. A critical analysis of the use of laboratoriesand consultants in junior high school science courses. Unpublisheddoctoral dissertation. University of Texas, 1962.
Kuder Manual. Kuder general interest survey (form E). Chicago:Science Research Associates, Inc., 1964.
Larkin, T. C. A comparison of linear and branching methods ofprogrammed instruction in a secondary school. EducationalReview, 1964, 40, 269-282.
Larkin, T. C., & Keith, G. M. The effects of linear and branchingmethods of programmed instruction on learning and retention of atopic in elementary science. Programed Learning, 1964, 1, 12-16.
Lawson, C. A., Burmester, M. A., & Nelson, C. H. Developing ascrambled book and measuring its effectiveness as an aid to learning
natural science. Science Education, 1960, 44, 347-358.
86
Leahy, D. J., & Siegel, B. N. The science teacher and programmedinstruction. Science Teacher, 1962, 29, 40-41.
Lysaught, J. P., & Williams, C. M. A guide to programmed instruction.New York: John Wiley & Sons, Inc., 1963.
Mager, R. F. Preparing objectives for programmed instruction. SanFrancisco: Pearson Publishers, 1961.
Michigan Department of Public Instruction. Open-ended laboratory-centered science for EIdes 7-8-9. Lansing, Michigan: Departmentof Public Instruction, 1965.
Navarra, J. G. Developing generalizations in elementary science.Science Education, 1963, 47, 245-250.
Norton, J. E. The need for an activity-centered science program.Science Education, 1963, 47, 285-291.
Pollard, W. N. Use of a card deck unit in teaching biology.American Biology Teacher, 1964, 26, 203-206.
Powell, V. F. Programmed instruction in high school chemistry.Journal of Chemical Education, 1963, 40, 23-24.
Pressey, S. L. A simple apparatus which gives tests and scoresand teaches. School and Society, 1926, 23, 586.
Probst, L. Programmed learning in the schools. Science Teacher,1962, 29, 34-35.
Reusch, R. N. & Cornell, P. H. An experimental program on chemicalequilibrium. Journal of Chemical Education, 1963, 40, 27-28.
Schippers, J. V. An investigation of the problem method ofinstruction in sixth-grade science classes. Unpublished doctoraldissertation. State University of Iowa, 1962.
Shay, C. Relationship of intelligence to step-size on a teachingmachine program. Journal of Educational Psychology, 1961, 52,98-103.
Silberman, H. F. Self teaching devices and programmed materials.Review of Educational Research, 1962, 17, 179-193.
Skinner, B. F. The science of learning and the art of teaching.Harvard Educational Review, 1954, 36, 86-97.
87
Stolurow, L. M. Implications of cur:ent research and future trends.Journal of Educational Research, 1962, 55, 519-527.
Travers, R. W. Essentials of learning. New York: The MacMillanCompany, 1963.
Van Deventer, W. C. Teaching of science at the college and universitylevel; programmed instruction. Review of Educational Research,1964, 34, 337-339.
Van Deventer, W. C. .Michigan prepared project on junior highschool science. Science Teacher, 1963, 31, 29-30.
Wash, J. A., Jr. An experiment in the use of programed materialsin teaching high school chemistry. Unpublished doctoraldissertation. University of Georgia, 1964.
Winer, B. J. Statistical principles in experimental design. New York:McGraw-Hill, 1952.
Wong, H. K. Programming a high school biology course. AmericanBiology Teacher, 1964, 26 169-172.
Zabka, FL A field study contrasting programmed instruction and thetraditional classroom presentation in grades seven and eight.Unpublished doctoral dissertation.

88
FOOTNOTE
/Wolf, R., & Klopfer, L. Test scorer and statistical analysis
2. Chicago: The University of Chicago, 1963. Unpublished
mimeographed paper.

Al7PENDIX A
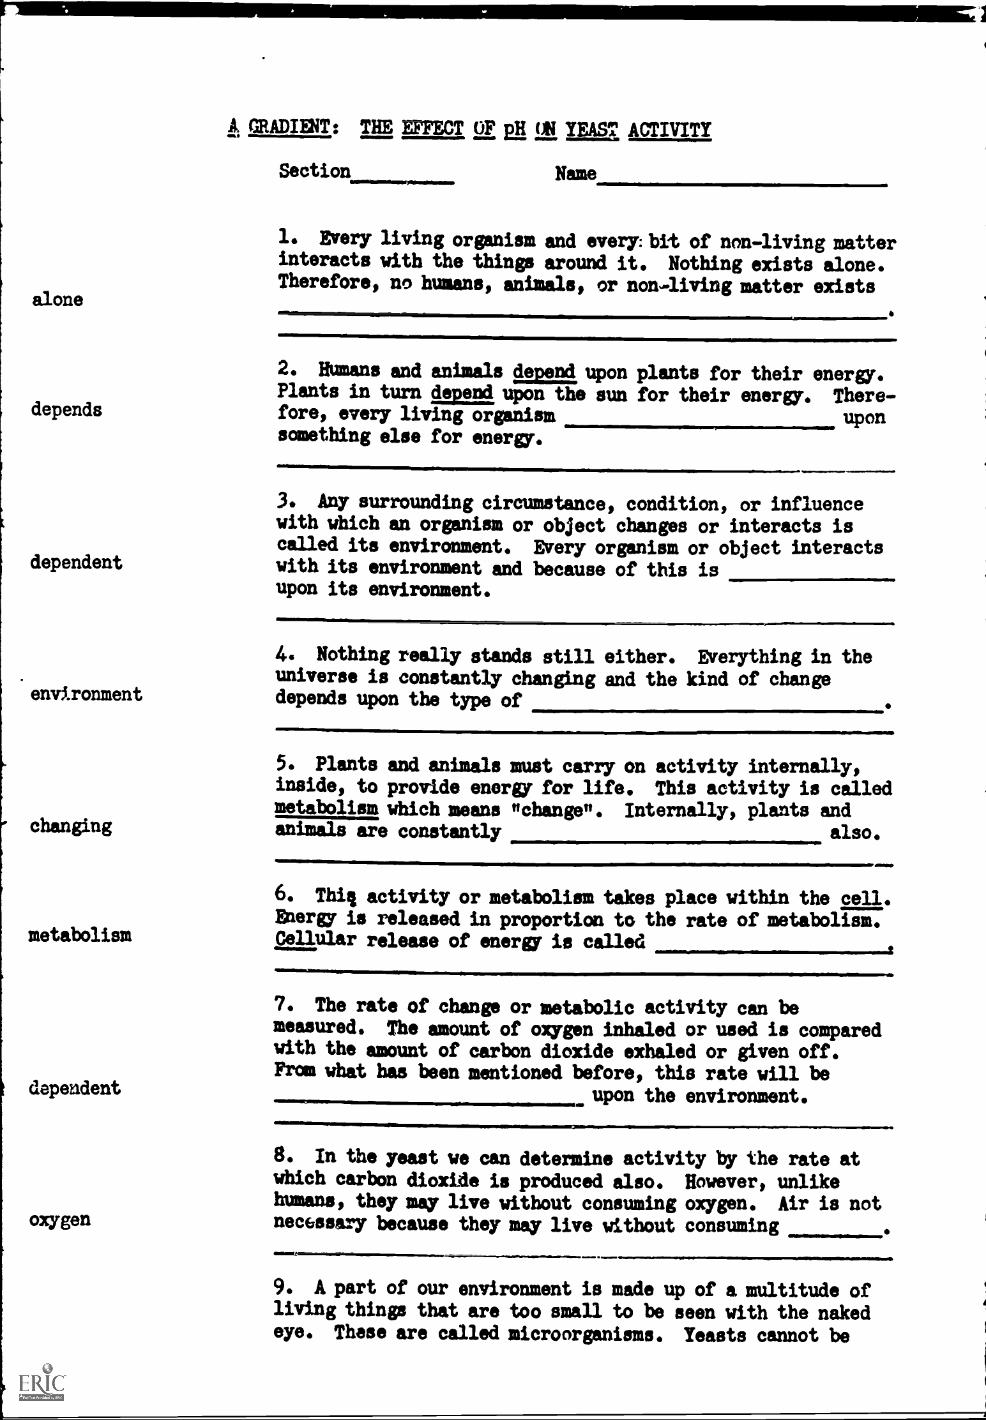
alone
depends
dependent
MADIENT: THE EFFECT OF pit 0N YEAST ACTIVITY
Section 3111111 Name
1. Every living organism and every: bit of non-living matterinteracts with the things around it. Nothing exists alone.Therefore, no humans, animals, or non-living matter exists
2. Humans and animals depend upon plants for their energy.Plants in turn depend upon the sun for their energy. There-fore, every living organism uponsomething else for energy.
3. Any surrounding circumstance, condition, or influencewith which an organism or object changes or interacts iscalled its environment. Every organism or object interactswith its environment and because of this isupon its environment.
4. Nothing really stands still either. Everything in theuniverse is constantly changing and the kind of change
environment depends upon the type of
changing
metabolism
dependent
oxygen
5. Plants and animals must carry on activity internally,inside, to provide energy for life. This activity is calledmetabolism which means "change ". Internally, plants andanimals are constantly also.
6. This activity or metabolism takes place within the cell.Energy is released in proportion to the rate of metabolism.Cellular release of energy is called
7. The rate of change or metabolic activity can bemeasured. The amount of oxygen inhaled or used is comparedwith the amount of carbon dioxide exhaled or given off.From what has been mentioned before, this rate will be
upon the environment.
8. In the yeast we can determine activity by the rate atwhich carbon dioxide is produced also. However, unlikehumans, they may live without consuming oxygen. Air is notneftssary because they may live without consuming
9. A. part of our environment is made up of a. multitude ofliving things that are too small to be seen with the nakedeye. These are called microorganisms. Yeasts cannot be
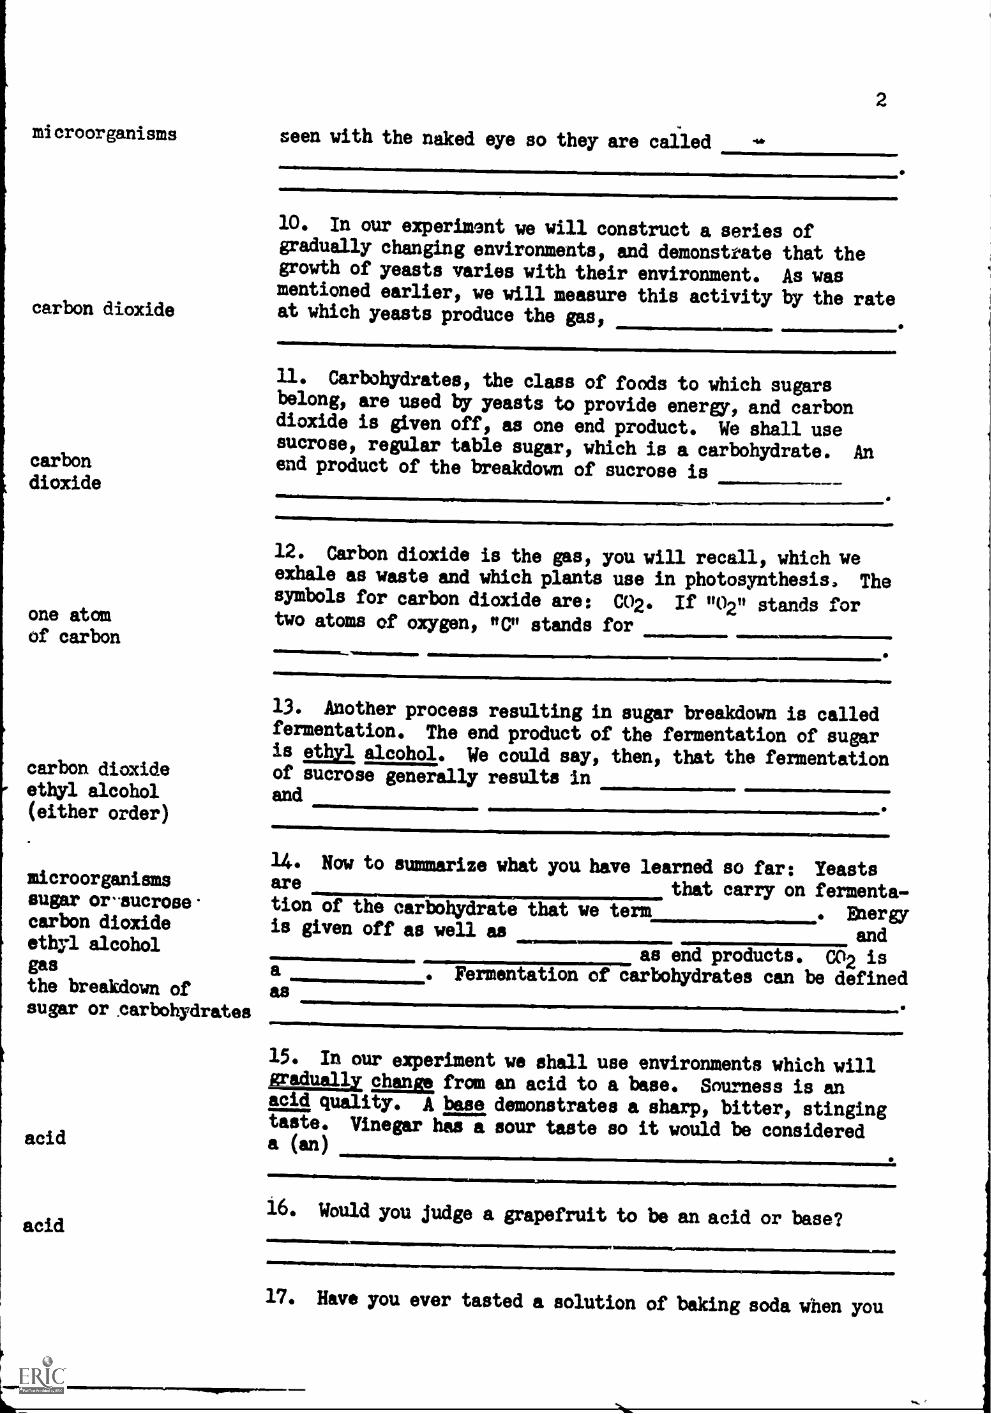
microorganisms seen with the naked eye so they are called
carbon dioxide
carbondioxide
one atomof carbon
carbon dioxideethyl alcohol(either order)
microorganismssugar or
dioxideethyl alcoholgas
2
10. In our experiment we will construct a series ofgradually changing environments, and demonstrate that thegrowth of yeasts varies with their environment. As wasmentioned earlier, we will measure this activity by the rateat which yeasts produce the gas,
11. Carbohydrates, the class of foods to which sugarsbelong, are used by yeasts to provide energy, and carbondioxide is given off, as one end product. We shall usesucrose, regular table sugar, which is a carbohydrate. Anend product of the breakdown of sucrose is
,,=1011.
12. Carbon dioxide is the gas, you will recall, which weexhale as waste and which plants use in photosynthesis. Thesymbols for carbon dioxide are: CO2. If "02" stands fortwo atoms of oxygen, "C" stands for
13. Another process resulting in sugar breakdown is calledfermentation. The end product of the fermentation of sugaris ethyl alcohol. We could say, then, that the fermentationof sucrose generally results inand
14. Now to summarize what you have learned so far: Yeastsare that carry on fermenta-tion of the carbohydrate that we term ,. Energyis given off as well as and
as end products. CO2 isa . Fermentation of carbohydrates can be defined
the breakdown of assugar or carbohydrates
acid
acid
15. In our experiment we shall use environments which willgradually change, from an acid to a base. Sourness is anaci d quality. A base demonstrates a sharp, bitter, stingingtaste. Vinegar has a sour taste so it would be considereda (an)
16. Would you judge a grapefruit to be an acid or base?
17. Have you ever tasted a solution of baking soda when you
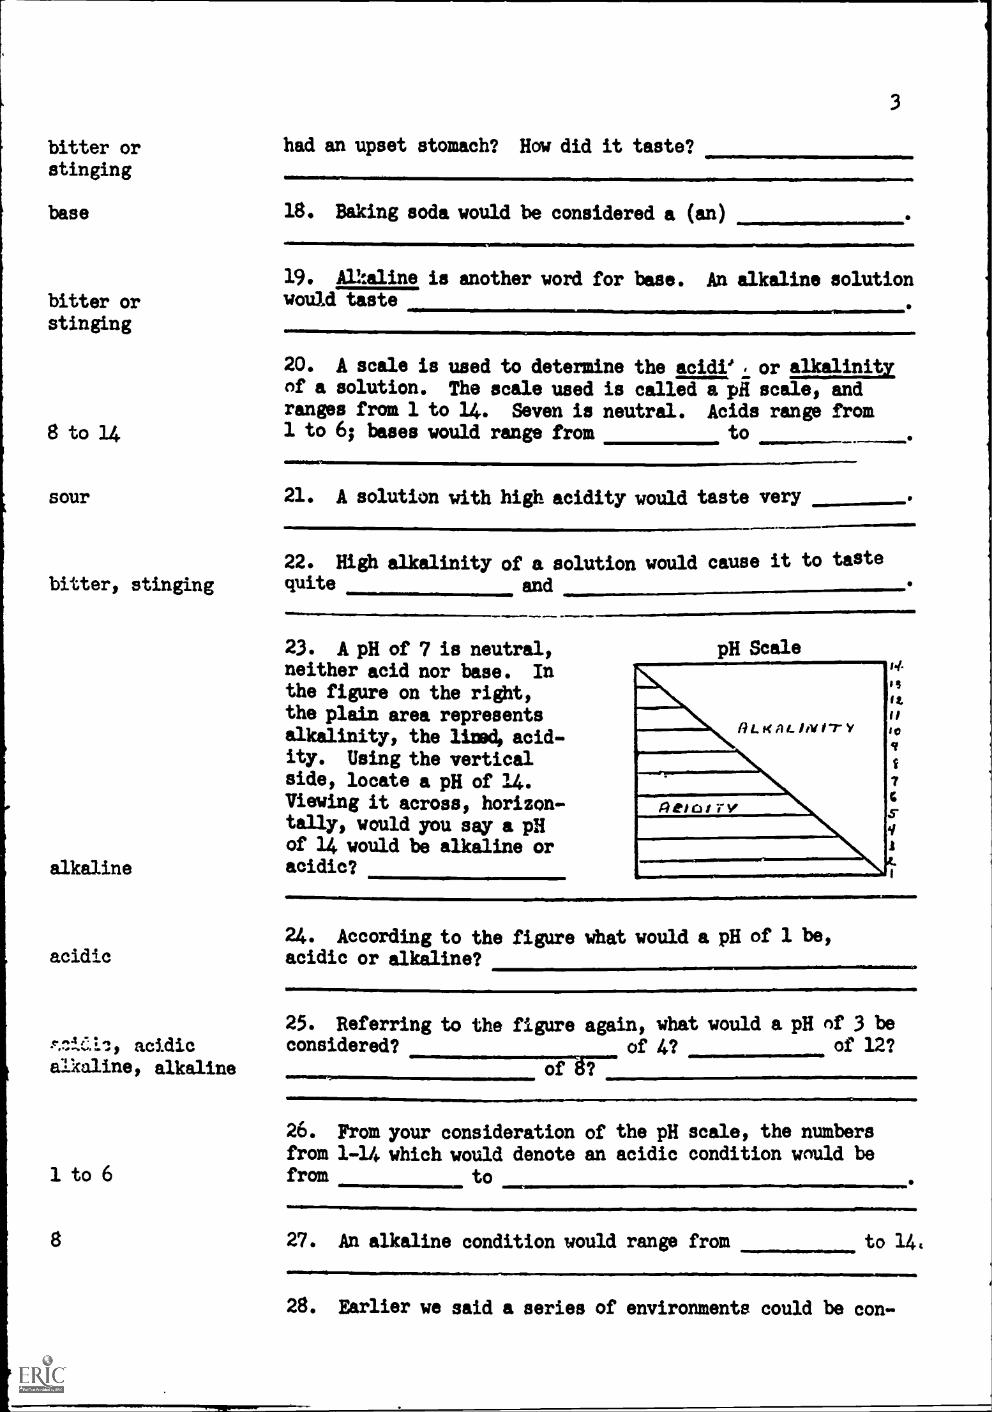
bitter orstinging
had an upset stomach? How did it taste?
=11111111,
3
base 18. Baking soda would be considered a (an)
bitter orstinging
8 to 14
sour
,m1MEIN/
19. AL:aline is another word for base. An alkaline solutionwould taste
20. A scale is used to determine the acidi' or alkalinity,of a solution. The scale used is called a pH scale, andranges from 1 to 14. Seven is neutral. Acids range from1 to 6; bases would range from to
21. A solution with high acidity would taste very
22. High alkalinity of a solution would cause it to tastebitter, stinging quite and
alkaline
23. A pH of 7 is neutral,neither acid nor base. Inthe figure on the right,the plain area representsalkalinity, the hind, acid-ity. Using the verticalside, locate a pH of 14.Viewing it across, horizon-tally, would you say a pHof 14 would be alkaline oracidic?
pH Scale
A LK AL IN I Y
Attorrse
S4.
5"
24. According to the figure what would a pH of 1 be,acidic acidic or alkaline?
^4/..n acidic
alkaline, alkaline
1 to 6
8
25. Referring to the figure again, what would a pH of 3 beconsidered? of 4? of 12?
ofd?
26. From your consideration of the pH scale, the numbersfrom 1-14 which would denote an acidic condition would befrom to
27. An alkaline condition would range from to 14,
28. Earlier we said a series of environments could be con-
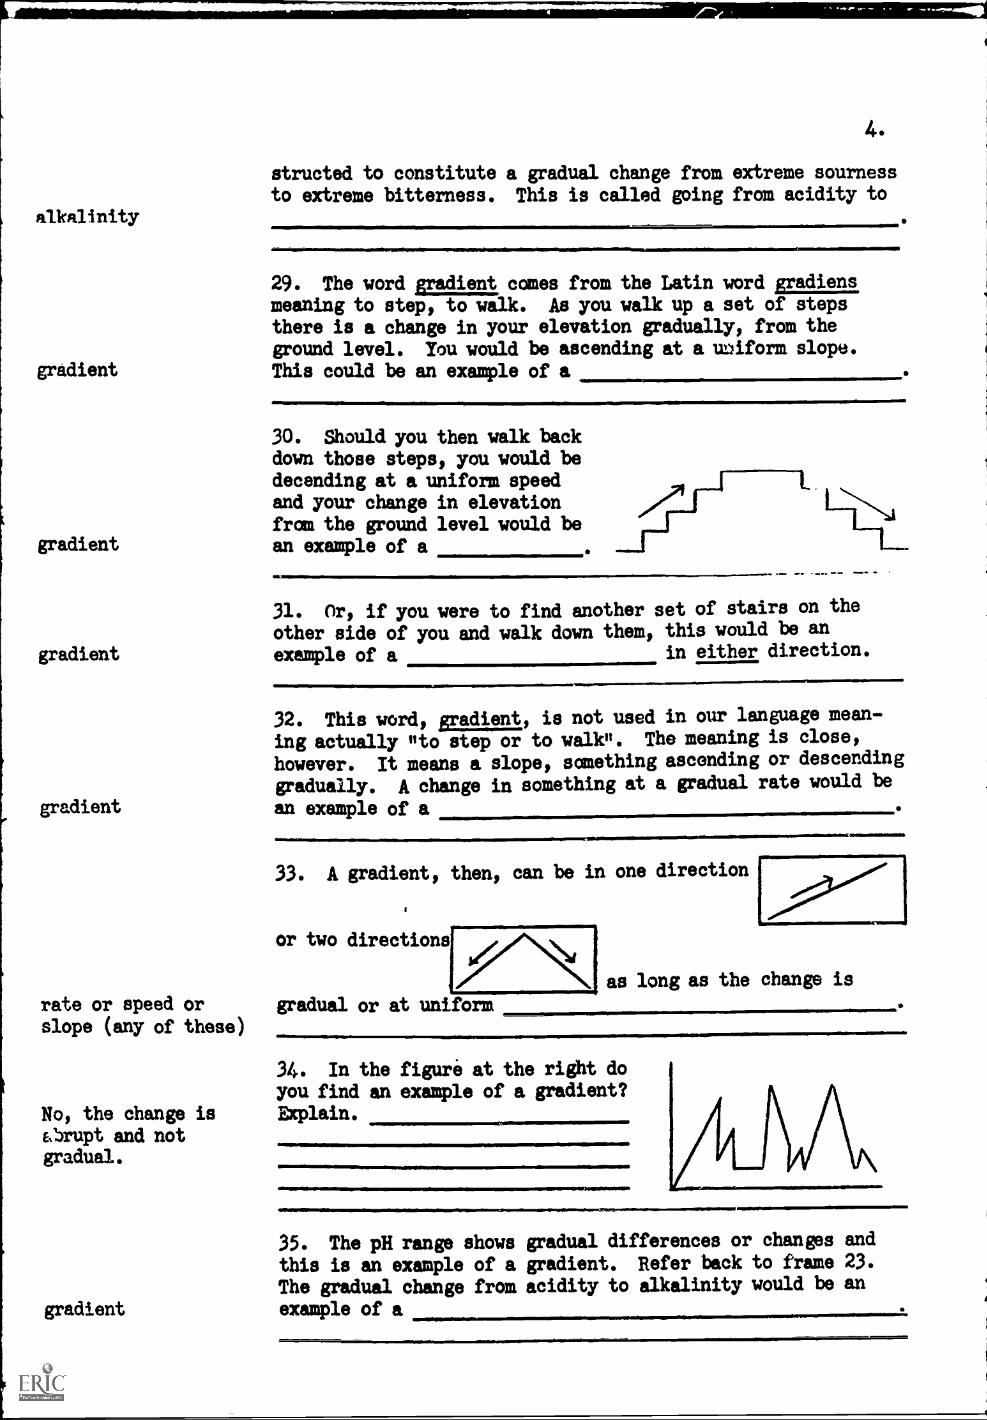
alkalinity
gradient
gradient
gradient
gradient
4.
structed to constitute a gradual change from extreme sournessto extreme bitterness. This is called going from acidity to
29. The word gradient comes from the Latin word pradiensmeaning to step, to walk. As you walk up a set of stepsthere is a change in your elevation gradually, from theground level. You would be ascending at a uniform slope.
This could be an example of a
30. Should you then walk backdown those steps, you would bedecending at a uniform speedand your change in elevationfrom the ground level would bean example of a
31. Or, if you were to find another set of stairs on the
other side of you and walk down them, this would be an
example of a in either direction.
32. This word, gradient, is not used in our language mean-
ing actually +Ito step or to walkIl. The meaning is close,
however. It means a slope, something ascending or descending
gradually. A change in something at a gradual rate would be
an example of a
33. A gradient, then, can be in one direction
or two directions
as long as the change is
rate or speed or gradual or at uniformslope (any of these)
34. In the figure at the right doyou find an example of a gradient?
No, the change is Explain.
Ebrupt and notgradual.
gradient
35. The pH range shows gradual differences or changes and
this is an example of a gradient. Refer back to frame 23.
The gradual change from acidity to alkalinity would be an
example of a
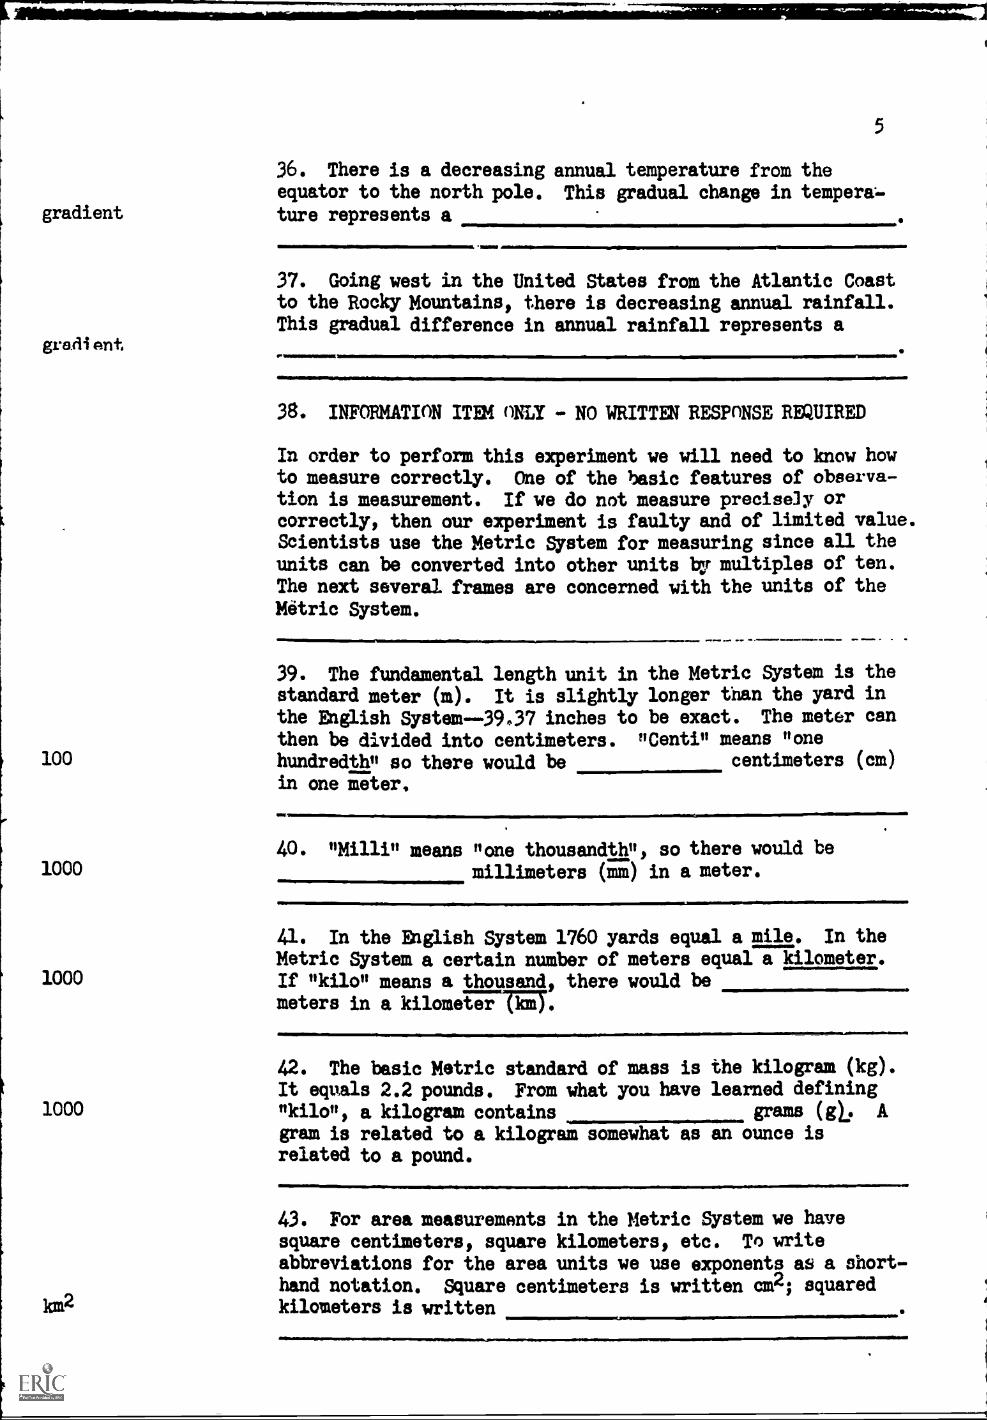
gradient
grediAnt
5
36. There is a decreasing annual temperature from theequator to the north pole. This gradual change in tempera-ture represents a
37. Going west in the United States from the Atlantic Coastto the Rocky Mountains, there is decreasing annual rainfall.This gradual difference in annual rainfall represents a
wit
38. INFORMATION ITEM ONLY - NO WRITTEN RESPONSE REQUIRED
In order to perform this experiment we will need to know howto measure correctly. One of the basic features of observa-tion is measurement. If we do not measure precisely orcorrectly, then our experiment is faulty and of limited value.Scientists use the Metric System for measuring since all theunits can be converted into other units by multiples of ten.The next several frames are concerned with the units of theMetric System.
39. The fundamental length unit in the Metric System is thestandard meter (m). It is slightly longer than the yard inthe English System--39.37 inches to be exact. The meter can
then be divided into centimeters. "Conti" means "one100 hundredth" so there would be centimeters (cm)
in one meter,
40. "Milli" means "one thousandth ", so there would be1000 millimeters (mm) in a meter.
41. In the English System 1760 yards equal a mile. In the
Metric System a certain number of meters equal a kilometer.1000 If "kilo" means a thousand, there would be
meters in a kilometer.
42. The basic Metric standard of mass is the kilogram (kg).It equals 2.2 pounds. From what you have learned defining
1000 "kilo ", a kilogram contains grams (gl: Agram is related to a kilogram somewhat as an ounce isrelated to a pound.
km2
43. For area measurements in the Metric System we havesquare centimeters, square kilometers, etc. To writeabbreviations for the area units we use exponents as a short-hand notation. Square centimeters is written cm2; squaredkilometers is written
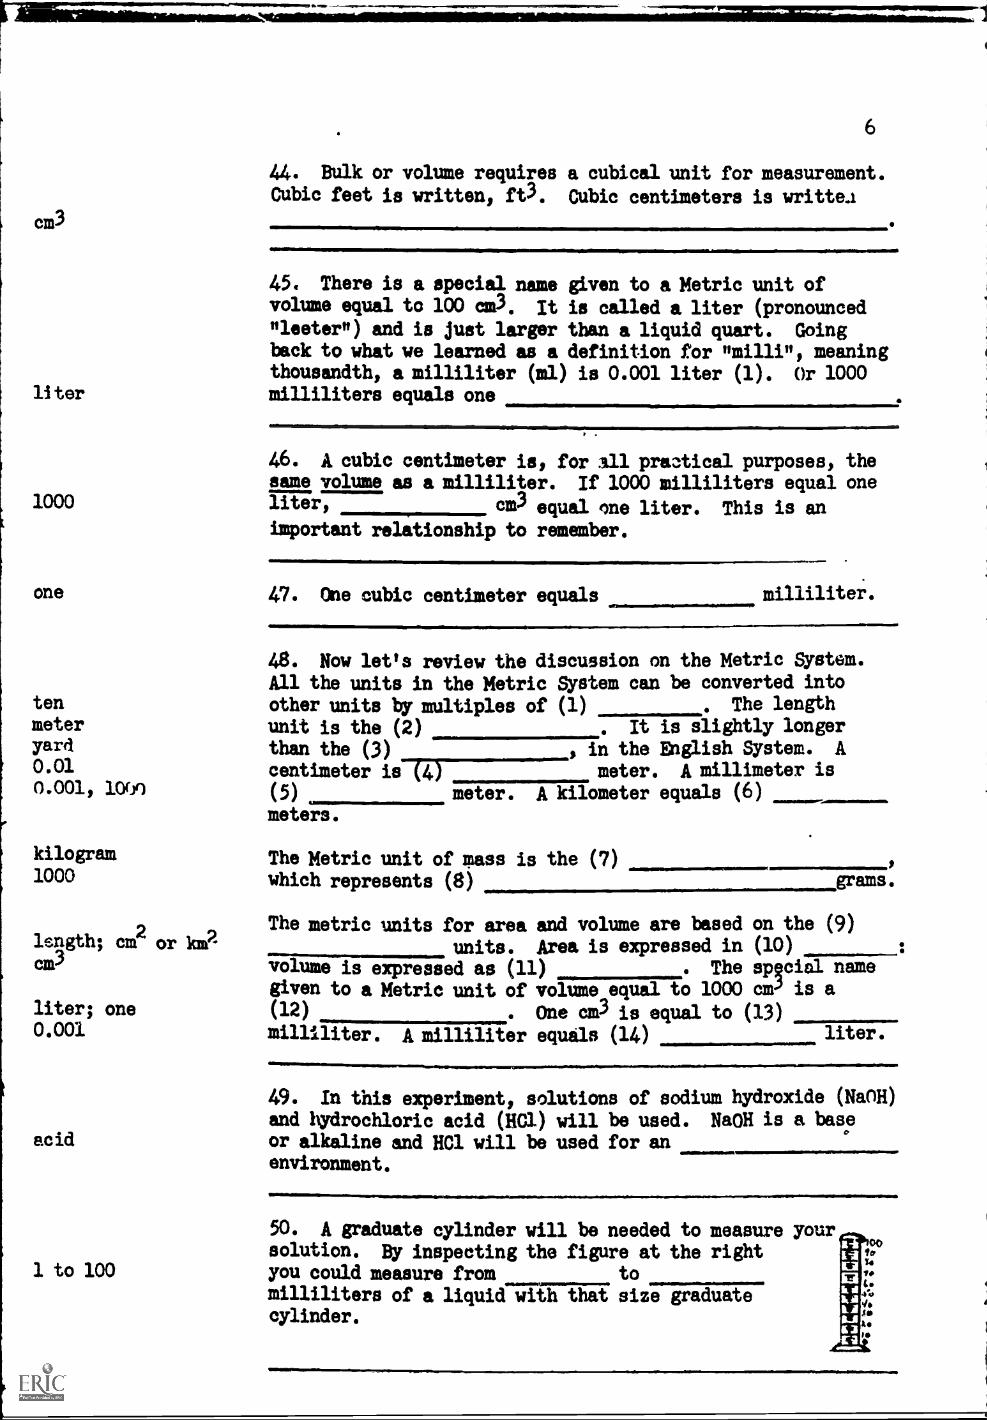
cm3
ter
1000
one
tenmeteryard0.010.001, 1000
kilogram1000
6
44. Bulk or volume requires a cubical unit for measurement.
Cubic feet is written, ft3. Cubic centimeters is writtea
45. There is a special name given to a Metric unit ofvolume equal to 100 cm3. It is called a liter (pronouncednleeterft) and is just larger than a liquid quart. Goingback to what we learned as a definition for Hmillin, meaningthousandth, a milliliter (ml) is 0.001 liter (1). Or 1000milliliters equals one
46. A cubic centimeter is, for 311 practical purposes, thesame volume as a milliliter. If 1000 milliliters equal oneliter, cm3 equal one liter. This is animportant relationship to remember.
47. One cubic centimeter equals milliliter.
48. Now let's review the discussion on the Metric System.
All the units in the Metric System can be converted intoother units by multiples of (1) The length
unit is the (2)than the (3)
centimeter is (4)
(5) meter.meters.
. It is slightly longer
, in the English System. Ameter. A millimeter is
A kilometer equals (6)
The Metric unit of mass is the (7)which represents (8) grams.
The metric units for area and volume are based on the (9)length; cie or km? units. Area is expressed in (10)cm3 volume is expressed as (11) . The sprial name
given to a Metric unit of volume equal to 1000 am' is aliter; one (12) . One cm3 is equal to (13)0.001 milliliter. A milliliter equals (14)
acid
1 to 100
liter.
49. In this experiment, solutions of sodium hydroxide (NaOH)and hydrochloric acid (HC1) will be used. NaOH is a base
or alkaline and HC1 will be used for anenvironment.
50. A graduate cylinder will be needed to measure yoursolution. By inspecting the figure at the rightyou could measure from tomilliliters of a liquid with that size graduatecylinder.
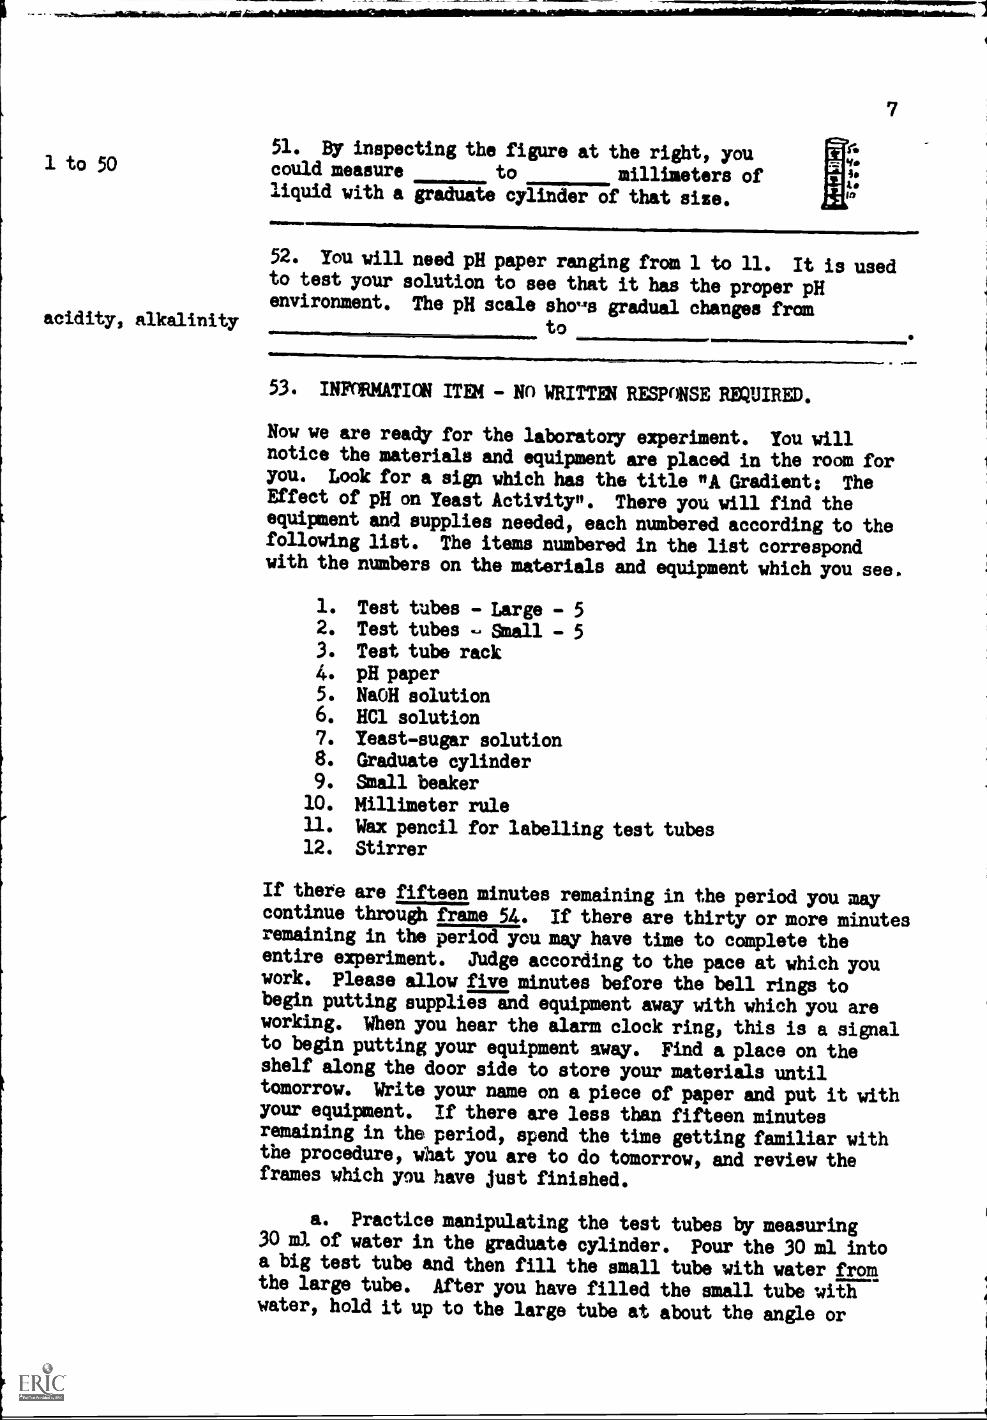
1 to 50
acidity, alkalinity
51. By inspecting the figure at the right, youcould measure to millimeters ofliquid with a graduate cylinder of that sire.111
IA
7
52. You will need pH paper ranging from 1 to 11. It is usedto test your solution to see that it has the proper pHenvironment. The pH scale sho"s gradual changes from
to
53. INFIRMATION ITEM - No WRITTEN RESPONSE REQUIRED.
Now we are ready for the laboratory experiment. You willnotice the materials and equipment are placed in the room foryou. Look for a sign which has the title "A Gradient: TheEffect of pH on Yeast Activity". There you will find theequipment and supplies needed, each numbered according to thefollowing list. The items numbered in the list correspondwith the numbers on the materials and equipment which you see.
1. Test tubes - Large - 52. Test tubes - Small - 53. Test tube rack4. pH paper5. NaOH solution6. HC1 solution7. Yeast-sugar solution8. Graduate cylinder9. Small beaker10. Millimeter rule11. Wax pencil for labelling test tubes12. Stirrer
If there are fifteen minutes remaining in the period you maycontinue through frame 54. If there are thirty or more minutesremaining in the period you may have time to complete theentire experiment. Judge according to the pace at which youwork. Please allow five minutes before the bell rings tobegin putting supplies and equipment away with which you areworking. When you hear the alarm clock ring, this is a signalto begin putting your equipment away. Find a place on theshelf along the door side to store your materials untiltomorrow. Write your name on a piece of paper and put it withyour equipment. If there are less than fifteen minutesremaining in the period, spend the time getting familiar withthe procedure, that you are to do tomorrow, and review theframes which you have just finished.
a. Practice manipulating the test tubes by measuring30 ml of water in the graduate cylinder. Pour the 30 ml intoa big test tube and then fill the small tube with water fromthe large tube. After you have filled the small tube withwater, hold it up to the large tube at about the angle or
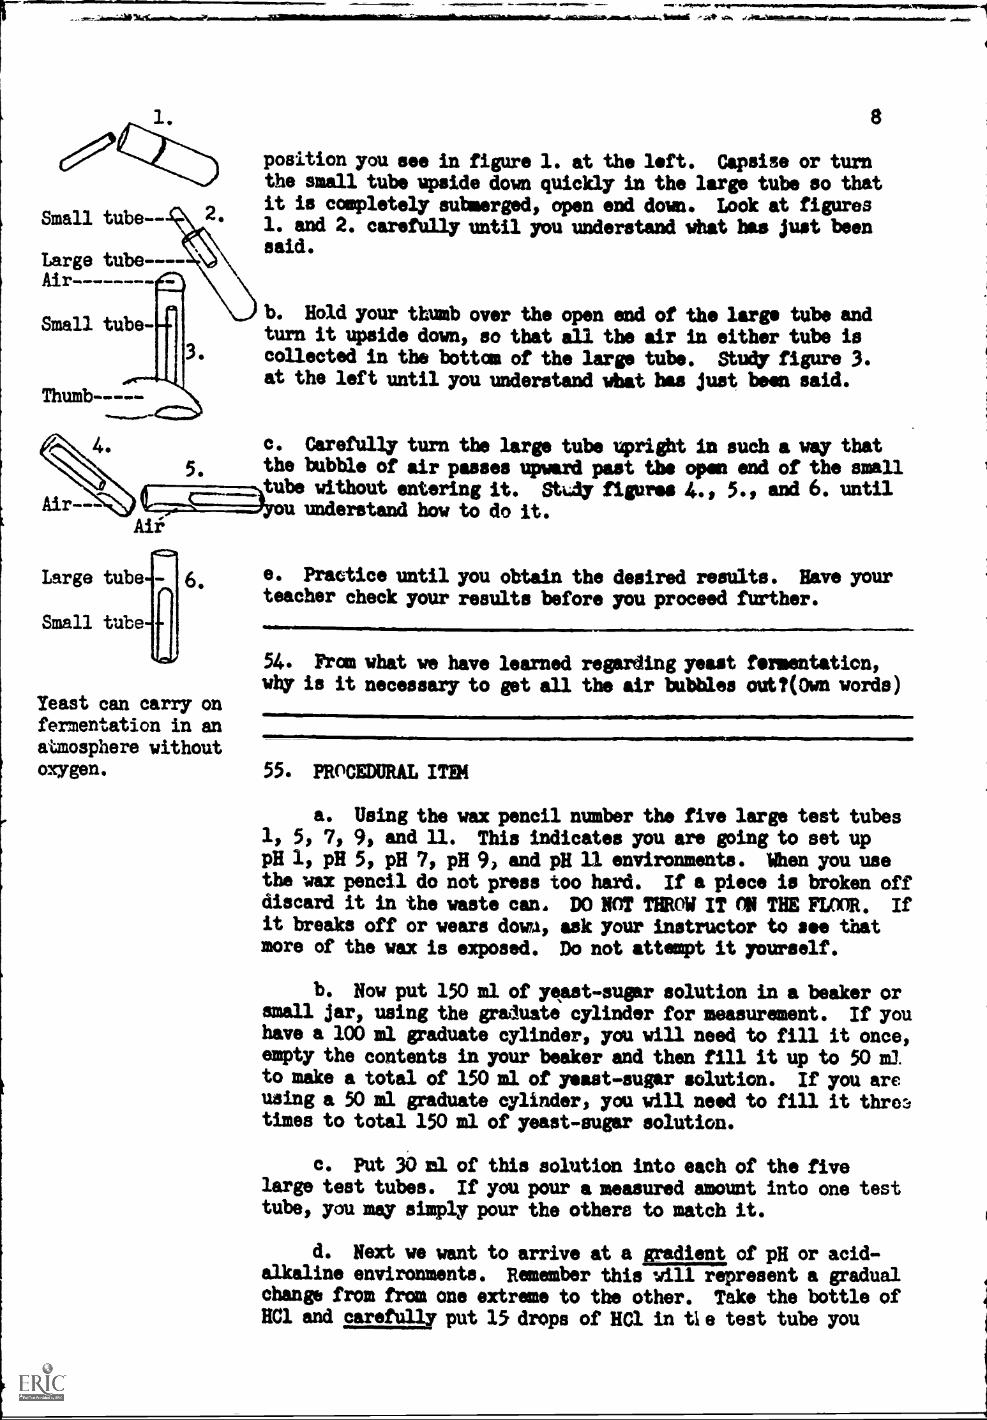
Small tube--
Large tube- -- -
Air
Small tube-
Thumb
4.
Air- -
5.
8
position you see in figure 1. at the left. Capsise or turnthe small tube upside down quickly in the large tube so thatit is completely submerged, open end down. Look at figures1. and 2. carefully until you understand %tat has just beensaid.
b. Hold your thumb over the open end of the large tube andturn it upside down, so that all the air in either tube iscollected in the bottom of the large tube. Study figure 3.at the left until you understand what has just been said.
c. Carefully turn the large tube upright in such a way thatthe bubble of air passes upward past the open end of the smalltube without entering it. Stt:dy figures 4. , 5., and 6. untilu understand how to do it.
Air
Large tube
Small tube
Yeast can carry onfermentation in anatmosphere withoutoxygen.
e. Practice until you obtain the desired results. Have yourteacher check your results before you proceed further.
54. From what we have learned regarding yeast fermentation,why is it necessary to get all the air bubbles out?(Own words)
55. PROCEDURAL ITEM
a. Using the wax pencil number the five large test tubes1, 5, 7, 9, and 11. This indicates you are going to set uppH 1, pH 5, pH 7, pH 9, and pH 11 environments. When you usethe wax pencil do not press too hard. If a piece is broken offdiscard it in the waste can. DO NOT THROW IT ON THE FLOOR. Ifit breaks off or wears dowu, ask your instructor to see thatmore of the wax is exposed. Do not attempt it yourself.
b. Now put 150 ml of yeast -sugar solution in a beaker orsmall jar, using the graduate cylinder for measurement. If youhave a 100 ml graduate cylinder, you will need to fill it once,empty the contents in your beaker and then fill it up to 50 na.
to make a total of 150 ml of yeast-sugar solution. If you areusing a 50 ml graduate cylinder, you will need to fill it thr©itimes to total 150 ml of yeast-sugar solution.
c. put 30 ml of this solution into each of the fivelarge test tubes. If you pour a measured amount into one testtube, you may simply pour the others to match it.
d. Next we want to arrive at a gradient of pH or acid-alkaline environments. Remember this will represent a gradualchange from tram one extreme to the other. Take the bottle ofHC1 and carefully put 15 drops of HC1 in tie test tube you
9a
labelled "1 ". This will yield a highly acidic environment.
e. Put 2 drops of HC1 in the test tube labelled "5 ".
f. Now take the bottle of NaOH and put 15 drops in thetube labelled "11 ".
g. Put 5 drops of NaOH in the test tube labelled "9 ".
h. Put 2 drops of NaOH in the teat tube labelled win.
i. Place a 6" strip of pH paper on a paper towel.
j. Now take a stirrer and stir the contents of testtube "1 ". Shake off any excess solution. If you don't your
6" strip of pH paper will absorb too much of the solution. The
color wili spread like a blotter. Put the tip of the stirrer
on a small portion of the strip of pH paper. Check to see that
the change of color of the paper matches the pH code color.The pH code color is indicated on the pH paper container.Study the color chart on the container. Notice that there are
numbers "1" to "12" on the container. This is the pH rangethat can be tested with this pH paper. Now notice that aslightly different color is associated with each number. Youwill be interested in the colors for 1, 5, 7, 9, and 11. Eachof your respective environments should change the pH papereach of these five colors on the color chart. If your testtube "1" matches the color indicated for "1" on the colorchart, you need not add any more acid or base. If your test
color is not correct, add one drop at a time of either HC1 orNaOH, depending upon whether your solution needs to be moreacidic or more basic. If for example, your "7" is dark blue,it is too basic. You need to start adding a drop at a time of
HC1. Then test after adding each drop. An acid and base canneutralize each other.
k. Test each of the remaining solutions in the same way,
remembering to rinse the stirrer each time you proceed to adifferent test tube. If you are careless about this procedure,your results may not be correct because solution is transferredfrom one test tube to another.
1. The next step is tricky as you probably discoveredfrom practicing with water. Fill the small tubes with liquidfrom each of the large tubes, one at a time.
m. Capsize the small tube quickly in the large tube sothat it is completely submerged, open end down.
n. Hold your thumb over the open end of the large tubeand turn it upside down, so that all of the air in either tubeis collected in the bottom (now turned upward) of the largetube.
9b
o. Carefully turn the large tube upright in such a vaythat the bubble of air passes upward past the openend of the small tube without entering it. Youryeast are now ready to carry on activity.
p. Place the test tubes upright in the test tube rack.Leave them at room temperature for 24 hours. Youmust have the small test tube submerged within thelarge test tube befori you leave them or you willnot be able to collect the carbon dioxide that isgiven off.
q. Clean all equipment lihich you have used at this time,and put it back in place.
GO ON TO THE NEXT PAGE, page 10.
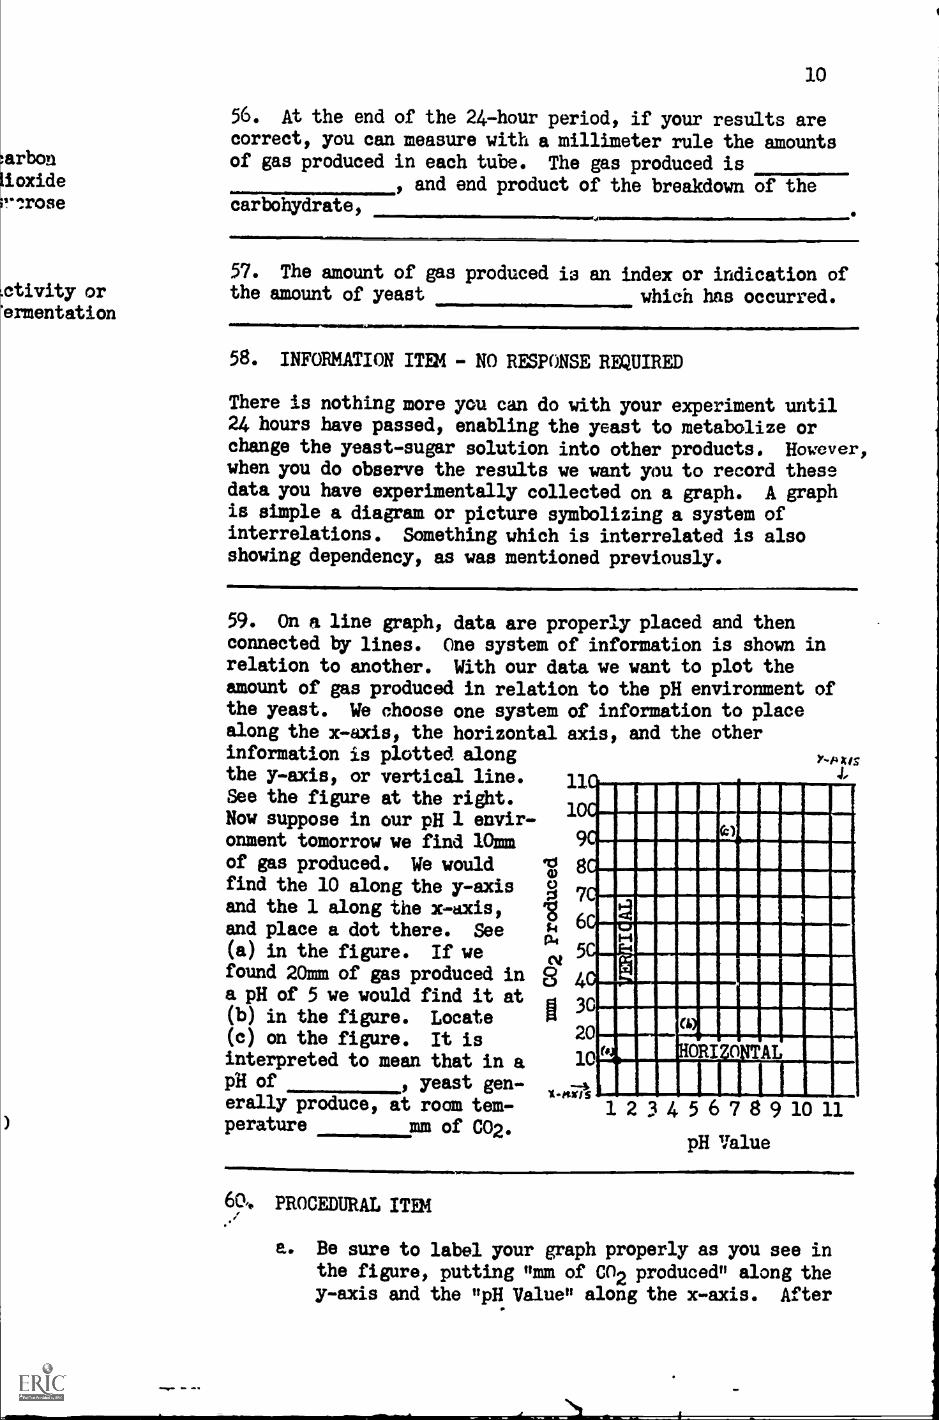
10
56. At the end of the 24-hour period, if your results arecorrect, you can measure with a millimeter rule the amounts
:arbors of gas produced in each tube. The gas produced is['oxide , and end product of the breakdown of the;r rose carbohydrate,
.ctivity or
'ermentation
57. The amount of gas produced is an index or indication ofthe amount of yeast which has occurred.
58. INFORMATION ITEM - NO RESPONSE REQUIRED
There is nothing more you can do with your experiment until24 hours have passed, enabling the yeast to metabolize orchange the yeast-sugar solution into other products. However,when you do observe the results we want you to record thesedata you have experimentally collected on a graph. A graphis simple a diagram or picture symbolizing a system ofinterrelations. Something which is interrelated is alsoshowing dependency, as was mentioned previously.
59. On a line graph, data are properly placed and thenconnected by lines. One system of information is shown inrelation to another. With our data we want to plot theamount of gas produced in relation to the pH environment ofthe yeast. We choose one system of information to placealong the x-axis, the horizontal axis, and the otherinformation is plotted along Y-H4/.7
the y-axis, or vertical line. 11See the figure at the right.
10Now suppose in our pH 1 envir-onment tomorrow we find 10mm 9C
of gas produced. We would qi 8Cfind the 10 along the y-axis R 70and the 1 along the x-axis,
k 6Cfrand place a dot there. See 1-4
(a) in the figure. If we 5C. ,,F-4
found 20mm of gas produced in 4a pH of 5 we would find it at
30(b) in the figure. Locate(c) on the figure. It is 20
interpreted to mean that in a 10
pH of , yeast gen-erally produce, at room tem-perature mm of CO2.
aJ
1 2 3 4 5 6 7 8 9 10 11
pH Value
69,. PROCEDURAL ITEM
a. Be sure to label your graph properly as you see inthe figure, putting "mm of CO2 produce& along they-axis and the tipH Value along the x-axis. After
na
you have measured the millimeters of gas produced and know therange of millimeters you'll need, then mark off along the y-axis(Look back at the figure in frame 59.)
b. If your greatest production is 8C,11m and your lowest0mm, then you would need to mark off o through 80 along they-axis. Study the figure in frame 59.
c. Keep all the intervals or spaces between numerals thesame. Put your numerals right at the lines on the graph paper.Study this on the figure of frame 59.
61. Along the =-axis your range of pH will need to be from 111 to
62. Now put this exercise aside. When you come to class thenext science period, begin with frame 63.
63. PROCEDURAL ITEM - NO WRITTEN RESPONSE NECESSARY
a.- Begin by observing the yeast activity, evidenced bythe production of CO2. The CO2 should have collected in thesmall test tube. Remember carbon dioxide is a gas, so allyou will see is that the solution, which was in the small tube,has been displaced.
b. Using your millimeter rule, measure as accurately aspossible to the nearest millimeter, the carbon dioxide producedin each tube. Examine your millimeter rule carefully. Noticethe number "15". This means 15 centimeters. Since there are10 millimeters in one centimeter, 15 centimeters equal 150millimeters. Place your millimeter rule along side the smalltube having carbon dioxide in it. Do not remove the smalltube having carbon dioxide before you measure. Place thebeginning of the millimeter rule beside the beginning of theCU2 production. Where the Cn2 production ends, read across tothe point on your millimeter rule.
c. After you have measured each one, and recorded thedata along the left margin of this sheet of paper, then plotyour information on a piece of graph paper. You will find apiece of graph paper on the teacher's desk. Refer back toframes 58, 59, and 60 if you need to review instructions forgraphing. Do not ask for help without studying thoroughly.
. .
d. At this time, empty the contents of your test tubes,and wash them thoroughly. Find a test tube brush near thesinks to aid you. After you have cleaned them, turn thetest tubes upside down in your rack, and place them backwhere you first found them.
lib
e. From the data you have collected in your experimenta-tion, try to answer questions found in frames 64 through 68in your own words.
Your answer will der a4. What is the optimum (meaning "best) pH for yeastpond upon your activity at roam temperature?results. Usually theoptimum pH is from5 to 7. 65. Does the extent of yeast activity in the series of tubes
constitute a gradient?
66. If your yeast activity has constituted a gradient, how
(CO OK TO THE NETT PAGE, page12.)
Answer dependsupon results
would you describe it?
12
TLQ rate of increase 67. Define gradient.or &crease in eventsof nature; a gradualchange of events
There is a gradualchange in theamount of CO2
produced as oneproceeds from muchacidity to less, andfrom much alkalinityto less.
68. What is the relationship of your millimeters of gasproduced to the pH gradient?
FUR_ THER INVESTIGATIoNS
69. When you have determined the optimum pH for the activityof yeast, you may wish to investigate the relationship ofyeast activity to other gradients. When you find that timeallows, maintain the optimum pH, as you have determined it,and set up a gradient of nutrition using varying concentra-tions of sugar as a food source.
In this experiment you would be determining if varying con-centrations of sugar would make any difference in the yeastactivity instead of varying pHs. In your former experimentthe sugar was kept constant, while the pH was varied. Nowyou may keep the pH constant, (at the optimum or best pH)and vary the amounts of sugar. A yeast solution is avail-able if you plan to carry out this experiment. Then usingwhat you have learned in the former experiment be on yourown from this point. Remembers Be a true scientist--beaccurate; keep record of all that you do; measure precisely.
70. A gradient of salinity (degree of saltiness) usingvarying solutions of table salt (NaC1) and optimum pH maybe used to determine yeast activity. Be sure to start withvery dilute solutions. Anything diluted is mixed withwater or another liquid to diminish the strength of a solu-tion.
71. A gradient of chlorination, using varying dilutions(water mixed with a liquid) of commercial Clorox as achlorine source may be used to demonstrate a gradient ofyeast activity. Be sure to start with yea dilute solutions.
72. If you persue the experiment mentioned in frames 68and 69, determine the killing point of the microorganisms.
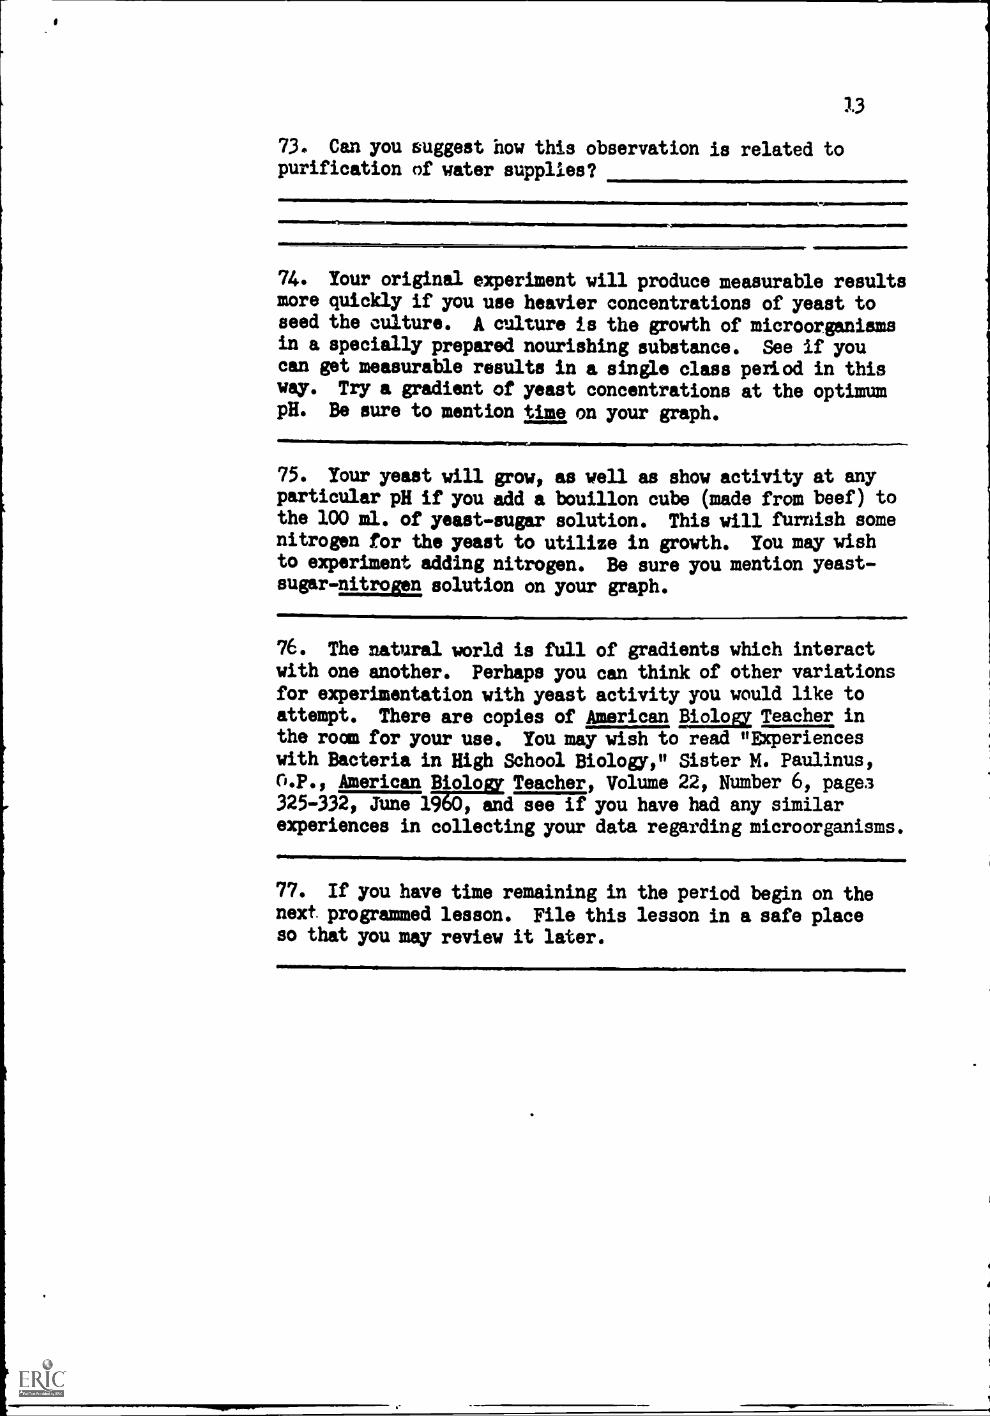
73. Can you suggest how this observation is related topurification of water supplies?
74. Your original experiment will produce measurable resultsmore quickly if you use heavier concentrations of yeast toseed the culture. A culture is the growth of microorganismsin a specially prepared nourishing substance. See if youcan get measurable results in a single class period in thisway. Try a gradient of yeast concentrations at the optimumpH. Be sure to mention time on your graph.
111111mma
75. Your yeast will grow, as well as show activity at anyparticular pH if you add a bouillon cube (made from beef) tothe 100 ml. of yeast-sugar solution. This will furnish somenitrogen for the yeast to utilize in growth. You may wishto experiment adding nitrogen. Be sure you mention yeast-sugar-nitrogen solution on your graph.
76. The natural world is full of gradients which interactwith one another. Perhaps you can think of other variationsfor experimentation with yeast activity you would like toattempt. There are copies of American Biology Teacher inthe roam for your use. You may wish to read nEXperienceswith Bacteria in High School Biology, Sister M. Paulinus,O.P., American Biolo Teacher, Volume 22, Number 6, pages325 -332, June 1960, and see if you have had any similarexperiences in collecting your data regarding microorganisms.
77. If you have time remaining in the period begin on thenext programmed lesson. File this lesson in a safe placeso that you may review it later.
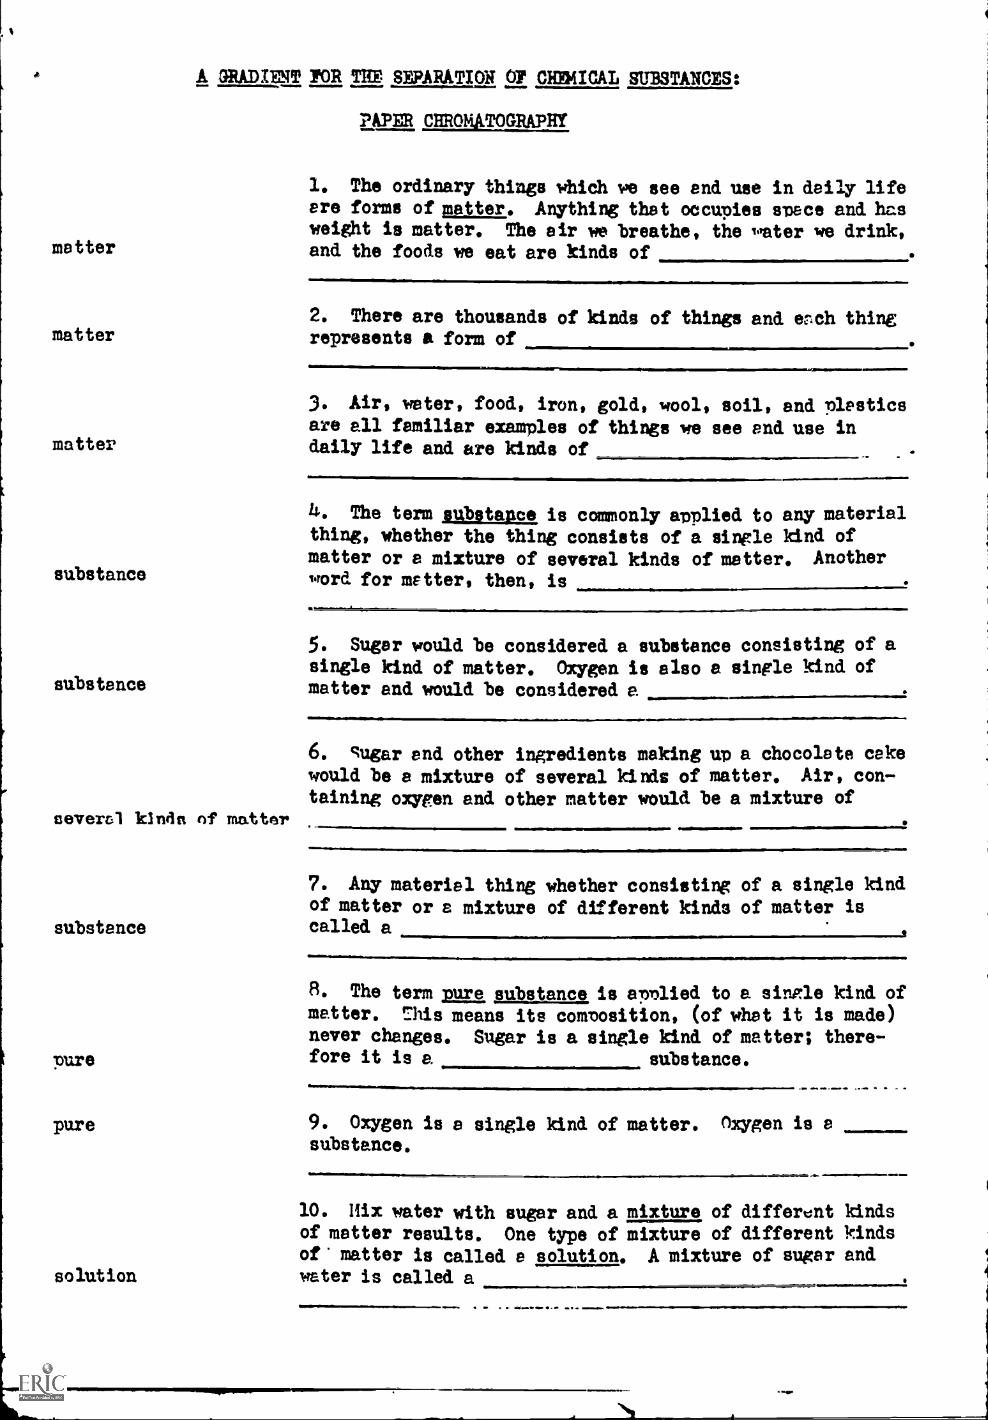
matter
matter
matter
substance
substance
A GRADIMIT FOR THE SEPARATION OP CHEMICAL SUBSTANCES:
PAPER CHROMATOGRAPHY
1. The ordinary things which we see end use in daily lifeare forms of matter. Anything that occupies space and hasweight is matter. The air we breathe, the water we drink,and the foods we eat are kinds of
2. There are thousands of kinds of things and ench thingrepresents a form of
3. Air, water, food, iron, gold, wool, soil, and plastics
are all familiar examples of things we see end use indaily life and are kinds of
4. The term substance is commonly applied to any materialthing, whether the thing consists of a single kind ofmatter or a mixture of several kinds of matter. Anotherword for matter, then, is
5. Sugar would be considered a substance consisting of asingle kind of matter. Oxygen is also a single kind ofmatter and would be considered a,
6. sugar end other ingredients making up a chocolate cakewould be a mixture of several kinds of matter. Air, con-taining oxygen and other matter would be a mixture of
several klmin of matter
substance
7. Any materiel thing whether consisting of a single kindof matter or a mixture of different kinds of matter iscalled a
8. The term pure substance is applied to a single kind ofmatter. This means its composition, (of whet it is made)never changes. Sugar is a single kind of matter; there-
pure fore it is a. substance.
pure 9. Oxygen is a single kind of matter. Oxygen is asubstance.
solution
10. Mix water with sugar and a mixture of different kindsof matter results. One type of mixture of different kindsof matter is called a solution. A mixture of sugar andwater is called a
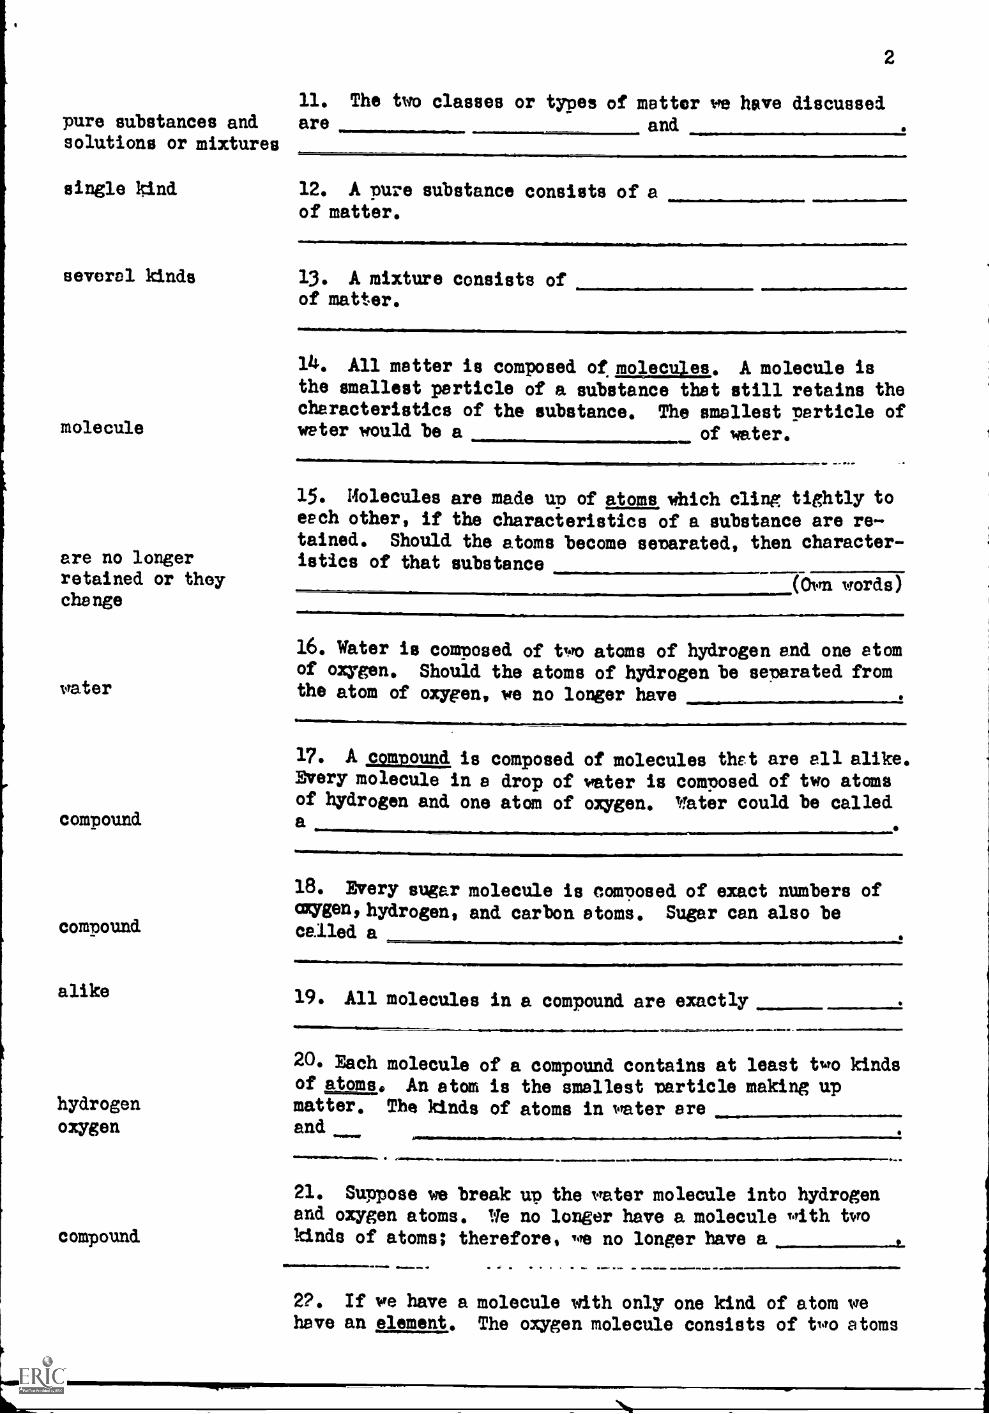
2
11. The two classes or types of matter we have discussedpure substances and are._ andsolutions or mixtures
single kind 12. A pure substance consists of aof matter.
several kinds 13. A mixture consists ofof matter.
molecule
are no longerretained or theychange
water
compound
compound
alike
14. All matter is composed of. molecules. A molecule isthe smallest particle of a substance that still retains thecharacteristics of the substance. The smallest particle ofwater would be a of water.
15. Molecules are made up of atoms which cling tightly toeach other, if the characteristics of a substance are re-tained. Should the atoms become senarated, then character-istics of that substance
(Own words)
16. Water is composed of two atoms of hydrogen and one atomof oxygen. Should the atoms of hydrogen be separated fromthe atom of oxygen, we no longer have
17. A compound is composed of molecules that are all alike.Every molecule in a drop of water is composed of two atomsof hydrogen and one atom of oxygen. Vater could be calleda
18. Every sugar molecule is composed of exact numbers ofoxygen, hydrogen, and carbon atoms. Sugar can also becalled a
19. All molecules in a compound are exactly
20. Each molecule of a compound contains at least two kindsof atoms. An atom is the smallest particle making up
hydrogen matter. The kinds of atoms in water areoxygen and
compound
21. Suppose we break up the rater molecule into hydrogenand oxygen atoms. We no longer have a molecule with twokinds of atoms; therefore, we no longer have a
22. If we have a molecule with only one kind of atom wehave an element. The oxygen molecule consists of two atoms
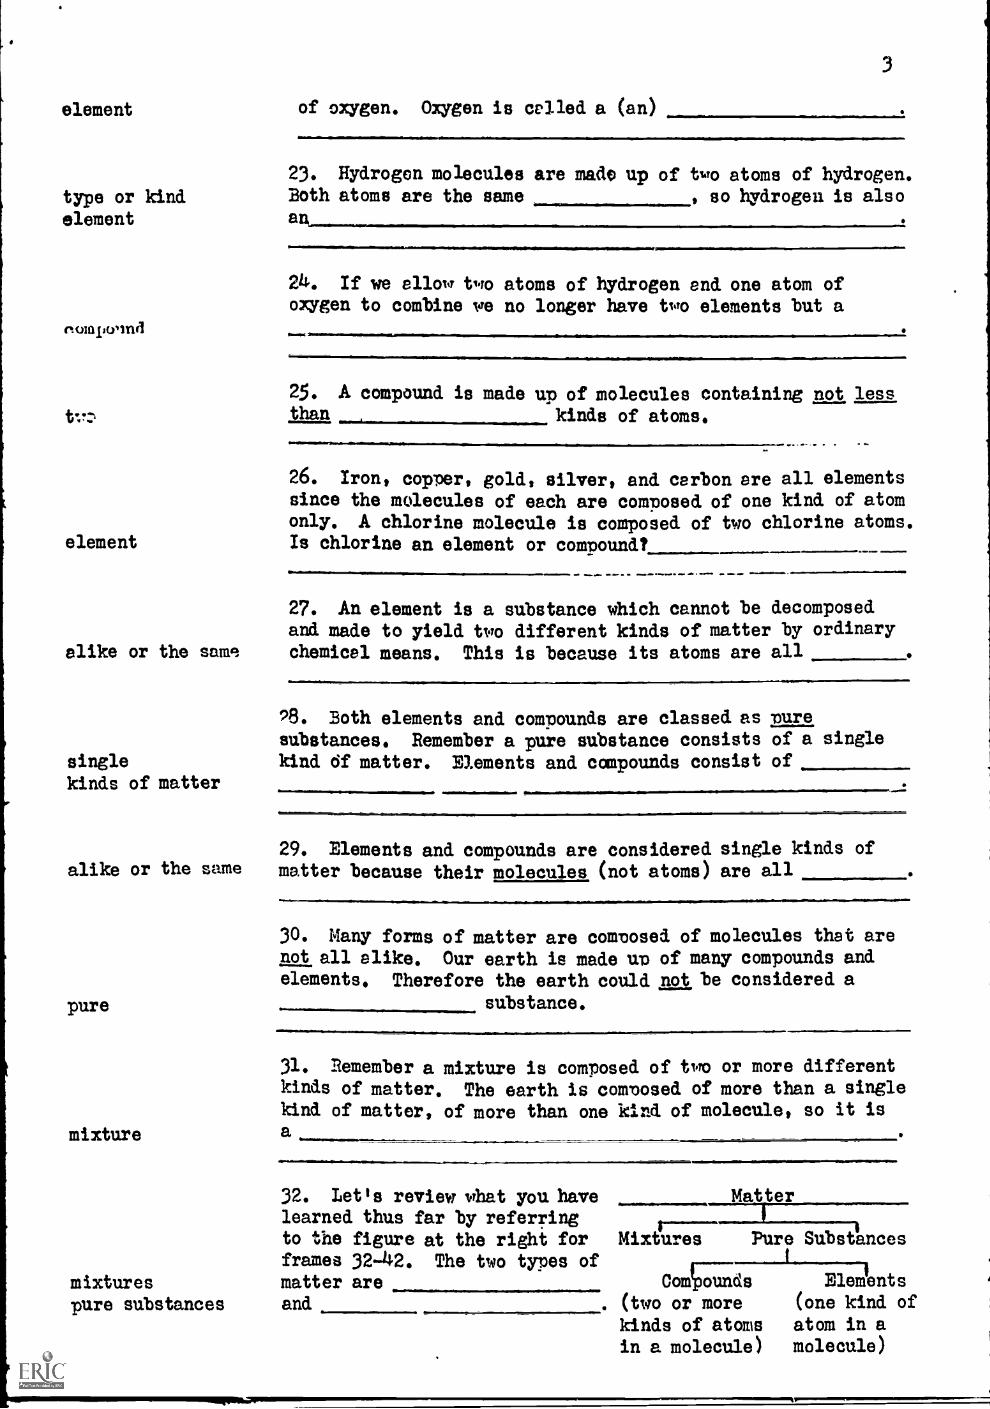
3
element of oxygen. Oxygen is celled a (an)
type or kind
element
nomponnd
23. Hydrogen molecules are made up of two atoms of hydrogen.Both atoms are the same , so hydrogen is also
24. If we allow two atoms of hydrogen end one atom ofoxygen to combine we no longer have two elements but a
25. A compound is made up of molecules containing not lessthan kinds of atoms.
26. Iron, copper, gold, silver, and carbon are all elementssince the molecules of each are composed of one kind of atomonly. A chlorine molecule is composed of two chlorine atoms.
element Is chlorine an element or compound?
27. An element is a substance which cannot be decomposedand made to yield two different kinds of matter by ordinary
alike or the same: chemical means. This is because its atoms are all
28. Both elements and compounds are classed as puresubstances. Remember a pure substance consists of a single
single kind df matter. Elements and compounds consist ofkinds of matter
alike or the same
pure
mixture
mixturespure substances
29. Elements and compounds are considered single kinds ofmatter because their molecules (not atoms) are all
30. Many forms of matter are composed of molecules that are
not all alike. Our earth is made up of many compounds andelements. Therefore the earth could not be considered a
substance.
1111.101
31. Remember a mixture is composed of two or more differentkinds of matter. The earth is composed of more than a singlekind of matter, of more than one kind of molecule, so it is
a
32. Let's review what you have Matterlearned thus far b referriy ngto the figure at the right forframes 32-42. The two types ofmatter areand
Mixtures Pure Substances
0o41oTu;ds Eledents
(two or more (one kind of
kinds of atoms atom in a
in a molecule) molecule)
elementscompounds
(any order)
more than one kindof matter or morethan one kind ofmolecule
one kind of matteror one kind ofmolecule
elements, compounds(any order)
alike or the same
33. Pure substances include eltd.
34. A mixture is comrosed ofOwn Words
35. A pure substance consists of onlyOwn 'Yords1
36. Both and are
pure substances.
37. Both elements and compounds are pure substances becLlsotheir molecules are Own words).
38. A molecule is the smallest particle of a substancethe characteristics that still retains
of a substance Own words).
atoms 39. A molecule is made up oftightly to each other.
which cling
4O. If the atoms in a molecule are all one kind, the
element substance is called an
41. If the atoms in a molecule consist of two or more
comnound kinds of atoms, the substance is called a
weight
substance
compounds
color
42. Matter is anything occupying space and having
43. Another /4ord for matter is
11.1011
44. Chemistry is a science which deals with the composition
and characteristics or properties of substances, and their
reactions. Chemists, then, would work with mixtures,
elements, and.
45. One of the most valuable methods which chemists have
for separating small amounts of pure substances from a
mixture of chemical compounds is that of chromatography.
Chromatography is a word made from two Greek words,chromatos, meaning "color", and graphos, meaning °write".
Chromatography then means writing.
46. In our experiment we will experiment with der
chromatography, '.?hen you have completed the experiment,
you can expect to see "color writing" on
5
1147. The caper has to be a snecial kind, a norous (full of
tiny holes) paper so it can absorb moisture. Filter manner
is used in our experiment to absorb
48. A small amount of the solution (mixture) that we want
to separate, is 'placed on one end of a stria of filter
paper. A liquid (water or other) which will dissolve the
compounds in the mixture is allowed to creep up the paper.
This liquid is called a solvent. Water could be used as
a
49. As the solvent ascends up the filter naper through the
spot of mixture placed on the paper, the pigments move with
it. Pigments are coloring matter and can be separated by
means of chromatography.
50. The pigments move with the solvent for a certain dis4,
tance, but not indefinitely because the pigments are held
by the paper, some strongly, some weakly. Which pigments
do you think would travel or "write" color the farthest
distance, those which are strongly held by the paper or
weakly held?
51. With each component traveling at its own rate, the
individual components become separated. A component is one
of the parts of a whole. The compounds with different
pigments could be called
52. Any compound or mixture is made up of comnonents. If
we separated water into hydrogen and oxygen, hydrogen and
oxygen would be considered of water.
53. When the solvent (water or other) dries, each comnon-
ent is left in pure form apart from the others so that each
now makes a separate spot on the paper. Each of these
components would be known as a nure
54. Now we can define chromatography more completely. It
is a method of analysis in which the flow of a solvent
promotes the separation cf substances in a porous medium.
The porous medium in our experiment is filter
55. Analysis means e. separating or breaking up of any
whole into its parts. We shall be analyzing a mixture to
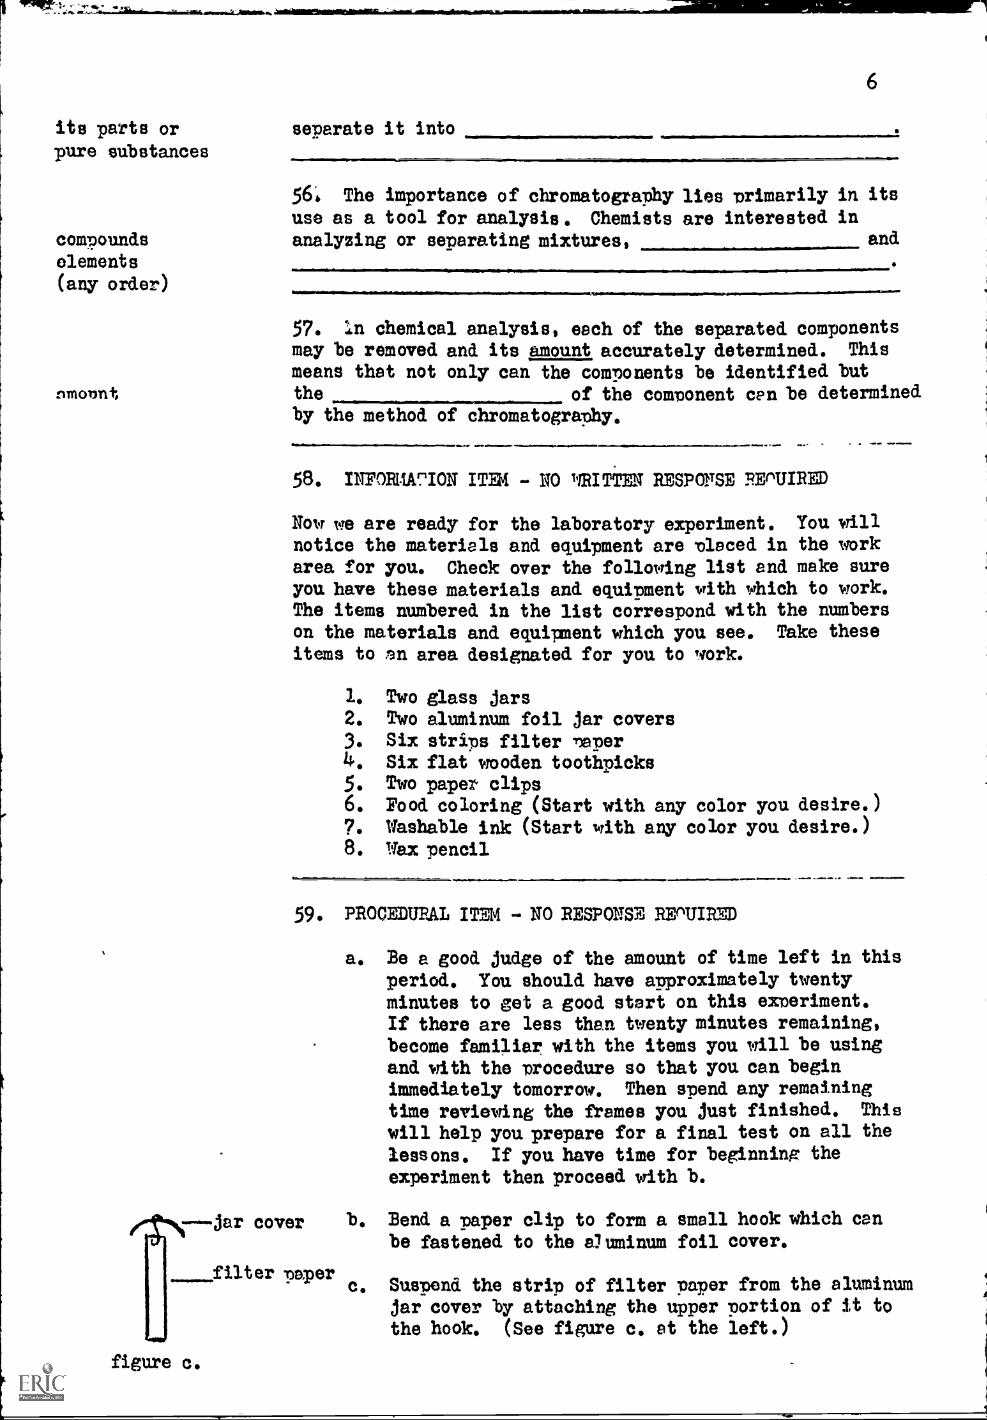
its parts or separate it into
pure substances
6
56; The importance of chromatography lies primarily in itsuse as a tool for analysis. Chemists are interested in
compounds analyzing or separating mixtures, and
elements(any order)
amount
57. in chemical analysis, each of the separated componentsmay be removed and its amount accurately determined. This
means that not only can the components be identified butthe of the component cen be determinedby the method of chromatography.
58. INFORA7ION ITIM - NO WRITTEN RESPOITSE PEnUIRED
Now we are ready for the laboratory experiment. You willnotice the materiels and equipment are placed in the workarea for you. Check over the following list and make sureyou have these materials and equipment with which to work.The items numbered in the list correspond with the numberson the materials and equipment which you see. Take these
items to an area designated for you to work.
1. Two glass jars2. Two aluminum foil jar covers3. Six strips filter 'leper4. Six flat wooden toothpicks5. Two paper clips6. Food coloring (Start with any color you desire.)
7. Washable ink (Start with any color you desire.)8. Wax pencil
59. PROCEDURAL ITEM - NO RESPONSE BEMIRED
a. Be a good judge of the amount of time left in thisperiod. You should have approximately twentyminutes to get a good start on this experiment.If there are less than twenty minutes remaining,become familiar with the items you will be usingand with the procedure so that you can beginimmediately tomorrow. Then spend any remainingtime reviewing the frames you just finished. This
will help you. prepare for a final test on all the
lessons. If you have time for beginning theexperiment then proceed with b.
---jar cover b. Bend a paper clip to form a small hook which can
11%44
be fastened to the euminum foil cover.
filter paperthe aluminumc Sus. Suspend the strip of filter paper from
jar cover by attaching the upper portion of it tothe hook. (See figure c. at the left.)
figure c.
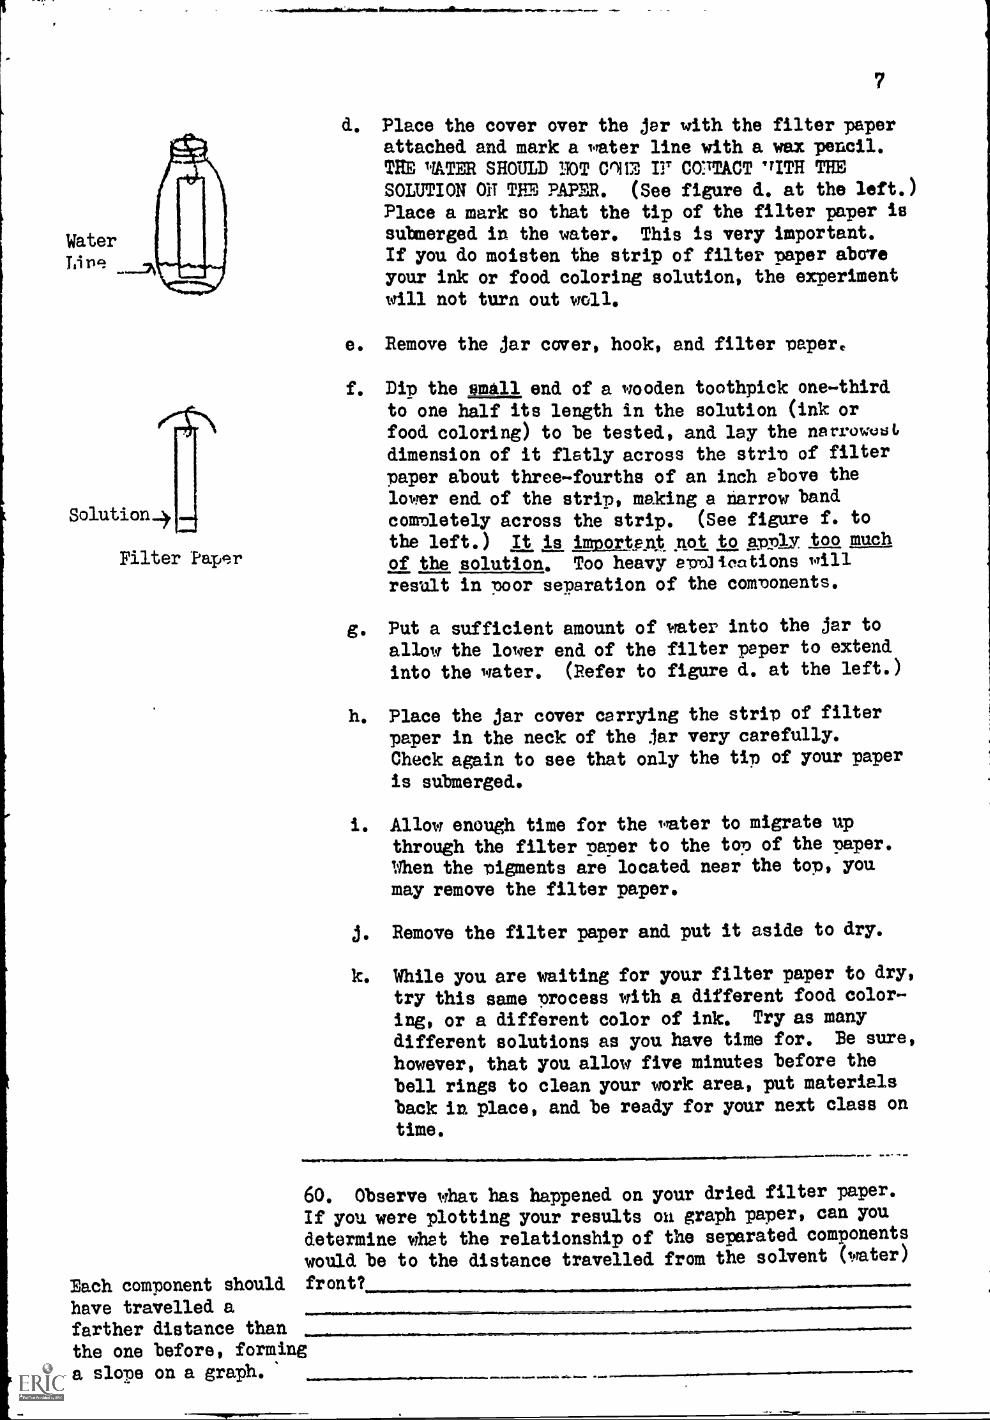
Solution..*
Filter Paper
7
d. Place the cover over the jar with the filter paperattached and mark a water line with a wax pencil.THE HATER SHOULD NOT C112 TY CO:ITACT 'TITH THE
SOLUTION Oil THE PAPER. (See figure d. at the left.)Place a mark so that the tip of the filter paper issubmerged in the water. This is very important.If you do moisten the strip of filter paper aboveyour ink or food coloring solution, the experimentwill not turn out wolf.
e. Remove the jar cover, hook, and filter paper.
f. Dip the mmall end of a wooden toothpick one-thirdto one half its length in the solution (ink orfood coloring) to be tested, and lay the narrowolstdimension of it flatly across the strip of filterpaper about three-fourths of an inch above the
lower end of the strip, making a narrow bandcompletely across the strip. (See figure f. to
the left.) It is important not to apply too muchof the solution. Too heavy apm3ications will
result in poor separation of the components.
g. Put a sufficient amount of water into the jar to
allow the lower end of the filter paper to extendinto the water. (Refer to figure d. at the left.)
h. Place the jar cover carrying the strip of filterpaper in the neck of the jar very carefully.
Check again to see that only the tip of your paperis submerged.
i. Allow enough time for the water to migrate upthrough the filter paper to the to of the paper.
When the pigments are located near the top, ypumay remove the filter paper.
j. Remove the filter paper and put it aside to dry.
k. While you are waiting for your filter paper to dry,
try this same process with a different food color-
ing, or a different color of ink. Try as many
different solutions as you have time for. Be sure,
however, that you allow five minutes before the
bell rings to clean your work area, put materialsback in place, and be ready for your next class on
time.
Nr......almilmwarana
60. Observe what has happened on your dried filter paper.
If you were plotting your results ou graph paper, can you
determine what the relationship of the separated components
would be to the distance travelled from the solvent (eater)
Each component should front?
have travelled afarther distance thanthe one before, forminga slope on a graph.
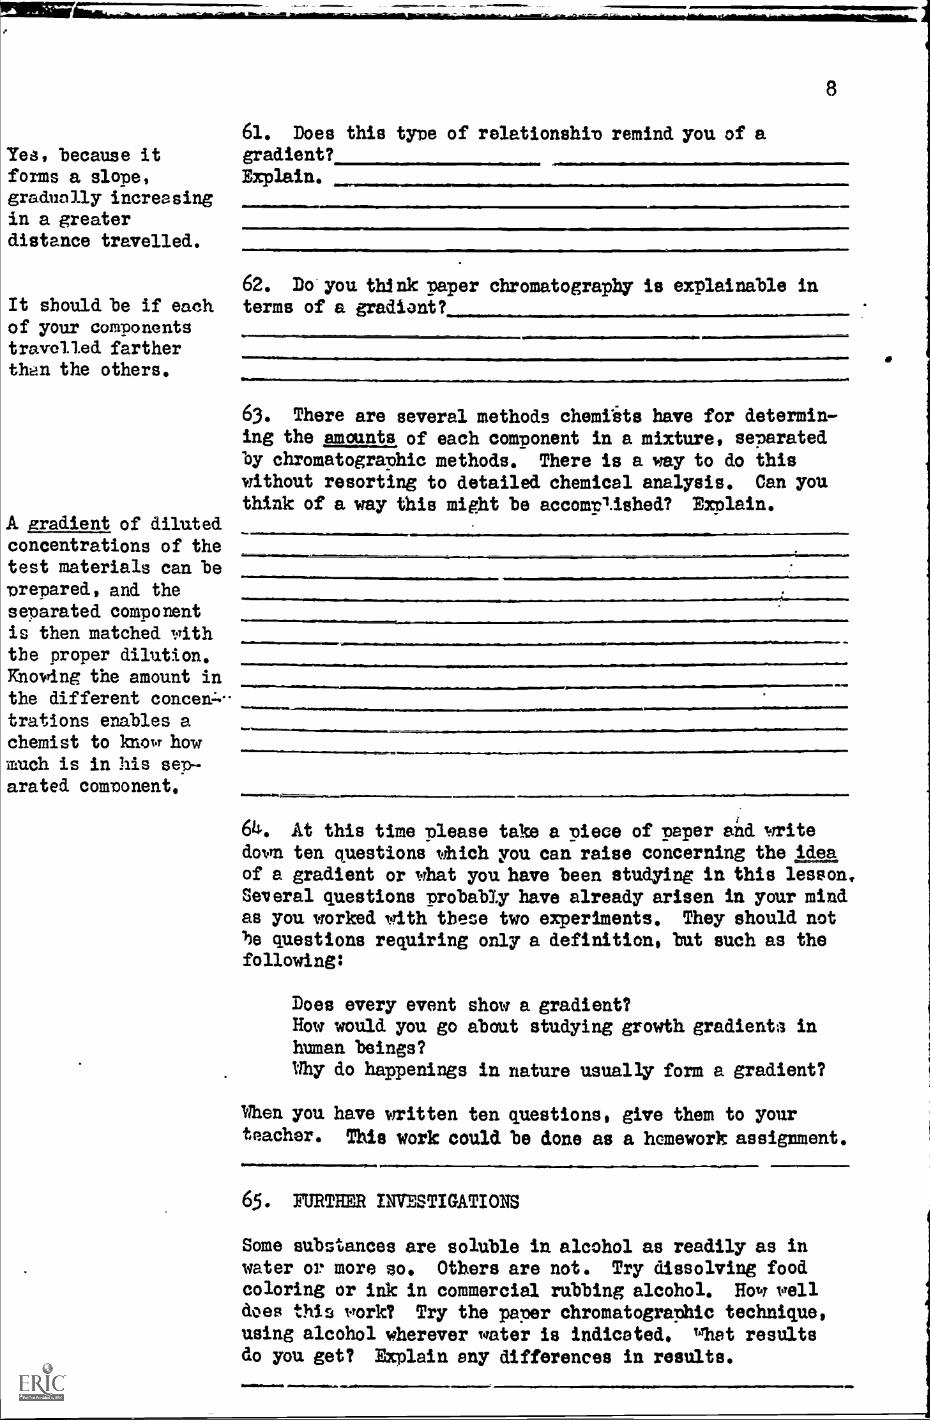
61. Does this type of relationship remind you of aYes, because it gradient?
forms a slope, Explain.gradually increasingin a greaterdistance travelled.
IIIMIEMMO
8
62. Do you think Paper chromatography is explainable inIt should be if each terms of a gradiant?of your componentstravelled fartherth8n the others.
63. There are several methods chemiits have for determining the amounts of each component in a mixture, separatedby chromatographic methods. There is a way to do thiswithout resorting to detailed chemical analysis. Can youthink of a way this might be accomtliehed? Explain.
A gradient of dilutedconcentrations of thetest materials can be
prepared, and theseparated componentis then matched withthe proper dilution.Knowing the amount inthe different concen»- miftwormy. 111111trations enables achemist to know howmuch is in his see,arated component.
....1111.0111ft
64. At this time please take a piece of raper and writedorm ten questions Which you can raise concerning the ideaof a gradient or what you have been studying in this lesson.Several questions probably have already arisen in your mindas you worked with these two experiments. They should notbe questions requiring only a definition, but such as thefollowing:
Does every event show a gradient?How would you go about studying growth gradienta inhuman beings?
Why do happenings in nature usually form a gradient?
When you have written ten questions, give them to yourteacher. This work could be done as a homework assignment.1111
65. FURTHER INVESTIGATIONS
Some substances are soluble in alcohol as readily as inwater or more so. Others are not. Try dissolving foodcoloring or ink in commercial rubbing alcohol. How welldoes this work? Try the paper chromatographic technique,using alcohol wherever water is indicated. whet resultsdo you get? Explain any differences in results.
9
66. The natural world is full of gradients, of thingswhich change gradually. In your experiment you probablyfound that compounds gradually travel on filter paperfarther than the one before.
The filter paper has more of an attraction for some than itdoes otherg, and absorbs and holds them more strongly.Thus, a gradient is demonstrated by how strongly a componentis attracted by filter paper.
You might be interested in knowing how long chromatographyhas been in rise. There are several methods other thanpaper that can be used. Are you curious to know whatextent chromatography is used in modern chemistry? Thinkof ways you might go about finding answers to thesequestions. There are references available to you. in thisroom.
67. If you have time remaining in the period begin on thenext programmed lesson. File this lesson in a safe placeso that you may review it later.
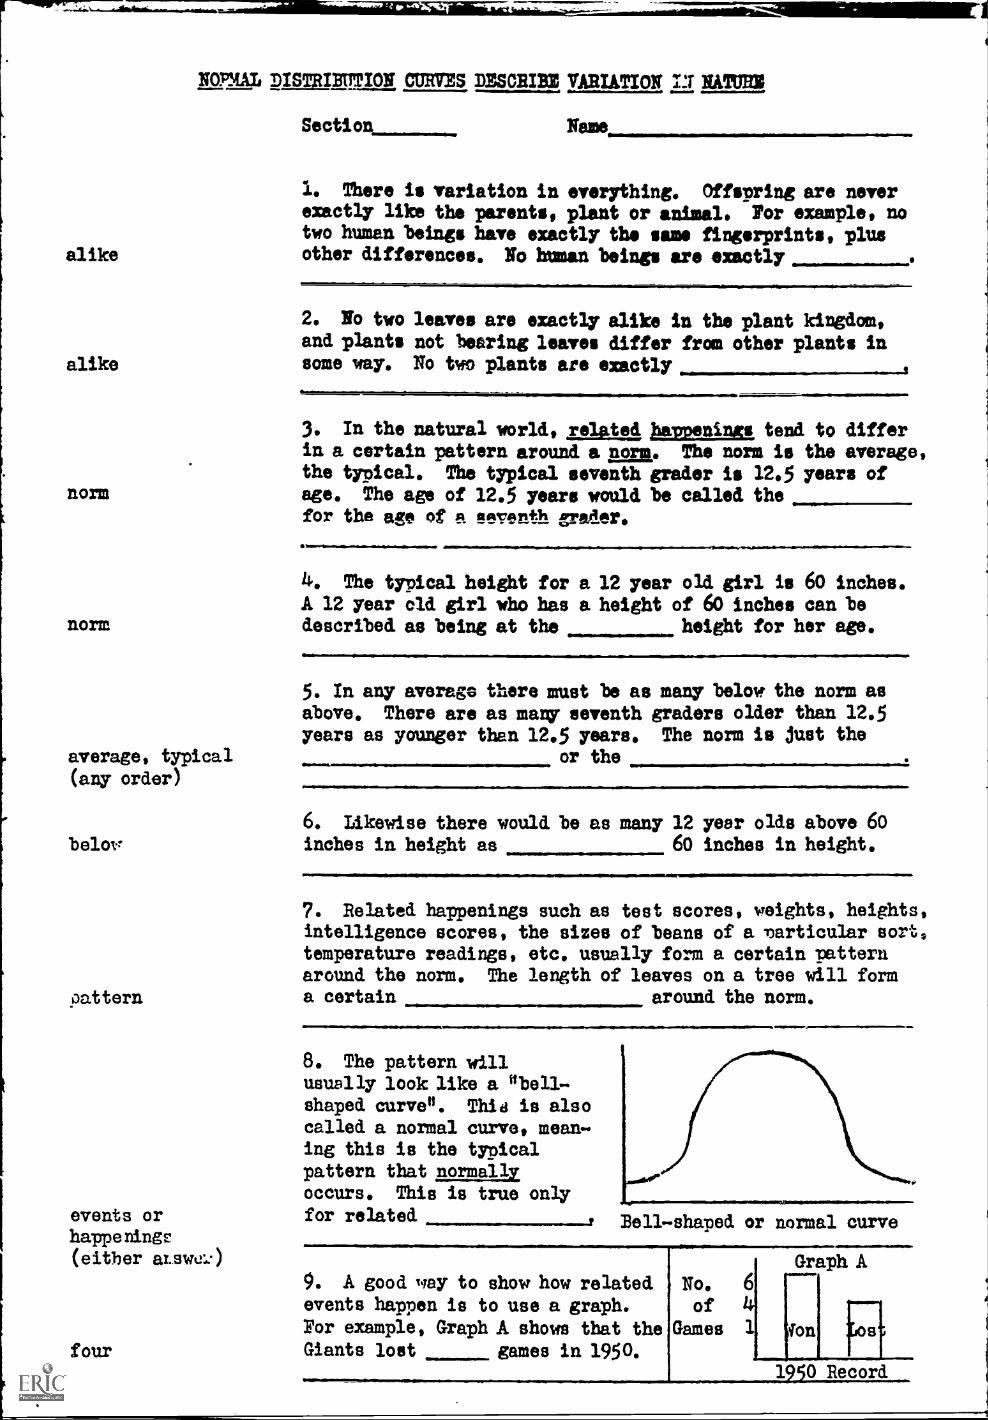
NUM DISTRIBUTION CURVES DESCRIBE VARIATION 1.1 NATE=
alike
alike
norm
norm
average, typical(any order)
belor
pattern
events orhapperinge(either atswe0
four
Section Name,
1. There is variation in everything. Offspring are neverexactly like the parents, plant or animal. For example, notwo human beings have exactly the same fingerprints, plusother differences. No human beings are exactly
2. No two leaves are exactly alike in the plant kingdom,and plants not bearing leaves differ from other plants insome way. No two plants are exactly
3. In the natural world, relatedin a certain pattern around &Amthe typical. The typical seventhage. The age of 12.5 years wouldfor the age of a seventh grader.1111!
tend to differThe norm is the average,
grader is 12.5 years ofbe called the
4, The typical height for a 12 year old girl is 60 inches.A 12 year old girl who has a height of 60 inches can bedescribed as being at the height for her age.
5. In any average there must be as many below the norm asabove. There are as many seventh graders older than 12.5years as younger than 12.5 years. The norm is just the
or the
6. Likewise there would be as many 12 year olds above 60inches in height as 60 inches in height.
7. Related happenings such as test scores, weights, heights,intelligence scores, the sizes of beans of a 'Particular sort,temperature readings, etc. usually form a certain patternaround the norm. The length of leaves on a tree will forma certain around the norm.
8. The pattern willusually look like a "bell.shaped curves. Thin is alsocalled a normal curve, mean.lag this is the typicalpattern that normallyoccurs. This is true onlyfor related Bellshaped or normal curve
9. A good way to show how relatedevents happen is to use a graph.
For example, Graph A shows that theGiants lost games in 1950.
No.
ofGames
1250 Record
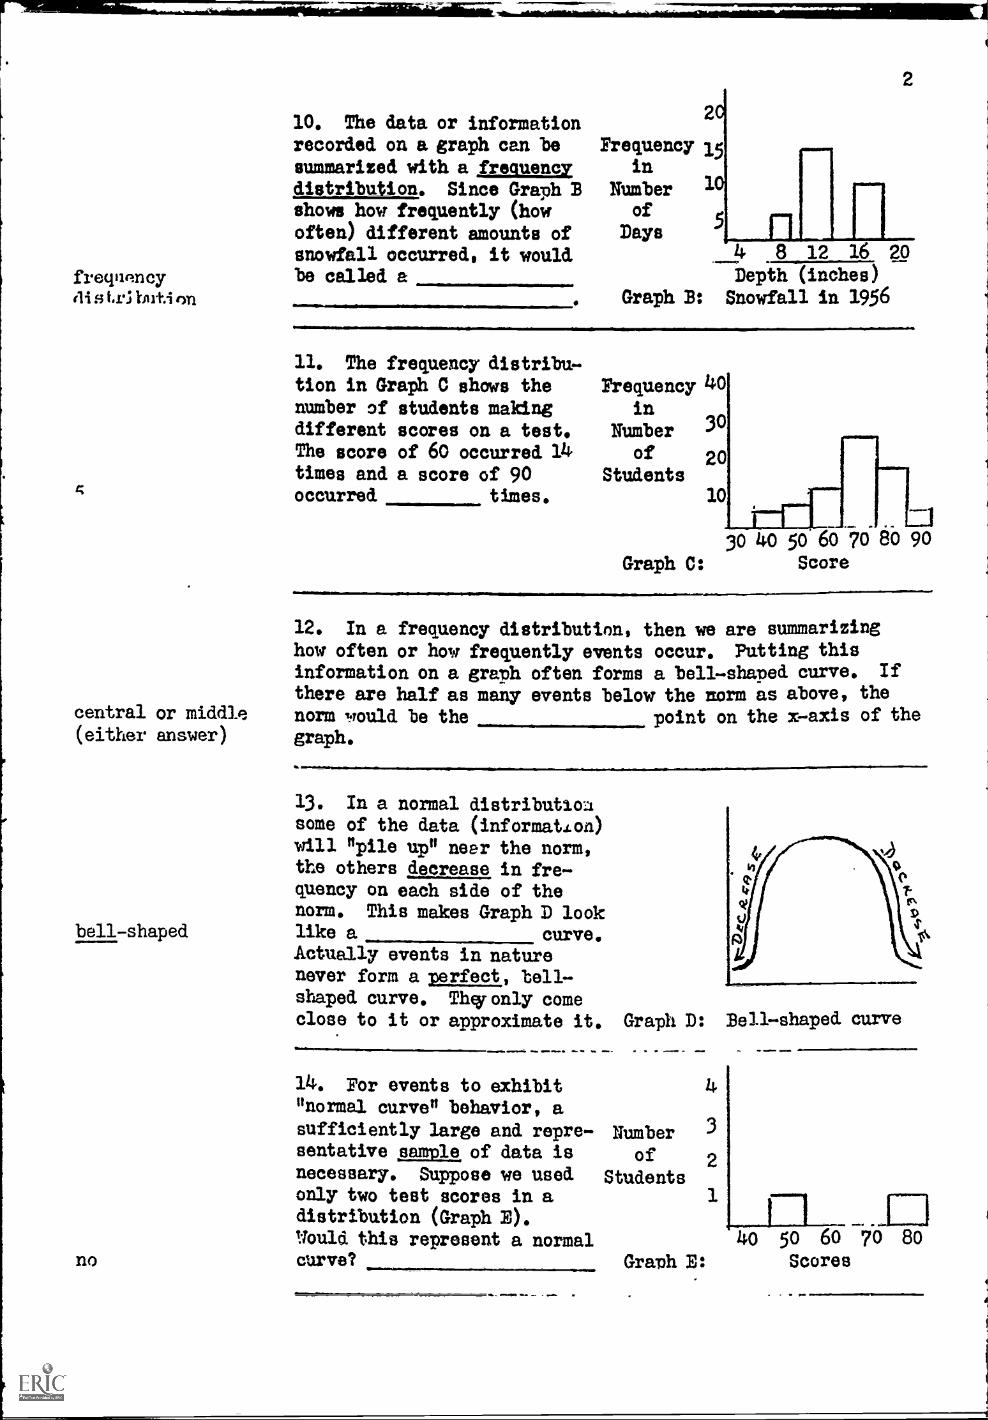
frequencyAli s ter.; but-i
6
central or middle(eithe answer)
bell-shaped
no
10. The data or information:ecorcileelleocin attr:Irceaalliiebily
distribution. Since Graph Bshows how frequently (howoften) different amounts ofsnowfall occurred, it wouldbe called a
20
Frequency 15in
Number 10
of5Days
41111111.
2
y 8 12 16 20
Depth (inches)Graph B: Snowfall in 1956
11. The frequency distribu-tion in Graph C shows thenumber of students making
different scores on a test.The score of 60 occurred 14times and a score of 90occurred times.
Frequency. 40
inNumber 30
of 20Students
10
2:130 40 50 60 70 80 90
Graph C: Score
12. In a frequency distribution, then we are summarizinghow often or how frequently events occur. Putting thisinformation on a graph often forms a bell-shaped curve. If
there are half as many events below the norm as above, thenorm would be the point on the m-axis of thegraph.
13. In a normal distributionsome of the data (informatIon)will "pile up" near the norm,the others decrease in fre-quency on each side of thenorm. This makes Graph D looklike a curve.Actually events in naturenever form a perfect, bell-shaped curve. The only comeclose to it or approximate it.
14. For events to exhibit"normal curve" behavior, asufficiently large and repre-sentative sample of data isnecessary. Suppose we usedonly two test scores in adistribution (Graph E).
Graph D: Bell-shaped curve
4
Number 3
of 2Students
1
Would this represent a normal 40 50 60 70 80curve? Graph E: Scores
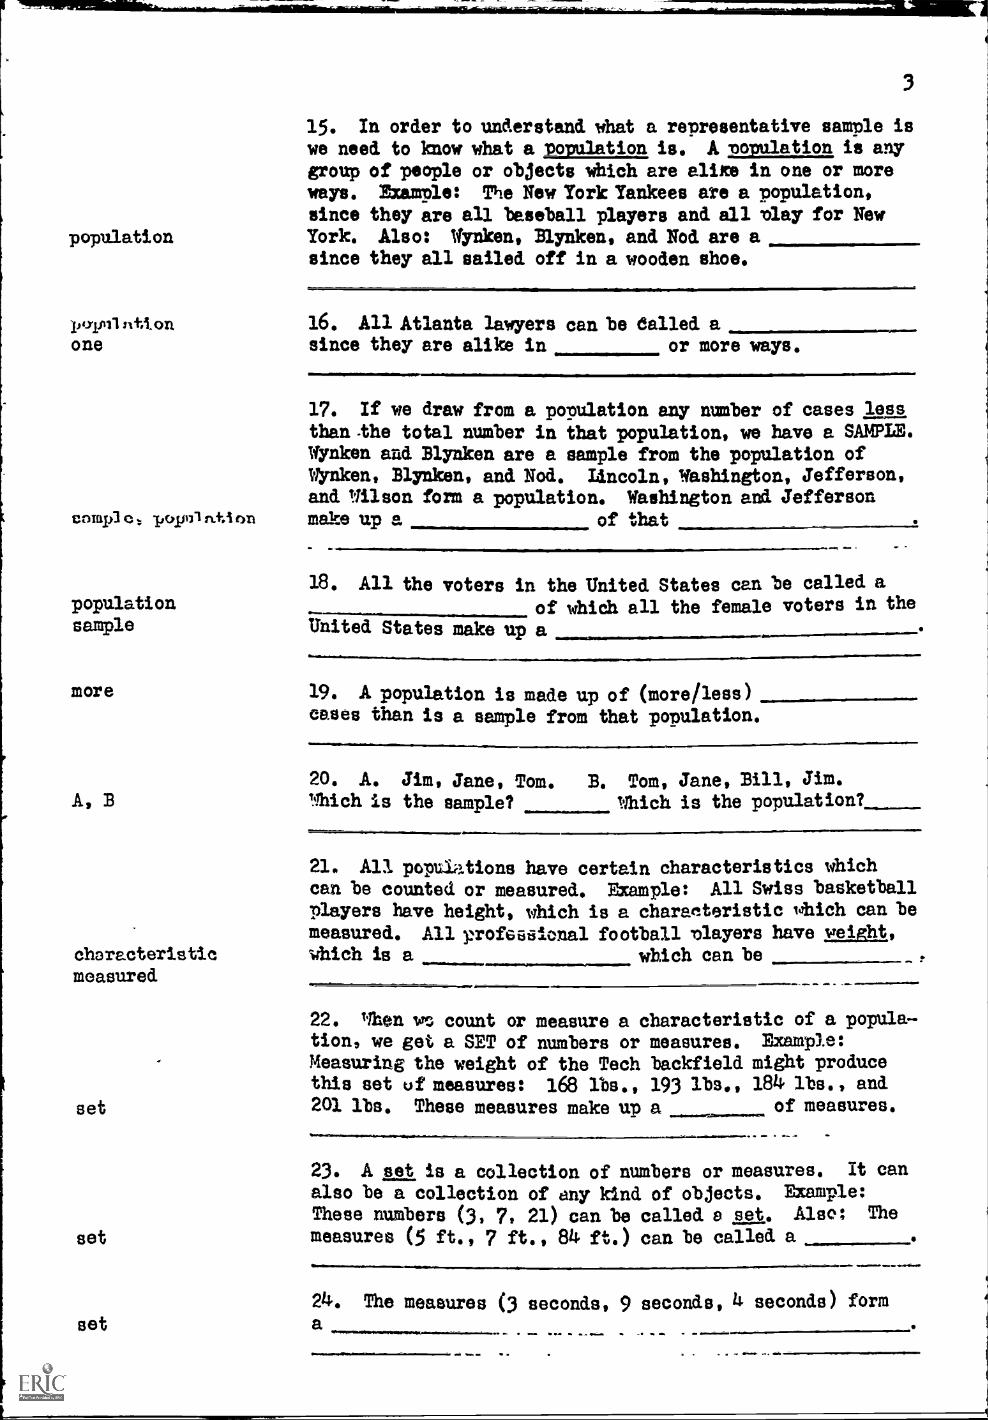
population
3
15. In order to understand what a representative sample iswe need to know what a Population is. A population is any
group of people or objects which are alixe in one or moreways. Example: The New York Yankees are a population,since they are all baseball players and all Play for NewYork. Also: Wynken, Blynken, and Nod are asince they all sailed off in a wooden shoe.
poprillntton 16. All Atlanta lawyers can be dolled aone since they are alike in or more ways.
cmapi
17. If we draw from a population any number of cases lessthan-the total number in that population, we have a SAMPLE.Wynken and Blynken are a sample from the population ofWynken, Blynken, and Nod. Lincoln, Washington, Jefferson,and Wilson form a population. Washington and Jeffersonmake up a of that
18. All the voters in the United States can be called apopulation of which all the female voters in the
sample United States make up a
more 19. A population is made up of (more/less)eases than is a sample from that population.
A, B
characteristicmeasured
set
set
set
20. A. Jim, Jane, Tom. B. Tom, Jane, Bill, Jim.Which is the sample? which is the population?
21. All populations have certain characteristics whichcan be counted or measured. Example: All Swiss basketball
players have height, which is a characteristic which can bemeasured. All profs tonal football Players have weight,which is a which can be
22. when wv.) count or measure a characteristic of a population, we get a SET of numbers or measures. Example:
Measuring the weight of the Tech backfield might producethis set of measures: 168 lbs., 193 lbs., 184 lbs., and201 lbs. These measures make up a of measures.
23. A set is a collection of numbers or measures. It can
also be a collection of any kind of objects. Example:
These numbers (3, 7, 21) can be called a set. Also; The
measures (5 ft., 7 ft., 84 ft.) can be called a
24. The measures (3 seconds, 9 seconds, 4 seconds) forma .1.. 4. a.. or ft ma.
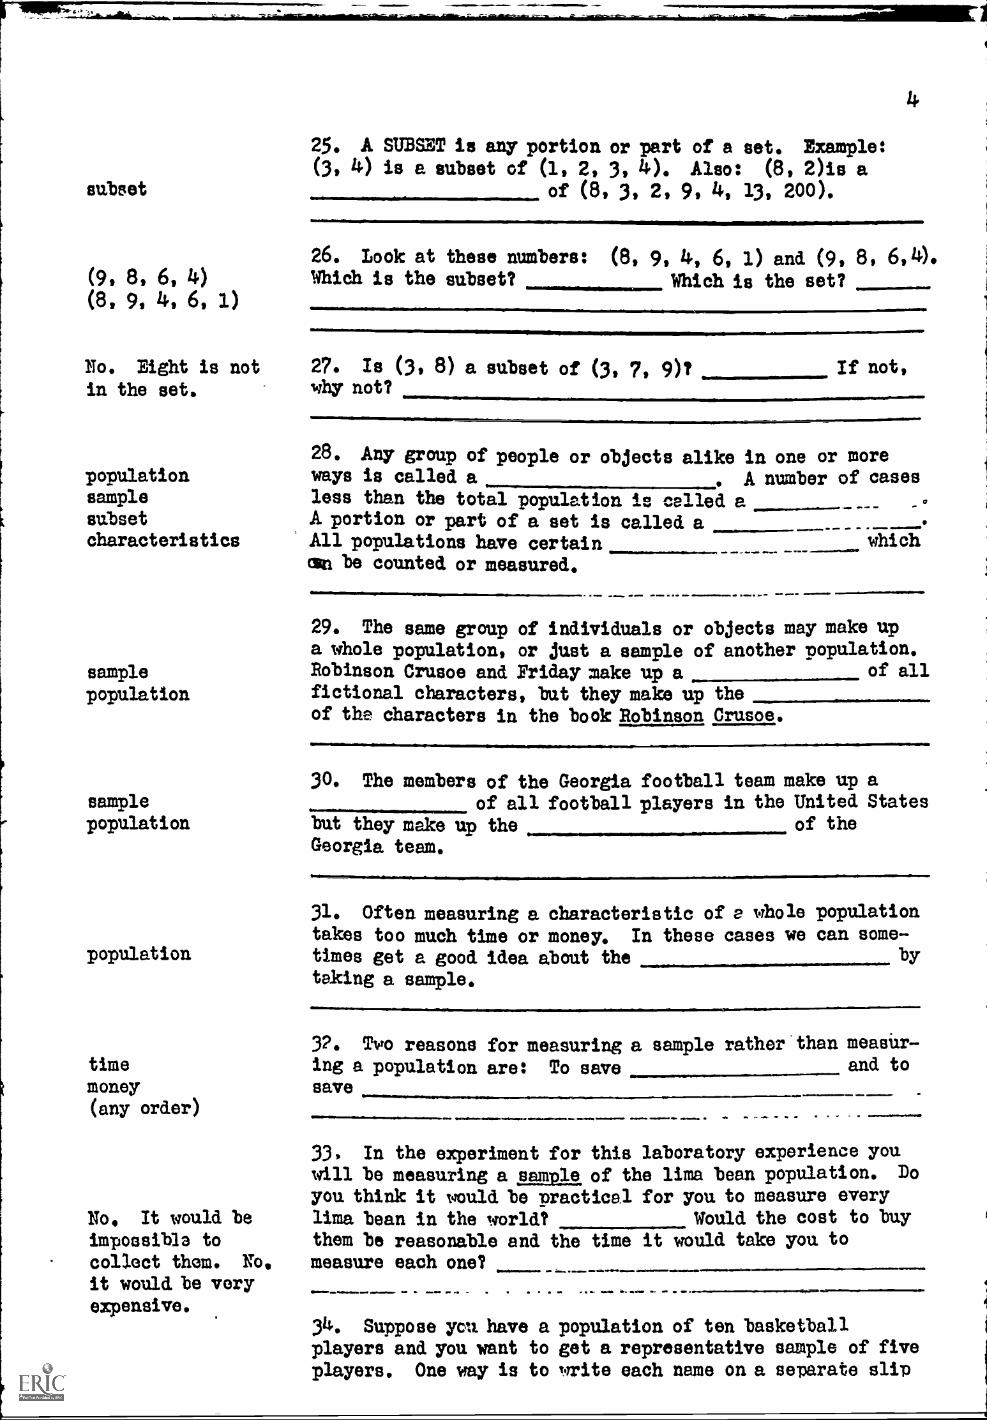
subset
(9, 8, 6, 4)
(8, 9, 4,, 6, 1)
Mo. Eight is not
in the set.
populationsamplesubsetcharacteristics
sample
population
samplepopulation
population
time
money(any order)
No. It would be
impossibla tocollect them. NO,
it would be veryexpensive.
25. A SUBSET is any portion or part of a set. Example:(3, 4) is a subset of (1, 2, 3, 4). Also: (8, 2)is a
of (8, 3, 2, 9, 4, 13, 200).
26. Look at these numbers: (8, 9, 4, 6, i) and (9, 8, 6914.Which is the subset? Which is the set?
27. Is (3, 8) a subset of (3, 7, 9)?why not?
If not,
28. Any group of people or objects alike in one or moreways is called a . A number of casesless than the total population is celled aA portion or part of a set is called aAll populations have certainama be counted or measured.
which
29. The same group of individuals or objects may make upa whole population, or just a sample of another population.Robinson Crusoe and Friday make up a of all
fictional characters, but they make up theof the characters in the book Robinson Crusoe.
30. The members of the Georgia football team make up aof all football players in the United States
but they make up the. of theGeorgia team.
31. Often measuring a characteristic of e whole populationtakes too much time or money. In these cases we can some-times get a good idea about the by
taking a sample.
32. Two reasons for measuring a sample rather than measur-ing a population are: To save and to
save
33, In the experiment for this laboratory experience youwill be measuring a sample of the lima bean population. Do
you think it would be practical for you to measure everylima bean in the world? Would the cost to buy
them be reasonable and the time it would take you tomeasure each one? II=,...
34. Suppose you. have a population of ten basketballplayers and you want to get a representative sample of fiveplayers. One way is to write each name on a separate slip
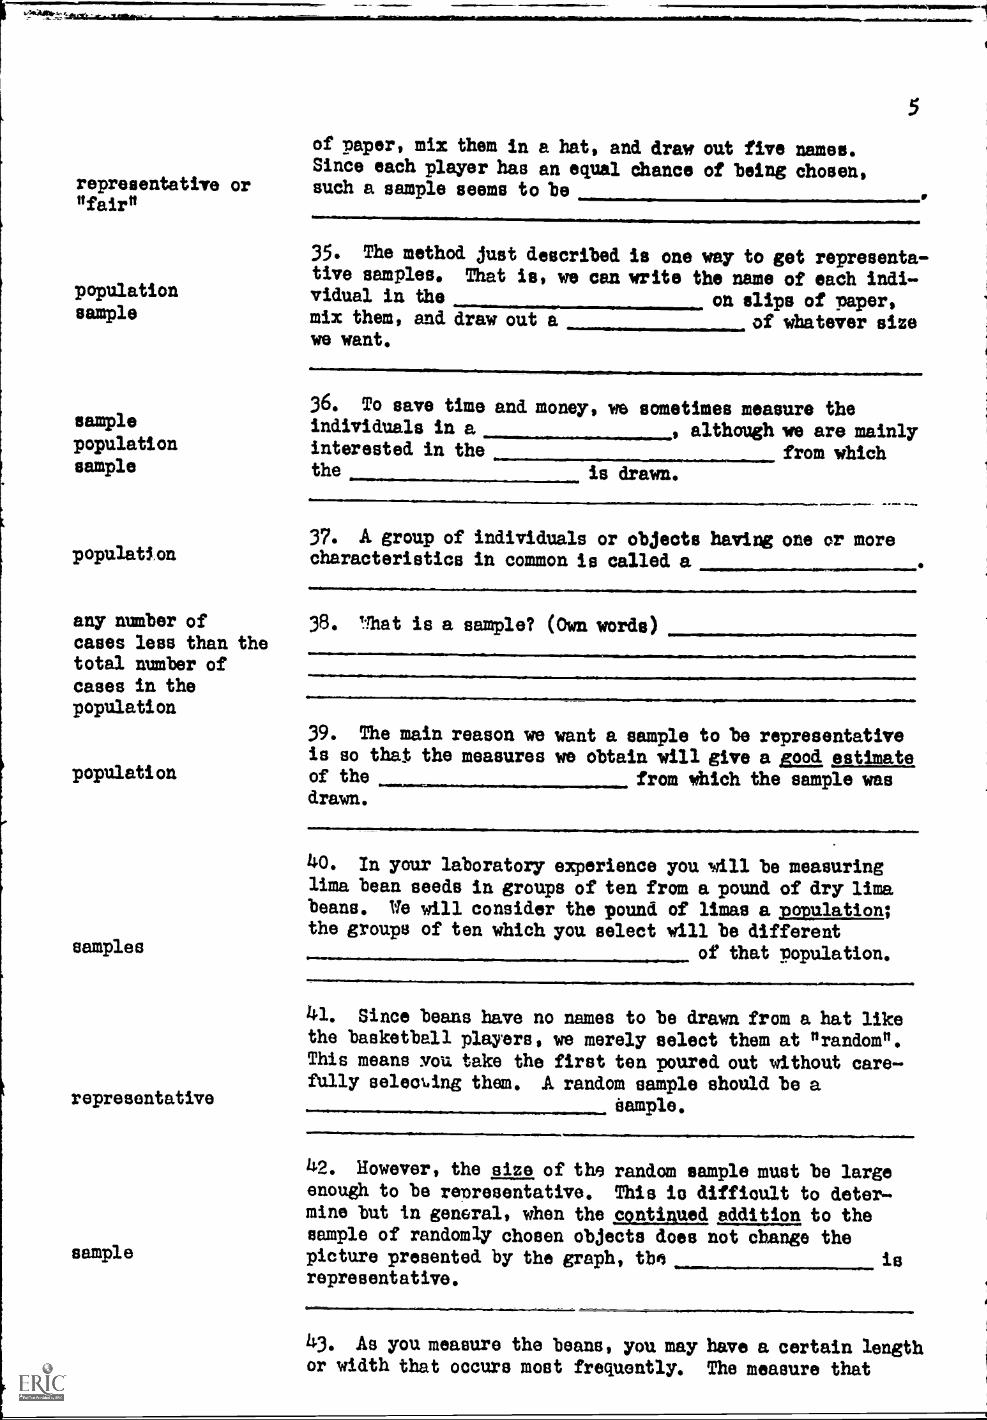
representative or"fair"
populationsample
sample
populationsample
population
any number ofcases less than thetotal number ofcases in thepopulation
population
samples
representative
sample
of paper, mix them in a hat, and draw out five names.Since each player has an equal chance of being chosen,such a sample seems to be
5
35. The method just describedtive samples. That is, we canvidual in themix them, and draw out awe want.
is one way to get representa-write the name of each indi-
on slips of paper,of whatever size
36. To save time and money, we sometimes measure theindividuals in a I although we are mainlyinterested in the from whichthe, is drawn.
37. A group of individuals or objects having one or morecharacteristics in common is called a
38. 1:let is a sample? (Own words)
39. The main reason we want a sample to be representativeis so that the measures we obtain will give a good estimateof the from which the sample wasdrawn.
40. In your laboratory experience you gill be measuringlima bean seeds in groups of ten from a pound of dry limabeans. We will consider the pound of limas a population;the groups of ten which you select will be different
of that 'copulation.
41, Since beans have no names to be drawn from a hat likethe basketball players, we merely select them at "random".This means 310u take the first ten poured out without care-fully seleoLing them. A random sample should be a
sample.IwwWwwIMIN=4111.11.`
h2. However, the size of the random sample must be largeenough to be representative. This io difficult to deter-mine but in general, when the continued addition to thesample of randomly chosen objects does not change thepicture presented by the graph, tbn isrepresentative.
43. As you measure the beans, you may have a certain lengthor width that occurs most frequently. The measure that
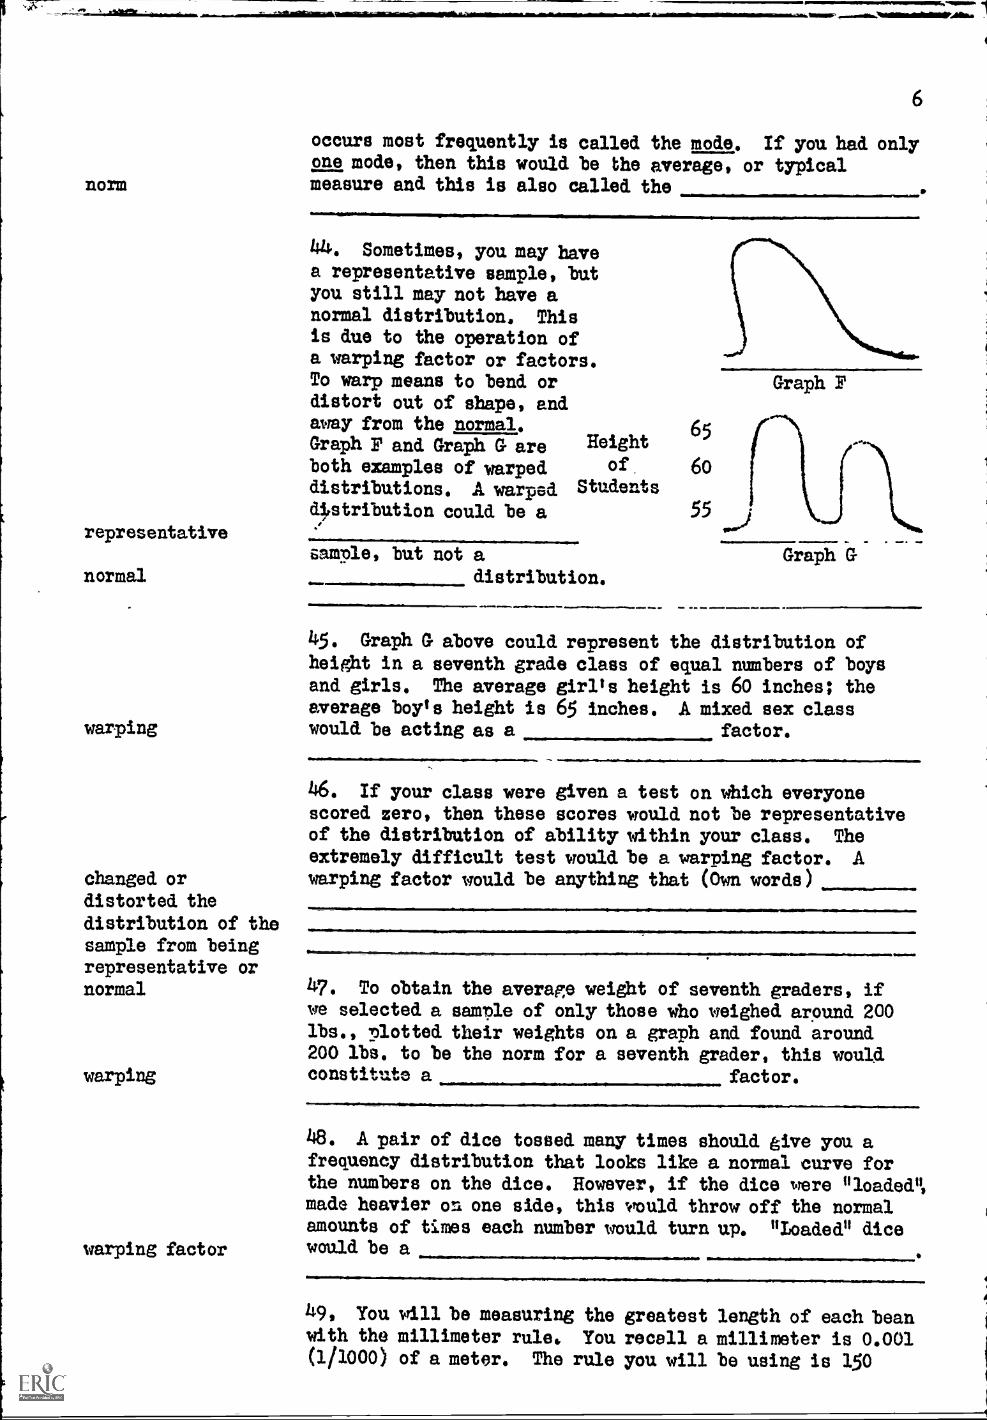
.161111.11,
norm
representative
normal
warping
changed ordistorted the
distribution of thesample from beingrepresentative ornormal
warping
warping factor
111111MMIIIIMIL,..1111111111111.
WAMW.,mosmdlilOMMMOIMMAPAIft.
6
occurs most frequently is called the mode. If you had onlyone mode, then this would be the average, or typicalmeasure and this is also called the
44. Sometimes, you may havea representative sample, butyou still may not have anormal distribution. Thisis due to the operation ofa warping factor or factors.To warp means to bend ordistort out of shape, andaway from the normal.Graph P and Graph G are Height
both examples of warped of
distributions. A warped Studentsdistribution could be a
sample, but not a
distribution.
65
60
55
Graph F
Graph G
45. Graph G above could represent the distribution ofheight in a seventh grade class of equal numbers of boysand girls. The average girl's height is 60 inches; theaverage boy's height is 65 inches. A mixed sex classwould be acting as a factor.
46. If your class were given a test on which everyonescored zero, then these scores would not be representativeof the distribution of ability within your class. The
extremely difficult test would be a warring factor. Awarping factor would be anything that (Own words)
47. To obtain the average weight of seventh graders, ifwe selected a sample of only those who weighed around 200lbs., plotted their weights on a graph and found around200 lbs. to be the norm for a seventh grader, this wouldconstitute a factor.
48. A pair of dice tossed many times should give you afrequency distribution that looks like a normal curve forthe numbers on the dice. However, if the dice were Illoadedo,made heavier on one side, this would throw off the normalamounts of times each number would turn up. "Loaded" dicewould be a
49, You will be measuring the greatest length of each beanwith the millimeter rule.. You recall a millimeter is 0.001(1/1000) of a meter. The rule you will be using is 150
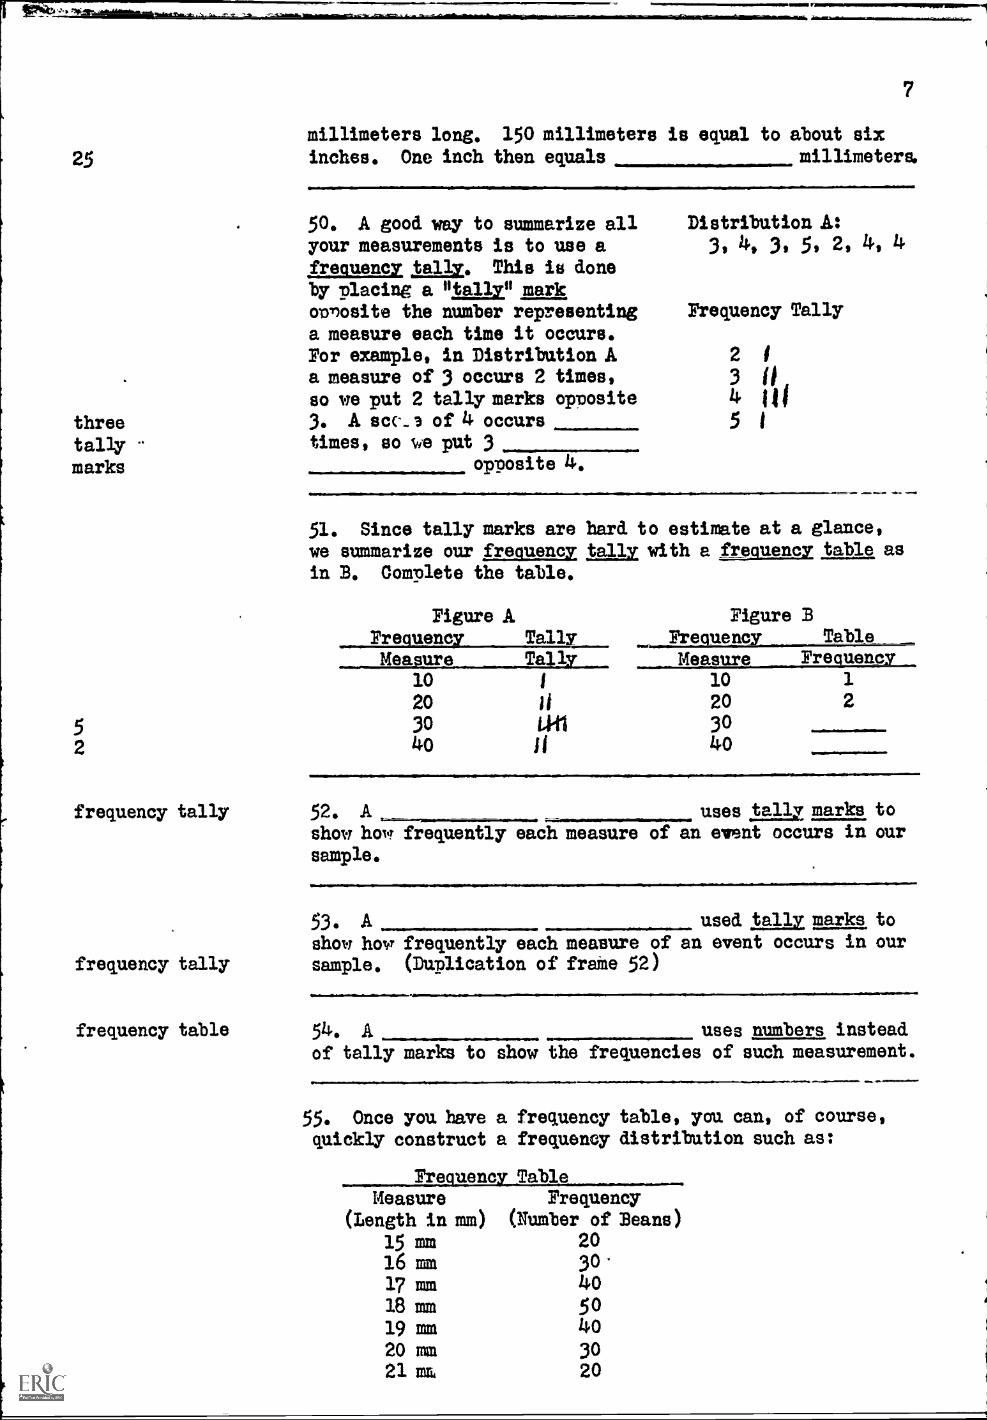
MUMS V
25
7
millimeters long. 150 millimeters is equal to about six
inches. One inch then equals millimeters.
50. A good way to summarize all Distribution A:
your measurements is to use a 3, LP, 3, 5, 2, 4, 4
frequency tally. This is doneby placing a litany" markvonosite the number representing Frequency Tally
a measure each time it occurs.For example, in Distribution A 2 i
a measure of 3 occurs 2 times, 3so we put 2 tally marks opposite 4 la
three 3. A SCC..3 of 4 occurs 5 1
tally times, so ue put 3
marks opposite 4.
52
frequency tally
51. Since tally marks are bard to estimate at a glance,we summarize our frequency tally with a frequency table asin B. Complete the table.
Figure A Figure BFrequency Tally Frequency Table
Measure------ Measure Frequency10 1 10 1
20 a 20 2
30 al 30
4o II 40
52. A uses tally marks to
show how frequently each measure of an event occurs in our
sample.
53. A used tally marks to
show how frequently each measure of an event occurs in ourfrequency tally sample. (Duplication of frathe 52)
frequency table 54. A uses numbers instead
of tally marks to show the frequencies of such measurement.
55. Once you have a frequency table, you can, of course,quickly construct a frequency distribution such as:
Frequent TableMeasure Frequency
(Length in mm) (Number of Beans)
15 mm 2016 mm 30'17 mm 4018 mm 5019 mm 4020 mm 3021 rim, 20
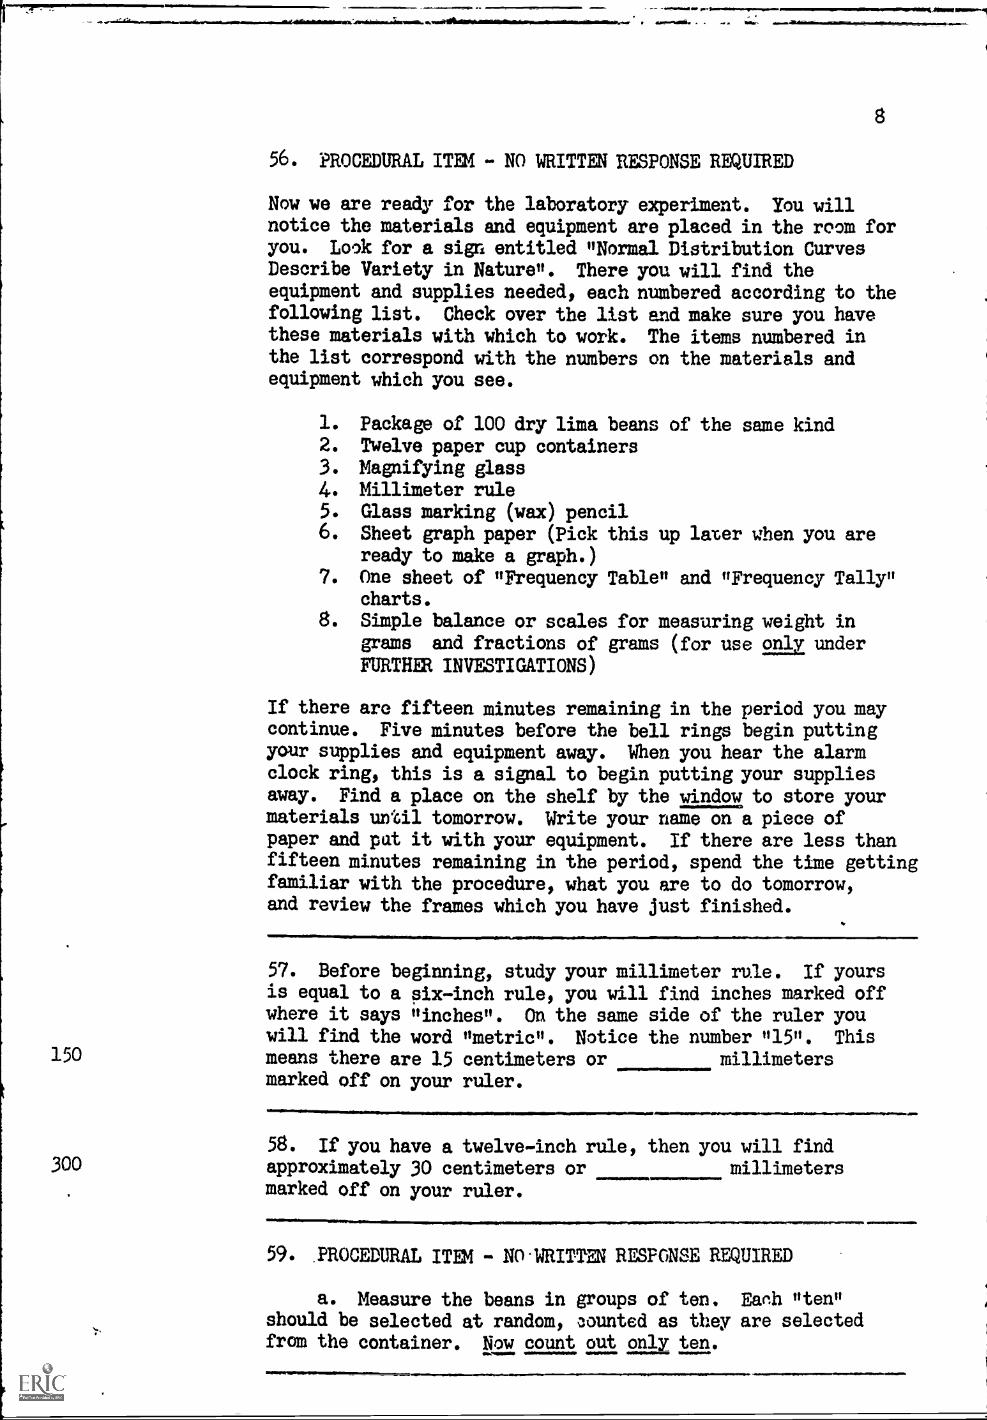
8
56. PROCEDURAL ITEM - NO WRITTEN RESPONSE REQUIRED
Now we are ready for the laboratory experiment. You willnotice the materials and equipment are placed in the room foryou. Look for a sign entitled "Normal Distribution CurvesDescribe Variety in Nature ". There you will find theequipment and supplies needed, each numbered according to thefollowing list. Check over the list and make sure you havethese materials with which to work. The items numbered inthe list correspond with the numbers on the materials andequipment which you see.
1. Package of 100 dry lima beans of the same kind2. Twelve paper cup containers3. Magnifying glass4. Millimeter rule5. Glass marking (wax) pencil6. Sheet graph paper (Pick this up later when you are
ready to make a graph.)7. One sheet of "Frequency Table" and "Frequency Tally"
charts.8. Simple balance or scales for measuring weight in
grams and fractions of grams (for use only underFURTHER INVESTIGATIONS)
If there are fifteen minutes remaining in the period you maycontinue. Five minutes before the bell rings begin puttingyour supplies and equipment away. When you hear the alarmclock ring, this is a signal to begin putting your suppliesaway. Find a place on the shelf by the window to store yourmaterials until tomorrow. Write your name o a piece ofpaper and pat it with your equipment. If there are less thanfifteen minutes remaining in the period, spend the time gettingfamiliar with the procedure, what you are to do tomorrow,and review the frames which you have just finished.
57. Before beginning, study your millimeter rule. If yoursis equal to a six-inch rule, you will find inches marked offwhere it says "inches ". On the same side of the ruler youwill find the word "metric ". Notice the number "15". This
150 means there are 15 centimeters or millimetersmarked off on your ruler.
58. If you have a twelve-inch rule, then you will find300 approximately 30 centimeters or millimeters
marked off on your ruler.
59. PROCEDURAL ITEM - NO.WRITTEN RESPONSE REQUIRED
a. Measure the beans in groups of ten. Each "ten"should be selected at random, counted as they are selectedfrom the container. Now count out only ten.
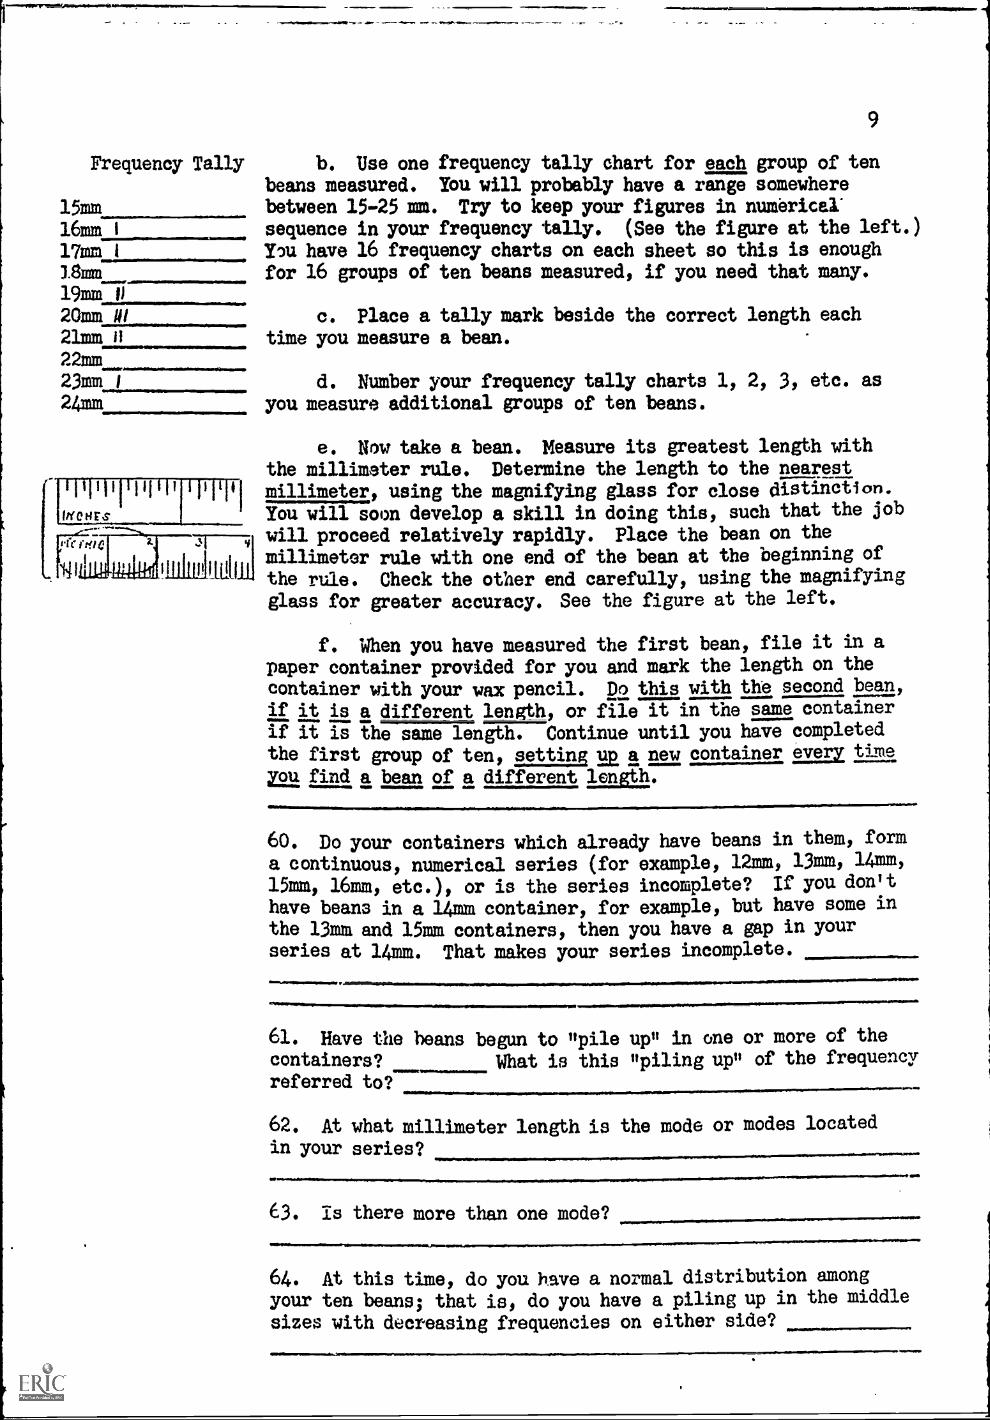
9
Frequency Tally b. Use one frequency tally chart for each group of tenbeans measured. You will probably have a range somewhere
15mm between 15 -25 mm. Try to keep your figures in numerical.
16mm I sequence in your frequency tally. (See the figure at the left.)
17mm You have 16 frequency charts on each sheet so this is enough18mm for 16 groups of ten beans measured, if you need that many.19mm20mm MI c. Place a tally mark beside the correct length each21mm 11 time you measure a bean.22mm_.23mm d. Number your frequency tally charts 1, 2, 3, etc. as24mm you measure additional groups of ten beans.
e. Now take a bean. Measure its greatest length withthe millimeter rule. Determine the length to the nearestmillimeter, using the magnifying glass for close distinction.You will soon develop a skill in doing this, such that the job
will proceed relatively rapidly. Place the bean on themillimeter rule with one end of the bean at the beginning of
/1111-14-116- the rule. Check the other end carefully, using the magnifyingglass for greater accuracy. See the figure at the left.
f. When you have measured the first bean, file it in apaper container provided for you and mark the length on the
container with your wax pencil. Do this with the second bean,
if it is a different length, or file it in the same containerif it is the same length. Continue until you have completed
the first group of ten, setting up a new container, every, time
you find a bean of a different length.
60. Do your containers which already have beans in them, form
a continuous, numerical series (for example, 12mm, 13mm, 14mm,
15mm, 16mm, etc.), or is the series incomplete? If you don't
have beans in a 14mm container, for example, but have some inthe 13mm and 15mm containers, then you have a gap in yourseries at 14mm. That makes your series incomplete.
61. Have the beans begun to "pile up" in one or more of thecontainers? What is this "piling up" of the frequency
referred to?
62. At what millimeter length is the mode or modes locatedin your series? on.mm63. Is there more than one mode?
64. At this time, do you have a normal distribution amongyour ten beans; that is, do you have a piling up in the middle
sizes with decreasing frequencies on either side?
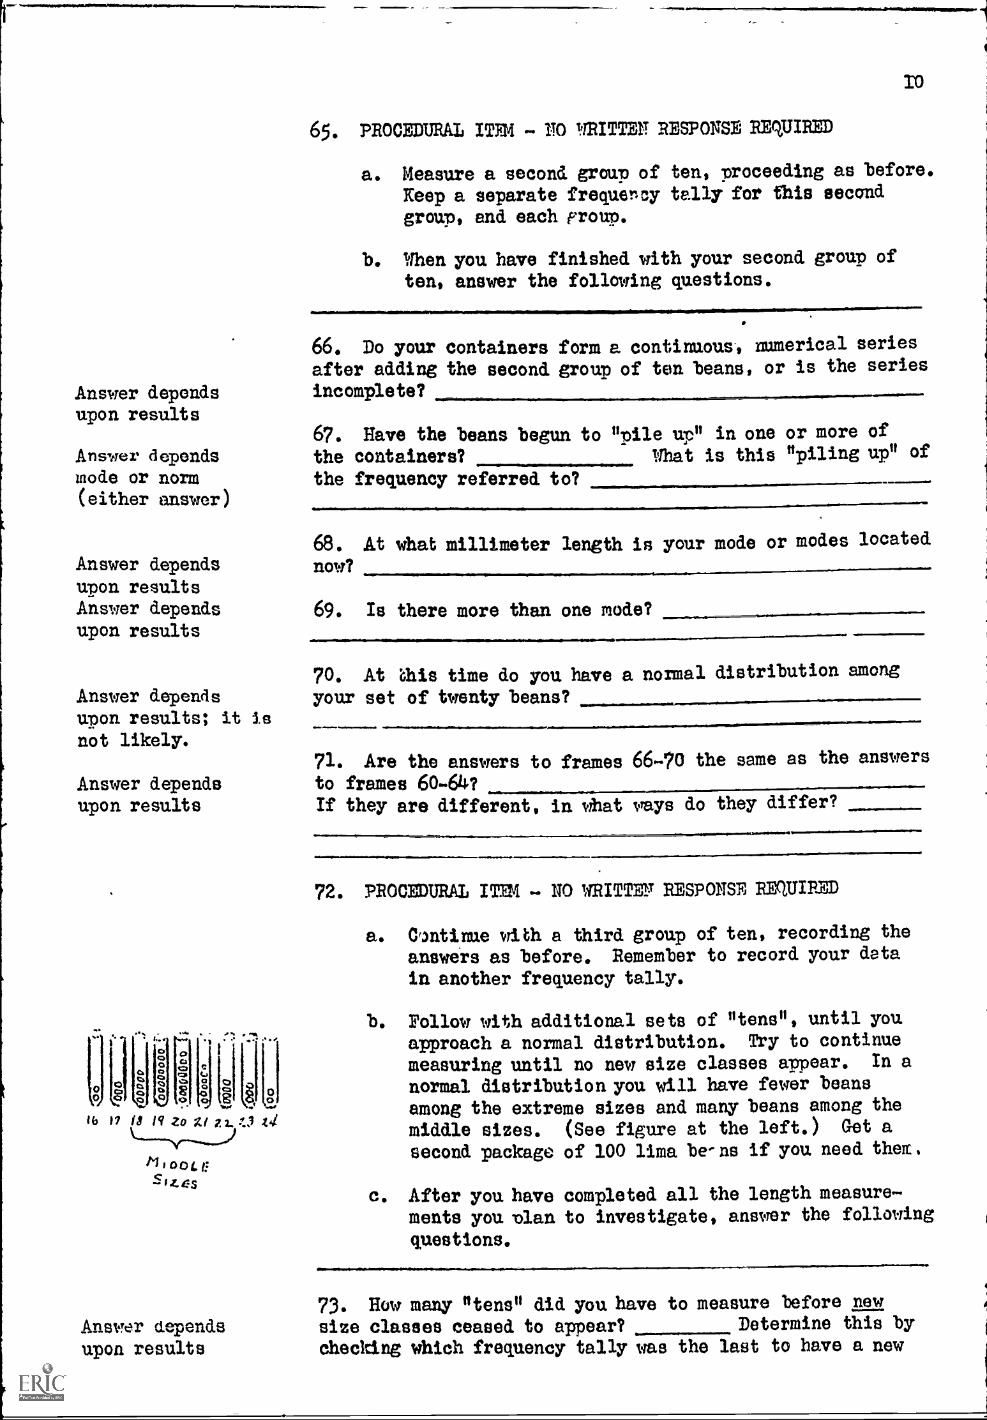
Answer dependsupon results
Answer dependsmode or norm(either answer)
Answer dependsupon resultsAnswer dependsupon results
Answer dependsupon results; it is
not likely.
Answer dependsupon results
OOOOO
0
0O
.
ifIHM 1.2oX12.2 St4
ooL6`I z. Es
Answer dependsupon results
10
65. PROCEDURAL ITEM . FO WRITTEN RESPONSE REQUIRED
a. Measure a second group of ten, proceeding as before.
Keep a separate frequency tally for this second
group, and each group.
b. When you have finished with your second group often, answer the following questions.
66. Do your containers form a continuous, numerical series
after adding the second group of ten beans, or is the series
incomplete?
67. Have the beans begun to "pile up" in one or more of
the containers? What is this "piling up" of
the frequency referred to?
68. At what millimeter length is your mode or modes located
now?
69. Is there more than one mode?
70. At this time do you have a normal distribution amongyour set of twenty beans?
71. Are the answers to frames 6670 the same as the answersto frames 60-64?If they are different, in what ways do they differ?
72. PROCEDURAL ITEM . NO WRITTEN RESPONSE REQUIRED
a. extinue with a third group of ten, recording theanswers as before. Remember to record your data
in another frequency tally.
b. Follow with additional sets of "tens", until youapproach a normal distribution. Try to continue
measuring until no new size classes appear. In a
normal distribution you will have fewer beansamong the extreme sizes and many beans among the
middle sizes. (See figure at the left.) Get a
second package of 100 lima be-ns if you need them.
c. After you have completed all the length measurements you Dian to investigate, answer the followingquestions.
010Iri.IONIMPoommg
73. How many "tens" did you have to measure before newsize classes ceased to appear? Determine this by
checking which frequency tally was the last to have a new
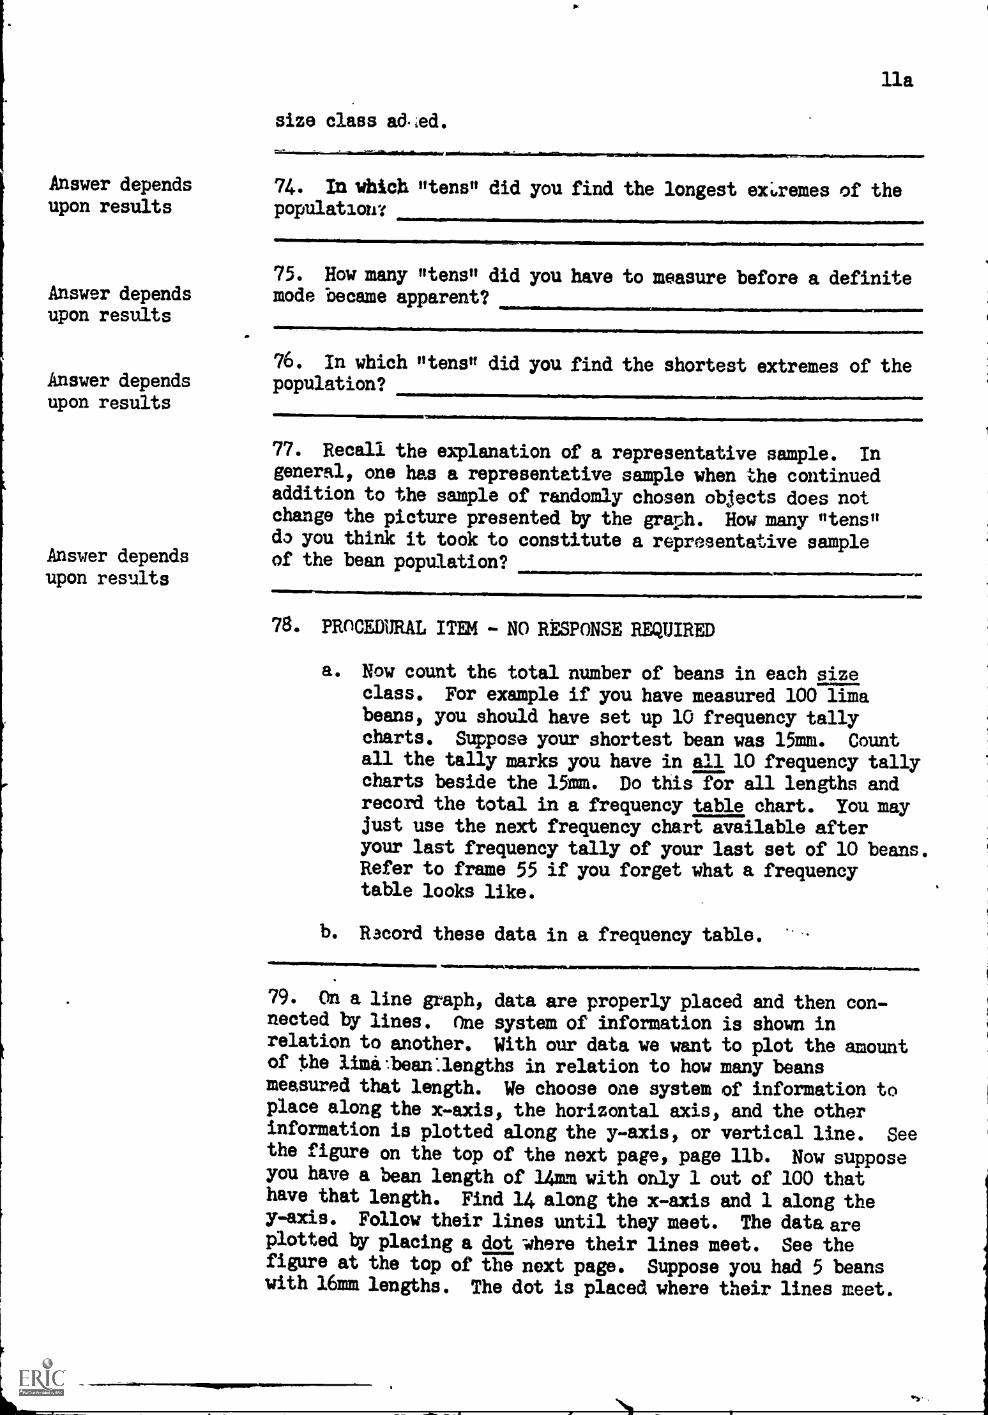
Answer dependsupon results
Answer dependsupon results
Answer dependsupon results
Answer dependsupon results
Ila
size class ad,ed.
74. In which "tens" did you find the longest extremes of thepopulation:
75. How many "tens" did you have to measure before a definitemode became apparent?
76. In which tttenstt did you find the shortest extremes of thepopulation?
77. Recall the explanation of a representative sample. Ingeneral, one has a representative sample when the continuedaddition to the sample of randomly chosen objects does notchange the picture presented by the graph. How many "tens"do you think it took to constitute a representative sampleof the bean population?
78. PROCEDURAL ITEM - NO RESPONSE REQUIRED
a. Now count th6 total number of beans in each sizeclass. For example if you have measured 100 limabeans, you should have set up 10 frequency tallycharts. Suppose your shortest bean was 15mm. Countall the tally marks you have in all 10 frequency tallycharts beside the 15mm. Do this for all lengths andrecord the total in a frequency table chart. You mayjust use the next frequency chart available afteryour last frequency tally of your last set of 10 beans.Refer to frame 55 if you forget what a frequencytable looks like.
b. R3cord these data in a frequency table.
79. On a line graph, data are properly placed and then con-nected by lines. One system of information is shown inrelation to another. With our data we want to plot the amountof the limi:beanllengths in relation to how many beansmeasured that length. We choose one system of information toplace along the x-axis, the horizontal axis, and the otherinformation is plotted along the y-axis, or vertical line. Seethe figure on the top of the next page, page lib. Now supposeyou have a bean length of 14mm with only 1 out of 100 thathave that length. Find 14 along the x-axis and 1 along they-axis. Follow their lines until they meet. The data areplotted by placing a dot where their lines meet. See thefigure at the top of the next page. Suppose you had 5 beanswith 16mm lengths. The dot is placed where their lines meet.
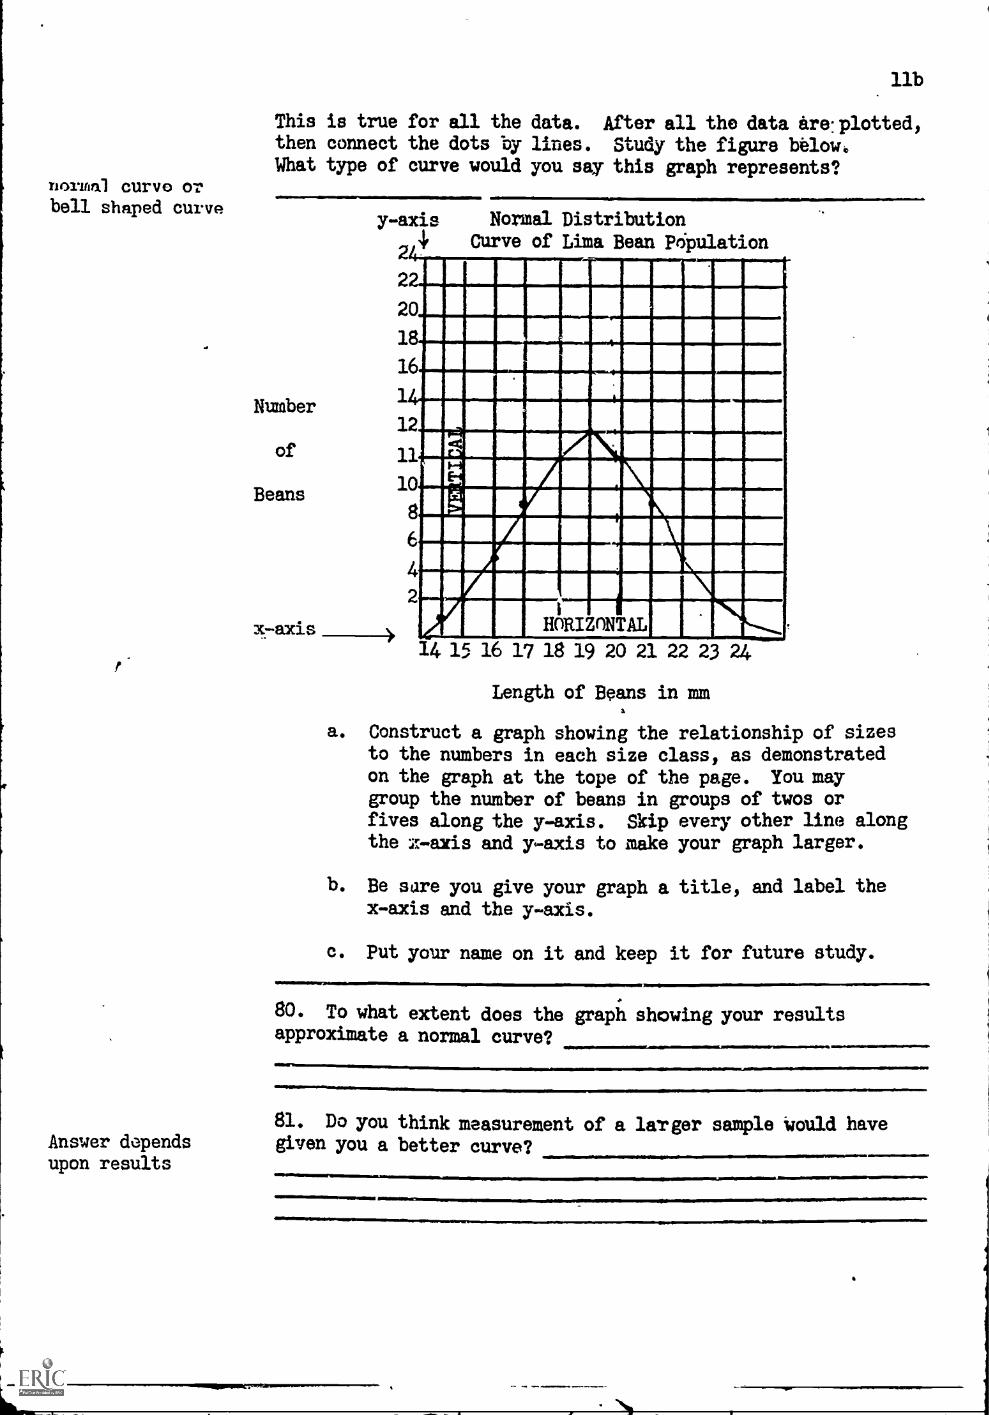
normal curve OTbell shaped curve
llb
This is true for all the data. After all the data are:plotted,then connect the dots by lines. Study the figure below.What type of curve would you say this graph represents?
Number
of
Beans
x-axis
y-axis Normal Distribution
4 Curve of Lima Bean Pdpulation
2
20
18s s S s .
16 16- k
14,
.
,
12,I
11
10
8
6
4
icc
1'.4
El AI._ t
-.
1-1'HORIZONTAL
14 15 16 17 18 19 20 21 22 23 24
Length of Beans in mma
a. Construct a graph showing the relationship of sizesto the numbers in each size class, as demonstratedon the graph at the tope of the page. You maygroup the number of beans in groups of twos orfives along the y-axis. Skip every other line alongthe z-axis and y-axis to make your graph larger.
b. Be sure you give your graph a title, and label thex-axis and the y-axis.
011101
c. Put your name on it and keep it for future study.
80. To what extent does the graph showing your resultsapproximate a normal curve?
81. Do you think measurement of a larger sample would haveAnswer depends given you a better curve?upon results
Answer dependsupon results
12
82. On the basis of your graph, do you wish to change yourconclusions concerning what you thought was the size of arepresentative sample which you measured?
83. PROCEDURAL InM - NO WRITTEN RESPONSE BEMIRED
a. Check with your teacher to see if there is timefor you to complote this section. Go to frame 97if there is not time for you to complete thissection.
b. ?pow go through this same experiment measuring thewidth of the beans instead of the length. Measurethe beans in groups of ten. If you are using thesame population of beans, and it would be best touse the same one, mix all your beans back together.Shake them well, and then draw ten at random. Ifyou have turned your beans back in, select anypackage of 100.
c. Secure two sheets of frequency tally charts, andfinish using the space left on your other frequencytable chart sheet.
d. After measuring, file the beans in containers.Proceed as you did when measuring lengths; set upa separate container for each width. Clean off theold length figure and replace it by the widthfigure, if you have not already done so.
e. After you have finished the first set of ten,answer the set of the following Questions.
84. Do your.containers form a continuous series or is theAnswer depends series incomplete?upon results
85. Have the beans begun to "pile up" in one of theAnswer depends containers?
unon results
Answer dependsupon results
Answer dependsupon results
Answer dependsupon results
86. If so, where is the mode or modes located in yourseries?
87. Is there more than one mode?
88. At this time, do you have a normal distribution amongyour first set of ten beans?
89. PROCEDURAL ITEM - NO WRITTEN RESPONSE REWIRED
a. Measure a second group of ten, proceeding as before.
Answer dependsupon results
Answer dependsupon results
Answer depends
upon results
Answer dependsupon results
Take the total
number of extremebeans, place that
number in the num-erator, and put thetotal number of beans
13
As you go elong, answer the set of questionsmentally about each of the remaining sets of tens.
b. After you ba completed all the width measurzmentsyou plan te i4vestigate, answer the followingquestions.
90. How many "tens" did you have to measure before newsize classes ceased to appear?
91. How many "tens" did you have to Measure before adefinite mode.became apparent?
92. In which "tens" did you find the longest extremes ofthe population?
93. In which "tens" did you find the shortest extremes of
the population?
94. How probable do you think it would be to pull a singlebeen at random from the population which would be representa-tive of one of these extremes?
in your population in 95. How many "tens" do you think it took to constitute athe denominator. representative sample of the bean population?Reduce the fraction.
96. PROCEDURAL ITEM - NO WRITTEN RESPONSE REWIRED
a. Now count the total number of beans in each size
class.
b. Record this information in a frequency table. Use
these figures on your graph.
C. Construct a graph showing the relationship of sizes
to the numbers in each size class.
de Be sure you label the xp-axis end the y-axis.
e. Give your graph a title.
f. Put your name on it and keep it for future study.
97 Try to answer how you think normal curves and gradients
There is a gradual . might be related.increase up to themode and then agradual decreasefrom the mode.
0.1=.11.11111."
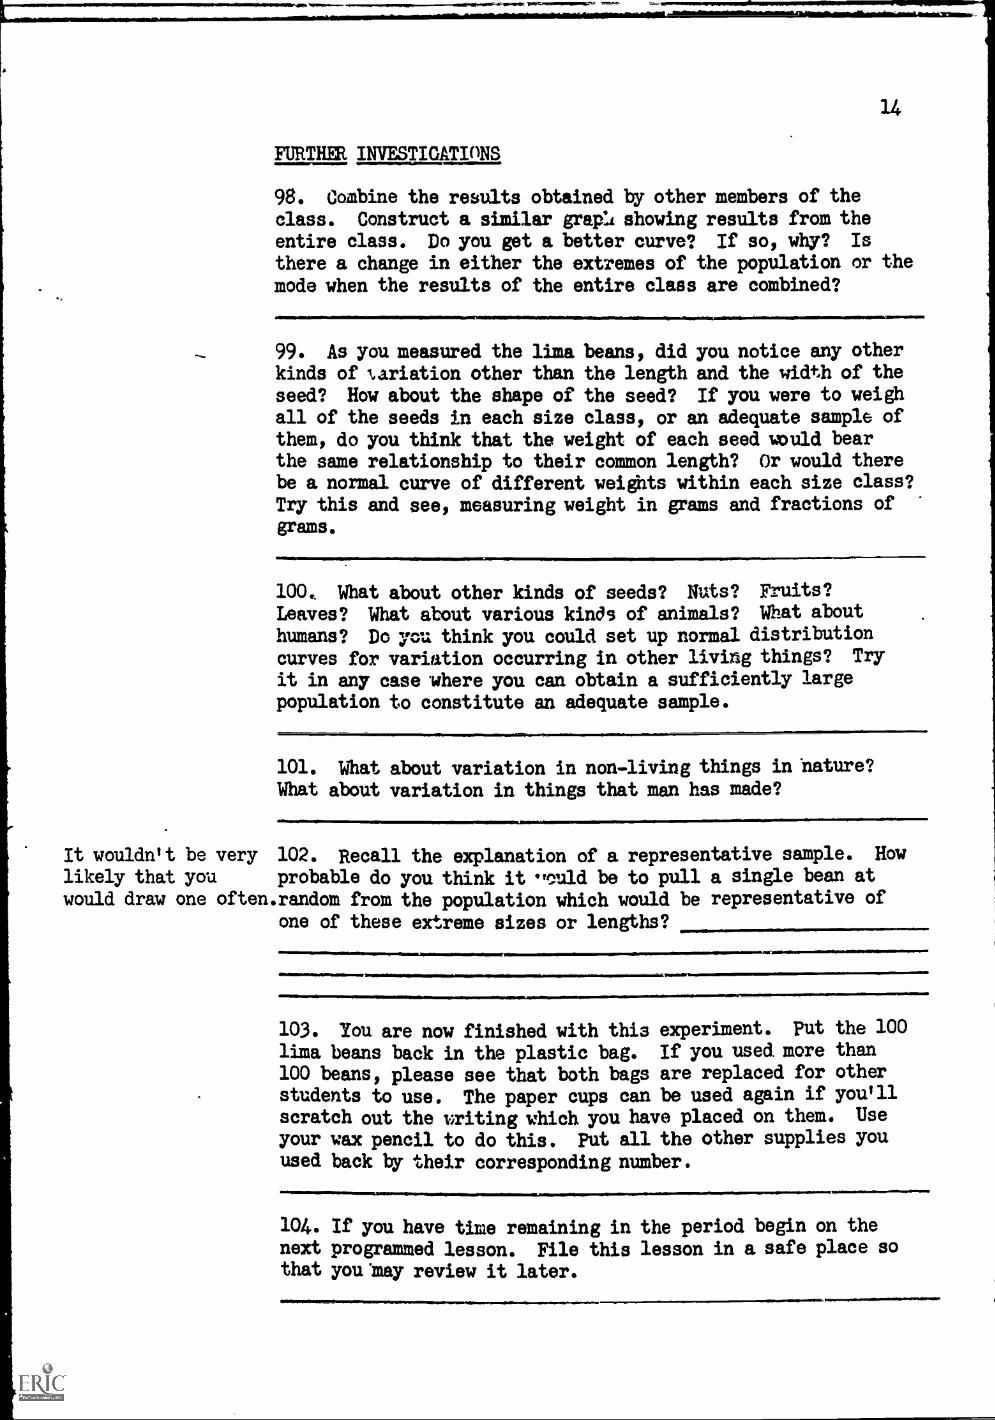
14
FURTHER. INVESTIGATIONS
98. Combine the results obtained by other members of theclass. Construct a similar grapli showing results from theentire class. Do you get a better curve? If so, why? Is
there a change in either the extremes of the population or themode when the results of the entire class are combined?
99. As you measured the lima beans, did you notice any otherkinds of 1ariation other than the length and the width of theseed? How about the shape of the seed? If you were to weigh
all of the seeds In each size class, or an adequate sample ofthem, do you think that the weight of each seed would bearthe same relationship to their common length? Or would therebe a normal curve of different weights within each size class?Try this and see, measuring weight in grams and fractions ofgrams.
100, What about other kinds of seeds? Nuts? Fruits?
Leaves? What about various kinds of animals? What about
humans? Do you think you could set up normal distributioncurves for variation occurring in other living things? Try
it in any case where you can obtain a sufficiently largepopulation to constitute an adequate sample.
101. What about variation in non-living things in nature?What about variation in things that man has made?
It wouldn't be very 102. Recall the explanation of a representative sample. How
likely that you probable do you think it .Irgild be to pull a single bean atwould draw one often.random from the population which would be representative of
one of these extreme sizes or lengths?
4111111.
103. You are now finished with this experiment. Put the 100
lima beans back in the plastic bag. If you used more than
100 beans, please see that both bags are replaced for other
students to use. The paper cups can be used again if you'llscratch out the liriting which you have placed on them. Use
your wax pencil to do this. Put all the other supplies you
used back by their corresponding number.
104. If you have time remaining in the period begin on thenext programmed lesson. File this lesson in a safe place sothat youbay review it later.
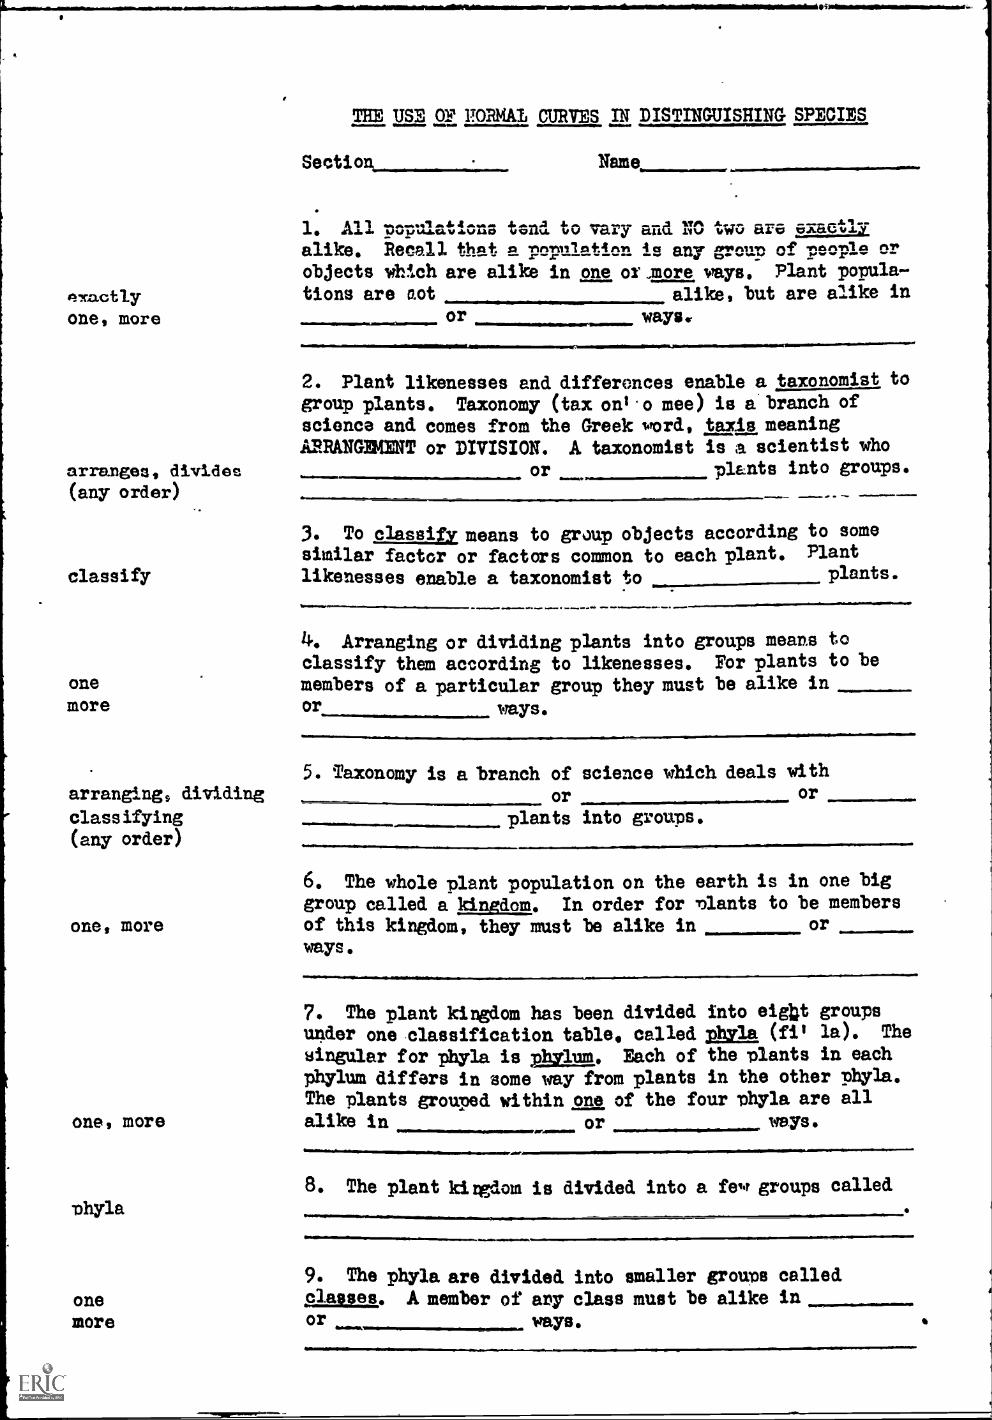
THE USE OF FORMAI CURVES IN DISTINGUISHING SPECIES
Section Name
1. All pozulatione tend to vary and NO two are exaetlYalike. Recall that a pmpi7int4on is any groin) of people or
objects which are alike in one or.,more ways. Plant popula
st.xactly tions are aot alike, but are alike in
one, more or ways..
arranges, divideci
(any order)
classify
one
more
2. Plant likenesses and differences enable a taxonomist togroup plants. Taxonomy (tax onl.o mee) is a branch ofscience and comes from the Greek word, taxis meaningARRANGEMENT or DIVISION. A taxonomist is a scientist who
or plants into groups.
3. To classify means to group objects according to somesimilar factor or factors common to each plant. Plant
likenesses enable a taxonomist to plants.
4. Arranging or dividing plants into groups means toclassify them according to likenesses. For plants to be
members of a particular group they must be alike inor ways.
5. Taxonomy is a branch of science which deals witharranging, dividing or or
classifying plants into groups.(any order)
one, more
one, more
-phyla
6. The whole plant population on the earth is in one biggroup called a kingdom. In order for -plants to be members
of this kingdom, they must be alike in or
ways.
7. The plant kingdom has been divided into eight groupsunder one classification table, called Phyla (fit la). The
singular for phyla is phylum. Each of the plants in eachphylum differs in some way from plants in the other phyla.The plants grouped within one of the four phyla are allalike in or ways.
8. The plant kirgdom is divided into a few groups called
9. The phyla are divided into smaller groups called
one classes. A member of arty class must be alike in
more or ways.
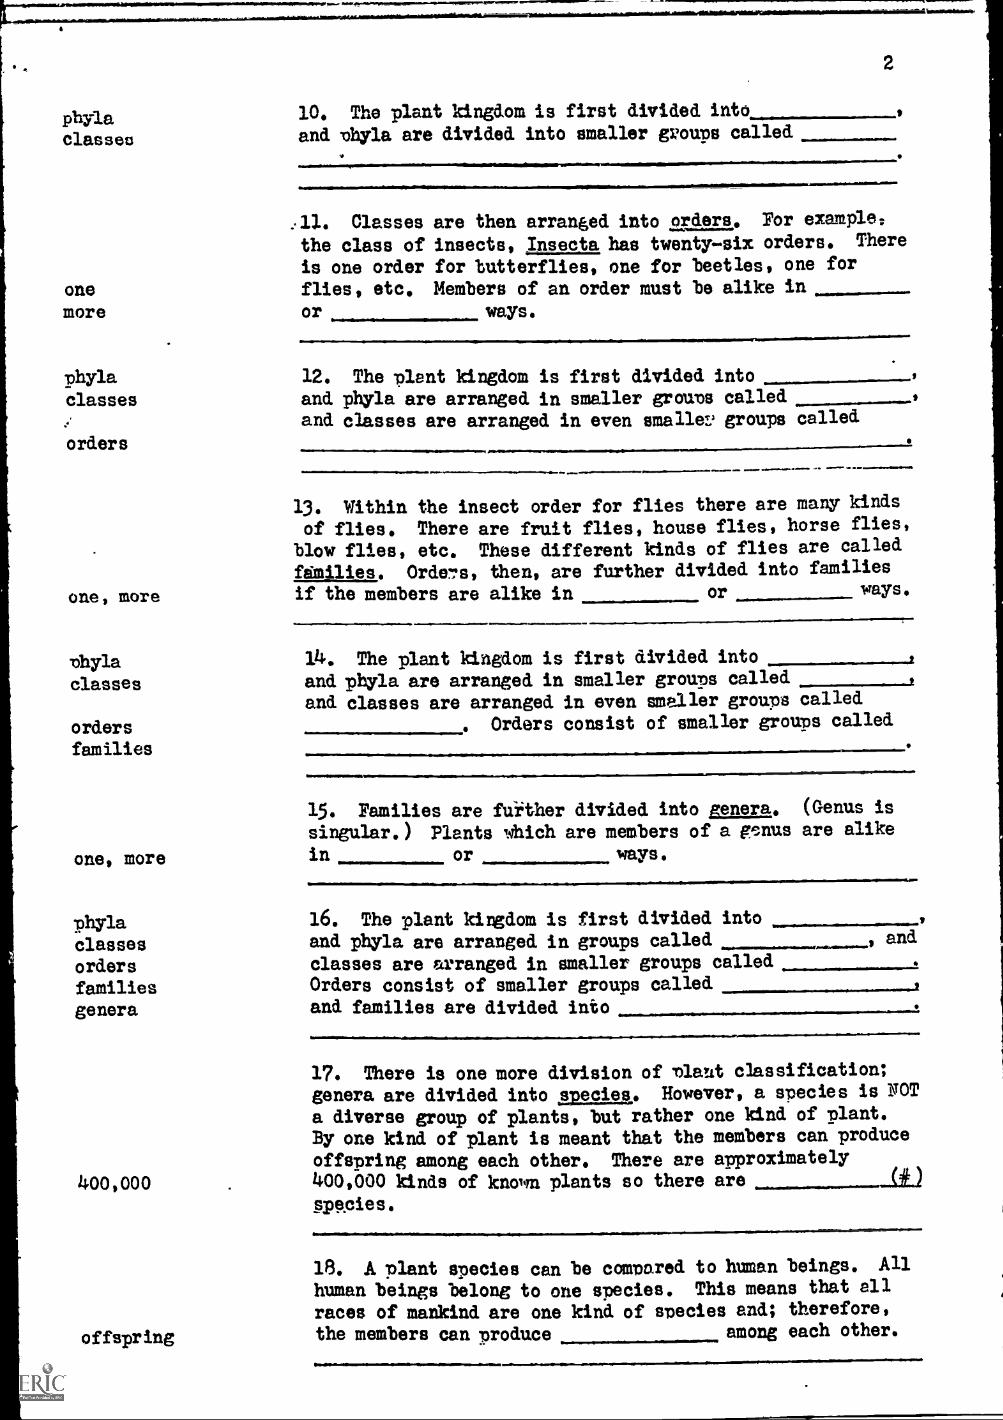
phylaClasses
2
10. The plant kingdom is first divided into
and phyla are divided into smaller groups called
.01111
:11. Classes are then arranged into orders. For example;
the class of insects, Insecta has twentysix orders. There
is one order for butterflies, one for beetles, one for
one flies, etc. Members of an order must be alike in
more or ways.
phylaclasses
orders
one, more
phylaclasses
orders
families
one, more
12. The plant kingdom is first divided intoand phyla are arranged in smaller groups called 9
and classes are arranged in even smallev groups called
13. Within the insect order for flies there are many kinds
of flies. There are fruit flies, house flies, horse flies,
blow flies, etc. These different kinds of flies are called
families. Orde77s, then, are further divided into families
if the members are alike in or ways.
14. The plant kingdom is first divided intoand phyla are arranged in smaller groups calledand classes are arranged in even smaller groups called
. Orders consist of smaller groups called
15. Families are fuither divided into genera. (Genus is
singular.) Plants which are members of a genus are alike
in or, ways.
phyla 16. The plant kingdom is first divided into
classes and phyla are arranged in groups called ., and
orders classes are arranged in smaller groups called
families Orders consist of smaller groups called
genera and families are divided into
400,000
offspring
17. There is one more division of plant classification;genera are divided into species.. However, a species is NOT
a diverse group of plants, but rather one kind of plant.
By one kind of plant is meant that the members can produceoffspring among each other. There are approximately400,000 kinds of known plants so there are (P)
18. A plant species can be compared to human beings. All
human beings belong to one species. This means that all
races of mankind are one kind of species and; therefore,
the members can produce among each other.
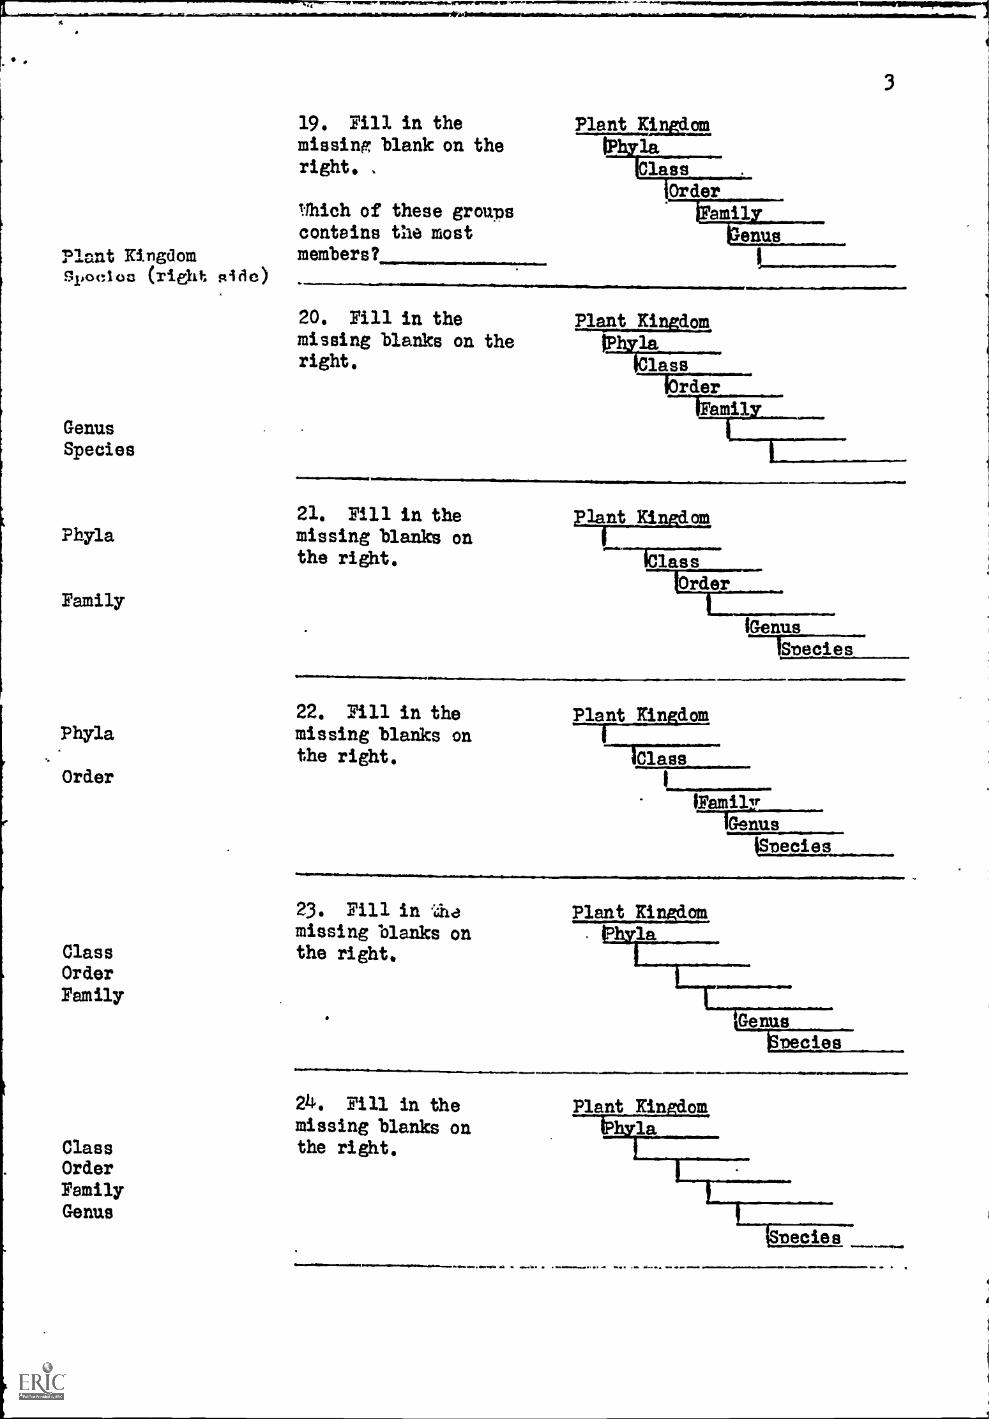
19. Fill in the Plant Kiwismissing blank on the laright. . Class
Orderlihich of these groups samilcontains the most anus
Plant Kingdom members?Spoolou (right side)
GenusSpecies
20. Fill in the Plant Kingdommissing blanks on the
111*aright. Mass
lOrder
bilamqy
21. Fill in thePhyla missing blanks on
the right.
Family
Phyla
Order
Plant Kingdomant
--E1137----1Order _
iGenus
1S-oecies
22. Fill in the Plant Kingdommissing blanks on 1
the right. Class
1Genus
....ma.0.1.1111...a.mar..I
23. Pill in diamissing blanks on
Class the right.OrderFamily
121. ant Kingdomla
GenusDecies
24. Fill in themissing blanks on
Class the right.OrderFamilyGenus
Plant Kingdomla
Decies
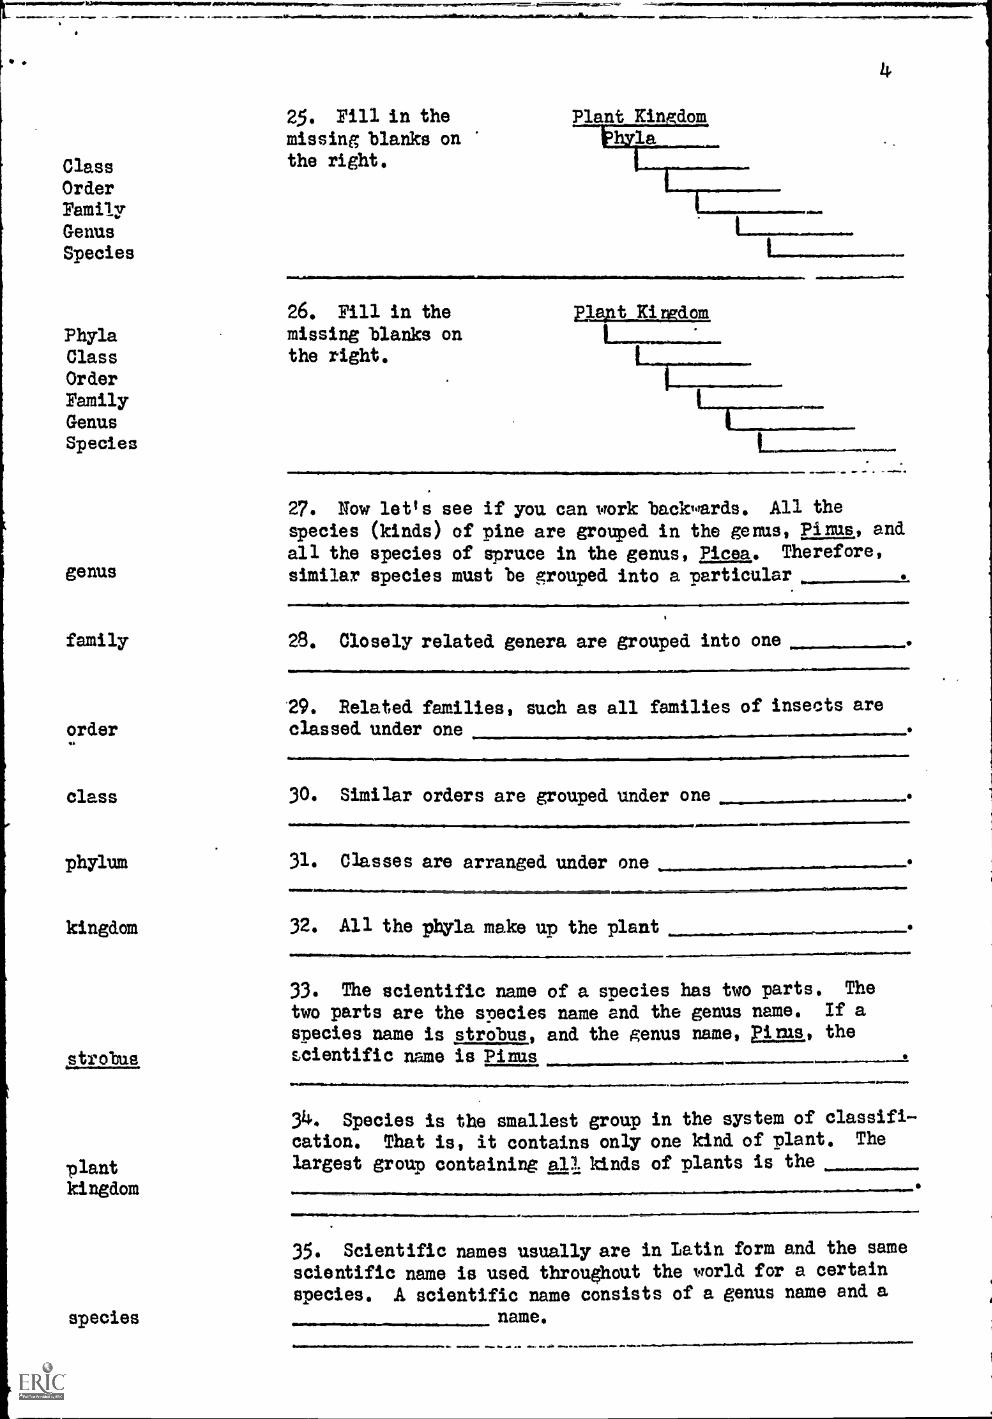
ClassOrderFamilyGenusSpecies
25. Fill in themissing blanks onthe right.
4
Plant Kin dom
26. Fill in the
Phyla missing blanks onClass the right.
OrderFamilyGenusSpecies
genus
family
order
class
phylum
kingdom
strobus
plantkingdom
species
naltilin121
L
27. Now let's see if you can work backwards. All the
species (kinds) of pine are grouped in the genus, Pinus, and
all the species of spruce in the genus, Picea. Therefore,
similar species must be grouped into a particular
28. Closely related genera are grouped into one
29. Related families, such as all families of insects areclassed under one
30. Similar orders are grouped under one ---/31. Classes are arranged under one
32. All the phyla make up the plant
33. The scientific name of a species has two parts. The
two parts are the species name and the genus name. If a
species name is strobus, and the genus name, Pirus, thescientific name is Pinus
34. Species is the smallest group in the system of classifi-cation. That is, it contains only one kind of plant. The
largest group containing all kinds of plants is the
all=1.M.111111, 1.11.1 0111
35. Scientific names usually are in Latin form and the same
scientific name is used throughout the world for a certainspecies. A scientific name consists of a genus name and a
name.
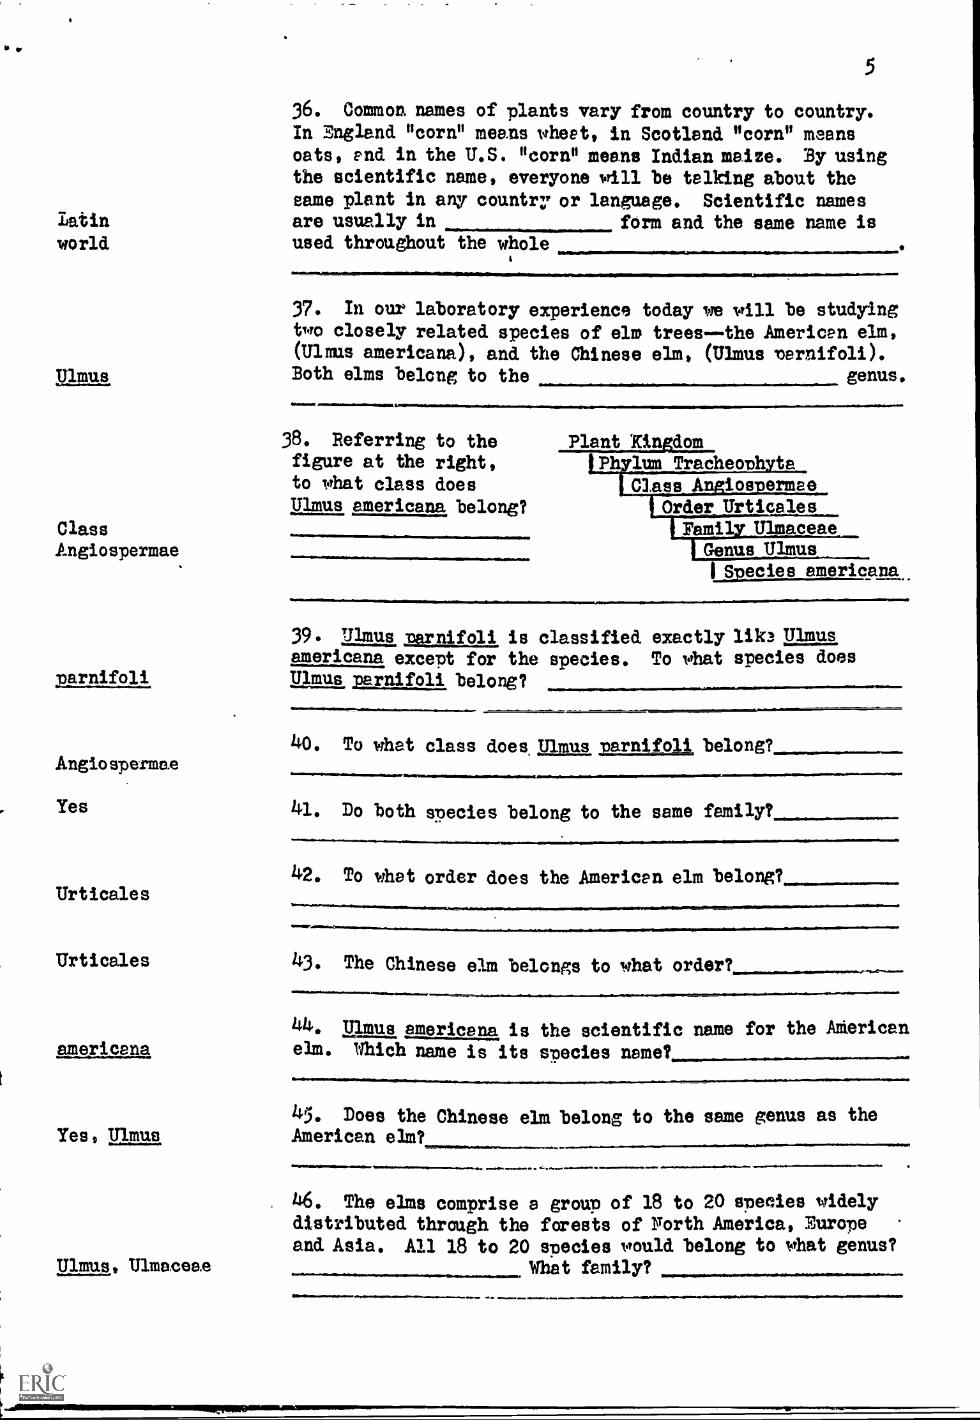
5
36. Common names of plants vary from country to country.
In England "corn" means wheet, in Scotland "corn" meansoats, end in the U.S. "corn" means Indian maize. By usingthe scientific name, everyone will be talking about thesame plant in any country or language, Scientific namesare usually in form and the same name isused throughout the whole
37. In our laboratory experience today we will be studying
two closely related species of elm treesthe American elm,(Ulnas americana), and the Chinese elm, (Ulmus pernifoli).Both elms belong to the genus.
38. Referring to thefigure at the right,to what class doesUlmus americana belong?
Plant KingdomPhylum Tracheoph to
Class A ios ermeeOrder UrticalesFamil Ulmaceae
Genus Ulmus
I Species americana
39. Ulmus oarnifoli is classified exactly lik3 Ulmusamericana except for the species. To what species doesUlmus narnifoli belong?
40. To what class does, Ulmus parnifoli belong?
41. Do both species belong to the same family?
42. To whet order does the Americen elm belong?
43. The Chinese elm belongs to what order? 411.+0
44. Ulmus americana is the scientific name for the Adericanelm. Which name is its snecies name?4145. Does the Chinese elm belong to the same genus as theAmerican elm?
46. The elms comprise a group of 18 to 20 species widelydistributed through the forests of Worth America, Europeand Asia. All 18 to 20 species would belong to what genus?
What family?
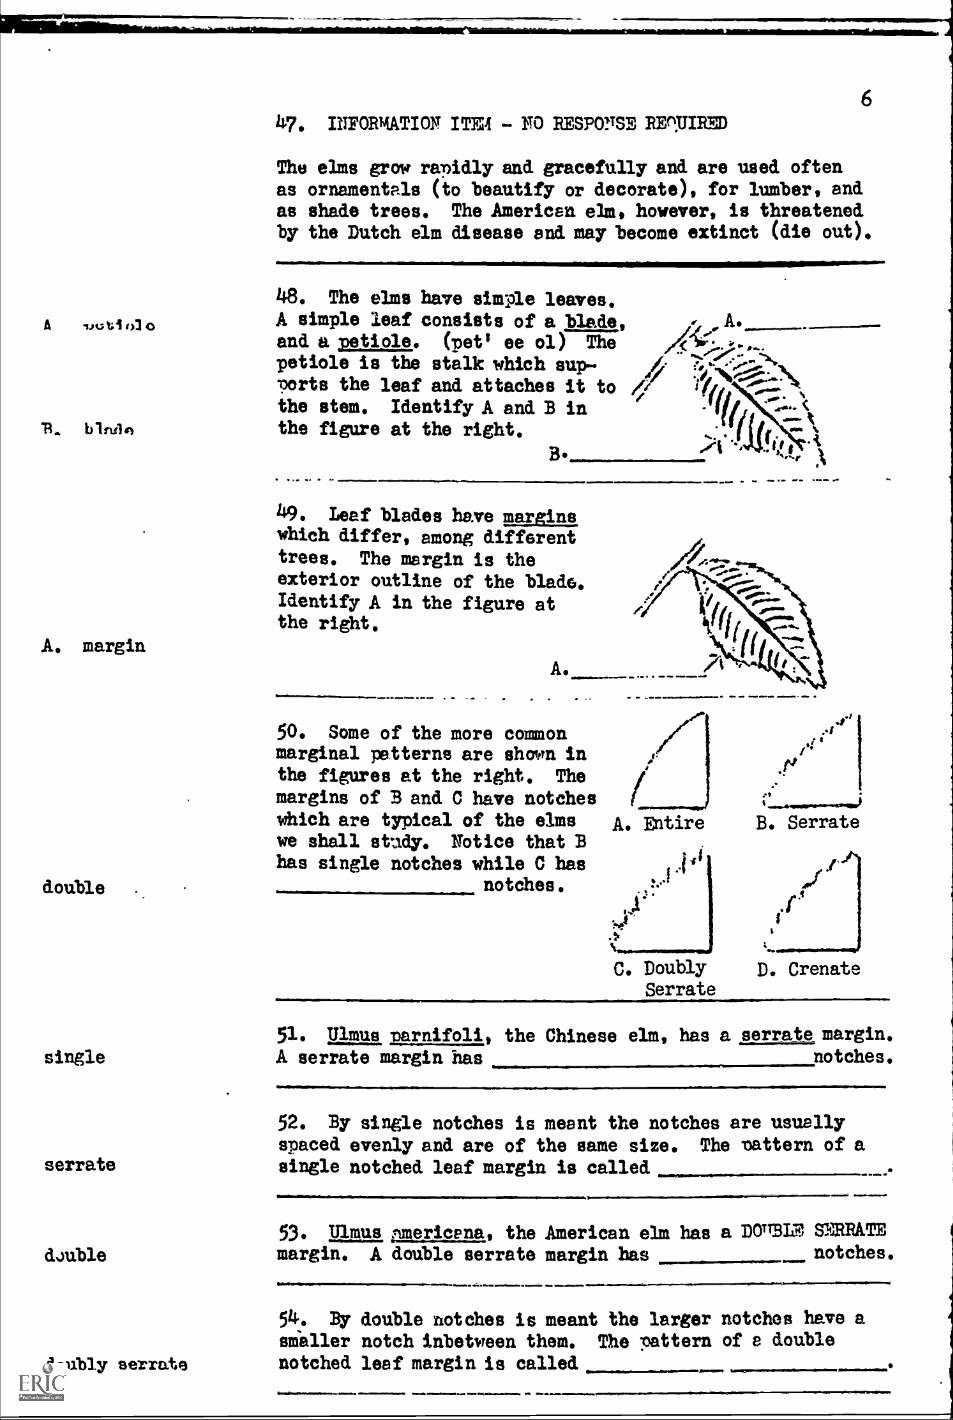
11. b1m1n
A. margin
double
single
serrate
double
doubly serrate
647. INFORMATION ITFA1 - NO RESPOSE RETIRE)
The elms grow rapidly and gracefully and are used oftenas ornamentals (to beautify or decorate), for lumber, andas shade trees. The American elm, however, is threatenedby the Dutch elm disease and may become extinct (die out).
48. The elms have simple leaves.A simple leaf consists of a blade,and a petiole. (pet' ee ol) Thepetiole is the stalk which sup- A#ports the leaf and attaches it tothe stem. Identify A and B inthe figure at the right.
A
it
B. )1. '04%4! I
49. Leaf blades have marginswhich differ, among differenttrees. The margin is theexterior outline of the blade.Identify A in the figure atthe right.
A.
50. Some of the more commonmarginal patterns are shown inthe figures at the right.. The
margins of B and C have notcheswhich are typical of the elmswe shall stady. Notice that Bhas single notches while C has
notches.
/41/14._,.4w-1"LN
.00°' .
A. Entire
C. DoublySerrate
D. Crenate
51. Ulmus parnifoli, the Chinese elm, has a serrate margin.A serrate margin has notches.
52. By single notches is meant the notches are usually
spaced evenly and are of the same size. The oattern of a
single notched leaf margin is called
53. Ulmus nmericana, the American elm has a DOTTBLE SERRATEmargin. A double serrate margin has notches.
54. By double notches is meant the larger notches have asmaller notch inbetween them. The pattern of e doublenotched leaf margin is called,
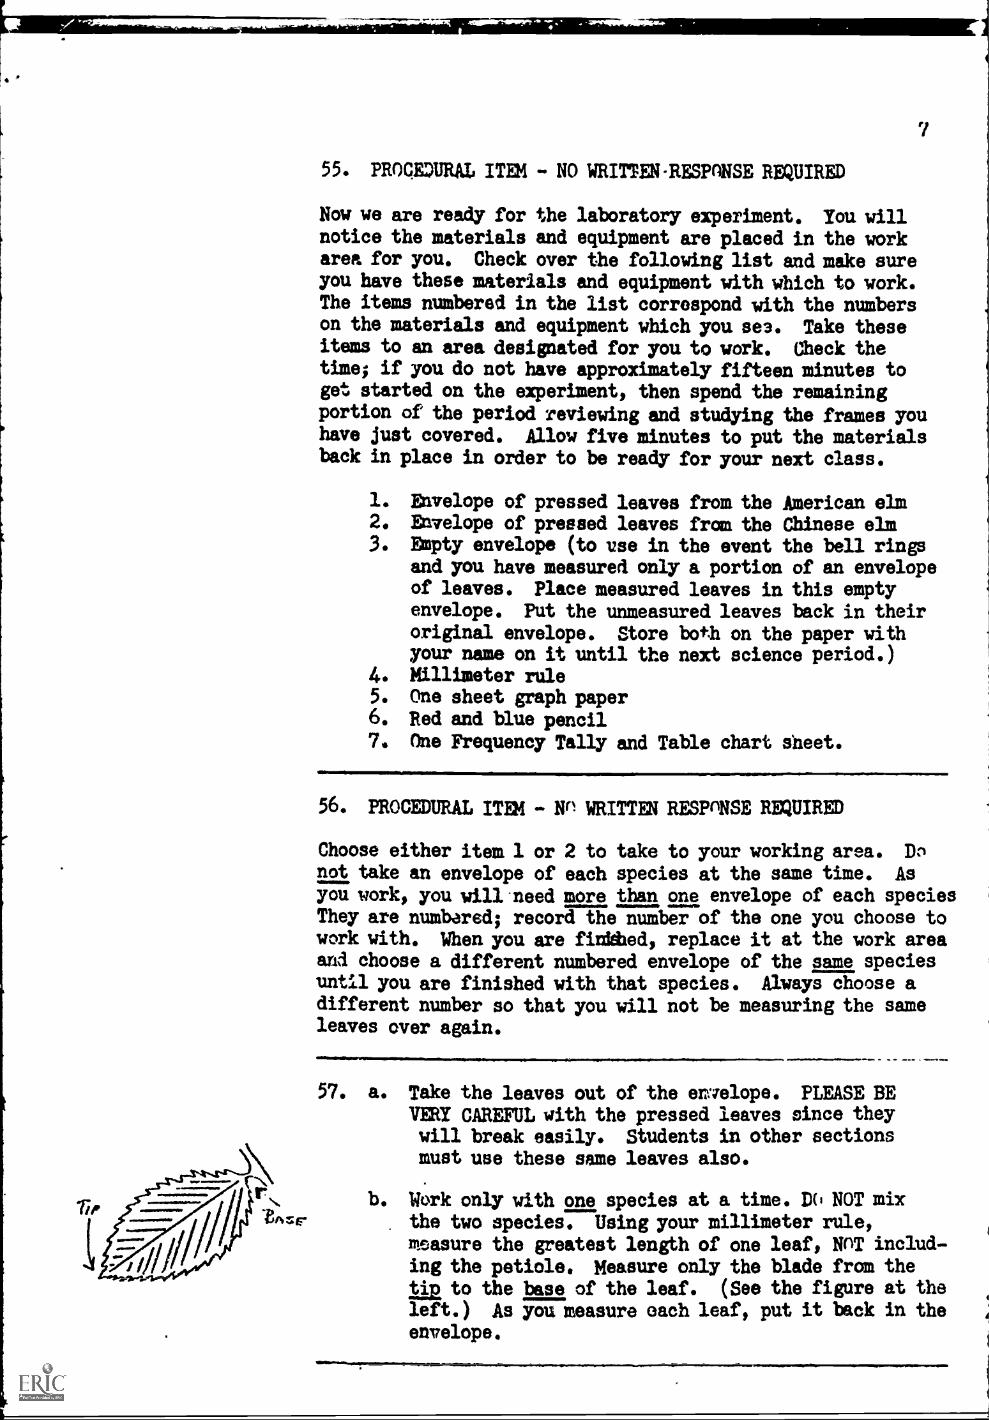
lie
Nb. Work only with one species at a time. DO NOT mix
TA.sr the two species. Using your millimeter rule,measure the greatest length of one leaf, NOT includ-ing the petiole. Measure only the blade from thetin to the base of the leaf. (See the figure at theleft.) As you measure each leaf, put it back in theenvelope.
vell1111111^,111141111,P1. ;;.
7
55. PROCEDURAL ITEM - NO WRITTEN-RESPnNSE REQUIRED
Now we are ready for the laboratory experiment. You willnotice the materials and equipment are placed in the workarea for you. Check over the following list and make sureyou have these materials and equipment with which to work.The items numbered in the list correspond with the numberson the materials and equipment which you see. Take theseitems to an area designated for you to work. Check thetime; if you do not have approximately fifteen minutes toget started on the experiment, then spend the remaining
portion of the period reviewing and studying the frames youhave just covered. Allow five minutes to put the materialsback in place in order to be ready for your next class.
1. Envelope of pressed leaves from the American elm2. Envelope of pressed leaves from the Chinese elm3. Empty envelope (to use in the event the bell rings
and you have measured only a portion of an envelopeof leaves. Place measured leaves in this emptyenvelope. Put the unmeasured leaves back in theiroriginal envelope. Store both on the paper withyour name on it until the next science period.)
4. Millimeter rule5. One sheet graph paper6. Red and blue pencil7. One Frequency Tally and Table chart sheet.
56. PROCEDURAL ITEM - No WRITTEN RESPONSE REQUIRED
Choose either item 1 or 2 to take to your working area. Dcnot take an envelope of each species at the same time. As
you work, you will need more than one envelope of each speciesThey are numbered, record the number of the one you choose towork with. When you are finiehed, replace it at the work areaand choose a different numbered envelope of the same speciesuntil you are finished with that species. Always choose adifferent number so that you will not be measuring the sameleaves over again.
57. a. Take the leaves out of the envelope. PLEASE BEVERY CAREFUL with the pressed leaves since theywill break easily. Students in other sectionsmust use these same leaves also.
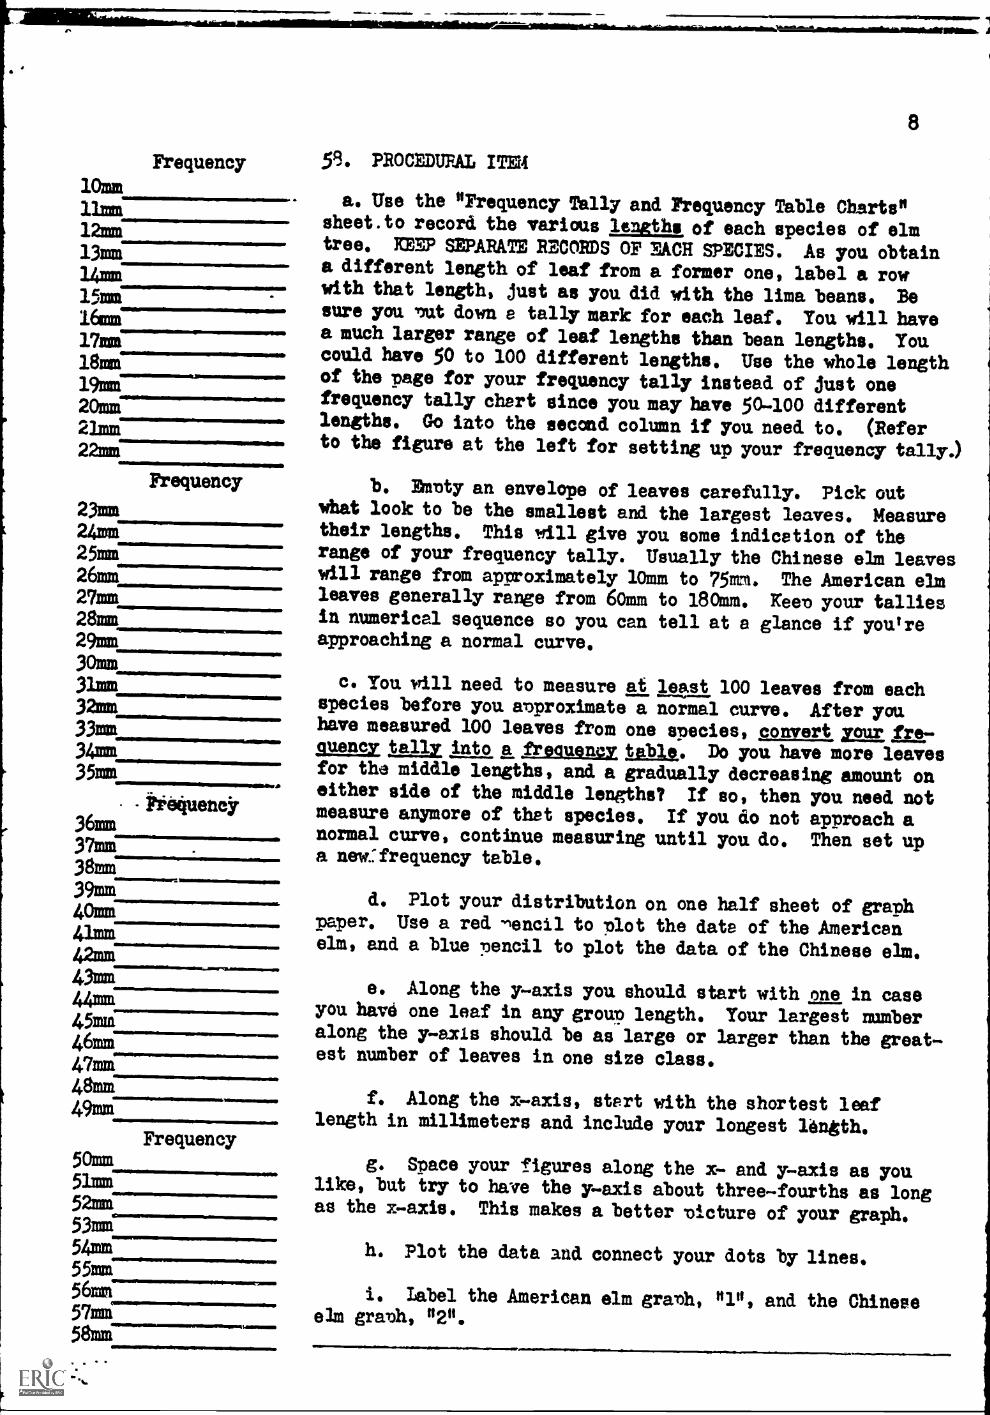
10mm11mm12mm13mm14m15mm16mm17mm18mm19mm20mm21mm22mm
Frequency
23mm24mm25mm26mm27mm28mm29mm30mm31mm32mm33mm34=35mm
it;Oquener
Frequency
36mm
37mm38mm
39mm40mm41mm
42mm43mm44mm45mm46mm47mm48mm
49mm
Frequency50mm51mm52mm53mmc
55na56m57m58mm
.41.1MMIlmmtwmis
1.11111111111
8
53. PROCEDURAL ITEM
a. Use the "Frequency Tally and Frequency Table Charts"sheet. to record the various lengths, of each species of elmtree, KEEP SEPARATE RECORDS OF EACH SPECIES. As you obtaina different length of leaf from a former one, label a rowwith that length, just as you did with the lima beans. Besure you nut down a tally mark for each leaf. You will havea much larger range of leaf lengths than bean lengths. Youcould have 50 to 100 different lengths. Use the whole lengthof the rage for your frequency tally instead of just onefrequency tally chart since you may have 50-100 differentlengths. Go into the second column if you need to. (Referto the figure at the left for setting up your frequency tally.)
b. Batty an envelope of leaves carefully. Pick outwhat look to be the smallest and the largest leaves. Measuretheir lengths. This will give you some indication of therange of your frequency tally. Usually the Chinese elm leaveswill range from approximately 10mm to 75mm. The American elmleaves generally range from 60mm to 180mm. Keep your talliesin numerical sequence so you can tell at a glance if you'reapproaching a normal curve.
c. You will need to measure at least 100 leaves from eachspecies before you approximate a normal curve. After youhave measured 100 leaves from one species, convert zaLro fre-guano: tally into a frequency table,. Do you have more leavesfor the middle lengths, and a gradually decreasing amount oneither side of the middle lengths? If so, then you need notmeasure anymore of that species. If you do not approach anormal curve, continue measuring until you do. Then set upa new:frequency table.
d. Plot your distribution on one half sheet of graphpaper. Use a red nencil to plot the date of the Americanelm, and a blue pencil to plot the data of the Chinese elm.
e. Along the y-axis you should start with one in caseyou have one leaf in any group length. Your largest numberalong the y-axis should be as large or larger than the great-est number of leaves in one size class.
f. Along the x-axis, start with the shortest leaflength in millimeters and include your longest length.
g. Space your figures along the x- and y-axis as youlike, but try to have the y-axis about three-fourths as longas the x-axis. This makes a better picture of your graph.
h. Plot the data and connect your dots by lines,
i. Label the American elm graph, "1", and the Chineseelm graph, "2".
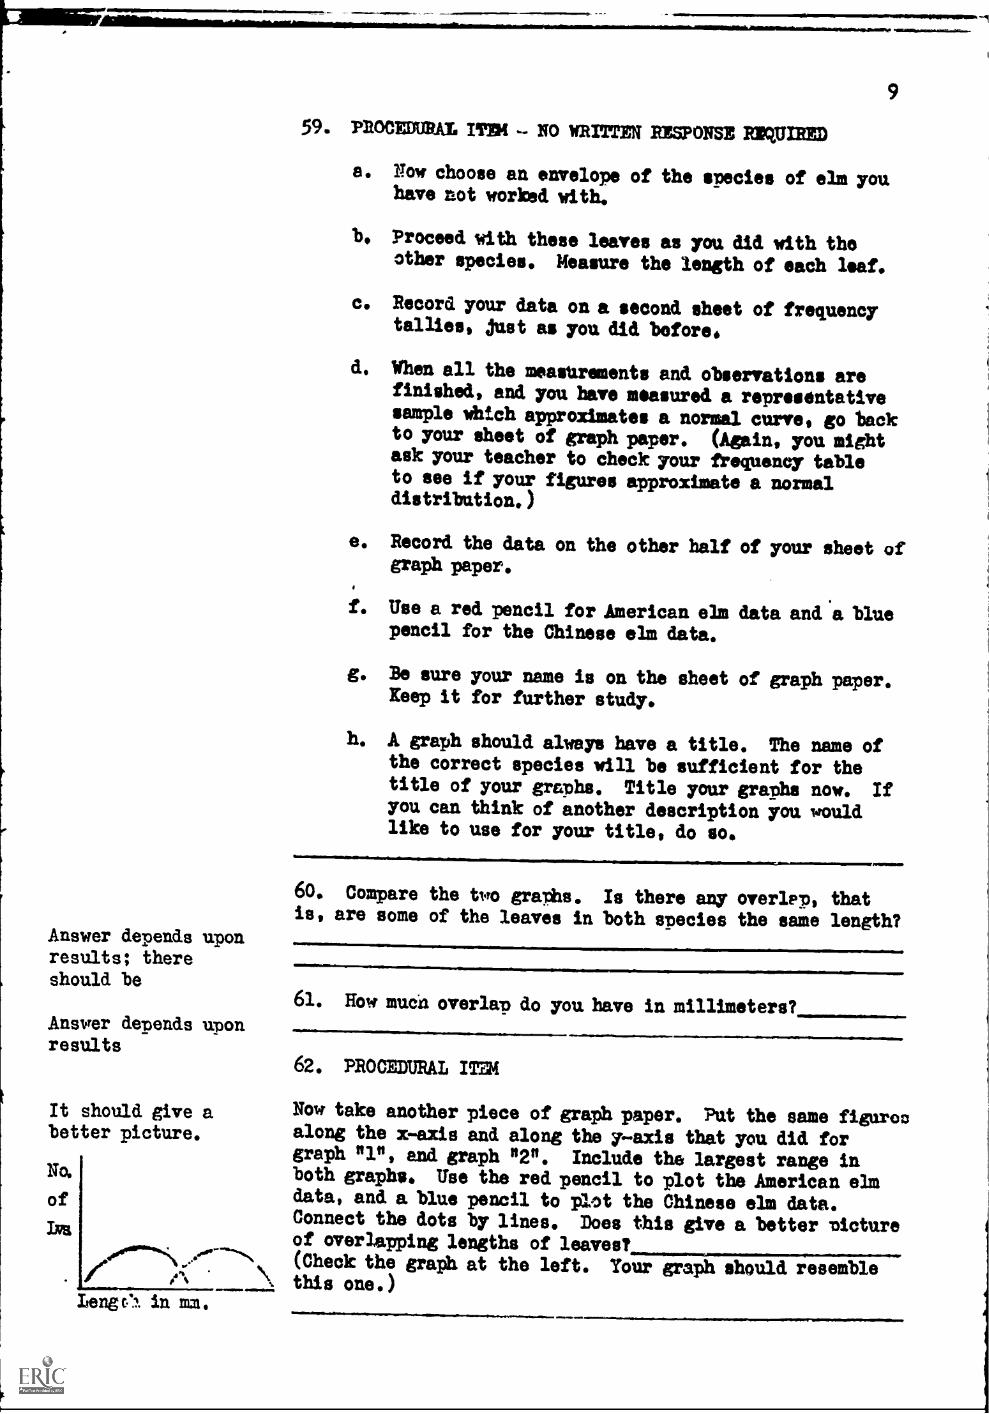
Answer depends uponresults; thereshould be
Answer depends uponresults
It should give abetter picture.
No.
of
Fast
#:
Lange. in mm.
59. PROCEDURAL Ina( NO WRITTEN RESPONSE REQUIRED
a. Now choose an envelope of the stecies of elm youhave not worked with.
b. Proceed with these leaves as you did with theother species. Measure the length of each leaf.
c. Record your data on a second sheet of frequencytallies, just as you did before.
d. When all the meastirements and observations arefinished, and you have measured a representativesample which approximates a normal curve, go backto your sheet of graph paper. (Again, you mightask your teacher to check your frequency tableto see if your figures approximate a normaldistribution.)
e. Record the data on the other half of your sheet ofgraph paper.
f. Use a red pencil for American elm data and a bluepencil for the Chinese elm data.
g. Be sure your name is on the sheet of graph paper.Keep it for further study.
h. A graph should always have a title. The name ofthe correct species will be sufficient for thetitle of your graphs. Title your graphs now. Ifyou can think of another description you wouldlike to use for your title, do so.
1,60. Compare the two graths. Is there any overlap, thatis, are some of the leaves in both species the same length?
61. How much overlap do you have in millimeters?,
62. PROCEDURAL ITEM
Now take another piece of graph paper. Put the same figurooalong the x-exis and along the 7axis that you did forgraph "1", and graph "2". Include the largest range inboth graphs. Use the red pencil to plot the American elmdata, and a blue pencil to plot the Chinese elm data.Connect the dots by lines. Does this give a better tictureof overlapping lengths of leaves?(Check the graph at the left. Your graph should resemblethis one.)
Answer will dependupon results
Answer will dependupon results
Answer will AO.LAIIA
upon ruonits
Answer depends
upon results
Answer dependsupon results
Answer dependsupon results
Answer dependsupon results
10
63. If your results yielded an overlap of 15mm. that isvery good. What conclusions would you draw from thecomparison of lengths of the two species on your graph asto the nearness of relationship of the two species ?,
AK.A.V1014'
64. From the sample of leaves drawn from the total popula-tion of leaves from the American elm tree, do the related
events seem to form a pattern of a normal, bell-shapedcurve?
65. Does your sample of Chinese elm leaf lengths show anormal distribution?
66. Have the data "'.iled up" on graph "1"?
67. Where is the mode located on graph "1"?
68. Have the data "piled up" on graph "2"?
69. here is the mode located on graph "2"?
70. PROCEDURAL ITS[ . NO WRITTEN RESPONSE REWIRED
. There should be if yoursample is large.
. - .
a. Check with your teadhgr to see if there is timefor you to proceed with this section. If not,please go to frame 86.
b. lbw measure the mak:at width of each loaf inan envelope Do this for each species. You willhave to eb imete, using your judgment as to wherethe leaf is the widest. Work with only OPESPECIES at a time.
c. Set up a frequency tally and a frequency tablefor the information on the widths of your leaves.
d. When you have measured a representative sampleof leaves in each species and recorded the tallymarks, set up frequency tables.
e. Plot these data on another sheet of graph paper.
f. Label the American elm data "3", and the Chineseelm data "4".
g. Remember to use the proper colored pencils.
h. Title your graph and file it for further study.Do you have some overlapping again?
There should bewith an adequatesample
Answer dependsupon results
11
71. Compare graphs "3" and "4". Is there any overlap ofleaf widths in the two species?
72. How much overlap do you have in millimeters?
73. What conclusions whould you draw from the comparisonsAnswer depends of widths as to the nearness of relationship?upon results
Answer depends 74. Where is the mode located on graph "3"?upon results
Answer depondnupon results
75. Where is the mode located on graph 11107___.
76. Check with your teacher to see if there is time foryou to complete this section. If not, please skip toframe 86.
a. Place a leaf topsurface downward and count thenumber of notches on the right side of the leaf. (In the
American elm consider only the large, notches.) In determining "right" and "left", consider right and left tocorrespond to your own right and left hands. Trork with
one envelope of leaves at a time for one species.
b. Secure a frequency tally chart and a frequencytable chart from the main supply.
c. When you have counted the right side notches ofall your sample of leaves and recorded the data, plot thedata on a third sheet of gvaph paper as you did the otherdata.
d. Label the American elm graph "5" and the Chineseelm graph "6". Keep the graph for further study.
77. Compare graphs "5" and "6". Is there any overlappingThere should be if evident in the number of notches on the right side?the sample is large.
Answer dependsupon results
.......78. What conclusions would you draw from the comparisonof right side notches as to the nearness of relationship?
......111,Answer depends 79. Uhere is the mode loceted on gravhupon results .411
Answer depends 80. Where is the mode located on graph "6"?,upon results
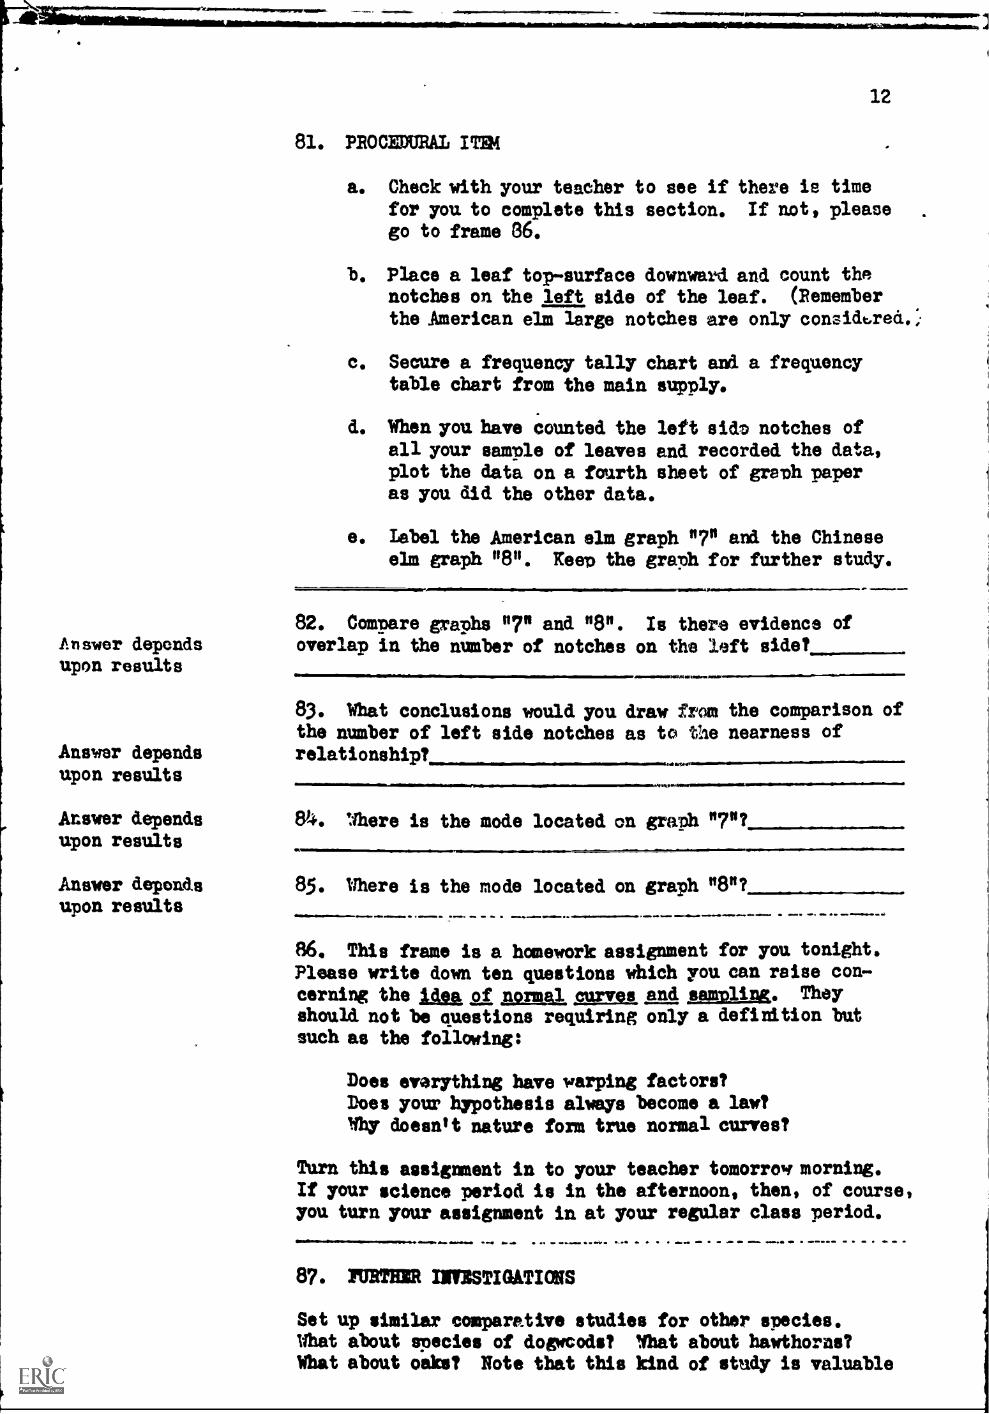
12
81. PROCEMORAL ITEM
a. Check with your teacher to see if there is timefor you to complete this section. If not, pleasego to frame 66.
b. Place a leaf top-surface downward and count thenotches on the left side of the leaf. (Remember
the American elm large notches are only considbred.:
c. Secure a frequency tally chart and a frequencytable chart from the main supply.
d. When you have counted the left side notches ofall your sample of leaves and recorded the data,plot the data on a fourth sheet of graph paperas you did the other data.
e. Label the American elm graph "7" and the Chineseelm graph "8". Keep the graph for further study.
.11Ma*V
82. Compare graphs "7" and "8". Is there evidence ofAnswer depends overlap in the number of notches on the left side?upon results
Answer dependsupon results
83. What conclusions would you draw from the comparison ofthe number of left side notches as to the nearness ofrelationship?
.01Mnelm.....
Answer depends 84. Where is the mode located on graph "7"?upon results
Answer depends 85. Where is the mode located on graph "8"?upon results moo
86. This frame is a homework:assignment for you tonight.Please write down ten questions which you can raise con-cerning the Adea of normal, purves and samplinx. Theyshould not be questions requiring only a definition butsuch as the following:
Does everything have warping factors?Does your hypothesis always become a law?Why doesn't nature form true normal curves?
Turn this assignment in to your teacher tomorrow, morning.If your science period is in the afternoon, then, of course,you turn your assignment in at your regular class period.
010 0. di NM. am ND 0. 40
87. FURTHER INTBSTIUTIONS
Set up similar comparative studies for other species.What about apecies of dogwcods? What about hawthorns?What about oaks? Note that this kind of study is valuable
13
only for closelr related species. More distantly relatedspecies are readily distinguished by characteristics whichdo not overlap.
88. Try to write a general description of each speciesfrom the date that you have, in such a 'roar that a personseeing them in nature could readily distinguish them.These are the kinds of data taxonomists use in describingspecies and distinguishing them from one another.
89. If you have time remaining in the period begin on thenext programmed lesson. Pile this lesson in a safe placeso that you my review it later.
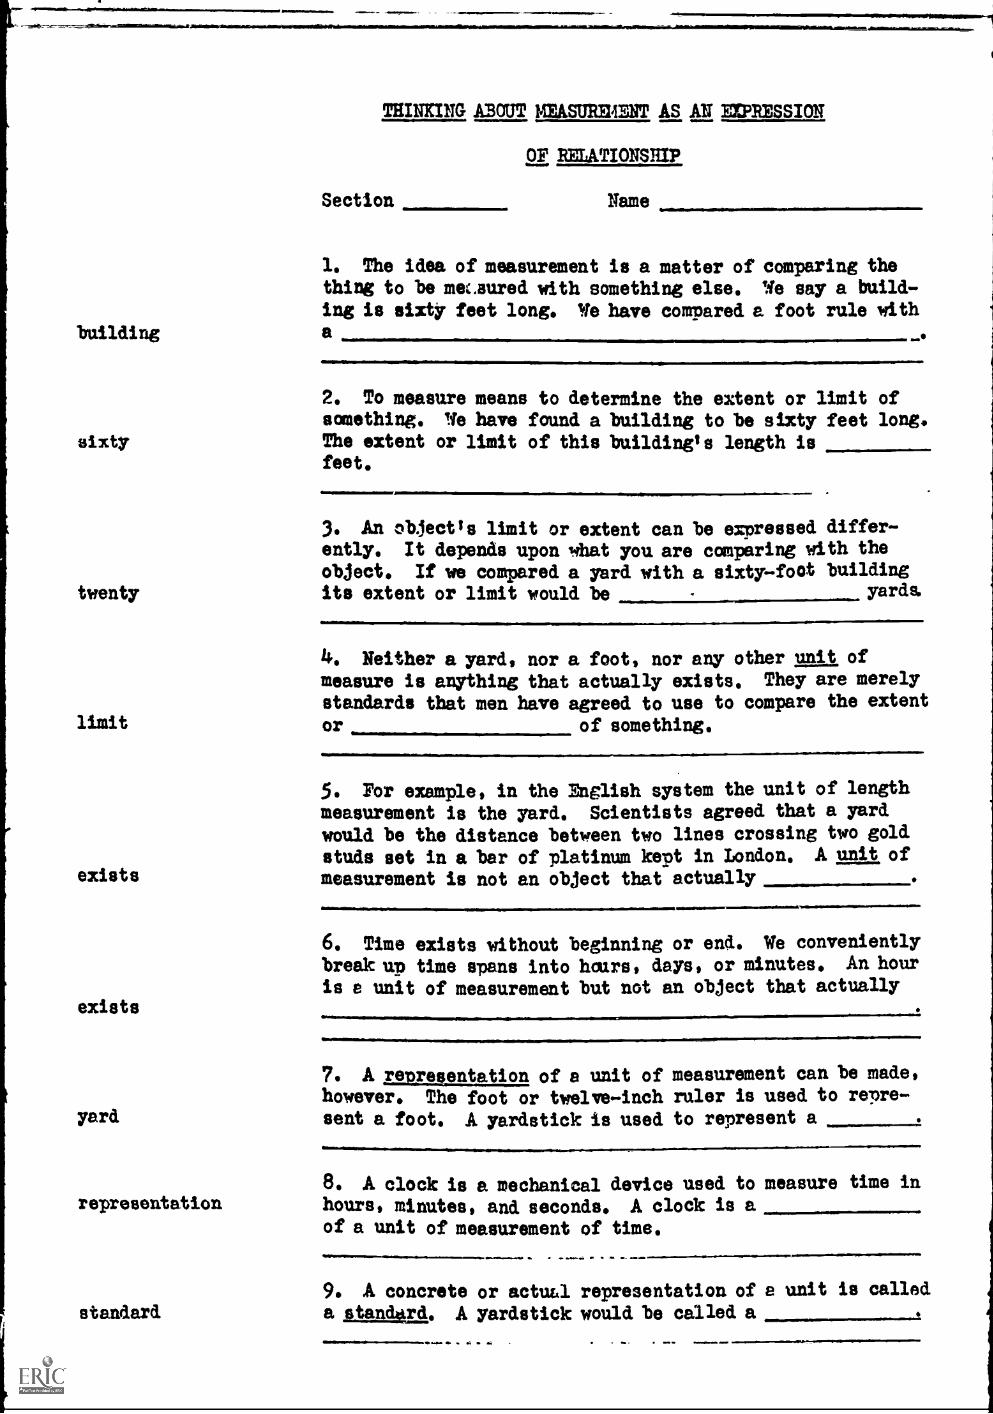
building
s x ty
twenty
limit
exists
THINKING ABOUT MEASUREMENT AS AN PIPRESSION
OF RELATIONSHIP
NameSection
I. The idea of measurement is a matter of comparing thething to be mec.aured with something else. We say a build-ing is sixty feet long. We have compared a foot rule witha
2. To measure means to determine the extent or limit ofsomething. Ile have found a building to be sixty feet long.The extent or limit of this building's length isfeet.
3. An object's limit or extent can be expressed differ-ently. It depends upon what you are comparing with theobject. If we compared a yard with a sixty-foot buildingits extent or limit would be yards.
4. Neither a yard, nor a foot, nor any other unit ofmeasure is anything that actually exists. They are merely
standards that men have agreed to use to compare the extentOr of something.
5. For example, in the English system the unit of length
measurement is the yard. Scientists agreed that a yard
would be the distance between two lines crossing two gold
studs set in a bar of platinum kept in London. A unit of
measurement is not an object that actually
6. Time exists without beginning or end. We conveniently
break:up time spans into hairs, days, or minutes. An hour
is e unit of measurement but not an object that actuallyexists
yard.
representation
standard
7. A representation of a unit of measurement can be made,however. The foot or twelve-inch ruler is used to repre-sent a foot. A yardstick is used to represent a
11111Oe
8. A clock is a mechanical device used to measure time in
hours, minutes, and seconds. A clock is aof a unit of measurement of time.
9. A concrete or actual representation of a unit is calleda standard. A yardstick would be called a
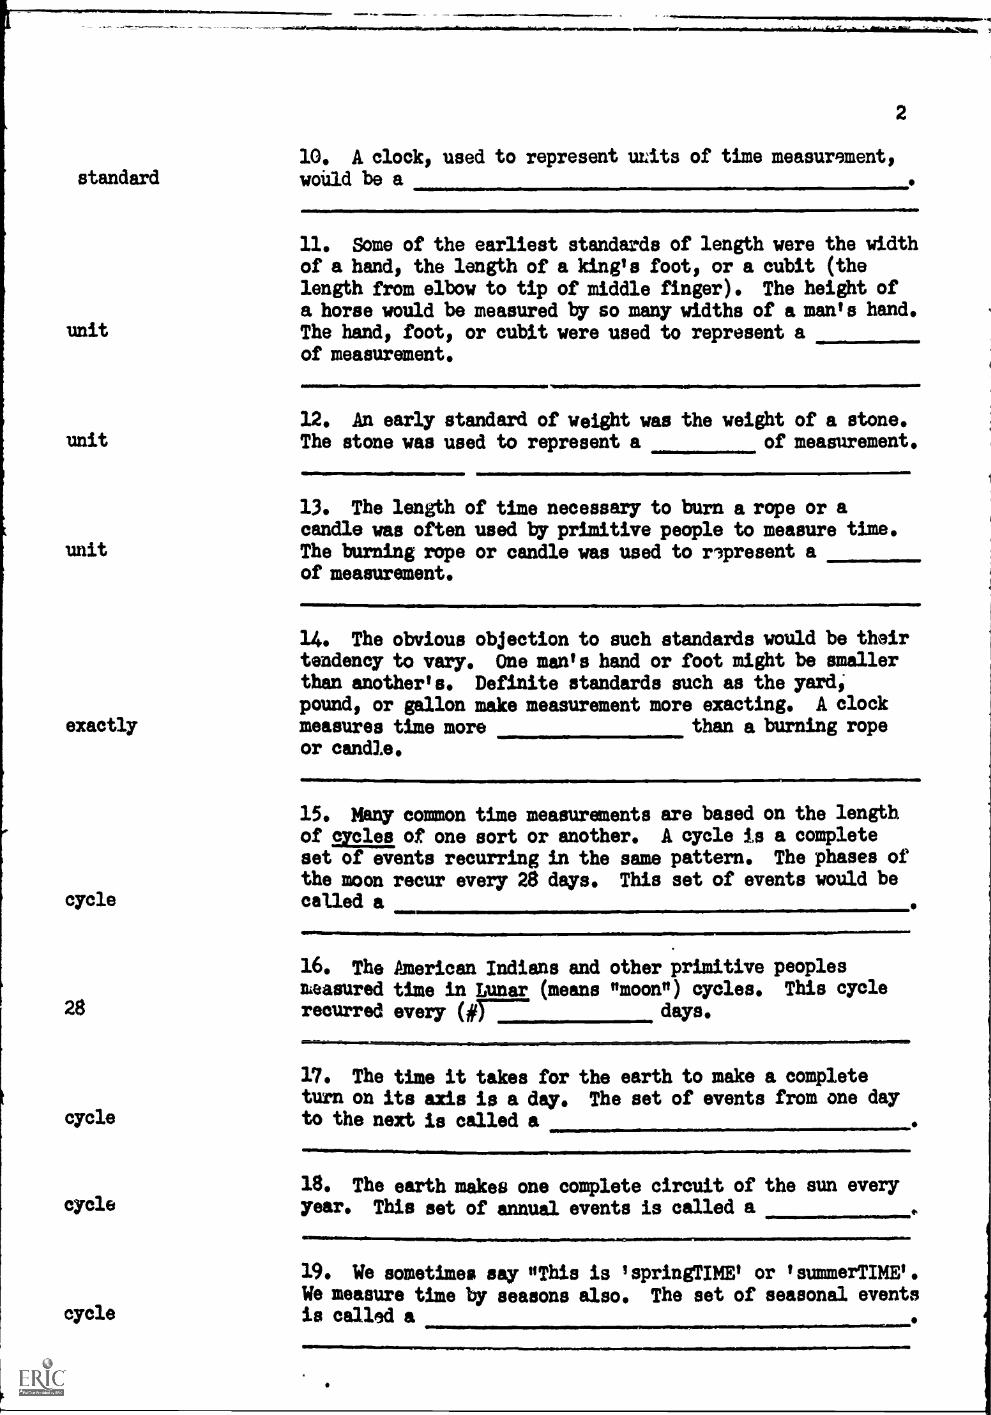
10. A clock, used to represent wits of time measurement,standard would be a
unit
unit
unit
exactly
cycle
28
cycle
cycle
cycle
2
11. Some of the earliest standards of length were the widthof a hand, the length of a king's foot, or a cubit (thelength from elbow to tip of middle finger). The height ofa horse would be measured by so many widths of a man's hand.The hand, foot, or cubit were used to represent aof measurement.
12. An early standard of weight was the weight of a stone.The stone was used to represent a of measurement.
13. The length of time necessary to burn a rope or acandle was often used by primitive people to measure time.The burning rope or candle was used to represent aof measurement.
14. The obvious objection to such standards would be theirtendency to vary. One man's hand or foot might be smallerthan anther's. Definite standards such as the yard;pound, or gallon make measurement more exacting. A clock
measures time more than a burning ropeor candle.
15. Many common time measurements are based on the lengthof cycles of one sort or another. A cycle is a completeset of events recurring in the same pattern. The phases of
the moon recur every 28 days. This set of events would becalled a
16. The American Indians and other primitive peoplesmeasured time in Lunar (means "moon") cycles. This cycle
recurred every (g---- days.
17. The time it takes for the earth to make a completeturn on its axis is a day. The set of events from one dayto the next is called a
18. The earth makes one complete circuit of the sun everyyear. This set of annual events is called a
19. We sometimes say "This is 'springTIME' or 'summerTIME'.We measure time by seasons also. The set of seasonal eventsis called a
unit
unit
existohnndayd
standards
millimeter
3
20. Temperature is measured by the expansion or contraction
of mercury within a thermometer divided into units calleddegrees. A temperature is not an object that exists but it
is represented by a of measurement called
a degree.
21. Sound is not an object that exists but is measured bya representative of measurement, the number
of vibrations within a given time.
22. Whatever the type of measurement, we measure somethingby comparing it with something else. A unit of measurementdoes NOT actually , but it has an actual,
concrete representation called a
23. Increased need and wider use brought the necessity of
definite standards of measurement. The Metric System has
gradually been replacing the old units. The Metric unitsof measurement are not objects which exist, but have actual,
concrete representations called
24. Recall that scientists use the Metric System since all
the units can be converted into other units by multiples often. In previous laboratory experiences you have been
using a rule often, which is a
standard of the Metric System.1INFORMATION ITEM - NO RESPONSE REQUIREDFrames 2535 are a review of the units on measurementin the Metric System.
25. The fundamental length unit in the Metric System isthe standard meter (m). It is slightly longer than the yardin the English System-- -39.37 inches to be exact. The meter
can then be divided into centimeters. "Conti" means "one100 hundredth" so tKre would be centimeters (cm)
in one meter.
26. "Milli" means "one thousandth", so there would be1000 millimeters Omniin a meter.
27. In the English System 1760 yards equal a mile. In the
Metric System a certain number of meters equal a kilometer.1000 If "kilo" means a thousand, there would be
meters in a kilomeG7TERY..11111
11111101MmIni.J..ms
28. The basic Metric standard of mass is the kilogram (kg).It equals 2.2 pounds. From what you have learned defining
1000 "kilo", a kilogram contains grams (g). A
gram is related to a kilogram somewhat as an ounce isrelated to a pound.
INSMINNOMINIMIMMENMIMMOMEONNOMMONNIONNMayINIIMMmwf
4
29. For area measurements'in the Metric System we havesquare centimeters, square kilameters etc. To writeabbreviations for the area units we usi3 exponents as ashorthand notation. Square centimeters is written cm2;
km2 squared kilometers is written
cm3
liter
one thousand
one
30. Bulk or volume requires a cubical unit for measure-ment. Cubic feet is written, ft3 . Cubic centimeters iswritten
31. There is a special name given to a Metric unit ofvolume equal to 1000 cm3. It is called a liter (pronounced"leeter") and is just larger than a liquid quart. Goingback to what we learned as a definition for "milli", mean-ing thousandth, a milliliter (ml) is 0.001 liter (1). Or1000 milliliters equals one
..,111.11.==a1,
32. A cubic centimeter is, for all practical purposes,the same volume as a milliliter. If one thousand milli-liters equal one liter, cm3equal one liter. This is an important relationship toremember.
33. To repeat, one cubic centimeter equalsmilliliter.
34. Now let's review the discussion on the Metric System.All the units in the Metric Systems can be converted into
ten other units by multiples of (1) 4 The lengthmeter unit is the (2) . It is slightly longeryard than the (3) in the English System.0.01 A centimeter is (4) meter. A millimeter0.001 is (5) meter. A kilometer equals1000 (6) meters.
110.MMIIMIPI111111 mtkilogram 35. The Metric unit of mass is the (1)1000 which represents (2) grams. The metriclength units for area and volume are based on the (3)cm2 or km2 units. Area is expressed in (4) ; volumecm3 is expressed as (5) . The special name
given to a Metric unit of volume equal to 1000 cm3 is aliter; one (6) . One cm3 is equal to (7)0.001 milliliter. A milliliter equals (8) liter.
....=..m.............11.0.1.1..
36. In one experiment you worked with microscopic yeasts.You will be working with another microscopic organism
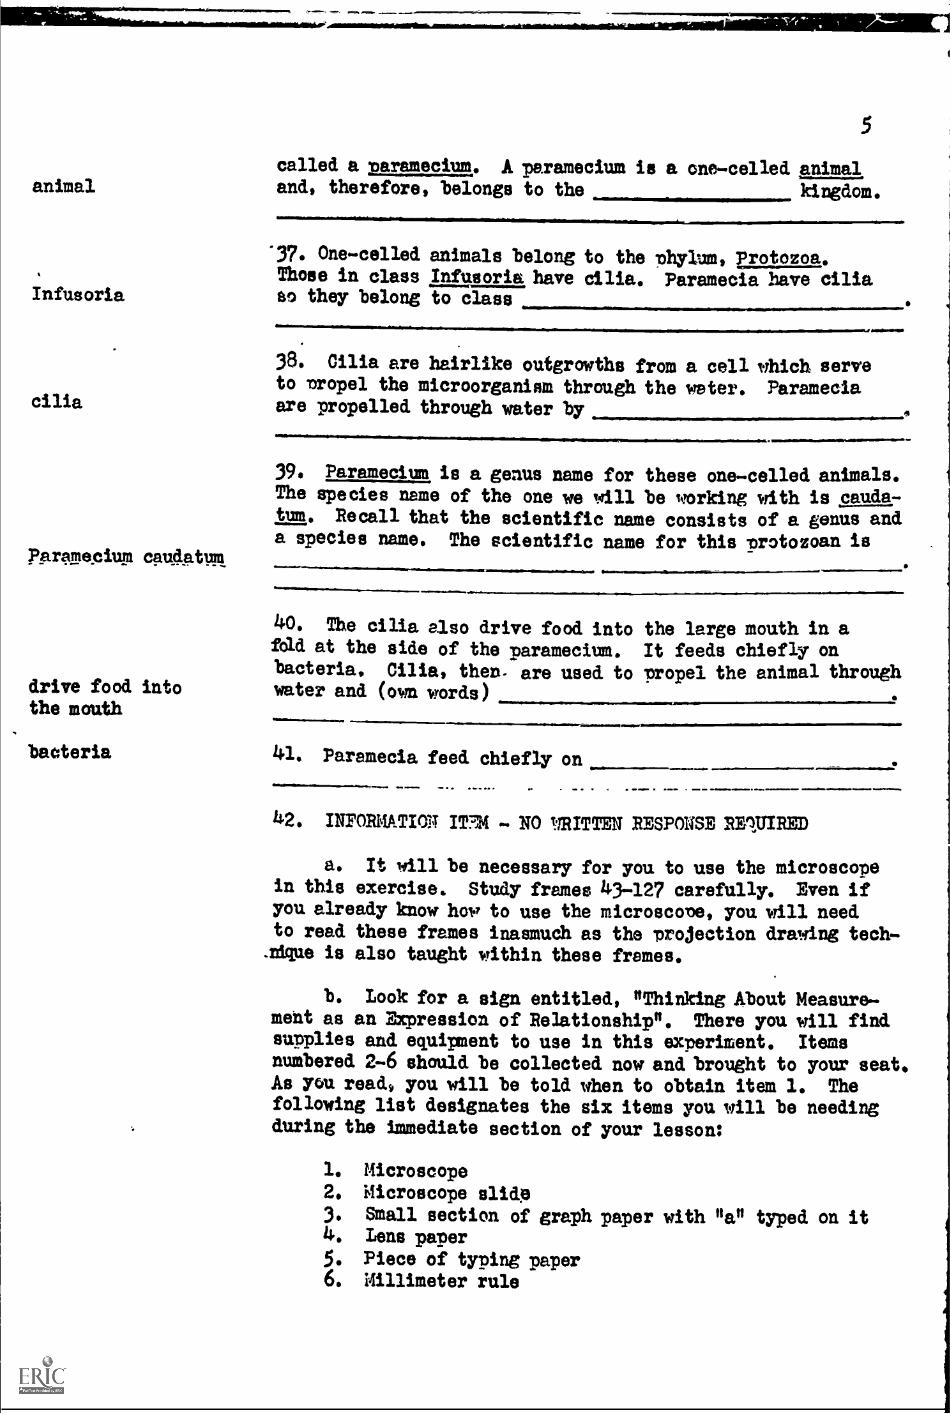
animal
Infusoria
5
called a 'paramecium. A paramecium is a one-celled animaland, therefore, belongs to thee kingdom.
"37. One-celled animals belong to the phylum, Protozoa.Those in class Infusoria have cilia. Paramecia have ciliaso they belong to class
1/111
38. Cilia are hairlike outgrowths from a cell which serveto propel the microorganism through the water. Paramecia
cilia are propelled through water by
39. Paramecium is a genus name for these one-celled animals.The species name of the one we will be working with is cauda-turn. Recall that the scientific name consists of a genus anda species name. The scientific name for this -protozoan is
Paramecium caudatum
40. The cilia also drive food into the large mouth in afold at the side of the paramecium. It feeds chiefly onbacteria. Cilia, then- are used to propel the animal through
drive food into water and (own words)the mouth
bacteria 41. Paramecia feed chiefly on
42. INFORMATION ITEM . NO VRITTEN RESPONSE REWIRED
a. It will be necessary for you to use the microscopein this exercise. Study frames 43-127 carefully. Even ifyou already know how to use the microscone, you will needto read these frames inasmuch as the projection drawing tech -Ague is also taught within these frames.
b. Look for a sign entitled, "Thinking About Measure-ment as an Etpression of Relationship". There you will findsupplies and equipment to use in this experiment. Itemsnumbered 2-6 should be collected now and brought to your seat.As you read, you will be told when to obtain item 1. Thefollowing list designates the six items you will be needingduring the immediate section of your lesson:
1. Microscope2. Microscope slidp3. Small section of graph paper with "a" typed on it4. Lens paper
5. Piece of typing paper6. Millimeter rule
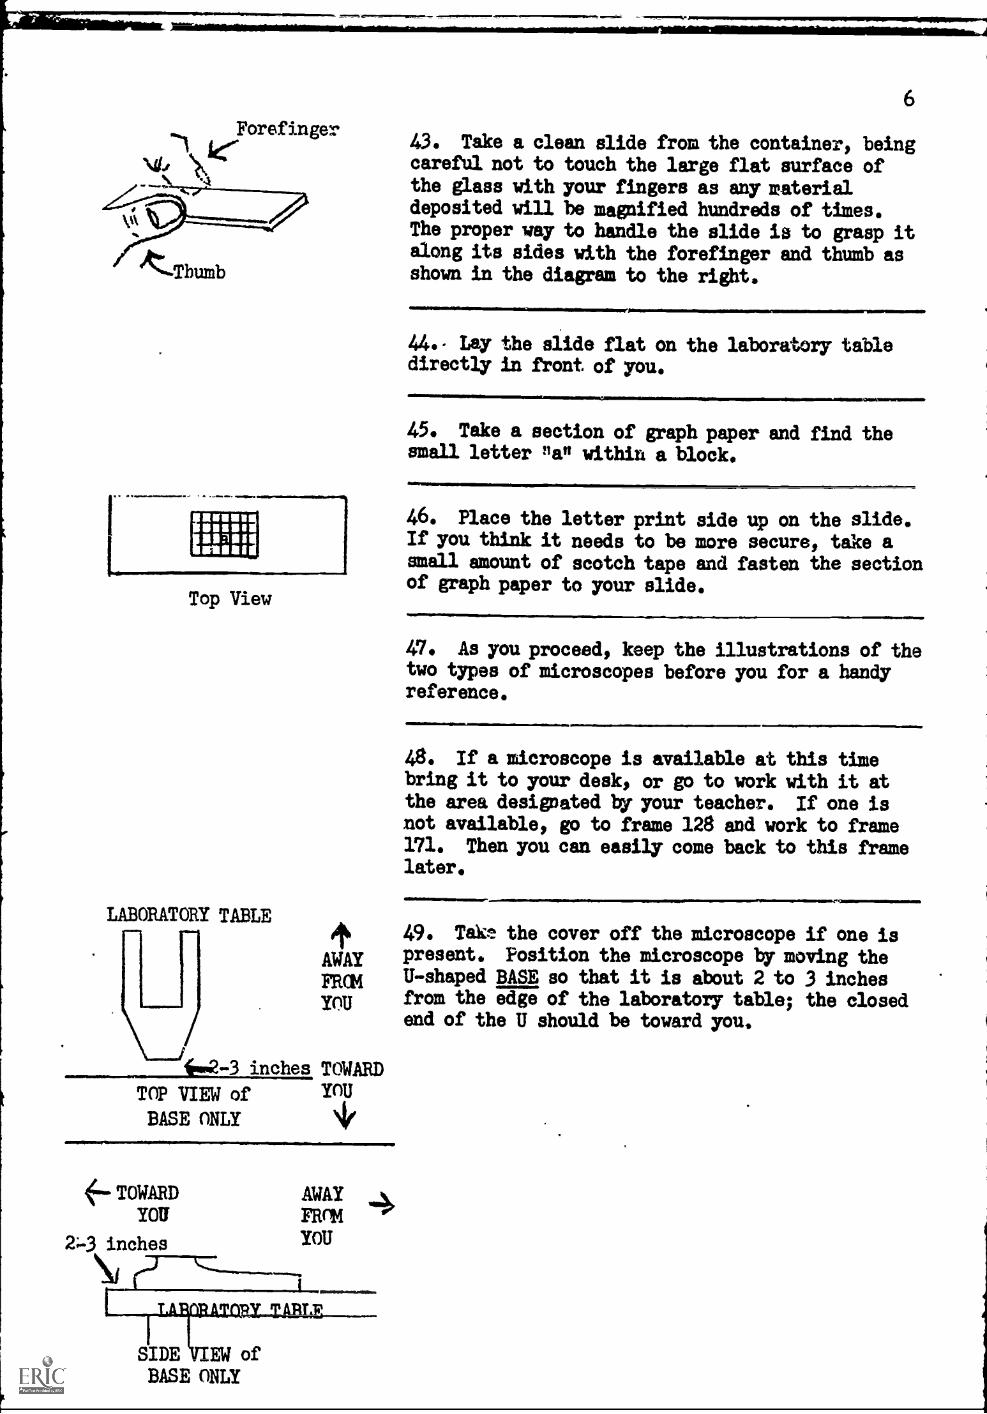
."\
Forefinger
.4
staaasgfti
Top View
LABORATORY TABLE
AWAYFRCMYOU
402-3 inches TOWARD
TOP VIEW of YOU
BASE ONLY
&TOWARDYOU
Z-3 inches
Sd
AWAY .1.
FRCIM
YOU
SIDE ._EW ofBASE ONLY
6
43. Take a clean slide from the container, beingcareful not to touch the large flat surface ofthe glass with your fingers as any materialdeposited will be magnified hundreds of times.The proper way to handle the slide is to grasp italong its sides with the forefinger and thumb asshown in the diagram to the right.
44. Lay the slide flat on the laboratory tabledirectly in front of you.
45. Take a section of graph paper and find thesmall letter "a" within a block.
46. Place the letter print side up on the slide.If you think it needs to be more secure, take asmall amount of scotch tape and fasten the sectionof graph paper to your slide.
47. As you proceed, keep the illustrations of thetwo types of microscopes before you for a handyreference.
48. If a microscope is available at this timebring it to your desk, or go to work with it atthe area designated by your teacher. If one isnot available, go to frame 128 and work to frame171. Then you can easily come back to this framelater.
49. Tak° the cover off the microscope if one ispresent. Position the microscope by moving theU-shaped BASE so that it is about 2 to 3 inchesfrom the edge of the laboratory table; the closedend of the U should be toward you.
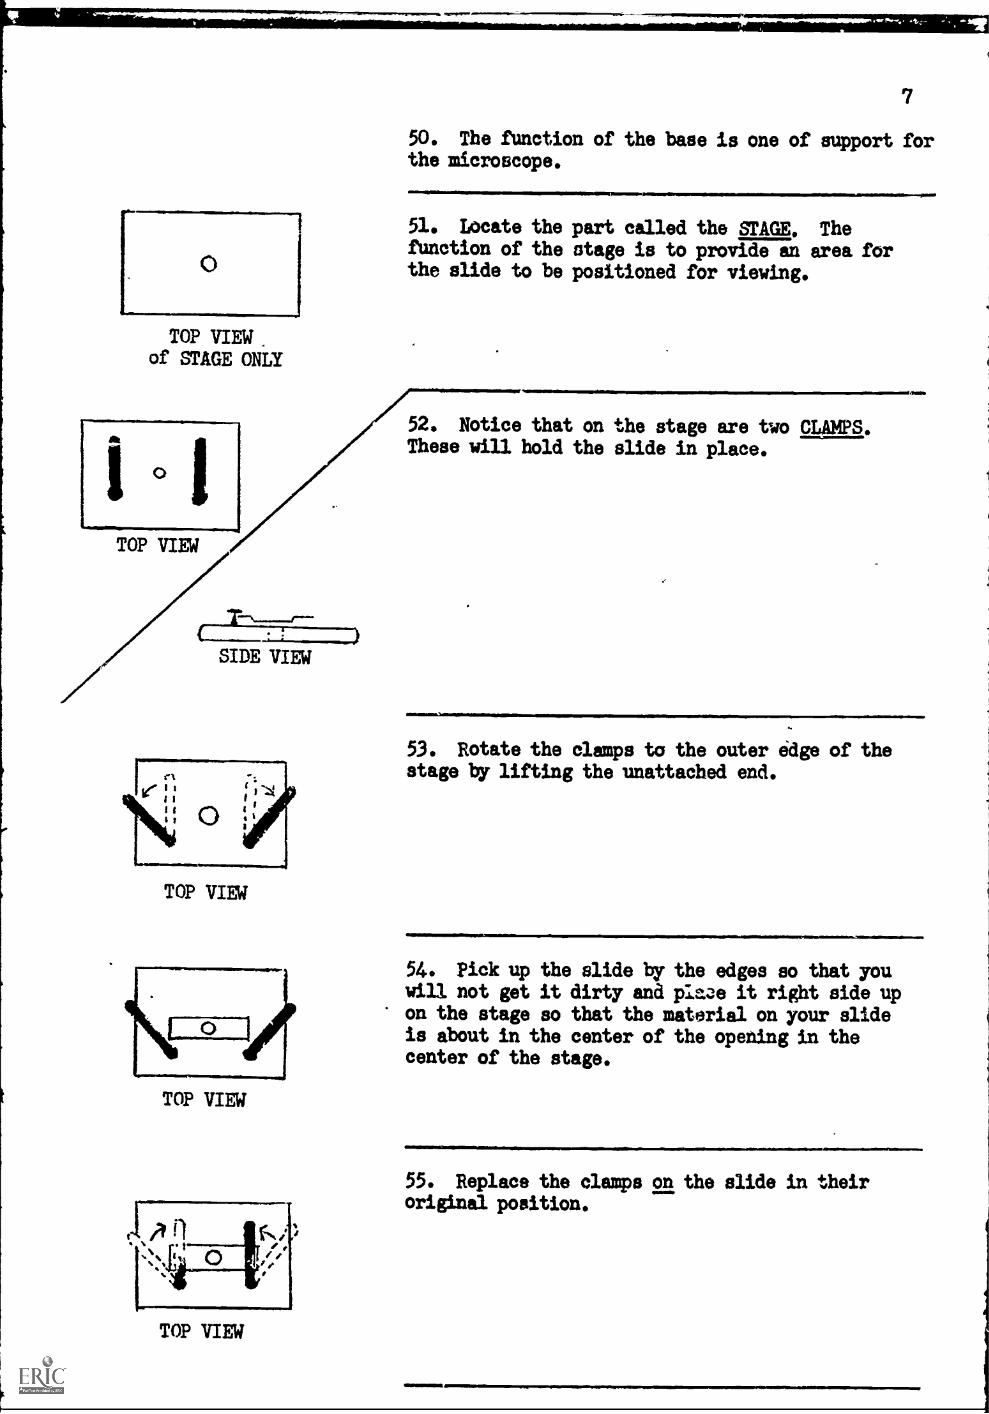
vem
1160.
0
TOP VIEW,of STAGE ONLY
TOP VIEW
SIDE VIEW
TOP VIEW
TOP VIEW
TOP VIEW
7
50. The function of the base is one of support forthe microscope.
51. Locate the part called the STAGE, Thefunction of the stage is to provide an area forthe slide to be positioned for viewing.
52. Notice that on the stage are two CLAMPS.These will hold the slide in place.
53. Rotate the clamps to the outer edge of thestage by lifting the unattached end.
54. Pick up the slide by the edges so that youwill not get it dirty and pIaae it right side upon the stage so that the material on your slideis about in the center of the opening in thecenter of the stage.
55. Replace the clamps on the slide in theiroriginal position.
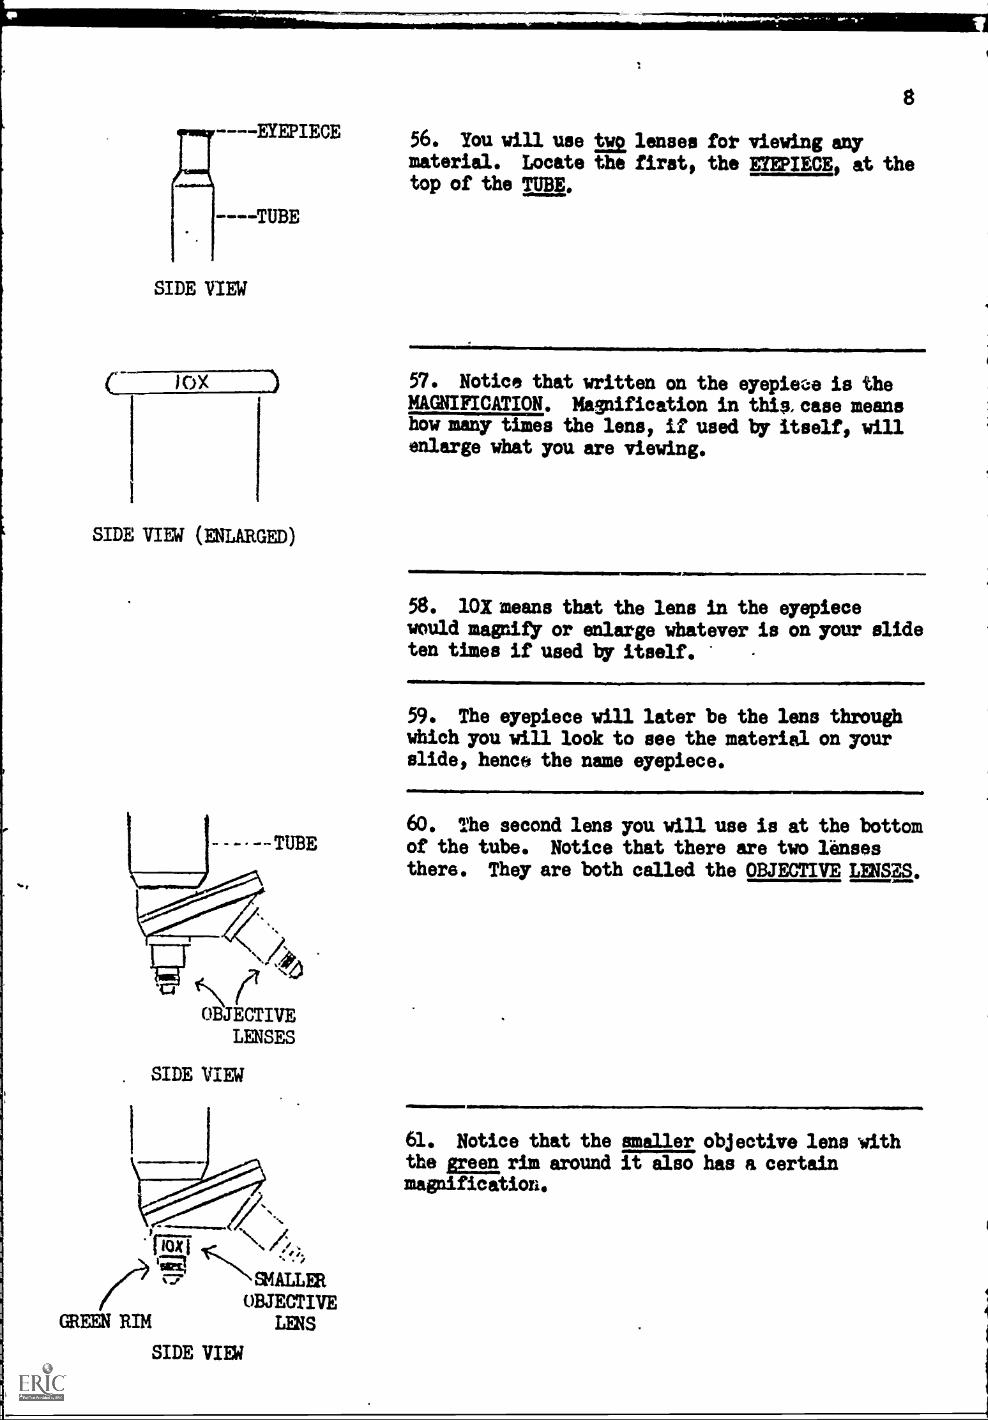
----EYEPIECE
----TUBE
SIDE VIEW
X
SIDE VIEW (ENLARGED)
--TUBE
,4OBJECTIVE
LENSES
SIDE VIEW
NNSMALLEROBJECTIVE
GREEN RIM LENS
SIDE VIEW
8
56. You will use _1st lenses for viewing anymaterial. Locate the first, the EYEPIECE, at thetop of the 1mm
57. Notice that written on the eyepiece is theMAGNIFICATION. Magnification in thin, case meanshow many times the lens, if used by itself, willenlarge what you are viewing.
58. 101:means that the lens in the eyepiecewould magnify or enlarge whatever is on your slideten times if used by itself.
59. The eyepiece will later be the lens throughwhich you will look to see the material on yourslide, hence the name eyepiece.
60. The second lens you will use is at the bottomof the tube. Notice that there are two lensesthere. They are both called the OBJECTIVE LENSES.
61. Notice that the smaller objective lens withthe green rim around it also has a certainmagnification.
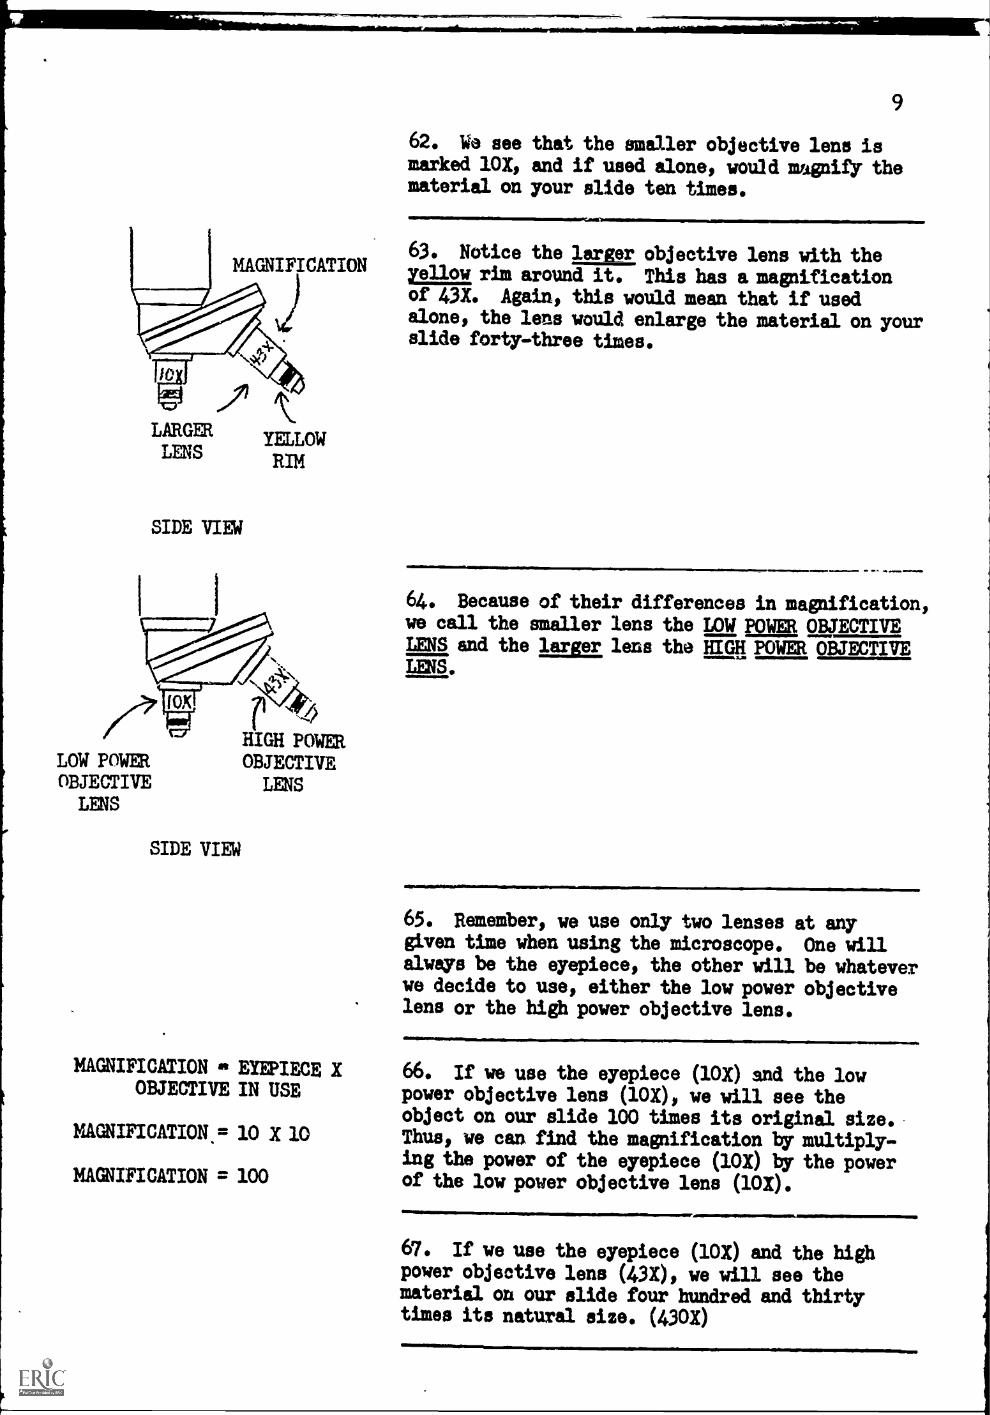
MAGNIFICATION yellow. rim around it. This has a magnificationof 43X. Again, this would mean that if usedalone, the lens would enlarge the material on yourslide forty-three times.
9
62. Us see that the smaller objective lens ismarked 10X, and if used alone, would magnify thematerial on your slide ten times.
63. Notice the 1.Imrs objective lens with the
Tz)
LARGERLENS
SIDE VIEW
YELLOWRIM
LOW POWEROBJECTIVE
LENS
SIDE VIEW
HIGH POWEROBJECTIVE
LENS
MAGNIFICATION it EYEPIECE XOBJECTIVE IN USE
MAGNIFICATION = 10 X 10
MAGNIFICATION = 100
64. Because of their differences in magnification,we call the smaller lens the LOW POWER OBJECTIVELENS and the larger lens the HIGH POWER OBJECTIVELENS.
65. RemeMber, we use only two lenses at anygiven time when using the microscope. One willalways be the eyepiece, the other will be whateverwe decide to use, either the low power objectivelens or the high power objective lens.
66. If we use the eyepiece (101) and the lowpower objective lens (10X), we will see theobject on our slide 100 times its original size.Thus, we can find the magnification by multiply-ing the power of the eyepiece (104 by the powerof the low power objective lens (10X).
67. If we use the eyepiece (10X) and the highpower objective lens (43X), we will see thematerial on our slide four hundred and thirtytimes its natural size. (4301)
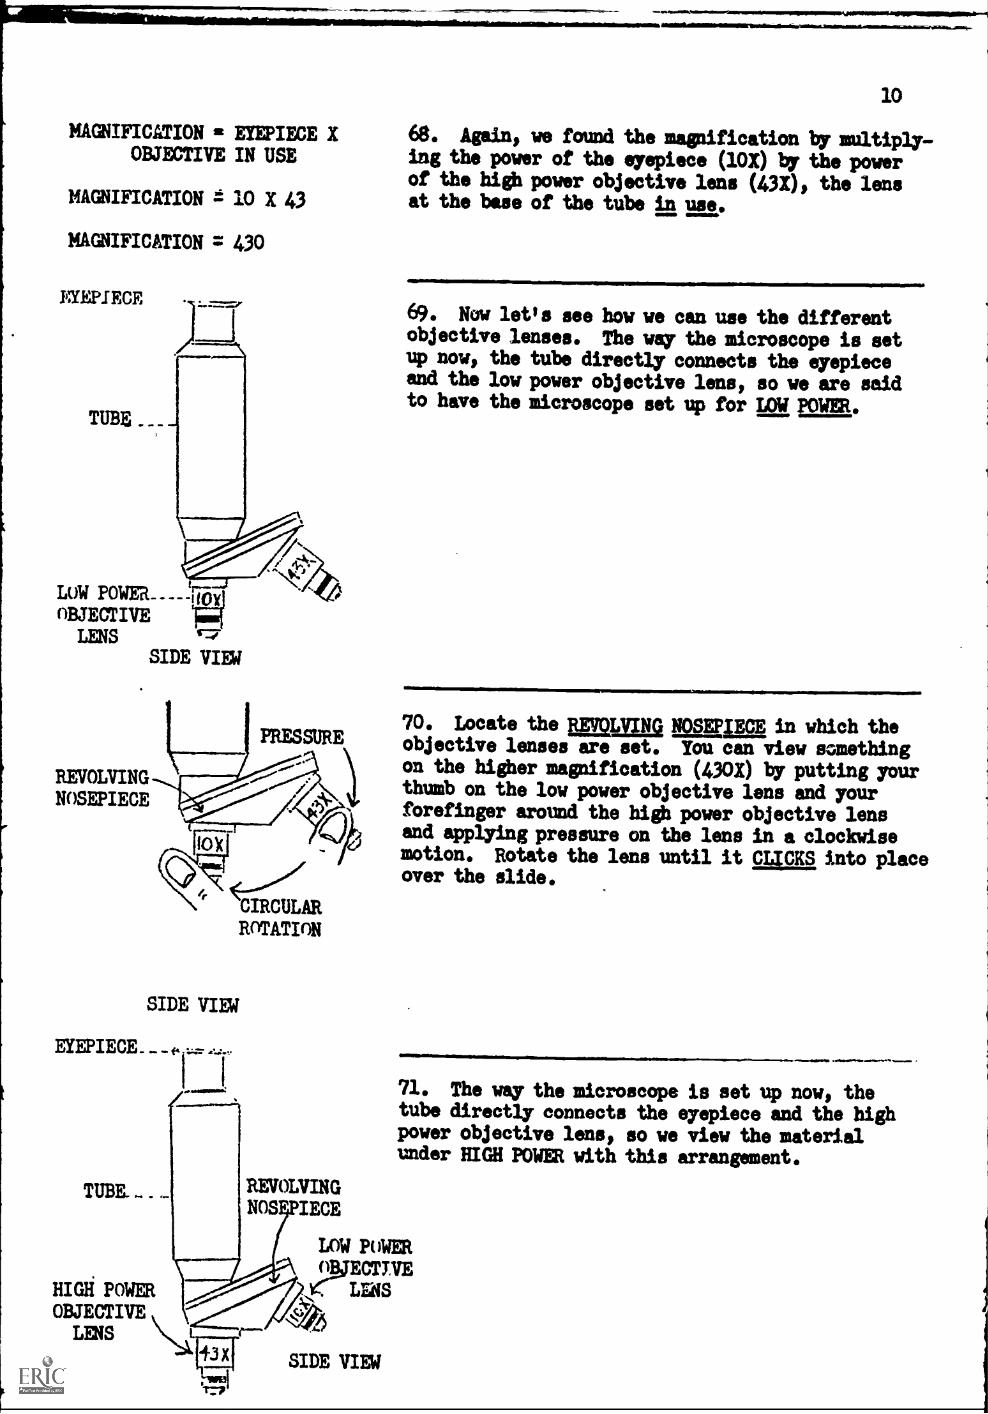
MAGNIFICATION it EYEPIECE XOBJECTIVE IN USE
MAGNIFICATION t 10 X 43
MAGNIFICATION = 430
EYEPIECE
TUBE
LOWOBJECTIVELENS
SIDE VIEW
REVOLVINGNOSEPIECE
TUBE_
IOk
CIRCULARROTATION
SIDE VIEW
HIGH POWEROBJECTIVELENS
1 1.
REVOLVINGNOS 'IECE
10
68. Again, we found the magnification by multiply-ing the power of the eyepiece (101) by the powerof the high power objective lens (43X), the lensat the base of the tube in use.
69. Now let's see how we can use the differentobjective lenses. The wiry the microscope is setup now, the tube directly connects the eyepieceand the low power objective lens, so we are saidto have the microscope set up for LOW ROWER.
70. Locate the muyin Nom= in which theobjective lenses are set. You can view somethingon the higher magnification (430X) by putting yourthumb on the low power objective lens and yourforefinger around the high power objective lensand applying pressure on the lens in a clockwisemotion. Rotate the lens until it CLOCKS into placeover the slide.
,
71. The way the microscope is set up now, thetube directly connects the eyepiece and the highpower objective lens, so we view the material=der HIGH POWER with this arrangement.
LOW POWERoNECTIVEVT LYAS
45
SIDE VIEW
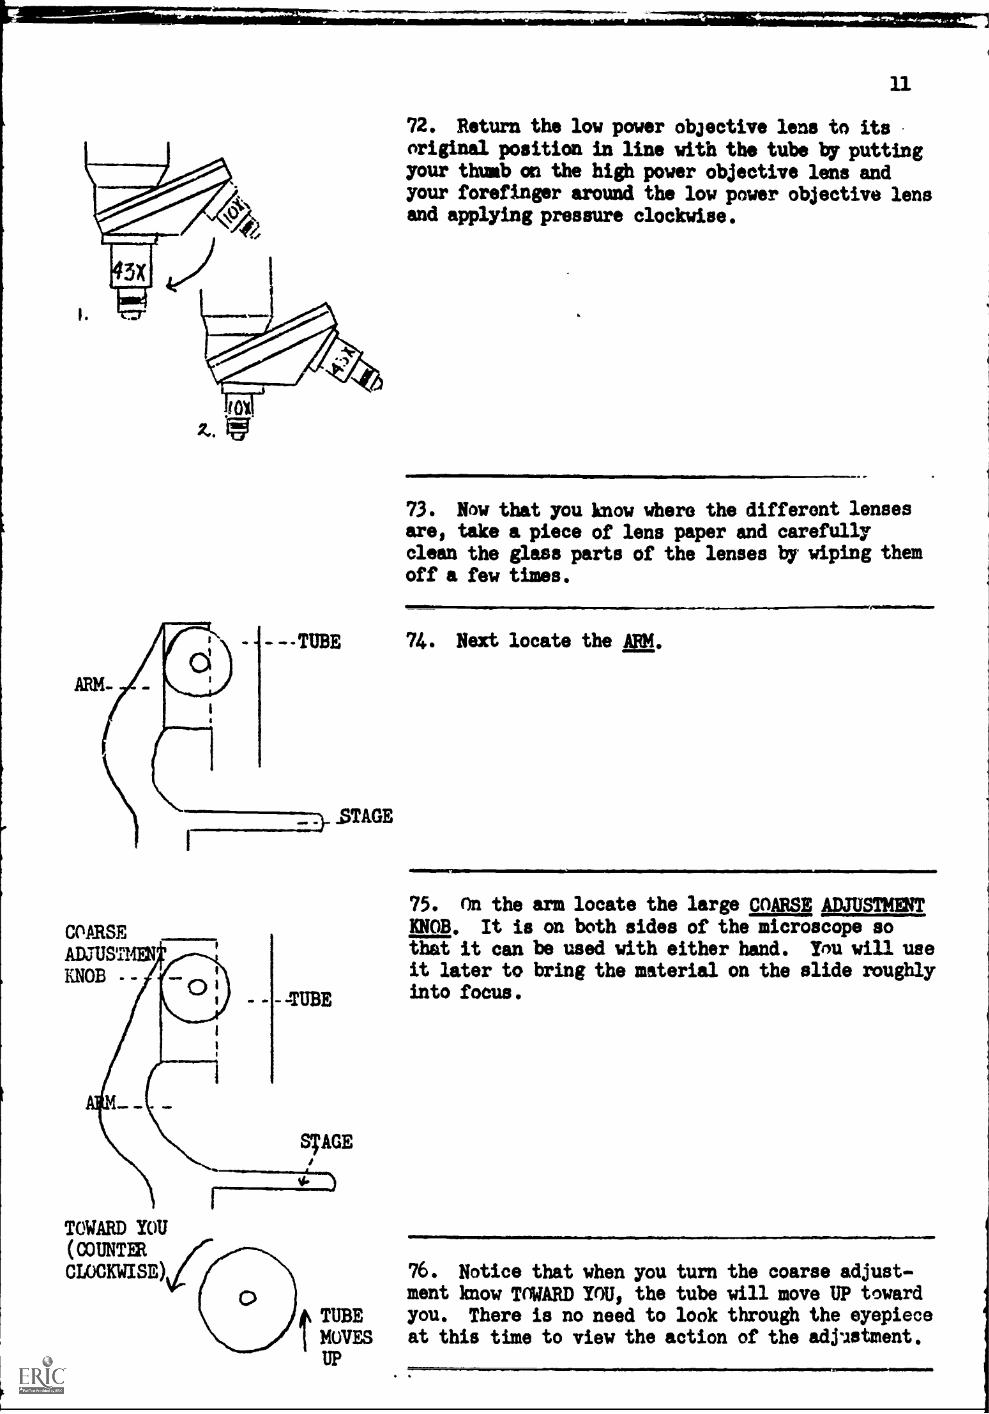
COARSEADJUSTNINKNOB -
11
72. Return the low power objective lens to its
original position in line with the tube by puttingyour thumb on the high power objective lens andyour forefinger around the low power objective lensand applying pressure clockwise.
73. Now that you know where the different lensesare, take a piece of lens paper and carefullyclean the glass parts of the lenses by wiping themoff a few times.
---TUBE 74. Next locate the ARM.
L _STAGE
-TUBE
TOWARD YOU(COUNTER
CLOCKWISE)
STAGE
75. On the arm locate the large COARSE ADJUSTMENTKNOB. It is on both sides of the microscope sothat it can be used with either hand. You will useit later to bring the material on the slide roughlyinto focus.
76. Notice that when you turn the coarse adjust-ment know TOWARD YOU, the tube will move UP toward
It% TUBE you. There is no need to look through the eyepieceMOVES at this time to view the action of the adjustment.UP
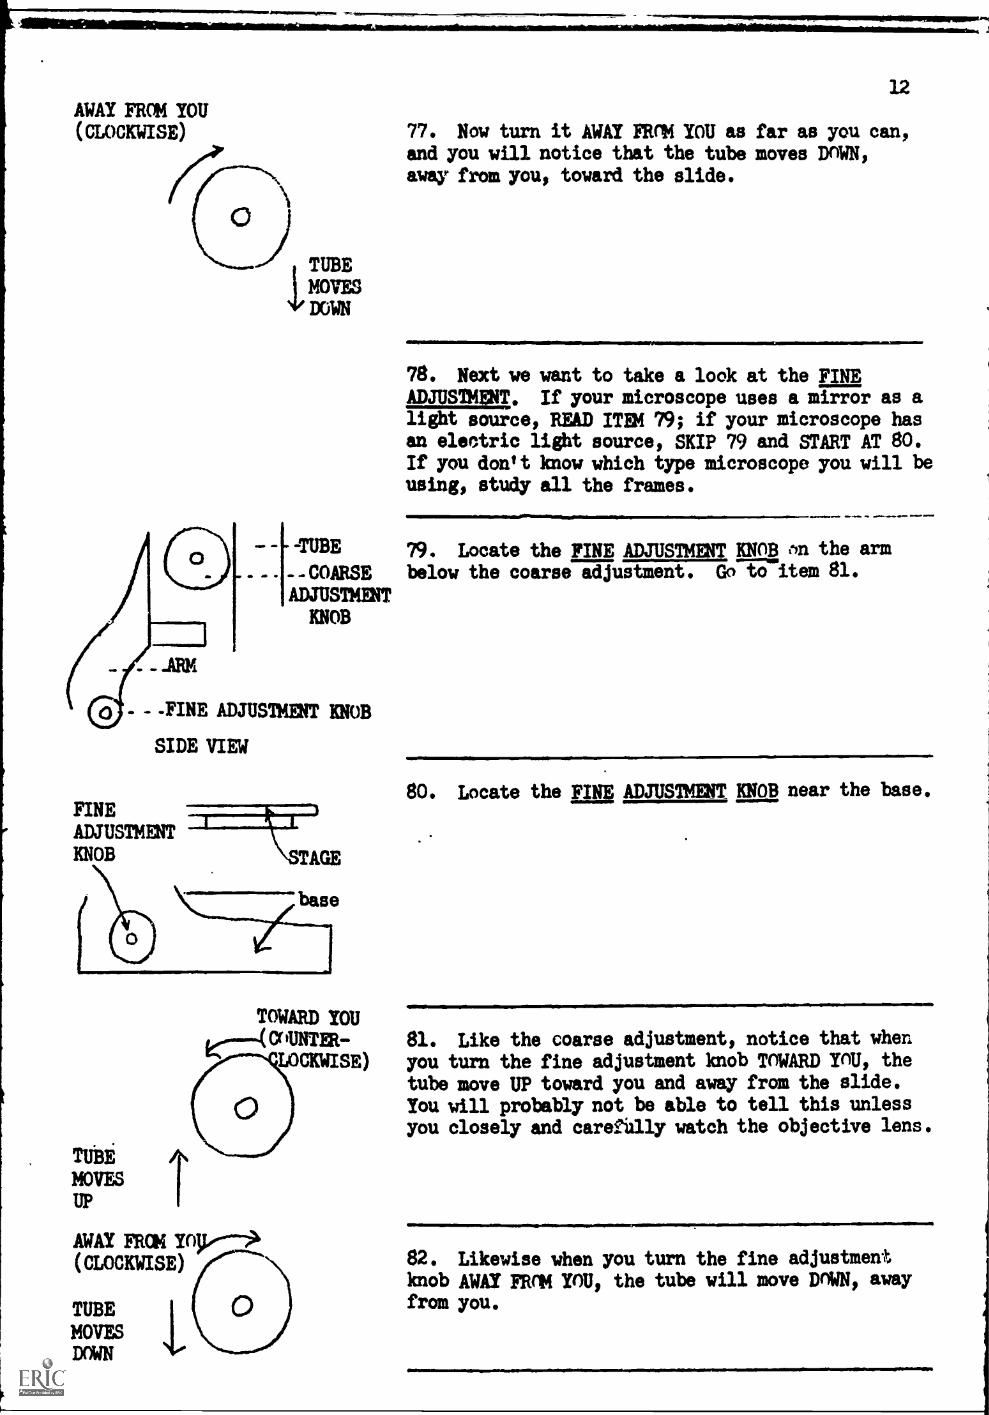
AWAY FROM YOU(CLOCKWISE)
) TUBEMOVESDOWN
-TUBE
- --COARSEADOSTMENT
KNOB
- -FINE ADJUSTMENT KNOB
SIDE VIEW
FINEADJUSTMENTKNOB
MOVESUP
TOWARD YOUkz....-4CrIUNTER-
LOCKWISE)
AWAY FRS Ynye-(CLOCKWISE)
TUBEMOVESDOWN
12
77. Now turn it AWAY FRnm YOU as far as you can,and you will notice that the tube moves DOWN,away from you, toward the slide.
78. Next we want to take a look at the FINEADJUSTMENT. If your microscope uses a mirror as alight source, READ ITEM 79; if your microscope hasan electric light source, SKIP 79 and START AT 80.If you don't know which type microscope you will beusing, study all the frames.
79. Locate the FINE ADJUSTMENT KNOB m the armbelow the coarse adjustment. Go o item 81.
80. Locate the FINE ADJUSTMENT KNOB near the base.
81. Like the coarse adjustment, notice that whenyou turn the fine adjustment knob TOWARD YOU, thetube move UP toward you and away from the slide.You will probably not be able to tell this unlessyou closely and careully watch the objective lens.
82. Likewise when you turn the fine adjustmentknob AWAY FROM YOU, the tube will move DOWN, awayfrom you.
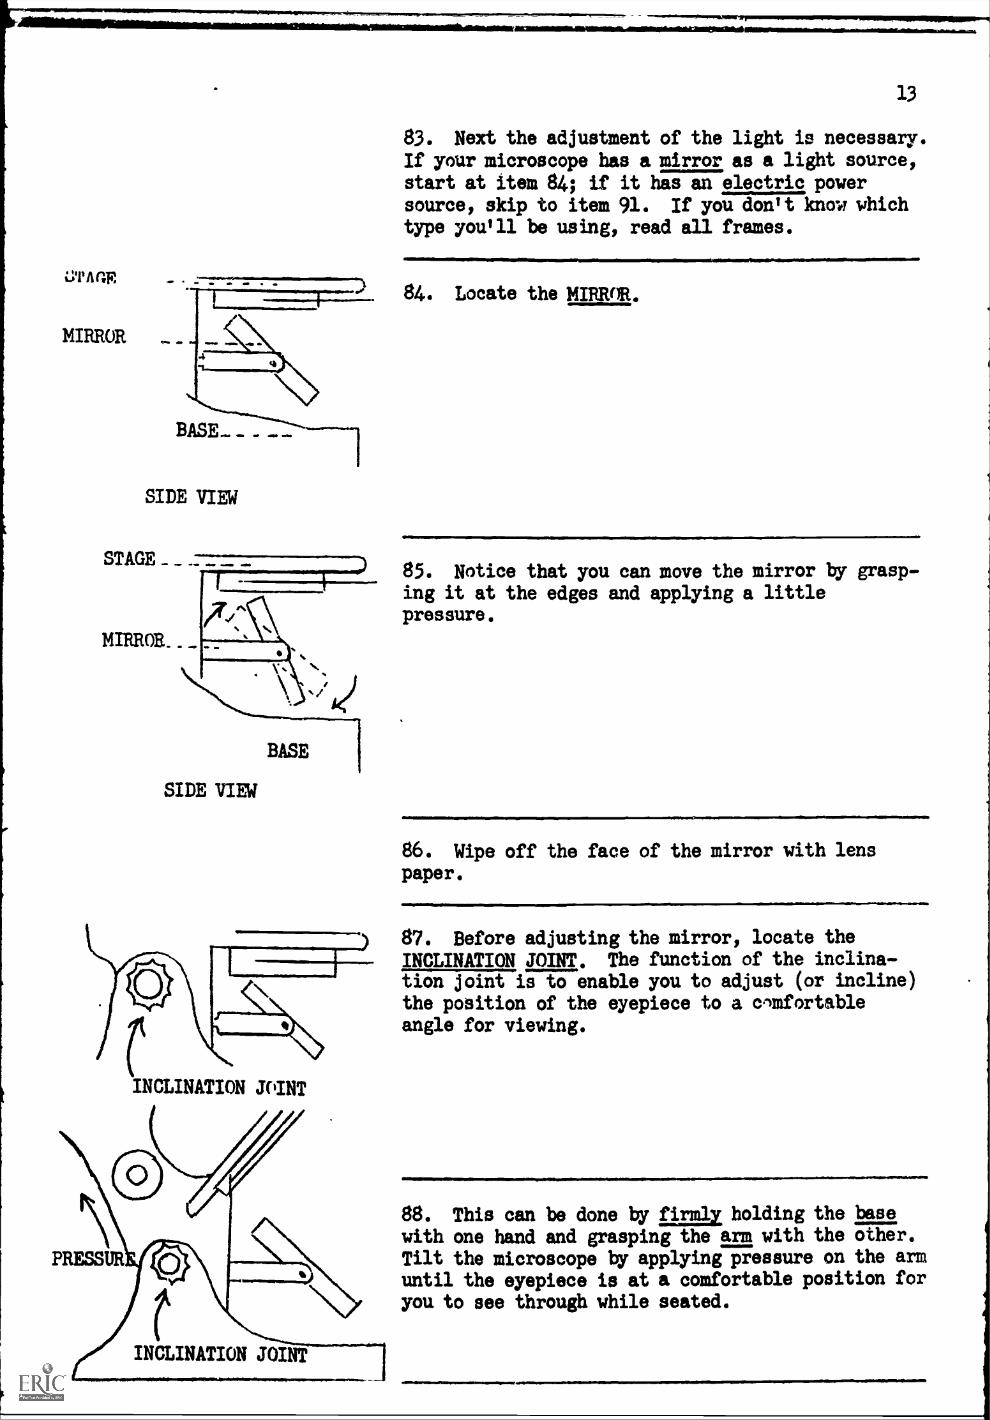
MIRROR _ _(-k,>4
BA.SIDE VIEW
STAGE _ _ _
MIRROR_ _
BASE
SIDE VIEW
13
83. Next the adjustment of the light is necessary.
If your microscope has a mirror as a light source,start at item 84; if it has an electric powersource, skip to item 91. If you don't know whichtype you'll be using, read all frames.
84. Locate the MIRROR.
) 85. Notice that you can move the mirror by grasp-ing it at the edges and applying a littlepressure.
INCLINATION JOINT
86. Wipe off the face of the mirror with lenspaper.
87. Before adjusting the mirror, locate the
INCLINATION JOINT. The function of the inclina-tion joint is to enable you to adjust (or incline)the position of the eyepiece to a comfortableangle for viewing.
88. This can be done by Ein_ holding the base
with one hand and grasping the arm with the other.Tilt the microscope by applying pressure on the armuntil the eyepiece is at a comfortable position foryou to see through while seated.
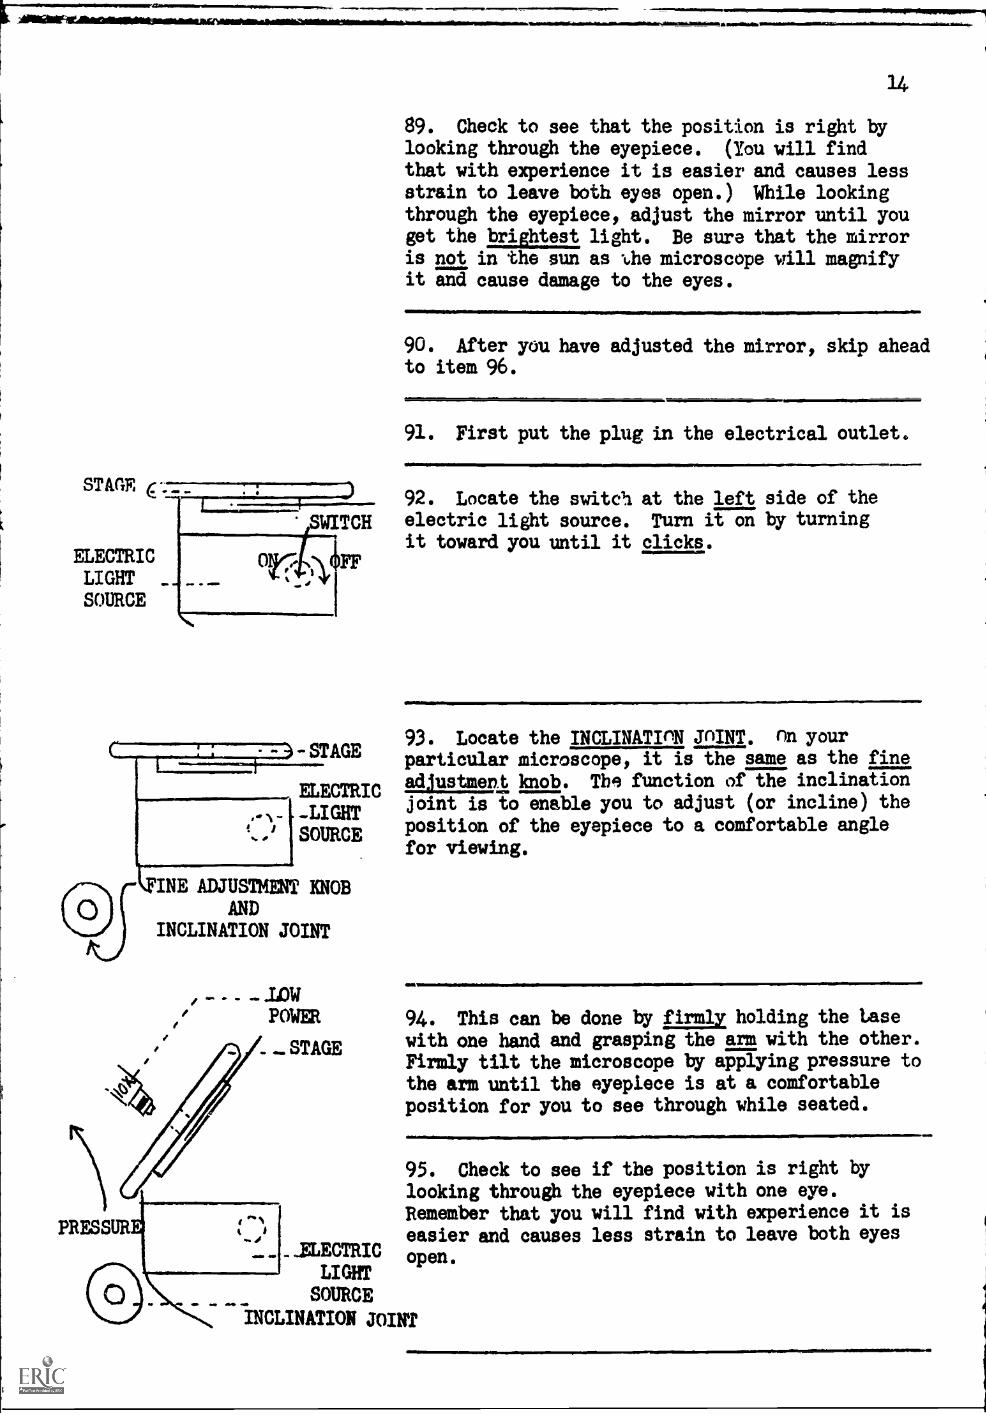
STAGE.)
14
89. Check to see that the position is right bylooking through the eyepiece. (You will find
that with experience it is easier and causes lessstrain to leave both eyes open.) While lookingthrough the eyepiece, adjust the mirror until youget the brightest light. Be sure that the mirroris not in the sun as -die microscope will magnifyit and cause damage to the eyes.
90. After you have adjusted the mirror, skip aheadto item 96.
91. First put the plug in the electrical outlet.
1 92. Locate the switch at the left side of the
SWITCH electric light source. Turn it on by turningit toward you until it clicks.
ELECTRIC OFFLIGHT _
SOURCE
STAGE93. Locate the INCLINATInN JnINT, On your
particular microscope, it is the same as the fine
ELECTRICadjustment knob. The function of the inclination
-LIGHTjoint is to enable you to adjust (or incline) the
SOURCEposition of the eyepiece to a comfortable anglefor viewing.
INE ADJUSTMENT KNOB
ANDINCLINATIONINCLINATION JOINT
... . . LOW.
1 POWER 94. This can be done by firmly holding the Lase
. -.STAGEwith one hand and grasping the arm with the other.'
Firmly tilt the microscope by applying pressure tothe arm until the eyepiece is at a comfortableposition for you to see through while seated.
PRESSOR
95. Check to see if the position is right bylooking through the eyepiece with one eye.Remember that you will find with experience it iseasier and causes less strain to leave both eyes
.ELECTRICeasier
LIGHT
SOURCEINCLINATION JOINT
MIS
15
96. Before focusing check and see that you havethe microscope on low power, the coarse adjustmentknob is turned as far down, away from you, aspossible, and that the material on the slide isabout in the center of the opening in the stage.
IMEMIWIMW
97. With your eye to the eyepiece, SLOWLY turnthe coarse adjustment knob TOWARD YOU (counter-clockwise) so that the tube moves up. Keepturning it until the material comes roughly intofocus. (If the tube goes up more than one inch,you will not get the material in focus. You haveeither gone too fast and missed it or you mightcheck the position of the material on the slideand see that it is in the center of the openingin the stage.)
98. After you get it roughly in focus, use thefine adjustment to sharpen the image. Thenposition the letter so that you can see all of it.
99. Note the position of the material under themicroscope. The letter is reversed so that theletter 'tan should appear upside down.
100. Nate also that what looks like a continuousprinted letter to the unaided eye, now appears tobe rough ink blots on coarse papor fibers.
101. While looking through the microscope, gallmove the slide to the right with your finger.
Note that the image moved in the oppositedirection or to the left.
102. While looking through the microscope, slowlymove the slide to the left until the imagereaches the center of the field of vision again.Note that the image moved in the oppositedirection or to the right.
103. Move the slide slowly forward toward theupper edge of the stage. Nrte that the imagemoves in the opposite direction.
IIIMIMMONOr
104. Move the slide back toward the center ofthe field of vision and again you will see thatthe image appears to move in the opposite direction.
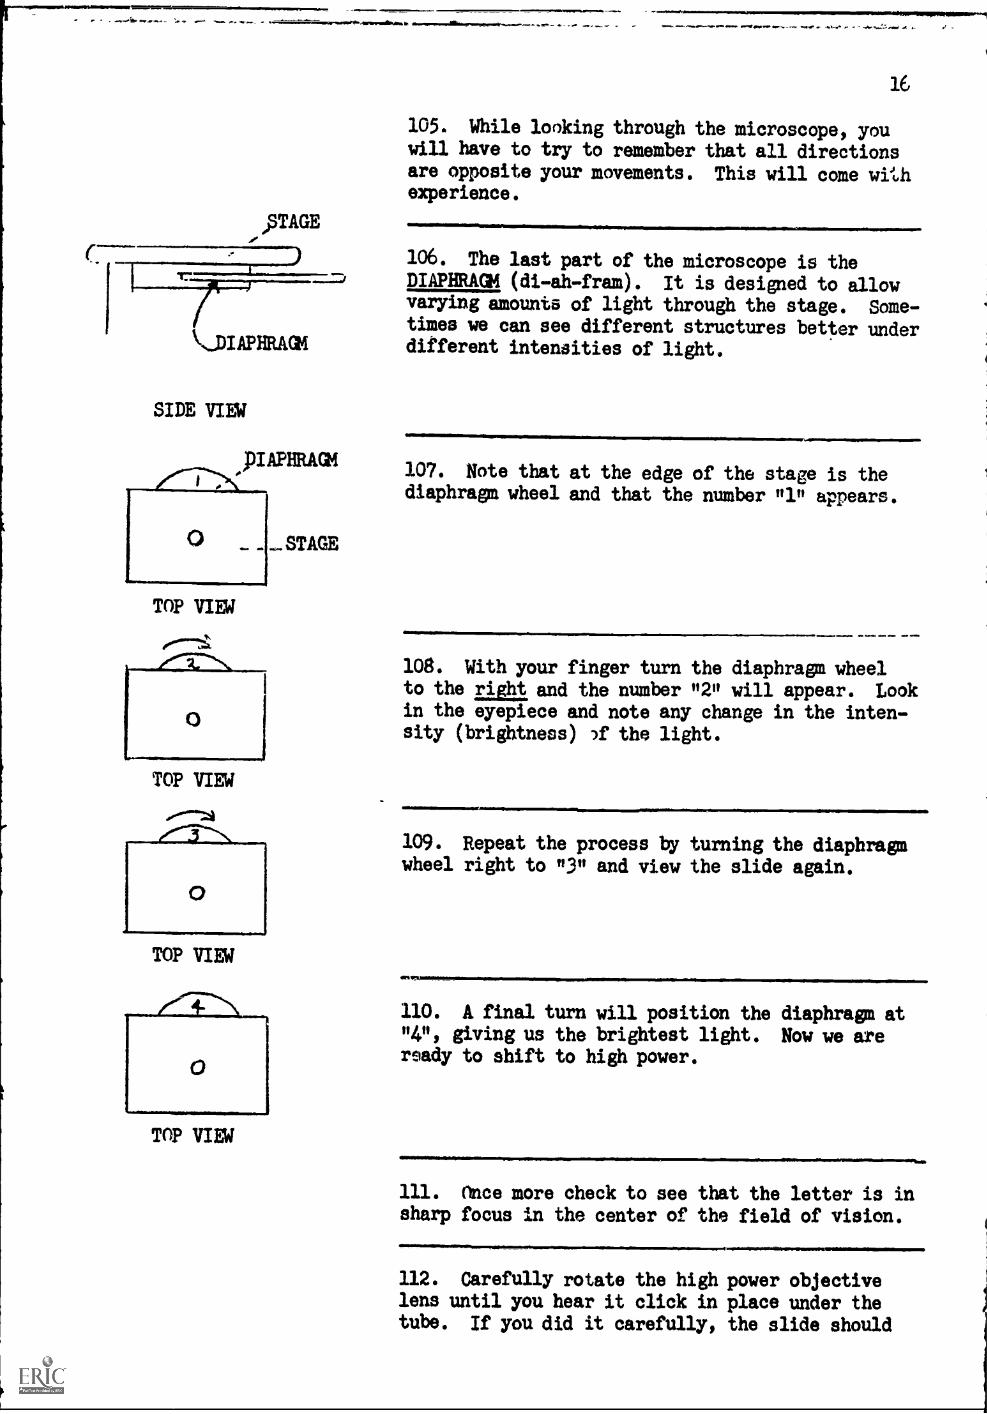
ftTAGE
ks_DIAPHRACIM
SIDE VIEW
LAPHRAGM
TOP VIEW
TOP VIEW
TOP VIEW
TOP VIEW
STAGE
16
105. While looking through the microscope, youwill have to try to remember that all directionsare opposite your movements. This will come withexperience.
106. The last part of the microscope is theDIAPHRAGM (di-ah-fram). It is designed to allowvarying amounts of light through the stage. Some-times we can see different structures better underdifferent intensities of light.
107. Note that at the edge of the stage is thediaphragm wheel and that the number "1" appears.
108. With your finger turn the diaphragm wheelto the right and the number 112 will appear. Lookin the eyepiece and note any change in the inten-sity (brightness) if the light.
109. Repeat the process by turning the diaphragmwheel right to 311 and view the slide again.
11.17%.111MI~AMINININNIMIN.'
110. A final turn will position the diaphragm at"4", giving us the brightest light. Now we areready to shift to high power.
111. Once more check to see that the letter is insharp focus in the center of the field of vision.
112. Carefully rotate the high power objectivelens until you hear it click in place under thetube. If you did it carefully, the slide should
17
be automatically in focus under high power. Ifyou see that the high power objective lens willhit the slide, turn the coarse adjustment knobtoward you about an inch and try again.
113. Under high power, use ijaor the.fine adjust,ment to focus if needed. While looking at theletter, focus only k turning toward you. If youneed to focus by turning away from you, look tothe side to make sure that the lens is not goingto crush the microscope slide.
114 When the letter is in focus, notice that youcan only see a portion of the letter and that thelight is dimmer. Remember that you are seeing theobject 430 times its natural and the lightthat was on only a small part of the letter before,is filling up the entire field of vision.
115. Now turn back to L(W power. Focus the letter"au again.
MINE ammeimmloOmm.-
116. Put a sheet of typing paper just to theright of the microscopa base if you are right-handed. Place xt to the left if you are left-handed.
117. Observe the letter "a" within the block ofgraph paper with your left eye if you are right-handed, and with your right eye if you are left-handed.
118. Visualize with your other eye the same imageon your sheet of typing paper that you see throughthe microscope. At first you will think this isimpossible, but keep looking even though you thinkyou'll never see anything. Wait patiently. Keeptrying.
119. Once you see the image projection, it canthen be traced with your pencil. Trace the blockof graph paper in which you find the letter Ha".
120. This is called "projection drawing". Youhave seen an image projected on a sheet oftyping paper, and have drawn this image. Thus itis called "projection drawing".
About 3.5 millimeters
18
121. After you have drawn the image of the block,measure one side in millimeters. All sides arethe same so the measurement of one is sufficient.
122. What is the length of the image of theblock in millimeters?
123. Now measure the actual block of graph paperalong one side. Its length in millimeters is
124. To calculate how much your image wasenlarged or magnified you need only to divideyour answer in frame 123 into the answer of frame122. Dividing the length of the actual block ofgraph paper into its image gives you the degreeof magnification. The degree of magnificationis the number of times your image was enlargedat a distance from the ocular to your sheet oftyping paper.
125. What is the degree of ma .faizatt.si of yourAnswer depends upon results image?
126. Find the number oa the microscope which youhave just used. What is the number?
127. Later you will need to use the microscopeagain and it would be best to use the samemicroscope, if possible. Put the microscope backon the main desk for it to be used by others atthis time.
128. PROCEDURAL ITEM - NO WRITTEN RESPONSE
Now we are ready for the laboratory experiment.You will notice the materials and equipment areplaced in the work area for you. Check over thefollowing list and make sure you have thesematerials and equipment with which to work. Theitems numbered in the list correspond with thenumbers on the materials and equipment which yousee. Take these items to an area designatedfor you to work. Check the time; if you do nothave approximately fifteen minutes to get startedon the experiment, then spend the remainingportion of the period reviewing and studying theframes you have just covered. Allow five minutes
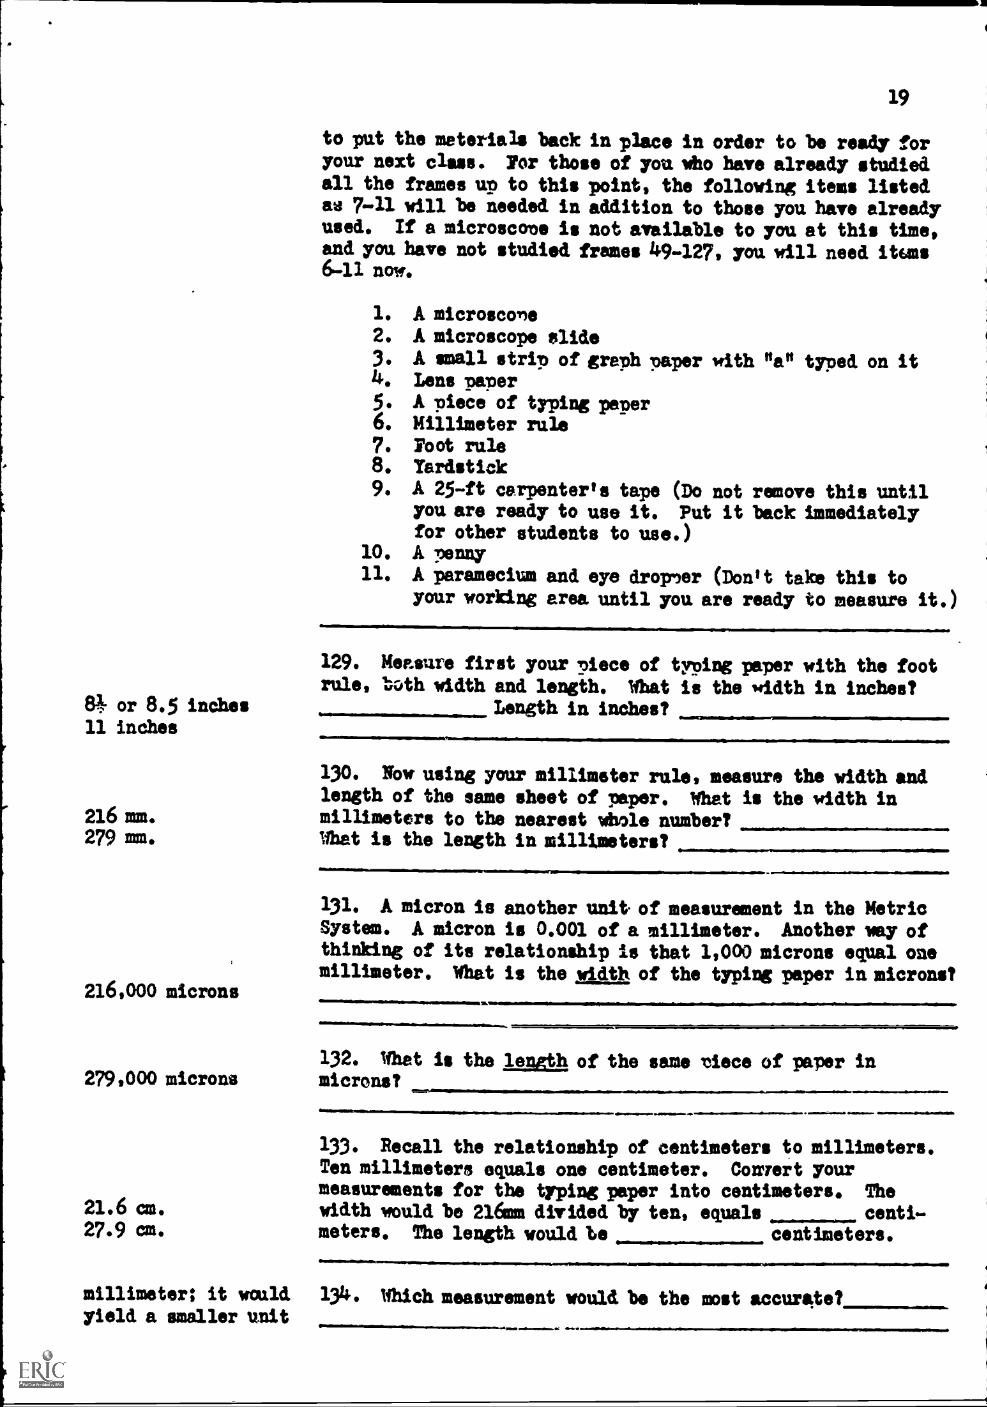
19
to put the materials back in place in order to be ready foryour next class. For those of you Who have already studiedall the frames up to this point, the following items listedas 7-11 will be needed in addition to those you have alreadyused. If a microscope is not available to you at this time,and you have not studied frames 49-127, you will need ituns6-11 now.
1. A microscore2. A microscope slide3. A small strip of graph paper with "a" typed on it4. Lens paper5. A piece of typing paper6. Millimeter rule7. Foot rule8. Yardstick9. A 25-ft carpenter's tape (Do not remove this until
you are ready to use it. Put it back immediatelyfor other students to use.)
10. A penny11. A paramecium and eye dropper (Don't take this to
your working area until you are ready to measure it.)
129. Measure first your piece of typing paper with the footrule, both width and length. What is the width in inches?
8 or 8.5 indium Length in inches?11 inches
216mm.279 mm.
216,000 microns
130. Now using your millimeter rule, measure the width andlength of the same sheet of paper. What is the width inmillimeters to the nearest whole number?What is the length in millimeters?
131. A micron is another unit of measurement in the MetricSystem. A micron is 0.001 of a millimeter. Another way ofthinking of its relationship is that 1,000 microns equal onemillimeter. What is the width of the typing paper in microns?
132. What is the length of the same niece of paper in279,000 microns microns?
00.1011OPOMPO
133. Recall the relationship of centimeters to millimeters.Ten millimeters equals one centimeter. Cowart yourmeasurements for the typing paper into centimeters. The
21.6 cm. width would be 216mm divided by ten, equals centi-27.9 cm. meters. The length would be, centimeters.
millimeter; it would 134. Which measurement would, be the most accurate?yield a smaller unit
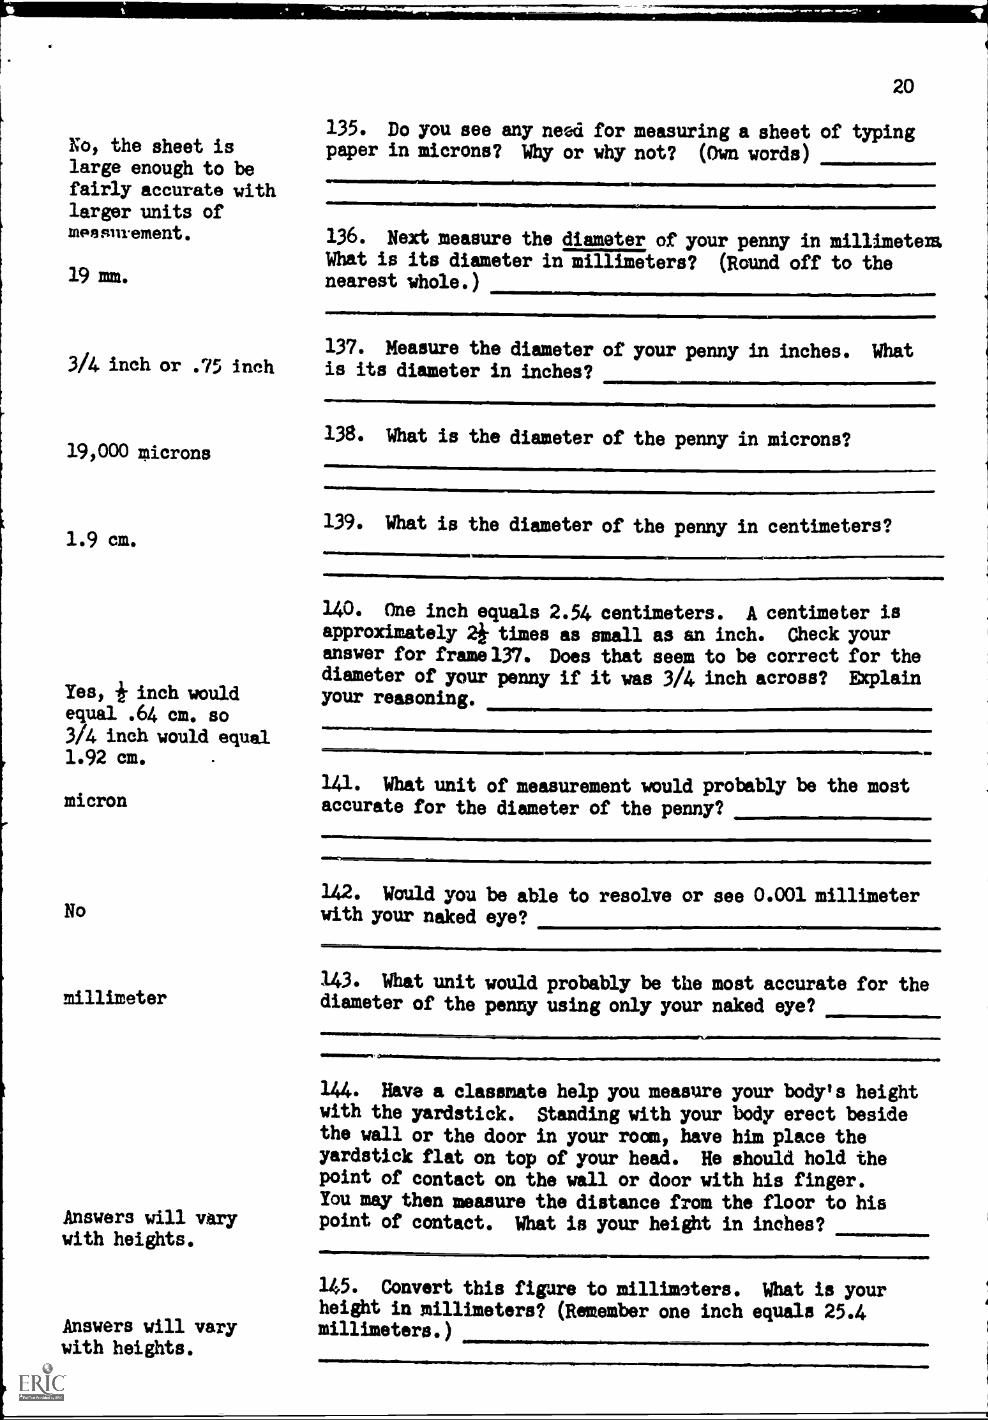
No, the sheet islarge enough to befairly accurate withlarger units ofmp9smement.
19 mm.
3/4 inch or .75 inch
19,000 microns
1.9 cm.
Yes, inch wouldequal .64 cm. so3/4 inch would equal1.92 cm.
micron
No
millimeter
Answers will varywith heights.
Answers will varywith heights.
20
135. Do you see any need for measuring a sheet of typingpaper in microns? Why or why not? (Own words)
136. Next measure the diameter of your penny in millimetemWhat is its diameter in millimeters? (Round off to thenearest whole.)
137. Measure the diameter of your penny in inches. Whatis its diameter in inches?
NassemalmobV
138. What is the diameter of the penny in microns?
139. What is the diameter of the penny in centimeters?
140. One inch equals 2.54 centimeters. A centimeter isapproximately 2 times as small as an inch. Check youranswer for frame137. Does that seem to be correct for thediameter of your penny if it was 3/4 inch across? Explainyour reasoning.
141. What unit of measurement would probably be the mostaccurate for the diameter of the penny?
142. Would you be able to resolve or see 0.001 millimeterwith your naked eye?
143. What unit would probably be the most accurate for thediameter of the penny using only your naked eye?
144. Have a classmate help you measure your body's heightwith the yardstick. Standing with your body erect besidethe wall or the door in your room, have him place theyardstick flat on top of your head. He should hold thepoint of contact on the wall or door with his finger.You may then measure the distance from the floor to hispoint of contact. What is your height in inches?
145. Convert this figure to millimeters. What is yourheight in millimeters? (Remember one inch equals 25.4millimeters.)
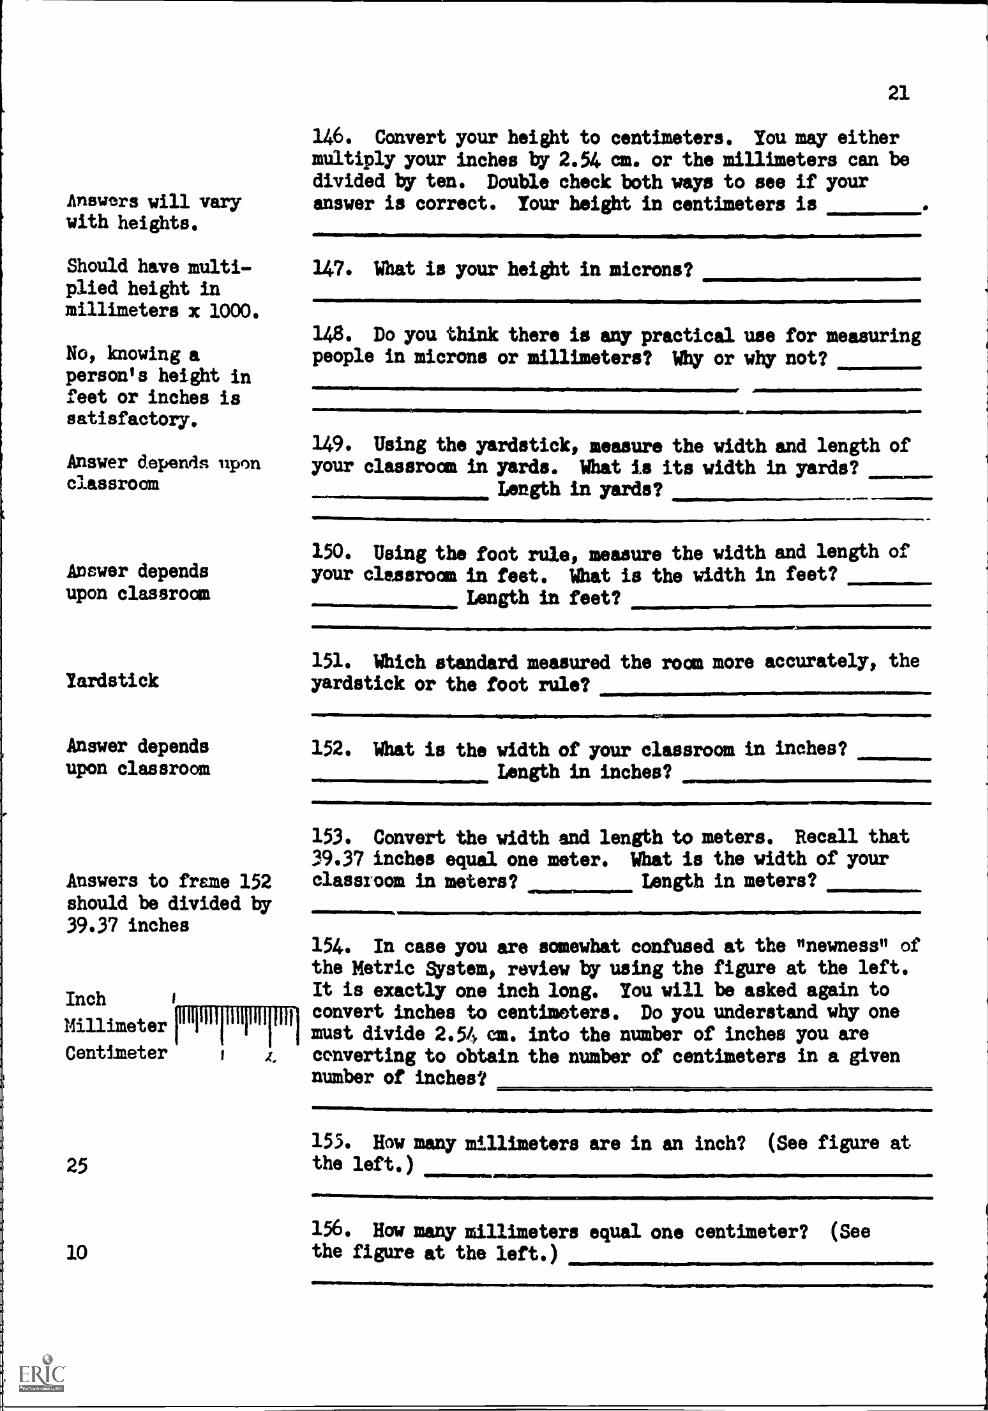
Answers will varywith heights.
Should have multi-plied height inmillimeters x 1000.
No, knowing aperson's height infeet or inches issatisfactory.
Answer depends uponclassroom
Answer dependsupon classroom
Yardstick
Answer dependsupon classroom
Answers to frame 152should be divided by39.37 inches
Inch
Millimeter
Centimeter
25
10
21
146. Convert your height to centimeters. You may eithermultiply your inches by 2.54 cm. or the millimeters can bedivided by ten. Double check both ways to see if youranswer is correct. Your height in centimeters is
147. What is your height in microns?
148. Do you think there is any practical use for measuringpeople in microns or millimeters? Why or why not?
149. Using the yardstick, measure the width and length ofyour classroom in yards. What is its width in yards?
Length in yards?
150. Using the foot rule, measure the width and length ofyour classroom in feet. What is the width in feet?
Length in feet?
151. Which standard measured the room more accurately, theyardstick or the foot rule?
152. What is the width of your classroom in inches?Length in inches?
153. Convert the width and length to meters. Recall that39.37 inches equal one meter. What is the width of yourclassroom in meters? Length in meters?
154. In case you are somewhat confused at the "newness" ofthe Metric System, review by using the figure at the left.It is exactly one inch long. You will be asked again toconvert inches to centimeters. Do you understand why onemust divide 2.54 cm. into the number of inches you areconverting to obtain the number of centimeters in a givennumber of inches?
155. How many millimeters are in an inch? (See figure atthe left.)
156. How many millimeters equal one centimeter? (See
the figure at the left.)
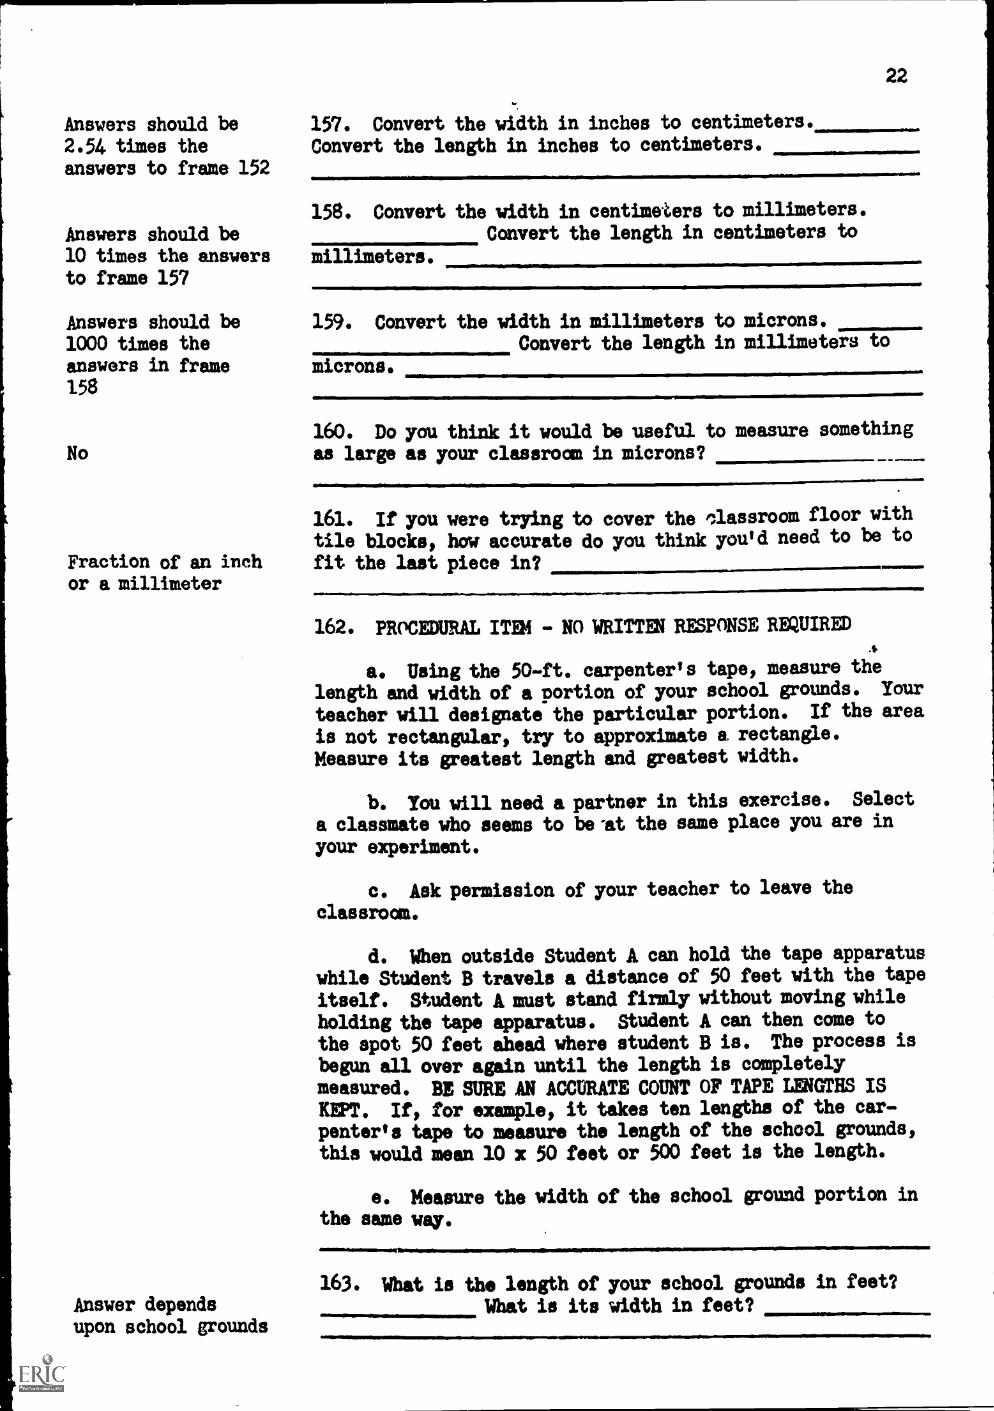
Answers should be2.54 times theanswers to frame 152
157. Convert the width in inches to centimeters.
Convert the length in inches to centimeters.
22
158. Convert the width in centimeters to millimeters.
Answers should be10 times the answers millimeters.to frame 157
Answers should be1000 times theanswers in frame158
Convert the length in centimeters to
159. Convert the width in millimeters to microns.Convert the length in millimeters to
microns.
160. Do you think it would be useful to measure somethingNo as large as your classroom in microns?
Fraction of an inchor a millimeter
Answer dependsupon school grounds
161. If you were trying to cover the ,lassroom floor with
tile blocks, how accurate do you think you'd need to be to
fit the last piece in?
162. PROCEDURAL ITEM - NO WRITTEN RESPONSE REQUIRED
a. Using the 50-ft. carpenter's tape, measure the
length and width of a portion of your school grounds. Your
teacher will designate the particular portion. If the area
is not rectangular, try to approximate a rectangle.
Measure its greatest length and greatest width.
b. You will need a partner in this exercise. Select
a classmate who seems to beat the same place you are in
your experiment.
c. Ask permission of your teacher to leave the
classroom.
d. When outside Student A can hold the tape apparatuswhile Student B travels a distance of 50 feet with the tape
itself. Student A, must stand firmly without moving while
holding the tape apparatus. Student A can then come to
the spot 50 feet ahead where student B is. The process is
begun all over again until the length is completelymeasured. BE SURE AN ACCURATE COUNT OF TAPE LENGTHS ISKEPT. If, for example, it takes ten lengths of the car-penter's tape to measure the length of the school grounds,this would mean 10 x 50 feet or 500 feet is the length.
e. Measure the width of the school ground portion inthe same way.
11111Mmar11111.. A11104.1
163. What is the length of your school grounds in feet?What is its width in feet?
23
Answer depends on 164. Convert the length into inches. Convertschool grounds the width into inches.
Answer depends onschool grounds
Answer depends onschool grounds
Answer depends onschool grounds
Answer depends onschool grounds
Answer depends onschool grounds
Fairly accurately buthaving to replace thelength of the tapequite often wouldintroduce human error.
Yes, the tape wouldhave been replacedonly half as often
Paramecium
165. What is the school grounds length in meters? Onemeter equals 39.37 inches.) The width inmeters is
166. Convert the length measurement into yards.Convert the width measurement into yards.
167. What is the length of the school grounds in centime-ters? What is the width of the schoolgrounds in centimeters?
168. Convert the length to millimetersConvert the width to millimeters
169. What is the length of the school grounds in microns?What is the width in
microns?
170. How accurately do you think you mear...:ed the school
grounds with a 50-ft. carpenter's tape?
171. Do you think a 100-ft. carpenter's tape would havegiven you more accuracy? Explain your answer.
172. PROCEDURAL ITEM - NO WRITTEN RESPONSE REQUIRED
a. Now you will need the microscope. Set it up
ready to use. Look for the number of the micro-scope which you previously used. The number isrecorded in frame 126. If you have not studied
frames 49-127, do so now. Then come back to this
section.
b. Take a microscope slide, and using an eye dropperput a drop or two of water in the middle of yourslide from the infusion culture containing para-mecia or some other ciliate protozoan.
C. Focus the microscope properly on low power andtry to locate a one-celled animal that resemblesthe figure at the left. An active parameciumwill look like a white dot darting across yourfield of vision.
24
d. Place a sheet of typing paper just to the rightof the microscope base if you are right-handed.Place it to the left if you are left-handed.
e. Now as you observe the paramecium with your lefteye (if right-handed) or right eye (if left-handed), visualize with your other eye the sameimage on your typing paper that you see throughthe microscope. Try to locate the parameciumwhen it is not too active and trace its image.
173. Measure the image of your paramecium. What is itsAnswer depends upon length in millimeters?size of paramecium
174. What is the correct measurement of your paramecium?To determine it, divide the degree of magnification youobtained (frame 125) into the length of the image of yourparamecium. What is the length of your paramecium in
Answer depends upon millimeters?size of paramecium
Answer depends uponsize of paramecium
111ww
175. Tour answer is probably a decimal figure, much lessthan one. Convert your answer to microns. Remember one
millimeter equals 1000 microns.
176. How practical do you think it would be to measure aNot practical in any paramecium in meters or yards?of the three cases. In feet? In inches?An extremely small Why or why not?unit is needed
177. Can you see why the unit of measurement called the"micron" was invented? Explain why you think it was
Microscopic measurement necessary.can be made moreaccurately
Yes, the smaller theobject the smallerthe unit needed
178. Do you see a relationship between the size of theobject being measured, and the size of the unit needed fornecessary accuracy?
179. Do you see a relationship between the desired degreeof accuracy and the size of measurement units used?
Yes, the more accur- Explain.acy desired the
smaller the unit thatshould be used
180. When you are through with the microscope, please dothe following so that the next person to use the microscopewill be able to start off as you did.
25
a. Position the microscope so that it is again in anupright position by holding the base and applyingpressure on the arm.
b. Shift to low power.
c. Take the slide off the stage.
d. Return the clamps to the original position.
e. Turn the coarse adjustment away from you until itis all the way down, and then turn it back towardyou so that the low power objective is about oneinch from the stage.
f. Set the diaphragm wheel at ullf by turning thediaphragm right.
g. If the microscope has an electric power source,unplug it and wrap the cord around the base.
h. Wipe off any water on the stage or surroundinglaboratory table.
i. Put the cover on the microscope if it has one.
j. Clean off the slide and the cover slip.
FURTHER INVESTIGATIONS
181. If you have extra time you might be interested inconsidering the following questions. How important is itthat you know about the 50 cents if (a) you have only $1.50when you are ordering dinner at a restaurant? (b) youhave $151.50 in your checking account at the bank whenyou wish to buy an article of clothing? (c) you have$5,151.50 in your savings account when you wish to make adown payment on a house? (d) a proposed large expenditureby the company for which you work is $55,151.50? (e) an
intercontinental ballistics missile costs $5,151,151,151.50?Why?
182. If you have time remaining in the period begin onthe next programmed lesson. File this lesson in a safeplace so that you may review it later.
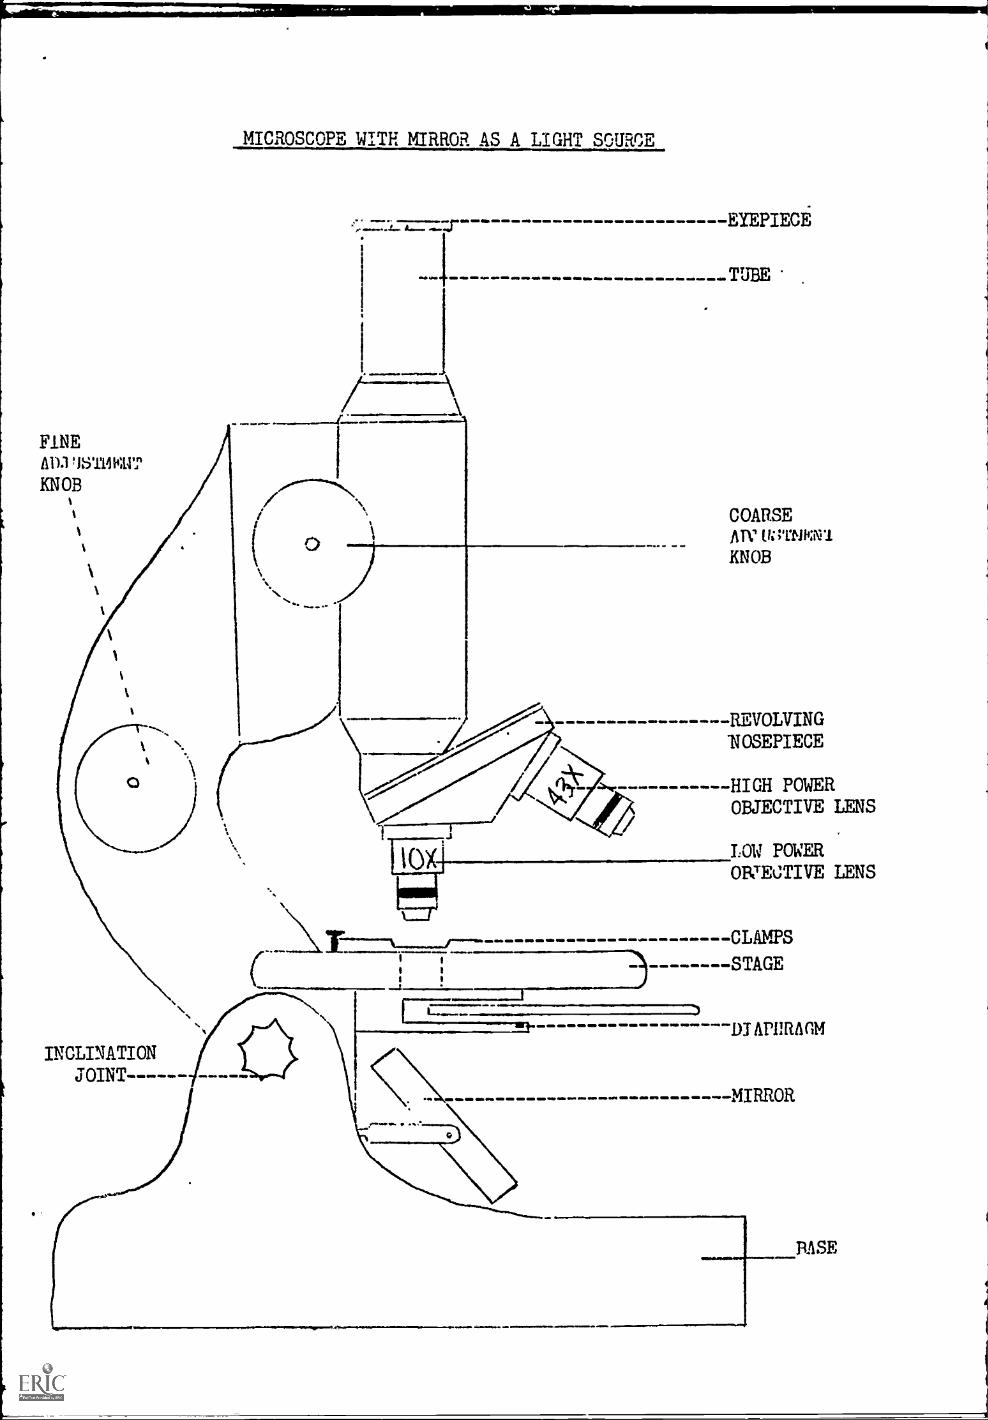
FINEM).1 !1;3111141,11,"
KNOB
MICROSCOPE WITH MIRROR AS A LIGHT SOURCE
EYEPIECE
TUBE
COARSEMV tr;
KNOB
REVOLVINGNOSEPIECE
HIGH POWEROBJECTIVE LENS
LOW POWEROBJECTIVE LENS
CLAMPS
STAGE
DIAITRAGM
INCLINATIONJOINT
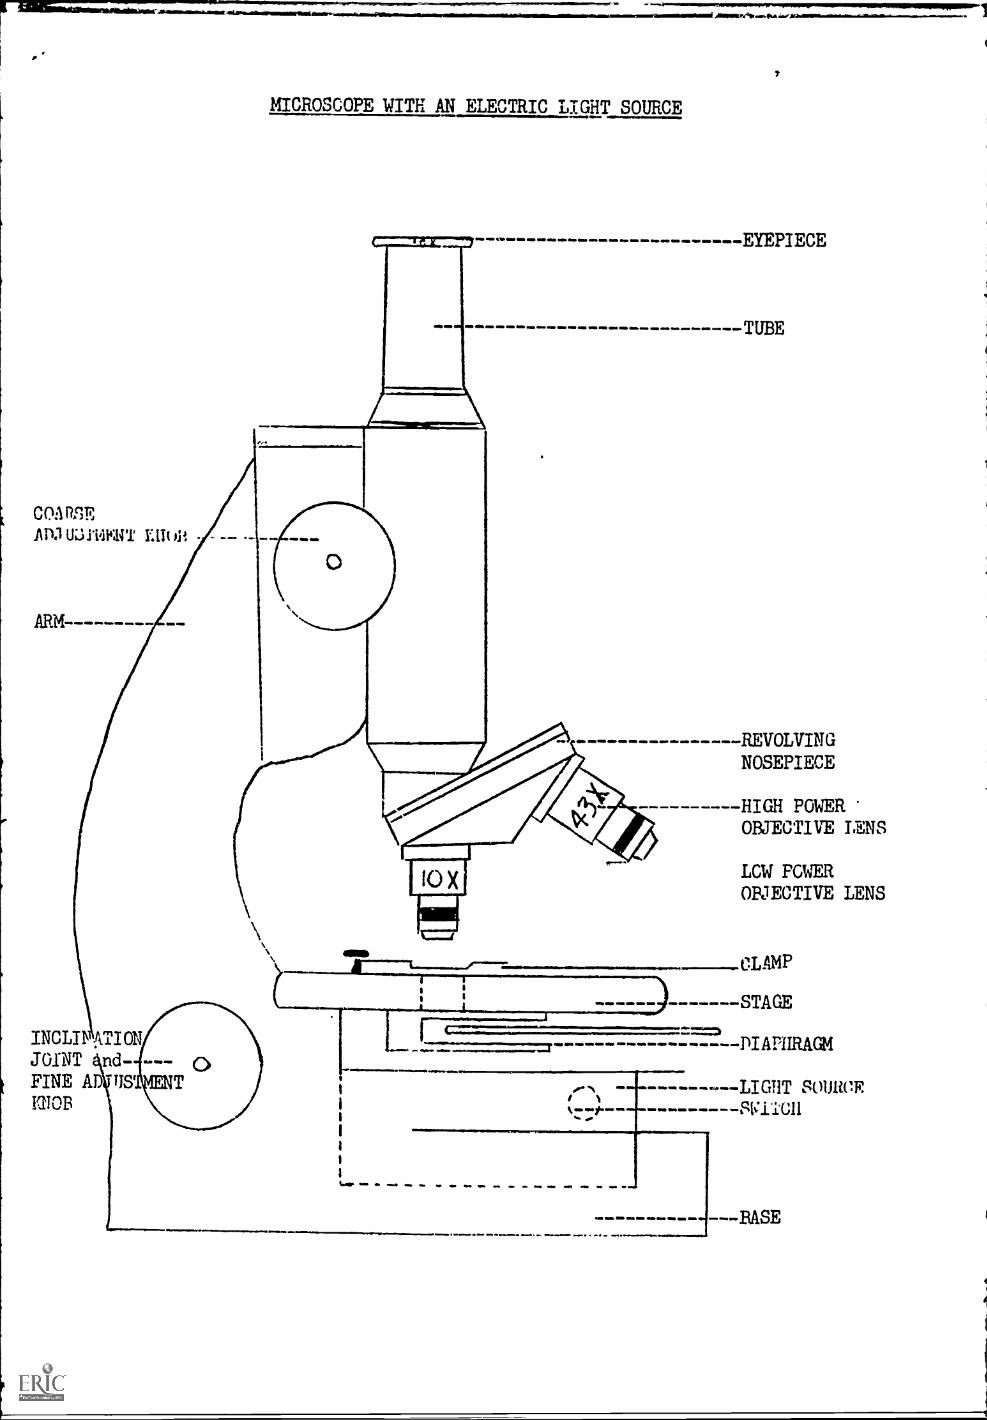
Coif RicT,
113U39'i4 eNT E1114,
ARM
MICROSCOPE WITH AN ELECTRIC LIGHT SOURCE
INCLII ATION
JOINT nd-FINE AD USKNOB
.e..
EYEPIECE
TUBE
REVOLVINGNOSEPIECE
IMIMMMOMMI
HIGH POWEROBJECTIVE LENS
LCW FGWEROBJECTIVE LENS
CLAMP
STAGE
DIAPHRAGM
-- - - - - -- -LIGHT SOUR .E
------- __sviTcli
IMMO OPP 1MM 44P /MP IM we.
BASE
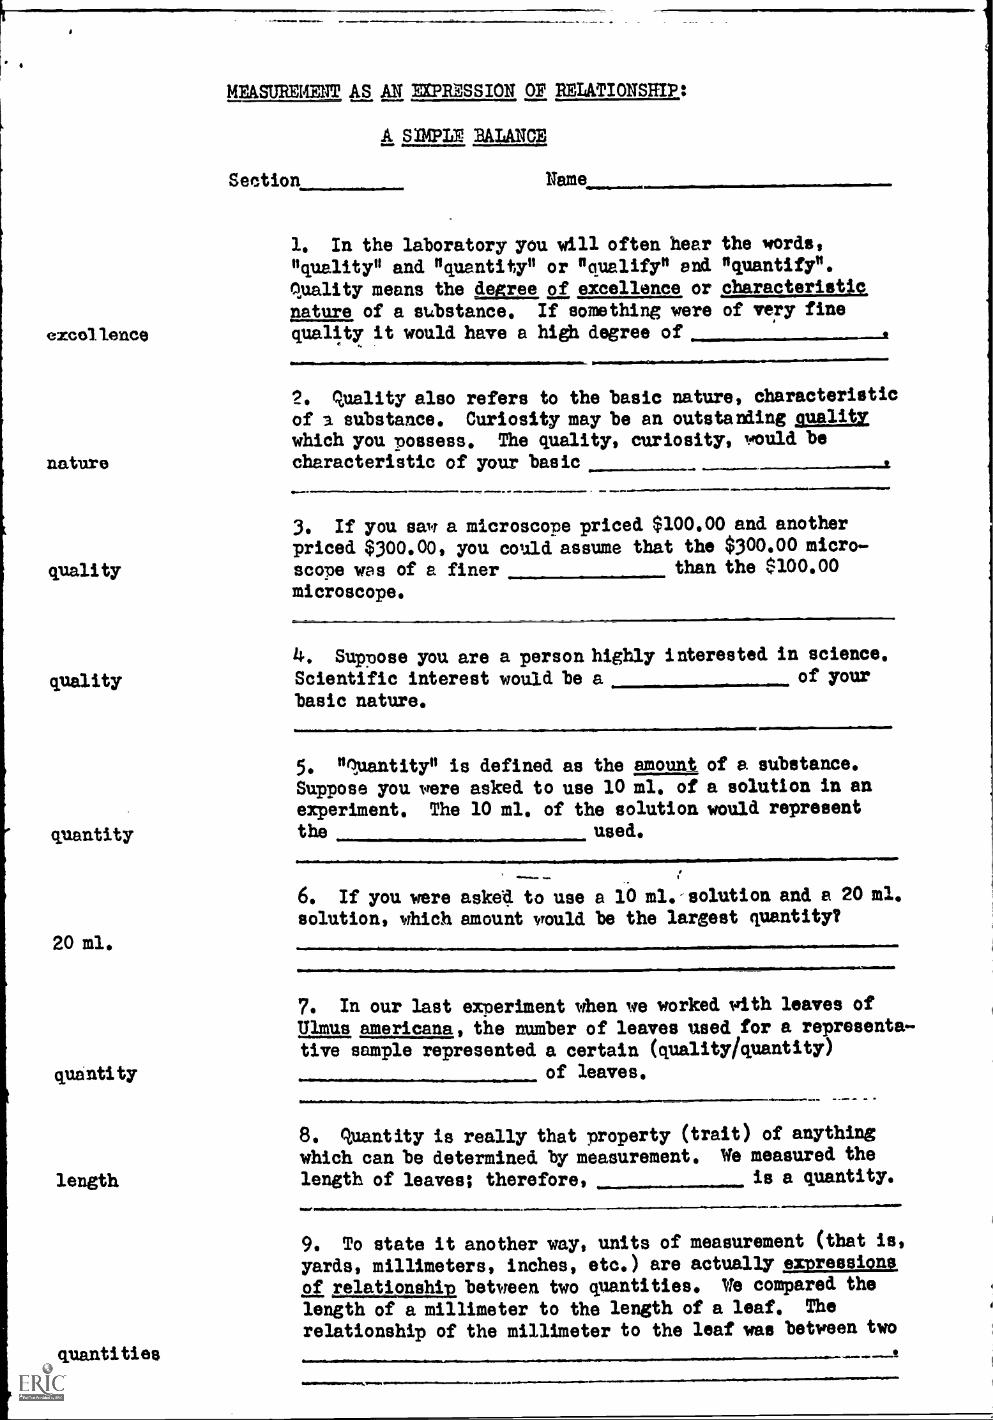
excollenCe
nature
quality
quality
quantity
20 ml.
quantity
length
quantities
MEASUREMENT AS AN MPRESSION OF RELATIONSHIP:
A SIMPLE BALANCE
Section Name
1. In the laboratory' you will often hear
"quality" and "quantity" or "qualify" endquality means the degree of excellence ornature of a substance. If something werequality it would have a high degree of
the words,"quantify".
characteristicof very fine
2. quality also refers to the basic nature, characteristicof a substance. Curiosity may be an outstanding aualitY,which you possess. The quality, curiosity, would becharacteristic of your basic
3. If you saw a microscope priced $100.00 and anotherpriced $300.00, you could assume that the $300.00 micro-scope was of a finer than the $100.00
microscope.
4. Suppose you are a person highly interested in science.Scientific interest would be a, of your
basic nature.
5. "luantity" is defined as the amount of a substance.
Suppose you were asked to use 10 ml. of a solution in anexperiment. The 10 ml. of the solution would representthe used.
6. If you were asked to use a 10 ml.-solution and a 20 ml.solution, which amount would be the largest quantity?
7. In our last experiment when we worked with leaves ofUlmus americana, the number of leaves used for a representa-tive sample represented a certain (quality quantity)
of leaves.
8. quantity is really that property (trait) of anythingwhich can be determined by measurement. We measured the
length of leaves; therefore, is a quantity.
um,
9. To state it another way, units of measurement (that is,
yards, millimeters, inches, etc.) are actually expressionsof relationship between two quantities. We compared the
length of a millimeter to the length of a leaf. The
relationship of the millimeter to the leaf was between two
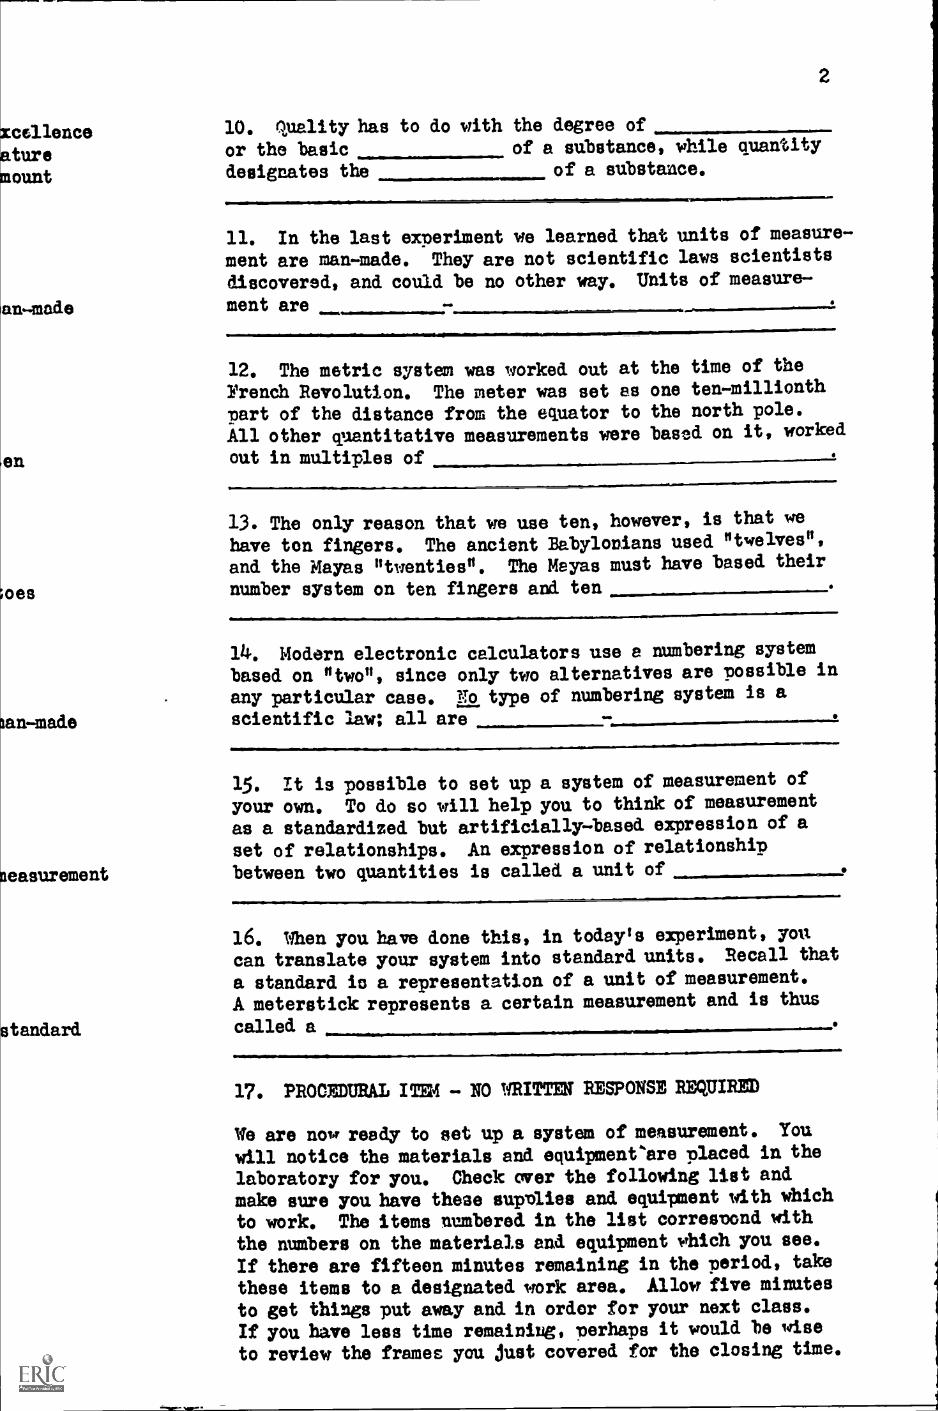
2
xcellence 10. quality has to do with the degree of
attire or the basic of a substance, while quantity
mount designates the of a substance.
an-made
en
oes
an-made
measurement
standard
11. In the last experiment we learned that units of measure-
ment are man-made. They are not scientific laws scientists
discovered, and could be no other way. Units of measure-
ment are
12. The metric system was worked out at the time of the
French Revolution. The meter was set as one ten-millionth
part of the distance from the equator to the north pole.
All other quantitative measurements were based on it, worked
out in multiples of
13. The only reason that we use ten, however, is that we
have ton fingers. The ancient Babylonians used "twelves",
and the Mayas "twenties". The Mayas must have based their
number system on ten fingers and ten
14, Modern electronic calculators use a numbering system
based on "two", since only two alternatives are possible in
any particular case. No type of numbering system is a
scientific law; all are
15. It is possible to set up a system of measurement of
your own. To do so will help you to think of measurement
as a standardized but artificially-based expression of a
set of relationships. An expression of relationship
between two quantities is called a unit of
16. When you have done this, in today's experiment, you.
can translate your system into standard units. Recall that
a standard is a representation of a unit of measurement.
A meterstick: represents a certain measurement and is thus
called a
17. PROCEDURAL ITEM - NO WRITTEN RESPONSE REQUIRED
We are now ready to set up a system of measurement. You
will notice the materials and equipment'are placed in the
laboratory for you. Check over the following list and
make sure you have these supmlies and equipment with which
to work. The items numbered in the list correspond with
the numbers on the materials and equipment which you see.
If there are fifteen minutes remaining in the period, take
these items to a designated work area. Allow five minutes
to get things put away and in order for your next class.
If you have less time remainiug, perhaps it would be wise
to review the frames you just covered for the closing time.
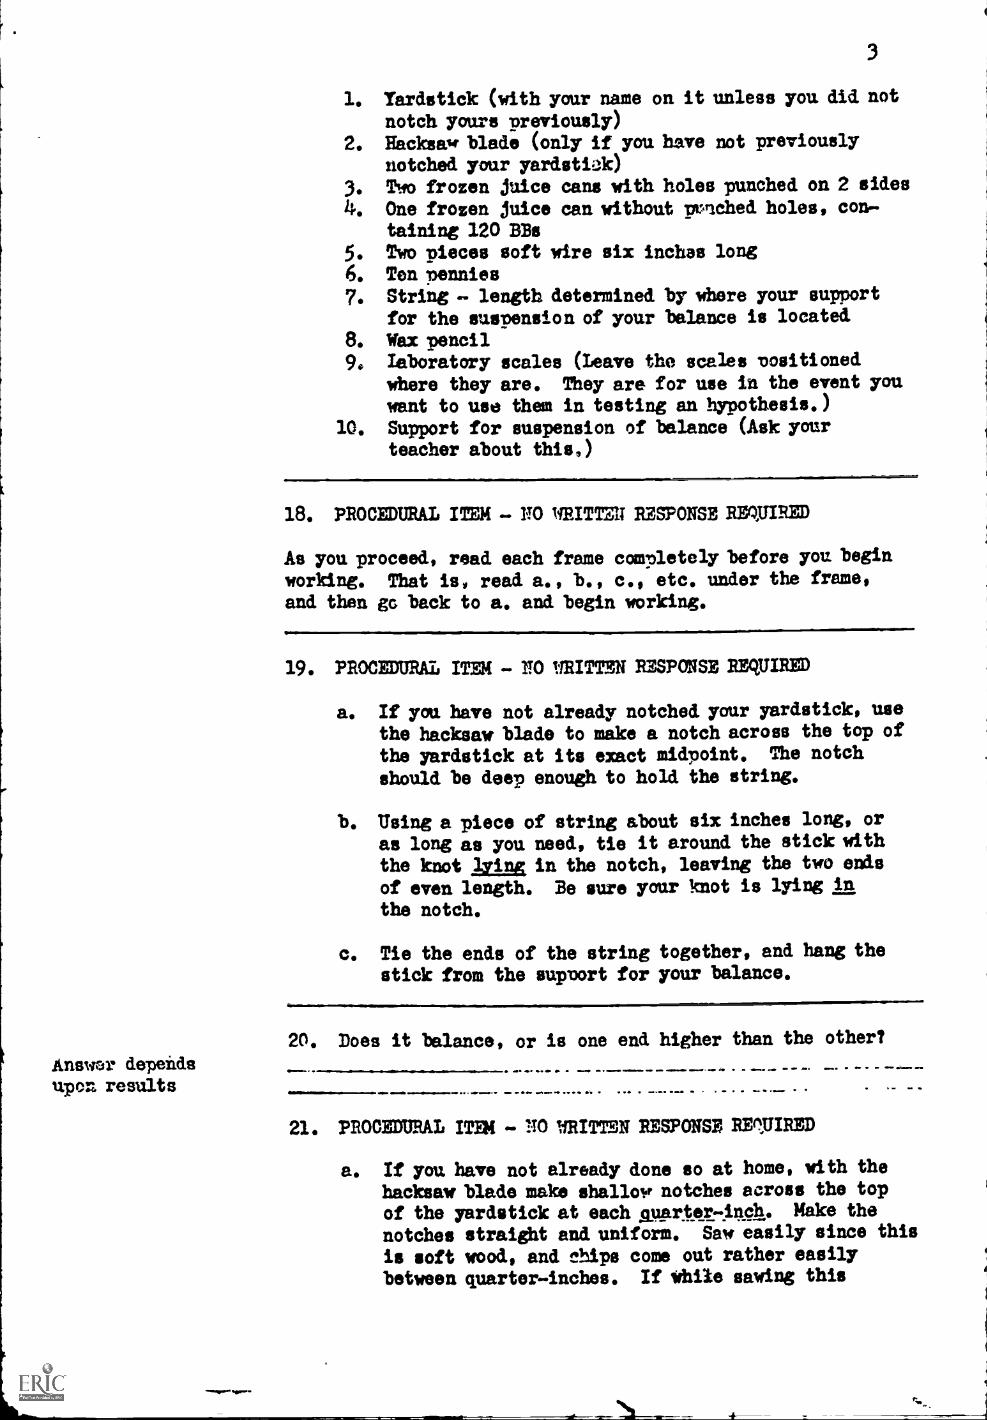
3
1. Yardstick (with your name on it unless you did not
notch yours previously)
2. Hacksaw blade (only if you have not previouslynotched your yardstick)
3. Two frozen juice cans with holes punched on 2 sides
4. One frozen juice can without mtiched holes, con-taining 120 BBs
5. Two pieces soft wire six inches long6. Ten pennies7. String - length determined by where your support
for the suspension of your balance is located
8. Wax pencil9. laboratory scales (Leave the scales positioned
where they are. They are for use in the event youwant to use them in testing an hypothesis.)
10. Support for suspension of balance (Ask yourteacher about this,)
18. PROCEDURAL ITEM - NO WRITTM RESPONSE murRED
As you proceed, read each frame completely before you beginworking. That is read a., b., c., etc. under the frame,and than go back to a, and begin working.
19. PROCEDURAL ITEM - PTO MITTEN RESPONSE REQUIRED
a. If you have not already notched your yardstick, usethe hacksaw blade to make a notch across the top ofthe yardstick at its exact midpoint. The notch
should be deep enough to hold the string.
b. Using a piece of string about six inches long, oras long as you need, tie it around the stick with
the knot lit= in the notch, leaving the two ends
of even length. Be sure your knot is lying in
the notch.
c. Tie the ends of the string together, and hang thestick from the support for your balance.
20. Does it balance, or is one end higher than the other?
.111 - 40 Ma el.
21. PROCEDURAL ITEK - NO MITTEN RESPONSE RETIRED
a. If you have not already done so at home, with thehacksaw blade make shallow notches across the topof the yardstick at each nuarter-inch. Make the
notches straight and uniform. Saw easily since this
is soft wood, and chips come out rather easilybetween quarter-inches. If While sawing this
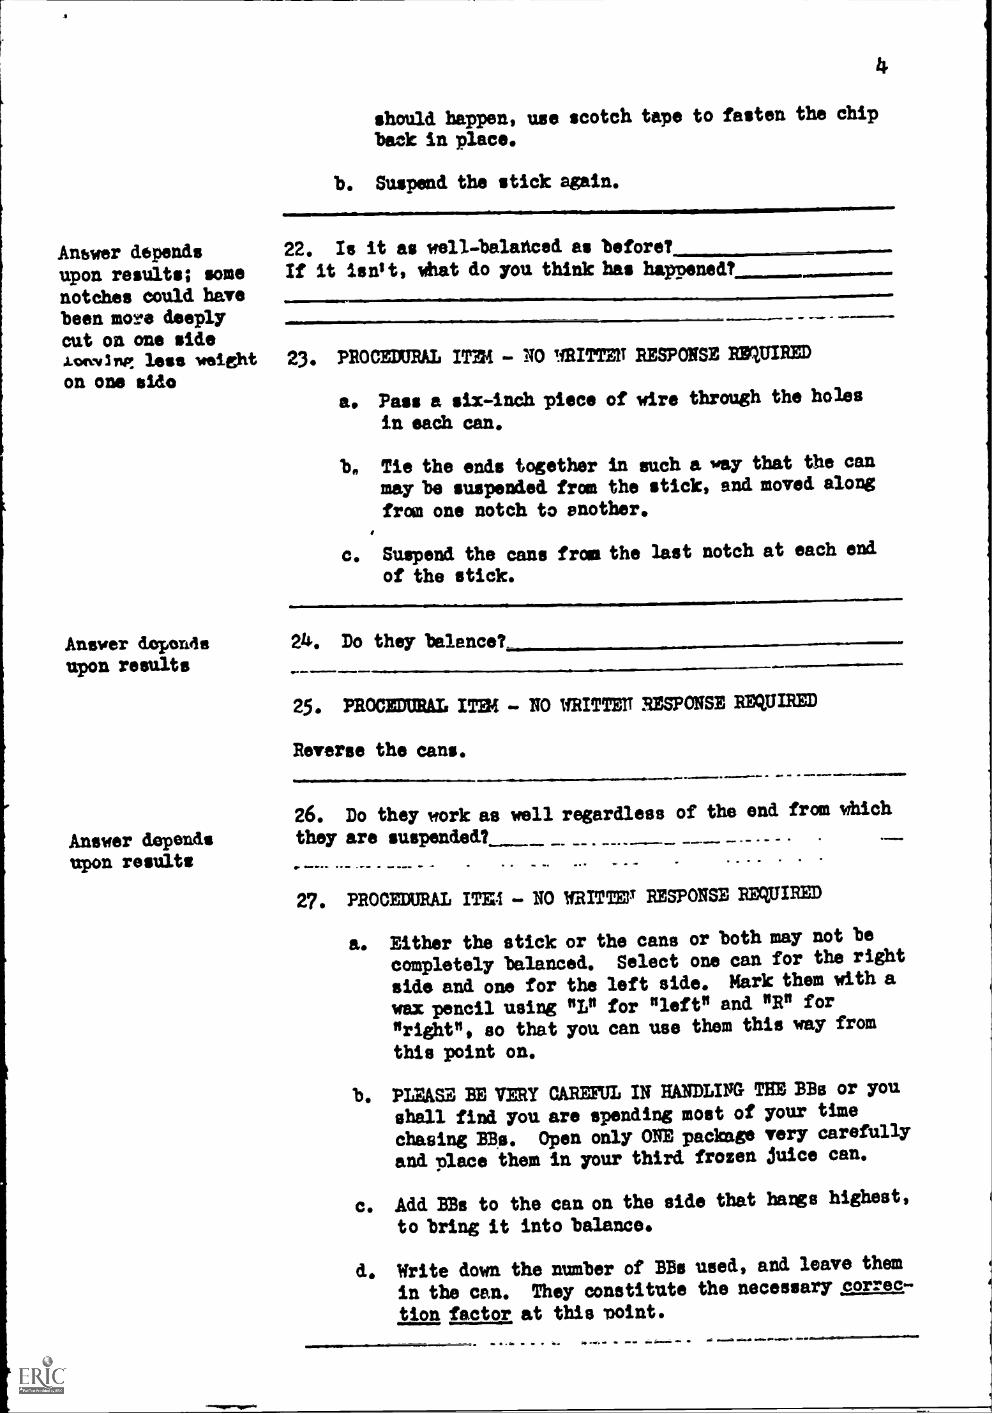
Answer dependsupon results; somenotches could havebeen more deeplycut on one sidelowiSTIP: less weight
on one lido
Answer dependsupon results
Answer dependsupon results
should happen, use scotch tape to fasten the chip
back in place.
b. Suspend the stick again.
22. Is it as well- balanced as before?
If it isn't, What do you think has happened?
23. PROCEDURAL IT34 - NO T.fRITTEN RESPONSE REWIRED
a. Pass a six-inch piece of wire through the holes
in each can.
be Tie the ends together in such a way that the can
may be suspended from the stick, and moved along
from one notch to another.
c. Suspend the cane from the last notch at each end
of the stick.
24. Do they balance?
25. PROCEDURAL ITER - NO WRITTEU RESPONSE REQUIRED
Reverse the cans.
26. Do they work as well regardless of the end from which
they are suspended?
27. PROCEDURAL ITE4 - NO UMW' RESPONSE REQUIRED
a. Either the stick or the cans or both may not be
completely balanced. Select one can for the right
side and one for the left side. Mark them with a
wax pencil using "IP for "left" and "R" for
"right", so that you can use them this way from
this point on.
b. PLEASE BE VERY CAREFUL IN HANDLING THE BBs or you
shall find you are spending most of your time
chasing BBs. Open only ONE package very carefully
and place them in your third frozen juice can.
c. Add. BBs to the can on the side that bangs highest,
to bring it into balance.
de Write down the number of BBs used, and leave them
in the can. They constitute the necessary correc-
tion factor at this *point.
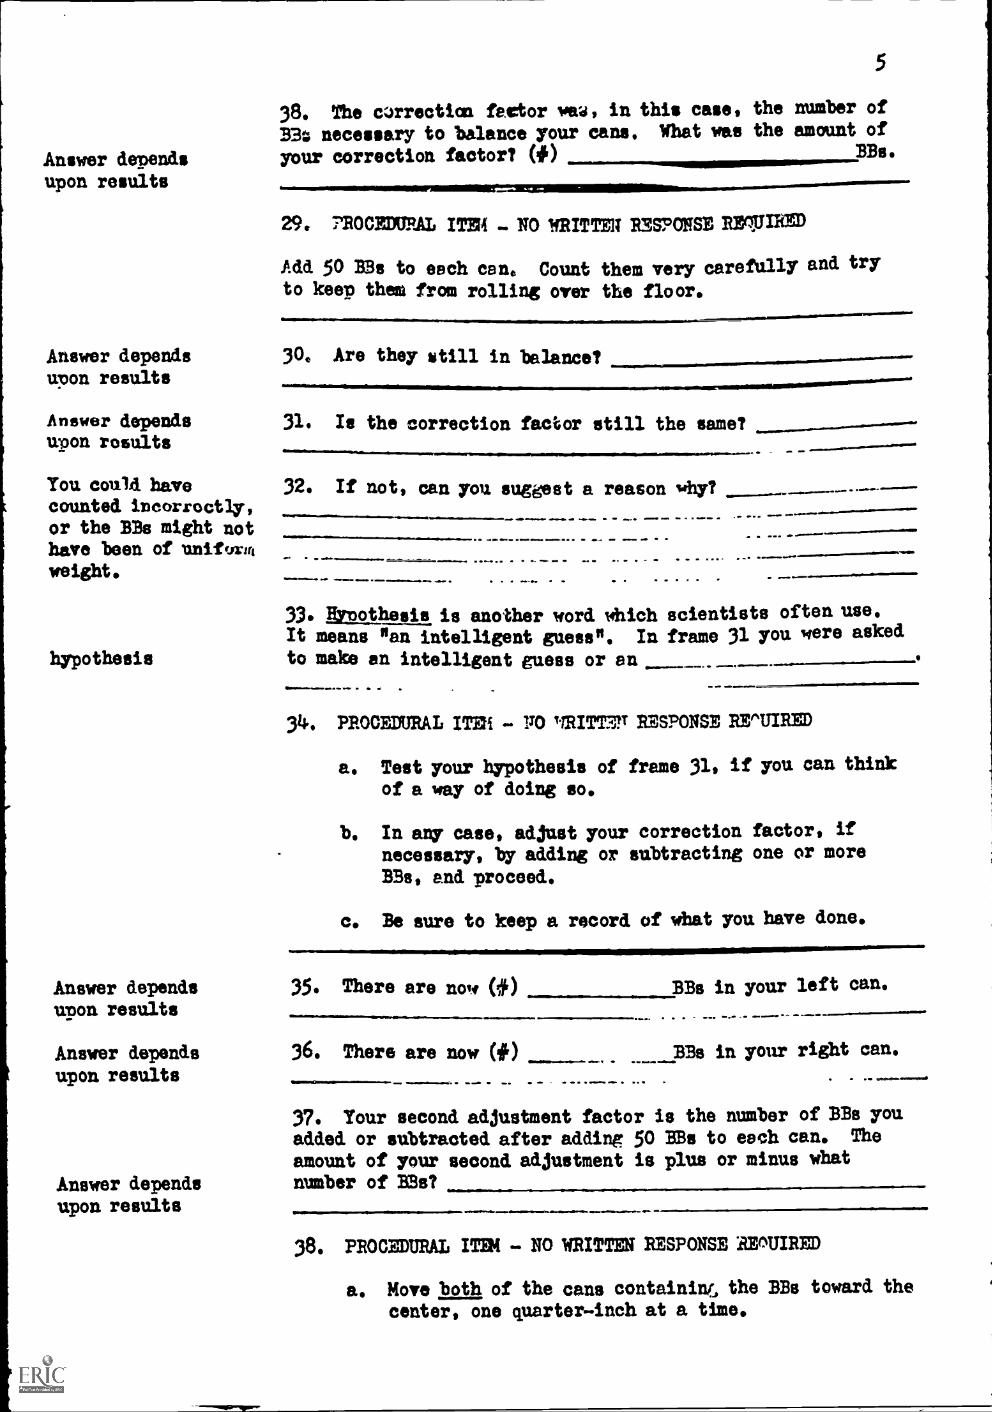
Answer dependsupon results
5
38. The correction factor was, in this case, the number of
B3,4 necessary to balance your cans. What was the amount of
your correction factor? (#) BBs.
29. TROCBDUP.AL ITER - NO WRITTEN RESPONSE REVIRM
Add 50 BBs to each can. Count them very carefully and try
to keep them from rolling over the floor.
Answer depends 30. Are they %till in balance?upon results
Answer depends 31. Is the correction factor still the same?upon rosults
You could havecounted incorroctly,
or the BBs might nothave been of uniformweight.
hypothesis
Answer dependsupon results
32. If not, can you suggest a reason why?
...111.111111. - -
33. Hypothesis is another word Which scientists often use.It means "an intelligent guess". In frame 31 you were asked
to make an intelligent guess or an
34. PROCEDURAL ITER YO 9RITT3IT RESPONSE REPTIRIM
a. Test your hypothesis of frame 31, if you can think
of a way of doing so.
b. In any case, adjust your correction factor, ifnecessary, by adding or subtracting one or moreBBs, and proceed.
c. Be sure to keep a record of what you have done.
35. There are now 00 BBs in your left can.
Answer depends 36. There are now (#)
upon results
Answer dependsupon results
BBs in your right can.
37. Your second adjustment factor is the number of BBs youadded or subtracted after adding 50 BBs to each can. The
amount of your second adjustment is plus or minus whatnumber of BBs?
38. PROCEDURAL ITEM - NO WRITTEN RESPONSE 'BEMIRED
a, Move both of the cans containing, the BBs toward thecenter, one quarter-inch at a time.
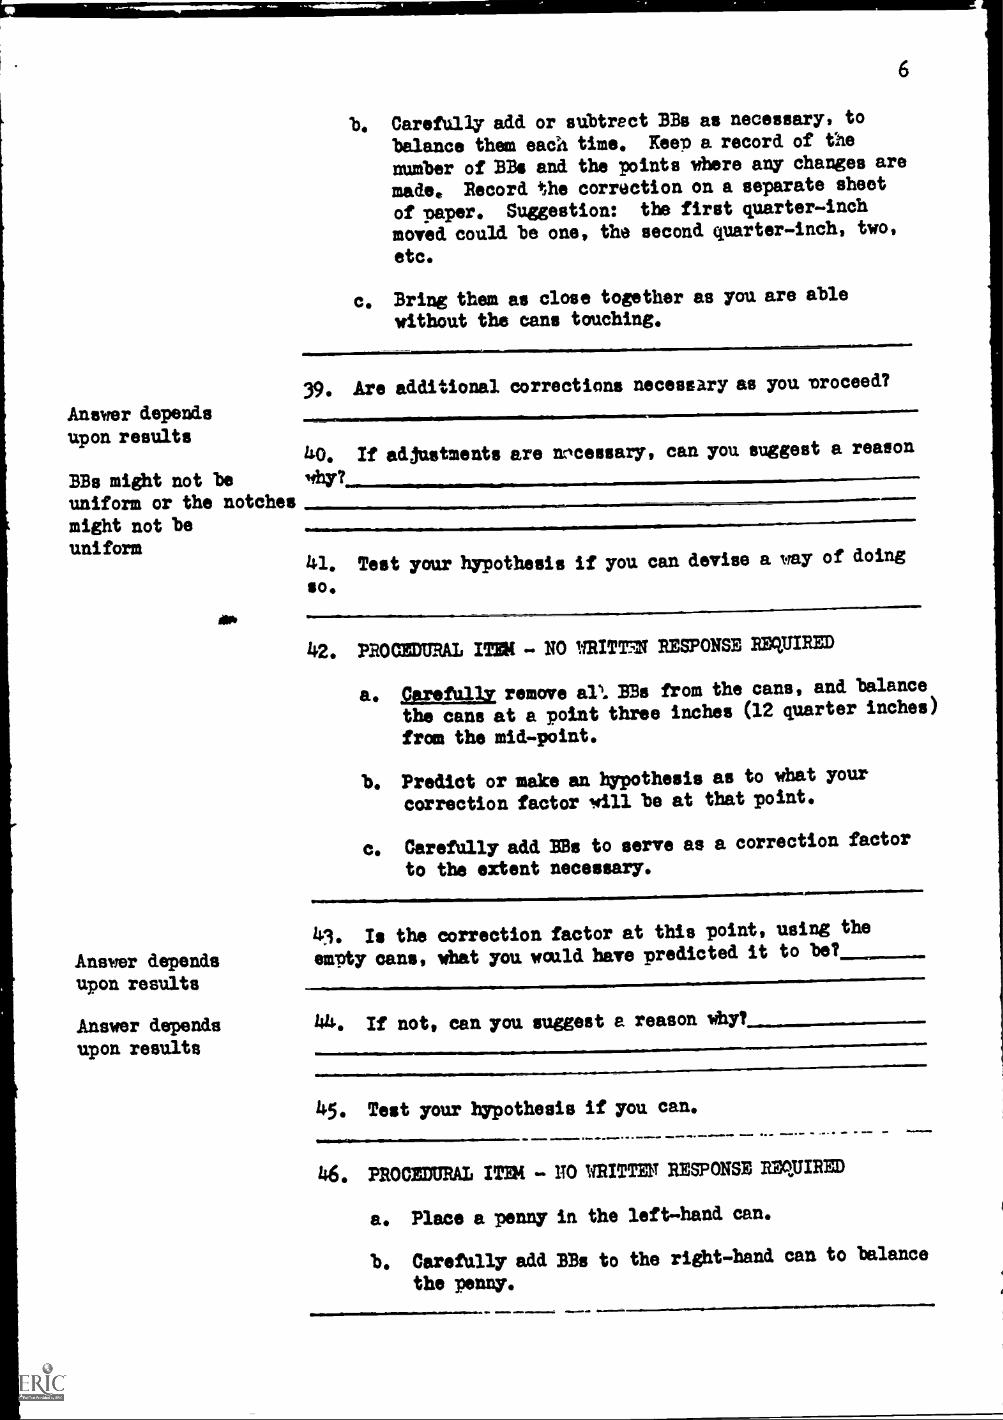
6
b. Carefully add or subtract BBs as necessary, to
balance them each time. Keep a record of the
number of BBs and the points where any changes are
made. Record the correction on a separate sheet
of paper. Suggestion: the first quarter -inch
moved could be one, the second quarter -inch, two,
etc.
c. Bring them as close together as you are able
without the cans touching.
39. Are additional corrections necessary as you Proceed?
Answer depends
upon results40. If adjustments are necessary, can you suggest a reason
BBs might not be ithy?
uniform or the notches
might not beuniform
41. Test your hypothesis if you can devise a way of doing
so.
42. PROCEDURAL ITEM - NO WRITT7T RESPONSE REQUIRED
a. Carefully remove al: BBs from the cans, and balance
the cans at a point three inches (12 quarter inches)
from the mid-point.
b. Predict or make an hypothesis as to what your
correction factor be at that point.
c. Carefully add BBs to serve as a correction factor
to the extent necessary.
i'3, Is the correction factor at this point, using the
Answer depends empty cane, what you would have predicted it to be?
upon results
Answer depends 144. If not, can you suggest a reason why?
upon results
45. Test your hypothesis if you can.
mlm.
46. PROCEDURAL ITEM . ITO WRITTE1T RESPONSE REQUIRED
a. Place a penny in the left-hand can.
b. Carefully add BBs to the right-band can to balance
the penny.
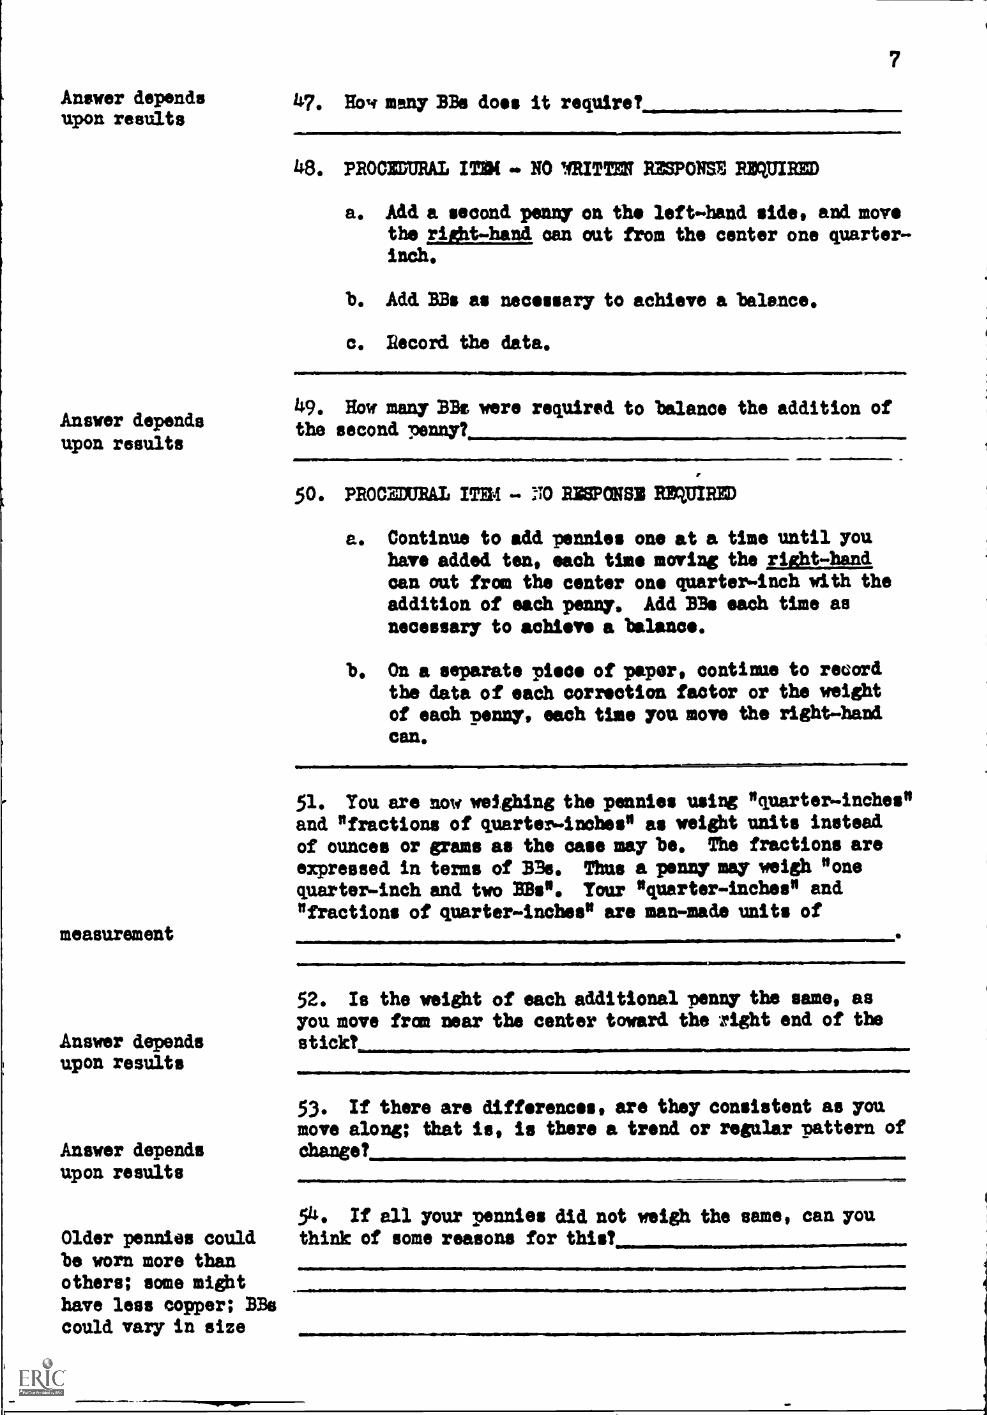
Answer dependsupon results
Answer depends
upon results
7
47. Hour many BBe does it require ?,
48. PROCEDURAL IT( » NO MITTEN RESPONSE REQUIRED
a. Add a second penny on the left-hand side, and movethe rift- -hand can out from the center one quarter-inch.
b. Add. BBs as necessary to achieve a balance.
0. Record the data.
1...49. How many BBs were required to balance the addition ofthe second penny?
50. PROCEDURLL ITEM - NO RESPONSE REWIRED
a. Continue to add pennies one at a time until youhave added ten, each time moving the right -hand,
can out from the center one quarter-inch with theaddition of each penny, Add BBs each time as
necessary to achieve a balance.
b. On a separate piece of paper, continue to recordthe data of each correction factor or the weightof each penny, each time you move the right-bandcan.
51. You are now weighing the pennies using "quarter-inches"and "fractions of quarter-inches" as weight units insteadof ounces or grams as the case may be. The fractions are
expressed in terms of B3s. Thus a penny may weigh "one
quarter-inch and two BBs". Tour "quarter-inches" and"fractions of quarter-inches" are man-made units of
measurement
Answer dependsupon results
Answer dependsupon results
52. Is the weight of each additional penny the same, asyou move from near the center toward the right end of thestick?
elINIMIIIIMIII
53. If there are differences, are they consistent as youmove along; that is, is there a trend or regular pattern ofchange?
54. If all your pennies did not weigh the same, can youOlder pennies could think of some reasons for this?
be worn more thanothers; some mighthave less copper; BBscould vary in size
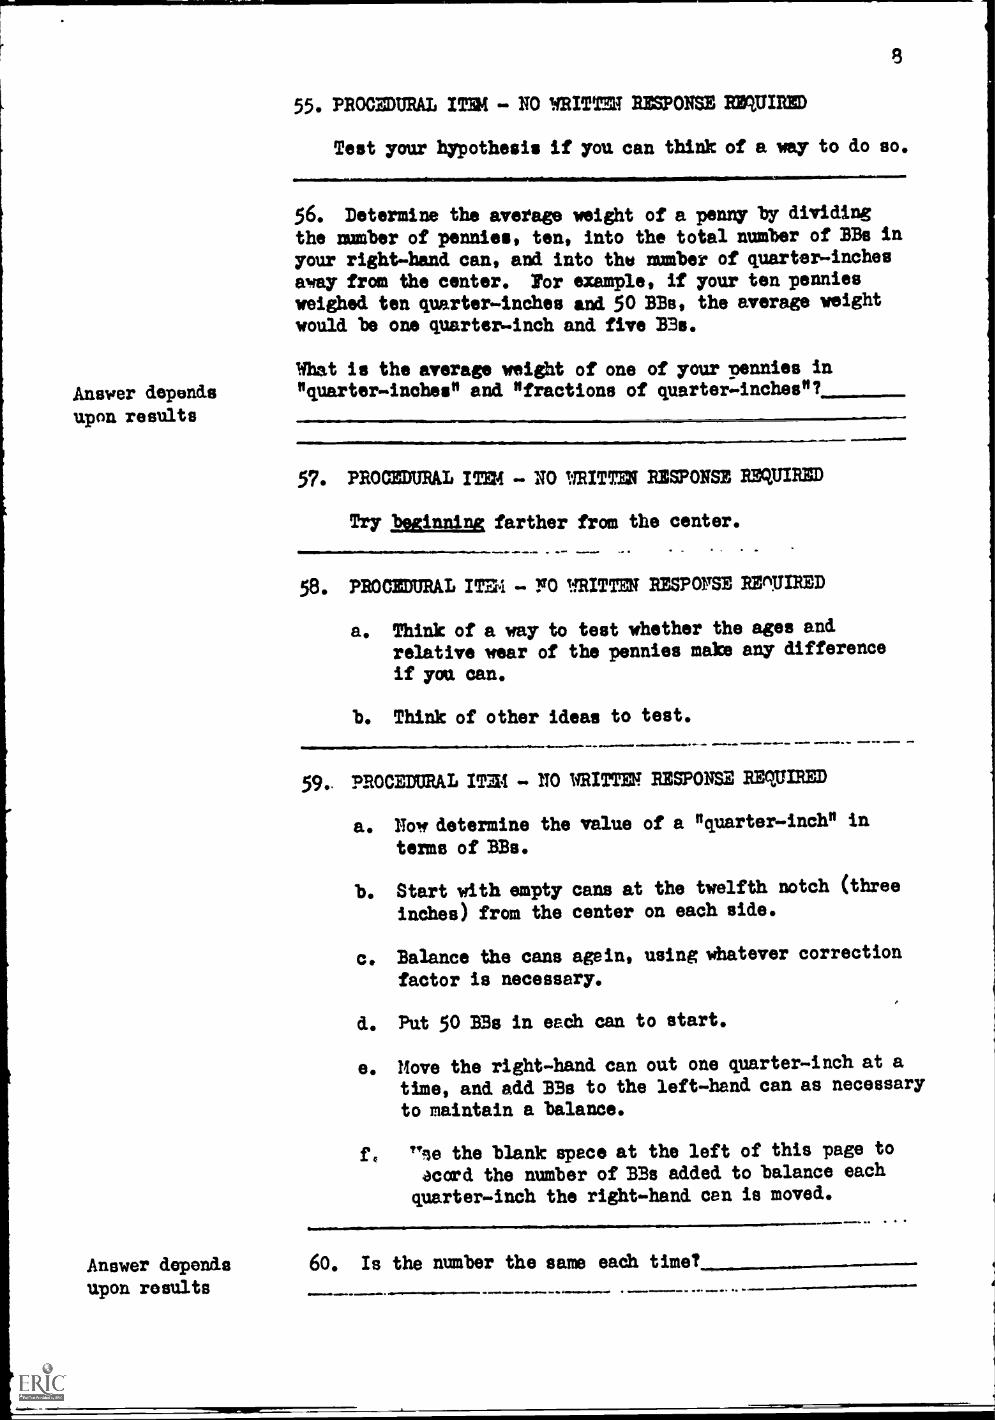
Answer depends
upon results
8
55. PROCMURAL ITS! - NO WRITTEN RESPONSE REQUIRED
Test your hypothesis if you can think of a way to do so.
56. Determine the average weight of a penny by dividingthe number of pennies, ten, into the total number of BBs in
your right-hand can, and into the amber of quarter-inches
away from the center. lor example, if your ten penniesweighed ten quarter - inches and 50 BBs, the average weightwould be one quarter-inch and five 33s.
What is the average weight of one of your pennies in"quarter-inches" and "fractions of quarter- inches " ?,
5?. PROCEDURAL - NO 1:TRITIMI RESPONSE REQUIRED
Try Nginning farther from the center.
58. PROCEDURAL FO WRITTEN RESPONSE BEMIRED
a. Think of away to test whether the ages andrelative wear of the pennies make any difference
if you can.
b. Think of other ideas to test.
...................a.a.ml
PROCEDURAL ITEU - NO WRITTEN RESPONSE REQUIRED
a. Now determine the value of a "quarter-inch" in
terms of BBs.
b. Start with empty cans at the twelfth notch (three
inches) from the center on each side.
c. Balance the cans again, using whatever correction
factor is necessary.
d. Put 50 BBs in each can to start.
e. Hove the right-hand can out one quarter-inch at a
time, and add BBs to the left-hand can as necessaryto maintain a balance.
"se the blank space at the left of this page to
acord the number of Ms added to balance each
quarter-inch the right-hand can is moved.
Answer depends 60. Is the number the same each time?
upon results Il 6,
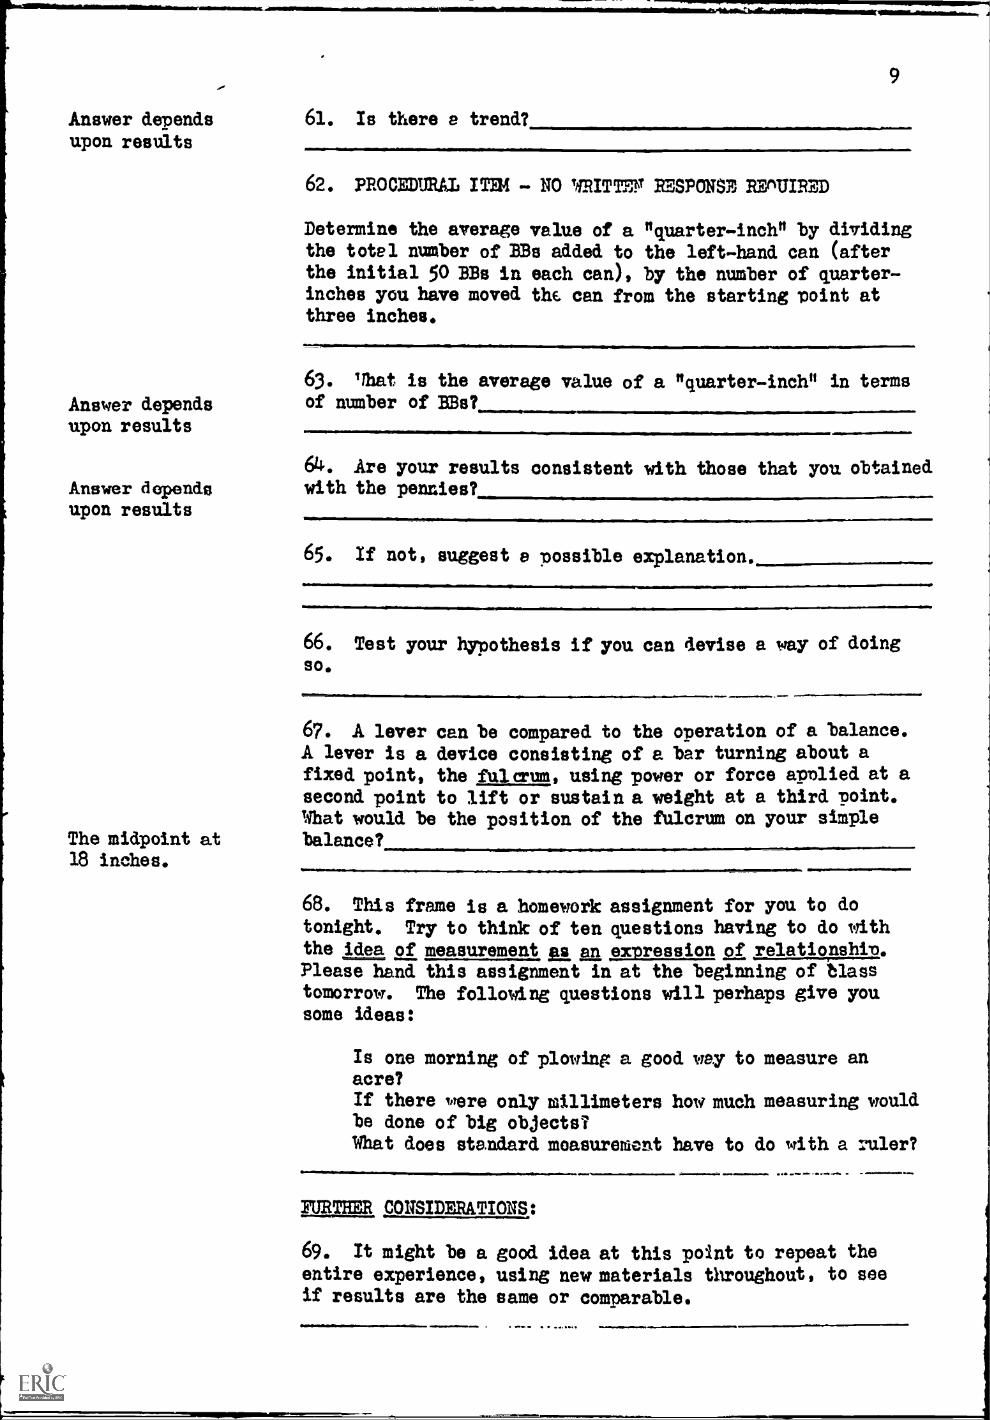
Answer dependsupon results
Answer dependsupon results
Answer dependsupon results
The midpoint at18 inches.
61. Is there e trend?
9
62. PROCEDURAL IT ER - NO WRITTEF RESPONSE RE'UIBED
Determine the average value of a "quarter-inch" by dividingthe totel number of BBs added to the left-hand can (after
the initial 50 BBs in each can), by the number of quarter-inches you have moved the can from the starting point atthree inches.
63. 'Mat is the average value of a "quarter-inch" in termsof number of BBs?
64. Are your results consistent with those that you obtainedwith the pennies?
65. If not, suggest a possible explanation.
66. Test your hypothesis if you can devise a way of doingso.
67. A lever can be compared to the operation of a balance.A lever is a device consisting of a bar turning about afixed point, the fulcrum, using power or force applied at asecond point to lift or sustain a weight at a third point.What would be the position of the fulcrum on your simplebalance?
68. This frame is a homework assignment for you to dotonight. Try to think of ten questions having to do withthe idea of measurement a an expression Df. relationship.Please hand this assignment in at the beginning of Blasstomorrow. The following questions will perhaps give yousome ideas:
Is one morning of plowing a good way to measure anacre?
If there were only millimeters how, much measuring wouldbe done of big objects?What does standard measurement have to do with a ruler?
FURTHER CONSIDERATIONS:
69. It might be a good idea at this point to repeat theentire experience, using new materials throughout, to seeif results are the same or comparable.
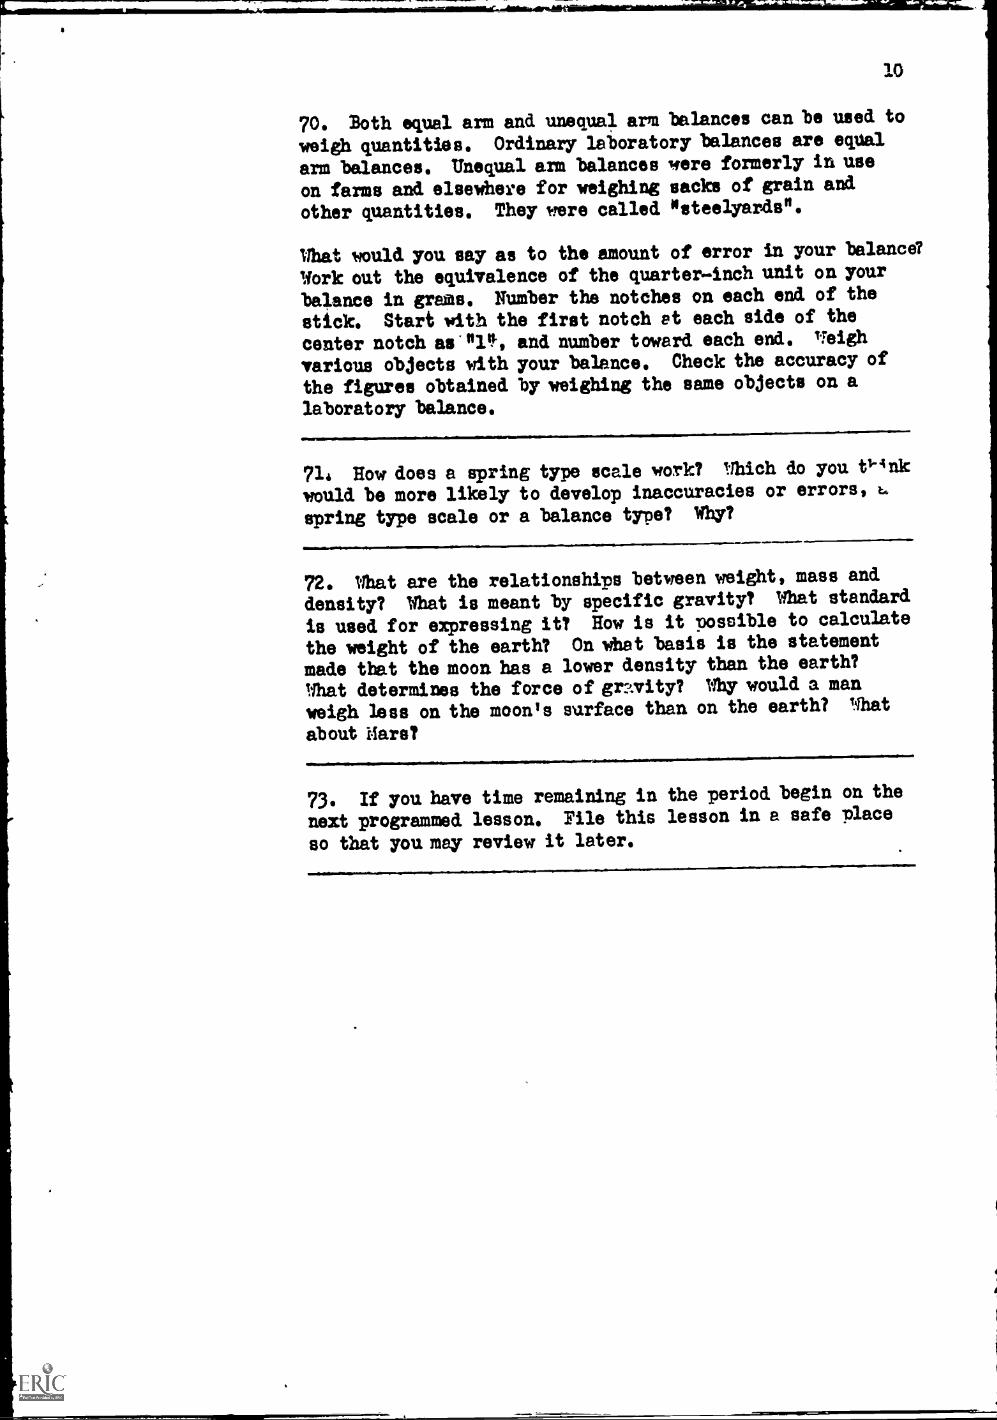
70. Both equal arm and unequal arm balances can be used to
weigh quantities. Ordinary laboratory balances are equal
arm balances. Unequal arm balances were formerly in use
on farms and elsewhere for weighing sacks of grain and
other quantities. They were called *steelyards".
What would you say as to the amount of error in your balance?
Work out the equivalence of the quarter-inch unit on your
balance in grams. Number the notches on each end of the
stick. Start with the first notch et each side of the
center notch as'n111., and number toward each end. neigh
various objects with your balance. Check the accuracy of
the figures obtained by weighing the same objects on a
laboratory balance.
714 How does a spring type scale work? Which do you e4nk
mould be more likely to develop inaccuracies or errors,
spring type scale or a balance type? Why?
72. What are the relationships between weight, mass and
density? What is meant by specific gravity? What standard
is used for expressing it? How is it possible to calculate
the weight of the earth? On what basis is the statement
made that the moon has a lower density than the earth?
What determines the force of gravity? Why would a man
weigh less on the moon's surface than on the earth?
about Mars?
73. If you have time remaining in the period begin on the
next programmed lesson. File this lesson in a safe place
so that you may review it later.
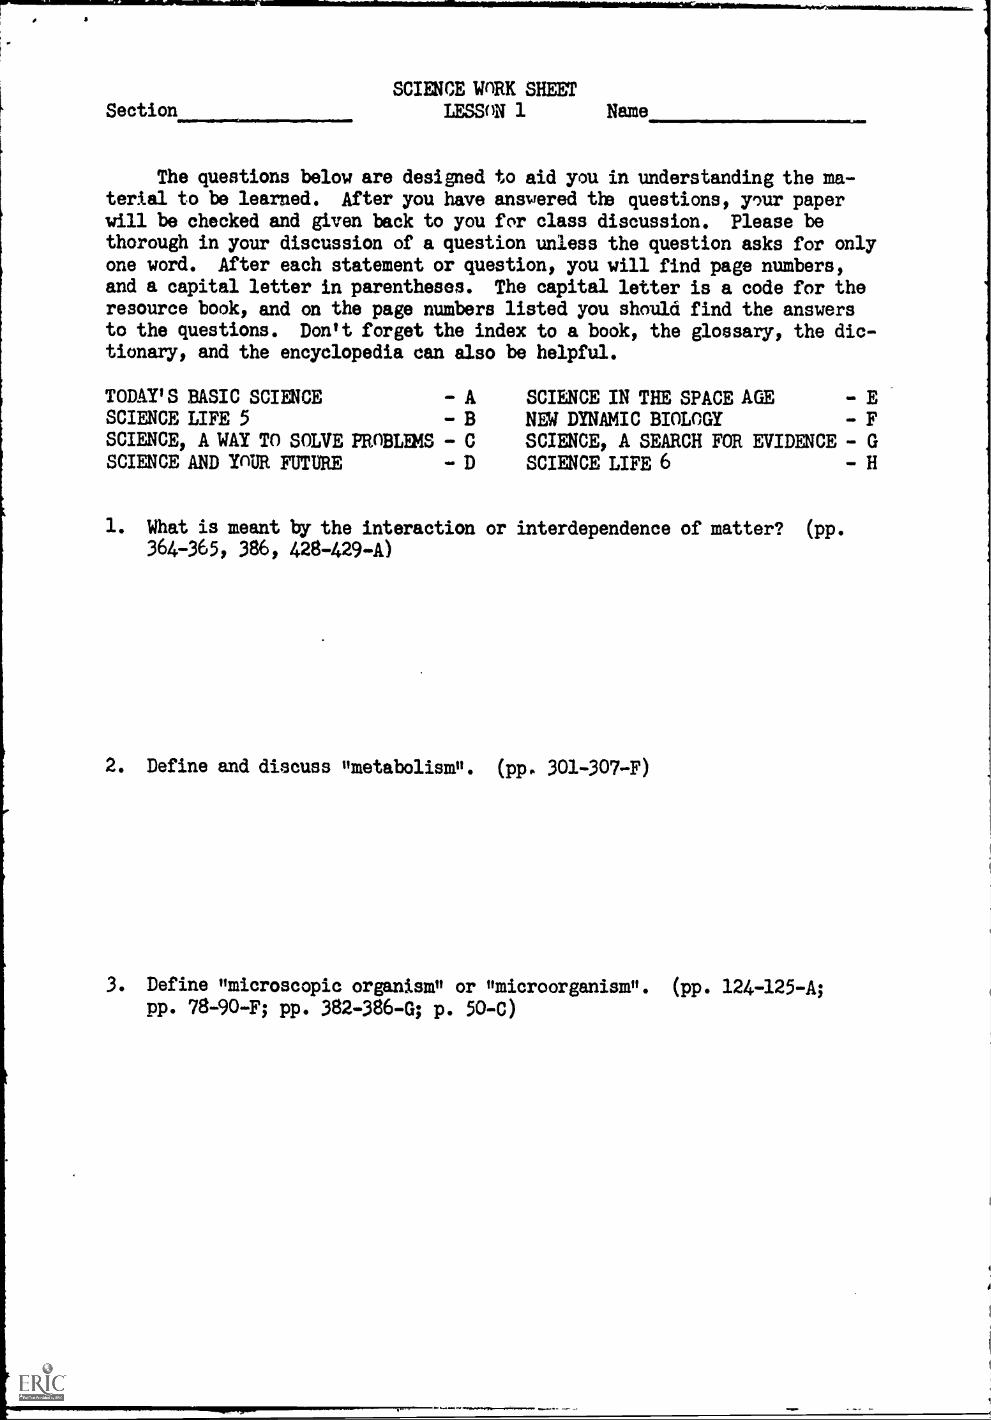
SectionSCIENCE WnRK SHEET
LESSON 1 Name
The questions below are designed to aid you in understanding the ma-terial to be learned. After you have answered the questions, y'ur paperwill be checked and given back to you for class discussion. Please bethorough in your discussion of a question unless the question asks for onlyone word. After each statement or question, you will find page numbers,and a capital letter in parentheses. The capital letter is a code for theresource book, and on the page numbers listed you should find the answersto the questions. Don't forget the index to a book, the glossary, the dic-tionary, and the encyclopedia can also be helpful.
TODAY'S BASIC SCIENCESCIENCE LIFE 5SCIENCE, A. WAY TO SOLVE
SCIENCE AND YOUR FUTURE
- A SCIENCE IN THE SPACE AGE - EB NEW DYNAMIC BIOLOGY - F
PROBLEMS C SCIENCE, A SEARCH FOR EVIDENCE - GD SCIENCE LIFE 6 - H
1. What is meant by the interaction or interdependence of matter? (pp.
364-365, 386, 428-429-A)
2. Define and discuss "metabolism". (pp. 301-307-F)
3. Define "microscopic organism" or "microorganism ". (pp. 124-125-A;pp. 78-90-F; pp. 382-386-G; p. 50-C)
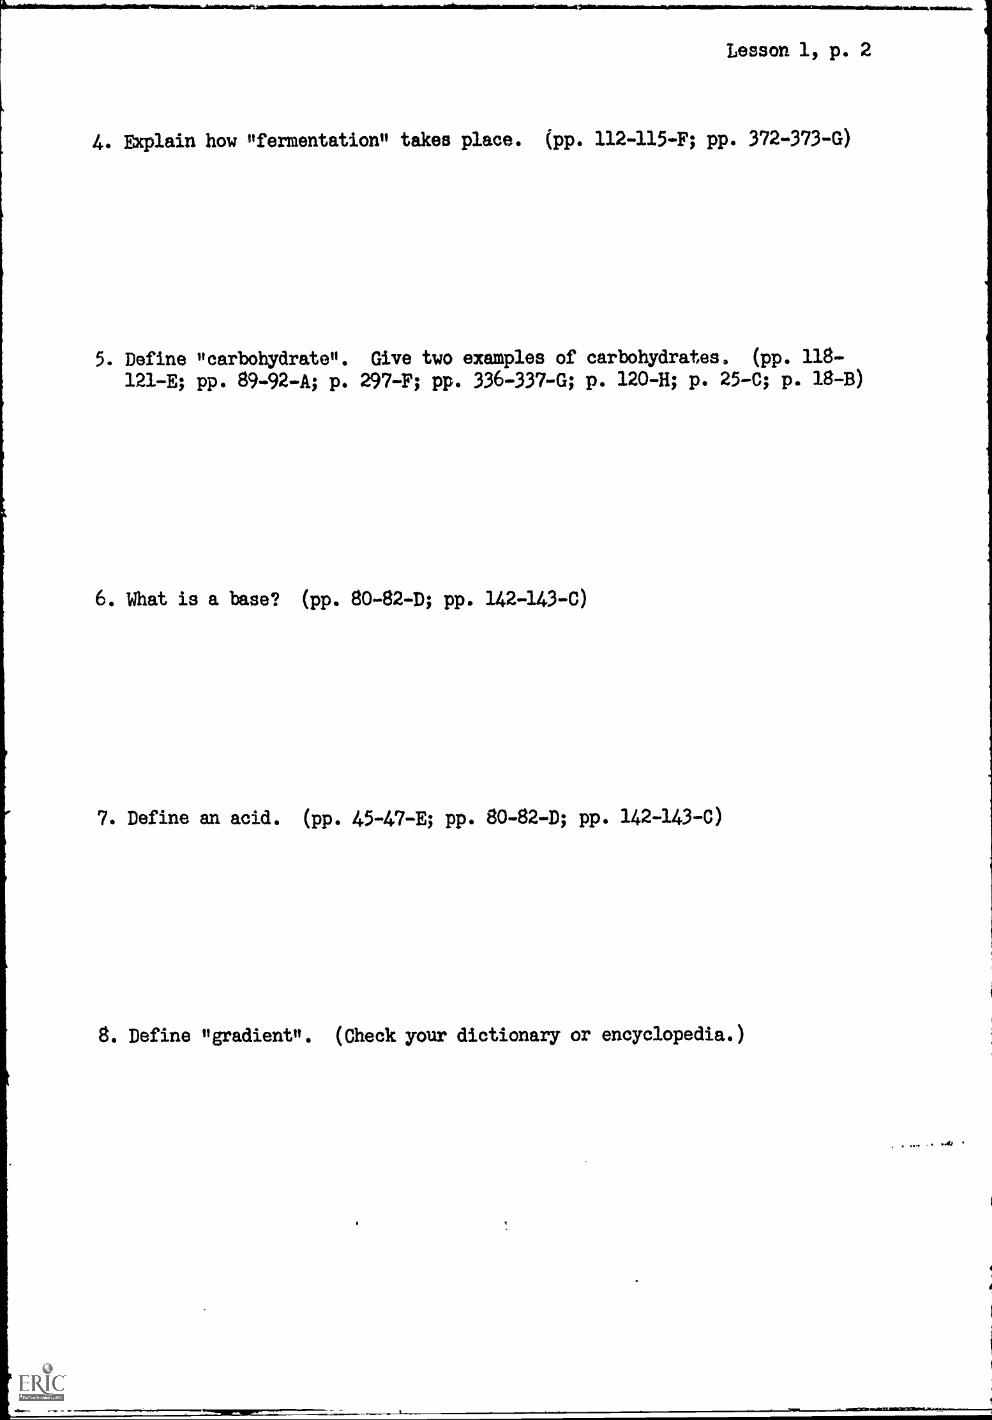
Lesson 1, p. 2
4. Explain how "fermentation" takes place. (pp. 112-115-F; pp. 372-373-G)
5. Define "carbohydrate ". Give two examples of carbohydrates. (pp. 118-
121 -E; pp. 89-92-A; p. 297-F; pp. 336-337-G; p. 120-H; p. 25-C; p. 18-B)
6. What is a base? (pp. 80-82-D; pp. 142-143-C)
7. Define an acid. (pp. 45-47-E; pp. 80-82-D; pp. 142-143-C)
8. Define "gradient ". (Check your dictionary or encyclopedia.)
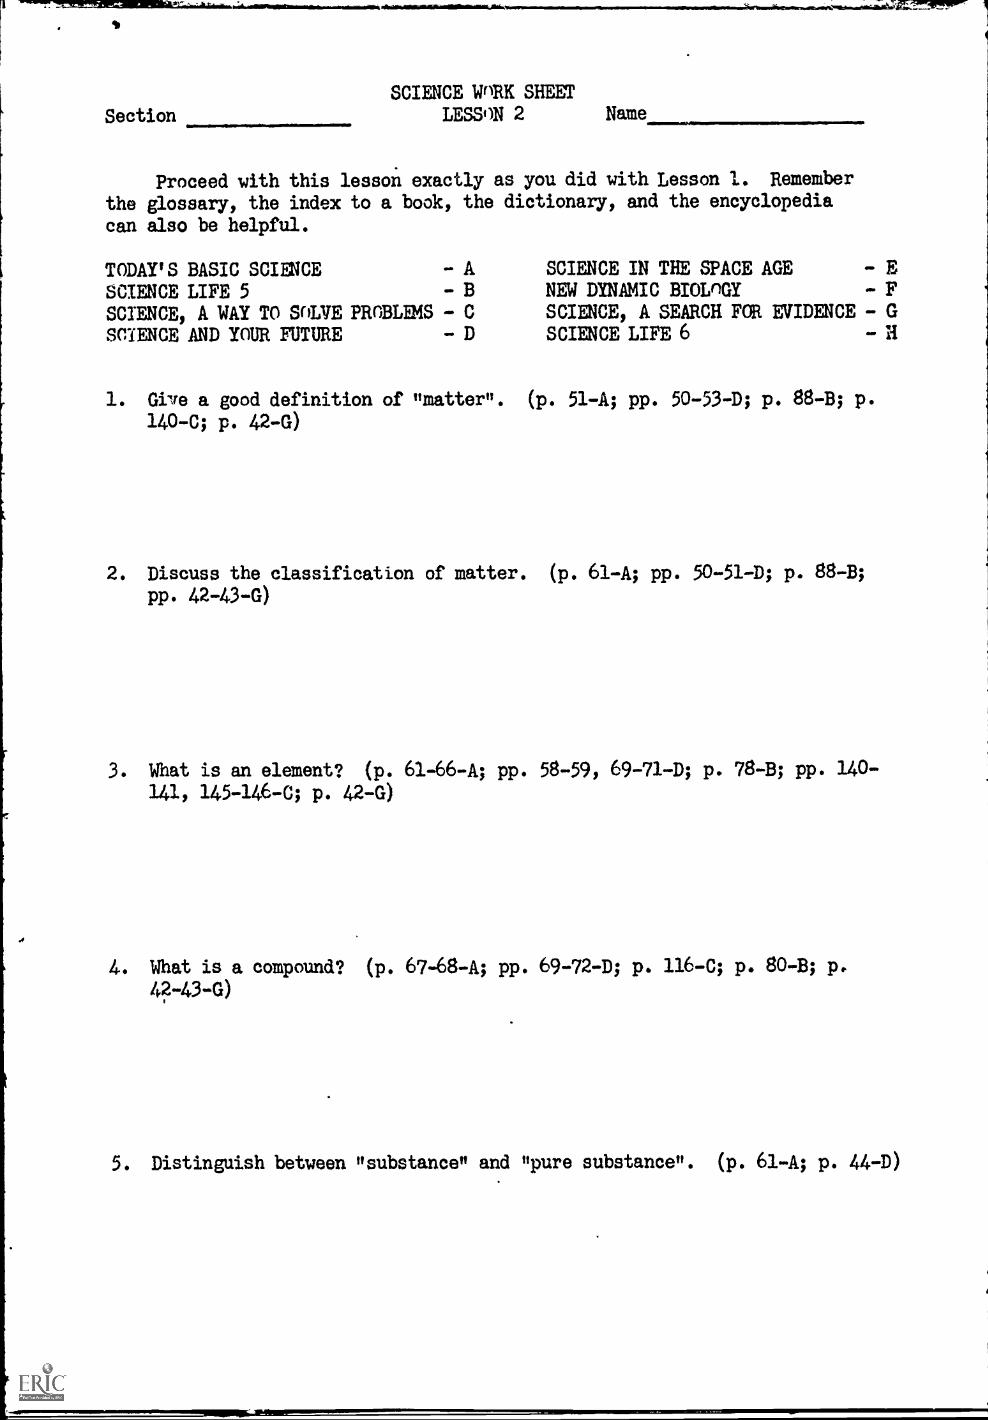
Section
SCIENCE WnRK SHEETLESSON 2 Name
Proceed with this lesson exactly as you did with Lesson 1. Remember
the glossary, the index to a book, the dictionary, and the encyclopedia
can also be helpful.
TODAY'S BASIC SCIENCE - A
SCIENCE LIFE 5 BSCIENCE, A WAY TO SOLVE PROBLEMS - CSCIENCE AND YOUR FUTURE D
SCIENCE IN THE SPACE AGE ENEW DYNAMIC BIOLOGY FSCIENCE, A SEARCH FOR EVIDENCE - GSCIENCE LIFE 6 - iI
1. Give a good definition of "matter". (p. 51-A; pp. 50-53-D; p. 88-B; p.
140-C; p. 42-G)
2. Discuss the classification of matter. (p. 61-A; pp. 50-51-D; p. 88 -B;
pp. 42-43-G)
3. What is an element? (p. 61-66-A; pp. 58-59, 69-71-D; p. 78 -B; pp. 140 -
141, 145-146-C; p. 42-G)
4. What is a compound? (p. 67 -68 -A; pp. 69-72-D; p. 116-C; p. 80-B; p.
42-43-G)
5. Distinguish between "substance" and "pure substance". (p. 61-A; p. 44-D)
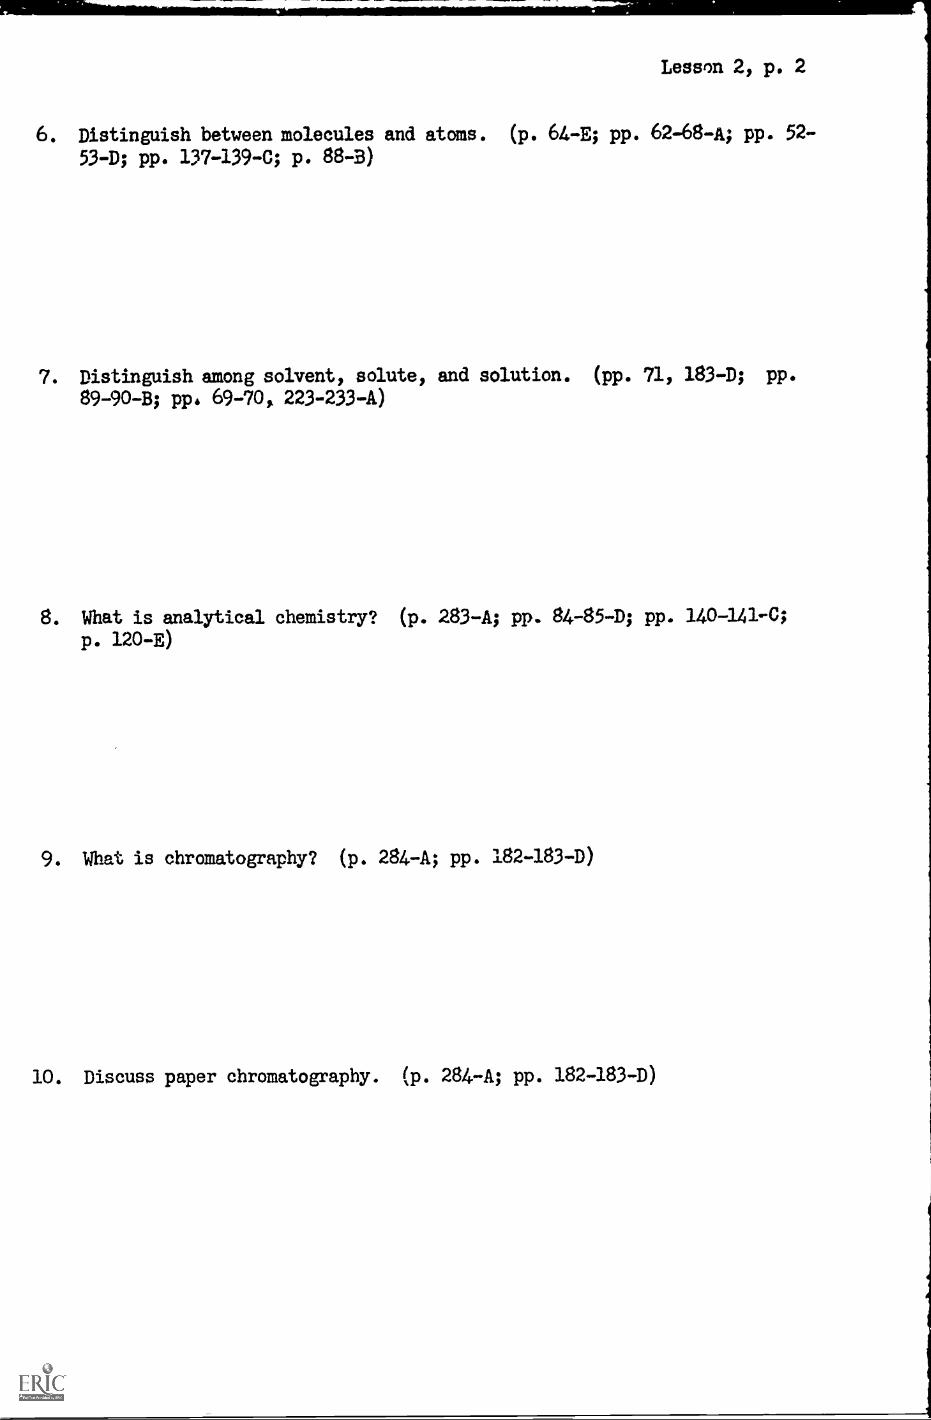
Lesson 2, p. 2
6. Distinguish between molecules and atoms. (p. 64-E; pp. 62-68-A; pp. 52 -
53 -D; pp. 137-139-C; p. 88-B)
7. Distinguish among solvent, solute, and solution. (pp. 71, 183-D; pp.
89-90-B; pp. 69-70, 223-233-A)
8. What is analytical chemistry? (p. 283-A; pp. 84-85-D; pp. 140-141-C;
p. 120-E)
9. What is chromatography? (p. 284-A; pp. 182-183-D)
10. Discuss paper chromatography. (p. 284-A; pp. 182-183-D)
A
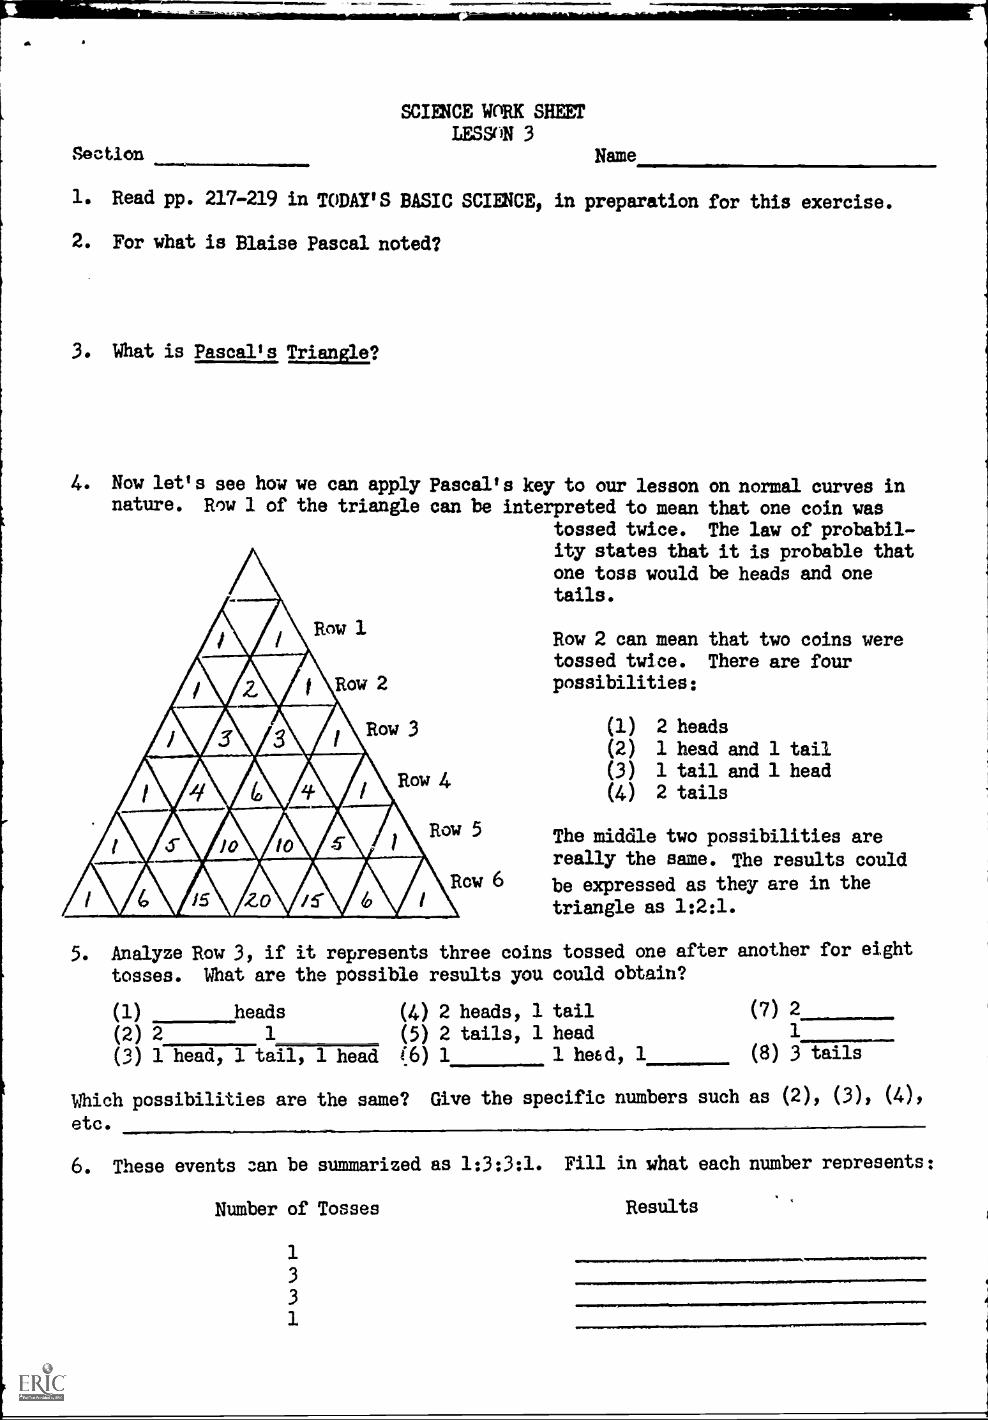
Section
SCIENCE WORK SHEET
LESS()N 3
Name
1. Read pp. 217-219 in TODAY'S BASIC SCIENCE, in preparation for this exercise.
2. For what is Blaise Pascal noted?
3. What is Pascal's Triangle?
4. Now let's see how we can apply Pascal's key to our lesson on normal curves innature. Row 1 of the triangle can be interpreted to mean that one coin was
tossed twice. The law of probabil-ity states that it is probable thatone toss would be heads and onetails.
44iRwo1
A..441FAA
w 2
.8; 14: Row 5io
Virrerair 6
Row 3
Row 2 can mean that two coins weretossed twice. There are fourpossibilities:
(1) 2 heads(2) 1 head and 1 tail
(3) 1 tail and 1 head
(4) 2 tails
The middle two possibilities are
really the same. The results could
be expressed as they are in thetriangle as 1:2:1.
5. Analyze Row 3, if it represents three coins tossed one after another for eight
tosses. What are the possible results you could obtain?
(1) heads (4) 2 heads, 1 tail (7) 2
(2) 2 1 (5) 2 tails, 1 head 1
(3) 1 head, 1 tail, 1 head (6) 1 1 heed, 1 (8) 3 tails
Which possibilities are the same? Give the specific numbers such as (2), (3), (4),
etc. s,6. These events can be summarized as 1:3:3:1. Fill in what each number represents:
Number of Tosses Results
1
3
3
1
.11.11=0P11
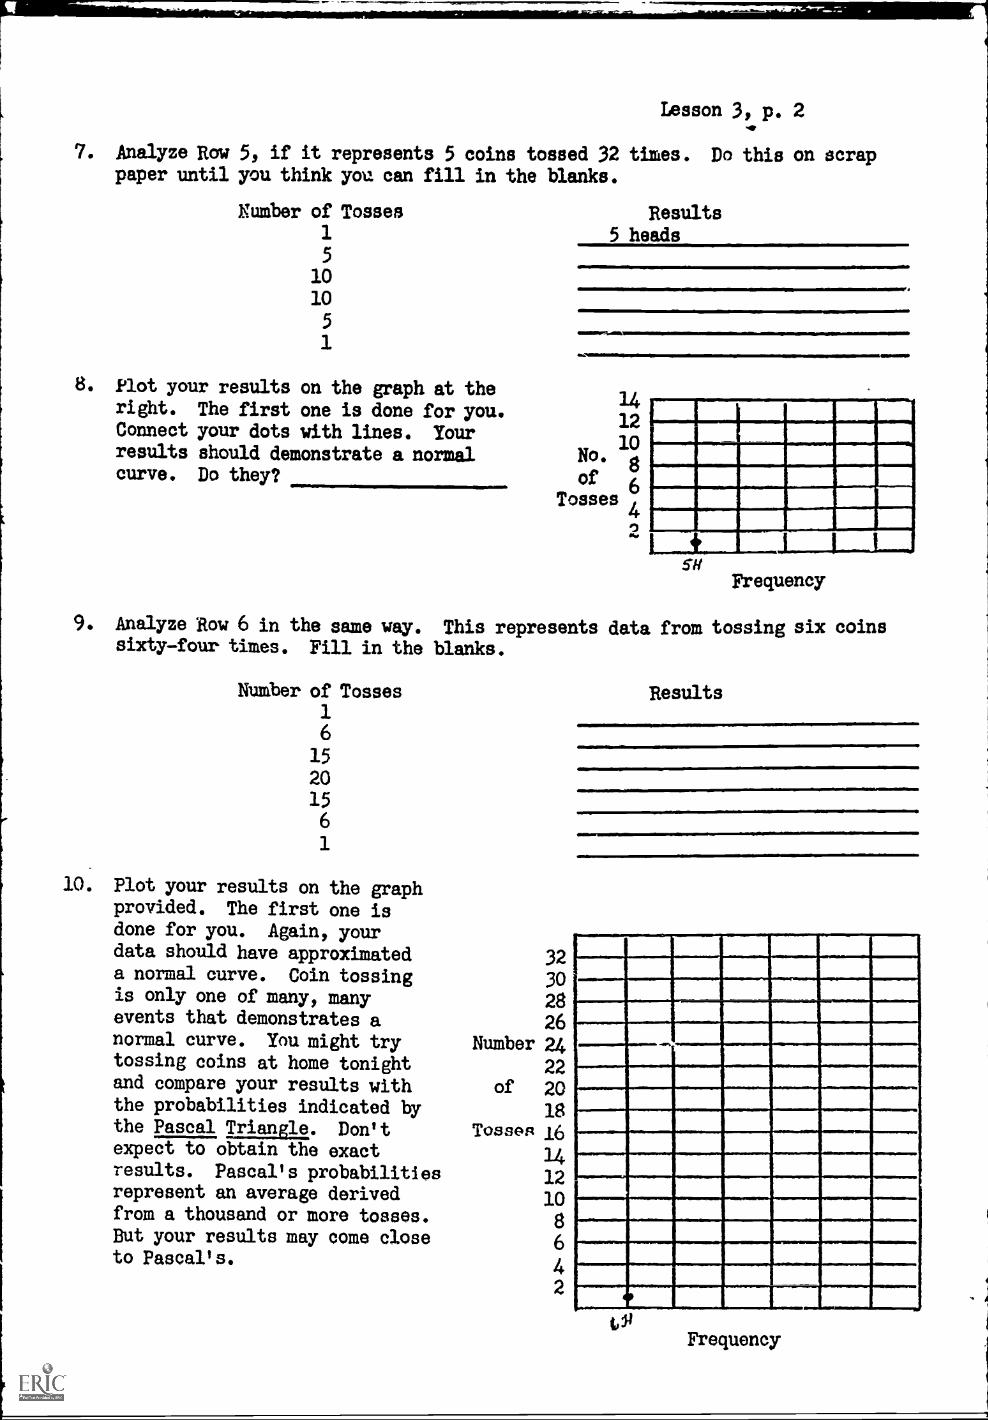
Lesson 3, p. 2
7. Analyze Row 5, if it represents 5 coins tossed 32 times. Do this on scrappaper until you think you can fill in the blanks.
Number of Tosses1
5
1010
5
1
8. Plot your results on the graph at theright. The first one is done for you.Connect your dots with lines. Yourresults should demonstrate a normalcurve. Do they?
Results5 heads
111111
14120
No.1
8of
6Tosses
SEFrequency
9. Analyze Row 6 in the same way. This represents data from tossing six coinssixty-four times. Fill in the blanks.
Number of Tosses16
1520156
1
10. Plot your results on the graphprovided. The first one isdone for you. Again, yourdata should have approximateda normal curve. Coin tossingis only one of many, manyevents that demonstrates anormal curve. You might trytossing coins at home tonightand compare your results withthe probabilities indicated bythe Pascal Triangle. Don'texpect to obtain the exactresults. Pascal's probabilitiesrepresent an average derivedfrom a thousand or more tosses.But your results may come closeto Pascal's.
3230
2826
Number 24
22of 20
18Tosses 16
14121086
42
Results
Frequency
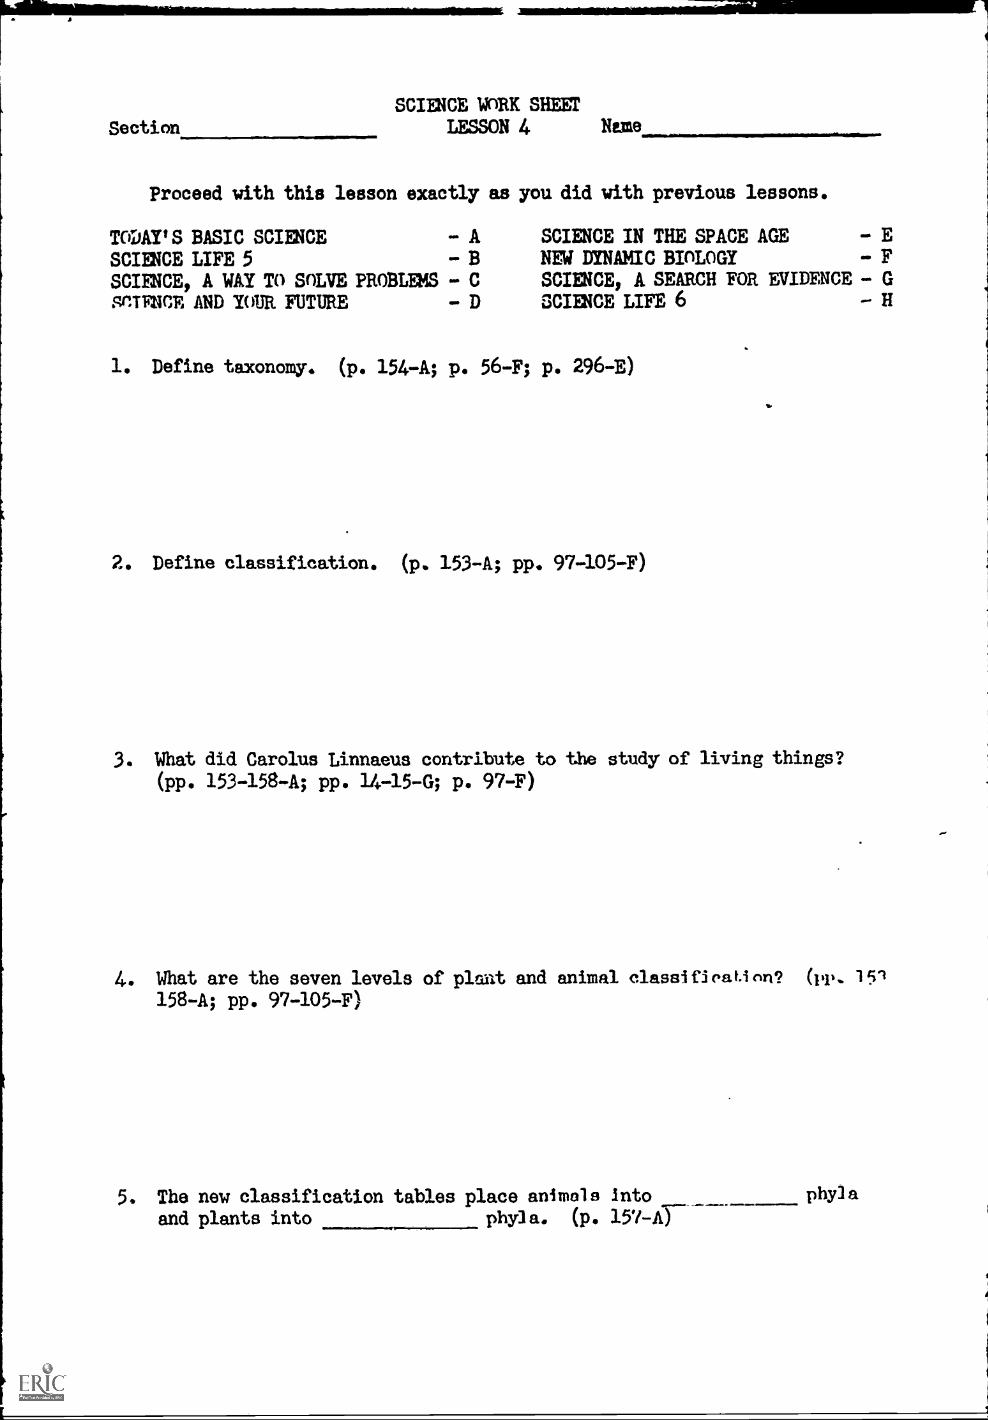
Section
SCIENCE WORK SHEETLESSON 4 Nome
Proceed with this lesson exactly as you did with previous lessons.
TODAY'S BASIC SCIENCE - A
SCIENCE LIFE 5 BSCIENCE, A WAY TO SOLVE PROBLEMS - C
SnUNCE AND 701.1R FUTURE - D
SCIENCE IN THE SPACE AGE E
NEW DYNAMIC BIOLOGY - FSCIENCE, A SEARCH FOR EVIDENCE - GSCIENCE LIFE 6 H
1. Define taxonomy. (p. 154-A; p. 56-F; p. 296-E)
2. Define classification. (p. 153-A; pp. 97-105-F)
3. What did Carolus Linnaeus contribute to the study of living things?
(pp. 153-158-A; pp. 14-15-G; p. 97-F)
4. What are the seven levels of plant and animal classitleaLinn? (Pr- 151158 -A; pp. 97-105-F)
5. The new classification tables place animals Into phyla
and plants into phyla. (p. 157-A)
Lesson 4, p. 2
6. In what ways does a species differ from a geniis? (pp. 153- 158 -A; pp.
14-15-G; p. 101-F)
7. Why do scientists prefer to use Latin in giving scientific names to
plants and animals? (pp. 153-158-A; pp. 14 -15 -G)
8. Define sample as it pertains to scientific investigation. (p. 22-G)
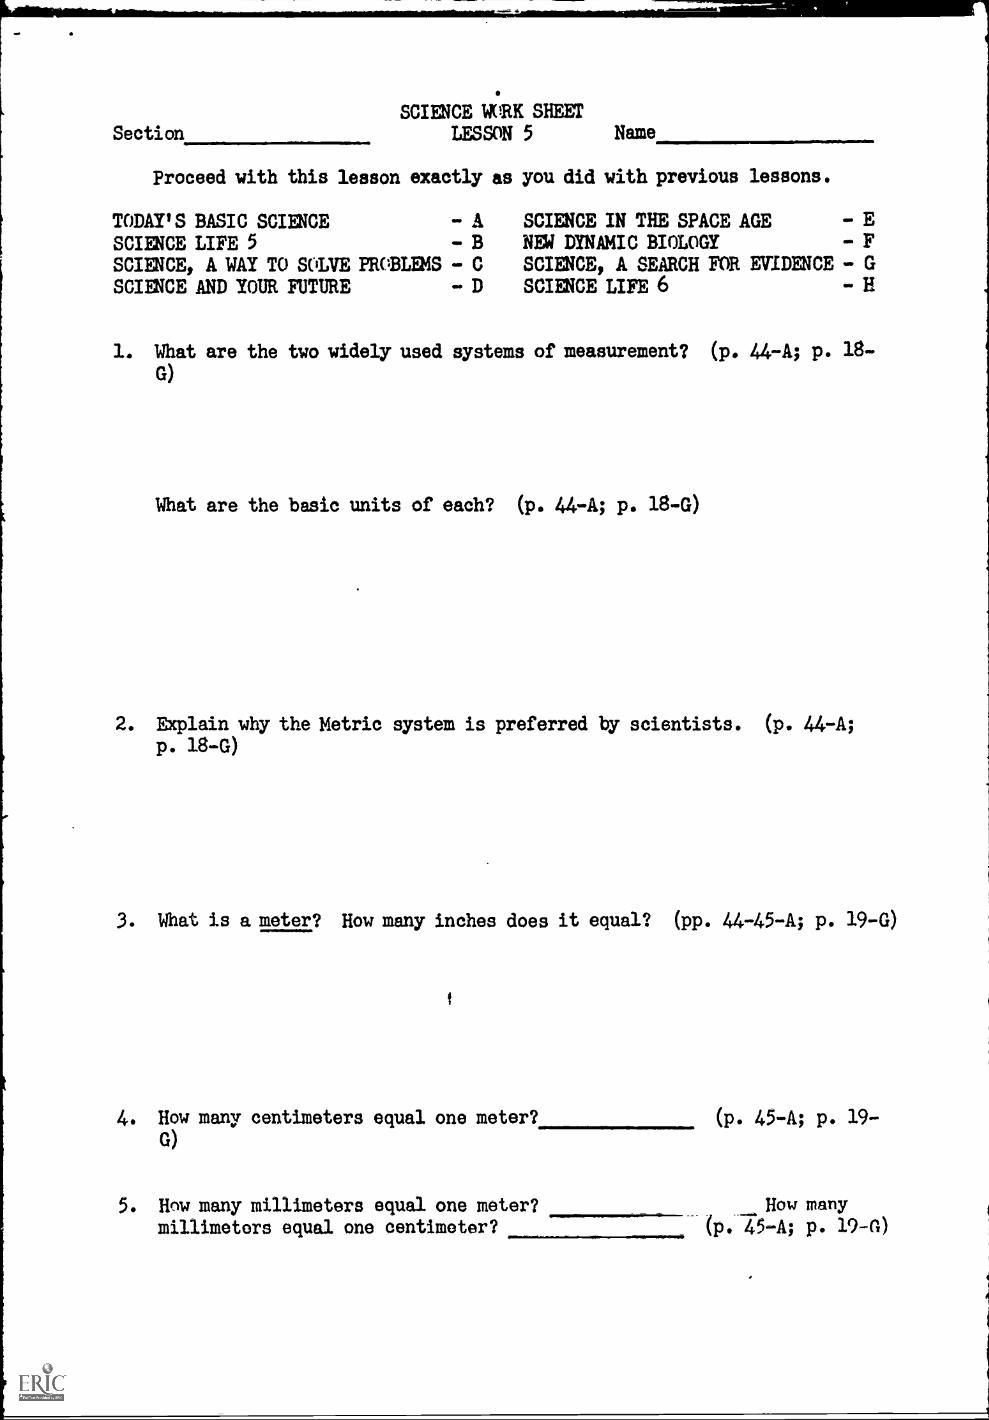
SectionSCIENCE WORK SHEET
LESSON 5 Name
Proceed with this lesson exactly as you did with previous lessons.
TODAY'S BASIC SCIENCE - A SCIENCE IN THE SPACE AGE - E
SCIENCE LIFE 5 - B NV DYNAMIC BIOLOGY - F
SCIENCE, A WAY TO SOLVE PROBLEMS - C SCIENCE, A SEARCH FOR EVIDENCE - GSCIENCE AND YOUR. FUTURE - D SCIENCE LIFE 6 - H
1. What are the two widely used systems of measurement? (p. 44-A; p. 18-G)
What are the basic units of each? (p. 44-A; p. l8-G)
2. Explain why the Metric system is preferred by scientists. (p. 44-A;p. l8 -G)
3. What is a meter? How many inches does it equal? (pp. 44-45-A; p. 19-G)
4. How many centimeters equal one meter? (p. 45-A; p. 19-G)
5. Hnw many millimeters equal one meter? How many
millimeters equal one centimeter? 45-A; p. 1941)
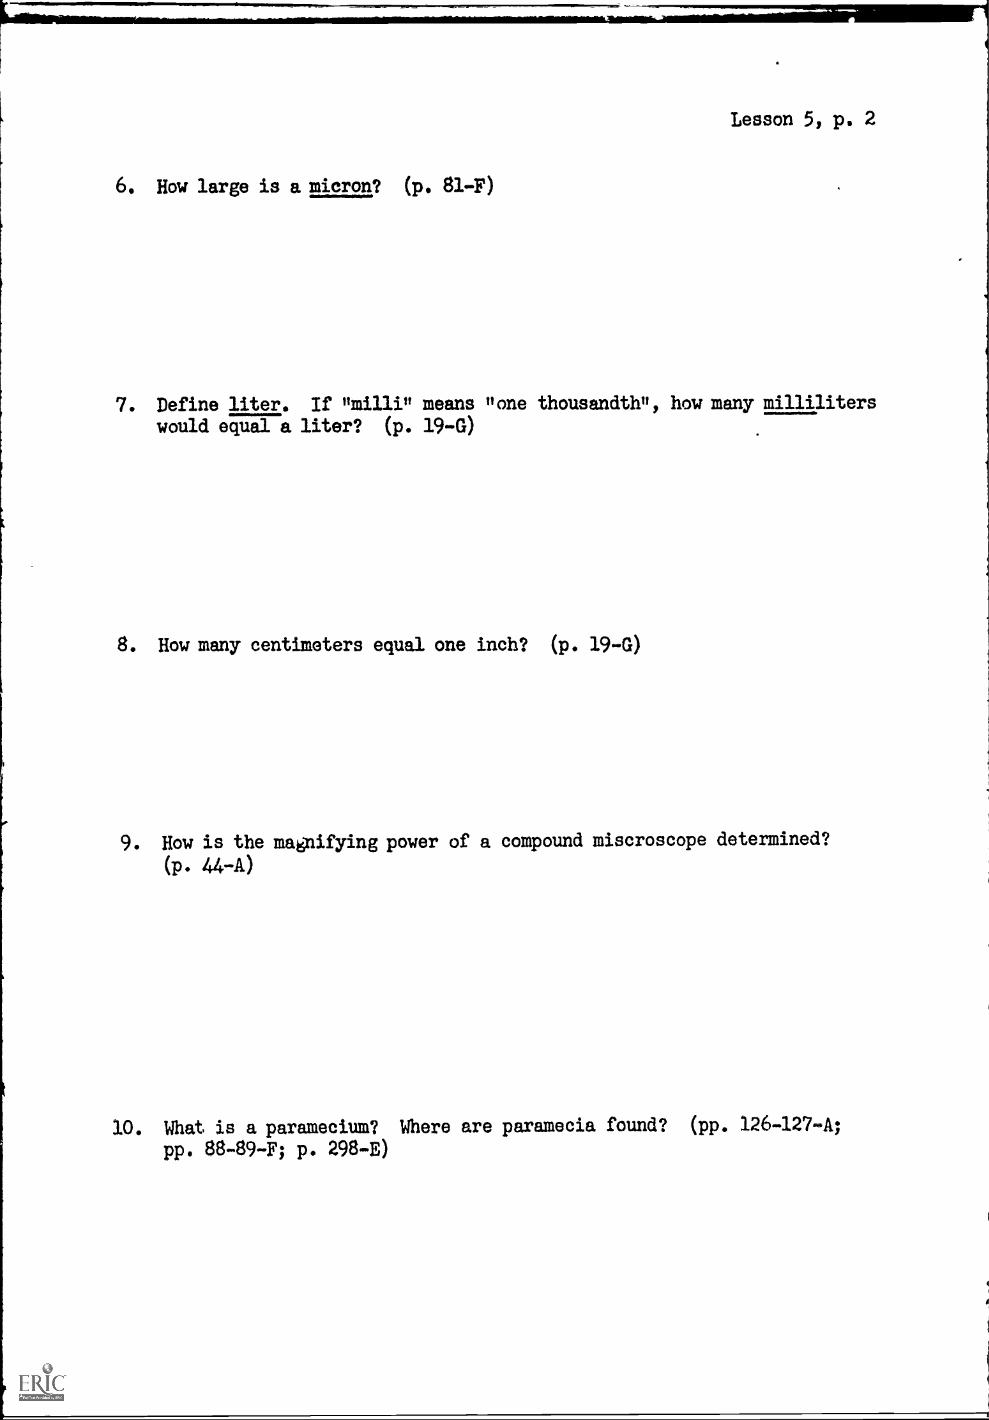
Lesson 5, p. 2
6. How large is a micron? (p. 81-F)
7. Define liter. If nmillin means none thousandth", how many milliliters
would equal a liter? (p. 19-G)
8. How many centimeters equal one inch? (p. 19-G)
9. How is the magnifying power of a compound miscroscope determined?
(13. 44-A)
10. What is a paramecium? Where are paramecia found? (pp. 126-127-A;
pp. 88-89-F; p. 298-E)
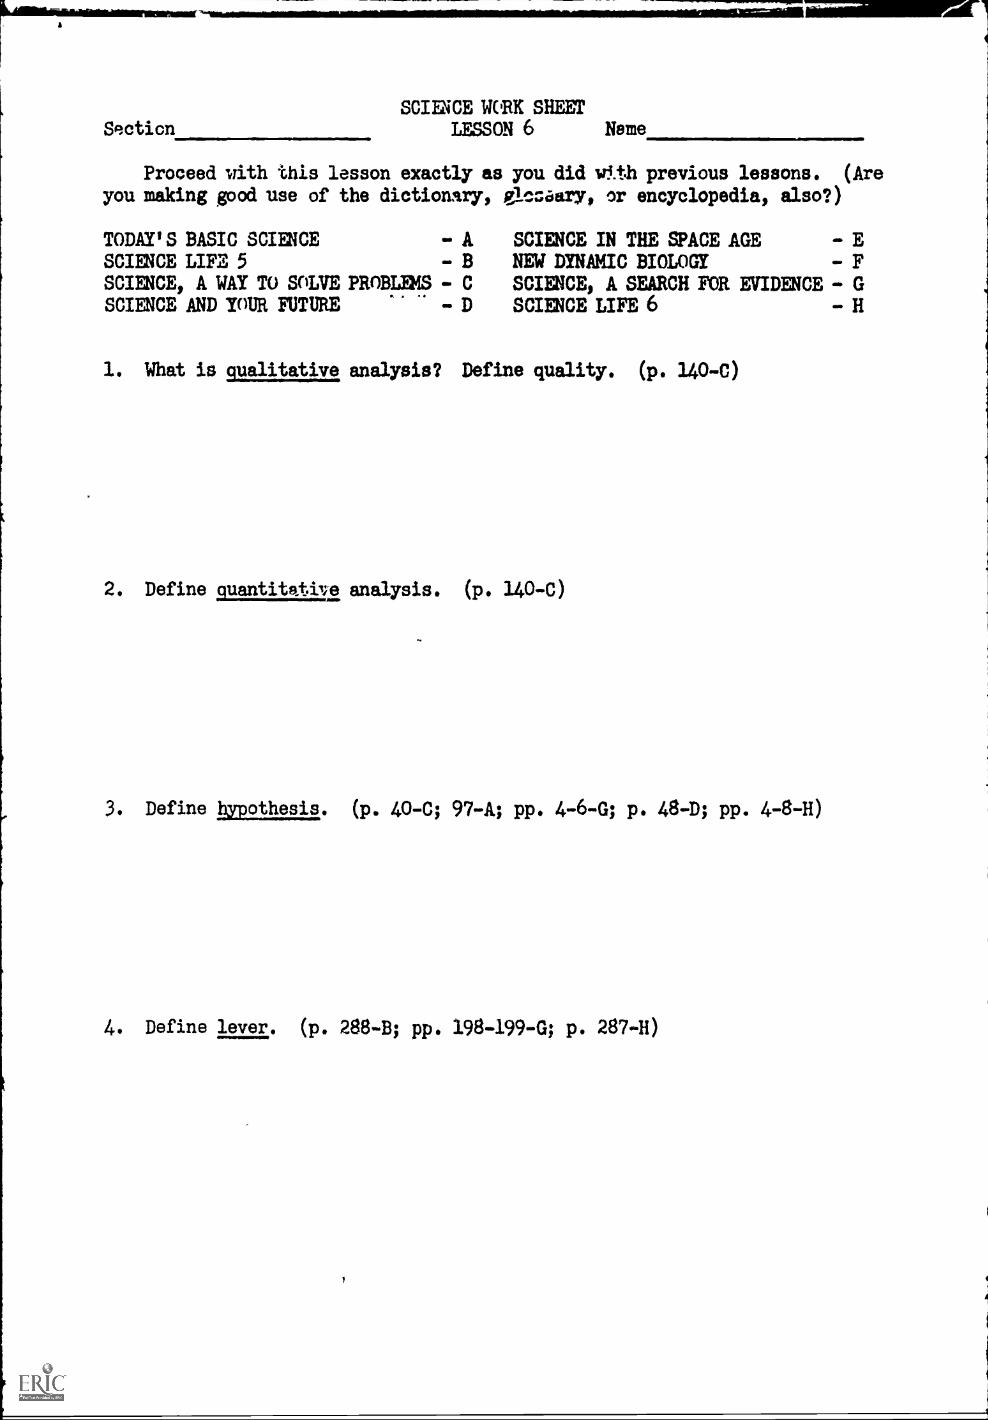
Section=ICE WRK SHEET
LESSON 6 Name =.111011
Proceed with this lesson exactly as you did with previous lessons. (Are
you making good use of the dictionary, giczaary, or encyclopedia, also?)
TODAY'S BASIC SCIENCE - ASCIENCE LIFE 5 BSCIENCE, A WAY TO SOLVE PROBLEMS - CSCIENCE AND YOUR FUTURE - D
SCIENCE IN THE SPACE AGE - ENEW DYNAMIC BIOLOGY - FSCIENCE, A SEARCH FOR EVIDENCE - GSCIENCE LIFE 6 - H
1. What is qualitative analysis? Define quality. (p. 140-C)
2. Define quantitative analysis. (p. 140-C)
3. Define hypothesis. (p. 40-C; 97-A; pp. 4-6-G; p. 48-D; pp. 4-8-H)
4. Define lever. (p. 288-B; pp. 198-199-G; p. 287-H)
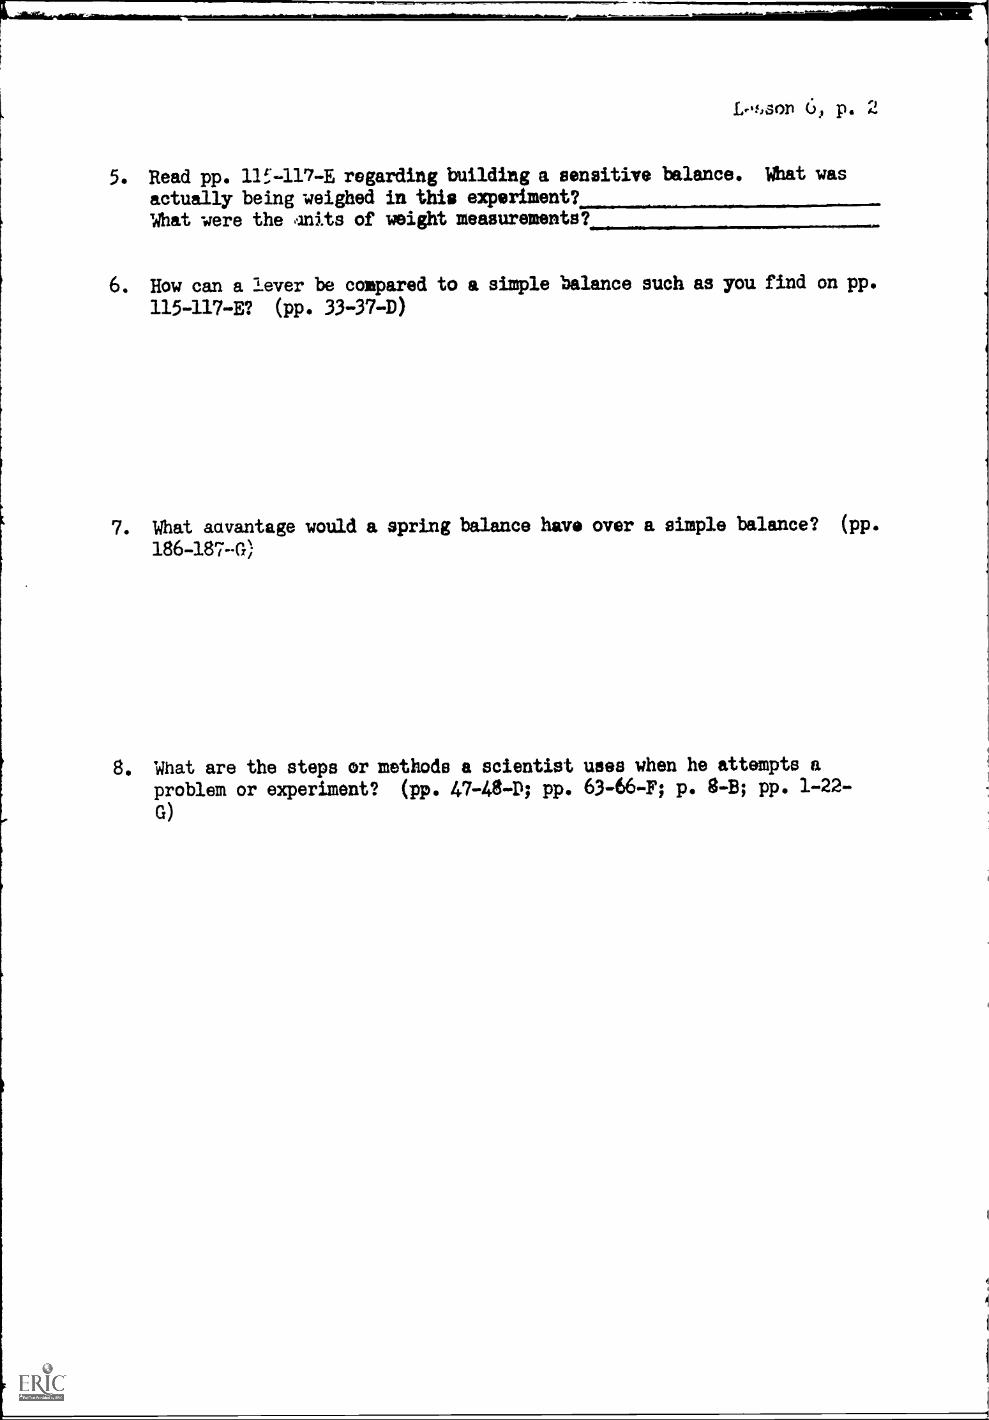
Lof,sor 6, p. 2
5. Read pp. 11f.-117-E regarding building a sensitive balance. Vast was
actually being weighed in this experiment?What were the Inits of weight measurements? ,ar..mre
6. How can a lever be compared to a simple balance such as you find on pp.
115-117-E? (pp. 33-37-D)
7. What aavantage would a spring balance have over a simple balance? (pp.
186-187--G)
8. What are the steps or methods a scientist uses when he attempts a
problem or experiment? (pp. 47-48-D; pp. 63-66-F; p. 8 -B; pp. 1-22 -
G)

ATIF(FV,IIX B
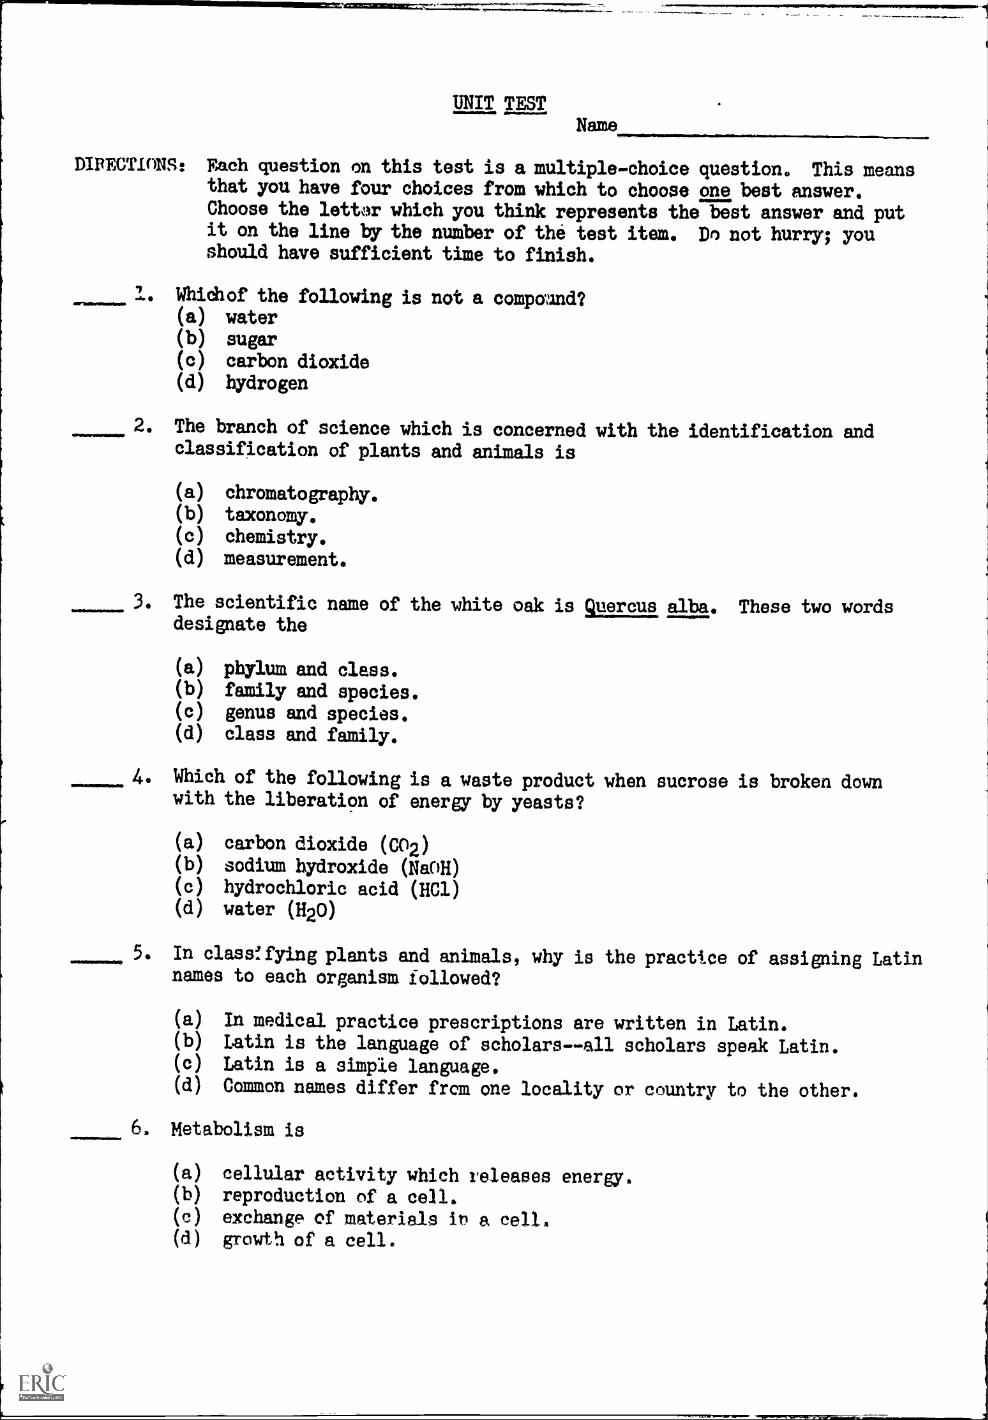
UNIT TESTName
DIRECTIONS: Each question on this test is a multiple-choice question. This meansthat you have four choices from which to choose one best answer.Choose the letter which you think represents the best answer and putit on the line by the number of the test item. Do not hurry; youshould have sufficient time to finish.
4111010100111.011.111/11101111
..=7.0
1. Which of the following is not a compolnd?(a) water(b) sugar(c) carbon dioxide(d) hydrogen
2. The branch of science which is concerned with the identification andclassification of plants and animals is
(a) chromatography.(b) taxonomy.(c) chemistry.(d) measurement.
3. The scientific name of the white oak is gyercus alba. These two wordsdesignate the
(a) phylum and class.(b) family and species.(c) genus and species.(d) class and family.
4. Which of the following is a waste product when sucrose is broken downwith the liberation of energy by yeasts?
(a) carbon dioxide (CO2)(b) sodium hydroxide (NaOH)(c) hydrochloric acid (HCl)(d) water (H20)
5. In classffying plants and animals, why is the practice of assigning Latinnames to each organism followed?
(a) In medical, practice prescriptions are written in Latin.(b) Latin is the language of scholars--all scholars speak Latin.(c) Latin is a simple language.(d) Common names differ from one locality or country to the other.
Metabolism is
(a)
(b)
(c)
(d)
cellular activity which releases energy.reproduction of a cell.exchange of materials it a cell.growth of a cell.
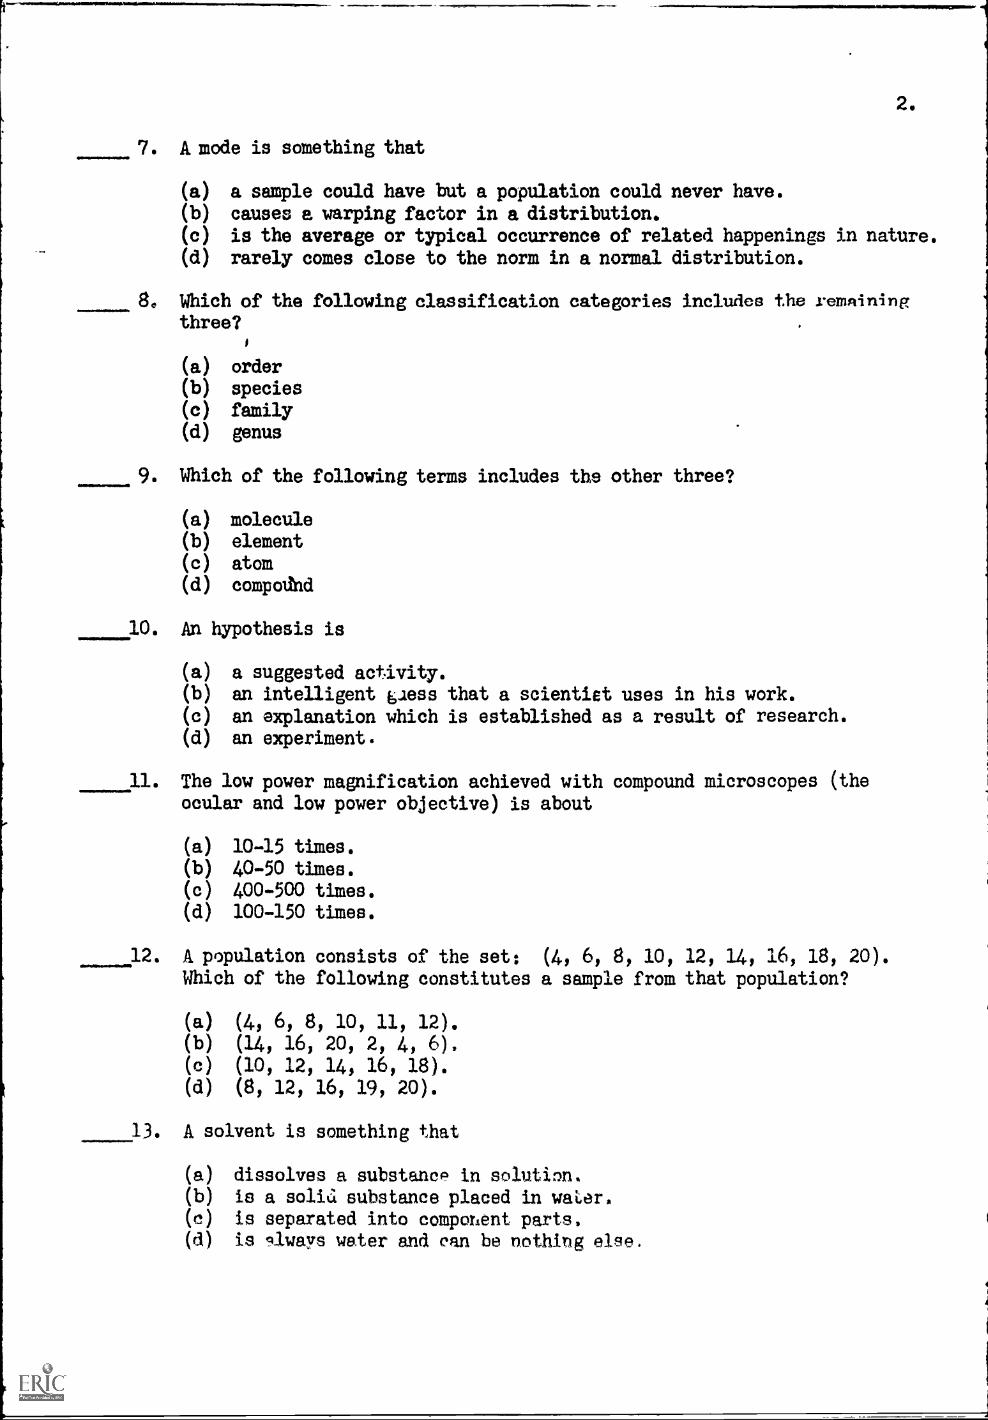
7. A mode is something that
(a) a sample could have but a population could never have.(b) causes a warping factor in a distribution.(c) is the average or typical occurrence of related happenings in nature.(d) rarely comes close to the norm in a normal distribution.
8. Which of the following classification categories includes the remainingthree?
(a) order(b) species(c) family(d) genus
9. Which of the following terms includes the other three?
(a) molecule(b) element(c) atom(d) compound
10. An hypothesis is
(a) a suggested activity.(b) an intelligent 6aess that a scientist uses in his work.(c) an explanation which is established as a result of research.(d) an experiment.
11. The low power magnification achieved with compound microscopes (theocular and low power objective) is about
(a) 10-15 times.(b) 40-50 times.
(c) 400-500 times.(d) 100-150 times.
12. A population consists of the set: (4, 6, 8, 10, 12, 14, 16, 18, 20).Which of the following constitutes a sample from that population?
(a) (4, 6, 8, 10, 11, 12).(b) (14, 16, 20, 2, 4, 6).(c) (10, 12, 14, 16, 18).(d) (8, 12, 16, 19, 20).
13. A solvent is something that
(a) dissolves a substance in solution.(b) is a solitl substance placed in water.(c) is separated into component parts.(d) is qlways lister and can be nothing else,
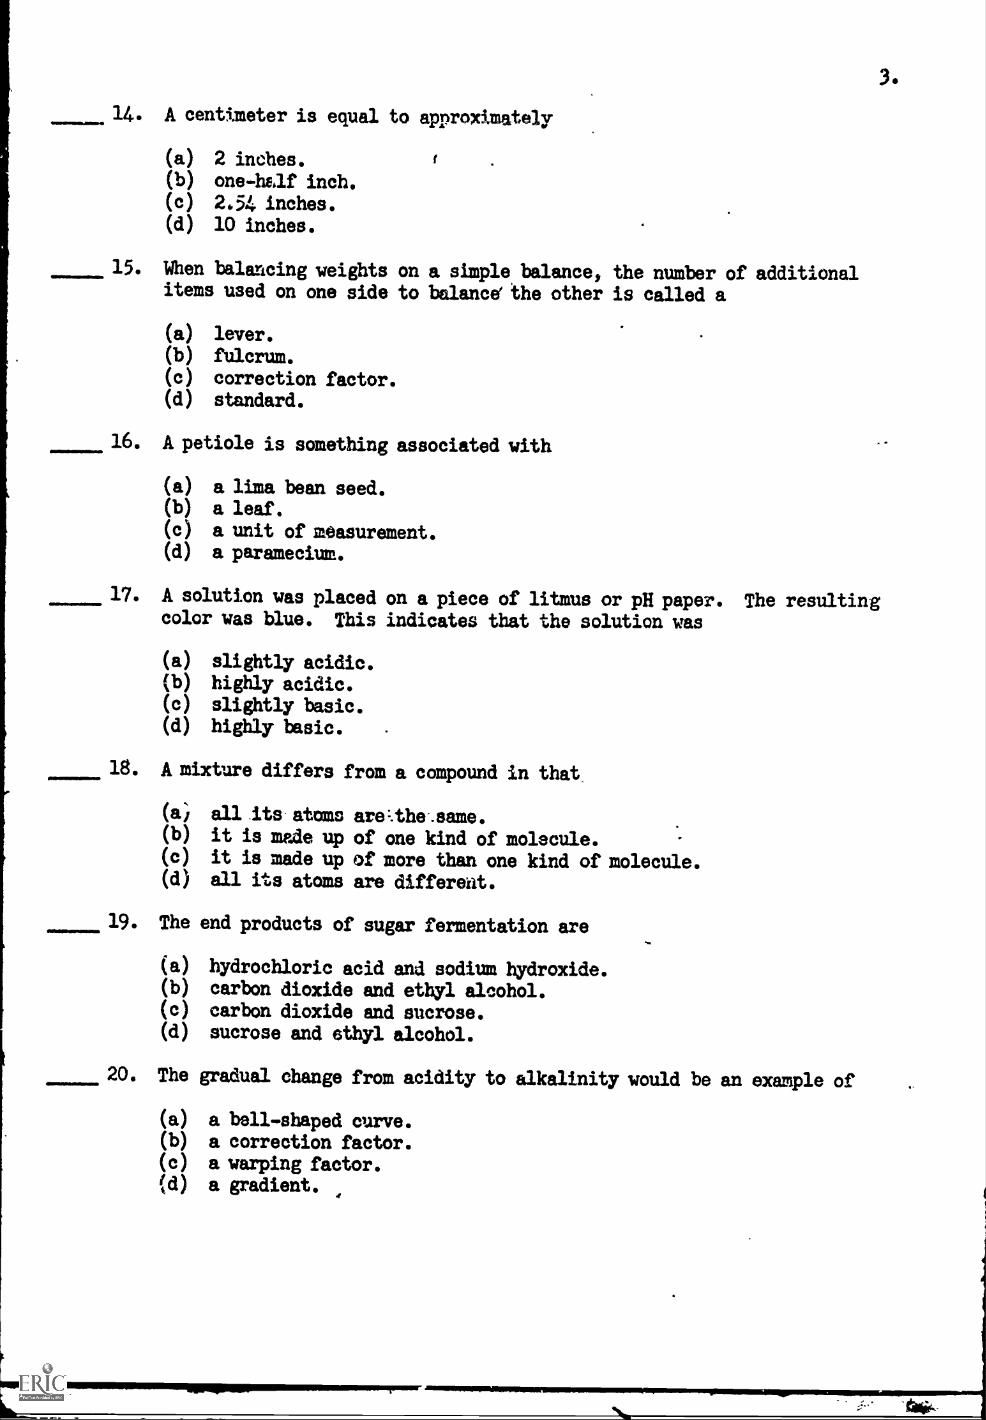
3.14. A centimeter is equal to approximately
(a) 2 inches.(b) one -half inch.(c) 2.54 inches.(d) 10 inches.
1'
15. When balancing weights on a simple balance, the number of additionalitems used on one side to balance' the other is called a
(a) lever.(b) fulcrum.(c) correction factor.(d) standard.
16. A petiole is something associated with
(a) a lima bean seed.(b) a leaf.(c) a unit of measurement.(d) a paramecium.
17. A solution was placed on a piece of litmus or pH paper. The resultingcolor was blue. This indicates that the solution was
(a) slightly acidic.(b) highly acidic.(c) slightly basic.(d) highly basic.
18. A mixture differs from a compound in that
(a/ all its atoms are:.the%same.(b) it is made up of one kind of molecule.(c) it is made up of more than one kind of molecule.(d) all its atoms are different.
19. The end products of sugar fermentation are
(a) hydrochloric acid and sodium hydroxide.(b) carbon dioxide and ethyl alcohol.(c) carbon dioxide and sucrose.(d) sucrose and ethyl alcohol.
20. The gradual change from acidity to alkalinity would be an example of
(a) a bell-shaped curve.(b) a correction factor.(c) a warping factor.(d) a gradient.
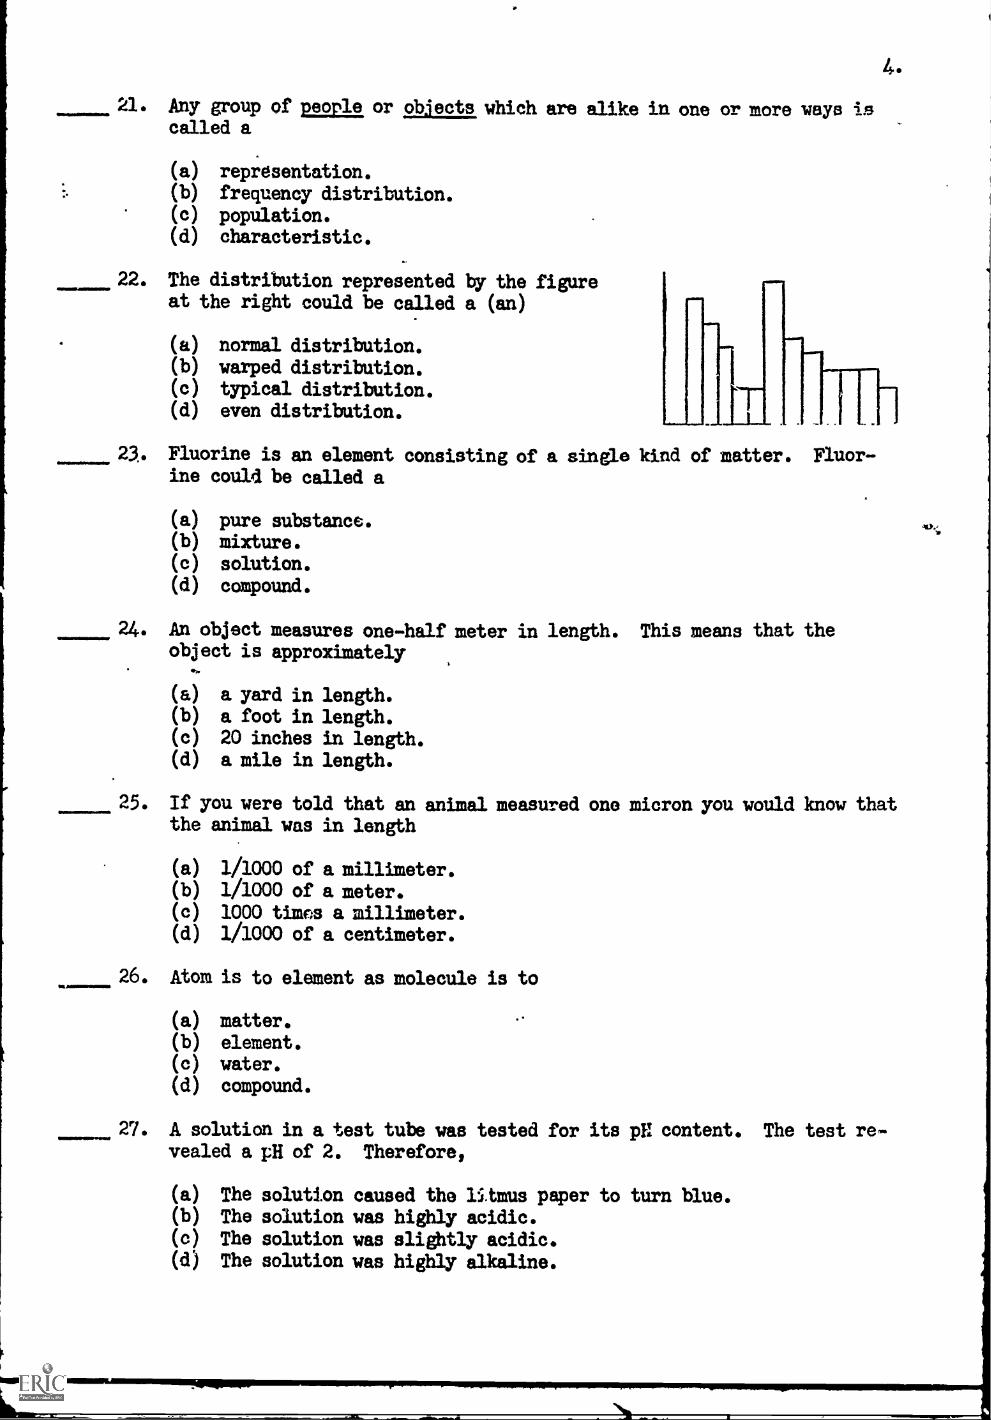
4.
21. Any group of people or objects which are alike in one or more ways iscalled a
(a) representation.(b) frequency distribution.(c) population.(d) characteristic.
22. The distribution represented by the figureat the right could be called a (an)
(a)(b)
(c)
(d)
normal distribution.warped distribution.typical distribution.even distribution. T
23. Fluorine is an element consisting of a single kind of matter. Fluor-ine could be called a
(a) pure substance.(b) mixture.(c) solution.(d) compound.
24. An object measures one-half meter in length. This means that theobject is approximately
(a) a yard in length.(b) a foot in length.(c) 20 inches in length.(d) a mile in length.
25. If you were told that an animal measured one micron you would know thatthe animal was in length
(a) 1/1000 of a millimeter.(b) 1/1000 of a meter.(c) 1000 times a millimeter.(d) 1/1000 of a centimeter.
26. Atom is to element as molecule is to
(a) matter.(b) element.(c) water.(d) compound.
27. A solution in a test tube was tested for its pH content. The test re-vealed a pH of 2. Therefore,
(a) The solution caused the litmus paper to turn blue.(b) The solution was highly acidic.(c) The solution was slightly acidic.(d) The solution was highly alkaline.
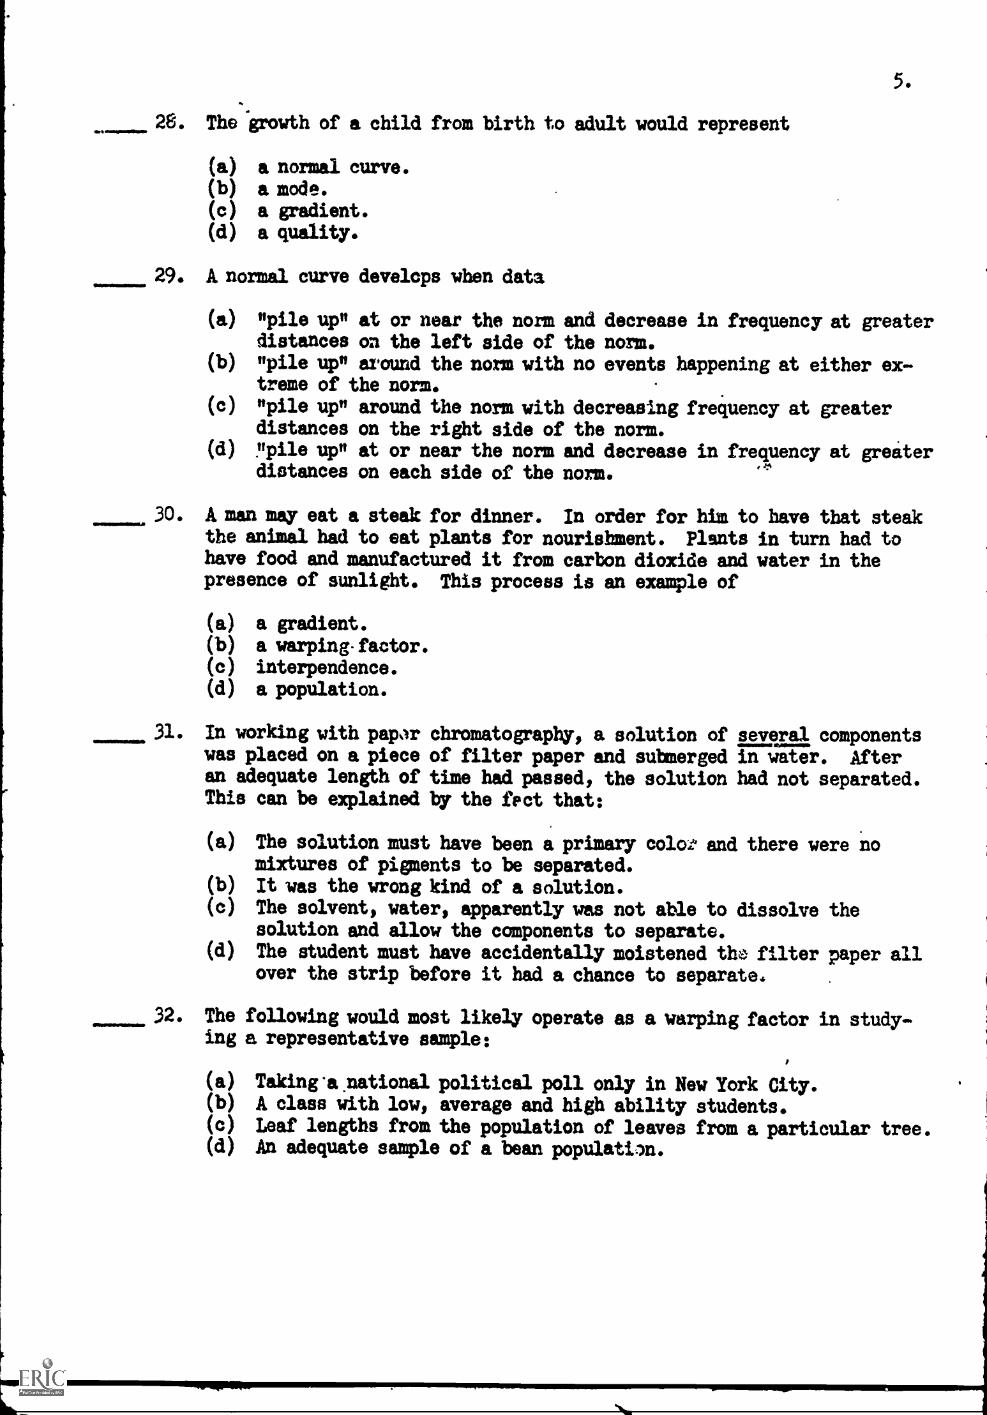
5.
28. The growth of a child from birth to adult would represent
(a) a normal curve.(b) a mode.(c) a gradient.(d) a quality.
29. A. normal curve develops when data
(a) "pile up" at or near the norm and decrease in frequency at greaterdistances on the left side of the norm.
(b) "pile up" around the norm with no events happening at either ex-treme of the norm.
(c) "pile up" around the norm with decreasing frequency at greaterdistances on the right side of the norm.
(d) "pile up" at or near the norm and decrease in frequency at greaterdistances on each side of the norm.
30. A man may eat a steak for dinner. In order for him to have that steakthe animal had to eat plants for nourishment. Plants in turn had tohave food and manufactured it from carbon dioxide and water in thepresence of sunlight. This process is an example of
(a) a gradient.(b) a warping- factor.
(c) interpendence.(d) a population.
31. In working with paper chromatography, a solution of several componentswas placed on a piece of filter paper and submerged in water. Afteran adequate length of time had passed, the solution had not separated.This can be explained by the fact that:
(a) The solution must have been a primary cola: and there were nomixtures of pigments to be separated.
(b) It was the wrong kind of a solution.(c) The solvent, water, apparently was not able to dissolve the
solution and allow the components to separate.(d) The student must have accidentally moistened the filter paper all
over the strip before it had a chance to separate.
32. The following would most likely operate as a warping factor in study-ing a representative sample:
(a) Takinranational political poll only in New York City.(b) A class with low, average and high ability students.(c) Leaf lengths from the population of leaves from a particular tree.(d) An adequate sample of a bean population.
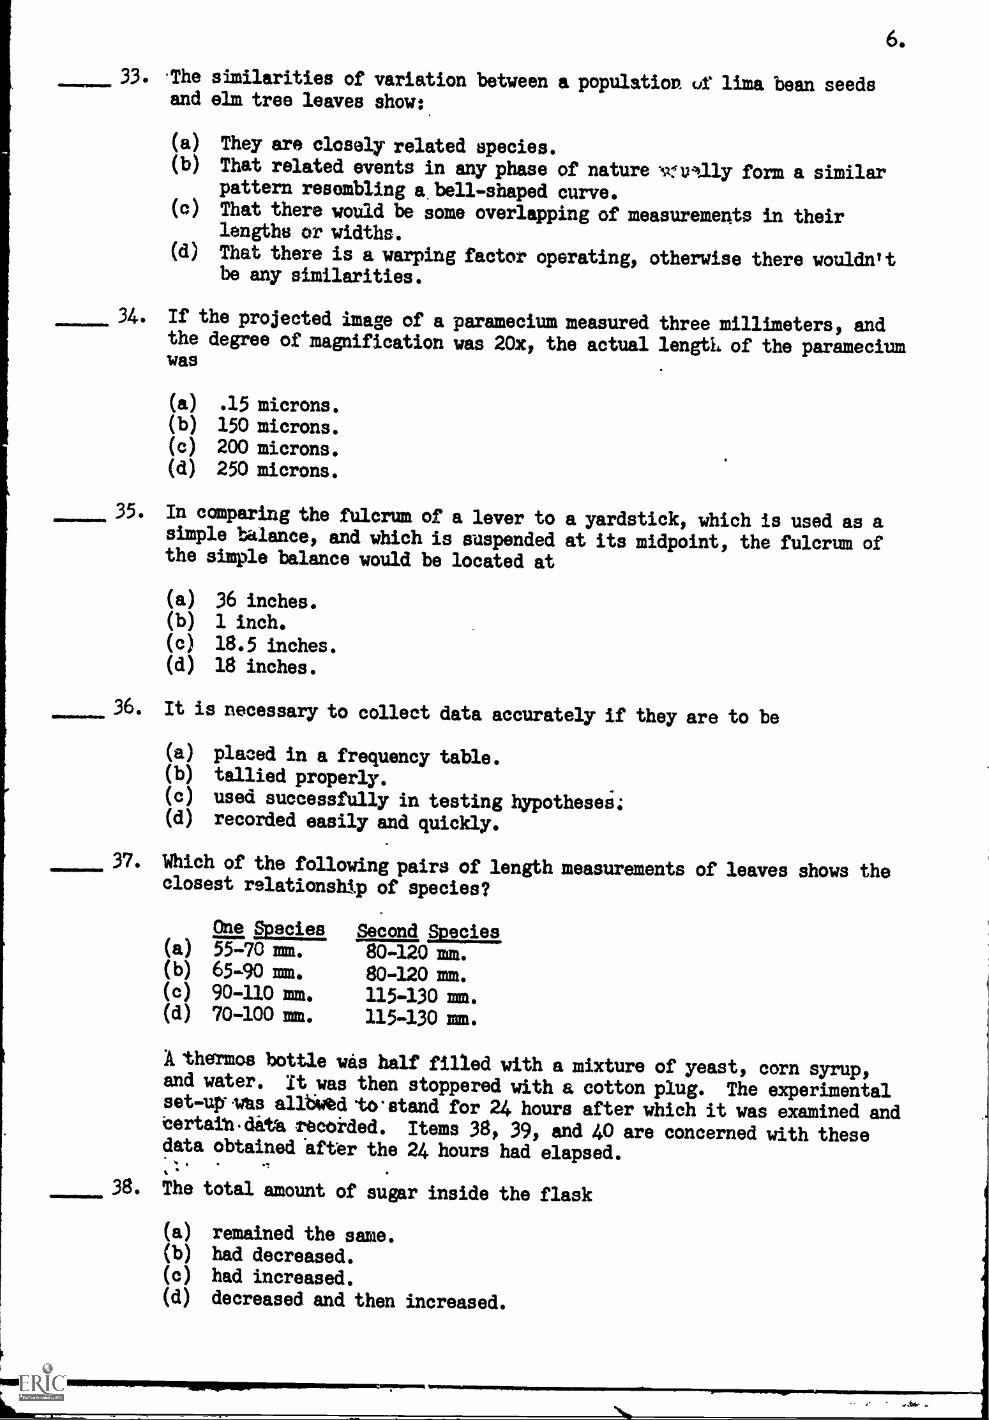
33. The similarities of variation between a population t#t lima bean seedsand elm tree leaves show:
(a)
(b)
(a)
(d)
6.
They are closely related species.That related events in any phase of nature wullly form a similarpattern resembling a bell-shaped curve.That there would be some overlapping of measurements in theirlengths or widths.
That there is a warping factor operating, otherwise there wouldnItbe any similarities.
34. If the projected image of a paramecium measured three millimeters, andthe degree of magnification was 20x, the actual length of the parameciumwas
(a) .15 microns.(b) 150 microns.(c) 200 microns.(d) 250 microns.
35. In comparing the fulcrum of a lever to a yardstick, which is used as asimple balance, and which is suspended at its midpoint, the fulcrum ofthe simple balance would be located at
(a)
(b)
(c)
(d)
36 inches.1 inch.
18.5 inches.18 inches.
is necessary to collect data accurately if they are to be
placed in a frequency table.tallied properly.
used successfully in testing hypotheses;recorded easily and quickly.
37. Which of the following pairs of length measurements of leaves showsclosest relationship of species?
One Species Second poecies(a) 55-70 =4 80-120 mm.(b) 65-90 mm. 80-120 mm.(c) 90-110 mm. 115-130 mm.(d) 70-100 mm. 115-130 mm.
the
A. thermos bottle was half filled with a mixture of yeast, corn syrup,and water. It was then stoppered with a cotton plug. The experimentalset-up idis allbutd.to.stand for 24 hours after which it was examined andtertaindith recoided. Items 38, 39, and 40 are concerned with thesedata obtained after the 24 hours had elapsed.
.1
38. The total amount of sugar inside the flask
(a) remained the same.(b) had decreased.(c) had increased.(d) decreased and then increased.
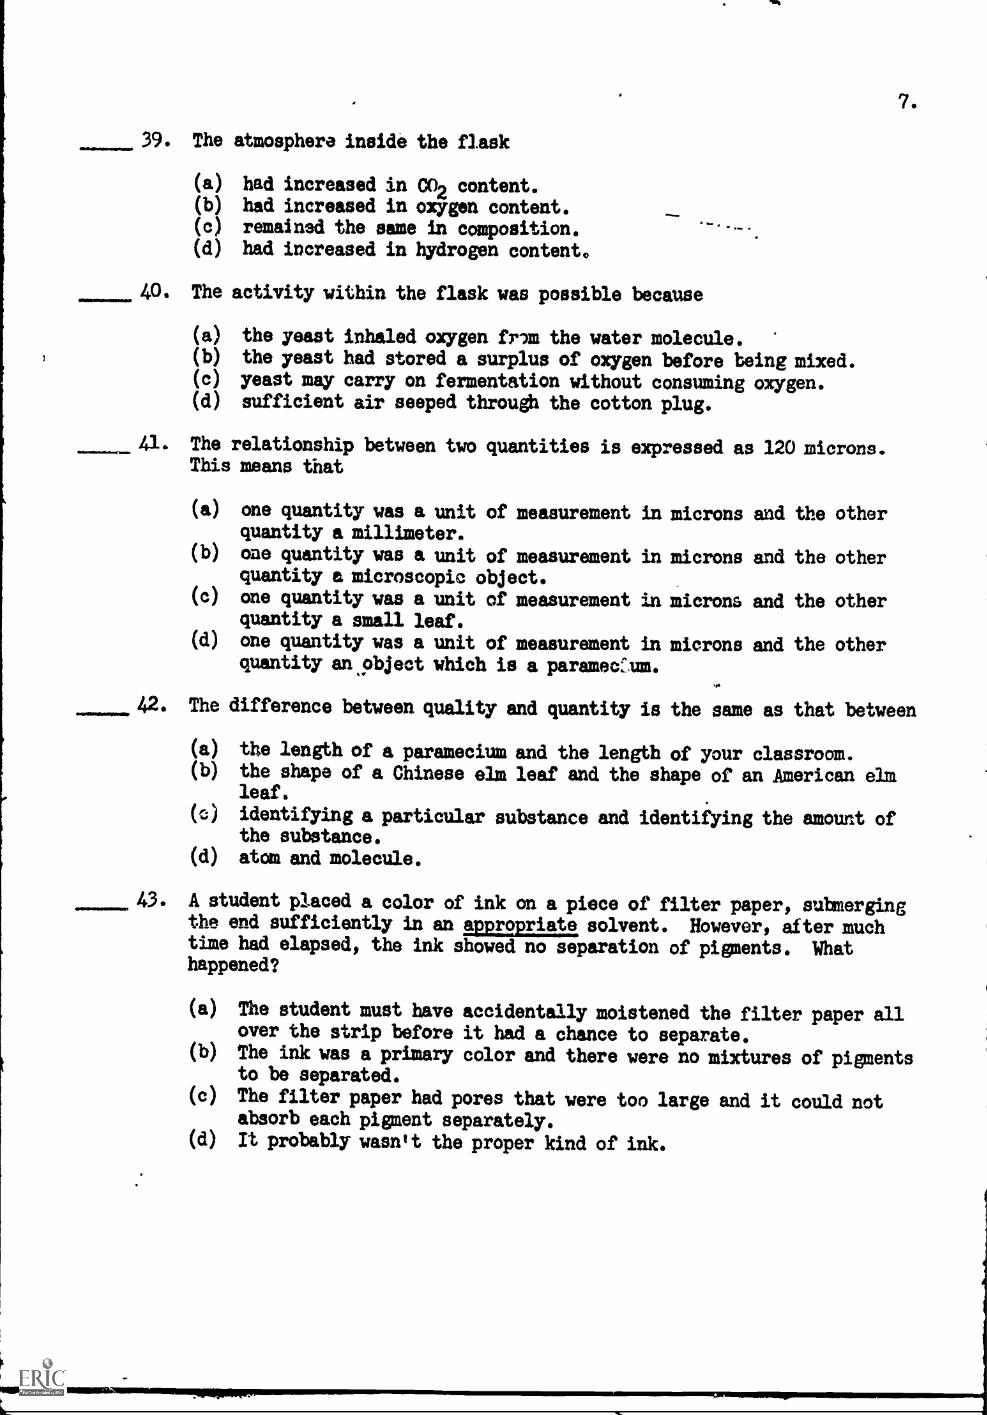
7.
39. The atmosphere inside the flask
(a) had increased in CO2 content.(b) had increased in oxygen content.(c) remained the same in composition.(d) had increased in hydrogen content.
40. The activity within the flask was possible because
(a) the yeast inhaled oxygen frlm the water molecule.(b) the yeast had stored a surplus of oxygen before being mixed.(c) yeast may carry on fermentation without consuming oxygen.(d) sufficient air seeped through the cotton plug.
41. The relationship between two quantities is expressed as 120 microns.This means that
(a) one quantity was a unit of measurement in microns and the otherquantity a millimeter.
(b) one quantity was a unit of measurement in microns and the otherquantity a microscopic object.
(c) one quantity was a unit of measurement in microns and the otherquantity a small leaf.
(d) one quantity was a unit of measurement in microns and the otherquantity an object which is a paramecium.
42. The difference between quality and quantity is the same as that between
(a) the length of a paramecium and the length of your classroom.(b) the shape of a Chinese elm leaf and the shape of an American elm
leaf.(c) identifying a particular substance and identifying the amount of
the substance.(d) atom and molecule.
43. A student placed a color of ink on a piece of filter paper, submergingthe end sufficiently in an appropriate solvent. However, after muchtime had elapsed, the ink showed no separation of pigments. Whathappened?
(a) The student must have accidentally moistened the filter paper allover the strip before it had a chance to separate.
(b) The ink was a primary color and there were no mixtures of pigmentsto be separated.
(c) The filter paper had pores that were too large and it could notabsorb each pigment separately.
(d) It probably wasn't the proper kind of ink.
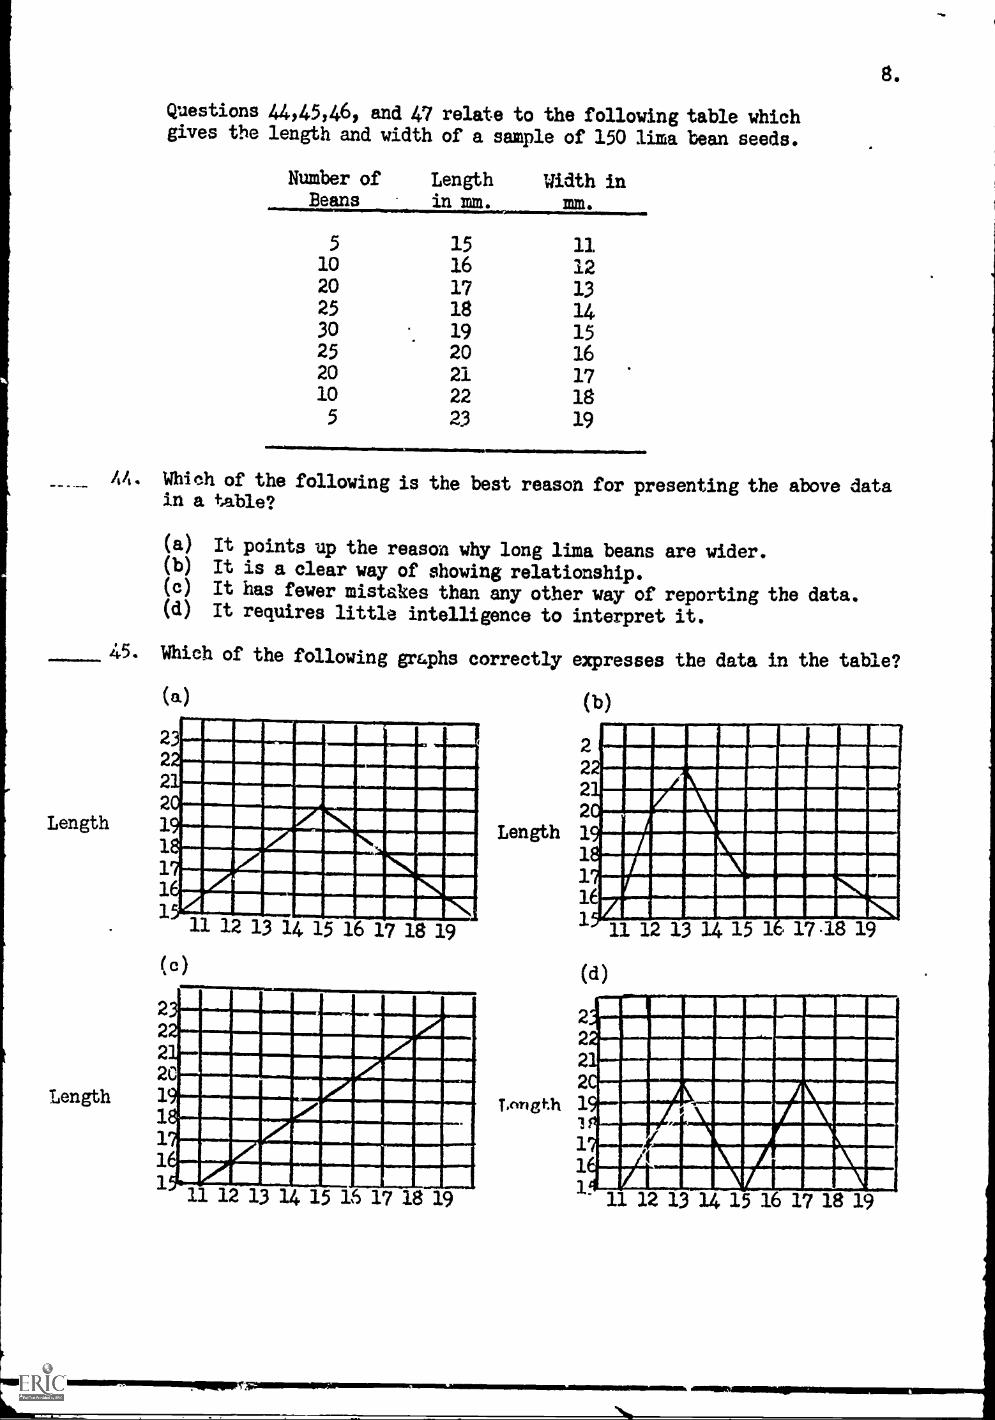
8.
Questions 44,45,46, and 47 relate to the following table whichgives the length and width of a sample of 150 lima bean seeds.
Number ofBeans
510202530252010
5
Lengthin mm.
Width inmm.
15 1116 1217 1318 1419 1520 1621 1722 1823 19
44. Which of the following is the best reason for presenting the above datain a table?
(a) It points up the reason why long lima beans are wider.(b) It is a clear way of showing relationship.(c) It has fewer mistakes than any other way of reporting the data.(d) It requires little intelligence to interpret it.
45. Which of the following graphs correctly expresses the data in the table?
(a)
23
2
2
2Length 1
111
111 12 13 14 15 16 17 18 19
4 mmumnpommonunimIniraimusmumalmomrAI 1111 1111 11111 III 621
WA21 111111111111111101.1111111111111111
11,1
(c)
22
2
20
Length 1
3.11Oro,11
111
11 12 13 14 15 16 17 18 19
Length
(b)
2 I 11111111111111
1111111"1111111112
2oiniMin
1.11111/11111101111.11111111111111111ilsommlinusimsim161111111111111111111111111111011111
X41111111111111111111111111111111,111 12 13 14 15 1 17.18 19
(d)
2
2
2
2
Longth 11
11
1111111111111111111114 1111111W01111111NNW 11111111,4111.1111
111111.1111115U1U alIFSIVA1111111110
. IPA11 12 13 14 15 16 17 18 19
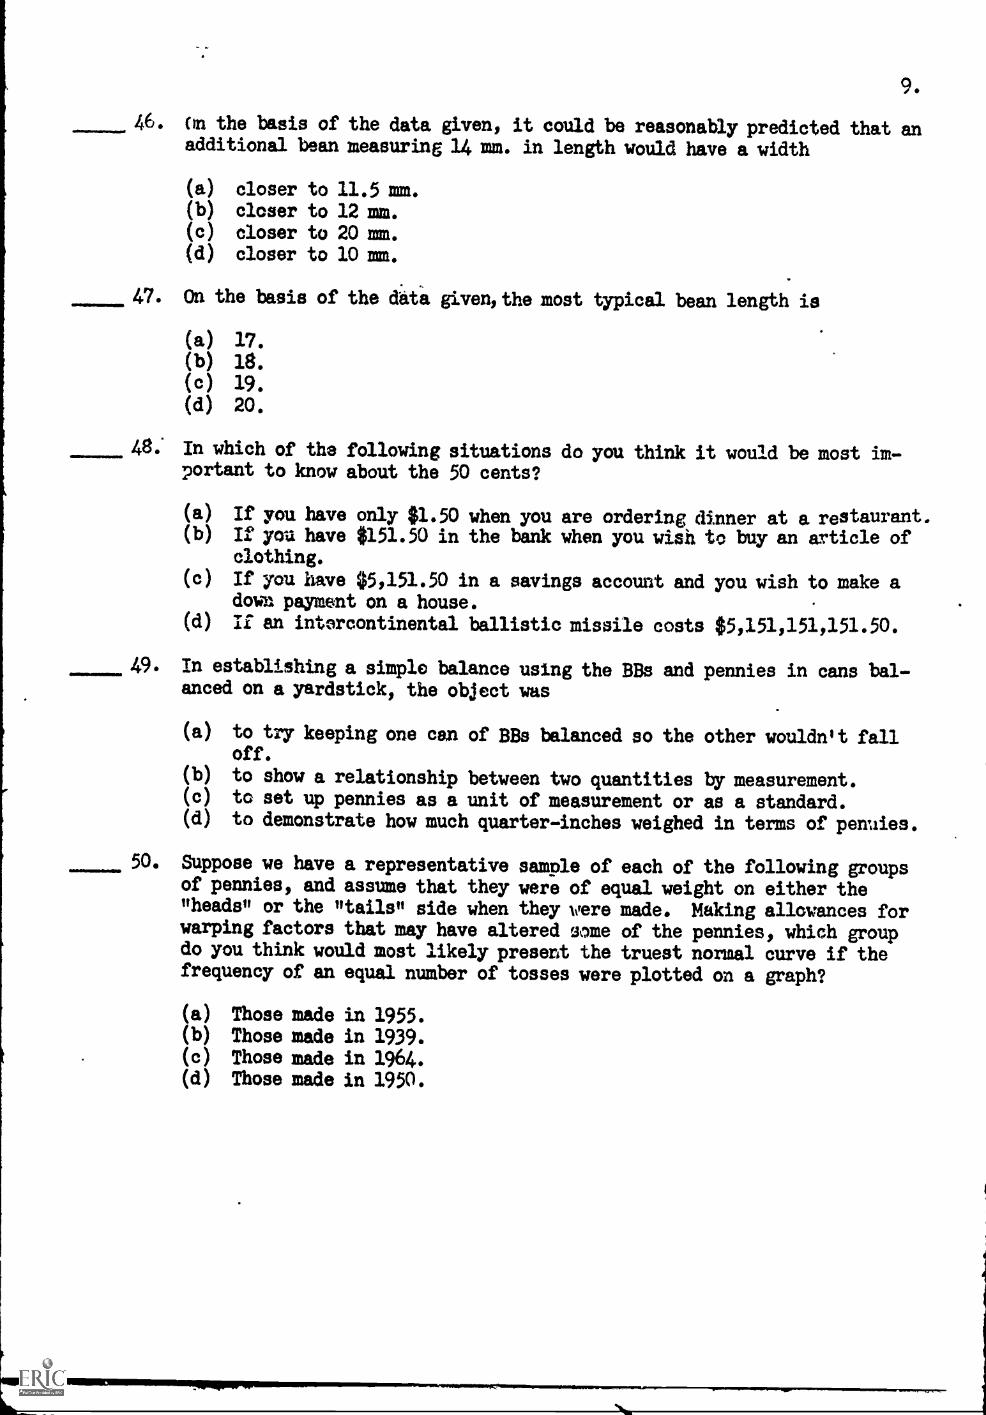
9.
46. On the basis of the data given, it could be reasonably predicted that anadditional bean measuring 14 mm. in length would have a width
(a) closer to 11.5 mm.(b) closer to 12 mm.(c) closer to 20 mm.(d) closer to 10 mm.
47. On the basis of the data given, the most typical bean length is
(a) 17.(b) 18.(c) 19.
(d) 20.
48 In which of the following situations do you think it would be most im-portant to know about the 50 cents?
(a) If you have only $1.50 when you are ordering dinner at a restaurant.(b) If you have $151.50 in the bank when you wish to buy an article of
clothing.(c) If you have $5,151.50 in a savings account and you wish to make a
down payment on a house.(d) If an intorcontinental ballistic missile costs $5,151,151,151.50.
49. In establishing a simple balance using the BBs and pennies in cans bal-anced on a yardstick, the object was
(a) to try keeping one can of BBs balanced so the other wouldn't falloff.
(b) to show a relationship between two quantities by measurement.(c) to set up pennies as a unit of measurement or as a standard.(d) to demonstrate how much quarter-inches weighed in terms of pennies.
50. Suppose we have a representative sample of each of the following groupsof pennies, and assume that they were of equal weight on either the"heads" or the nails!' side when they were made. Making allowances forwarping factors that may have altered some of the pennies, which groupdo you think would most likely present the truest normal curve if thefrequency of an equal number of tosses were plotted on a graph?
(a) Those made in 1955.(b) Those made in 1939.(c) Those made in 1964.(d) Those made in 1950.
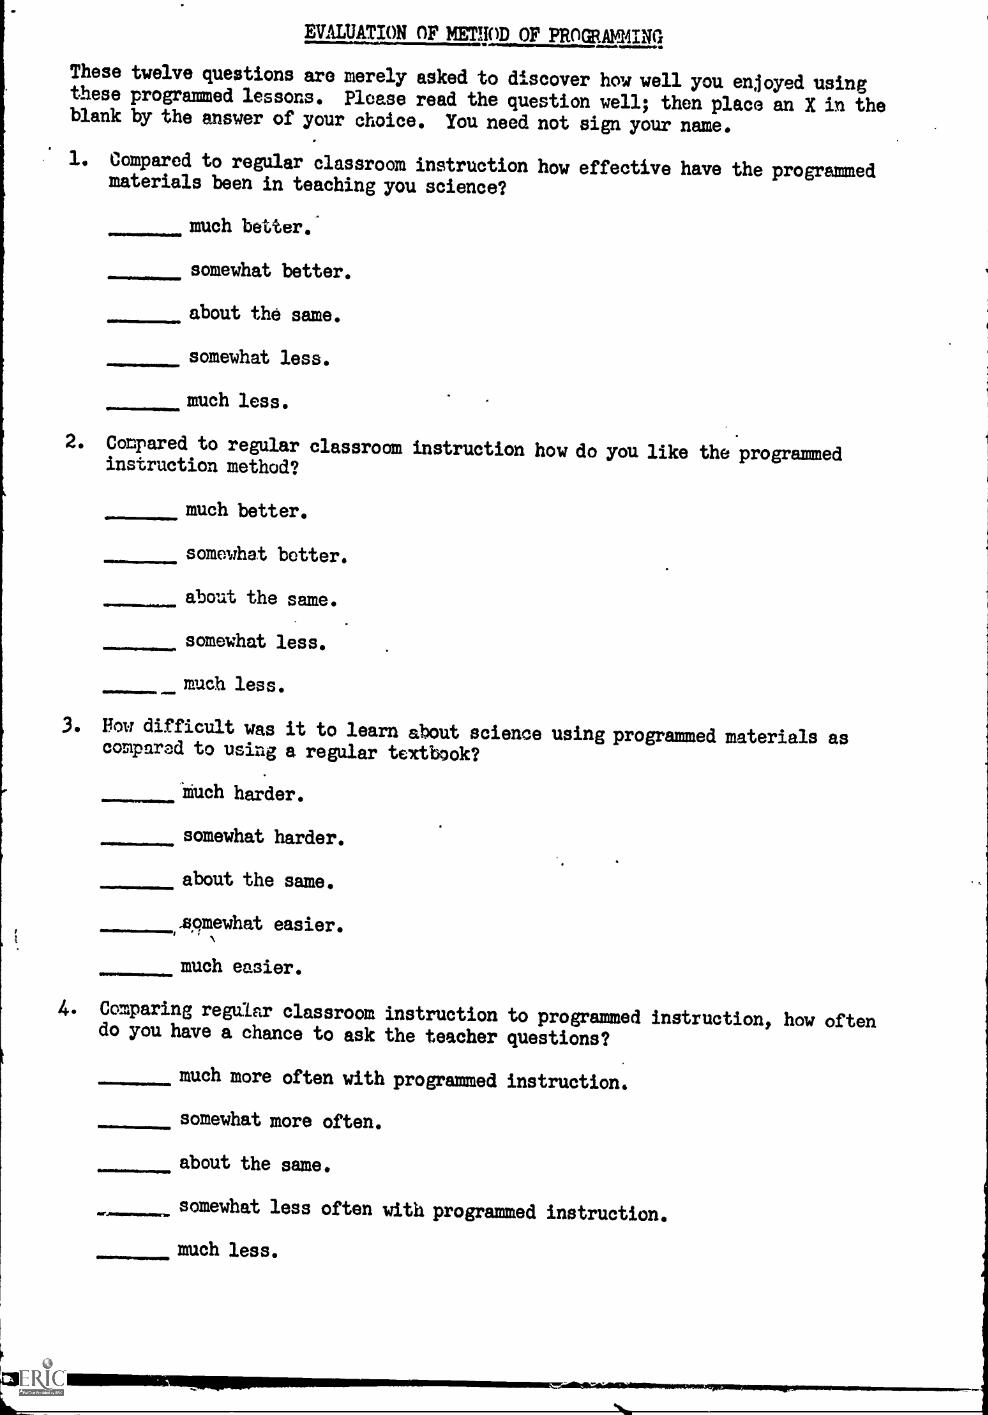
EVALUATION OF METHOD OF PROGRAMMINg
These twelve questions are merely asked to discover how well you enjoyed usingthese programmed lessons. Please read the question well; then place an X in theblank by the answer of your choice. You need not sign your name.
1. Compared to regular classroom instruction how effective have the programmedmaterials been in teaching you science?
much better.
somewhat better.
about the same.
somewhat less.
much less.
2. Coppared to regular classroom instruction how do you like the programmedinstruction method?
much better.
somewhat better.
about the same.
somewhat less.
much less.
3. How difficult was it to learn about science using programmed materials ascomparad to using a regular textbook?
Much harder.
somewhat harder.
about the same.
_somewhat easier.
much easier.
4. Comparing regular classroom instruction to programmed instruction, how oftendo you have a chance to ask the teacher questions?
much more often with programmed instruction.
somewhat more often.
about the same.
somewhat less often with programmed instruction.
much less.
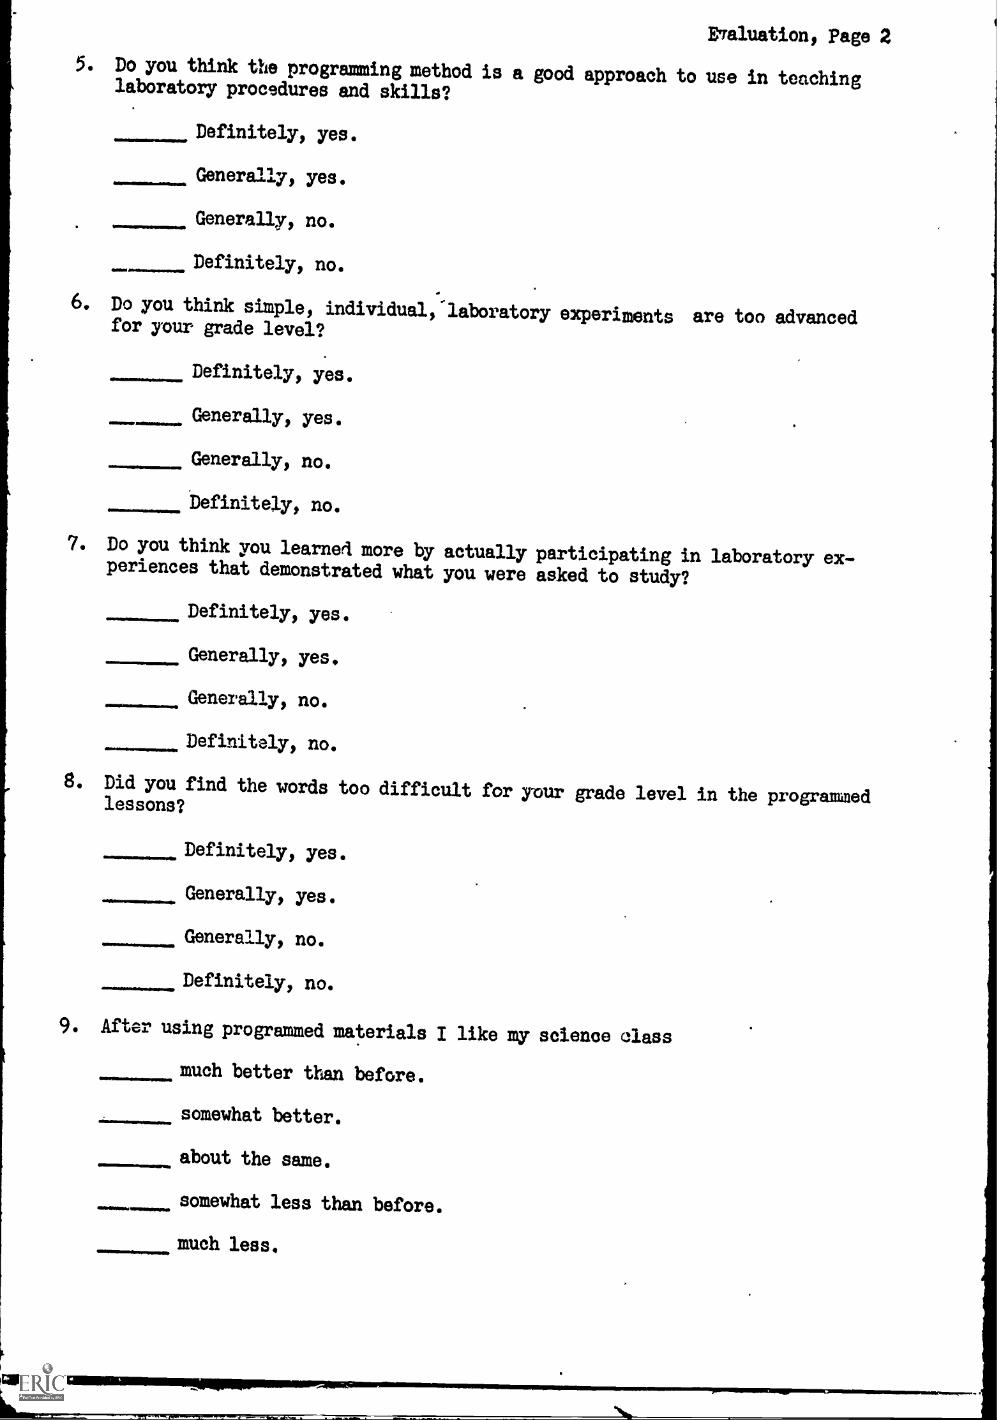
E'raluation, Page 2
5. Do you think the programming method is a good approach to use in teachinglaboratory procedures and skills?
Definitely, yes.
Generally, yes.
Generally, no.
Definitely, no.
6. Do you think simple, individual,-laboratory experiments are too advancedfor your grade level?
Definitely, yes.
Generally, yes.
Generally, no.
Definitely, no.
7. Do you think you learned more by actually participating in laboratory ex-periences that demonstrated what you were asked to study?
Definitely, yes.
Generally, yes.
Generally, no.
Definitely, no.11110.11.1=1.M1110111111
8. Did you find the words too difficult for your grade level in the programmedlessons?
Definitely, yes.
Generally, yes.
Generally, no.
Definitely, no.
9. After using programmed materials I like my science class
much better than before.
somewhat better.
about the same.
somewhat less than before.
much less.
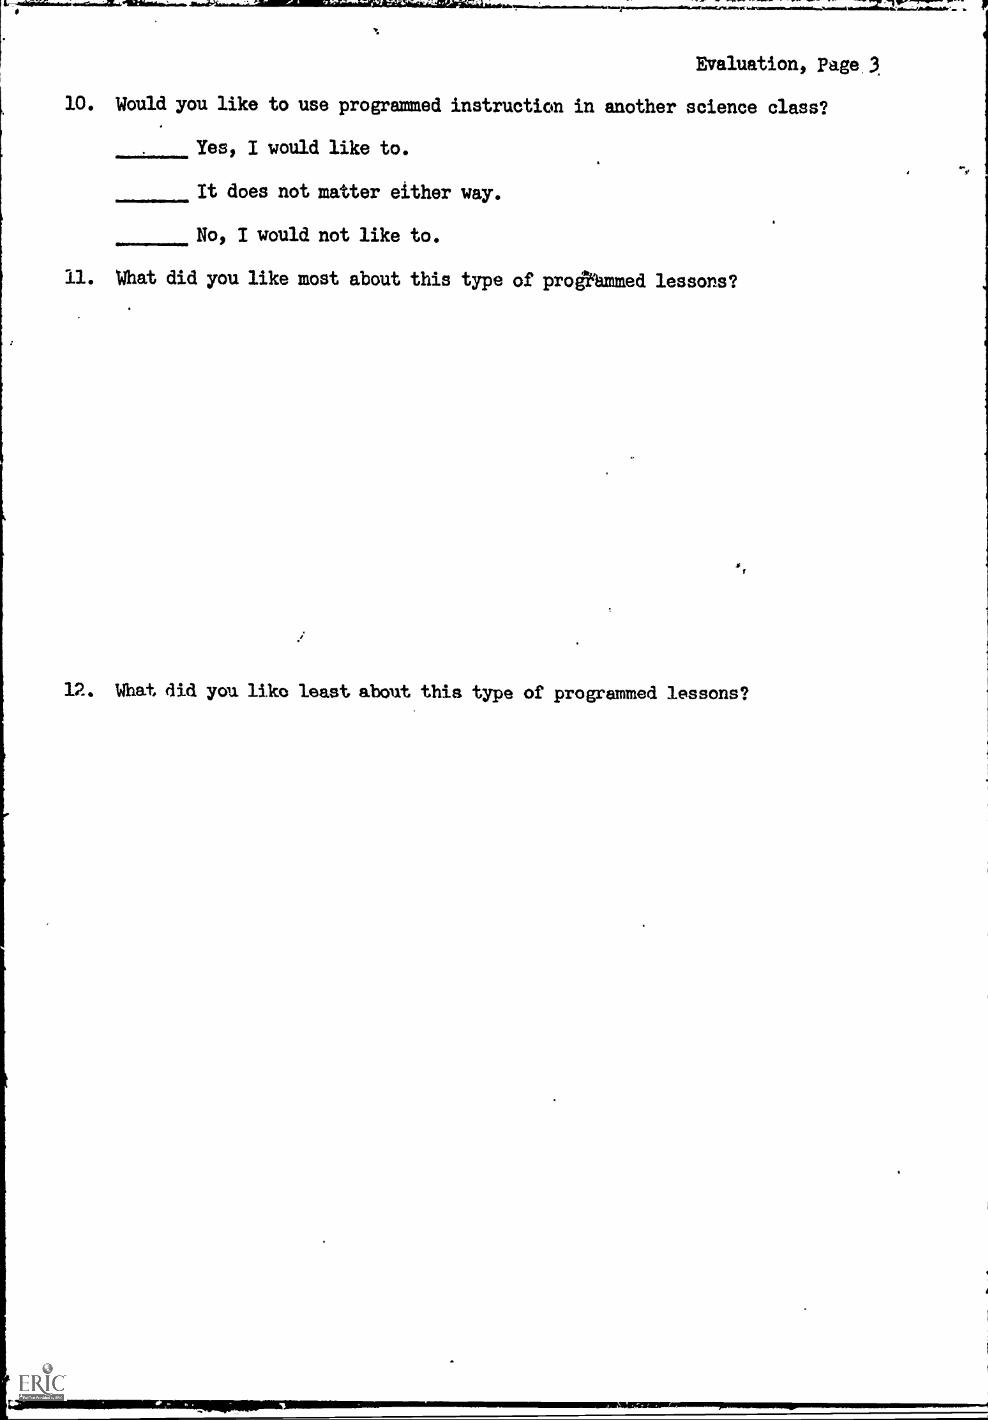
Evaluation, Page 3
10. Would you like to use programmed instruction in another science class?
Yes, I would like to.
It does not matter either way.
No, I would not like to.
11. What did you like most about this type of prodVammed lessons?
12. What did you li.k© least about this type of programmed lessons?

APPENDIX C
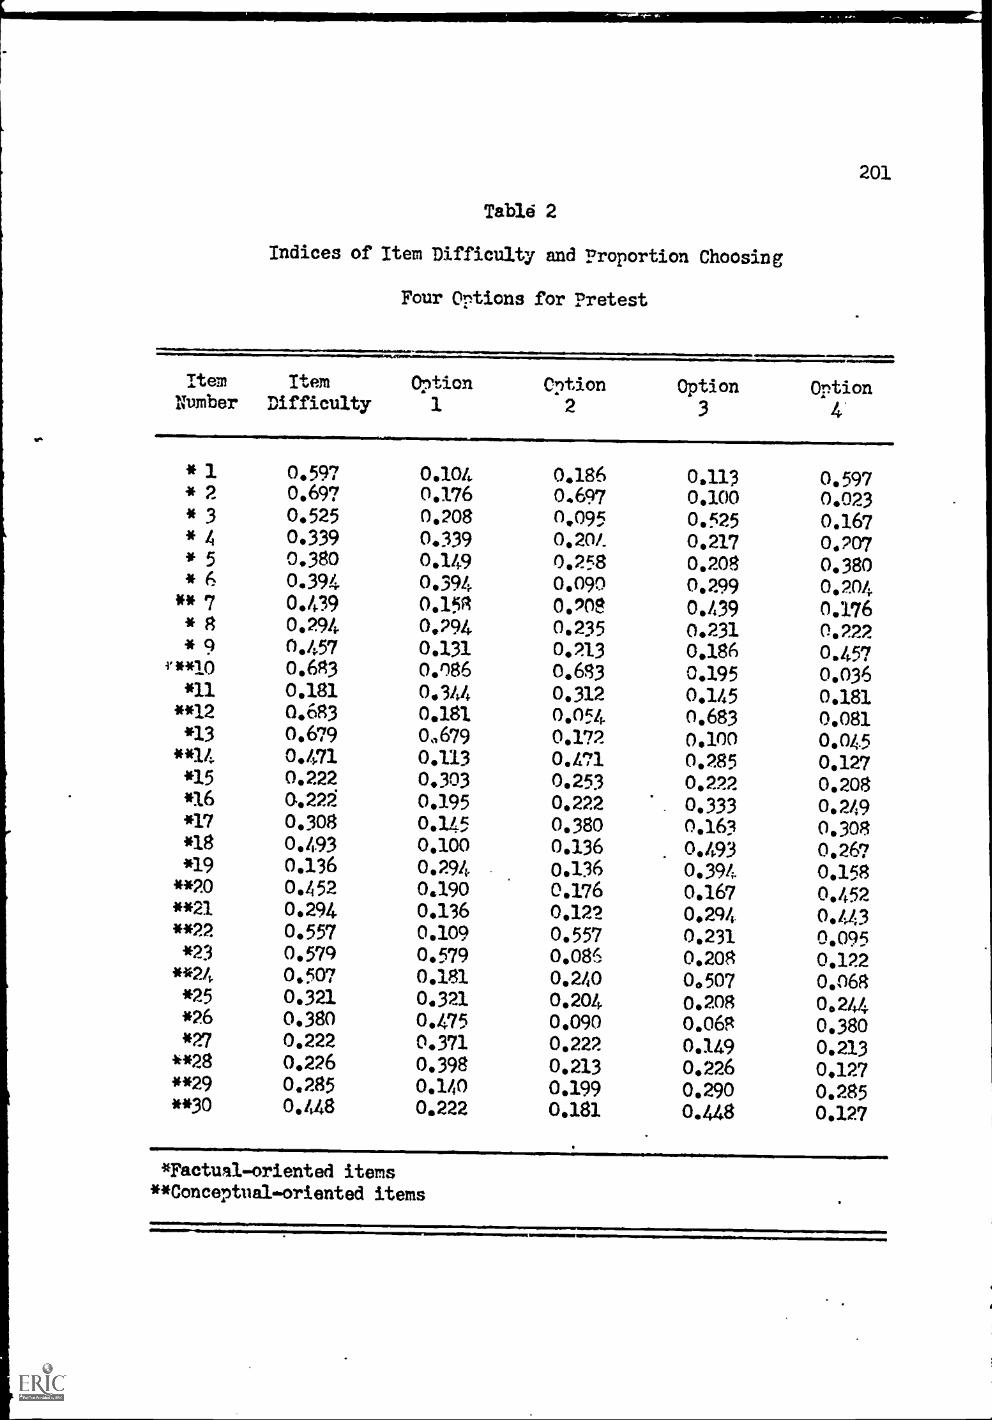
Table 2
Indices of Item Difficulty and Proportion Choosing
Four Options for Pretest
ItemNumber
ItemDifficulty
Option1
Cption2
* 1 0.597 0.104 0.186* 2 0.697 0.176 0,697* 3 0.525 0.208 0.095* 4 0.339 0.339 0.20k* 5 0.380 0.149 0.258* 6 0.394 0.394 0.090** 7 0.439 0.191 0.908* 8 0.294 0.294 0.235* 9 0,457 0.131 0.213
v**10 0.683 0,086 0.683*11 0.181 0.344 0.312
**12 0.683 0.181 0.054*13 0.679 0679 0.172
**14 0.471 0.113 0.471*15 0.222 0.303 0.253*16 0.222 0.195 0.222*17 0,308 0.145 0.380*18 0.493 0.100 0.136*19 0.136 0.294 0.136**20 0.452 0.190 0.176**21 0.294 0.136 0.122**22 0.557 0.109 0.557*23 0.579 0.579 0.086**24 0.507 0.181 0.240*25 0.321 0.321 0.204*26 0.380 0.475 0.090*27 0.222 0.371 0.222
**28 0.226 0.398 0.213**29 0.285 0.140 0.199**30 0.448 0.222 0.181
201
Option Option3 4
0.113 0.5970.100 0.0230.525 0.1670.217 0.7070.208 0.3800.299 0.2040.139 0.1760.231 0.2220.186 0.4570.195 0.0360.145 0.1810.683 0.0810.100 0.0450.285 0,1270.222 0.208
.
0.333 0.2490.163 0,3080.193 0.2670.394 0.1580,167 0.4520.294 0.4430.231 0.0950.208 0.1220.507 0.0680.208 0.2440.068 0.3800.149 0.2130.226 0.1270.290 0.2850.448 0.127
*Factual-oriented items**Conceptual-oriented items
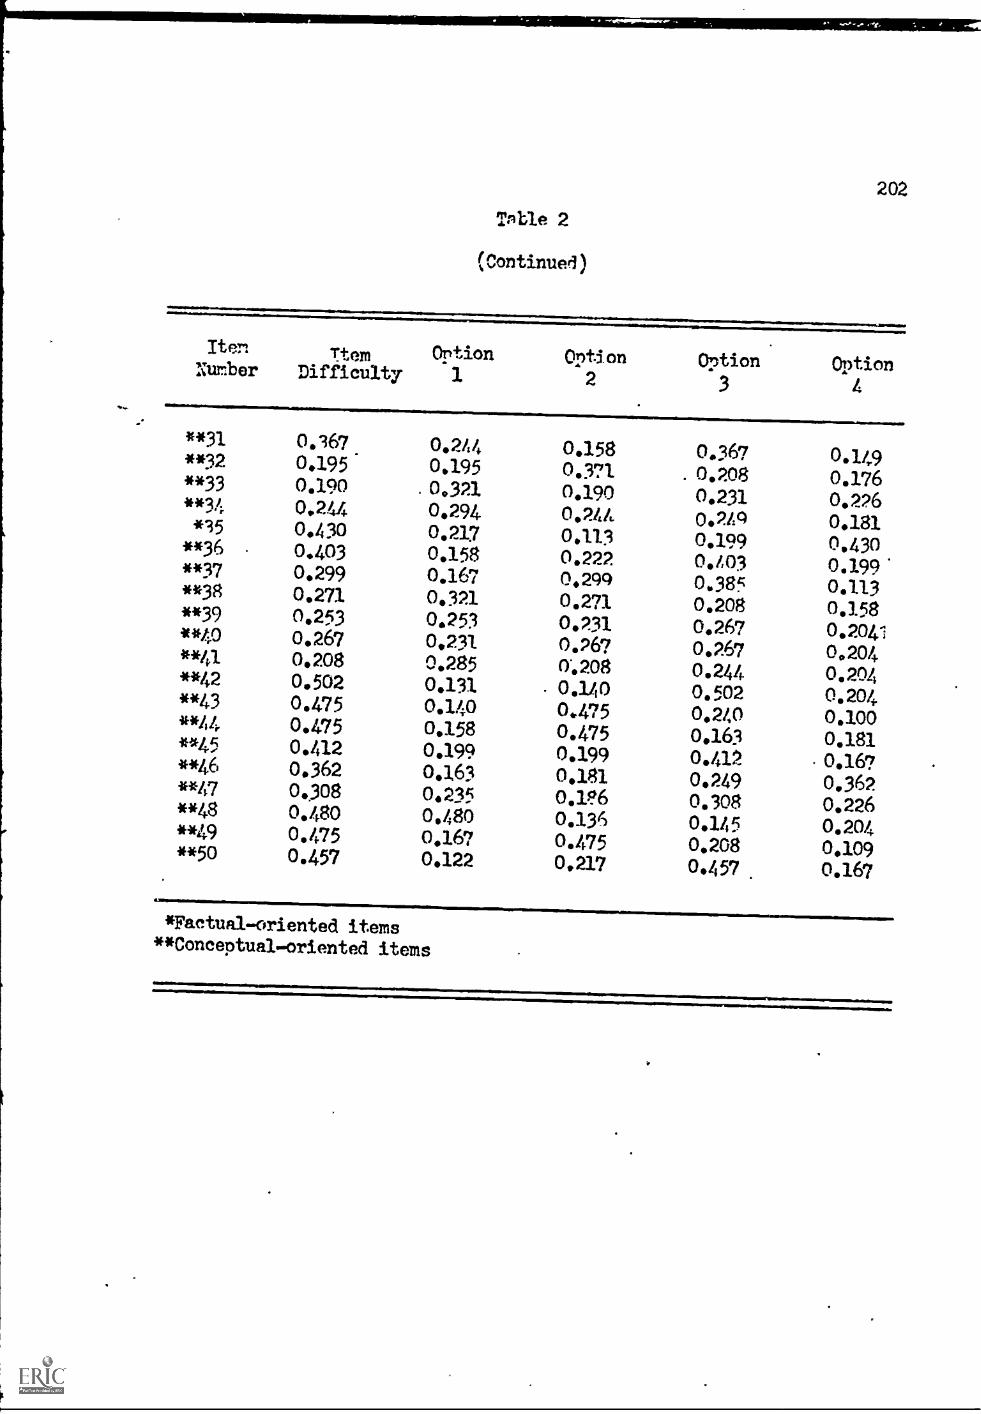
r
ONNINMWINNIOMmIMNImoi
Table 2
(Continued)
202
Iter Ttem Option Option Option OptionNumber Difficulty 1 2 3 4
**31
**32**33**34*35
**36**37
**38**39**40
**41**42
**43
**44**45**46**47
**48**49**50
0.167 0,244 0.158 0.3670.195' 0.195 0.371 . 0.2080.190 .0.321 0.190 0.2310.244 0.294 0.244 0.2A90.430 0.217 0.113 0.1990.403 0.158 0.222 0,/,030.299 0.167 0,299 0.3850.271 0.321 0.271 0.2080.253 0.253 0.231 0.2670.267 0.231 0.267 0.2670.208 0.285 0.208 0.2440.502 0.131 0.140 0.5020.475 0.140 0.475 0.2400.475 0.158 0.475 0.1630.412 0.199 0.199 0.4120.362 0.163 0.181 0.2490.308 0.235 0,16 0.3080.480 0.480 0.136 0.1450.475 0.167 0.1.75 0.2080.457 0.122 0,217 0.457.
0.149
0.1760.2260.1810.4300.199'0.1130.1580.204=
0.2040.2040.2040.1000.1810.16?0.3620.2260.2040.1090.167
*Factual-oriented items**Conceptual-oriented items
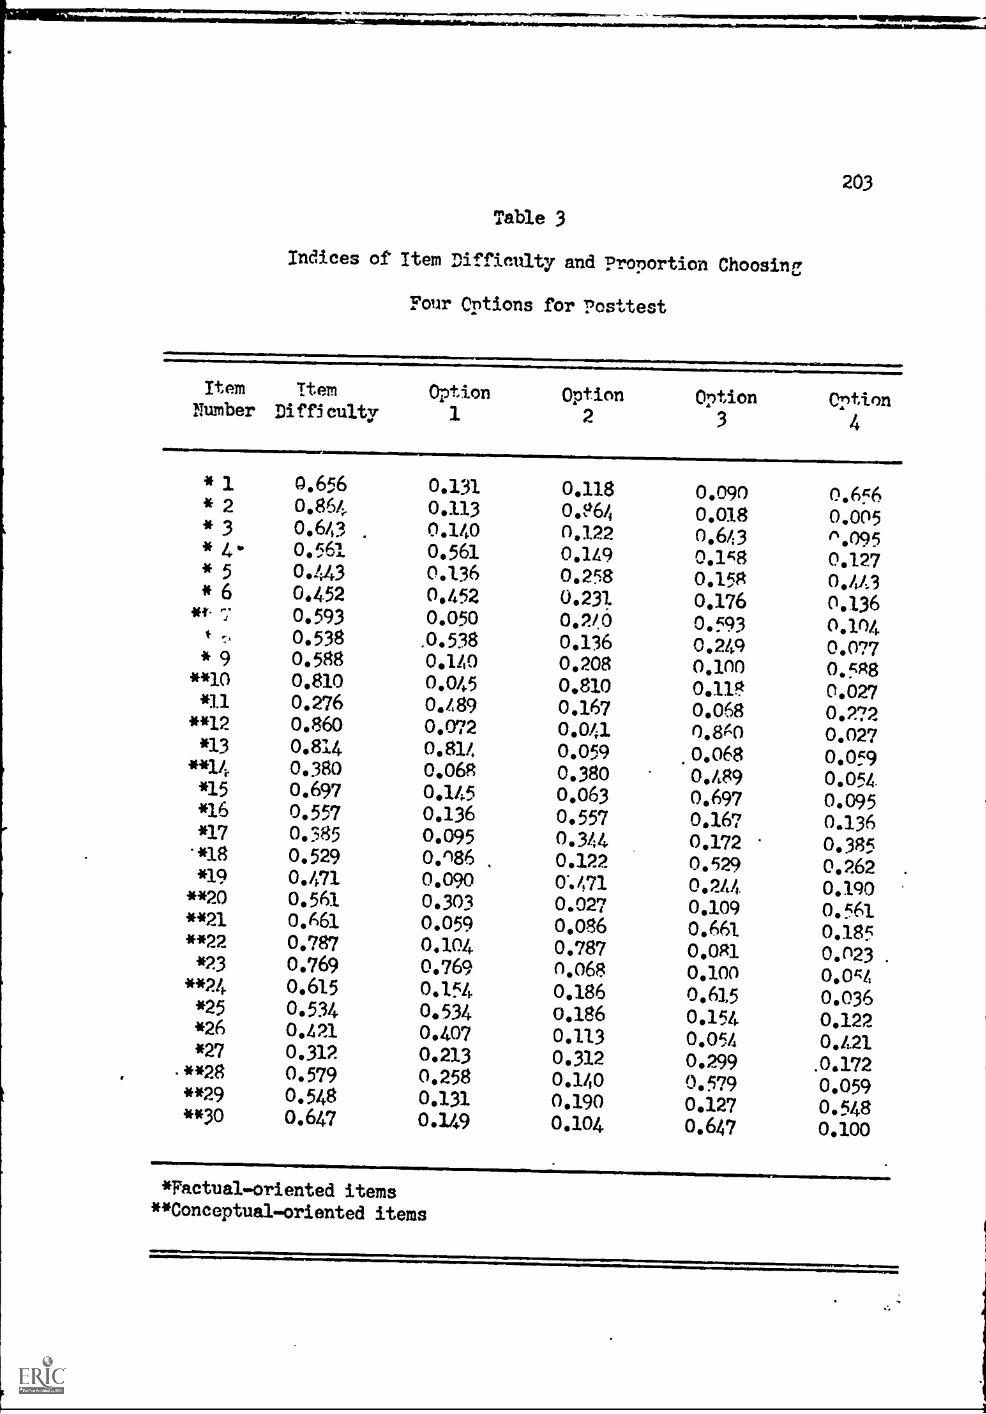
Table 3
Indices of Item Difficulty and Proportion Choosing
Four Options for Posttest
Item
NumberItem
DifficultyOption
1Option2
* 1 0,656 0.131 0.118* 2 0.864 0.113 0.864* 3 0.61,3 0.140 0.122* 4" 0.561 0.561 0.149* 5 0.443 0.136 0.258* 6 0.452 0,452 0,231
itt- T 0.593 0.050 0.2!O* 0.538 .0.538 0.136* 9 0,588 0.140 0.208
**10 0.810 0,045 0.810*11 0.276 0.489 0.167
**12 0.860 0.072 0.041*13 0.814 0,814 0.059
**14 0.380 0,068 0,380*15 0.697 0.145 0.063*16 0.557 0.136 0.557*17 0.385 0.095 0.344'*18 0.529 0.086. 0.122*19 0.471 0.090 0..471
**20 0.561 0.303 0.027**21 0.661 0.059 0.086**22 0.787 0.104 0.787*73 0.769 0.769 0,068
**24 0.615 0.154 0,186*25 0.534 0,534 0,186*26 0.421 0.407 0.113*27 0.312 0.213 0.312
.**28 0.579 0,258 0.140**29 0.548 0,131 0.190**30 0.647 0.149 0,104
203
Option Option3 4
0.090 0.6560.018 0.0050.643 ".0950.158 0.1270.158 0,41.3
0,176 0,1360.593 0.1040.249 0.0770.100 0.5880.118 0.0270.068 0.2720.8t<0 0.027
.0,068 0,0590,189 0.0540.697 0.0950.167 0.1360.172 0.3850.529 0.2620.244 0.19()0.109 0.5610.661 0.1850.081 0.0230.100 0.0540.615 0,0360,154 0,1220.054 0.4210.299 .0.1720.579 0.0590.127 0.5480.647 0.100
*Factual-oriented items**Conceptual-oriented items
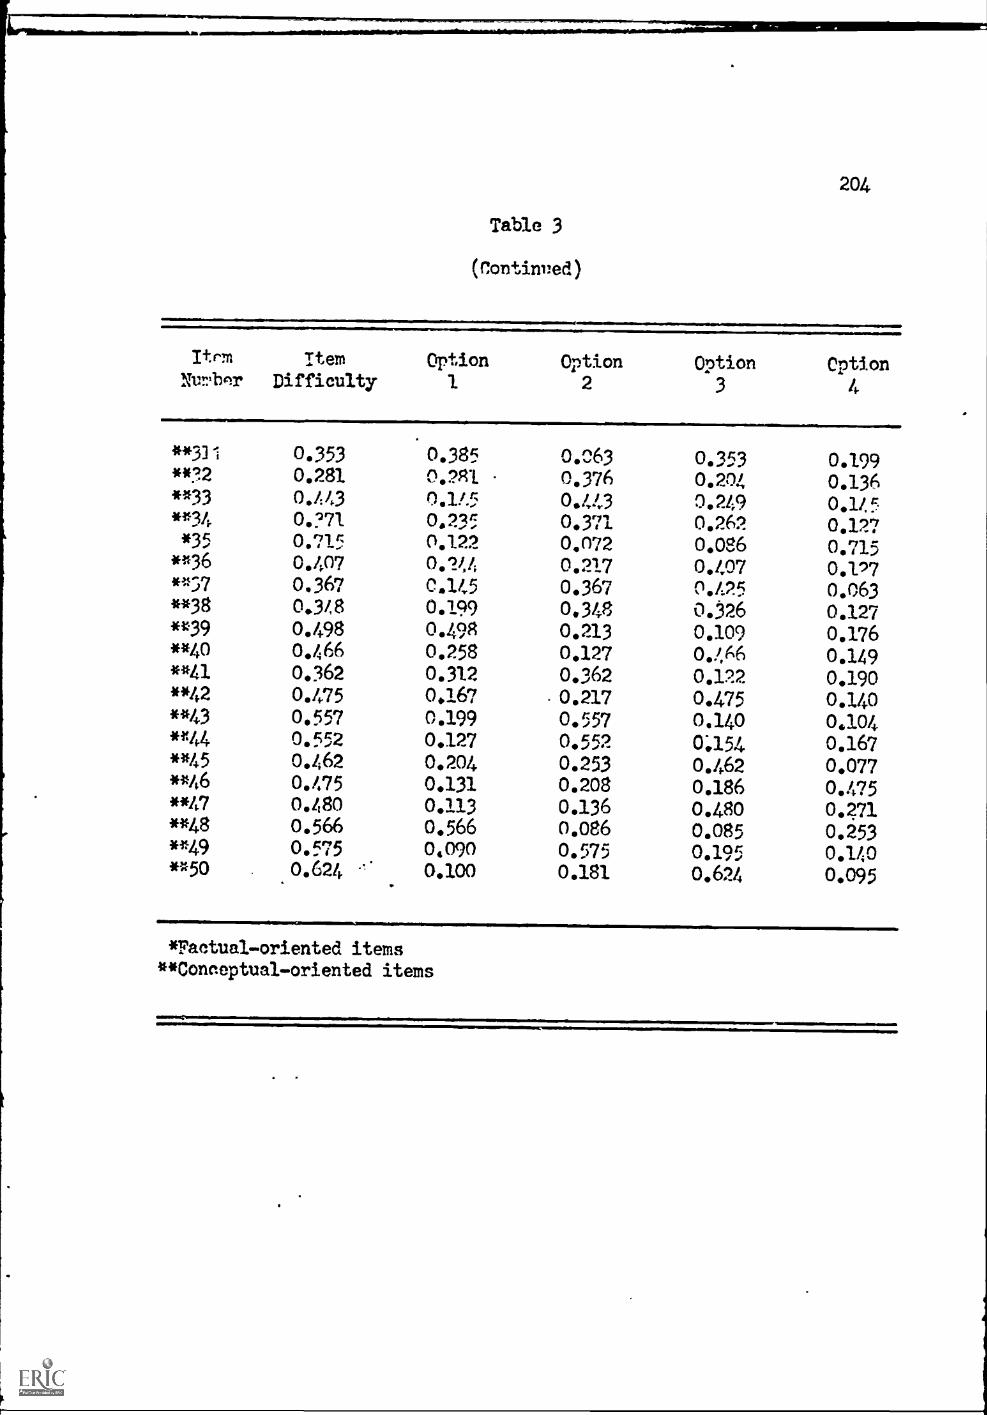
Table 3
(Continued)
Itrm Item Option OptionNi r.ibem Difficulty 1 2
* *3] 0.353 0.385 0.063**?2 0.281 0.281 0.376**33 0.1:1,3 0.1!.5 0.443**34 0.?71 0.235 0.371*35 0.715 0.122 0.072**36 0.407 0.244 0.217**57 0.367 0.145 0.367**38 0.348 0.199 0.348*3:39 0.498 0.498 0.213**40 0.466 0.258 0,127**41 0.362 0.312 0.362**42 0.475 0.167 0.217**43 0.557 0.199 0.557"44 0.552 0.127 0.552**45 0.462 0.204 0.253**46 0.475 0.131 0.208**47 0.480 0.113 0.136**48 0.566 0.566 0.086**49 0.575 0,090 0.575**50 0.624 0.100 0.181
204
Option Option3 4
0.353 0.1990.204 0.1360.249 0.1450.262 0.1270.086 0.7150.407 0.1970.125 0.063
0.326 0.1270.109 0.1760.4A6 0.1490.122 0.1900.475 0.1400.140 0.1040-.154 0.167
0.462 0.0770.186 0.4750.480 0.2710.085 0.2530.195 0.1400.624 0.095
*Factual-oriented items**Conceptual-oriented items
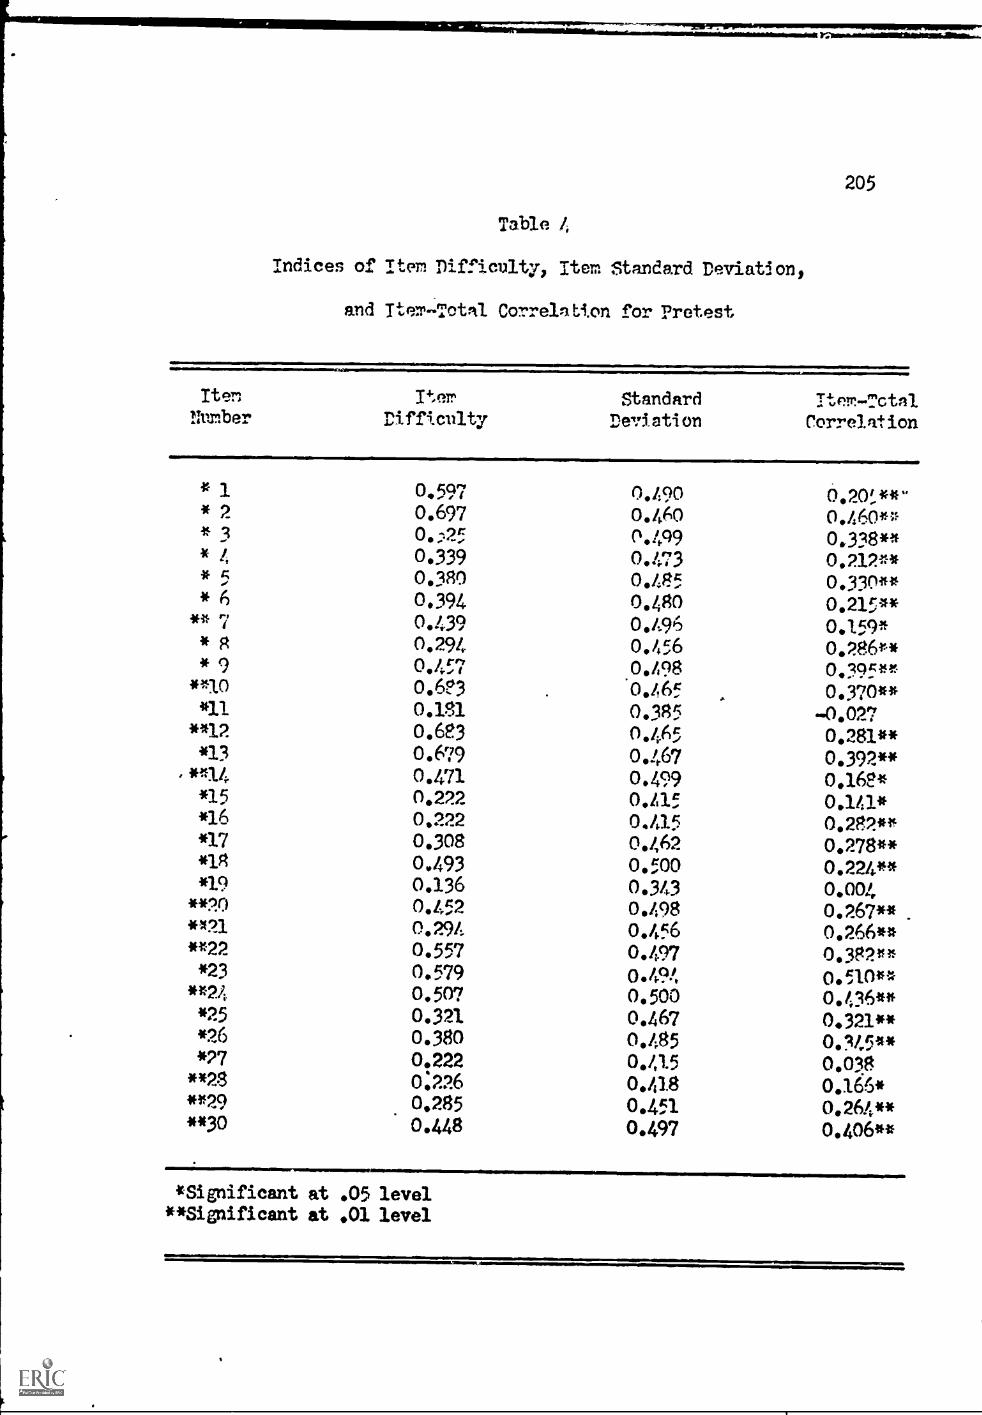
205
Table 4
Indices of Item Difficulty, Item Standard Deviation,
and Tter otal Correlat-ton for Pretest
Item
Number'ter
Diffi cultyStandard
Deviation
*1 0.597 0.490*2 0.697 0.460*3 0.'25 0.499*4 0.339 0.473*5 0.380
0
0./85*6 0.394 0, 048
** 7 0.439 0.496*8 0.294 0./56*9 0.457 0.498**10 0.6n '0,465*11 0.181 0.385**12 0,683 0.465*13 0.679 0.467
**1.4. 0.471 0.499*15 0.222 0.415*16 0,222 0.415*17
C
0.462*18 04349; 0.500*19 0.136 0.343
**20 0.452 0.498*121 0.294 0.456**22 0.557 0.497*23 0.579 0.494
**2A 0.507 0.500*25 0.321 0.467*26 0.380 0 .485*27 0.222 0.415**28 0:226 0.418**29 0.285 044**30 0.448 0.474?
Ttem-TctalCorrelation
0.20',**"
0.460**0.338**0.212**
0.330**0.215**0.159*0.2864!.*
0.395 4$
20.0374**
0.281**
0.168*
0.392 **
0.278**0.282**
0.224**
0)(0.267 **
0.266**
0.382**
(()(02F:i
0045**0.0380.166*0.264**0.406**
*Significant at .05 level**Significant at .01 level
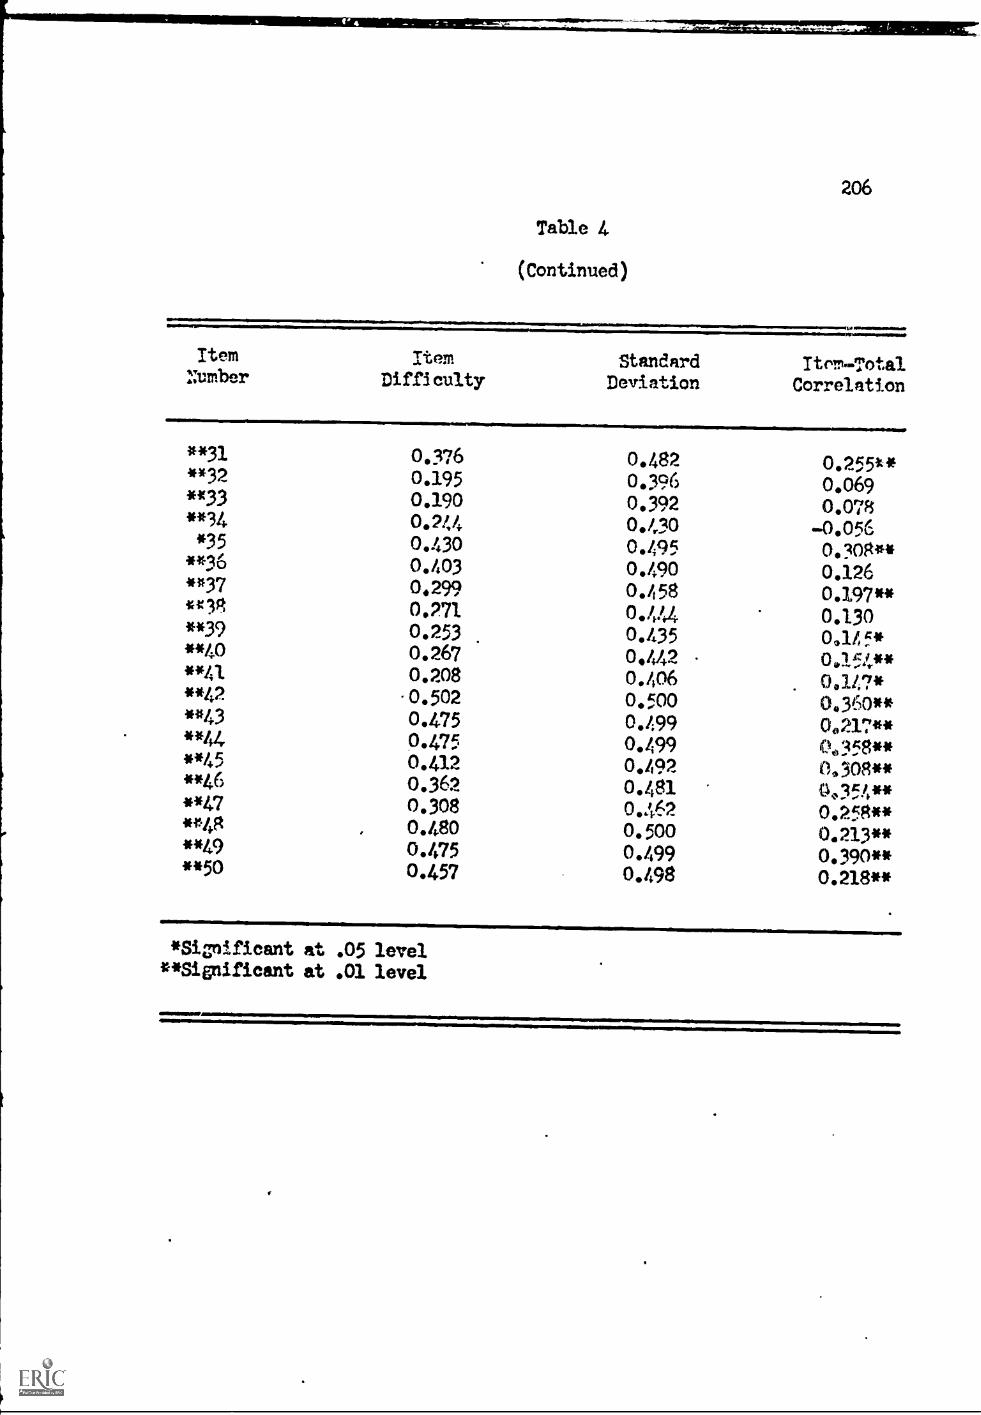
Table 4
(Continued)
206
ItemNumber
**31* *32
**33
**34*35
**36**37
*4: 3$
**39* *440
**41**42
**43**44
**45**46**47**48
**49**50
ItemDifficulty
StandardDeviation
Itrr-TotalCorrelation
0.376 0.482 0.255t*0.195 0.396 0.0690.190 0.392 0.0780.244 0.430 -0.0560.430 0.495 0.308**0.403 0.490 0.1260.299 0.458 0.197 **0.271 0.444 0.1300.253 0.435 0,1/5*0.267 0,/+2.2 0054**0.208 0.406 0./47*0.502 0.500 0.360**0.475 0.499 0.217**0.475 0.499 0.358**0.412 0./,92 0.308**0.362 0.481 0054**0.308 0.!p62 0.258**0.480 0.500 0.213**0.475 0.499 0.390**0.457 0./98 0.218**
*Siolificant at .05 level* *Significant at .01 level
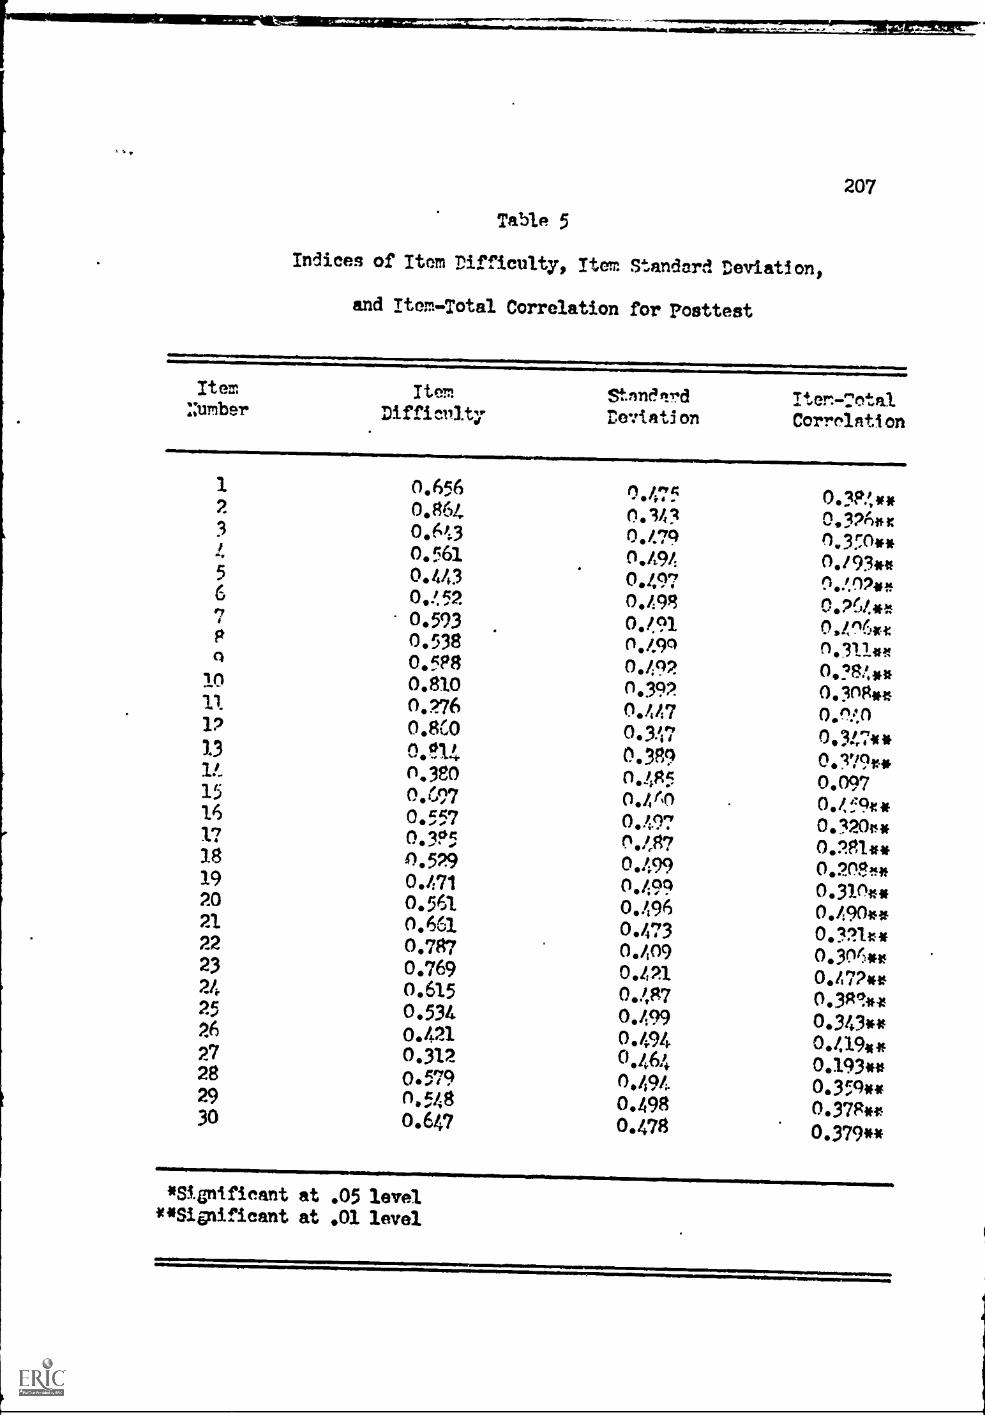
Table 5
Indices of Item Difficulty, Item Standard Deviation,
and Ttem-Total Correlation for Posttest
207
ItemNumber
Item stnnOtr-d
DeviationIter-TotalCorrnlation
1 0.656 0.475 0.3P4**2 0.864 0.30 0.326*x3 0.6/:3 0.479 0.350**4 0.561 0.494 0./93**5 0.443 0.497 0.407**6 0.452 0.498 0.264**7 0.593
0.491 0,An6ittP 0.538 0.490 0.311im0 0.5P8 0.492 0,?84**in 0.810 0,392 0.308**
11 0.276 0.447 0.^401? 0.8(.0 0.347 0.347*,13 0.!14 0089 O.:179r*11.
0.380 0.485 0.09715 0.697 0.4 r0 0.4599 *16 0.557 0.497 00201$*17 0.35 0,487 0.281**18 0.529 0.499 0.208!s*19 0.471 0.499 0,310**20 0.561 0.496 0.490**21. 0.661 0.473 0021**22 0.787 0.409 0.306**23 0.769 0.421 0.472**24 0.615 0,487 0.381*.r25 0.534 0.499 0,343 **26 0.421 0.494 0.419**27 0.312 0,464 0.193**28 0.579 0.494 0.359**29 0.548 0.498 0.378**30 0.647 0.478 0.379**
*Significant at .05 level**Significant at .01 level
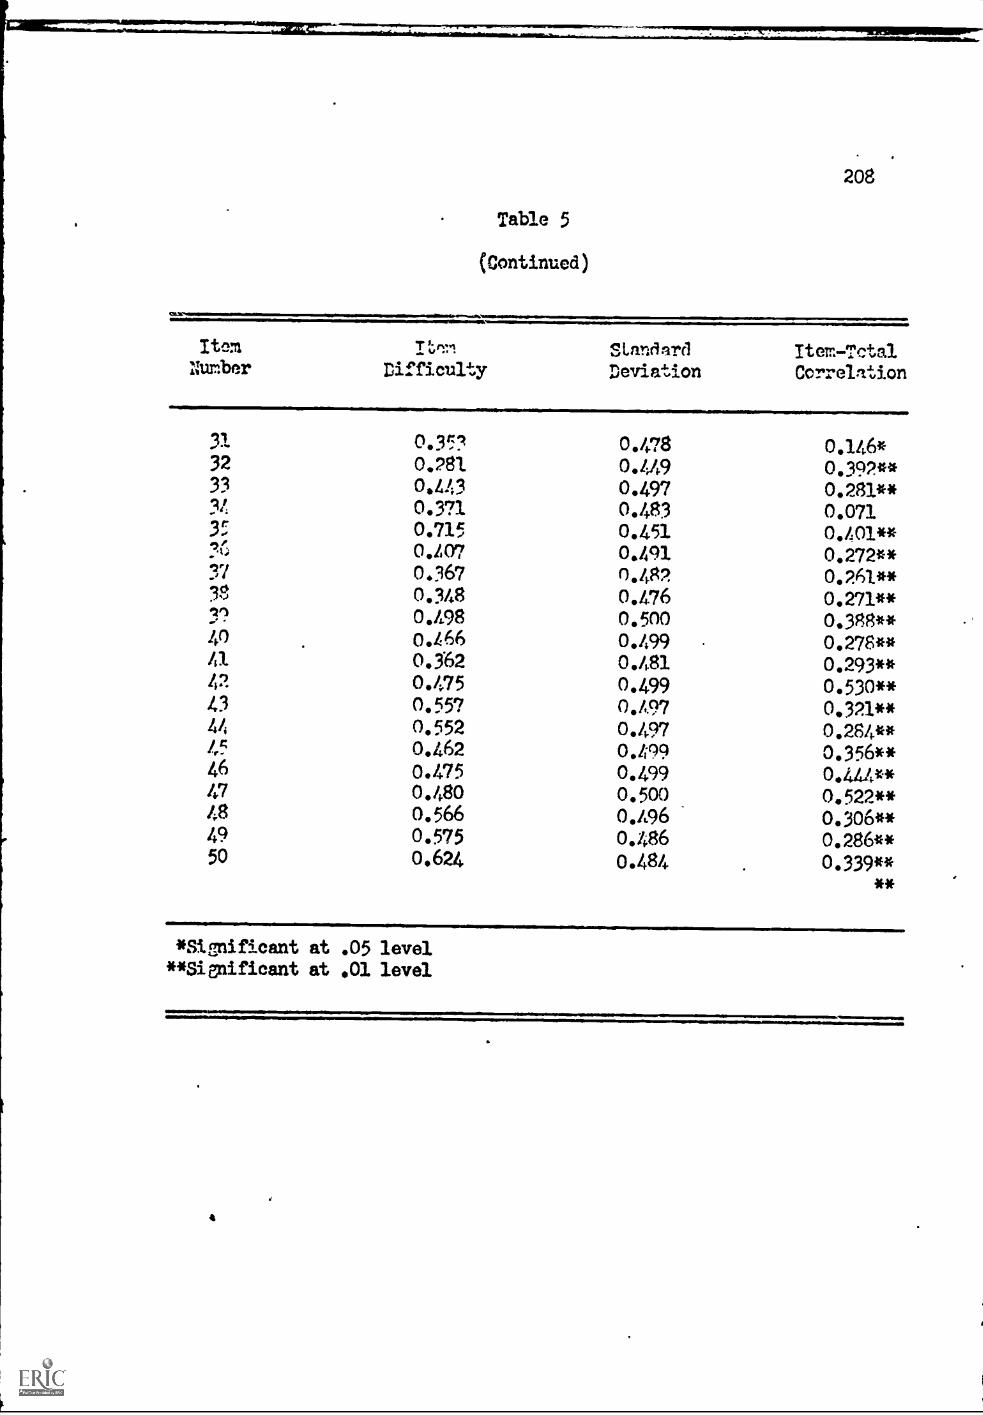
etag..1111M
Table 5
(Continued)
208
ItemNumber
3132
33
34
35
.4;
373837
404142
4344
454647484950
Ttrri
Difficultystandard
DeviationItem-TotalCorrelation
0.3:53 0.478 0.146*0.281 0.449 0.392**0.443 0.497 0.281**0.371 0.483 0.0710.715 0.451 0.401**0.407 0.491 0.272**0.36? 0,482 0.261**0.348 0.476 0.271**0.498 0.500 0.388**0.466 0.499 0.278**0.362 0.481 0.293**0.475 0.499 0.530**0.55? 0.497 0.321**0.552 0.497 0.284**0.462 0.499 0.356**0.475 0.499 0.444**0.480 0.500 0.522**0.566 0.496 0.306**0.575 0.486 0.286**0.624 0.484 0.339 **
* *
*Significant at .05 level**Significant at .01 level
rem1=0=w
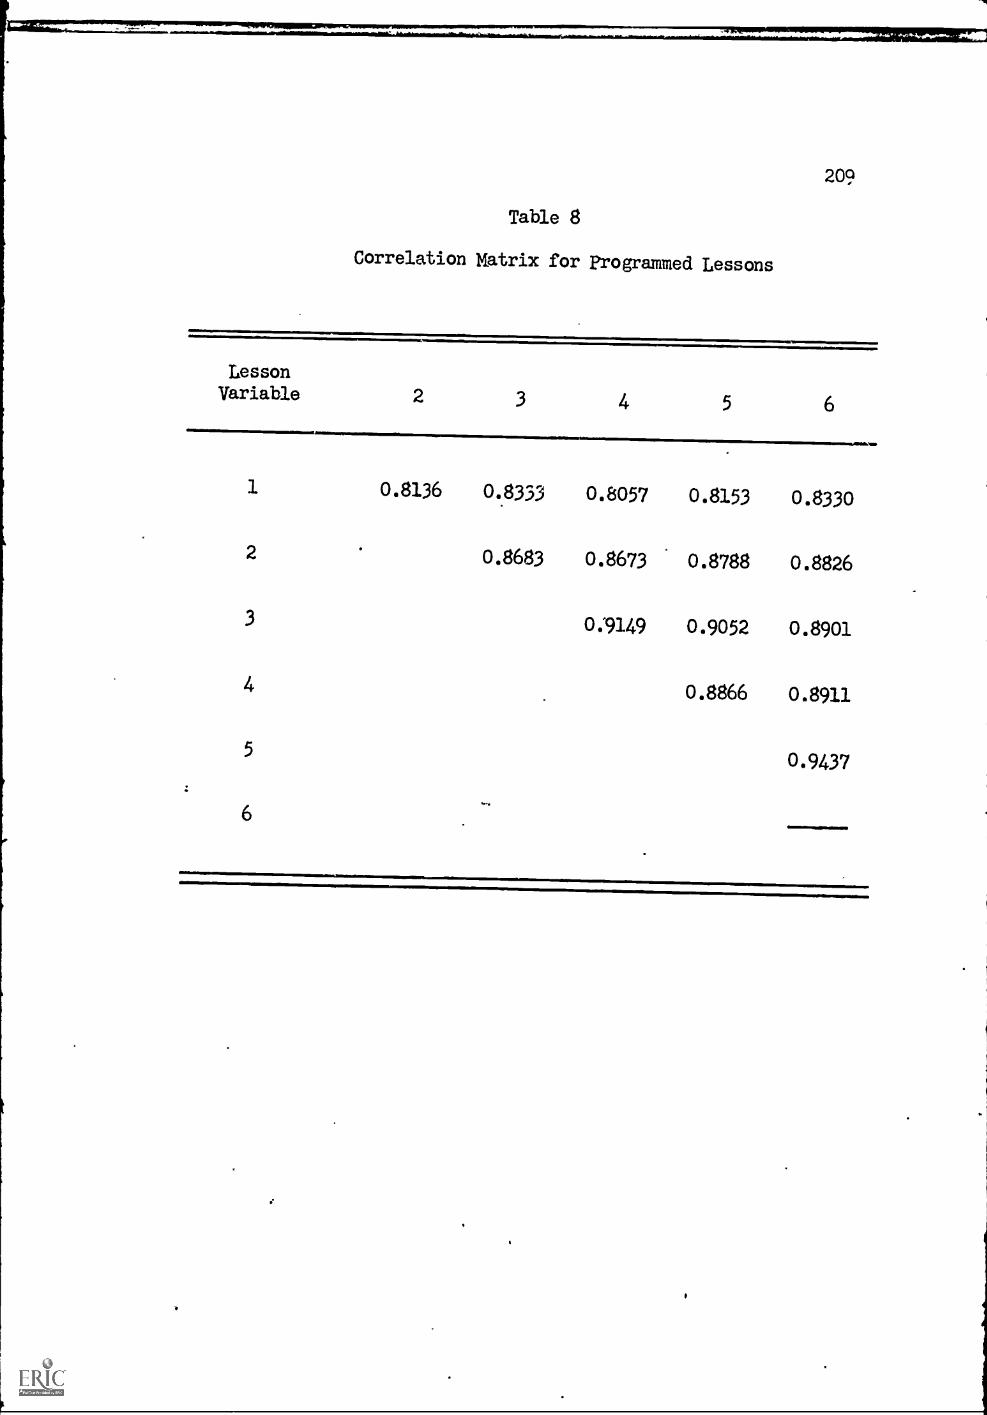
209
Table 8
Correlation Matrix for programmed Lessons
LessonVariable 2 3 4 5 6
1
2
3
4
5
6
0.8136 0.8333
0.8683
0.8057
0.8673
0.9149
0.8153
0.8788
0.9052
0.8866
0.8330
0.8826
0.8901
0.8911
0.9437

APPFEDIX D
abb/14;4010".. Kinovm.....511..A1
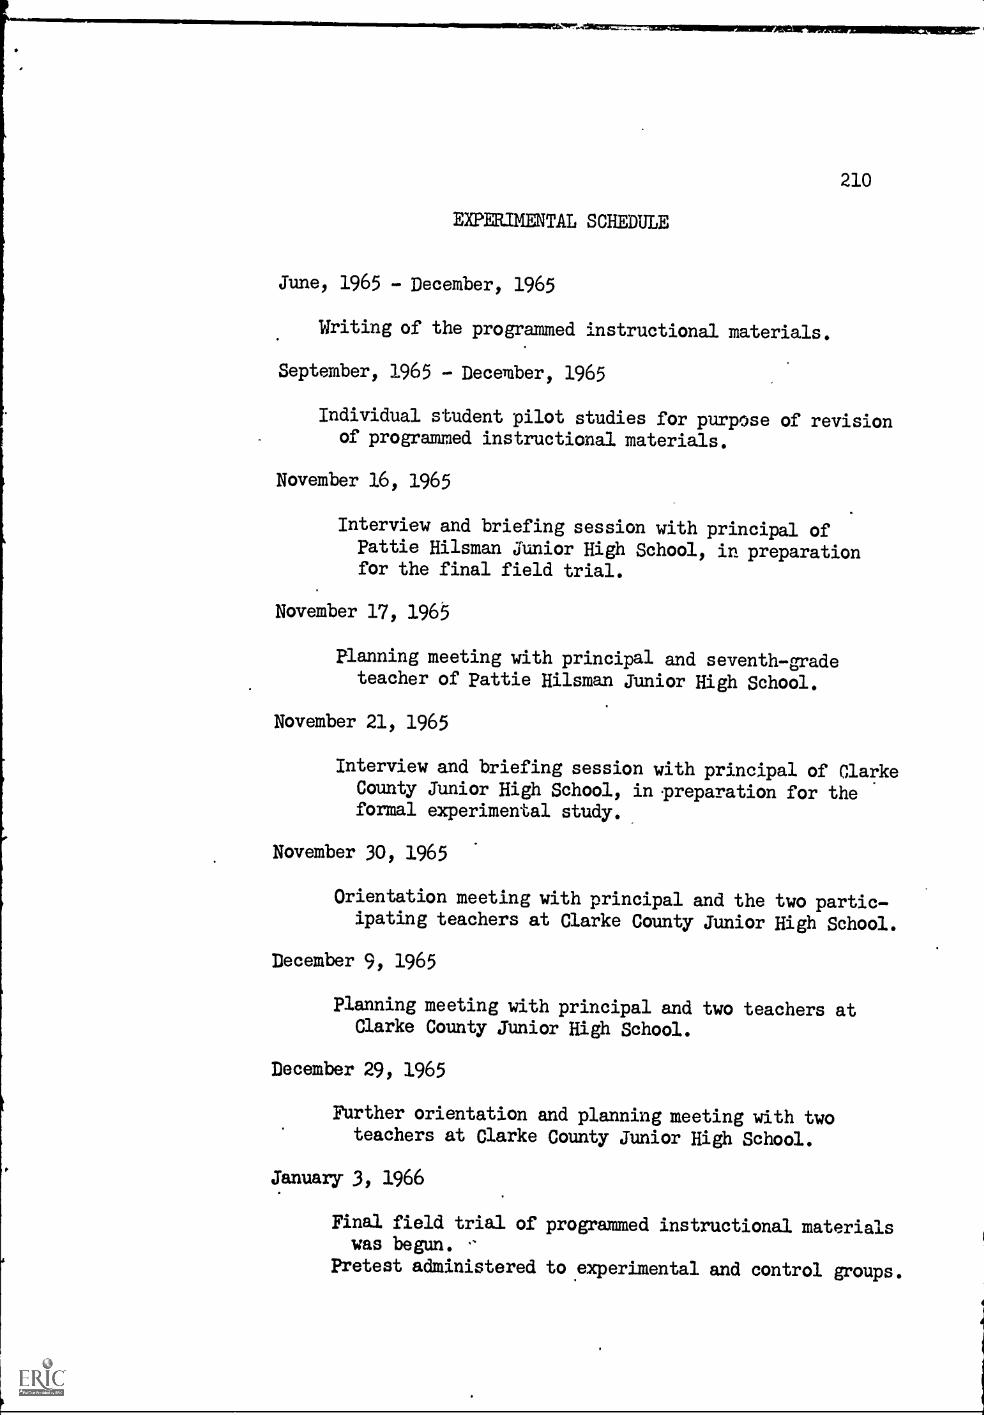
210
EXPERIMENTAL SCHEDULE
June, 1965 - December, 1965
Writing of the programmed instructional materials.
September, 1965 - December, 1965
Individual student pilot studies for purpose of revisionof programmed instructional materials.
November 16, 1965
Interview and briefing session with principal ofPattie Hilsman Junior High School, in preparationfor the final field trial.
November 17, 1965
Planning meeting with principal and seventh-gradeteacher of Pattie Hilsman Junior High School.
November 21, 1965
Interview and briefing session with principal of ClarkeCounty Junior High School, in .preparation for theformal experimental study.
November 30, 1965
Orientation meeting with principal and the two partic-ipating teachers at Clarke County Junior High School.
December 9, 1965
Planning meeting with principal and two teachers atClarke County Junior High School.
December 29, 1965
Further orientation and planning meeting with twoteachers at Clarke County Junior High School.
January 3, 1966
Final field trial of programmed instructional materialswas begun.
Pretest administered to experimental and control groups.
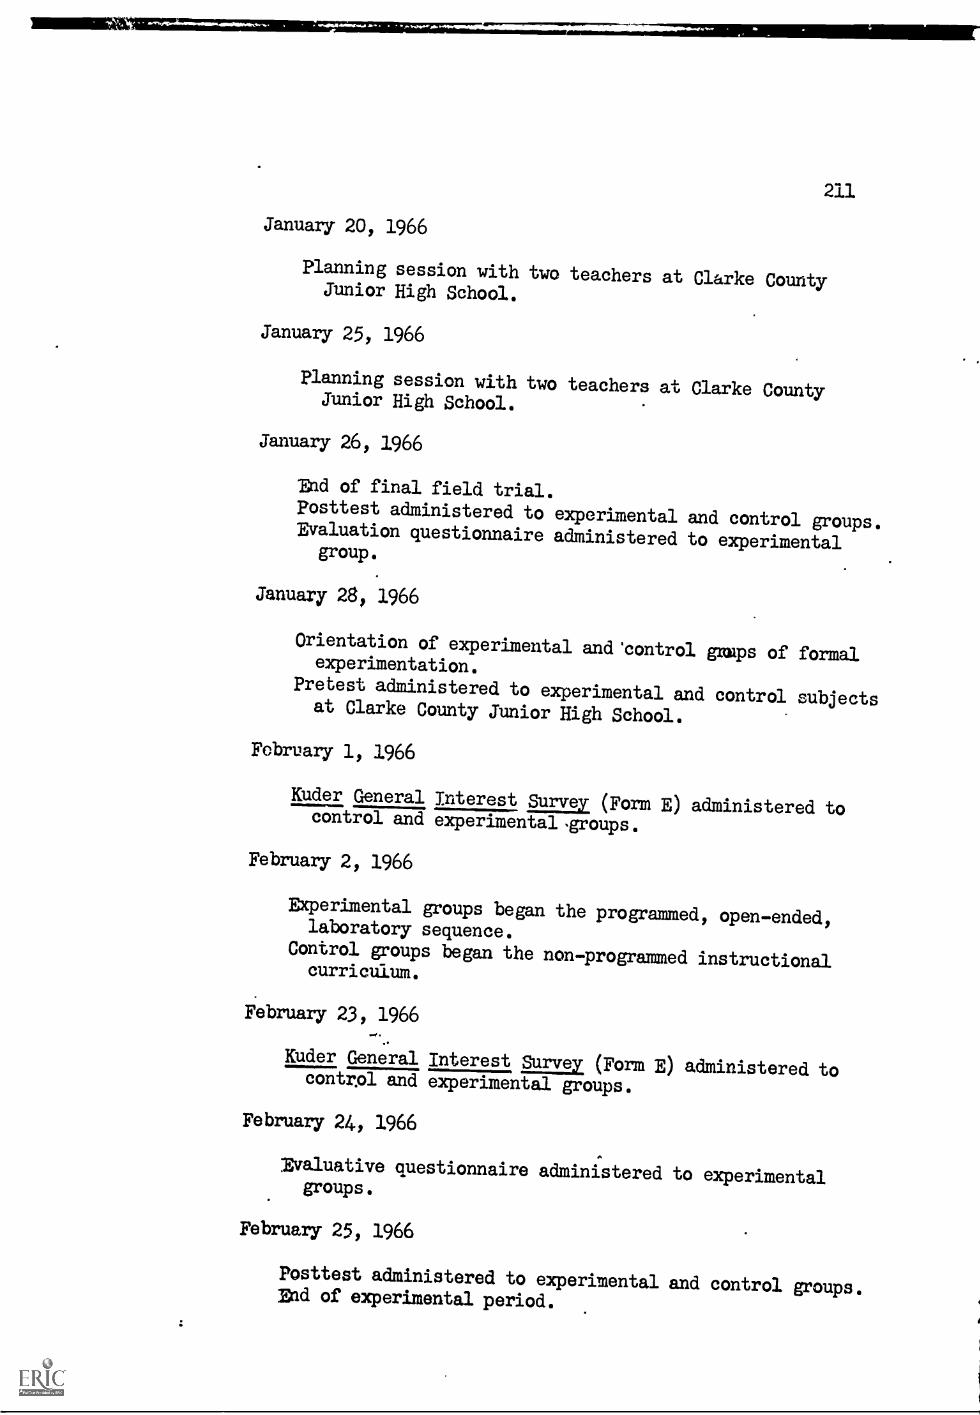
January 20, 1966
211
Planning session with two teachers at Clarke CountyJunior High School.
January 25, 1966
Planning session with two teachers at Clarke CountyJunior High School.
January 26, 1966
"Rid of final field trial.Posttest administered to experimental and control groups.Evaluation questionnaire administered to experimental
group.
January 28, 1966
Orientation of experimental and 'control gimps of formalexperimentation.
Pretest administered to experimental and control subjectsat Clarke County Junior High School.
February 1, 1966
Kuder General Interest Survey (Form E) administered tocontrol and experimental sgroups.
February 2, 1966
Experimental groups began the programmed, open-ended,laboratory sequence.
Control groups began the non-programmed instructionalcurriculum.
February 23, 1966-4.
Kuder General Interest, Survey (Form E) administered tocontrol and experimental groups.
February 24, 1966
Evaluative questionnaire administered to experimentalgroups.
February 25, 1966
Posttest administered to experimental and control groups.Bid of experimental period.
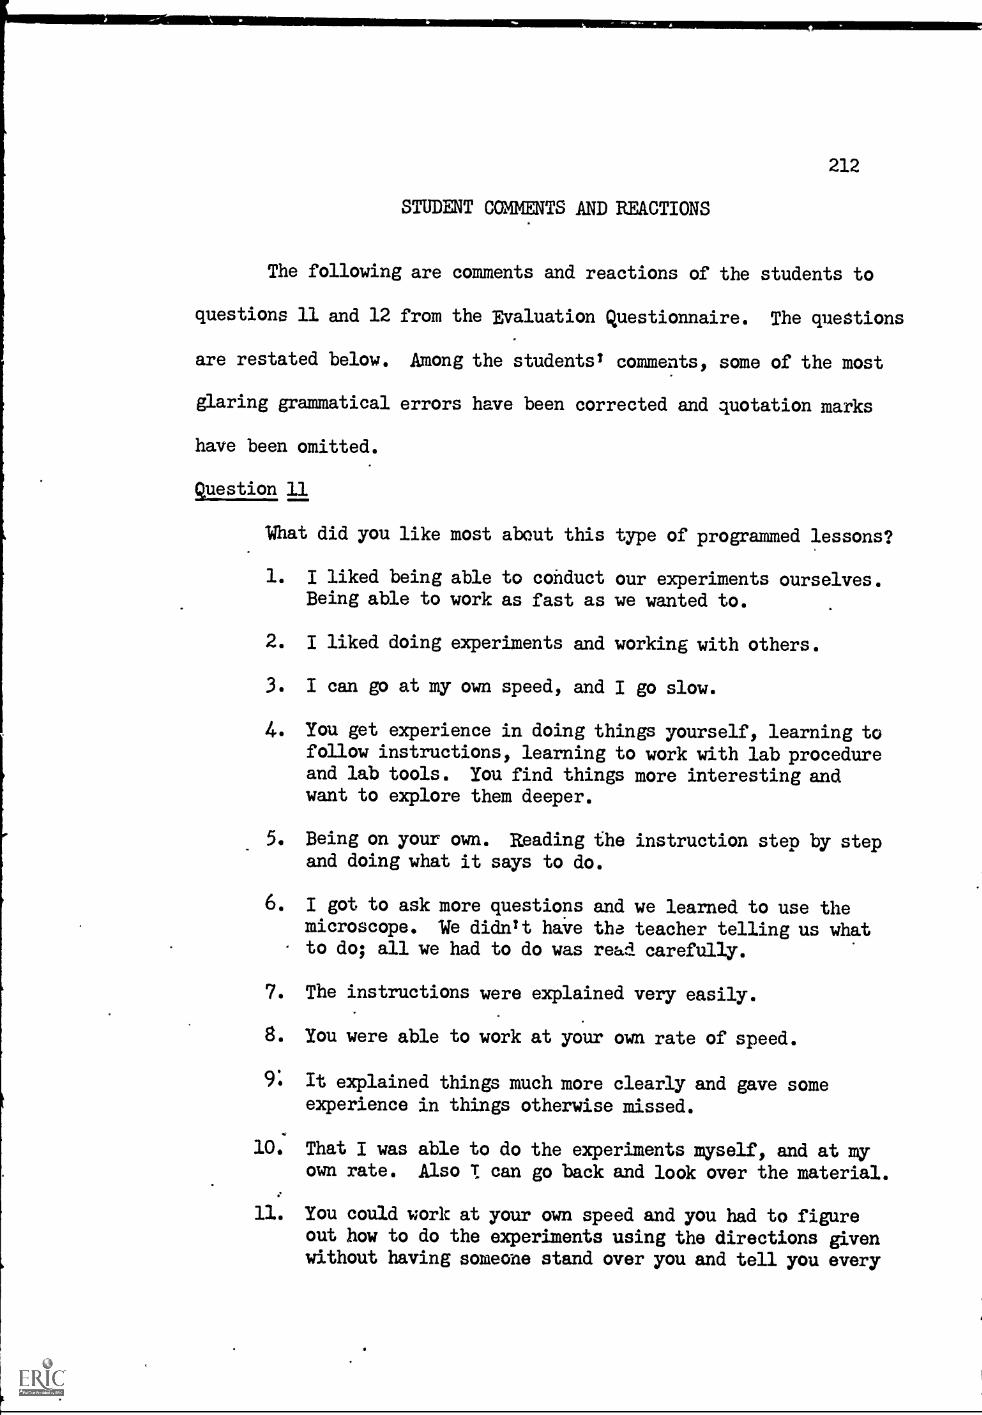
212
STUDENT COMMENTS AND REACTIONS
The following are comments and reactions of the students to
questions 11 and 12 from the Evaluation Questionnaire. The questions
are restated below. Among the students/ comments, some of the most
glaring grammatical errors have been corrected and quotation marks
have been omitted.
Question 11
What did you like most about this type of programmed lessons?
1. I liked being able to conduct our experiments ourselves.Being able to work as fast as we wanted to.
2. I liked doing experiments and working with others.
3. I can go at my own speed, and I go slow.
4. You get experience in doing things yourself, learning to
follow instructions, learning to work with lab procedureand lab tools. You find things more interesting andwant to explore them deeper.
5. Being on your own. Reading the instruction step by stepand doing what it says to do.
6. I got to ask more questions and we learned to use themicroscope. We didnTt have tha teacher telling us whatto do; all we had to do was read carefully.
7. The instructions were explained very easily.
8. You were able to work at your own rate of speed.
9: It explained things much more clearly and gave someexperience in things otherwise missed.
10. That I was able to do the experiments myself, and at myown rate. Also I can go back and look over the material.
11. You could work at your own speed and you had to figureout how to do the experiments using the directions givenwithout having someone stand over you and tell you every
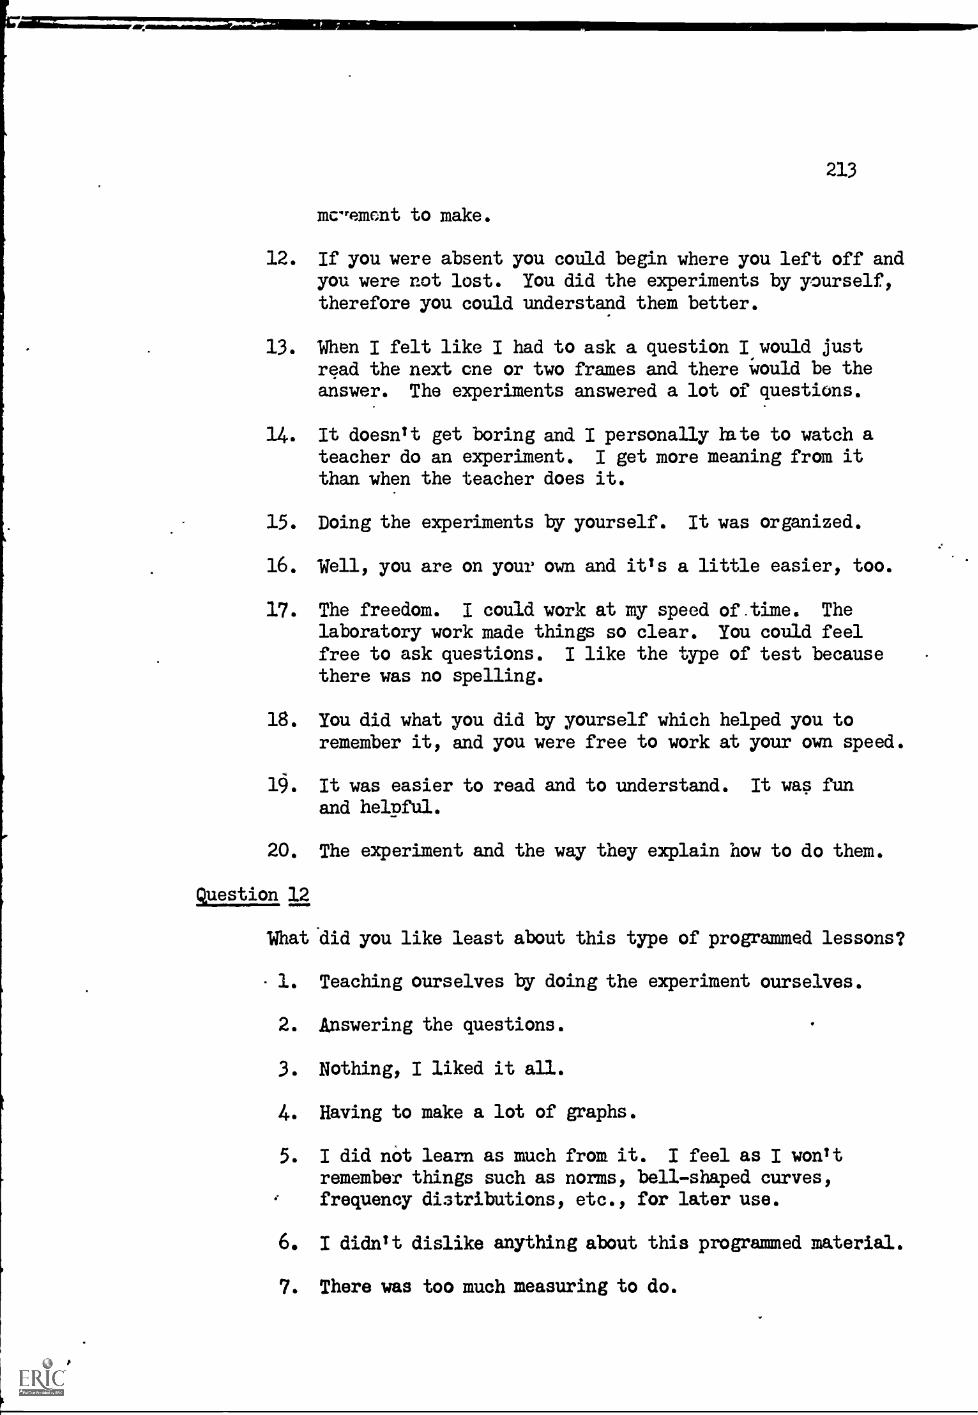
213
mc-emcnt to make.
12. If you were absent you could begin where you left off andyou were not lost. You did the experiments by yourself,therefore you could understand them better.
13. When I felt like I had to ask a question I would justread the next cne or two frames and there would be theanswer. The experiments answered a lot of questions.
14. It doesn't get boring and I personally lute to watch ateacher do an experiment. I get more meaning from itthan when the teacher does it.
15. Doing the experiments by yourself. It was organized.
16. Well, you are on your own and it's a little easier, too.
17. The freedom. I could work at my speed of.time. Thelaboratory work made things so clear. You could feelfree to ask questions. I like the type of test becausethere was no spelling.
18. You did what you did by yourself which helped you toremember it, and you were free to work at your own speed.
19. It was easier to read and to understand. It was funand helpful.
20. The experiment and the way they explain how to do them.
Question 12
What *did you like least about this type of programmed lessons?
1. Teaching ourselves by doing the experiment ourselves.
2. Answering the questions.
3. Nothing, I liked it all.
4. Having to make a lot of graphs.
5. I did not learn as much from it. I feel as I won'tremember things such as norms, bell-shaped curves,frequency distributions, etc., for later use.
6. I didn't dislike anything about this programmed material.
7. There was too much measuring to do.
214
8. There was alot of detailed work.
9. Some of the questions seem useless.
10. I think I would have understood a little better if theteacher could have talked to us more about the lessons.
11. I liked working at my own speed, but I didn't haveenough time to finish.
12. Some of the material used was misplaced or lost if wedid not finish the work in one day.
13. Not really anything. I enjoyed it very much.
14. The frames repeat themselves too often to suit me.
15. I liked it all.
16. Well, I didn't like all those questions even thoughthey were important.
17. Well, at the end, it was so much to look over for thetest. But that was all.
18. Too many questions to answer.
19. Answers on the side.
20. I was bored.


