Embed Size (px)
Citation preview
TOTAL SOLAR AND SPECTRAL IRRADIANCE VARIATIONSFROM SOLAR CYCLES 21 TO 23
J.M. Pap1, M. Turmon2, L. Floyd3, C. Frohlich4, and Ch. Wehrli4
1University of California, Los Angeles, 405, Hilgard Ave., Los Angeles, CA 87095 USA2Jet Propulsion Laboratory, California Institute of Technology, Pasadena, CA 91109 USA
3Interferometrics Inc., 14120 Parke Long Ct., Chantilly, VA 20151 USA4Physikalisch-Meteorologishes Observatorium, Davos, 33 Dorfstrasse, CH-7260, Davos-Dorf, Switzerland
ABSTRACT
Total solar and UV irradiances have been measured from various space platforms for more than two decades. Morerecently, observations of the “Variability of solar IRradiance and Gravity Oscillations” (VIRGO) experiment on SOHOprovided information about spectral irradiance variations in the near-UV at 402 nm, visible at 500 nm, and near-IRat 862 nm. Analyses based on these space-borne irradiance measurements have convinced the skeptics that solarirradiance at various wavelengths and in the entire spectrum is changing with the waxing and waning solar activity.The main goal of this paper is to review the short- and long-term variations in total solar and spectral irradiances andtheir relation to the evolution of magnetic fields from solar cycles 21 to 23.
INTRODUCTIONThe multi-decade long measurements of total solar and spectral irradiance established conclusively that the Sun’s
radiative output varies on various time scales: from minutes to the 11-year solar cycle (Willson and Hudson, 1988).On time scales of minutes to hours, the effect of granulation, meso-, and supergranulation has been recognized insolar irradiance, whereas the rapid irradiance fluctuations in the 5-minute range are due to the p -mode oscillations(e.g. Frohlich et al, 1997). On time scales of days to months, the evolution of active regions plays a dominant rolein irradiance changes. In the case of total irradiance, the short-term irradiance changes are attributed to the combinedeffect of sunspots and faculae (Willson et al., 1981). Similar results have been obtained by studying the VIRGOspectral irradiances at 402, 500, and 862 nm (Frohlich et al., 1997; Pap et al.; 1999). The main causes of the short-term variations in UV irradiance are the plages as they evolve and move across the solar disk, although the effectof the network can also be identified in the short-term UV irradiance changes (Pap, 1992; Woods et al., 2000). Thelonger term irradiance variations on time scales of years to decades are attributed to the changing emission of faculaeand the magnetic network (e.g., Foukal and Lean, 1988). Since variations in the solar energy flux that persist overlong periods of time may trigger climate changes (e.g. Hansen et al., 1993; Reid, 1997), it is important to identify thecauses of irradiance variations and thus the possibilities for a solar forcing of climate on time scales of decades andcenturies.
Although considerable information exists on irradiance variations, we still lack the understanding of the underlyingphysical mechanisms. Correlative studies indicate that a major portion of irradiance changes is related to the surfacemanifestations of solar activity, such as sunspots and faculae (Foukal and Lean, 1988; Frohlich and Lean, 1998).However, there is growing evidence that the current empirical models, solely based on the effect of sunspot darkeningand faculae brightening, cannot explain all the aspects of the observed irradiance variations (Frohlich and Pap, 1989;Kuhn, 1996; Frohlich et al., 1997; Wehrli et al., 1998; Kuhn et al., 1998), i.e., there is remaining variability in solarirradiance after removing the effect of sunspots and faculae. Identification of this residual variation is a difficultproblem since global effects, such as temperature and radius changes (Delache et al., 1986; Kuhn et al., 1998; Pap etal., 2001a), large scale convective cells or mixing flows (Ribes et al., 1985; Fox and Sofia, 1994), differential rotationin the solar interior (Kuhn, 1996) may also produce irradiance changes.
In this paper we study the effect of solar magnetic fields on solar total and spectral irradiances. For this purpose
2
we use the composite total irradiance compiled by Frohlich and Lean (1998), the Mg II h & k core-to-wing ratio(hereafter Mg c/w) compiled by Floyd et al. (2001), the VIRGO spectral irradiance data, Photometric Sunspot Index(PSI), and the magnetic field strength measurements performed at the National Solar Observatory at Kitt Peak and bythe “Michelson Doppler Imager” (MDI) experiment on SOHO.
TOTAL SOLAR AND SPECTRAL IRRADIANCE RECORDContinuoues measurements of total solar and UV irradiances from various space platforms have been conducted on
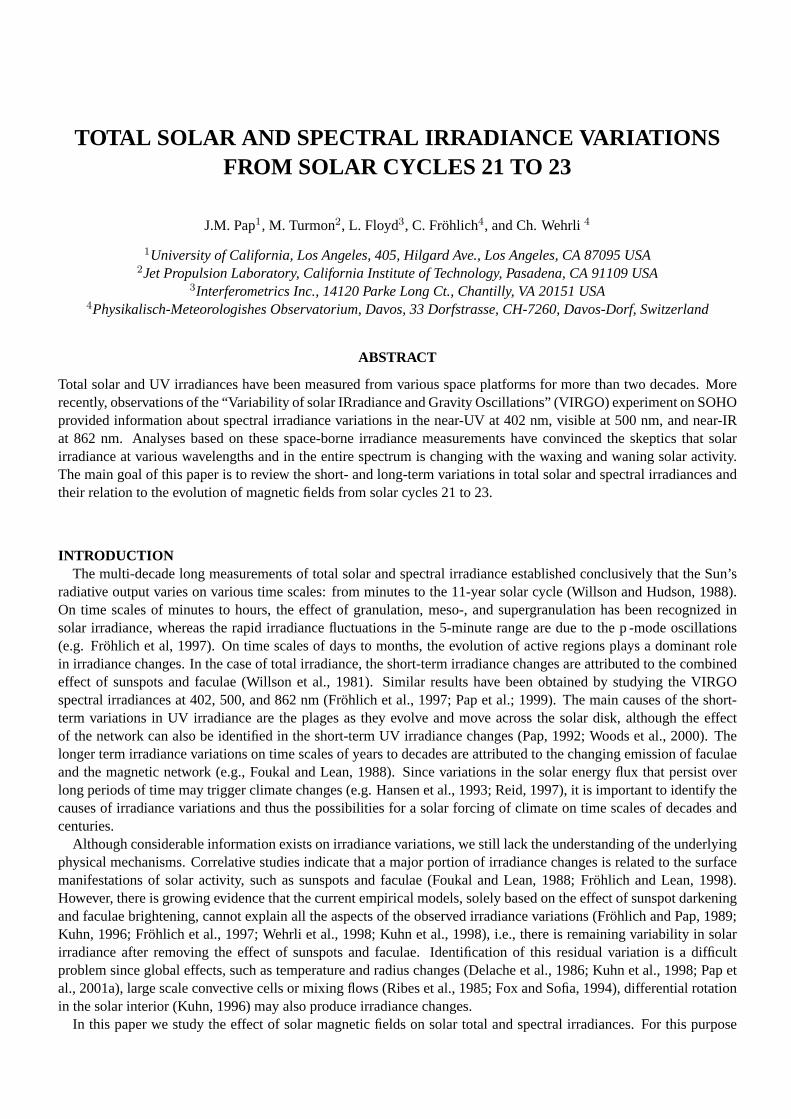
daily bases since late November of 1978 (see details by DeLand and Cebula, 1998; Frohlich, 2000; Floyd et al., 2001).The various total irradiance time series are presented on the left-side of Figure 1 (upper panel), while the lower panelshows the composite total irradiance compiled from the measurements of the ERB, ACRIM I, ACRIM II, and VIRGOexperiments (see details by Frohlich and Lean, 1998). As can be seen, the scale of the measurements varies fromone experiment to the other, resulting from the limited absolute accuracy (±0.2%) of the calibration of the individualmeasurements. However, the precision and stability of the measurements is much better – making it possible to studythe relative variations in total irradiance as a function of solar cycle and from one cycle to the other.
To illustrate the variations in UV irradiance, the long-term Mg c/w is shown on the right-side of Figure 1. ThisMg c/w composite has been computed from the Nimbus-7, NOAA9, and UARS/SUSIM measurements using theiroverlapping time intervals (Floyd et al., 2001). The advantage of using the Mg c/w is that this ratio is calculatedfrom the irradiance in the core of the Mg 280 nm line, which is highly variable, to the less variable irradiance atneighboring continuum wavelengths. Therefore, the Mg c/w is relatively insensitive to instrumental effects and it isused as a reasonably good indicator of UV irradiance variations between 200 and 300 nm (e.g. DeLand and Cebula,1998). As can be seen, both total irradiance and the Mg c/w vary in parallel with the solar cycle, being higher duringsolar maximum.
1364
1366
1368
1370
1372
1374
0 2000 4000 6000Days (Epoch Jan 0, 1980)
HF
ACRIM I
ERBS
SOVA2
ACRIM II
VIRGO
0.2%
78 79 80 81 82 83 84 85 86 87 88 89 90 91 92 93 94 95 96 97 98 99 00 Year
1363136413651366136713681369
Sol
ar Ir
radi
ance
(W
m−
2 )
0 1000 2000 3000 4000 5000 6000 7000 8000Data between November 8, 1978 and December 9, 2000
0.25
0.26
0.27
0.28
0.29
Mg
h &
k c
/w r
atio
on
UA
RS
/SU
SIM
Sca
le
Nimbus−7/SBUV, NOAA9/SBUV2 and UARS/SUSIM Mg c/w
Fig. 1. The various total irradiance time series are presented on the left-side panel (upper part), thecomposite total solar irradiance, derived from the Nimbus-7/ERB (HF), SMM/ACRIM I, UARS/ACRIM II andSOHO/VIRGO (version 3.50), is shown on the lower part (updated from Frohlich, 2000). The compositeMg core-to-wing ratio index, formed from the Nimbus-7/SBUV, NOAA9/SBUV2 and SUSIM V19r3 indices,is given on the right side panel (updated from Floyd et al., 2001).
While considerable information exists about the variations in total solar and UV irradiances, variations in thevisible and infrared parts of the spectrum are less understood, mainly because of the lack of long-term space-basedmeasurements. The Sunphotometers (SPM) of VIRGO have provided the first information about the changes inthe near-UV, visible and near-infrared spectral ranges at selected wavelengths at 402, 500, and 862 nm. However,
3
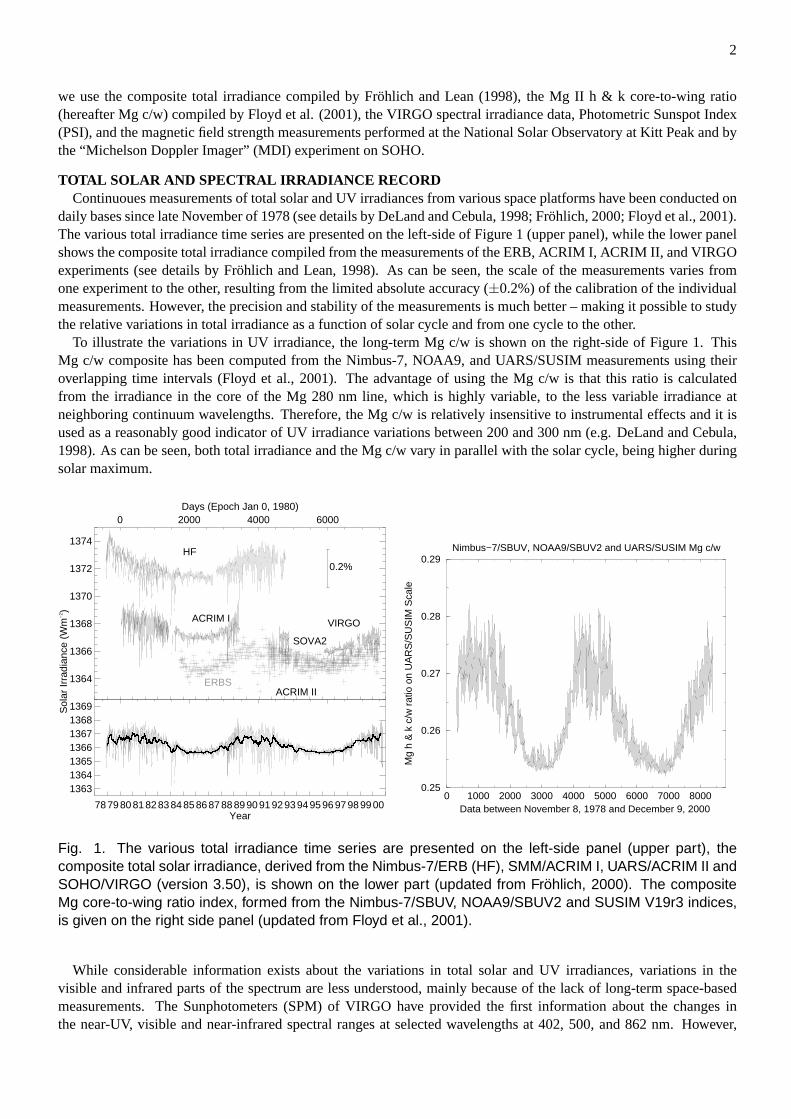
evaluation of the VIRGO spectral data is a difficult task, especially because of the degradation of the SPM instrument(see details by Frohlich et al., 1997). Since we cannot correct properly for the degradation of the SPM instrument, onehas to find other ways to remove instrumental trends, i.e., using quite Sun periods when irradiance was not influencedby active regions (Frohlich et al., 1997) or statistical methods (Pap et al., 1999). Unfortunately, the solar-cycle-relatedtrend is also removed this way from the data – making it possible to study only the effect of active regions on spectralirradiance. The VIRGO SPM data, after removing the instrumental and longer term trends, as described by Pap et al.(1999), are shown on the left-side panel of Figure 2 for the time interval of 1996 to 1998. The SPM spectral irradianceat 402 nm, together with PSI and the Mg c/w ratio is plotted on the right side panel. We note that PSI is computedfrom the area, position, and contrast of sunspots (Frohlich et al., 1994) and is used to model the effect of sunspots onirradiance, while Mg c/w is used as a proxy for the changing emission of faculae. As can be seen, the VIRGO 402,500, and 862 nm spectral data vary in phase and the effect of active regions is clearly resolved in the VIRGO spectralirradiances as shown on the right-side panel of Figure 2. We note that the short-term variations in the VIRGO spectraland total irradiance data correlate well with each other (Pap et al., 1999).
0.0 100.0 200.0 300.0 400.0 500.0 600.0 700.0 800.0Data between May 1, 1996 and February 21, 1998
-0.002
-0.001
0.000
0.001
SS
A-D
etre
nded
VIR
GO
Spe
ctra
l Irr
adia
nce
SSA-Reconstructed (RCs > 4) VIRGO Spectral Irradiance (WL = 200)
Near-UV at 402 nmVisible at 500 nmNear-IR at 862 nm
0.0 100.0 200.0 300.0 400.0 500.0 600.0 700.0 800.0Data between May 1, 1996 and February 21, 1998
-8.0
-4.0
0.0
4.0
8.0
Nor
mal
ized
and
SS
A-D
etre
nded
Tim
e S
erie
s
Comparison of VIRGO Near-UV Irradiance, PSI and Mg c/w Variations
Near-UVPSIMg c/w
Fig. 2. The solid (black) line on the left-side panel shows the near-UV irradiance reconstructed withoutthe instrumental trend components, the dashed grey line shows the same for the visible and the long-dashed gray line shows the same for the infrared. The SPM near-UV spectral irradiance together with thePhotometric Sunspot Index and the M c/w ratio are presented on the right-side panel (updated from Pap etal., 1999.)
Effect of Magnetic Fields on Long-Term Irradiance VariationsTo study the effect of the magnetic fields on long-term irradiance variations, we have used the magnetic field
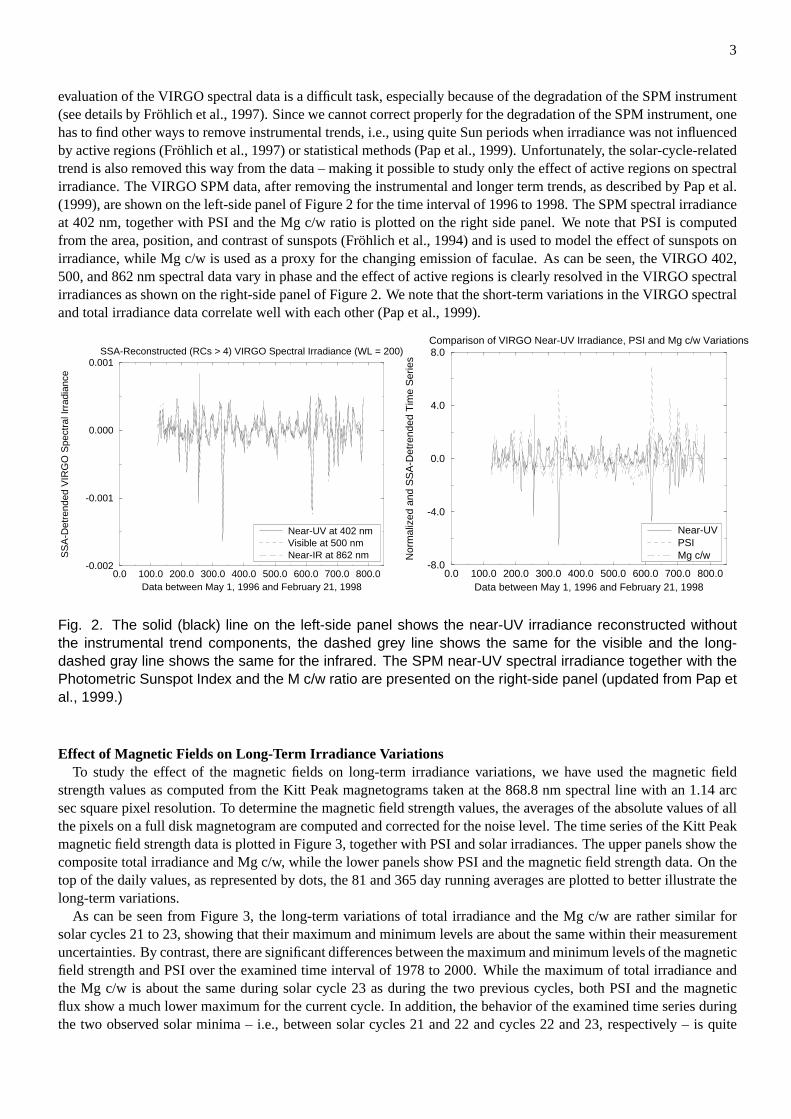
strength values as computed from the Kitt Peak magnetograms taken at the 868.8 nm spectral line with an 1.14 arcsec square pixel resolution. To determine the magnetic field strength values, the averages of the absolute values of allthe pixels on a full disk magnetogram are computed and corrected for the noise level. The time series of the Kitt Peakmagnetic field strength data is plotted in Figure 3, together with PSI and solar irradiances. The upper panels show thecomposite total irradiance and Mg c/w, while the lower panels show PSI and the magnetic field strength data. On thetop of the daily values, as represented by dots, the 81 and 365 day running averages are plotted to better illustrate thelong-term variations.
As can be seen from Figure 3, the long-term variations of total irradiance and the Mg c/w are rather similar forsolar cycles 21 to 23, showing that their maximum and minimum levels are about the same within their measurementuncertainties. By contrast, there are significant differences between the maximum and minimum levels of the magneticfield strength and PSI over the examined time interval of 1978 to 2000. While the maximum of total irradiance andthe Mg c/w is about the same during solar cycle 23 as during the two previous cycles, both PSI and the magneticflux show a much lower maximum for the current cycle. In addition, the behavior of the examined time series duringthe two observed solar minima – i.e., between solar cycles 21 and 22 and cycles 22 and 23, respectively – is quite
4
0 1000 2000 3000 4000 5000 6000 7000 8000Data between November 16, 1978 and September 29, 2000
1362
1363
1364
1365
1366
1367
1368
1369
Com
posi
te T
otal
Sol
ar Ir
radi
ance
(W
/m2)
Nimbus−7/ERB, SMM/ACRIM I, UARS/ACRIM II & SOHO/VIRGO
TSI81−Day365−Day
0 1000 2000 3000 4000 5000 6000 7000 8000Data between November 8, 1978 and December 9, 2000
0.25
0.26
0.27
0.28
0.29
Com
posi
te M
g C
ore−
to−W
ing
Rat
io
Nimbus−7/SBUV, NOAA9/SBUV2 & UARS/SUSIM
Mg c/w81−Day 365−Day
0 1000 2000 3000 4000 5000 6000 7000 8000Data between December 1, 1981 and July 18, 2000
0
1000
2000
3000
4000
PS
I (pp
m)
Photometric Sunspot Index
PSI81−Day 365−Day
0 1000 2000 3000 4000 5000 6000 7000 8000Data between November 8, 1978 and December 31, 2000
0
10
20
30
40
Mag
netic
Fie
ld S
tren
gth
(Gau
ss)
Kitt Peak Magnetic Field Measurements
MField81−Day365−Day
Fig. 3. The upper panels show the composite total irradiance and Mg c/w, while the lower panels show thePhotometric Sunspot Index and the absolute values of the averaged magnetic field strength as computedfrom the Kitt Peak measurements. Dots show the daily values, the heavy lines show the 81 and 365 dayrunning means of data.
different. As seen from Figure 3, there is a two year long flat minimum between solar cycles 21 and 22 in PSI andthe magnetic flux, while both total irradiance and Mg c/w show a much shorter minimum. In other words, there is aphase shift between the variations in the magnetic flux and the photospheric and chromospheric irradiances at boththe end of the declining portion of cycle 21 and at the beginning of the rising portion of cycle 22 – irradiance leadingthe magnetic field variations.
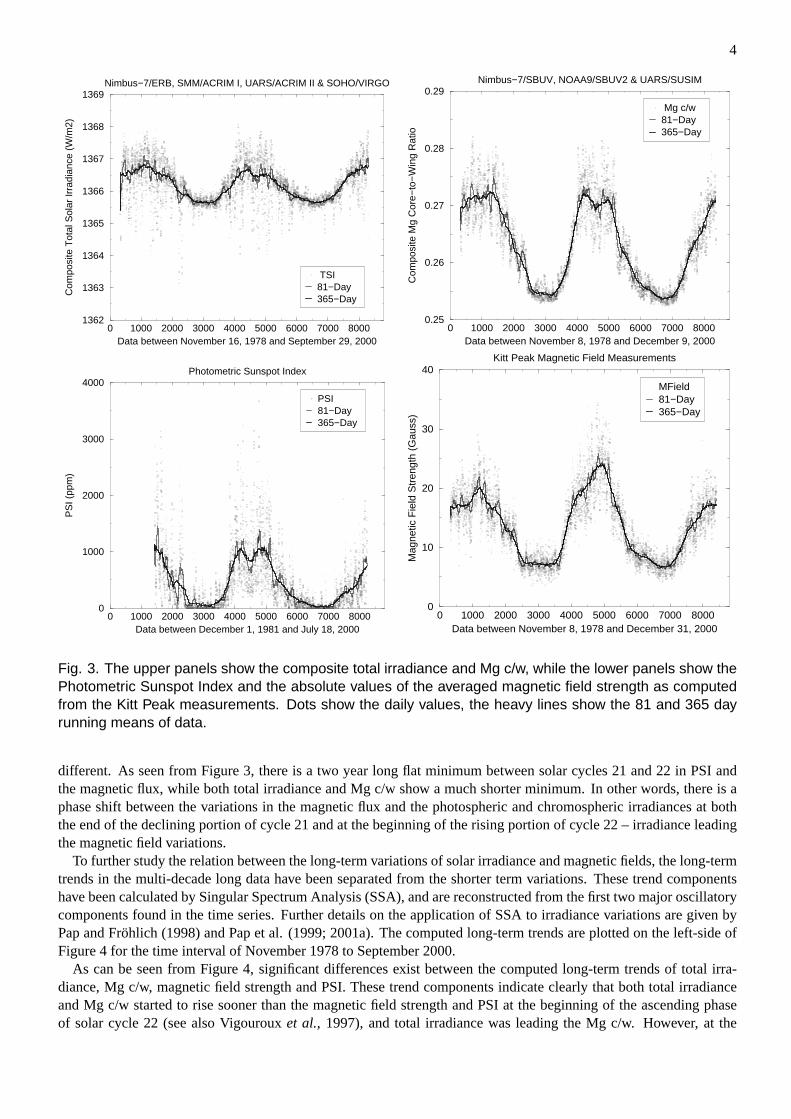
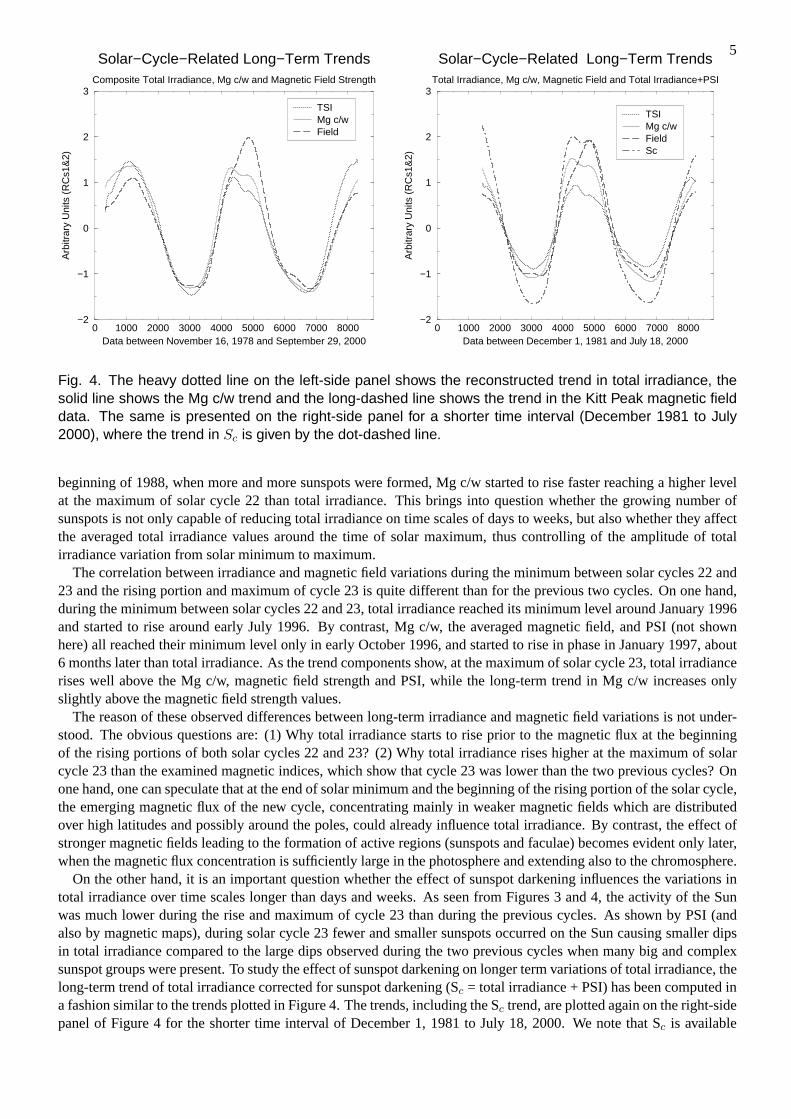
To further study the relation between the long-term variations of solar irradiance and magnetic fields, the long-termtrends in the multi-decade long data have been separated from the shorter term variations. These trend componentshave been calculated by Singular Spectrum Analysis (SSA), and are reconstructed from the first two major oscillatorycomponents found in the time series. Further details on the application of SSA to irradiance variations are given byPap and Frohlich (1998) and Pap et al. (1999; 2001a). The computed long-term trends are plotted on the left-side ofFigure 4 for the time interval of November 1978 to September 2000.
As can be seen from Figure 4, significant differences exist between the computed long-term trends of total irra-diance, Mg c/w, magnetic field strength and PSI. These trend components indicate clearly that both total irradianceand Mg c/w started to rise sooner than the magnetic field strength and PSI at the beginning of the ascending phaseof solar cycle 22 (see also Vigourouxet al., 1997), and total irradiance was leading the Mg c/w. However, at the
5
0 1000 2000 3000 4000 5000 6000 7000 8000Data between November 16, 1978 and September 29, 2000
−2
−1
0
1
2
3
Arb
itrar
y U
nits
(R
Cs1
&2)
Solar−Cycle−Related Long−Term TrendsComposite Total Irradiance, Mg c/w and Magnetic Field Strength
TSIMg c/wField
0 1000 2000 3000 4000 5000 6000 7000 8000Data between December 1, 1981 and July 18, 2000
−2
−1
0
1
2
3
Arb
itrar
y U
nits
(R
Cs1
&2)
Solar−Cycle−Related Long−Term TrendsTotal Irradiance, Mg c/w, Magnetic Field and Total Irradiance+PSI
TSIMg c/wFieldSc
Fig. 4. The heavy dotted line on the left-side panel shows the reconstructed trend in total irradiance, thesolid line shows the Mg c/w trend and the long-dashed line shows the trend in the Kitt Peak magnetic fielddata. The same is presented on the right-side panel for a shorter time interval (December 1981 to July2000), where the trend in Sc is given by the dot-dashed line.
beginning of 1988, when more and more sunspots were formed, Mg c/w started to rise faster reaching a higher levelat the maximum of solar cycle 22 than total irradiance. This brings into question whether the growing number ofsunspots is not only capable of reducing total irradiance on time scales of days to weeks, but also whether they affectthe averaged total irradiance values around the time of solar maximum, thus controlling of the amplitude of totalirradiance variation from solar minimum to maximum.
The correlation between irradiance and magnetic field variations during the minimum between solar cycles 22 and23 and the rising portion and maximum of cycle 23 is quite different than for the previous two cycles. On one hand,during the minimum between solar cycles 22 and 23, total irradiance reached its minimum level around January 1996and started to rise around early July 1996. By contrast, Mg c/w, the averaged magnetic field, and PSI (not shownhere) all reached their minimum level only in early October 1996, and started to rise in phase in January 1997, about6 months later than total irradiance. As the trend components show, at the maximum of solar cycle 23, total irradiancerises well above the Mg c/w, magnetic field strength and PSI, while the long-term trend in Mg c/w increases onlyslightly above the magnetic field strength values.
The reason of these observed differences between long-term irradiance and magnetic field variations is not under-stood. The obvious questions are: (1) Why total irradiance starts to rise prior to the magnetic flux at the beginningof the rising portions of both solar cycles 22 and 23? (2) Why total irradiance rises higher at the maximum of solarcycle 23 than the examined magnetic indices, which show that cycle 23 was lower than the two previous cycles? Onone hand, one can speculate that at the end of solar minimum and the beginning of the rising portion of the solar cycle,the emerging magnetic flux of the new cycle, concentrating mainly in weaker magnetic fields which are distributedover high latitudes and possibly around the poles, could already influence total irradiance. By contrast, the effect ofstronger magnetic fields leading to the formation of active regions (sunspots and faculae) becomes evident only later,when the magnetic flux concentration is sufficiently large in the photosphere and extending also to the chromosphere.
On the other hand, it is an important question whether the effect of sunspot darkening influences the variations intotal irradiance over time scales longer than days and weeks. As seen from Figures 3 and 4, the activity of the Sunwas much lower during the rise and maximum of cycle 23 than during the previous cycles. As shown by PSI (andalso by magnetic maps), during solar cycle 23 fewer and smaller sunspots occurred on the Sun causing smaller dipsin total irradiance compared to the large dips observed during the two previous cycles when many big and complexsunspot groups were present. To study the effect of sunspot darkening on longer term variations of total irradiance, thelong-term trend of total irradiance corrected for sunspot darkening (Sc = total irradiance + PSI) has been computed ina fashion similar to the trends plotted in Figure 4. The trends, including the Sc trend, are plotted again on the right-sidepanel of Figure 4 for the shorter time interval of December 1, 1981 to July 18, 2000. We note that Sc is available
6
only for the time interval of December 1981 to July 2000, since PSI has not been calculated prior to December 1981because of the large uncertainties of the measured sunspot areas (see details by Frohlich et al., 1994).
As can be seen from Figure 4, if sunspots were not present on the Sun, the amplitude of the solar cycle variationof total irradiance would be considerably higher than the 0.1% solar-cycle variation observed over the previous twosolar cycles. It is interesting to note that the amplitude of total irradiance variation from minimum to maximum seemsto be lower when the activity of the Sun is high, indicating that the strong magnetic fields of sunspots are capable toblock the energy transported to the photospheric layers on longer time scales. In contrast, the trend in total irradianceappears higher during the weak solar cycle 23, when the sunspot magnetic fields cannot block effectively the energytransport to the photosphere. This peculiar behavior of total irradiance over stronger and weaker solar cycles alsoindicates that besides magnetic fields, additional mechanisms are also at work to shape the long-term variations intotal irradiance, which are missed in the empirical models currently used to study the climate impact of irradiancevariations.
Effect of Magnetic Fields on Short-Term Irradiance VariationsTo study the relation between the short-term variations in solar irradiance and magnetic fields, their residual time
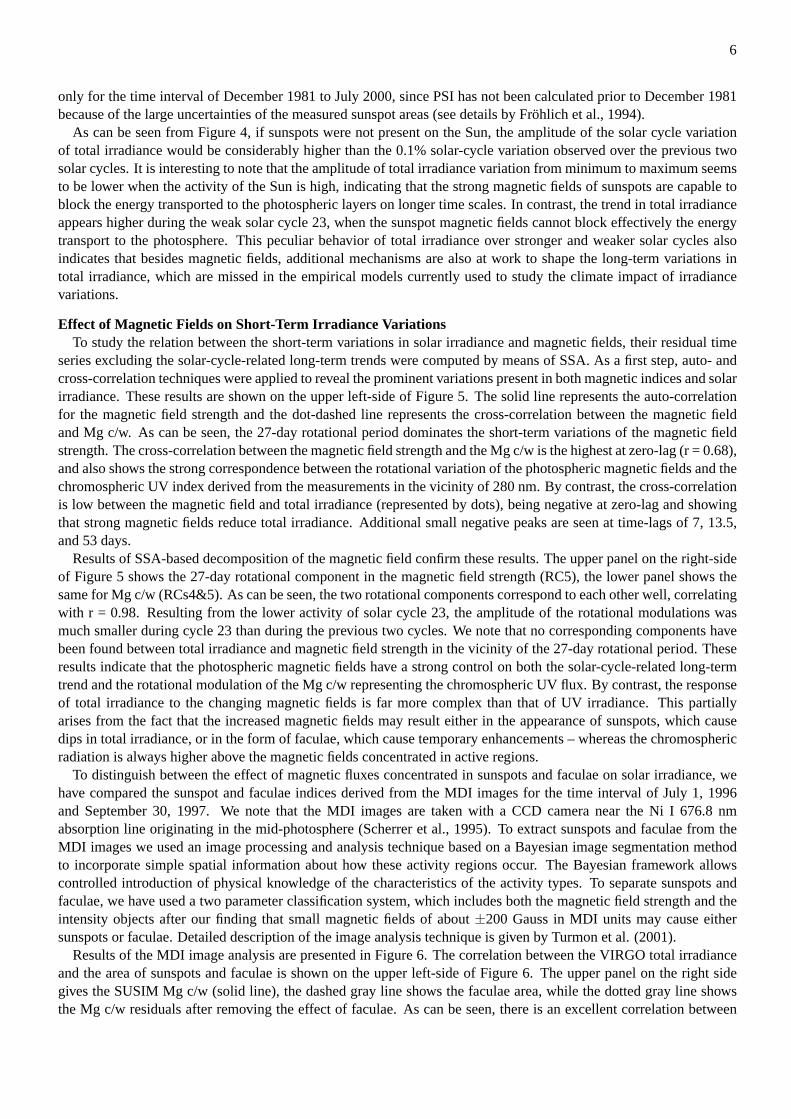
series excluding the solar-cycle-related long-term trends were computed by means of SSA. As a first step, auto- andcross-correlation techniques were applied to reveal the prominent variations present in both magnetic indices and solarirradiance. These results are shown on the upper left-side of Figure 5. The solid line represents the auto-correlationfor the magnetic field strength and the dot-dashed line represents the cross-correlation between the magnetic fieldand Mg c/w. As can be seen, the 27-day rotational period dominates the short-term variations of the magnetic fieldstrength. The cross-correlation between the magnetic field strength and the Mg c/w is the highest at zero-lag (r = 0.68),and also shows the strong correspondence between the rotational variation of the photospheric magnetic fields and thechromospheric UV index derived from the measurements in the vicinity of 280 nm. By contrast, the cross-correlationis low between the magnetic field and total irradiance (represented by dots), being negative at zero-lag and showingthat strong magnetic fields reduce total irradiance. Additional small negative peaks are seen at time-lags of 7, 13.5,and 53 days.
Results of SSA-based decomposition of the magnetic field confirm these results. The upper panel on the right-sideof Figure 5 shows the 27-day rotational component in the magnetic field strength (RC5), the lower panel shows thesame for Mg c/w (RCs4&5). As can be seen, the two rotational components correspond to each other well, correlatingwith r = 0.98. Resulting from the lower activity of solar cycle 23, the amplitude of the rotational modulations wasmuch smaller during cycle 23 than during the previous two cycles. We note that no corresponding components havebeen found between total irradiance and magnetic field strength in the vicinity of the 27-day rotational period. Theseresults indicate that the photospheric magnetic fields have a strong control on both the solar-cycle-related long-termtrend and the rotational modulation of the Mg c/w representing the chromospheric UV flux. By contrast, the responseof total irradiance to the changing magnetic fields is far more complex than that of UV irradiance. This partiallyarises from the fact that the increased magnetic fields may result either in the appearance of sunspots, which causedips in total irradiance, or in the form of faculae, which cause temporary enhancements – whereas the chromosphericradiation is always higher above the magnetic fields concentrated in active regions.
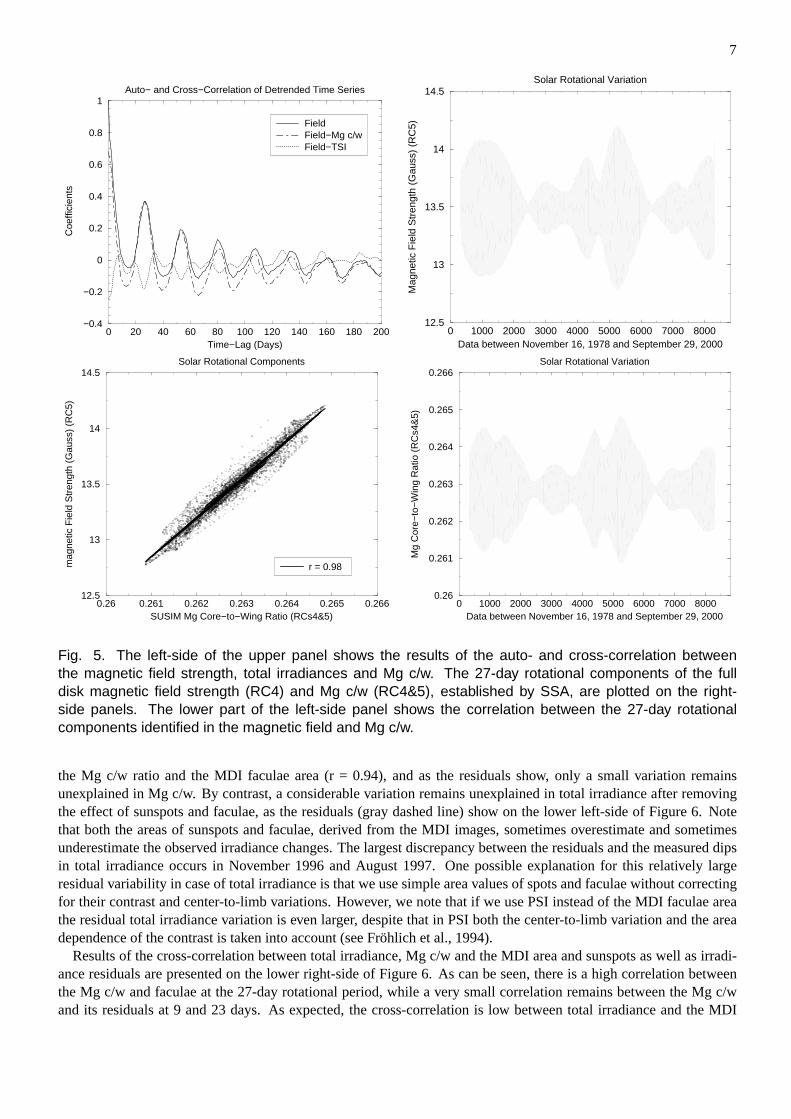
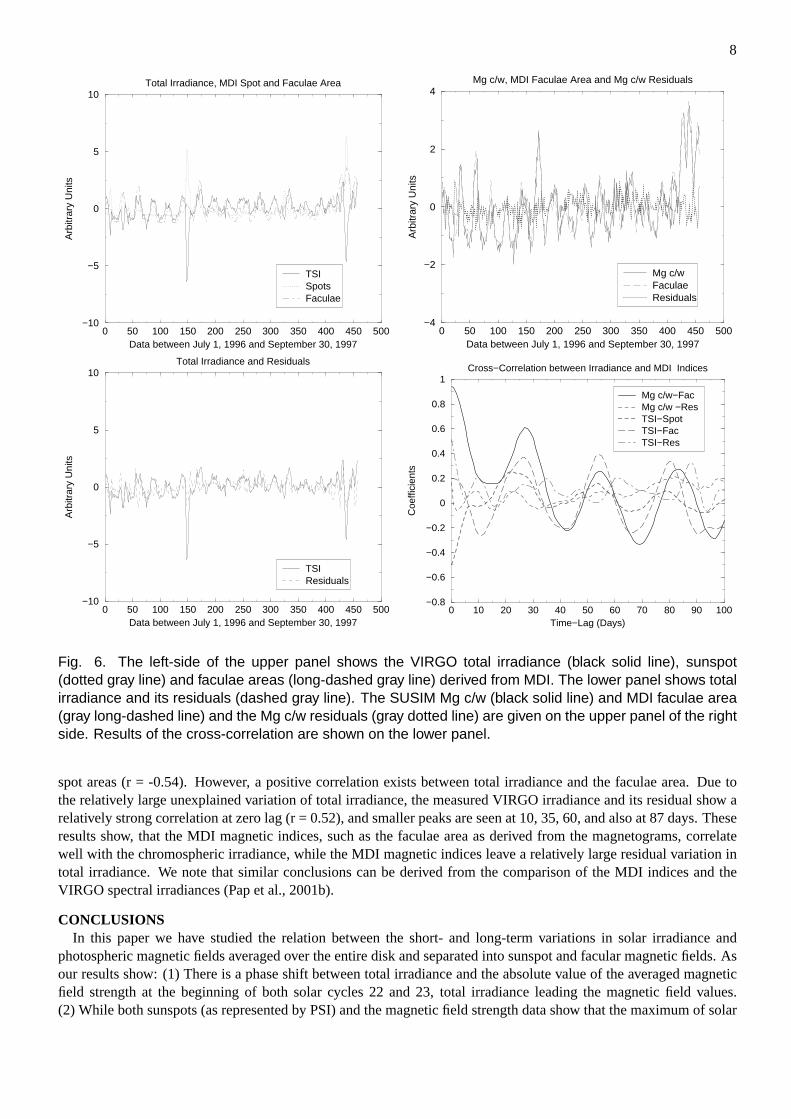
To distinguish between the effect of magnetic fluxes concentrated in sunspots and faculae on solar irradiance, wehave compared the sunspot and faculae indices derived from the MDI images for the time interval of July 1, 1996and September 30, 1997. We note that the MDI images are taken with a CCD camera near the Ni I 676.8 nmabsorption line originating in the mid-photosphere (Scherrer et al., 1995). To extract sunspots and faculae from theMDI images we used an image processing and analysis technique based on a Bayesian image segmentation methodto incorporate simple spatial information about how these activity regions occur. The Bayesian framework allowscontrolled introduction of physical knowledge of the characteristics of the activity types. To separate sunspots andfaculae, we have used a two parameter classification system, which includes both the magnetic field strength and theintensity objects after our finding that small magnetic fields of about±200 Gauss in MDI units may cause eithersunspots or faculae. Detailed description of the image analysis technique is given by Turmon et al. (2001).
Results of the MDI image analysis are presented in Figure 6. The correlation between the VIRGO total irradianceand the area of sunspots and faculae is shown on the upper left-side of Figure 6. The upper panel on the right sidegives the SUSIM Mg c/w (solid line), the dashed gray line shows the faculae area, while the dotted gray line showsthe Mg c/w residuals after removing the effect of faculae. As can be seen, there is an excellent correlation between
7
0 20 40 60 80 100 120 140 160 180 200Time−Lag (Days)
−0.4
−0.2
0
0.2
0.4
0.6
0.8
1
Coe
ffici
ents
Auto− and Cross−Correlation of Detrended Time Series
FieldField−Mg c/wField−TSI
0 1000 2000 3000 4000 5000 6000 7000 8000Data between November 16, 1978 and September 29, 2000
12.5
13
13.5
14
14.5
Mag
netic
Fie
ld S
tren
gth
(Gau
ss)
(RC
5)
Solar Rotational Variation
0.26 0.261 0.262 0.263 0.264 0.265 0.266SUSIM Mg Core−to−Wing Ratio (RCs4&5)
12.5
13
13.5
14
14.5
mag
netic
Fie
ld S
tren
gth
(Gau
ss)
(RC
5)
Solar Rotational Components
r = 0.98
0 1000 2000 3000 4000 5000 6000 7000 8000Data between November 16, 1978 and September 29, 2000
0.26
0.261
0.262
0.263
0.264
0.265
0.266
Mg
Cor
e−to
−W
ing
Rat
io (
RC
s4&
5)
Solar Rotational Variation
Fig. 5. The left-side of the upper panel shows the results of the auto- and cross-correlation betweenthe magnetic field strength, total irradiances and Mg c/w. The 27-day rotational components of the fulldisk magnetic field strength (RC4) and Mg c/w (RC4&5), established by SSA, are plotted on the right-side panels. The lower part of the left-side panel shows the correlation between the 27-day rotationalcomponents identified in the magnetic field and Mg c/w.
the Mg c/w ratio and the MDI faculae area (r = 0.94), and as the residuals show, only a small variation remainsunexplained in Mg c/w. By contrast, a considerable variation remains unexplained in total irradiance after removingthe effect of sunspots and faculae, as the residuals (gray dashed line) show on the lower left-side of Figure 6. Notethat both the areas of sunspots and faculae, derived from the MDI images, sometimes overestimate and sometimesunderestimate the observed irradiance changes. The largest discrepancy between the residuals and the measured dipsin total irradiance occurs in November 1996 and August 1997. One possible explanation for this relatively largeresidual variability in case of total irradiance is that we use simple area values of spots and faculae without correctingfor their contrast and center-to-limb variations. However, we note that if we use PSI instead of the MDI faculae areathe residual total irradiance variation is even larger, despite that in PSI both the center-to-limb variation and the areadependence of the contrast is taken into account (see Frohlich et al., 1994).
Results of the cross-correlation between total irradiance, Mg c/w and the MDI area and sunspots as well as irradi-ance residuals are presented on the lower right-side of Figure 6. As can be seen, there is a high correlation betweenthe Mg c/w and faculae at the 27-day rotational period, while a very small correlation remains between the Mg c/wand its residuals at 9 and 23 days. As expected, the cross-correlation is low between total irradiance and the MDI
8
0 50 100 150 200 250 300 350 400 450 500Data between July 1, 1996 and September 30, 1997
−10
−5
0
5
10
Arb
itrar
y U
nits
Total Irradiance, MDI Spot and Faculae Area
TSISpotsFaculae
0 50 100 150 200 250 300 350 400 450 500Data between July 1, 1996 and September 30, 1997
−4
−2
0
2
4
Arb
itrar
y U
nits
Mg c/w, MDI Faculae Area and Mg c/w Residuals
Mg c/wFaculaeResiduals
0 50 100 150 200 250 300 350 400 450 500Data between July 1, 1996 and September 30, 1997
−10
−5
0
5
10
Arb
itrar
y U
nits
Total Irradiance and Residuals
TSIResiduals
0 10 20 30 40 50 60 70 80 90 100Time−Lag (Days)
−0.8
−0.6
−0.4
−0.2
0
0.2
0.4
0.6
0.8
1
Coe
ffici
ents
Cross−Correlation between Irradiance and MDI Indices
Mg c/w−FacMg c/w −ResTSI−SpotTSI−FacTSI−Res
Fig. 6. The left-side of the upper panel shows the VIRGO total irradiance (black solid line), sunspot(dotted gray line) and faculae areas (long-dashed gray line) derived from MDI. The lower panel shows totalirradiance and its residuals (dashed gray line). The SUSIM Mg c/w (black solid line) and MDI faculae area(gray long-dashed line) and the Mg c/w residuals (gray dotted line) are given on the upper panel of the rightside. Results of the cross-correlation are shown on the lower panel.
spot areas (r = -0.54). However, a positive correlation exists between total irradiance and the faculae area. Due tothe relatively large unexplained variation of total irradiance, the measured VIRGO irradiance and its residual show arelatively strong correlation at zero lag (r = 0.52), and smaller peaks are seen at 10, 35, 60, and also at 87 days. Theseresults show, that the MDI magnetic indices, such as the faculae area as derived from the magnetograms, correlatewell with the chromospheric irradiance, while the MDI magnetic indices leave a relatively large residual variation intotal irradiance. We note that similar conclusions can be derived from the comparison of the MDI indices and theVIRGO spectral irradiances (Pap et al., 2001b).
CONCLUSIONSIn this paper we have studied the relation between the short- and long-term variations in solar irradiance and
photospheric magnetic fields averaged over the entire disk and separated into sunspot and facular magnetic fields. Asour results show: (1) There is a phase shift between total irradiance and the absolute value of the averaged magneticfield strength at the beginning of both solar cycles 22 and 23, total irradiance leading the magnetic field values.(2) While both sunspots (as represented by PSI) and the magnetic field strength data show that the maximum of solar
9
cycle 23 is lower than the maxima of the two previous cycles, the long-term variation of total irradiance and theMg II h & k ratio is rather symmetrical over the last two and half cycles – showing that the maximum level of solarirradiance is higher during solar cycle 23 than the maximum of the magnetic indices. (3) Our results also indicatethat while there is a considerably large residual variation in total irradiance after removing the effect of sunspots andfaculae, both the short- and long-term variations of the Mg c/w ratio correlate well with the magnetic field variations.
The reason of these discrepancies between the short- and long-term variations of total irradiance and magnetic fieldindices is not understood. Although we cannot rule out the possibility of instrumental effects, which may influencethe long-term precision of irradiance time series, the systematic differences between the multi-decade long totalirradiance composite and the magnetic surrogates on both short and long time scales (Frohlich and Pap, 1989; Kuhn,1996; Vigouroux et al., 1997; Frohlich et al., 1997) point to the direction of the presence of unidentified component(s)which may be missed in the current irradiance models. On one hand, one can raise the question whether the emergingnew magnetic fields can cause an early rise in total irradiance at the beginning of the ascending phase of the solarcycle – well before the concentration of the magnetic flux tubes is sufficiently large enough at the photospheric levelsto form active regions and extending also to the chromosphere, and thus influencing UV irradiance. As the resultsof cross-correlation and Singular Spectrum Analysis show, variations of the photospheric magnetic fields control thechromospheric UV irradiance variations on both short and long time scales. In contrast, the magnetic field variationscannot fully account for either the short- or the long-term variations in total irradiance.
As shown by the long-term irradiance measurements, the amplitude of the peak-to-peak variation of total irradianceis about±0.1% during solar cycles 21 and 22 (see Frohlich, 2000). However, our results indicate that total irradiancerises slightly higher during the maximum of solar cycle 23 than during the two previous cycles. It remains to be seenwhether this relation between the strength of the solar cycle and the amplitude of the solar-cycle-related total irradiancevariations is consistent, i.e., the maximum level of total irradiance is higher during weaker cycles and lower duringstronger cycles or it may be related to uncalibrated instrumental effects. Since we lack the physical understandingof irradiance variations, we need to continue the uninterrupted space-based observations of total irradiance to furtherstudy the relation between the strength of the solar cycle and the maximum activity level of total irradiance. If ourcurrent finding stands (i.e., is not a result of instrumental effects), we need to re-evaluate our long-term empiricalirradiance models, which assume that total irradiance varies in a fashion similar to the sunspot number – showinglarger cycle-to-cyle variations during high activity cycles and smaller variations during weaker cycles.
Further studies are required on this subject and identification of the missing irradiance components is an importantissue to better understand the physical processes below the photosphere and to better understand the climate impact ofsolar variability. For this purpose we need to combine our efforts to identify small scale magnetic features and possibletemperature and radius changes which may also contribute to total irradiance variations – in parallel with efforts toprovide irradiance measurements with better long-term precision and higher resolution solar images to study the effectof the evolution and distribution of solar magnetic fields on total irradiance.
ACKNOWLEDGEMENTSThe authors gratefully acknowledge the past and ongoing efforts of the VIRGO and MDI teams to produce the
SOHO/VIRGO irradiance data and MDI images. SOHO is a mission of international cooperation between ESAand NASA. NSO/Kitt Peak magnetic data used here are produced cooperatively by NSF/NOAO, NASA/GSFC andNOAA/SEC. This research was supported by a grant NAG 5-7877 from the SOHO Office of NASA’s Office of SpaceScience.
REFERENCESDelache, Ph, F. Laclare, and H. Sadsaoud, inAdvance in Helio- and Asteroseismology, edited by J. Christensen-
Dalsgaard and S. Frandsen, IAU Press, p. 223., 1986.DeLand, M.T. and R.P. Cebula,JGR, 103, 16251–73, 1998.Floyd, L., D. Prinz, P. C. Crane, and L.C. Herring,Adv. Space Res., in press, 2001.Foukal, P. and L. Lean,ApJ.328, 347, 1988.Fox, P. and S. Sofia, inThe Sun as a Variable Star: Solar and Stellar Irradiance Variations, edited by J.M. Pap, C.
Frohlich, H.S. Hudson, and S.K. Solanki, Cambridge Univ. Press., p. 280, 1994.Frohlich, C. and J. Pap,Astron. Astrophys., 220, 272, 1989.Frohlich, C., J. Pap, and H.S. Hudson, H.S.,Solar Phys., 152, 111, 1994Frohlich et al., inThe First Results from SOHO, edited by B. Fleck and Z. Sestka,Solar Phys., 170, 1, 1997.

10
Frohlich, C. and J. Lean,Geoph.Res.Let., 25, 4377, 1998.Frohlich, C.,Space Science Reviews94, 15, 2000.Hansen, J., A. Lacis, R. Ruedy, M. Sato, and H. Wilson,Natl. Geogr. Explor., 9, 142, 1993.Kuhn, J., inGlobal Changes in the Sun, edited by T. Roca-Cortes, Cambridge Univ. Press, p. 231, 1996.Kuhn, J., R.I. Bush, X. Scheick, and Ph. Scherrer, 1998,Nature392, 155, 1998.Pap, J.,Astron. Astrophys264, 249, 1992.Pap, J., and C. Frohlich, C.,J. Atmosp. Sol. Terr. Phys.8(70), 31, 1998.Pap, J., M. Anklin, C. Frohlich, Ch. Wehrli, F. Varadi, and L. Floyd,Adv. Space Res., 24, 215, 1999.Pap, J., J.P., Rozelot, F. Laclare, and F. Varadi, F.,Astron. & Astrophys., in press, 2001aPap, J., M. Turmon, and S. Mukhtar, S.,Astrophys. J., in preparation, 2001b.Reid, G.,Climatic Change, 37, 391, 1997.Ribes, E., P. Mein, and A. Mangeney,Nature, 318, 170, 1985.Scherrer et al.: 1995, inThe SOHO Mission, edited by B. Fleck, V. Domingo and A. Poland, Kluwer Academic
Publishers, p. 129, 1995.Turmon, M., J. Pap, and S. Mukhtar,ApJ, submitted, 2001.Vigouroux, A., J. Pap, and Ph. Delache,Solar Phys., 176, 1, 1997.Wehrli, C., T. Appourchaux, D. Crommelynck, W. Finsterle, and J. Pap, inSounding Solar and Stellar Interiors,
edited by. J. Provost and F.X. Schmieder, Kluwer Academic Publishers, p. 209, 1998.Willson, R.C., S. Gulkis, M. Janssen, H.S. Hudson, and G.A. Chapman,Science, 211, 700, 1981.Willson, R.C. and H.S. Hudson,Nature, 332, 810, 1988.Woods, T., W.K. Tobiska, G.J. Rottman, and J. Worden,JGR, 105, 27,195, 2000.


