Embed Size (px)
Citation preview
Measurement And Uncertainty Of The Long Term Total
Solar Irradiance Trend
Steven Dewitte, Dominique Crommelynck, Sabri Mekaoui andAlexandre JoukoffRoyal Meteorological Institute of Belgium
July 1, 2004
Abstract. A possible long term trend of the total solar irradiance could be a naturalcause for climate variations on Earth. Measurement of the total solar irradiance withspace radiometers have started in 1978. We present a new total solar irradiancecomposite, with an uncertainty of +/- 0.35 W/m2. From the minimum in 1995 tothe maximum in 2002 the total solar irradiance increased by 1.6 W/m2. In betweenthe minima of 1987 and 1995 the total solar irradiance increased by 0.15 W/m2.
Keywords: Total Solar Irradiance
1. Introduction
The solar energy input is the driving term in the Earth’s energy bud-get. Possible long term variations of the Total Solar Irradiance (TSI)are therefore expected to result in climate changes on Earth. Themonitoring of the long term TSI is thus necessary for climate changestudies.
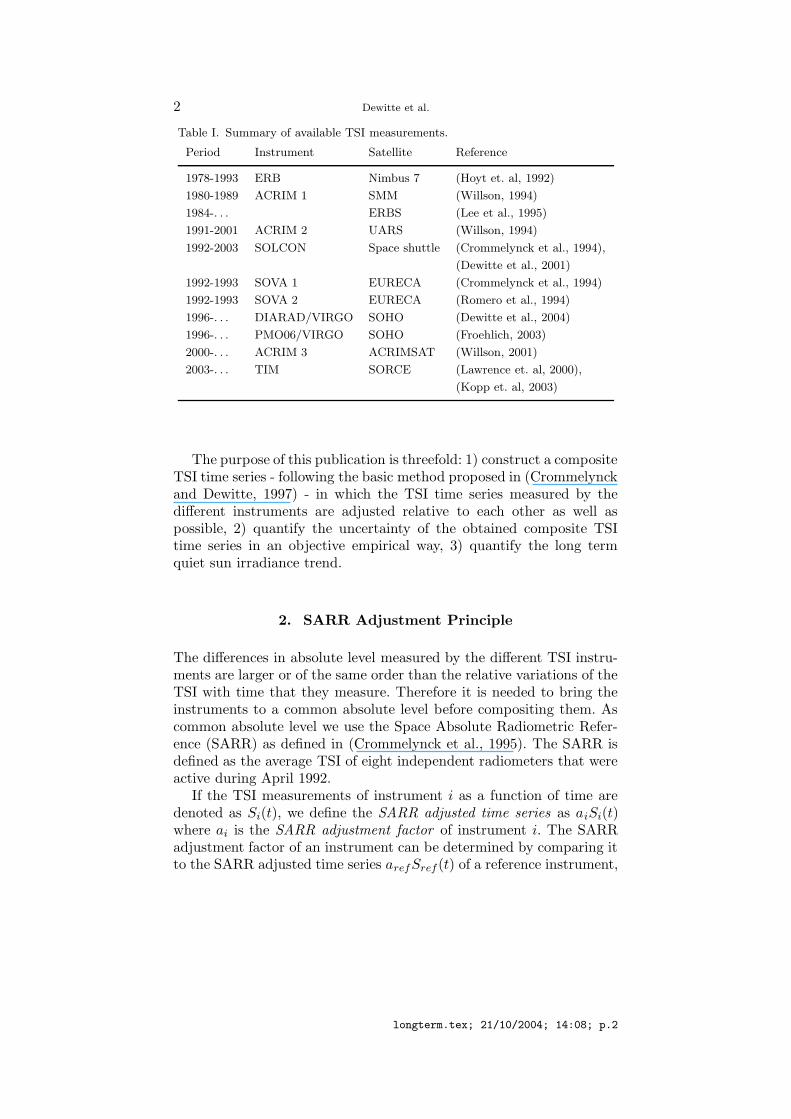
TSI measurements of acceptable quality for long term monitoringexist ’only’ since 1978, which is relatively short compared to climatetime scales. The currently available long term TSI measurements aresummarised in table I.
Since the measurement periods for individual instruments are lim-ited - see column 1 of table I - the TSI measurements of differentinstruments have to be composited in order to construct a long termTSI time series.
Different TSI composites have been proposed in (Crommelynck andDewitte, 1997), (Froehlich and Lean, 1998) and (Willson and Mord-vinov, 2003). The obtained composite TSI time series in these threestudies show some substantial differences, e.g. (Willson and Mordvinov,2003) find an increase of the ’quiet sun’ irradiance level of 0.8 W/m2
between the solar minima in 1986 and 1996, while (Froehlich and Lean,1998) find no difference between the two minima.
The inherent uncertainty in the available TSI measurements has notbeen explicitely quantified so far.
c© 2004 Kluwer Academic Publishers. Printed in the Netherlands.
longterm.tex; 21/10/2004; 14:08; p.1
2 Dewitte et al.
Table I. Summary of available TSI measurements.
Period Instrument Satellite Reference
1978-1993 ERB Nimbus 7 (Hoyt et. al, 1992)
1980-1989 ACRIM 1 SMM (Willson, 1994)
1984-. . . ERBS (Lee et al., 1995)
1991-2001 ACRIM 2 UARS (Willson, 1994)
1992-2003 SOLCON Space shuttle (Crommelynck et al., 1994),
(Dewitte et al., 2001)
1992-1993 SOVA 1 EURECA (Crommelynck et al., 1994)
1992-1993 SOVA 2 EURECA (Romero et al., 1994)
1996-. . . DIARAD/VIRGO SOHO (Dewitte et al., 2004)
1996-. . . PMO06/VIRGO SOHO (Froehlich, 2003)
2000-. . . ACRIM 3 ACRIMSAT (Willson, 2001)
2003-. . . TIM SORCE (Lawrence et. al, 2000),
(Kopp et. al, 2003)
The purpose of this publication is threefold: 1) construct a compositeTSI time series - following the basic method proposed in (Crommelynckand Dewitte, 1997) - in which the TSI time series measured by thedifferent instruments are adjusted relative to each other as well aspossible, 2) quantify the uncertainty of the obtained composite TSItime series in an objective empirical way, 3) quantify the long termquiet sun irradiance trend.
2. SARR Adjustment Principle
The differences in absolute level measured by the different TSI instru-ments are larger or of the same order than the relative variations of theTSI with time that they measure. Therefore it is needed to bring theinstruments to a common absolute level before compositing them. Ascommon absolute level we use the Space Absolute Radiometric Refer-ence (SARR) as defined in (Crommelynck et al., 1995). The SARR isdefined as the average TSI of eight independent radiometers that wereactive during April 1992.
If the TSI measurements of instrument i as a function of time aredenoted as Si(t), we define the SARR adjusted time series as aiSi(t)where ai is the SARR adjustment factor of instrument i. The SARRadjustment factor of an instrument can be determined by comparing itto the SARR adjusted time series arefSref (t) of a reference instrument,
longterm.tex; 21/10/2004; 14:08; p.2
Long term total solar irradiance. 3
by putting aiSi(t) = arefSref(t) where (.) denotes the average over thecomparison period.
As a prime reference we use the SOLCON instrument, which wasactive during the April 1992 period when the SARR was defined.
3. SARR Adjustment Of DIARAD, ACRIM 2, SOVA 1
And SOVA 2 Through SOLCON
From SOLCON as a prime reference, we derive the SARR adjustmentfactors of DIARAD, ACRIM 2, SOVA 1 and SOVA 2. ACRIM 2 andDIARAD will further be used as secondary references.
The SOLCON instrument has two radiometric channels, SOLCON-Left and SOLCON-Right. We use the SARR adjustment factors derivedfor SOLCON in (Crommelynck et al., 1995), asolcon-left=0.999228 andasolcon-right=0.999823.
For DIARAD we use the ageing corrected measurements as de-scribed in (Dewitte et al., 2004) as original measurements. We derivethe DIARAD SARR adjustment factor by comparing it to the SOL-CON reference instrument during the SOLCON International Extremeultraviolet Hithchiker 3 (IEH-3) space shuttle flight in Oct-Nov 1998,yielding adiarad=1.000295.
For ACRIM 2 we use the version 3 available fromhttp://www.acrim.com. We derive the ACRIM 2 SARR adjustmentfactor by comparing it to the SOLCON reference instrument duringthe SOLCON ATmospheric Laboratory for Applications and Science 2(ATLAS 2) space shuttle flight in April 1993, yielding aacrim2=1.001295.
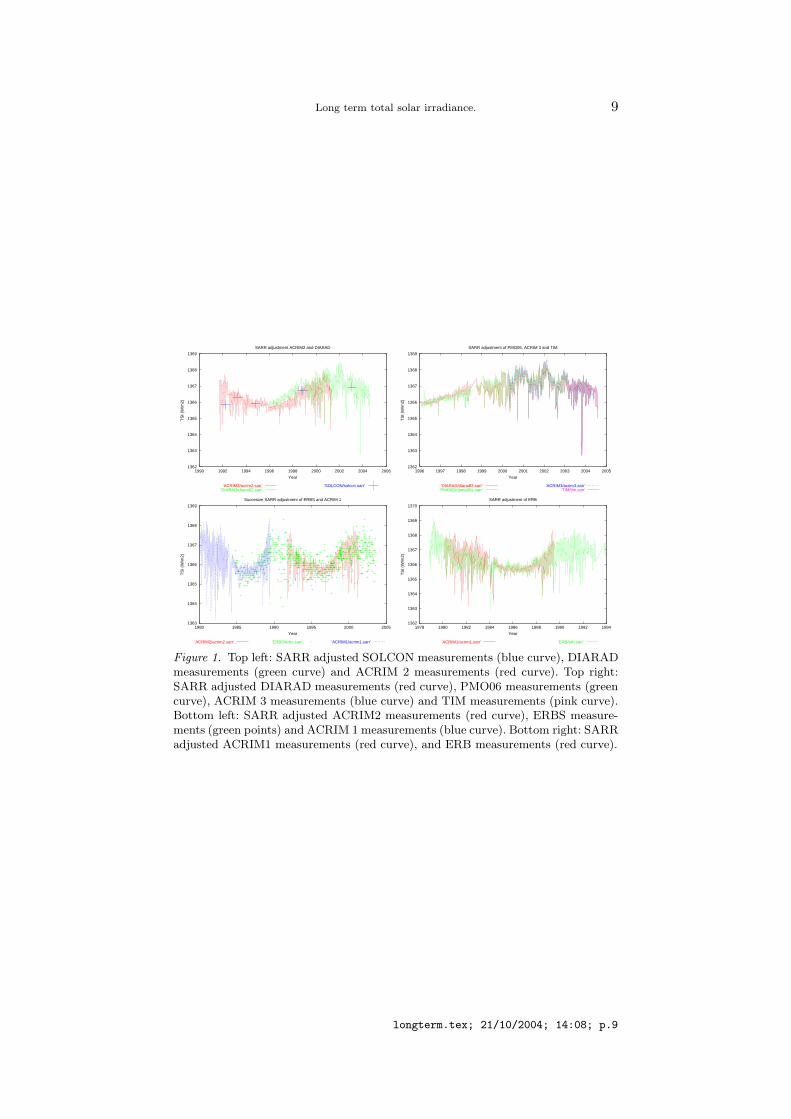
The top left part of figure 1 shows the SARR adjusted SOLCON,DIARAD and ACRIM 2 measurements. One can verify visually thatthe ACRIM 2 measurements (red curve) have been ’tied’ to the SOL-CON measurement in 1993 (second blue cross) and that the DIARADmeasurements (green curve) have been ’tied’ to the SOLCON measure-ments in 1998 (fourth blue cross). There is a good continuity betweenthe TSI values measured by ACRIM2 before mid 1995 and the TSIvalues measured by DIARAD from 1996 onwards.
For SOVA 1, we use the measurements from (Crommelynck et al.,1994). For SOVA 2, we use the measurements from (Romero et al.,1994). We derive the SARR adjustment factors by comparison withSOLCON in 1993. We obtain asova1=1.000799 and asova2=0.999703.
longterm.tex; 21/10/2004; 14:08; p.3
4 Dewitte et al.
4. SARR Adjustment Of PMO06, ACRIM 3 And TIM
Through DIARAD
From DIARAD as a secondary reference, we derive the SARR adjust-ment factors of PMO06, ACRIM 3 and TIM.
For PMO06 we use the ageing corrected version as described in(Dewitte et al., 2004) as original measurements, and we findapmo6=1.000661.
For ACRIM 3 we use the version 0403 available fromhttp://www.acrim.com as original measurements, and we findaacrim3=1.000404.
For TIM we use the version 3 available from http://lasp.colorado.eduas original measurements, and we find atim=1.004137.
The top right part of figure 1 shows the SARR adjusted DIARAD,PMO06, ACRIM 3 and TIM measurements. One can verify visuallythat the PMO06 measurements (green curve), ACRIM 3 measurements(blue curve) and TIM measurements (pink curve) have been ’tied’ tothe DIARAD measurements (underlying red curve).
5. SARR Adjustment Of ERBS Through ACRIM 2,
ACRIM 1 Through ERBS And Of ERB Through ERBS
From ACRIM 2 as a secondary reference, we derive the SARR adjust-ment factor of ERBS. ERBS is further used as a tertiary reference toderive the SARR adjustment factor of ACRIM 1. Finally ACRIM 1 isused as a quaternary reference to derive the SARR adjustment factorof ERB. The choice of the order of references is made based on the timeperiods when the instruments are available, not on their quality.
We use the ERBS meaurements from (Lee et al., 1995) as originalmeasurements and we find aerbs= 1.000536.
For ACRIM 1 we use the version 1 available fromhttp://www.acrim.com as original measurements, and we findaacrim1=0.999026.
The bottom left part of figure 1 shows the SARR adjusted ACRIM2, ERBS and ACRIM 1 measurements. One can verify visually thatthe ACRIM 1 measurements (blue curve) have been ’tied’ to the ERBSmeasurements (green points), which have in turn been ’tied’ to theACRIM 2 measurements (red curve).
For ERB we use the version from (Hoyt et. al, 1992). We use ACRIM1 as a reference during the entire period of overlap, except in the periodfrom December 1980 to February 1984 when the quality of the ACRIM
longterm.tex; 21/10/2004; 14:08; p.4
Long term total solar irradiance. 5
1 measurements was degraded due to the SMM ’spin mode’. We findaerb=0.995867.
The bottom right part of figure 1 shows the SARR adjusted ACRIM1 and ERB measurements. One can verify visually that the ERB mea-surements (green curve) have been ’tied’ to the ACRIM 1 measurements(red curve) during the entire period of overlap except during the SMMspin mode period.
6. TSI Composite And Uncertainty
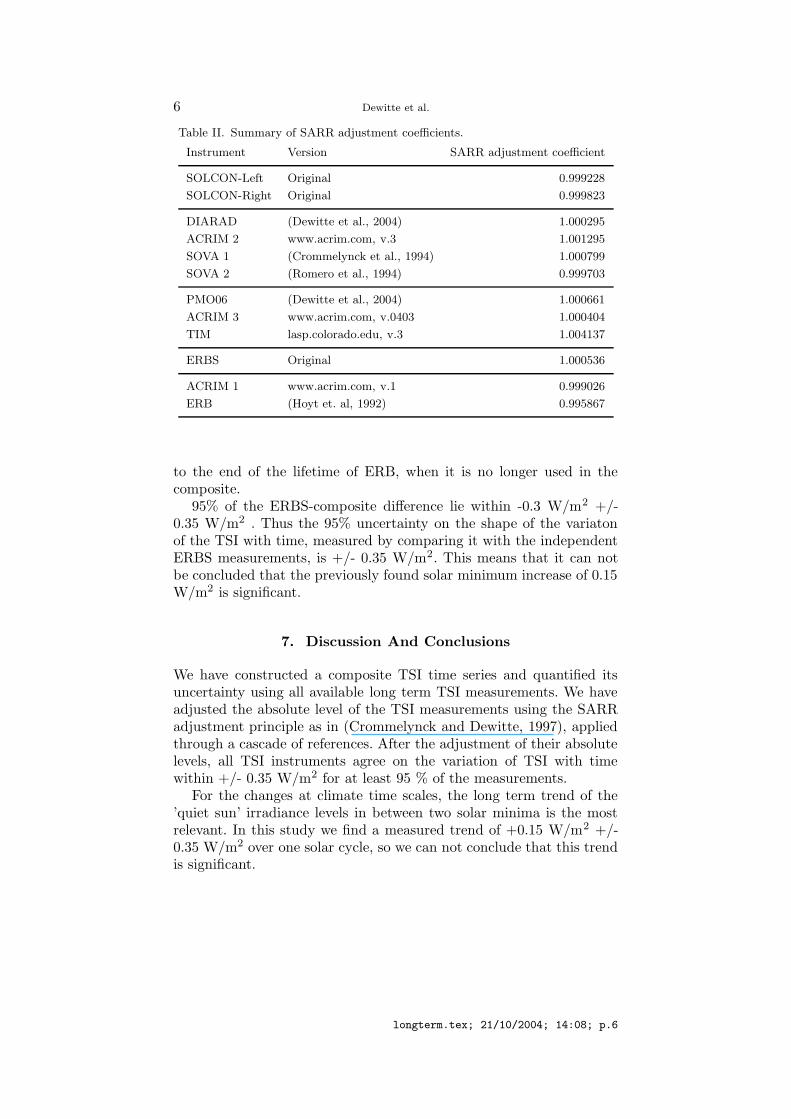
After their SARR adjustment all the TSI instruments are ’tied’ togetherat the same absolute level. Some differences in the detailed TSI timevariations measured by the different instruments still exist. The finalbest estimate of the ’true’ TSI variation is obtained as a compositeTSI series. For a given day the value of the composite TSI is definedas the average of the SARR adjusted daily mean TSI measurements ofall available instruments, with the exclusion of ERBS and SOLCON.For reference, the used SARR adjustment coefficients are compiled intable II.
The running yearly mean of the TSI composite reached a minimumof 1365.67 W/m2 at the beginming of 1987, a maximum of 1367.08W/m2 during 1991, a minimum of 1365.82 W/m2 at the end of 1995,and a maximum of 1367.42 W/m2 at the end of 2001. Thus the TSIcycle amplitude was 1.4 W/m2 and 1.6 W/m2 for the last two solarcycles, and the change between the last two minima was 0.15 W/m2.
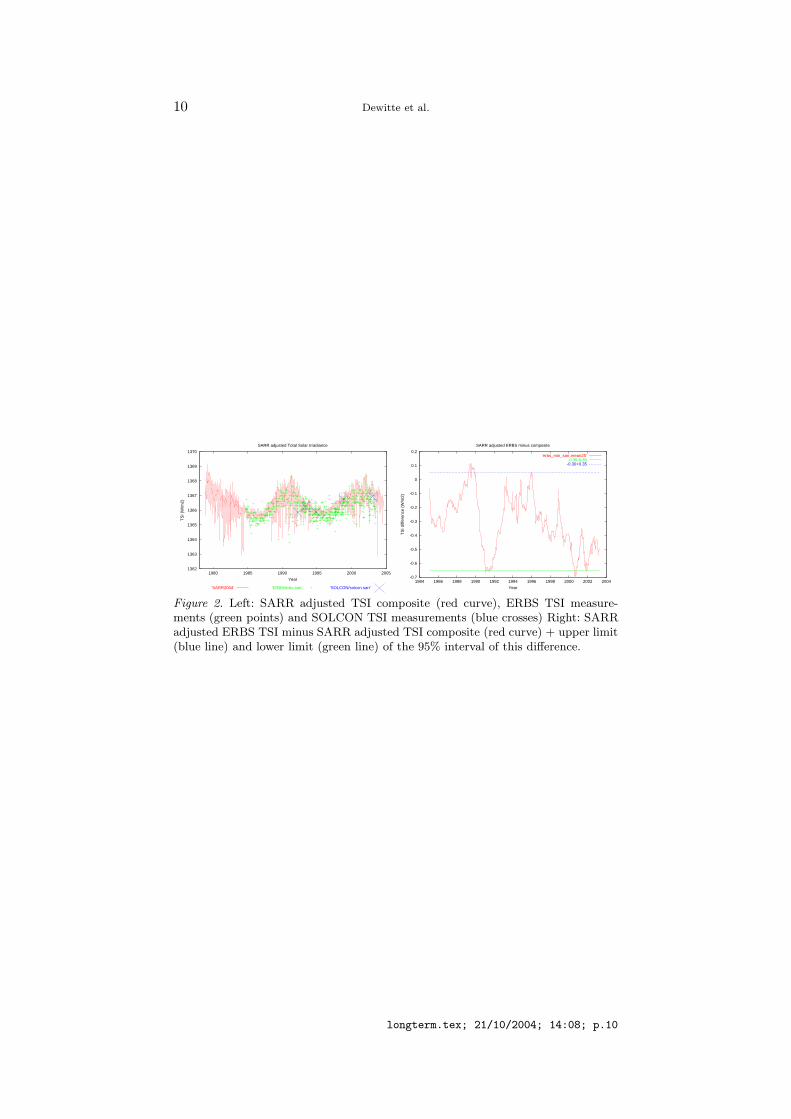
The left part of figure 2 shows the composite time series (red curve),the ERBS measurements (green points) and the SOLCON measure-ments (blue crosses). As the ERBS measurements have been excluded inthe composite TSI calculation, they can be used as partly independentmeasurements for an assesment of the uncertainty of the TSI composite.The independence is only partly because the ERBS measurements havebeen used to make the connection between the ACRIM 1 and ACRIM2 measurements in section 5. The right part of figure 2 shows thedifference (red curve) between the ERBS time series and the compositetime series. To reduce the noise on the difference a 25 point runningmean has been applied to the difference.
The strongest features visible in the ERBS minus composite differ-ence are a decrease by about 0.75 W/m2 from end 1989 to 1991, and anopposite increase by about 0.6 W/m2 from 1992 to 1993. The increasecorreponds to the sudden disagreement between ERBS and ERB, whichwill be further discussed in the next section. The decrease corresponds
longterm.tex; 21/10/2004; 14:08; p.5
6 Dewitte et al.
Table II. Summary of SARR adjustment coefficients.
Instrument Version SARR adjustment coefficient
SOLCON-Left Original 0.999228
SOLCON-Right Original 0.999823
DIARAD (Dewitte et al., 2004) 1.000295
ACRIM 2 www.acrim.com, v.3 1.001295
SOVA 1 (Crommelynck et al., 1994) 1.000799
SOVA 2 (Romero et al., 1994) 0.999703
PMO06 (Dewitte et al., 2004) 1.000661
ACRIM 3 www.acrim.com, v.0403 1.000404
TIM lasp.colorado.edu, v.3 1.004137
ERBS Original 1.000536
ACRIM 1 www.acrim.com, v.1 0.999026
ERB (Hoyt et. al, 1992) 0.995867
to the end of the lifetime of ERB, when it is no longer used in thecomposite.
95% of the ERBS-composite difference lie within -0.3 W/m2 +/-0.35 W/m2 . Thus the 95% uncertainty on the shape of the variatonof the TSI with time, measured by comparing it with the independentERBS measurements, is +/- 0.35 W/m2. This means that it can notbe concluded that the previously found solar minimum increase of 0.15W/m2 is significant.
7. Discussion And Conclusions
We have constructed a composite TSI time series and quantified itsuncertainty using all available long term TSI measurements. We haveadjusted the absolute level of the TSI measurements using the SARRadjustment principle as in (Crommelynck and Dewitte, 1997), appliedthrough a cascade of references. After the adjustment of their absolutelevels, all TSI instruments agree on the variation of TSI with timewithin +/- 0.35 W/m2 for at least 95 % of the measurements.
For the changes at climate time scales, the long term trend of the’quiet sun’ irradiance levels in between two solar minima is the mostrelevant. In this study we find a measured trend of +0.15 W/m2 +/-0.35 W/m2 over one solar cycle, so we can not conclude that this trendis significant.
longterm.tex; 21/10/2004; 14:08; p.6
Long term total solar irradiance. 7
Our results are different from (Willson and Mordvinov, 2003) whofind a trend of 0.8 W/m2 and from (Froehlich and Lean, 1998) whofind no trend. The differences can be explained since we use the ERBSradiometer to bridge the gap between ACRIM 1 and ACRIM 2, whilein the cited studies the ERB radiometer is used. We preferred not touse ERB, since it is believed (Lee et al., 1995) that ERB had a shift ofabout 0.8 W/m2 after switch-off and switch-on between Sep. 1989 andMay 1990. The ERB shift is visible in the right part of figure 2 as theincrease of the ERBS minus composite difference by 0.8 W/m2 around1990. The ERB shift, which was corrected in (Froehlich and Lean,1998) and not corrected in (Willson and Mordvinov, 2003), explainsthe difference between these two studies. In (Willson and Mordvinov,2003) the decrease of the ERBS minus ERB difference from 1989 to1991 is not interpreted as an upward shift of ERB, but as an ageing ofERBS.
For the extrapolation of TSI measurements at climate time scales,see e.g. (Lean et al., 1995), an estimate of the long term quiet sunirradiance variation of 3.3 W/m2 over 300 years - corresponding toan average trend of 0.11 W/m2 per decade - has been used. To verifythis estimate by measurements, would require a TSI record with anuncertainty lower than +/- 0.1 W/m2 over one solar cycle, or with anuncertainty lower than +/- 0.2 W/m2 over two solar cycles. Such lowuncertainties on the long term TSI measurements have not been metso far, but it is not excluded that they can be met in the future, byextension of the time series and progress in technology. In this contextit is promising to note that the radiometers DIARAD and TIM agreeon the long term variation of the TSI over 1.5 years within +/- 0.1W/m2. Both radiometers have side by side cavity construction, whichcan explain their good stability. If both radiometers continue to func-tion well and to agree well over the next few years, we can obtain aTSI record over one solar cycle with an uncertainty as low as +/- 0.1W/m2, which is the limit of what is needed.
Acknowledgements
We acknowledge the efforts of the VIRGO investigation on SOHO, acooperative mission of ESA and NASA. We thank the NASA SmallShuttle Payloads Project Office for the SOLCON flight opportunities.We thank Richard Willson for the provision of the ACRIM data andRobert Lee III for the provision of the ERBS data. The work pre-sented in this article was supported by the Belgian Science Policy officethrough the ESA PRODEX program.
longterm.tex; 21/10/2004; 14:08; p.7
8 Dewitte et al.
References
Crommelynck, D., Domingo, V., Fichot, A. and Lee, R.B. Total Solar IrradianceObservations from the EURECA and ATLAS Experiments. In J. Pap et al.,editors, The Sun as a Variable Star: Solar and Stellar Irradiance Variations,63–69, Cambridge Univ. Press, New York, 1994.
Crommelynck, D., A. Fichot, R. B. Lee III and J. Romero, First realisation of theSpace Absolute Radiometric Reference during the ATLAS 2 flight period. Adv.
Space Res. 16:17–23, 1995.Crommelynck, D. and S. Dewitte. Solar constant temporal and frequency charac-
teristics. Solar Physics, 173:171–191, 1997.Dewitte S., A. Joukoff, D. Crommelynck, R. B. Lee III, R. Helizon and R.S. Wilson.
Contribution of the Solar Constant (SOLCON) program to the long term totalsolar irradiance observations. Journal Geophysical Research, 106(A8): 15759–15766, 10.1029/2000JA900160, 2001.
Dewitte S., D. Crommelynck and A. Joukoff. Total solar irradiance observa-tions from DIARAD/VIRGO. Journal Geophysical Research, 109, A02102,doi:10.1029/2002JA009694, 2004.
Frohlich, C., and J. Lean. The Sun’s total irradiance: cycles and trends in the pasttwo decades and associated climate change uncertainties. Geophysical Research
Letters, 25:4377–4380, 1998.Frohlich, C. Long-Term Behaviour of Space Radiometers. Metrologia, 40:60–65,
2003.Hoyt, D. V., H. L. Kyle, J. R. Hickey and R. H. Maschhoff. The Nimbus-7 solar total
irradiance: a new algorithm for its derivation. Journal Geophysical Research,97:51–63, 1992.
Kopp, G., Lawrence, G., and Rottman, G. Total Irradiance Monitor Design andOn-Orbit Functionality. In SPIE Proc. 5171-4, 2003, in press.
Lawrence, G.M., G. Rottman, J. Harder and T. Woods. Solar Total IrradianceMonitor (TIM). Metrologia, 37:407–410 , 2000.
Lee, R. B., III, et al. Long-term total solar irradiance variability during sunspotcycle 22. Journal Geophysical Research, 100:1667–1675, 1995.
Lean, J., J. Beer and R. Bradley. Reconstruction of solar irradiance since 1610:Implications for climate change. Geophysical Research Letters, 22:3195–3198,1995.
Romero, J., Wehrli, C. and Frohlich, C. Solar total irradiance variability fromSOVA2 on board EURECA. Solar Physics, 152: 23–29, 1994.
Willson, R. C. Irradiance observations of SMM, Spacelab 1, UARS and ATLASexperiments. In J. Pap et al., editors, The Sun as a Variable Star: Solar and
Stellar Irradiance Variations, 54–62, Cambridge Univ. Press, New York, 1994.Willson, R. C. The ACRIMSAT/ACRIM3 experiment-Extending the Precision,
Long-Term Total Solar Irradiance Climate Database, Earth Observer, 13:14–17,2001.
Willson, R.C., A.V. Mordvinov. Secular total solar irradiance trend during solar cy-cles 21-23. Geophysical Research Letters, 30(5):1199, doi:10.1029/2002GL016038,2003.
longterm.tex; 21/10/2004; 14:08; p.8
Long term total solar irradiance. 9
1362
1363
1364
1365
1366
1367
1368
1369
1990 1992 1994 1996 1998 2000 2002 2004 2006
TS
I (W
/m2)
Year
SARR adjustment ACRIM2 and DIARAD
’ACRIM2/acrim2.sarr’’DIARAD/diaradl2.sarr’
’SOLCON/solcon.sarr’
1362
1363
1364
1365
1366
1367
1368
1369
1996 1997 1998 1999 2000 2001 2002 2003 2004 2005
TS
I (W
/m2)
Year
SARR adjustment of PMO06, ACRIM 3 and TIM
’DIARAD/diaradl2.sarr’’PMO06V/pmo06v.sarr’
’ACRIM3/acrim3.sarr’’TIM/tim.sarr’
1363
1364
1365
1366
1367
1368
1369
1980 1985 1990 1995 2000 2005
TS
I (W
/m2)
Year
Succesive SARR adjustment of ERBS and ACRIM 1
’ACRIM2/acrim2.sarr’ ’ERBS/erbs.sarr’ ’ACRIM1/acrim1.sarr’
1362
1363
1364
1365
1366
1367
1368
1369
1370
1978 1980 1982 1984 1986 1988 1990 1992 1994
TS
I (W
/m2)
Year
SARR adjustment of ERB
’ACRIM1/acrim1.sarr’ ’ERB/erb.sarr’
Figure 1. Top left: SARR adjusted SOLCON measurements (blue curve), DIARADmeasurements (green curve) and ACRIM 2 measurements (red curve). Top right:SARR adjusted DIARAD measurements (red curve), PMO06 measurements (greencurve), ACRIM 3 measurements (blue curve) and TIM measurements (pink curve).Bottom left: SARR adjusted ACRIM2 measurements (red curve), ERBS measure-ments (green points) and ACRIM 1 measurements (blue curve). Bottom right: SARRadjusted ACRIM1 measurements (red curve), and ERB measurements (red curve).
longterm.tex; 21/10/2004; 14:08; p.9
10 Dewitte et al.
1362
1363
1364
1365
1366
1367
1368
1369
1370
1980 1985 1990 1995 2000 2005
TS
I (W
/m2)
Year
SARR adjusted Total Solar Irradiance
’SARR2004’ ’ERBS/erbs.sarr’ ’SOLCON/solcon.sarr’
-0.7
-0.6
-0.5
-0.4
-0.3
-0.2
-0.1
0
0.1
0.2
1984 1986 1988 1990 1992 1994 1996 1998 2000 2002 2004
TS
I diff
eren
ce (
W/m
2)
Year
SARR adjusted ERBS minus composite
’erbs_min_sarr.mean25’-0.30-0.35-0.30+0.35
Figure 2. Left: SARR adjusted TSI composite (red curve), ERBS TSI measure-ments (green points) and SOLCON TSI measurements (blue crosses) Right: SARRadjusted ERBS TSI minus SARR adjusted TSI composite (red curve) + upper limit(blue line) and lower limit (green line) of the 95% interval of this difference.
longterm.tex; 21/10/2004; 14:08; p.10


