Embed Size (px)
Citation preview
!"#$%NORTH %LAKE %TAHOE
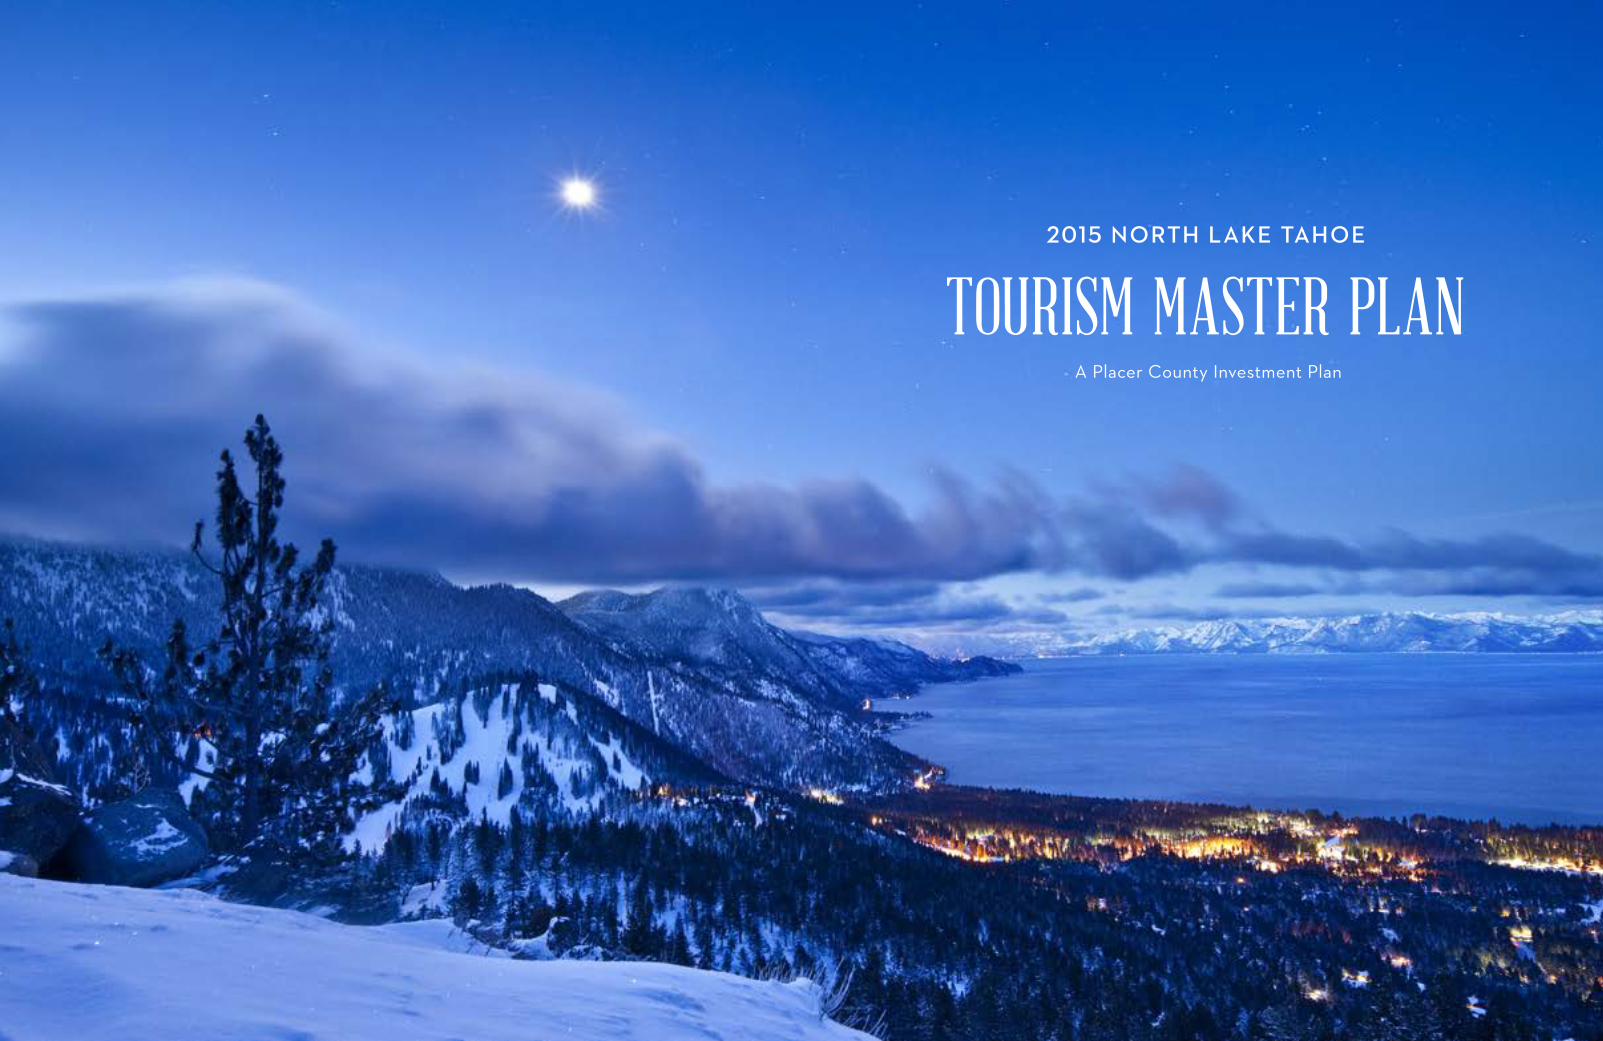
TOURISM MASTER PLAN A Placer County Investment Plan
xx ACKNOWLEDGMENTS
xx INTRODUCTION AND PLAN SUMMARYxx Purpose of Plan xx Methodology + Process xx Organization of the Plan xx Relationship to Other Plans
CHAPTER 01 NORTH!LAKE!TAHOE!TODAY xx Community Overview xx History of Tourism Planning in North Lake Tahoe
CHAPTER 02 MARKET!CONDITIONS xx International + National Trends xx Regional Trends xx Competitive Analysis xx Visitor Demographic Profile xx Visitor Experiences xx Accommodations xx Transportation xx Visitor Information
CHAPTER 03 FUNDING!CONDITIONS xx Economic Trends xx Existing Resources xx Revenue Source Alternatives
CHAPTER 04 VISION"!GOALS!#!PRIORITIES xx Vision xx Emerging Trends xx Focus Area + Goals xx Priorities Identified Through the Public Process
CHAPTER 05 ACTION!PLAN!MATRIX xx Overview xx Tier 1 Priorities xx Tier 2 Priorities
APPENDIX%A | Relevant Studies
• Placer County General Plan - Introduction, Placer County, May 2013
• The Economic Significance of Travel to the North Lake Tahoe Area, 2003–2012 Detailed Visitor Impact Estimates, Executive Summary, (Dean Runyan Associates) September 2013
• North Lake Tahoe Marketing Performance Report, April 2013 – October 2013; November 2013–March 2014
• North Lake Tahoe Competitive Dynamics (SMG) 2013
• Tourism Business Improvement Districts (SMG) 2010
• Bay to Tahoe Basin Recreation and Tourism Travel Impact Study - Executive Summary (El Dorado County Transportation Commission) May 2014
• Lake Tahoe Basin Prosperity Plan – Executive Summary (Applied Development Economics) November 2010
• 2014 Intercept Research – Executive Summary (Rosal, Remen, Cares) October 2014
• Transit Vision (LSC, Inc.) 2013
• North Lake Tahoe - Truckee Bicycle and Trail Plan Executive Summary (Placer County Transportation Planning Agency PCTPA) October 2011
• The Economic Benefits of the North Lake Tahoe /Truckee Transit Vision, (Economic & Planning Systems, Inc.) November 2014
APPENDIX%B | Background Info
• North Lake Tahoe Resort Association (NLTRA) Strategic Goals - 2011–2016
• NLTRA Organization Flow Chart - 2014
• NLTRA Capital Investment and Transportation 5 year Work Plan - 2014
TABLE OF CONTENTS
2015 TOURISM MASTER PLAN TASK FORCEWALTER!AUERBACH Auerbach Engineering Corporation
GARY!DAVIS Gary Davis Group
JOY!DOYLE North Tahoe Business Association
PHIL!GILANFARR CB’s Pizza & Grill
KALIOPE!KOPLEY Uncorked/Soupa/Petra
CADENCE!MATIJEVICH Placer County, Executive Office
JENNIFER!MERCHANT Placer County, Executive Office
ALEX!MOURELATOS Mourelatos Lakeshore Resort
RON!PARSON Granlibakken Management Company
PLACER COUNTY BOARD OF SUPERVISORSJACK!DURAN | District 1
ROBERT!WEYGANDT | District 2
JIM!HOLMES | District 3
KIRK!UHLER | District 4
JENNIFER!MONTGOMERY | District 5NLTRA PROJECT STAFFSANDY!EVANS!HALL CEO
MARC!SABELLA Director of Finance and Human Resources
JOHN!THOMPSON Tourism Director
RON!TREABESS Director of Partnerships and Planning
The following individuals and organizations helped develop the 2015 North Tahoe Tourism Master Plan.
NLTRA BOARD OF DIRECTORSWALTER!AUERBACH Auerbach Engineering Corporation
SUE!BUSBY Castle Peak Property Management
PHIL!GILANFARR CB’s Pizza & Grill
KALIOPE!KOPLEY Uncorked, Soupa, and Petra
TOM!LOTSHAW Tahoe Regional Planning Agency
BRENDAN!MADIGAN Alpenglow Sports
JOSEPH!MATTIOLI The Ritz-Carlton Lake Tahoe
JENNIFER!MERCHANT Placer County Executive Office
VALLI!MURNANE Tahoe Cross Country
DAVID!TIRMAN JMA Ventures, LLC
BRETT!WILLIAMS Agate Bay Realty
ADAM!WILSON Northstar California Resort
CONSULTANT TEAMAGNEW$!BECK
DESIGN!WORKSHOP
FRESHTRACKS!
SDBX!STUDIO
ACKNOWLEDGEMENTS
master plan!|!!%
overall visitation concentrated on weekends and peak holiday periods.3 Studies suggest that at-tracting more domestic and international visitors can move the region toward more of a year-round destination rather than the current peak season/offseason cycle. Additionally, trends indicate that to compete at the national and international levels and attain the vision outlined in the 2015 Tourism Master Plan, the communities in North Lake Tahoe need to continue to invest in tourism and visitor experience infrastructure.
North Lake Tahoe relies on a tourism-driven economy and it will continue to do so for years to come. Annually, visitors spend over $500 million in North Lake Tahoe. Over 60% of employment and 51% of all earnings can be attributed to tour-ism.3 Lake Tahoe is central to the area’s economy, and the health of the economy depends on a thriving local community and providing visitors a world-class experience.
The 2015 North Lake Tahoe Tourism Master Plan (2015 Tourism Master Plan) lays out a framework of tourism investment strategies that can work in concert to continue to transform North Lake Tahoe into a national and international destina-tion.
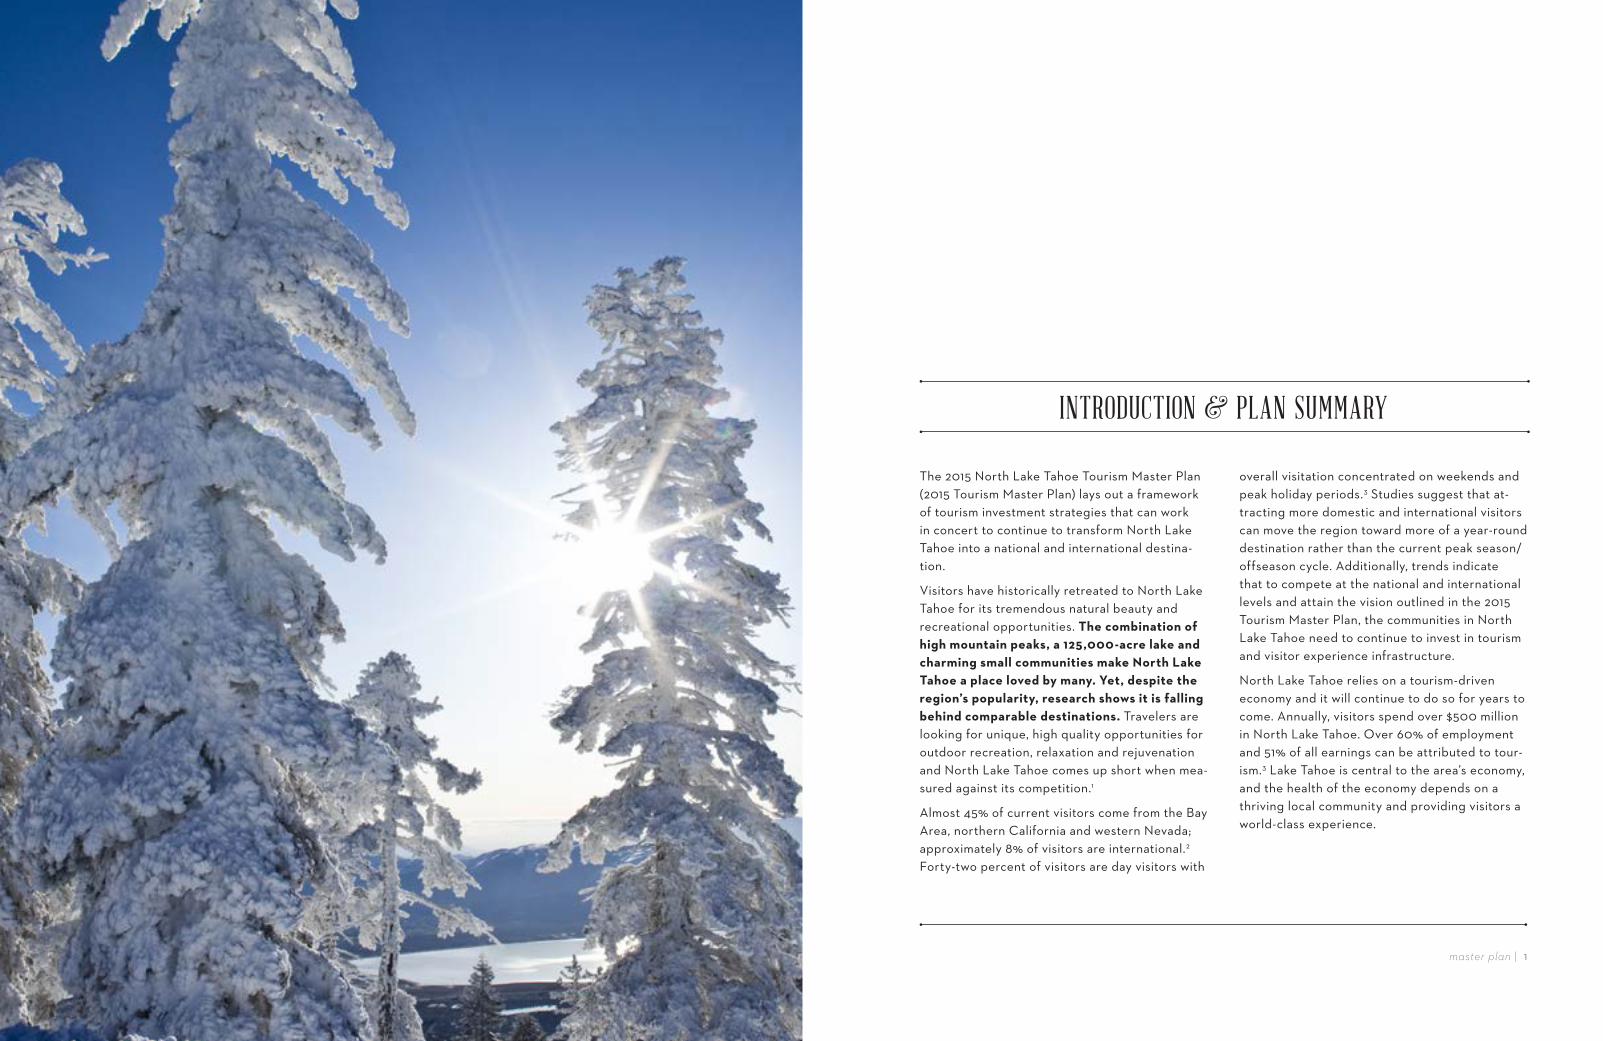
Visitors have historically retreated to North Lake Tahoe for its tremendous natural beauty and recreational opportunities. The combination of high mountain peaks, a 125,000-acre lake and charming small communities make North Lake Tahoe a place loved by many. Yet, despite the region’s popularity, research shows it is falling behind comparable destinations. Travelers are looking for unique, high quality opportunities for outdoor recreation, relaxation and rejuvenation and North Lake Tahoe comes up short when mea-sured against its competition.1
Almost 45% of current visitors come from the Bay Area, northern California and western Nevada; approximately 8% of visitors are international.2 Forty-two percent of visitors are day visitors with
INTRODUCTION & PLAN SUMMARY
master plan!!|!!&'!!|!master plan
The 1995 North Lake Tahoe Tourism Development Master Plan was North Lake Tahoe’s first tourism master plan. Placer County funded the initial 1995 plan because of static economic conditions, low visitor numbers and rising visitor expecta-tions. In 2004 the North Lake Tahoe Tourism and Community Investment Master Plan was devel-oped to update the 1995 plan in response to the changing tourism industry. The 2015 North Lake Tahoe Tourism Master Plan serves as the second update of the original 1995 plan.
The purpose of the 2015 Tourism Master Plan is to provide a roadmap for Transient Occupancy Tax (TOT) investment within North Lake Tahoe in order to improve the tourism experience. The plan defines the area’s long-term tourism vision and identifies goals, objectives and potential funding opportunities that the North Lake Tahoe Resort Association (NLTRA) can use to recom-mend policy and decision making over the next eight years.
Specifically, the 2015 Tourism Master Plan aims to:
Provide guidance for future tourism investment strategies in North Lake Tahoe based on the best available current market data and tourism industry trends.
•( &'()*+, implementation strategies and actions to assist Placer County, North Lake Tahoe, partner agencies and NLTRA in aligning visions and attaining common goals.
•( -)*.+ with other plans currently in place that are working to strengthen the tourism econo-my in North Lake Tahoe.
•( *+/&01&0-(, robust public outreach into the planning process to define investment priori-ties over the next eight years.
•( /&+(*+', to transform North Lake Tahoe into a national and international recreation destination.
ROLE%OF%THE%NORTH%LAKE%TAHOE% RESORT%ASSOCIATION
NLTRA serves as a principal advisor to Placer County to guide a tourism investment strategy that builds on North Lake Tahoe’s strengths, capitalizes on the spectacular natural environment and supports environmental stewardship of Lake Tahoe and the area’s vital communities. Having a strong, healthy, thriving workforce is also critical to the economy, and tourism works to support in-frastructure that promotes strong communities. At its core, NLTRA’s mission is to promote North Lake Tahoe as a domestic and international tourism destination by supporting business efforts that enhance the economic, environmental and cultural climate of the area.
Planning and development of the 2015 Tourism Master Plan occurred over the past three years. Research and analysis was conducted and perti-nent planning documents and previous plans were reviewed. Visitor surveys were completed during 2012 and 2014 to better understand who the North Lake Tahoe visitor is, where they are from and what activities they enjoy. An analysis of the travel industry’s economic significance to North Lake Tahoe provided data on travel spending and the economic contributions of various visitor types. Research of comparable summer and winter des-tinations identified current trends and revealed North Lake Tahoe’s strengths and weaknesses in relationship to the comparable set. Additional tourism and economic studies were reviewed to understand international, national and regional tourism and economic trends and their importance for North Lake Tahoe.
The 2015 Tourism Master Plan Task Force included community leaders and Placer County represen-tation. They assisted in the document’s develop-ment and review. Their review of the research and
METHODOLOGY!#!PROCESS
PURPOSE!OF!THE!PLAN
master plan!!|!!)*!!|!!master plan
analysis coupled with their real-world experience resulted in the creation of draft goals and objec-tives that were vetted and improved through a robust public input process.
During the spring and summer of 2015 a series of public workshops were held around the North Shore to share the 2015 Tourism Master Plan’s vision and gather a wide range of ideas on the strategic focus areas. These ideas were then used to create a public survey to gather feedback on priorities. An interactive website provided easy-to-access information and offered another avenue for public feedback.
The ideas and feedback shared throughout the four month outreach process were used to refine the draft goals and pointed to key priorities that will be used to direct investment of TOT funds over the next eight years. Upon approval by the Placer County Board of Supervisors the 2015 Tourism Master Plan will serve as a guide for long-term tourism investments in North Lake Tahoe’s communities.
Achieving the 2015 Tourism Master Plan’s vision requires more than what the NLTRA or Placer
County can accomplish individually. NLTRA and Placer County may not be the project lead for all of the goals and objectives but may serve as advocates. As the action plan moves forward, the appropriate lead agency or organization may develop or identify additional strategies, detailed implementation plans and funding sources to achieve each objective and realize the vision.
Tourism is North Lake Tahoe’s primary economic driver and growing the area’s tourism economy is critical in order to help keep and attract full-time residents. North Lake Tahoe’s 1995 and 2004 tourism master plans addressed five key areas to enhance the area’s tourism industry: visitor activ-ities + facilities, transportation, marketing + sales, visitor information and resource development. Through the collaboration of many partners, a number of accomplishments have been made in these five areas to move North Lake Tahoe toward providing an improved visitor experience. For example, the Kings Beach Commercial Core Improvement Project is transforming that com-munity’s town center into a more walkable, at-tractive destination. Bike trails in Tahoe City now provide a lakeside experience and improvements occurred for public parks and lakeshore facilities. On the transportation side, enhancements were made by adding nonstop flights that now connect the Reno-Tahoe International Airport to New York and Mexico.
MARKET%AND%FUNDING%CONDITIONS
Since 2004, North Lake Tahoe has strengthened its brand recognition as a destination for out-door recreation and human powered sports, and a number of events such as Ironman and Tough Mudder were recruited to North Lake Tahoe. Vis-itor information improved with the expansion of
the Tahoe City Visitor Center; completion of the Wayfinding Plan, Wayfinding Design Guidelines Manual and Location Master Plan; and creation of the Official Visitor Guide. Resources to im-plement tourism enhancements were sustained with North Lake Tahoe’s 2012 vote to renew the 2% TOT collected specifically in eastern Placer County. Additionally, annual revenues from TOT increased 35% from 2008 to 2015.
The 2015 Tourism Master Plan builds upon these successes and refines North Lake Tahoe’s tourism goals and objectives in order to respond to current trends and meet the target visitor’s changing needs and expectations. A review of comparable destinations revealed that destina-tions are looking for ways to distinguish them-selves from competitors through niche markets. In other words, North Lake Tahoe is not simply a tourist destination. It is a destination for out-door recreation enthusiasts who are seeking experiences in a beautiful natural environment. Therefore, engaging target visitor segments with carefully calibrated messages and providing a variety of authentic attractions is important for North Lake Tahoe.
North Lake Tahoe’s brand position as a destina-tion for outdoor recreation and human powered sports is supported by surveys showing recre-ation as a primary driver of North Lake Tahoe visitor activities. Additionally, during the Great Recession the outdoor recreation market contin-ued to grow even while other sectors contracted and that growth remains today. Facility improve-ments, such as a fully connected trail system, can support the types of recreation activities visitors desire.
Nationwide trends indicate that visitors have increased expectations for lodging and are more critical of aging infrastructure. This demand for new or redeveloped lodging is evident in North Lake Tahoe where newly developed accommo-
dations available in the mountain areas of Squaw Valley and Northstar generate almost $2 million more TOT than the older lodging available at Lake Tahoe. Additionally, North Lake Tahoe has a limited supply of midrange, branded hotels, which puts the destination at a disadvantage against comparable destinations.
Dean Runyan’s economic study estimates that although almost 42% of North Lake Tahoe’s visi-tors are day visitors they only account for 11% of total visitor spending. The domestic and interna-tional visitor segment tends to stay longer, has a greater economic impact and typically arrives by air. These findings suggest the need to grow North Lake Tahoe as an overnight destination and increase air service capacity.
A study of comparable destinations reveals that high quality transit service has become a key element of the destination resort experience. The transit services available at other compara-ble destinations provide a substantially greater level of service which allows for higher levels of ridership. The importance of a convenient, clear and easy to navigate transportation system is growing. Increasingly, resort visitors expect to easily walk, bike or take transit to attractions and destinations.
PLAN!SUMMARY
master plan!!|!!+,!!|!!master plan
The demand for consumer-friendly technology that provides easy, on-site control of travel plan-ning and booking continues to grow. Social media has become a major channel of communication in the tourism industry. As consumers look more and more toward word-of-mouth recommenda-tions, this communication method has become ingrained in the travel industry tool kit and North Lake Tahoe must adapt its messaging and visitor information to be easily accessible in a world of ever-changing technology.
Funding to support tourism infrastructure im-provements and marketing efforts is continually challenging. Although the economy is recovering from the Great Recession, private sector invest-ments have not returned to pre-recession levels. There is an increased dependency on TOT to fund tourism infrastructure improvements and the growth of the existing TOT is not keeping pace with the increasing demand. Alternative funding sources, such as Tourism Business Improvement Districts, are being developed by many comparable destinations. This and other funding opportunities may need to be evaluated for North Lake Tahoe.
!"#$%MASTER%PLAN%VISION%STATEMENT
North Lake Tahoe is known as the premier inter-national mountain resort destination of the West. Visitors and residents alike enjoy Lake Tahoe’s iconic natural environment, exceptional built ame-nities, and diverse and world-class experiences.
!"#$%MASTER%PLAN%GOALS
Based on the review of current market and fund-ing conditions and public input, the 2015 Tour-ism Master Plan identifies five goals, one within each focus area, to build the tourism economy of North Lake Tahoe and position the region to achieve the vision of the plan.
Focus Area: 2*3*(&04-/(*2*(*,34546-/*)*(*,3
Goal: Create, maintain and support great ameni-ties, fun things to do and quality places to stay so target audiences want to come here from around the nation and the world.
Focus Area: (0-+31&0(-(*&+
Goal: Get people where they want and need to go while reducing congestion and dependency on the private automobile through development and promotion of a multimodal transportation network.
Focus Area: 7-08,(*+.4-+943-),3
Goal: Bring more visitors to North Lake Tahoe who stay longer, return often and travel during the off-peak periods, while maintaining affinity with the northern California/Bay Area consumer and continuing to expand group business.
Focus Area: 2*3*(&04*+6&07-(*&+
Goal: Enhance the visitor experience by connect-ing guests to North Lake Tahoe’s many excep-tional places, businesses and adventures.
Focus Area: 0,3&'0/,49,2,)&17,+(
Goal: Compete nationally and internationally by increasing, leveraging and/or reprioritizing re-sources for tourism development and destination marketing.
PRIORITIES%IDENTIFIED%THROUGH%THE% PUBLIC%PROCESS
Through a four-month public outreach process the public identified their top priorities for the 2015 Tourism Master Plan, as described below:
• 2*3*(&046-/*)*(*,3: Complete, expand and maintain all trail systems (i.e., bikes, pedestri-ans, cross-country ski). Add user amenities to trail systems such as restrooms, water foun-
master plan!!|!!-.!!|!!master plan
tains and bike fix-it stations. Incorporate trail signage and link trails to public transportation. Complete the gaps in existing cross-country and mountain bike trail systems.
• (0-+31&0(-(*&+: Implement the Transit Vision to provide year-round, frequent (every 30 minutes) and free buses from 6 a.m. – 2 a.m. between North Tahoe, Squaw Valley, Northstar, Kings Beach, Truckee and Crystal Bay/Incline Village.
• 2*3*(&04*+6&07-(*&+: Implement highly user-friendly visitor guide technology that is accessible on a variety of devices. This may include: website upgrades, development of mo-bile applications (apps), local business training, integration with social media and increased use of established visitor information tools.
IMPLEMENTATION
The 2015 Tourism Master Plan presents an action plan to achieve the priorities identified by the public and confirmed by the Master Plan Task Force and appropriate NLTRA committees. Tier 1 priorities received substantially more support during the public outreach process and were subsequently confirmed by as being the highest priority. Tier 2 priorities include those objectives receiving the next highest level of public sup-
port. This two tiered system will guide recom-mendations for allocating limited TOT funds.
Partnerships must be developed and funding secured in order to achieve the 2015 Tourism Master Plan’s goals and objectives. Therefore the Action Plan Matrix, found in Chapter 5, identi-fies the lead and partnering agencies/organiza-tions, estimated total costs, potential additional funding sources and short-term and long-term objectives. Through implementation of the action plan North Lake Tahoe will take a substantial step toward becoming the premier international mountain resort destination of the West.
RELATIONSHIP%TO%OTHER%PLANS%
The 2015 Tourism Master Plan aims to coordinate with and support existing plans and processes already working to improve the region’s tourism industry and visitor infrastructure. For example, regulatory changes associated with the 2012 revised and updated Tahoe Regional Planning Agency (TRPA) Regional Plan (Regional Plan) and Placer County’s June 2015 Public Review Draft Tahoe Basin Area Plan (Area Plan) establish the platform to make necessary environmen-tal threshold gains while also improving aging infrastructure. NLTRA must continue to support Placer County’s efforts to streamline permitting processes and advocate for a collaboration of agencies and departments to assist projects that are consistent with the principles of environmen-tal redevelopment.
No one entity can restore, revitalize and refresh North Lake Tahoe. But through a collaborative approach progress can be achieved. The 2015 Tourism Master Plan acknowledges the impor-tance of other planning efforts and looks to those plans for guidance and synergy. The Action Plan Matrix located in Chapter 5 illustrates how this document’s goals and objectives align with potential partnering agencies and funding op-portunities.
The 2015 Tourism Master Plan is coordinated with the following plans:
• (01-40,.*&+-)41)-+:4The TRPA is a bi-state planning and regulatory agency responsible for land use and environmental protection in Lake Tahoe. The revised Regional Plan pro-vides regulatory conformance throughout the Tahoe Basin; creates incentives connected to walkable, bikeable town centers; and removes development from sensitive lands for the pur-pose of increasing lake clarity. It also provides new incentives to invest in private properties, as well as, tools that allow for more compre-hensive management of land coverage as op-posed to a parcel-based approach. Another key component of the updated plan is the transfer of certain planning processes and permitting authority to the local jurisdictions. Funda-mental to implementing North Lake Tahoe’s vision is the creation of a more predictable and consistent regulatory process. The Regional Plan establishes a mechanism to reduce reg-ulatory barriers, stimulate the redevelopment of aged buildings and implement environmen-tal improvements. The updated plan offers a launching point to improve visitor experience in North Lake Tahoe.
• 1)-/,04/&'+(;4(-<&,4=-3*+4-0,-41)-+: In con-
junction with the approved Regional Plan, the region’s governmental agencies are close to completing their respective Area Plans. Placer County has four sub-areas within the Tahoe Basin, two of which include the town centers of Tahoe City and Kings Beach. The Area Plan will be the primary land management tool for the area and is necessary to employ the incentives identified in the Regional Plan.
• 1)-/,04/&'+(;4.,+,0-)41)-+: The General Plan is a countywide policy document that provides an overall framework for the develop-ment of land in Placer County and for protec-tion of the natural and cultural resources of the county.
• 1/(1-4+&0(<4)-8,4(-<&,/(0'/8,,4=*/;/),4-+94(0-*)41)-+: This document, developed by the Placer County Transportation Planning Agency (PCTPA), provides a master plan for locating trail systems in North Lake Tahoe and Truckee. Implementation of the plan can help establish the region as a world class cycling destination with a system of paths, trails and pedestrian facilities that visitors seek to com-plement their healthy outdoor lifestyles and environmental values.
• (71&40,.*&+-)4(0-+3*(41)-+4–47&=*)*(;4>?@A:4The Tahoe Metropolitan Planning Organization (TMPO) Mobility Plan identifies the coordi-nation of transportation elements to allow seamless transit connection within the Tahoe Basin. Transportation goals of the 2015 Tourism Master Plan should be aligned with the Mobil-ity Plan to access funding sources and create project partners to implement improvements.
• (-<&,410&31,0*(;4/,+(,04)-8,4(-<&,4=-3*+410&31,0*(;41)-+:4The Prosperity Plan iden-tifies business clusters and opportunities for future economic development, which include tourism, health and wellness, and environ-
master plan!!|!!%%%/!!|!!master plan
mental innovation. One primary outcome was the formation of the Tahoe Prosperity Center which North Lake Tahoe can leverage for sup-port to improve tourism and visitor services.
• (01-4(-<&,43'3(-*+-=*)*(;4-/(*&+41)-+: This program is part of TRPA’s implementation of the Regional Plan’s Sustainable Communities Strategy and sets achievable strategies for citizens, businesses and local governments that will lead to regional sustainability. Desired outcomes include greenhouse gas reduction through transportation and transit strategies, increased walking and biking, and business retention and expansion.
• +&0(<4)-8,4(-<&,40,3&0(4(0*-+.),4(0-+3*(42*3*&+: The Transit Vision has been developed by the Truckee North Tahoe Transportation Management Association to provide fre-quent and free transit access along the major roadways of North Lake Tahoe and Truckee. Planned transit improvements include year-round night service past 6 p.m. and 30-minute service for the entire resort triangle from North Lake Tahoe to Truckee. Benefits include improved mobility, enhanced economic vitality, reduced congestion, improved air quality and increased attractiveness for destination stays.
• +&0(<4)-8,4(-<&,4/&77'+*(;4B-;6*+9*+.43*.-+-.,49,3*.+43(-+9-09347-+'-): The manual sets forth guidelines for community wayfinding signage that improves the visitor (and resident) “wayfinding” experience. It includes a sche-matic concept for signage design that can be adapted to local features. Community wayfin-ding signage enhances the visitor experience by improving ease of navigation around the region. Visitors are likely to become more com-fortable driving, biking or walking around an unfamiliar area when properly guided.
North Lake Tahoe is located in the Sierra Nevada
-!!|!!executive summary
master plan!|!!%&%'!!|!!master plan
Mountain Range in eastern Placer County. The area has magnificent natural beauty highlighted by 191 square miles of Lake Tahoe’s crystal clear waters and surrounding mountain peaks, some reaching nearly 9,000 feet in elevation. While the area is home to some 14,500-15,000 full time residents, it is within a four-hour drive of approx-
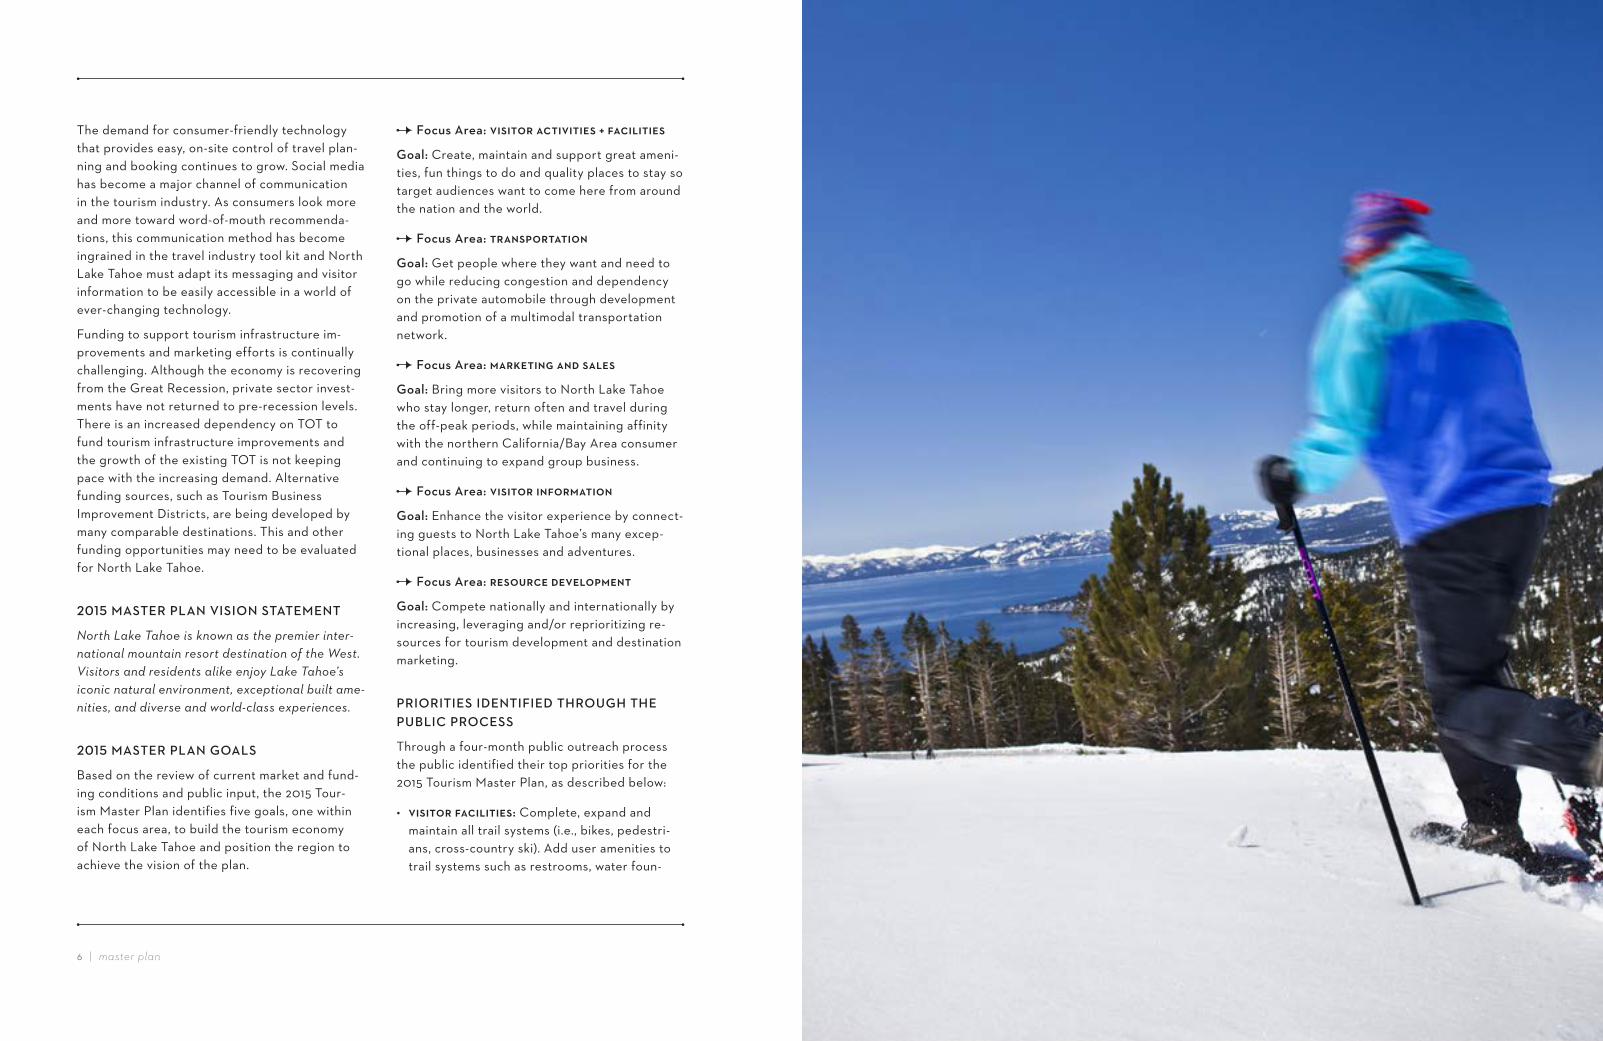
imately 13.4 million people.4 The area hosts an ideal year-round climate with average summer highs of 75 degrees and winter lows of 20 de-grees. Three hundred and twelve days of sun-shine and average winter snowfalls of 409 inches combine to provide ideal weather for enjoying the area’s many outdoor activities.
LOCAL%POPULATION
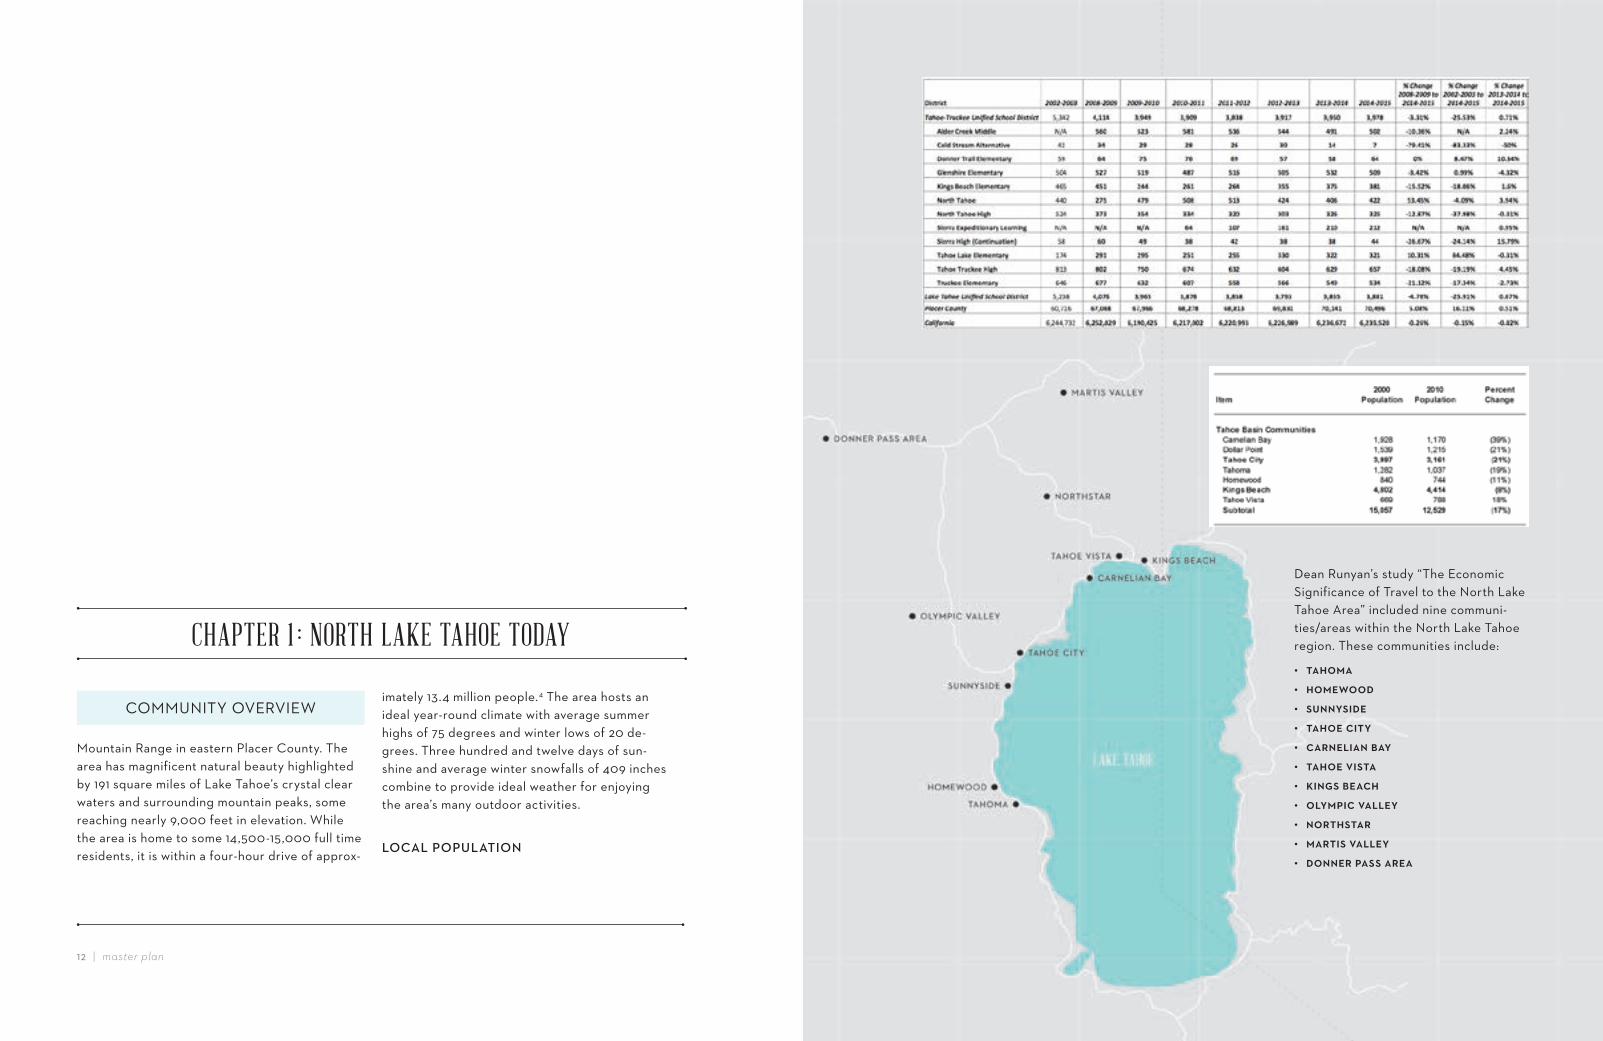
Dean Runyan’s study “The Economic Significance of Travel to the North Lake Tahoe Area” included nine communi-ties/areas within the North Lake Tahoe region. These communities include:
• (-<&7-• <&7,B&&9• 3'++;3*9,• (-<&,4/*(;• /-0+,)*-+4=-;• (-<&,42*3(-• 8*+.34=,-/<• &);71*/42-)),;• +&0(<3(-0• 7-0(*342-)),;• 9&++,041-334-0,-
CHAPTER 1 : NORTH LAKE TAHOE TODAY
COMMUNITY!OVERVIEW
master plan!!|!!%)%*!!|!!master plan
The permanent population base in North Lake Tahoe declined by 17% between 2000 and 2010.5 From the 2002/2003 to 2014/2015 school years North Lake Tahoe Truckee K-12 school enrollment declined from 5,342 to 3,978.6 However, there are recent indicators of slow growth in the region. All but five Tahoe-Truckee Unified Schools had an increase in 2015 enrollment from 2014 and their 2015/2016 enrollment again increased to 4,030 students. Similar to other regional districts such as the Lake Tahoe Unified School District in South Lake Tahoe, Tahoe-Truckee Unified School District’s enrollment has been steady over the last five years6
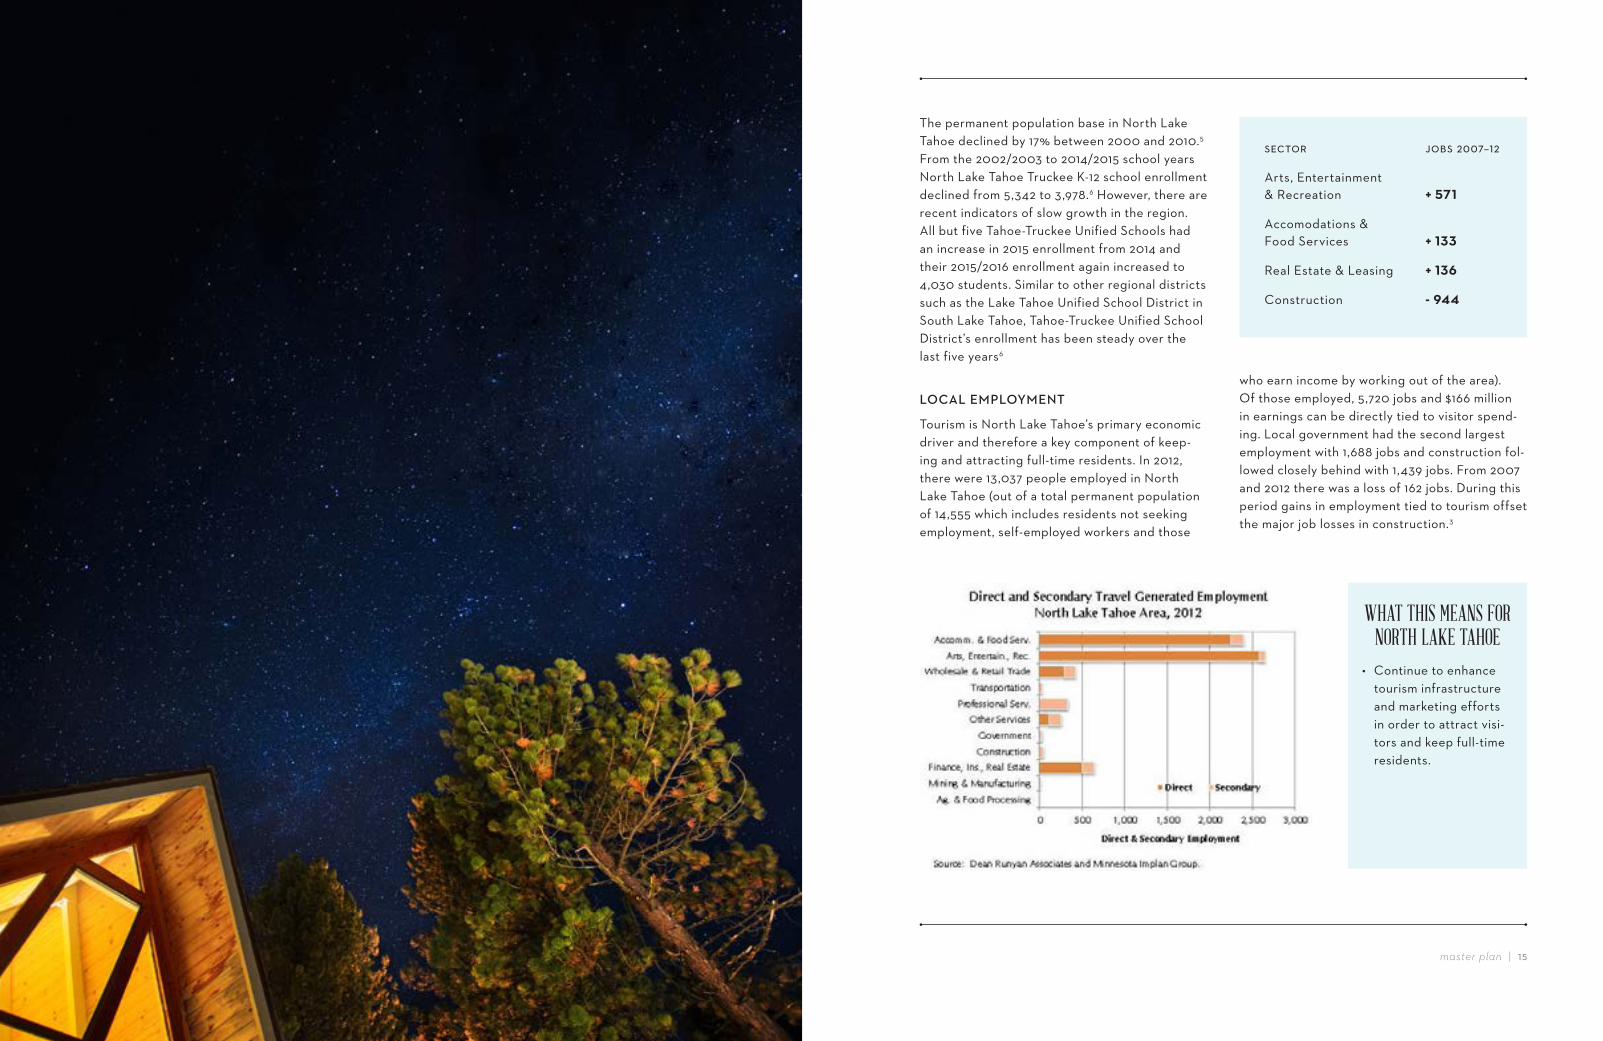
LOCAL%EMPLOYMENT%
Tourism is North Lake Tahoe’s primary economic driver and therefore a key component of keep-ing and attracting full-time residents. In 2012, there were 13,037 people employed in North Lake Tahoe (out of a total permanent population of 14,555 which includes residents not seeking employment, self-employed workers and those
WHAT THIS MEANS FOR NORTH LAKE TAHOE
• Continue to enhance tourism infrastructure and marketing efforts in order to attract visi-tors and keep full-time residents.
who earn income by working out of the area). Of those employed, 5,720 jobs and $166 million in earnings can be directly tied to visitor spend-ing. Local government had the second largest employment with 1,688 jobs and construction fol-lowed closely behind with 1,439 jobs. From 2007 and 2012 there was a loss of 162 jobs. During this period gains in employment tied to tourism offset the major job losses in construction.3
012345 6470('//+–%'
Arts, Entertainment & Recreation !"#$%
Accomodations & Food Services !"%&&
Real Estate & Leasing !"%&'
Construction (")**
master plan!!|!!%+%,!!|!!master plan
such as the Lakeside Trail, bus shelters, Tran-sit Center and Tahoe Vista Recreation Area enhancements.
• Pilot programs for snow removal from trails occurred in Squaw Valley and Tahoe City from the Wye to the transit center.
• An Area Plan is underway for North Tahoe, Tahoe City, Kings Beach and the West Shore, as well as master planning for Homewood Mountain Resort, Squaw Valley and Northstar.
• Kings Beach Commercial Core Improvement Project is transforming the four-lane highway into a three-lane multimodal corridor with bike lanes, sidewalks, intersection improvements, corridor beautification, public parking, public bus shelters and traffic calming measures.
• Bike trails have been built on the West Shore, Midway Bridge to Squaw Valley, and Tahoe City and trails are being built on the North Shore, Northstar/Martis Valley and along the Truckee River.
• Improvements occurred for public parks and the lakeshore facilities such as Squaw Valley Community Park, Heritage Plaza and Tahoe Vista Recreation Area.
• Public infrastructure improvements were constructed as part of the Kings Beach Com-mercial Core Improvement Project, the Tahoe Maritime Museum and the Historic Fish Hatch-ery Interpretive Center.
• The boat ramp facility in Lake Forest was rede-veloped and expanded
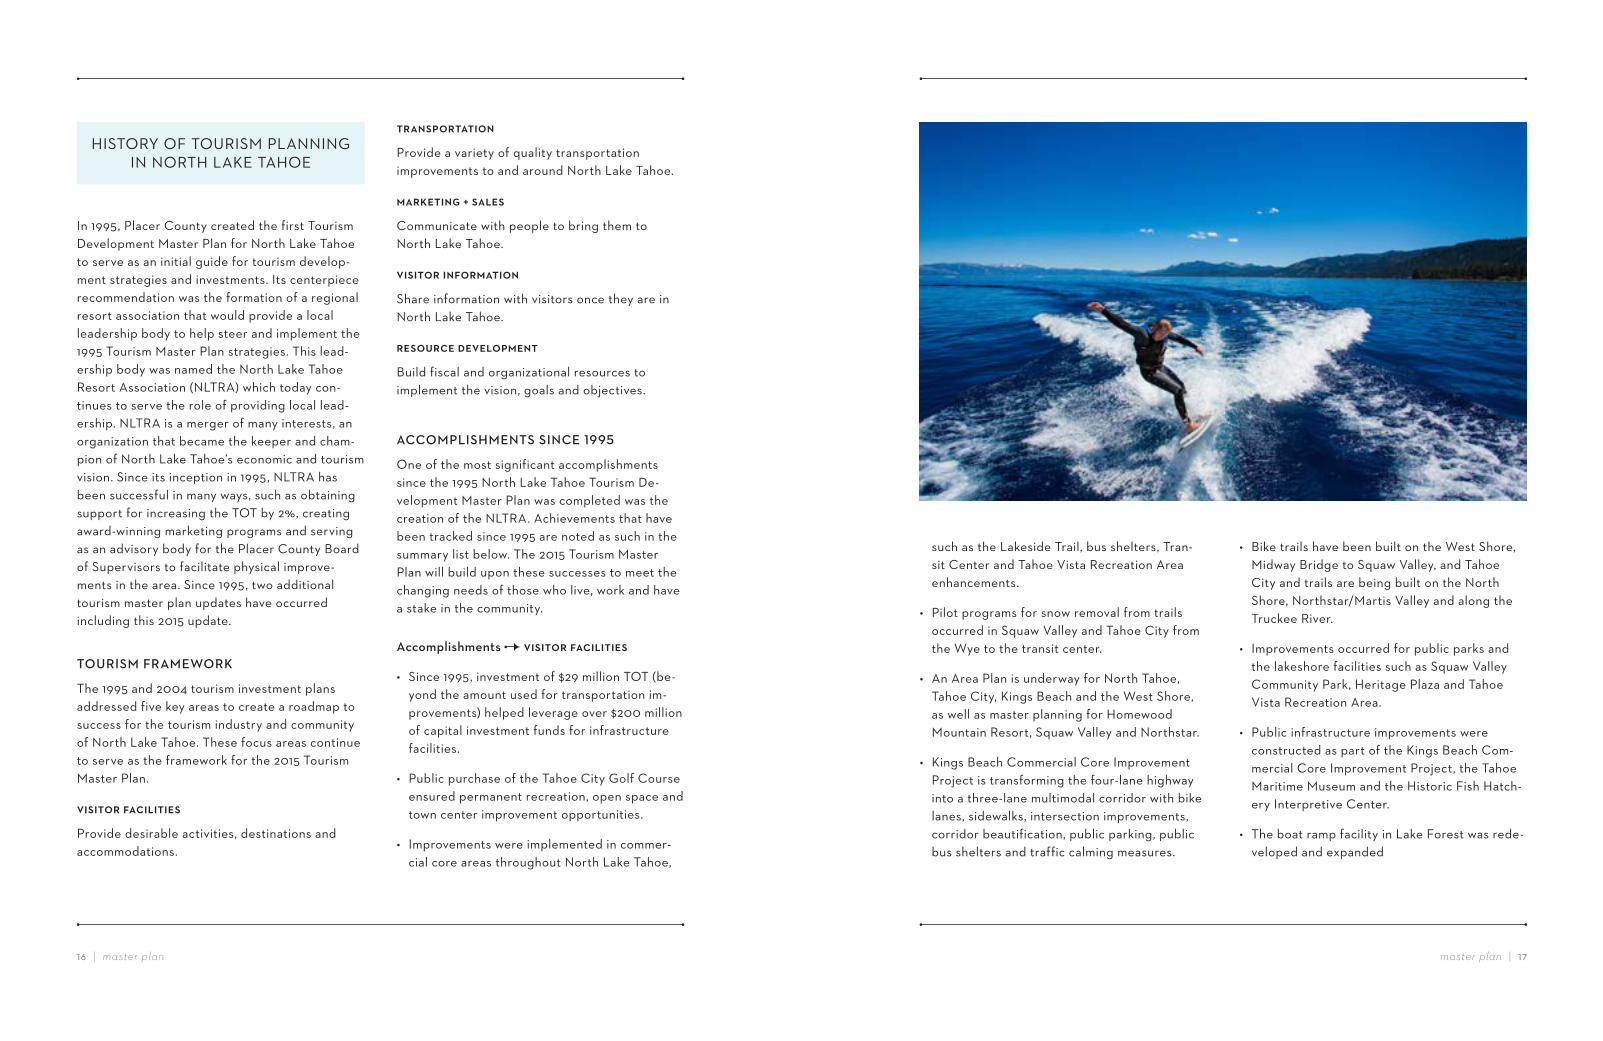
In 1995, Placer County created the first Tourism Development Master Plan for North Lake Tahoe to serve as an initial guide for tourism develop-ment strategies and investments. Its centerpiece recommendation was the formation of a regional resort association that would provide a local leadership body to help steer and implement the 1995 Tourism Master Plan strategies. This lead-ership body was named the North Lake Tahoe Resort Association (NLTRA) which today con-tinues to serve the role of providing local lead-ership. NLTRA is a merger of many interests, an organization that became the keeper and cham-pion of North Lake Tahoe’s economic and tourism vision. Since its inception in 1995, NLTRA has been successful in many ways, such as obtaining support for increasing the TOT by 2%, creating award-winning marketing programs and serving as an advisory body for the Placer County Board of Supervisors to facilitate physical improve-ments in the area. Since 1995, two additional tourism master plan updates have occurred including this 2015 update.
TOURISM%FRAMEWORK%
The 1995 and 2004 tourism investment plans addressed five key areas to create a roadmap to success for the tourism industry and community of North Lake Tahoe. These focus areas continue to serve as the framework for the 2015 Tourism Master Plan.
2*3*(&046-/*)*(*,3
Provide desirable activities, destinations and accommodations.
(0-+31&0(-(*&+4
Provide a variety of quality transportation improvements to and around North Lake Tahoe.
7-08,(*+.4543-),3
Communicate with people to bring them to North Lake Tahoe.
2*3*(&04*+6&07-(*&+
Share information with visitors once they are in North Lake Tahoe.
0,3&'0/,49,2,)&17,+(
Build fiscal and organizational resources to implement the vision, goals and objectives.
ACCOMPLISHMENTS%SINCE%#CC$
One of the most significant accomplishments since the 1995 North Lake Tahoe Tourism De-velopment Master Plan was completed was the creation of the NLTRA. Achievements that have been tracked since 1995 are noted as such in the summary list below. The 2015 Tourism Master Plan will build upon these successes to meet the changing needs of those who live, work and have a stake in the community.
Accomplishments 2*3*(&046-/*)*(*,34
• Since 1995, investment of $29 million TOT (be-yond the amount used for transportation im-provements) helped leverage over $200 million of capital investment funds for infrastructure facilities.
• Public purchase of the Tahoe City Golf Course ensured permanent recreation, open space and town center improvement opportunities.
• Improvements were implemented in commer-cial core areas throughout North Lake Tahoe,
HISTORY!OF!TOURISM!PLANNING! IN!NORTH!LAKE!TAHOE
master plan!!|!!%-%.!!|!!master plan
Accomplishments 0,3&'0/,49,2,)&17,+(4
• North Lake Tahoe has twice voted to renew the 2% TOT collected specifically in eastern Placer County to help improve visitor facilities (2002 and 2012).
• TOT revenue increased 35% from 2008 to 2015.
• NLTRA and Incline Village Crystal Bay Visi-tors Bureau formed a marketing cooperative to leverage marketing funds and promote the North Lake Tahoe region as a single vacation destination.
• Partnerships and structural relationships accessed $25 million in funds from the Federal Lands Access Program for the SR 89/Fanny Bridge Community Revitalization Project and TOT dollars were leveraged 1:8 for each dollar spent of agency, local, state and federal funds.
Accomplishments (0-+31&0(-(*&+
• Over 55% of the North Lake Tahoe-Truckee Bicycle and Trail Plan is complete—providing 23 miles of Class I paths since 1995.
• More than $21 million of the 2% TOT funding has been used to improve transportation ser-vices and facilities since 1995.
• Transportation enhancements to the basic Tahoe Area Regional Transit (TART) system have been initiated; including free skier shuttle, nightrider and airport shuttle services; summer 30-minute headways; and year-round hourly service to and from Truckee on Hwy 267.
• Transportation infrastructure improvements have occurred, including the Tahoe City Transit Center, new bus shelters, natural gas buses, new branding for transit vehicles and programs, pedestrian safety crossings on highways, radar speed advisory signage and additional parking improvements.
• The North Shore Parking Needs Assessment Study has been completed to inform an update of area parking requirements, parking design standards and an assessment of public parking financing and implementation strategies.
• Local, state and federal agencies are work-
ing together to realign SR 89 in Tahoe City to provide more pedestrian and bicycle paths while restoring Fanny Bridge, an 84-year old historic landmark.
• Long range transit visioning and planning with partners is underway to provide a high quality visitor experience with less reliance on private automobiles.
• Jet Blue Airlines is offering a nonstop flight from New York and the Reno Airport has also added nonstop service from Guadalajara, Mexi-co on Volaris Airlines.
• A consortium of regional business entities is continuing to work to increase air access through the recently established Reno-Tahoe Regional Air Service Corporation (RASC).
Accomplishments 7-08,(*+.4543-),34
• A Special Events policy was developed to iden-tify and attract large spectator or participatory events targeted for specific periods of the year.
• The North Lake Tahoe brand position for out-door recreation and human powered sports was developed.
• Human powered sport events, including Iron-man, Ironman 70.3, USA Cycling, Lacrosse Summit, Triple Crown Sports, Tough Mudder, Ta-Hoe Nalu and more were recruited to North Lake Tahoe.
• Since 2009 over $350,000 in grants was contributed to community events and over $1,000,000 has been spent in marketing dollars for event sponsorships.
• Investments in the Human Power Sports Initia-tive and related tourism amenities were made, such as paddleboard and kayak racks and bike trail signage.
• Out-of-market and in-market consumer mes-saging were aligned with the Touch the Lake, Peak Your Adventure and High Notes in-market campaigns.
• Programs to position North Lake Tahoe as a premier Nordic center were developed, such as a Nordic multi-area ski pass, advertising in Nordic publications, Nordic events and trail signage.
Accomplishments 2*3*(&04*+6&07-(*&+4
• The Wayfinding Plan was established with a goal of 50 signs installed by 2016, and a Way-finding Design Guidelines Manual and Location Master Plan were developed.
• The Tahoe City Visitor Center expansion was completed which added visitor and business services such as sponsorship opportunities, concierge services, local event ticket sales, business/artists of the month and kiosks/dis-plays showcasing locally made and local artisan products for sale.
• NLTRA and California State Parks partnered to provide a tented kiosk at the Kings Beach State Recreation Area that increased visibility.
• A visitor information display was created in the Auburn and Truckee California Welcome Centers and the Tahoe Maritime Museum on the West Shore.
• Guest visitation at visitor centers increased by 238% from 2009/2010 to 2013/2014 and creat-ed over 185,000 local business recommenda-tions through visitor interactions.
• The Official Visitor Guide was created and placed in almost all lodging properties and visitor centers in North Lake Tahoe, Truckee and Auburn.
master plan!!|!!'%'/!!|!!master plan
INTERNATIONAL!#!NATIONALThe world has seen many changes in the past 11 years. Since 2004, a major global economic downturn took place, oil prices skyrocketed, international conflicts continued, social media and the Internet boomed and awareness of cli-mate change increased. Specifically, events that impacted tourism included:
• The Great Recession affected discretionary spending habits.
• Facebook, YouTube, Twitter and other social media platforms were launched.
• Apple released the iPhone, promoting and dra-matically increasing smartphone usage.
• International tourism grew.
Growth of the global tourism industry outpaces the growth of the global gross domestic prod-uct (GDP) year after year. Globally, tourism is
anticipated to grow by 4.4% per year for the next 10 years in comparison to the overall global GDP that is anticipated to grow at 3.5%.7 Along with the growth, there has been a change in leisure travelers’ preferences and choices. According to Randall Travel Marketing, the national Top 10 Travel and Tourism Trends in 2014 were:8
• Three percent increase in profit across all industry sectors (airlines, hotels, etc.) Lodging rates are catching up from past decreases.
• New leisure consumer behavior: long term modest spending; greater demands for lodg-ing, experiences and value; and a willingness to forgo travel unless the price and offer is good.
• Business travel has returned to pre-recession levels. However, video conferencing, Skype, etc. continue to reduce the overall number of business trips and managers remain less likely to send people out to the field.
• Although travel for meetings has returned to prior levels in most sectors, government and academic sectors still lag behind. Meetings with a combination of in-person and video con-ferencing have increased.
CHAPTER 2: MARKET CONDITIONS
ECONOMIC!&!TOURISM!TRENDS
• Leisure travel continues positive growth, but with new behaviors. There is less per-person spending and travelers are more critical of aging infrastructure (hotels, etc.)
• Social media continues an accelerated growth trajectory – consumers tend to trust each other rather than marketers.
• Demand is high for consumer-friendly technol-ogy (websites, mobile apps, etc.) that provides easy on demand control over travel planning and booking.
• Overall cost increases and new user-fees are common for all travel related segments.
• Time poverty is more of a factor than ever and is now a major driver of decisions.
• Consumers are wiser, more resourceful and centered on value and quality of experience.
Recreation is a significant component of not only North Lake Tahoe’s tourism economy but also the national and international economy. The Outdoor Industry Foundation estimates outdoor recreation (including human powered sport events) contributes $646 billion annually to the U.S. economy. Between 2005 and 2011 this market segment grew approximately 5% annually while other sectors contracted.9 According to the Global Wellness Institute, the global health and wellness tourism market (including spas, health resorts, national and state parks, fitness centers, yoga studios and retreats, specialty restaurants and complementary medical centers) grossed $439 billion in 2014 and is expected to grow by 55% to $678.5 billion by 2017. Wellness tourists spend, on average, 130% more than the average tourist.10
Travel planning habits have shifted over the last several years, with social media and mobile devices being used more often. Travelers are moving from pre-planning to making reservations on-the-go with mobile bookings and using social media to determine where they will stay and what they will do. Additionally, tourists participating in human powered activities are planning for their trips by researching online and consulting friends and fam-ily. They are also recommending destinations by posting on social media sites. The percentage of adventure travelers using Facebook (78%) has more than doubled since 2010. 11
WHAT THIS MEANS FOR NORTH LAKE TAHOE
• Monitor changes in demographics and visitor expectations.
• Continue to encourage infrastructure investments (hotels, attractions and transportation and pedestrian facili-ties.)
• Invest in facilities that support recre-ation.
• Consider the traveler’s experience get-ting to and around North Lake Tahoe.
• Use and encourage the use of Web-based strategies and social media platforms.
• Provide and encourage the use of easily navigated websites and clear messaging for bookings and activity planning.
''!!|!!master plan
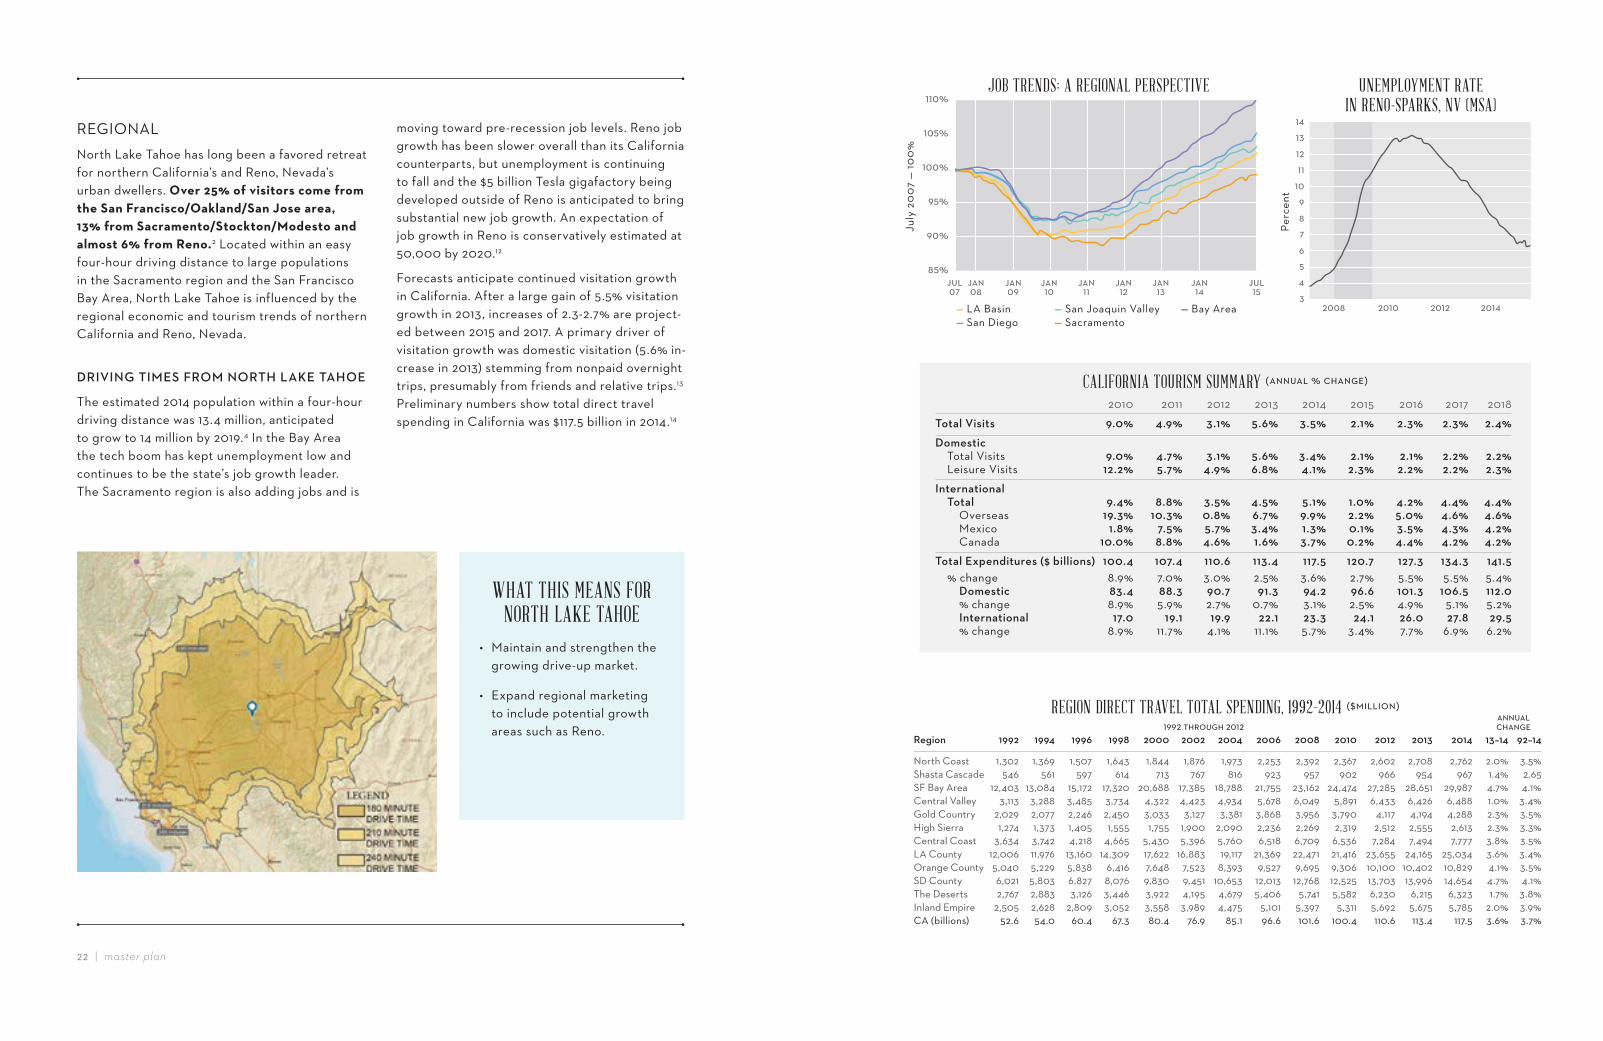
REGIONAL!North Lake Tahoe has long been a favored retreat for northern California’s and Reno, Nevada’s urban dwellers. Over 25% of visitors come from the San Francisco/Oakland/San Jose area, 13% from Sacramento/Stockton/Modesto and almost 6% from Reno.2 Located within an easy four-hour driving distance to large populations in the Sacramento region and the San Francisco Bay Area, North Lake Tahoe is influenced by the regional economic and tourism trends of northern California and Reno, Nevada.
DRIVING%TIMES%FROM%NORTH%LAKE%TAHOE
The estimated 2014 population within a four-hour driving distance was 13.4 million, anticipated to grow to 14 million by 2019.4 In the Bay Area the tech boom has kept unemployment low and continues to be the state’s job growth leader. The Sacramento region is also adding jobs and is
moving toward pre-recession job levels. Reno job growth has been slower overall than its California counterparts, but unemployment is continuing to fall and the $5 billion Tesla gigafactory being developed outside of Reno is anticipated to bring substantial new job growth. An expectation of job growth in Reno is conservatively estimated at 50,000 by 2020.12
Forecasts anticipate continued visitation growth in California. After a large gain of 5.5% visitation growth in 2013, increases of 2.3-2.7% are project-ed between 2015 and 2017. A primary driver of visitation growth was domestic visitation (5.6% in-crease in 2013) stemming from nonpaid overnight trips, presumably from friends and relative trips.13 Preliminary numbers show total direct travel spending in California was $117.5 billion in 2014.14
WHAT THIS MEANS FOR NORTH LAKE TAHOE
• Maintain and strengthen the growing drive-up market.
• Expand regional marketing to include potential growth areas such as Reno.
JOB TRENDS: A REGIONAL PERSPECTIVE
CALIFORNIA TOURISM SUMMARY 89::;9<(=(2>9:?1@
REGION DIRECT TRAVEL TOTAL SPENDING, 1992–2014 8ABC<<C4:@
UNEMPLOYMENT RATE IN RENO-SPARKS, NV (MSA)
— LA Basin — San Joaquin Valley — Bay Area — San Diego — Sacramento
July
20
07 —
100
%
Perc
ent
2010 2011 2012 2013 2014 2015 2016 2017 2018
Total Visits 9.0% 4.9% 3.1% 5.6% 3.5% 2.1% 2.3% 2.3% 2.4%Domestic Total Visits 9.0% 4.7% 3.1% 5.6% 3.4% 2.1% 2.1% 2.2% 2.2% Leisure Visits 12.2% 5.7% 4.9% 6.8% 4.1% 2.3% 2.2% 2.2% 2.3%International Total 9.4% 8.8% 3.5% 4.5% 5.1% 1.0% 4.2% 4.4% 4.4% Overseas 19.3% 10.3% 0.8% 6.7% 9.9% 2.2% 5.0% 4.6% 4.6% Mexico 1.8% 7.5% 5.7% 3.4% 1.3% 0.1% 3.5% 4.3% 4.2% Canada 10.0% 8.8% 4.6% 1.6% 3.7% 0.2% 4.4% 4.2% 4.2% Total Expenditures ($ billions) 100.4 107.4 110.6 113.4 117.5 120.7 127.3 134.3 141.5 % change 8.9% 7.0% 3.0% 2.5% 3.6% 2.7% 5.5% 5.5% 5.4% Domestic 83.4 88.3 90.7 91.3 94.2 96.6 101.3 106.5 112.0 % change 8.9% 5.9% 2.7% 0.7% 3.1% 2.5% 4.9% 5.1% 5.2% International 17.0 19.1 19.9 22.1 23.3 24.1 26.0 27.8 29.5 % change 8.9% 11.7% 4.1% 11.1% 5.7% 3.4% 7.7% 6.9% 6.2%
9::;9< %--'(3>54;?>('/%' 2>9:?1Region 1992 1994 1996 1998 2000 2002 2004 2006 2008 2010 2012 2013 2014 13–14 92–14
North Coast 1,302 1,369 1,507 1,643 1,844 1,876 1,973 2,253 2,392 2,367 2,602 2,708 2,762 2.0% 3.5%Shasta Cascade 546 561 597 614 713 767 816 923 957 902 966 954 967 1.4% 2.65SF Bay Area 12,403 13,084 15,172 17,320 20,688 17,385 18,788 21,755 23,162 24,474 27,285 28,651 29,987 4.7% 4.1%Central Valley 3,113 3,288 3,485 3,734 4,322 4,423 4,934 5,678 6,049 5,891 6,433 6,426 6,488 1.0% 3.4%Gold Country 2,029 2,077 2,246 2,450 3,033 3,127 3,381 3,868 3,956 3,790 4,117 4,194 4,288 2.3% 3.5%High Sierra 1,274 1,373 1,405 1,555 1,755 1,900 2,090 2,236 2,269 2,319 2,512 2,555 2,613 2.3% 3.3%Central Coast 3,634 3,742 4,218 4,665 5,430 5,396 5,760 6,518 6,709 6,536 7,284 7,494 7,777 3.8% 3.5%LA County 12,006 11,976 13,160 14,309 17,622 16,883 19,117 21,369 22,471 21,416 23,655 24,165 25,034 3.6% 3.4%Orange County 5,040 5,229 5,838 6,416 7,648 7,523 8,393 9,527 9,695 9,306 10,100 10,402 10,829 4.1% 3.5%SD County 6,021 5,803 6,827 8,076 9,830 9,451 10,653 12,013 12,768 12,525 13,703 13,996 14,654 4.7% 4.1%The Deserts 2,767 2,883 3,126 3,446 3,922 4,195 4,679 5,406 5,741 5,582 6,230 6,215 6,323 1.7% 3.8%Inland Empire 2,505 2,628 2,809 3,052 3,558 3,989 4,475 5,101 5,397 5,311 5,692 5,675 5,785 2.0% 3.9%CA (billions) 52.6 54.0 60.4 67.3 80.4 76.9 85.1 96.6 101.6 100.4 110.6 113.4 117.5 3.6% 3.7%
master plan!!|!!')'*!!|!!master plan%-!!|!!chapter 1
HOW!NORTH!LAKE!TAHOE!STACKS!UP!COMPARED!TO!OTHER!COMMUNITIES!Trends of comparable destinations affect how North Lake Tahoe must plan for the future and effectively market itself. The North Lake Tahoe tourism offerings include outdoor recreation as well as food and wine and compete with both summer and winter destinations. Strategic Mar-keting Group’s (SMG) 2014 comparison analysis evaluated Napa, Sonoma, Santa Cruz, Monterey, San Diego and Mammoth Lakes as comparable summer destinations and Summit County, Colora-do; Mammoth Lakes; Telluride, Colorado and Park City, Utah as comparable winter destinations.
SUMMER%COMPARABLES%
In the summer, North Lake Tahoe’s activities are focused on outdoor recreation at Lake Tahoe. Sur-rounding mountains and ski resorts also offer a wide array of activities. The region has developed numerous summer events which are complement-ed by a variety of free community-based events. However, similar events can also be found in other destinations which have more compelling offer-ings for that specific market segment. For exam-ple, Napa, Sonoma and Monterey have stronger positioning and infrastructure to support food and wine events than North Lake Tahoe. However, North Lake Tahoe is home to a number of state parks and historic sites and could capitalize on these unique assets to engage visitors.
In October 2011, Congress passed a bill authoriz-ing summer and year-round activities at ski areas on Forest System lands. The act paved the way for more robust summer operations at the nation’s 121 ski areas that operate on public lands. The measure allowed ski resorts located in Arizona,
California, Colorado, Idaho, Montana, New Hamp-shire, New Mexico, Oregon, Vermont, Washing-ton and Wyoming to offer guests a wide array of summer activities, including zip lines, mountain biking and mountain bike parks, ropes courses and Frisbee golf courses.
An alliance between the National Ski Areas As-sociation (NSAA) and the International Mountain Bicycling Association (IMBA) was signed soon after the bill passed in 2011. The partnership has a shared aim of increasing visitation and improv-ing summer mountain biking experiences at U.S. ski areas. Kirkwood Mountain Resort has been a long-standing IMBA destination partner, and Winter Park Resort, Park City Lodging, Grand Targhee Resort, Crested Butte Mountain Resort and Canyons Resort are also destination partners that leverage IMBA’s resources to provide trail design and market their resorts.
Expanding summer activities at ski resorts is a growing trend. Vail has plans for mountain parks at Vail Mountain, Breckenridge and Heavenly. The new facilities are anticipated to triple sum-mer attendance.16 In the North Lake Tahoe area improvements are planned for Northstar which has a strong history of downhill mountain biking. As more resorts add summer facilities, common offerings are likely to include ropes courses, ziplines and mountain bike trails or parks. Squaw
COMPETITIVE!ANALYSIS
master plan!!|!!'+',!!|!!master plan
Valley’s summer offerings include hiking, biking, paintball, disc golf, roller skating and swimming. Alpine Meadows and other North Lake Tahoe ski areas typically allow hiking and biking.
WINTER%COMPARABLES%
Overall, North Lake Tahoe is competitive with its winter comparable set. The investments made by both Vail Resorts and KSL Resorts have estab-lished a high standard for the types of amenities and overall experience that destination skiers seek. The villages at Northstar and Squaw Valley provide high quality lodging, along with shopping, dining and activities. However, North Lake Tahoe does not offer the level of comprehensive public transportation found in other competitive moun-tain destinations that allows skiers to easily travel between the ski resorts.
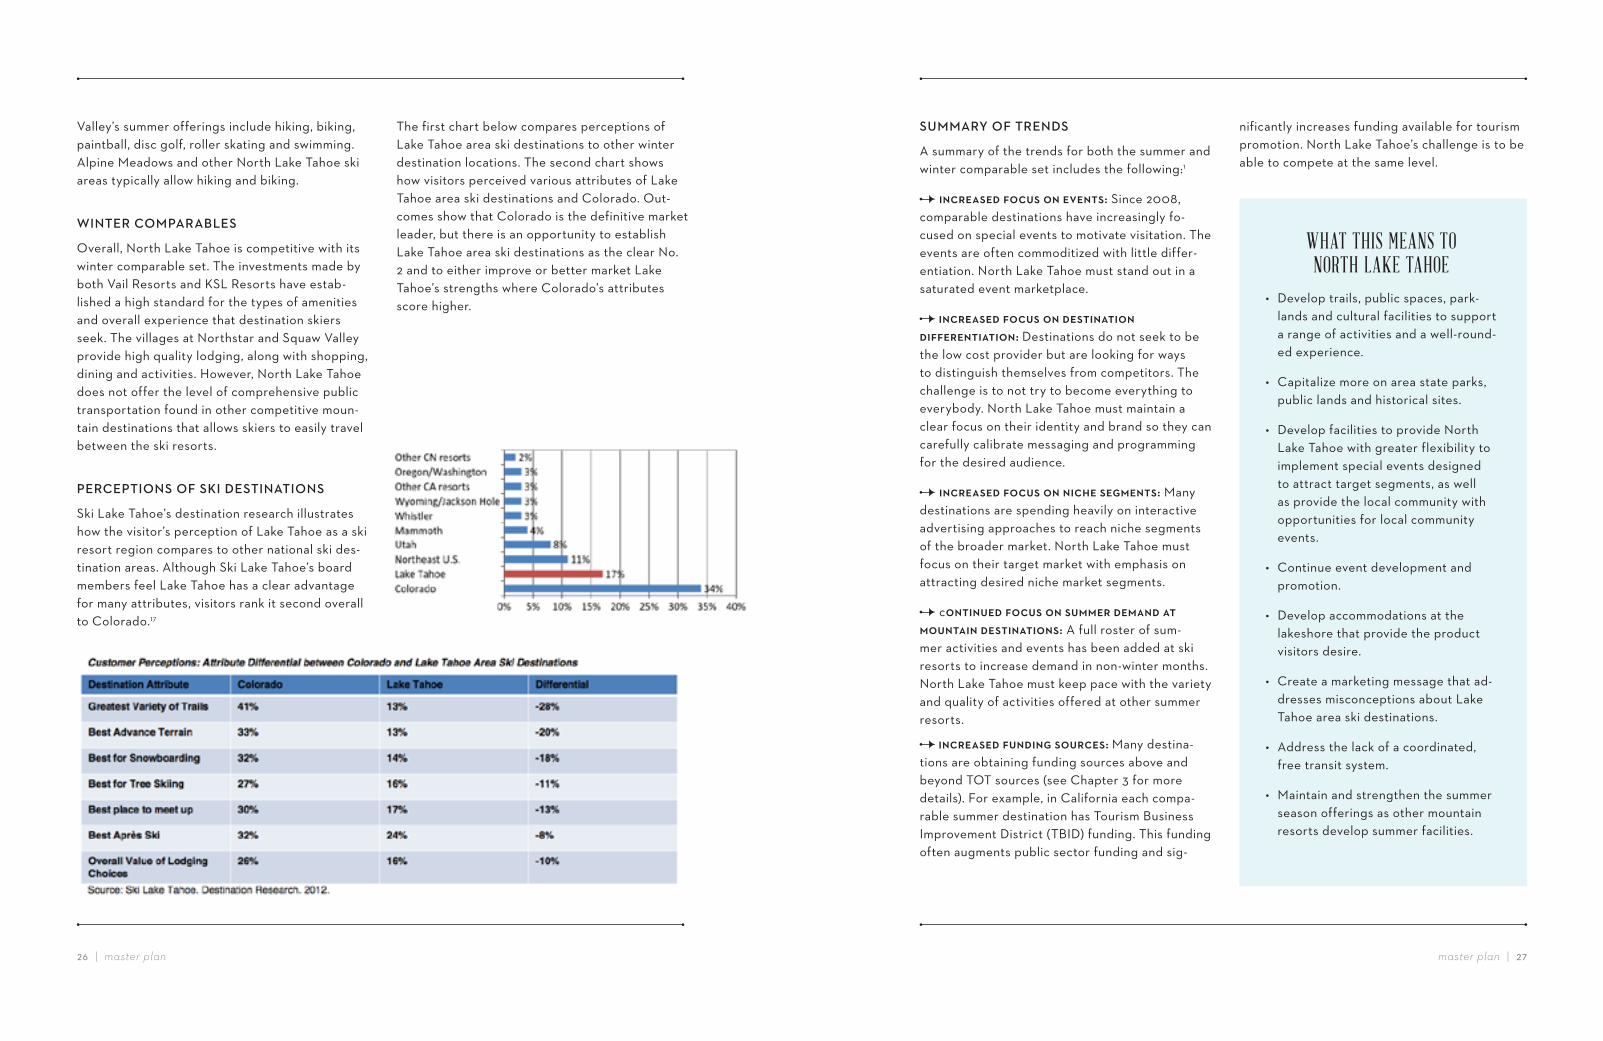
PERCEPTIONS%OF%SKI%DESTINATIONS
Ski Lake Tahoe’s destination research illustrates how the visitor’s perception of Lake Tahoe as a ski resort region compares to other national ski des-tination areas. Although Ski Lake Tahoe’s board members feel Lake Tahoe has a clear advantage for many attributes, visitors rank it second overall to Colorado.17
SUMMARY%OF%TRENDS
A summary of the trends for both the summer and winter comparable set includes the following:1
*+/0,-3,946&/'34&+4,2,+(3: Since 2008, comparable destinations have increasingly fo-cused on special events to motivate visitation. The events are often commoditized with little differ-entiation. North Lake Tahoe must stand out in a saturated event marketplace.
4*+/0,-3,946&/'34&+49,3(*+-(*&+4 9*66,0,+(*-(*&+:4Destinations do not seek to be the low cost provider but are looking for ways to distinguish themselves from competitors. The challenge is to not try to become everything to everybody. North Lake Tahoe must maintain a clear focus on their identity and brand so they can carefully calibrate messaging and programming for the desired audience.
*+/0,-3,946&/'34&+4+*/<,43,.7,+(3: Many destinations are spending heavily on interactive advertising approaches to reach niche segments of the broader market. North Lake Tahoe must focus on their target market with emphasis on attracting desired niche market segments.
c&+(*+',946&/'34&+43'77,049,7-+94-(47&'+(-*+49,3(*+-(*&+3: A full roster of sum-mer activities and events has been added at ski resorts to increase demand in non-winter months. North Lake Tahoe must keep pace with the variety and quality of activities offered at other summer resorts.
4*+/0,-3,946'+9*+.43&'0/,3:4Many destina-tions are obtaining funding sources above and beyond TOT sources (see Chapter 3 for more details). For example, in California each compa-rable summer destination has Tourism Business Improvement District (TBID) funding. This funding often augments public sector funding and sig-
The first chart below compares perceptions of Lake Tahoe area ski destinations to other winter destination locations. The second chart shows how visitors perceived various attributes of Lake Tahoe area ski destinations and Colorado. Out-comes show that Colorado is the definitive market leader, but there is an opportunity to establish Lake Tahoe area ski destinations as the clear No. 2 and to either improve or better market Lake Tahoe’s strengths where Colorado’s attributes score higher.
nificantly increases funding available for tourism promotion. North Lake Tahoe’s challenge is to be able to compete at the same level.
WHAT THIS MEANS TO NORTH LAKE TAHOE
• Develop trails, public spaces, park-lands and cultural facilities to support a range of activities and a well-round-ed experience.
• Capitalize more on area state parks, public lands and historical sites.
• Develop facilities to provide North Lake Tahoe with greater flexibility to implement special events designed to attract target segments, as well as provide the local community with opportunities for local community events.
• Continue event development and promotion.
• Develop accommodations at the lakeshore that provide the product visitors desire.
• Create a marketing message that ad-dresses misconceptions about Lake Tahoe area ski destinations.
• Address the lack of a coordinated, free transit system.
• Maintain and strengthen the summer season offerings as other mountain resorts develop summer facilities.
'.!!|!!master plan
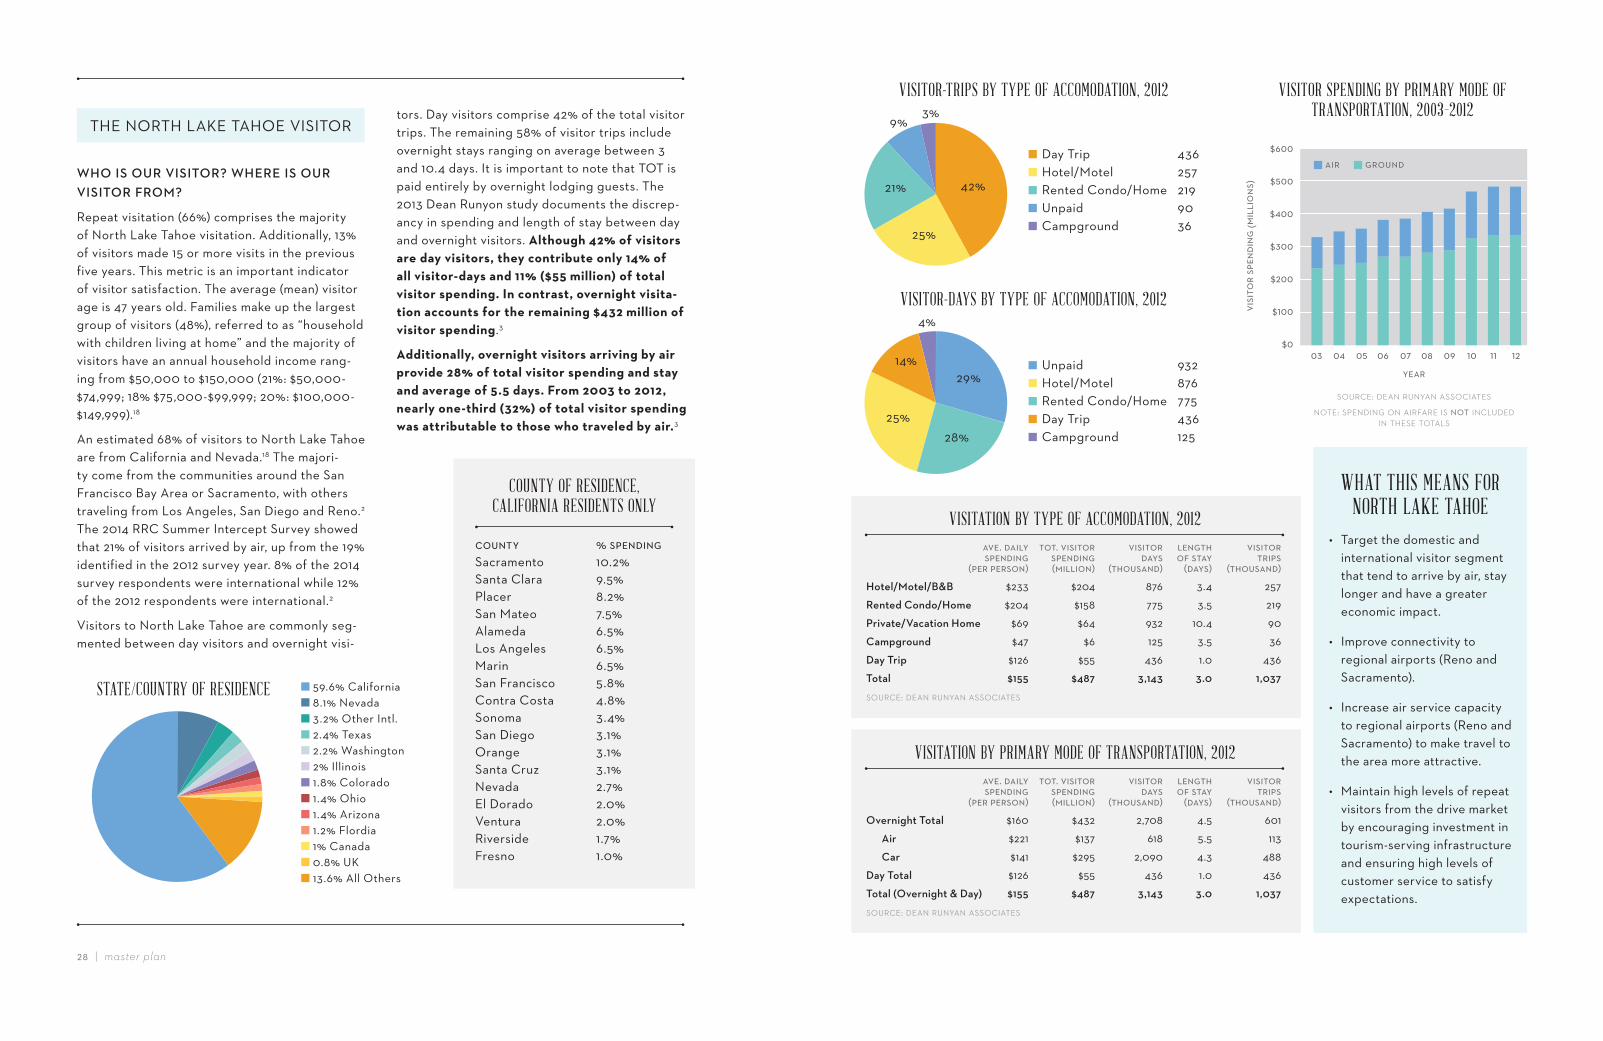
WHO%IS%OUR%VISITOR?%WHERE%IS%OUR% VISITOR%FROM?% !Repeat visitation (66%) comprises the majority of North Lake Tahoe visitation. Additionally, 13% of visitors made 15 or more visits in the previous five years. This metric is an important indicator of visitor satisfaction. The average (mean) visitor age is 47 years old. Families make up the largest group of visitors (48%), referred to as “household with children living at home” and the majority of visitors have an annual household income rang-ing from $50,000 to $150,000 (21%: $50,000-$74,999; 18% $75,000-$99,999; 20%: $100,000-$149,999).18
An estimated 68% of visitors to North Lake Tahoe are from California and Nevada.18 The majori-ty come from the communities around the San Francisco Bay Area or Sacramento, with others traveling from Los Angeles, San Diego and Reno.2
The 2014 RRC Summer Intercept Survey showed that 21% of visitors arrived by air, up from the 19% identified in the 2012 survey year. 8% of the 2014 survey respondents were international while 12% of the 2012 respondents were international.2
Visitors to North Lake Tahoe are commonly seg-mented between day visitors and overnight visi-
tors. Day visitors comprise 42% of the total visitor trips. The remaining 58% of visitor trips include overnight stays ranging on average between 3 and 10.4 days. It is important to note that TOT is paid entirely by overnight lodging guests. The 2013 Dean Runyon study documents the discrep-ancy in spending and length of stay between day and overnight visitors. Although 42% of visitors are day visitors, they contribute only 14% of all visitor-days and 11% ($55 million) of total visitor spending. In contrast, overnight visita-tion accounts for the remaining $432 million of visitor spending.3
Additionally, overnight visitors arriving by air provide 28% of total visitor spending and stay and average of 5.5 days. From 2003 to 2012, nearly one-third (32%) of total visitor spending was attributable to those who traveled by air.3
THE!NORTH!LAKE!TAHOE!VISITOR!
WHAT THIS MEANS FOR NORTH LAKE TAHOE
• Target the domestic and international visitor segment that tend to arrive by air, stay longer and have a greater economic impact.
• Improve connectivity to regional airports (Reno and Sacramento).
• Increase air service capacity to regional airports (Reno and Sacramento) to make travel to the area more attractive.
• Maintain high levels of repeat visitors from the drive market by encouraging investment in tourism-serving infrastructure and ensuring high levels of customer service to satisfy expectations.
VISITATION BY TYPE OF ACCOMODATION, 2012 9D1E(F9C<G 343E(DC0C345 DC0C345 <1:?3> DC0C345 0H1:FC:? 0H1:FC:? F9G0 4I(039G 35CH0 8H15(H1504:@ 8BC<<C4:@ 83>4;09:F@ 8F9G0@ 83>4;09:F@Hotel/Motel/B&B $233 $204 876 3.4 257
Rented Condo/Home $204 $158 775 3.5 219
Private/Vacation Home $69 $64 932 10.4 90
Campground $47 $6 125 3.5 36
Day Trip $126 $55 436 1.0 436
Total $155 $487 3,143 3.0 1,037"#$%&'(!)'*+!%$+,*+!*""#&-*.'"
"#$%&'(!)'*+!%$+,*+!*""#&-*.'"+#.'(!"/'+)-+0!#+!*-%1*%'!-"!:43!-+&2$)')!
-+!.3'"'!.#.*2"
DC0C
345(
0H1:
FC:?
( 8BC<
<C4
:0@
G195
VISITATION BY PRIMARY MODE OF TRANSPORTATION, 2012 9D1E(F9C<G 343E(DC0C345 DC0C345 <1:?3> DC0C345 0H1:FC:? 0H1:FC:? F9G0 4I(039G 35CH0 8H15(H1504:@ 8BC<<C4:@ 83>4;09:F@ 8F9G0@ 83>4;09:F@Overnight Total $160 $432 2,708 4.5 601
Air $221 $137 618 5.5 113
Car $141 $295 2,090 4.3 488
Day Total $126 $55 436 1.0 436
Total (Overnight & Day) $155 $487 3,143 3.0 1,037"#$%&'(!)'*+!%$+,*+!*""#&-*.'"
Day Trip 436 Hotel/Motel 257 Rented Condo/Home 219 Unpaid 90 Campground 36
Unpaid 932 Hotel/Motel 876 Rented Condo/Home 775 Day Trip 436 Campground 125
VISITOR-TRIPS BY TYPE OF ACCOMODATION, 2012
STATE/COUNTRY OF RESIDENCE
VISITOR SPENDING BY PRIMARY MODE OF TRANSPORTATION, 2003–2012
VISITOR-DAYS BY TYPE OF ACCOMODATION, 2012
42%
25%
21%
9%
25%
29%
28%
14%
3%
4%
(9C5((((( (?54;:F
59.6% California 8.1% Nevada 3.2% Other Intl. 2.4% Texas 2.2% Washington 2% Illinois 1.8% Colorado 1.4% Ohio 1.4% Arizona 1.2% Flordia 1% Canada 0.8% UK 13.6% All Others
24;:3G =(0H1:FC:?Sacramento 10.2%Santa Clara 9.5%Placer 8.2%San Mateo 7.5%Alameda 6.5%Los Angeles 6.5%Marin 6.5%San Francisco 5.8%Contra Costa 4.8%Sonoma 3.4%San Diego 3.1%Orange 3.1%Santa Cruz 3.1%Nevada 2.7%El Dorado 2.0%Ventura 2.0%Riverside 1.7%Fresno 1.0%
COUNTY OF RESIDENCE, CALIFORNIA RESIDENTS ONLY
master plan!!|!!&%&/!!|!!master plan
WHAT%DO%VISITORS%DO%WHEN%THEY%ARE%HERE?%
North Lake Tahoe offers a full range of recreation experiences. Recreational opportunities include hiking, camping, mountain biking, golfing, boating and other water activities such as kayaking and paddle boarding in the summer and fall seasons. Snowmobiling, ice-skating, alpine and Nordic skiing and sledding are popular in the winter and early spring.
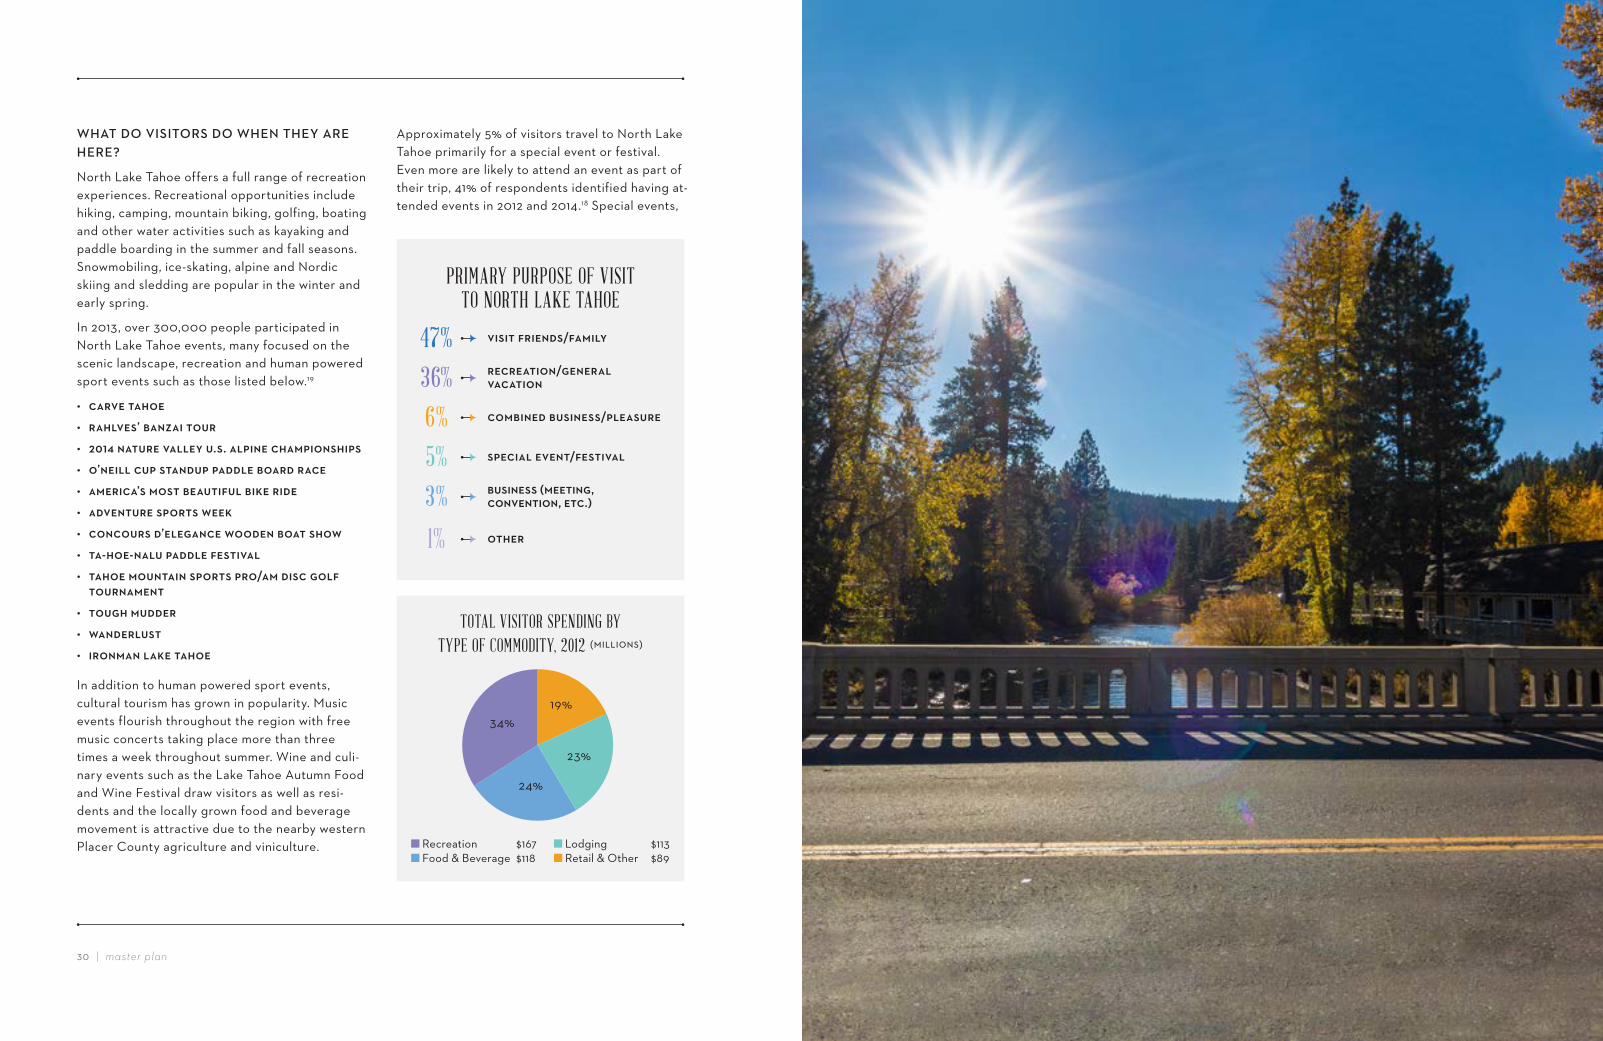
In 2013, over 300,000 people participated in North Lake Tahoe events, many focused on the scenic landscape, recreation and human powered sport events such as those listed below.19
• /-02,4(-<&,• 0-<)2,3’4=-+D-*4(&'0• >?EF4+-('0,42-)),;4'G3G4-)1*+,4/<-71*&+3<*13• &’+,*))4/'143(-+9'141-99),4=&-0940-/,• -7,0*/-’347&3(4=,-'(*6')4=*8,40*9,• -92,+('0,431&0(34B,,8• /&+/&'0349’,),.-+/,4B&&9,+4=&-(43<&B• (--<&,-+-)'41-99),46,3(*2-)• (-<&,47&'+(-*+431&0(3410&/-749*3/4.&)64
(&'0+-7,+(• (&'.<47'99,0• B-+9,0)'3(• *0&+7-+4)-8,4(-<&,
In addition to human powered sport events, cultural tourism has grown in popularity. Music events flourish throughout the region with free music concerts taking place more than three times a week throughout summer. Wine and culi-nary events such as the Lake Tahoe Autumn Food and Wine Festival draw visitors as well as resi-dents and the locally grown food and beverage movement is attractive due to the nearby western Placer County agriculture and viniculture.
Approximately 5% of visitors travel to North Lake Tahoe primarily for a special event or festival. Even more are likely to attend an event as part of their trip, 41% of respondents identified having at-tended events in 2012 and 2014.18 Special events,
PRIMARY PURPOSE OF VISIT TO NORTH LAKE TAHOE
47% 2*3*(460*,+93/6-7*);
36% 0,/0,-(*&+/.,+,0-)4 2-/-(*&+
6% /&7=*+,94='3*+,33/1),-3'0,
5% 31,/*-)4,2,+(/6,3(*2-)
3% ='3*+,334H7,,(*+.I4 4444444444444444 /&+2,+(*&+I4,(/GJ
1% &(<,0
Recreation $167 Food & Beverage $118
Lodging $113 Retail & Other $89
TOTAL VISITOR SPENDING BY TYPE OF COMMODITY, 2012 8BC<<C4:0@
24%
23%
19%34%
master plan!!|!!&&&'!!|!!master plan
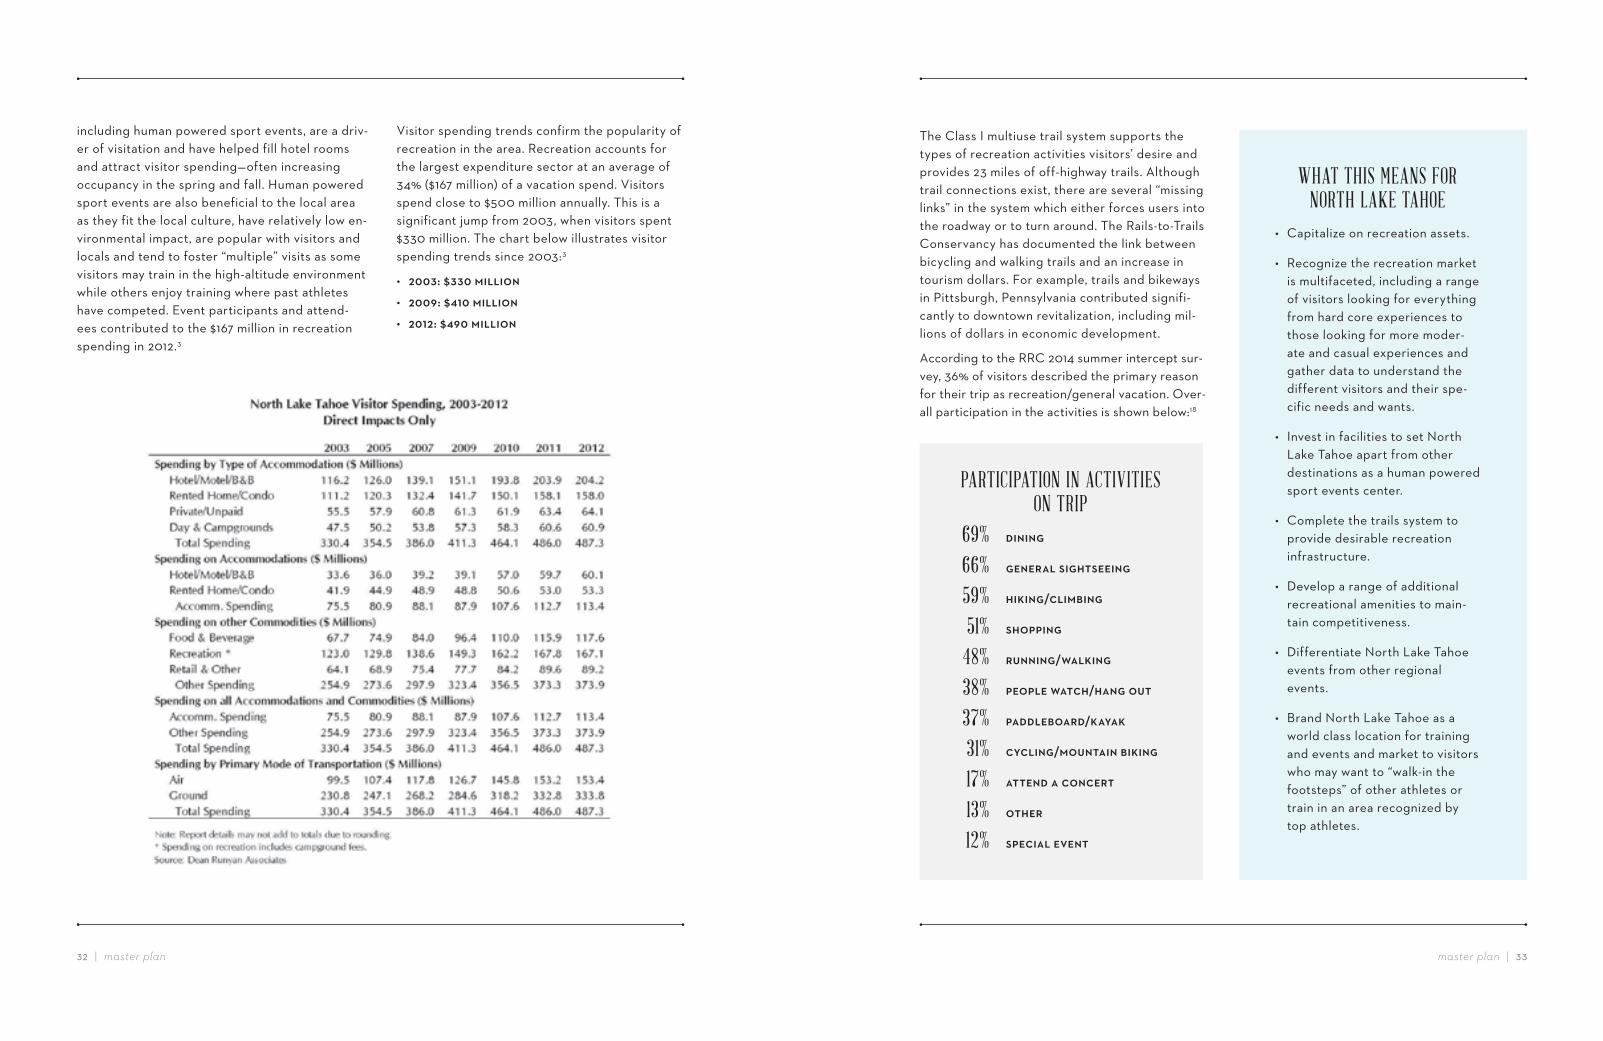
Visitor spending trends confirm the popularity of recreation in the area. Recreation accounts for the largest expenditure sector at an average of 34% ($167 million) of a vacation spend. Visitors spend close to $500 million annually. This is a significant jump from 2003, when visitors spent $330 million. The chart below illustrates visitor spending trends since 2003:3
• >??@:4K@@?47*))*&+• >??L:4KFE?47*))*&+• >?E>:4KFL?47*))*&+
The Class I multiuse trail system supports the types of recreation activities visitors’ desire and provides 23 miles of off-highway trails. Although trail connections exist, there are several “missing links” in the system which either forces users into the roadway or to turn around. The Rails-to-Trails Conservancy has documented the link between bicycling and walking trails and an increase in tourism dollars. For example, trails and bikeways in Pittsburgh, Pennsylvania contributed signifi-cantly to downtown revitalization, including mil-lions of dollars in economic development.
According to the RRC 2014 summer intercept sur-vey, 36% of visitors described the primary reason for their trip as recreation/general vacation. Over-all participation in the activities is shown below:18
WHAT THIS MEANS FOR NORTH LAKE TAHOE
• Capitalize on recreation assets.
• Recognize the recreation market is multifaceted, including a range of visitors looking for everything from hard core experiences to those looking for more moder-ate and casual experiences and gather data to understand the different visitors and their spe-cific needs and wants.
• Invest in facilities to set North Lake Tahoe apart from other destinations as a human powered sport events center.
• Complete the trails system to provide desirable recreation infrastructure.
• Develop a range of additional recreational amenities to main-tain competitiveness.
• Differentiate North Lake Tahoe events from other regional events.
• Brand North Lake Tahoe as a world class location for training and events and market to visitors who may want to “walk-in the footsteps” of other athletes or train in an area recognized by top athletes.
PARTICIPATION IN ACTIVITIES ON TRIP
69% 9*+*+.
66% .,+,0-)43*.<(3,,*+.
59% <*8*+.//)*7=*+.
51% 3<&11*+.
48% 0'++*+./B-)8*+.
38% 1,&1),4B-(/</<-+.4&'(
37% 1-99),=&-09/8-;-8
31% /;/)*+./7&'+(-*+4=*8*+.
17% -((,+94-4/&+/,0(
13% &(<,0
12% 31,/*-)4,2,+(
including human powered sport events, are a driv-er of visitation and have helped fill hotel rooms and attract visitor spending—often increasing occupancy in the spring and fall. Human powered sport events are also beneficial to the local area as they fit the local culture, have relatively low en-vironmental impact, are popular with visitors and locals and tend to foster “multiple” visits as some visitors may train in the high-altitude environment while others enjoy training where past athletes have competed. Event participants and attend-ees contributed to the $167 million in recreation spending in 2012.3
master plan!!|!!&)&*!!|!!master plan
WHERE%DO%VISITORS%STAY%WHEN%THEY%ARE%HERE?
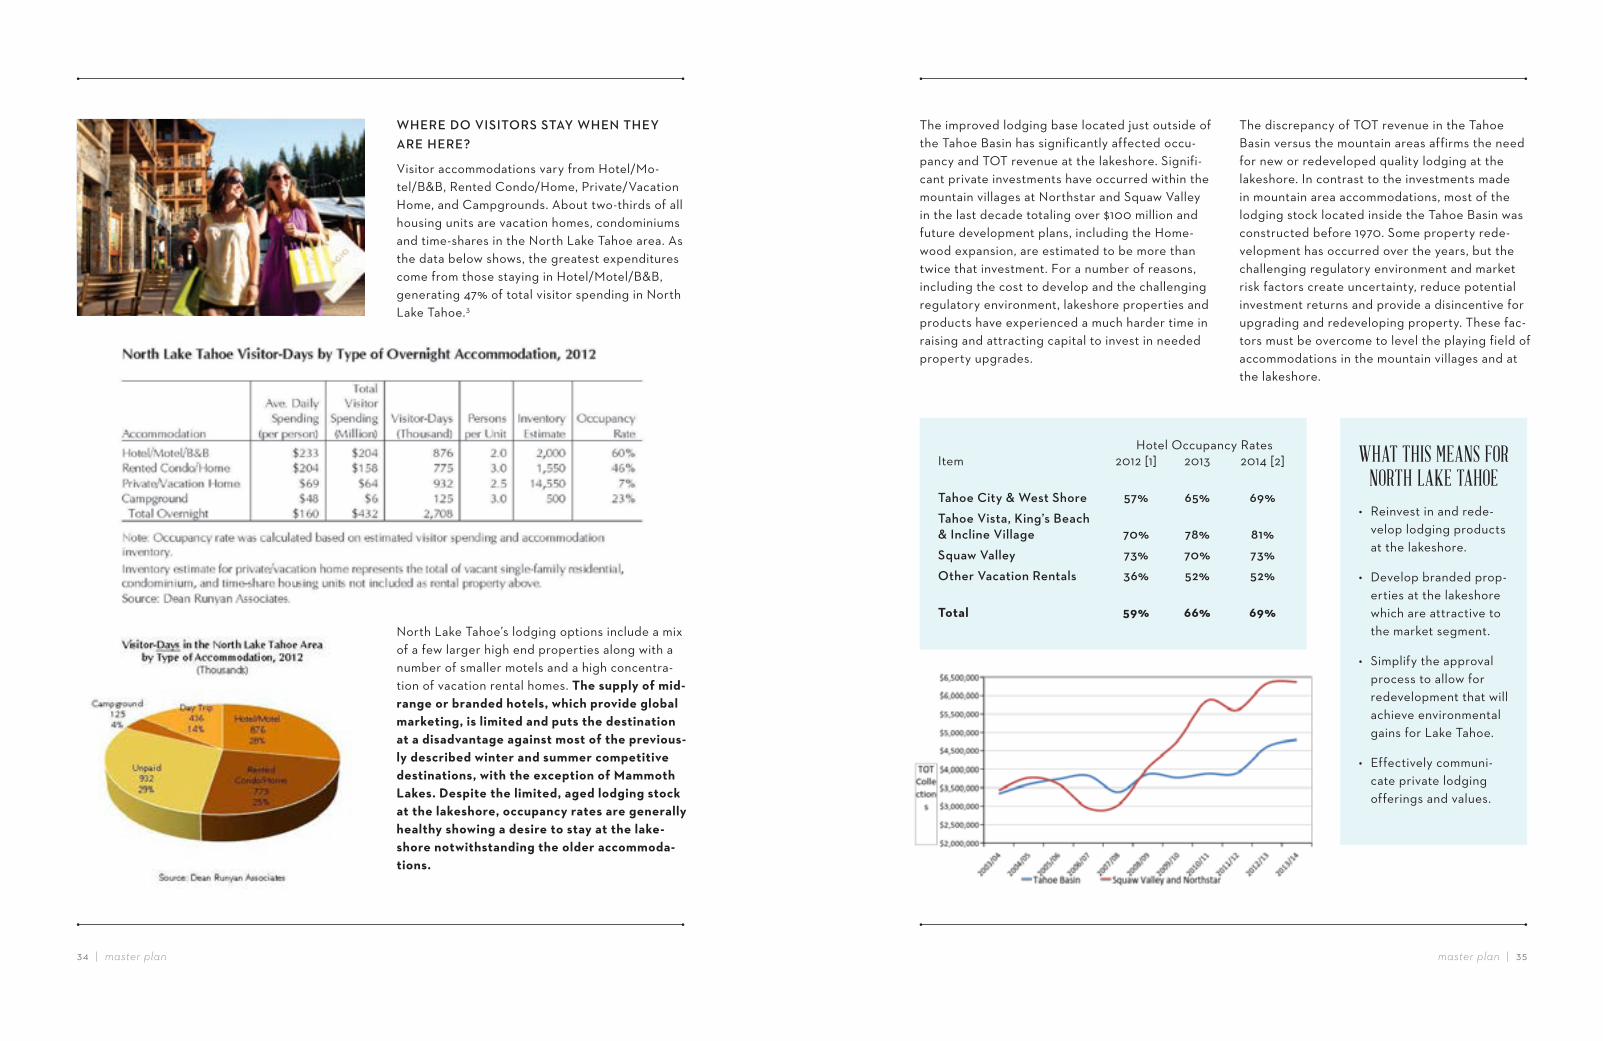
Visitor accommodations vary from Hotel/Mo-tel/B&B, Rented Condo/Home, Private/Vacation Home, and Campgrounds. About two-thirds of all housing units are vacation homes, condominiums and time-shares in the North Lake Tahoe area. As the data below shows, the greatest expenditures come from those staying in Hotel/Motel/B&B, generating 47% of total visitor spending in North Lake Tahoe.3
North Lake Tahoe’s lodging options include a mix of a few larger high end properties along with a number of smaller motels and a high concentra-tion of vacation rental homes. The supply of mid-range or branded hotels, which provide global marketing, is limited and puts the destination at a disadvantage against most of the previous-ly described winter and summer competitive destinations, with the exception of Mammoth Lakes. Despite the limited, aged lodging stock at the lakeshore, occupancy rates are generally healthy showing a desire to stay at the lake-shore notwithstanding the older accommoda-tions.
The improved lodging base located just outside of the Tahoe Basin has significantly affected occu-pancy and TOT revenue at the lakeshore. Signifi-cant private investments have occurred within the mountain villages at Northstar and Squaw Valley in the last decade totaling over $100 million and future development plans, including the Home-wood expansion, are estimated to be more than twice that investment. For a number of reasons, including the cost to develop and the challenging regulatory environment, lakeshore properties and products have experienced a much harder time in raising and attracting capital to invest in needed property upgrades.
The discrepancy of TOT revenue in the Tahoe Basin versus the mountain areas affirms the need for new or redeveloped quality lodging at the lakeshore. In contrast to the investments made in mountain area accommodations, most of the lodging stock located inside the Tahoe Basin was constructed before 1970. Some property rede-velopment has occurred over the years, but the challenging regulatory environment and market risk factors create uncertainty, reduce potential investment returns and provide a disincentive for upgrading and redeveloping property. These fac-tors must be overcome to level the playing field of accommodations in the mountain villages and at the lakeshore.
WHAT THIS MEANS FOR NORTH LAKE TAHOE
• Reinvest in and rede-velop lodging products at the lakeshore.
• Develop branded prop-erties at the lakeshore which are attractive to the market segment.
• Simplify the approval process to allow for redevelopment that will achieve environmental gains for Lake Tahoe.
• Effectively communi-cate private lodging offerings and values.
Hotel Occupancy Rates Item 2012 [1] 2013 2014 [2]
Tahoe City & West Shore 57% 65% 69%Tahoe Vista, King’s Beach & Incline Village 70% 78% 81%Squaw Valley 73% 70% 73%Other Vacation Rentals 36% 52% 52%
Total 59% 66% 69%
master plan!!|!!&+&,!!|!!master plan%-!!|!!chapter 1
HOW%DO%VISITORS%GET%HERE?% %
Overall, the majority of visitors (81%) arrive by private automobile. However, those that arrive by air service (21%)2 have a higher average per day expenditure, a longer length of stay and generate 28% of the total overnight visitor expenditures.3 From 2003 to 2012, the amount of visitor spending attributed to those who trav-eled by air increased by 54% from $99.5 million to $153.4 million.3 The RRC 2014 visitor survey reconfirms the higher average spending from visitors arriving by air.18
VISITATION BY PRIMARY MODE OF TRANSPORTATION, 2012
9D1E(F9C<G(0H1:FC:? 343E(DC0C345(0H1:FC:? DC0C345(F9G0 <1:?3>(4I(039G DC0C345(35CH0 8H15(H1504:@ 8BC<<C4:@ 83>4;09:F@ 8F9G0@ 83>4;09:F@Overnight Total $160 $432 2,708 4.5 601
Air $221 $137 618 5.5 113
Car $141 $295 2,090 4.3 488
Day Total $126 $55 436 1.0 436
Total (Overnight & Day) $155 $487 3,143 3.0 1,037"#$%&'(!)'*+!%$+,*+!*""#&-*.'"
NORTH LAKE TAHOE VISITOR SURVEY SUMMER 2014 F4B103C2 FCF(G4;(I<G(34? 29<CI45:C9(9519 C:315:93C4:9< 4;30CF1(29 G10 :4 79G(9519 04E(29<
What do you Under $100 20% 19% 7% 7% 12%estimate that you $100 – $299 25% 15% 3% 20% 18% 12%and your immediate $300 – $499 12% 11% 6% 13% 16% 13%travel party will $500 – $699 11% 9% 16% 15% 16% 7%spend in total $700 – $999 4% 8% 10% 10% 7% 11%while in North $1,000 – $1,999 18% 11% 23% 12% 15% 17%Lake Tahoe? $2,000 – $2,999 5% 10% 16% 7% 8% 11% $3,000 or more 2% 11% 23% 11% 6% 15% Don’t know/not sure 5% 5% 3% 5% 6% 2%
Total 100% 100% 100% 100% 100% 100%Average $678 $1,058 $1,802 $1,070 $976 $1,307Median $400 $650 $1,500 $600 $600 $950n= 53 235 30 101 180 90
"#$%&'(!%%&!*""#&-*.'"
DC0C
345(
0H1:
FC:?
( 8BC<
<C4
:0@
G195
VISITOR SPENDING BY PRIMARY MODE OF TRANSPORTATION, 2003–2012
(9C5((((( (?54;:F
master plan!!|!!&-&.!!|!!master plan
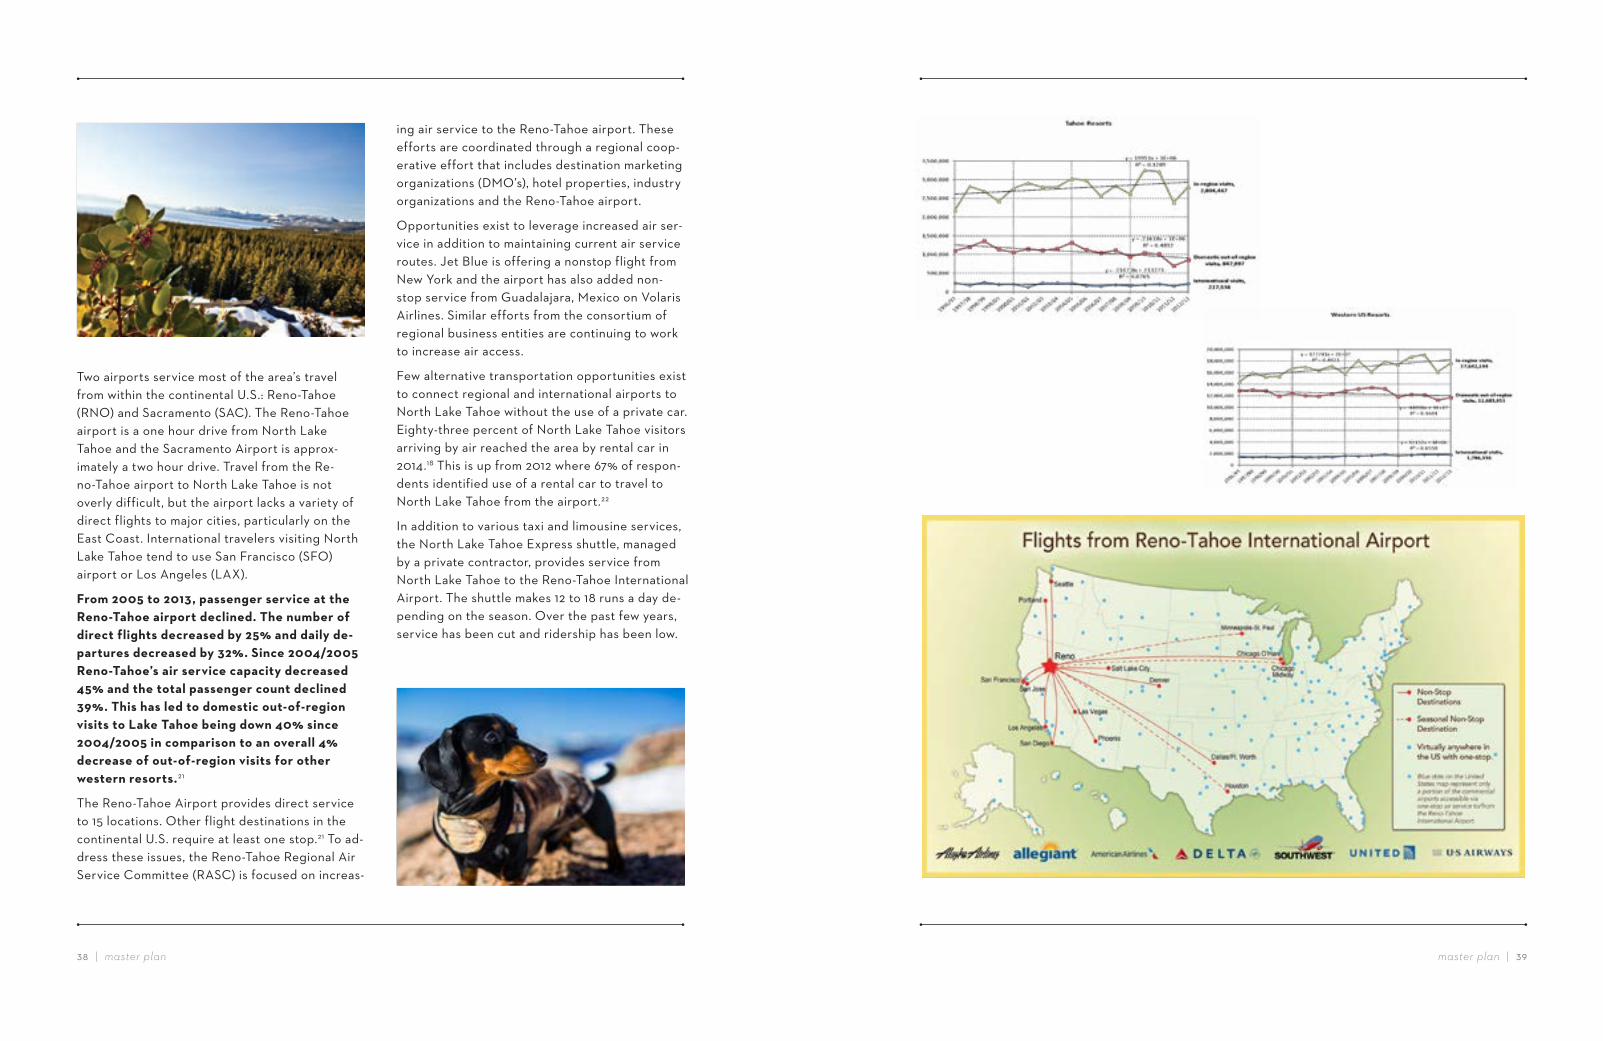
Two airports service most of the area’s travel from within the continental U.S.: Reno-Tahoe (RNO) and Sacramento (SAC). The Reno-Tahoe airport is a one hour drive from North Lake Tahoe and the Sacramento Airport is approx-imately a two hour drive. Travel from the Re-no-Tahoe airport to North Lake Tahoe is not overly difficult, but the airport lacks a variety of direct flights to major cities, particularly on the East Coast. International travelers visiting North Lake Tahoe tend to use San Francisco (SFO) airport or Los Angeles (LAX).
From 2005 to 2013, passenger service at the Reno-Tahoe airport declined. The number of direct flights decreased by 25% and daily de-partures decreased by 32%. Since 2004/2005 Reno-Tahoe’s air service capacity decreased 45% and the total passenger count declined 39%. This has led to domestic out-of-region visits to Lake Tahoe being down 40% since 2004/2005 in comparison to an overall 4% decrease of out-of-region visits for other western resorts.21
The Reno-Tahoe Airport provides direct service to 15 locations. Other flight destinations in the continental U.S. require at least one stop.21 To ad-dress these issues, the Reno-Tahoe Regional Air Service Committee (RASC) is focused on increas-
ing air service to the Reno-Tahoe airport. These efforts are coordinated through a regional coop-erative effort that includes destination marketing organizations (DMO’s), hotel properties, industry organizations and the Reno-Tahoe airport.
Opportunities exist to leverage increased air ser-vice in addition to maintaining current air service routes. Jet Blue is offering a nonstop flight from New York and the airport has also added non-stop service from Guadalajara, Mexico on Volaris Airlines. Similar efforts from the consortium of regional business entities are continuing to work to increase air access.
Few alternative transportation opportunities exist to connect regional and international airports to North Lake Tahoe without the use of a private car. Eighty-three percent of North Lake Tahoe visitors arriving by air reached the area by rental car in 2014.18 This is up from 2012 where 67% of respon-dents identified use of a rental car to travel to North Lake Tahoe from the airport.22
In addition to various taxi and limousine services, the North Lake Tahoe Express shuttle, managed by a private contractor, provides service from North Lake Tahoe to the Reno-Tahoe International Airport. The shuttle makes 12 to 18 runs a day de-pending on the season. Over the past few years, service has been cut and ridership has been low.
master plan!!|!!*%*/!!|!!master plan
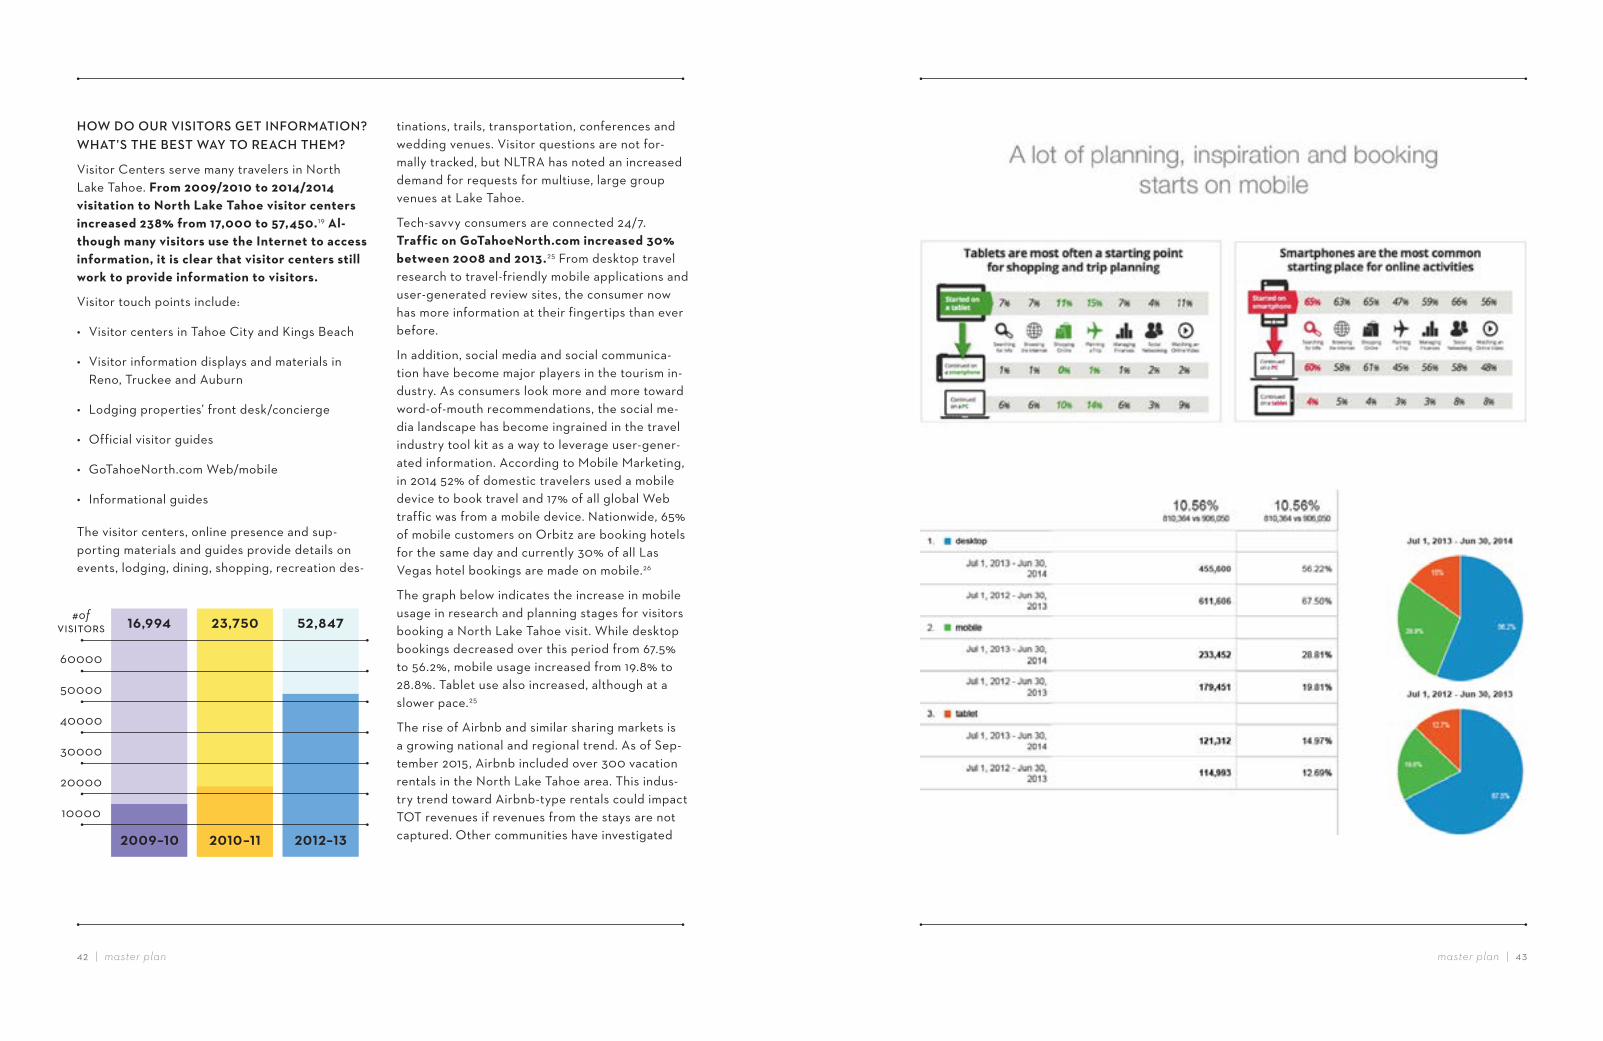
HOW%DO%VISITORS%GET%AROUND%ONCE%THEY%ARE%HERE?
The majority of visitors (80%) arrive by private automobile2 and the primary roadway network consists of three state highways that loop Lake Tahoe. Due to topographical constraints, the overall road network is very limited, with little in the way of alternate routes. Access into the Placer County portion of the Tahoe Basin is via two connector highways from Interstate 80 and the Town of Truckee. Although public transit has continued to improve, the road system and broad geographic layout of North Lake Tahoe make it challenging to provide a coordinated, efficient way for visitors to get around once at Lake Tahoe. A Cross Lake Ferry project by the Tahoe Transportation District would provide more di-rect access from North Lake Tahoe to South Lake Tahoe. In addition to the Tahoe Area Regional Transit (TART) bus service, visitors have several transportation options for mobility, including:
• 10*2-(,4-'(&7&=*),
• 0,+(-)4/-03
• (-M*43,02*/,
• )*7&43,02*/,
• 60,,4+*.<((*7,43<'((),34H3,-3&+-)J
• B*+(,0438*,043<'((),3
• 0,3&0(43<'((),3
• =*/;/),4-+941,9,3(0*-+4(0-*)3
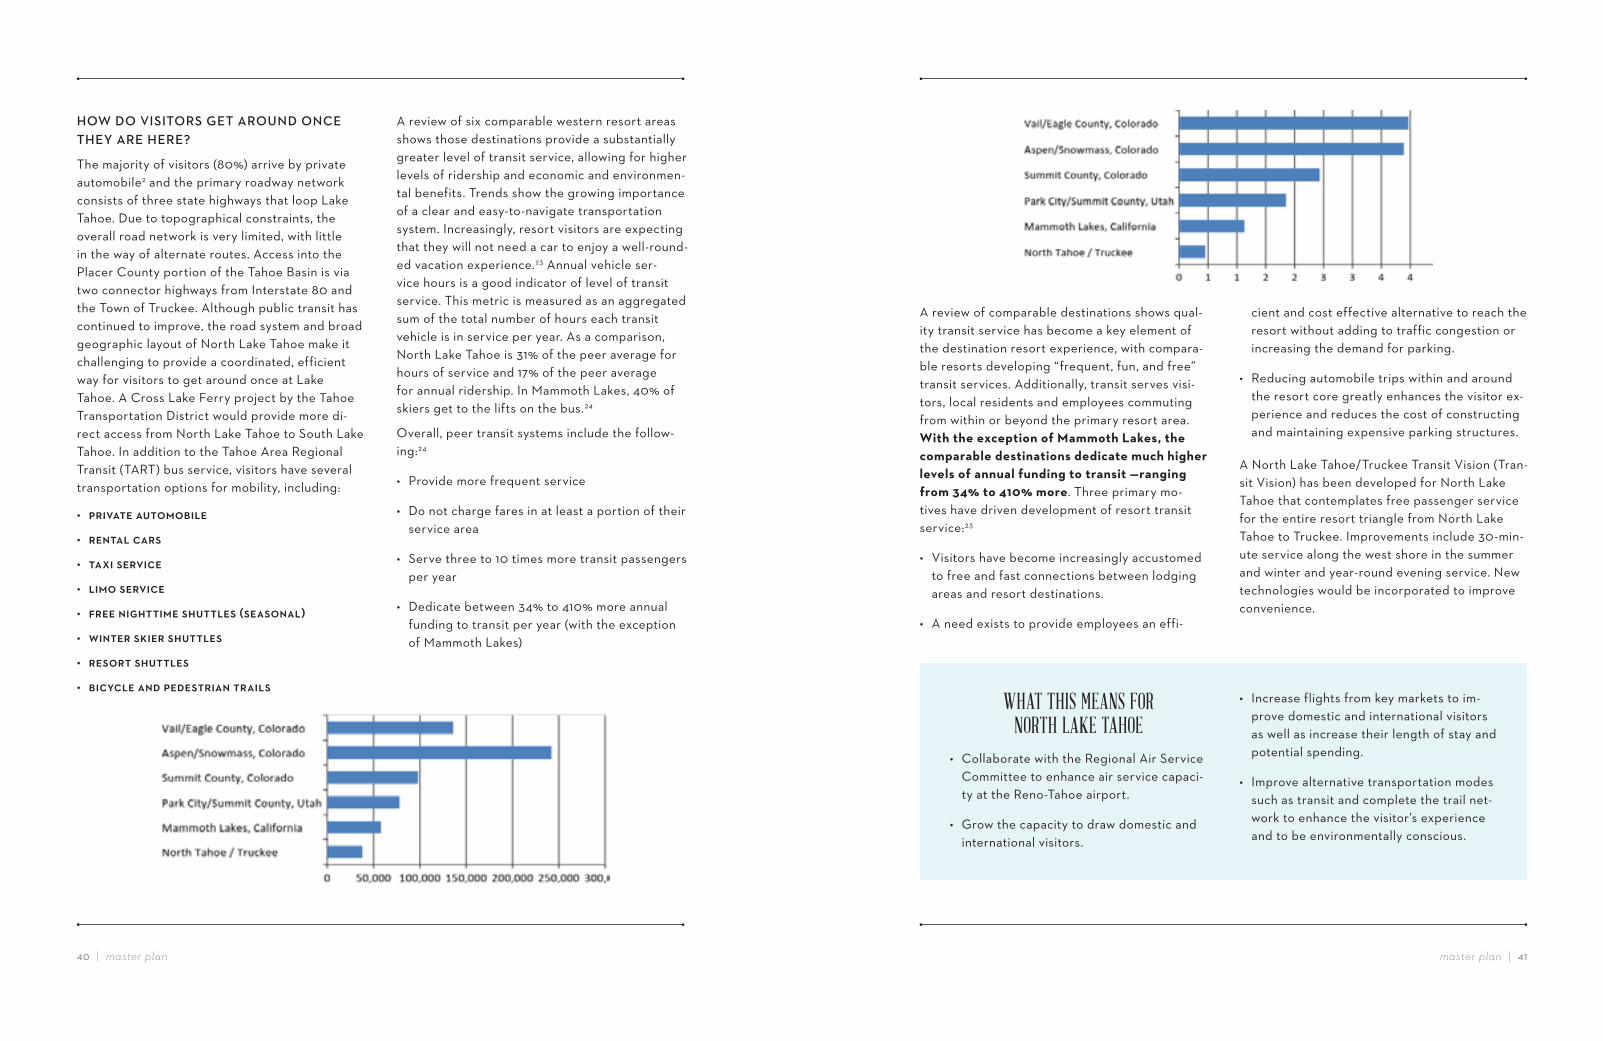
A review of comparable destinations shows qual-ity transit service has become a key element of the destination resort experience, with compara-ble resorts developing “frequent, fun, and free” transit services. Additionally, transit serves visi-tors, local residents and employees commuting from within or beyond the primary resort area. With the exception of Mammoth Lakes, the comparable destinations dedicate much higher levels of annual funding to transit —ranging from 34% to 410% more. Three primary mo-tives have driven development of resort transit service:23
• Visitors have become increasingly accustomed to free and fast connections between lodging areas and resort destinations.
• A need exists to provide employees an effi-
A review of six comparable western resort areas shows those destinations provide a substantially greater level of transit service, allowing for higher levels of ridership and economic and environmen-tal benefits. Trends show the growing importance of a clear and easy-to-navigate transportation system. Increasingly, resort visitors are expecting that they will not need a car to enjoy a well-round-ed vacation experience.23 Annual vehicle ser-vice hours is a good indicator of level of transit service. This metric is measured as an aggregated sum of the total number of hours each transit vehicle is in service per year. As a comparison, North Lake Tahoe is 31% of the peer average for hours of service and 17% of the peer average for annual ridership. In Mammoth Lakes, 40% of skiers get to the lifts on the bus.24
Overall, peer transit systems include the follow-ing:24
• Provide more frequent service
• Do not charge fares in at least a portion of their service area
• Serve three to 10 times more transit passengers per year
• Dedicate between 34% to 410% more annual funding to transit per year (with the exception of Mammoth Lakes)
cient and cost effective alternative to reach the resort without adding to traffic congestion or increasing the demand for parking.
• Reducing automobile trips within and around the resort core greatly enhances the visitor ex-perience and reduces the cost of constructing and maintaining expensive parking structures.
A North Lake Tahoe/Truckee Transit Vision (Tran-sit Vision) has been developed for North Lake Tahoe that contemplates free passenger service for the entire resort triangle from North Lake Tahoe to Truckee. Improvements include 30-min-ute service along the west shore in the summer and winter and year-round evening service. New technologies would be incorporated to improve convenience.
WHAT THIS MEANS FOR NORTH LAKE TAHOE
• Collaborate with the Regional Air Service Committee to enhance air service capaci-ty at the Reno-Tahoe airport.
• Grow the capacity to draw domestic and international visitors.
• Increase flights from key markets to im-prove domestic and international visitors as well as increase their length of stay and potential spending.
• Improve alternative transportation modes such as transit and complete the trail net-work to enhance the visitor’s experience and to be environmentally conscious.
master plan!!|!!*&*'!!|!!master plan
tinations, trails, transportation, conferences and wedding venues. Visitor questions are not for-mally tracked, but NLTRA has noted an increased demand for requests for multiuse, large group venues at Lake Tahoe.
Tech-savvy consumers are connected 24/7. Traffic on GoTahoeNorth.com increased 30% between 2008 and 2013.25 From desktop travel research to travel-friendly mobile applications and user-generated review sites, the consumer now has more information at their fingertips than ever before.
In addition, social media and social communica-tion have become major players in the tourism in-dustry. As consumers look more and more toward word-of-mouth recommendations, the social me-dia landscape has become ingrained in the travel industry tool kit as a way to leverage user-gener-ated information. According to Mobile Marketing, in 2014 52% of domestic travelers used a mobile device to book travel and 17% of all global Web traffic was from a mobile device. Nationwide, 65% of mobile customers on Orbitz are booking hotels for the same day and currently 30% of all Las Vegas hotel bookings are made on mobile.26
The graph below indicates the increase in mobile usage in research and planning stages for visitors booking a North Lake Tahoe visit. While desktop bookings decreased over this period from 67.5% to 56.2%, mobile usage increased from 19.8% to 28.8%. Tablet use also increased, although at a slower pace.25
The rise of Airbnb and similar sharing markets is a growing national and regional trend. As of Sep-tember 2015, Airbnb included over 300 vacation rentals in the North Lake Tahoe area. This indus-try trend toward Airbnb-type rentals could impact TOT revenues if revenues from the stays are not captured. Other communities have investigated
HOW%DO%OUR%VISITORS%GET%INFORMATION?%WHAT’S%THE%BEST%WAY%TO%REACH%THEM?
Visitor Centers serve many travelers in North Lake Tahoe. From 2009/2010 to 2014/2014 visitation to North Lake Tahoe visitor centers increased 238% from 17,000 to 57,450. 19 Al-though many visitors use the Internet to access information, it is clear that visitor centers still work to provide information to visitors.
Visitor touch points include:
• Visitor centers in Tahoe City and Kings Beach
• Visitor information displays and materials in Reno, Truckee and Auburn
• Lodging properties’ front desk/concierge
• Official visitor guides
• GoTahoeNorth.com Web/mobile
• Informational guides
The visitor centers, online presence and sup-porting materials and guides provide details on events, lodging, dining, shopping, recreation des-
#ofDC0C3450
60000
50000
40000
30000
20000
10000
+,,)-%,
%'.))*
+,%,-%%
+&.$#,
+,%+-%&
#+./*$
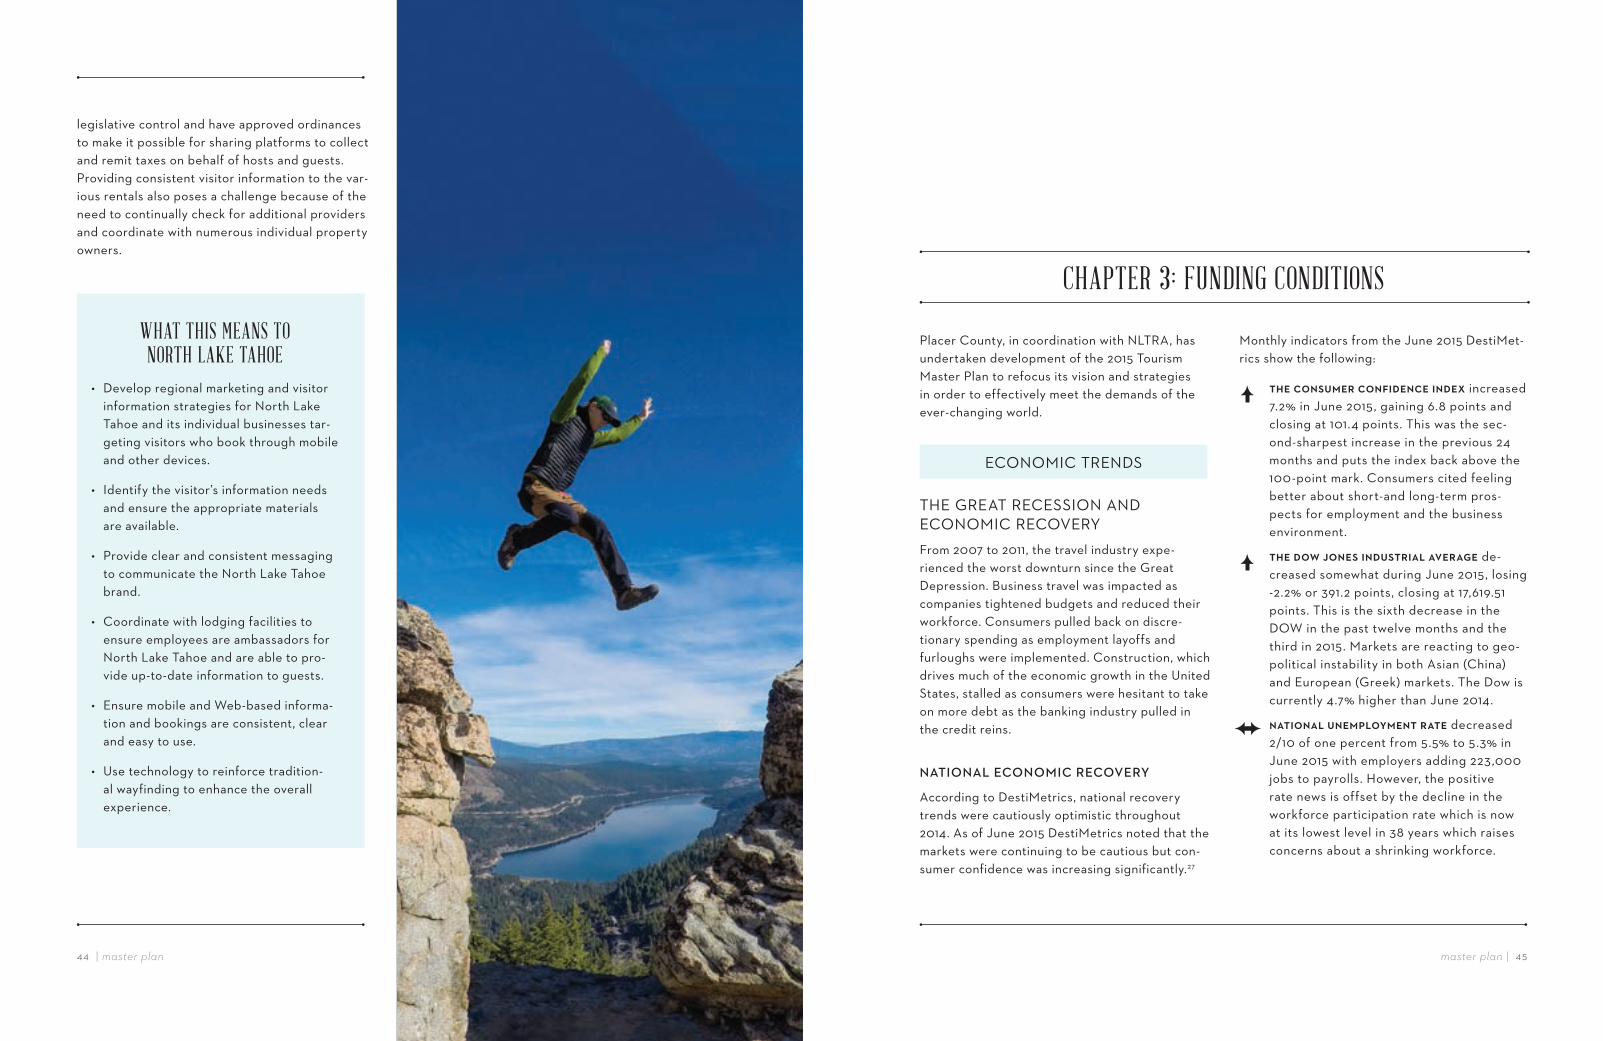
master plan!|!!*)**!!|!master plan
legislative control and have approved ordinances to make it possible for sharing platforms to collect and remit taxes on behalf of hosts and guests. Providing consistent visitor information to the var-ious rentals also poses a challenge because of the need to continually check for additional providers and coordinate with numerous individual property owners.
WHAT THIS MEANS TO NORTH LAKE TAHOE
• Develop regional marketing and visitor information strategies for North Lake Tahoe and its individual businesses tar-geting visitors who book through mobile and other devices.
• Identify the visitor’s information needs and ensure the appropriate materials are available.
• Provide clear and consistent messaging to communicate the North Lake Tahoe brand.
• Coordinate with lodging facilities to ensure employees are ambassadors for North Lake Tahoe and are able to pro-vide up-to-date information to guests.
• Ensure mobile and Web-based informa-tion and bookings are consistent, clear and easy to use.
• Use technology to reinforce tradition-al wayfinding to enhance the overall experience.
CHAPTER 3: FUNDING CONDITIONS
Placer County, in coordination with NLTRA, has undertaken development of the 2015 Tourism Master Plan to refocus its vision and strategies in order to effectively meet the demands of the ever-changing world.
THE!GREAT!RECESSION!AND! ECONOMIC!RECOVERYFrom 2007 to 2011, the travel industry expe-rienced the worst downturn since the Great Depression. Business travel was impacted as companies tightened budgets and reduced their workforce. Consumers pulled back on discre-tionary spending as employment layoffs and furloughs were implemented. Construction, which drives much of the economic growth in the United States, stalled as consumers were hesitant to take on more debt as the banking industry pulled in the credit reins.
NATIONAL%ECONOMIC%RECOVERY
According to DestiMetrics, national recovery trends were cautiously optimistic throughout 2014. As of June 2015 DestiMetrics noted that the markets were continuing to be cautious but con-sumer confidence was increasing significantly.27
Monthly indicators from the June 2015 DestiMet-rics show the following:
(<,4/&+3'7,04/&+6*9,+/,4*+9,M increased 7.2% in June 2015, gaining 6.8 points and closing at 101.4 points. This was the sec-ond-sharpest increase in the previous 24 months and puts the index back above the 100-point mark. Consumers cited feeling better about short-and long-term pros-pects for employment and the business environment.
(<,49&B4N&+,34*+9'3(0*-)4-2,0-., de-creased somewhat during June 2015, losing -2.2% or 391.2 points, closing at 17,619.51 points. This is the sixth decrease in the DOW in the past twelve months and the third in 2015. Markets are reacting to geo-political instability in both Asian (China) and European (Greek) markets. The Dow is currently 4.7% higher than June 2014.
+-(*&+-)4'+,71)&;7,+(40-(, decreased 2/10 of one percent from 5.5% to 5.3% in June 2015 with employers adding 223,000 jobs to payrolls. However, the positive rate news is offset by the decline in the workforce participation rate which is now at its lowest level in 38 years which raises concerns about a shrinking workforce.
ECONOMIC!TRENDS
master plan!!|!!*+*,!!|!!master plan
CALIFORNIA%ECONOMIC%RECOVERY
California’s GDP grew by 2.8% in 2014, outpac-ing the national growth rate of 2.2% and making California the world’s eighth largest economy.28 Unemployment levels are equal to or less than pre-recession levels in all regions of the state except Sacramento which is anticipated to reach those levels soon.29 Fortunately for Lake Tahoe, the predominant visitor origination areas of San Francisco, San Mateo and Marin counties have done the best in terms of economic recovery.
NORTH%LAKE%TAHOE%ECONOMIC% RECOVERY
In spite of a four-year drought that has impacted the area’s ski seasons, North Lake Tahoe ex-perienced record collections of TOT in 2012-13 of $11,686,906 and $11,982,996 in 2013-14. TOT collections continue to exceed the pre-recession peak amounts (2007/2008 TOT of $9,244,712) collected in the region.30
The calendar year of 2013 also saw record set-ting collection of sales tax in North Lake Tahoe of $2,607,051. However, sales tax collections dropped to $2,397,297 in 2014. Although the
2014 sales tax total is less than the $2,410,928 collected in 2007, there are still signs of a strong tourism recovery with a 29.6% TOT increase over pre-recession numbers.30
*+-7-08,(4/&+9*(*&+3
Ski area ownership partners have made signif-icant investments in the region, elevating the skiing, recreation, retail, lodging and real estate products. Lakeshore communities lack the same level of private investment that is being made in the surrounding mountain resorts. While lakeshore communities enjoy the amenity of Lake Tahoe, they are falling behind in retail and lodging products as evidenced by stagnant and falling sales tax and TOT in these geographic ar-eas. Private investment in lakeshore communities is constrained by complex, unpredictable entitle-ment and environmental restrictions. In addition, development at Lake Tahoe is expensive. For example, outside of the Tahoe Basin a structured parking space costs approximately $25,000 per space. The cost per space within the Tahoe Basin is $75,000. A short construction season and oth-er locational factors add to project costs.31
EXISTING!RESOURCES!FOR! NORTH!TAHOE!MARKET!
The promotion of a tourism destination in California comes with unique considerations. The burden on local funding and the private sector to support tourism infrastructure has increased over the years due to reduced state budgets and the elimination of redevelopment agencies. Traditionally in California, the primary source of local tourism promotion funding is the TOT. However, in most jurisdictions TOT is not dedicated to tourism promotion, as it is in other states. More frequently, TOT is used as part of a local government’s general fund, where it is sub-ject to competition with other non-tourism uses.
The amounts and conditions under which TOT is provided to support tourism vary considerably, usually the result of a contractual agreement between the county or city and a local desti-nation marketing organization (DMO). Such a contractual agreement exists between Placer County and NLTRA. This agreement is annually reviewed and approved by both the County and NLTRA.
Threats to available tourism funding could occur in the future as the amount of TOT available for eastern Placer County tourism may be reduced in times of economic downturn or reduced County resources. The TOT may be earmarked for more general uses within the County instead of tourism.
EASTERN%PLACER%COUNTY%TRANSIT% OCCUPANCY%TAX
Currently, TOT for the North Lake Tahoe area is 10%, which includes the additional 2% which is strictly for use in eastern Placer County. In 2002
and 2012 voters approved continuation of the additional 2% TOT for the purpose of investing in capital projects and services to support tourism within eastern Placer County. Specifically, the additional funds are to be used to reduce traffic congestion/tourist impacts; support transpor-tation services; build/maintain local bike trails, parks, indoor recreation opportunities, sidewalks, and beaches; and provide other public services.
Between 1996 and 2012, eastern Placer Coun-ty collected $30 million from the 2% TOT. The money was used to secure matching grant funds from state, federal, county and local sources to generate $160 million dollars30 to support public improvement projects and services that could not otherwise have been afforded. Over the past years, TOT funds have helped:
• ='*)94=*8,4(0-*)3: West Shore, Midway Bridge to Squaw Valley, Tahoe City Lakeside, and those being planned on the North Shore, Northstar/Martis Valley, and along the Truckee River
• *710&2,41'=)*/41-0834-+94(<,4)-8,3<&0,: Squaw Valley Community Park, Commons Beach, Tahoe Vista Recreation Area and Heri-tage Plaza
• 3'11&0(41'=)*/4*+60-3(0'/('0,: Tahoe City and Kings Beach sidewalk projects, North Tahoe Events Center, Tahoe Maritime Museum and the Historic Fish Hatchery Interpretive Center
• *+/0,-3,4(0-+31&0(-(*&+43,02*/,3: Tahoe City Transit Center, airport shuttle, free seasonal nighttime shuttles and bus shelters
From 2011-2014 total TOT collection in eastern Placer County exceeded $11 million.30 As state and federal infrastructure funding has declined, larger amounts of TOT funds are being allocated to transportation projects and services.
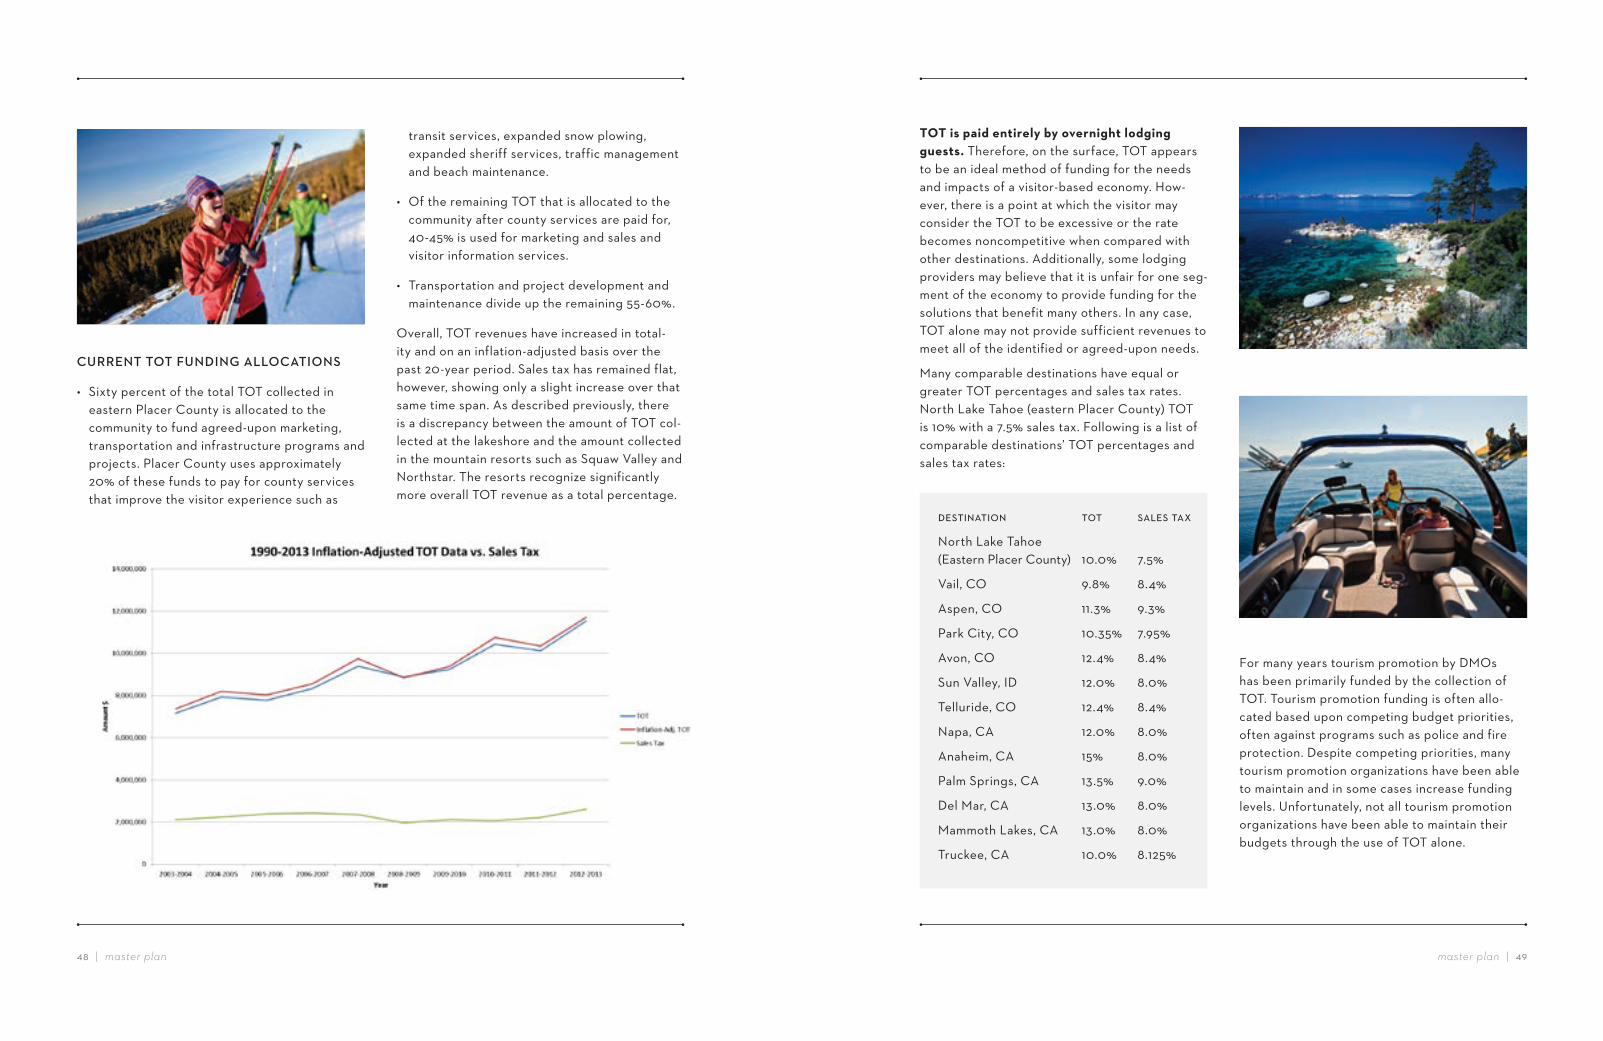
master plan!!|!!*-*.!!|!!master plan
CURRENT%TOT%FUNDING%ALLOCATIONS
• Sixty percent of the total TOT collected in eastern Placer County is allocated to the community to fund agreed-upon marketing, transportation and infrastructure programs and projects. Placer County uses approximately 20% of these funds to pay for county services that improve the visitor experience such as
transit services, expanded snow plowing, expanded sheriff services, traffic management and beach maintenance.
• Of the remaining TOT that is allocated to the community after county services are paid for, 40-45% is used for marketing and sales and visitor information services.
• Transportation and project development and maintenance divide up the remaining 55-60%.
Overall, TOT revenues have increased in total-ity and on an inflation-adjusted basis over the past 20-year period. Sales tax has remained flat, however, showing only a slight increase over that same time span. As described previously, there is a discrepancy between the amount of TOT col-lected at the lakeshore and the amount collected in the mountain resorts such as Squaw Valley and Northstar. The resorts recognize significantly more overall TOT revenue as a total percentage.
TOT is paid entirely by overnight lodging guests. Therefore, on the surface, TOT appears to be an ideal method of funding for the needs and impacts of a visitor-based economy. How-ever, there is a point at which the visitor may consider the TOT to be excessive or the rate becomes noncompetitive when compared with other destinations. Additionally, some lodging providers may believe that it is unfair for one seg-ment of the economy to provide funding for the solutions that benefit many others. In any case, TOT alone may not provide sufficient revenues to meet all of the identified or agreed-upon needs.
Many comparable destinations have equal or greater TOT percentages and sales tax rates. North Lake Tahoe (eastern Placer County) TOT is 10% with a 7.5% sales tax. Following is a list of comparable destinations’ TOT percentages and sales tax rates:
For many years tourism promotion by DMOs has been primarily funded by the collection of TOT. Tourism promotion funding is often allo-cated based upon competing budget priorities, often against programs such as police and fire protection. Despite competing priorities, many tourism promotion organizations have been able to maintain and in some cases increase funding levels. Unfortunately, not all tourism promotion organizations have been able to maintain their budgets through the use of TOT alone.
F103C:93C4: 343 09<10(39J(
North Lake Tahoe (Eastern Placer County) 10.0% 7.5%
Vail, CO 9.8% 8.4%
Aspen, CO 11.3% 9.3%
Park City, CO 10.35% 7.95%
Avon, CO 12.4% 8.4%
Sun Valley, ID 12.0% 8.0%
Telluride, CO 12.4% 8.4%
Napa, CA 12.0% 8.0%
Anaheim, CA 15% 8.0%
Palm Springs, CA 13.5% 9.0%
Del Mar, CA 13.0% 8.0%
Mammoth Lakes, CA 13.0% 8.0%
Truckee, CA 10.0% 8.125%
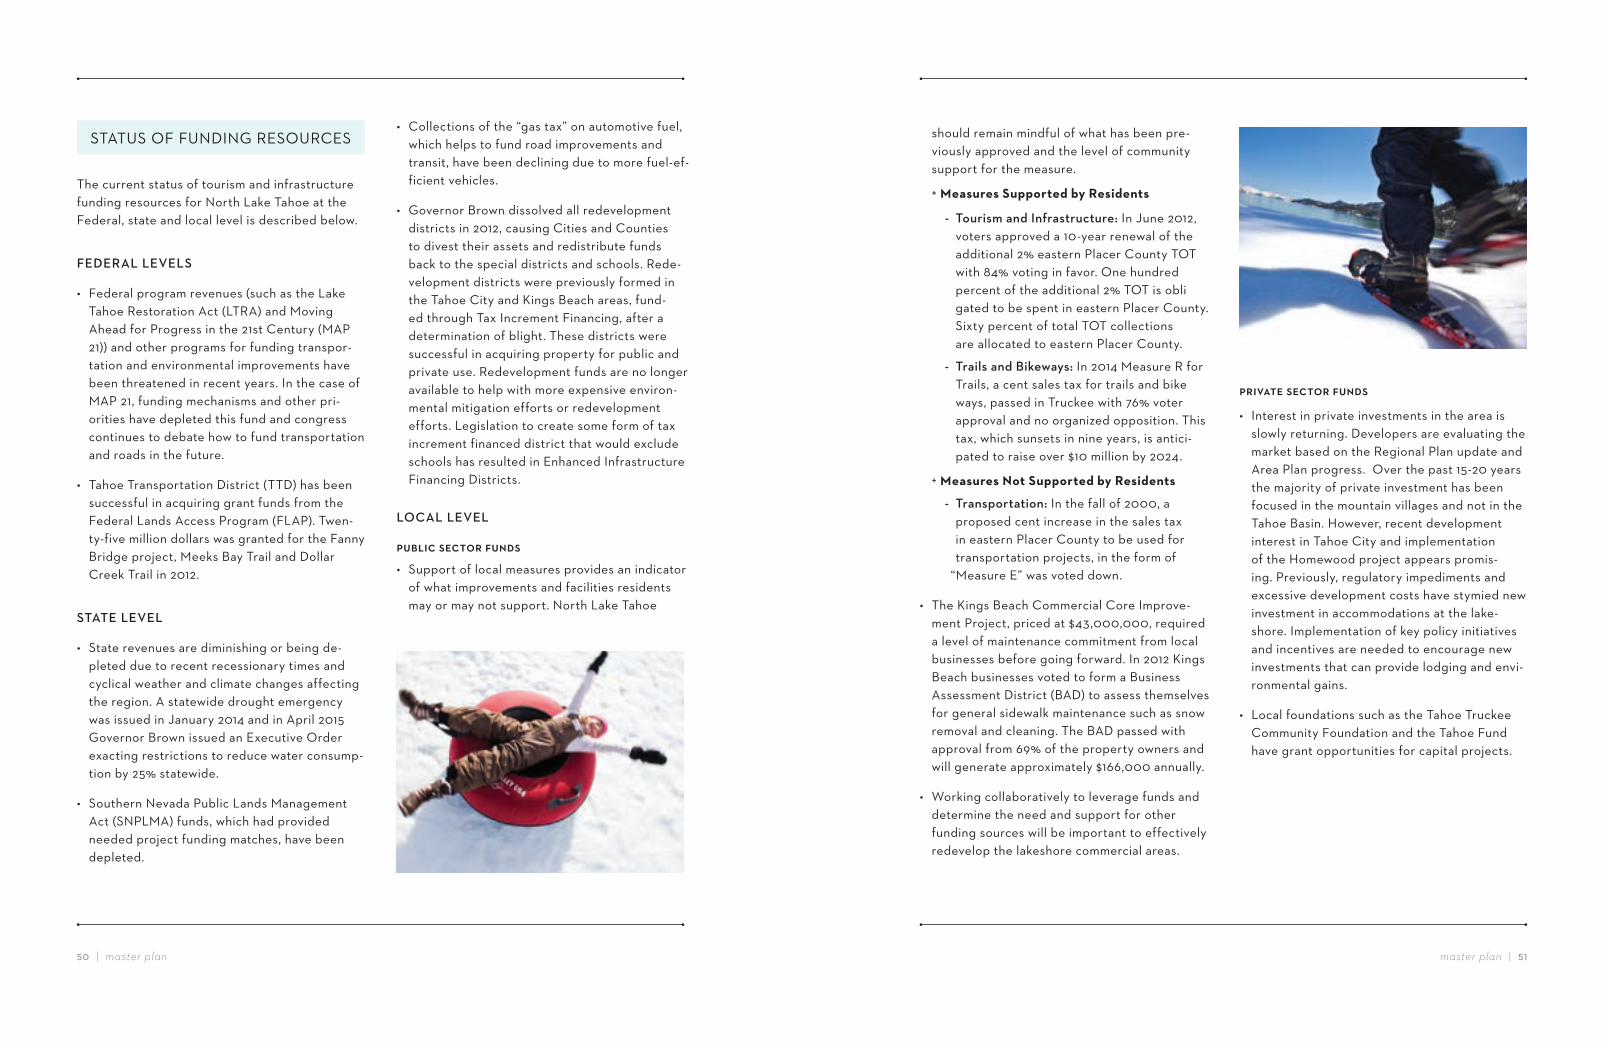
master plan!!|!!)%)/!!|!!master plan
• Collections of the “gas tax” on automotive fuel, which helps to fund road improvements and transit, have been declining due to more fuel-ef-ficient vehicles.
• Governor Brown dissolved all redevelopment districts in 2012, causing Cities and Counties to divest their assets and redistribute funds back to the special districts and schools. Rede-velopment districts were previously formed in the Tahoe City and Kings Beach areas, fund-ed through Tax Increment Financing, after a determination of blight. These districts were successful in acquiring property for public and private use. Redevelopment funds are no longer available to help with more expensive environ-mental mitigation efforts or redevelopment efforts. Legislation to create some form of tax increment financed district that would exclude schools has resulted in Enhanced Infrastructure Financing Districts.
LOCAL%LEVEL
1'=)*/43,/(&046'+93
• Support of local measures provides an indicator of what improvements and facilities residents may or may not support. North Lake Tahoe
The current status of tourism and infrastructure funding resources for North Lake Tahoe at the Federal, state and local level is described below.
FEDERAL%LEVELS
• Federal program revenues (such as the Lake Tahoe Restoration Act (LTRA) and Moving Ahead for Progress in the 21st Century (MAP 21)) and other programs for funding transpor-tation and environmental improvements have been threatened in recent years. In the case of MAP 21, funding mechanisms and other pri-orities have depleted this fund and congress continues to debate how to fund transportation and roads in the future.
• Tahoe Transportation District (TTD) has been successful in acquiring grant funds from the Federal Lands Access Program (FLAP). Twen-ty-five million dollars was granted for the Fanny Bridge project, Meeks Bay Trail and Dollar Creek Trail in 2012.
STATE%LEVEL
• State revenues are diminishing or being de-pleted due to recent recessionary times and cyclical weather and climate changes affecting the region. A statewide drought emergency was issued in January 2014 and in April 2015 Governor Brown issued an Executive Order exacting restrictions to reduce water consump-tion by 25% statewide.
• Southern Nevada Public Lands Management Act (SNPLMA) funds, which had provided needed project funding matches, have been depleted.
STATUS!OF!FUNDING!RESOURCES should remain mindful of what has been pre-viously approved and the level of community support for the measure.
+ Measures Supported by Residents
- Tourism and Infrastructure: In June 2012, voters approved a 10-year renewal of the additional 2% eastern Placer County TOT with 84% voting in favor. One hundred percent of the additional 2% TOT is obli gated to be spent in eastern Placer County. Sixty percent of total TOT collections are allocated to eastern Placer County.
- Trails and Bikeways: In 2014 Measure R for Trails, a cent sales tax for trails and bike ways, passed in Truckee with 76% voter approval and no organized opposition. This tax, which sunsets in nine years, is antici- pated to raise over $10 million by 2024.
+ Measures Not Supported by Residents
- Transportation: In the fall of 2000, a proposed cent increase in the sales tax in eastern Placer County to be used for transportation projects, in the form of “Measure E” was voted down.
• The Kings Beach Commercial Core Improve-ment Project, priced at $43,000,000, required a level of maintenance commitment from local businesses before going forward. In 2012 Kings Beach businesses voted to form a Business Assessment District (BAD) to assess themselves for general sidewalk maintenance such as snow removal and cleaning. The BAD passed with approval from 69% of the property owners and will generate approximately $166,000 annually.
• Working collaboratively to leverage funds and determine the need and support for other funding sources will be important to effectively redevelop the lakeshore commercial areas.
10*2-(,43,/(&046'+93
• Interest in private investments in the area is slowly returning. Developers are evaluating the market based on the Regional Plan update and Area Plan progress. Over the past 15-20 years the majority of private investment has been focused in the mountain villages and not in the Tahoe Basin. However, recent development interest in Tahoe City and implementation of the Homewood project appears promis-ing. Previously, regulatory impediments and excessive development costs have stymied new investment in accommodations at the lake-shore. Implementation of key policy initiatives and incentives are needed to encourage new investments that can provide lodging and envi-ronmental gains.
• Local foundations such as the Tahoe Truckee Community Foundation and the Tahoe Fund have grant opportunities for capital projects.
master plan!!|!!)&)'!!|!master plan
BUSINESS%ASSESSMENT%DISTRICTS
A Business Assessment District is a financing mechanism which allows a district to collect special assessments to finance improvements constructed or acquired by the district. Creation requires approval of a majority of landowners based on financial obligations. Improvements that provide a direct and special benefit to the district can be financed; e.g., streets, sidewalks, curbs and gutters, water, sewer, gas, lighting and drainage facilities. General public benefit facili-ties such as parks, schools, libraries and adminis-trative facilities may not be financed.
COMMUNITY%SERVICE%AREAS%
A Community Service Area (CSA) is, in essence, an improvement district in which certain infra-structure improvements can be funded by special assessments paid for by the owners of proper-ties that benefit from the improvements. Placer County has in place a designated County Service Area that covers the entire county.
A specific CSA could be designated in the North Lake Tahoe area by the Placer County Board of Supervisors, allowing revenues to be raised and expended within the boundaries of the designat-ed CSA. Although theoretically possible, it would be difficult to impose an improvement zone without a vote of support of the property owners within the CSA. Revenues would likely be best suited for limited types of public improvements, such as street improvements.
ENHANCED%INFRASTRUCTURE%FINANCING%DISTRICTS
In response to the dissolution of California Re-development Agencies, Senate Bill 628 passed
REVENUE!SOURCE!ALTERNATIVES in the fall of 2014 to allow for the creation of Enhanced Infrastructure Financing Districts (EIFDs) within a city or county. EIFDs allow for Tax Increment Financing of a broader scope of revenues (excluding school districts) and for a broader group of objectives including infrastruc-ture, environmental mitigation and economic growth strategies. Funds may be used to finance the construction or rehabilitation of a variety of public infrastructure and private facilities. Examples include parking, transit facilities, parks and open spaces, and projects which implement a sustainable-communities strategy. Specific re-quirements must be met before creating an EIFD for entities, such as Placer County, that previous-ly had a redevelopment agency.
TOURIST%BUSINESS%IMPROVEMENT% DISTRICT%FUNDING
A Tourist Business Improvement District (TBID) is a reliable source of funding typically generated by an assessment on lodging stays within a desti-nation. The funds can then be used for marketing efforts designed to increase occupancy and room rates for lodging businesses. The collected funds are used to provide services desired by and di-rectly benefiting the businesses in the district.
To create a funding source that cannot be allo-cated for other purposes, many tourism commu-nities are implementing a TBID which is having an impact on the tourism promotion landscape. These communities are planning to develop TBIDs as a hedge against potential future budget reductions that would threaten tourism-based economies.
TBID has become a major source of tourism funding. There are now approximately 88 des-tinations in California using TBID funding. Each of the California regions in North Lake Tahoe’s summer comparable set are funded by TBIDs and use this form of tourism promotion funding either
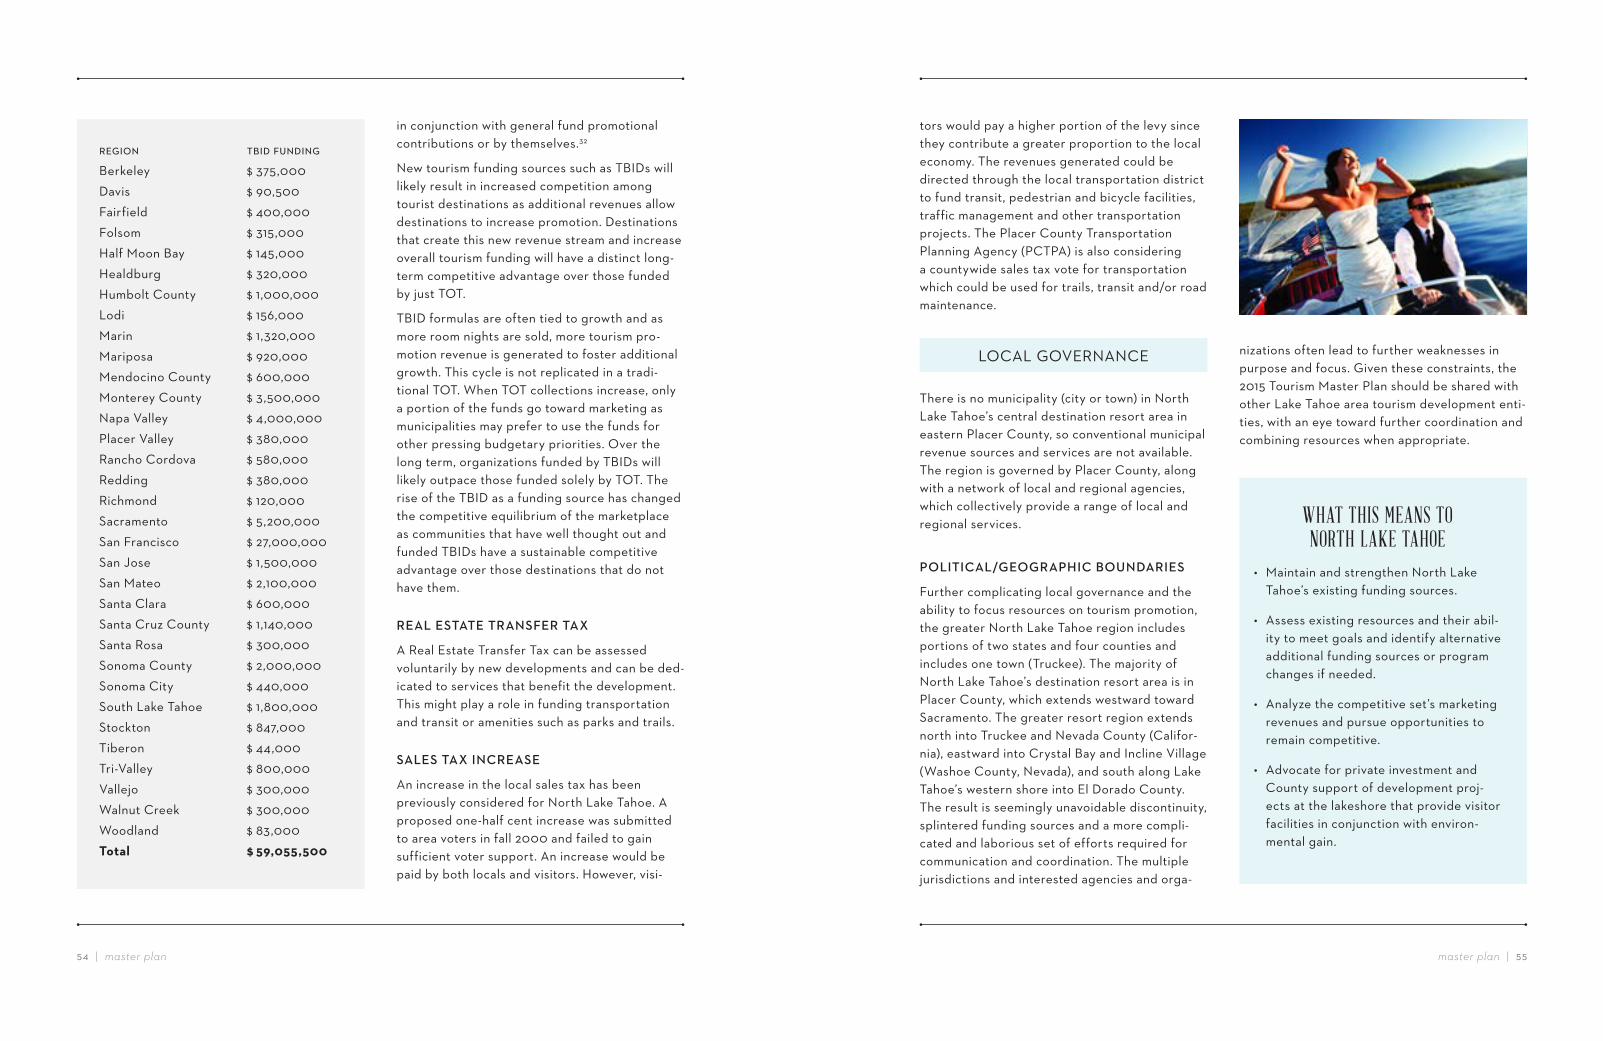
master plan!!|!!)))*!!|!!master plan
in conjunction with general fund promotional contributions or by themselves.32
New tourism funding sources such as TBIDs will likely result in increased competition among tourist destinations as additional revenues allow destinations to increase promotion. Destinations that create this new revenue stream and increase overall tourism funding will have a distinct long-term competitive advantage over those funded by just TOT.
TBID formulas are often tied to growth and as more room nights are sold, more tourism pro-motion revenue is generated to foster additional growth. This cycle is not replicated in a tradi-tional TOT. When TOT collections increase, only a portion of the funds go toward marketing as municipalities may prefer to use the funds for other pressing budgetary priorities. Over the long term, organizations funded by TBIDs will likely outpace those funded solely by TOT. The rise of the TBID as a funding source has changed the competitive equilibrium of the marketplace as communities that have well thought out and funded TBIDs have a sustainable competitive advantage over those destinations that do not have them.
REAL%ESTATE%TRANSFER%TAX
A Real Estate Transfer Tax can be assessed voluntarily by new developments and can be ded-icated to services that benefit the development. This might play a role in funding transportation and transit or amenities such as parks and trails.
SALES%TAX%INCREASE
An increase in the local sales tax has been previously considered for North Lake Tahoe. A proposed one-half cent increase was submitted to area voters in fall 2000 and failed to gain sufficient voter support. An increase would be paid by both locals and visitors. However, visi-
tors would pay a higher portion of the levy since they contribute a greater proportion to the local economy. The revenues generated could be directed through the local transportation district to fund transit, pedestrian and bicycle facilities, traffic management and other transportation projects. The Placer County Transportation Planning Agency (PCTPA) is also considering a countywide sales tax vote for transportation which could be used for trails, transit and/or road maintenance.
There is no municipality (city or town) in North Lake Tahoe’s central destination resort area in eastern Placer County, so conventional municipal revenue sources and services are not available. The region is governed by Placer County, along with a network of local and regional agencies, which collectively provide a range of local and regional services.
POLITICAL/GEOGRAPHIC%BOUNDARIES
Further complicating local governance and the ability to focus resources on tourism promotion, the greater North Lake Tahoe region includes portions of two states and four counties and includes one town (Truckee). The majority of North Lake Tahoe’s destination resort area is in Placer County, which extends westward toward Sacramento. The greater resort region extends north into Truckee and Nevada County (Califor-nia), eastward into Crystal Bay and Incline Village (Washoe County, Nevada), and south along Lake Tahoe’s western shore into El Dorado County. The result is seemingly unavoidable discontinuity, splintered funding sources and a more compli-cated and laborious set of efforts required for communication and coordination. The multiple jurisdictions and interested agencies and orga-
nizations often lead to further weaknesses in purpose and focus. Given these constraints, the 2015 Tourism Master Plan should be shared with other Lake Tahoe area tourism development enti-ties, with an eye toward further coordination and combining resources when appropriate.
LOCAL!GOVERNANCE
WHAT THIS MEANS TO NORTH LAKE TAHOE
• Maintain and strengthen North Lake Tahoe’s existing funding sources.
• Assess existing resources and their abil-ity to meet goals and identify alternative additional funding sources or program changes if needed.
• Analyze the competitive set’s marketing revenues and pursue opportunities to remain competitive.
• Advocate for private investment and County support of development proj-ects at the lakeshore that provide visitor facilities in conjunction with environ-mental gain.
51?C4: 37CF(I;:FC:?Berkeley $ 375,000Davis $ 90,500Fairfield $ 400,000Folsom $ 315,000Half Moon Bay $ 145,000Healdburg $ 320,000Humbolt County $ 1,000,000Lodi $ 156,000Marin $ 1,320,000Mariposa $ 920,000Mendocino County $ 600,000Monterey County $ 3,500,000Napa Valley $ 4,000,000Placer Valley $ 380,000Rancho Cordova $ 580,000Redding $ 380,000Richmond $ 120,000Sacramento $ 5,200,000San Francisco $ 27,000,000San Jose $ 1,500,000San Mateo $ 2,100,000Santa Clara $ 600,000Santa Cruz County $ 1,140,000Santa Rosa $ 300,000Sonoma County $ 2,000,000Sonoma City $ 440,000South Lake Tahoe $ 1,800,000Stockton $ 847,000Tiberon $ 44,000Tri-Valley $ 800,000Vallejo $ 300,000Walnut Creek $ 300,000Woodland $ 83,000Total $ 59,055,500
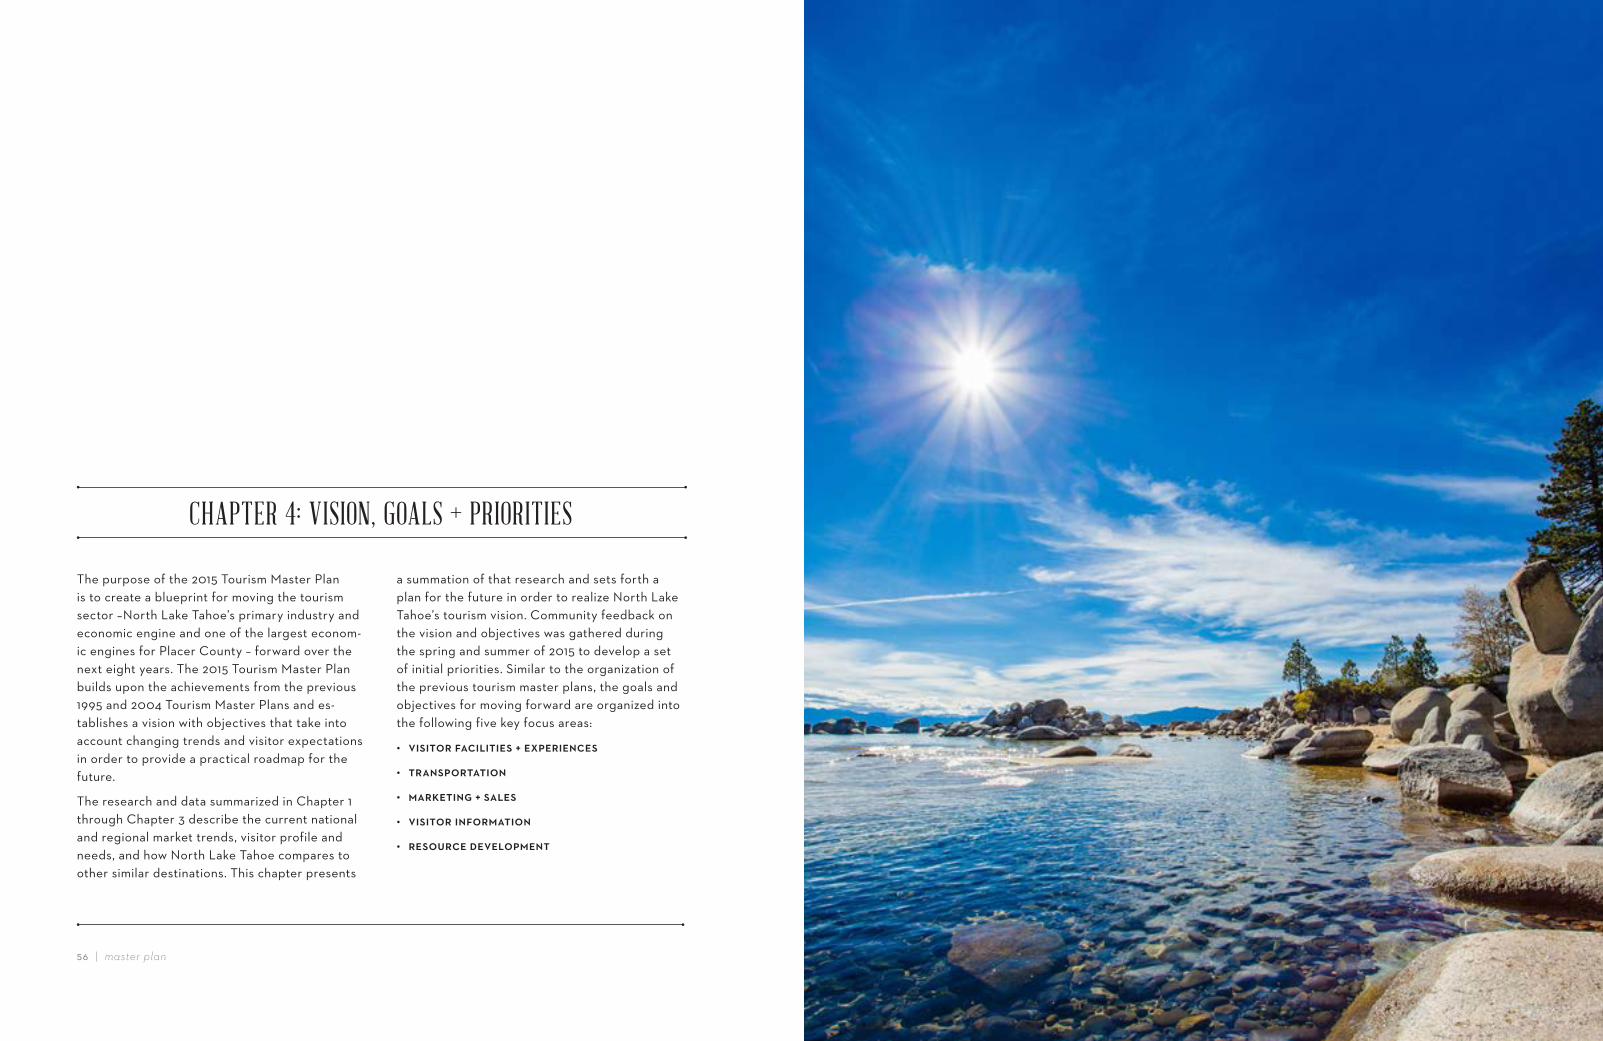
master plan!!|!!)+),!!|!!master plan
CHAPTER 4: VISION, GOALS + PRIORITIES
The purpose of the 2015 Tourism Master Plan is to create a blueprint for moving the tourism sector –North Lake Tahoe’s primary industry and economic engine and one of the largest econom-ic engines for Placer County – forward over the next eight years. The 2015 Tourism Master Plan builds upon the achievements from the previous 1995 and 2004 Tourism Master Plans and es-tablishes a vision with objectives that take into account changing trends and visitor expectations in order to provide a practical roadmap for the future.
The research and data summarized in Chapter 1 through Chapter 3 describe the current national and regional market trends, visitor profile and needs, and how North Lake Tahoe compares to other similar destinations. This chapter presents
a summation of that research and sets forth a plan for the future in order to realize North Lake Tahoe’s tourism vision. Community feedback on the vision and objectives was gathered during the spring and summer of 2015 to develop a set of initial priorities. Similar to the organization of the previous tourism master plans, the goals and objectives for moving forward are organized into the following five key focus areas:
• 2*3*(&046-/*)*(*,3454,M1,0*,+/,3
• (0-+31&0(-(*&+
• 7-08,(*+.4543-),3
• 2*3*(&04*+6&07-(*&+
• 0,3&'0/,49,2,)&17,+(
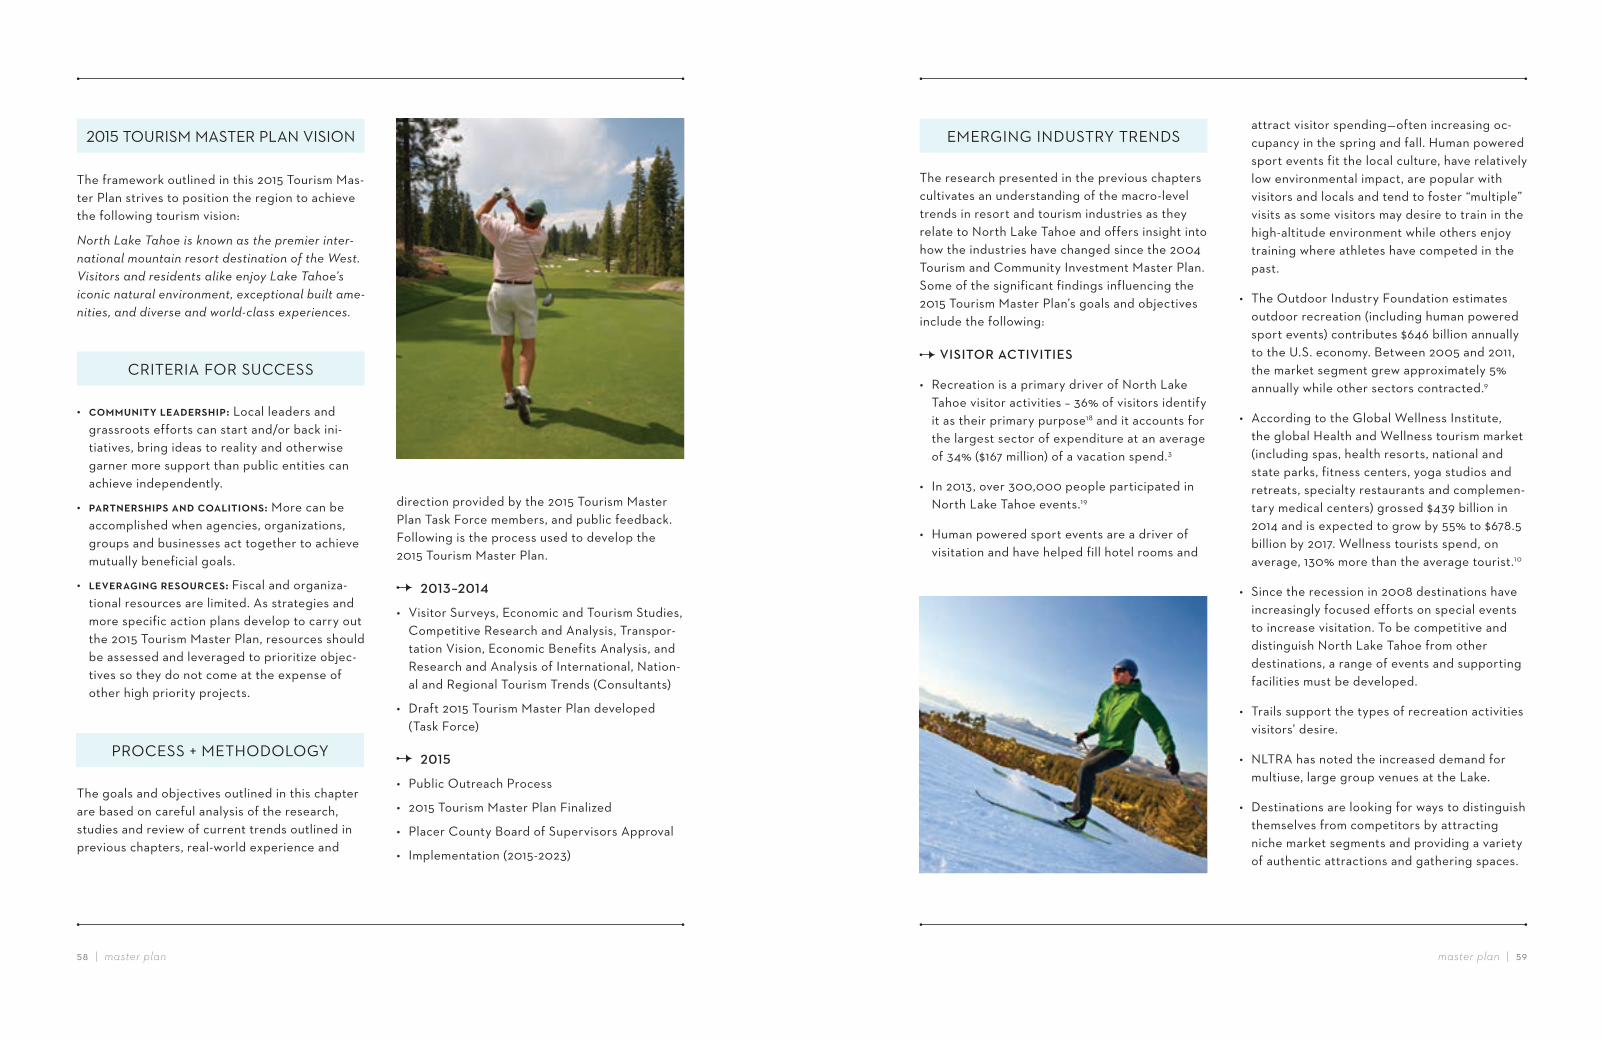
master plan!!|!!)-).!!|!!master plan
The framework outlined in this 2015 Tourism Mas-ter Plan strives to position the region to achieve the following tourism vision:
North Lake Tahoe is known as the premier inter-national mountain resort destination of the West. Visitors and residents alike enjoy Lake Tahoe’s iconic natural environment, exceptional built ame-nities, and diverse and world-class experiences.
• /&77'+*(;4),-9,03<*1: Local leaders and grassroots efforts can start and/or back ini-tiatives, bring ideas to reality and otherwise garner more support than public entities can achieve independently.
• 1-0(+,03<*134-+94/&-)*(*&+3: More can be accomplished when agencies, organizations, groups and businesses act together to achieve mutually beneficial goals.
• ),2,0-.*+.40,3&'0/,3:4Fiscal and organiza-tional resources are limited. As strategies and more specific action plans develop to carry out the 2015 Tourism Master Plan, resources should be assessed and leveraged to prioritize objec-tives so they do not come at the expense of other high priority projects.
The goals and objectives outlined in this chapter are based on careful analysis of the research, studies and review of current trends outlined in previous chapters, real-world experience and
direction provided by the 2015 Tourism Master Plan Task Force members, and public feedback. Following is the process used to develop the 2015 Tourism Master Plan.
%%!"#OP!"#Q
• Visitor Surveys, Economic and Tourism Studies, Competitive Research and Analysis, Transpor-tation Vision, Economic Benefits Analysis, and Research and Analysis of International, Nation-al and Regional Tourism Trends (Consultants)
• Draft 2015 Tourism Master Plan developed (Task Force)
%%!"#$
• Public Outreach Process
• 2015 Tourism Master Plan Finalized
• Placer County Board of Supervisors Approval
• Implementation (2015-2023)
KLMN!TOURISM!MASTER!PLAN!VISION
CRITERIA!FOR!SUCCESS
PROCESS!#!METHODOLOGY
The research presented in the previous chapters cultivates an understanding of the macro-level trends in resort and tourism industries as they relate to North Lake Tahoe and offers insight into how the industries have changed since the 2004 Tourism and Community Investment Master Plan. Some of the significant findings influencing the 2015 Tourism Master Plan’s goals and objectives include the following:
%VISITOR%ACTIVITIES
• Recreation is a primary driver of North Lake Tahoe visitor activities – 36% of visitors identify it as their primary purpose18 and it accounts for the largest sector of expenditure at an average of 34% ($167 million) of a vacation spend.3
• In 2013, over 300,000 people participated in North Lake Tahoe events.19
• Human powered sport events are a driver of visitation and have helped fill hotel rooms and
attract visitor spending—often increasing oc-cupancy in the spring and fall. Human powered sport events fit the local culture, have relatively low environmental impact, are popular with visitors and locals and tend to foster “multiple” visits as some visitors may desire to train in the high-altitude environment while others enjoy training where athletes have competed in the past.
• The Outdoor Industry Foundation estimates outdoor recreation (including human powered sport events) contributes $646 billion annually to the U.S. economy. Between 2005 and 2011, the market segment grew approximately 5% annually while other sectors contracted.9
• According to the Global Wellness Institute, the global Health and Wellness tourism market (including spas, health resorts, national and state parks, fitness centers, yoga studios and retreats, specialty restaurants and complemen-tary medical centers) grossed $439 billion in 2014 and is expected to grow by 55% to $678.5 billion by 2017. Wellness tourists spend, on average, 130% more than the average tourist.10
• Since the recession in 2008 destinations have increasingly focused efforts on special events to increase visitation. To be competitive and distinguish North Lake Tahoe from other destinations, a range of events and supporting facilities must be developed.
• Trails support the types of recreation activities visitors’ desire.
• NLTRA has noted the increased demand for multiuse, large group venues at the Lake.
• Destinations are looking for ways to distinguish themselves from competitors by attracting niche market segments and providing a variety of authentic attractions and gathering spaces.
EMERGING!INDUSTRY!TRENDS
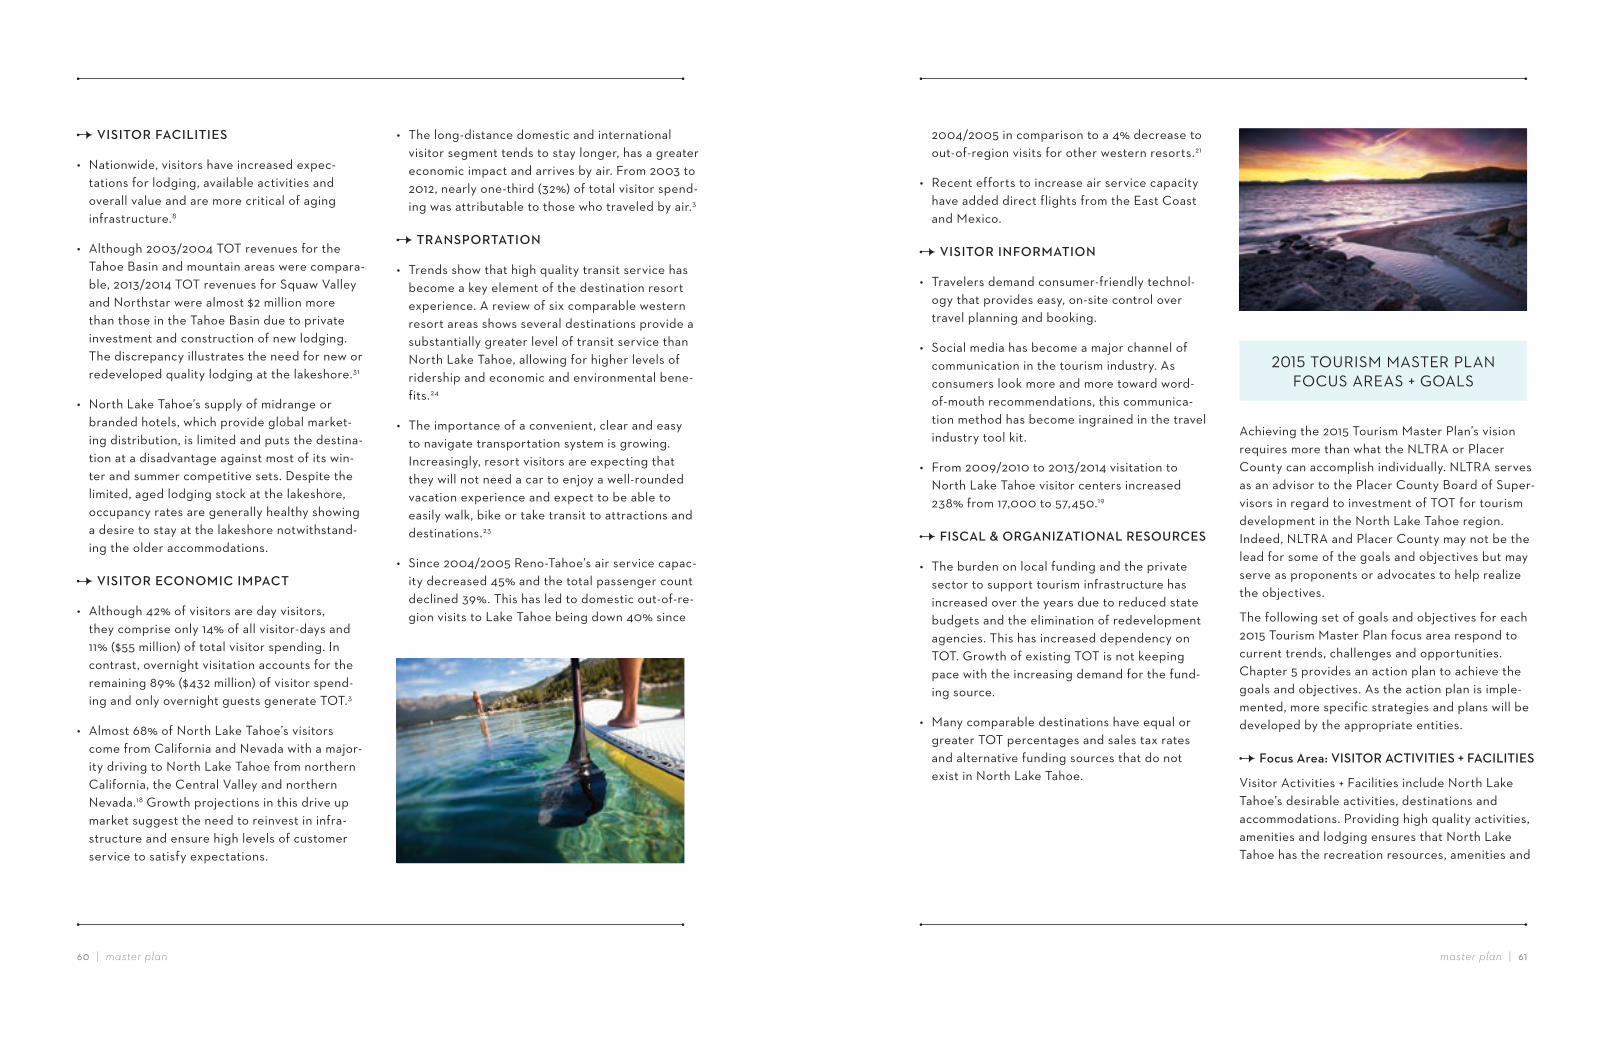
master plan!!|!!,%,/!!|!!master plan
%VISITOR%FACILITIES
• Nationwide, visitors have increased expec-tations for lodging, available activities and overall value and are more critical of aging infrastructure.8
• Although 2003/2004 TOT revenues for the Tahoe Basin and mountain areas were compara-ble, 2013/2014 TOT revenues for Squaw Valley and Northstar were almost $2 million more than those in the Tahoe Basin due to private investment and construction of new lodging. The discrepancy illustrates the need for new or redeveloped quality lodging at the lakeshore.31
• North Lake Tahoe’s supply of midrange or branded hotels, which provide global market-ing distribution, is limited and puts the destina-tion at a disadvantage against most of its win-ter and summer competitive sets. Despite the limited, aged lodging stock at the lakeshore, occupancy rates are generally healthy showing a desire to stay at the lakeshore notwithstand-ing the older accommodations.
%VISITOR%ECONOMIC%IMPACT
• Although 42% of visitors are day visitors, they comprise only 14% of all visitor-days and 11% ($55 million) of total visitor spending. In contrast, overnight visitation accounts for the remaining 89% ($432 million) of visitor spend-ing and only overnight guests generate TOT.3
• Almost 68% of North Lake Tahoe’s visitors come from California and Nevada with a major-ity driving to North Lake Tahoe from northern California, the Central Valley and northern Nevada.18 Growth projections in this drive up market suggest the need to reinvest in infra-structure and ensure high levels of customer service to satisfy expectations.
• The long-distance domestic and international visitor segment tends to stay longer, has a greater economic impact and arrives by air. From 2003 to 2012, nearly one-third (32%) of total visitor spend-ing was attributable to those who traveled by air.3
%TRANSPORTATION
• Trends show that high quality transit service has become a key element of the destination resort experience. A review of six comparable western resort areas shows several destinations provide a substantially greater level of transit service than North Lake Tahoe, allowing for higher levels of ridership and economic and environmental bene-fits.24
• The importance of a convenient, clear and easy to navigate transportation system is growing. Increasingly, resort visitors are expecting that they will not need a car to enjoy a well-rounded vacation experience and expect to be able to easily walk, bike or take transit to attractions and destinations.23
• Since 2004/2005 Reno-Tahoe’s air service capac-ity decreased 45% and the total passenger count declined 39%. This has led to domestic out-of-re-gion visits to Lake Tahoe being down 40% since
2004/2005 in comparison to a 4% decrease to out-of-region visits for other western resorts.21
• Recent efforts to increase air service capacity have added direct flights from the East Coast and Mexico.
%VISITOR%INFORMATION
• Travelers demand consumer-friendly technol-ogy that provides easy, on-site control over travel planning and booking.
• Social media has become a major channel of communication in the tourism industry. As consumers look more and more toward word-of-mouth recommendations, this communica-tion method has become ingrained in the travel industry tool kit.
• From 2009/2010 to 2013/2014 visitation to North Lake Tahoe visitor centers increased 238% from 17,000 to 57,450.19
%FISCAL%&%ORGANIZATIONAL%RESOURCES
• The burden on local funding and the private sector to support tourism infrastructure has increased over the years due to reduced state budgets and the elimination of redevelopment agencies. This has increased dependency on TOT. Growth of existing TOT is not keeping pace with the increasing demand for the fund-ing source.
• Many comparable destinations have equal or greater TOT percentages and sales tax rates and alternative funding sources that do not exist in North Lake Tahoe.
KLMN!TOURISM!MASTER!PLAN! FOCUS!AREAS!#!GOALS
Achieving the 2015 Tourism Master Plan’s vision requires more than what the NLTRA or Placer County can accomplish individually. NLTRA serves as an advisor to the Placer County Board of Super-visors in regard to investment of TOT for tourism development in the North Lake Tahoe region. Indeed, NLTRA and Placer County may not be the lead for some of the goals and objectives but may serve as proponents or advocates to help realize the objectives.
The following set of goals and objectives for each 2015 Tourism Master Plan focus area respond to current trends, challenges and opportunities. Chapter 5 provides an action plan to achieve the goals and objectives. As the action plan is imple-mented, more specific strategies and plans will be developed by the appropriate entities.
Focus Area: VISITOR%ACTIVITIES%R%FACILITIES%
Visitor Activities + Facilities include North Lake Tahoe’s desirable activities, destinations and accommodations. Providing high quality activities, amenities and lodging ensures that North Lake Tahoe has the recreation resources, amenities and
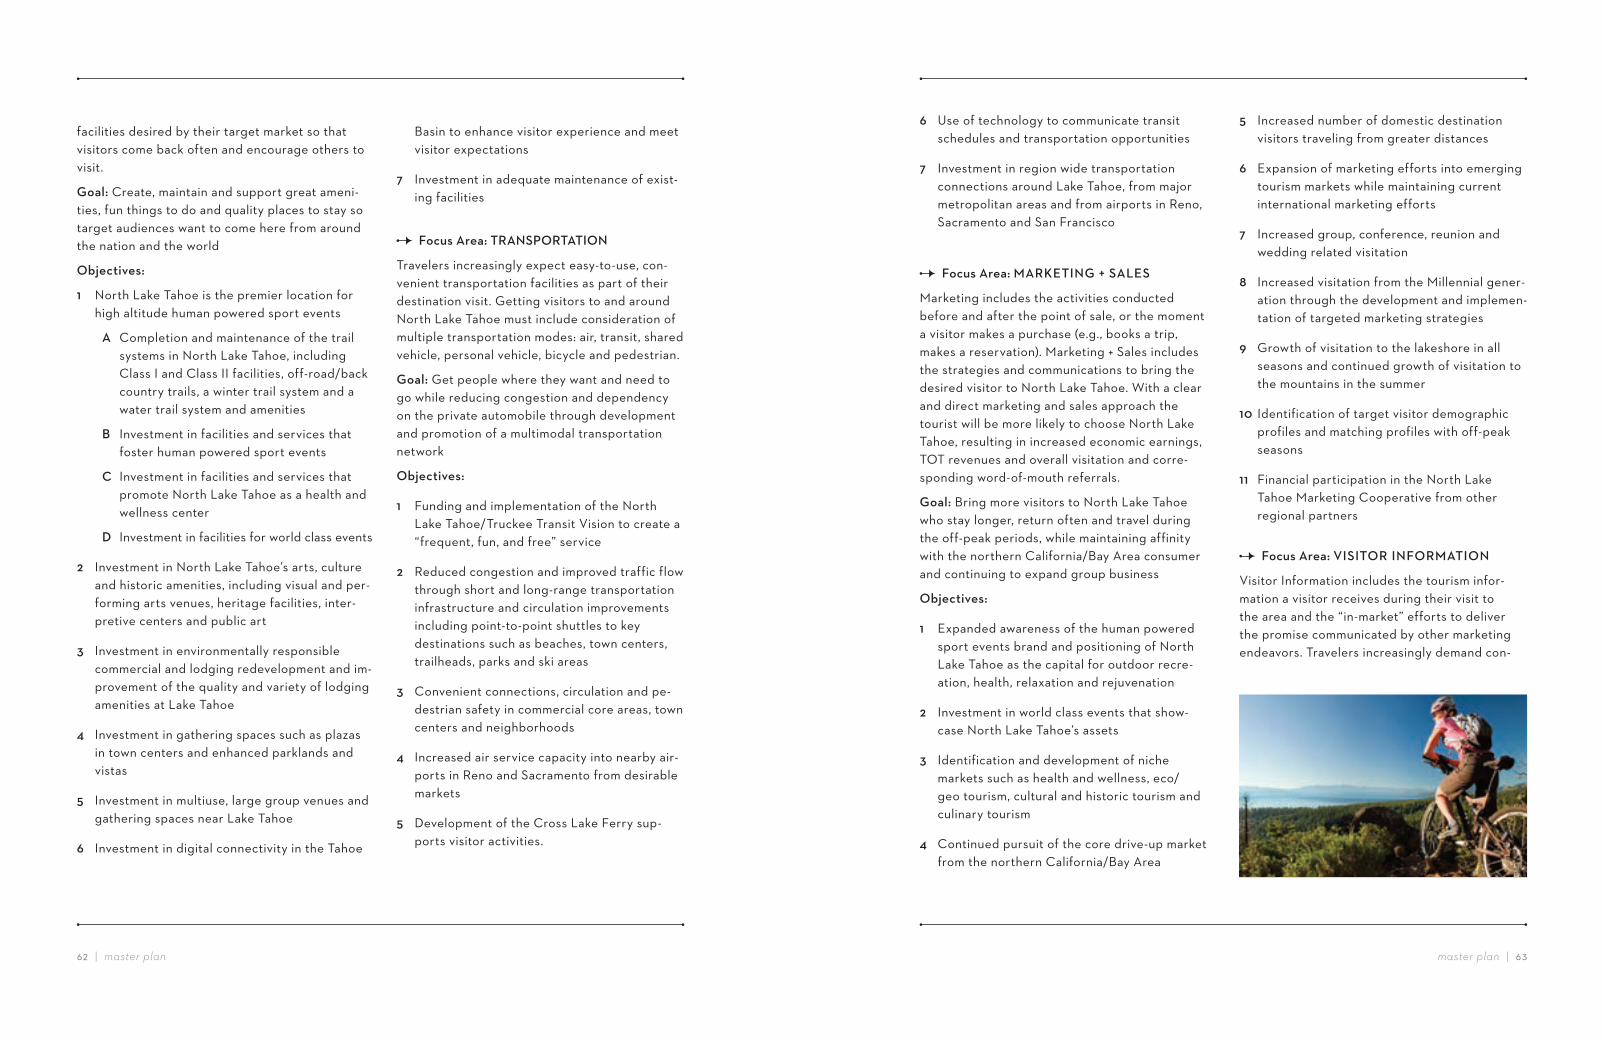
master plan!!|!!,&,'!!|!!master plan
facilities desired by their target market so that visitors come back often and encourage others to visit.
Goal: Create, maintain and support great ameni-ties, fun things to do and quality places to stay so target audiences want to come here from around the nation and the world
Objectives:
1 North Lake Tahoe is the premier location for high altitude human powered sport events
A Completion and maintenance of the trail systems in North Lake Tahoe, including Class I and Class II facilities, off-road/back country trails, a winter trail system and a water trail system and amenities
B Investment in facilities and services that foster human powered sport events
C Investment in facilities and services that promote North Lake Tahoe as a health and wellness center
D Investment in facilities for world class events
2 Investment in North Lake Tahoe’s arts, culture and historic amenities, including visual and per-forming arts venues, heritage facilities, inter-pretive centers and public art
3 Investment in environmentally responsible commercial and lodging redevelopment and im-provement of the quality and variety of lodging amenities at Lake Tahoe
4 Investment in gathering spaces such as plazas in town centers and enhanced parklands and vistas
5 Investment in multiuse, large group venues and gathering spaces near Lake Tahoe
6 Investment in digital connectivity in the Tahoe
Basin to enhance visitor experience and meet visitor expectations
7 Investment in adequate maintenance of exist-ing facilities
Focus Area: TRANSPORTATION
Travelers increasingly expect easy-to-use, con-venient transportation facilities as part of their destination visit. Getting visitors to and around North Lake Tahoe must include consideration of multiple transportation modes: air, transit, shared vehicle, personal vehicle, bicycle and pedestrian.
Goal: Get people where they want and need to go while reducing congestion and dependency on the private automobile through development and promotion of a multimodal transportation network
Objectives:
1 Funding and implementation of the North Lake Tahoe/Truckee Transit Vision to create a “frequent, fun, and free” service
2 Reduced congestion and improved traffic flow through short and long-range transportation infrastructure and circulation improvements including point-to-point shuttles to key destinations such as beaches, town centers, trailheads, parks and ski areas
3 Convenient connections, circulation and pe-destrian safety in commercial core areas, town centers and neighborhoods
4 Increased air service capacity into nearby air-ports in Reno and Sacramento from desirable markets
5 Development of the Cross Lake Ferry sup-ports visitor activities.
6 Use of technology to communicate transit schedules and transportation opportunities
7 Investment in region wide transportation connections around Lake Tahoe, from major metropolitan areas and from airports in Reno, Sacramento and San Francisco
Focus Area: MARKETING%R%SALES
Marketing includes the activities conducted before and after the point of sale, or the moment a visitor makes a purchase (e.g., books a trip, makes a reservation). Marketing + Sales includes the strategies and communications to bring the desired visitor to North Lake Tahoe. With a clear and direct marketing and sales approach the tourist will be more likely to choose North Lake Tahoe, resulting in increased economic earnings, TOT revenues and overall visitation and corre-sponding word-of-mouth referrals.
Goal: Bring more visitors to North Lake Tahoe who stay longer, return often and travel during the off-peak periods, while maintaining affinity with the northern California/Bay Area consumer and continuing to expand group business
Objectives:
1 Expanded awareness of the human powered sport events brand and positioning of North Lake Tahoe as the capital for outdoor recre-ation, health, relaxation and rejuvenation
2 Investment in world class events that show-case North Lake Tahoe’s assets
3 Identification and development of niche markets such as health and wellness, eco/geo tourism, cultural and historic tourism and culinary tourism
4 Continued pursuit of the core drive-up market from the northern California/Bay Area
5 Increased number of domestic destination visitors traveling from greater distances
6 Expansion of marketing efforts into emerging tourism markets while maintaining current international marketing efforts
7 Increased group, conference, reunion and wedding related visitation
8 Increased visitation from the Millennial gener-ation through the development and implemen-tation of targeted marketing strategies
9 Growth of visitation to the lakeshore in all seasons and continued growth of visitation to the mountains in the summer
10 Identification of target visitor demographic profiles and matching profiles with off-peak seasons
11 Financial participation in the North Lake Tahoe Marketing Cooperative from other regional partners
Focus Area: VISITOR%INFORMATION
Visitor Information includes the tourism infor-mation a visitor receives during their visit to the area and the “in-market” efforts to deliver the promise communicated by other marketing endeavors. Travelers increasingly demand con-
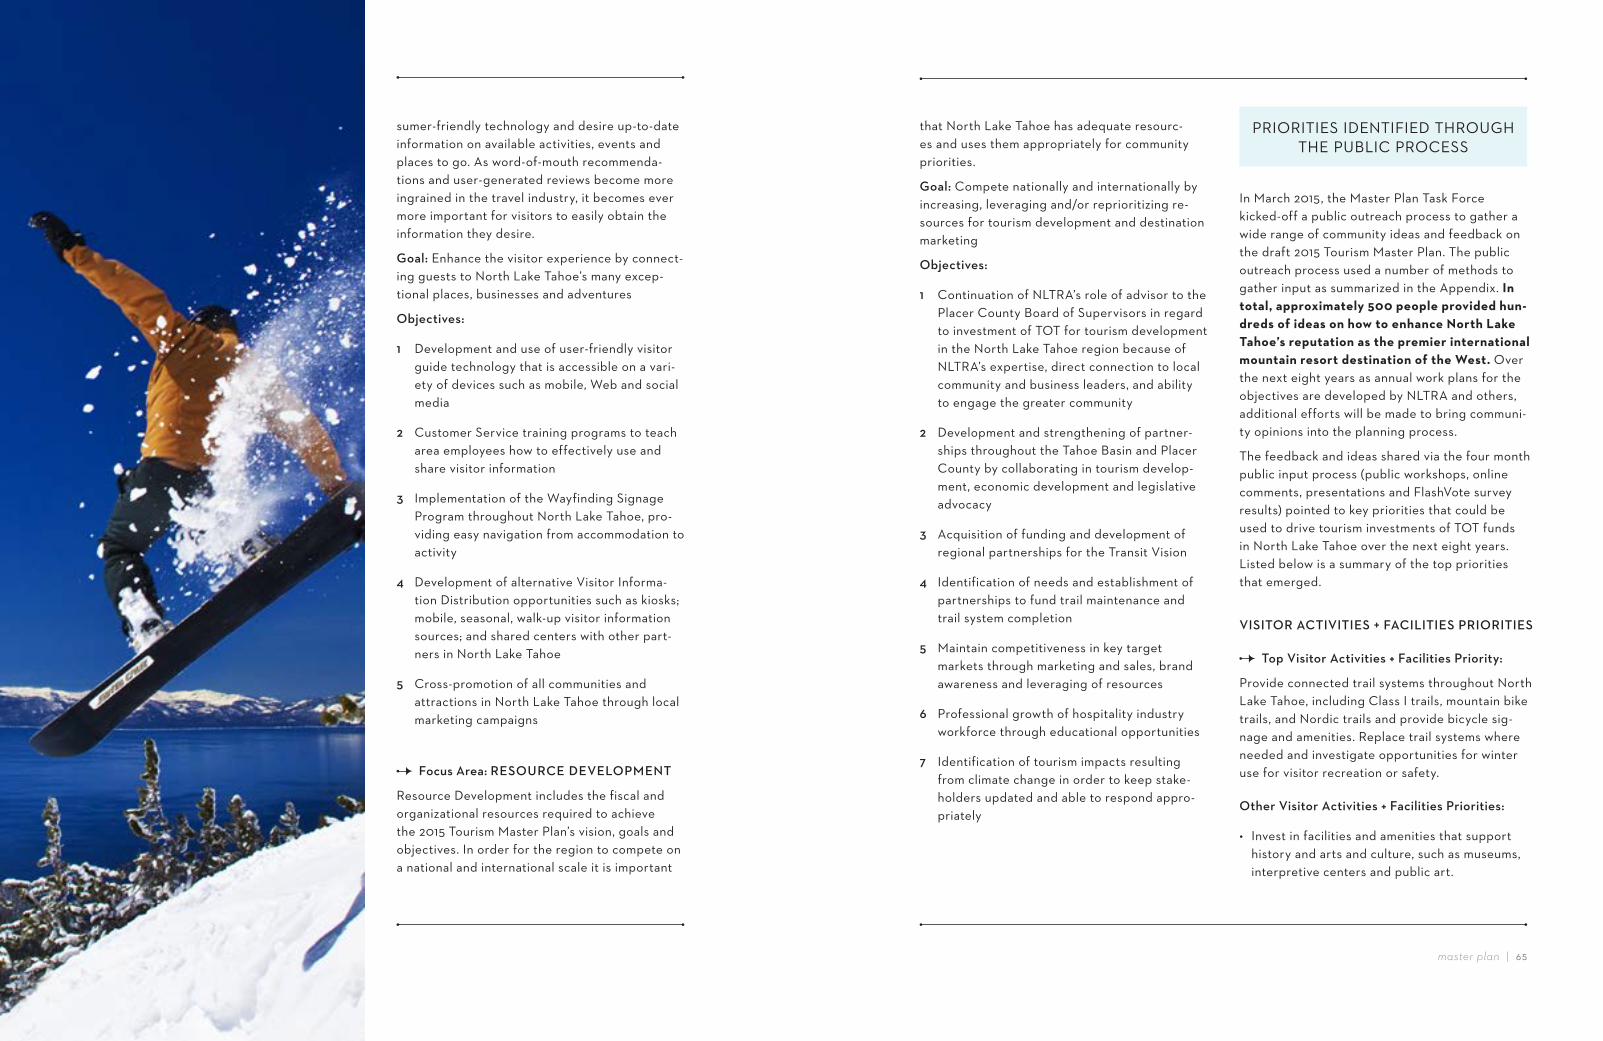
master plan!!|!!,)
sumer-friendly technology and desire up-to-date information on available activities, events and places to go. As word-of-mouth recommenda-tions and user-generated reviews become more ingrained in the travel industry, it becomes ever more important for visitors to easily obtain the information they desire.
Goal: Enhance the visitor experience by connect-ing guests to North Lake Tahoe’s many excep-tional places, businesses and adventures
Objectives:
1 Development and use of user-friendly visitor guide technology that is accessible on a vari-ety of devices such as mobile, Web and social media
2 Customer Service training programs to teach area employees how to effectively use and share visitor information
3 Implementation of the Wayfinding Signage Program throughout North Lake Tahoe, pro-viding easy navigation from accommodation to activity
4 Development of alternative Visitor Informa-tion Distribution opportunities such as kiosks; mobile, seasonal, walk-up visitor information sources; and shared centers with other part-ners in North Lake Tahoe
5 Cross-promotion of all communities and attractions in North Lake Tahoe through local marketing campaigns
Focus Area: RESOURCE%DEVELOPMENT
Resource Development includes the fiscal and organizational resources required to achieve the 2015 Tourism Master Plan’s vision, goals and objectives. In order for the region to compete on a national and international scale it is important
that North Lake Tahoe has adequate resourc-es and uses them appropriately for community priorities.
Goal: Compete nationally and internationally by increasing, leveraging and/or reprioritizing re-sources for tourism development and destination marketing
Objectives:
1 Continuation of NLTRA’s role of advisor to the Placer County Board of Supervisors in regard to investment of TOT for tourism development in the North Lake Tahoe region because of NLTRA’s expertise, direct connection to local community and business leaders, and ability to engage the greater community
2 Development and strengthening of partner-ships throughout the Tahoe Basin and Placer County by collaborating in tourism develop-ment, economic development and legislative advocacy
3 Acquisition of funding and development of regional partnerships for the Transit Vision
4 Identification of needs and establishment of partnerships to fund trail maintenance and trail system completion
5 Maintain competitiveness in key target markets through marketing and sales, brand awareness and leveraging of resources
6 Professional growth of hospitality industry workforce through educational opportunities
7 Identification of tourism impacts resulting from climate change in order to keep stake-holders updated and able to respond appro-priately
In March 2015, the Master Plan Task Force kicked-off a public outreach process to gather a wide range of community ideas and feedback on the draft 2015 Tourism Master Plan. The public outreach process used a number of methods to gather input as summarized in the Appendix. In total, approximately 500 people provided hun-dreds of ideas on how to enhance North Lake Tahoe’s reputation as the premier international mountain resort destination of the West. Over the next eight years as annual work plans for the objectives are developed by NLTRA and others, additional efforts will be made to bring communi-ty opinions into the planning process.
The feedback and ideas shared via the four month public input process (public workshops, online comments, presentations and FlashVote survey results) pointed to key priorities that could be used to drive tourism investments of TOT funds in North Lake Tahoe over the next eight years. Listed below is a summary of the top priorities that emerged.
VISITOR%ACTIVITIES%R%FACILITIES%PRIORITIES%
Top Visitor Activities + Facilities Priority:
Provide connected trail systems throughout North Lake Tahoe, including Class I trails, mountain bike trails, and Nordic trails and provide bicycle sig-nage and amenities. Replace trail systems where needed and investigate opportunities for winter use for visitor recreation or safety.
Other Visitor Activities + Facilities Priorities:
• Invest in facilities and amenities that support history and arts and culture, such as museums, interpretive centers and public art.
PRIORITIES!IDENTIFIED!THROUGH!THE!PUBLIC!PROCESS
master plan!|!!,+,,!!|!!master plan
• Advance efforts to update and improve the quality and variety of lodging properties at the lakeshore.
• Create more public gathering and use spaces such as: plazas, parks, vista points, and group and event spaces.
TRANSPORTATION%PRIORITIES%
Top Transportation Priority
Fund and implement the Transit Vision to pro-vide “frequent, fun, and free” transit service. The year-round service would be free to the rider, have a 30-minute frequency and operate from 6 a.m.to 2 a.m. during the peak season and 6 a.m. – 9:30 p.m. during the shoulder season. It would provide transit connectivity between North Lake Tahoe, Truckee and Donner Summit and use tech-nology to communicate transit schedules.
Other Transportation Priorities:
• Create point-to-point shuttles to key destina-tions such as beaches, town centers, trailheads, parks and ski areas.
• Invest in sidewalks and pedestrian infrastruc-ture and amenities to increase safety and convenience and improve the visitor’s experi-ence of walking in commercial core areas, town centers and neighborhoods.
• Advocate for and invest in more direct flights into the Reno and Sacramento Airports to attract destination visitors and reduce personal automobile use.
VISITOR%INFORMATION%PRIORITIES
Top Visitor Information Priority:
Implement user-friendly visitor guide technology that is accessible on a variety of devices. This may include: website upgrades, development of applications (apps), local business training, integration with social media and increased use of established visitor information tools.
Other Visitor Information Priorities:
• Implement more vehicular and pedestrian way-finding signage and maps pointing to down-towns; historic, scenic and recreation sites; and photo-opportunity locations.
• Create mobile, seasonal, walk-up visitor infor-mation at popular locations and events.
CHAPTER 5: ACTION PLAN
The 2015 Tourism Master Plan process included research and analysis to understand the current tourism environment, development of draft goals and objectives and public outreach to identify community tourism priorities. Two sets of priori-ties were born out of the public outreach process – a singular, top priority (Tier 1) and a subset of additional priorities (Tier 2) in each of the five key focus areas. Substantially more public sup-port existed for the objectives identified as the top priority for future investment of TOT.
The Master Plan Task Force and pertinent NL-TRA committees reviewed the tourism priorities identified by the public and confirmed that the priorities could be used in decision-making to allocate limited TOT funds. Therefore, the Action Plan Matrix presents the priorities as Tier 1 and Tier 2 priorities. Tier 1 priorities received the most substantial support from the public and were affirmed by the Master Plan Task Force and NLTRA committees. Tier 2 priorities include action items to achieve the remaining 2015 Tour-ism Master Plan objectives for Visitor Activities + Facilities, Transportation, Marketing+ Sales and Visitor Information.
Over the next eight years, successful completion of the 2015 North Tahoe Tourism Master Plan goals and objections will require the efforts of many agencies and partners in the region. While investment of TOT is recommended for the following priorities, additional funding sources will also be necessary. The Action Plan Matrix is a long range (eight year) plan which identifies potential partners and funding sources that may be utilized as well as short- and long-term objec-tives.
The Action Plan Matrix is organized according to the focus areas presented within the 2015 Tourism Master Plan and does not necessarily correspond with TOT funding that may be allo-cated for a particular action item. For example, air travel is described in the 2015 Tourism Master Plan under “Transportation.” However, the Trans-portation objective to “Advocate for and invest in more direct flights into the Reno-Tahoe and Sacramento airports to attract destination visi-tors and reduce personal automobile use” may be funded from the Marketing allocation depending on where the greatest benefit is derived. Estimat-ed costs shown in the matrix represent the total overall estimated cost of the project, not the amount of TOT to be invested.
OVERVIEW
master plan!!|!!,-,.!!|!!master plan
VISITOR!ACTIVITIES!#!FACILITIES! TIER!M!PRIORITY
TRANSPORTATION!TIER!M!PRIORITY
ACTION"ITEM"
Provide connected trail systems throughout North Lake Tahoe including:
• Class I trails
• Mountain bike trails
• Nordic trails
• Bicycle signage and amenities
• Capital replacement program for trails
• Winter use of trail systems
ACTION"ITEM"
Fund and implement the Transit Vision to provide frequent, fun, and free Transit Service:• Year-round transit• Free to the rider• 30 -minute frequency• 6 a.m.–2 a.m. during peak season• 6 a.m.– 9:30 p.m. during shoulder season• Connectivity between North Lake
Tahoe, Squaw Valley, Northstar, Kings Beach, Truckee and Donner Summit
• Use of technology to communicate transit schedules
PARTICIPATING%ENTITIES
Lead Agencies/Organizations
• Placer County
• Tahoe City Public Utility District
• North Tahoe Public Utility District
• Squaw Valley Public Service District
• Northstar Community Service District
• Donner Summit Public Utility District
Partnering Agencies/Organizations
• Tahoe Transportation District
• North Lake Tahoe Resort Association
• Tahoe Bicycle Coalitions
• Tahoe Regional Planning Agency
Private Organizations/Entities
• Local bike store owners
• User groups
PARTICIPATING%ENTITIES
Lead Agencies/Organizations
• Placer County/Tahoe Area Regional Transit
• Truckee-North Tahoe Transportation Manage-ment Associations
Partnering Agencies/Organizations
• Town of Truckee
• Washoe County/Incline Village
• Tahoe Transportation District
• Tahoe Regional Planning Agency
ESTIMATED%TOTAL%COSTS
• Trail Construction: $51.65M for 28 miles
• Trail Signage and Amenities: $40K annually
• Capital Replacement Fund: $500K annually
• Maintenance and Snow Removal: $50K - $100K annually
2015 Investment:
• Construction: $800K
• Replacement: $700K
• Snow Removal: $70K
Additional Resources Required:
• $33K– $55M total over 8 years
POTENTIAL%ADDITIONAL%FUNDING%SOURCES%
• 0.5 cent Placer Sales Tax
• Federal, State and Local Grants
• Recreation Districts
• Eastern Placer additional TOT
TIMELINE
Short-Term (<2 yr.)
• Develop master plan for trail development and maintenance to determine funding needs
• Study winter use of trail systems and identify criteria and funding mechanisms
• Initiate sales tax ballot measure for 2016
• Work with stakeholders to identify grant fund-ing possibilities
Long-Term (>2 yr.)
• Convene user groups and bike store owners to determine trail amenity and signage needs
• North Lake Tahoe Resort Association
Private Organizations/Entities
• Ski areas
• Incline Village Crystal Bay Visitor Bureau
ESTIMATED%TOTAL%COSTS
• Local Share of Capital Improvements: $500K annually
• Operations, Marketing and Administration: $7.1M annually
2015 Investment:
• $4.5M annually
Additional Resources Required:
• $3.1M annually
POTENTIAL%ADDITIONAL%FUNDING%SOURCES
• 0.5 cent Placer Sales Tax
• Ski areas
• Town of Truckee
• Washoe County
• Increase of eastern Placer TOT
• State and Federal funding/grants
TIMELINE
Short-Term (<2 yr.)
• Initiate sales tax ballot measure for 2016
• Acquire other funding source(s)
• Work with Ski resorts and other jurisdictions to determine contribution and mechanism
Long-Term (>2 yr.)
• Reduce headways during peak traffic times
• Service residential areas with shuttles or park & rides
• Analyze feasibility of HOV lanes in key high traffic areas
• Work with trail user groups and lead agencies to complete mountain bike trail connections and map of the trail systems
• Work with public lands to develop trail signage for Nordic skiing and mountain biking
• Identify the sections of trail that merit snow removal
TIER 1 PRIORITIES
master plan!!|!!+%+/!!|!!master plan
MARKETING!#!SALES!TIER!M!PRIORITY
ACTION"ITEM"
Increase domestic and international destination visitors traveling from longer distances:
• Increase visitor length of stay
• Increase average visitor per person spend
• Integrate priority marketing themes of health and outdoor recreation followed by relaxation and rejuvenation into all messaging
PARTICIPATING%ENTITIES
Lead Agencies/Organizations
• North Lake Tahoe Resort Association
• North Lake Tahoe Marketing Cooperative
• Reno-Tahoe Regional Air Service Corporation (RASC)
Partnering Agencies/Organizations
• Reno Sparks Convention & Visitors Authority
• Reno-Tahoe International Airport
• Sacramento Airport
• Ski Lake Tahoe
• Sierra Ski Marketing Council
• Visit California
• International Tour & Travel Operators
• South Lake Tahoe Visitors Authority
• High Sierra Visitor Council
• Placer County Visitor Bureau
Private Organizations/Entities
• Ski areas
• Lodging properties
• Businesses
• Attractions
ESTIMATED%TOTAL%COSTS
• Marketing and Administration: $1.5M – $2.5M annually
2015 Investment:
• $600K
Additional Resources Required:
• $900K – $1.9M annually
POTENTIAL%ADDITIONAL%FUNDING%SOURCES%
• Eastern Placer additional TOT
• Tourism Business Improvement District
• Expand cooperative partnership funding
TIMELINE
Short-Term (<2 yr.)
• Work within existing marketing budget to iden-tify strategies that will grow length of stay and visitor spend
• Identify target visitor demographic profiles and match profiles with off-peak seasons
• Convene lodging representatives and ski areas to identify strategies to attract more destination visitors to North Lake Tahoe and to provide de-sired funding levels to be competitive with other mountain resorts in the West
• In partnership with RASC, continue to identify key air service markets and support with funding
• Determine a preferred alternative funding mechanism with stakeholders and take steps to implement
Long-Term (>2 yr.)
• Increase direct flight options, both domestically and internationally into Reno-Tahoe and Sacra-mento airports
• Solicit group and business travel from broader markets during shoulder seasons
• Work with emerging international markets such as China and Brazil to increase visitation
• Help local businesses to better understand cultural and language differences of foreign visitors
• Continue to recruit and host outdoor recre-ation and Human Powered Sport events that attract large numbers of domestic and interna-tional visitors
• Promote connecting ground services to allow the visitor the opportunity to reach the North Lake Tahoe area without a personal automobile
VISITOR!INFORMATION TIER!M!PRIORITY
ACTION"ITEM"
Implement user-friendly visitor guide technology that is accessible on a vari-ety of devices:
• Upgraded website
• Applications (apps)
• Use of social media
• Local business training
• Increased use of established visitor information tools.
PARTICIPATING%ENTITIES
Lead Agencies/Organizations
• North Lake Tahoe Resort Association
• North Lake Tahoe Marketing Cooperative
• Visitor Information Centers
Partnering Agencies/Organizations
• North Tahoe Business Association
• Tahoe City Downtown Association
• West Shore Business Association
• Squaw Valley Business
• Northstar Business
• Incline Village Business Association• Truckee Donner Chamber of Commerce
Private Organizations/Entities
• Businesses• Lodging Properties
ESTIMATED%TOTAL%COSTS
• Marketing and Administration: $200K - $300K annually
2015 Investment:• $180K
Additional Resources Required:• $20K– $120K annually
POTENTIAL%ADDITIONAL%FUNDING%SOURCES%
• Partner agency contributions• Business sponsorships
TIMELINE
Short-Term (<2 yr.)
• Complete a new Web format for easier consum-er navigation
• Work with local tourism leaders in hospitality training to develop a training program for local businesses, training to start summer 2016
• Work with public relations/social media agency to increase engagement of visitors in market through social media
• Investigate effective technological ways to pro-vide visitor information
Long-Term (>2 yr.)
• Remain at the cutting edge of technological changes impacting how consumers get their information for travel
• Conduct intercept research and focus group re-search to understand changes in consumer travel behaviors
• Support all efforts to improve broadband and cellular access to all parts of North Lake Tahoe
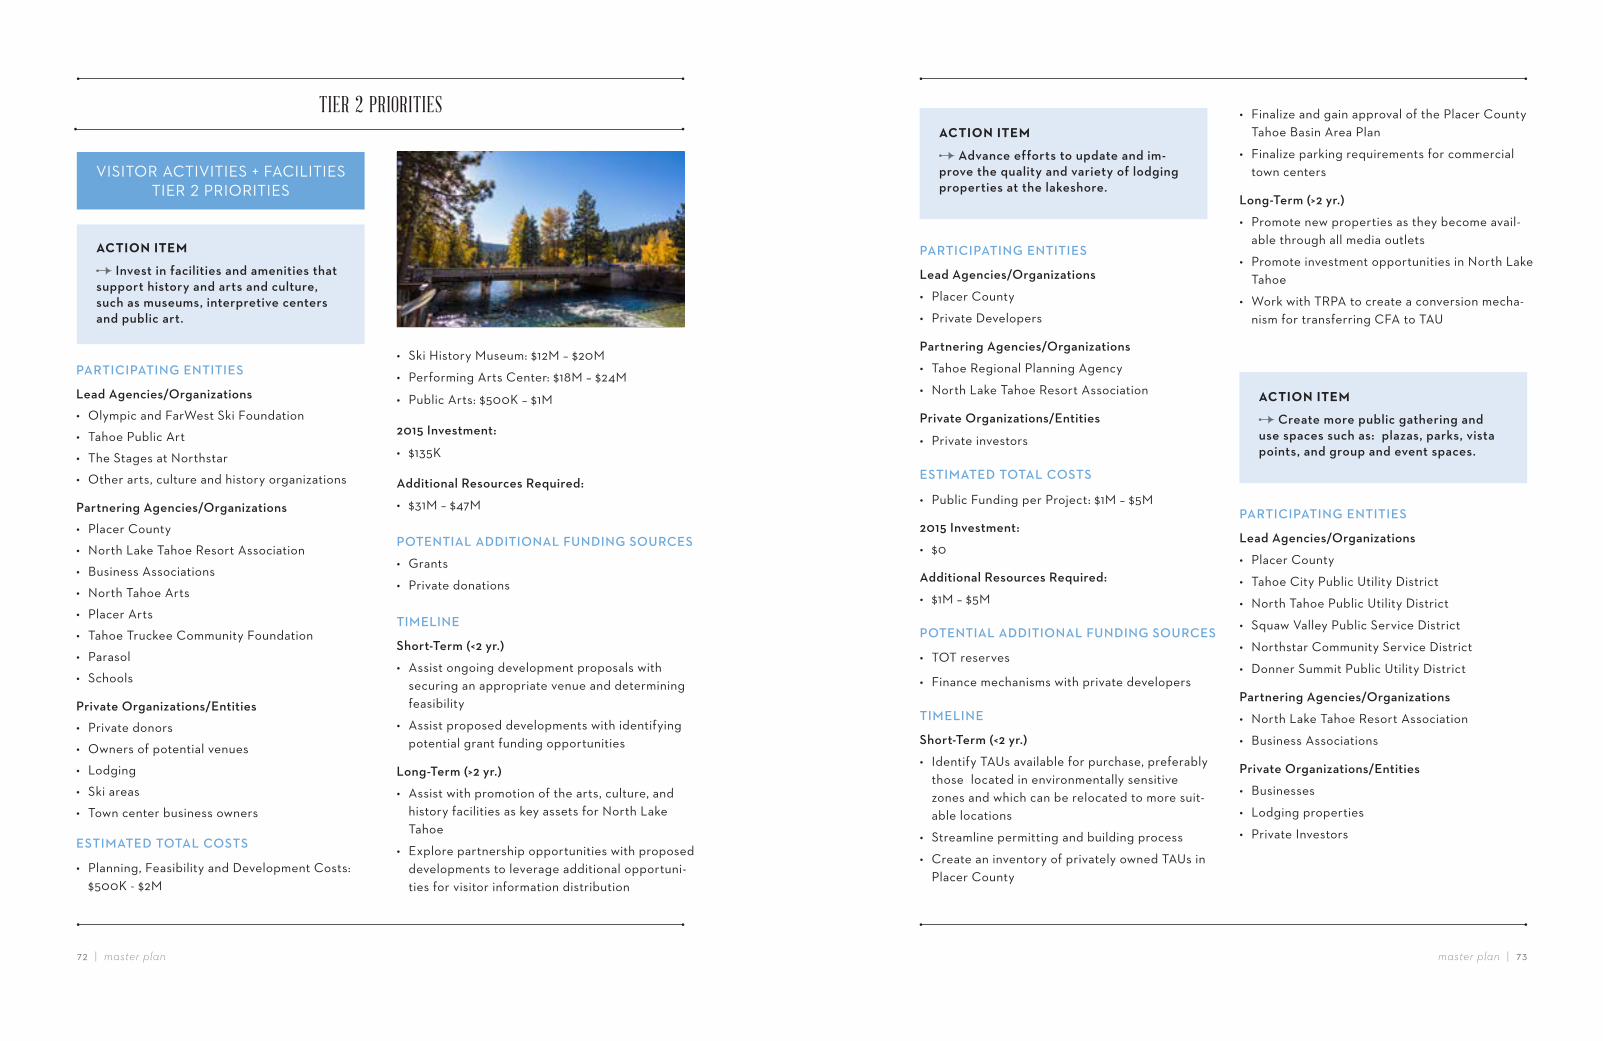
master plan!!|!!+&+'!!|!!master plan
VISITOR!ACTIVITIES!#!FACILITIES! TIER!K!PRIORITIES
ACTION"ITEM"
Invest in facilities and amenities that support history and arts and culture, such as museums, interpretive centers and public art.
ACTION"ITEM"
Advance efforts to update and im-prove the quality and variety of lodging properties at the lakeshore.
ACTION"ITEM"
Create more public gathering and use spaces such as: plazas, parks, vista points, and group and event spaces.
PARTICIPATING%ENTITIES
Lead Agencies/Organizations• Olympic and FarWest Ski Foundation• Tahoe Public Art• The Stages at Northstar• Other arts, culture and history organizations
Partnering Agencies/Organizations• Placer County• North Lake Tahoe Resort Association• Business Associations• North Tahoe Arts• Placer Arts• Tahoe Truckee Community Foundation• Parasol• Schools
Private Organizations/Entities• Private donors• Owners of potential venues• Lodging • Ski areas• Town center business owners
ESTIMATED%TOTAL%COSTS
• Planning, Feasibility and Development Costs: $500K - $2M
PARTICIPATING%ENTITIES
Lead Agencies/Organizations
• Placer County
• Private Developers
Partnering Agencies/Organizations
• Tahoe Regional Planning Agency
• North Lake Tahoe Resort Association
Private Organizations/Entities
• Private investors
ESTIMATED%TOTAL%COSTS
• Public Funding per Project: $1M – $5M
2015 Investment:
• $0
Additional Resources Required:
• $1M – $5M
POTENTIAL%ADDITIONAL%FUNDING%SOURCES%
• TOT reserves
• Finance mechanisms with private developers
TIMELINE
Short-Term (<2 yr.)
• Identify TAUs available for purchase, preferably those located in environmentally sensitive zones and which can be relocated to more suit-able locations
• Streamline permitting and building process
• Create an inventory of privately owned TAUs in Placer County
PARTICIPATING%ENTITIES
Lead Agencies/Organizations
• Placer County
• Tahoe City Public Utility District
• North Tahoe Public Utility District
• Squaw Valley Public Service District
• Northstar Community Service District
• Donner Summit Public Utility District
Partnering Agencies/Organizations
• North Lake Tahoe Resort Association
• Business Associations
Private Organizations/Entities
• Businesses
• Lodging properties
• Private Investors
• Ski History Museum: $12M – $20M
• Performing Arts Center: $18M – $24M
• Public Arts: $500K – $1M
2015 Investment:
• $135K
Additional Resources Required:
• $31M – $47M
POTENTIAL%ADDITIONAL%FUNDING%SOURCES%
• Grants
• Private donations
TIMELINE
Short-Term (<2 yr.)
• Assist ongoing development proposals with securing an appropriate venue and determining feasibility
• Assist proposed developments with identifying potential grant funding opportunities
Long-Term (>2 yr.)
• Assist with promotion of the arts, culture, and history facilities as key assets for North Lake Tahoe
• Explore partnership opportunities with proposed developments to leverage additional opportuni-ties for visitor information distribution
• Finalize and gain approval of the Placer County Tahoe Basin Area Plan
• Finalize parking requirements for commercial town centers
Long-Term (>2 yr.)
• Promote new properties as they become avail-able through all media outlets
• Promote investment opportunities in North Lake Tahoe
• Work with TRPA to create a conversion mecha-nism for transferring CFA to TAU
TIER 2 PRIORITIES
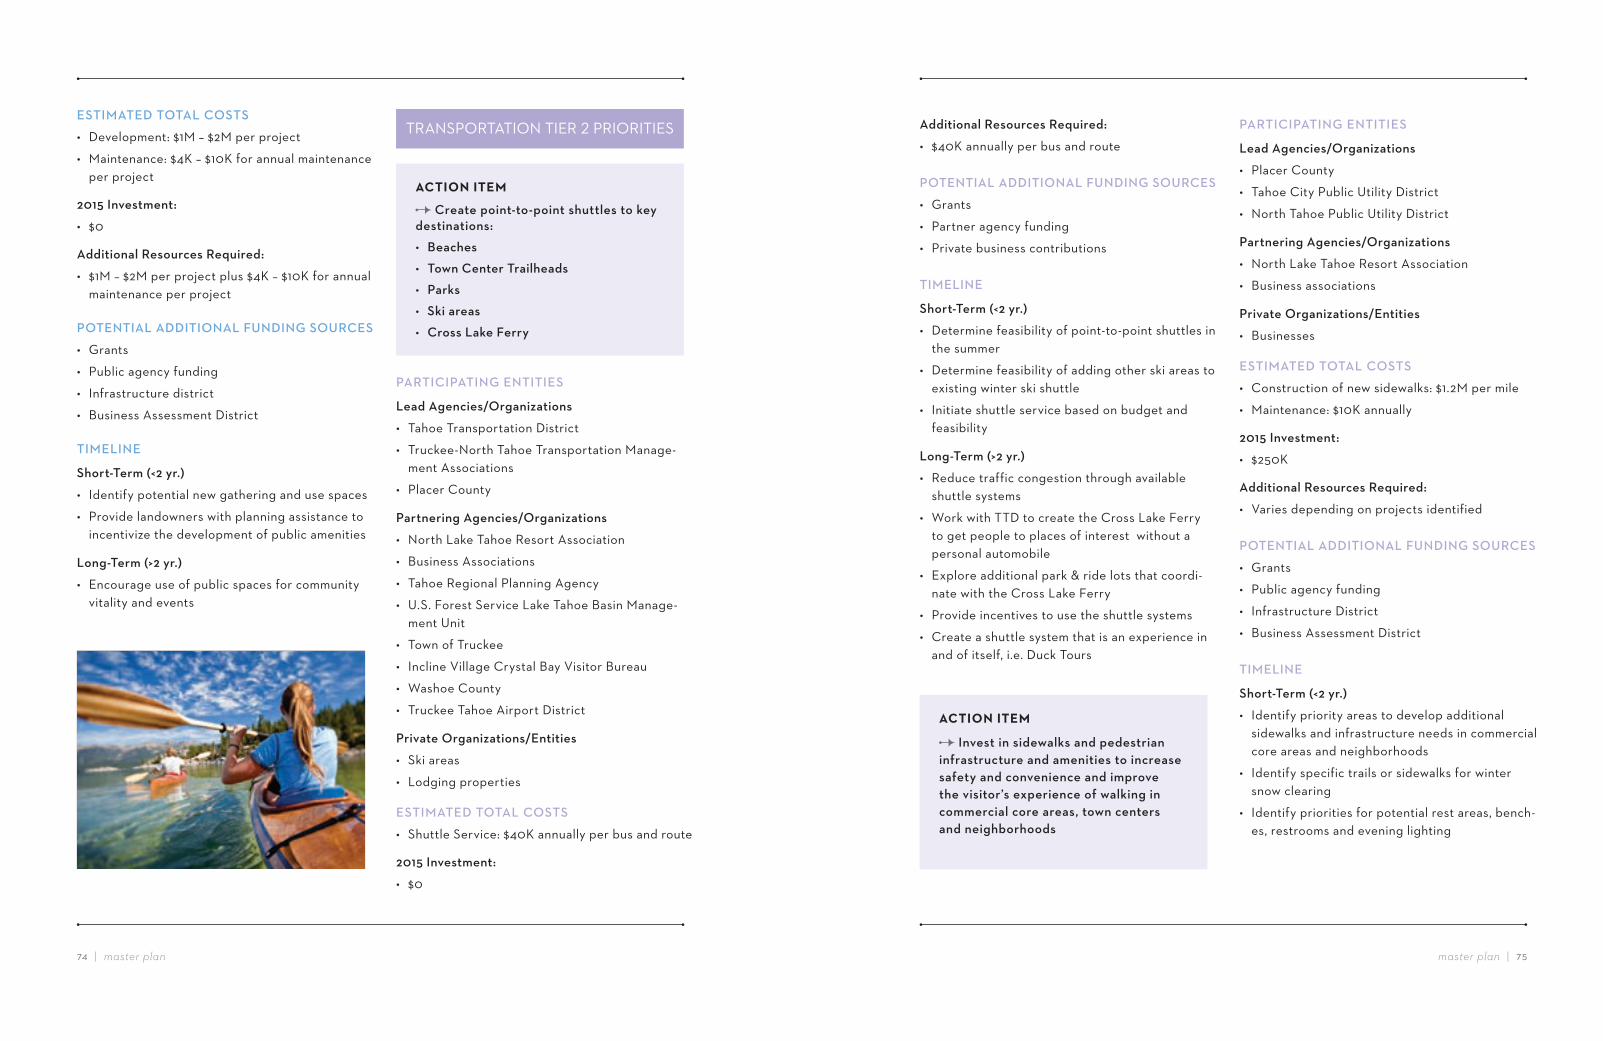
master plan!!|!!+)+*!!|!!master plan
ESTIMATED%TOTAL%COSTS
• Development: $1M – $2M per project
• Maintenance: $4K – $10K for annual maintenance per project
2015 Investment:
• $0
Additional Resources Required:
• $1M – $2M per project plus $4K – $10K for annual maintenance per project
POTENTIAL%ADDITIONAL%FUNDING%SOURCES%
• Grants
• Public agency funding
• Infrastructure district
• Business Assessment District
TIMELINE
Short-Term (<2 yr.)
• Identify potential new gathering and use spaces
• Provide landowners with planning assistance to incentivize the development of public amenities
Long-Term (>2 yr.)
• Encourage use of public spaces for community vitality and events
ACTION"ITEM"
Create point-to-point shuttles to key destinations:• Beaches• Town Center Trailheads • Parks • Ski areas• Cross Lake Ferry
ACTION"ITEM"
Invest in sidewalks and pedestrian infrastructure and amenities to increase safety and convenience and improve the visitor’s experience of walking in commercial core areas, town centers and neighborhoods
TRANSPORTATION!TIER!K!PRIORITIES
PARTICIPATING%ENTITIES
Lead Agencies/Organizations
• Tahoe Transportation District
• Truckee-North Tahoe Transportation Manage-ment Associations
• Placer County
Partnering Agencies/Organizations
• North Lake Tahoe Resort Association
• Business Associations
• Tahoe Regional Planning Agency
• U.S. Forest Service Lake Tahoe Basin Manage-ment Unit
• Town of Truckee
• Incline Village Crystal Bay Visitor Bureau
• Washoe County
• Truckee Tahoe Airport District
Private Organizations/Entities
• Ski areas
• Lodging properties
ESTIMATED%TOTAL%COSTS
• Shuttle Service: $40K annually per bus and route
2015 Investment:
• $0
PARTICIPATING%ENTITIES
Lead Agencies/Organizations
• Placer County
• Tahoe City Public Utility District
• North Tahoe Public Utility District
Partnering Agencies/Organizations
• North Lake Tahoe Resort Association
• Business associations
Private Organizations/Entities
• Businesses
ESTIMATED%TOTAL%COSTS
• Construction of new sidewalks: $1.2M per mile
• Maintenance: $10K annually
2015 Investment:
• $250K
Additional Resources Required:
• Varies depending on projects identified
POTENTIAL%ADDITIONAL%FUNDING%SOURCES%
• Grants
• Public agency funding
• Infrastructure District
• Business Assessment District
TIMELINE
Short-Term (<2 yr.)
• Identify priority areas to develop additional sidewalks and infrastructure needs in commercial core areas and neighborhoods
• Identify specific trails or sidewalks for winter snow clearing
• Identify priorities for potential rest areas, bench-es, restrooms and evening lighting
Additional Resources Required:
• $40K annually per bus and route
POTENTIAL%ADDITIONAL%FUNDING%SOURCES%
• Grants
• Partner agency funding
• Private business contributions
TIMELINE
Short-Term (<2 yr.)
• Determine feasibility of point-to-point shuttles in the summer
• Determine feasibility of adding other ski areas to existing winter ski shuttle
• Initiate shuttle service based on budget and feasibility
Long-Term (>2 yr.)
• Reduce traffic congestion through available shuttle systems
• Work with TTD to create the Cross Lake Ferry to get people to places of interest without a personal automobile
• Explore additional park & ride lots that coordi-nate with the Cross Lake Ferry
• Provide incentives to use the shuttle systems
• Create a shuttle system that is an experience in and of itself, i.e. Duck Tours
master plan!!|!!+++,!!|!!master plan
ACTION"ITEM"
Advocate for and invest in more di-rect flights into the Reno and Sacramen-to Airports to attract destination visitors and reduce personal automobile use.
Long-Term (>2 yr.)
• Initiate sidewalk improvements as determined above
• Create a snow removal schedule for priority areas
• Identify and secure a funding mechanism for maintenance for pedestrian amenities and sidewalks
PARTICIPATING%ENTITIES
Lead Agencies/Organizations
• Regional Air Service Committee
• North Lake Tahoe Marketing Co-op
• Reno-Tahoe Airport Authority
Partnering Agencies/Organizations
• North Lake Tahoe Resort Association
• Truckee Tahoe Airport Authority
• Sacramento Airport
Private Organizations/Entities
• Ski areas
• Lodging and gaming owners
ESTIMATED%TOTAL%COSTS
• Administration and Promotions: $100K- $250K annually
2015 Investment:
• $100K
Additional Resources Required:
• $0 - $150K annually
POTENTIAL%ADDITIONAL%FUNDING%SOURCES%
• Tourist Business Improvement District
• Increase in TOT
TIMELINE
Short-Term (<2 yr.)
• Continue to work with the Regional Air Service Committee to identify prospective destinations and providers
• Initiate new service into Reno-Tahoe Internation-al Airport where possible
• Meet with Sacramento airport directors to dis-cuss potential for additional direct service
Long-Term (>2 yr.)
• Market to new destinations served by direct air service to Reno-Tahoe and Sacramento airports to increase passenger use of air service
• Provide connecting ground services to allow the visitor the opportunity to reach the North Lake Tahoe area without a personal automobile
ACTION"ITEM"
Invest in world class events that showcase North Lake Tahoe’s assets.
ACTION"ITEM"
Expand international visitation from emerging tourism markets.
PARTICIPATING%ENTITIES
Lead Agencies/Organizations
• North Lake Tahoe Resort Association
• Event producers
Partnering Agencies/Organizations
• Business associations
• Incline Village Crystal Bay Visitor Bureau
PARTICIPATING%ENTITIES
Lead Agencies/Organizations
• North Lake Tahoe Resort Association
• North Lake Tahoe Marketing Cooperative
Partnering Agencies/Organizations
• Sierra Ski Marketing Council
• Ski Lake Tahoe
• Visit California
Private Organizations/Entities
• Agencies in other countries
• Media
• Travel and tour operators
ESTIMATED%TOTAL%COSTS
• Marketing and Administration: $75K - $150K annually
2015 Investment:
• $60K
Additional Resources Required:
• $15K – $90K
POTENTIAL%ADDITIONAL%FUNDING%SOURCES%
• Visit California
• State grants
• Lodging properties
TIMELINE
Short-Term (<2 yr.)
• Create an International Marketing Committee within the existing Cooperative made up of local stakeholders
• South Lake Tahoe Visitors Authority
• Truckee Donner Chamber
• Town of Truckee
• Emergency personnel
• Other jurisdictions
• Public venue owners
Private Organizations/Entities
• Ski areas
• Venue owners
ESTIMATED%TOTAL%COSTS
• Events, Marketing and Administration: $500K - $800K annually
2015 Investment:
• $615K
Additional Resources Required:
• $0 – $185K
POTENTIAL%ADDITIONAL%FUNDING%SOURCES%
• Event producers
• Sponsors
• Participant or spectator fees
• Business advertising
TIMELINE
Short-Term (<2 yr.)
• Evaluate long term approach to current events
• Develop an Event Permitting Plan of Action in collaboration with regional permitting agencies
Long-Term (>2 yr.)
• Develop relationships with sports media compa-nies to develop North Lake Tahoe events
• Expand Home Town Hero social network pro-gramming
MARKETING!#!SALES! TIER!K!PRIORITIES
master plan!!|!!+-+.!!|!!master plan
ACTION"ITEM"
Increase group, conference, reunion and wedding related visitation.
ACTION"ITEM"
Develop and implement marketing strat-egies to attract the Millennial generation.
• Increase sales and public relation efforts in current International markets
• Increase local educational efforts on interna-tional demand and travel patterns
• Redevelop local activity itineraries to highlight the multitude of choices
• Distribute itineraries to regional partners in northern and southern California/Nevada
Long-Term (>2 yr.)
• Develop media and travel industry contacts in emerging markets
• Collaborate with regional and state, and na-tional trade agencies to increase our tourism product awareness in second and third tier markets for California and Nevada
PARTICIPATING%ENTITIES
Lead Agencies/Organizations
• North Lake Tahoe Resort Association
• North Lake Tahoe Marketing Cooperative
Partnering Agencies/Organizations
• Chambers of Commerce
Private Organizations/Entities
• Lodging properties
ESTIMATED%TOTAL%COSTS
• Marketing and Administration: $250K- $300K annually
2015 Investment:
• $200K
PARTICIPATING%ENTITIES
Lead Agencies/Organizations
• North Lake Tahoe Resort Association
• North Lake Tahoe Marketing Cooperative
Partnering Agencies/Organizations
• Business associations
Private Organizations/Entities
• Creative and public relations/social media agencies
ESTIMATED%TOTAL%COSTS
• Marketing and Administration: $50K - $100K annually
2015 Investment:
• $0
Additional Resources Required:
• $50K – $100K annually
POTENTIAL%ADDITIONAL%FUNDING%SOURCES%
• North Lake Tahoe Marketing Cooperative Partners
TIMELINE
Short-Term (<2 yr.)
• Continue to research buying and travel trends of the Millennial generation
• Improve electronic information access to keep up with current trends
• Develop targeted messaging direct to consumer
• Increase social media platform footprint and activities through age specific messaging
• Increase presence on age-appropriate specific interest blogs
Long-Term (>2 yr.)
• Increase media coverage of local athletes in the Millenial demographic
• Sponsor local hero/athlete program from mid-dle school age to adulthood
• Leverage current local professional athletes through event appearances and contests
Additional Resources Required:
• $50K – $150K annually
POTENTIAL%ADDITIONAL%FUNDING%SOURCES%
• Lodging properties
• Reno Spark Convention and Visitor Authority
• South Lake Tahoe Visitor Authority
TIMELINE
Short-Term (<2 yr.)
• Increase follow up from local bridal fairs
• Purchase databases from bridal and reunion publications
• Increase the marketing messages on our web-site for these specific markets
• Develop custom email messaging to individual conference markets
Long-Term (>2 yr.)
• Develop a marketing plan for regional and national publications for wedding and reunion markets
• Join collegiate alumni associations
• Research additional out-of-market sales oppor-tunities through trade shows and events
ACTION"ITEM"
Develop and implement marketing strat-egies to diversify winter product oSerings in response to climate change.
PARTICIPATING%ENTITIES
Lead Agencies/Organizations
• North Lake Tahoe Resort Association
• North Lake Tahoe Marketing Cooperative
Partnering Agencies/Organizations
• Business associations
Private Organizations/Entities
• Creative and public relations/social media agencies
• Ski areas
ESTIMATED%TOTAL%COSTS
• Marketing and Administration: $50K - $100K annually
2015 Investment:
• $50K
Additional Resources Required:
• $0 – $50K
POTENTIAL%ADDITIONAL%FUNDING%SOURCES%
• Ski areas
• Activity companies
• Lodging properties
TIMELINE
Short-Term (<2 yr.)
• Develop “Plan B” marketing initiatives that automatically go into action in case of weather challenges
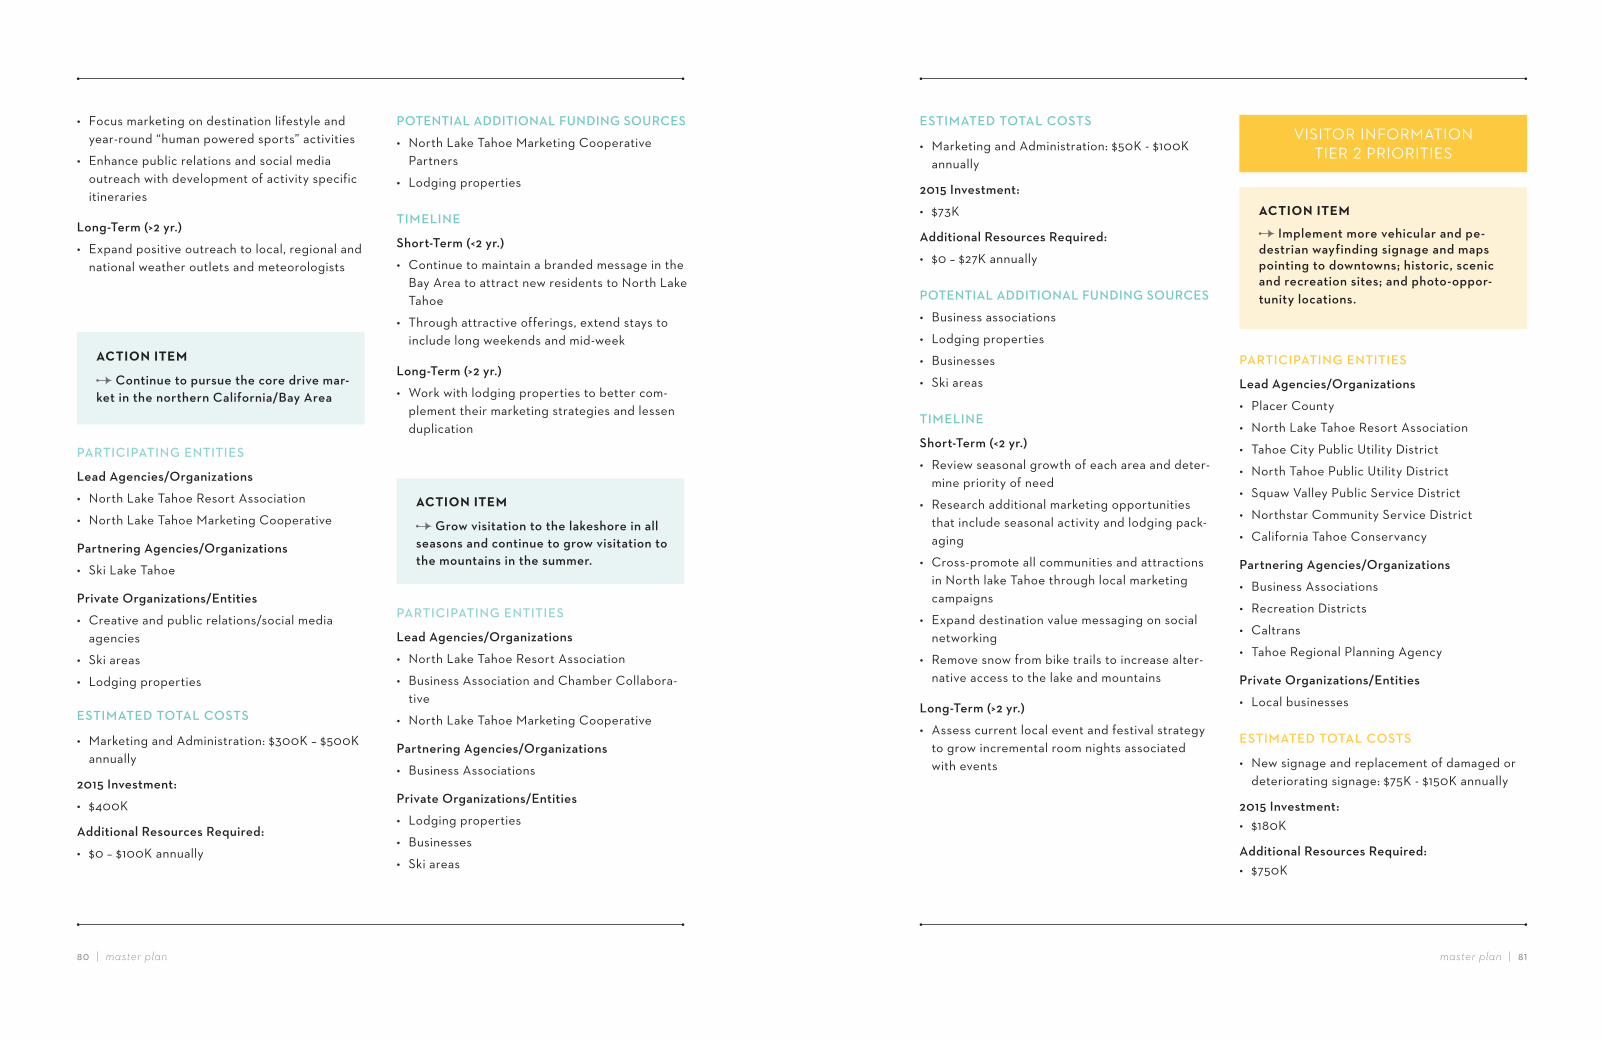
master plan!!|!!.%./!!|!!master plan
• Focus marketing on destination lifestyle and year-round “human powered sports” activities
• Enhance public relations and social media outreach with development of activity specific itineraries
Long-Term (>2 yr.)
• Expand positive outreach to local, regional and national weather outlets and meteorologists
ACTION"ITEM"
Continue to pursue the core drive mar-ket in the northern California/Bay Area
ACTION"ITEM"
Grow visitation to the lakeshore in all seasons and continue to grow visitation to the mountains in the summer.
PARTICIPATING%ENTITIES
Lead Agencies/Organizations
• North Lake Tahoe Resort Association
• North Lake Tahoe Marketing Cooperative
Partnering Agencies/Organizations
• Ski Lake Tahoe
Private Organizations/Entities
• Creative and public relations/social media agencies
• Ski areas
• Lodging properties
ESTIMATED%TOTAL%COSTS
• Marketing and Administration: $300K – $500K annually
2015 Investment:
• $400K
Additional Resources Required:
• $0 – $100K annually
PARTICIPATING%ENTITIES
Lead Agencies/Organizations
• North Lake Tahoe Resort Association
• Business Association and Chamber Collabora-tive
• North Lake Tahoe Marketing Cooperative
Partnering Agencies/Organizations
• Business Associations
Private Organizations/Entities
• Lodging properties
• Businesses
• Ski areas
ESTIMATED%TOTAL%COSTS
• Marketing and Administration: $50K - $100K annually
2015 Investment:
• $73K
Additional Resources Required:
• $0 – $27K annually
POTENTIAL%ADDITIONAL%FUNDING%SOURCES%
• Business associations
• Lodging properties
• Businesses
• Ski areas
TIMELINE
Short-Term (<2 yr.)
• Review seasonal growth of each area and deter-mine priority of need
• Research additional marketing opportunities that include seasonal activity and lodging pack-aging
• Cross-promote all communities and attractions in North lake Tahoe through local marketing campaigns
• Expand destination value messaging on social networking
• Remove snow from bike trails to increase alter-native access to the lake and mountains
Long-Term (>2 yr.)
• Assess current local event and festival strategy to grow incremental room nights associated with events
POTENTIAL%ADDITIONAL%FUNDING%SOURCES%
• North Lake Tahoe Marketing Cooperative Partners
• Lodging properties
TIMELINE
Short-Term (<2 yr.)
• Continue to maintain a branded message in the Bay Area to attract new residents to North Lake Tahoe
• Through attractive offerings, extend stays to include long weekends and mid-week
Long-Term (>2 yr.)
• Work with lodging properties to better com-plement their marketing strategies and lessen duplication
VISITOR!INFORMATION TIER!K!PRIORITIES
ACTION"ITEM"
Implement more vehicular and pe-destrian wayfinding signage and maps pointing to downtowns; historic, scenic and recreation sites; and photo-oppor-tunity locations.
PARTICIPATING%ENTITIES
Lead Agencies/Organizations
• Placer County
• North Lake Tahoe Resort Association
• Tahoe City Public Utility District
• North Tahoe Public Utility District
• Squaw Valley Public Service District
• Northstar Community Service District
• California Tahoe Conservancy
Partnering Agencies/Organizations
• Business Associations
• Recreation Districts
• Caltrans
• Tahoe Regional Planning Agency
Private Organizations/Entities
• Local businesses
ESTIMATED%TOTAL%COSTS
• New signage and replacement of damaged or deteriorating signage: $75K - $150K annually
2015 Investment:• $180K
Additional Resources Required:• $750K
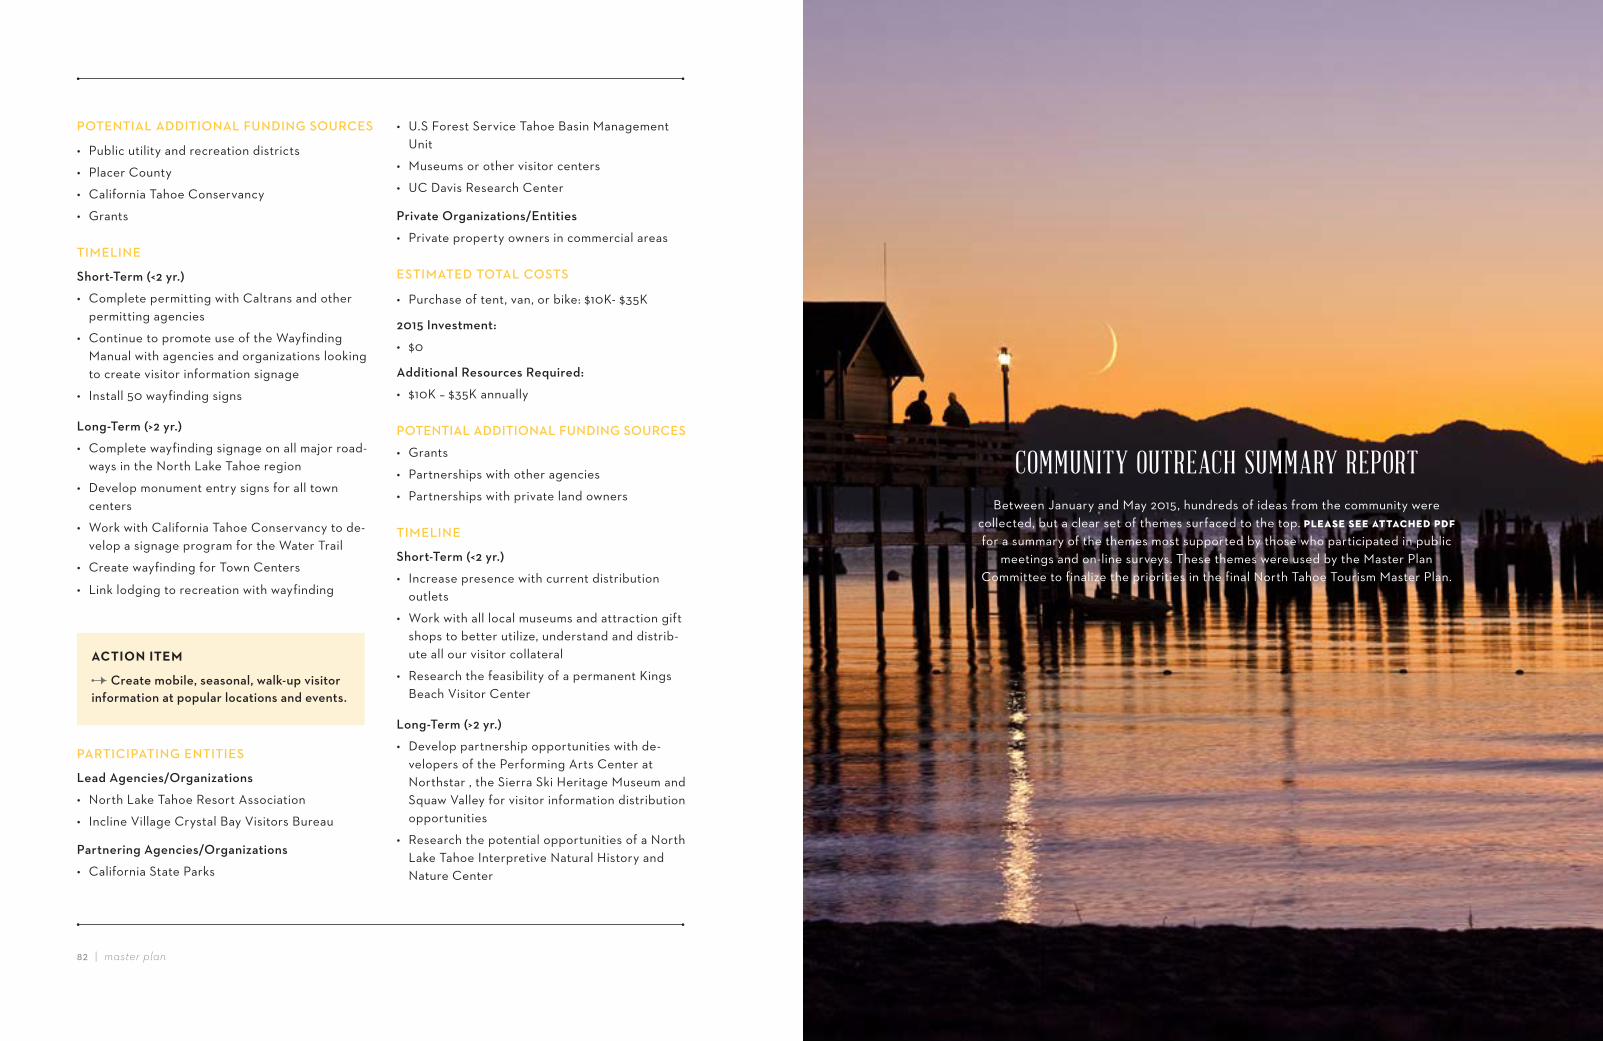
master plan!!|!!.&.'!!|!!master plan
POTENTIAL%ADDITIONAL%FUNDING%SOURCES%
• Public utility and recreation districts
• Placer County
• California Tahoe Conservancy
• Grants
TIMELINE
Short-Term (<2 yr.)
• Complete permitting with Caltrans and other permitting agencies
• Continue to promote use of the Wayfinding Manual with agencies and organizations looking to create visitor information signage
• Install 50 wayfinding signs
Long-Term (>2 yr.)
• Complete wayfinding signage on all major road-ways in the North Lake Tahoe region
• Develop monument entry signs for all town centers
• Work with California Tahoe Conservancy to de-velop a signage program for the Water Trail
• Create wayfinding for Town Centers
• Link lodging to recreation with wayfinding
ACTION"ITEM"
Create mobile, seasonal, walk-up visitor information at popular locations and events.
PARTICIPATING%ENTITIES
Lead Agencies/Organizations
• North Lake Tahoe Resort Association
• Incline Village Crystal Bay Visitors Bureau
Partnering Agencies/Organizations
• California State Parks
• U.S Forest Service Tahoe Basin Management Unit
• Museums or other visitor centers
• UC Davis Research Center
Private Organizations/Entities
• Private property owners in commercial areas
ESTIMATED%TOTAL%COSTS
• Purchase of tent, van, or bike: $10K- $35K
2015 Investment:
• $0
Additional Resources Required:
• $10K – $35K annually
POTENTIAL%ADDITIONAL%FUNDING%SOURCES%
• Grants
• Partnerships with other agencies
• Partnerships with private land owners
TIMELINE
Short-Term (<2 yr.)
• Increase presence with current distribution outlets
• Work with all local museums and attraction gift shops to better utilize, understand and distrib-ute all our visitor collateral
• Research the feasibility of a permanent Kings Beach Visitor Center
Long-Term (>2 yr.)
• Develop partnership opportunities with de-velopers of the Performing Arts Center at Northstar , the Sierra Ski Heritage Museum and Squaw Valley for visitor information distribution opportunities
• Research the potential opportunities of a North Lake Tahoe Interpretive Natural History and Nature Center
COMMUNITY OUTREACH SUMMARY REPORTBetween January and May 2015, hundreds of ideas from the community were
collected, but a clear set of themes surfaced to the top. 0123425422536637829509:5for a summary of the themes most supported by those who participated in public
meetings and on-line surveys. These themes were used by the Master Plan Committee to finalize the priorities in the final North Tahoe Tourism Master Plan.