Embed Size (px)
Citation preview

3
Contents
Foreword 4
User Feedback 4
Acknowledgments 4
Using this Document 4
Executive summary 5
1. Current Methodology 7
2. Within Year Analysis 8
Investigating flow variation using ANOVA and coefficient of the variance 8
Investigating seasonal, weekly and daily variation 11
Testing of preliminary strata 14
Conclusions 15
Peer Review 16
Implementation 17
3. Between Year Approach 18
Investigating average growth in traffic using ANOVA 18
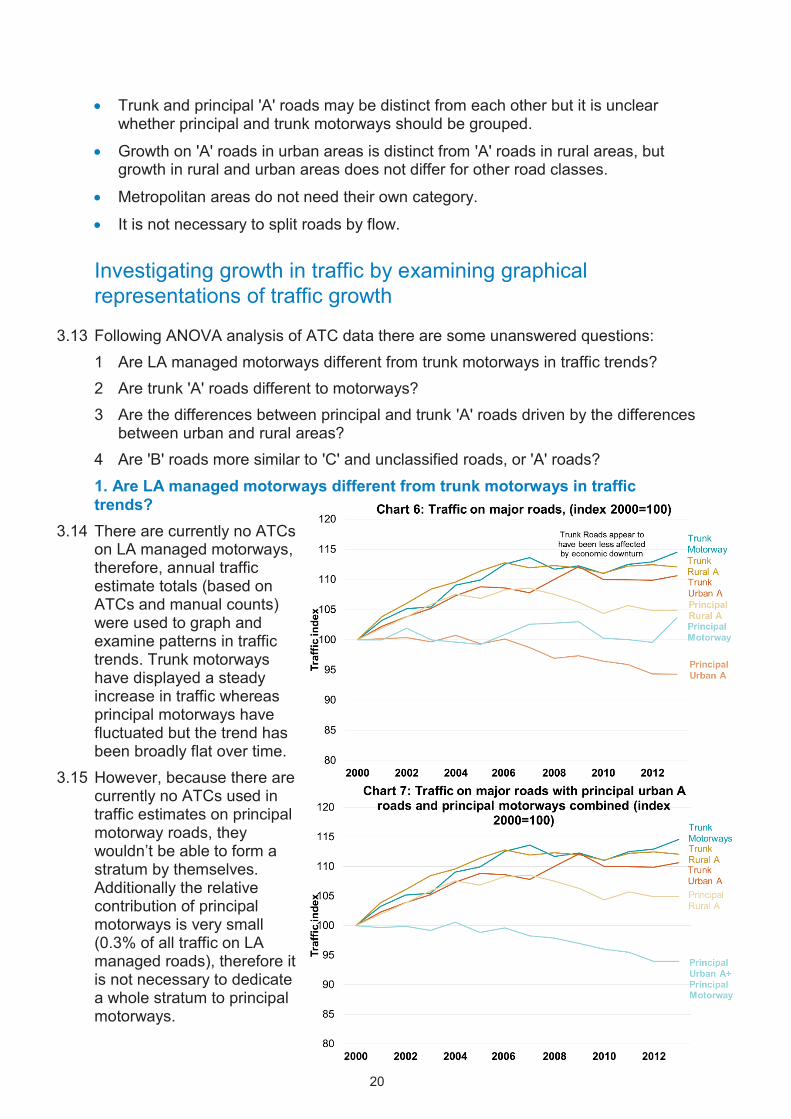
Investigating growth in traffic by examining graphical representations of traffic growth 20
Peer Review 22
Implementation 23
4. Conclusions 24
Annex A: Current Stratification 25
Annex B: Within Year ANOVA results 26
Annex C: Within Year graphical analysis detail 27
Annex D: Between Year ANOVA results 30

4
Foreword
The Department for Transport's Road Traffic Statistics Team have conducted a review of the traffic estimates for Great Britain. The aim of the review was to seek opportunities for innovation and efficiencies in the production of traffic statistics, without degrading their quality in terms of accuracy and reliability, timeliness and meeting user needs. This document gives a detailed overview of the stratification project which was undertaken as part of the review, including statistical methods and results. It has been updated since original publication in August 2015 to reflect the results of implementing the new stratification in the July 2018 road traffic estimate publications. For a short summary of this project, its conclusions and all of the other projects within the review please refer to the Overview document1.
User Feedback
We are keen to receive user feedback on the issues covered in this document. This can be given via the Road Traffic Statistics Team inbox: [email protected].
Acknowledgments
DfT is grateful to Charles Lound and Jim O’Donoghue from the Office for National Statistics (ONS) Methodology Advisory Service (MAS) for their input and helpful advice, and to the UK Statistics Authority for providing this support for the project via the Quality Improvement Fund.
Using this Document
This document is laid out in chronological order of the analysis carried out, with subsections for each variable considered. At the end of each chapter is a summary of what was concluded from that analysis, some variables are revisited during each piece of analysis until a firm conclusion is reached.
1 Available at www.gov.uk/government/statistics/road-traffic-statistics-methodology-review
5
Executive summary
The Department for Transport (DfT) publishes annual and quarterly estimates of traffic on Great Britain's roads here. DfT traffic estimates are based on observations of traffic on samples of road links, defined as a stretch of road between two junctions. The traffic observations are collected by a panel sample of Automatic Traffic Counters and by an annual sample of around 7,000 manual counts. A fundamental component of the traffic estimation process is the stratification of the sample of Automatic Traffic Counters. The aim of stratification is to minimise sampling error by grouping together roads with similar traffic patterns. The main aspect of this project was to explore whether the current stratification groups are the best categorisation to group together road links with similar traffic flow patterns. The approach taken by the project was to look at the effects of certain road attributes on fluctuations in traffic flow. Those attributes found to affect traffic flow could be used as divisors for the stratification categories. This document provides a detailed overview of the stratification project, including statistical methods and results.
Current Stratification The current stratification was introduced in the early 2000s. It comprises of a large number of categories, some of which have quite a small sample of Automatic Traffic Counters (ATCs) within them meaning that estimates for these categories can be quite noisy.
Analyses The project used data from the DfT's network of 200 ATCs, allowing comparisons across different times of the day, different times of year and between different years to be made. Exploratory analyses aimed to determine what road characteristics are important with regards to variations in traffic flow. The analyses are split into two main sections: the first looked at variations within the year, which relates to expansion factors; and the second at variations between years, which related to growth factors. The analysis investigated the level of variation in traffic observed at each ATC, as well as variations between day and night, weekday and weekend, seasonal variations and variations in flow between years. All analyses were peer reviewed by an external methodological expert from the Office for National Statistics.
6
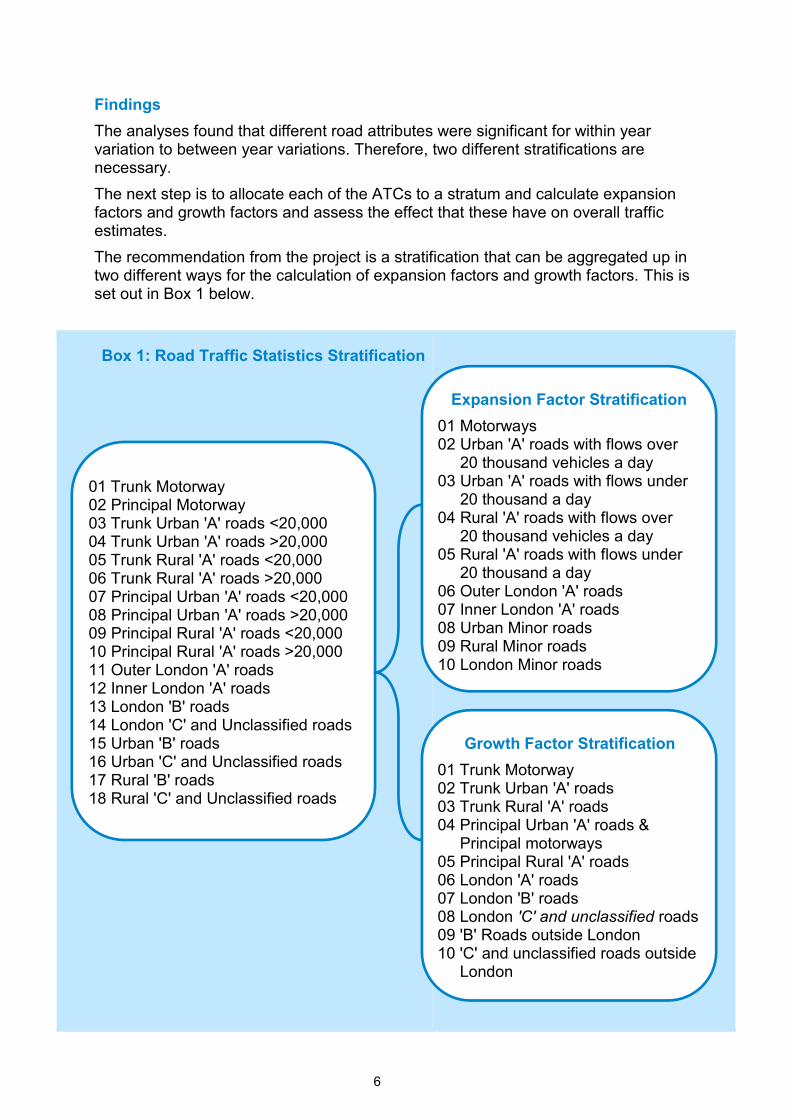
Findings The analyses found that different road attributes were significant for within year variation to between year variations. Therefore, two different stratifications are necessary. The next step is to allocate each of the ATCs to a stratum and calculate expansion factors and growth factors and assess the effect that these have on overall traffic estimates. The recommendation from the project is a stratification that can be aggregated up in two different ways for the calculation of expansion factors and growth factors. This is set out in Box 1 below.
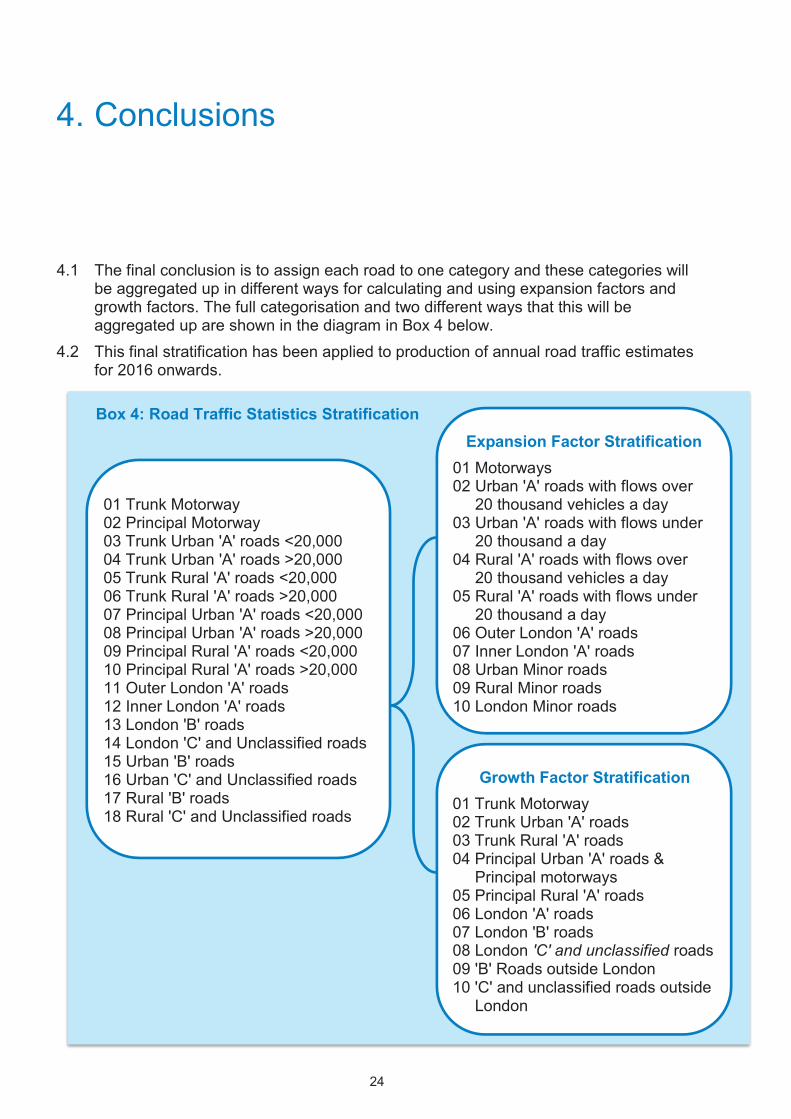
Box 1: Road Traffic Statistics Stratification
01 Trunk Motorway 02 Principal Motorway 03 Trunk Urban 'A' roads <20,000 04 Trunk Urban 'A' roads >20,000 05 Trunk Rural 'A' roads <20,000 06 Trunk Rural 'A' roads >20,000 07 Principal Urban 'A' roads <20,000 08 Principal Urban 'A' roads >20,000 09 Principal Rural 'A' roads <20,000 10 Principal Rural 'A' roads >20,000 11 Outer London 'A' roads 12 Inner London 'A' roads 13 London 'B' roads 14 London 'C' and Unclassified roads 15 Urban 'B' roads 16 Urban 'C' and Unclassified roads 17 Rural 'B' roads 18 Rural 'C' and Unclassified roads
Expansion Factor Stratification 01 Motorways 02 Urban 'A' roads with flows over 20 thousand vehicles a day 03 Urban 'A' roads with flows under 20 thousand a day 04 Rural 'A' roads with flows over 20 thousand vehicles a day 05 Rural 'A' roads with flows under 20 thousand a day 06 Outer London 'A' roads 07 Inner London 'A' roads 08 Urban Minor roads 09 Rural Minor roads 10 London Minor roads
Growth Factor Stratification 01 Trunk Motorway 02 Trunk Urban 'A' roads 03 Trunk Rural 'A' roads 04 Principal Urban 'A' roads & Principal motorways 05 Principal Rural 'A' roads 06 London 'A' roads 07 London 'B' roads 08 London 'C' and unclassified roads 09 'B' Roads outside London 10 'C' and unclassified roads outside London
7
1. Current Methodology
Introduction 1.1 The Department for Transport's traffic estimates are based on observations of traffic
on samples of road links, defined as a stretch of road between two junctions. These are used to derive quarterly and annual road traffic estimates as published here.
1.2 A fundamental component of the Traffic Statistics estimation process is the stratification of the sample. This groups together roads that have been shown to have similar traffic patterns based on road characteristics such as road classification and flow level. The sample is then stratified across these groups to increase how well it represents the road network as a whole.
1.3 This sample stratification applies to both manual counts, which are conducted over a 12 hour period for one neutral day of the year, and Automatic Traffic Counters (ATCs) which are static and count traffic continuously throughout the year from a national network of around 200 ATCs.
1.4 Not every link is counted every year, a sample of links are counted and then expansion factors and growth factors are applied to get an annual traffic estimate of the whole network in a given year. The stratification is also applied when producing both expansion factors and growth factors, therefore, it needs to take into account both variation within the year and variation between years.
Current Stratification 1.5 The current stratification was introduced in the early 2000s (see Annex A). It
comprises of a large number of categories (22), some of which have quite a small sample of Automatic Traffic Counters (ATCs) within them, meaning that estimates for these categories can be quite noisy. The characteristics used for categorising roads into the 22 groups are:
Whether the road is in London, and one instance of whether it is in outer, inner or central London
The Road Class (Motorway, 'A' Road, Minor Road)
Whether the road link directly passes through Urban or Rural areas. Additionally the classification makes reference to different levels of area types such as ‘mostly rural’.
Whether the road is in a Holiday area (based on Local Authority classification which takes into account things such as whether there is a national park or a seaside town within the authority).
The level of vehicle flow (AADF) on the road link.
11
Investigating seasonal, weekly and daily variation
2.19 The next step in this project was to look at different aspects of variation within the year. The coefficient of the variance calculated above is based on daily level data. As a result, the variation does not take into account the variation between day and night which is important with regards to calculating expansion factors. The expansion factor calculation was broken down into three components; 1 A ratio between the average 24 hour and the average 12 hour period (7AM till
7PM), where a ratio of 1 would signal that all of the traffic is during the daytime and a ratio of 0.5 would signal that there is an even split between day and night.
2 The ratio between the average working weekday (Monday to Friday) and average weekend day, where a number greater than 1 signals that the average weekend day is busier compared to the average weekday and visa-versa.
3 A crude seasonality factor was calculated by dividing the three months with typically the highest flow (July, August, September) by three months that typically have the lowest flow (December, January, February), where a larger number signals greater seasonality.
2.20 These three ratios and the mean daily flow for each site were examined using cluster charts and ANOVA techniques in order to isolate important road characteristics that could be used for identification of strata.
London and Metropolitan areas 2.21 All three metrics found a significant difference between London and the rest of the
UK's road traffic patterns. This confirms the conclusions from the previous analysis. 2.22 To test for the differences between area groups within London, Tukey’s HSD was
used as part of ANOVA analysis on all three metrics for three area groups; Outer London, Inner or Central London, and other Urban areas. All three groups were significantly different from each other on day-night and weekend-weekday metrics while none of them were significantly different according to the seasonal metric.
2.23 Testing the differences between road classes and flow within London were shown to be largely insignificant with the exception of the differences between 'A' and unclassified roads.
2.24 London was significantly different from metropolitan areas on all three metrics while there were no significant differences between metropolitan areas and other urban areas, confirming previous analysis that suggested London should be separate but further distinction based on metropolitan area status is not necessary.
Road Classifications 2.25 Analysis found a distinction between major roads and minor roads on two of the three
metrics (weekday-to-weekend ratio was not found to be significantly different).
Major Roads 2.26 Outside London, 'A' roads and motorways were only significantly different for the 24
hour-12 hour ratio. This makes intuitive sense, a higher proportion of the total traffic on 'A' roads takes place during the daytime than for motorways where traffic is more evenly distributed throughout the day and night (i.e. the level of variation is higher for 'A' roads).
12
Minor Roads 2.27 'B', 'C' and unclassified roads also appear to be poor indicators of variation, each
minor road type was not significantly different from the others on any of the metrics used suggesting a minor road grouping makes sense. Additionally, 'A' and 'B' roads appear not to be distinct from each other based on these three metrics.
2.28 Based on the above analysis and the analysis that has been carried out using the coefficient of the variance, road classification appears to represent more of a continuum of types of roads with non-distinct boundaries between neighbouring road types. While broad categories are different from one another (major and minor) and some roads are different from others ('A' roads compared to 'C' and unclassified roads, for example) there is no clear point at which to break up the sample by classification.
2.29 To investigate further, Tukey’s HSD was used as part of ANOVA analysis on all three metrics (Day and night, Weekend and weekday and seasonal metrics) and for five groups (Motorway, 'A' road, 'B' road, 'C' road and unclassified road). Very few differences were found to be significant, the results of this Tukey HSD are summarised in the table in Annex B.
2.30 From this we can conclude that both motorways and minor roads need to be distinct groups, but it is unclear whether 'B' roads should be combined with 'A' roads or 'C' and unclassified roads. Also, the evidence is not conclusive as to whether 'A' roads should be combined with motorways or have their own group.
Road management Principal 'A' roads and trunk 'A' roads outside London were only found to be significantly different on the seasonal metric suggesting that road management should not be separated out. However, some distinction was found between motorways and 'A' roads of both types which provides some evidence, but not conclusive evidence, that 'A' roads and motorways could be separated.
Level of flow 2.31 Looking purely at
motorways and 'A' roads, and also 'A' roads on their own, dummy variables were created to compare different levels of flow: above 10 thousand vehicles a day versus below 10 thousand vehicles, and so on for splits at 20 thousand, 30 thousand, 40 thousand, and 50 thousand vehicles a day
Definition: Road management The trunk road network, consisting of most of the motorways and some 'A' roads in England, is managed at the national level by Highways England and is collectively referred to as the Strategic Road Network. All other roads are local authority managed (sometimes called principal).
13
on average. These dummy variables were tested by comparing the means of three metrics.
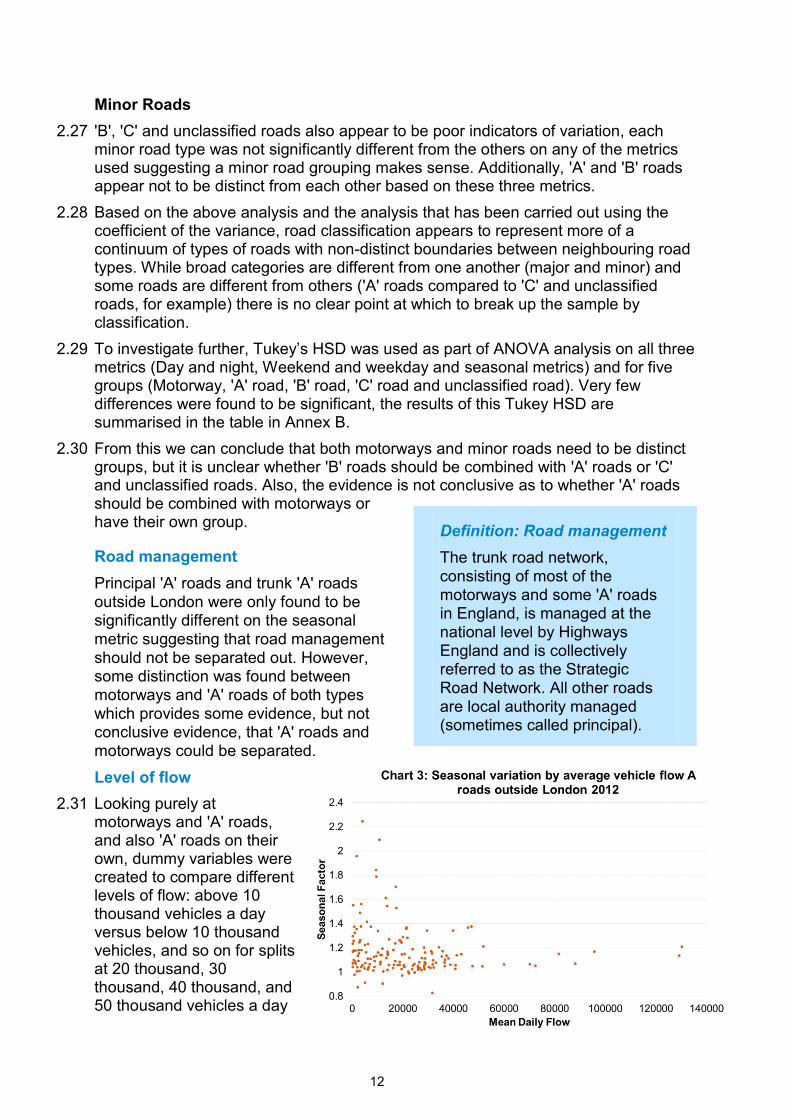
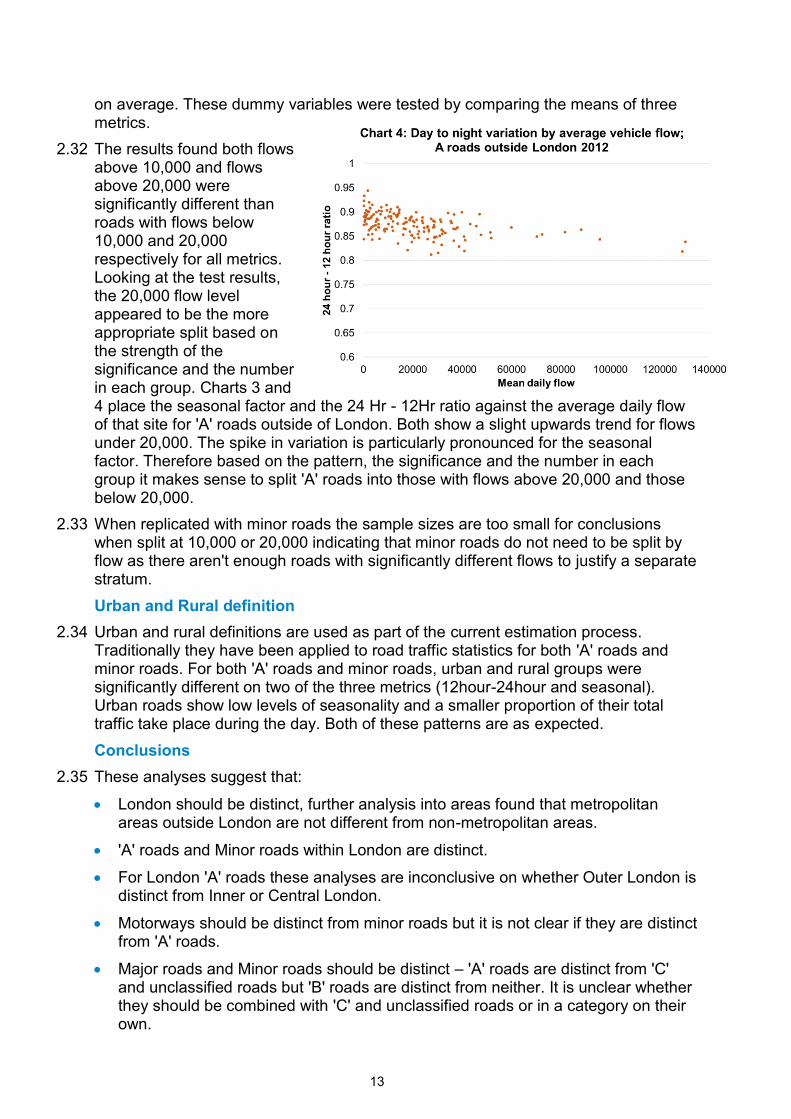
2.32 The results found both flows above 10,000 and flows above 20,000 were significantly different than roads with flows below 10,000 and 20,000 respectively for all metrics. Looking at the test results, the 20,000 flow level appeared to be the more appropriate split based on the strength of the significance and the number in each group. Charts 3 and 4 place the seasonal factor and the 24 Hr - 12Hr ratio against the average daily flow of that site for 'A' roads outside of London. Both show a slight upwards trend for flows under 20,000. The spike in variation is particularly pronounced for the seasonal factor. Therefore based on the pattern, the significance and the number in each group it makes sense to split 'A' roads into those with flows above 20,000 and those below 20,000.
2.33 When replicated with minor roads the sample sizes are too small for conclusions when split at 10,000 or 20,000 indicating that minor roads do not need to be split by flow as there aren't enough roads with significantly different flows to justify a separate stratum.
Urban and Rural definition 2.34 Urban and rural definitions are used as part of the current estimation process.
Traditionally they have been applied to road traffic statistics for both 'A' roads and minor roads. For both 'A' roads and minor roads, urban and rural groups were significantly different on two of the three metrics (12hour-24hour and seasonal). Urban roads show low levels of seasonality and a smaller proportion of their total traffic take place during the day. Both of these patterns are as expected.
Conclusions 2.35 These analyses suggest that:
London should be distinct, further analysis into areas found that metropolitan areas outside London are not different from non-metropolitan areas.
'A' roads and Minor roads within London are distinct.
For London 'A' roads these analyses are inconclusive on whether Outer London is distinct from Inner or Central London.
Motorways should be distinct from minor roads but it is not clear if they are distinct from 'A' roads.
Major roads and Minor roads should be distinct – 'A' roads are distinct from 'C' and unclassified roads but 'B' roads are distinct from neither. It is unclear whether they should be combined with 'C' and unclassified roads or in a category on their own.
14
Roads with flows above 20,000 should be split from roads with flows below 20,000 for 'A' roads only, and 'A' roads do not need to be split by management status.
For both major and minor roads, urban and rural areas should be separated.
Testing of preliminary strata
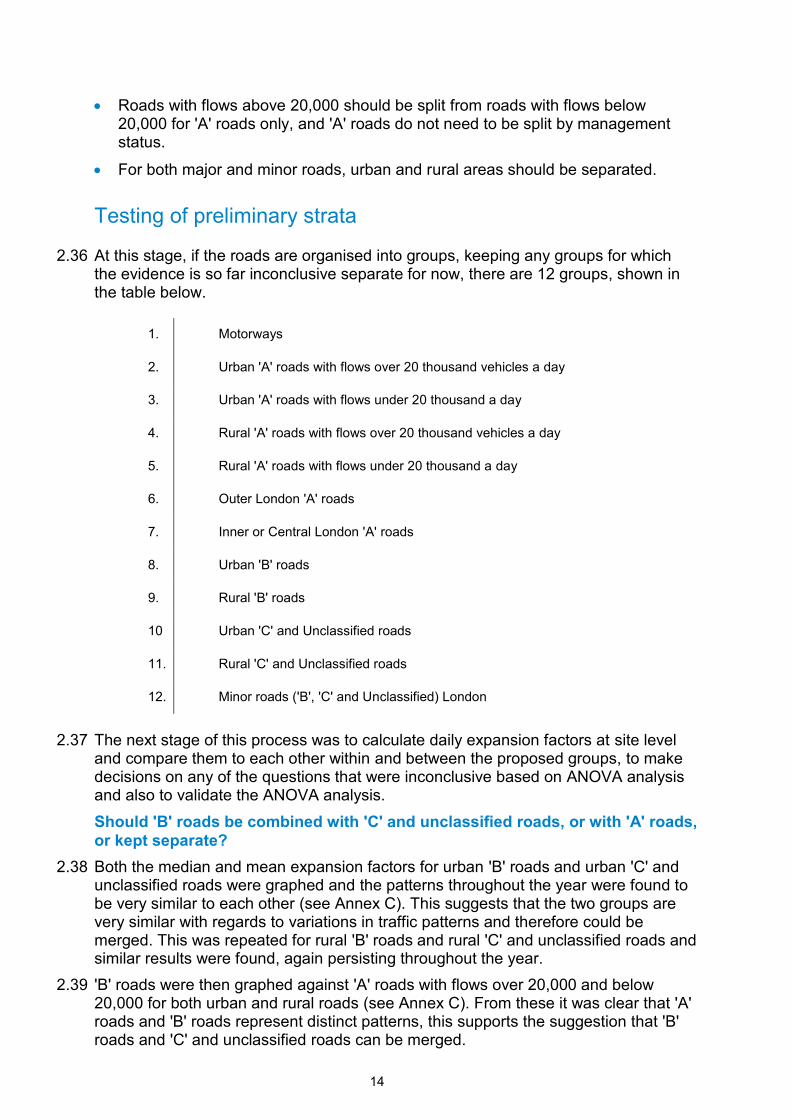
2.36 At this stage, if the roads are organised into groups, keeping any groups for which the evidence is so far inconclusive separate for now, there are 12 groups, shown in the table below.
2.37 The next stage of this process was to calculate daily expansion factors at site level and compare them to each other within and between the proposed groups, to make decisions on any of the questions that were inconclusive based on ANOVA analysis and also to validate the ANOVA analysis.
Should 'B' roads be combined with 'C' and unclassified roads, or with 'A' roads, or kept separate?
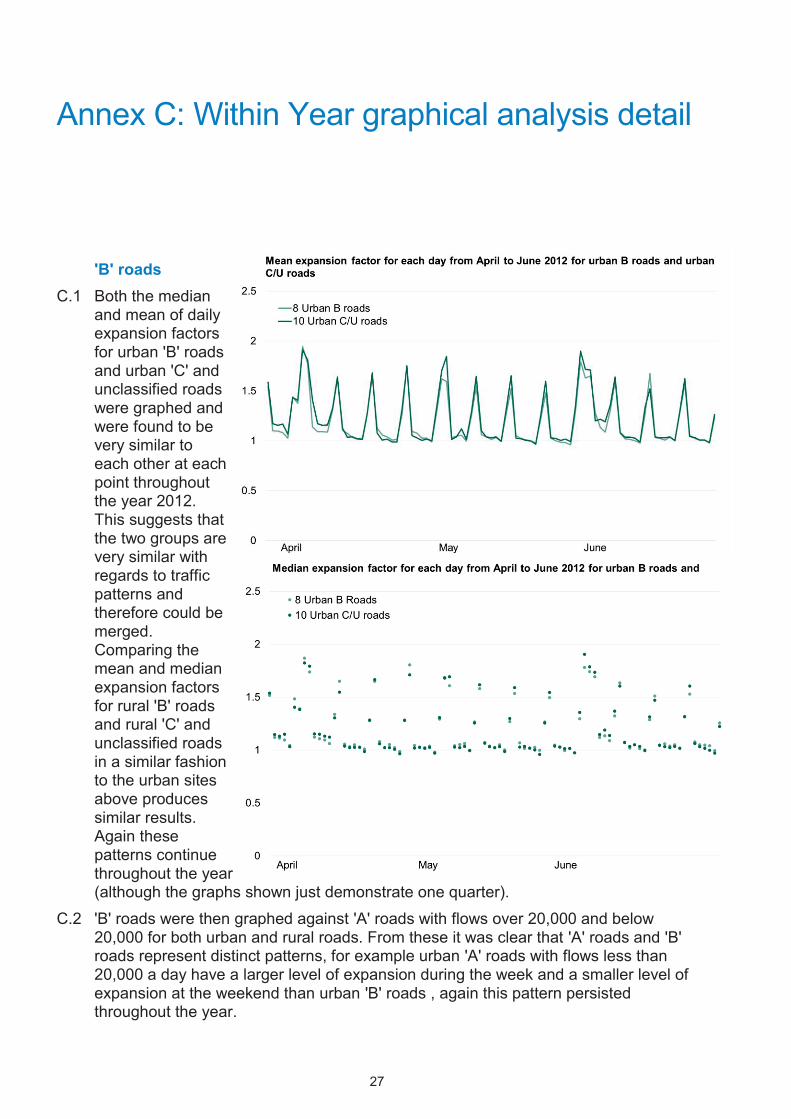
2.38 Both the median and mean expansion factors for urban 'B' roads and urban 'C' and unclassified roads were graphed and the patterns throughout the year were found to be very similar to each other (see Annex C). This suggests that the two groups are very similar with regards to variations in traffic patterns and therefore could be merged. This was repeated for rural 'B' roads and rural 'C' and unclassified roads and similar results were found, again persisting throughout the year.
2.39 'B' roads were then graphed against 'A' roads with flows over 20,000 and below 20,000 for both urban and rural roads (see Annex C). From these it was clear that 'A' roads and 'B' roads represent distinct patterns, this supports the suggestion that 'B' roads and 'C' and unclassified roads can be merged.
1. Motorways
2. Urban 'A' roads with flows over 20 thousand vehicles a day
3. Urban 'A' roads with flows under 20 thousand a day
4. Rural 'A' roads with flows over 20 thousand vehicles a day
5. Rural 'A' roads with flows under 20 thousand a day
6. Outer London 'A' roads
7. Inner or Central London 'A' roads
8. Urban 'B' roads
9. Rural 'B' roads
10 Urban 'C' and Unclassified roads
11. Rural 'C' and Unclassified roads
12. Minor roads ('B', 'C' and Unclassified) London
15
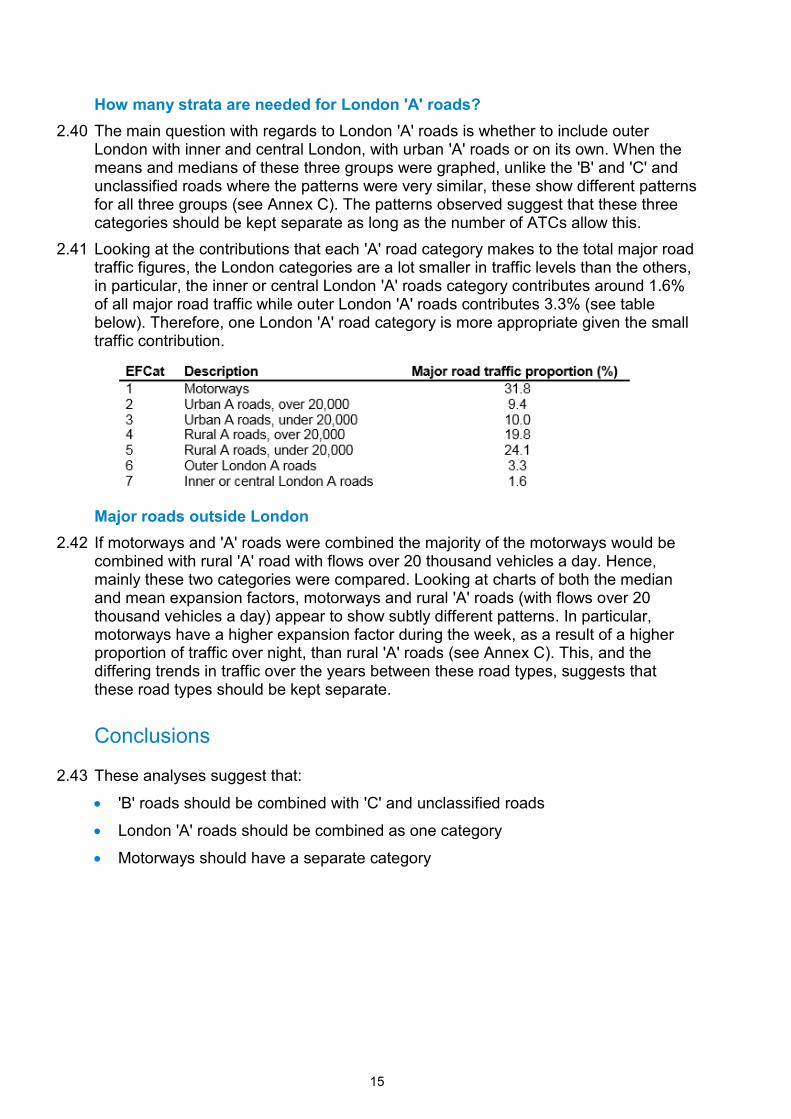
How many strata are needed for London 'A' roads? 2.40 The main question with regards to London 'A' roads is whether to include outer
London with inner and central London, with urban 'A' roads or on its own. When the means and medians of these three groups were graphed, unlike the 'B' and 'C' and unclassified roads where the patterns were very similar, these show different patterns for all three groups (see Annex C). The patterns observed suggest that these three categories should be kept separate as long as the number of ATCs allow this.
2.41 Looking at the contributions that each 'A' road category makes to the total major road traffic figures, the London categories are a lot smaller in traffic levels than the others, in particular, the inner or central London 'A' roads category contributes around 1.6% of all major road traffic while outer London 'A' roads contributes 3.3% (see table below). Therefore, one London 'A' road category is more appropriate given the small traffic contribution.
Major roads outside London 2.42 If motorways and 'A' roads were combined the majority of the motorways would be
combined with rural 'A' road with flows over 20 thousand vehicles a day. Hence, mainly these two categories were compared. Looking at charts of both the median and mean expansion factors, motorways and rural 'A' roads (with flows over 20 thousand vehicles a day) appear to show subtly different patterns. In particular, motorways have a higher expansion factor during the week, as a result of a higher proportion of traffic over night, than rural 'A' roads (see Annex C). This, and the differing trends in traffic over the years between these road types, suggests that these road types should be kept separate.
Conclusions
2.43 These analyses suggest that:
'B' roads should be combined with 'C' and unclassified roads
London 'A' roads should be combined as one category
Motorways should have a separate category
16
2.44 Based on the results of these analyses above the new suggested stratification strata
are now:
Peer Review
2.45 An independent methodological advisor from the ONS reviewed the within year analyses set out in this Chapter, and carried out one final check on this categorisation. This was to run a regression with fixed effects that takes into account the effect that day of the week and month have on the expansion factors (region was also tested and not found to be significant).
2.46 The fitted model had an R-squared of 43%, and so only goes some of the way in explaining the variation in Expansion Factors. Other factors, such as the weather and the timing of school holidays will also play a part, but have not been factored into the model.
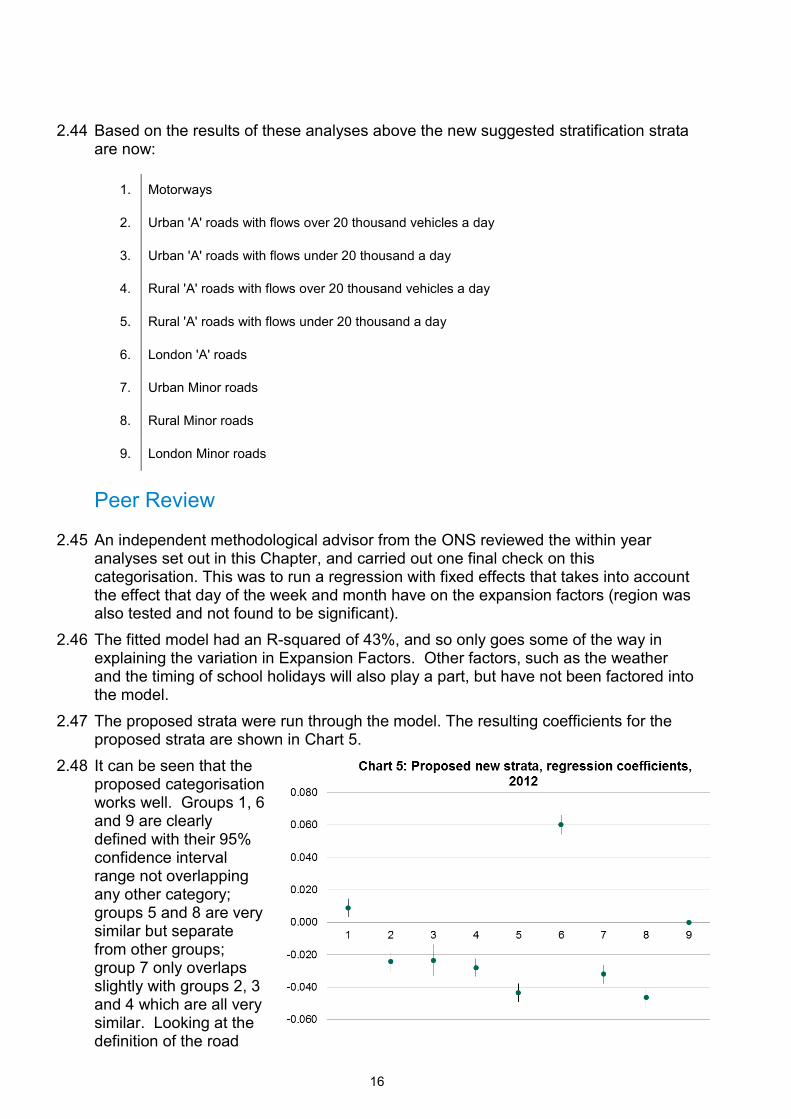
2.47 The proposed strata were run through the model. The resulting coefficients for the proposed strata are shown in Chart 5.
2.48 It can be seen that the proposed categorisation works well. Groups 1, 6 and 9 are clearly defined with their 95% confidence interval range not overlapping any other category; groups 5 and 8 are very similar but separate from other groups; group 7 only overlaps slightly with groups 2, 3 and 4 which are all very similar. Looking at the definition of the road
1. Motorways
2. Urban 'A' roads with flows over 20 thousand vehicles a day
3. Urban 'A' roads with flows under 20 thousand a day
4. Rural 'A' roads with flows over 20 thousand vehicles a day
5. Rural 'A' roads with flows under 20 thousand a day
6. London 'A' roads
7. Urban Minor roads
8. Rural Minor roads
9. London Minor roads
17
categories, these groupings seem intuitively reasonable. (Note that the estimate for category 9 is set to zero (anti-logged, this is 1) and the coefficients for the other categories are relative to this.)
2.49 When replicated by DfT statisticians with 2012 data, and then reproduced with 2013 data, the same pattern was found.
2.50 A slightly more detailed breakdown of strata was also tested with Motorways split between urban/London and other; and minor roads classified according to class of road ('B'/'C'/unclassified). From this, three further category separations were suggested for further investigation. Following replication with both 2012 and 2013 data and discussions between DfT and MAS these were not pursued.
Implementation
2.51 During 2017, DfT statisticians tested the implementation of the stratification for expansion factors on the full 2016 dataset.
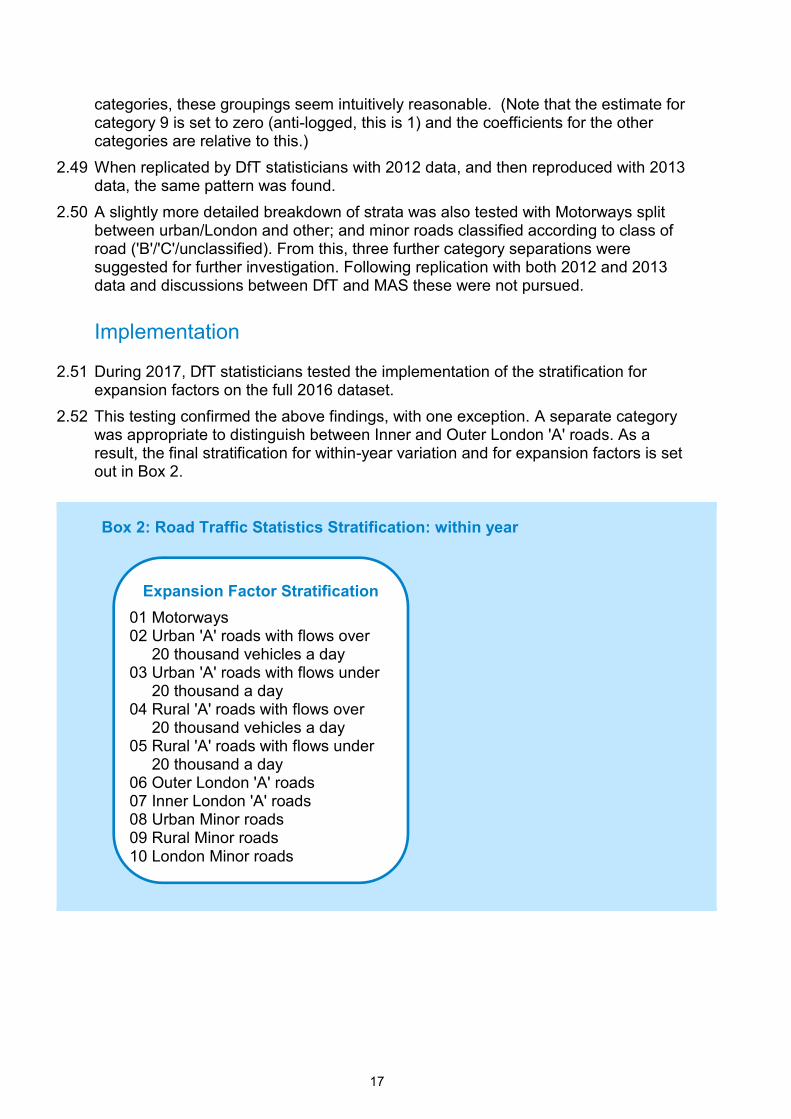
2.52 This testing confirmed the above findings, with one exception. A separate category was appropriate to distinguish between Inner and Outer London 'A' roads. As a result, the final stratification for within-year variation and for expansion factors is set out in Box 2.
Box 2: Road Traffic Statistics Stratification: within year
Expansion Factor Stratification 01 Motorways 02 Urban 'A' roads with flows over 20 thousand vehicles a day 03 Urban 'A' roads with flows under 20 thousand a day 04 Rural 'A' roads with flows over 20 thousand vehicles a day 05 Rural 'A' roads with flows under 20 thousand a day 06 Outer London 'A' roads 07 Inner London 'A' roads 08 Urban Minor roads 09 Rural Minor roads 10 London Minor roads
18
3. Between Year Approach
3.1 The aim of the stratification project was to identify what road or area type attributes are important with regards to explaining variation, in order to group roads together that display similar variation. It is important to understand variation between years.
3.2 Some manual counts on major roads are done annually, others at 2, 4 and 8 year intervals. For those done less frequently than annually, the previous year's annual average daily flow (AADF) figure is converted to an AADF for the year in question. This is done through the application of a growth factor for the relevant stratification category, to convert the estimate from the year before to the year in question. Therefore, it is important to group roads together that display similar variation between years for the application of growth factors. The growth factor is calculated from Automatic Traffic Counter (ATC) data.
3.3 In the same way as for the within year analysis, flow and variations in flow from ATC data was combined with geographical information about the road network from Ordnance Survey's Integrated Transport Network and other sources.
3.4 The use of manual count data for the between year analyses was considered. Growth factors were calculated from links that are counted every year and the same methodology was applied to these growth factors as for the ATC growth factors. However, links with higher flows are more likely to be counted every year and this underlying bias meant that the sample size available was not large enough to provide conclusive results and this analysis was disregarded.
Investigating average growth in traffic using ANOVA
3.5 An average growth factor was calculated from ATC data for 1993 to 2013. This average was linked to observable characteristics of the road links as outlined in the introduction to Chapter 2. Growth factors for individual years and 5-year averages were also calculated and investigated, but it was found that there was too much variability in growth, and extreme outliers skewed the analysis. These alternatives are discussed further in the peer review section.
3.6 Annex D provides a table that summarises which variables were found to have a significant effect on growth in traffic based on this ANOVA analysis.
Road Classification 3.7 Major and Minor roads were found to be distinct. Looking into more detailed
classification; Motorways were found to be clearly distinct in traffic growth patterns to all other road types. However 'B' and 'C' roads were not clearly distinct from any other road type. To try to establish which groupings of classification are more appropriate, ANOVAs were run with 'B' roads grouped with 'A' roads, and 'B' roads grouped with 'C' and unclassified roads separately. Both of these ANOVAs came out as significant. This suggests that the relationship between traffic growth and road classification follows more of a continuum than distinct groups and further
19
investigation is needed to decide how to split by road class. In the data that the traffic team use as a sample framework for minor roads, 'C' and unclassified roads are currently grouped together. For this reason it makes sense to group 'C' and unclassified roads together, although this may be reviewed further if the sample frame data were to change.
Road management 3.8 Unfortunately there are no ATCs on local authority managed motorways. Therefore,
local authority managed motorways are excluded from this ATC analysis (see the next section using graphical representations of traffic flows to investigate principal motorways). Trunk motorways were not significantly different from Trunk 'A' roads, however, both trunk 'A' roads and Motorways were significantly different from both minor roads and principal 'A' roads. This suggests that Trunk 'A' roads and principal 'A' roads have distinct traffic growth patterns, it also suggests that trunk 'A' roads could be combined with motorways to form an SRN stratum.
Area type: Urban and Rural 3.9 Urban areas, rural areas and motorways were found to be significantly different from
one another when comparing all roads. Further breakdown suggests that 'A' roads have significantly different traffic growth in urban and rural areas, but that minor road traffic does not differ between areas.
Area type: Metropolitan vs non-metropolitan 3.10 Metropolitan areas (excluding London) were found to be significantly different from
non-metropolitan areas. However, by nature metropolitan areas are more likely to be classed as urban areas, therefore, it is possible that the differences between metropolitan areas and non-metropolitan areas are driven by the amount of urban and rural within the areas. Filtering by urban and then by rural and examining the differences between average growth factors in metropolitan and non-metropolitan areas found no significant differences. Therefore this suggests that it is not necessary to split roads by both urban and rural and metropolitan and non-metropolitan areas.
Flow 3.11 Dummy variables were created to compare different levels of flow, these were above
10 thousand vehicles a day versus below 10 thousand vehicles, and so on for splits at 20 thousand, 30 thousand, 40 thousand, and 50 thousand vehicles a day on average. Although some significant differences were found for all roads and major roads, when split by road classification, no differences were significant. Therefore, it appears that differences in growth seen between roads of different flows are largely accounted for by the differences in flow between different road classifications, for example motorways generally have a much larger flow than 'A' roads. Therefore, this does not suggest that splitting by flow will provide any extra indication of traffic growth trends over grouping by road class.
Conclusions 3.12 These analyses suggest that:
London should be separate from the rest of the country
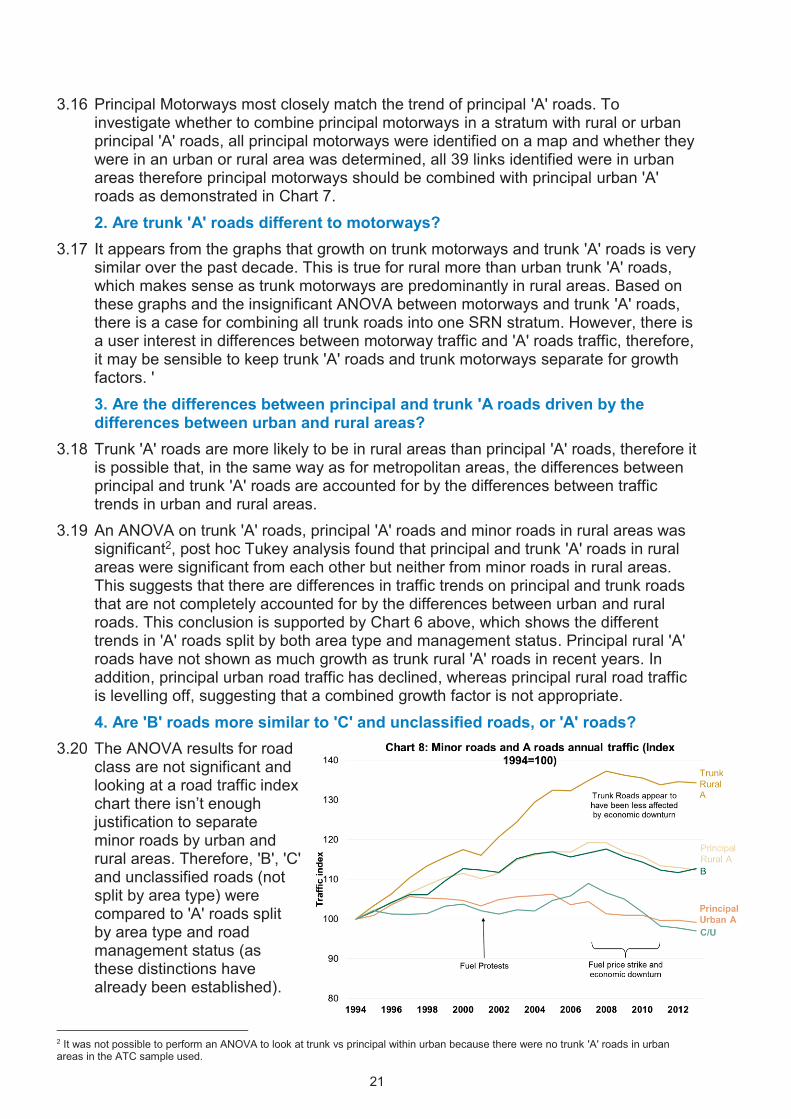
Major and minor roads are distinct but distinction between road classifications is unclear, particularly for 'B' roads. 'C' and unclassified roads should be grouped together due to the framework used.
22
3.21 Chart 8 shows that the trend of traffic on 'B' roads is most similar to rural principal 'A' roads. This was investigated further examining different combinations of road groupings and although the similarity with rural principal 'A' is striking, it looks to be a coincidence rather than anything systematic. Therefore, it is recommended that 'B' roads are a separate growth factor category.
Conclusions These analyses suggest that: 1. Local authority managed motorways should be combined with rural local authority managed 'A' roads.
2. Trunk 'A' roads and Motorways should be kept separate. 3. Principal and Trunk 'A' roads are distinct even within urban and rural areas.
4. 'B' roads should have a separate growth factor category.
Peer Review
3.22 An independent methodological advisor from MAS (ONS) reviewed the analysis carried out by DfT. They recommended not to focus too much on the results of the ANOVA using GFs averaged over a number of years and suggested looking at graphs indexed to different years to ensure that trends persisted.
3.23 The peer reviewer ran the annual growth rates through a fixed effects model, with road class, area (urban/rural) and year as a fixed effect. The inclusion of year dramatically increases the R-squared, from close to zero to around 0.7, clearly indicating that the general trend in traffic growth is the most important factor. This is intuitive, but necessary to prove.
3.24 The data was also run through a model regressing annual growth rates against year by road class by area. It was found that:
─ London generally has lower growth rates than other urban areas, which in turn tend to be lower than for rural areas (note that the coefficients used in this analysis are a simple average of the three road types in each area) supporting the recommendation to split by rural, urban and London.
─ Rural 'A' roads have consistently lower growth factors than other rural roads and urban 'C' and unclassified roads have consistently higher growth factors than other urban roads providing evidence for splitting by road classification within area.
─ London 'C' and unclassified roads have lower growth factors in most years than other London roads3.
─ 'C' and unclassified roads in rural and urban areas are clearly distinct from 'B' roads and 'A' roads.
─ It was also found that road management status makes a difference. 3.25 Taken together, these support the proposed stratification of road type by area
proposed for the derivation of growth factors.
3 However, the London 'B' road results are erratic, reflecting the small number of count points. DfT are upgrading the London network and are currently re-sampling for more sites, which aims to increase the number of ATC sites on 'B' roads. The stratification of links within London will be reassessed when the new network is completed and running.
23
Implementation
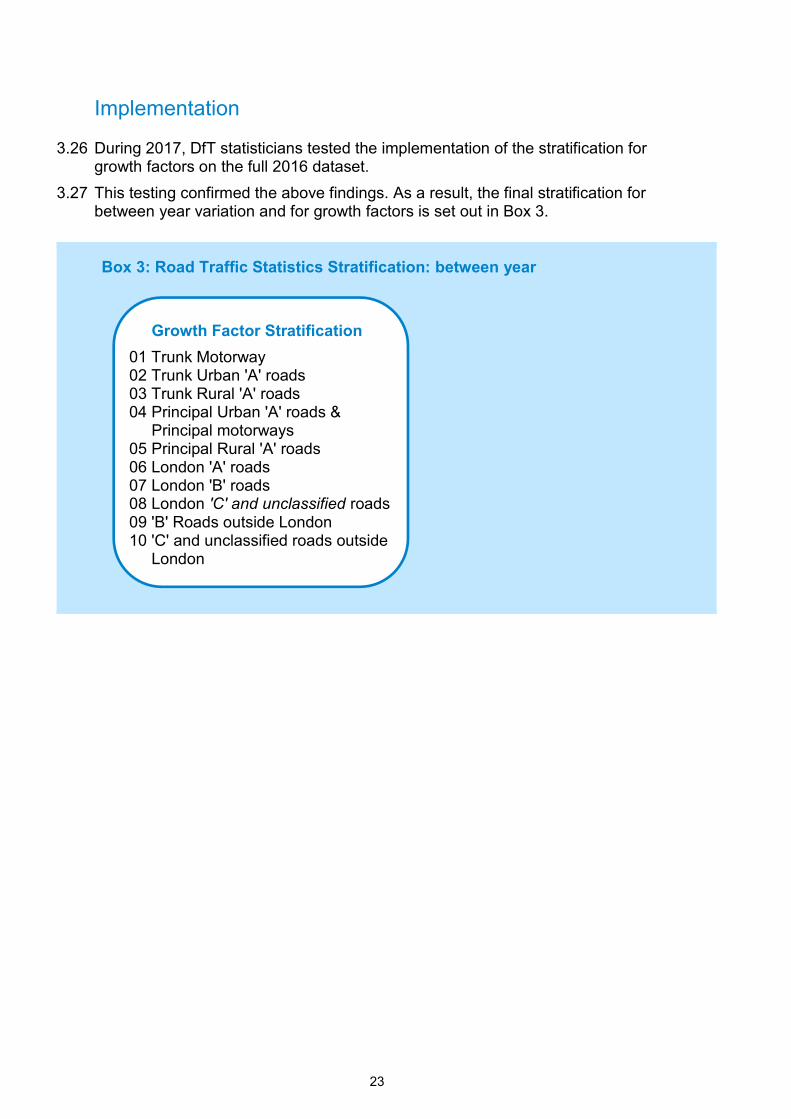
3.26 During 2017, DfT statisticians tested the implementation of the stratification for growth factors on the full 2016 dataset.
3.27 This testing confirmed the above findings. As a result, the final stratification for between year variation and for growth factors is set out in Box 3.
Box 3: Road Traffic Statistics Stratification: between year
Growth Factor Stratification 01 Trunk Motorway 02 Trunk Urban 'A' roads 03 Trunk Rural 'A' roads 04 Principal Urban 'A' roads & Principal motorways 05 Principal Rural 'A' roads 06 London 'A' roads 07 London 'B' roads 08 London 'C' and unclassified roads 09 'B' Roads outside London 10 'C' and unclassified roads outside London
25
Annex A: Current Stratification
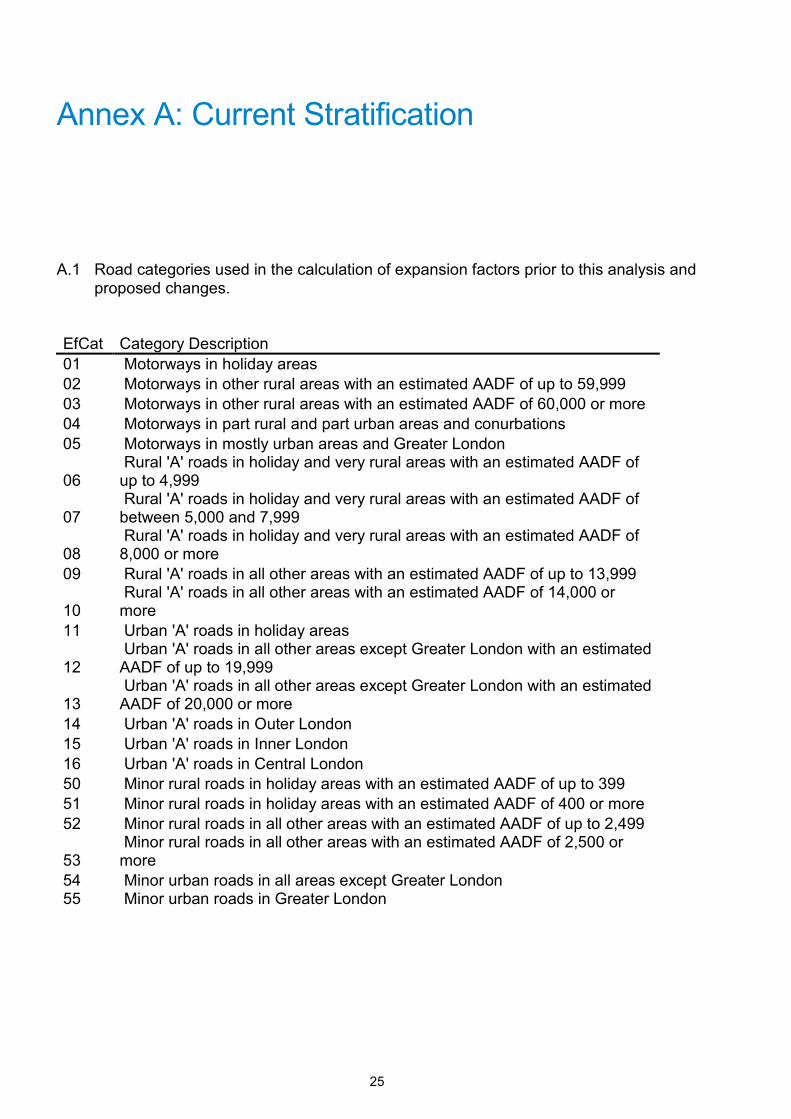
A.1 Road categories used in the calculation of expansion factors prior to this analysis and proposed changes.
EfCat Category Description 01 Motorways in holiday areas 02 Motorways in other rural areas with an estimated AADF of up to 59,999 03 Motorways in other rural areas with an estimated AADF of 60,000 or more 04 Motorways in part rural and part urban areas and conurbations 05 Motorways in mostly urban areas and Greater London
06 Rural 'A' roads in holiday and very rural areas with an estimated AADF of up to 4,999
07 Rural 'A' roads in holiday and very rural areas with an estimated AADF of between 5,000 and 7,999
08 Rural 'A' roads in holiday and very rural areas with an estimated AADF of 8,000 or more
09 Rural 'A' roads in all other areas with an estimated AADF of up to 13,999
10 Rural 'A' roads in all other areas with an estimated AADF of 14,000 or more
11 Urban 'A' roads in holiday areas
12 Urban 'A' roads in all other areas except Greater London with an estimated AADF of up to 19,999
13 Urban 'A' roads in all other areas except Greater London with an estimated AADF of 20,000 or more
14 Urban 'A' roads in Outer London 15 Urban 'A' roads in Inner London 16 Urban 'A' roads in Central London 50 Minor rural roads in holiday areas with an estimated AADF of up to 399 51 Minor rural roads in holiday areas with an estimated AADF of 400 or more 52 Minor rural roads in all other areas with an estimated AADF of up to 2,499
53 Minor rural roads in all other areas with an estimated AADF of 2,500 or more
54 Minor urban roads in all areas except Greater London 55 Minor urban roads in Greater London
26
Annex B: Within Year ANOVA results
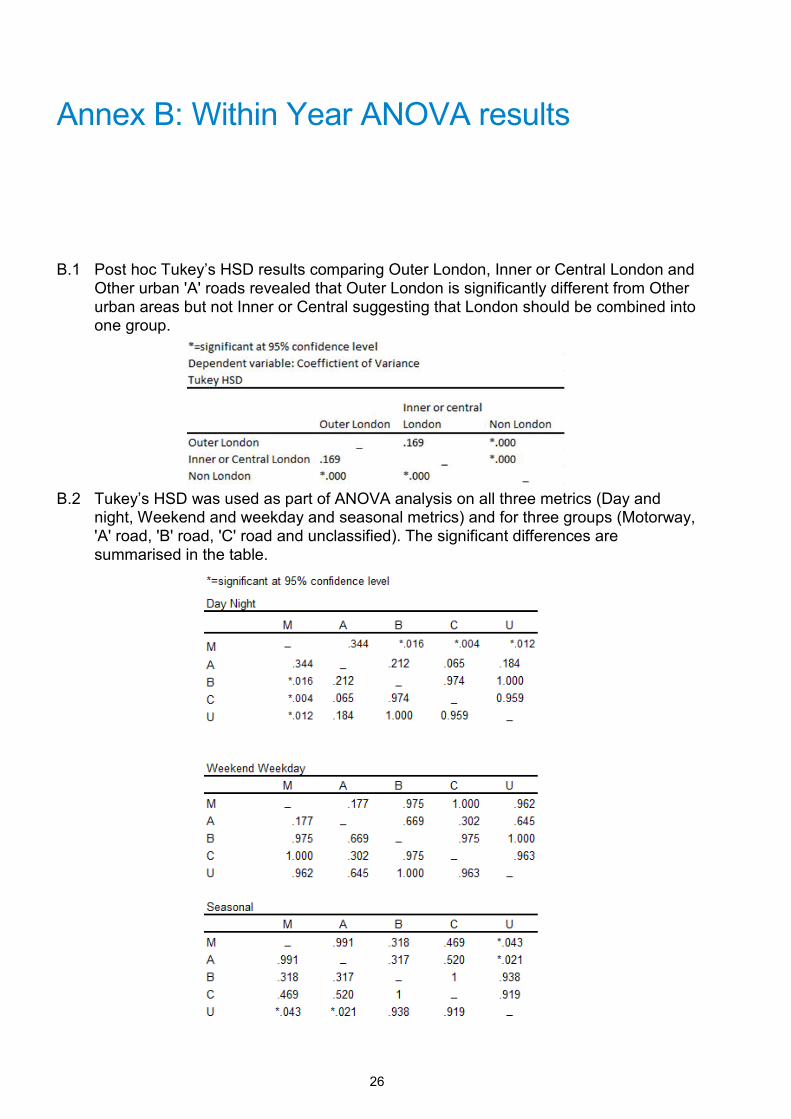
B.1 Post hoc Tukey’s HSD results comparing Outer London, Inner or Central London and Other urban 'A' roads revealed that Outer London is significantly different from Other urban areas but not Inner or Central suggesting that London should be combined into one group.
B.2 Tukey’s HSD was used as part of ANOVA analysis on all three metrics (Day and night, Weekend and weekday and seasonal metrics) and for three groups (Motorway, 'A' road, 'B' road, 'C' road and unclassified). The significant differences are summarised in the table.
28
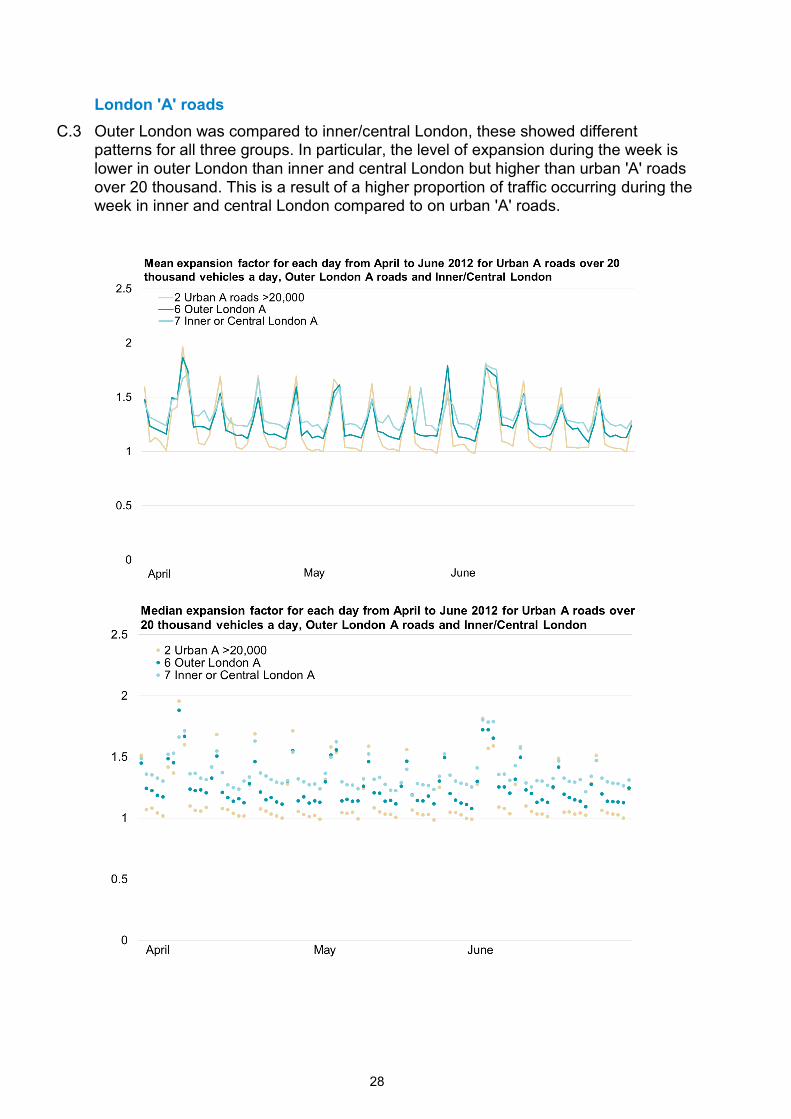
London 'A' roads C.3 Outer London was compared to inner/central London, these showed different
patterns for all three groups. In particular, the level of expansion during the week is lower in outer London than inner and central London but higher than urban 'A' roads over 20 thousand. This is a result of a higher proportion of traffic occurring during the week in inner and central London compared to on urban 'A' roads.
29
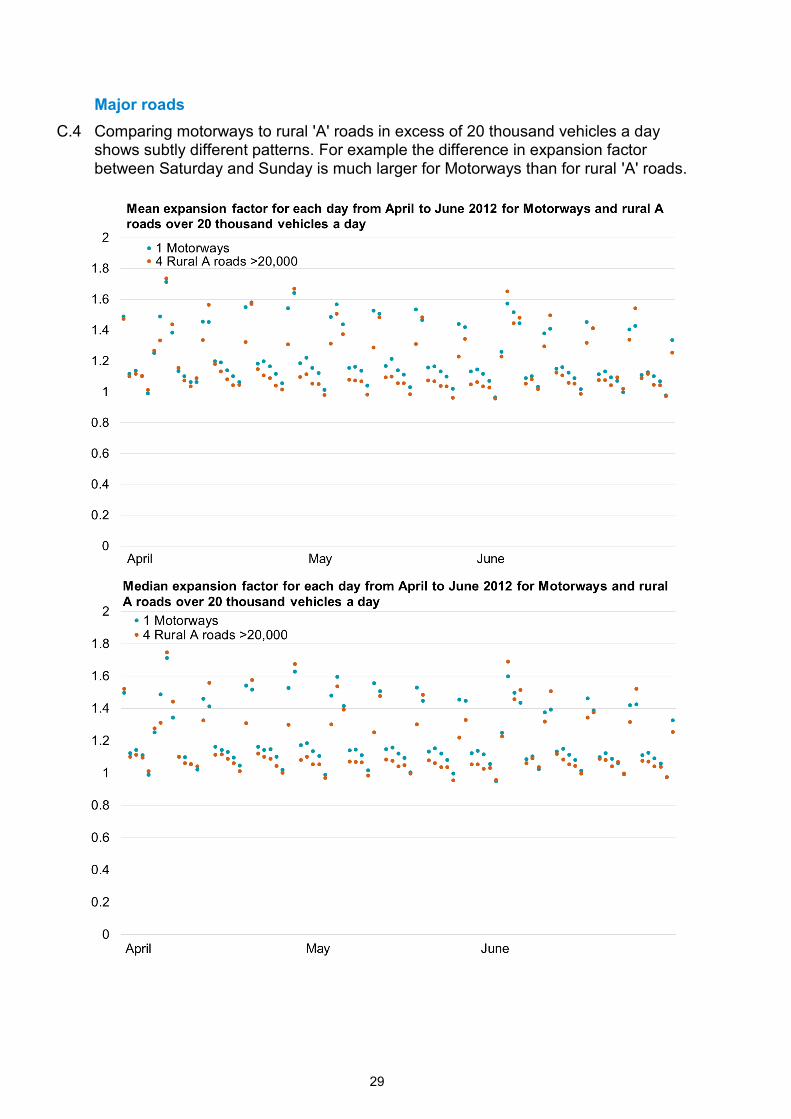
Major roads C.4 Comparing motorways to rural 'A' roads in excess of 20 thousand vehicles a day
shows subtly different patterns. For example the difference in expansion factor between Saturday and Sunday is much larger for Motorways than for rural 'A' roads.
30
Annex D: Between Year ANOVA results
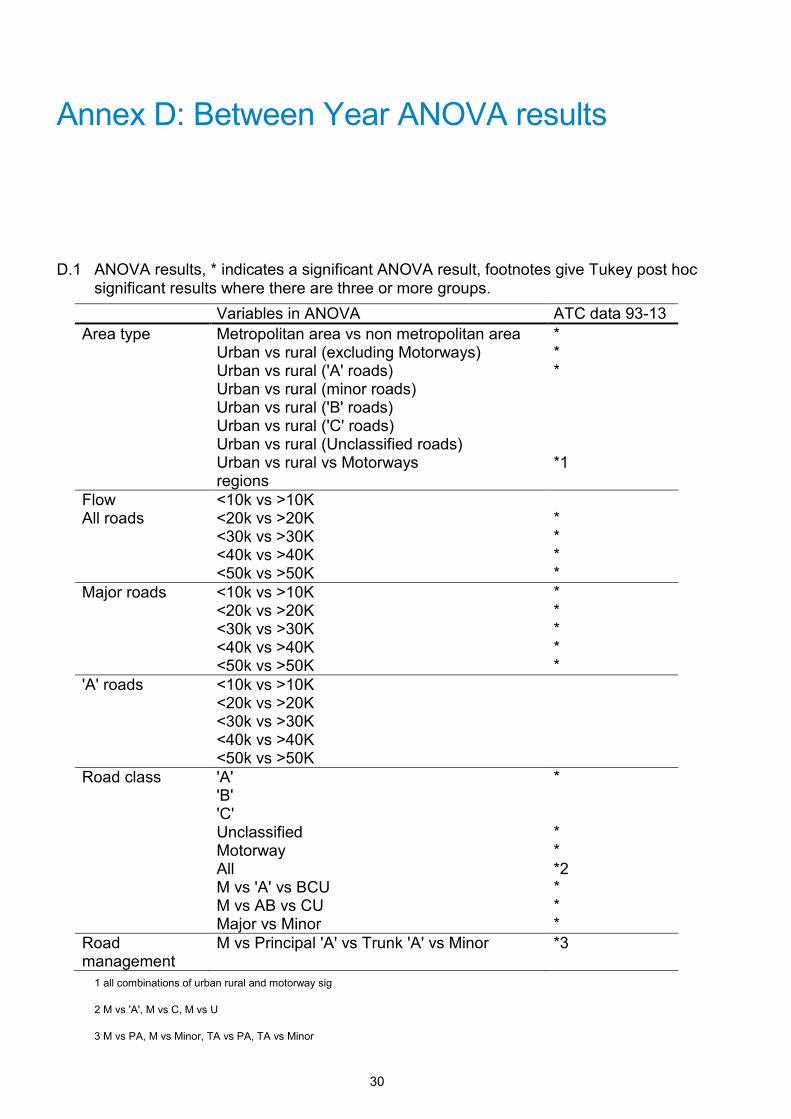
D.1 ANOVA results, * indicates a significant ANOVA result, footnotes give Tukey post hocsignificant results where there are three or more groups.
1 all combinations of urban rural and motorway sig
2 M vs 'A', M vs C, M vs U
3 M vs PA, M vs Minor, TA vs PA, TA vs Minor
Variables in ANOVA ATC data 93-13 Area type Metropolitan area vs non metropolitan area *
Urban vs rural (excluding Motorways) * Urban vs rural ('A' roads) * Urban vs rural (minor roads) Urban vs rural ('B' roads) Urban vs rural ('C' roads) Urban vs rural (Unclassified roads) Urban vs rural vs Motorways *1regions
Flow <10k vs >10K All roads <20k vs >20K *
<30k vs >30K * <40k vs >40K * <50k vs >50K *
Major roads <10k vs >10K * <20k vs >20K * <30k vs >30K * <40k vs >40K * <50k vs >50K *
'A' roads <10k vs >10K <20k vs >20K <30k vs >30K <40k vs >40K <50k vs >50K
Road class 'A' * 'B' 'C' Unclassified * Motorway * All *2M vs 'A' vs BCU *M vs AB vs CU *Major vs Minor *
Road management
M vs Principal 'A' vs Trunk 'A' vs Minor *3