Embed Size (px)
Citation preview

Transportation Research Part C 20 (2012) 185–198
Contents lists available at ScienceDirect
Transportation Research Part C
journal homepage: www.elsevier .com/locate / t rc
Development and evaluation of a constrained optimization modelfor traffic signal plan transition
Jisun Lee a, Billy M. Williams b,⇑a Department of Transport Safety and Disaster Prevention Research, The Korea Transport Institute, 1160 Simindaero Ilsanseo-gu, Goyang-si,Gyeonggi-do 411-701, Republic of Koreab Department of Civil, Construction, and Environmental Engineering, North Carolina State University, 2501 Stinson Drive, Raleigh, NC 27695-7908, USA
a r t i c l e i n f o
Keywords:Traffic controlSignal plan transitionControl optimizationGenetic algorithms
0968-090X/$ - see front matter � 2011 Elsevier Ltddoi:10.1016/j.trc.2011.05.008
⇑ Corresponding author. Tel.: +1 919 515 7813; faE-mail address: [email protected] (B.M. W
a b s t r a c t
In advanced traffic signal control systems, plan transition is the process of switching fromone timing plan to another to accommodate changes in traffic demand. In traditional coor-dinated system operation, whether plans are set by time of day or by traffic responsive planselection, traffic flow can be severely disrupted by the sudden changes in traffic signal tim-ing. Although various transition methods have been developed and refined, existing tran-sition methods are not based on optimizing operational measures of effectiveness duringplan transition periods. As the first step in remedying this situation, this paper presentsa non-linear mathematical model that provides constrained delay minimization throughincremental and simultaneous adjustments in offset and cycle length during plan transi-tions. According to the simulation results, currently used transition methods tend to assignan excessive amount of green time to the main street, resulting in additional side streetdelay without performance improvement for the total transportation network. By contrast,the proposed transition method showed measurable improvement in delay performanceunder a broad range of traffic and geometric conditions.
� 2011 Elsevier Ltd. All rights reserved.
1. Introduction
From a traffic operations perspective, signal transition is typically understood as the process of switching from one timingplan to another to accommodate changes in traffic demand. In traditional coordinated system operation, signal plans are setby time of day or by traffic responsive plan selection. In either case, traffic flow along the coordinated arterial can be neg-atively impacted by disruptions to platoon progression during the plan transition stage. This operational phenomenon moti-vates the search for a signal plan transition method that minimizes traffic flow disruption during the transition period.However, a greater proportion of research effort in signal plan transition has been focused on analysis and evaluation ofexisting transition methods than has been devoted to the development of optimal transition strategies. When the goal movesbeyond comparison of implemented plan transition methods to the improvement and optimization of transition perfor-mance, an important avenue of research involves the development and evaluation of a constrained optimization modelfor traffic signal plan transition.
Therefore, the fundamental issue to be addressed in this research is how to switch the current timing plan to the next onein a way that minimizing the flow disruption that can cause a temporary, but potentially sharp, decline in system perfor-mance in terms of vehicle delay. Given that improved system performance is the overarching objective of advanced traffic
. All rights reserved.
x: +1 919 515 7908.illiams).
186 J. Lee, B.M. Williams / Transportation Research Part C 20 (2012) 185–198
control, meaningful measures of effectiveness (MOEs) should play a key role in the development, evaluation, and field appli-cation of plan transition methods. Nevertheless, existing transition methods do not include explicit consideration of trafficflow MOE sand likewise do not involve the optimization of traffic flow MOEs during the transition period. Instead of MOEoptimization, existing transition methods are based on minimization of secondary factors such as parameter variation ortime spent in transition. Such indirect metrics cannot ensure that effective, near optimal traffic operations will be achievedduring the transition period. Therefore, the proposed transition method directly considers operational MOEs in the objectivefunction to be optimized during the transition period.
The goal of this research is to develop and evaluate a comprehensive transition methodology for coordinated arterial sys-tems. In support of this goal, the research will seek to achieve the following objectives:
� Review relevant literature and the state of practice in signal transition methods.� Develop a new transition method based on delay minimization.� Develop systematic simulation environments to evaluate transition methods.� Comparatively analyze the performance of the proposed method alongside legacy transition methods.
2. Literature review
One class of legacy transition methods seeks to minimize the total time spent on signal plan transition. These approachesare based on the idea that using non-optimal control parameters during the transition period can have disruptive effects ontraffic operation. Therefore, these approaches tried to attain effective traffic operation by minimizing the duration of thetransition period. As a meaningful example of these kinds of approaches, Lieberman and Wicks (1974) proposed the RapidSignal Transition Algorithm (RAST), which was essentially designed to minimize the number and duration of interveningsub-optimal signal intervals.
A second class of methods is based on studies aimed at keeping the cycle by cycle changes in control parameters such asoffset or cycle length relatively small during the transition period. These approaches are based on the idea that gradual tran-sitioning to the new optimal parameters can minimize disturbances of traffic flow during the transition period. Ross (1977)examined the impact of transition algorithms on average speed and stops per vehicle under the various volume conditionsusing the NETSIM model and the frontage road system of the Central Expressway in Dallas. In a similar study, Basu (1981)examined the factors influencing the number of signal timing plans using the NETSIM and TRANSYT models. It is noteworthythat this second general approach, to some degree, runs counter to the first approach of minimizing the total transition time.
Traffic signal controller vendors and the developers of CORSIM worked together to develop a family of practical ap-proaches for effecting signal plan transition. These approaches can be generally categorized as Dwell, Add, Subtract, Shortway,Immediate, Two-cycle, and Three-cycle, although they go under various names among the different controller vendors. The Addtransition method allows the local controller to change the offset through lengthening the cycle by increasing all phases pro-portionally to their splits subject to a maximum cycle by cycle change. Conversely, the Subtract transition method correctsthe offset by shortening all phases, subject to minimum green times, pedestrian intervals, and a specified percentage of thecycle length of the new signal plan. The Shortway transition method selects either the Add or Subtract method based onwhich method can achieve the transition over a shorter transition period. Some controller vendors refer to this methodas Smooth or Bestway. In most cases, the Add, Subtract, and Shortway methods proportionally allocate offset variation toall phases including non-coordinated phases.
In contrast, the Dwell transition method, which is also referred to as the Longway by some vendors, will cause the con-troller to rest in the coordinated phases until the new coordination plan is reached. Therefore, this method can cause signif-icant congestion on the side street and should generally be avoided during saturated conditions. This method of achievingoffset transition through changes to the coordinated phases only is extended through the related methods known as Imme-diate, Two-cycle, and Three-cycle transition. As the names imply, these methods complete the transition to new settings overthe specified number of cycles.
Simulation studies have been conducted to evaluate the performance of the transition methods mentioned above. Nelsonand Bullock (2000) conducted impact analyses of emergency vehicle preemption on corridor operation using a hardware-in-the-loop simulation system. In this study, they employed plan transition as a recovery algorithm to resynchronize the con-troller after the preemption terminated. They found that the Smooth transition algorithm, using 20% and 17% respectively asthe maximum cycle change percentages for Add and Subtract, performed the best under most of the scenarios evaluated.
Using both gradual transitioning and a linear quadratic optimization technique, Mussa et al. (2003) modeled the transi-tion problem as a linear dynamic process with disutility measures assumed to be sum of squares of the deviations of thecoordination parameters such as cycle length, splits, and offset during the transition period. As a solution algorithm, theyemployed a linear quadratic optimization technique to determine optimal number of transition steps and the optimal tran-sition step size. However, this study assumed the disutility measure to be the deviation of the control parameters instead of asystem performance MOE, such as average vehicle delay.
Shelby et al. (2006) compared the performance of several transition methods at a single intersection and arterial network.For the arterial network experiment the researchers found that the Shortway method was the most effective transition meth-od across a wide range of conditions.

J. Lee, B.M. Williams / Transportation Research Part C 20 (2012) 185–198 187
Obenberger and Collura (2007) evaluated traffic signal transition strategies for preemption control using software-in-the-loop simulation. This research showed that a statistically significant interaction exists between traffic volume levels andtransition performance. The authors concluded that selecting the most effective transition method needs to be based on traf-fic volume levels and traffic signal configurations.
Cohen et al. (2007) analyzed the performance of various transition methods by using CORSIM 6.0. Their experiments wereconducted by using a 10-intersection arterial in Tucson, Arizona and an additional hypothetical network. In this study,authors showed that the Dwell method produced a substantial shockwave in the performance measures. By contrast, theSubtract method had a very smooth and stable performance profile.
Yun et al. (2008) evaluated the impacts of changes in TOD timing plans using actual traffic controllers. To calculate per-formance of transition algorithms, this study employed a VISSIM-based HILS environment with a four-intersection arterial.Authors pointed out that the experiments of this study were conducted using relatively long cycle lengths in its TOD timingplans and therefore that it would be necessary to employ a more diverse set of TOD timing plans.
As can be seen by the brief general discussion above, existing plan transition methods are based on the assumption thateffective traffic operation during plan transitions will be attained either by a gradual change of the plan parameters or byminimization of the time spent on plan transition. However, development of these heuristic methods involved no explicitestimation and optimization of traffic control performance. Therefore, the opportunity exists to provide improved coordi-nated system operation through development of a plan transition method based on direct optimization of systemperformance.
3. Methodology
This section presents the research methodology for developing and evaluating the delay minimization based signal tran-sition method. First, a basic strategy for the proposed transition method is presented. Second, the proposed transition modelformulation based on non-linear optimization is described. Third, a genetic algorithm (GA) based solution method for theproposed transition model is presented. The fourth subsection provides a systematic procedure for comparatively evaluatingthe various transition methods. The final subsection describes the specific simulation system development environmentsused for transition method evaluation.
3.1. Basic strategy
The basic strategy of this research is to minimize average vehicle delay during the transition period. Therefore, all controlvariables, including both number of transition steps and the transition step size, will be jointly optimized in order to min-imize average vehicle delay during the transition period. This represents a fundamental departure from existing transitionmethods. Within a constraint search space, the proposed transition method conducts incremental and simultaneous adjust-ments in offsets, cycle lengths, and phase splits. Plan transition methods and even real-time adaptive control algorithmshave traditionally considered cycle length and offset calculations separately. This traditional approach ignores the directrelationship between offsets and system cycle length during the transition period. In other words, stepwise changes in off-sets must be accompanied by specific stepwise changes in background cycle length and vice versa during the transition per-iod. Furthermore, in addition to jointly optimizing offsets and cycle length, the proposed transition strategy relaxes therequirement for a common cycle length during the transition period. This relaxation of the common cycle length constraintduring plan transition should intuitively result in a more efficient transition and allow minimization of unnecessary sidestreet delay. In summary, the basic strategy behind the proposed transition method is aimed at minimizing vehicle delayduring the transition period by deploying joint constrained optimization of incremental and simultaneous adjustments inoffsets, intersection cycle lengths, and phase splits.
3.2. Model formulation
This section presents the model formulation designed to implement the proposed basic strategy. The objective function ofthe model formulation indicates the sum of average vehicle delay for each intersection during the transition period. In thisresearch, the Highway Capacity Manual (HCM) delay equation (TRB, 2000) for an arterial is used to estimate average vehicledelay. Therefore, the delay equation of the proposed transition model can be expressed as the function of cycle length, greentime, flow, and arrival pattern (progression factors) for each intersection.
Of course, accurate estimation of the arrival pattern at downstream intersections is essential to the evaluation the pro-gression quality of coordinated movements. Based on the simplifying assumption that vehicles released from upstream sig-nals will reach the downstream signal in the free flow travel time with no platoon dispersion, the implementation of theproposed method used in this study calculates a percent arrival under green and corresponding progression factor for eachevaluated interim timing solution. The volume arriving under green is a linear function of the volume arriving from the up-stream through movement, volume arriving from the upstream side street approaches, upstream through green, down-stream through green, cycle length, offset, and link travel time. This estimated volume arriving under green is used tofollow the HCM procedures of calculating platoon ratio, determining arrival type and progression adjustment factor, and

188 J. Lee, B.M. Williams / Transportation Research Part C 20 (2012) 185–198
finally calculating the associated progression factor. Therefore, the coordination impact of candidate interim cycle length,offset, and green split solutions is considered through inclusion of HCM-based progression factors in the objective function.Although platoon dispersion was not included in the study presented in this paper, a platoon dispersion-based method forestimating progression factors could be employed.
As a non-linear optimization model, the proposed transition model includes three important decision variables that con-trol the transition process. The first decision variable is the number of transition steps, n, within the transition time period(i.e., How many cycles are needed to effectively complete the signal transition?). The second decision variable is the steplength’ bðDCÞj, for each transition step. These two variables are used for calculating background cycle length, bCj, which isa common cycle length used for the operations of a coordinated arterial. By using the number of transition steps, n, andthe step length, bðDCÞj, the stepwise cycle transition can be conducted for the coordinated arterial, which is modeled withthe first constraint equation of the proposed model formulation below. Minimum phase splits as user defined constraintsand cycle length constraints on total ring splits are implicit in the optimization model. As a non-linear optimization model,the proposed transition model is as follows:
MinimizeXm
i¼1
Xn
j¼1iDjðiCj; iG
kj ; i/j; iqk
j Þ ð1Þ
Subject to bCj�1 þ bðDCÞj ¼ bCj for 1 6 j 6 n ð2Þ
bCj þ iðD/Þj ¼ iCj for 1 6 i 6 m; 1 6 j 6 n ð3Þ
Xn
j¼1bðDCÞj ¼ CV ð4Þ
Xn
j¼1iðD/Þj ¼ iOV for 1 6 i 6 m ð5Þ
TPCB6 n 6
TPCA;CA 6 iCj 6 CB for 1 6 i 6 m; 1 6 j 6 n ð6Þ
iG1j þ iG
2j ¼ iG
5j þ iG
6j for 1 6 i 6 m; 1 6 j 6 n ð7Þ
iG3j þ iG
4j ¼ iG
7j þ iG
8j for 1 6 i 6 m;1 6 j 6 n ð8Þ
bðDCÞj P 0; iðD/Þj P 0 for 1 6 i 6 m;1 6 j 6 n ð9Þ
where i is the intersection, j the transition step, k the phase, n the total number of transition steps, iCj the cycle length ofintersection i at transition step j, i/j the offset of intersection i at transition step j, iG
kj the phase k green time of intersection
i at transition step j, iqkj the phase k traffic flow of intersection i at transition step j, iDj the average vehicle delay of intersec-
tion i at transition step j, bCj the background cycle length at transition step j, bðDCÞj the cycle variation at transition step j,iðD/Þj the offset variation of intersection i at transition step j, CA the current cycle length of signal timing plan, CB the nextcycle length of signal timing plan, CV the cycle variation during the transition period and iOV is the offset variation of inter-section i during the transition period, TP is transition time period.
Finally, the third key decision variable is the offset variation, iðD/Þj, to be adjusted for each intersection at each transitionstep. Therefore, the cycle length for the individual intersections can be determined by adding the offset variation, iðD/Þj, tothe background cycle length, bCj, which indicates the offset transition process modeled at the second constraint equation ofthe proposed model formulation (Eq. (3)). Eqs. (4) and (5), the third and fourth constraint equations, indicate conservation oftotal variation in cycle and offset, respectively during the transition period. In addition, the number of transition steps shouldbe decided through the transition time period (TP) and two background cycle lengths, CA and CB, for the arterial operationbefore and after the transition period, Eq. (6). For a more realistic arterial operation, the offset transition independently oper-ates for each intersection during the transition period. Therefore, a specific intersection may complete its own offset tran-sition earlier than other intersections if this result has a beneficial effect on the transition model objective function. Asdescribed below, the current cycle length and offset are decoded from constrained values of offset variation and input intothe vehicle delay objective function along with flow rates and constrained values of green times.
3.3. Solution algorithm
This section presents the solution algorithm designed to efficiently solve the transition model presented in the previoussection. A fundamental issue with complex and large-scale mathematical problems such as signal timing optimization is

J. Lee, B.M. Williams / Transportation Research Part C 20 (2012) 185–198 189
how to efficiently reach the global optimum solution if one exists or a near optimal solution otherwise. Genetic algorithms(GA) are an attractive class of computational models for solving such complex problems. This research employed a GA-basedoptimization module built on Vitri, an objected-oriented framework implemented in Java. Vitri is a large-scale decision sup-port system (Baugh, 2010), and the original Vitri kernel was developed by John Baugh at North Carolina State University.
In order to apply the Vitri framework to the signal timing optimization problem, a new class titled SignalOrganism wasadded to Vitri by extending ByteArrayOrganism, an abstract class of the Vitri framework. Also, a member function within theSignalOrganism class was designed to calculate the fitness of the selected organism by using the HCM delay equation. In GA-based optimization problems, the decoding process can be simply conducted using the boundary condition of the feasibleregion for the decision variables. Therefore, it is an essential part of the decoding process to decide the upper and lowerboundary for the decision variables.
At the transition step j, the step length should be less than the residual amount of the cycle transition. Besides, minimumoffset transition should be conducted for each intersection at this step because the intersection cycle length, iCj, at the fol-lowing steps should be less than or equal to the next cycle length, CB, as described in the proposed model formulation. Other-wise, by adding excessive offset variation to the background cycle, bCj, at the following steps, the cycle length, iCj, forindividual intersection may be greater than the next cycle length, CB, during the transition period. Therefore, maximum steplength should be decided by subtracting the minimum amount of the offset transition from the residual amount of the cycletransition. In this case, the minimum amount of the offset transition should be selected from the intersection with the largestoffset transition residual in order to satisfy the cycle length constraint for all intersections at this step. The boundary of thecycle variation at the transition step j is as follows:
0 6 bDCj 6 CV�Xj�1
k¼1
DCk
" #� max
iðiOV �
Xj�1
k¼1iDukÞ=ðn� jÞ
" #for 1 6 i 6 m;1 6 j 6 n� 1 ð10Þ
The offset variation, iðD/Þj, boundary of the intersection i at the step j can be decided from Eq. (11). The offset variation atthis step should be less than or equal to the residual amount of the offset transition. Also, it should satisfy the cycle lengthconstraint, therefore it should be less than or equal to the residual amount of the cycle transition as well as the offset tran-sition. On the other hand, the minimum offset variation at this step can be determined by conducting the maximum offsettransition available for the following steps. That is, the minimum offset variation is equal to the residual amount of the offsettransition minus the maximum offset transition amount for the residual steps. The offset variation, iðD/Þj, boundary of theintersection i at the step j is as follows:
max 0;Pj�1
k¼0ðiOV� iDukÞ � ðn� j� 1Þ
Pj
k¼1ðCV� bDCkÞ
� �6 iDuj 6
min CV�Pj
k¼1bDCk; iOV�
Pj�1
k¼0iDuk
� �for 1 6 i 6 m;1 6 j 6 n� 1
ð11Þ
Using the boundary conditions described above, the decoding process for the cycle variation and the offset variation can beconducted as follows:
bDCj ¼MinDC þ ðMaxDC �MinDCÞ �Xn�1
i¼0
bi � 2i
!10
=ð2n � 1Þ ð12Þ
iDuj ¼ MinDuþ ðMaxDu�MinDuÞ �Xn�1
i¼0
bi � 2i
!10
=ð2n � 1Þ ð13Þ
where MinDC is the minimum cycle variation, MaxDC the maximum cycle variation, MinD/ the minimum offset variation,MaxD/ is maximum offset variation, n the number of bits used in a binary string, and bi is ith bit value (0 or 1).
Once the cycle variation and offset variation are determined through the decoding process above, the cycle lengths andoffsets for individual intersections can be calculated because both bC0 and i/0 are already known through the current signaltiming plan, and also the cycle lengths are used for calculating phase splits as follows:
SPmain ¼Xu2
i¼u1
MinSPi þ iCj �Xu4
i¼u1
MinSPi
!�
Xn�1
i¼0
bi � 2i
!10
=ð2n � 1Þ ð14Þ
SPside ¼ iCj � SPmain ð15Þ
SPu1 ¼MinSPu1 þ SPmain �Xu2
i¼u1
MinSPi
!�
Xn�1
i¼0
bi � 2i
!10
=ð2n � 1Þ ð16Þ
SPu2 ¼ SPmain � SPu1 ð17Þ

190 J. Lee, B.M. Williams / Transportation Research Part C 20 (2012) 185–198
SPu3 ¼MinSPu3 þ SPside �Xu4
i¼u3
MinSPi
!�
Xn�1
i¼0
bi � 2i
!10
=ð2n � 1Þ ð18Þ
SPu4 ¼ SPside � SPu3 ð19Þ
SPu5 ¼MinSPu5 þ SPmain �Xu6
i¼u5
MinSPi
!�
Xn�1
i¼0
bi � 2i
!10
=ð2n � 1Þ ð20Þ
SPu6 ¼ SPmain � SPu5 ð21Þ
SPu7 ¼MinSPu7 þ SPside �Xu8
i¼u7
MinSPi
!�
Xn�1
i¼0
bi � 2i
!10
=ð2n � 1Þ ð22Þ
SPu8 ¼ SPside � SPu7 ð23Þ
where iCj is the cycle length of intersection i at the step j, SPmain the main street split time, SPside the side street split time, SPi
the split time of phase i, i = /1, /2, . . . , /8, MinSPi is minimum split time of phase i, n is number of bits used in a binary string,and bi is the ith bit value (0 or 1).
In the same manner, the decoding process for phase splits was simply conducted by using the upper and lower boundaryconditions. Once the control parameters are determined through the decoding process above, the GA-based optimizationmodule calculates the fitness of the selected organism through the HCM delay equation within the SignalOrganism class.Rather than establish convergence criteria, in order to establish a consistent computation time, the GA was run for 100 gen-erations in all cases. The control parameters used in the GA-based optimization process are as follows:
� Fitness value: control delay per vehicle.� Population size: 200.� Selection mechanism: binary tournament selection.� Genetic operator: uniform crossover.� Crossover probability: 0.75.� Mutation probability: 0.03.� Number of generations: 100.
3.4. Evaluation procedure
This section presents an evaluation procedure for transition methods examined in this research. In general, field evalu-ations for prototype transition methods are unpredictable and potentially unsafe, and they might result in significant trafficflow disruption. Therefore, this research evaluated transition methods through carefully designed simulation experiments.CORSIM was chosen to evaluate existing transition methods because CORSIM supports widely used transition methods forpre-timed and actuated control modes. However, for the proposed transition method a specially developed simulated controllogic was required. Recall that the proposed transition model allows each intersection in an arterial to take a different cyclelength during the transition period. Currently available simulation software, including CORSIM, cannot emulate the processof switching from coordinated control to isolated control within a continuous simulation. Therefore, an external control logicthat can handle the cycle length switching process during the transition period was developed for this research. For the pro-posed transition method, CORSIM models the entire simulated traffic environment except for the signal timing control,which is governed by the external controller. The specific development environments for the external controller are pre-sented in the following section.
A hypothetical three-intersection arterial was selected as a simulation test-bed for evaluating the transition methods.Each approach of the intersection has a single exclusive left-turn lane and the number of full lanes on main and side streetswas set to 3 and 1, respectively. Turning movement ratios for each intersection were set to 20%, 70%, and 10% for left,through, and right turns, respectively. The entry volume ratio of for the coordinated arterial changes from 50:50 to 55:45during the transition period. Concurrently, the volume-to-capacity ratio (v/c) increases from 0.5 to 0.8 for the transition intopeak. In case of the transition out of peak, v/c decreases from 0.8 to 0.5. The common and control factors mentioned aboveand shown in Table 1 were integrated to create a broad set of traffic scenarios.
Link length was varied in order to investigate platoon dispersion effect on the transition performance. The approach vol-ume ratio for the main and side streets was varied to investigate the relative impact to coordinated and side street trafficunder various levels of through traffic dominance. Three entry volume patterns were used in order to compare performancewhen entry volume increases at differing rates across the transition period. The linear pattern transitions the traffic intensityat an even rate. The logarithmic pattern has a higher rate of increase in the beginning of the transition period, and the expo-nential pattern has a higher rate at the end of the transition period. It is important to note here that the volumes used in the

Table 1Control factors for the simulated transition experiments.
Control factor Possible values Number of possible values
Link length (feet) 700, 1000, and 1300 3Approach volume ratio (main:side) 60:40, 70:30, and 80:20 3Entry volume pattern Linear, exponential, logarithmic 3Pedestrian intensity (pph) None, light (100–250), moderate (250–500), heavy (500+) 4
J. Lee, B.M. Williams / Transportation Research Part C 20 (2012) 185–198 191
HCM delay equation to evaluate fitness in the experimental implementation of the proposed algorithm used an assumed lin-ear demand transition in all cases. Ultimately the algorithm should be implemented with the ability to sense and incorporatethe actual demand transition pattern. However, emulating this capability in these initial design experiments would haveonly served to exaggerate the comparative advantage of the proposed algorithm in the non-linear demand transition scenar-ios, and using a fixed linear demand transition assumption allowed testing of the robustness of the method under a simpledemand transition assumption.
Pedestrian movements are also an important consideration at many urban intersections. Previous plan transition studieshave not considered pedestrian impedance. This research used CORSIM’s embedded pedestrian intensity parameter as thefinal experimental control factor. However, CORSIM’s method for modeling the impact of pedestrian flows is relatively sim-plistic. Therefore, the research results for the scenarios that include pedestrian intensity should be considered incompleteand tentative. Based on the defined common and experimental control factors, optimized signal plans for the traffic condi-tions before and after transition were determined off line using Trafficware’s Synchro software program.
The control factor levels above define 108 unique simulation scenarios. Simulation transition experiments were con-ducted with 10 random number seeds for each scenario, bringing the total number of distinct simulation runs to 1080 con-ducted for the proposed method and each of the applicable legacy transition methods. Therefore, as summarized in theresults section below, 270 runs were executed for the ‘‘no pedestrian’’ scenarios for the proposed method and for all sevenof the legacy methods, and 810 runs were conducted for the ‘‘with pedestrian’’ scenarios for the proposed method and theImmediate, Two-cycle, and Two-cycle methods. The number of runs per scenario was determined principally to support thestatistical analyses presented in the results section below. In terms of precision in the average vehicle delay results, the 10runs provide 95% confidence bounds on the order of ±0.5 s per vehicle for each scenario.
The simulation runs covered a 40-min period. In each run, the initial traffic pattern continued for 15 min, and the finaltraffic pattern was constant over the last 15 min. In the 10-min period from the 15-min mark to the 25-min mark, the variousentry volume pattern schemes were applied to transition from the initial to the final flow pattern. Therefore, the start of sig-nal plan transition was scheduled for the 15-min mark. A 10-min transition period was selected to correspond in general tothe plan update interval of current traffic control systems. The majority of plan-based traffic control systems use a 10–15-min period as the plan transition interval. Given the study’s primary research goal of performing initial comparative tests ofthe proposed transition optimization method, it was important to set the proposed method within the context of the cur-rently available transition methods.
3.5. Development environments
This section presents the development environments of the simulation systems designed to test the proposed transitionmethod according to the evaluation procedure proposed in the previous section. As primary components of the simulationsystems, this research employed the CORSIM simulation model, a newly coded traffic controller emulator, and an interfacemodule to connect the controller emulator to CORSIM. Also, as mentioned above, Synchro was employed to design the signaltiming plans to use before and after transition period.
As shown below, the CORSIM run time environment (RTE) is linked with CORSIM, which means that the CORSIM RTE andCORSIM must run within a single platform. CORSIM supports the Dynamic Link Library (DLL) method as a way of modularprogramming. Although the DLL approach has strong points such as an effective management of hardware resources, a stan-dard DLL cannot be used under distributed computing environments. Therefore, the CORSIM RTE DLL must share a singleplatform with CORSIM. The controller emulator is implemented as a multi-task structure under the Linux operating systemsenvironment. Because CORSIM and the CORSIM RTE usually occupy considerable hardware resources during the simulationperiod, the controller emulator needs to be separated from CORSIM platform to provide acceptable performance. The com-munication between two systems is maintained via an Ethernet network.
As a key component of the simulation systems, the controller emulator is comprised of tasks and communication facilitiessuch as socket and inter-process communications (IPCs) as illustrated in Fig. 2. As a task spawn, the StartUp task creates IPCsand all the tasks of the controller emulator. Secondly, the Interface task serves as the communication task and is responsiblefor the data exchange with the CORSIM RTE via an Ethernet network. Loading the detector data (Det_Info) into the sharedmemory, the Interface task informs the DetInfo task of the loading completion through the semaphore #1. Next, the DetInfotask fetches the detector data from the shared memory arranged by lane and by link. At the end of the cycle, the DetInfo taskchecks traffic pattern change through the traffic data and updates the control status(Cntl_Status) that is divided into befor-

192 J. Lee, B.M. Williams / Transportation Research Part C 20 (2012) 185–198
e_trans, during_trans, and after_trans. Once the traffic pattern changes, the DetInfo task sends a message to the GroupControltask. As the cycle transition manager, the GroupControl task increases the background cycle count (Cur_Back_Cycle) everysecond and decides the next background cycle length according to the current control status information updated by theDetInfo task. The IntControl task decides the current phase number (Cur_Ph) by comparing the current cycle count withthe phase release point (Rel_Point) every simulation time step. Then, the IntControl task sends the Interface task a message,indicating that the Interface task can fetch the current signal data (Sig_Info) from the shared memory.
Although the controller emulator was designed to exchange data with CORSIM, an additional interface module wasneeded to perform the CORSIM internal database update and to perform the data communication between the controlleremulator and CORSIM. In accessing the CORSIM data structure during operation, the CORSIM RTE can import either prede-fined functions or CORSIM data structures exported from the CORSIM process area. The former method is known as theApplication Programming Interface (API), and the latter method is known as the shared memory technology. While APIs pro-vide a safe and easy means of extracting and setting CORSIM data, they may be slower than the shared memory. Based onthese analyses, this research implemented a DLL type CORSIM RTE, enabling CORSIM to efficiently send detector data to thecontroller emulator and also to receive signal output back from the controller emulator every one-second simulation time-step.
4. Simulation results
The simulation experiments were conducted according to the evaluation procedures described above to compare the de-lay performance among the transition methods. As mentioned above, existing, widely-used transition methods could be di-rectly evaluated within the CORSIM environment. However, the proposed transition method could only be evaluatedthrough the proposed hierarchical simulation system illustrated in Fig. 1. Also, in keeping with the findings of Nelson andBullock (2000) the transition experiments used 20% and 17% respectively as the maximum amount of addition and subtrac-tion adjustment per cycle for the Dwell, Add, Subtract, and Shortway methods.
GroupControl
StartUp
DetInfo
IntControlInterface CLI
Terminate
Shared MemoryShared Memory
CORSIMRTE
Det_Info
Sig_Info
Det_Info
Det_Info
1
1 22
Cntl_Status
Sig_Info
Cntl_Status Cur_Back_Cycle
Cur_Ph Rel_PointUser_Cmd
Sys_Info
Term_FlagTask
Message Queue
Semaphore
Notes
Start_Flag
Fig. 2. Task model of the controller emulator.
ControllerEmulator
CORSIM RTE
ControllerEmulator
ControllerEmulator
TCP/IP
Linux-basedmulti-task software
Win-32 basedDynamic Link Library
MS-Windows basedCommercial Applications
CORSIM
Synchro
Fig. 1. Simulation systems architecture.
J. Lee, B.M. Williams / Transportation Research Part C 20 (2012) 185–198 193
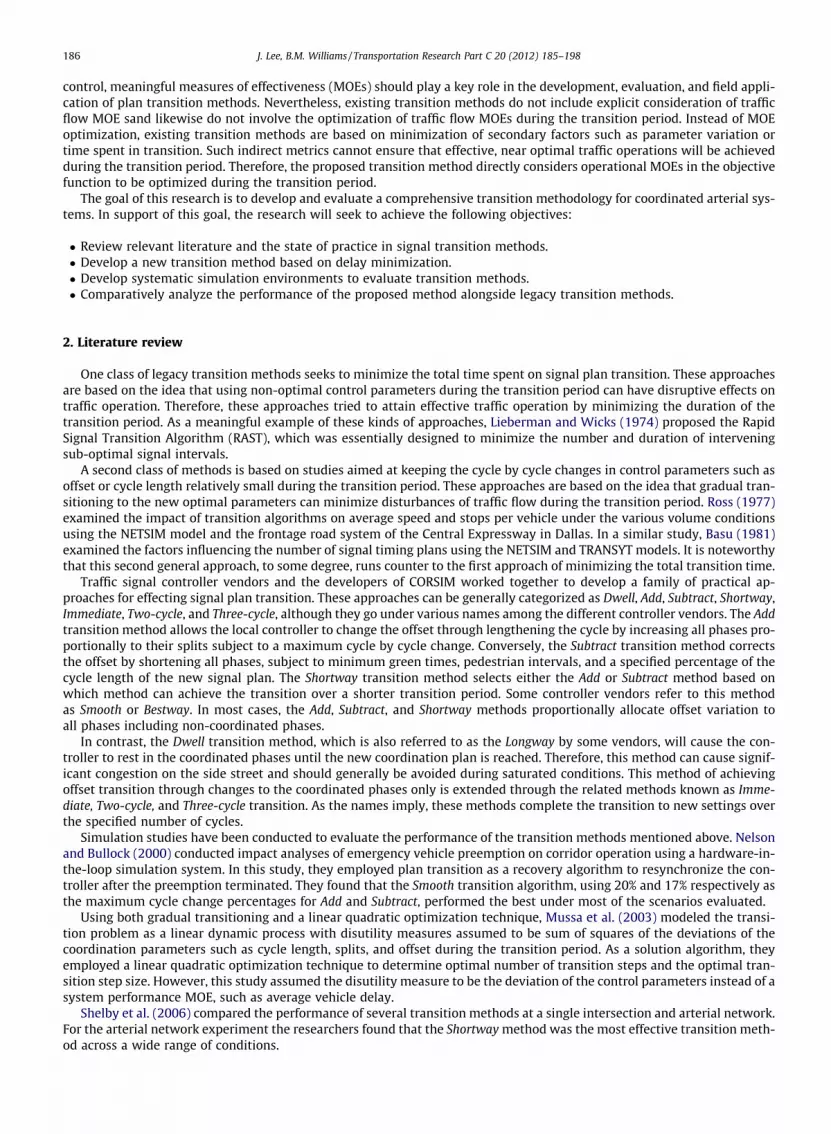
4.1. Transition into peak demand
Table 2 shows the delay results averaged within each link length category. As mentioned above, there are 90 distinct runsaveraged in each table cell. The runs represent all nine combinations of the flow pattern and volume ratio levels with thespecified link length. Only the no pedestrian scenarios are included. The bold figures in the table indicate the minimum delayfor the corresponding condition. According to the delay results, the proposed transition method was the most effective dur-ing the transition period in all cases. When compared in terms of the average delay during the transition period, the averagedelay for the proposed method is lower than that of the Shortway method by 16.4%, 15.9%, and 17.9% for 700, 1000, and1300 ft, respectively. Aside from the proposed transition method, only the Subtract and Shortway methods showed relativelygood performance for most test cases.
Statistical testing was performed on the results in Table 2. First a repeated measure ANOVA test was conducted for mainstreet, side street, and total average vehicle delay. As expected, the null hypothesis that the average delay for all methods isequal was roundly rejected in all cases (p values were negligible in all cases). Following the ANOVA test, the methods wereordered from least to highest delay and paired t-tests were conducted for the adjacent methods to determine where lines ofsignificant difference can be drawn in the ordered lists. In Table 2, the underlined values indicate the methods that are in-cluded in the best performing statistical group using a 0.05 significance level.
Table 3 shows the delay results by entry volume pattern. As in Table 2, each cell represents the average of 90 runs, tenruns each for the 9 combinations of the link length and volume ratio levels. The bold and underline annotations again denotethe lowest delay and best performing statistical grouping, respectively. According to the results, the proposed transitionmethod showed the best performance for all entry volume patterns. As compared with the Subtract method, the proposedmethod decreased the delay by 15.1%, 15.1%, and 16.5% for the exponential, linear, and log pattern, respectively, duringthe transition period. The Subtract and Shortway transition methods showed best performance among the existing transitionmethods, and the Immediate transition method was more disruptive than the other legacy transition methods.
The results shown in Table 4 are the delay averaged within each approach volume ratio category. The proposed methodand the Shortway methods showed generally consistent lowest delay for all approach volume ratios, while the others meth-ods experienced delay that varied relatively with the approach volume ratio. The methods that achieve the cycle lengtheningand offset transition through main street green adjustments only (Immediate, Two-cycle, Three-cycle, and Dwell) experiencedsignificant delay increases for the side street as the predominance of main street traffic increases. A note of explanation isrequired for the results for the 80:20 volume ratio condition. In the simulation studies, the Shortway method always chosethe Subtract option under the 80:20 volume ratio. Therefore, the Shortway and Subtract results are identical for the 80:20volume ratio scenarios.
Table 2Average delay by link length for transition into peak.
Link length Street Proposed Immediate Two Three Dwell Add Subtract Shortway
700 ft Main 20.57 25.49 23.94 23.22 27.67 29.54 24.15 25.18
Side 22.78 54.14 47.64 40.59 46.20 30.83 27.19 28.45
Total 21.24 33.61 30.47 27.77 32.95 29.89 24.96 26.00
1000 ft Main 20.22 26.26 24.85 23.73 28.44 28.71 23.61 24.37
Side 23.41 54.53 47.65 40.52 45.33 30.76 27.12 28.36
Total 21.18 34.43 31.22 28.18 33.31 29.29 24.61 25.46
1300 ft Main 21.04 28.17 25.65 23.21 30.82 32.14 26.60 24.57
Side 23.60 57.92 49.27 40.49 38.80 31.63 27.89 28.94
Total 21.82 36.74 32.09 27.46 32.39 31.50 26.69 25.77
Table 3Average delay by entry flow pattern for transition into peak.
Pattern Street Proposed Immediate Two Three Dwell Add Subtract Shortway
Exp Main 20.04 25.59 23.85 22.35 27.91 29.36 24.03 23.99
Side 22.43 50.40 45.28 38.45 40.02 29.88 25.86 27.10
Total 20.72 32.64 29.65 26.35 31.12 29.30 24.37 24.76
Linear Main 20.61 26.67 24.85 23.44 29.27 30.11 24.80 24.72
Side 23.42 56.03 47.96 40.19 43.39 30.88 27.44 28.81
Total 21.45 35.18 31.30 27.82 33.10 30.16 25.42 25.81
Log Main 21.20 27.65 25.75 24.39 29.75 30.93 25.53 25.41
Side 23.95 60.16 51.32 42.97 46.93 32.46 28.90 29.86
Total 22.07 36.96 32.84 29.24 34.43 31.22 26.47 26.66

Table 4Average delay by approach volume ratio for transition into peak.
Ratio Street Proposed Immediate Two Three Dwell Add Subtract Shortway
60:40 Main 20.62 25.21 24.88 24.68 28.47 28.83 23.89 25.09
Side 23.04 53.22 46.63 41.42 44.77 27.03 24.39 26.78
Total 21.57 36.20 33.31 31.00 34.44 28.04 24.04 25.76
70:30 Main 20.79 26.12 24.62 23.16 29.74 30.84 26.42 24.97
Side 23.38 55.81 47.94 39.58 32.78 30.02 28.31 29.48
Total 21.57 34.12 30.73 27.03 30.64 30.58 27.05 26.31
80:20 Main 20.43 28.59 24.95 22.34 28.72 30.73 24.06 24.06
Side 23.38 57.55 50.00 40.61 52.79 36.17 29.50 29.50
Total 21.10 34.45 29.75 25.38 33.56 32.06 25.16 25.16
194 J. Lee, B.M. Williams / Transportation Research Part C 20 (2012) 185–198
Fig. 3 shows the effect of pedestrian volume intensity on the performance of the transition methods. The each value in thefigure is averages of 270 runs, ten runs each for the 27 combinations of the link length, flow pattern, and volume ratio levels.Since CORSIM only supports pedestrian intensity for the pre-timed transition methods (Immediate, Two-cycle and, Three-cy-cle), the other legacy methods were excluded from the pedestrian intensity performance evaluation. According to the anal-ysis results, all the transition methods experience increased average vehicle delay, especially on the side street, as thepedestrian intensity increases from the light to the heavy condition. Compared with the Three-cycle transition method(the legacy method with the best performance), the proposed method decreased the average delay by 24.0%, 25.1%, and23.8% for light, moderate, and heavy pedestrian intensity, respectively, during the transition period, and all transition meth-ods showed a similar increasing rate of average delay during the transition. Given that the method for modeling pedestrianeffects in CORSIM is somewhat simplistic, the results should be considered preliminary and provisional. Therefore, detailedstatistical tests were not performed on the pedestrian intensity tests.
4.2. Transition out of peak demand
This section provides the delay performance results for the transition out of peak demand. Table 5 shows the delay resultsaveraged within each link length category. As in the transition into peak, 90 distinct runs averaged in each table cell repre-sent all nine combinations of the flow pattern and approach volume ratio levels. Only the no pedestrian scenarios are in-cluded. According to the delay results, the proposed transition method showed the most effective delay performance inmost test cases. The several cases where the proposed method did not yield the minimum delay were for main street delaywith 700 and 1300 ft link lengths.
While the Subtract and Shortway transition methods showed good delay performance in the case of the transition intopeak, the Three-cycle transition method showed relatively good performance at the transition out of peak. The cycle lengthsyielded by the Three-cycle methods generally exist between current plan’s cycle length and next plan’s cycle length duringthe transition period because the next plan’s cycle length is shorter than the current plan’s cycle length at the decreasingflow pattern. However, the cycle length yielded by the Subtract and Shortway transition methods was shorter than the nextplan’s cycle length at the decreasing flow pattern. Therefore, the Three-cycle methods provided good delay performance byassigning longer green time to the main street than the Subtract and Shortway transition methods. Although the Subtract andShortway transition methods have the mechanism to assign additional green time to the side street, they could not provideenough green time to the side street either due to the shortened cycle length during the transition period in the case of thetransition out of peak. Therefore, the delay performance for side streets was not good in most cases.
Table 6 shows the delay results by entry flow pattern. According to the results, the proposed transition method showedthe best performance for all test cases. However, the proposed method did not yield the minimum delay for main street withexponential and logarithmic entry flow pattern. In these cases, the best performer was the Shortway transition method. Evenin these cases however, the proposed method yielded lower total delay. Generally, the Three-cycle transition method showedbest performance among the existing transition methods, and the Dwell method was more disruptive than the other legacytransition methods.
Table 7 shows the delay results averaged within each approach volume ratio category. The Three-cycle transition methodgenerally showed best performance among the existing transition methods, and the Dwell transition method showed worstdelay result for most test cases. Although the proposed method showed good simulation results for most cases, the differ-ence between the proposed and existing methods was very slight. Moreover, there were some cases where the Three-cycletransition method surpassed the proposed method in main and side street delay, as shown in Table 7. Even in these caseshowever, the proposed method yielded lower total delay.
Fig. 4 shows the effect of pedestrian volume intensity on the performance of the transition methods. According to theanalysis results, all the transition methods experienced more increased delay as the pedestrian intensity increases fromthe moderate to the heavy condition, when compared with the increase from the light to the moderate condition. The Imme-

Fig. 3. Average delay by pedestrian intensity for transition into peak.
Table 5Average delay by link length for transition out of peak.
Link length Street Proposed Immediate Two Three Dwell Add Subtract Shortway
700 ft Main 23.38 23.97 23.37 22.99 24.15 24.49 24.11 23.52
Side 26.97 32.39 31.54 31.32 45.36 39.17 36.65 37.20
Total 24.45 26.89 26.21 25.85 30.61 29.11 28.18 27.89
1000 ft Main 22.44 23.53 23.02 22.61 25.12 24.16 24.12 22.91Side 27.65 35.01 31.27 30.96 56.82 39.40 36.94 37.14
Total 24.04 27.14 25.92 25.52 33.37 29.02 28.27 27.47
1300 ft Main 23.24 24.81 23.80 23.30 26.92 24.32 23.82 22.25Side 27.06 50.19 30.86 30.29 59.19 38.06 36.91 36.73
Total 24.38 32.92 26.40 25.87 35.06 28.56 27.87 26.79
J. Lee, B.M. Williams / Transportation Research Part C 20 (2012) 185–198 195

Table 6Average delay by entry flow pattern for transition out of peak.
Pattern Street Proposed Immediate Two Three Dwell Add Subtract Shortway
Exp Main 22.72 23.72 23.08 22.66 25.16 23.98 23.59 22.59Side 26.54 38.38 30.35 29.97 52.95 37.83 35.80 35.96
Total 23.84 28.46 25.66 25.23 32.65 28.35 27.47 26.84
Linear Main 22.94 24.13 23.43 22.98 25.41 24.39 24.06 22.95Side 27.10 39.45 31.46 31.06 53.97 39.18 36.99 37.28
Total 24.18 29.07 26.27 25.81 33.06 29.02 28.19 27.50
Log Main 23.39 24.47 23.68 23.25 25.62 24.60 24.40 23.13Side 28.03 39.76 31.86 31.54 54.44 39.62 37.72 37.84
Total 24.85 29.43 26.61 26.19 33.34 29.31 28.66 27.81
Table 7Average delay by approach volume ratio for transition out of peak.
Ratio Street Proposed Immediate Two Three Dwell Add Subtract Shortway
60:40 Main 21.60 20.32 19.96 19.67 21.00 20.70 20.97 20.72
Side 26.47 45.06 36.03 35.48 53.84 49.91 40.82 42.46
Total 23.42 29.23 25.90 25.51 32.34 30.69 28.20 28.56
70:30 Main 23.43 22.45 21.75 21.51 26.10 26.57 24.59 22.24
Side 27.06 38.68 30.80 30.56 48.44 34.46 35.91 36.35
Total 24.25 27.28 25.49 25.52 32.37 28.88 28.03 26.48
80:20 Main 24.03 29.55 28.48 27.71 29.08 25.71 26.49 25.72
Side 28.15 33.84 26.84 26.53 59.09 32.27 33.77 32.26
Total 24.93 30.44 28.15 26.91 34.35 27.11 28.09 27.11
196 J. Lee, B.M. Williams / Transportation Research Part C 20 (2012) 185–198
diate method was more disruptive than the Two- and Three-cycle transition methods, especially on the side street. Generally,the proposed transition method showed best performance for the transition period. Compared with the Three-cycle transitionmethod (the legacy method with the best performance), the proposed method decreased the total network delay by 8.6%,13.7%, and 10.8% for light, moderate, and heavy pedestrian intensity, respectively, during the transition period.
5. Conclusions
This paper has presented a model formulation and preliminary simulation tests for a constrained optimization method ofsignal plan transition. The average delay performance of various legacy transition methods along with the proposed methodhas been examined during the transition period under various geometric and traffic conditions. Also, the impedance effectsof pedestrian volume intensity on transition performance were comparatively evaluated. The experimental results lead tothe following conclusions:
� The proposed transition method generally exhibits the best performance for all scenario cases. For all main and side streetmovements during the transition period, the proposed method is the sole statistically significant best performing transi-tion method for transition into peak and the overall performance is nearly as strong in transition out of peak. In theabsence of pedestrians, the proposed transition method decreased average delay by an average of approximately 18.7%during the transition period when compared with the Shortway transition method, the best performer among the existingtransition methods. The proposed method is generally in the best performing group in terms of statistical significance andis the sole best performing method in the majority situations.� A fundamental limitation of existing transition methods is that their transition logic utilizes cycle adjustment process as a
tool for only offset synchronization, regardless of changes in traffic demand during the transition period. Therefore theexisting transition methods supersede the truthful cycle length adjustment during transition and therefore cannot guar-antee responsive cycle length changes to accommodate changes in actual traffic demand during the transition period.� In the case of the transition into peak, the superior performance of the Shortway method among the legacy methods val-
idates its popularity in current coordinated systems. Although it does appear that the Shortway method is able to restorecoordination more quickly in certain situations due to its flexibility of choosing between the Add and Subtract methods, itis also obvious in the simulation results that the Subtract method is the work horse for the Shortway method. This vali-dates the intuition that the shortened transition cycle lengths provided by the Subtract method results in lower delay forunsaturated traffic conditions. There are in fact several cases where the Subtract method outperformed the Shortwaymethod.

Fig. 4. Average delay by pedestrian intensity for transition out of peak.
J. Lee, B.M. Williams / Transportation Research Part C 20 (2012) 185–198 197
� Under the transition out of peak, the Three-cycle transition methods showed relatively good performance results amongthe existing transition methods. The Three-cycle transition method was in the best performing group in terms of statisticalsignificance, and was the best performing method in several scenario cases. When compared with the Subtract and Short-way methods, best performers in the transition into peak, the Three-cycle transition method generally yielded moreappropriate cycle length that lies between peak and post-peak plan’s cycle length during the transition period. Therefore,the Three-cycle methods provided good delay performance by assigning longer green time to the main street than the Sub-tract and Shortway transition methods.� On the other hand, the cycle lengths yielded by the Subtract and Shortway methods during the transition out of peak were
excessively short as compared with the current (peak) plan’s cycle length. The sudden change in cycle length results fromtheir transition mechanism that calculates transitional cycle length by reducing a certain amount of time from the next(post-peak) plan’s cycle length. Therefore, the shortened cycle length had a negative impact on delay performance of theSubtract and Shortway methods at the beginning of transition period with high v/c ratio.� As the pedestrian volumes intensity increases from light to heavy condition, all transition methods including the pro-
posed method experienced increased average delay for both the main street and side streets. The proposed methodwas again the best performer among the compared methods.

198 J. Lee, B.M. Williams / Transportation Research Part C 20 (2012) 185–198
� A key feature of the proposed method is its ability to preserve sufficient green time for improved side street performanceand overall system performance while not sacrificing and in most cases actually improving main street performance. Inmost cases, the Immediate transition method showed the worst delay performance for both the main and side streets forboth transition into and out of peak demand.
The conclusions above are well-supported by the experimental findings and provide a firm basis for the claims that thetransition period delay minimization problem can be effectively formulated as a practically solvable non-linear optimizationproblem and that plan transition control provides robust operational improvement over a broad range of geometric and traf-fic conditions.
In terms of future basic research, the highest priorities would be to extend this work to investigate:
� Saturated traffic conditions.� Validation within traffic responsive plan selection (TRPS) systems with sub-optimal timing plans caused by prediction
error for future traffic conditions and/or lack of near optimal plan options.� Inclusion of explicit platoon dispersion modeling in the fitness function.
These future studies should also be conducted on a broader range of coordinated system sizes, configurations, and con-ditions. In terms of change in traffic intensity, this broader range of conditions should include varying degrees in the mag-nitude and rate of change. However, the present study and results are sufficient to provide a clear sense of the performanceof legacy signal plan transition methods relative to practically achievable near optimal transition control.
In terms of future applied research, the proposed plan transitions optimization model is ready to be implemented in aprototype system and subjected to field tests. If optimized transition control proves to provide consistent and significantreduction in the flow disruption traditionally experienced and expected during plan transition, broad implementation couldlead to wider acceptance and use of TRPS.
Acknowledgment
This work was supported by the National Science Foundation through Grant Number 0245285.
References
Basu, S., 1981. A Study of the Factors Influencing the Number of Signal Timing Plans Required for UTCS First Generation Traffic Control Systems, Report No.FHWA/RD-80/039, Federal Highway Administration, Washington, D.C.
Baugh, J., 2010. Vitri – A High Performance System for Heuristic Optimization. <http://www4.ncsu.edu/~jwb/vitri/> (accessed 2010).Cohen, D., Head, L., Shelby, S., 2007. Performance Analysis of Coordinated Traffic Signals During Transition. Transportation Research Record 2035, TRB,
Washington, DC, pp. 19–31.Lieberman, E., Wicks, D., 1974. A Rapid Signal Transition Algorithm. Transportation Research Record 505, TRB, Washington, DC, pp. 1–15.Mussa, R., Selekwa, M., Chiteshe, A., 2003. Development of Optimal Timing Plans’s Transition Procedure. Transportation Research Board 82nd Annual
Meeting CD-ROM. TRB, Washington, DC.Nelson, E., Bullock, D., 2000. Impact Evaluation of Emergency Vehicle Preemption on Signalized Corridor Operation: An Evaluation. Transportation Research
Record 1727, TRB, Washington, DC, pp. 1–11.Obenberger, J., Collura, J., 2007. Methodology to Assess Traffic Signal Transition Strategies for Exit Preemption Control. Transportation Research Record
2035, TRB, Washington, DC, pp. 158–168.Ross, P., 1977. An evaluation of network signal timing transition algorithms. Transportation Engineering 47 (9), 17–21 (Institute of Transportation
Engineers, Washington, DC).Shelby, S., Bullock, D., Gettman, D., 2006. Transition Methods in Traffic Signal Control. Transportation Research Record 1978, TRB, Washington, DC, pp. 130–
140.Transportation Research Board, 2000. Highway Capacity Manual. fourth ed. National Research Council, Washington, DC.Yun, I., Best, M., Park, B., 2008. Traffic Controller Performance during Time-of-day Transition at Coordinated Actuated Signal Systems. Transportation
Research Record 2080, TRB, Washington, DC, pp. 92–99.


