Embed Size (px)
Citation preview
Tcp
AMa
Ab
Ac
d
a
ARRAA
KCcCTP
1
icd
S7
(
h0
Journal of Chromatography A, 1364 (2014) 295–302
Contents lists available at ScienceDirect
Journal of Chromatography A
j o ur na l ho me page: www.elsev ier .com/ locate /chroma
ransient isotachophoresis-capillary zone electrophoresis withontactless conductivity and ultraviolet detection for the analysis ofaralytic shellfish toxins in mussel samples
emi S. Abdul Keyona,b,c,d, Rosanne M. Guijtb, Christopher J. S. Bolchc,ichael C. Breadmorea,∗
Australian Centre for Research on Separation Science, School of Physical Sciences, University of Tasmania, GPO Box 252-75, Hobart, Tasmania 7001,ustraliaAustralian Centre for Research on Separation Science, Pharmacy School of Medicine, University of Tasmania, GPO Box 252-26, Hobart, Tasmania 7001,ustraliaInstitute for Marine and Antarctic Studies, University of Tasmania, Locked Bag 1370, 7250 Launceston, Tasmania, AustraliaDepartment of Chemistry, Faculty of Science, Universiti Teknologi Malaysia, 81310 UTM Johor Bahru, Johor, Malaysia
r t i c l e i n f o
rticle history:eceived 2 July 2014eceived in revised form 20 August 2014ccepted 22 August 2014vailable online 29 August 2014
eywords:apacitively coupled contactlessonductivity detectorapillary electrophoresisransient isotachophoresisaralytic shellfish toxins
a b s t r a c t
The accumulation of paralytic shellfish toxins (PSTs) in contaminated shellfish is a serious health riskmaking early detection important to improve shellfish safety and biotoxin management. Capillaryelectrophoresis (CE) has been proven as a high resolution separation technique compatible withminiaturization, making it an attractive choice in the development of portable instrumentation for early,on-site detection of PSTs. In this work, capillary zone electrophoresis (CZE) with capacitively coupledcontactless conductivity detector (C4D) and UV detection were examined with counter-flow transientisotachophoresis (tITP) to improve the sensitivity and deal with the high conductivity sample matrix. Thehigh sodium concentration in the sample was used as the leading ion while l-alanine was used as the ter-minating electrolyte (TE) and background electrolyte (BGE) in which the toxins were separated. Carefuloptimization of the injected sample volume and duration of the counter-flow resulted in limit of detec-tions (LODs) ranging from 74.2 to 1020 ng/mL for tITP-CZE-C4D and 141 to 461 ng/mL for tITP-CZE-UV, an8–97 fold reduction compared to conventional CZE. The LODs were adequate for the analysis of PSTs inshellfish samples close to the regulatory limit. Intra-day and inter-day repeatability values (percentagerelative standard deviation, n = 3) of tITP-CZE-C4D and tITP-CZE-UV methods for both migration time and
peak height were in the range of 0.82–11% and 0.76–10%, respectively. The developed method was appliedto the analysis of a contaminated mussel sample and validated against an Association of Official AnalyticalChemists (AOAC)-approved method for PSTs analysis by high performance liquid chromatography (HPLC)with fluorescence detection (FLD) after pre-column oxidation of the sample. The method presented haspotential for incorporation in to field-deployable devices for the early detection of PSTs on-site.. Introduction
Paralytic shellfish toxins (PSTs) are potent natural biotox-
ns produced mainly by marine dinoflagellates (e.g. Alexandriumatenella, Alexandrium tamarense, Alexandrium minutum, Gymno-inium catenatum) [1–4] and freshwater cyanobacteria (e.g.∗ Corresponding author at: Australian Centre for Research on Separation Science,chool of Chemistry, University of Tasmania, GPO Box 252-75, Hobart, Tasmania001, Australia. Tel.: +61 3 6226 2154; fax: +61 3 6226 2858.
E-mail addresses: [email protected], [email protected]. Breadmore).
ttp://dx.doi.org/10.1016/j.chroma.2014.08.074021-9673/© 2014 Elsevier B.V. All rights reserved.
© 2014 Elsevier B.V. All rights reserved.
Anabaena circinalis) [5,6]. PSTs are of particular concern in shellfish-producing areas because they accumulate in the digestive gland offilter-feeding shellfish such as mussels, scallops and oysters. Whilethey do not harm the shellfish, consumption of PSTs-contaminatedshellfish can, in serious cases, result in the death of seafood con-sumers from respiratory arrest and cardiovascular shock due toblockage of voltage-gated sodium channels [7–10]. The allowablelevel of PSTs in shellfish is 800 �g/kg [11,12], which correspondswith 800 ng/mL of PSTs in shellfish extract following the procedure
described in the AOAC methods [12,13].Rapid, quantitative on-site PSTs detection and quantifica-tion using portable analytical instrumentation would improvebiotoxin management by providing timely biotoxin information

2 romat
tcselti(mmowwbp[iip[ae
naatetc[Unrfdpsc(cCnd
ccuiodm
2
2
(NdNscB
96 A.S. Abdul Keyon et al. / J. Ch
o shellfish producers to manage stock harvests around biotoxinlosure periods, and reduce losses due to harvested/packedeafood product loss or recall, and the risk of the sale of seafoodxceeding limits for safe human consumption. Various ana-ytical techniques have been developed and employed forhe assay of PSTs, including mouse assay [13], enzyme-linkedmmunosorbent assay (ELISA) [14–17], receptor binding assayRBA) [18,19], saxiphilin-based assay [20,21] and high perfor-
ance liquid chromatography (HPLC) [12,22–33]. Among theseethods, ELISA is the only to have been commercially devel-
ped in a test kit for PSTs detection in contaminated shellfish orater samples (i.e. www.r-biopharm.com, www.biosense.com,ww.abraxiskits.com, www.anconbiotech.com and www.
eaconkits.com). While these commercial kits are consideredortable and can be used to detect PSTs on-site, Campbell et al.34] pointed out they have the potential to produce subjectiventerpretation of results. The Association of Official Analyt-cal Chemists (AOAC)-approved HPLC methods with pre- orost-column oxidation for fluorescence detection (HPLC-FLD)11,12,30], and more recently, HPLC-MS, are the most widely usednalytical methods for PSTs determination [31–33,35], but are notasily miniaturized for on-site PSTs detection.
Capillary electrophoresis (CE) has been developed as an alter-ative separation method for PSTs [36–44] as it provides rapidnd efficient separation with minimal consumption of samplend reagents. Significantly, it is inherently more miniaturizablehan HPLC and a number of portable capillary and microchiplectrophoresis devices have been developed [45–56], includinghe Mars Organic Analyser [45,51,53], hand-held portable isota-hophoresis (ITP) system [49] and the Medimate Multireader®
50,56]. CE methods developed for the analysis of PSTs used eitherV [36,40–44] or/and MS [36,39,40,44] detection. MS is currentlyot readily amenable to being portable, while for UV, photomet-ic detector based on light-emitting diodes (LEDs) has to be usedor portability option [57,58]. We previously compared these twoetection modes with another two that have been realized inortable instrumentation, namely, C4D and FLD for the analy-is of PSTs in mussel sample [44]. Whilst micellar electrokinetichromatography (MEKC) coupled with FLD had good sensitivity60.9–1040 ng/mL), selectivity was compromised by the AOAC pre-olumn oxidation method required to render the PSTs fluorescent.4D achieved similar limit of detections (LODs) to FLD without theeed for this reaction, but failed when applied to mussel extractsue to sample matrix interference.
In this work, capillary zone electrophoresis (CZE) withounter-flow transient isotachophoresis (tITP) is used for the pre-oncentration of the PSTs and reduction of matrix interferences bysing the sodium ion from the saline sample matrix as the leading
on. The method was successfully used to determine concentrationf PSTs in a contaminated mussel sample and the outcomes vali-ated against data obtained using the AOAC-approved HPLC-FLDethod [12].
. Materials and methods
.1. Standards and reagents
Standards of PSTs preserved in acid medium (saxitoxinSTX), decarbamoylSTX (dcSTX), neosaxitoxin (NEO), decarbamoyl-EO (dcNEO), gonyautoxin1 to gonyautoxin4 (GTX1-4) andecarbamoylgonyautoxin2-3 (dcGTX2-3)) were purchased from
ational Research Council of Canada, Institute for Marine Bio-ciences (Halifax, Canada). All standards, each having differentoncentrations, were diluted with Milli-Q water (Millipore,edford, MA, USA) to the desired concentrations. A PST mixture
ogr. A 1364 (2014) 295–302
for method development consisted of 2.5 �M of STX (750 ng/mL),dcSTX (640 ng/mL), NEO (790 ng/mL), dcNEO (680 ng/mL), GTX3(990 ng/mL), GTX4 (1050 ng/mL) and dcGTX3 (880 ng/mL), and7.5 �M of GTX1 (3080 ng/mL), GTX2 (2960 ng/mL) and dcGTX2(2640 ng/mL). The mixture was prepared at low concentration dueto the limited concentration of the stock standard for each PST inorder to combine all 10 PSTs. The background electrolyte (BGE),which also acted as the TE, contained 500 mM l-alanine (EGA-Chemie, Steinheim, Germany) and 500 mM acetic acid (Merck,Germany) (pH 3.5), prepared by mixing 1.1 g of l-alanine and 1.4 mLof glacial acetic acid with 25 mL of Milli-Q water. To induce tITP dur-ing method development using standards, 25 mM sodium chloridesolution (Sigma Aldrich, St. Louis, MO, USA) was added to the PSTsmixture to allow the sodium ion to function as leading ion for thecationic toxins.
2.2. Instrumentation
All experiments were performed with an Agilent HP3DCE sys-tem (Agilent Technologies, Waldbronn, Germany). A TraceDec®
C4D cell (Innovative Sensor Technologies, Innsbruck, Austria) waslocated inside the cassette; operated at −12 Db(approximately 25%of full output voltage) and a gain of 150%; the signal filter func-tion was turned on to reduce baseline drift. Separation was carriedout using 100 cm long 50 �m I.D fused-silica capillary (Polymicro-Technologies Phoenix, AZ, USA) with the UV detector positioned8.5 cm from the outlet (monitored at 200 nm, bandwidth 16 nm)with the C4D cell 13.5 cm from the outlet. New capillaries wererinsed for 20 min each with 1 M NaOH, Milli-Q water and BGE beforeanalysis. Between runs, the same conditioning procedure was per-formed (5 min each) with additional voltage conditioning with BGEfor 5 min. This was conducted in order to obtain better migrationtime reproducibility. All separations were performed at 25 ◦C and+30 kV applied to the inlet vial. Samples were injected at 50 mbarfor 103 s (86 nL, 5% of the total capillary volume), unless otherwisestated. Signals were collected using an Agilent 35900E analogue-to-digital convertor (Agilent Technologies, Waldbronn, Germany).Peaks were integrated and processed using 3D-CE ChemStationsoftware available in CE. Normal integration option was applied,however for asymmetric peaks, tangent skim option was used forintegration.
2.3. tITP-CZE
The tITP-CZE procedures are schematically presented in Fig. 1aand b. First, the capillary was filled with the BGE/TE and then thesample containing sodium (leading ion) was introduced into thecapillary by hydrodynamic injection at 50 mbar. A short BGE/TEplug was then introduced into the capillary by electrokinetic injec-tion (25 kV) with application of a negative hydrodynamic pressureof 50 mbar. A voltage of +30 kV was applied for separation of theanalytes.
2.4. Preparation of mussel sample
The mussel sample was collected during algal bloom of A.tamarense in Tasmania (October 2012). Extraction and clean-upof the mussel were performed according to the guidelines inAOAC Official Method 2005.06 [12]. Briefly, 5.0 g of homogenizedraw meat was mixed with 3 mL 1% acetic acid solution, vortexedfor 1 min, boiled in a water bath (100 ◦C) for 5 min, re-vortexedand then cooled in a cold water bath (5 ◦C) for 5 min. After cen-
trifugation at 4500 rpm for 10 min, the sample supernatant wascollected. Another 3 mL of 1% acetic acid was added to the precipi-tant and the extraction repeated. The supernatants were pooled andstored at −20 ◦C. Before analysis, the extract solution (0.5 mL) was
A.S. Abdul Keyon et al. / J. Chromat
Fig. 1. Schematic representation of the procedures used in tITP-CZE (a) withoutcounter-flow and (b) with counter-flow (1) Filling the capillary with backgroundelectrolyte (BGE) which also acted as terminating electrolyte (T). (2) HydrodynamiciiS
fWy
3
lhtimswdcotmh[fso4a
njection of sample (S) containing sodium ion as leading ion (L). (3) Electrokineticnjection of T (BGE) (while applying hydrodynamic counter-flow (CF) in (b). (4)tarting tITP-CZE mode.
urther filtered using a Sep-Pak C18 sorbent cartridge (360 mgaters, Australia). The column effluent was collected for PST anal-
sis. No sodium chloride was added to the extract.
. Results and discussion
In ITP, target analytes are focused into discrete zones betweeneading electrolyte (co-ion with electrophoretic mobility, �ep
igher than the target analytes) and TE (co-ion with �ep lowerhan target analytes). For the PSTs, sodium ion is an attractive lead-ng ion because its �ep (51.9 × 10⁻⁹ m2 V−1 s−1 [59]) is greater than
any organic cations. Conveniently, there is a high abundance ofodium in seawater and marine or freshwater organism extractshich allows establishment of an ITP system solely by the intro-uction of TE after injection in the sodium-containing sample. Thisan be done through injection of a discreet TE zone followed by BGEr by simply using the same electrolyte as TE and BGE. In this work,he latter approach was selected because the low conductive TE is
ore appropriate for use with C4D than using the higher mobility,igher conductivity sodium acetate reported in our previous work44]. To aid in BGE selection, PeakMaster (version 5.3, availableor free download from www.web.natur.cuni.cz/∼gas) was used to
elect a suitable electrolyte composition. Based on the pKa valuesf PSTs (>8.5) [36] and the effective mobilities ranging from 13 to5 × 10−9 m2 V−1 s−1, BGE/TEs based on glutamic acid (pH 2.6), �-lanine (pH 4.1), and l-alanine (pH 3.5) were identified as potentialogr. A 1364 (2014) 295–302 297
candidates and experimentally tested. Encouraging results wereobtained with l-alanine, although some of the toxin peaks wereonly partially resolved from the Na+ peak and peaks were slightlyunsymmetrical; this BGE/TE was selected for optimization of thetITP conditions. Unsymmetrical peak shape was expected as it iscaused by electromigration dispersion, which is enhanced whenusing C4D because a large difference between the electrophoreticmobility of the analyte (toxin in this case) and the electrolyte co-ionis required to maximize the peak response [60].
3.1. Effect of BGE/TE concentration on the stacking andseparation performance
From a practical point of view, it is important to first estab-lish the BGE concentration required for good separation selectivityusing C4D. Fig. 2a and b shows the effect of BGE concentration (fourconcentrations) on tITP-CZE of the toxins with both C4D and UVdetection, respectively, when 86 nL (5% of the capillary volume) ofthe PSTs mixture was injected. Representative electropherogramsusing a total of six different BGE concentrations can be found inSupplementary Information file Fig. 2. From Fig. 2a, using 100 mMl-alanine, a very large Na+ peak was observed (nearly 15 min wide)and six small peaks corresponding to PSTs migrated just afterthe sharp edge of the Na+ peak. These peaks corresponded to themonovalent PSTs (dcGTX2, dcGTX3, GTX2, GTX3, GTX1 and GTX4)indicating that the four faster divalent PSTs (dcSTX, STX, dcNEOand NEO) were not separated from the Na+ peak, most likely dueto them still been concentrated as ITP zones at the rear bound-ary of the Na+ peak. As the concentration of BGE was increased,the Na+ peak becomes narrower, and the initial ITP stage estab-lished from injection of the saline sample becomes shorter andthus the divalent PSTs peaks emerge at 500 mM l-alanine. All ofthe PSTs could be fully resolved from Na+ when the concentrationof l-alanine was increased to 850 mM. These trends were con-firmed using UV detection (Fig. 2b) where both NEO and STX/dcNEOstarted to migrate out from Na+ at a BGE concentration of 500 mM.Note that the UV detection window was located 5 cm after C4D cell;providing a longer effective separation length for UV detection thanfor C4D. While the higher concentration of BGE allowed for bet-ter resolution, the detection signals decreased significantly for C4D(approximately a 10-fold reduction for the six monovalent PSTs) asa result of the increased background conductivity of the BGE. Thesignal decreased only by a factor of two for UV detection. For C4Din particular, this indicates a trade-off between the higher concen-trations of BGE required to rapidly dissipate the ITP zone and lowconcentrations of BGE required for good sensitivity. The divalentPSTs group just emerged from the Na+ peak at 500 mM l-alanine;hence this concentration was selected for further optimization.
3.2. Effect of counter-flow and optimization of sample volumeinjected
Resolving the divalent PSTs from the Na+ zone using 500 mMl-alanine requires more effective separation length. This can berealized by minimizing the movement of the ITP zone toward thedetector during the ITP stage thereby maximizing the capillarylength remaining for separation of the PSTs. This is most easily doneby applying a counter-flow during ITP [61–63], which is schemati-cally shown in Fig. 1b. To investigate the effect of the counter-flow,its duration was varied from 1 to 5 min using maximum pres-sure available in the instrument (−50 mbar) and at an optimumvoltage of 25 kV. These results are summarized in Fig. 3a show-
ing migration time as a function of counter-flow duration. The Na+peak dissipated faster as the counter-flow duration was increased,allowing for the separation of the divalent PSTs. The migration timeof divalent PSTs decreased steeply from 23–24 min to 18–19 min

298 A.S. Abdul Keyon et al. / J. Chromatogr. A 1364 (2014) 295–302
Fig. 2. Electropherograms of PSTs during tITP-CZE detected with (a) C4D and (b) UV showing effect of various BGE concentrations on stacking and separation. l-alanine (pH3 5 mMS ) dcN
wccPtamcitca
IoTsi(1t
.5) as BGE/TE, 86 nL was injected. The concentration of PSTs mixture (mixed with 2eparation conducted at +30 kV and 25 ◦C. Peak identification: (1) dcSTX, (2) STX, (3
hen the ITP duration was increased from 1 min to 5 min. Thisan be explained by the fact that the ITP occurred close to theapillary entrance during application of counter-flow, allowing allSTs to migrate away from the ITP zone with improved resolu-ion. The monovalent PSTs showed a decrease in migration timet 3 min, after which they slightly increased again, indicating theaximum counter-flow duration that could be applied. Increased
ounter-flow duration allowed faster separation, but as illustratedn Fig. 3b, sensitivity decreased with counter-flow duration due tohe diffusion between zones when applying the counter-flow. As aompromise between sensitivity and selectivity, 3 min was selecteds the optimum duration for the counter-flow.
Having established the optimal counter-flow and duration forTP, the injected sample volume was optimized between 86 nL (5%f total capillary volume) and 344 nL (20% of total capillary volume).he sensitivity of the method logically increased with the injectedample volume although it compromised the separation time. For
nstance, the migration time of GTX4 was 9 min later when 344 nL20%) of sample was injected in comparison with an injection of72 nL (10%) sample. Consequently, there was a decrease in resolu-ion (Fig. 4), indicating shorter effective capillary length availablesodium chloride) injected and other conditions are described in experimental part.EO, (4) NEO, (5) dcGTX2, (6) dcGTX3, (7) GTX2, (8) GTX3, (9) GTX1, (10) GTX4.
for zone electrophoresis. An injection plug of 172 nL of sample pro-vided the highest PSTs sensitivity while still allowing for baselineresolution.
The optimum conditions were: 500 mM l-alanine (pH 3.5) asBGE/TE, injection of 172 nL sample at 50 mbar (10% of total cap-illary volume), electrokinetic injection of BGE/TE at 25 kV with acounter-flow of 50 mbar for 3 min. Using these conditions and asshowed in Fig. 5, the PSTs were successfully concentrated and sep-arated, with the exception of STX and dcNEO which could not befully resolved. The optimized tITP-CZE-UV and tITP-CZE-C4D wereevaluated in terms of linearity, LOD, intra-day and inter-day preci-sion, and sensitivity enhancement factors (SEFs), with the resultsbeing presented in Table 1. The linear range for the divalent andmonovalent PSTs analyzed by tITP-CZE-C4D were between 70 and6200 ng/mL (regression coefficient (R2) > 0.980) and between 210and 12,000 ng/mL (R2 > 0.985), respectively. The LODs ranged from74.2 to 1020 ng/mL for tITP-CZE-C4D and 141–461 ng/mL for tITP-
CZE-UV. The LODs for STX and NEO were superior when comparedto the LODs using capillary ITP-CZE-UV method demonstrated byThibault et al. [36]. Importantly, the reported LOD values for allPSTs were below or close to the regulatory limit for shellfish sample
A.S. Abdul Keyon et al. / J. Chromatogr. A 1364 (2014) 295–302 299
Fig. 3. Effect of the duration of counter-flow on (a) migration time and (b) peak areaof PSTs standard mixture. Counter-flow was applied during TE (BGE) electrokineticinjection at 25 kV. 172 nL sample was injected. BGE/TE: 500 mM l-alanine (pH 3.5).The concentration of PSTs mixture injected and other conditions are described inexperimental part. Peak identification as indicated in Fig. 2.
Fig. 4. Plot of resolution vs. sample volume injected for PSTs standard mixture.3 min counter-flow was applied during electrokinetic injection of TE (BGE) at 25 kV.BGE/TE: 500 mM l-alanine (pH 3.5). The concentration of PSTs mixture injected isdescribed in experimental part. Peak identification as indicated in Fig. 2.
Fig. 5. Electropherograms of PSTs standards mixture under optimum tITP-CZE con-ditions detected with (a) C4D and (b) UV. Optimum conditions: l-alanine (pH 3.5)
as BGE/TE, 172 nL was injected. Counter-flow was applied at 25 kV for 3 min duringelectrokinetic injection of TE (BGE). Separation was conducted at +30 kV and 25 ◦C.Peak identification as indicated in Fig. 2.except for GTX4 (1020 ng/mL). The tITP-CZE methods afforded SEFsbetween 8 and 97 folds with C4D and 19–84 with UV (Table 1).The presented method was at least two times more sensitive thanour previous CZE-UV or CZE-C4D methods [44]. It is importantto note that this modest gain in sensitivity was achieved in thepresence of a high concentration of salt, a sample matrix propertythat was problematic in our previously reported method limitingthe applicability of CE to shellfish samples. Percentage relativestandard deviations (%RSD) for intra-day variations in migrationtime and peak height for PSTs analyzed by tITP-CZE-C4D werebetween 0.82–1.5 and 2.2–9.2, respectively. Inter-day %RSDs of thesame performance criteria were 0.88–1.8 and 4.8–11, respectively.The %RSD were slightly higher than expected, probably due to slightchanges in viscosity between electrolytes in the counter-flow dur-ing the ITP stage.
3.3. Application of tITP-CZE method to mussel sample
The tITP-CZE method was applied for the direct determination ofPSTs in a naturally contaminated mussel sample (replicates n = 3).As illustrated in the electropherograms in Fig. 6a and b, STX and/ordcNEO, dcGTX2, GTX2, GTX3 and GTX1 were detected in the musselsample with both UV and C4D, although it is clear from the figuresthat the peaks obtained with UV detection are very small and arenot above the detection limit and cannot be quantified with thisdetector. C4D and UV are universal detection techniques [64,65],and as such prone to background interferences when comparedto more specific detection technique such as fluorescence detec-tion. Therefore the identity of all PSTs peaks were confirmed bystandard addition. The toxin concentration found in mussel sam-ple was determined with a 5-point calibration and was reported asSTX-equivalent (�g STX-eq/kg) (Table 2) using only the C4D trace.STX-equivalent is an internationally accepted reporting methodfor PSTs found in contaminated shellfish [12,13,19,30], which wascalculated by incorporating toxicity equivalence factors (TEFs)[11,29]. To further confirm the validity and potential applicabilityof the current method, we compared the results obtained from theanalysis of the same contaminated mussel sample with the AOAC-
approved pre-column oxidation HPLC-FLD method. In contrast toour current method, it is well-known that the pre-column oxida-tion method unavoidably produced multiple oxidation products forsome toxins which result in multiple overlapping peaks, thus the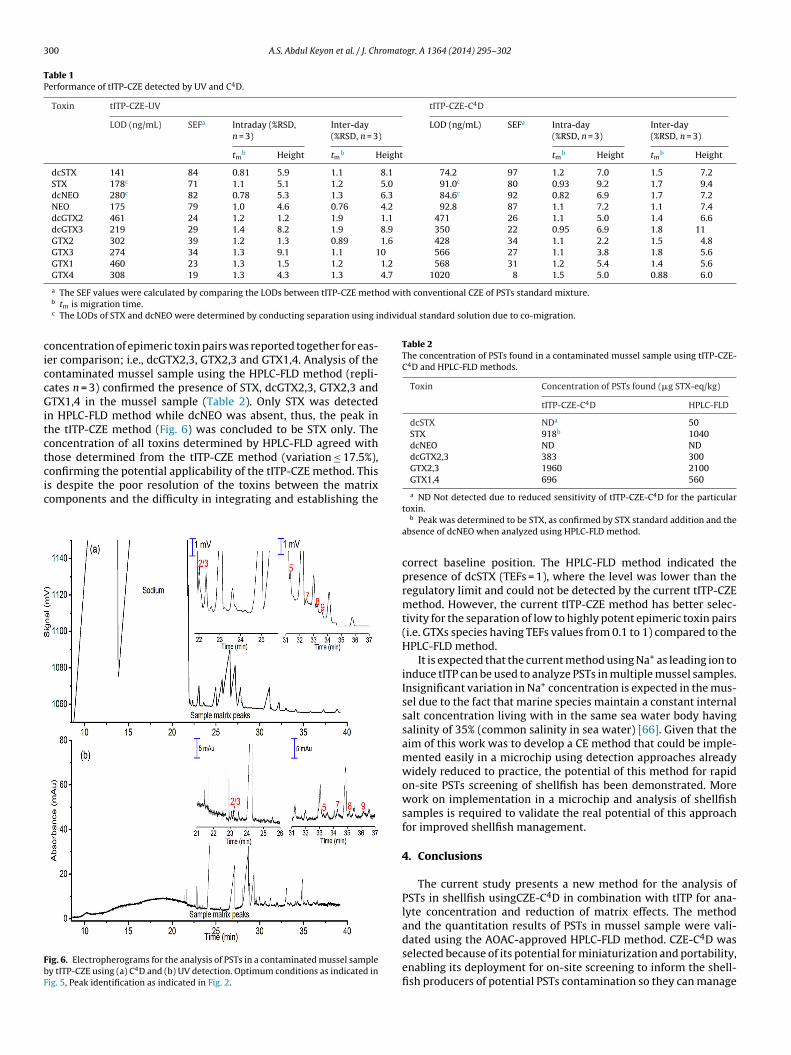
300 A.S. Abdul Keyon et al. / J. Chromatogr. A 1364 (2014) 295–302
Table 1Performance of tITP-CZE detected by UV and C4D.
Toxin tITP-CZE-UV tITP-CZE-C4D
LOD (ng/mL) SEFa Intraday (%RSD,n = 3)
Inter-day(%RSD, n = 3)
LOD (ng/mL) SEFa Intra-day(%RSD, n = 3)
Inter-day(%RSD, n = 3)
tmb Height tm
b Height tmb Height tm
b Height
dcSTX 141 84 0.81 5.9 1.1 8.1 74.2 97 1.2 7.0 1.5 7.2STX 178c 71 1.1 5.1 1.2 5.0 91.0c 80 0.93 9.2 1.7 9.4dcNEO 280c 82 0.78 5.3 1.3 6.3 84.6c 92 0.82 6.9 1.7 7.2NEO 175 79 1.0 4.6 0.76 4.2 92.8 87 1.1 7.2 1.1 7.4dcGTX2 461 24 1.2 1.2 1.9 1.1 471 26 1.1 5.0 1.4 6.6dcGTX3 219 29 1.4 8.2 1.9 8.9 350 22 0.95 6.9 1.8 11GTX2 302 39 1.2 1.3 0.89 1.6 428 34 1.1 2.2 1.5 4.8GTX3 274 34 1.3 9.1 1.1 10 566 27 1.1 3.8 1.8 5.6GTX1 460 23 1.3 1.5 1.2 1.2 568 31 1.2 5.4 1.4 5.6GTX4 308 19 1.3 4.3 1.3 4.7 1020 8 1.5 5.0 0.88 6.0
od with conventional CZE of PSTs standard mixture.
ndividual standard solution due to co-migration.
ciccGitctcic
FbF
Table 2The concentration of PSTs found in a contaminated mussel sample using tITP-CZE-C4D and HPLC-FLD methods.
Toxin Concentration of PSTs found (�g STX-eq/kg)
tITP-CZE-C4D HPLC-FLD
dcSTX NDa 50STX 918b 1040dcNEO ND NDdcGTX2,3 383 300
a The SEF values were calculated by comparing the LODs between tITP-CZE methb tm is migration time.c The LODs of STX and dcNEO were determined by conducting separation using i
oncentration of epimeric toxin pairs was reported together for eas-er comparison; i.e., dcGTX2,3, GTX2,3 and GTX1,4. Analysis of theontaminated mussel sample using the HPLC-FLD method (repli-ates n = 3) confirmed the presence of STX, dcGTX2,3, GTX2,3 andTX1,4 in the mussel sample (Table 2). Only STX was detected
n HPLC-FLD method while dcNEO was absent, thus, the peak inhe tITP-CZE method (Fig. 6) was concluded to be STX only. Theoncentration of all toxins determined by HPLC-FLD agreed withhose determined from the tITP-CZE method (variation ≤ 17.5%),
onfirming the potential applicability of the tITP-CZE method. Thiss despite the poor resolution of the toxins between the matrixomponents and the difficulty in integrating and establishing theig. 6. Electropherograms for the analysis of PSTs in a contaminated mussel sampley tITP-CZE using (a) C4D and (b) UV detection. Optimum conditions as indicated inig. 5, Peak identification as indicated in Fig. 2.
GTX2,3 1960 2100GTX1,4 696 560
a ND Not detected due to reduced sensitivity of tITP-CZE-C4D for the particular
toxin.b Peak was determined to be STX, as confirmed by STX standard addition and theabsence of dcNEO when analyzed using HPLC-FLD method.
correct baseline position. The HPLC-FLD method indicated thepresence of dcSTX (TEFs = 1), where the level was lower than theregulatory limit and could not be detected by the current tITP-CZEmethod. However, the current tITP-CZE method has better selec-tivity for the separation of low to highly potent epimeric toxin pairs(i.e. GTXs species having TEFs values from 0.1 to 1) compared to theHPLC-FLD method.
It is expected that the current method using Na+ as leading ion toinduce tITP can be used to analyze PSTs in multiple mussel samples.Insignificant variation in Na+ concentration is expected in the mus-sel due to the fact that marine species maintain a constant internalsalt concentration living with in the same sea water body havingsalinity of 35% (common salinity in sea water) [66]. Given that theaim of this work was to develop a CE method that could be imple-mented easily in a microchip using detection approaches alreadywidely reduced to practice, the potential of this method for rapidon-site PSTs screening of shellfish has been demonstrated. Morework on implementation in a microchip and analysis of shellfishsamples is required to validate the real potential of this approachfor improved shellfish management.
4. Conclusions
The current study presents a new method for the analysis ofPSTs in shellfish usingCZE-C4D in combination with tITP for ana-lyte concentration and reduction of matrix effects. The methodand the quantitation results of PSTs in mussel sample were vali-
dated using the AOAC-approved HPLC-FLD method. CZE-C4D wasselected because of its potential for miniaturization and portability,enabling its deployment for on-site screening to inform the shell-fish producers of potential PSTs contamination so they can manage
romat
hoibectatfoisc
A
((WMwaAs
R
[
[
[
[
[
[
[
[
[
[
[
[
[
[
[
[
[
[
[
[
[
[
[
[
[
[
[
[
[
[
[
[
[
A.S. Abdul Keyon et al. / J. Ch
arvest-scheduling around harvest closures. The tITP system devel-ped in this study exploits the naturally high sodium concentrationn mussel samples to act as leading ion in the tITP stage, in com-ination with one electrolyte acting as BGE and TE (BGE/TE). Thislegant separation chemistry was combined with a hydrodynamicounter-flow during tITP step for improved stacking and separa-ion performance. The obtained LODs of PSTs ranged between 74.2nd 1020 ng/mL for tITP-CZE-C4D and from 141 to 461 ng/mL forITP-CZE-UV with enhancement in detection sensitivity rangingrom 8 to 97 folds over conventional CZE and at least two-foldver our previous methods. Importantly, this enhanced sensitiv-ty was achieved while reducing sample matrix effects in the highalinity mussel sample and allowed the determination of PSTs inontaminated mussel below or close to the regulatory limit.
cknowledgements
The authors would like to thank the Australian Research Council,ARC), for a QEII Fellowship (DP0984745) and Future FellowshipFT130100101) and the University of Tasmania for funding support.
e also acknowledge scholarships from the Ministry of Educationalaysia (MOE) and Universiti Teknologi Malaysia for A.S.A.K. Weould like to thank Department of Primary Industries, Parks, Water
nd Environment of Tasmania (DPIPWE) and Advanced Analyticalustralia Sydney for the contribution of HPLC-FLD results on musselample.
eferences
[1] E.J. Schantz, J.M. Lynch, G. Vayvada, K. Matsumoto, H. Rapoport, The purificationand characterization of the poison produced by Gonyaulax catenella in axenicculture, Biochemistry (Mosc) 5 (1966) 1191–1195.
[2] Y. Oshima, M. Hasegawa, T. Yasumoto, G. Hallegraeff, S. Blackburn, Dinoflag-ellate Gymnodinium catenatum as the source of paralytic shellfish toxins inTasmanian shellfish, Toxicon 25 (1987) 1105–1111.
[3] Y. Oshima, S.I. Blackburn, G.M. Hallegraeff, Comparative study on paralyticshellfish toxin profiles of the dinoflagellate Gymnodinium catenatum from threedifferent countries, Mar. Biol. 116 (1993) 471–476.
[4] A. Negri, D. Stirling, M. Quilliam, S. Blackburn, C. Bolch, I. Burton, G. Eaglesham,K. Thomas, J. Walter, R. Willis, Three novel hydroxybenzoate saxitoxin ana-logues isolated from the dinoflagellate Gymnodinium catenatum, Chem. Res.Toxicol. 16 (2003) 1029–1033.
[5] G.M. Hallegraeff, Harmful algal blooms in the Australian region, Mar. Pollut.Bull. 25 (1992) 186–190.
[6] A.P. Negri, G.J. Jones, Bioaccumulation of paralytic shellfish poisoning (PSP)toxins from the cyanobacterium Anabaena circinalis by the freshwater musselAlathyria condola, Toxicon 33 (1995) 667–678.
[7] T. Narahashi, H.G. Haas, Interaction of DDT with the components of lobsternerve membrane conductance, J. Gen. Physiol. 51 (1968) 177–198.
[8] D. Andrinolo, P. Gomes, S. Fraga, P. Soares-Da-Silva, N. Lagos, Transport ofthe organic cations gonyautoxin 2/3 epimers, a paralytic shellfish poisontoxin, through the human and rat intestinal epitheliums, Toxicon 40 (2002)1389–1397.
[9] G.P. Rossini, P. Hess, Phycotoxins: chemistry, mechanisms of action and shell-fish poisoning, EXS 100 (2010) 65–122.
10] D.S. Bhakuni, D.S. Rawat, Bioactive Marine Natural Products, Springer, NewYork, 2005.
11] E. Panel, Opinion of the scientific panel on contaminants in the foodchain on a request from the European commission on marine biotoxins inshellfish–saxitoxin group, EFSA J. 1019 (2009) 1–76.
12] AOAC, Official Method 2005.06: Paralytic Shellfish Poisoning Toxins in Shellfish.Pre-chromatographic Oxidation and Liquid Chromatography with Fluores-cence Detection, AOAC International, Gaithersburg, MD, 2005.
13] AOAC, Official Method 959.08: Paralytic Shellfish Poison Biological Method:Final Action, AOAC International, Gaithersburg, MD, 2005.
14] F.S. Chu, T.S. Fan, Indirect enzyme-linked immunosorbent assay for saxitoxinin shellfish, J. AOAC Int. 68 (1985) 13–16.
15] E. Usleber, E. Schneider, G. Terplan, Direct enzyme immunoassay in microtitra-tion plate and test strip format for the detection of saxitoxin in shellfish, Lett.Appl. Microbiol. 13 (1991) 275–277.
16] E. Usleber, M. Donald, M. Straka, E. Märtlbauer, Comparison of enzymeimmunoassay and mouse bioassay for determining paralytic shellfish poison-
ing toxins in shellfish, Food Addit. Contam. 14 (1997) 193–198.17] F.S. Chu, K.H. Hsu, X. Huang, R. Barrett, C. Allison, Screening of paralytic shell-fish posioning toxins in naturally occurring samples with three different directcompetitive enzyme-linked immunosorbent assays, J. Agric. Food. Chem. 44(1996) 4043–4047.
[
ogr. A 1364 (2014) 295–302 301
18] F.M. Van Dolah, T.A.L. Field, G.J. Doucette, L. Bean, B. Niedzwiadek, D.F.K. Rawn,Single-laboratory validation of the microplate receptor binding assay for par-alytic shellfish toxins in shellfish, J. AOAC Int. 92 (2009) 1705–1713.
19] AOAC, Official Methods of Analysis 2011.27: First Action 2011: Paralytic Shell-fish Poisoning in Shellfish by Receptor Binding Assay, AOAC International,Gaithersburg, MD, 2012.
20] L.E. Llewellyn, J. Doyle, A.P. Negri, A high-throughput, microtiter plate assayfor paralytic shellfish poisons using the saxitoxin-specific receptor, saxiphilin,Anal. Biochem. 261 (1998) 51–56.
21] L.E. Llewellyn, J. Doyle, Microtitre plate assay for paralytic shellfish toxins usingsaxiphilin: gauging the effects of shellfish extract matrices, salts and pH uponassay performance, Toxicon 39 (2000) 217–224.
22] J.J. Sullivan, W.T. Iwaoka, High pressure liquid chromatographic determinationof toxins associated with paralytic shellfish poisoning, J. AOAC Int. 66 (1983)297–303.
23] J.J. Sullivan, M.M. Wekell, L.L. Kentala, Application of HPLC for the determina-tion of PSP toxins in shellfish, J. Food Sci. 50 (1985) 26–29.
24] J.F. Lawrence, C. Ménard, C.F. Charbonneau, S. Hall, A study of ten toxins asso-ciated with paralytic shellfish poison using prechromatographic oxidation andliquid chromatography with fluorescence detection, J. AOAC Int. 74 (1991)404–409.
25] J.F. Lawrence, C. Menard, Liquid chromatographic determination of paralyticshellfish poisons in shellfish after prechromatographic oxidation, J. AOAC Int.74 (1991) 1006–1012.
26] J.F. Lawrence, C. Ménard, C. Cleroux, Evaluation of prechromatographic oxida-tion for liquid chromatographic determination of paralytic shellfish poisons inshellfish, J. AOAC Int. 78 (1995) 514–520.
27] J.F. Lawrence, B. Niedzwiadek, C. Menard, L. De Rojas Astudillo, R. Biré, P.A.Burdaspal, A. Ceredi, B. Davis, E. Dias, G. Eaglesham, S. Franca, S. Gallacher, D.Graham, B. Hald, L. Heinze, E. Hellwig, K.M. Jonker, K. Kapp, S. Krys, K. Kurz, J.P.Lacaze, A. Gago Martinez, P. McNabb, C. Ménard, A. Milandri, C. Nsengiyumva,P. Pereira, N. Pineiro, R. Poletti, G. Riddell, A. Selwood, A. Stern, R. Tiebach,H. Van Den Top, P. Wezenbeek, I.C. Yen, Quantitative determination of para-lytic shellfish poisoning toxins in shellfish using prechromatographic oxidationand liquid chromatography with fluorescence detection: collaborative study, J.AOAC Int. 88 (2005) 1714–1732.
28] Y. Oshima, M. Machida, K. Sasaki, Liquid chromatographic-fluorometric analy-sis of paralytic shellfish toxins, Agric. Biol. Chem. 48 (1984) 1707–1711.
29] Y. Oshima, Postcolumn derivatization liquid chromatographic method for par-alytic shellfish toxins, J. AOAC Int. 78 (1995) 528–532.
30] AOAC, Official Method 2011.02. First Action 2011: Paralytic Shellfish Toxins inMussels, Clams, Scallops and Oysters by Liquid Chromatography Post-ColumnOxidation, AOAC International, Gaithersburg, MD, 2012.
31] X. Fang, X. Fan, Y. Tang, J. Chen, J. Lu, Liquid chromatography/quadrupoletime-of-flight mass spectrometry for determination of saxitoxin and decar-bamoylsaxitoxin in shellfish, J. Chromatogr. A 1036 (2004) 233–237.
32] C. Dell’Aversano, P. Hess, M.A. Quilliam, Hydrophilic interaction liquidchromatography-mass spectrometry for the analysis of paralytic shellfish poi-soning (PSP) toxins, J. Chromatogr. A 1081 (2005) 190–201.
33] S.J. Sayfritz, J.A.B. Aasen, T. Aune, Determination of paralytic shellfish poisoningtoxins in Norwegian shellfish by liquid chromatography with fluorescence andtandem mass spectrometry detection, Toxicon 52 (2008) 330–340.
34] K. Campbell, D.F.K. Rawn, B. Niedzwiadek, C.T. Elliott, Paralytic shellfish poi-soning (PSP) toxin binders for optical biosensor technology: problems andpossibilities for the future: a review, Food Addit. Contam. 28 (2011) 711–725.
35] C. Dell’Aversano, J.A. Walter, I.W. Burton, D.J. Stirling, E. Fattorusso, M.A.Quilliam, Isolation and structure elucidation of new and unusual saxitoxinanalogues from mussels, J. Nat. Prod. 71 (2008) 1518–1523.
36] P. Thibault, S. Pleasance, M.V. Laycock, Analysis of paralytic shellfish poisonsby capillary electrophoresis, J. Chromatogr. 542 (1991) 483–501.
37] S. Pleasance, S.W. Ayer, M.V. Laycock, P. Thibault, Ionspray mass spectrom-etry of marine toxins. III. Analysis of paralytic shellfish poisoning toxins byflow-injection analysis, liquid chromatography/mass spectrometry and cap-illary electrophoresis/mass spectrometry, Rapid Commun. Mass Spectrom. 6(1992) 14–24.
38] S. Pleasance, P. Thibault, J. Kelly, Comparison of liquid-junction and coaxialinterfaces for capillary electrophoresis-mass spectrometry with application tocompounds of concern to the aquaculture industry, J. Chromatogr. 591 (1992)325–339.
39] A. Buzy, P. Thibault, M.V. Laycock, Development of a capillary electrophoresismethod for the characterization of enzymatic products arising from the car-bamoylase digestion of paralytic shellfish poisoning toxins, J. Chromatogr. A688 (1994) 301–316.
40] S.J. Locke, P. Thibault, Improvement in detection limits for the determinationof paralytic shellfish poisoning toxins in shellfish tissues using capillary elec-trophoresis/electrospray mass spectrometry and discontinuous buffer systems,Anal. Chem. 66 (1994) 3436–3446.
41] N. Pineiro, J.M. Leão, A. Gago Martínez, J.A. Rodríguez Vázquez, Capillary elec-trophoresis with diode array detection as an alternative analytical method forparalytic and amnesic shellfish toxins, J. Chromatogr. A 847 (1999) 223–232.
42] A. Gago-Martínez, J.M. Leão, N. Pineiro, E. Carballal, E. Vaquero, M. Nogueiras,
J.A. Rodríguez-Vázquez, An application of capillary electrophoresis for the anal-ysis of algal toxins from the aquatic environment, Int. J. Environ. Anal. Chem.83 (2003) 443–456.43] Y. Wu, A. Yam Tat Ho, P.Y. Qian, K.S.Y. Leung, Z. Cai, J.M. Lin, Determi-nation of paralytic shellfish toxins in dinoflagellate Alexandrium tamarense

3 romat
[
[
[
[
[
[
[
[
[
[
[
[
[
[
[
[
[
[
[
[
[
[
02 A.S. Abdul Keyon et al. / J. Ch
by using isotachophoresis/capillary electrophoresis, J. Sep. Sci. 29 (2006)399–404.
44] A.S.A. Keyon, R.M. Guijt, A. Gaspar, A.A. Kazarian, P.N. Nesterenko, C.J. Bolch,M.C. Breadmore, Capillary electrophoresis for the analysis of paralytic shellfishpoisoning toxins in shellfish: comparison of detection methods, Electrophore-sis 35 (2014) 1496–1503.
45] A.M. Skelley, J.R. Scherer, A.D. Aubrey, W.H. Grover, R.H.C. Ivester, P. Ehrenfre-und, F.J. Grunthaner, J.L. Bada, R.A. Mathies, Development and evaluation of amicrodevice for amino acid biomarker detection and analysis on Mars, Proc.Natl. Acad. Sci. U. S. A. 102 (2005) 1041–1046.
46] C. Berg, D.C. Valdez, P. Bergeron, M.F. Mora, C.D. Garcia, A. Ayon, Lab-on-a-robot:integrated microchip CE, power supply, electrochemical detector, wireless unit,and mobile platform, Electrophoresis 29 (2008) 4914–4921.
47] J.P. Hutchinson, C. Johns, M.C. Breadmore, E.F. Hilder, R.M. Guijt, C.Lennard, G. Dicinoski, P.R. Haddad, Identification of inorganic ions inpost-blast explosive residues using portable CE instrumentation and capaci-tively coupled contactless conductivity detection, Electrophoresis 29 (2008)4593–4602.
48] R.J. Meagher, A.V. Hatch, R.F. Renzi, A.K. Singh, An integrated microfluidic plat-form for sensitive and rapid detection of biological toxins, Lab Chip 8 (2008)2046–2053.
49] G.V. Kaigala, M. Bercovici, M. Behnam, D. Elliott, J.G. Santiago, C.J. Back-house, Miniaturized system for isotachophoresis assays, Lab Chip 10 (2010)2242–2250.
50] A. Floris, S. Staal, S. Lenk, E. Staijen, D. Kohlheyer, J. Eijkel, A. Van Den Berg, A pre-filled, ready-to-use electrophoresis based lab-on-a-chip device for monitoringlithium in blood, Lab Chip 10 (2010) 1799–1806.
51] M. Benhabib, T.N. Chiesl, A.M. Stockton, J.R. Seherer, R.A. Mathies, Multichannelcapillary electrophoresis microdevice and instrumentation for in situ plan-etary analysis of organic molecules and biomarkers, Anal. Chem. 82 (2010)2372–2379.
52] P. Kubán, A. Seiman, N. Makarõtseva, M. Vaher, M. Kaljurand, In situdetermination of nerve agents in various matrices by portable capillary elec-
tropherograph with contactless conductivity detection, J. Chromatogr. A 1218(2011) 2618–2625.53] J. Kim, E.C. Jensen, A.M. Stockton, R.A. Mathies, Universal microfluidic automa-ton for autonomous sample processing: application to the Mars organicanalyzer, Anal. Chem. 85 (2013) 7682–7688.
[
ogr. A 1364 (2014) 295–302
54] Y.T. Kim, J.Y. Choi, Y. Chen, T.S. Seo, Integrated slidable and valveless polymerasechain reaction-capillary electrophoresis microdevice for pathogen detection,RSC Adv. 3 (2013) 8461–8467.
55] J. Sáiz, T.D. Mai, P.C. Hauser, C. García-Ruiz, Determination of nitrogen mustarddegradation products in water samples using a portable capillary electrophore-sis instrument, Electrophoresis 34 (2013) 2078–2084.
56] M. Ávila, A. Floris, S. Staal, A. Ríos, J. Eijkel, A. van den Berg, Point of care creati-nine measurement for diagnosis of renal disease using a disposable microchip,Electrophoresis 34 (2013) 2956–2961.
57] C. Johns, M. Macka, P.R. Haddad, Design and performance of a light-emittingdiode detector compatible with a commercial capillary electrophoresis instru-ment, Electrophoresis 25 (2004) 3145–3152.
58] M. Ryvolová, J. Preisler, F. Foret, P.C. Hauser, P. Krásensky, B. Paull, M. Macka,Combined contactless conductometric, photometric, and fluorimetric sin-gle point detector for capillary separation methods, Anal. Chem. 82 (2010)129–135.
59] J. Pospichal, P. Gebauer, P. Bocek, Measurement of mobilities and dissociationconstants by capillary isotachophoresis, Chem. Rev. 89 (1989) 419–430.
60] C. Johns, M.C. Breadmore, M. Macka, M. Ryvolová, P.R. Haddad, Recentsignificant developments in detection and method development for the deter-mination of inorganic ions by CE, Electrophoresis 30 (2009) S53–S67.
61] F.M. Everaerts, J. Vacík, T.P.E.M. Verhegen, J. Zuska, Displacement electrophore-sis. Experiments with countrflow of electrolyte, J. Chromatogr. 49 (1970)262–268.
62] A.M. Enlund, D. Westerlund, Enhancing detectability in CE by combining an iso-tachophoretic preconcentration with capillary zone electrophoresis in a singlecapillary, Chromatographia 46 (1997) 315–321.
63] N.J. Reinhoud, U.R. Tjaden, J. Van der Greef, Automated isotachophoretic analytefocusing for capillary zone electrophoresis in a single capillary using hydro-dynamic back-pressure programming, J. Chromatogr. 641 (1993) 155–162.
64] B. Gas, M. Demjanenko, J. Vacík, High-frequency contactless conductivity detec-tion in isotachophoresis, J. Chromatogr. 192 (1980) 253–257.
65] J.G.A. Brito-Neto, J.A. Fracassi da Silva, L. Blanes, C.L. do Lago, Understand-
ing capacitively coupled contactless conductivity detection in capillary andmicrochip electrophoresis. Part 1. Fundamentals, Electroanalysis 17 (2005)1198–1206.66] J.L. Sumich, J.F. Morrissey, Introduction to the Biology of Marine Life, Jones &Bartlett Learning, 2004.


