Embed Size (px)
Citation preview

ARTICLE IN PRESS
0042-207X/$ - se
doi:10.1016/j.va
CorrespondiE-mail addre
Vacuum 76 (2004) 369–376
www.elsevier.com/locate/vacuum
Travelling-wave-sustained discharges
K. Makashevaa, K. Marinovb, A. Shivarovab,, L. Stoevb, Kh. Tarnevc
aGroupe de physique des plasmas, Universite de Montreal, Montreal, Quebec, Canada H3C 3J7bFaculty of Physics, Sofia University, 5 J. Bourchier Blvd., 1164 Sofia, Bulgaria
cDepartament of Applied Physics, Technical UniversitySofia, 8 Kliment Ohridski Str., 1000 Sofia, Bulgaria
Abstract
The paper presents a review on recent development in modelling and diagnostics of diffusion-controlled gas
discharges produced in the fields of travelling waves as well as on their instabilities, with a stress on the results obtained
in the Plasma and Gas-discharge Physics Group at Sofia University. Directed to basic features of the discharge, the
discussion is on argon discharges with unmagnetized and magnetized plasma production.
r 2004 Elsevier Ltd. All rights reserved.
Keywords: High-frequency discharges; Plasma diagnostics; Instabilities of gas discharges
1. Introduction
The travelling-wave-sustained discharges(TWSDs) are comparatively new plasma sources.Depending on the type of the guided modes whichmaintain the discharges, they show up in twomodifications: surface wave sustained discharges(SWSDs) [1,2] as plasma sources without anexternal magnetic field and Trivelpiece-Gouldmode sustained discharges (TGMSDs) [3] forplasma production in an external magnetic field.The active research on the TWSDs is motivated
by the flexibility of their production: They exist inthe total gas pressure range ½p ¼ ð1:33 103 1 105Þ Pa of the gas discharges and in a very
e front matter r 2004 Elsevier Ltd. All rights reserv
cuum.2004.07.054
ng author. Fax: +359-2-9625276.
ss: [email protected] (A. Shivarova).
wide frequency range ðf o=2p ¼ 200 kHz10GHzÞ: This makes TWSDs very attractive foruse in the gas-discharge applications [4]. Since theydisplay very well the basis of the gas discharges asself-consistent field-plasma structures, their consid-eration as a prototype of high-frequency discharges,in general, provokes interest in their modelling.By the theoretical results for the discharge
structure discussed, the diagnostic method de-scribed and the instability of the dischargepresented, the paper stresses the self-consistentplasma-wave behaviour of the TWSDs.
2. General description of the discharges
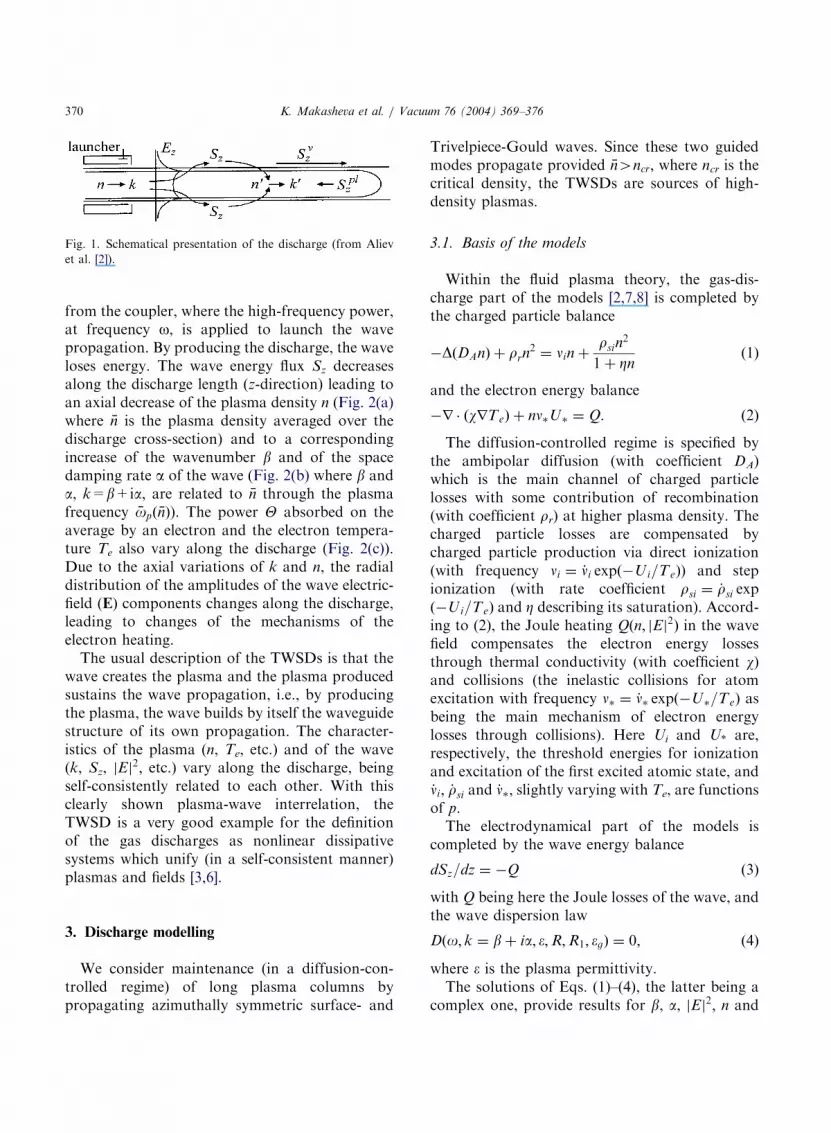
Fig. 1 shows schematically the TWSDs: Theplasma column produced is extended far away
ed.
ARTICLE IN PRESS
Fig. 1. Schematical presentation of the discharge (from Aliev
et al. [2]).
K. Makasheva et al. / Vacuum 76 (2004) 369–376370
from the coupler, where the high-frequency power,at frequency o, is applied to launch the wavepropagation. By producing the discharge, the waveloses energy. The wave energy flux Sz decreasesalong the discharge length (z-direction) leading toan axial decrease of the plasma density n (Fig. 2(a)where n is the plasma density averaged over thedischarge cross-section) and to a correspondingincrease of the wavenumber b and of the spacedamping rate a of the wave (Fig. 2(b) where b anda, k=b+ia, are related to n through the plasmafrequency opð nÞ). The power Y absorbed on theaverage by an electron and the electron tempera-ture Te also vary along the discharge (Fig. 2(c)).Due to the axial variations of k and n, the radialdistribution of the amplitudes of the wave electric-field (E) components changes along the discharge,leading to changes of the mechanisms of theelectron heating.The usual description of the TWSDs is that the
wave creates the plasma and the plasma producedsustains the wave propagation, i.e., by producingthe plasma, the wave builds by itself the waveguidestructure of its own propagation. The character-istics of the plasma (n, Te, etc.) and of the wave(k, Sz, Ej j2; etc.) vary along the discharge, beingself-consistently related to each other. With thisclearly shown plasma-wave interrelation, theTWSD is a very good example for the definitionof the gas discharges as nonlinear dissipativesystems which unify (in a self-consistent manner)plasmas and fields [3,6].
3. Discharge modelling
We consider maintenance (in a diffusion-con-trolled regime) of long plasma columns bypropagating azimuthally symmetric surface- and
Trivelpiece-Gould waves. Since these two guidedmodes propagate provided n4ncr; where ncr is thecritical density, the TWSDs are sources of high-density plasmas.
3.1. Basis of the models
Within the fluid plasma theory, the gas-dis-charge part of the models [2,7,8] is completed bythe charged particle balance
DðDAnÞ þ rrn2 ¼ nin þ
rsin2
1þ Znð1Þ
and the electron energy balance
r ðwrTeÞ þ nn U ¼ Q: ð2Þ
The diffusion-controlled regime is specified bythe ambipolar diffusion (with coefficient DA)which is the main channel of charged particlelosses with some contribution of recombination(with coefficient rr) at higher plasma density. Thecharged particle losses are compensated bycharged particle production via direct ionization(with frequency ni ¼ _ni expðUi=TeÞ) and stepionization (with rate coefficient rsi ¼ _rsi expðUi=TeÞ and Z describing its saturation). Accord-ing to (2), the Joule heating Qðn; Ej j2Þ in the wavefield compensates the electron energy lossesthrough thermal conductivity (with coefficient w)and collisions (the inelastic collisions for atomexcitation with frequency n ¼ _n expðU =TeÞ asbeing the main mechanism of electron energylosses through collisions). Here Ui and U* are,respectively, the threshold energies for ionizationand excitation of the first excited atomic state, and_ni; _rsi and _n ; slightly varying with Te, are functionsof p.The electrodynamical part of the models is
completed by the wave energy balance
dSz=dz ¼ Q ð3Þ
with Q being here the Joule losses of the wave, andthe wave dispersion law
Dðo; k ¼ bþ ia; ;R;R1; gÞ ¼ 0; ð4Þ
where e is the plasma permittivity.The solutions of Eqs. (1)–(4), the latter being a
complex one, provide results for b, a, Ej j2; n and

ARTICLE IN PRESS
0.0 0.2 0.4 0.6 0.80.0
0.2
0.4
0.6
βR
αR
ω /ω
pβR, αR
0 50 100 1503.6
3.7
3.8
3.9
4.0
4.1
z [cm]
Θ [1
06 e
V/s
]
Θ
2.24
2.26
2.28
2.30
2.32
Te
[eV
]
Te
0 50 100 1500
1
2
3
4
n [1
010 c
m-3
]
z [cm] (a) (b) (c)
Fig. 2. Axial variations of n (in (a)), of b and a (presented in terms of ðo= opÞ-variations in (b)) and of Y and Te (in (c)) in a SWSD.
f o/2p ¼ 133MHz, p=13.3Pa, gas temperature Tg=300K, m=2. Inner and outer radii, respectively R=1.4 cm, R1=1.5 cm of the
glass tube with permittivity g ¼ 4:4: z=0 is the discharge onset; a ¼ b determines the discharge end (from Marinov et al. [5]).
0.0 0.4 0.8 1.2 1.60.0
0.2
0.4
0.6
0.8
1.0
1.2
2.4µ = 2.0
2.42.3 2.2 2.1
µ = 2.0
ν/ω = 0.065
βR
ω/ ω
p
Fig. 3. Changes of b with n; expressed through op; forp=6.65Pa ðn=o ¼ 0:065Þ; f=144MHz, Tg=600K, R=1.4 cm,
R1=1.5 cm, g ¼ 4:4: The parameter m characterizes the radialinhomogeneity of the plasma density. Discharge ends marked
by symbols, discharge onset by the dash (from Makasheva and
Shivarova [7]).
K. Makasheva et al. / Vacuum 76 (2004) 369–376 371
Te. Being a closed set of equations for plasma- andwave-characteristics, it ensures the self-consistentdescription of the discharge. Through the non-linear processes of step ionization and recombina-tion in (1), n is related to Te and through it (seesubsection 3.3), to the wave field intensity: nðjEj2Þ:Thus, in accordance with the definition of the gasdischarges, the set of Eqs. (1)–(4) couples plasma-and wave-characteristics on a nonlinear level.
3.2. Wave properties and electron heating
The radial distribution of the electric fieldcomponents and the space damping rate of thewave determine the type and the regimes ofelectron heating.With the radial variation of the plasma density
in diffusion-controlled discharges, their descrip-tion requires using the wave dispersion law (4) inradially inhomogeneous plasmas [2,7,8]. More-over, for covering the total ranges of variation of p
and f, as well as the different types (local and non-local ones) and regimes (of weak and strongcollisions) of electron heating, the dispersion lawshould be for plasmas with arbitrary collisions[7,8].Over the total length of discharges in a regime of
strong collisions ðn=oX1 where n is the electron-neutral elastic collision frequency) and over themain (long) part of discharges in a regime of weakcollisions ðn oÞ positioned in the lower ðo= opÞ-range of the wave phase diagrams (Fig. 3) up tothe maximum of b, the electron heating is in thealmost homogeneous Ez-field of the wave (the
range of large N ¼ n=ncr in Fig. 4(a)). The powerdeposition is uniform across the plasma-columncross-section and the thermal conductivity in (2) isnegligible. This determines conditions of localheating. The solution for the electron temperatureTeðzÞ ¼ U = lnð EðzÞ
2=E2i Þ shows that the wavefield itself (with intensity EðzÞ
2) appears as amaintenance field; here Ei is a normalizing field [2].Related to the radial distribution of the wave
electric field components for low plasma density,the power input at the end of discharges in aregime of weak collisions ðn=o 1Þ is localized inthe outer region across the discharge radius. Forproper values of the parameter m of the radial

ARTICLE IN PRESS
0.51.0
1.52.0
2.53.0
65
43
21
0
1
2
3
Ez
N r/R
0.51.0
1.52.0
2.53.0
65
43
21
0
1
2
3
Er
r/RN
(a)
(b)
Fig. 4. Radial and axial (presented through N ¼ n=ncr)
variations of the axial Ez (a) and radial Er (b) components of
the Trivelpiece-Gould mode, both normalized to Ezðr ¼ 0Þ:oR=c ¼ 0:1; n/o ¼ 0:1; m ¼ 2:1 and Oe=o ¼ 0:5 where c is the
vacuum light speed and Oe the electron gyro-frequency (from
Schluter et al. [9]).
K. Makasheva et al. / Vacuum 76 (2004) 369–376372
plasma density inhomogeneity, this increase of theamplitudes is a resonant enhancement, mainly, ofthe radial electric field component of the wave(Fig. 4(b)). This is associated with wave dampingdue to resonance absorption at the transformationof the guided wave, which produces the discharge,into a volume wave. The minimum of b on thephase diagrams (Fig. 3) marks the appearance ofthe resonance absorption at the discharge walls.No matter whether resonance absorption does ordoes not occur, the localized power input drivesthe mechanism of thermal conductivity deter-mining nonlocal type of electron heating in thewave field. The solution of (2), TeðzÞ ¼
U = lnðhE2ðzÞi=E2i Þ; shows that in the case of
weak collisions an effective field hE2ðzÞi; defined
through n(r,z) and Eðr; zÞ 2; maintains the dis-
charge end [2,7]. Since the description here iswithin the fluid plasma theory, effects likecollisionless heating (e.g. [10], for SWSDs) de-scribed by the kinetic theory are not considered.The power Y ¼ Q= n absorbed on the average by
an electron is a characteristic of the dischargewhich is related to the maintenance field intensity[7]. Thus, instead of being expressed through themaintenance field intensity, Te can be expressedby Y:
Te ¼ U = ln YðzÞ=Yi
: ð5Þ
Here Yi ¼ _n U and Q and n in Y are averagedover the discharge cross-section.
3.3. Condition for discharge maintenance and wave
power balance
A Bessel type of radial profile of the plasmadensity nðrÞ ¼ nðr ¼ 0ÞJ0ðmr=RÞ is an approximatesolution (with very good accuracy [2]) of thecharged particle balance (1). Owing to the non-linear processes of step ionization and recombina-tion, the plasma density n(r=0) at the dischargeaxis, resulting from Eq. (1), is related, through niand rsi, to Te:
mR
2DA? þ rrnðr ¼ 0Þ ¼ ni þ
rsinðr ¼ 0Þ
1þ Znðr ¼ 0Þ: ð6Þ
Eq. (6) appears as a condition for dischargemaintenance, which replaces the Schottky condi-tion m=R
2DA? ¼ ni: After using Eq. (5), the
plasma density comes out finally related to themaintenance field intensity or, equivalently, to Y:
Yð n; zÞ
Yi
¼
mR
2DA? þ rr ~m nðzÞ
_ni þ ½ _rsi ~m nðzÞ=ð1þ Z ~m nðzÞÞ
" #1=s
ð7Þ
where ~m ¼ m=2J1ðmÞ and J1 is the Bessel function.According to Eq. (7), with the plasma densityincrease (Fig. 5), Y first decreases, due to theincreasing step ionization, reaches a plateau,because of its saturation, and then increases,related to the increasing recombination.

ARTICLE IN PRESS
K. Makasheva et al. / Vacuum 76 (2004) 369–376 373
The wave power balance Eq. (3) can be easilyreduced to an expression [2]
d n
dz¼
2að nÞ nðzÞ1þ ð nðzÞ=Yð nÞÞðdY=d nÞ ð nðzÞ=að nÞÞðda=d nÞ
;
ð8Þ
which, relating the axial gradient of the plasmadensity to the axial variation of a and Y, showsthat self-consistent description of the dischargescan be achieved provided the (n a)- and (n Y)-relations are known.Thus, the set of Eqs. (1)–(4) coupling the plasma
characteristics (Te and n) to the wave character-istics (a and Ej j2) ensures a self-consistent descrip-tion of the discharge, based on the nonlinearity:
108
109
1010
1011
1012
1013
1014
0
4
8
12
16
p = 66.5 Pa
p = 665 Pa
p = 6.65 Pa
ΘSch
ΘSch
ΘSch
Θ [
106 e
V/s
]
n [cm-3]
Fig. 5. (Y n)-dependences for different p-values. Notation of
end and onsets of 144-MHz discharges as in Fig. 3. The broken
lines (Ysch) show Y-values defined by the Schottky condition.R=1.4 cm, m=2.1 (from Koleva et al. [11]).
0.0 0.4 0.8 1.2 1.6 2.0
0.2
0.4
0.6
0.8
1.0
66.5 Pa
66.5 Pa
133 Pa
133 Pa
133 Pa
40 Pa
40 Pa40 Paω /ω
p
αR, βR0 20 40
0
4
8
12
p = 66.5p = 133 Pa
N
z [cm](a) (b)
Fig. 6. Axial variations, presented in terms of changing ðo= opÞ; ofprofiles of N ¼ n=ncr and Y, respectively, in solid and dashed curves (bm=2.35 (from Schluter et al. [8]).
the thermal nonlinearity, expressed by Teð Ej j2Þ
and, finally, the ionization nonlinearity nð Ej j2Þ
described by Eq. (7) and the relation of Y to thewave field intensity. The value of m comes out byapplying the Bohm criterion [6] at the boundarybetween the plasma and the wall sheath. The totalpower P ¼ pR2
R L
0 YðzÞ nðzÞ dz applied for main-tenance of a discharge with a given length L
determines the plasma density nðz ¼ 0Þ at thedischarge onset.
3.4. Axial self-consistent structure of the discharge
Microwave (2.45GHz) discharges are pickedhere for presenting the axial self-consistent struc-ture of TWSDs. Fig. 6 shows results for TGMSDs[8] sustained at different gas pressures. With the p-increase, n increases causing an increase of a (Fig.6(a)) and, consequently, steeper decrease of theplasma density (Fig. 6(b)) along the main (long)part of the discharge which is produced by localheating. Evidence of non-local heating in regionsof resonance absorption of the waves is shown bythe fast drops of the plasma density at thedischarge end. The longitudinal diffusion, notconsidered here, would slightly influence the veryend of the discharge acting in an oppositedirection, i.e. it would slightly extend the dis-charge. The electron temperature Te decreases withthe increase in p (Fig. 6(c)). The external magneticfield B0 increases the efficiency of the dischargeproduction: Due to the reduction of the diffusionlosses, Te and Y decrease with increasing B0.
0 20 40 60 801.3
1.4
1.5
1.6
1.7
1.8
p = 66.5 Pa
p = 40 Pa
p = 133 PaTe
[eV
]
z [cm]60 80
Θ [1
06 e
V/s
]
p = 40 Pa
Pa
0.0
0.6
1.2
1.8
(c)
b and a, respectively, in solid and dashed curves (a) and axial) as well as of Te (c), for f=2.45GHz, R=1cm, B0=0.07T and

ARTICLE IN PRESS
K. Makasheva et al. / Vacuum 76 (2004) 369–376374
Therefore, the self-consistent description of theTWSDs is based on the ð n aÞ- and ð n YÞ-relations, resulting, respectively, from Eqs. (4) and(6). Besides determining d n=dz; a determines thetype of the electron heating. The power Ydetermines Te and also (in a combination with n)the absorbed power QðzÞ ¼ nðzÞYðzÞ and the totalpower P.
4. Discharge diagnostics
The clear display of self-consistent wave-plasmabehaviour has been employed in development ofnew diagnostic methods, specific for TWSDs: theradiophysics methods [1] which provide results forplasma characteristics from measurements of thewave propagation properties. Among these meth-ods, the interferogram method [1,2,12] has beenwidely used for accumulating results for the axialprofiles of the plasma density nðzÞ: In its originalform, the method combines measurements ofthe axial variation of b with use of the wavedispersion law in radially homogeneous collision-less plasmas.Our recent extension [13] of the interferogram
method provides results for nðzÞ; n, m, Y, Tg andTe. The set nðzÞ; n and m (Fig. 7(a)) of plasmacharacteristics is obtained by combining theoreti-cal phase diagrams for radially inhomogeneouscollisional plasmas with experimental data for b(z)and a(z). Since a is very sensitive to changes of nand m, the measurements of a provide thepossibility to have n and m determined [13,14].
0 82
3
4
5
6
µ = 2.35
µ = 2.4
p = 1
z
Θ [1
07 e
V/s
]
0 5 10 15 20
0.8
1.6
2.4
3.2
p = 40.0 Pa
µ = 2.35
µ = 2.4
ν = 1.85x10⁹ s
-1
µ = 2.35
n [1
012 c
m-3
]
z [cm](a) (b)
Fig. 7. (a): Experimental results for n and m, as given on the figure, aTheoretical results (for two m-values) in dashed curves. (b): Experimtheoretical results (curves). (c): Experimental data for Y(z) (symbols)(lower curves) and m=2.4 (upper curves). f=2.45GHz, R=0.3 cm, R
The axial profile of Y (Fig. 7(b)) is obtained bymeasuring the absorbed power Q in its dependenceon the length of the plasma column. Comparison(Fig. 7(c)) of theoretical and experimental resultsfor Y gives the value of the gas temperature,within the accuracy shown in the figure. Theelectron temperature Te is obtained from itsrelation (5) to Y.
5. Instability of diffusion controlled discharges
Although the models of TWSDs considerdischarge maintenance at a given frequency o,like in Section 3, a narrow-band signal is alwaysthe signal producing the discharge. This createsperturbations of the plasma parameters which lead(through cross-phase modulation (XPM) effects)to a modulation type instability of the discharge[5]. The XPM of surface waves has been recentlyintroduced in the discharge models [5,15] forexplanation of experimental data [16,17] whichdemonstrate that the experimentally observed gainof the instability is more than two orders ofmagnitude larger than that predicted by self-phasemodulation only [16]. Such a treatment, based onXPM, is in accordance with the generalization ofthe Lighthill criterion for XPM [18] which showsenlarged possibilities for an unstable behaviour.Besides, in diffusion-controlled discharges, the typeof the plasma density response [5,19,20] dependson the ratio between the characteristic plasma-response time and the perturbation frequency.
0 8 16 242.5
3.0
3.5
4.0
4.5
5.0
Tg = 300 K
Tg = 400 K
Tg = 600 K
p = 40 Pa
z [cm]
Θ [1
07 eV
/s]
16 24 32
33 Pa p = 65.5 Pa
p = 40.0 Pa
p = 13.3 Pa
p = 8.0 Pa
[cm] (c)
s well for nðzÞ given by the symbols and their fit (solid curve).ental data (symbols) for Y(z) and their comparison with theand theoretical results (curves) for different Tg-values; m=2.351=0.45 cm, eg=3.78 (from Makasheva and Shivarova [13]).
ARTICLE IN PRESS
0 50 1000
2
4
6
8
10
|∆f | < 6 kHz
-30 kHz
-20 kHz-10 kHz
|A-Ω
(z)|/
|A-Ω
(z=0
)|
z [cm]0 50 100
0
2
4
6
8
10
|∆f | < 6 kHz
30 kHz20 kHz10 kHz
|AΩ
(z)|/
|AΩ(z
=0)|
z [cm]0 50 100
10-4
10-2
100
102
104
-30 kHz
-20 kHz-10 kHz
10 kHz 20 kHz
30 kHz
|A(z
)|/|A
(z=0
)|
z [cm](a) (b) (c)
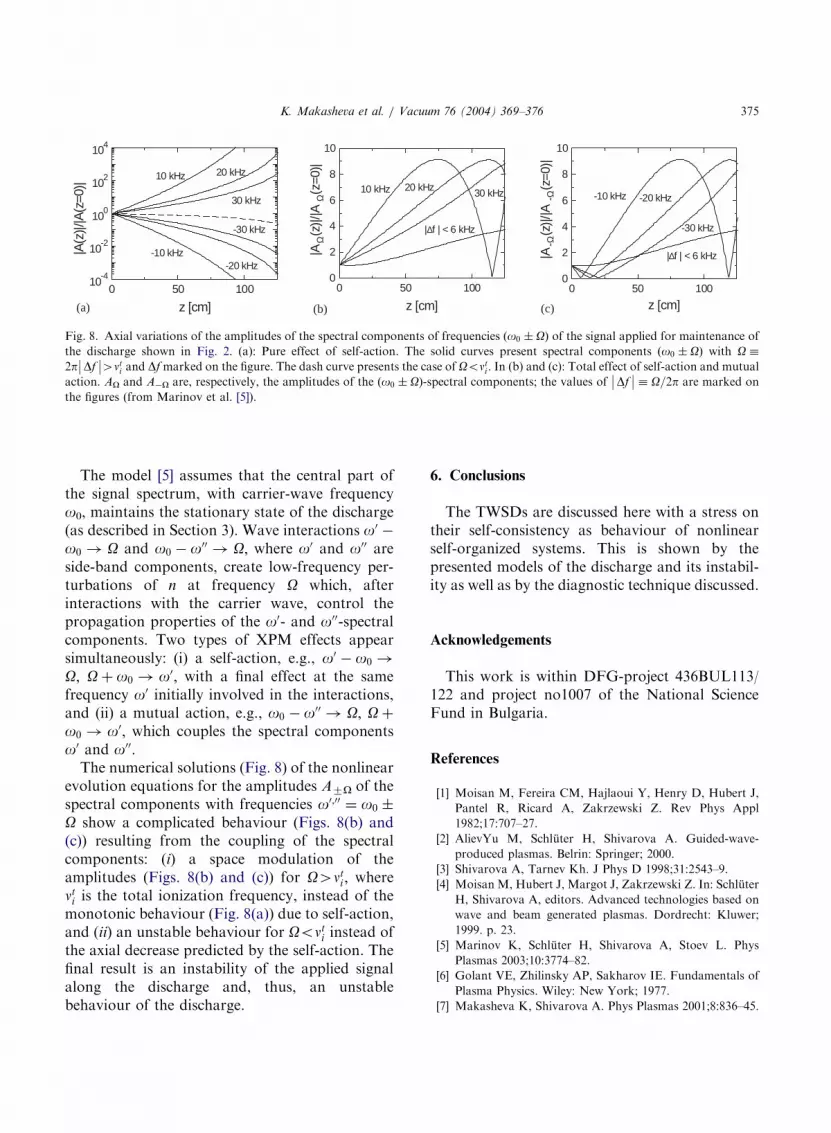
Fig. 8. Axial variations of the amplitudes of the spectral components of frequencies ðo0 OÞ of the signal applied for maintenance ofthe discharge shown in Fig. 2. (a): Pure effect of self-action. The solid curves present spectral components ðo0 OÞ with O
2p Df 4nt
i and Dfmarked on the figure. The dash curve presents the case of Oonti : In (b) and (c): Total effect of self-action and mutual
action. AO and AO are, respectively, the amplitudes of the ðo0 OÞ-spectral components; the values of Df O=2p are marked on
the figures (from Marinov et al. [5]).
K. Makasheva et al. / Vacuum 76 (2004) 369–376 375
The model [5] assumes that the central part ofthe signal spectrum, with carrier-wave frequencyo0, maintains the stationary state of the discharge(as described in Section 3). Wave interactions o0
o0 ! O and o0 o00 ! O; where o0 and o00 areside-band components, create low-frequency per-turbations of n at frequency O which, afterinteractions with the carrier wave, control thepropagation properties of the o0- and o00-spectralcomponents. Two types of XPM effects appearsimultaneously: (i) a self-action, e.g., o0 o0 !O; Oþ o0 ! o0; with a final effect at the samefrequency o0 initially involved in the interactions,and (ii) a mutual action, e.g., o0 o00 ! O; Oþ
o0 ! o0; which couples the spectral componentso0 and o00:The numerical solutions (Fig. 8) of the nonlinear
evolution equations for the amplitudes A7O of thespectral components with frequencies o0;00 ¼ o0 O show a complicated behaviour (Figs. 8(b) and(c)) resulting from the coupling of the spectralcomponents: (i) a space modulation of theamplitudes (Figs. 8(b) and (c)) for O4nt
i ; wherent
i is the total ionization frequency, instead of themonotonic behaviour (Fig. 8(a)) due to self-action,and (ii) an unstable behaviour for Oont
i instead ofthe axial decrease predicted by the self-action. Thefinal result is an instability of the applied signalalong the discharge and, thus, an unstablebehaviour of the discharge.
6. Conclusions
The TWSDs are discussed here with a stress ontheir self-consistency as behaviour of nonlinearself-organized systems. This is shown by thepresented models of the discharge and its instabil-ity as well as by the diagnostic technique discussed.
Acknowledgements
This work is within DFG-project 436BUL113/122 and project no1007 of the National ScienceFund in Bulgaria.
References
[1] Moisan M, Fereira CM, Hajlaoui Y, Henry D, Hubert J,
Pantel R, Ricard A, Zakrzewski Z. Rev Phys Appl
1982;17:707–27.
[2] AlievYu M, Schluter H, Shivarova A. Guided-wave-
produced plasmas. Belrin: Springer; 2000.
[3] Shivarova A, Tarnev Kh. J Phys D 1998;31:2543–9.
[4] Moisan M, Hubert J, Margot J, Zakrzewski Z. In: Schluter
H, Shivarova A, editors. Advanced technologies based on
wave and beam generated plasmas. Dordrecht: Kluwer;
1999. p. 23.
[5] Marinov K, Schluter H, Shivarova A, Stoev L. Phys
Plasmas 2003;10:3774–82.
[6] Golant VE, Zhilinsky AP, Sakharov IE. Fundamentals of
Plasma Physics. Wiley: New York; 1977.
[7] Makasheva K, Shivarova A. Phys Plasmas 2001;8:836–45.

ARTICLE IN PRESS
K. Makasheva et al. / Vacuum 76 (2004) 369–376376
[8] Schluter H, Shivarova A, Tarnev Kh. Contrib Plasma Phys
2003;43:206–15.
[9] Schluter H, Shivarova A, Tarnev Kh. J Electromagn
Waves Appl 2002;16:37–58.
[10] Aliev Yu M, Maximov AV, Kortshagen U, Schluter H,
Shivarova A. Phys Rev E 1995;51:6091–103.
[11] Koleva I, Makasheva K, Paunska Ts, Schluter H,
Shivarova A, Tarnev Kh. Contrib Plasma Phys 2004; 44:
565–70.
[12] Zakrzewski Z, Moisan M, Glaude VMM, Beaudry C,
Leprince P. Plasma Phys 1977; 77–83.
[13] Makasheva K, Shivarova A. IEEE Trans Plasma Sci
2002;30:384–90.
[14] Kirov K, Makasheva K, Shivarova A. Vacuum
2000;58:280–6.
[15] Schluter H, Shivarova A, Stoev L. Phys Scr
2002;65:518–21.
[16] Grozev D, Kirov K, Makasheva K, Shivarova A. IEEE
Trans Plasma Sci 1997;25:415–22.
[17] Boke M, Grozev D, Himmel G, Kirov K, Schluter H,
Shivarova A. In: Schluter H, Shivarova A, editors.
Advanced technologies based on wave and beam generated
plasmas. Dordrecht: Kluwer; 1999. p. 505.
[18] Agrawal GP. Nonlinear fiber optics. Academic Press: San
Diego; 2001.
[19] Georgieva M, Shivarova A, Urdev I. J Appl Phys
1994;52:391–407.
[20] Ostrikov KN, Yu MY, Azarenkov NA. J Appl Phys
1998;84:4176–9.


