Embed Size (px)
Citation preview

27
Leucistic Common Redshank However, there was more to come as we headed inland a short distance and came across a foraging group of the endemic Gray’s Lark, another lifer for most of us, and were shown the very pale, almost white, form of the Tractrac Chat found in this very harsh environment. Now birded out, we said farewell and a big “Thank you”” to Mark and headed for a celebratory dinner in Swakopmund at the end of an extraordinary day’s birding. The next (Monday) morning on our way inland we stopped briefly to confirm that the Black Skimmer was still present. The bird did a fly-past including a bit of skimming for a great finale. It had been confirmed when seen in flight the previous day to be of the same (North American) sub-species as the one seen near Cape Town, almost certainly confirming that this was the same individual. We later heard that it stayed until the Wednesday, allowing a group of twitchers who had flown to Cape Town the previous Saturday and missed it to make a second trip and connect with it this time.
Trends in Namibian Waterbird Populations 9 :
Waders and Shorebirds - Part 1
Holger Kolberg Directorate Scientific Services
Ministry of Environment and Tourism Windhoek
The following is a summary of waterbird count data for selected species in Namibia, covering the period 1977 to December 2008. For each species the Red Data Book (RDB) status, both global and Namibian, is given, the population trend as per Wetlands International, the number of times the species was counted, the number of times it has passed the 1% population criterion, the maximum count and the sites where it has passed the 1% population criterion. The local trend is calculated using the computer programme TRIM (see an earlier publication for the selection criteria and methods) (Lanioturdus 43 (2) – Ed.). Population trends are graphically presented as indices relative to a base year (in this case 1991) and thus all have a value of 1 for 1991. Thus an index value of 2 indicates a doubling of the population relative to 1991 and an index of 0.5 would mean half of the 1991 figure. A slope value of 1 would indicate a perfectly stable population, whereas any value above 1 means a positive trend and a value of less than 1 a negative trend. (Larger scale replications of the graphs in this article are attached to the end of this edition).

28
9.1 African Black Oystercatcher (Haematopus moquini)1
Photo © Eckart Demasius IUCN RDB Status: Near Threatened Namibia RDB Status: Near Threatened WI Trend: Increasing This southern African breeding endemic is locally common from Lüderitz southwards with a healthy population at Walvis Bay. This bird has profited from the invasion of the coastline by the alien mussel Mytilus galloprovicialis which resulted in a steady food supply and hence increased breeding success. No of times counted: 139 No of times past 1% population (=55): 57 Maximum count: 622 at Lüderitz Peninsula on 15 January 1996 Past 1% population at: Lüderitz Peninsula (22), Sandwich Harbour (2), Walvis Bay (33) Trend analysis Number of sites: 4 Number of observed counts: 62 Number of missing counts: 10 Total number of counts: 72 Sites containing more than 10% of the total count: Site Number % Lüderitz Peninsula2297 44.7
1 Names follow Hockey, P.A.R., Dean, W.R.J. and Ryan, P.G. (eds) 2005. Roberts – Birds of Southern Africa, VIIth Edition. The Trustees of the John Voelcker Bird Book Fund, Cape Town, South Africa.
Sandwich Harbour 550 10.7 Walvis Bay 2196 42.7 Overall slope: Uncertain 1.0103 ±0.0357
-1
0
1
2
3
4
5
6
1991
1992
1993
1994
1995
1996
1997
1998
1999
2000
2001
2002
2003
2004
2005
2006
2007
2008
Year
Tren
d (1
991
= 1)
± s
td. e
rr.
Figure 1 : Trend of African Black Oystercatcher in Namibia from 1991 to 2008.
9.2 Black-winged Stilt (Himantopus himantopus)
Photo © Eckart Demasius IUCN RDB Status: Least concern Namibia RDB Status: ? WI Trend: Increasing This wader is fairly common worldwide and has benefited from the proliferation of artificial wetlands such as sewage works and water storage dams. This is probably the reason why this population is increasing in Namibia. No of times counted: 358 No of times past 1% population (=230): 35 Maximum count: 1086 at Walvis Bay on 15 July 2007
29
Past 1% population at: Fischer’s Pan (1), Lake Oponono (12), Tsumkwe Pans (7), Walvis Bay (15) Trend analysis Number of sites: 20 Number of observed counts: 267 Number of missing counts: 93 Total number of counts: 360 Sites containing more than 10% of the total count: Site Number % Lake Oponono 4166 25.1 Tsumkwe Pans 2887 17.4 Walvis Bay 5699 34.3 Overall slope: Moderate increase (p<0.05) 1.0444 ±0.0177
0
0.5
1
1.5
2
2.5
1991
1992
1993
1994
1995
1996
1997
1998
1999
2000
2001
2002
2003
2004
2005
2006
2007
2008
Year
Tren
d (1
991
= 1)
± s
td. e
rr.
Figure 2 : Trend of Black-winged Stilt population in Namibia from 1991 to 2008.
9.3 Pied Avocet (Recurvirostra avosetta)
Photo © Eckart Demasius
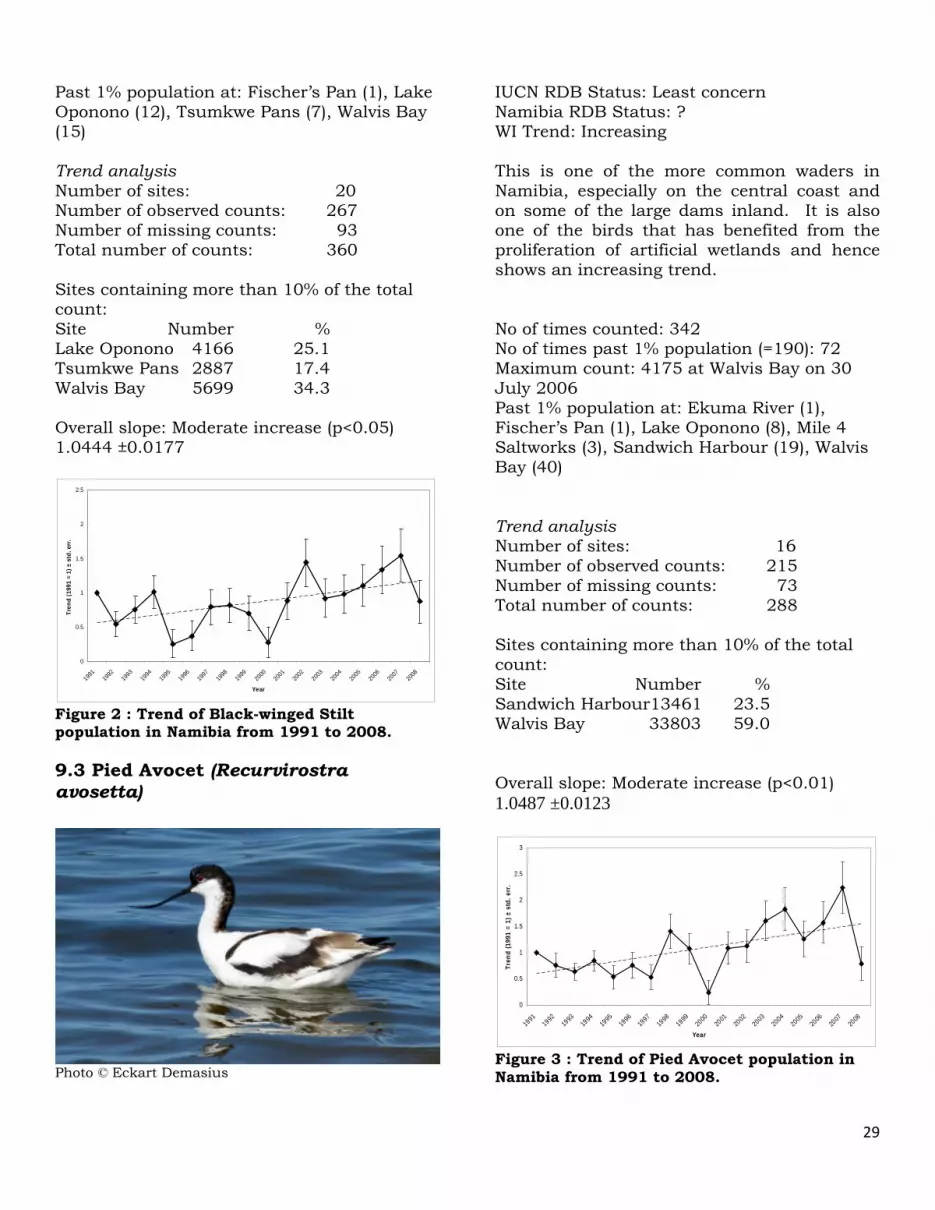
IUCN RDB Status: Least concern Namibia RDB Status: ? WI Trend: Increasing This is one of the more common waders in Namibia, especially on the central coast and on some of the large dams inland. It is also one of the birds that has benefited from the proliferation of artificial wetlands and hence shows an increasing trend. No of times counted: 342 No of times past 1% population (=190): 72 Maximum count: 4175 at Walvis Bay on 30 July 2006 Past 1% population at: Ekuma River (1), Fischer’s Pan (1), Lake Oponono (8), Mile 4 Saltworks (3), Sandwich Harbour (19), Walvis Bay (40) Trend analysis Number of sites: 16 Number of observed counts: 215 Number of missing counts: 73 Total number of counts: 288 Sites containing more than 10% of the total count: Site Number % Sandwich Harbour13461 23.5 Walvis Bay 33803 59.0 Overall slope: Moderate increase (p<0.01) 1.0487 ±0.0123
0
0.5
1
1.5
2
2.5
3
1991
1992
1993
1994
1995
1996
1997
1998
1999
2000
2001
2002
2003
2004
2005
2006
2007
2008
Year
Tren
d (1
991
= 1)
± s
td. e
rr.
Figure 3 : Trend of Pied Avocet population in Namibia from 1991 to 2008.

30
9.4 Water Thick-knee (Burhinus vermiculatus)
Photo © Eckart Demasius IUCN RDB Status: Least concern Namibia RDB Status: ? WI Trend: Unknown This bird is common in the Caprivi and regularly encountered in the seasonally flooded oshanas of north-central Namibia. Its shy and secretive nature probably accounts for the low numbers counted. No of times counted: 45 No of times past 1% population (=1000): 0 Maximum count: 80 at Mahango Game Reserve on 6 January 1999 Past 1% population at: Nowhere Trend analysis Number of sites: 3 Number of observed counts: 44 Number of missing counts: 10 Total number of counts: 54 Sites containing more than 10% of the total count: Site Number % Mahango Game Res 507 92.5 Overall slope: Uncertain 1.1153 ±0.0658
-40
-20
0
20
40
60
80
1991
1992
1993
1994
1995
1996
1997
1998
1999
2000
2001
2002
2003
2004
2005
2006
2007
2008
Year
Tren
d (1
991
= 1)
± s
td. e
rr.
Figure 4 : Trend of Water Thick-knee population in Namibia from 1991 to 2008.
9.5 Blacksmith Lapwing (Vanellus armatus)
Photo © Eckart Demasius IUCN RDB Status: Least concern Namibia RDB Status: ? WI Trend: Increasing This is probably the most commonly encountered wader in Namibia and it too has benefited from the increase in artificial wetlands. No of times counted: 606 No of times past 1% population (=10000): 0 Maximum count: 386 at Tsumkwe Pans on 19 April 1993 Past 1% population at: Nowhere Trend analysis Number of sites: 20 Number of observed counts: 272 Number of missing counts: 88 Total number of counts: 360

31
Sites containing more than 10% of the total count: Site Number % Mahango Game Res 1919 26.1 Tsumkwe Pans 1754 23.8 Overall slope: Uncertain 1.0235 ±0.0145
0
0.5
1
1.5
2
2.5
1991
1992
1993
1994
1995
1996
1997
1998
1999
2000
2001
2002
2003
2004
2005
2006
2007
2008
Year
Tren
d (1
991
= 1)
± s
td. e
rr.
Figure 5 : Trend of Blacksmith Lapwing population in Namibia from 1991 to 2008.
9.6 Crowned Lapwing (Vanellus coronatus)
Photo © Eckart Demasius IUCN RDB Status: Least concern Namibia RDB Status: ? WI Trend: Unknown This lapwing is mostly confined to inland Namibia where it is regularly seen during bird counts.
No of times counted: 50 No of times past 1% population (=6500): 0 Maximum count: 102 at Fischer’s Pan on 22 January 2004 Past 1% population at: Nowhere Trend analysis Number of sites: 4 Number of observed counts: 56 Number of missing counts: 16 Total number of counts: 72 Sites containing more than 10% of the total count: Site Number % Fischer’s Pan 241 49.8 Mahango Game Res 97 20.0 Tsumkwe Pans 129 26.7 Overall slope: Uncertain 1.2874 ±1.5411
-80000
-60000
-40000
-20000
0
20000
40000
60000
80000
1991
1992
1993
1994
1995
1996
1997
1998
1999
2000
2001
2002
2003
2004
2005
2006
2007
2008
Figure 6 : Trend of Crowned Lapwing population in Namibia from 1991 to 2008.
9.7 African Wattled Lapwing (Vanellus senegallus)
Photo © Neil Thomson

32
IUCN RDB Status: Least concern Namibia RDB Status: ? WI Trend: Stable This wader is restricted to the Caprivi in Namibia where it is common but never occurs in large flocks. One bird was reported from Walvis Bay in 1998. No of times counted: 57 No of times past 1% population (=1000): 0 Maximum count: 91 at Shamvura, Okavango River, on 12 February 2005 Past 1% population at: Nowhere Trend analysis Number of sites: 3 Number of observed counts: 43 Number of missing counts: 11 Total number of counts: 54 Sites containing more than 10% of the total count: Site Number % Mahango Game Res186 32.7 Shamvura 365 64.3 Overall slope: Uncertain 0.9569 ±0.0678
-0.5
0
0.5
1
1.5
2
2.5
3
3.5
4
1991
1992
1993
1994
1995
1996
1997
1998
1999
2000
2001
2002
2003
2004
2005
2006
2007
2008
Year
Tren
d (1
991
= 1)
± s
td. e
rr.
Figure 7 : Trend of African Wattled Lapwing population in Namibia from 1991 to 2008.
9.8 Grey Plover (Pluvialis squatarola)
Photo © Eckart Demasius IUCN RDB Status: Least concern Namibia RDB Status: ? WI Trend: Unknown This is a common Holarctic breeding migrant to the Namibian coast with large numbers regularly recorded at Sandwich Harbour and Walvis Bay. No of times counted: 212 No of times past 1% population (=900): 14 Maximum count: 3362 at Walvis Bay on 15 May 1983 Past 1% population at: Sandwich Harbour (1), Walvis Bay (13) Trend analysis Number of sites: 8 Number of observed counts: 112 Number of missing counts: 32 Total number of counts: 144 Sites containing more than 10% of the total count: Site Number % Sandwich Harbour7354 25.2 Walvis Bay 19856 67.9 Overall slope: Uncertain 0.9763 ±0.0173

33
0
0.5
1
1.5
2
2.5
3
3.5
4
1991
1992
1993
1994
1995
1996
1997
1998
1999
2000
2001
2002
2003
2004
2005
2006
2007
2008
Year
Tren
d (1
991
= 1)
± s
td. e
rr.
Figure 8 : Trend of Grey Plover population in Namibia from 1991 to 2008. References: IUCN 2009. IUCN Red List of Threatened Species. Version 2009.1 www.iucnredlist.org Wetlands International. 2006. Waterbird Population Estimates – Fourth Edition. S. Delany and D. Scott (Eds.), Wetlands International, Wageningen, The Netherlands Simmons, R.E. and Brown, C.J. In press. Birds to watch in Namibia: red, rare and endemic species. Ministry of Environment and Tourism and Namibia Nature Foundation, Windhoek.
Atlas Update These are exciting times we are living in – bird distributions are changing and SABAP2 is an ideal opportunity to use and improve your birding skills and to help remap the distribution of our birds. In response to Holger Kolberg’s post on Facebook when Namibia went past 200 pentads atlased, Les Underhill posted the following :- “When the enormous amount of ad hoc data is added to the full protocol lists for Namibia progress is really good – while full protocol lists remain the first prize ad hoc lists are really valuable to provide basic data for all thinly covered areas such as Namibia, and in South Africa for much of the Northern Cape and other thinly covered areas.” There we have it again – if you are unable to spend the full two hours atlasing please submit your ad hoc list anyway – this data is also valuable.
Namibia comprises 10 584 pentads. This is more than double the number of pentads incorporated in the largest region in South Africa (Northern Cape 5 103 pentads). South Africa, Lesotho and Swaziland have been atlasing for over five years now while the atlas has been going in Namibia for less than one year. I am pleased to be able to say that on 08/10/2012 the number of records (sightings) submitted by Namibian atlasers (11 039) overtook the number (11 036) submitted by atlasers for Lesotho although at that stage they had submitted more full protocol cards than we had. On 13/12/2012 we achieved 2% coverage – 212 pentads. This has taken a bit over six months – according to Les Underhill it took the Northern Cape, the largest of the South African provinces (which has less than half the number of pentads we have) a full year to achieve their 2% mark. At the same time we were only 4 cards behind Lesotho (394 vs 398). On 15/12/2012 we equaled the number of cards submitted for Lesotho (398). On 14/01/2013 we passed 20 000 records on full protocol cards. By 04/02/2013 a total of 529 full protocol atlas cards for 278 pentads comprising 23 371 accepted records had been submitted. This constitutes some full protocol coverage for about 2.6% of the pentads in Namibia. I am also pleased to be able to say that quite a number of ad hoc lists and incidental sightings have been submitted. The maps of Namibia on the ADU website are starting to “gain a bit of colour”. The next target we should be looking at closing in on is Swaziland. The atlasers there have submitted 49 418 records on 740 full protocol cards so we have a fair way to go to overtake them. Let’s make the most of the summer season and get as many of those migrants into our data base as possible before they depart again. It is hoped that more atlas workshops will be presented in the near future and hopefully we will be able to get more of our members on board to participate in this worthwhile project. Believe me – “birding with a purpose” is fun. Neil Thomson


