Embed Size (px)
Citation preview

© 2014 Japan Exchange Group, Inc. and/or its affiliates. All rights reserved.
TSE Market Appeal and Features
- A Global Comparison - May 2014
New Listings, Tokyo Stock Exchange, Inc.

© 2014 Japan Exchange Group, Inc. and/or its affiliates. All rights reserved. 1
Content
2. Benefits and Features of IPO Market in Japan
1. Japanese Market and Biotech Sector
3. Comparison among Major Stock Markets

2 © 2014 Japan Exchange Group, Inc. and/or its affiliates. All rights reserved.
Establishing Japan Exchange Group (JPX) January 2013 marked the establishment of Japan Exchange Group, following the business combination between Tokyo Stock Exchange Group and Osaka Securities Exchange.
4.97%
Japan Exchange Group, Inc.
Combined Holding Company
Japan Exchange Regulation1
Self-regulatory Organization
Japan Securities Clearing Corporation
Clearing Organization
Tokyo Stock Exchange, Inc.
Cash Market Operator
Osaka Exchange, Inc.2
Derivatives Market Operator
Note: 1 The name of “Tokyo Stock Exchange Regulation” changed to “Japan Exchange Regulation” on April 1, 2014. 2 The name of “Osaka Securities Exchange Co., Ltd.” changed to “Osaka Exchange, Inc.” on March 24, 2014.

3 © 2014 Japan Exchange Group, Inc. and/or its affiliates. All rights reserved.
Structure of TSE Cash Equity Market JPX offers several markets with different concepts to allow companies to make an optimal choice.
- Various Sectors and
Growth Companies -
1st Section - Large-sized companies -
1,805 Companies
2nd Section - Medium-sized
companies - 550 Companies
Market Of The High-growth and
EmeRging Stocks 195 Companies
Available to both individual and professional investors
JASDAQ Standard
815 Companies
JASDAQ Growth
48 Companies
Equity Market Other Cash Products
ETF 155 ETFs
ETN 23 ETNs
REIT 44 REITs
Professional-oriented market: Only available to professional investors Note: As of March 31, 2014
Country Fund 1 Country Fund
Venture Fund 2 Venture Funds
6 Companies 5 Programs

4 © 2014 Japan Exchange Group, Inc. and/or its affiliates. All rights reserved.
Stock Market Index Performance TOPIX, which represents the movement of the Tokyo market overall, is recording a high growth rate as compared with other markets.
Source: Bloomberg Note: As of March 31, 2014. Indices rebased to 100 as of November 1, 2012.
162
90
100
110
120
130
140
150
160
170
180
11/01/12 01/01/13 03/01/13 05/01/13 07/01/13 09/01/13 11/01/13 01/01/14 03/01/14
TOPIX (Japan) NYSE Composite (US) Nasdaq Composite (US)FTSE All Shares (UK) S&P/HKEx Large Cap Index (Hong Kong) FTSE Straits Times Index (Singapore)KOSPI (Korea) TWSE Index (Taiwan)

5 © 2014 Japan Exchange Group, Inc. and/or its affiliates. All rights reserved.
0
100
200
300
400
500
600
700
800
900
Jan-09 Jul-09 Jan-10 Jul-10 Jan-11 Jul-11 Jan-12 Jul-12 Jan-13 Jul-13 Jan-14
Mon
thly
Tra
ding
Val
ue (
USD
bill
ion)
1st section
Value of Share Trading (1st section)
Value of share trading is recording a high growth rate since November, 2012.
Source: Tokyo Stock Exchange Note: 1 USD= 100 JPY
542

6 © 2014 Japan Exchange Group, Inc. and/or its affiliates. All rights reserved.
19 22
37
52
64
0
10
20
30
40
50
60
70
80
2009 2010 2011 2012 2013
Number
of IPO
IPOs in Japan
IPOs figures showed a significant increase to 641 in 2013 from 52 in 2012, confirming a full-fledged recovery in the Japanese IPO market. The number of IPOs is expected to increase from 2013 onward.
Note 1: The number includes Tokyo Pro Market and REITs.

7 © 2014 Japan Exchange Group, Inc. and/or its affiliates. All rights reserved.
Number of IPOs in 2013 Japan ranks No.3 globally by number of IPOs in 2013.
191
107
64 54 50 36 36
0
20
40
60
80
100
120
140
160
180
200
US GreaterChina
Japan UK Australia SouthKorea
India
Num
ber
of I
POs
in 2
013
Source: “EY Global IPO Trends 4Q 2013” Note: The number is based on priced IPOs as of 2 December and expected IPOs by end of December.

8 © 2014 Japan Exchange Group, Inc. and/or its affiliates. All rights reserved.
IPOs in Japan in 2013
Number of IPOs by Market in Japan in 2013 (Total: 64 Cos)1
Note: 1 The data includes Tokyo Pro Market and REITs. 2 The data excludes Tokyo Pro Market and REITs.
Number of IPOs by Sector in Japan in 2013 (Total: 54 Cos)2
Service, 13Cos, 24%
EC/Retail, 8Cos, 15%
Web Service, 8Cos, 15%
Biotech, 5Cos, 9%
Software/SI, 5Cos, 9%
Construction, 3Cos, 5%
Real Estate, 3Cos, 6%
Game, 1Cos, 2%
Others, 8Cos, 15%
TSE 1st, 6Cos, 10%
TSE 2nd, 6Cos, 9%
TSE Mothers, 29Cos, 45%
TSE JASDAQ Standard,
11Cos, 17%
TSE JASDAQ Growth, 1Cos,
2%
TSE TOKYO PRO Market, 4Cos, 6% TSE REIT,
6Cos, 9%
Fukuoka SE, 1Cos, 2%

9 © 2014 Japan Exchange Group, Inc. and/or its affiliates. All rights reserved.
Rank Listing Date Company Name Sector
TotalIPO Amont(US$ m)
Offering ofNew Shares
(US$ m)
Offeringfor Sale(US$ m)
Market Cap(IPO Price)(US$ m)
Market Cap(First Price)
(US$ m)
Market Cap(30-Dec-13)
(US$ m)
1 3-Jul-13 SUNTORY BEVERAGE & FOOD LTD Foods 3,881 2,883 998 9,579 9,641 10,367
2 19-Dec-13 ASHIKAGA HOLDINGS CO LTD Banks 266 231 35 1,365 1,466 1,398
3 22-Mar-13 BROADLEAF CO LTD Software/SI 233 25 208 267 297 508
4 20-Sep-13 OPEN HOUSE CO LTD Real Estate 149 96 53 492 580 680
5 27-Mar-13 TAMA HOME CO LTD Construction 91 64 27 283 490 295
6 11-Jun-13 PEPTIDREAM INC Biotech 78 42 36 322 1,018 1,863
7 15-Mar-13 KONOIKE TRANSPORT CO LTD Land Transportation 70 26 44 290 399 441
8 6-Dec-13 ONCOLYS BIOPHARMA INC Biotech 66 47 19 221 298 273
9 22-Nov-13 ZIGEXN CO LTD Web Service 59 6 53 306 893 984
10 18-Dec-13 SIGMAXYZ INC Service 55 6 49 142 142 303
11 26-Jun-13 REPROCELL INC Biotech 48 21 27 266 1,478 791
12 10-Dec-13 V-CUBE INC Web Service 44 20 25 142 215 320
13 19-Mar-13 FALTEC CO LTD Transportation Equipment 40 14 26 117 123 118
14 13-Dec-13 NIPPON AQUA CO LTD Construction 30 26 4 110 137 221
15 19-Mar-13 ASANTE INC Service 28 9 19 107 119 108
16 13-Feb-13 MEDRX CO LTD Biotech 27 22 5 51 113 121
17 8-Oct-13 ENERES CO LTD Service 25 12 13 118 301 762
18 19-Dec-13 WILL GROUP INC Service 24 10 15 66 64 63
19 3-Dec-13 RIDE ON EXPRESS CO LTD Service 24 5 19 90 140 134
20 14-Mar-13 ALTPLUS INC Game 23 14 10 60 161 194
21 24-Dec-13 HUMAN METABOLOME TECHNOLOGIE Biotech 22 12 10 66 147 257
22 18-Dec-13 ABIST CO LTD Service 21 16 5 69 69 60
23 17-Dec-13 AZUMA HOUSE CO LTD Real Estate 21 9 12 62 68 66
24 9-Dec-13 HOTTO LINK INC Web Service 15 5 9 49 131 444
25 9-Apr-13 SANYO HOMES CORP Construction 14 13 2 86 154 90
IPOs in Japan in 2013 IPO Amount Ranking
SUNTORY raised more than 3 billion US$ and its IPO was the 2nd biggest IPO in the world in 2013.
Note: 1 USD = 100 JPY

10 © 2014 Japan Exchange Group, Inc. and/or its affiliates. All rights reserved.
Rank Listing Date Company Name SectorActual PER(IPO Price)
Actual PER(First Price)
Change(IPO Price
to Fist Price)
TotalIPO Amont
(US$ m)
Market Cap(IPO Price)(US$ m)
Market Cap(27-Dec-13)
(US$ m)
1 11-Jun-13 PEPTIDREAM INC Biotech 3,231.0 10,209.8 216% 78 322 1,786
2 20-Nov-13 MEDIA DO CO LTD Web Service 1,639.7 5,848.3 257% 13 74 270
3 9-Dec-13 HOTTO LINK INC Web Service 168.1 446.3 166% 15 49 355
4 10-Jul-13 DREAM VISION CO LTD EC/Retail 126.0 252.5 100% 12 35 21
5 10-Dec-13 V-CUBE INC Web Service 121.4 184.3 52% 44 142 277
6 22-Nov-13 ZIGEXN CO LTD Web Service 85.9 250.4 192% 59 306 971
7 9-Apr-13 SANYO HOMES CORP Construction 73.3 130.8 79% 14 86 88
8 14-Mar-13 ALTPLUS INC Game 53.5 143.2 168% 23 60 192
9 29-Nov-13 ALLIED ARCHITECTS INC Web Service 52.1 171.6 229% 13 70 172
10 12-Mar-13 SOFTMAX CO LTD/JAPAN Software/SI 45.5 193.0 324% 7 25 58
11 25-Apr-13 AUCFAN CO LTD Web Service 45.4 182.9 303% 10 46 265
12 3-Jul-13 SUNTORY BEVERAGE & FOOD LTD Foods 41.0 41.2 1% 3,881 9,579 10,352
13 3-Dec-13 RIDE ON EXPRESS CO LTD Service 39.0 60.6 55% 24 90 137
14 27-Mar-13 Tama Home CO LTD Construction 36.1 62.6 73% 91 283 291
15 11-Dec-13 O-UCCINO INC Web Service 36.1 83.0 130% 6 43 64
16 10-Jul-13 PHOTOCREATE CO LTD Web Service 30.3 68.5 126% 4 20 23
17 13-Dec-13 NIPPON AQUA CO LTD Construction 30.2 37.7 25% 30 110 216
18 18-Dec-13 ABIST CO LTD Service 29.8 29.8 0% 21 69 57
19 11-Dec-13 ENCOURAGE TECHNOLOGIES CO LT Software/SI 28.9 62.7 117% 13 55 104
20 19-Dec-13 SHIN PRO MAINT INC Service 28.7 67.5 135% 4 15 31
21 8-Oct-13 ENERES CO LTD Service 28.6 73.3 156% 25 118 748
22 18-Dec-13 ARCHITECTS STUDIO JAPAN INC Service 28.5 63.9 124% 7 30 72
23 19-Dec-13 WILL GROUP INC Service 22.9 21.9 -4% 24 66 67
24 20-Nov-13 M&A CAPITAL PARTNERS CO LTD Service 21.3 71.0 233% 5 64 117
25 20-Sep-13 OPEN HOUSE CO LTD Real Estate 19.5 23.0 18% 149 492 677
IPOs in Japan in 2013 PER Ranking
Tech Sector attract high level of investor interests.
Note: 1 “Actual PER" = "Market Cap" / "Net Profit (the most recent business year)" 2 1 USD = 100 JPY

11 © 2014 Japan Exchange Group, Inc. and/or its affiliates. All rights reserved.
IPO Amount by Exchanges in 2014 1Q Tokyo Stock Exchange ranks No.3 globally by IPO amount.
Source: Renaissance Capital “1Q 2014 Global IPO Review” Note: Global statistics include IPOs with a deal size of at least $100 million and exclude closed-end funds and SPACs. Data as of Mar. 28, 2014.
7.2 5.5
4.6 4.2
2.0 1.8 0.0
2.0
4.0
6.0
8.0
NYSE HKEx Tokyo SE LSE Main Euronext/Amsterdam
Shanghai SE
IPO
Am
ount
in 2
014
1Q(U
S$ b
illio
n)
12 © 2014 Japan Exchange Group, Inc. and/or its affiliates. All rights reserved.
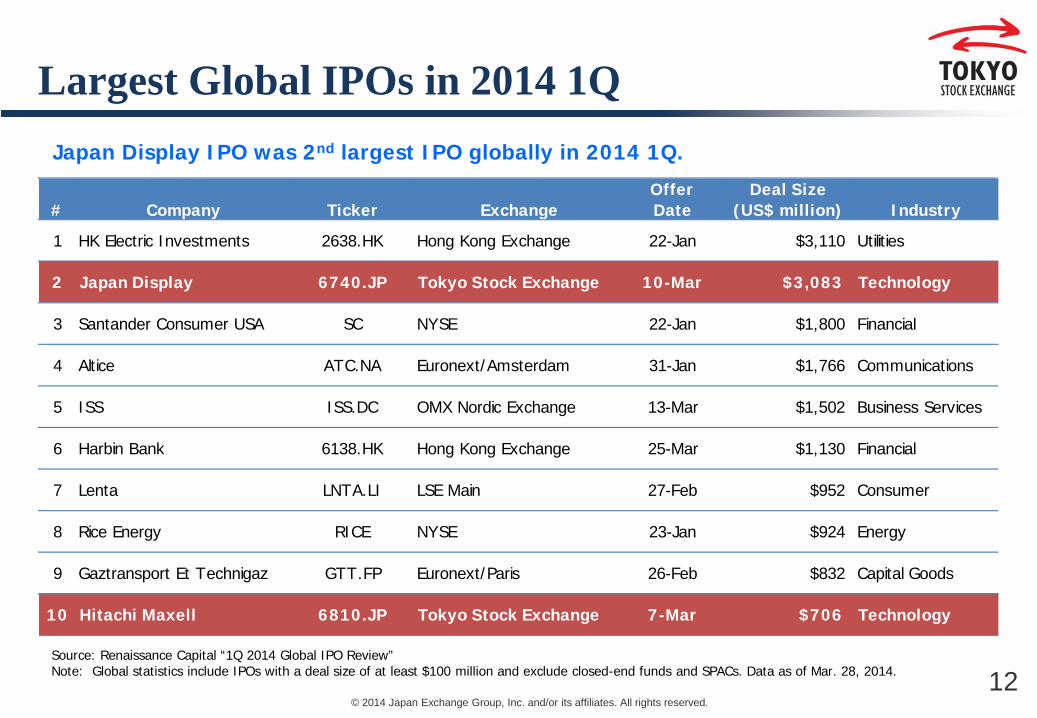
Largest Global IPOs in 2014 1Q Japan Display IPO was 2nd largest IPO globally in 2014 1Q.
Source: Renaissance Capital “1Q 2014 Global IPO Review” Note: Global statistics include IPOs with a deal size of at least $100 million and exclude closed-end funds and SPACs. Data as of Mar. 28, 2014.
# Company Ticker ExchangeOfferDate
Deal Size(US$ million) Industry
1 HK Electric Investments 2638.HK Hong Kong Exchange 22-Jan $3,110 Utilities
2 Japan Display 6740.JP Tokyo Stock Exchange 10-Mar $3,083 Technology
3 Santander Consumer USA SC NYSE 22-Jan $1,800 Financial
4 Altice ATC.NA Euronext/Amsterdam 31-Jan $1,766 Communications
5 ISS ISS.DC OMX Nordic Exchange 13-Mar $1,502 Business Services
6 Harbin Bank 6138.HK Hong Kong Exchange 25-Mar $1,130 Financial
7 Lenta LNTA.LI LSE Main 27-Feb $952 Consumer
8 Rice Energy RICE NYSE 23-Jan $924 Energy
9 Gaztransport Et Technigaz GTT.FP Euronext/Paris 26-Feb $832 Capital Goods
10 Hitachi Maxell 6810.JP Tokyo Stock Exchange 7-Mar $706 Technology

13 © 2014 Japan Exchange Group, Inc. and/or its affiliates. All rights reserved.
Information & Communication,
$11B, 32%
Services, $10B, 29%
Biotech, $9B, 26%
Retail Trade, $1B, 3%
Real Estate, $1B, 3%
Insurance, $1B, 2%
Others, $2B, 5%
Mothers Market Capitalization by Industrial Sector Biotech sector is one of the largest sector by market capitalization in TSE Mothers market.
Mothers Market Capitalization by Industrial Sector
Source: Bloomberg Note: As of December 30, 2013. 1 USD = 100 JPY
14 © 2014 Japan Exchange Group, Inc. and/or its affiliates. All rights reserved.
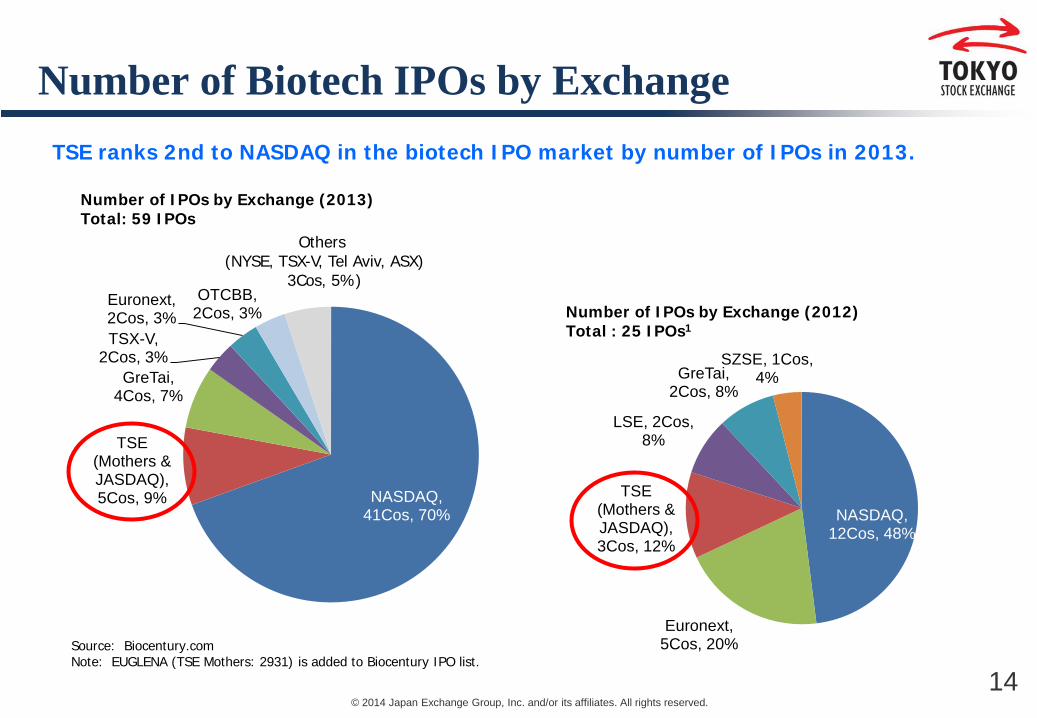
Number of Biotech IPOs by Exchange TSE ranks 2nd to NASDAQ in the biotech IPO market by number of IPOs in 2013.
Source: Biocentury.com Note: EUGLENA (TSE Mothers: 2931) is added to Biocentury IPO list.
Number of IPOs by Exchange (2012) Total : 25 IPOs1
Number of IPOs by Exchange (2013) Total: 59 IPOs
NASDAQ, 12Cos, 48%
Euronext, 5Cos, 20%
TSE (Mothers & JASDAQ), 3Cos, 12%
LSE, 2Cos, 8%
GreTai, 2Cos, 8%
SZSE, 1Cos, 4%
NASDAQ, 41Cos, 70%
TSE (Mothers & JASDAQ), 5Cos, 9%
GreTai, 4Cos, 7%
TSX-V, 2Cos, 3%
Euronext, 2Cos, 3%
OTCBB, 2Cos, 3%
Others (NYSE, TSX-V, Tel Aviv, ASX)
3Cos, 5%)

15 © 2014 Japan Exchange Group, Inc. and/or its affiliates. All rights reserved.
#Listingdate Ticker Market Sector Sub Sector Book Runner Company Name
TotalIPO Amont(US$ m)
Offering ofNew Shares
(US$ m)
Offeringfor Sale(US$ m)
Market Cap(IPO Price)(US$ m)
Market Cap(First Price)(US$ m)
Market Cap(31-Mar-14)
(US$ m)
Change ofMarket Cap
(IPO to 31-Mar-14)
1 26-Mar-14 7779 Mothers Medical Device Medical Device SMBC Nikko CYBERDYNE INC 90 45 44 402 924 1,400 249%
2 13-Feb-14 4589 Mothers Pharmaceutical(Drug Discovery)
Ophthalmic Mitsubishi UFJMorgan Stanley Acucela 190 166 25 641 819 563 -12%
3 24-Dec-13 6090 Mothers Service DiagnosticSupply/Service
Ichiyoshi Human Metabolome Technologies 22 12 10 66 147 99 49%
2 6-Dec-13 4588 Mothers Pharmaceutical(Drug Discovery)
Infectious SMBC Nikko Oncolys BioPharma 66 47 19 221 298 143 -35%
5 26-Jun-13 4978 JQGrowth
Chemicals(Drug Discovery,
RegenerativeMedicine)
DiagnosticGene/Celltherapy
Supply/Service
SMBC Nikko REPROCELL INC 48 21 27 266 1,478 437 65%
6 11-Jun-13 4587 Mothers Pharmaceutical(Drug Discovery)
CancerEndocrine/Metab
olicInfectious
Mizuho PEPTIDREAM INC 78 42 36 322 1,018 1,083 236%
7 13-Feb-13 4586 Mothers Pharmaceutical(Drug Discovery)
CardiovascularInflammation
Nomura MEDRX CO LTD 27 22 5 51 113 89 75%
8 20-Dec-12 2931 Mothers Food Food SMBC Nikko EUGLENA CO LTD 11 9 2 45 104 787 1644%
9 11-Dec-12 4585 Mothers Pharmaceutical(Drug Discovery)
Infectious Nomura UMN PHARMA INC 43 28 15 98 90 180 84%
10 30-Nov-12 4584 Mothers Pharmaceutical(Drug Discovery)
AutoimmuneCancer
MusculoskeletalNomura GENE TECHNO SCIENCE CO LTD 12 7 5 23 30 50 113%
Recent Biotech & Medtech IPOs Acucela successfully completed its IPO and raised US$166 million as a U.S. company.
Source: Bloomberg, BioCentury Note: 1 1 USD= 100 JPY 2 Sub Sector based on classification of BioCentury

16 © 2014 Japan Exchange Group, Inc. and/or its affiliates. All rights reserved.
Biotech Index Performance in 2013 Nikkei BP Bio INDEX outperformed in 2013.
128%
66% 62% 59% 51%
39%
0%
20%
40%
60%
80%
100%
120%
140%
Nikkei BP Bio NASDAQBiotechnology
BioCenturyLondon
BioCentury100
NYSE ArcaBiotechnology
BioCenturyEurope
Source: Biocentury.com, Nikkei Biotech Online

17 © 2014 Japan Exchange Group, Inc. and/or its affiliates. All rights reserved.
Number of Biotech & Medtech IPOs 5 biotech companies, highest number in history, succeeded IPO on Tokyo Stock Exchange in 2013.
1 1
2
4 4
2
1
3 3 3
1
4
3
5
2
0
1
2
3
4
5
2000 2001 2002 2003 2004 2005 2006 2007 2008 2009 2010 2011 2012 2013 20141Q
Num
ber
of B
iote
ch &
Med
tech
IPO
s

© 2014 Japan Exchange Group, Inc. and/or its affiliates. All rights reserved. 18
2. Features and Benefits of IPO Market in Japan
1. Japanese Market and Biotech Sector
3. Comparison among Major Stock Markets

19 © 2014 Japan Exchange Group, Inc. and/or its affiliates. All rights reserved.
Features of IPO Market in Japan
• Successful Small IPOs
• High Liquidity
• Low IPO Cost & High IPO Valuation
• Flexible IPO Structure
• Successful Follow-on Offerings
1
2
3
4
5

20 © 2014 Japan Exchange Group, Inc. and/or its affiliates. All rights reserved.
1. Successful Small IPOs More than 90% of IPOs in Japan raised less than $50M.
Source: Tokyo Stock Exchange, NASDAQ website, Hong Kong Exchanges and Clearing Limited website, Singapore Exchange website Note: The total number of IPOs in each country. It includes new listings of foreign companies in the country, excludes listings without public offerings
or selling. It includes new listings on the OTCBB in the United States. Exchange rates as of the listing date.
72%
5% 17%
33%
20%
12%
45% 24%
4%
32%
8% 5%
2%
24%
7% 14%
20% 13% 5%
5% 7% 14%
2% 3% 3% 5%
0%
10%
20%
30%
40%
50%
60%
70%
80%
90%
100%
Japan U.S. Hong Kong Singapore
Perc
enta
ge o
f IP
Os
by
Offe
ring
Amou
nt (
2012
) (%
)
Less than$10M
$10Mor more
$50Mor more
$100Mor more
$200Mor more
$500Mor more
$1Bor more
Comparison of Number of IPOs by Offering Amount (US, Japan, Hong Kong, Singapore)

21 © 2014 Japan Exchange Group, Inc. and/or its affiliates. All rights reserved.
2. High Liquidity - Comparison of Emerging Enterprise Markets
TSE Mothers is larger and more liquid than HKEX GEM and SGX Catalist. Number of Listed Companies (as at of end of Dec. 2013) Trading Value (2013)1
Turnover Velocity (2013)2 Market Capitalization (as of end of Dec. 2013)1
Source: Tokyo Stock Exchange, Hong Kong Exchanges and Clearing Limited, Singapore Exchange Note: 1 Converted into USD as at the end of Dec 2013 2 Turnover Velocity = Annual Trading Value / Market Capitalization as at the end of Dec. 2013
193 192 139
0
50
100
150
200
250
TSE Mothers HKEX GEM SGX Catalist
Num
ber
of L
iste
d Co
mpa
nies
34,235
17,282 7,378
0
10,000
20,000
30,000
40,000
TSE Mothers HKEX GEM SGX Catalist
Mar
ket
Cap
(U
S$ m
illio
n)
265
10 15 0
50
100
150
200
250
300
TSE Mothers HKEX GEM SGX Catalist
Valu
e of
Sha
re T
radi
ng
(US$
bill
ion)
775%
59%
209%
0%
200%
400%
600%
800%
TSE Mothers HKEX GEM SGX Catalist
Turn
over
Vel
ocity
(%)

22 © 2014 Japan Exchange Group, Inc. and/or its affiliates. All rights reserved.
3. Low IPO Cost & High IPO Valuation Listing expenses at listing on TSE Mothers is much lower than at listing on HKEX GEM or SGX Catalist. IPO valuation in TSE Mothers is relatively higher than IPO valuation in the others.
The Median of Expenses through IPO (2012) The Median of PE Ratio of IPO Price(2012)
The Median of Expenses Ratio through IPO (2012) The Median of PE Ratio of First Price(2012)
8.0%
29.9% 28.6%
0.0%
10.0%
20.0%
30.0%
40.0%
TSE Mothers HKEX GEM SGX CATALIST
Expe
nses
(%
)
0.32
2.21 1.38
0.00
0.50
1.00
1.50
2.00
2.50
TSE Mothers HKEX GEM SGX CATALIST
Expe
nses
(U
S$ M
)
32.0x
16.9 x 18.9 x
0.0x5.0x
10.0x15.0x20.0x25.0x30.0x35.0x
TSE Mothers HKEX GEM SGX CATALIST
PER
(x)
(firs
t pr
ice)
19.6x 13.6 x 13.3 x
0.0x
5.0x
10.0x
15.0x
20.0x
TSE Mothers HKEX GEM SGX CATALIST
PER
(x)
(IPO
pric
e)

23 © 2014 Japan Exchange Group, Inc. and/or its affiliates. All rights reserved.
TSE Mothers HKEX GEM SGX CATALISTMin Median Max Min Median Max Min Median Max
Number of IPOs 23 Cos. 12 Cos. 8 Cos.
Revenue (US$ M) 2.5 US$31.4M 189.2 3.5 US$19.3M 42.4 12.1 US$30.8M 164.1
Profit (US$ M) -10 US$2.4M 9.3 0.7 US$2.8M 10.1 0.6 US$2.3M 4.9
IPO Amount (Offering andSelling) (US$ M)
2.3 US$8.2M 148.1 5.2 US$10.6M 25.7 3.9 US$5.5M 13.2
Offering (US$ M) 0.5 US$3.9M 99.8 5.2 US$8.9M 25.7 3.3 US$4.6M 13.2
Net proceeds (US$ M) 0.4 US$3.6M 92.8 3.1 US$6.9M 22.5 1.8 US$3.2M 11.8
Expenses (US$ M) 0.04 US$0.32M 6.99 1.93 US$2.21M 4.87 0.92 US$1.38M 2.23
Expenses(%) 7.0% 8.0% 8.1% 12.5% 29.9% 48.5% 10.1% 28.6% 54.9%
Selling (US$ M) 0.7 US$4.2M 48.3 8.5 US$8.5M 8.5 0.5 US$1.1M 2.9
PER (x) (IPO price) 6.6 x 19.6 x 41.9 x 2.5 x 13.6 x 53.9 x 4.1 x 13.3 x 69 x
PER (x) (first price) 15.5 x 32.0x 61.6 x 3.1 x 16.9 x 64.6 x 4.7 x 18.9 x 77.3 x
Market Cap(IPO price)(US$M)
16 US$38.9M 503.4 20.6 US$42.6M 103 19.8 US$26.8M 69.6
Market Cap(first price)(US$M)
28.3 US$86.7M 534.6 21.7 US$46.7M 85.5 23.1 US$37.6M 90.4
Change(%) -8% 93% 213% -17% 11% 63% 12% 29% 55%
3. Low IPO Cost & High IPO Valuation
1
Source: Prospectus and annual report of each company. Note: 1 Comprehensive income is used for SGX CATALIST companies that do not disclose net income. 2 Listing expenses is defined as the difference between the amount raised and the net proceeds. 3 Exchange rates as of the listing date.
2
Comparison of IPOs in 2012 among Emerging Enterprise Markets

24 © 2014 Japan Exchange Group, Inc. and/or its affiliates. All rights reserved.
4. Flexible IPO Structure Tokyo market accepts flexible IPO structure and procedure. No limit to the ownership of the largest shareholder. No rules about lock-up period. However, lock-up of three months or six months are generically set as a
market practice. No restrictions on offering for sale at IPO even on Emerging Enterprise Markets, Mothers or JASDAQ. In 97% of the IPO in Japan, both offering of new shares and offering for sale are implemented. Tokyo
market is providing funding opportunities and investment income realization opportunities of major shareholders and/or management.
Note: Population is 158 companies that conducted IPO in Japan from 2010 Jan. to 2013 Dec.
Breakdown of the lock-up period for the major shareholder at the time of IPO
Breakdown of IPO Structure
90 days (3 months), 67 Cos, 42%
180 days (6 months), 82 Cos, 52%
90 days and 180 days
(Depends on shareholder),
9 Cos, 6%
Offering of New Shares,
1 Cos, 1%
Both offering of new shares and offering for sale,
154 Cos, 97%
Offering for Sale, 3 Cos, 2%

25 © 2014 Japan Exchange Group, Inc. and/or its affiliates. All rights reserved.
5. Successful Follow-on Offerings Many biotech Companies successfully conduct follow-on offerings in 2013.
Equity Financing by Biotech Cos in 2013
Note: 1 Raised amount of companies which list on JASDAQ Growth or JASDAQ Standard was sum up only finance carried out after integration of market in July, 2013.
2 1USD = 100 JPY
139.3 119.3
100.3 94.5 94.2
68.5 38.0
28.8 26.9
22.3 12.4
10.0 8.2
7.0 5.7
4.0 3.2 3.2
1.3
0.0 50.0 100.0 150.0
ANGES MG INCTAKARA BIO INC
ONCOTHERAPY SCIENCE INCNANOCARRIER CO LTD
I'ROM HOLDINGS CO LTDEUGLENA CO LTD
SHIN NIPPON BIOMEDICAL LABOR3D MATRIX LTD
SYMBIO PHARMACEUTICALS LTDMEDINET CO LTDPEPTIDREAM INC
D.WESTERN THERAPEUTICS INSTIGNI GROUP LTDMEDIBIC GROUP
CHIOME BIOSCIENCE INCSYSMEX CORP
SOGO RINSHO HOLDINGS CO LTDSOSEI GROUP CORP
REPROCELL INC
Equity Financing (US$ million)
Public Offering Private Placement

26 © 2014 Japan Exchange Group, Inc. and/or its affiliates. All rights reserved.
Key Benefits of Listing on TSE
Fundraising
Expansion of Business in Japan
M&A with Japanese Companies
Expand fundraising opportunities with High Net Worth Individuals that hold US$15.68 trillion in assets as of end of 2013
High valuation due to great interest in foreign stocks
Enhance corporate profile and credibility in Japan Expand opportunities for strategic alliances with Japanese
corporations
Increase chances of M&A with Japanese corporations
27 © 2014 Japan Exchange Group, Inc. and/or its affiliates. All rights reserved.
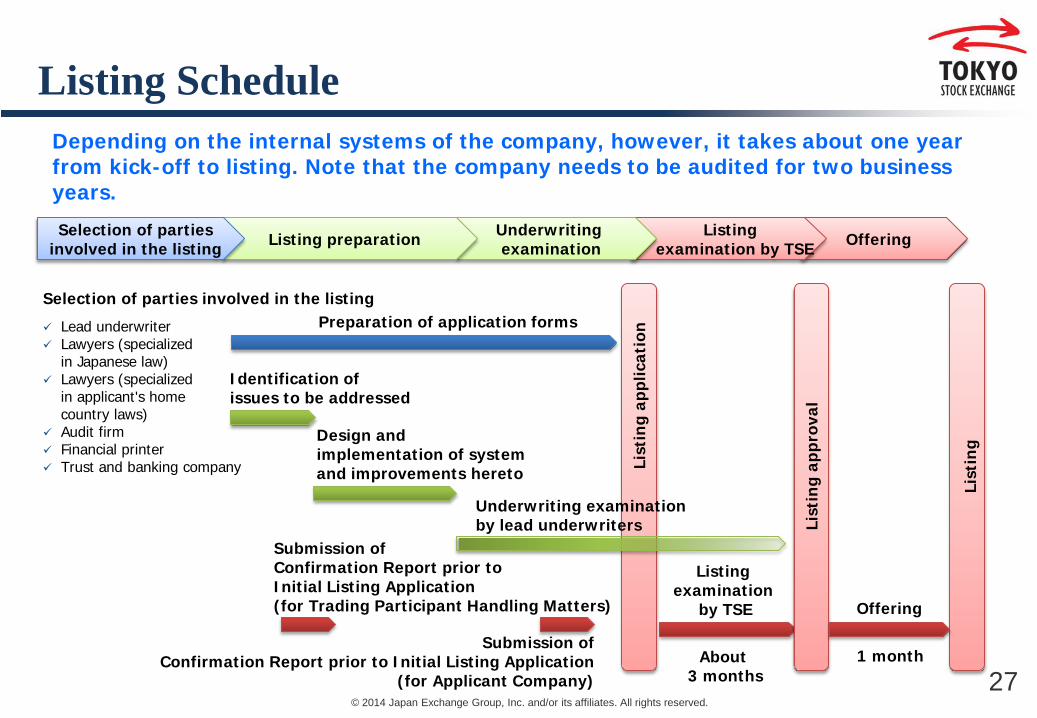
Listing Schedule Depending on the internal systems of the company, however, it takes about one year from kick-off to listing. Note that the company needs to be audited for two business years.
Offering Listing examination by TSE
Underwriting examination Listing preparation Selection of parties
involved in the listing
Selection of parties involved in the listing
Lead underwriter Lawyers (specialized
in Japanese law) Lawyers (specialized
in applicant's home country laws)
Audit firm Financial printer Trust and banking company
Preparation of application forms
Underwriting examination by lead underwriters
List
ing
appl
icat
ion
List
ing
appr
oval
List
ing
About 3 months
Identification of issues to be addressed
Design and implementation of system and improvements hereto
1 month
Offering
Listing examination
by TSE
Submission of Confirmation Report prior to Initial Listing Application (for Trading Participant Handling Matters)
Submission of Confirmation Report prior to Initial Listing Application
(for Applicant Company)

28 © 2014 Japan Exchange Group, Inc. and/or its affiliates. All rights reserved.
Roles of Each Party Involved in an IPO
Financial Services Agency
Trust and Banking Company
Lead Underwriter
Issuer
Law Firm (Japanese law
/home country laws)
Audit Firm (foreign audit
firm, etc.)
TSE and JPX Regulation
Listing examination
Consultation and underwriting examination
Submission of a “Sponsor’s Letter of Recommendation”
Filing of statutory disclosure documents
Financial Printer
Legal check and review Legal opinion Assistance in preparing
disclosure documents
Audit (audit opinion)
Printing of prospectus
Assistance in preparing disclosure documents
Shareholder services Dividend payment bank Issuance of JDRs
Lead underwriting agreement

29 © 2014 Japan Exchange Group, Inc. and/or its affiliates. All rights reserved.
Formal Requirements for Listing Each market has different criteria in line with its concept.
Note: 1USD = 100JPY
1st Section 2nd Section Standard GrowthNumber of shareholders 2,200 or more 800 or more 200 or more ―Tradable shares
Number of tradable shares 20,000 unitsor more
4,000 unitsor more
2,000 unitsor more
―
Market capitalization oftradable shares
JPY 1 billion(USD 10m)
or more
JPY 1 billion(USD 10m)
or more
JPY 500 million(USD 5m)or more
―
Ratio of tradable shares tolisted shares 35% or more 30% or more 25% or more ―
Public offering ― ―500 trading units
or more ―
Market capitalization of listedshares
JPY 25 billion(USD 250m)
or more
JPY 2 billion(USD 20m)
or more
JPY 1 billion(USD 10m)
or more―
Number of years of businessoperation 1 year or more ―
Shareholders' equity ―JPY 200 million
(USD 2m) or more Not negative ―
Amount of profits or Marketcapitalization ―
[Ordinary profit]JPY100 million(USD 1m) or more[Market cap]JPY5 billion(USD 50m) or more
― ―
―
―
Main MarketMothers
JASDAQ TOKYOPRO Market
3 years or more
JPY 1 billion (USD 10m) or more
[Ordinary profit]Total amount of JPY500 million (USD 5m) or morein the last 2 fiscal years[Market cap]Market cap: JPY 50 billion (USD 500m) or moreSales: JPY 10 billion (USD 100m) or more
10 percent or moreor 1,000 trading units
200 or more
JPY 500 million(USD 5m)or more
―
―

30 © 2014 Japan Exchange Group, Inc. and/or its affiliates. All rights reserved.
Stock Trading Value by Investor Category (2013) Foreign investors account for more than half of trading in the TSE 1st Section. By contrast, individual investors make up the majority in the TSE 2nd Section, Mothers, and JASDAQ.
Average Daily Trading Value
USD 26,130 M
TSE
2nd
Sect
ion
TSE
1st S
ecti
on
TSE
Mot
hers
TSE
JASD
AQ
Source: TSE Note: 1 USD= 100 JPY
54% 13%
9%
24%
Foreign Investors
Proprietary Trading
Domestic Institutional
Investors
Individuals
Average Daily Trading Value
USD 1,136 M
Average Daily Trading Value USD 867 M
Average Daily Trading Value USD 146 M
15% 3%
12%
70%
16% 3%
8%
73%
17% 3%
9%
71%
Foreign Investors
Foreign Investors
Foreign Investors
Individuals Individuals
Individuals
Domestic Institutional
Investors
Proprietary Trading
Domestic Institutional
Investors
Proprietary Trading
Domestic Institutional
Investors
Proprietary Trading
© 2014 Japan Exchange Group, Inc. and/or its affiliates. All rights reserved. 31
2. Benefits and Features of IPO Market in Japan
1. Japanese Market and Biotech Sector
3. Comparison among Major Stock Markets

32 © 2014 Japan Exchange Group, Inc. and/or its affiliates. All rights reserved.
Number of Listed Companies Tokyo Stock Exchange exceeds NYSE and NASDAQ in terms of number of listed companies.
Source: WFE Note: Number of listed companies as of the end of December 2013
3,886 3,419
2,736 2,637 2,371
1,813 1,643 1,536 953 866 776
0
500
1,000
1,500
2,000
2,500
3,000
3,500
4,000
4,500
TMXGroup
TokyoStock
Exchange
LondonSE Group
NASDAQOMX
NYSEEuronext
(US)
KoreaExchange
HongKong
Exchanges
ShenzhenSE
ShanghaiSE
TaiwanSE
SingaporeExchange
Num
ber
of L
iste
d Co
mpa
nies

33 © 2014 Japan Exchange Group, Inc. and/or its affiliates. All rights reserved.
Market Capitalization Tokyo Stock Exchange ranks No.3 globally and No. 1 in Asia by market capitalization.
17,397
//
//
Source: WFE Note: Domestic market capitalization as of the end of December 2013
6,085
4,543 4,429
3,101 2,497 2,114
1,452 1,235 823 744 0
1,000
2,000
3,000
4,000
5,000
6,000
7,000
8,000
NYSEEuronext
(US)
NASDAQOMX
TokyoStock
Exchange
LondonSE Group
Hong KongExchanges
ShanghaiSE
TMXGroup
ShenzhenSE
KoreaExchange
TaiwanSE
SingaporeExchange
Mar
ket
Capi
taliz
atio
n (U
SD b
illio
n)
17,950

34 © 2014 Japan Exchange Group, Inc. and/or its affiliates. All rights reserved.
Value of Share Trading in the World Tokyo Stock Exchange ranked No. 1 outside of the U.S. by value of share trading.
Source: WFE Note: Value of share trading - Electronic order book trades in 2013
13,700
9,585
6,305
3,859 3,731 2,233
1,371 1,323 1,285 624
0
2,000
4,000
6,000
8,000
10,000
12,000
14,000
16,000
NYSEEuronext
(US)
NASDAQOMX
TokyoStock
Exchange
ShenzhenSE
ShanghaiSE
LondonSE Group
TMXGroup
Hong KongExchanges
KoreaExchange
TaiwanSE
Valu
e of
Sha
re T
radi
ng (
USD
bill
ion)

35 © 2014 Japan Exchange Group, Inc. and/or its affiliates. All rights reserved.
Turnover Velocity Tokyo Stock Exchange has high turnover velocity.
Source: WFE Note: Turnover velocity = yearly value of share trading / average of market capitalization in 2013
291.8%
178.7% 152.0% 148.6%
110.2% 85.1% 80.9% 66.9% 56.7% 45.5%
0.0%
50.0%
100.0%
150.0%
200.0%
250.0%
300.0%
ShenzhenSE
NASDAQOMX
TokyoStock
Exchange
ShanghaiSE
KoreaExchange
NYSEEuronext
(US)
TaiwanSE
TMXGroup
LondonSE Group
Hong KongExchanges
Turn
over
Vel
ocity
(%
)

36 © 2014 Japan Exchange Group, Inc. and/or its affiliates. All rights reserved.
Valuation: PER Valuations for Japanese companies are higher than other markets based on PER.
Source: Bloomberg Note: Based on estimated PER from Bloomberg as of January 6, 2014. PER = Price/Estimated EPS Ratio
15.6 15.4 15.0 14.7 14.6 13.7 13.3
9.9 9.8
0.0
2.0
4.0
6.0
8.0
10.0
12.0
14.0
16.0
18.0
TOPIX(Japan)
S&P 500(US)
ASXS&P 300
(Australia)
S&P/TSXComposite(Canada)
TWSE Index(Taiwan)
FTSE StraitsTimes Index(Singapore)
FTSEAll Shares
(UK)
S&P/HKExLarge Cap
Index(Hong Kong)
KOSPI(Korea)
PER
(x)

© 2014 Japan Exchange Group, Inc. and/or its affiliates. All rights reserved.
Hidetoshi Nagata (Mr.)
General Manager, Head of Global Listing Tel : +81-50-3377-7763 (Direct) E-mail : [email protected]
Junichiro Goto (Mr.)
Account Manager, New Listings Dept. Tel : +81-50-3377-7422 (Direct) E-mail : [email protected]
Please note that this presentation is for informational purposes only. Japan Exchange Group, Inc. and Tokyo Stock Exchange, Inc. are not responsible for any damage caused by using the information contained herein. Please also note that the information is not guaranteed to be complete, correct, or up-to-date, and may be changed without notice. Unauthorized copying, reproduction, republishing, uploading, posting, transmitting or duplicating any part of the material is prohibited.
【Important Information】
【Contact】
Daekak Lee (Mr.)
Co-Head, New Listings Dept. Tel : +81-50-3377-7370 (Direct) E-mail : [email protected]