Embed Size (px)
Citation preview
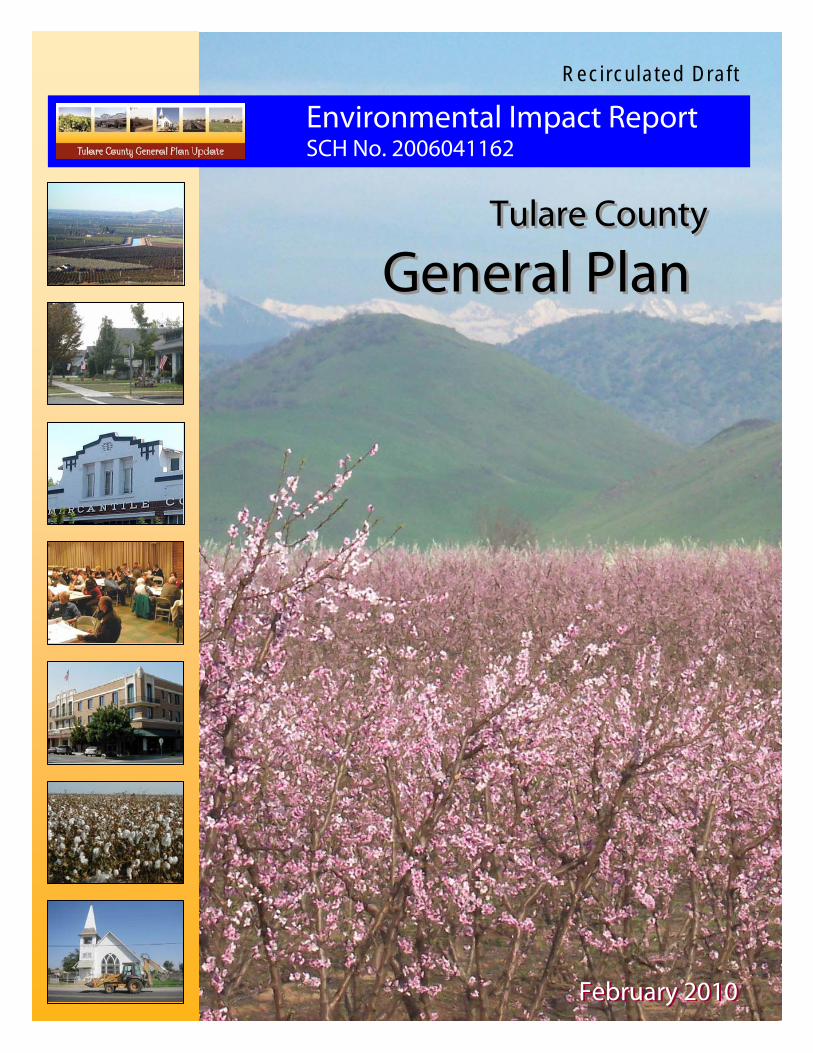
Environmental Impact ReportSCH No. 2006041162
Tulare CountyTulare County
General PlanGeneral Plan
Rec i rcu la ted Dra f t
February 2010February 2010

Housing Element
Correction to All General Plan 2030 Update Documents The Housing Element is subject to specific State statutory requirements for periodic updates. To meet mandated State timelines, the Tulare County Housing Element was prepared and adopted on a separate schedule. A new Tulare County Housing Element was formally adopted by the Board of Supervisors on March 23, 2010. All references in the February 2010 proposed General Plan 2030 Update, Notice of Availability, Recirculated Draft Environmental Impact Report and Background Report to the Tulare County Housing Element or the 2003 Tulare County Housing Element shall by this notice be deemed to refer to the 2010 Tulare County Housing Element, adopted March 23, 2010. A copy is available from the Tulare County Resources Management Agency and is available on the Internet at http://generalplan.co.tulare.ca.us/.
Addendum

TULARE COUNTY GENERAL PLAN 2030 UPDATE Recirculated Draft EIR SCH# 2006041162
Prepared for February 2010 County of Tulare 5961 South Mooney Boulevard Visalia, CA 93277 (559) 624-7000
2600 Capitol Avenue Suite 200 Sacramento, CA 95816 916.564.4500 www.esassoc.com
Los Angeles
Oakland
Olympia
Petaluma
Portland
San Diego
San Francisco
Seattle
Tampa
Woodland Hills
207497

Tulare County General Plan 2030 Update i ESA / 207497 Recirculated Draft Environmental Impact Report February 2010
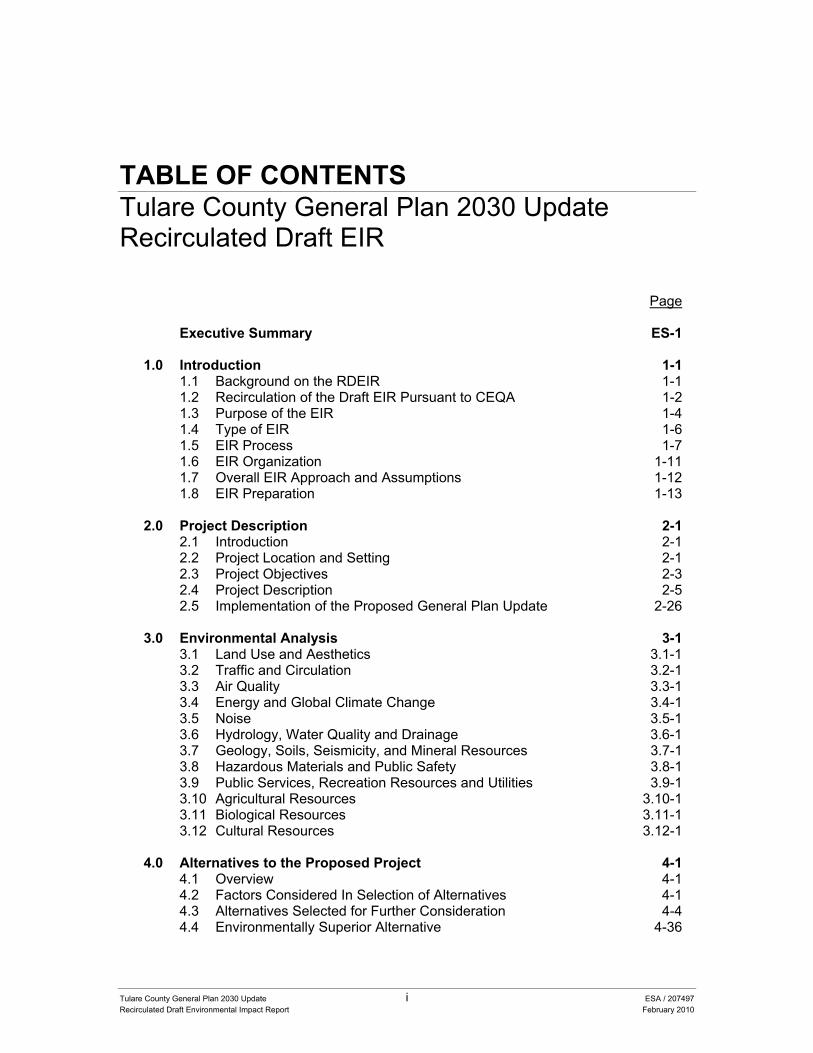
TABLE OF CONTENTS Tulare County General Plan 2030 Update Recirculated Draft EIR
Page
Executive Summary ES-1
1.0 Introduction 1-1 1.1 Background on the RDEIR 1-1 1.2 Recirculation of the Draft EIR Pursuant to CEQA 1-2 1.3 Purpose of the EIR 1-4 1.4 Type of EIR 1-6 1.5 EIR Process 1-7 1.6 EIR Organization 1-11 1.7 Overall EIR Approach and Assumptions 1-12 1.8 EIR Preparation 1-13
2.0 Project Description 2-1
2.1 Introduction 2-1 2.2 Project Location and Setting 2-1 2.3 Project Objectives 2-3 2.4 Project Description 2-5 2.5 Implementation of the Proposed General Plan Update 2-26
3.0 Environmental Analysis 3-1
3.1 Land Use and Aesthetics 3.1-1 3.2 Traffic and Circulation 3.2-1 3.3 Air Quality 3.3-1 3.4 Energy and Global Climate Change 3.4-1 3.5 Noise 3.5-1 3.6 Hydrology, Water Quality and Drainage 3.6-1 3.7 Geology, Soils, Seismicity, and Mineral Resources 3.7-1 3.8 Hazardous Materials and Public Safety 3.8-1 3.9 Public Services, Recreation Resources and Utilities 3.9-1 3.10 Agricultural Resources 3.10-1 3.11 Biological Resources 3.11-1 3.12 Cultural Resources 3.12-1
4.0 Alternatives to the Proposed Project 4-1 4.1 Overview 4-1 4.2 Factors Considered In Selection of Alternatives 4-1 4.3 Alternatives Selected for Further Consideration 4-4 4.4 Environmentally Superior Alternative 4-36
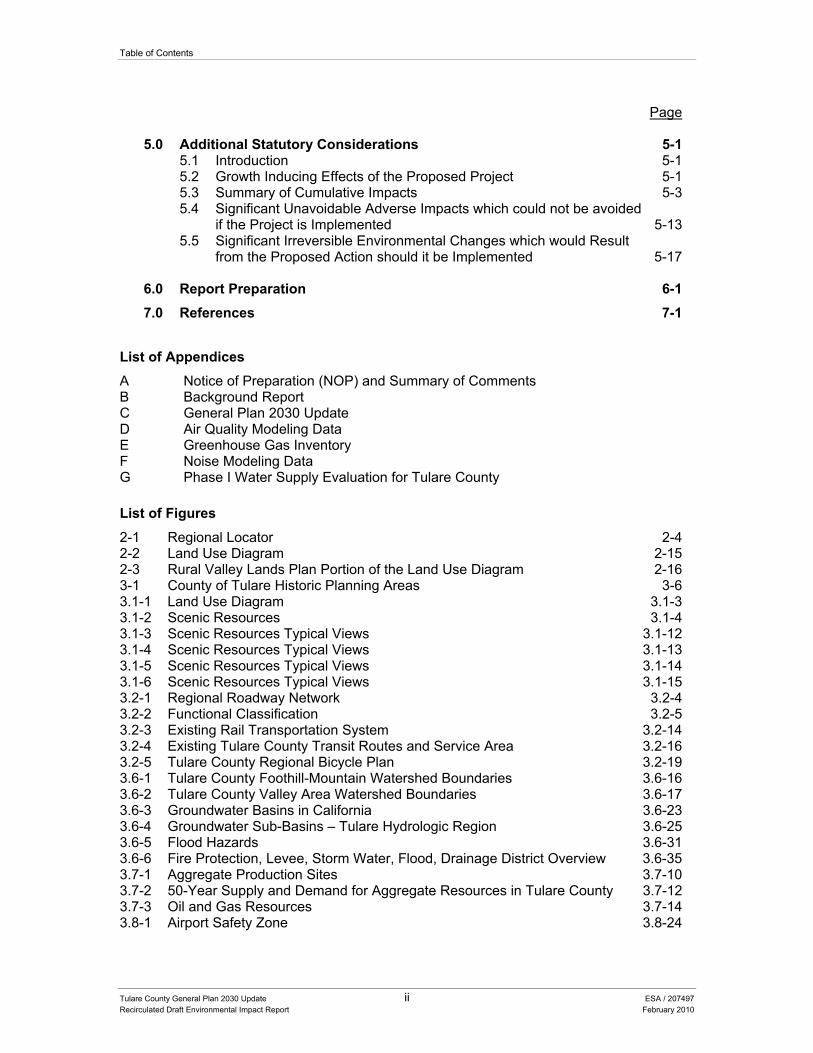
Table of Contents
Tulare County General Plan 2030 Update ii ESA / 207497 Recirculated Draft Environmental Impact Report February 2010
Page 5.0 Additional Statutory Considerations 5-1
5.1 Introduction 5-1 5.2 Growth Inducing Effects of the Proposed Project 5-1 5.3 Summary of Cumulative Impacts 5-3 5.4 Significant Unavoidable Adverse Impacts which could not be avoided
if the Project is Implemented 5-13 5.5 Significant Irreversible Environmental Changes which would Result
from the Proposed Action should it be Implemented 5-17
6.0 Report Preparation 6-1 7.0 References 7-1
List of Appendices A Notice of Preparation (NOP) and Summary of Comments B Background Report C General Plan 2030 Update D Air Quality Modeling Data E Greenhouse Gas Inventory F Noise Modeling Data G Phase I Water Supply Evaluation for Tulare County
List of Figures 2-1 Regional Locator 2-4 2-2 Land Use Diagram 2-15 2-3 Rural Valley Lands Plan Portion of the Land Use Diagram 2-16 3-1 County of Tulare Historic Planning Areas 3-6 3.1-1 Land Use Diagram 3.1-3 3.1-2 Scenic Resources 3.1-4 3.1-3 Scenic Resources Typical Views 3.1-12 3.1-4 Scenic Resources Typical Views 3.1-13 3.1-5 Scenic Resources Typical Views 3.1-14 3.1-6 Scenic Resources Typical Views 3.1-15 3.2-1 Regional Roadway Network 3.2-4 3.2-2 Functional Classification 3.2-5 3.2-3 Existing Rail Transportation System 3.2-14 3.2-4 Existing Tulare County Transit Routes and Service Area 3.2-16 3.2-5 Tulare County Regional Bicycle Plan 3.2-19 3.6-1 Tulare County Foothill-Mountain Watershed Boundaries 3.6-16 3.6-2 Tulare County Valley Area Watershed Boundaries 3.6-17 3.6-3 Groundwater Basins in California 3.6-23 3.6-4 Groundwater Sub-Basins – Tulare Hydrologic Region 3.6-25 3.6-5 Flood Hazards 3.6-31 3.6-6 Fire Protection, Levee, Storm Water, Flood, Drainage District Overview 3.6-35 3.7-1 Aggregate Production Sites 3.7-10 3.7-2 50-Year Supply and Demand for Aggregate Resources in Tulare County 3.7-12 3.7-3 Oil and Gas Resources 3.7-14 3.8-1 Airport Safety Zone 3.8-24
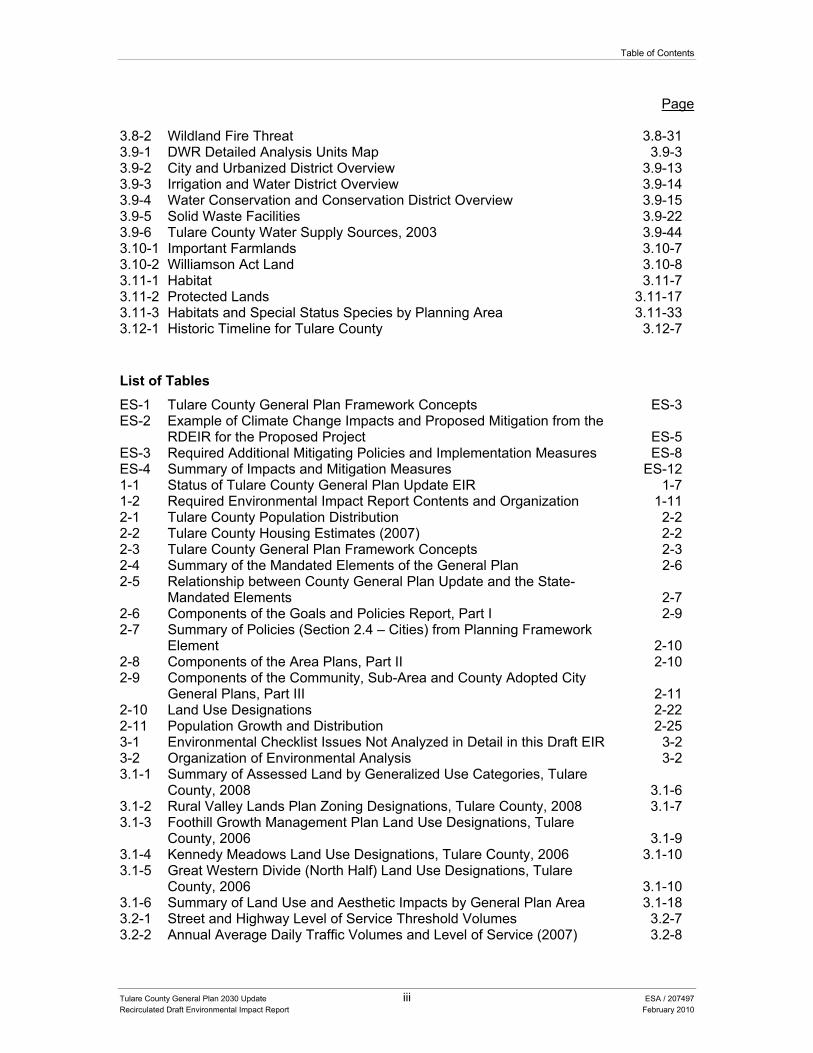
Table of Contents
Tulare County General Plan 2030 Update iii ESA / 207497 Recirculated Draft Environmental Impact Report February 2010
Page
3.8-2 Wildland Fire Threat 3.8-31 3.9-1 DWR Detailed Analysis Units Map 3.9-3 3.9-2 City and Urbanized District Overview 3.9-13 3.9-3 Irrigation and Water District Overview 3.9-14 3.9-4 Water Conservation and Conservation District Overview 3.9-15 3.9-5 Solid Waste Facilities 3.9-22 3.9-6 Tulare County Water Supply Sources, 2003 3.9-44 3.10-1 Important Farmlands 3.10-7 3.10-2 Williamson Act Land 3.10-8 3.11-1 Habitat 3.11-7 3.11-2 Protected Lands 3.11-17 3.11-3 Habitats and Special Status Species by Planning Area 3.11-33 3.12-1 Historic Timeline for Tulare County 3.12-7
List of Tables ES-1 Tulare County General Plan Framework Concepts ES-3 ES-2 Example of Climate Change Impacts and Proposed Mitigation from the
RDEIR for the Proposed Project ES-5 ES-3 Required Additional Mitigating Policies and Implementation Measures ES-8 ES-4 Summary of Impacts and Mitigation Measures ES-12 1-1 Status of Tulare County General Plan Update EIR 1-7 1-2 Required Environmental Impact Report Contents and Organization 1-11 2-1 Tulare County Population Distribution 2-2 2-2 Tulare County Housing Estimates (2007) 2-2 2-3 Tulare County General Plan Framework Concepts 2-3 2-4 Summary of the Mandated Elements of the General Plan 2-6 2-5 Relationship between County General Plan Update and the State-
Mandated Elements 2-7 2-6 Components of the Goals and Policies Report, Part I 2-9 2-7 Summary of Policies (Section 2.4 – Cities) from Planning Framework
Element 2-10 2-8 Components of the Area Plans, Part II 2-10 2-9 Components of the Community, Sub-Area and County Adopted City
General Plans, Part III 2-11 2-10 Land Use Designations 2-22 2-11 Population Growth and Distribution 2-25 3-1 Environmental Checklist Issues Not Analyzed in Detail in this Draft EIR 3-2 3-2 Organization of Environmental Analysis 3-2 3.1-1 Summary of Assessed Land by Generalized Use Categories, Tulare
County, 2008 3.1-6 3.1-2 Rural Valley Lands Plan Zoning Designations, Tulare County, 2008 3.1-7 3.1-3 Foothill Growth Management Plan Land Use Designations, Tulare
County, 2006 3.1-9 3.1-4 Kennedy Meadows Land Use Designations, Tulare County, 2006 3.1-10 3.1-5 Great Western Divide (North Half) Land Use Designations, Tulare
County, 2006 3.1-10 3.1-6 Summary of Land Use and Aesthetic Impacts by General Plan Area 3.1-18 3.2-1 Street and Highway Level of Service Threshold Volumes 3.2-7 3.2-2 Annual Average Daily Traffic Volumes and Level of Service (2007) 3.2-8
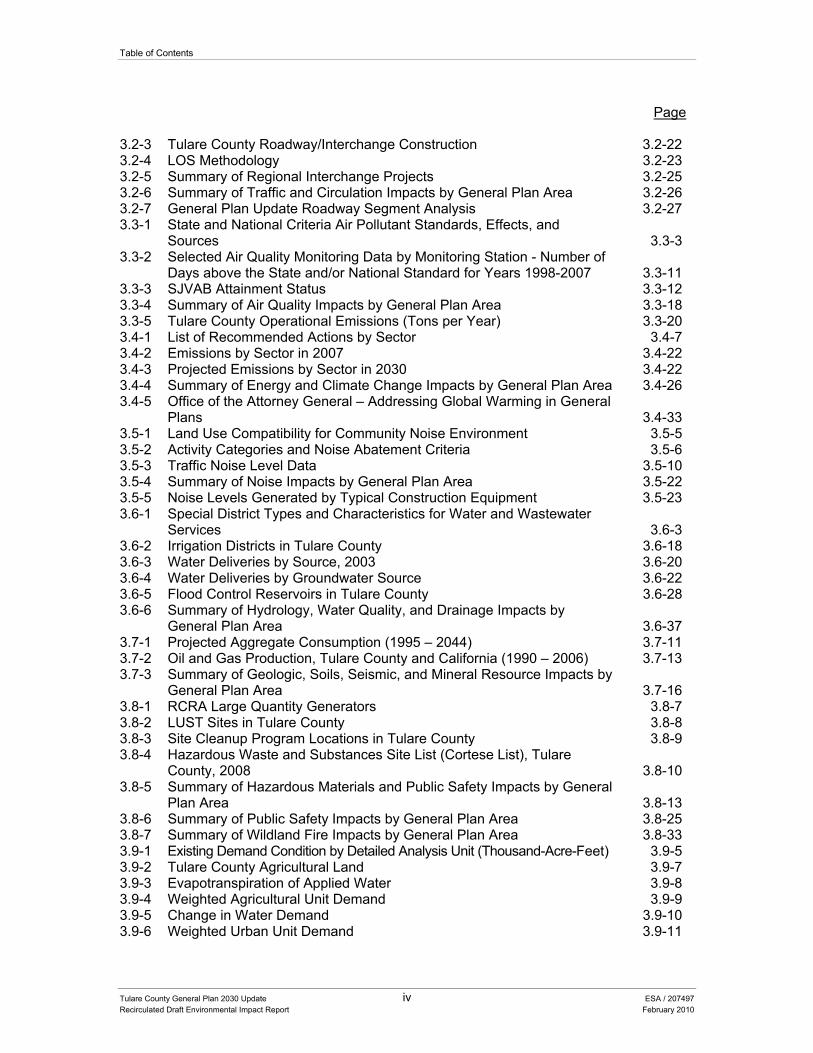
Table of Contents
Tulare County General Plan 2030 Update iv ESA / 207497 Recirculated Draft Environmental Impact Report February 2010
Page
3.2-3 Tulare County Roadway/Interchange Construction 3.2-22 3.2-4 LOS Methodology 3.2-23 3.2-5 Summary of Regional Interchange Projects 3.2-25 3.2-6 Summary of Traffic and Circulation Impacts by General Plan Area 3.2-26 3.2-7 General Plan Update Roadway Segment Analysis 3.2-27 3.3-1 State and National Criteria Air Pollutant Standards, Effects, and
Sources 3.3-3 3.3-2 Selected Air Quality Monitoring Data by Monitoring Station - Number of
Days above the State and/or National Standard for Years 1998-2007 3.3-11 3.3-3 SJVAB Attainment Status 3.3-12 3.3-4 Summary of Air Quality Impacts by General Plan Area 3.3-18 3.3-5 Tulare County Operational Emissions (Tons per Year) 3.3-20 3.4-1 List of Recommended Actions by Sector 3.4-7 3.4-2 Emissions by Sector in 2007 3.4-22 3.4-3 Projected Emissions by Sector in 2030 3.4-22 3.4-4 Summary of Energy and Climate Change Impacts by General Plan Area 3.4-26 3.4-5 Office of the Attorney General – Addressing Global Warming in General
Plans 3.4-33 3.5-1 Land Use Compatibility for Community Noise Environment 3.5-5 3.5-2 Activity Categories and Noise Abatement Criteria 3.5-6 3.5-3 Traffic Noise Level Data 3.5-10 3.5-4 Summary of Noise Impacts by General Plan Area 3.5-22 3.5-5 Noise Levels Generated by Typical Construction Equipment 3.5-23 3.6-1 Special District Types and Characteristics for Water and Wastewater
Services 3.6-3 3.6-2 Irrigation Districts in Tulare County 3.6-18 3.6-3 Water Deliveries by Source, 2003 3.6-20 3.6-4 Water Deliveries by Groundwater Source 3.6-22 3.6-5 Flood Control Reservoirs in Tulare County 3.6-28 3.6-6 Summary of Hydrology, Water Quality, and Drainage Impacts by
General Plan Area 3.6-37 3.7-1 Projected Aggregate Consumption (1995 – 2044) 3.7-11 3.7-2 Oil and Gas Production, Tulare County and California (1990 – 2006) 3.7-13 3.7-3 Summary of Geologic, Soils, Seismic, and Mineral Resource Impacts by
General Plan Area 3.7-16 3.8-1 RCRA Large Quantity Generators 3.8-7 3.8-2 LUST Sites in Tulare County 3.8-8 3.8-3 Site Cleanup Program Locations in Tulare County 3.8-9 3.8-4 Hazardous Waste and Substances Site List (Cortese List), Tulare
County, 2008 3.8-10 3.8-5 Summary of Hazardous Materials and Public Safety Impacts by General
Plan Area 3.8-13 3.8-6 Summary of Public Safety Impacts by General Plan Area 3.8-25 3.8-7 Summary of Wildland Fire Impacts by General Plan Area 3.8-33 3.9-1 Existing Demand Condition by Detailed Analysis Unit (Thousand-Acre-Feet) 3.9-5 3.9-2 Tulare County Agricultural Land 3.9-7 3.9-3 Evapotranspiration of Applied Water 3.9-8 3.9-4 Weighted Agricultural Unit Demand 3.9-9 3.9-5 Change in Water Demand 3.9-10 3.9-6 Weighted Urban Unit Demand 3.9-11
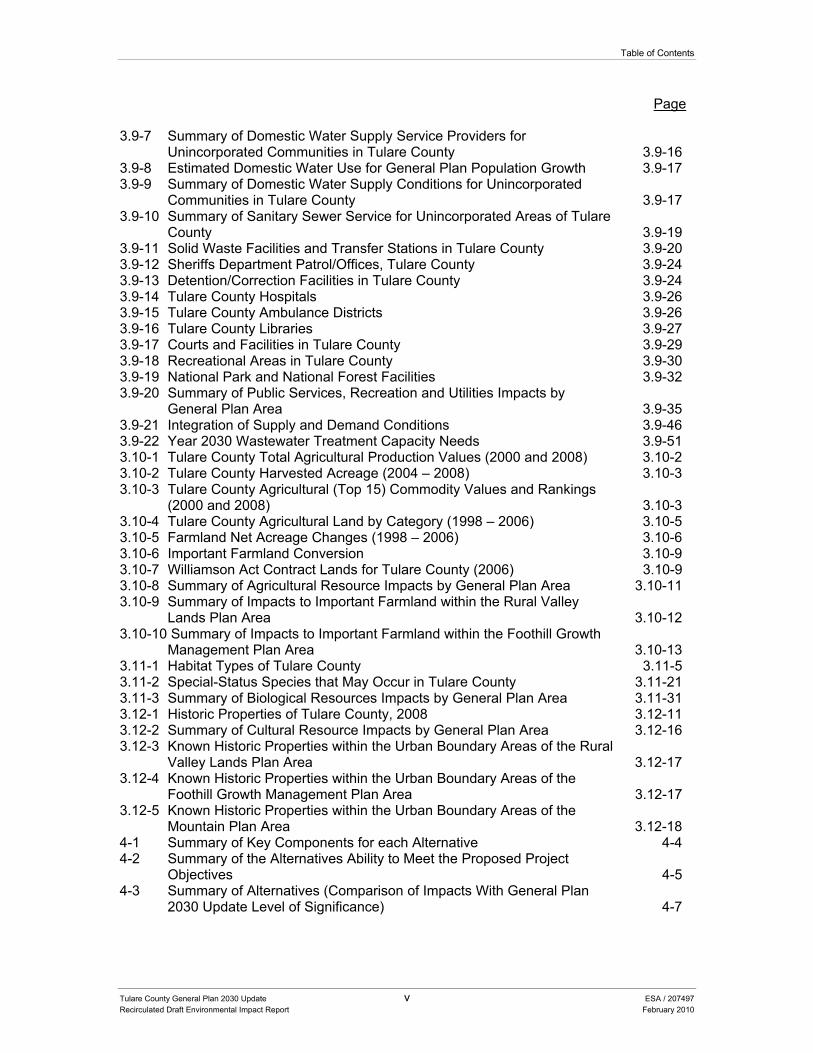
Table of Contents
Tulare County General Plan 2030 Update v ESA / 207497 Recirculated Draft Environmental Impact Report February 2010
Page
3.9-7 Summary of Domestic Water Supply Service Providers for Unincorporated Communities in Tulare County 3.9-16
3.9-8 Estimated Domestic Water Use for General Plan Population Growth 3.9-17 3.9-9 Summary of Domestic Water Supply Conditions for Unincorporated
Communities in Tulare County 3.9-17 3.9-10 Summary of Sanitary Sewer Service for Unincorporated Areas of Tulare
County 3.9-19 3.9-11 Solid Waste Facilities and Transfer Stations in Tulare County 3.9-20 3.9-12 Sheriffs Department Patrol/Offices, Tulare County 3.9-24 3.9-13 Detention/Correction Facilities in Tulare County 3.9-24 3.9-14 Tulare County Hospitals 3.9-26 3.9-15 Tulare County Ambulance Districts 3.9-26 3.9-16 Tulare County Libraries 3.9-27 3.9-17 Courts and Facilities in Tulare County 3.9-29 3.9-18 Recreational Areas in Tulare County 3.9-30 3.9-19 National Park and National Forest Facilities 3.9-32 3.9-20 Summary of Public Services, Recreation and Utilities Impacts by
General Plan Area 3.9-35 3.9-21 Integration of Supply and Demand Conditions 3.9-46 3.9-22 Year 2030 Wastewater Treatment Capacity Needs 3.9-51 3.10-1 Tulare County Total Agricultural Production Values (2000 and 2008) 3.10-2 3.10-2 Tulare County Harvested Acreage (2004 – 2008) 3.10-3 3.10-3 Tulare County Agricultural (Top 15) Commodity Values and Rankings
(2000 and 2008) 3.10-3 3.10-4 Tulare County Agricultural Land by Category (1998 – 2006) 3.10-5 3.10-5 Farmland Net Acreage Changes (1998 – 2006) 3.10-6 3.10-6 Important Farmland Conversion 3.10-9 3.10-7 Williamson Act Contract Lands for Tulare County (2006) 3.10-9 3.10-8 Summary of Agricultural Resource Impacts by General Plan Area 3.10-11 3.10-9 Summary of Impacts to Important Farmland within the Rural Valley
Lands Plan Area 3.10-12 3.10-10 Summary of Impacts to Important Farmland within the Foothill Growth
Management Plan Area 3.10-13 3.11-1 Habitat Types of Tulare County 3.11-5 3.11-2 Special-Status Species that May Occur in Tulare County 3.11-21 3.11-3 Summary of Biological Resources Impacts by General Plan Area 3.11-31 3.12-1 Historic Properties of Tulare County, 2008 3.12-11 3.12-2 Summary of Cultural Resource Impacts by General Plan Area 3.12-16 3.12-3 Known Historic Properties within the Urban Boundary Areas of the Rural
Valley Lands Plan Area 3.12-17 3.12-4 Known Historic Properties within the Urban Boundary Areas of the
Foothill Growth Management Plan Area 3.12-17 3.12-5 Known Historic Properties within the Urban Boundary Areas of the
Mountain Plan Area 3.12-18 4-1 Summary of Key Components for each Alternative 4-4 4-2 Summary of the Alternatives Ability to Meet the Proposed Project
Objectives 4-5 4-3 Summary of Alternatives (Comparison of Impacts With General Plan
2030 Update Level of Significance) 4-7
Table of Contents
Tulare County General Plan 2030 Update vi ESA / 207497 Recirculated Draft Environmental Impact Report February 2010
Page
4-4 Summary of Policies (Section 2.4 – Cities) from Planning Framework Element 4-19
5-1 Population Growth and Distribution 5-2 5-2 Regional Population Projections and Planning Efforts 5-5
List of Acronyms
μg/m3 Micrograms Per Cubic Meter AADT Annual Average Daily Traffic AB Assembly Bill AC Asphaltic Concrete ACEP Agricultural Conservation Easement Program ACFP Animal Confinement Facilities Plan ACM Asbestos-Containing Materials ADT Average Daily Traffic ADWF Average Dry Weather Flows AE Exclusive Agriculture af/ac Acre-Feet Per Acre af/yr Acre-Feet Per Year ALUC Airport Land Use Commission ANSI American National Standards Institute ARPA Archeological Resources Protection Act AST Aboveground Storage Tank BACM Best Available Control Measures BACT Best Available Control Technology bbl Barrel BLM Bureau Of Land Management BMP Best Management Practices BN&SF Burlington Northern & Santa Fe Rail Road BOD Biological Oxygen Demand B.P. Before Present BTA Bicycle Transportation Account CAA Federal Clean Air Act CACUAB County Adopted City Urban Area Boundary CACUDB County Adopted City Urban Development Boundary CA SHL California State Historic Landmark CalARP California Accidental Release Prevention Cal EPA California Environmental Protection Agency Cal/OSHA California Occupational Safety And Health Administration Caltrans California Department Of Transportation CALUP Comprehensive Airport Land Use Plan CAPCOA California Air Pollution Control Officers Association CARB California Air Resources Board CAT Climate Action Team CC Community Commercial CCAA California Clean Air Act CCR California Code Of Regulations
Table of Contents
Tulare County General Plan 2030 Update vii ESA / 207497 Recirculated Draft Environmental Impact Report February 2010
CDF California Department Of Forestry And Fire Prevention CDFFP/TCFD California Department Of Forestry And Fire Protection/Tulare County
Fire Department CDFG California Department Of Fish And Game CEC California Energy Commission CEQA California Environmental Quality Act CERCLA Comprehensive Environmental Response, Compensation, And Liability
Act cf Cubic Feet CFR Code Of Federal Regulations CH4 Methane CHP California Highway Patrol CIMIS California Irrigation Management Information System CIP Capital Improvement Plan CIWMB California Integrated Waste Management Board Cl Chlorine CLG Certified Local Government Program CMP Congestion Management Program CNDDB California Natural Diversity Database CNEL Community Noise Equivalent Level CNPS California Native Plant Society CO Carbon Monoxide CO2 Carbon Dioxide CO2e CO2 Equivalents COLT City Owned Local Transit COTYAC County Of Tulare Youth Adventure Camp CPUC California Public Utilities Commission CR Commercial Recreation CRHR California Register Of Historical Resources CRT Cathode Ray Tubes CSA County Service Area CSC Species Of Special Concern CSD Community Service District CSD County Sanitation District SCT Candidate-Threatened Species CUPA Certified Unified Program Agency CVC Cross Valley Canal CVFPB Central Valley Flood Protection Board CVP Central Valley Project CVRWQCB Central Valley Regional Water Quality Control Board CWA Clean Water Act DAU Detailed Analysis Unit dB Decibel dBA A-Weighted Decibel DBP Disinfection Byproducts DEIR Draft Environmental Impact Report DFG Department Of Fish And Game DHS California Department Of Health Services DNL Day-Night Average Sound Level DOF California Department Of Finance
Table of Contents
Tulare County General Plan 2030 Update viii ESA / 207497 Recirculated Draft Environmental Impact Report February 2010
DOT Department Of Transportation DPH California Department Of Public Health DPM Diesel Particulate Matter DTSC Department Of Toxic Substance Control DU Dwelling Unit DWP Drinking Water Program DWR California Department Of Water Resources EHD Environmental Health Division EIR Environmental Impact Report ESA Endangered Species Act ESD Equivalent Single Family Dwelling ET Evapotranspiration ETAW Evapotranspiration Of Applied Water FA Foothill Agricultural/Agriculture FAA Federal Aviation Administration FAR Federal Aviation Regulations FAR Floor Area Ratio FBO Fixed Base Operator FEMA Federal Emergency Management Agency FGMP Foothill Growth Management Plan FHWA Federal Highway Administration FIRM Flood Insurance Rate Maps FMMP Farmland Mapping And Monitoring Program FMU Foothill Mixed Use FRAP Fire And Resource Assessment Program g Gravity GAMAQI Guide For Assessing And Mitigating Air Quality Impacts GC General Commercial GHG Greenhouse Gas GIS Geographic Information System GPA General Plan Amendments GPI General Plan Initiatives gpm Gallons Per Minute GWDN Half Plan Great Western Divide (North Half) Plan GWP Global Warming Potential HABS Historic American Building Survey HAER Historic American Engineering Record HC Highway Commercial HCM Highway Capacity Manual HCP Habitat Conservation Plan HDB Hamlet Development Boundaries HDR High Density Residential HFCs Hydrofluorocarbons HHSA Health And Human Services Agency HI Heavy Industrial HOV High Occupancy Vehicle HR Hydrologic Region HSAA Hazardous Substance Account Act HSR High Speed Rail
Table of Contents
Tulare County General Plan 2030 Update ix ESA / 207497 Recirculated Draft Environmental Impact Report February 2010
HUD Department Of Housing And Urban Development HWCF Hazardous Waste Collection Facility HWMP Hazardous Waste Management Program HWTS Hazardous Waste Tracking System Hz Hertz ID Irrigation Districts IPCC Intergovernmental Panel On Climate Change IR Irrigation District IRWMP Integrated Regional Water Management Plan ISO Insurance Services Office JPA Joint Powers Association JPWA Joint Powers Wastewater Authority KDWCD Kaweah Delta Water Conservation District KWBHCP Kern Water Bank Habitat Conservation Plan kWh Kilowatt-Hours LAFCo Local Area Formation Commission LandGEM Landfill Gas Emissions Model Version 3.5 LAS Las Vegas Mccarran International Airport LCFS Low Carbon Fuel Standard Ldn Day-Night Average Sound Level LDR Low Density Residential LEED Leadership In Energy And Environmental Design LEED-ND LEED-Neighborhood Development Leq Equivalent Sound Level LI Light Industrial LMDR Low-Medium Density Residential LOS Level Of Service LQG Large Quantity Hazardous Waste Generator LTS Less Than Significant LUFT Leaking Underground Fuel Tank LUST Leaking Underground Storage Tank MBTA Migratory Bird Treaty Act MCL Maximum Contaminant Levels MDR Medium Density Residential mgd Million Gallons Per Day mg/L Milligrams Per Liter MHDR Medium-High Density Residential MMcf Million Cubic Feet MMRP Mitigation Monitoring And Reporting Program MOU Memorandum Of Understanding MPO Metropolitan Planning Organization MR Mountain Residential MRZ Mineral Resource Zones MSR Municipal Service Review MU Mixed Use MWC Mutual Water Company mya Million Years Ago N2O Nitrous Oxide NAAQS National Ambient Air Quality Standards NAHC Native American Heritage Commission
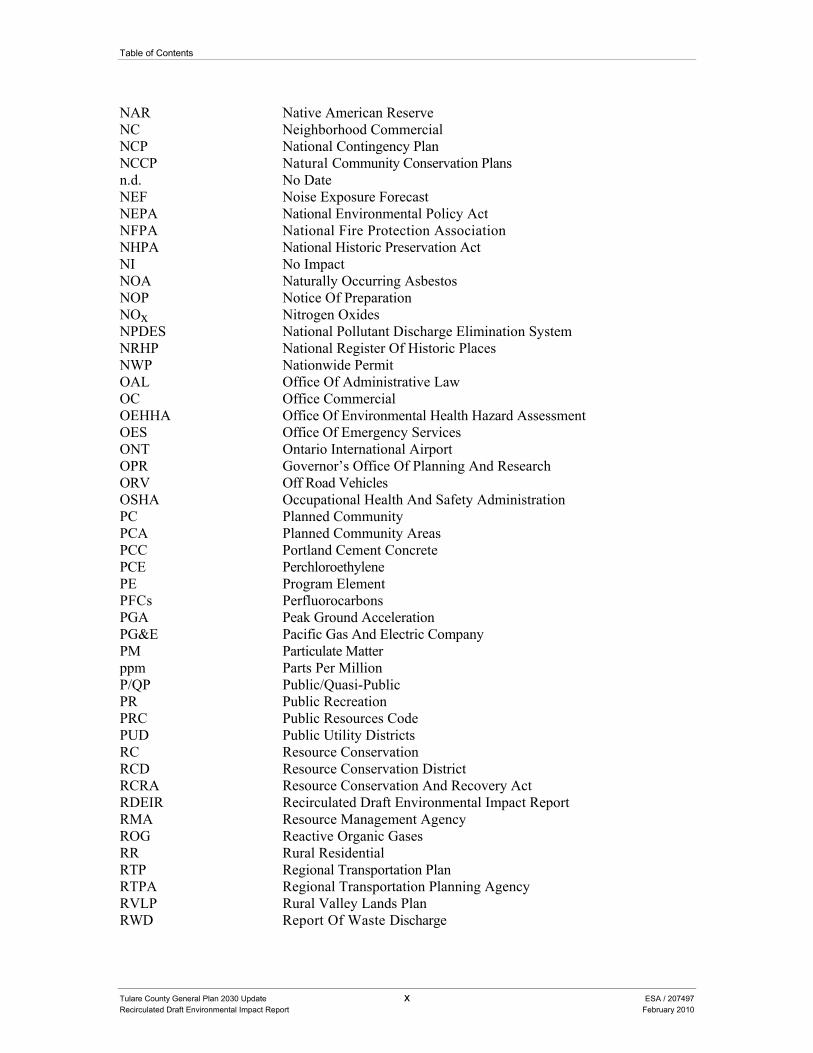
Table of Contents
Tulare County General Plan 2030 Update x ESA / 207497 Recirculated Draft Environmental Impact Report February 2010
NAR Native American Reserve NC Neighborhood Commercial NCP National Contingency Plan NCCP Natural Community Conservation Plans n.d. No Date NEF Noise Exposure Forecast NEPA National Environmental Policy Act NFPA National Fire Protection Association NHPA National Historic Preservation Act NI No Impact NOA Naturally Occurring Asbestos NOP Notice Of Preparation NOx Nitrogen Oxides NPDES National Pollutant Discharge Elimination System NRHP National Register Of Historic Places NWP Nationwide Permit OAL Office Of Administrative Law OC Office Commercial OEHHA Office Of Environmental Health Hazard Assessment OES Office Of Emergency Services ONT Ontario International Airport OPR Governor’s Office Of Planning And Research ORV Off Road Vehicles OSHA Occupational Health And Safety Administration PC Planned Community PCA Planned Community Areas PCC Portland Cement Concrete PCE Perchloroethylene PE Program Element PFCs Perfluorocarbons PGA Peak Ground Acceleration PG&E Pacific Gas And Electric Company PM Particulate Matter ppm Parts Per Million P/QP Public/Quasi-Public PR Public Recreation PRC Public Resources Code PUD Public Utility Districts RC Resource Conservation RCD Resource Conservation District RCRA Resource Conservation And Recovery Act RDEIR Recirculated Draft Environmental Impact Report RMA Resource Management Agency ROG Reactive Organic Gases RR Rural Residential RTP Regional Transportation Plan RTPA Regional Transportation Planning Agency RVLP Rural Valley Lands Plan RWD Report Of Waste Discharge
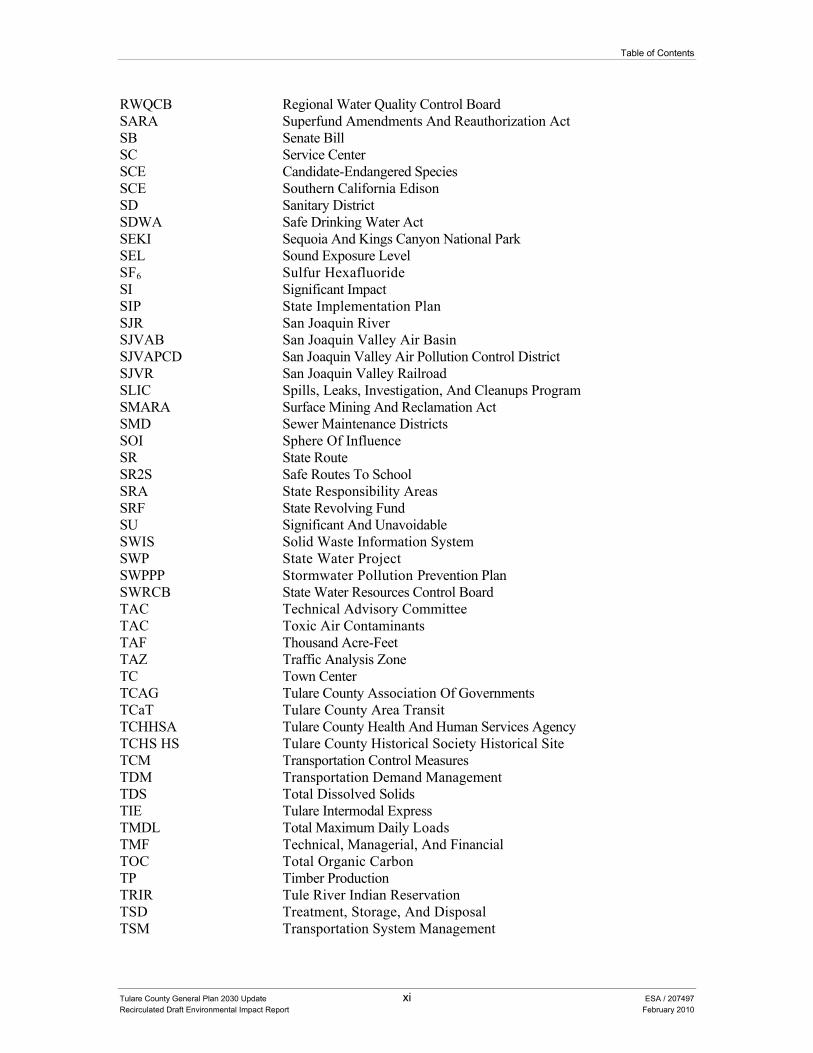
Table of Contents
Tulare County General Plan 2030 Update xi ESA / 207497 Recirculated Draft Environmental Impact Report February 2010
RWQCB Regional Water Quality Control Board SARA Superfund Amendments And Reauthorization Act SB Senate Bill SC Service Center SCE Candidate-Endangered Species SCE Southern California Edison SD Sanitary District SDWA Safe Drinking Water Act SEKI Sequoia And Kings Canyon National Park SEL Sound Exposure Level SF6 Sulfur Hexafluoride SI Significant Impact SIP State Implementation Plan SJR San Joaquin River SJVAB San Joaquin Valley Air Basin SJVAPCD San Joaquin Valley Air Pollution Control District SJVR San Joaquin Valley Railroad SLIC Spills, Leaks, Investigation, And Cleanups Program SMARA Surface Mining And Reclamation Act SMD Sewer Maintenance Districts SOI Sphere Of Influence SR State Route SR2S Safe Routes To School SRA State Responsibility Areas SRF State Revolving Fund SU Significant And Unavoidable SWIS Solid Waste Information System SWP State Water Project SWPPP Stormwater Pollution Prevention Plan SWRCB State Water Resources Control Board TAC Technical Advisory Committee TAC Toxic Air Contaminants TAF Thousand Acre-Feet TAZ Traffic Analysis Zone TC Town Center TCAG Tulare County Association Of Governments TCaT Tulare County Area Transit TCHHSA Tulare County Health And Human Services Agency TCHS HS Tulare County Historical Society Historical Site TCM Transportation Control Measures TDM Transportation Demand Management TDS Total Dissolved Solids TIE Tulare Intermodal Express TMDL Total Maximum Daily Loads TMF Technical, Managerial, And Financial TOC Total Organic Carbon TP Timber Production TRIR Tule River Indian Reservation TSD Treatment, Storage, And Disposal TSM Transportation System Management
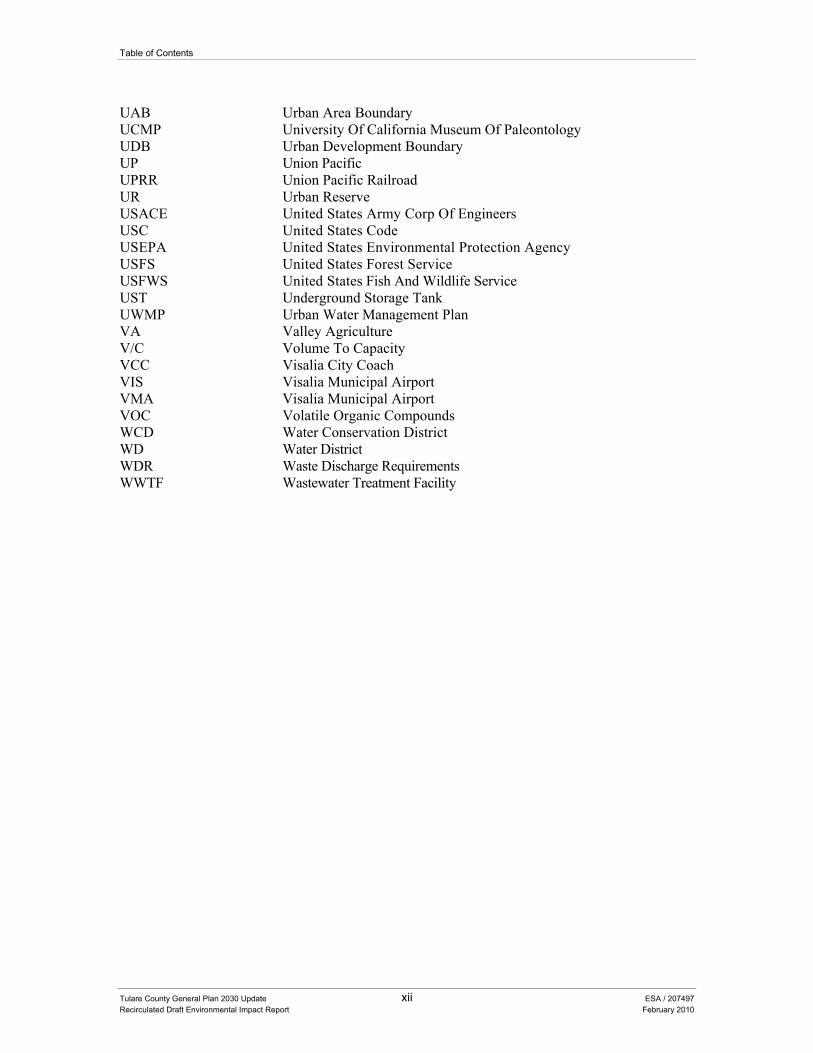
Table of Contents
Tulare County General Plan 2030 Update xii ESA / 207497 Recirculated Draft Environmental Impact Report February 2010
UAB Urban Area Boundary UCMP University Of California Museum Of Paleontology UDB Urban Development Boundary UP Union Pacific UPRR Union Pacific Railroad UR Urban Reserve USACE United States Army Corp Of Engineers USC United States Code USEPA United States Environmental Protection Agency USFS United States Forest Service USFWS United States Fish And Wildlife Service UST Underground Storage Tank UWMP Urban Water Management Plan VA Valley Agriculture V/C Volume To Capacity VCC Visalia City Coach VIS Visalia Municipal Airport VMA Visalia Municipal Airport VOC Volatile Organic Compounds WCD Water Conservation District WD Water District WDR Waste Discharge Requirements WWTF Wastewater Treatment Facility
Tulare County General Plan 2030 Update ES-1 ESA / 207497 Recirculated Draft Environmental Impact Report February 2010
EXECUTIVE SUMMARY
Introduction The California Environmental Quality Act (CEQA) requires that all state and local government agencies consider the environmental consequences of programs and projects over which they have discretionary authority before taking action on those projects or programs. Where there is substantial evidence that a project may have a significant effect on the environment, the agency shall prepare an environmental impact report (EIR) (CEQA Guidelines, Section 15164[a]). An EIR is an informational document that will inform public agency decision makers and the general public of the significant environmental effects of a project, identify possible ways to minimize the significant effects, and describe reasonable alternatives to the project.
CEQA requires that a draft EIR be prepared and circulated for public review. Following the close of the public review period, the lead agency prepares a final EIR, which includes the comments received during the review period (either verbatim or in summary), and responses to the significant environmental issues raised in those comments. Prior to taking action on a proposed project, the lead agency must certify the EIR and make certain findings.
A lead agency is required to recirculate a draft EIR, prior to certification, when “significant new information” is added to the EIR after the public review period begins (CEQA Guidelines Section 15088.5). New information is deemed significant if it reveals the following:
• A new significant environmental impact resulting from either the project itself or a new proposed mitigation measure;
• A substantial increase in the severity of an environmental impact would result unless mitigation measures are adopted that reduce the impact to a level of insignificance;
• A feasible project alternative or mitigation measure considerably different from others previously analyzed would clearly lessen the significant environmental impacts of the project, but the project proponent declines to adopt it; or
• The draft EIR was so fundamentally flawed that it precluded meaningful public review and comment.
In addition, a lead agency may choose to recirculate an EIR if additional studies or analysis is conducted for a project before a specific action is taken by local decision makers to approve a project.
Tulare County General Plan 2030 Update
Tulare County General Plan 2030 Update ES-2 ESA / 207497 Recirculated Draft Environmental Impact Report February 2010
Recirculation may be limited to those chapters or portions of the EIR that have been modified. Public notice and circulation of the recirculated draft EIR is required, per CEQA Guidelines Sections 15086 and 15087.
Project Overview The proposed Tulare County General Plan 2030 Update establishes a planning framework and policies for the planning period to 2030 and is considered a comprehensive update of the County of Tulare’s (County) current General Plan. The General Plan Update will provide for the continuation of many existing policies, modifications of others, and the addition of new policies. The General Plan Update project documents consist of the General Plan Update document (consisting of three parts: Part I: the Goals & Policies Report, Part II: the Area Plans, and Part III: the Community and other Plans [the plans in Part III will not be changed as part of this update, except for Dinuba (revised by this update to include the Dinuba Golf Course) and Pixley (revised by this update to include Harmon Field)]), the Environmental Impact Report, and the General Plan 2010 Background Report. A complete description of the General Plan Update is described in Chapter 2, “Project Description,” of this document.
Project Objectives Although the proposed project was developed to meet several fairly broad objectives (i.e., the requirements of State law, etc.) the General Plan Update was also developed through an extensive public outreach process to reflect the specific policy needs of Tulare County. To help determine what these specific policy needs are, the Tulare County Board of Supervisors considered input received from the many community workshops, the Tulare County General Plan Update Technical Advisory Committee, and the Planning Commission, on the fundamental values that would guide the preparation of the General Plan Update. As a result of this input, the following five value statements were identified:
• The beauty of the County and the health and safety of its residents will be protected and enhanced.
• The County will create and facilitate opportunities to improve the lives of all County residents.
• The County will protect its agricultural economy while diversifying employment opportunities.
• Every community will have the opportunity to prosper from economic growth. • Growth will pay its own way providing sustainable, high quality infrastructure and services.
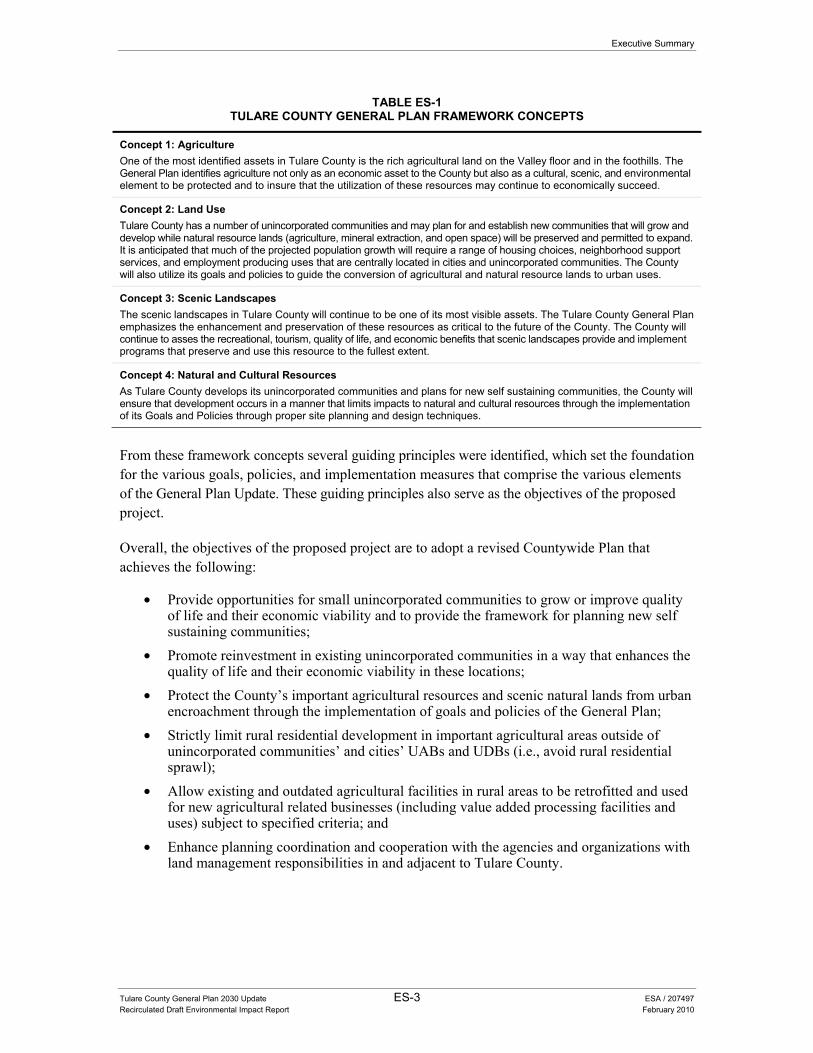
From these value statements, four framework concepts (see Table ES-1 below) were developed for the General Plan.
Executive Summary
Tulare County General Plan 2030 Update ES-3 ESA / 207497 Recirculated Draft Environmental Impact Report February 2010
TABLE ES-1TULARE COUNTY GENERAL PLAN FRAMEWORK CONCEPTS
Concept 1: Agriculture One of the most identified assets in Tulare County is the rich agricultural land on the Valley floor and in the foothills. The General Plan identifies agriculture not only as an economic asset to the County but also as a cultural, scenic, and environmental element to be protected and to insure that the utilization of these resources may continue to economically succeed.
Concept 2: Land Use Tulare County has a number of unincorporated communities and may plan for and establish new communities that will grow and develop while natural resource lands (agriculture, mineral extraction, and open space) will be preserved and permitted to expand. It is anticipated that much of the projected population growth will require a range of housing choices, neighborhood support services, and employment producing uses that are centrally located in cities and unincorporated communities. The County will also utilize its goals and policies to guide the conversion of agricultural and natural resource lands to urban uses.
Concept 3: Scenic Landscapes The scenic landscapes in Tulare County will continue to be one of its most visible assets. The Tulare County General Plan emphasizes the enhancement and preservation of these resources as critical to the future of the County. The County will continue to asses the recreational, tourism, quality of life, and economic benefits that scenic landscapes provide and implement programs that preserve and use this resource to the fullest extent.
Concept 4: Natural and Cultural Resources As Tulare County develops its unincorporated communities and plans for new self sustaining communities, the County will ensure that development occurs in a manner that limits impacts to natural and cultural resources through the implementation of its Goals and Policies through proper site planning and design techniques.
From these framework concepts several guiding principles were identified, which set the foundation for the various goals, policies, and implementation measures that comprise the various elements of the General Plan Update. These guiding principles also serve as the objectives of the proposed project.
Overall, the objectives of the proposed project are to adopt a revised Countywide Plan that achieves the following:
• Provide opportunities for small unincorporated communities to grow or improve quality of life and their economic viability and to provide the framework for planning new self sustaining communities;
• Promote reinvestment in existing unincorporated communities in a way that enhances the quality of life and their economic viability in these locations;
• Protect the County’s important agricultural resources and scenic natural lands from urban encroachment through the implementation of goals and policies of the General Plan;
• Strictly limit rural residential development in important agricultural areas outside of unincorporated communities’ and cities’ UABs and UDBs (i.e., avoid rural residential sprawl);
• Allow existing and outdated agricultural facilities in rural areas to be retrofitted and used for new agricultural related businesses (including value added processing facilities and uses) subject to specified criteria; and
• Enhance planning coordination and cooperation with the agencies and organizations with land management responsibilities in and adjacent to Tulare County.
Tulare County General Plan 2030 Update
Tulare County General Plan 2030 Update ES-4 ESA / 207497 Recirculated Draft Environmental Impact Report February 2010
Project Location The County of Tulare is bordered by Fresno County to the north and Kern County to the south. Kings County is located on the west side of Tulare County while Inyo County borders the County to the east. The crest of the Sierras forms the boundary with Inyo County. The northern border of Tulare County is an irregular line that passes just south of the City of Reedley and State Route 180. The southern border is a consistent east-west trending line, comprising the south standard parallel south of Mount Diablo, located north of the City of Delano. The western border generally trends north-south in a straight-line north and south just east of Corcoran. Along the eastern border is Inyo County.
Tulare County is located in a geographically diverse region with the majestic peaks of the Sierra Nevada framing its eastern region, while its western portion includes the San Joaquin Valley floor, which is very fertile and extensively cultivated. Tulare and Fresno Counties consistently rank as the top leading agricultural-producing counties in the U.S. In addition to its agricultural production, the County’s economic base also includes agricultural packing and shipping operations. Small and medium size manufacturing plants are located in the western part of the county and are increasing in number. Tulare County also contains various well known parks and open space areas including portions of Sequoia National Forest, Sequoia National Monument, Inyo National Forest, and Kings Canyon National Park. Sequoia National Park is entirely contained within the County.
Tulare County contains approximately 4,840 square miles (3,097,600 acres) within its borders and can be divided into three general topographical zones: a valley region; a foothill region east of the valley area; and a mountain region just east of the foothills. The eastern half of the County is generally comprised of public lands, which include not only the parks listed above, but also the Mountain Home State Forest, Golden Trout Wilderness area, and portions of the Dome Land and south Sierra Wilderness areas. The County also contains one state park and two wildlife refuges. Colonel Allensworth State Historical Park, located in the southwestern corner of the county, provides picnic and camping areas. The Pixley National Wildlife Refuge provides habitat for the endangered blunt-nosed leopard lizard, the San Joaquin kit fox, the Tipton Kangaroo rat, as well as a wintering area for migratory waterfowl. The Blue Ridge National Wildlife Refuge was established to protect habitat for the California condor, Gymnogyps californianus.
Implementation of the Proposed General Plan Implementation Measures are identified at the end of each Element of the General Plan Update. An Implementation Measure is a specific action, program, procedure, or technique that is provided to help ensure that appropriate actions are taken to implement the General Plan. The Implementation Measures will comprise a Work Plan that will assist in carrying out the Goals and Policies of the General Plan Update. The Implementation Measures state which policy, or policies, it supports, the County departments responsible for seeing that implementation is achieved, and provides an anticipated timeline for completion.
Executive Summary
Tulare County General Plan 2030 Update ES-5 ESA / 207497 Recirculated Draft Environmental Impact Report February 2010
California Environmental Quality Act Compliance This recirculated draft EIR (RDEIR [which supersedes the original DEIR]) for the proposed project was prepared in compliance with CEQA and the CEQA Guidelines (California Code of Regulations, Title 14). As described in the CEQA Guidelines, Section 15121(a), an EIR is a public information document that assesses the potential environmental effects of a project, as well as identifies mitigation measures and alternatives to the project that could reduce or avoid adverse environmental impacts. CEQA guidelines require that state and local government agencies consider the environmental consequences of a project over which they have discretionary authority. Consequently, the RDEIR is an informational document used in the planning and decision-making process. It is not the purpose of an EIR to recommend either approval or denial of a project.
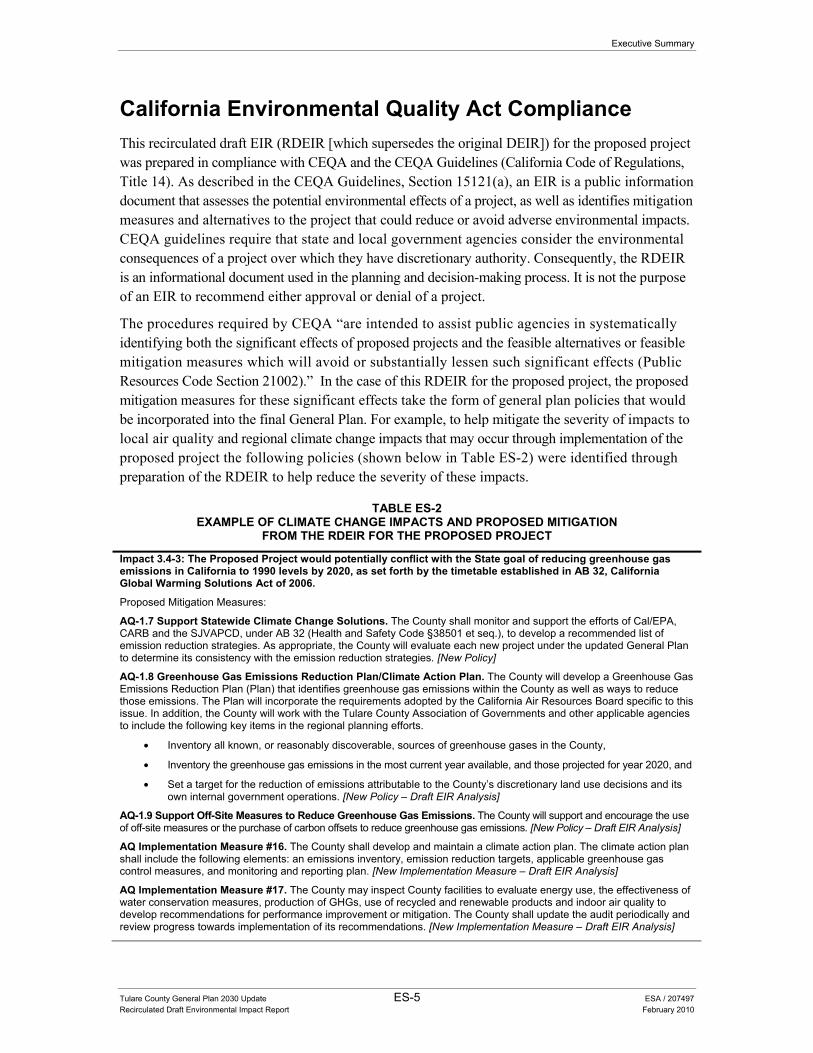
The procedures required by CEQA “are intended to assist public agencies in systematically identifying both the significant effects of proposed projects and the feasible alternatives or feasible mitigation measures which will avoid or substantially lessen such significant effects (Public Resources Code Section 21002).” In the case of this RDEIR for the proposed project, the proposed mitigation measures for these significant effects take the form of general plan policies that would be incorporated into the final General Plan. For example, to help mitigate the severity of impacts to local air quality and regional climate change impacts that may occur through implementation of the proposed project the following policies (shown below in Table ES-2) were identified through preparation of the RDEIR to help reduce the severity of these impacts.
TABLE ES-2EXAMPLE OF CLIMATE CHANGE IMPACTS AND PROPOSED MITIGATION
FROM THE RDEIR FOR THE PROPOSED PROJECT
Impact 3.4-3: The Proposed Project would potentially conflict with the State goal of reducing greenhouse gas emissions in California to 1990 levels by 2020, as set forth by the timetable established in AB 32, California Global Warming Solutions Act of 2006.
Proposed Mitigation Measures:
AQ-1.7 Support Statewide Climate Change Solutions. The County shall monitor and support the efforts of Cal/EPA, CARB and the SJVAPCD, under AB 32 (Health and Safety Code §38501 et seq.), to develop a recommended list of emission reduction strategies. As appropriate, the County will evaluate each new project under the updated General Plan to determine its consistency with the emission reduction strategies. [New Policy]
AQ-1.8 Greenhouse Gas Emissions Reduction Plan/Climate Action Plan. The County will develop a Greenhouse Gas Emissions Reduction Plan (Plan) that identifies greenhouse gas emissions within the County as well as ways to reduce those emissions. The Plan will incorporate the requirements adopted by the California Air Resources Board specific to this issue. In addition, the County will work with the Tulare County Association of Governments and other applicable agencies to include the following key items in the regional planning efforts.
• Inventory all known, or reasonably discoverable, sources of greenhouse gases in the County,
• Inventory the greenhouse gas emissions in the most current year available, and those projected for year 2020, and
• Set a target for the reduction of emissions attributable to the County’s discretionary land use decisions and its own internal government operations. [New Policy – Draft EIR Analysis]
AQ-1.9 Support Off-Site Measures to Reduce Greenhouse Gas Emissions. The County will support and encourage the use of off-site measures or the purchase of carbon offsets to reduce greenhouse gas emissions. [New Policy – Draft EIR Analysis]
AQ Implementation Measure #16. The County shall develop and maintain a climate action plan. The climate action plan shall include the following elements: an emissions inventory, emission reduction targets, applicable greenhouse gas control measures, and monitoring and reporting plan. [New Implementation Measure – Draft EIR Analysis]
AQ Implementation Measure #17. The County may inspect County facilities to evaluate energy use, the effectiveness of water conservation measures, production of GHGs, use of recycled and renewable products and indoor air quality to develop recommendations for performance improvement or mitigation. The County shall update the audit periodically and review progress towards implementation of its recommendations. [New Implementation Measure – Draft EIR Analysis]
Tulare County General Plan 2030 Update
Tulare County General Plan 2030 Update ES-6 ESA / 207497 Recirculated Draft Environmental Impact Report February 2010
The original DEIR for the proposed project was submitted to the State Clearinghouse (SCH 2006041162) and released for public and agency review on January 14, 2008. The DEIR was circulated for public review and comment for an extended period of over 90 days (January 14, 2008 through April 15, 2008) to allow for maximum public involvement and input. A copy of the Notice of Completion (including extensions, published January 14, 2008), requesting public comment, is attached to this RDEIR as Appendix A.
Reader’s Guide to the Recirculated DEIR (RDEIR) As the CEQA lead agency, the County of Tulare is responsible for the preparation and certification of the EIR prior to approving or carrying out the proposed project. The discretionary action before the lead agency is the approval and adoption of the General Plan 2030. In its role as the lead agency, the County has directed the recirculation of the draft EIR for the proposed project.
Notice of Recirculation Recirculation of a draft EIR requires notification of responsible and trustee agencies and the general public, per CEQA Guidelines Sections 15086 and 15087. The lead agency need only recirculate those chapters or portions of the draft EIR that have been modified. For the proposed project, the County has chosen to recirculate the entire DEIR, which is now referred to as the recirculated DEIR, or RDEIR.
Purpose of Recirculation During 2009, the County of Tulare made several changes to the General Plan 2030 Update in response to a variety of public comments received on the proposed project. The County developed an updated land use/circulation diagram and initiated a Climate Action Strategy. The County also updated the stationary air emission analysis, baseline data in the 2010 Background Report, and the water supply analysis. Other modifications include revision of some policies in Part I: Goals and Policies Report and Part II: Area Plans, of the General Plan Update, and reorganization of the EIR. A summary of these changes is provided below.
Updated Topics within the Recirculated DEIR (RDEIR) To address comments provided on the original DEIR, the County has taken the following steps to provide additional background information and analysis as part of the RDEIR:
• Updated Land Use/Circulation Diagram: The County has developed a land use/circulation diagram showing the location of all future growth areas proposed as part of the General Plan Update. Refer to Figure 2-2 in Chapter 2, Project Description. This diagram is derived from the TC Planning Areas (Figure 4-1) in the Goals and Policies Report (Part I of the General Plan Update). This figure also identifies the Urban Development Boundaries within which future urban growth is expected to occur.
• Initiate Climate Action Strategy: In light of the recent legislative actions specific to sustainability and climate change, the County has initiated a Climate Action Strategy specific to its unique rural nature. As an initial step, the County has prepared a Greenhouse Gas
Executive Summary
Tulare County General Plan 2030 Update ES-7 ESA / 207497 Recirculated Draft Environmental Impact Report February 2010
(GHG) Inventory for the Planning Area. Information from the inventory as well as applicable regulatory information is incorporated into the Air Quality section (Section 3.3) and the Energy and Global Climate Change section (Section 3.4) of this RDEIR and an initial, proposed Climate Action Plan has been prepared. Subsequently, the analysis of air quality impacts now includes a more robust discussion of the proposed project’s impacts associated with climate change. Additionally, the General Plan Update now includes a number of additional policies (in the areas of sustainability, energy conservation, and climate change) that will assist the County in meeting the GHG emissions reduction goals set by the State.
• Updated Stationary Air Emission Analysis: The RDEIR includes a more thorough list of estimates for stationary sources of air pollution (see Section 3.3, “Air Quality” and Section 3.4, “Energy and Global Climate Change”), including industrial emissions, residential emissions, agricultural emissions, landfills, power plants, and oil and gas production. Many of these sources were developed as part of the Greenhouse Gas Inventory report and subsequently incorporated into the RDEIR.
• Updated General Plan Background Report (“2010 Background Report”): To the extent feasible, the County has updated baseline data in the 2010 Background Report for topics for which more recent data was available. These topics include Demographics, Land Use, Agriculture, Recreation, and Open Space, Biological Resources, Air Quality, Safety (including Geologic and Seismic Hazards, Flood Hazards, Fire Hazards, Human-Made Hazards, and Climate Change), Biological Resources, Archaeological Resources, and Historical Resources, Natural Resources (including Mineral Resources, Oil and Gas Resources, and Timber Resources), and Scenic Landscapes. The 2010 Background Report is a supporting document to the EIR that provides both historic and baseline information that is incorporated by reference to this EIR. This report is also included as Appendix B to this RDEIR.
• Updated Water Supply Analysis: The RDEIR incorporates the results of a water supply evaluation prepared by Tully and Young for the proposed project. Using the most current (or readily available) data from the Department of Water Resources and other sources, the water supply evaluation provides a representation of ‘existing’ supply and demand conditions and projects ‘future’ conditions contemplated by the proposed project. Section 3.6 “Hydrology, Water Quality, and Drainage” and 3.9 “Public Services, Recreation Resources, and Utilities” of this RDEIR have been prepared with information from the water supply evaluation, which is included as Appendix G. These updated sections (and the water supply evaluation) are intended to supplement the original water supply information provided in the General Plan Background Report.
• Enforceability of Goals and Policies: The County has reviewed Part I, Goals & Policies Report, of the General Plan Update and revised some policies to provide for greater enforceability. The updated Goals & Policies Report (Part I of the General Plan Update) refines the “project” that is evaluated in this RDEIR.
• Organization of the RDEIR: The County has simplified the organization of the RDEIR to more closely resemble the CEQA Checklist found in Appendix G of the CEQA Guidelines. While the original DEIR incorporated the Background Report information and data by reference, this RDEIR includes relevant information from the 2010 Background Report and other pertinent sources directly in the “Environmental Setting” and “Regulatory Setting” sections of each RDEIR resource section. Much of this information has been updated, as described previously.
This summary only represents the primary modifications included as part of the RDEIR. The County reviewed and considered all comments received and has taken this recirculation opportunity to address a variety of other comments submitted on the original January 2008 Draft EIR, although
Tulare County General Plan 2030 Update
Tulare County General Plan 2030 Update ES-8 ESA / 207497 Recirculated Draft Environmental Impact Report February 2010
many changes do not constitute significant new information per CEQA. Because of this, as well as continued developments in the areas of air quality and climate change impacts regulation, the County has opted to republish the entire document, rather than selected sections. Although a part of the administrative record, because of the recirculation, the previous comments received on the original January 2008 DEIR do not require a written response in the Final EIR, and the County, as provided in CEQA Guidelines, section 15088.5(f) (1), will not respond to individual comments received on the original January 2008 DEIR but will respond to new comments received on this revised RDEIR in the Final EIR.
Summary of Environmental Impacts and Mitigation Measures Table ES-3 lists the revised or new policies and implementation measures that were identified through the CEQA process as additional mitigating policies or implementation measures for potential impacts analyzed in this RDEIR. Table ES-4 presents a summary of impacts and mitigation measures identified in this RDEIR including those proposed in this RDEIR. It is organized to correspond with the environmental issues discussed throughout the RDEIR. The table is arranged in four columns: 1) environmental impacts; 2) mitigation measure; 3) significance before mitigation; and 4) significance after mitigation.
TABLE ES-3 REQUIRED ADDITIONAL MITIGATING POLICIES AND IMPLEMENTATION MEASURES
3.1 Land Use and Aesthetics PFS-1.7 Coordination with Service Providers. The County shall work with special districts, community service districts, public utility districts, mutual water companies, private water purveyors, sanitary districts, and sewer maintenance districts to provide adequate public facilities and to plan/coordinate, as appropriate, future utility corridors in an effort to minimize future land use conflicts. [New Policy – Modified Draft EIR Analysis] LU-7.12 Historic Buildings and Areas. The County shall seek to encourage preservation of buildings and areas with special and recognized historic, architectural, or aesthetic value. New development should respect architecturally and historically significant buildings and areas. Landscaping, original roadways, sidewalks, and other public realm features of historic buildings or neighborhoods shall be restored or repaired where ever feasible. [New Policy – Modified Draft EIR Analysis] LU-7.18 Lighting. The County shall continue to improve and maintain lighting in park and recreation facilities to prevent nuisance light and glare spillage on adjoining residential areas. [New Policy – Draft EIR Analysis]. LU-7.19 Minimize Lighting Impacts. The County shall ensure that lighting in residential areas and along County roadways shall be designed to prevent artificial lighting from reflecting into adjacent natural or open space areas. [New Policy – Draft EIR Analysis]. 3.2 Traffic and Circulation TC-2.7 Rail Facilities and Existing Development. The County shall ensure that new railroad rights-of-way, yards, or stations adjacent to existing residential or commercial areas are screened or buffered to reduce noise, air, and visual impacts [New Policy – Draft EIR Analysis]. 3.4 Energy and Global Climate Change ERM-4.7 Reduce Energy Use in County Facilities. Continue to integrate energy efficiency and conservation into all County functions. ERM-4.8 Energy Efficiency Standards. The County shall encourage renovations and new development to incorporate energy efficiency and conservation measures that exceed State Title 24 standards. When feasible, the County shall offer incentives for use of energy reduction measures such as expedited permit processing, reduced fees, and technical assistance. AQ-1.7 Support Statewide Climate Change Solutions. The County shall monitor and support the efforts of Cal/EPA, CARB and the SJVAPCD, under AB 32 (Health and Safety Code §38501 et seq.), to develop a recommended list of emission reduction strategies. As appropriate, the County will evaluate each new project under the updated General Plan to determine its consistency with the emission reduction strategies. [New Policy]
Executive Summary
Tulare County General Plan 2030 Update ES-9 ESA / 207497 Recirculated Draft Environmental Impact Report February 2010
TABLE ES-3 (CONTINUED)
REQUIRED ADDITIONAL MITIGATING POLICIES AND IMPLEMENTATION MEASURES
AQ-1.8 Greenhouse Gas Emissions Reduction Plan/Climate Action Plan. The County will develop a Greenhouse Gas Emissions Reduction Plan (Plan) that identifies greenhouse gas emissions within the County as well as ways to reduce those emissions. The Plan will incorporate the requirements adopted by the California Air Resources Board specific to this issue. In addition, the County will work with the Tulare County Association of Governments and other applicable agencies to include the following key items in the regional planning efforts. o Inventory all known, or reasonably discoverable, sources of greenhouse gases in the County, o Inventory the greenhouse gas emissions in the most current year available, and those projected for year 2020, and o Set a target for the reduction of emissions attributable to the County’s discretionary land use decisions and its own
internal government operations. [New Policy – Draft EIR Analysis] AQ-1.9 Support Off-Site Measures to Reduce Greenhouse Gas Emissions. The County will support and encourage the use of off-site measures or the purchase of carbon offsets to reduce greenhouse gas emissions. [New Policy – Draft EIR Analysis] AQ Implementation Measure #16. The County shall develop and maintain a climate action plan. The climate action plan shall include the following elements: an emissions inventory, emission reduction targets, applicable greenhouse gas control measures, and monitoring and reporting plan. [New Implementation Measure – Draft EIR Analysis] AQ Implementation Measure #17. The County may inspect County facilities to evaluate energy use, the effectiveness of water conservation measures, production of GHGs, use of recycled and renewable products and indoor air quality to develop recommendations for performance improvement or mitigation. The County shall update the audit periodically and review progress towards implementation of its recommendations. [New Implementation Measure – Draft EIR Analysis] 3.5 Noise HS-8.13 Noise Analysis. The County shall require a detailed noise impact analysis in areas where current or future exterior noise levels from transportation or stationary sources have the potential to exceed the adopted noise policies of the Noise Element, where there is development of new noise sensitive land uses or the development of potential noise generating land uses near existing sensitive land uses. The noise analysis shall be the responsibility of the project applicant and be prepared by a qualified acoustical engineer (i.e., a Registered Professional Engineer in the State of California, etc.). The analysis shall include recommendations and evidence to establish mitigation that will reduce noise exposure to acceptable levels (such as those referenced in Table 10-1 of the Health and Safety Element). [New Policy – Draft EIR Analysis]. HS-8.14 Sound Attenuation Features. The County shall require sound attenuation features such as walls, berming, heavy landscaping, between commercial, industrial, and residential uses to reduce noise and vibration impacts. [New Policy – Draft EIR Analysis]. HS-8.15 Noise Buffering. The County shall require noise buffering or insulation in new development along major streets, highways, and railroad tracks. [New Policy - Draft EIR Analysis]. HS-8.16 State Noise Insulation Standards. The County shall enforce the State Noise Insulation Standards (California Administrative Code, Title 24) and Chapter 35 of the Uniform Building Code. [New Policy - Draft EIR Analysis]. HS-8.17 Coordinate with Caltrans. The County shall work with Caltrans to mitigate noise impacts on sensitive receptors near State roadways, by requiring noise buffering or insulation in new construction. [New Policy - Draft EIR Analysis]. HS-8.18 Construction Noise. The County shall seek to limit the potential noise impacts of construction activities by limiting construction activities to the hours of 7 am to 7 pm, Monday through Saturday when construction activities are located near sensitive receptors. No construction shall occur on Sundays or national holidays without a permit from the County to minimize noise impacts associated with development near sensitive receptors. [New Policy - Draft EIR Analysis]. 3.7 Geology, Soils, Seismicity, and Mineral Resources HS-2.8 Alquist-Priolo Act Compliance. The County shall not permit any structure for human occupancy to be placed within designated Earthquake Fault Zones (pursuant to and as determined by the Alquist-Priolo Earthquake Fault Zoning Act; Public Resources Code, Chapter 7.5) unless the specific provisions of the Act and Title 14 of the California Code of Regulations have been satisfied. [New Policy – Draft EIR Analysis] 3.8 Hazardous Materials and Public Safety HS-4.8 Hazardous Materials Studies. The County shall ensure that the proponents of new development projects address hazardous materials concerns through the preparation of Phase I or Phase II hazardous materials studies for each identified site as part of the design phase for each project. Recommendations required to satisfy federal or State cleanup standards outlined in the studies will be implemented as part of the construction phase for each project. [New Policy – Draft EIR Analysis].
Tulare County General Plan 2030 Update
Tulare County General Plan 2030 Update ES-10 ESA / 207497 Recirculated Draft Environmental Impact Report February 2010
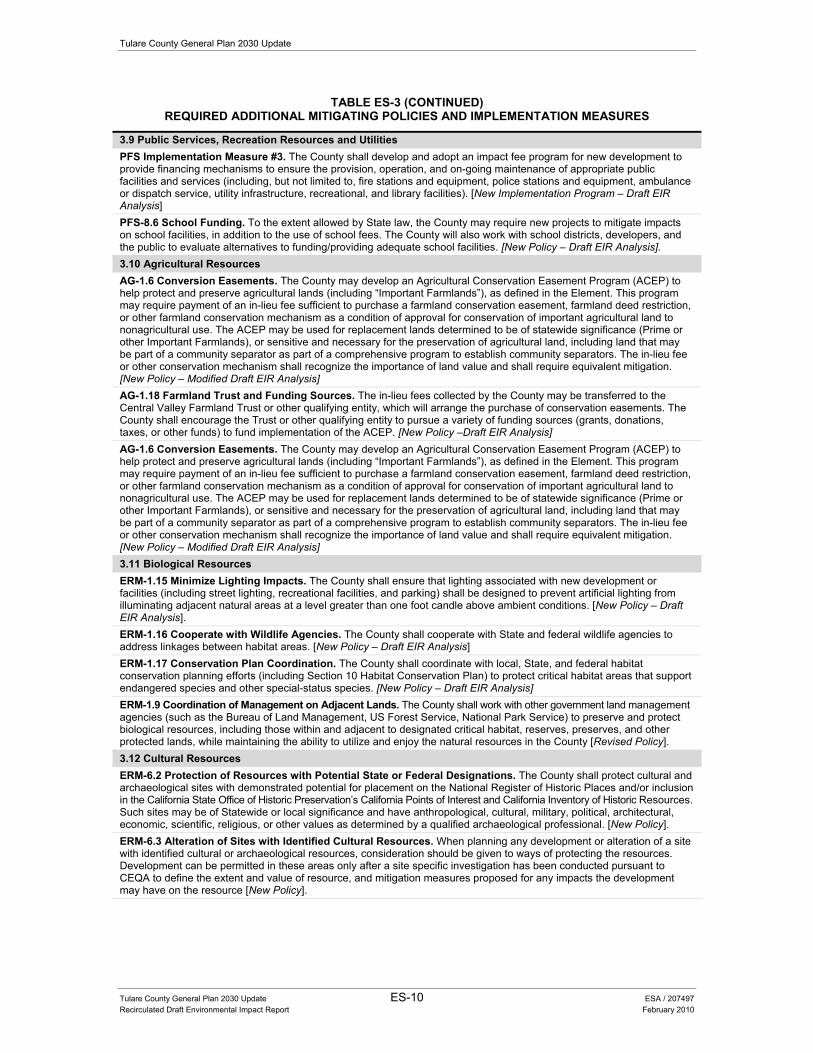
TABLE ES-3 (CONTINUED) REQUIRED ADDITIONAL MITIGATING POLICIES AND IMPLEMENTATION MEASURES
3.9 Public Services, Recreation Resources and Utilities PFS Implementation Measure #3. The County shall develop and adopt an impact fee program for new development to provide financing mechanisms to ensure the provision, operation, and on-going maintenance of appropriate public facilities and services (including, but not limited to, fire stations and equipment, police stations and equipment, ambulance or dispatch service, utility infrastructure, recreational, and library facilities). [New Implementation Program – Draft EIR Analysis] PFS-8.6 School Funding. To the extent allowed by State law, the County may require new projects to mitigate impacts on school facilities, in addition to the use of school fees. The County will also work with school districts, developers, and the public to evaluate alternatives to funding/providing adequate school facilities. [New Policy – Draft EIR Analysis]. 3.10 Agricultural Resources AG-1.6 Conversion Easements. The County may develop an Agricultural Conservation Easement Program (ACEP) to help protect and preserve agricultural lands (including “Important Farmlands”), as defined in the Element. This program may require payment of an in-lieu fee sufficient to purchase a farmland conservation easement, farmland deed restriction, or other farmland conservation mechanism as a condition of approval for conservation of important agricultural land to nonagricultural use. The ACEP may be used for replacement lands determined to be of statewide significance (Prime or other Important Farmlands), or sensitive and necessary for the preservation of agricultural land, including land that may be part of a community separator as part of a comprehensive program to establish community separators. The in-lieu fee or other conservation mechanism shall recognize the importance of land value and shall require equivalent mitigation. [New Policy – Modified Draft EIR Analysis] AG-1.18 Farmland Trust and Funding Sources. The in-lieu fees collected by the County may be transferred to the Central Valley Farmland Trust or other qualifying entity, which will arrange the purchase of conservation easements. The County shall encourage the Trust or other qualifying entity to pursue a variety of funding sources (grants, donations, taxes, or other funds) to fund implementation of the ACEP. [New Policy –Draft EIR Analysis] AG-1.6 Conversion Easements. The County may develop an Agricultural Conservation Easement Program (ACEP) to help protect and preserve agricultural lands (including “Important Farmlands”), as defined in the Element. This program may require payment of an in-lieu fee sufficient to purchase a farmland conservation easement, farmland deed restriction, or other farmland conservation mechanism as a condition of approval for conservation of important agricultural land to nonagricultural use. The ACEP may be used for replacement lands determined to be of statewide significance (Prime or other Important Farmlands), or sensitive and necessary for the preservation of agricultural land, including land that may be part of a community separator as part of a comprehensive program to establish community separators. The in-lieu fee or other conservation mechanism shall recognize the importance of land value and shall require equivalent mitigation. [New Policy – Modified Draft EIR Analysis] 3.11 Biological Resources ERM-1.15 Minimize Lighting Impacts. The County shall ensure that lighting associated with new development or facilities (including street lighting, recreational facilities, and parking) shall be designed to prevent artificial lighting from illuminating adjacent natural areas at a level greater than one foot candle above ambient conditions. [New Policy – Draft EIR Analysis]. ERM-1.16 Cooperate with Wildlife Agencies. The County shall cooperate with State and federal wildlife agencies to address linkages between habitat areas. [New Policy – Draft EIR Analysis] ERM-1.17 Conservation Plan Coordination. The County shall coordinate with local, State, and federal habitat conservation planning efforts (including Section 10 Habitat Conservation Plan) to protect critical habitat areas that support endangered species and other special-status species. [New Policy – Draft EIR Analysis] ERM-1.9 Coordination of Management on Adjacent Lands. The County shall work with other government land management agencies (such as the Bureau of Land Management, US Forest Service, National Park Service) to preserve and protect biological resources, including those within and adjacent to designated critical habitat, reserves, preserves, and other protected lands, while maintaining the ability to utilize and enjoy the natural resources in the County [Revised Policy]. 3.12 Cultural Resources ERM-6.2 Protection of Resources with Potential State or Federal Designations. The County shall protect cultural and archaeological sites with demonstrated potential for placement on the National Register of Historic Places and/or inclusion in the California State Office of Historic Preservation’s California Points of Interest and California Inventory of Historic Resources. Such sites may be of Statewide or local significance and have anthropological, cultural, military, political, architectural, economic, scientific, religious, or other values as determined by a qualified archaeological professional. [New Policy]. ERM-6.3 Alteration of Sites with Identified Cultural Resources. When planning any development or alteration of a site with identified cultural or archaeological resources, consideration should be given to ways of protecting the resources. Development can be permitted in these areas only after a site specific investigation has been conducted pursuant to CEQA to define the extent and value of resource, and mitigation measures proposed for any impacts the development may have on the resource [New Policy].
Executive Summary
Tulare County General Plan 2030 Update ES-11 ESA / 207497 Recirculated Draft Environmental Impact Report February 2010
TABLE ES-3 (CONTINUED) REQUIRED ADDITIONAL MITIGATING POLICIES AND IMPLEMENTATION MEASURES
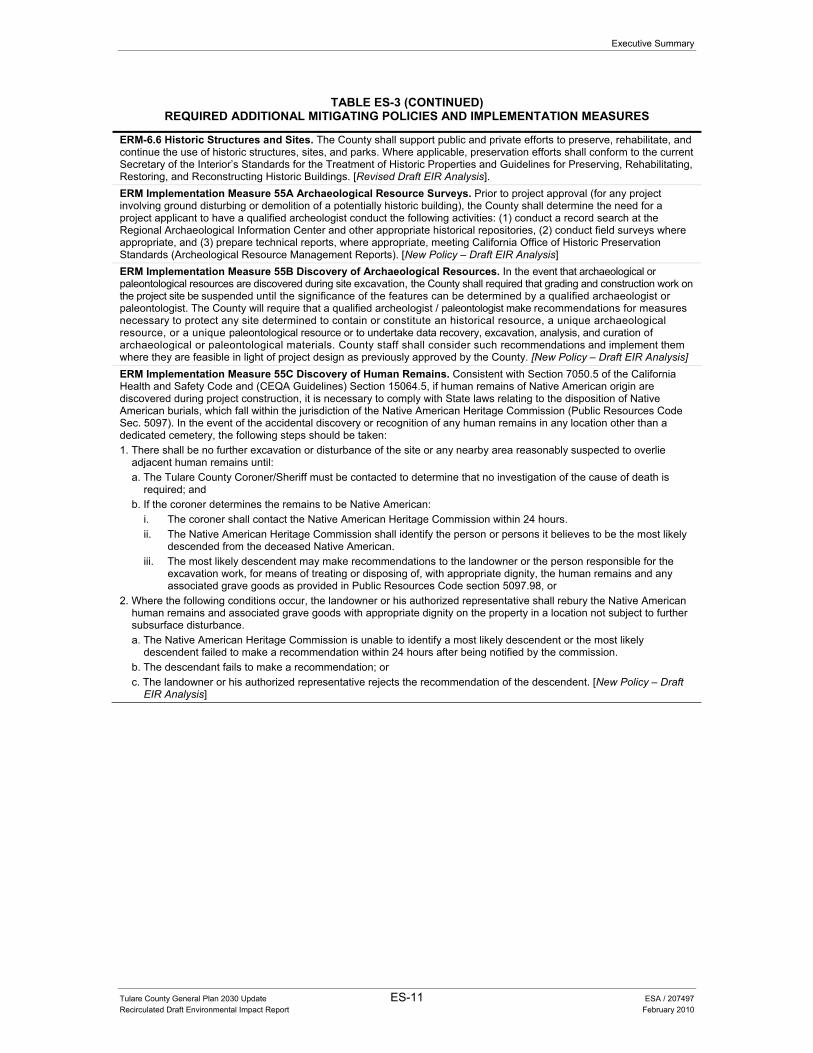
ERM-6.6 Historic Structures and Sites. The County shall support public and private efforts to preserve, rehabilitate, and continue the use of historic structures, sites, and parks. Where applicable, preservation efforts shall conform to the current Secretary of the Interior’s Standards for the Treatment of Historic Properties and Guidelines for Preserving, Rehabilitating, Restoring, and Reconstructing Historic Buildings. [Revised Draft EIR Analysis]. ERM Implementation Measure 55A Archaeological Resource Surveys. Prior to project approval (for any project involving ground disturbing or demolition of a potentially historic building), the County shall determine the need for a project applicant to have a qualified archeologist conduct the following activities: (1) conduct a record search at the Regional Archaeological Information Center and other appropriate historical repositories, (2) conduct field surveys where appropriate, and (3) prepare technical reports, where appropriate, meeting California Office of Historic Preservation Standards (Archeological Resource Management Reports). [New Policy – Draft EIR Analysis] ERM Implementation Measure 55B Discovery of Archaeological Resources. In the event that archaeological or paleontological resources are discovered during site excavation, the County shall required that grading and construction work on the project site be suspended until the significance of the features can be determined by a qualified archaeologist or paleontologist. The County will require that a qualified archeologist / paleontologist make recommendations for measures necessary to protect any site determined to contain or constitute an historical resource, a unique archaeological resource, or a unique paleontological resource or to undertake data recovery, excavation, analysis, and curation of archaeological or paleontological materials. County staff shall consider such recommendations and implement them where they are feasible in light of project design as previously approved by the County. [New Policy – Draft EIR Analysis] ERM Implementation Measure 55C Discovery of Human Remains. Consistent with Section 7050.5 of the California Health and Safety Code and (CEQA Guidelines) Section 15064.5, if human remains of Native American origin are discovered during project construction, it is necessary to comply with State laws relating to the disposition of Native American burials, which fall within the jurisdiction of the Native American Heritage Commission (Public Resources Code Sec. 5097). In the event of the accidental discovery or recognition of any human remains in any location other than a dedicated cemetery, the following steps should be taken: 1. There shall be no further excavation or disturbance of the site or any nearby area reasonably suspected to overlie
adjacent human remains until: a. The Tulare County Coroner/Sheriff must be contacted to determine that no investigation of the cause of death is
required; and b. If the coroner determines the remains to be Native American:
i. The coroner shall contact the Native American Heritage Commission within 24 hours. ii. The Native American Heritage Commission shall identify the person or persons it believes to be the most likely
descended from the deceased Native American. iii. The most likely descendent may make recommendations to the landowner or the person responsible for the
excavation work, for means of treating or disposing of, with appropriate dignity, the human remains and any associated grave goods as provided in Public Resources Code section 5097.98, or
2. Where the following conditions occur, the landowner or his authorized representative shall rebury the Native American human remains and associated grave goods with appropriate dignity on the property in a location not subject to further subsurface disturbance. a. The Native American Heritage Commission is unable to identify a most likely descendent or the most likely
descendent failed to make a recommendation within 24 hours after being notified by the commission. b. The descendant fails to make a recommendation; or c. The landowner or his authorized representative rejects the recommendation of the descendent. [New Policy – Draft
EIR Analysis]
Tulare County General Plan 2030 Update
Less Than Significant = LTS Potentially Significant = PS Significant and Unavoidable = SU
Tulare County General Plan 2030 Update ES-12 ESA / 207497 Recirculated Draft Environmental Impact Report February 2010
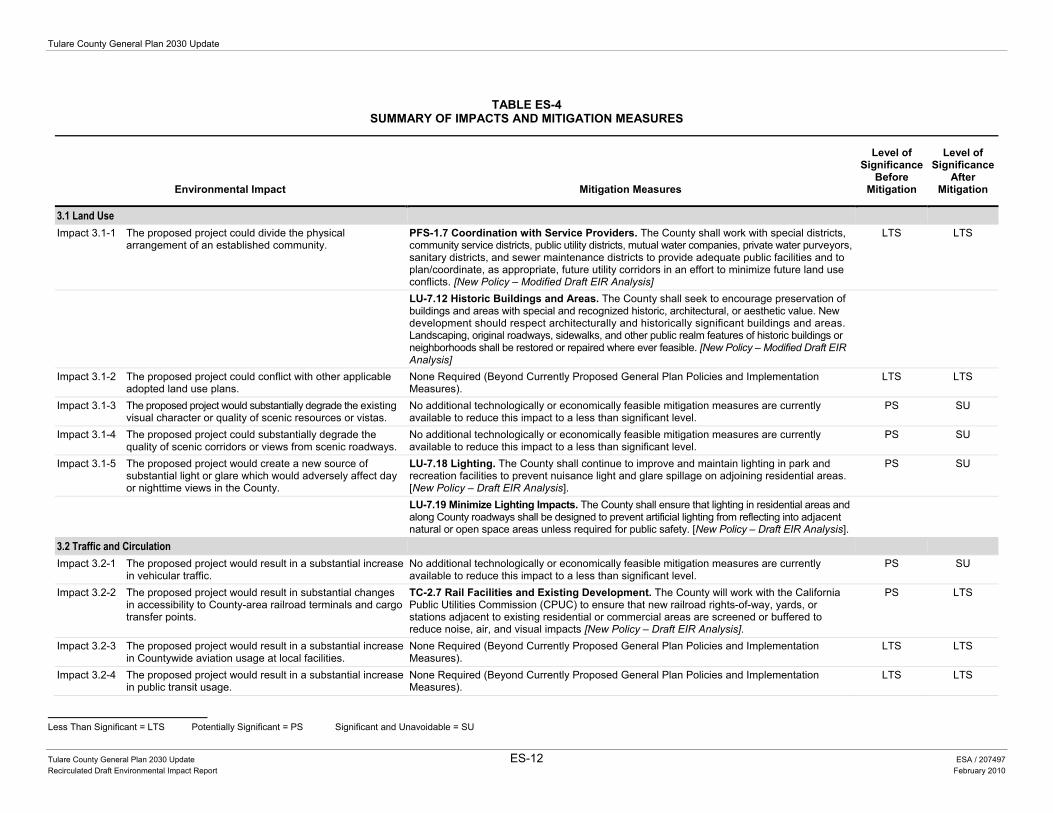
TABLE ES-4SUMMARY OF IMPACTS AND MITIGATION MEASURES
Environmental Impact Mitigation Measures
Level of Significance
Before Mitigation
Level of Significance
After Mitigation
3.1 Land Use Impact 3.1-1 The proposed project could divide the physical
arrangement of an established community. PFS-1.7 Coordination with Service Providers. The County shall work with special districts, community service districts, public utility districts, mutual water companies, private water purveyors, sanitary districts, and sewer maintenance districts to provide adequate public facilities and to plan/coordinate, as appropriate, future utility corridors in an effort to minimize future land use conflicts. [New Policy – Modified Draft EIR Analysis]
LTS LTS
LU-7.12 Historic Buildings and Areas. The County shall seek to encourage preservation of buildings and areas with special and recognized historic, architectural, or aesthetic value. New development should respect architecturally and historically significant buildings and areas. Landscaping, original roadways, sidewalks, and other public realm features of historic buildings or neighborhoods shall be restored or repaired where ever feasible. [New Policy – Modified Draft EIR Analysis]
Impact 3.1-2 The proposed project could conflict with other applicable adopted land use plans.
None Required (Beyond Currently Proposed General Plan Policies and Implementation Measures).
LTS LTS
Impact 3.1-3 The proposed project would substantially degrade the existing visual character or quality of scenic resources or vistas.
No additional technologically or economically feasible mitigation measures are currently available to reduce this impact to a less than significant level.
PS SU
Impact 3.1-4 The proposed project could substantially degrade the quality of scenic corridors or views from scenic roadways.
No additional technologically or economically feasible mitigation measures are currently available to reduce this impact to a less than significant level.
PS SU
Impact 3.1-5 The proposed project would create a new source of substantial light or glare which would adversely affect day or nighttime views in the County.
LU-7.18 Lighting. The County shall continue to improve and maintain lighting in park and recreation facilities to prevent nuisance light and glare spillage on adjoining residential areas. [New Policy – Draft EIR Analysis].
PS SU
LU-7.19 Minimize Lighting Impacts. The County shall ensure that lighting in residential areas and along County roadways shall be designed to prevent artificial lighting from reflecting into adjacent natural or open space areas unless required for public safety. [New Policy – Draft EIR Analysis].
3.2 Traffic and Circulation Impact 3.2-1 The proposed project would result in a substantial increase
in vehicular traffic. No additional technologically or economically feasible mitigation measures are currently available to reduce this impact to a less than significant level.
PS SU
Impact 3.2-2 The proposed project would result in substantial changes in accessibility to County-area railroad terminals and cargo transfer points.
TC-2.7 Rail Facilities and Existing Development. The County will work with the California Public Utilities Commission (CPUC) to ensure that new railroad rights-of-way, yards, or stations adjacent to existing residential or commercial areas are screened or buffered to reduce noise, air, and visual impacts [New Policy – Draft EIR Analysis].
PS LTS
Impact 3.2-3 The proposed project would result in a substantial increase in Countywide aviation usage at local facilities.
None Required (Beyond Currently Proposed General Plan Policies and Implementation Measures).
LTS LTS
Impact 3.2-4 The proposed project would result in a substantial increase in public transit usage.
None Required (Beyond Currently Proposed General Plan Policies and Implementation Measures).
LTS LTS
Executive Summary
Less Than Significant = LTS Potentially Significant = PS Significant and Unavoidable = SU
Tulare County General Plan 2030 Update ES-13 ESA / 207497 Recirculated Draft Environmental Impact Report February 2010
TABLE ES-4 (CONTINUED)SUMMARY OF IMPACTS AND MITIGATION MEASURES
Environmental Impact Mitigation Measures
Level of Significance
Before Mitigation
Level of Significance
After Mitigation
Impact 3.2-5 The proposed project would result in a substantial increase in bicycle and pedestrian activity.
None Required (Beyond Currently Proposed General Plan Policies and Implementation Measures).
LTS LTS
3.3 Air Quality Impact 3.3-1 The proposed project could expose a variety of sensitive
land uses to construction-related air quality emissions. None Required (Beyond Currently Proposed General Plan Policies and Implementation Measures).
LTS LTS
Impact 3.3-2 The proposed project would result in a cumulatively considerable net increase of criteria air pollutants that result in a violation of an air quality standard.
No additional technologically or economically feasible mitigation measures are currently available to reduce this impact to a less than significant level.
PS SU
Impact 3.3-3 The proposed project could conflict with or obstruct implementation of an applicable air quality plan.
No additional technologically or economically feasible mitigation measures are currently available to reduce this impact to a less than significant level.
PS SU
Impact 3.3-4 The proposed project could expose sensitive receptors to substantial pollutant concentrations that could affect public health.
No additional technologically or economically feasible mitigation measures are currently available to reduce this impact to a less than significant level.
PS SU
Impact 3.3-5 The proposed project could create objectionable odors affecting a substantial number of people.
None Required (Beyond Currently Proposed General Plan Policies and Implementation Measures).
LTS LTS
3.4 Energy and Global Climate Change Impact 3.4-1 The proposed project could result in the wasteful,
inefficient, or unnecessary consumption of energy by residential, commercial, industrial, or public uses associated with increased demand due to anticipated population growth in the County.
None Required (Beyond Currently Proposed General Plan Policies and Implementation Measures).
LTS LTS
Impact 3.4-2 The proposed project would not result in the wasteful, inefficient, or unnecessary consumption of energy in the construction and operation of new buildings.
ERM-4.7 Reduce Energy Use in County Facilities. Continue to integrate energy efficiency and conservation into all County functions.
LTS LTS
ERM-4.8 Energy Efficiency Standards. The County shall encourage renovations and new development to incorporate energy efficiency and conservation measures that exceed State Title 24 standards. When feasible, the County shall offer incentives for use of energy reduction measures such as expedited permit processing, reduced fees, and technical assistance.
Impact 3.4-3 The proposed project would potentially conflict with the State goal of reducing greenhouse gas emissions in California to 1990 levels by 2020, as set forth by the timetable established in AB 32, California Global Warming Solutions Act of 2006.
AQ-1.7 Support Statewide Climate Change Solutions. The County shall monitor and support the efforts of Cal/EPA, CARB and the SJVAPCD, under AB 32, to develop a recommended list of emission reduction strategies. As appropriate, the County will evaluate each new project under the updated General Plan to determine its consistency with the emission reduction strategies. [New Policy]
PS SU
Tulare County General Plan 2030 Update
Less Than Significant = LTS Potentially Significant = PS Significant and Unavoidable = SU
Tulare County General Plan 2030 Update ES-14 ESA / 207497 Recirculated Draft Environmental Impact Report February 2010
TABLE ES-4 (CONTINUED)SUMMARY OF IMPACTS AND MITIGATION MEASURES
Environmental Impact Mitigation Measures
Level of Significance
Before Mitigation
Level of Significance
After Mitigation
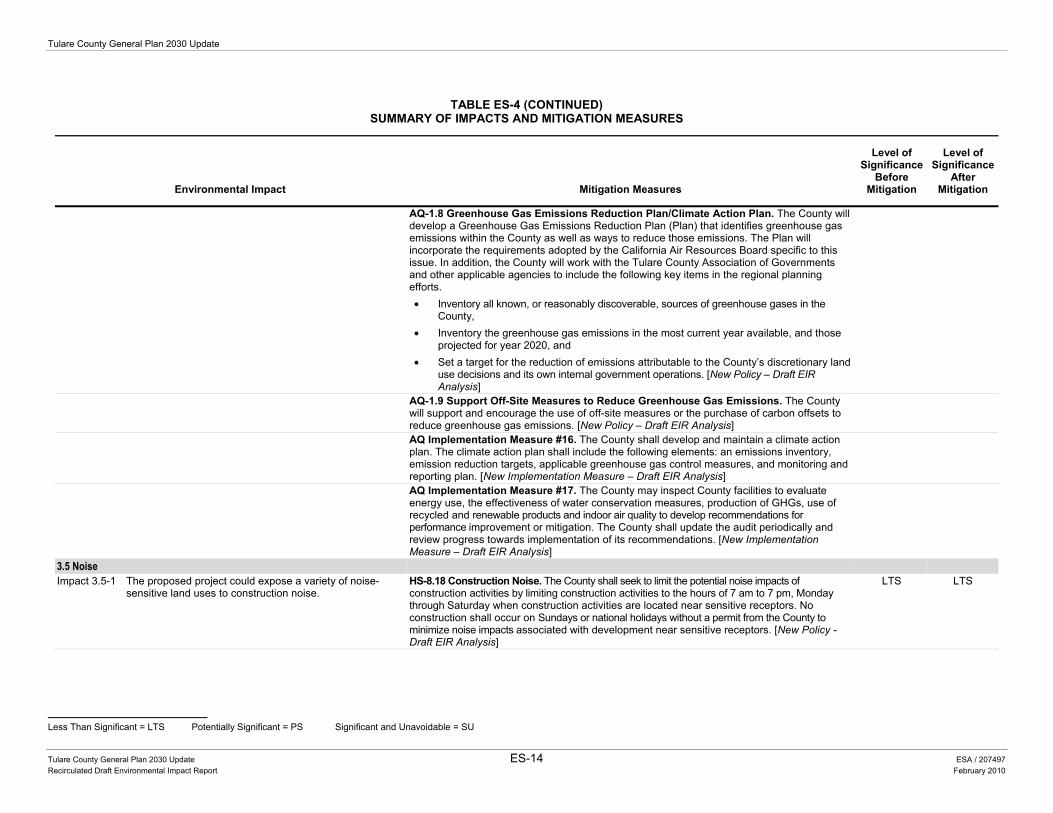
AQ-1.8 Greenhouse Gas Emissions Reduction Plan/Climate Action Plan. The County will develop a Greenhouse Gas Emissions Reduction Plan (Plan) that identifies greenhouse gas emissions within the County as well as ways to reduce those emissions. The Plan will incorporate the requirements adopted by the California Air Resources Board specific to this issue. In addition, the County will work with the Tulare County Association of Governments and other applicable agencies to include the following key items in the regional planning efforts. • Inventory all known, or reasonably discoverable, sources of greenhouse gases in the
County, • Inventory the greenhouse gas emissions in the most current year available, and those
projected for year 2020, and • Set a target for the reduction of emissions attributable to the County’s discretionary land
use decisions and its own internal government operations. [New Policy – Draft EIR Analysis]
AQ-1.9 Support Off-Site Measures to Reduce Greenhouse Gas Emissions. The County will support and encourage the use of off-site measures or the purchase of carbon offsets to reduce greenhouse gas emissions. [New Policy – Draft EIR Analysis]
AQ Implementation Measure #16. The County shall develop and maintain a climate action plan. The climate action plan shall include the following elements: an emissions inventory, emission reduction targets, applicable greenhouse gas control measures, and monitoring and reporting plan. [New Implementation Measure – Draft EIR Analysis]
AQ Implementation Measure #17. The County may inspect County facilities to evaluate energy use, the effectiveness of water conservation measures, production of GHGs, use of recycled and renewable products and indoor air quality to develop recommendations for performance improvement or mitigation. The County shall update the audit periodically and review progress towards implementation of its recommendations. [New Implementation Measure – Draft EIR Analysis]
3.5 Noise Impact 3.5-1 The proposed project could expose a variety of noise-
sensitive land uses to construction noise. HS-8.18 Construction Noise. The County shall seek to limit the potential noise impacts of construction activities by limiting construction activities to the hours of 7 am to 7 pm, Monday through Saturday when construction activities are located near sensitive receptors. No construction shall occur on Sundays or national holidays without a permit from the County to minimize noise impacts associated with development near sensitive receptors. [New Policy - Draft EIR Analysis]
LTS LTS
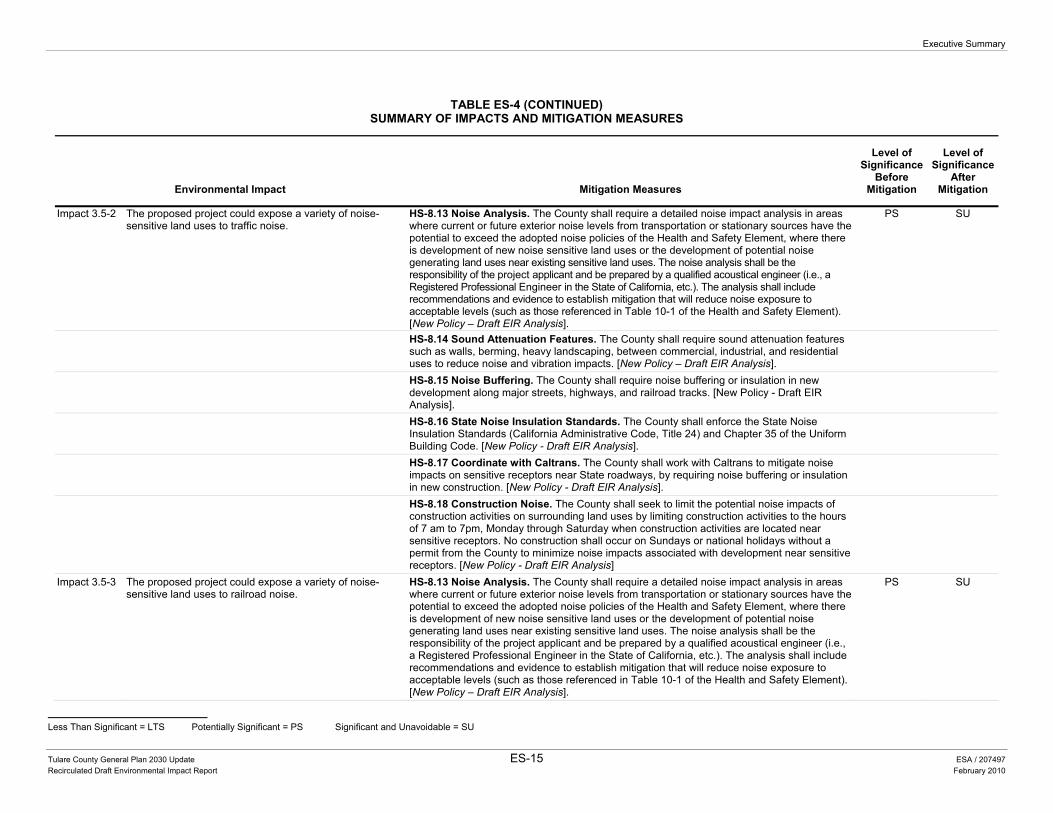
Executive Summary
Less Than Significant = LTS Potentially Significant = PS Significant and Unavoidable = SU
Tulare County General Plan 2030 Update ES-15 ESA / 207497 Recirculated Draft Environmental Impact Report February 2010
TABLE ES-4 (CONTINUED)SUMMARY OF IMPACTS AND MITIGATION MEASURES
Environmental Impact Mitigation Measures
Level of Significance
Before Mitigation
Level of Significance
After Mitigation
Impact 3.5-2 The proposed project could expose a variety of noise-sensitive land uses to traffic noise.
HS-8.13 Noise Analysis. The County shall require a detailed noise impact analysis in areas where current or future exterior noise levels from transportation or stationary sources have the potential to exceed the adopted noise policies of the Health and Safety Element, where there is development of new noise sensitive land uses or the development of potential noise generating land uses near existing sensitive land uses. The noise analysis shall be the responsibility of the project applicant and be prepared by a qualified acoustical engineer (i.e., a Registered Professional Engineer in the State of California, etc.). The analysis shall include recommendations and evidence to establish mitigation that will reduce noise exposure to acceptable levels (such as those referenced in Table 10-1 of the Health and Safety Element). [New Policy – Draft EIR Analysis].
PS SU
HS-8.14 Sound Attenuation Features. The County shall require sound attenuation features such as walls, berming, heavy landscaping, between commercial, industrial, and residential uses to reduce noise and vibration impacts. [New Policy – Draft EIR Analysis].
HS-8.15 Noise Buffering. The County shall require noise buffering or insulation in new development along major streets, highways, and railroad tracks. [New Policy - Draft EIR Analysis].
HS-8.16 State Noise Insulation Standards. The County shall enforce the State Noise Insulation Standards (California Administrative Code, Title 24) and Chapter 35 of the Uniform Building Code. [New Policy - Draft EIR Analysis].
HS-8.17 Coordinate with Caltrans. The County shall work with Caltrans to mitigate noise impacts on sensitive receptors near State roadways, by requiring noise buffering or insulation in new construction. [New Policy - Draft EIR Analysis].
HS-8.18 Construction Noise. The County shall seek to limit the potential noise impacts of construction activities on surrounding land uses by limiting construction activities to the hours of 7 am to 7pm, Monday through Saturday when construction activities are located near sensitive receptors. No construction shall occur on Sundays or national holidays without a permit from the County to minimize noise impacts associated with development near sensitive receptors. [New Policy - Draft EIR Analysis]
Impact 3.5-3 The proposed project could expose a variety of noise-sensitive land uses to railroad noise.
HS-8.13 Noise Analysis. The County shall require a detailed noise impact analysis in areas where current or future exterior noise levels from transportation or stationary sources have the potential to exceed the adopted noise policies of the Health and Safety Element, where there is development of new noise sensitive land uses or the development of potential noise generating land uses near existing sensitive land uses. The noise analysis shall be the responsibility of the project applicant and be prepared by a qualified acoustical engineer (i.e., a Registered Professional Engineer in the State of California, etc.). The analysis shall include recommendations and evidence to establish mitigation that will reduce noise exposure to acceptable levels (such as those referenced in Table 10-1 of the Health and Safety Element). [New Policy – Draft EIR Analysis].
PS SU
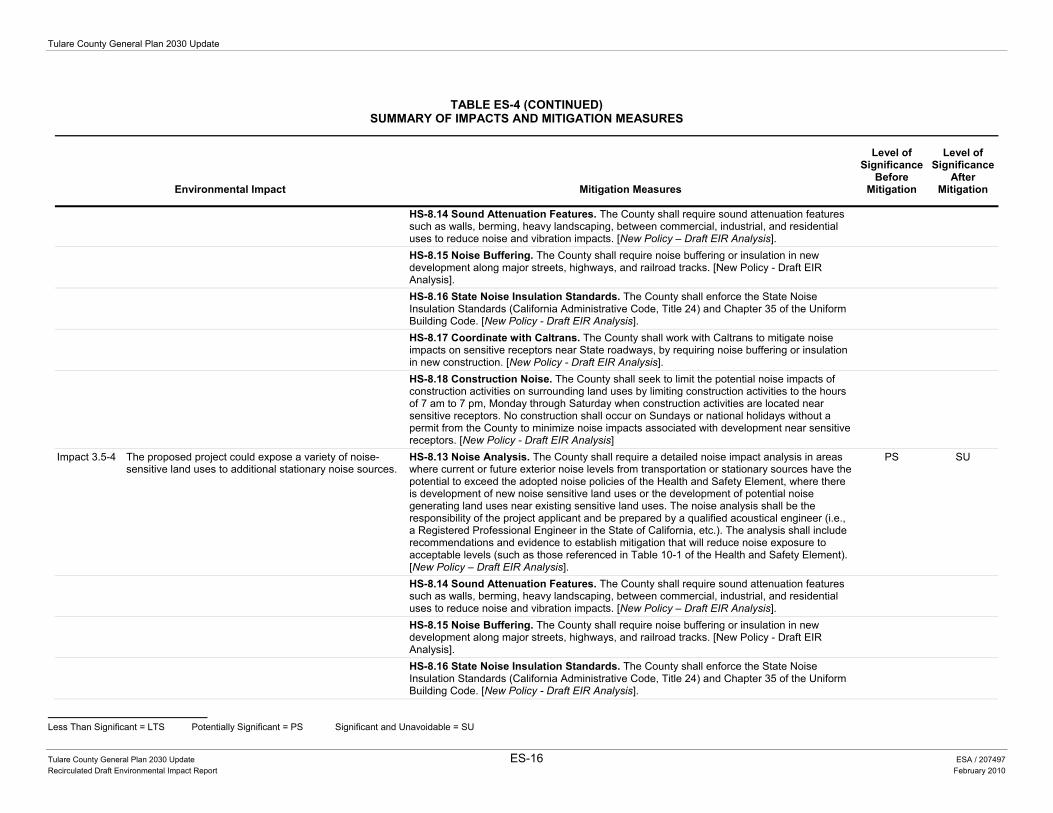
Tulare County General Plan 2030 Update
Less Than Significant = LTS Potentially Significant = PS Significant and Unavoidable = SU
Tulare County General Plan 2030 Update ES-16 ESA / 207497 Recirculated Draft Environmental Impact Report February 2010
TABLE ES-4 (CONTINUED)SUMMARY OF IMPACTS AND MITIGATION MEASURES
Environmental Impact Mitigation Measures
Level of Significance
Before Mitigation
Level of Significance
After Mitigation
HS-8.14 Sound Attenuation Features. The County shall require sound attenuation features such as walls, berming, heavy landscaping, between commercial, industrial, and residential uses to reduce noise and vibration impacts. [New Policy – Draft EIR Analysis].
HS-8.15 Noise Buffering. The County shall require noise buffering or insulation in new development along major streets, highways, and railroad tracks. [New Policy - Draft EIR Analysis].
HS-8.16 State Noise Insulation Standards. The County shall enforce the State Noise Insulation Standards (California Administrative Code, Title 24) and Chapter 35 of the Uniform Building Code. [New Policy - Draft EIR Analysis].
HS-8.17 Coordinate with Caltrans. The County shall work with Caltrans to mitigate noise impacts on sensitive receptors near State roadways, by requiring noise buffering or insulation in new construction. [New Policy - Draft EIR Analysis].
HS-8.18 Construction Noise. The County shall seek to limit the potential noise impacts of construction activities on surrounding land uses by limiting construction activities to the hours of 7 am to 7 pm, Monday through Saturday when construction activities are located near sensitive receptors. No construction shall occur on Sundays or national holidays without a permit from the County to minimize noise impacts associated with development near sensitive receptors. [New Policy - Draft EIR Analysis]
Impact 3.5-4 The proposed project could expose a variety of noise-sensitive land uses to additional stationary noise sources.
HS-8.13 Noise Analysis. The County shall require a detailed noise impact analysis in areas where current or future exterior noise levels from transportation or stationary sources have the potential to exceed the adopted noise policies of the Health and Safety Element, where there is development of new noise sensitive land uses or the development of potential noise generating land uses near existing sensitive land uses. The noise analysis shall be the responsibility of the project applicant and be prepared by a qualified acoustical engineer (i.e., a Registered Professional Engineer in the State of California, etc.). The analysis shall include recommendations and evidence to establish mitigation that will reduce noise exposure to acceptable levels (such as those referenced in Table 10-1 of the Health and Safety Element). [New Policy – Draft EIR Analysis].
PS SU
HS-8.14 Sound Attenuation Features. The County shall require sound attenuation features such as walls, berming, heavy landscaping, between commercial, industrial, and residential uses to reduce noise and vibration impacts. [New Policy – Draft EIR Analysis].
HS-8.15 Noise Buffering. The County shall require noise buffering or insulation in new development along major streets, highways, and railroad tracks. [New Policy - Draft EIR Analysis].
HS-8.16 State Noise Insulation Standards. The County shall enforce the State Noise Insulation Standards (California Administrative Code, Title 24) and Chapter 35 of the Uniform Building Code. [New Policy - Draft EIR Analysis].
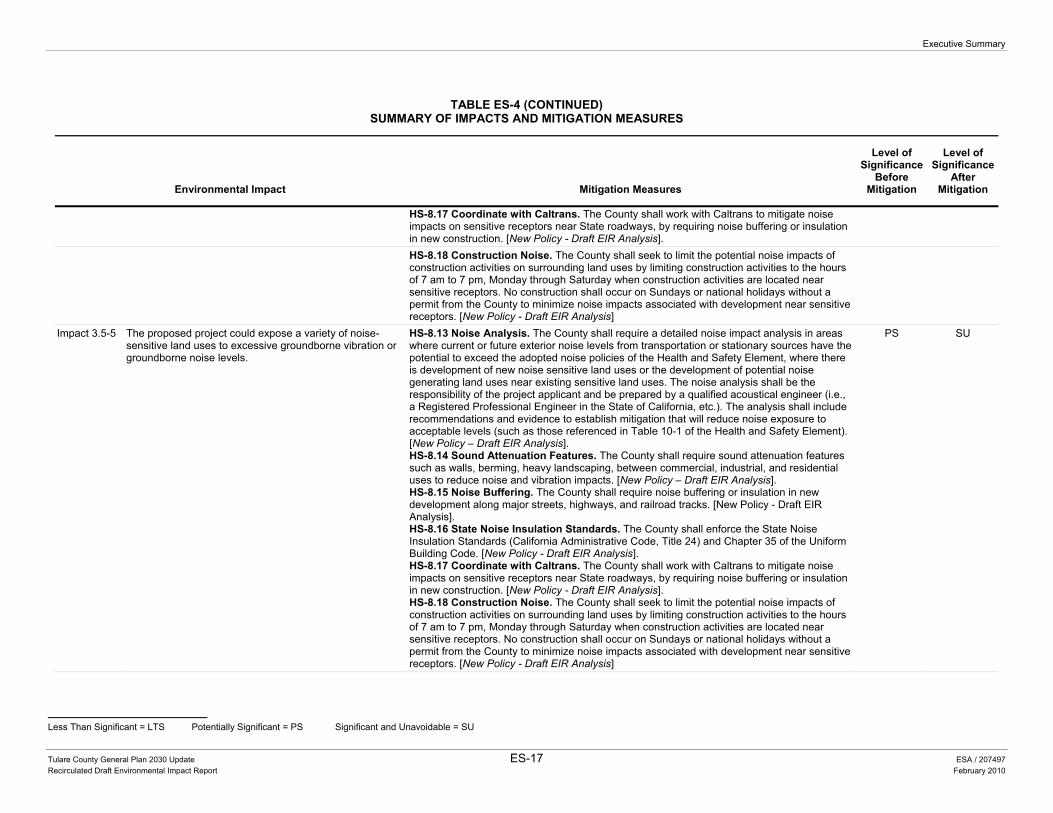
Executive Summary
Less Than Significant = LTS Potentially Significant = PS Significant and Unavoidable = SU
Tulare County General Plan 2030 Update ES-17 ESA / 207497 Recirculated Draft Environmental Impact Report February 2010
TABLE ES-4 (CONTINUED)SUMMARY OF IMPACTS AND MITIGATION MEASURES
Environmental Impact Mitigation Measures
Level of Significance
Before Mitigation
Level of Significance
After Mitigation
HS-8.17 Coordinate with Caltrans. The County shall work with Caltrans to mitigate noise impacts on sensitive receptors near State roadways, by requiring noise buffering or insulation in new construction. [New Policy - Draft EIR Analysis].
HS-8.18 Construction Noise. The County shall seek to limit the potential noise impacts of construction activities on surrounding land uses by limiting construction activities to the hours of 7 am to 7 pm, Monday through Saturday when construction activities are located near sensitive receptors. No construction shall occur on Sundays or national holidays without a permit from the County to minimize noise impacts associated with development near sensitive receptors. [New Policy - Draft EIR Analysis]
Impact 3.5-5 The proposed project could expose a variety of noise-sensitive land uses to excessive groundborne vibration or groundborne noise levels.
HS-8.13 Noise Analysis. The County shall require a detailed noise impact analysis in areas where current or future exterior noise levels from transportation or stationary sources have the potential to exceed the adopted noise policies of the Health and Safety Element, where there is development of new noise sensitive land uses or the development of potential noise generating land uses near existing sensitive land uses. The noise analysis shall be the responsibility of the project applicant and be prepared by a qualified acoustical engineer (i.e., a Registered Professional Engineer in the State of California, etc.). The analysis shall include recommendations and evidence to establish mitigation that will reduce noise exposure to acceptable levels (such as those referenced in Table 10-1 of the Health and Safety Element). [New Policy – Draft EIR Analysis]. HS-8.14 Sound Attenuation Features. The County shall require sound attenuation features such as walls, berming, heavy landscaping, between commercial, industrial, and residential uses to reduce noise and vibration impacts. [New Policy – Draft EIR Analysis]. HS-8.15 Noise Buffering. The County shall require noise buffering or insulation in new development along major streets, highways, and railroad tracks. [New Policy - Draft EIR Analysis]. HS-8.16 State Noise Insulation Standards. The County shall enforce the State Noise Insulation Standards (California Administrative Code, Title 24) and Chapter 35 of the Uniform Building Code. [New Policy - Draft EIR Analysis]. HS-8.17 Coordinate with Caltrans. The County shall work with Caltrans to mitigate noise impacts on sensitive receptors near State roadways, by requiring noise buffering or insulation in new construction. [New Policy - Draft EIR Analysis]. HS-8.18 Construction Noise. The County shall seek to limit the potential noise impacts of construction activities on surrounding land uses by limiting construction activities to the hours of 7 am to 7 pm, Monday through Saturday when construction activities are located near sensitive receptors. No construction shall occur on Sundays or national holidays without a permit from the County to minimize noise impacts associated with development near sensitive receptors. [New Policy - Draft EIR Analysis]
PS SU
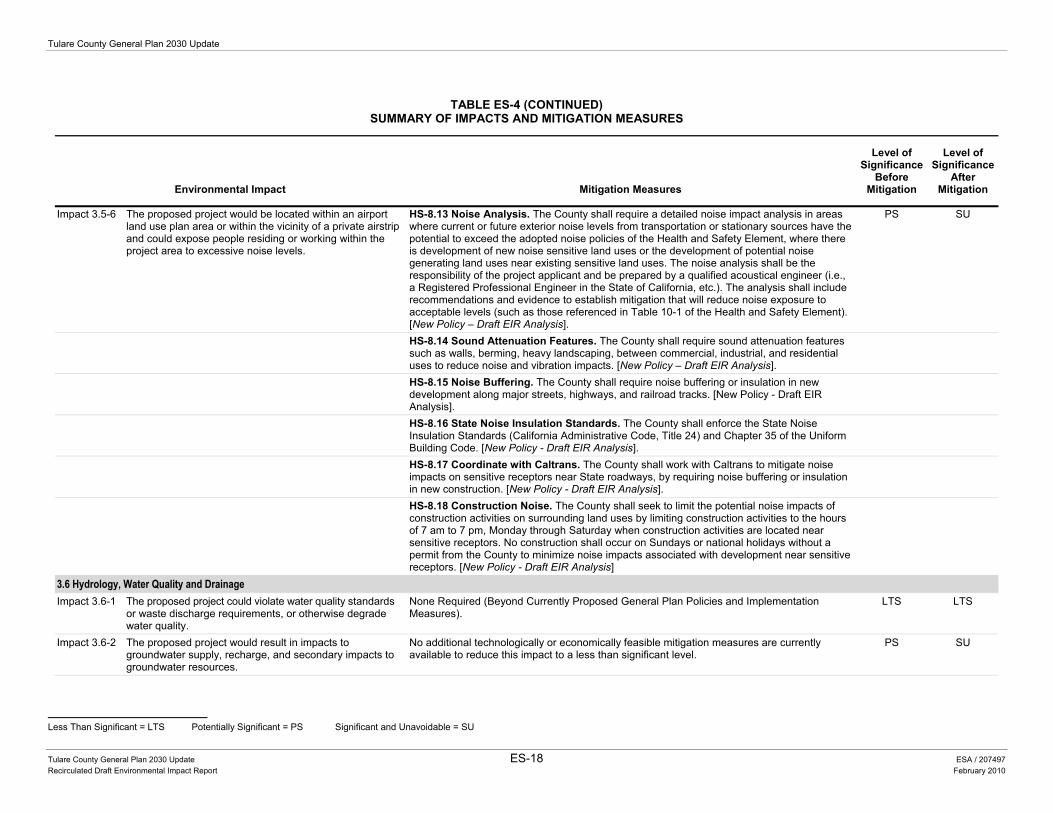
Tulare County General Plan 2030 Update
Less Than Significant = LTS Potentially Significant = PS Significant and Unavoidable = SU
Tulare County General Plan 2030 Update ES-18 ESA / 207497 Recirculated Draft Environmental Impact Report February 2010
TABLE ES-4 (CONTINUED)SUMMARY OF IMPACTS AND MITIGATION MEASURES
Environmental Impact Mitigation Measures
Level of Significance
Before Mitigation
Level of Significance
After Mitigation
Impact 3.5-6 The proposed project would be located within an airport land use plan area or within the vicinity of a private airstrip and could expose people residing or working within the project area to excessive noise levels.
HS-8.13 Noise Analysis. The County shall require a detailed noise impact analysis in areas where current or future exterior noise levels from transportation or stationary sources have the potential to exceed the adopted noise policies of the Health and Safety Element, where there is development of new noise sensitive land uses or the development of potential noise generating land uses near existing sensitive land uses. The noise analysis shall be the responsibility of the project applicant and be prepared by a qualified acoustical engineer (i.e., a Registered Professional Engineer in the State of California, etc.). The analysis shall include recommendations and evidence to establish mitigation that will reduce noise exposure to acceptable levels (such as those referenced in Table 10-1 of the Health and Safety Element). [New Policy – Draft EIR Analysis].
PS SU
HS-8.14 Sound Attenuation Features. The County shall require sound attenuation features such as walls, berming, heavy landscaping, between commercial, industrial, and residential uses to reduce noise and vibration impacts. [New Policy – Draft EIR Analysis].
HS-8.15 Noise Buffering. The County shall require noise buffering or insulation in new development along major streets, highways, and railroad tracks. [New Policy - Draft EIR Analysis].
HS-8.16 State Noise Insulation Standards. The County shall enforce the State Noise Insulation Standards (California Administrative Code, Title 24) and Chapter 35 of the Uniform Building Code. [New Policy - Draft EIR Analysis].
HS-8.17 Coordinate with Caltrans. The County shall work with Caltrans to mitigate noise impacts on sensitive receptors near State roadways, by requiring noise buffering or insulation in new construction. [New Policy - Draft EIR Analysis].
HS-8.18 Construction Noise. The County shall seek to limit the potential noise impacts of construction activities on surrounding land uses by limiting construction activities to the hours of 7 am to 7 pm, Monday through Saturday when construction activities are located near sensitive receptors. No construction shall occur on Sundays or national holidays without a permit from the County to minimize noise impacts associated with development near sensitive receptors. [New Policy - Draft EIR Analysis]
3.6 Hydrology, Water Quality and Drainage Impact 3.6-1 The proposed project could violate water quality standards
or waste discharge requirements, or otherwise degrade water quality.
None Required (Beyond Currently Proposed General Plan Policies and Implementation Measures).
LTS LTS
Impact 3.6-2 The proposed project would result in impacts to groundwater supply, recharge, and secondary impacts to groundwater resources.
No additional technologically or economically feasible mitigation measures are currently available to reduce this impact to a less than significant level.
PS SU
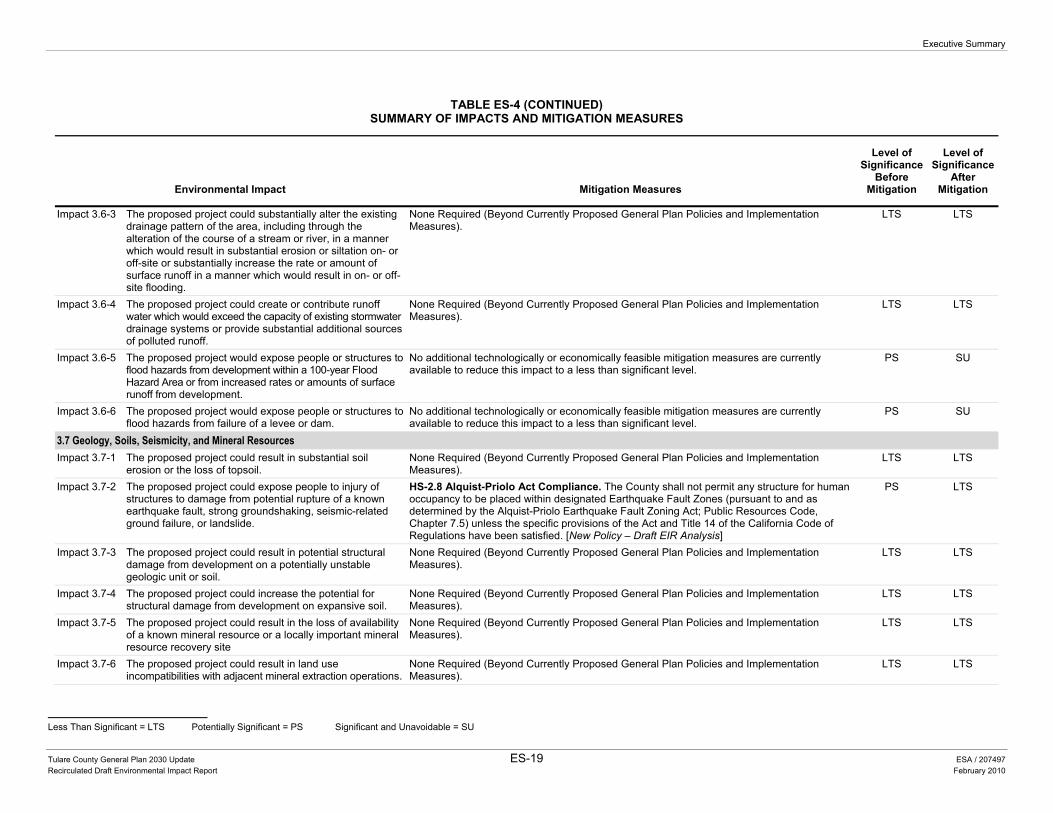
Executive Summary
Less Than Significant = LTS Potentially Significant = PS Significant and Unavoidable = SU
Tulare County General Plan 2030 Update ES-19 ESA / 207497 Recirculated Draft Environmental Impact Report February 2010
TABLE ES-4 (CONTINUED)SUMMARY OF IMPACTS AND MITIGATION MEASURES
Environmental Impact Mitigation Measures
Level of Significance
Before Mitigation
Level of Significance
After Mitigation
Impact 3.6-3 The proposed project could substantially alter the existing drainage pattern of the area, including through the alteration of the course of a stream or river, in a manner which would result in substantial erosion or siltation on- or off-site or substantially increase the rate or amount of surface runoff in a manner which would result in on- or off-site flooding.
None Required (Beyond Currently Proposed General Plan Policies and Implementation Measures).
LTS LTS
Impact 3.6-4 The proposed project could create or contribute runoff water which would exceed the capacity of existing stormwater drainage systems or provide substantial additional sources of polluted runoff.
None Required (Beyond Currently Proposed General Plan Policies and Implementation Measures).
LTS LTS
Impact 3.6-5 The proposed project would expose people or structures to flood hazards from development within a 100-year Flood Hazard Area or from increased rates or amounts of surface runoff from development.
No additional technologically or economically feasible mitigation measures are currently available to reduce this impact to a less than significant level.
PS SU
Impact 3.6-6 The proposed project would expose people or structures to flood hazards from failure of a levee or dam.
No additional technologically or economically feasible mitigation measures are currently available to reduce this impact to a less than significant level.
PS SU
3.7 Geology, Soils, Seismicity, and Mineral Resources Impact 3.7-1 The proposed project could result in substantial soil
erosion or the loss of topsoil. None Required (Beyond Currently Proposed General Plan Policies and Implementation Measures).
LTS LTS
Impact 3.7-2 The proposed project could expose people to injury of structures to damage from potential rupture of a known earthquake fault, strong groundshaking, seismic-related ground failure, or landslide.
HS-2.8 Alquist-Priolo Act Compliance. The County shall not permit any structure for human occupancy to be placed within designated Earthquake Fault Zones (pursuant to and as determined by the Alquist-Priolo Earthquake Fault Zoning Act; Public Resources Code, Chapter 7.5) unless the specific provisions of the Act and Title 14 of the California Code of Regulations have been satisfied. [New Policy – Draft EIR Analysis]
PS LTS
Impact 3.7-3 The proposed project could result in potential structural damage from development on a potentially unstable geologic unit or soil.
None Required (Beyond Currently Proposed General Plan Policies and Implementation Measures).
LTS LTS
Impact 3.7-4 The proposed project could increase the potential for structural damage from development on expansive soil.
None Required (Beyond Currently Proposed General Plan Policies and Implementation Measures).
LTS LTS
Impact 3.7-5 The proposed project could result in the loss of availability of a known mineral resource or a locally important mineral resource recovery site
None Required (Beyond Currently Proposed General Plan Policies and Implementation Measures).
LTS LTS
Impact 3.7-6 The proposed project could result in land use incompatibilities with adjacent mineral extraction operations.
None Required (Beyond Currently Proposed General Plan Policies and Implementation Measures).
LTS LTS
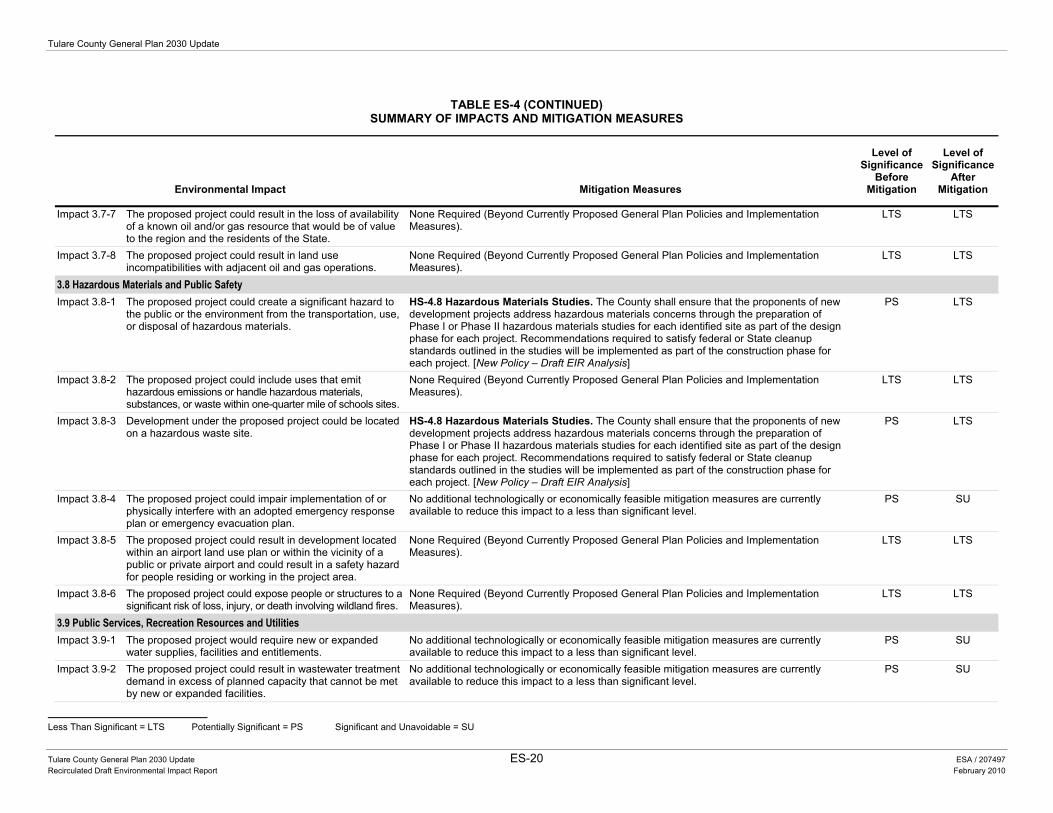
Tulare County General Plan 2030 Update
Less Than Significant = LTS Potentially Significant = PS Significant and Unavoidable = SU
Tulare County General Plan 2030 Update ES-20 ESA / 207497 Recirculated Draft Environmental Impact Report February 2010
TABLE ES-4 (CONTINUED)SUMMARY OF IMPACTS AND MITIGATION MEASURES
Environmental Impact Mitigation Measures
Level of Significance
Before Mitigation
Level of Significance
After Mitigation
Impact 3.7-7 The proposed project could result in the loss of availability of a known oil and/or gas resource that would be of value to the region and the residents of the State.
None Required (Beyond Currently Proposed General Plan Policies and Implementation Measures).
LTS LTS
Impact 3.7-8 The proposed project could result in land use incompatibilities with adjacent oil and gas operations.
None Required (Beyond Currently Proposed General Plan Policies and Implementation Measures).
LTS LTS
3.8 Hazardous Materials and Public Safety Impact 3.8-1 The proposed project could create a significant hazard to
the public or the environment from the transportation, use, or disposal of hazardous materials.
HS-4.8 Hazardous Materials Studies. The County shall ensure that the proponents of new development projects address hazardous materials concerns through the preparation of Phase I or Phase II hazardous materials studies for each identified site as part of the design phase for each project. Recommendations required to satisfy federal or State cleanup standards outlined in the studies will be implemented as part of the construction phase for each project. [New Policy – Draft EIR Analysis]
PS LTS
Impact 3.8-2 The proposed project could include uses that emit hazardous emissions or handle hazardous materials, substances, or waste within one-quarter mile of schools sites.
None Required (Beyond Currently Proposed General Plan Policies and Implementation Measures).
LTS LTS
Impact 3.8-3 Development under the proposed project could be located on a hazardous waste site.
HS-4.8 Hazardous Materials Studies. The County shall ensure that the proponents of new development projects address hazardous materials concerns through the preparation of Phase I or Phase II hazardous materials studies for each identified site as part of the design phase for each project. Recommendations required to satisfy federal or State cleanup standards outlined in the studies will be implemented as part of the construction phase for each project. [New Policy – Draft EIR Analysis]
PS LTS
Impact 3.8-4 The proposed project could impair implementation of or physically interfere with an adopted emergency response plan or emergency evacuation plan.
No additional technologically or economically feasible mitigation measures are currently available to reduce this impact to a less than significant level.
PS SU
Impact 3.8-5 The proposed project could result in development located within an airport land use plan or within the vicinity of a public or private airport and could result in a safety hazard for people residing or working in the project area.
None Required (Beyond Currently Proposed General Plan Policies and Implementation Measures).
LTS LTS
Impact 3.8-6 The proposed project could expose people or structures to a significant risk of loss, injury, or death involving wildland fires.
None Required (Beyond Currently Proposed General Plan Policies and Implementation Measures).
LTS LTS
3.9 Public Services, Recreation Resources and Utilities Impact 3.9-1 The proposed project would require new or expanded
water supplies, facilities and entitlements. No additional technologically or economically feasible mitigation measures are currently available to reduce this impact to a less than significant level.
PS SU
Impact 3.9-2 The proposed project could result in wastewater treatment demand in excess of planned capacity that cannot be met by new or expanded facilities.
No additional technologically or economically feasible mitigation measures are currently available to reduce this impact to a less than significant level.
PS SU
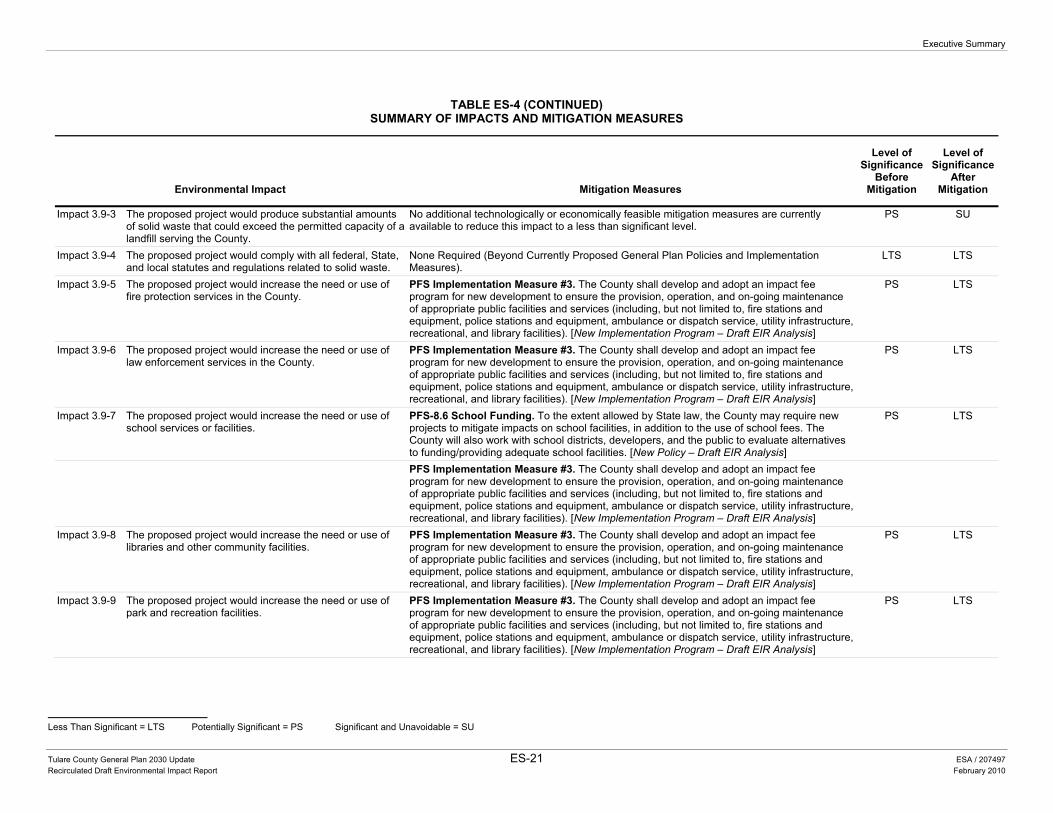
Executive Summary
Less Than Significant = LTS Potentially Significant = PS Significant and Unavoidable = SU
Tulare County General Plan 2030 Update ES-21 ESA / 207497 Recirculated Draft Environmental Impact Report February 2010
TABLE ES-4 (CONTINUED)SUMMARY OF IMPACTS AND MITIGATION MEASURES
Environmental Impact Mitigation Measures
Level of Significance
Before Mitigation
Level of Significance
After Mitigation
Impact 3.9-3 The proposed project would produce substantial amounts of solid waste that could exceed the permitted capacity of a landfill serving the County.
No additional technologically or economically feasible mitigation measures are currently available to reduce this impact to a less than significant level.
PS SU
Impact 3.9-4 The proposed project would comply with all federal, State, and local statutes and regulations related to solid waste.
None Required (Beyond Currently Proposed General Plan Policies and Implementation Measures).
LTS LTS
Impact 3.9-5 The proposed project would increase the need or use of fire protection services in the County.
PFS Implementation Measure #3. The County shall develop and adopt an impact fee program for new development to ensure the provision, operation, and on-going maintenance of appropriate public facilities and services (including, but not limited to, fire stations and equipment, police stations and equipment, ambulance or dispatch service, utility infrastructure, recreational, and library facilities). [New Implementation Program – Draft EIR Analysis]
PS LTS
Impact 3.9-6 The proposed project would increase the need or use of law enforcement services in the County.
PFS Implementation Measure #3. The County shall develop and adopt an impact fee program for new development to ensure the provision, operation, and on-going maintenance of appropriate public facilities and services (including, but not limited to, fire stations and equipment, police stations and equipment, ambulance or dispatch service, utility infrastructure, recreational, and library facilities). [New Implementation Program – Draft EIR Analysis]
PS LTS
Impact 3.9-7 The proposed project would increase the need or use of school services or facilities.
PFS-8.6 School Funding. To the extent allowed by State law, the County may require new projects to mitigate impacts on school facilities, in addition to the use of school fees. The County will also work with school districts, developers, and the public to evaluate alternatives to funding/providing adequate school facilities. [New Policy – Draft EIR Analysis]
PS LTS
PFS Implementation Measure #3. The County shall develop and adopt an impact fee program for new development to ensure the provision, operation, and on-going maintenance of appropriate public facilities and services (including, but not limited to, fire stations and equipment, police stations and equipment, ambulance or dispatch service, utility infrastructure, recreational, and library facilities). [New Implementation Program – Draft EIR Analysis]
Impact 3.9-8 The proposed project would increase the need or use of libraries and other community facilities.
PFS Implementation Measure #3. The County shall develop and adopt an impact fee program for new development to ensure the provision, operation, and on-going maintenance of appropriate public facilities and services (including, but not limited to, fire stations and equipment, police stations and equipment, ambulance or dispatch service, utility infrastructure, recreational, and library facilities). [New Implementation Program – Draft EIR Analysis]
PS LTS
Impact 3.9-9 The proposed project would increase the need or use of park and recreation facilities.
PFS Implementation Measure #3. The County shall develop and adopt an impact fee program for new development to ensure the provision, operation, and on-going maintenance of appropriate public facilities and services (including, but not limited to, fire stations and equipment, police stations and equipment, ambulance or dispatch service, utility infrastructure, recreational, and library facilities). [New Implementation Program – Draft EIR Analysis]
PS LTS
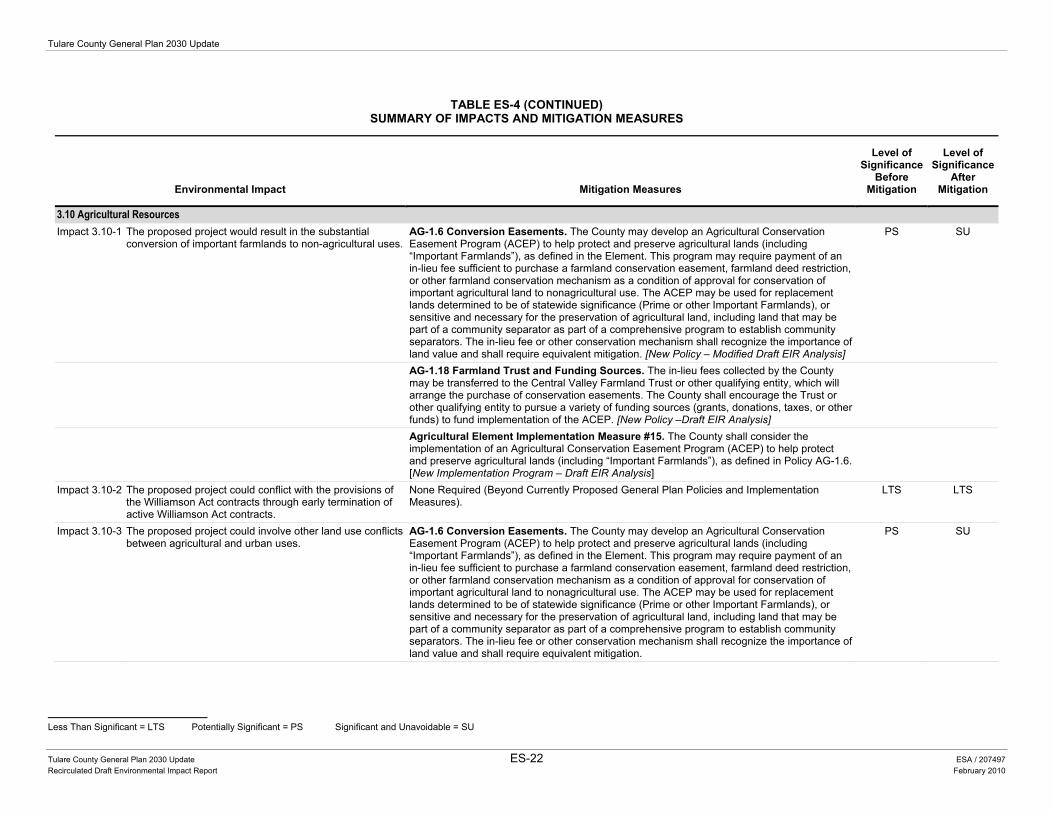
Tulare County General Plan 2030 Update
Less Than Significant = LTS Potentially Significant = PS Significant and Unavoidable = SU
Tulare County General Plan 2030 Update ES-22 ESA / 207497 Recirculated Draft Environmental Impact Report February 2010
TABLE ES-4 (CONTINUED)SUMMARY OF IMPACTS AND MITIGATION MEASURES
Environmental Impact Mitigation Measures
Level of Significance
Before Mitigation
Level of Significance
After Mitigation
3.10 Agricultural Resources Impact 3.10-1 The proposed project would result in the substantial
conversion of important farmlands to non-agricultural uses.AG-1.6 Conversion Easements. The County may develop an Agricultural Conservation Easement Program (ACEP) to help protect and preserve agricultural lands (including “Important Farmlands”), as defined in the Element. This program may require payment of an in-lieu fee sufficient to purchase a farmland conservation easement, farmland deed restriction, or other farmland conservation mechanism as a condition of approval for conservation of important agricultural land to nonagricultural use. The ACEP may be used for replacement lands determined to be of statewide significance (Prime or other Important Farmlands), or sensitive and necessary for the preservation of agricultural land, including land that may be part of a community separator as part of a comprehensive program to establish community separators. The in-lieu fee or other conservation mechanism shall recognize the importance of land value and shall require equivalent mitigation. [New Policy – Modified Draft EIR Analysis]
PS SU
AG-1.18 Farmland Trust and Funding Sources. The in-lieu fees collected by the County may be transferred to the Central Valley Farmland Trust or other qualifying entity, which will arrange the purchase of conservation easements. The County shall encourage the Trust or other qualifying entity to pursue a variety of funding sources (grants, donations, taxes, or other funds) to fund implementation of the ACEP. [New Policy –Draft EIR Analysis]
Agricultural Element Implementation Measure #15. The County shall consider the implementation of an Agricultural Conservation Easement Program (ACEP) to help protect and preserve agricultural lands (including “Important Farmlands”), as defined in Policy AG-1.6. [New Implementation Program – Draft EIR Analysis]
Impact 3.10-2 The proposed project could conflict with the provisions of the Williamson Act contracts through early termination of active Williamson Act contracts.
None Required (Beyond Currently Proposed General Plan Policies and Implementation Measures).
LTS LTS
Impact 3.10-3 The proposed project could involve other land use conflicts between agricultural and urban uses.
AG-1.6 Conversion Easements. The County may develop an Agricultural Conservation Easement Program (ACEP) to help protect and preserve agricultural lands (including “Important Farmlands”), as defined in the Element. This program may require payment of an in-lieu fee sufficient to purchase a farmland conservation easement, farmland deed restriction, or other farmland conservation mechanism as a condition of approval for conservation of important agricultural land to nonagricultural use. The ACEP may be used for replacement lands determined to be of statewide significance (Prime or other Important Farmlands), or sensitive and necessary for the preservation of agricultural land, including land that may be part of a community separator as part of a comprehensive program to establish community separators. The in-lieu fee or other conservation mechanism shall recognize the importance of land value and shall require equivalent mitigation.
PS SU
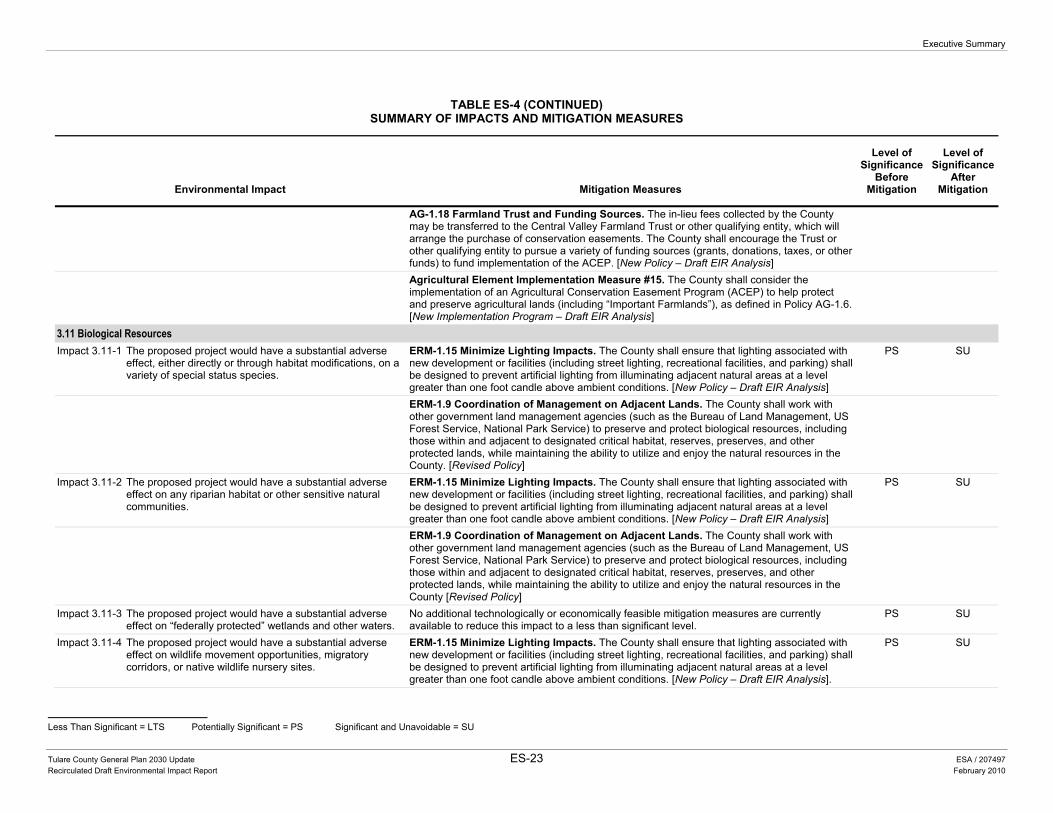
Executive Summary
Less Than Significant = LTS Potentially Significant = PS Significant and Unavoidable = SU
Tulare County General Plan 2030 Update ES-23 ESA / 207497 Recirculated Draft Environmental Impact Report February 2010
TABLE ES-4 (CONTINUED)SUMMARY OF IMPACTS AND MITIGATION MEASURES
Environmental Impact Mitigation Measures
Level of Significance
Before Mitigation
Level of Significance
After Mitigation
AG-1.18 Farmland Trust and Funding Sources. The in-lieu fees collected by the County may be transferred to the Central Valley Farmland Trust or other qualifying entity, which will arrange the purchase of conservation easements. The County shall encourage the Trust or other qualifying entity to pursue a variety of funding sources (grants, donations, taxes, or other funds) to fund implementation of the ACEP. [New Policy – Draft EIR Analysis]
Agricultural Element Implementation Measure #15. The County shall consider the implementation of an Agricultural Conservation Easement Program (ACEP) to help protect and preserve agricultural lands (including “Important Farmlands”), as defined in Policy AG-1.6. [New Implementation Program – Draft EIR Analysis]
3.11 Biological Resources Impact 3.11-1 The proposed project would have a substantial adverse
effect, either directly or through habitat modifications, on a variety of special status species.
ERM-1.15 Minimize Lighting Impacts. The County shall ensure that lighting associated with new development or facilities (including street lighting, recreational facilities, and parking) shall be designed to prevent artificial lighting from illuminating adjacent natural areas at a level greater than one foot candle above ambient conditions. [New Policy – Draft EIR Analysis]
PS SU
ERM-1.9 Coordination of Management on Adjacent Lands. The County shall work with other government land management agencies (such as the Bureau of Land Management, US Forest Service, National Park Service) to preserve and protect biological resources, including those within and adjacent to designated critical habitat, reserves, preserves, and other protected lands, while maintaining the ability to utilize and enjoy the natural resources in the County. [Revised Policy]
Impact 3.11-2 The proposed project would have a substantial adverse effect on any riparian habitat or other sensitive natural communities.
ERM-1.15 Minimize Lighting Impacts. The County shall ensure that lighting associated with new development or facilities (including street lighting, recreational facilities, and parking) shall be designed to prevent artificial lighting from illuminating adjacent natural areas at a level greater than one foot candle above ambient conditions. [New Policy – Draft EIR Analysis]
PS SU
ERM-1.9 Coordination of Management on Adjacent Lands. The County shall work with other government land management agencies (such as the Bureau of Land Management, US Forest Service, National Park Service) to preserve and protect biological resources, including those within and adjacent to designated critical habitat, reserves, preserves, and other protected lands, while maintaining the ability to utilize and enjoy the natural resources in the County [Revised Policy]
Impact 3.11-3 The proposed project would have a substantial adverse effect on “federally protected” wetlands and other waters.
No additional technologically or economically feasible mitigation measures are currently available to reduce this impact to a less than significant level.
PS SU
Impact 3.11-4 The proposed project would have a substantial adverse effect on wildlife movement opportunities, migratory corridors, or native wildlife nursery sites.
ERM-1.15 Minimize Lighting Impacts. The County shall ensure that lighting associated with new development or facilities (including street lighting, recreational facilities, and parking) shall be designed to prevent artificial lighting from illuminating adjacent natural areas at a level greater than one foot candle above ambient conditions. [New Policy – Draft EIR Analysis].
PS SU
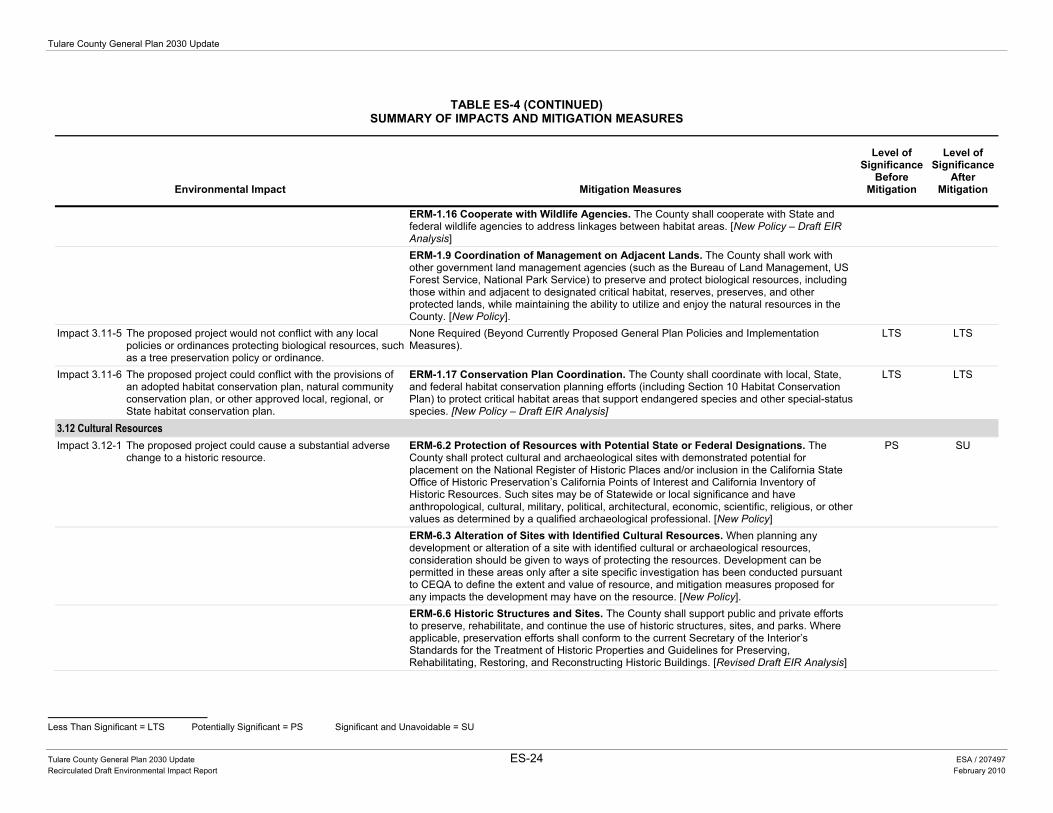
Tulare County General Plan 2030 Update
Less Than Significant = LTS Potentially Significant = PS Significant and Unavoidable = SU
Tulare County General Plan 2030 Update ES-24 ESA / 207497 Recirculated Draft Environmental Impact Report February 2010
TABLE ES-4 (CONTINUED)SUMMARY OF IMPACTS AND MITIGATION MEASURES
Environmental Impact Mitigation Measures
Level of Significance
Before Mitigation
Level of Significance
After Mitigation
ERM-1.16 Cooperate with Wildlife Agencies. The County shall cooperate with State and federal wildlife agencies to address linkages between habitat areas. [New Policy – Draft EIR Analysis]
ERM-1.9 Coordination of Management on Adjacent Lands. The County shall work with other government land management agencies (such as the Bureau of Land Management, US Forest Service, National Park Service) to preserve and protect biological resources, including those within and adjacent to designated critical habitat, reserves, preserves, and other protected lands, while maintaining the ability to utilize and enjoy the natural resources in the County. [New Policy].
Impact 3.11-5 The proposed project would not conflict with any local policies or ordinances protecting biological resources, such as a tree preservation policy or ordinance.
None Required (Beyond Currently Proposed General Plan Policies and Implementation Measures).
LTS LTS
Impact 3.11-6 The proposed project could conflict with the provisions of an adopted habitat conservation plan, natural community conservation plan, or other approved local, regional, or State habitat conservation plan.
ERM-1.17 Conservation Plan Coordination. The County shall coordinate with local, State, and federal habitat conservation planning efforts (including Section 10 Habitat Conservation Plan) to protect critical habitat areas that support endangered species and other special-status species. [New Policy – Draft EIR Analysis]
LTS LTS
3.12 Cultural Resources Impact 3.12-1 The proposed project could cause a substantial adverse
change to a historic resource. ERM-6.2 Protection of Resources with Potential State or Federal Designations. The County shall protect cultural and archaeological sites with demonstrated potential for placement on the National Register of Historic Places and/or inclusion in the California State Office of Historic Preservation’s California Points of Interest and California Inventory of Historic Resources. Such sites may be of Statewide or local significance and have anthropological, cultural, military, political, architectural, economic, scientific, religious, or other values as determined by a qualified archaeological professional. [New Policy]
PS SU
ERM-6.3 Alteration of Sites with Identified Cultural Resources. When planning any development or alteration of a site with identified cultural or archaeological resources, consideration should be given to ways of protecting the resources. Development can be permitted in these areas only after a site specific investigation has been conducted pursuant to CEQA to define the extent and value of resource, and mitigation measures proposed for any impacts the development may have on the resource. [New Policy].
ERM-6.6 Historic Structures and Sites. The County shall support public and private efforts to preserve, rehabilitate, and continue the use of historic structures, sites, and parks. Where applicable, preservation efforts shall conform to the current Secretary of the Interior’s Standards for the Treatment of Historic Properties and Guidelines for Preserving, Rehabilitating, Restoring, and Reconstructing Historic Buildings. [Revised Draft EIR Analysis]
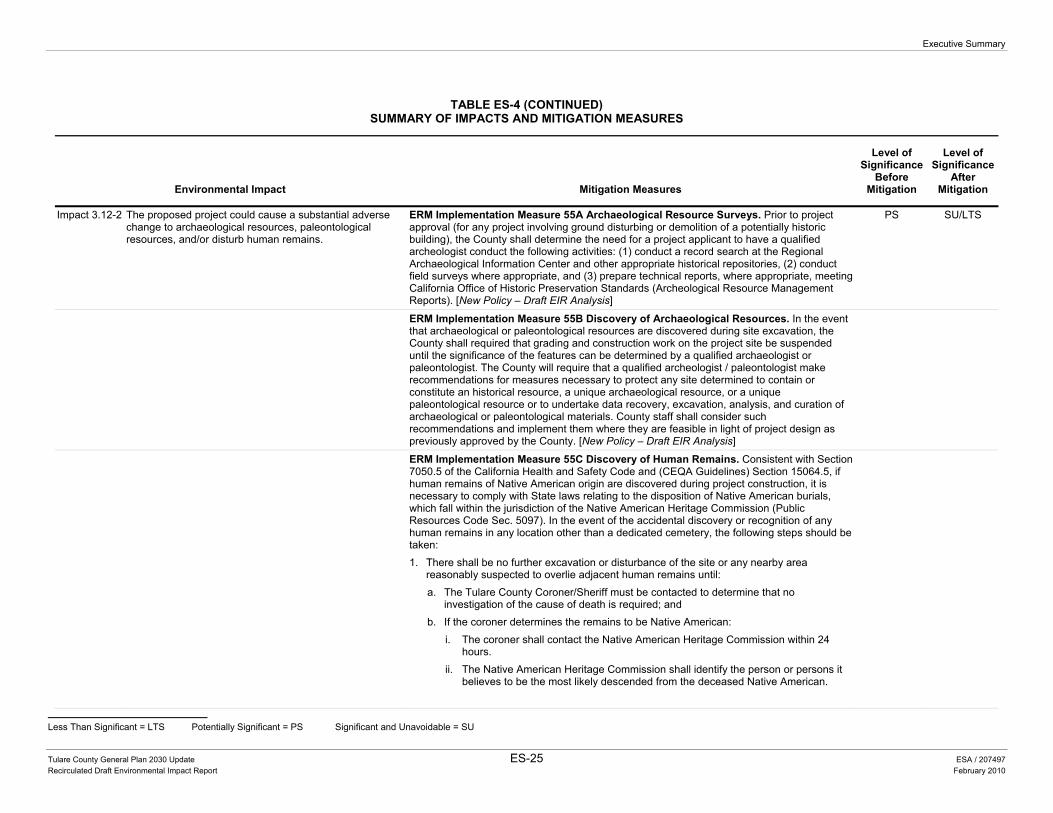
Executive Summary
Less Than Significant = LTS Potentially Significant = PS Significant and Unavoidable = SU
Tulare County General Plan 2030 Update ES-25 ESA / 207497 Recirculated Draft Environmental Impact Report February 2010
TABLE ES-4 (CONTINUED)SUMMARY OF IMPACTS AND MITIGATION MEASURES
Environmental Impact Mitigation Measures
Level of Significance
Before Mitigation
Level of Significance
After Mitigation
Impact 3.12-2 The proposed project could cause a substantial adverse change to archaeological resources, paleontological resources, and/or disturb human remains.
ERM Implementation Measure 55A Archaeological Resource Surveys. Prior to project approval (for any project involving ground disturbing or demolition of a potentially historic building), the County shall determine the need for a project applicant to have a qualified archeologist conduct the following activities: (1) conduct a record search at the Regional Archaeological Information Center and other appropriate historical repositories, (2) conduct field surveys where appropriate, and (3) prepare technical reports, where appropriate, meeting California Office of Historic Preservation Standards (Archeological Resource Management Reports). [New Policy – Draft EIR Analysis]
PS SU/LTS
ERM Implementation Measure 55B Discovery of Archaeological Resources. In the event that archaeological or paleontological resources are discovered during site excavation, the County shall required that grading and construction work on the project site be suspended until the significance of the features can be determined by a qualified archaeologist or paleontologist. The County will require that a qualified archeologist / paleontologist make recommendations for measures necessary to protect any site determined to contain or constitute an historical resource, a unique archaeological resource, or a unique paleontological resource or to undertake data recovery, excavation, analysis, and curation of archaeological or paleontological materials. County staff shall consider such recommendations and implement them where they are feasible in light of project design as previously approved by the County. [New Policy – Draft EIR Analysis]
ERM Implementation Measure 55C Discovery of Human Remains. Consistent with Section 7050.5 of the California Health and Safety Code and (CEQA Guidelines) Section 15064.5, if human remains of Native American origin are discovered during project construction, it is necessary to comply with State laws relating to the disposition of Native American burials, which fall within the jurisdiction of the Native American Heritage Commission (Public Resources Code Sec. 5097). In the event of the accidental discovery or recognition of any human remains in any location other than a dedicated cemetery, the following steps should be taken: 1. There shall be no further excavation or disturbance of the site or any nearby area
reasonably suspected to overlie adjacent human remains until: a. The Tulare County Coroner/Sheriff must be contacted to determine that no
investigation of the cause of death is required; and b. If the coroner determines the remains to be Native American:
i. The coroner shall contact the Native American Heritage Commission within 24 hours.
ii. The Native American Heritage Commission shall identify the person or persons it believes to be the most likely descended from the deceased Native American.
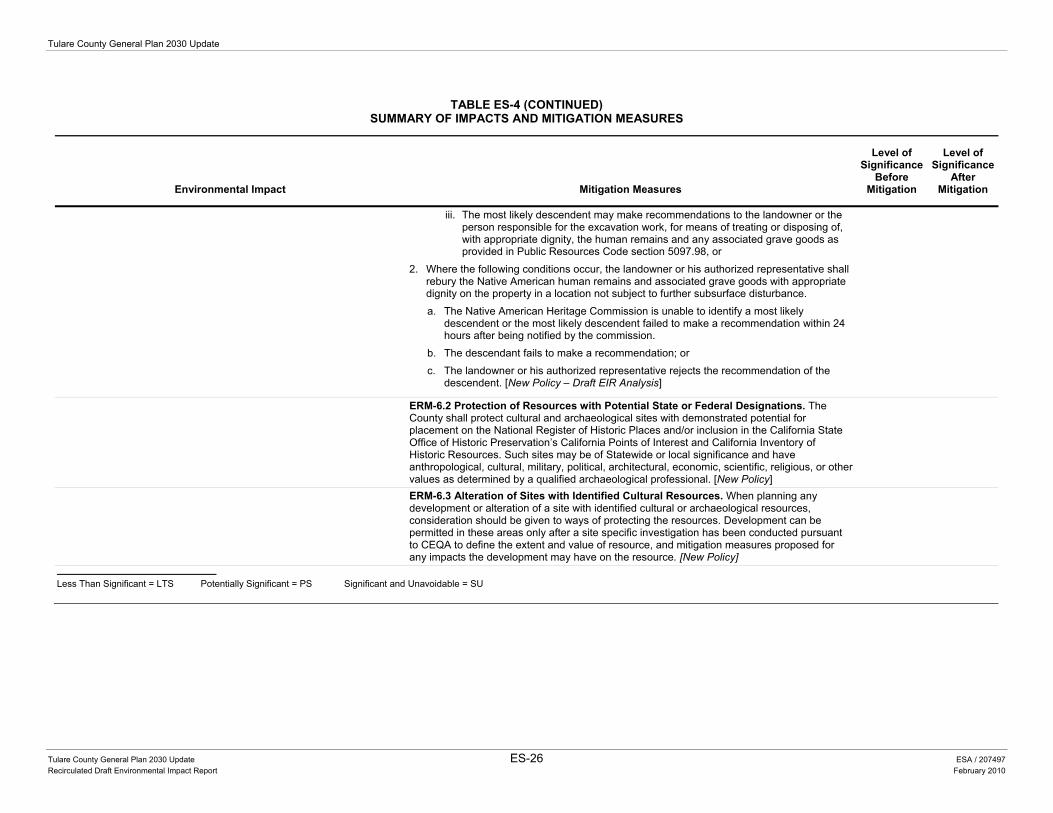
Tulare County General Plan 2030 Update
Tulare County General Plan 2030 Update ES-26 ESA / 207497 Recirculated Draft Environmental Impact Report February 2010
TABLE ES-4 (CONTINUED)SUMMARY OF IMPACTS AND MITIGATION MEASURES
Environmental Impact Mitigation Measures
Level of Significance
Before Mitigation
Level of Significance
After Mitigation
iii. The most likely descendent may make recommendations to the landowner or the person responsible for the excavation work, for means of treating or disposing of, with appropriate dignity, the human remains and any associated grave goods as provided in Public Resources Code section 5097.98, or
2. Where the following conditions occur, the landowner or his authorized representative shall rebury the Native American human remains and associated grave goods with appropriate dignity on the property in a location not subject to further subsurface disturbance. a. The Native American Heritage Commission is unable to identify a most likely
descendent or the most likely descendent failed to make a recommendation within 24 hours after being notified by the commission.
b. The descendant fails to make a recommendation; or c. The landowner or his authorized representative rejects the recommendation of the
descendent. [New Policy – Draft EIR Analysis]
ERM-6.2 Protection of Resources with Potential State or Federal Designations. The County shall protect cultural and archaeological sites with demonstrated potential for placement on the National Register of Historic Places and/or inclusion in the California State Office of Historic Preservation’s California Points of Interest and California Inventory of Historic Resources. Such sites may be of Statewide or local significance and have anthropological, cultural, military, political, architectural, economic, scientific, religious, or other values as determined by a qualified archaeological professional. [New Policy]
ERM-6.3 Alteration of Sites with Identified Cultural Resources. When planning any development or alteration of a site with identified cultural or archaeological resources, consideration should be given to ways of protecting the resources. Development can be permitted in these areas only after a site specific investigation has been conducted pursuant to CEQA to define the extent and value of resource, and mitigation measures proposed for any impacts the development may have on the resource. [New Policy]
Less Than Significant = LTS Potentially Significant = PS Significant and Unavoidable = SU
Tulare County General Plan 2030 Update 1-1 ESA / 207497 Recirculated Draft Environmental Impact Report February 2010
CHAPTER 1.0 Introduction
1.1 Background on the RDEIR The proposed Tulare County General Plan 2030 Update establishes a planning framework and policies for the planning period to 2030 and is considered a comprehensive update of the County of Tulare’s (County) current General Plan. The General Plan 2030 Update will provide for the continuation of many existing policies, modifications of others, and the addition of new policies. The General Plan Update project documents consist of the General Plan 2030 Update document (consisting of three parts: Part I: the Goals & Policies Report, Part II: the Area Plans, and Part III: the Community and other Plans [the plans in Part III will not be changed as part of this update, except for Dinuba (revised by this update to include the Dinuba Golf Course) and Pixley (revised by this update to include Harmon Field)]), the Environmental Impact Report, and the General Plan Background Report (referred to as “2010 Background Report”). A complete description of the General Plan Update is described in Chapter 2, “Project Description,” of this document.
A Notice of Preparation stating the County’s intent to prepare an Environmental Impact Report (EIR) on this project and requesting comments on the scope of the EIR as issued on April 25, 2006. The Notice of Preparation (NOP) and a summary of the comments received are attached to this recirculated draft Environmental Impact Report (RDEIR) as Appendix A.
In January 2008, the County published the Tulare County General Plan 2030 Update Draft Environmental Impact Report (DEIR). The original DEIR assessed the environmental implications of implementing the proposed Tulare County General Plan 2030 Update (proposed project or General Plan Update). The original DEIR was circulated for public review and comment for an extended period of over 90 days (January 14, 2008 through April 15, 2008) to allow for maximum public involvement and input. A copy of the Notice of Completion (including extensions, published January 14, 2008), requesting public comment, is attached to this RDEIR as Appendix A.
During the public review period, the County accepted approximately 90 written communications (over 770 pages of written communication with more than 800 pages of attachments) from agencies, organizations and individuals with comments on the General Plan Update and original DEIR. The Notice of Preparation (NOP) of the original DEIR and a summary of the comments received are attached to this RDEIR as Appendix A.
The County and its consultants reviewed these comments to determine whether any additional environmental analysis would be required to respond to issues raised in the comments. Based on
Tulare County General Plan 2030 Update
Tulare County General Plan 2030 Update 1-2 ESA / 207497 Recirculated Draft Environmental Impact Report February 2010
that review, the County determined that several subjects warranted additional information, analysis or clarification and, consequently, a revised DEIR (this RDEIR) was prepared for recirculation.
Although a part of the administrative record, the previous comments received on the January 2008 draft EIR do not require a written response in the Final EIR because a revised DEIR (this RDEIR) was prepared for recirculation. The County, as provided in CEQA Guidelines, section 15088.5(f)(1), will not respond to individual comments received on the January 2008 Draft EIR but will respond to new comments received on this revised RDEIR in the Final EIR. A copy of the Notice of Completion, including the notice to the public requesting comments on this RDEIR, is included in Appendix A.
1.2 Recirculation of the Draft EIR Pursuant to CEQA The County evaluated the potential need to recirculate the original DEIR based on the statutory requirements described in Section 21092.1 of the Public Resources Code. This section states that:
When significant new information is added to an environmental impact report after notice has been given pursuant to Section 21092 and consultation has occurred pursuant to Sections 21104 and 21153, but prior to certification, the public agency shall give notice again pursuant to Section 21092, and consult again pursuant to Sections 21104 and 21153 before certifying the environmental impact report.
“Significant new information” requiring recirculation includes, for example, a disclosure showing that:
• A new significant environmental impact would result from the project or from a new mitigation measure proposed to be implemented.
• A substantial increase in the severity of an environmental impact would result unless mitigation measures are adopted that reduce the impact to a level of insignificance.
• A feasible project alternative or mitigation measure considerably different from others previously analyzed would clearly lessen the environmental impacts of the project, but the project’s proponents decline to adopt it.
• The Draft EIR was so fundamentally and basically inadequate and conclusory in nature that meaningful public review and comment were precluded.
In addition, a lead agency may choose to recirculate a DEIR if additional studies or analysis are conducted for a project before a specific action is taken by local decision makers to approve a project. Recirculation may be limited to those chapters or portions of the DEIR that have been modified. Public notice and circulation of the recirculated DEIR is required, per California Environmental Quality Act (CEQA) Guidelines Sections 15086 and 15087. The discretionary action before the lead agency is the approval and adoption of the final General Plan.
In its role as the lead agency, the County has directed the recirculation of the draft EIR for the proposed project. Consideration of the various comments received on the original January 2008 DEIR as well as continued developments in the areas of air quality and climate change impacts regulation resulted in the County’s decision to update a number of sections of the original DEIR
1. Introduction
Tulare County General Plan 2030 Update 1-3 ESA / 207497 Recirculated Draft Environmental Impact Report February 2010
as well as the Background Report. A summary of the primary modifications in response to the comments received is included below.
Updated Topics within the Recirculated DEIR (RDEIR) To address comments provided on the original DEIR, the County has taken the following steps to provide additional background information and analysis as part of the RDEIR:
• Updated Land Use/Circulation Diagram: The County has developed a land use/circulation diagram showing the location of all future growth areas proposed as part of the General Plan Update. Refer to Figure 2-2 in Chapter 2, Project Description. This diagram is derived from the Tulare County Planning Areas (Figure 4-1) in the Goals and Policies Report (Part I of the General Plan Update). This figure also identifies the Urban Development Boundaries within which future urban growth is expected to occur.
• Initiate Climate Action Strategy: In light of the recent legislative actions specific to sustainability and climate change, the County has initiated a Climate Action Strategy specific to its unique rural nature. As an initial step, the County has prepared a Greenhouse Gas (GHG) Inventory for the Planning Area. Information from the inventory as well as applicable regulatory information is incorporated into the Air Quality section (Section 3.3) and the Energy and Global Climate Change section (Section 3.4) of this RDEIR and an initial, proposed Climate Action Plan has been prepared. Subsequently, the analysis of air quality impacts now includes a more robust discussion of the proposed project’s impacts associated with climate change. Additionally, the General Plan Update now includes a number of additional policies (in the areas of sustainability, energy conservation, and climate change) that will assist the County in meeting the GHG emissions reduction goals set by the State.
• Updated Stationary Air Emission Analysis: The RDEIR includes a more thorough list of estimates for stationary sources of air pollution (see Section 3.3, “Air Quality” and Section 3.4, “Energy and Global Climate Change”), including industrial emissions, residential emissions, agricultural emissions, landfills, power plants, and oil and gas production. Many of these sources were developed as part of the Greenhouse Gas Inventory report and subsequently incorporated into the RDEIR.
• Updated General Plan Background Report (“2010 Background Report”): To the extent feasible, the County has updated baseline data in the 2010 Background Report for topics for which more recent data was available. These topics include Demographics, Land Use, Agriculture, Recreation, and Open Space, Biological Resources, Air Quality, Safety (including Geologic and Seismic Hazards, Flood Hazards, Fire Hazards, Human-Made Hazards, and Climate Change), Biological Resources, Archaeological Resources, and Historical Resources, Natural Resources (including Mineral Resources, Oil and Gas Resources, and Timber Resources), and Scenic Landscapes. The 2010 Background Report is a supporting document to the EIR that provides both historic and baseline information that is incorporated by reference to this EIR. This report is also included as Appendix B to this RDEIR.
• Updated Water Supply Analysis: The RDEIR incorporates the results of a water supply evaluation prepared by Tully and Young for the proposed project. Using the most current (or readily available) data from the Department of Water Resources and other sources, the water supply evaluation provides a representation of ‘existing’ supply and demand conditions and projects ‘future’ conditions contemplated by the proposed project. Section 3.6 “Hydrology, Water Quality, and Drainage” and 3.9 “Public Services, Recreation Resources, and Utilities” of this RDEIR have been prepared with information from
Tulare County General Plan 2030 Update
Tulare County General Plan 2030 Update 1-4 ESA / 207497 Recirculated Draft Environmental Impact Report February 2010
the water supply evaluation, which is included as Appendix G. These updated sections (and the water supply evaluation) are intended to supplement the original water supply information provided in the General Plan Background Report.
• Enforceability of Goals and Policies: The County has reviewed Part I, Goals & Policies Report, of the General Plan Update and revised some policies to provide for greater enforceability. The updated Goals & Policies Report (Part I of the General Plan Update) refines the “project” that is evaluated in this RDEIR.
• Organization of the EIR: The County has simplified the organization of the RDEIR to more closely resemble the CEQA Checklist found in Appendix G of the CEQA Guidelines. While the original DEIR incorporated the Background Report information and data by reference, this RDEIR includes relevant information from the 2010 Background Report directly in the “Environmental Setting” and “Regulatory Setting” sections of each EIR resource section. Much of this information has been updated, as described previously.
As previously described, this summary only represents the primary modifications included as part of the RDEIR. The County reviewed and considered all comments received and has taken this recirculation opportunity to address a variety of other comments submitted on the January 2008 Draft EIR, although many changes do not constitute significant new information per CEQA. Because of this as well as continued developments in the areas of air quality and climate change impacts regulation, the County has opted to republish the entire document, rather than selected sections. Although a part of the administrative record, because of the recirculation, the previous comments received on the January 2008 draft EIR do not require a written response in the Final EIR, and the County, as provided in CEQA Guidelines, section 15088.5(f)(1), will not respond to individual comments received on the January 2008 Draft EIR but will respond to new comments received on this revised RDEIR in the Final EIR.
1.3 Purpose of the EIR CEQA requires that all state and local government agencies consider the environmental consequences of programs and projects over which they have discretionary authority before taking action on them. The County of Tulare is the CEQA lead agency for the proposed project and the Tulare County Board of Supervisors, as the lead agency’s decision-making body, will consider the information presented in this RDEIR before taking discretionary action on the proposed project.
This RDEIR has two primary purposes:
• The document will assist the County in complying with CEQA requirements for the analysis of environmental impacts by including a complete and comprehensive evaluation of the physical impacts of the project and its alternatives.
• The document will inform interested stakeholders (including local residents) and members of the Board of Supervisors and Tulare County Planning Commission of the environmental impacts prior to the Planning Commission making its recommendations and the Board of Supervisors taking action on the project.
1. Introduction
Tulare County General Plan 2030 Update 1-5 ESA / 207497 Recirculated Draft Environmental Impact Report February 2010
Additionally, the RDEIR is intended to identify ways to minimize significant effects of the proposed project and describe reasonable alternatives to the proposed project that would avoid or reduce the proposed project’s significant effects (State CEQA Guidelines Section 15121[a]).
The General Plan 2030 Update document consists of three Parts: Part I: the Goals and Policies Report, Part II: the Area Plans and Part III: the Community and Sub-area plans. These parts consist of policies and implementation measures to guide the future growth of the County (see Chapter 2.0 “Project Description”). Only Parts I and II of this policy document will be adopted as part of the General Plan Update project. Part III, consisting of previously adopted community and sub-area plans, will remain unchanged, except for Dinuba (revised by this update to include the Dinuba Golf Course) and Pixley (revised by this update to include Harmon Field). Part I and II are included in Appendix C to this RDEIR. A compilation of Part III is available upon request to the Tulare County Resource Management Agency as well as on the County’s website at www.co.tulare.ca.us/.
This RDEIR evaluates the potential impacts resulting from adoption and implementation of the project. The information contained in this EIR will be used to inform local decision makers and the general public of the potentially significant environmental impacts associated with the proposed project and to assist County officials in reviewing and considering adoption of the proposed project or one of the alternatives. This EIR may also be used as a first-tier (or “program”) environmental document for subsequent environmental review of specific plans and infrastructure improvements, general plan and zoning amendments, impact fees, and other local development plans and proposals.
As readers will see in reviewing this document, various chapters refer readers not only to the above-described General Plan 2030 Update document, which contains the policies that will guide future actions of the County, but also to another General Plan document as well: the revised General Plan Background Report, referred to as the 2010 Background Report. This latter, highly informative document includes a great deal of information relevant to the environmental settings for various impact topics, in addition to providing relevant information to the EIR impact discussions. Relevant information from the 2010 Background Report is included in the regulatory and environmental settings for each resource topic discussed. Additionally, the EIR incorporates by reference or briefly summarizes information from both the 2010 Background Report and the General Plan 2030 Update document as needed. Because of the interrelatedness of the EIR and these two General Plan documents, readers should consider all three documents as contributing to the County’s CEQA compliance for the proposed General Plan Update.
Section 15150 of the CEQA Guidelines permits documents of lengthy technical detail to be incorporated by reference in an EIR. Specifically, Section 15150 states that an EIR may “incorporate by reference all or portions of another document which is a matter of public record or is generally available to the public…” Consequently, the 2010 Background Report is incorporated by reference (as Appendix B).
Additionally, Section 15146(b) of the CEQA Guidelines states that an EIR on a project such as the adoption or amendment of a local general plan “should focus on the secondary effects that can be
Tulare County General Plan 2030 Update
Tulare County General Plan 2030 Update 1-6 ESA / 207497 Recirculated Draft Environmental Impact Report February 2010
expected to follow from the adoption or amendment, but the EIR need not be as detailed as an EIR on the specific construction projects that might follow.” The purpose of this RDEIR is to provide analysis on the effects that can be expected from implementation of the General Plan Update, but will not provide detail on the impacts of specific development or construction projects that might follow.
1.4 Type of EIR The CEQA Guidelines provide information on the types of environmental analysis that can be used to analyze a project, and one of these is a Program EIR. According to the CEQA Guidelines (Section 15168[a]), a local agency may prepare a program-level EIR that can be characterized as one large project or series of actions that are linked geographically; logical parts of a chain of contemplated events; rules, regulations, or plans that govern the conduct of a continuing program; or individual activities carried out under the same authorizing statutory or regulatory authority and having generally similar environmental effects that can be mitigated in similar ways.
Under CEQA, a Program EIR can function as a first-tier environmental document that assesses and documents the broad environmental impacts of a program with the understanding that a more detailed site-specific review may be required to assess future projects implemented under the program. As described above, the analysis contained in this EIR may also be used as a reference for subsequent environmental review of community plans, specific plans, infrastructure improvements, zoning amendments, impact fees, and other development plans and proposals within Tulare County.
With respect to the processing of subsequent, more site-specific projects, the County, in making optimal use of this EIR once it is certified, intends to take advantage of two separate, but complementary processes authorized by CEQA that are intended to streamline the review of projects consistent with approved general plans. These two processes are described below to put the public on notice of how, specifically, the County intends to use this EIR in the future.
First, as noted above, this Program EIR also functions as a first-tier EIR. Thus, the scope of future site-specific approvals may be narrowed, pursuant to the rules for tiering set forth in CEQA Guidelines Section 15152. That section provides, for example, that where a first-tier EIR has “adequately addressed” the subject of cumulative impacts, such impacts need not be revisited in second- and/or third-tier documents. According to subdivision (f)(3) of Section 15152, significant effects identified in a first-tier EIR are adequately addressed, for purposes of later approvals, if the lead agency determines that such effects either (a) “have been mitigated or avoided as a result of the prior [EIR] and findings adopted in connection with that prior [EIR]” or (b) “have been examined at a sufficient level of detail in the prior [EIR] to enable those effects to be mitigated or avoided by site-specific revisions, the imposition of conditions, or by other means in connection with the approval of the later project.”
Second, future environmental review can also be streamlined pursuant to Public Resources Code Section 21083.3 and CEQA Guidelines Section 15183. These provisions generally limit the scope of necessary environmental review for site-specific approvals following the preparation of an EIR for a general plan. For such site-specific approvals, CEQA generally applies only to impacts that
1. Introduction
Tulare County General Plan 2030 Update 1-7 ESA / 207497 Recirculated Draft Environmental Impact Report February 2010
are “peculiar to the parcel or to the project” and that have not been disclosed in the general plan EIR, except where “substantial new information” shows that previously identified impacts will be more significant than previously assumed. Notably, impacts are considered not to be “peculiar to the parcel or to the project” if they can be substantially mitigated pursuant to previously adopted “uniformly applied development policies or standards.”
1.5 EIR Process In preparing this EIR and considering approval of the proposed project, the County has completed, or will complete, the activities identified in Table 1-1. Each of these activities is further described below.
TABLE 1-1STATUS OF TULARE COUNTY GENERAL PLAN UPDATE EIR
Activity Status
Notice of Preparation - Preparation and Circulation Completed Spring 2006 Public Scoping Meetings and/or Workshops Completed Spring 2006 Draft EIR (DEIR) – Preparation Completed Fall 2007 Draft EIR (DEIR) – Circulation – 60 Day Public Review and Comment Completed Spring 2008 Recirculated Draft EIR (RDEIR) – Circulation 60 Day Public Review and Comment In progress Final EIR – Preparation To be completed Final EIR – Circulation To be completed
Notice of Preparation In accordance with Section 15082(a) of the CEQA Guidelines, the County prepared and circulated a Notice of Preparation (NOP) of a Draft EIR for the proposed project. The NOP was circulated for a 30-day comment period, which began on April 29, 2006, and ended on May 29, 2006. Appendix A contains a copy of the NOP; and copies of the comment letters received during the 30-day comment period (April 29, 2006, to May 29, 2006), as well as letters that were received after the close of the comment period. All letters, including those received late, were considered in preparation of the original 2008 DEIR and continued to be considered in preparation of this RDEIR.
Draft EIR As noted in the beginning of this chapter, in January of 2008 the original DEIR (prepared after the NOP comment period noted above) was circulated for public review and comment for an extended period of over 90 days (January 14, 2008 through April 15, 2008) to allow for maximum public involvement and input. A copy of the Notice of Completion (including extensions, published January 14, 2008), requesting public comment, is attached to this RDEIR as Appendix A. During the public review period the County accepted approximately 90 written communications from agencies, organizations and individuals with comments on the General Plan Update and original DEIR. The County subsequently determined that several subjects within the Background Report and EIR
Tulare County General Plan 2030 Update
Tulare County General Plan 2030 Update 1-8 ESA / 207497 Recirculated Draft Environmental Impact Report February 2010
warranted additional information, analysis or clarification and decided to revise and recirculate this RDEIR.
Recirculated Draft EIR (RDEIR) This document constitutes the recirculated draft Environmental Impact Report (RDEIR). The RDEIR contains a description of the proposed project, discusses potential proposed project impacts, and discusses measures (draft general plan policies and/or revisions to draft general plan policies) to be implemented to mitigate impacts found to be significant, as well as analyzes several proposed project alternatives.
As required by CEQA, this RDEIR focuses on significant or potentially significant environmental effects (CEQA Guidelines Section 15143). Comments received on the NOP helped to refine the list of environmental issues evaluated in the original January 2008 DEIR and comments received on the original January 2008 DEIR helped to further refine those topics addressed in this RDEIR.
The impacts analyzed in this RDEIR, including those considered to be less than significant, are summarized in Table ES-3 of the Executive Summary.
Public Review of the Recirculated Draft EIR (RDEIR) This document will be circulated to numerous agencies, organizations, and interested groups and persons for comment during the 60-day public review period for the RDEIR. A public notice will be posted at the Tulare County Resource Management Agency, Tulare County public libraries (listed below), and on the General Plan website. The RDEIR, along with copies of documents referenced herein, is also available for public review at the following locations during the review period:
Tulare County Resource Management Agency Government Plaza 5961 South Mooney Boulevard Visalia, CA 93277
Tulare County Website http://www.co.tulare.ca.us/
Alpaugh Library 3816 Avenue 54 Alpaugh, CA 93201
Dinuba Library 150 South “I” Street Dinuba, CA 93618
Earlimart Library 780 East Washington Street Earlimart, CA 93219
Exeter Library 230 East Chestnut Exeter, CA 93221
Ivanhoe Library 15964 Heather Ivanhoe, CA 93235
Lindsay Library 165 North Gale Hill Street Lindsay, CA 93247
Pixley Library Pixley Union Elementary School 300 North School Pixley, CA 93256
Springville Library 35800 Highway 190 Springville, CA 93265
Strathmore Library 19646 Road 230 Strathmore, CA 93267
Terra Bella Library 23825 Avenue 92 Terra Bella, CA 93270
Three Rivers Library 42052 Eggers Drive Three Rivers, CA 93271
Tipton Library 301 East Woods Avenue Tipton, CA 93272
Visalia Library 200 West Oak Avenue Visalia, CA 93291
Woodlake Library 400 West Whitney
1. Introduction
Tulare County General Plan 2030 Update 1-9 ESA / 207497 Recirculated Draft Environmental Impact Report February 2010
Cutler/Orosi Library 12646 Avenue 416 Orosi, CA 93647
Woodlake, CA 93286
To obtain a copy of the RDEIR, please contact the Resource Management Agency at 559-624-7000 or by email at [email protected].
Public comment is encouraged during the 60-day public review period under CEQA. Public comments on the RDEIR received during the 60-day public review period will be addressed in the FEIR. Public comment is also encouraged on the Final EIR and General Plan Update at the public hearings that will be held later before the Tulare County Planning Commission and Board of Supervisors.
Final EIR, EIR Certification, and Project Approval Written comments received during the CEQA statutory public comment period in response to this RDEIR will be addressed in a response to comments document, which, together with the RDEIR, will constitute the Final EIR1. County of Tulare staff will make recommendations to the Planning Commission and to the Board of Supervisors. The Board of Supervisors will review the Final EIR for adequacy and consider it for certification, pursuant to the requirements of Section 15090 of the CEQA Guidelines. Certification consists of three separate but related findings:
• The Final EIR has been completed in compliance with CEQA. • The Final EIR was presented to the decision-making body of the lead agency, and the
decision-making body reviewed and considered the information contained in the Final EIR prior to approving the project.
• The Final EIR reflects the lead agency’s independent judgment and analysis.
If the Board of Supervisors certifies the Final EIR and chooses to approve the proposed project, the Board will then be required to adopt findings on the feasibility of reducing or avoiding significant environmental effects (CEQA Guidelines, Section 15091, subd. (a)) and to adopt a statement of overriding considerations that identifies the proposed project benefits that outweigh the proposed project’s significant unavoidable effects (CEQA Guidelines, Section 15093).
The findings required by Section 15091, subdivision (a), will require the Board of Supervisors to make one or more of the following three findings with respect to each significant effect identified in this EIR:
1 Although a part of the administrative record, because of the recirculation, the previous comments received on the January 2008 draft EIR do not require a written response in the Final EIR, and the County, as provided in CEQA Guidelines, section 15088.5(f)(1), will not respond to individual comments received on the January 2008 Draft EIR but will respond to new comments received on this revised and recirculated DEIR in the Final EIR.
Tulare County General Plan 2030 Update
Tulare County General Plan 2030 Update 1-10 ESA / 207497 Recirculated Draft Environmental Impact Report February 2010
• Changes or alterations have been required in, or incorporated into, the project that avoid or substantially lessen the significant environmental effect as identified in the Final EIR.
• Such changes or alterations are within the responsibility and jurisdiction of another public agency and not the agency making the finding. Such changes have been adopted by such other agency or can and should be adopted by such other agency.
• Specific economic, legal, social, technological, or other considerations, including provision of employment opportunities for highly trained workers, make infeasible the mitigation measures or project alternatives identified in the Final EIR.
According to CEQA Guidelines Section 15093, which sets forth the requirements for statements of overriding considerations:
• CEQA requires the decision-making agency to balance, as applicable, the economic, legal, social, technological, or other benefits of a General Plan Update against its unavoidable environmental risks when determining whether to approve the project. If the specific economic, legal, social, technological, or other benefits of a General Plan Update outweigh the unavoidable adverse environmental effects, the adverse environmental effects may be considered “acceptable.”
• When the lead agency approves a project that will result in significant effects identified in the Final EIR that are not avoided or substantially lessened, the agency shall state in writing the specific reasons to support its action, based on the Final EIR and/or other information in the record. The statement of overriding considerations shall be supported by substantial evidence in the record.
Public Resources Code Section 21081.6(a)(1), requires lead agencies to “adopt a reporting or monitoring program for the changes made to the project or conditions of project approval, adopted in order to mitigate or avoid significant effects on the environment.” This mitigation monitoring and reporting program (MMRP) will be adopted when the Board adopts the findings described above. Monitoring Reports regarding the MMRP will be consolidated with the annual report required in state law and in Policy PF 7.1 “Annual Review” of the General Plan 2030 Update. Throughout this RDEIR, mitigation measures have been clearly identified and presented in language that will facilitate the establishment of an MMRP. Any mitigation measures adopted by the County may take the form of policies and implementation measures integrated into the General Plan itself. This approach is encouraged by the same statute, which, in subdivision (b), states that “conditions of project approval may be set forth in referenced documents which address required mitigation measures or, in the case of the adoption of a plan, policy, regulation, or other public project, by incorporating the mitigation measures into the plan, policy, regulation, or project design.” Case law gives the County the option of integrating its MMRP directly into the General Plan as well. (See Rio Vista Farm Bureau Center v. County of Solano (1992) 5 Cal.App.4th 351, 380-381.)
If and when, the Board of Supervisors certifies the adequacy of the Final EIR and approves the proposed project (with the accompanying findings and statement of overriding considerations), the County will file a Notice of Determination with both the County Clerk of the County of Tulare and the State Clearinghouse. The posting of the Notice of Determination will initiate a 30-day statute of limitations during which any affected party can initiate litigation challenging the General Plan on CEQA grounds.
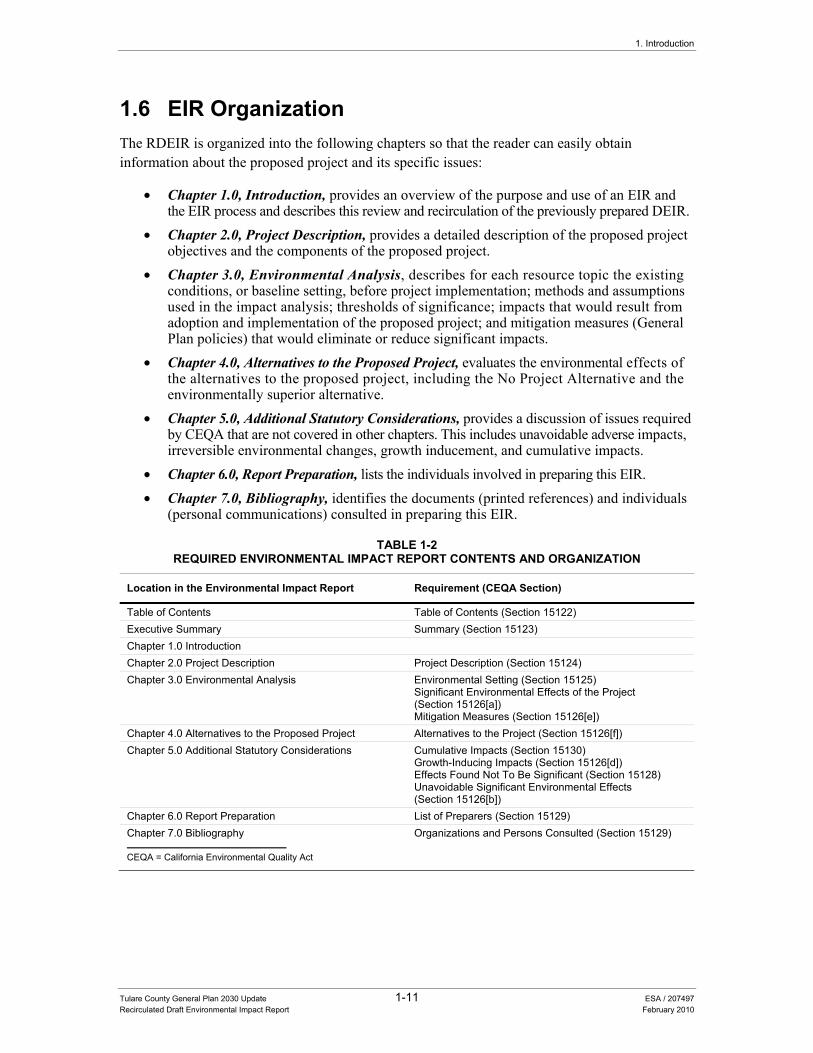
1. Introduction
Tulare County General Plan 2030 Update 1-11 ESA / 207497 Recirculated Draft Environmental Impact Report February 2010
1.6 EIR Organization The RDEIR is organized into the following chapters so that the reader can easily obtain information about the proposed project and its specific issues:
• Chapter 1.0, Introduction, provides an overview of the purpose and use of an EIR and the EIR process and describes this review and recirculation of the previously prepared DEIR.
• Chapter 2.0, Project Description, provides a detailed description of the proposed project objectives and the components of the proposed project.
• Chapter 3.0, Environmental Analysis, describes for each resource topic the existing conditions, or baseline setting, before project implementation; methods and assumptions used in the impact analysis; thresholds of significance; impacts that would result from adoption and implementation of the proposed project; and mitigation measures (General Plan policies) that would eliminate or reduce significant impacts.
• Chapter 4.0, Alternatives to the Proposed Project, evaluates the environmental effects of the alternatives to the proposed project, including the No Project Alternative and the environmentally superior alternative.
• Chapter 5.0, Additional Statutory Considerations, provides a discussion of issues required by CEQA that are not covered in other chapters. This includes unavoidable adverse impacts, irreversible environmental changes, growth inducement, and cumulative impacts.
• Chapter 6.0, Report Preparation, lists the individuals involved in preparing this EIR. • Chapter 7.0, Bibliography, identifies the documents (printed references) and individuals
(personal communications) consulted in preparing this EIR.
TABLE 1-2REQUIRED ENVIRONMENTAL IMPACT REPORT CONTENTS AND ORGANIZATION
Location in the Environmental Impact Report Requirement (CEQA Section)
Table of Contents Table of Contents (Section 15122) Executive Summary Summary (Section 15123) Chapter 1.0 Introduction Chapter 2.0 Project Description Project Description (Section 15124) Chapter 3.0 Environmental Analysis Environmental Setting (Section 15125)
Significant Environmental Effects of the Project (Section 15126[a]) Mitigation Measures (Section 15126[e])
Chapter 4.0 Alternatives to the Proposed Project Alternatives to the Project (Section 15126[f]) Chapter 5.0 Additional Statutory Considerations Cumulative Impacts (Section 15130)
Growth-Inducing Impacts (Section 15126[d]) Effects Found Not To Be Significant (Section 15128) Unavoidable Significant Environmental Effects (Section 15126[b])
Chapter 6.0 Report Preparation List of Preparers (Section 15129) Chapter 7.0 Bibliography Organizations and Persons Consulted (Section 15129)
CEQA = California Environmental Quality Act
Tulare County General Plan 2030 Update
Tulare County General Plan 2030 Update 1-12 ESA / 207497 Recirculated Draft Environmental Impact Report February 2010
1.7 Overall EIR Approach and Assumptions This RDEIR is a complete EIR with updated information on the Planning Area’s environmental setting taken in part from the 2010 Background Report (October 2004, updated 2008/2010), impact analysis, mitigation measures, and evaluation of a range of project alternatives. The revised 2010 Background Report is a supporting document that provided baseline information, but is not part of the EIR. This report is provided as Appendix B of this document.
As more fully described above under the Section entitled “Type of EIR”, this RDEIR has been prepared as a Program EIR. As a Program EIR, this document focuses on the overall effects of the project. However, the analysis does not examine in detail the localized effects of potential site-specific projects that may occur under the overall umbrella of this program in future years. In fact, this RDEIR assumes that specific development projects and infrastructure improvement proposals submitted to the County may need independent environmental analysis in accordance with the requirements of CEQA. The nature of general plans is such that many proposed policies are intended to be general, with details to be later determined during the implementation phases of the general plan. Consequently, many of the impacts and mitigation measures can only be described in general or qualitative terms.
CEQA mandates that lead agencies adopt MMRPs (Mitigation Monitoring and Reporting Programs) for projects identified as having significant impacts where mitigation measures have been identified to reduce the impacts to a less-than-significant level. MMRPs are intended to ensure compliance during project implementation. These programs provide the additional advantages of providing staff and decision-makers with feedback as to the effectiveness of mitigation measures, as well as the experience and information to shape future mitigation measures.
The proposed General Plan Update is intended to be self-mitigating, in that the policies and implementation measures are designed to mitigate environmental impacts. This EIR clearly identifies how the impacts of future development in Tulare County will be mitigated through the implementation of the policies and measures of the project. A significance criterion is an identifiable quantitative, qualitative, or performance level of a particular significant environmental effect that, if exceeded, indicates that the impact is considered to be significant.
The analysis provided in this RDEIR is based on the following key assumptions:
• Full Implementation. This analysis assumes that all policies in the proposed General Plan will be fully implemented and all future development will be consistent with the population projections used in developing the future growth scenario for the County’s various area plans. The County’s overall Planning Area also includes the land within the Kings River and Mountain Sub-Area plans and the various community plans. However, no changes are proposed for these plans as part of the General Plan Update.
• Development Assumptions for 2030. Overall, it is assumed that a majority of the County’s growth will occur within cities and, to a much lesser extent, within unincorporated communities and hamlets. This analysis looks at the impacts associated with development at the General Plan Update’s planning horizon of 2030 using the Tulare County Association of Governments (TCAG) population projections as a basis for the population targets associated with the proposed project. However, development under the General Plan Update
1. Introduction
Tulare County General Plan 2030 Update 1-13 ESA / 207497 Recirculated Draft Environmental Impact Report February 2010
will likely be incremental and timed in response to market conditions dependent upon infrastructure capabilities.
Documents Incorporated By Reference Section 15150 of the CEQA Guidelines permits documents of lengthy technical detail to be incorporated by reference in an EIR. Specifically, Section 15150 states that an EIR may “incorporate by reference all or portions of another document which is a matter of public record or is generally available to the public ....” Incorporated documents are to be briefly summarized in the EIR and made available to the public for inspection or reference. This RDEIR incorporates by reference the documents noted below, of which both the 2010 Background Report (Appendix B of this RDEIR) and the General Plan 2030 Update policy document (Appendix C) are provided as appendices to this RDEIR.
• 2010 Background Report. This is a supporting document that provided baseline information, but is not part of the EIR. This report provides a detailed description of the conditions that existed within the Planning Area during the development of the General Plan. For the Tulare County General Plan, the 2010 Background Report reflects conditions within the Planning Area in 2008.
• General Plan 2030 Update policy document. This document consists of Part I: the Goals and Policies Report which contains the current set of goals, policies, and implementation measures that will guide future land use decisions within the County. It also contains Part II: Area Plans as modified by this General Plan 2030 update. Parts I and II have been updated to include several additional policies or suggestions received from County stakeholders. Part III consists of individual, existing community, sub-area and other localized plans. The plans in Part III will not be changed as part of this update, except for Dinuba (revised by this update to include the Dinuba Golf Course) and Pixley (revised by this update to include Harmon Field).
1.8 EIR Preparation This RDEIR is a factual, objective, public-disclosure document that takes no position on the merits of the proposed project, but rather provides information on which decisions about the proposed project can be based. This document has been prepared for the County of Tulare in accordance with CEQA (Public Resources Code Section 21000 et seq.) and the State CEQA Guidelines (14 CCR 15000 et. seq.). Staff members from the County of Tulare and the consulting team who helped prepare this EIR are identified in Chapter 6.0, Report Preparation.

Tulare County General Plan 2030 Update 2-1 ESA / 207497 Recirculated Draft Environmental Impact Report February 2010
CHAPTER 2.0 Project Description
2.1 Introduction The project analyzed in this recirculated draft Environmental Impact Report (RDEIR) is the proposed Tulare County General Plan 2030 Update (proposed project), which consists of a comprehensive update of the County’s current General Plan, including the continuation of many existing policies, modifications of others, and the addition of new policies. To help describe the proposed project, this chapter provides background information regarding the regional location of the County; describes what comprises a General Plan in California; outlines the project objectives and the policy development process; and identifies the key themes/components of the General Plan Update. Alternatives to the proposed project are summarized in this document’s Executive Summary and more fully described in Chapter 4.0 (“Alternatives to the Proposed Project”) of this EIR.
2.2 Project Location and Setting Tulare County is located in a geographically diverse region with the majestic peaks of the Sierra Nevada framing its eastern region, while its western portion includes the San Joaquin Valley floor, which is very fertile and extensively cultivated. The County is connected regionally via State Route 99 (SR 99), which is the primary north-south highway in the County. State highways 63 (north/south), 65 (north/south), 190 (east/west), and 198 (east/west) serve to connect the various cities, communities and regions within the County.
Tulare County consistently ranks amongst the top two leading agricultural-producing counties in the U.S., sharing this recognition with its larger neighbor to the north, Fresno County. In addition to agricultural production, the County’s economic base also includes agricultural packing and shipping operations. Small and medium size manufacturing plants are located in the western part of the County and are increasing in number.
Tulare County is also known for its unique open space area. The County contains Mt. Whitney, the tallest mountain in the 48 contiguous states, as well as various well known parks and open space areas including portions of Sequoia National Forest, Giant Sequoia National Monument, Inyo National Forest, and Kings Canyon National Park. Sequoia National Park is entirely contained within the County. Tulare County contains approximately 4,840 square miles within its borders and can be divided into three general topographical zones: a valley region; a foothill region east of the valley area; and a mountain region just east of the foothills. The eastern third of the County is generally comprised of public lands, which include not only the parks and forests listed above, but also the Mountain Home State Forest, Golden Trout Wilderness Area, and portions of the Dome Land
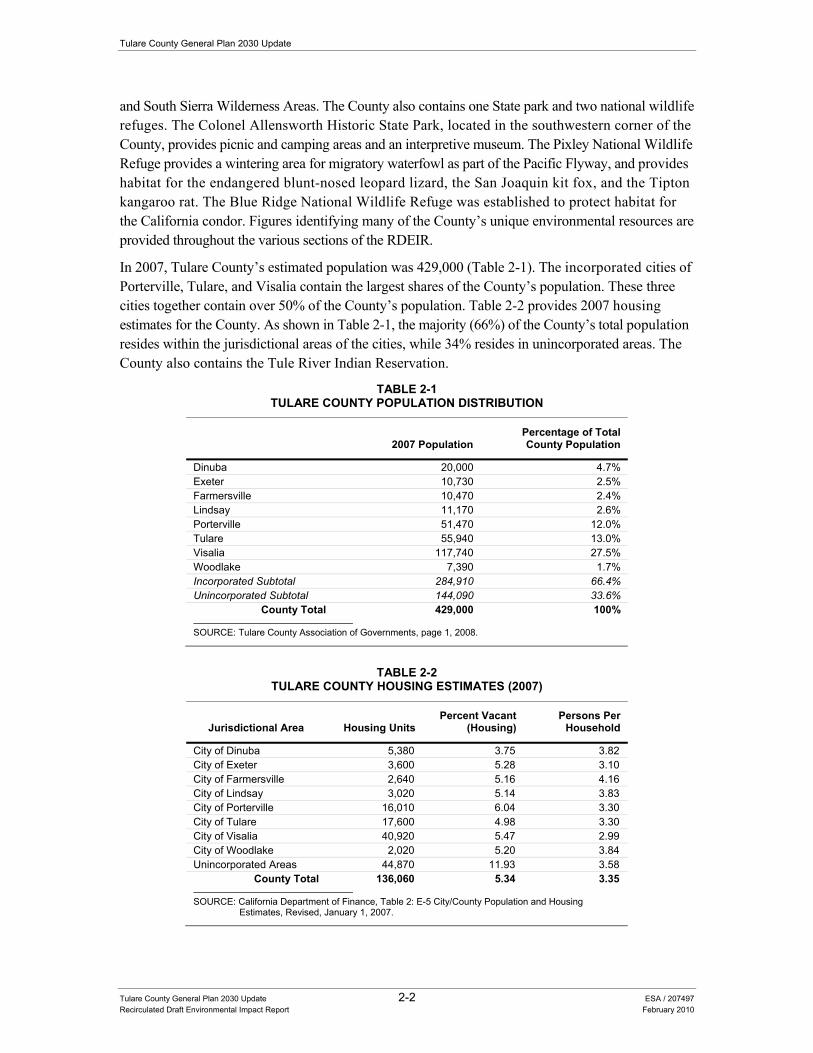
Tulare County General Plan 2030 Update
Tulare County General Plan 2030 Update 2-2 ESA / 207497 Recirculated Draft Environmental Impact Report February 2010
and South Sierra Wilderness Areas. The County also contains one State park and two national wildlife refuges. The Colonel Allensworth Historic State Park, located in the southwestern corner of the County, provides picnic and camping areas and an interpretive museum. The Pixley National Wildlife Refuge provides a wintering area for migratory waterfowl as part of the Pacific Flyway, and provides habitat for the endangered blunt-nosed leopard lizard, the San Joaquin kit fox, and the Tipton kangaroo rat. The Blue Ridge National Wildlife Refuge was established to protect habitat for the California condor. Figures identifying many of the County’s unique environmental resources are provided throughout the various sections of the RDEIR.
In 2007, Tulare County’s estimated population was 429,000 (Table 2-1). The incorporated cities of Porterville, Tulare, and Visalia contain the largest shares of the County’s population. These three cities together contain over 50% of the County’s population. Table 2-2 provides 2007 housing estimates for the County. As shown in Table 2-1, the majority (66%) of the County’s total population resides within the jurisdictional areas of the cities, while 34% resides in unincorporated areas. The County also contains the Tule River Indian Reservation.
TABLE 2-1TULARE COUNTY POPULATION DISTRIBUTION
2007 Population Percentage of Total County Population
Dinuba 20,000 4.7% Exeter 10,730 2.5% Farmersville 10,470 2.4% Lindsay 11,170 2.6% Porterville 51,470 12.0% Tulare 55,940 13.0% Visalia 117,740 27.5% Woodlake 7,390 1.7% Incorporated Subtotal 284,910 66.4% Unincorporated Subtotal 144,090 33.6%
County Total 429,000 100%
SOURCE: Tulare County Association of Governments, page 1, 2008.
TABLE 2-2
TULARE COUNTY HOUSING ESTIMATES (2007)
Jurisdictional Area Housing Units Percent Vacant
(Housing) Persons Per
Household
City of Dinuba 5,380 3.75 3.82 City of Exeter 3,600 5.28 3.10 City of Farmersville 2,640 5.16 4.16 City of Lindsay 3,020 5.14 3.83 City of Porterville 16,010 6.04 3.30 City of Tulare 17,600 4.98 3.30 City of Visalia 40,920 5.47 2.99 City of Woodlake 2,020 5.20 3.84 Unincorporated Areas 44,870 11.93 3.58
County Total 136,060 5.34 3.35
SOURCE: California Department of Finance, Table 2: E-5 City/County Population and Housing Estimates, Revised, January 1, 2007.
2. Project Description
Tulare County General Plan 2030 Update 2-3 ESA / 207497 Recirculated Draft Environmental Impact Report February 2010
County Boundaries The County of Tulare is bordered by Fresno County to the north and Kern County to the south. Kings County is located on the west side of Tulare County while Inyo County borders the County to the east (see Figure 2-1). The crest of the Sierra Nevada mountain range forms the boundary with Inyo County. The northern border of Tulare County is an irregular line that passes just south of the Cities of Kingsburg and Reedley and State Highway 180. The southern border is a consistent east-west trending line, comprising the south standard parallel south of Mount Diablo, located north of the City of Delano in Kern County. The western border generally trends north-south in a straight-line north and south just east of the Cities of Corcoran and Hanford in Kings County.
2.3 Project Objectives Although the proposed project was developed to meet several fairly broad objectives (i.e., the requirements of State law, etc.) the General Plan Update was also developed through an extensive public outreach process to reflect the specific policy needs of Tulare County. To help determine what these specific policy needs are, the Tulare County Board of Supervisors considered input received from the many community workshops, the Tulare County General Plan Update Technical Advisory Committee, and the Planning Commission, on the fundamental values that would guide the preparation of the General Plan Update. As a result of this input, the following five value statements were identified:
• The beauty of the County and the health and safety of its residents will be protected and enhanced.
• The County will create and facilitate opportunities to improve the lives of all County residents. • The County will protect its agricultural economy while diversifying employment
opportunities. • Every community will have the opportunity to prosper from economic growth. • Growth will pay its own way providing sustainable, high quality infrastructure and services.
From these value statements, four framework concepts (see Table 2-3 below) were developed for the General Plan.
TABLE 2-3 TULARE COUNTY GENERAL PLAN FRAMEWORK CONCEPTS
Concept 1: Agriculture One of the most identified assets in Tulare County is the rich agricultural land on the Valley floor and in the foothills. The General Plan identifies agriculture not only as an economic asset to the County but also as a cultural, scenic, and environmental element to be protected and to insure that the utilization of these resources may continue to economically succeed.
Concept 2: Land Use Tulare County has a number of unincorporated communities and may plan for and establish new communities that will grow and develop while natural resource lands (agriculture, mineral extraction, and open space) will be preserved and permitted to expand. It is anticipated that much of the projected population growth will require a range of housing choices, neighborhood support services, and employment producing uses that are centrally located in cities and unincorporated communities. The County will also utilize its goals and policies to guide the conversion of agricultural and natural resource lands to urban uses.
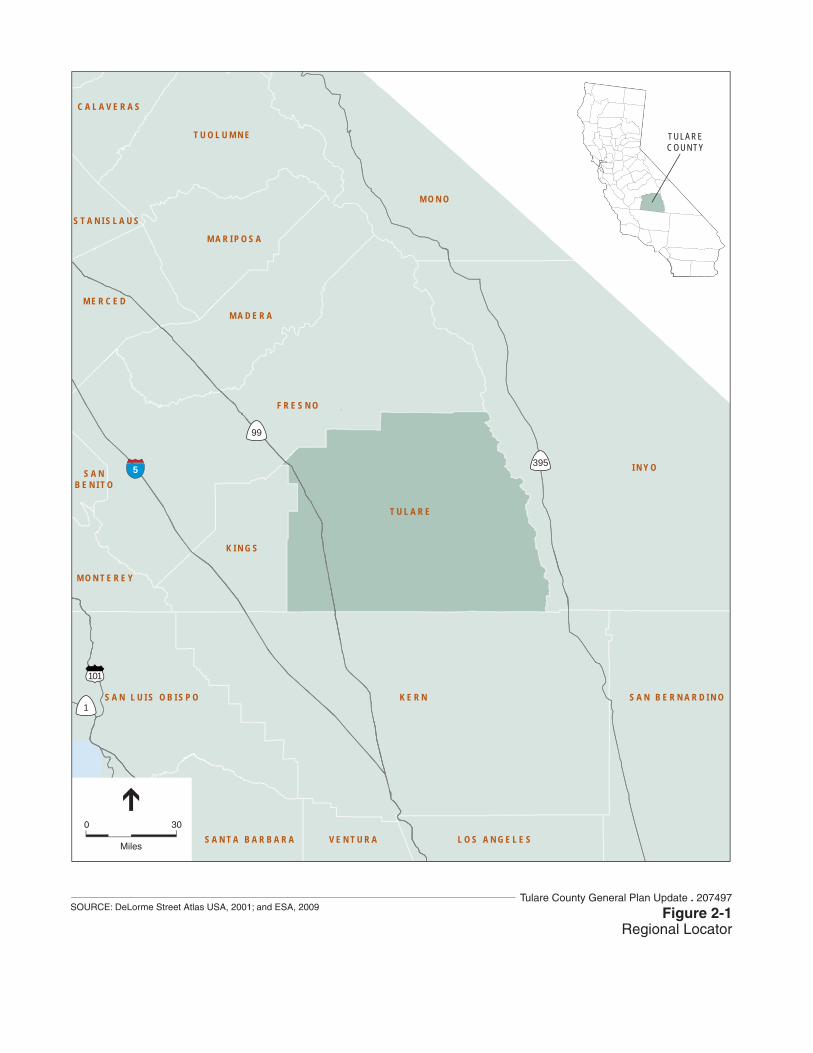
395
101
5
99
1
M A D E R A
F R E S N O
K E R N S A N B E R N A R D I N O
V E N T U R A L O S A N G E L E SS A N T A B A R B A R A
I N Y OS A NB E N I T O
M O N T E R E Y
S A N L U I S O B I S P O
S T A N I S L A U S
M E R C E D
C A L A V E R A S
T U O L U M N E
M O N O
M A R I P O S A
T U L A R E
K I N G S
0 30
Miles
TULARECOUNTY
Figure 2-1Regional Locator
SOURCE: DeLorme Street Atlas USA, 2001; and ESA, 2009Tulare County General Plan Update . 207497
2. Project Description
Tulare County General Plan 2030 Update 2-5 ESA / 207497 Recirculated Draft Environmental Impact Report February 2010
TABLE 2-3 (CONTINUED)TULARE COUNTY GENERAL PLAN FRAMEWORK CONCEPTS
Concept 3: Scenic Landscapes The scenic landscapes in Tulare County will continue to be one of its most visible assets. The Tulare County General Plan emphasizes the enhancement and preservation of these resources as critical to the future of the County. The County will continue to asses the recreational, tourism, quality of life, and economic benefits that scenic landscapes provide and implement programs that preserve and use this resource to the fullest extent.
Concept 4: Natural and Cultural Resources As Tulare County develops its unincorporated communities and plans for new self sustaining communities, the County will ensure that development occurs in a manner that limits impacts to natural and cultural resources through the implementation of its Goals and Policies through proper site planning and design techniques.
From these framework concepts several guiding principles were identified, which set the foundation for the various goals, policies, and implementation measures that comprise the various elements of the General Plan Update. These guiding principles also serve as the objectives of the proposed project.
Overall, the objectives of the proposed project are to adopt a revised Countywide Plan that achieves the following:
• Provide opportunities for small unincorporated communities to grow or improve quality of life and their economic viability and to provide the framework for planning new self sustaining communities;
• Promote reinvestment in existing unincorporated communities in a way that enhances the quality of life and their economic viability in these locations;
• Protect the County’s important agricultural resources and scenic natural lands from urban encroachment through the implementation of goals and policies of the General Plan;
• Strictly limit rural residential development in important agricultural areas outside of unincorporated communities’ and cities’ UABs and UDBs (i.e., avoid rural residential sprawl);
• Allow existing and outdated agricultural facilities in rural areas to be retrofitted and used for new agricultural related businesses (including value added processing facilities and uses) subject to specified criteria; and
• Enhance planning coordination and cooperation with the agencies and organizations with land management responsibilities in and adjacent to Tulare County.
2.4 Project Description
General Plans in California State law requires each county and city to prepare and adopt a comprehensive and long-range General Plan for its physical development (Government Code Section 65300). Each General Plan must address the seven topics (referred to as “elements”) of land use, circulation, housing, open-space, conservation, safety, and noise as identified in State law (Government Code Section 65302), to the extent that the topics are locally relevant. A summary of the primary objectives to be addressed within each of these elements is provided in Table 2-4. Cities and counties in the San Joaquin Valley must also address air quality matters as specified by Government Code Section 65302.1. Cities and counties may also include other topics of local interest, as they choose (Government Code Section 65303).
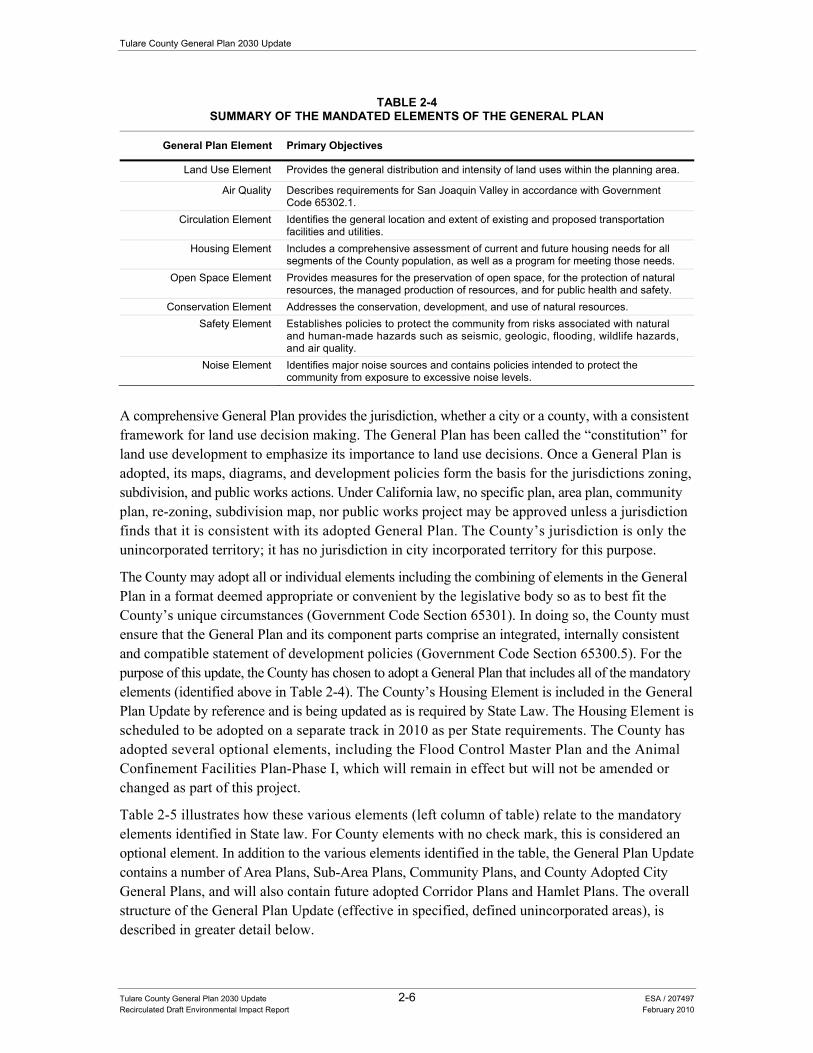
Tulare County General Plan 2030 Update
Tulare County General Plan 2030 Update 2-6 ESA / 207497 Recirculated Draft Environmental Impact Report February 2010
TABLE 2-4 SUMMARY OF THE MANDATED ELEMENTS OF THE GENERAL PLAN
General Plan Element Primary Objectives
Land Use Element Provides the general distribution and intensity of land uses within the planning area.
Air Quality Describes requirements for San Joaquin Valley in accordance with Government Code 65302.1.
Circulation Element Identifies the general location and extent of existing and proposed transportation facilities and utilities.
Housing Element Includes a comprehensive assessment of current and future housing needs for all segments of the County population, as well as a program for meeting those needs.
Open Space Element Provides measures for the preservation of open space, for the protection of natural resources, the managed production of resources, and for public health and safety.
Conservation Element Addresses the conservation, development, and use of natural resources. Safety Element Establishes policies to protect the community from risks associated with natural
and human-made hazards such as seismic, geologic, flooding, wildlife hazards, and air quality.
Noise Element Identifies major noise sources and contains policies intended to protect the community from exposure to excessive noise levels.
A comprehensive General Plan provides the jurisdiction, whether a city or a county, with a consistent framework for land use decision making. The General Plan has been called the “constitution” for land use development to emphasize its importance to land use decisions. Once a General Plan is adopted, its maps, diagrams, and development policies form the basis for the jurisdictions zoning, subdivision, and public works actions. Under California law, no specific plan, area plan, community plan, re-zoning, subdivision map, nor public works project may be approved unless a jurisdiction finds that it is consistent with its adopted General Plan. The County’s jurisdiction is only the unincorporated territory; it has no jurisdiction in city incorporated territory for this purpose.
The County may adopt all or individual elements including the combining of elements in the General Plan in a format deemed appropriate or convenient by the legislative body so as to best fit the County’s unique circumstances (Government Code Section 65301). In doing so, the County must ensure that the General Plan and its component parts comprise an integrated, internally consistent and compatible statement of development policies (Government Code Section 65300.5). For the purpose of this update, the County has chosen to adopt a General Plan that includes all of the mandatory elements (identified above in Table 2-4). The County’s Housing Element is included in the General Plan Update by reference and is being updated as is required by State Law. The Housing Element is scheduled to be adopted on a separate track in 2010 as per State requirements. The County has adopted several optional elements, including the Flood Control Master Plan and the Animal Confinement Facilities Plan-Phase I, which will remain in effect but will not be amended or changed as part of this project.
Table 2-5 illustrates how these various elements (left column of table) relate to the mandatory elements identified in State law. For County elements with no check mark, this is considered an optional element. In addition to the various elements identified in the table, the General Plan Update contains a number of Area Plans, Sub-Area Plans, Community Plans, and County Adopted City General Plans, and will also contain future adopted Corridor Plans and Hamlet Plans. The overall structure of the General Plan Update (effective in specified, defined unincorporated areas), is described in greater detail below.
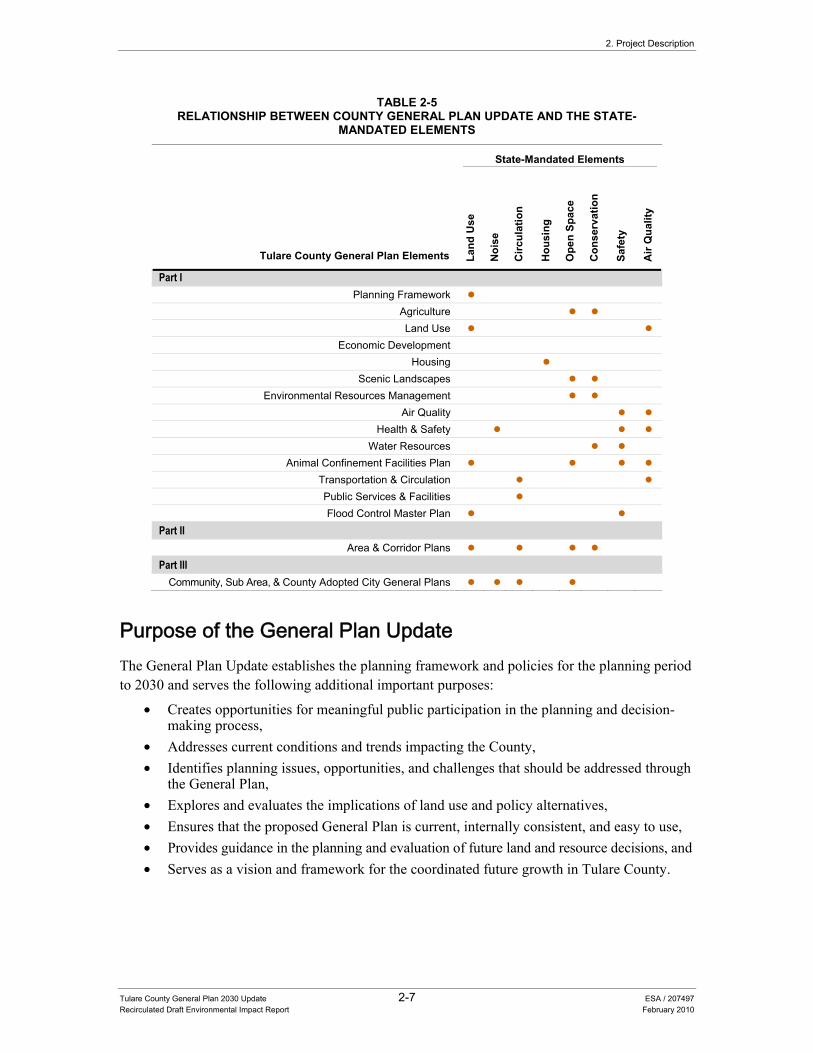
2. Project Description
Tulare County General Plan 2030 Update 2-7 ESA / 207497 Recirculated Draft Environmental Impact Report February 2010
TABLE 2-5RELATIONSHIP BETWEEN COUNTY GENERAL PLAN UPDATE AND THE STATE-
MANDATED ELEMENTS
State-Mandated Elements
Tulare County General Plan Elements Land
Use
Noi
se
Circ
ulat
ion
Hou
sing
Ope
n Sp
ace
Con
serv
atio
n
Safe
ty
Air
Qua
lity
Part I Planning Framework
Agriculture Land Use
Economic Development Housing
Scenic Landscapes Environmental Resources Management
Air Quality Health & Safety
Water Resources Animal Confinement Facilities Plan
Transportation & Circulation Public Services & Facilities Flood Control Master Plan
Part II Area & Corridor Plans
Part III Community, Sub Area, & County Adopted City General Plans
Purpose of the General Plan Update The General Plan Update establishes the planning framework and policies for the planning period to 2030 and serves the following additional important purposes:
• Creates opportunities for meaningful public participation in the planning and decision-making process,
• Addresses current conditions and trends impacting the County, • Identifies planning issues, opportunities, and challenges that should be addressed through
the General Plan, • Explores and evaluates the implications of land use and policy alternatives, • Ensures that the proposed General Plan is current, internally consistent, and easy to use, • Provides guidance in the planning and evaluation of future land and resource decisions, and • Serves as a vision and framework for the coordinated future growth in Tulare County.
Tulare County General Plan 2030 Update
Tulare County General Plan 2030 Update 2-8 ESA / 207497 Recirculated Draft Environmental Impact Report February 2010
Description of the General Plan Update Tulare County General Plan 2030 Update is the product of an update process that, in 2010, added a variety of important new goals and policies to existing components of the County’s General Plan. In addition, some obsolete policies of the General Plan were deleted by this update process. In many cases, those obsolete policies were replaced by new provisions. Further, a Work Plan, consisting of implementation measures, was included.
The General Plan 2030 Update consists of a comprehensive update of Tulare County’s existing General Plan. The historic three tier structure remains, formalized as three “Parts.” The key General Plan policy document includes Part I: the Goals and Policies Report and Part II: Area Plans. Part III consists of individual, existing Community, sub-area and other localized plans. The plans in Part III will not be changed as part of this update, except for Dinuba (revised by this update to include the Dinuba Golf Course) and Pixley (revised by this update to include Harmon Field). Another key General Plan document is the 2010 Background Report (included as Appendix B of this RDEIR).
Part I: Goals and Policies Report Part I (the Goals and Policies Report) of the General Plan 2030 Update document contains the goals and policies that will guide future decisions within the County unincorporated areas. It also identifies implementation measures that will ensure the goals and policies of the General Plan Update are carried out. This section identifies how this document is organized and provides a summary of its content.
The Goals and Policies Report (Part I of the General Plan Update) sets out a hierarchy of goals, policies, and implementation measures designed to guide future development in the County. To provide a comprehensive and easy-to-use format, the Goals and Policies Report is divided into four components. Each component contains a set of related elements that have been grouped together based on the close relationship of those elements. Appendix C includes a copy of the entire draft General Plan 2030 Update. A summary of the four components is provided below.
Each component will start with an overview of the elements contained in that component and present the guiding principles used in the preparation of these elements. The individual elements will build on these guiding principles, with each element containing a set of goals and policies that will be used to guide the future of the County. At the end of each element or chapter is a proposed workplan (list of implementation measures) showing how the goals and policies will be implemented. All four components and the various elements that comprise each component are summarized below in Table 2-6.
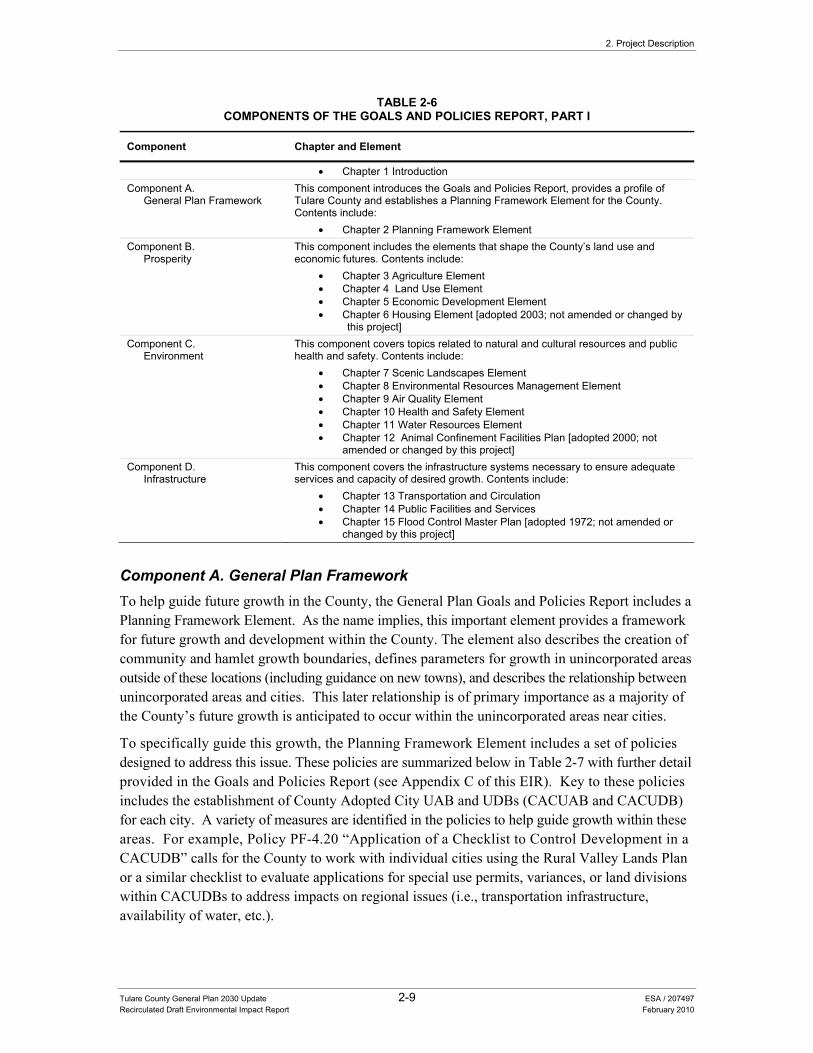
2. Project Description
Tulare County General Plan 2030 Update 2-9 ESA / 207497 Recirculated Draft Environmental Impact Report February 2010
TABLE 2-6 COMPONENTS OF THE GOALS AND POLICIES REPORT, PART I
Component Chapter and Element
• Chapter 1 Introduction Component A.
General Plan Framework This component introduces the Goals and Policies Report, provides a profile of Tulare County and establishes a Planning Framework Element for the County. Contents include:
• Chapter 2 Planning Framework Element Component B.
Prosperity This component includes the elements that shape the County’s land use and economic futures. Contents include:
• Chapter 3 Agriculture Element • Chapter 4 Land Use Element • Chapter 5 Economic Development Element • Chapter 6 Housing Element [adopted 2003; not amended or changed by
this project] Component C.
Environment This component covers topics related to natural and cultural resources and public health and safety. Contents include:
• Chapter 7 Scenic Landscapes Element • Chapter 8 Environmental Resources Management Element • Chapter 9 Air Quality Element • Chapter 10 Health and Safety Element • Chapter 11 Water Resources Element • Chapter 12 Animal Confinement Facilities Plan [adopted 2000; not
amended or changed by this project] Component D.
Infrastructure This component covers the infrastructure systems necessary to ensure adequate services and capacity of desired growth. Contents include:
• Chapter 13 Transportation and Circulation • Chapter 14 Public Facilities and Services • Chapter 15 Flood Control Master Plan [adopted 1972; not amended or
changed by this project]
Component A. General Plan Framework To help guide future growth in the County, the General Plan Goals and Policies Report includes a Planning Framework Element. As the name implies, this important element provides a framework for future growth and development within the County. The element also describes the creation of community and hamlet growth boundaries, defines parameters for growth in unincorporated areas outside of these locations (including guidance on new towns), and describes the relationship between unincorporated areas and cities. This later relationship is of primary importance as a majority of the County’s future growth is anticipated to occur within the unincorporated areas near cities.
To specifically guide this growth, the Planning Framework Element includes a set of policies designed to address this issue. These policies are summarized below in Table 2-7 with further detail provided in the Goals and Policies Report (see Appendix C of this EIR). Key to these policies includes the establishment of County Adopted City UAB and UDBs (CACUAB and CACUDB) for each city. A variety of measures are identified in the policies to help guide growth within these areas. For example, Policy PF-4.20 “Application of a Checklist to Control Development in a CACUDB” calls for the County to work with individual cities using the Rural Valley Lands Plan or a similar checklist to evaluate applications for special use permits, variances, or land divisions within CACUDBs to address impacts on regional issues (i.e., transportation infrastructure, availability of water, etc.).
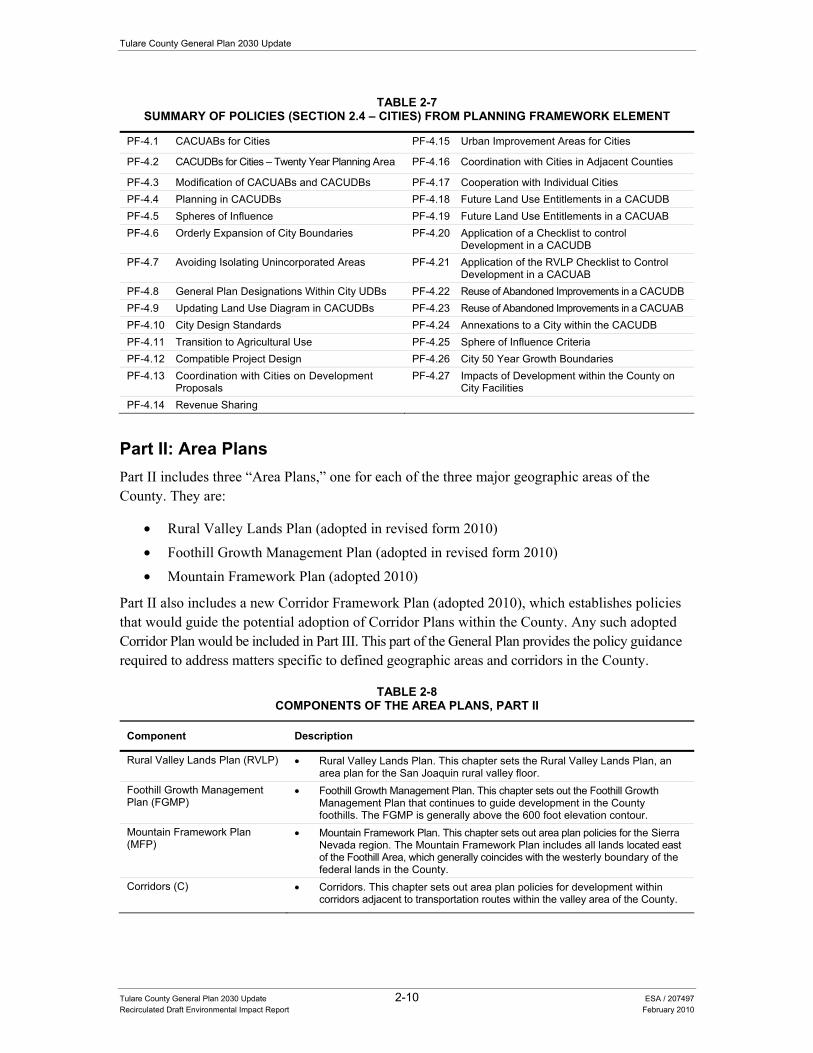
Tulare County General Plan 2030 Update
Tulare County General Plan 2030 Update 2-10 ESA / 207497 Recirculated Draft Environmental Impact Report February 2010
TABLE 2-7SUMMARY OF POLICIES (SECTION 2.4 – CITIES) FROM PLANNING FRAMEWORK ELEMENT
PF-4.1 CACUABs for Cities PF-4.15 Urban Improvement Areas for Cities
PF-4.2 CACUDBs for Cities – Twenty Year Planning Area PF-4.16 Coordination with Cities in Adjacent Counties
PF-4.3 Modification of CACUABs and CACUDBs PF-4.17 Cooperation with Individual Cities PF-4.4 Planning in CACUDBs PF-4.18 Future Land Use Entitlements in a CACUDB PF-4.5 Spheres of Influence PF-4.19 Future Land Use Entitlements in a CACUAB PF-4.6 Orderly Expansion of City Boundaries PF-4.20 Application of a Checklist to control
Development in a CACUDB PF-4.7 Avoiding Isolating Unincorporated Areas PF-4.21 Application of the RVLP Checklist to Control
Development in a CACUAB PF-4.8 General Plan Designations Within City UDBs PF-4.22 Reuse of Abandoned Improvements in a CACUDB PF-4.9 Updating Land Use Diagram in CACUDBs PF-4.23 Reuse of Abandoned Improvements in a CACUAB PF-4.10 City Design Standards PF-4.24 Annexations to a City within the CACUDB PF-4.11 Transition to Agricultural Use PF-4.25 Sphere of Influence Criteria PF-4.12 Compatible Project Design PF-4.26 City 50 Year Growth Boundaries PF-4.13 Coordination with Cities on Development
Proposals PF-4.27 Impacts of Development within the County on
City Facilities PF-4.14 Revenue Sharing
Part II: Area Plans Part II includes three “Area Plans,” one for each of the three major geographic areas of the County. They are:
• Rural Valley Lands Plan (adopted in revised form 2010) • Foothill Growth Management Plan (adopted in revised form 2010) • Mountain Framework Plan (adopted 2010)
Part II also includes a new Corridor Framework Plan (adopted 2010), which establishes policies that would guide the potential adoption of Corridor Plans within the County. Any such adopted Corridor Plan would be included in Part III. This part of the General Plan provides the policy guidance required to address matters specific to defined geographic areas and corridors in the County.
TABLE 2-8COMPONENTS OF THE AREA PLANS, PART II
Component Description
Rural Valley Lands Plan (RVLP) • Rural Valley Lands Plan. This chapter sets the Rural Valley Lands Plan, an area plan for the San Joaquin rural valley floor.
Foothill Growth Management Plan (FGMP)
• Foothill Growth Management Plan. This chapter sets out the Foothill Growth Management Plan that continues to guide development in the County foothills. The FGMP is generally above the 600 foot elevation contour.
Mountain Framework Plan (MFP)
• Mountain Framework Plan. This chapter sets out area plan policies for the Sierra Nevada region. The Mountain Framework Plan includes all lands located east of the Foothill Area, which generally coincides with the westerly boundary of the federal lands in the County.
Corridors (C) • Corridors. This chapter sets out area plan policies for development within corridors adjacent to transportation routes within the valley area of the County.
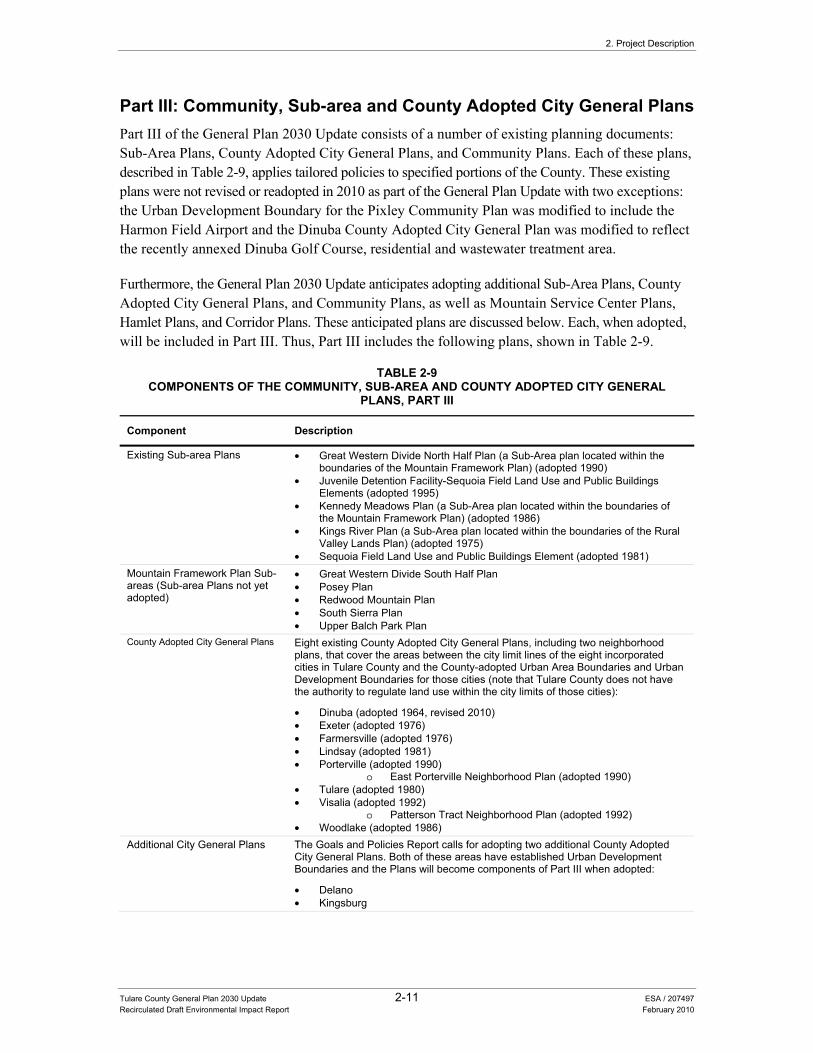
2. Project Description
Tulare County General Plan 2030 Update 2-11 ESA / 207497 Recirculated Draft Environmental Impact Report February 2010
Part III: Community, Sub-area and County Adopted City General Plans Part III of the General Plan 2030 Update consists of a number of existing planning documents: Sub-Area Plans, County Adopted City General Plans, and Community Plans. Each of these plans, described in Table 2-9, applies tailored policies to specified portions of the County. These existing plans were not revised or readopted in 2010 as part of the General Plan Update with two exceptions: the Urban Development Boundary for the Pixley Community Plan was modified to include the Harmon Field Airport and the Dinuba County Adopted City General Plan was modified to reflect the recently annexed Dinuba Golf Course, residential and wastewater treatment area.
Furthermore, the General Plan 2030 Update anticipates adopting additional Sub-Area Plans, County Adopted City General Plans, and Community Plans, as well as Mountain Service Center Plans, Hamlet Plans, and Corridor Plans. These anticipated plans are discussed below. Each, when adopted, will be included in Part III. Thus, Part III includes the following plans, shown in Table 2-9.
TABLE 2-9COMPONENTS OF THE COMMUNITY, SUB-AREA AND COUNTY ADOPTED CITY GENERAL
PLANS, PART III
Component Description
Existing Sub-area Plans • Great Western Divide North Half Plan (a Sub-Area plan located within the boundaries of the Mountain Framework Plan) (adopted 1990)
• Juvenile Detention Facility-Sequoia Field Land Use and Public Buildings Elements (adopted 1995)
• Kennedy Meadows Plan (a Sub-Area plan located within the boundaries of the Mountain Framework Plan) (adopted 1986)
• Kings River Plan (a Sub-Area plan located within the boundaries of the Rural Valley Lands Plan) (adopted 1975)
• Sequoia Field Land Use and Public Buildings Element (adopted 1981) Mountain Framework Plan Sub-areas (Sub-area Plans not yet adopted)
• Great Western Divide South Half Plan • Posey Plan • Redwood Mountain Plan • South Sierra Plan • Upper Balch Park Plan
County Adopted City General Plans Eight existing County Adopted City General Plans, including two neighborhood plans, that cover the areas between the city limit lines of the eight incorporated cities in Tulare County and the County-adopted Urban Area Boundaries and Urban Development Boundaries for those cities (note that Tulare County does not have the authority to regulate land use within the city limits of those cities):
• Dinuba (adopted 1964, revised 2010) • Exeter (adopted 1976) • Farmersville (adopted 1976) • Lindsay (adopted 1981) • Porterville (adopted 1990)
o East Porterville Neighborhood Plan (adopted 1990) • Tulare (adopted 1980) • Visalia (adopted 1992)
o Patterson Tract Neighborhood Plan (adopted 1992) • Woodlake (adopted 1986)
Additional City General Plans The Goals and Policies Report calls for adopting two additional County Adopted City General Plans. Both of these areas have established Urban Development Boundaries and the Plans will become components of Part III when adopted:
• Delano • Kingsburg
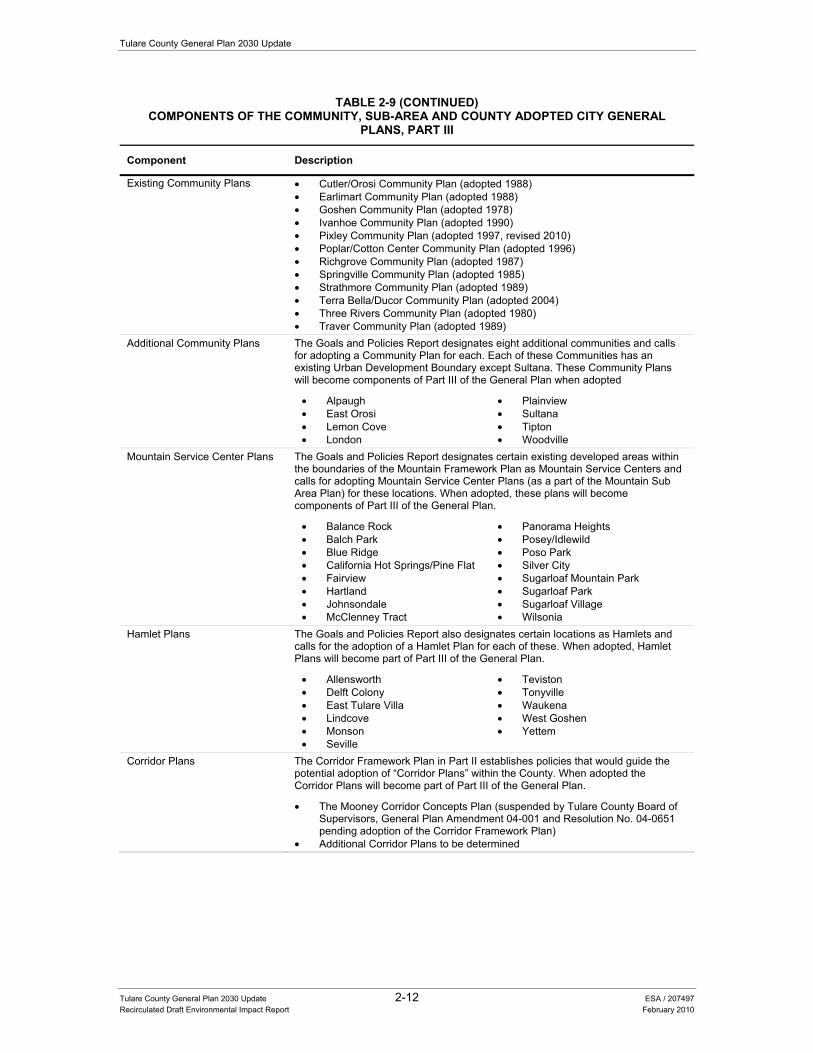
Tulare County General Plan 2030 Update
Tulare County General Plan 2030 Update 2-12 ESA / 207497 Recirculated Draft Environmental Impact Report February 2010
TABLE 2-9 (CONTINUED)COMPONENTS OF THE COMMUNITY, SUB-AREA AND COUNTY ADOPTED CITY GENERAL
PLANS, PART III
Component Description
Existing Community Plans • Cutler/Orosi Community Plan (adopted 1988) • Earlimart Community Plan (adopted 1988) • Goshen Community Plan (adopted 1978) • Ivanhoe Community Plan (adopted 1990) • Pixley Community Plan (adopted 1997, revised 2010) • Poplar/Cotton Center Community Plan (adopted 1996) • Richgrove Community Plan (adopted 1987) • Springville Community Plan (adopted 1985) • Strathmore Community Plan (adopted 1989) • Terra Bella/Ducor Community Plan (adopted 2004) • Three Rivers Community Plan (adopted 1980) • Traver Community Plan (adopted 1989)
Additional Community Plans The Goals and Policies Report designates eight additional communities and calls for adopting a Community Plan for each. Each of these Communities has an existing Urban Development Boundary except Sultana. These Community Plans will become components of Part III of the General Plan when adopted
• Alpaugh • East Orosi • Lemon Cove • London
• Plainview • Sultana • Tipton • Woodville
Mountain Service Center Plans The Goals and Policies Report designates certain existing developed areas within the boundaries of the Mountain Framework Plan as Mountain Service Centers and calls for adopting Mountain Service Center Plans (as a part of the Mountain Sub Area Plan) for these locations. When adopted, these plans will become components of Part III of the General Plan.
• Balance Rock • Balch Park • Blue Ridge • California Hot Springs/Pine Flat • Fairview • Hartland • Johnsondale • McClenney Tract
• Panorama Heights • Posey/Idlewild • Poso Park • Silver City • Sugarloaf Mountain Park • Sugarloaf Park • Sugarloaf Village • Wilsonia
Hamlet Plans The Goals and Policies Report also designates certain locations as Hamlets and calls for the adoption of a Hamlet Plan for each of these. When adopted, Hamlet Plans will become part of Part III of the General Plan.
• Allensworth • Delft Colony • East Tulare Villa • Lindcove • Monson • Seville
• Teviston • Tonyville • Waukena • West Goshen • Yettem
Corridor Plans The Corridor Framework Plan in Part II establishes policies that would guide the potential adoption of “Corridor Plans” within the County. When adopted the Corridor Plans will become part of Part III of the General Plan.
• The Mooney Corridor Concepts Plan (suspended by Tulare County Board of Supervisors, General Plan Amendment 04-001 and Resolution No. 04-0651 pending adoption of the Corridor Framework Plan)
• Additional Corridor Plans to be determined
2. Project Description
Tulare County General Plan 2030 Update 2-13 ESA / 207497 Recirculated Draft Environmental Impact Report February 2010
Key Policy Changes and Project Information The General Plan Update is a policy plan that relies on individual policies to direct the growth of future urban development to locations as set out in Policy PF-1.2 of the Goals and Policies Report (Part I of the General Plan Update), including Urban Development Boundaries, Hamlet Development Boundaries, Mountain Service Centers, and Foothill, Urban, and Regional Growth Corridors. These locations are identified below in Figure 2-2.
The most significant changes1 to the policies of the General Plan Update include:
• Consolidate the seven required general plan elements. The required elements are: Land Use, Circulation, Housing, Open Space, Conservation, Safety and Noise. The County’s Housing Element is incorporated in the General Plan Update by reference but is not being updated as part of the proposed project. The Housing Element was last updated in 2003 and will be adopted on a separate track as per State requirements, which also includes a separate environmental review process.
• Add new optional elements, create standalone topical elements to address key issues identified during public workshops, and incorporate existing voluntary elements. These new optional elements are: Agriculture, Economic Development, Scenic Landscapes, and Water Resources. Two existing optional elements will remain. The Flood Control Master Plan adopted in 1972 and the Animal Confinement Facilities Plan (ACFP) adopted in 2000 are also included in the General Plan by reference. The Flood Control Master Plan is Chapter 15 in Component D-Infrastructure and the ACFP is Chapter 12 in Component C-Environment. Finally, the issue of air quality, a required topic to be addressed by the general plan, is also addressed as a separate element.
• Identify Hamlet Development Boundaries for 11 unincorporated areas. The lands within the boundaries are exempt from the Rural Valley Lands Plan (RVLP). These hamlets are: Allensworth, Delft Colony, East Tulare Villa, Lindcove, Monson, Seville, Teviston, Tonyville, Waukena, West Goshen, and Yettem. The provision for hamlets would allow compatible infill development other than that provided by the RVLP, including mixed use and commercial opportunities.
• Support planning for regional growth corridors at select locations on Highway 99 and 65 (Part II: Area Plans). Once corridor boundaries are adopted through future amendments to the General Plan Land Use Designation Map, lands within these corridors will also be exempt from the Rural Valley Lands Plan. This provision allows the County to adopt regional growth corridors to maximize the economic development potential of areas located along major transportation routes for uses such as industrial, regional retail, office parks, and highway commercial. Interim policies would be established until regional growth corridor plans are adopted.
• Updates the Rural Valley Lands Plan and Foothill Growth Management Plan. The RVLP and FGMP will be adopted in revised form. These revisions include the omission of obsolete or outdated information and policies, provide clarification to policies and consistency with the Land Use Element, identify responsible agencies, identify implementation timeframes, and restore a comprehensive list of FGMP development standards.
1 Unless specified otherwise, the changes mentioned are to Part I: Goals and Policies Report of the General Plan 2030 Update.
Tulare County General Plan 2030 Update
Tulare County General Plan 2030 Update 2-14 ESA / 207497 Recirculated Draft Environmental Impact Report February 2010
• Consolidate Mountain Framework Plan (Part II: Area Plans). This provides unified planning policies and sub-area planning requirements for unincorporated mountain areas under County jurisdiction including the identification of the following 16 Mountain Service Centers: Balance Rock, Balch Park, Blue Ridge, California Hot Springs/Pine Flat, Fairview, Hartland, Johnsondale, McClenney Tract, Panorama Heights, Posey/Idlewild, Poso Park, Silver City, Sugarloaf Mountain Park, Sugarloaf Park, Sugarloaf Village, and Wilsonia.
• Establish consistent content requirements for Community Plans. This would include greater emphasis on community design, infrastructure provision, and financing. The new general plan would also require updated and enhanced development standards. New urban land use designations would be applied at the time of future Community Plan Updates to provide consistent application on a countywide basis.
• Provide clear criteria for when and how unincorporated communities and hamlets can grow. Communities would have to fulfill specific conditions for expansion as defined by the General Plan. The County would require that infrastructure exists before or be provided concurrent with new development.
• Expand upon the existing new town policy. New criteria for evaluating proposals would include: the new town must demonstrate a fiscally neutral or positive impact on the County, an infrastructure Master Plan must be prepared, the applicant must demonstrate access to water, and the project must strive to have a balanced mix of land uses.
• Require new development to pay its own way. Policies provide for use of a variety of financing mechanisms to construct, operate, and maintain public services and facilities to support new development. These mechanisms include impact fees, formation of assessment districts, new or reorganized special districts, homeowners associations, grants, and any future funding mechanisms that may become available.
• Regulate County water resources. The County would develop a ground water exportation ordinance, discourage a large conversion of agricultural water for urban development, and seek opportunities for ground water recharge.
• Ensure a sustainable long term water supply. The County will participate in integrated regional water management planning efforts, establish critical water supply areas, and protect existing water quality.
• Changes to land use designations on individual parcels are not proposed. Proposed changes to Land Use Designations and requisite densities would not be implemented until changes are proposed in future general plan updates and amendments or through development and adoption of new Community Plans, Hamlet Plans, Mountain sub-area plans, Foothill, Urban, and Regional Growth Corridors, and Mountain Service Center Plans.
• Changes to boundaries are not being proposed at this time. Individual property owner requested changes to land use designations are not proposed at this time. The Goals and Policies Report (Part I of the General Plan Update) designates land use in certain areas where Sub-Area plans have not, to date, been adopted, or where a general urban land use designation existed per the Urban Boundaries Element (1974). Hamlets, Communities, and Mountain Service Centers are existing unincorporated urban areas, with urban type zoning. The remainder of the undesignated areas are designated as Resource Conservation or Native American Reserve. The only exception is to include the already developed Harmon Field Airport site in the Pixley Urban Development Boundary, and previously annexed land in the City of Dinuba.
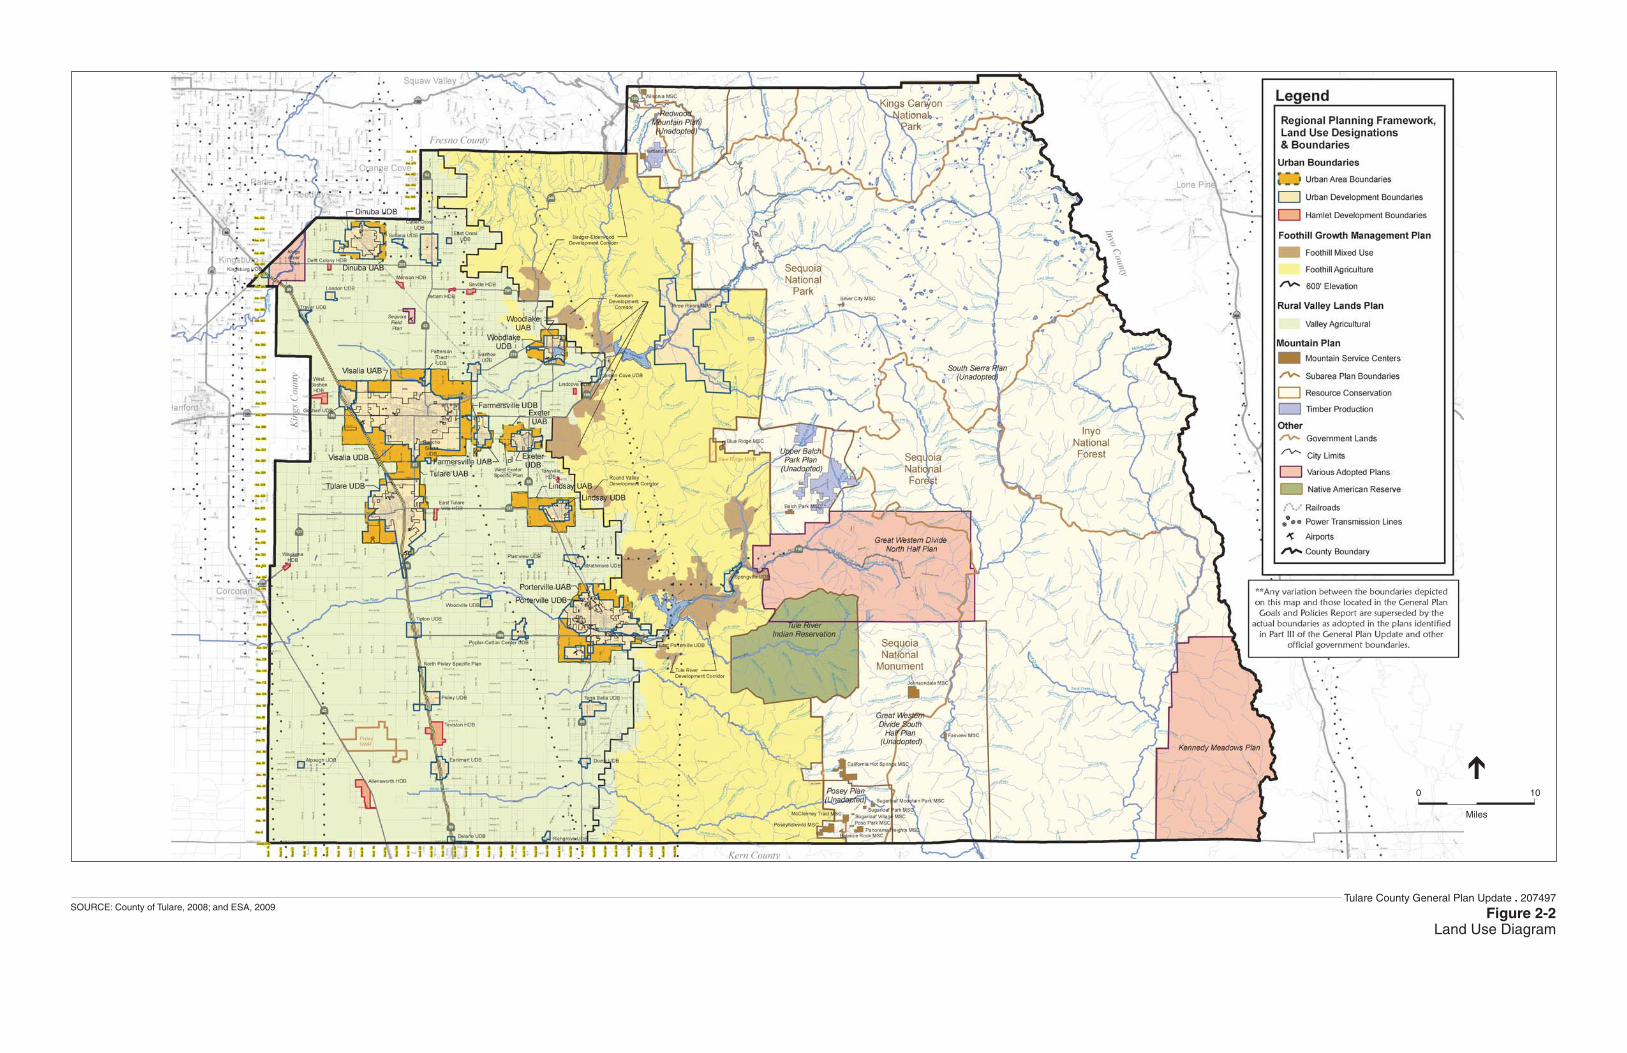
0 10
Miles
Tulare County General Plan Update . 207497
Figure 2-2Land Use Diagram
SOURCE: County of Tulare, 2008; and ESA, 2009
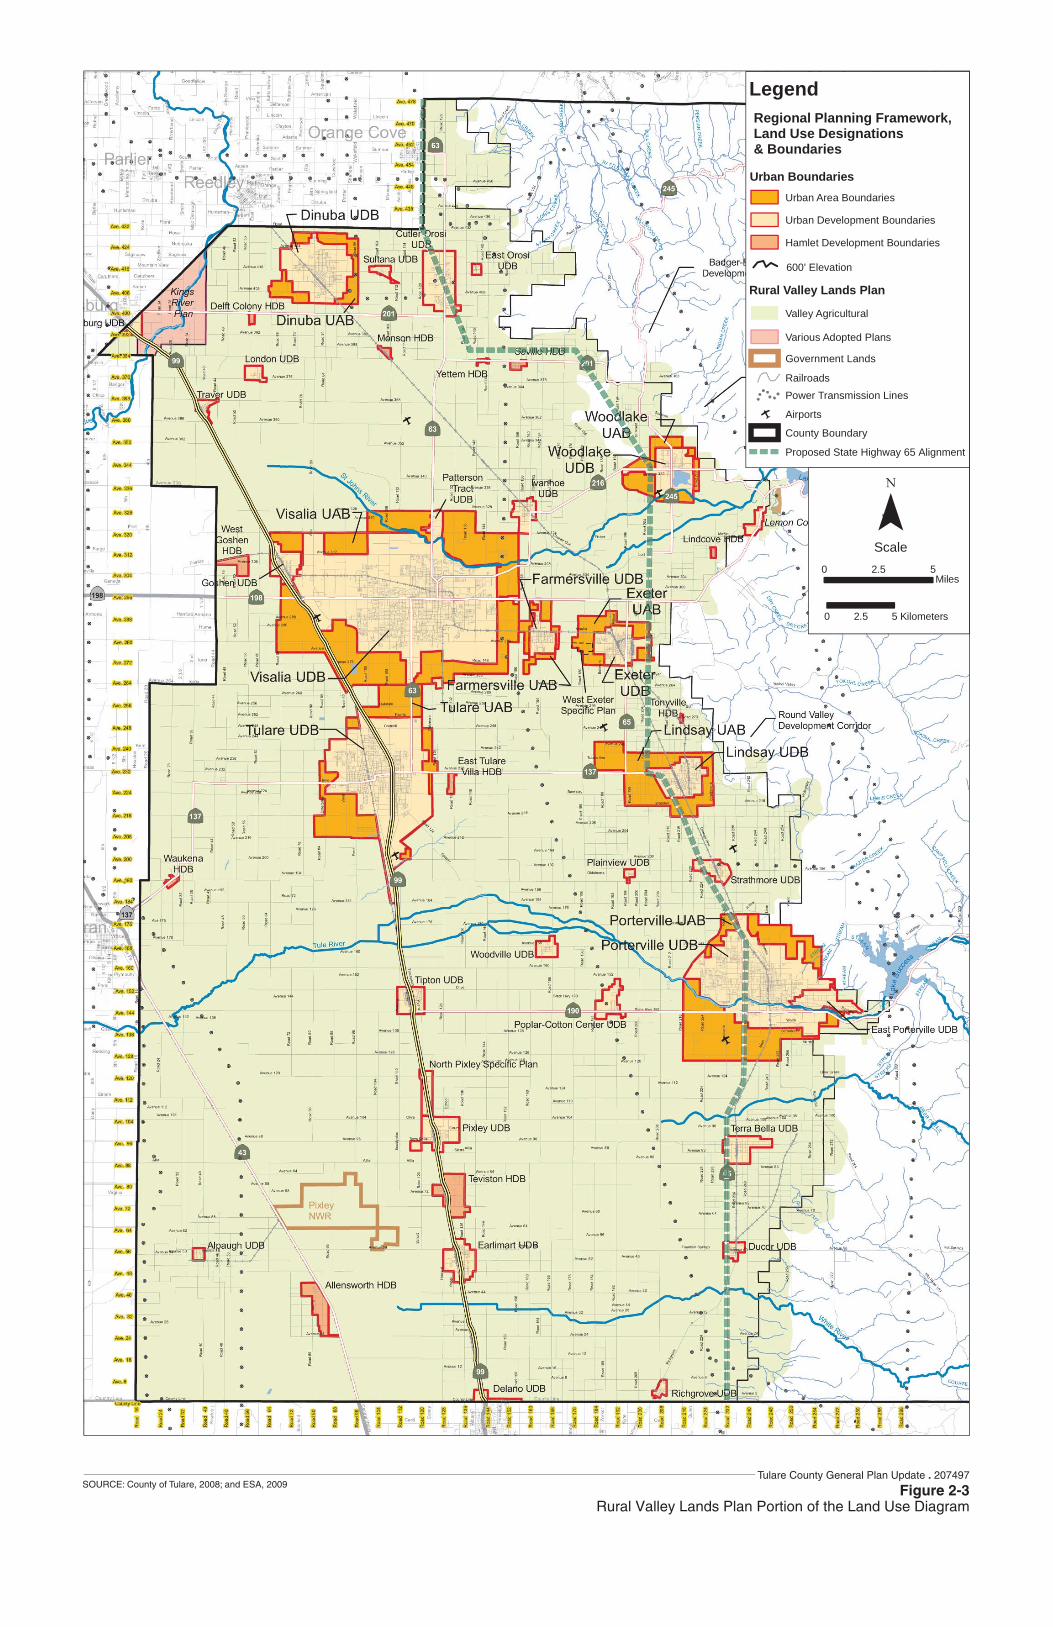
Legend
Rural Valley Lands Plan
Regional Planning Framework,Land Use Designations& Boundaries
Various Adopted Plans
Urban Development Boundaries
Hamlet Development Boundaries
Urban Area oundaries
Urban Boundaries
Power Transmission LinesRailroads
Airports
County Boundary
Valley Agricultural
600' Elevation
Government Lands
0 52.5Miles
0 52.5 Kilometers
B
Proposed State Highway 65 Alignment
Scale
Tulare County General Plan Update . 207497
Figure 2-3Rural Valley Lands Plan Portion of the Land Use Diagram
SOURCE: County of Tulare, 2008; and ESA, 2009
2. Project Description
Tulare County General Plan 2030 Update 2-17 ESA / 207497 Recirculated Draft Environmental Impact Report February 2010
Land Use Diagram and Planning Areas The General Plan Land Use (and Circulation) Diagram identifies the various planning areas where future population growth is anticipated to occur under the proposed project (see Figure 2-2 and 2-3). These planning areas include urban boundaries, area plans and adopted plans and are described below. The Land Use Diagram is derived from Figure 4-1: Tulare County Planning Areas, in the Goals and Policies Report (Part I of the General Plan Update). Please see Goals and Policies Report, Part 1, Chapter 4: Land Use, for a detailed description of the Land Use Diagram under Land Use Diagram and Standards.
The Circulation Diagram for Tulare County is shown in Figure 2-3. This diagram is derived from the TC Roads System (Figure 13-1) in the Goals and Policies Report (Part I of the General Plan Update). This figure shows the County’s regional road system. The major roadways are identified by the following types: arterial (major), arterial (minor), collector (major), and freeway. The proposed State Highway 65 Alignment is also identified in Figure 2-3.
Urban Boundaries As shown in Figures 2-2 and 2-3, urban boundaries are primarily found around concentrated urban types of land uses and/or zoning, including residential, commercial, and industrial uses. These uses are typically found around incorporated cities and within unincorporated communities, and hamlets. There are three types of urban boundaries within Tulare County: Urban Area Boundaries, Urban Development Boundaries, and Hamlet Development Boundaries. These are further discussed below.
Urban Development Boundaries Urban Development Boundaries (UDB) is a development boundary drawn around cities and unincorporated communities. For cities, the UDB is an officially adopted and mapped County line delineating the area expected for urban growth over a 20-year period. The UDB is located outside of the city limits but within the Urban Area Boundary (UABs). UABs are described below. For the unincorporated communities, the UDB is a County adopted line that divides land to be developed from land to be protected for agricultural, natural, or rural uses. The area within the UDB serves as the official planning area for communities over a 20 year period. The General Plan 2030 Update assumes that a majority of future growth will occur within the CACUDBs for the County’s cities and communities. Land within an unincorporated community UDB is assumed appropriate for development and is not subject to the Rural Valley Lands Plan (in Part II of the General Plan 2030 Update policy document). The Rural Valley Lands Plan area is discussed later in this section.
Planned Community Areas (PCA) contain areas suitable for comprehensive planning for long term community development on large tracts of land with a minimum of 200 continuous acres and allows for master planning where a community plan typically does not exist. The County has yet to adopt any boundaries for such areas.
Tulare County General Plan 2030 Update
Tulare County General Plan 2030 Update 2-18 ESA / 207497 Recirculated Draft Environmental Impact Report February 2010
Allowable land use types within UDBs include: Valley Agriculture, Foothill Agriculture, Resource Conservation, Urban Reserve, Rural Residential, Low Density Residential, Low-Medium Density Residential, Medium Density Residential, Medium-High Residential, High Density Residential, General Commercial, Neighborhood Commercial, Community Commercial, Highway Commercial, Town Center, Service Commercial, Commercial Office, Commercial Recreation, Mixed Use, Planned Community Area, Light Industrial, Heavy Industrial, Public/Quasi-Public, and Public Recreation.
Urban Area Boundaries Urban Area Boundaries (UAB) are officially adopted and illustrated by a boundary diagram showing the County lines around incorporated cities. An UAB is located outside of the UDB and the incorporated city limits. The UABs establish areas around incorporated cities where the County and cities may coordinate plans, policies, and standards relating to building construction, parcel mapping, subdivision development, land use and zoning regulations, street and highway construction, public utility systems, and other closely related matters affecting the orderly development of incorporated city urban fringe areas.
The area between the UDB and the UAB is considered to be the next logical area in which urban development may occur. Although it is the intent of the General Plan that this area will at some time become appropriate for urban development, generally no public purpose is served by permitting intensive development therein. As cities grow and expand, it is logical to assume the UDBs will be correspondingly expanded or established until they coincide with the UAB. The land lying between the UDB and the UAB is typically designated as rural residential, agriculture, and may include existing grandfathered land uses.
Allowable land use types within UABs generally include: Valley Agriculture, Resource Conservation, and Rural Residential.
Hamlet Development Boundaries Hamlet Development Boundaries (HDB) are identified and will be officially adopted and illustrated by a diagram showing County line around a hamlet as part of the General Plan Update, which is an unincorporated area that shares many of the characteristics of a community but on a smaller scale. HDBs divide lands suitable for urban development from lands to be protected for agricultural, natural, or rural uses. Land inside a HDB is assumed appropriate for development and is not subject to the criteria evaluation of development as established in the Rural Valley Lands Plan. Similar to the UDBs or CACUDBs discussed above, the General Plan assumes that future growth subsequent to the General Plan would occur within HDBs. The General Plan contains criteria used to define an unincorporated area as a “hamlet”. No hamlets are identified in the foothill area of the County during this General Plan Update (see Figure 2-2).
Allowable land use types within HDBs include: Resource Conservation, Urban Reserve, Low-Medium Residential, Medium Density Residential, High Density Residential, General Commercial, Highway Commercial, Service Commercial, Commercial Recreation, Mixed Use, Light Industrial, Heavy Industrial, Public-Quasi-Public, and Public Recreation.
2. Project Description
Tulare County General Plan 2030 Update 2-19 ESA / 207497 Recirculated Draft Environmental Impact Report February 2010
Area Plans (Part II of the General Plan Update) As shown in Figure 2-2, Tulare County contains three planning areas that are based on three different geographic regions of the County: Rural Valley Lands Plan, Foothill Growth Management Plan, and the Mountain Framework Plan. The Corridor Framework Plan is also considered an area plan. Each of these planning areas is discussed below. These planning areas contain resources and opportunities that distinguish themselves from each other. The Area Plans are set out in and more fully described in Part II of the General Plan 2030 Update policy document (see Appendix C).
Rural Valley Lands Plan The Rural Valley Lands Plan (RVLP) includes development policies and standards that prescribe land use and circulation patterns for the valley region of Tulare County, generally below the 600-foot elevation contour line along the foothills of the Sierra Nevada. The RVLP also applies to portions of the foothill region with Valley Agricultural designation as well as the areas outside the UDBs, HDBs, and UABs and other adopted land use plans which may include urban corridors, planned communities, and the Kings River Plan. The primary purpose of the RVLP is to ensure that land developed for non-agricultural uses are programmed in a gradual outward extension of present non-agricultural areas such that agricultural lands remain unfragmented and the costs of providing services are minimized. The RVLP is intended to achieve this purpose through implementation of a system of criteria that evaluate a parcel’s suitability for non-agricultural zoning.
Planned Community Areas (PCA) are areas within the Rural Valley Lands Plan that establish areas suitable for comprehensive planning for long term community development on large tracts of land with a minimum of 200 continuous acres and allows for master planning where a community plan typically does not exist. The PCA must be consistent with the policies for the RVLP. The County has yet to adopt any boundaries for such areas.
Allowable land use types within the RVLP include: Valley Agriculture, Planned Community Areas and Resource Conservation.
Corridors Framework Plan The Corridors Framework Plan provides guidance for development within corridors adjacent to major transportation routes in the County. The County may adopt three types of Corridor Plans. Regional Growth Corridor Plans are to be located in the unincorporated portions of the County that are adjacent to major transportation routes outside of adopted Urban Area Boundaries (UABs), Urban Development Boundaries (UDBs), and Hamlet Development Boundaries (HDBs). Urban Corridors are to be located within urban boundaries and Planned Communities. Scenic Highway Corridors are to be located in established or eligible State Scenic Highways. The General Plan assumes that some future urban growth and development as part of implementation of the General Plan Update would occur within the corridor areas of the County.
Allowable land use types within Corridors can include: Highway Commercial, Commercial Recreation, Mixed Use, Planned Community Area, Resource Conservation, Light Industrial, Heavy Industrial, and Public/Quasi-Public.
Tulare County General Plan 2030 Update
Tulare County General Plan 2030 Update 2-20 ESA / 207497 Recirculated Draft Environmental Impact Report February 2010
Foothill Growth Management Plan The Foothill Growth Management Plan (FGMP) includes development policies and standards that prescribe land use and circulation patterns for the foothills of Tulare County, generally above the 600-foot elevation line. The FGMP covers an area of land bounded on the east by the federally-owned parks in the Sierra Nevada Mountains and on the west by privately-owned lands on the San Joaquin Valley floor. The plan’s policies set out guidelines for community identity, new development, recreation/open space, agriculture, environmental protection, scenic corridors protection, history/archaeology, infrastructure facilities, and public services. The objectives of the FGMP are to direct urban and suburban growth to specific areas within the foothills in order to protect the environment, maintain agricultural viability, and provide State and county services in a cost-efficient and safe manner. Lands within the FGMP area that are most suited to experience future growth include established development corridors and UDBs. The FGMP identifies lands outside of communities such as Three Rivers and Springville. The following lands are described in Part II, Chapter 3, Foothill Growth Management Plan of the General Plan 2030 Update (see Appendix C):
• Foothill Mixed Use, • Foothill Agriculture, • Planned Community Area (PCA), and • Valley Agriculture.
Planned Community Areas (PCA) are areas within the Foothill Growth Management Plan area that establish areas suitable for comprehensive planning for long term community development on large tracts of land with a minimum of 200 continuous acres and allows for master planning where a community plan typically does not exist. The PCA must be consistent with the policies for the FGMP. The County has yet to adopt any boundaries for such areas.
Allowable land use types allowable within the FGMP area include: Foothill Agriculture, Resource Conservation, Planned Community Area, and Foothill Mixed Use.
Mountain Framework Plan The Mountain Framework Plan (see Figure 2-2) provides policy guidance in the unincorporated mountain area east of the FGMP which generally coincided with the western boundary of federal lands. This includes lands under the jurisdiction of the National Park Service (Sequoia National Park), the U.S. Forest Service (USFS) (Giant Sequoia National Monument), and the Bureau of Land Management (BLM). The County has never adopted an overall plan for the mountain area. The private lands in this region amount to about 40,000 acres identified in the following seven separate geographical locations or “sub-areas”:
• Kennedy Meadows (1986), • Great Western Divide - North ½ (1990), • Great Western Divide - South ½ (unadopted), • Redwood Mountain (unadopted), • Posey (unadopted),
2. Project Description
Tulare County General Plan 2030 Update 2-21 ESA / 207497 Recirculated Draft Environmental Impact Report February 2010
• Upper Balch Park (unadopted), and • South Sierra (unadopted).
Areas designated for development in the Mountain Framework Plan primarily include existing communities or in areas adjacent to existing communities are identified as mountain service centers and are designated as Mixed Use until a sub-area plan is adopted. The Mountain Framework Plan also contains developed areas consisting of private in-holdings and remote properties located outside of mountain service centers, which are identified as mountain service areas and are designated as Resource Conservation until a sub-area plan is adopted.
Planned Community Areas (PCA) are areas within the Mountain Framework Plan area that establish areas suitable for comprehensive planning for long term community development on large tracts of land with a minimum of 200 continuous acres and allows for master planning where a community plan typically does not exist. The PCA must be consistent with the policies for the Mountain Framework Plan. The County has yet to adopt any boundaries for such areas.
Allowable land use types within Mountain Framework Plan include: Resource Conservation, Timber Production, Native American Reserve, Mountain Residential, Medium Density Residential, General Commercial, Neighborhood Commercial, Commercial Recreation, Mixed Use, Planned Community Area and Public/Quasi-Public.
Land Use Designations As previously described, the General Plan Land Use and Circulation Diagrams (also known as the TC Planning Areas (Figure 4-1) and TC Roads System (Figure 13-1) in the Goals and Policies Report, Part I of the General Plan Update) identify the various planning areas where future population growth is anticipated to occur. Consistent with these areas, the General Plan Update also identifies a range of land uses and development standards that reflect both existing and proposed future development within these planning areas, including the various Community Plans, Hamlet Plans, Corridor Plans, Sub-area Plans, Planned Community Areas, and County Adopted City General Plans. Table 2-10 identifies the land use designations and standards used in Tulare County. These new designations will be applied to communities upon community plan updates. The previous discussion of the various planning areas identifies the specific land uses that are allowed within each area.
State planning law requires General Plans to establish “standards of population density and building intensity” for the various land use designations in the plan (Government Code § 65302(a)). To satisfy this requirement, the General Plan includes a common set of land use designations and identifies standards for each land use designation (as shown in Table 2-10). Currently existing community plans, some area and sub-area plans, and county adopted city general plans have land use designations and standards and intensities that are not being updated at this time and are incorporated by reference in Part III.
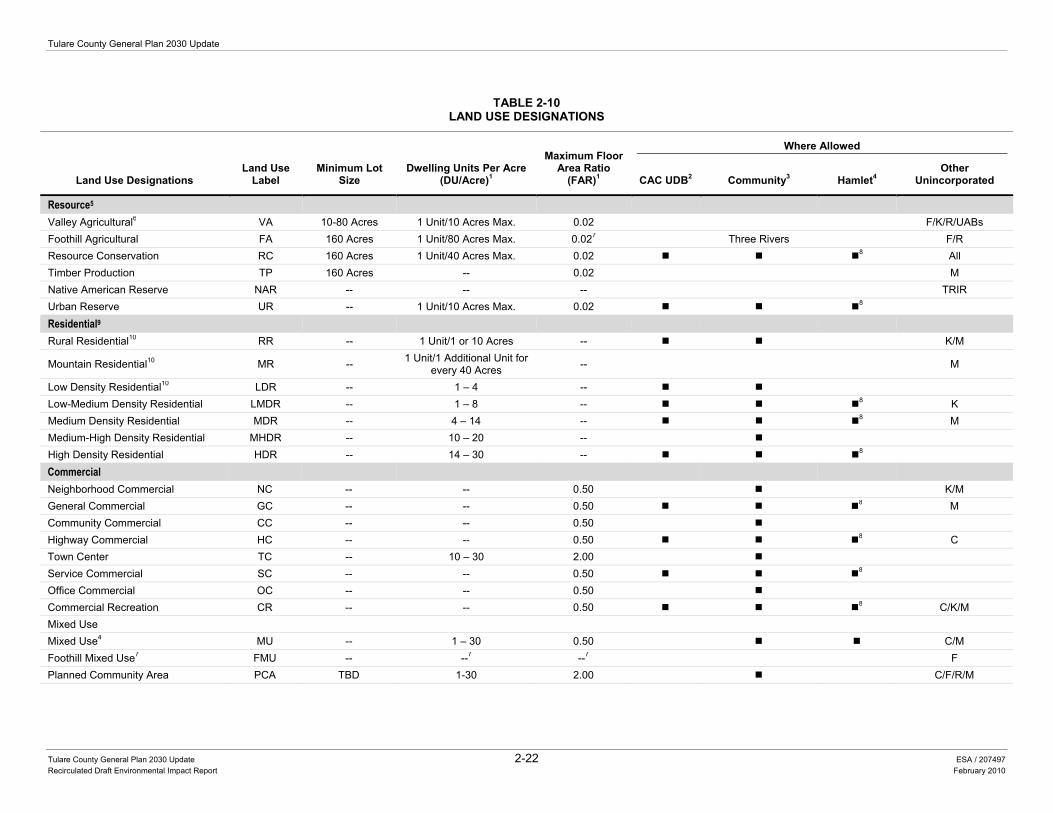
Tulare County General Plan 2030 Update
Tulare County General Plan 2030 Update 2-22 ESA / 207497 Recirculated Draft Environmental Impact Report February 2010
TABLE 2-10 LAND USE DESIGNATIONS
Land Use Designations Land Use
Label Minimum Lot
Size Dwelling Units Per Acre
(DU/Acre)1
Maximum Floor Area Ratio
(FAR)1
Where Allowed
CAC UDB2 Community3 Hamlet4 Other
Unincorporated
Resource5 Valley Agricultural6 VA 10-80 Acres 1 Unit/10 Acres Max. 0.02 F/K/R/UABs Foothill Agricultural FA 160 Acres 1 Unit/80 Acres Max. 0.027 Three Rivers F/R Resource Conservation RC 160 Acres 1 Unit/40 Acres Max. 0.02 8 All Timber Production TP 160 Acres -- 0.02 M Native American Reserve NAR -- -- -- TRIR Urban Reserve UR -- 1 Unit/10 Acres Max. 0.02 8 Residential9 Rural Residential10 RR -- 1 Unit/1 or 10 Acres -- K/M
Mountain Residential10 MR -- 1 Unit/1 Additional Unit for every 40 Acres -- M
Low Density Residential10 LDR -- 1 – 4 -- Low-Medium Density Residential LMDR -- 1 – 8 -- 8 K Medium Density Residential MDR -- 4 – 14 -- 8 M Medium-High Density Residential MHDR -- 10 – 20 -- High Density Residential HDR -- 14 – 30 -- 8 Commercial Neighborhood Commercial NC -- -- 0.50 K/M General Commercial GC -- -- 0.50 8 M Community Commercial CC -- -- 0.50 Highway Commercial HC -- -- 0.50 8 C Town Center TC -- 10 – 30 2.00 Service Commercial SC -- -- 0.50 8 Office Commercial OC -- -- 0.50 Commercial Recreation CR -- -- 0.50 8 C/K/M Mixed Use Mixed Use4 MU -- 1 – 30 0.50 C/M Foothill Mixed Use7 FMU -- --7 --7 F Planned Community Area PCA TBD 1-30 2.00 C/F/R/M
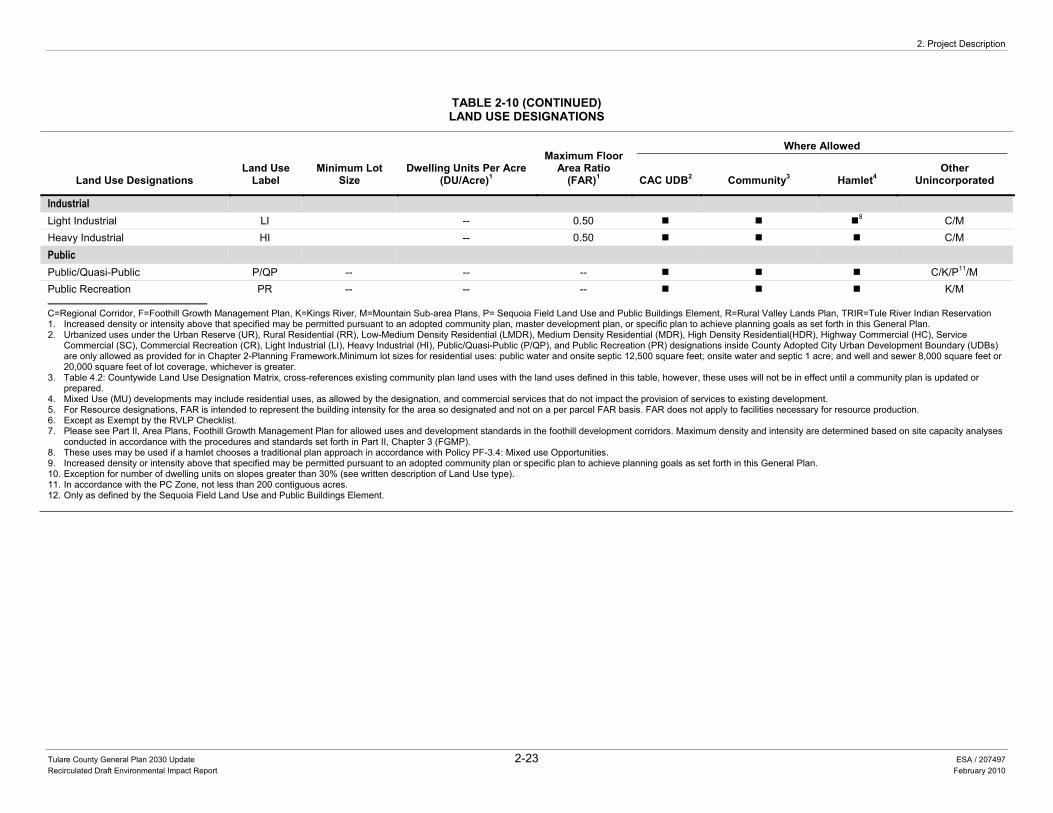
2. Project Description
Tulare County General Plan 2030 Update 2-23 ESA / 207497 Recirculated Draft Environmental Impact Report February 2010
TABLE 2-10 (CONTINUED)LAND USE DESIGNATIONS
Land Use Designations Land Use
Label Minimum Lot
Size Dwelling Units Per Acre
(DU/Acre)1
Maximum Floor Area Ratio
(FAR)1
Where Allowed
CAC UDB2 Community3 Hamlet4 Other
Unincorporated
Industrial Light Industrial LI -- 0.50 8 C/M Heavy Industrial HI -- 0.50 C/M Public Public/Quasi-Public P/QP -- -- -- C/K/P11/M Public Recreation PR -- -- -- K/M
C=Regional Corridor, F=Foothill Growth Management Plan, K=Kings River, M=Mountain Sub-area Plans, P= Sequoia Field Land Use and Public Buildings Element, R=Rural Valley Lands Plan, TRIR=Tule River Indian Reservation 1. Increased density or intensity above that specified may be permitted pursuant to an adopted community plan, master development plan, or specific plan to achieve planning goals as set forth in this General Plan. 2. Urbanized uses under the Urban Reserve (UR), Rural Residential (RR), Low-Medium Density Residential (LMDR), Medium Density Residential (MDR), High Density Residential(HDR), Highway Commercial (HC), Service
Commercial (SC), Commercial Recreation (CR), Light Industrial (LI), Heavy Industrial (HI), Public/Quasi-Public (P/QP), and Public Recreation (PR) designations inside County Adopted City Urban Development Boundary (UDBs) are only allowed as provided for in Chapter 2-Planning Framework.Minimum lot sizes for residential uses: public water and onsite septic 12,500 square feet; onsite water and septic 1 acre; and well and sewer 8,000 square feet or 20,000 square feet of lot coverage, whichever is greater.
3. Table 4.2: Countywide Land Use Designation Matrix, cross-references existing community plan land uses with the land uses defined in this table, however, these uses will not be in effect until a community plan is updated or prepared.
4. Mixed Use (MU) developments may include residential uses, as allowed by the designation, and commercial services that do not impact the provision of services to existing development. 5. For Resource designations, FAR is intended to represent the building intensity for the area so designated and not on a per parcel FAR basis. FAR does not apply to facilities necessary for resource production. 6. Except as Exempt by the RVLP Checklist. 7. Please see Part II, Area Plans, Foothill Growth Management Plan for allowed uses and development standards in the foothill development corridors. Maximum density and intensity are determined based on site capacity analyses
conducted in accordance with the procedures and standards set forth in Part II, Chapter 3 (FGMP). 8. These uses may be used if a hamlet chooses a traditional plan approach in accordance with Policy PF-3.4: Mixed use Opportunities. 9. Increased density or intensity above that specified may be permitted pursuant to an adopted community plan or specific plan to achieve planning goals as set forth in this General Plan. 10. Exception for number of dwelling units on slopes greater than 30% (see written description of Land Use type). 11. In accordance with the PC Zone, not less than 200 contiguous acres. 12. Only as defined by the Sequoia Field Land Use and Public Buildings Element.
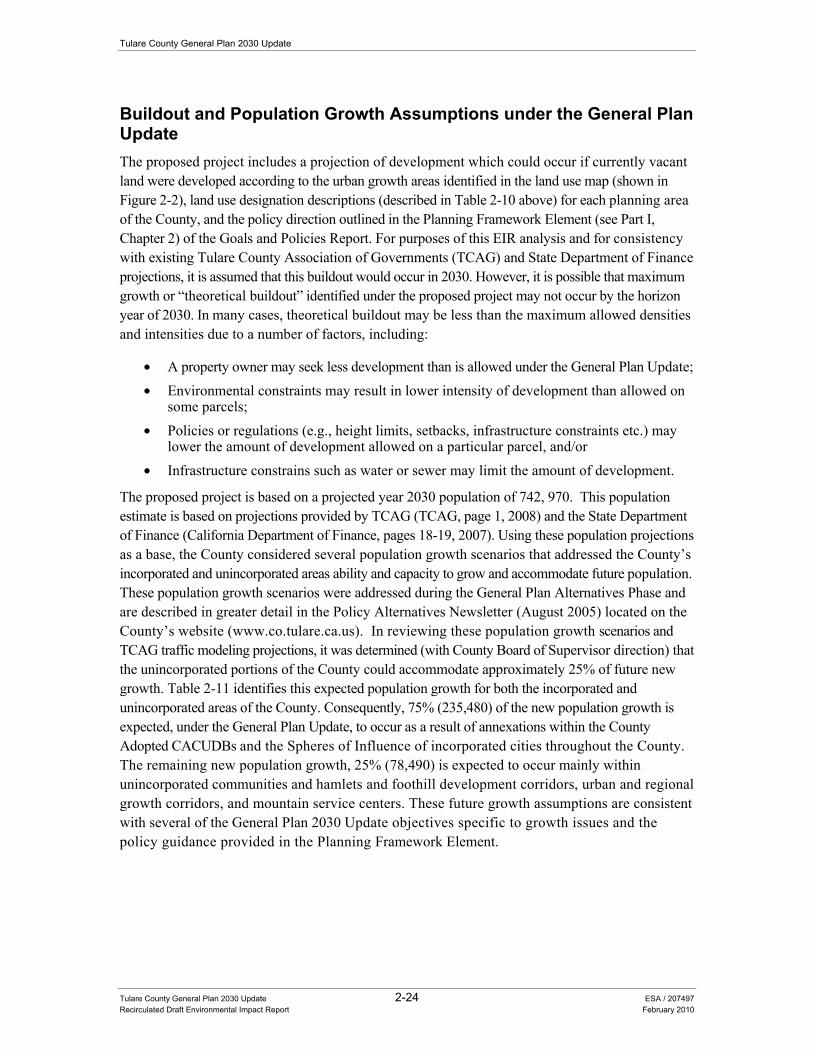
Tulare County General Plan 2030 Update
Tulare County General Plan 2030 Update 2-24 ESA / 207497 Recirculated Draft Environmental Impact Report February 2010
Buildout and Population Growth Assumptions under the General Plan Update The proposed project includes a projection of development which could occur if currently vacant land were developed according to the urban growth areas identified in the land use map (shown in Figure 2-2), land use designation descriptions (described in Table 2-10 above) for each planning area of the County, and the policy direction outlined in the Planning Framework Element (see Part I, Chapter 2) of the Goals and Policies Report. For purposes of this EIR analysis and for consistency with existing Tulare County Association of Governments (TCAG) and State Department of Finance projections, it is assumed that this buildout would occur in 2030. However, it is possible that maximum growth or “theoretical buildout” identified under the proposed project may not occur by the horizon year of 2030. In many cases, theoretical buildout may be less than the maximum allowed densities and intensities due to a number of factors, including:
• A property owner may seek less development than is allowed under the General Plan Update; • Environmental constraints may result in lower intensity of development than allowed on
some parcels; • Policies or regulations (e.g., height limits, setbacks, infrastructure constraints etc.) may
lower the amount of development allowed on a particular parcel, and/or • Infrastructure constrains such as water or sewer may limit the amount of development.
The proposed project is based on a projected year 2030 population of 742, 970. This population estimate is based on projections provided by TCAG (TCAG, page 1, 2008) and the State Department of Finance (California Department of Finance, pages 18-19, 2007). Using these population projections as a base, the County considered several population growth scenarios that addressed the County’s incorporated and unincorporated areas ability and capacity to grow and accommodate future population. These population growth scenarios were addressed during the General Plan Alternatives Phase and are described in greater detail in the Policy Alternatives Newsletter (August 2005) located on the County’s website (www.co.tulare.ca.us). In reviewing these population growth scenarios and TCAG traffic modeling projections, it was determined (with County Board of Supervisor direction) that the unincorporated portions of the County could accommodate approximately 25% of future new growth. Table 2-11 identifies this expected population growth for both the incorporated and unincorporated areas of the County. Consequently, 75% (235,480) of the new population growth is expected, under the General Plan Update, to occur as a result of annexations within the County Adopted CACUDBs and the Spheres of Influence of incorporated cities throughout the County. The remaining new population growth, 25% (78,490) is expected to occur mainly within unincorporated communities and hamlets and foothill development corridors, urban and regional growth corridors, and mountain service centers. These future growth assumptions are consistent with several of the General Plan 2030 Update objectives specific to growth issues and the policy guidance provided in the Planning Framework Element.
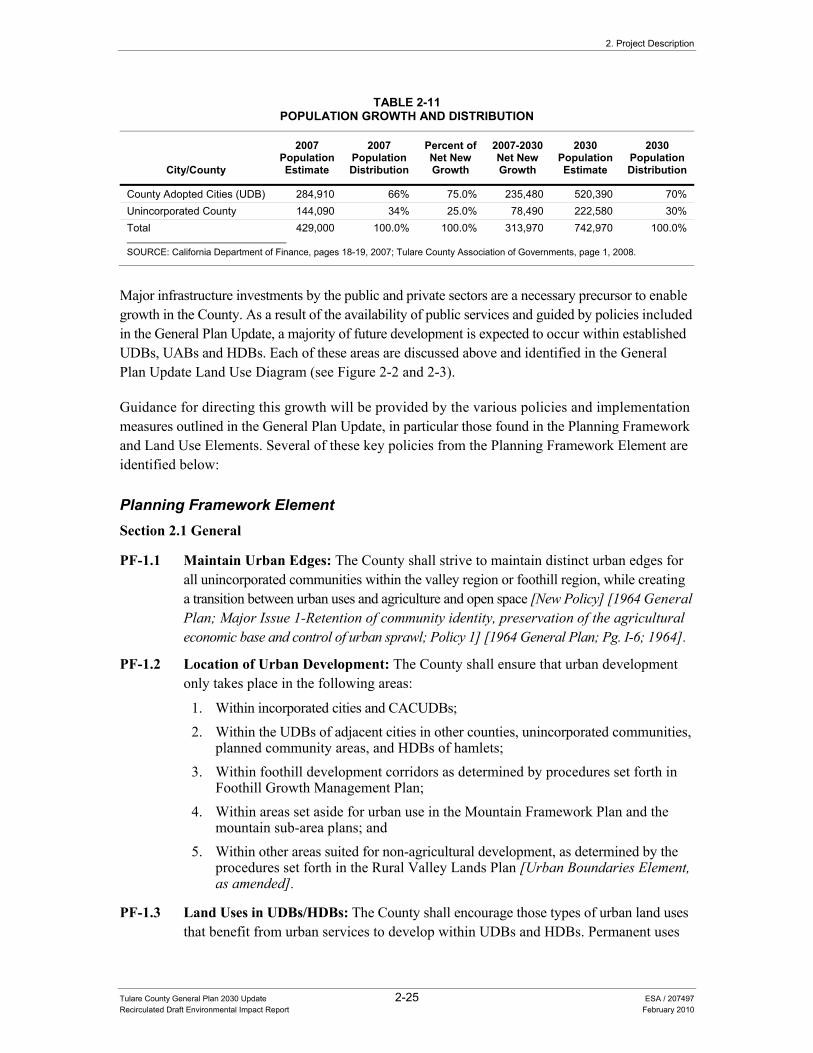
2. Project Description
Tulare County General Plan 2030 Update 2-25 ESA / 207497 Recirculated Draft Environmental Impact Report February 2010
TABLE 2-11POPULATION GROWTH AND DISTRIBUTION
City/County
2007 Population Estimate
2007 Population Distribution
Percent of Net New Growth
2007-2030 Net New Growth
2030 Population Estimate
2030 Population Distribution
County Adopted Cities (UDB) 284,910 66% 75.0% 235,480 520,390 70% Unincorporated County 144,090 34% 25.0% 78,490 222,580 30% Total 429,000 100.0% 100.0% 313,970 742,970 100.0%
SOURCE: California Department of Finance, pages 18-19, 2007; Tulare County Association of Governments, page 1, 2008.
Major infrastructure investments by the public and private sectors are a necessary precursor to enable growth in the County. As a result of the availability of public services and guided by policies included in the General Plan Update, a majority of future development is expected to occur within established UDBs, UABs and HDBs. Each of these areas are discussed above and identified in the General Plan Update Land Use Diagram (see Figure 2-2 and 2-3).
Guidance for directing this growth will be provided by the various policies and implementation measures outlined in the General Plan Update, in particular those found in the Planning Framework and Land Use Elements. Several of these key policies from the Planning Framework Element are identified below:
Planning Framework Element Section 2.1 General
PF-1.1 Maintain Urban Edges: The County shall strive to maintain distinct urban edges for all unincorporated communities within the valley region or foothill region, while creating a transition between urban uses and agriculture and open space [New Policy] [1964 General Plan; Major Issue 1-Retention of community identity, preservation of the agricultural economic base and control of urban sprawl; Policy 1] [1964 General Plan; Pg. I-6; 1964].
PF-1.2 Location of Urban Development: The County shall ensure that urban development only takes place in the following areas:
1. Within incorporated cities and CACUDBs; 2. Within the UDBs of adjacent cities in other counties, unincorporated communities,
planned community areas, and HDBs of hamlets; 3. Within foothill development corridors as determined by procedures set forth in
Foothill Growth Management Plan; 4. Within areas set aside for urban use in the Mountain Framework Plan and the
mountain sub-area plans; and 5. Within other areas suited for non-agricultural development, as determined by the
procedures set forth in the Rural Valley Lands Plan [Urban Boundaries Element, as amended].
PF-1.3 Land Uses in UDBs/HDBs: The County shall encourage those types of urban land uses that benefit from urban services to develop within UDBs and HDBs. Permanent uses
Tulare County General Plan 2030 Update
Tulare County General Plan 2030 Update 2-26 ESA / 207497 Recirculated Draft Environmental Impact Report February 2010
which do not benefit from urban services shall be discouraged within these areas. This shall not apply to agricultural or agricultural support uses, including the cultivation of land or other uses accessory to the cultivation of land provided that such accessory uses are time-limited through Special Use Permit procedures [New Policy].
PF-1.4 Available Infrastructure: The County shall encourage urban development to locate in existing UDBs and HDBs where infrastructure is available or may be established in conjunction with development. The County shall ensure that development does not occur unless adequate infrastructure is available, that sufficient water supplies are available or can be made available, and that there are adequate provisions for long term management and maintenance of infrastructure and identified water supplies [New Policy].
PF-1.6 Appropriate Land Uses by Location: The County shall utilize the Land Use Element and adopted County Adopted City General Plans, Community Plans, Hamlet Plans, Planned Communities, Corridor Areas, or Area Plans to designate land uses and intensities that reflect and maintain the appropriate level of urbanized development in each County Adopted City General Plan, Community Plan, Hamlet Plan, Planned Community, Corridor Area, or Area Plan [New Policy].
PF-1.10 Non-Conforming Uses – General: Any previously and legally established use, building, or parcel that may not be expressly permitted by this plan in any given land use designation or the implementing zoning shall be allowed to continue in accordance with the Tulare County Zoning Ordinance and General Plan [New Policy].
Section 2.2 Communities
PF-2.6 Land Use Consistency: The County shall require all community plans to use the same land use designations as used in this Countywide General Plan (See Chapter 4, Land Use). All community plans shall also utilize a similar form and content, the content may change due to the new requirements such as Global Climate Change and Livable Community Concepts, as described on the table provided (Table 2.2-2: Community Plan Content). Changes to this format may be considered for unique and special circumstances as determined appropriate by the County. Until such time as a Community Plan is adopted for those communities without existing Community Plans, the land use designation shall be mixed use, which promotes the integration of a compatible mix of residential types and densities, commercial uses, public facilities, and services and employment opportunities [Urban Boundaries Element; Chapter IV; C. Current and Advanced Planning; Implementation Program C-1] [Urban Boundaries Element; Chapter IV; Pg; 19; 1988, Modified].
2.5 Implementation of the Proposed General Plan Update Implementation Measures set forth at the end of each Element and Chapter of Part I and Part II of the General Plan Update will constitute a preliminary, anticipated Work Plan to assist in carrying out the Goals and Policies. An Implementation Measure is a specific action, program, procedure, or technique. The Implementation Measures are provided to help ensure that appropriate actions are taken to implement the General Plan. The Implementation Measures state which policy(ies) the
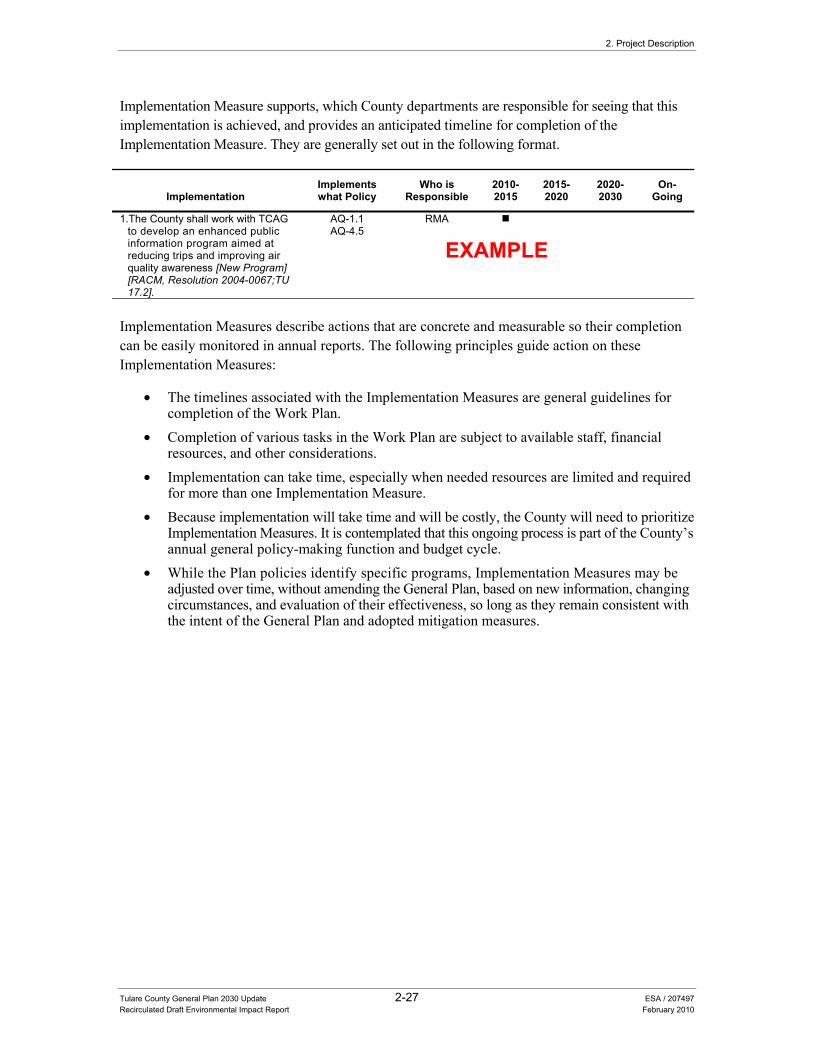
2. Project Description
Tulare County General Plan 2030 Update 2-27 ESA / 207497 Recirculated Draft Environmental Impact Report February 2010
Implementation Measure supports, which County departments are responsible for seeing that this implementation is achieved, and provides an anticipated timeline for completion of the Implementation Measure. They are generally set out in the following format.
Implementation Implements what Policy
Who is Responsible
2010-2015
2015-2020
2020-2030
On-Going
1.The County shall work with TCAG to develop an enhanced public information program aimed at reducing trips and improving air quality awareness [New Program] [RACM, Resolution 2004-0067;TU 17.2].
AQ-1.1 AQ-4.5
RMA
EXAMPLE
Implementation Measures describe actions that are concrete and measurable so their completion can be easily monitored in annual reports. The following principles guide action on these Implementation Measures:
• The timelines associated with the Implementation Measures are general guidelines for completion of the Work Plan.
• Completion of various tasks in the Work Plan are subject to available staff, financial resources, and other considerations.
• Implementation can take time, especially when needed resources are limited and required for more than one Implementation Measure.
• Because implementation will take time and will be costly, the County will need to prioritize Implementation Measures. It is contemplated that this ongoing process is part of the County’s annual general policy-making function and budget cycle.
• While the Plan policies identify specific programs, Implementation Measures may be adjusted over time, without amending the General Plan, based on new information, changing circumstances, and evaluation of their effectiveness, so long as they remain consistent with the intent of the General Plan and adopted mitigation measures.

Tulare County General Plan 2030 Update 3-1 ESA / 207497 Recirculated Draft Environmental Impact Report February 2010
CHAPTER 3.0 Environmental Analysis
Readers Guide to the Environmental Analysis To assist the reader of this document, this section provides an overview of the organization and content of the environmental analysis conducted for the proposed General Plan 2030 Update project described in Chapter 2. The following information includes a description of the overall scope of the environmental analysis (including those environmental resource topics addressed), a description of the organization and content of each resource section, and a description of the baseline year used in the environmental analysis.
Scope of the Environmental Analysis Sections 3.1 through 3.12 of this chapter provide a detailed discussion of the existing conditions (environmental setting) in the Planning Area (generally the unincorporated Tulare County) and describe the impacts resulting from implementation of the proposed project. The setting information was used to form the foundation on which impacts associated with the Draft Land Use and Circulation Diagram (known as the Tulare County Planning Areas (Figure 4-1) and Tulare County Roads System (Figure 13-1) in the Goals and Policies Report, Part I of the General Plan Update) is evaluated. The impact discussion also identifies mitigating policies and implementation measures from the proposed project that serve to mitigate or reduce significant impacts to a less-than-significant level.
As part of the proposed project, an NOP with an environmental checklist (based on Appendix G “Environmental Checklist” of the CEQA Guidelines) was prepared and circulated for public review and comment (see Appendix A of the recirculated draft Environmental Impact Report [RDEIR]). On the basis of the NOP and public input, the scope of environmental resources and issues to be addressed in the RDEIR for the proposed project was established.
The environmental checklist prepared for this RDEIR reported the potential impacts related to implementation of the proposed project based on information known at the time of its preparation. To ensure that this RDEIR provided a comprehensive evaluation of all topics that may be significantly affected by the proposed project (including the Draft Land Use and Circulation Diagram); the topics in the checklist, including those topics in the checklist as revised by the proposed 2009 CEQA guideline amendments, were again reviewed during preparation of this recirculated EIR.
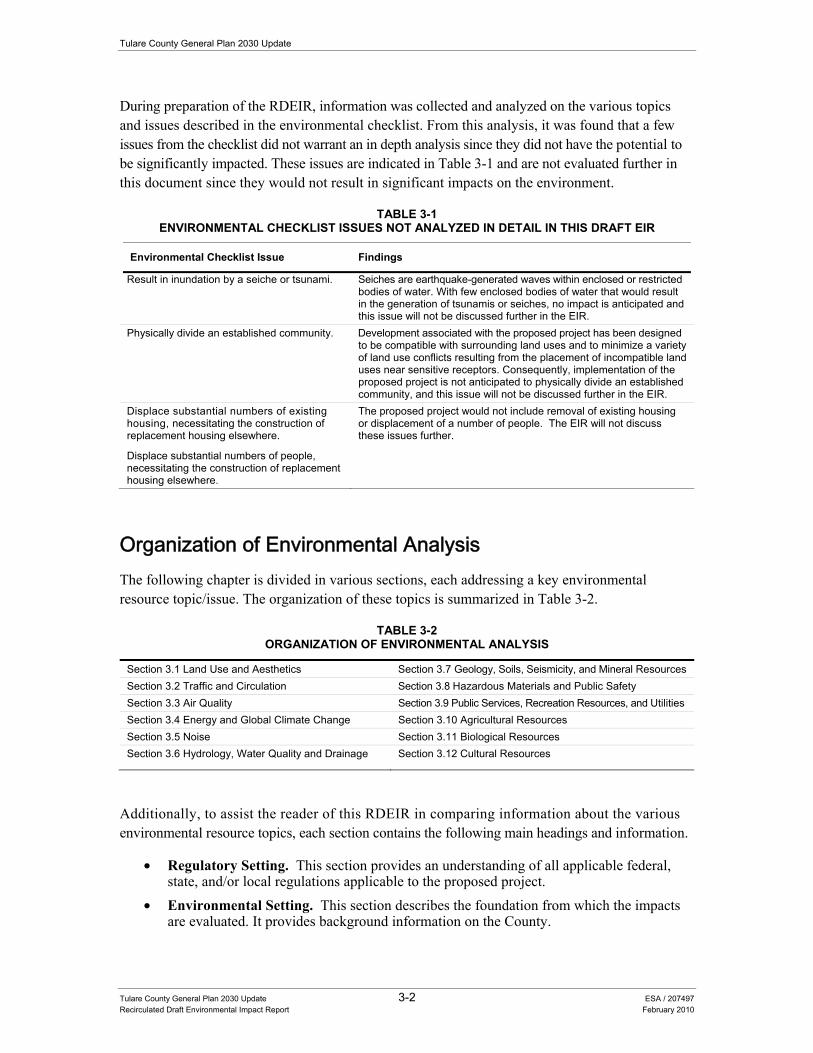
Tulare County General Plan 2030 Update
Tulare County General Plan 2030 Update 3-2 ESA / 207497 Recirculated Draft Environmental Impact Report February 2010
During preparation of the RDEIR, information was collected and analyzed on the various topics and issues described in the environmental checklist. From this analysis, it was found that a few issues from the checklist did not warrant an in depth analysis since they did not have the potential to be significantly impacted. These issues are indicated in Table 3-1 and are not evaluated further in this document since they would not result in significant impacts on the environment.
TABLE 3-1 ENVIRONMENTAL CHECKLIST ISSUES NOT ANALYZED IN DETAIL IN THIS DRAFT EIR
Environmental Checklist Issue Findings
Result in inundation by a seiche or tsunami. Seiches are earthquake-generated waves within enclosed or restricted bodies of water. With few enclosed bodies of water that would result in the generation of tsunamis or seiches, no impact is anticipated and this issue will not be discussed further in the EIR.
Physically divide an established community. Development associated with the proposed project has been designed to be compatible with surrounding land uses and to minimize a variety of land use conflicts resulting from the placement of incompatible land uses near sensitive receptors. Consequently, implementation of the proposed project is not anticipated to physically divide an established community, and this issue will not be discussed further in the EIR.
Displace substantial numbers of existing housing, necessitating the construction of replacement housing elsewhere.
Displace substantial numbers of people, necessitating the construction of replacement housing elsewhere.
The proposed project would not include removal of existing housing or displacement of a number of people. The EIR will not discuss these issues further.
Organization of Environmental Analysis The following chapter is divided in various sections, each addressing a key environmental resource topic/issue. The organization of these topics is summarized in Table 3-2.
TABLE 3-2 ORGANIZATION OF ENVIRONMENTAL ANALYSIS
Section 3.1 Land Use and Aesthetics Section 3.7 Geology, Soils, Seismicity, and Mineral Resources Section 3.2 Traffic and Circulation Section 3.8 Hazardous Materials and Public Safety Section 3.3 Air Quality Section 3.9 Public Services, Recreation Resources, and Utilities Section 3.4 Energy and Global Climate Change Section 3.10 Agricultural Resources Section 3.5 Noise Section 3.11 Biological Resources Section 3.6 Hydrology, Water Quality and Drainage Section 3.12 Cultural Resources
Additionally, to assist the reader of this RDEIR in comparing information about the various environmental resource topics, each section contains the following main headings and information.
• Regulatory Setting. This section provides an understanding of all applicable federal, state, and/or local regulations applicable to the proposed project.
• Environmental Setting. This section describes the foundation from which the impacts are evaluated. It provides background information on the County.
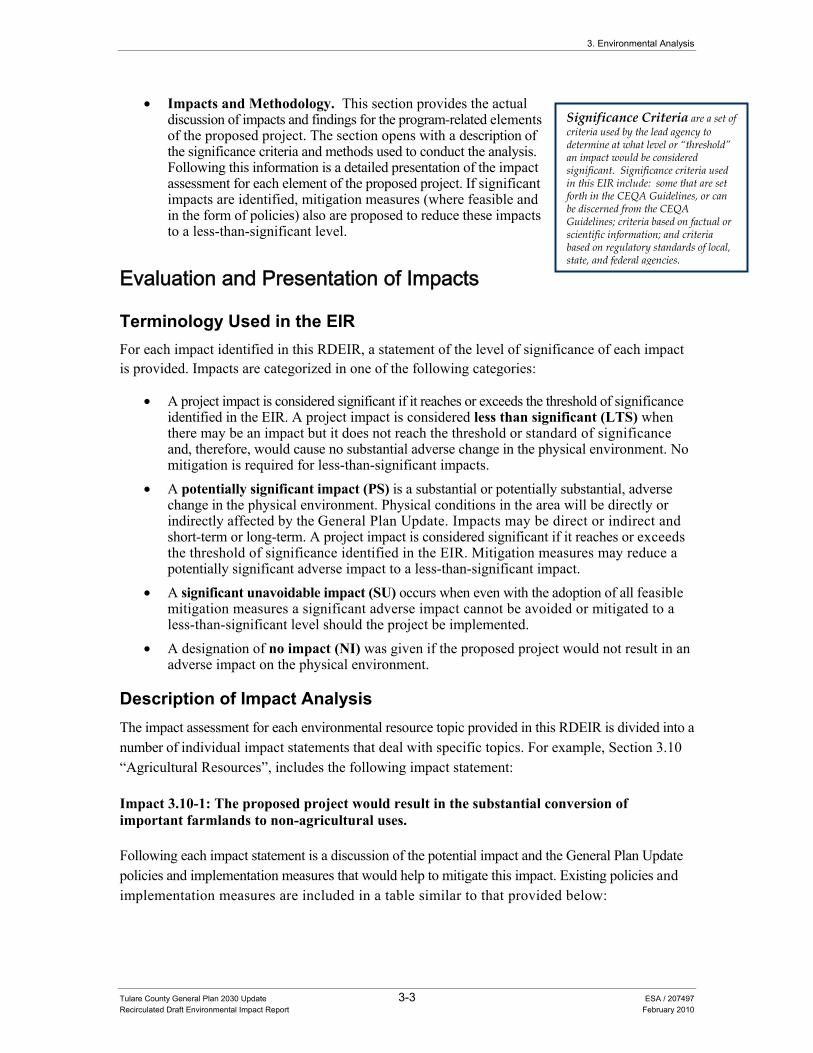
3. Environmental Analysis
Tulare County General Plan 2030 Update 3-3 ESA / 207497 Recirculated Draft Environmental Impact Report February 2010
Significance Criteria are a set of criteria used by the lead agency to determine at what level or “threshold” an impact would be considered significant. Significance criteria used in this EIR include: some that are set forth in the CEQA Guidelines, or can be discerned from the CEQA Guidelines; criteria based on factual or scientific information; and criteria based on regulatory standards of local, state, and federal agencies.
• Impacts and Methodology. This section provides the actual discussion of impacts and findings for the program-related elements of the proposed project. The section opens with a description of the significance criteria and methods used to conduct the analysis. Following this information is a detailed presentation of the impact assessment for each element of the proposed project. If significant impacts are identified, mitigation measures (where feasible and in the form of policies) also are proposed to reduce these impacts to a less-than-significant level.
Evaluation and Presentation of Impacts
Terminology Used in the EIR For each impact identified in this RDEIR, a statement of the level of significance of each impact is provided. Impacts are categorized in one of the following categories:
• A project impact is considered significant if it reaches or exceeds the threshold of significance identified in the EIR. A project impact is considered less than significant (LTS) when there may be an impact but it does not reach the threshold or standard of significance and, therefore, would cause no substantial adverse change in the physical environment. No mitigation is required for less-than-significant impacts.
• A potentially significant impact (PS) is a substantial or potentially substantial, adverse change in the physical environment. Physical conditions in the area will be directly or indirectly affected by the General Plan Update. Impacts may be direct or indirect and short-term or long-term. A project impact is considered significant if it reaches or exceeds the threshold of significance identified in the EIR. Mitigation measures may reduce a potentially significant adverse impact to a less-than-significant impact.
• A significant unavoidable impact (SU) occurs when even with the adoption of all feasible mitigation measures a significant adverse impact cannot be avoided or mitigated to a less-than-significant level should the project be implemented.
• A designation of no impact (NI) was given if the proposed project would not result in an adverse impact on the physical environment.
Description of Impact Analysis The impact assessment for each environmental resource topic provided in this RDEIR is divided into a number of individual impact statements that deal with specific topics. For example, Section 3.10 “Agricultural Resources”, includes the following impact statement:
Impact 3.10-1: The proposed project would result in the substantial conversion of important farmlands to non-agricultural uses.
Following each impact statement is a discussion of the potential impact and the General Plan Update policies and implementation measures that would help to mitigate this impact. Existing policies and implementation measures are included in a table similar to that provided below:
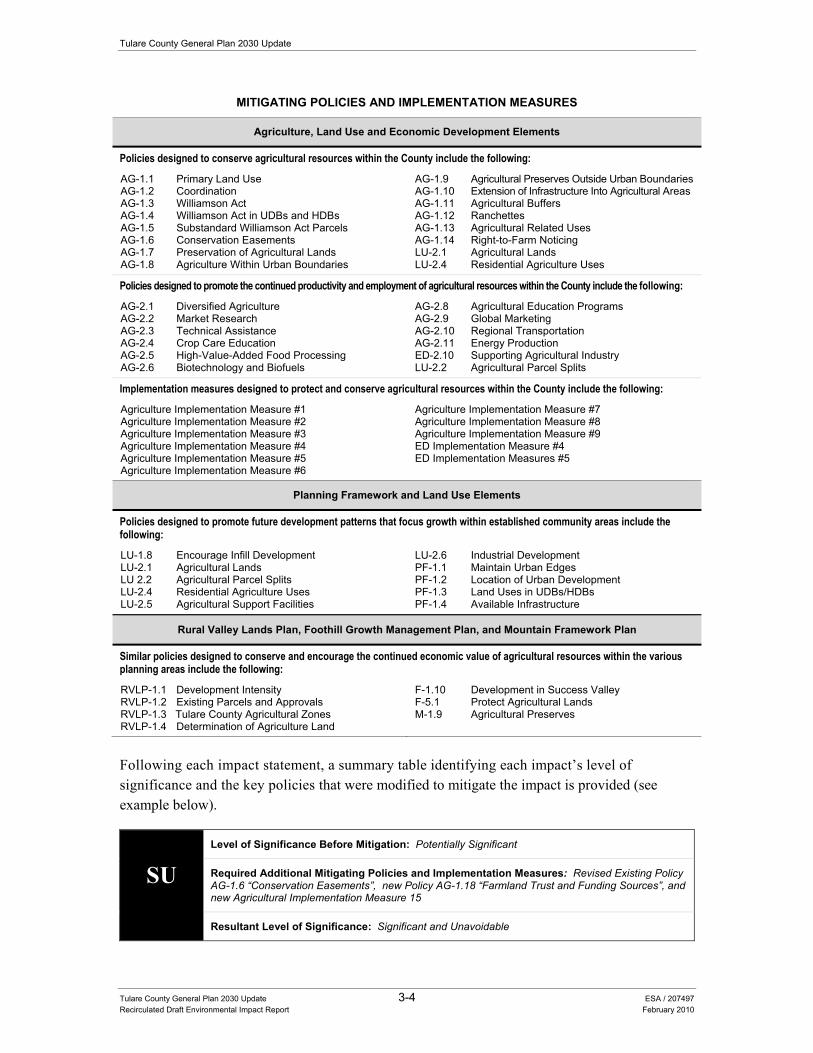
Tulare County General Plan 2030 Update
Tulare County General Plan 2030 Update 3-4 ESA / 207497 Recirculated Draft Environmental Impact Report February 2010
MITIGATING POLICIES AND IMPLEMENTATION MEASURES
Agriculture, Land Use and Economic Development Elements
Policies designed to conserve agricultural resources within the County include the following:
AG-1.1 Primary Land Use AG-1.2 Coordination AG-1.3 Williamson Act AG-1.4 Williamson Act in UDBs and HDBs AG-1.5 Substandard Williamson Act Parcels AG-1.6 Conservation Easements AG-1.7 Preservation of Agricultural Lands AG-1.8 Agriculture Within Urban Boundaries
AG-1.9 Agricultural Preserves Outside Urban Boundaries AG-1.10 Extension of Infrastructure Into Agricultural Areas AG-1.11 Agricultural Buffers AG-1.12 Ranchettes AG-1.13 Agricultural Related Uses AG-1.14 Right-to-Farm Noticing LU-2.1 Agricultural Lands LU-2.4 Residential Agriculture Uses
Policies designed to promote the continued productivity and employment of agricultural resources within the County include the following:
AG-2.1 Diversified Agriculture AG-2.2 Market Research AG-2.3 Technical Assistance AG-2.4 Crop Care Education AG-2.5 High-Value-Added Food Processing AG-2.6 Biotechnology and Biofuels
AG-2.8 Agricultural Education Programs AG-2.9 Global Marketing AG-2.10 Regional Transportation AG-2.11 Energy Production ED-2.10 Supporting Agricultural Industry LU-2.2 Agricultural Parcel Splits
Implementation measures designed to protect and conserve agricultural resources within the County include the following:
Agriculture Implementation Measure #1 Agriculture Implementation Measure #2 Agriculture Implementation Measure #3 Agriculture Implementation Measure #4 Agriculture Implementation Measure #5 Agriculture Implementation Measure #6
Agriculture Implementation Measure #7 Agriculture Implementation Measure #8 Agriculture Implementation Measure #9 ED Implementation Measure #4 ED Implementation Measures #5
Planning Framework and Land Use Elements
Policies designed to promote future development patterns that focus growth within established community areas include the following:
LU-1.8 Encourage Infill Development LU-2.1 Agricultural Lands LU 2.2 Agricultural Parcel Splits LU-2.4 Residential Agriculture Uses LU-2.5 Agricultural Support Facilities
LU-2.6 Industrial Development PF-1.1 Maintain Urban Edges PF-1.2 Location of Urban Development PF-1.3 Land Uses in UDBs/HDBs PF-1.4 Available Infrastructure
Rural Valley Lands Plan, Foothill Growth Management Plan, and Mountain Framework Plan
Similar policies designed to conserve and encourage the continued economic value of agricultural resources within the various planning areas include the following:
RVLP-1.1 Development Intensity RVLP-1.2 Existing Parcels and Approvals RVLP-1.3 Tulare County Agricultural Zones RVLP-1.4 Determination of Agriculture Land
F-1.10 Development in Success Valley F-5.1 Protect Agricultural Lands M-1.9 Agricultural Preserves
Following each impact statement, a summary table identifying each impact’s level of significance and the key policies that were modified to mitigate the impact is provided (see example below).
SU Level of Significance Before Mitigation: Potentially Significant
Required Additional Mitigating Policies and Implementation Measures: Revised Existing Policy AG-1.6 “Conservation Easements”, new Policy AG-1.18 “Farmland Trust and Funding Sources”, and new Agricultural Implementation Measure 15
Resultant Level of Significance: Significant and Unavoidable
3. Environmental Analysis
Tulare County General Plan 2030 Update 3-5 ESA / 207497 Recirculated Draft Environmental Impact Report February 2010
Baseline Year As stated in the CEQA Guidelines (Section 15125(a)), an EIR must describe the existing conditions in the vicinity of the proposed project. For each of the environmental resources assessed in this RDEIR, the description of existing environmental and regulatory conditions is included under the “Regulatory Setting” and “Environmental Setting” headings in each section.
In describing existing conditions, it is necessary to establish a date at which these conditions exist. As stated in the State CEQA Guidelines (Section 15125(a)), existing conditions are normally assessed “at the time the notice of preparation is published” or if a notice of preparation is not published “at the time environmental analysis is commenced”. The section further states, “This environmental setting will normally constitute the baseline physical conditions by which a Lead Agency determines whether an impact is significant”.
As the original notice of preparation for the original DEIR was prepared in 2006, the County established baseline physical conditions for this environmental analysis as those conditions that existed in the Planning Area at the time that the RDEIR was prepared (2008 to 2009). Given the broad programmatic nature of this RDEIR for the General Plan 2030 Update, much of the baseline condition has been updated from that previously used for the original DEIR using the most recent countywide resource data available from Federal, State, and other regional sources. This updated information includes use of current Farmland Mapping and Monitoring Program data from the California Department of Conservation. However, some of the available baseline data may reference an earlier time period, due to the nature of the data (flood zones, soil conditions, seismic conditions, water conditions, etc) and the frequency in which the agencies responsible for collecting and mapping resource data update their information. The methodology discussion for each environmental resource section in this chapter provides specific information on the types of data used to characterize baseline conditions and prepare each individual analysis.
Analysis of Planning Area As previously described in Chapter 2 “Project Description”, the County of Tulare has historically used three planning areas that are based on the three different geographic regions of the County. These areas include the Rural Valley Lands Plan, Foothill Growth Management Plan, and the Mountain Framework Plan (shown below). The proposed General Plan 2030 Update also provides a framework for the adoption of new area plans called corridor plans through its Corridor Framework Plan. The location of the individual corridor plans will be established by the General Plan amendments. To the extent feasible, the environmental analysis contained in this chapter identifies impacts specific to each planning area for the County.
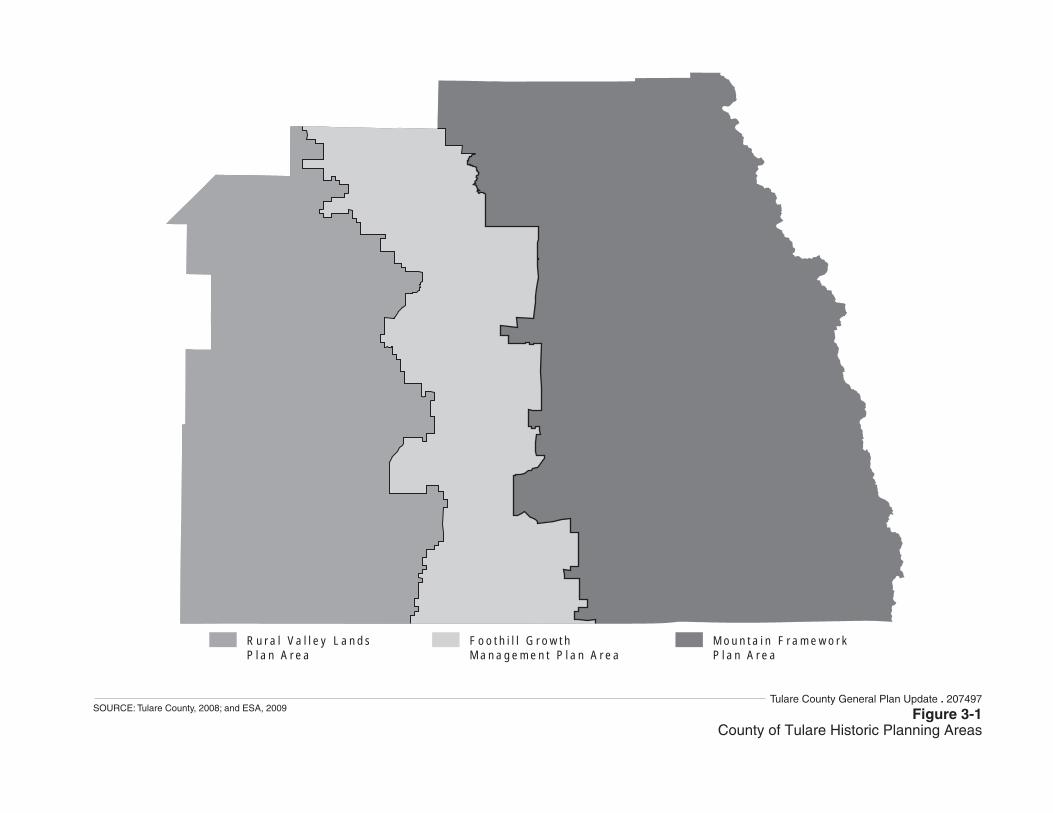
M o u n t a i n F r a m e w o r kP l a n A r e a
F o o t h i l l G r o w t hM a n a g e m e n t P l a n A r e a
R u r a l V a l l e y L a n d sP l a n A r e a
Figure 3-1County of Tulare Historic Planning Areas
SOURCE: Tulare County, 2008; and ESA, 2009Tulare County General Plan Update . 207497
Tulare County General Plan 2030 Update 3.1-1 ESA / 207497 Recirculated Draft Environmental Impact Report February 2010
SECTION 3.1 Land Use and Aesthetics
Introduction To provide the context on which potential impacts can be assessed, this section presents information on existing land uses and the visual quality of the planning area. The regulatory setting provides a description of applicable federal and State regulatory policies. The environmental setting provides a brief description of existing land use and visual resources (typical views) in the County. A description of the potential impacts of the proposed project is also provided and includes the identification of feasible mitigation (General Plan policies) designed to avoid or lessen the impacts. The County’s Land Use Diagram is shown in Figure 3.1-1.
The following environmental and regulatory settings were developed from information contained in the 2010 Background Report (see Chapter 3.0 “Land Use” and Chapter 11.0 “Scenic Landscapes”), incorporated by reference and summarized below. This document is also attached as Appendix B to this recirculated draft Environmental Impact Report (RDEIR).
Regulatory Setting There are no State or Federal land use regulations relevant to the proposed project. However, applicable Federal and State regulations specific to aesthetic resources are described below.
Federal Regulations Visual impacts related to highway projects are typically analyzed using the guidelines outlined in the publication Visual Impact Assessment for Highway Projects, published by the Federal Highway Administration (FHWA) of the U.S. Department of Transportation in March 1981.
Six principal steps are required to assess visual impacts:
1. Define the project setting and viewshed. 2. Identify key views for visual assessment. 3. Analyze existing visual resources and viewer response. 4. Depict the visual appearance of project alternatives. 5. Assess the visual impacts of project alternatives. 6. Propose methods to mitigate adverse visual impacts.
Tulare County General Plan 2030 Update
Tulare County General Plan 2030 Update 3.1-2 ESA / 207497 Recirculated Draft Environmental Impact Report February 2010
Methodology for Assessing Project Impacts The visual impacts of the proposed project are determined by assessing the visual resource change due to the project and predicting viewer response to change. Visual resource change is the sum of the change in visual character and the change in visual quality.
The first step in determining visual resource change is to assess the compatibility of the proposed project with the visual character of the existing landscape. The second step is to compare the visual quality of the existing resources with projected visual quality after the proposed project is constructed.
The viewer response to project changes is the sum of viewer exposure and viewer sensitivity to the proposed project. The resulting level of visual impact is determined by combining the severity of resource change with the degree to which people are likely to oppose the change.
Definition of Visual Impact Levels • Low: Minor adverse change to the existing visual resource, with low viewer response to
change in the visual environment. May not require mitigation. • Moderate: Moderate adverse change to the visual resource with moderate viewer response.
Impact can be mitigated within five years using conventional practices. • Moderately High: Moderate adverse visual resource change with high viewer response
of high adverse visual resource change with moderate viewer response. Extraordinary mitigation practices may be required. Landscape treatment required will generally take longer than five years to mitigate.
• High: A high level of adverse change to the resource or a high level of viewer response to visual change such that architectural design and landscape treatment cannot mitigate the impacts. Viewer response level is high. An alternative project design may be required to avoid highly adverse impacts.
State Regulations
California Scenic Highway Program Many State highways are located in areas of outstanding natural beauty. California’s Scenic Highway Program was created by the Legislature in 1963 to preserve and protect scenic highway corridors from change which would diminish the aesthetic value of lands adjacent to highways. The State laws governing the Scenic Highway Program are found in the Streets and Highways Code, Section 260 et seq. The State Scenic Highway System includes a list of highways that are either eligible for designation as scenic highways or are currently designated. These highways are identified in Section 263 of the Streets and Highways Code.
A highway may be designated scenic depending upon how much of the natural landscape can be seen by travelers, the scenic quality of the landscape, and the extent to which development intrudes upon the traveler’s enjoyment of the view. When a city or county nominates an eligible scenic highway for official designation, it must identify and define the scenic corridor of the highway.

0 10
Miles
Tulare County General Plan Update . 207497
Figure 3.1-1Land Use Diagram
SOURCE: County of Tulare, 2008; and ESA, 2009
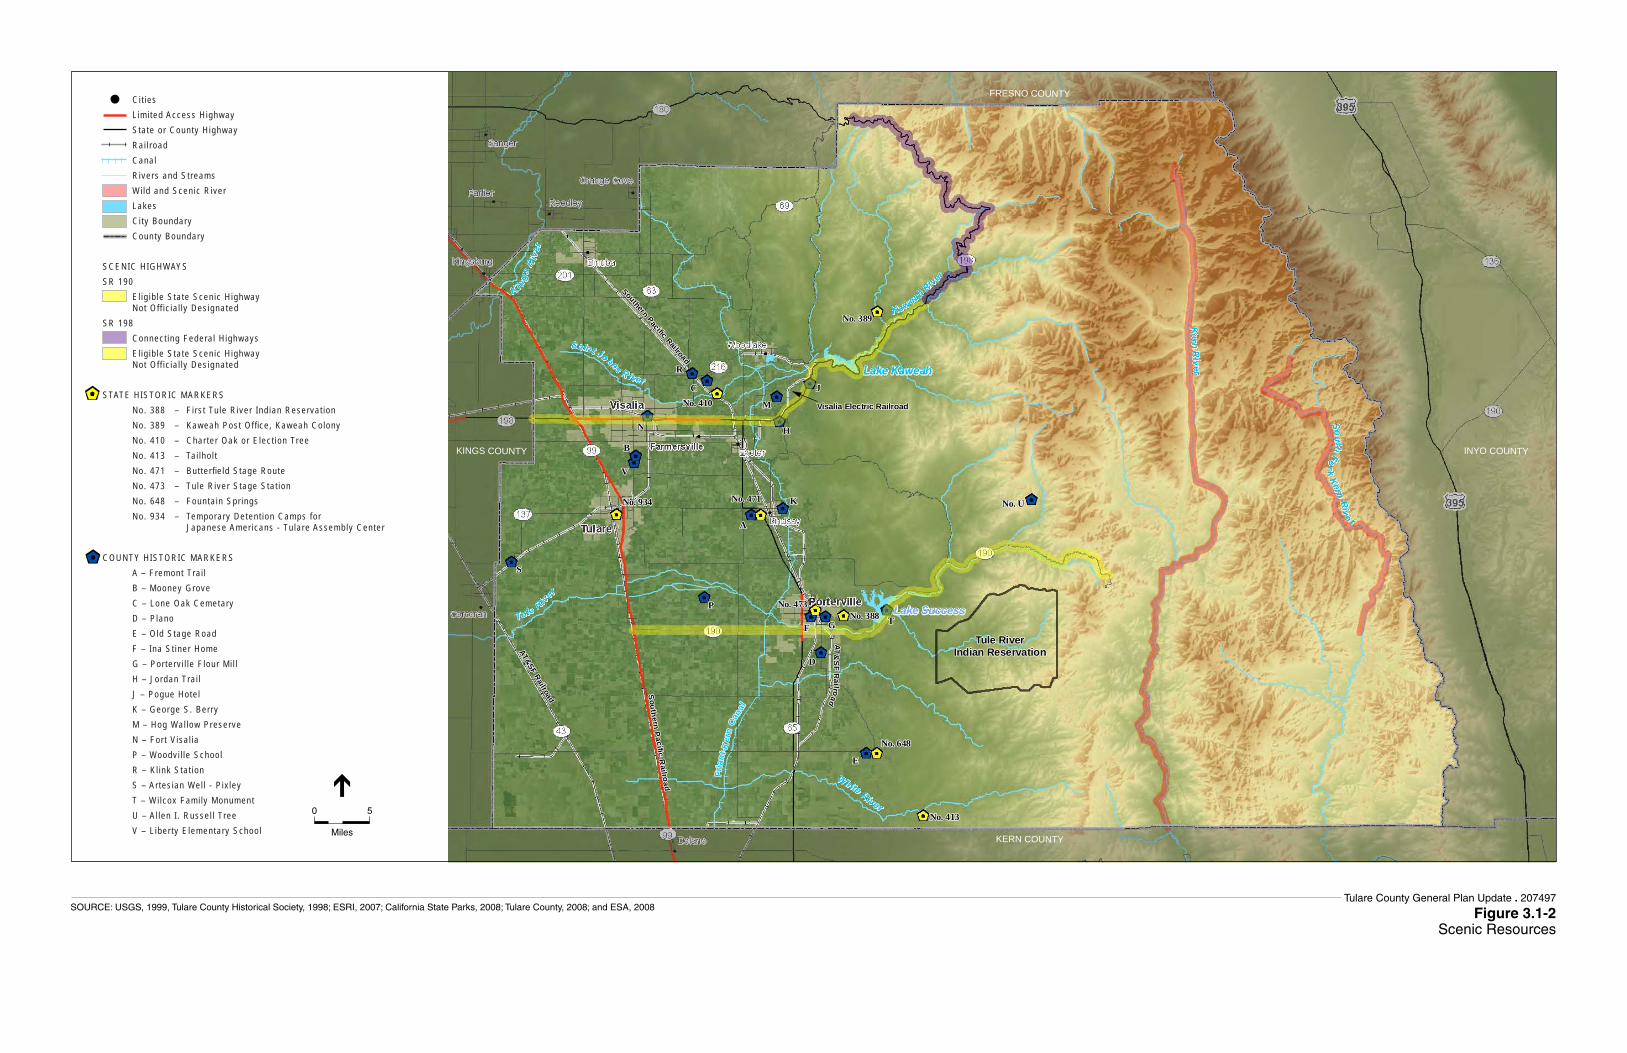
Tule RiverIndian ReservationAT&SF
Rai lroad
AT&S
FR
ai lroad
Southern PacificRailroad
Sou th ern
Pa ci fi c
Rai l roa d
Fria
nt-K
ern
Cana
l
Visalia Electric Railroad
No. 389
No. 388
No. 410
No. 413
No. 471
No. 473
No. 648
No. 934
B
A
C
D
E
F
H
M
N
P
S
No. U
G
J
K
R
T
V
Tule RiverIndian ReservationAT&SF
Rai lroad
AT&S
FR
ai lroad
Southern PacificRailroad
Sou th ern
Pa ci fi c
Rai l roa d
Fria
nt-K
ern
Cana
l
Visalia Electric Railroad
No. 389
No. 388
No. 410
No. 413
No. 471
No. 473
No. 648
No. 934
B
A
C
D
E
F
H
M
N
P
S
No. U
G
J
K
R
T
V
FRESNO COUNTY
INYO COUNTY
KERN COUNTY
KINGS COUNTY
C i t ies L im i ted Access H ighway Sta te o r County H ighway Ra i l road Cana l R ivers and St reams Wi ld and Scen ic R iver Lakes C i ty Boundary County Boundary
SCENIC HIGHWAYSSR 190 E l ig ib le S ta te Scen ic H ighway Not Off i c ia l l y Des igna tedSR 198 Connec t ing Federa l H ighways E l ig ib le S ta te Scen ic H ighway Not Off i c ia l l y Des igna ted
STATE HISTORIC MARKERS No. 388 – F i rs t Tu le R iver Ind ian Reserva t ion No. 389 – Kaweah Pos t Office , Kaweah Co lony No. 410 – Char te r Oak o r E lec t ion Tree No. 413 – Ta i lho l t No . 471 – But te rfie ld S tage Route No. 473 – Tu le R iver S tage Sta t ion No. 648 – Founta in Spr ings No. 934 – Temporary Deten t ion Camps fo r Japanese Amer icans - Tu la re Assembly Center
COUNTY HISTORIC MARKERS A – Fremont Tra i l B – Mooney Grove C – Lone Oak Cemetary D – P lano E – O ld S tage Road F – Ina S t iner Home G – Por te rv i l l e F lour M i l l H – Jordan Tra i l J – Pogue Hote l K – George S. Ber ry M – Hog Wal low Preserve N – For t Visa l ia P – Woodv i l le Schoo l R – K l ink S ta t ion S – Ar tes ian Wel l - P ix ley T – Wi lcox Fami ly Monument U – A l len I . Russe l l Tree V – L iber ty E lementary Schoo l
0 5
Miles
Tulare County General Plan Update . 207497
Figure 3.1-2Scenic Resources
SOURCE: USGS, 1999, Tulare County Historical Society, 1998; ESRI, 2007; California State Parks, 2008; Tulare County, 2008; and ESA, 2008
3.1 Land Use and Aesthetics
Tulare County General Plan 2030 Update 3.1-5 ESA / 207497 Recirculated Draft Environmental Impact Report February 2010
Because a scenic corridor is the land generally adjacent to and visible from the highway, it is identified using a motorist’s line of vision. A reasonable boundary is selected when the view extends to the distant horizon.
The corridor protection program does not preclude development, but seeks to encourage quality development that does not degrade the scenic value of the corridor. Jurisdictional boundaries of the nominating agency are also considered. The agency must also adopt ordinances to preserve the scenic quality of the corridor or document such regulations that already exist in various portions of local codes. These ordinances make up the scenic corridor protection program.
County roads can also become part of the Scenic Highway System. To receive an official designation, the county must follow the same process required for official designation of State Scenic Highways. The minimum requirements for scenic corridor protection include:
• Regulation of land use and density of development; • Detailed land and site planning; • Control of outdoor advertising (including a ban on billboards); • Careful attention to and control of earthmoving and landscaping; and • Careful attention to design and appearance of structures and equipment. Citizen participation
in developing these requirements is very important if the program is to have popular support.
Designated candidate scenic highways and County scenic roads are shown on Figure 3.1-2. The minimum requirements for scenic corridor protection include:
Environmental Setting This section contains an overview of the land use and aesthetic conditions of Tulare County. As previously described, this environmental setting was developed from information contained in the 2010 Background Report (see Chapter 3.0 “Land Use” and Chapter 11.0 “Scenic Landscapes” of Appendix B of this RDEIR), incorporated by reference and summarized below.
Land Use
Regional Land Use Patterns Tulare County is located in a geographically diverse region with the majestic peaks of the Sierra Nevada framing its eastern region, while its western portion includes the San Joaquin Valley floor, which is very fertile and extensively cultivated. In addition to its agricultural production, the County’s economic base also includes agricultural packing and shipping operations. Small and medium size manufacturing plants are located in the western part of the county and are increasing in number. Tulare County contains portions of Sequoia National Forest, Sequoia National Monument, Inyo National Forest, and Kings Canyon National Park. Sequoia National Park is entirely contained within the county. The Land Use Diagram is shown in Figure 3.1-1.
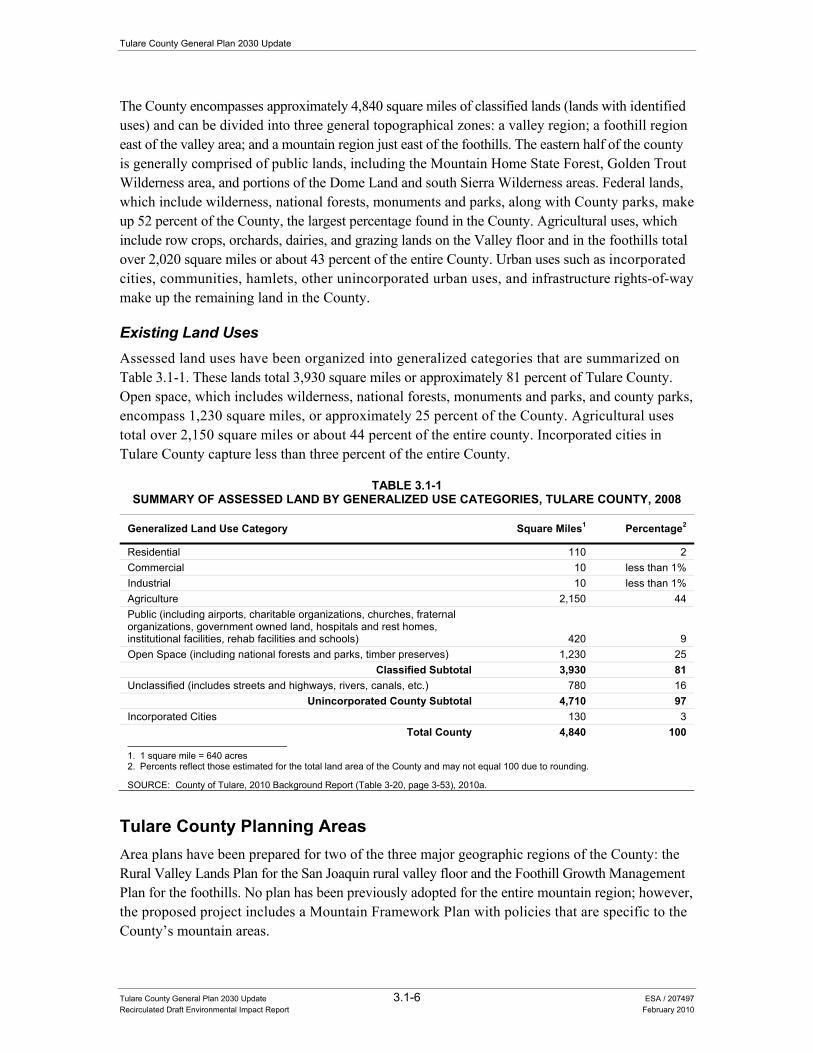
Tulare County General Plan 2030 Update
Tulare County General Plan 2030 Update 3.1-6 ESA / 207497 Recirculated Draft Environmental Impact Report February 2010
The County encompasses approximately 4,840 square miles of classified lands (lands with identified uses) and can be divided into three general topographical zones: a valley region; a foothill region east of the valley area; and a mountain region just east of the foothills. The eastern half of the county is generally comprised of public lands, including the Mountain Home State Forest, Golden Trout Wilderness area, and portions of the Dome Land and south Sierra Wilderness areas. Federal lands, which include wilderness, national forests, monuments and parks, along with County parks, make up 52 percent of the County, the largest percentage found in the County. Agricultural uses, which include row crops, orchards, dairies, and grazing lands on the Valley floor and in the foothills total over 2,020 square miles or about 43 percent of the entire County. Urban uses such as incorporated cities, communities, hamlets, other unincorporated urban uses, and infrastructure rights-of-way make up the remaining land in the County.
Existing Land Uses Assessed land uses have been organized into generalized categories that are summarized on Table 3.1-1. These lands total 3,930 square miles or approximately 81 percent of Tulare County. Open space, which includes wilderness, national forests, monuments and parks, and county parks, encompass 1,230 square miles, or approximately 25 percent of the County. Agricultural uses total over 2,150 square miles or about 44 percent of the entire county. Incorporated cities in Tulare County capture less than three percent of the entire County.
TABLE 3.1-1SUMMARY OF ASSESSED LAND BY GENERALIZED USE CATEGORIES, TULARE COUNTY, 2008
Generalized Land Use Category Square Miles1 Percentage2
Residential 110 2 Commercial 10 less than 1% Industrial 10 less than 1% Agriculture 2,150 44 Public (including airports, charitable organizations, churches, fraternal organizations, government owned land, hospitals and rest homes, institutional facilities, rehab facilities and schools) 420 9 Open Space (including national forests and parks, timber preserves) 1,230 25
Classified Subtotal 3,930 81 Unclassified (includes streets and highways, rivers, canals, etc.) 780 16
Unincorporated County Subtotal 4,710 97 Incorporated Cities 130 3
Total County 4,840 100
1. 1 square mile = 640 acres 2. Percents reflect those estimated for the total land area of the County and may not equal 100 due to rounding.
SOURCE: County of Tulare, 2010 Background Report (Table 3-20, page 3-53), 2010a.
Tulare County Planning Areas Area plans have been prepared for two of the three major geographic regions of the County: the Rural Valley Lands Plan for the San Joaquin rural valley floor and the Foothill Growth Management Plan for the foothills. No plan has been previously adopted for the entire mountain region; however, the proposed project includes a Mountain Framework Plan with policies that are specific to the County’s mountain areas.
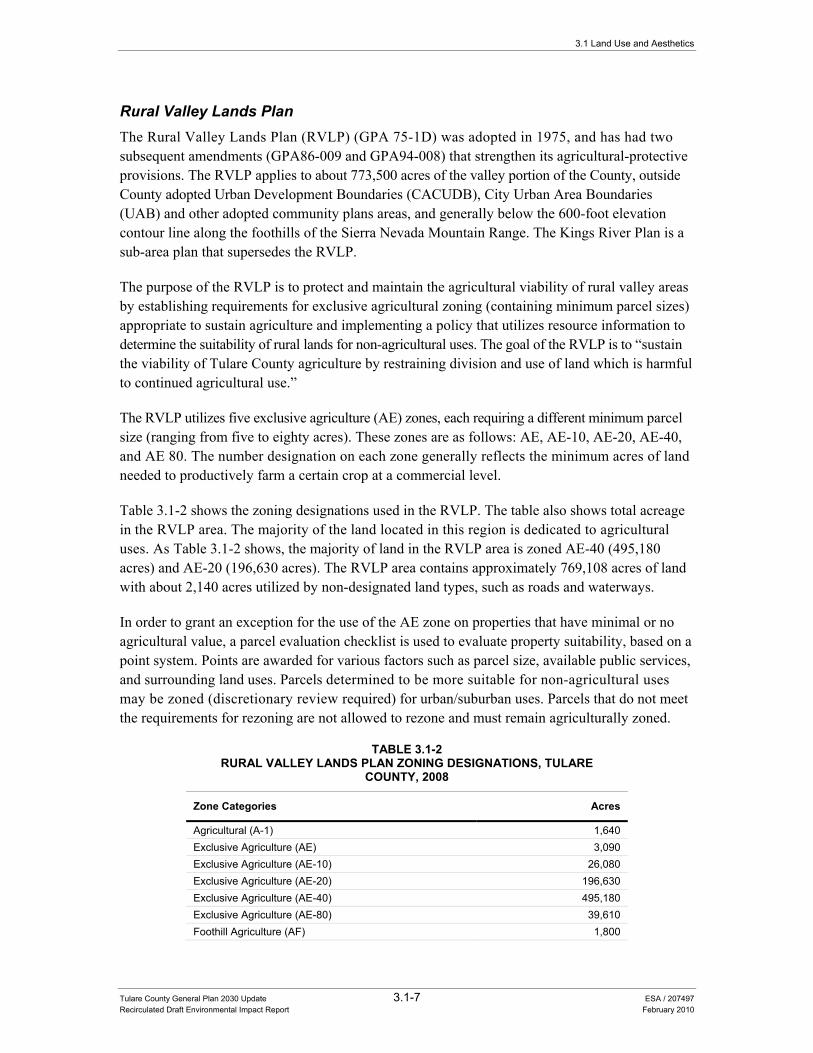
3.1 Land Use and Aesthetics
Tulare County General Plan 2030 Update 3.1-7 ESA / 207497 Recirculated Draft Environmental Impact Report February 2010
Rural Valley Lands Plan The Rural Valley Lands Plan (RVLP) (GPA 75-1D) was adopted in 1975, and has had two subsequent amendments (GPA86-009 and GPA94-008) that strengthen its agricultural-protective provisions. The RVLP applies to about 773,500 acres of the valley portion of the County, outside County adopted Urban Development Boundaries (CACUDB), City Urban Area Boundaries (UAB) and other adopted community plans areas, and generally below the 600-foot elevation contour line along the foothills of the Sierra Nevada Mountain Range. The Kings River Plan is a sub-area plan that supersedes the RVLP.
The purpose of the RVLP is to protect and maintain the agricultural viability of rural valley areas by establishing requirements for exclusive agricultural zoning (containing minimum parcel sizes) appropriate to sustain agriculture and implementing a policy that utilizes resource information to determine the suitability of rural lands for non-agricultural uses. The goal of the RVLP is to “sustain the viability of Tulare County agriculture by restraining division and use of land which is harmful to continued agricultural use.”
The RVLP utilizes five exclusive agriculture (AE) zones, each requiring a different minimum parcel size (ranging from five to eighty acres). These zones are as follows: AE, AE-10, AE-20, AE-40, and AE 80. The number designation on each zone generally reflects the minimum acres of land needed to productively farm a certain crop at a commercial level.
Table 3.1-2 shows the zoning designations used in the RVLP. The table also shows total acreage in the RVLP area. The majority of the land located in this region is dedicated to agricultural uses. As Table 3.1-2 shows, the majority of land in the RVLP area is zoned AE-40 (495,180 acres) and AE-20 (196,630 acres). The RVLP area contains approximately 769,108 acres of land with about 2,140 acres utilized by non-designated land types, such as roads and waterways.
In order to grant an exception for the use of the AE zone on properties that have minimal or no agricultural value, a parcel evaluation checklist is used to evaluate property suitability, based on a point system. Points are awarded for various factors such as parcel size, available public services, and surrounding land uses. Parcels determined to be more suitable for non-agricultural uses may be zoned (discretionary review required) for urban/suburban uses. Parcels that do not meet the requirements for rezoning are not allowed to rezone and must remain agriculturally zoned.
TABLE 3.1-2RURAL VALLEY LANDS PLAN ZONING DESIGNATIONS, TULARE
COUNTY, 2008
Zone Categories Acres
Agricultural (A-1) 1,640 Exclusive Agriculture (AE) 3,090 Exclusive Agriculture (AE-10) 26,080 Exclusive Agriculture (AE-20) 196,630 Exclusive Agriculture (AE-40) 495,180 Exclusive Agriculture (AE-80) 39,610 Foothill Agriculture (AF) 1,800
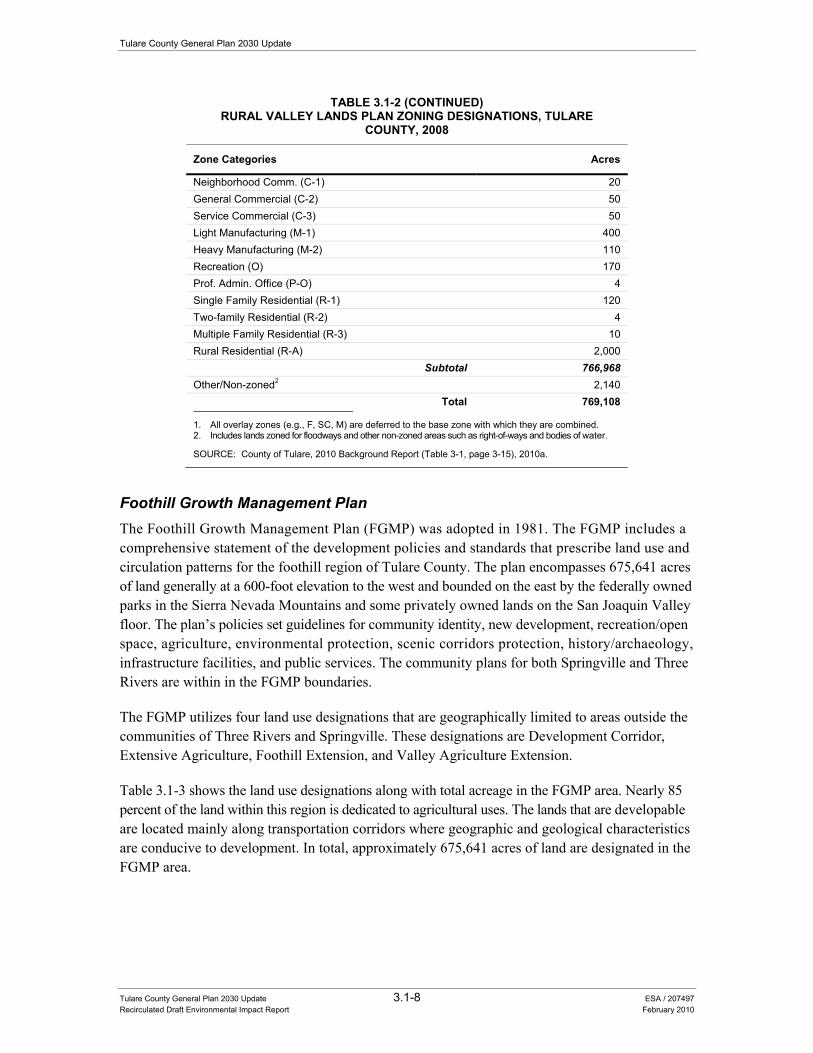
Tulare County General Plan 2030 Update
Tulare County General Plan 2030 Update 3.1-8 ESA / 207497 Recirculated Draft Environmental Impact Report February 2010
TABLE 3.1-2 (CONTINUED)RURAL VALLEY LANDS PLAN ZONING DESIGNATIONS, TULARE
COUNTY, 2008
Zone Categories Acres
Neighborhood Comm. (C-1) 20 General Commercial (C-2) 50 Service Commercial (C-3) 50 Light Manufacturing (M-1) 400 Heavy Manufacturing (M-2) 110 Recreation (O) 170 Prof. Admin. Office (P-O) 4 Single Family Residential (R-1) 120 Two-family Residential (R-2) 4 Multiple Family Residential (R-3) 10 Rural Residential (R-A) 2,000
Subtotal 766,968 Other/Non-zoned2 2,140
Total 769,108
1. All overlay zones (e.g., F, SC, M) are deferred to the base zone with which they are combined. 2. Includes lands zoned for floodways and other non-zoned areas such as right-of-ways and bodies of water.
SOURCE: County of Tulare, 2010 Background Report (Table 3-1, page 3-15), 2010a.
Foothill Growth Management Plan The Foothill Growth Management Plan (FGMP) was adopted in 1981. The FGMP includes a comprehensive statement of the development policies and standards that prescribe land use and circulation patterns for the foothill region of Tulare County. The plan encompasses 675,641 acres of land generally at a 600-foot elevation to the west and bounded on the east by the federally owned parks in the Sierra Nevada Mountains and some privately owned lands on the San Joaquin Valley floor. The plan’s policies set guidelines for community identity, new development, recreation/open space, agriculture, environmental protection, scenic corridors protection, history/archaeology, infrastructure facilities, and public services. The community plans for both Springville and Three Rivers are within in the FGMP boundaries.
The FGMP utilizes four land use designations that are geographically limited to areas outside the communities of Three Rivers and Springville. These designations are Development Corridor, Extensive Agriculture, Foothill Extension, and Valley Agriculture Extension.
Table 3.1-3 shows the land use designations along with total acreage in the FGMP area. Nearly 85 percent of the land within this region is dedicated to agricultural uses. The lands that are developable are located mainly along transportation corridors where geographic and geological characteristics are conducive to development. In total, approximately 675,641 acres of land are designated in the FGMP area.
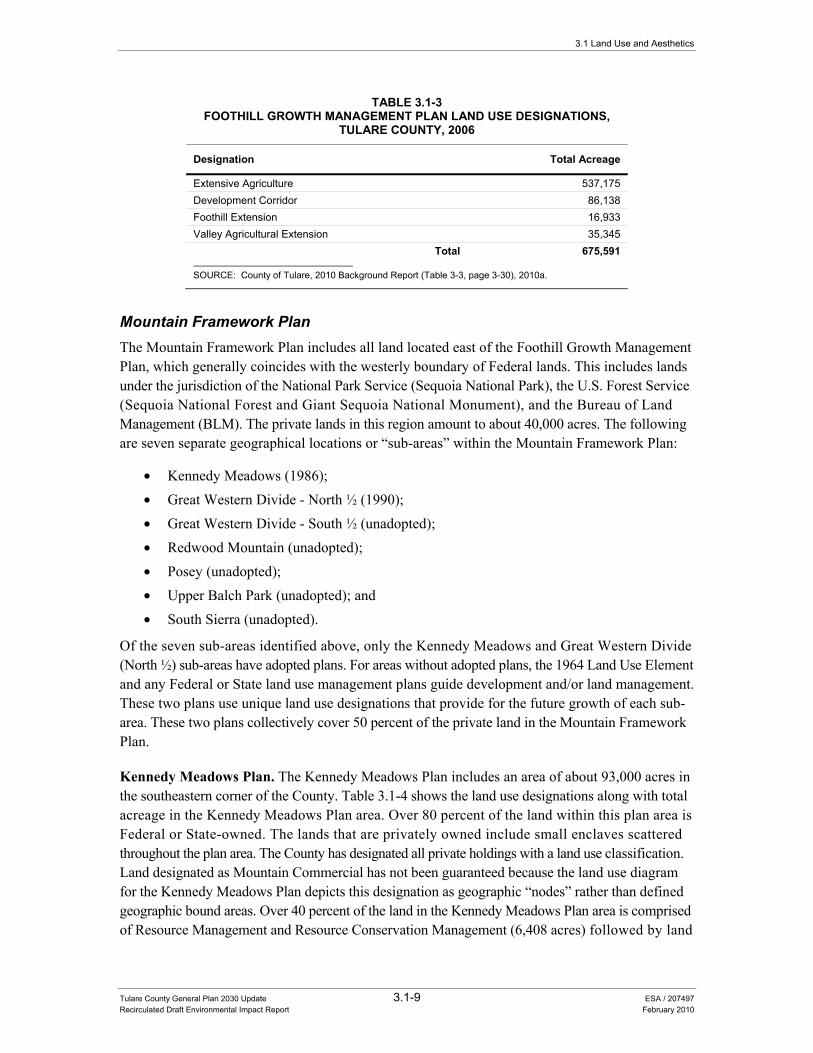
3.1 Land Use and Aesthetics
Tulare County General Plan 2030 Update 3.1-9 ESA / 207497 Recirculated Draft Environmental Impact Report February 2010
TABLE 3.1-3FOOTHILL GROWTH MANAGEMENT PLAN LAND USE DESIGNATIONS,
TULARE COUNTY, 2006
Designation Total Acreage
Extensive Agriculture 537,175 Development Corridor 86,138 Foothill Extension 16,933 Valley Agricultural Extension 35,345
Total 675,591
SOURCE: County of Tulare, 2010 Background Report (Table 3-3, page 3-30), 2010a.
Mountain Framework Plan The Mountain Framework Plan includes all land located east of the Foothill Growth Management Plan, which generally coincides with the westerly boundary of Federal lands. This includes lands under the jurisdiction of the National Park Service (Sequoia National Park), the U.S. Forest Service (Sequoia National Forest and Giant Sequoia National Monument), and the Bureau of Land Management (BLM). The private lands in this region amount to about 40,000 acres. The following are seven separate geographical locations or “sub-areas” within the Mountain Framework Plan:
• Kennedy Meadows (1986); • Great Western Divide - North ½ (1990); • Great Western Divide - South ½ (unadopted); • Redwood Mountain (unadopted); • Posey (unadopted); • Upper Balch Park (unadopted); and • South Sierra (unadopted).
Of the seven sub-areas identified above, only the Kennedy Meadows and Great Western Divide (North ½) sub-areas have adopted plans. For areas without adopted plans, the 1964 Land Use Element and any Federal or State land use management plans guide development and/or land management. These two plans use unique land use designations that provide for the future growth of each sub-area. These two plans collectively cover 50 percent of the private land in the Mountain Framework Plan.
Kennedy Meadows Plan. The Kennedy Meadows Plan includes an area of about 93,000 acres in the southeastern corner of the County. Table 3.1-4 shows the land use designations along with total acreage in the Kennedy Meadows Plan area. Over 80 percent of the land within this plan area is Federal or State-owned. The lands that are privately owned include small enclaves scattered throughout the plan area. The County has designated all private holdings with a land use classification. Land designated as Mountain Commercial has not been guaranteed because the land use diagram for the Kennedy Meadows Plan depicts this designation as geographic “nodes” rather than defined geographic bound areas. Over 40 percent of the land in the Kennedy Meadows Plan area is comprised of Resource Management and Resource Conservation Management (6,408 acres) followed by land
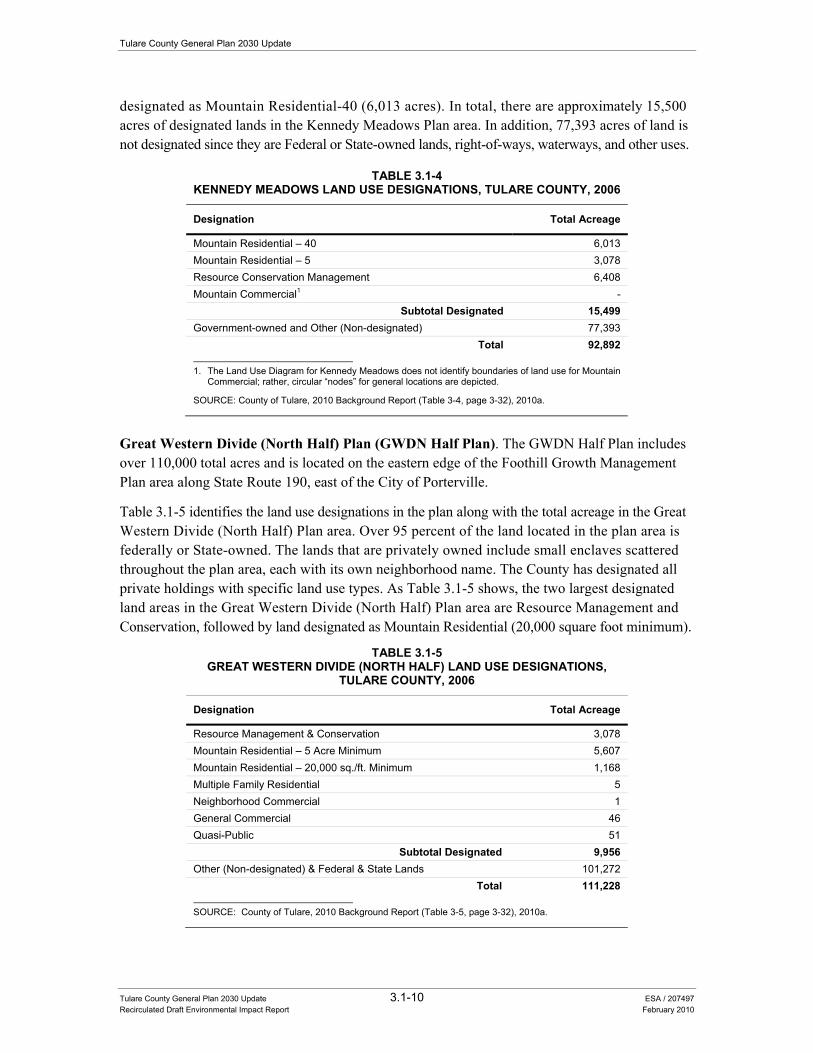
Tulare County General Plan 2030 Update
Tulare County General Plan 2030 Update 3.1-10 ESA / 207497 Recirculated Draft Environmental Impact Report February 2010
designated as Mountain Residential-40 (6,013 acres). In total, there are approximately 15,500 acres of designated lands in the Kennedy Meadows Plan area. In addition, 77,393 acres of land is not designated since they are Federal or State-owned lands, right-of-ways, waterways, and other uses.
TABLE 3.1-4KENNEDY MEADOWS LAND USE DESIGNATIONS, TULARE COUNTY, 2006
Designation Total Acreage
Mountain Residential – 40 6,013 Mountain Residential – 5 3,078 Resource Conservation Management 6,408 Mountain Commercial1 -
Subtotal Designated 15,499 Government-owned and Other (Non-designated) 77,393
Total 92,892
1. The Land Use Diagram for Kennedy Meadows does not identify boundaries of land use for Mountain Commercial; rather, circular “nodes” for general locations are depicted.
SOURCE: County of Tulare, 2010 Background Report (Table 3-4, page 3-32), 2010a.
Great Western Divide (North Half) Plan (GWDN Half Plan). The GWDN Half Plan includes over 110,000 total acres and is located on the eastern edge of the Foothill Growth Management Plan area along State Route 190, east of the City of Porterville.
Table 3.1-5 identifies the land use designations in the plan along with the total acreage in the Great Western Divide (North Half) Plan area. Over 95 percent of the land located in the plan area is federally or State-owned. The lands that are privately owned include small enclaves scattered throughout the plan area, each with its own neighborhood name. The County has designated all private holdings with specific land use types. As Table 3.1-5 shows, the two largest designated land areas in the Great Western Divide (North Half) Plan area are Resource Management and Conservation, followed by land designated as Mountain Residential (20,000 square foot minimum).
TABLE 3.1-5GREAT WESTERN DIVIDE (NORTH HALF) LAND USE DESIGNATIONS,
TULARE COUNTY, 2006
Designation Total Acreage
Resource Management & Conservation 3,078 Mountain Residential – 5 Acre Minimum 5,607 Mountain Residential – 20,000 sq./ft. Minimum 1,168 Multiple Family Residential 5 Neighborhood Commercial 1 General Commercial 46 Quasi-Public 51
Subtotal Designated 9,956 Other (Non-designated) & Federal & State Lands 101,272
Total 111,228
SOURCE: County of Tulare, 2010 Background Report (Table 3-5, page 3-32), 2010a.
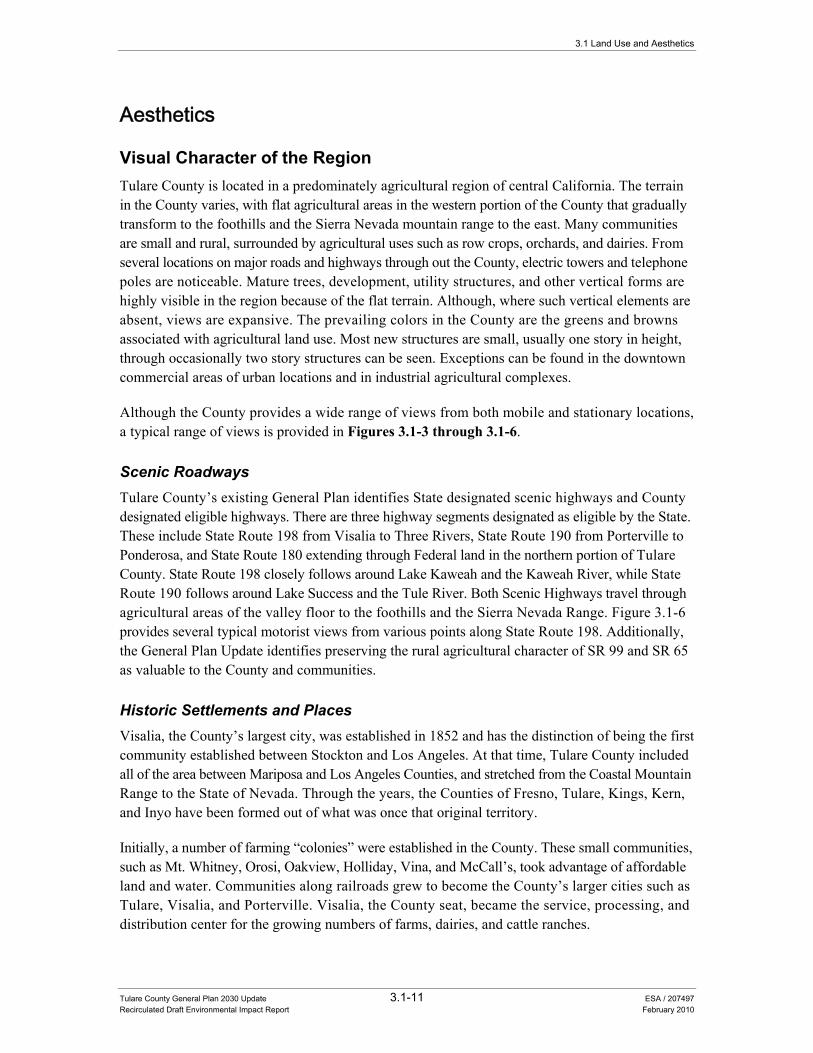
3.1 Land Use and Aesthetics
Tulare County General Plan 2030 Update 3.1-11 ESA / 207497 Recirculated Draft Environmental Impact Report February 2010
Aesthetics
Visual Character of the Region Tulare County is located in a predominately agricultural region of central California. The terrain in the County varies, with flat agricultural areas in the western portion of the County that gradually transform to the foothills and the Sierra Nevada mountain range to the east. Many communities are small and rural, surrounded by agricultural uses such as row crops, orchards, and dairies. From several locations on major roads and highways through out the County, electric towers and telephone poles are noticeable. Mature trees, development, utility structures, and other vertical forms are highly visible in the region because of the flat terrain. Although, where such vertical elements are absent, views are expansive. The prevailing colors in the County are the greens and browns associated with agricultural land use. Most new structures are small, usually one story in height, through occasionally two story structures can be seen. Exceptions can be found in the downtown commercial areas of urban locations and in industrial agricultural complexes.
Although the County provides a wide range of views from both mobile and stationary locations, a typical range of views is provided in Figures 3.1-3 through 3.1-6.
Scenic Roadways Tulare County’s existing General Plan identifies State designated scenic highways and County designated eligible highways. There are three highway segments designated as eligible by the State. These include State Route 198 from Visalia to Three Rivers, State Route 190 from Porterville to Ponderosa, and State Route 180 extending through Federal land in the northern portion of Tulare County. State Route 198 closely follows around Lake Kaweah and the Kaweah River, while State Route 190 follows around Lake Success and the Tule River. Both Scenic Highways travel through agricultural areas of the valley floor to the foothills and the Sierra Nevada Range. Figure 3.1-6 provides several typical motorist views from various points along State Route 198. Additionally, the General Plan Update identifies preserving the rural agricultural character of SR 99 and SR 65 as valuable to the County and communities.
Historic Settlements and Places Visalia, the County’s largest city, was established in 1852 and has the distinction of being the first community established between Stockton and Los Angeles. At that time, Tulare County included all of the area between Mariposa and Los Angeles Counties, and stretched from the Coastal Mountain Range to the State of Nevada. Through the years, the Counties of Fresno, Tulare, Kings, Kern, and Inyo have been formed out of what was once that original territory.
Initially, a number of farming “colonies” were established in the County. These small communities, such as Mt. Whitney, Orosi, Oakview, Holliday, Vina, and McCall’s, took advantage of affordable land and water. Communities along railroads grew to become the County’s larger cities such as Tulare, Visalia, and Porterville. Visalia, the County seat, became the service, processing, and distribution center for the growing numbers of farms, dairies, and cattle ranches.
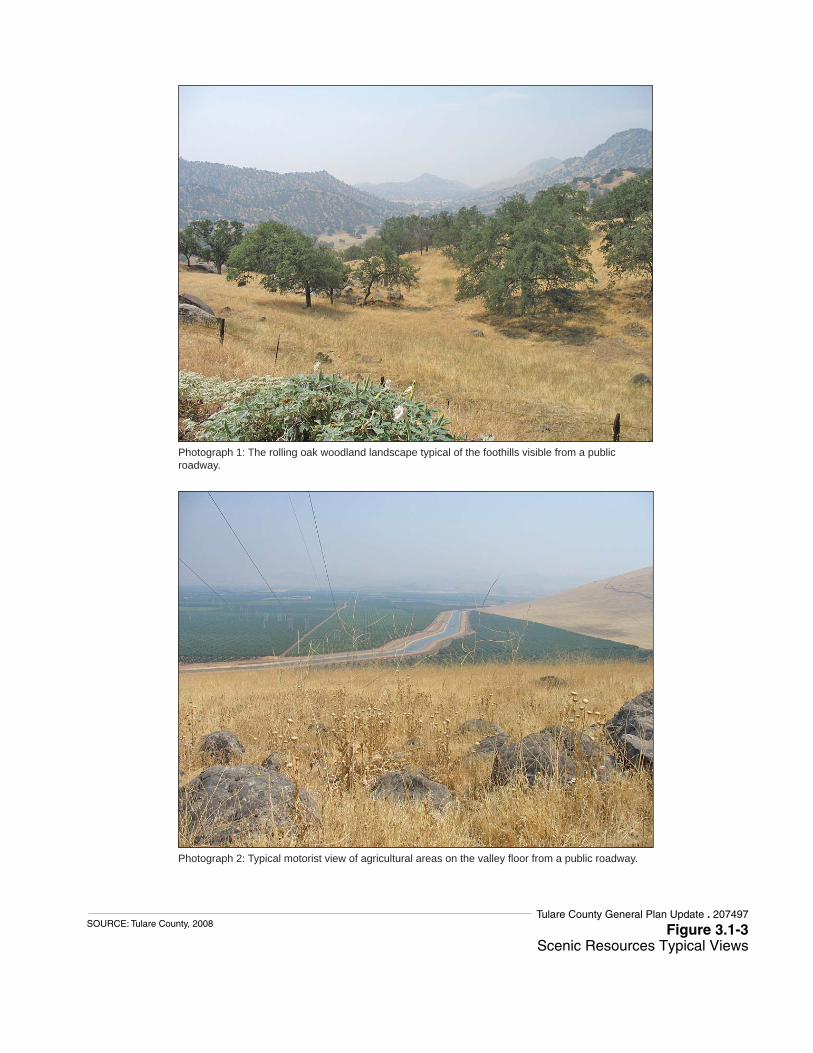
Photograph 1: The rolling oak woodland landscape typical of the foothills visible from a public roadway.
Photograph 2: Typical motorist view of agricultural areas on the valley floor from a public roadway.
Figure 3.1-3Scenic Resources Typical Views
SOURCE: Tulare County, 2008Tulare County General Plan Update . 207497
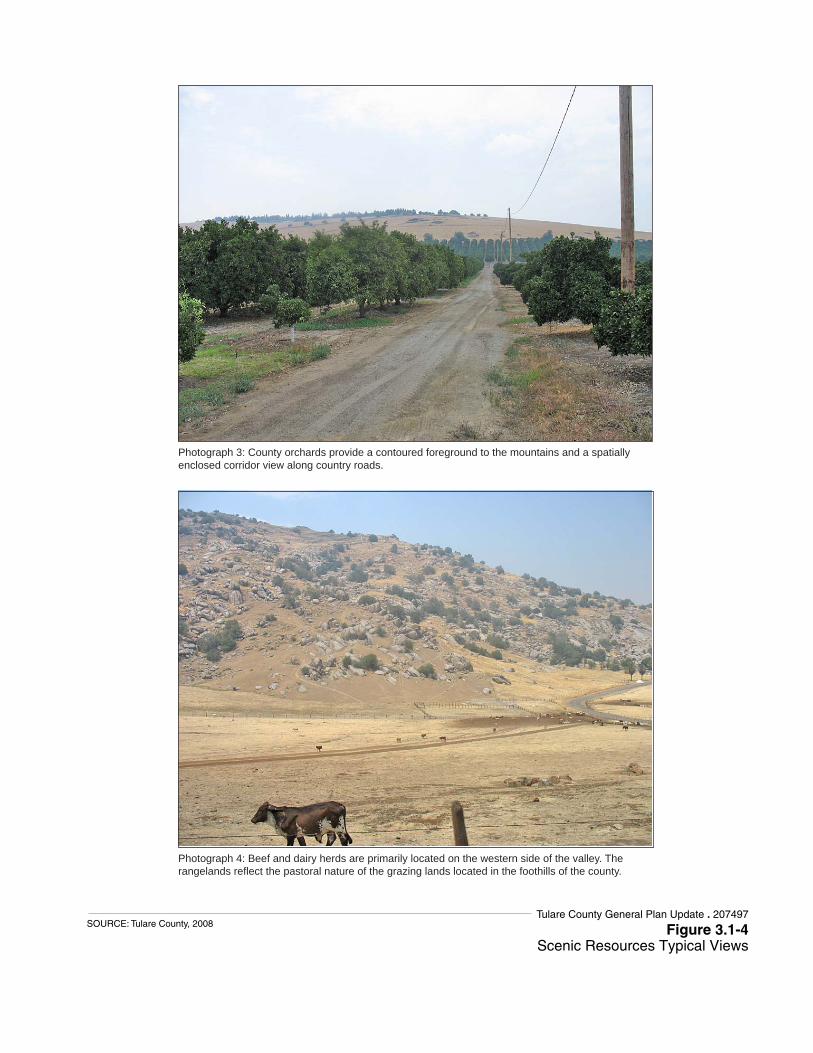
Photograph 3: County orchards provide a contoured foreground to the mountains and a spatially enclosed corridor view along country roads.
Photograph 4: Beef and dairy herds are primarily located on the western side of the valley. The rangelands reflect the pastoral nature of the grazing lands located in the foothills of the county.
Figure 3.1-4Scenic Resources Typical Views
SOURCE: Tulare County, 2008Tulare County General Plan Update . 207497
Photograph 5: Water delivery resources add movement and edges to the valley.
Photograph 6: Water resources create a lush working landscape and add movement and edges to the valley.
Figure 3.1-5Scenic Resources Typical Views
SOURCE: Tulare County, 2008Tulare County General Plan Update . 207497
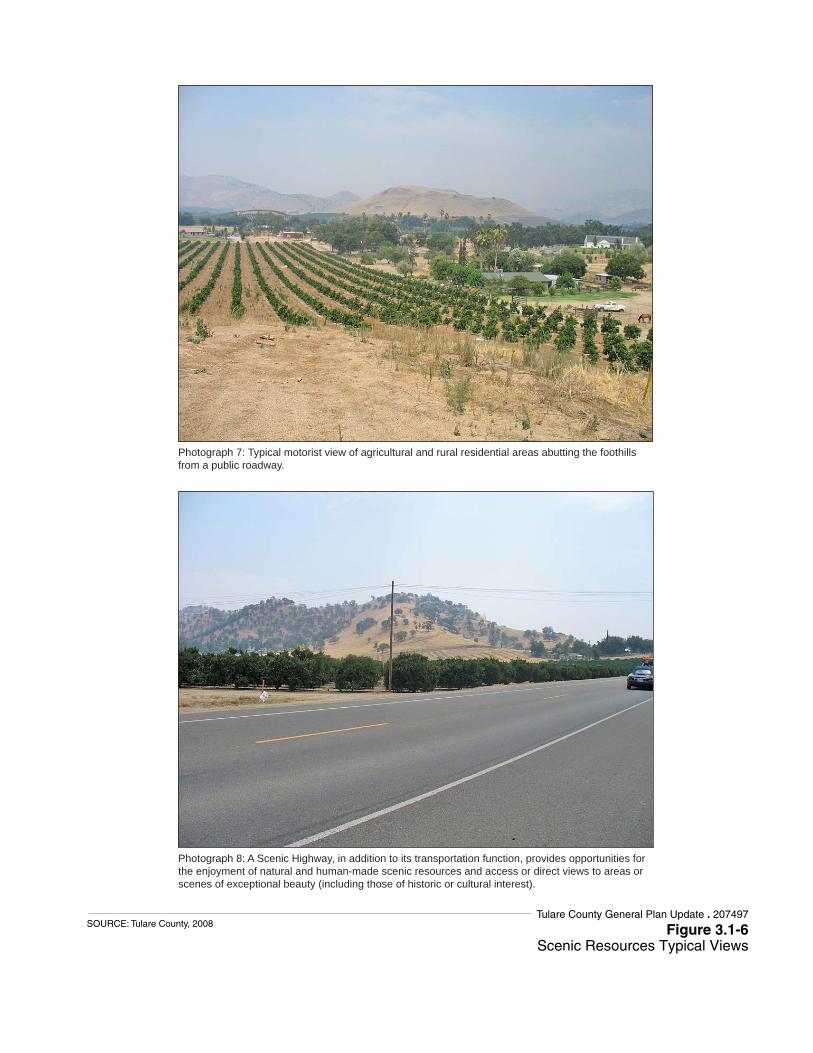
Photograph 7: Typical motorist view of agricultural and rural residential areas abutting the foothills from a public roadway.
Photograph 8: A Scenic Highway, in addition to its transportation function, provides opportunities for the enjoyment of natural and human-made scenic resources and access or direct views to areas or scenes of exceptional beauty (including those of historic or cultural interest).
Figure 3.1-6Scenic Resources Typical Views
SOURCE: Tulare County, 2008Tulare County General Plan Update . 207497
Tulare County General Plan 2030 Update
Tulare County General Plan 2030 Update 3.1-16 ESA / 207497 Recirculated Draft Environmental Impact Report February 2010
The Tulare County Historical Society has placed 26 markers throughout the county designating important historic places (Figure 3.1-2). These markers reflect the historic places, important events, and scenery. They mark both visual assets and cultural features. When combined with the scenic travel experience of Tulare County’s rural roads and highways, these places provide “points-of-interest.”
Sensitive Receptors Sensitive receptors subject to the potential effects of visual changes resulting from future development anticipated under the proposed project consist of travelers along local roadways and regional highways; and, permanent residents in the various unincorporated community plan areas. Given the programmatic nature of this analysis, specific locations of potential receptors have not been identified at this time.
Light and Glare There are primarily two sources of light intrusion:
• light emanating from structural interiors and passing through windows; and • light from exterior sources, such as street lighting, building illumination, security
lighting, event lighting in resort areas, traffic headlights, and landscape lighting.
Land uses such as residences, hospitals, and hotels are considered light sensitive, as they are typically occupied by persons who have expectations for privacy during evening hours and are subject to disturbance by bright light sources. At night, lights from cities and communities illuminate the developed areas, providing contrast with the generally uninterrupted darkness of the surrounding agricultural lands and mountains. The preservation of views of the night sky has been identified as valuable to the community.
Glare results mainly from sunlight reflection off flat building surfaces with glass and reflective metal surfaces typically contributing to the highest degree of reflectivity. Glare can also be produced during evening and nighttime hours by the reflection of artificial light sources, such as automobile headlights. Glare generation is typically related to either moving vehicles or sun angles, although glare resulting from reflected sunlight can occur regularly at certain times of the year. Glare-sensitive uses generally include residences and transportation corridors.
Existing sources of light and glare within the County are primarily focused in the cities, communities, hamlets, and other urban development boundary areas. It is anticipated that most new sources of light and glare (resulting from build-out of the General Plan) will occur within and around these urbanized areas, as shown in Figure 3.1-2. A majority of the County is used for agricultural purposes (with some scattered rural residential uses) and therefore currently contains limited sources of light and glare outside of more urbanized community areas.
3.1 Land Use and Aesthetics
Tulare County General Plan 2030 Update 3.1-17 ESA / 207497 Recirculated Draft Environmental Impact Report February 2010
Impacts and Mitigation Measures
Significance Criteria The significance criteria for this analysis were developed from criteria presented in Appendix G, “Environmental Checklist Form”, of the CEQA Guidelines and based on the professional judgment of the County of Tulare and its consultants. The proposed project would result in a significant impact if it would:
• Physically divide an established community; • Conflict with any applicable land use plan, policy or regulation of an agency with
jurisdiction over the project adopted for the purpose of avoiding or mitigating a significant environmental effect;
• Substantially degrade the existing visual character or quality of the site and its surroundings;
• Have a substantial adverse effect on a scenic vista; • Substantially damage scenic resources, including, but not limited to, trees, rock
outcroppings, and historic buildings within a State scenic highway; or • Create a new source of substantial light or glare which would adversely affect day or
nighttime views in the area.
Methodology Land use impacts are described qualitatively. Land use changes enabled by the General Plan Update were compared to the existing level of development on lands within the County. The analysis also considered the compatibility of land uses proposed next to each other.
Aesthetics and visual resources are subjective by nature. Consequently, the level of a project’s visual impact is difficult to quantify. In addition, it is difficult to estimate the impact development would have on countywide aesthetic resources, since some individual projects can enhance the aesthetic quality of an area. Therefore, this analysis was conducted qualitatively, assessing potential growth implications of the proposed project. General Plan Update policies are also evaluated to determine the extent to which they would protect existing scenic landscapes or resources and minimize the degradation of the County’s visual quality.
Summary of Impacts This section evaluates land use and aesthetic impacts related to the proposed project. For this programmatic evaluation, impacts have been assessed for the overall General Plan along with the various planning areas that comprise the County, with Table 3.1-6 providing an overview of these impacts for the proposed project and the various planning areas.
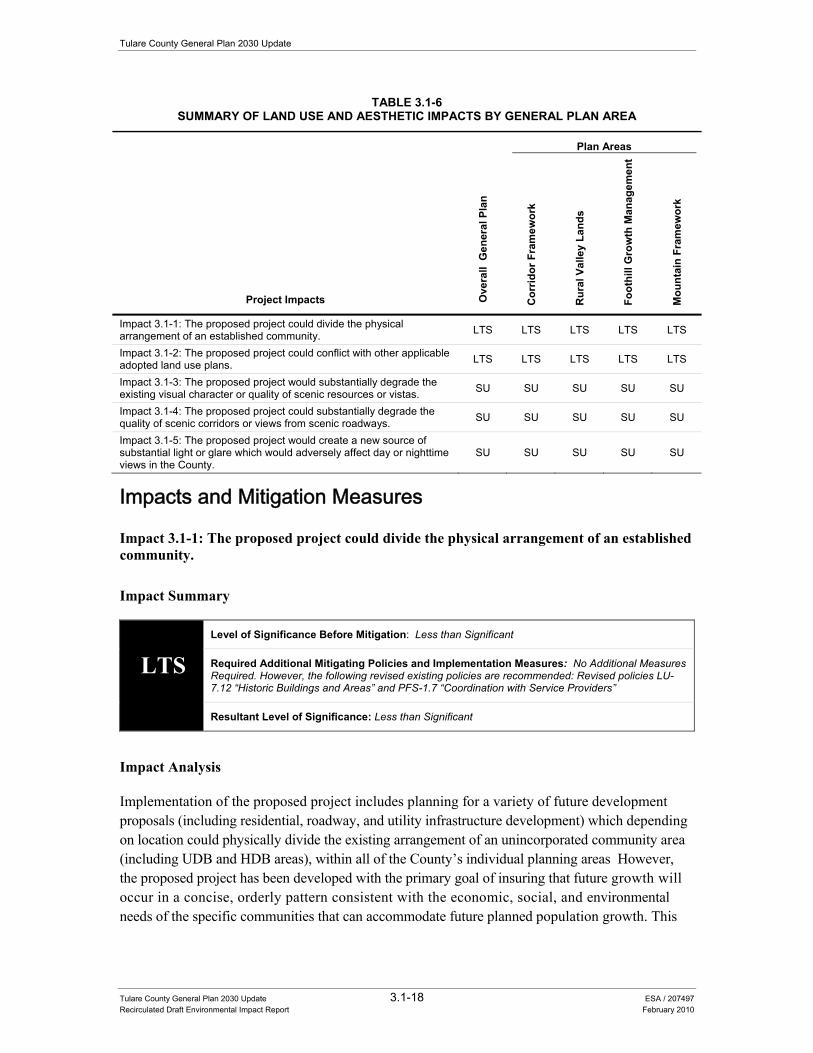
Tulare County General Plan 2030 Update
Tulare County General Plan 2030 Update 3.1-18 ESA / 207497 Recirculated Draft Environmental Impact Report February 2010
TABLE 3.1-6 SUMMARY OF LAND USE AND AESTHETIC IMPACTS BY GENERAL PLAN AREA
Project Impacts Ove
rall
Gen
eral
Pla
n
Plan Areas
Cor
ridor
Fra
mew
ork
Rur
al V
alle
y La
nds
Foot
hill
Gro
wth
Man
agem
ent
Mou
ntai
n Fr
amew
ork
Impact 3.1-1: The proposed project could divide the physical arrangement of an established community. LTS LTS LTS LTS LTS
Impact 3.1-2: The proposed project could conflict with other applicable adopted land use plans. LTS LTS LTS LTS LTS
Impact 3.1-3: The proposed project would substantially degrade the existing visual character or quality of scenic resources or vistas. SU SU SU SU SU
Impact 3.1-4: The proposed project could substantially degrade the quality of scenic corridors or views from scenic roadways. SU SU SU SU SU
Impact 3.1-5: The proposed project would create a new source of substantial light or glare which would adversely affect day or nighttime views in the County.
SU SU SU SU SU
Impacts and Mitigation Measures
Impact 3.1-1: The proposed project could divide the physical arrangement of an established community.
Impact Summary
LTS Level of Significance Before Mitigation: Less than Significant
Required Additional Mitigating Policies and Implementation Measures: No Additional Measures Required. However, the following revised existing policies are recommended: Revised policies LU-7.12 “Historic Buildings and Areas” and PFS-1.7 “Coordination with Service Providers”
Resultant Level of Significance: Less than Significant
Impact Analysis
Implementation of the proposed project includes planning for a variety of future development proposals (including residential, roadway, and utility infrastructure development) which depending on location could physically divide the existing arrangement of an unincorporated community area (including UDB and HDB areas), within all of the County’s individual planning areas However, the proposed project has been developed with the primary goal of insuring that future growth will occur in a concise, orderly pattern consistent with the economic, social, and environmental needs of the specific communities that can accommodate future planned population growth. This
3.1 Land Use and Aesthetics
Tulare County General Plan 2030 Update 3.1-19 ESA / 207497 Recirculated Draft Environmental Impact Report February 2010
concept of orderly growth will help future land use planning decisions balance the development of needed infrastructure within existing and proposed community areas so that community continuity is maintained within these areas. The proposed project has been developed with the primary goal of insuring that future growth will occur in an orderly manner, which will help to prevent urban sprawl and ensure community-wide compatibility. For example, the proposed project promotes the land use principles of smart growth (i.e., creating walkable communities, discouraging sprawl, etc.) and requires the preparation of specific plans for larger develop projects to help minimize future land use conflicts between existing and proposed land uses.
Policies and implementation measures included as part of the General Plan Update that would minimize this impact are summarized below by general plan element. For example, the Land Use and Transportation & Circulation Elements provide guidance on the future development of urban areas and roadways to ensure the orderly placement of compatible land uses near existing similar land uses, while promoting a variety of smart growth land use concepts (see Policies LU-1.1, LU-1.2, LU-1.4, LU-1.8, and LU-1.9). A variety of policies also encourage the clustering of similar land uses to encourage compact and cohesive development. Policy LU-4.1 accomplishes this by encouraging the development of small scale neighborhood convenience and grocery facilities that are designed to meet the everyday shopping needs of local surrounding residents. Other policies from the Transportation & Circulation Element promote the development of cohesive land uses by encouraging a balanced transportation system (see Policy TC-1.18) that facilitates the use of alternative modes of transportation (see Policies TC-5.1, TC-4.4, and TC-4.5) via a well-connected network of transportation routes that do not physically divide neighborhoods.
Future development can also physically divide existing neighborhoods through the development of new land uses in a manner that contributes to the abandonment or neglect of older neighborhoods (including central or downtown areas). The Land Use and Environmental Resource Management Elements contain a variety of policies that encourage the preservation of existing historic areas and older neighborhoods (see Policies LU-7.8, LU-7.11 through LU-7.14, ERM-6.6, and ERM-6.7). Additionally, Policy LU-4.5 encourages the development of new commercial areas that are consistent with the existing design (including building facades, landscaping, lighting, etc.) of the surrounding community. Also, Policy LU-7.10 encourages the enhancement of key community entry points to encourage transitional zones between communities that encourage visitation.
A variety of other policies from the Land Use, Scenic Landscapes, Agriculture, Environmental Resource Management, and Public Facilities & Services Elements promote community cohesiveness by encouraging the placement of compatible land uses (see Policies LU-1.3, LU-3.6, LU-3.8 and LU-5.4), the use of buffers to minimize a variety of negative land use impacts (see Policies LU-5.6, LU-6.2, AG-1.11, and ERM-1.8), and the development of environmentally sensitive land uses (i.e., minimal soil erosion, groundwater recharge soil areas, maximum use of beneficial vegetation, etc.) within existing open space areas (see Policies LU-1.1, ERM-1.2, LU-7.2, SL-3.2). Additionally, Policies PFS-9.2, PFS-9.3 and PFS-9.4 call for the future placement of utility corridors that do not affect the economic use of adjacent properties or result in the division of an existing neighborhood area. A variety of other policies have been developed to minimize land use conflicts between sensitive land uses, local airport facilities and mineral extraction areas. Further,
Tulare County General Plan 2030 Update
Tulare County General Plan 2030 Update 3.1-20 ESA / 207497 Recirculated Draft Environmental Impact Report February 2010
Policy PF-1.11 requires the County to utilize standardized rules for reviewing and adopting boundaries for community plans, hamlet plans, and various other plans. Other policies within the Planning Framework Element which support development of compatible land uses and cooperative planning between the County and individual cities and provide the framework for future development within UDBs and UABs are Policies PF-4.1, PF-4.2, PF-4.3, PF-4.4, PF-4.6, PF-4.8, PF-4.9, PF-4.13. Policy PF-4.16 also directs the County to coordinate with cities in adjacent counties to implement well planned development. Overall, new development associated with the proposed project would represent a continuation of the existing community areas of the County and would not result in the physical division of an existing community within any of the County’s planning areas. With implementation of the below mentioned policies, this impact is considered less-than-significant.
MITIGATING POLICIES AND IMPLEMENTATION MEASURES
Land Use Element Transportation & Circulation Element
Policies are designed to minimize any potential impact of dividing the physical arrangement of an established community by ensuring that growth occurs in an organized manner, including the following:
LU-1.1 Smart Growth and Healthy Communities LU-1.2 Innovative Development LU-1.4 Compact Development LU-1.8 Encourage Infill Development LU-1.9 Specific Plans LU-4.1 Neighborhood Commercial Uses LU-7.3 Friendly Streets LU-7.4 Streetscape Continuity
TC-1.13 Land Dedication for Roadways and Other Travel Modes
TC-1.18 Balanced System TC-4.4 Nodal Land Use Patterns that Support Public
Transit TC-4.5 Transit Coordination TC-5.1 Bicycle/Pedestrian Trail System
Land Use Element Environmental Resource Management Element
Policies and implementation measures designed to minimize this impact through the protection of the City’s traditional neighborhoods and historic districts include the following:
LU-4.5 Commercial Building Design LU-7.8 Building Abatement LU-7.10 Gateways/Entry Points LU-7.11 Adaptive Reuse LU-7.12 Historic Buildings and Areas LU-7.14 Contextual and Compatible Design Land Use Implementation Measure #11
ERM-6.6 Historic Structures and Sites ERM-6.7 Cooperation of Property Owners ERM Implementation Measure #51
Planning Framework, Land Use, Scenic Landscapes, Agriculture, Environmental Resource Management, and Public Facilities & Services Elements
Policies and implementation measures designed to promote compatible land use development and patterns that minimize impacts to surrounding land uses (including open space uses) include the following:
PF-1.11 Interpretation of Boundaries PF-4.1 CACUABs for Cities PF-4.2 CACUDBs for Cities – Twenty Year Planning
Area PF-4.3 Modification of CACUABs and CACUDBs PF-4.4 Planning in CACUDBs PF-4.6 Orderly Expansion of City Boundaries PF-4.8 General Plan Designations Within City UDBs PF-4.9 Updating Land Use Diagram in CACUDBs PF-4.13 Coordination with Cities on Development
Proposals PF-4.16 Coordination with Cities in Adjacent Counties PF-6.1 Plans for Jurisdictions, Agencies, District,
Utilities, and Native American Tribes PF-6.3 Consultation on Annexation Proposals
SL-3.2 Urban Expansion-Edges SL-3.4 Planned Communities AG-1.11 Agricultural Buffers ERM-1.2 Development in Environmentally Sensitive
Areas ERM-1.3 Encourage Cluster Development ERM-1.8 Open Space Buffers PFS-9.2 Appropriate Siting of Natural Gas and Electric
Systems PFS-9.3 Transmission Corridors PFS-9.4 Power Transmission Lines Land Use Implementation Measure #1 Land Use Implementation Measure #2 Land Use Implementation Measure #3 Land Use Implementation Measure #4
3.1 Land Use and Aesthetics
Tulare County General Plan 2030 Update 3.1-21 ESA / 207497 Recirculated Draft Environmental Impact Report February 2010
LU-1.3 Prevent Incompatible Uses LU-3.6 Project Design LU-3.8 Rural Residential Interface LU-5.4 Compatibility with Surrounding Land Use LU-5.6 Industrial Use Buffer LU-6.2 Buffers LU-7.2 Integrate Natural Features
Land Use Implementation Measure #11 Land Use Implementation Measure #12 Land Use Implementation Measure #13 Land Use Implementation Measure #14 Land Use Implementation Measure #15 Land Use Implementation Measure #16 Land Use Implementation Measure #17
Transportation & Circulation Element Health & Safety Element
Policies designed to promote compatible development near County airport facilities include the following:
TC-3.4 Airport Compatibility TC-3.6 Airport Encroachment
HS-3.1 Airport Land Use Compatibility Plan HS-3.2 Compliance with FAA Regulations HS-8.4 Airport Noise Contours
Environmental Resource Management Element
Policies designed to promote compatible development near mineral extraction resource areas include the following:
ERM-2.7 Minimize Adverse Impacts ERM-2.8 Minimize Hazards and Nuisances ERM-2.9 Compatibility
ERM-2.10 Incompatible Development ERM-3.2 Limited Mining in Urban Areas
Required Additional Mitigating Policies and Implementation Measures
Although this impact is considered less-than-significant, the following revised policies (LU-7.12 “Historic Buildings and Areas” and PFS-1.7 “Coordination with Service Providers”) are recommended to ensure that this impact remains less-than-significant:
• PFS-1.7 Coordination with Service Providers. The County shall work with special districts, community service districts, public utility districts, mutual water companies, private water purveyors, sanitary districts, and sewer maintenance districts to provide adequate public facilities and to plan/coordinate, as appropriate, future utility corridors in an effort to minimize future land use conflicts. [New Policy – Modified Draft EIR Analysis]
• LU-7.12 Historic Buildings and Areas. The County shall seek to encourage preservation of buildings and areas with special and recognized historic, architectural, or aesthetic value. New development should respect architecturally and historically significant buildings and areas. Landscaping, original roadways, sidewalks, and other public realm features of historic buildings or neighborhoods shall be restored or repaired where ever feasible. [New Policy – Modified Draft EIR Analysis]
Significance after Implementation of Mitigation for Impact 3.1-1
As stated above, no additional technologically or economically feasible mitigation measures are currently available to reduce this impact to a less than significant level. Consequently, this impact is considered significant and unavoidable.
Tulare County General Plan 2030 Update
Tulare County General Plan 2030 Update 3.1-22 ESA / 207497 Recirculated Draft Environmental Impact Report February 2010
Impact 3.1-2: The proposed project could conflict with other applicable adopted land use plans.
Impact Summary
LTS Level of Significance Before Mitigation: Less than Significant
Required Additional Mitigating Policies and Implementation Measures: None Required.
Resultant Level of Significance: Less than Significant
Impact Analysis
In addition to the County of Tulare, other key city, County, and regional agencies in the vicinity of the County include the following:
• Cities of Dinuba, Exeter, Farmersville, Lindsay, Porterville, Tulare, Visalia, and Woodlake
• Tulare County Local Agency Formation Commission
• Counties of Fresno, Kern, Inyo, and Kings
• Tulare County Association of Governments
• Neighboring Cities of Delano, Kingsburg, Reedley, Corcoran and Orange Cove
• Kaweah Delta WCD and Upper Kings River WCD
• San Joaquin Valley Air Pollution Control District
• Tulare County Airport Land Use Commission
• Central Valley Regional Water Quality Control Board
The proposed project was designed specifically to achieve and promote consistency with the planning documents of other key neighboring land use agencies or other agencies that may have jurisdiction over future projects anticipated under buildout of the General Plan Update.
Policies and implementation measures included as part of the General Plan Update that would minimize this impact are summarized below. For example, policies within the Transportation & Circulation and Health & Safety Elements encourage the development of a uniform land use policy with other local jurisdictions and encourage continued participation by the County in regional transportation and planning programs administered by a variety of agencies including the Tulare County Association of Governments (TCAG), the California Department of Transportation (Caltrans), and the San Joaquin Valley Air Pollution Control District (SJVAPCD) (see Policies AQ-1.1, AQ-1.2, AQ-2.1, and AQ Implementation Measure #1). Some policies (see Policy WR-2.2 and WR-3.2) require the County to participate in integrated regional water management planning and water quality monitoring/enforcement programs. Other policies (see Policies TC-3.4, TC-3.6, HS-3.1, HS-3.2, and HS-8.4) require the County to ensure that all development within the vicinity of local airport facilities be consistent with the policies adopted by the Tulare County Airport Land Use Commission and the most recently adopted Comprehensive Airport Land Use Plan.
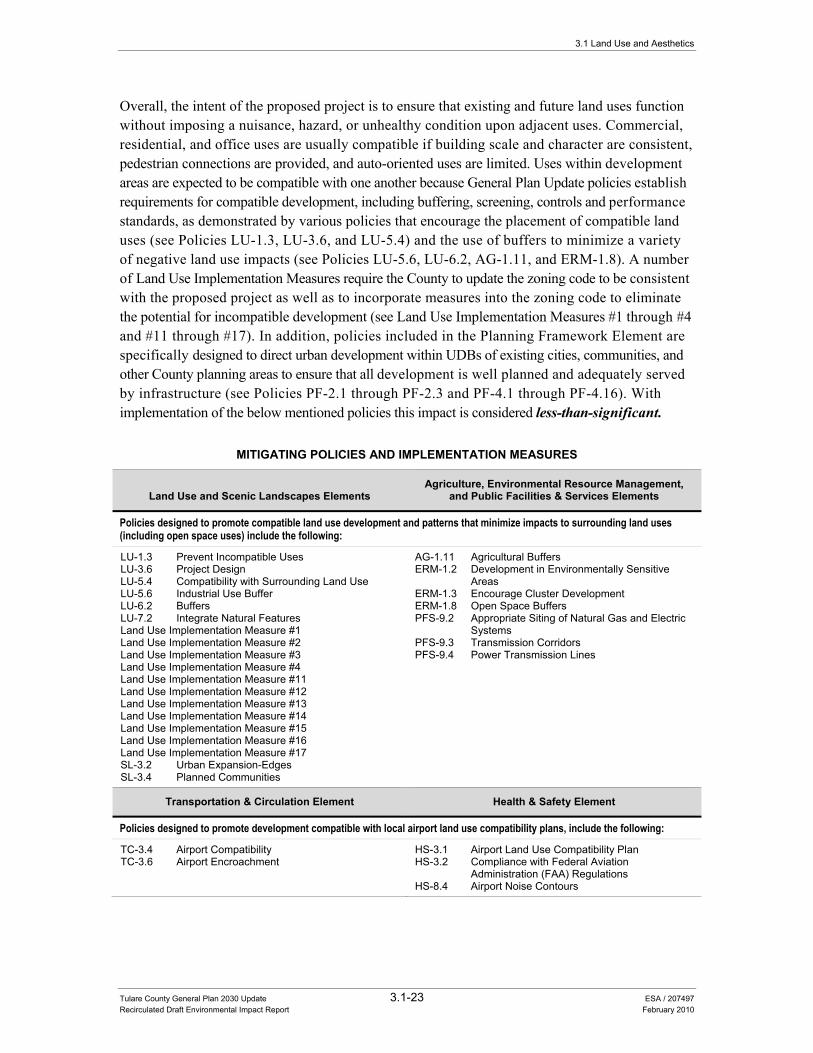
3.1 Land Use and Aesthetics
Tulare County General Plan 2030 Update 3.1-23 ESA / 207497 Recirculated Draft Environmental Impact Report February 2010
Overall, the intent of the proposed project is to ensure that existing and future land uses function without imposing a nuisance, hazard, or unhealthy condition upon adjacent uses. Commercial, residential, and office uses are usually compatible if building scale and character are consistent, pedestrian connections are provided, and auto-oriented uses are limited. Uses within development areas are expected to be compatible with one another because General Plan Update policies establish requirements for compatible development, including buffering, screening, controls and performance standards, as demonstrated by various policies that encourage the placement of compatible land uses (see Policies LU-1.3, LU-3.6, and LU-5.4) and the use of buffers to minimize a variety of negative land use impacts (see Policies LU-5.6, LU-6.2, AG-1.11, and ERM-1.8). A number of Land Use Implementation Measures require the County to update the zoning code to be consistent with the proposed project as well as to incorporate measures into the zoning code to eliminate the potential for incompatible development (see Land Use Implementation Measures #1 through #4 and #11 through #17). In addition, policies included in the Planning Framework Element are specifically designed to direct urban development within UDBs of existing cities, communities, and other County planning areas to ensure that all development is well planned and adequately served by infrastructure (see Policies PF-2.1 through PF-2.3 and PF-4.1 through PF-4.16). With implementation of the below mentioned policies this impact is considered less-than-significant.
MITIGATING POLICIES AND IMPLEMENTATION MEASURES
Land Use and Scenic Landscapes Elements Agriculture, Environmental Resource Management,
and Public Facilities & Services Elements
Policies designed to promote compatible land use development and patterns that minimize impacts to surrounding land uses (including open space uses) include the following:
LU-1.3 Prevent Incompatible Uses LU-3.6 Project Design LU-5.4 Compatibility with Surrounding Land Use LU-5.6 Industrial Use Buffer LU-6.2 Buffers LU-7.2 Integrate Natural Features Land Use Implementation Measure #1 Land Use Implementation Measure #2 Land Use Implementation Measure #3 Land Use Implementation Measure #4 Land Use Implementation Measure #11 Land Use Implementation Measure #12 Land Use Implementation Measure #13 Land Use Implementation Measure #14 Land Use Implementation Measure #15 Land Use Implementation Measure #16 Land Use Implementation Measure #17 SL-3.2 Urban Expansion-Edges SL-3.4 Planned Communities
AG-1.11 Agricultural Buffers ERM-1.2 Development in Environmentally Sensitive
Areas ERM-1.3 Encourage Cluster Development ERM-1.8 Open Space Buffers PFS-9.2 Appropriate Siting of Natural Gas and Electric
Systems PFS-9.3 Transmission Corridors PFS-9.4 Power Transmission Lines
Transportation & Circulation Element Health & Safety Element
Policies designed to promote development compatible with local airport land use compatibility plans, include the following:
TC-3.4 Airport Compatibility TC-3.6 Airport Encroachment
HS-3.1 Airport Land Use Compatibility Plan HS-3.2 Compliance with Federal Aviation
Administration (FAA) Regulations HS-8.4 Airport Noise Contours
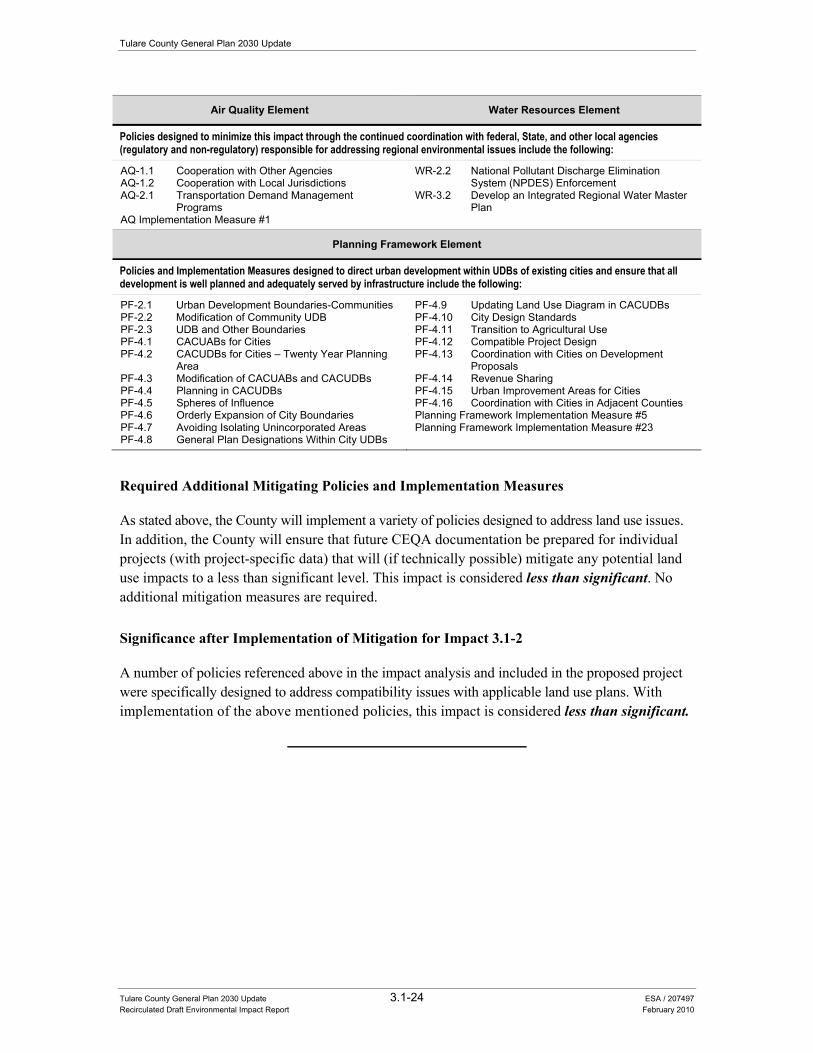
Tulare County General Plan 2030 Update
Tulare County General Plan 2030 Update 3.1-24 ESA / 207497 Recirculated Draft Environmental Impact Report February 2010
Air Quality Element Water Resources Element
Policies designed to minimize this impact through the continued coordination with federal, State, and other local agencies (regulatory and non-regulatory) responsible for addressing regional environmental issues include the following:
AQ-1.1 Cooperation with Other Agencies AQ-1.2 Cooperation with Local Jurisdictions AQ-2.1 Transportation Demand Management
Programs AQ Implementation Measure #1
WR-2.2 National Pollutant Discharge Elimination System (NPDES) Enforcement
WR-3.2 Develop an Integrated Regional Water Master Plan
Planning Framework Element
Policies and Implementation Measures designed to direct urban development within UDBs of existing cities and ensure that all development is well planned and adequately served by infrastructure include the following:
PF-2.1 Urban Development Boundaries-Communities PF-2.2 Modification of Community UDB PF-2.3 UDB and Other Boundaries PF-4.1 CACUABs for Cities PF-4.2 CACUDBs for Cities – Twenty Year Planning
Area PF-4.3 Modification of CACUABs and CACUDBs PF-4.4 Planning in CACUDBs PF-4.5 Spheres of Influence PF-4.6 Orderly Expansion of City Boundaries PF-4.7 Avoiding Isolating Unincorporated Areas PF-4.8 General Plan Designations Within City UDBs
PF-4.9 Updating Land Use Diagram in CACUDBs PF-4.10 City Design Standards PF-4.11 Transition to Agricultural Use PF-4.12 Compatible Project Design PF-4.13 Coordination with Cities on Development
Proposals PF-4.14 Revenue Sharing PF-4.15 Urban Improvement Areas for Cities PF-4.16 Coordination with Cities in Adjacent Counties Planning Framework Implementation Measure #5 Planning Framework Implementation Measure #23
Required Additional Mitigating Policies and Implementation Measures
As stated above, the County will implement a variety of policies designed to address land use issues. In addition, the County will ensure that future CEQA documentation be prepared for individual projects (with project-specific data) that will (if technically possible) mitigate any potential land use impacts to a less than significant level. This impact is considered less than significant. No additional mitigation measures are required.
Significance after Implementation of Mitigation for Impact 3.1-2
A number of policies referenced above in the impact analysis and included in the proposed project were specifically designed to address compatibility issues with applicable land use plans. With implementation of the above mentioned policies, this impact is considered less than significant.
3.1 Land Use and Aesthetics
Tulare County General Plan 2030 Update 3.1-25 ESA / 207497 Recirculated Draft Environmental Impact Report February 2010
Impact 3.1-3: The proposed project would substantially degrade the existing visual character or quality of scenic resources or vistas.
Impact Summary
SU Level of Significance Before Mitigation: Potentially Significant
Required Additional Mitigating Policies and Implementation Measures: No additional feasible mitigation available
Resultant Level of Significance: Significant and Unavoidable
Impact Analysis
The visual character of the County is influenced by the quality of its roadways, boulevards, multi use paths/trails, view corridors, and the land uses adjoining them (i.e., open space, neighborhoods, etc.). Visual quality is often affected by a variety of factors including General Plan land use designations and policies, specific plan requirements, zoning regulations and enforcement, and private property maintenance. Specific development projects resulting from implementation of the proposed project would result in temporary changes in local visual conditions during construction of specific projects in the County. However, given the relatively short-term nature of these construction-related activities, construction-related visual impacts are considered less-than-significant.
A major focus of the proposed project is the enhancement of the visual quality of the County and its surroundings. By adopting the Land Use, Scenic Landscapes, and Environmental Resources Management Elements, the County is taking proactive steps to improve its visual character. For example, the Land Use and Scenic Landscape Elements focus on policies at different levels, from community specific policies that are designed to improve the quality of existing community centers or neighborhoods (see Policy SL-3.1) to broader policies that are designed for expanding communities (see Policies SL-3.2 and SL-3.4). Policy ERM-5.18 provides direction for the County to protect the visibility of the night sky in communities, therefore protecting the visual quality of an area. All of these policies have the common goal of improving the visual quality of the County by maintaining or enhancing existing scenic resource conditions (see Policies SL-1.1, SL-1.2, SL-1.3 and PFS-9.4), developing guidelines to improve future development projects, or creating capital improvements which improve community aesthetics.
The preservation of urban landscapes can also contribute to the scenic quality of a specific location. Preservation of the existing built environment is also a key goal of the proposed project, with both the Land Use and Scenic Landscapes Elements containing a variety of policies designed to preserve the existing historic character of the County’s communities, hamlets, and rural areas. Policies LU-7.1, LU-7.2, and LU-7.3 encourage the development of new structures and infrastructure that build on the natural landscapes and features of the existing setting. Policies LU-7.8, LU-7.11, LU-7.12, and LU-7.13 encourage the County to implement a variety of measures designed to preserve historic resources, which include abatement programs for dilapidated buildings, adaptive reuse of historic
Tulare County General Plan 2030 Update
Tulare County General Plan 2030 Update 3.1-26 ESA / 207497 Recirculated Draft Environmental Impact Report February 2010
structures, and continued coordination with local preservation groups to improve building facades and other features.
The Scenic Landscapes Element also includes a number of policies designed to protect scenic views for travelers along County roadways and provide guidance on the development of infrastructure that minimizes impacts to existing scenic landscapes. Policies SL-2.1 and SL-2.3 call for the continued maintenance of a designated system of County Scenic Routes and State Scenic Highways. Additionally, Policy SL-2.2 identifies a list of measures (i.e., maintaining the rural character of roadway rights-of-ways, highway signage, and related roadway and structure design; protecting primary viewsheds from development; and prohibiting development of highway commercial projects that do not respond to their physical or cultural context) designed to protect the “gateway highways” (SR 190 and SR 198) to the Sequoias. Gateway highways provide routes to natural open space areas of the County. Policies designed to maintain this rural-agricultural character include SL-1.1, SL-1.2, SL-1.3 and SL-2.2.
Policies have also been developed or continued for each of the County’s Planning Areas (i.e., corridors, valley, foothills, etc.) to address their own unique scenic landscape issues. For example, Policy C-1.3 supports the development of Scenic Corridor Protection Plans to protect the scenic qualities of local roadways. The proposed project contains a number of policies in the Foothill Growth Management Plan Element (see Policies FGMP-1.7, FGMP-6.1 through FGMP-6.4, and FGMP Implementation Measure #13) that minimize impacts to scenic resources within the foothills. Policy FGMP-8.18 ensures that hilltop development is designed to preserve the existing skyline and scenic panorama of the foothills. Policy FGMP-8.19 also encourages preservation of unique scenic resources in the foothills. Additionally, Scenic Landscapes Implementation Measure #3 requires the County to prepare design guidelines for County Scenic Routes in the Rural Valley Land Plan areas (similar to those guidelines already maintained for the foothills). Scenic Landscapes Implementation Measure #4 requires the County to work with the Three Rivers and Springville communities to prepare the “Sequoia Gateway Guidelines” for future community plan updates specific to those areas.
While, it is assumed that some new development (i.e., new residential, commercial, or infrastructure-related, etc.) resulting from population growth associated with the proposed project would result in changes to existing views within all portions of the County’s planning areas (i.e., communities, hamlets, or rural areas), a majority of these changes would be focused in the unincorporated communities of the Rural Valley Lands Plan geographical area where most existing unincorporated communities are located and where growth has traditionally occurred in the County (see Figure 3.1-2). As a portion of this new development could be proposed on land currently used for a variety of rural residential, agricultural, and open space uses, new development would alter the existing open space views of surrounding visible areas and contrast with the surrounding open space/agricultural environment at the edge of these new development areas. Consequently, even with implementation of the below mentioned policies and implementation measure, this impact is still considered potentially significant.
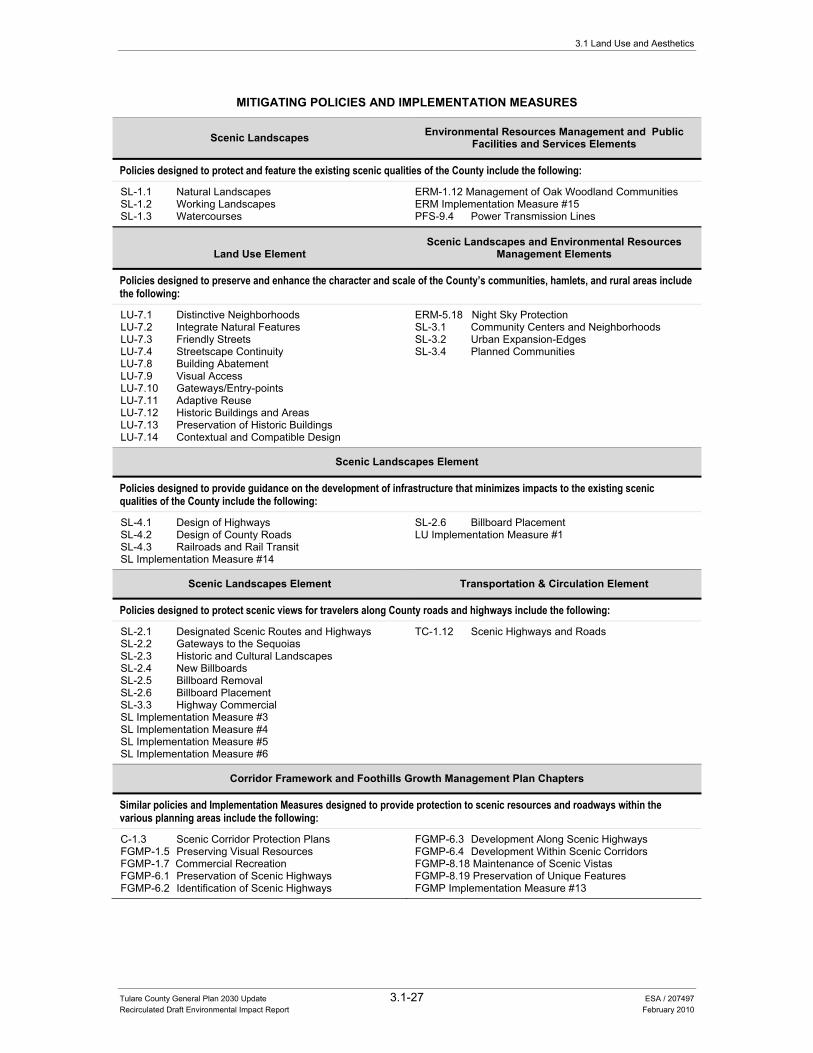
3.1 Land Use and Aesthetics
Tulare County General Plan 2030 Update 3.1-27 ESA / 207497 Recirculated Draft Environmental Impact Report February 2010
MITIGATING POLICIES AND IMPLEMENTATION MEASURES
Scenic Landscapes Environmental Resources Management and Public Facilities and Services Elements
Policies designed to protect and feature the existing scenic qualities of the County include the following:
SL-1.1 Natural Landscapes SL-1.2 Working Landscapes SL-1.3 Watercourses
ERM-1.12 Management of Oak Woodland Communities ERM Implementation Measure #15 PFS-9.4 Power Transmission Lines
Land Use Element Scenic Landscapes and Environmental Resources
Management Elements
Policies designed to preserve and enhance the character and scale of the County’s communities, hamlets, and rural areas include the following:
LU-7.1 Distinctive Neighborhoods LU-7.2 Integrate Natural Features LU-7.3 Friendly Streets LU-7.4 Streetscape Continuity LU-7.8 Building Abatement LU-7.9 Visual Access LU-7.10 Gateways/Entry-points LU-7.11 Adaptive Reuse LU-7.12 Historic Buildings and Areas LU-7.13 Preservation of Historic Buildings LU-7.14 Contextual and Compatible Design
ERM-5.18 Night Sky Protection SL-3.1 Community Centers and Neighborhoods SL-3.2 Urban Expansion-Edges SL-3.4 Planned Communities
Scenic Landscapes Element
Policies designed to provide guidance on the development of infrastructure that minimizes impacts to the existing scenic qualities of the County include the following:
SL-4.1 Design of Highways SL-4.2 Design of County Roads SL-4.3 Railroads and Rail Transit SL Implementation Measure #14
SL-2.6 Billboard Placement LU Implementation Measure #1
Scenic Landscapes Element Transportation & Circulation Element
Policies designed to protect scenic views for travelers along County roads and highways include the following:
SL-2.1 Designated Scenic Routes and Highways SL-2.2 Gateways to the Sequoias SL-2.3 Historic and Cultural Landscapes SL-2.4 New Billboards SL-2.5 Billboard Removal SL-2.6 Billboard Placement SL-3.3 Highway Commercial SL Implementation Measure #3 SL Implementation Measure #4 SL Implementation Measure #5 SL Implementation Measure #6
TC-1.12 Scenic Highways and Roads
Corridor Framework and Foothills Growth Management Plan Chapters
Similar policies and Implementation Measures designed to provide protection to scenic resources and roadways within the various planning areas include the following:
C-1.3 Scenic Corridor Protection Plans FGMP-1.5 Preserving Visual Resources FGMP-1.7 Commercial Recreation FGMP-6.1 Preservation of Scenic Highways FGMP-6.2 Identification of Scenic Highways
FGMP-6.3 Development Along Scenic Highways FGMP-6.4 Development Within Scenic Corridors FGMP-8.18 Maintenance of Scenic Vistas FGMP-8.19 Preservation of Unique Features FGMP Implementation Measure #13
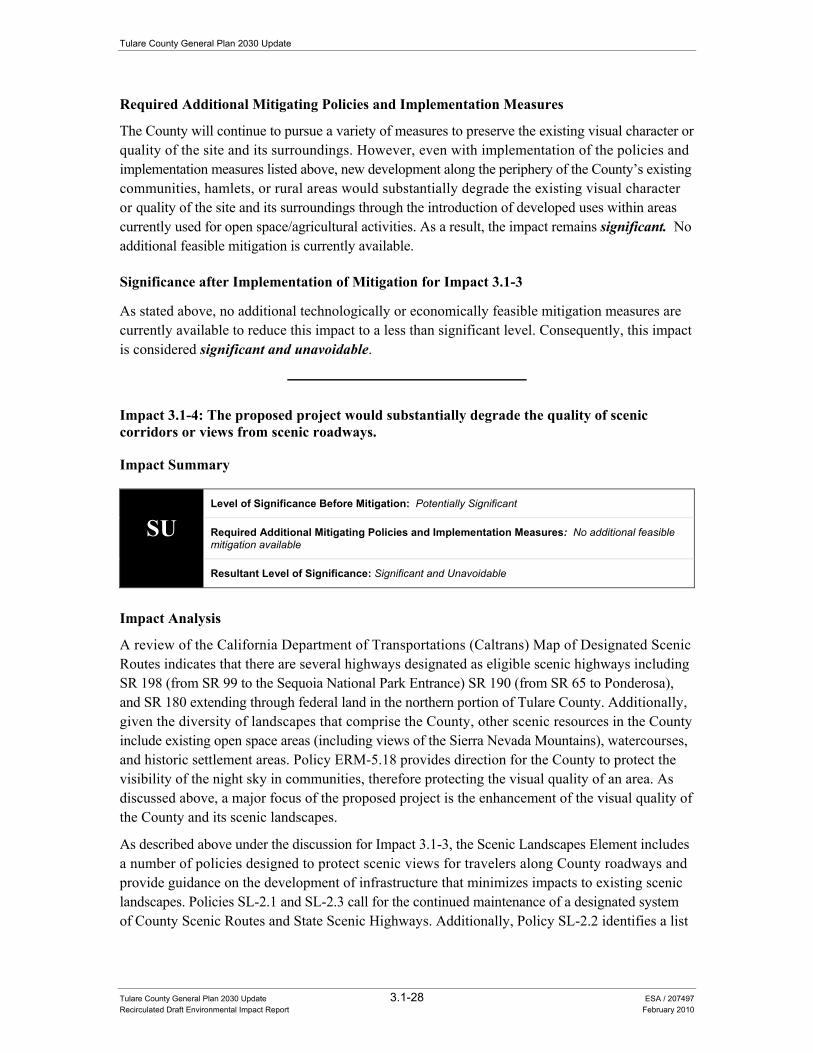
Tulare County General Plan 2030 Update
Tulare County General Plan 2030 Update 3.1-28 ESA / 207497 Recirculated Draft Environmental Impact Report February 2010
Required Additional Mitigating Policies and Implementation Measures
The County will continue to pursue a variety of measures to preserve the existing visual character or quality of the site and its surroundings. However, even with implementation of the policies and implementation measures listed above, new development along the periphery of the County’s existing communities, hamlets, or rural areas would substantially degrade the existing visual character or quality of the site and its surroundings through the introduction of developed uses within areas currently used for open space/agricultural activities. As a result, the impact remains significant. No additional feasible mitigation is currently available.
Significance after Implementation of Mitigation for Impact 3.1-3
As stated above, no additional technologically or economically feasible mitigation measures are currently available to reduce this impact to a less than significant level. Consequently, this impact is considered significant and unavoidable.
Impact 3.1-4: The proposed project would substantially degrade the quality of scenic corridors or views from scenic roadways.
Impact Summary
SU Level of Significance Before Mitigation: Potentially Significant
Required Additional Mitigating Policies and Implementation Measures: No additional feasible mitigation available
Resultant Level of Significance: Significant and Unavoidable
Impact Analysis
A review of the California Department of Transportations (Caltrans) Map of Designated Scenic Routes indicates that there are several highways designated as eligible scenic highways including SR 198 (from SR 99 to the Sequoia National Park Entrance) SR 190 (from SR 65 to Ponderosa), and SR 180 extending through federal land in the northern portion of Tulare County. Additionally, given the diversity of landscapes that comprise the County, other scenic resources in the County include existing open space areas (including views of the Sierra Nevada Mountains), watercourses, and historic settlement areas. Policy ERM-5.18 provides direction for the County to protect the visibility of the night sky in communities, therefore protecting the visual quality of an area. As discussed above, a major focus of the proposed project is the enhancement of the visual quality of the County and its scenic landscapes.
As described above under the discussion for Impact 3.1-3, the Scenic Landscapes Element includes a number of policies designed to protect scenic views for travelers along County roadways and provide guidance on the development of infrastructure that minimizes impacts to existing scenic landscapes. Policies SL-2.1 and SL-2.3 call for the continued maintenance of a designated system of County Scenic Routes and State Scenic Highways. Additionally, Policy SL-2.2 identifies a list
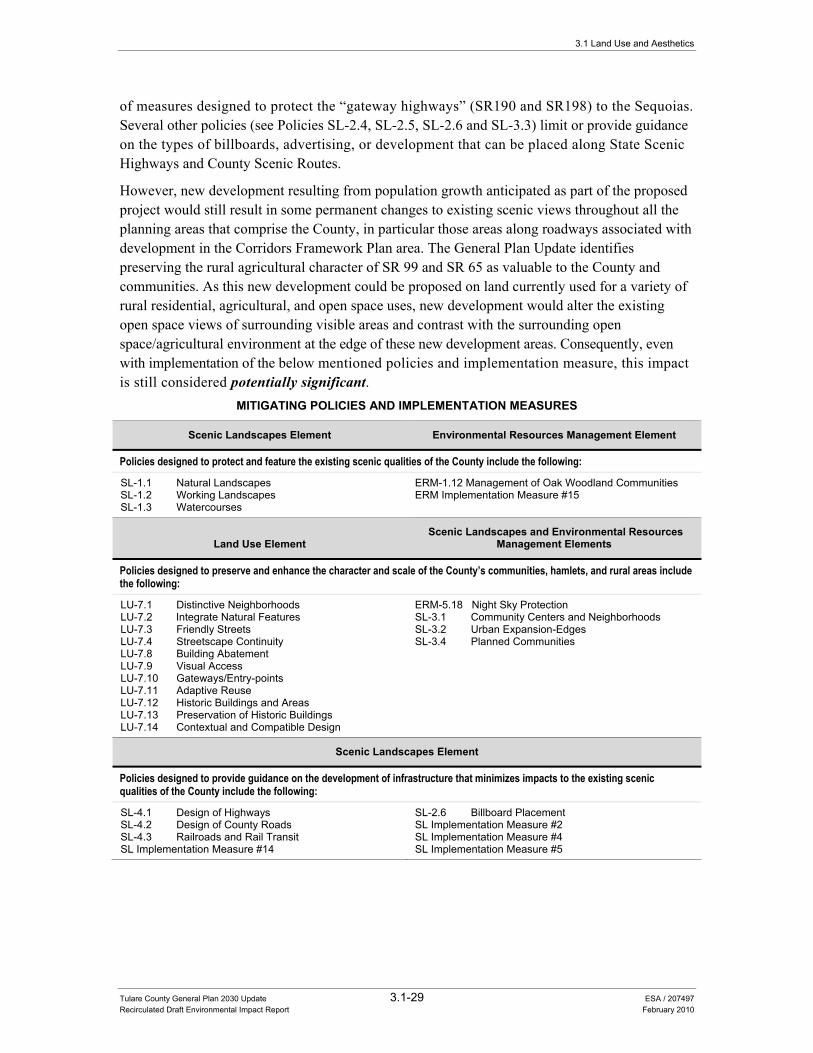
3.1 Land Use and Aesthetics
Tulare County General Plan 2030 Update 3.1-29 ESA / 207497 Recirculated Draft Environmental Impact Report February 2010
of measures designed to protect the “gateway highways” (SR190 and SR198) to the Sequoias. Several other policies (see Policies SL-2.4, SL-2.5, SL-2.6 and SL-3.3) limit or provide guidance on the types of billboards, advertising, or development that can be placed along State Scenic Highways and County Scenic Routes.
However, new development resulting from population growth anticipated as part of the proposed project would still result in some permanent changes to existing scenic views throughout all the planning areas that comprise the County, in particular those areas along roadways associated with development in the Corridors Framework Plan area. The General Plan Update identifies preserving the rural agricultural character of SR 99 and SR 65 as valuable to the County and communities. As this new development could be proposed on land currently used for a variety of rural residential, agricultural, and open space uses, new development would alter the existing open space views of surrounding visible areas and contrast with the surrounding open space/agricultural environment at the edge of these new development areas. Consequently, even with implementation of the below mentioned policies and implementation measure, this impact is still considered potentially significant.
MITIGATING POLICIES AND IMPLEMENTATION MEASURES
Scenic Landscapes Element Environmental Resources Management Element
Policies designed to protect and feature the existing scenic qualities of the County include the following:
SL-1.1 Natural Landscapes SL-1.2 Working Landscapes SL-1.3 Watercourses
ERM-1.12 Management of Oak Woodland Communities ERM Implementation Measure #15
Land Use Element Scenic Landscapes and Environmental Resources
Management Elements
Policies designed to preserve and enhance the character and scale of the County’s communities, hamlets, and rural areas include the following:
LU-7.1 Distinctive Neighborhoods LU-7.2 Integrate Natural Features LU-7.3 Friendly Streets LU-7.4 Streetscape Continuity LU-7.8 Building Abatement LU-7.9 Visual Access LU-7.10 Gateways/Entry-points LU-7.11 Adaptive Reuse LU-7.12 Historic Buildings and Areas LU-7.13 Preservation of Historic Buildings LU-7.14 Contextual and Compatible Design
ERM-5.18 Night Sky Protection SL-3.1 Community Centers and Neighborhoods SL-3.2 Urban Expansion-Edges SL-3.4 Planned Communities
Scenic Landscapes Element
Policies designed to provide guidance on the development of infrastructure that minimizes impacts to the existing scenic qualities of the County include the following:
SL-4.1 Design of Highways SL-4.2 Design of County Roads SL-4.3 Railroads and Rail Transit SL Implementation Measure #14
SL-2.6 Billboard Placement SL Implementation Measure #2 SL Implementation Measure #4 SL Implementation Measure #5
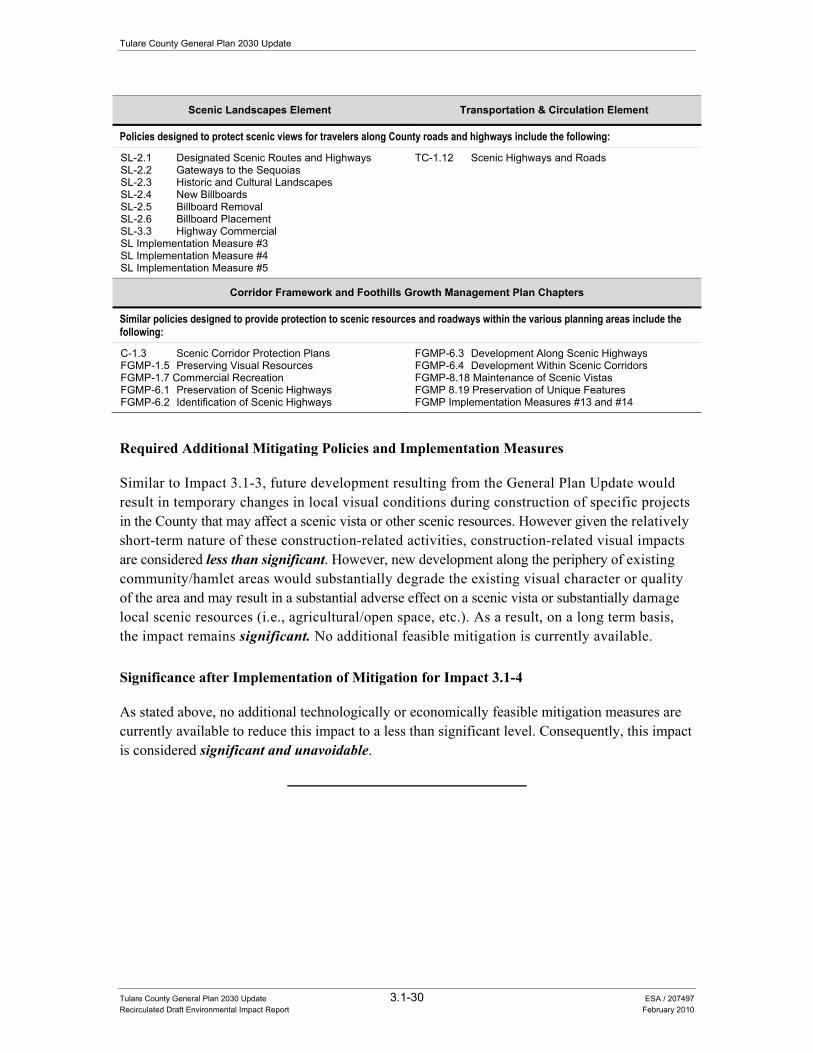
Tulare County General Plan 2030 Update
Tulare County General Plan 2030 Update 3.1-30 ESA / 207497 Recirculated Draft Environmental Impact Report February 2010
Scenic Landscapes Element Transportation & Circulation Element
Policies designed to protect scenic views for travelers along County roads and highways include the following:
SL-2.1 Designated Scenic Routes and Highways SL-2.2 Gateways to the Sequoias SL-2.3 Historic and Cultural Landscapes SL-2.4 New Billboards SL-2.5 Billboard Removal SL-2.6 Billboard Placement SL-3.3 Highway Commercial SL Implementation Measure #3 SL Implementation Measure #4 SL Implementation Measure #5
TC-1.12 Scenic Highways and Roads
Corridor Framework and Foothills Growth Management Plan Chapters
Similar policies designed to provide protection to scenic resources and roadways within the various planning areas include the following:
C-1.3 Scenic Corridor Protection Plans FGMP-1.5 Preserving Visual Resources FGMP-1.7 Commercial Recreation FGMP-6.1 Preservation of Scenic Highways FGMP-6.2 Identification of Scenic Highways
FGMP-6.3 Development Along Scenic Highways FGMP-6.4 Development Within Scenic Corridors FGMP-8.18 Maintenance of Scenic Vistas FGMP 8.19 Preservation of Unique Features FGMP Implementation Measures #13 and #14
Required Additional Mitigating Policies and Implementation Measures
Similar to Impact 3.1-3, future development resulting from the General Plan Update would result in temporary changes in local visual conditions during construction of specific projects in the County that may affect a scenic vista or other scenic resources. However given the relatively short-term nature of these construction-related activities, construction-related visual impacts are considered less than significant. However, new development along the periphery of existing community/hamlet areas would substantially degrade the existing visual character or quality of the area and may result in a substantial adverse effect on a scenic vista or substantially damage local scenic resources (i.e., agricultural/open space, etc.). As a result, on a long term basis, the impact remains significant. No additional feasible mitigation is currently available.
Significance after Implementation of Mitigation for Impact 3.1-4
As stated above, no additional technologically or economically feasible mitigation measures are currently available to reduce this impact to a less than significant level. Consequently, this impact is considered significant and unavoidable.

3.1 Land Use and Aesthetics
Tulare County General Plan 2030 Update 3.1-31 ESA / 207497 Recirculated Draft Environmental Impact Report February 2010
Impact 3.1-5: The proposed project would create a new source of substantial light or glare which would adversely affect day or nighttime views in the County.
Impact Summary
SU Level of Significance Before Mitigation: Potentially Significant
Required Additional Mitigating Policies and Implementation Measures: New Policies LU-7.18 “Lighting” and LU-7.19 “Minimize Lighting Impacts”
Resultant Level of Significance: Significant and Unavoidable
Impact Analysis
As planned growth and development occur through implementation of the proposed project, additional lighting will be required to provide nighttime street and building illumination, security lighting, traffic lights, and light associated with new recreation areas.
Existing sources of light and glare within the County are primarily focused in the cities, hamlets, and other urban development boundary areas (see Figure 3.1-2). It is anticipated that most new sources of light and glare (resulting from build-out of the proposed project) will occur within and around these urbanized areas. A majority of the County is used for agricultural purposes (with some scattered rural residential uses) and therefore currently contains limited sources of light and glare.
The proposed project addresses the topic of glare and new light in a variety of ways. The Land Use Element provides various policies calling for the screening of some land uses and the maintenance of visual accessibility to ensure new development maintains existing views of natural areas. Policy ERM-5.18 provides direction for the County to protect the visibility of the night sky in communities, therefore protecting the visual quality of an area. The Scenic Landscapes Element also includes several policies (see Policies SL-2.4, SL-2.5, SL-2.6, and SL-3.3) that would limit the use of billboards, advertising, or development that would introduce forms of nuisance lighting along State Scenic Highways, County Scenic Routes, or other areas that currently have limited amounts of existing development.
However, new development resulting from population growth anticipated as part of the General Plan Update would increase the amount of light and glare within urban development boundary areas associated with the development of urban uses, such as additional parking lots, building lights, and streetlights within areas that currently have no light or minimal amounts of light and glare. While the types of lighting and their specific locations are not specified at this point, development proposed under the proposed project would increase the amount of spill light and glare to parcels adjacent to new development within the urban development boundary areas. However, even with implementation of the below mentioned policies and implementation measures, this impact is still considered potentially significant.
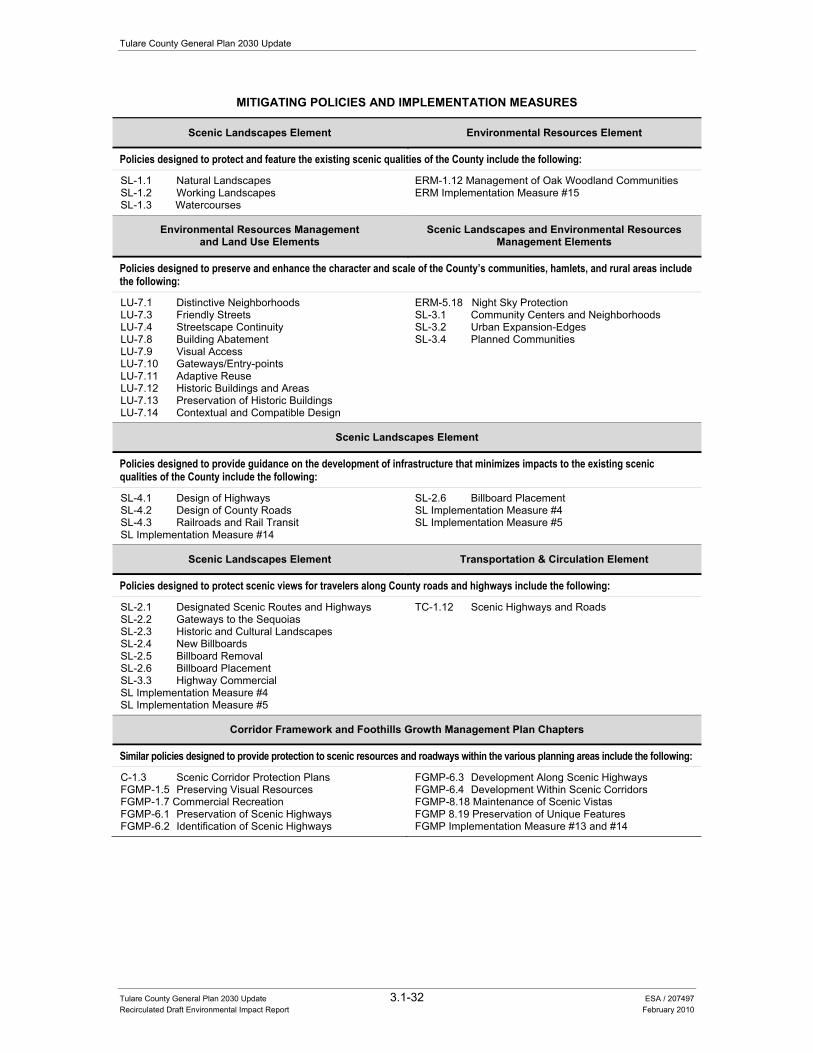
Tulare County General Plan 2030 Update
Tulare County General Plan 2030 Update 3.1-32 ESA / 207497 Recirculated Draft Environmental Impact Report February 2010
MITIGATING POLICIES AND IMPLEMENTATION MEASURES
Scenic Landscapes Element Environmental Resources Element
Policies designed to protect and feature the existing scenic qualities of the County include the following:
SL-1.1 Natural Landscapes SL-1.2 Working Landscapes SL-1.3 Watercourses
ERM-1.12 Management of Oak Woodland Communities ERM Implementation Measure #15
Environmental Resources Management and Land Use Elements
Scenic Landscapes and Environmental Resources Management Elements
Policies designed to preserve and enhance the character and scale of the County’s communities, hamlets, and rural areas include the following:
LU-7.1 Distinctive Neighborhoods LU-7.3 Friendly Streets LU-7.4 Streetscape Continuity LU-7.8 Building Abatement LU-7.9 Visual Access LU-7.10 Gateways/Entry-points LU-7.11 Adaptive Reuse LU-7.12 Historic Buildings and Areas LU-7.13 Preservation of Historic Buildings LU-7.14 Contextual and Compatible Design
ERM-5.18 Night Sky Protection SL-3.1 Community Centers and Neighborhoods SL-3.2 Urban Expansion-Edges SL-3.4 Planned Communities
Scenic Landscapes Element
Policies designed to provide guidance on the development of infrastructure that minimizes impacts to the existing scenic qualities of the County include the following:
SL-4.1 Design of Highways SL-4.2 Design of County Roads SL-4.3 Railroads and Rail Transit SL Implementation Measure #14
SL-2.6 Billboard Placement SL Implementation Measure #4 SL Implementation Measure #5
Scenic Landscapes Element Transportation & Circulation Element
Policies designed to protect scenic views for travelers along County roads and highways include the following:
SL-2.1 Designated Scenic Routes and Highways SL-2.2 Gateways to the Sequoias SL-2.3 Historic and Cultural Landscapes SL-2.4 New Billboards SL-2.5 Billboard Removal SL-2.6 Billboard Placement SL-3.3 Highway Commercial SL Implementation Measure #4 SL Implementation Measure #5
TC-1.12 Scenic Highways and Roads
Corridor Framework and Foothills Growth Management Plan Chapters
Similar policies designed to provide protection to scenic resources and roadways within the various planning areas include the following:
C-1.3 Scenic Corridor Protection Plans FGMP-1.5 Preserving Visual Resources FGMP-1.7 Commercial Recreation FGMP-6.1 Preservation of Scenic Highways FGMP-6.2 Identification of Scenic Highways
FGMP-6.3 Development Along Scenic Highways FGMP-6.4 Development Within Scenic Corridors FGMP-8.18 Maintenance of Scenic Vistas FGMP 8.19 Preservation of Unique Features FGMP Implementation Measure #13 and #14
3.1 Land Use and Aesthetics
Tulare County General Plan 2030 Update 3.1-33 ESA / 207497 Recirculated Draft Environmental Impact Report February 2010
Required Additional Mitigating Policies and Implementation Measures
In addition to the above mentioned policies, the following new Policies LU-7.18 “Lighting” and LU-7.19 “Minimize Lighting Impacts” are required to address this impact:
• LU-7.18 Lighting. The County shall continue to improve and maintain lighting in park and recreation facilities to prevent nuisance light and glare spillage on adjoining residential areas. [New Policy – Draft EIR Analysis].
• LU-7.19 Minimize Lighting Impacts. The County shall ensure that lighting in residential areas and along County roadways shall be designed to prevent artificial lighting from reflecting into adjacent natural or open space areas unless required for public safety. [New Policy – Draft EIR Analysis].
As stated above, the County will continue to enforce a variety of measures designed to minimize impacts resulting from a new source of substantial light or glare which would adversely affect day or nighttime views in the area. However, even with implementation of the policies and implementation measures listed above (including the new Policies “LU-7.18 “Lighting” and LU-7.19 “Minimize Lighting Impacts”), new development would result in substantial new sources of light and glare within areas currently used for a variety of open space/agricultural activities. As a result, the impact remains significant. No additional feasible mitigation is currently available.
Significance after Implementation of Mitigation for Impact 3.1-5
As stated above, no additional technologically or economically feasible mitigation measures are currently available to reduce this impact to a less than significant level. Consequently, this impact is considered significant and unavoidable.

Tulare County General Plan 2030 Update 3.2-1 ESA / 207497 Recirculated Draft Environmental Impact Report February 2010
SECTION 3.2 Traffic and Circulation
Introduction This section of the recirculated draft Environmental Impact Report (RDEIR) describes transportation and circulation conditions in Tulare County and provides a program-level evaluation of the proposed project’s impacts on the transportation systems (highways, local roads, bikeways, bus and rail transit systems, and aviation) in the Planning Area. Given the programmatic nature of the RDEIR, the environmental setting describes the existing traffic and transportation network within the County, including federal highways, state routes, and local roadways that could be affected by the proposed project. The regulatory setting section includes a description of applicable State and local regulatory policies and criteria for evaluating potential impacts associated with the proposed project. A description of the potential impacts of the proposed project is also provided and includes the identification of feasible mitigation (general plan policies) to avoid or lessen the impacts.
The following environmental and regulatory settings were developed from information contained in the 2010 Background Report (see Chapter 5.0 “Transportation and Circulation”), incorporated by reference and summarized below. This document is also attached as Appendix B to this RDEIR.
Regulatory Setting There are no State or federal traffic and circulation regulations relevant to the proposed project.
Local Regulations
Regional Transportation Plan The Regional Transportation Plan (RTP) is a multi-modal, long-range planning document prepared by the Tulare County Association of Governments (TCAG). The RTP includes programs and policies for congestion management, transit, bicycles and pedestrians, roadways, freight, and constrained financing. The RTP is updated every two years to address a 20-year projection of needs. Each agency responsible for building and managing transportation facilities, including the County of Tulare, has implementation responsibilities under the RTP. The RTP relies on local plans and policies governing circulation and transportation to identify the region’s future multi-modal transportation system.
Tulare County General Plan 2030 Update
Tulare County General Plan 2030 Update 3.2-2 ESA / 207497 Recirculated Draft Environmental Impact Report February 2010
Transportation Control Measures Transportation Control Measures (TCM) are designed to reduce vehicle miles traveled, vehicle idling, and/or traffic congestion in order to reduce vehicle emissions. Currently, Tulare County is a nonattainment region under the Federal Clean Air Act (CAA) and the California Clean Air Act (CCAA). Both of these acts require implementation of TCMs. These TCMs for Tulare County are as follows:
• Rideshare Programs; • Park and Ride Lots; • Alternate Work Schedules; • Bicycle Facilities; • Public Transit; • Traffic Flow Improvement; and • Passenger Rail and Support Facilities.
Local Transportation Funding Local contribution to State Highways and regional roadway system in Tulare County is optional by the cities. In Tulare County, Measure R was passed that will generate at least $650 million (30 years) to fund local transportation improvements within the cities and County. These projects may advance projects in the RTP and provide more funds for interchanges and road maintenance. The Measure R expenditure plan can be found on TCAG’s website (www.tularecog.org).
Another means of collecting revenue for local streets and roads is through impact and developer fees. Each of the cities and Tulare County has the responsibility and authority to enact and collect these fees in order to make transportation improvements. Tulare County is in the process of creating a Traffic Impact Fee for improvements on County roadway facilities. A Traffic Impact Fee Study (October 2009) has been prepared. This Traffic Impact Fee is expected to be considered and if adopted, implemented following adoption of the General Plan and related EIR.
According to the RTP, several cities will be spending local funds to implement road improvements within their city limits on the regional road system. Traffic Impact Fee programs that have been or may be adopted by the County and the major cities in the County will supplement other funding opportunities to reduce current congestion levels and maintenance conditions on local streets and roads.
Environmental Setting This section contains an overview of the transportation facilities in Tulare County, including the major streets and highways, transit systems, bicycle and pedestrian facilities, and airports. As previously described, this environmental setting was developed from information contained in the 2010 Background Report (see Chapter 5.0 “Transportation and Circulation” of Appendix B of this RDEIR), incorporated by reference and summarized below.
3.2 Traffic and Circulation
Tulare County General Plan 2030 Update 3.2-3 ESA / 207497 Recirculated Draft Environmental Impact Report February 2010
Streets and Highways Figure 3.2-1 identifies Tulare County’s relationship to the California State Highway system, nearby counties, cities and communities. Figure 3.2-2 identifies the designated street and highway network contained in the existing Circulation Element adopted by the County in 1963 and provides a definition of roads of significance throughout the County. The County’s State Route network, which lies primarily west of the Sierra Nevada Mountains, includes State Routes (SR) 43, 63, 65, 99, 137, 180, 190, 198, 201, 216, and 245.
Some prominent County roadways include, but are not limited to, Alta Avenue (Road 80), Caldwell Avenue/Visalia Road (Avenue 280), Demaree Road/Hillman Street (Road 108), Tulare Avenue (Avenue 232), Olive Avenue (Avenue 152), Spruce Road (Road 204), El Monte Way (Avenue 416), Paige Avenue (Avenue 216), Farmersville Boulevard (Road 164), Road 192, and Road 152. Additionally, the highway system includes numerous County-maintained local roads, as well as local streets and highways within each of the eight cities and several unincorporated communities.
The County is linked to Fresno County and Kern County principally by State Route 99. This route provides the only continuous north/south route through the County and is heavily used for regional travel. The entire length of State Route 99 in Tulare County and State Route 198 through Visalia and a portion of State Route 65 in Porterville are constructed to freeway standards.
Major Roadways
State Route 99 Currently, State Route 99 is a 4/5 lane divided freeway with a landscaped median. The northbound segment between Betty Drive in Goshen to Avenue 384 south of Kingsburg (Fresno County) contains three travel lanes; the remainder of State Route 99 in Tulare County contains two northbound and two southbound travel lanes. With 55,000 daily trips near Avenue 264 (Tagus), State Route 99 is the second most traveled roadway in the County. In addition, it is estimated that 28% of these trips are trucks.
The City of Tulare, western Visalia, and the communities of Earlimart, Teviston, Pixley, Tipton, Goshen, and Traver are located on State Route 99 and are directly impacted by this freeway. Specifically, positive economic impacts are realized along this corridor for highway commercial type uses, such as fast food restaurants, service stations, and motels.
According to the Route 99 Corridor Enhancement Master Plan (Caltrans, pages 35-36, 2004), traffic volumes beyond 2030 show a need for an eight-lane freeway. In some locations there may also be a need for high occupancy vehicle (HOV) lanes and auxiliary lanes in urban areas.
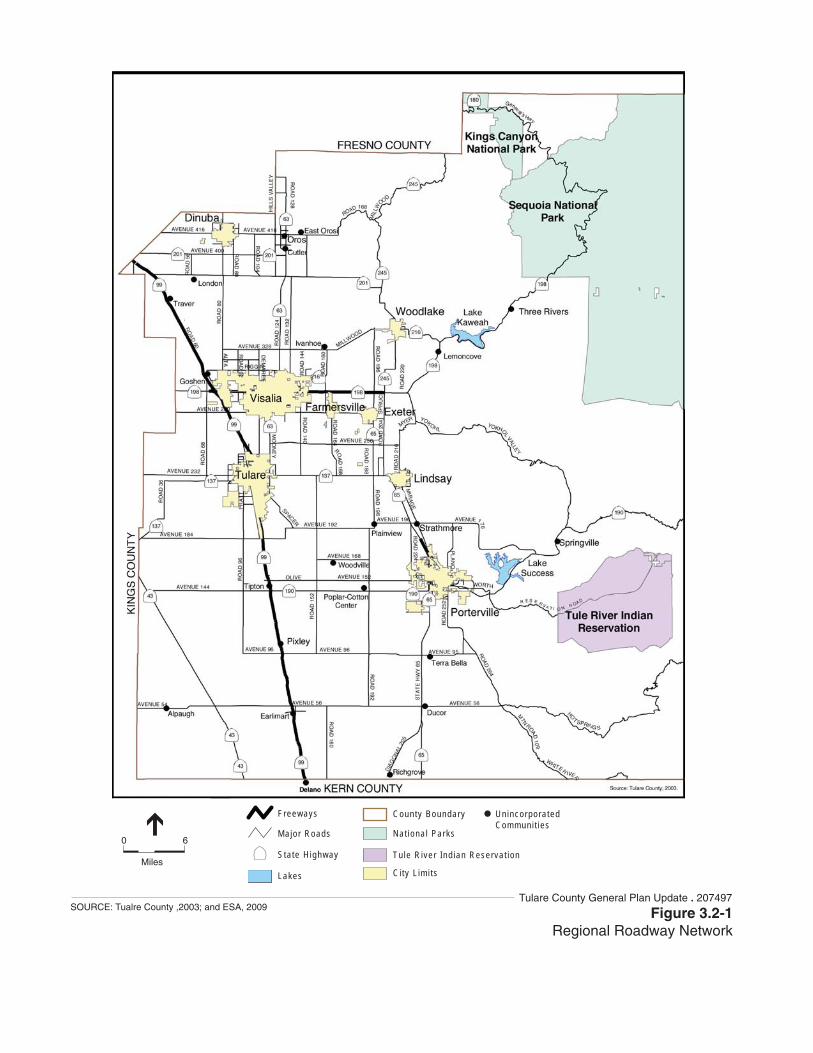
Tulare County General Plan Update . 207497SOURCE: Tualre County ,2003; and ESA, 2009
Major Roads
Freeways
Sta te H ighway
Lakes
Tu le R iver Ind ian Reserva t ion
Nat iona l Parks
County Boundary Un incorpora tedCommuni t ies
Ci ty L imi ts
60
Miles
Figure 3.2-1Regional Roadway Network
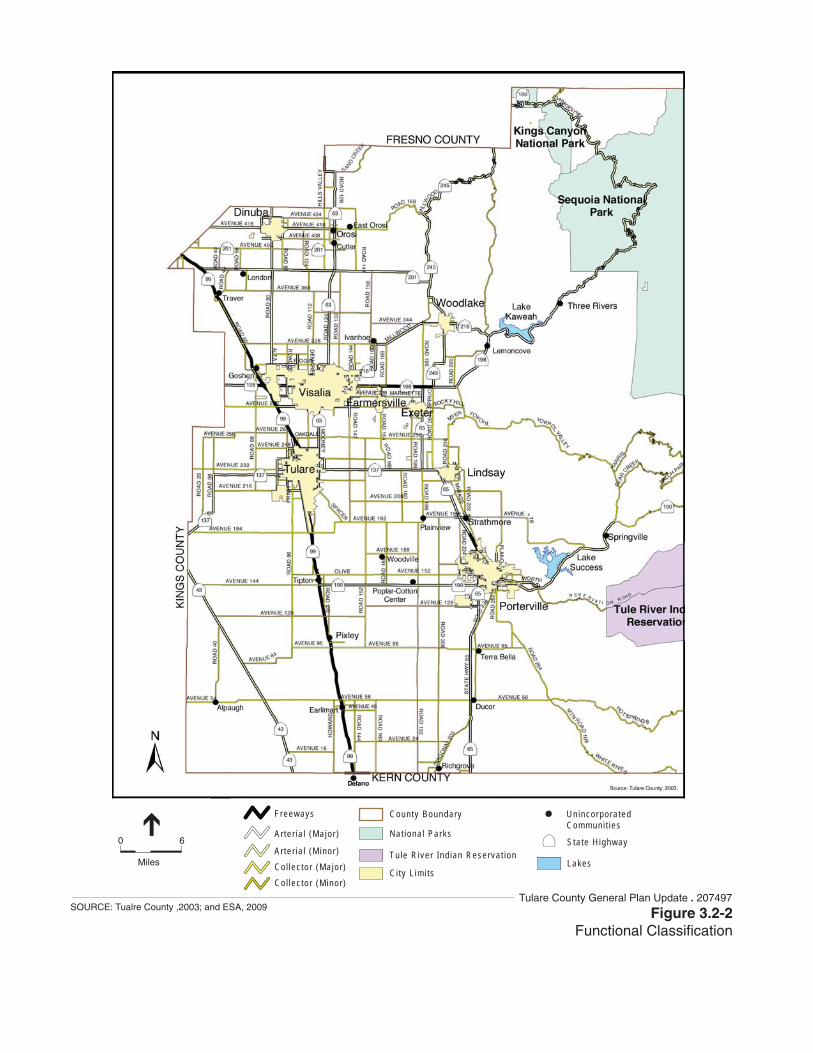
Tulare County General Plan Update . 207497SOURCE: Tualre County ,2003; and ESA, 2009
Ar ter ia l (Ma jor )
Ar te r ia l (M inor )Co l lec to r (Ma jor )Co l lec to r (Minor )
Freeways
Sta te H ighway
LakesTu le R iver Ind ian Reserva t ion
Nat iona l Parks
County Boundary Un incorpora tedCommuni t ies
Ci ty L imi ts
60
Miles
Figure 3.2-2Functional Classification
Tulare County General Plan 2030 Update
Tulare County General Plan 2030 Update 3.2-6 ESA / 207497 Recirculated Draft Environmental Impact Report February 2010
State Routes 65 and 198 The two other freeway segments in Tulare County are State Route 65 in Porterville and State Route 198 in Visalia. State Route 65 in Porterville is constructed to freeway standards from just south of State Route 190 to just north of Henderson Avenue. State Route 65 also provides a connection to Bakersfield for south County residents in Strathmore, Terra Bella, Ducor, Porterville, and Lindsay areas. State Route 65 carries 26,000 daily vehicles near State Route 190.
The segment of State Route 198 that is constructed to freeway standards is between State Route 99 and Road 180. The last major construction project on a State Route in Tulare County was on State Route 198 through the City of Visalia where four at grade intersections were eliminated. The $100 million plus project was completed in 2001. Continuing west into Kings County, State Route 198 links the City of Visalia and community of Goshen in Tulare County to the cities of Hanford and Lemoore in Kings County, and beyond to Interstate 5. To the east of the City of Visalia, State Route 198 provides direct access to the unincorporated communities of Lind Cove, Lemon Cove and Three Rivers as well as to Sequoia National Park where State Route 198 terminates and continues on as the General’s Highway. With 64,000 daily trips in central Visalia, State Route 198 is the most heavily traveled roadway in Tulare County.
State Routes 137 and 190 Both of these expressways are at grade and offer major throughways for southern Tulare County in an east west direction. State Route 137 starts at Waukena, west of Tulare, where it eventually turns into Tulare Avenue and heads east where it merges with State Route 65 near Lindsay. Average daily trips on State Route 137 reach 22,100 in central Tulare. State Route 190 begins at State Route 99 heading east as a typical two lane County road until the road crosses State Route 65 into Porterville, where it changes into an at grade expressway through town, eventually turning into a two lane mountainous roadway where it ends in Ponderosa. State Route 190 carries 25,100 daily trips near State Route 65. In the future these state routes are planned as four lane roadways.
Avenue 416 Avenue 416 is a four-lane expressway connecting the City of Dinuba and Cutler/Orosi. The County of Tulare primarily maintains this east/west roadway.
Roadway Level of Service For a road system of a given capacity, the volume-to-capacity ratio is the primary indicator of the transportation system's performance. Volume-to-capacity is a measure of demand and supply, and is equal to the number of vehicles assigned to a segment divided by the vehicular capacity of that segment. For example, if the assigned volume is 1,500 vehicles and the segment capacity is 2,000 vehicles, the volume-to-capacity ratio is 0.75. This ratio is converted to a letter grade called Level of Service (LOS).
The LOS is identified with a letter from A through F, and is described in terms of speed and travel time, freedom to maneuver, interruptions, comfort, convenience, and safety. The letter A represents
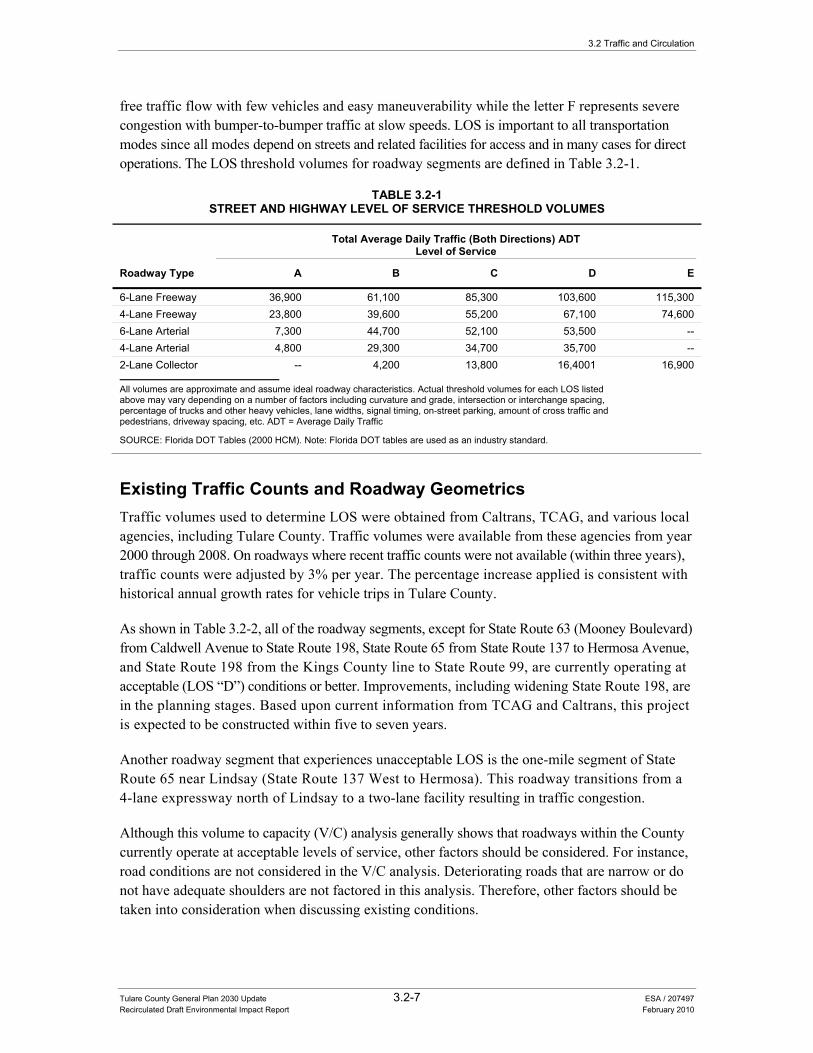
3.2 Traffic and Circulation
Tulare County General Plan 2030 Update 3.2-7 ESA / 207497 Recirculated Draft Environmental Impact Report February 2010
free traffic flow with few vehicles and easy maneuverability while the letter F represents severe congestion with bumper-to-bumper traffic at slow speeds. LOS is important to all transportation modes since all modes depend on streets and related facilities for access and in many cases for direct operations. The LOS threshold volumes for roadway segments are defined in Table 3.2-1.
TABLE 3.2-1STREET AND HIGHWAY LEVEL OF SERVICE THRESHOLD VOLUMES
Roadway Type
Total Average Daily Traffic (Both Directions) ADT Level of Service
A B C D E
6-Lane Freeway 36,900 61,100 85,300 103,600 115,300 4-Lane Freeway 23,800 39,600 55,200 67,100 74,600 6-Lane Arterial 7,300 44,700 52,100 53,500 -- 4-Lane Arterial 4,800 29,300 34,700 35,700 -- 2-Lane Collector -- 4,200 13,800 16,4001 16,900
All volumes are approximate and assume ideal roadway characteristics. Actual threshold volumes for each LOS listed above may vary depending on a number of factors including curvature and grade, intersection or interchange spacing, percentage of trucks and other heavy vehicles, lane widths, signal timing, on‐street parking, amount of cross traffic and pedestrians, driveway spacing, etc. ADT = Average Daily Traffic
SOURCE: Florida DOT Tables (2000 HCM). Note: Florida DOT tables are used as an industry standard.
Existing Traffic Counts and Roadway Geometrics Traffic volumes used to determine LOS were obtained from Caltrans, TCAG, and various local agencies, including Tulare County. Traffic volumes were available from these agencies from year 2000 through 2008. On roadways where recent traffic counts were not available (within three years), traffic counts were adjusted by 3% per year. The percentage increase applied is consistent with historical annual growth rates for vehicle trips in Tulare County.
As shown in Table 3.2-2, all of the roadway segments, except for State Route 63 (Mooney Boulevard) from Caldwell Avenue to State Route 198, State Route 65 from State Route 137 to Hermosa Avenue, and State Route 198 from the Kings County line to State Route 99, are currently operating at acceptable (LOS “D”) conditions or better. Improvements, including widening State Route 198, are in the planning stages. Based upon current information from TCAG and Caltrans, this project is expected to be constructed within five to seven years.
Another roadway segment that experiences unacceptable LOS is the one-mile segment of State Route 65 near Lindsay (State Route 137 West to Hermosa). This roadway transitions from a 4-lane expressway north of Lindsay to a two-lane facility resulting in traffic congestion.
Although this volume to capacity (V/C) analysis generally shows that roadways within the County currently operate at acceptable levels of service, other factors should be considered. For instance, road conditions are not considered in the V/C analysis. Deteriorating roads that are narrow or do not have adequate shoulders are not factored in this analysis. Therefore, other factors should be taken into consideration when discussing existing conditions.
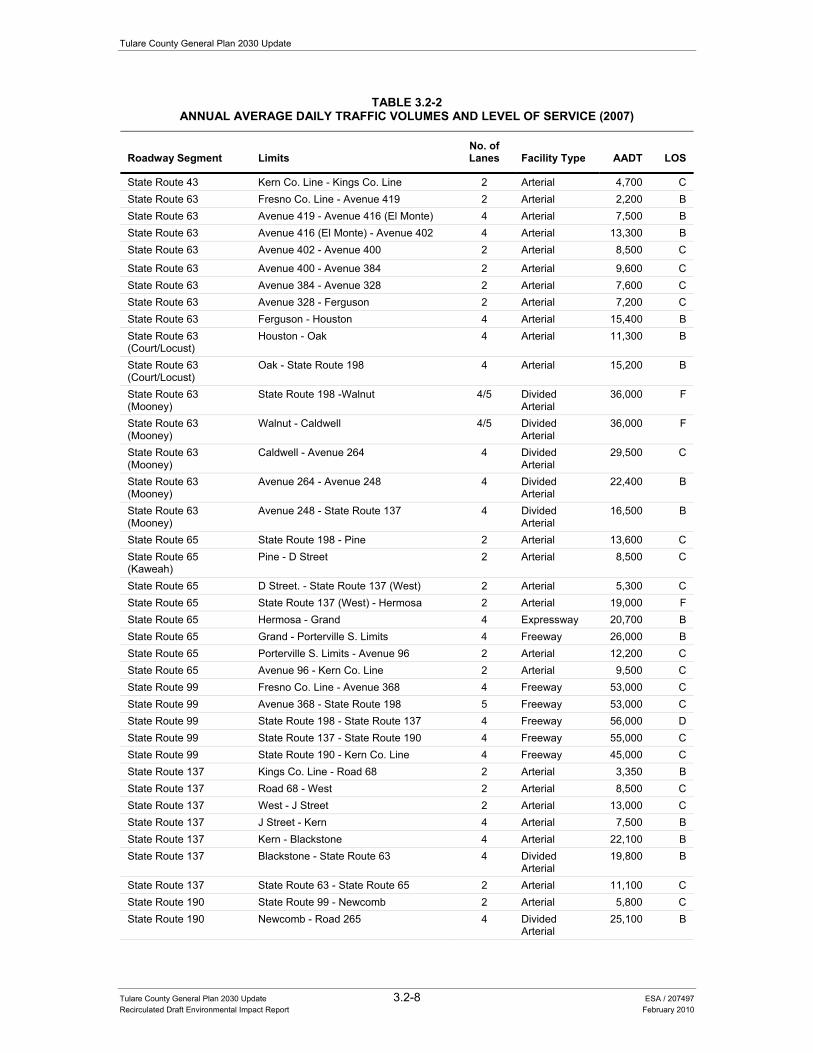
Tulare County General Plan 2030 Update
Tulare County General Plan 2030 Update 3.2-8 ESA / 207497 Recirculated Draft Environmental Impact Report February 2010
TABLE 3.2-2ANNUAL AVERAGE DAILY TRAFFIC VOLUMES AND LEVEL OF SERVICE (2007)
Roadway Segment Limits No. of Lanes Facility Type AADT LOS
State Route 43 Kern Co. Line - Kings Co. Line 2 Arterial 4,700 C State Route 63 Fresno Co. Line - Avenue 419 2 Arterial 2,200 B State Route 63 Avenue 419 - Avenue 416 (El Monte) 4 Arterial 7,500 B State Route 63 Avenue 416 (El Monte) - Avenue 402 4 Arterial 13,300 B State Route 63 Avenue 402 - Avenue 400 2 Arterial 8,500 C
State Route 63 Avenue 400 - Avenue 384 2 Arterial 9,600 C State Route 63 Avenue 384 - Avenue 328 2 Arterial 7,600 C State Route 63 Avenue 328 - Ferguson 2 Arterial 7,200 C State Route 63 Ferguson - Houston 4 Arterial 15,400 B State Route 63 (Court/Locust)
Houston - Oak 4 Arterial 11,300 B
State Route 63 (Court/Locust)
Oak - State Route 198 4 Arterial 15,200 B
State Route 63 (Mooney)
State Route 198 -Walnut 4/5 Divided Arterial
36,000 F
State Route 63 (Mooney)
Walnut - Caldwell 4/5 Divided Arterial
36,000 F
State Route 63 (Mooney)
Caldwell - Avenue 264 4 Divided Arterial
29,500 C
State Route 63 (Mooney)
Avenue 264 - Avenue 248 4 Divided Arterial
22,400 B
State Route 63 (Mooney)
Avenue 248 - State Route 137 4 Divided Arterial
16,500 B
State Route 65 State Route 198 - Pine 2 Arterial 13,600 C State Route 65 (Kaweah)
Pine - D Street 2 Arterial 8,500 C
State Route 65 D Street. - State Route 137 (West) 2 Arterial 5,300 C State Route 65 State Route 137 (West) - Hermosa 2 Arterial 19,000 F State Route 65 Hermosa - Grand 4 Expressway 20,700 B State Route 65 Grand - Porterville S. Limits 4 Freeway 26,000 B State Route 65 Porterville S. Limits - Avenue 96 2 Arterial 12,200 C State Route 65 Avenue 96 - Kern Co. Line 2 Arterial 9,500 C State Route 99 Fresno Co. Line - Avenue 368 4 Freeway 53,000 C State Route 99 Avenue 368 - State Route 198 5 Freeway 53,000 C State Route 99 State Route 198 - State Route 137 4 Freeway 56,000 D State Route 99 State Route 137 - State Route 190 4 Freeway 55,000 C State Route 99 State Route 190 - Kern Co. Line 4 Freeway 45,000 C State Route 137 Kings Co. Line - Road 68 2 Arterial 3,350 B State Route 137 Road 68 - West 2 Arterial 8,500 C State Route 137 West - J Street 2 Arterial 13,000 C State Route 137 J Street - Kern 4 Arterial 7,500 B State Route 137 Kern - Blackstone 4 Arterial 22,100 B State Route 137 Blackstone - State Route 63 4 Divided
Arterial 19,800 B
State Route 137 State Route 63 - State Route 65 2 Arterial 11,100 C State Route 190 State Route 99 - Newcomb 2 Arterial 5,800 C State Route 190 Newcomb - Road 265 4 Divided
Arterial 25,100 B
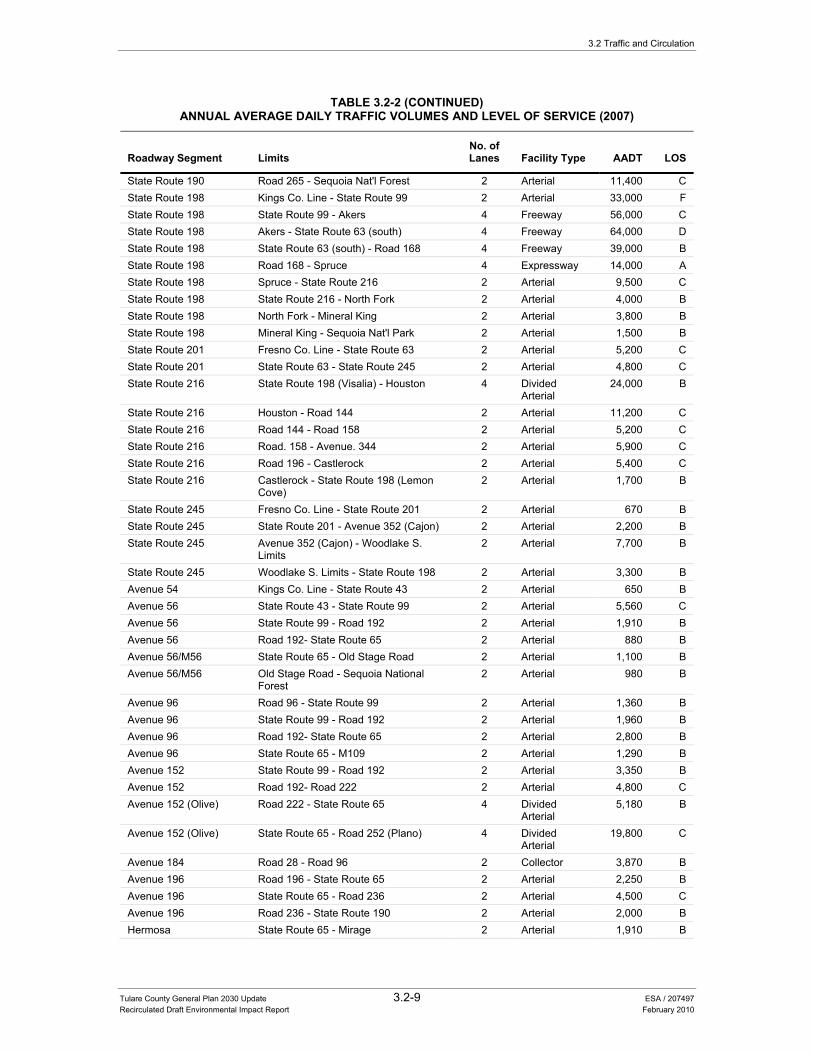
3.2 Traffic and Circulation
Tulare County General Plan 2030 Update 3.2-9 ESA / 207497 Recirculated Draft Environmental Impact Report February 2010
TABLE 3.2-2 (CONTINUED)ANNUAL AVERAGE DAILY TRAFFIC VOLUMES AND LEVEL OF SERVICE (2007)
Roadway Segment Limits No. of Lanes Facility Type AADT LOS
State Route 190 Road 265 - Sequoia Nat'l Forest 2 Arterial 11,400 C State Route 198 Kings Co. Line - State Route 99 2 Arterial 33,000 F State Route 198 State Route 99 - Akers 4 Freeway 56,000 C State Route 198 Akers - State Route 63 (south) 4 Freeway 64,000 D State Route 198 State Route 63 (south) - Road 168 4 Freeway 39,000 B State Route 198 Road 168 - Spruce 4 Expressway 14,000 A State Route 198 Spruce - State Route 216 2 Arterial 9,500 C State Route 198 State Route 216 - North Fork 2 Arterial 4,000 B State Route 198 North Fork - Mineral King 2 Arterial 3,800 B State Route 198 Mineral King - Sequoia Nat'l Park 2 Arterial 1,500 B State Route 201 Fresno Co. Line - State Route 63 2 Arterial 5,200 C State Route 201 State Route 63 - State Route 245 2 Arterial 4,800 C State Route 216 State Route 198 (Visalia) - Houston 4 Divided
Arterial 24,000 B
State Route 216 Houston - Road 144 2 Arterial 11,200 C State Route 216 Road 144 - Road 158 2 Arterial 5,200 C State Route 216 Road. 158 - Avenue. 344 2 Arterial 5,900 C State Route 216 Road 196 - Castlerock 2 Arterial 5,400 C State Route 216 Castlerock - State Route 198 (Lemon
Cove) 2 Arterial 1,700 B
State Route 245 Fresno Co. Line - State Route 201 2 Arterial 670 B State Route 245 State Route 201 - Avenue 352 (Cajon) 2 Arterial 2,200 B State Route 245 Avenue 352 (Cajon) - Woodlake S.
Limits 2 Arterial 7,700 B
State Route 245 Woodlake S. Limits - State Route 198 2 Arterial 3,300 B Avenue 54 Kings Co. Line - State Route 43 2 Arterial 650 B Avenue 56 State Route 43 - State Route 99 2 Arterial 5,560 C Avenue 56 State Route 99 - Road 192 2 Arterial 1,910 B Avenue 56 Road 192- State Route 65 2 Arterial 880 B Avenue 56/M56 State Route 65 - Old Stage Road 2 Arterial 1,100 B Avenue 56/M56 Old Stage Road - Sequoia National
Forest 2 Arterial 980 B
Avenue 96 Road 96 - State Route 99 2 Arterial 1,360 B Avenue 96 State Route 99 - Road 192 2 Arterial 1,960 B Avenue 96 Road 192- State Route 65 2 Arterial 2,800 B Avenue 96 State Route 65 - M109 2 Arterial 1,290 B Avenue 152 State Route 99 - Road 192 2 Arterial 3,350 B Avenue 152 Road 192- Road 222 2 Arterial 4,800 C Avenue 152 (Olive) Road 222 - State Route 65 4 Divided
Arterial 5,180 B
Avenue 152 (Olive) State Route 65 - Road 252 (Plano) 4 Divided Arterial
19,800 C
Avenue 184 Road 28 - Road 96 2 Collector 3,870 B Avenue 196 Road 196 - State Route 65 2 Arterial 2,250 B Avenue 196 State Route 65 - Road 236 2 Arterial 4,500 C Avenue 196 Road 236 - State Route 190 2 Arterial 2,000 B Hermosa State Route 65 - Mirage 2 Arterial 1,910 B
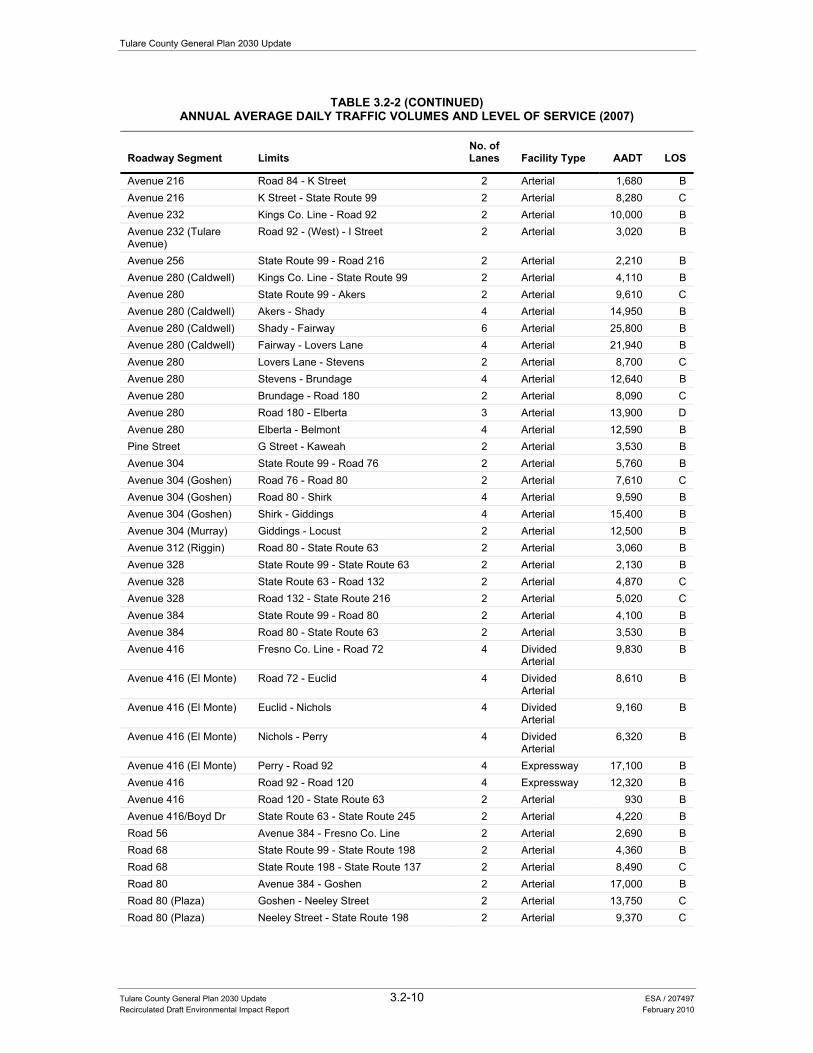
Tulare County General Plan 2030 Update
Tulare County General Plan 2030 Update 3.2-10 ESA / 207497 Recirculated Draft Environmental Impact Report February 2010
TABLE 3.2-2 (CONTINUED)ANNUAL AVERAGE DAILY TRAFFIC VOLUMES AND LEVEL OF SERVICE (2007)
Roadway Segment Limits No. of Lanes Facility Type AADT LOS
Avenue 216 Road 84 - K Street 2 Arterial 1,680 B Avenue 216 K Street - State Route 99 2 Arterial 8,280 C Avenue 232 Kings Co. Line - Road 92 2 Arterial 10,000 B Avenue 232 (Tulare Avenue)
Road 92 - (West) - I Street 2 Arterial 3,020 B
Avenue 256 State Route 99 - Road 216 2 Arterial 2,210 B Avenue 280 (Caldwell) Kings Co. Line - State Route 99 2 Arterial 4,110 B Avenue 280 State Route 99 - Akers 2 Arterial 9,610 C Avenue 280 (Caldwell) Akers - Shady 4 Arterial 14,950 B Avenue 280 (Caldwell) Shady - Fairway 6 Arterial 25,800 B Avenue 280 (Caldwell) Fairway - Lovers Lane 4 Arterial 21,940 B Avenue 280 Lovers Lane - Stevens 2 Arterial 8,700 C Avenue 280 Stevens - Brundage 4 Arterial 12,640 B Avenue 280 Brundage - Road 180 2 Arterial 8,090 C Avenue 280 Road 180 - Elberta 3 Arterial 13,900 D Avenue 280 Elberta - Belmont 4 Arterial 12,590 B Pine Street G Street - Kaweah 2 Arterial 3,530 B Avenue 304 State Route 99 - Road 76 2 Arterial 5,760 B Avenue 304 (Goshen) Road 76 - Road 80 2 Arterial 7,610 C Avenue 304 (Goshen) Road 80 - Shirk 4 Arterial 9,590 B Avenue 304 (Goshen) Shirk - Giddings 4 Arterial 15,400 B Avenue 304 (Murray) Giddings - Locust 2 Arterial 12,500 B Avenue 312 (Riggin) Road 80 - State Route 63 2 Arterial 3,060 B Avenue 328 State Route 99 - State Route 63 2 Arterial 2,130 B Avenue 328 State Route 63 - Road 132 2 Arterial 4,870 C Avenue 328 Road 132 - State Route 216 2 Arterial 5,020 C Avenue 384 State Route 99 - Road 80 2 Arterial 4,100 B Avenue 384 Road 80 - State Route 63 2 Arterial 3,530 B Avenue 416 Fresno Co. Line - Road 72 4 Divided
Arterial 9,830 B
Avenue 416 (El Monte) Road 72 - Euclid 4 Divided Arterial
8,610 B
Avenue 416 (El Monte) Euclid - Nichols 4 Divided Arterial
9,160 B
Avenue 416 (El Monte) Nichols - Perry 4 Divided Arterial
6,320 B
Avenue 416 (El Monte) Perry - Road 92 4 Expressway 17,100 B Avenue 416 Road 92 - Road 120 4 Expressway 12,320 B Avenue 416 Road 120 - State Route 63 2 Arterial 930 B Avenue 416/Boyd Dr State Route 63 - State Route 245 2 Arterial 4,220 B Road 56 Avenue 384 - Fresno Co. Line 2 Arterial 2,690 B Road 68 State Route 99 - State Route 198 2 Arterial 4,360 B Road 68 State Route 198 - State Route 137 2 Arterial 8,490 C Road 80 Avenue 384 - Goshen 2 Arterial 17,000 B Road 80 (Plaza) Goshen - Neeley Street 2 Arterial 13,750 C Road 80 (Plaza) Neeley Street - State Route 198 2 Arterial 9,370 C
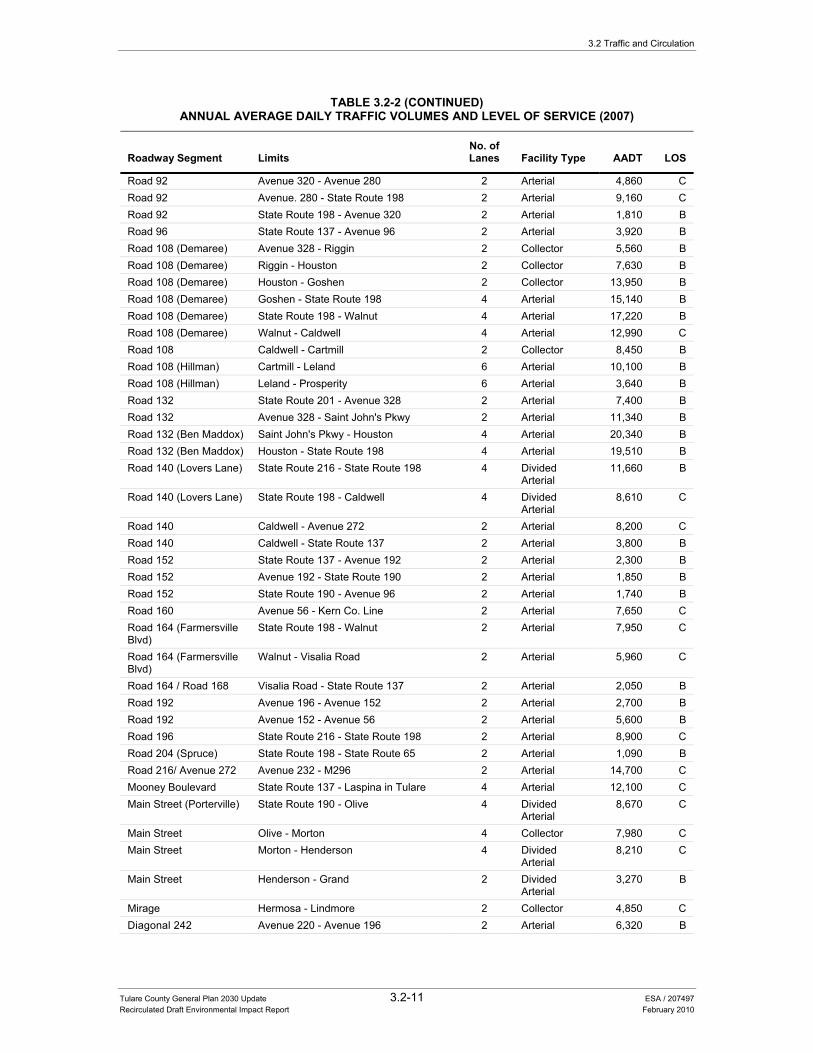
3.2 Traffic and Circulation
Tulare County General Plan 2030 Update 3.2-11 ESA / 207497 Recirculated Draft Environmental Impact Report February 2010
TABLE 3.2-2 (CONTINUED)ANNUAL AVERAGE DAILY TRAFFIC VOLUMES AND LEVEL OF SERVICE (2007)
Roadway Segment Limits No. of Lanes Facility Type AADT LOS
Road 92 Avenue 320 - Avenue 280 2 Arterial 4,860 C Road 92 Avenue. 280 - State Route 198 2 Arterial 9,160 C Road 92 State Route 198 - Avenue 320 2 Arterial 1,810 B Road 96 State Route 137 - Avenue 96 2 Arterial 3,920 B Road 108 (Demaree) Avenue 328 - Riggin 2 Collector 5,560 B Road 108 (Demaree) Riggin - Houston 2 Collector 7,630 B Road 108 (Demaree) Houston - Goshen 2 Collector 13,950 B Road 108 (Demaree) Goshen - State Route 198 4 Arterial 15,140 B Road 108 (Demaree) State Route 198 - Walnut 4 Arterial 17,220 B Road 108 (Demaree) Walnut - Caldwell 4 Arterial 12,990 C Road 108 Caldwell - Cartmill 2 Collector 8,450 B Road 108 (Hillman) Cartmill - Leland 6 Arterial 10,100 B Road 108 (Hillman) Leland - Prosperity 6 Arterial 3,640 B Road 132 State Route 201 - Avenue 328 2 Arterial 7,400 B Road 132 Avenue 328 - Saint John's Pkwy 2 Arterial 11,340 B Road 132 (Ben Maddox) Saint John's Pkwy - Houston 4 Arterial 20,340 B Road 132 (Ben Maddox) Houston - State Route 198 4 Arterial 19,510 B Road 140 (Lovers Lane) State Route 216 - State Route 198 4 Divided
Arterial 11,660 B
Road 140 (Lovers Lane) State Route 198 - Caldwell 4 Divided Arterial
8,610 C
Road 140 Caldwell - Avenue 272 2 Arterial 8,200 C Road 140 Caldwell - State Route 137 2 Arterial 3,800 B Road 152 State Route 137 - Avenue 192 2 Arterial 2,300 B Road 152 Avenue 192 - State Route 190 2 Arterial 1,850 B Road 152 State Route 190 - Avenue 96 2 Arterial 1,740 B Road 160 Avenue 56 - Kern Co. Line 2 Arterial 7,650 C Road 164 (Farmersville Blvd)
State Route 198 - Walnut 2 Arterial 7,950 C
Road 164 (Farmersville Blvd)
Walnut - Visalia Road 2 Arterial 5,960 C
Road 164 / Road 168 Visalia Road - State Route 137 2 Arterial 2,050 B Road 192 Avenue 196 - Avenue 152 2 Arterial 2,700 B Road 192 Avenue 152 - Avenue 56 2 Arterial 5,600 B Road 196 State Route 216 - State Route 198 2 Arterial 8,900 C Road 204 (Spruce) State Route 198 - State Route 65 2 Arterial 1,090 B Road 216/ Avenue 272 Avenue 232 - M296 2 Arterial 14,700 C Mooney Boulevard State Route 137 - Laspina in Tulare 4 Arterial 12,100 C Main Street (Porterville) State Route 190 - Olive 4 Divided
Arterial 8,670 C
Main Street Olive - Morton 4 Collector 7,980 C Main Street Morton - Henderson 4 Divided
Arterial 8,210 C
Main Street Henderson - Grand 2 Divided Arterial
3,270 B
Mirage Hermosa - Lindmore 2 Collector 4,850 C Diagonal 242 Avenue 220 - Avenue 196 2 Arterial 6,320 B
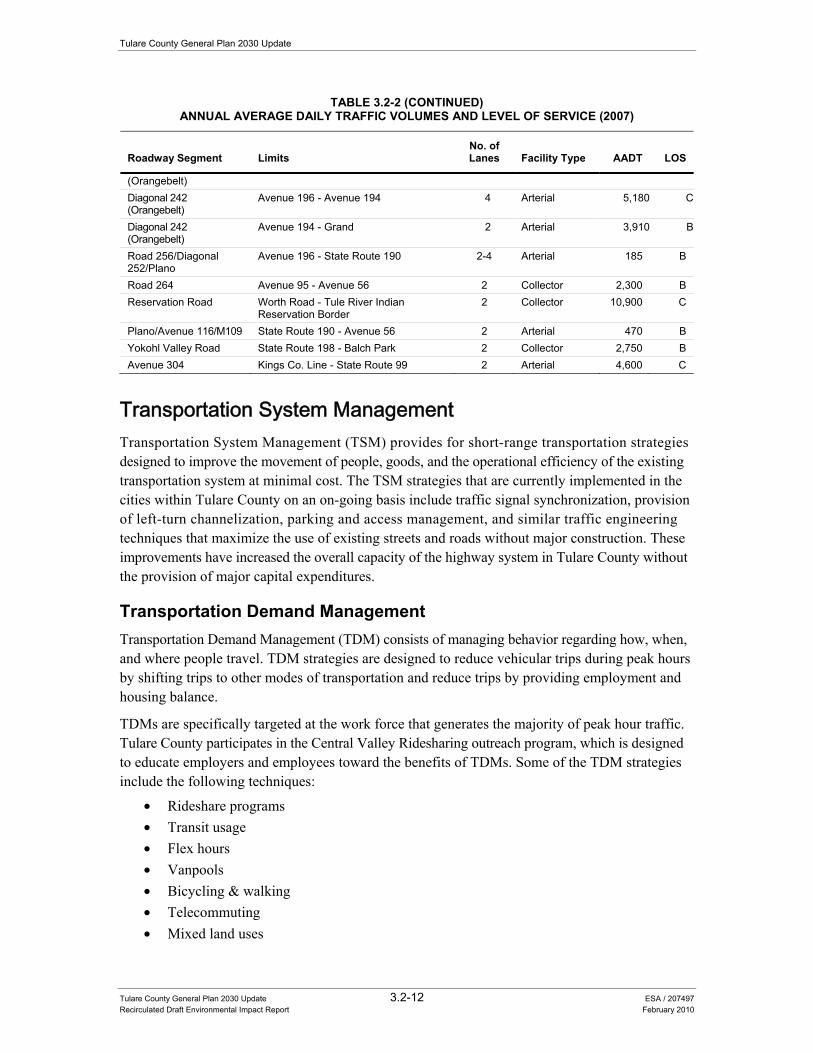
Tulare County General Plan 2030 Update
Tulare County General Plan 2030 Update 3.2-12 ESA / 207497 Recirculated Draft Environmental Impact Report February 2010
TABLE 3.2-2 (CONTINUED)ANNUAL AVERAGE DAILY TRAFFIC VOLUMES AND LEVEL OF SERVICE (2007)
Roadway Segment Limits No. of Lanes Facility Type AADT LOS
(Orangebelt) Diagonal 242 (Orangebelt)
Avenue 196 - Avenue 194 4 Arterial 5,180 C
Diagonal 242 (Orangebelt)
Avenue 194 - Grand 2 Arterial 3,910 B
Road 256/Diagonal 252/Plano
Avenue 196 - State Route 190 2-4 Arterial 185 B
Road 264 Avenue 95 - Avenue 56 2 Collector 2,300 B Reservation Road Worth Road - Tule River Indian
Reservation Border 2 Collector 10,900 C
Plano/Avenue 116/M109 State Route 190 - Avenue 56 2 Arterial 470 B Yokohl Valley Road State Route 198 - Balch Park 2 Collector 2,750 B Avenue 304 Kings Co. Line - State Route 99 2 Arterial 4,600 C
Transportation System Management Transportation System Management (TSM) provides for short-range transportation strategies designed to improve the movement of people, goods, and the operational efficiency of the existing transportation system at minimal cost. The TSM strategies that are currently implemented in the cities within Tulare County on an on-going basis include traffic signal synchronization, provision of left-turn channelization, parking and access management, and similar traffic engineering techniques that maximize the use of existing streets and roads without major construction. These improvements have increased the overall capacity of the highway system in Tulare County without the provision of major capital expenditures.
Transportation Demand Management Transportation Demand Management (TDM) consists of managing behavior regarding how, when, and where people travel. TDM strategies are designed to reduce vehicular trips during peak hours by shifting trips to other modes of transportation and reduce trips by providing employment and housing balance.
TDMs are specifically targeted at the work force that generates the majority of peak hour traffic. Tulare County participates in the Central Valley Ridesharing outreach program, which is designed to educate employers and employees toward the benefits of TDMs. Some of the TDM strategies include the following techniques:
• Rideshare programs • Transit usage • Flex hours • Vanpools • Bicycling & walking • Telecommuting • Mixed land uses
3.2 Traffic and Circulation
Tulare County General Plan 2030 Update 3.2-13 ESA / 207497 Recirculated Draft Environmental Impact Report February 2010
In Tulare County, the areas with the most severe traffic congestion and which are potential candidates for TDM strategies include the Cities of Visalia, Tulare and Porterville. The City of Visalia, with a population of 120,958, has the highest peak hour congestion in the County. The City of Tulare has a population of 57,375. Trips generated between industries and employment in Visalia and Tulare contribute to the congestion on the State Route 63 (Mooney Boulevard), the Demaree Street/Hillman Street/Road 108, and State Route 137 (Tulare Avenue) corridors during peak hours. In addition, interchanges on State Route 99 in Tulare and State Route 198 in Visalia also experience peak hour congestion.
The City of Porterville, with a population of 51,638, is also showing signs of congestion on portions of its primary street network, i.e., the Olive Avenue, Henderson Avenue, Jaye Street, State Route 190 corridors. Dinuba, with a population of 20,993, experiences peak hour congestion on the Alta Avenue and El Monte Way corridors. These regions in the County have the highest potential to experience severe traffic congestion and are prime candidates to utilize TDM strategies.
Rail Transportation Union Pacific (UP), Burlington Northern & Santa Fe Rail Road (BN&SF), and San Joaquin Valley Railroad (SJVR), provide freight service in Tulare County, connecting the County with major markets within California (Oakland/San Francisco/San Jose, Sacramento, and Los Angeles) and to other destinations. The San Joaquin Valley Railroad recently abandoned an approximately 30 mile stretch of rail between Jovista and Strathmore on the east side of the County. Routes of principal rail lines in the County are identified in Figure 3.2-3. Freight terminals and service to specific industries are located throughout the County.
High Speed Rail The California High Speed Rail Authority is currently in the process of implementing a high-speed rail system that would provide passenger transportation and goods movement services throughout much of California. Through the planning and environmental review process, the preferred alignment and stations have been identified. Although the preferred alignment travels through the southwest portion of Tulare County, the nearest stations would probably be located in Hanford, Fresno and Bakersfield.
Aviation The Tulare County Board of Supervisors adopted the Tulare County Aviation Element and Airport System Plan in April 1985, as part of the Tulare County Circulation Element. The element addresses the aviation needs within the County. At the present time, there are eight airports in the County. The public owned airports are Visalia Municipal, Porterville Municipal, Woodlake, Mefford Field and Sequoia Field. Two of the airports are private airports open to public use (Eckert and Thunderhawk). There are also a number of privately owned, special use airports. According to Tulare County, Alta Airport is currently closed and Badger Field is under Federal Aviation Administration (FAA) recertification as a restricted private airfield.
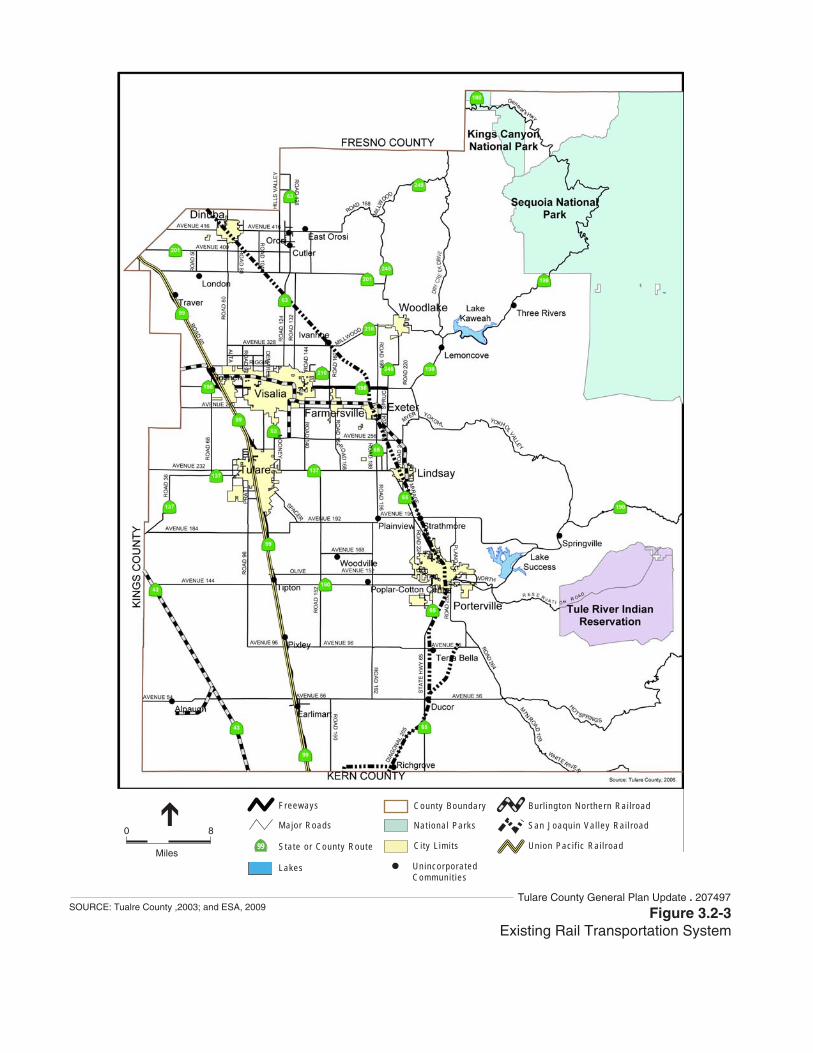
Sta te or County Route
Major Roads
Lakes Unincorpora tedCommuni t ies
Ci ty L imi ts
San Joaqu in Va l ley Ra i l road
Bur l ing ton Nor thern Ra i l road
Union Pac i f i c Ra i l road80
Miles
County Boundary
Nat iona l Parks
Freeways
99
Tulare County General Plan Update . 207497SOURCE: Tualre County ,2003; and ESA, 2009 Figure 3.2-3
Existing Rail Transportation System
3.2 Traffic and Circulation
Tulare County General Plan 2030 Update 3.2-15 ESA / 207497 Recirculated Draft Environmental Impact Report February 2010
Only Visalia, Porterville, and Mefford Field (City of Tulare) airports generate significant air traffic for the County’s circulation system. The only passenger air service within the County is provided at the Visalia Municipal Airport (VIS). This service is a daily circuit from VIS to Ontario (ONT) and Las Vegas (LAS) with connections to other destinations.
Public Transportation The cities of Dinuba, Woodlake, Exeter, and Porterville provide either dial-a-ride service or fixed-route transit service. The cities of Tulare (fixed route service annual ridership of 346,343 and a Dial-a-Ride service annual ridership of 34,328), and Visalia (total ridership of 1,460,000) operate their own public transportation services and intermodal transit centers to diversify travel linkage.
Tulare County Area Transit Tulare County Area Transit (TCaT) has been providing rural route service between various cities and towns since 1981. Trans West Specialists has been the contractor and operator of TCaT since its inception. TCaT provides both rural route service and local demand responsive service in and around various County communities. TCaT operates 8 different fixed route services between communities and provides a local dial a ride program within communities.
TCaT is the primary transportation outlet linking Tulare County’s rural and unincorporated communities to other communities in the region. Consisting of several routes from Three Rivers to Delano to Dinuba, TCaT interconnects the County’s transportation needs in relation to the rural composition of the area.
TCaT offers bus service between cities and communities in the County via eight routes (see Figure 3.2-4):
• The North County route serves Visalia, north Visalia, Seville, Cutler, Orosi, Patterson Tract, East Orosi, Yettem, Seville, Sultana, and Dinuba (Monday through Saturday);
• The South County route includes Delano (Kern County), Richgrove, Earlimart, Teviston, Pixley, Tipton, Matheny Tract, and Tulare (Monday through Saturday);
• The Northeast County route includes Visalia, Three Rivers, Woodlake, Ivanhoe, and Lemon Cove (Monday through Saturday);
• The Southeast County route includes Visalia, Tulare, Lindsay, Strathmore and Porterville (Monday through Saturday);
• The Lindsay-Strathmore-Plainview-Porterville route runs Monday through Friday; • The Woodville-Poplar-Porterville route, which serves Woodville, Cotton Center, Poplar,
and Porterville (Monday through Friday); • The Dinuba-London-Traver-Delft Colony Route that serves Delft Colony, London,
Dinuba, and Traver (Monday through Friday); • Porterville-Springville route runs Tuesday, Thursday and Friday only and Porterville-
Terra Bella route runs Monday and Wednesday only.
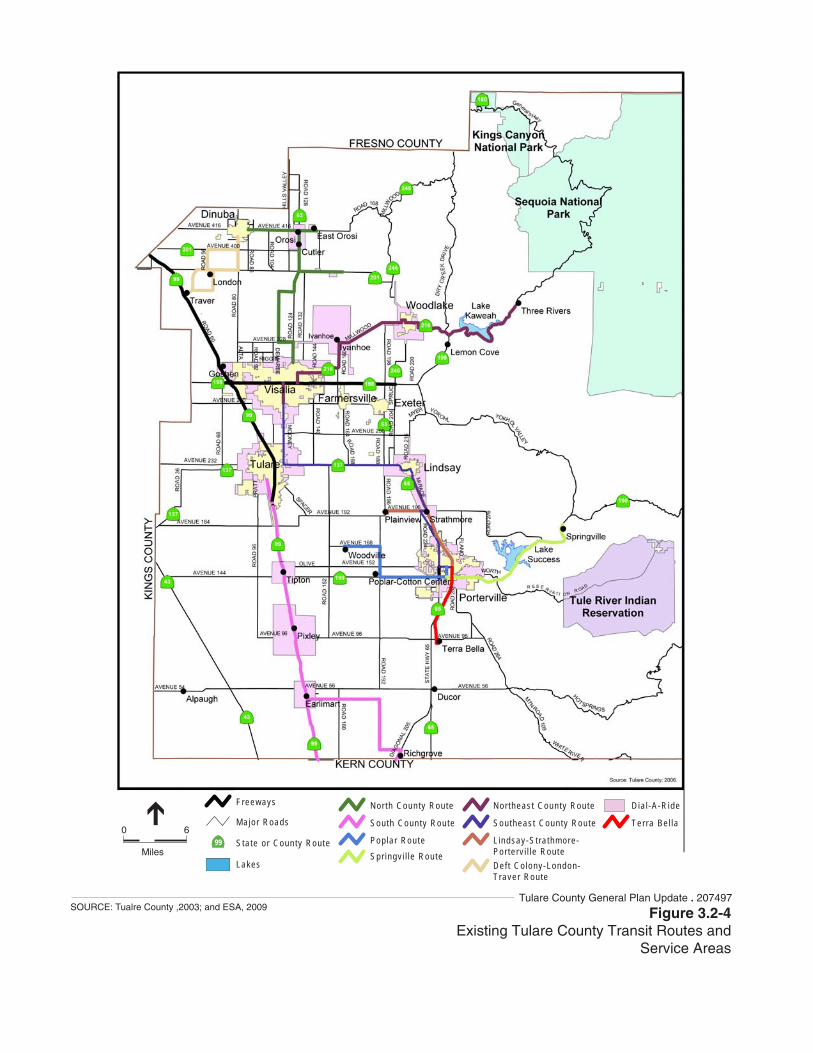
South County Route
Pop lar RouteSpr ingv i l le Route
Nor th County Route
Southeast County Route
L indsay-St ra thmore-Por te rv i l le RouteDef t Co lony-London-Traver Route
Nor theas t County Route
60
Miles
Major Roads
Freeways
Sta te or County Route
Lakes
99
Ter ra Be l la
D ia l -A-R ide
Tulare County General Plan Update . 207497
Figure 3.2-4Existing Tulare County Transit Routes and
Service Areas
SOURCE: Tualre County ,2003; and ESA, 2009
3.2 Traffic and Circulation
Tulare County General Plan 2030 Update 3.2-17 ESA / 207497 Recirculated Draft Environmental Impact Report February 2010
TCaT is the primary transportation outlet linking Tulare County’s rural and unincorporated communities to other communities within the region. Consisting of several routes from Three Rivers to Delano to Dinuba, TCaT interconnects the County’s transportation needs in relation to the rural composition of the area.
Visalia City Coach Visalia City Coach (VCC) is the main public transportation link within the City of Visalia as well as several surrounding cities. VCC operates seven days a week, with a one-way fare of $1.00 ($0.75 for handicapped and disabled). An all day ride pass is offered for $2.00. On weekdays service is provided from 6:00 am to 9:30 p.m., Saturday and Sunday service is provided between 9:00 a.m. to 6:30 p.m. VCC offers many stops within Visalia and provides transit service to the downtown transit center to better provide the community with a variety of transportation options throughout the County.
City of Porterville - City Owned Local Transit Since 1997, City Owned Local Transit (COLT) has been the fixed route provider for the City of Porterville. COLT service provides eight routes within the City of Porterville, running Monday through Friday from 7:00 a.m. to 7:00 p.m. and 9:00 a.m. to 5:00 p.m. on Saturdays. These routes link to a downtown transit center and the general public can ride on a one-way trip for $1.00. According to the COLT website total ridership totaled 515,523 for the 2007/08 fiscal year. Dial-a-ride is offered from Monday through Friday from 7:00 a.m. to 8:00 p.m. and Saturday from 9:00 a.m. to 6:00 p.m. with a cost of $1.50 per ride for seniors and $3.00 for general passengers.
City of Dinuba The City of Dinuba provides both fixed route service and dial-a-ride service for the surrounding residents. Dinuba is under contract with MV Transportation to provide transit service until 2009. Two fixed routes are provided; one is for citywide movements (Jolly Trolley) and the second provides a commercial route (Dinuba Connection) that serves major retail locations throughout the city. The Jolly Trolley operates from 9:00 a.m. to 6:00 p.m. with a fare of $0.25. The Dinuba Connection operates from 7:00 a.m. to 9:00 p.m. on Monday through Friday. The Dinuba Connection route is $1.50 for most riders and students/seniors pay $1.25. The dial-a-ride is offered from 7:30 a.m. to 4:30 p.m. with a cost of $1.50 per ride.
City of Woodlake The City of Woodlake provides Dial-A-Ride services. A one-way fare is $0.75 for general passengers and $0.25 for seniors. The service is available everyday between 7:00 a.m. to 3:30 p.m.
City of Exeter The City of Exeter provides Dial-A-Ride services. A one-way fare is $2.00 and service is available from 8:30 a.m. to 4:15 p.m. Monday through Friday. Seniors (65 years of age or older) ride for free.
Tulare County General Plan 2030 Update
Tulare County General Plan 2030 Update 3.2-18 ESA / 207497 Recirculated Draft Environmental Impact Report February 2010
Tulare Transit Express Tulare Intermodal Express (TIE) has been city operated since 1992; currently, the routes have increased in number to the present day of six within the city limits. The fares for the general public are $1.00 with links to TCAT, VCC, and Greyhound’s and Orange Belt’s services. Services run from 6:30 a.m. to 6:00 p.m. Monday through Friday and 9:00 a.m. to 5:30 p.m. on Saturdays. A Dial-A-Ride service is provided for $2.00 and operates Monday through Friday from 6:00 a.m. to 6:00 p.m. and on Saturdays from 7:00 a.m. to 6:00 p.m.
County of Tulare Dial-a-Ride County of Tulare Dial-a-Ride offers service in most of the major communities of Tulare County. Dial-a-Ride service offers curb-to-curb service within most of the populated areas of Tulare County. This service operates on weekdays from 5:30 a.m. to 6:00 p.m. and on Saturdays 7:00 a.m. to 6:00 p.m. Currently, fares range from $0.75 to $1.50 for adults and pick-up is usually made in one hour of the phoned-in request. Punch passes ($13.00) and Monthly passes ($45.00) are also available for purchase. Dial-a-Ride also provides these services in Tulare County:
• Cutler/Orosi/East Orosi/Seville/Ivanhoe; • Lindsay/Tonyville/Strathmore; and • Pixley/Tipton/Earlimart/Woodlake.
Non-Motorized Systems As part of the RTP, TCAG plans to adopt the Tulare County Regional Bike Plan (as shown on Figure 3.2-5) at the end of 2007. This Plan provides for connections between major urban and recreational facilities within the County. The cities of Visalia and Tulare have recently updated their Bikeway Plan, which identify various phases of planning and the implementation of bikeway facilities. Exeter and Porterville have received grant funds to construct bikeways. Other local agencies are currently developing bicycle plans with help from TCAG to finance these plans through State Bicycle Transportation Account (BTA).
In addition to bikeways, a variety of non-motorized circulation systems are also found through out the County. These circulation systems are described below.
Recreational Walkways Tulare County has historically developed walkways for recreational and practical purposes. The Mill Creek Trail, St. John’s Trail, and the Tule River Trail are examples of recreational walkways located in Tulare County. The Mill Creek Trail and St. John’s Trail are located in the City of Visalia and the Tule River Trail is located in the City of Porterville. The Mill Creek Trail is a signed route that is intended for pedestrians while the St. John’s Trail is paved and used by pedestrians and bicyclist. These facilities provide people the incentive to walk to places of interest while enjoying a preserved route.
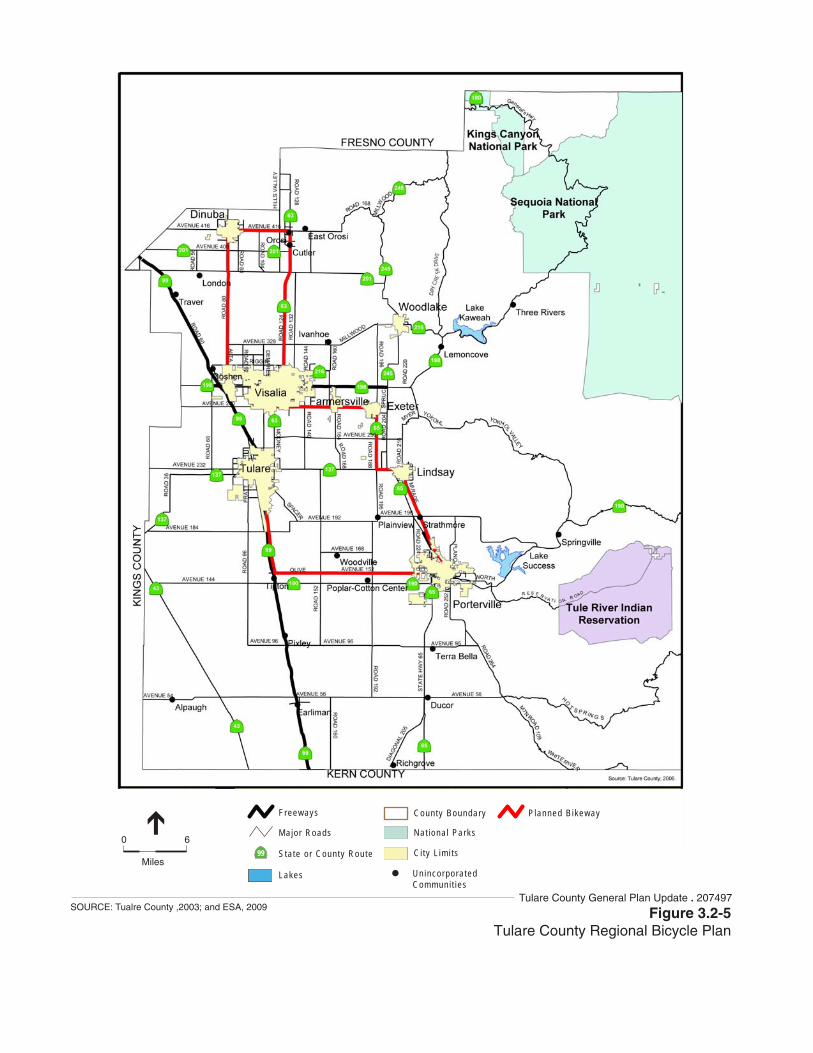
Major Roads
Freeways
Sta te or County Route
Lakes
Nat iona l Parks
County Boundary P lanned B ikeway
Unincorpora tedCommuni t ies
Ci ty L imi ts60
Miles99
Tulare County General Plan Update . 207497SOURCE: Tualre County ,2003; and ESA, 2009 Figure 3.2-5
Tulare County Regional Bicycle Plan
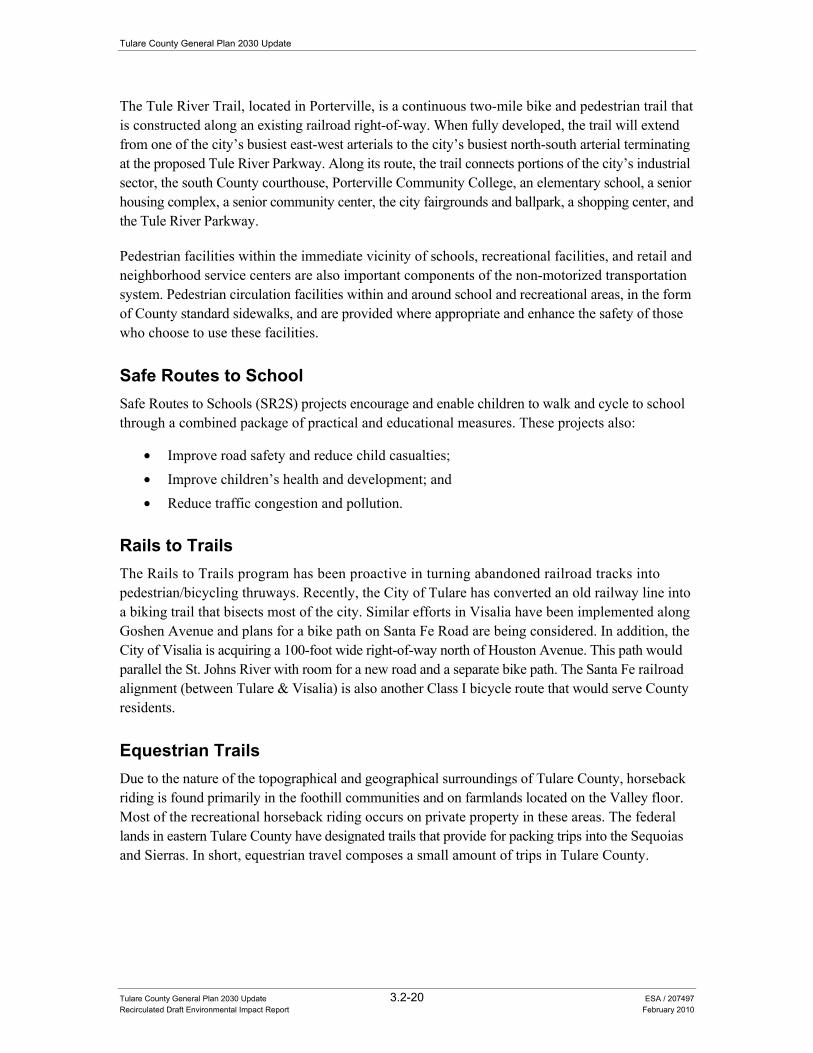
Tulare County General Plan 2030 Update
Tulare County General Plan 2030 Update 3.2-20 ESA / 207497 Recirculated Draft Environmental Impact Report February 2010
The Tule River Trail, located in Porterville, is a continuous two-mile bike and pedestrian trail that is constructed along an existing railroad right-of-way. When fully developed, the trail will extend from one of the city’s busiest east-west arterials to the city’s busiest north-south arterial terminating at the proposed Tule River Parkway. Along its route, the trail connects portions of the city’s industrial sector, the south County courthouse, Porterville Community College, an elementary school, a senior housing complex, a senior community center, the city fairgrounds and ballpark, a shopping center, and the Tule River Parkway.
Pedestrian facilities within the immediate vicinity of schools, recreational facilities, and retail and neighborhood service centers are also important components of the non-motorized transportation system. Pedestrian circulation facilities within and around school and recreational areas, in the form of County standard sidewalks, and are provided where appropriate and enhance the safety of those who choose to use these facilities.
Safe Routes to School Safe Routes to Schools (SR2S) projects encourage and enable children to walk and cycle to school through a combined package of practical and educational measures. These projects also:
• Improve road safety and reduce child casualties; • Improve children’s health and development; and • Reduce traffic congestion and pollution.
Rails to Trails The Rails to Trails program has been proactive in turning abandoned railroad tracks into pedestrian/bicycling thruways. Recently, the City of Tulare has converted an old railway line into a biking trail that bisects most of the city. Similar efforts in Visalia have been implemented along Goshen Avenue and plans for a bike path on Santa Fe Road are being considered. In addition, the City of Visalia is acquiring a 100-foot wide right-of-way north of Houston Avenue. This path would parallel the St. Johns River with room for a new road and a separate bike path. The Santa Fe railroad alignment (between Tulare & Visalia) is also another Class I bicycle route that would serve County residents.
Equestrian Trails Due to the nature of the topographical and geographical surroundings of Tulare County, horseback riding is found primarily in the foothill communities and on farmlands located on the Valley floor. Most of the recreational horseback riding occurs on private property in these areas. The federal lands in eastern Tulare County have designated trails that provide for packing trips into the Sequoias and Sierras. In short, equestrian travel composes a small amount of trips in Tulare County.
3.2 Traffic and Circulation
Tulare County General Plan 2030 Update 3.2-21 ESA / 207497 Recirculated Draft Environmental Impact Report February 2010
Impacts and Mitigation Measures
Significance Criteria The significance criteria for this analysis were developed from criteria presented in Appendix G “Environmental Checklist Form” of the CEQA Guidelines and based on the professional judgment of the County of Tulare and its consultants. The proposed project would result in a significant impact if it would:
• Cause an increase in traffic which is substantial in relation to the existing traffic load and capacity of the street system (i.e., result in a substantial increase in either the number of vehicle trips, the volume-to-capacity ratio on roads, or congestion at intersections);
• Exceed, either individually or cumulatively, a level of service standard established by the County congestion management agency for designated roads or highways;
• Cause an increase in rail traffic which is considered substantial in relation to the existing capacity of the rail system;
• Cause an increase in aviation usage which is considered substantial in relation to the existing capacity of the aviation system;
• Cause an increase in transit usage which is considered substantial in relation to the existing capacity of the public transportation system; or
• Cause an increase in bike and pedestrian usage which is considered substantial in relation to the existing capacity of the non-motorized system.
Methodology Transportation and circulation needs are closely tied to the location and distribution of land uses. Section 65302(b) of the Government Code requires that a circulation element must be included in a general plan. The circulation element must address the general location and extent of existing and proposed major thoroughfares, transportation routes, terminals, and other local public utilities and facilities, all correlated with the land use element.
In order to determine the magnitude of impact on streets and highways for each alternative, the County and its consultants utilized the TCAG Regional Travel Demand Forecast Model. The TCAG model contains many socioeconomic data attributes including information related to number of households and number of employees per traffic analysis zone (TAZ). A TAZ is a special area delineated by TCAG for tabulating traffic-related data- especially journey-to-work and place-of-work statistics. A TAZ usually consists of one or more census blocks, block groups, or census tracts. The household and employee data is run as part of a model of the County roadway network that contains number of lanes, speed, capacity class, etc.
The future roadway system has been developed and is assumed in the TCAG model. The roadway system is based upon individual city’s general plan circulation elements and projects contained in the Regional Transportation Plan (RTP). A list of future transportation projects is identified in Table 3.2-3. Many of these projects are identified in the County’s current RTP, with funding provided from a variety of sources (i.e., Regional Improvement Program, State Transportation Improvement Programs, Measure R, etc.).
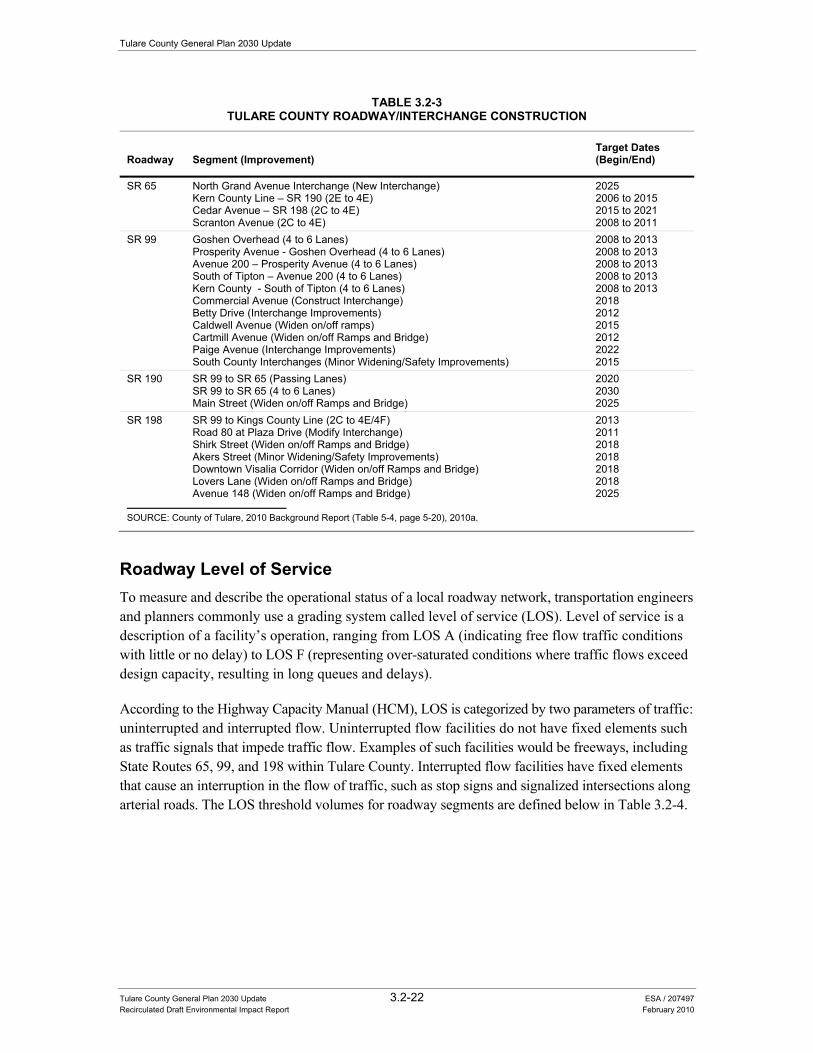
Tulare County General Plan 2030 Update
Tulare County General Plan 2030 Update 3.2-22 ESA / 207497 Recirculated Draft Environmental Impact Report February 2010
TABLE 3.2-3TULARE COUNTY ROADWAY/INTERCHANGE CONSTRUCTION
Roadway Segment (Improvement) Target Dates (Begin/End)
SR 65 North Grand Avenue Interchange (New Interchange) Kern County Line – SR 190 (2E to 4E) Cedar Avenue – SR 198 (2C to 4E) Scranton Avenue (2C to 4E)
2025 2006 to 2015 2015 to 2021 2008 to 2011
SR 99 Goshen Overhead (4 to 6 Lanes) Prosperity Avenue - Goshen Overhead (4 to 6 Lanes) Avenue 200 – Prosperity Avenue (4 to 6 Lanes) South of Tipton – Avenue 200 (4 to 6 Lanes) Kern County - South of Tipton (4 to 6 Lanes) Commercial Avenue (Construct Interchange) Betty Drive (Interchange Improvements) Caldwell Avenue (Widen on/off ramps) Cartmill Avenue (Widen on/off Ramps and Bridge) Paige Avenue (Interchange Improvements) South County Interchanges (Minor Widening/Safety Improvements)
2008 to 2013 2008 to 2013 2008 to 2013 2008 to 2013 2008 to 2013 2018 2012 2015 2012 2022 2015
SR 190 SR 99 to SR 65 (Passing Lanes) SR 99 to SR 65 (4 to 6 Lanes) Main Street (Widen on/off Ramps and Bridge)
2020 2030 2025
SR 198 SR 99 to Kings County Line (2C to 4E/4F) Road 80 at Plaza Drive (Modify Interchange) Shirk Street (Widen on/off Ramps and Bridge) Akers Street (Minor Widening/Safety Improvements) Downtown Visalia Corridor (Widen on/off Ramps and Bridge) Lovers Lane (Widen on/off Ramps and Bridge) Avenue 148 (Widen on/off Ramps and Bridge)
2013 2011 2018 2018 2018 2018 2025
SOURCE: County of Tulare, 2010 Background Report (Table 5-4, page 5-20), 2010a.
Roadway Level of Service To measure and describe the operational status of a local roadway network, transportation engineers and planners commonly use a grading system called level of service (LOS). Level of service is a description of a facility’s operation, ranging from LOS A (indicating free flow traffic conditions with little or no delay) to LOS F (representing over-saturated conditions where traffic flows exceed design capacity, resulting in long queues and delays).
According to the Highway Capacity Manual (HCM), LOS is categorized by two parameters of traffic: uninterrupted and interrupted flow. Uninterrupted flow facilities do not have fixed elements such as traffic signals that impede traffic flow. Examples of such facilities would be freeways, including State Routes 65, 99, and 198 within Tulare County. Interrupted flow facilities have fixed elements that cause an interruption in the flow of traffic, such as stop signs and signalized intersections along arterial roads. The LOS threshold volumes for roadway segments are defined below in Table 3.2-4.
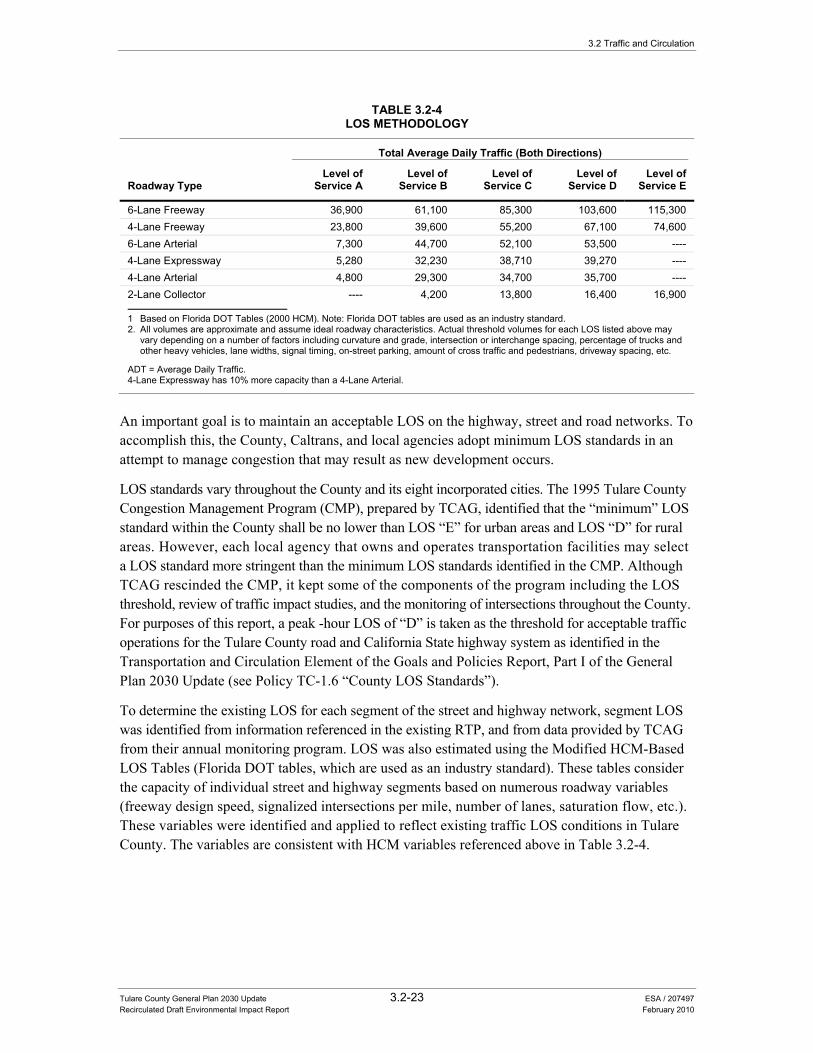
3.2 Traffic and Circulation
Tulare County General Plan 2030 Update 3.2-23 ESA / 207497 Recirculated Draft Environmental Impact Report February 2010
TABLE 3.2-4 LOS METHODOLOGY
Roadway Type
Total Average Daily Traffic (Both Directions)
Level of Service A
Level of Service B
Level of Service C
Level of Service D
Level of Service E
6-Lane Freeway 36,900 61,100 85,300 103,600 115,300 4-Lane Freeway 23,800 39,600 55,200 67,100 74,600 6-Lane Arterial 7,300 44,700 52,100 53,500 ---- 4-Lane Expressway 5,280 32,230 38,710 39,270 ---- 4-Lane Arterial 4,800 29,300 34,700 35,700 ---- 2-Lane Collector ---- 4,200 13,800 16,400 16,900
1 Based on Florida DOT Tables (2000 HCM). Note: Florida DOT tables are used as an industry standard. 2. All volumes are approximate and assume ideal roadway characteristics. Actual threshold volumes for each LOS listed above may
vary depending on a number of factors including curvature and grade, intersection or interchange spacing, percentage of trucks and other heavy vehicles, lane widths, signal timing, on-street parking, amount of cross traffic and pedestrians, driveway spacing, etc.
ADT = Average Daily Traffic. 4-Lane Expressway has 10% more capacity than a 4-Lane Arterial.
An important goal is to maintain an acceptable LOS on the highway, street and road networks. To accomplish this, the County, Caltrans, and local agencies adopt minimum LOS standards in an attempt to manage congestion that may result as new development occurs.
LOS standards vary throughout the County and its eight incorporated cities. The 1995 Tulare County Congestion Management Program (CMP), prepared by TCAG, identified that the “minimum” LOS standard within the County shall be no lower than LOS “E” for urban areas and LOS “D” for rural areas. However, each local agency that owns and operates transportation facilities may select a LOS standard more stringent than the minimum LOS standards identified in the CMP. Although TCAG rescinded the CMP, it kept some of the components of the program including the LOS threshold, review of traffic impact studies, and the monitoring of intersections throughout the County. For purposes of this report, a peak -hour LOS of “D” is taken as the threshold for acceptable traffic operations for the Tulare County road and California State highway system as identified in the Transportation and Circulation Element of the Goals and Policies Report, Part I of the General Plan 2030 Update (see Policy TC-1.6 “County LOS Standards”).
To determine the existing LOS for each segment of the street and highway network, segment LOS was identified from information referenced in the existing RTP, and from data provided by TCAG from their annual monitoring program. LOS was also estimated using the Modified HCM-Based LOS Tables (Florida DOT tables, which are used as an industry standard). These tables consider the capacity of individual street and highway segments based on numerous roadway variables (freeway design speed, signalized intersections per mile, number of lanes, saturation flow, etc.). These variables were identified and applied to reflect existing traffic LOS conditions in Tulare County. The variables are consistent with HCM variables referenced above in Table 3.2-4.
Tulare County General Plan 2030 Update
Tulare County General Plan 2030 Update 3.2-24 ESA / 207497 Recirculated Draft Environmental Impact Report February 2010
Analysis Results Given that the proposed project is considered a long-range planning document that includes some level of new development predominately within the County’s existing communities, hamlets, or rural areas, it is expected that the existing transportation system will require improvements in order to accommodate the proposed levels of development.
A series of model runs were conducted to evaluate the effectiveness of the circulation plan. As a result of this analysis, it was determined that the following roadways (with several outside the immediate jurisdiction of the County) would require future improvements (mitigation in the form of widening, additional lanes, etc.):
• State Route 63 (Mooney Boulevard) between Avenue 272 and Avenue 248: widen from 4 to 6 lanes.
• State Route 137 between State Route 99 and State Route 63: widen from 4 to 6 lanes. Due to existing residential, commercial, and school developments along this corridor, widening to 6 lanes may be unlikely to occur. Alternative capacity increasing projects on adjacent corridors should be considered.
• State Route 190 between State Route 65 and Road 265: widen from 4 to 6 lanes.
• State Route 198 between Kings Co. line and Road 68: widen from 4 to 6 lanes.
• State Route 198 between Akers Street and State Route 63 (south): widen from 4 to 6 lanes.
• State Route 198 between State Route 63 (south) and Road 168: widen from 4 to 6 lanes.
• Caldwell Avenue between Fairway Street and Lovers Lane (City of Visalia): widen from 4 to 6 lanes.
• Demaree Street between Goshen Avenue and State Route 198 (City of Visalia): due to existing residential and commercial development along the corridor, it is unlikely that this roadway would be widened from 4 to 6 lanes between Goshen Avenue and State Route 198. Additional north-south access should be considered; currently, Demaree Street is the only north-south crossing over the railroad (just north of Goshen Avenue) that exists between Akers Street and Mooney Boulevard. This results in excessive travel demand on the Demaree Street corridor. Additional north-south access along the Linwood Street or Chinowth Street alignments should be considered.
• Lovers Lane between State Route 198 and Caldwell Avenue (City of Visalia): widen from 4 to 6 lanes.
• State Route 63 (Dinuba Highway) between Avenue 402 and Avenue 368: widen from 2 to 4 lanes.
• State Route 65 between Road 204 (Spruce) and Hermosa Street: widen from 4 to 6 lanes.
• Demaree Street between State Route 198 – Walnut Avenue (City of Visalia): due to existing residential and commercial development along the corridor, it is unlikely that this roadway would be widened from 4 to 6 lanes between State Route 198 and Walnut Avenue. Based upon review of the traffic models for each alternative, additional north-south capacity is available on County Center Drive and Chinowth Street that would provide adequate relief of the Demaree Street corridor.
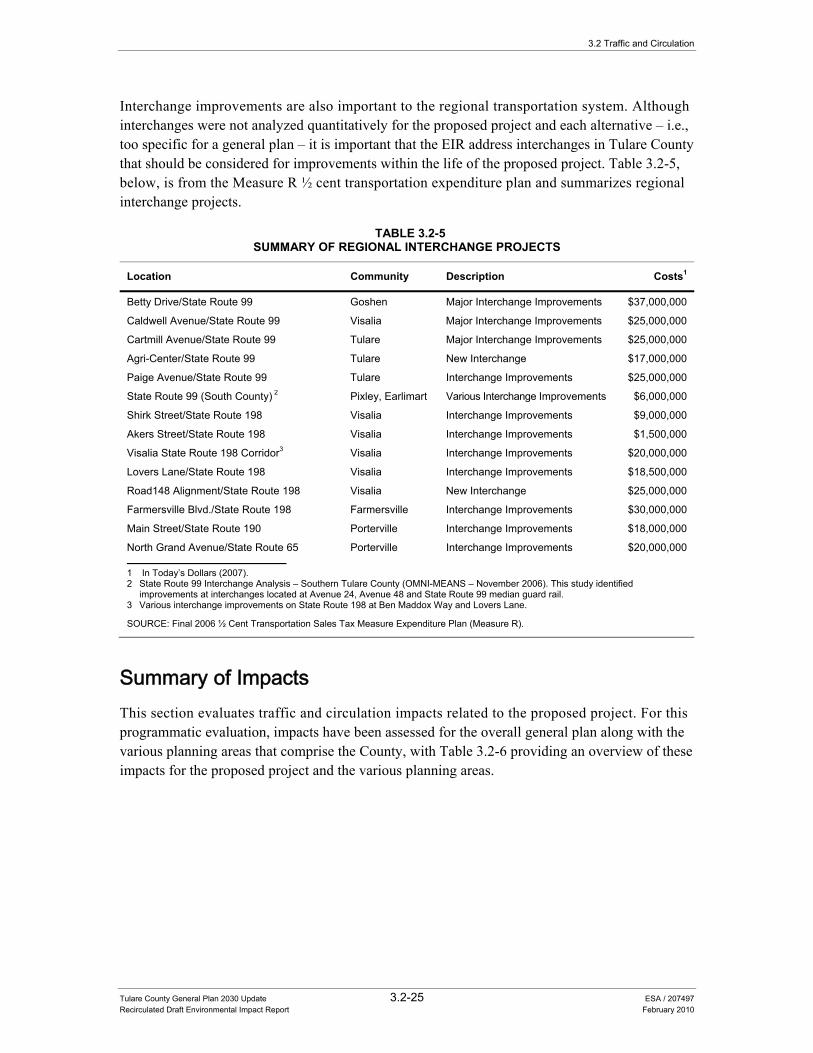
3.2 Traffic and Circulation
Tulare County General Plan 2030 Update 3.2-25 ESA / 207497 Recirculated Draft Environmental Impact Report February 2010
Interchange improvements are also important to the regional transportation system. Although interchanges were not analyzed quantitatively for the proposed project and each alternative – i.e., too specific for a general plan – it is important that the EIR address interchanges in Tulare County that should be considered for improvements within the life of the proposed project. Table 3.2-5, below, is from the Measure R ½ cent transportation expenditure plan and summarizes regional interchange projects.
TABLE 3.2-5SUMMARY OF REGIONAL INTERCHANGE PROJECTS
Location Community Description Costs1
Betty Drive/State Route 99 Goshen Major Interchange Improvements $37,000,000
Caldwell Avenue/State Route 99 Visalia Major Interchange Improvements $25,000,000
Cartmill Avenue/State Route 99 Tulare Major Interchange Improvements $25,000,000
Agri-Center/State Route 99 Tulare New Interchange $17,000,000
Paige Avenue/State Route 99 Tulare Interchange Improvements $25,000,000
State Route 99 (South County) 2 Pixley, Earlimart Various Interchange Improvements $6,000,000
Shirk Street/State Route 198 Visalia Interchange Improvements $9,000,000
Akers Street/State Route 198 Visalia Interchange Improvements $1,500,000
Visalia State Route 198 Corridor3 Visalia Interchange Improvements $20,000,000
Lovers Lane/State Route 198 Visalia Interchange Improvements $18,500,000
Road148 Alignment/State Route 198 Visalia New Interchange $25,000,000
Farmersville Blvd./State Route 198 Farmersville Interchange Improvements $30,000,000
Main Street/State Route 190 Porterville Interchange Improvements $18,000,000
North Grand Avenue/State Route 65 Porterville Interchange Improvements $20,000,000
1 In Today’s Dollars (2007). 2 State Route 99 Interchange Analysis – Southern Tulare County (OMNI-MEANS – November 2006). This study identified
improvements at interchanges located at Avenue 24, Avenue 48 and State Route 99 median guard rail. 3 Various interchange improvements on State Route 198 at Ben Maddox Way and Lovers Lane.
SOURCE: Final 2006 ½ Cent Transportation Sales Tax Measure Expenditure Plan (Measure R).
Summary of Impacts This section evaluates traffic and circulation impacts related to the proposed project. For this programmatic evaluation, impacts have been assessed for the overall general plan along with the various planning areas that comprise the County, with Table 3.2-6 providing an overview of these impacts for the proposed project and the various planning areas.
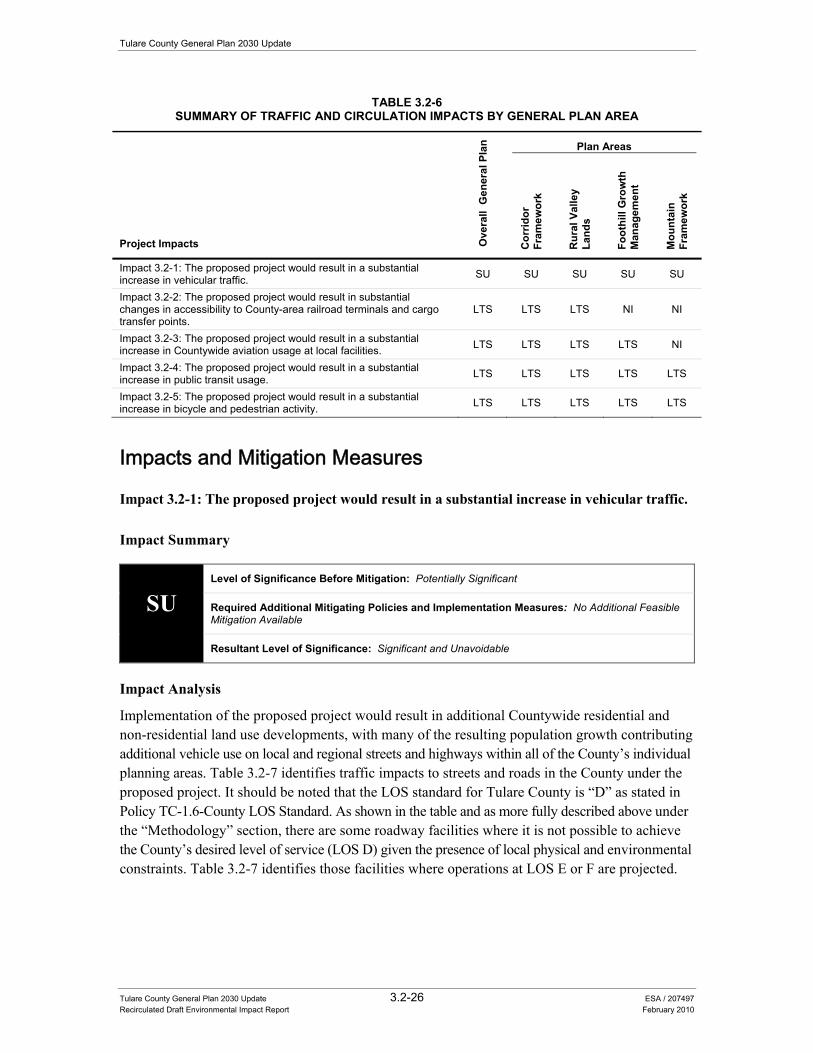
Tulare County General Plan 2030 Update
Tulare County General Plan 2030 Update 3.2-26 ESA / 207497 Recirculated Draft Environmental Impact Report February 2010
TABLE 3.2-6 SUMMARY OF TRAFFIC AND CIRCULATION IMPACTS BY GENERAL PLAN AREA
Project Impacts Ove
rall
Gen
eral
Pla
n Plan Areas
Cor
ridor
Fr
amew
ork
Rur
al V
alle
y La
nds
Foot
hill
Gro
wth
M
anag
emen
t
Mou
ntai
n Fr
amew
ork
Impact 3.2-1: The proposed project would result in a substantial increase in vehicular traffic. SU SU SU SU SU
Impact 3.2-2: The proposed project would result in substantial changes in accessibility to County-area railroad terminals and cargo transfer points.
LTS LTS LTS NI NI
Impact 3.2-3: The proposed project would result in a substantial increase in Countywide aviation usage at local facilities. LTS LTS LTS LTS NI
Impact 3.2-4: The proposed project would result in a substantial increase in public transit usage. LTS LTS LTS LTS LTS
Impact 3.2-5: The proposed project would result in a substantial increase in bicycle and pedestrian activity. LTS LTS LTS LTS LTS
Impacts and Mitigation Measures
Impact 3.2-1: The proposed project would result in a substantial increase in vehicular traffic.
Impact Summary
SU Level of Significance Before Mitigation: Potentially Significant
Required Additional Mitigating Policies and Implementation Measures: No Additional Feasible Mitigation Available
Resultant Level of Significance: Significant and Unavoidable
Impact Analysis
Implementation of the proposed project would result in additional Countywide residential and non-residential land use developments, with many of the resulting population growth contributing additional vehicle use on local and regional streets and highways within all of the County’s individual planning areas. Table 3.2-7 identifies traffic impacts to streets and roads in the County under the proposed project. It should be noted that the LOS standard for Tulare County is “D” as stated in Policy TC-1.6-County LOS Standard. As shown in the table and as more fully described above under the “Methodology” section, there are some roadway facilities where it is not possible to achieve the County’s desired level of service (LOS D) given the presence of local physical and environmental constraints. Table 3.2-7 identifies those facilities where operations at LOS E or F are projected.
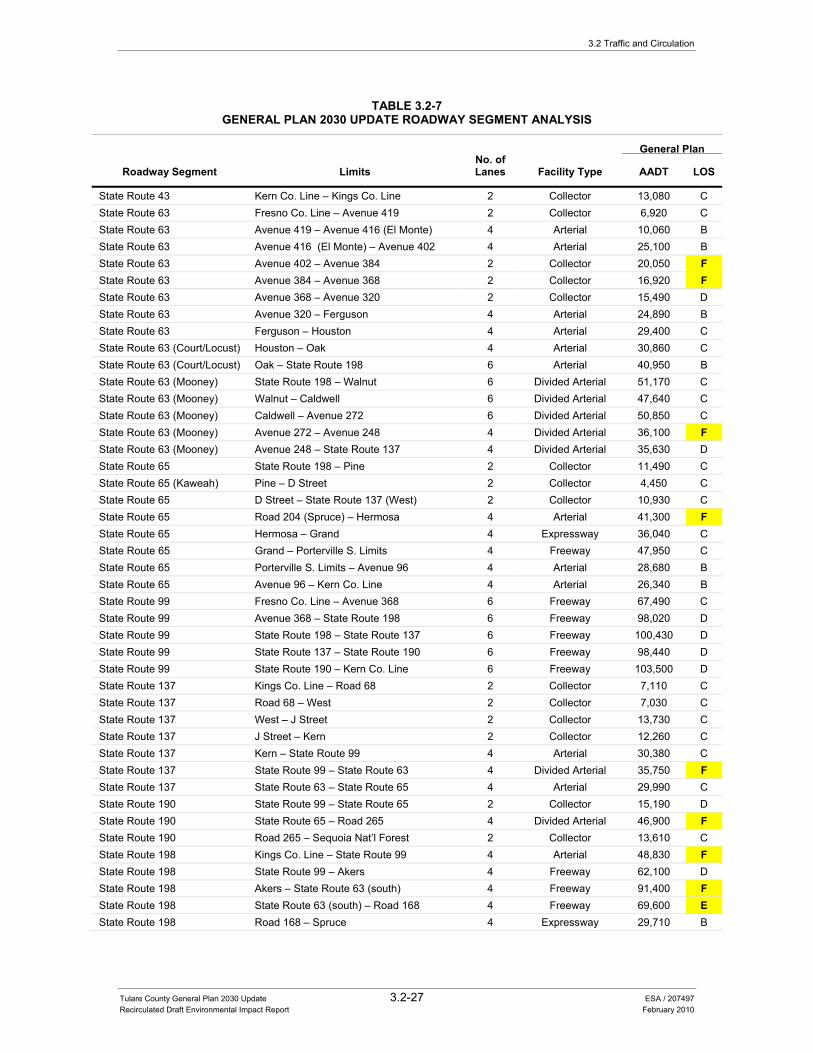
3.2 Traffic and Circulation
Tulare County General Plan 2030 Update 3.2-27 ESA / 207497 Recirculated Draft Environmental Impact Report February 2010
TABLE 3.2-7 GENERAL PLAN 2030 UPDATE ROADWAY SEGMENT ANALYSIS
Roadway Segment Limits No. of Lanes Facility Type
General Plan
AADT LOS
State Route 43 Kern Co. Line – Kings Co. Line 2 Collector 13,080 C State Route 63 Fresno Co. Line – Avenue 419 2 Collector 6,920 C State Route 63 Avenue 419 – Avenue 416 (El Monte) 4 Arterial 10,060 B State Route 63 Avenue 416 (El Monte) – Avenue 402 4 Arterial 25,100 B State Route 63 Avenue 402 – Avenue 384 2 Collector 20,050 F State Route 63 Avenue 384 – Avenue 368 2 Collector 16,920 F State Route 63 Avenue 368 – Avenue 320 2 Collector 15,490 D State Route 63 Avenue 320 – Ferguson 4 Arterial 24,890 B State Route 63 Ferguson – Houston 4 Arterial 29,400 C State Route 63 (Court/Locust) Houston – Oak 4 Arterial 30,860 C State Route 63 (Court/Locust) Oak – State Route 198 6 Arterial 40,950 B State Route 63 (Mooney) State Route 198 – Walnut 6 Divided Arterial 51,170 C State Route 63 (Mooney) Walnut – Caldwell 6 Divided Arterial 47,640 C State Route 63 (Mooney) Caldwell – Avenue 272 6 Divided Arterial 50,850 C State Route 63 (Mooney) Avenue 272 – Avenue 248 4 Divided Arterial 36,100 F State Route 63 (Mooney) Avenue 248 – State Route 137 4 Divided Arterial 35,630 D State Route 65 State Route 198 – Pine 2 Collector 11,490 C State Route 65 (Kaweah) Pine – D Street 2 Collector 4,450 C State Route 65 D Street – State Route 137 (West) 2 Collector 10,930 C State Route 65 Road 204 (Spruce) – Hermosa 4 Arterial 41,300 F State Route 65 Hermosa – Grand 4 Expressway 36,040 C State Route 65 Grand – Porterville S. Limits 4 Freeway 47,950 C State Route 65 Porterville S. Limits – Avenue 96 4 Arterial 28,680 B State Route 65 Avenue 96 – Kern Co. Line 4 Arterial 26,340 B State Route 99 Fresno Co. Line – Avenue 368 6 Freeway 67,490 C State Route 99 Avenue 368 – State Route 198 6 Freeway 98,020 D State Route 99 State Route 198 – State Route 137 6 Freeway 100,430 D State Route 99 State Route 137 – State Route 190 6 Freeway 98,440 D State Route 99 State Route 190 – Kern Co. Line 6 Freeway 103,500 D State Route 137 Kings Co. Line – Road 68 2 Collector 7,110 C State Route 137 Road 68 – West 2 Collector 7,030 C State Route 137 West – J Street 2 Collector 13,730 C State Route 137 J Street – Kern 2 Collector 12,260 C State Route 137 Kern – State Route 99 4 Arterial 30,380 C State Route 137 State Route 99 – State Route 63 4 Divided Arterial 35,750 F State Route 137 State Route 63 – State Route 65 4 Arterial 29,990 C State Route 190 State Route 99 – State Route 65 2 Collector 15,190 D State Route 190 State Route 65 – Road 265 4 Divided Arterial 46,900 F State Route 190 Road 265 – Sequoia Nat’l Forest 2 Collector 13,610 C State Route 198 Kings Co. Line – State Route 99 4 Arterial 48,830 F State Route 198 State Route 99 – Akers 4 Freeway 62,100 D State Route 198 Akers – State Route 63 (south) 4 Freeway 91,400 F State Route 198 State Route 63 (south) – Road 168 4 Freeway 69,600 E State Route 198 Road 168 – Spruce 4 Expressway 29,710 B
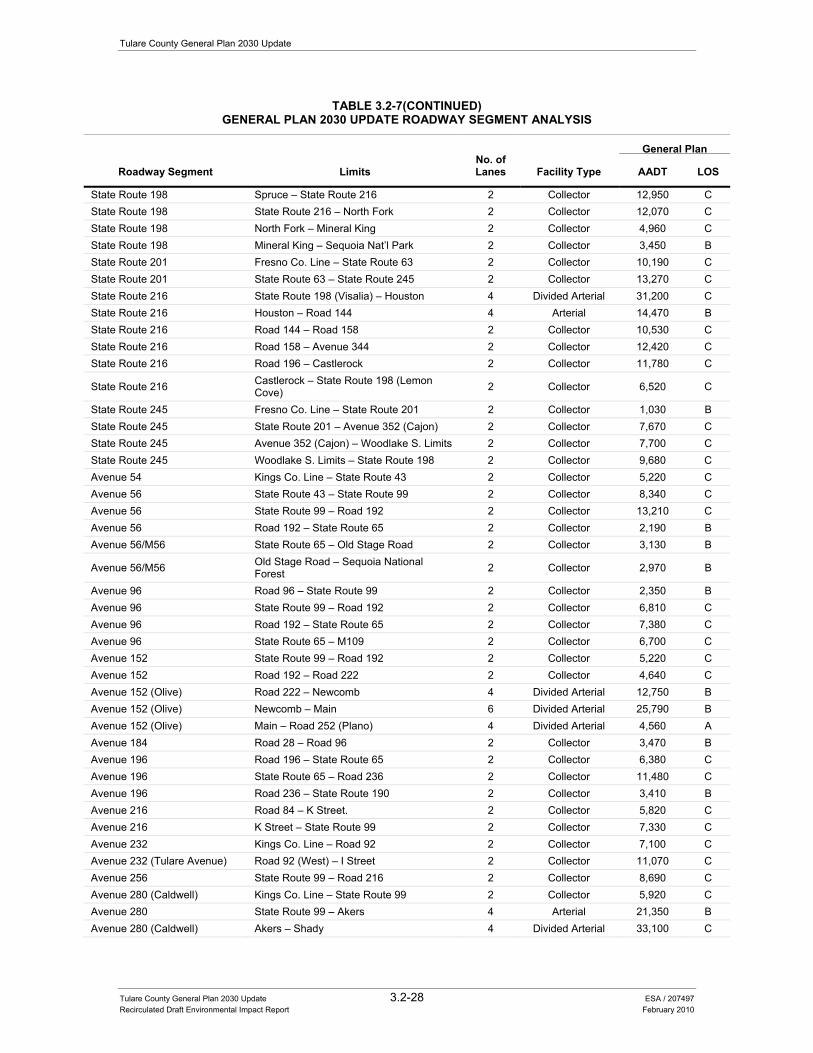
Tulare County General Plan 2030 Update
Tulare County General Plan 2030 Update 3.2-28 ESA / 207497 Recirculated Draft Environmental Impact Report February 2010
TABLE 3.2-7(CONTINUED) GENERAL PLAN 2030 UPDATE ROADWAY SEGMENT ANALYSIS
Roadway Segment Limits No. of Lanes Facility Type
General Plan
AADT LOS
State Route 198 Spruce – State Route 216 2 Collector 12,950 C State Route 198 State Route 216 – North Fork 2 Collector 12,070 C State Route 198 North Fork – Mineral King 2 Collector 4,960 C State Route 198 Mineral King – Sequoia Nat’l Park 2 Collector 3,450 B State Route 201 Fresno Co. Line – State Route 63 2 Collector 10,190 C State Route 201 State Route 63 – State Route 245 2 Collector 13,270 C State Route 216 State Route 198 (Visalia) – Houston 4 Divided Arterial 31,200 C State Route 216 Houston – Road 144 4 Arterial 14,470 B State Route 216 Road 144 – Road 158 2 Collector 10,530 C State Route 216 Road 158 – Avenue 344 2 Collector 12,420 C State Route 216 Road 196 – Castlerock 2 Collector 11,780 C
State Route 216 Castlerock – State Route 198 (Lemon Cove) 2 Collector 6,520 C
State Route 245 Fresno Co. Line – State Route 201 2 Collector 1,030 B State Route 245 State Route 201 – Avenue 352 (Cajon) 2 Collector 7,670 C State Route 245 Avenue 352 (Cajon) – Woodlake S. Limits 2 Collector 7,700 C State Route 245 Woodlake S. Limits – State Route 198 2 Collector 9,680 C Avenue 54 Kings Co. Line – State Route 43 2 Collector 5,220 C Avenue 56 State Route 43 – State Route 99 2 Collector 8,340 C Avenue 56 State Route 99 – Road 192 2 Collector 13,210 C Avenue 56 Road 192 – State Route 65 2 Collector 2,190 B Avenue 56/M56 State Route 65 – Old Stage Road 2 Collector 3,130 B
Avenue 56/M56 Old Stage Road – Sequoia National Forest 2 Collector 2,970 B
Avenue 96 Road 96 – State Route 99 2 Collector 2,350 B Avenue 96 State Route 99 – Road 192 2 Collector 6,810 C Avenue 96 Road 192 – State Route 65 2 Collector 7,380 C Avenue 96 State Route 65 – M109 2 Collector 6,700 C Avenue 152 State Route 99 – Road 192 2 Collector 5,220 C Avenue 152 Road 192 – Road 222 2 Collector 4,640 C Avenue 152 (Olive) Road 222 – Newcomb 4 Divided Arterial 12,750 B Avenue 152 (Olive) Newcomb – Main 6 Divided Arterial 25,790 B Avenue 152 (Olive) Main – Road 252 (Plano) 4 Divided Arterial 4,560 A Avenue 184 Road 28 – Road 96 2 Collector 3,470 B Avenue 196 Road 196 – State Route 65 2 Collector 6,380 C Avenue 196 State Route 65 – Road 236 2 Collector 11,480 C Avenue 196 Road 236 – State Route 190 2 Collector 3,410 B Avenue 216 Road 84 – K Street. 2 Collector 5,820 C Avenue 216 K Street – State Route 99 2 Collector 7,330 C Avenue 232 Kings Co. Line – Road 92 2 Collector 7,100 C Avenue 232 (Tulare Avenue) Road 92 (West) – I Street 2 Collector 11,070 C Avenue 256 State Route 99 – Road 216 2 Collector 8,690 C Avenue 280 (Caldwell) Kings Co. Line – State Route 99 2 Collector 5,920 C Avenue 280 State Route 99 – Akers 4 Arterial 21,350 B Avenue 280 (Caldwell) Akers – Shady 4 Divided Arterial 33,100 C
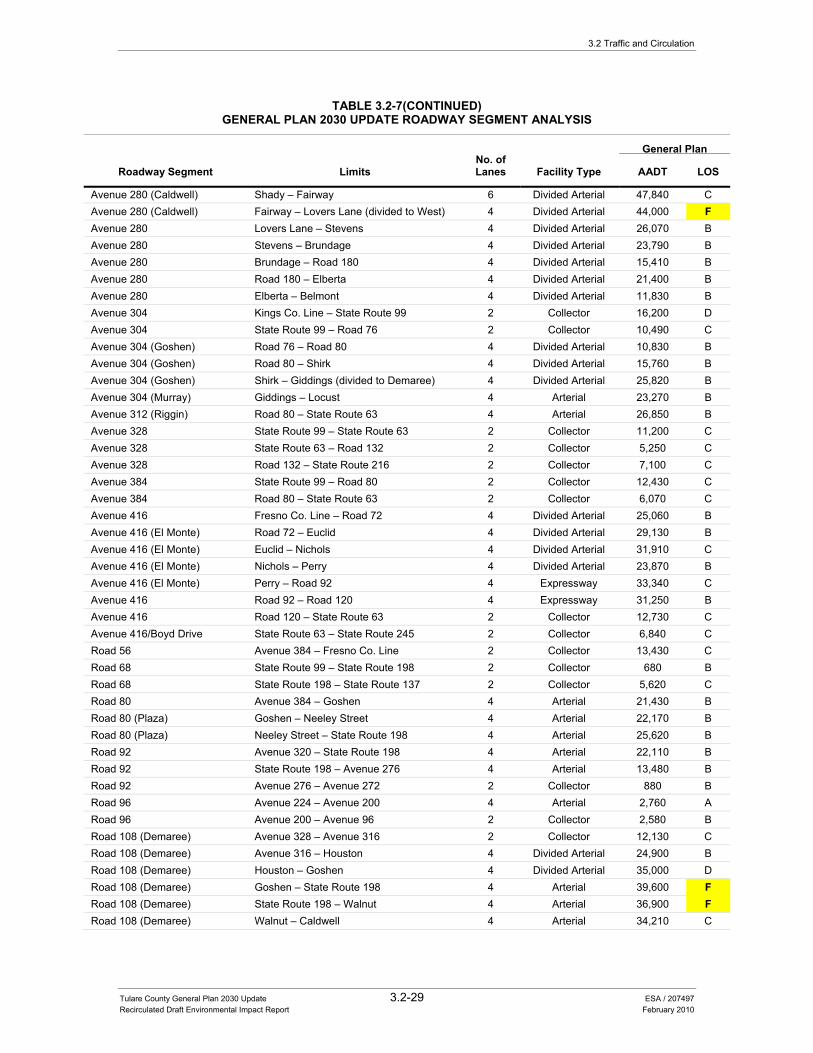
3.2 Traffic and Circulation
Tulare County General Plan 2030 Update 3.2-29 ESA / 207497 Recirculated Draft Environmental Impact Report February 2010
TABLE 3.2-7(CONTINUED) GENERAL PLAN 2030 UPDATE ROADWAY SEGMENT ANALYSIS
Roadway Segment Limits No. of Lanes Facility Type
General Plan
AADT LOS
Avenue 280 (Caldwell) Shady – Fairway 6 Divided Arterial 47,840 C Avenue 280 (Caldwell) Fairway – Lovers Lane (divided to West) 4 Divided Arterial 44,000 F Avenue 280 Lovers Lane – Stevens 4 Divided Arterial 26,070 B Avenue 280 Stevens – Brundage 4 Divided Arterial 23,790 B Avenue 280 Brundage – Road 180 4 Divided Arterial 15,410 B Avenue 280 Road 180 – Elberta 4 Divided Arterial 21,400 B Avenue 280 Elberta – Belmont 4 Divided Arterial 11,830 B Avenue 304 Kings Co. Line – State Route 99 2 Collector 16,200 D Avenue 304 State Route 99 – Road 76 2 Collector 10,490 C Avenue 304 (Goshen) Road 76 – Road 80 4 Divided Arterial 10,830 B Avenue 304 (Goshen) Road 80 – Shirk 4 Divided Arterial 15,760 B Avenue 304 (Goshen) Shirk – Giddings (divided to Demaree) 4 Divided Arterial 25,820 B Avenue 304 (Murray) Giddings – Locust 4 Arterial 23,270 B Avenue 312 (Riggin) Road 80 – State Route 63 4 Arterial 26,850 B Avenue 328 State Route 99 – State Route 63 2 Collector 11,200 C Avenue 328 State Route 63 – Road 132 2 Collector 5,250 C Avenue 328 Road 132 – State Route 216 2 Collector 7,100 C Avenue 384 State Route 99 – Road 80 2 Collector 12,430 C Avenue 384 Road 80 – State Route 63 2 Collector 6,070 C Avenue 416 Fresno Co. Line – Road 72 4 Divided Arterial 25,060 B Avenue 416 (El Monte) Road 72 – Euclid 4 Divided Arterial 29,130 B Avenue 416 (El Monte) Euclid – Nichols 4 Divided Arterial 31,910 C Avenue 416 (El Monte) Nichols – Perry 4 Divided Arterial 23,870 B Avenue 416 (El Monte) Perry – Road 92 4 Expressway 33,340 C Avenue 416 Road 92 – Road 120 4 Expressway 31,250 B Avenue 416 Road 120 – State Route 63 2 Collector 12,730 C Avenue 416/Boyd Drive State Route 63 – State Route 245 2 Collector 6,840 C Road 56 Avenue 384 – Fresno Co. Line 2 Collector 13,430 C Road 68 State Route 99 – State Route 198 2 Collector 680 B Road 68 State Route 198 – State Route 137 2 Collector 5,620 C Road 80 Avenue 384 – Goshen 4 Arterial 21,430 B Road 80 (Plaza) Goshen – Neeley Street 4 Arterial 22,170 B Road 80 (Plaza) Neeley Street – State Route 198 4 Arterial 25,620 B Road 92 Avenue 320 – State Route 198 4 Arterial 22,110 B Road 92 State Route 198 – Avenue 276 4 Arterial 13,480 B Road 92 Avenue 276 – Avenue 272 2 Collector 880 B Road 96 Avenue 224 – Avenue 200 4 Arterial 2,760 A Road 96 Avenue 200 – Avenue 96 2 Collector 2,580 B Road 108 (Demaree) Avenue 328 – Avenue 316 2 Collector 12,130 C Road 108 (Demaree) Avenue 316 – Houston 4 Divided Arterial 24,900 B Road 108 (Demaree) Houston – Goshen 4 Divided Arterial 35,000 D Road 108 (Demaree) Goshen – State Route 198 4 Arterial 39,600 F Road 108 (Demaree) State Route 198 – Walnut 4 Arterial 36,900 F Road 108 (Demaree) Walnut – Caldwell 4 Arterial 34,210 C
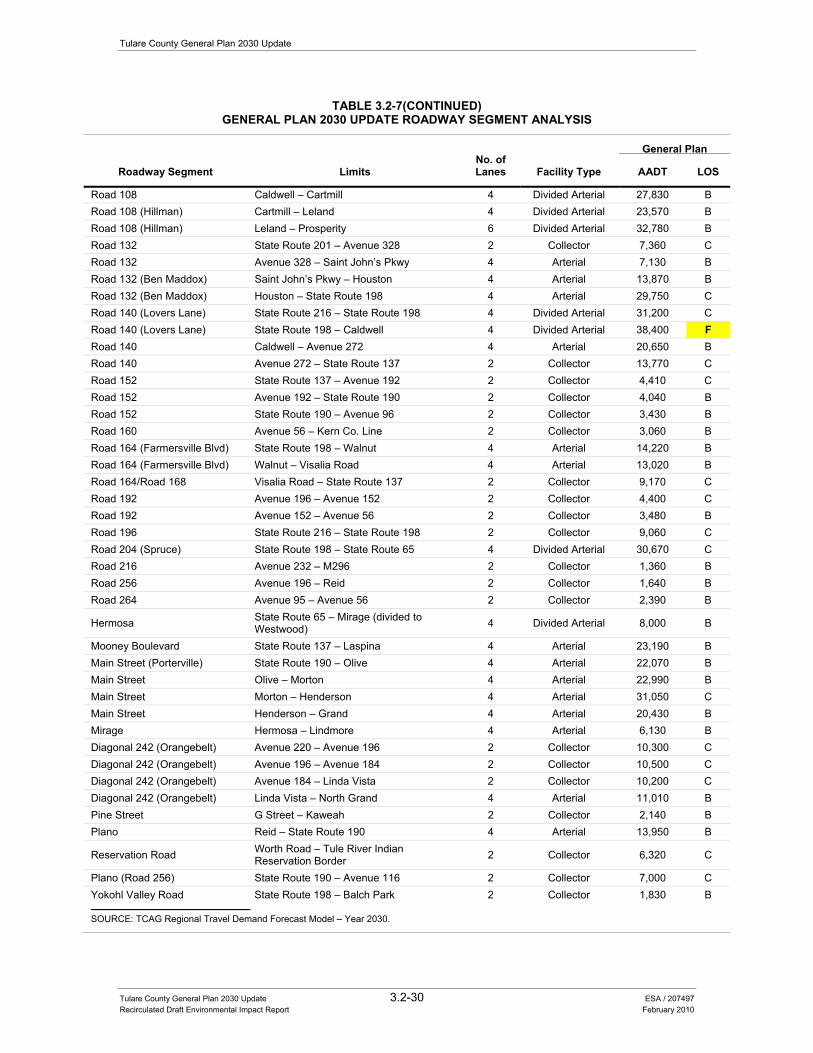
Tulare County General Plan 2030 Update
Tulare County General Plan 2030 Update 3.2-30 ESA / 207497 Recirculated Draft Environmental Impact Report February 2010
TABLE 3.2-7(CONTINUED) GENERAL PLAN 2030 UPDATE ROADWAY SEGMENT ANALYSIS
Roadway Segment Limits No. of Lanes Facility Type
General Plan
AADT LOS
Road 108 Caldwell – Cartmill 4 Divided Arterial 27,830 B Road 108 (Hillman) Cartmill – Leland 4 Divided Arterial 23,570 B Road 108 (Hillman) Leland – Prosperity 6 Divided Arterial 32,780 B Road 132 State Route 201 – Avenue 328 2 Collector 7,360 C Road 132 Avenue 328 – Saint John’s Pkwy 4 Arterial 7,130 B Road 132 (Ben Maddox) Saint John’s Pkwy – Houston 4 Arterial 13,870 B Road 132 (Ben Maddox) Houston – State Route 198 4 Arterial 29,750 C Road 140 (Lovers Lane) State Route 216 – State Route 198 4 Divided Arterial 31,200 C Road 140 (Lovers Lane) State Route 198 – Caldwell 4 Divided Arterial 38,400 F Road 140 Caldwell – Avenue 272 4 Arterial 20,650 B Road 140 Avenue 272 – State Route 137 2 Collector 13,770 C Road 152 State Route 137 – Avenue 192 2 Collector 4,410 C Road 152 Avenue 192 – State Route 190 2 Collector 4,040 B Road 152 State Route 190 – Avenue 96 2 Collector 3,430 B Road 160 Avenue 56 – Kern Co. Line 2 Collector 3,060 B Road 164 (Farmersville Blvd) State Route 198 – Walnut 4 Arterial 14,220 B Road 164 (Farmersville Blvd) Walnut – Visalia Road 4 Arterial 13,020 B Road 164/Road 168 Visalia Road – State Route 137 2 Collector 9,170 C Road 192 Avenue 196 – Avenue 152 2 Collector 4,400 C Road 192 Avenue 152 – Avenue 56 2 Collector 3,480 B Road 196 State Route 216 – State Route 198 2 Collector 9,060 C Road 204 (Spruce) State Route 198 – State Route 65 4 Divided Arterial 30,670 C Road 216 Avenue 232 – M296 2 Collector 1,360 B Road 256 Avenue 196 – Reid 2 Collector 1,640 B Road 264 Avenue 95 – Avenue 56 2 Collector 2,390 B
Hermosa State Route 65 – Mirage (divided to Westwood) 4 Divided Arterial 8,000 B
Mooney Boulevard State Route 137 – Laspina 4 Arterial 23,190 B Main Street (Porterville) State Route 190 – Olive 4 Arterial 22,070 B Main Street Olive – Morton 4 Arterial 22,990 B Main Street Morton – Henderson 4 Arterial 31,050 C Main Street Henderson – Grand 4 Arterial 20,430 B Mirage Hermosa – Lindmore 4 Arterial 6,130 B Diagonal 242 (Orangebelt) Avenue 220 – Avenue 196 2 Collector 10,300 C Diagonal 242 (Orangebelt) Avenue 196 – Avenue 184 2 Collector 10,500 C Diagonal 242 (Orangebelt) Avenue 184 – Linda Vista 2 Collector 10,200 C Diagonal 242 (Orangebelt) Linda Vista – North Grand 4 Arterial 11,010 B Pine Street G Street – Kaweah 2 Collector 2,140 B Plano Reid – State Route 190 4 Arterial 13,950 B
Reservation Road Worth Road – Tule River Indian Reservation Border 2 Collector 6,320 C
Plano (Road 256) State Route 190 – Avenue 116 2 Collector 7,000 C Yokohl Valley Road State Route 198 – Balch Park 2 Collector 1,830 B
SOURCE: TCAG Regional Travel Demand Forecast Model – Year 2030.
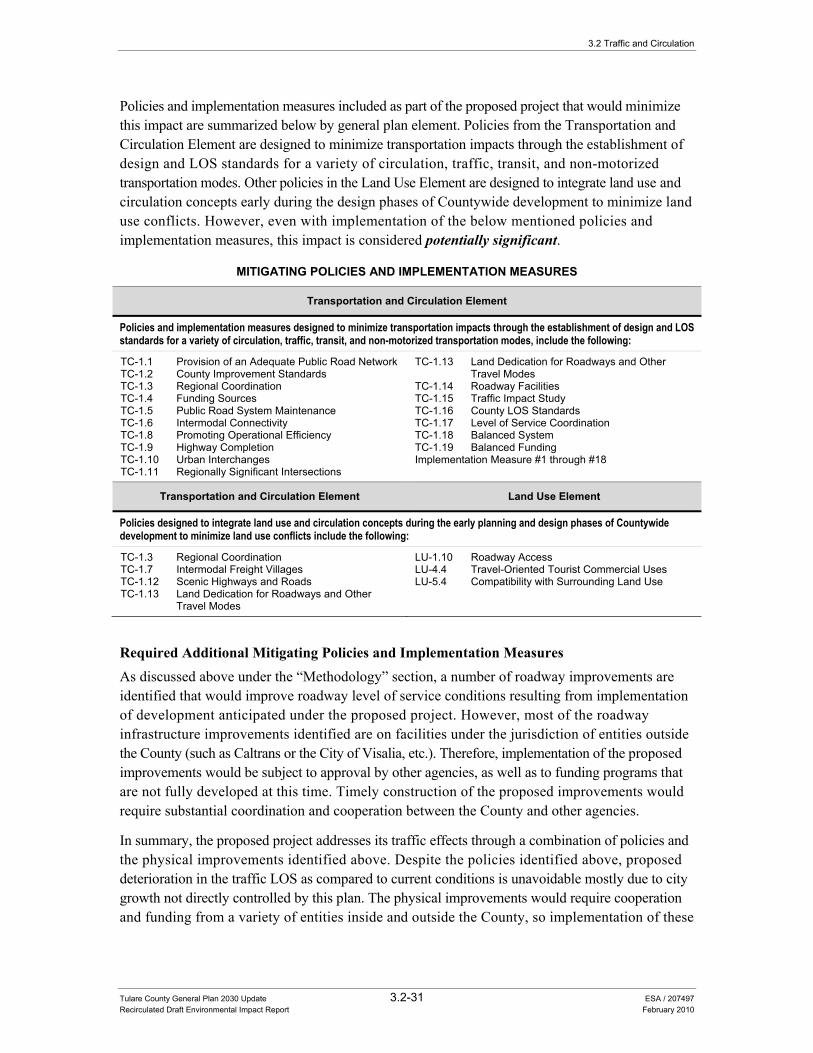
3.2 Traffic and Circulation
Tulare County General Plan 2030 Update 3.2-31 ESA / 207497 Recirculated Draft Environmental Impact Report February 2010
Policies and implementation measures included as part of the proposed project that would minimize this impact are summarized below by general plan element. Policies from the Transportation and Circulation Element are designed to minimize transportation impacts through the establishment of design and LOS standards for a variety of circulation, traffic, transit, and non-motorized transportation modes. Other policies in the Land Use Element are designed to integrate land use and circulation concepts early during the design phases of Countywide development to minimize land use conflicts. However, even with implementation of the below mentioned policies and implementation measures, this impact is considered potentially significant.
MITIGATING POLICIES AND IMPLEMENTATION MEASURES
Transportation and Circulation Element
Policies and implementation measures designed to minimize transportation impacts through the establishment of design and LOS standards for a variety of circulation, traffic, transit, and non-motorized transportation modes, include the following:
TC-1.1 Provision of an Adequate Public Road Network TC-1.2 County Improvement Standards TC-1.3 Regional Coordination TC-1.4 Funding Sources TC-1.5 Public Road System Maintenance TC-1.6 Intermodal Connectivity TC-1.8 Promoting Operational Efficiency TC-1.9 Highway Completion TC-1.10 Urban Interchanges TC-1.11 Regionally Significant Intersections
TC-1.13 Land Dedication for Roadways and Other Travel Modes
TC-1.14 Roadway Facilities TC-1.15 Traffic Impact Study TC-1.16 County LOS Standards TC-1.17 Level of Service Coordination TC-1.18 Balanced System TC-1.19 Balanced Funding Implementation Measure #1 through #18
Transportation and Circulation Element Land Use Element
Policies designed to integrate land use and circulation concepts during the early planning and design phases of Countywide development to minimize land use conflicts include the following:
TC-1.3 Regional Coordination TC-1.7 Intermodal Freight Villages TC-1.12 Scenic Highways and Roads TC-1.13 Land Dedication for Roadways and Other
Travel Modes
LU-1.10 Roadway Access LU-4.4 Travel-Oriented Tourist Commercial Uses LU-5.4 Compatibility with Surrounding Land Use
Required Additional Mitigating Policies and Implementation Measures As discussed above under the “Methodology” section, a number of roadway improvements are identified that would improve roadway level of service conditions resulting from implementation of development anticipated under the proposed project. However, most of the roadway infrastructure improvements identified are on facilities under the jurisdiction of entities outside the County (such as Caltrans or the City of Visalia, etc.). Therefore, implementation of the proposed improvements would be subject to approval by other agencies, as well as to funding programs that are not fully developed at this time. Timely construction of the proposed improvements would require substantial coordination and cooperation between the County and other agencies.
In summary, the proposed project addresses its traffic effects through a combination of policies and the physical improvements identified above. Despite the policies identified above, proposed deterioration in the traffic LOS as compared to current conditions is unavoidable mostly due to city growth not directly controlled by this plan. The physical improvements would require cooperation and funding from a variety of entities inside and outside the County, so implementation of these

Tulare County General Plan 2030 Update
Tulare County General Plan 2030 Update 3.2-32 ESA / 207497 Recirculated Draft Environmental Impact Report February 2010
improvements cannot be guaranteed solely through the County’s actions. As a result, this impact remains significant. No additional feasible mitigation is currently available.
Significance after Implementation of Mitigation for Impact 3.2-1
As stated above, no additional technologically or economically feasible mitigation measures are currently available to reduce this impact to a less than significant level. Consequently, this impact is considered significant and unavoidable.
Impact 3.2-2: The proposed project could result in substantial changes in accessibility to County-area railroad terminals and cargo transfer points.
Impact Summary
LTS Level of Significance Before Mitigation: Potentially Significant
Required Additional Mitigating Policies and Implementation Measures: New Policy TC-2.7 “Rail Facilities and Existing Development”
Resultant Level of Significance: Less than Significant
Impact Analysis
A qualitative analysis has been applied to assess environmental impacts for rail transportation in Tulare County. Additional population growth in the County and throughout the State is expected to increase demand for freight movement through Tulare County. As a result, more freight will be hauled and more rail traffic will occur. Changes in accessibility to railroad terminals and cargo transfer points could be affected by population growth and land use changes resulting from implementation of the proposed project. Development associated with the proposed project could affect rail transportation activities near existing and proposed railroad facilities including those within the Corridor Framework and Rural Valley Lands geographic areas. The Foothill Growth Management and Mountain Framework geographic areas have limited access to railroad facilities and would likely experience no impacts.
Policies and implementation measures included as part of the proposed project that would minimize this impact are summarized below by general plan element. Policies from the Transportation and Circulation Element are designed to minimize transportation impacts through the establishment of design and LOS standards for a variety of circulation, traffic, transit, and non-motorized transportation modes. Additionally, Policy TC-2.4 also requires the County to continue coordinating with TCAG and the High Speed Rail Commission in efforts to locate the HSR corridor in Tulare County. Other policies (see Policy TC-2.5) are designed to protect important railroad right-of-way for future rail expansion activities. Policies in the Land Use Element are designed to integrate land use and circulation concepts early during the design phases of Countywide
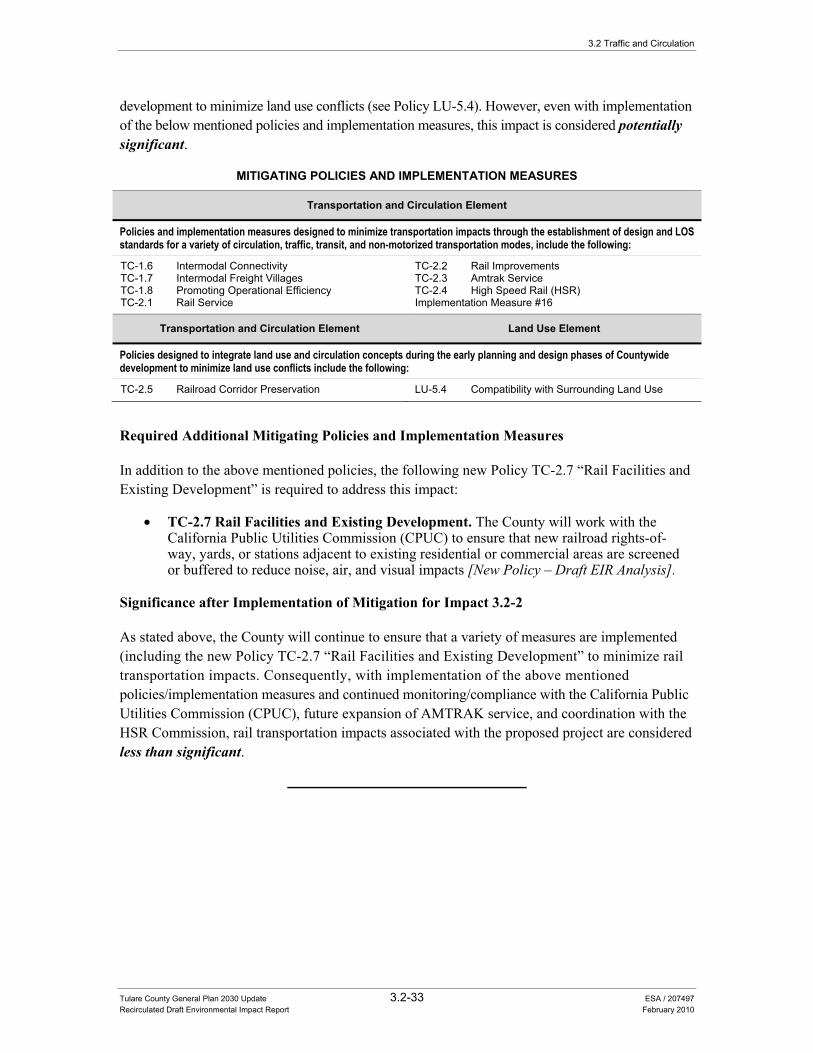
3.2 Traffic and Circulation
Tulare County General Plan 2030 Update 3.2-33 ESA / 207497 Recirculated Draft Environmental Impact Report February 2010
development to minimize land use conflicts (see Policy LU-5.4). However, even with implementation of the below mentioned policies and implementation measures, this impact is considered potentially significant.
MITIGATING POLICIES AND IMPLEMENTATION MEASURES
Transportation and Circulation Element
Policies and implementation measures designed to minimize transportation impacts through the establishment of design and LOS standards for a variety of circulation, traffic, transit, and non-motorized transportation modes, include the following:
TC-1.6 Intermodal Connectivity TC-1.7 Intermodal Freight Villages TC-1.8 Promoting Operational Efficiency TC-2.1 Rail Service
TC-2.2 Rail Improvements TC-2.3 Amtrak Service TC-2.4 High Speed Rail (HSR) Implementation Measure #16
Transportation and Circulation Element Land Use Element
Policies designed to integrate land use and circulation concepts during the early planning and design phases of Countywide development to minimize land use conflicts include the following:
TC-2.5 Railroad Corridor Preservation LU-5.4 Compatibility with Surrounding Land Use
Required Additional Mitigating Policies and Implementation Measures
In addition to the above mentioned policies, the following new Policy TC-2.7 “Rail Facilities and Existing Development” is required to address this impact:
• TC-2.7 Rail Facilities and Existing Development. The County will work with the California Public Utilities Commission (CPUC) to ensure that new railroad rights-of-way, yards, or stations adjacent to existing residential or commercial areas are screened or buffered to reduce noise, air, and visual impacts [New Policy – Draft EIR Analysis].
Significance after Implementation of Mitigation for Impact 3.2-2
As stated above, the County will continue to ensure that a variety of measures are implemented (including the new Policy TC-2.7 “Rail Facilities and Existing Development” to minimize rail transportation impacts. Consequently, with implementation of the above mentioned policies/implementation measures and continued monitoring/compliance with the California Public Utilities Commission (CPUC), future expansion of AMTRAK service, and coordination with the HSR Commission, rail transportation impacts associated with the proposed project are considered less than significant.
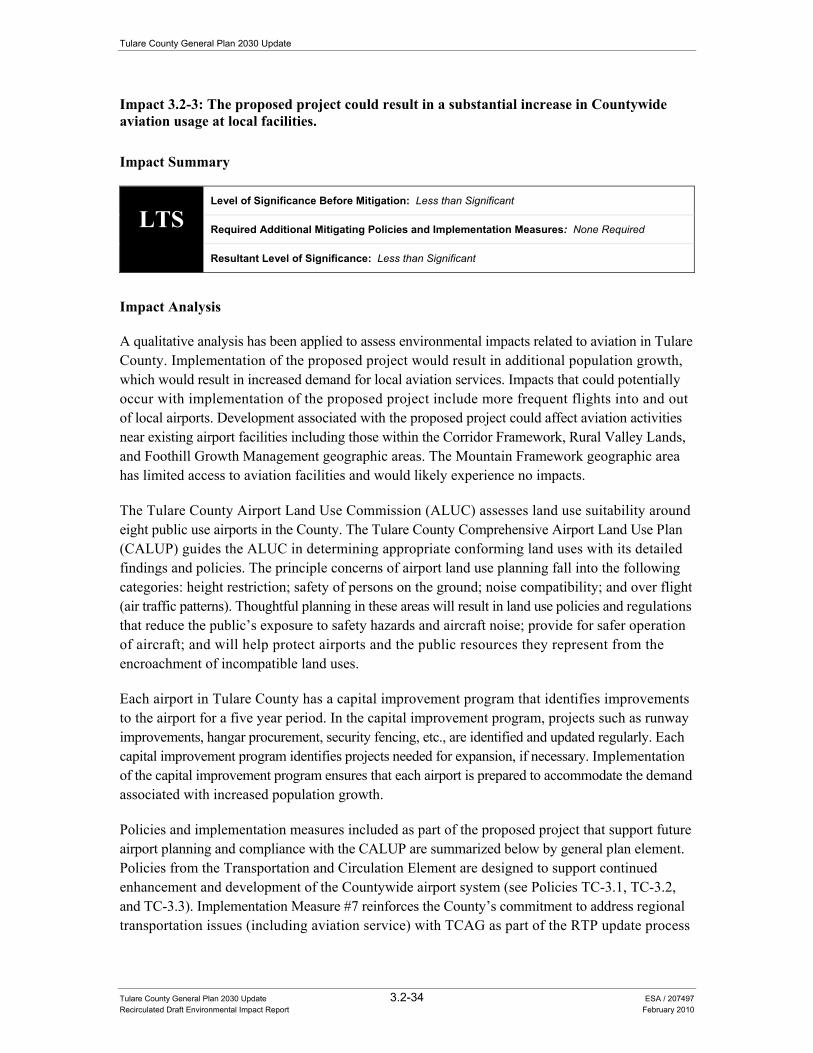
Tulare County General Plan 2030 Update
Tulare County General Plan 2030 Update 3.2-34 ESA / 207497 Recirculated Draft Environmental Impact Report February 2010
Impact 3.2-3: The proposed project could result in a substantial increase in Countywide aviation usage at local facilities.
Impact Summary
LTS Level of Significance Before Mitigation: Less than Significant
Required Additional Mitigating Policies and Implementation Measures: None Required
Resultant Level of Significance: Less than Significant
Impact Analysis
A qualitative analysis has been applied to assess environmental impacts related to aviation in Tulare County. Implementation of the proposed project would result in additional population growth, which would result in increased demand for local aviation services. Impacts that could potentially occur with implementation of the proposed project include more frequent flights into and out of local airports. Development associated with the proposed project could affect aviation activities near existing airport facilities including those within the Corridor Framework, Rural Valley Lands, and Foothill Growth Management geographic areas. The Mountain Framework geographic area has limited access to aviation facilities and would likely experience no impacts.
The Tulare County Airport Land Use Commission (ALUC) assesses land use suitability around eight public use airports in the County. The Tulare County Comprehensive Airport Land Use Plan (CALUP) guides the ALUC in determining appropriate conforming land uses with its detailed findings and policies. The principle concerns of airport land use planning fall into the following categories: height restriction; safety of persons on the ground; noise compatibility; and over flight (air traffic patterns). Thoughtful planning in these areas will result in land use policies and regulations that reduce the public’s exposure to safety hazards and aircraft noise; provide for safer operation of aircraft; and will help protect airports and the public resources they represent from the encroachment of incompatible land uses.
Each airport in Tulare County has a capital improvement program that identifies improvements to the airport for a five year period. In the capital improvement program, projects such as runway improvements, hangar procurement, security fencing, etc., are identified and updated regularly. Each capital improvement program identifies projects needed for expansion, if necessary. Implementation of the capital improvement program ensures that each airport is prepared to accommodate the demand associated with increased population growth.
Policies and implementation measures included as part of the proposed project that support future airport planning and compliance with the CALUP are summarized below by general plan element. Policies from the Transportation and Circulation Element are designed to support continued enhancement and development of the Countywide airport system (see Policies TC-3.1, TC-3.2, and TC-3.3). Implementation Measure #7 reinforces the County’s commitment to address regional transportation issues (including aviation service) with TCAG as part of the RTP update process
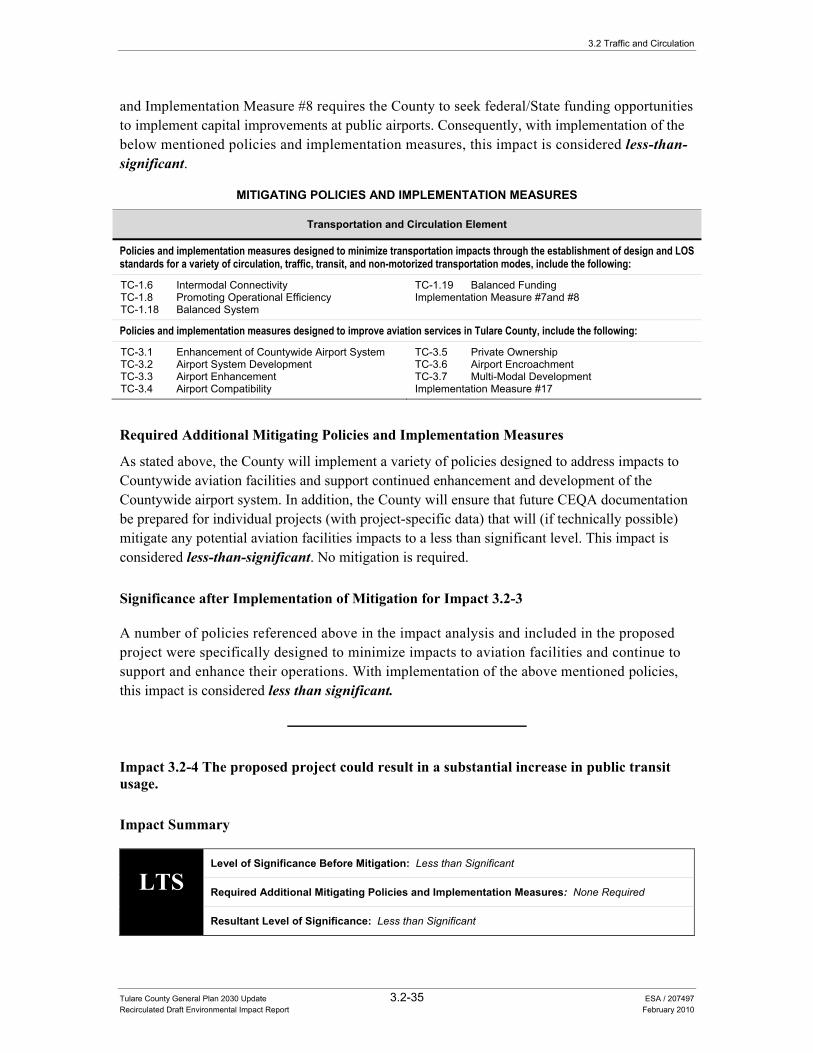
3.2 Traffic and Circulation
Tulare County General Plan 2030 Update 3.2-35 ESA / 207497 Recirculated Draft Environmental Impact Report February 2010
and Implementation Measure #8 requires the County to seek federal/State funding opportunities to implement capital improvements at public airports. Consequently, with implementation of the below mentioned policies and implementation measures, this impact is considered less-than-significant.
MITIGATING POLICIES AND IMPLEMENTATION MEASURES
Transportation and Circulation Element
Policies and implementation measures designed to minimize transportation impacts through the establishment of design and LOS standards for a variety of circulation, traffic, transit, and non-motorized transportation modes, include the following:
TC-1.6 Intermodal Connectivity TC-1.8 Promoting Operational Efficiency TC-1.18 Balanced System
TC-1.19 Balanced Funding Implementation Measure #7and #8
Policies and implementation measures designed to improve aviation services in Tulare County, include the following:
TC-3.1 Enhancement of Countywide Airport System TC-3.2 Airport System Development TC-3.3 Airport Enhancement TC-3.4 Airport Compatibility
TC-3.5 Private Ownership TC-3.6 Airport Encroachment TC-3.7 Multi-Modal Development Implementation Measure #17
Required Additional Mitigating Policies and Implementation Measures
As stated above, the County will implement a variety of policies designed to address impacts to Countywide aviation facilities and support continued enhancement and development of the Countywide airport system. In addition, the County will ensure that future CEQA documentation be prepared for individual projects (with project-specific data) that will (if technically possible) mitigate any potential aviation facilities impacts to a less than significant level. This impact is considered less-than-significant. No mitigation is required.
Significance after Implementation of Mitigation for Impact 3.2-3
A number of policies referenced above in the impact analysis and included in the proposed project were specifically designed to minimize impacts to aviation facilities and continue to support and enhance their operations. With implementation of the above mentioned policies, this impact is considered less than significant.
Impact 3.2-4 The proposed project could result in a substantial increase in public transit usage.
Impact Summary
LTS Level of Significance Before Mitigation: Less than Significant
Required Additional Mitigating Policies and Implementation Measures: None Required
Resultant Level of Significance: Less than Significant
Tulare County General Plan 2030 Update
Tulare County General Plan 2030 Update 3.2-36 ESA / 207497 Recirculated Draft Environmental Impact Report February 2010
Impact Analysis
A qualitative analysis has been applied to assess environmental impacts related to public transit in Tulare County. Implementation of the proposed project would result in additional population growth, which would result in increased demand for Countywide transit services, within all of the County’s individual planning areas.
Tulare County Area Transit (TCaT) is the County’s transit provider. It serves rural communities and provides links to all of Tulare County’s cities via a fleet of shuttle buses. Impacts due to increased growth will be identified through updates of short and long range transit development plans and the annual unmet transit needs hearing. As new population growth occurs and transit demand increases, additional transit services will be developed to ensure that adequate supply exists. Largely market driven, transit service will expand as needed and will be self mitigating.
Policies and implementation measures included as part of the proposed project that would minimize this impact are summarized below by general plan element. Policies from the Transportation and Circulation Element are designed to support continued coordination of local transportation programs to facilitate connectivity with City operated transit systems (see Policy TC-4.5) and support of TCAG for development of transit services outlined in the County’s Transit Development Plan (see Policies TC-4.3 and TC-4.2). Additionally, Policy TC-4.7 promotes the reservation of transit stops in conjunction with development projects and Policy FGMP-8.16 encourages the concentration of development along major travel routes to facilitate the expansion of transit service within the Foothill Growth Management Plan area. Policy TC-1.6 “Intermodal Connectivity” requires the County to ensure, whenever possible, an interconnected highway, roadway, and public transit system. Implementation Measure #7 reinforces the County’s commitment to address regional transportation issues (including transit service) with TCAG as part of the RTP update process and Implementation Measure #18 requires the County to seek federal/State funding opportunities to implement regional transit projects. Consequently, with implementation of the below mentioned policies and implementation measures, this impact is considered less-than-significant.
MITIGATING POLICIES AND IMPLEMENTATION MEASURES
Transportation and Circulation and Foothill Growth Management Plan Elements
Policies and implementation measures designed to minimize transportation impacts through the establishment of design and LOS standards for a variety of circulation, traffic, transit, and non-motorized transportation modes, include the following:
TC-1.3 Regional Coordination TC-1.4 Funding Sources TC-1.6 Intermodal Connectivity TC-1.18 Balanced System
TC-1.19 Balanced Funding Implementation Measure #7 FGMP-8.16 Proximity to Transportation
Policies and implementation measures designed to improve public transit services in Tulare County, include the following:
TC-4.1 Transportation Programs TC-4.2 Determine Transit Needs TC-4.3 Support Tulare County Area Transit TC-4.4 Nodal Land Use Patterns that Support Public
Transit
TC-4.5 Transit Coordination TC-4.6 San Joaquin Valley Intelligent Transportation
System Strategic Deployment Plan TC-4.7 Transit Ready Development Implementation Measures #18, #19, and #20
3.2 Traffic and Circulation
Tulare County General Plan 2030 Update 3.2-37 ESA / 207497 Recirculated Draft Environmental Impact Report February 2010
Required Additional Mitigating Policies and Implementation Measures
As stated above, the County will implement a variety of policies designed to address impacts to public transit facilities and continue to support enhancement and development of the County’s public transit system. In addition, the County will ensure that future CEQA documentation be prepared for individual projects (with project-specific data) that will (if technically possible) mitigate any potential public transit impacts to a less than significant level. This impact is considered less than significant. No mitigation is required.
Significance after Implementation of Mitigation for Impact 3.2-4
A number of policies referenced above in the impact analysis and included in the proposed project were specifically designed to minimize impacts to public transit. With implementation of the above mentioned policies, this impact is considered less than significant.
Impact 3.2-5 The proposed project could result in a substantial increase in bicycle and pedestrian activity.
Impact Summary
LTS Level of Significance Before Mitigation: Less than Significant
Required Additional Mitigating Policies and Implementation Measures: None Required
Resultant Level of Significance: Less than Significant
Impact Analysis
A qualitative analysis has been applied to assess environmental impacts related to bicycle and pedestrian facilities in Tulare County. Implementation of the proposed project would result in additional residential and non-residential land use development. Development anticipated under the proposed project would result in increased demand for bicycle and pedestrian facilities. A portion of the people associated with the additional development would use bicycle and pedestrian facilities. Thus, the demand for bicycle and pedestrian facilities would increase within all of the County’s individual planning areas.
Implementation of the Transportation and Circulation Element policies (see Policies TC-5.1 through TC-5.9) and the objectives of the Tulare County Regional Bicycle Plan will minimize impacts to the maintenance of existing and future planned facilities. Specifically, TC-5.1 “Bicycle/Pedestrian Trail System” requires the County to coordinate with TCAG on the development of a Countywide multi-purpose trail system. TC-5.6 “Regional Bicycle Plan” requires the County to update and maintain the Tulare County Regional Bicycle Plan as necessary. Implementation Measure #23 requires the County to evaluate the objectives of the Tulare County Regional Bicycle
Tulare County General Plan 2030 Update
Tulare County General Plan 2030 Update 3.2-38 ESA / 207497 Recirculated Draft Environmental Impact Report February 2010
Plan every five years in coordination with the five year General Plan review. In addition, design standards that encourage walking and bicycling are encouraged in the Land Use Element of the General Plan 2030 Update (see Policies LU-7.1, LU-7.3, and LU-7.4). Future development under the proposed project is guided by connectivity and integration of design standards that provide for bicycle and pedestrian facilities that encourage non-motorized modes of transportation. Consequently, with implementation of the below mentioned policies, this impact is considered less than significant.
MITIGATING POLICIES AND IMPLEMENTATION MEASURES
Transportation and Circulation Element
Policies designed to minimize transportation impacts through the establishment of design and LOS standards for a variety of circulation, traffic, transit, and non-motorized transportation modes, include the following:
TC-5.1 Bicycle/Pedestrian Trail System TC-5.2 Consider Non-Motorized Modes in Planning
and Development TC-5.3 Provisions for Bicycle Use TC-5.4 Design Standards for Bicycle Routes TC-5.5 Facilities
TC-5.6 Regional Bicycle Plan TC-5.7 Designated Bike Paths TC-5.8 Multi-Use Trails TC-5.9 Existing Facilities Implementation Measures #21 through #28
Land Use Element
Policies designed to integrate land use and circulation concepts during the early planning and design phases of Countywide development to minimize land use conflicts include the following:
LU-7.1 Distinctive Neighborhoods LU-7.3 Friendly Streets LU-7.4 Streetscape Continuity
Required Additional Mitigating Policies and Implementation Measures
As stated above, the County will implement a variety of policies designed to minimize impacts to bicycle and pedestrian facilities and provide support for development of additional facilities. In addition, the County will ensure that future CEQA documentation be prepared for individual projects (with project-specific data) that will (if technically possible) mitigate any potential pedestrian or bicycle facility impacts to a less than significant level. This impact is considered less than significant. No mitigation is required.
Significance after Implementation of Mitigation for Impact 3.2-5
A number of policies referenced above in the impact analysis and included in the proposed project were specifically designed to minimize impacts to pedestrian and bicycle facilities and opportunities. With implementation of the above mentioned policies, this impact is considered less than significant.
Tulare County General Plan 2030 Update 3.3-1 ESA / 207497 Recirculated Draft Environmental Impact Report February 2010
SECTION 3.3 Air Quality
Introduction This section of the recirculated draft Environmental Impact Report (RDEIR) addresses potential impacts to a variety of air quality issues specific to Tulare County. The regulatory setting provides a description of applicable federal, State and local regulatory policies. The environmental setting provides a description of air quality conditions in the County. A description of the potential impacts of the proposed project is also provided and includes the identification of feasible mitigation (general plan policies) to avoid or lessen the impacts.
The closely-related topics associated with global climate change are addressed in Section 3.4 “Energy and Global Climate Change” of this RDEIR.
The following environmental and regulatory settings were developed from information contained in the 2010 Background Report (see Section 6.0 “Air Quality”), incorporated by reference and summarized below. This document is attached as Appendix B of this RDEIR.
Regulatory Setting Federal, State, and local regulations pertaining to air quality issues are described below.
Federal Regulations
Federal Clean Air Act The Federal Clean Air Act (CAA), adopted in 1970 and amended twice thereafter (including the 1990 amendments), establishes the framework for modern air pollution control. The act directs the Environmental Protection Agency (EPA) to establish ambient air standards, the National Ambient Air Quality Standards (NAAQS) (see Table 3.3-1) for six pollutants: ozone, carbon monoxide, lead, nitrogen dioxide, particulate matter (less than 10 microns in diameter [PM10] and less than 2.5 microns in diameter [PM2.5]), and sulfur dioxide. The standards are divided into primary and secondary standards; the former are set to protect human health with an adequate margin of safety and the latter to protect environmental values, such as plant and animal life.
Areas that do not meet the ambient air quality standards are called “non-attainment areas”. The Federal CAA requires each state to submit a State Implementation Plan (SIP) for non-attainment
Tulare County General Plan 2030 Update
Tulare County General Plan 2030 Update 3.3-2 ESA / 207497 Recirculated Draft Environmental Impact Report February 2010
areas. The SIP, which is reviewed and approved by the EPA, must demonstrate how the federal standards will be achieved. Failing to submit a plan or secure approval could lead to the denial of federal funding and permits for such improvements as highway construction and sewage treatment plants. For cases in which the SIP is submitted by the State but fails to demonstrate achievement of the standards, the EPA is directed to prepare a federal implementation plan or EPA can “bump up” the air basin in question to a classification with a later attainment date that allows time for additional reductions needed to demonstrate attainment, as is the case for the San Joaquin Valley.
SIPs are not single documents. They are a compilation of new and previously submitted plans, programs (such as monitoring, modeling, permitting, etc.), district rules, state regulations and federal controls. The California SIP relies on the same core set of control strategies, including emission standards for cars and heavy trucks, fuel regulations and limits on emissions from consumer products. California State law makes the California Air Resources Board (CARB) the lead agency for all purposes related to the SIP. Local air districts and other agencies, such as the Bureau of Automotive Repair and the Department of Pesticide Regulation, prepare SIP elements and submit them to CARB for review and approval. The CARB forwards SIP revisions to the EPA for approval and publication in the Federal Register.
Prevention of Significant Deterioration provisions within the Federal CAA require that measures be taken to “preserve, protect, and enhance the air quality in national parks, national wilderness areas, national monuments, national seashores, and other areas of special national or regional natural, recreation, scenic or historic values.” There are strict requirements for areas designated as “Class 1”.
Visibility Protection. One of the goals of the CAA is to protect visibility in Class 1 areas. To implement this goal, the EPA has created Regional Haze Regulations for Protection of Visibility in National Parks and Wilderness Areas.
Sequoia and Kings Canyon National Park (SEKI). SEKI is mandated by the CAA (SEKI has a Class 1 designation) and the National Park Organic Act to protect the air quality-related values and resources within the SEKI. As a result of these regulations, the SEKI Air Resources program has been involved in air quality monitoring for approximately 20 years. The program currently includes implementation of a daily air quality advisory for SEKI; research into the effects of air pollutants on the decline of amphibians; research and monitoring of ozone, nitrogen, and particulates; monitoring of ultraviolet radiation, synthetic chemicals, PM10, and air quality effects on visibility. The air program also includes cooperation with the federal, state, and regional governmental agencies that address air quality including the EPA, the CARB, and the San Joaquin Valley Air Pollution Control District (SJVAPCD).
State Regulations
California Clean Air Act The California CAA of 1988 establishes an air quality management process that generally parallels the federal process. The California CAA, however, focuses on attainment of the State
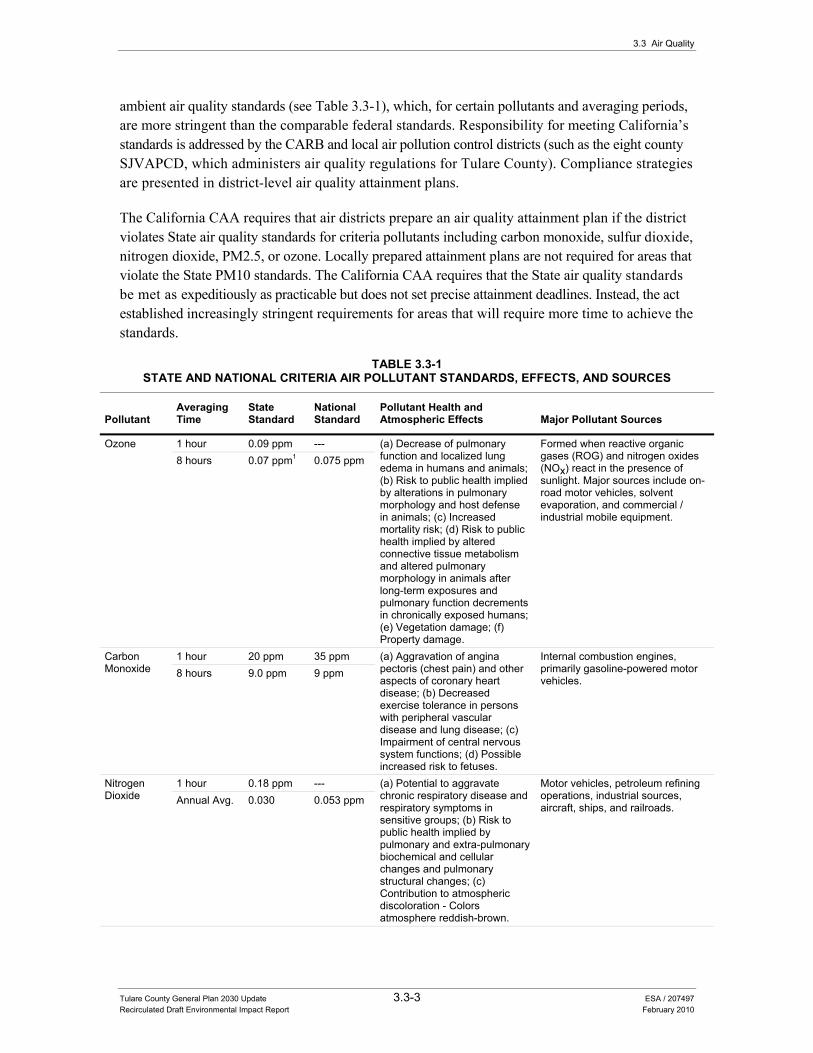
3.3 Air Quality
Tulare County General Plan 2030 Update 3.3-3 ESA / 207497 Recirculated Draft Environmental Impact Report February 2010
ambient air quality standards (see Table 3.3-1), which, for certain pollutants and averaging periods, are more stringent than the comparable federal standards. Responsibility for meeting California’s standards is addressed by the CARB and local air pollution control districts (such as the eight county SJVAPCD, which administers air quality regulations for Tulare County). Compliance strategies are presented in district-level air quality attainment plans.
The California CAA requires that air districts prepare an air quality attainment plan if the district violates State air quality standards for criteria pollutants including carbon monoxide, sulfur dioxide, nitrogen dioxide, PM2.5, or ozone. Locally prepared attainment plans are not required for areas that violate the State PM10 standards. The California CAA requires that the State air quality standards be met as expeditiously as practicable but does not set precise attainment deadlines. Instead, the act established increasingly stringent requirements for areas that will require more time to achieve the standards.
TABLE 3.3-1 STATE AND NATIONAL CRITERIA AIR POLLUTANT STANDARDS, EFFECTS, AND SOURCES
Pollutant Averaging Time
State Standard
National Standard
Pollutant Health and Atmospheric Effects Major Pollutant Sources
Ozone 1 hour 0.09 ppm --- (a) Decrease of pulmonary function and localized lung edema in humans and animals; (b) Risk to public health implied by alterations in pulmonary morphology and host defense in animals; (c) Increased mortality risk; (d) Risk to public health implied by altered connective tissue metabolism and altered pulmonary morphology in animals after long-term exposures and pulmonary function decrements in chronically exposed humans; (e) Vegetation damage; (f) Property damage.
Formed when reactive organic gases (ROG) and nitrogen oxides (NOx) react in the presence of sunlight. Major sources include on-road motor vehicles, solvent evaporation, and commercial / industrial mobile equipment.
8 hours 0.07 ppm1 0.075 ppm
Carbon Monoxide
1 hour 20 ppm 35 ppm (a) Aggravation of angina pectoris (chest pain) and other aspects of coronary heart disease; (b) Decreased exercise tolerance in persons with peripheral vascular disease and lung disease; (c) Impairment of central nervous system functions; (d) Possible increased risk to fetuses.
Internal combustion engines, primarily gasoline-powered motor vehicles.
8 hours 9.0 ppm 9 ppm
Nitrogen Dioxide
1 hour 0.18 ppm --- (a) Potential to aggravate chronic respiratory disease and respiratory symptoms in sensitive groups; (b) Risk to public health implied by pulmonary and extra-pulmonary biochemical and cellular changes and pulmonary structural changes; (c) Contribution to atmospheric discoloration - Colors atmosphere reddish-brown.
Motor vehicles, petroleum refining operations, industrial sources, aircraft, ships, and railroads.
Annual Avg. 0.030 0.053 ppm
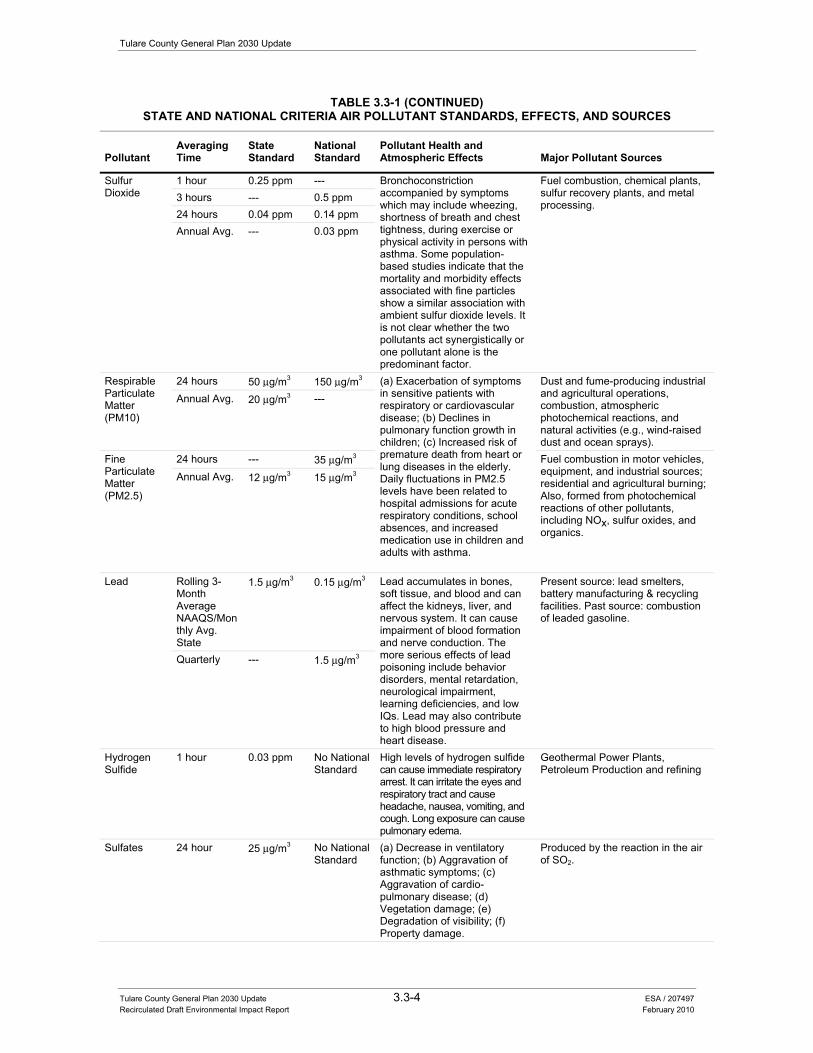
Tulare County General Plan 2030 Update
Tulare County General Plan 2030 Update 3.3-4 ESA / 207497 Recirculated Draft Environmental Impact Report February 2010
TABLE 3.3-1 (CONTINUED)STATE AND NATIONAL CRITERIA AIR POLLUTANT STANDARDS, EFFECTS, AND SOURCES
Pollutant Averaging Time
State Standard
National Standard
Pollutant Health and Atmospheric Effects Major Pollutant Sources
Sulfur Dioxide
1 hour 0.25 ppm --- Bronchoconstriction accompanied by symptoms which may include wheezing, shortness of breath and chest tightness, during exercise or physical activity in persons with asthma. Some population-based studies indicate that the mortality and morbidity effects associated with fine particles show a similar association with ambient sulfur dioxide levels. It is not clear whether the two pollutants act synergistically or one pollutant alone is the predominant factor.
Fuel combustion, chemical plants, sulfur recovery plants, and metal processing.
3 hours --- 0.5 ppm 24 hours 0.04 ppm 0.14 ppm Annual Avg. --- 0.03 ppm
Respirable Particulate Matter (PM10)
24 hours 50 μg/m3 150 μg/m3 (a) Exacerbation of symptoms in sensitive patients with respiratory or cardiovascular disease; (b) Declines in pulmonary function growth in children; (c) Increased risk of premature death from heart or lung diseases in the elderly. Daily fluctuations in PM2.5 levels have been related to hospital admissions for acute respiratory conditions, school absences, and increased medication use in children and adults with asthma.
Dust and fume-producing industrial and agricultural operations, combustion, atmospheric photochemical reactions, and natural activities (e.g., wind-raised dust and ocean sprays).
Annual Avg. 20 μg/m3 ---
Fine Particulate Matter (PM2.5)
24 hours --- 35 μg/m3 Fuel combustion in motor vehicles, equipment, and industrial sources; residential and agricultural burning; Also, formed from photochemical reactions of other pollutants, including NOx, sulfur oxides, and organics.
Annual Avg. 12 μg/m3 15 μg/m3
Lead Rolling 3-Month Average NAAQS/Monthly Avg. State
1.5 μg/m3 0.15 μg/m3 Lead accumulates in bones, soft tissue, and blood and can affect the kidneys, liver, and nervous system. It can cause impairment of blood formation and nerve conduction. The more serious effects of lead poisoning include behavior disorders, mental retardation, neurological impairment, learning deficiencies, and low IQs. Lead may also contribute to high blood pressure and heart disease.
Present source: lead smelters, battery manufacturing & recycling facilities. Past source: combustion of leaded gasoline.
Quarterly --- 1.5 μg/m3
Hydrogen Sulfide
1 hour 0.03 ppm No National Standard
High levels of hydrogen sulfide can cause immediate respiratory arrest. It can irritate the eyes and respiratory tract and cause headache, nausea, vomiting, and cough. Long exposure can cause pulmonary edema.
Geothermal Power Plants, Petroleum Production and refining
Sulfates 24 hour 25 μg/m3 No National Standard
(a) Decrease in ventilatory function; (b) Aggravation of asthmatic symptoms; (c) Aggravation of cardio-pulmonary disease; (d) Vegetation damage; (e) Degradation of visibility; (f) Property damage.
Produced by the reaction in the air of SO2.
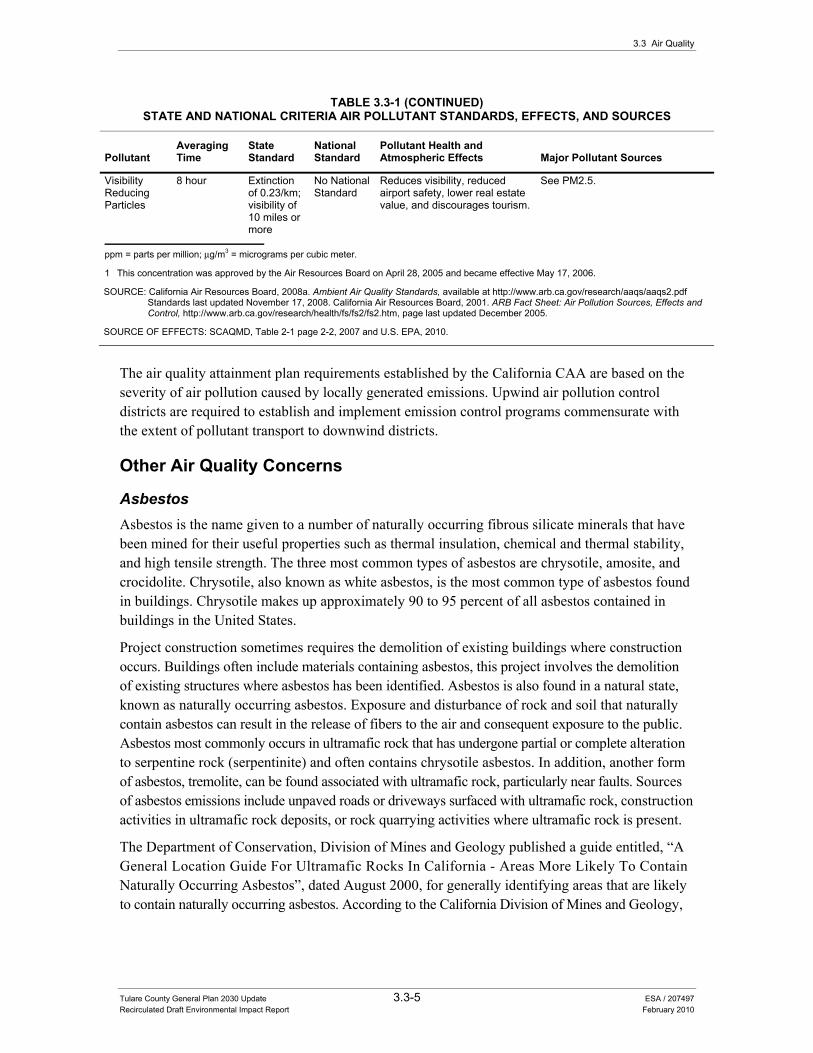
3.3 Air Quality
Tulare County General Plan 2030 Update 3.3-5 ESA / 207497 Recirculated Draft Environmental Impact Report February 2010
TABLE 3.3-1 (CONTINUED)STATE AND NATIONAL CRITERIA AIR POLLUTANT STANDARDS, EFFECTS, AND SOURCES
Pollutant Averaging Time
State Standard
National Standard
Pollutant Health and Atmospheric Effects Major Pollutant Sources
Visibility Reducing Particles
8 hour Extinction of 0.23/km; visibility of 10 miles or more
No National Standard
Reduces visibility, reduced airport safety, lower real estate value, and discourages tourism.
See PM2.5.
ppm = parts per million; μg/m3 = micrograms per cubic meter.
1 This concentration was approved by the Air Resources Board on April 28, 2005 and became effective May 17, 2006.
SOURCE: California Air Resources Board, 2008a. Ambient Air Quality Standards, available at http://www.arb.ca.gov/research/aaqs/aaqs2.pdf Standards last updated November 17, 2008. California Air Resources Board, 2001. ARB Fact Sheet: Air Pollution Sources, Effects and Control, http://www.arb.ca.gov/research/health/fs/fs2/fs2.htm, page last updated December 2005.
SOURCE OF EFFECTS: SCAQMD, Table 2-1 page 2-2, 2007 and U.S. EPA, 2010.
The air quality attainment plan requirements established by the California CAA are based on the severity of air pollution caused by locally generated emissions. Upwind air pollution control districts are required to establish and implement emission control programs commensurate with the extent of pollutant transport to downwind districts.
Other Air Quality Concerns
Asbestos Asbestos is the name given to a number of naturally occurring fibrous silicate minerals that have been mined for their useful properties such as thermal insulation, chemical and thermal stability, and high tensile strength. The three most common types of asbestos are chrysotile, amosite, and crocidolite. Chrysotile, also known as white asbestos, is the most common type of asbestos found in buildings. Chrysotile makes up approximately 90 to 95 percent of all asbestos contained in buildings in the United States.
Project construction sometimes requires the demolition of existing buildings where construction occurs. Buildings often include materials containing asbestos, this project involves the demolition of existing structures where asbestos has been identified. Asbestos is also found in a natural state, known as naturally occurring asbestos. Exposure and disturbance of rock and soil that naturally contain asbestos can result in the release of fibers to the air and consequent exposure to the public. Asbestos most commonly occurs in ultramafic rock that has undergone partial or complete alteration to serpentine rock (serpentinite) and often contains chrysotile asbestos. In addition, another form of asbestos, tremolite, can be found associated with ultramafic rock, particularly near faults. Sources of asbestos emissions include unpaved roads or driveways surfaced with ultramafic rock, construction activities in ultramafic rock deposits, or rock quarrying activities where ultramafic rock is present.
The Department of Conservation, Division of Mines and Geology published a guide entitled, “A General Location Guide For Ultramafic Rocks In California - Areas More Likely To Contain Naturally Occurring Asbestos”, dated August 2000, for generally identifying areas that are likely to contain naturally occurring asbestos. According to the California Division of Mines and Geology,
Tulare County General Plan 2030 Update
Tulare County General Plan 2030 Update 3.3-6 ESA / 207497 Recirculated Draft Environmental Impact Report February 2010
rock formations that contain naturally occurring asbestos are known to be present in 44 of California’s 58 counties, including Tulare County.
In July 2001, CARB approved an Air Toxic Control Measure for construction, grading, quarrying and surface mining operations to minimize Naturally Occurring Asbestos (NOA) emissions. The regulation requires application of best management practices to control fugitive dust in areas known to have NOA, as well as requiring notification to the local air district prior to commencement of ground-disturbing activities.
Valley Fever Valley Fever, or coccidioidomycosis, is a pulmonary infection of human and other mammals caused by inhalation of the spores of the fungus Coccidioides immitis, which grows in the soil of the Southwestern United States. The fungus is very prevalent in the soils of California’s San Joaquin Valley including Tulare County. Transmission of Valley Fever occurs mostly through naturally occurring winds, as well as dust storms blowing “infected” dust (dust containing Valley Fever fungus spores) from the surrounding foothills into cities. Coccidioides immitis is most prevalent in undisturbed soils. Since the valley portion of Tulare County is preponderantly disturbed agricultural land, the risk of infection due to developments on agricultural land are considered low. Identification of spores in the soil is very difficult. Most research to identify areas with Valley Fever spores rely on identifying suitable habitat conducive the life cycle of the organism. Exposure to Valley Fever spores can be reduced by the controlling fugitive dust during soil disturbing activities through compliance with SJVAPCD fugitive dust regulations.
California Air Resources Board The CARB is responsible for establishing and reviewing the State ambient air quality standards, compiling the California State Implementation Plan (SIP) and securing approval of that plan from the U.S. EPA. As noted previously, federal clean air laws require areas with unhealthy levels of ozone, inhalable particulate matter, carbon monoxide, nitrogen dioxide, and sulfur dioxide to develop SIPs. SIPs are comprehensive plans that describe how an area will attain NAAQS. The 1990 amendments to the Federal CAA set deadlines for attainment based on the severity of an area’s air pollution problem. State law makes CARB the lead agency for all purposes related to the SIP. The California SIP is periodically modified by the CARB to reflect the latest emission inventories, planning documents, and rules and regulations of various air basins. The CARB produces a major part of the SIP for pollution sources that are statewide in scope; however, it relies on the local air districts to provide emissions inventory data and additional strategies for sources under their jurisdiction. The SIP consists of the emission standards for vehicular sources and consumer products set by the CARB, and attainment plans adopted by the local air agencies as approved by CARB. The EPA reviews the air quality SIPs to verify conformity with CAA mandates and to ensure that they will achieve air quality goals when implemented. If EPA determines that a SIP is inadequate, it may prepare a Federal Implementation Plan for the nonattainment area, and may impose additional control measures.
3.3 Air Quality
Tulare County General Plan 2030 Update 3.3-7 ESA / 207497 Recirculated Draft Environmental Impact Report February 2010
In addition to preparation of the SIP, the CARB also regulates mobile emission sources in California, such as construction equipment, trucks, automobiles, and oversees the activities of air quality management districts and air pollution control districts, which are organized at the county or regional level. The local or regional air districts are primarily responsible for regulating stationary emission sources at industrial and commercial facilities within their jurisdiction and for preparing the air quality plans that are required under the Federal CAA and California CAA.
The CARB is the lead agency as identified by AB 32 for determining programs and regulations that will help California reduce its greenhouse gas emissions.
Local Regulations
San Joaquin Valley Air Pollution Control District The San Joaquin Valley Air Pollution Control District (SJVAPCD) is made up of eight counties in California’s Central Valley: San Joaquin, Stanislaus, Merced, Madera, Fresno, Kings, Tulare and the San Joaquin Valley Air Basin portion of Kern.
The SJVAPCD is primarily responsible for regulating stationary source emissions within Tulare County and preparing the air quality plans (or portions thereof) for its jurisdiction. SJVAPCD’s primary approach of implementing local air quality plans occurs through the adoption of specific rules and regulations. Stationary sources within the jurisdiction are regulated by the SJVAPCD’s permit authority over such sources and through its review and planning activities. For example, the SJVAPCD adopted its Regulation VIII-Fugitive Dust Control, on October 21, 1993 and amended it on several occasions since then. This regulation consists of a series of emission reduction rules intended to implement the PM10 Maintenance Plan. The PM10 Maintenance Plan emphasizes reducing fugitive dust as a means of achieving attainment of the federal standards for PM10. Regulation VIII specifically addresses the following activities:
• construction, demolition, excavation, extraction; • handling and storage of bulk materials; • landfill disposal sites; • paved and unpaved roads; and • vehicle and/or equipment parking, shipping and receiving, transfer, fueling, and service
areas.
The SJVAPCD has limited authority to regulate transportation sources and indirect sources that attract motor vehicle trips.
• SJVAPCD Rule 9510 (Indirect Source Review) requires developers to mitigate project emissions through 1) on-site design features that reduce trips and vehicle miles traveled, 2) controls on other emission sources, and 3) with reductions obtained through the payment of a mitigation fee used to fund off-site air quality mitigation projects. Rule 9510 requires construction related NOx emission reductions of 20 percent and PM10 reductions of 45 percent. Rule 9510 requires a 33 percent reduction in operational NOx
Tulare County General Plan 2030 Update
Tulare County General Plan 2030 Update 3.3-8 ESA / 207497 Recirculated Draft Environmental Impact Report February 2010
emissions and a 50 percent reduction in PM10. The reductions are calculated by comparing the unmitigated baseline emissions and mitigated emissions from the first year of project operation. The SJVAPCD recommends using the URBEMIS model to quantify project emissions and emission reductions. Rule 9510 was adopted to reduce the impacts of development on SJVAPCD’s attainment plans.
Other SJVAPCD Rules and Regulations that affect development in Tulare County include:
• SJVAPCD Rule 2201 (New and Modified Stationary Source Review): This rule requires new and modified stationary emission sources to implement best available control technology and to offset emissions exceeding thresholds contained in the rule. The rule implements the federal Title V permitting program for the San Joaquin Valley Air Basin.
• SJVAPCD Rule 4002 – National Environmental Standards for Hazardous Air Pollutants (NESHAPs). The NESHAPs regulation applies primarily to projects involving the demolition of existing structures. If there are asbestos-containing materials (ACM) to be removed from the structures, the removal may be subject to Rule 4002. Project applicants are required to determine if the structures are considered ‘regulated facilities’ under NESHAP by contacting the SJVAPCD. If there are regulated facilities to be demolished, the facilities must be inspected to determine if any ACM is present. If ACM is present, the project must follow the SJVAPCD requirements, and potentially, Cal-OSHA and Cal-EPA regulations.
• SJVAPCD Rule 4102 (Nuisance): The purpose of this rule is to protect the health and safety of the public, and applies to any source operation that emits or may emit air contaminants or other materials.
• SJVAPCD Rule 4601 (Architectural Coatings): The purpose of this rule is to limit Volatile Organic Compounds (VOC) emissions from architectural coatings. Emissions are reduced by limits on VOC content and providing requirements on coatings storage, cleanup, and labeling.
• SJVAPCD Rule 4641 (Cutback, Slow Cure, and Emulsified Asphalt, Paving and Maintenance Operations): The purpose of this rule is to limit VOC emissions from asphalt paving and maintenance operations. If asphalt paving will be used, then the paving operations will be subject to Rule 4641.
• SJVAPCD Rule 4901 (Woodburning Fireplaces and Woodburning Heaters): The purpose of this rule is to reduce carbon monoxide (CO), and PM10 from the installation and use of wood burning fireplaces (open-hearth fireplace), and wood burning heaters. The rule limits the sale of certain woodburning devices and limits the installation of fireplaces and wood burning heaters per acre. The rule includes a woodburning curtailment program that goes into effect on days with unhealthful air quality. Areas not served by natural gas are exempt from the rule requirements.
• SJVAPCD Rule 9410 (Employer Based Trip Reduction): The purpose of this rule is to reduce vehicle miles traveled by employees that commute to their worksites. The rule applies to employers with 100 employees or more during specified time frames. Employers will be required to implement an Employer Trip Reduction Plan and to prepare commute verification reports on an annual basis.
The SJVAPCD’s Governing Board has also recently adopted the 2008 PM2.5 Plan. This plan highlights a variety of measures designed to achieve all the PM2.5 standards - the 1997 federal standards, the 2006 federal standards, and the state standard - as soon as possible.
3.3 Air Quality
Tulare County General Plan 2030 Update 3.3-9 ESA / 207497 Recirculated Draft Environmental Impact Report February 2010
The district has published a Guide for Assessing and Mitigating Air Quality Impacts (GAMAQI) (SJVAPCD, page 1, 2002), an advisory document that provides lead agencies, consultants, and project applicants with uniform procedures for addressing air quality in environmental documents. A major part of the GAMAQI includes a discussion of air quality control measures that are recommended for use in mitigating construction and operation-related impacts. The district has also published Air Quality Guidelines for General Plans (SJVAPCD, page 1-1, 2005), which provides guidance to local officials and staff on developing and implementing local policies and programs to be included in local jurisdictions’ general plans.
Environmental Setting Tulare County falls within the southern portion of the San Joaquin Valley Air Basin (SJVAB), which is bordered on the east by the Sierra Nevada range, on the west by the Coast Ranges, and on the south by the Tehachapi Mountains. These features restrict air movement through and out of the SJVAB.
The topography of Tulare County significantly varies in elevation from its eastern to western borders, which results in large climatic variations that ultimately affect air quality. The western portion of the County is within the low-lying areas of the SJVAB. This portion of the County is much dryer in comparison to the eastern portion that is located on the slopes of the Sierra Nevada Mountains. The higher elevation contributes to both increased precipitation and a cooler climate.
Wind direction and velocity in the eastern section varies significantly from the western portion of the County. The western side receives northwesterly winds. The eastern side of the County exhibits more variable wind patterns, but the wind direction is typically up-slope during the day and down-slope in the evening. Generally, the wind direction in the eastern portion of the County is westerly; however terrain differences can create moderate directional changes.
The SJVAB is highly susceptible to pollutant accumulation over time due to the transport of pollutants into the SJVAB from upwind sources. Stationary emission sources in the County include the use of cleaning and surface coatings and industrial processes, road dust, local burning, construction/demolition activities, and fuel combustion. Mobile emissions are primarily generated from the operation of vehicles. According to air quality monitoring data, the SJVAB has been in violation for exceeding ozone and PM10 emission standards for many years.
Existing Emission Sources Unlike other air basins in California, the pollution of the SJVAB is not produced in large urban areas. Instead emissions are generated over many moderate sized communities. Emission levels in the San Joaquin Valley have generally been decreasing overall since 1990. This can be primarily attributed to motor vehicle emission controls, reducing the amount of vehicle emissions.
The main source of carbon monoxide (CO) and nitrogen oxides (NOx) emissions occurs from motor vehicles. The largest contributor to reactive organic gases (ROG) emissions focuses on the
Tulare County General Plan 2030 Update
Tulare County General Plan 2030 Update 3.3-10 ESA / 207497 Recirculated Draft Environmental Impact Report February 2010
oil and gas production area located in the lower part of the SJVAB, which includes Tulare County. ROG emissions from vehicles have been decreasing since 1985 due to stricter standards even though the vehicle miles have been increasing. Direct PM10 emissions have decreased between the years 1975 and 1995 and have remained relatively constant since 2000. Vehicles traveling on unpaved roads and agricultural activities are a substantial source of PM10 emissions in the SJVAB.
Air Quality Monitoring and Existing Emission Levels
Geographic areas and air basins are classified for each pollutant as either attainment or non-attainment. In general, “non-attainment” means that the applicable standard has been exceeded anywhere within the air basin (Table 3.3-2). Measured ambient air pollutant concentrations determine the attainment status within an area. There are several ambient air monitoring stations in Tulare County, three of which are located in mountainous areas at Sequoia National Park: Lower Kaweah (measures ozone); Sequoia and Kings Canyon National Park ([SEKI], measures ozone); and Lookout Point at Sequoia National Park (measures ozone). An air monitoring station is also located in a low-lying area of the County in Visalia (North Church Street - measures ozone, PM10, PM2.5, and CO). The air monitoring station at SEKI typically records the highest levels of ozone in Tulare County. According to the National Parks Conservation Association, SEKI ranked number 1 in ground-level ozone production out of all the National Parks in 2004. This ground-level ozone is responsible for hazy conditions that SEKI often experiences. As a result, SEKI does conduct visibility monitoring. Table 3.3-2 shows ambient air quality data for maximum concentrations of the non-attainment pollutants at each of the air monitoring stations located in Tulare County.
SJVAB Attainment Status The federal non-attainment designation is subdivided into five categories (listed in order of increasing severity): marginal, moderate, serious, severe, and extreme. The degree of an area’s non-attainment status reflects the extent of the pollution and the expected time period required in order to achieve attainment.
Designated non-attainment areas are generally subject to more stringent review by CARB and EPA. In the endeavor to improve air quality to achieve the standards, projects are subject to more stringent pollution control strategies and requirements for mitigation measures (such as mobile source reduction measures). If the NAAQS are not achieved within the specified timeframe, federal highway funding penalties (and a federally administered implementation plan incorporating potentially harsh measures to achieve the NAAQS) will result.
In summary, the attainment status of SJVAB is presented in Table 3.3-3.
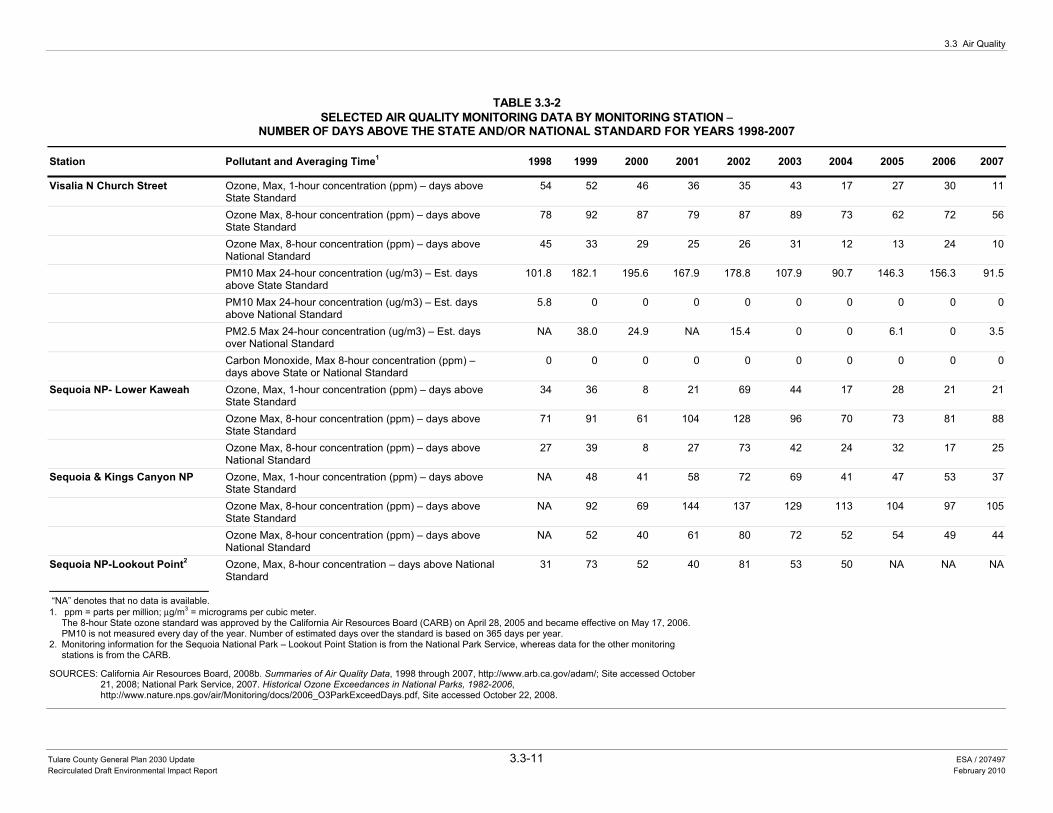
3.3 Air Quality
Tulare County General Plan 2030 Update 3.3-11 ESA / 207497 Recirculated Draft Environmental Impact Report February 2010
TABLE 3.3-2SELECTED AIR QUALITY MONITORING DATA BY MONITORING STATION −
NUMBER OF DAYS ABOVE THE STATE AND/OR NATIONAL STANDARD FOR YEARS 1998-2007
Station Pollutant and Averaging Time1 1998 1999 2000 2001 2002 2003 2004 2005 2006 2007
Visalia N Church Street Ozone, Max, 1-hour concentration (ppm) – days above State Standard
54 52 46 36 35 43 17 27 30 11
Ozone Max, 8-hour concentration (ppm) – days above State Standard
78 92 87 79 87 89 73 62 72 56
Ozone Max, 8-hour concentration (ppm) – days above National Standard
45 33 29 25 26 31 12 13 24 10
PM10 Max 24-hour concentration (ug/m3) – Est. days above State Standard
101.8 182.1 195.6 167.9 178.8 107.9 90.7 146.3 156.3 91.5
PM10 Max 24-hour concentration (ug/m3) – Est. days above National Standard
5.8 0 0 0 0 0 0 0 0 0
PM2.5 Max 24-hour concentration (ug/m3) – Est. days over National Standard
NA 38.0 24.9 NA 15.4 0 0 6.1 0 3.5
Carbon Monoxide, Max 8-hour concentration (ppm) – days above State or National Standard
0 0 0 0 0 0 0 0 0 0
Sequoia NP- Lower Kaweah Ozone, Max, 1-hour concentration (ppm) – days above State Standard
34 36 8 21 69 44 17 28 21 21
Ozone Max, 8-hour concentration (ppm) – days above State Standard
71 91 61 104 128 96 70 73 81 88
Ozone Max, 8-hour concentration (ppm) – days above National Standard
27 39 8 27 73 42 24 32 17 25
Sequoia & Kings Canyon NP Ozone, Max, 1-hour concentration (ppm) – days above State Standard
NA 48 41 58 72 69 41 47 53 37
Ozone Max, 8-hour concentration (ppm) – days above State Standard
NA 92 69 144 137 129 113 104 97 105
Ozone Max, 8-hour concentration (ppm) – days above National Standard
NA 52 40 61 80 72 52 54 49 44
Sequoia NP-Lookout Point2 Ozone, Max, 8-hour concentration – days above National Standard
31 73 52 40 81 53 50 NA NA NA
“NA” denotes that no data is available. 1. ppm = parts per million; μg/m3 = micrograms per cubic meter. The 8-hour State ozone standard was approved by the California Air Resources Board (CARB) on April 28, 2005 and became effective on May 17, 2006. PM10 is not measured every day of the year. Number of estimated days over the standard is based on 365 days per year. 2. Monitoring information for the Sequoia National Park – Lookout Point Station is from the National Park Service, whereas data for the other monitoring
stations is from the CARB.
SOURCES: California Air Resources Board, 2008b. Summaries of Air Quality Data, 1998 through 2007, http://www.arb.ca.gov/adam/; Site accessed October 21, 2008; National Park Service, 2007. Historical Ozone Exceedances in National Parks, 1982-2006, http://www.nature.nps.gov/air/Monitoring/docs/2006_O3ParkExceedDays.pdf, Site accessed October 22, 2008.
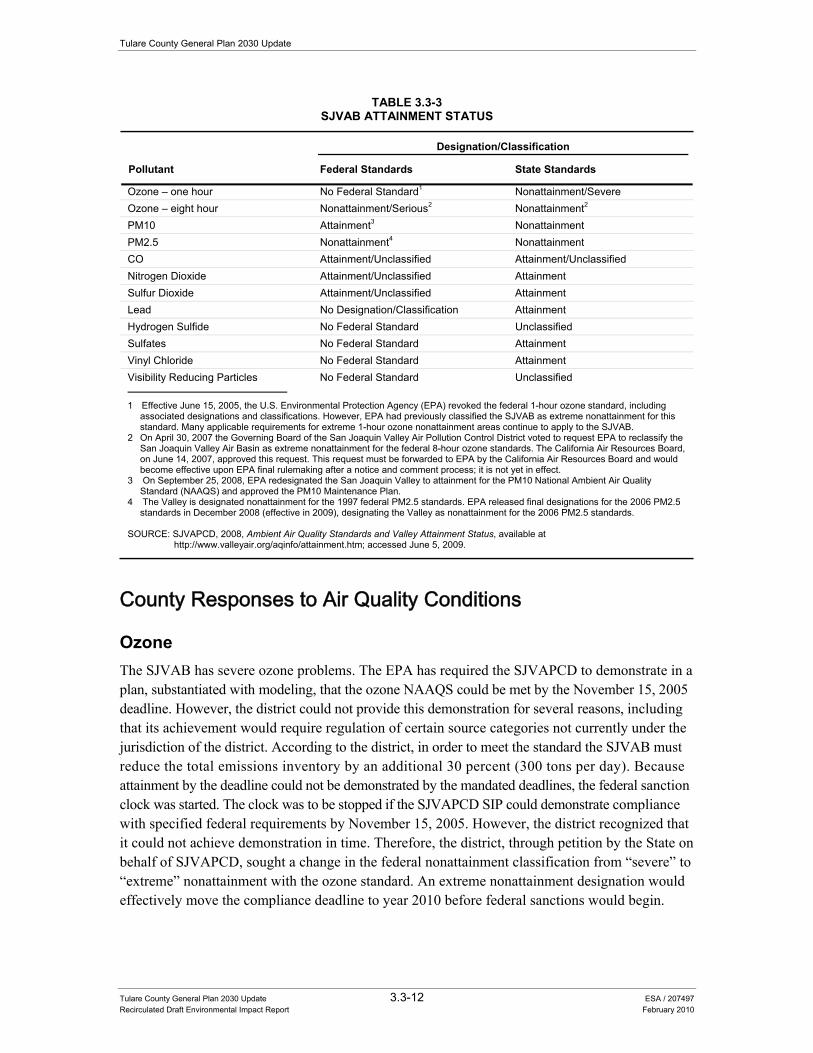
Tulare County General Plan 2030 Update
Tulare County General Plan 2030 Update 3.3-12 ESA / 207497 Recirculated Draft Environmental Impact Report February 2010
TABLE 3.3-3SJVAB ATTAINMENT STATUS
Designation/Classification
Pollutant Federal Standards State Standards
Ozone – one hour No Federal Standard1 Nonattainment/Severe Ozone – eight hour Nonattainment/Serious2 Nonattainment2 PM10 Attainment3 Nonattainment PM2.5 Nonattainment4 Nonattainment CO Attainment/Unclassified Attainment/Unclassified Nitrogen Dioxide Attainment/Unclassified Attainment Sulfur Dioxide Attainment/Unclassified Attainment Lead No Designation/Classification Attainment Hydrogen Sulfide No Federal Standard Unclassified Sulfates No Federal Standard Attainment Vinyl Chloride No Federal Standard Attainment Visibility Reducing Particles No Federal Standard Unclassified
1 Effective June 15, 2005, the U.S. Environmental Protection Agency (EPA) revoked the federal 1-hour ozone standard, including
associated designations and classifications. However, EPA had previously classified the SJVAB as extreme nonattainment for this standard. Many applicable requirements for extreme 1-hour ozone nonattainment areas continue to apply to the SJVAB.
2 On April 30, 2007 the Governing Board of the San Joaquin Valley Air Pollution Control District voted to request EPA to reclassify the San Joaquin Valley Air Basin as extreme nonattainment for the federal 8-hour ozone standards. The California Air Resources Board, on June 14, 2007, approved this request. This request must be forwarded to EPA by the California Air Resources Board and would become effective upon EPA final rulemaking after a notice and comment process; it is not yet in effect.
3 On September 25, 2008, EPA redesignated the San Joaquin Valley to attainment for the PM10 National Ambient Air Quality Standard (NAAQS) and approved the PM10 Maintenance Plan.
4 The Valley is designated nonattainment for the 1997 federal PM2.5 standards. EPA released final designations for the 2006 PM2.5 standards in December 2008 (effective in 2009), designating the Valley as nonattainment for the 2006 PM2.5 standards.
SOURCE: SJVAPCD, 2008, Ambient Air Quality Standards and Valley Attainment Status, available at http://www.valleyair.org/aqinfo/attainment.htm; accessed June 5, 2009.
County Responses to Air Quality Conditions
Ozone The SJVAB has severe ozone problems. The EPA has required the SJVAPCD to demonstrate in a plan, substantiated with modeling, that the ozone NAAQS could be met by the November 15, 2005 deadline. However, the district could not provide this demonstration for several reasons, including that its achievement would require regulation of certain source categories not currently under the jurisdiction of the district. According to the district, in order to meet the standard the SJVAB must reduce the total emissions inventory by an additional 30 percent (300 tons per day). Because attainment by the deadline could not be demonstrated by the mandated deadlines, the federal sanction clock was started. The clock was to be stopped if the SJVAPCD SIP could demonstrate compliance with specified federal requirements by November 15, 2005. However, the district recognized that it could not achieve demonstration in time. Therefore, the district, through petition by the State on behalf of SJVAPCD, sought a change in the federal nonattainment classification from “severe” to “extreme” nonattainment with the ozone standard. An extreme nonattainment designation would effectively move the compliance deadline to year 2010 before federal sanctions would begin.
3.3 Air Quality
Tulare County General Plan 2030 Update 3.3-13 ESA / 207497 Recirculated Draft Environmental Impact Report February 2010
On February 23, 2004, EPA publicly announced its intention to grant the request by the State of California to voluntarily reclassify the SJVAB from a “severe” to an “extreme” 1-hour ozone nonattainment area. The EPA stated that, except for a demonstration of attainment of the ozone standard by 2005, the SJVAPCD has submitted all of the required severe area plan requirements and they were deemed complete. The CARB submitted the 2004 Extreme Ozone Attainment Demonstration Plan to EPA on November 15, 2004. On August 21, 2008, the District adopted Clarifications for the 2004 Extreme Ozone Attainment Demonstration Plan for 1-hour Ozone, and on October 16, 2008, EPA proposed to approve the District's 2004 Extreme Ozone Attainment Demonstration Plan for 1-hour Ozone.
The County continues to evaluate and consider a variety of federal, State, and SJVAPCD programs in order to respond to the non-attainment designation for Ozone that the SJVAB has received, and will continue to adopt resolutions to implement these programs. The Tulare County Board of Supervisor resolutions are described below. These resolutions were adopted in 2002 and 2004, respectively.
Resolution 2002-0157. Resolution 2002-0157, as adopted on March 5, 2002, requires the County to commit to implementing the Reasonably Available Control Measures included in the Resolution. The following Reasonably Available Control Measures were included in the resolution:
• Increasing transit service to the unincorporated communities of Woodville, Poplar and Cotton Center;
• Purchase of three new buses and installation of additional bicycle racks on buses; • Public outreach to encourage the use of alternative modes of transportation; • Providing preferential parking for carpools and vanpools; • Removing on-street parking and providing bus pullouts in curbs to improve traffic flow; • Supporting the purchase of hybrid vehicles for the County fleet; • Mandating that the General Plan 2030 Update implement land use policies supporting
public transit and vehicle trip reduction; and • Programming $13,264,000 of highway widening projects.
Resolution 2004-0067. As part of a follow up effort to Resolution 2002-0157 and to address the federal reclassification to Extreme non-attainment for ozone, the County Board of Supervisors adopted Resolution 2004-067. The resolution contains additional Reasonably Available Control Measures as summarized below:
• Encouraging land use patterns which support public transit and alternative modes of transportation;
• Exploring concepts of Livable Communities as they address housing incentives and transportation;
• Consideration of incentives to encourage developments in unincorporated communities that are sensitive to air quality concerns; and
• Exploring ways to enhance van/carpool incentives, alternative work schedules, and other Transportation Demand Management strategies.
Tulare County General Plan 2030 Update
Tulare County General Plan 2030 Update 3.3-14 ESA / 207497 Recirculated Draft Environmental Impact Report February 2010
PM10 On September 25, 2008, EPA redesignated the San Joaquin Valley to attainment for the PM10 NAAQS and approved the PM10 Maintenance Plan. However, prior to this redesignation, Tulare County Board of Supervisors adopted the following resolution (Resolution 2002-0812) on October 29, 2002. Although now designated in attainment of the federal PM10 standard, all requirements included in the SJVAPCD PM10 Plan are still in effect.
The resolution contains the following Best Available Control Measures (BACMs) to be implemented in order to reduce PM10 emissions in the County:
• Paving or stabilizing of unpaved roads and alleys;
• Paving, vegetating, chemically stabilizing unpaved access points onto paved roads;
• Curbing, paving, or stabilizing shoulders on paved roads;
• Frequent routine sweeping or cleaning of paved roads;
• Intensive street cleaning requirements for industrial paved roads and streets providing access to industrial/ construction sites; and
• Debris removal after wind and rain runoff when blocking roadways.
Impacts and Mitigation Measures
Significance Criteria The significance criteria for this analysis were developed from criteria presented in Appendix G, “Environmental Checklist Form”, of the CEQA Guidelines and based on the professional judgment of the County of Tulare and its consultants. The proposed project would result in a significant impact if it would:
• Result in a cumulatively considerable net increase of any criteria pollutant for which the project region is a nonattainment area for an applicable federal or State ambient air quality standard (including releasing emissions that exceed quantitative thresholds for ozone precursors);
• Conflict with or obstruct implementation of the applicable air quality plan;
• Violate any air quality standard or contribute substantially to an existing or projected air quality violation;
• Expose sensitive receptors to substantial pollutant concentrations; or
• Create objectionable odors affecting a substantial number of people.
3.3 Air Quality
Tulare County General Plan 2030 Update 3.3-15 ESA / 207497 Recirculated Draft Environmental Impact Report February 2010
Criteria Pollutants For construction impacts, the pollutant of greatest concern to the District is respirable particulate matter (PM10).1 The SJVAPCD recommends that significance be based on a consideration of the control measures to be implemented during project construction (SJVAPCD, page 23, 2002). Compliance with Regulation VIII, Rule 8011, and implementation of appropriate mitigation measures to control PM10 emissions are considered by the SJVAPCD to be sufficient to render a project’s construction-related impacts less than significant. The SJVAPCD GAMAQI contains a list of feasible control measures for construction-related PM10 emissions.
The SJVAPCD’s GAMAQI also includes significance criteria for evaluating operational-phase emissions from direct and indirect sources associated with a project. Indirect sources include motor vehicle traffic resulting from the project and do not include stationary sources covered under permit with the SJVAPCD. For this analysis, the project would be considered to have a significant effect on the environment if it would exceed the following thresholds:
• Cause a net increase in pollutant emissions of reactive organic gases (ROG) or NOx exceeding 10 tons per year.
• Cause a violation of State CO concentration standards. The level of significance of CO emissions from mobiles sources is determined by modeling the ambient concentration under project conditions and comparing the resultant 1- and 8-hour concentrations to the respective State CO standards of 20.0 and 9.0 parts per million.
• Cause “visible dust emissions” due to onsite operations and thereby violate SJVAPCD Regulation VIII2.
Although the SJVAPCD GAMAQI recognizes that PM10 is a major air quality issue in the basin, it does not establish quantitative thresholds for potential impact significance. However, for the purposes of this analysis, a PM10 emission of 15 tons per year from project operations is used as a significance threshold. 15 tons per year is the SJVAPCD threshold level at which new stationary sources requiring SJVAPCD permits must provide emissions “offsets”. This threshold of significance for PM10 is consistent with the ROG and NOx thresholds of 10 tons per year, which are also offset thresholds established in SJVAPCD Rule 2201.
Stationary sources that comply, or that would comply, with SJVAPCD Rules and Regulations are generally not considered to have a significant air quality impact.
Toxic Air Contaminants The operation of any project with the potential to expose sensitive receptors to substantial levels of toxic air contaminants (TACs) would be deemed to have a potentially significant impact. More specifically, proposed development projects that have the potential to expose the public to TACs in excess of the following thresholds would be considered to have a significant air quality impact: 1 Construction equipment emits particulate matter, carbon monoxide and ozone precursors. The SJVAPCD has determined that
these emissions would cause a significant air quality impact only in the case of a very large or very intense construction project (SJVAPCD, 2002).
2 Visible dust is defined by the SJVAPCD as “visible dust of such opacity as to obscure an observer’s view to a degree equal to or greater than an opacity of 40 percent, for a period or periods aggregating more than three minutes in any one hour.”
Tulare County General Plan 2030 Update
Tulare County General Plan 2030 Update 3.3-16 ESA / 207497 Recirculated Draft Environmental Impact Report February 2010
• Probability of contracting cancer for the Maximally Exposed Individual3 exceeds 10 in one million.
• Ground-level concentrations of non-carcinogenic TACs would result in a Hazard Index greater than 1 for the Maximally Exposed Individual.
Application of these standards would typically apply to the preparation of more detailed project-specific health risk assessments (based on a detailed air dispersion modeling effort) that would occur as individual projects are considered under the proposed project. For this programmatic assessment of the proposed project, the assessment of TACs is conducted at a qualitative level with specific policies and implementation measures provided to address the potential impacts associated with this issue.
Methodology Buildout of the proposed project will allow planned development to occur within both developed and undeveloped portions of the County. This assessment includes emissions attributable to all unincorporated land within Tulare County. It does not include emissions associated with incorporated cities within Tulare County. Therefore, unincorporated Tulare County is considered to be the organizational boundary for the assessment. While buildout will ultimately be market driven, for modeling purposes this analysis is based on the assumption that most uses will be developed by the year 2030 and emissions were estimated for this planning horizon. This analysis is based on thresholds included in the SJVAPCD’s GAMAQI (SJVAPCD, pages 21-29, 2002) and traffic information provided by the Tulare County Association of Governments (TCAG, 2007a).
The operational emissions analysis included in the Draft Conformity Analysis for the 2007 Tulare County Federal Transportation Improvement Program and 2007 Tulare County Regional Transportation Plan (TCAG, 2007b) is based on the EMFAC 2002 model rather than EMFAC 2007. Although, EMFAC 2007 has now been approved for use, no new Conformity Analysis has been prepared since approval; therefore, the activity data used here is based on the most recent analysis available.
EMFAC 2007 was approved by EPA on January 18, 2008 and must be used for all modeling after April 18, 2008. As a result, it is now required to be used in new transportation conformity analyses. In addition, FHWA California Division issued a letter dated February 1, 2007 that indicated that a six-month transitional period must use the new vehicle fleet data in conformity demonstrations. Conformity determinations where emission modeling was started after August 1, 2007, must use the updated vehicle fleet data.
Notably, the emissions analyzed and presented below have been quantified based on the EMFAC2007 emissions model for on-road vehicles.
In regards to natural gas combustion, the Gas Company (formerly Southern California Gas) provided data for calendar year 2007 in million cubic feet, for residential, commercial, and industrial usage.
3 Maximally Exposed Individual represents the worst-case risk estimate based on a theoretical person continuously exposed for 70
years at the point of highest compound concentration in air.
3.3 Air Quality
Tulare County General Plan 2030 Update 3.3-17 ESA / 207497 Recirculated Draft Environmental Impact Report February 2010
Residential natural gas consumption in 2030 was estimated using the predicted population growth rate. Commercial and industrial consumption were assumed to increase commensurate with job growth. Criteria pollutant emissions associated with natural gas combustion were based on emission factors included in the U.S. EPA AP-42 Fifth Edition, (AP-42) Chapter 1 (External Combustion Sources), Section 1.4 (Natural Gas Combustion) (U.S. EPA, page 1.4-6, 1998). AP-42 is a compilation of emission factors and associated documentation for many air pollution sources that is maintained by U.S. EPA.
Off-road emissions were calculated using CARB’s OFFROAD2007 Model and represent 2007 emissions. The off-road model captures emissions from various types of off-road equipment, including agricultural, construction, lawn and garden and off-road recreation, which includes equipment from hedge trimmers to cranes. Using the off-road model, analysts generated a tons-per-day average for all off-road equipment, using a “Monday-Sunday” averaging period and “Annual” as the month or season. To obtain an annual estimate for 2007, this number was multiplied by 365. The model estimates emissions for all off-road mobile sources in Tulare County, including unincorporated and incorporated areas. Because the scope of this analysis includes unincorporated areas only, total County emissions were allocated to unincorporated Tulare County based on the percent of the population that live in unincorporated Tulare County in 2007. For 2030 emissions, the 2007 emissions values were assumed to increase in accordance with the job growth rate (10.5 percent).
Dairy and feedlot associated emissions in Tulare County are based on information provided in the Tulare County Draft Phase I Animal Confinement Facilities Plan Supplemental Program EIR (Jones and Stokes, Tables 3-7a and 3-7b, follows page 3-24, 2006), which assumed buildout by the year 2020.
Appendix D of this RDEIR provides detailed emission calculations from the various models used in this analysis.
Summary of Impacts This section evaluates air quality impacts related to the proposed project. For this programmatic evaluation, impacts have been assessed for the overall general plan along with the various planning areas that comprise the County, with Table 3.3-4 providing an overview of these impacts for the proposed project and the various planning areas. Impact statements provided in this section address the intent of the CEQA Guideline questions specific to the topic of air quality, yet are not taken verbatim from the Guidelines. Instead, impact statements have been tailored to fit the General Plan 2030 Update.
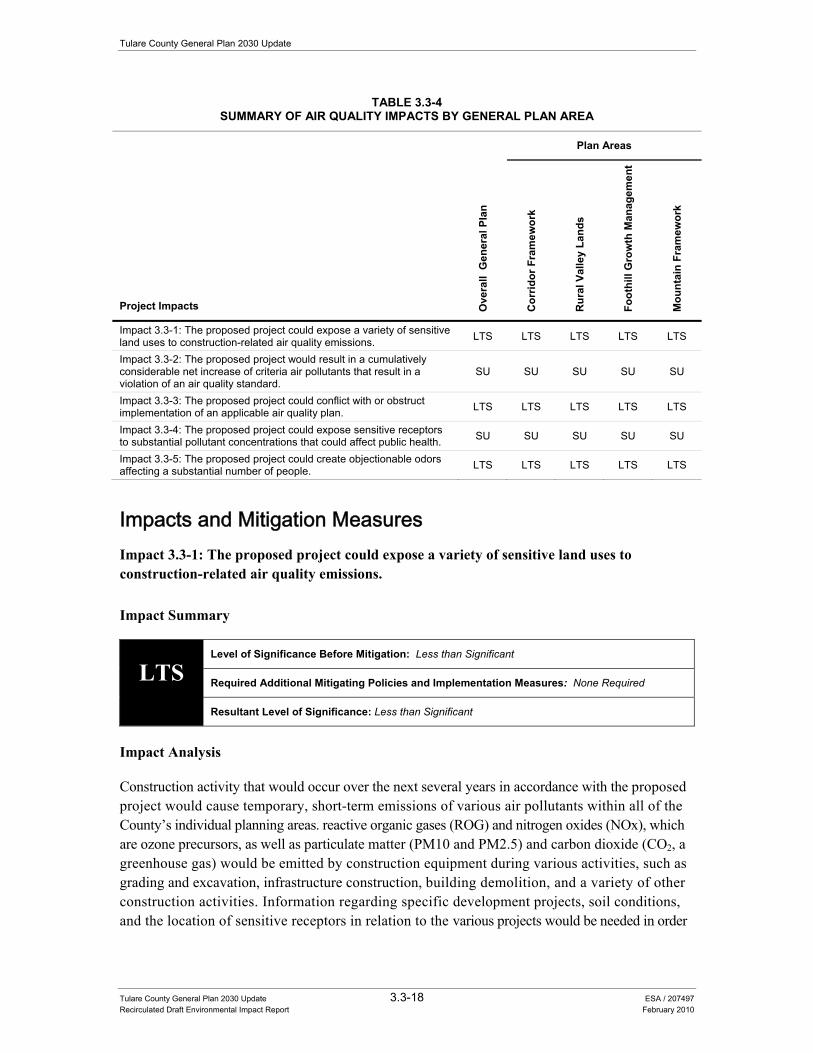
Tulare County General Plan 2030 Update
Tulare County General Plan 2030 Update 3.3-18 ESA / 207497 Recirculated Draft Environmental Impact Report February 2010
TABLE 3.3-4 SUMMARY OF AIR QUALITY IMPACTS BY GENERAL PLAN AREA
Project Impacts Ove
rall
Gen
eral
Pla
n
Plan Areas
Cor
ridor
Fra
mew
ork
Rur
al V
alle
y La
nds
Foot
hill
Gro
wth
Man
agem
ent
Mou
ntai
n Fr
amew
ork
Impact 3.3-1: The proposed project could expose a variety of sensitive land uses to construction-related air quality emissions. LTS LTS LTS LTS LTS
Impact 3.3-2: The proposed project would result in a cumulatively considerable net increase of criteria air pollutants that result in a violation of an air quality standard.
SU SU SU SU SU
Impact 3.3-3: The proposed project could conflict with or obstruct implementation of an applicable air quality plan. LTS LTS LTS LTS LTS
Impact 3.3-4: The proposed project could expose sensitive receptors to substantial pollutant concentrations that could affect public health. SU SU SU SU SU
Impact 3.3-5: The proposed project could create objectionable odors affecting a substantial number of people. LTS LTS LTS LTS LTS
Impacts and Mitigation Measures Impact 3.3-1: The proposed project could expose a variety of sensitive land uses to construction-related air quality emissions.
Impact Summary
LTS Level of Significance Before Mitigation: Less than Significant
Required Additional Mitigating Policies and Implementation Measures: None Required
Resultant Level of Significance: Less than Significant
Impact Analysis
Construction activity that would occur over the next several years in accordance with the proposed project would cause temporary, short-term emissions of various air pollutants within all of the County’s individual planning areas. reactive organic gases (ROG) and nitrogen oxides (NOx), which are ozone precursors, as well as particulate matter (PM10 and PM2.5) and carbon dioxide (CO2, a greenhouse gas) would be emitted by construction equipment during various activities, such as grading and excavation, infrastructure construction, building demolition, and a variety of other construction activities. Information regarding specific development projects, soil conditions, and the location of sensitive receptors in relation to the various projects would be needed in order
3.3 Air Quality
Tulare County General Plan 2030 Update 3.3-19 ESA / 207497 Recirculated Draft Environmental Impact Report February 2010
to quantify the level of impact associated with construction activity. However, given the amount of development associated with implementation of the proposed project, it is reasonable to assume that some large-scale construction activity would exceed SJVAPCD adopted thresholds over the next 21 years and would potentially increase health risks associated with criteria pollutant exposure, such as lung irritation from ozone and mortality and morbidity from respirable particulate matter, during the temporary duration of construction. Actual significance would be determined on a project-by-project basis as future development applications are submitted.
Additionally, a variety of policies are designed to address construction-related air quality impacts including requiring contractors to implement appropriate dust suppression measures (see Policy AQ-4.2 “Dust Suppression Measures”). Other policies include policies AQ-2.2 “Indirect Source Review”, AQ-4.1 “Air Pollution Control Technology” and AQ-4.3 “Paving or Treatment of Roadways for Reduced Air Emissions.” CARB and SJVAPCD regulations also reduce this impact. The CARB has adopted regulations for New Off-Road Diesel Engines and Equipment that result in cleaner equipment being placed in service as older, higher emitting equipment is retired. CARB also adopted the In-Use Off-Road Diesel Vehicle Regulation requiring NOx and PM10 emission reductions from equipment and vehicles currently in operation. SJVAPCD Regulation VIII includes requirements to control fugitive dust emissions during construction activities and requires commercial projects over 5 acres and residential projects over 10 acres to file a Dust Control Plan. With implementation of the above mentioned policies and regulations, this impact is considered less-than-significant.
Required Additional Mitigating Policies and Implementation Measures
As stated above, the County will implement a variety of policies would minimize construction-related air quality impacts. In addition, a number of regulations and standards exist that target construction-related air quality pollutants. The County will ensure that future CEQA documentation be prepared for individual projects (with project-specific data) that will (if technically possible) mitigate any construction-related air quality impact to a less than significant level. This impact is considered less than significant. No mitigation is required.
Significance after Implementation of Mitigation for Impact 3.3-1
A number of policies referenced above in the impact analysis and included in the proposed project were specifically designed to minimize exposure of a variety of sensitive land uses to construction-related air quality emissions. With implementation of the above mentioned policies, this impact is considered less than significant.
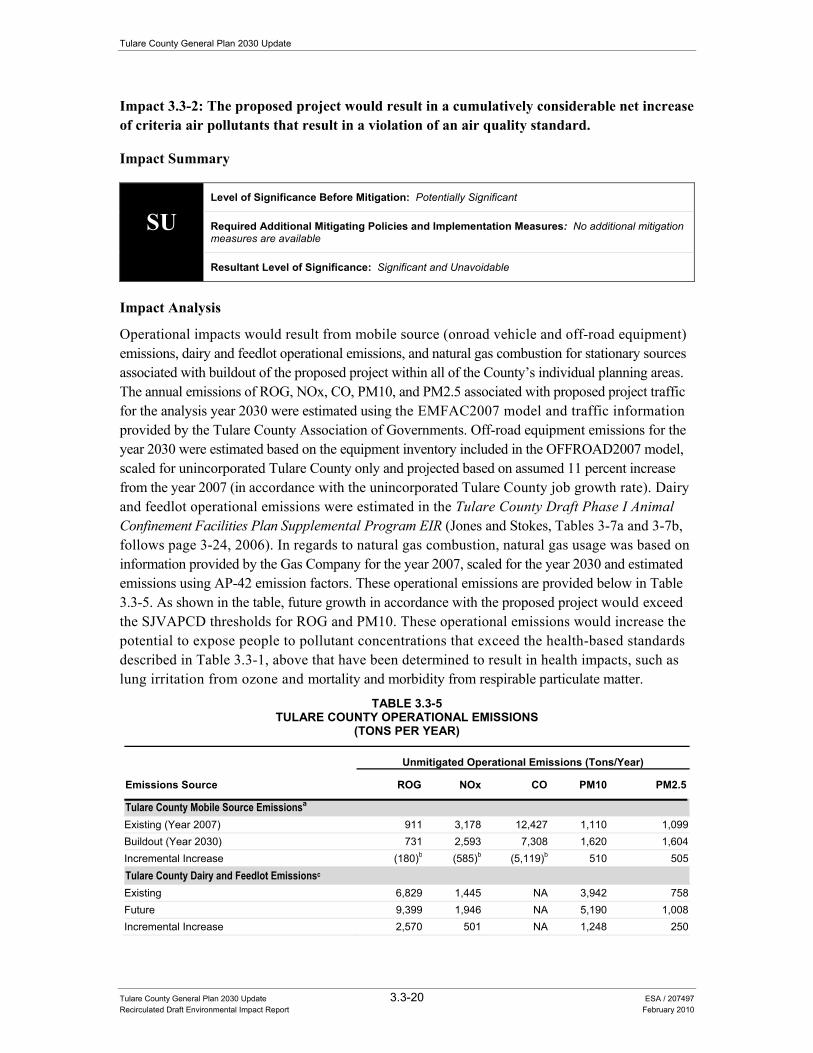
Tulare County General Plan 2030 Update
Tulare County General Plan 2030 Update 3.3-20 ESA / 207497 Recirculated Draft Environmental Impact Report February 2010
Impact 3.3-2: The proposed project would result in a cumulatively considerable net increase of criteria air pollutants that result in a violation of an air quality standard.
Impact Summary
SU Level of Significance Before Mitigation: Potentially Significant
Required Additional Mitigating Policies and Implementation Measures: No additional mitigation measures are available
Resultant Level of Significance: Significant and Unavoidable
Impact Analysis
Operational impacts would result from mobile source (onroad vehicle and off-road equipment) emissions, dairy and feedlot operational emissions, and natural gas combustion for stationary sources associated with buildout of the proposed project within all of the County’s individual planning areas. The annual emissions of ROG, NOx, CO, PM10, and PM2.5 associated with proposed project traffic for the analysis year 2030 were estimated using the EMFAC2007 model and traffic information provided by the Tulare County Association of Governments. Off-road equipment emissions for the year 2030 were estimated based on the equipment inventory included in the OFFROAD2007 model, scaled for unincorporated Tulare County only and projected based on assumed 11 percent increase from the year 2007 (in accordance with the unincorporated Tulare County job growth rate). Dairy and feedlot operational emissions were estimated in the Tulare County Draft Phase I Animal Confinement Facilities Plan Supplemental Program EIR (Jones and Stokes, Tables 3-7a and 3-7b, follows page 3-24, 2006). In regards to natural gas combustion, natural gas usage was based on information provided by the Gas Company for the year 2007, scaled for the year 2030 and estimated emissions using AP-42 emission factors. These operational emissions are provided below in Table 3.3-5. As shown in the table, future growth in accordance with the proposed project would exceed the SJVAPCD thresholds for ROG and PM10. These operational emissions would increase the potential to expose people to pollutant concentrations that exceed the health-based standards described in Table 3.3-1, above that have been determined to result in health impacts, such as lung irritation from ozone and mortality and morbidity from respirable particulate matter.
TABLE 3.3-5TULARE COUNTY OPERATIONAL EMISSIONS
(TONS PER YEAR)
Emissions Source
Unmitigated Operational Emissions (Tons/Year)
ROG NOx CO PM10 PM2.5
Tulare County Mobile Source Emissionsa Existing (Year 2007) 911 3,178 12,427 1,110 1,099Buildout (Year 2030) 731 2,593 7,308 1,620 1,604Incremental Increase (180)b (585)b (5,119)b 510 505Tulare County Dairy and Feedlot Emissionsc Existing 6,829 1,445 NA 3,942 758Future 9,399 1,946 NA 5,190 1,008Incremental Increase 2,570 501 NA 1,248 250
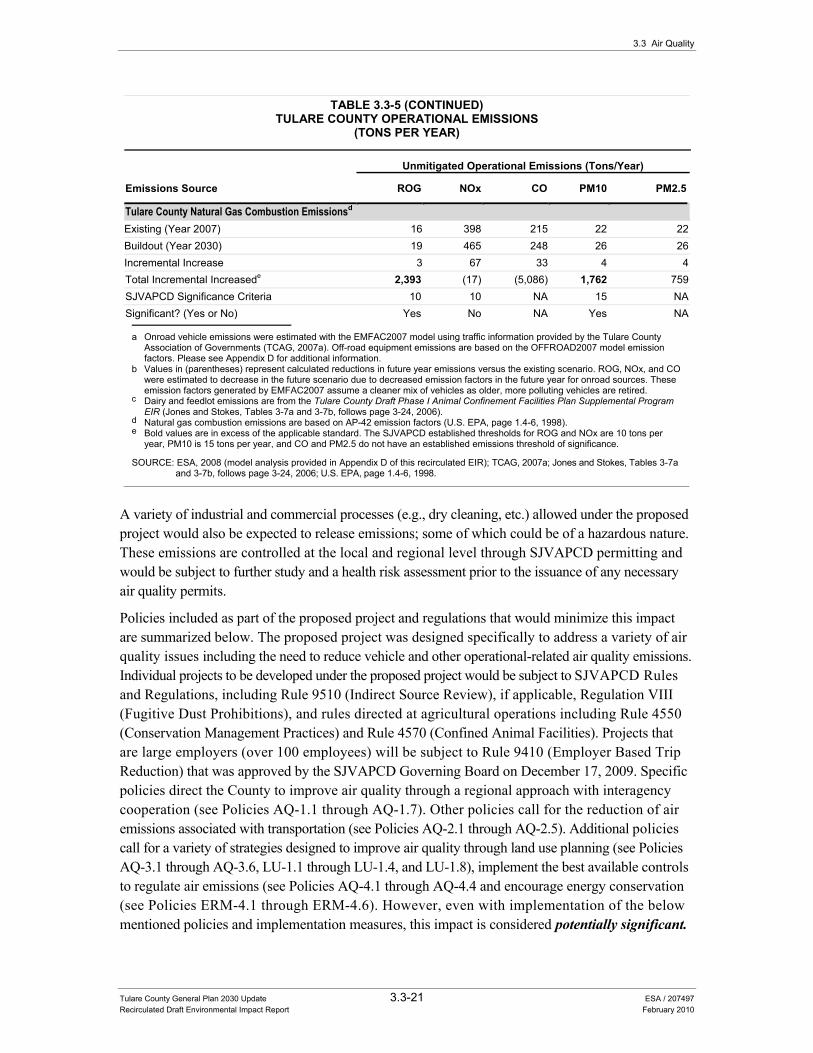
3.3 Air Quality
Tulare County General Plan 2030 Update 3.3-21 ESA / 207497 Recirculated Draft Environmental Impact Report February 2010
TABLE 3.3-5 (CONTINUED)TULARE COUNTY OPERATIONAL EMISSIONS
(TONS PER YEAR)
Emissions Source
Unmitigated Operational Emissions (Tons/Year)
ROG NOx CO PM10 PM2.5
Tulare County Natural Gas Combustion Emissionsd
Existing (Year 2007) 16 398 215 22 22Buildout (Year 2030) 19 465 248 26 26Incremental Increase 3 67 33 4 4Total Incremental Increasede 2,393 (17) (5,086) 1,762 759SJVAPCD Significance Criteria 10 10 NA 15 NASignificant? (Yes or No) Yes No NA Yes NA
a Onroad vehicle emissions were estimated with the EMFAC2007 model using traffic information provided by the Tulare County Association of Governments (TCAG, 2007a). Off-road equipment emissions are based on the OFFROAD2007 model emission factors. Please see Appendix D for additional information.
b Values in (parentheses) represent calculated reductions in future year emissions versus the existing scenario. ROG, NOx, and CO were estimated to decrease in the future scenario due to decreased emission factors in the future year for onroad sources. These emission factors generated by EMFAC2007 assume a cleaner mix of vehicles as older, more polluting vehicles are retired.
c Dairy and feedlot emissions are from the Tulare County Draft Phase I Animal Confinement Facilities Plan Supplemental Program EIR (Jones and Stokes, Tables 3-7a and 3-7b, follows page 3-24, 2006).
d Natural gas combustion emissions are based on AP-42 emission factors (U.S. EPA, page 1.4-6, 1998). e Bold values are in excess of the applicable standard. The SJVAPCD established thresholds for ROG and NOx are 10 tons per
year, PM10 is 15 tons per year, and CO and PM2.5 do not have an established emissions threshold of significance.
SOURCE: ESA, 2008 (model analysis provided in Appendix D of this recirculated EIR); TCAG, 2007a; Jones and Stokes, Tables 3-7a and 3-7b, follows page 3-24, 2006; U.S. EPA, page 1.4-6, 1998.
A variety of industrial and commercial processes (e.g., dry cleaning, etc.) allowed under the proposed project would also be expected to release emissions; some of which could be of a hazardous nature. These emissions are controlled at the local and regional level through SJVAPCD permitting and would be subject to further study and a health risk assessment prior to the issuance of any necessary air quality permits.
Policies included as part of the proposed project and regulations that would minimize this impact are summarized below. The proposed project was designed specifically to address a variety of air quality issues including the need to reduce vehicle and other operational-related air quality emissions. Individual projects to be developed under the proposed project would be subject to SJVAPCD Rules and Regulations, including Rule 9510 (Indirect Source Review), if applicable, Regulation VIII (Fugitive Dust Prohibitions), and rules directed at agricultural operations including Rule 4550 (Conservation Management Practices) and Rule 4570 (Confined Animal Facilities). Projects that are large employers (over 100 employees) will be subject to Rule 9410 (Employer Based Trip Reduction) that was approved by the SJVAPCD Governing Board on December 17, 2009. Specific policies direct the County to improve air quality through a regional approach with interagency cooperation (see Policies AQ-1.1 through AQ-1.7). Other policies call for the reduction of air emissions associated with transportation (see Policies AQ-2.1 through AQ-2.5). Additional policies call for a variety of strategies designed to improve air quality through land use planning (see Policies AQ-3.1 through AQ-3.6, LU-1.1 through LU-1.4, and LU-1.8), implement the best available controls to regulate air emissions (see Policies AQ-4.1 through AQ-4.4 and encourage energy conservation (see Policies ERM-4.1 through ERM-4.6). However, even with implementation of the below mentioned policies and implementation measures, this impact is considered potentially significant.
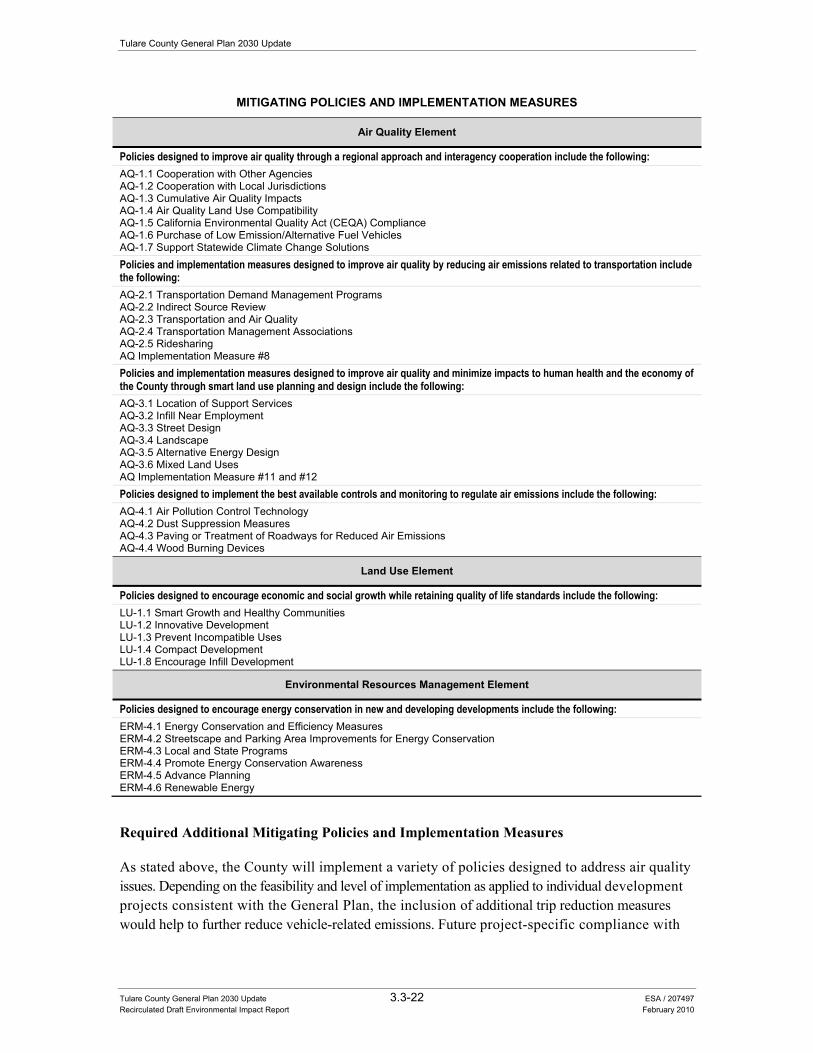
Tulare County General Plan 2030 Update
Tulare County General Plan 2030 Update 3.3-22 ESA / 207497 Recirculated Draft Environmental Impact Report February 2010
MITIGATING POLICIES AND IMPLEMENTATION MEASURES
Air Quality Element
Policies designed to improve air quality through a regional approach and interagency cooperation include the following: AQ-1.1 Cooperation with Other Agencies AQ-1.2 Cooperation with Local Jurisdictions AQ-1.3 Cumulative Air Quality Impacts AQ-1.4 Air Quality Land Use Compatibility AQ-1.5 California Environmental Quality Act (CEQA) Compliance AQ-1.6 Purchase of Low Emission/Alternative Fuel Vehicles AQ-1.7 Support Statewide Climate Change Solutions Policies and implementation measures designed to improve air quality by reducing air emissions related to transportation include the following: AQ-2.1 Transportation Demand Management Programs AQ-2.2 Indirect Source Review AQ-2.3 Transportation and Air Quality AQ-2.4 Transportation Management Associations AQ-2.5 Ridesharing AQ Implementation Measure #8 Policies and implementation measures designed to improve air quality and minimize impacts to human health and the economy of the County through smart land use planning and design include the following: AQ-3.1 Location of Support Services AQ-3.2 Infill Near Employment AQ-3.3 Street Design AQ-3.4 Landscape AQ-3.5 Alternative Energy Design AQ-3.6 Mixed Land Uses AQ Implementation Measure #11 and #12 Policies designed to implement the best available controls and monitoring to regulate air emissions include the following: AQ-4.1 Air Pollution Control Technology AQ-4.2 Dust Suppression Measures AQ-4.3 Paving or Treatment of Roadways for Reduced Air Emissions AQ-4.4 Wood Burning Devices
Land Use Element
Policies designed to encourage economic and social growth while retaining quality of life standards include the following:LU-1.1 Smart Growth and Healthy Communities LU-1.2 Innovative Development LU-1.3 Prevent Incompatible Uses LU-1.4 Compact Development LU-1.8 Encourage Infill Development
Environmental Resources Management Element
Policies designed to encourage energy conservation in new and developing developments include the following: ERM-4.1 Energy Conservation and Efficiency Measures ERM-4.2 Streetscape and Parking Area Improvements for Energy Conservation ERM-4.3 Local and State Programs ERM-4.4 Promote Energy Conservation Awareness ERM-4.5 Advance Planning ERM-4.6 Renewable Energy
Required Additional Mitigating Policies and Implementation Measures
As stated above, the County will implement a variety of policies designed to address air quality issues. Depending on the feasibility and level of implementation as applied to individual development projects consistent with the General Plan, the inclusion of additional trip reduction measures would help to further reduce vehicle-related emissions. Future project-specific compliance with
3.3 Air Quality
Tulare County General Plan 2030 Update 3.3-23 ESA / 207497 Recirculated Draft Environmental Impact Report February 2010
SJVAPCD regulations and permitting would also help to reduce air quality emissions associated with individual projects. As stated earlier, SJVAPCD Regulation VIII (Fugitive Dust Prohibitions), and Rule 4550 (Conservation Management Practices) will help to reduce project PM10 emissions. SJVAPCD Rule 9510 will reduce project related NOx and PM10 emissions during project construction and operation. Rule 9410 (Employer Based Trip Reduction) will reduce vehicle-related emissions from new and existing large employers. Rule 2201 (New and Modified Stationary Source Review) requires new and modified facilities to implement best available control technology (BACT) to reduce criteria pollutant emissions and to offset emissions that exceed thresholds contained in the rule. New and existing dairies and feedlots are subject to Rule 4570 (Confined Animal Facilities) that will reduce ROG emissions. Also, the County will continue to ensure that a variety of PM10, PM2.5, and related ROG reducing measures are implemented under all future development projects to minimize air quality impacts through project specific CEQA mitigation measures and permit conditions.
However, total air quality emissions associated with buildout of the proposed project would still exceed SJVAPCD thresholds for NOx, ROG and PM10. As a result, the impact remains significant. No additional feasible mitigation measures are available.
Significance after Implementation of Mitigation for Impact 3.3-2
As stated above, no additional technologically or economically feasible mitigation measures are currently available to reduce this impact to a less than significant level. Consequently, this impact is considered significant and unavoidable.
Impact 3.3-3: The proposed project could conflict with or obstruct implementation of an applicable air quality plan.
Impact Summary
SU Level of Significance Before Mitigation: Potentially Significant
Required Additional Mitigating Policies and Implementation Measures: No additional policies or mitigation measures are available
Resultant Level of Significance: Significant and Unavoidable
Impact Analysis
The proposed project was designed specifically to achieve and promote consistency with the planning documents of other key neighboring land use agencies or other agencies that have jurisdiction over the project. Policies and implementation measures included as part of the proposed project that would potentially reduce this impact are more fully described above under Impact 3.3-2. Specific policies direct the County to improve air quality through a regional approach with interagency cooperation (see Policies AQ-1.1 through AQ-1.7). Other policies call for the reduction of air emissions associated with transportation (see Policies AQ-2.1 through AQ-2.5). Additional policies
Tulare County General Plan 2030 Update
Tulare County General Plan 2030 Update 3.3-24 ESA / 207497 Recirculated Draft Environmental Impact Report February 2010
call for a variety of strategies designed to improve air quality through land use planning (see Policies AQ-3.1 through AQ-3.6, LU-1.1 through LU-1.4, and LU-1.8), implement the best available controls to regulate air emissions (see Policies AQ-4.1 through AQ-4.4), and encourage energy conservation (see Policies ERM-4.1 through ERM-4.6).
The SJVAPCD has rules and regulations described earlier that help to reduce the impacts of growth on the applicable air quality plans. For example, Rule 9510-Indirect Source Review was adopted to provide emission reductions that allowed the SJVAPCD to demonstrate attainment of the federal PM10 standard and contributed reductions that assist in attaining federal ozone standards. Rule 9510 also contributes toward attainment of state standards for these pollutants. SJVAPCD Regulation VIII – Fugitive PM10 Prohibitions requires controls for sources of particulate matter necessary for attaining the federal PM10 standards and achieving progress toward attaining the state PM10 standards. Rule 2201 – New and Modified Stationary Source Review is designed so that new and modified stationary/industrial sources provide emission controls and offsets that ensure that stationary sources decline over time and do not impact the applicable air quality plans.
The SJVAPCD has adopted regulations for confined animal facilities (Rule 4570) and operates a permitting program under Rule 2201 that requires new and modified facilities to implement best available control technology (BACT) to reduce particulate matter emissions and the ozone precursor, ROG and other criteria pollutants. In addition, the SJVAPCD is scheduled to adopt amendments to Rule 4570 in the second quarter of 2010 to obtain additional reductions required to meet a 22.9 ton per day ROG reduction commitment in the SJVAPCD 2007 Ozone Attainment Plan. Under the SJVAPCD permitting program, new and modified confined animal facilities are required to meet BACT requirements defined as the most stringent emission limitation or control technique achieved in practice for such category and class of source, or any other emission limitation or control technique, including process and equipment changes of basic or control equipment, found by the Air Pollution Control Officer to be cost effective and technologically feasible for such class or category of sources or for a specific source. BACT is determined on a project by project basis so that new technology is required as it is demonstrated to be feasible and meets cost-effectiveness thresholds or is achieved in practice at a similar facility.
The County consults with the SJVAPCD during the permitting and CEQA process for new and modified dairies where the County is the Lead Agency and the SJVAPCD is a Responsible Agency. In some cases, a dairy project may require no additional County approvals, but the SJVAPCD determines its permit is a discretionary permit requiring CEQA compliance. In those cases, the SJVAPCD becomes the Lead Agency and conducts a CEQA review and would require projects to include feasible mitigation measures to reduce potentially significant impacts. This requirement ensures that the air quality impacts of new and modified dairies will be fully assessed and that all feasible measures are required.
This analysis assumes that growth in population, vehicle use and other source categories will occur at historically robust rates. The amount of growth predicted, although accommodated by the SJVAPCD attainment plan, could make it more difficult to attain the 8-hour ozone standard by the 2023 attainment date. The SJVAPCD ozone attainment plan relies on yet to be identified future measures that require technological advancements for emission reductions required to achieve the ozone standards. This
3.3 Air Quality
Tulare County General Plan 2030 Update 3.3-25 ESA / 207497 Recirculated Draft Environmental Impact Report February 2010
results in some uncertainty as to whether the growth accommodated by the project would conflict with or obstruct the applicable attainment plans.
Based on the fact that the SJVAPCD is still developing future regulatory efforts and the amount of growth that may occur, the potential that a significant impact could occur remains a possibility. Even with implementation of the above mentioned policies and regulations, this impact is considered potentially significant.
Required Additional Mitigating Policies and Implementation Measures
As stated above, the County will implement a variety of policies designed to address air quality issues. In addition, the County will ensure that future CEQA documentation be prepared for individual projects (with project-specific data) that will (if technically possible) mitigate any potential air quality impacts to a less than significant level. However, even with implementation of the above mentioned policies and regulations, implementation of the General Plan 2030 Update would still result in a significant impact. No additional feasible mitigation is currently available.
Significance after Implementation of Mitigation for Impact 3.3-3
As stated above, no additional technologically or economically feasible mitigation measures are currently available to reduce this impact to a less than significant level. Consequently, this impact is considered significant and unavoidable.
Impact 3.3-4: The proposed project could expose sensitive receptors to substantial pollutant concentrations that could affect public health.
Impact Summary
SU Level of Significance Before Mitigation: Potentially Significant
Required Additional Mitigating Policies and Implementation Measures: No additional mitigation measures are available
Resultant Level of Significance: Significant and Unavoidable
Impact Analysis
Development resulting from buildout of the proposed project could place sensitive land uses near local intersections or roadways associated with air pollutant emissions that exceed State or federal ambient air quality standards within all of the County’s individual planning areas. Similarly, existing sensitive land uses near local roadways that experience increased levels of traffic resulting from buildout of the proposed project could be exposed to air pollutant emissions that exceed State and/or federal ambient air quality standards. In addition to these air pollutant emissions, a variety of TAC emissions could also be released from various construction and operations (i.e., dairy or feedlot operations, industrial processes, diesel equipment and vehicles) associated with the proposed
Tulare County General Plan 2030 Update
Tulare County General Plan 2030 Update 3.3-26 ESA / 207497 Recirculated Draft Environmental Impact Report February 2010
project. The California Air Resources Board has declared that diesel particulate matter (DPM) from diesel engine exhaust is a TAC. Additionally, the California Office of Environmental Health Hazard Assessment (OEHHA) has determined that chronic exposure to DPM can cause carcinogenic and non-carcinogenic health effects. Ammonia is also considered a TAC and is a precursor to PM2.5. Ammonia is generated when urea from the cow urine and feces is hydrolyzed to form ammonium by contact with the urease enzyme, which is abundant in places inhabited by dairy cows (Pinder, et al, 2003).
Development under the proposed project could place residential and other sensitive receptors in proximity to sources of TACs (such as high volume roadways, industrial uses, etc.). The CARB adopted the Air Quality and Land Use Handbook (CARB, 2005) to provide guidance to planning agencies and air districts for considering potential impacts to sensitive land uses proposed in proximity to TACs emission sources. The goal of the guidance document is to protect sensitive receptors, such as children, seniors, and acutely ill and chronically ill persons, from exposure to TACs emissions by encouraging adequate separation between new sensitive land uses (residential, educational, healthcare) proposed adjacent to TAC sources in order to minimize land use incompatibility. The recommendations provided are voluntary and do not constitute a requirement or mandate for either land use agencies or local air districts.
Stationary sources of TAC emissions are subject to SJVAPCD Regulation VII (Toxic Air Pollutants) which includes rules to address toxic emissions from several specific common sources. New sources of TACs must comply with SJVAPCD Rule 2520 (Federally Mandated Operating Permits) which provides administrative mechanisms for enforcing federal requirements for hazardous air pollutants. The state also adopts regulations that are implemented by the SJVAPCD to control toxic emissions through Air Toxic Control Measures and reporting programs that disclose toxic impacts to the public such as the Air Toxic Hot Spots Act. Often, controls designed to reduce ROG and PM10 also reduce toxic emissions.
The SJVAPCD GAMAQI identifies potential sources of TAC emissions that should be considered when siting new sources of TACs or when applicants propose to locate new sensitive receptors near an existing source of TACs. The GAMAQI provides criteria for determining the significance of impacts of toxic emissions. Projects that result in an increase in cancer risk of 10 in one million or a non-cancer risk Hazard Index greater than one are considered to have a significant impact. In addition, the SJVAPCD in its role as a CEQA commenting agency reviews projects to identify potential TAC impacts and reviews Health Risk Assessments prepared to quantify the potential risks for adequacy. The County will use the health risk criteria from the GAMAQI and require Health Risk Assessments where appropriate in accordance with SJVAPCD guidance.
Policies included as part of the proposed project to help address a variety of issues (including air quality and TAC concerns) associated with the inappropriate siting of sensitive land uses near other incompatible uses include Policies AQ-3.1 through AQ-3.6, LU-1.1 through LU-1.4, and LU-1.8. Additionally, subsequent CEQA documentation prepared for individual projects would have project-specific data and will be required to address, and to the extent feasible, mitigate any significant or potentially significant air quality impacts to a less-than-significant level. Examples of mitigation that may be proposed include intersection/roadway capacity improvements or additional land use siting and required setbacks or moving truck loading docks farther from sensitive receptors. However, it
3.3 Air Quality
Tulare County General Plan 2030 Update 3.3-27 ESA / 207497 Recirculated Draft Environmental Impact Report February 2010
should be noted, the ability to mitigate these potential impacts is contingent on a variety of factors including the severity of the air quality impact, existing land use conditions and the technical feasibility of being able to implement any proposed mitigation measures (e.g., relocations, road widening, etc.).
Policies included as part of the proposed project that would minimize this impact are summarized above in the discussion for Impact 3.3-2. However, even with implementation of these policies, this impact is still considered potentially significant.
Required Additional Mitigating Policies and Implementation Measures
As stated above, the County will implement a variety of policies designed to address air quality issues. The County will also continue to discourage the siting of industrial or dairy/feedlot uses near sensitive land uses. In addition, the County will ensure that future CEQA documentation be prepared for individual projects (with project-specific data) that will (if technically possible) mitigate any potential air quality impacts to a less than significant level. However, even with implementation of the above mentioned policies and regulations, implementation of the General Plan 2030 Update would still result in a significant impact. No additional feasible mitigation is currently available.
Significance after Implementation of Mitigation for Impact 3.3-4
Given the technological and economical uncertainty as to whether future air quality impacts associated with the potential exposure of sensitive receptors to substantial pollutant concentrations could be adequately mitigated, this impact remains significant and unavoidable.
Impact 3.3-5: The proposed project could create objectionable odors affecting a substantial number of people.
Impact Summary
LTS Level of Significance Before Mitigation: Less than Significant
Required Additional Mitigating Policies and Implementation Measures: None Required
Resultant Level of Significance: Less than Significant
Impact Analysis
Construction activity will require the operation of equipment which may generate exhaust from either gasoline or diesel fuel. Construction of new buildings will also require the application of architectural coatings and the paving of roads which would generate odors from materials such as paints and asphalt. However, these odors are of a temporary or short-term nature and quickly disperse into the surrounding atmosphere.
Tulare County General Plan 2030 Update
Tulare County General Plan 2030 Update 3.3-28 ESA / 207497 Recirculated Draft Environmental Impact Report February 2010
Future residential and commercial development would also involve minor, odor-generating activities, such as backyard barbeque smoke, garden equipment exhaust, and the application of exterior paint for home improvement activities. These types of odors are typical of most residential communities and are not considered significant generators of odor impacts. The SJVAPCD’s Guide for Assessing and Mitigating Air Quality Impacts includes distance thresholds for common odor sources as guidance for determining if projects should conduct more detailed odor assessments and implement mitigation measures, if required. The County uses the SJVAPCD distance thresholds during project reviews to identify potential odor impacts.
In regards to dairy and feedlot development, SJVAPCD regulations to control ROG emissions from confined animal facilities (Rule 4570) and permitting under Rule 2201 would also result in lower potential for odor impacts. In addition, the County imposes management and housekeeping practices that reduce potential odors and other impacts on dairy and feedlot operations as conditions of approval. In regard to all development types in general, CEQA documentation prepared for individual projects would have project-specific data and will be required to address, and if necessary, mitigate any significant or potentially significant air quality odor impacts to a less than significant level.
Policies included as part of the proposed project that would minimize this impact are summarized above in the discussion for Impact 3.3-2. However, with implementation of the below mentioned policies and regulations, this impact is considered less than significant.
Required Additional Mitigating Policies and Implementation Measures
As stated above, the County will implement a variety of policies designed to address a variety of nuisance issues (including odor concerns) associated with the inappropriate siting of sensitive land uses near other incompatible uses include Policies AQ-3.1 through AQ-3.6, LU-1.1 through LU-1.4, and LU-1.8. SJVAPCD regulations on dairy and feedlot operations would also help to reduce this potential impact. These policies and regulations are specifically designed to address air quality and odor impacts at new or expanded existing dairy and feedlot facilities. In addition, the County will ensure that future CEQA documentation be prepared for individual projects (with project-specific data) that will (if technically possible) mitigate any nuisance impacts to a less than significant level. This impact is considered less than significant. No mitigation is required.
Significance after Implementation of Mitigation for Impact 3.3-5
A number of policies referenced above in the impact analysis and included in the proposed project were specifically designed to minimize nuisance issues, such as objectionable odors. With implementation of the above mentioned policies, this impact is considered less than significant.
Tulare County General Plan 2030 Update 3.4-1 ESA / 207497 Recirculated Draft Environmental Impact Report February 2010
SECTION 3.4 Energy and Global Climate Change
Introduction This section provides an analysis of the current regulatory framework related to energy and global climate change in California. This section includes setting information for energy resources in the County. Impacts related to energy and global climate change are analyzed and mitigation measures are provided for any potentially significant impacts. Public health impacts related to global climate change are primarily associated with increased air pollutant concentrations, wildland fires, flooding, and reduced water supplies. These impacts are discussed in Section 3.3 “Air Quality”, Section 3.6 “Hydrology, Water Quality, and Drainage” and Section 3.8 “Hazardous Materials and Public Safety”.
The following environmental and regulatory settings were developed from information contained in the 2010 Background Report (see Chapter 6.0 “Air Quality and Climate Change”), incorporated by reference and summarized below. This document is also attached as Appendix B of this recirculated draft Environmental Impact Report (RDEIR). Emission data provided in this section was also obtained from the Tulare County Greenhouse Gas (GHG) Inventory prepared for the General Plan 2030 Update (see Appendix E of this RDEIR).
Regulatory Setting The following sections provide federal, State and local regulations for energy as well as regulations for greenhouse gases and global climate change.
Federal Regulations On the federal level, the U.S. Department of Transportation, U.S. Department of Energy, and U.S. Environmental Protection Agency (EPA) are three agencies with substantial influence over energy policies and programs. Generally, federal agencies influence transportation energy consumption through establishment and enforcement of fuel economy standards for automobiles and light trucks, through funding of energy-related research and development projects, and through funding for transportation infrastructure projects.
The National Energy Policy, developed in May 2001, proposes recommendations on energy use and on the repair and expansion of the nation’s energy infrastructure. The policy is based on the finding that growth in U.S. energy consumption is outpacing the current rate of production. Based
Tulare County General Plan 2030 Update
Tulare County General Plan 2030 Update 3.4-2 ESA / 207497 Recirculated Draft Environmental Impact Report February 2010
on this policy document, during the years 2000 to 2020, the growth in the consumption of oil is predicted to increase by 33 percent, natural gas by over 50 percent, and electricity by 45 percent. While federal policy promotes further improvements in energy use through conservation, it focuses on increased development of domestic oil, gas, and coal and the use of hydroelectric and nuclear power resources. To address the over-reliance on natural gas for new electric power plants, the federal policy proposes research in clean coal technology and expanding the generation of energy to include energy derived from landfill gas, wind, and biomass sources.
The federal government has initiated several actions that will result in substantial reductions in greenhouse gases nationally. Although the regulations are not yet in effect, this information is provided to show the scale of the federal role in reducing greenhouse gas emissions and that action is occurring at all levels of government.
Light-Duty Vehicle Greenhouse Gas Emissions Standards and Corporate Average Fuel Economy Standards On September 15, 2009, EPA and the Department of Transportation’s National Highway Safety Administration proposed a National Program that would dramatically reduce greenhouse gas emissions and improve fuel economy for new cars and trucks sold in the United States (USEPA, pages 49459-49468, 2009a). The combined EPA and Department of Transportation’s National Highway Safety Administration standards that make up this proposed National Program would apply to passenger cars, light-duty trucks, and medium-duty passenger vehicles, covering model years 2012 through 2016. These vehicles must meet an estimated combined average emissions level of 250 grams of carbon dioxide per mile, equivalent to 35.5 miles per gallon if the automobile industry were to meet this carbon dioxide level solely through fuel economy improvements. Together, these proposed standards would cut carbon dioxide emissions by an estimated 950 million metric tons and 1.8 billion barrels of oil over the lifetime of the vehicles sold under the program (model years 2012-2016).
Stationary Source Regulation: Prevention of Significant Deterioration and Title V Greenhouse Gas Tailoring Rule On September 30, 2009, EPA announced a proposal that is focused on large facilities emitting over 25,000 tons of greenhouse gases a year. These facilities would be required to obtain permits that would demonstrate they are using the best practices and technologies to minimize GHG emissions. The rule proposes new thresholds for GHGs that define when Clean Air Act permits under the New Source Review and Title V operating permits programs would be required for new or existing industrial facilities.
The proposed thresholds would “tailor” the permit programs to limit which facilities would be required to obtain New Source Review and Title V permits and would cover nearly 70 percent of the national GHG emissions that come from stationary sources, including those from the nation’s largest emitters—including power plants, refineries, and cement production facilities. Small farms, restaurants and many other types of small facilities would not be subject to these permitting programs (USEPA, 2009b). The proposal anticipates a five-year initial phase after which the program thresholds will be re-evaluated.
3.4 Energy and Global Climate Change
Tulare County General Plan 2030 Update 3.4-3 ESA / 207497 Recirculated Draft Environmental Impact Report February 2010
Federal Executive Order 13423 This Executive Order requires federal agencies to measure, manage, and reduce greenhouse gas emissions toward agency-defined targets. It describes a process by which agency goals will be set and reported to the President by the Chair of Council on Environmental Quality. Federal agencies have the largest vehicle fleets and building holdings of any other business or entity in the Nation. A year 2000 inventory reported that the agencies owned or leased over 376,000 vehicles. Reductions from federal agencies are expected to be substantial. The Executive Order also requires agencies to meet a number of energy, water, and waste reduction targets, including:
• 30% reduction in vehicle fleet petroleum use by 2020; • 26% improvement in water efficiency by 2020; • 50% recycling and waste diversion by 2015; • 95% of all applicable contracts will meet sustainability requirements; • Implementation of the 2030 net-zero-energy building requirement; • Implementation of the stormwater provisions of the Energy Independence and Security
Act of 2007, Section 438; and • Development of guidance for sustainable Federal building locations in alignment with the
Livability Principles put forward by the Department of Housing and Urban Development, the Department of Transportation, and the EPA (CEQ, 2009).
State Regulations
California Public Utilities Commission and California Energy Commission On the State level, the California Public Utilities Commission and California Energy Commission (CEC) are two agencies with authority over different aspects of energy. The California Public Utilities Commission regulates privately owned utilities in the energy, rail, telecommunications, and water fields. The CEC collects and analyzes energy-related data, prepares State-wide energy policy recommendations and plans, promotes and funds energy efficiency programs, and regulates the power plant siting process.
The California Constitution vests in the California Public Utilities Commission, the exclusive power and sole authority to regulate privately owned or investor-owned public utilities. This exclusive power extends to all aspects of the location, design, construction, maintenance, and operation of public utility facilities. Nevertheless, the California Public Utilities Commission has provisions for regulated utilities to work closely with local governments and give due consideration to their concerns.
Assembly Bill 1890 - The Electric Utility Industry Restructuring Act The Electric Utility Industry Restructuring Act (Assembly Bill 1890) made the generation of electricity competitive in California. The legislation became law on September 23, 1996. Before restructuring, a single utility provided each customer with generation, transmission, distribution,
Tulare County General Plan 2030 Update
Tulare County General Plan 2030 Update 3.4-4 ESA / 207497 Recirculated Draft Environmental Impact Report February 2010
and metering and billing of electricity. As of March 31, 1998, the new structure allowed customers in most, but not all, existing electric utility service areas to choose their electric generation supplier.
Restructuring also brought changes to the transmission of electricity. Previously restricted transmission facilities were opened to power generators on a fair and equitable basis, overseen by a new organization, the Independent System Operator. The Independent System Operator has been given the responsibility for assuring reliability of the high voltage transmission system. Local utilities continued to distribute electricity.
Title 24 of the California Code of Regulations The State of California regulates energy consumption under Title 24 of the California Code of Regulations. The Title 24 Building Energy Efficiency Standards were developed by the CEC and apply to energy consumed for heating, cooling, ventilation, water heating, and lighting in new residential and non-residential buildings. The CEC updates these standards periodically. The current standards (2008 Standards) became effective on January 1, 2010. Under Assembly Bill 970, signed September 2000, the CEC will update and implement its appliance and building efficient standards to make “maximum feasible” reduction in unnecessary energy consumption.
AB 1493 - Greenhouse Gas Auto Standards California Assembly Bill (AB) 1493, enacted on July 22, 2002, required the California Air Resources Board (CARB) to develop and adopt regulations that reduce greenhouse gases emitted by passenger vehicles and light duty trucks. The regulation was stalled by automaker lawsuits and by the EPA’s denial of an implementation waiver. On January 21, 2009, the CARB requested that EPA reconsider its previous waiver denial. On January 26, 2009, President Obama directed that EPA assess whether the denial of the waiver was appropriate. On June 30, 2009, EPA granted the waiver request, which begins with motor vehicles in the 2009 model year.
Executive Order S-3-05 Executive Order S-3-05 was signed by Governor Schwarzenegger on June 1, 2005. This executive order established emission reduction targets for California. Specifically, the executive order established the following targets:
• By 2010, reduce greenhouse gas emissions to 2000 levels; • By 2020, reduce greenhouse gas emissions to 1990 levels; and • By 2050, reduce greenhouse gas emissions to 80 percent below 1990 levels.
The executive order additionally ordered that the Secretary of the California Environmental Protection Agency (Cal EPA) would coordinate oversight of the efforts among State agencies made to meet the targets and report to the Governor and the State Legislature biannually on progress made toward meeting the greenhouse gas emission targets. Cal EPA was also directed to report biannually on the impacts to California of global warming, including impacts to water supply, public health, agriculture, the coastline, and forestry, and prepare and report on mitigation and adaptation plans to combat these impacts.
3.4 Energy and Global Climate Change
Tulare County General Plan 2030 Update 3.4-5 ESA / 207497 Recirculated Draft Environmental Impact Report February 2010
In response to the EO, the Secretary of Cal EPA created the Climate Action Team (CAT), composed of representatives from the Air Resources Board; Business, Transportation, & Housing; Department of Food and Agriculture; Energy Commission; California Integrated Waste Management Board (CIWMB); Resources Agency; and the California Public Utilities Commission. The CAT prepared a recommended list of strategies for the State to pursue to reduce climate change emission in the State (California Climate Action Team, 2006).
Executive Order S-1-07 Executive Order S-1-07, the Low Carbon Fuel Standard (LCFS) (issued on January 18, 2007), calls for a reduction of at least 10 percent in the carbon intensity of California's transportation fuels by 2020. It instructed the California Environmental Protection Agency to coordinate activities between the University of California, the California Energy Commission and other State agencies to develop and propose a draft compliance schedule to meet the 2020 target. Furthermore, it directed CARB to consider initiating regulatory proceedings to establish and implement the LCFS. In response, CARB identified the LCFS as an early action item with a regulation to be adopted and implemented by 2010.
Assembly Bill 32: California Global Warming Solutions Act of 2006 In 2006, California passed the California Global Warming Solutions Act of 2006 (Assembly Bill No. 32; California Health and Safety Code Division 25.5, Sections 38500, et seq., or AB 32), which requires the CARB to design and implement emission limits, regulations, and other measures, such that Statewide greenhouse gas emissions will be reduced to 1990 levels by 2020.
In December 2007, CARB approved the 2020 emission limit of 427 million metric tons of CO2 equivalents (CO2e) of greenhouse gases (CARB, page 2, 2007b). The 2020 target of 427 million metric tons of CO2e requires the reduction of 169 million metric tons of CO2e, or approximately 30 percent, from the State’s projected 2020 emissions of 596 million metric tons of CO2e (business-as-usual).
Also in December 2007, CARB adopted mandatory reporting and verification regulations pursuant to AB 32. The regulations became effective on January 1, 2009, with the first reports covering 2008 emissions. The mandatory reporting regulations require reporting for certain types of facilities that make up the bulk of the stationary source emissions in California. Currently, the draft regulation language identifies major facilities as those that generate more than 25,000 metric tons/year of CO2e. Cement plants, oil refineries, electric-generating facilities/providers, cogeneration facilities, and hydrogen plants and other stationary combustion sources that emit more than 25,000 metric tons/year CO2e, make up 94 percent of the point source CO2e emissions in California (CARB, page 12, 2007a).
In June, 2008, CARB published its Climate Change Draft Scoping Plan (CARB, page ES-1, 2008a). The Climate Change Draft Scoping Plan reported that CARB met the first milestones set by AB 32 in 2007: developing a list of early actions to begin sharply reducing greenhouse gas emissions; assembling an inventory of historic emissions; and establishing the 2020 emissions limit. After consideration of public comment and further analysis, CARB adopted the Climate Change Scoping Plan (Scoping Plan) in December, 2008 (CARB, page ES-1, 2008b). The Scoping Plan proposes a
Tulare County General Plan 2030 Update
Tulare County General Plan 2030 Update 3.4-6 ESA / 207497 Recirculated Draft Environmental Impact Report February 2010
set of actions designed to reduce overall carbon emissions in California. Key elements of the Scoping Plan include:
• Expanding and strengthening existing energy efficiency programs as well as building and appliance standards;
• Achieving a Statewide renewables energy mix of 33 percent; • Developing a California cap-and-trade program that links with other Western Climate
Initiative partner programs to create a regional market system; • Establishing targets for transportation-related greenhouse gas emissions for regions
throughout California, and pursuing policies and incentives to achieve those targets; • Adopting and implementing measures pursuant to existing State laws and policies,
including California’s clean car standards, goods movement measures, and the Low Carbon Fuel Standard; and
• Creating targeted fees, including a public goods charge on water use, fees on high global warming potential gases, and a fee to fund the administrative costs of the State’s long-term commitment to AB 32 implementation. (CARB, pages ES-3 – ES-4, 2008b)
The Scoping Plan notes that “[a]fter Board approval of this plan, the measures in it will be developed and adopted through the normal rulemaking process, with public input” (CARB, page ES-4, 2008b).
The Scoping Plan states that local governments are “essential partners” in the effort to reduce greenhouse gas emissions, and that they have “broad influence and, in some cases, exclusive jurisdiction” over activities that contribute to greenhouse gas emissions. Local governments may contribute to significant direct and indirect greenhouse gas emissions through their planning and permitting processes, local ordinances, outreach and education efforts, and municipal operations. Many of the proposed measures to reduce greenhouse gas emissions rely on local government actions. The plan encourages local governments to reduce greenhouse gas emissions by approximately 15 percent from current levels by 2020 (CARB, pages 26-27, 2008b).
The Scoping Plan also included recommended measures that were developed to reduce greenhouse gas emissions from key sources and activities while improving public health, promoting a cleaner environment, preserving our natural resources, and ensuring that the impacts of the reductions are equitable and do not disproportionately impact low-income and minority communities. These measures, shown below in Table 3.4-1 by sector, also put the State on a path to meet the long-term 2050 goal of reducing California’s greenhouse gas emissions to 80 percent below 1990 levels. These measures were presented to and approved by the CARB on December 11, 2008.
The total reduction for the recommended measures is 174 million metric tons/year of CO2e, slightly exceeding the 169 million metric tons/year of CO2e of reductions estimated to be needed in the Scoping Plan. The measures in the Scoping Plan approved by the Board will be developed over the next two years and be in place by 2012.
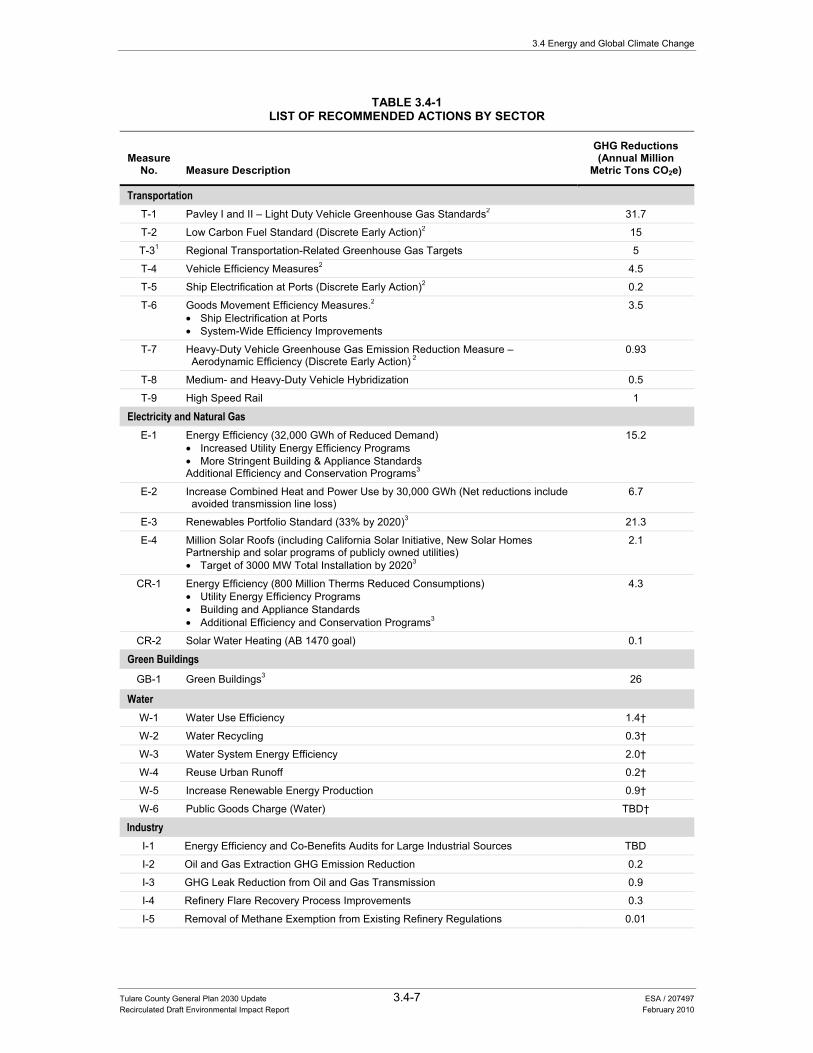
3.4 Energy and Global Climate Change
Tulare County General Plan 2030 Update 3.4-7 ESA / 207497 Recirculated Draft Environmental Impact Report February 2010
TABLE 3.4-1LIST OF RECOMMENDED ACTIONS BY SECTOR
Measure No. Measure Description
GHG Reductions (Annual Million
Metric Tons CO2e)
Transportation T-1 Pavley I and II – Light Duty Vehicle Greenhouse Gas Standards2 31.7
T-2 Low Carbon Fuel Standard (Discrete Early Action)2 15
T-31 Regional Transportation-Related Greenhouse Gas Targets 5
T-4 Vehicle Efficiency Measures2 4.5
T-5 Ship Electrification at Ports (Discrete Early Action)2 0.2
T-6 Goods Movement Efficiency Measures.2 • Ship Electrification at Ports • System-Wide Efficiency Improvements
3.5
T-7 Heavy-Duty Vehicle Greenhouse Gas Emission Reduction Measure – Aerodynamic Efficiency (Discrete Early Action) 2
0.93
T-8 Medium- and Heavy-Duty Vehicle Hybridization 0.5
T-9 High Speed Rail 1
Electricity and Natural Gas E-1 Energy Efficiency (32,000 GWh of Reduced Demand)
• Increased Utility Energy Efficiency Programs • More Stringent Building & Appliance Standards Additional Efficiency and Conservation Programs3
15.2
E-2 Increase Combined Heat and Power Use by 30,000 GWh (Net reductions include avoided transmission line loss)
6.7
E-3 Renewables Portfolio Standard (33% by 2020)3 21.3
E-4 Million Solar Roofs (including California Solar Initiative, New Solar Homes Partnership and solar programs of publicly owned utilities) • Target of 3000 MW Total Installation by 20203
2.1
CR-1 Energy Efficiency (800 Million Therms Reduced Consumptions) • Utility Energy Efficiency Programs • Building and Appliance Standards • Additional Efficiency and Conservation Programs3
4.3
CR-2 Solar Water Heating (AB 1470 goal) 0.1
Green Buildings GB-1 Green Buildings3 26
Water W-1 Water Use Efficiency 1.4†
W-2 Water Recycling 0.3†
W-3 Water System Energy Efficiency 2.0†
W-4 Reuse Urban Runoff 0.2†
W-5 Increase Renewable Energy Production 0.9†
W-6 Public Goods Charge (Water) TBD†
Industry I-1 Energy Efficiency and Co-Benefits Audits for Large Industrial Sources TBD
I-2 Oil and Gas Extraction GHG Emission Reduction 0.2
I-3 GHG Leak Reduction from Oil and Gas Transmission 0.9
I-4 Refinery Flare Recovery Process Improvements 0.3
I-5 Removal of Methane Exemption from Existing Refinery Regulations 0.01
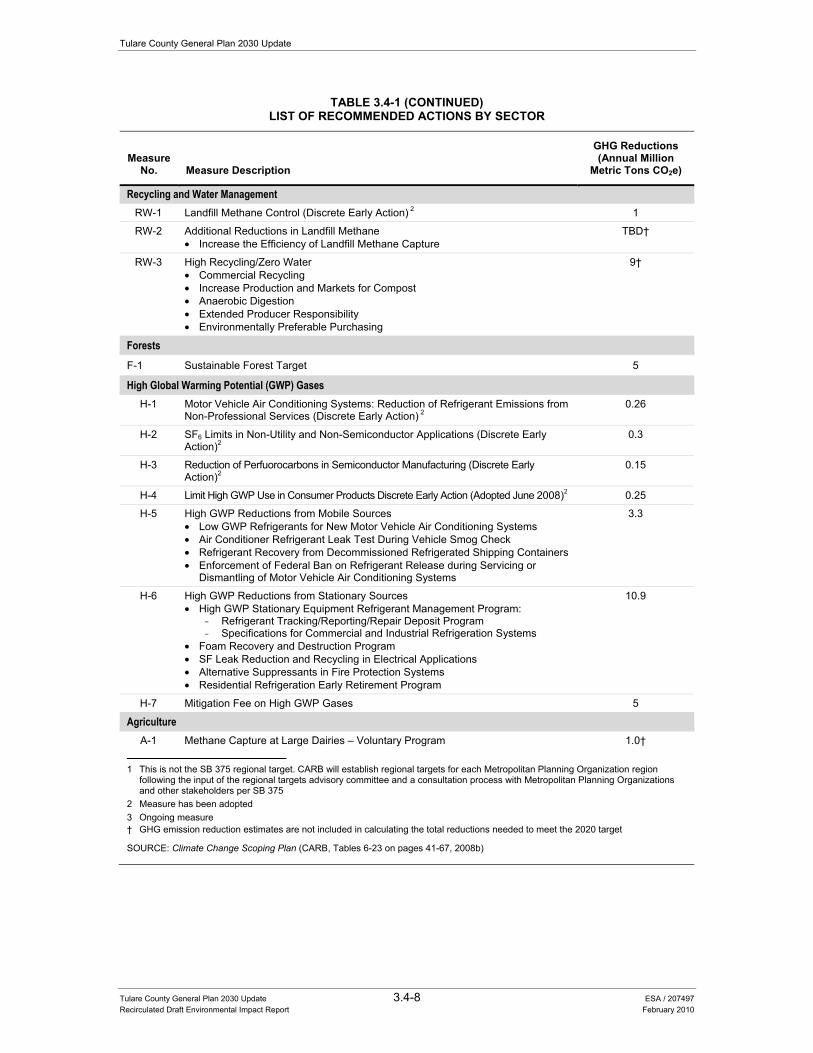
Tulare County General Plan 2030 Update
Tulare County General Plan 2030 Update 3.4-8 ESA / 207497 Recirculated Draft Environmental Impact Report February 2010
TABLE 3.4-1 (CONTINUED)LIST OF RECOMMENDED ACTIONS BY SECTOR
Measure No. Measure Description
GHG Reductions (Annual Million
Metric Tons CO2e)
Recycling and Water Management RW-1 Landfill Methane Control (Discrete Early Action) 2 1
RW-2 Additional Reductions in Landfill Methane • Increase the Efficiency of Landfill Methane Capture
TBD†
RW-3 High Recycling/Zero Water • Commercial Recycling • Increase Production and Markets for Compost • Anaerobic Digestion • Extended Producer Responsibility • Environmentally Preferable Purchasing
9†
Forests F-1 Sustainable Forest Target 5
High Global Warming Potential (GWP) Gases H-1 Motor Vehicle Air Conditioning Systems: Reduction of Refrigerant Emissions from
Non-Professional Services (Discrete Early Action) 2 0.26
H-2 SF6 Limits in Non-Utility and Non-Semiconductor Applications (Discrete Early Action)2
0.3
H-3 Reduction of Perfuorocarbons in Semiconductor Manufacturing (Discrete Early Action)2
0.15
H-4 Limit High GWP Use in Consumer Products Discrete Early Action (Adopted June 2008)2 0.25
H-5 High GWP Reductions from Mobile Sources • Low GWP Refrigerants for New Motor Vehicle Air Conditioning Systems • Air Conditioner Refrigerant Leak Test During Vehicle Smog Check • Refrigerant Recovery from Decommissioned Refrigerated Shipping Containers • Enforcement of Federal Ban on Refrigerant Release during Servicing or
Dismantling of Motor Vehicle Air Conditioning Systems
3.3
H-6 High GWP Reductions from Stationary Sources • High GWP Stationary Equipment Refrigerant Management Program:
- Refrigerant Tracking/Reporting/Repair Deposit Program - Specifications for Commercial and Industrial Refrigeration Systems
• Foam Recovery and Destruction Program • SF Leak Reduction and Recycling in Electrical Applications • Alternative Suppressants in Fire Protection Systems • Residential Refrigeration Early Retirement Program
10.9
H-7 Mitigation Fee on High GWP Gases 5
Agriculture A-1 Methane Capture at Large Dairies – Voluntary Program 1.0†
1 This is not the SB 375 regional target. CARB will establish regional targets for each Metropolitan Planning Organization region
following the input of the regional targets advisory committee and a consultation process with Metropolitan Planning Organizations and other stakeholders per SB 375
2 Measure has been adopted 3 Ongoing measure † GHG emission reduction estimates are not included in calculating the total reductions needed to meet the 2020 target
SOURCE: Climate Change Scoping Plan (CARB, Tables 6-23 on pages 41-67, 2008b)
3.4 Energy and Global Climate Change
Tulare County General Plan 2030 Update 3.4-9 ESA / 207497 Recirculated Draft Environmental Impact Report February 2010
Senate Bill 1368 Senate Bill (SB) 1368 is the companion bill of AB 32, also signed by Governor Schwarzenegger in September 2006. SB 1368 required the California Public Utilities Commission to establish a GHG emission performance standard for baseload generation from investor-owned utilities by February 1, 2007. The California Energy Commission (CEC) was also required to establish a similar standard for local publicly-owned utilities by June 30, 2007. These standards cannot exceed the GHG emission rate from a baseload combined-cycle natural gas-fired plant. The legislation further required that all electricity provided to California, including imported electricity, must be generated from plants that meet the standards set by the California Public Utilities Commission and CEC. On May 28, 2007 the Energy Commission adopted regulations pursuant to SB 1368 establishing and implementing a GHG emission performance standard for baseload generation of local publicly owned electric utilities. The final rulemaking package was submitted to the Office of Administrative Law on June 1, 2007 with a request for expedited review. On June 29, 2007 the Office of Administrative Law issued a decision disapproving the rulemaking action. After revisions, the Office of Administrative Law approved the regulatory action on October 16, 2007.
Senate Bill 97 Governor Schwarzenegger signed Senate Bill (SB) 97, a CEQA and greenhouse gas emission bill, into law on August 24, 2007. SB 97 requires the Governor’s Office of Planning and Research (OPR) to prepare CEQA guidelines for the mitigation of GHG emissions, including, but not limited to, effects associated with transportation or energy consumption. The Resources Agency certified and adopted the guidelines on December 31, 2009 and submitted them for review by the Office of Administrative Law. The adopted amendments will become effective after the Office of Administrative Law completes its review of the adopted amendments and rulemaking file, and transmits the adopted amendments to the Secretary of State for inclusion in the California Code of Regulations. OPR and the Resources Agency are required to periodically review the guidelines to incorporate new information or criteria adopted by CARB pursuant to the Global Warming Solutions Act, scheduled for 2012.
Governor’s Office of Planning and Research (OPR) On June 19, 2008, OPR published a technical advisory on CEQA and Climate Change. The advisory provides OPR’s perspective on the emerging role of CEQA in addressing climate change and greenhouse gas emissions, while recognizing that approaches and methodologies for calculating greenhouse gas emissions and addressing environmental impacts through CEQA review are rapidly evolving. The advisory recognizes that OPR will develop, and the Resources Agency will adopt amendments to the CEQA Guidelines pursuant to SB 97. In the interim, the technical advisory “offers informal guidance regarding the steps lead agencies should take to address climate change in their CEQA documents” (OPR, page 2, 2008).
The technical advisory points out that neither CEQA nor the CEQA Guidelines prescribe thresholds of significance or particular methodologies for performing an impact analysis. “This is left to lead agency judgment and discretion, based upon factual data and guidance from regulatory agencies
Tulare County General Plan 2030 Update
Tulare County General Plan 2030 Update 3.4-10 ESA / 207497 Recirculated Draft Environmental Impact Report February 2010
and other sources where available and applicable” (OPR, page 4, 2008). OPR recommends that “the global nature of climate change warrants investigation of a Statewide threshold of significance for GHG emissions” (OPR, page 4, 2008). Until such a standard is established, OPR advises that each lead agency should develop its own approach to performing an analysis for projects that generate greenhouse gas emissions (OPR, page 5, 2008).
Agencies should then assess whether the emissions are “cumulatively considerable” even though a project’s greenhouse gas emissions may be individually limited. OPR states: “Although climate change is ultimately a cumulative impact, not every individual project that emits GHGs must necessarily be found to contribute to a significant cumulative impact on the environment” (OPR, page 6, 2008). Individual lead agencies may undertake a project-by-project analysis, consistent with available guidance and current CEQA practice (OPR, page 6, 2008).
Finally, if the lead agency determines emissions are a cumulatively considerable contribution to a significant cumulative impact, the lead agency must investigate and implement ways to mitigate the emissions (OPR, page 5, 2008). OPR states: “Mitigation measures will vary with the type of project being contemplated, but may include alternative project designs or locations that conserve energy and water, measures that reduce vehicle miles traveled by fossil-fueled vehicles, measures that contribute to established regional or programmatic mitigation strategies, and measures that sequester carbon to offset the emissions from the project” (OPR, pages 6-7, 2008). OPR concludes that “A lead agency is not responsible for wholly eliminating all GHG emissions from a project; the CEQA standard is to mitigate to a level that is “less-than-significant” (OPR, page 7, 2008). The technical advisory includes a list of mitigation measures that can be applied on a project-by-project basis.
OPR Proposed Amendments to the CEQA Guidelines On April 13, 2009, OPR submitted to the Secretary for Natural Resources its proposed amendments to the State CEQA Guidelines for GHG emissions, as required by Public Resources Code section 21083.05 (Senate Bill 97) (OPR, pages 1-5, 2009). These proposed CEQA Guideline amendments would provide guidance to public agencies regarding the analysis and mitigation of the effects of GHG emissions in draft CEQA documents. The Natural Resources Agency is conducting formal rulemaking in 2009, prior to certifying and adopting the amendments, as required by Senate Bill 97. From October 23, 2009 to November 10, 2009, the Natural Resources Agency held a public comment period on the proposed revisions to the CEQA Guidelines amendments. The Natural Resources Agency approved the amendments on December 31, 2009. The amendments were submitted to the Office of Administrative Law (OAL) for review and will become effective after the OAL completes its review of the adopted amendments and rulemaking file, and transmits the adopted amendments to the Secretary of State for inclusion in the California Code of Regulations.
The proposed amendments suggest relatively modest changes to various portions of the existing CEQA Guidelines. Modifications address those issues where analysis of GHG emissions may differ in some respects from more traditional CEQA analysis.
3.4 Energy and Global Climate Change
Tulare County General Plan 2030 Update 3.4-11 ESA / 207497 Recirculated Draft Environmental Impact Report February 2010
Proposed amendments include a new section (15064.4) to assist lead agencies in determining the significance of the GHG impacts. This section urges lead agencies to quantify, where possible, the GHG emissions of proposed projects. In addition to quantification, this section recommends consideration of several other qualitative factors that may be used in determination of significance including: (1) the extent to which the project may increase or reduce GHG emissions as compared to the existing environmental setting; (2) whether the GHG emissions exceed a threshold of significance that the lead agency determines applies to the project; and (3) the extent to which the project complies with regulations or requirements adopted to implement a Statewide, regional, or local plan for the reduction or mitigation of GHG emissions.
The proposed amendments include a new subdivision 15064.7(c) to clarify that in developing thresholds of significance, a lead agency may appropriately review thresholds developed by other public agencies, including the CARB’s recommended CEQA Thresholds, or suggested by other experts, such as the California Air Pollution Control Officers Association, so long as any threshold chosen is supported by substantial evidence.
The proposed amendments also include a new subdivision 15130(f) to emphasize that the effects of GHG emissions are cumulative, and should be analyzed when the incremental contribution of those emission may be cumulatively considerable.
In addition, the amendments add a new set of environmental checklist questions (VII. Greenhouse Gas Emissions) to the CEQA Guidelines Appendix G. The new set includes the following two questions:
a. Generate GHG emissions, either directly or indirectly, that may have a significant impact on the environment?
b. Conflict with any applicable plan, policy or regulation of an agency adopted for the purpose of reducing the emissions of GHG?
SB 375 SB 375 (Steinberg) was signed into law in 2008. It builds on AB 32 to connect the reduction of GHG emissions from cars and light trucks to land use and transportation policy. The transportation sector represents the State’s largest contributor of greenhouse gases. Accordingly, SB 375 seeks (1) to use the regional transportation planning process to help achieve AB 32 goals; (2) to use CEQA streamlining as an incentive to encourage residential projects which help achieve AB 32 goals to reduce GHG emissions; and (3) to coordinate the regional housing needs allocation process with the regional transportation planning process. SB 375 aligns regional land use, transportation, housing and greenhouse gas reduction planning efforts. It requires CARB to set greenhouse gas emission reduction targets for passenger vehicles and light trucks for 2020 and 2035. The targets are for the 18 Metropolitan Planning Organizations in California. Metropolitan Planning Organizations are responsible for preparing Sustainable Community Strategies and, if needed, Alternative Planning Strategies, that will include the region’s strategy for meeting the established targets. Tulare County Association of Governments is the Metropolitan Planning Organization for Tulare County. Implementation of SB 375 is a multi-year process, with regional GHG reduction targets to be determined in late 2010.
Tulare County General Plan 2030 Update
Tulare County General Plan 2030 Update 3.4-12 ESA / 207497 Recirculated Draft Environmental Impact Report February 2010
California Air Pollution Control Officers Association (CAPCOA) In January 2008, the California Air Pollution Control Officers Association (CAPCOA) issued a “white paper” on evaluating and addressing GHGs under CEQA (CAPCOA, 2008). This resource guide was prepared to support local governments as they develop their programs and policies around climate change issues. The paper is not a guidance document. It is not intended to dictate or direct how any agency chooses to address GHG emissions. Rather, it is intended to provide a common platform of information about key elements of CEQA as they pertain to GHG, including an analysis of different approaches to setting significance thresholds.
The paper notes that for a variety of reasons local agencies may decide not to have a CEQA threshold. Local agencies may also decide to assess projects on a case-by-case basis when the projects come forward. The paper also discusses a range of GHG emission thresholds that could be used. The range of thresholds discusses includes a GHG threshold of zero and several non-zero thresholds. Non-zero thresholds include percentage reductions for new projects that would allow the State to meet its goals for GHG emissions reductions by 2020 and perhaps 2050. These would be determined by a comparison of new emissions versus business as usual emissions and the reductions required would be approximately 30 percent to achieve 2020 goals and 90 percent (effectively immediately) to achieve the more aggressive 2050 goals. These goals could be varied to apply differently to new project, by economic sector, or by region in the State.
Other non-zero thresholds are discussed in the paper include:
• 900 metric tons/year CO2e (a market capture approach); • 10,000 metric tons/year CO2e (potential CARB mandatory reporting level with Cap and
Trade); • 25,000 metric tons/year CO2e (the CARB mandatory reporting level for the Statewide
emissions inventory); • 40,000 to 50,000 metric tons/year CO2e (regulated emissions inventory capture – using
percentages equivalent to those used in air districts for criteria air pollutants), • Projects of Statewide importance (9,000 metric tons/year CO2e for residential, 13,000 metric
tons/year CO2e for office project, and 41,000 metric tons/year CO2e for retail projects), and • Unit-based thresholds and efficiency-based thresholds that were not quantified in the report.
CARB Draft GHG Significance Thresholds On October 24, 2008, CARB released its Preliminary Draft Staff Proposal on Recommended Approaches for Setting Interim Significance Thresholds for Greenhouse Gases under the California Environmental Quality Act for review and public comment (CARB, 2008c). The Proposal states benchmarks or standards that assist lead agencies in the significance determination for industrial, residential, and commercial projects. OPR staff is working on final recommendations to thresholds, consistent with OPR’s timeline for issuing draft CEQA guidelines addressing GHG emissions and to provide much needed guidance to lead agencies in the near term. The Proposal currently focuses on two sectors for which local agencies are typically the CEQA lead agency: industrial projects; and residential and commercial projects. Future proposals will focus on transportation projects, large dairies and power plant projects.
3.4 Energy and Global Climate Change
Tulare County General Plan 2030 Update 3.4-13 ESA / 207497 Recirculated Draft Environmental Impact Report February 2010
For industrial projects, CARB recommends that projects below the industrial screening level (7,000 metric tons/year CO2e) can be found to be less-than-significant. For residential and commercial projects, CARB staff's objective is to develop a threshold on performance standards that will substantially reduce the GHG emissions from new projects and streamline the permitting of carbon-efficient projects. Performance standards will address the five major emission sub-sources for the sector: energy use, transportation, water use, waste, and construction. Projects may alternatively incorporate mitigation equivalent to these performance standards, such as measures from green building rating systems. CARB staff has not proposed a numerical threshold for commercial or residential projects.
San Joaquin Valley Air Pollution Control District Draft GHG Significance Thresholds The San Joaquin Valley Air Pollution Control District (SJVAPCD) issued guidance for addressing greenhouse gas in CEQA documents that was adopted on December 17, 2009. The SJVAPCD proposes a threshold based on implementing predetermined best performance standards that would reduce emissions by an amount consistent with AB 32 targets. The guidance for land use projects is intended to assist local agencies. Local agencies are not required to use the SJVAPCD thresholds.
Under the SJVAPCD proposal, projects requiring project specific environmental review would be evaluated according to a Best Performance Standards approach. Projects complying with the greenhouse gas emission reduction requirements established as Best Performance Standards would not require project specific quantification of greenhouse gas emissions and would be determined to have a less than significant individual and cumulative impact for greenhouse gas emissions. Projects not complying with greenhouse gas emission reduction requirements established as Best Performance Standards would require quantification of project specific greenhouse gas emissions. To be determined to have a less than significant individual and cumulative impact on global climate change, project specific greenhouse gas emissions have to be reduced or mitigated by 29 percent from Business-as-Usual greenhouse gas emissions. Projects requiring preparation of an Environmental Impact Report would require quantification of project specific greenhouse gas emissions. Projects implementing Best Performance Standards or achieving at least a 29 percent greenhouse gas emission reduction compared to Business-as-Usual would be determined to have a less than significant individual and cumulative impact for greenhouse gas emissions. The SJVAPCD will begin a public process of quantifying emission reductions for measures comprising Best Performance Standards in early 2010. Until the quantification process is complete, use of this approach is not appropriate for use in making significance determinations for climate change impacts.
Local Regulations At the local level, Tulare County’s regulatory and planning activities directly influence how, and to what extent, energy is used in the County. Local regulations governing the design, construction and use of buildings affect operational energy needs. Transportation policy decisions directly affect petroleum-based fuel requirements.
Tulare County General Plan 2030 Update
Tulare County General Plan 2030 Update 3.4-14 ESA / 207497 Recirculated Draft Environmental Impact Report February 2010
Environmental Setting
Natural Gas and Electric Service Southern California Edison provides electric service to the majority of Tulare County, including the majority of the San Joaquin Valley and the foothills. Natural gas service is primarily provided by The Gas Company (formerly Southern California Gas Company). Pacific Gas & Electric also serves northern Tulare County’s electric needs on limited basis. The electrical facilities network includes both overhead and underground lines, with new development required to install underground service lines. All utility providers indicate that additional service should be available to new development, depending on the necessary load of the services requested.
Greenhouse Gases Some gases in the atmosphere affect the Earth’s heat balance by absorbing infrared radiation. These gases can prevent the escape of heat in much the same way as glass in a greenhouse. This is often referred to as the “greenhouse effect,” and it is responsible for maintaining a habitable climate. On Earth the gases believed to be most responsible for global warming are water vapor, carbon dioxide (CO2), methane (CH4), nitrous oxide (N2O), hydrofluorocarbons (HFCs), perfluorocarbons (PFCs), and sulfur hexafluoride (SF6). Enhancement of the greenhouse effect can occur when concentrations of these gases exceed the natural concentrations in the atmosphere. Of these gases, CO2 and methane are emitted in the greatest quantities from human activities. Emissions of CO2 are largely by-products of fossil fuel combustion, whereas methane primarily results from the anaerobic decomposition of organic matter associated with wetlands and swamps, agricultural practices and landfills. Sulfur hexafluoride is a GHG commonly used in the utility industry as an insulating gas in transformers and other electronic equipment. Sulfur hexafluoride, while comprising a small fraction of the total GHGs emitted annually world-wide, is a much more potent GHG with 23,900 times the global warming potential as CO2. There is widespread international scientific agreement that human-caused increases in GHGs has and will continue to contribute to global warming, although there is much uncertainty concerning the magnitude and rate of the warming.
Globally, climate change has the potential to impact numerous environmental resources through potential, though uncertain, impacts related to future air temperatures and precipitation patterns. The projected effects of global warming on weather and climate are likely to vary regionally, but are expected to include the following direct effects (IPCC, 2001):
• Higher maximum temperatures and more hot days over nearly all land areas; • Higher minimum temperatures, fewer cold days and frost days over nearly all land areas; • Reduced diurnal temperature range over most land areas; • Increase of heat index over land areas; and • More intense precipitation events.
3.4 Energy and Global Climate Change
Tulare County General Plan 2030 Update 3.4-15 ESA / 207497 Recirculated Draft Environmental Impact Report February 2010
Also, there are many secondary effects that are projected to result from global warming, including global rise in sea level, impacts to agriculture, changes in disease vectors, and changes in habitat and biodiversity. While the possible outcomes and the feedback mechanisms involved are not fully understood, and much research remains to be done, the potential for substantial environmental, social, and economic consequences over the long term may be great.
Historical Context As noted in the Climate Action Team Report to Governor Schwarzenegger and the Legislature (“CAT Report”) (California Climate Action Team, pages 6-7, 2006), the Earth’s climate has always changed and evolved. This is most clearly exemplified in the 100,000-year ice-age cycles that have occurred. As described in the CAT Report, the last 10,000 years, and more specifically the last millennium, has been warm and one of the most stable climates observed (Climate Action Team, pages 6-7, 2006). Yet the CAT Report states that during the 20th century a rapid change in the climate and climate change pollutants has occurred and these changes are attributable to human activities. Climate change is described by the CAT Report as a “shift in the ‘average weather’ that a given region experiences” (California Climate Action Team, pages 6-7, 2006), and that this can be measured by changes in temperature, wind patterns, precipitation, and storms.
According to the CAT Report, human activities including the burning of coal, oil, and natural gas, and the reduction of forests have contributed to an increase in CO2 in the atmosphere by approximately 30 percent since the late 1800s, and that the increase in CO2 and other greenhouse gases, and change in land surface has had a major influence on some of the “key factors that govern climate change…”
Baseline Conditions The California Energy Commission (CEC) estimated that in 2004, California produced 492 million gross metric tons of CO2-equivalent greenhouse gas emissions (CEC, pages i-ii, 2006). The CEC found that transportation is the source of 41 percent of the State’s GHG emissions, which is followed by electricity generation at 22 percent and industrial sources at 21 percent.
Potential Effects of Global Climate Change Future global climate change conditions have the potential to affect a number of different resources, including water resources and wildland fires. From a Statewide perspective, global climate change could affect California’s environmental resources through potential, though uncertain, changes related to future air temperatures and precipitation and their resulting impacts on water temperatures, reservoir operations, sea levels and stream runoff (County of Tulare, 2010 Background Report, pages 8-80 – 8-81, 2010a). Such changes could threaten California’s economy, public health and environment (County of Tulare, 2010 Background Report, page 8-81, 2010a).
The following sections summarize current scientific literature related to the effects of global climate change on water resources, including potential effects to precipitation, runoff, and flooding, and wildland fire hazards. Section 3.7 “Hydrology, Water Quality and Drainage” contains a complete discussion of water resources in Tulare County. Water supply and infrastructure for Tulare County
Tulare County General Plan 2030 Update
Tulare County General Plan 2030 Update 3.4-16 ESA / 207497 Recirculated Draft Environmental Impact Report February 2010
is discussed in Section 3.6 “Public Services, Utilities and Recreation”. Wildland fire threat in Tulare County is addressed in Section 3.9 “Hazardous Materials and Public Safety”.
Water Supply Global climate change is expected to impact California’s water supply through a diminishing Sierra snowpack. Although much uncertainty remains with respect to the effects of global climate change on California’s water supplies, it is expected that increased amounts of winter runoff could be accompanied by increases in flood event severity and warrant additional dedication of wet season storage space for flood control instead of using the water for supply conservation, as is the standard practice. This change in water management could, in turn, lead to more frequent water shortages during high water demand periods (County of Tulare, 2010 Background Report, page 8-83, 2010a). Many regional studies have shown that only small changes in inflows into reservoirs could result in large changes in the reliability of water yields from those reservoirs (County of Tulare, 2010 Background Report, page 8-83, 2010a).
State Water Project (SWP) and Central Valley Project (CVP) A report prepared by the California Department of Water Resources in response to Executive Order S-3-05 represents the most current complete analysis of changes to SWP and CVP operations that would be likely to occur as a result of climate change (County of Tulare, 2010 Background Report, page 8-83, 2010a). Contained in the report is an analysis of the potential impacts of climate change on SWP and CVP operations and deliveries and on Delta water quality and water levels. Results discussed in the report include projections from 2035 through 2064 under four potential climate change scenarios compared to a base case scenario that does not assume climate change effects. Four potential climate change scenarios were included, based upon modeling output from two separate global climate models. Three of these scenarios included decreased average annual precipitation, while one included increased average annual precipitation. Results from the investigation are considered preliminary, incorporate several assumptions regarding the effects of climate change on California water resources, and reflect a limited number of climate change scenarios.
Results from the four modeled scenarios indicated effects to SWP and CVP operations (County of Tulare, 2010 Background Report, page 8-84, 2010a). Resulting from shifts in seasonal and annual average runoff, the amount of water delivered by the SWP and CVP was reduced considerably. The wetter scenario exhibited increased winter season runoff and decreased April-July runoff, but resulted in a 3 percent average annual increase in CVP South of Delta deliveries (County of Tulare, 2010 Background Report, page 8-84, 2010a).
Tulare County receives some of its water supplies from the CVP and SWP. Surface water supplies in Tulare County from the CVP and SWP could potentially be reduced as a result of climate change effects.
3.4 Energy and Global Climate Change
Tulare County General Plan 2030 Update 3.4-17 ESA / 207497 Recirculated Draft Environmental Impact Report February 2010
Surface Water Quality Water quality is affected by several variables, including runoff volume and timing, the physical characteristics of the watershed and water temperature. A combination of changes to these factors could affect several natural processes that serve to eliminate pollutants in water bodies. For example, an overall decrease in stream flows could concentrate pollutants and prevent contaminants from flushing from point sources (County of Tulare, 2010 Background Report, page 8-84, 2010a).
Groundwater Few scientific studies have been performed on the effects of global climate change on specific groundwater basins, groundwater quality or groundwater recharge characteristics (County of Tulare, 2010 Background Report, page 8-84, 2010a). Warmer temperatures could increase the period where water enters the ground by reducing soil freeze. Conversely, warmer temperatures could also lead to higher evaporation or shorter rainfall seasons, which would mean that soil deficits would persist for longer time periods. Reductions in spring runoff and higher evapotranspiration would likely reduce the amount of water available for recharge, but additional winter runoff could increase the amount of runoff available for recharge (County of Tulare, 2010 Background Report, page 8-84, 2010a). Groundwater serves as a major source of water supply in Tulare County, which could result in serious implications for water supply in the County.
Sudden Climate Change Most global climate models project that anthropogenic climate change will be a continuous and fairly gradual process through the end of this century (County of Tulare, 2010 Background Report, page 8-85, 2010a). California is expected to be able to adapt to the water supply challenges posed by climate change, even at warmer and dryer projections. Sudden and unexpected changes, however, could leave water managers unprepared, which, in extreme situations could have significant implications for California’s water supplies.
Amount of Precipitation Most precipitation events in California occur during the October through April rainy season with most of California’s precipitation, in terms of amount of water, falling during November through March. An investigation completed by the Department of Water Resources indicated a statistically significant increasing trend in total precipitation in northern and central California since the late 1960s (County of Tulare, 2010 Background Report, page 8-85, 2010a). A single investigation by Bardini and others showed a trend of potentially decreasing annual precipitation in California; however, this result is probably related to the specific subset of data that the Bardini study relied upon, wherein extremes at the beginning or end of time series data can substantially impact the identified trend (County of Tulare, 2010 Background Report, page 8-85, 2010a). An investigation of rainfall during November through March from 1930 through 1997 indicated significant increases in California rainfall (distinct from snowfall) (County of Tulare, 2010 Background Report, page 8-85, 2010a).
Tulare County General Plan 2030 Update
Tulare County General Plan 2030 Update 3.4-18 ESA / 207497 Recirculated Draft Environmental Impact Report February 2010
There is also evidence that the amount of precipitation that occurs on an annual basis is becoming more variable. That is, periods of both high and low rainfall are becoming more common. Specifically, a study performed by the Department of Water Resources indicates that present day variability in annual precipitation is about 75 percent greater than that of the early 20th century (County of Tulare, 2010 Background Report, page 8-85, 2010a).
Snowpack and Snowmelt In addition to potentially increased precipitation, snowpack and snowmelt may also be substantially affected by climate change. Because much of California’s precipitation falls as snow in the Sierra Nevada and southern Cascades, the State’s snowpack represents a significant reservoir of water that can support beneficial uses. Specifically, about 35 percent of the State’s usable annual surface water supply is derived from the annual snowmelt (County of Tulare, 2010 Background Report, page 8-86, 2010a). As air temperatures increase due to climate change, the water stored in California’s snowpack could be affected in two ways: first, increasing temperatures could result in earlier snowmelt. Second, a substantial reduction in snowpack in California could occur concurrent with an increase in winter rainfall (County of Tulare, 2010 Background Report, page 8-86, 2010a).
Runoff and Flooding Runoff needs to be considered in terms of annual and peak runoff volumes. Annual runoff is measured during the annual water year (October 1 through September 30), and includes river flows derived from precipitation events, snowmelt, and river base flow. Peak runoff is typically measured for individual storm events. Like annual runoff, peak runoff results from precipitation events, snowmelt, and river base flow. Precipitation across California appears to have increased over the past century, and individual water years have become more variable in terms of the amount of precipitation that occurs. It follows, then, that similar variable trends would be seen for runoff.
In relation to snowpack, winter storms provide snow to higher elevations that have historically melted from April through July. This process effectively stores water in California’s snowpack until the spring snowmelt, when the water flows downstream and into major rivers and reservoirs, providing a significant portion of the water supply for the dry summer and autumn periods. April through July runoff in both the Sacramento and San Joaquin rivers shows a decreasing trend over the last century, indicating that in both watersheds, an increasing percentage of runoff is occurring earlier in the year, when many reservoirs are managed primarily for flood control and not for water supply (County of Tulare, 2010 Background Report, page 8-86 – 8-87, 2010a).
As discussed above, it is anticipated that climate change will have a substantial effect on the timing and magnitude of snowfall, rainfall, and snowmelt events in California. Large annual variations in winter rainfall and runoff, which are normal in California, create uncertainty surrounding potential changes in flooding as a result of climate change. Independent climate modeling efforts are predicting that trends towards more variable river flows and more frequent flooding events will continue into the future, as a result of climate change (County of Tulare, 2010 Background Report, page 8-88, 2010a).
3.4 Energy and Global Climate Change
Tulare County General Plan 2030 Update 3.4-19 ESA / 207497 Recirculated Draft Environmental Impact Report February 2010
Flooding Implications for Tulare County The effects of climate change have serious implications for snowmelt and runoff. Increasing snowmelt from rising temperatures coupled with increasing precipitation in the form of rain and less falling as snow in the mountains could result in greater flows in mountain streams and rivers. Additionally, increasing variability in storm events could affect flood control measures, such as levees and reservoirs.
Tulare County contains a number of rivers and waterways. Several major waterways include Kern River, Kaweah River and Tule River. The Kern River flows north to south through the Sierra Nevada Mountains in eastern Tulare County. The headwaters for the Kaweah and Tule Rivers are located in the Sierra Nevada Mountains. These rivers flow west into the Tulare Lake Basin. A number of mountain streams flow into the Kaweah and Tule Rivers and their respective reservoirs, Lake Kaweah and Lake Success. Lake Kaweah and Lake Success both serve as flood control structures. Kaweah and Tule Rivers, their tributaries, and Lake Kaweah and Lake Success could be subject to increased frequency or severity of flooding from upstream areas as a result of increased snowmelt and runoff. A number of communities are located near these waterbodies, including Three Rivers, Woodlake, Lemoncove, Springville, and Porterville, and could be exposed to an increase in flooding associated with the effects of climate change.
Wildland Fire Hazards A number of preliminary studies have analyzed the potential for climate change effects to affect wildland fire hazards. These studies indicate that there is a potential for significant increases in the number of fires escaping initial attack, particularly in areas in which the fuels are dominated by grass and brush. These studies indicate that subtle shifts in fire behavior of the sort that might be induced by the climate changes anticipated for the next century are of sufficient magnitude to result in an increase in the number of fires in areas where brush fuels dominate (County of Tulare, 2010 Background Report, page 8-89, 2010a). It is expected that increases in temperatures and changes in precipitation as a result of climate change would have the most effects on wildland fire patterns. At this time, these are only preliminary general assumptions regarding the effects of climate change on wildland fire hazards.
Impacts and Mitigation Measures
Significance Criteria Neither the CEQA statute nor Guidelines prescribe thresholds of significance or a particular methodology for performing an impact analysis, and as of this writing no State agency or local air quality management district has issued any regulations or standards of significance for the analysis of GHGs under CEQA; as with most environmental topics, significance criteria are left to the judgment and discretion of the lead agency. The CEQA Guidelines Amendments approved by OPR on December 31, 2009 make clear that the identification and adoption of appropriate CEQA thresholds is a matter left to the discretion of the lead agency.
Tulare County General Plan 2030 Update
Tulare County General Plan 2030 Update 3.4-20 ESA / 207497 Recirculated Draft Environmental Impact Report February 2010
Land use projects may contribute to the phenomenon of global climate change in ways that would be experienced worldwide, and with some specific effects felt in California. However, no scientific study has established a direct causal link between individual land use project impacts and global warming. AB 32 requires State-wide GHG emissions to be reduced to 1990 levels by 2020. Although these State-wide reductions are now mandated by law, no generally applicable GHG emission threshold has yet been established. The CEQA Guidelines Amendments provide limited regulatory agency guidance on global climate change analysis in CEQA documents, but do not mandate a numeric threshold.
CEQA Guidelines Section 15064(b) provides that the “determination of whether a project may have a significant effect on the environment calls for careful judgment on the part of the public agency involved, based to the extent possible on scientific and factual data,” and further, states that an “ironclad definition of significant effect is not always possible because the significance of an activity may vary with the setting.”
Because no applicable numeric thresholds have yet been defined, and because the precise causal link between an individual project’s emissions and global climate change has not been developed, it is reasonable to conclude that an individual development project cannot generate a high enough quantity of GHG emissions to affect global climate change. However, individual projects incrementally contribute toward the potential for global climate change on a cumulative basis in concert with all other past, present, and reasonably foreseeable future projects. Thus, this EIR analyzes whether this project’s potential contribution to global warming impacts is cumulatively considerable.
The significance criteria for this analysis were developed from guidance presented in Appendix F, “Energy Conservation”, of the CEQA Guidelines Amendments and based on the professional judgment of the County of Tulare and its consultants. The proposed project would result in a significant impact if it would:
• Result in inefficient, wasteful and unnecessary consumption of energy by residential, commercial, industrial, or public uses associated with increased demand due to anticipated population growth in the County;
• Result in the wasteful, inefficient, or unnecessary consumption of energy in the construction and operation of new buildings; or
• Conflict with the State goal of reducing greenhouse gas emissions in California to 1990 levels by 2020, as set forth by the timetable established in AB 32, California Global Warming Solutions Act of 2006.
Methodology Buildout under the General Plan 2030 Update would affect energy use in two ways: construction of new development would require energy use and project operations would result in increases in energy use through changes in vehicle miles traveled and increases in overall energy use from operation of additional residential, office, industrial, and agricultural uses. The analysis in this EIR provides a program-level assessment of the effects of implementing the proposed project.
3.4 Energy and Global Climate Change
Tulare County General Plan 2030 Update 3.4-21 ESA / 207497 Recirculated Draft Environmental Impact Report February 2010
As noted above, OPR issued guidance in the form of a Technical Advisory in June 2008 regarding how to address climate change through CEQA review. The recommended approach for GHG analysis included in OPR’s June 2008 release is to (1) identify and quantify GHG emissions, (2) assess the significance of the impact on climate change, and (3) if significant, identify alternatives and/or mitigation measures to reduce the impact below significance. The County has followed this guidance in its analysis.
A Greenhouse Gas (GHG) Inventory was compiled for existing GHG emissions and the GHG emissions expected to occur subsequent to buildout of the General Plan 2030 Update (see Appendix E of this RDEIR). The inventory was performed using protocols established by the California Climate Action Registry (County of Tulare, 2010 Background Report, page 6-34, 2010a), and by the GHG Protocol Initiative (County of Tulare, 2010 Background Report, page 6-33, 2010a). In keeping with protocol guidelines, the process used to perform the GHG inventory is as follows:
• Set organizational boundaries • Set operational boundaries • Identify sources of emissions • Collect data on emissions for a representative period of time • Calculate GHG emissions from data using data-specific emission factors • Create an inventory of CO2e emissions that is complete and transparent
This assessment includes emissions attributable to all unincorporated land within Tulare County. It does not include emissions associated with incorporated cities within Tulare County. Therefore, unincorporated Tulare County is considered to be the organizational boundary for the assessment. The assessment includes emission inventories for five main sectors of emission sources, including: electricity; natural gas; solid waste; mobile sources; and dairy/feedlot.
2007 emissions were calculated using data from calendar year 2007, when available. When data from 2007 was unavailable, data from 2006 were used as a proxy. 2030 projections assume that overall build-out outlined in the Tulare County General Plan 2030 Update would occur. 2030 projections also assume a ‘business-as-usual’ trajectory for generation and emission of greenhouse gases in the County.
The inventory includes all reasonably discoverable emissions generated within the unincorporated areas of Tulare County, generated by both public and private sources. This inventory includes direct and indirect emissions resulting from the energy (electricity and natural gas), mobile source (on- and off-road), agriculture (dairy/feedlots), and solid waste (landfills) sectors in Tulare County. The assessment of these emissions includes: CO2 from production of electricity, use of natural gas, and operation of mobile sources; methane from production of electricity, use of natural gas, decomposition of solid waste, operation of mobile sources, and operation of dairy/feedlots; and nitrous oxide from production of electricity, use of natural gas, and operation of mobile sources. This assessment does not include emissions of sulfur hexafluoride, HFCs, or PFCs, which were
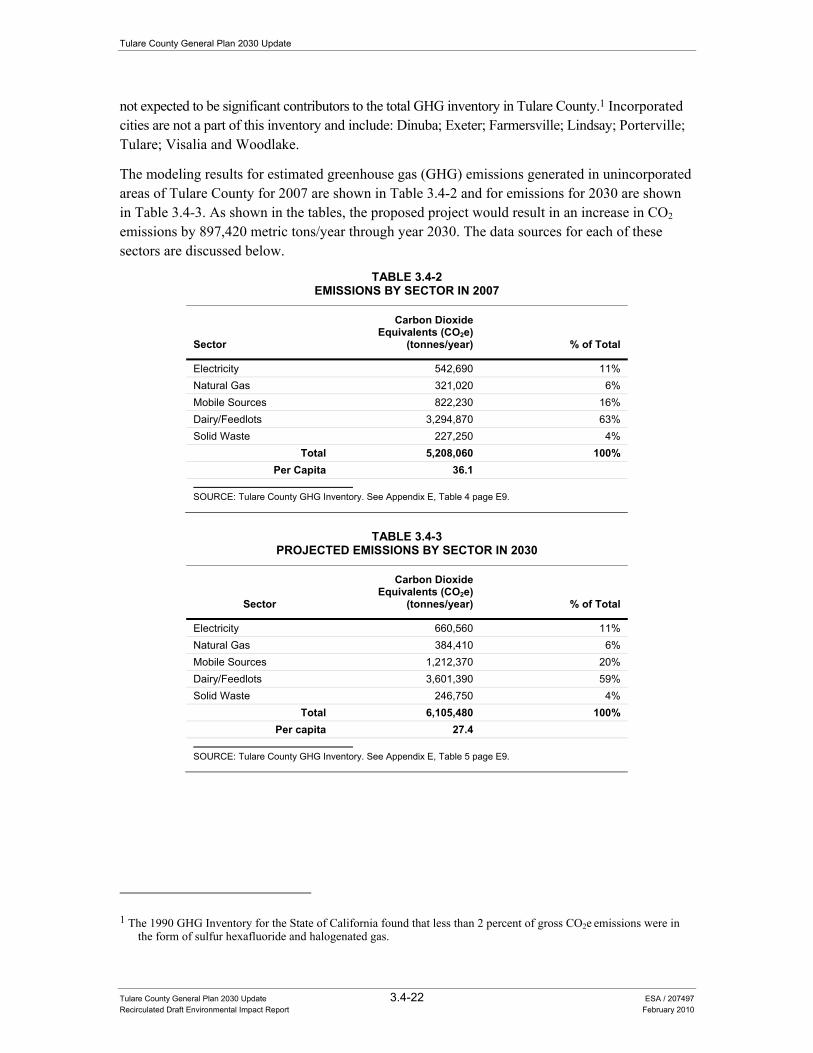
Tulare County General Plan 2030 Update
Tulare County General Plan 2030 Update 3.4-22 ESA / 207497 Recirculated Draft Environmental Impact Report February 2010
not expected to be significant contributors to the total GHG inventory in Tulare County.1 Incorporated cities are not a part of this inventory and include: Dinuba; Exeter; Farmersville; Lindsay; Porterville; Tulare; Visalia and Woodlake.
The modeling results for estimated greenhouse gas (GHG) emissions generated in unincorporated areas of Tulare County for 2007 are shown in Table 3.4-2 and for emissions for 2030 are shown in Table 3.4-3. As shown in the tables, the proposed project would result in an increase in CO2 emissions by 897,420 metric tons/year through year 2030. The data sources for each of these sectors are discussed below.
TABLE 3.4-2EMISSIONS BY SECTOR IN 2007
Sector
Carbon Dioxide Equivalents (CO2e)
(tonnes/year) % of Total
Electricity 542,690 11% Natural Gas 321,020 6% Mobile Sources 822,230 16% Dairy/Feedlots 3,294,870 63% Solid Waste 227,250 4%
Total 5,208,060 100% Per Capita 36.1
SOURCE: Tulare County GHG Inventory. See Appendix E, Table 4 page E9.
TABLE 3.4-3
PROJECTED EMISSIONS BY SECTOR IN 2030
Sector
Carbon Dioxide Equivalents (CO2e)
(tonnes/year) % of Total
Electricity 660,560 11% Natural Gas 384,410 6% Mobile Sources 1,212,370 20% Dairy/Feedlots 3,601,390 59% Solid Waste 246,750 4%
Total 6,105,480 100% Per capita 27.4
SOURCE: Tulare County GHG Inventory. See Appendix E, Table 5 page E9.
1 The 1990 GHG Inventory for the State of California found that less than 2 percent of gross CO2e emissions were in the form of sulfur hexafluoride and halogenated gas.
3.4 Energy and Global Climate Change
Tulare County General Plan 2030 Update 3.4-23 ESA / 207497 Recirculated Draft Environmental Impact Report February 2010
Electricity
2007 Emissions Pacific Gas and Electric Company (PG&E) provided data for 2007 electricity consumption in unincorporated Tulare County in kilowatt-hours (kWh), separated by residential, commercial, and industrial usage. PG&E also provided PG&E-specific CO2 emission rates (emission factors) for electricity for 2007. Of note, PG&E provided its ClimateSmart2 emission rate, which is a multi-year average, as a proxy for its 2007 emission rate.
Southern California Edison (SCE) provided data for electricity consumption in unincorporated Tulare County in kWh, separated by residential, commercial/industrial, agricultural, and street lighting usage. Data was provided for December 1, 2005 to November 30, 2006. This analysis assumes that electricity use during this period is similar to electricity use in 2007. SCE did not provide an SCE-specific emission factor; therefore, this analysis uses a regional emission factor from the California Climate Action Registry.
Neither utility provide utility-specific emission factors for nitrous oxide or methane. Therefore, this analysis uses a regional emission factor from California Climate Action Registry for nitrous oxide and methane estimates.
2030 Emissions Residential and street light electricity consumption in 2030 was estimated using the predicted population growth rate. This analysis assumes that, under a business-as-usual trajectory, residential electricity consumption will grow at the same rate as the population—approximately 54 percent from 2007 to 2030.
Commercial, industrial, and agricultural electricity consumption is assumed to increase commensurate with job growth. The Tulare County Association of Governments predicts that the number of jobs in unincorporated Tulare County will increase by approximately 11 percent between 2007 and 2030.
Natural Gas
2007 Emissions The Gas Company (formerly Southern California Gas) provided data for calendar year 2007 in million cubic feet, for residential, commercial, and industrial usage. The Gas Company also provided a company-specific emission factor for CO2, but not for nitrous oxide or methane. Therefore, this analysis uses a U.S. average emission factor from California Climate Action Registry for nitrous oxide and methane estimates.
2 PG&E’s ClimateSmart™ program provides a voluntary option for PG&E customers to calculate their monthly GHG emissions from electricity use, and to offset those emissions by funding GHG emissions reduction projects.
Tulare County General Plan 2030 Update
Tulare County General Plan 2030 Update 3.4-24 ESA / 207497 Recirculated Draft Environmental Impact Report February 2010
2030 Emissions Residential natural gas consumption in 2030 was estimated using the predicted population growth rate. Commercial and industrial consumption were assumed to increase commensurate with job growth. See Appendix D and E of this RDEIR for details on all calculations performed for this analysis.
Solid Waste
2007 Emissions Annual generation of methane emissions were calculated using the USEPA’s Landfill Gas Emissions Model Version 3.02 (LandGEM) (USEPA, pages 16-17, 2008). The model uses as inputs the amount of waste placed in the landfill annually; a factor (Lo) for the potential methane generation capacity, which depends on the type and composition of waste placed in the landfill; and a factor (k) for the methane generation rate, which determines the rate of methane generation for the mass of waste in the landfill, and which is related to environmental conditions within the landfill – primarily the amount of moisture.
Tulare County Resource Management Agency (RMA) provided data for the three active landfills in Tulare County: Visalia Disposal Site, Woodville Disposal Site and Teapot Dome Disposal Site. Because the landfills are owned, operated, and managed by the County, landfill emissions are included as direct emissions by the County. RMA provided data for total tonnage of the waste in place as of 2007 and the annual tonnage reports for 1996-2007, as well as information about which landfills flare methane emissions and which use generators. ESA ran the LandGem model using the default values for the potential methane generation capacity (Lo) and methane generation rate (k). See Appendix E of this RDEIR for calculations, additional assumptions, and emission factors.
2030 Emissions Total production of solid waste in 2030 was projected using the predicted population growth rate. Also, according to RMA, Teapot Dome Disposal Site will reach its permitted capacity during 2009 if the current disposal rate continues. Consequently, emission calculations assume that future waste generation for Teapot Dome Disposal Site will be redirected to Woodville Disposal Site.
Mobile Sources
2007 Emissions Off-road emissions were calculated using CARB’s OFFROAD2007 Model (County of Tulare, 2010 Background Report, page 6-36, 2010a), and represent 2007 emissions. The off-road model captures emissions from various types of off-road equipment, including agricultural, construction, lawn and garden, and off-road recreation, which includes equipment from hedge trimmers to cranes. Using the off-road model, a tons-per-day average was generated for all off-road equipment, using a “Monday-Sunday” averaging period and “Annual” as the month or season. To obtain an annual estimate for 2007, this number was multiplied by 365. The model estimates emissions for all off-road mobile sources in Tulare County, including unincorporated and incorporated areas. Because the
3.4 Energy and Global Climate Change
Tulare County General Plan 2030 Update 3.4-25 ESA / 207497 Recirculated Draft Environmental Impact Report February 2010
scope of this analysis includes unincorporated areas only, total County emissions were allocated to unincorporated Tulare County based on the percent of the population that lived in unincorporated Tulare County in 2007 (34 percent).
On-road emissions were derived using vehicle miles traveled data from the Tulare County Association of Governments (TCAG, 2007), and emission factors from CARB’s EMFAC2007 model. This model is used to calculate emission rates from all motor vehicle classifications, from passenger cars to heavy-duty trucks, operating on highways, freeways, and local roads in California (CARB, 2008d). Because vehicle miles traveled data was for all of Tulare County, including incorporated cities, total County emissions were allocated to unincorporated Tulare County based on the percent of the population that lived in unincorporated Tulare County in 2007 (i.e., 34 percent) and 2030 (i.e., 30 percent).
2030 Emissions Year 2030 off-road emissions were calculated using Tulare County Association of Government’s predicted job growth rate. This analysis assumes that, under a business-as-usual trajectory, off-road equipment usage will grow at the same rate as employment, approximately 11 percent from 2007 to 2030.
Year 2030 on-road emissions were calculated using Tulare County Association of Government’s vehicle miles traveled estimates for 2030. See Appendix D and E of this RDEIR for calculations.
Dairy/Feedlot
2007 and 2030 Emissions Dairy and feedlot operational emissions were estimated in the Tulare County Draft Phase I Animal Confinement Facilities Plan Supplemental Program EIR (County of Tulare, 2010 Background Report, Tables 3-7a and 3-7b, follows page 3-24, 2010a). Total dairy and feedlot emissions of methane are derived using emission rates associated with manure decomposition and enteric digestion. The analysis calculates methane emissions under existing conditions (2006), and complete build-out conditions (2020). This analysis assumes that emissions in 2006 emissions are similar to emissions in 2007, and that emissions in 2030 will be similar to those in 2020.
Summary of Impacts This section evaluates energy and climate change impacts related to the proposed project. Impact statements address the intent of the current CEQA Guidelines (specific to climate change questions), yet are not taken verbatim from the Guidelines. Instead, impact statements have been tailored to fit the General Plan 2030 Update. For this programmatic evaluation, impacts have been assessed for the overall general plan along with the various planning areas that comprise the County, with Table 3.4-4 providing an overview of these impacts for the proposed project and the various planning areas. Given the nature of the impacts, it is anticipated that implementation of the proposed project would result in similar impacts to all geographic planning areas of the County.
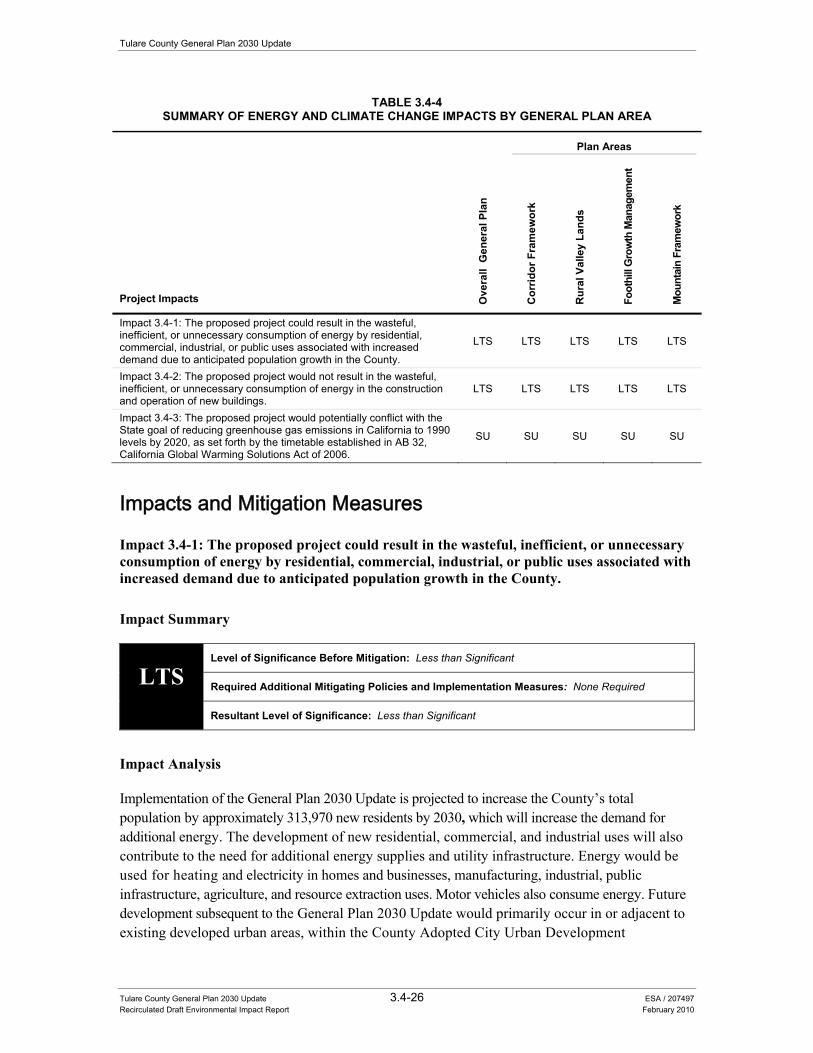
Tulare County General Plan 2030 Update
Tulare County General Plan 2030 Update 3.4-26 ESA / 207497 Recirculated Draft Environmental Impact Report February 2010
TABLE 3.4-4 SUMMARY OF ENERGY AND CLIMATE CHANGE IMPACTS BY GENERAL PLAN AREA
Project Impacts Ove
rall
Gen
eral
Pla
n
Plan Areas
Cor
ridor
Fra
mew
ork
Rur
al V
alle
y La
nds
Foot
hill
Gro
wth
Man
agem
ent
Mou
ntai
n Fr
amew
ork
Impact 3.4-1: The proposed project could result in the wasteful, inefficient, or unnecessary consumption of energy by residential, commercial, industrial, or public uses associated with increased demand due to anticipated population growth in the County.
LTS LTS LTS LTS LTS
Impact 3.4-2: The proposed project would not result in the wasteful, inefficient, or unnecessary consumption of energy in the construction and operation of new buildings.
LTS LTS LTS LTS LTS
Impact 3.4-3: The proposed project would potentially conflict with the State goal of reducing greenhouse gas emissions in California to 1990 levels by 2020, as set forth by the timetable established in AB 32, California Global Warming Solutions Act of 2006.
SU SU SU SU SU
Impacts and Mitigation Measures
Impact 3.4-1: The proposed project could result in the wasteful, inefficient, or unnecessary consumption of energy by residential, commercial, industrial, or public uses associated with increased demand due to anticipated population growth in the County.
Impact Summary
LTS Level of Significance Before Mitigation: Less than Significant
Required Additional Mitigating Policies and Implementation Measures: None Required
Resultant Level of Significance: Less than Significant
Impact Analysis
Implementation of the General Plan 2030 Update is projected to increase the County’s total population by approximately 313,970 new residents by 2030, which will increase the demand for additional energy. The development of new residential, commercial, and industrial uses will also contribute to the need for additional energy supplies and utility infrastructure. Energy would be used for heating and electricity in homes and businesses, manufacturing, industrial, public infrastructure, agriculture, and resource extraction uses. Motor vehicles also consume energy. Future development subsequent to the General Plan 2030 Update would primarily occur in or adjacent to existing developed urban areas, within the County Adopted City Urban Development
3.4 Energy and Global Climate Change
Tulare County General Plan 2030 Update 3.4-27 ESA / 207497 Recirculated Draft Environmental Impact Report February 2010
Boundaries, County Adopted City Urban Area Boundaries, Hamlet Development Boundaries (HDBs), Planned Community Areas (PCAs), Mountain Service Centers (MSCs), and Development Corridors in the Foothill Growth Management Plan (FGMP). These land use patterns allow for the logical extension and utilization of existing utilities, public services, and other amenities such as proximity to employment centers, commercial uses, and public transit. Such land use patterns reduce dependence on motor vehicles and allows for stronger public transportation systems and development of pedestrian and bicycle paths. Along with implementation of the policies discussed below, the proposed project would not result in inefficient or wasteful consumption of energy.
Policies and implementation measures that minimize this impact are included as part of the General Plan 2030 Update. The Transportation and Circulation (TC) and Air Quality (AQ) Elements include policies that support the use of public transit over personal vehicle use through funding mechanisms or transit planning efforts (see Policies TC-1.6, TC-1.18, TC-3.7, TC-4.2, TC-4.3, TC-4.7, and AQ Implementation Measure #8). A number of policies support the design of pedestrian and bicycle facilities in future development subsequent to the General Plan (see Policies LU-7.3, TC-5.1, TC-5.2, TC-5.3, TC-5.4, TC-5.6, TC-5.7, TC-5.9, AQ-3.3, HS-9.1, HS-9.1, HS-9.2 and HS Implementation Measure #24 and TC Implementation Measures #21– #28). Policies AQ-2.2 and AQ-2.3 require future development to mitigate air quality impacts by providing bicycle and pedestrian facilities, increasing density, creating mixed use developments, supporting public transit, creating incentives for carpooling and alternative fuel vehicles, and providing telecommuting programs. Several land use (LU) and AQ policies support the creation of mixed use, infill, high density developments (see Policies LU-1.1, LU-1.2, LU-1.8, and AQ-3.6 and LU Implementation Measure #7). Policy LU-2.1, LU-3.1, LU-3.3, LU-4.1, LU-6.3, TC-4.4, AQ-3.1, and AQ-3.2 and LU Implementation Measure #3 direct development to within cities, unincorporated communities, and hamlets where public services and facilities, infrastructure, employment centers and other amenities are available. TC Implementation Measure #6 requires the County to update roadway improvement standards to account for air emissions reductions, enhancement of public safety, and smart growth design principles for pedestrian/bicycle facilities and traffic calming devices. TC Implementation Measures #8 and #18 contain provisions for the County and other entities to obtain funding for alternative modes of transportation. Policies LU-2.1, PFS-1.8, PFS-1.15, PFS-1.16, PFS-2.4, and PFS-3.3 direct new development to locate where there are existing utilities and services, which would minimize increasing energy use for construction and operation of new utilities and services. With implementation of the below mentioned policies, this impact is considered less than significant.
MITIGATING POLICIES AND IMPLEMENTATION MEASURES
Land Use, Air Quality, Health and Safety, and Foothill Growth Management Plan Elements Transportation and Circulation Element
Policies designed to minimize vehicle miles traveled through the support of future development patterns that increase the use of alternative forms of transportation and non-motorized transportation.
LU-6.3 Schools in Neighborhoods LU-7.3 Friendly Streets AQ-2.2 Indirect Source Review AQ-2.3 Transportation and Air Quality AQ-2.4 Transportation Management Associations AQ-2.5 Ridesharing
TC-1.6 Intermodal Connectivity TC-1.18 Balanced System TC-2.1 Rail Service TC-2.4 High Speed Rail (HSR) TC-3.7 Multi-modal Development TC-4.2 Determine Transit Needs
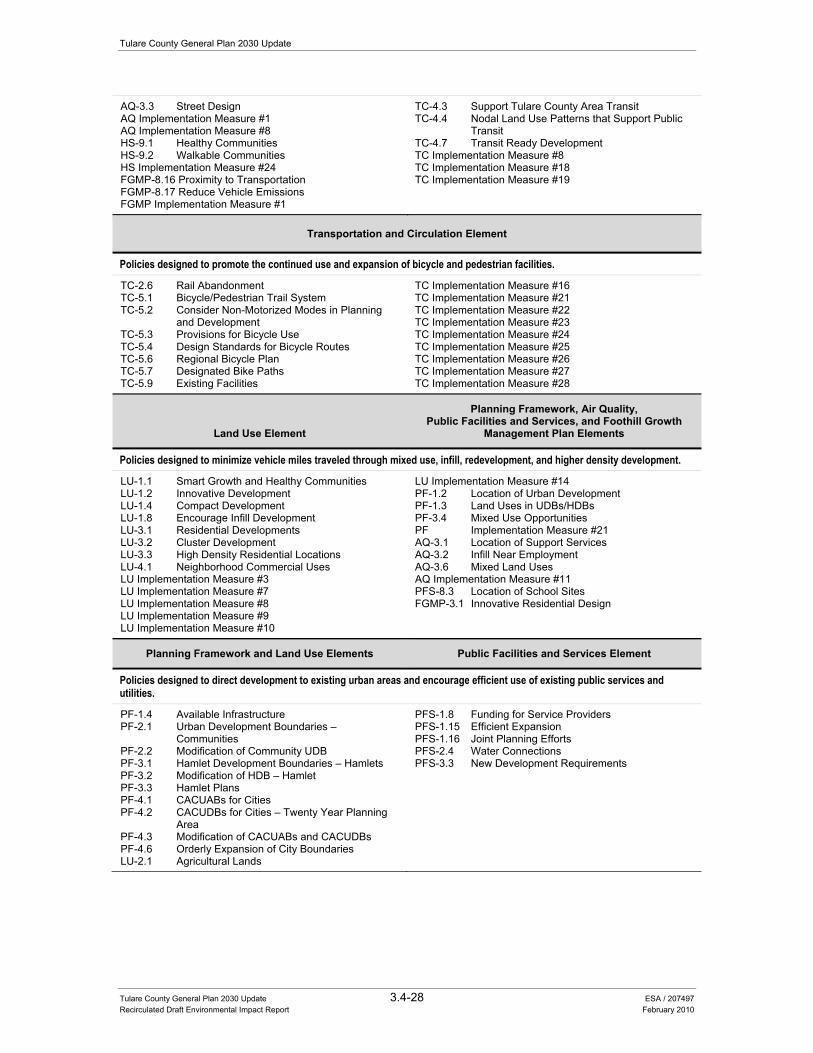
Tulare County General Plan 2030 Update
Tulare County General Plan 2030 Update 3.4-28 ESA / 207497 Recirculated Draft Environmental Impact Report February 2010
AQ-3.3 Street Design AQ Implementation Measure #1 AQ Implementation Measure #8 HS-9.1 Healthy Communities HS-9.2 Walkable Communities HS Implementation Measure #24 FGMP-8.16 Proximity to Transportation FGMP-8.17 Reduce Vehicle Emissions FGMP Implementation Measure #1
TC-4.3 Support Tulare County Area Transit TC-4.4 Nodal Land Use Patterns that Support Public
Transit TC-4.7 Transit Ready Development TC Implementation Measure #8 TC Implementation Measure #18 TC Implementation Measure #19
Transportation and Circulation Element
Policies designed to promote the continued use and expansion of bicycle and pedestrian facilities.
TC-2.6 Rail Abandonment TC-5.1 Bicycle/Pedestrian Trail System TC-5.2 Consider Non-Motorized Modes in Planning
and Development TC-5.3 Provisions for Bicycle Use TC-5.4 Design Standards for Bicycle Routes TC-5.6 Regional Bicycle Plan TC-5.7 Designated Bike Paths TC-5.9 Existing Facilities
TC Implementation Measure #16 TC Implementation Measure #21 TC Implementation Measure #22 TC Implementation Measure #23 TC Implementation Measure #24 TC Implementation Measure #25 TC Implementation Measure #26 TC Implementation Measure #27 TC Implementation Measure #28
Land Use Element
Planning Framework, Air Quality, Public Facilities and Services, and Foothill Growth
Management Plan Elements
Policies designed to minimize vehicle miles traveled through mixed use, infill, redevelopment, and higher density development.
LU-1.1 Smart Growth and Healthy Communities LU-1.2 Innovative Development LU-1.4 Compact Development LU-1.8 Encourage Infill Development LU-3.1 Residential Developments LU-3.2 Cluster Development LU-3.3 High Density Residential Locations LU-4.1 Neighborhood Commercial Uses LU Implementation Measure #3 LU Implementation Measure #7 LU Implementation Measure #8 LU Implementation Measure #9 LU Implementation Measure #10
LU Implementation Measure #14 PF-1.2 Location of Urban Development PF-1.3 Land Uses in UDBs/HDBs PF-3.4 Mixed Use Opportunities PF Implementation Measure #21 AQ-3.1 Location of Support Services AQ-3.2 Infill Near Employment AQ-3.6 Mixed Land Uses AQ Implementation Measure #11 PFS-8.3 Location of School Sites FGMP-3.1 Innovative Residential Design
Planning Framework and Land Use Elements Public Facilities and Services Element
Policies designed to direct development to existing urban areas and encourage efficient use of existing public services and utilities.
PF-1.4 Available Infrastructure PF-2.1 Urban Development Boundaries –
Communities PF-2.2 Modification of Community UDB PF-3.1 Hamlet Development Boundaries – Hamlets PF-3.2 Modification of HDB – Hamlet PF-3.3 Hamlet Plans PF-4.1 CACUABs for Cities PF-4.2 CACUDBs for Cities – Twenty Year Planning
Area PF-4.3 Modification of CACUABs and CACUDBs PF-4.6 Orderly Expansion of City Boundaries LU-2.1 Agricultural Lands
PFS-1.8 Funding for Service Providers PFS-1.15 Efficient Expansion PFS-1.16 Joint Planning Efforts PFS-2.4 Water Connections PFS-3.3 New Development Requirements
3.4 Energy and Global Climate Change
Tulare County General Plan 2030 Update 3.4-29 ESA / 207497 Recirculated Draft Environmental Impact Report February 2010
Required Additional Mitigating Policies and Implementation Measures
As stated above, the County will implement a number of policies designed to minimize wasteful, inefficient, or unnecessary consumption of energy through implementation of the proposed project. In addition, the County will ensure that future CEQA documentation be prepared for individual projects (with project-specific data) that will (if technically possible) mitigate any potential pedestrian or bicycle facility impacts to a less than significant level. This impact is considered less than significant. No additional mitigation measures are required.
Significance after Implementation of Mitigation for Impact 3.4-1
A number of policies referenced above in the impact analysis and included in the proposed project were specifically designed to minimize impacts to pedestrian and bicycle facilities and opportunities. With implementation of the above mentioned policies, this impact is considered less than significant.
Impact 3.4-2: The proposed project could result in the wasteful, inefficient, or unnecessary consumption of energy in the construction and operation of new buildings.
Impact Summary
LTS Level of Significance Before Mitigation: Less than Significant
Required Additional Mitigating Policies and Implementation Measures: New Policies ERM-4.7 “Reduce Energy Use in County Facilities” and ERM-4.8 “Energy Efficiency Standards”
Resultant Level of Significance: Less than Significant
Impact Analysis
Implementation of the General Plan 2030 Update would result in the construction of a number of new office, commercial, industrial, and residential buildings. Office, commercial, and industrial buildings typically use more energy than residential buildings due to their large size as well as space heating and cooling, lighting, refrigeration, and manufacturing processes. Future development of buildings for these land uses could utilize a number of techniques to minimize energy use during construction and operation of the buildings. Some techniques that would reduce energy demands for new buildings could include, but are not limited to, passive heating, cooling, and lighting; high levels of insulation; proper building orientation; use of energy efficient appliances; natural ventilation; and appropriate landscaping. Additionally, new and existing buildings could rely on alternative forms of energy, such as solar energy, to reduce reliance on petroleum based energy sources that emit GHGs.
The General Plan 2030 Update includes a number of policies that support and encourage the use of building technologies and use of alternative forms of energy to maximize energy efficiency and minimize energy use to the extent feasible. Policies AQ-3.5, LU-7.15, ERM-4.1 through ERM-4.4, and ERM-4.6 promote the continued participation in energy conservation programs and the promotion of energy conservation measures including the use of solar power, planting of shade
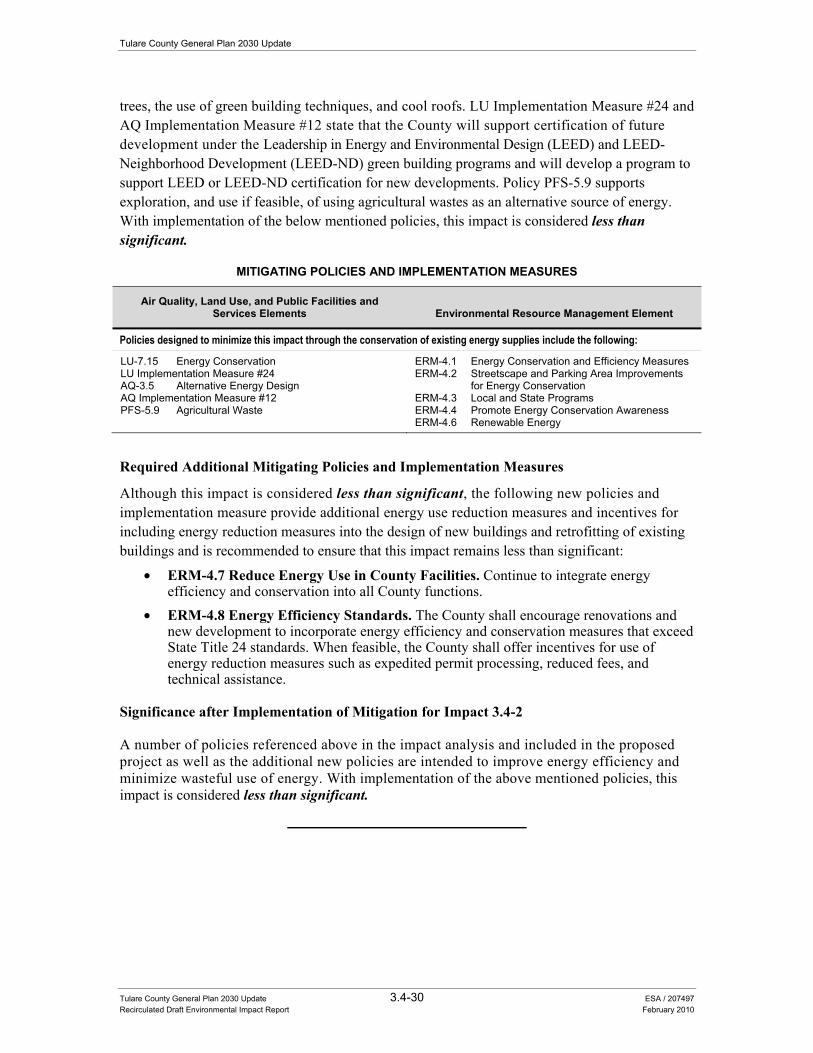
Tulare County General Plan 2030 Update
Tulare County General Plan 2030 Update 3.4-30 ESA / 207497 Recirculated Draft Environmental Impact Report February 2010
trees, the use of green building techniques, and cool roofs. LU Implementation Measure #24 and AQ Implementation Measure #12 state that the County will support certification of future development under the Leadership in Energy and Environmental Design (LEED) and LEED-Neighborhood Development (LEED-ND) green building programs and will develop a program to support LEED or LEED-ND certification for new developments. Policy PFS-5.9 supports exploration, and use if feasible, of using agricultural wastes as an alternative source of energy. With implementation of the below mentioned policies, this impact is considered less than significant.
MITIGATING POLICIES AND IMPLEMENTATION MEASURES
Air Quality, Land Use, and Public Facilities and Services Elements Environmental Resource Management Element
Policies designed to minimize this impact through the conservation of existing energy supplies include the following:
LU-7.15 Energy Conservation LU Implementation Measure #24 AQ-3.5 Alternative Energy Design AQ Implementation Measure #12 PFS-5.9 Agricultural Waste
ERM-4.1 Energy Conservation and Efficiency Measures ERM-4.2 Streetscape and Parking Area Improvements
for Energy Conservation ERM-4.3 Local and State Programs ERM-4.4 Promote Energy Conservation Awareness ERM-4.6 Renewable Energy
Required Additional Mitigating Policies and Implementation Measures
Although this impact is considered less than significant, the following new policies and implementation measure provide additional energy use reduction measures and incentives for including energy reduction measures into the design of new buildings and retrofitting of existing buildings and is recommended to ensure that this impact remains less than significant:
• ERM-4.7 Reduce Energy Use in County Facilities. Continue to integrate energy efficiency and conservation into all County functions.
• ERM-4.8 Energy Efficiency Standards. The County shall encourage renovations and new development to incorporate energy efficiency and conservation measures that exceed State Title 24 standards. When feasible, the County shall offer incentives for use of energy reduction measures such as expedited permit processing, reduced fees, and technical assistance.
Significance after Implementation of Mitigation for Impact 3.4-2
A number of policies referenced above in the impact analysis and included in the proposed project as well as the additional new policies are intended to improve energy efficiency and minimize wasteful use of energy. With implementation of the above mentioned policies, this impact is considered less than significant.
3.4 Energy and Global Climate Change
Tulare County General Plan 2030 Update 3.4-31 ESA / 207497 Recirculated Draft Environmental Impact Report February 2010
Impact 3.4-3: The proposed project would potentially conflict with the State goal of reducing greenhouse gas emissions in California to 1990 levels by 2020, as set forth by the timetable established in AB 32, California Global Warming Solutions Act of 2006.
Impact Summary
SU
Level of Significance Before Mitigation: Potentially Significant
Required Additional Mitigating Policies and Implementation Measures: Revised Policy AQ-1.7 “Support Statewide Climate Change Solutions” and new Policies AQ-1.8 “Greenhouse Gas Emissions Reduction Plan”, AQ-1.9 “Support Off-Site Measures to Reduce Greenhouse Gas Emissions”, and new AQ Implementation Measures #16 and #17
Resultant Level of Significance: Significant and Unavoidable
Impact Analysis
The existing and projected GHG inventory includes direct and indirect emissions resulting from the energy (electricity and natural gas), mobile source (on- and off-road), agriculture (dairy/feedlots), and solid waste (landfills) sectors in unincorporated Tulare County.
This analysis addresses the new initial study checklist questions in CEQA Guidelines Amendments for greenhouse gas emissions:
1. Generate greenhouse gas emissions, either directly or indirectly, that may have a significant impact on the environment?
2. Conflict with any applicable plan, policy or regulation of an agency adopted for the purpose of reducing the emissions of greenhouse gases?
The County has quantified the direct and indirect greenhouse gas emission that will be emitted by the project and compared this amount to CARB’s reporting threshold for major sources to respond to question a) above. The County’s analysis examines the project’s impact on AB 32 and the CARB Scoping Plan to answer question b) above.
Three types of analyses are used to determine whether the project could be in conflict with the State goals for reducing greenhouse gas emissions. The analyses are as follows:
a. Any potential conflict with the CARB’s Scoping Plan measures, including the nine (9) discrete early action strategies.
b. The relative size of the project. The project’s greenhouse gas emissions will be compared to the size of major facilities that are required to report greenhouse gas emissions (25,000 metric tons/year of CO2e) to the State; and the project size will be compared to the estimated greenhouse reduction State goal of 174 million metric tons per year of CO2e emissions by 2020. The 25,000 metric ton annual limit identifies the large stationary point sources in California that make up approximately 94 percent of the stationary emissions. If the project’s total emissions are below this limit, its total emissions are equivalent in size to the smaller projects in California that as a group only make up 6 percent of all stationary emissions. It is assumed that the activities of these smaller projects generally would not conflict with State’s ability to reach AB 32 overall goals. In reaching its goals the CARB will focus upon the largest emitters of greenhouse gas emissions.
Tulare County General Plan 2030 Update
Tulare County General Plan 2030 Update 3.4-32 ESA / 207497 Recirculated Draft Environmental Impact Report February 2010
c. The basic energy efficiency parameters of a project to determine whether its design is inherently energy inefficient.
With regard to Item A, the proposed project does not pose any apparent conflict with the CARB’s Scoping Plan measures and early action strategies (see Table 3.4-1). The early action strategies were incorporated into the Scoping Plan. The policies and implementation measures included in the proposed project are supportive of many of the Scoping Plan measures. In particular, Scoping Plan measures related to energy conservation and green building standards, regional transportation targets, water conservation, solid waste, and agriculture are supported by numerous policies as listed earlier under Impact 3.4-1 and 3.4-2. The Attorney General recommended measures listed in Table 3.4-5 provide additional details regarding policies and implementation measures supportive of the Scoping Plan. Policy AQ-1.8 requires the County to prepare a Climate Action Plan that will include greenhouse gas reduction targets. The Climate Action Plan targets will allow the County to demonstrate consistency with the targets included in the Scoping Plan. New development will be required to provide project level reductions through the implementation of policies, programs, and mitigation measures designed to reduce greenhouse gas emissions to show consistency at the project level.
With regard to Item B, in 2007, Tulare County generated approximately 5.2 million tons of CO2e. The largest portion of these emissions (63 percent) is attributed to dairies/feedlots, while the second largest portion (16 percent) is from mobile sources. Per capita emissions in 2007 were approximately 36 tons of CO2e per resident. See Table 3.4-2 for 2007 annual emissions per sector.
In 2030, Tulare County is forecast to generate approximately 6.1 million tons of CO2e. The largest portion of these emissions (59 percent) is attributed to dairies/feedlots, while the second largest portion (20 percent) is from mobile sources. Per capita emissions in 2030 are projected to be approximately 27 tons of CO2e per resident. See Table 3.4-3 for 2030 annual emissions per sector.
The incremental increase of CO2e emissions of the proposed project (year 2030) versus existing (year 2007) would be approximately 897,420 metric tons/year of CO2e. The proposed project would exceed the lower reporting limit for major sources, which is 25,000 metric tons/year of CO2e. When compared to the overall State reduction goal of approximately 174 million metric tons/year of CO2e, the incremental increase of GHG emissions for the proposed project (897,420 metric tons/year of CO2e or 0.5 percent of the State goal) is substantial and could conflict with the State’s ability to meet the AB 32 goals.
With regard to Item C, the County has implemented a number of policies to encourage energy conservation in future development subsequent to the General Plan (Policies ERM-4.1 through ERM-4.4, AQ-3.5, and LU-7.15 and LU Implementation Measure #24, AQ Implementation Measure #3, and AQ Implementation Measure #12).
In summary, the proposed project addresses the issue of climate change in a variety of ways that include adopting a land use plan that is consistent and supports Tulare County Regional Blueprint principles along with implementation of a variety of policies designed to reduce both mobile (i.e., supporting transportation alternatives to the motor vehicle) and stationary sources (i.e., supporting energy efficiency and conservation measures that exceed State Title 24 standards) of GHG emissions.
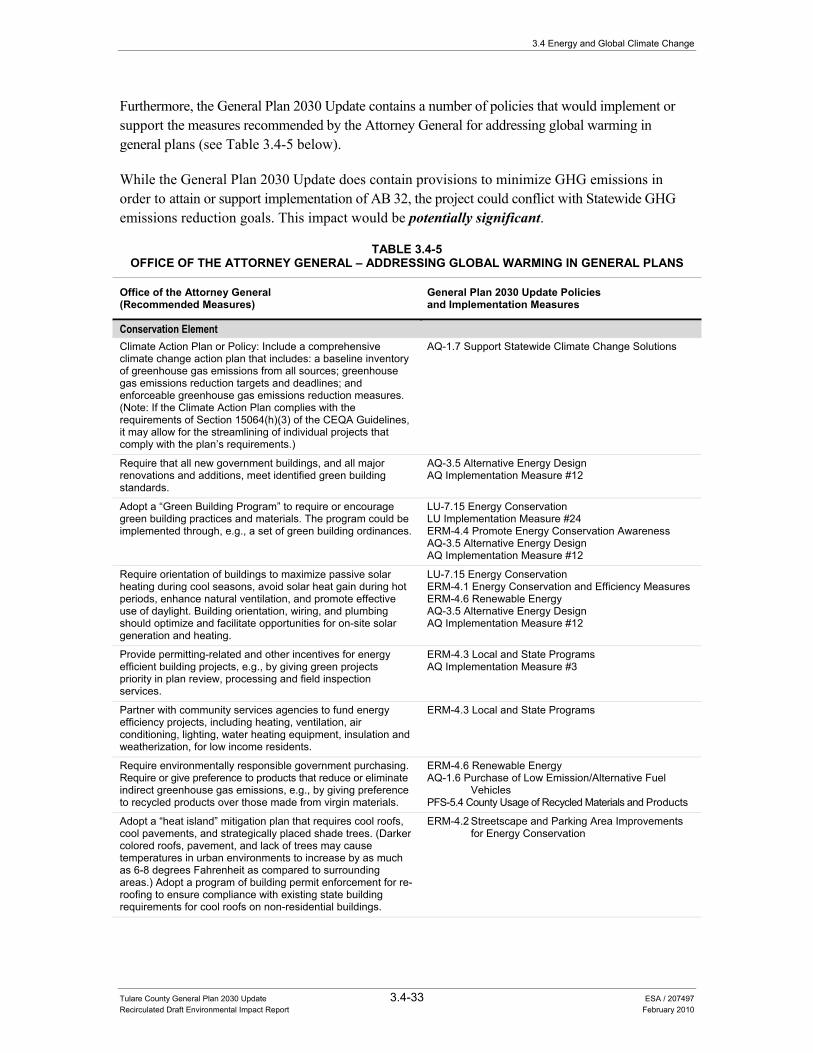
3.4 Energy and Global Climate Change
Tulare County General Plan 2030 Update 3.4-33 ESA / 207497 Recirculated Draft Environmental Impact Report February 2010
Furthermore, the General Plan 2030 Update contains a number of policies that would implement or support the measures recommended by the Attorney General for addressing global warming in general plans (see Table 3.4-5 below).
While the General Plan 2030 Update does contain provisions to minimize GHG emissions in order to attain or support implementation of AB 32, the project could conflict with Statewide GHG emissions reduction goals. This impact would be potentially significant.
TABLE 3.4-5OFFICE OF THE ATTORNEY GENERAL – ADDRESSING GLOBAL WARMING IN GENERAL PLANS
Office of the Attorney General (Recommended Measures)
General Plan 2030 Update Policies and Implementation Measures
Conservation Element Climate Action Plan or Policy: Include a comprehensive climate change action plan that includes: a baseline inventory of greenhouse gas emissions from all sources; greenhouse gas emissions reduction targets and deadlines; and enforceable greenhouse gas emissions reduction measures. (Note: If the Climate Action Plan complies with the requirements of Section 15064(h)(3) of the CEQA Guidelines, it may allow for the streamlining of individual projects that comply with the plan’s requirements.)
AQ-1.7 Support Statewide Climate Change Solutions
Require that all new government buildings, and all major renovations and additions, meet identified green building standards.
AQ-3.5 Alternative Energy Design AQ Implementation Measure #12
Adopt a “Green Building Program” to require or encourage green building practices and materials. The program could be implemented through, e.g., a set of green building ordinances.
LU-7.15 Energy Conservation LU Implementation Measure #24 ERM-4.4 Promote Energy Conservation Awareness AQ-3.5 Alternative Energy Design AQ Implementation Measure #12
Require orientation of buildings to maximize passive solar heating during cool seasons, avoid solar heat gain during hot periods, enhance natural ventilation, and promote effective use of daylight. Building orientation, wiring, and plumbing should optimize and facilitate opportunities for on-site solar generation and heating.
LU-7.15 Energy Conservation ERM-4.1 Energy Conservation and Efficiency Measures ERM-4.6 Renewable Energy AQ-3.5 Alternative Energy Design AQ Implementation Measure #12
Provide permitting-related and other incentives for energy efficient building projects, e.g., by giving green projects priority in plan review, processing and field inspection services.
ERM-4.3 Local and State Programs AQ Implementation Measure #3
Partner with community services agencies to fund energy efficiency projects, including heating, ventilation, air conditioning, lighting, water heating equipment, insulation and weatherization, for low income residents.
ERM-4.3 Local and State Programs
Require environmentally responsible government purchasing. Require or give preference to products that reduce or eliminate indirect greenhouse gas emissions, e.g., by giving preference to recycled products over those made from virgin materials.
ERM-4.6 Renewable Energy AQ-1.6 Purchase of Low Emission/Alternative Fuel
Vehicles PFS-5.4 County Usage of Recycled Materials and Products
Adopt a “heat island” mitigation plan that requires cool roofs, cool pavements, and strategically placed shade trees. (Darker colored roofs, pavement, and lack of trees may cause temperatures in urban environments to increase by as much as 6-8 degrees Fahrenheit as compared to surrounding areas.) Adopt a program of building permit enforcement for re-roofing to ensure compliance with existing state building requirements for cool roofs on non-residential buildings.
ERM-4.2 Streetscape and Parking Area Improvements for Energy Conservation
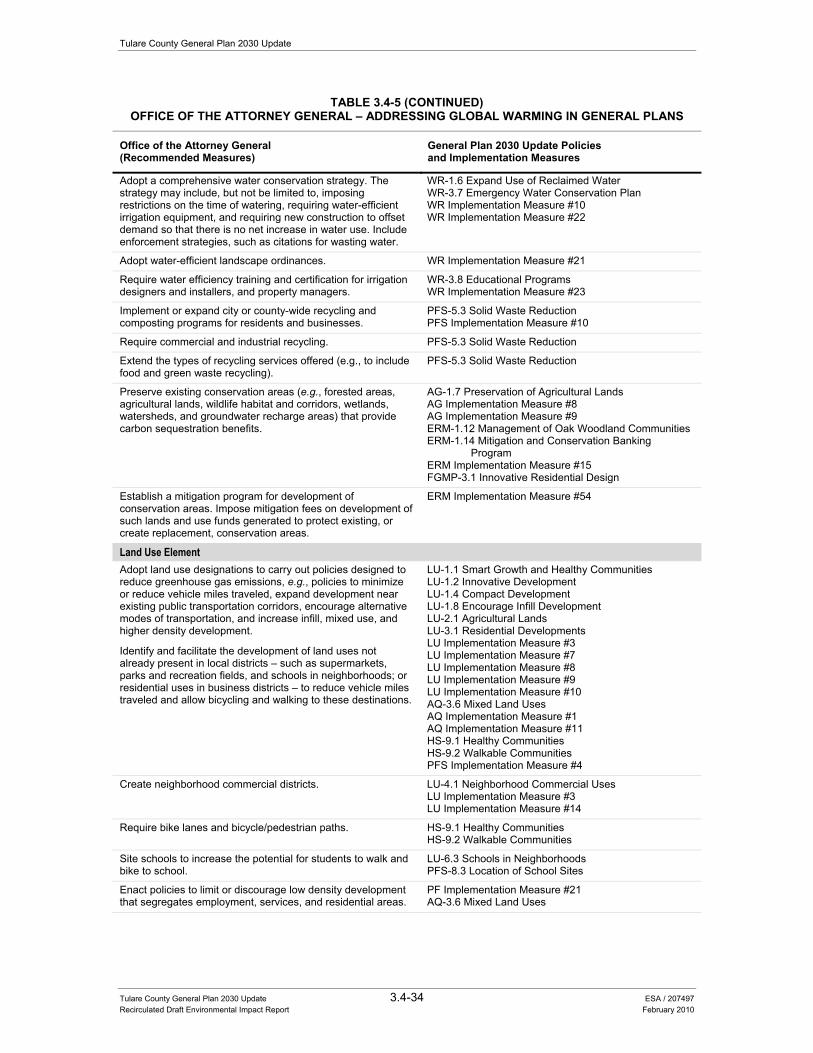
Tulare County General Plan 2030 Update
Tulare County General Plan 2030 Update 3.4-34 ESA / 207497 Recirculated Draft Environmental Impact Report February 2010
TABLE 3.4-5 (CONTINUED)OFFICE OF THE ATTORNEY GENERAL – ADDRESSING GLOBAL WARMING IN GENERAL PLANS
Office of the Attorney General (Recommended Measures)
General Plan 2030 Update Policies and Implementation Measures
Adopt a comprehensive water conservation strategy. The strategy may include, but not be limited to, imposing restrictions on the time of watering, requiring water-efficient irrigation equipment, and requiring new construction to offset demand so that there is no net increase in water use. Include enforcement strategies, such as citations for wasting water.
WR-1.6 Expand Use of Reclaimed Water WR-3.7 Emergency Water Conservation Plan WR Implementation Measure #10 WR Implementation Measure #22
Adopt water-efficient landscape ordinances. WR Implementation Measure #21
Require water efficiency training and certification for irrigation designers and installers, and property managers.
WR-3.8 Educational Programs WR Implementation Measure #23
Implement or expand city or county-wide recycling and composting programs for residents and businesses.
PFS-5.3 Solid Waste Reduction PFS Implementation Measure #10
Require commercial and industrial recycling. PFS-5.3 Solid Waste Reduction
Extend the types of recycling services offered (e.g., to include food and green waste recycling).
PFS-5.3 Solid Waste Reduction
Preserve existing conservation areas (e.g., forested areas, agricultural lands, wildlife habitat and corridors, wetlands, watersheds, and groundwater recharge areas) that provide carbon sequestration benefits.
AG-1.7 Preservation of Agricultural Lands AG Implementation Measure #8 AG Implementation Measure #9 ERM-1.12 Management of Oak Woodland Communities ERM-1.14 Mitigation and Conservation Banking
Program ERM Implementation Measure #15 FGMP-3.1 Innovative Residential Design
Establish a mitigation program for development of conservation areas. Impose mitigation fees on development of such lands and use funds generated to protect existing, or create replacement, conservation areas.
ERM Implementation Measure #54
Land Use Element Adopt land use designations to carry out policies designed to reduce greenhouse gas emissions, e.g., policies to minimize or reduce vehicle miles traveled, expand development near existing public transportation corridors, encourage alternative modes of transportation, and increase infill, mixed use, and higher density development.
Identify and facilitate the development of land uses not already present in local districts – such as supermarkets, parks and recreation fields, and schools in neighborhoods; or residential uses in business districts – to reduce vehicle miles traveled and allow bicycling and walking to these destinations.
LU-1.1 Smart Growth and Healthy Communities LU-1.2 Innovative Development LU-1.4 Compact Development LU-1.8 Encourage Infill Development LU-2.1 Agricultural Lands LU-3.1 Residential Developments LU Implementation Measure #3 LU Implementation Measure #7 LU Implementation Measure #8 LU Implementation Measure #9 LU Implementation Measure #10 AQ-3.6 Mixed Land Uses AQ Implementation Measure #1 AQ Implementation Measure #11 HS-9.1 Healthy Communities HS-9.2 Walkable Communities PFS Implementation Measure #4
Create neighborhood commercial districts. LU-4.1 Neighborhood Commercial Uses LU Implementation Measure #3 LU Implementation Measure #14
Require bike lanes and bicycle/pedestrian paths. HS-9.1 Healthy Communities HS-9.2 Walkable Communities
Site schools to increase the potential for students to walk and bike to school.
LU-6.3 Schools in Neighborhoods PFS-8.3 Location of School Sites
Enact policies to limit or discourage low density development that segregates employment, services, and residential areas.
PF Implementation Measure #21 AQ-3.6 Mixed Land Uses
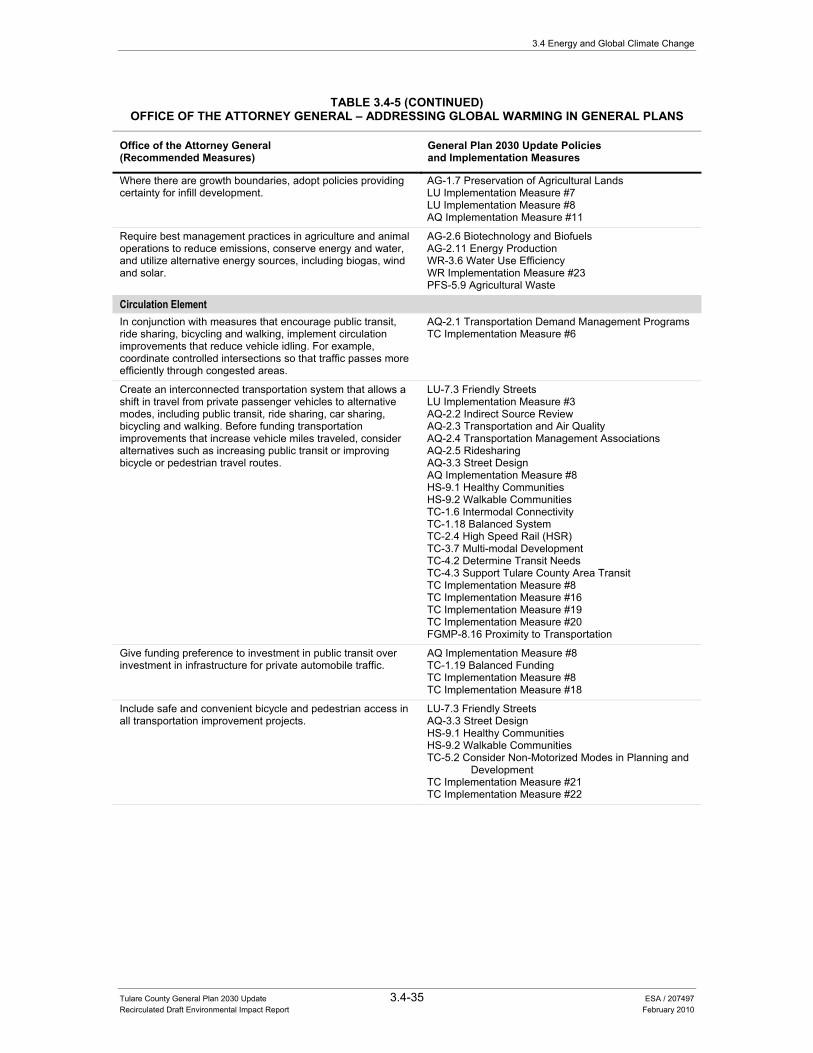
3.4 Energy and Global Climate Change
Tulare County General Plan 2030 Update 3.4-35 ESA / 207497 Recirculated Draft Environmental Impact Report February 2010
TABLE 3.4-5 (CONTINUED)OFFICE OF THE ATTORNEY GENERAL – ADDRESSING GLOBAL WARMING IN GENERAL PLANS
Office of the Attorney General (Recommended Measures)
General Plan 2030 Update Policies and Implementation Measures
Where there are growth boundaries, adopt policies providing certainty for infill development.
AG-1.7 Preservation of Agricultural Lands LU Implementation Measure #7 LU Implementation Measure #8 AQ Implementation Measure #11
Require best management practices in agriculture and animal operations to reduce emissions, conserve energy and water, and utilize alternative energy sources, including biogas, wind and solar.
AG-2.6 Biotechnology and Biofuels AG-2.11 Energy Production WR-3.6 Water Use Efficiency WR Implementation Measure #23 PFS-5.9 Agricultural Waste
Circulation Element In conjunction with measures that encourage public transit, ride sharing, bicycling and walking, implement circulation improvements that reduce vehicle idling. For example, coordinate controlled intersections so that traffic passes more efficiently through congested areas.
AQ-2.1 Transportation Demand Management Programs TC Implementation Measure #6
Create an interconnected transportation system that allows a shift in travel from private passenger vehicles to alternative modes, including public transit, ride sharing, car sharing, bicycling and walking. Before funding transportation improvements that increase vehicle miles traveled, consider alternatives such as increasing public transit or improving bicycle or pedestrian travel routes.
LU-7.3 Friendly Streets LU Implementation Measure #3 AQ-2.2 Indirect Source Review AQ-2.3 Transportation and Air Quality AQ-2.4 Transportation Management Associations AQ-2.5 Ridesharing AQ-3.3 Street Design AQ Implementation Measure #8 HS-9.1 Healthy Communities HS-9.2 Walkable Communities TC-1.6 Intermodal Connectivity TC-1.18 Balanced System TC-2.4 High Speed Rail (HSR) TC-3.7 Multi-modal Development TC-4.2 Determine Transit Needs TC-4.3 Support Tulare County Area Transit TC Implementation Measure #8 TC Implementation Measure #16 TC Implementation Measure #19 TC Implementation Measure #20 FGMP-8.16 Proximity to Transportation
Give funding preference to investment in public transit over investment in infrastructure for private automobile traffic.
AQ Implementation Measure #8 TC-1.19 Balanced Funding TC Implementation Measure #8 TC Implementation Measure #18
Include safe and convenient bicycle and pedestrian access in all transportation improvement projects.
LU-7.3 Friendly Streets AQ-3.3 Street Design HS-9.1 Healthy Communities HS-9.2 Walkable Communities TC-5.2 Consider Non-Motorized Modes in Planning and
Development TC Implementation Measure #21 TC Implementation Measure #22
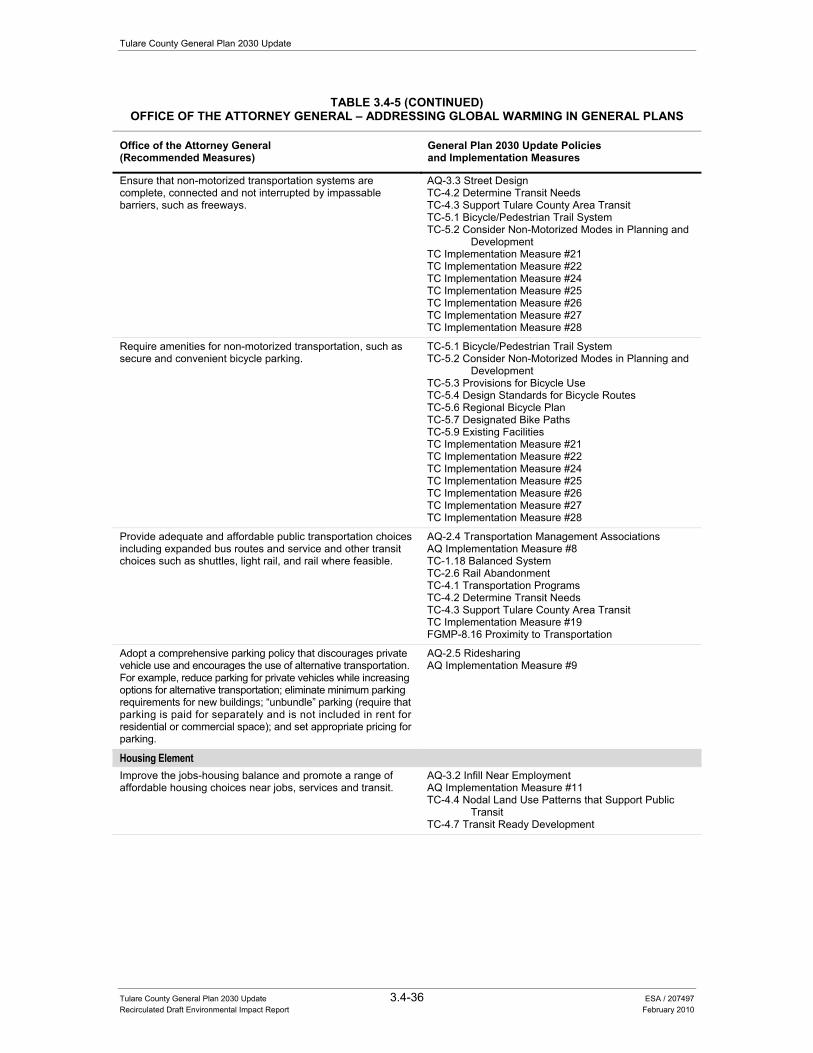
Tulare County General Plan 2030 Update
Tulare County General Plan 2030 Update 3.4-36 ESA / 207497 Recirculated Draft Environmental Impact Report February 2010
TABLE 3.4-5 (CONTINUED)OFFICE OF THE ATTORNEY GENERAL – ADDRESSING GLOBAL WARMING IN GENERAL PLANS
Office of the Attorney General (Recommended Measures)
General Plan 2030 Update Policies and Implementation Measures
Ensure that non-motorized transportation systems are complete, connected and not interrupted by impassable barriers, such as freeways.
AQ-3.3 Street Design TC-4.2 Determine Transit Needs TC-4.3 Support Tulare County Area Transit TC-5.1 Bicycle/Pedestrian Trail System TC-5.2 Consider Non-Motorized Modes in Planning and
Development TC Implementation Measure #21 TC Implementation Measure #22 TC Implementation Measure #24 TC Implementation Measure #25 TC Implementation Measure #26 TC Implementation Measure #27 TC Implementation Measure #28
Require amenities for non-motorized transportation, such as secure and convenient bicycle parking.
TC-5.1 Bicycle/Pedestrian Trail System TC-5.2 Consider Non-Motorized Modes in Planning and
Development TC-5.3 Provisions for Bicycle Use TC-5.4 Design Standards for Bicycle Routes TC-5.6 Regional Bicycle Plan TC-5.7 Designated Bike Paths TC-5.9 Existing Facilities TC Implementation Measure #21 TC Implementation Measure #22 TC Implementation Measure #24 TC Implementation Measure #25 TC Implementation Measure #26 TC Implementation Measure #27 TC Implementation Measure #28
Provide adequate and affordable public transportation choices including expanded bus routes and service and other transit choices such as shuttles, light rail, and rail where feasible.
AQ-2.4 Transportation Management Associations AQ Implementation Measure #8 TC-1.18 Balanced System TC-2.6 Rail Abandonment TC-4.1 Transportation Programs TC-4.2 Determine Transit Needs TC-4.3 Support Tulare County Area Transit TC Implementation Measure #19 FGMP-8.16 Proximity to Transportation
Adopt a comprehensive parking policy that discourages private vehicle use and encourages the use of alternative transportation. For example, reduce parking for private vehicles while increasing options for alternative transportation; eliminate minimum parking requirements for new buildings; “unbundle” parking (require that parking is paid for separately and is not included in rent for residential or commercial space); and set appropriate pricing for parking.
AQ-2.5 Ridesharing AQ Implementation Measure #9
Housing Element Improve the jobs-housing balance and promote a range of affordable housing choices near jobs, services and transit.
AQ-3.2 Infill Near Employment AQ Implementation Measure #11 TC-4.4 Nodal Land Use Patterns that Support Public
Transit TC-4.7 Transit Ready Development
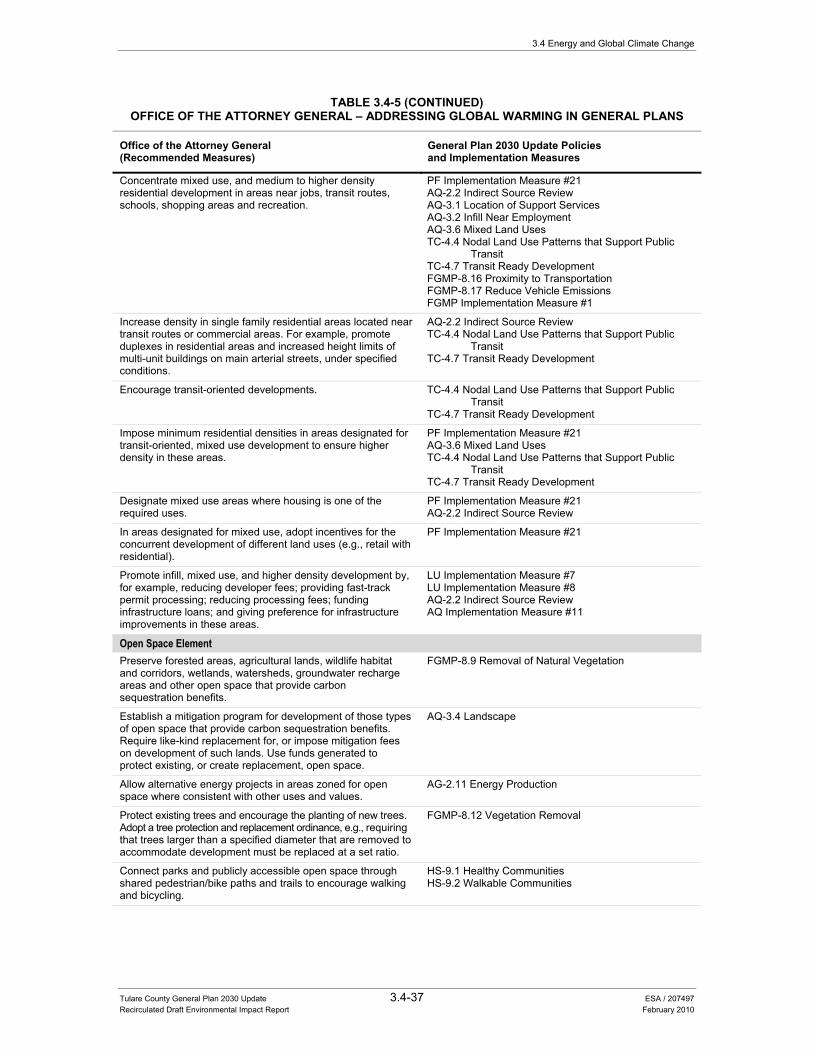
3.4 Energy and Global Climate Change
Tulare County General Plan 2030 Update 3.4-37 ESA / 207497 Recirculated Draft Environmental Impact Report February 2010
TABLE 3.4-5 (CONTINUED)OFFICE OF THE ATTORNEY GENERAL – ADDRESSING GLOBAL WARMING IN GENERAL PLANS
Office of the Attorney General (Recommended Measures)
General Plan 2030 Update Policies and Implementation Measures
Concentrate mixed use, and medium to higher density residential development in areas near jobs, transit routes, schools, shopping areas and recreation.
PF Implementation Measure #21 AQ-2.2 Indirect Source Review AQ-3.1 Location of Support Services AQ-3.2 Infill Near Employment AQ-3.6 Mixed Land Uses TC-4.4 Nodal Land Use Patterns that Support Public
Transit TC-4.7 Transit Ready Development FGMP-8.16 Proximity to Transportation FGMP-8.17 Reduce Vehicle Emissions FGMP Implementation Measure #1
Increase density in single family residential areas located near transit routes or commercial areas. For example, promote duplexes in residential areas and increased height limits of multi-unit buildings on main arterial streets, under specified conditions.
AQ-2.2 Indirect Source Review TC-4.4 Nodal Land Use Patterns that Support Public
Transit TC-4.7 Transit Ready Development
Encourage transit-oriented developments. TC-4.4 Nodal Land Use Patterns that Support Public Transit
TC-4.7 Transit Ready Development
Impose minimum residential densities in areas designated for transit-oriented, mixed use development to ensure higher density in these areas.
PF Implementation Measure #21 AQ-3.6 Mixed Land Uses TC-4.4 Nodal Land Use Patterns that Support Public
Transit TC-4.7 Transit Ready Development
Designate mixed use areas where housing is one of the required uses.
PF Implementation Measure #21 AQ-2.2 Indirect Source Review
In areas designated for mixed use, adopt incentives for the concurrent development of different land uses (e.g., retail with residential).
PF Implementation Measure #21
Promote infill, mixed use, and higher density development by, for example, reducing developer fees; providing fast-track permit processing; reducing processing fees; funding infrastructure loans; and giving preference for infrastructure improvements in these areas.
LU Implementation Measure #7 LU Implementation Measure #8 AQ-2.2 Indirect Source Review AQ Implementation Measure #11
Open Space Element Preserve forested areas, agricultural lands, wildlife habitat and corridors, wetlands, watersheds, groundwater recharge areas and other open space that provide carbon sequestration benefits.
FGMP-8.9 Removal of Natural Vegetation
Establish a mitigation program for development of those types of open space that provide carbon sequestration benefits. Require like-kind replacement for, or impose mitigation fees on development of such lands. Use funds generated to protect existing, or create replacement, open space.
AQ-3.4 Landscape
Allow alternative energy projects in areas zoned for open space where consistent with other uses and values.
AG-2.11 Energy Production
Protect existing trees and encourage the planting of new trees. Adopt a tree protection and replacement ordinance, e.g., requiring that trees larger than a specified diameter that are removed to accommodate development must be replaced at a set ratio.
FGMP-8.12 Vegetation Removal
Connect parks and publicly accessible open space through shared pedestrian/bike paths and trails to encourage walking and bicycling.
HS-9.1 Healthy Communities HS-9.2 Walkable Communities
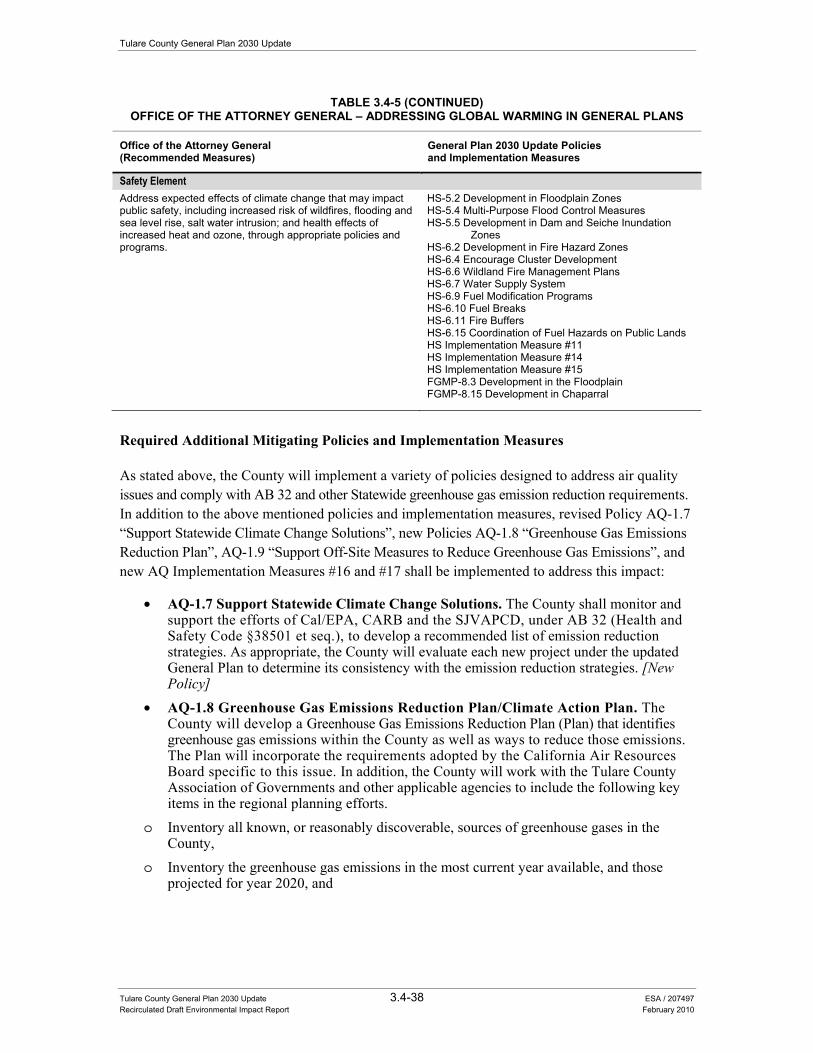
Tulare County General Plan 2030 Update
Tulare County General Plan 2030 Update 3.4-38 ESA / 207497 Recirculated Draft Environmental Impact Report February 2010
TABLE 3.4-5 (CONTINUED)OFFICE OF THE ATTORNEY GENERAL – ADDRESSING GLOBAL WARMING IN GENERAL PLANS
Office of the Attorney General (Recommended Measures)
General Plan 2030 Update Policies and Implementation Measures
Safety Element Address expected effects of climate change that may impact public safety, including increased risk of wildfires, flooding and sea level rise, salt water intrusion; and health effects of increased heat and ozone, through appropriate policies and programs.
HS-5.2 Development in Floodplain Zones HS-5.4 Multi-Purpose Flood Control Measures HS-5.5 Development in Dam and Seiche Inundation
Zones HS-6.2 Development in Fire Hazard Zones HS-6.4 Encourage Cluster Development HS-6.6 Wildland Fire Management Plans HS-6.7 Water Supply System HS-6.9 Fuel Modification Programs HS-6.10 Fuel Breaks HS-6.11 Fire Buffers HS-6.15 Coordination of Fuel Hazards on Public Lands HS Implementation Measure #11 HS Implementation Measure #14 HS Implementation Measure #15 FGMP-8.3 Development in the Floodplain FGMP-8.15 Development in Chaparral
Required Additional Mitigating Policies and Implementation Measures
As stated above, the County will implement a variety of policies designed to address air quality issues and comply with AB 32 and other Statewide greenhouse gas emission reduction requirements. In addition to the above mentioned policies and implementation measures, revised Policy AQ-1.7 “Support Statewide Climate Change Solutions”, new Policies AQ-1.8 “Greenhouse Gas Emissions Reduction Plan”, AQ-1.9 “Support Off-Site Measures to Reduce Greenhouse Gas Emissions”, and new AQ Implementation Measures #16 and #17 shall be implemented to address this impact:
• AQ-1.7 Support Statewide Climate Change Solutions. The County shall monitor and support the efforts of Cal/EPA, CARB and the SJVAPCD, under AB 32 (Health and Safety Code §38501 et seq.), to develop a recommended list of emission reduction strategies. As appropriate, the County will evaluate each new project under the updated General Plan to determine its consistency with the emission reduction strategies. [New Policy]
• AQ-1.8 Greenhouse Gas Emissions Reduction Plan/Climate Action Plan. The County will develop a Greenhouse Gas Emissions Reduction Plan (Plan) that identifies greenhouse gas emissions within the County as well as ways to reduce those emissions. The Plan will incorporate the requirements adopted by the California Air Resources Board specific to this issue. In addition, the County will work with the Tulare County Association of Governments and other applicable agencies to include the following key items in the regional planning efforts.
o Inventory all known, or reasonably discoverable, sources of greenhouse gases in the County,
o Inventory the greenhouse gas emissions in the most current year available, and those projected for year 2020, and
3.4 Energy and Global Climate Change
Tulare County General Plan 2030 Update 3.4-39 ESA / 207497 Recirculated Draft Environmental Impact Report February 2010
o Set a target for the reduction of emissions attributable to the County’s discretionary land use decisions and its own internal government operations. [New Policy – Draft EIR Analysis]
• AQ-1.9 Support Off-Site Measures to Reduce Greenhouse Gas Emissions. The County will support and encourage the use of off-site measures or the purchase of carbon offsets to reduce greenhouse gas emissions. [New Policy – Draft EIR Analysis]
• AQ Implementation Measure #16. The County shall develop and maintain a climate action plan. The climate action plan shall include the following elements: an emissions inventory, emission reduction targets, applicable greenhouse gas control measures, and monitoring and reporting plan. [New Implementation Measure – Draft EIR Analysis]
• AQ Implementation Measure #17. The County may inspect County facilities to evaluate energy use, the effectiveness of water conservation measures, production of GHGs, use of recycled and renewable products and indoor air quality to develop recommendations for performance improvement or mitigation. The County shall update the audit periodically and review progress towards implementation of its recommendations. [New Implementation Measure – Draft EIR Analysis]
Significance after Implementation of Mitigation for Impact 3.4-3
As previously described, the proposed project addresses the issue of climate change in a variety of ways that include adopting a land use plan that is consistent and supports regional blueprint principles along with implementation of a variety of policies designed to reduce both mobile (i.e., supporting transportation alternatives to the motor vehicle) and stationary sources (i.e., supporting energy efficiency and conservation measures that exceed State Title 24 standards) of GHG emissions.
Depending on the feasibility and level of implementation as applied to individual development projects consistent with the General Plan, the inclusion of additional trip reduction measures identified under Impact 3.4-1, would help to reduce vehicle-related CO2 emissions. Future project-specific compliance with SJVAPCD permitting would also help to reduce air quality emissions associated with individual projects. Revised Policy AQ-1.7, new Policies AQ-1.8 and AQ-1.9, and new AQ Implementation Measure #16 require the County to monitor State GHG emissions reduction requirements and prepare a Greenhouse Gas Emissions Reduction Plan, which would help bring the County into compliance with AB 32.
The emission level at which project generated CO2e would result in or contribute to a significant impact has not been defined. Consequently, the increase in greenhouse gases by the proposed project of 0.5 percent of the State AB 32 goal places the proposed project in conflict with the goal of the State to reduce up to 174 million metric tons CO2e/yr. Therefore, as a conservative determination, this impact would remain significant. Implementation of the proposed project including the adoption of the policies listed above would still result in a significant and unavoidable impact.

Tulare County General Plan 2030 Update 3.5-1 ESA / 207497 Recirculated Draft Environmental Impact Report February 2010
SECTION 3.5 Noise
Introduction To provide the context on which potential impacts can be assessed, this section presents information on existing baseline noise levels and sources within Tulare County. Given the highly technical nature of this resource topic, this section begins with background information on key terms and the characteristics of sound. The regulatory section includes a description of applicable State, local and regional plans and/or programs and associated goals and objectives. The environmental setting includes a description of some typical noise sources in Tulare County. A description of the potential impacts of the proposed project is also provided and includes the identification of feasible mitigation (general plan policies) to avoid or lessen the impacts.
The following environmental and regulatory settings were developed from information contained in the 2010 Background Report (see Chapter 8.0 “Safety”), incorporated by reference and summarized below. This document is attached as Appendix B to this recirculated draft Environmental Impact Report (RDEIR).
Characteristics of Sound
Glossary of General Terms Ambient Noise. The total noise associated with a given environment and usually comprising
sounds from many sources, both near and far.
Attenuation. Reduction in the level of sound resulting from absorption by the topography, the atmosphere, distance, barriers, and other factors.
A-weighted decibel (dBA). A unit of measurement for noise based on a frequency weighting system that approximates the frequency response of the human ear.
Community Noise Equivalent Level (CNEL). Used to characterize average sound levels over a 24-hour period, with weighting factors included for evening and nighttime sound levels. Leq values (equivalent sound levels measured over a 1 hour period - see below) for the evening period (7:00 p.m. to 10:00 p.m.) are increased by 5 dB, while Leq values for the nighttime period (10:00 p.m. to 7:00 a.m.) are increased by 10 dB. For a given set of sound measurements, the CNEL value will usually be no more than 1 dB higher than the Ldn value (see below). In practice, CNEL and Ldn are often used interchangeably.
Tulare County General Plan 2030 Update
Tulare County General Plan 2030 Update 3.5-2 ESA / 207497 Recirculated Draft Environmental Impact Report February 2010
Decibel (dBA). A unit of measurement describing the amplitude of sound, equal to 20 times the logarithm to the base 10 of the ratio of the pressure of the sound measured to the reference pressure (which is 20 micronewtons per square meter).
Day-Night Average Sound Level (Ldn). Average sound exposure over a 24-hour period. Ldn values are calculated from hourly Leq values, with the Leq values for the nighttime period (10:00 p.m. to 7:00 a.m.) increased by 10 dB to reflect the greater disturbance potential from nighttime noises.
Equivalent Sound Level (Leq). The level of a steady-state sound that, in a stated time period and at a stated location, has the same sound energy as the time-varying sound (approximately equal to the average sound level). The equivalent sound level measured over a 1-hour period is called the hourly Leq or Leq (h).
Lmax and Lmin. The maximum and minimum sound levels, respectively, recorded during a measurement period. When a sound meter is set to the “slow” response setting, as is typical for most community noise measurements, the Lmax and Lmin values are the maximum and minimum levels recorded typically for 1-second periods.
Percentile-Exceeded Sound Level (Lx). The sound level exceeded during a given percentage of a measurement period. Examples include L10, L50, and L90. L10 is the A-weighted sound level that is exceeded 10% of the measurement period, L50 is the level exceeded 50% of the period, and so on. L50 is the median sound level measured during the measurement period. L90, the sound level exceeded 90% of the time, excludes high localized sound levels produced by nearby sources such as single car passages or bird chirps. L90 is often used to represent the background sound level. L50 is also used to provide a less conservative assessment of the background sound level.
Sensitive Receptors. Sensitive receptors are defined to include residential areas, hospitals, convalescent homes and facilities, schools, and other similar land uses.
Noise Principles and Descriptors Noise is defined as unwanted sound. Sound, traveling in the form of waves from a source, exerts a sound pressure level (referred to as sound level) that is measured in decibels (dB), with zero dB corresponding roughly to the threshold of human hearing and 120 dB corresponding to the threshold of pain. Pressure waves traveling through air exert a force registered by the human ear as sound.
Sound pressure fluctuations can be measured in units of hertz (Hz), which correspond to the frequency of a particular sound. Typically, sound does not consist of a single frequency, but rather a broad band of frequencies varying in levels of magnitude (sound power). When all the audible frequencies of a sound are measured, a sound spectrum consisting of a range of frequencies spanning 20 to 20,000 Hz is plotted. The sound pressure level, therefore, constitutes the additive force exerted by a sound corresponding to the sound frequency-sound power level spectrum.
The typical human ear is not equally sensitive to all frequencies of the audible sound spectrum. As a consequence, when assessing potential noise impacts, sound is measured with an electronic filter that deemphasizes the frequencies below 1,000 Hz and above 5,000 Hz in a manner corresponding to the human ear’s decreased sensitivity to low and extremely high frequencies as compared to the frequency mid-range. This method of frequency weighting is referred to as A-weighting and is expressed in units of A-weighted decibels (dBA). Frequency A-weighting
3.5 Noise
Tulare County General Plan 2030 Update 3.5-3 ESA / 207497 Recirculated Draft Environmental Impact Report February 2010
follows an international standard methodology of frequency de-emphasis and is typically applied to community noise measurements. Selected representative noise sources and their corresponding A-weighted noise levels are shown in Figure 3.5-1.
Noise Exposure and Community Noise Noise level is a measure of noise at a given moment. The noise levels presented in Table 3.5-1 describe the effects of short-duration noise levels. Noise exposure, meanwhile, is measured over a period of time. Noise exposure in a community, or community noise, comes from both background sources (e.g., distant traffic noise) and single-event sources (e.g., a nearby vehicle passing by, an aircraft flyover, or a siren). Noise from background sources changes gradually throughout the day, while single-event noise fluctuates by the minute or second. Background noise is often not consciously identified by an individual, while single-event noise is generally identifiable. The total noise exposure of a community is the sum of background and single-event noise sources taken over a period of time.
In order to characterize the noise environment of a community, noise measurements are taken over a period of time. Given that noise in a community varies with time, several statistical descriptors are used to evaluate cumulative noise impacts. The most frequently used noise descriptors are summarized below. The DNL and CNEL descriptors used specifically with 24-hour noise measurements and account for the variations in sensitivity to noise at different times of day.
Leq: the equivalent sound level is used to describe noise over a specified period of time, typically one hour, in terms of a single numerical value. The Leq is the constant sound level which would contain the same acoustic energy as the varying sound level, during the same time period (i.e., the average noise exposure level for the given time period).
Lmax: the instantaneous maximum noise level for a specified period of time. L50: the noise level that is equaled or exceeded 50 percent of the specified time period. L50
represents the median sound level. L90: the noise level that is equaled or exceeded 90 percent of the specified time period. L90 is
sometimes used to represent the background sound level. DNL: Also termed Ldn, the DNL is the 24-hour day and night A-weighted noise exposure level
that accounts for the greater sensitivity of most people to nighttime noise by weighting noise levels at night (“penalizing” nighttime noises). Noise between 10 p.m. and 7 a.m. is weighted (penalized) by adding 10 dBA to take into account the greater annoyance of nighttime noises.
CNEL: similar to the DNL the Community Noise Equivalent Level (CNEL) adds a 5 dBA “penalty” for the evening hours between 7 p.m. and 10 p.m. in addition to a 10 dBA penalty between the hours of 10 p.m. and 7 a.m.
According to the Traffic Noise Analysis Protocol, Traffic Noise Supplement (Caltrans, pages 50-54, 1998), as a general rule, in areas where traffic dominates the noise environment, the Leq during the peak-hour is generally equivalent to the DNL at that location.
Tulare County General Plan 2030 Update
Tulare County General Plan 2030 Update 3.5-4 ESA / 207497 Recirculated Draft Environmental Impact Report February 2010
Effects of Noise on People The effects of noise on people can be placed into three categories:
• Subjective effects of annoyance, nuisance, dissatisfaction • Interference with activities such as speech, sleep, learning • Physiological effects such as hearing loss or sudden startling
Environmental noise typically produces effects in the first two categories. Within those categories, individual thresholds of annoyance vary widely, and different tolerances to noise tend to develop, based on an individual’s past experiences with noise. There are no universal noise level thresholds that correspond to specific levels of annoyance and dissatisfaction.
However, an important factor of predicting a human reaction to a new noise environment is the way it compares to the existing environment to which one has adapted: the so called “ambient noise” level. In general, the more a new noise exceeds the previous ambient noise level, the less acceptable the new noise will be judged by those hearing it. With regard to increases in A-weighted noise level, the following relationships occur:
• Except in carefully controlled laboratory experiments, a change of 1 dBA cannot be perceived.
• Outside the laboratory, a 3 dBA change is considered a just-noticeable difference. • A change in level of at least 5 dBA is required before a change in human response would be
expected. • A 10 dBA change is subjectively heard as approximately a doubling in loudness and can
cause adverse response.
These relationships occur in part because of the logarithmic nature of sound and the decibel system used to describe sound. The human ear perceives sound in a non-linear fashion; the decibel scale was developed based on logarithms to accurately characterize human sound perception. Because the decibel scale is based on logarithms, two noise sources do not combine in a simple additive fashion, rather logarithmically. For example, if two identical noise sources produce noise levels of 50 dBA, the combined sound level would be 53 dBA, not 100 dBA.
Noise Attenuation Point sources of noise, including stationary mobile sources such as idling vehicles, attenuate (lessen) at a rate between 6 dBA for hard sites and 7.5 dBA for soft sites for each doubling of distance from the reference measurement. Hard sites are those with a reflective surface between the source and the receiver such as parking lots or smooth bodies of water. No excess ground attenuation is assumed for hard sites and the changes in noise levels with distance (drop-off rate) is simply the geometric spreading of the noise from the source. Soft sites have an absorptive ground surface such as soft dirt, grass, or scattered bushes and trees. In addition to geometric spreading, an excess ground attenuation value of 1.5 dBA (per doubling distance) is normally assumed for soft sites. Line sources (such as traffic noise from vehicles) attenuate at a rate between 3 dBA for hard sites and 4.5 dBA for soft sites for each doubling of distance from the reference measurement (Caltrans, page 27, 1998).
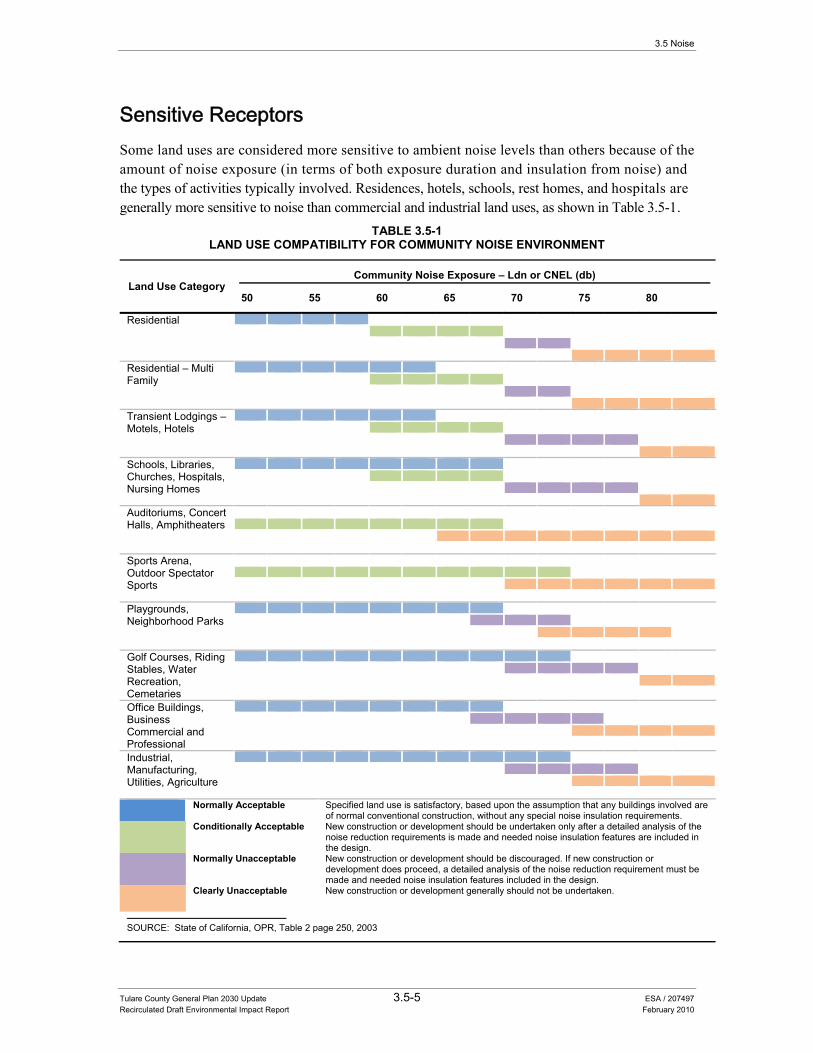
3.5 Noise
Tulare County General Plan 2030 Update 3.5-5 ESA / 207497 Recirculated Draft Environmental Impact Report February 2010
Sensitive Receptors Some land uses are considered more sensitive to ambient noise levels than others because of the amount of noise exposure (in terms of both exposure duration and insulation from noise) and the types of activities typically involved. Residences, hotels, schools, rest homes, and hospitals are generally more sensitive to noise than commercial and industrial land uses, as shown in Table 3.5-1.
TABLE 3.5-1 LAND USE COMPATIBILITY FOR COMMUNITY NOISE ENVIRONMENT
Land Use Category Community Noise Exposure – Ldn or CNEL (db)
50 55 60 65 70 75 80
Residential
Residential – Multi Family
Transient Lodgings – Motels, Hotels
Schools, Libraries, Churches, Hospitals, Nursing Homes
Auditoriums, Concert Halls, Amphitheaters
Sports Arena, Outdoor Spectator Sports
Playgrounds, Neighborhood Parks
Golf Courses, Riding Stables, Water Recreation, Cemetaries
Office Buildings, Business Commercial and Professional
Industrial, Manufacturing, Utilities, Agriculture
Normally Acceptable Specified land use is satisfactory, based upon the assumption that any buildings involved are of normal conventional construction, without any special noise insulation requirements.
Conditionally Acceptable New construction or development should be undertaken only after a detailed analysis of the noise reduction requirements is made and needed noise insulation features are included in the design.
Normally Unacceptable New construction or development should be discouraged. If new construction or development does proceed, a detailed analysis of the noise reduction requirement must be made and needed noise insulation features included in the design.
Clearly Unacceptable New construction or development generally should not be undertaken.
SOURCE: State of California, OPR, Table 2 page 250, 2003
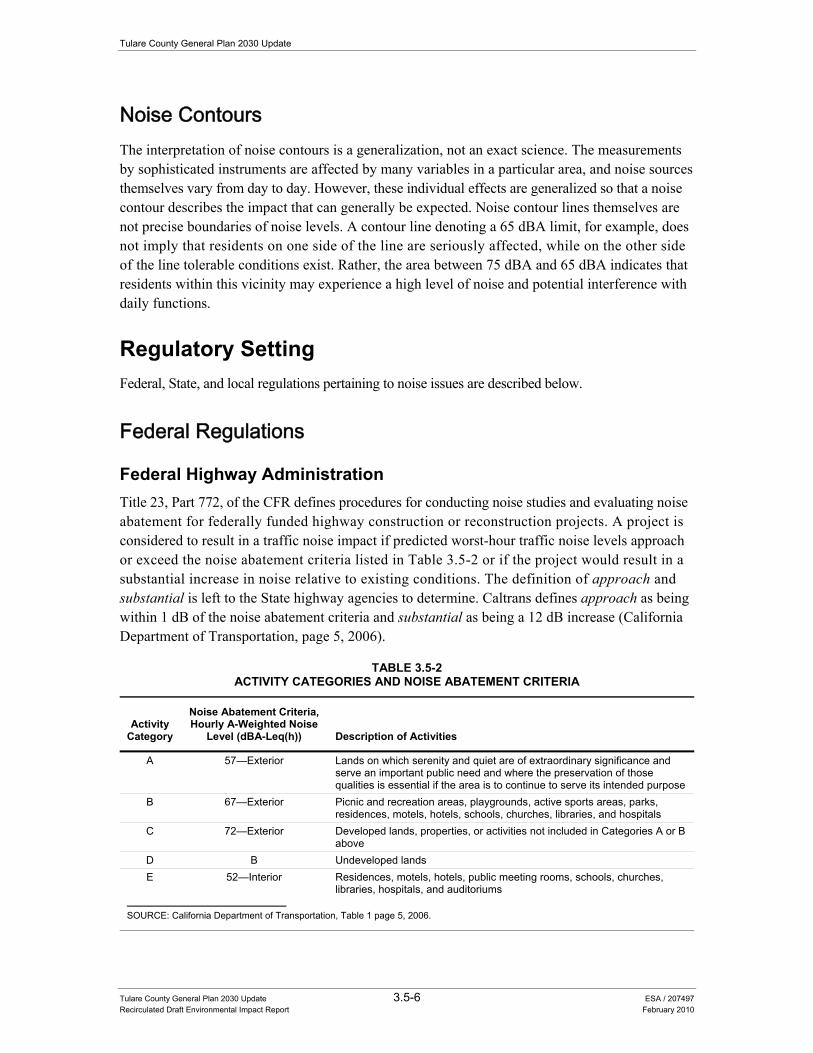
Tulare County General Plan 2030 Update
Tulare County General Plan 2030 Update 3.5-6 ESA / 207497 Recirculated Draft Environmental Impact Report February 2010
Noise Contours The interpretation of noise contours is a generalization, not an exact science. The measurements by sophisticated instruments are affected by many variables in a particular area, and noise sources themselves vary from day to day. However, these individual effects are generalized so that a noise contour describes the impact that can generally be expected. Noise contour lines themselves are not precise boundaries of noise levels. A contour line denoting a 65 dBA limit, for example, does not imply that residents on one side of the line are seriously affected, while on the other side of the line tolerable conditions exist. Rather, the area between 75 dBA and 65 dBA indicates that residents within this vicinity may experience a high level of noise and potential interference with daily functions.
Regulatory Setting Federal, State, and local regulations pertaining to noise issues are described below.
Federal Regulations
Federal Highway Administration Title 23, Part 772, of the CFR defines procedures for conducting noise studies and evaluating noise abatement for federally funded highway construction or reconstruction projects. A project is considered to result in a traffic noise impact if predicted worst-hour traffic noise levels approach or exceed the noise abatement criteria listed in Table 3.5-2 or if the project would result in a substantial increase in noise relative to existing conditions. The definition of approach and substantial is left to the State highway agencies to determine. Caltrans defines approach as being within 1 dB of the noise abatement criteria and substantial as being a 12 dB increase (California Department of Transportation, page 5, 2006).
TABLE 3.5-2ACTIVITY CATEGORIES AND NOISE ABATEMENT CRITERIA
Activity Category
Noise Abatement Criteria, Hourly A-Weighted Noise
Level (dBA-Leq(h)) Description of Activities
A 57—Exterior Lands on which serenity and quiet are of extraordinary significance and serve an important public need and where the preservation of those qualities is essential if the area is to continue to serve its intended purpose
B 67—Exterior Picnic and recreation areas, playgrounds, active sports areas, parks, residences, motels, hotels, schools, churches, libraries, and hospitals
C 72—Exterior Developed lands, properties, or activities not included in Categories A or B above
D B Undeveloped lands E 52—Interior Residences, motels, hotels, public meeting rooms, schools, churches,
libraries, hospitals, and auditoriums
SOURCE: California Department of Transportation, Table 1 page 5, 2006.
3.5 Noise
Tulare County General Plan 2030 Update 3.5-7 ESA / 207497 Recirculated Draft Environmental Impact Report February 2010
United States Environmental Protection Agency The U.S. Environmental Protection Agency (USEPA) has identified the relationship between noise levels and human response. The EPA has determined that over a 24-hour period, an Leq of 70 dBA will result in some hearing loss. Interference with activity and annoyance will not occur if exterior levels are maintained at an Leq of 55 dBA and interior levels at or below 45 dBA. Although these levels are relevant for planning and design and useful for informational purposes, they are not land use planning criteria because they do not consider economic cost, technical feasibility, or the needs of the community.
The EPA has set 55 dBA Ldn as the basic goal for residential environments. However, other federal agencies, in consideration of their own program requirements and goals, as well as difficulty of actually achieving a goal of 55 dBA Ldn, have generally agreed on the 65 dBA Ldn level as being appropriate for residential uses. At 65 dBA Ldn activity interference is kept to a minimum, and annoyance levels are still low. It is also a level that can realistically be achieved.
Department of Housing and Urban Development The Department of Housing and Urban Development (HUD) was established in response to the Urban Development Act of 1965 (Public Law 90-448). HUD was tasked by the Housing and Urban Development Act of 1965 (Public Law 89-117) “to determine feasible methods of reducing the economic loss and hardships suffered by homeowners as a result of the depreciation in the value of their properties following the construction of airports in the vicinity of their homes.”
HUD first issued formal requirements related specifically to noise in 1971 (HUD Circular 1390.2). These requirements contained standards for exterior noise levels along with policies for approving HUD-supported or assisted housing projects in high noise areas. In general, these requirements established the following three zones:
• 65 dBA Ldn or less - an acceptable zone where all projects could be approved. • Exceeding 65 dBA Ldn but not exceeding 75 dBA Ldn - a normally unacceptable zone where
mitigation measures would be required and each project would have to be individually evaluated for approval or denial. These measures must provide 5 dBA of attenuation above the attenuation provided by standard construction required in a 65 to 70 dBA Ldn area and 10 dBA of attenuation in a 70 to 75 dBA Ldn area.
• Exceeding 75 dBA Ldn - an unacceptable zone in which projects would not, as a rule, be approved.
HUD’s regulations do not include interior noise standards. Rather a goal of 45 dBA Ldn is set forth and attenuation requirements are geared towards achieving that goal. HUD assumes that using standard construction techniques and materials, any building will provide sufficient attenuation so that if the exterior level is 65 dBA Ldn or less, the interior level will be 45 dBA Ldn or less. Thus, structural attenuation is assumed at 20 dBA. However, HUD regulations were promulgated solely for residential development requiring government funding and are not related to the operation of schools or churches.
Tulare County General Plan 2030 Update
Tulare County General Plan 2030 Update 3.5-8 ESA / 207497 Recirculated Draft Environmental Impact Report February 2010
The federal government regulates occupational noise exposure common in the workplace through the Occupational Health and Safety Administration (OSHA) under the USEPA. Noise exposure of this type is dependant on work conditions and is addressed through a facility’s or construction contractor’s health and safety plan.
State Regulations
California Department of Transportation Procedures used by Caltrans to assess noise abatement and mitigation are described in Traffic Noise Analysis Protocol for New Highway Construction, Reconstruction, and Retrofit Barrier Projects (California Department of Transportation, 2006). The noise abatement criteria are the same as those described above for the Federal Highway Administration.
California Code of Regulations The California Code of Regulations contains requirements for the construction of new hotels, motels, apartment houses, and dwellings other than detached single-family dwellings to limit the extent of noise transmitted into habitable spaces. These requirements are known collectively as the California Noise Insulation Standards and set forth an interior standard of 45 dB (CNEL or Ldn). These standards are typically enforced by local agencies through the building permit application process.
Governor’s Office of Planning and Research The Governor’s Office of Planning and Research (OPR) has developed guidelines for the preparation of general plans (State of California, OPR, 2003). These include land use compatibility guidelines for noise exposure.
In California, cities and counties are required to adopt a noise element as part of their General Plans. The purpose of noise elements is to establish a land use pattern that minimizes the exposure of residents of the community to excessive noise. The State of California General Plan Guidelines, published by the Governor’s Office of Planning and Research, defines land-use compatibility guideline criteria for noise exposure. These criteria, shown above in Table 3.5-1, are the basis for most land-use compatibility criteria used by cities and counties.
Local Regulations As discussed above, cities and counties are required to adopt a noise element as part of their General Plans. Noise elements serve as a planning guide for development. In addition, most jurisdictions have noise ordinances that serve as enforcement mechanisms to control noise from specific human-made sources. Each jurisdiction has its own noise ordinances and General Plan noise elements.
3.5 Noise
Tulare County General Plan 2030 Update 3.5-9 ESA / 207497 Recirculated Draft Environmental Impact Report February 2010
Environmental Setting
Traffic Noise Roadways and traffic noise are the dominant source of ambient noise in the County. The noise generated from vehicles using roads within the County is governed primarily by the number of vehicles, type of vehicles (mix of automobiles, trucks, and other large vehicles), and speed. Using Sound32 (Caltrans' computer implementation of the FHWA Traffic Noise Prediction Model) and traffic information provided in Section 3.2 “Transportation and Circulation” (of this RDEIR) baseline traffic noise contours for major roads in the County were developed. Table 3.5-3 summarizes the daily traffic volumes, the predicted Ldn noise level at 100 feet from the roadway centerline, and the distance from the roadway centerline to the 60-, 65-, and 70-dB-Ldn contours. The contour levels correspond to the land use compatibility levels used by Tulare County and specified in Table 3.5-3. Since these calculated contours do not take into account shielding caused by local buildings, walls, or topographical features, the distances should be considered to be worst-case estimates of noise exposure along roadways in the county.
Railroad Operations Noise Tulare County railroad operations consist of high speed mainline operations on the Burlington Northern-Santa Fe Railroad (formerly Atchison, Topeka and Santa Fe) in the southwest corner of the County and on the Union Pacific Railroad (formerly Southern Pacific Transportation Company) along SR 99. Lower speeds occur on various branch lines located throughout the County on the San Joaquin Valley Railroad. The existing rail system is shown in Figure 3.2-3 in Section 3.2, “Traffic and Circulation.”
Noise levels from mainline operations within Tulare County were quantified using the analytical methods developed in 1973 by Wyle Laboratories (County of Tulare, 2010 Background Report, page 8-52, 2010a). The Wyle methodology calculates noise exposure based upon reference noise level data for various types of trains under different operating conditions, distance from the tracks, speed and the characteristics of the track the trains are passing over.
In order to provide a comparison of the noise levels predicted by the Wyle methodology to those actually occurring in Tulare County, and to document single-event noise levels, noise level measurements were conducted at various locations near or away from grade crossings. The reference measurement distance was 100 feet from the center of the tracks. Specific noise level data are described in the following sections describing operations for each railroad. Railroad noise levels are described below by railroad operator.
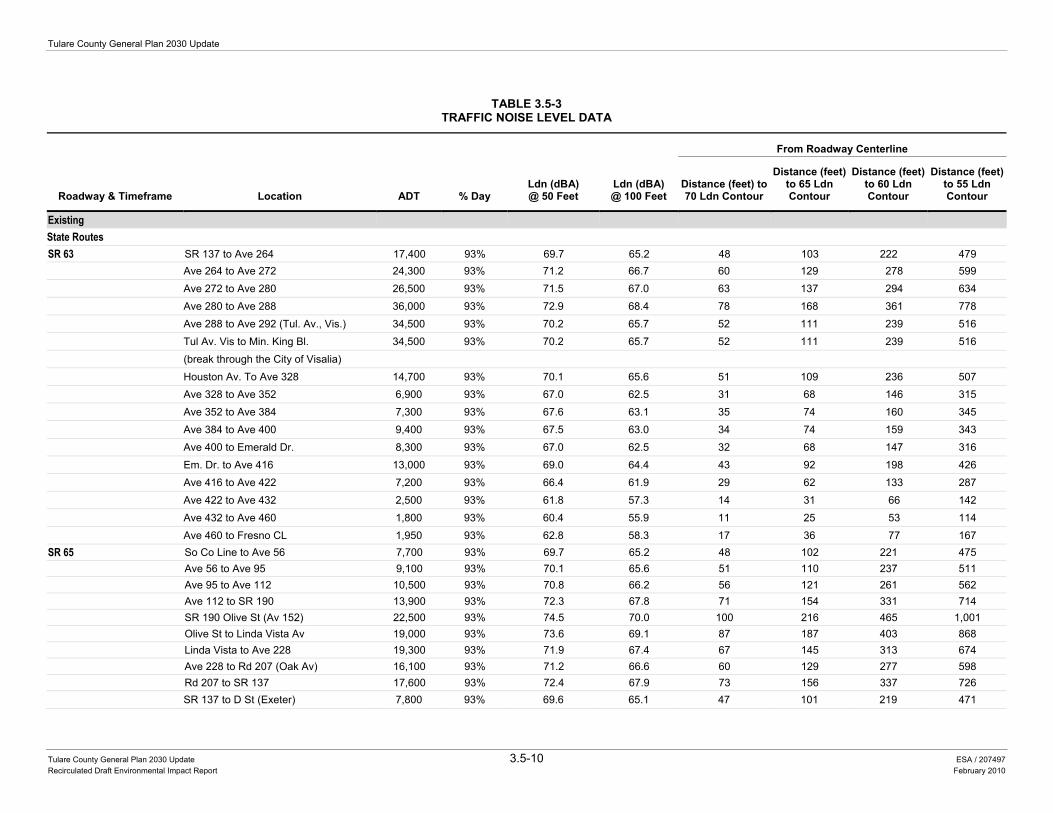
Tulare County General Plan 2030 Update
Tulare County General Plan 2030 Update 3.5-10 ESA / 207497 Recirculated Draft Environmental Impact Report February 2010
TABLE 3.5-3TRAFFIC NOISE LEVEL DATA
Roadway & Timeframe Location ADT % Day Ldn (dBA) @ 50 Feet
Ldn (dBA) @ 100 Feet
From Roadway Centerline
Distance (feet) to 70 Ldn Contour
Distance (feet) to 65 Ldn Contour
Distance (feet) to 60 Ldn Contour
Distance (feet) to 55 Ldn Contour
Existing State Routes SR 63 SR 137 to Ave 264 17,400 93% 69.7 65.2 48 103 222 479 Ave 264 to Ave 272 24,300 93% 71.2 66.7 60 129 278 599
Ave 272 to Ave 280 26,500 93% 71.5 67.0 63 137 294 634
Ave 280 to Ave 288 36,000 93% 72.9 68.4 78 168 361 778
Ave 288 to Ave 292 (Tul. Av., Vis.) 34,500 93% 70.2 65.7 52 111 239 516
Tul Av. Vis to Min. King Bl. 34,500 93% 70.2 65.7 52 111 239 516
(break through the City of Visalia)
Houston Av. To Ave 328 14,700 93% 70.1 65.6 51 109 236 507
Ave 328 to Ave 352 6,900 93% 67.0 62.5 31 68 146 315
Ave 352 to Ave 384 7,300 93% 67.6 63.1 35 74 160 345
Ave 384 to Ave 400 9,400 93% 67.5 63.0 34 74 159 343
Ave 400 to Emerald Dr. 8,300 93% 67.0 62.5 32 68 147 316
Em. Dr. to Ave 416 13,000 93% 69.0 64.4 43 92 198 426
Ave 416 to Ave 422 7,200 93% 66.4 61.9 29 62 133 287
Ave 422 to Ave 432 2,500 93% 61.8 57.3 14 31 66 142
Ave 432 to Ave 460 1,800 93% 60.4 55.9 11 25 53 114
Ave 460 to Fresno CL 1,950 93% 62.8 58.3 17 36 77 167 SR 65 So Co Line to Ave 56 7,700 93% 69.7 65.2 48 102 221 475 Ave 56 to Ave 95 9,100 93% 70.1 65.6 51 110 237 511 Ave 95 to Ave 112 10,500 93% 70.8 66.2 56 121 261 562 Ave 112 to SR 190 13,900 93% 72.3 67.8 71 154 331 714 SR 190 Olive St (Av 152) 22,500 93% 74.5 70.0 100 216 465 1,001 Olive St to Linda Vista Av 19,000 93% 73.6 69.1 87 187 403 868 Linda Vista to Ave 228 19,300 93% 71.9 67.4 67 145 313 674 Ave 228 to Rd 207 (Oak Av) 16,100 93% 71.2 66.6 60 129 277 598 Rd 207 to SR 137 17,600 93% 72.4 67.9 73 156 337 726 SR 137 to D St (Exeter) 7,800 93% 69.6 65.1 47 101 219 471
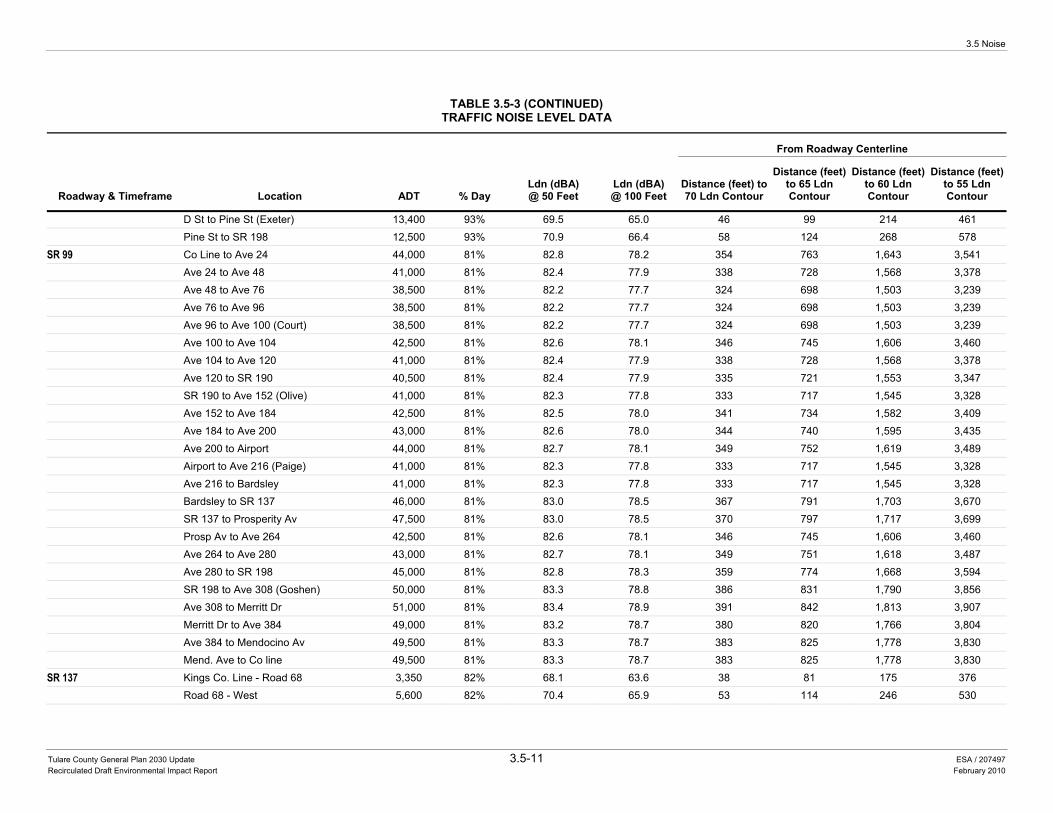
3.5 Noise
Tulare County General Plan 2030 Update 3.5-11 ESA / 207497 Recirculated Draft Environmental Impact Report February 2010
TABLE 3.5-3 (CONTINUED)TRAFFIC NOISE LEVEL DATA
Roadway & Timeframe Location ADT % Day Ldn (dBA) @ 50 Feet
Ldn (dBA) @ 100 Feet
From Roadway Centerline
Distance (feet) to 70 Ldn Contour
Distance (feet) to 65 Ldn Contour
Distance (feet) to 60 Ldn Contour
Distance (feet) to 55 Ldn Contour
D St to Pine St (Exeter) 13,400 93% 69.5 65.0 46 99 214 461
Pine St to SR 198 12,500 93% 70.9 66.4 58 124 268 578
SR 99 Co Line to Ave 24 44,000 81% 82.8 78.2 354 763 1,643 3,541
Ave 24 to Ave 48 41,000 81% 82.4 77.9 338 728 1,568 3,378
Ave 48 to Ave 76 38,500 81% 82.2 77.7 324 698 1,503 3,239
Ave 76 to Ave 96 38,500 81% 82.2 77.7 324 698 1,503 3,239
Ave 96 to Ave 100 (Court) 38,500 81% 82.2 77.7 324 698 1,503 3,239
Ave 100 to Ave 104 42,500 81% 82.6 78.1 346 745 1,606 3,460
Ave 104 to Ave 120 41,000 81% 82.4 77.9 338 728 1,568 3,378
Ave 120 to SR 190 40,500 81% 82.4 77.9 335 721 1,553 3,347
SR 190 to Ave 152 (Olive) 41,000 81% 82.3 77.8 333 717 1,545 3,328
Ave 152 to Ave 184 42,500 81% 82.5 78.0 341 734 1,582 3,409
Ave 184 to Ave 200 43,000 81% 82.6 78.0 344 740 1,595 3,435
Ave 200 to Airport 44,000 81% 82.7 78.1 349 752 1,619 3,489
Airport to Ave 216 (Paige) 41,000 81% 82.3 77.8 333 717 1,545 3,328
Ave 216 to Bardsley 41,000 81% 82.3 77.8 333 717 1,545 3,328
Bardsley to SR 137 46,000 81% 83.0 78.5 367 791 1,703 3,670
SR 137 to Prosperity Av 47,500 81% 83.0 78.5 370 797 1,717 3,699
Prosp Av to Ave 264 42,500 81% 82.6 78.1 346 745 1,606 3,460
Ave 264 to Ave 280 43,000 81% 82.7 78.1 349 751 1,618 3,487
Ave 280 to SR 198 45,000 81% 82.8 78.3 359 774 1,668 3,594
SR 198 to Ave 308 (Goshen) 50,000 81% 83.3 78.8 386 831 1,790 3,856
Ave 308 to Merritt Dr 51,000 81% 83.4 78.9 391 842 1,813 3,907
Merritt Dr to Ave 384 49,000 81% 83.2 78.7 380 820 1,766 3,804
Ave 384 to Mendocino Av 49,500 81% 83.3 78.7 383 825 1,778 3,830
Mend. Ave to Co line 49,500 81% 83.3 78.7 383 825 1,778 3,830
SR 137 Kings Co. Line - Road 68 3,350 82% 68.1 63.6 38 81 175 376
Road 68 - West 5,600 82% 70.4 65.9 53 114 246 530
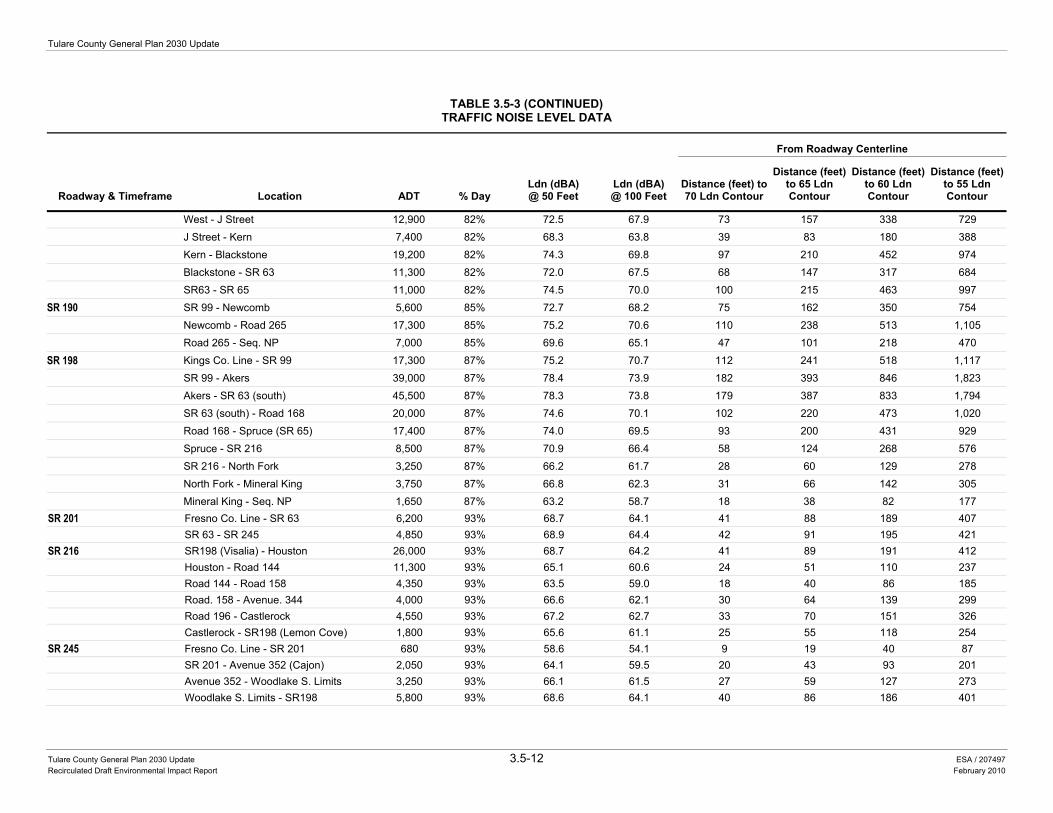
Tulare County General Plan 2030 Update
Tulare County General Plan 2030 Update 3.5-12 ESA / 207497 Recirculated Draft Environmental Impact Report February 2010
TABLE 3.5-3 (CONTINUED)TRAFFIC NOISE LEVEL DATA
Roadway & Timeframe Location ADT % Day Ldn (dBA) @ 50 Feet
Ldn (dBA) @ 100 Feet
From Roadway Centerline
Distance (feet) to 70 Ldn Contour
Distance (feet) to 65 Ldn Contour
Distance (feet) to 60 Ldn Contour
Distance (feet) to 55 Ldn Contour
West - J Street 12,900 82% 72.5 67.9 73 157 338 729
J Street - Kern 7,400 82% 68.3 63.8 39 83 180 388
Kern - Blackstone 19,200 82% 74.3 69.8 97 210 452 974
Blackstone - SR 63 11,300 82% 72.0 67.5 68 147 317 684
SR63 - SR 65 11,000 82% 74.5 70.0 100 215 463 997
SR 190 SR 99 - Newcomb 5,600 85% 72.7 68.2 75 162 350 754
Newcomb - Road 265 17,300 85% 75.2 70.6 110 238 513 1,105
Road 265 - Seq. NP 7,000 85% 69.6 65.1 47 101 218 470
SR 198 Kings Co. Line - SR 99 17,300 87% 75.2 70.7 112 241 518 1,117
SR 99 - Akers 39,000 87% 78.4 73.9 182 393 846 1,823
Akers - SR 63 (south) 45,500 87% 78.3 73.8 179 387 833 1,794
SR 63 (south) - Road 168 20,000 87% 74.6 70.1 102 220 473 1,020
Road 168 - Spruce (SR 65) 17,400 87% 74.0 69.5 93 200 431 929
Spruce - SR 216 8,500 87% 70.9 66.4 58 124 268 576
SR 216 - North Fork 3,250 87% 66.2 61.7 28 60 129 278
North Fork - Mineral King 3,750 87% 66.8 62.3 31 66 142 305
Mineral King - Seq. NP 1,650 87% 63.2 58.7 18 38 82 177 SR 201 Fresno Co. Line - SR 63 6,200 93% 68.7 64.1 41 88 189 407 SR 63 - SR 245 4,850 93% 68.9 64.4 42 91 195 421 SR 216 SR198 (Visalia) - Houston 26,000 93% 68.7 64.2 41 89 191 412 Houston - Road 144 11,300 93% 65.1 60.6 24 51 110 237 Road 144 - Road 158 4,350 93% 63.5 59.0 18 40 86 185 Road. 158 - Avenue. 344 4,000 93% 66.6 62.1 30 64 139 299 Road 196 - Castlerock 4,550 93% 67.2 62.7 33 70 151 326 Castlerock - SR198 (Lemon Cove) 1,800 93% 65.6 61.1 25 55 118 254 SR 245 Fresno Co. Line - SR 201 680 93% 58.6 54.1 9 19 40 87 SR 201 - Avenue 352 (Cajon) 2,050 93% 64.1 59.5 20 43 93 201 Avenue 352 - Woodlake S. Limits 3,250 93% 66.1 61.5 27 59 127 273 Woodlake S. Limits - SR198 5,800 93% 68.6 64.1 40 86 186 401
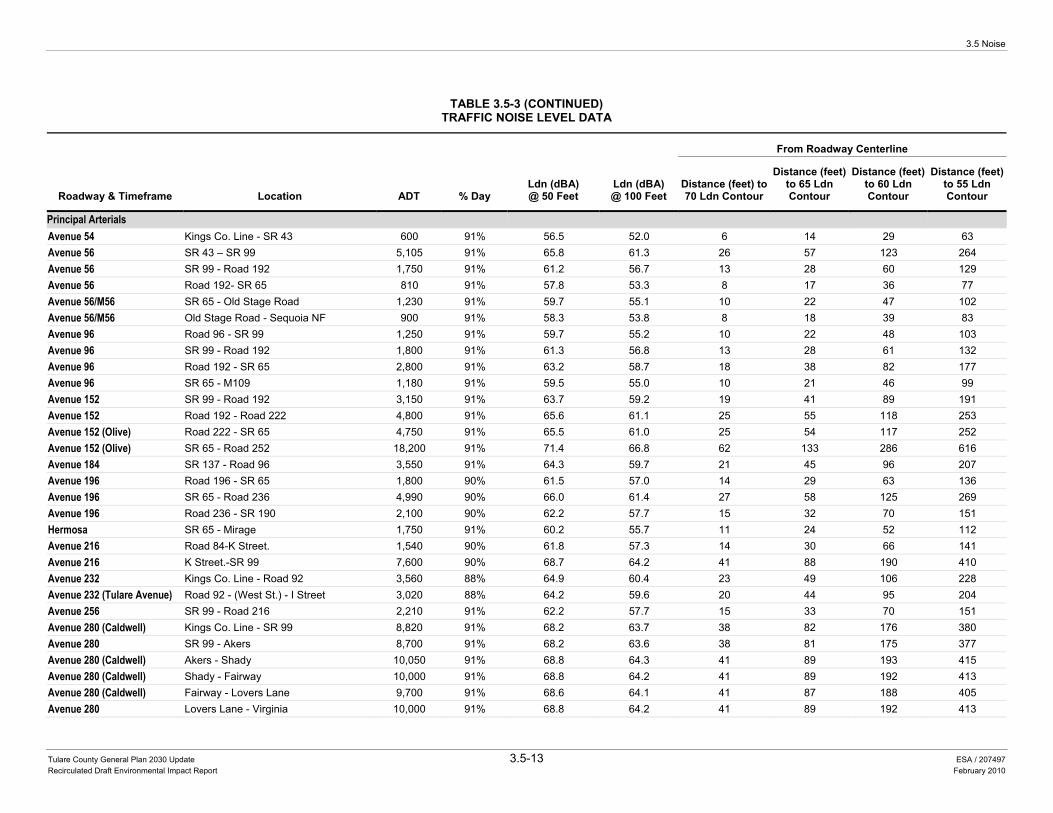
3.5 Noise
Tulare County General Plan 2030 Update 3.5-13 ESA / 207497 Recirculated Draft Environmental Impact Report February 2010
TABLE 3.5-3 (CONTINUED)TRAFFIC NOISE LEVEL DATA
Roadway & Timeframe Location ADT % Day Ldn (dBA) @ 50 Feet
Ldn (dBA) @ 100 Feet
From Roadway Centerline
Distance (feet) to 70 Ldn Contour
Distance (feet) to 65 Ldn Contour
Distance (feet) to 60 Ldn Contour
Distance (feet) to 55 Ldn Contour
Principal Arterials Avenue 54 Kings Co. Line - SR 43 600 91% 56.5 52.0 6 14 29 63 Avenue 56 SR 43 – SR 99 5,105 91% 65.8 61.3 26 57 123 264 Avenue 56 SR 99 - Road 192 1,750 91% 61.2 56.7 13 28 60 129 Avenue 56 Road 192- SR 65 810 91% 57.8 53.3 8 17 36 77 Avenue 56/M56 SR 65 - Old Stage Road 1,230 91% 59.7 55.1 10 22 47 102 Avenue 56/M56 Old Stage Road - Sequoia NF 900 91% 58.3 53.8 8 18 39 83 Avenue 96 Road 96 - SR 99 1,250 91% 59.7 55.2 10 22 48 103 Avenue 96 SR 99 - Road 192 1,800 91% 61.3 56.8 13 28 61 132 Avenue 96 Road 192 - SR 65 2,800 91% 63.2 58.7 18 38 82 177 Avenue 96 SR 65 - M109 1,180 91% 59.5 55.0 10 21 46 99 Avenue 152 SR 99 - Road 192 3,150 91% 63.7 59.2 19 41 89 191 Avenue 152 Road 192 - Road 222 4,800 91% 65.6 61.1 25 55 118 253 Avenue 152 (Olive) Road 222 - SR 65 4,750 91% 65.5 61.0 25 54 117 252 Avenue 152 (Olive) SR 65 - Road 252 18,200 91% 71.4 66.8 62 133 286 616 Avenue 184 SR 137 - Road 96 3,550 91% 64.3 59.7 21 45 96 207 Avenue 196 Road 196 - SR 65 1,800 90% 61.5 57.0 14 29 63 136 Avenue 196 SR 65 - Road 236 4,990 90% 66.0 61.4 27 58 125 269 Avenue 196 Road 236 - SR 190 2,100 90% 62.2 57.7 15 32 70 151 Hermosa SR 65 - Mirage 1,750 91% 60.2 55.7 11 24 52 112 Avenue 216 Road 84-K Street. 1,540 90% 61.8 57.3 14 30 66 141 Avenue 216 K Street.-SR 99 7,600 90% 68.7 64.2 41 88 190 410 Avenue 232 Kings Co. Line - Road 92 3,560 88% 64.9 60.4 23 49 106 228 Avenue 232 (Tulare Avenue) Road 92 - (West St.) - I Street 3,020 88% 64.2 59.6 20 44 95 204 Avenue 256 SR 99 - Road 216 2,210 91% 62.2 57.7 15 33 70 151 Avenue 280 (Caldwell) Kings Co. Line - SR 99 8,820 91% 68.2 63.7 38 82 176 380 Avenue 280 SR 99 - Akers 8,700 91% 68.2 63.6 38 81 175 377 Avenue 280 (Caldwell) Akers - Shady 10,050 91% 68.8 64.3 41 89 193 415 Avenue 280 (Caldwell) Shady - Fairway 10,000 91% 68.8 64.2 41 89 192 413 Avenue 280 (Caldwell) Fairway - Lovers Lane 9,700 91% 68.6 64.1 41 87 188 405 Avenue 280 Lovers Lane - Virginia 10,000 91% 68.8 64.2 41 89 192 413
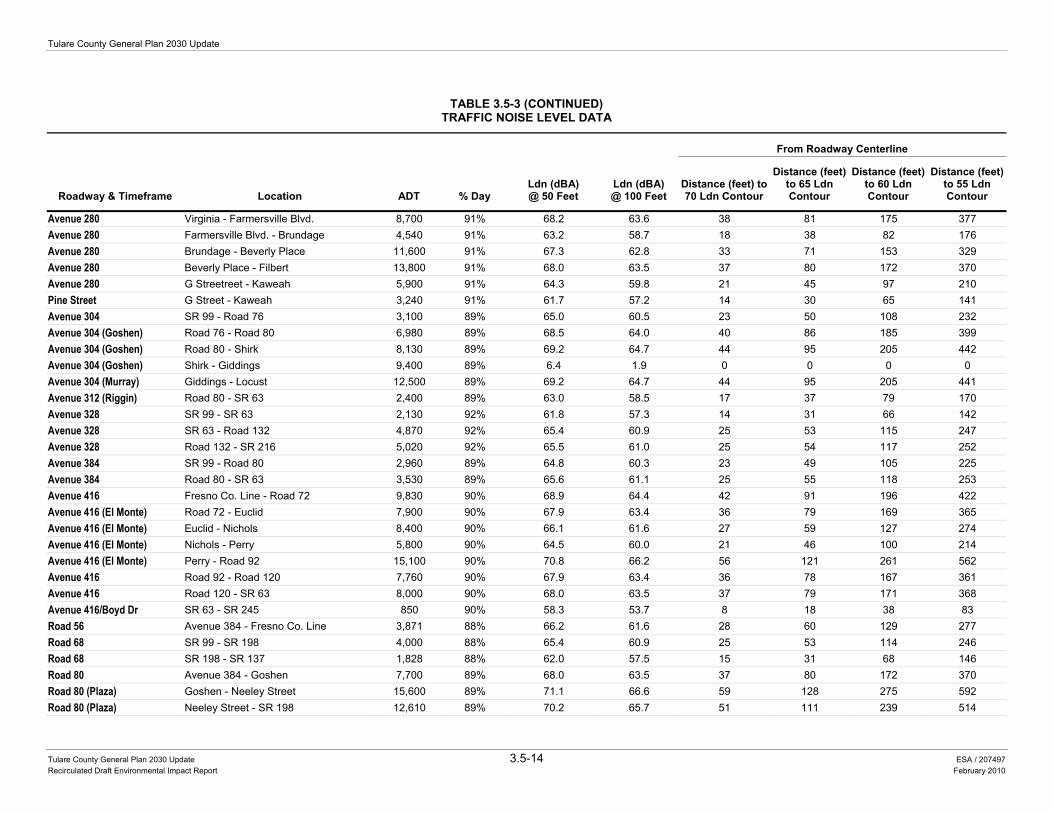
Tulare County General Plan 2030 Update
Tulare County General Plan 2030 Update 3.5-14 ESA / 207497 Recirculated Draft Environmental Impact Report February 2010
TABLE 3.5-3 (CONTINUED)TRAFFIC NOISE LEVEL DATA
Roadway & Timeframe Location ADT % Day Ldn (dBA) @ 50 Feet
Ldn (dBA) @ 100 Feet
From Roadway Centerline
Distance (feet) to 70 Ldn Contour
Distance (feet) to 65 Ldn Contour
Distance (feet) to 60 Ldn Contour
Distance (feet) to 55 Ldn Contour
Avenue 280 Virginia - Farmersville Blvd. 8,700 91% 68.2 63.6 38 81 175 377 Avenue 280 Farmersville Blvd. - Brundage 4,540 91% 63.2 58.7 18 38 82 176 Avenue 280 Brundage - Beverly Place 11,600 91% 67.3 62.8 33 71 153 329 Avenue 280 Beverly Place - Filbert 13,800 91% 68.0 63.5 37 80 172 370 Avenue 280 G Streetreet - Kaweah 5,900 91% 64.3 59.8 21 45 97 210 Pine Street G Street - Kaweah 3,240 91% 61.7 57.2 14 30 65 141 Avenue 304 SR 99 - Road 76 3,100 89% 65.0 60.5 23 50 108 232 Avenue 304 (Goshen) Road 76 - Road 80 6,980 89% 68.5 64.0 40 86 185 399 Avenue 304 (Goshen) Road 80 - Shirk 8,130 89% 69.2 64.7 44 95 205 442 Avenue 304 (Goshen) Shirk - Giddings 9,400 89% 6.4 1.9 0 0 0 0 Avenue 304 (Murray) Giddings - Locust 12,500 89% 69.2 64.7 44 95 205 441 Avenue 312 (Riggin) Road 80 - SR 63 2,400 89% 63.0 58.5 17 37 79 170 Avenue 328 SR 99 - SR 63 2,130 92% 61.8 57.3 14 31 66 142 Avenue 328 SR 63 - Road 132 4,870 92% 65.4 60.9 25 53 115 247 Avenue 328 Road 132 - SR 216 5,020 92% 65.5 61.0 25 54 117 252 Avenue 384 SR 99 - Road 80 2,960 89% 64.8 60.3 23 49 105 225 Avenue 384 Road 80 - SR 63 3,530 89% 65.6 61.1 25 55 118 253 Avenue 416 Fresno Co. Line - Road 72 9,830 90% 68.9 64.4 42 91 196 422 Avenue 416 (El Monte) Road 72 - Euclid 7,900 90% 67.9 63.4 36 79 169 365 Avenue 416 (El Monte) Euclid - Nichols 8,400 90% 66.1 61.6 27 59 127 274 Avenue 416 (El Monte) Nichols - Perry 5,800 90% 64.5 60.0 21 46 100 214 Avenue 416 (El Monte) Perry - Road 92 15,100 90% 70.8 66.2 56 121 261 562 Avenue 416 Road 92 - Road 120 7,760 90% 67.9 63.4 36 78 167 361 Avenue 416 Road 120 - SR 63 8,000 90% 68.0 63.5 37 79 171 368 Avenue 416/Boyd Dr SR 63 - SR 245 850 90% 58.3 53.7 8 18 38 83 Road 56 Avenue 384 - Fresno Co. Line 3,871 88% 66.2 61.6 28 60 129 277 Road 68 SR 99 - SR 198 4,000 88% 65.4 60.9 25 53 114 246 Road 68 SR 198 - SR 137 1,828 88% 62.0 57.5 15 31 68 146 Road 80 Avenue 384 - Goshen 7,700 89% 68.0 63.5 37 80 172 370 Road 80 (Plaza) Goshen - Neeley Street 15,600 89% 71.1 66.6 59 128 275 592 Road 80 (Plaza) Neeley Street - SR 198 12,610 89% 70.2 65.7 51 111 239 514
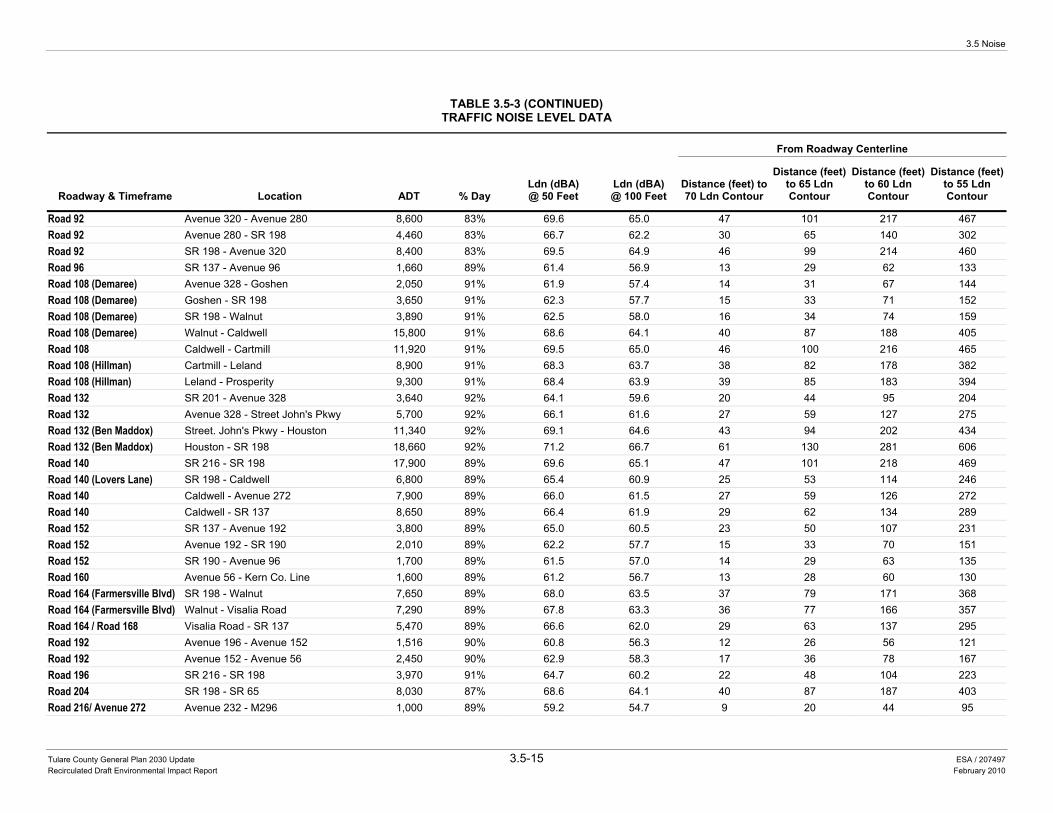
3.5 Noise
Tulare County General Plan 2030 Update 3.5-15 ESA / 207497 Recirculated Draft Environmental Impact Report February 2010
TABLE 3.5-3 (CONTINUED)TRAFFIC NOISE LEVEL DATA
Roadway & Timeframe Location ADT % Day Ldn (dBA) @ 50 Feet
Ldn (dBA) @ 100 Feet
From Roadway Centerline
Distance (feet) to 70 Ldn Contour
Distance (feet) to 65 Ldn Contour
Distance (feet) to 60 Ldn Contour
Distance (feet) to 55 Ldn Contour
Road 92 Avenue 320 - Avenue 280 8,600 83% 69.6 65.0 47 101 217 467 Road 92 Avenue 280 - SR 198 4,460 83% 66.7 62.2 30 65 140 302 Road 92 SR 198 - Avenue 320 8,400 83% 69.5 64.9 46 99 214 460 Road 96 SR 137 - Avenue 96 1,660 89% 61.4 56.9 13 29 62 133 Road 108 (Demaree) Avenue 328 - Goshen 2,050 91% 61.9 57.4 14 31 67 144 Road 108 (Demaree) Goshen - SR 198 3,650 91% 62.3 57.7 15 33 71 152 Road 108 (Demaree) SR 198 - Walnut 3,890 91% 62.5 58.0 16 34 74 159 Road 108 (Demaree) Walnut - Caldwell 15,800 91% 68.6 64.1 40 87 188 405 Road 108 Caldwell - Cartmill 11,920 91% 69.5 65.0 46 100 216 465 Road 108 (Hillman) Cartmill - Leland 8,900 91% 68.3 63.7 38 82 178 382 Road 108 (Hillman) Leland - Prosperity 9,300 91% 68.4 63.9 39 85 183 394 Road 132 SR 201 - Avenue 328 3,640 92% 64.1 59.6 20 44 95 204 Road 132 Avenue 328 - Street John's Pkwy 5,700 92% 66.1 61.6 27 59 127 275 Road 132 (Ben Maddox) Street. John's Pkwy - Houston 11,340 92% 69.1 64.6 43 94 202 434 Road 132 (Ben Maddox) Houston - SR 198 18,660 92% 71.2 66.7 61 130 281 606 Road 140 SR 216 - SR 198 17,900 89% 69.6 65.1 47 101 218 469 Road 140 (Lovers Lane) SR 198 - Caldwell 6,800 89% 65.4 60.9 25 53 114 246 Road 140 Caldwell - Avenue 272 7,900 89% 66.0 61.5 27 59 126 272 Road 140 Caldwell - SR 137 8,650 89% 66.4 61.9 29 62 134 289 Road 152 SR 137 - Avenue 192 3,800 89% 65.0 60.5 23 50 107 231 Road 152 Avenue 192 - SR 190 2,010 89% 62.2 57.7 15 33 70 151 Road 152 SR 190 - Avenue 96 1,700 89% 61.5 57.0 14 29 63 135 Road 160 Avenue 56 - Kern Co. Line 1,600 89% 61.2 56.7 13 28 60 130 Road 164 (Farmersville Blvd) SR 198 - Walnut 7,650 89% 68.0 63.5 37 79 171 368 Road 164 (Farmersville Blvd) Walnut - Visalia Road 7,290 89% 67.8 63.3 36 77 166 357 Road 164 / Road 168 Visalia Road - SR 137 5,470 89% 66.6 62.0 29 63 137 295 Road 192 Avenue 196 - Avenue 152 1,516 90% 60.8 56.3 12 26 56 121 Road 192 Avenue 152 - Avenue 56 2,450 90% 62.9 58.3 17 36 78 167 Road 196 SR 216 - SR 198 3,970 91% 64.7 60.2 22 48 104 223 Road 204 SR 198 - SR 65 8,030 87% 68.6 64.1 40 87 187 403 Road 216/ Avenue 272 Avenue 232 - M296 1,000 89% 59.2 54.7 9 20 44 95
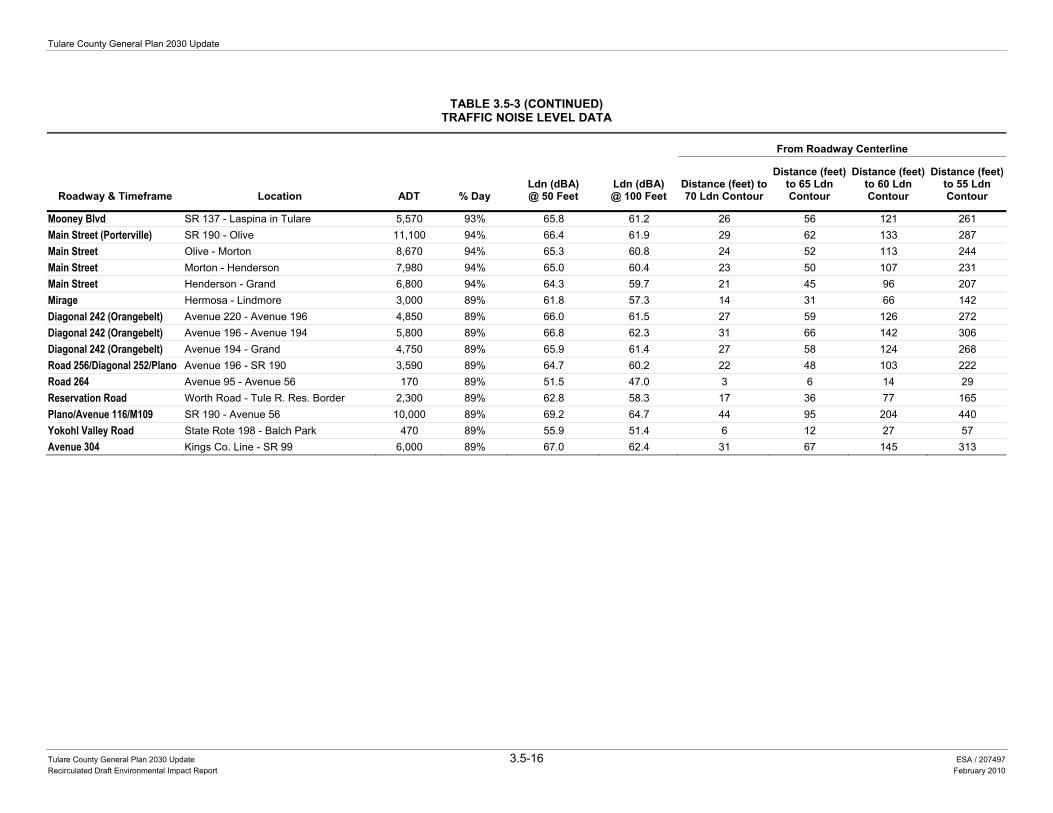
Tulare County General Plan 2030 Update
Tulare County General Plan 2030 Update 3.5-16 ESA / 207497 Recirculated Draft Environmental Impact Report February 2010
TABLE 3.5-3 (CONTINUED)TRAFFIC NOISE LEVEL DATA
Roadway & Timeframe Location ADT % Day Ldn (dBA) @ 50 Feet
Ldn (dBA) @ 100 Feet
From Roadway Centerline
Distance (feet) to 70 Ldn Contour
Distance (feet) to 65 Ldn Contour
Distance (feet) to 60 Ldn Contour
Distance (feet) to 55 Ldn Contour
Mooney Blvd SR 137 - Laspina in Tulare 5,570 93% 65.8 61.2 26 56 121 261 Main Street (Porterville) SR 190 - Olive 11,100 94% 66.4 61.9 29 62 133 287 Main Street Olive - Morton 8,670 94% 65.3 60.8 24 52 113 244 Main Street Morton - Henderson 7,980 94% 65.0 60.4 23 50 107 231 Main Street Henderson - Grand 6,800 94% 64.3 59.7 21 45 96 207 Mirage Hermosa - Lindmore 3,000 89% 61.8 57.3 14 31 66 142 Diagonal 242 (Orangebelt) Avenue 220 - Avenue 196 4,850 89% 66.0 61.5 27 59 126 272 Diagonal 242 (Orangebelt) Avenue 196 - Avenue 194 5,800 89% 66.8 62.3 31 66 142 306 Diagonal 242 (Orangebelt) Avenue 194 - Grand 4,750 89% 65.9 61.4 27 58 124 268 Road 256/Diagonal 252/Plano Avenue 196 - SR 190 3,590 89% 64.7 60.2 22 48 103 222 Road 264 Avenue 95 - Avenue 56 170 89% 51.5 47.0 3 6 14 29 Reservation Road Worth Road - Tule R. Res. Border 2,300 89% 62.8 58.3 17 36 77 165 Plano/Avenue 116/M109 SR 190 - Avenue 56 10,000 89% 69.2 64.7 44 95 204 440 Yokohl Valley Road State Rote 198 - Balch Park 470 89% 55.9 51.4 6 12 27 57 Avenue 304 Kings Co. Line - SR 99 6,000 89% 67.0 62.4 31 67 145 313
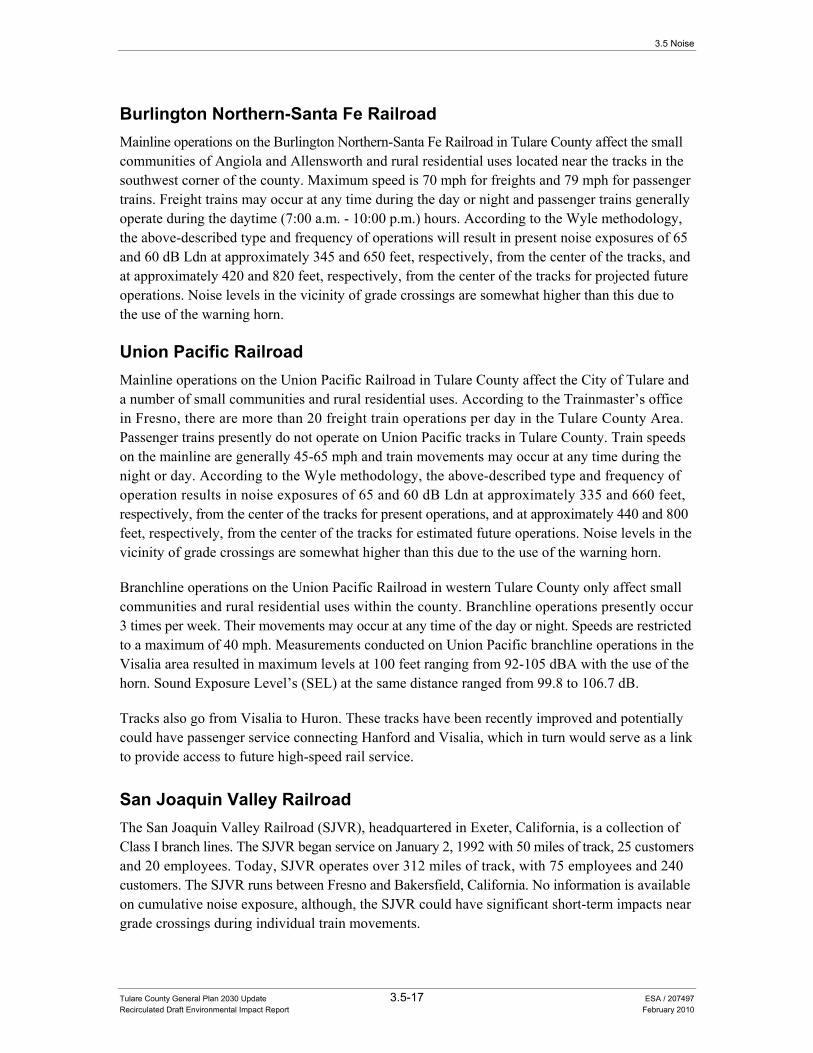
3.5 Noise
Tulare County General Plan 2030 Update 3.5-17 ESA / 207497 Recirculated Draft Environmental Impact Report February 2010
Burlington Northern-Santa Fe Railroad Mainline operations on the Burlington Northern-Santa Fe Railroad in Tulare County affect the small communities of Angiola and Allensworth and rural residential uses located near the tracks in the southwest corner of the county. Maximum speed is 70 mph for freights and 79 mph for passenger trains. Freight trains may occur at any time during the day or night and passenger trains generally operate during the daytime (7:00 a.m. - 10:00 p.m.) hours. According to the Wyle methodology, the above-described type and frequency of operations will result in present noise exposures of 65 and 60 dB Ldn at approximately 345 and 650 feet, respectively, from the center of the tracks, and at approximately 420 and 820 feet, respectively, from the center of the tracks for projected future operations. Noise levels in the vicinity of grade crossings are somewhat higher than this due to the use of the warning horn.
Union Pacific Railroad Mainline operations on the Union Pacific Railroad in Tulare County affect the City of Tulare and a number of small communities and rural residential uses. According to the Trainmaster’s office in Fresno, there are more than 20 freight train operations per day in the Tulare County Area. Passenger trains presently do not operate on Union Pacific tracks in Tulare County. Train speeds on the mainline are generally 45-65 mph and train movements may occur at any time during the night or day. According to the Wyle methodology, the above-described type and frequency of operation results in noise exposures of 65 and 60 dB Ldn at approximately 335 and 660 feet, respectively, from the center of the tracks for present operations, and at approximately 440 and 800 feet, respectively, from the center of the tracks for estimated future operations. Noise levels in the vicinity of grade crossings are somewhat higher than this due to the use of the warning horn.
Branchline operations on the Union Pacific Railroad in western Tulare County only affect small communities and rural residential uses within the county. Branchline operations presently occur 3 times per week. Their movements may occur at any time of the day or night. Speeds are restricted to a maximum of 40 mph. Measurements conducted on Union Pacific branchline operations in the Visalia area resulted in maximum levels at 100 feet ranging from 92-105 dBA with the use of the horn. Sound Exposure Level’s (SEL) at the same distance ranged from 99.8 to 106.7 dB.
Tracks also go from Visalia to Huron. These tracks have been recently improved and potentially could have passenger service connecting Hanford and Visalia, which in turn would serve as a link to provide access to future high-speed rail service.
San Joaquin Valley Railroad The San Joaquin Valley Railroad (SJVR), headquartered in Exeter, California, is a collection of Class I branch lines. The SJVR began service on January 2, 1992 with 50 miles of track, 25 customers and 20 employees. Today, SJVR operates over 312 miles of track, with 75 employees and 240 customers. The SJVR runs between Fresno and Bakersfield, California. No information is available on cumulative noise exposure, although, the SJVR could have significant short-term impacts near grade crossings during individual train movements.
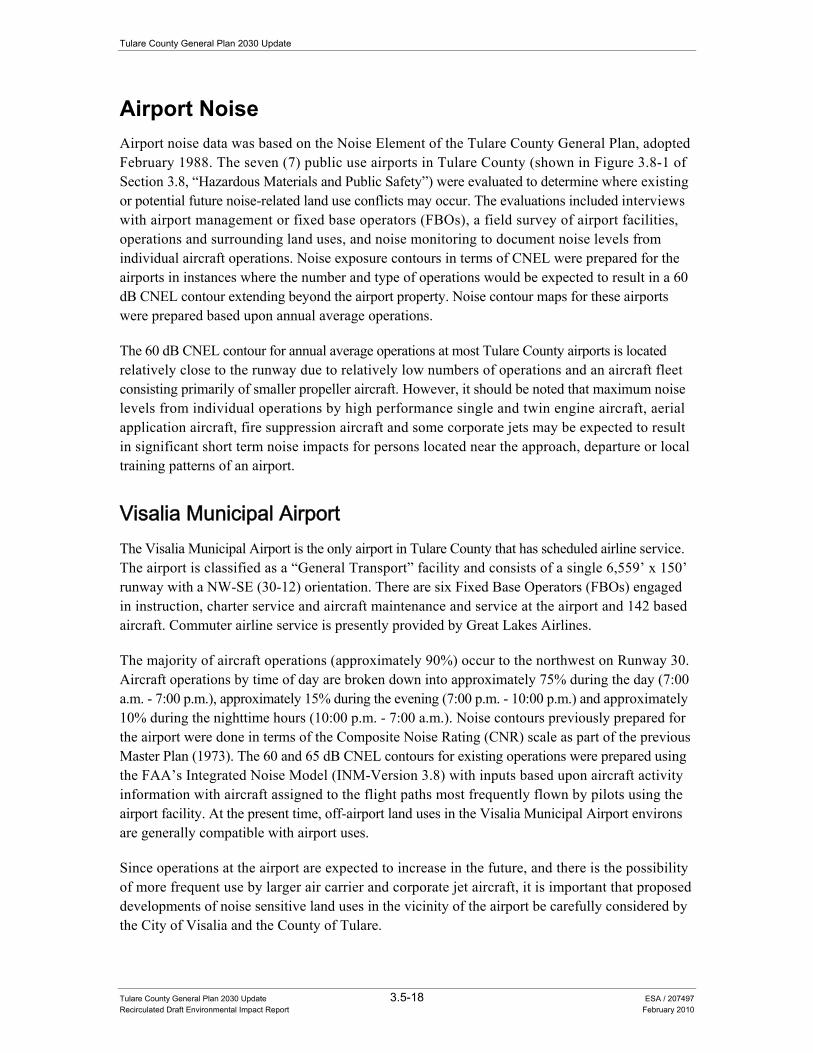
Tulare County General Plan 2030 Update
Tulare County General Plan 2030 Update 3.5-18 ESA / 207497 Recirculated Draft Environmental Impact Report February 2010
Airport Noise Airport noise data was based on the Noise Element of the Tulare County General Plan, adopted February 1988. The seven (7) public use airports in Tulare County (shown in Figure 3.8-1 of Section 3.8, “Hazardous Materials and Public Safety”) were evaluated to determine where existing or potential future noise-related land use conflicts may occur. The evaluations included interviews with airport management or fixed base operators (FBOs), a field survey of airport facilities, operations and surrounding land uses, and noise monitoring to document noise levels from individual aircraft operations. Noise exposure contours in terms of CNEL were prepared for the airports in instances where the number and type of operations would be expected to result in a 60 dB CNEL contour extending beyond the airport property. Noise contour maps for these airports were prepared based upon annual average operations.
The 60 dB CNEL contour for annual average operations at most Tulare County airports is located relatively close to the runway due to relatively low numbers of operations and an aircraft fleet consisting primarily of smaller propeller aircraft. However, it should be noted that maximum noise levels from individual operations by high performance single and twin engine aircraft, aerial application aircraft, fire suppression aircraft and some corporate jets may be expected to result in significant short term noise impacts for persons located near the approach, departure or local training patterns of an airport.
Visalia Municipal Airport The Visalia Municipal Airport is the only airport in Tulare County that has scheduled airline service. The airport is classified as a “General Transport” facility and consists of a single 6,559’ x 150’ runway with a NW-SE (30-12) orientation. There are six Fixed Base Operators (FBOs) engaged in instruction, charter service and aircraft maintenance and service at the airport and 142 based aircraft. Commuter airline service is presently provided by Great Lakes Airlines.
The majority of aircraft operations (approximately 90%) occur to the northwest on Runway 30. Aircraft operations by time of day are broken down into approximately 75% during the day (7:00 a.m. - 7:00 p.m.), approximately 15% during the evening (7:00 p.m. - 10:00 p.m.) and approximately 10% during the nighttime hours (10:00 p.m. - 7:00 a.m.). Noise contours previously prepared for the airport were done in terms of the Composite Noise Rating (CNR) scale as part of the previous Master Plan (1973). The 60 and 65 dB CNEL contours for existing operations were prepared using the FAA’s Integrated Noise Model (INM-Version 3.8) with inputs based upon aircraft activity information with aircraft assigned to the flight paths most frequently flown by pilots using the airport facility. At the present time, off-airport land uses in the Visalia Municipal Airport environs are generally compatible with airport uses.
Since operations at the airport are expected to increase in the future, and there is the possibility of more frequent use by larger air carrier and corporate jet aircraft, it is important that proposed developments of noise sensitive land uses in the vicinity of the airport be carefully considered by the City of Visalia and the County of Tulare.
3.5 Noise
Tulare County General Plan 2030 Update 3.5-19 ESA / 207497 Recirculated Draft Environmental Impact Report February 2010
Porterville Municipal Airport Porterville Municipal Airport is owned by the City of Porterville. The primary runway (30-12) is 6,000 feet long. A 4,000-foot cross-wind runway (25-7) is designated as abandoned by the City of Porterville Airport Master Plan. Flight schools and aircraft charter FBO’s and a California Department of Forestry (CDF) and Fire Prevention operation are located at the airport. During the fire season 3 to 6 fire suppression aircraft may be based at the field. In addition to operations provided by based aircraft, transient corporate jets commonly use the field. On a typical busy day 5 or 6 of these jets may use the field. Approximately 70% of airport operations occur on Runway 30. About 75% of operations at the airport occur during the daytime hours (7:00 a.m. - 7:00 p.m.), 20% during the evening hours (7:00 p.m. - 10:00 p.m.) and 5% during the nighttime hours (10:00 p.m. - 7:00 a.m.). A standard left hand pattern is used on runway 30-12. Land uses adjacent to the airport include agricultural, commercial, industrial and recreational uses. Based on reported operational information, 60 and 65 dB CNEL contours were prepared for existing annual average operations at the airport.
Tulare Municipal Airport (Mefford Field) Mefford Field is owned and managed by the City of Tulare. The one runway at the airport is 3,900 feet long. It is estimated that about 70% of airport operations occur to the northwest on Runway 31. It is also estimated that about 70% of aircraft use the airport during the daytime hours (7:00 a.m. to 7:00 p.m.), 25% during the evening hours (7:00 p.m. to 10:00 p.m.) and 5% during the nighttime hours (10:00 p.m. to 7:00 a.m.) Land uses located to the east of the airport include the Tulare Country Club and golf course. The Elk Bayou Park is located south of the airport. Commercial uses border the north and west sides of the airport along SR 99. The 1972 Master Plan for the airport included a noise contour map in terms of the Noise Exposure Forecast (NEF) scale. 60 and 65 dB CNEL contours were prepared for airport operations.
Woodlake Airport The Woodlake Airport is owned and managed by the City of Woodlake. The one runway at the airport is 3,355 feet long. It is estimated that departing and landing aircraft use Runway 25, 90% of the time and Runway 7 the remainder of the time. Most aircraft use a standard left hand pattern in departing or landing at the airport. About 95% of aircraft operations occur during the daytime hours. The airport is generally surrounded by agricultural land uses with the exception of some residential uses to the east along the river.
Sequoia Field Sequoia Field is owned by the County of Tulare and managed by one of the fixed-base operators. The single airport runway is 3,020 feet long by 60 feet wide. Operations occur between 7:00 a.m. and 7:00 p.m. approximately 70% of the time, between 7:00 p.m. and 10:00 p.m. approximately 10% of the time, and between 10:00 p.m. and 7:00 a.m. approximately 20% of the time. Maximum noise levels from such departures and also from departures by aerial application aircraft could be expected to result in significant short-term noise impacts in areas located near the airport. Land uses in the
Tulare County General Plan 2030 Update
Tulare County General Plan 2030 Update 3.5-20 ESA / 207497 Recirculated Draft Environmental Impact Report February 2010
vicinity of the airport include agricultural uses, scattered residential uses, and a Tulare County detention facility. Several homes are located near established flight corridors in the vicinity of the airport (west of Rd. 112). Local pilots attempt to avoid existing homes, but future development could result in noise-related land use conflicts, especially if airport operations increase significantly in the future.
Eckert Field Eckert Field is privately owned and managed, but is open for public use. The one runway at the airport is 2,050 feet long including the overrun. The airport owner estimates that there are approximately 7,000 annual operations at the airfield. About 90% or more of general aviation aircraft operations occur during the daytime hours. A standard left hand pattern is used by most pilots at the airport. Eckert Field is surrounded by citrus groves.
Thunderhawk Field Thunderhawk Field is a privately owned and maintained facility. The field contains a single runway that is 2,400 feet long and 50 feet wide. Surrounding land uses are mostly agricultural, with the exception of some scattered residential uses. Due to the number and type of aircraft at the facility, the 60 dB CNEL noise contour does not extend beyond the airport property.
Stationary Noise Sources Stationary noise sources in Tulare County include manufacturing operations, sand and gravel mining, and agricultural operations. Tulare County’s manufacturing plants consist of a number of different manufacturing operations, including food processing. The following description of some stationary noise sources in Tulare County is intended to be representative of the primary stationary noise sources found within the County. Further description of these noise sources can also be found in the 2010 Background Report (Appendix B of this RDEIR).
Sand and Gravel Extraction and Processing The Kaweah River Rock Company is located southeast of Woodlake and represents the type of sand and gravel extraction and processing operation that could occur in Tulare County. The plant generally operates 18 hours per day, 5 days per week. The plant occasionally operates 24-hours per day and on Saturdays. Excavation equipment consists of backhoes, graders, loaders, a drag line and off-road haul trucks. At any one time, it is common to have the drag line, backhoe or one of the loaders working in conjunction with the off-road haul trucks.
Noise levels at 700 feet from such an excavation operation using a CAT992A loader and 2 CAT 769B trucks on January 12, 1987, ranged from 47.5 to 66.5 dBA with an Leq of 61 dBA. At 1,200 feet, the same operation generated noise levels of 46-61 dBA with an Leq of 55 dBA. The processing area of the operation contains 3 crushing and/or screening plants that are used to produce certain products. On January 12, 1986, the processing plant containing one jaw crusher, one cone crusher and four screens was in operation. At 200 feet, the plant produced noise levels of approximately 77 dBA. Additionally, a CAT 988B loader working around the processing plant generated noise levels of 75-80 dBA at 150 feet.
3.5 Noise
Tulare County General Plan 2030 Update 3.5-21 ESA / 207497 Recirculated Draft Environmental Impact Report February 2010
Agricultural Operations Farming operations are common throughout Tulare County with the exception of some mountainous areas and heavily developed areas within larger communities. Some of the more common noise sources associated with farming operations include tractors, harvesting equipment and spray equipment. In order to document noise levels generated by such equipment, noise levels were measured at various locations throughout the county. Examples of measured levels include a cotton picker operating at roughly 500 feet away, which produced a noise level of 58 dBA. A larger diesel-powered wheel tractor pulling a 20-foot disk generated levels of 72-75 dBA at approximately 150 feet. An International 574 diesel-powered wheel tractor (smaller than the above) pulling a furrowing appliance generated levels of 69-79 dBA at approximately 50 feet. Also measured were a Randall weed sprayer with a National one cylinder diesel engine which produced 74-75 dBA at 50 feet, an FMC Bean 267 engine-driven speed sprayer (345C.i.V8) which produced 92-97 dBA at 50 feet depending upon orientation, and an Aerofan 391 speed sprayer which generated 74-76 dBA at 100-300 feet.
The above-described levels do not include all types of farm equipment, but do present a range of levels that may be expected. A good general rule-of-thumb is that a diesel engine will produce noise levels of 75-85 dBA at approximately 50 feet. Although farming operations occasionally generate significant noise levels, such levels generally do not last more than a few hours at a given location unless a stationary piece of equipment such as a pump master (or engine) is involved. For this reason, significant cumulative noise exposure as defined by Ldn would not generally be expected to result from typical farming operations within Tulare County. Other noise sources associated with agricultural operations include:
• Wind machines, • Diesel engines on wells, and • Crop dusters.
Impacts and Mitigation Measures
Significance Criteria The significance criteria for this analysis were developed from criteria presented in Appendix G “Environmental Checklist Form” of the CEQA Guidelines and based on the professional judgment of the County of Tulare and its consultants. The proposed project would result in a significant impact if it would:
• Expose persons to or generate noise levels in excess of standards established in any applicable plan or noise ordinance, or applicable standards of other agencies;
• Expose persons to or generate excessive ground-borne vibration or ground-borne noise levels;
• Expose people residing or working in the project area to excessive noise levels (not applicable to the proposed project), for a project located within an airport land use plan or, where such a plan has not been adopted, within two miles of a public airport or public use airport; or
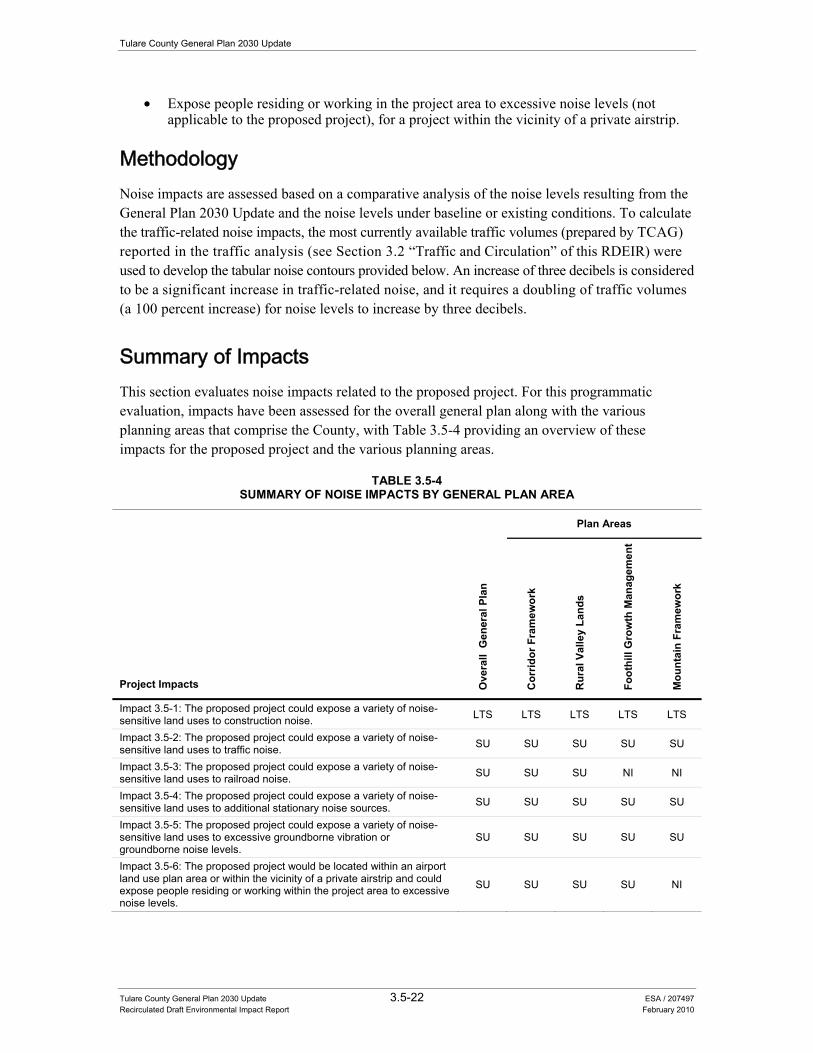
Tulare County General Plan 2030 Update
Tulare County General Plan 2030 Update 3.5-22 ESA / 207497 Recirculated Draft Environmental Impact Report February 2010
• Expose people residing or working in the project area to excessive noise levels (not applicable to the proposed project), for a project within the vicinity of a private airstrip.
Methodology Noise impacts are assessed based on a comparative analysis of the noise levels resulting from the General Plan 2030 Update and the noise levels under baseline or existing conditions. To calculate the traffic-related noise impacts, the most currently available traffic volumes (prepared by TCAG) reported in the traffic analysis (see Section 3.2 “Traffic and Circulation” of this RDEIR) were used to develop the tabular noise contours provided below. An increase of three decibels is considered to be a significant increase in traffic-related noise, and it requires a doubling of traffic volumes (a 100 percent increase) for noise levels to increase by three decibels.
Summary of Impacts This section evaluates noise impacts related to the proposed project. For this programmatic evaluation, impacts have been assessed for the overall general plan along with the various planning areas that comprise the County, with Table 3.5-4 providing an overview of these impacts for the proposed project and the various planning areas.
TABLE 3.5-4 SUMMARY OF NOISE IMPACTS BY GENERAL PLAN AREA
Project Impacts Ove
rall
Gen
eral
Pla
n
Plan Areas C
orrid
or F
ram
ewor
k
Rur
al V
alle
y La
nds
Foot
hill
Gro
wth
Man
agem
ent
Mou
ntai
n Fr
amew
ork
Impact 3.5-1: The proposed project could expose a variety of noise-sensitive land uses to construction noise. LTS LTS LTS LTS LTS
Impact 3.5-2: The proposed project could expose a variety of noise-sensitive land uses to traffic noise. SU SU SU SU SU
Impact 3.5-3: The proposed project could expose a variety of noise-sensitive land uses to railroad noise. SU SU SU NI NI
Impact 3.5-4: The proposed project could expose a variety of noise-sensitive land uses to additional stationary noise sources. SU SU SU SU SU
Impact 3.5-5: The proposed project could expose a variety of noise-sensitive land uses to excessive groundborne vibration or groundborne noise levels.
SU SU SU SU SU
Impact 3.5-6: The proposed project would be located within an airport land use plan area or within the vicinity of a private airstrip and could expose people residing or working within the project area to excessive noise levels.
SU SU SU SU NI
3.5 Noise
Tulare County General Plan 2030 Update 3.5-23 ESA / 207497 Recirculated Draft Environmental Impact Report February 2010
Impacts and Mitigation Measures
Impact 3.5-1: The proposed project could expose a variety of noise-sensitive land uses to construction noise.
Impact Summary
LTS Level of Significance Before Mitigation: Less than Significant
Required Additional Mitigating Policies and Implementation Measures: New Policy HS-8.18 “Construction Noise”
Resultant Level of Significance: Less than Significant
Impact Analysis
Construction related noise is considered a short-term noise impact associated with demolition, site preparation, grading, and other construction-related activities. Two types of short-term noise impacts could occur during these construction-related activities. First, the transport of workers and the movement of materials to and from the construction site could incrementally increase noise levels along local access roads. The second source of noise would result from the physical activities (e.g., grading, etc.) associated with any construction-related activities. Construction is performed in various distinct steps, each with its own mix of equipment, workers, and activities. Consequently, each step has its own noise characteristics.
For example, the highest construction noise levels could be generated during grading and excavation, with lower noise levels occurring during actual building construction. Large pieces of earth-moving equipment, such as pile drivers, graders, scrapers, and bulldozers, generate maximum noise levels of 85 to 90 dBA at a distance of 50 feet (see Table 3.5-5). Using the information provided in Table 3.5-5, an estimate of composite construction noise for commercial and industrial development can be characterized as 89 dBA Leq when measured at a distance of 50 feet from the construction area. Residential development is slightly lower with a composite noise level of 88 dBA Leq. These values take into account the number, pieces, and spacing of the types of equipment used for each type of activity. Finally, using the 89 dBA Leq value and assuming that construction would occur for approximately 8 hours per day, the CNEL is estimated at 84 dBA at 50 feet (83 dBA CNEL for residential construction).
TABLE 3.5-5NOISE LEVELS GENERATED BY TYPICAL CONSTRUCTION EQUIPMENT
Type of Equipment Range of Sound Levels
Measured (dBA of 50 feet) Suggested Sound Levels for
Analysis (dBA of 50 feet)
Pile Drivers, 12,000 to 18,000 ft –lb/blow 81 to 96 93 Rock Drills 83 to 99 96 Jack Hammers 75 to 85 82 Pneumatic Tools 78 to 88 85
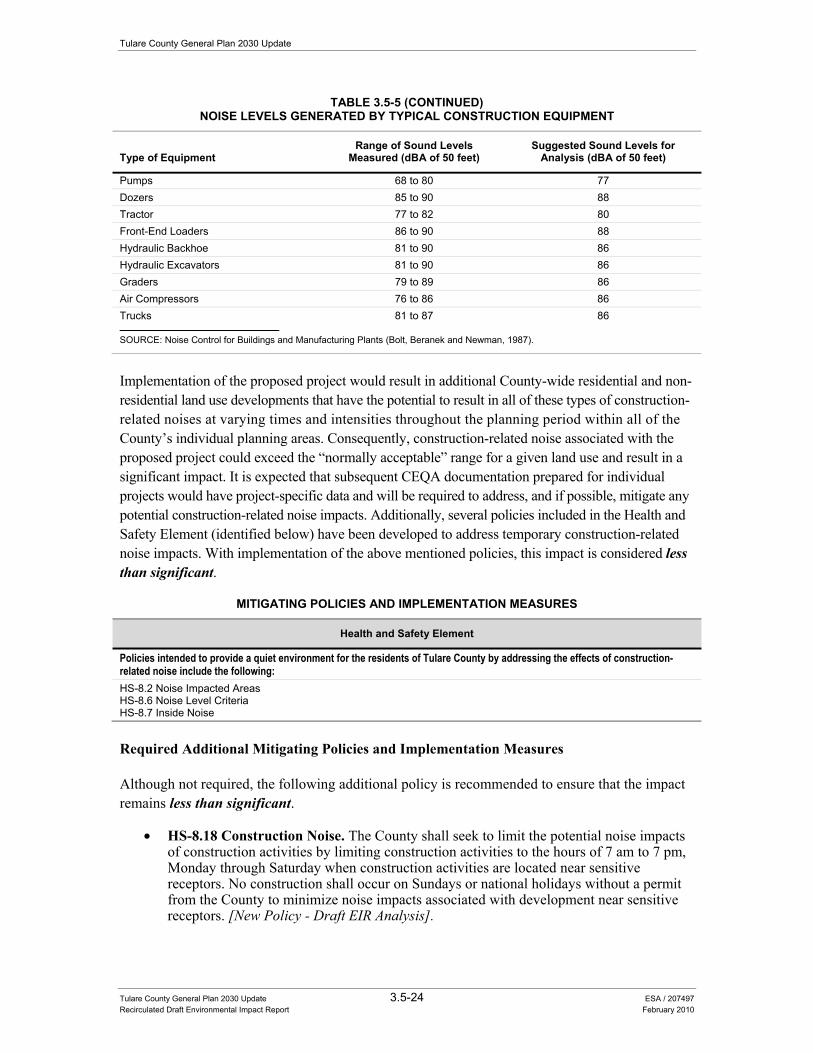
Tulare County General Plan 2030 Update
Tulare County General Plan 2030 Update 3.5-24 ESA / 207497 Recirculated Draft Environmental Impact Report February 2010
TABLE 3.5-5 (CONTINUED)NOISE LEVELS GENERATED BY TYPICAL CONSTRUCTION EQUIPMENT
Type of Equipment Range of Sound Levels
Measured (dBA of 50 feet) Suggested Sound Levels for
Analysis (dBA of 50 feet)
Pumps 68 to 80 77 Dozers 85 to 90 88 Tractor 77 to 82 80 Front-End Loaders 86 to 90 88 Hydraulic Backhoe 81 to 90 86 Hydraulic Excavators 81 to 90 86 Graders 79 to 89 86 Air Compressors 76 to 86 86 Trucks 81 to 87 86
SOURCE: Noise Control for Buildings and Manufacturing Plants (Bolt, Beranek and Newman, 1987).
Implementation of the proposed project would result in additional County-wide residential and non-residential land use developments that have the potential to result in all of these types of construction-related noises at varying times and intensities throughout the planning period within all of the County’s individual planning areas. Consequently, construction-related noise associated with the proposed project could exceed the “normally acceptable” range for a given land use and result in a significant impact. It is expected that subsequent CEQA documentation prepared for individual projects would have project-specific data and will be required to address, and if possible, mitigate any potential construction-related noise impacts. Additionally, several policies included in the Health and Safety Element (identified below) have been developed to address temporary construction-related noise impacts. With implementation of the above mentioned policies, this impact is considered less than significant.
MITIGATING POLICIES AND IMPLEMENTATION MEASURES
Health and Safety Element
Policies intended to provide a quiet environment for the residents of Tulare County by addressing the effects of construction-related noise include the following: HS-8.2 Noise Impacted Areas HS-8.6 Noise Level Criteria HS-8.7 Inside Noise
Required Additional Mitigating Policies and Implementation Measures
Although not required, the following additional policy is recommended to ensure that the impact remains less than significant.
• HS-8.18 Construction Noise. The County shall seek to limit the potential noise impacts of construction activities by limiting construction activities to the hours of 7 am to 7 pm, Monday through Saturday when construction activities are located near sensitive receptors. No construction shall occur on Sundays or national holidays without a permit from the County to minimize noise impacts associated with development near sensitive receptors. [New Policy - Draft EIR Analysis].
3.5 Noise
Tulare County General Plan 2030 Update 3.5-25 ESA / 207497 Recirculated Draft Environmental Impact Report February 2010
Significance after Implementation of Mitigation for Impact 3.5-1
Supplementing the policies referenced above in the impact analysis with the new Policy HS-8.18 will minimize construction noise impacts to noise-sensitive land uses. With implementation of these policies, this impact is considered less than significant.
Impact 3.5-2: The proposed project could expose a variety of noise-sensitive land uses to traffic noise.
Impact Summary
SU
Level of Significance Before Mitigation: Potentially Significant
Required Additional Mitigating Policies and Implementation Measures: New policies HS-8.13 “Noise Analysis”, HS-8.14 “Sound Attenuation Features”, HS-8.15 “Noise Buffering”, HS-8.16 “State Noise Insulation Standards”, HS-8.17 “Coordinate with Caltrans”, and HS-8.18 “Construction Noise”
Resultant Level of Significance: Significant and Unavoidable
Impact Analysis
Potential impacts on existing land uses are the result of additional on-road mobile sources (vehicles) traveling along local roadways. Traffic noise modeling was performed for the County roadway system using the traffic volumes generated by TCAG’s traffic model for the proposed project (see Section 3.2 “Transportation & Circulation”) and the proposed project alternatives. The calculations indicate that traffic volume increases under the proposed project would not significantly alter the noise environment along a majority of the County’s roadway segments. However, as shown in Appendix F of this document (Noise Modeling Data), some roadway segments modeled for the County would experience a significant increase in traffic noise within all of the County’s individual planning areas. However, the actual level of impact would depend on the presence and location of any existing or proposed land uses in relation to the noise source. A complete inventory of all traffic noise modeling results (including those roadways not experiencing a significant increase in noise levels) is provided in Appendix F of this RDEIR.
While an increase of 3 to 5 dBA is considered potentially significant, it is only significant if it affects sensitive land uses. It is expected that subsequent CEQA documentation prepared for individual projects would have project-specific data and will be required to address, and if possible, mitigate any potential operations-related noise impacts to a less-than-significant level. Examples of mitigation that may be proposed include various types of shielding (e.g., vegetation, etc.) or sound walls. However, it should be noted, the ability to mitigate this potential impact is contingent on a variety of factors including the severity of the noise impact, existing land use conditions and the technical feasibility of being able to implement any proposed mitigation measures.
Tulare County General Plan 2030 Update
Tulare County General Plan 2030 Update 3.5-26 ESA / 207497 Recirculated Draft Environmental Impact Report February 2010
Policies included as part of the proposed project that would minimize this impact are summarized below. The Health and Safety Element provide a number of policies that have been developed to address noise and land use compatibility issues associated with the proposed project. For example, policies have been developed to provide guidance on the analysis and mitigation of future project-related noise issues. These policies include identifying appropriate noise levels for sensitive receptors (policy HS-8.3), noise compatibility guidelines (policies HS-8.5, HS-8.6, HS-8.8), and criteria for peak generating land uses (see policy HS-8.11). Additional policies have been designed to promote compatible development that minimizes a variety of nuisance related impacts (i.e., visual, noise, etc.). Additional policies from both the Land Use and Health and Safety Elements (see Policies LU-1.3, LU-5.4, HS-8.1, HS-8.3, and HS-8.4) prevent the placement of incompatible noise generating land uses (i.e., industrial, railroads, airports, etc.) within residential areas. However, even with implementation of the below mentioned policies and implementation measures, this impact is considered potentially significant.
MITIGATING POLICIES AND IMPLEMENTATION MEASURES
Health and Safety Element
Policies designed to provide guidance on the analysis, mitigation and monitoring of a variety of noise-related impacts that could occur within the County include the following: HS-8.2 Noise Impacted Areas HS-8.5 State Noise Standards HS-8.6 Noise Level Criteria HS-8.7 Inside Noise
HS-8.8 Adjacent Uses HS-8.9 County Equipment HS-8.10 Automobile Noise Enforcement HS-8.11 Peak Noise Generators
Health and Safety Element Land Use Element
Policies designed to promote compatible development within areas that minimize impacts (including noise) to surrounding land uses include the following: HS-8.1 Economic Base Protection HS-8.3 Noise Sensitive Land Uses HS-8.4 Airport Noise Contours
LU-1.3 Prevent Incompatible Uses LU-5.4 Compatibility with Surrounding Land Use
Required Additional Mitigating Policies and Implementation Measures
In addition to the above mentioned policies and implementation measures, the following new policies are required to address this impact:
• HS-8.13 Noise Analysis. The County shall require a detailed noise impact analysis in areas where current or future exterior noise levels from transportation or stationary sources have the potential to exceed the adopted noise policies of the Health and Safety Element, where there is development of new noise sensitive land uses or the development of potential noise generating land uses near existing sensitive land uses. The noise analysis shall be the responsibility of the project applicant and be prepared by a qualified acoustical engineer (i.e., a Registered Professional Engineer in the State of California, etc.). The analysis shall include recommendations and evidence to establish mitigation that will reduce noise exposure to acceptable levels (such as those referenced in Table 10-1 of the Health and Safety Element). [New Policy – Draft EIR Analysis].
• HS-8.14 Sound Attenuation Features. The County shall require sound attenuation features such as walls, berming, heavy landscaping, between commercial, industrial, and residential uses to reduce noise and vibration impacts. [New Policy – Draft EIR Analysis].
3.5 Noise
Tulare County General Plan 2030 Update 3.5-27 ESA / 207497 Recirculated Draft Environmental Impact Report February 2010
• HS-8.15 Noise Buffering. The County shall require noise buffering or insulation in new development along major streets, highways, and railroad tracks. [New Policy - Draft EIR Analysis].
• HS-8.16 State Noise Insulation Standards. The County shall enforce the State Noise Insulation Standards (California Administrative Code, Title 24) and Chapter 35 of the Uniform Building Code. [New Policy - Draft EIR Analysis].
• HS-8.17 Coordinate with Caltrans. The County shall work with Caltrans to mitigate noise impacts on sensitive receptors near State roadways, by requiring noise buffering or insulation in new construction. [New Policy - Draft EIR Analysis].
• HS-8.18 Construction Noise. The County shall seek to limit the potential noise impacts of construction activities on surrounding land uses by limiting construction activities to the hours of 7 am to 7 pm, Monday through Saturday when construction activities are located near sensitive receptors. No construction shall occur on Sundays or national holidays without a permit from the County to minimize noise impacts associated with development near sensitive receptors. [New Policy - Draft EIR Analysis].
As stated above, the County will implement a variety of policies designed to address noise issues (including the new policies HS-8.13 “Noise Analysis”, HS-8.14 “Sound Attenuation Features”, HS-8.15 “Noise Buffering”, HS-8.16 “State Noise Insulation Standards”, HS-8.17 “Coordinate with Caltrans”, and HS-8.18 “Construction Noise”). The County will also continue to discourage the siting of industrial uses near sensitive land uses. In addition, the County will ensure that future CEQA documentation be prepared for individual projects (with project-specific data) that will (if technically possible) mitigate any potential noise impacts to a less-than-significant level. However, it should be noted, the ability to mitigate this potential impact is contingent upon a variety of factors including the severity of the noise impact, existing land use conditions and the technical feasibility of being able to implement any proposed mitigation measures. Given the uncertainty as to whether future noise impacts could be adequately mitigated for all the individual projects that will be implemented as part (i.e., establishment of setbacks near at-grade railroad crossings, etc.) of the proposed project, this impact remains significant. No additional feasible mitigation is currently available.
Significance after Implementation of Mitigation for Impact 3.5-2
As stated above, no additional technologically or economically feasible mitigation measures are currently available to reduce this impact to a less than significant level. Consequently, this impact is considered significant and unavoidable.
Tulare County General Plan 2030 Update
Tulare County General Plan 2030 Update 3.5-28 ESA / 207497 Recirculated Draft Environmental Impact Report February 2010
Impact 3.5-3: The proposed project could expose a variety of noise-sensitive land uses to railroad noise.
Impact Summary
SU
Level of Significance Before Mitigation: Potentially Significant
Required Additional Mitigating Policies and Implementation Measures: New policies HS-8.13 “Noise Analysis”, HS-8.14 “Sound Attenuation Features”, HS-8.15 “Noise Buffering”, HS-8.16 “State Noise Insulation Standards”, HS-8.17 “Coordinate with Caltrans”, and HS-8.18 “Construction Noise”
Resultant Level of Significance: Significant and Unavoidable
Impact Analysis
Railroad noise primarily occurs from existing operations along the Union Pacific Railroad (UPRR) line, which runs north-south through the County. Other rail lines that serve the County include the San Joaquin Valley Railroad and the Burlington Northern Santa Fe. Because of the uncertainties associated with future operational details, no comprehensive noise predictions are included in this analysis. However, buildout of the proposed project could locate residential land uses in the vicinity of the UPRR (or other railroad) corridor, which could result in the exposure of sensitive receptors to noise levels that exceed County standards for some locations within the Corridor Framework and Rural Valley Lands geographic areas. The Foothill Growth Management and Mountain Framework geographic areas have limited access to railroad facilities and would likely experience no impacts. The actual level of impact would depend on the presence and location of any existing or proposed land uses in relation to the noise source. While an increase of 3 to 5 dBA is considered potentially significant, it is only significant if it affects sensitive land uses. It is expected that subsequent CEQA documentation prepared for individual projects would have project-specific data and will be required to address, and if possible, mitigate any potential operations-related noise impacts to a less-than-significant level. Examples of mitigation that may be proposed include various types of shielding (e.g., vegetation, etc.), sound walls, or noise-reducing building treatments. The County may also consider the establishment of “Quiet Zones” or setback areas adjacent to railroad crossings in an effort to minimize noise impacts (e.g., train whistles, etc.) to a variety of sensitive land uses. However, it should be noted, the ability to mitigate this potential impact is contingent upon a variety of factors including the severity of the noise impact, existing land use conditions and the technical feasibility of being able to implement any proposed mitigation measures.
Policies included as part of the proposed project that would minimize this impact are summarized below. The Health and Safety Element provide a number of policies that have been developed to address noise and land use compatibility issues associated with the proposed project. For example, policies have been developed to provide guidance on the analysis and mitigation of future project-related noise issues. These policies include identifying appropriate noise levels for sensitive receptors (policy HS-8.3), noise compatibility guidelines (policies HS-8.5, HS-8.6, HS-8.8), and criteria for peak generating land uses (see policy HS-8.11). Additional policies have been designed to promote compatible development that minimizes a variety of nuisance related impacts (i.e., visual,
3.5 Noise
Tulare County General Plan 2030 Update 3.5-29 ESA / 207497 Recirculated Draft Environmental Impact Report February 2010
noise, etc.). Additional policies from both the Land Use and Health and Safety Elements (see Policies LU-1.3, LU-5.4, HS-8.1, HS-8.3, and HS-8.4) prevent the placement of incompatible noise generating land uses (i.e., industrial, railroads, airports, etc.) within residential areas. However, even with implementation of the below mentioned policies and implementation measures, this impact is considered potentially significant.
MITIGATING POLICIES AND IMPLEMENTATION MEASURES
Health and Safety Element
Policies designed to provide guidance on the analysis, mitigation and monitoring of a variety of noise-related impacts that could occur within the County include the following: HS-8.2 Noise Impacted Areas HS-8.5 State Noise Standards HS-8.6 Noise Level Criteria HS-8.7 Inside Noise
HS-8.8 Adjacent Uses HS-8.9 County Equipment HS-8.10 Automobile Noise Enforcement HS-8.11 Peak Noise Generators
Health and Safety Element Land Use Element
Policies designed to promote compatible development within areas that minimize impacts (including noise) to surrounding land uses include the following: HS-8.1 Economic Base Protection HS-8.3 Noise Sensitive Land Uses HS-8.4 Airport Noise Contours
LU-1.3 Prevent Incompatible Uses LU-5.4 Compatibility with Surrounding Land Use
Required Additional Mitigating Policies and Implementation Measures
In addition to the above mentioned policies and implementation measures, the following new policies are required to address this impact:
• HS-8.13 Noise Analysis. The County shall require a detailed noise impact analysis in areas where current or future exterior noise levels from transportation or stationary sources have the potential to exceed the adopted noise policies of the Health and Safety Element, where there is development of new noise sensitive land uses or the development of potential noise generating land uses near existing sensitive land uses. The noise analysis shall be the responsibility of the project applicant and be prepared by a qualified acoustical engineer (i.e., a Registered Professional Engineer in the State of California, etc.). The analysis shall include recommendations and evidence to establish mitigation that will reduce noise exposure to acceptable levels (such as those referenced in Table 10-1 of the Health and Safety Element). [New Policy – Draft EIR Analysis].
• HS-8.14 Sound Attenuation Features. The County shall require sound attenuation features such as walls, berming, heavy landscaping, between commercial, industrial, and residential uses to reduce noise and vibration impacts. [New Policy – Draft EIR Analysis].
• HS-8.15 Noise Buffering. The County shall require noise buffering or insulation in new development along major streets, highways, and railroad tracks. [New Policy - Draft EIR Analysis].
• HS-8.16 State Noise Insulation Standards. The County shall enforce the State Noise Insulation Standards (California Administrative Code, Title 24) and Chapter 35 of the Uniform Building Code. [New Policy - Draft EIR Analysis].
• HS-8.17 Coordinate with Caltrans. The County shall work with Caltrans to mitigate noise impacts on sensitive receptors near State roadways, by requiring noise buffering or insulation in new construction. [New Policy - Draft EIR Analysis].
Tulare County General Plan 2030 Update
Tulare County General Plan 2030 Update 3.5-30 ESA / 207497 Recirculated Draft Environmental Impact Report February 2010
• HS-8.18 Construction Noise. The County shall seek to limit the potential noise impacts of construction activities on surrounding land uses by limiting construction activities to the hours of 7 am to 7 pm, Monday through Saturday when construction activities are located near sensitive receptors. No construction shall occur on Sundays or national holidays without a permit from the County to minimize noise impacts associated with development near sensitive receptors. [New Policy - Draft EIR Analysis].
As stated above, the County will implement a variety of policies designed to address noise issues (including the new policies HS-8.13 “Noise Analysis”, HS-8.14 “Sound Attenuation Features”, HS-8.15 “Noise Buffering”, HS-8.16 “State Noise Insulation Standards”, HS-8.17 “Coordinate with Caltrans”, and HS-8.18 “Construction Noise” ). The County will also continue to discourage the siting of industrial uses near sensitive land uses. In addition, the County will ensure that future CEQA documentation be prepared for individual projects (with project-specific data) that will (if technically possible) mitigate any potential noise impacts to a less-than-significant level. However, it should be noted, the ability to mitigate this potential impact is contingent upon a variety of factors including the severity of the noise impact, existing land use conditions and the technical feasibility of being able to implement any proposed mitigation measures. Given the uncertainty as to whether future noise impacts could be adequately mitigated for all the individual projects that will be implemented as part (i.e., establishment of setbacks near at-grade railroad crossings, etc.) of the proposed project, this impact remains significant. No additional feasible mitigation is currently available.
Significance after Implementation of Mitigation for Impact 3.5-3
As stated above, no additional technologically or economically feasible mitigation measures are currently available to reduce this impact to a less than significant level. Consequently, this impact is considered significant and unavoidable.
Impact 3.5-4: The proposed project could expose a variety of noise-sensitive land uses to additional stationary noise sources.
Impact Summary
SU
Level of Significance Before Mitigation: Potentially Significant
Required Additional Mitigating Policies and Implementation Measures: New policies HS-8.13 “Noise Analysis”, HS-8.14 “Sound Attenuation Features”, HS-8.15 “Noise Buffering”, HS-8.16 “State Noise Insulation Standards”, HS-8.17 “Coordinate with Caltrans”, and HS-8.18 “Construction Noise”
Resultant Level of Significance: Significant and Unavoidable
Impact Analysis
The siting of new industrial development and designated growth areas may increase noise levels in their proximity. This could occur due to the continual presence of heavy trucks used for the
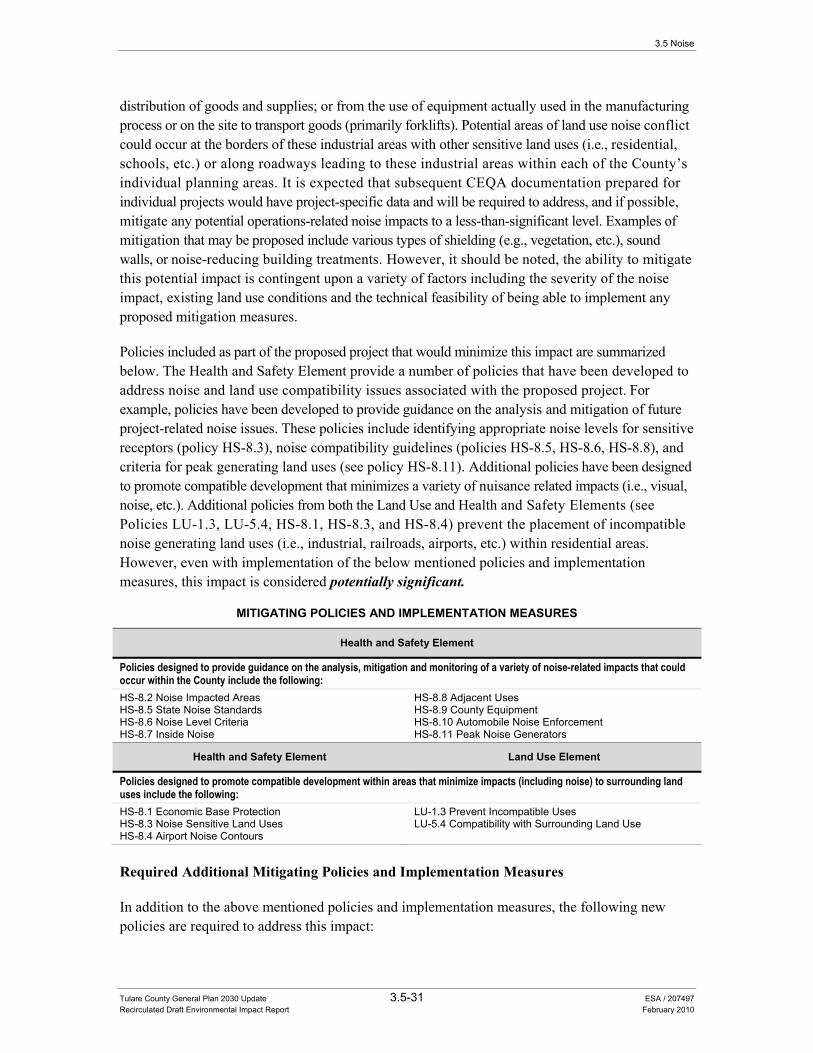
3.5 Noise
Tulare County General Plan 2030 Update 3.5-31 ESA / 207497 Recirculated Draft Environmental Impact Report February 2010
distribution of goods and supplies; or from the use of equipment actually used in the manufacturing process or on the site to transport goods (primarily forklifts). Potential areas of land use noise conflict could occur at the borders of these industrial areas with other sensitive land uses (i.e., residential, schools, etc.) or along roadways leading to these industrial areas within each of the County’s individual planning areas. It is expected that subsequent CEQA documentation prepared for individual projects would have project-specific data and will be required to address, and if possible, mitigate any potential operations-related noise impacts to a less-than-significant level. Examples of mitigation that may be proposed include various types of shielding (e.g., vegetation, etc.), sound walls, or noise-reducing building treatments. However, it should be noted, the ability to mitigate this potential impact is contingent upon a variety of factors including the severity of the noise impact, existing land use conditions and the technical feasibility of being able to implement any proposed mitigation measures.
Policies included as part of the proposed project that would minimize this impact are summarized below. The Health and Safety Element provide a number of policies that have been developed to address noise and land use compatibility issues associated with the proposed project. For example, policies have been developed to provide guidance on the analysis and mitigation of future project-related noise issues. These policies include identifying appropriate noise levels for sensitive receptors (policy HS-8.3), noise compatibility guidelines (policies HS-8.5, HS-8.6, HS-8.8), and criteria for peak generating land uses (see policy HS-8.11). Additional policies have been designed to promote compatible development that minimizes a variety of nuisance related impacts (i.e., visual, noise, etc.). Additional policies from both the Land Use and Health and Safety Elements (see Policies LU-1.3, LU-5.4, HS-8.1, HS-8.3, and HS-8.4) prevent the placement of incompatible noise generating land uses (i.e., industrial, railroads, airports, etc.) within residential areas. However, even with implementation of the below mentioned policies and implementation measures, this impact is considered potentially significant.
MITIGATING POLICIES AND IMPLEMENTATION MEASURES
Health and Safety Element
Policies designed to provide guidance on the analysis, mitigation and monitoring of a variety of noise-related impacts that could occur within the County include the following: HS-8.2 Noise Impacted Areas HS-8.5 State Noise Standards HS-8.6 Noise Level Criteria HS-8.7 Inside Noise
HS-8.8 Adjacent Uses HS-8.9 County Equipment HS-8.10 Automobile Noise Enforcement HS-8.11 Peak Noise Generators
Health and Safety Element Land Use Element
Policies designed to promote compatible development within areas that minimize impacts (including noise) to surrounding land uses include the following: HS-8.1 Economic Base Protection HS-8.3 Noise Sensitive Land Uses HS-8.4 Airport Noise Contours
LU-1.3 Prevent Incompatible Uses LU-5.4 Compatibility with Surrounding Land Use
Required Additional Mitigating Policies and Implementation Measures
In addition to the above mentioned policies and implementation measures, the following new policies are required to address this impact:
Tulare County General Plan 2030 Update
Tulare County General Plan 2030 Update 3.5-32 ESA / 207497 Recirculated Draft Environmental Impact Report February 2010
• HS-8.13 Noise Analysis. The County shall require a detailed noise impact analysis in areas where current or future exterior noise levels from transportation or stationary sources have the potential to exceed the adopted noise policies of the Health and Safety Element, where there are development of new noise sensitive land uses or the development of potential noise generating land uses near existing sensitive land uses. The noise analysis shall be the responsibility of the project applicant and be prepared by a qualified acoustical engineer (i.e., a Registered Professional Engineer in the State of California, etc.). The analysis shall include recommendations and evidence to establish mitigation that will reduce noise exposure to acceptable levels (such as those referenced in Table 10-1 of the Health and Safety Element). [New Policy – Draft EIR Analysis].
• HS-8.14 Sound Attenuation Features. The County shall require sound attenuation features such as walls, berming, heavy landscaping, between commercial, industrial, and residential uses to reduce noise and vibration impacts. [New Policy – Draft EIR Analysis].
• HS-8.15 Noise Buffering. The County shall require noise buffering or insulation in new development along major streets, highways, and railroad tracks. [New Policy - Draft EIR Analysis].
• HS-8.16 State Noise Insulation Standards. The County shall enforce the State Noise Insulation Standards (California Administrative Code, Title 24) and Chapter 35 of the Uniform Building Code. [New Policy - Draft EIR Analysis].
• HS-8.17 Coordinate with Caltrans. The County shall work with Caltrans to mitigate noise impacts on sensitive receptors near State roadways, by requiring noise buffering or insulation in new construction. [New Policy - Draft EIR Analysis].
• HS-8.18 Construction Noise. The County shall seek to limit the potential noise impacts of construction activities on surrounding land uses by limiting construction activities to the hours of 7 am to 7 pm, Monday through Saturday when construction activities are located near sensitive receptors. No construction shall occur on Sundays or national holidays without a permit from the County to minimize noise impacts associated with development near sensitive receptors. [New Policy - Draft EIR Analysis].
As stated above, the County will implement a variety of policies designed to address noise issues (including the new policies HS-8.13 “Noise Analysis”, HS-8.14 “Sound Attenuation Features”, HS-8.15 “Noise Buffering”, HS-8.16 “State Noise Insulation Standards”, HS-8.17 “Coordinate with Caltrans”, and HS-8.18 “Construction Noise” ). The County will also continue to discourage the siting of industrial uses near sensitive land uses. In addition, the County will ensure that future CEQA documentation be prepared for individual projects (with project-specific data) that will (if technically possible) mitigate any potential noise impacts to a less-than-significant level. However, it should be noted, the ability to mitigate this potential impact is contingent upon a variety of factors including the severity of the noise impact, existing land use conditions and the technical feasibility of being able to implement any proposed mitigation measures. Given the uncertainty as to whether future noise impacts could be adequately mitigated for all the individual projects that will be implemented as part (i.e., establishment of setbacks near at-grade railroad crossings, etc.) of the proposed project, this impact remains significant. No additional feasible mitigation is currently available.
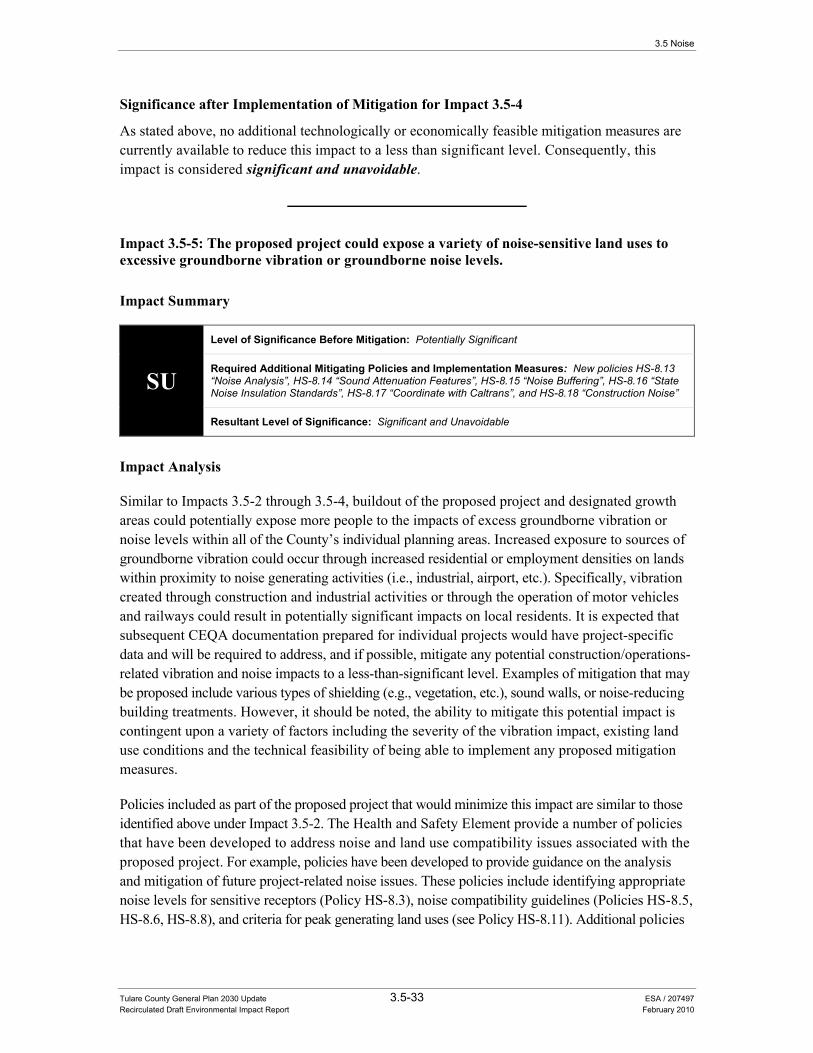
3.5 Noise
Tulare County General Plan 2030 Update 3.5-33 ESA / 207497 Recirculated Draft Environmental Impact Report February 2010
Significance after Implementation of Mitigation for Impact 3.5-4
As stated above, no additional technologically or economically feasible mitigation measures are currently available to reduce this impact to a less than significant level. Consequently, this impact is considered significant and unavoidable.
Impact 3.5-5: The proposed project could expose a variety of noise-sensitive land uses to excessive groundborne vibration or groundborne noise levels.
Impact Summary
SU
Level of Significance Before Mitigation: Potentially Significant
Required Additional Mitigating Policies and Implementation Measures: New policies HS-8.13 “Noise Analysis”, HS-8.14 “Sound Attenuation Features”, HS-8.15 “Noise Buffering”, HS-8.16 “State Noise Insulation Standards”, HS-8.17 “Coordinate with Caltrans”, and HS-8.18 “Construction Noise”
Resultant Level of Significance: Significant and Unavoidable
Impact Analysis
Similar to Impacts 3.5-2 through 3.5-4, buildout of the proposed project and designated growth areas could potentially expose more people to the impacts of excess groundborne vibration or noise levels within all of the County’s individual planning areas. Increased exposure to sources of groundborne vibration could occur through increased residential or employment densities on lands within proximity to noise generating activities (i.e., industrial, airport, etc.). Specifically, vibration created through construction and industrial activities or through the operation of motor vehicles and railways could result in potentially significant impacts on local residents. It is expected that subsequent CEQA documentation prepared for individual projects would have project-specific data and will be required to address, and if possible, mitigate any potential construction/operations-related vibration and noise impacts to a less-than-significant level. Examples of mitigation that may be proposed include various types of shielding (e.g., vegetation, etc.), sound walls, or noise-reducing building treatments. However, it should be noted, the ability to mitigate this potential impact is contingent upon a variety of factors including the severity of the vibration impact, existing land use conditions and the technical feasibility of being able to implement any proposed mitigation measures.
Policies included as part of the proposed project that would minimize this impact are similar to those identified above under Impact 3.5-2. The Health and Safety Element provide a number of policies that have been developed to address noise and land use compatibility issues associated with the proposed project. For example, policies have been developed to provide guidance on the analysis and mitigation of future project-related noise issues. These policies include identifying appropriate noise levels for sensitive receptors (Policy HS-8.3), noise compatibility guidelines (Policies HS-8.5, HS-8.6, HS-8.8), and criteria for peak generating land uses (see Policy HS-8.11). Additional policies
Tulare County General Plan 2030 Update
Tulare County General Plan 2030 Update 3.5-34 ESA / 207497 Recirculated Draft Environmental Impact Report February 2010
have been designed to promote compatible development that minimizes a variety of nuisance related impacts (i.e., visual, noise, etc.). Additional policies from both the Land Use and Health and Safety Elements (see Policies LU-1.3, LU-5.4, HS-8.1, HS-8.3, and HS-8.4) prevent the placement of incompatible noise generating land uses (i.e., industrial, railroads, airports, etc.) within residential areas. However, even with implementation of the below mentioned policies and implementation measures, this impact is considered potentially significant.
Required Additional Mitigating Policies and Implementation Measures
In addition to the above mentioned policies and implementation measures, the following new policies are required to address this impact:
• HS-8.13 Noise Analysis. The County shall require a detailed noise impact analysis in areas where current or future exterior noise levels from transportation or stationary sources have the potential to exceed the adopted noise policies of the Health and Safety Element, where there are development of new noise sensitive land uses or the development of potential noise generating land uses near existing sensitive land uses. The noise analysis shall be the responsibility of the project applicant and be prepared by a qualified acoustical engineer (i.e., a Registered Professional Engineer in the State of California, etc.). The analysis shall include recommendations and evidence to establish mitigation that will reduce noise exposure to acceptable levels (such as those referenced in Table 10-1 of the Health and Safety Element). [New Policy – Draft EIR Analysis].
• HS-8.14 Sound Attenuation Features. The County shall require sound attenuation features such as walls, berming, heavy landscaping, between commercial, industrial, and residential uses to reduce noise and vibration impacts. [New Policy – Draft EIR Analysis].
• HS-8.15 Noise Buffering. The County shall require noise buffering or insulation in new development along major streets, highways, and railroad tracks. [New Policy - Draft EIR Analysis].
• HS-8.16 State Noise Insulation Standards. The County shall enforce the State Noise Insulation Standards (California Administrative Code, Title 24) and Chapter 35 of the Uniform Building Code. [New Policy - Draft EIR Analysis].
• HS-8.17 Coordinate with Caltrans. The County shall work with Caltrans to mitigate noise impacts on sensitive receptors near State roadways, by requiring noise buffering or insulation in new construction. [New Policy - Draft EIR Analysis].
• HS-8.18 Construction Noise. The County shall seek to limit the potential noise impacts of construction activities on surrounding land uses by limiting construction activities to the hours of 7 am to 7 pm, Monday through Saturday when construction activities are located near sensitive receptors. No construction shall occur on Sundays or national holidays without a permit from the County to minimize noise impacts associated with development near sensitive receptors. [New Policy - Draft EIR Analysis].
Significance after Implementation of Mitigation for Impact 3.5-5
As stated above, no additional technologically or economically feasible mitigation measures are currently available to reduce this impact to a less than significant level. Consequently, this impact is considered significant and unavoidable.

3.5 Noise
Tulare County General Plan 2030 Update 3.5-35 ESA / 207497 Recirculated Draft Environmental Impact Report February 2010
Impact 3.5-6: The proposed project would be located within an airport land use plan area or within the vicinity of a private airstrip and could expose people residing or working within the project area to excessive noise levels.
Impact Summary
SU Level of Significance Before Mitigation: Potentially Significant
Required Additional Mitigating Policies and Implementation Measures: No additional mitigation is currently available
Resultant Level of Significance: Significant and Unavoidable
Impact Analysis
Implementation of the General Plan 2030 Update would result in additional residential and non-residential land use developments. These land use developments could result in new urban development, including new urban land uses in the vicinity of airports and private airstrips, of which the County has nine public airports. New development near aviation facilities could be exposed to excessive airport-related noise levels within the Corridor Framework, Rural Valley Lands, and Foothill Growth Management geographic areas. The Mountain Framework geographic area has limited access to aviation facilities and would likely experience no impacts.
The Airport Land Use Commission (ALUC) was established to ensure that there are no direct conflicts with land uses, noise, or other issues that would impact the functionality and safety of airport operations. One of the key functions of the ALUC is to require that cities’ and counties’ general plans and zoning ordinances are consistent with Comprehensive Airport Land Use Plans (CALUP), which contain noise contours, restrictions for types of construction and building heights in navigable air space, as well as requirements impacting the establishment or construction of sensitive uses within close proximity to airports.
Overall, the intent of the proposed General Plan is to ensure that existing and future land uses function without imposing a nuisance, hazard, or unhealthy condition upon adjacent uses. Policies included as part of the General Plan 2030 Update that would minimize conflicts with local airports are summarized below by general plan element. The Land Use Element provides a number of policies that establish requirements for compatible development, including buffering, screening, controls and performance standards, and the siting of compatible land uses (see Policies LU-1.3, LU-3.6, and LU-5.4). Other policies from the Transportation and Circulation and Health and Safety Elements (see Policies TC-3.4, TC-3.6, HS-3.1, HS-3.2, and HS-8.4) require the County to ensure that all development within the vicinity of local airport facilities is consistent with the policies adopted by the Tulare County Airport Land Use Commission and the most recently adopted Airport Land Use Compatibility Plan. However, even with implementation of the below mentioned policies and implementation measures, this impact is considered potentially significant.
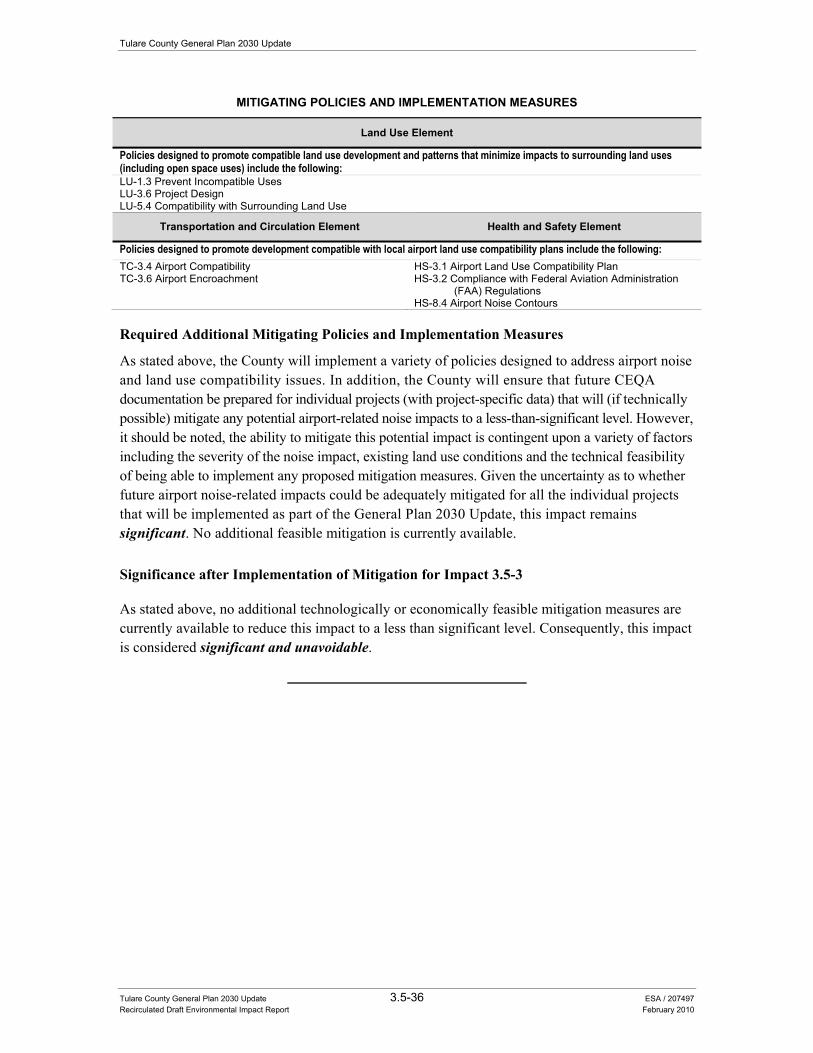
Tulare County General Plan 2030 Update
Tulare County General Plan 2030 Update 3.5-36 ESA / 207497 Recirculated Draft Environmental Impact Report February 2010
MITIGATING POLICIES AND IMPLEMENTATION MEASURES
Land Use Element
Policies designed to promote compatible land use development and patterns that minimize impacts to surrounding land uses (including open space uses) include the following: LU-1.3 Prevent Incompatible Uses LU-3.6 Project Design LU-5.4 Compatibility with Surrounding Land Use
Transportation and Circulation Element Health and Safety Element
Policies designed to promote development compatible with local airport land use compatibility plans include the following:TC-3.4 Airport Compatibility TC-3.6 Airport Encroachment
HS-3.1 Airport Land Use Compatibility Plan HS-3.2 Compliance with Federal Aviation Administration
(FAA) Regulations HS-8.4 Airport Noise Contours
Required Additional Mitigating Policies and Implementation Measures
As stated above, the County will implement a variety of policies designed to address airport noise and land use compatibility issues. In addition, the County will ensure that future CEQA documentation be prepared for individual projects (with project-specific data) that will (if technically possible) mitigate any potential airport-related noise impacts to a less-than-significant level. However, it should be noted, the ability to mitigate this potential impact is contingent upon a variety of factors including the severity of the noise impact, existing land use conditions and the technical feasibility of being able to implement any proposed mitigation measures. Given the uncertainty as to whether future airport noise-related impacts could be adequately mitigated for all the individual projects that will be implemented as part of the General Plan 2030 Update, this impact remains significant. No additional feasible mitigation is currently available.
Significance after Implementation of Mitigation for Impact 3.5-3
As stated above, no additional technologically or economically feasible mitigation measures are currently available to reduce this impact to a less than significant level. Consequently, this impact is considered significant and unavoidable.
Tulare County General Plan 2030 Update 3.6-1 ESA / 207497 Recirculated Draft Environmental Impact Report February 2010
SECTION 3.6 Hydrology, Water Quality and Drainage
Introduction This section of the recirculated draft Environmental Impact Report (RDEIR) addresses potential impacts to water resources, water quality, and drainage in Tulare County. The regulatory setting provides an overview of applicable federal, State, and local regulations. The environmental setting includes discussions of existing surface and groundwater resources, water quality issues and drainage and flooding. Impacts to water and wastewater treatment and distribution systems (i.e., water utilities) are addressed in Section 3.9, “Public Services, Recreation and Utilities”. Analysis of potential impacts that could result from implementing the proposed project and identification of feasible mitigation (general plan policies) to avoid or lessen potential environmental impacts conclude this section.
The following discussion of water resources, groundwater and water quality incorporated data from several sources, including:
• Tulare County General Plan 2010 Background Report, Chapter 8 “Public Safety” and Section 10.2 “Water Resources.” This report is attached to this RDEIR as Appendix B and is cited as 2010 Background Report.
• Water Resources General Plan Update County of Tulare (Keller, Wegley and Associates, 2006). This report is contained in the Tulare County General Plan 2010 Background Report as Appendix C;
• California Department of Water Resources (DWR) Bulletin 118-2003 and updated DWR sub-basin information. Available online; <http://www.groundwater.water.ca.gov/bulletin118/basin_desc/basins_t-y.cfm> Accessed May 31, 2009 (DWR, 2009a);
• California Water Plan 2005. DWR Bulletin 160-2005. Available online: <http://www.waterplan.water.ca.gov/previous/cwpu2005/index.cfm#vol1> (DWR, 2005); and
• A Phase I Water Supply Evaluation for Tulare County (Tully and Young Engineers. 2009). This report is incorporated by reference and is also included as Appendix G to this RDEIR.
The following environmental and regulatory settings were developed from information contained in the materials mentioned above and in the 2010 Background Report (see Chapters 7.0 “Public Services and Utilities” and 10.0 “Natural Resources”), incorporated by reference and summarized below. As mentioned above, the 2010 Background Report is attached as Appendix B to this RDEIR.
Tulare County General Plan 2030 Update
Tulare County General Plan 2030 Update 3.6-2 ESA / 207497 Recirculated Draft Environmental Impact Report February 2010
Characteristics of Water and Wastewater In Tulare County, there are 18 types of special districts that provide water, wastewater, flood protection, and other water-related services (see Table 3.6-1). They are typically governed by a Board of Directors that may or may not be associated with the Tulare County Board of Supervisors. However, all are public agencies and subject to federal, State and local regulations. Furthermore, all of these agencies must coordinate with local government (City, County or LAFCo) when proposing to change their boundaries, type of services, fees, structures such as drainage canals or water treatment plants, or, in some cases, increasing the number of service connections.
With the passage of SB 610 (cited below), SB 221 (cited below) and other changes to the State Water Code, water providers are now required to provide more information about water and wastewater service capabilities than under previous requirements. As described in the regulatory setting, SB 610 also includes two catch-all provisions that require assessments when: (1) an amount of water will be required equivalent to, or greater than, the amount of water required by a 500 dwelling unit project; or (2) a project will be served by a public water system less than 5,000 connections, and it will increase the number of connections by 10 percent or more, or increase water demand for such system by an equivalent amount. This second item, addressing smaller water systems, covers proposed new developments for homes, businesses and/or industrial facilities such as meat processing plants, ethanol processing plants or similar large water users. SB 610 and SB 221 are further described below in the “Regulatory Setting” section.
Units of Measurement This RDEIR uses different units of measurement for water at rest (volume measured in gallons, cubic feet or acre-feet) and water in motion (flow measured in units of volume per unit of time). Water resources contained in lakes, groundwater basins and reservoirs are generally described in terms of acre-feet. An acre-foot is the volume of water that would cover one acre one foot deep, equivalent to 325,851 gallons. The term acre-feet per year (af/yr) is used in this section to discuss annual water use. Flows measured in terms of million gallons per day (mgd) or gallons per minute (gpm) are often used to describe flows related to water utility systems, such as those discussed in Section 3.9. A flow of one cubic foot per second is approximately equal to either 450 gallons per minute or two acre-feet per day (24 hours). Where it is relevant to provide a converted value, the converted value will be provided in parentheses [i.e., 1,121 mgd (1 af/yr)].
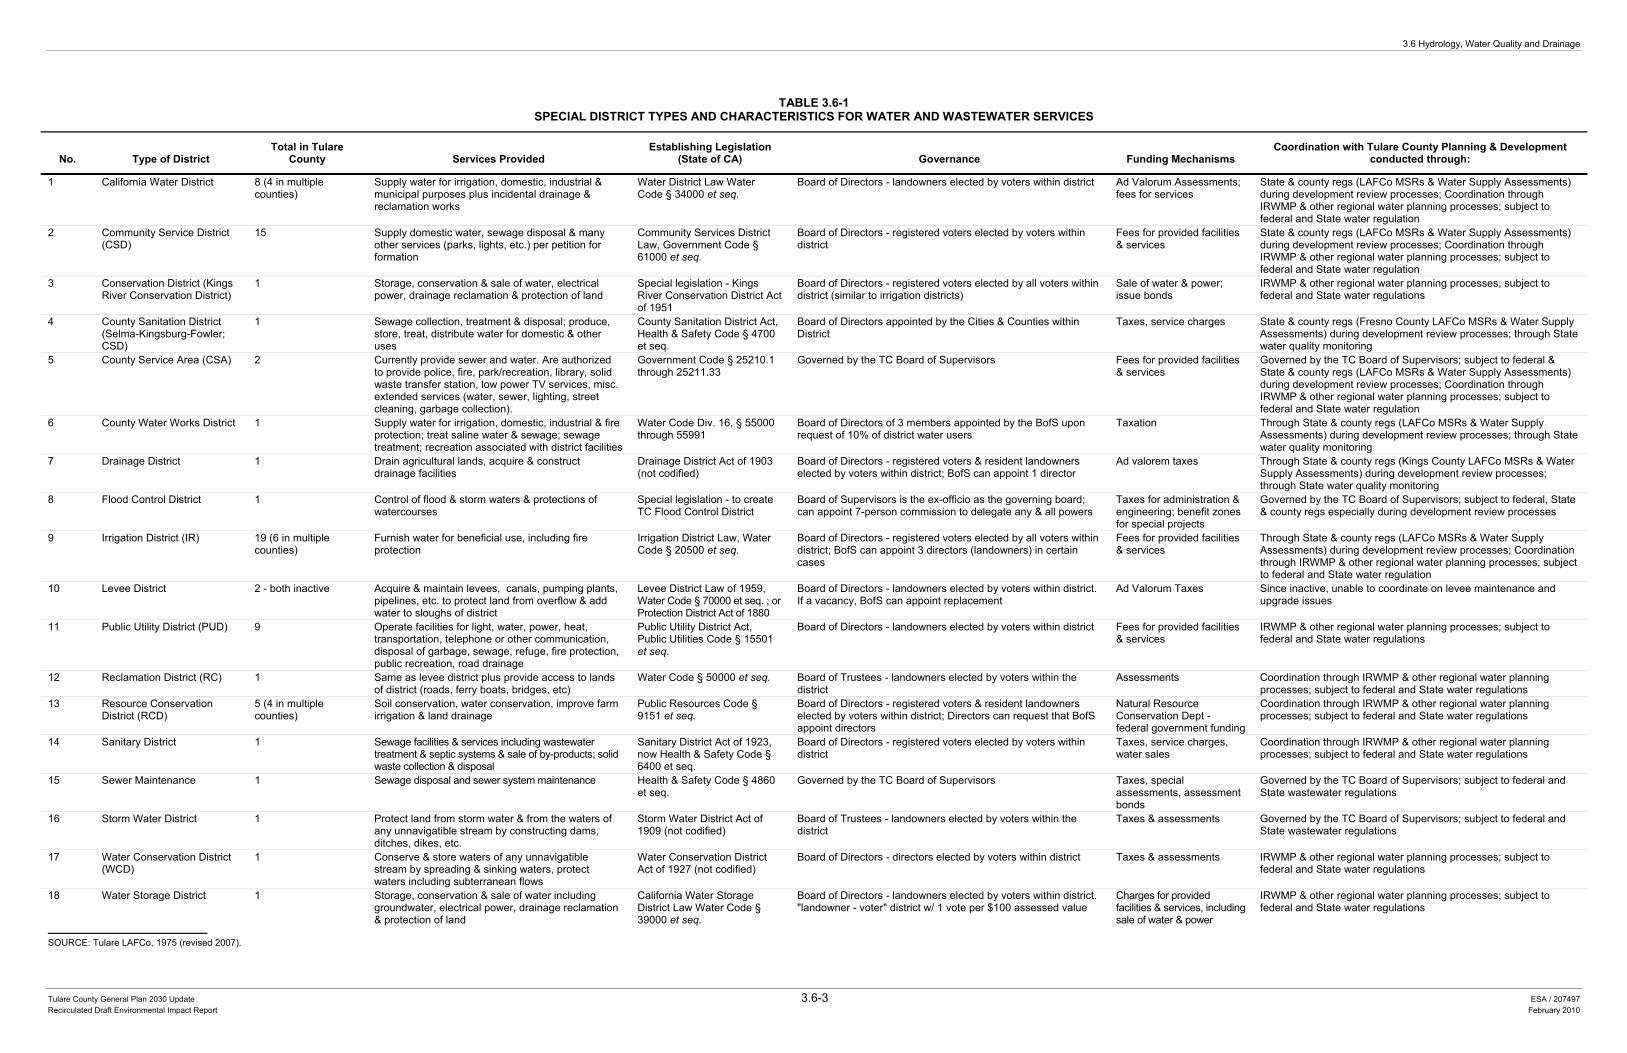
3.6 Hydrology, Water Quality and Drainage
Tulare County General Plan 2030 Update 3.6-3 ESA / 207497 Recirculated Draft Environmental Impact Report February 2010
TABLE 3.6-1SPECIAL DISTRICT TYPES AND CHARACTERISTICS FOR WATER AND WASTEWATER SERVICES
No. Type of District Total in Tulare
County Services Provided Establishing Legislation
(State of CA) Governance Funding Mechanisms Coordination with Tulare County Planning & Development
conducted through:
1 California Water District 8 (4 in multiple counties)
Supply water for irrigation, domestic, industrial & municipal purposes plus incidental drainage & reclamation works
Water District Law Water Code § 34000 et seq.
Board of Directors - landowners elected by voters within district Ad Valorum Assessments; fees for services
State & county regs (LAFCo MSRs & Water Supply Assessments) during development review processes; Coordination through IRWMP & other regional water planning processes; subject to federal and State water regulation
2 Community Service District (CSD)
15 Supply domestic water, sewage disposal & many other services (parks, lights, etc.) per petition for formation
Community Services District Law, Government Code § 61000 et seq.
Board of Directors - registered voters elected by voters within district
Fees for provided facilities & services
State & county regs (LAFCo MSRs & Water Supply Assessments) during development review processes; Coordination through IRWMP & other regional water planning processes; subject to federal and State water regulation
3 Conservation District (Kings River Conservation District)
1 Storage, conservation & sale of water, electrical power, drainage reclamation & protection of land
Special legislation - Kings River Conservation District Act of 1951
Board of Directors - registered voters elected by all voters within district (similar to irrigation districts)
Sale of water & power; issue bonds
IRWMP & other regional water planning processes; subject to federal and State water regulations
4 County Sanitation District (Selma-Kingsburg-Fowler; CSD)
1 Sewage collection, treatment & disposal; produce, store, treat, distribute water for domestic & other uses
County Sanitation District Act, Health & Safety Code § 4700 et seq.
Board of Directors appointed by the Cities & Counties within District
Taxes, service charges State & county regs (Fresno County LAFCo MSRs & Water Supply Assessments) during development review processes; through State water quality monitoring
5 County Service Area (CSA) 2 Currently provide sewer and water. Are authorized to provide police, fire, park/recreation, library, solid waste transfer station, low power TV services, misc. extended services (water, sewer, lighting, street cleaning, garbage collection).
Government Code § 25210.1 through 25211.33
Governed by the TC Board of Supervisors Fees for provided facilities & services
Governed by the TC Board of Supervisors; subject to federal & State & county regs (LAFCo MSRs & Water Supply Assessments) during development review processes; Coordination through IRWMP & other regional water planning processes; subject to federal and State water regulation
6 County Water Works District 1 Supply water for irrigation, domestic, industrial & fire protection; treat saline water & sewage; sewage treatment; recreation associated with district facilities
Water Code Div. 16, § 55000 through 55991
Board of Directors of 3 members appointed by the BofS upon request of 10% of district water users
Taxation Through State & county regs (LAFCo MSRs & Water Supply Assessments) during development review processes; through State water quality monitoring
7 Drainage District 1 Drain agricultural lands, acquire & construct drainage facilities
Drainage District Act of 1903 (not codified)
Board of Directors - registered voters & resident landowners elected by voters within district; BofS can appoint 1 director
Ad valorem taxes Through State & county regs (Kings County LAFCo MSRs & Water Supply Assessments) during development review processes; through State water quality monitoring
8 Flood Control District 1 Control of flood & storm waters & protections of watercourses
Special legislation - to create TC Flood Control District
Board of Supervisors is the ex-officio as the governing board; can appoint 7-person commission to delegate any & all powers
Taxes for administration & engineering; benefit zones for special projects
Governed by the TC Board of Supervisors; subject to federal, State & county regs especially during development review processes
9 Irrigation District (IR) 19 (6 in multiple counties)
Furnish water for beneficial use, including fire protection
Irrigation District Law, Water Code § 20500 et seq.
Board of Directors - registered voters elected by all voters within district; BofS can appoint 3 directors (landowners) in certain cases
Fees for provided facilities & services
Through State & county regs (LAFCo MSRs & Water Supply Assessments) during development review processes; Coordination through IRWMP & other regional water planning processes; subject to federal and State water regulation
10 Levee District 2 - both inactive Acquire & maintain levees, canals, pumping plants, pipelines, etc. to protect land from overflow & add water to sloughs of district
Levee District Law of 1959, Water Code § 70000 et seq. ; or Protection District Act of 1880
Board of Directors - landowners elected by voters within district. If a vacancy, BofS can appoint replacement
Ad Valorum Taxes Since inactive, unable to coordinate on levee maintenance and upgrade issues
11 Public Utility District (PUD) 9 Operate facilities for light, water, power, heat, transportation, telephone or other communication, disposal of garbage, sewage, refuge, fire protection, public recreation, road drainage
Public Utility District Act, Public Utilities Code § 15501 et seq.
Board of Directors - landowners elected by voters within district Fees for provided facilities & services
IRWMP & other regional water planning processes; subject to federal and State water regulations
12 Reclamation District (RC) 1 Same as levee district plus provide access to lands of district (roads, ferry boats, bridges, etc)
Water Code § 50000 et seq. Board of Trustees - landowners elected by voters within the district
Assessments Coordination through IRWMP & other regional water planning processes; subject to federal and State water regulations
13 Resource Conservation District (RCD)
5 (4 in multiple counties)
Soil conservation, water conservation, improve farm irrigation & land drainage
Public Resources Code § 9151 et seq.
Board of Directors - registered voters & resident landowners elected by voters within district; Directors can request that BofS appoint directors
Natural Resource Conservation Dept - federal government funding
Coordination through IRWMP & other regional water planning processes; subject to federal and State water regulations
14 Sanitary District 1 Sewage facilities & services including wastewater treatment & septic systems & sale of by-products; solid waste collection & disposal
Sanitary District Act of 1923, now Health & Safety Code § 6400 et seq.
Board of Directors - registered voters elected by voters within district
Taxes, service charges, water sales
Coordination through IRWMP & other regional water planning processes; subject to federal and State water regulations
15 Sewer Maintenance 1 Sewage disposal and sewer system maintenance Health & Safety Code § 4860 et seq.
Governed by the TC Board of Supervisors Taxes, special assessments, assessment bonds
Governed by the TC Board of Supervisors; subject to federal and State wastewater regulations
16 Storm Water District 1 Protect land from storm water & from the waters of any unnavigatible stream by constructing dams, ditches, dikes, etc.
Storm Water District Act of 1909 (not codified)
Board of Trustees - landowners elected by voters within the district
Taxes & assessments Governed by the TC Board of Supervisors; subject to federal and State wastewater regulations
17 Water Conservation District (WCD)
1 Conserve & store waters of any unnavigatible stream by spreading & sinking waters, protect waters including subterranean flows
Water Conservation District Act of 1927 (not codified)
Board of Directors - directors elected by voters within district Taxes & assessments IRWMP & other regional water planning processes; subject to federal and State water regulations
18 Water Storage District 1 Storage, conservation & sale of water including groundwater, electrical power, drainage reclamation & protection of land
California Water Storage District Law Water Code § 39000 et seq.
Board of Directors - landowners elected by voters within district. "landowner - voter" district w/ 1 vote per $100 assessed value
Charges for provided facilities & services, including sale of water & power
IRWMP & other regional water planning processes; subject to federal and State water regulations
SOURCE: Tulare LAFCo, 1975 (revised 2007).

3.6 Hydrology, Water Quality and Drainage
Tulare County General Plan 2030 Update 3.6-5 ESA / 207497 Recirculated Draft Environmental Impact Report February 2010
Regulatory Setting The following federal, State and local agencies and statutory authorities relevant to water (including groundwater) resources, water quality and drainage are applicable to the proposed project. Water resources in California are managed by a complex system of federal, State, and local regulations. Oversight of these regulations is conducted by a similarly complex network of federal, State and local agencies. Clean water standards set at the federal level are delegated to State and local agencies. Water quality regulations include federal and State oversight of point and non-point pollutants, protection of wetlands, and oversight of wastewater and recycled water. The regulations discussed below also include federal, State and local regulations concerning flood management and drainage, and discuss recent flood management regulations signed into law in 2007.
Federal and State Regulations
Clean Water Act The federal Clean Water Act established the basic structure for regulating discharges of pollutants into “waters of the United States.” The act specifies a variety of regulatory and non-regulatory tools to sharply reduce direct pollutant discharges into waterways, finance municipal wastewater treatment facilities, and manage polluted runoff. Its regulations cover streams, wetlands and other natural water systems as well as municipal water and wastewater facilities and services.
Section 303(d) requires states, territories, and authorized tribes to develop a list of water-quality limited segments of rivers and other water bodies under their jurisdiction. These waters on the list do not meet water quality standards, even after point sources of pollution have installed the minimum required levels of pollution control technology. The law requires that these jurisdictions establish priority rankings for waters on the list and develop action plans, called Total Maximum Daily Loads (TMDL), to improve water quality. The Regional Water Quality Control Board (RWQCB) manages this regulatory program.
Section 401 requires every applicant for a federal permit or license for any activity that may result in a discharge to a water body to obtain a water quality certification that the proposed activity will comply with applicable water quality standards. A Section 401 permit for land development projects is often obtained from a State RWQCB office in coordination with a Section 404 (wetlands) permit.
Section 402 regulates point- and nonpoint-source discharges to surface waters through the National Pollutant Discharge Elimination System (NPDES) program. In California, the SWRCB oversees the NPDES program, which is administered by the Regional Water Quality Control Boards (RWQCBs). The NPDES program provides for both general permits (those that cover a number of similar or related activities) and individual permits. The RWQCB manages the NPDES program including the General Construction Stormwater NPDES Permit program, which is further described below.
Tulare County General Plan 2030 Update
Tulare County General Plan 2030 Update 3.6-6 ESA / 207497 Recirculated Draft Environmental Impact Report February 2010
Section 404 of the Clean Water Act establishes a program to regulate the discharge of dredged and fill material into waters of the U.S., including some wetlands. Activities in waters of the U.S. that are regulated under this program include fills for development, water resource projects (e.g., reservoirs and levees), infrastructure development (e.g., highways and airports), and conversion of wetlands to uplands for farming and forestry. The U.S. Army Corps of Engineers (Corps) manages this regulatory program.
Implementation of the proposed project, including land development, would be subject to regulation under Sections 401, 402, and/or 404 of the Clean Water Act. Implementation of Section 303(d) occurs through Basin Plan activities of each RWQCB, as further explained below.
California Water Code The California Water Code establishes the governing law pertaining to all aspects of water management in California. The California Water Code establishes the Department of Water Resources (DWR) as the primary research and supply development and management agency for water, and the State Water Resources Control Board (SWRCB) for overall water quality policy development and for dealing with water rights issues. There are also nine RWQCBs that are responsible for the regulation, enforcement, and protection of the beneficial uses of water.
Under Water Code § 10004 – 10013, DWR is required to prepare and update the California Water Plan, a policy document that guides the development and management of the State’s water resources. The plan is updated every five years to reflect changes in resources and urban, agricultural, and environmental water demands. It suggests ways of managing demand and augmenting supply to balance water supply with demand. Information from the 2005 Water Plan, containing 2003 data, is used in this EIR because data for the 2010 Water Plan (for the Tulare Lake Basin) is not yet available.
Large portions of the Water Code regulate California’s system of water rights. The state water right system is referred to as a “dual system” in which both the riparian doctrine and the prior appropriation doctrine apply. Riparian rights result from the ownership of land bordering a surface water source (a stream, lake, or pond). These rights normally are senior in priority to most appropriative rights, and riparian landowners may use natural flows directly for beneficial purposes on riparian lands without a permit from the SWRCB.
Appropriative rights are acquired by diverting surface water and applying it to a beneficial use. Before 1914, appropriative rights could be obtained by simply diverting and using the water, posting a notice of appropriation at the point of diversion, and recording a copy of the notice with the county recorder. Since 1914, the acquisition of an appropriative right also requires a permit from the SWRCB.
The SWRCB is responsible for overseeing the water rights and water quality functions of the State, such as the Clean Water Act Section 303d Program discussed above. The SWRCB has jurisdiction to issue permits and licenses for appropriation from surface and underground streams. The California
3.6 Hydrology, Water Quality and Drainage
Tulare County General Plan 2030 Update 3.6-7 ESA / 207497 Recirculated Draft Environmental Impact Report February 2010
courts have jurisdiction over the use of percolating ground water, riparian use of surface waters, and the appropriative use of surface waters from diversions begun before 1914.
Other sections of the water code were amended in 2004 to require, with certain exceptions, that all urban water suppliers to install water meters on all municipal and industrial water service connections that are located in its service area on or before January 1, 2025. This law affects the larger water districts within Tulare County.
Federal Emergency Management Agency (FEMA) FEMA is the federal agency that oversees floodplains and manages the nation’s flood insurance program. FEMA’s regulations govern the delineation of floodplains and establish requirements for floodplain management. Tulare County Flood Control District, a countywide special district governed by the County Board of Supervisors, oversees the local flood program. As part of their role overseeing the National Flood Insurance Program, the Tulare County Flood Control District is seeking guidance from the County Board of Supervisors for participation in the FEMA Community Rating System. The County’s Flood Plain Administrator uses FEMA maps to determine areas that are within the 100-year floodplain and 500-year floodplain. FEMA conducted extensive map updates (including in and near the City of Visalia, June 2009) as well as digitized all its flood insurance rate maps throughout the nation over the past 5 years. This intensive FEMA “map mod” process was completed on June 16, 2009 and is now being integrated with the County flood management program. FEMA’s requirement for elevation certificates for structures in established flood zones reflects the new flood zones.
Central Valley Flood Protection Board Any project encroaching into rivers, waterways, and floodways within and adjacent to federal-and State-authorized flood control projects or within designated floodways must receive approval from the State Central Valley Flood Protection Board (CVFPB; formerly the Reclamation Board). Under California Water Code § 8534, 8608, and 8710–8723, the Flood Board is required to enforce, within its jurisdiction, on behalf of the State of California, appropriate standards for the construction, maintenance, and protection of adopted flood control plans that will best protect the public from floods. The Flood Board’s jurisdiction encompasses the Central Valley, including all tributaries and distributaries of the Sacramento and San Joaquin Rivers and excluding the Tulare and Buena Vista Basins. The Flood Board exercises jurisdiction over State and federal levees, of which Tulare County has none. A 1995 jurisdictional Agreement between Tulare County and the Bureau of Reclamation authorizes Tulare County’s determination of flood controls for Cottonwood Creek, Cross Creek and the St. Johns River. This agreement will cover the levee section, the waterside area between project levees, a 10-foot-wide strip adjacent to the landward levee toe, the area within 30 feet of the top to the banks with no levees, and within designated floodways adopted by the Flood Board.
Tulare County General Plan 2030 Update
Tulare County General Plan 2030 Update 3.6-8 ESA / 207497 Recirculated Draft Environmental Impact Report February 2010
California 2007 Flood Management Regulations In 2007, the Legislature passed and Governor Schwarzenegger signed important legislation that will push California to improve its long term flood protection by better understanding the capacity of the Central Valley’s levees, developing plans to better manage the flood protection system, and mandating that local land use planning and development identify the risks of flooding (APA, 2008). Local governments are also required to incorporate current information (using data from FEMA, DWR and local drainage districts) about areas subject to flooding and drainage issues onto County flood maps. In California, all local governments including Tulare County, are also newly required to annually incorporate updated flood information into the County’s General Plan Land Use Element (Government Code Sections 65302(a)) and, after January 2009, into the County General Plan Conservation and Safety Element [Government Code Sections 65302(d) and (g)]. Although Tulare County is not included in the geographic area of the anticipated Central Valley Flood Control Plan, it will be subject to Statewide requirements that require up-to-date flood-risk and drainage problem areas be identified, mapped and addressed through County General Plan policies, maps and land use diagrams. If new areas are identified as flood risk areas in the General Plan maps, the County zoning ordinance (including zone district maps for affected areas) will need to be amended to correlate with the General Plan. These changes are in addition to the recent FEMA map modifications for areas in and around Visalia, discussed above under the heading “Flood Emergency Management Agency (FEMA).” In addition, the County has recently accepted and approved the Tulare County Storm Water Management Plan that was prepared by the California Department of Water Resources (DWR).
Local Groundwater Management Programs Some local agencies have specific statutory authority to manage groundwater resources in their service areas. Other local agencies may manage groundwater under authority provided by general enabling legislation, such as Water Code Section 10750 et seq. A few counties, however not including Tulare County, have adopted local ordinances to administer groundwater management. AB 3030 (passed in 1992; Water Code Section 10750 et seq.) provided broad general authority for local agencies to adopt groundwater management plans and to impose assessments to finance the cost of implementing the plans. To date, about 200 local agencies have adopted AB 3030 groundwater management plans; however there is no Tulare Lake Basin Groundwater Plan or other coordinated County-wide effort to manage groundwater resources.
Porter-Cologne Water Quality Control Act Under the Porter-Cologne Water Quality Control Act, water quality objectives are limits or levels of water quality constituents or characteristics established for the purpose of protecting beneficial uses. The Act requires the RWQCBs to establish water quality objectives while acknowledging that water quality may be changed to some degree without unreasonably affecting beneficial uses. Designated beneficial uses, together with the corresponding water quality objectives, also constitute water quality standards under the federal Clean Water Act. Therefore, the water quality objectives form the regulatory references for meeting State and federal requirements for water quality control. A change in water quality is only allowed if the change is consistent with the maximum beneficial
3.6 Hydrology, Water Quality and Drainage
Tulare County General Plan 2030 Update 3.6-9 ESA / 207497 Recirculated Draft Environmental Impact Report February 2010
use of the waters of the State, would not unreasonably affect the present or anticipated beneficial uses, and would not result in water quality lower than that specified in applicable water quality control plans. All aspects of the proposed project would be subject to the Porter-Cologne Water Quality Control Act.
Basin Plans and Water Quality Objectives The Porter-Cologne Water Quality Control Act provides for the development and periodic review of water quality control plans (referred to as basin plans) that designate beneficial uses of California’s major rivers and groundwater basins and establish narrative and numerical water quality objectives for those waters. Beneficial uses represent the services and qualities of a water body (i.e., the reasons why the water body is considered valuable), while water quality objectives represent the standards necessary to protect and support those beneficial uses. Basin plans are primarily implemented through the NPDES permitting system and by issuing waste discharge regulations to ensure that water quality objectives are met.
Basin plans provide the technical basis for determining waste discharge requirements and taking regulatory enforcement actions if deemed necessary. The project area is located within the jurisdiction of the Central Valley RWQCB (CVRWQCB). A basin plan has been adopted for the Tulare Lake Basin (Region 5; CVRWQCB, Second Edition, 2004), which comprises the drainage area of the San Joaquin Valley south of the San Joaquin River and includes all of Tulare County.
General Construction Stormwater NPDES Permit As mentioned above, the CVRWQCB administers the NPDES stormwater permitting program in the Central Valley Region for construction activities. Construction activities disturbing one acre or more of land are subject to the permitting requirements of the NPDES General Permit for Discharges of Storm Water Runoff Associated with Construction Activity (General Construction Permit). For qualifying projects, the project applicant must submit a Notice of Intent to the RWQCB to be covered by the General Construction Permit prior to beginning construction. The General Construction Permit requires the preparation and implementation of a stormwater pollution prevention plan (SWPPP), which must also be completed before construction begins. Implementation of the SWPPP starts with the commencement of construction and continues through the completion of the project. Upon project completion, the applicant must submit a Notice of Termination to the RWQCB to indicate that construction is completed. Similarly, the County administers a variety of stormwater management measures designed to monitor and control construction discharges, consistent with its own individual NPDES permit.
Dewatering Discharges to Surface Waters Permit CVRWQCB Order No. 5-00-175, “Waste Discharge Requirements General Order for Dewatering and Other Low Threat Discharges to Surface Waters,” provides that such discharges shall meet (1) effluent limitations criteria related to biological oxygen demand (BOD), total suspended solids, settleable solids, chlorine, pH, and flow; (2) solids disposal requirements related to screenings and
Tulare County General Plan 2030 Update
Tulare County General Plan 2030 Update 3.6-10 ESA / 207497 Recirculated Draft Environmental Impact Report February 2010
other solids removed from liquid wastes; and (3) receiving water limitations related to dissolved oxygen concentration; oils, greases, waxes, and other materials that can form visible films on the water surface or streambed; constituents, including floating material and suspended material, that would create a nuisance or adversely affect beneficial uses; discoloration; fungi, slimes, and other objectionable growths; increases in turbidity; pH; deposition of materials; changes in temperature; taste and odor-producing substances; radionuclides; degradation of aquatic communities or biota; toxic pollutants in water, sediment, or biota; and other violations of water quality standards. Construction of new public facilities where dewatering of sediments is necessary would require compliance with Order No. 5-00-175.
Streambed Alteration Agreement Program Under Sections 1600–1616 of the California Fish and Game Code, any person, business, state or local government agency, or public utility that proposes an activity that would (1) substantially divert or obstruct the natural flow, (2) substantially modify the bed or bank of any river, stream, or lake, or (3) deposit or dispose debris, waste, or other material containing crumbled, flaked, or ground pavement where it can pass into any river, stream, or lake, is required to notify the California Department of Fish and Game (CDFG). The streambed alteration agreement that the notifying entity and CDFG execute after such notification identifies potential impacts of construction and mitigation measures required to minimize and avoid impacts.
Cortese-Knox-Hertzberg Governmental Reorganization Act of 2000 The Cortese-Knox-Hertzberg Governmental Reorganization Act of 2000, although not specified as a land use or water law, provides an important link by requiring California Local Agency Formation Commissions (LAFCOs) to conduct municipal service reviews (MSRs) for specified public agencies, including drainage and flood protection districts, under their jurisdiction. One aspect of a municipal service review is to evaluate an agency’s ability to provide public services within its ultimate service area. A municipal service review is required before an agency can update its sphere of influence (SOI).
Safe Drinking Water Act The Safe Drinking Water Act (SDWA) was established to protect the quality of waters actually or potentially designated for drinking use, whether from aboveground or underground sources. Contaminants of concern in a domestic water supply are those that either pose a health threat or in some way alter the aesthetic acceptability of the water (e.g. – color or odor). Primary and secondary maximum contaminant levels (MCLs) are established for numerous constituents of concern including turbidity, total dissolved solids (TDS), chloride (Cl), fluoride, nitrate, priority pollutant metals and organic compounds, selenium, bromate, trihalomethane and haloacetic acid precursors, radioactive compounds, and gross radioactivity. All domestic water suppliers must follow the requirements established by this Act and its associated amendments. The Act also features a drinking water state revolving loan fund made available to public water systems to help them comply with national primary drinking water regulations and to upgrade water treatment systems; and requirements for
3.6 Hydrology, Water Quality and Drainage
Tulare County General Plan 2030 Update 3.6-11 ESA / 207497 Recirculated Draft Environmental Impact Report February 2010
the U.S. Environmental Protection Agency (EPA) to establish drinking water standards based on risk assessment and cost/benefit analysis.
Drinking Water Regulations The California Department of Public Health (DPH) serves as the primary responsible agency for drinking water regulations, including those of the federal SDWA, Surface Water Treatment Rule and other standards listed below. DPH must adopt drinking water quality standards at least as stringent as federal standards, and may also regulate contaminants to more stringent standards than U.S. EPA, or develop additional standards. DPH regulations cover over 150 contaminants, including microorganisms, particulates, inorganics, natural organics, synthetic organics, radionuclides, and disinfection byproducts (DBPs).
A major component of the DPH Division of Drinking Water and Environmental Management is the Drinking Water Program (DWP) that regulates public water systems. The California Department of Health Services (DHS) is responsible for regulating public water systems and small water systems and monitoring them for compliance with the State Water Code and Federal Drinking Water Quality requirements. Additional regulatory responsibilities include the issuance of operational permits, routine water system inspections, evaluation of water quality monitoring data, and follow up compliance activities. DHS provides oversight and enforcement for those systems in Tulare County with more than 200 connections. Other functions include supporting and promoting water systems security, providing support for small water systems and for improving technical, managerial, and financial (TMF) capacity, and providing subsidized funding for water system improvements under the State Revolving Fund (SRF) and Proposition 50. DHS works with the County Health and Human Services Agency, Environmental Health Division to provide local oversight regarding these water quality issues.
Surface Water Treatment Rule The Federal Surface Water Treatment Rule is implemented by the California Surface Water Treatment Rule, which satisfies three specific requirements of the Safe Drinking Water Act by: (1) establishing criteria for determining when filtration is required for surface waters; (2) defining minimum levels of disinfection for surface waters; and (3) addressing Cryptosporidium spp., Giardia lamblia, Legionella spp., E. Coli, viruses, turbidity, and heterotrophic plate count by setting a treatment technique. A treatment technique is set in lieu of an MCL for a contaminant when it is not technologically or economically feasible to measure that contaminant. The Surface Water Treatment Rule applies to all drinking water supply activities in California with its implementation overseen by the California Department of Public Health (DPH).
Stage 1 and Stage 2 Disinfectants and Disinfection Byproducts Rule and Long-Term 1 and Long-Term 2 Enhanced Surface Water Treatment Rule The Stage 1 Disinfectants and Disinfection Byproducts Rule established maximum residual disinfectant level goals and maximum residual disinfectant levels for chlorine, chloramines, and
Tulare County General Plan 2030 Update
Tulare County General Plan 2030 Update 3.6-12 ESA / 207497 Recirculated Draft Environmental Impact Report February 2010
chlorine dioxide. It also establishes MCL goals and MCLs for trihalomethanes, five haloacetic acids, chlorite, and bromate. The primary purpose of the Long-Term 1 Enhanced Surface Water Treatment Rule is to improve microbial control, especially for Cryptosporidium.
Water systems that use surface water and conventional filtration treatment are required to remove specified percentages of organic materials, measured as total organic carbon (TOC), which may react with disinfectants to form DBPs. Removal is to be achieved through a treatment technique (e.g., enhanced coagulation or enhanced softening), unless the system meets alternative criteria. The overall goal of this group of regulations is to balance the risks from microbial pathogens with those from carcinogenic DBPs. All domestic water suppliers must follow the requirements of these rules, which are overseen by DPH.
Water Supply Regulations
Urban Water Management Planning Act In 1983, the California Legislature enacted the Urban Water Management Planning Act (Water Code § 10610 – 10656). The Act states that every public and private urban water supplier that provides water to 3,000 or more customers, or that provides over 3,000 acre-feet of water annually, should make every effort to ensure the appropriate level of reliability in its water service sufficient to meet the needs of its various categories of customers during normal, dry, and multiple dry years. The Act requires that urban water suppliers adopt and submit an urban water management plan (UWMP) at least once every five years to the California Department of Water Resources (DWR). Non-compliant urban water suppliers are ineligible to receive most State funding or receive drought assistance from the State until the UWMP is submitted pursuant to the Urban Water Management Planning Act. More information and a link to completed UWMPs are found on the DWR website: http://www.owue.water.ca.gov/urbanplan/.
Senate Bills 610 and 221 (SB 610 and SB 221) Companion measures SB 610 and SB 221, legislation that took effect in January 2002, require increased efforts to identify and assess the reliability of anticipated water supplies and envision increased levels of communication between municipal planning authorities and local water suppliers. SB 610 (Water Code § 10910 et seq.) requires that a supply assessment be completed for all projects as defined by Water Code section 10912. In addition to specific large developments defined as projects, SB 610 also includes two catch-all provisions that require assessments when: (1) an amount of water will be required equivalent to, or greater than, the amount of water required by a 500 dwelling unit project; or (2) a project will be served by a public water system less than 5,000 connections, and it will increase the number of connections by 10 percent or more, or increase water demand for such system by an equivalent amount. This second item, addressing smaller water systems, covers proposed new developments for homes, businesses and/or industrial facilities such as meat processing plants, ethanol processing plants or similar large water users.
SB 221 requires that cities and counties impose a new condition of tentative subdivision approval, requiring that the applicant provide a detailed verification from the applicable water supplier that
3.6 Hydrology, Water Quality and Drainage
Tulare County General Plan 2030 Update 3.6-13 ESA / 207497 Recirculated Draft Environmental Impact Report February 2010
a sufficient water supply will be available before the final subdivision map can be approved. It applies to subdivisions of 500 units or more, projects that would employ 1,000 or more workers, and similar to SB 610, also applies to increases of ten percent or more of service connections for public water systems with less than 5,000 service connections. The law defines criteria for determining sufficient water supply such as using normal, single dry, and multiple dry year hydrology and identifying the amount of water that the supplier can reasonable rely on to meet existing and future planned uses. Rights to extract additional groundwater if used for the project must be substantiated.
SB 610 also amends the Urban Water Management Planning Act to require additional information in UWMPs if groundwater is identified as a source available to the supplier. The information required includes a copy of any groundwater management plan adopted by the supplier, a copy of the adjudication order or decree for adjudicated basins, and if non adjudicated, whether the basin has been identified as being over drafted or projected to be over drafted in the most current DWR publication on that basin. If the basin is in overdraft, that plan must include current efforts to eliminate any long term overdraft. A key provision in SB 610 assures that water supply issues are thoroughly considered as part of the environmental review process, but only for the projects as described above. These projects must include a water supply assessment, containing specified information from the local public water supplier anticipated to provide water to the project.
Regional Water Management Planning Act In 2000, the Legislature passed the Integrated Regional Water Management Planning Act, which allows a regional water management group to prepare and adopt an Integrated Regional Water Management Plan (IRWMP) that includes qualified programs or projects or qualified reports or studies identified in Water Code § 10540 et seq. Many of the water management elements identified in the Act are also part of an UWMP. The intent of the Legislature is to encourage local agencies to work cooperatively to manage their available local and imported water supplies to improve the quality, quantity, and reliability of those supplies. Tulare County has several IRWMPs covering the County. The Southern Sierra IRWMP covers the eastern two-thirds of the County. The Poso IRWMP is soon to be absorbed in the Kern County IRWMP in the area covering the most southerly reaches of valley floor and foothills of Tulare County. The Kaweah IRWMP and Tule River IRWMP may also be combined into one IRWMP covering the central County valley floor and foothills. The Kings River Basin IRWMP covers the most northerly reaches of Tulare County.
Local Regulations
Tulare County Environmental Health Regulations The County Health and Human Services Agency (HHSA), Environmental Health Division has been granted primacy by the DHS, is responsible for the administration and enforcement of the Safe Drinking Water Act involving those systems in Tulare County with less than 200 connections. County Environmental Health staff are also responsible for development review, approval and
Tulare County General Plan 2030 Update
Tulare County General Plan 2030 Update 3.6-14 ESA / 207497 Recirculated Draft Environmental Impact Report February 2010
enforcement related to private wells and septic systems, for properties not served by water or wastewater districts or other public entities.
Tulare County Land Development Regulations The Tulare County Resource Management Agency (RMA) is responsible for review, approval and enforcement of planning and land development throughout the unincorporated portions of the County. County regulations that direct planning and land development (and related water and wastewater utilities) include the Tulare County General Plan, Zoning Ordinance, Subdivision Ordinance and CEQA procedures. This work is shared between County Planning, Development Services, Engineering and other divisions or departments of RMA, and in coordination with the Environmental Health Division of the Tulare County Health and Human Services Agency, the Tulare County Fire Department, the Tulare County Redevelopment Agency, the Tulare County Association of Governments (TCAG), and County LAFCo.
The County’s flood damage prevention code is intended to promote public health, safety, and general welfare in addition to minimizing public and private losses due to flood conditions. The County code provisions to protect against flooding include requiring uses vulnerable to floods be protected against flood damage at the time of initial construction; controlling the alteration of natural flood plains; and preventing or regulating the construction of flood barriers which will unnaturally divert flood waters or which may increase flood hazards in other areas. The County flood damage prevention code, most recently amended by Ord. No. 3212 and effective October 29, 1998, is modeled based upon FEMA guidance. County flood management regulations will be affected by the proposed project as State laws passed in 2007 require additional flood management measures be incorporated into the County ordinance code, flood maps and General Plan Safety Element. The new laws are discussed above, under the heading “California 2007 Flood Management Regulations” (APA, 2008).
Environmental Setting Precipitation provides California with nearly 200 million acre-feet (maf) of surface water supply on an average basis. Of this renewable supply, about 65 percent is cycled by trees and other plants through evaporation and transpiration. The remaining 35 percent of precipitation remains in the State's hydrologic system as runoff. Over 30 percent of the State's runoff is not explicitly designated for urban, agricultural, or environmental uses. This water flows through the hydrologic system to the Pacific Ocean or to salt sinks. The remaining runoff (2 – 3 percent) is available as a renewable water supply for urban, agricultural, and environmental uses.
Geographic Description of Watersheds, Rivers and Streams The State Department of Water Resources (DWR) subdivides the State into regions for planning purposes. The largest planning unit is the hydrologic region, corresponding to the State’s major drainage basins. Tulare County is primarily located within California Department of Water Resource’s Tulare Lake Hydrologic Region (Tulare HR), located south of the San Joaquin River
3.6 Hydrology, Water Quality and Drainage
Tulare County General Plan 2030 Update 3.6-15 ESA / 207497 Recirculated Draft Environmental Impact Report February 2010
watershed.1 The Tulare Lake Basin is a closed drainage basin at the south end of the San Joaquin Valley, encompassing stream channels draining to Kern, Tulare, and Buena Vista Lakes. The watersheds of Tulare County are shown on Figure 3.6-1 which depicts the entire County, while Figure 3.6-2 shows the Valley portion of the County’s main watersheds. The Friant-Kern Canal, shown on the right side of Figure 3.6-2, demarcates the boundary between the valley and upper watersheds.
Tulare County encompasses 4,840 square miles in the San Joaquin River Basin. Local streams in Tulare County flow from the Sierra Nevada Mountains westwards towards the San Joaquin Valley. The Tulare County General Plan defines four rivers and their watersheds in the County: Kings River Watershed, Kaweah Watershed, Tule Watershed, and Deer Creek/White River Watershed. Water districts in the County have developed facilities consisting generally of unlined canals and gravity or low pressure pipelines to take advantage of these locally derived surface water resources.
Local Surface Water The Kings River Watershed encompasses 1,742 square miles, ranging in elevation from 500 to 14,000 feet above sea level. Demand is primarily agricultural. The primary local water supply comes from the Kings River, through operation of Courtright Reservoir (123,200 acre-feet), Wishon Reservoir (128,300 acre-feet), and Pine Flat Reservoir (1,000,000 acre-feet) (California Data Exchange Program, 2009). Yearly average runoff for the Kings River is 1,689,700 acre-feet, although runoff varies greatly depending on annual climatic conditions.
The Kaweah Watershed is south of the Kings River Watershed. The Kaweah River drains 561 square miles of the Sierra Nevada Mountains, and is actually a tributary to the Tule River. The primary source of local water supply is the Kaweah River, and operations of Terminus Reservoir/Lake Kaweah. Lake Kaweah was recently enlarged to 183,800 acre-feet capacity to increase flood protection for downstream communities. Average annual runoff of the Kaweah River is approximately 430,000 acre-feet.
Farther south, the Tule River Watershed is primarily supplied by the Tule River, which drains 390 square miles above Lake Success (capacity 82,300 acre-feet). Average annual runoff of the Tule River is about 136,000 acre-feet. Camp Nelson Water Company diverts water from Belknap Creek for its supply. Springville Public Utility District owns pre-1914 water rights, including rights reserved for the eventual development of land within the district (Keller, Wegley and Associates, 2006).
The Deer Creek/White River Watershed is in the southern portion of the County. Surface supplies emanate from a low-elevation stream group. This area has the highest dependence on imported CVP water of any region in Tulare County.
1 Some data, notably many of those compiled at the state level by DWR, are aggregated at the level of 10 Hydrologic Regions. Data at this level can be of limited use as these regions do not coincide with administrative or political boundaries, as in the case of Tulare County and Tulare Lake HR.
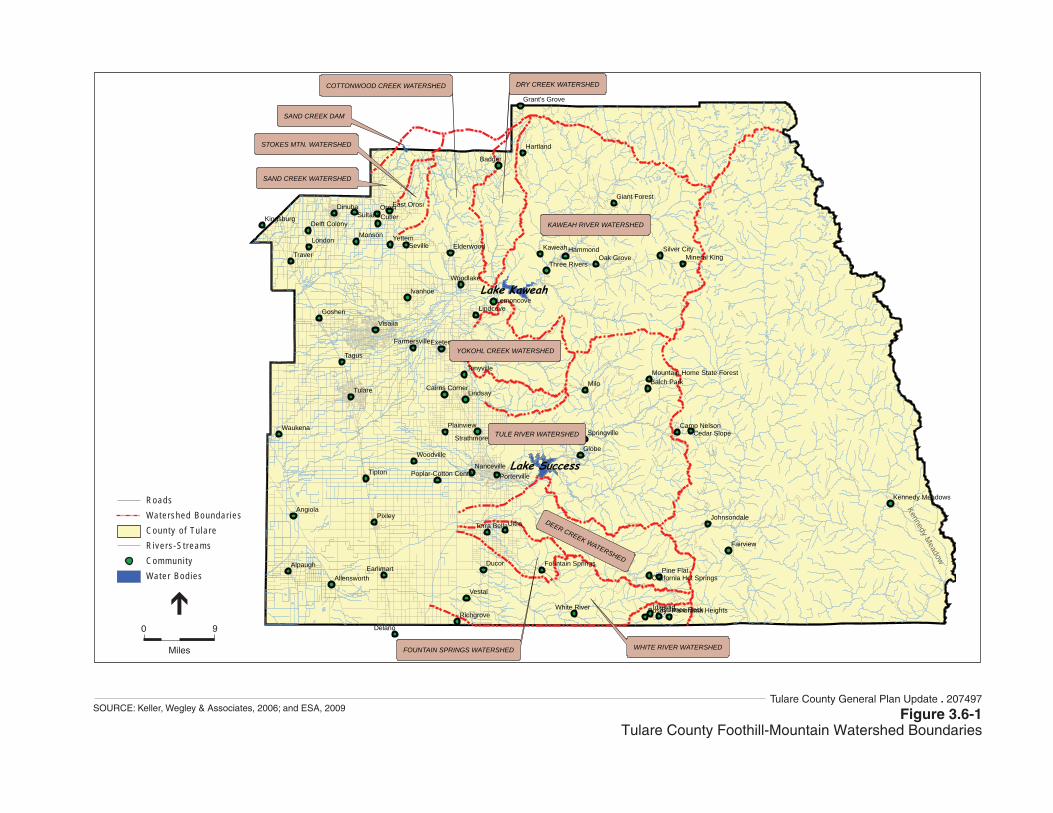
KAWEAH RIVER WATERSHED
DRY CREEK WATERSHED
SAND CREEK DAM
STOKES MTN. WATERSHED
SAND CREEK WATERSHED
YOKOHL CREEK WATERSHED
TULE RIVER WATERSHED
WHITE RIVER WATERSHEDFOUNTAIN SPRINGS WATERSHED
DEER CREEK WATERSHED
COTTONWOOD CREEK WATERSHED
KennedyM
eadow
Lake Success
Lake Kaweah
Milo
Ultra
Globe
Tagus
Orosi
Badger
KaweahYettemMonson
Tulare
Exeter
Dinuba
Delano
Pixley
Tipton
London
Cutler
Goshen
Traver
Angiola
Waukena
HammondSeville
Sultana
Lindsay
Visalia
Ivanhoe
Alpaugh
Fairview
Lindcove
Woodlake
Pine Flat
Tonyville
Oak Grove
Elderwood
Earlimart
Woodville
Kingsburg
Plainview
Lemoncove
Balch Park
Nanceville
Strathmore
Johnsondale
SpringvilleCamp Nelson
White River
Allensworth
Cedar Slope
Silver City
Porterville
Terra Bella
Three RiversMineral King
Giant Forest
Delft Colony
Farmersville
Cairns Corner
Kennedy Meadows
Fountain Springs
Poplar-Cotton Center
California Hot Springs
Mountain Home State Forest
Posey
Ducor
Vestal
Idlewild
Hartland
Richgrove
East Orosi
Balance Rock
Grant's Grove
Panorama Heights
RoadsWatershed Boundar iesCounty o f Tu la reRivers -S t reamsCommuni tyWater Bod ies
0 9
Miles
Figure 3.6-1Tulare County Foothill-Mountain Watershed Boundaries
SOURCE: Keller, Wegley & Associates, 2006; and ESA, 2009Tulare County General Plan Update . 207497
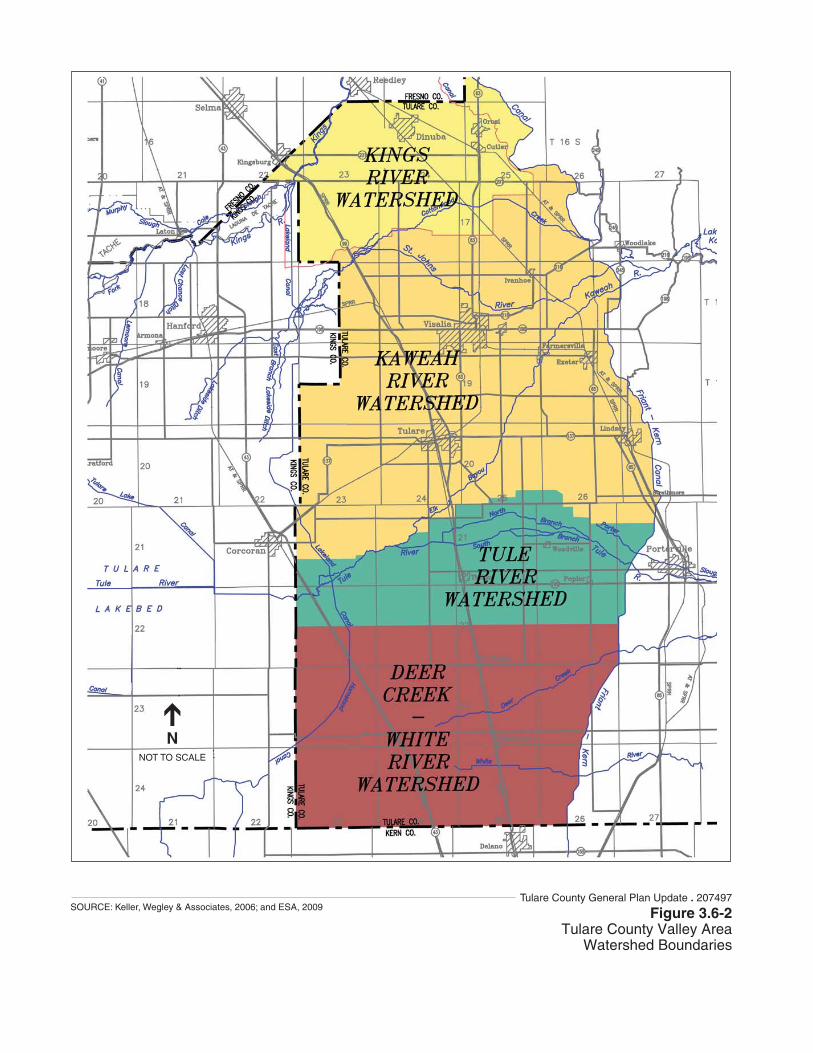
NNOT TO SCALE
Figure 3.6-2Tulare County Valley Area
Watershed Boundaries
SOURCE: Keller, Wegley & Associates, 2006; and ESA, 2009Tulare County General Plan Update . 207497
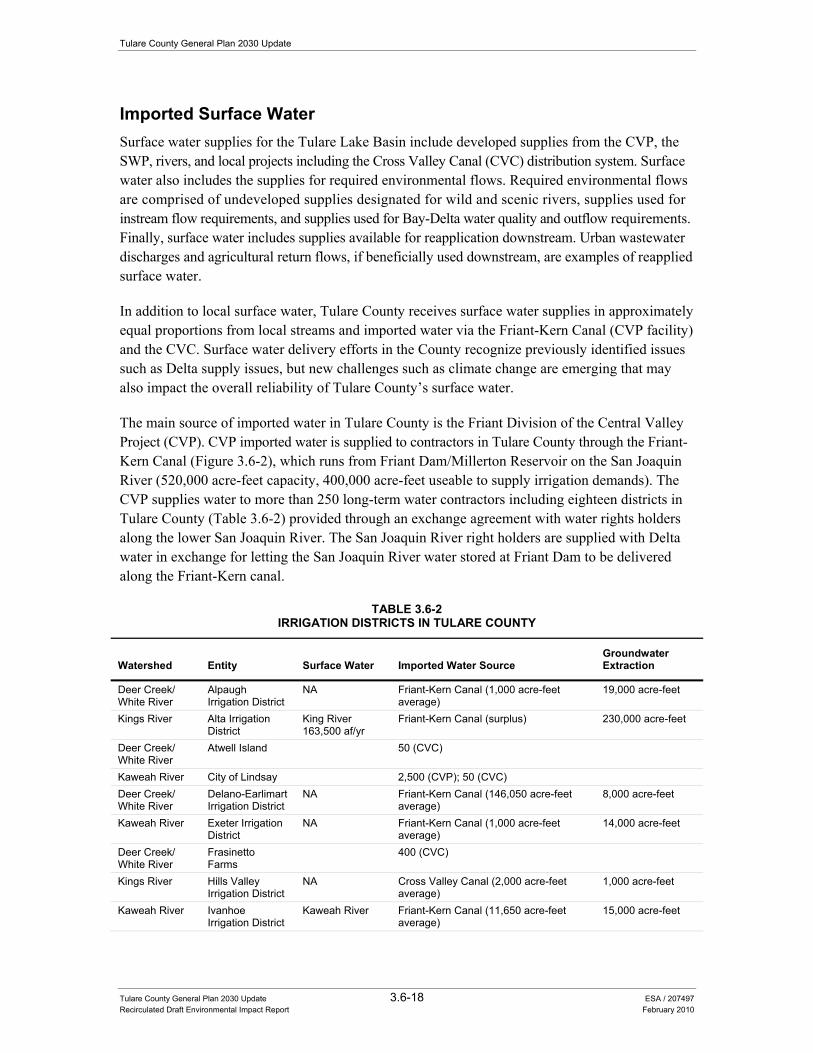
Tulare County General Plan 2030 Update
Tulare County General Plan 2030 Update 3.6-18 ESA / 207497 Recirculated Draft Environmental Impact Report February 2010
Imported Surface Water Surface water supplies for the Tulare Lake Basin include developed supplies from the CVP, the SWP, rivers, and local projects including the Cross Valley Canal (CVC) distribution system. Surface water also includes the supplies for required environmental flows. Required environmental flows are comprised of undeveloped supplies designated for wild and scenic rivers, supplies used for instream flow requirements, and supplies used for Bay-Delta water quality and outflow requirements. Finally, surface water includes supplies available for reapplication downstream. Urban wastewater discharges and agricultural return flows, if beneficially used downstream, are examples of reapplied surface water.
In addition to local surface water, Tulare County receives surface water supplies in approximately equal proportions from local streams and imported water via the Friant-Kern Canal (CVP facility) and the CVC. Surface water delivery efforts in the County recognize previously identified issues such as Delta supply issues, but new challenges such as climate change are emerging that may also impact the overall reliability of Tulare County’s surface water.
The main source of imported water in Tulare County is the Friant Division of the Central Valley Project (CVP). CVP imported water is supplied to contractors in Tulare County through the Friant-Kern Canal (Figure 3.6-2), which runs from Friant Dam/Millerton Reservoir on the San Joaquin River (520,000 acre-feet capacity, 400,000 acre-feet useable to supply irrigation demands). The CVP supplies water to more than 250 long-term water contractors including eighteen districts in Tulare County (Table 3.6-2) provided through an exchange agreement with water rights holders along the lower San Joaquin River. The San Joaquin River right holders are supplied with Delta water in exchange for letting the San Joaquin River water stored at Friant Dam to be delivered along the Friant-Kern canal.
TABLE 3.6-2 IRRIGATION DISTRICTS IN TULARE COUNTY
Watershed Entity Surface Water Imported Water Source Groundwater Extraction
Deer Creek/ White River
Alpaugh Irrigation District
NA Friant-Kern Canal (1,000 acre-feet average)
19,000 acre-feet
Kings River Alta Irrigation District
King River 163,500 af/yr
Friant-Kern Canal (surplus) 230,000 acre-feet
Deer Creek/ White River
Atwell Island 50 (CVC)
Kaweah River City of Lindsay 2,500 (CVP); 50 (CVC) Deer Creek/ White River
Delano-Earlimart Irrigation District
NA Friant-Kern Canal (146,050 acre-feet average)
8,000 acre-feet
Kaweah River Exeter Irrigation District
NA Friant-Kern Canal (1,000 acre-feet average)
14,000 acre-feet
Deer Creek/ White River
Frasinetto Farms
400 (CVC)
Kings River Hills Valley Irrigation District
NA Cross Valley Canal (2,000 acre-feet average)
1,000 acre-feet
Kaweah River Ivanhoe Irrigation District
Kaweah River Friant-Kern Canal (11,650 acre-feet average)
15,000 acre-feet
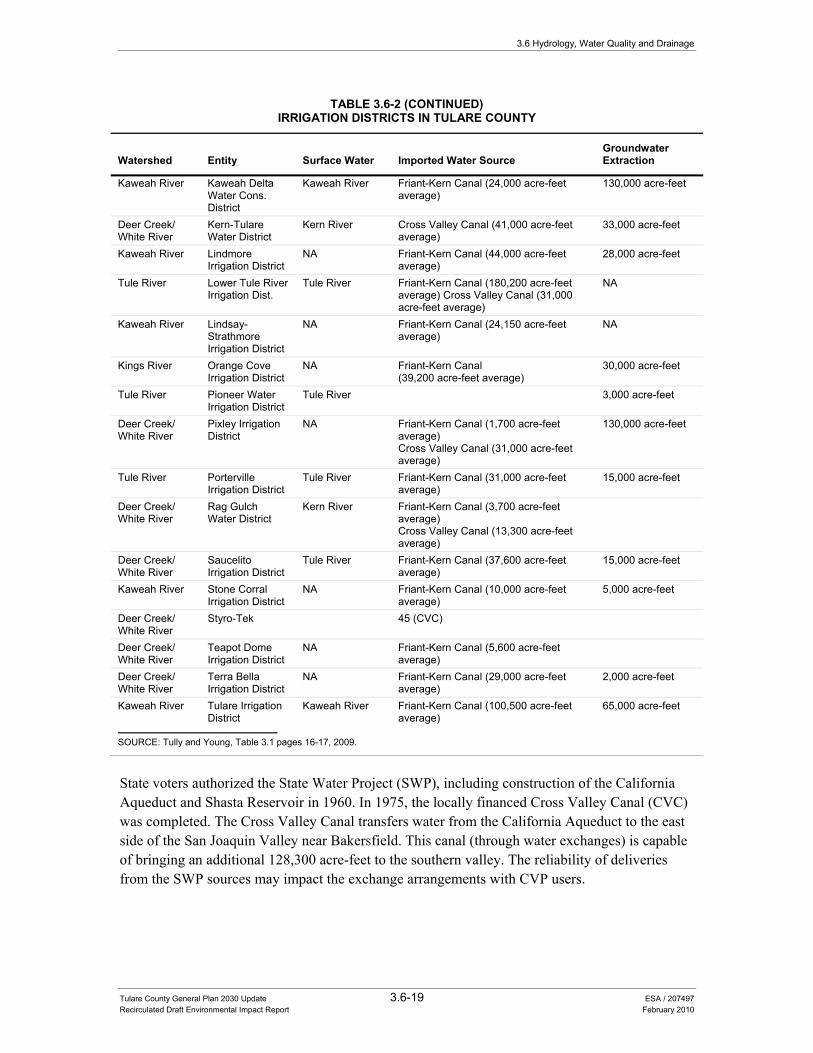
3.6 Hydrology, Water Quality and Drainage
Tulare County General Plan 2030 Update 3.6-19 ESA / 207497 Recirculated Draft Environmental Impact Report February 2010
TABLE 3.6-2 (CONTINUED) IRRIGATION DISTRICTS IN TULARE COUNTY
Watershed Entity Surface Water Imported Water Source Groundwater Extraction
Kaweah River Kaweah Delta Water Cons. District
Kaweah River Friant-Kern Canal (24,000 acre-feet average)
130,000 acre-feet
Deer Creek/ White River
Kern-Tulare Water District
Kern River Cross Valley Canal (41,000 acre-feet average)
33,000 acre-feet
Kaweah River Lindmore Irrigation District
NA Friant-Kern Canal (44,000 acre-feet average)
28,000 acre-feet
Tule River Lower Tule River Irrigation Dist.
Tule River Friant-Kern Canal (180,200 acre-feet average) Cross Valley Canal (31,000 acre-feet average)
NA
Kaweah River Lindsay-Strathmore Irrigation District
NA Friant-Kern Canal (24,150 acre-feet average)
NA
Kings River Orange Cove Irrigation District
NA Friant-Kern Canal (39,200 acre-feet average)
30,000 acre-feet
Tule River Pioneer Water Irrigation District
Tule River 3,000 acre-feet
Deer Creek/ White River
Pixley Irrigation District
NA Friant-Kern Canal (1,700 acre-feet average) Cross Valley Canal (31,000 acre-feet average)
130,000 acre-feet
Tule River Porterville Irrigation District
Tule River Friant-Kern Canal (31,000 acre-feet average)
15,000 acre-feet
Deer Creek/ White River
Rag Gulch Water District
Kern River Friant-Kern Canal (3,700 acre-feet average) Cross Valley Canal (13,300 acre-feet average)
Deer Creek/ White River
Saucelito Irrigation District
Tule River Friant-Kern Canal (37,600 acre-feet average)
15,000 acre-feet
Kaweah River Stone Corral Irrigation District
NA Friant-Kern Canal (10,000 acre-feet average)
5,000 acre-feet
Deer Creek/ White River
Styro-Tek 45 (CVC)
Deer Creek/ White River
Teapot Dome Irrigation District
NA Friant-Kern Canal (5,600 acre-feet average)
Deer Creek/ White River
Terra Bella Irrigation District
NA Friant-Kern Canal (29,000 acre-feet average)
2,000 acre-feet
Kaweah River Tulare Irrigation District
Kaweah River Friant-Kern Canal (100,500 acre-feet average)
65,000 acre-feet
SOURCE: Tully and Young, Table 3.1 pages 16-17, 2009.
State voters authorized the State Water Project (SWP), including construction of the California Aqueduct and Shasta Reservoir in 1960. In 1975, the locally financed Cross Valley Canal (CVC) was completed. The Cross Valley Canal transfers water from the California Aqueduct to the east side of the San Joaquin Valley near Bakersfield. This canal (through water exchanges) is capable of bringing an additional 128,300 acre-feet to the southern valley. The reliability of deliveries from the SWP sources may impact the exchange arrangements with CVP users.
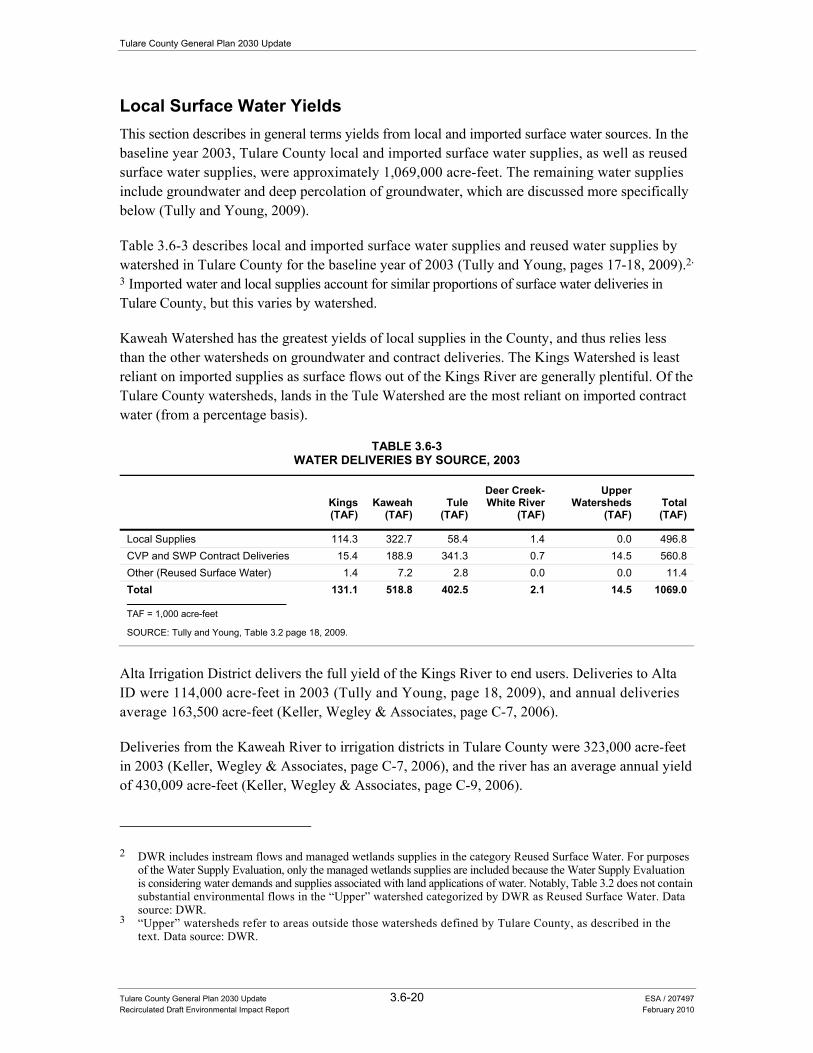
Tulare County General Plan 2030 Update
Tulare County General Plan 2030 Update 3.6-20 ESA / 207497 Recirculated Draft Environmental Impact Report February 2010
Local Surface Water Yields This section describes in general terms yields from local and imported surface water sources. In the baseline year 2003, Tulare County local and imported surface water supplies, as well as reused surface water supplies, were approximately 1,069,000 acre-feet. The remaining water supplies include groundwater and deep percolation of groundwater, which are discussed more specifically below (Tully and Young, 2009).
Table 3.6-3 describes local and imported surface water supplies and reused water supplies by watershed in Tulare County for the baseline year of 2003 (Tully and Young, pages 17-18, 2009).2,
3 Imported water and local supplies account for similar proportions of surface water deliveries in Tulare County, but this varies by watershed.
Kaweah Watershed has the greatest yields of local supplies in the County, and thus relies less than the other watersheds on groundwater and contract deliveries. The Kings Watershed is least reliant on imported supplies as surface flows out of the Kings River are generally plentiful. Of the Tulare County watersheds, lands in the Tule Watershed are the most reliant on imported contract water (from a percentage basis).
TABLE 3.6-3WATER DELIVERIES BY SOURCE, 2003
Kings (TAF)
Kaweah (TAF)
Tule (TAF)
Deer Creek-White River
(TAF)
Upper Watersheds
(TAF) Total (TAF)
Local Supplies 114.3 322.7 58.4 1.4 0.0 496.8 CVP and SWP Contract Deliveries 15.4 188.9 341.3 0.7 14.5 560.8 Other (Reused Surface Water) 1.4 7.2 2.8 0.0 0.0 11.4 Total 131.1 518.8 402.5 2.1 14.5 1069.0
TAF = 1,000 acre-feet
SOURCE: Tully and Young, Table 3.2 page 18, 2009.
Alta Irrigation District delivers the full yield of the Kings River to end users. Deliveries to Alta ID were 114,000 acre-feet in 2003 (Tully and Young, page 18, 2009), and annual deliveries average 163,500 acre-feet (Keller, Wegley & Associates, page C-7, 2006).
Deliveries from the Kaweah River to irrigation districts in Tulare County were 323,000 acre-feet in 2003 (Keller, Wegley & Associates, page C-7, 2006), and the river has an average annual yield of 430,009 acre-feet (Keller, Wegley & Associates, page C-9, 2006).
2 DWR includes instream flows and managed wetlands supplies in the category Reused Surface Water. For purposes of the Water Supply Evaluation, only the managed wetlands supplies are included because the Water Supply Evaluation is considering water demands and supplies associated with land applications of water. Notably, Table 3.2 does not contain substantial environmental flows in the “Upper” watershed categorized by DWR as Reused Surface Water. Data source: DWR.
3 “Upper” watersheds refer to areas outside those watersheds defined by Tulare County, as described in the text. Data source: DWR.
3.6 Hydrology, Water Quality and Drainage
Tulare County General Plan 2030 Update 3.6-21 ESA / 207497 Recirculated Draft Environmental Impact Report February 2010
The average historical annual yield of the Tule River is 141,960 acre-feet (Keller, Wegley & Associates, page C-14, 2006), and the entire yield is typically put to use within the Tule River Watershed (Keller, Wegley & Associates, page C-14, 2006).
Deer Creek and White River have only limited and intermittent surface water flows.
Imported Surface Water Yields Contracts with the Friant Division of the CVP are very significant for contractors within Tulare County. Class 1 water is the first 800,000 acre-feet of ‘firm’ Friant supply, from which contractors in the County receive a total of 404,900 acre-feet per year (Keller, Wegley & Associates, page C-25 and tables, 2006). Class 2 supplies start to develop after all Class 1 contracts have been filled and total 565,200 acre-feet per year in the County (Keller, Wegley & Associates, page C-25 and tables, 2006). Class 1 supplies are thus much more reliable than Class 2 supplies. CVP facilities Statewide deliver their full contract allocations only 20 percent of the time. Tulare County CVP Contractors may also receive “221 Water” which is water available through the CVP system in times of surplus (Tully and Young, page 19, 2009).
Cross Valley Canal deliveries bring up to 128,300 acre-feet of additional water into the region. Table 3.6-3 outlines the contract amounts in each watershed.
Groundwater This section characterizes groundwater supplies in Tulare County. Historically groundwater resources have been extracted to satisfy about one third of existing urban and agricultural demands, but are limited by groundwater basin yield in some locations and water quality issues in others. Groundwater planning efforts in the County are addressing some identified issues such as groundwater overdraft, but new challenges such as the potential for groundwater adjudication may impact the overall reliability of the County’s groundwater supplies.
Geographic and Hydrogeologic Characteristics Tulare County encompasses approximately 4,840 square miles in the southern San Joaquin Valley. This analysis focuses on the western portion of the County that overlies the aquifers discussed below. As noted previously, Tulare County is primarily located within California Department of Water Resources Tulare Lake Hydrologic Region (Tulare HR).4 The City of Visalia is the major population center in Tulare County, and is entirely dependent on groundwater for its supply.
DWR classifies groundwater supplies according to two distinct categories. The first is Net Groundwater and the second is Deep Percolation of Surface and Groundwater. Net Groundwater
4 Some data, notably many of those compiled at the state level by DWR, are aggregated at the level of 10 Hydrologic Regions. Although these data may be the best available on some topics, data at this level can be of limited use as these regions do not coincide with administrative or political boundaries as in the case of Tulare County and Tulare Lake HR.
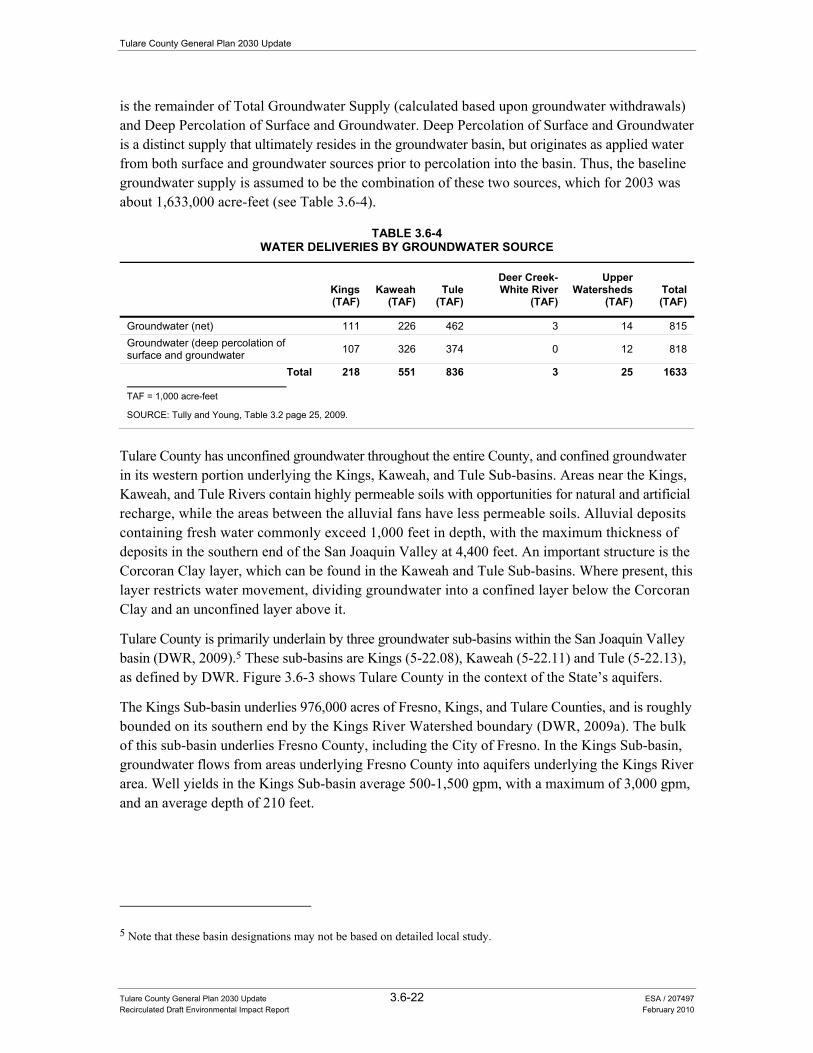
Tulare County General Plan 2030 Update
Tulare County General Plan 2030 Update 3.6-22 ESA / 207497 Recirculated Draft Environmental Impact Report February 2010
is the remainder of Total Groundwater Supply (calculated based upon groundwater withdrawals) and Deep Percolation of Surface and Groundwater. Deep Percolation of Surface and Groundwater is a distinct supply that ultimately resides in the groundwater basin, but originates as applied water from both surface and groundwater sources prior to percolation into the basin. Thus, the baseline groundwater supply is assumed to be the combination of these two sources, which for 2003 was about 1,633,000 acre-feet (see Table 3.6-4).
TABLE 3.6-4WATER DELIVERIES BY GROUNDWATER SOURCE
Kings (TAF)
Kaweah (TAF)
Tule (TAF)
Deer Creek-White River
(TAF)
Upper Watersheds
(TAF) Total (TAF)
Groundwater (net) 111 226 462 3 14 815 Groundwater (deep percolation of surface and groundwater 107 326 374 0 12 818
Total 218 551 836 3 25 1633
TAF = 1,000 acre-feet
SOURCE: Tully and Young, Table 3.2 page 25, 2009.
Tulare County has unconfined groundwater throughout the entire County, and confined groundwater in its western portion underlying the Kings, Kaweah, and Tule Sub-basins. Areas near the Kings, Kaweah, and Tule Rivers contain highly permeable soils with opportunities for natural and artificial recharge, while the areas between the alluvial fans have less permeable soils. Alluvial deposits containing fresh water commonly exceed 1,000 feet in depth, with the maximum thickness of deposits in the southern end of the San Joaquin Valley at 4,400 feet. An important structure is the Corcoran Clay layer, which can be found in the Kaweah and Tule Sub-basins. Where present, this layer restricts water movement, dividing groundwater into a confined layer below the Corcoran Clay and an unconfined layer above it.
Tulare County is primarily underlain by three groundwater sub-basins within the San Joaquin Valley basin (DWR, 2009).5 These sub-basins are Kings (5-22.08), Kaweah (5-22.11) and Tule (5-22.13), as defined by DWR. Figure 3.6-3 shows Tulare County in the context of the State’s aquifers.
The Kings Sub-basin underlies 976,000 acres of Fresno, Kings, and Tulare Counties, and is roughly bounded on its southern end by the Kings River Watershed boundary (DWR, 2009a). The bulk of this sub-basin underlies Fresno County, including the City of Fresno. In the Kings Sub-basin, groundwater flows from areas underlying Fresno County into aquifers underlying the Kings River area. Well yields in the Kings Sub-basin average 500-1,500 gpm, with a maximum of 3,000 gpm, and an average depth of 210 feet.
5 Note that these basin designations may not be based on detailed local study.
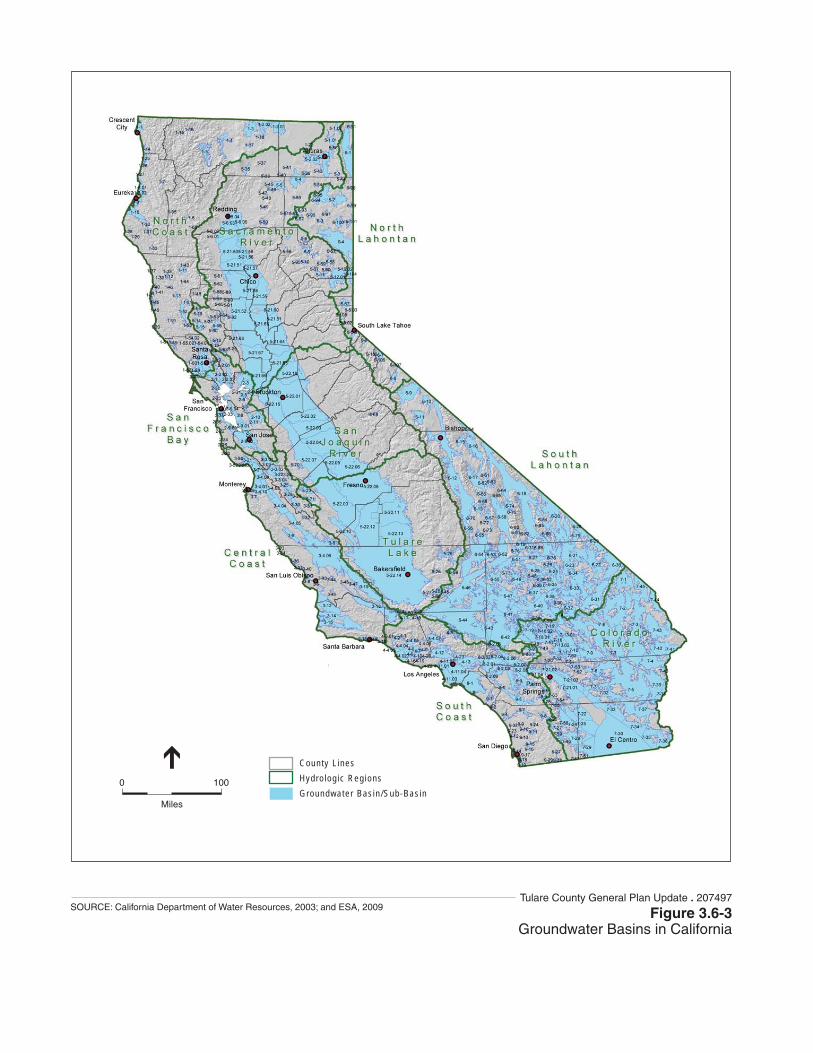
County L inesHydro log ic Reg ionsGroundwater Bas in /Sub-Bas in
0 100
Miles
Figure 3.6-3Groundwater Basins in California
SOURCE: California Department of Water Resources, 2003; and ESA, 2009Tulare County General Plan Update . 207497
Tulare County General Plan 2030 Update
Tulare County General Plan 2030 Update 3.6-24 ESA / 207497 Recirculated Draft Environmental Impact Report February 2010
The Kings Sub-basin is a “Type C,” or low level of knowledge, basin, indicating that there is not enough data to estimate its groundwater extraction or a groundwater budget. Estimates of specific groundwater yields for the basin range from 0.2 percent to 36 percent, with a recent estimate of 11.3 percent on average (DWR, pages 2-3, 2006).
The Kaweah Sub-basin underlies 446,000 acres, primarily in Tulare County, with its western portion underlying Kings County. Within Tulare County, the Kaweah Sub-basin coincides with the Kaweah River Watershed. Well yields in Kaweah Sub-basin average 1,000-2,000 gpm, with a maximum of 2,500 gpm, with well depths ranging from 100-500 feet. The estimated average specific yield for this sub-basin is 10.8 percent (DWR, pages 1-4, 2004a).
The Kaweah sub-basin has a “Type B” level of groundwater balance knowledge, indicating a use-based estimate of its groundwater budget. The Kaweah River is the major source of recharge to the area. DWR estimates natural recharge to be 62,400 af/yr. There are approximately 286,000 acre-feet of applied water recharged into the sub-basin, and an unknown amount of artificial recharge. Annual urban and agricultural extraction is estimated to be 58,800 acre-feet and 699,000 acre-feet, respectively. Other extractions and subsurface inflow were not determined.
The Tule Sub-basin is in the southwestern portion of Tulare County, underlying 467,000 acres. Within Tulare County, the Tule Sub-basin coincides with the Tule River, Deer Creek and White River watersheds. There are hydrogeologic connections between Tulare County and Kern and/or Kings Counties adjoining Tule Sub-basin.6 The estimated average specific yield for this sub-basin is 9.5 percent (DWR, pages 1-2, 2004b). Land subsidence of 12 to 16 feet has occurred in the sub-basin in the past. Maximum well yields in the Tule Sub-basin are 3,000 gpm, with average yields not reported.
Tule Sub-basin has a “Type B” level of groundwater balance knowledge. Natural recharge is estimated at 34,000 af/yr, and there are about 201,000 acre-feet of applied water recharge. Annual urban extraction is estimated to be 19,300 af/yr, and annual agricultural extraction was estimated to be 641,000 af/yr. Other extractions and subsurface inflow and outflow were not determined (DWR, page 3, 2004b).
In the Foothills region outside of these defined sub-basins, groundwater is also used, with extractions primarily derived from unconfined aquifers. In the eastern portion of the County in the Sierra Foothills, wells are less productive as the groundwater aquifer characteristics are less suitable to large-scale groundwater storage. Specifically, moving into the foothills the permeable and loamy soils give rise to fractured rock aquifers. Nevertheless, in certain areas communities have been successful in harnessing groundwater from these types of aquifers.
Figure 3.6-4 shows the enumerated groundwater sub-basins underlying Tulare County.
6 The Tule Sub basin is probably at least partially defined based on political, rather that hydrogeologic characteristics. A small portion of Tulare Lake Sub basin (5-22.12) underlies Tulare County, but is not detailed in this analysis.
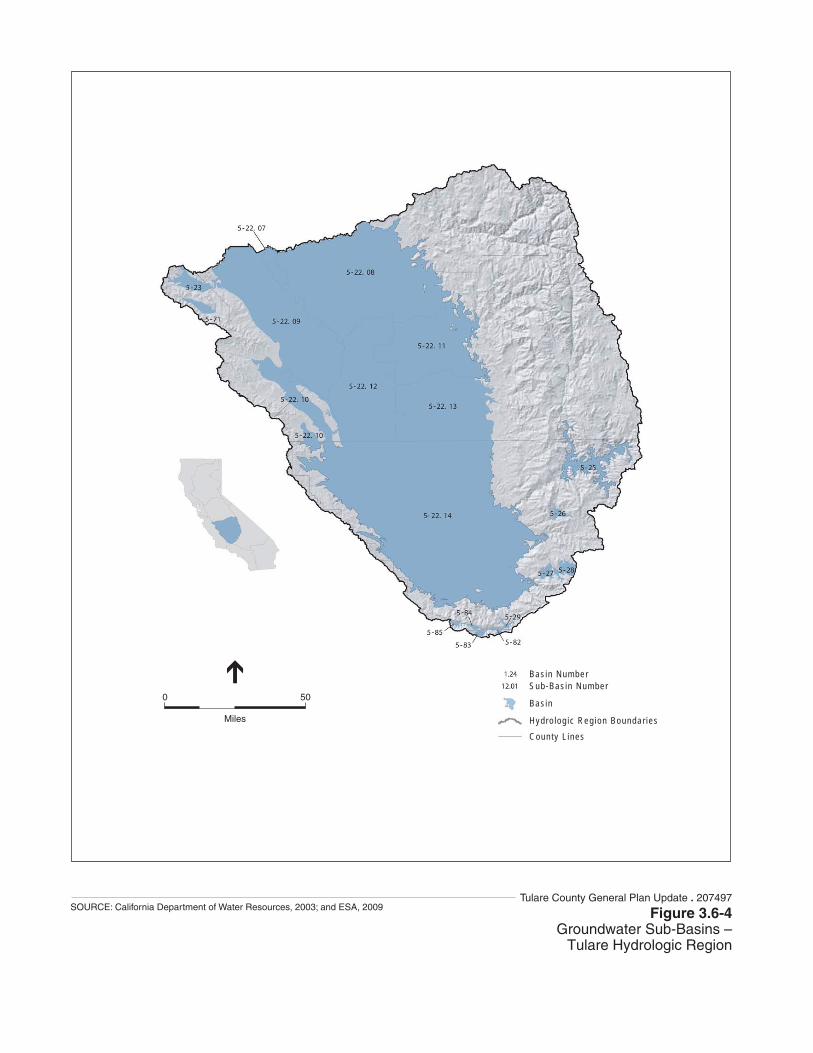
Bas in NumberSub-Bas in Number
Bas in
Hydro log ic Reg ion Boundar iesCounty L ines
0 50
Miles
Figure 3.6-4Groundwater Sub-Basins –
Tulare Hydrologic Region
SOURCE: California Department of Water Resources, 2003; and ESA, 2009Tulare County General Plan Update . 207497
Tulare County General Plan 2030 Update
Tulare County General Plan 2030 Update 3.6-26 ESA / 207497 Recirculated Draft Environmental Impact Report February 2010
Groundwater Use and Overdraft in Tulare County As mentioned above Tulare County relies on a combination of local surface water, imported surface water, and groundwater to meet its agricultural and urban demands. Groundwater is particularly important as a water source in the region. DWR classifies groundwater supplies according to two distinct categories. The first is Net Groundwater and the second is Deep Percolation of Surface and Groundwater. Net Groundwater is the remainder of Total Groundwater Supply (calculated based upon groundwater withdrawals) and Deep Percolation of Surface and Groundwater. Deep Percolation of Surface and Groundwater is a distinct supply that ultimately resides in the groundwater basin, but originates as applied water from both surface and groundwater sources prior to percolation into the basin. Thus, the baseline groundwater supply is assumed to be the combination of these two sources, which for 2003 was about 1,633,000 acre-feet (see Table 3.6-4, above).
Groundwater has historically accounted for 41% of total water supply in Tulare Lake Hydrologic Region (Tulare HR), among the highest percentages in the State (Tully and Young, page 25, 2009). In addition, the sum total use of groundwater in Tulare HR is higher than the total groundwater use in any other HR. The Kings, Tule, and Kaweah Basins were all among 11 basins identified by DWR in 1980 as being in a ‘critical condition of overdraft’.7 As of 2003, this determination has not been revisited (Tully and Young, page 25, 2009).
Groundwater pumping increases in Tulare County when surface supplies available to the County are reduced. Surface water supplies have been reduced in recent years due to drought, environmental restrictions, and other factors, discussed below.
Estimates of groundwater overdraft vary for the Tulare HR. Total overdraft has been recently estimated at 820,000 af/yr (County of Tulare, 2010 Background Report, page 10-11, 2010a), while historical overdraft has been estimated at 308,000 af/yr for the period 1921-1993 (Tully and Young, page 25, 2009). DWR estimated changes in groundwater storage for the Tulare HR over a range of recent water year types as +263,000 acre-feet in 1998, -1,625,000 acre-feet in 2000, and -4,115,000 acre-feet in 2001 (DWR, 2005).
In Tulare County, groundwater yields tend to increase with distance from the foothills. However, since demands for groundwater increase as well, groundwater overdraft also tends to increase in the westward direction (Keller, Wegley & Associates, page C-8, 2006).
Subsidence has occurred in various parts of the County. In the Kaweah Sub-basin, subsidence of up to four feet has occurred due to compaction. Subsidence is addressed further in Section 3.7, “Geology, Soils, Seismicity, and Mineral Resources.”
In response to such overdraft, there are at least 19 entities in Tulare County with active groundwater management programs (County of Tulare, 2010 Background Report, page 10-12, 2010a). Among the
7 Water Code §12924. ‘A basin is subject to critical conditions of overdraft when continuation of present water management practices would probably result in significant adverse overdraft-related environmental, social, or economic impacts.’
3.6 Hydrology, Water Quality and Drainage
Tulare County General Plan 2030 Update 3.6-27 ESA / 207497 Recirculated Draft Environmental Impact Report February 2010
larger programs are those administered by the Kaweah Delta Water Conservation District, the Kings River Water Conservation District, the Tulare Irrigation District, the Lower Tule Water Users Association, the Alta Irrigation District, and the Kings River Water Conservation District.
Groundwater recharge occurs both naturally and artificially. Natural recharge consists of percolation from lakes, drainage channels, and rainfall. Artificial recharge occurs through seepage from conveyance facilities and percolation from irrigation, as well as deliveries of surface water to recharge basins, open land, unlined canals, and fields in the off-season. Recharge can serve to stabilize groundwater reservoirs and utilize groundwater storage capacity made available by the removal of water from the groundwater aquifer. Most recharge programs are designed to retain and percolate surface water supplies not immediately needed or used for irrigation.
Water Quality In most areas of Tulare County, groundwater quality is acceptable for agricultural and urban uses through normal treatment and delivery operations. Where local impairments exist, the primary constituents of concern are high TDS, nitrate, arsenic, and organic compounds such as herbicides, pesticides and fertilizers, as well as instances of radiological parameters such as uranium and radium 228. However, these are not of significant concern across most of the sub-basins.
The salinity of groundwater typically increases in a westward direction across the San Joaquin Valley. Conversely, nitrates and radiological components present near the Sierra foothills region decrease with distance from the Foothills.
The Kings Sub-basin’s groundwater near the Sierra foothills may be high in nitrates and sometimes radiological contaminants, and there are localized instances of pesticide impairment (DWR, page 4, 2006). Farther from the foothills, naturally occurring contaminants are diluted by surface water recharge, and replaced with organic contaminants. All communities in the Kings Sub-basin are influenced by water quality issues to some extent (Keller, Wegley & Associates, page C-8, 2006).
The Kaweah sub-basin has high nitrate areas on its eastern side where TDS values typically range from 300-600 mg/L.
The Tule Sub-basin has some of the most significant issues in the County, with chlorides, nitrates, and DBCP extending several miles from the Sierra foothills including beneath the City of Lindsay. Water quality in this area is variable. Communities along the Highway 99 axis have access to good quality deep and shallow sources, while water quality in other areas is unacceptable due to arsenic and other naturally occurring contaminants. Arsenic is a locally specific problem. For example, several communities, such as Alpaugh, had wells brought into noncompliance when Maximum Contaminant Levels for arsenic were reduced from 50 ppb to 10 ppb several years ago.
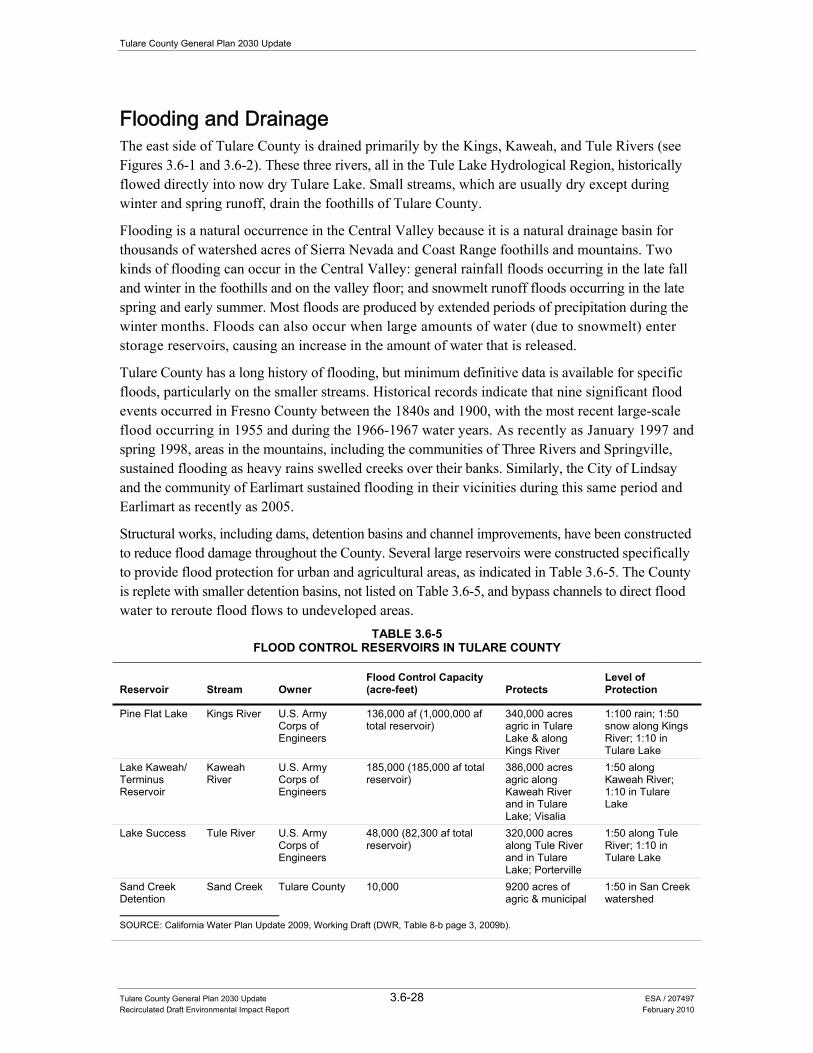
Tulare County General Plan 2030 Update
Tulare County General Plan 2030 Update 3.6-28 ESA / 207497 Recirculated Draft Environmental Impact Report February 2010
Flooding and Drainage The east side of Tulare County is drained primarily by the Kings, Kaweah, and Tule Rivers (see Figures 3.6-1 and 3.6-2). These three rivers, all in the Tule Lake Hydrological Region, historically flowed directly into now dry Tulare Lake. Small streams, which are usually dry except during winter and spring runoff, drain the foothills of Tulare County.
Flooding is a natural occurrence in the Central Valley because it is a natural drainage basin for thousands of watershed acres of Sierra Nevada and Coast Range foothills and mountains. Two kinds of flooding can occur in the Central Valley: general rainfall floods occurring in the late fall and winter in the foothills and on the valley floor; and snowmelt runoff floods occurring in the late spring and early summer. Most floods are produced by extended periods of precipitation during the winter months. Floods can also occur when large amounts of water (due to snowmelt) enter storage reservoirs, causing an increase in the amount of water that is released.
Tulare County has a long history of flooding, but minimum definitive data is available for specific floods, particularly on the smaller streams. Historical records indicate that nine significant flood events occurred in Fresno County between the 1840s and 1900, with the most recent large-scale flood occurring in 1955 and during the 1966-1967 water years. As recently as January 1997 and spring 1998, areas in the mountains, including the communities of Three Rivers and Springville, sustained flooding as heavy rains swelled creeks over their banks. Similarly, the City of Lindsay and the community of Earlimart sustained flooding in their vicinities during this same period and Earlimart as recently as 2005.
Structural works, including dams, detention basins and channel improvements, have been constructed to reduce flood damage throughout the County. Several large reservoirs were constructed specifically to provide flood protection for urban and agricultural areas, as indicated in Table 3.6-5. The County is replete with smaller detention basins, not listed on Table 3.6-5, and bypass channels to direct flood water to reroute flood flows to undeveloped areas.
TABLE 3.6-5FLOOD CONTROL RESERVOIRS IN TULARE COUNTY
Reservoir Stream Owner Flood Control Capacity (acre-feet) Protects
Level of Protection
Pine Flat Lake Kings River U.S. Army Corps of Engineers
136,000 af (1,000,000 af total reservoir)
340,000 acres agric in Tulare Lake & along Kings River
1:100 rain; 1:50 snow along Kings River; 1:10 in Tulare Lake
Lake Kaweah/ Terminus Reservoir
Kaweah River
U.S. Army Corps of Engineers
185,000 (185,000 af total reservoir)
386,000 acres agric along Kaweah River and in Tulare Lake; Visalia
1:50 along Kaweah River; 1:10 in Tulare Lake
Lake Success Tule River U.S. Army Corps of Engineers
48,000 (82,300 af total reservoir)
320,000 acres along Tule River and in Tulare Lake; Porterville
1:50 along Tule River; 1:10 in Tulare Lake
Sand Creek Detention
Sand Creek Tulare County 10,000 9200 acres of agric & municipal
1:50 in San Creek watershed
SOURCE: California Water Plan Update 2009, Working Draft (DWR, Table 8-b page 3, 2009b).
3.6 Hydrology, Water Quality and Drainage
Tulare County General Plan 2030 Update 3.6-29 ESA / 207497 Recirculated Draft Environmental Impact Report February 2010
Flood Governance Flood and drainage management in Tulare County are conducted by a network of federal, State and local agencies, each with responsibility to enforce various flood management regulations. At the federal level, official floodplain maps are maintained by the Federal Emergency Management Agency (FEMA) as an important part of the national flood insurance program. FEMA determines areas subject to flood hazards and designates these areas by relative risk of flooding on maps for each community, known as Flood Insurance Rate Maps (FIRM). A 100-year flood is considered for purposes of land use planning and protection of property and human safety. Figure 3.6-5 shows the most recent available FEMA flood information, while Figure 3.6-6 shows the special districts in Tulare County that oversee drainage, flood control and levees facilities. It should be noted that the two level districts are currently inactive. Also at the federal level, the Corps operates Pine Flat, Terminus (Lake Kaweah) and Lake Success Reservoirs, each with significant flood flow capacity, as indicated in Table 3.6-5. Coordination with the Corps’ operations is especially important during flood emergencies.
State agencies have a larger role than ever before, due to the passage of important new flood management regulations in 2007 (described in the Regulatory Setting, above). DWR is the key State agency to implement the new flood management regulations. The State Office of Emergency Services (OES) provides emergency response in coordination with other available agencies. The jurisdiction of the Central Valley Flood Protection Board (formerly the Reclamation Board) extends into Tulare County, where it retains its oversight of levees, and also has a new review capacity over the Tulare County General Plan Safety Element. Tulare County is required to submit its draft Safety Element to the CVFPB for review at least 90 days prior to adopting the element. The CVFPB is required to respond with its written recommendations within 60 days. The Board is authorized to address the uses of land in areas subject to flooding that would offer protection from unreasonable flooding risks and to recommend methods and strategies for reducing flood risk and protecting flood areas (Government Code Sec. 65302.7). However, the CVFPB’s anticipated Plan for Central Valley Flood Protection will not extend into the Tulare Lake Hydrologic Region, an area that drains into the now dry Tulare Lake.
The Tulare County Flood Control District, a countywide district governed by the County Board of Supervisors, is the local flood management agency. Tulare County participates in the National Flood Insurance Program Community Rating System, uses FEMA insurance rate maps, and enforces Ordinance Code of Tulare County, Part VII, Chapter 27, Flood Damage Prevention. The County Zoning Ordinance also provides regulations to reduce flood hazards through land use regulations.
Until recently, the County program described above was sufficient to meet federal, State and local regulations. However, Tulare County is now required to use State and local information (in addition to FEMA maps) to annually incorporate updated flood information into the County’s General Plan Land Use Element (Government Code Sections 65302(a)) and, after January 2009, into the County General Plan Conservation and Safety Element (Government Code Sections 65302(d) and (g)). Tulare County will be subject to Statewide requirements that require up-to-date flood-risk and drainage problem areas be identified, mapped and addressed through County General Plan policies, maps and land use diagrams. If new areas are identified as flood risk areas in the General Plan maps, the County Zoning Ordinance (including zone district maps for affected areas) will need to be
Tulare County General Plan 2030 Update
Tulare County General Plan 2030 Update 3.6-30 ESA / 207497 Recirculated Draft Environmental Impact Report February 2010
amended to correlate with the General Plan. County General Plan and Zone Ordinance Maps are also expected to reflect June 2009 FEMA map modifications for areas in and around Visalia.
The “Regulatory Setting” above presents additional information on recent regulatory changes and related agency roles.
100-Year Flood Hazard The 100-year flood is defined as the flood event that has a one percent chance of occurring in any given year. It is important to note that the delineation of areas within the 100-year floodplain represents a statistical probability for the long-term average occurrence of flooding. Actually, flooding can occur in a 100-year floodplain more or less frequently than once in a hundred years. Smaller floods have an even greater chance of occurring in any year and pose hazards as well. Areas that are sporadically flooded only become inundated as a result of more uncommon and extreme precipitation/runoff events.
The boundaries of the 100-year floodplain are delineated by FEMA on the basis of hydrology, topography, and modeling of flow during predicted rainstorms. Figure 3.6-5 shows areas of the County that fall within FEMA-designated 100-year flood zones. 100-year flood zones are located throughout the western portion of the County from a number of streams and St. Johns River, White River, and Tule River.
The flood carrying capacity in rivers and streams has decreased as trees, vegetation, and structures (e.g., bridges, trestles, buildings) have increased along the Kaweah, Kings, and Tule Rivers. Unsecured and uprooted material can be carried down a river, clogging channels and piling up against trestles and bridge abutments that can, in turn, give way or collapse, increasing blockage and flooding potential. Flooding can force waters out of the river channel and above its ordinary floodplain. Confined floodplains can result in significantly higher water elevations and higher flow rates during high runoff and flood events.
Updated channel analyses have not been performed to determine the amount of obstruction posed by vegetation and development in the Kaweah, Kings, or Tule River channels. Also, FEMA analysis of predicted flooding does not account for the effects of continued land subsidence, local drainage issues or the rise in sea level associated with the greenhouse effect. As such, FEMA maps depicting the 100-year floodplain for the rivers probably do not reflect the true extent and risk of flooding hazards in Tulare County.
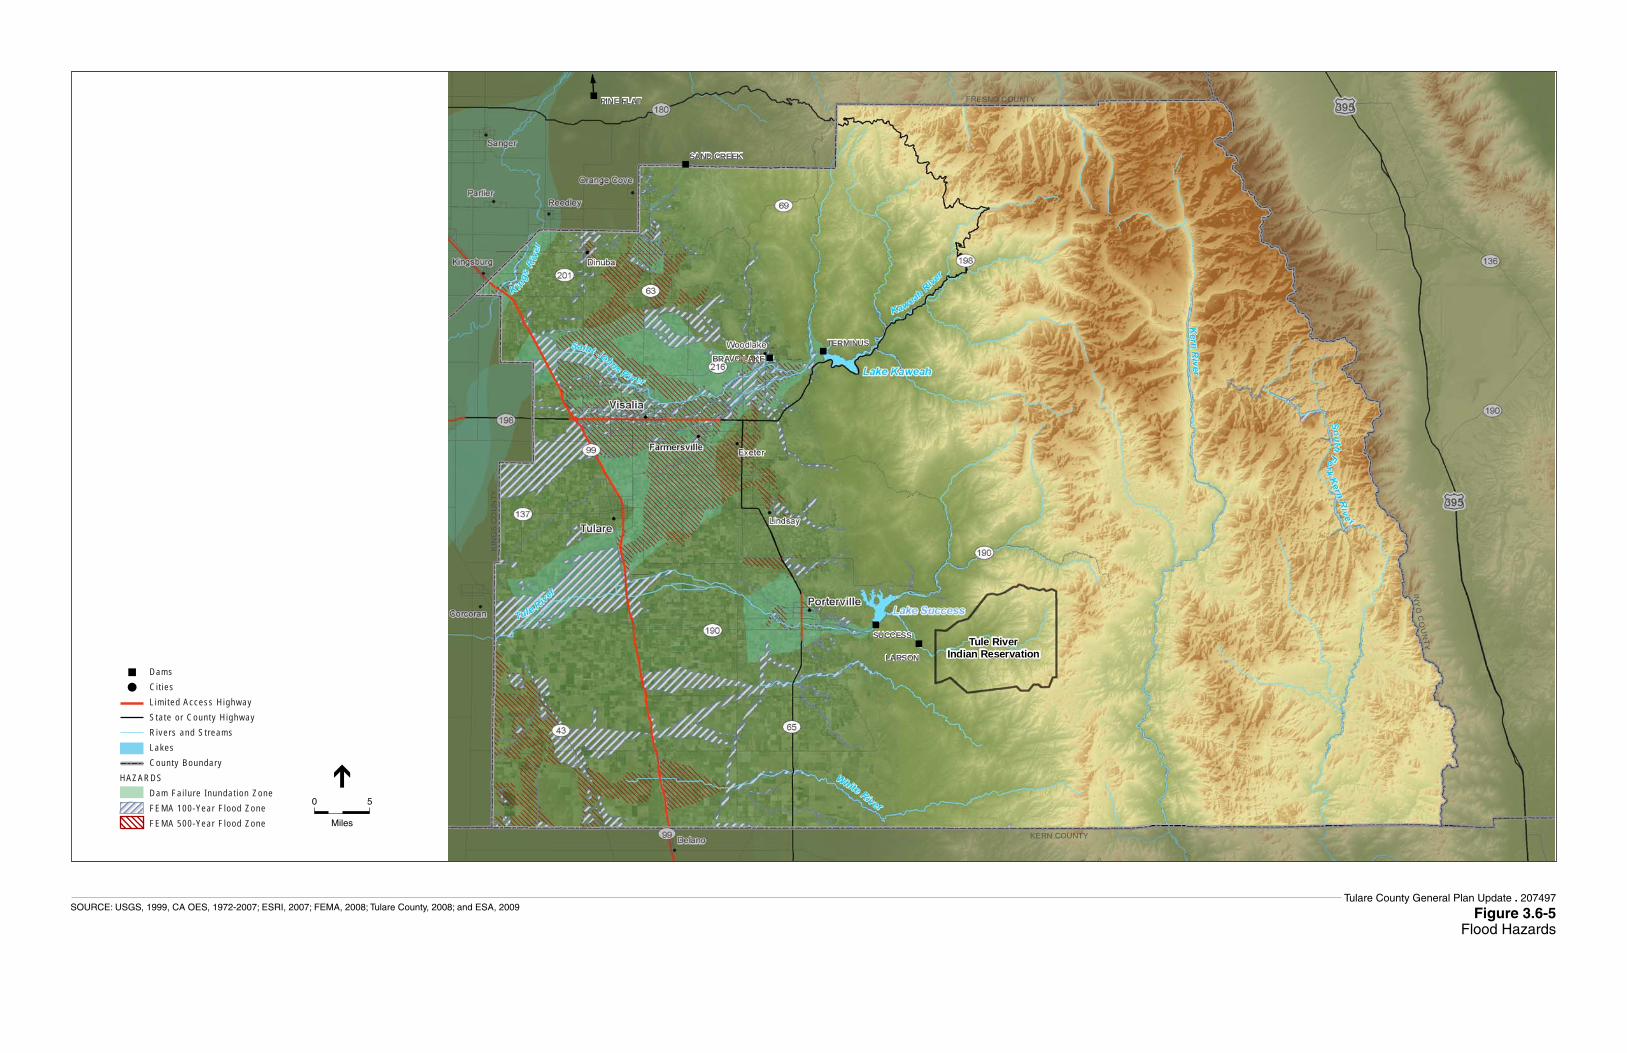
FRESNO COUNTY
INY
OC
OU
NTY
KERN COUNTY
KIN
GS
CO
UN
TY
Tule RiverIndian ReservationLARSON
SUCCESS
TERMINUS
SAND CREEK
BRAVO LAKE
PINE FLAT
Dams C i t ies L im i ted Access H ighway Sta te o r County H ighway R ivers and St reams Lakes County BoundaryHAZARDS Dam Fa i lu re Inundat ion Zone FEMA 100-Year F lood Zone FEMA 500-Year F lood Zone
0 5
Miles
Tulare County General Plan Update . 207497
Figure 3.6-5Flood Hazards
SOURCE: USGS, 1999, CA OES, 1972-2007; ESRI, 2007; FEMA, 2008; Tulare County, 2008; and ESA, 2009

3.6 Hydrology, Water Quality and Drainage
Tulare County General Plan 2030 Update 3.6-33 ESA / 207497 Recirculated Draft Environmental Impact Report February 2010
200-Year and 500-Year Flood Hazards The 200-year and 500-year flood hazard areas are established in the same manner as the 100-year flood hazard area. New California regulations require use a 200-year flood hazard areas for some urban areas in which more than 10,000 residents area protected by project levees (Public Resources Code 5096.805). The 500-year flood is defined as the flood event that has a 0.2 percent chance of occurring in any given year. Like the 100-year floodplain, it is important to note that the delineation of areas within the 200-year or 500-year floodplain zone represents a statistical probability for the long-term average occurrence of flooding. Actually, flooding can occur in a 200-year or 500-year floodplain more or less frequently than once every two hundred or five hundred years. Smaller floods (i.e., a 100-year event) have an even greater chance of occurring in any year and pose hazards as well. Areas that are sporadically flooded only become inundated as a result of more uncommon and extreme precipitation/runoff events. Like 100-year flood zones, 500-year flood zones are located throughout the western portion of the County near the above mentioned streams and rivers (see Figure 3.6-5).
Local Drainage and Levee Failure Issues Localized drainage issues occur throughout the County, generally in proximity to floodplains as shown on Figure 3.6-6. Levees have been built throughout the region, primarily to increase available land for agriculture. Such levees rarely meet current standards for flood protection. In locations where homes or other urban development occurs behind agricultural levees, those areas are likely to experience drainage issues as flood waters are held behind the levee, unable to drain to the river. Identification of potential drainage and levee issues and prevention of development in affected areas has been found to be more effective than fixing such problems through larger levees. Continued encroachment by adjacent property owners, budget limitations, along with environmental limitations on maintenance of natural and manmade watercourses has resulted in the reduced effectiveness of these structures.
Dam Failure Inundation Two major dams could cause substantial flooding in Tulare County in the event of a failure: Terminus Dam on Lake Kaweah and Success Dam on Lake Success. In addition, there are many smaller dams throughout the County that would cause localized flooding in the event of their failing. However, a comprehensive analysis of the potential for dam failure and possible downstream effects for these upstream dams has been undertaken by the U.S. Army Corps of Engineers, resulting in the recent construction of Fuse gates at Terminus Dam and the on going seismic remediation and enlargement projects of the Success Dam expected to begin construction in 2012. Figure 3.6-5 shows areas of the County that could be subject to dam inundation in the event of dam failure. The inundation area below Terminus Dam extends to portions of the Woodlake area, Farmersville, Visalia, Ivanhoe, and Goshen. The inundation area below Success Dam covers the city of Porterville. Orosi and Cutler are located within the inundation area of Sand Creek Dam.
Tulare County General Plan 2030 Update
Tulare County General Plan 2030 Update 3.6-34 ESA / 207497 Recirculated Draft Environmental Impact Report February 2010
Dam failure can result from numerous natural or human activities, such as earthquakes, erosion, improper siting, rapidly rising flood waters, and structural and design flaws. Flooding due to dam failure can cause loss of life, damage to property, and other ensuing hazards. Damage to electric-generating facilities and transmission lines associated with hydro-electric dams could also affect life support systems in communities outside the immediate hazard area.
Flood, Levee, Stormwater and Drainage Districts There is one flood control district, the Tulare County Flood Control District, established by State legislation in November 1969 and encompassing the entire County (Figure 3.6-6). The Act establishing the District provides the following powers to the District:
The Act also establishes the Board of Supervisors of Tulare County ex-officio as the governing Board of the District. Also, the Board appoints a commission of seven members to which may be delegated any or all of the Board’s powers under the Act (Tulare LAFCo, page 13-1, 1975). As such, the County Flood District has the authority to address local drainage, flooding and related issues such as levee failure. There are also two levee districts (Levee No. 1 and Levee No. 2) located along the St. John’s River north of Visalia, however these districts are inactive. There is also one storm water district (Deer Creek) and one Drainage District (Tulare Lake).
Impacts and Mitigation Measures
Significance Criteria The significance criteria for this analysis were adapted from criteria presented in Appendix G, “Environmental Checklist Form”, of the CEQA Guidelines and based on the professional judgment of the County of Tulare and its consultants. The proposed project would result in a significant impact if it would:
• Violate any water quality standards or Waste Discharge Requirements, or otherwise substantially degrade water quality;
• Substantially deplete groundwater supplies or interfere substantially with groundwater recharge such that there should be a net deficit in aquifer volume or a lowering of the local groundwater table level (e.g., the production rate of pre-existing nearby wells would drop to a level which would not support existing land uses or planned uses for which permits have been granted);
• Substantially alter the existing drainage pattern of the site or area, including through the alteration of the course of a stream or river, in a manner which would result in substantial erosion or siltation on- or off-site;
• Substantially alter the existing drainage pattern of the site or area, including through alteration of the course of a stream or river, or substantially increase the rate or amount of surface runoff in a manner which would result in flooding on- or off-site;
• Create or contribute runoff water which would exceed the capacity of existing or planned storm water drainage systems or provide substantial additional sources of polluted runoff;
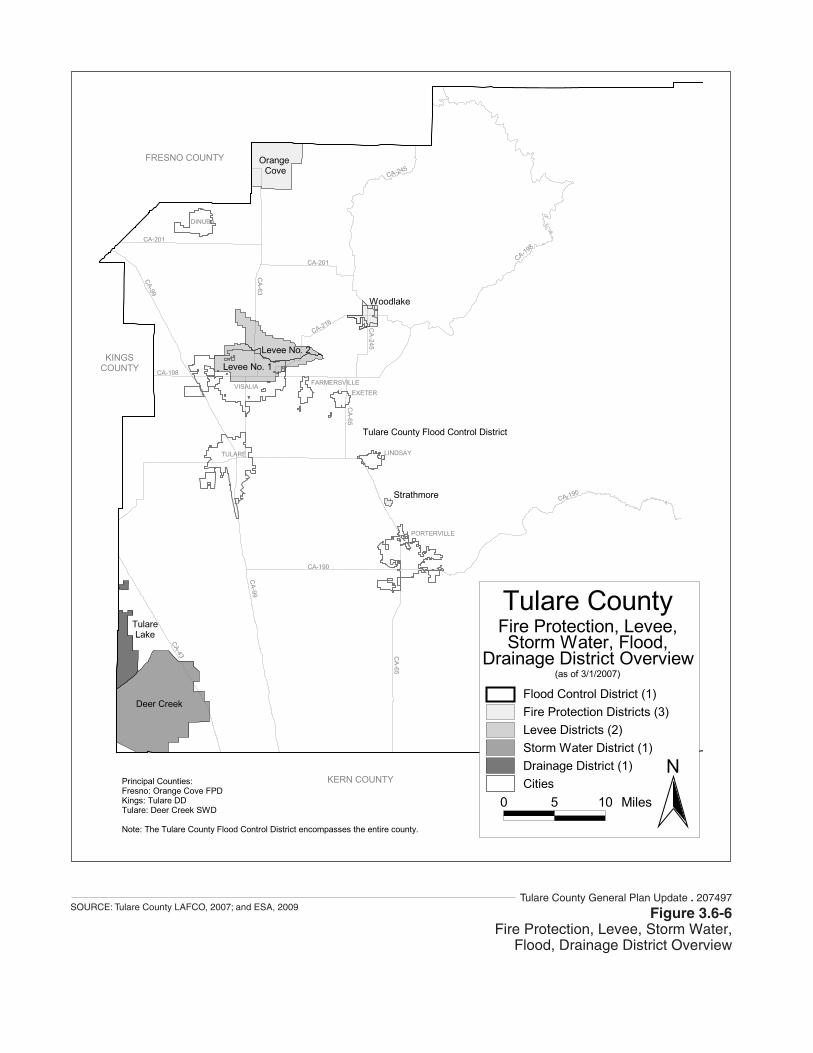
Figure 3.6-6Fire Protection, Levee, Storm Water,
Flood, Drainage District Overview
SOURCE: Tulare County LAFCO, 2007; and ESA, 2009Tulare County General Plan Update . 207497
Tulare County General Plan 2030 Update
Tulare County General Plan 2030 Update 3.6-36 ESA / 207497 Recirculated Draft Environmental Impact Report February 2010
• Place people or structures within a 100-year flood hazard area, as mapped on a federal Flood Hazard Boundary or Flood Insurance Rate Map or other flood hazard delineation map;
• Place people or structures within a 100-year flood hazard area structures that would impede or redirect flood flows; or
• Expose people or structures to a significant risk of loss, injury, or death involving flooding, including flooding as a result of the failure of a levee or dam.
Methodology This section evaluates potential water resource impacts related to water quality, groundwater and flood protection for urban, rural and agriculture uses by the proposed project. Implementation of the proposed project would result in varying levels of growth-related impacts on all water resources as well as affect State, county, special district and other agencies that have a role in water quality, groundwater and flood-related issues. The first step in the impact analysis was to establish significance criteria consistent with CEQA and Tulare County Guidelines that was used as a basis for identifying and evaluating impacts.
Evaluation of the County’s water resources involved understanding of existing and anticipated water supplies from local watersheds, imported surface water and groundwater. In developing the environmental setting for this section, information from the 2005 Water Plan, containing 2003 data, is used in this EIR because data for the 2010 Water Plan (for the Tulare Lake Basin) is not yet available. Then existing and anticipated demand for known groundwater supplies were identified. By comparing existing and future anticipated supply and demand, potential impacts related to water quality and groundwater supplies were identified. Flooding and drainage impacts were considered in the context of existing floodplain protection and the changing regulatory context of flooding and drainage issues. These potential impacts were then assessed in the context of the proposed project policies to determine impact levels before and after mitigation.
Assessment of Countywide water supply plus water and wastewater service-related issues are discussed in Section 3.9 “Public Services, Recreation, and Utilities” under Impact 3.9-1.
Summary of Impacts This section evaluates hydrology, water quality, and drainage impacts related to the proposed project. For this programmatic evaluation, impacts have been assessed for the overall general plan along with the various planning areas that comprise the County, with Table 3.6-6 providing an overview of these impacts for the proposed project and the various planning areas. Given the nature of the impacts, it is anticipated that implementation of the proposed project would result in similar impacts to all geographic planning areas of the County.
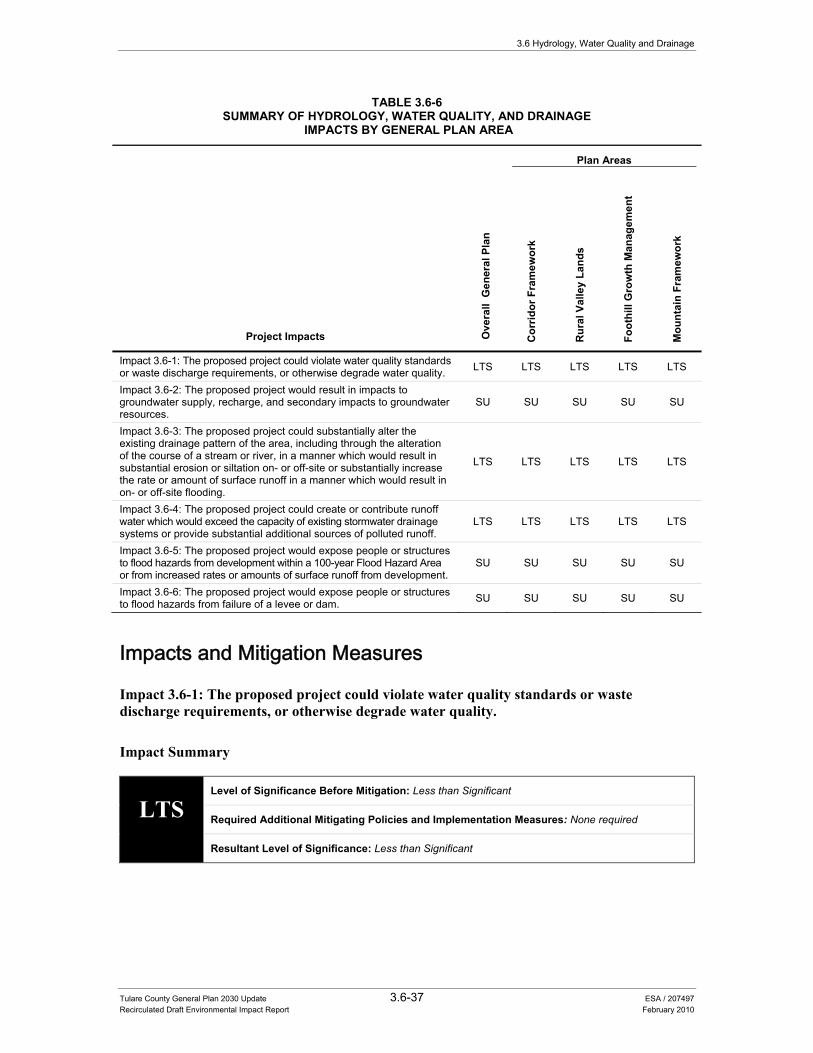
3.6 Hydrology, Water Quality and Drainage
Tulare County General Plan 2030 Update 3.6-37 ESA / 207497 Recirculated Draft Environmental Impact Report February 2010
TABLE 3.6-6SUMMARY OF HYDROLOGY, WATER QUALITY, AND DRAINAGE
IMPACTS BY GENERAL PLAN AREA
Project Impacts Ove
rall
Gen
eral
Pla
n
Plan Areas
Cor
ridor
Fra
mew
ork
Rur
al V
alle
y La
nds
Foot
hill
Gro
wth
Man
agem
ent
Mou
ntai
n Fr
amew
ork
Impact 3.6-1: The proposed project could violate water quality standards or waste discharge requirements, or otherwise degrade water quality. LTS LTS LTS LTS LTS
Impact 3.6-2: The proposed project would result in impacts to groundwater supply, recharge, and secondary impacts to groundwater resources.
SU SU SU SU SU
Impact 3.6-3: The proposed project could substantially alter the existing drainage pattern of the area, including through the alteration of the course of a stream or river, in a manner which would result in substantial erosion or siltation on- or off-site or substantially increase the rate or amount of surface runoff in a manner which would result in on- or off-site flooding.
LTS LTS LTS LTS LTS
Impact 3.6-4: The proposed project could create or contribute runoff water which would exceed the capacity of existing stormwater drainage systems or provide substantial additional sources of polluted runoff.
LTS LTS LTS LTS LTS
Impact 3.6-5: The proposed project would expose people or structures to flood hazards from development within a 100-year Flood Hazard Area or from increased rates or amounts of surface runoff from development.
SU SU SU SU SU
Impact 3.6-6: The proposed project would expose people or structures to flood hazards from failure of a levee or dam. SU SU SU SU SU
Impacts and Mitigation Measures
Impact 3.6-1: The proposed project could violate water quality standards or waste discharge requirements, or otherwise degrade water quality.
Impact Summary
LTS Level of Significance Before Mitigation: Less than Significant
Required Additional Mitigating Policies and Implementation Measures: None required
Resultant Level of Significance: Less than Significant
Tulare County General Plan 2030 Update
Tulare County General Plan 2030 Update 3.6-38 ESA / 207497 Recirculated Draft Environmental Impact Report February 2010
Impact Analysis
Both point sources, such as direct drainage sources, and nonpoint source of water pollution, such as urban runoff, are typically discharged via separate storm drains to “Waters of the United States” and are therefore regulated under the federal Clean Water Act (CWA). Consequently, the County must comply with provisions of the CWA, including federal water quality, waste discharge, and total maximum daily load standards. Development of the proposed project would potentially impact the quality of runoff and other pollutant loadings to receiving waters. Water quality impacts may also be significantly greater during the rainy season.
The construction and use of new individual or community septic systems would occur throughout the County subsequent to the General Plan. Septic systems and their associated leach fields can be a source of groundwater contamination. Depending on site specific characteristics, such as proximity to surface water and groundwater resources, soil type, and slope, septic systems could be restricted in certain parts of the County. Determination of site suitability for septic systems would be analyzed on a case by case basis.
Policies included as part of the proposed project that would minimize this impact are summarized below by general plan element. Policies WR-1.9 and WR-2.1 through WR-2.8 require continued compliance with water quality standards and implementation of best management practices. Additional policies address water quality concerns by ensuring adequate stormwater drainage infrastructure (see PFS-4.1 through PFS-4.5). Additionally, Policy PFS-1.3 and Public Facilities and Services Implementation Measures #1, #2, and #3 provide for the funding mechanism to provide additional or expanded services in conjunction with new development. The proposed project also includes policies that identify resources that should be protected from water quality impacts (see Policies ERM-2.7, ERM-5.20, FGMP-8.6, FGMP-9.5, and WR-3.10). A number of policies require new development to minimize water quality impacts associated with wastewater and stormwater runoff through implementation of development standards and maintenance requirements for septic systems (see Policies FGMP-8.2, FGMP-8.4, PFS-2.5, PFS-3.1, PFS-3.3, PFS-3.5, PFS-3.6, WR-2.8, WR-2.9, and PFS Implementation Measure #7). The Water Resources Element includes policies that require monitoring and collection of water quality data for surface water and groundwater resources (see Policies WR-1.2 and WR-1.7). With implementation of the below mentioned policies and implementation measures, this impact is considered less than significant.
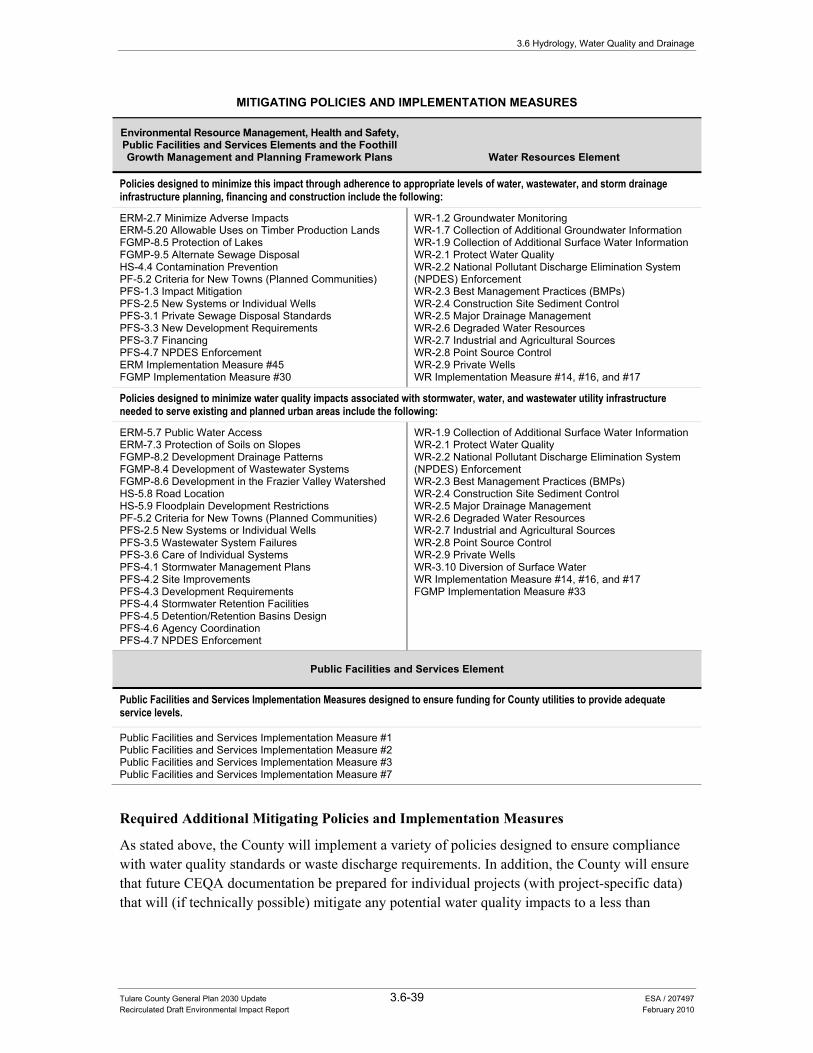
3.6 Hydrology, Water Quality and Drainage
Tulare County General Plan 2030 Update 3.6-39 ESA / 207497 Recirculated Draft Environmental Impact Report February 2010
MITIGATING POLICIES AND IMPLEMENTATION MEASURES
Environmental Resource Management, Health and Safety, Public Facilities and Services Elements and the Foothill Growth Management and Planning Framework Plans Water Resources Element
Policies designed to minimize this impact through adherence to appropriate levels of water, wastewater, and storm drainage infrastructure planning, financing and construction include the following:
ERM-2.7 Minimize Adverse Impacts ERM-5.20 Allowable Uses on Timber Production Lands FGMP-8.5 Protection of Lakes FGMP-9.5 Alternate Sewage Disposal HS-4.4 Contamination Prevention PF-5.2 Criteria for New Towns (Planned Communities) PFS-1.3 Impact Mitigation PFS-2.5 New Systems or Individual Wells PFS-3.1 Private Sewage Disposal Standards PFS-3.3 New Development Requirements PFS-3.7 Financing PFS-4.7 NPDES Enforcement ERM Implementation Measure #45 FGMP Implementation Measure #30
WR-1.2 Groundwater Monitoring WR-1.7 Collection of Additional Groundwater Information WR-1.9 Collection of Additional Surface Water Information WR-2.1 Protect Water Quality WR-2.2 National Pollutant Discharge Elimination System (NPDES) Enforcement WR-2.3 Best Management Practices (BMPs) WR-2.4 Construction Site Sediment Control WR-2.5 Major Drainage Management WR-2.6 Degraded Water Resources WR-2.7 Industrial and Agricultural Sources WR-2.8 Point Source Control WR-2.9 Private Wells WR Implementation Measure #14, #16, and #17
Policies designed to minimize water quality impacts associated with stormwater, water, and wastewater utility infrastructure needed to serve existing and planned urban areas include the following:
ERM-5.7 Public Water Access ERM-7.3 Protection of Soils on Slopes FGMP-8.2 Development Drainage Patterns FGMP-8.4 Development of Wastewater Systems FGMP-8.6 Development in the Frazier Valley Watershed HS-5.8 Road Location HS-5.9 Floodplain Development Restrictions PF-5.2 Criteria for New Towns (Planned Communities) PFS-2.5 New Systems or Individual Wells PFS-3.5 Wastewater System Failures PFS-3.6 Care of Individual Systems PFS-4.1 Stormwater Management Plans PFS-4.2 Site Improvements PFS-4.3 Development Requirements PFS-4.4 Stormwater Retention Facilities PFS-4.5 Detention/Retention Basins Design PFS-4.6 Agency Coordination PFS-4.7 NPDES Enforcement
WR-1.9 Collection of Additional Surface Water Information WR-2.1 Protect Water Quality WR-2.2 National Pollutant Discharge Elimination System (NPDES) Enforcement WR-2.3 Best Management Practices (BMPs) WR-2.4 Construction Site Sediment Control WR-2.5 Major Drainage Management WR-2.6 Degraded Water Resources WR-2.7 Industrial and Agricultural Sources WR-2.8 Point Source Control WR-2.9 Private Wells WR-3.10 Diversion of Surface Water WR Implementation Measure #14, #16, and #17 FGMP Implementation Measure #33
Public Facilities and Services Element
Public Facilities and Services Implementation Measures designed to ensure funding for County utilities to provide adequate service levels.
Public Facilities and Services Implementation Measure #1 Public Facilities and Services Implementation Measure #2 Public Facilities and Services Implementation Measure #3 Public Facilities and Services Implementation Measure #7
Required Additional Mitigating Policies and Implementation Measures
As stated above, the County will implement a variety of policies designed to ensure compliance with water quality standards or waste discharge requirements. In addition, the County will ensure that future CEQA documentation be prepared for individual projects (with project-specific data) that will (if technically possible) mitigate any potential water quality impacts to a less than

Tulare County General Plan 2030 Update
Tulare County General Plan 2030 Update 3.6-40 ESA / 207497 Recirculated Draft Environmental Impact Report February 2010
significant level. This impact is considered less than significant. No additional mitigation measures are required.
Significance after Implementation of Mitigation for Impact 3.6-1
A number of policies referenced above in the impact analysis and included in the proposed project were specifically designed to ensure future development subsequent to the proposed project will not violate water quality standards or waste discharge requirements. With implementation of the above mentioned policies, this impact is considered less than significant.
Impact 3.6-2: The proposed project would result in impacts to groundwater supply, recharge, and secondary impacts to groundwater resources.
Impact Summary
SU Level of Significance Before Mitigation: Potentially Significant
Required Additional Mitigating Policies and Implementation Measures: None Available
Resultant Level of Significance: Significant and Unavoidable
Impact Analysis
Implementation of the proposed project would result in an increased demand on groundwater supplies for urban, rural, and agricultural uses within the unincorporated areas of the County. Growth associated with the proposed project would require additional groundwater pumping for designated urban development areas of the County where surface water is not available. Water supply impacts related to continued use as well as increased dependence upon groundwater are also discussed under Impact 3.9-1 within Section 3.9.
There are three major sub-basins that yield groundwater within the Tulare County region, the Tule sub-basin located in the southwest region of the County (Tule River, Deer Creek, and White River watersheds), the Kaweah sub-basin located in the mid west region of the County (Kaweah River watershed), and the Kings sub-basin located in the northwest region of the County (Kings River watershed).
The publication, “California’s Groundwater – Bulletin 118, Update 2003”, published by the California Department of Water Resources contains a wide range of information pertaining to groundwater basins and sub-basins throughout California. Box O Critical Conditions of Overdraft (reference Pg. 98 of California’s Groundwater – Bulletin 118, Update 2003), identifies the Tule, Kaweah, and Kings sub-basins, along with eight other sub-basins throughout the State, as being in a “critical condition of overdraft”. The information summarized below was derived from the referenced publication.
3.6 Hydrology, Water Quality and Drainage
Tulare County General Plan 2030 Update 3.6-41 ESA / 207497 Recirculated Draft Environmental Impact Report February 2010
Tule Sub-Basin: Groundwater recharge is primarily from stream recharge and from deep percolation of applied irrigation water. Changes in groundwater levels are based on annual water level measurements by DWR and cooperators. On average, the sub-basin water level has increased about four feet from 1970 through 2000. The period from 1970 to 1978 showed a general decline, bottoming out at 13 feet below 1970 levels in 1978. There is a steep increase in water levels in the ten year period from 1978 to 1988, topping out at 20 feet above 1970 water levels in 1988. There is a very sharp decrease in water levels of 34 feet from 1988 to 1995, with the lowest level reached in 1993 at 16 feet below 1970 water levels. From 1995 to 2000, water levels generally increase, eventually reaching four feet above 1970 water levels in 2000. The natural recharge into the sub-basin is estimated at 34,400 acre-ft. Artificial recharge and subsurface inflow are not determined. There is about 201,000 acre-ft. of applied water recharge into the sub-basin. Annual urban extraction and annual agricultural extraction are estimated to be 19,300 acre-ft and 641,000 acre-ft, respectively. Other extractions and subsurface outflow are not determined.
Kaweah Sub-Basin: Changes in groundwater levels are based on annual water level measurements by DWR and cooperators. On average, the sub-basin water level has declined about 12 feet from 1970 through 2000. The period from 1970 to 1978 showed steep declines totaling about 25 feet. The ten year period from 1978 to 1988 saw stabilization and rebound of about 50 feet, bringing water levels above the 1970 water level by 25 feet. 1988 through 1995 again showed steep declines, bottoming out in 1995 at nearly 35 feet below the 1970 level. Water levels then rose about 22 feet from 1996 to 2000, bringing water levels to approximately 12 feet below 1970 levels. Natural recharge is estimated to be 62,400 acre-ft. Artificial recharge was not determined for all entities, but Lakeside Irrigation District has recharged about 7,000 acre-ft. per year and in wet years may recharge up to 30,000 acre-ft. There is approximately 286,000 acre-ft. of applied water recharge into the sub-basin. Subsurface inflow was not determined. Annual urban and agricultural extraction is estimated to be 58,800 acre-ft. and 699,000 acre-ft, respectively. Other extractions and subsurface inflow were not determined.
Kings Sub-Basin: Groundwater recharge occurs from river and stream seepage, deep percolation of irrigation water, canal seepage, and intentional recharge. Limited information is available regarding groundwater trends and estimated recharge and extractions in the sub-basin. Most well water levels indicated a response to the 1976-77 drought. After the 1987-1992 drought, wells in the northeast showed water levels from 10 to 40 feet below pre-1976-77 drought water levels. Water levels in the western sub-basin experienced declines of 10 to 50 feet during the 1987-92 drought and are in various stages of recovery to mid-1980s levels. Water levels in the southeast (Tulare County area), generally, recovered to mid-1980s levels.
A 2009 assessment of Groundwater Availability of the Central Valley Aquifer, California: U.S. Geological Survey Professional Paper 1766, (Faunt, C.C., ed. 2009) provides further information about area groundwater overdraft. The study indicates that net annual pumpage (1962-2003) of groundwater use has been steadily increasing It also provides a numerical model to use in assessing impacts to the Central Valley hydrologic system as another tool (a new computer model) that could be used to understand impacts of the proposed project and to implement necessary changes to protect groundwater resources.
The majority of domestic water purveyors in unincorporated areas of the County would continue to be dependent upon groundwater to meet their water needs. The impact associated with continued use and increased dependence upon groundwater is more fully discussed in Section 3.9 “Public Services, Recreation and Utilities” under Impact 3.9-1 related to water supplies.
Tulare County General Plan 2030 Update
Tulare County General Plan 2030 Update 3.6-42 ESA / 207497 Recirculated Draft Environmental Impact Report February 2010
Some of the broad issues affecting groundwater supplies in Tulare County that could have an impact on land use planning decisions over the 20 year planning period include: groundwater overdraft; population growth within and near Tulare County; joint management of shared aquifers; groundwater adjudications; and institutional changes to the water regulatory framework, as discussed below.
Groundwater Overdraft In some of the unincorporated urban development areas, there are concerns that adequate water supplies cannot be achieved through sustainable groundwater management, that is, without creating declining groundwater levels, and adversely affecting existing wells. Such concerns are heightened by the fact that most of these areas are presently dependent upon groundwater supplies.
In addition to depletion of water faster than it can be naturally or artificially recharged, declining water tables can impact the basin as a water resource. Impacts can include (i) increased pumping expenses, (ii) impacts to water quality, and (iii) subsidence that can in some cases permanently decrease the storage capacity of the aquifer. Thus, overdraft itself can have effects beyond depletion of an existing quantity of water, but also can impact the ability to use the basin as a storage facility. The future value of such storage capacity in California is potentially very high, and should be taken into account in today’s groundwater management. It should also be noted that such impacts are not limited to the portions of the basin directly underlying the water user responsible for the overdraft, but can impact neighboring users as well.
Population Growth Within and Near Tulare County Cities in the region, including Visalia, Exeter, Fresno, Bakersfield, and others, rely on groundwater for much or all of their water supply. Increases in urban water demand resulting from population growth may be offset by decreases in other forms of water use (i.e. agricultural water conversion) or increases in water use efficiency. But the nature and extent of agricultural water conversion and water use efficiency measures is not known. Moreover, the hydrogeologic implications of increased localized pumping in groundwater basins (i.e. the potential for cones of depression) are not known. Current regional trends suggest that future urban growth may rely on groundwater supplies to meet demand.
In addition to its increase in demands for groundwater, urbanization may negatively affect groundwater recharge. Urbanization generally reduces the amount of permeable surfaces for percolation of water into underlying basins. Urban planning efforts that include development of permeable surfaces in urban settings, infiltration basins, and other measures for stormwater capture can offset such effects, while providing flood control benefits.
Joint Management of Shared Aquifers Declining groundwater levels adjacent to Tulare County can affect groundwater yields and sustainability in Tulare County. Any development or management in adjacent counties that overly shared sub-basins may adversely impact Tulare County’s ability to manage its own groundwater supplies.
3.6 Hydrology, Water Quality and Drainage
Tulare County General Plan 2030 Update 3.6-43 ESA / 207497 Recirculated Draft Environmental Impact Report February 2010
The importance of managing groundwater across political boundaries in this region has been recognized. For example, an Integrated Regional Water Management Plan for the Kings River Basin acknowledges the need for collaboration between Fresno, Kings, and Tulare Counties, and includes recharge efforts to help mitigate for historic overdrafting of the basin.
Groundwater Adjudications Although hydrologic connections between surface water and groundwater are well-documented, California groundwater law is for the most part separate from surface water law. Landowners overlying groundwater aquifers may drill wells and extract water for use on their land, correlative to neighboring landowners. Where surplus groundwater supplies are available, groundwater may be appropriated for use on non-overlying lands. Most agricultural extractions are considered overlying use while urban extractions are generally considered groundwater appropriations.
Conflicts over the nature and extent of groundwater use can result in lawsuits that force adjudication of a groundwater basin. In such cases, a court determines how much groundwater each owner can extract, and enforces limitations on each user’s water allocations. An adjudication process within any of the sub-basins in the County could impact supplies available to manage for existing and anticipated demands.
Potential Changes in California Groundwater Law The potential also exists for future legislation to change California’s groundwater regulations, and if so might change the way groundwater is used in Tulare County and elsewhere. Other states have recognized the potential for problems arising from lack of groundwater management. The Arizona legislature, for example, implemented policies in the 1980s and 1990s to quantify rights to use groundwater supplies and to store groundwater. Colorado has integrated rights to pump groundwater with surface water rights doctrine, and has a watershed-based system of regional water governance, as opposed to California’s reliance largely on local decision-making.
The point of describing other legal frameworks is to highlight the fact that there are other ways of managing groundwater and surface water, and to point out that governmental laws evolve over time. If future legislation changes the way groundwater (and surface) water are regulated in California, it could change the way the resource can be used in Tulare County. Interpreting the success of groundwater management efforts throughout the State cannot be achieved at present time. While there are many examples of local agency successes, there are neither mandates to prepare groundwater management plans nor reporting requirements when plans are implemented, so a comprehensive assessment of local planning efforts is not possible. Additionally, many plans have been adopted only recently, during a period of several consecutive wet years, so many of the plan components are either untested or not implemented. At a minimum, successful groundwater management should be defined as maintaining and maximizing long term reliability of the groundwater resource, focused on preventing significant depletion of groundwater in storage over the long term and preventing significant degradation of groundwater quality.
Tulare County General Plan 2030 Update
Tulare County General Plan 2030 Update 3.6-44 ESA / 207497 Recirculated Draft Environmental Impact Report February 2010
With more than 200 agencies participating in plans and more than 120 of those involved in coordinated plans with other agencies, Assembly Bill 3030 (also termed the 1992 Groundwater Management Act) has resulted in a heightened awareness of groundwater management. Additionally, annual reports published by a few water agencies indicate that they are indeed moving toward better coordination throughout the basin and more effective management of all water supplies. Given the history of groundwater management in California, these seemingly small steps toward better management may actually represent significant steps forward.
Financial incentives play a large role in driving groundwater management activities. For example, under grant and loan programs resulting from Proposition 13 passed in 2000, local agencies submitted applications proposing a total increase in annual water yield of more than 300,000 acre-feet through groundwater storage projects. Additional projects and programs would be developed with sufficient funding for feasibility and pilot studies. Unfortunately, not enough funding exists for the entire County, and many other legal and institutional barriers remain. It is clear that further incentives would help agencies move ahead more aggressively in their groundwater management planning efforts.
Within the southern portion of the Tule sub-basin (Deer Creek/White River watershed), dependable surface water supply became available with the construction of the Friant Division of the Central Valley Project. Contracts issued as a result of the construction of the Friant Dam and the Friant Kern Canal were designed to abate the groundwater overdraft which has been occurring in the area, and in some cases, to reduce the declining groundwater trend. As the overall recharge capabilities away from the Deer Creek and White River channels are limited due to geologic characteristics, the channels have become the primary focus for recharge activities. For example, the Delano-Earlimart Irrigation District has increased the White River channel capabilities by purchasing property adjacent to the channel and constructing about 80 acres of recharge facilities. The Delano-Earlimart Irrigation District has initiated an evaluation of alternative water management strategies aimed at addressing the lack of capability of groundwater recharge on a District-wide basis and the continued conversion of lands from annual to permanent crops. Considerable planning is underway relative to development proposals along the Highway 99 corridor in the Deer Creek/White River watershed. The maintenance of the groundwater reservoir through this area is dependent on the continued capability to have surface water sources available for delivery into the area. Natural recharge of the groundwater reservoirs underlying the communities of Earlimart and Pixley is insufficient to sustain the agricultural plantings in the area and the community water systems.
Within the Kaweah sub-basin, the Kaweah Delta Water Conservation District (KDWCD) recently completed a Water Resources Investigation which specifically examined the groundwater conditions within the KDWCD boundaries. The investigation showed that the overall underground reservoir was over-drafted at level between 17,000 and 36,000 acre-feet per year. The static groundwater trend within the Kaweah sub-basin is ever decreasing, as is the corresponding quantity of water being held in storage in the groundwater reservoir. Downward groundwater level trends have decreased somewhat as a result of the State Water Project and delivery of Project supplies to lands in Kings County. These water deliveries have also helped to further decrease the outflow of water from lands within Tulare County to lands within Kings County.
3.6 Hydrology, Water Quality and Drainage
Tulare County General Plan 2030 Update 3.6-45 ESA / 207497 Recirculated Draft Environmental Impact Report February 2010
The City of Visalia (which lies within the Kaweah sub-basin) has adopted a very aggressive policy designed to mitigate the downward trend in static water elevations and declining quantity of water available in the groundwater reservoir. These procedures started with a Proposition 218 based process wherein $100,000 per year was authorized to be generated, at a minimum, from a customer surcharge to develop groundwater management programs, purchase surface water for recharge and purchase water rights for delivery into areas impacting the groundwater reservoir underneath the City. Additionally, the City has imposed a land based charge on lands being converted from agricultural to urban uses to address the shift of water supply from a conjunctive use basis to that of exclusive groundwater. The funds are to be utilized for projects which address the mitigation steps required to reverse the decline in the groundwater elevations beneath the City. Furthermore, entities within the Kaweah sub-basin have joined forces to manage available water supply under an Integrated Regional Water Management Plan.
Within the Kings sub-basin, static groundwater levels exhibit a gradual decline over time. For this reason, the Groundwater Management Plans of each of the entities within the Kings sub-basin emphasize conjunctive use operations with each entity actively pursuing groundwater recharge as a function of the management aspects of the adopted Groundwater Management Plans. These plans include policies to encourage recharge where conditions are conducive to such recharge efforts and to allow for delivery of surface water to areas which are not able to enjoy such recharge conditions. The principal purpose of plan policies is to mitigate the general decline in the amount of water in storage within the groundwater reservoir and associated static levels. The Alta Irrigation District’s participation in the Integrated Regional Water Management Plan for the Kings River Basin has led to significant groundwater recharge efforts and includes both projects which are currently being implemented and additional projects in the planning stage. These projects are aimed at increasing the amount of water being recharged into the area south of Avenue 384 and extending between Highway 99 to the west and Road 80 to the east. Depending on the outcome of a study being completed to evaluate the feasibility of a surface water treatment plant that could provide domestic water to the communities of Cutler, Orosi, East Orosi, Sultana, and the City of Dinuba, continued reliance on groundwater for domestic use could be abated.
Several policies included in the Water Resources Element of the proposed project would strive to improve groundwater management practices through groundwater monitoring and research as well as protecting groundwater resources through revisions to current regulations regarding well permits and procedures, as discussed below. The proposed project also contains provisions to protect groundwater recharge areas and increase groundwater infiltration. The establishment of an ongoing groundwater monitoring program throughout the County would facilitate the evaluation of groundwater levels, storage, and recharge. This information would be compiled with groundwater data from public and private water suppliers well permit data, and other applicable sources.
Policies WR-1.1 and WR-1.3 relate to improving groundwater management through the development of an ordinance that will regulate the extraction and exportation of groundwater from Tulare County. The ordinance will set up a permit process for groundwater export. Some of the issues considered during the permit process will include a determination that the extraction will not substantially increase the overdraft of the groundwater underlying the County; will not adversely affect the long term ability for storage or transmission of groundwater within the aquifer; will not (together
Tulare County General Plan 2030 Update
Tulare County General Plan 2030 Update 3.6-46 ESA / 207497 Recirculated Draft Environmental Impact Report February 2010
with other extractions) exceed the safe yield of the groundwater underlying the County unless the safe yield is exceeded only by extractions in connection with a conjunctive use program approved by the County. Policy WR-1.4 establishes specific criteria to be met in order to transfer water used agricultural purposes (within the prior ten years) for domestic consumption. This policy encourages the supplemental agricultural water supply to be used for other agricultural purposes or recharge efforts.
Policy WR-1.5 relates to encouraging groundwater recharge by clustering development to leave identified recharge areas in open space, avoid lining of channels and streams, alteration of existing agricultural practices, or substitution of drainage methods that will transport polluted waters away from identified recharge areas. Policy WR-1.6 would improve the County’s building, zoning, and subdivision ordinances by incorporating provisions for the use of reclaimed wastewater, water conserving appliances, drought tolerant landscaping, and other water conservation techniques.
Policies WR-1.7, WR-1.8, WR-3.2, and WR-3.4 encourage the County to work with other agencies and organizations that share water management responsibilities in the County to enhance modeling efforts and ensure that comprehensive groundwater management plans and implementation programs for the entire valley floor area are maintained.
Policies WR-3.6 and WR-3.8 relate to the development of educational programs targeted at reducing water consumption on agricultural lands and enhancing groundwater recharge. Under the policies, the County would develop an education program to inform residents of water conservation techniques and the importance of water quality and adequate water supplies. Programs may include informational flyers, community workshops, technology transfer fairs, and other various means of education and information dissemination. Additionally, Policies WR-3.7 and WR-3.8 require the County to continue its implementation of water conservation measures which would also serve to protect groundwater resources.
Policies WR-3.9 and WR-3.10 would protect groundwater recharge areas in the County by carefully regulating the type of development within these areas. These policies would amend County ordinances to include development standards which protect groundwater basins and surface water drainage areas and provide incentives for use of conservation techniques. The County will also study the feasibility of establishing development or design standards for the protection of groundwater recharge areas, such as placing limitations on the amount of impervious surfaces.
Effective implementation of groundwater management practices are necessary to meet future water demands via groundwater extraction, without creating declining groundwater levels, and adversely affecting existing wells. Interpreting the success of groundwater management efforts throughout the State cannot be achieved at present time. While there are many examples of local agency successes, there are neither mandates to prepare groundwater management plans nor reporting requirements when plans are implemented, so a comprehensive assessment of local planning efforts is not possible. Additionally, many plans have been adopted only recently, during a period of several consecutive wet years, so many of the plan components are either untested or not implemented. At a minimum, successful groundwater management should be defined as maintaining and maximizing long term reliability of the groundwater resource, focused on preventing significant
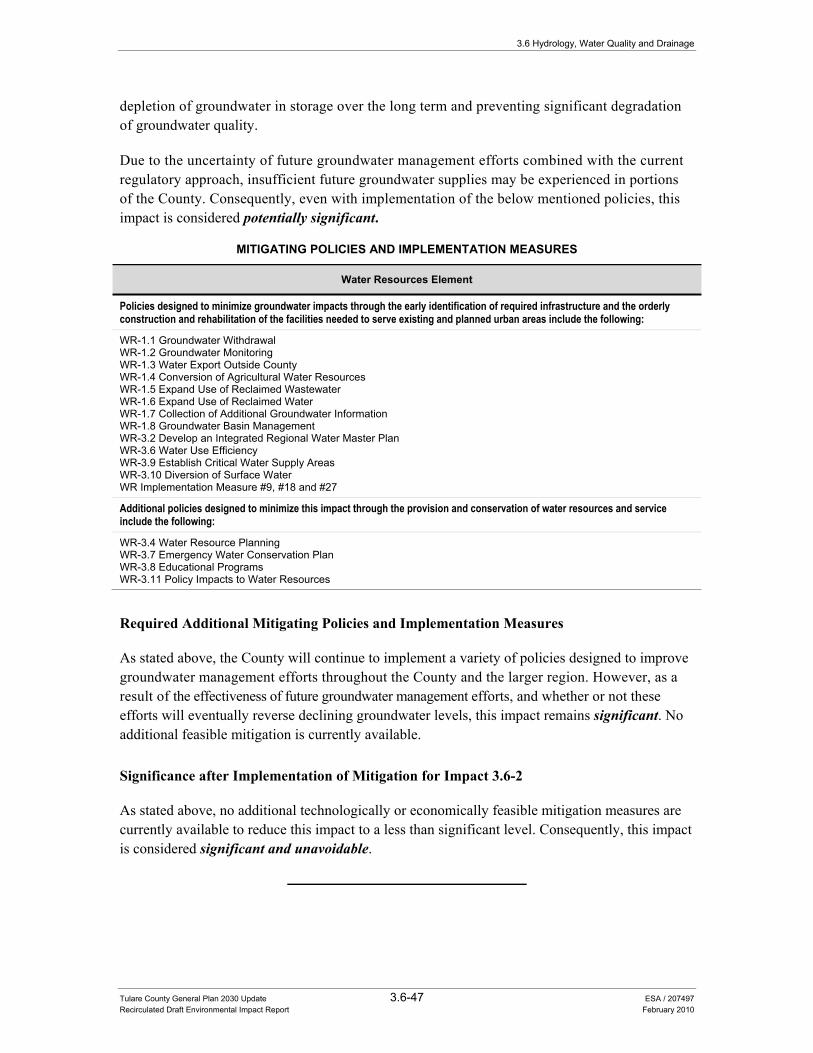
3.6 Hydrology, Water Quality and Drainage
Tulare County General Plan 2030 Update 3.6-47 ESA / 207497 Recirculated Draft Environmental Impact Report February 2010
depletion of groundwater in storage over the long term and preventing significant degradation of groundwater quality.
Due to the uncertainty of future groundwater management efforts combined with the current regulatory approach, insufficient future groundwater supplies may be experienced in portions of the County. Consequently, even with implementation of the below mentioned policies, this impact is considered potentially significant.
MITIGATING POLICIES AND IMPLEMENTATION MEASURES
Water Resources Element
Policies designed to minimize groundwater impacts through the early identification of required infrastructure and the orderlyconstruction and rehabilitation of the facilities needed to serve existing and planned urban areas include the following:
WR-1.1 Groundwater Withdrawal WR-1.2 Groundwater Monitoring WR-1.3 Water Export Outside County WR-1.4 Conversion of Agricultural Water Resources WR-1.5 Expand Use of Reclaimed Wastewater WR-1.6 Expand Use of Reclaimed Water WR-1.7 Collection of Additional Groundwater Information WR-1.8 Groundwater Basin Management WR-3.2 Develop an Integrated Regional Water Master Plan WR-3.6 Water Use Efficiency WR-3.9 Establish Critical Water Supply Areas WR-3.10 Diversion of Surface Water WR Implementation Measure #9, #18 and #27
Additional policies designed to minimize this impact through the provision and conservation of water resources and service include the following:
WR-3.4 Water Resource Planning WR-3.7 Emergency Water Conservation Plan WR-3.8 Educational Programs WR-3.11 Policy Impacts to Water Resources
Required Additional Mitigating Policies and Implementation Measures
As stated above, the County will continue to implement a variety of policies designed to improve groundwater management efforts throughout the County and the larger region. However, as a result of the effectiveness of future groundwater management efforts, and whether or not these efforts will eventually reverse declining groundwater levels, this impact remains significant. No additional feasible mitigation is currently available.
Significance after Implementation of Mitigation for Impact 3.6-2
As stated above, no additional technologically or economically feasible mitigation measures are currently available to reduce this impact to a less than significant level. Consequently, this impact is considered significant and unavoidable.
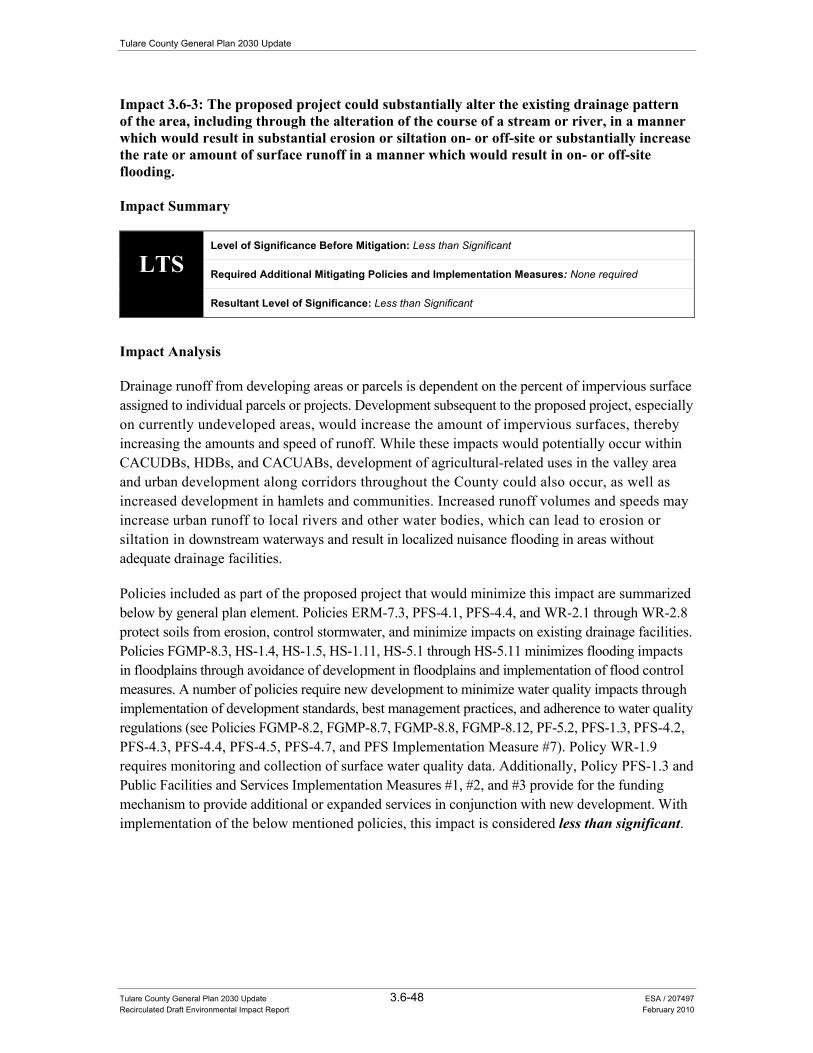
Tulare County General Plan 2030 Update
Tulare County General Plan 2030 Update 3.6-48 ESA / 207497 Recirculated Draft Environmental Impact Report February 2010
Impact 3.6-3: The proposed project could substantially alter the existing drainage pattern of the area, including through the alteration of the course of a stream or river, in a manner which would result in substantial erosion or siltation on- or off-site or substantially increase the rate or amount of surface runoff in a manner which would result in on- or off-site flooding.
Impact Summary
LTS Level of Significance Before Mitigation: Less than Significant
Required Additional Mitigating Policies and Implementation Measures: None required
Resultant Level of Significance: Less than Significant
Impact Analysis
Drainage runoff from developing areas or parcels is dependent on the percent of impervious surface assigned to individual parcels or projects. Development subsequent to the proposed project, especially on currently undeveloped areas, would increase the amount of impervious surfaces, thereby increasing the amounts and speed of runoff. While these impacts would potentially occur within CACUDBs, HDBs, and CACUABs, development of agricultural-related uses in the valley area and urban development along corridors throughout the County could also occur, as well as increased development in hamlets and communities. Increased runoff volumes and speeds may increase urban runoff to local rivers and other water bodies, which can lead to erosion or siltation in downstream waterways and result in localized nuisance flooding in areas without adequate drainage facilities.
Policies included as part of the proposed project that would minimize this impact are summarized below by general plan element. Policies ERM-7.3, PFS-4.1, PFS-4.4, and WR-2.1 through WR-2.8 protect soils from erosion, control stormwater, and minimize impacts on existing drainage facilities. Policies FGMP-8.3, HS-1.4, HS-1.5, HS-1.11, HS-5.1 through HS-5.11 minimizes flooding impacts in floodplains through avoidance of development in floodplains and implementation of flood control measures. A number of policies require new development to minimize water quality impacts through implementation of development standards, best management practices, and adherence to water quality regulations (see Policies FGMP-8.2, FGMP-8.7, FGMP-8.8, FGMP-8.12, PF-5.2, PFS-1.3, PFS-4.2, PFS-4.3, PFS-4.4, PFS-4.5, PFS-4.7, and PFS Implementation Measure #7). Policy WR-1.9 requires monitoring and collection of surface water quality data. Additionally, Policy PFS-1.3 and Public Facilities and Services Implementation Measures #1, #2, and #3 provide for the funding mechanism to provide additional or expanded services in conjunction with new development. With implementation of the below mentioned policies, this impact is considered less than significant.
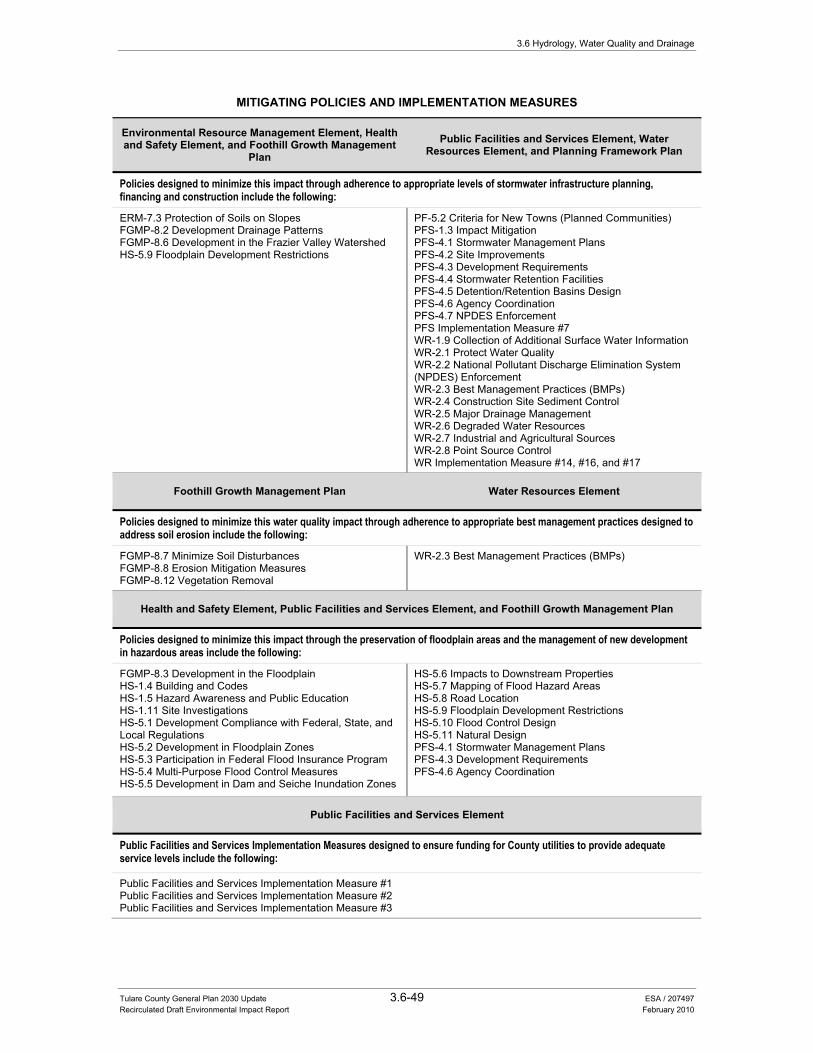
3.6 Hydrology, Water Quality and Drainage
Tulare County General Plan 2030 Update 3.6-49 ESA / 207497 Recirculated Draft Environmental Impact Report February 2010
MITIGATING POLICIES AND IMPLEMENTATION MEASURES
Environmental Resource Management Element, Health and Safety Element, and Foothill Growth Management
Plan Public Facilities and Services Element, Water
Resources Element, and Planning Framework Plan
Policies designed to minimize this impact through adherence to appropriate levels of stormwater infrastructure planning, financing and construction include the following:
ERM-7.3 Protection of Soils on Slopes FGMP-8.2 Development Drainage Patterns FGMP-8.6 Development in the Frazier Valley Watershed HS-5.9 Floodplain Development Restrictions
PF-5.2 Criteria for New Towns (Planned Communities) PFS-1.3 Impact Mitigation PFS-4.1 Stormwater Management Plans PFS-4.2 Site Improvements PFS-4.3 Development Requirements PFS-4.4 Stormwater Retention Facilities PFS-4.5 Detention/Retention Basins Design PFS-4.6 Agency Coordination PFS-4.7 NPDES Enforcement PFS Implementation Measure #7 WR-1.9 Collection of Additional Surface Water Information WR-2.1 Protect Water Quality WR-2.2 National Pollutant Discharge Elimination System (NPDES) Enforcement WR-2.3 Best Management Practices (BMPs) WR-2.4 Construction Site Sediment Control WR-2.5 Major Drainage Management WR-2.6 Degraded Water Resources WR-2.7 Industrial and Agricultural Sources WR-2.8 Point Source Control WR Implementation Measure #14, #16, and #17
Foothill Growth Management Plan Water Resources Element
Policies designed to minimize this water quality impact through adherence to appropriate best management practices designed to address soil erosion include the following:
FGMP-8.7 Minimize Soil Disturbances FGMP-8.8 Erosion Mitigation Measures FGMP-8.12 Vegetation Removal
WR-2.3 Best Management Practices (BMPs)
Health and Safety Element, Public Facilities and Services Element, and Foothill Growth Management Plan
Policies designed to minimize this impact through the preservation of floodplain areas and the management of new development in hazardous areas include the following:
FGMP-8.3 Development in the Floodplain HS-1.4 Building and Codes HS-1.5 Hazard Awareness and Public Education HS-1.11 Site Investigations HS-5.1 Development Compliance with Federal, State, and Local Regulations HS-5.2 Development in Floodplain Zones HS-5.3 Participation in Federal Flood Insurance Program HS-5.4 Multi-Purpose Flood Control Measures HS-5.5 Development in Dam and Seiche Inundation Zones
HS-5.6 Impacts to Downstream Properties HS-5.7 Mapping of Flood Hazard Areas HS-5.8 Road Location HS-5.9 Floodplain Development Restrictions HS-5.10 Flood Control Design HS-5.11 Natural Design PFS-4.1 Stormwater Management Plans PFS-4.3 Development Requirements PFS-4.6 Agency Coordination
Public Facilities and Services Element
Public Facilities and Services Implementation Measures designed to ensure funding for County utilities to provide adequate service levels include the following:
Public Facilities and Services Implementation Measure #1 Public Facilities and Services Implementation Measure #2 Public Facilities and Services Implementation Measure #3
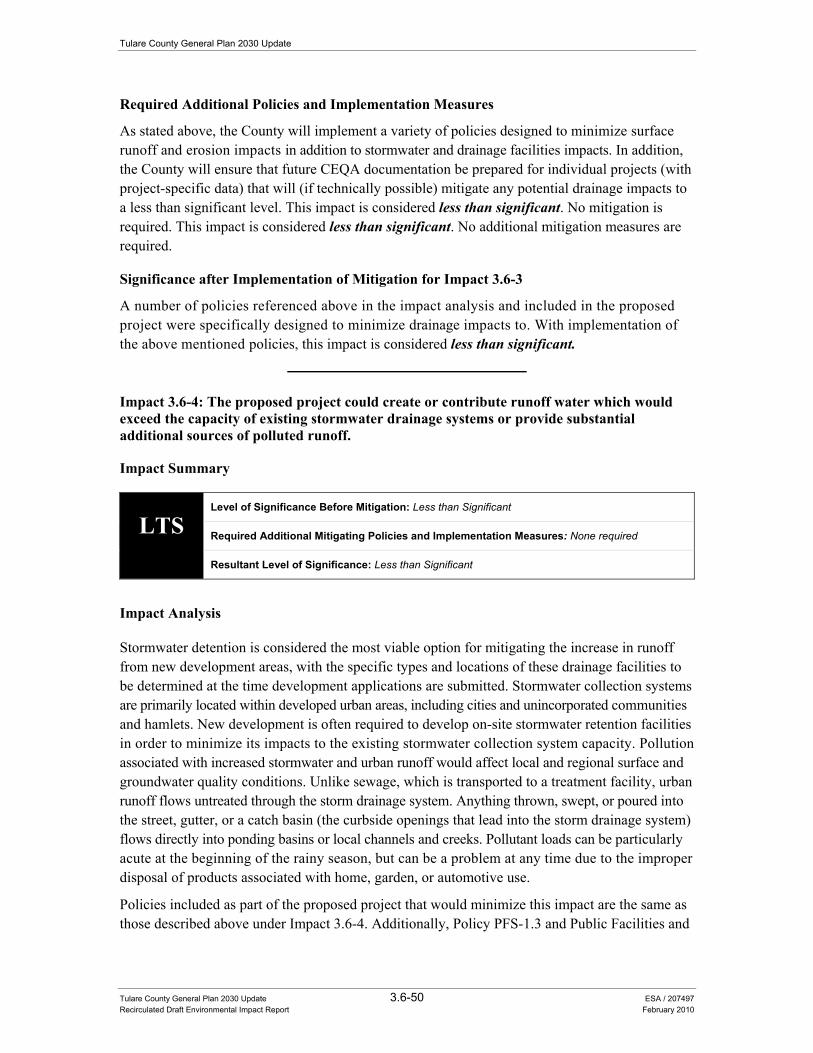
Tulare County General Plan 2030 Update
Tulare County General Plan 2030 Update 3.6-50 ESA / 207497 Recirculated Draft Environmental Impact Report February 2010
Required Additional Policies and Implementation Measures
As stated above, the County will implement a variety of policies designed to minimize surface runoff and erosion impacts in addition to stormwater and drainage facilities impacts. In addition, the County will ensure that future CEQA documentation be prepared for individual projects (with project-specific data) that will (if technically possible) mitigate any potential drainage impacts to a less than significant level. This impact is considered less than significant. No mitigation is required. This impact is considered less than significant. No additional mitigation measures are required.
Significance after Implementation of Mitigation for Impact 3.6-3
A number of policies referenced above in the impact analysis and included in the proposed project were specifically designed to minimize drainage impacts to. With implementation of the above mentioned policies, this impact is considered less than significant.
Impact 3.6-4: The proposed project could create or contribute runoff water which would exceed the capacity of existing stormwater drainage systems or provide substantial additional sources of polluted runoff.
Impact Summary
LTS Level of Significance Before Mitigation: Less than Significant
Required Additional Mitigating Policies and Implementation Measures: None required
Resultant Level of Significance: Less than Significant
Impact Analysis
Stormwater detention is considered the most viable option for mitigating the increase in runoff from new development areas, with the specific types and locations of these drainage facilities to be determined at the time development applications are submitted. Stormwater collection systems are primarily located within developed urban areas, including cities and unincorporated communities and hamlets. New development is often required to develop on-site stormwater retention facilities in order to minimize its impacts to the existing stormwater collection system capacity. Pollution associated with increased stormwater and urban runoff would affect local and regional surface and groundwater quality conditions. Unlike sewage, which is transported to a treatment facility, urban runoff flows untreated through the storm drainage system. Anything thrown, swept, or poured into the street, gutter, or a catch basin (the curbside openings that lead into the storm drainage system) flows directly into ponding basins or local channels and creeks. Pollutant loads can be particularly acute at the beginning of the rainy season, but can be a problem at any time due to the improper disposal of products associated with home, garden, or automotive use.
Policies included as part of the proposed project that would minimize this impact are the same as those described above under Impact 3.6-4. Additionally, Policy PFS-1.3 and Public Facilities and
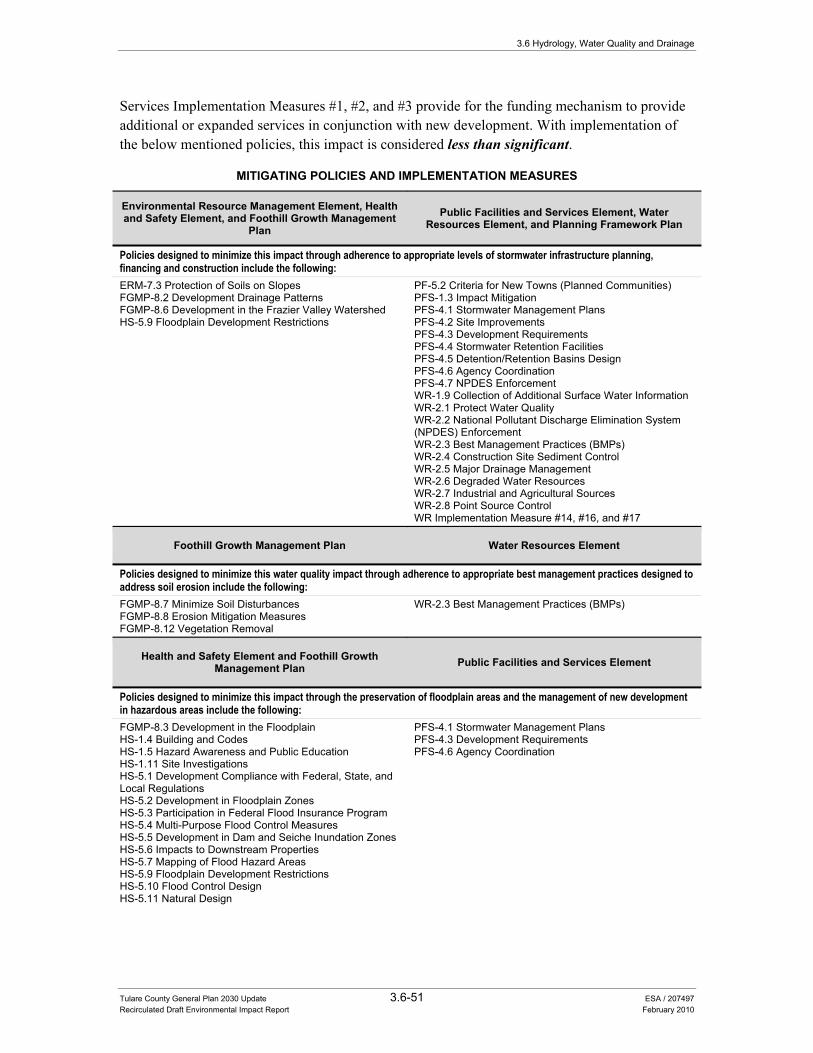
3.6 Hydrology, Water Quality and Drainage
Tulare County General Plan 2030 Update 3.6-51 ESA / 207497 Recirculated Draft Environmental Impact Report February 2010
Services Implementation Measures #1, #2, and #3 provide for the funding mechanism to provide additional or expanded services in conjunction with new development. With implementation of the below mentioned policies, this impact is considered less than significant.
MITIGATING POLICIES AND IMPLEMENTATION MEASURES
Environmental Resource Management Element, Health and Safety Element, and Foothill Growth Management
Plan Public Facilities and Services Element, Water
Resources Element, and Planning Framework Plan
Policies designed to minimize this impact through adherence to appropriate levels of stormwater infrastructure planning, financing and construction include the following: ERM-7.3 Protection of Soils on Slopes FGMP-8.2 Development Drainage Patterns FGMP-8.6 Development in the Frazier Valley Watershed HS-5.9 Floodplain Development Restrictions
PF-5.2 Criteria for New Towns (Planned Communities) PFS-1.3 Impact Mitigation PFS-4.1 Stormwater Management Plans PFS-4.2 Site Improvements PFS-4.3 Development Requirements PFS-4.4 Stormwater Retention Facilities PFS-4.5 Detention/Retention Basins Design PFS-4.6 Agency Coordination PFS-4.7 NPDES Enforcement WR-1.9 Collection of Additional Surface Water Information WR-2.1 Protect Water Quality WR-2.2 National Pollutant Discharge Elimination System (NPDES) Enforcement WR-2.3 Best Management Practices (BMPs) WR-2.4 Construction Site Sediment Control WR-2.5 Major Drainage Management WR-2.6 Degraded Water Resources WR-2.7 Industrial and Agricultural Sources WR-2.8 Point Source Control WR Implementation Measure #14, #16, and #17
Foothill Growth Management Plan Water Resources Element
Policies designed to minimize this water quality impact through adherence to appropriate best management practices designed to address soil erosion include the following: FGMP-8.7 Minimize Soil Disturbances FGMP-8.8 Erosion Mitigation Measures FGMP-8.12 Vegetation Removal
WR-2.3 Best Management Practices (BMPs)
Health and Safety Element and Foothill Growth Management Plan Public Facilities and Services Element
Policies designed to minimize this impact through the preservation of floodplain areas and the management of new development in hazardous areas include the following: FGMP-8.3 Development in the Floodplain HS-1.4 Building and Codes HS-1.5 Hazard Awareness and Public Education HS-1.11 Site Investigations HS-5.1 Development Compliance with Federal, State, and Local Regulations HS-5.2 Development in Floodplain Zones HS-5.3 Participation in Federal Flood Insurance Program HS-5.4 Multi-Purpose Flood Control Measures HS-5.5 Development in Dam and Seiche Inundation Zones HS-5.6 Impacts to Downstream Properties HS-5.7 Mapping of Flood Hazard Areas HS-5.9 Floodplain Development Restrictions HS-5.10 Flood Control Design HS-5.11 Natural Design
PFS-4.1 Stormwater Management Plans PFS-4.3 Development Requirements PFS-4.6 Agency Coordination
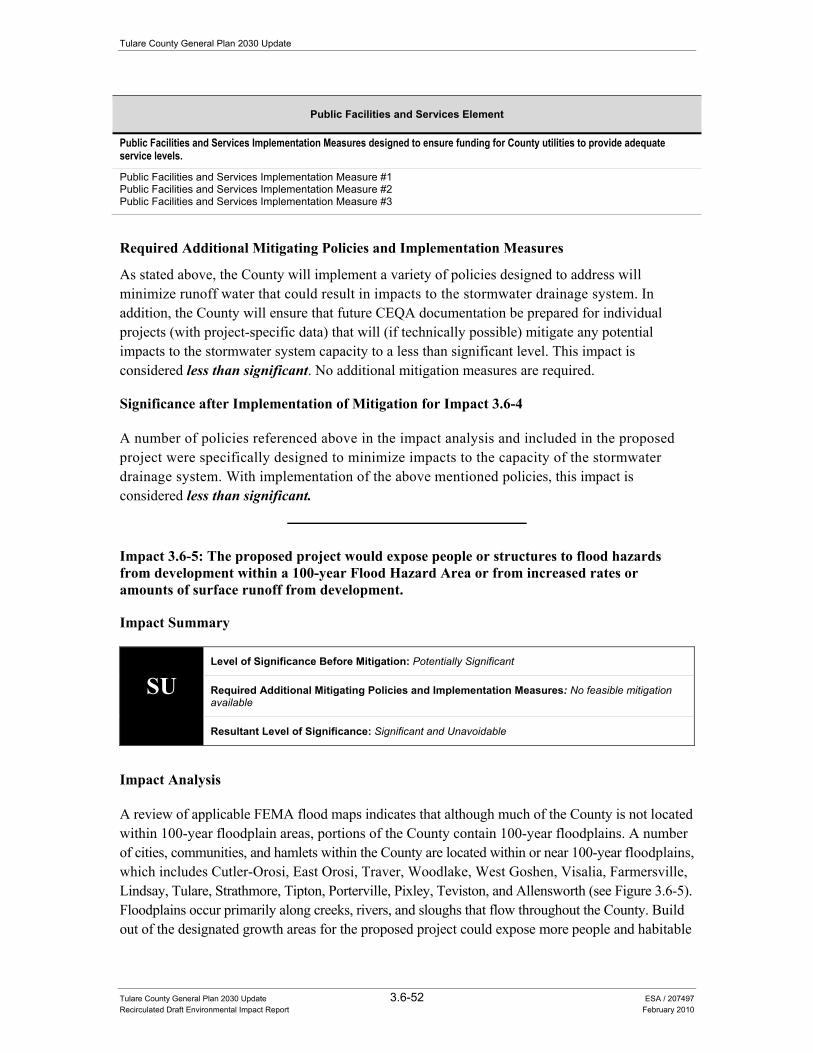
Tulare County General Plan 2030 Update
Tulare County General Plan 2030 Update 3.6-52 ESA / 207497 Recirculated Draft Environmental Impact Report February 2010
Public Facilities and Services Element
Public Facilities and Services Implementation Measures designed to ensure funding for County utilities to provide adequate service levels.
Public Facilities and Services Implementation Measure #1 Public Facilities and Services Implementation Measure #2 Public Facilities and Services Implementation Measure #3
Required Additional Mitigating Policies and Implementation Measures
As stated above, the County will implement a variety of policies designed to address will minimize runoff water that could result in impacts to the stormwater drainage system. In addition, the County will ensure that future CEQA documentation be prepared for individual projects (with project-specific data) that will (if technically possible) mitigate any potential impacts to the stormwater system capacity to a less than significant level. This impact is considered less than significant. No additional mitigation measures are required.
Significance after Implementation of Mitigation for Impact 3.6-4
A number of policies referenced above in the impact analysis and included in the proposed project were specifically designed to minimize impacts to the capacity of the stormwater drainage system. With implementation of the above mentioned policies, this impact is considered less than significant.
Impact 3.6-5: The proposed project would expose people or structures to flood hazards from development within a 100-year Flood Hazard Area or from increased rates or amounts of surface runoff from development.
Impact Summary
SU Level of Significance Before Mitigation: Potentially Significant
Required Additional Mitigating Policies and Implementation Measures: No feasible mitigation available
Resultant Level of Significance: Significant and Unavoidable
Impact Analysis
A review of applicable FEMA flood maps indicates that although much of the County is not located within 100-year floodplain areas, portions of the County contain 100-year floodplains. A number of cities, communities, and hamlets within the County are located within or near 100-year floodplains, which includes Cutler-Orosi, East Orosi, Traver, Woodlake, West Goshen, Visalia, Farmersville, Lindsay, Tulare, Strathmore, Tipton, Porterville, Pixley, Teviston, and Allensworth (see Figure 3.6-5). Floodplains occur primarily along creeks, rivers, and sloughs that flow throughout the County. Build out of the designated growth areas for the proposed project could expose more people and habitable
3.6 Hydrology, Water Quality and Drainage
Tulare County General Plan 2030 Update 3.6-53 ESA / 207497 Recirculated Draft Environmental Impact Report February 2010
structures to potential flooding if development occurs within or adjacent to these floodplain areas. Build out of the proposed project could also result in the placement of structures, including residences, within 100-year floodplains resulting in redirection of flood flows such that additional people and structures could be exposed to flooding. Under future climate change conditions, it is possible that flooding could increase in frequency or in geographic areas exposed to flood hazards that were not previously within a floodplain area. Increased amounts of the snowpack may melt under future climate change conditions further contributing to increased flood flows. Analysis of flood hazards would occur on a case by case basis for future individual projects to determine site specific flooding impacts.
Recent State legislation related to flood protection and risk management is described above under “Regulatory Setting”. Because the County of Tulare already has a flood management ordinance (Ordinance Code of Tulare County, Part VII, Chapter 27) that has been approved by FEMA and that substantially complies with the new requirements, the County is able to use that information to comply with new Safety Element requirements (APA, page 12, 2008 –). However, the new laws do require updating emergency response programs based upon new FEMA and DWR flood maps, flood data and flood management requirements. Until the County has implemented needed updates of its land use maps with current flood information, and met Safety Element provisions as now defined in Government Code 65302(g), flood related impacts of the proposed project will be significant.
Policies included as part of the proposed project that would reduce this impact are summarized below by general plan element. Specific policies from the draft Health and Safety Element direct the County to preserve floodway areas (see Policies HS-5.2, HS-5.4, and HS-5.9) and limit development in hazardous areas (see Policies HS-1.2, HS-1.3, and HS-5.5). Other policies require the County to ensure that new flood control projects do not adversely affect or contribute to flooding hazards (see Policy HS-5.6) or require the County to review projects for their exposure to flooding (Policy HS-1.11) or inundation due to dam failure (see Policy HS-5.5). Policies from the Public Facilities and Services Element (see Policies PFS-4.1, PFS-4.2, PFS-4.3, PFS-4.4, and PFS-4.6) require the provision of adequate levels of storm water drainage infrastructure to protect the public and property from storm water damage and minimize flooding. Additional policies from the Health and Safety Element require the County to continue to participate in the National Flood Insurance Program (see Policy HS-5.3) and require adequate emergency response (see Policy HS-1.1) in the event of a flood emergency. Policy HS-1.12 directs the County to expand home addressing requirements for emergency service response. Health and Safety Element Implementation Measures #1 through #3, #5, #9, #17, and #19 aim to ensure proper and efficient emergency response to disasters, including flooding, through updating emergency response plans and staff training. With implementation of the below mentioned policies, this impact is considered significant and unavoidable.
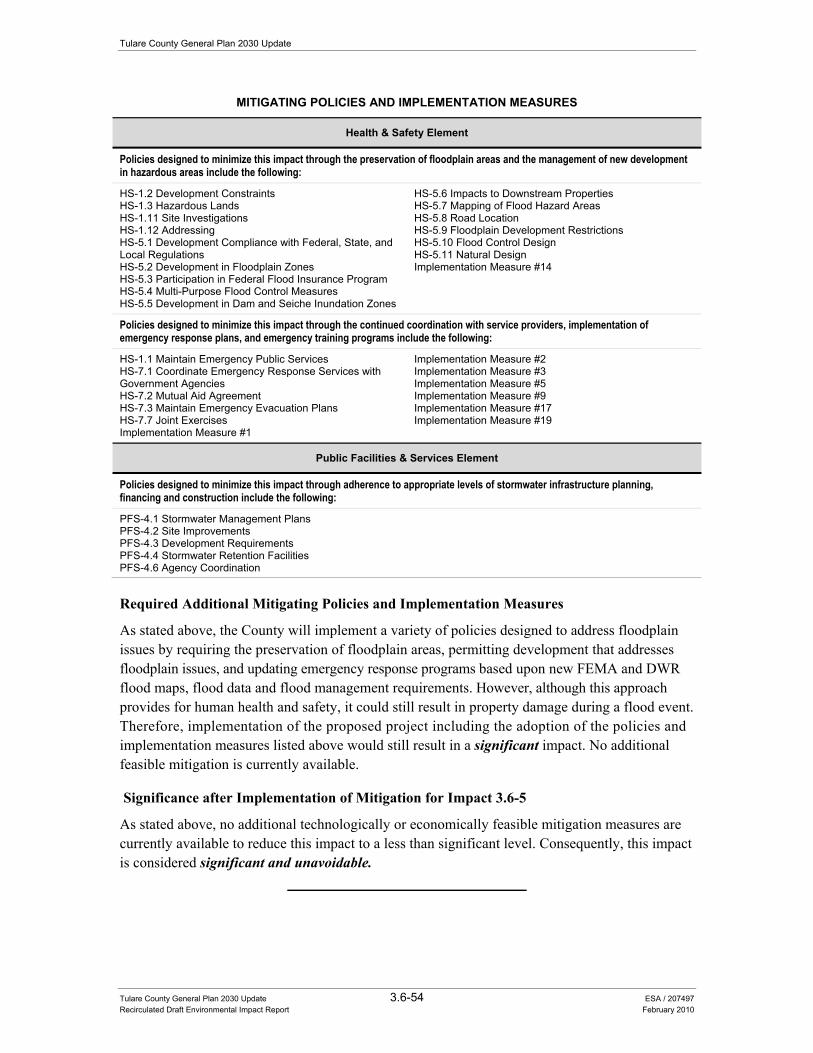
Tulare County General Plan 2030 Update
Tulare County General Plan 2030 Update 3.6-54 ESA / 207497 Recirculated Draft Environmental Impact Report February 2010
MITIGATING POLICIES AND IMPLEMENTATION MEASURES
Health & Safety Element
Policies designed to minimize this impact through the preservation of floodplain areas and the management of new development in hazardous areas include the following:
HS-1.2 Development Constraints HS-1.3 Hazardous Lands HS-1.11 Site Investigations HS-1.12 Addressing HS-5.1 Development Compliance with Federal, State, and Local Regulations HS-5.2 Development in Floodplain Zones HS-5.3 Participation in Federal Flood Insurance Program HS-5.4 Multi-Purpose Flood Control Measures HS-5.5 Development in Dam and Seiche Inundation Zones
HS-5.6 Impacts to Downstream Properties HS-5.7 Mapping of Flood Hazard Areas HS-5.8 Road Location HS-5.9 Floodplain Development Restrictions HS-5.10 Flood Control Design HS-5.11 Natural Design Implementation Measure #14
Policies designed to minimize this impact through the continued coordination with service providers, implementation of emergency response plans, and emergency training programs include the following:
HS-1.1 Maintain Emergency Public Services HS-7.1 Coordinate Emergency Response Services with Government Agencies HS-7.2 Mutual Aid Agreement HS-7.3 Maintain Emergency Evacuation Plans HS-7.7 Joint Exercises Implementation Measure #1
Implementation Measure #2 Implementation Measure #3 Implementation Measure #5 Implementation Measure #9 Implementation Measure #17 Implementation Measure #19
Public Facilities & Services Element
Policies designed to minimize this impact through adherence to appropriate levels of stormwater infrastructure planning, financing and construction include the following:
PFS-4.1 Stormwater Management Plans PFS-4.2 Site Improvements PFS-4.3 Development Requirements PFS-4.4 Stormwater Retention Facilities PFS-4.6 Agency Coordination
Required Additional Mitigating Policies and Implementation Measures
As stated above, the County will implement a variety of policies designed to address floodplain issues by requiring the preservation of floodplain areas, permitting development that addresses floodplain issues, and updating emergency response programs based upon new FEMA and DWR flood maps, flood data and flood management requirements. However, although this approach provides for human health and safety, it could still result in property damage during a flood event. Therefore, implementation of the proposed project including the adoption of the policies and implementation measures listed above would still result in a significant impact. No additional feasible mitigation is currently available.
Significance after Implementation of Mitigation for Impact 3.6-5
As stated above, no additional technologically or economically feasible mitigation measures are currently available to reduce this impact to a less than significant level. Consequently, this impact is considered significant and unavoidable.
3.6 Hydrology, Water Quality and Drainage
Tulare County General Plan 2030 Update 3.6-55 ESA / 207497 Recirculated Draft Environmental Impact Report February 2010
Impact 3.6-6: The proposed project would expose people or structures to flood hazards from failure of a levee or dam.
Impact Summary
SU Level of Significance Before Mitigation: Potentially Significant
Required Additional Mitigating Policies and Implementation Measures: No feasible mitigation available
Resultant Level of Significance: Significant and Unavoidable
Impact Analysis
In addition to flood hazards associated with 100-year flood zones, flood inundation resulting from levee or dam failure due to a variety of factors is a potential hazard for the County. As noted in the “Environmental Setting” above, two major dams could cause substantial flooding in Tulare County in the event of a failure: Terminus Dam and Success Dam. Other dams that could result in flooding due to dam failure include Sand Creek, Pine Flat, Bravo Lake, and Larson. Figure 3.6-5 shows the areas within the County, including some areas containing cities and unincorporated communities and hamlets, which could be inundated as a result of dam failure. In addition, there are many smaller dams throughout the County that would cause localized flooding in the event of their failing. However, a comprehensive analysis of the potential for dam failure and possible downstream effects for these upstream dams has not been undertaken. Although dam failure can result from numerous natural or human activities, such as earthquakes, erosion, improper siting, rapidly rising flood waters, and structural and design flaws, the likelihood for this to happen remains minimal. Under future climate change conditions, the hydrologic regimes the dams and levees were designed for may not be adequate to deal with new flood flow patterns. Consequently, future climate change conditions may cause dams and levees to be more susceptible to failure, which could in turn expose more people and structures to flooding from dam or levee failure.
Recent flood events, including Hurricane Katrina, have brought to the forefront a heightened awareness of the dangers of levee failure which has led to increased public scrutiny of new development projects that are located in floodplain areas protected by levees. Levees typically fail in one of two ways: (1) overtopping of the levee during peak flows or (2) structural failure. Structural failure can occur as a result of a variety of factors including seismic activity, erosion, damage from vegetation and rodents. Both types of levee failure can result in deep flooding within the adjacent floodplain. In summary, the risk of living behind a levee system is that there could be a minor, major, or catastrophic failure of the levee.
Policies included as part of the proposed project that would minimize this impact are summarized below by general plan element. Specific policies from the Health and Safety Element direct the County to preserve floodway areas (see Policies HS-5.2, HS-5.4, and HS-5.9) and limit development in hazardous areas (see Policies HS-1.2, HS-1.3, and HS-5.5). Other policies require the County to ensure that new flood control projects do not adversely affect or contribute to flooding hazards (see Policy HS-5.6) or require the County to review projects for their exposure to inundation
Tulare County General Plan 2030 Update
Tulare County General Plan 2030 Update 3.6-56 ESA / 207497 Recirculated Draft Environmental Impact Report February 2010
due to dam failure (see Policy HS-5.5). Policies from the draft Public Facilities and Services Element (PFS-4.1, PFS-4.2, PFS-4.3, PFS-4.4, and PFS-4.6) require the provision of adequate levels of storm water drainage infrastructure to protect the public and property from storm water damage and minimize flooding. Additional policies from the draft Health and Safety Element require the County to continue to participate in the National Flood Insurance Program (see Policy HS-5.3) and require adequate emergency response (Policy HS-1.1) in the event of a flood emergency. Policy HS-1.12 directs the County to expand home addressing requirements for emergency service response. However, even with implementation of the below mentioned policies and implementation measures, structural integrity of existing levees in the County is unknown. Therefore, this impact is considered potentially significant.
MITIGATING POLICIES AND IMPLEMENTATION MEASURES
Health & Safety Element
Policies designed to minimize this impact through the preservation of floodplain areas and the management of new development in hazardous areas include the following:
HS-1.2 Development Constraints HS-1.3 Hazardous Lands HS-1.11 Site Investigations HS-1.12 Addressing HS-5.1 Development Compliance with Federal, State, and Local Regulations HS-5.2 Development in Floodplain Zones HS-5.3 Participation in Federal Flood Insurance Program HS-5.4 Multi-Purpose Flood Control Measures HS-5.5 Development in Dam and Seiche Inundation Zones
HS-5.6 Impacts to Downstream Properties HS-5.7 Mapping of Flood Hazard Areas HS-5.8 Road Location HS-5.9 Floodplain Development Restrictions HS-5.10 Flood Control Design HS-5.11 Natural Design Implementation Measure #14
Policies designed to minimize this impact through the continued coordination with service providers, implementation of emergency response plans, and emergency training programs include the following:
HS-1.1 Maintain Emergency Public Services HS-7.1 Coordinate Emergency Response Services with Government Agencies HS-7.2 Mutual Aid Agreement HS-7.3 Maintain Emergency Evacuation Plans HS-7.7 Joint Exercises Implementation Measure #1
Implementation Measure #2 Implementation Measure #3 Implementation Measure #5 Implementation Measure #9 Implementation Measure #17 Implementation Measure #19
Public Facilities & Services Element
Policies designed to minimize this impact through adherence to appropriate levels of stormwater infrastructure planning, financing and construction include the following:
PFS-4.1 Stormwater Management Plans PFS-4.2 Site Improvements PFS-4.3 Development Requirements PFS-4.4 Stormwater Retention Facilities PFS-4.6 Agency Coordination
Required Additional Mitigating Policies and Implementation Measures
As stated above, the County will implement a variety of policies designed to address floodplain issues by requiring the preservation of floodplain areas, permitting development that addresses floodplain issues, and updating emergency response programs based upon new FEMA and DWR flood maps, flood data and flood management requirements. However, although this approach provides for human health and safety, it could still result in property damage during a flood event.
3.6 Hydrology, Water Quality and Drainage
Tulare County General Plan 2030 Update 3.6-57 ESA / 207497 Recirculated Draft Environmental Impact Report February 2010
Therefore, implementation of the proposed project including the adoption of the policies and implementation measures listed above would still result in a significant impact. No additional feasible mitigation is currently available.
Significance after Implementation of Mitigation for Impact 3.6-6
As stated above, no additional technologically or economically feasible mitigation measures are currently available to reduce this impact to a less than significant level. Consequently, this impact is considered significant and unavoidable.

Tulare County General Plan 2030 Update 3.7-1 ESA / 207497 Recirculated Draft Environmental Impact Report February 2010
SECTION 3.7 Geology, Soils, Seismicity, and Mineral Resources
Introduction To provide the context on which potential impacts of the proposed project can be assessed, this section presents information on the geologic, mineral, seismic, and soil setting of Tulare County. The environmental setting presents a description of local topography, geology, mineral resources, soil resources, and regional seismicity. The regulatory section includes a description of applicable State, local and regional plans and/or programs and associated goals and objectives. A description of the potential impacts of the proposed project is also provided and includes the identification of feasible mitigation (general plan policies) to avoid or lessen the impacts. Agricultural resources, which are closely associated with soil resources, are addressed in Section 3.10 “Agricultural Resources” of this recirculated draft Environmental Impact Report (RDEIR).
The following environmental and regulatory settings were developed from information contained in the 2010 Background Report (see Chapter 8.0 “Safety” and Chapter 10.0 “Natural Resources”), incorporated by reference and summarized below. The 2010 Background Report is included in this RDEIR as Appendix B.
Regulatory Setting There are no federal or local regulations pertaining to geologic, soil, seismic, or mineral resources relevant to the proposed project. The following State regulations are identified below.
State Regulations
Alquist-Priolo Earthquake Fault Zoning Act The Alquist-Priolo Earthquake Fault Zoning Act (formerly the Alquist-Priolo Special Studies Zone Act et. seq.), signed into law December 1972, requires the delineation of zones along active faults in California. The purpose of the Alquist-Priolo Act is to regulate development on or near active fault traces to reduce the hazards associated with fault rupture and to prohibit the location of most structures for human occupancy across these traces. Cities and counties must regulate certain development projects within the zones, which includes withholding permits until geologic investigations are conducted in order to demonstrate that development sites are not threatened
Tulare County General Plan 2030 Update
Tulare County General Plan 2030 Update 3.7-2 ESA / 207497 Recirculated Draft Environmental Impact Report February 2010
by future surface displacement (County of Tulare, 2010 Background Report, page 8-3, 2010a). Surface fault rupture is not necessarily restricted to the area within an Alquist-Priolo Zone.
Seismic Hazards Mapping Act, 1991 The Seismic Hazards Mapping Act (et. seq.) was developed to protect the public from the effects of strong groundshaking, liquefaction, landslides, or other ground failure/hazards caused by earthquakes. This act requires the State Geologist to delineate seismic hazard zones and requires cities, counties, and other local permitting agencies to regulate certain development projects within these zones. Before a development permit is granted for a site within a seismic hazard zone, a geotechnical investigation of the site has to be conducted and appropriate mitigation measures incorporated into the project design.
California Building Code The California Building Code is another name for the body of regulations known as the California Code of Regulations (CCR), Title 24, Part 2, Section 101 et seq. which is a portion of the California Building Standards Code. Title 24 is assigned to the California Building Standards Commission, which, by law, is responsible for coordinating all building standards. Under State law, all building standards must be centralized in Title 24 or they are not enforceable.
Published by the International Conference of Building Officials, the Uniform Building Code is a widely adopted model building code in the United States. The California Building Code incorporates by reference the Uniform Building Code with necessary California amendments. About one-third of the text within the California Building Code has been tailored for California earthquake conditions.
California Health and Safety Code The California Health and Safety Code, Section 1250(et seq.), define essential facilities as those structures which are necessary for emergency operations subsequent to a natural disaster. These facilities include hospitals and other medical facilities having surgery and emergency treatment areas, fire and police stations, tanks or other structures containing water or other fire-suppression materials, emergency vehicle shelters and garages, structures and equipment in emergency-preparedness centers, standby power-generating equipment for essential facilities, and structures and equipment in government communication centers and other facilities required for emergency response. These facilities are subject to more stringent design and construction standards, as prescribed in Title 24, Chapter 23 of the California Code of Regulations, thus minimizing potential damage. Chapter 23 also applies to skilled nursing facilities, public schools and State-owned or State-leased essential services buildings regulated by the Office of Statewide Health Planning and Development and the Office of the State Architect, Structural Safety Section.
California Department of Transportation (Caltrans) Caltrans has developed roadway design standards including those for seismic safety. Consideration of earthquake hazards in roadway design is detailed in the 2006 Highway Design Manual published
3.7 Geology, Soils, Seismicity and Mineral Resources
Tulare County General Plan 2030 Update 3.7-3 ESA / 207497 Recirculated Draft Environmental Impact Report February 2010
by Caltrans. Modifications to local highways and roads would be required to adhere to Caltrans engineering standards to minimize settlement.
California Surface Mining and Reclamation Act of 1975 Enacted by the State Legislature in 1975, the Surface Mining and Reclamation Act (SMARA), Public Resources Code Section 2710 et seq., insures a continuing supply of mineral resources for the State. The act also creates surface mining and reclamation policy to assure that:
• Production and conservation of minerals is encouraged; • Environmental effects are prevented or minimized; • Consideration is given to recreational activities, watersheds, wildlife, range and forage,
and aesthetic enjoyment; • Mined lands are reclaimed to a useable condition once mining is completed; and • Hazards to public safety both now and in the future are eliminated.
Areas in the State (city or county) that do not have their own regulations for mining and reclamation activities rely on the Department of Conservation, Division of Mines and Geology, Office of Mine Reclamation to enforce this law. SMARA contains provisions for the inventory of mineral lands in the State of California. The State Geologist, in accordance with the State Board’s Guidelines for Classification and Designation of Mineral Lands, must classify Mineral Resource Zones (MRZ) as designated below:
• MRZ-1. Areas where available geologic information indicates that there is minimal likelihood of significant resources.
• MRZ-2. Areas underlain by mineral deposits where geologic data indicate that significant mineral deposits are located or likely to be located.
• MRZ-3. Areas where mineral deposits are found but the significance of the deposits cannot be evaluated without further exploration.
• MRZ-4. Areas where there is not enough information to assess the zone. These are areas that have unknown mineral resource significance.
SMARA only covers mining activities that impact or disturb the surface of the land. Deep mining (tunnel) or petroleum and gas production is not covered by SMARA.
California Laws for Conservation of Petroleum and Gas Division 3, Section 3000 et seq., of the Public Resources Code includes the California Laws for Conservation of Petroleum and Gas. These regulations include laws relating to the conservation, utilization, and supervision of oil and gas resources.
Tulare County General Plan 2030 Update
Tulare County General Plan 2030 Update 3.7-4 ESA / 207497 Recirculated Draft Environmental Impact Report February 2010
Environmental Setting Tulare County is divided into two major physiographic and geologic provinces: the Sierra Nevada Mountains and the Central Valley. The Sierra Nevada Physiographic Province, in the eastern portion of the County, is underlain by metamorphic and igneous rock. It consists mainly of homogeneous granitic rocks, with several islands of older metamorphic rock. The central and western parts of the County are part of the Central Valley Province, underlain by marine and non-marine sedimentary rocks. It is basically a flat, alluvial plain, with soil consisting of material deposited by the uplifting of the mountains.
The foothill area of the County is essentially a transition zone, containing old alluvial soils that have been dissected by the west-flowing rivers and streams that carry runoff from the Sierra Nevada Mountains. This gently rolling topography is punctured in many areas by outcropping soft bedrock, with native mountain soils generally quite dense and compact.
Geologic, Seismic, and Soil Conditions Seismicity varies greatly between the two major geologic provinces represented in Tulare County. The Central Valley is an area of relatively low tectonic activity bordered by mountain ranges on either side. The Sierra Nevada Mountains, partially located within Tulare County, are the result of tectonic plate movement which resulted in the creation of the mountain range. The Coast Range on the west side of the Central Valley is also a result of these forces, and the continued uplifting of Pacific and North American tectonic plates continues to elevate these ranges. The remaining seismic hazards in Tulare County generally result from movement along faults associated with the creation of these ranges.
Earthquakes are typically measured in terms of magnitude and intensity. The most commonly known measurement is the Richter Scale, a logarithmic scale which measures the magnitude (strength) of a quake. The Modified Mercalli Intensity Scale measures the intensity of an earthquake as a function of the following factors:
• Magnitude and location of the epicenter; • Geologic characteristics; • Groundwater characteristics; • Duration and characteristic of the ground motion; and • Structural characteristics of a building.
Faults Faults are the indications of past seismic activity. It is assumed that those that have been active most recently are the most likely to be active in the future. Recent seismic activity is measured in a geologic timescale. Geologically recent is defined as having occurred within the last two million years (the Quaternary Period). All faults believed to have been active during Quaternary time are considered “potentially active.”
3.7 Geology, Soils, Seismicity and Mineral Resources
Tulare County General Plan 2030 Update 3.7-5 ESA / 207497 Recirculated Draft Environmental Impact Report February 2010
Although a number of faults have been located along the western edge of the Sierra Nevada Mountains, none are known to be active. The Owens Valley Fault Group poses the greatest seismic threat. The center of the fault zone is thought to be able to produce a maximum probable earthquake of 7.0 on the Richter Scale at a recurrence interval of 125 years, while the central area is thought to be capable of producing an earthquake of 8.25 magnitude every 300 to 10,000 years.
There are three faults within the region that have been, and will be, principal sources of potential seismic activity within Tulare County. These faults are described below:
• San Andreas Fault. The San Andreas Fault is located approximately 40 miles west of the Tulare County boundary. This fault has a long history of activity, and is thus the primary focus in determining seismic activity within the County. Seismic activity along the fault varies along its span from the Gulf of California to Cape Mendocino. Just west of Tulare County lays the “Central California Active Area,” section of the San Andreas Fault where many earthquakes have originated.
• Owens Valley Fault Group. The Owens Valley Fault Group is a complex system containing both active and potentially active faults, located on the eastern base of the Sierra Nevada Mountains. The Group is located within Tulare and Inyo Counties and has historically been the source of seismic activity within Tulare County.
• Clovis Fault. The Clovis Fault is considered to be active within the Quaternary Period, although there is no historic evidence of its activity, and is therefore classified as “potentially active.” This fault lies approximately six miles south of the Madera County boundary in Fresno County. Activity along this fault could potentially generate more seismic activity in Tulare County than the San Andreas or Owens Valley fault systems. In particular, a strong earthquake on the Fault could affect northern Tulare County. However, because of the lack of historic activity along the Clovis Fault, inadequate evidence exists for assessing maximum earthquake impacts.
Groundshaking Groundshaking is the primary seismic hazard in Tulare County because of the County’s seismic setting and its record of historical activity. Thus, emphasis focuses on the analysis of expected levels of groundshaking, which is directly related to the magnitude of a specific quake and the distance from a quake’s epicenter. Magnitude is a measure of the amount of energy released in an earthquake, with higher magnitudes causing increased groundshaking over longer periods of time, thereby affecting a larger area. Groundshaking intensity, which is often a more useful measure of earthquake effects than magnitude, is a qualitative measure of the effects felt by the population.
The common way to describe ground motion during an earthquake is with the motion parameters of acceleration and velocity in addition to the duration of the shaking. A common measure of ground motion is the peak ground acceleration (PGA), which is the largest value of horizontal acceleration obtained from a seismograph. PGA is expressed as the percentage of the acceleration due to gravity (g), which is approximately 980 centimeters per second squared.
The San Joaquin Valley portion of Tulare County is located on alluvial deposits, which tend to experience greater groundshaking intensities than areas located on hard rock. Therefore, structures
Tulare County General Plan 2030 Update
Tulare County General Plan 2030 Update 3.7-6 ESA / 207497 Recirculated Draft Environmental Impact Report February 2010
located in this area will tend to suffer greater damage from groundshaking than those located in the foothill and mountain areas. However, existing alluvium valleys and weathered or decomposed zones are scattered throughout the mountainous portions of the County, which could also experience stronger intensities than the surrounding solid rock areas. The geologic characteristics of an area can therefore be a greater hazard than its distance to the epicenter of the quake.
The Five County Seismic Safety Element projects that with the maximum probable earthquake of a magnitude 8 to 8.5 centered along the San Andreas Fault, “relatively low levels of shaking should be expected in the eastern and central parts of the valley.” The eastern portion of the County is composed of four “Sierran Zones,” the boundaries of which are determined by the predicted effects of the maximum probable earthquake on the Owens Valley Fault. Since the mountains are underlain primarily by granitic rock, these zones tend to experience very low levels of groundshaking. However, most of the people residing in these zones do not live on the hard rock. Instead, residences tend to be built in alluvial valleys or the weathered and decomposed zones in the meadows or foothills. These areas will experience stronger groundshaking intensities. Characteristics within these microzones may vary greatly; thus, groundshaking potential in the Sierran zones is more accurately analyzed on a site-by-site basis.
Older buildings constructed before current building codes were in effect, and even newer buildings constructed before earthquake resistance provisions were included in the current building codes, are most likely to suffer damage in an earthquake. Most of Tulare County’s buildings are no more than one or two stories in height and are of wood frame construction, which is considered the most structurally resistant to earthquake damage. Older masonry buildings (without earthquake-resistance reinforcement) are the most susceptible to structural failure, which causes the greatest loss of life. The State of California has identified unreinforced masonry buildings (URMs) as a safety issue during earthquakes. In high risk areas (Bay Area), inventories and programs to mitigate this issue are required. Because Tulare County is not considered a high risk area, State law only recommends (as opposed to requires) that local jurisdictions adopt programs to retrofit URMs.
The susceptibility of a structure to damage from earthquake groundshaking is also related to the foundation material underlying the structure. A foundation of rock or very firm material intensifies short period motions, which affect the low, rigid buildings more than those that are tall and flexible. A deep layer of water-logged soft alluvium may cushion low, rigid buildings, but accentuate the motion in tall buildings. The amplified motion resulting from softer alluvium soils can also severely damage older masonry buildings.
Liquefaction Liquefaction is a process whereby soil is temporarily transformed to a fluid form during intense and prolonged groundshaking. Areas most prone to liquefaction are those that are water saturated (e.g., where the water table is less than 30 feet below the surface) and consist of relatively uniform sands that are low to medium density. In addition to necessary soil conditions, the ground acceleration and duration of the earthquake must be of sufficient energy to induce liquefaction. Scientific studies have shown that the ground acceleration must approach 0.3 g before liquefaction occurs in a sandy soil with relative densities typical of the San Joaquin alluvial deposits.
3.7 Geology, Soils, Seismicity and Mineral Resources
Tulare County General Plan 2030 Update 3.7-7 ESA / 207497 Recirculated Draft Environmental Impact Report February 2010
Liquefaction during major earthquakes has caused severe damage to structures on level ground as a result of settling, tilting, or floating. Such damage occurred in San Francisco on bay-filled areas during the 1989 Loma Prieta earthquake, even though the epicenter was several miles away. If liquefaction occurs in or under a sloping soil mass, the entire mass may flow toward a lower elevation, such as that which occurred along the coastline near Seward, Alaska during the 1964 earthquake. Also of particular concern in terms of developed and newly developing areas are fill areas that have been poorly compacted.
No specific county-wide assessments to identify liquefaction hazards have been performed in Tulare County. Areas where groundwater is less than 30 feet below the surface occur primarily in the San Joaquin Valley portion of the County. However, soil types in the area are not conducive to liquefaction because they are either too coarse or too high in clay content. Areas subject to 0.3 g acceleration or greater are located in a small section of the Sierra Nevada Mountains along the Tulare-Inyo County boundary. However, the depth to groundwater in such areas is greater than in the valley, which would minimize liquefaction potential as well. Detailed geotechnical engineering investigations would be necessary to more accurately evaluate liquefaction potential in specific areas and to identify and map the extent of locations subject to liquefaction. Due to the relatively low population levels and possible development levels in that area, a case by case investigation would be more appropriate as future development is considered.
Settlement Settlement can occur in poorly consolidated soils during groundshaking. During settlement, the soil materials are physically rearranged by the shaking and result in reduced stabling alignment of the individual minerals. Settlement of sufficient magnitude to cause significant structural damage is normally associated with rapidly deposited alluvial soils, or improperly founded or poorly compacted fill. These areas are known to undergo extensive settling with the addition of irrigation water, but evidence due to groundshaking is not available. Fluctuating groundwater levels also may have changed the local soil characteristics. Sufficient subsurface data is lacking to conclude that settlement would occur during a large earthquake; however, the data is sufficient to indicate that the potential exists in Tulare County.
Other Geologic Hazards
Landslides Landslides are a geologic hazard influenced by four factors:
• Strength of rock and resistance to failure, which is a function of rock type (or geologic formation);
• Geologic structure or orientation of a surface along which slippage could occur; • Water (can add weight to a potentially unstable mass or influence strength of a potential
failure surface); and, • Topography (amount of slope in combination with gravitation forces).
Tulare County General Plan 2030 Update
Tulare County General Plan 2030 Update 3.7-8 ESA / 207497 Recirculated Draft Environmental Impact Report February 2010
Tulare County has three geologic environments: the valley, foothills, and mountains. The range in topography between these three areas presents a range of landslide hazards. As of June 2009, the California Geological Survey had not developed landslide hazard identification maps for Tulare County. However, it is reasonable to assume that certain areas in Tulare County are more prone to landslides than others. Such areas can be found in foothill and mountain areas where fractured and steep slopes are present (as in the Sierra Nevada Mountains), where less consolidated or weathered soils overlie bedrock, or where inadequate ground cover accelerates erosion. Additionally, development grading operations can create unstable slopes due to cut and fill activities. Erosion and slumping of soils can also occur along bluffs along the Kaweah, Kings, and Tule Rivers.
These areas where steep slopes are present are typically not heavily populated and most are located in federal or State lands. Roadways such as SR 198 and SR 190 in eastern Tulare County could be affected by landslides in the event of an earthquake or heavy rain. California Geological Survey geologists determined that catastrophic failure was unlikely, but long-term road maintenance could be compromised due to undercutting of the slope by the creeks below the roads. There is no risk of large landslides in the valley area of the County due to its relatively flat topography. There is, however, the potential for small slides and slumping along the steep banks of rivers or creeks.
Subsidence Subsidence occurs when a large portion of land is displaced vertically, usually due to the withdrawal of groundwater, oil, or natural gas. Soils that are particularly subject to subsidence include those with high silt or clay content. Subsidence caused by groundwater withdrawal generally presents a more serious problem, since it can affect large areas. Oil and gas withdrawal, on the other hand, tends to affect smaller, localized areas. Some areas of the Central Valley have subsided more than 20 feet during the past 50 years. No mapping or local records identifying this occurrence in Tulare County are currently available.
Seiche A seiche is a standing wave produced in a body of water such as a reservoir, lake, or harbor, by wind, atmospheric changes, or earthquakes. Seiches have the potential to damage shoreline structures, dams, and levees. Studies of true seismic seiches are limited, but the largest recorded seiche was 1.2 feet during the 1964 Alaska earthquake. Since this is less than wave heights that could be expected from wind-induced waves, earthquake-induced seiches are not considered a risk in Tulare County. In addition, the effects from a seiche would be similar to the flood hazard for a particular area, and the risk of occurrence is perceived as considerably less than the risk of flooding.
Volcanic Hazards The nearest volcanoes lie to the northeast of Tulare County in Mono County, in the Mammoth Lakes/Long Valley area. The most serious effect on Tulare County of an eruption in the Mammoth Lakes, area according to the California Geological Survey, would be ash deposition. Such an occurrence is highly unlikely, for two reasons. First, ash deposition in the County would be dependent upon an improbable northeast wind configuration. Second, and most importantly, although some of these volcanoes were active as recently as 800 years ago, they are not considered by geologists
3.7 Geology, Soils, Seismicity and Mineral Resources
Tulare County General Plan 2030 Update 3.7-9 ESA / 207497 Recirculated Draft Environmental Impact Report February 2010
to be active. In the past decade, however, there has been renewed interest in the area by geologists, as a result of new patterns of earthquakes and uplifting of the earths’ crust; it was hypothesized by some that the area may be entering a new period of activity. A volcanic eruption during the winter could result in snowmelt and lead to flooding. The State has formulated a contingency plan, the Response Plan for Volcano Hazards in the Long Valley Caldera and Mono Craters Region, California (USGS, 2002) designed to notify the public in the event of an earthquake in the Long Valley area.
Mineral, Oil, and Gas Resources Economically, the most important minerals that are extracted in Tulare County are sand, gravel, crushed rock, and natural gas. Other minerals that could be mined commercially include tungsten, which has been mined to some extent, and relatively small amounts of chromite, copper, gold, lead, manganese, silver, zinc, barite, feldspar, limestone, and silica. Minerals that are present but do not exist in the quantities desired for commercial mining include antimony, asbestos, graphite, iron, molybdenum, nickel, radioactive minerals, phosphate, construction rock, and sulfur.
Aggregate Resources Aggregate resources are the most valuable mineral resource in the County because it is a major component of the Portland cement concrete (PCC) and asphaltic concrete (AC). PCC and AC are essential to constructing roads, buildings, and providing for other infrastructure needs. There are four streams that have provided the main source of high quality sand and gravel in Tulare County to make PCC and AC. They include the Kaweah River, Lewis Creek, Deer Creek and the Tule River. The highest quality deposits are located at the Kaweah and Tule Rivers. Lewis Creek deposits are considerably inferior to that of the other two rivers. This is due to the fact that the sand and gravel particles in Lewis Creek are flat. The higher quality aggregate resource areas located along the Kaweah River, near Lemon Cove, and a location on the Tule River between Porterville and Lake Success (see Figure 3.7-1). These deposits are ideal because the streams have steep gradients, which wash away soft, weak rocks allowing concentrated amounts of the desired round and hardened material in the streambed.
Projected Potential Shortages There is estimated to be a total of 932 million tons of aggregate resources in Tulare County. This figure includes 219 million tons of reserves available for mining and 200 million tons that are located in the hard rock quarries southeast of Porterville. Of that total, 19 million tons are located in Northern Tulare County, which is expected to be depleted by the year 2010 unless new resources are permitted for mining. Lemon Cove has been the most highly extracted area for PCC quality aggregate supplies.
Past studies have shown that there is a strong correlation between the total amount of aggregate production and the population in a defined area. Using this correlation, the historical rate of consumption of aggregate resources in the entire County has been calculated to be 5.33 tons, per person, per year. This rate was calculated using the population and reported aggregate production
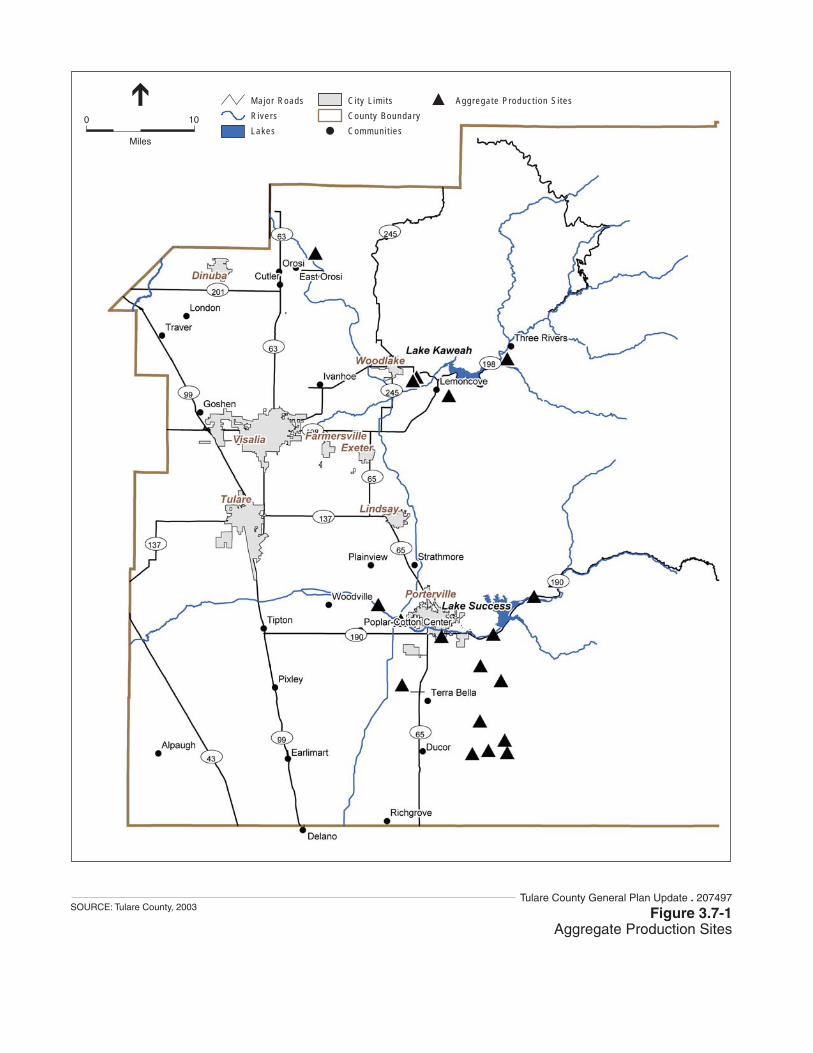
0 10
Miles
Major RoadsRiversLakes
Ci ty L im i tsCounty BoundaryCommuni t ies
Aggregate Produc t ion S i tes
Figure 3.7-1Aggregate Production Sites
SOURCE: Tulare County, 2003Tulare County General Plan Update . 207497
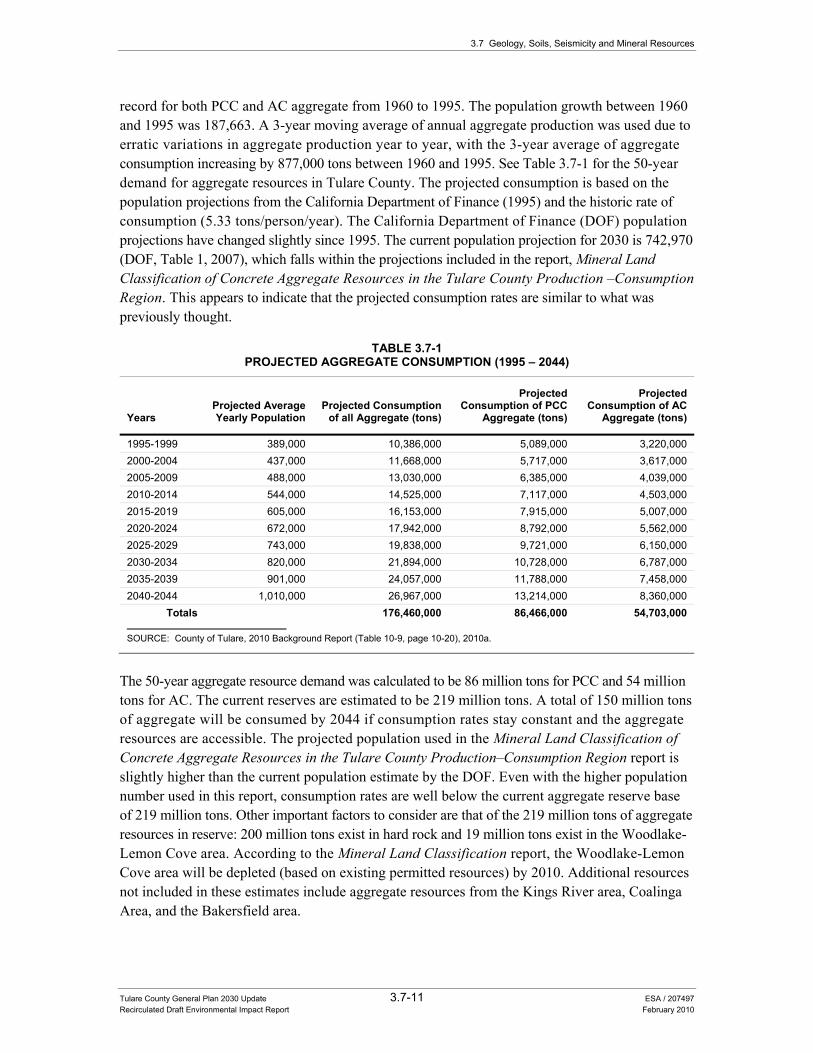
3.7 Geology, Soils, Seismicity and Mineral Resources
Tulare County General Plan 2030 Update 3.7-11 ESA / 207497 Recirculated Draft Environmental Impact Report February 2010
record for both PCC and AC aggregate from 1960 to 1995. The population growth between 1960 and 1995 was 187,663. A 3-year moving average of annual aggregate production was used due to erratic variations in aggregate production year to year, with the 3-year average of aggregate consumption increasing by 877,000 tons between 1960 and 1995. See Table 3.7-1 for the 50-year demand for aggregate resources in Tulare County. The projected consumption is based on the population projections from the California Department of Finance (1995) and the historic rate of consumption (5.33 tons/person/year). The California Department of Finance (DOF) population projections have changed slightly since 1995. The current population projection for 2030 is 742,970 (DOF, Table 1, 2007), which falls within the projections included in the report, Mineral Land Classification of Concrete Aggregate Resources in the Tulare County Production –Consumption Region. This appears to indicate that the projected consumption rates are similar to what was previously thought.
TABLE 3.7-1PROJECTED AGGREGATE CONSUMPTION (1995 – 2044)
Years Projected Average Yearly Population
Projected Consumption of all Aggregate (tons)
Projected Consumption of PCC
Aggregate (tons)
Projected Consumption of AC
Aggregate (tons)
1995-1999 389,000 10,386,000 5,089,000 3,220,000 2000-2004 437,000 11,668,000 5,717,000 3,617,000 2005-2009 488,000 13,030,000 6,385,000 4,039,000 2010-2014 544,000 14,525,000 7,117,000 4,503,000 2015-2019 605,000 16,153,000 7,915,000 5,007,000 2020-2024 672,000 17,942,000 8,792,000 5,562,000 2025-2029 743,000 19,838,000 9,721,000 6,150,000 2030-2034 820,000 21,894,000 10,728,000 6,787,000 2035-2039 901,000 24,057,000 11,788,000 7,458,000 2040-2044 1,010,000 26,967,000 13,214,000 8,360,000
Totals 176,460,000 86,466,000 54,703,000
SOURCE: County of Tulare, 2010 Background Report (Table 10-9, page 10-20), 2010a.
The 50-year aggregate resource demand was calculated to be 86 million tons for PCC and 54 million tons for AC. The current reserves are estimated to be 219 million tons. A total of 150 million tons of aggregate will be consumed by 2044 if consumption rates stay constant and the aggregate resources are accessible. The projected population used in the Mineral Land Classification of Concrete Aggregate Resources in the Tulare County Production–Consumption Region report is slightly higher than the current population estimate by the DOF. Even with the higher population number used in this report, consumption rates are well below the current aggregate reserve base of 219 million tons. Other important factors to consider are that of the 219 million tons of aggregate resources in reserve: 200 million tons exist in hard rock and 19 million tons exist in the Woodlake-Lemon Cove area. According to the Mineral Land Classification report, the Woodlake-Lemon Cove area will be depleted (based on existing permitted resources) by 2010. Additional resources not included in these estimates include aggregate resources from the Kings River area, Coalinga Area, and the Bakersfield area.
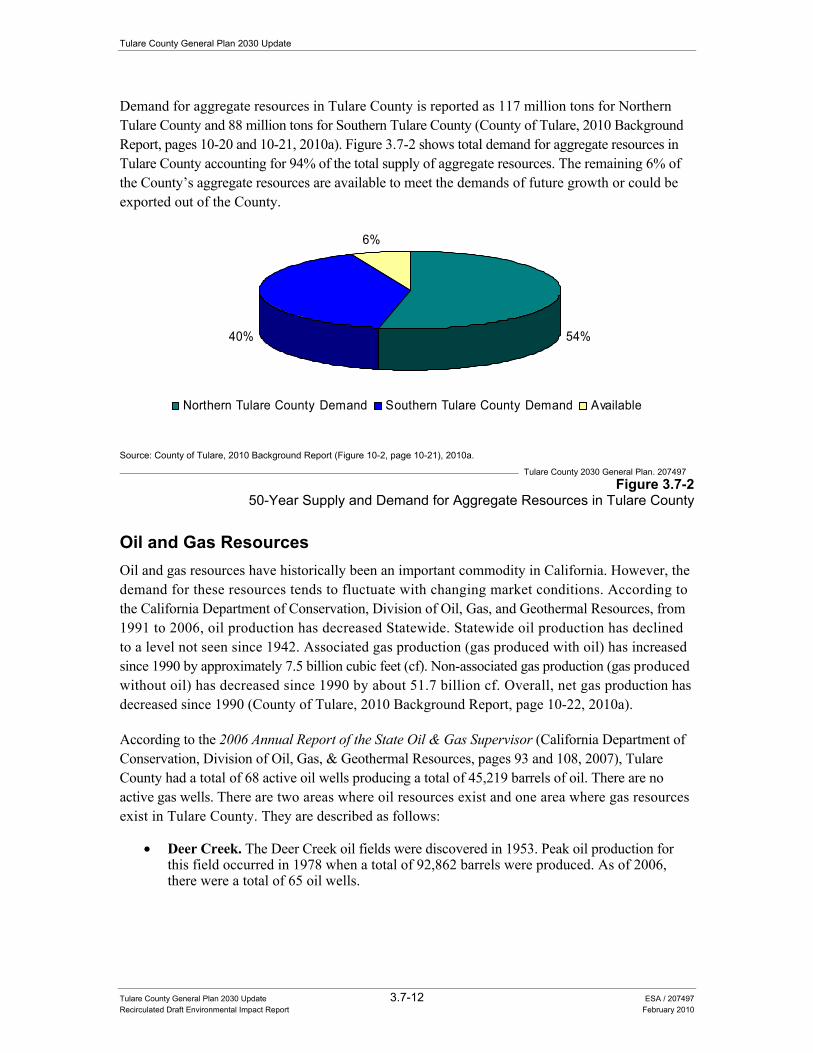
Tulare County General Plan 2030 Update
Tulare County General Plan 2030 Update 3.7-12 ESA / 207497 Recirculated Draft Environmental Impact Report February 2010
Demand for aggregate resources in Tulare County is reported as 117 million tons for Northern Tulare County and 88 million tons for Southern Tulare County (County of Tulare, 2010 Background Report, pages 10-20 and 10-21, 2010a). Figure 3.7-2 shows total demand for aggregate resources in Tulare County accounting for 94% of the total supply of aggregate resources. The remaining 6% of the County’s aggregate resources are available to meet the demands of future growth or could be exported out of the County.
54%40%
6%
Northern Tulare County Demand Southern Tulare County Demand Available
Source: County of Tulare, 2010 Background Report (Figure 10-2, page 10-21), 2010a. Tulare County 2030 General Plan. 207497
Figure 3.7-2 50-Year Supply and Demand for Aggregate Resources in Tulare County
Oil and Gas Resources Oil and gas resources have historically been an important commodity in California. However, the demand for these resources tends to fluctuate with changing market conditions. According to the California Department of Conservation, Division of Oil, Gas, and Geothermal Resources, from 1991 to 2006, oil production has decreased Statewide. Statewide oil production has declined to a level not seen since 1942. Associated gas production (gas produced with oil) has increased since 1990 by approximately 7.5 billion cubic feet (cf). Non-associated gas production (gas produced without oil) has decreased since 1990 by about 51.7 billion cf. Overall, net gas production has decreased since 1990 (County of Tulare, 2010 Background Report, page 10-22, 2010a).
According to the 2006 Annual Report of the State Oil & Gas Supervisor (California Department of Conservation, Division of Oil, Gas, & Geothermal Resources, pages 93 and 108, 2007), Tulare County had a total of 68 active oil wells producing a total of 45,219 barrels of oil. There are no active gas wells. There are two areas where oil resources exist and one area where gas resources exist in Tulare County. They are described as follows:
• Deer Creek. The Deer Creek oil fields were discovered in 1953. Peak oil production for this field occurred in 1978 when a total of 92,862 barrels were produced. As of 2006, there were a total of 65 oil wells.
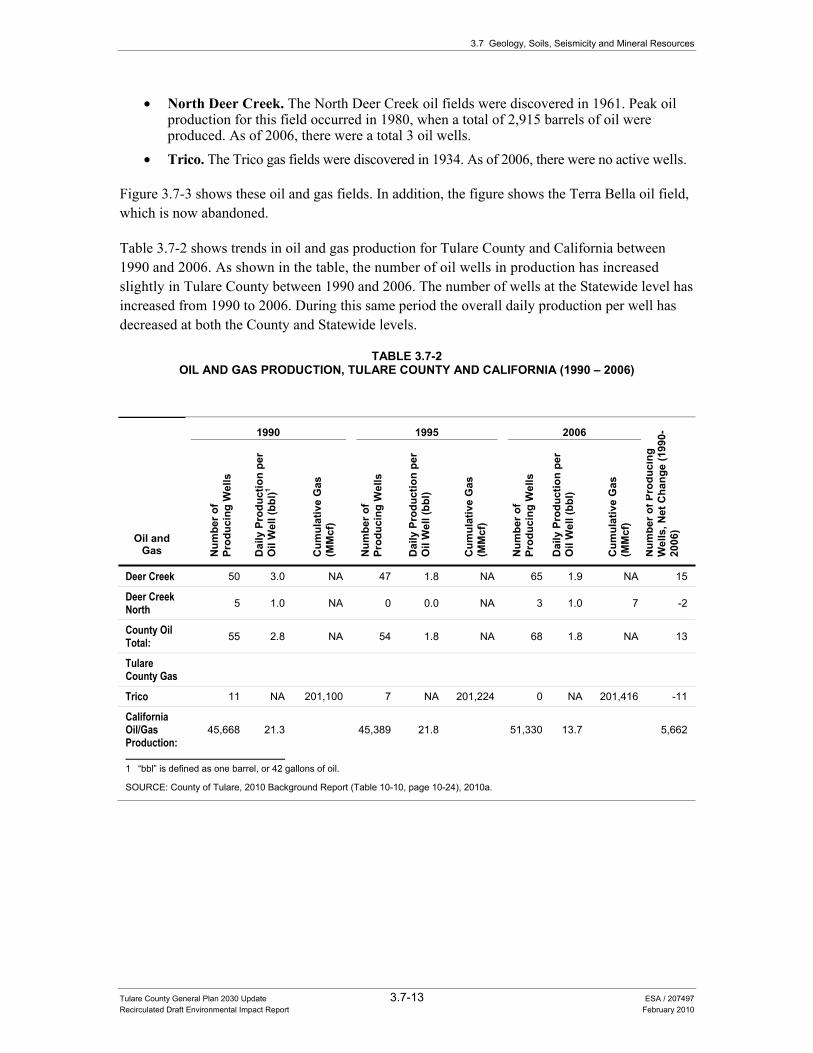
3.7 Geology, Soils, Seismicity and Mineral Resources
Tulare County General Plan 2030 Update 3.7-13 ESA / 207497 Recirculated Draft Environmental Impact Report February 2010
• North Deer Creek. The North Deer Creek oil fields were discovered in 1961. Peak oil production for this field occurred in 1980, when a total of 2,915 barrels of oil were produced. As of 2006, there were a total 3 oil wells.
• Trico. The Trico gas fields were discovered in 1934. As of 2006, there were no active wells.
Figure 3.7-3 shows these oil and gas fields. In addition, the figure shows the Terra Bella oil field, which is now abandoned.
Table 3.7-2 shows trends in oil and gas production for Tulare County and California between 1990 and 2006. As shown in the table, the number of oil wells in production has increased slightly in Tulare County between 1990 and 2006. The number of wells at the Statewide level has increased from 1990 to 2006. During this same period the overall daily production per well has decreased at both the County and Statewide levels.
TABLE 3.7-2OIL AND GAS PRODUCTION, TULARE COUNTY AND CALIFORNIA (1990 – 2006)
Oil and Gas
1990 1995 2006
Num
ber o
f Pro
duci
ng
Wel
ls, N
et C
hang
e (1
990-
2006
)
Num
ber o
f Pr
oduc
ing
Wel
ls
Dai
ly P
rodu
ctio
n pe
r O
il W
ell (
bbl)1
Cum
ulat
ive
Gas
(M
Mcf
)
Num
ber o
f Pr
oduc
ing
Wel
ls
Dai
ly P
rodu
ctio
n pe
r O
il W
ell (
bbl)
Cum
ulat
ive
Gas
(M
Mcf
)
Num
ber o
f Pr
oduc
ing
Wel
ls
Dai
ly P
rodu
ctio
n pe
r O
il W
ell (
bbl)
Cum
ulat
ive
Gas
(M
Mcf
)
Deer Creek 50 3.0 NA 47 1.8 NA 65 1.9 NA 15
Deer Creek North 5 1.0 NA 0 0.0 NA 3 1.0 7 -2
County Oil Total: 55 2.8 NA 54 1.8 NA 68 1.8 NA 13
Tulare County Gas
Trico 11 NA 201,100 7 NA 201,224 0 NA 201,416 -11
California Oil/Gas Production:
45,668 21.3 45,389 21.8 51,330 13.7 5,662
1 “bbl” is defined as one barrel, or 42 gallons of oil.
SOURCE: County of Tulare, 2010 Background Report (Table 10-10, page 10-24), 2010a.
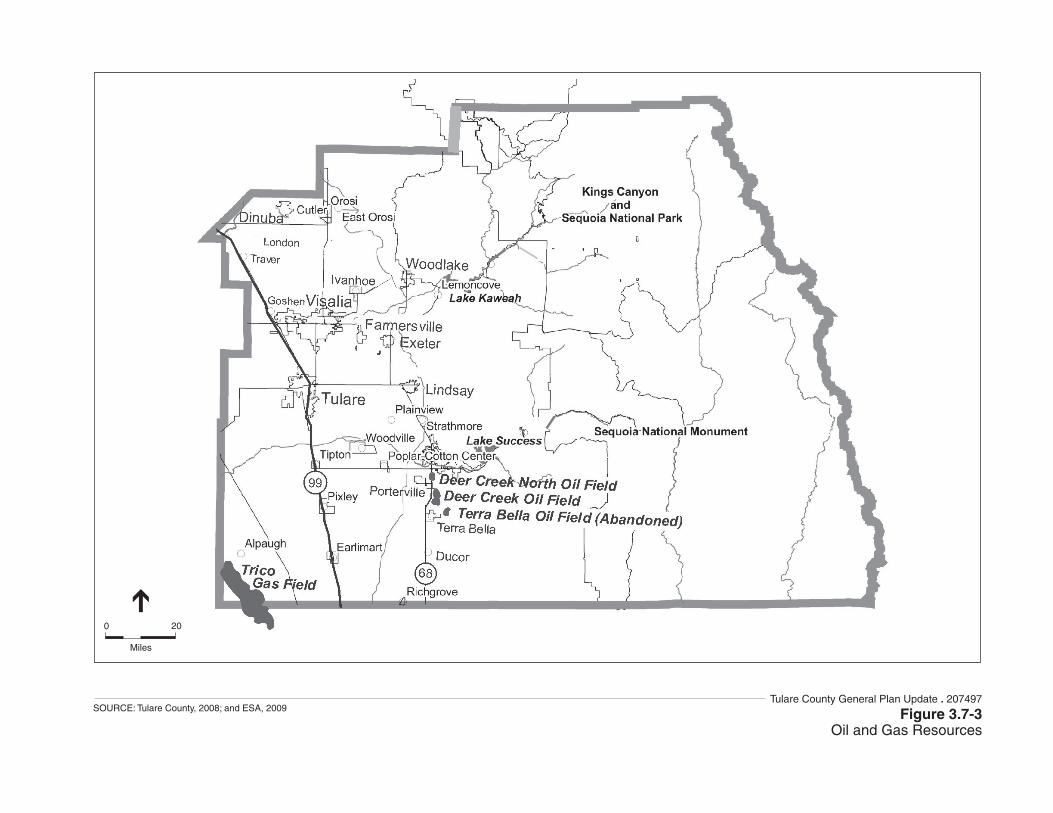
0 20
Miles
Figure 3.7-3Oil and Gas Resources
SOURCE: Tulare County, 2008; and ESA, 2009Tulare County General Plan Update . 207497
3.7 Geology, Soils, Seismicity and Mineral Resources
Tulare County General Plan 2030 Update 3.7-15 ESA / 207497 Recirculated Draft Environmental Impact Report February 2010
Impacts and Mitigation Measures
Significance Criteria The significance criteria for this analysis were developed from criteria presented in Appendix G “Environmental Checklist Form” of the CEQA Guidelines and based on the professional judgment of the County of Tulare and its consultants. The proposed project would result in a significant impact if it would:
• Expose people or structures to potential substantial adverse effects, including the risk of loss, injury, or death involving: o Rupture of a known earthquake fault, as delineated on the most recent Alquist-Priolo
Earthquake Fault Zoning Map issued by the State Geologist for the area or based on other substantial evidence of a known fault.
o Strong seismic ground shaking. o Seismic-related ground failure, including liquefaction. o Landslides;
• Result in substantial soil erosion or the loss of topsoil; • Be located on a geologic unit or soil that is unstable, or that would become unstable as a
result of the project, and potentially result in on- or off-site landslide, lateral spreading, subsidence, liquefaction, or collapse;
• Be located on expansive soil, as defined in Table 18-1-B of the Uniform Building Code, creating substantial risks to life or property;
• Result in the loss or availability of a known mineral resource that would be of value to the region and the residents of the State;
• Result in the loss of availability of a locally important mineral resource recovery site delineated on a local general plan, specific plan or other land use plan;
• Result in land use conflicts with adjacent mineral extraction operations; • Result in the loss of availability of a known oil and/or gas resource that would be of value
to the region and the residents of the State; or • Result in land use incompatibilities with adjacent oil and gas operations.
Methodology The assessment of impacts to geologic and soil resources as well as analysis of seismic hazards is a qualitative review of the existing geologic, soil, and seismic conditions within the County and a determination of whether the proposed project includes adequate provisions to ensure safety for County residents, visitors and businesses as well as continued protection of these resources.
The potential for geologic and seismic impacts as a result of implementation of the proposed project was reviewed and evaluated using readily available background information, such as pertinent geologic maps and seismic hazard maps. Key sources of information included the California Division of Mines and Geology and the United States Geologic Survey.
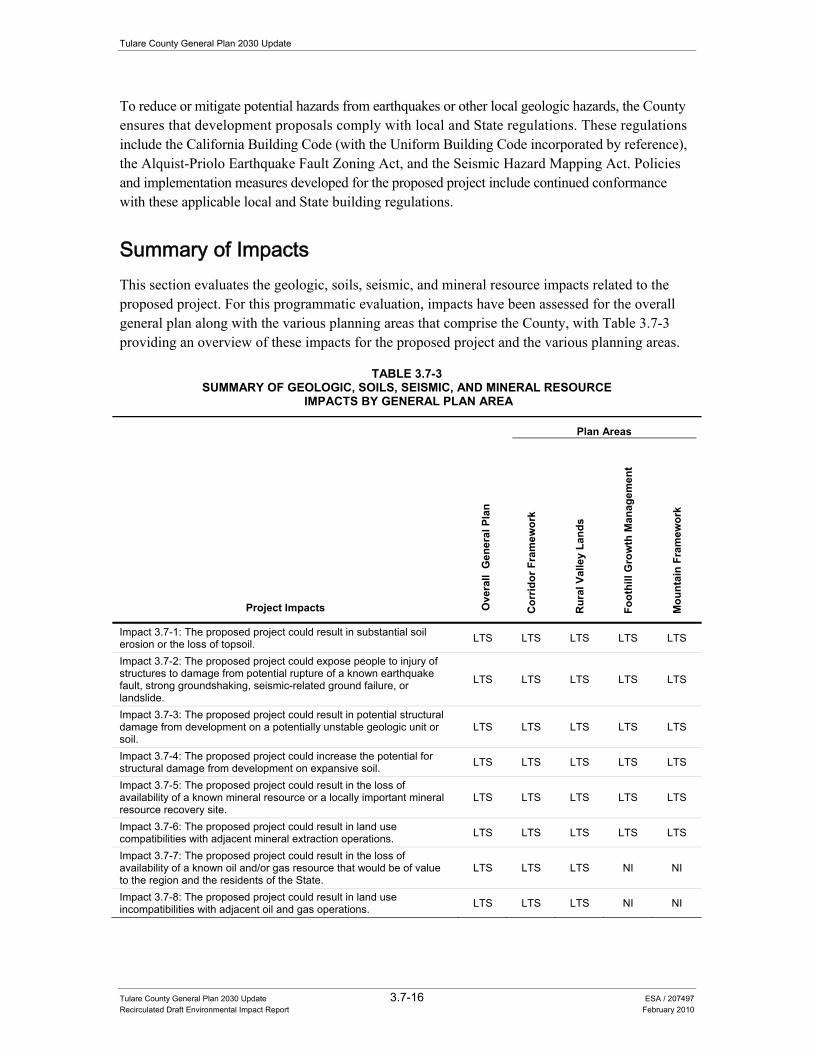
Tulare County General Plan 2030 Update
Tulare County General Plan 2030 Update 3.7-16 ESA / 207497 Recirculated Draft Environmental Impact Report February 2010
To reduce or mitigate potential hazards from earthquakes or other local geologic hazards, the County ensures that development proposals comply with local and State regulations. These regulations include the California Building Code (with the Uniform Building Code incorporated by reference), the Alquist-Priolo Earthquake Fault Zoning Act, and the Seismic Hazard Mapping Act. Policies and implementation measures developed for the proposed project include continued conformance with these applicable local and State building regulations.
Summary of Impacts This section evaluates the geologic, soils, seismic, and mineral resource impacts related to the proposed project. For this programmatic evaluation, impacts have been assessed for the overall general plan along with the various planning areas that comprise the County, with Table 3.7-3 providing an overview of these impacts for the proposed project and the various planning areas.
TABLE 3.7-3 SUMMARY OF GEOLOGIC, SOILS, SEISMIC, AND MINERAL RESOURCE
IMPACTS BY GENERAL PLAN AREA
Project Impacts Ove
rall
Gen
eral
Pla
n
Plan Areas
Cor
ridor
Fra
mew
ork
Rur
al V
alle
y La
nds
Foot
hill
Gro
wth
Man
agem
ent
Mou
ntai
n Fr
amew
ork
Impact 3.7-1: The proposed project could result in substantial soil erosion or the loss of topsoil. LTS LTS LTS LTS LTS
Impact 3.7-2: The proposed project could expose people to injury of structures to damage from potential rupture of a known earthquake fault, strong groundshaking, seismic-related ground failure, or landslide.
LTS LTS LTS LTS LTS
Impact 3.7-3: The proposed project could result in potential structural damage from development on a potentially unstable geologic unit or soil.
LTS LTS LTS LTS LTS
Impact 3.7-4: The proposed project could increase the potential for structural damage from development on expansive soil. LTS LTS LTS LTS LTS
Impact 3.7-5: The proposed project could result in the loss of availability of a known mineral resource or a locally important mineral resource recovery site.
LTS LTS LTS LTS LTS
Impact 3.7-6: The proposed project could result in land use compatibilities with adjacent mineral extraction operations. LTS LTS LTS LTS LTS
Impact 3.7-7: The proposed project could result in the loss of availability of a known oil and/or gas resource that would be of value to the region and the residents of the State.
LTS LTS LTS NI NI
Impact 3.7-8: The proposed project could result in land use incompatibilities with adjacent oil and gas operations. LTS LTS LTS NI NI
3.7 Geology, Soils, Seismicity and Mineral Resources
Tulare County General Plan 2030 Update 3.7-17 ESA / 207497 Recirculated Draft Environmental Impact Report February 2010
Impacts and Mitigation Measures
Impact 3.7-1: The proposed project could result in substantial soil erosion or the loss of topsoil.
Impact Summary
LTS Level of Significance Before Mitigation: Less than Significant
Required Additional Mitigating Policies and Implementation Measures: None required
Resultant Level of Significance: Less than Significant
Impact Analysis
Erosion is a natural and inevitable geologic process whereby earth materials are loosened, worn away, decomposed or dissolved, and are removed from one place and transported to another location. Precipitation, running water, and wind are all factors that contribute to erosion. Ordinarily, erosion proceeds very slowly as to be imperceptible, but when the natural equilibrium of the environment is changed, the rate of erosion can be greatly accelerated. Accelerated erosion within an urban area can cause damage by undermining structures, blocking storm sewers and depositing silt, sand, or mud in roads and tunnels. Consequently, these erosion effects can result in a variety of aesthetic, maintenance and engineering problems. Additionally, eroded materials are eventually deposited into local waterways where the carried silt remains suspended for some time, constituting a pollutant and altering the normal balance of a waterway ecosystem.
The County’s topography varies from west to east ranging from relatively flat areas (with soil conditions that exhibit minimal potential for erosion impacts) to relatively steep areas with greater potential for soil erosion conditions. Development activities resulting from buildout of the designated growth areas would accelerate the erosion rate through both an increase in short-term construction-related activities and an overall increase in the amount of impervious surfaces within all of the County’s individual planning areas. Development in the County would be subject to local (i.e., County Storm Water Management Plan) and State codes and requirements for erosion control and grading. In addition, project sites encompassing an area of one or more acres would require compliance with best management practices included as part of a National Pollutant Discharge Elimination System (NPDES) permit and consequently the development and implementation of a Storm Water Pollution Prevention Plan (SWPPP).
Consequently, erosion-related effects can be minimized through implementation of the policies provided as part of the Water Resources and Health and Safety Elements in the Goals and Policies Report (Part I of the General Plan 2030 Update). Policies WR-2.2, WR-2.3, and WR-2.4 relate specifically to monitoring construction activities through NPDES enforcement, requiring the use of Best Management Practices (BMPs), and other mitigation measures designed to control erosion and protect surface water and groundwater from the adverse effects of construction activities. Other policies from the Health and Safety Element (see Policies HS-2.3 and HS-2.4) limit
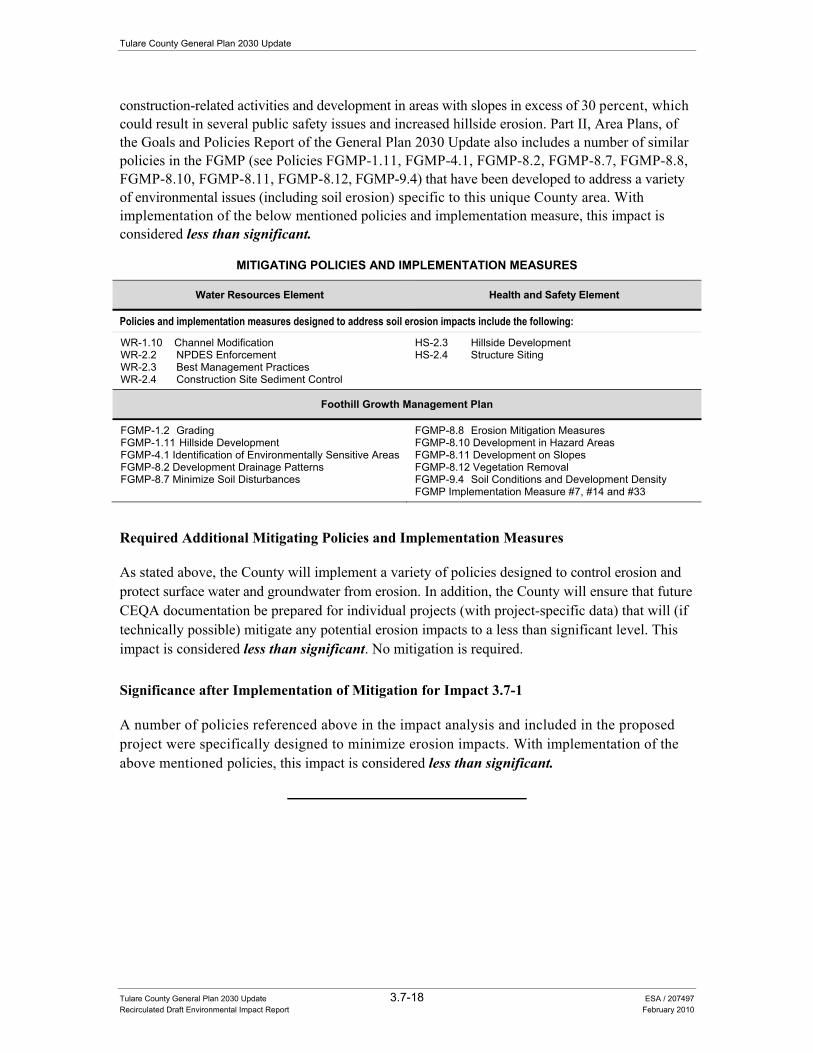
Tulare County General Plan 2030 Update
Tulare County General Plan 2030 Update 3.7-18 ESA / 207497 Recirculated Draft Environmental Impact Report February 2010
construction-related activities and development in areas with slopes in excess of 30 percent, which could result in several public safety issues and increased hillside erosion. Part II, Area Plans, of the Goals and Policies Report of the General Plan 2030 Update also includes a number of similar policies in the FGMP (see Policies FGMP-1.11, FGMP-4.1, FGMP-8.2, FGMP-8.7, FGMP-8.8, FGMP-8.10, FGMP-8.11, FGMP-8.12, FGMP-9.4) that have been developed to address a variety of environmental issues (including soil erosion) specific to this unique County area. With implementation of the below mentioned policies and implementation measure, this impact is considered less than significant.
MITIGATING POLICIES AND IMPLEMENTATION MEASURES
Water Resources Element Health and Safety Element
Policies and implementation measures designed to address soil erosion impacts include the following:
WR-1.10 Channel Modification WR-2.2 NPDES Enforcement WR-2.3 Best Management Practices WR-2.4 Construction Site Sediment Control
HS-2.3 Hillside Development HS-2.4 Structure Siting
Foothill Growth Management Plan
FGMP-1.2 Grading FGMP-1.11 Hillside Development FGMP-4.1 Identification of Environmentally Sensitive Areas FGMP-8.2 Development Drainage Patterns FGMP-8.7 Minimize Soil Disturbances
FGMP-8.8 Erosion Mitigation Measures FGMP-8.10 Development in Hazard Areas FGMP-8.11 Development on Slopes FGMP-8.12 Vegetation Removal FGMP-9.4 Soil Conditions and Development Density FGMP Implementation Measure #7, #14 and #33
Required Additional Mitigating Policies and Implementation Measures
As stated above, the County will implement a variety of policies designed to control erosion and protect surface water and groundwater from erosion. In addition, the County will ensure that future CEQA documentation be prepared for individual projects (with project-specific data) that will (if technically possible) mitigate any potential erosion impacts to a less than significant level. This impact is considered less than significant. No mitigation is required.
Significance after Implementation of Mitigation for Impact 3.7-1
A number of policies referenced above in the impact analysis and included in the proposed project were specifically designed to minimize erosion impacts. With implementation of the above mentioned policies, this impact is considered less than significant.
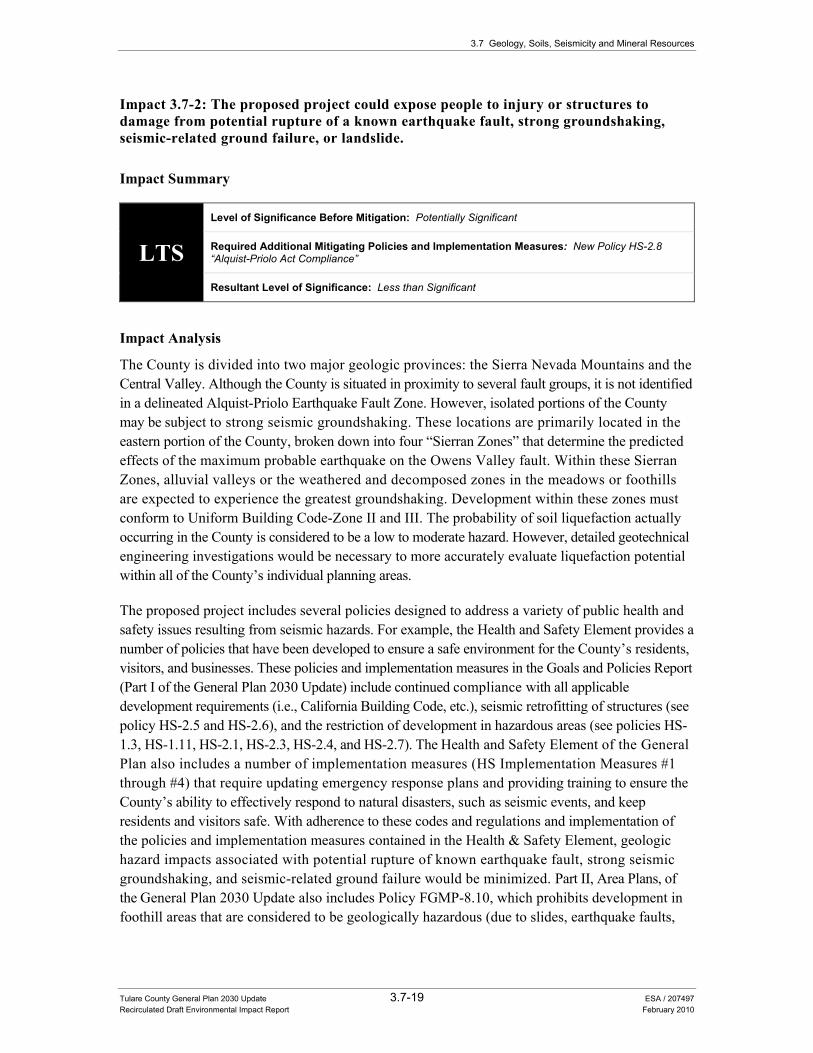
3.7 Geology, Soils, Seismicity and Mineral Resources
Tulare County General Plan 2030 Update 3.7-19 ESA / 207497 Recirculated Draft Environmental Impact Report February 2010
Impact 3.7-2: The proposed project could expose people to injury or structures to damage from potential rupture of a known earthquake fault, strong groundshaking, seismic-related ground failure, or landslide.
Impact Summary
LTS Level of Significance Before Mitigation: Potentially Significant
Required Additional Mitigating Policies and Implementation Measures: New Policy HS-2.8 “Alquist-Priolo Act Compliance”
Resultant Level of Significance: Less than Significant
Impact Analysis
The County is divided into two major geologic provinces: the Sierra Nevada Mountains and the Central Valley. Although the County is situated in proximity to several fault groups, it is not identified in a delineated Alquist-Priolo Earthquake Fault Zone. However, isolated portions of the County may be subject to strong seismic groundshaking. These locations are primarily located in the eastern portion of the County, broken down into four “Sierran Zones” that determine the predicted effects of the maximum probable earthquake on the Owens Valley fault. Within these Sierran Zones, alluvial valleys or the weathered and decomposed zones in the meadows or foothills are expected to experience the greatest groundshaking. Development within these zones must conform to Uniform Building Code-Zone II and III. The probability of soil liquefaction actually occurring in the County is considered to be a low to moderate hazard. However, detailed geotechnical engineering investigations would be necessary to more accurately evaluate liquefaction potential within all of the County’s individual planning areas.
The proposed project includes several policies designed to address a variety of public health and safety issues resulting from seismic hazards. For example, the Health and Safety Element provides a number of policies that have been developed to ensure a safe environment for the County’s residents, visitors, and businesses. These policies and implementation measures in the Goals and Policies Report (Part I of the General Plan 2030 Update) include continued compliance with all applicable development requirements (i.e., California Building Code, etc.), seismic retrofitting of structures (see policy HS-2.5 and HS-2.6), and the restriction of development in hazardous areas (see policies HS-1.3, HS-1.11, HS-2.1, HS-2.3, HS-2.4, and HS-2.7). The Health and Safety Element of the General Plan also includes a number of implementation measures (HS Implementation Measures #1 through #4) that require updating emergency response plans and providing training to ensure the County’s ability to effectively respond to natural disasters, such as seismic events, and keep residents and visitors safe. With adherence to these codes and regulations and implementation of the policies and implementation measures contained in the Health & Safety Element, geologic hazard impacts associated with potential rupture of known earthquake fault, strong seismic groundshaking, and seismic-related ground failure would be minimized. Part II, Area Plans, of the General Plan 2030 Update also includes Policy FGMP-8.10, which prohibits development in foothill areas that are considered to be geologically hazardous (due to slides, earthquake faults,
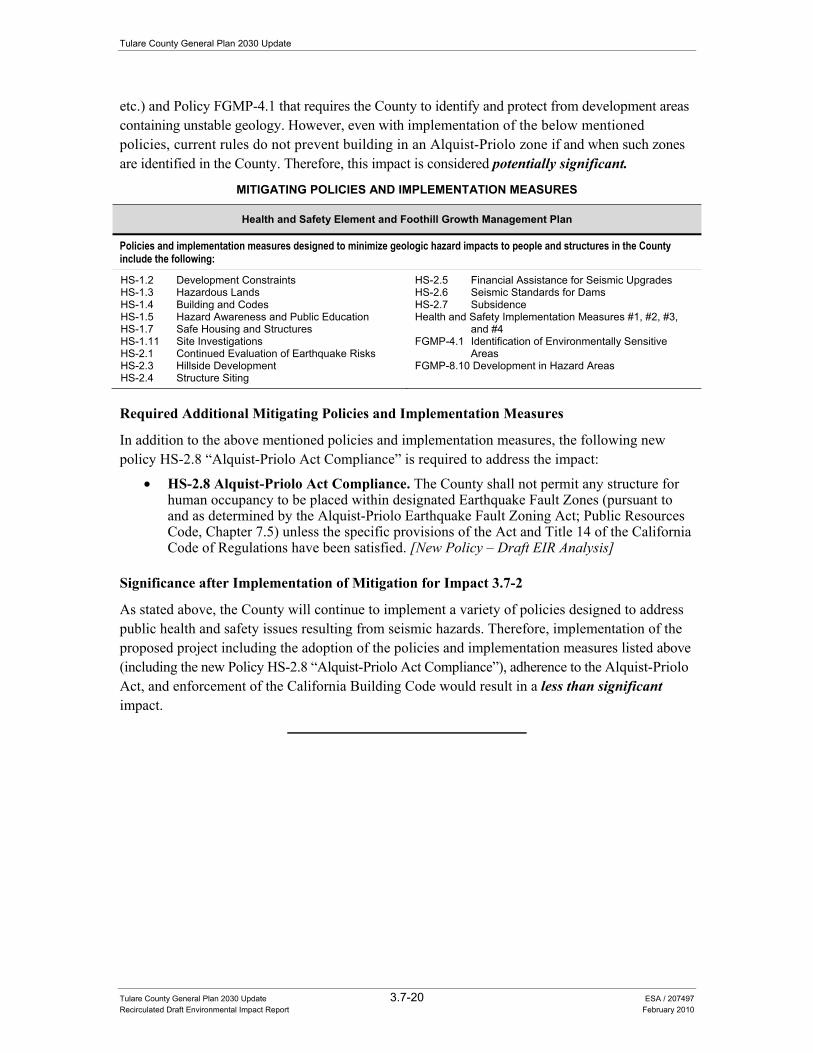
Tulare County General Plan 2030 Update
Tulare County General Plan 2030 Update 3.7-20 ESA / 207497 Recirculated Draft Environmental Impact Report February 2010
etc.) and Policy FGMP-4.1 that requires the County to identify and protect from development areas containing unstable geology. However, even with implementation of the below mentioned policies, current rules do not prevent building in an Alquist-Priolo zone if and when such zones are identified in the County. Therefore, this impact is considered potentially significant.
MITIGATING POLICIES AND IMPLEMENTATION MEASURES
Health and Safety Element and Foothill Growth Management Plan
Policies and implementation measures designed to minimize geologic hazard impacts to people and structures in the County include the following:
HS-1.2 Development Constraints HS-1.3 Hazardous Lands HS-1.4 Building and Codes HS-1.5 Hazard Awareness and Public Education HS-1.7 Safe Housing and Structures HS-1.11 Site Investigations HS-2.1 Continued Evaluation of Earthquake Risks HS-2.3 Hillside Development HS-2.4 Structure Siting
HS-2.5 Financial Assistance for Seismic Upgrades HS-2.6 Seismic Standards for Dams HS-2.7 Subsidence Health and Safety Implementation Measures #1, #2, #3,
and #4 FGMP-4.1 Identification of Environmentally Sensitive
Areas FGMP-8.10 Development in Hazard Areas
Required Additional Mitigating Policies and Implementation Measures
In addition to the above mentioned policies and implementation measures, the following new policy HS-2.8 “Alquist-Priolo Act Compliance” is required to address the impact:
• HS-2.8 Alquist-Priolo Act Compliance. The County shall not permit any structure for human occupancy to be placed within designated Earthquake Fault Zones (pursuant to and as determined by the Alquist-Priolo Earthquake Fault Zoning Act; Public Resources Code, Chapter 7.5) unless the specific provisions of the Act and Title 14 of the California Code of Regulations have been satisfied. [New Policy – Draft EIR Analysis]
Significance after Implementation of Mitigation for Impact 3.7-2
As stated above, the County will continue to implement a variety of policies designed to address public health and safety issues resulting from seismic hazards. Therefore, implementation of the proposed project including the adoption of the policies and implementation measures listed above (including the new Policy HS-2.8 “Alquist-Priolo Act Compliance”), adherence to the Alquist-Priolo Act, and enforcement of the California Building Code would result in a less than significant impact.
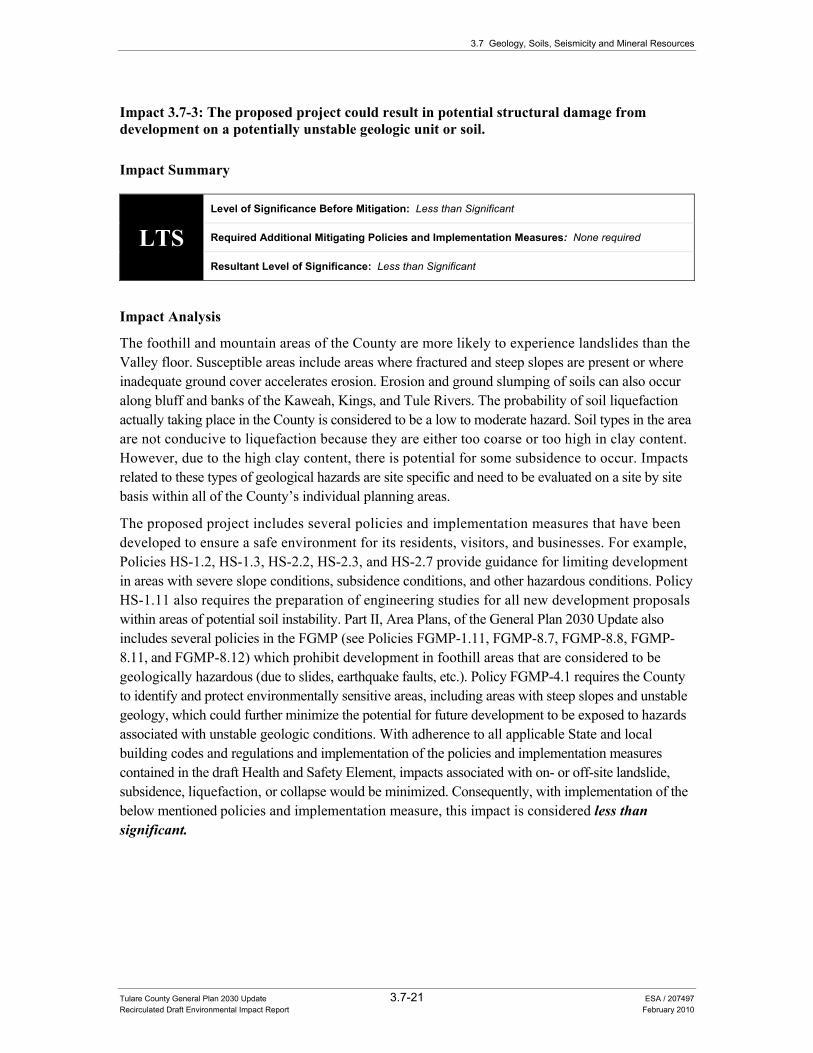
3.7 Geology, Soils, Seismicity and Mineral Resources
Tulare County General Plan 2030 Update 3.7-21 ESA / 207497 Recirculated Draft Environmental Impact Report February 2010
Impact 3.7-3: The proposed project could result in potential structural damage from development on a potentially unstable geologic unit or soil.
Impact Summary
LTS Level of Significance Before Mitigation: Less than Significant
Required Additional Mitigating Policies and Implementation Measures: None required
Resultant Level of Significance: Less than Significant
Impact Analysis
The foothill and mountain areas of the County are more likely to experience landslides than the Valley floor. Susceptible areas include areas where fractured and steep slopes are present or where inadequate ground cover accelerates erosion. Erosion and ground slumping of soils can also occur along bluff and banks of the Kaweah, Kings, and Tule Rivers. The probability of soil liquefaction actually taking place in the County is considered to be a low to moderate hazard. Soil types in the area are not conducive to liquefaction because they are either too coarse or too high in clay content. However, due to the high clay content, there is potential for some subsidence to occur. Impacts related to these types of geological hazards are site specific and need to be evaluated on a site by site basis within all of the County’s individual planning areas.
The proposed project includes several policies and implementation measures that have been developed to ensure a safe environment for its residents, visitors, and businesses. For example, Policies HS-1.2, HS-1.3, HS-2.2, HS-2.3, and HS-2.7 provide guidance for limiting development in areas with severe slope conditions, subsidence conditions, and other hazardous conditions. Policy HS-1.11 also requires the preparation of engineering studies for all new development proposals within areas of potential soil instability. Part II, Area Plans, of the General Plan 2030 Update also includes several policies in the FGMP (see Policies FGMP-1.11, FGMP-8.7, FGMP-8.8, FGMP-8.11, and FGMP-8.12) which prohibit development in foothill areas that are considered to be geologically hazardous (due to slides, earthquake faults, etc.). Policy FGMP-4.1 requires the County to identify and protect environmentally sensitive areas, including areas with steep slopes and unstable geology, which could further minimize the potential for future development to be exposed to hazards associated with unstable geologic conditions. With adherence to all applicable State and local building codes and regulations and implementation of the policies and implementation measures contained in the draft Health and Safety Element, impacts associated with on- or off-site landslide, subsidence, liquefaction, or collapse would be minimized. Consequently, with implementation of the below mentioned policies and implementation measure, this impact is considered less than significant.
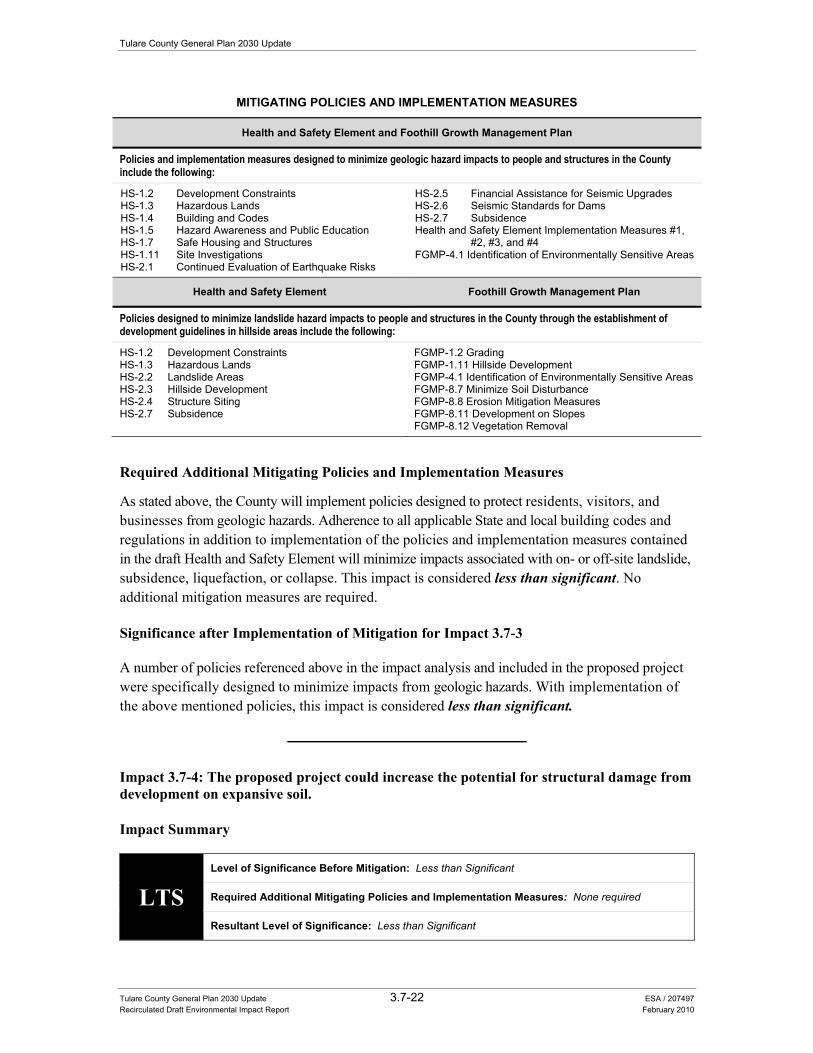
Tulare County General Plan 2030 Update
Tulare County General Plan 2030 Update 3.7-22 ESA / 207497 Recirculated Draft Environmental Impact Report February 2010
MITIGATING POLICIES AND IMPLEMENTATION MEASURES
Health and Safety Element and Foothill Growth Management Plan
Policies and implementation measures designed to minimize geologic hazard impacts to people and structures in the County include the following:
HS-1.2 Development Constraints HS-1.3 Hazardous Lands HS-1.4 Building and Codes HS-1.5 Hazard Awareness and Public Education HS-1.7 Safe Housing and Structures HS-1.11 Site Investigations HS-2.1 Continued Evaluation of Earthquake Risks
HS-2.5 Financial Assistance for Seismic Upgrades HS-2.6 Seismic Standards for Dams HS-2.7 Subsidence Health and Safety Element Implementation Measures #1,
#2, #3, and #4 FGMP-4.1 Identification of Environmentally Sensitive Areas
Health and Safety Element Foothill Growth Management Plan
Policies designed to minimize landslide hazard impacts to people and structures in the County through the establishment of development guidelines in hillside areas include the following:
HS-1.2 Development Constraints HS-1.3 Hazardous Lands HS-2.2 Landslide Areas HS-2.3 Hillside Development HS-2.4 Structure Siting HS-2.7 Subsidence
FGMP-1.2 Grading FGMP-1.11 Hillside Development FGMP-4.1 Identification of Environmentally Sensitive Areas FGMP-8.7 Minimize Soil Disturbance FGMP-8.8 Erosion Mitigation Measures FGMP-8.11 Development on Slopes FGMP-8.12 Vegetation Removal
Required Additional Mitigating Policies and Implementation Measures
As stated above, the County will implement policies designed to protect residents, visitors, and businesses from geologic hazards. Adherence to all applicable State and local building codes and regulations in addition to implementation of the policies and implementation measures contained in the draft Health and Safety Element will minimize impacts associated with on- or off-site landslide, subsidence, liquefaction, or collapse. This impact is considered less than significant. No additional mitigation measures are required.
Significance after Implementation of Mitigation for Impact 3.7-3
A number of policies referenced above in the impact analysis and included in the proposed project were specifically designed to minimize impacts from geologic hazards. With implementation of the above mentioned policies, this impact is considered less than significant.
Impact 3.7-4: The proposed project could increase the potential for structural damage from development on expansive soil.
Impact Summary
LTS Level of Significance Before Mitigation: Less than Significant
Required Additional Mitigating Policies and Implementation Measures: None required
Resultant Level of Significance: Less than Significant
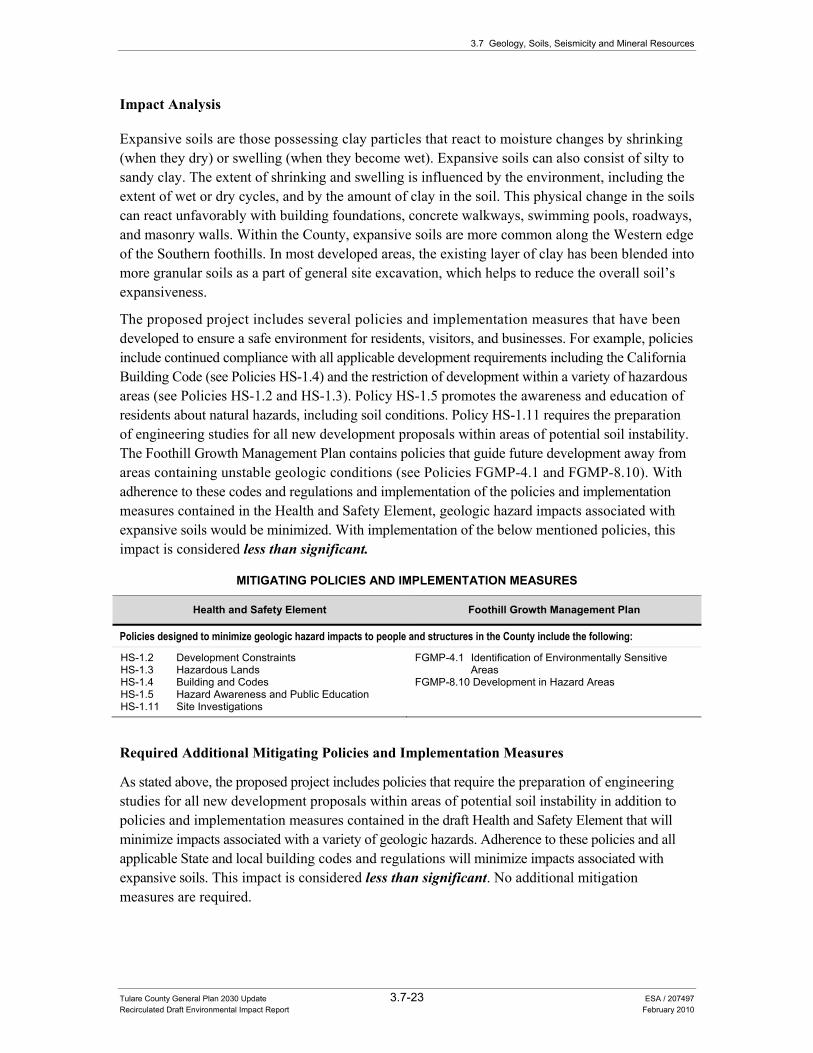
3.7 Geology, Soils, Seismicity and Mineral Resources
Tulare County General Plan 2030 Update 3.7-23 ESA / 207497 Recirculated Draft Environmental Impact Report February 2010
Impact Analysis
Expansive soils are those possessing clay particles that react to moisture changes by shrinking (when they dry) or swelling (when they become wet). Expansive soils can also consist of silty to sandy clay. The extent of shrinking and swelling is influenced by the environment, including the extent of wet or dry cycles, and by the amount of clay in the soil. This physical change in the soils can react unfavorably with building foundations, concrete walkways, swimming pools, roadways, and masonry walls. Within the County, expansive soils are more common along the Western edge of the Southern foothills. In most developed areas, the existing layer of clay has been blended into more granular soils as a part of general site excavation, which helps to reduce the overall soil’s expansiveness.
The proposed project includes several policies and implementation measures that have been developed to ensure a safe environment for residents, visitors, and businesses. For example, policies include continued compliance with all applicable development requirements including the California Building Code (see Policies HS-1.4) and the restriction of development within a variety of hazardous areas (see Policies HS-1.2 and HS-1.3). Policy HS-1.5 promotes the awareness and education of residents about natural hazards, including soil conditions. Policy HS-1.11 requires the preparation of engineering studies for all new development proposals within areas of potential soil instability. The Foothill Growth Management Plan contains policies that guide future development away from areas containing unstable geologic conditions (see Policies FGMP-4.1 and FGMP-8.10). With adherence to these codes and regulations and implementation of the policies and implementation measures contained in the Health and Safety Element, geologic hazard impacts associated with expansive soils would be minimized. With implementation of the below mentioned policies, this impact is considered less than significant.
MITIGATING POLICIES AND IMPLEMENTATION MEASURES
Health and Safety Element Foothill Growth Management Plan
Policies designed to minimize geologic hazard impacts to people and structures in the County include the following:
HS-1.2 Development Constraints HS-1.3 Hazardous Lands HS-1.4 Building and Codes HS-1.5 Hazard Awareness and Public Education HS-1.11 Site Investigations
FGMP-4.1 Identification of Environmentally Sensitive Areas
FGMP-8.10 Development in Hazard Areas
Required Additional Mitigating Policies and Implementation Measures
As stated above, the proposed project includes policies that require the preparation of engineering studies for all new development proposals within areas of potential soil instability in addition to policies and implementation measures contained in the draft Health and Safety Element that will minimize impacts associated with a variety of geologic hazards. Adherence to these policies and all applicable State and local building codes and regulations will minimize impacts associated with expansive soils. This impact is considered less than significant. No additional mitigation measures are required.
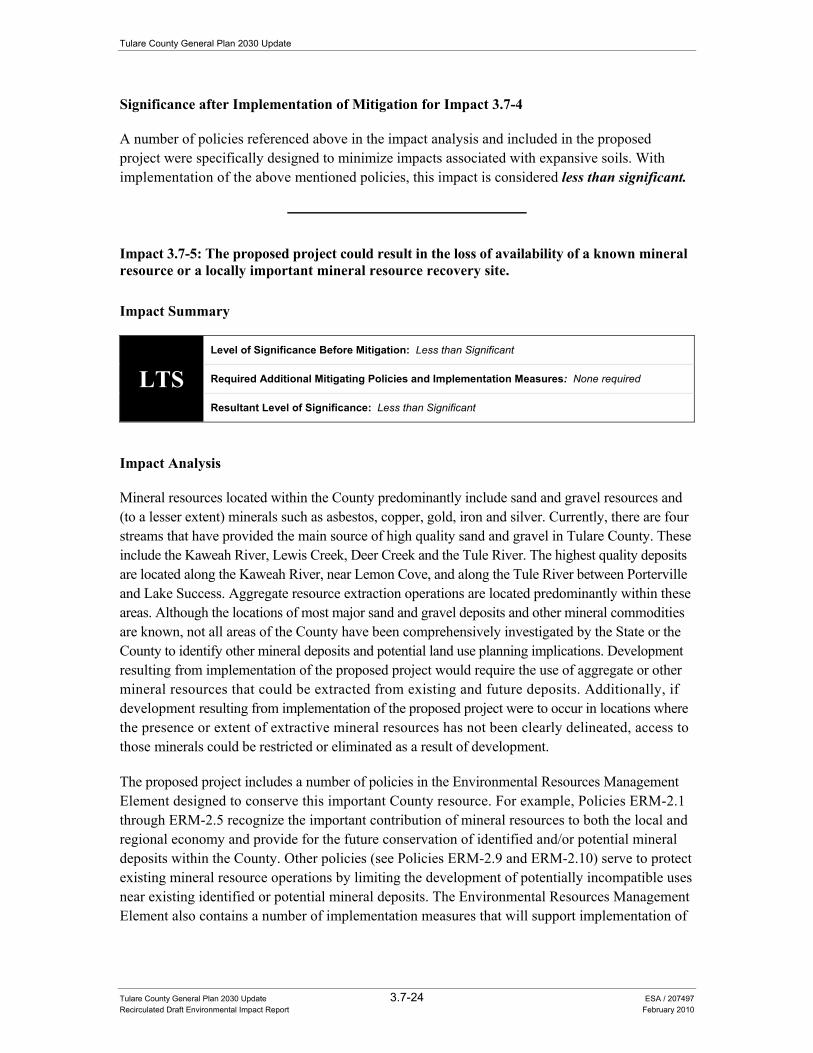
Tulare County General Plan 2030 Update
Tulare County General Plan 2030 Update 3.7-24 ESA / 207497 Recirculated Draft Environmental Impact Report February 2010
Significance after Implementation of Mitigation for Impact 3.7-4
A number of policies referenced above in the impact analysis and included in the proposed project were specifically designed to minimize impacts associated with expansive soils. With implementation of the above mentioned policies, this impact is considered less than significant.
Impact 3.7-5: The proposed project could result in the loss of availability of a known mineral resource or a locally important mineral resource recovery site.
Impact Summary
LTS Level of Significance Before Mitigation: Less than Significant
Required Additional Mitigating Policies and Implementation Measures: None required
Resultant Level of Significance: Less than Significant
Impact Analysis
Mineral resources located within the County predominantly include sand and gravel resources and (to a lesser extent) minerals such as asbestos, copper, gold, iron and silver. Currently, there are four streams that have provided the main source of high quality sand and gravel in Tulare County. These include the Kaweah River, Lewis Creek, Deer Creek and the Tule River. The highest quality deposits are located along the Kaweah River, near Lemon Cove, and along the Tule River between Porterville and Lake Success. Aggregate resource extraction operations are located predominantly within these areas. Although the locations of most major sand and gravel deposits and other mineral commodities are known, not all areas of the County have been comprehensively investigated by the State or the County to identify other mineral deposits and potential land use planning implications. Development resulting from implementation of the proposed project would require the use of aggregate or other mineral resources that could be extracted from existing and future deposits. Additionally, if development resulting from implementation of the proposed project were to occur in locations where the presence or extent of extractive mineral resources has not been clearly delineated, access to those minerals could be restricted or eliminated as a result of development.
The proposed project includes a number of policies in the Environmental Resources Management Element designed to conserve this important County resource. For example, Policies ERM-2.1 through ERM-2.5 recognize the important contribution of mineral resources to both the local and regional economy and provide for the future conservation of identified and/or potential mineral deposits within the County. Other policies (see Policies ERM-2.9 and ERM-2.10) serve to protect existing mineral resource operations by limiting the development of potentially incompatible uses near existing identified or potential mineral deposits. The Environmental Resources Management Element also contains a number of implementation measures that will support implementation of
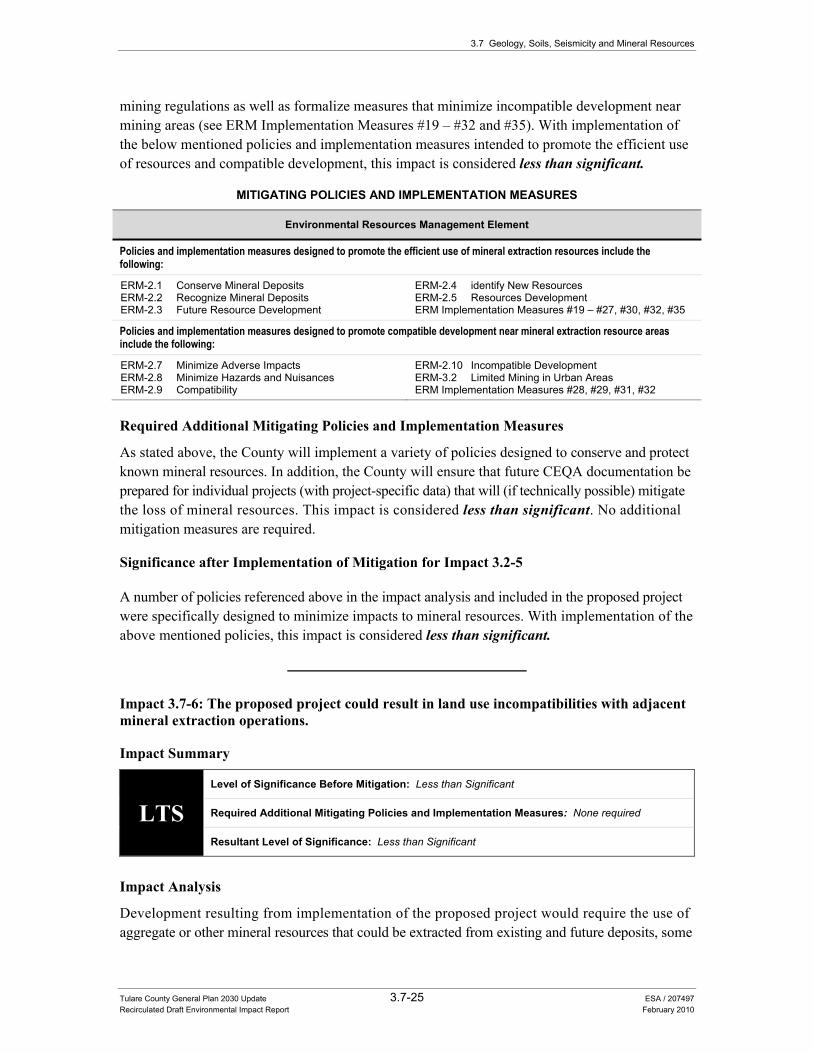
3.7 Geology, Soils, Seismicity and Mineral Resources
Tulare County General Plan 2030 Update 3.7-25 ESA / 207497 Recirculated Draft Environmental Impact Report February 2010
mining regulations as well as formalize measures that minimize incompatible development near mining areas (see ERM Implementation Measures #19 – #32 and #35). With implementation of the below mentioned policies and implementation measures intended to promote the efficient use of resources and compatible development, this impact is considered less than significant.
MITIGATING POLICIES AND IMPLEMENTATION MEASURES
Environmental Resources Management Element
Policies and implementation measures designed to promote the efficient use of mineral extraction resources include the following:
ERM-2.1 Conserve Mineral Deposits ERM-2.2 Recognize Mineral Deposits ERM-2.3 Future Resource Development
ERM-2.4 identify New Resources ERM-2.5 Resources Development ERM Implementation Measures #19 – #27, #30, #32, #35
Policies and implementation measures designed to promote compatible development near mineral extraction resource areas include the following:
ERM-2.7 Minimize Adverse Impacts ERM-2.8 Minimize Hazards and Nuisances ERM-2.9 Compatibility
ERM-2.10 Incompatible Development ERM-3.2 Limited Mining in Urban Areas ERM Implementation Measures #28, #29, #31, #32
Required Additional Mitigating Policies and Implementation Measures
As stated above, the County will implement a variety of policies designed to conserve and protect known mineral resources. In addition, the County will ensure that future CEQA documentation be prepared for individual projects (with project-specific data) that will (if technically possible) mitigate the loss of mineral resources. This impact is considered less than significant. No additional mitigation measures are required.
Significance after Implementation of Mitigation for Impact 3.2-5
A number of policies referenced above in the impact analysis and included in the proposed project were specifically designed to minimize impacts to mineral resources. With implementation of the above mentioned policies, this impact is considered less than significant.
Impact 3.7-6: The proposed project could result in land use incompatibilities with adjacent mineral extraction operations.
Impact Summary
LTS Level of Significance Before Mitigation: Less than Significant
Required Additional Mitigating Policies and Implementation Measures: None required
Resultant Level of Significance: Less than Significant
Impact Analysis
Development resulting from implementation of the proposed project would require the use of aggregate or other mineral resources that could be extracted from existing and future deposits, some
Tulare County General Plan 2030 Update
Tulare County General Plan 2030 Update 3.7-26 ESA / 207497 Recirculated Draft Environmental Impact Report February 2010
of which may be located within or adjacent to river habitats or other environmentally sensitive areas. In addition, some of the anticipated growth under the proposed project could occur in proximity to areas of significant mineral resources or existing mineral extraction operations. Consequently, potential land use conflicts (i.e., increased noise, dust, traffic, etc.) between existing or future mineral resource extraction sites and potential urban and suburban development could occur within all of the County’s individual planning areas.
The proposed project includes a number of policies in the Environmental Resources Management Element designed to protect sensitive land uses and environmentally sensitive areas from mineral resource extraction activities. For example, Policy ERM-3.2 limits new commercial mining operations within community areas (CACUDB, etc.) due to a variety of environmental and compatibility concerns. Policies ERM-2.9 and ERM-2.10 limit the development of incompatible land uses adjacent or near identified or potential mineral deposits. Additionally, Policies ERM-2.7 and ERM-2.8 ensure that mining operations minimize adverse effects to a range of environmental issues (i.e., water quality, air quality, aesthetics, hazards, nuisances, etc.). Policy ERM-2.13 also requires that all surface mine operations be subject to the requirements of the Surface Mining and Reclamation Act. The Environmental Resources Management Element also contains a number of implementation measures that will formalize measures that minimize incompatible development near mining areas (see ERM Implementation Measures #28, #29, #31, and #32). Therefore, land use compatibility issues with adjacent mineral extraction operations are considered less than significant for the proposed project. However, these issues may need to be evaluated in the site-specific environmental review for future development proposals.
MITIGATING POLICIES AND IMPLEMENTATION MEASURES
Environmental Resources Management Element
Policies and implementation measures designed to promote compatible development near mineral extraction resource areas include the following:
ERM-2.7 Minimize Adverse Impacts ERM-2.8 Minimize Hazards and Nuisances ERM-2.9 Compatibility
ERM-2.10 Incompatible Development ERM-2.13 SMARA Requirements ERM-3.2 Limited Mining in Urban Areas ERM Implementation Measures #28, #29, #31, #32
Required Additional Mitigating Policies and Implementation Measures
As stated above, the County will implement a variety of policies that address compatibility issues between mineral resource extraction activities and sensitive land uses or environmentally sensitive areas. In addition, the County will ensure that future CEQA documentation be prepared for individual projects (with project-specific data) that will (if technically possible) mitigate any potential compatibility impacts to a less than significant level. This impact is considered less than significant. No additional mitigation measures are required.
Significance after Implementation of Mitigation for Impact 3.2-6
A number of policies referenced above in the impact analysis and included in the proposed project were specifically designed to minimize land use compatibility impacts. With implementation of the above mentioned policies, this impact is considered less than significant.
3.7 Geology, Soils, Seismicity and Mineral Resources
Tulare County General Plan 2030 Update 3.7-27 ESA / 207497 Recirculated Draft Environmental Impact Report February 2010
Impact 3.7-7: The proposed project could result in the loss of availability of a known oil and/or gas resource that would be of value to the region and the residents of the State.
Impact Summary
LTS Level of Significance Before Mitigation: Less than Significant
Required Additional Mitigating Policies and Implementation Measures: None required
Resultant Level of Significance: Less than Significant
Impact Analysis
Oil and gas resources are located within the County. Active oil wells are located in the Deer Creek oil field (near the City of Porterville) area, which contained, as of 2006, 65 oil wells. As of 2006, the North Deer Creek oil field (near the City of Porterville) area contained 3 active oil wells. The Trico gas fields (southwestern corner of Tulare County) contained no active wells in 2006. If development resulting from implementation of the proposed project were to occur in locations near existing oil/gas operations or where the presence or extent of oil/gas resources have not been clearly delineated, access to those resources could be restricted or eliminated as a result of development.
The proposed project includes a number of policies in the Environmental Resources Management Element designed to conserve this important County resource. For example, Policies ERM-3.3 and ERM-3.4 recognize the importance of continuing oil and gas operations that are considered compatible with surrounding land uses. With implementation of the below mentioned policies, this impact is considered less than significant.
MITIGATING POLICIES AND IMPLEMENTATION MEASURES
Environmental Resources Management Element
Policies designed to promote the efficient use of oil/gas resources include the following:
ERM-3.3 Small-Scale Oil and Gas Extraction ERM-3.4 Oil and Gas Extraction ERM-3.5 Reclamation of Oil and Gas Sites
Required Additional Mitigating Policies and Implementation Measures
As stated above, the County will implement a variety of policies designed to conserve and protect known oil and gas resources. In addition, the County will ensure that future CEQA documentation be prepared for individual projects (with project-specific data) that will (if technically possible) mitigate any potential impacts to oil and gas resources to a less than significant level. This impact is considered less than significant. No additional mitigation measures are required.
Significance after Implementation of Mitigation for Impact 3.7-7
A number of policies referenced above in the impact analysis and included in the proposed project were specifically designed to minimize impacts to oil and gas resources. With implementation of the above mentioned policies, this impact is considered less than significant.
Tulare County General Plan 2030 Update
Tulare County General Plan 2030 Update 3.7-28 ESA / 207497 Recirculated Draft Environmental Impact Report February 2010
Impact 3.7-8: The proposed project could result in land use incompatibilities with adjacent oil and gas operations.
Impact Summary
LTS Level of Significance Before Mitigation: Less than Significant
Required Additional Mitigating Policies and Implementation Measures: None required
Resultant Level of Significance: Less than Significant
Impact Analysis
As more fully described above under Impact 3.7-7, the Goals and Policies Report (Part I of the General Plan 2030 Update) includes a number of policies in the Environmental Resources Management Element designed to protect sensitive land uses and environmentally sensitive areas from mineral resource extraction activities. For example, Policies ERM-3.3 and ERM-3.4 allow the development of small scale oil and gas operations (by special use permit) only when these new facilities can demonstrate compatibility with surrounding land uses. State law mandates that no building intended for human occupancy may be located near any active oil or gas well unless suitable safety and fire protection measures (including setbacks) are approved by the local fire department. In addition, if any plugged and abandoned or unrecorded wells are damaged or uncovered during specific project-related excavation or grading activities, State regulations require specific notification and remedial plugging operations. Therefore, land use compatibility issues with adjacent gas/oil operations are considered less than significant for the proposed project. However, these issues may need to be evaluated in the site-specific environmental review for future development proposals.
MITIGATING POLICIES AND IMPLEMENTATION MEASURES
Environmental Resources Management Element
Policies designed to promote the efficient use of oil/gas resources include the following:
ERM-3.3 Small-scale Oil and Gas Extraction ERM-3.4 Oil and Gas Extraction
ERM-3.5 Reclamation of Oil and Gas Sites
Required Additional Mitigating Policies and Implementation Measures
As stated above, the County will implement a variety of policies that address compatibility issues between oil and gas extraction activities and sensitive land uses or environmentally sensitive areas. In addition, the County will ensure that future CEQA documentation be prepared for individual projects (with project-specific data) that will (if technically possible) mitigate any potential compatibility impacts to a less than significant level. This impact is considered less than significant. No additional mitigation measures are required.
Significance after Implementation of Mitigation for Impact 3.2-8
A number of policies referenced above in the impact analysis and included in the proposed project were specifically designed to minimize land use compatibility impacts. With implementation of the above mentioned policies, this impact is considered less than significant.
Tulare County General Plan 2030 Update 3.8-1 ESA / 207497 Recirculated Draft Environmental Impact Report February 2010
SECTION 3.8 Hazardous Materials and Public Safety
Introduction This section of the recirculated draft Environmental Impact Report (RDEIR) addresses a variety of hazardous materials and public safety issues related to the proposed project. Given the programmatic nature of this RDEIR, the environmental setting presents an overview of existing hazards and public safety issues specific to the County. These issues include hazardous materials, airport safety, and wildland fire hazards. The regulatory setting section includes a description of applicable federal, State, and local plans and/or programs and associated goals and policies. A description of the potential impacts of the proposed project is also provided and includes the identification of feasible mitigation (general plan policies) to avoid or lessen the impacts.
This section of the RDEIR is divided into the following resource topics:
• Hazardous Materials. • Airport Hazards. • Urban and Wildland Hazards.
The closely-related public safety topic of flooding is discussed in Section 3.6 “Hydrology, Water Quality, and Drainage” of this RDEIR.
The following environmental and regulatory settings were developed from information contained in the 2010 Background Report (see Chapter 8.0 “Safety”), incorporated by reference and summarized below. This document is attached as Appendix B to this RDEIR.
Hazardous Materials
Regulatory Setting The storage, use, and handling of hazardous materials by industries and businesses are subject to various federal and State regulations. A brief overview of these regulations follows.
Federal Regulations The principal federal legislation is the Resource Conservation and Recovery Act (RCRA), which is administered by the United States Environmental Protection Agency (EPA). RCRA places
Tulare County General Plan 2030 Update
Tulare County General Plan 2030 Update 3.8-2 ESA / 207497 Recirculated Draft Environmental Impact Report February 2010
reporting, permitting, and operational control requirements on those who generate, treat, store, or dispose of hazardous waste. The federal Hazardous Materials Transport Act, administered by the U.S. Department of Transportation, requires detailed manifesting and reporting of hazardous materials shipped on the U.S. highway system; it also contains packaging requirements for shipped materials. The Clean Water Act, also administered by the EPA, controls the discharge of hazardous materials or hazardous waste to waters of the U.S. or to local wastewater treatment plants. A discussion of the Clean Water Act can be found in Section 3.9 “Public Facilities, Recreation and Services”. Additional regulations governing hazardous wastes and materials are discussed below.
Comprehensive Environmental Response, Compensation, and Liability Act (CERCLA) CERCLA, commonly referred to as Superfund, was enacted on December 11, 1980. The purpose of CERCLA was to provide authorities with the ability to respond to uncontrolled releases of hazardous substances from inactive hazardous waste sites that endanger public health and the environment. CERCLA established prohibitions and requirements concerning closed and abandoned hazardous waste sites, provided for liability of persons responsible for releases of hazardous waste at such sites, and established a trust fund to provide for cleanup when no responsible party could be identified. Additionally, CERCLA provided for the revision and republishing of the National Contingency Plan (NCP) that provides the guidelines and procedures needed to respond to releases and threatened releases of hazardous substances, pollutants, or contaminants. The NCP also provides for the National Priorities List, a list of national priorities among releases or threatened releases throughout the United States for the purpose of taking remedial action.
The Superfund Amendments and Reauthorization Act (SARA) amended CERCLA on October 17, 1986. This amendment increased the size of the Hazardous Response Trust Fund to $8.5 billion, expanded EPA's response authority, strengthened enforcement activities at Superfund sites; and broadened the application of the law to include federal facilities.
Resource Conservation and Recovery Act of 1976 (RCRA) RCRA is the nation’s hazardous waste control law. It defines hazardous waste, provides for a cradle-to-grave tracking system and imposes stringent requirements on treatment, storage and disposal facilities. RCRA requires environmentally sound closure of hazardous waste management units at treatment, storage, and disposal facilities. The EPA is the principal agency responsible for the administration of RCRA, SARA, and CERCLA.
Occupational Safety and Health Act of 1970 Through the enactment of this act, the Occupational Safety and Health Administration (OSHA) was obligated to prepare and enforce occupational health and safety regulations with the goal of providing employees a safe working environment. OSHA regulations apply to the work place and cover activities ranging from confined space entry to toxic chemical exposure. OSHA regulates workplace exposure to hazardous chemicals and activities by promulgating regulations specifying work place procedures and equipment.
3.8 Hazardous Materials and Public Safety
Tulare County General Plan 2030 Update 3.8-3 ESA / 207497 Recirculated Draft Environmental Impact Report February 2010
Hazardous Materials Transportation Act The Hazardous Materials Transportation Act (regulated by the U.S. Department of Transportation) regulates the interstate transport of hazardous materials and waste. This act specifies driver-training requirements, load labeling procedures, and container design and safety specifications. Transporters of hazardous wastes must also meet the requirements of additional statutes such as RCRA, discussed previously.
State Regulations At the State level, existing legislation allows State agencies to accept the delegation of federal responsibility for hazardous materials and hazardous waste management. The Porter-Cologne Water Quality Control Act allows the State Water Resources Control Board (SWRCB) and the Regional Water Quality Control Board (RWQCB) to accept responsibility for the implementation of the Clean Water Act. The Hazardous Waste Control Act of 1977, and recent amendments to its implementation regulations, provides the Department of Health Services (DHS) with the lead role in administering the RCRA program. The Hazardous Substances Highway Spill Containment Act provides the California Highway Patrol (CHP) with the authority to respond to spills of hazardous materials on the State’s highway system.
Hazardous Substance Account Act (1984) This act, known as the California Superfund, has three purposes: 1) to respond to releases of hazardous substances; 2) to compensate for damages caused by such releases; and 3) to pay the State's 10 percent share in CERCLA cleanups. Contaminated sites that fail to score above a certain threshold level in the EPA's ranking system may be placed on the California Superfund list of hazardous wastes requiring cleanup.
Department of Toxic Substance Control (DTSC) California Environmental Protection Agency (Cal/EPA) has regulatory responsibility under Title 22 of the California Code of Regulations (CCR) for administration of the State and federal Superfund programs for the management and cleanup of hazardous materials. The DTSC is responsible for regulating hazardous waste facilities and overseeing the cleanup of hazardous waste sites in California. The Hazardous Waste Management Program (HWMP) regulates hazardous waste through its permitting, enforcement and Unified Program activities. HWMP maintains the EPA authorization to implement the RCRA program in California, and develops regulations, policies, guidance and technical assistance/training to assure the safe storage, treatment, transportation and disposal of hazardous wastes.
State Water Resources Control Board (SWRCB) Acting through the RWQCB, the SWRCB regulates surface and groundwater quality pursuant to the Porter-Cologne Water Quality Act, the federal Clean Water Act, and the Underground Tank Law. Under these laws, RWQCB is authorized to supervise the cleanup of hazardous waste sites referred by local agencies in those situations where water quality may be affected.
Tulare County General Plan 2030 Update
Tulare County General Plan 2030 Update 3.8-4 ESA / 207497 Recirculated Draft Environmental Impact Report February 2010
California Occupational Safety and Health Administration (Cal/OSHA) Cal/OSHA and the Federal OSHA are the agencies responsible for assuring worker safety in the handling and use of chemicals in the workplace. Pursuant to the Occupational Safety and Health Act of 1970, Federal OSHA has adopted numerous regulations pertaining to worker safety, contained in the Code of Federal Regulations Title 29 (29 CFR). These regulations set standards for safe workplaces and work practices, including standards relating to hazardous material handling. Cal/OSHA assumes primary responsibility for developing and enforcing State workplace safety regulations. Because California has a federally approved OSHA program, it is required to adopt regulations that are at least as stringent as those identified in 29 CFR. Cal/OSHA standards are generally more stringent than federal regulations. Cal/OSHA regulations concerning the use of hazardous materials in the workplace are included under Title 8 of the California Code of Regulations (CCR).
Hazardous Materials Transport California law requires that Hazardous Waste (as defined in California Health and Safety Code Division 20, Chapter 6.5) be transported by a California registered hazardous waste transporter that meets specific registration requirements. State agencies tasked with primary responsibility for enforcing federal and State regulations and responding to hazardous materials transportation emergencies are the California Highway Patrol (CHP) and the California Department of Transportation (Caltrans). Together, these agencies determine container types used and license hazardous waste haulers for hazardous waste transportation on public roads. The CHP is responsible for designating State and federal roadways as hazardous materials truck routes for three categories of hazardous materials: explosives, poisons that can be inhaled and radioactive material. These categories of hazardous materials can only be transported on routes designated by the CHP.
Universal Waste Rule Universal wastes are hazardous wastes that are generated by a wide variety of people. Examples include cathode ray tubes (CRTs; including televisions and computer monitors), consumer (non-automotive) batteries, fluorescent tubes and other mercury-containing lamps, and consumer electronics. Universal waste rules allow common, low-hazard wastes to be managed under less stringent requirements than other hazardous wastes. California’s Universal Waste Rule became effective on February 8, 2002. Since that time, several other common wastes have been added to the list of universal wastes. These include mercury wastes, consumer electronic devices and CRTs. Other wastes may be added to the list over time. In general, universal wastes may not be discarded in ordinary solid waste landfills.
Local Regulations At the local level, existing plans and agencies guide and regulate the production, disposal, and transport of hazardous materials and hazardous waste management.
3.8 Hazardous Materials and Public Safety
Tulare County General Plan 2030 Update 3.8-5 ESA / 207497 Recirculated Draft Environmental Impact Report February 2010
Tulare County Health and Human Services Agency, Environmental Health Division The Unified Hazardous Waste and Hazardous Management Regulatory Program (SB 1082, Health and Safety Code section 25260 et seq) is a State and local effort to consolidate, coordinate, and make consistent existing programs regulating hazardous waste and hazardous materials management. The Unified Program is implemented at the local level by a Certified Unified Program Agency (CUPA).
The Tulare County Health and Human Services Agency (TCHHSA), Environmental Health Division (EHD) through the County of Tulare is the CUPA for all cities and unincorporated areas within Tulare County. The CUPA was created by the California legislature to minimize the number of inspections and different fees for businesses. The EHD was certified as the County CUPA in December 1996. As the CUPA, the EHD operates the following programs in the County:
• Aboveground Storage Tank (AST) Program Spill Control and Countermeasure Plan and requirements;
• California Accidental Release Prevention (CalARP) Program; • Hazardous Materials Release Response Plans & Inventory (Business Plan); • Hazardous Waste Generator and Onsite Hazardous Waste Treatment (Tiered Permit); • Underground Storage Tank (UST) Program; and • Hazardous Material Inventory Requirements of Article 80 of the Uniform Fire Code.
Under a contract with the SWRCB, the County through the EHD conducts the Local Oversight Program, which provides oversight of corrective action at leaking underground fuel tank (LUFT) sites throughout Tulare County.
Tulare County Hazardous Waste Management Plan Tulare County has prepared a Hazardous Waste Management Plan (HWMP) in accordance with California Health and Safety Code Section 24135 et seq. The Tulare County HWMP, which was developed in May 1989, identifies hazardous waste generators within the County, amounts and types of waste produced, and projected waste generation. In addition, the plan identifies the need for any potential future locations of treatment, storage, and disposal (TSD) facilities and includes policies and potential impacts for the management of hazardous waste within the County. The major goal of the HWMP is to reduce the need for new hazardous waste facilities by reducing waste at its source through recycling, reduced use of hazardous materials, and public education.
Tulare County Multi-Hazard Functional Plan Tulare County has prepared a Multi-Hazard Functional Plan to serve as the County’s emergency response plan. The plan addresses responses to various emergency incidents, responsibilities of various agencies, and sources of outside assistance. The following types of emergencies are addressed in the Multi-Hazard Functional Plan:
Tulare County General Plan 2030 Update
Tulare County General Plan 2030 Update 3.8-6 ESA / 207497 Recirculated Draft Environmental Impact Report February 2010
• Earthquakes; • Dam Failure; • Flood; • Wildfire; • War Emergency; • Hazardous Materials Incident; • Aircraft Crash; and • Volcanic Eruption.
This plan also identifies evacuation centers and addresses evacuation routes, which include all freeways, highways, and arterials that are located outside of the 100-year flood plain.
Environmental Setting
Hazardous Waste Hazardous wastes generated by residents and businesses in the County contribute to environmental and human health hazards. Proper waste management and disposal practices can minimize public concern over toxicity and the contamination of soils, water, and air. This section describes how hazardous waste is managed in Tulare County, including generation, transportation, disposal, treatment, storage, disposal facilities, and contaminated sites.
Hazardous Waste Generators In 2007, the DTSC Hazardous Waste Tracking System (HWTS) manifest data reports that approximately 5,925 tons of hazardous waste was transported from all categories of generators in Tulare County. As of November 2008, hazardous waste data available for 2008 indicated that approximately 7,160 tons of hazardous waste was generated in the County (County of Tulare, 2010 Background Report, page 8-34, 2010a). Tulare County contains several categories of hazardous waste generators: Resource Conservation and Recovery Act (RCRA) Large Quantity Hazardous Waste Generator (LQG) and two tiers of hazardous waste generators developed by the Tulare County CUPA, which are identified by the CUPA as within Program Element (PE) 2254 and Program Element 2258.
A RCRA LQG is defined as a generator of more than 1,000 kilograms (kg) of RCRA-designated hazardous waste per month. In 2007, there were eight RCRA LQGs and there are five projected for 2008. The number of these entities varies from month to month because designation is based on the generation of more than 1,000 kg of hazardous waste in a month. Table 3.8-1 contains a current list of regularly identified RCRA LQGs.
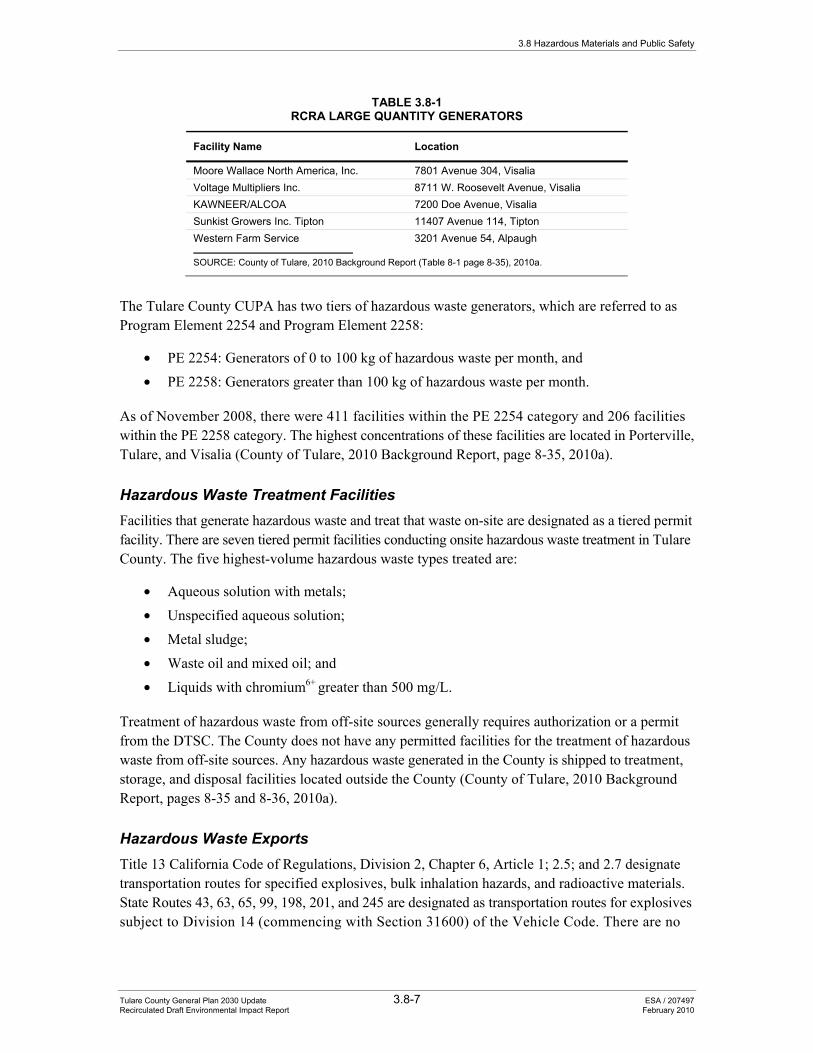
3.8 Hazardous Materials and Public Safety
Tulare County General Plan 2030 Update 3.8-7 ESA / 207497 Recirculated Draft Environmental Impact Report February 2010
TABLE 3.8-1RCRA LARGE QUANTITY GENERATORS
Facility Name Location
Moore Wallace North America, Inc. 7801 Avenue 304, Visalia Voltage Multipliers Inc. 8711 W. Roosevelt Avenue, Visalia KAWNEER/ALCOA 7200 Doe Avenue, Visalia Sunkist Growers Inc. Tipton 11407 Avenue 114, Tipton Western Farm Service 3201 Avenue 54, Alpaugh
SOURCE: County of Tulare, 2010 Background Report (Table 8-1 page 8-35), 2010a.
The Tulare County CUPA has two tiers of hazardous waste generators, which are referred to as Program Element 2254 and Program Element 2258:
• PE 2254: Generators of 0 to 100 kg of hazardous waste per month, and • PE 2258: Generators greater than 100 kg of hazardous waste per month.
As of November 2008, there were 411 facilities within the PE 2254 category and 206 facilities within the PE 2258 category. The highest concentrations of these facilities are located in Porterville, Tulare, and Visalia (County of Tulare, 2010 Background Report, page 8-35, 2010a).
Hazardous Waste Treatment Facilities Facilities that generate hazardous waste and treat that waste on-site are designated as a tiered permit facility. There are seven tiered permit facilities conducting onsite hazardous waste treatment in Tulare County. The five highest-volume hazardous waste types treated are:
• Aqueous solution with metals; • Unspecified aqueous solution; • Metal sludge; • Waste oil and mixed oil; and • Liquids with chromium6+ greater than 500 mg/L.
Treatment of hazardous waste from off-site sources generally requires authorization or a permit from the DTSC. The County does not have any permitted facilities for the treatment of hazardous waste from off-site sources. Any hazardous waste generated in the County is shipped to treatment, storage, and disposal facilities located outside the County (County of Tulare, 2010 Background Report, pages 8-35 and 8-36, 2010a).
Hazardous Waste Exports Title 13 California Code of Regulations, Division 2, Chapter 6, Article 1; 2.5; and 2.7 designate transportation routes for specified explosives, bulk inhalation hazards, and radioactive materials. State Routes 43, 63, 65, 99, 198, 201, and 245 are designated as transportation routes for explosives subject to Division 14 (commencing with Section 31600) of the Vehicle Code. There are no
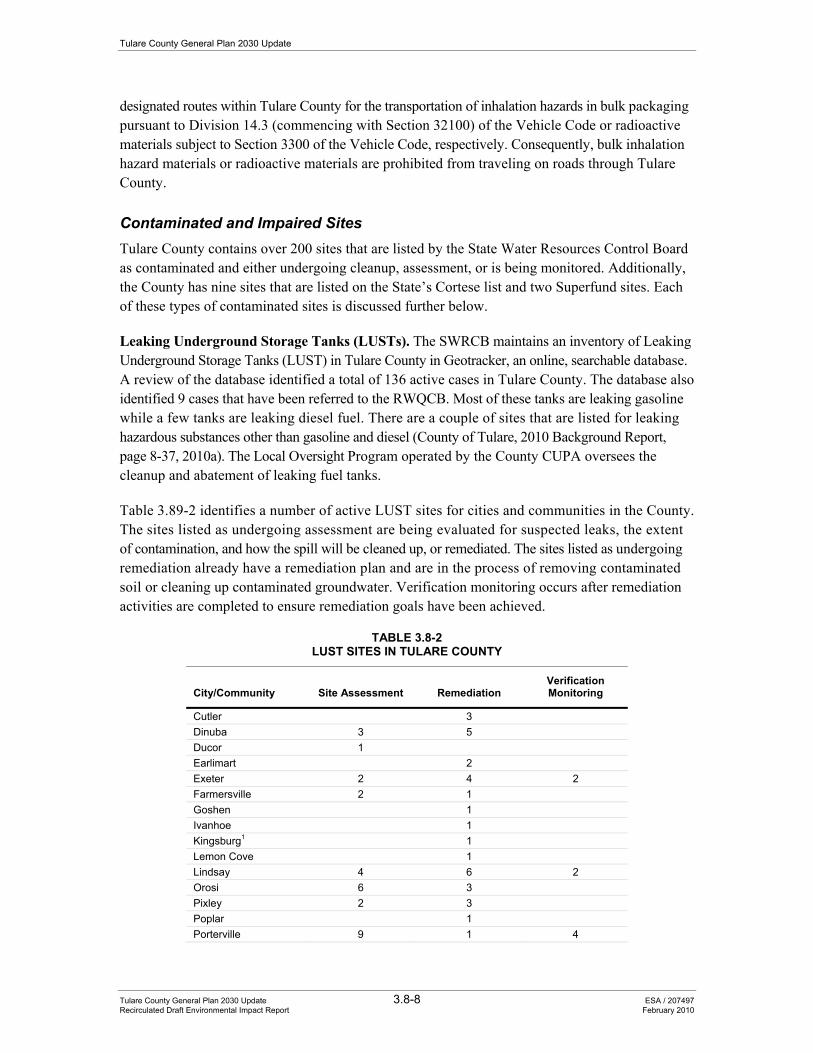
Tulare County General Plan 2030 Update
Tulare County General Plan 2030 Update 3.8-8 ESA / 207497 Recirculated Draft Environmental Impact Report February 2010
designated routes within Tulare County for the transportation of inhalation hazards in bulk packaging pursuant to Division 14.3 (commencing with Section 32100) of the Vehicle Code or radioactive materials subject to Section 3300 of the Vehicle Code, respectively. Consequently, bulk inhalation hazard materials or radioactive materials are prohibited from traveling on roads through Tulare County.
Contaminated and Impaired Sites Tulare County contains over 200 sites that are listed by the State Water Resources Control Board as contaminated and either undergoing cleanup, assessment, or is being monitored. Additionally, the County has nine sites that are listed on the State’s Cortese list and two Superfund sites. Each of these types of contaminated sites is discussed further below.
Leaking Underground Storage Tanks (LUSTs). The SWRCB maintains an inventory of Leaking Underground Storage Tanks (LUST) in Tulare County in Geotracker, an online, searchable database. A review of the database identified a total of 136 active cases in Tulare County. The database also identified 9 cases that have been referred to the RWQCB. Most of these tanks are leaking gasoline while a few tanks are leaking diesel fuel. There are a couple of sites that are listed for leaking hazardous substances other than gasoline and diesel (County of Tulare, 2010 Background Report, page 8-37, 2010a). The Local Oversight Program operated by the County CUPA oversees the cleanup and abatement of leaking fuel tanks.
Table 3.89-2 identifies a number of active LUST sites for cities and communities in the County. The sites listed as undergoing assessment are being evaluated for suspected leaks, the extent of contamination, and how the spill will be cleaned up, or remediated. The sites listed as undergoing remediation already have a remediation plan and are in the process of removing contaminated soil or cleaning up contaminated groundwater. Verification monitoring occurs after remediation activities are completed to ensure remediation goals have been achieved.
TABLE 3.8-2LUST SITES IN TULARE COUNTY
City/Community Site Assessment Remediation Verification Monitoring
Cutler 3 Dinuba 3 5 Ducor 1 Earlimart 2 Exeter 2 4 2 Farmersville 2 1 Goshen 1 Ivanhoe 1 Kingsburg1 1 Lemon Cove 1 Lindsay 4 6 2 Orosi 6 3 Pixley 2 3 Poplar 1 Porterville 9 1 4
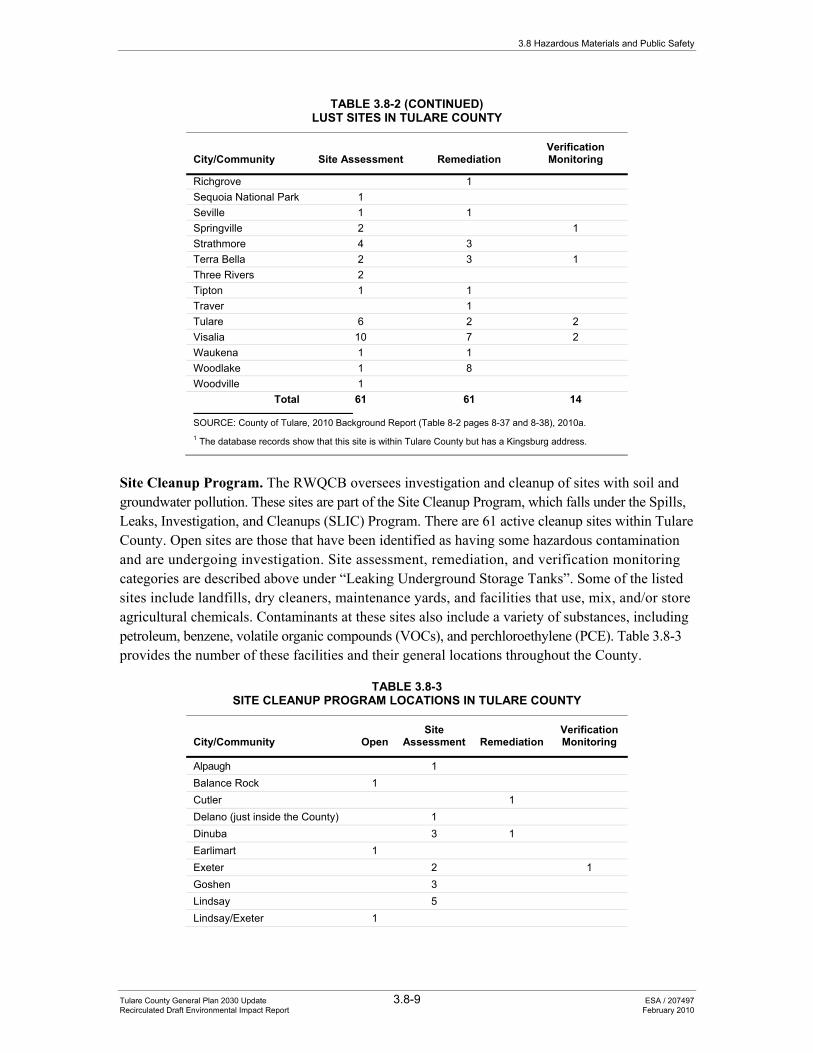
3.8 Hazardous Materials and Public Safety
Tulare County General Plan 2030 Update 3.8-9 ESA / 207497 Recirculated Draft Environmental Impact Report February 2010
TABLE 3.8-2 (CONTINUED)LUST SITES IN TULARE COUNTY
City/Community Site Assessment Remediation Verification Monitoring
Richgrove 1 Sequoia National Park 1 Seville 1 1 Springville 2 1 Strathmore 4 3 Terra Bella 2 3 1 Three Rivers 2 Tipton 1 1 Traver 1 Tulare 6 2 2 Visalia 10 7 2 Waukena 1 1 Woodlake 1 8 Woodville 1
Total 61 61 14
SOURCE: County of Tulare, 2010 Background Report (Table 8-2 pages 8-37 and 8-38), 2010a. 1 The database records show that this site is within Tulare County but has a Kingsburg address.
Site Cleanup Program. The RWQCB oversees investigation and cleanup of sites with soil and groundwater pollution. These sites are part of the Site Cleanup Program, which falls under the Spills, Leaks, Investigation, and Cleanups (SLIC) Program. There are 61 active cleanup sites within Tulare County. Open sites are those that have been identified as having some hazardous contamination and are undergoing investigation. Site assessment, remediation, and verification monitoring categories are described above under “Leaking Underground Storage Tanks”. Some of the listed sites include landfills, dry cleaners, maintenance yards, and facilities that use, mix, and/or store agricultural chemicals. Contaminants at these sites also include a variety of substances, including petroleum, benzene, volatile organic compounds (VOCs), and perchloroethylene (PCE). Table 3.8-3 provides the number of these facilities and their general locations throughout the County.
TABLE 3.8-3SITE CLEANUP PROGRAM LOCATIONS IN TULARE COUNTY
City/Community Open Site
Assessment Remediation Verification Monitoring
Alpaugh 1 Balance Rock 1 Cutler 1 Delano (just inside the County) 1 Dinuba 3 1 Earlimart 1 Exeter 2 1 Goshen 3 Lindsay 5 Lindsay/Exeter 1
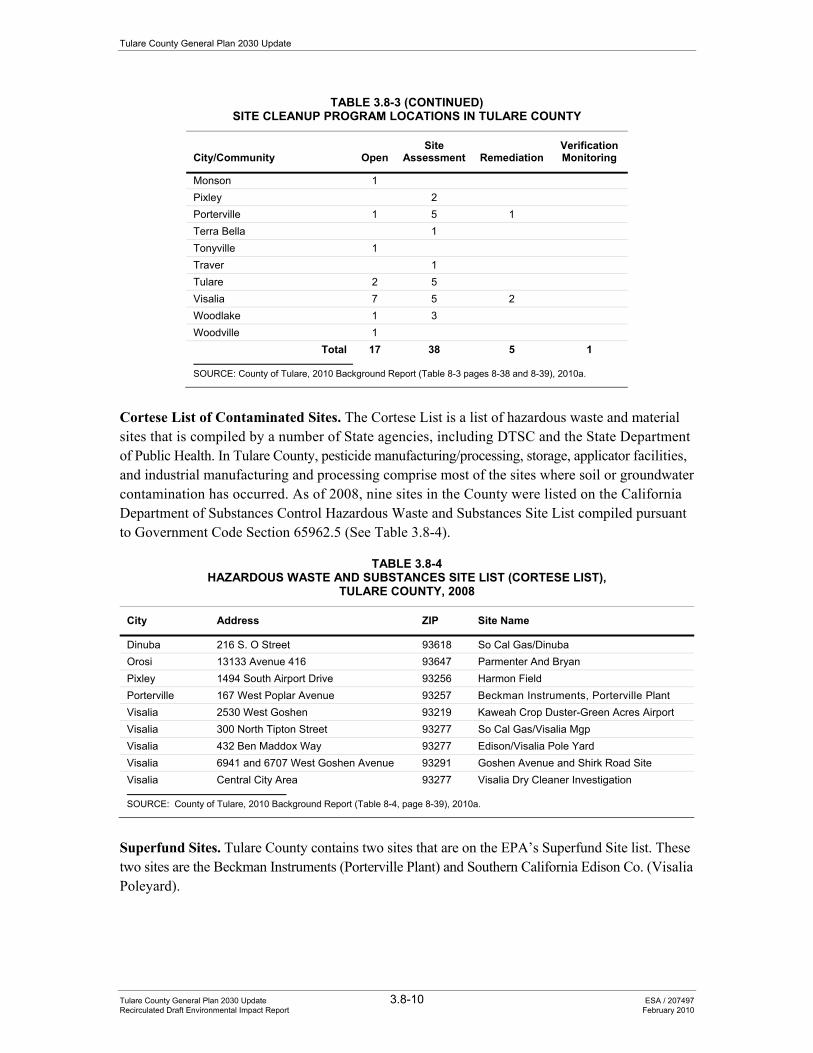
Tulare County General Plan 2030 Update
Tulare County General Plan 2030 Update 3.8-10 ESA / 207497 Recirculated Draft Environmental Impact Report February 2010
TABLE 3.8-3 (CONTINUED)SITE CLEANUP PROGRAM LOCATIONS IN TULARE COUNTY
City/Community Open Site
Assessment Remediation Verification Monitoring
Monson 1 Pixley 2 Porterville 1 5 1 Terra Bella 1 Tonyville 1 Traver 1 Tulare 2 5 Visalia 7 5 2 Woodlake 1 3 Woodville 1
Total 17 38 5 1
SOURCE: County of Tulare, 2010 Background Report (Table 8-3 pages 8-38 and 8-39), 2010a.
Cortese List of Contaminated Sites. The Cortese List is a list of hazardous waste and material sites that is compiled by a number of State agencies, including DTSC and the State Department of Public Health. In Tulare County, pesticide manufacturing/processing, storage, applicator facilities, and industrial manufacturing and processing comprise most of the sites where soil or groundwater contamination has occurred. As of 2008, nine sites in the County were listed on the California Department of Substances Control Hazardous Waste and Substances Site List compiled pursuant to Government Code Section 65962.5 (See Table 3.8-4).
TABLE 3.8-4HAZARDOUS WASTE AND SUBSTANCES SITE LIST (CORTESE LIST),
TULARE COUNTY, 2008
City Address ZIP Site Name
Dinuba 216 S. O Street 93618 So Cal Gas/Dinuba Orosi 13133 Avenue 416 93647 Parmenter And Bryan Pixley 1494 South Airport Drive 93256 Harmon Field Porterville 167 West Poplar Avenue 93257 Beckman Instruments, Porterville Plant Visalia 2530 West Goshen 93219 Kaweah Crop Duster-Green Acres Airport Visalia 300 North Tipton Street 93277 So Cal Gas/Visalia Mgp Visalia 432 Ben Maddox Way 93277 Edison/Visalia Pole Yard Visalia 6941 and 6707 West Goshen Avenue 93291 Goshen Avenue and Shirk Road Site Visalia Central City Area 93277 Visalia Dry Cleaner Investigation
SOURCE: County of Tulare, 2010 Background Report (Table 8-4, page 8-39), 2010a.
Superfund Sites. Tulare County contains two sites that are on the EPA’s Superfund Site list. These two sites are the Beckman Instruments (Porterville Plant) and Southern California Edison Co. (Visalia Poleyard).
3.8 Hazardous Materials and Public Safety
Tulare County General Plan 2030 Update 3.8-11 ESA / 207497 Recirculated Draft Environmental Impact Report February 2010
The Beckman Instruments (Porterville Plant) site covers about 500 acres. The company has manufactured printed circuit boards and electronic instrument parts at the facility since 1968. Disposal of wastes from 1974 until 1983 resulted in groundwater contamination and soil contamination in the area of the plant. Cleanup activities began in 1983 with removal of discharge pond liquids, liners, and surface soils. Groundwater monitoring wells were installed and affected residents were provided with alternative water supplies. Soil cleanup has been completed and all the components for the groundwater cleanup have been constructed and are operating. The site is now undergoing monitored natural attenuation1 (County of Tulare, 2010 Background Report, page 8-40, 2010a).
The Southern California Edison Co. (Visalia Poleyard) site covers 20 acres and is located at 432 Ben Maddox Way in Visalia. This site was operated as a utility pole treatment yard from the 1920s until 1980. Wood preservatives were used and stored on site during operations. Leaking tanks and stored treated poles contaminated groundwater and soil. The closest residence is ¼ mile away. A pilot steam injection/vapor extraction system was utilized to remove contaminated groundwater, which contained creosote, diesel oil, and other hydrocarbons. All cleanup activities are completed and a covenant to restrict use of the property was completed in May 2007 (County of Tulare, 2010 Background Report, page 8-40, 2010a).
Household Hazardous Waste The Tulare County Resource Management Agency Solid Waste Division operates a Household Hazardous Waste program. Under this program, residents in the County can safely dispose of hazardous materials, such as pesticides, household cleaners, and paint products. Additionally, residents can utilize this program to dispose of used motor oil and universal wastes, which includes consumer batteries, CRTs (e.g., televisions and computer monitors), fluorescent tubes and other mercury-containing lamps, and consumer electronics (County of Tulare, 2010 Background Report, page 8-42, 2010a).
Most Saturdays the County operates a Permanent Household Hazardous Waste Collection Facility (HWCF) located in Visalia. The County also hosts mobile collection events throughout the year. In 2007, there were 13 mobile one-day collection events in the County. At the one-day collection events of the HWCF, the County collected over 227,700 pounds of household hazardous waste in 2007 (County of Tulare, 2010 Background Report, page 8-42, 2010a).
Used Oil. Used oil can be disposed of by residences at the HWCF or at a number of used motor oil collection locations throughout the County. These locations are generally auto repair shops and auto parts stores. In 2007, 246 tons of used motor oil was collected (County of Tulare, 2010 Background Report, page 8-42, 2010a).
Universal and Electronic Waste. In 2007, over 91,700 pounds of universal and e-waste were collected in Tulare County (County of Tulare, 2010 Background Report, page 8-42, 2010a).
1 Monitored Natural Attenuation. Natural attenuation relies on natural processes to clean up or attenuate pollution in soil and groundwater. Natural attenuation occurs at most polluted sites. However, the right conditions must exist underground to clean sites properly. If not, cleanup will not be quick enough or complete enough. Scientists monitor these conditions to make sure natural attenuation is working.
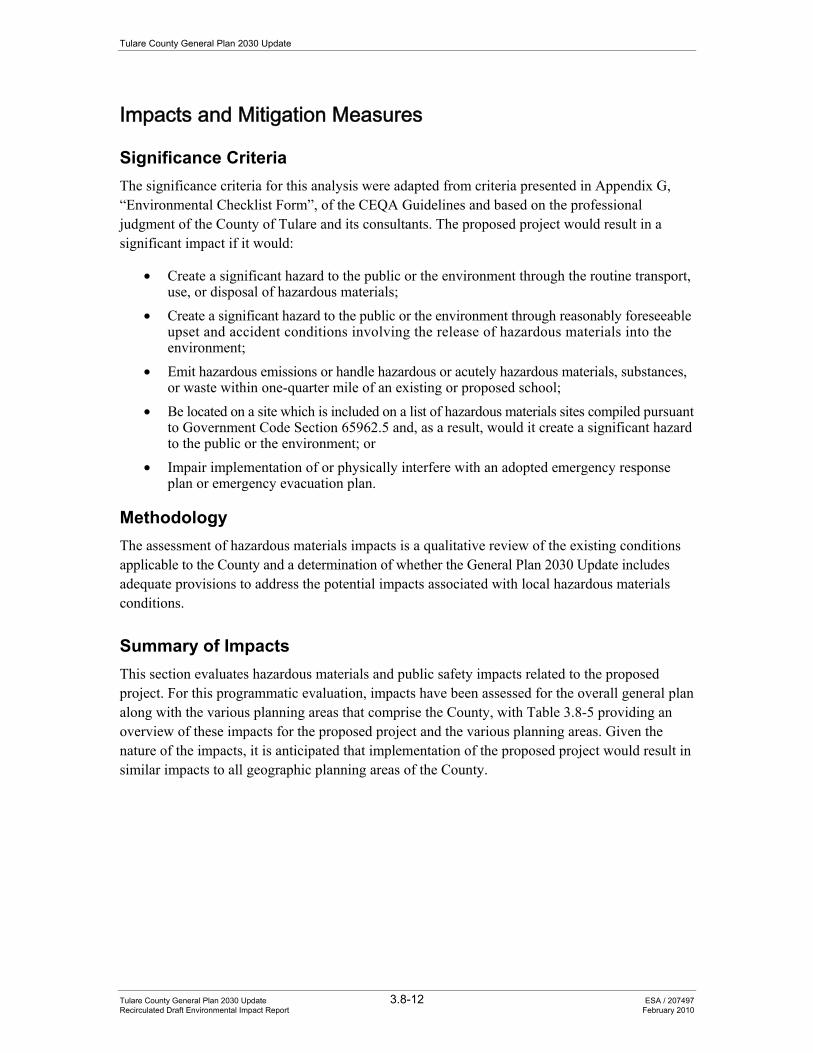
Tulare County General Plan 2030 Update
Tulare County General Plan 2030 Update 3.8-12 ESA / 207497 Recirculated Draft Environmental Impact Report February 2010
Impacts and Mitigation Measures
Significance Criteria The significance criteria for this analysis were adapted from criteria presented in Appendix G, “Environmental Checklist Form”, of the CEQA Guidelines and based on the professional judgment of the County of Tulare and its consultants. The proposed project would result in a significant impact if it would:
• Create a significant hazard to the public or the environment through the routine transport, use, or disposal of hazardous materials;
• Create a significant hazard to the public or the environment through reasonably foreseeable upset and accident conditions involving the release of hazardous materials into the environment;
• Emit hazardous emissions or handle hazardous or acutely hazardous materials, substances, or waste within one-quarter mile of an existing or proposed school;
• Be located on a site which is included on a list of hazardous materials sites compiled pursuant to Government Code Section 65962.5 and, as a result, would it create a significant hazard to the public or the environment; or
• Impair implementation of or physically interfere with an adopted emergency response plan or emergency evacuation plan.
Methodology The assessment of hazardous materials impacts is a qualitative review of the existing conditions applicable to the County and a determination of whether the General Plan 2030 Update includes adequate provisions to address the potential impacts associated with local hazardous materials conditions.
Summary of Impacts This section evaluates hazardous materials and public safety impacts related to the proposed project. For this programmatic evaluation, impacts have been assessed for the overall general plan along with the various planning areas that comprise the County, with Table 3.8-5 providing an overview of these impacts for the proposed project and the various planning areas. Given the nature of the impacts, it is anticipated that implementation of the proposed project would result in similar impacts to all geographic planning areas of the County.
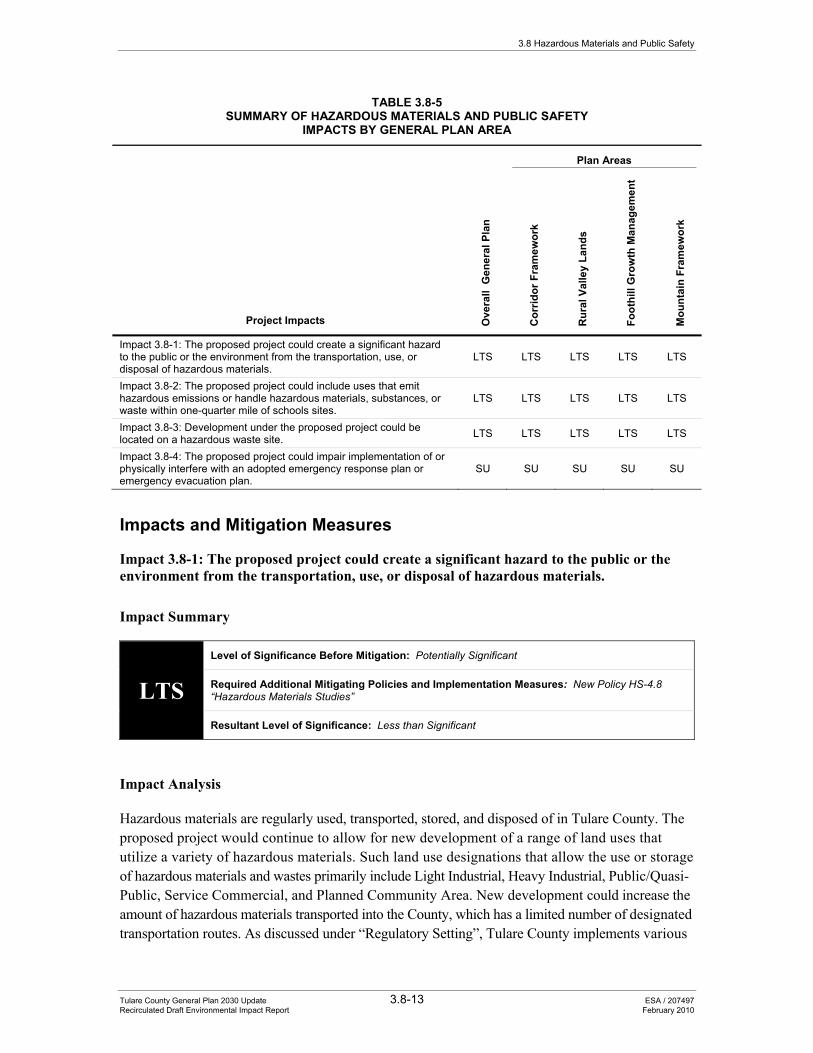
3.8 Hazardous Materials and Public Safety
Tulare County General Plan 2030 Update 3.8-13 ESA / 207497 Recirculated Draft Environmental Impact Report February 2010
TABLE 3.8-5 SUMMARY OF HAZARDOUS MATERIALS AND PUBLIC SAFETY
IMPACTS BY GENERAL PLAN AREA
Project Impacts Ove
rall
Gen
eral
Pla
n
Plan Areas
Cor
ridor
Fra
mew
ork
Rur
al V
alle
y La
nds
Foot
hill
Gro
wth
Man
agem
ent
Mou
ntai
n Fr
amew
ork
Impact 3.8-1: The proposed project could create a significant hazard to the public or the environment from the transportation, use, or disposal of hazardous materials.
LTS LTS LTS LTS LTS
Impact 3.8-2: The proposed project could include uses that emit hazardous emissions or handle hazardous materials, substances, or waste within one-quarter mile of schools sites.
LTS LTS LTS LTS LTS
Impact 3.8-3: Development under the proposed project could be located on a hazardous waste site. LTS LTS LTS LTS LTS
Impact 3.8-4: The proposed project could impair implementation of or physically interfere with an adopted emergency response plan or emergency evacuation plan.
SU SU SU SU SU
Impacts and Mitigation Measures
Impact 3.8-1: The proposed project could create a significant hazard to the public or the environment from the transportation, use, or disposal of hazardous materials.
Impact Summary
LTS Level of Significance Before Mitigation: Potentially Significant
Required Additional Mitigating Policies and Implementation Measures: New Policy HS-4.8 “Hazardous Materials Studies”
Resultant Level of Significance: Less than Significant
Impact Analysis
Hazardous materials are regularly used, transported, stored, and disposed of in Tulare County. The proposed project would continue to allow for new development of a range of land uses that utilize a variety of hazardous materials. Such land use designations that allow the use or storage of hazardous materials and wastes primarily include Light Industrial, Heavy Industrial, Public/Quasi-Public, Service Commercial, and Planned Community Area. New development could increase the amount of hazardous materials transported into the County, which has a limited number of designated transportation routes. As discussed under “Regulatory Setting”, Tulare County implements various
Tulare County General Plan 2030 Update
Tulare County General Plan 2030 Update 3.8-14 ESA / 207497 Recirculated Draft Environmental Impact Report February 2010
federal, State, and local regulations that govern the use, transportation, storage and disposal of these materials. The Tulare County Environmental Health Division (EHD) performs regular inspections and permits these facilities in order to minimize the risks associated with the use of hazardous materials. Additionally, Tulare County implements and regularly updates a Multi-Hazard Functional Plan (described above in the “Regulatory Setting”) that serves as the County’s emergency response plan. The plan addresses responses to various emergency incidents, responsibilities of various agencies, and sources of outside assistance. While the activities and facilities that transport, use, and store hazardous materials in Tulare County are generally well monitored, releases due to accidents, misuse, or natural disasters (e.g., earthquakes) could occur. In addition to public health impacts, the accidental release of hazardous materials or waste could result in such impacts to the environment as contamination of surface and groundwater, biological resources, and air quality. For example, potential surface or groundwater contamination could result from leaking underground storage tanks. An example of an impact to air quality could be an accidental release of hazardous air emissions. Potential impacts to biological resources could result from releases of hazardous materials to sensitive habitats, such as vernal pools, that contain special status species.
The proposed project includes a number of policies that help ensure the safety of its residents, visitors, and businesses. Policies included as part of the proposed project that would minimize this impact are summarized below. For example, the Health & Safety Element provides a number of policies and implementation measures that have been developed to address hazardous materials concerns including the safe storage, use, transportation, and disposal of hazardous materials (see Policy HS-4.1), continued compliance with all applicable local, State, and federal safety standards (see Policy HS-4.1), continued coordination with the California Highway Patrol to establish procedures for the movement of hazardous waste (see Policy HS-4.2), and the monitoring of studies on pesticide use and its effects on residents and wildlife (see Policy HS-4.6). Other policies require the continued education of County residents about household hazardous waste and its proper disposal (see Policy HS-4.5). Additional policies from both the Land Use and Health and Safety Elements (see Policies LU-1.3, LU-5.4, and HS-4.3) prevent the placement of incompatible land uses within residential areas or near properties that produce or store hazardous materials. Policy HS-4.7 directs the County to work with State and federal land managers to coordinate the handling and disposal of hazardous materials on public lands. Other policies aim to avoid land use conflicts and minimize the potential for exposure and contamination from hazardous materials through review of new development proposals and creation of buffers between incompatible uses (Policies HS-4.4 and LU-5.6). The proposed project includes implementation measures that direct the County to create specific development standards and the Hazardous Waste Management Plan to avoid locating incompatible uses near each other (Health & Safety Implementation Measures #12 and #13). However, even with implementation of the below mentioned policies and implementation measures, this impact is considered potentially significant.
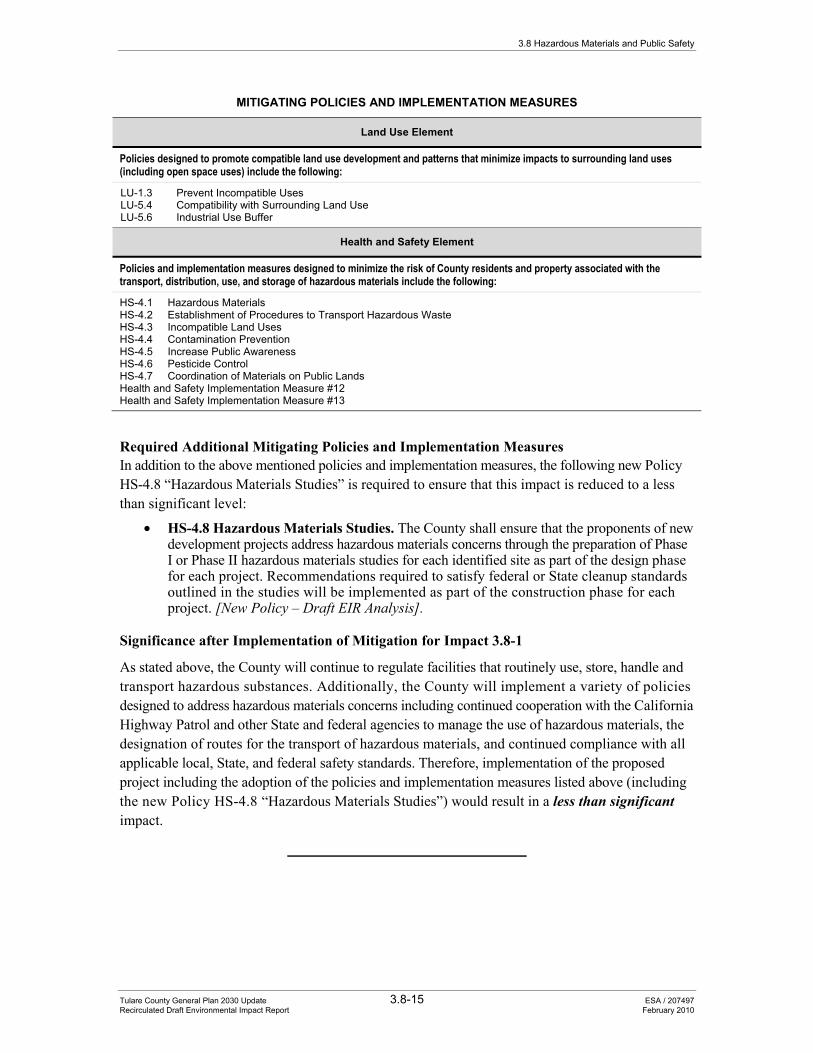
3.8 Hazardous Materials and Public Safety
Tulare County General Plan 2030 Update 3.8-15 ESA / 207497 Recirculated Draft Environmental Impact Report February 2010
MITIGATING POLICIES AND IMPLEMENTATION MEASURES
Land Use Element
Policies designed to promote compatible land use development and patterns that minimize impacts to surrounding land uses (including open space uses) include the following:
LU-1.3 Prevent Incompatible Uses LU-5.4 Compatibility with Surrounding Land Use LU-5.6 Industrial Use Buffer
Health and Safety Element
Policies and implementation measures designed to minimize the risk of County residents and property associated with the transport, distribution, use, and storage of hazardous materials include the following:
HS-4.1 Hazardous Materials HS-4.2 Establishment of Procedures to Transport Hazardous Waste HS-4.3 Incompatible Land Uses HS-4.4 Contamination Prevention HS-4.5 Increase Public Awareness HS-4.6 Pesticide Control HS-4.7 Coordination of Materials on Public Lands Health and Safety Implementation Measure #12 Health and Safety Implementation Measure #13
Required Additional Mitigating Policies and Implementation Measures In addition to the above mentioned policies and implementation measures, the following new Policy HS-4.8 “Hazardous Materials Studies” is required to ensure that this impact is reduced to a less than significant level:
• HS-4.8 Hazardous Materials Studies. The County shall ensure that the proponents of new development projects address hazardous materials concerns through the preparation of Phase I or Phase II hazardous materials studies for each identified site as part of the design phase for each project. Recommendations required to satisfy federal or State cleanup standards outlined in the studies will be implemented as part of the construction phase for each project. [New Policy – Draft EIR Analysis].
Significance after Implementation of Mitigation for Impact 3.8-1
As stated above, the County will continue to regulate facilities that routinely use, store, handle and transport hazardous substances. Additionally, the County will implement a variety of policies designed to address hazardous materials concerns including continued cooperation with the California Highway Patrol and other State and federal agencies to manage the use of hazardous materials, the designation of routes for the transport of hazardous materials, and continued compliance with all applicable local, State, and federal safety standards. Therefore, implementation of the proposed project including the adoption of the policies and implementation measures listed above (including the new Policy HS-4.8 “Hazardous Materials Studies”) would result in a less than significant impact.
Tulare County General Plan 2030 Update
Tulare County General Plan 2030 Update 3.8-16 ESA / 207497 Recirculated Draft Environmental Impact Report February 2010
Impact 3.8-2: The proposed project could include uses that emit hazardous emissions or handle hazardous materials, substances, or waste within one-quarter mile of school sites.
Impact Summary
LTS Level of Significance Before Mitigation: Less than Significant
Required Additional Mitigating Policies and Implementation Measures: None required
Resultant Level of Significance: Less than Significant
Impact Analysis
Schools are one of several sensitive receptors that must be taken into consideration when the County is approving new land uses or transportation routes that may accommodate the production, storage, use, or transportation of hazardous materials and/or waste. Implementation of the proposed project would result in increased population levels in designated growth areas and would increase the number of school-age children as well. A potential increase in levels of residential development would generate an increase in the number of students (dependent upon future household sizes and make-ups), and would necessitate the need to construct additional school facilities. New school sites should be evaluated for their proximity and potential exposure to hazardous materials as they are proposed for development. Potential school sites should be selected to minimize their exposure to a variety of hazardous conditions. In addition to general CEQA requirements, school acquisition/development projects to be funded under the State School Facilities Program must also satisfy several specific requirements established under the California Education Code and California Code of Regulations. These regulations require that potential school hazards relating to soils, seismicity, hazards and hazardous materials, and flooding be addressed during the school site selection process. Compliance with these requirements will address significant impacts associated with the siting of new public schools within the County.
The proposed project includes a number of policies that help ensure the safety of its residents (including school children), visitors, and businesses. Policies included as part of the proposed project that would minimize this impact are summarized below by general plan element. For example, the Health & Safety Element provides a number of policies and implementation measures that have been developed to address general hazardous materials concerns including the safe storage, use, transportation, and disposal of hazardous materials (see Policy HS-4.1), continued compliance with all applicable local, State, and federal safety standards (see Policy HS-4.1), continued coordination with the California Highway Patrol to establish procedures for the movement of hazardous waste (see Policy HS-4.2), and the monitoring of studies on pesticide use and its effects on residents and wildlife (see Policy HS-4.6). Additional policies from both the Land Use and Health & Safety Elements (see Policies LU-1.3, LU-5.4, and HS-4.3) prevent the placement of incompatible land uses, such as schools and land uses that use, produce or store hazardous materials and waste, near each other. Through review of new development proposals and creation of buffers, Policies HS-4.4, LU-5.6, and LU-6.2 would minimize the potential for locating a potentially hazardous land use near schools. The proposed project includes implementation
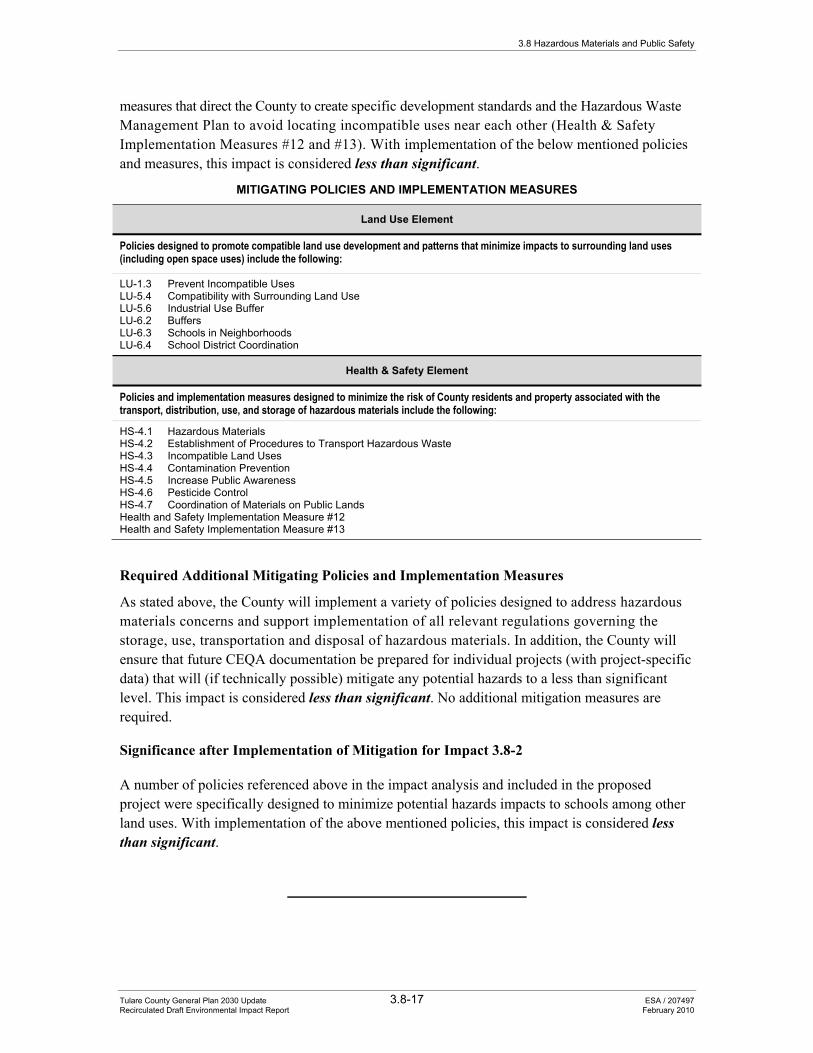
3.8 Hazardous Materials and Public Safety
Tulare County General Plan 2030 Update 3.8-17 ESA / 207497 Recirculated Draft Environmental Impact Report February 2010
measures that direct the County to create specific development standards and the Hazardous Waste Management Plan to avoid locating incompatible uses near each other (Health & Safety Implementation Measures #12 and #13). With implementation of the below mentioned policies and measures, this impact is considered less than significant.
MITIGATING POLICIES AND IMPLEMENTATION MEASURES
Land Use Element
Policies designed to promote compatible land use development and patterns that minimize impacts to surrounding land uses (including open space uses) include the following:
LU-1.3 Prevent Incompatible Uses LU-5.4 Compatibility with Surrounding Land Use LU-5.6 Industrial Use Buffer LU-6.2 Buffers LU-6.3 Schools in Neighborhoods LU-6.4 School District Coordination
Health & Safety Element
Policies and implementation measures designed to minimize the risk of County residents and property associated with the transport, distribution, use, and storage of hazardous materials include the following:
HS-4.1 Hazardous Materials HS-4.2 Establishment of Procedures to Transport Hazardous Waste HS-4.3 Incompatible Land Uses HS-4.4 Contamination Prevention HS-4.5 Increase Public Awareness HS-4.6 Pesticide Control HS-4.7 Coordination of Materials on Public Lands Health and Safety Implementation Measure #12 Health and Safety Implementation Measure #13
Required Additional Mitigating Policies and Implementation Measures
As stated above, the County will implement a variety of policies designed to address hazardous materials concerns and support implementation of all relevant regulations governing the storage, use, transportation and disposal of hazardous materials. In addition, the County will ensure that future CEQA documentation be prepared for individual projects (with project-specific data) that will (if technically possible) mitigate any potential hazards to a less than significant level. This impact is considered less than significant. No additional mitigation measures are required.
Significance after Implementation of Mitigation for Impact 3.8-2
A number of policies referenced above in the impact analysis and included in the proposed project were specifically designed to minimize potential hazards impacts to schools among other land uses. With implementation of the above mentioned policies, this impact is considered less than significant.
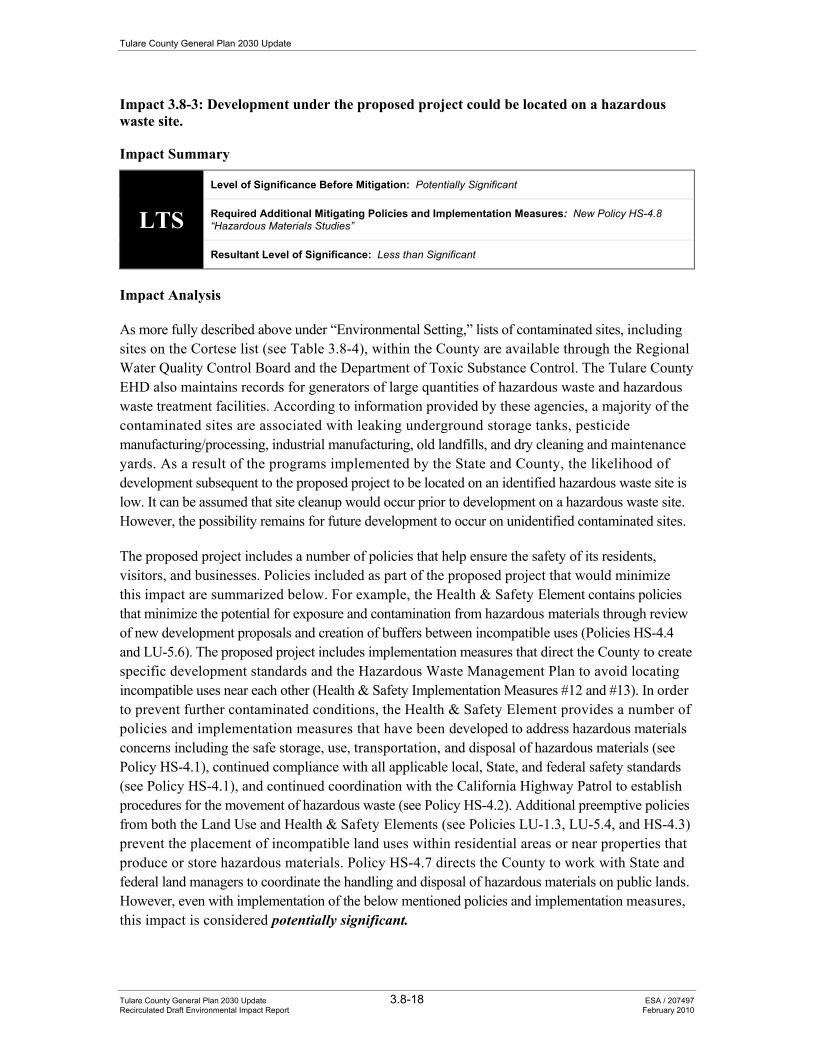
Tulare County General Plan 2030 Update
Tulare County General Plan 2030 Update 3.8-18 ESA / 207497 Recirculated Draft Environmental Impact Report February 2010
Impact 3.8-3: Development under the proposed project could be located on a hazardous waste site.
Impact Summary
LTS Level of Significance Before Mitigation: Potentially Significant
Required Additional Mitigating Policies and Implementation Measures: New Policy HS-4.8 “Hazardous Materials Studies”
Resultant Level of Significance: Less than Significant
Impact Analysis
As more fully described above under “Environmental Setting,” lists of contaminated sites, including sites on the Cortese list (see Table 3.8-4), within the County are available through the Regional Water Quality Control Board and the Department of Toxic Substance Control. The Tulare County EHD also maintains records for generators of large quantities of hazardous waste and hazardous waste treatment facilities. According to information provided by these agencies, a majority of the contaminated sites are associated with leaking underground storage tanks, pesticide manufacturing/processing, industrial manufacturing, old landfills, and dry cleaning and maintenance yards. As a result of the programs implemented by the State and County, the likelihood of development subsequent to the proposed project to be located on an identified hazardous waste site is low. It can be assumed that site cleanup would occur prior to development on a hazardous waste site. However, the possibility remains for future development to occur on unidentified contaminated sites.
The proposed project includes a number of policies that help ensure the safety of its residents, visitors, and businesses. Policies included as part of the proposed project that would minimize this impact are summarized below. For example, the Health & Safety Element contains policies that minimize the potential for exposure and contamination from hazardous materials through review of new development proposals and creation of buffers between incompatible uses (Policies HS-4.4 and LU-5.6). The proposed project includes implementation measures that direct the County to create specific development standards and the Hazardous Waste Management Plan to avoid locating incompatible uses near each other (Health & Safety Implementation Measures #12 and #13). In order to prevent further contaminated conditions, the Health & Safety Element provides a number of policies and implementation measures that have been developed to address hazardous materials concerns including the safe storage, use, transportation, and disposal of hazardous materials (see Policy HS-4.1), continued compliance with all applicable local, State, and federal safety standards (see Policy HS-4.1), and continued coordination with the California Highway Patrol to establish procedures for the movement of hazardous waste (see Policy HS-4.2). Additional preemptive policies from both the Land Use and Health & Safety Elements (see Policies LU-1.3, LU-5.4, and HS-4.3) prevent the placement of incompatible land uses within residential areas or near properties that produce or store hazardous materials. Policy HS-4.7 directs the County to work with State and federal land managers to coordinate the handling and disposal of hazardous materials on public lands. However, even with implementation of the below mentioned policies and implementation measures, this impact is considered potentially significant.
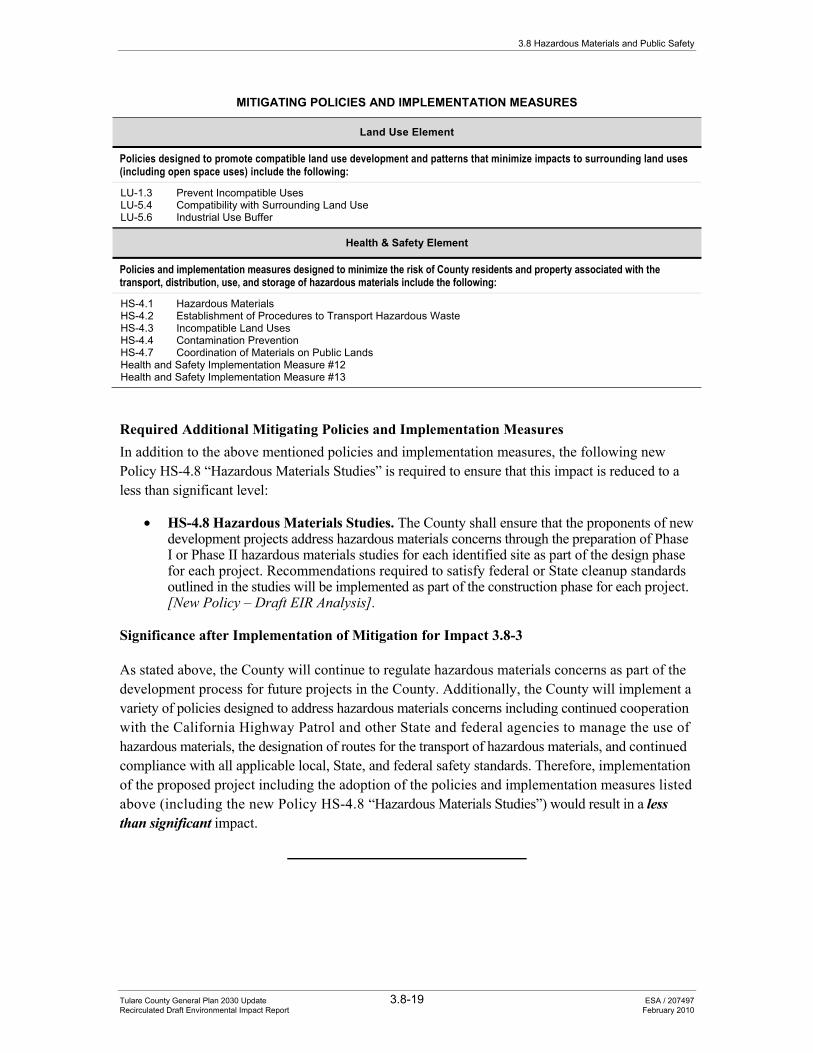
3.8 Hazardous Materials and Public Safety
Tulare County General Plan 2030 Update 3.8-19 ESA / 207497 Recirculated Draft Environmental Impact Report February 2010
MITIGATING POLICIES AND IMPLEMENTATION MEASURES
Land Use Element
Policies designed to promote compatible land use development and patterns that minimize impacts to surrounding land uses (including open space uses) include the following:
LU-1.3 Prevent Incompatible Uses LU-5.4 Compatibility with Surrounding Land Use LU-5.6 Industrial Use Buffer
Health & Safety Element
Policies and implementation measures designed to minimize the risk of County residents and property associated with the transport, distribution, use, and storage of hazardous materials include the following:
HS-4.1 Hazardous Materials HS-4.2 Establishment of Procedures to Transport Hazardous Waste HS-4.3 Incompatible Land Uses HS-4.4 Contamination Prevention HS-4.7 Coordination of Materials on Public Lands Health and Safety Implementation Measure #12 Health and Safety Implementation Measure #13
Required Additional Mitigating Policies and Implementation Measures In addition to the above mentioned policies and implementation measures, the following new Policy HS-4.8 “Hazardous Materials Studies” is required to ensure that this impact is reduced to a less than significant level:
• HS-4.8 Hazardous Materials Studies. The County shall ensure that the proponents of new development projects address hazardous materials concerns through the preparation of Phase I or Phase II hazardous materials studies for each identified site as part of the design phase for each project. Recommendations required to satisfy federal or State cleanup standards outlined in the studies will be implemented as part of the construction phase for each project. [New Policy – Draft EIR Analysis].
Significance after Implementation of Mitigation for Impact 3.8-3
As stated above, the County will continue to regulate hazardous materials concerns as part of the development process for future projects in the County. Additionally, the County will implement a variety of policies designed to address hazardous materials concerns including continued cooperation with the California Highway Patrol and other State and federal agencies to manage the use of hazardous materials, the designation of routes for the transport of hazardous materials, and continued compliance with all applicable local, State, and federal safety standards. Therefore, implementation of the proposed project including the adoption of the policies and implementation measures listed above (including the new Policy HS-4.8 “Hazardous Materials Studies”) would result in a less than significant impact.
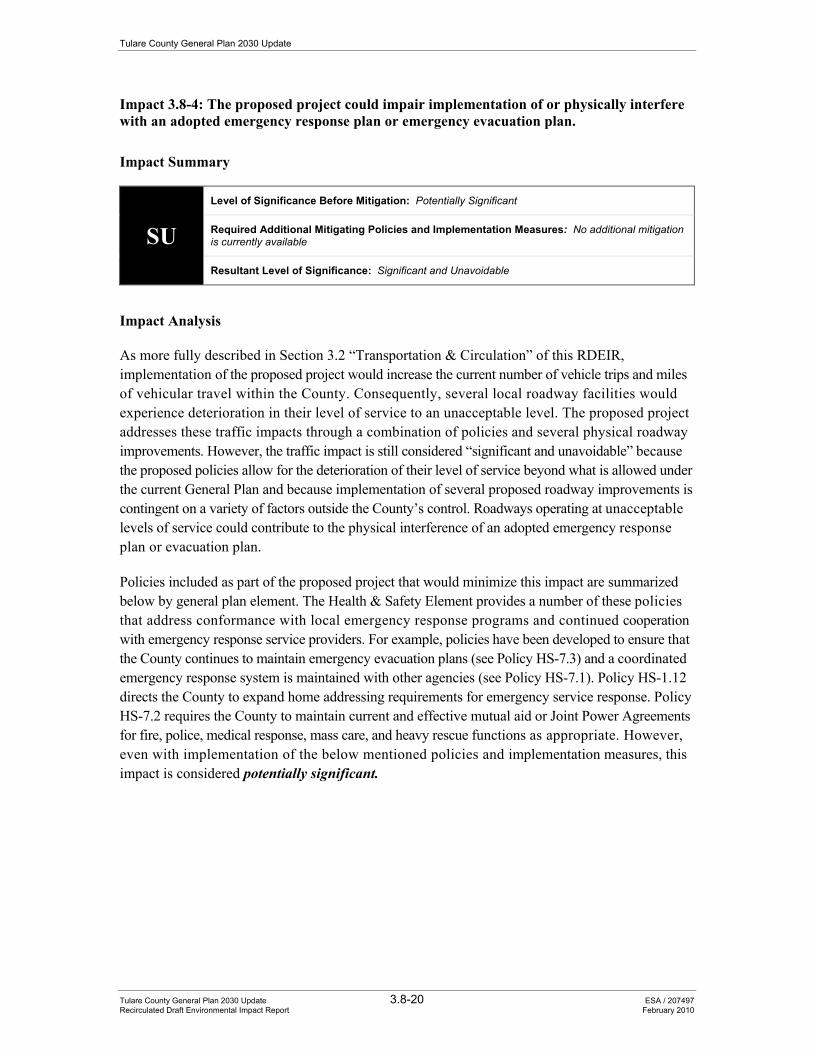
Tulare County General Plan 2030 Update
Tulare County General Plan 2030 Update 3.8-20 ESA / 207497 Recirculated Draft Environmental Impact Report February 2010
Impact 3.8-4: The proposed project could impair implementation of or physically interfere with an adopted emergency response plan or emergency evacuation plan.
Impact Summary
SU Level of Significance Before Mitigation: Potentially Significant
Required Additional Mitigating Policies and Implementation Measures: No additional mitigation is currently available
Resultant Level of Significance: Significant and Unavoidable
Impact Analysis
As more fully described in Section 3.2 “Transportation & Circulation” of this RDEIR, implementation of the proposed project would increase the current number of vehicle trips and miles of vehicular travel within the County. Consequently, several local roadway facilities would experience deterioration in their level of service to an unacceptable level. The proposed project addresses these traffic impacts through a combination of policies and several physical roadway improvements. However, the traffic impact is still considered “significant and unavoidable” because the proposed policies allow for the deterioration of their level of service beyond what is allowed under the current General Plan and because implementation of several proposed roadway improvements is contingent on a variety of factors outside the County’s control. Roadways operating at unacceptable levels of service could contribute to the physical interference of an adopted emergency response plan or evacuation plan.
Policies included as part of the proposed project that would minimize this impact are summarized below by general plan element. The Health & Safety Element provides a number of these policies that address conformance with local emergency response programs and continued cooperation with emergency response service providers. For example, policies have been developed to ensure that the County continues to maintain emergency evacuation plans (see Policy HS-7.3) and a coordinated emergency response system is maintained with other agencies (see Policy HS-7.1). Policy HS-1.12 directs the County to expand home addressing requirements for emergency service response. Policy HS-7.2 requires the County to maintain current and effective mutual aid or Joint Power Agreements for fire, police, medical response, mass care, and heavy rescue functions as appropriate. However, even with implementation of the below mentioned policies and implementation measures, this impact is considered potentially significant.
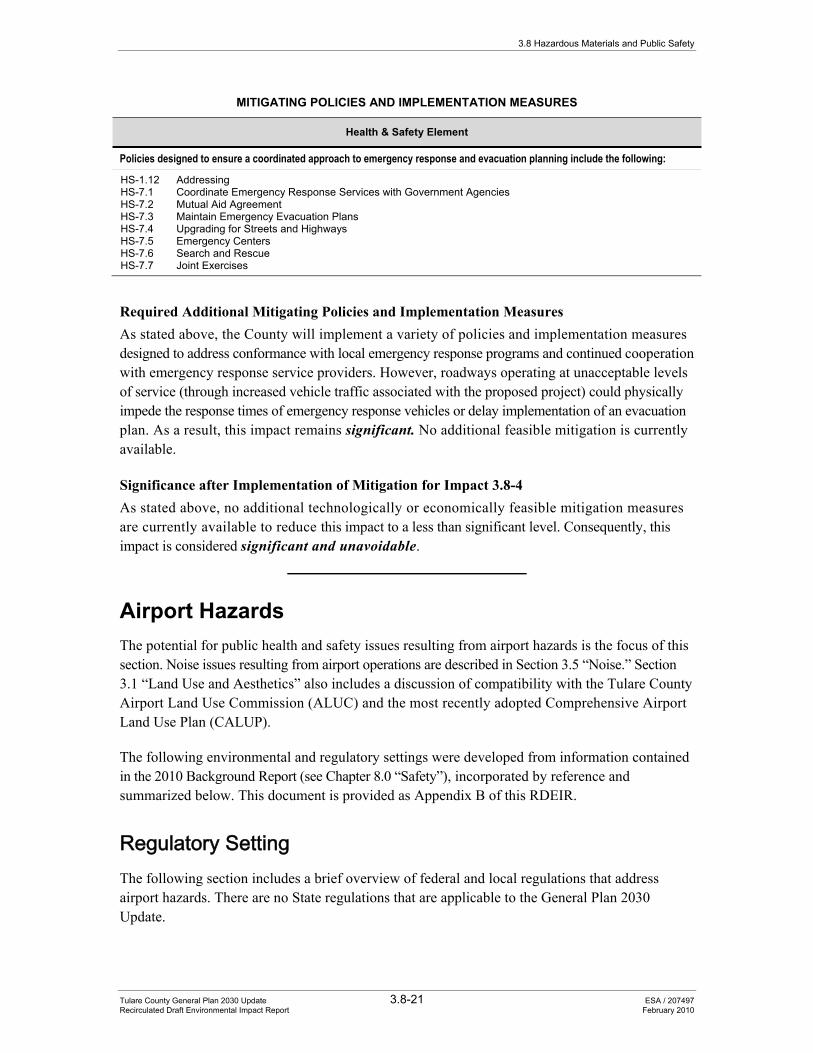
3.8 Hazardous Materials and Public Safety
Tulare County General Plan 2030 Update 3.8-21 ESA / 207497 Recirculated Draft Environmental Impact Report February 2010
MITIGATING POLICIES AND IMPLEMENTATION MEASURES
Health & Safety Element
Policies designed to ensure a coordinated approach to emergency response and evacuation planning include the following:
HS-1.12 Addressing HS-7.1 Coordinate Emergency Response Services with Government Agencies HS-7.2 Mutual Aid Agreement HS-7.3 Maintain Emergency Evacuation Plans HS-7.4 Upgrading for Streets and Highways HS-7.5 Emergency Centers HS-7.6 Search and Rescue HS-7.7 Joint Exercises
Required Additional Mitigating Policies and Implementation Measures As stated above, the County will implement a variety of policies and implementation measures designed to address conformance with local emergency response programs and continued cooperation with emergency response service providers. However, roadways operating at unacceptable levels of service (through increased vehicle traffic associated with the proposed project) could physically impede the response times of emergency response vehicles or delay implementation of an evacuation plan. As a result, this impact remains significant. No additional feasible mitigation is currently available.
Significance after Implementation of Mitigation for Impact 3.8-4 As stated above, no additional technologically or economically feasible mitigation measures are currently available to reduce this impact to a less than significant level. Consequently, this impact is considered significant and unavoidable.
Airport Hazards The potential for public health and safety issues resulting from airport hazards is the focus of this section. Noise issues resulting from airport operations are described in Section 3.5 “Noise.” Section 3.1 “Land Use and Aesthetics” also includes a discussion of compatibility with the Tulare County Airport Land Use Commission (ALUC) and the most recently adopted Comprehensive Airport Land Use Plan (CALUP).
The following environmental and regulatory settings were developed from information contained in the 2010 Background Report (see Chapter 8.0 “Safety”), incorporated by reference and summarized below. This document is provided as Appendix B of this RDEIR.
Regulatory Setting The following section includes a brief overview of federal and local regulations that address airport hazards. There are no State regulations that are applicable to the General Plan 2030 Update.
Tulare County General Plan 2030 Update
Tulare County General Plan 2030 Update 3.8-22 ESA / 207497 Recirculated Draft Environmental Impact Report February 2010
Federal Regulations
Federal Aviation Regulations (FAR) Part 77 Human-made objects, objects of natural growth, or high terrain on or near airports, may constitute hazards to aircraft in flight. Federal Aviation Regulations (FAR) Part 77, Objects Affecting Navigable Airspace, establishes standards for determining obstructions to navigable airspace around an airport. These regulations require that the Federal Aviation Administration (FAA) be notified of proposals related to the construction of potentially hazardous structures located in an airport’s imaginary surfaces (as defined by FAR Part 77). Through the 7460-1 review process, the FAA conducts “aeronautical studies” of proposed projects to determine whether they would pose risks to aircraft; though deviation from the Part 77 standards does not necessarily mean that a safety hazard exists, only that offending objects must be evaluated by the FAA and that mitigating actions such as marking or lighting may be required if appropriate.
Local Regulations
Tulare County Comprehensive Airport Land Use Plan The Tulare County Airport Land Use Commission (ALUC) adopted a Comprehensive Airport Land Use Plan for the eight operating public-use airports in Tulare County in June 1992. The airport planning areas are divided into six traffic compatibility zones, which are determined by their location in relation to runways, approach/departure patterns, and common airport traffic (overflight zones). Each zone has identified acceptable and unacceptable uses, which are determined by the safety, noise, overflight, and airspace impacts associated with each particular zone. The ALUC must review the general and specific plans of local jurisdictions for consistency with the County's Comprehensive Airport Land Use Plan (CALUP).
Environmental Setting Airport safety issues are associated with flight hazards and airport hazards associated with surrounding land uses. Flight hazards can be physical (e.g., tall structures that would obstruct airspace), visual (such as glare caused by lights or reflective surfaces), or electronic (interference with aircraft instruments or communication systems). As urban areas grow, there is an increased need for airport operations. Such increased activity generates an increased risk of aircraft crash hazards. With proper land use planning, aircraft safety risks are reduced, primarily by avoiding incompatible land uses.
When land use controls combine with safety areas, the risks to both people on the ground and aircraft utilizing the airport is decreased. The risk to persons on the ground being harmed by a falling plane is small. However, an air crash is a high consequence event. Therefore, when a crash does occur it can be catastrophic. These considerations have led to the adoption of safety standards which determine acceptable land uses (assuming a crash will occur) rather than attempting to estimate accident probabilities. While the majority of Tulare County airports have not experienced a serious aircraft accident, aircraft accidents are possible.
3.8 Hazardous Materials and Public Safety
Tulare County General Plan 2030 Update 3.8-23 ESA / 207497 Recirculated Draft Environmental Impact Report February 2010
Airport Safety Zones for height restrictions are established by FAR, Part 77, for the purpose of protecting navigable airspace. These same zones are adopted by the Tulare County ALUC to determine safety zones and compatible land uses in the vicinity of all Tulare County public use airports. Tulare County contains the following 7 active public use airports:
• Eckert Field; • Porterville Municipal Airport; • Sequoia Field; • Thunderhawk Field; • Tulare Municipal Airport (Mefford Field); • Visalia Municipal Airport (VMA); and • Woodlake Municipal Airport.
Figure 3.8-1 shows the locations of these airports. In addition, both Alta Airport and Pixley Airport (Harmon Field) have recently been closed. Tulare County contains a number of small private air strips, which are generally located in rural areas. These air strips primarily serve agricultural purposes, such as landing strips for crop duster aircraft.
Impacts and Mitigation Measures
Significance Criteria The significance criteria for this analysis were developed from criteria presented in Appendix G, “Environmental Checklist Form”, of the CEQA Guidelines and based on the professional judgment of the County of Tulare and its consultants. The proposed project would result in a significant impact if it would:
• Be located within an airport land use plan area or, where such a plan has not been adopted, be within two miles of a public airport or public use airport, and result in a safety hazard for people residing or working in the project area; or
• Be located within the vicinity of a private airstrip and result in a safety hazard for people residing or working in the project area.
Methodology The assessment of airport-related hazard impacts is a qualitative review of the existing conditions applicable to the County and a determination of whether the General Plan 2030 Update includes adequate provisions to address the potential impacts associated with local airport-related conditions.
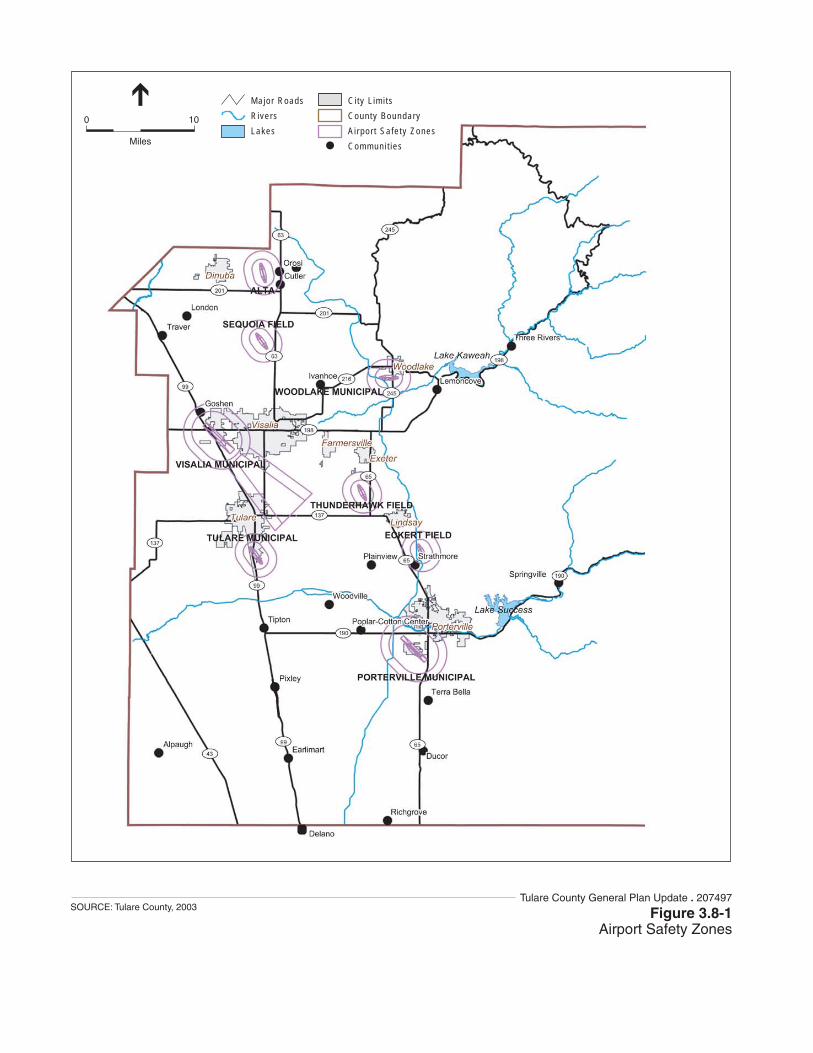
0 10
Miles
Major RoadsRiversLakes
Ci ty L im i tsCounty BoundaryA i rpor t Sa fe ty ZonesCommuni t ies
Figure 3.8-1Airport Safety Zones
SOURCE: Tulare County, 2003Tulare County General Plan Update . 207497
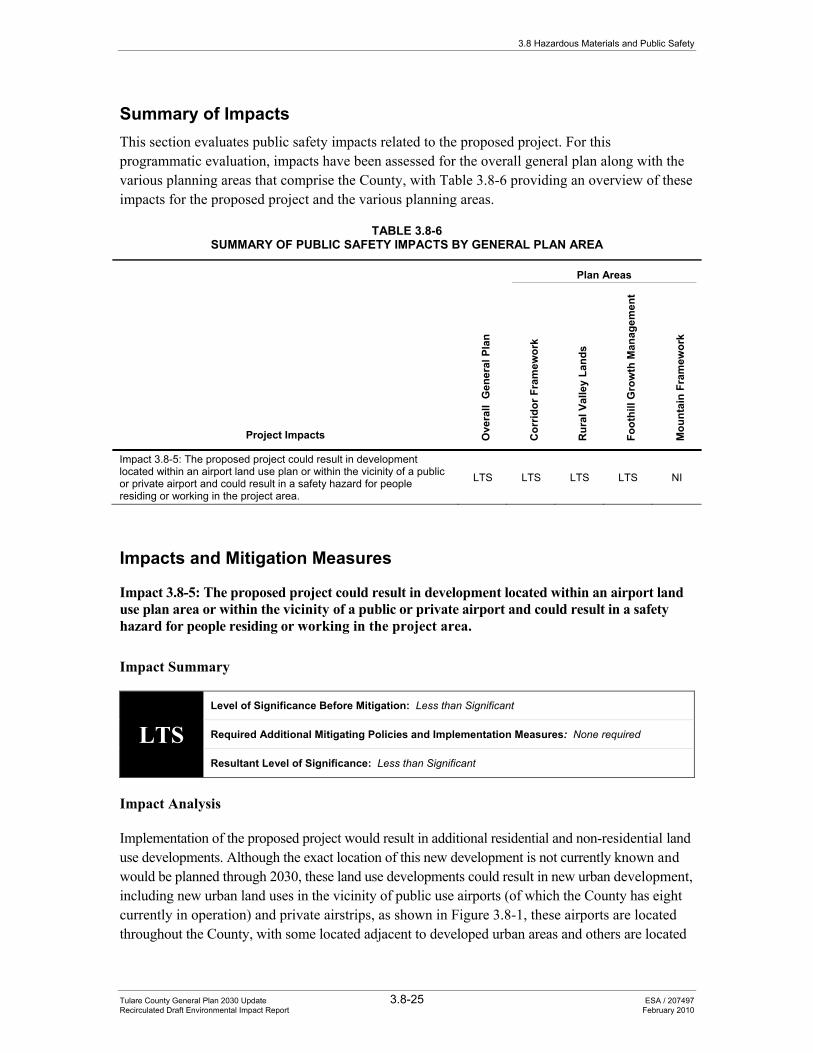
3.8 Hazardous Materials and Public Safety
Tulare County General Plan 2030 Update 3.8-25 ESA / 207497 Recirculated Draft Environmental Impact Report February 2010
Summary of Impacts This section evaluates public safety impacts related to the proposed project. For this programmatic evaluation, impacts have been assessed for the overall general plan along with the various planning areas that comprise the County, with Table 3.8-6 providing an overview of these impacts for the proposed project and the various planning areas.
TABLE 3.8-6 SUMMARY OF PUBLIC SAFETY IMPACTS BY GENERAL PLAN AREA
Project Impacts Ove
rall
Gen
eral
Pla
n
Plan Areas
Cor
ridor
Fra
mew
ork
Rur
al V
alle
y La
nds
Foot
hill
Gro
wth
Man
agem
ent
Mou
ntai
n Fr
amew
ork
Impact 3.8-5: The proposed project could result in development located within an airport land use plan or within the vicinity of a public or private airport and could result in a safety hazard for people residing or working in the project area.
LTS LTS LTS LTS NI
Impacts and Mitigation Measures
Impact 3.8-5: The proposed project could result in development located within an airport land use plan area or within the vicinity of a public or private airport and could result in a safety hazard for people residing or working in the project area.
Impact Summary
LTS Level of Significance Before Mitigation: Less than Significant
Required Additional Mitigating Policies and Implementation Measures: None required
Resultant Level of Significance: Less than Significant
Impact Analysis
Implementation of the proposed project would result in additional residential and non-residential land use developments. Although the exact location of this new development is not currently known and would be planned through 2030, these land use developments could result in new urban development, including new urban land uses in the vicinity of public use airports (of which the County has eight currently in operation) and private airstrips, as shown in Figure 3.8-1, these airports are located throughout the County, with some located adjacent to developed urban areas and others are located
Tulare County General Plan 2030 Update
Tulare County General Plan 2030 Update 3.8-26 ESA / 207497 Recirculated Draft Environmental Impact Report February 2010
in more rural areas. It can also be assumed that a number of small, private airstrips primarily used for agriculture-related uses are located in rural areas of the County. A majority of the development that would occur subsequent to approval of the proposed project would generally be located within the future growth areas (i.e., CACUDBs, HDBs, and CACUABs). As shown in Figure 3.8-1, airports that are located adjacent to or within cities and communities within the County include Alta (closed), Visalia Municipal, Woodlake Municipal, Thunderhawk Field, Tulare Municipal, Eckert Field, Porterville Municipal, and Harmon Field (closed). New development near aviation facilities, particularly multi-story structures, large concentrations of people, or developments with aerial features such as antennas, could create hazards to aviation. Conversely, location of new development near aviation facilities, including private airstrips, could result in safety hazards to people living and working nearby from the potentially severe consequences of aircraft accidents.
The Airport Land Use Commission (ALUC) was established to ensure that there are no direct conflicts with land uses, noise, or other issues that would impact the functionality and safety of airport operations. One of the key functions of the ALUC is to review cities’ and counties’ general plans and zoning ordinances for consistency with the Comprehensive Airport Land Use Plans (CALUPs), which contain noise contours, restrictions for types of construction and building heights in navigable air space, as well as requirements impacting the establishment or construction of sensitive uses within close proximity to airports.
Overall, the intent of the proposed project is to ensure that existing and future land uses function without imposing a nuisance, hazard, or unhealthy condition upon adjacent uses. Policies included as part of the proposed project that would minimize conflicts with public use airports are summarized below. The Land Use Element provides a number of policies that establish requirements for compatible development; including buffering; screening, controls and performance standards, and the siting of compatible land uses (see Policies LU-1.3, LU-3.6, LU-5.4, and LU-6.2). Other policies from the Transportation & Circulation and Health & Safety Elements (see Policies TC-3.4, TC-3.6, HS-3.1, HS-3.2, and HS-8.4) require the County to ensure that all development within the vicinity of local airport facilities is consistent with the policies adopted by the Tulare County Airport Land Use Commission and the most recently adopted Comprehensive Airport Land Use Plan. With implementation of the below mentioned policies, this impact is considered less than significant.
MITIGATING POLICIES AND IMPLEMENTATION MEASURES
Land Use Element
Policies designed to promote compatible land use development and patterns that minimize impacts to surrounding land uses (including open space uses) include the following:
LU-1.3 Prevent Incompatible Uses LU-3.6 Project Design LU-5.4 Compatibility with Surrounding Land Use LU-6.2 Buffers
Transportation & Circulation Element Health & Safety Element
Policies designed to promote development compatible with local airport land use compatibility plans, include the following:
TC-3.4 Airport Compatibility TC-3.6 Airport Encroachment
HS-3.1 Airport Land Use Compatibility Plan HS-3.2 Compliance with FAA Regulations HS-8.4 Airport Noise Contours
3.8 Hazardous Materials and Public Safety
Tulare County General Plan 2030 Update 3.8-27 ESA / 207497 Recirculated Draft Environmental Impact Report February 2010
Required Additional Mitigating Policies and Implementation Measures
As stated above, the County will implement a number of policies designed to minimize airport-related hazards or nuisances. In addition, the County will ensure that future CEQA documentation be prepared for individual projects (with project-specific data) that will (if technically possible) mitigate any potential airport-related safety impacts to a less than significant level. This impact is considered less than significant. No additional mitigation measures are required.
Significance after Implementation of Mitigation for Impact 3.8-5
A number of policies referenced above in the impact analysis and included in the proposed project were specifically designed to minimize impacts to airport-related safety impacts. With implementation of the above mentioned policies, this impact is considered less than significant.
Urban and Wildland Fire Hazards The following section describes urban fire hazards, wildland fire hazards, fire prevention measures, and construction standards in Tulare County. Issues associated with the provision of fire protection services are addressed in Section 3.9 “Public Services, Recreation and Utilities.”
The following environmental and regulatory settings were developed from information contained in the 2010 Background Report (see Chapter 8.0 “Safety”), incorporated by reference and summarized below. This document is provided as Appendix B of this RDEIR.
Regulatory Setting The following section includes a brief overview of State and local regulations that address urban and wildland fire hazards. There are no applicable federal regulations for urban and wildland fire hazards.
State Regulations
Public Resources Code Section 4290 Public Resources Code (PRC) Section 4290 sets minimum fire safety standards for development in State Responsibility Areas. These minimum fire safety standards identify:
• Road standards for fire equipment access. • Standards for signs identifying streets, roads, and buildings. • Minimum private water supply reserves for emergency fire use. • Standards for fuel breaks and greenbelts.
Tulare County General Plan 2030 Update
Tulare County General Plan 2030 Update 3.8-28 ESA / 207497 Recirculated Draft Environmental Impact Report February 2010
Local Regulations
Fire Construction Standards Tulare County established the Fire-Safe Regulations and Road Standards (Ordinance No. 542), which address requirements for signage and building addresses, zoning, water, parcel map, the subdivision ordinance, and road standards to comply with the Public Resources Code Section 4290. The ordinance includes the following requirements, which are implemented by the County Resource Management Agency and the Tulare County Fire Department during plan review of new projects:
• Emergency access shall be ensured by minimum 18-foot road widths with surfaces accommodating conventional vehicles and 40,000-pound loads, grades not exceeding 16 percent, curve radii of at least 50 feet, dead ends meeting maximum length requirements with turnouts and turnarounds, and roadway structures and gate entrances that do not obstruct clear passage of authorized vehicles.
• Signing and building numbering shall facilitate locating a fire and avoiding delays in response time by being sufficiently visible, nonduplicative, and indicative of location and any traffic access limitations.
• Emergency water sources shall be available and accessible in adequate quantities to combat wildfire with labeled hydrants meeting uniform specifications.
• Fuel modification shall be practiced to reduce the intensity of a wildfire by reducing the volume and density of flammable vegetation adjacent to structures and in the general vicinity of development.
The County also amended the Tulare County Zoning Ordinance (TC Ordinance No. 352) by Ordinance No. 2982 effective January 2, 1992, adding Section 2 to address fire safety road requirements in State Responsibility Areas.
Environmental Setting Both urban and wildland fire hazards exist in Tulare County, creating the potential for injury, loss of life, and property damage. Urban fires primarily involve the uncontrolled burning of residential, commercial, or industrial structures due to human activities. Wildland fires affect grass, forest, and brushlands, as well as any structures on these lands. Such fires can result from either human-made or natural causes. The type and amount of fuel, topography, and climate are the primary factors influencing the degree of fire risk. Vegetation fires comprised the majority of fires in Tulare County according to the California Department of Forestry and Fire Protection (CDF). Most of the fires are caused by human activities involving motor vehicles and equipment, arson, and debris burning.
Urban Fire Hazards Urban fires primarily involve the uncontrolled burning of residential, commercial, and industrial structures due to human-made causes. Factors that exacerbate urban structural fires include substandard building construction, highly flammable materials, delay in response time, and inadequate fire protection services.
3.8 Hazardous Materials and Public Safety
Tulare County General Plan 2030 Update 3.8-29 ESA / 207497 Recirculated Draft Environmental Impact Report February 2010
The Tulare County Fire Department currently reviews development plans and building permits for compliance with the Uniform Building Code. Until recently, minimal enforcement of structural fire codes (for example, building codes requiring interior sprinkler systems and fire-safe building materials) has taken place. As a result, many of the structures in Tulare County that were built prior to 1987 may be substandard in terms of fire safety. There is not an existing program for retrofitting such structures (with the exception of those structures that legally require inspection, such as institutional buildings).
Wildland Fire Hazards Throughout California, communities are increasingly concerned about wildfire safety as increased development occurs in the foothills and mountain areas, and subsequent fire control measures have affected the natural cycle of the ecosystem. Suppression of natural fires allows the understory to become dense, creating the potential for larger and more intense wildland fires. Wind, steepness of terrain, and naturally volatile or hot-burning vegetation contribute to wildland fire hazard potential. The threat of wildland fires also increases as the terrain in the County becomes increasingly steep in the foothills and mountains. Where human access exists in wildland areas, such as the Sierra Nevada Mountains and foothills, the risk of fire increases because of a greater chance for human carelessness and historic and current fire management practices. Human activities such as smoking, debris burning, and equipment operation are the major causes of wildland fires.
Although the total number of fires in the oak savannah portions of the lower Sierra foothills may have increased with five-acre lot subdivision activity, the size and duration of fires appears to have been reduced in this area due to firebreaks created by driveways and roads, reduced fuels and “checkerboard” fuel patterns through individual safe area vegetation clearance (Public Resources Code section 4291); increased vigilance fostering early fire reporting; and early intervention (fire suppression) efforts by individuals and fire companies.
On the other hand, the creation of residential parcels in this area has compounded the potential for property damage from fires and has significantly complicated firefighting responsibilities in the area. Wildland firefighting strategies have become similar to municipal firefighting efforts. Foothill and mountain subdivisions have also virtually eliminated prescribed burning as a means of fire suppression.
Fire Hazard Severity According to Fire and Resource Assessment Program (FRAP) Fire Threat data, Fire Threat is a combination of two factors:
1. Fire frequency, or the likelihood of a given area burning, and 2. Potential fire behavior (hazard). These two factors are combined to create the following
threat classes: • Little or No Threat • Moderate • High • Very High • Extreme
Tulare County General Plan 2030 Update
Tulare County General Plan 2030 Update 3.8-30 ESA / 207497 Recirculated Draft Environmental Impact Report February 2010
Within the County, over 1,029,130 acres (33% of the total area) are classified as “Very High” fire threat and approximately 454,680 acres (15% of the total area) are classified as “High” fire threat. The portion of the County that transitions from the valley floor into the foothills and mountains is characterized by high to very high threat of wildland fires. Steeper terrain in these areas increases the threat of wildland fires. These areas are shown on Figure 3.8-2. The western portion of the County has little or no threat of wildland fires (County of Tulare, 2010 Background Report, page 8-20, 2010a).
Impacts and Mitigation Measures
Methodology The assessment of fire hazard impacts is a qualitative review of the existing conditions applicable to the County and a determination of whether the proposed project includes adequate provisions to address the potential impacts associated with local urban and wildland fire hazard conditions.
Significance Criteria The significance criteria for this analysis were developed from criteria presented in Appendix G, “Environmental Checklist Form”, of the CEQA Guidelines and based on the professional judgment of the County of Tulare and its consultants. The proposed project would result in a significant impact if it would:
• Expose people or structures to a significant risk of loss, injury, or death involving wildland fires, including where wildlands are adjacent to urbanized areas or where residences are intermixed with wildlands.
Summary of Impacts This section evaluates wildland fire impacts related to the proposed project. For this programmatic evaluation, impacts have been assessed for the overall general plan along with the various planning areas that comprise the County, with Table 3.8-7 providing an overview of these impacts for the proposed project and the various planning areas. Given the nature of the impacts, it is anticipated that implementation of the proposed project would result in similar impacts to all geographic planning areas of the County.
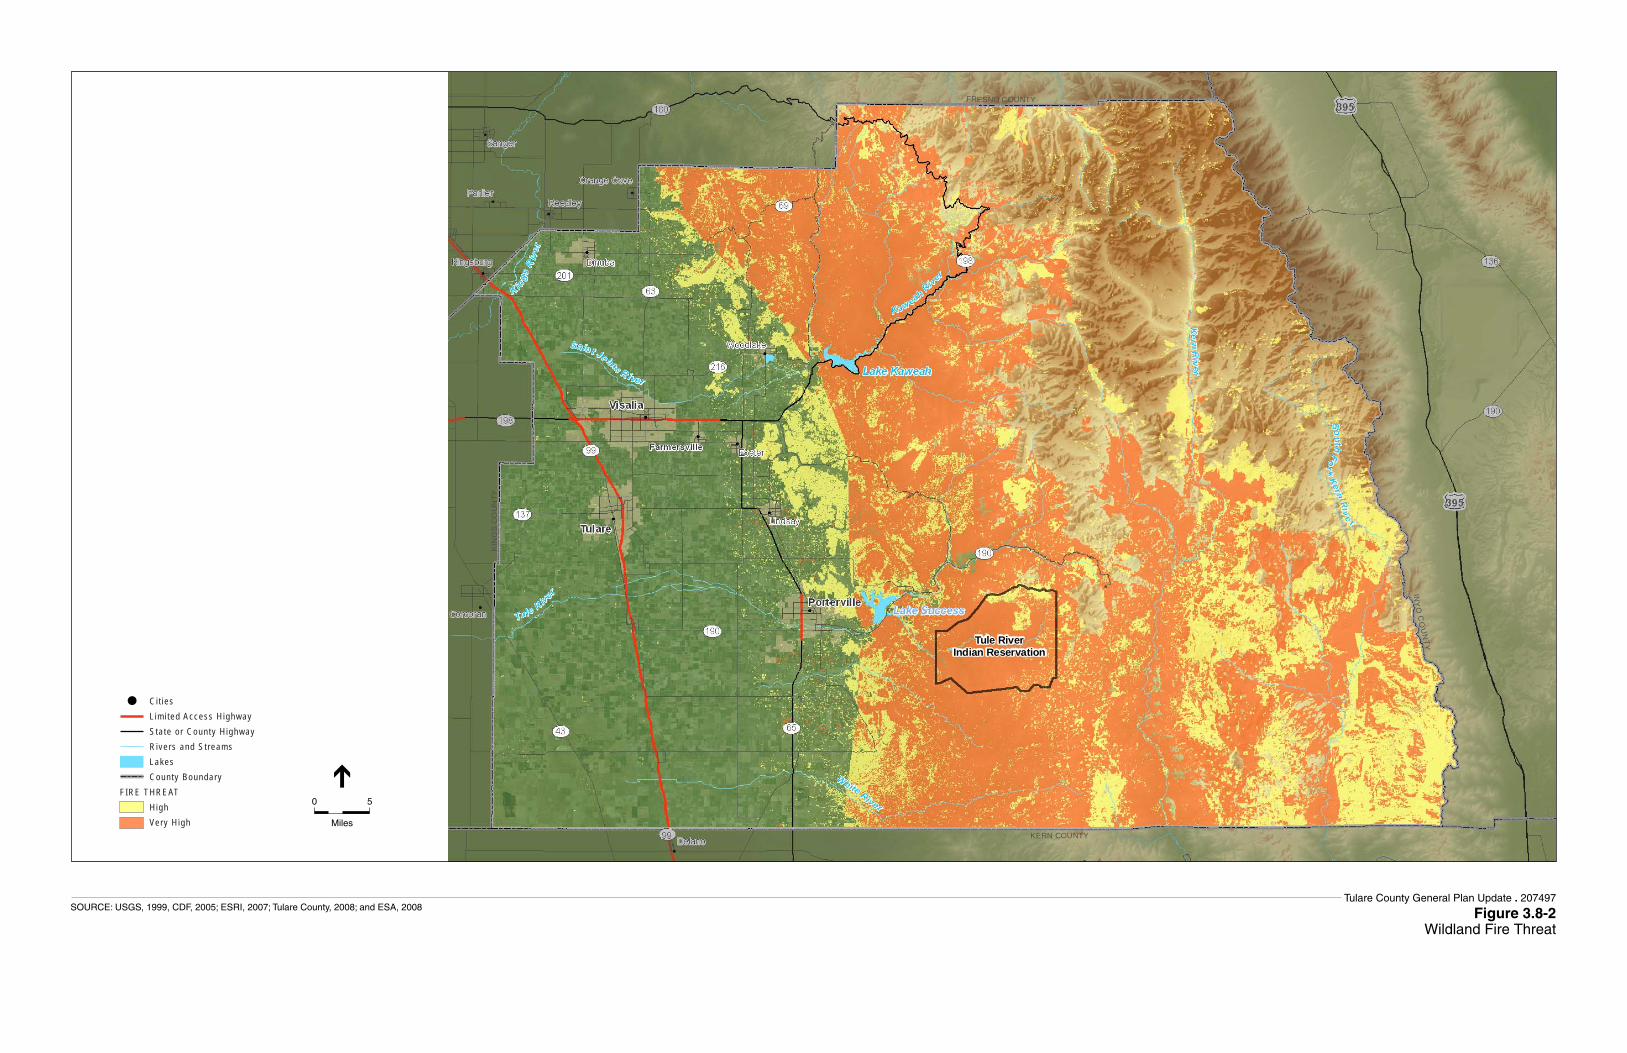
FRESNO COUNTY
INY
OC
OU
NTY
KERN COUNTY
KIN
GS
CO
UN
TY
Tule RiverIndian Reservation
C i t ies L im i ted Access H ighway Sta te o r County H ighway R ivers and St reams Lakes County BoundaryFIRE THREAT H igh Very H igh
0 5
Miles
Tulare County General Plan Update . 207497
Figure 3.8-2Wildland Fire Threat
SOURCE: USGS, 1999, CDF, 2005; ESRI, 2007; Tulare County, 2008; and ESA, 2008

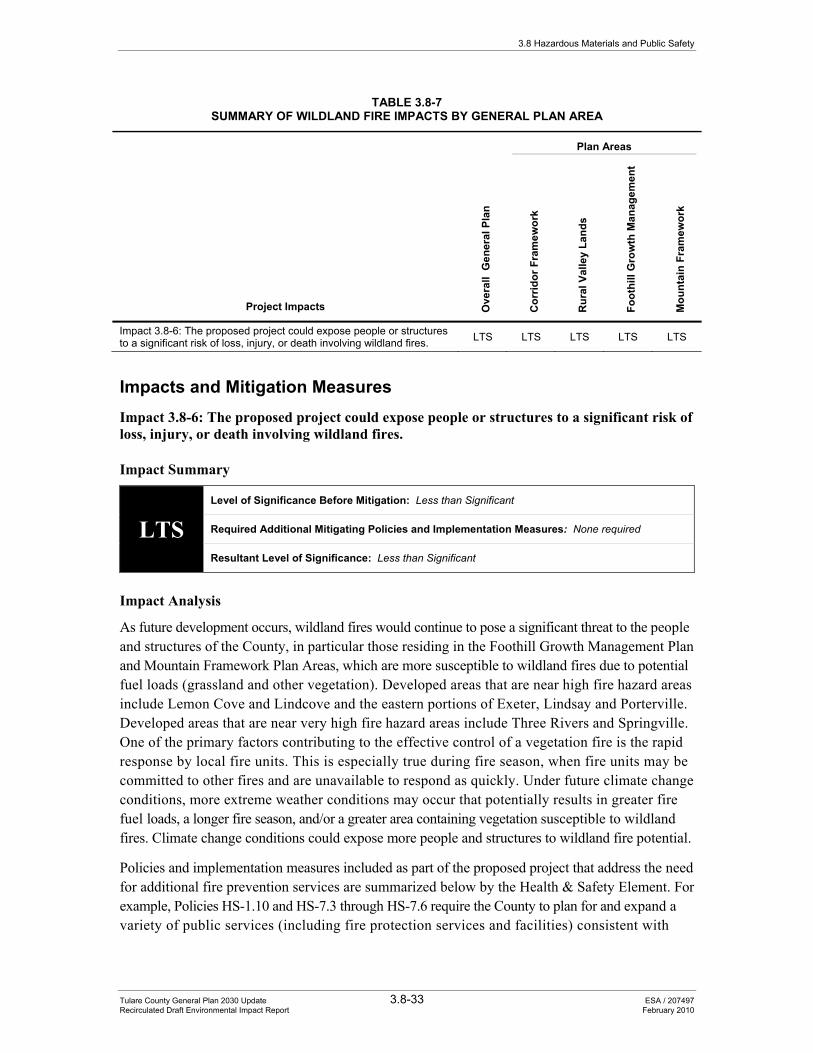
3.8 Hazardous Materials and Public Safety
Tulare County General Plan 2030 Update 3.8-33 ESA / 207497 Recirculated Draft Environmental Impact Report February 2010
TABLE 3.8-7 SUMMARY OF WILDLAND FIRE IMPACTS BY GENERAL PLAN AREA
Project Impacts Ove
rall
Gen
eral
Pla
n
Plan Areas
Cor
ridor
Fra
mew
ork
Rur
al V
alle
y La
nds
Foot
hill
Gro
wth
Man
agem
ent
Mou
ntai
n Fr
amew
ork
Impact 3.8-6: The proposed project could expose people or structures to a significant risk of loss, injury, or death involving wildland fires. LTS LTS LTS LTS LTS
Impacts and Mitigation Measures Impact 3.8-6: The proposed project could expose people or structures to a significant risk of loss, injury, or death involving wildland fires.
Impact Summary
LTS Level of Significance Before Mitigation: Less than Significant
Required Additional Mitigating Policies and Implementation Measures: None required
Resultant Level of Significance: Less than Significant
Impact Analysis
As future development occurs, wildland fires would continue to pose a significant threat to the people and structures of the County, in particular those residing in the Foothill Growth Management Plan and Mountain Framework Plan Areas, which are more susceptible to wildland fires due to potential fuel loads (grassland and other vegetation). Developed areas that are near high fire hazard areas include Lemon Cove and Lindcove and the eastern portions of Exeter, Lindsay and Porterville. Developed areas that are near very high fire hazard areas include Three Rivers and Springville. One of the primary factors contributing to the effective control of a vegetation fire is the rapid response by local fire units. This is especially true during fire season, when fire units may be committed to other fires and are unavailable to respond as quickly. Under future climate change conditions, more extreme weather conditions may occur that potentially results in greater fire fuel loads, a longer fire season, and/or a greater area containing vegetation susceptible to wildland fires. Climate change conditions could expose more people and structures to wildland fire potential.
Policies and implementation measures included as part of the proposed project that address the need for additional fire prevention services are summarized below by the Health & Safety Element. For example, Policies HS-1.10 and HS-7.3 through HS-7.6 require the County to plan for and expand a variety of public services (including fire protection services and facilities) consistent with
Tulare County General Plan 2030 Update
Tulare County General Plan 2030 Update 3.8-34 ESA / 207497 Recirculated Draft Environmental Impact Report February 2010
community needs. Policy PFS-7.5 indicates the County shall strive to maintain fire department staffing and response time goals consistent with National Fire Protection Association (NFPA) standards. Policies HS-6.14, HS-7.1, HS-7.2, HS-7.7 and PFS-7.4 promote the implementation of a coordinated emergency response plan both locally and regionally. Policies HS-1.4, HS-6.1, HS-6.5 through HS-6.12, FGMP-10.2, FGMP-10.3, and Public Facilities & Services Implementation Measure #12 provide requirements regarding fire safety and building standards for new development. Policy HS-1.12 directs the County to expand home addressing requirements for emergency service response. Policy HS-6.13 directs the County to support the restoration of disturbed land resulting from wildfires and HS-6.15 provides direction on reducing fuel related hazards. Additionally, policy PFS-1.3 and Public Facilities & Services Implementation Measures #1, #2, and #3 provide for the funding mechanism to provide additional or expanded services in conjunction with new development. With implementation of the below mentioned policies and implementation measures, this impact is considered less than significant.
MITIGATING POLICIES AND IMPLEMENTATION MEASURES
Health & Safety Element Planning Framework, Public Facilities & Services Elements and Foothill Growth Management Plan
Policies and implementation measures designed to minimize this impact through the continued provision of fire protection services and emergency response planning include the following:
HS-1.4 Building and Codes HS-1.5 Hazard Awareness and Public Education HS-1.6 Public Safety Programs HS-1.8 Response Times Planning in GIS HS-1.9 Emergency Access HS-1.10 Emergency Services Near Assisted Living
Housing HS-1.12 Addressing HS-6.1 New Building Fire Hazards HS-6.2 Development in Fire Hazard Zones HS-6.3 Consultation with Fire Service Districts HS-6.4 Encourage Cluster Development HS-6.5 Fire Risk Recommendations HS-6.6 Wildland Fire Management Plans HS-6.7 Water Supply System HS-6.8 Private Water Supply HS-6.9 Fuel Modification Programs HS-6.10 Fuel Breaks HS-6.11 Fire Buffers HS-6.12 Weed Abatement HS-6.13 Restoration of Disturbed Lands HS-6.14 Coordination with Cities HS-6.15 Coordination of Fuel Hazards on Public Lands HS-7.1 Coordinate Emergency Response Services
with Government Agencies HS-7.2 Mutual Aid Agreement HS-7.3 Maintain Emergency Evacuation Plans HS-7.4 Upgrading for Streets and Highways HS-7.5 Emergency Centers HS-7.6 Search and Rescue HS-7.7 Joint Exercises HS Implementation Measure #15 HS Implementation Measures #16
PF-5.2 Criteria for New Towns (Planned Communities) PFS-1.3 Impact Mitigation PFS-2.1 Water Supply PFS-7.1 Fire Protection PFS-7.2 Fire Protection Standards PFS-7.3 Visible Signage for Roads and Buildings PFS-7.4 Interagency Fire Protection Cooperation PFS-7.5 Fire Staffing and Response Time Standards PFS-7.6 Provision of Station Facilities and Equipment PFS-7.7 Cost Sharing PFS-7.11 Locations of Fire and Sheriff Stations/Sub-
stations FGMP-10.2 Provision of Safety Services FGMP-10.3 Fire and Crime Protection Plan
Public Facilities & Services Element
Public Facilities and Services Implementation Measures designed to ensure funding for County services to provide adequate service levels include the following:
3.8 Hazardous Materials and Public Safety
Tulare County General Plan 2030 Update 3.8-35 ESA / 207497 Recirculated Draft Environmental Impact Report February 2010
Health & Safety Element Planning Framework, Public Facilities & Services Elements and Foothill Growth Management Plan
Policies and implementation measures designed to minimize this impact through the continued provision of fire protection services and emergency response planning include the following:
Public Facilities & Services Implementation Measure #1 Public Facilities & Services Implementation Measure #2 Public Facilities & Services Implementation Measure #3 Public Facilities & Services Implementation Measure #12
Required Additional Mitigating Policies and Implementation Measures
As stated above, the County will implement a variety of policies designed to address fire hazards and minimize exposure of people and structures to fire hazards. In addition, the County will ensure that future CEQA documentation be prepared for individual projects (with project-specific data) that will (if technically possible) mitigate any potential impacts associated with fire hazards to a less than significant level. This impact is considered less than significant. No mitigation is required.
Significance after Implementation of Mitigation for Impact 3.8-6
A number of policies referenced above in the impact analysis and included in the proposed project were specifically designed to minimize impacts associated with fire hazards. With implementation of the above mentioned policies, this impact is considered less than significant.

Tulare County General Plan 2030 Update 3.9-1 ESA / 207497 Recirculated Draft Environmental Impact Report February 2010
SECTION 3.9 Public Services, Recreation Resources and Utilities
Introduction This section of the recirculated draft Environmental Impact Report (RDEIR) addresses potential impacts to public services, recreation, and utilities within Tulare County. The regulatory setting provides a description of applicable federal, State, and local regulations and policies. The environmental setting provides a description of wastewater, water supply and delivery, electricity, and natural gas utilities; service systems for solid waste disposal; police, fire, and emergency response services; and recreation facilities in the County. A description of the potential impacts of the proposed project is also provided and includes the identification of feasible mitigation (general plan policies) to avoid or lessen the impacts.
As previously described, the broader topic of water resources (including water quality, regional hydrology, and flooding issues) is more fully described in Section 3.6 “Hydrology, Water Quality, and Drainage”. Additionally, the closely-related topic associated with energy resources is addressed in Section 3.4 “Energy and Global Climate Change” of this RDEIR.
The following environmental and regulatory settings were developed from information contained in the 2010 Background Report (see Chapter 7.0 “Public Services and Utilities”), incorporated by reference and summarized below. This document is provided as Appendix B of this RDEIR.
Characteristics of Water and Wastewater The following evaluation of water supplies and wastewater treatment services is largely based upon A Phase I Water Supply Evaluation prepared by Tully and Young (hereinafter referred to as “Tully and Young, 2009”), included in its entirety in Appendix G of this RDEIR. Earlier information was developed from information presented in the “Water Resources General Plan Update County of Tulare”, prepared by Keller, Wegley & Associates in 2006 (hereinafter referred to as “Keller Wegley, 2006”) and included in the 2010 Background Report. The 2010 Background Report is included in this RDEIR as Appendix B.
During 2006 and 2007, Omni Means Engineers evaluated domestic water and wastewater service districts serving Tulare County and this information is included in the 2010 Background Report. Much of this detailed information on service capabilities was updated and incorporated into County of Tulare Local Agency Formation Commission (LAFCo) adopted Municipal Service
Tulare County General Plan 2030 Update
Tulare County General Plan 2030 Update 3.9-2 ESA / 207497 Recirculated Draft Environmental Impact Report February 2010
Reviews (hereinafter referred to as MSRs; Omni Means Engineers, 2006a, 2006b and 2007). Other data sources are referenced in the text below. These reviews are available upon request from the Tulare LAFCo or the Tulare County Resource Management Agency.
Water in California is managed by a complex system of federal, state, and local regulations. Oversight of these regulations is conducted by a similarly complex network of federal, state and local agencies. As previously described, Section 3.6, “Hydrology, Water Quality and Drainage” of this RDEIR provides additional information regarding the County’s broader hydrologic setting, including supportive information pertaining to water, wastewater, flood protection and the provisions of SB 610 and SB 221, which contain water supply requirements for new development. To provide the reader with a complete set of these regulatory policies and regulations, the reader is directed to Section 3.6. Information on how these regulations will be put into practice in coordination with implementation of the proposed General Plan is also provided, along with a description of the units of measurement used to describe water and wastewater issues.
Water and Wastewater - Environmental Setting
Existing Water Demand Existing water demand conditions were estimated based upon planning data available from the California Department of Water Resources (DWR). DWR subdivides California into geographical study areas for planning purposes. Existing Tulare County water demand conditions were calculated based on water demand data provided by DWR (summarized below) at the finest level of detail available – the Detailed Analysis Unit (DAU).
The DAUs included in this water demand analysis are: Alta, Consolidated, Deer Creek, Kaweah Delta, Kaweah River, Kaweah-Tule Interstream, Kings River, Kings-Kaweah Interstream, Northeastern Kern, Orange Cove, Poso Creek, Tulare Lake, Tule Delta, Tule River, and Upper Kern River (see Figure 3.9-1). Where some DAUs straddle the Tulare County line, only the portion of the DAU inside the county boundary was considered for purposes of the water demand analysis.
Based upon water demand data developed by DWR for the 2009 Water Plan Update, existing water demand in Tulare County is assumed to be similar to the annual demand for 2003 represented in water budgets developed by DWR for the aforementioned DAUs. For the 2009 Water Plan Update, DWR is using Water Years 1999, 2002 and 2003 to represent water demands under various hydrologic conditions. Compared to 1999 and 2002, 2003 was an average water year in the Tulare Lake Hydrologic Region and thus, assumed to be ‘average’ within Tulare County. This was determined by reviewing average historic precipitation in the City of Visalia – and comparing the average precipitation with the precipitation in 1999, 2002 and 2003. Average precipitation in Visalia is approximately 11 inches per year. In 2003, the precipitation measured at Visalia, California was close to 7.5 inches.1 Notably, while not approaching the average, 2002 was considerably drier (than 2003), while 1999 saw slightly more precipitation (than 2003) (Tully and Young, page 2, 2009).
1 California Irrigation Management Information System (CIMIS) indicates that precipitation was 5.69 in. and 8.11 in. in 2002 and 1999 respectively (Tully and Young, page 2, 2009).
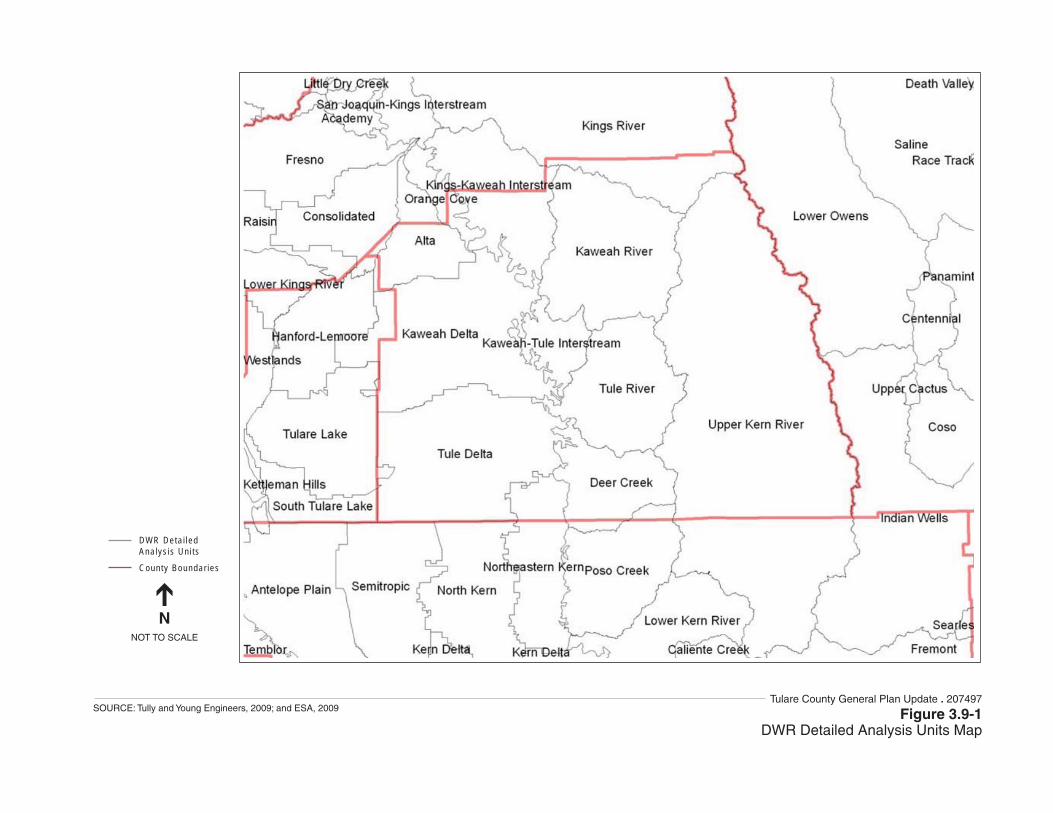
DWR Deta i ledAna lys is Un i ts
County Boundar ies
NNOT TO SCALE
Figure 3.9-1DWR Detailed Analysis Units Map
SOURCE: Tully and Young Engineers, 2009; and ESA, 2009Tulare County General Plan Update . 207497
Tulare County General Plan 2030 Update
Tulare County General Plan 2030 Update 3.9-4 ESA / 207497 Recirculated Draft Environmental Impact Report February 2010
Another indication that 2003 was an average year compared to 1999 and 2002 is that CVP deliveries to the Friant-Kern Canal contractors were significantly greater than in 2002, and still slightly less than in 1999.2 While 1999 and 2003 showed similarities in terms of precipitation and CVP deliveries, because 2003 is more current data, it was selected as the most representative of existing demands.
For each DAU, DWR calculates Agricultural, Urban and Environmental demands. Within the Agricultural demand category, DWR calculates applied water demands for both crop production and conveyance purposes. For the Urban demand category, DWR subdivides applied water demands by Large Landscape, Commercial, Industrial, Energy Production, Residential – Interior, and Residential – Exterior land-use categories. DWR also estimates applied water demands in the “Urban” demand category for both conveyance and groundwater recharge. The Environmental demands are divided into Instream, Wild and Scenic, Required Delta Outflow, and Managed Wetlands categories. For purposes of this analysis, only the Managed Wetlands demand component will be estimated because it is the only “Environmental” demand category directly related to Tulare County land uses.
Existing water demands are presented by DAU in Table 3.9-1. For 2003, total applied water demand for the Agricultural, Urban and Environmental demand components described above, was 2,702,100 acre-feet. Notably, 97 percent of total demand was in the three DAUs with the majority of the high quality agricultural land – Alta, Kaweah Delta and Tule Delta. Also, 97 percent of “Urban” demand is within the same three DAUs, as the largest communities in Tulare County are located in and around the prime agricultural land.
Not only are the demands in these three DAUs important for the existing demand calculation but these same DAUs are important for the future condition demand analysis because the incorporated cities, communities and hamlets Tulare County has identified as potential urban growth areas are located on the valley floor in proximity to the productive agricultural lands.
As explained in the discussion of future water demand, below, a portion of the existing irrigated agricultural lands in these areas are assumed to be taken out of production and replaced with urban uses. Therefore, the future water demand analysis will focus on the change in land uses in and around these areas.
Future Water Demand Currently, all land in designated community Urban Development Boundaries and hamlet development boundaries, as well as the land in the Urban Development Boundary of each incorporated city is under Tulare County land-use jurisdiction. The future water demand condition assumes that Tulare County retains land-use jurisdiction over all communities and hamlets, as well as development within the City Urban Development Boundary. Assuming that the County retains land-use jurisdiction, even if not ultimately the situation, the future demand estimate reflects the most conservative (highest) representation of the potential water resources impacts related to the land-use planning decisions by Tulare County.
2 Friant-Kern Canal deliveries were 1,091,241 AF, 770,071 AF, and 1,022,012 AF in 1999, 2002, and 2003 respectively.
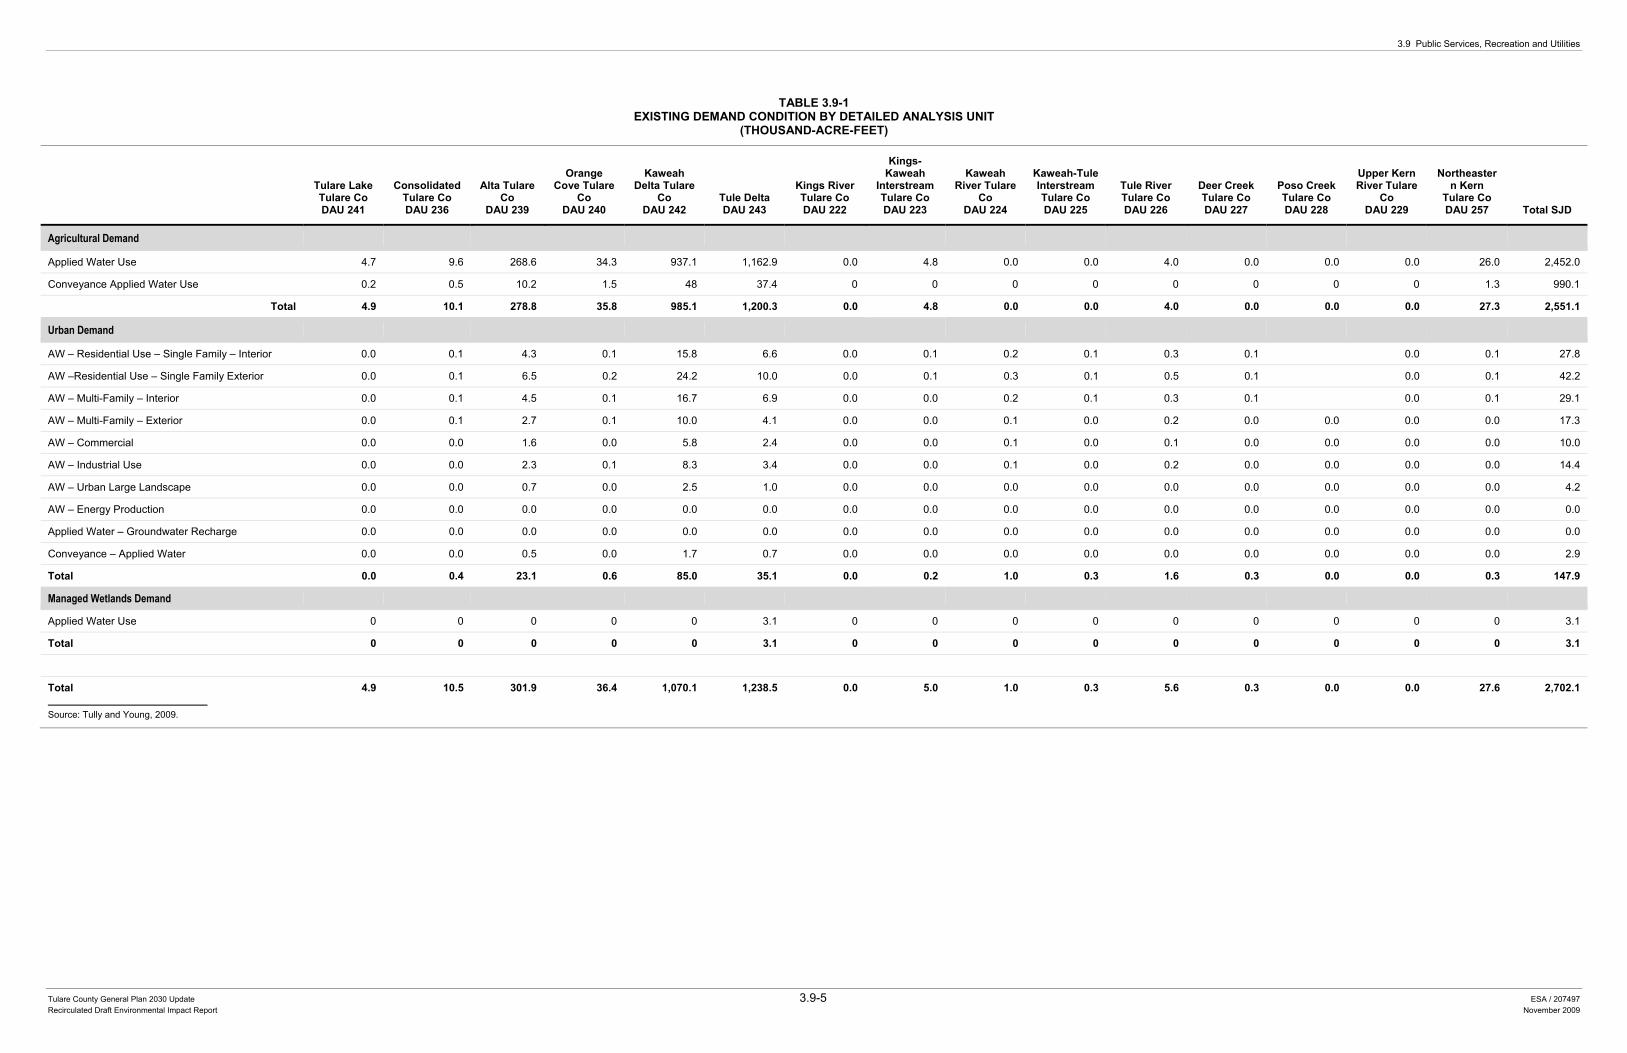
3.9 Public Services, Recreation and Utilities
Tulare County General Plan 2030 Update 3.9-5 ESA / 207497 Recirculated Draft Environmental Impact Report November 2009
TABLE 3.9-1EXISTING DEMAND CONDITION BY DETAILED ANALYSIS UNIT
(THOUSAND-ACRE-FEET)
Tulare Lake Tulare Co DAU 241
Consolidated Tulare Co DAU 236
Alta Tulare Co
DAU 239
Orange Cove Tulare
Co DAU 240
Kaweah Delta Tulare
Co DAU 242
Tule Delta DAU 243
Kings River Tulare Co DAU 222
Kings-Kaweah
Interstream Tulare Co DAU 223
Kaweah River Tulare
Co DAU 224
Kaweah-Tule Interstream Tulare Co DAU 225
Tule River Tulare Co DAU 226
Deer Creek Tulare Co DAU 227
Poso Creek Tulare Co DAU 228
Upper Kern River Tulare
Co DAU 229
Northeastern Kern
Tulare Co DAU 257 Total SJD
Agricultural Demand Applied Water Use 4.7 9.6 268.6 34.3 937.1 1,162.9 0.0 4.8 0.0 0.0 4.0 0.0 0.0 0.0 26.0 2,452.0
Conveyance Applied Water Use 0.2 0.5 10.2 1.5 48 37.4 0 0 0 0 0 0 0 0 1.3 990.1
Total 4.9 10.1 278.8 35.8 985.1 1,200.3 0.0 4.8 0.0 0.0 4.0 0.0 0.0 0.0 27.3 2,551.1
Urban Demand AW – Residential Use – Single Family – Interior 0.0 0.1 4.3 0.1 15.8 6.6 0.0 0.1 0.2 0.1 0.3 0.1 0.0 0.1 27.8
AW –Residential Use – Single Family Exterior 0.0 0.1 6.5 0.2 24.2 10.0 0.0 0.1 0.3 0.1 0.5 0.1 0.0 0.1 42.2
AW – Multi-Family – Interior 0.0 0.1 4.5 0.1 16.7 6.9 0.0 0.0 0.2 0.1 0.3 0.1 0.0 0.1 29.1
AW – Multi-Family – Exterior 0.0 0.1 2.7 0.1 10.0 4.1 0.0 0.0 0.1 0.0 0.2 0.0 0.0 0.0 0.0 17.3
AW – Commercial 0.0 0.0 1.6 0.0 5.8 2.4 0.0 0.0 0.1 0.0 0.1 0.0 0.0 0.0 0.0 10.0
AW – Industrial Use 0.0 0.0 2.3 0.1 8.3 3.4 0.0 0.0 0.1 0.0 0.2 0.0 0.0 0.0 0.0 14.4
AW – Urban Large Landscape 0.0 0.0 0.7 0.0 2.5 1.0 0.0 0.0 0.0 0.0 0.0 0.0 0.0 0.0 0.0 4.2
AW – Energy Production 0.0 0.0 0.0 0.0 0.0 0.0 0.0 0.0 0.0 0.0 0.0 0.0 0.0 0.0 0.0 0.0
Applied Water – Groundwater Recharge 0.0 0.0 0.0 0.0 0.0 0.0 0.0 0.0 0.0 0.0 0.0 0.0 0.0 0.0 0.0 0.0
Conveyance – Applied Water 0.0 0.0 0.5 0.0 1.7 0.7 0.0 0.0 0.0 0.0 0.0 0.0 0.0 0.0 0.0 2.9
Total 0.0 0.4 23.1 0.6 85.0 35.1 0.0 0.2 1.0 0.3 1.6 0.3 0.0 0.0 0.3 147.9
Managed Wetlands Demand
Applied Water Use 0 0 0 0 0 3.1 0 0 0 0 0 0 0 0 0 3.1
Total 0 0 0 0 0 3.1 0 0 0 0 0 0 0 0 0 3.1
Total 4.9 10.5 301.9 36.4 1,070.1 1,238.5 0.0 5.0 1.0 0.3 5.6 0.3 0.0 0.0 27.6 2,702.1
Source: Tully and Young, 2009.

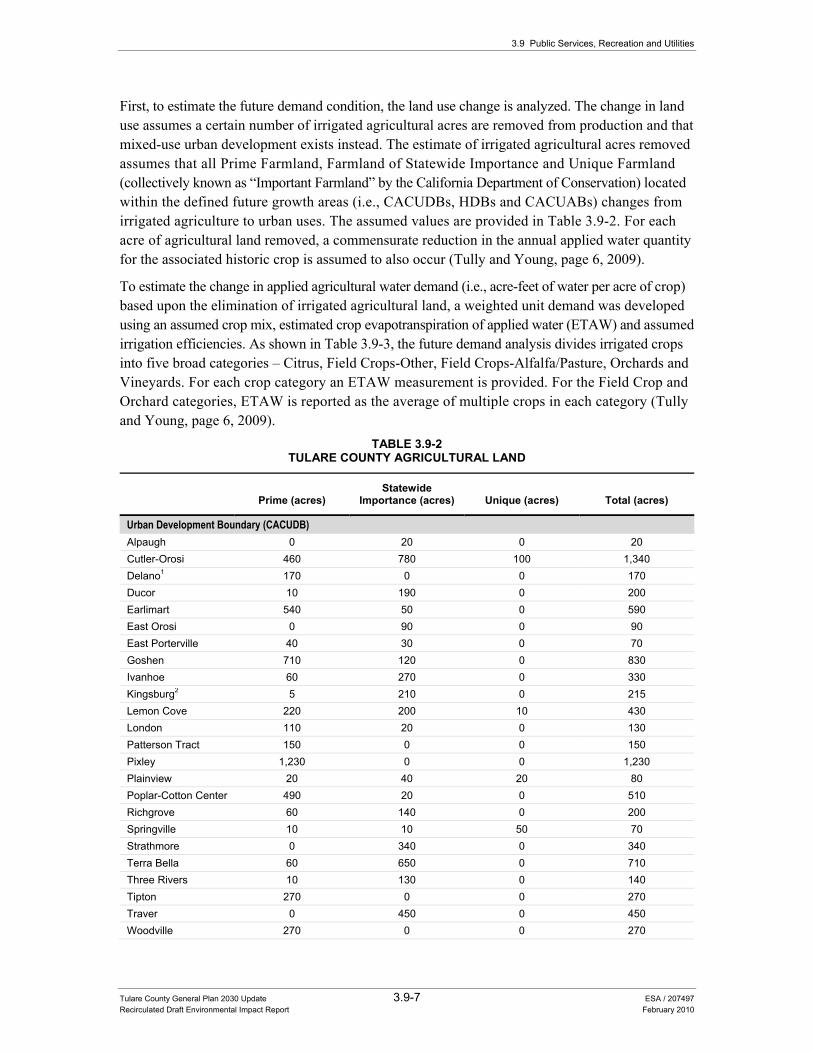
3.9 Public Services, Recreation and Utilities
Tulare County General Plan 2030 Update 3.9-7 ESA / 207497 Recirculated Draft Environmental Impact Report February 2010
First, to estimate the future demand condition, the land use change is analyzed. The change in land use assumes a certain number of irrigated agricultural acres are removed from production and that mixed-use urban development exists instead. The estimate of irrigated agricultural acres removed assumes that all Prime Farmland, Farmland of Statewide Importance and Unique Farmland (collectively known as “Important Farmland” by the California Department of Conservation) located within the defined future growth areas (i.e., CACUDBs, HDBs and CACUABs) changes from irrigated agriculture to urban uses. The assumed values are provided in Table 3.9-2. For each acre of agricultural land removed, a commensurate reduction in the annual applied water quantity for the associated historic crop is assumed to also occur (Tully and Young, page 6, 2009).
To estimate the change in applied agricultural water demand (i.e., acre-feet of water per acre of crop) based upon the elimination of irrigated agricultural land, a weighted unit demand was developed using an assumed crop mix, estimated crop evapotranspiration of applied water (ETAW) and assumed irrigation efficiencies. As shown in Table 3.9-3, the future demand analysis divides irrigated crops into five broad categories – Citrus, Field Crops-Other, Field Crops-Alfalfa/Pasture, Orchards and Vineyards. For each crop category an ETAW measurement is provided. For the Field Crop and Orchard categories, ETAW is reported as the average of multiple crops in each category (Tully and Young, page 6, 2009).
TABLE 3.9-2TULARE COUNTY AGRICULTURAL LAND
Prime (acres) Statewide
Importance (acres) Unique (acres) Total (acres)
Urban Development Boundary (CACUDB) Alpaugh 0 20 0 20 Cutler-Orosi 460 780 100 1,340 Delano1 170 0 0 170 Ducor 10 190 0 200 Earlimart 540 50 0 590 East Orosi 0 90 0 90 East Porterville 40 30 0 70 Goshen 710 120 0 830 Ivanhoe 60 270 0 330 Kingsburg2 5 210 0 215 Lemon Cove 220 200 10 430 London 110 20 0 130 Patterson Tract 150 0 0 150 Pixley 1,230 0 0 1,230 Plainview 20 40 20 80 Poplar-Cotton Center 490 20 0 510 Richgrove 60 140 0 200 Springville 10 10 50 70 Strathmore 0 340 0 340 Terra Bella 60 650 0 710 Three Rivers 10 130 0 140 Tipton 270 0 0 270 Traver 0 450 0 450 Woodville 270 0 0 270
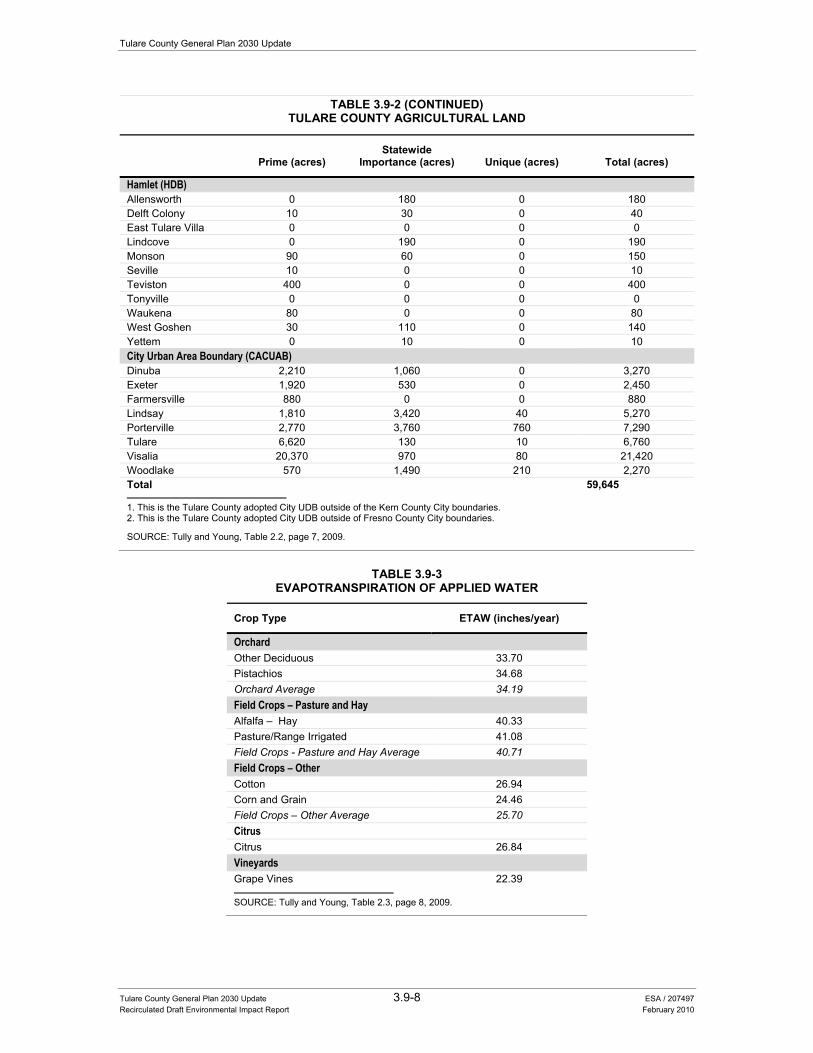
Tulare County General Plan 2030 Update
Tulare County General Plan 2030 Update 3.9-8 ESA / 207497 Recirculated Draft Environmental Impact Report February 2010
TABLE 3.9-2 (CONTINUED)TULARE COUNTY AGRICULTURAL LAND
Prime (acres) Statewide
Importance (acres) Unique (acres) Total (acres)
Hamlet (HDB) Allensworth 0 180 0 180 Delft Colony 10 30 0 40 East Tulare Villa 0 0 0 0 Lindcove 0 190 0 190 Monson 90 60 0 150 Seville 10 0 0 10 Teviston 400 0 0 400 Tonyville 0 0 0 0 Waukena 80 0 0 80 West Goshen 30 110 0 140 Yettem 0 10 0 10 City Urban Area Boundary (CACUAB) Dinuba 2,210 1,060 0 3,270 Exeter 1,920 530 0 2,450 Farmersville 880 0 0 880 Lindsay 1,810 3,420 40 5,270 Porterville 2,770 3,760 760 7,290 Tulare 6,620 130 10 6,760 Visalia 20,370 970 80 21,420 Woodlake 570 1,490 210 2,270 Total 59,645
1. This is the Tulare County adopted City UDB outside of the Kern County City boundaries. 2. This is the Tulare County adopted City UDB outside of Fresno County City boundaries.
SOURCE: Tully and Young, Table 2.2, page 7, 2009.
TABLE 3.9-3
EVAPOTRANSPIRATION OF APPLIED WATER
Crop Type ETAW (inches/year)
Orchard Other Deciduous 33.70 Pistachios 34.68 Orchard Average 34.19 Field Crops – Pasture and HayAlfalfa – Hay 40.33 Pasture/Range Irrigated 41.08 Field Crops - Pasture and Hay Average 40.71 Field Crops – Other Cotton 26.94 Corn and Grain 24.46 Field Crops – Other Average 25.70 Citrus Citrus 26.84 Vineyards Grape Vines 22.39
SOURCE: Tully and Young, Table 2.3, page 8, 2009.
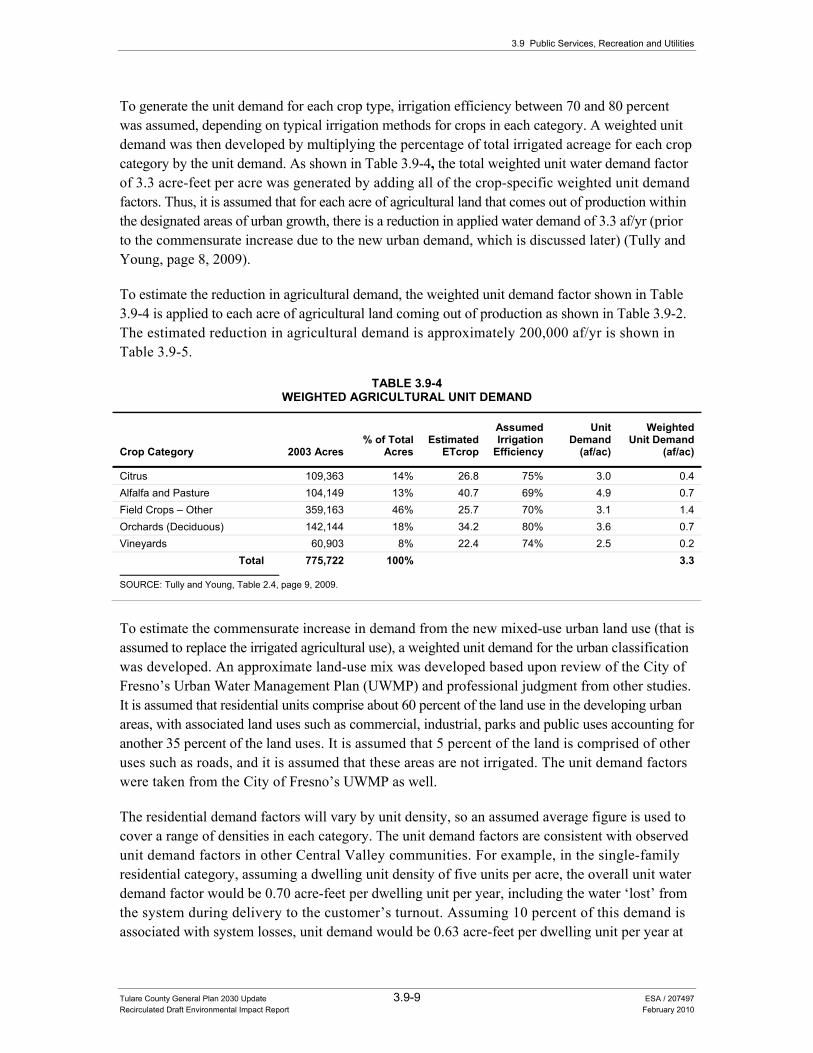
3.9 Public Services, Recreation and Utilities
Tulare County General Plan 2030 Update 3.9-9 ESA / 207497 Recirculated Draft Environmental Impact Report February 2010
To generate the unit demand for each crop type, irrigation efficiency between 70 and 80 percent was assumed, depending on typical irrigation methods for crops in each category. A weighted unit demand was then developed by multiplying the percentage of total irrigated acreage for each crop category by the unit demand. As shown in Table 3.9-4, the total weighted unit water demand factor of 3.3 acre-feet per acre was generated by adding all of the crop-specific weighted unit demand factors. Thus, it is assumed that for each acre of agricultural land that comes out of production within the designated areas of urban growth, there is a reduction in applied water demand of 3.3 af/yr (prior to the commensurate increase due to the new urban demand, which is discussed later) (Tully and Young, page 8, 2009).
To estimate the reduction in agricultural demand, the weighted unit demand factor shown in Table 3.9-4 is applied to each acre of agricultural land coming out of production as shown in Table 3.9-2. The estimated reduction in agricultural demand is approximately 200,000 af/yr is shown in Table 3.9-5.
TABLE 3.9-4WEIGHTED AGRICULTURAL UNIT DEMAND
Crop Category 2003 Acres % of Total
Acres Estimated
ETcrop
Assumed Irrigation
Efficiency
Unit Demand
(af/ac)
Weighted Unit Demand
(af/ac)
Citrus 109,363 14% 26.8 75% 3.0 0.4 Alfalfa and Pasture 104,149 13% 40.7 69% 4.9 0.7 Field Crops – Other 359,163 46% 25.7 70% 3.1 1.4 Orchards (Deciduous) 142,144 18% 34.2 80% 3.6 0.7 Vineyards 60,903 8% 22.4 74% 2.5 0.2
Total 775,722 100% 3.3
SOURCE: Tully and Young, Table 2.4, page 9, 2009.
To estimate the commensurate increase in demand from the new mixed-use urban land use (that is assumed to replace the irrigated agricultural use), a weighted unit demand for the urban classification was developed. An approximate land-use mix was developed based upon review of the City of Fresno’s Urban Water Management Plan (UWMP) and professional judgment from other studies. It is assumed that residential units comprise about 60 percent of the land use in the developing urban areas, with associated land uses such as commercial, industrial, parks and public uses accounting for another 35 percent of the land uses. It is assumed that 5 percent of the land is comprised of other uses such as roads, and it is assumed that these areas are not irrigated. The unit demand factors were taken from the City of Fresno’s UWMP as well.
The residential demand factors will vary by unit density, so an assumed average figure is used to cover a range of densities in each category. The unit demand factors are consistent with observed unit demand factors in other Central Valley communities. For example, in the single-family residential category, assuming a dwelling unit density of five units per acre, the overall unit water demand factor would be 0.70 acre-feet per dwelling unit per year, including the water ‘lost’ from the system during delivery to the customer’s turnout. Assuming 10 percent of this demand is associated with system losses, unit demand would be 0.63 acre-feet per dwelling unit per year at
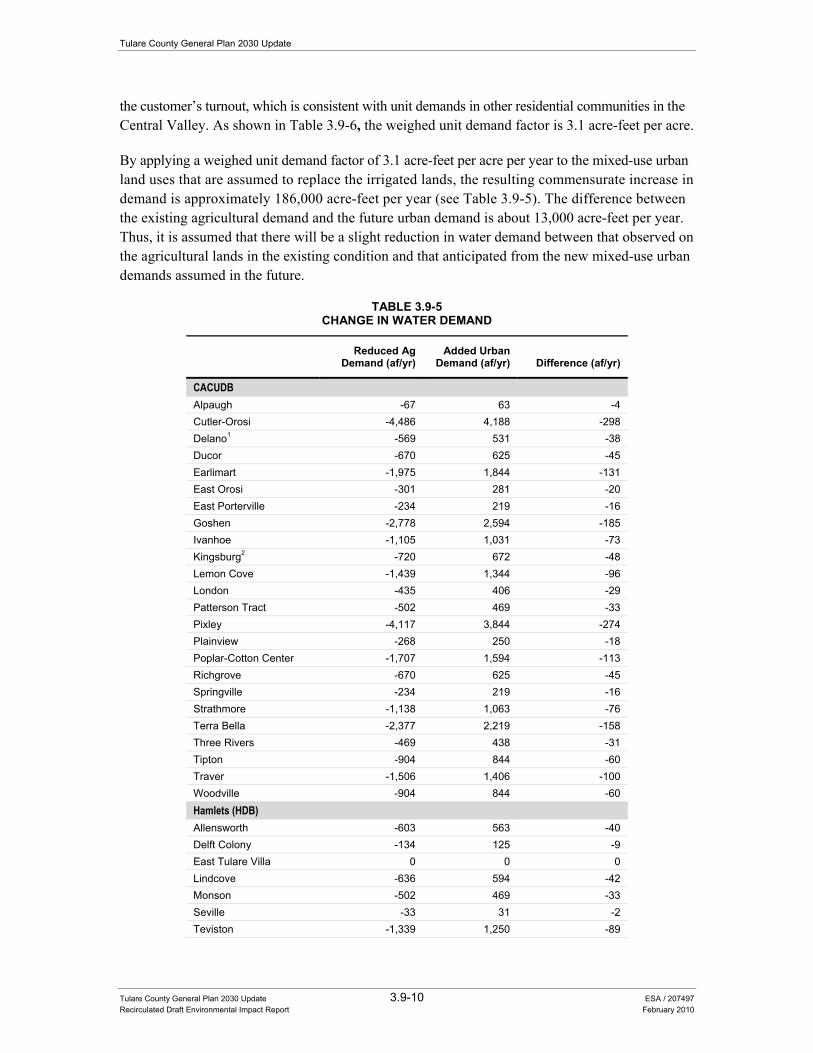
Tulare County General Plan 2030 Update
Tulare County General Plan 2030 Update 3.9-10 ESA / 207497 Recirculated Draft Environmental Impact Report February 2010
the customer’s turnout, which is consistent with unit demands in other residential communities in the Central Valley. As shown in Table 3.9-6, the weighed unit demand factor is 3.1 acre-feet per acre.
By applying a weighed unit demand factor of 3.1 acre-feet per acre per year to the mixed-use urban land uses that are assumed to replace the irrigated lands, the resulting commensurate increase in demand is approximately 186,000 acre-feet per year (see Table 3.9-5). The difference between the existing agricultural demand and the future urban demand is about 13,000 acre-feet per year. Thus, it is assumed that there will be a slight reduction in water demand between that observed on the agricultural lands in the existing condition and that anticipated from the new mixed-use urban demands assumed in the future.
TABLE 3.9-5CHANGE IN WATER DEMAND
Reduced Ag
Demand (af/yr) Added Urban
Demand (af/yr) Difference (af/yr)
CACUDB Alpaugh -67 63 -4 Cutler-Orosi -4,486 4,188 -298 Delano1 -569 531 -38 Ducor -670 625 -45 Earlimart -1,975 1,844 -131 East Orosi -301 281 -20 East Porterville -234 219 -16 Goshen -2,778 2,594 -185 Ivanhoe -1,105 1,031 -73 Kingsburg2 -720 672 -48 Lemon Cove -1,439 1,344 -96 London -435 406 -29 Patterson Tract -502 469 -33 Pixley -4,117 3,844 -274 Plainview -268 250 -18 Poplar-Cotton Center -1,707 1,594 -113 Richgrove -670 625 -45 Springville -234 219 -16 Strathmore -1,138 1,063 -76 Terra Bella -2,377 2,219 -158 Three Rivers -469 438 -31 Tipton -904 844 -60 Traver -1,506 1,406 -100 Woodville -904 844 -60 Hamlets (HDB) Allensworth -603 563 -40 Delft Colony -134 125 -9 East Tulare Villa 0 0 0 Lindcove -636 594 -42 Monson -502 469 -33 Seville -33 31 -2 Teviston -1,339 1,250 -89
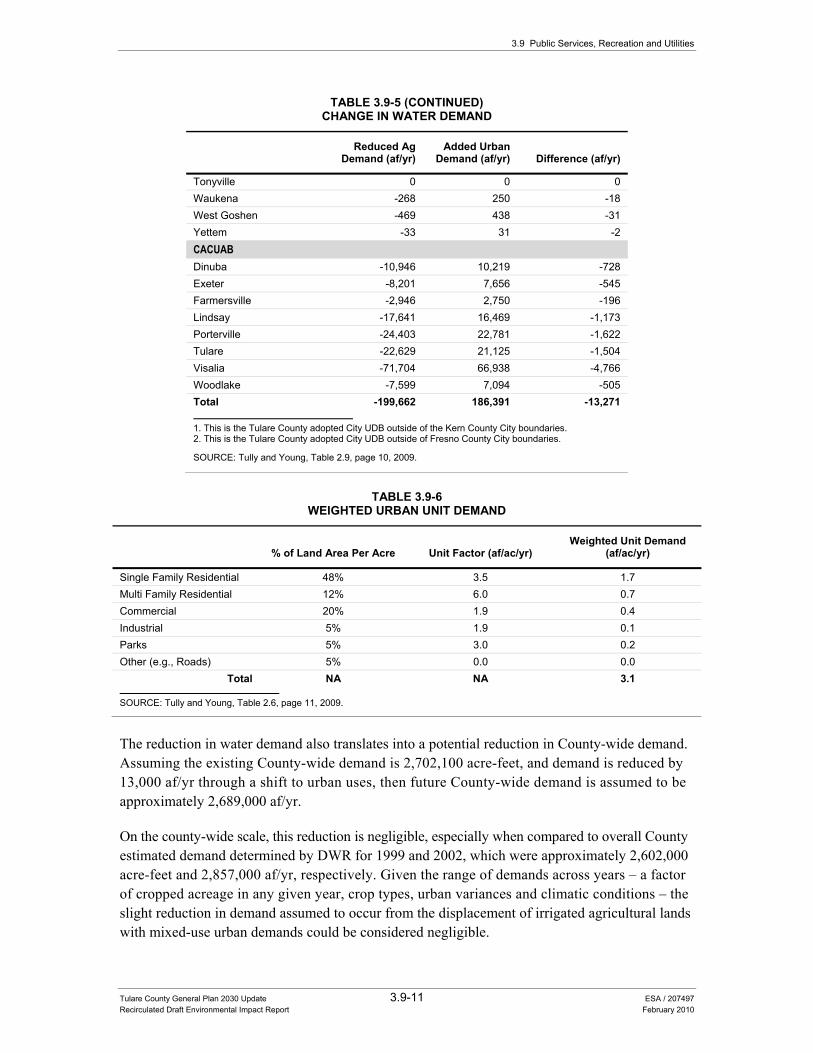
3.9 Public Services, Recreation and Utilities
Tulare County General Plan 2030 Update 3.9-11 ESA / 207497 Recirculated Draft Environmental Impact Report February 2010
TABLE 3.9-5 (CONTINUED)CHANGE IN WATER DEMAND
Reduced Ag
Demand (af/yr) Added Urban
Demand (af/yr) Difference (af/yr)
Tonyville 0 0 0 Waukena -268 250 -18 West Goshen -469 438 -31 Yettem -33 31 -2 CACUAB Dinuba -10,946 10,219 -728 Exeter -8,201 7,656 -545 Farmersville -2,946 2,750 -196 Lindsay -17,641 16,469 -1,173 Porterville -24,403 22,781 -1,622 Tulare -22,629 21,125 -1,504 Visalia -71,704 66,938 -4,766 Woodlake -7,599 7,094 -505 Total -199,662 186,391 -13,271
1. This is the Tulare County adopted City UDB outside of the Kern County City boundaries. 2. This is the Tulare County adopted City UDB outside of Fresno County City boundaries.
SOURCE: Tully and Young, Table 2.9, page 10, 2009.
TABLE 3.9-6
WEIGHTED URBAN UNIT DEMAND
% of Land Area Per Acre Unit Factor (af/ac/yr) Weighted Unit Demand
(af/ac/yr)
Single Family Residential 48% 3.5 1.7 Multi Family Residential 12% 6.0 0.7 Commercial 20% 1.9 0.4 Industrial 5% 1.9 0.1 Parks 5% 3.0 0.2 Other (e.g., Roads) 5% 0.0 0.0
Total NA NA 3.1
SOURCE: Tully and Young, Table 2.6, page 11, 2009.
The reduction in water demand also translates into a potential reduction in County-wide demand. Assuming the existing County-wide demand is 2,702,100 acre-feet, and demand is reduced by 13,000 af/yr through a shift to urban uses, then future County-wide demand is assumed to be approximately 2,689,000 af/yr.
On the county-wide scale, this reduction is negligible, especially when compared to overall County estimated demand determined by DWR for 1999 and 2002, which were approximately 2,602,000 acre-feet and 2,857,000 af/yr, respectively. Given the range of demands across years – a factor of cropped acreage in any given year, crop types, urban variances and climatic conditions – the slight reduction in demand assumed to occur from the displacement of irrigated agricultural lands with mixed-use urban demands could be considered negligible.
Tulare County General Plan 2030 Update
Tulare County General Plan 2030 Update 3.9-12 ESA / 207497 Recirculated Draft Environmental Impact Report February 2010
For purposes of this evaluation and given the preceding analysis, the average County demand represented for 2003 is assumed to also approximate the future baseline water demand condition given the anticipated displacement of irrigated agriculture with mixed-use urban growth. For this evaluation, the future County-wide applied water demand is assumed to be 2,700,000 af/yr, with 2,350,000 acre-feet the average demand for agriculture and 350,000 acre-feet the average demand for urban needs.3
Local Water and Wastewater Service Systems Large and small water systems that provide domestic water service to unincorporated communities in the County are operated and managed by a variety of public districts and private water companies. The various types of districts, including California water districts (WDs), community service districts (CSDs), irrigation districts (IDs), public utility districts (PUDs), are organized under various state legislation. While largely self-governing, they are subject to federal and state drinking water and other water quality laws discussed above. By comparison, mutual water companies are privately owned and operated, and although also subject to many governmental regulations, are less subject to governmental review and coordination. Figure 3.9-2 provides an overview of city and urbanized districts, while Figure 3.9-3 and Figure 3.9-4 show irrigation and water districts, as well as water conservation and conservation districts.
Furthermore, although water districts and water companies are not directly subject to County control, the County must coordinate its plans for growth and development with these entities in order to assure that services can be provided on a timely basis to areas planned for future growth (i.e., CACUDBs, HDBs, and CACUABs). This is done, in part, through the County LAFCo conducting MSRs for public service agencies, as described under Regulatory Setting.
Local Water Service Providers Table 3.9-7 identifies unincorporated communities within the County, and the water districts that provide domestic water service to those communities. Their water supply source (groundwater and/or surface water) and MSR status is also provided. Since ongoing implementation and necessary updates of community plans are an important aspect of infrastructure planning and development to support continued growth within a specific community, the most recent update to each community plan is also noted in Table 3.9-7.
3 The subdivision of urban and agricultural demand reflects an estimated reduction of 200,000 acre-feet of agricultural demand, compared to the 2003 value in Table 3.9-1. A commensurate increase of 200,000 acre-feet occurs in urban demand, compared to the 2003 values in Table 3.9-1.
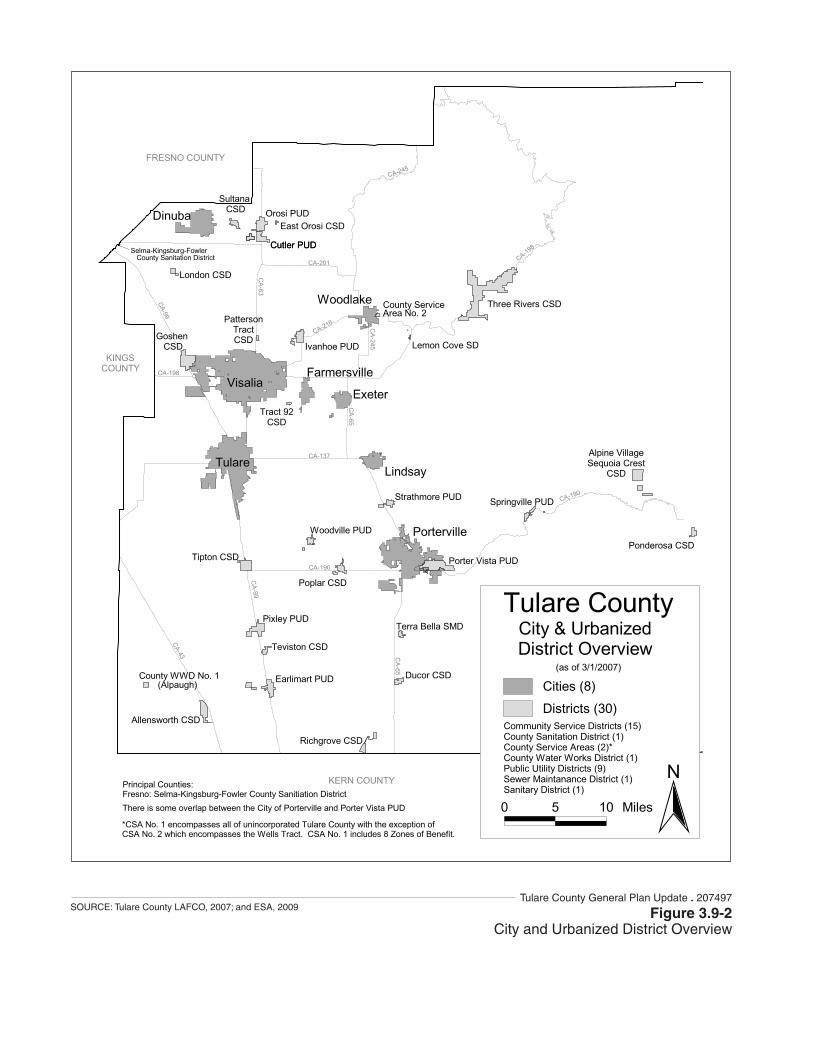
Figure 3.9-2City and Urbanized District Overview
SOURCE: Tulare County LAFCO, 2007; and ESA, 2009Tulare County General Plan Update . 207497
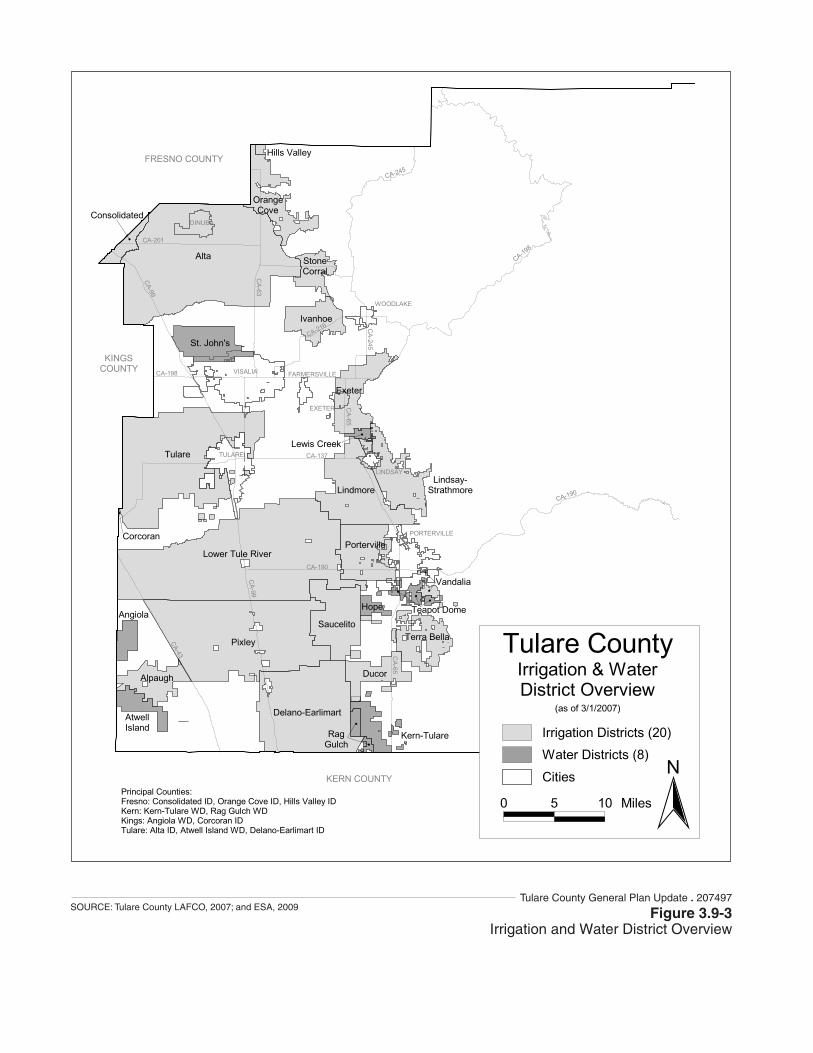
Figure 3.9-3Irrigation and Water District Overview
SOURCE: Tulare County LAFCO, 2007; and ESA, 2009Tulare County General Plan Update . 207497
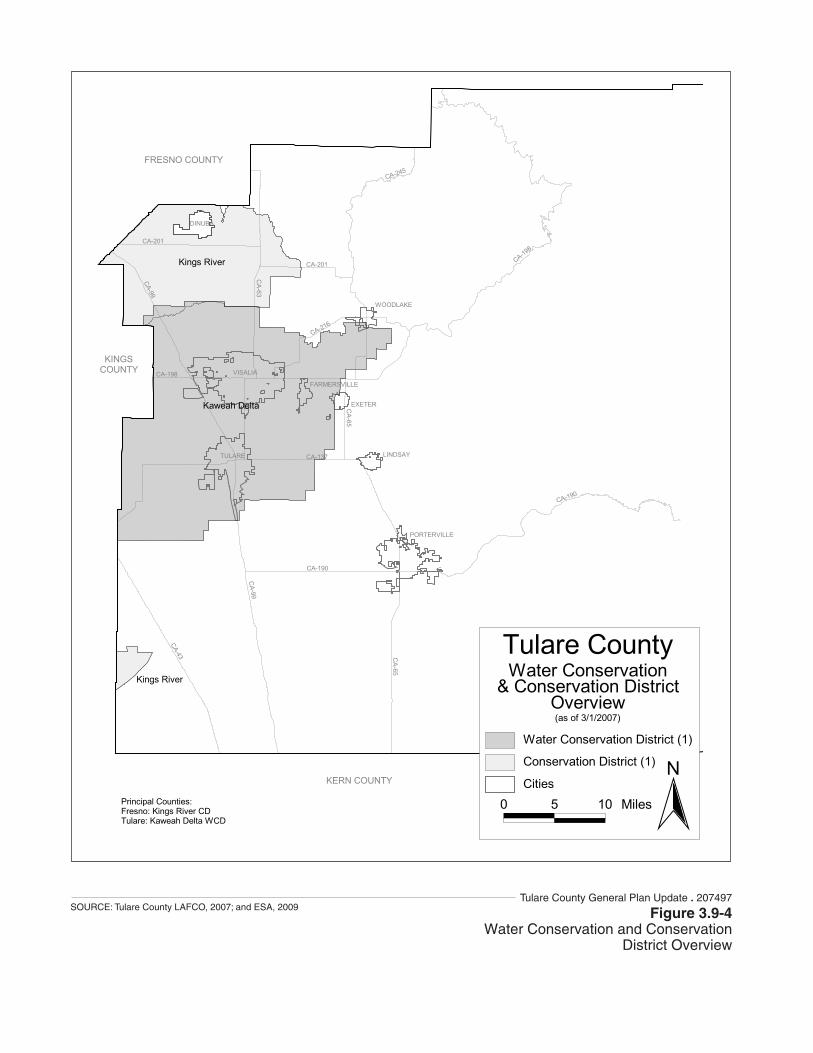
Figure 3.9-4Water Conservation and Conservation
District Overview
SOURCE: Tulare County LAFCO, 2007; and ESA, 2009Tulare County General Plan Update . 207497
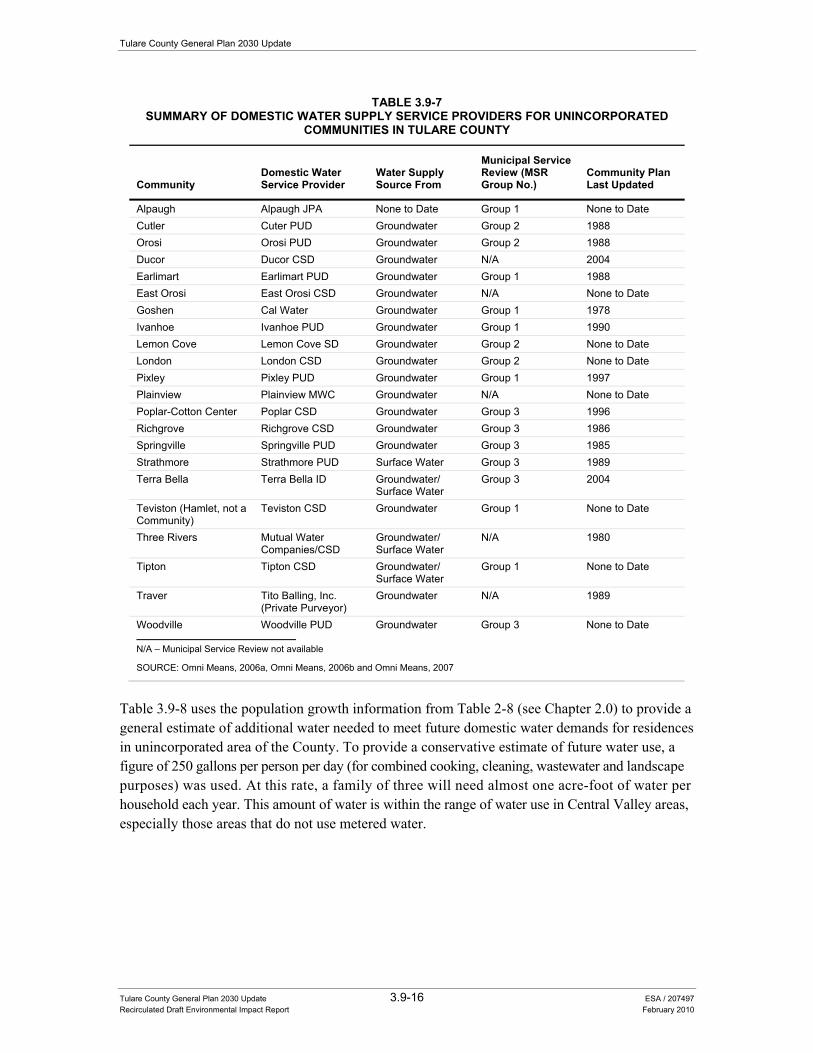
Tulare County General Plan 2030 Update
Tulare County General Plan 2030 Update 3.9-16 ESA / 207497 Recirculated Draft Environmental Impact Report February 2010
TABLE 3.9-7SUMMARY OF DOMESTIC WATER SUPPLY SERVICE PROVIDERS FOR UNINCORPORATED
COMMUNITIES IN TULARE COUNTY
Community Domestic Water Service Provider
Water Supply Source From
Municipal Service Review (MSR Group No.)
Community Plan Last Updated
Alpaugh Alpaugh JPA None to Date Group 1 None to Date Cutler Cuter PUD Groundwater Group 2 1988 Orosi Orosi PUD Groundwater Group 2 1988 Ducor Ducor CSD Groundwater N/A 2004 Earlimart Earlimart PUD Groundwater Group 1 1988 East Orosi East Orosi CSD Groundwater N/A None to Date Goshen Cal Water Groundwater Group 1 1978 Ivanhoe Ivanhoe PUD Groundwater Group 1 1990 Lemon Cove Lemon Cove SD Groundwater Group 2 None to Date London London CSD Groundwater Group 2 None to Date Pixley Pixley PUD Groundwater Group 1 1997 Plainview Plainview MWC Groundwater N/A None to Date Poplar-Cotton Center Poplar CSD Groundwater Group 3 1996 Richgrove Richgrove CSD Groundwater Group 3 1986 Springville Springville PUD Groundwater Group 3 1985 Strathmore Strathmore PUD Surface Water Group 3 1989 Terra Bella Terra Bella ID Groundwater/
Surface Water Group 3 2004
Teviston (Hamlet, not a Community)
Teviston CSD Groundwater Group 1 None to Date
Three Rivers Mutual Water Companies/CSD
Groundwater/ Surface Water
N/A 1980
Tipton Tipton CSD Groundwater/ Surface Water
Group 1 None to Date
Traver Tito Balling, Inc. (Private Purveyor)
Groundwater N/A 1989
Woodville Woodville PUD Groundwater Group 3 None to Date
N/A – Municipal Service Review not available
SOURCE: Omni Means, 2006a, Omni Means, 2006b and Omni Means, 2007
Table 3.9-8 uses the population growth information from Table 2-8 (see Chapter 2.0) to provide a general estimate of additional water needed to meet future domestic water demands for residences in unincorporated area of the County. To provide a conservative estimate of future water use, a figure of 250 gallons per person per day (for combined cooking, cleaning, wastewater and landscape purposes) was used. At this rate, a family of three will need almost one acre-foot of water per household each year. This amount of water is within the range of water use in Central Valley areas, especially those areas that do not use metered water.
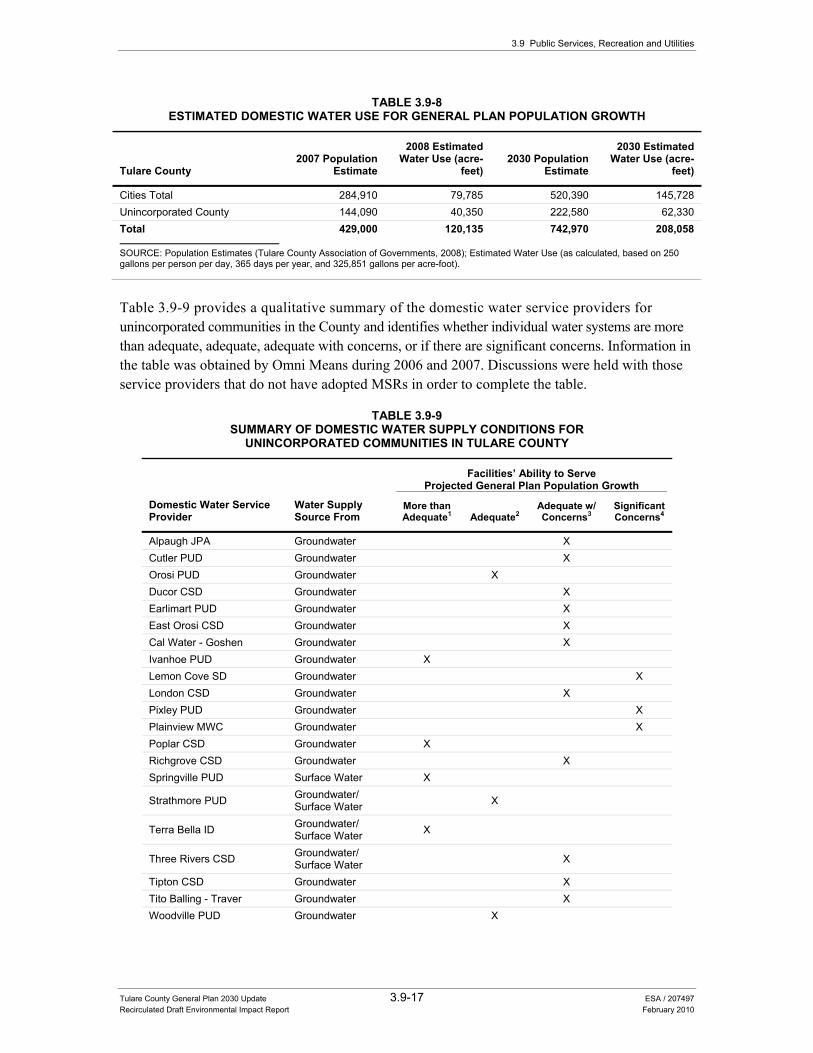
3.9 Public Services, Recreation and Utilities
Tulare County General Plan 2030 Update 3.9-17 ESA / 207497 Recirculated Draft Environmental Impact Report February 2010
TABLE 3.9-8ESTIMATED DOMESTIC WATER USE FOR GENERAL PLAN POPULATION GROWTH
Tulare County 2007 Population
Estimate
2008 Estimated Water Use (acre-
feet) 2030 Population
Estimate
2030 Estimated Water Use (acre-
feet)
Cities Total 284,910 79,785 520,390 145,728 Unincorporated County 144,090 40,350 222,580 62,330 Total 429,000 120,135 742,970 208,058
SOURCE: Population Estimates (Tulare County Association of Governments, 2008); Estimated Water Use (as calculated, based on 250 gallons per person per day, 365 days per year, and 325,851 gallons per acre-foot).
Table 3.9-9 provides a qualitative summary of the domestic water service providers for unincorporated communities in the County and identifies whether individual water systems are more than adequate, adequate, adequate with concerns, or if there are significant concerns. Information in the table was obtained by Omni Means during 2006 and 2007. Discussions were held with those service providers that do not have adopted MSRs in order to complete the table.
TABLE 3.9-9SUMMARY OF DOMESTIC WATER SUPPLY CONDITIONS FOR
UNINCORPORATED COMMUNITIES IN TULARE COUNTY
Domestic Water Service Provider
Water Supply Source From
Facilities’ Ability to Serve Projected General Plan Population Growth
More than Adequate1 Adequate2
Adequate w/ Concerns3
Significant Concerns4
Alpaugh JPA Groundwater X Cutler PUD Groundwater X Orosi PUD Groundwater X Ducor CSD Groundwater X Earlimart PUD Groundwater X East Orosi CSD Groundwater X Cal Water - Goshen Groundwater X Ivanhoe PUD Groundwater X Lemon Cove SD Groundwater X London CSD Groundwater X Pixley PUD Groundwater X Plainview MWC Groundwater X Poplar CSD Groundwater X Richgrove CSD Groundwater X Springville PUD Surface Water X
Strathmore PUD Groundwater/ Surface Water X
Terra Bella ID Groundwater/ Surface Water X
Three Rivers CSD Groundwater/ Surface Water X
Tipton CSD Groundwater X Tito Balling - Traver Groundwater X Woodville PUD Groundwater X
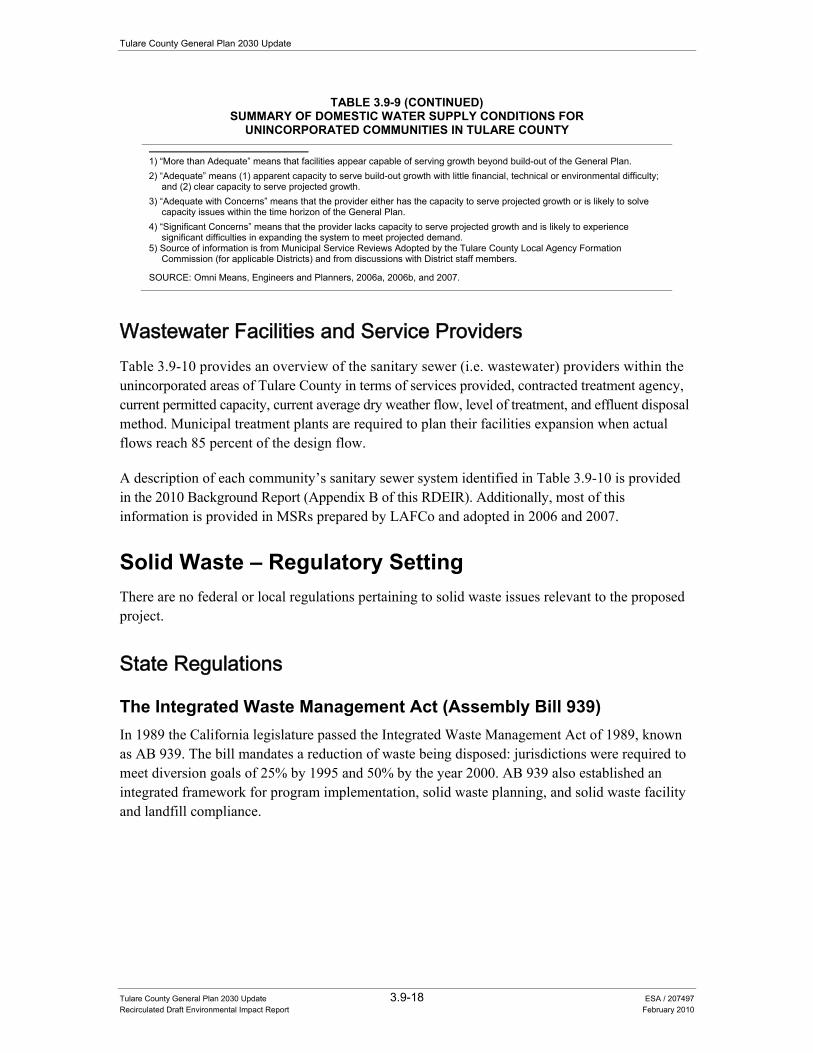
Tulare County General Plan 2030 Update
Tulare County General Plan 2030 Update 3.9-18 ESA / 207497 Recirculated Draft Environmental Impact Report February 2010
TABLE 3.9-9 (CONTINUED)SUMMARY OF DOMESTIC WATER SUPPLY CONDITIONS FOR
UNINCORPORATED COMMUNITIES IN TULARE COUNTY
1) “More than Adequate” means that facilities appear capable of serving growth beyond build-out of the General Plan. 2) “Adequate” means (1) apparent capacity to serve build-out growth with little financial, technical or environmental difficulty;
and (2) clear capacity to serve projected growth. 3) “Adequate with Concerns” means that the provider either has the capacity to serve projected growth or is likely to solve
capacity issues within the time horizon of the General Plan. 4) “Significant Concerns” means that the provider lacks capacity to serve projected growth and is likely to experience
significant difficulties in expanding the system to meet projected demand. 5) Source of information is from Municipal Service Reviews Adopted by the Tulare County Local Agency Formation
Commission (for applicable Districts) and from discussions with District staff members.
SOURCE: Omni Means, Engineers and Planners, 2006a, 2006b, and 2007.
Wastewater Facilities and Service Providers Table 3.9-10 provides an overview of the sanitary sewer (i.e. wastewater) providers within the unincorporated areas of Tulare County in terms of services provided, contracted treatment agency, current permitted capacity, current average dry weather flow, level of treatment, and effluent disposal method. Municipal treatment plants are required to plan their facilities expansion when actual flows reach 85 percent of the design flow.
A description of each community’s sanitary sewer system identified in Table 3.9-10 is provided in the 2010 Background Report (Appendix B of this RDEIR). Additionally, most of this information is provided in MSRs prepared by LAFCo and adopted in 2006 and 2007.
Solid Waste – Regulatory Setting There are no federal or local regulations pertaining to solid waste issues relevant to the proposed project.
State Regulations
The Integrated Waste Management Act (Assembly Bill 939) In 1989 the California legislature passed the Integrated Waste Management Act of 1989, known as AB 939. The bill mandates a reduction of waste being disposed: jurisdictions were required to meet diversion goals of 25% by 1995 and 50% by the year 2000. AB 939 also established an integrated framework for program implementation, solid waste planning, and solid waste facility and landfill compliance.
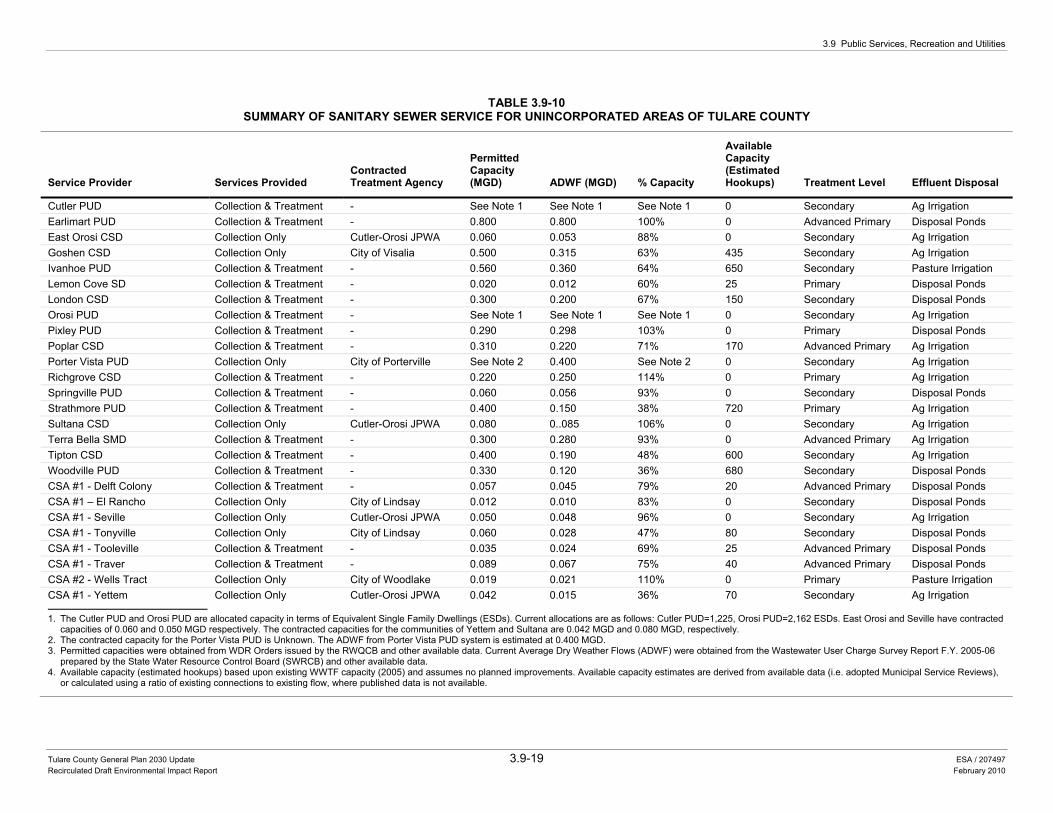
3.9 Public Services, Recreation and Utilities
Tulare County General Plan 2030 Update 3.9-19 ESA / 207497 Recirculated Draft Environmental Impact Report February 2010
TABLE 3.9-10SUMMARY OF SANITARY SEWER SERVICE FOR UNINCORPORATED AREAS OF TULARE COUNTY
Service Provider Services Provided Contracted Treatment Agency
Permitted Capacity (MGD) ADWF (MGD) % Capacity
Available Capacity (Estimated Hookups) Treatment Level Effluent Disposal
Cutler PUD Collection & Treatment - See Note 1 See Note 1 See Note 1 0 Secondary Ag Irrigation Earlimart PUD Collection & Treatment - 0.800 0.800 100% 0 Advanced Primary Disposal Ponds East Orosi CSD Collection Only Cutler-Orosi JPWA 0.060 0.053 88% 0 Secondary Ag Irrigation Goshen CSD Collection Only City of Visalia 0.500 0.315 63% 435 Secondary Ag Irrigation Ivanhoe PUD Collection & Treatment - 0.560 0.360 64% 650 Secondary Pasture Irrigation Lemon Cove SD Collection & Treatment - 0.020 0.012 60% 25 Primary Disposal Ponds London CSD Collection & Treatment - 0.300 0.200 67% 150 Secondary Disposal Ponds Orosi PUD Collection & Treatment - See Note 1 See Note 1 See Note 1 0 Secondary Ag Irrigation Pixley PUD Collection & Treatment - 0.290 0.298 103% 0 Primary Disposal Ponds Poplar CSD Collection & Treatment - 0.310 0.220 71% 170 Advanced Primary Ag Irrigation Porter Vista PUD Collection Only City of Porterville See Note 2 0.400 See Note 2 0 Secondary Ag Irrigation Richgrove CSD Collection & Treatment - 0.220 0.250 114% 0 Primary Ag Irrigation Springville PUD Collection & Treatment - 0.060 0.056 93% 0 Secondary Disposal Ponds Strathmore PUD Collection & Treatment - 0.400 0.150 38% 720 Primary Ag Irrigation Sultana CSD Collection Only Cutler-Orosi JPWA 0.080 0..085 106% 0 Secondary Ag Irrigation Terra Bella SMD Collection & Treatment - 0.300 0.280 93% 0 Advanced Primary Ag Irrigation Tipton CSD Collection & Treatment - 0.400 0.190 48% 600 Secondary Ag Irrigation Woodville PUD Collection & Treatment - 0.330 0.120 36% 680 Secondary Disposal Ponds CSA #1 - Delft Colony Collection & Treatment - 0.057 0.045 79% 20 Advanced Primary Disposal Ponds CSA #1 – El Rancho Collection Only City of Lindsay 0.012 0.010 83% 0 Secondary Disposal Ponds CSA #1 - Seville Collection Only Cutler-Orosi JPWA 0.050 0.048 96% 0 Secondary Ag Irrigation CSA #1 - Tonyville Collection Only City of Lindsay 0.060 0.028 47% 80 Secondary Disposal Ponds CSA #1 - Tooleville Collection & Treatment - 0.035 0.024 69% 25 Advanced Primary Disposal Ponds CSA #1 - Traver Collection & Treatment - 0.089 0.067 75% 40 Advanced Primary Disposal Ponds CSA #2 - Wells Tract Collection Only City of Woodlake 0.019 0.021 110% 0 Primary Pasture Irrigation CSA #1 - Yettem Collection Only Cutler-Orosi JPWA 0.042 0.015 36% 70 Secondary Ag Irrigation
1. The Cutler PUD and Orosi PUD are allocated capacity in terms of Equivalent Single Family Dwellings (ESDs). Current allocations are as follows: Cutler PUD=1,225, Orosi PUD=2,162 ESDs. East Orosi and Seville have contracted
capacities of 0.060 and 0.050 MGD respectively. The contracted capacities for the communities of Yettem and Sultana are 0.042 MGD and 0.080 MGD, respectively. 2. The contracted capacity for the Porter Vista PUD is Unknown. The ADWF from Porter Vista PUD system is estimated at 0.400 MGD. 3. Permitted capacities were obtained from WDR Orders issued by the RWQCB and other available data. Current Average Dry Weather Flows (ADWF) were obtained from the Wastewater User Charge Survey Report F.Y. 2005-06
prepared by the State Water Resource Control Board (SWRCB) and other available data. 4. Available capacity (estimated hookups) based upon existing WWTF capacity (2005) and assumes no planned improvements. Available capacity estimates are derived from available data (i.e. adopted Municipal Service Reviews),
or calculated using a ratio of existing connections to existing flow, where published data is not available.
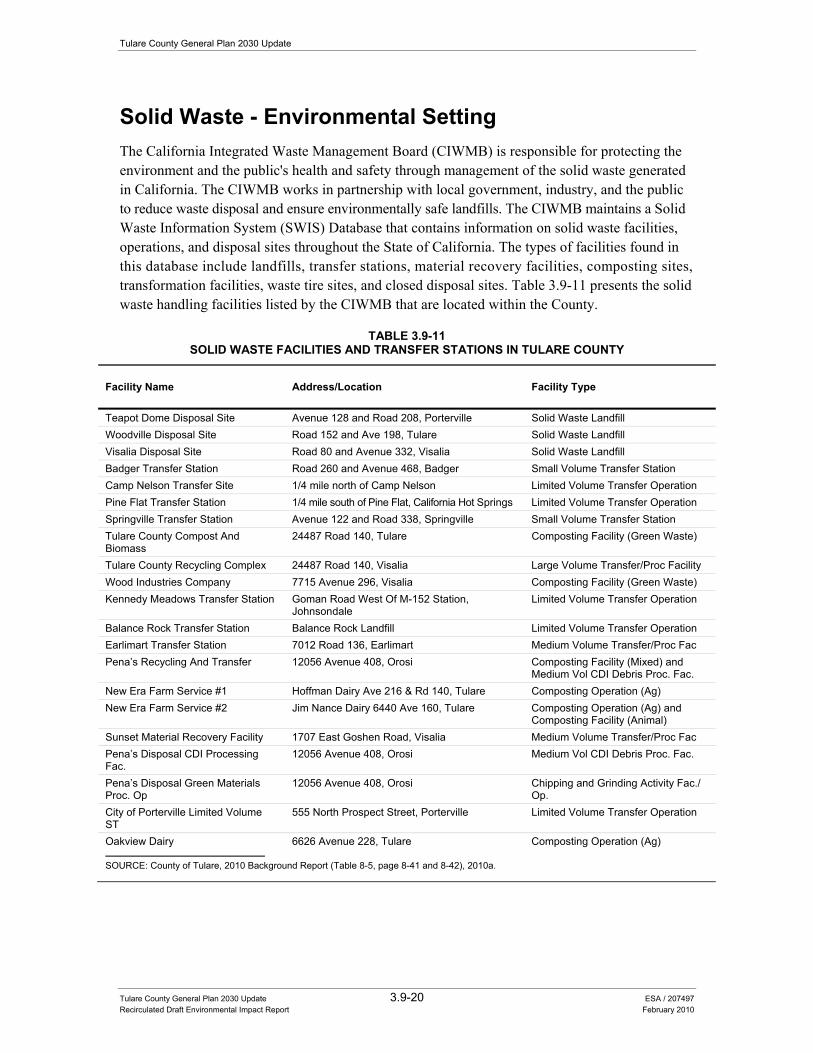
Tulare County General Plan 2030 Update
Tulare County General Plan 2030 Update 3.9-20 ESA / 207497 Recirculated Draft Environmental Impact Report February 2010
Solid Waste - Environmental Setting The California Integrated Waste Management Board (CIWMB) is responsible for protecting the environment and the public's health and safety through management of the solid waste generated in California. The CIWMB works in partnership with local government, industry, and the public to reduce waste disposal and ensure environmentally safe landfills. The CIWMB maintains a Solid Waste Information System (SWIS) Database that contains information on solid waste facilities, operations, and disposal sites throughout the State of California. The types of facilities found in this database include landfills, transfer stations, material recovery facilities, composting sites, transformation facilities, waste tire sites, and closed disposal sites. Table 3.9-11 presents the solid waste handling facilities listed by the CIWMB that are located within the County.
TABLE 3.9-11SOLID WASTE FACILITIES AND TRANSFER STATIONS IN TULARE COUNTY
Facility Name Address/Location Facility Type
Teapot Dome Disposal Site Avenue 128 and Road 208, Porterville Solid Waste Landfill Woodville Disposal Site Road 152 and Ave 198, Tulare Solid Waste Landfill Visalia Disposal Site Road 80 and Avenue 332, Visalia Solid Waste Landfill Badger Transfer Station Road 260 and Avenue 468, Badger Small Volume Transfer Station Camp Nelson Transfer Site 1/4 mile north of Camp Nelson Limited Volume Transfer Operation Pine Flat Transfer Station 1/4 mile south of Pine Flat, California Hot Springs Limited Volume Transfer Operation Springville Transfer Station Avenue 122 and Road 338, Springville Small Volume Transfer Station Tulare County Compost And Biomass
24487 Road 140, Tulare Composting Facility (Green Waste)
Tulare County Recycling Complex 24487 Road 140, Visalia Large Volume Transfer/Proc Facility Wood Industries Company 7715 Avenue 296, Visalia Composting Facility (Green Waste) Kennedy Meadows Transfer Station Goman Road West Of M-152 Station,
Johnsondale Limited Volume Transfer Operation
Balance Rock Transfer Station Balance Rock Landfill Limited Volume Transfer Operation Earlimart Transfer Station 7012 Road 136, Earlimart Medium Volume Transfer/Proc Fac Pena’s Recycling And Transfer 12056 Avenue 408, Orosi Composting Facility (Mixed) and
Medium Vol CDI Debris Proc. Fac. New Era Farm Service #1 Hoffman Dairy Ave 216 & Rd 140, Tulare Composting Operation (Ag) New Era Farm Service #2 Jim Nance Dairy 6440 Ave 160, Tulare Composting Operation (Ag) and
Composting Facility (Animal) Sunset Material Recovery Facility 1707 East Goshen Road, Visalia Medium Volume Transfer/Proc Fac Pena’s Disposal CDI Processing Fac.
12056 Avenue 408, Orosi Medium Vol CDI Debris Proc. Fac.
Pena’s Disposal Green Materials Proc. Op
12056 Avenue 408, Orosi Chipping and Grinding Activity Fac./ Op.
City of Porterville Limited Volume ST
555 North Prospect Street, Porterville Limited Volume Transfer Operation
Oakview Dairy 6626 Avenue 228, Tulare Composting Operation (Ag)
SOURCE: County of Tulare, 2010 Background Report (Table 8-5, page 8-41 and 8-42), 2010a.
3.9 Public Services, Recreation and Utilities
Tulare County General Plan 2030 Update 3.9-21 ESA / 207497 Recirculated Draft Environmental Impact Report February 2010
Solid Waste Production Solid waste produced in Tulare County in 1999 was estimated to be 230,000 tons. The average estimated solid waste generation rates for residential, commercial, and industrial land uses in 1999 are as follows:
• Residential - 81,532 tons/year; • Commercial - 116,086 tons/year; and • Industrial - 36,575 tons/year.
Solid waste collection in Tulare County is divided into sections. These sections are determined by the County of Tulare Board of Supervisors with only one license for each section issued. Currently there are eight sections that require a weekly pickup. The incorporated cities in Tulare County oversee solid waste collection within their city limits. Private companies offer solid waste collection services to other unincorporated areas of the County.
Solid Waste Disposal Facilities Tulare County operates three active solid waste disposal facilities (or landfills): Visalia, Woodville, and Teapot Dome. These landfills serve all of Tulare County as well as parts of surrounding counties. Similarly, a small amount of solid waste from Tulare County is transported to surrounding County landfills. In addition, there are seven transfer stations located throughout the isolated rural areas of the County for the convenience of those residents who live outside of waste collection service areas (see Table 3.9-11). Figure 3.9-5 shows the locations of these landfills and transfer stations.
The Teapot Dome facility is located at 21063 Avenue 128 in Porterville. This facility is open to the public. It serves the City of Porterville and unincorporated areas of southern Tulare, and northern Kern Counties. The approximate amount of waste disposed at Teapot Dome in 2003 was estimated to be 63,000 tons.
The Visalia facility is located at 22466 Road 80 in Visalia. This facility is also open to the public. It serves the Cities of Visalia, Farmersville, Dinuba, Exeter, Tulare, Woodlake, Fresno, and unincorporated areas of northern Tulare and southern Fresno Counties. The approximate amount of waste disposed at Visalia in 2003 was estimated to be 120,000 tons.
The Woodville facility is located at 19800 Road 152 in Woodville. This facility is also open to the public and serves the cities of Tulare, Exeter, Farmersville, Lindsay, Visalia, Woodlake, and unincorporated areas of central Tulare County. The approximate amount of waste disposed at Woodville in 2003 was estimated to be 68,000 tons.
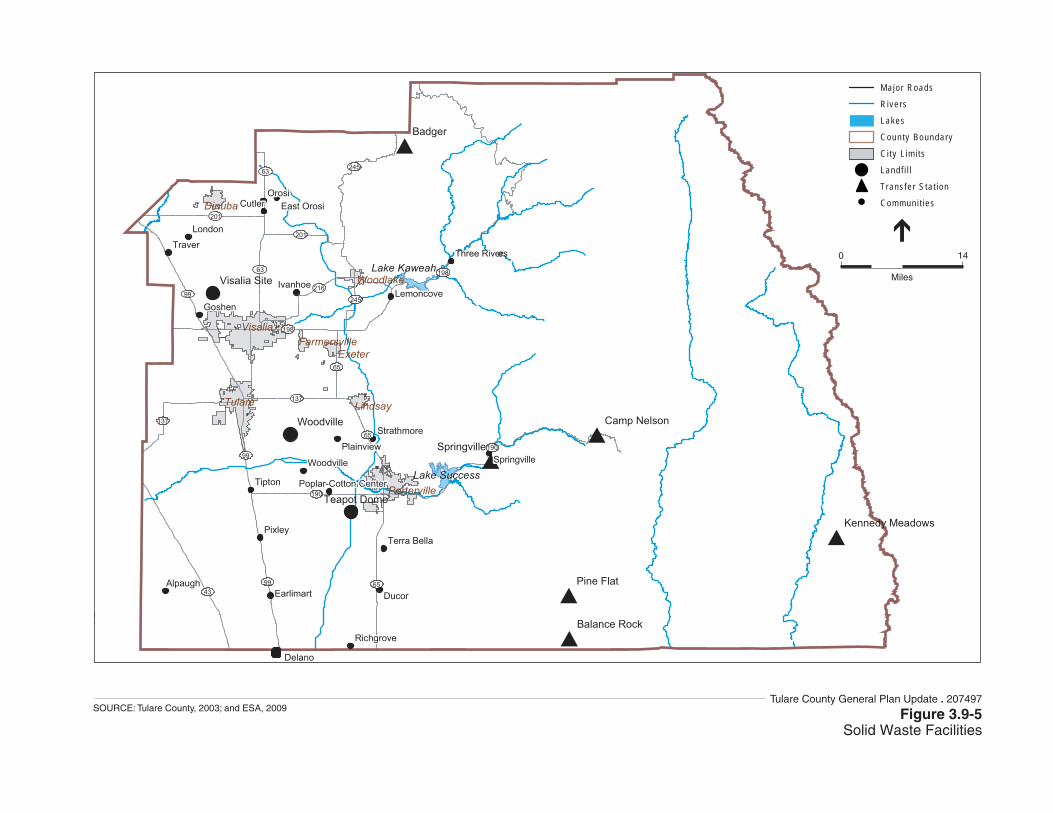
Source: Tulare County; 2003
±#
#
#
#
#
#
Tulare Lindsay
Exeter
Farmersville
Woodlake
Dinuba
Porterville
Visalia
201
245
216
245
63
63
198
198
137
99
65
190
190
43
201
137
6599
99
65
Woodville
Teapot Dome
Visalia Site
Badger
Pine Flat
Camp Nelson
Springville
Balance Rock
Kennedy Meadows
Orosi
Ducor
Pixley
Tipton
London
Cutler
Goshen
Traver
Ivanhoe
Alpaugh
Springville
Three Riverse
Richgrove
Earlimart
Woodville
Plainview
Lemoncove
Strathmore
East Orosi
Terra Bella
Poplar-Cotton CenterLake Success
Lake Kaweah
Delano
Major Roads
Rivers
Lakes
County Boundary
Ci ty L im i ts
Landf i l l
Trans fe r S ta t ion
Communi t ies
0 14
Miles
Figure 3.9-5Solid Waste Facilities
SOURCE: Tulare County, 2003; and ESA, 2009Tulare County General Plan Update . 207497
3.9 Public Services, Recreation and Utilities
Tulare County General Plan 2030 Update 3.9-23 ESA / 207497 Recirculated Draft Environmental Impact Report February 2010
Solid Waste Transfer Stations As identified in Table 3.9-11, the County also operates seven transfer stations that are located in rural areas for the convenience of the people who live near them. The transfer stations do not accept large volumes of waste. The County transports solid waste to the three landfills described above from the following transfer stations:
• Badger Transfer Station, east of Badger; • Balance Rock Transfer Station, north of Balance Rock; • Camp Nelson Transfer Station, northeast of Camp Nelson; • Earlimart Transfer Station, north of Earlimart; • Kennedy Meadows Transfer Station, in the southeast region of the County; • Pine Flat Transfer Station, north of Pine Flat; and, • Springville Transfer Station, south of Springville.
Recycling Programs Tulare County landfills accept wood, green waste, and tires for recycling purposes in addition to solid waste. The County also maintains a list of active recycling sites for wood and green waste, glass, cans, paper, waste oil, concrete, asphalt, brick, ceramic tile and porcelain, iron and metal, usable furniture, clothing, house wares, appliances, and computer and television monitors. Additionally, the County contains a number of composting facilities (see Table 3.9-11).
Law Enforcement - Regulatory Setting There are no federal, state, or local regulations pertaining to law enforcement issues relevant to the proposed project.
Law Enforcement - Environmental Setting As of 2004, the Tulare County Sheriff’s Department had 448 sworn officers serving its unincorporated population, which generates a level of service ratio of 3.2 officers per 1,000 residents. The ratio is above the accepted standard of 2.0 officers per 1,000 residents set by the Federal Bureau of Investigation. The Sheriff’s Department also has 186 non-sworn clerical and support staff amounting to 633 total staff employees.
Law enforcement protection service for the unincorporated County is divided into 22 areas with four stations. Table 3.9-12 identifies the name and location of each station and provides the number of service areas administered by each station. As shown in the table, the Porterville substation serves the largest number of areas with 10 patrols, followed by the Headquarters Patrol station in Visalia with six.
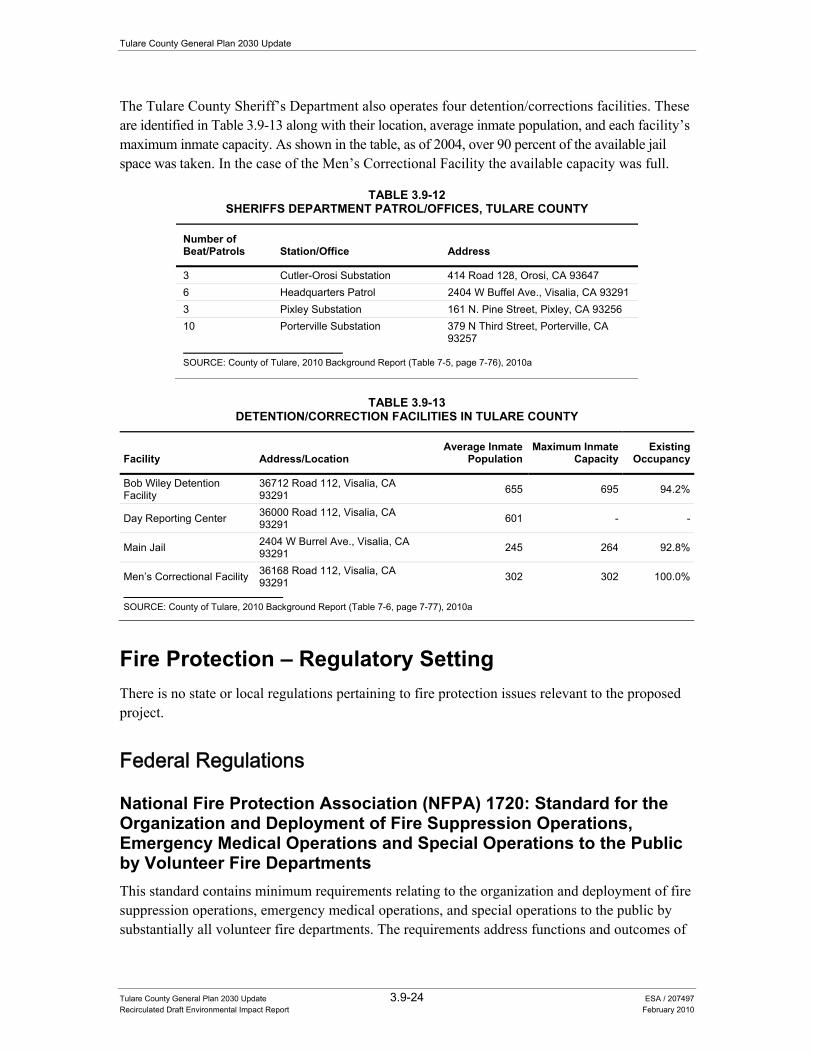
Tulare County General Plan 2030 Update
Tulare County General Plan 2030 Update 3.9-24 ESA / 207497 Recirculated Draft Environmental Impact Report February 2010
The Tulare County Sheriff’s Department also operates four detention/corrections facilities. These are identified in Table 3.9-13 along with their location, average inmate population, and each facility’s maximum inmate capacity. As shown in the table, as of 2004, over 90 percent of the available jail space was taken. In the case of the Men’s Correctional Facility the available capacity was full.
TABLE 3.9-12SHERIFFS DEPARTMENT PATROL/OFFICES, TULARE COUNTY
Number of Beat/Patrols Station/Office Address
3 Cutler-Orosi Substation 414 Road 128, Orosi, CA 93647 6 Headquarters Patrol 2404 W Buffel Ave., Visalia, CA 93291 3 Pixley Substation 161 N. Pine Street, Pixley, CA 93256 10 Porterville Substation 379 N Third Street, Porterville, CA
93257
SOURCE: County of Tulare, 2010 Background Report (Table 7-5, page 7-76), 2010a
TABLE 3.9-13
DETENTION/CORRECTION FACILITIES IN TULARE COUNTY
Facility Address/Location Average Inmate
PopulationMaximum Inmate
Capacity Existing
Occupancy
Bob Wiley Detention Facility
36712 Road 112, Visalia, CA 93291 655 695 94.2%
Day Reporting Center 36000 Road 112, Visalia, CA 93291 601 - -
Main Jail 2404 W Burrel Ave., Visalia, CA 93291 245 264 92.8%
Men’s Correctional Facility 36168 Road 112, Visalia, CA 93291 302 302 100.0%
SOURCE: County of Tulare, 2010 Background Report (Table 7-6, page 7-77), 2010a
Fire Protection – Regulatory Setting There is no state or local regulations pertaining to fire protection issues relevant to the proposed project.
Federal Regulations
National Fire Protection Association (NFPA) 1720: Standard for the Organization and Deployment of Fire Suppression Operations, Emergency Medical Operations and Special Operations to the Public by Volunteer Fire Departments This standard contains minimum requirements relating to the organization and deployment of fire suppression operations, emergency medical operations, and special operations to the public by substantially all volunteer fire departments. The requirements address functions and outcomes of
3.9 Public Services, Recreation and Utilities
Tulare County General Plan 2030 Update 3.9-25 ESA / 207497 Recirculated Draft Environmental Impact Report February 2010
fire department emergency service delivery, response capabilities, and resources. This standard also contains minimum requirements for managing resources and systems, such as health and safety, incident management, training, communications, and pre-incident planning. This standard addresses the strategic and system issues involving the organization, operation, and deployment of a fire department and does not address tactical operations at a specific emergency incident. However, it does not address fire prevention, community education, fire investigations, support services, personnel management, and budgeting.
Fire Protection - Environmental Setting Since July 1, 2007, Tulare County fire protection has been provided by the Tulare County Fire Department. Prior to this time, fire protection was provided by the California Department of Forestry (CDF). CDF is currently responsible for providing fire protection services to State Responsibility Areas (SRAs), which are areas in which the State Board of Forestry has determined that the state has the financial responsibility for fire prevention and suppression. In the Sequoia National Forest, the U.S. Forest Service is the responsible fire agency.
The Tulare County Fire Department’s Capital Improvement Plan (CIP) addresses current and future fire protection needs in the County, establishes priorities, sets level of service standards based on jurisdictional land uses, and establishes a long-range plan for fire prevention and protection activities. According to the CIP, conditions at the County’s 16 fire stations, operated by CDF and Tulare County, range “from excellent to poor,” with many of the facilities identified as inadequate for housing fire equipment. In addition, response times in the County have increased due to rapid growth without a corresponding growth in fire protection facilities and staffing. Therefore, as the County continues to grow, the risks of injury, loss of life, and property damage will also increase. The CIP identifies a lack of funding as the main obstacle to improving fire protection service. The Tulare County Fire Department is currently preparing an updated CIP that will be presented to the County Board of Supervisors for approval. In the future, the Fire Department plans to update the CIP every three to five years.
Tulare County Fire Department has 28 stations that are situated throughout the County within its most densely populated areas and currently maintains minimal staffing to meet the requirements set forth under NFPA 1720-1721 for a rural area. These requirements consist of one full-time person per station per shift with other paid on-call firefighters. While this is sufficient to meet the basic needs of the County, this level of staffing often results in an elevated fire loss value during some emergency conditions when compared with other departments with additional staff support. In addition to the need for additional staff, some facilities need repairs, replacements, or relocations. Currently, relocations are planned for the South Visalia and Alpaugh fire stations. Additional fire stations in need of relocation include West Olive, Tulare, and Dinuba fire stations.
Fire Prevention and Suppression Public protection classifications are designated by the Insurance Services Office (ISO). The ISO bases its classifications on a number of factors, including fire department location, equipment,
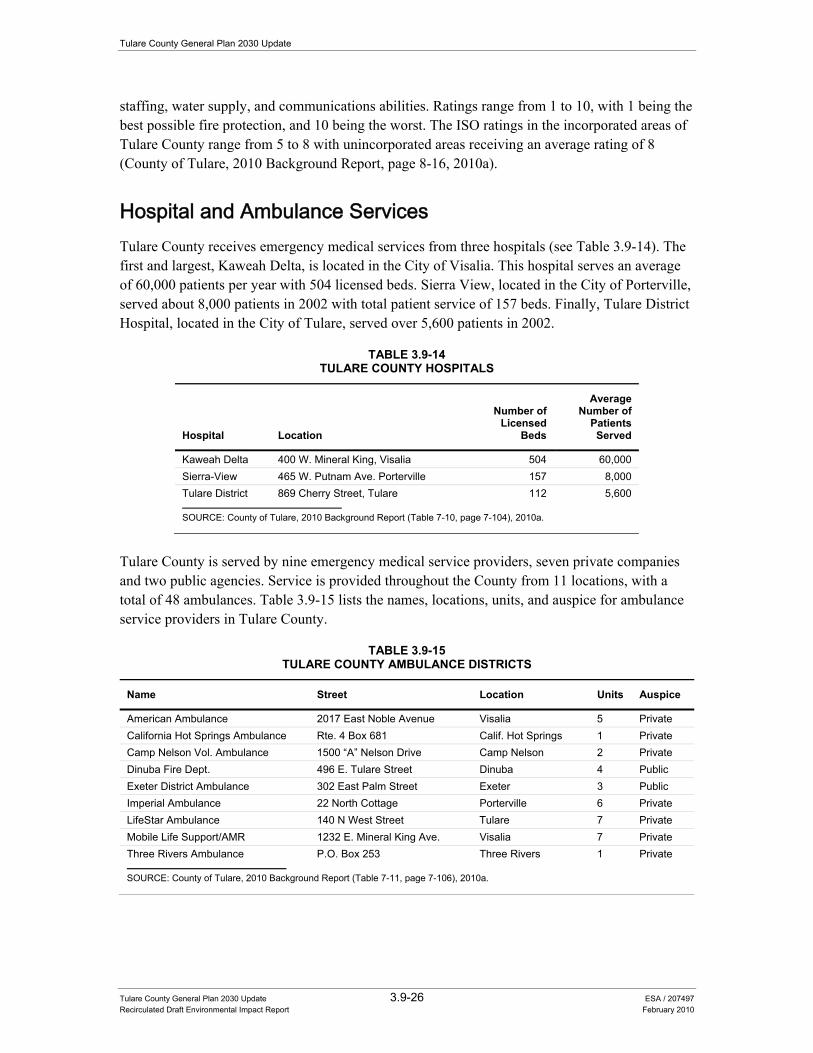
Tulare County General Plan 2030 Update
Tulare County General Plan 2030 Update 3.9-26 ESA / 207497 Recirculated Draft Environmental Impact Report February 2010
staffing, water supply, and communications abilities. Ratings range from 1 to 10, with 1 being the best possible fire protection, and 10 being the worst. The ISO ratings in the incorporated areas of Tulare County range from 5 to 8 with unincorporated areas receiving an average rating of 8 (County of Tulare, 2010 Background Report, page 8-16, 2010a).
Hospital and Ambulance Services Tulare County receives emergency medical services from three hospitals (see Table 3.9-14). The first and largest, Kaweah Delta, is located in the City of Visalia. This hospital serves an average of 60,000 patients per year with 504 licensed beds. Sierra View, located in the City of Porterville, served about 8,000 patients in 2002 with total patient service of 157 beds. Finally, Tulare District Hospital, located in the City of Tulare, served over 5,600 patients in 2002.
TABLE 3.9-14TULARE COUNTY HOSPITALS
Hospital Location
Number of Licensed
Beds
Average Number of
Patients Served
Kaweah Delta 400 W. Mineral King, Visalia 504 60,000 Sierra-View 465 W. Putnam Ave. Porterville 157 8,000 Tulare District 869 Cherry Street, Tulare 112 5,600
SOURCE: County of Tulare, 2010 Background Report (Table 7-10, page 7-104), 2010a.
Tulare County is served by nine emergency medical service providers, seven private companies and two public agencies. Service is provided throughout the County from 11 locations, with a total of 48 ambulances. Table 3.9-15 lists the names, locations, units, and auspice for ambulance service providers in Tulare County.
TABLE 3.9-15TULARE COUNTY AMBULANCE DISTRICTS
Name Street Location Units Auspice
American Ambulance 2017 East Noble Avenue Visalia 5 Private California Hot Springs Ambulance Rte. 4 Box 681 Calif. Hot Springs 1 Private Camp Nelson Vol. Ambulance 1500 “A” Nelson Drive Camp Nelson 2 Private Dinuba Fire Dept. 496 E. Tulare Street Dinuba 4 Public Exeter District Ambulance 302 East Palm Street Exeter 3 Public Imperial Ambulance 22 North Cottage Porterville 6 Private LifeStar Ambulance 140 N West Street Tulare 7 Private Mobile Life Support/AMR 1232 E. Mineral King Ave. Visalia 7 Private Three Rivers Ambulance P.O. Box 253 Three Rivers 1 Private
SOURCE: County of Tulare, 2010 Background Report (Table 7-11, page 7-106), 2010a.
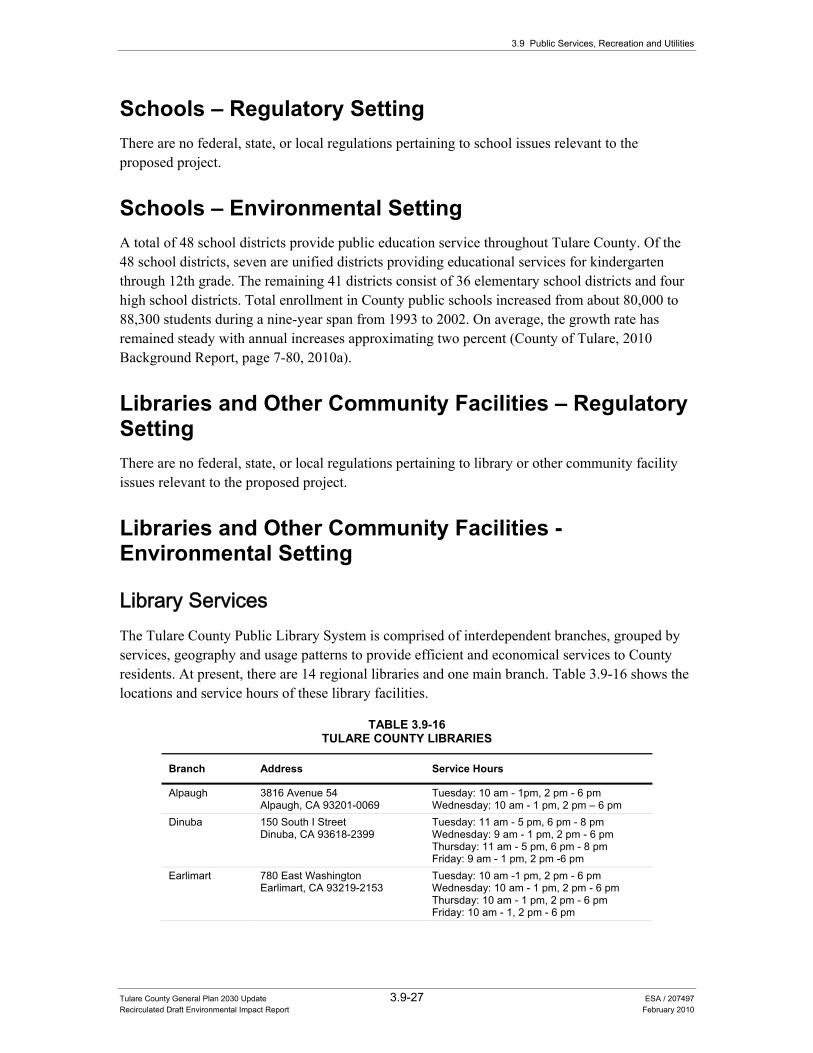
3.9 Public Services, Recreation and Utilities
Tulare County General Plan 2030 Update 3.9-27 ESA / 207497 Recirculated Draft Environmental Impact Report February 2010
Schools – Regulatory Setting There are no federal, state, or local regulations pertaining to school issues relevant to the proposed project.
Schools – Environmental Setting A total of 48 school districts provide public education service throughout Tulare County. Of the 48 school districts, seven are unified districts providing educational services for kindergarten through 12th grade. The remaining 41 districts consist of 36 elementary school districts and four high school districts. Total enrollment in County public schools increased from about 80,000 to 88,300 students during a nine-year span from 1993 to 2002. On average, the growth rate has remained steady with annual increases approximating two percent (County of Tulare, 2010 Background Report, page 7-80, 2010a).
Libraries and Other Community Facilities – Regulatory Setting There are no federal, state, or local regulations pertaining to library or other community facility issues relevant to the proposed project.
Libraries and Other Community Facilities - Environmental Setting
Library Services The Tulare County Public Library System is comprised of interdependent branches, grouped by services, geography and usage patterns to provide efficient and economical services to County residents. At present, there are 14 regional libraries and one main branch. Table 3.9-16 shows the locations and service hours of these library facilities.
TABLE 3.9-16TULARE COUNTY LIBRARIES
Branch Address Service Hours
Alpaugh
3816 Avenue 54 Alpaugh, CA 93201-0069
Tuesday: 10 am - 1pm, 2 pm - 6 pm Wednesday: 10 am - 1 pm, 2 pm – 6 pm
Dinuba
150 South I Street Dinuba, CA 93618-2399
Tuesday: 11 am - 5 pm, 6 pm - 8 pm Wednesday: 9 am - 1 pm, 2 pm - 6 pm Thursday: 11 am - 5 pm, 6 pm - 8 pm Friday: 9 am - 1 pm, 2 pm -6 pm
Earlimart
780 East Washington Earlimart, CA 93219-2153
Tuesday: 10 am -1 pm, 2 pm - 6 pm Wednesday: 10 am - 1 pm, 2 pm - 6 pm Thursday: 10 am - 1 pm, 2 pm - 6 pm Friday: 10 am - 1, 2 pm - 6 pm
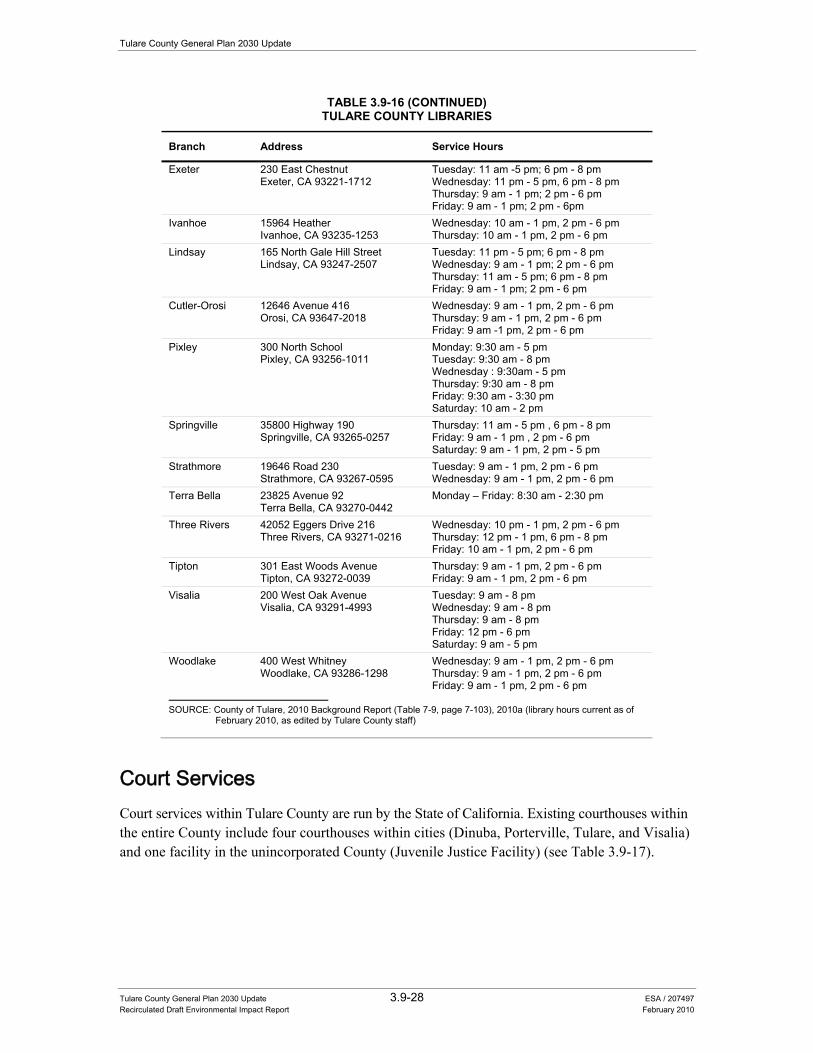
Tulare County General Plan 2030 Update
Tulare County General Plan 2030 Update 3.9-28 ESA / 207497 Recirculated Draft Environmental Impact Report February 2010
TABLE 3.9-16 (CONTINUED)TULARE COUNTY LIBRARIES
Branch Address Service Hours
Exeter
230 East Chestnut Exeter, CA 93221-1712
Tuesday: 11 am -5 pm; 6 pm - 8 pm Wednesday: 11 pm - 5 pm, 6 pm - 8 pm Thursday: 9 am - 1 pm; 2 pm - 6 pm Friday: 9 am - 1 pm; 2 pm - 6pm
Ivanhoe
15964 Heather Ivanhoe, CA 93235-1253
Wednesday: 10 am - 1 pm, 2 pm - 6 pm Thursday: 10 am - 1 pm, 2 pm - 6 pm
Lindsay
165 North Gale Hill Street Lindsay, CA 93247-2507
Tuesday: 11 pm - 5 pm; 6 pm - 8 pm Wednesday: 9 am - 1 pm; 2 pm - 6 pm Thursday: 11 am - 5 pm; 6 pm - 8 pm Friday: 9 am - 1 pm; 2 pm - 6 pm
Cutler-Orosi
12646 Avenue 416 Orosi, CA 93647-2018
Wednesday: 9 am - 1 pm, 2 pm - 6 pm Thursday: 9 am - 1 pm, 2 pm - 6 pm Friday: 9 am -1 pm, 2 pm - 6 pm
Pixley
300 North School Pixley, CA 93256-1011
Monday: 9:30 am - 5 pm Tuesday: 9:30 am - 8 pm Wednesday : 9:30am - 5 pm Thursday: 9:30 am - 8 pm Friday: 9:30 am - 3:30 pm Saturday: 10 am - 2 pm
Springville 35800 Highway 190 Springville, CA 93265-0257
Thursday: 11 am - 5 pm , 6 pm - 8 pm Friday: 9 am - 1 pm , 2 pm - 6 pm Saturday: 9 am - 1 pm, 2 pm - 5 pm
Strathmore 19646 Road 230 Strathmore, CA 93267-0595
Tuesday: 9 am - 1 pm, 2 pm - 6 pm Wednesday: 9 am - 1 pm, 2 pm - 6 pm
Terra Bella 23825 Avenue 92 Terra Bella, CA 93270-0442
Monday – Friday: 8:30 am - 2:30 pm
Three Rivers 42052 Eggers Drive 216 Three Rivers, CA 93271-0216
Wednesday: 10 pm - 1 pm, 2 pm - 6 pm Thursday: 12 pm - 1 pm, 6 pm - 8 pm Friday: 10 am - 1 pm, 2 pm - 6 pm
Tipton 301 East Woods Avenue Tipton, CA 93272-0039
Thursday: 9 am - 1 pm, 2 pm - 6 pm Friday: 9 am - 1 pm, 2 pm - 6 pm
Visalia 200 West Oak Avenue Visalia, CA 93291-4993
Tuesday: 9 am - 8 pm Wednesday: 9 am - 8 pm Thursday: 9 am - 8 pm Friday: 12 pm - 6 pm Saturday: 9 am - 5 pm
Woodlake 400 West Whitney Woodlake, CA 93286-1298
Wednesday: 9 am - 1 pm, 2 pm - 6 pm Thursday: 9 am - 1 pm, 2 pm - 6 pm Friday: 9 am - 1 pm, 2 pm - 6 pm
SOURCE: County of Tulare, 2010 Background Report (Table 7-9, page 7-103), 2010a (library hours current as of
February 2010, as edited by Tulare County staff)
Court Services Court services within Tulare County are run by the State of California. Existing courthouses within the entire County include four courthouses within cities (Dinuba, Porterville, Tulare, and Visalia) and one facility in the unincorporated County (Juvenile Justice Facility) (see Table 3.9-17).
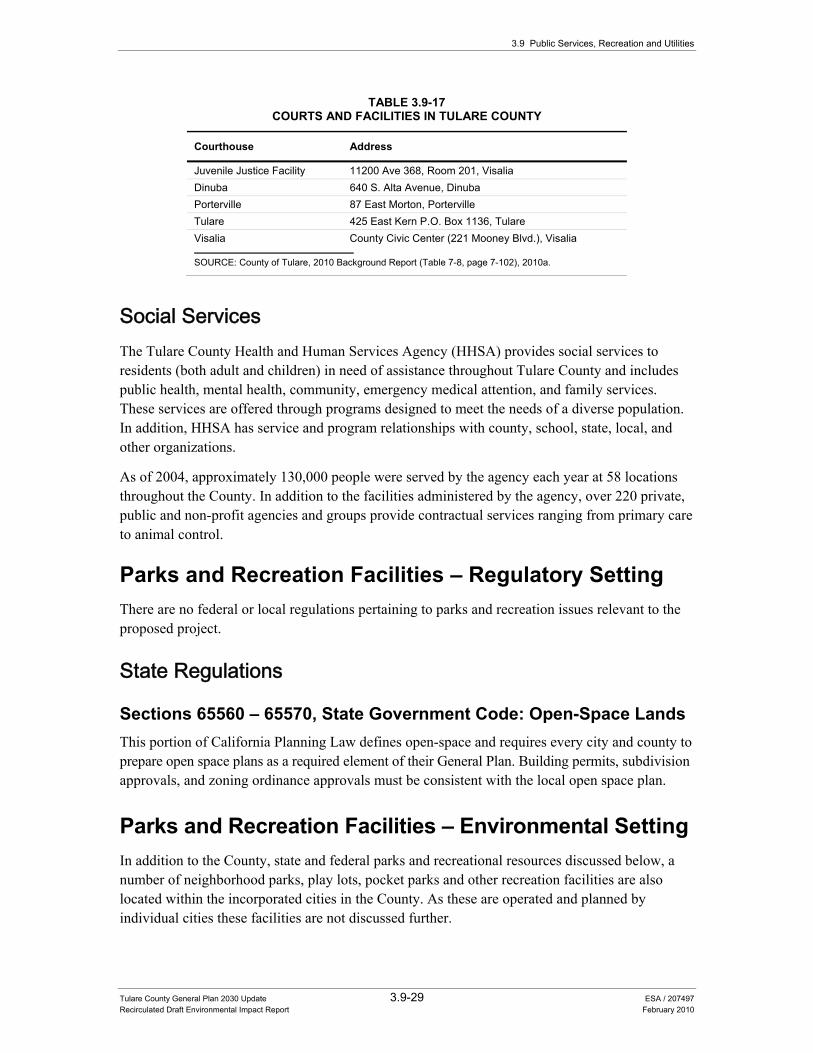
3.9 Public Services, Recreation and Utilities
Tulare County General Plan 2030 Update 3.9-29 ESA / 207497 Recirculated Draft Environmental Impact Report February 2010
TABLE 3.9-17COURTS AND FACILITIES IN TULARE COUNTY
Courthouse Address
Juvenile Justice Facility 11200 Ave 368, Room 201, Visalia Dinuba 640 S. Alta Avenue, Dinuba Porterville 87 East Morton, Porterville Tulare 425 East Kern P.O. Box 1136, Tulare Visalia County Civic Center (221 Mooney Blvd.), Visalia
SOURCE: County of Tulare, 2010 Background Report (Table 7-8, page 7-102), 2010a.
Social Services The Tulare County Health and Human Services Agency (HHSA) provides social services to residents (both adult and children) in need of assistance throughout Tulare County and includes public health, mental health, community, emergency medical attention, and family services. These services are offered through programs designed to meet the needs of a diverse population. In addition, HHSA has service and program relationships with county, school, state, local, and other organizations.
As of 2004, approximately 130,000 people were served by the agency each year at 58 locations throughout the County. In addition to the facilities administered by the agency, over 220 private, public and non-profit agencies and groups provide contractual services ranging from primary care to animal control.
Parks and Recreation Facilities – Regulatory Setting There are no federal or local regulations pertaining to parks and recreation issues relevant to the proposed project.
State Regulations
Sections 65560 – 65570, State Government Code: Open-Space Lands This portion of California Planning Law defines open-space and requires every city and county to prepare open space plans as a required element of their General Plan. Building permits, subdivision approvals, and zoning ordinance approvals must be consistent with the local open space plan.
Parks and Recreation Facilities – Environmental Setting In addition to the County, state and federal parks and recreational resources discussed below, a number of neighborhood parks, play lots, pocket parks and other recreation facilities are also located within the incorporated cities in the County. As these are operated and planned by individual cities these facilities are not discussed further.
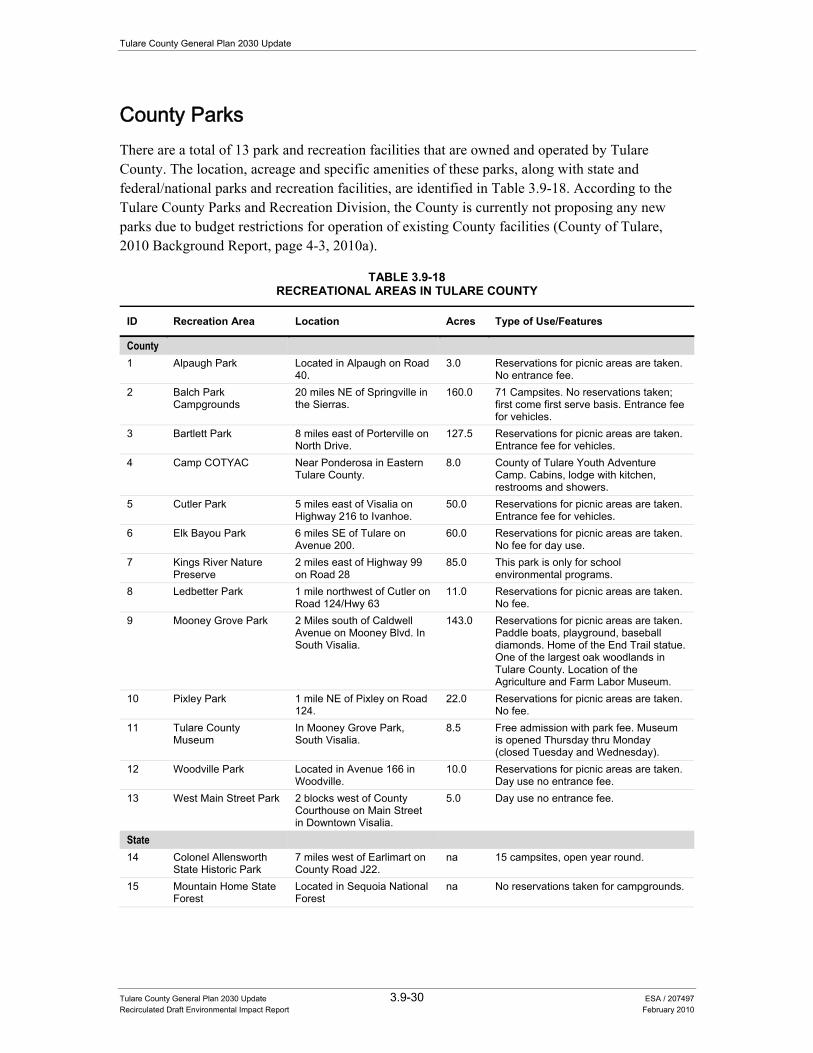
Tulare County General Plan 2030 Update
Tulare County General Plan 2030 Update 3.9-30 ESA / 207497 Recirculated Draft Environmental Impact Report February 2010
County Parks There are a total of 13 park and recreation facilities that are owned and operated by Tulare County. The location, acreage and specific amenities of these parks, along with state and federal/national parks and recreation facilities, are identified in Table 3.9-18. According to the Tulare County Parks and Recreation Division, the County is currently not proposing any new parks due to budget restrictions for operation of existing County facilities (County of Tulare, 2010 Background Report, page 4-3, 2010a).
TABLE 3.9-18RECREATIONAL AREAS IN TULARE COUNTY
ID Recreation Area Location Acres Type of Use/Features
County 1 Alpaugh Park Located in Alpaugh on Road
40. 3.0 Reservations for picnic areas are taken.
No entrance fee. 2 Balch Park
Campgrounds 20 miles NE of Springville in the Sierras.
160.0 71 Campsites. No reservations taken; first come first serve basis. Entrance fee for vehicles.
3 Bartlett Park 8 miles east of Porterville on North Drive.
127.5 Reservations for picnic areas are taken. Entrance fee for vehicles.
4 Camp COTYAC Near Ponderosa in Eastern Tulare County.
8.0 County of Tulare Youth Adventure Camp. Cabins, lodge with kitchen, restrooms and showers.
5 Cutler Park 5 miles east of Visalia on Highway 216 to Ivanhoe.
50.0 Reservations for picnic areas are taken. Entrance fee for vehicles.
6 Elk Bayou Park 6 miles SE of Tulare on Avenue 200.
60.0 Reservations for picnic areas are taken. No fee for day use.
7 Kings River Nature Preserve
2 miles east of Highway 99 on Road 28
85.0 This park is only for school environmental programs.
8 Ledbetter Park 1 mile northwest of Cutler on Road 124/Hwy 63
11.0 Reservations for picnic areas are taken. No fee.
9 Mooney Grove Park 2 Miles south of Caldwell Avenue on Mooney Blvd. In South Visalia.
143.0 Reservations for picnic areas are taken. Paddle boats, playground, baseball diamonds. Home of the End Trail statue. One of the largest oak woodlands in Tulare County. Location of the Agriculture and Farm Labor Museum.
10 Pixley Park 1 mile NE of Pixley on Road 124.
22.0 Reservations for picnic areas are taken. No fee.
11 Tulare County Museum
In Mooney Grove Park, South Visalia.
8.5 Free admission with park fee. Museum is opened Thursday thru Monday (closed Tuesday and Wednesday).
12 Woodville Park Located in Avenue 166 in Woodville.
10.0 Reservations for picnic areas are taken. Day use no entrance fee.
13 West Main Street Park 2 blocks west of County Courthouse on Main Street in Downtown Visalia.
5.0 Day use no entrance fee.
State 14 Colonel Allensworth
State Historic Park 7 miles west of Earlimart on County Road J22.
na 15 campsites, open year round.
15 Mountain Home State Forest
Located in Sequoia National Forest
na No reservations taken for campgrounds.
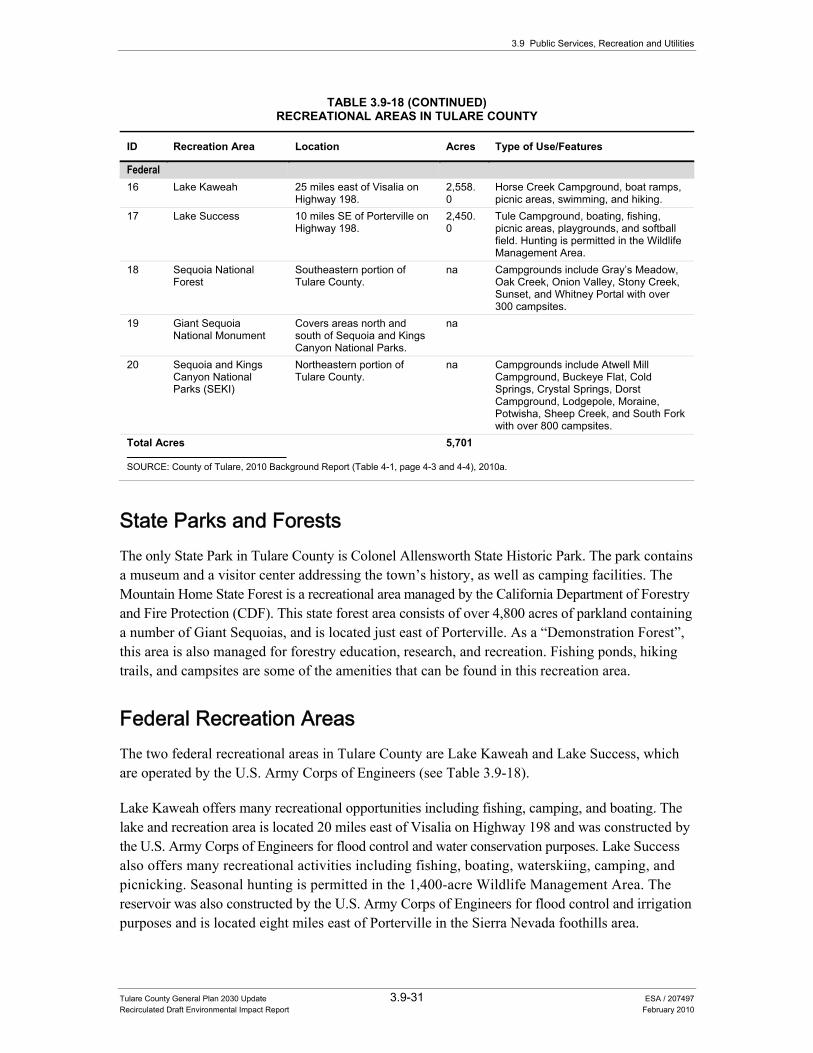
3.9 Public Services, Recreation and Utilities
Tulare County General Plan 2030 Update 3.9-31 ESA / 207497 Recirculated Draft Environmental Impact Report February 2010
TABLE 3.9-18 (CONTINUED)RECREATIONAL AREAS IN TULARE COUNTY
ID Recreation Area Location Acres Type of Use/Features
Federal 16 Lake Kaweah 25 miles east of Visalia on
Highway 198. 2,558.0
Horse Creek Campground, boat ramps, picnic areas, swimming, and hiking.
17 Lake Success 10 miles SE of Porterville on Highway 198.
2,450.0
Tule Campground, boating, fishing, picnic areas, playgrounds, and softball field. Hunting is permitted in the Wildlife Management Area.
18 Sequoia National Forest
Southeastern portion of Tulare County.
na Campgrounds include Gray’s Meadow, Oak Creek, Onion Valley, Stony Creek, Sunset, and Whitney Portal with over 300 campsites.
19 Giant Sequoia National Monument
Covers areas north and south of Sequoia and Kings Canyon National Parks.
na
20 Sequoia and Kings Canyon National Parks (SEKI)
Northeastern portion of Tulare County.
na Campgrounds include Atwell Mill Campground, Buckeye Flat, Cold Springs, Crystal Springs, Dorst Campground, Lodgepole, Moraine, Potwisha, Sheep Creek, and South Fork with over 800 campsites.
Total Acres 5,701
SOURCE: County of Tulare, 2010 Background Report (Table 4-1, page 4-3 and 4-4), 2010a.
State Parks and Forests The only State Park in Tulare County is Colonel Allensworth State Historic Park. The park contains a museum and a visitor center addressing the town’s history, as well as camping facilities. The Mountain Home State Forest is a recreational area managed by the California Department of Forestry and Fire Protection (CDF). This state forest area consists of over 4,800 acres of parkland containing a number of Giant Sequoias, and is located just east of Porterville. As a “Demonstration Forest”, this area is also managed for forestry education, research, and recreation. Fishing ponds, hiking trails, and campsites are some of the amenities that can be found in this recreation area.
Federal Recreation Areas The two federal recreational areas in Tulare County are Lake Kaweah and Lake Success, which are operated by the U.S. Army Corps of Engineers (see Table 3.9-18).
Lake Kaweah offers many recreational opportunities including fishing, camping, and boating. The lake and recreation area is located 20 miles east of Visalia on Highway 198 and was constructed by the U.S. Army Corps of Engineers for flood control and water conservation purposes. Lake Success also offers many recreational activities including fishing, boating, waterskiing, camping, and picnicking. Seasonal hunting is permitted in the 1,400-acre Wildlife Management Area. The reservoir was also constructed by the U.S. Army Corps of Engineers for flood control and irrigation purposes and is located eight miles east of Porterville in the Sierra Nevada foothills area.
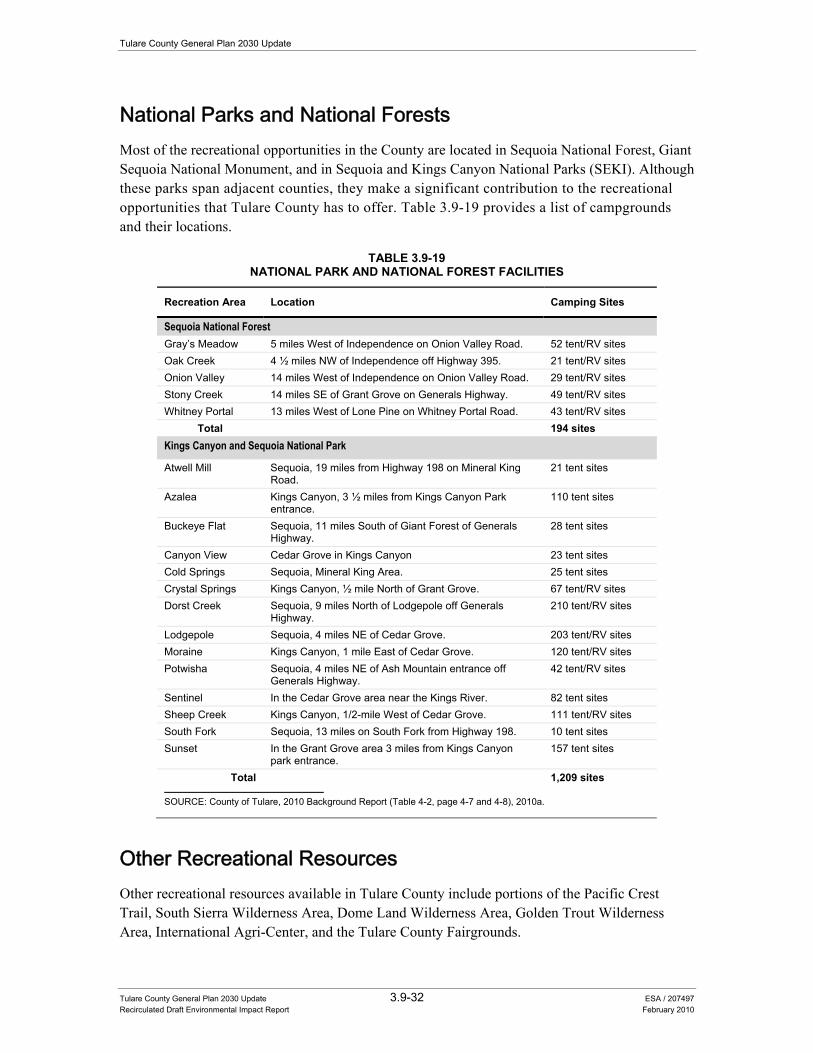
Tulare County General Plan 2030 Update
Tulare County General Plan 2030 Update 3.9-32 ESA / 207497 Recirculated Draft Environmental Impact Report February 2010
National Parks and National Forests Most of the recreational opportunities in the County are located in Sequoia National Forest, Giant Sequoia National Monument, and in Sequoia and Kings Canyon National Parks (SEKI). Although these parks span adjacent counties, they make a significant contribution to the recreational opportunities that Tulare County has to offer. Table 3.9-19 provides a list of campgrounds and their locations.
TABLE 3.9-19NATIONAL PARK AND NATIONAL FOREST FACILITIES
Recreation Area Location Camping Sites
Sequoia National Forest Gray’s Meadow 5 miles West of Independence on Onion Valley Road. 52 tent/RV sites Oak Creek 4 ½ miles NW of Independence off Highway 395. 21 tent/RV sites Onion Valley 14 miles West of Independence on Onion Valley Road. 29 tent/RV sites Stony Creek 14 miles SE of Grant Grove on Generals Highway. 49 tent/RV sites Whitney Portal 13 miles West of Lone Pine on Whitney Portal Road. 43 tent/RV sites
Total 194 sites Kings Canyon and Sequoia National Park
Atwell Mill Sequoia, 19 miles from Highway 198 on Mineral King Road.
21 tent sites
Azalea Kings Canyon, 3 ½ miles from Kings Canyon Park entrance.
110 tent sites
Buckeye Flat Sequoia, 11 miles South of Giant Forest of Generals Highway.
28 tent sites
Canyon View Cedar Grove in Kings Canyon 23 tent sites Cold Springs Sequoia, Mineral King Area. 25 tent sites Crystal Springs Kings Canyon, ½ mile North of Grant Grove. 67 tent/RV sites Dorst Creek Sequoia, 9 miles North of Lodgepole off Generals
Highway. 210 tent/RV sites
Lodgepole Sequoia, 4 miles NE of Cedar Grove. 203 tent/RV sites Moraine Kings Canyon, 1 mile East of Cedar Grove. 120 tent/RV sites Potwisha Sequoia, 4 miles NE of Ash Mountain entrance off
Generals Highway. 42 tent/RV sites
Sentinel In the Cedar Grove area near the Kings River. 82 tent sites Sheep Creek Kings Canyon, 1/2-mile West of Cedar Grove. 111 tent/RV sites South Fork Sequoia, 13 miles on South Fork from Highway 198. 10 tent sites Sunset In the Grant Grove area 3 miles from Kings Canyon
park entrance. 157 tent sites
Total 1,209 sites
SOURCE: County of Tulare, 2010 Background Report (Table 4-2, page 4-7 and 4-8), 2010a.
Other Recreational Resources Other recreational resources available in Tulare County include portions of the Pacific Crest Trail, South Sierra Wilderness Area, Dome Land Wilderness Area, Golden Trout Wilderness Area, International Agri-Center, and the Tulare County Fairgrounds.
3.9 Public Services, Recreation and Utilities
Tulare County General Plan 2030 Update 3.9-33 ESA / 207497 Recirculated Draft Environmental Impact Report February 2010
Impacts and Mitigation Measures
Significance Criteria The significance criteria for this analysis were developed from criteria presented in Appendix G, “Environmental Checklist Form”, of the CEQA Guidelines and based on the professional judgment of the County of Tulare and its consultants. The proposed project would result in a significant impact if it would:
• Require new or expanded water supplies, facilities and entitlements; • Exceed wastewater treatment requirements of the Central Valley Regional Water Quality
Control Board (CVRWQCB); • Require additional wastewater service and treatment capacity to serve the project’s
projected demand in addition to existing commitments; • Produce substantive solid waste that would exceed the permitted capacity of a landfill, or
other solid waste facility, serving the County; • Conflict with federal, state, and local statutes and regulations related to solid waste; • Increase the need or use of existing fire protection or law enforcement facilities such that
substantial physical deterioration of the facility would occur or be accelerated in order to maintain acceptable service ratios, response times;
• Increase the need or use of existing schools, libraries, or other county services such that substantial physical deterioration of the facility would occur or be accelerated;
• Increase the need or use of existing recreation resources, such as parks, such that substantial physical deterioration of the facilities would occur or be accelerated.
Methodology
Water Supply and Facilities Adequate water supply and facilities are essential if the County is to sustain growth and serve projected increases in employment and population. The main purpose of this water utility discussion is to address domestic water infrastructure provided by water districts, and to a lesser degree, by private water companies. Many of these districts are, to a large degree, self governing and not directly subject to County control. The County must coordinate its plans for growth and development with these districts in order to assure that services can be provided on a timely basis to planned future growth areas (i.e., CACUDBs, HDBs, and CACUABs).
Implementation of the proposed project would result in varying levels of growth-related impacts on each entity that provides domestic water service to a particular community. The first step in the impact analysis was to establish significance criteria consistent with CEQA and Tulare County Guidelines that was used as a basis for identifying and evaluating impacts.
Tulare County General Plan 2030 Update
Tulare County General Plan 2030 Update 3.9-34 ESA / 207497 Recirculated Draft Environmental Impact Report February 2010
After establishing the significance criteria, an overview of domestic water service providers in unincorporated communities within the County was compiled (see Environmental Setting, above). This overview first identifies population projections for the proposed project by unincorporated community as well as for all unincorporated areas. Since ongoing implementation and necessary updates of community plans are an important aspect of infrastructure planning and development to support continued growth within a specific community, the most recent update to each community plan was also noted. A qualitative assessment of the existing domestic water infrastructure for each community was also conducted in association with the Tulare County LAFCO MSR evaluation. A MSR evaluation, required under the Cortese-Knox-Hertzberg Governmental Reorganization Act of 2000, requires the County LAFCo to conduct MSRs for specified public agencies, including water and wastewater service providers under their jurisdiction. This qualitative assessment helped identify whether individual water systems are more than adequate, adequate, adequate with concerns, or if there are significant concerns. A brief description of each community water system then provided further available information including existing capacity, planned improvements, and potential constraints.
Following the overview of the community water systems, an overall impact analysis was performed, which identified potentially significant environmental impacts associated with the proposed project along with policies and implementation measures that would serve to mitigate identified impacts. Impacts that were found to be significant and unavoidable were also identified.
Wastewater Similar to water service, adequate sanitary sewer infrastructure is essential if Tulare County is to sustain economic growth and serve projected increases in employment and population. The primary purpose is to address wastewater infrastructure availability provided by government agencies throughout the unincorporated areas of the County. There are many sanitary sewer service providers in Tulare County including Sanitary Districts (SDs), Public Utility Districts (PUDs), Community Service Districts (CSDs), Sewer Maintenance Districts (SMDs), and County Service Areas (CSAs). Like water districts, sanitary sewer districts are, to a large degree, self governing and not directly subject to County control. The County must coordinate its plans for growth and development with these districts in order to assure that services can be provided on a timely basis to future growth areas (i.e., CACUDBs, HDBs, and CACUABs). Implementation of the proposed project would result in varying levels of impacts on each special district which provides sanitary sewer service to a particular community. The first step in the impact analysis was to establish significance criteria consistent with CEQA and Tulare County CEQA Guidelines that was used as a basis for identifying and evaluating impacts.
After establishing the significance criteria, an overview of the sanitary sewer service providers in unincorporated communities within the County was compiled (see Environmental Setting above). This overview includes a summary table that identifies the services provided by each special district (collection or collection and treatment), the current permitted capacity (based upon WDRs issued by the RWQCB and other available data), the current average dry weather flow, the level of treatment provided, and effluent disposal method. A brief description of each community sewer system is then provided which outlines available information including existing capacity, planned improvements, and potential constraints.
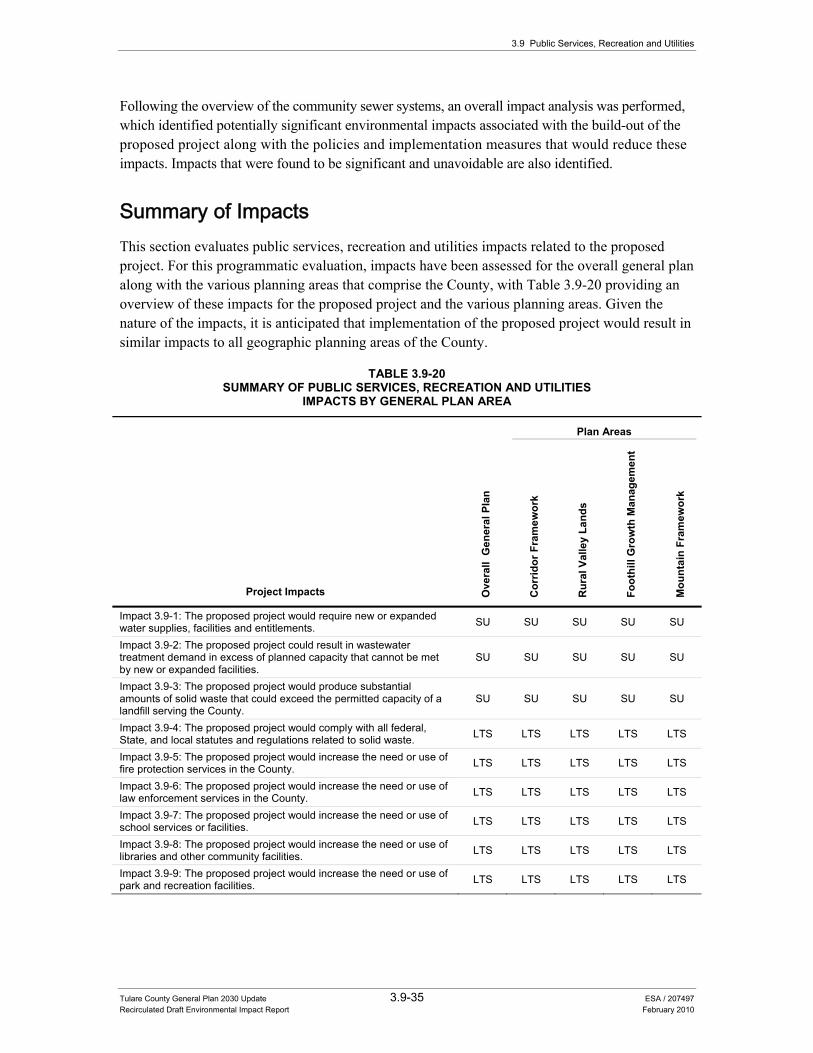
3.9 Public Services, Recreation and Utilities
Tulare County General Plan 2030 Update 3.9-35 ESA / 207497 Recirculated Draft Environmental Impact Report February 2010
Following the overview of the community sewer systems, an overall impact analysis was performed, which identified potentially significant environmental impacts associated with the build-out of the proposed project along with the policies and implementation measures that would reduce these impacts. Impacts that were found to be significant and unavoidable are also identified.
Summary of Impacts This section evaluates public services, recreation and utilities impacts related to the proposed project. For this programmatic evaluation, impacts have been assessed for the overall general plan along with the various planning areas that comprise the County, with Table 3.9-20 providing an overview of these impacts for the proposed project and the various planning areas. Given the nature of the impacts, it is anticipated that implementation of the proposed project would result in similar impacts to all geographic planning areas of the County.
TABLE 3.9-20 SUMMARY OF PUBLIC SERVICES, RECREATION AND UTILITIES
IMPACTS BY GENERAL PLAN AREA
Project Impacts Ove
rall
Gen
eral
Pla
n
Plan Areas
Cor
ridor
Fra
mew
ork
Rur
al V
alle
y La
nds
Foot
hill
Gro
wth
Man
agem
ent
Mou
ntai
n Fr
amew
ork
Impact 3.9-1: The proposed project would require new or expanded water supplies, facilities and entitlements. SU SU SU SU SU
Impact 3.9-2: The proposed project could result in wastewater treatment demand in excess of planned capacity that cannot be met by new or expanded facilities.
SU SU SU SU SU
Impact 3.9-3: The proposed project would produce substantial amounts of solid waste that could exceed the permitted capacity of a landfill serving the County.
SU SU SU SU SU
Impact 3.9-4: The proposed project would comply with all federal, State, and local statutes and regulations related to solid waste. LTS LTS LTS LTS LTS
Impact 3.9-5: The proposed project would increase the need or use of fire protection services in the County. LTS LTS LTS LTS LTS
Impact 3.9-6: The proposed project would increase the need or use of law enforcement services in the County. LTS LTS LTS LTS LTS
Impact 3.9-7: The proposed project would increase the need or use of school services or facilities. LTS LTS LTS LTS LTS
Impact 3.9-8: The proposed project would increase the need or use of libraries and other community facilities. LTS LTS LTS LTS LTS
Impact 3.9-9: The proposed project would increase the need or use of park and recreation facilities. LTS LTS LTS LTS LTS
Tulare County General Plan 2030 Update
Tulare County General Plan 2030 Update 3.9-36 ESA / 207497 Recirculated Draft Environmental Impact Report February 2010
Impacts and Mitigation Measures
Impact 3.9-1: The proposed project would require new or expanded water supplies, facilities and entitlements.
Impact Summary
SU Level of Significance Before Mitigation: Potentially Significant
Required Additional Mitigating Policies and Implementation Measures: No feasible mitigation available
Resultant Level of Significance: Significant and Unavoidable
Impact Analysis
Implementation of the proposed project would result in additional County-wide residential and non-residential land use development. Additional land use development consistent with the proposed project would increase the demand for water and, in some cases result in insufficient water supplies and facilities available to serve some of the unincorporated areas designated for urban development. In other cases, insufficient water treatment and conveyance facilities or water quality issues could result inability of domestic water service providers to meet water demands. Agricultural and other existing and planned land uses will also require reliable water supplies for crops, food processing and other non-domestic use. New or expanded water supplies, facilities and entitlements would be required to provide reliable water supplies for implementation of the proposed project.
Tulare County’s surface water and groundwater supplies are finite but renewable. The long term sustainability of these supplies is dependent upon both natural conditions (e.g. climate, soil permeability, topography and hydrogeology) and water supply management practices aimed at the distribution, conservation, reuse, and enhancement of supplies, including groundwater recharge efforts and implementation of best management practices (BMP). Increases in water demand that would occur subsequent to the proposed project would be determined by future water use and management practices and the intensity and distribution of future land uses. Although both water supply and water demand vary over time, the long term objective is to ensure that these two variables are held in balance, and that demand does not exceed supply for a prolonged period of time.
Domestic Water Supply and Service Facilities Provision of adequate supplies of domestic water in Tulare County is largely the responsibility of public sector water suppliers and private water companies that are not under the jurisdiction of the County. These suppliers must not only maintain supplies and facilities to serve existing water users, but also must expand supplies and facilities needed to accommodate planned population growth within each service area. It is not always possible to assure adequate supplies and facilities fifteen or twenty years in advance of growth due to funding limitations, permitting and environmental entitlements, and competing water users. As a result, this analysis of the adequacy of future water
3.9 Public Services, Recreation and Utilities
Tulare County General Plan 2030 Update 3.9-37 ESA / 207497 Recirculated Draft Environmental Impact Report February 2010
supplies is based upon whether or not there is a reasonable likelihood that public water suppliers will be able to successfully bring future water supplies on line where it is necessary to serve their respective districts.
As indicated in Table 3.9-9, in the unincorporated areas of the County, domestic water supplies are almost entirely derived from groundwater via private groundwater wells and smaller municipalities and special districts that draw their supplies from local groundwater sources. Groundwater recharge, although conducted by a number of individual water districts, is primarily conducted for storage and subsequent use of groundwater for agricultural use rather than for addressing groundwater overdraft and assuring a sustainable basin-wide water supply.
As indicated in Table 3.9-9, three of the twenty unincorporated communities are deemed to have significant concerns with regards to the ability of their respective water supplies to meet future demand. Significant concerns means that they currently lack the capacity to serve projected growth and would be likely to experience significant difficulties in expanding their water treatment and delivery systems to meet projected demand. Ten of the unincorporated communities are deemed to be adequate with concerns, meaning that the provider either has the capacity to serve projected growth or would be likely to solve capacity issues within the time horizon of the proposed project. Some of the service providers have concerns related to infrastructure constraints related to the ability to store and convey available or allocated water to serve the projected demand. In some of the unincorporated communities, the availability of additional water supplies to serve land uses and development consistent with the proposed project would depend on the feasibility of constructing a new water treatment facility that would utilize water from the Kings River supplies of the Alta Irrigation District, introduced into the Friant-Kern Canal by exchange. In some unincorporated communities, there are concerns that adequate water supplies cannot be achieved through sustainable groundwater management, that is, with creating declining groundwater levels, and adversely affecting existing wells. The issue of groundwater overdraft is covered in Section 3.6 “Hydrology, Water Quality and Drainage” (Impact 3.6-2) of this EIR.
However, the ability of the County to better assess the capabilities of water district supplies and facilities has improved in the recent past. Although water districts (including CSDs, IDs and PUDs) and companies are not directly subject to County control, the County has the responsibility and authority to evaluate its plans for growth and development with water and wastewater service providers. Coordination between agencies is conducted in order to assure that adequate services can be provided on a timely basis and over the long-term to planned future growth areas (i.e., CACUDBs, HDBs, and CACUABs).
Over the past 5 to 10 years, water resource and water utility regulations and management practices have been modified by the state legislature, judicial decisions and by water agencies to substantially increase the amount of information about water supply and availability of service facilities. As a result of increasing concerns about water supply and quality issues, the following water resource and utility information has become available or is now required to be provided upon requests for state funding or increased services:
Tulare County General Plan 2030 Update
Tulare County General Plan 2030 Update 3.9-38 ESA / 207497 Recirculated Draft Environmental Impact Report February 2010
• Municipal Service Reviews • Urban Water Management Plans • Integrated Water Resource Management Plans (IRWMP) • Floodplain and drainage information
Evaluation of the adequacy of services by the County is conducted through the RMA development review, comment and (potential) approval process. Once landowner applications for General Plan Amendments, specific plan approvals, rezonings, subdivisions and building permits are found to be complete, a land use application and its background materials are distributed to the applicable federal, state and local agencies for assessment of water and wastewater-related issues. Through the County land use review process, water and wastewater supply deficiencies can be identified and issues resolved prior to project approval.
Regional Water Supply and Water Entitlements Management of water rights within Tulare County continues to evolve in order to more efficiently manage water supply entitlements, and to ensure adequate water supplies continue to be available for agricultural as well as domestic use. As an example of this, the Ivanhoe Irrigation District and the Kaweah Delta Water Conservation District (KDWCD) have entered into an agreement calling for an exchange of resources. The agreement calls for dry year, low flow rights to accrue to the Ivanhoe Irrigation District along with a component of storage behind Terminus Dam. The storage component will allow for better management of water rights of the Ivanhoe Irrigation District. In exchange, the KDWCD would be allocated a portion of the Friant Division CVP contract of the Ivanhoe Irrigation District.
There are also regional efforts to manage water in a sustainable manner, including the 2007 formation of a Tulare County Water Commission designed to examine a wide variety of water issues that impact Tulare County. The Water Commission serves as an advisory body to the Tulare County Board of Supervisors. The Commission is made up of local water experts including engineers, water district managers, elected officials and community activists.
Agencies and organizations within the Upper Kings Basin Water Forum have joined together to manage available water supply under a Kings Basin Integrated Regional Water Management Plan (IRWMP). The participants anticipate implementation of the IRWMP, and other water interests throughout the Tulare Basin are coordinating to conduct similar IRWMP efforts. The principal source of surface water available within the Tule River Watershed is the yield of the Tule River, which is controlled by the operations of Success Reservoir. The Tule River has been declared a fully appropriated stream by the SWRCB. The following text from the report entitled “Water Resources General Plan Update” (Keller, Wegley & Associates, page C-4, 2006) describes water management efforts within the Tule River Watershed:
In an effort to further optimize the management of water within the Tule River Watershed, several of the entities within the Watershed have organized to form the Deer Creek and Tule River Authority. The Authority operates with both a Board of Directors and an Advisory Committee who have joined together to consider the optimization of the available water
3.9 Public Services, Recreation and Utilities
Tulare County General Plan 2030 Update 3.9-39 ESA / 207497 Recirculated Draft Environmental Impact Report February 2010
supplies, both local, as well as imported. Further, they have developed a Groundwater Management Plan which is currently undergoing its first major revision. One of the revisions being considered in the Plan is the inclusion of several of the domestic water purveyors located within the Tule River Watershed. A meeting has been held with the City of Porterville with regard to their potential interest in participation and discussions have taken place with regard to the inclusion of entities such as the Poplar Community Services District, the Tipton Community Services District and the Woodville Public Utility District. The goal is to coordinate, on a regional basis, issues related to both water quality and water quantity.
It is anticipated, over time, that an increase in the number of well head treatment and surface water treatment facilities will develop in order to address the demands associated with both existing population and increased population in unincorporated areas of the County that are located within the Tule River Watershed. Additional benefits are expected to be realized with the implementation of the seismic retrofit of Success Dam and the recent enlargement of Success Reservoir.
Within the Deer Creek/White River watershed, considerable planning is underway relative to development proposals along the Highway 99 corridor. The maintenance of the groundwater reservoir through this area is dependent upon the continued capability to have available surface water sources available for delivery into the area. Natural recharge of the groundwater reservoirs underlying the communities of Earlimart and Pixley is insufficient to sustain the agricultural plantings in the area and the community water systems. This was the case prior to the introduction of the Friant Division CVP water to the subject area. As the outcome of litigation is currently unknown, the development of a response plan to address reduction of surface water deliveries to the area remains to be developed, if necessary. One alternative currently under consideration includes capturing White River runoff upstream of Earlimart for the purpose of recharging the local groundwater aquifer.
Issues Affecting Supplies There are broad issues affecting surface water and groundwater supplies in Tulare County that could have an impact on land-use planning decisions over the 20 year planning period. These issues are regional, statewide and even global in nature. They include: Groundwater Overdraft; the San Joaquin River Restoration Settlement; Population Growth within and near Tulare County; Joint Management of Shared Aquifers; Groundwater Adjudications; Water Transfers and Exchanges; Delta Supply Issues; Climate Change and Variability; and Institutional Changes to the Water Regulatory Framework.
Groundwater Overdraft As described in previous sections, the groundwater basin in the Tulare Lake HR has experienced substantial overdraft. In addition to depletion of water faster than it can be naturally or artificially recharged, declining water tables can impact the basin as a resource. Impacts can include (i) increased pumping expenses, (ii) impacts to water quality, and (iii) subsidence that can in some cases permanently decrease the storage capacity of the aquifer. Thus, overdraft itself can have effects beyond depletion of an existing quantity of water, but also can impact the ability to use the basin as a storage facility. The future value of such storage capacity in California is potentially very high, and should be taken into account in today’s groundwater management. It should also be noted that
Tulare County General Plan 2030 Update
Tulare County General Plan 2030 Update 3.9-40 ESA / 207497 Recirculated Draft Environmental Impact Report February 2010
such impacts are not limited to the portions of the basin directly underlying the water user responsible for the overdraft, but can impact neighboring users as well.
San Joaquin River Restoration Settlement The San Joaquin River Restoration Settlement (SJR Settlement) could lead to decreased flows in the Friant-Kern Canal, resulting in reduced imported surface water supplies to some CVP contractors in Tulare County. One of the main purposes of building the Friant-Kern Canal was to reduce groundwater pumping in the southern San Joaquin Valley. As such, to the extent that these surface supply reductions cannot be compensated for by increased water use efficiency, water users may increase groundwater pumping in the region. The result may be exacerbation of existing declining water tables or initiation of overdraft where an aquifer was previously in a general balanced condition. Though the specific impact to Tulare County CVP contractors from the SJR Settlement is not fully understood (e.g. the SJR Settlement calls for mitigation, but will require substantial time and investment), this analysis cannot speculate on any reduction in surface water resources that would be directly attributable to the SJR Settlement.
Population Growth Within and Near Tulare County Cities in the region, including Visalia, Exeter, Fresno, Bakersfield, and others, rely on groundwater for much or all of their water supply. Increases in urban water demand resulting from population growth may be offset by decreases in other forms of water use (i.e. agricultural water conversion) or increases in water use efficiency. But the nature and extent of agricultural water conversion and water use efficiency measures is not known. Moreover, the hydrogeologic implications of increased localized pumping in groundwater basins (i.e. the potential for cones of depression) are not known. Current regional trends suggest that future urban growth may rely on groundwater supplies to meet demand.
In addition to its increase in demands for groundwater, urbanization may negatively affect groundwater recharge. Urbanization generally reduces the amount of permeable surfaces for percolation of water into underlying basins. Urban planning efforts that include development of permeable surfaces in urban settings, infiltration basins, and other measures for stormwater capture can offset such effects, while providing flood control benefits. Nevertheless, the extent and impacts of future urban growth in Tulare County on natural groundwater recharge is not fully known and should be considered in future planning efforts.
Joint Management of Shared Aquifers Declining groundwater levels adjacent to Tulare County can affect groundwater yields and sustainability in Tulare County. Any development or management in adjacent counties that overly shared sub-basins may adversely impact Tulare County’s ability to manage its own groundwater supplies.
The importance of managing groundwater across political boundaries in this region has been recognized. For example, an Integrated Regional Water Management Plan for the Kings River
3.9 Public Services, Recreation and Utilities
Tulare County General Plan 2030 Update 3.9-41 ESA / 207497 Recirculated Draft Environmental Impact Report February 2010
Basin acknowledges the need for collaboration between Fresno, Kings, and Tulare Counties, and includes recharge efforts to help mitigate for historic overdrafting of the basin.
Groundwater Adjudications Although hydrologic connections between surface water and groundwater are well-documented, California groundwater law is for the most part separate from surface water law. Landowners overlying groundwater aquifers may drill wells and extract water for use on their land, correlative to neighboring landowners. Where surplus groundwater supplies are available, groundwater may be appropriated for use on non-overlying lands. Most agricultural extractions are considered overlying use while urban extractions are generally considered groundwater appropriations.
Conflicts over the nature and extent of groundwater use can result in lawsuits that force adjudication of a groundwater basin. In such cases, a court determines how much groundwater each owner can extract, and enforces limitations on each user’s water allocations. An adjudication process within any of the sub-basins in the County could impact supplies available to manage for existing and anticipated demands.
Water Transfers and Exchanges As patterns of demand change in Tulare County, both spatially and with respect to classes of use, water transfers and exchanges may become increasingly important. As described above, water exchange arrangements already provide some imported water supplies to the County. Short-term transfers negotiated on the spot market currently make up the bulk of water transfers in the state, and can be an effective solution to drought conditions. However, reducing the long-term risk of drought-induced water shortfalls may necessitate the increase of longer-term agreements such as dry-year options that are triggered by specific water conditions. Challenges in water transfers are largely institutional: they include the need for better quantification and monitoring of water rights, the need to document and alleviate third-party impacts, and the need to streamline the water transfer process. Expanding the potential for transfer and exchanges in Tulare County may expand the portfolio of water supplies available to the County – thereby improving overall water supply reliability when some sources decline. In contrast, if locally generated water resources are allowed to transfer outside of the County, an impact to the overall availability and reliability of water for County needs could result.
Delta Supply Issues Delta water issues have broad implications throughout the state of California – even to areas that seem far removed from its locale. In Tulare County, water supplies are derived directly from the San Joaquin River via the Friant-Kern Canal and the Sacramento-San Joaquin Delta via the California Aqueduct and Cross Valley Canal through exchange arrangements with State Water Project water users. Any change to the water distribution systems in the Delta has immediate impact on the reliability of surface deliveries in Tulare County. The complex legal framework links deliveries of San Joaquin water directly to deliveries from the Delta.
Tulare County General Plan 2030 Update
Tulare County General Plan 2030 Update 3.9-42 ESA / 207497 Recirculated Draft Environmental Impact Report February 2010
For instance, the San Joaquin River Basin Exchange Contractors hold contract rights with the United States Bureau of Reclamation to replace the Contractors’ San Joaquin River water rights with water exported from the Sacramento-San Joaquin Delta in order to build and use Friant Dam. If USBR is unable to deliver Delta water to the Exchange Contractors, the Exchange Contractors may call for the water to be released from Friant Dam under the terms of their contracts, assuring their water supply but impacting Friant Division CVP contractors in Tulare County. Accordingly, issues affecting Delta exports have direct impacts on the water supply reliability issues in Tulare County.
Climate Change and Variability Climate change will affect California’s water resources through changes in precipitation patterns and through temperature warming that will change the seasonal patterns of streamflow around which California’s water resources system has been developed. California’s water system depends on the storage of water in three different ways: seasonal snowpack that delays runoff from winter precipitation until later in the water year when demands are higher; surface storage in the form of dams, lakes and reservoirs; and groundwater percolation and storage.
While there is growing consensus among scientists and water managers that climate change will impact water systems, the implications of climate change on these three classes of reservoirs are understood with varying levels of clarity. First, it is understood with high confidence that results of temperature modeling consistently suggest that California’s snowpack will decrease in coming decades, resulting in earlier patterns of runoff.
Second, it is very likely that operations of California’s surface water system will be affected from both the increased difficulty of balancing flood control and water storage, increasing the risk of sub-optimal use of storage. Also, increasing demands may be expected based on higher ET requirements or changed cropping patterns.
Third, there are reasons to expect that climate change may impact groundwater even though the direct climate connection is less well-understood. For example, changes in patterns of recharge are expected to result from changes in runoff patterns. However, the expected runoff change only increases the flow during existing peak recharge periods, so capturing of the additional runoff may be challenging. Climate change may also alter demands for groundwater indirectly, through changes in demand for and supply of surface water.
Institutional Issues Affecting Water Supplies The purpose of this section is to briefly note some institutional factors, including legal, regulatory, and legislative, that may impact both groundwater and surface water supplies in Tulare County over the coming decades.
Potential changes in California Groundwater Law The potential also exists for future legislation to change California’s groundwater regulations, and if so might change the way groundwater is used in Tulare County and elsewhere.
3.9 Public Services, Recreation and Utilities
Tulare County General Plan 2030 Update 3.9-43 ESA / 207497 Recirculated Draft Environmental Impact Report February 2010
Other states have recognized the potential for problems arising from lack of groundwater management. The Arizona legislature, for example, implemented policies in the 1980s and 1990s to quantify rights to use groundwater supplies and to store groundwater. Colorado has integrated rights to pump groundwater with surface water rights doctrine, and has a watershed-based system of regional water governance, as opposed to California’s reliance largely on local decision-making.
The point of describing other legal frameworks is to highlight the fact that there are other ways of managing groundwater and surface water, and to point out that the law evolves over time. If future legislation changes the way groundwater and surface water are regulated in California, it could change the way the resource can be used in Tulare County.
Regulatory Risk The term “regulatory risk” when used by drinking water purveyors refers to the uncertainty in future regulations. For example, risks to the acceptability of drinking water quality in a given water source can be brought on not by changes in the quality of the water supply itself, but by tightening of drinking water standards, or by uncertainty in the impacts of regulation. Trends towards more restrictive water quality standards may continue in future, possibly rendering existing sources of water unusable for some purposes.
Water Supply and Use Legislation In recent years, policies have been introduced to mitigate increasing water use in the State. One pending example is DWR’s 20 x 2020 program, which seeks to reduce per capita urban water use by 20% across the state per the February 2008 directive from the Governor. While legislation is still pending, if passed it will affect demand trajectories. Naturally, urban demands are a function of efficiency and population, so population growth greater than 20% could outstrip potential total demand reduction benefits from efficiency measures, resulting in continued increased demand and groundwater impacts. But the rate of decline may be slowed or reversed by such legislation, at least in the short term. Similarly, there has been increasing attention in California towards connections between land use change and water supply. For example, a water purveyor must prove that it has sufficient water to meet the demands of a development that has 500 units or more. Such trends in water planning and management are likely to continue as the fresh water resources become scarcer.
Summary of Water Supplies The baseline water supplies generally include surface and ground water. Specifically, surface water supplies include imported and local supplies as well as reused surface water (primarily managed wetlands applications). Also, groundwater includes both net groundwater and deep percolation of surface and ground water. Based on the information provided in “Environmental Setting” and the Phase I Water Supply Evaluation (Tully and Young, page 31, 2009), the baseline (2003) supply condition used below under “Integration” assumes the following:
• 1,069,000 surface water; and
• 1,633,000 acre feet of groundwater.
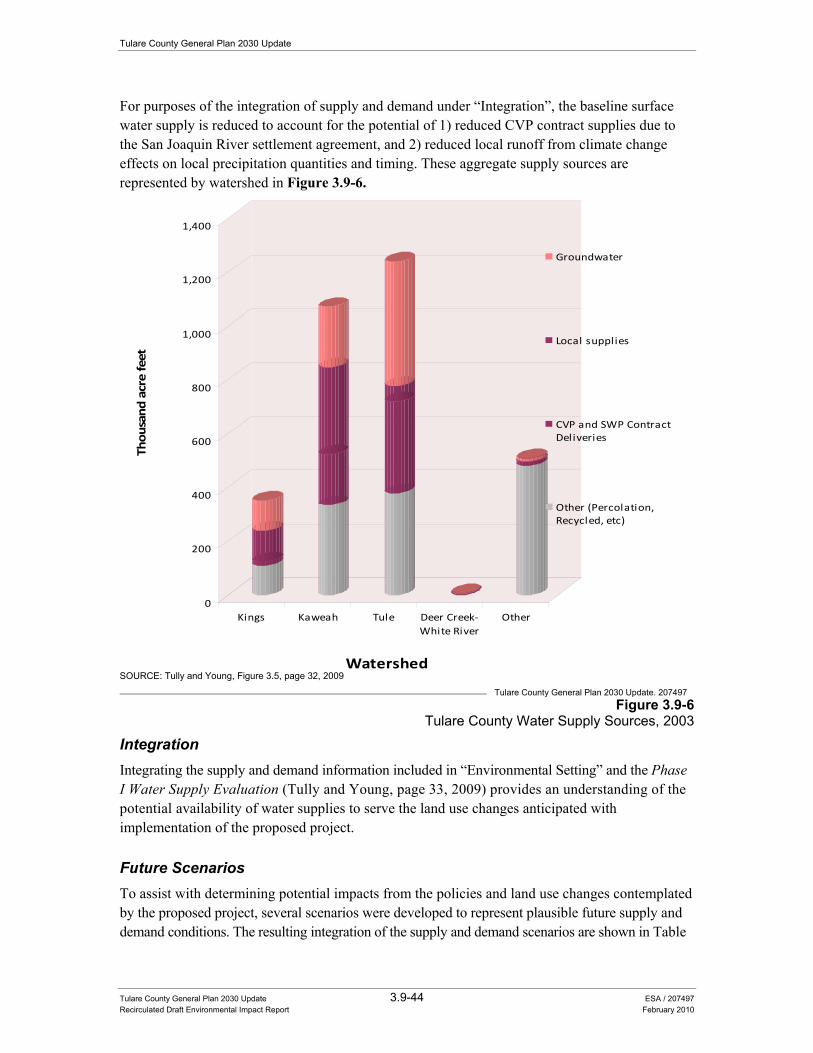
Tulare County General Plan 2030 Update
Tulare County General Plan 2030 Update 3.9-44 ESA / 207497 Recirculated Draft Environmental Impact Report February 2010
For purposes of the integration of supply and demand under “Integration”, the baseline surface water supply is reduced to account for the potential of 1) reduced CVP contract supplies due to the San Joaquin River settlement agreement, and 2) reduced local runoff from climate change effects on local precipitation quantities and timing. These aggregate supply sources are represented by watershed in Figure 3.9-6.
0
200
400
600
800
1,000
1,200
1,400
Thou
sand
acr
e fe
et
Kings Kaweah Tule Deer Creek-White River
Other
Watershed
Groundwater
Local supplies
CVP and SWP ContractDeliveries
Other (Percolation,Recycled, etc)
SOURCE: Tully and Young, Figure 3.5, page 32, 2009 Tulare County General Plan 2030 Update. 207497
Figure 3.9-6 Tulare County Water Supply Sources, 2003
Integration Integrating the supply and demand information included in “Environmental Setting” and the Phase I Water Supply Evaluation (Tully and Young, page 33, 2009) provides an understanding of the potential availability of water supplies to serve the land use changes anticipated with implementation of the proposed project.
Future Scenarios To assist with determining potential impacts from the policies and land use changes contemplated by the proposed project, several scenarios were developed to represent plausible future supply and demand conditions. The resulting integration of the supply and demand scenarios are shown in Table
3.9 Public Services, Recreation and Utilities
Tulare County General Plan 2030 Update 3.9-45 ESA / 207497 Recirculated Draft Environmental Impact Report February 2010
3.9-21. Scenarios were developed using the information from and the Phase I Water Supply Evaluation (Tully and Young, page 33, 2009) and include:
• Scenario 1 – this scenario represents the future baseline demand without conservation and assumes that the surface water and groundwater supplies are available as historically used;
• Scenario 2 – this scenario represents future demands with the conservation savings, with surface and groundwater supplies available as historically used;
• Scenario 3 – this scenario represents future baseline demands without conservation and assumes surface water resources are constrained;
• Scenario 4 – this scenario represents future demands with conservation and assumes surface water resources are constrained.
For each scenario, demand is represented for ‘normal’ and ‘dry’ conditions, where dry conditions reflect a five percent increase in overall demand due to reduced rainfall and increased temperatures, resulting in increased evapotranspiration of agricultural crops and urban landscaping.
The following should be noted when reviewing the representative values in the Table 3.9-21:
• For 1999 and 2002, the DWR water budgets for Tulare County indicated that total groundwater extractions to meet agricultural and urban applied water demands were approximately 1,485,000 and 1,960,000 af/yr, respectively. Under Scenario 3, which reflects 1) no additional savings from conservation, 2) increased demand from dry climatic conditions, and 3) reduced surface water availability, the groundwater extraction would be approximately 1,935,000 acre-feet – within the range of historic use. Though the 2002 groundwater extraction was likely contributing to overdraft of the basin, this scenario of changed land uses contemplated by the proposed project would not be expected to exacerbate conditions historically experienced or anticipated regardless of the proposed project land use changes. Under Scenario 2, conversely, groundwater pumping would be reduced from the 2003 baseline to approximately 1,476,000 acre-feet – also approximately within the range of the historic data.
• Conservation will be an important factor in helping mitigate current overdraft and/or reductions in surface water supplies. Land use changes contemplated by the proposed project provide an opportunity for the County to proactively implement available conservation measures. As demonstrated in Table 3.9-21, conservation can reduce demand by nearly 150,000 acre-feet annually.
• The surface water supply under Scenarios 3 and 4 are arbitrarily assumed to be reduced to 900,000 acre-feet. This reflects an unknown but potential reduction in 1) CVP contract supplies imported into the County due to the San Joaquin River settlement agreement, and 2) reduced local runoff from climate change effects on local precipitation quantities and timing.
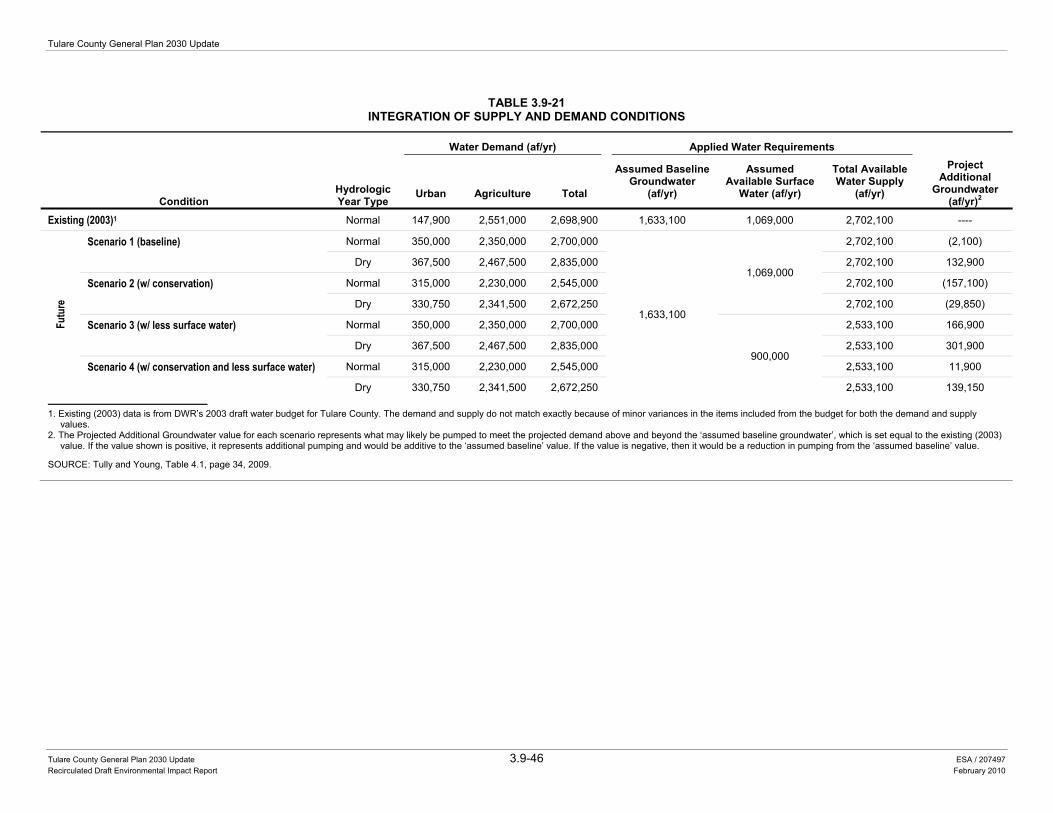
Tulare County General Plan 2030 Update
Tulare County General Plan 2030 Update 3.9-46 ESA / 207497 Recirculated Draft Environmental Impact Report February 2010
TABLE 3.9-21INTEGRATION OF SUPPLY AND DEMAND CONDITIONS
Condition Hydrologic Year Type
Water Demand (af/yr) Applied Water Requirements Project
Additional Groundwater
(af/yr)2 Urban Agriculture Total
Assumed Baseline Groundwater
(af/yr)
Assumed Available Surface
Water (af/yr)
Total Available Water Supply
(af/yr)
Existing (2003)1 Normal 147,900 2,551,000 2,698,900 1,633,100 1,069,000 2,702,100 ----
Futu
re
Scenario 1 (baseline) Normal 350,000 2,350,000 2,700,000
1,633,100
1,069,000
2,702,100 (2,100)
Dry 367,500 2,467,500 2,835,000 2,702,100 132,900
Scenario 2 (w/ conservation) Normal 315,000 2,230,000 2,545,000 2,702,100 (157,100)
Dry 330,750 2,341,500 2,672,250 2,702,100 (29,850)
Scenario 3 (w/ less surface water) Normal 350,000 2,350,000 2,700,000
900,000
2,533,100 166,900
Dry 367,500 2,467,500 2,835,000 2,533,100 301,900
Scenario 4 (w/ conservation and less surface water) Normal 315,000 2,230,000 2,545,000 2,533,100 11,900
Dry 330,750 2,341,500 2,672,250 2,533,100 139,150
1. Existing (2003) data is from DWR’s 2003 draft water budget for Tulare County. The demand and supply do not match exactly because of minor variances in the items included from the budget for both the demand and supply values.
2. The Projected Additional Groundwater value for each scenario represents what may likely be pumped to meet the projected demand above and beyond the ‘assumed baseline groundwater’, which is set equal to the existing (2003) value. If the value shown is positive, it represents additional pumping and would be additive to the ‘assumed baseline’ value. If the value is negative, then it would be a reduction in pumping from the ‘assumed baseline’ value.
SOURCE: Tully and Young, Table 4.1, page 34, 2009.
3.9 Public Services, Recreation and Utilities
Tulare County General Plan 2030 Update 3.9-47 ESA / 207497 Recirculated Draft Environmental Impact Report February 2010
Conclusion As demonstrated in this analysis, the actions contemplated in the proposed project are not anticipated to cause overall demand in the County to vary from within the range of demands seen historically and documented by DWR – a range of about 2,600,000 acre-feet to 2,850,000 acre-feet.
However, the shift in land use from irrigated agriculture to mixed-use urban development will likely result in the following two potential impacts:
• Urban uses will predominantly seek to be served by pumping groundwater on lands that may have previously been served with surface water. Though a few instances of treated surface water for urban needs are in place or being discussed, the vast majority of current urban needs in the County are met with groundwater. Thus, there may be an increase in groundwater extraction to serve the expanded urban needs. [Note that if irrigated agricultural lands displaced by the new urban demand were previously using groundwater, there is theoretically no change in the amount of groundwater extraction. Only in cases where lands were previously served with surface water would there be a likely increase in the total extraction of groundwater.]
o As discussed in the “Environmental Setting” and the Phase I Water Supply Evaluation (Tully and Young, page 35, 2009), there is also a likelihood of increased groundwater extraction regardless of adoption of the proposed project. This increase, though impacting the County, is not an impact caused by the actions contemplated by the proposed project.
• Because new or existing urban purveyors will be serving these new urban demands with groundwater, a potentially different supply source than that used by agricultural purveyors on the same land, urban purveyors will be expanding water supply entitlements to the groundwater.
Overall, it is important to note that Tulare County lacks a comprehensive water supply assessment and approach, and implementation strategy to address complex, regional water supply issues. Due to the fact that water supply sources are not always contained within jurisdictional boundaries, cooperation and coordination between all relevant regulatory agencies, municipalities, public and private water suppliers, and other stakeholders is critical. The County Water Commission can provide coordination and implementation functions. Policies included as part of the proposed project that would minimize this impact are summarized below by general plan element.
Policies PF-2.3, PF-2.4, PF-2.5, PF-2.6, and PF-3.3 would require the County to work with domestic water service providers as a part of the community and hamlet planning process. As a part of the community and hamlet planning process, the communities’ short- and long-term ability to provide necessary urban services is to be considered, which requires close coordination between the County and special districts that provide urban services (such as domestic water) to the respective communities.
Policies PF-6.5, WR-1.1, WR-3.2, WR-3.4, WR-3.12 and WR-3.13 encourage the County to participate in regional planning efforts to address issues related to the management of water resources within the County. These policies support coordination with adjacent counties and their cities,
Tulare County General Plan 2030 Update
Tulare County General Plan 2030 Update 3.9-48 ESA / 207497 Recirculated Draft Environmental Impact Report February 2010
regional councils of governments, state agencies, local water agencies, and management agencies, to ensure coordination on infrastructure efforts and funding in the region. The policies also support cooperation with water agencies on managing groundwater resources within the County through ordinances, project approvals, agreements, and groundwater management planning and implementation, to ensure an adequate, safe, and economically viable groundwater supply for existing and future development within the County. The policies support continued efforts to work with neighboring counties to implement joint water projects, such as a cross valley canal.
Policies ED-1.6, PFS-1.7, PFS-1.8, PFS-1.14 and PFS-1.16 encourage the County to pursue partnerships with water purveyors to work towards the development of public facilities and infrastructure improvements that benefit the community. Partnering with special districts is an important aspect of the provision of adequate public facilities, including identification of funding mechanisms to construct and maintain infrastructure improvements.
Policies WR-1.3, WR-3.1, WR-3.9, WR-3.11, and PFS-2.1 restrict the export of water to areas outside of the County, and encourage the development of additional water sources to ensure that there is “no net loss” of water for the County. Under these policies, the County would encourage the identification of additional water sources through the expansion of water storage reservoirs, development of groundwater banking, and promotion of water conservation programs. The County would also monitor actions taken at the federal and state levels which impact water resources in order to evaluate the effect that such actions may have on the County’s resources.
Policies WR-3.5, WR-3.6, WR-3.7, and WR-3.8 encourage water conservation through the use of drought tolerant landscaping, educational programs aimed at reducing water consumption on agricultural lands, and encouraging other public and private entities to develop educational programs targeting water conservation awareness and domestic use. Under Policy WR-3.7 the County would develop and emergency water conservation plan for County operated water systems to identify appropriate conservation policies that can be implemented during times of water shortages caused by drought, or other circumstances.
Current procedures and policies and programs contained in the proposed project would strive to secure adequate water supplies for unincorporated areas within the County that are designated for urban development through water use assessments and monitoring, determination of safe water yields, conservation, and reclamation and reuse. These policies and programs would reduce the onset and severity of water supply deficiencies which are presently not quantifiable. However, sufficient water supplies may not be available at this time to serve all future growth consistent with the proposed project within some of the unincorporated communities. New or expanded entitlements or facilities as previously described may be required.
As development proceeds over time, public water suppliers are afforded the opportunity to review projects within their respective service area to determine whether or not water supplies are available. At any time that sufficient water is not available, the supplier can notify the County of that fact and provide the basis for County denial of a project or projects until additional water supplies are available.
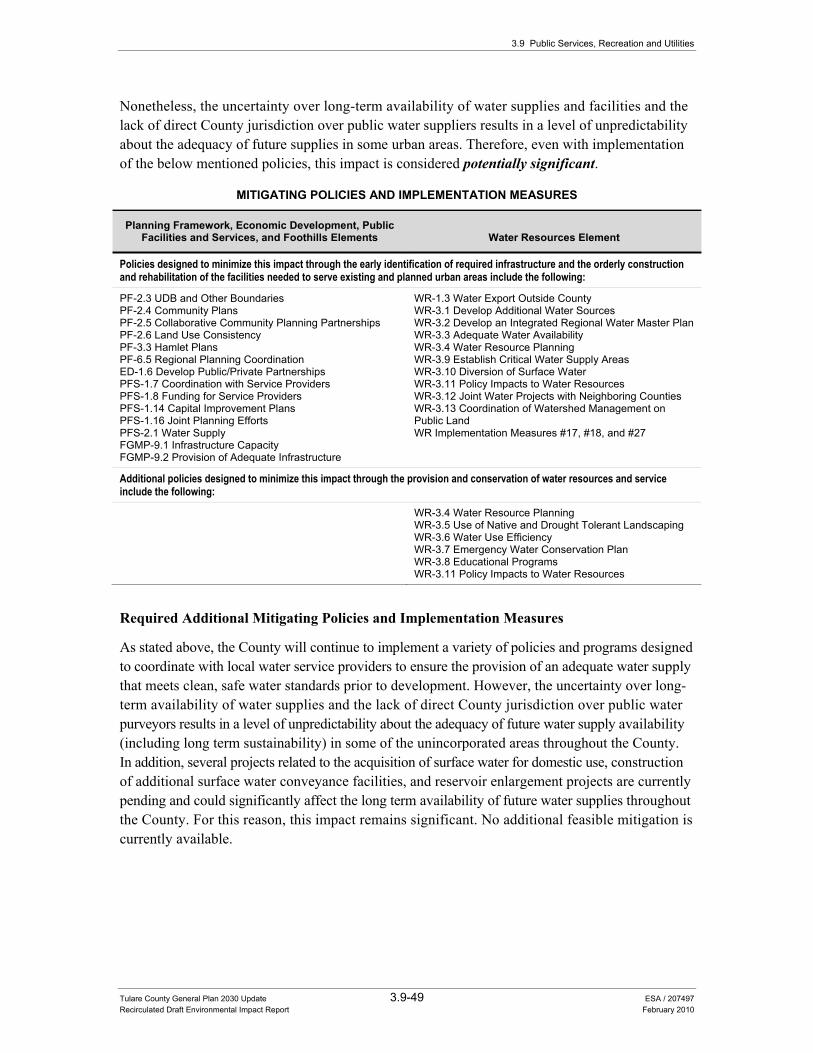
3.9 Public Services, Recreation and Utilities
Tulare County General Plan 2030 Update 3.9-49 ESA / 207497 Recirculated Draft Environmental Impact Report February 2010
Nonetheless, the uncertainty over long-term availability of water supplies and facilities and the lack of direct County jurisdiction over public water suppliers results in a level of unpredictability about the adequacy of future supplies in some urban areas. Therefore, even with implementation of the below mentioned policies, this impact is considered potentially significant.
MITIGATING POLICIES AND IMPLEMENTATION MEASURES
Planning Framework, Economic Development, Public Facilities and Services, and Foothills Elements Water Resources Element
Policies designed to minimize this impact through the early identification of required infrastructure and the orderly construction and rehabilitation of the facilities needed to serve existing and planned urban areas include the following:
PF-2.3 UDB and Other Boundaries PF-2.4 Community Plans PF-2.5 Collaborative Community Planning Partnerships PF-2.6 Land Use Consistency PF-3.3 Hamlet Plans PF-6.5 Regional Planning Coordination ED-1.6 Develop Public/Private Partnerships PFS-1.7 Coordination with Service Providers PFS-1.8 Funding for Service Providers PFS-1.14 Capital Improvement Plans PFS-1.16 Joint Planning Efforts PFS-2.1 Water Supply FGMP-9.1 Infrastructure Capacity FGMP-9.2 Provision of Adequate Infrastructure
WR-1.3 Water Export Outside County WR-3.1 Develop Additional Water Sources WR-3.2 Develop an Integrated Regional Water Master Plan WR-3.3 Adequate Water Availability WR-3.4 Water Resource Planning WR-3.9 Establish Critical Water Supply Areas WR-3.10 Diversion of Surface Water WR-3.11 Policy Impacts to Water Resources WR-3.12 Joint Water Projects with Neighboring Counties WR-3.13 Coordination of Watershed Management on Public Land WR Implementation Measures #17, #18, and #27
Additional policies designed to minimize this impact through the provision and conservation of water resources and service include the following:
WR-3.4 Water Resource Planning WR-3.5 Use of Native and Drought Tolerant Landscaping WR-3.6 Water Use Efficiency WR-3.7 Emergency Water Conservation Plan WR-3.8 Educational Programs WR-3.11 Policy Impacts to Water Resources
Required Additional Mitigating Policies and Implementation Measures
As stated above, the County will continue to implement a variety of policies and programs designed to coordinate with local water service providers to ensure the provision of an adequate water supply that meets clean, safe water standards prior to development. However, the uncertainty over long-term availability of water supplies and the lack of direct County jurisdiction over public water purveyors results in a level of unpredictability about the adequacy of future water supply availability (including long term sustainability) in some of the unincorporated areas throughout the County. In addition, several projects related to the acquisition of surface water for domestic use, construction of additional surface water conveyance facilities, and reservoir enlargement projects are currently pending and could significantly affect the long term availability of future water supplies throughout the County. For this reason, this impact remains significant. No additional feasible mitigation is currently available.
Tulare County General Plan 2030 Update
Tulare County General Plan 2030 Update 3.9-50 ESA / 207497 Recirculated Draft Environmental Impact Report February 2010
Significance after Implementation of Mitigation for Impact 3.9-1
As state above, no additional technologically or economically feasible mitigation measures are currently available to reduce impacts related to water supplies, facilities and entitlements to a less than significant level. Consequently, this impact is considered significant and unavoidable.
Impact 3.9-2: The proposed project could result in wastewater treatment demand in excess of planned capacity that cannot be met by new or expanded facilities.
Impact Summary
SU Level of Significance Before Mitigation: Potentially Significant
Required Additional Mitigating Policies and Implementation Measures: No feasible mitigation available
Resultant Level of Significance: Significant and Unavoidable
Impact Analysis
Provision of adequate wastewater system capacity in urban areas of Tulare County is largely the responsibility of public agencies that are not directly under the jurisdiction of the County. These agencies must not only maintain their systems and facilities to serve existing users, but must also expand as needed to accommodate projected growth within each service area. It is not always possible to assure adequate capacity and facilities fifteen or twenty years in advance of growth due to funding limitations, permitting requirements, and environmental entitlements. For this reason, this analysis focuses on how much capacity will be needed in order to support projected growth subsequent to the proposed project for each wastewater treatment provider in the unincorporated areas of the County. For unincorporated areas not identified as “communities” within the General Plan, an assumed growth estimate of 2% across the board is applied for capacity analysis purposes. Wastewater capacity needs by wastewater treatment provider are summarized in Table 3.9-22.
As indicated in Table 3.9-22, several of the wastewater treatment providers within the unincorporated areas of the County would need to increase the capacity of their WWTFs in order to accommodate projected growth resulting from the proposed project. This is not surprising, as previously mentioned, it is often difficult for small service provider’s to provide capacity for growth projected out for twenty years or more due to funding limitations and other constraints. For this reason, many service providers are unable to provide additional capacity for future growth until such time that developments are proposed and can assist financially to upgrade the infrastructure (often through some type of reimbursement agreement with the respective service provider). As indicated in Table 3.9-22, six wastewater treatment providers have been identified as having clear capacity to accommodate projected growth. In addition to the unincorporated communities that have clear capacity to accommodate projected growth, it is also likely that the eight incorporated cities within the County would have capacity to accommodate projected growth due to advanced planning and
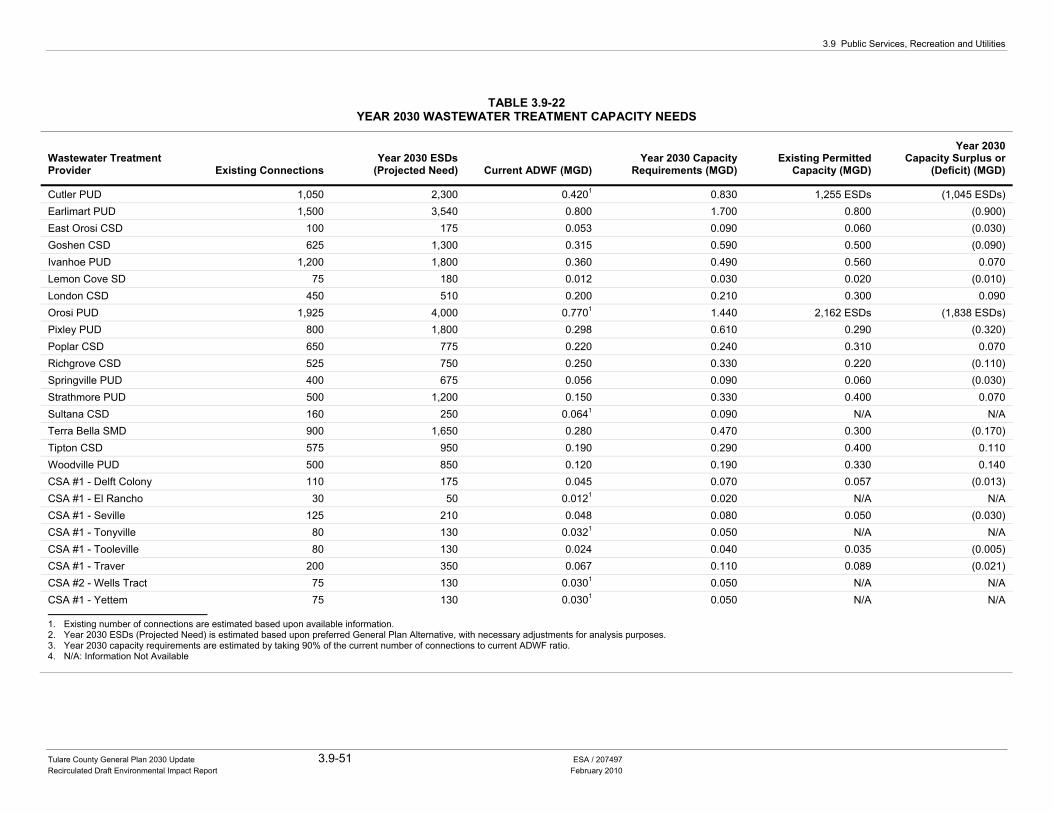
3.9 Public Services, Recreation and Utilities
Tulare County General Plan 2030 Update 3.9-51 ESA / 207497 Recirculated Draft Environmental Impact Report February 2010
TABLE 3.9-22YEAR 2030 WASTEWATER TREATMENT CAPACITY NEEDS
Wastewater Treatment Provider Existing Connections
Year 2030 ESDs (Projected Need) Current ADWF (MGD)
Year 2030 Capacity Requirements (MGD)
Existing Permitted Capacity (MGD)
Year 2030 Capacity Surplus or
(Deficit) (MGD)
Cutler PUD 1,050 2,300 0.4201 0.830 1,255 ESDs (1,045 ESDs) Earlimart PUD 1,500 3,540 0.800 1.700 0.800 (0.900) East Orosi CSD 100 175 0.053 0.090 0.060 (0.030) Goshen CSD 625 1,300 0.315 0.590 0.500 (0.090) Ivanhoe PUD 1,200 1,800 0.360 0.490 0.560 0.070 Lemon Cove SD 75 180 0.012 0.030 0.020 (0.010) London CSD 450 510 0.200 0.210 0.300 0.090 Orosi PUD 1,925 4,000 0.7701 1.440 2,162 ESDs (1,838 ESDs) Pixley PUD 800 1,800 0.298 0.610 0.290 (0.320) Poplar CSD 650 775 0.220 0.240 0.310 0.070 Richgrove CSD 525 750 0.250 0.330 0.220 (0.110) Springville PUD 400 675 0.056 0.090 0.060 (0.030) Strathmore PUD 500 1,200 0.150 0.330 0.400 0.070 Sultana CSD 160 250 0.0641 0.090 N/A N/A Terra Bella SMD 900 1,650 0.280 0.470 0.300 (0.170) Tipton CSD 575 950 0.190 0.290 0.400 0.110 Woodville PUD 500 850 0.120 0.190 0.330 0.140 CSA #1 - Delft Colony 110 175 0.045 0.070 0.057 (0.013) CSA #1 - El Rancho 30 50 0.0121 0.020 N/A N/A CSA #1 - Seville 125 210 0.048 0.080 0.050 (0.030) CSA #1 - Tonyville 80 130 0.0321 0.050 N/A N/A CSA #1 - Tooleville 80 130 0.024 0.040 0.035 (0.005) CSA #1 - Traver 200 350 0.067 0.110 0.089 (0.021) CSA #2 - Wells Tract 75 130 0.0301 0.050 N/A N/A CSA #1 - Yettem 75 130 0.0301 0.050 N/A N/A
1. Existing number of connections are estimated based upon available information. 2. Year 2030 ESDs (Projected Need) is estimated based upon preferred General Plan Alternative, with necessary adjustments for analysis purposes. 3. Year 2030 capacity requirements are estimated by taking 90% of the current number of connections to current ADWF ratio. 4. N/A: Information Not Available
Tulare County General Plan 2030 Update
Tulare County General Plan 2030 Update 3.9-52 ESA / 207497 Recirculated Draft Environmental Impact Report February 2010
capital improvement financing capabilities. It should also be noted that although this analysis is based upon the currently permitted capacity of each wastewater treatment provider, many service providers have projects that are currently in the planning, implementation, or completion stages that would increase wastewater treatment capacities. Some of these projects are identified below.
• Cutler-Orosi Joint WWTF capacity and operational improvements (underway) • Earlimart WWTF improvements increased capacity to 1.24 MGD (completed) • London WWTF improvements increased capacity to 0.50 MGD (completed) • Pixley WWTF improvements to increase capacity to 0.50 MGD (pending funding
availability) • Richgrove WWTF improvements to increase capacity and bring plant into compliance
with the RWQCB (planning stages, pending funding availability) • Springville WWTF wastewater reclamation project that would increase effluent disposal
capacity (planning stages, pending funding availability) • Evaluation of feasibility to construct a regional WWTF that would serve the communities
of Earlimart, Pixley, and Tipton (preparation of feasibility study underway) • New Package WWTF for the Traver community (pilot project, grant funding awarded,
project planning underway)
The above are known projects in Tulare County that are currently planned, being implemented, or have recently been completed. It is anticipated that those projects which have been recently completed and resulted in increased capacity will lead to the issuance of a new permit by the RWQCB.
The proposed project includes several policies that would reduce sanitary sewer impacts by addressing the service providers’ ability to meet increase capacity requirements resulting from projected growth during the planning process. Policies contained in the Planning Framework, Water Resources, and Public Services and Utilities Elements that would reduce impacts relating to increased sanitary sewer demands are listed below by general plan element.
Policies PF-1.4, PF-2.4, PF-2.5, PF-2.6, PF-2.7, and PF-3.3 would require the County to work with special districts that provide urban services as a part of the community and hamlet planning process. As a part of the community and hamlet planning process, the communities short and long term ability to provide necessary urban services is to be considered, which requires close coordination between the County, and special districts that provide urban services to the respective communities. These policies would ensure that development does not occur unless adequate infrastructure is available or can be made available for that area and that there are adequate provisions for long term maintenance. Policy PF-6.4 requires that CACUDBs be considered as the same area for which water and sewer system planning is to occur.
Policy WR-1.6 would encourage the use of treated wastewater and household grey water for irrigation of agricultural lands, recreation and open space areas, and large landscaped areas. These efforts, to be coordinated with wastewater treatment providers throughout the County, would not only reduce demand for groundwater, but would also to some degree, increase the effluent disposal capacity of wastewater treatment facilities without the need to acquire additional land for disposal.
3.9 Public Services, Recreation and Utilities
Tulare County General Plan 2030 Update 3.9-53 ESA / 207497 Recirculated Draft Environmental Impact Report February 2010
Policies WR-3.7 and WR-3.8 would reduce future wastewater demands through the development of an emergency water conservation plan and encouraging the development of educational programs (in conjunction with water purveyors) geared at promoting water conservation. These policies would require the County to incorporate provisions for the use of reclaimed water, water conserving appliances, drought tolerant landscaping, and other water conservation techniques into the County’s building, zoning, and subdivision ordinances.
Policy PFS-1.3 requires the County to review development proposals with regard to their impacts on infrastructure and requires that new development pay its proportionate share of the costs of infrastructure improvements required to serve the project to the extent permitted by State law. At any time that sufficient capacity is not available, the supplier can notify the County of that fact and provide the basis for County denial of a project or projects until service capacity is available.
Policies PFS-1.5, PFS-1.6, PFS-1.7, and PFS-1.8 relate to the implementation of programs and/or procedures to ensure that funding mechanisms necessary to adequately cover the costs related to planning, capital improvements, maintenance, and operations of necessary public facilities and services are in place, whether provided by the County or another entity. These policies require close coordination between the County and special districts throughout the County that are charged with the responsibility of providing urban services. These policies would require the County to develop and adopt an impact fee program for new development to ensure the provision, operation, and on going maintenance of County owned public facilities and services. Policy PFS-1.2 requires the County to prepare capital improvement programs for all County-owned and operated facilities and services to ensure consistency with the proposed project in order to maintain adequate levels of service to existing users. Policy PFS-3.7 encourages cooperation between the County and special districts when applying for State and Federal funding for major wastewater related expansions/upgrades when the improvements promote an efficient solution to wastewater treatment needs for the area and County.
Policy PFS-3.2 would ensure that the intensity and timing of proposed development is consistent with the availability of adequate wastewater treatment and disposal capacity. Policy PFS-3.3 would require that new development within a wastewater provider service area or zone of benefit connect to the wastewater system and pay appropriate fees for rights to capacity. The County may grant exceptions in extraordinary circumstances, but in these cases, the development would be required to connect to the wastewater system when capacity becomes available.
In conclusion, current project review procedures and policies and programs of the proposed project would strive to secure adequate wastewater services for unincorporated urban areas of the County through expansion and/or improvement of collection, treatment, and disposal systems as necessary to accommodate planned growth. These policies and programs would improve the likelihood that the increased demand for these services would be met, but their success depends upon the decisions of service providers who are not under jurisdiction of the County.
Overall, the uncertainty over long-term capacity of some service providers as previously noted and the lack of direct County jurisdiction over many of the wastewater service providers results in a level of unpredictability about the adequacy of capacity in some urban areas. Consequently, even with implementation of the below mentioned policies, this impact is considered potentially significant.
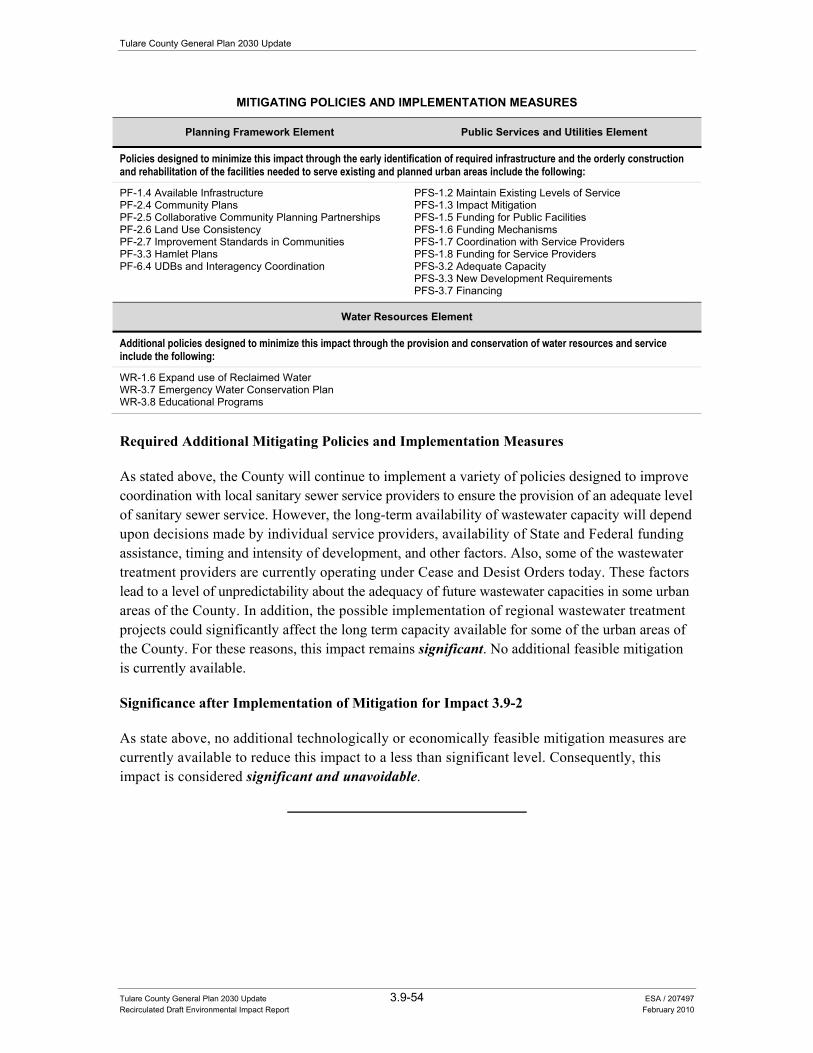
Tulare County General Plan 2030 Update
Tulare County General Plan 2030 Update 3.9-54 ESA / 207497 Recirculated Draft Environmental Impact Report February 2010
MITIGATING POLICIES AND IMPLEMENTATION MEASURES
Planning Framework Element Public Services and Utilities Element
Policies designed to minimize this impact through the early identification of required infrastructure and the orderly construction and rehabilitation of the facilities needed to serve existing and planned urban areas include the following:
PF-1.4 Available Infrastructure PF-2.4 Community Plans PF-2.5 Collaborative Community Planning Partnerships PF-2.6 Land Use Consistency PF-2.7 Improvement Standards in Communities PF-3.3 Hamlet Plans PF-6.4 UDBs and Interagency Coordination
PFS-1.2 Maintain Existing Levels of Service PFS-1.3 Impact Mitigation PFS-1.5 Funding for Public Facilities PFS-1.6 Funding Mechanisms PFS-1.7 Coordination with Service Providers PFS-1.8 Funding for Service Providers PFS-3.2 Adequate Capacity PFS-3.3 New Development Requirements PFS-3.7 Financing
Water Resources Element
Additional policies designed to minimize this impact through the provision and conservation of water resources and service include the following:
WR-1.6 Expand use of Reclaimed Water WR-3.7 Emergency Water Conservation Plan WR-3.8 Educational Programs Required Additional Mitigating Policies and Implementation Measures
As stated above, the County will continue to implement a variety of policies designed to improve coordination with local sanitary sewer service providers to ensure the provision of an adequate level of sanitary sewer service. However, the long-term availability of wastewater capacity will depend upon decisions made by individual service providers, availability of State and Federal funding assistance, timing and intensity of development, and other factors. Also, some of the wastewater treatment providers are currently operating under Cease and Desist Orders today. These factors lead to a level of unpredictability about the adequacy of future wastewater capacities in some urban areas of the County. In addition, the possible implementation of regional wastewater treatment projects could significantly affect the long term capacity available for some of the urban areas of the County. For these reasons, this impact remains significant. No additional feasible mitigation is currently available.
Significance after Implementation of Mitigation for Impact 3.9-2
As state above, no additional technologically or economically feasible mitigation measures are currently available to reduce this impact to a less than significant level. Consequently, this impact is considered significant and unavoidable.
3.9 Public Services, Recreation and Utilities
Tulare County General Plan 2030 Update 3.9-55 ESA / 207497 Recirculated Draft Environmental Impact Report February 2010
Impact 3.9-3: The proposed project would produce substantial amounts of solid waste that could exceed the permitted capacity of a landfill serving the County.
Impact Summary
SU Level of Significance Before Mitigation: Potentially Significant
Required Additional Mitigating Policies and Implementation Measures: No feasible mitigation available
Resultant Level of Significance: Significant and Unavoidable
Impact Analysis
Solid waste produced in Tulare County in 2006 was estimated to be 430,000 tons. The average estimated solid waste generation rates for residential, commercial, and industrial land uses in 2006 are as follows:
• Residential. 145,684 tons/year; • Self Haul. 121,217 tons/year; • Commercial. 109,392 tons/year; and • Industrial. 53,707 tons/year.
Tulare County operates three active landfills: Visalia, Woodville, and Teapot Dome. These landfills serve all of Tulare County as well as parts of surrounding counties. Approximately 184,000 tons/year of solid waste from Tulare County is transported to surrounding county landfills. In addition, there are seven transfer stations located throughout the isolated rural areas of the County for the convenience of those residents who live outside of waste collection service areas.
Currently, the average American produces 4.6 pounds of solid waste per day (EPA, page 1, 2006). Based on this average rate, population growth associated with the proposed project would result in an additional 89,830 tons per year of solid waste, with industrial and commercial land uses producing additional amounts of solid waste per year. Current estimates of solid waste disposal, total annual production of solid waste by 2030 is expected to amount to an estimated 319,830 tons per year or 880 tons per day. Application of a 50% diversion rate (compliance with AB 939) would result in the diversion of some waste per year; however, growth associated with the proposed project would result in the additional transfer of waste to the County’s landfills which may cause one or more facilities to exceed its permitted daily waste acceptance capacity. Alternative disposal locations or methods may be required to safely ensure that adequate waste disposal capacity is met for buildout of the proposed project.
Policies and implementation measures included as part of the proposed project that would address the continued provision of solid waste handling services are summarized below from the draft Public Services and Utilities Element. For example, policy PFS-5.6 indicates the County will require evidence that there is adequate capacity within the solid waste system for the processing, recycling,
Tulare County General Plan 2030 Update
Tulare County General Plan 2030 Update 3.9-56 ESA / 207497 Recirculated Draft Environmental Impact Report February 2010
transmission, and disposal of solid waste prior to approving new development. Policies PFS-5.3 through PFS-5.5, and Implementation Measure #7 require the County to promote a variety of solid waste reduction measures including the public/private usage of recycled materials. Additionally, policy PFS-1.3 and Public Facilities and Services Implementation Measures #1, #2, and #3 provide for the funding mechanism to provide additional or expanded services in conjunction with new development. However, even with implementation of the below mentioned policies and implementation measure, this impact is considered potentially significant.
MITIGATING POLICIES AND IMPLEMENTATION MEASURES
Public Facilities and Services Element
Policies designed to minimize this impact through the continued provision of solid waste services and recycling activities include the following: PFS-1.3 Impact Mitigation PFS-5.1 Land Use Compatibility with Solid Waste Facilities PFS-5.2 Notification PFS-5.3 Solid Waste Reduction PFS-5.4 County Usage of Recycled Materials and Products PFS-5.5 Private Use of Recycled Products
PFS-5.6 Ensure Capacity PFS-5.7 Provisions for Solid Waste Storage, Handling, and Collection PFS-5.8 Hazardous Waste Disposal Capabilities PFS-5.9 Agricultural Waste
Public Facilities and Services Implementation Measures designed to ensure funding for County utilities to provide adequate service levels.
Public Facilities and Services Implementation Measure #1 Public Facilities and Services Implementation Measure #2 Public Facilities and Services Implementation Measure #3 Public Facilities and Services Implementation Measure #6 Public Facilities and Services Implementation Measure #7
Required Additional Mitigating Policies and Implementation Measures
As stated above, the proposed project includes a number of policies and implementation measures designed to promote future County-wide recycling efforts and ensure the continued provision of solid waste recovery and collections services. Additionally, the County will continue to implement solid waste reduction programs in compliance with AB 939. However, to accommodate future solid waste needs resulting from additional growth associated with buildout of the proposed project, additional landfill capacity or waste disposal locations may be required for the County. The incorporated cities in Tulare County oversee solid waste collection within their city limits. Private companies offer solid waste collection services in other unincorporated areas of the County. It is assumed that these companies would continue to maximize the use of existing disposal options and plan for future waste disposal opportunities once existing disposal options reach their capacity, although future waste disposal opportunities may require greater handling costs depending on their location and method of transfer. Consequently, because of the uncertain availability of where and what these future waste disposal options may be by 2030, this impact remains significant. No additional feasible mitigation measures are currently available.
3.9 Public Services, Recreation and Utilities
Tulare County General Plan 2030 Update 3.9-57 ESA / 207497 Recirculated Draft Environmental Impact Report February 2010
Significance after Implementation for Impact 3.9-3
As stated above, no additional technologically or economically feasible mitigation measures are currently available to reduce this impact to a less than significant level. Consequently, this impact is considered significant and unavoidable.
Impact 3.9-4: The proposed project would comply with all federal, State, and local statutes and regulations related to solid waste.
Impact Summary
LTS Level of Significance Before Mitigation: Less than Significant
Required Additional Mitigating Policies and Implementation Measures: None required
Resultant Level of Significance: Less than Significant
Impact Analysis
In compliance with AB 939, the County continues to divert solid waste from local landfills through various conservation, recycling, and composting measures, including curbside recycling programs, household hazardous waste weekly collection site, and waste oil collection.
Policies and implementation measures included as part of the proposed project that would address the continued need to promote local and State solid waste and recycling programs are summarized below from the draft Public Services and Utilities Element. For example, policy PFS-5.6 indicates the County will require evidence that there is adequate capacity within the solid waste system for the processing, recycling, transmission, and disposal of solid waste prior to approving new development. Policies PFS-5.3 through PFS-5.5 and Implementation Measure #7 require the County to promote a variety of solid waste reduction measures including the public/private usage of recycled materials. Additionally, policy PFS-1.3 and Public Facilities and Services Implementation Measures #1, #2, and #3 provide for the funding mechanism to provide additional or expanded services in conjunction with new development. Further, various Water Resources and Air Quality policies included in the Goals and Policies Report (Part I of the General Plan 2030 Update) are designed to prevent degradation of air and water quality by a number of sources, including potential impacts due to solid waste transport and disposal (see Policies AQ-1.3, AQ-1.4, AQ-4.5, WR-2.1, WR-2.2, WR-2.3, WR-2.6, and WR-2.8). With implementation of the below mentioned policies, this impact is considered less than significant.
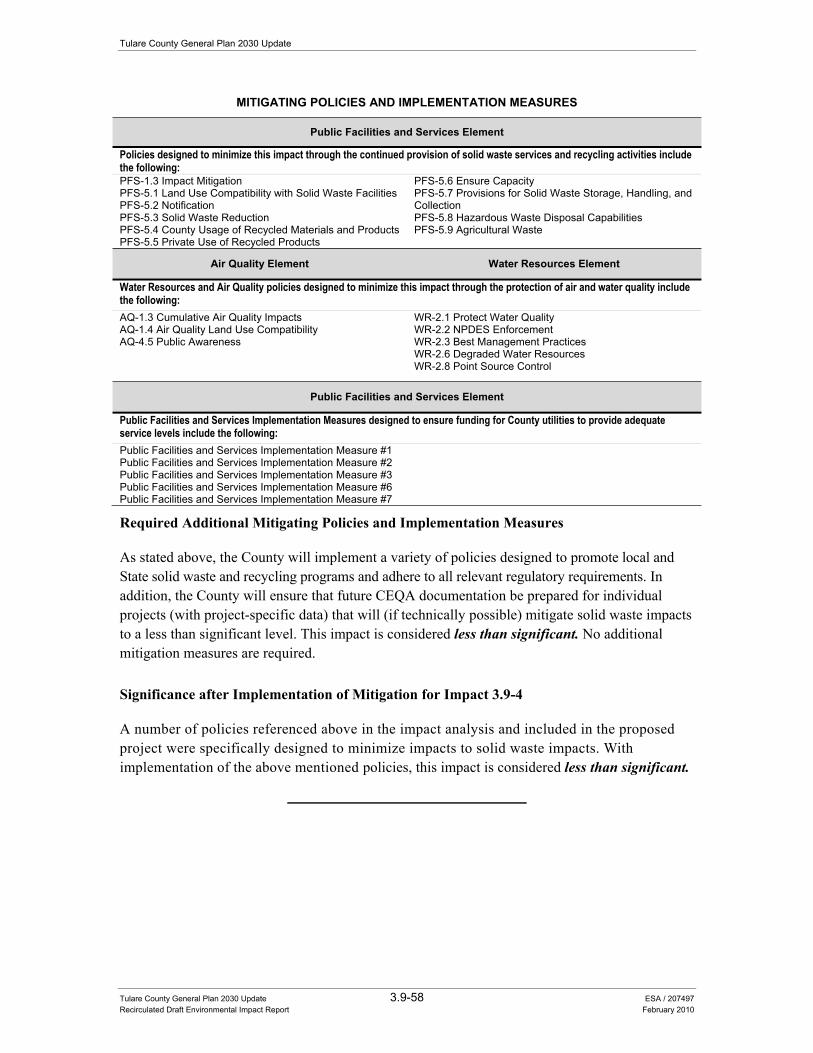
Tulare County General Plan 2030 Update
Tulare County General Plan 2030 Update 3.9-58 ESA / 207497 Recirculated Draft Environmental Impact Report February 2010
MITIGATING POLICIES AND IMPLEMENTATION MEASURES
Public Facilities and Services Element
Policies designed to minimize this impact through the continued provision of solid waste services and recycling activities include the following: PFS-1.3 Impact Mitigation PFS-5.1 Land Use Compatibility with Solid Waste Facilities PFS-5.2 Notification PFS-5.3 Solid Waste Reduction PFS-5.4 County Usage of Recycled Materials and Products PFS-5.5 Private Use of Recycled Products
PFS-5.6 Ensure Capacity PFS-5.7 Provisions for Solid Waste Storage, Handling, and Collection PFS-5.8 Hazardous Waste Disposal Capabilities PFS-5.9 Agricultural Waste
Air Quality Element Water Resources Element
Water Resources and Air Quality policies designed to minimize this impact through the protection of air and water quality include the following: AQ-1.3 Cumulative Air Quality Impacts AQ-1.4 Air Quality Land Use Compatibility AQ-4.5 Public Awareness
WR-2.1 Protect Water Quality WR-2.2 NPDES Enforcement WR-2.3 Best Management Practices WR-2.6 Degraded Water Resources WR-2.8 Point Source Control
Public Facilities and Services Element
Public Facilities and Services Implementation Measures designed to ensure funding for County utilities to provide adequate service levels include the following: Public Facilities and Services Implementation Measure #1 Public Facilities and Services Implementation Measure #2 Public Facilities and Services Implementation Measure #3 Public Facilities and Services Implementation Measure #6 Public Facilities and Services Implementation Measure #7
Required Additional Mitigating Policies and Implementation Measures
As stated above, the County will implement a variety of policies designed to promote local and State solid waste and recycling programs and adhere to all relevant regulatory requirements. In addition, the County will ensure that future CEQA documentation be prepared for individual projects (with project-specific data) that will (if technically possible) mitigate solid waste impacts to a less than significant level. This impact is considered less than significant. No additional mitigation measures are required.
Significance after Implementation of Mitigation for Impact 3.9-4
A number of policies referenced above in the impact analysis and included in the proposed project were specifically designed to minimize impacts to solid waste impacts. With implementation of the above mentioned policies, this impact is considered less than significant.
3.9 Public Services, Recreation and Utilities
Tulare County General Plan 2030 Update 3.9-59 ESA / 207497 Recirculated Draft Environmental Impact Report February 2010
Impact 3.9-5: The proposed project would increase the need or use of fire protection services in the County.
Impact Summary
LTS Level of Significance Before Mitigation: Potentially Significant
Required Additional Mitigating Policies and Implementation Measures: Revised Public Facilities and Services Implementation Measure #3
Resultant Level of Significance: Less than Significant
Impact Analysis
As noted in the 2010 Background Report (see Appendix B of this EIR), the California Department of Forestry and Fire Protection/Tulare County Fire Department (CDFFP/TCFD) serve 145,128 of Tulare County’s population. Dispatchers reported 14,022 responses in 2002, averaging 38.4 calls a day. Fire occurrence data generated by the department indicate a direct relationship between high use areas of the County and fire occurrence. The population increase in the mountain areas have caused increased wildland urban interface problems as well. Structures are being built throughout wildland areas wherein vegetation fires can spread rapidly. Providing adequate fire protection to those structures has become a major undertaking. The CDFFP/TCFD uses the 2003 Tulare Unit’s Fire Management Plan to guide fire protection and prevention throughout the County. The department uses an “attack” time protocol of less than 10 minutes to respond to 90 percent of the calls on the valley floor and less than 15 minutes on 75 percent of calls in the foothill and mountain areas.
Implementation of the proposed project would increase the overall demand on fire protection services to the County. Future growth in accordance with buildout of the proposed project is expected to generate the typical range of service calls, including structure fires, car fires, and electrical fires. New fire facilities, vehicles, equipment, and personnel will be required in order to provide adequate response times to serve future growth. Therefore, the County’s costs to maintain equipment and facilities and to train and equip personnel would also increase. Additionally, growth in existing rural areas would also increase the demand for fire protection services in those areas. However, the additional personnel and materials costs would be offset through the increased revenue, and fees, generated by future development. In addition, future projects will be reviewed by the County on an individual basis and will be required to comply with requirements (i.e., impact fees, etc.) in effect at the time building permits are issued.
Policies and implementation measures included as part of the proposed project that address the need for additional fire prevention services are summarized below by draft General Plan element. For example, Policies HS-1.10, HS-7.3 through HS-7.6 require the County to plan for and expand a variety of public services (including fire protection services and facilities) consistent with community needs. Policy PFS-7.5 indicates the County shall strive to maintain fire department staffing and response time goals consistent with National Fire Protection Association (NFPA)
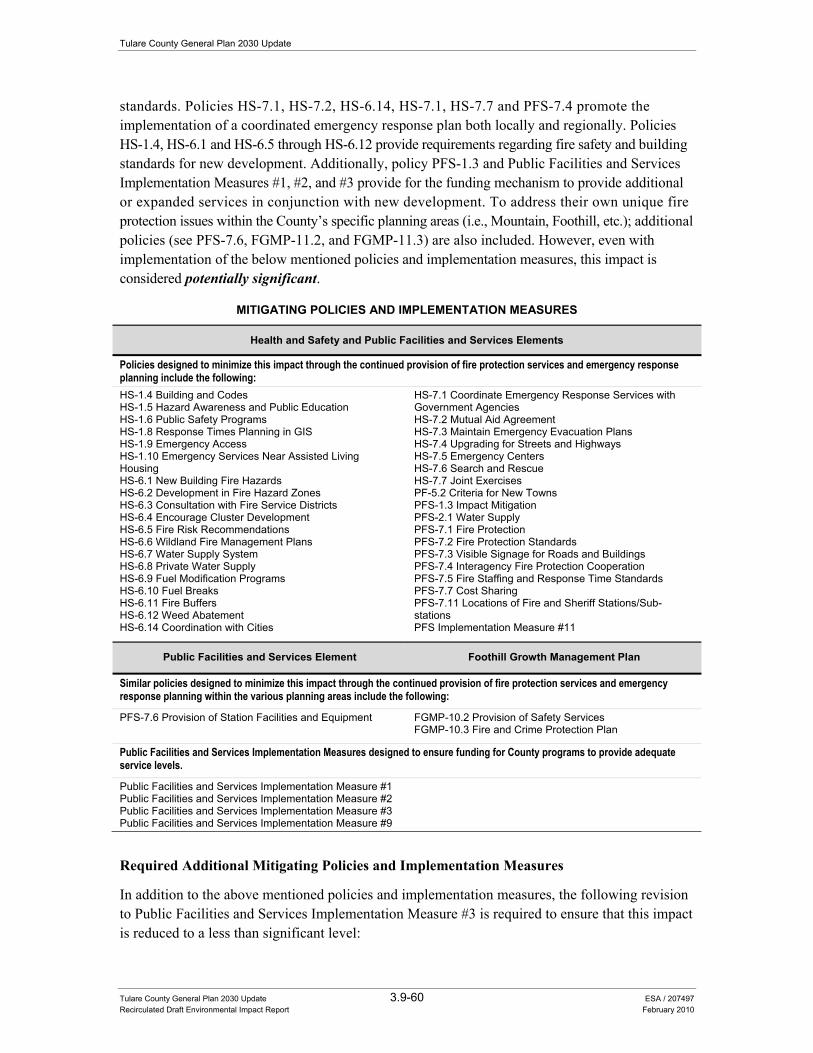
Tulare County General Plan 2030 Update
Tulare County General Plan 2030 Update 3.9-60 ESA / 207497 Recirculated Draft Environmental Impact Report February 2010
standards. Policies HS-7.1, HS-7.2, HS-6.14, HS-7.1, HS-7.7 and PFS-7.4 promote the implementation of a coordinated emergency response plan both locally and regionally. Policies HS-1.4, HS-6.1 and HS-6.5 through HS-6.12 provide requirements regarding fire safety and building standards for new development. Additionally, policy PFS-1.3 and Public Facilities and Services Implementation Measures #1, #2, and #3 provide for the funding mechanism to provide additional or expanded services in conjunction with new development. To address their own unique fire protection issues within the County’s specific planning areas (i.e., Mountain, Foothill, etc.); additional policies (see PFS-7.6, FGMP-11.2, and FGMP-11.3) are also included. However, even with implementation of the below mentioned policies and implementation measures, this impact is considered potentially significant.
MITIGATING POLICIES AND IMPLEMENTATION MEASURES
Health and Safety and Public Facilities and Services Elements
Policies designed to minimize this impact through the continued provision of fire protection services and emergency responseplanning include the following: HS-1.4 Building and Codes HS-1.5 Hazard Awareness and Public Education HS-1.6 Public Safety Programs HS-1.8 Response Times Planning in GIS HS-1.9 Emergency Access HS-1.10 Emergency Services Near Assisted Living Housing HS-6.1 New Building Fire Hazards HS-6.2 Development in Fire Hazard Zones HS-6.3 Consultation with Fire Service Districts HS-6.4 Encourage Cluster Development HS-6.5 Fire Risk Recommendations HS-6.6 Wildland Fire Management Plans HS-6.7 Water Supply System HS-6.8 Private Water Supply HS-6.9 Fuel Modification Programs HS-6.10 Fuel Breaks HS-6.11 Fire Buffers HS-6.12 Weed Abatement HS-6.14 Coordination with Cities
HS-7.1 Coordinate Emergency Response Services with Government Agencies HS-7.2 Mutual Aid Agreement HS-7.3 Maintain Emergency Evacuation Plans HS-7.4 Upgrading for Streets and Highways HS-7.5 Emergency Centers HS-7.6 Search and Rescue HS-7.7 Joint Exercises PF-5.2 Criteria for New Towns PFS-1.3 Impact Mitigation PFS-2.1 Water Supply PFS-7.1 Fire Protection PFS-7.2 Fire Protection Standards PFS-7.3 Visible Signage for Roads and Buildings PFS-7.4 Interagency Fire Protection Cooperation PFS-7.5 Fire Staffing and Response Time Standards PFS-7.7 Cost Sharing PFS-7.11 Locations of Fire and Sheriff Stations/Sub-stations PFS Implementation Measure #11
Public Facilities and Services Element Foothill Growth Management Plan
Similar policies designed to minimize this impact through the continued provision of fire protection services and emergency response planning within the various planning areas include the following:
PFS-7.6 Provision of Station Facilities and Equipment
FGMP-10.2 Provision of Safety Services FGMP-10.3 Fire and Crime Protection Plan
Public Facilities and Services Implementation Measures designed to ensure funding for County programs to provide adequate service levels.
Public Facilities and Services Implementation Measure #1 Public Facilities and Services Implementation Measure #2 Public Facilities and Services Implementation Measure #3 Public Facilities and Services Implementation Measure #9
Required Additional Mitigating Policies and Implementation Measures
In addition to the above mentioned policies and implementation measures, the following revision to Public Facilities and Services Implementation Measure #3 is required to ensure that this impact is reduced to a less than significant level:
3.9 Public Services, Recreation and Utilities
Tulare County General Plan 2030 Update 3.9-61 ESA / 207497 Recirculated Draft Environmental Impact Report February 2010
• PFS Implementation Measure #3. The County shall develop and adopt an impact fee program for new development to provide financing mechanisms to ensure the provision, operation, and on-going maintenance of appropriate public facilities and services (including, but not limited to, fire stations and equipment, police stations and equipment, ambulance or dispatch service, utility infrastructure, recreational, and library facilities). [New Implementation Program – Draft EIR Analysis].
Significance after Implementation for Impact 3.9-5
As stated above, the County will continue to ensure that future development projects mitigate impacts to the provision of adequate fire protection services through the various policies and implementation measures included in the General Plan. Therefore, implementation of the proposed project including the adoption of the policies and implementation measures listed above and the revised Public Facilities and Services Implementation Measure #3 would result in a less than significant impact.
Impact 3.9-6: The proposed project would increase the need or use of law enforcement services in the County.
Impact Summary
LTS Level of Significance Before Mitigation: Potentially Significant
Required Additional Mitigating Policies and Implementation Measures: Revised Public Facilities and Services Implementation Measure #3
Resultant Level of Significance: Less than Significant
Impact Analysis
As noted in the 2010 Background Report (Appendix B of this RDEIR), as of 2004, the Tulare County Sheriff’s Department had 448 sworn officers serving its unincorporated population (145,128), and generates a level of service ratio of 3.2 officers per 1,000 residents. The ratio is above the accepted standard of 2.0 officers per 1,000 residents set by the Federal Bureau of Investigation.
Implementation of the proposed project would increase the overall demand on law enforcement services to the County. Future growth in accordance with buildout of the proposed project is expected to generate the typical range of service calls. New police facilities, vehicles, equipment, and personnel will be required in order to provide adequate response times to serve future growth. Therefore, the County’s costs to maintain equipment and facilities and to train and equip personnel would also increase. Additionally, growth in existing rural areas would also increase the demand for law enforcement services in those areas. However, the additional personnel and materials costs would be offset through the increased revenue, and fees, generated by future development. In
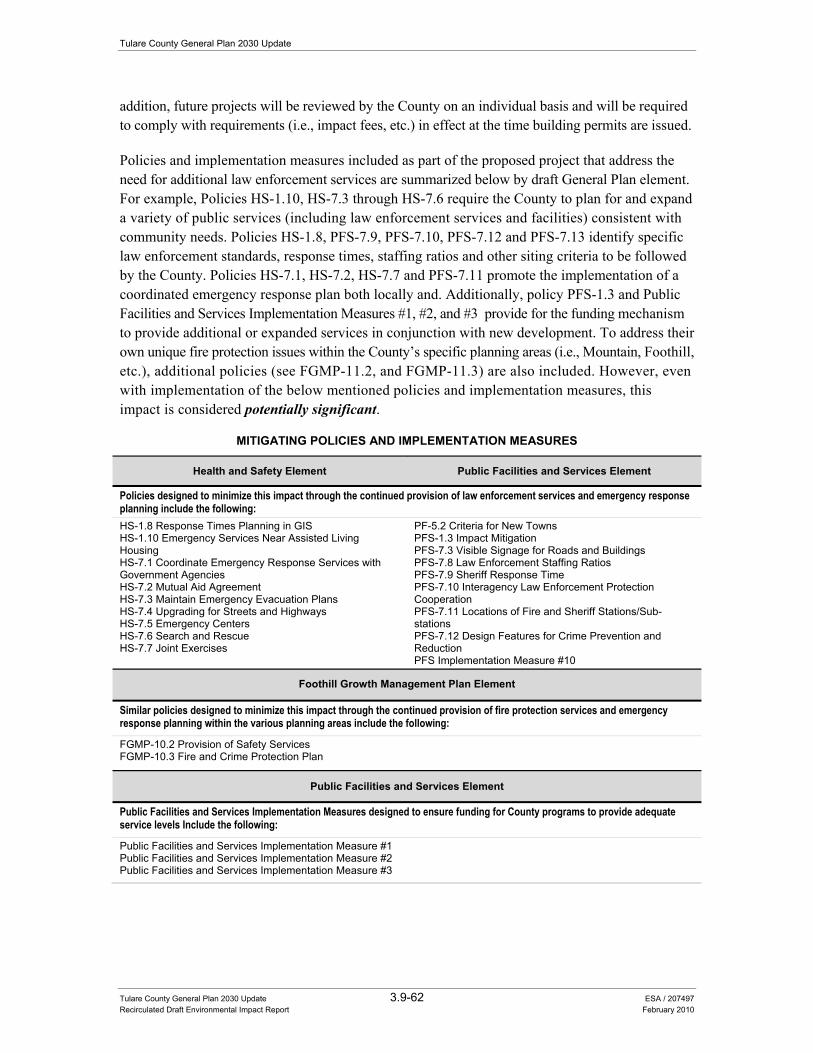
Tulare County General Plan 2030 Update
Tulare County General Plan 2030 Update 3.9-62 ESA / 207497 Recirculated Draft Environmental Impact Report February 2010
addition, future projects will be reviewed by the County on an individual basis and will be required to comply with requirements (i.e., impact fees, etc.) in effect at the time building permits are issued.
Policies and implementation measures included as part of the proposed project that address the need for additional law enforcement services are summarized below by draft General Plan element. For example, Policies HS-1.10, HS-7.3 through HS-7.6 require the County to plan for and expand a variety of public services (including law enforcement services and facilities) consistent with community needs. Policies HS-1.8, PFS-7.9, PFS-7.10, PFS-7.12 and PFS-7.13 identify specific law enforcement standards, response times, staffing ratios and other siting criteria to be followed by the County. Policies HS-7.1, HS-7.2, HS-7.7 and PFS-7.11 promote the implementation of a coordinated emergency response plan both locally and. Additionally, policy PFS-1.3 and Public Facilities and Services Implementation Measures #1, #2, and #3 provide for the funding mechanism to provide additional or expanded services in conjunction with new development. To address their own unique fire protection issues within the County’s specific planning areas (i.e., Mountain, Foothill, etc.), additional policies (see FGMP-11.2, and FGMP-11.3) are also included. However, even with implementation of the below mentioned policies and implementation measures, this impact is considered potentially significant.
MITIGATING POLICIES AND IMPLEMENTATION MEASURES
Health and Safety Element Public Facilities and Services Element
Policies designed to minimize this impact through the continued provision of law enforcement services and emergency response planning include the following: HS-1.8 Response Times Planning in GIS HS-1.10 Emergency Services Near Assisted Living Housing HS-7.1 Coordinate Emergency Response Services with Government Agencies HS-7.2 Mutual Aid Agreement HS-7.3 Maintain Emergency Evacuation Plans HS-7.4 Upgrading for Streets and Highways HS-7.5 Emergency Centers HS-7.6 Search and Rescue HS-7.7 Joint Exercises
PF-5.2 Criteria for New Towns PFS-1.3 Impact Mitigation PFS-7.3 Visible Signage for Roads and Buildings PFS-7.8 Law Enforcement Staffing Ratios PFS-7.9 Sheriff Response Time PFS-7.10 Interagency Law Enforcement Protection Cooperation PFS-7.11 Locations of Fire and Sheriff Stations/Sub-stations PFS-7.12 Design Features for Crime Prevention and Reduction PFS Implementation Measure #10
Foothill Growth Management Plan Element
Similar policies designed to minimize this impact through the continued provision of fire protection services and emergency response planning within the various planning areas include the following:
FGMP-10.2 Provision of Safety Services FGMP-10.3 Fire and Crime Protection Plan
Public Facilities and Services Element
Public Facilities and Services Implementation Measures designed to ensure funding for County programs to provide adequate service levels Include the following:
Public Facilities and Services Implementation Measure #1 Public Facilities and Services Implementation Measure #2 Public Facilities and Services Implementation Measure #3
3.9 Public Services, Recreation and Utilities
Tulare County General Plan 2030 Update 3.9-63 ESA / 207497 Recirculated Draft Environmental Impact Report February 2010
Required Additional Mitigating Policies and Implementation Measures
In addition to the above mentioned policies and implementation measures, the following revision to Public Facilities and Services Implementation Measure #3 is required to ensure that this impact is reduced to a less than significant level:
• PFS Implementation Measure #3. The County shall develop and adopt an impact fee program for new development to provide financing mechanisms to ensure the provision, operation, and on-going maintenance of appropriate public facilities and services (including, but not limited to, fire stations and equipment, police stations and equipment, utility infrastructure, recreational and library facilities). [New Implementation Program – Draft EIR Analysis].
Significance after Implementation for Impact 3.9-6
As stated above, the County will continue to ensure that future development projects mitigate impacts to the provision of adequate fire protection services through the various policies and implementation measures included in the General Plan. Therefore, implementation of the proposed project including the adoption of the policies and implementation measures listed above and the revised Public Facilities and Services Implementation Measure #3 would result in a less than significant impact.
Impact 3.9-7: The proposed project would increase the need or use of school services or facilities.
Impact Summary
LTS Level of Significance Before Mitigation: Potentially Significant
Required Additional Mitigating Policies and Implementation Measures: New policy PFS-8.6 “School Funding” and revisions to Public Facilities and Services Implementation Measure #3
Resultant Level of Significance: Less than Significant
Impact Analysis
As noted in the 2010 Background Report (see Appendix B of this EIR), a total of 48 school districts provide education throughout Tulare County. Of the 48 school districts, seven are unified school districts providing educational services for kindergarten through 12th grade. The remaining 41 districts consist of 36 elementary school districts and four high school districts. Many districts have only one school. Total enrolment in Tulare County public schools has increased from about 80,000 to 88,300 students during a nine-year span from 1993 to 2002. On average, the growth rate has remained steady with annual increases approximating two percent.
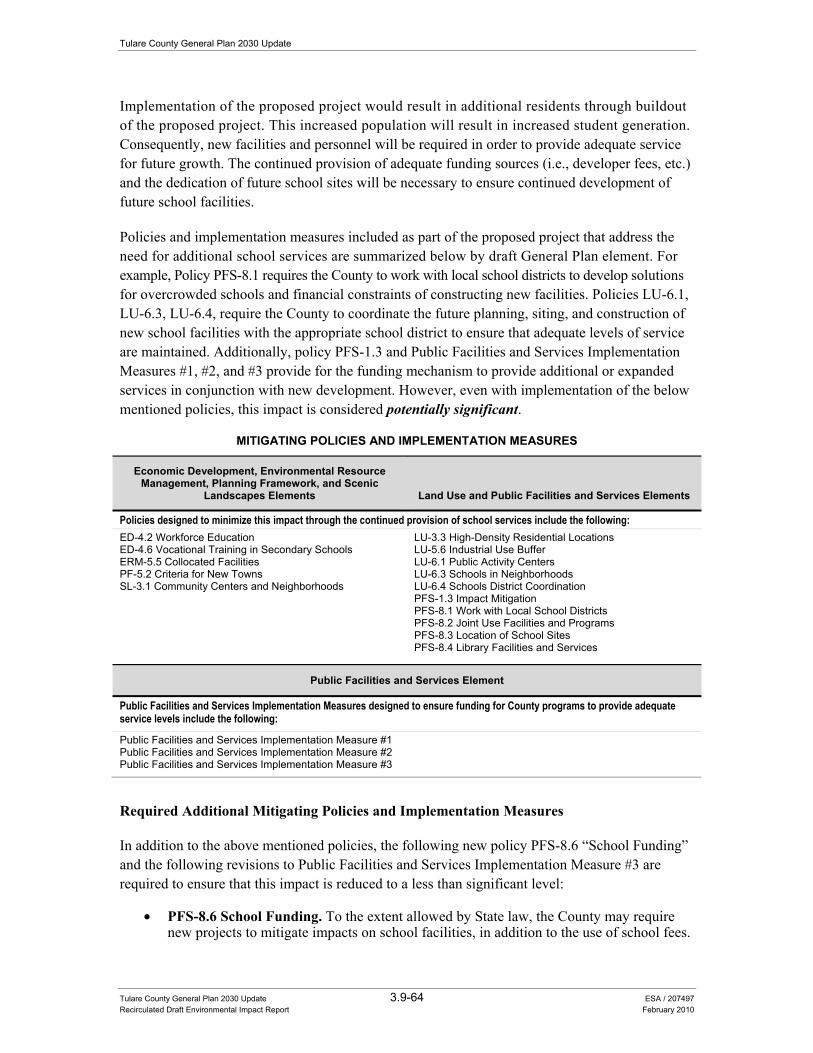
Tulare County General Plan 2030 Update
Tulare County General Plan 2030 Update 3.9-64 ESA / 207497 Recirculated Draft Environmental Impact Report February 2010
Implementation of the proposed project would result in additional residents through buildout of the proposed project. This increased population will result in increased student generation. Consequently, new facilities and personnel will be required in order to provide adequate service for future growth. The continued provision of adequate funding sources (i.e., developer fees, etc.) and the dedication of future school sites will be necessary to ensure continued development of future school facilities.
Policies and implementation measures included as part of the proposed project that address the need for additional school services are summarized below by draft General Plan element. For example, Policy PFS-8.1 requires the County to work with local school districts to develop solutions for overcrowded schools and financial constraints of constructing new facilities. Policies LU-6.1, LU-6.3, LU-6.4, require the County to coordinate the future planning, siting, and construction of new school facilities with the appropriate school district to ensure that adequate levels of service are maintained. Additionally, policy PFS-1.3 and Public Facilities and Services Implementation Measures #1, #2, and #3 provide for the funding mechanism to provide additional or expanded services in conjunction with new development. However, even with implementation of the below mentioned policies, this impact is considered potentially significant.
MITIGATING POLICIES AND IMPLEMENTATION MEASURES
Economic Development, Environmental Resource Management, Planning Framework, and Scenic
Landscapes Elements Land Use and Public Facilities and Services Elements
Policies designed to minimize this impact through the continued provision of school services include the following: ED-4.2 Workforce Education ED-4.6 Vocational Training in Secondary Schools ERM-5.5 Collocated Facilities PF-5.2 Criteria for New Towns SL-3.1 Community Centers and Neighborhoods
LU-3.3 High-Density Residential Locations LU-5.6 Industrial Use Buffer LU-6.1 Public Activity Centers LU-6.3 Schools in Neighborhoods LU-6.4 Schools District Coordination PFS-1.3 Impact Mitigation PFS-8.1 Work with Local School Districts PFS-8.2 Joint Use Facilities and Programs PFS-8.3 Location of School Sites PFS-8.4 Library Facilities and Services
Public Facilities and Services Element
Public Facilities and Services Implementation Measures designed to ensure funding for County programs to provide adequate service levels include the following:
Public Facilities and Services Implementation Measure #1 Public Facilities and Services Implementation Measure #2 Public Facilities and Services Implementation Measure #3
Required Additional Mitigating Policies and Implementation Measures
In addition to the above mentioned policies, the following new policy PFS-8.6 “School Funding” and the following revisions to Public Facilities and Services Implementation Measure #3 are required to ensure that this impact is reduced to a less than significant level:
• PFS-8.6 School Funding. To the extent allowed by State law, the County may require new projects to mitigate impacts on school facilities, in addition to the use of school fees.
3.9 Public Services, Recreation and Utilities
Tulare County General Plan 2030 Update 3.9-65 ESA / 207497 Recirculated Draft Environmental Impact Report February 2010
The County will also work with school districts, developers, and the public to evaluate alternatives to funding/providing adequate school facilities. [New Policy – Draft EIR Analysis].
• PFS Implementation Measure #3. The County shall develop and adopt an impact fee program for new development to provide financing mechanisms to ensure the provision, operation, and on-going maintenance of appropriate public facilities and services (including, but not limited to, fire stations and equipment, police stations and equipment, utility infrastructure, recreational and library facilities). [New Implementation Program – Draft EIR Analysis].
Significance after Implementation for Impact 3.9-7
To the extent allowed by State law, the County will continue to ensure that future development projects mitigate impacts on school facilities. State law, however, does severely limit the County’s ability to require proponents of new development to mitigate the impacts of new student populations on existing school facilities. Under Government Code Section 65996, Tulare County is limited to charging the statutorily created school impact fee to offset impacts to local school districts generated by General Plan Updates. Section 65996 also prohibits the disapproval of development projects based on the inadequacy of school facilities. The statute further provides that, with payment of the state-mandated school impact fees, impacts on school facilities are deemed to mitigate to less than significant levels. For these reasons, implementation of the proposed project including the adoption of the policies and implementation measures listed above (including the new policy PFS-8.6 “School Funding” and the revised Public Facilities and Services Implementation Measure #3) would result in a less than significant impact.
Impact 3.9-8: The proposed project would increase the need or use of libraries and other community facilities.
Impact Summary
LTS Level of Significance Before Mitigation: Potentially Significant
Required Additional Mitigating Policies and Implementation Measures: Revised Public Facilities and Services Implementation Measure #3
Resultant Level of Significance: Less than Significant
Impact Analysis
As noted in the 2010 Background Report (see Appendix B of this EIR), the Tulare County Public Library System is comprised of interdependent branches, grouped by services, geography and usage patterns to provide efficient and economical services to the residents of the County. At present, there are 14 small libraries and one main branch.
Tulare County General Plan 2030 Update
Tulare County General Plan 2030 Update 3.9-66 ESA / 207497 Recirculated Draft Environmental Impact Report February 2010
Implementation of the proposed project would increase the overall demand on library services to the County. Future growth in accordance with buildout of the proposed project is expected to generate additional demand on library services. New facilities, books, and personnel will be required in order to provide adequate service for future growth. Therefore, the County’s costs to build and maintain new facilities and personnel would also increase. However, the additional personnel and materials costs would be offset through the increased revenue, and fees, generated by future development. In addition, future projects will be reviewed by the County on an individual basis and will be required to comply with requirements (i.e., impact fees, etc.) in effect at the time building permits are issued.
Policies and implementation measures included as part of the proposed project that address the need for additional library and other community services are summarized below by draft General Plan element. For example, Policy PFS-8.4 indicates the County shall encourage expansion of library facilities and services as necessary to meet public needs. Policies ERM-5.5 and LU-6.1 indicate the County shall encourage the development of centrally located public activity centers that include parks, schools, libraries, and community centers in communities. Additionally, policy PFS-1.3 and Public Facilities and Services Implementation Measures #1, #2, and #3 provide for the necessary funding mechanisms to provide additional or expanded services in conjunction with new development. However, even with implementation of the below mentioned policies, this impact is considered potentially significant.
MITIGATING POLICIES AND IMPLEMENTATION MEASURES
Environmental Resource Management, Land Use and Planning Framework Elements Public Facilities and Services Element
Policies designed to minimize this impact through the continued provision of community services include the following:
ERM-5.5 Collocated Facilities LU-6.1 Public Activity Centers PF-5.2 Criteria for New Towns
PFS-1.3 Impact Mitigation PFS-8.4 Library Facilities and Services
Public Facilities and Services Element
Public Facilities and Services Implementation Measures designed to ensure funding for County programs to provide adequate service levels.
Public Facilities and Services Implementation Measure #1 Public Facilities and Services Implementation Measure #2 Public Facilities and Services Implementation Measure #3
Required Additional Mitigating Policies and Implementation Measures
In addition to the above mentioned policies and implementation measures, the following revision to Public Facilities and Services Implementation Measure #3 is required to ensure that this impact is reduced to a less than significant level:
• PFS Implementation Measure #3. The County shall develop and adopt an impact fee program for new development to provide financing mechanisms to ensure the provision, operation, and on-going maintenance of appropriate public facilities and services (including, but not limited to, fire stations and equipment, police stations and equipment,

3.9 Public Services, Recreation and Utilities
Tulare County General Plan 2030 Update 3.9-67 ESA / 207497 Recirculated Draft Environmental Impact Report February 2010
utility infrastructure, recreational and library facilities). [New Implementation Program – Draft EIR Analysis].
Significance after Implementation for Impact 3.9-8
As stated above, the County will continue to ensure that future development projects mitigate impacts to the provision of adequate library and other community services through the various policies and implementation measures included in the General Plan. Therefore, implementation of the proposed project including the adoption of the policies and implementation measures listed above and the revised Public Facilities and Services Implementation Measure #3 would result in a less than significant impact.
Impact 3.9-9: The proposed project would increase the need or use of park and recreation facilities.
Impact Summary
LTS Level of Significance Before Mitigation: Potentially Significant
Required Additional Mitigating Policies and Implementation Measures: Revised Public Facilities and Services Implementation Measure #3
Resultant Level of Significance: Less than Significant
Impact Analysis
Implementation of the proposed project would increase the overall demand on park and recreation-related activities to the County. Future growth in accordance with buildout of the proposed project is expected to generate additional demand on these types of services. Therefore, the County’s costs to build and maintain new facilities, programs, and personnel would also increase. However, the additional personnel and materials costs would be offset through the increased revenue, and fees, generated by future development. In addition, future projects will be reviewed by the County on an individual basis and will be required to comply with requirements (i.e., impact fees, etc.) in effect at the time building permits are issued.
Policies and implementation measures included as part of the proposed project that address the need for additional parks and recreation programs are summarized below by draft General Plan element. For example, Policy ERM-5.1 “Parks as Community Focal Points”, ERM-5.2 “Park Amenities”, and ERM-5.5 “Collocated Facilities” supports the County’s commitment to incorporating park facilities as part of future development within the various CACUDB areas. Policy ERM-5.3 “Park Dedication Requirements” requires the dedication of land or funding for the future acquisition and development of park sites and recreation programs. Policy ERM-5.6 “Location and Size Criteria for Parks” provides guidelines on the types and sizes of parks necessary to accommodate future use in the County. Additionally, policy ERM-5.13 “Funding For Recreational Areas and Facilities” and Public Facilities and Services Implementation Measures #1, #2, and #3 provide for the necessary funding mechanisms to provide additional or expanded
Tulare County General Plan 2030 Update
Tulare County General Plan 2030 Update 3.9-68 ESA / 207497 Recirculated Draft Environmental Impact Report February 2010
services in conjunction with new development. However, even with implementation of the below mentioned policies, this impact is considered potentially significant.
MITIGATING POLICIES AND IMPLEMENTATION MEASURES
Environmental Resource Management
Policies designed to minimize this impact through the continued provision of community services include the following: ERM-5.1 Parks as Community Focal Points ERM-5.2 Park Amenities ERM-5.3 Park Dedication Requirements ERM-5.4 Park-Related Organizations ERM-5.5 Collocated Facilities ERM-5.6 Location and Size Criteria for Parks ERM-5.7 Public Water Access ERM-5.8 Watercourse Development ERM-5.9 Encourage Development of Private Recreation Facilities ERM-5.10 Recreational Facilities for Special Use Groups
ERM-5.11Cooperation with Federal and State Agencies ERM-5.12 Meet Changing Recreational Needs ERM-5.13 Funding For Recreational Areas and Facilities ERM-5.14 Park Design ERM-5.15 Open Space Preservation ERM-5.16 Regional Recreation Planning ERM-5.17 Activity Prioritization ERM-5.18 Night Sky Protection ERM-5.19 Interagency Cooperation ERM-5.20 Allowable Uses on Timber Production Lands
Public Facilities and Services Element
Public Facilities and Services Implementation Measures designed to ensure funding for County programs to provide adequate service levels. Public Facilities and Services Implementation Measure #1 Public Facilities and Services Implementation Measure #2 Public Facilities and Services Implementation Measure #3
Required Additional Mitigating Policies and Implementation Measures
In addition to the above mentioned policies and implementation measures, the following revision to Public Facilities and Services Implementation Measure #3 is required to ensure that this impact is reduced to a less than significant level:
• PFS Implementation Measure #3. The County shall develop and adopt an impact fee program for new development to provide financing mechanisms to ensure the provision, operation, and on-going maintenance of appropriate public facilities and services (including, but not limited to, fire stations and equipment, police stations and equipment, utility infrastructure, recreational and library facilities). [New Implementation Program – Draft EIR Analysis].
Significance after Implementation for Impact 3.9-9
As stated above, the County will continue to ensure that future development projects mitigate impacts to the provision of adequate parks, recreation, and other community services through the various policies and implementation measures included in the General Plan. Therefore, implementation of the proposed project including the adoption of the policies and implementation measures listed above and the revised Public Facilities and Services Implementation Measure #3 would result in a less than significant impact.
Tulare County General Plan 2030 Update 3.10-1 ESA / 207497 Recirculated Draft Environmental Impact Report February 2010
SECTION 3.10 Agricultural Resources
Introduction This section of the recirculated draft Environmental Impact Report (RDEIR) addresses potential impacts to agricultural resources in Tulare County. The regulatory setting provides a description of applicable State and local regulatory policies. The environmental setting provides a description of agricultural resources in the County, including Important Farmlands (those lands classified and mapped by the Farmland Mapping and Monitoring Program of the California Department of Conservation) and Williamson Act contract lands. A description of the potential impacts of the proposed project is also provided and includes the identification of feasible mitigation (general plan policies) to avoid or lessen the impacts.
The closely-related topics associated with soil resources are addressed in Section 3.8 “Geology, Soils, Seismicity, and Mineral Resources” of this RDEIR.
The following environmental and regulatory settings were developed from information contained in the 2010 Background Report (see Chapter 4.0 “Agriculture, Recreation, and Open Space”), incorporated by reference and summarized below. This document is attached as Appendix B to the RDEIR.
Regulatory Setting There are no state or federal agricultural land regulations relevant to the proposed project, beyond the farmland designations and Williamson Act contracts, described below.
State Regulations
California Land Conservation Act Under the provisions of the Williamson Act (California Land Conservation Act of 1965, Section 51200), landowners contract with the County to maintain agricultural or open space use of their lands in return for reduced property tax assessment. The contract is self-renewing; however, the landowner may notify the County at any time of the intent to withdraw the land from its preserve status. There are two means by which the landowner may withdraw the land from its contract preserve status. First, the landowner may seek to cancel the contract. This takes the land out of the contract quickly with a minimal waiting period but the landowner pays a statutory penalty
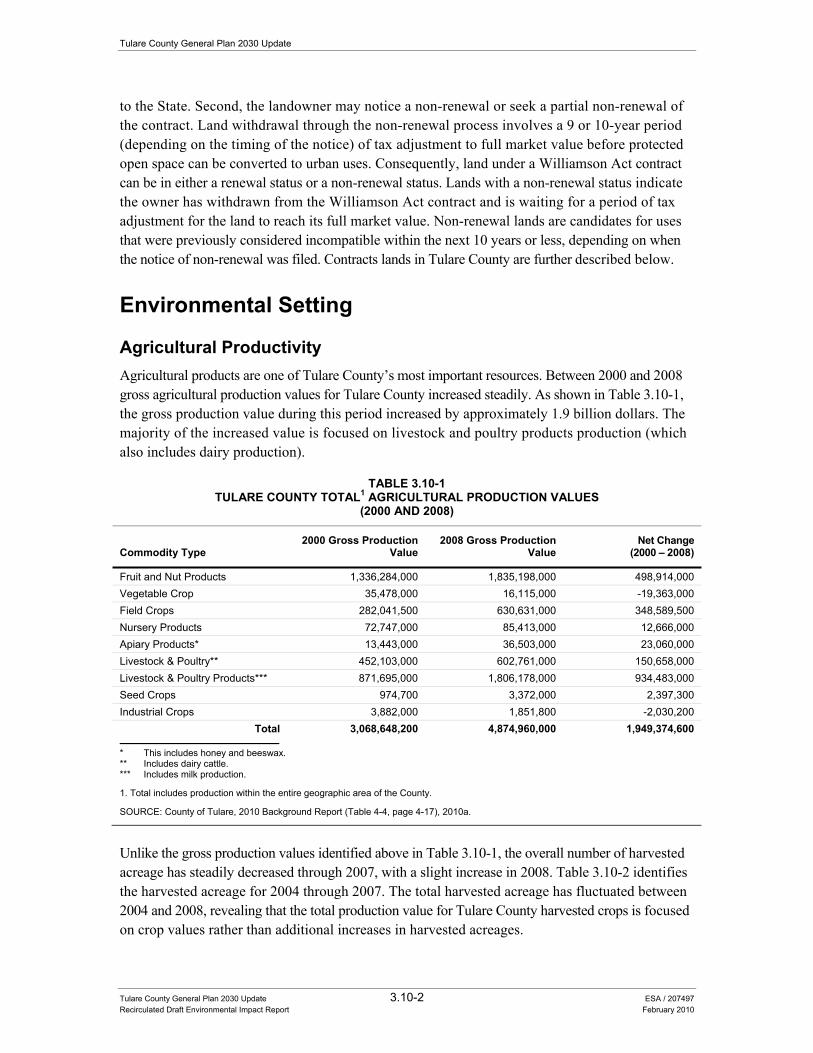
Tulare County General Plan 2030 Update
Tulare County General Plan 2030 Update 3.10-2 ESA / 207497 Recirculated Draft Environmental Impact Report February 2010
to the State. Second, the landowner may notice a non-renewal or seek a partial non-renewal of the contract. Land withdrawal through the non-renewal process involves a 9 or 10-year period (depending on the timing of the notice) of tax adjustment to full market value before protected open space can be converted to urban uses. Consequently, land under a Williamson Act contract can be in either a renewal status or a non-renewal status. Lands with a non-renewal status indicate the owner has withdrawn from the Williamson Act contract and is waiting for a period of tax adjustment for the land to reach its full market value. Non-renewal lands are candidates for uses that were previously considered incompatible within the next 10 years or less, depending on when the notice of non-renewal was filed. Contracts lands in Tulare County are further described below.
Environmental Setting
Agricultural Productivity Agricultural products are one of Tulare County’s most important resources. Between 2000 and 2008 gross agricultural production values for Tulare County increased steadily. As shown in Table 3.10-1, the gross production value during this period increased by approximately 1.9 billion dollars. The majority of the increased value is focused on livestock and poultry products production (which also includes dairy production).
TABLE 3.10-1TULARE COUNTY TOTAL1 AGRICULTURAL PRODUCTION VALUES
(2000 AND 2008)
Commodity Type 2000 Gross Production
Value 2008 Gross Production
Value Net Change
(2000 – 2008)
Fruit and Nut Products 1,336,284,000 1,835,198,000 498,914,000 Vegetable Crop 35,478,000 16,115,000 -19,363,000 Field Crops 282,041,500 630,631,000 348,589,500 Nursery Products 72,747,000 85,413,000 12,666,000 Apiary Products* 13,443,000 36,503,000 23,060,000 Livestock & Poultry** 452,103,000 602,761,000 150,658,000 Livestock & Poultry Products*** 871,695,000 1,806,178,000 934,483,000 Seed Crops 974,700 3,372,000 2,397,300 Industrial Crops 3,882,000 1,851,800 -2,030,200
Total 3,068,648,200 4,874,960,000 1,949,374,600
* This includes honey and beeswax. ** Includes dairy cattle. *** Includes milk production.
1. Total includes production within the entire geographic area of the County.
SOURCE: County of Tulare, 2010 Background Report (Table 4-4, page 4-17), 2010a.
Unlike the gross production values identified above in Table 3.10-1, the overall number of harvested acreage has steadily decreased through 2007, with a slight increase in 2008. Table 3.10-2 identifies the harvested acreage for 2004 through 2007. The total harvested acreage has fluctuated between 2004 and 2008, revealing that the total production value for Tulare County harvested crops is focused on crop values rather than additional increases in harvested acreages.
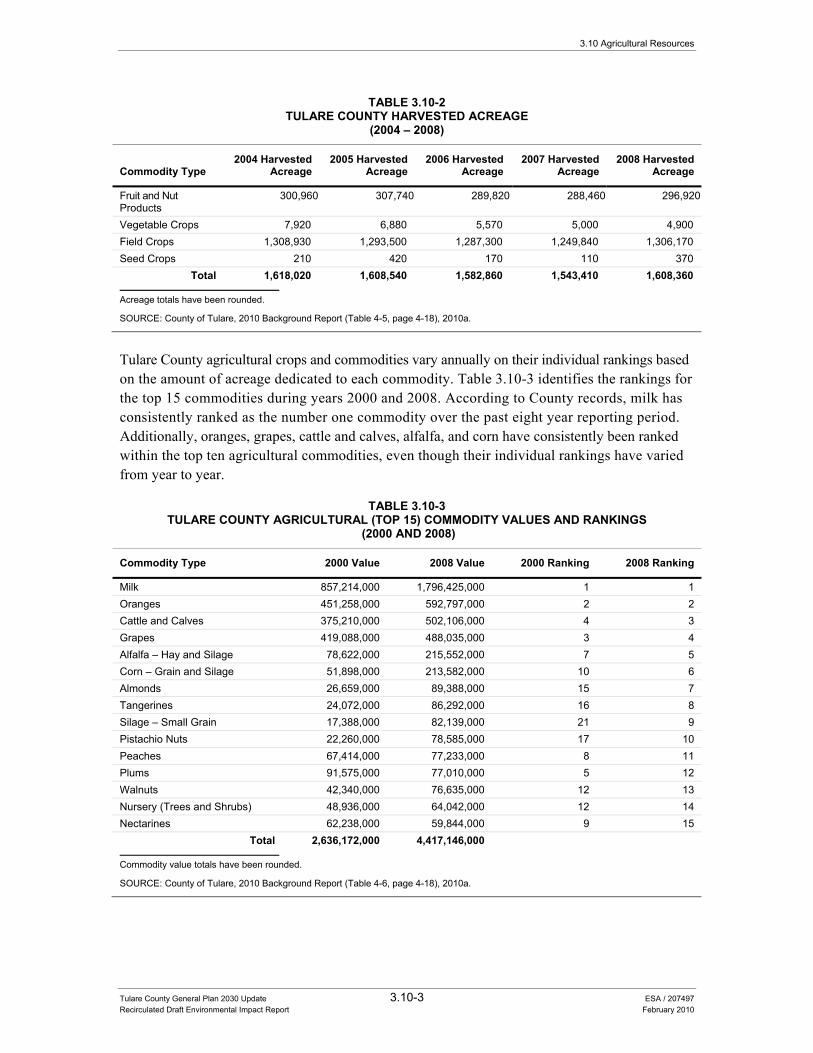
3.10 Agricultural Resources
Tulare County General Plan 2030 Update 3.10-3 ESA / 207497 Recirculated Draft Environmental Impact Report February 2010
TABLE 3.10-2TULARE COUNTY HARVESTED ACREAGE
(2004 – 2008)
Commodity Type 2004 Harvested
Acreage 2005 Harvested
Acreage 2006 Harvested
Acreage 2007 Harvested
Acreage 2008 Harvested
Acreage
Fruit and Nut Products
300,960 307,740 289,820 288,460 296,920
Vegetable Crops 7,920 6,880 5,570 5,000 4,900 Field Crops 1,308,930 1,293,500 1,287,300 1,249,840 1,306,170 Seed Crops 210 420 170 110 370
Total 1,618,020 1,608,540 1,582,860 1,543,410 1,608,360
Acreage totals have been rounded.
SOURCE: County of Tulare, 2010 Background Report (Table 4-5, page 4-18), 2010a.
Tulare County agricultural crops and commodities vary annually on their individual rankings based on the amount of acreage dedicated to each commodity. Table 3.10-3 identifies the rankings for the top 15 commodities during years 2000 and 2008. According to County records, milk has consistently ranked as the number one commodity over the past eight year reporting period. Additionally, oranges, grapes, cattle and calves, alfalfa, and corn have consistently been ranked within the top ten agricultural commodities, even though their individual rankings have varied from year to year.
TABLE 3.10-3TULARE COUNTY AGRICULTURAL (TOP 15) COMMODITY VALUES AND RANKINGS
(2000 AND 2008)
Commodity Type 2000 Value 2008 Value 2000 Ranking 2008 Ranking
Milk 857,214,000 1,796,425,000 1 1 Oranges 451,258,000 592,797,000 2 2 Cattle and Calves 375,210,000 502,106,000 4 3 Grapes 419,088,000 488,035,000 3 4 Alfalfa – Hay and Silage 78,622,000 215,552,000 7 5 Corn – Grain and Silage 51,898,000 213,582,000 10 6 Almonds 26,659,000 89,388,000 15 7 Tangerines 24,072,000 86,292,000 16 8 Silage – Small Grain 17,388,000 82,139,000 21 9 Pistachio Nuts 22,260,000 78,585,000 17 10 Peaches 67,414,000 77,233,000 8 11 Plums 91,575,000 77,010,000 5 12 Walnuts 42,340,000 76,635,000 12 13 Nursery (Trees and Shrubs) 48,936,000 64,042,000 12 14 Nectarines 62,238,000 59,844,000 9 15
Total 2,636,172,000 4,417,146,000
Commodity value totals have been rounded.
SOURCE: County of Tulare, 2010 Background Report (Table 4-6, page 4-18), 2010a.
Tulare County General Plan 2030 Update
Tulare County General Plan 2030 Update 3.10-4 ESA / 207497 Recirculated Draft Environmental Impact Report February 2010
Important Farmland The California Department of Conservation, Division of Land Resource Protection, maintains the Farmland Mapping and Monitoring Program (FMMP), which monitors the conversion of the state’s farmland to and from agricultural use. The map series identifies eight classifications (discussed below) and uses a minimum mapping unit size of 10 acres. The program also produces a biannual report on the amount of land converted from agricultural to non-agricultural use. The program maintains an inventory of state agricultural land and updates its “Important Farmland Series Maps” every two years. Although the program monitors a wide variety of farmland types (more fully described below), Important Farmland consists of lands classified as Prime Farmland, Farmland of Statewide Importance, and Unique Farmland.
Prime Farmland (P) Prime Farmland is farmland with the best combination of physical and chemical features to sustain long-term agricultural production. This land has the soil quality, growing season, and moisture supply needed to produce sustained high yields. Land must have been used for irrigated agricultural production at some time during the four years prior to the mapping date.
Farmland of Statewide Importance (S) Farmland of Statewide Importance is similar to Prime Farmland but has minor shortcomings, such as greater slopes or a lesser ability to store soil moisture. Land must have been used for irrigated agricultural production at some time during the four years prior to the mapping date.
Unique Farmland (U) Unique Farmland has lesser quality soils used for the production of the state's leading agricultural crops. This land is usually irrigated, but may include nonirrigated orchards or vineyards as found in some climatic zones in California. Land must have been cropped at some time during the four years prior to the mapping date.
Farmland of Local Importance (L) Farmland of Local Importance is land important to the local agricultural economy as determined by each county’s board of supervisors and a local advisory committee.
Grazing Land (G) Grazing Land is land on which the vegetation is suited to the grazing of livestock. This category was developed in cooperation with the California Cattlemen’s Association, the University of California Cooperative Extension, and other groups interested in the extent of grazing activities. The minimum mapping unit for Grazing Land is 40 acres.
Urban and Built-Up Land (D) Urban and Built-Up Land is land occupied by structures with a building density of at least 1 unit to 1.5 acres, or approximately 6 structures to a 10-acre parcel. This land is used for residential,
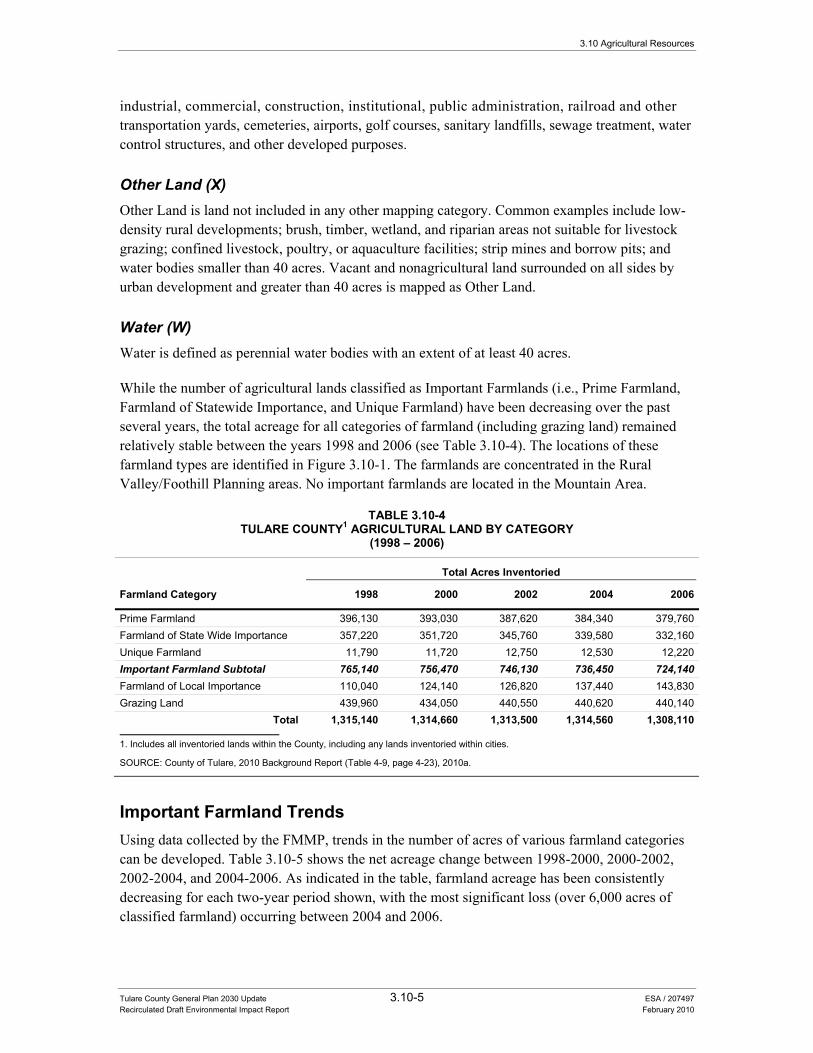
3.10 Agricultural Resources
Tulare County General Plan 2030 Update 3.10-5 ESA / 207497 Recirculated Draft Environmental Impact Report February 2010
industrial, commercial, construction, institutional, public administration, railroad and other transportation yards, cemeteries, airports, golf courses, sanitary landfills, sewage treatment, water control structures, and other developed purposes.
Other Land (X) Other Land is land not included in any other mapping category. Common examples include low-density rural developments; brush, timber, wetland, and riparian areas not suitable for livestock grazing; confined livestock, poultry, or aquaculture facilities; strip mines and borrow pits; and water bodies smaller than 40 acres. Vacant and nonagricultural land surrounded on all sides by urban development and greater than 40 acres is mapped as Other Land.
Water (W) Water is defined as perennial water bodies with an extent of at least 40 acres.
While the number of agricultural lands classified as Important Farmlands (i.e., Prime Farmland, Farmland of Statewide Importance, and Unique Farmland) have been decreasing over the past several years, the total acreage for all categories of farmland (including grazing land) remained relatively stable between the years 1998 and 2006 (see Table 3.10-4). The locations of these farmland types are identified in Figure 3.10-1. The farmlands are concentrated in the Rural Valley/Foothill Planning areas. No important farmlands are located in the Mountain Area.
TABLE 3.10-4TULARE COUNTY1 AGRICULTURAL LAND BY CATEGORY
(1998 – 2006)
Farmland Category
Total Acres Inventoried
1998 2000 2002 2004 2006
Prime Farmland 396,130 393,030 387,620 384,340 379,760Farmland of State Wide Importance 357,220 351,720 345,760 339,580 332,160Unique Farmland 11,790 11,720 12,750 12,530 12,220Important Farmland Subtotal 765,140 756,470 746,130 736,450 724,140Farmland of Local Importance 110,040 124,140 126,820 137,440 143,830Grazing Land 439,960 434,050 440,550 440,620 440,140
Total 1,315,140 1,314,660 1,313,500 1,314,560 1,308,110
1. Includes all inventoried lands within the County, including any lands inventoried within cities.
SOURCE: County of Tulare, 2010 Background Report (Table 4-9, page 4-23), 2010a.
Important Farmland Trends Using data collected by the FMMP, trends in the number of acres of various farmland categories can be developed. Table 3.10-5 shows the net acreage change between 1998-2000, 2000-2002, 2002-2004, and 2004-2006. As indicated in the table, farmland acreage has been consistently decreasing for each two-year period shown, with the most significant loss (over 6,000 acres of classified farmland) occurring between 2004 and 2006.
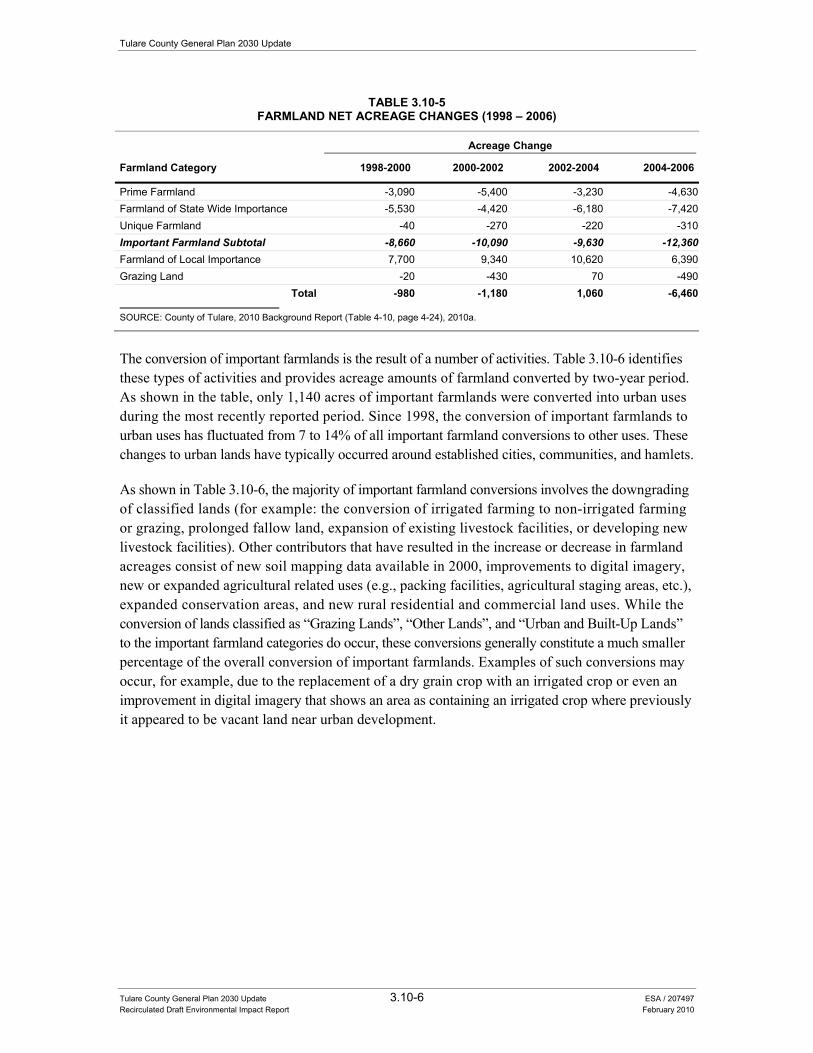
Tulare County General Plan 2030 Update
Tulare County General Plan 2030 Update 3.10-6 ESA / 207497 Recirculated Draft Environmental Impact Report February 2010
TABLE 3.10-5FARMLAND NET ACREAGE CHANGES (1998 – 2006)
Farmland Category
Acreage Change
1998-2000 2000-2002 2002-2004 2004-2006
Prime Farmland -3,090 -5,400 -3,230 -4,630Farmland of State Wide Importance -5,530 -4,420 -6,180 -7,420Unique Farmland -40 -270 -220 -310Important Farmland Subtotal -8,660 -10,090 -9,630 -12,360Farmland of Local Importance 7,700 9,340 10,620 6,390Grazing Land -20 -430 70 -490
Total -980 -1,180 1,060 -6,460
SOURCE: County of Tulare, 2010 Background Report (Table 4-10, page 4-24), 2010a.
The conversion of important farmlands is the result of a number of activities. Table 3.10-6 identifies these types of activities and provides acreage amounts of farmland converted by two-year period. As shown in the table, only 1,140 acres of important farmlands were converted into urban uses during the most recently reported period. Since 1998, the conversion of important farmlands to urban uses has fluctuated from 7 to 14% of all important farmland conversions to other uses. These changes to urban lands have typically occurred around established cities, communities, and hamlets.
As shown in Table 3.10-6, the majority of important farmland conversions involves the downgrading of classified lands (for example: the conversion of irrigated farming to non-irrigated farming or grazing, prolonged fallow land, expansion of existing livestock facilities, or developing new livestock facilities). Other contributors that have resulted in the increase or decrease in farmland acreages consist of new soil mapping data available in 2000, improvements to digital imagery, new or expanded agricultural related uses (e.g., packing facilities, agricultural staging areas, etc.), expanded conservation areas, and new rural residential and commercial land uses. While the conversion of lands classified as “Grazing Lands”, “Other Lands”, and “Urban and Built-Up Lands” to the important farmland categories do occur, these conversions generally constitute a much smaller percentage of the overall conversion of important farmlands. Examples of such conversions may occur, for example, due to the replacement of a dry grain crop with an irrigated crop or even an improvement in digital imagery that shows an area as containing an irrigated crop where previously it appeared to be vacant land near urban development.
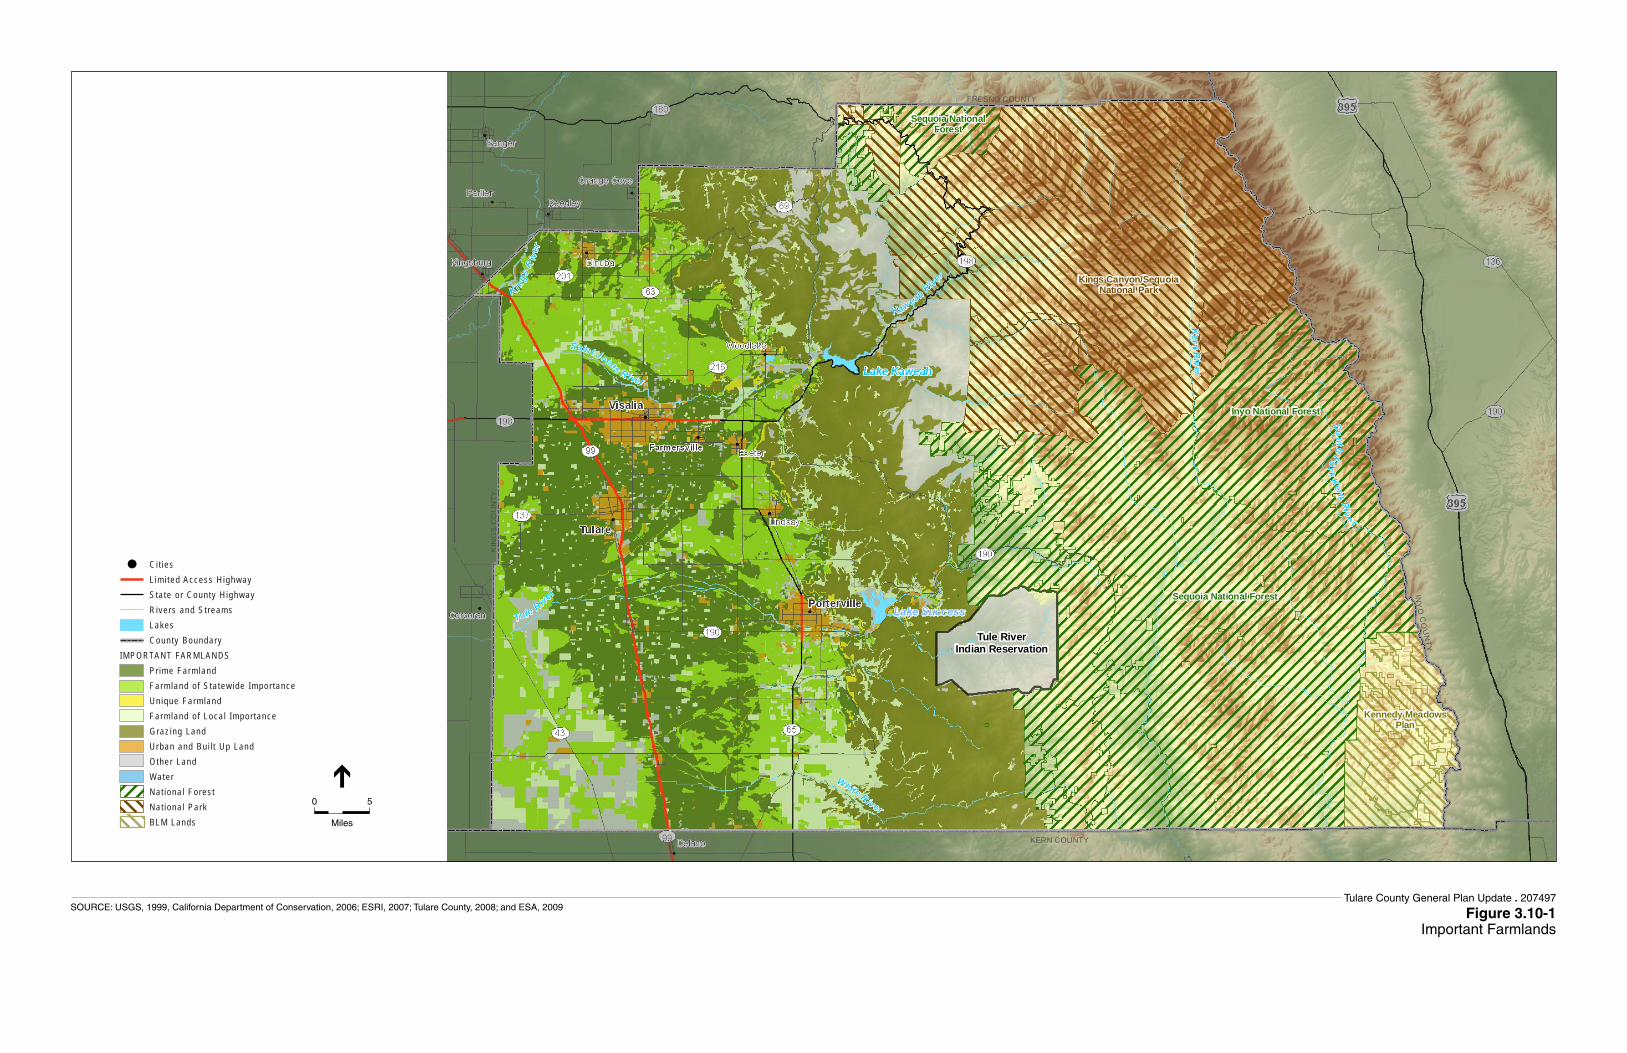
FRESNO COUNTY
INY
OC
OU
NTY
KERN COUNTY
KIN
GS
CO
UN
TY
Sequoia National Forest
Sequoia NationalForest
Inyo National Forest
Kings Canyon/SequoiaNational Park
Tule RiverIndian Reservation
Kennedy MeadowsPlan
C i t ies L im i ted Access H ighway Sta te o r County H ighway R ivers and St reams Lakes County BoundaryIMPORTANT FARMLANDS Pr ime Farmland Farmland o f S ta tewide Impor tance Un ique Farmland Farmland o f Loca l Impor tance Graz ing Land Urban and Bu i l t Up Land Other Land Water Nat iona l Fores t Nat iona l Park BLM Lands
0 5
Miles
Tulare County General Plan Update . 207497
Figure 3.10-1Important Farmlands
SOURCE: USGS, 1999, California Department of Conservation, 2006; ESRI, 2007; Tulare County, 2008; and ESA, 2009
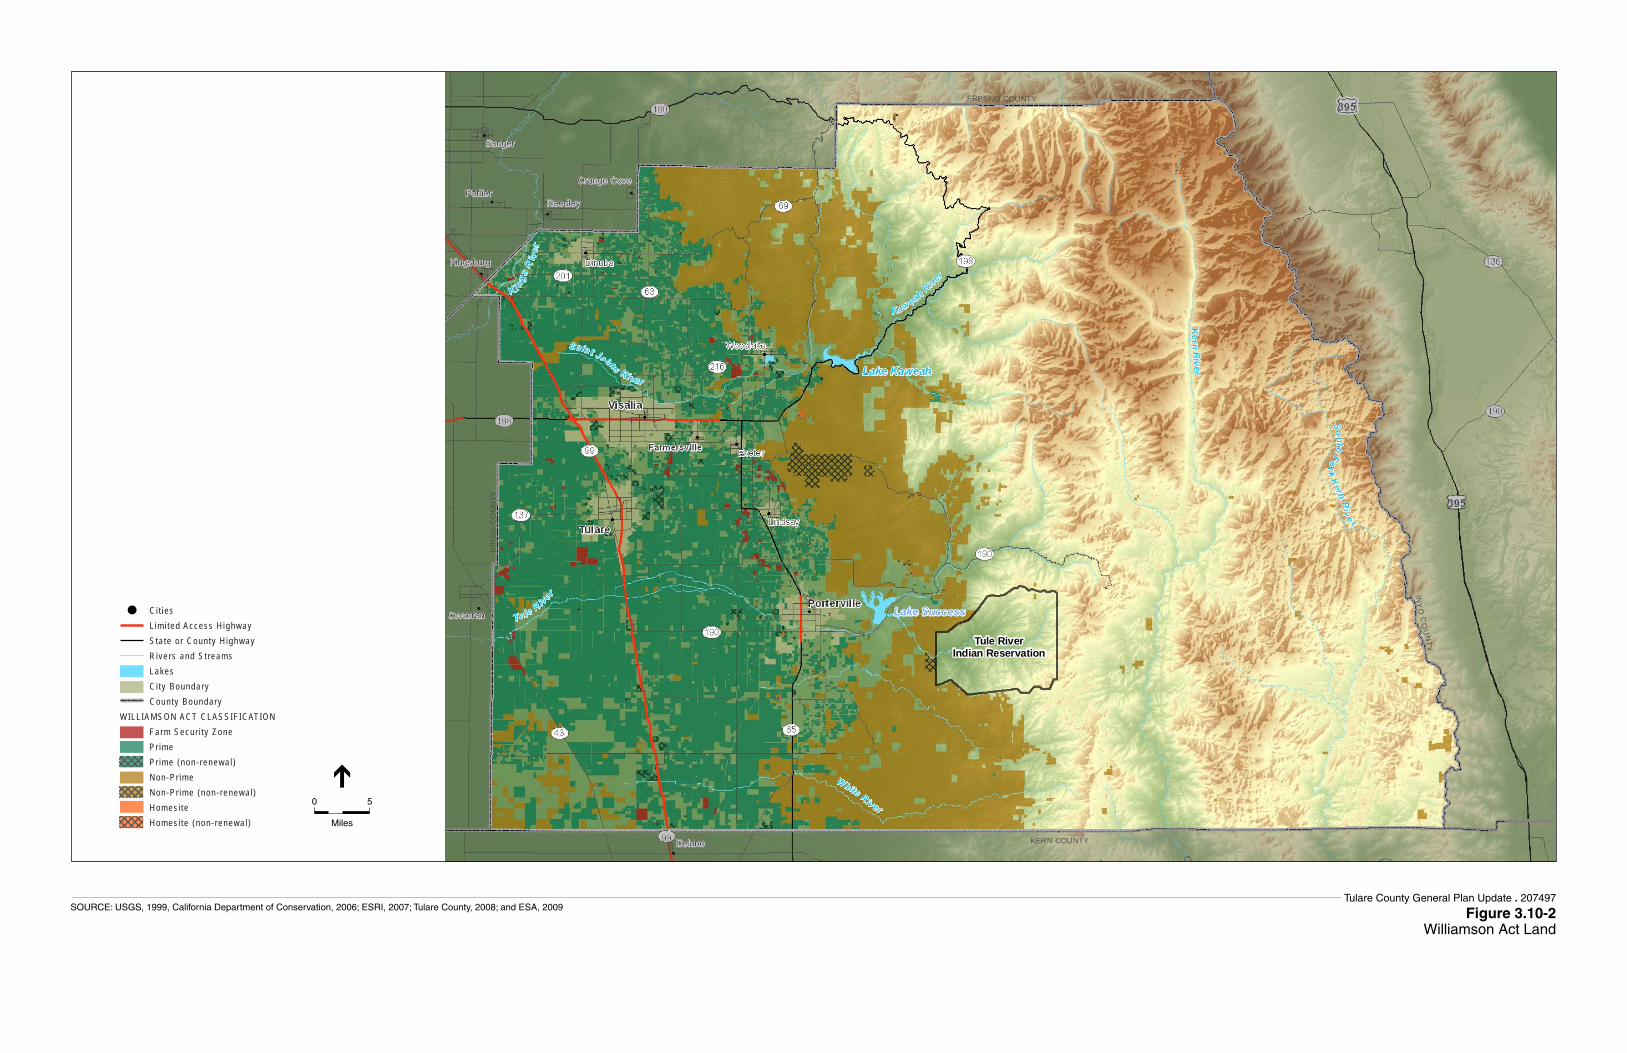
FRESNO COUNTY
INY
OC
OU
NTY
KERN COUNTY
KIN
GS
CO
UN
TY
Tule RiverIndian Reservation
C i t ies L im i ted Access H ighway Sta te o r County H ighway R ivers and St reams Lakes C i ty Boundary County BoundaryWILLIAMSON ACT CLASSIFICATION Farm Secur i t y Zone Pr ime Pr ime (non- renewal ) Non-Pr ime Non-Pr ime (non- renewal ) Homes i te Homes i te (non- renewal )
0 5
Miles
Tulare County General Plan Update . 207497
Figure 3.10-2Williamson Act Land
SOURCE: USGS, 1999, California Department of Conservation, 2006; ESRI, 2007; Tulare County, 2008; and ESA, 2009
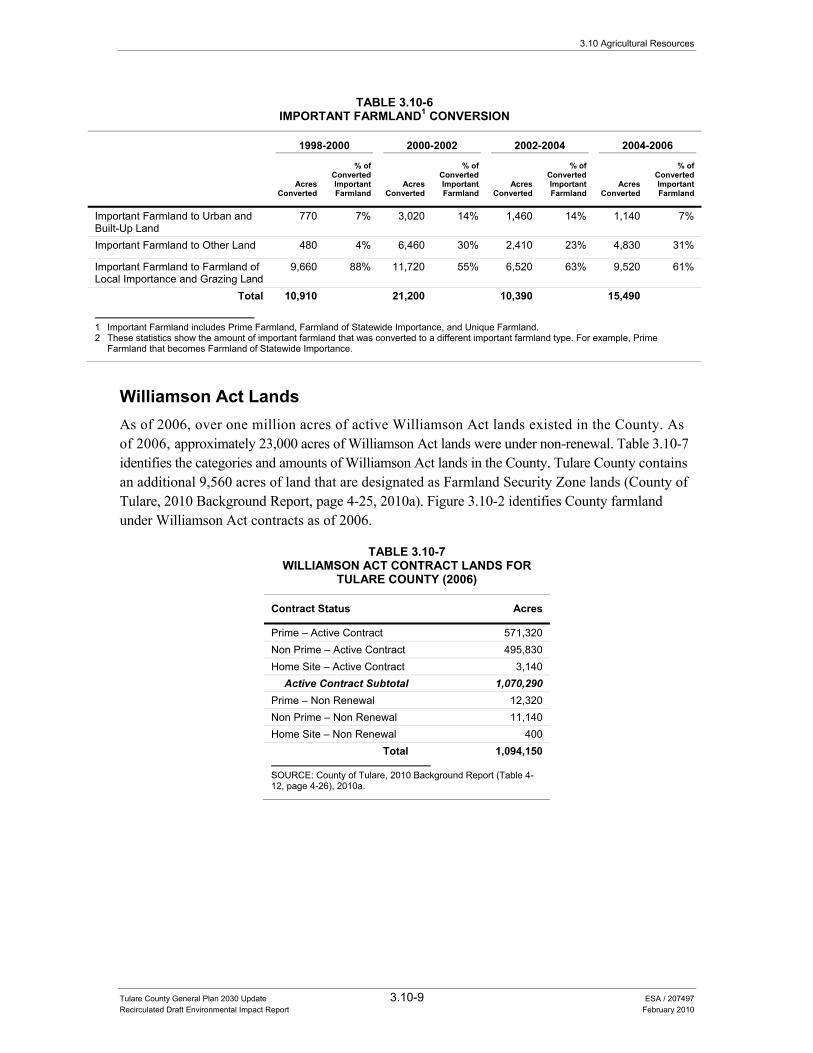
3.10 Agricultural Resources
Tulare County General Plan 2030 Update 3.10-9 ESA / 207497 Recirculated Draft Environmental Impact Report February 2010
TABLE 3.10-6 IMPORTANT FARMLAND1 CONVERSION
1998-2000 2000-2002 2002-2004 2004-2006
Acres
Converted
% of Converted Important Farmland
Acres Converted
% of Converted Important Farmland
Acres Converted
% of Converted Important Farmland
Acres Converted
% of Converted Important Farmland
Important Farmland to Urban and Built-Up Land
770 7% 3,020 14% 1,460 14% 1,140 7%
Important Farmland to Other Land 480 4% 6,460 30% 2,410 23% 4,830 31%
Important Farmland to Farmland of Local Importance and Grazing Land
9,660 88% 11,720 55% 6,520 63% 9,520 61%
Total 10,910 21,200 10,390 15,490
1 Important Farmland includes Prime Farmland, Farmland of Statewide Importance, and Unique Farmland. 2 These statistics show the amount of important farmland that was converted to a different important farmland type. For example, Prime
Farmland that becomes Farmland of Statewide Importance.
Williamson Act Lands As of 2006, over one million acres of active Williamson Act lands existed in the County. As of 2006, approximately 23,000 acres of Williamson Act lands were under non-renewal. Table 3.10-7 identifies the categories and amounts of Williamson Act lands in the County. Tulare County contains an additional 9,560 acres of land that are designated as Farmland Security Zone lands (County of Tulare, 2010 Background Report, page 4-25, 2010a). Figure 3.10-2 identifies County farmland under Williamson Act contracts as of 2006.
TABLE 3.10-7WILLIAMSON ACT CONTRACT LANDS FOR
TULARE COUNTY (2006)
Contract Status Acres
Prime – Active Contract 571,320 Non Prime – Active Contract 495,830 Home Site – Active Contract 3,140
Active Contract Subtotal 1,070,290 Prime – Non Renewal 12,320 Non Prime – Non Renewal 11,140 Home Site – Non Renewal 400
Total 1,094,150
SOURCE: County of Tulare, 2010 Background Report (Table 4-12, page 4-26), 2010a.
Tulare County General Plan 2030 Update
Tulare County General Plan 2030 Update 3.10-10 ESA / 207497 Recirculated Draft Environmental Impact Report February 2010
Impacts and Mitigation Measures
Significance Criteria The significance criteria for this analysis were developed from criteria presented in Appendix G “Environmental Checklist Form” of the CEQA Guidelines and based on the professional judgment of the County of Tulare and its consultants. The proposed project would result in a significant impact if it would:
• Convert Prime Farmland, Unique Farmland, or Farmland of Statewide Importance (Farmland) as shown on the maps prepared pursuant to the Farmland Mapping and Monitoring Program of the California Resources Agency, to non-agricultural use;
• Conflict with a Williamson Act contract; or • Involve other changes in the existing environment that, due to their location or nature,
could result in conversion of Farmland, to non-agricultural uses.
Methodology As more fully described in Chapter 2.0, “Project Description”, future development in Tulare County will be driven by projected population growth and the manner in which the distribution of this growth will be directed and managed by the County. One of the primary objectives of the proposed project is to focus growth in future growth areas (i.e., CACUDBs, HDBs and CACUABs). Consequently, the impact analysis provided below assumes that the majority of impacts to agricultural resources would occur within these areas shown in Figure 3.10-3.
To calculate these impacts, the most currently available GIS data (2006) from the California Department of Conservation’s FMMP and aerial photography were used to calculate acres of important farmlands with the potential to be affected by development associated with the proposed project. The analysis assumes full build-out of the various unincorporated community and hamlet areas.
Summary of Impacts This section evaluates agricultural resource impacts related to the proposed project. For this programmatic evaluation, impacts have been assessed for the overall general plan along with the various planning areas that comprise the County, with Table 3.10-8 providing an overview of these impacts for the proposed project and the various planning areas.
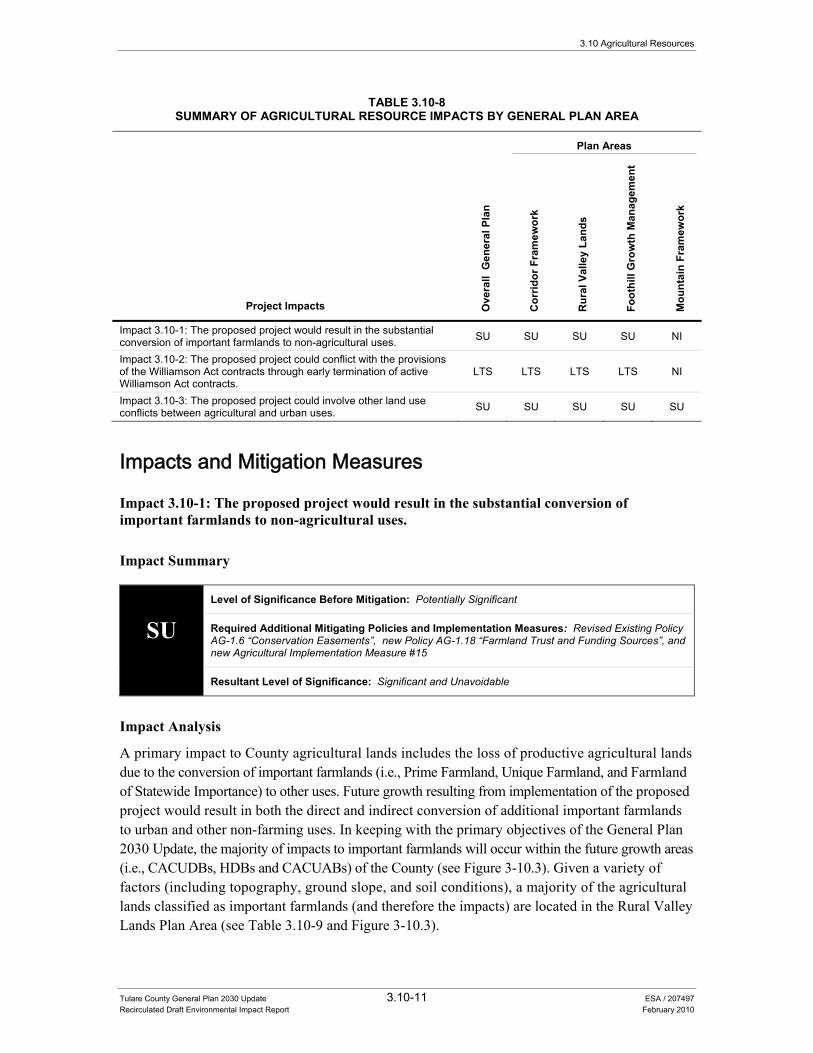
3.10 Agricultural Resources
Tulare County General Plan 2030 Update 3.10-11 ESA / 207497 Recirculated Draft Environmental Impact Report February 2010
TABLE 3.10-8 SUMMARY OF AGRICULTURAL RESOURCE IMPACTS BY GENERAL PLAN AREA
Project Impacts Ove
rall
Gen
eral
Pla
n
Plan Areas
Cor
ridor
Fra
mew
ork
Rur
al V
alle
y La
nds
Foot
hill
Gro
wth
Man
agem
ent
Mou
ntai
n Fr
amew
ork
Impact 3.10-1: The proposed project would result in the substantial conversion of important farmlands to non-agricultural uses. SU SU SU SU NI
Impact 3.10-2: The proposed project could conflict with the provisions of the Williamson Act contracts through early termination of active Williamson Act contracts.
LTS LTS LTS LTS NI
Impact 3.10-3: The proposed project could involve other land use conflicts between agricultural and urban uses. SU SU SU SU SU
Impacts and Mitigation Measures
Impact 3.10-1: The proposed project would result in the substantial conversion of important farmlands to non-agricultural uses.
Impact Summary
SU Level of Significance Before Mitigation: Potentially Significant
Required Additional Mitigating Policies and Implementation Measures: Revised Existing Policy AG-1.6 “Conservation Easements”, new Policy AG-1.18 “Farmland Trust and Funding Sources”, and new Agricultural Implementation Measure #15
Resultant Level of Significance: Significant and Unavoidable
Impact Analysis
A primary impact to County agricultural lands includes the loss of productive agricultural lands due to the conversion of important farmlands (i.e., Prime Farmland, Unique Farmland, and Farmland of Statewide Importance) to other uses. Future growth resulting from implementation of the proposed project would result in both the direct and indirect conversion of additional important farmlands to urban and other non-farming uses. In keeping with the primary objectives of the General Plan 2030 Update, the majority of impacts to important farmlands will occur within the future growth areas (i.e., CACUDBs, HDBs and CACUABs) of the County (see Figure 3-10.3). Given a variety of factors (including topography, ground slope, and soil conditions), a majority of the agricultural lands classified as important farmlands (and therefore the impacts) are located in the Rural Valley Lands Plan Area (see Table 3.10-9 and Figure 3-10.3).
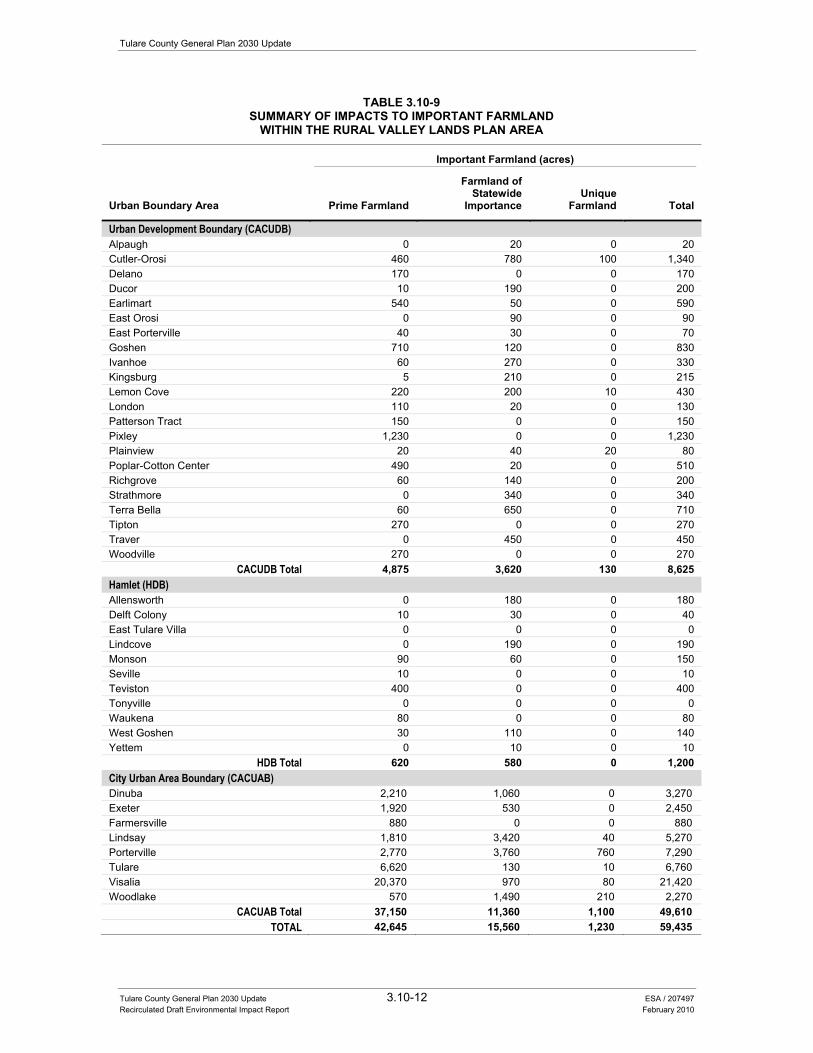
Tulare County General Plan 2030 Update
Tulare County General Plan 2030 Update 3.10-12 ESA / 207497 Recirculated Draft Environmental Impact Report February 2010
TABLE 3.10-9SUMMARY OF IMPACTS TO IMPORTANT FARMLAND
WITHIN THE RURAL VALLEY LANDS PLAN AREA
Urban Boundary Area
Important Farmland (acres)
Prime Farmland
Farmland of Statewide
Importance Unique
Farmland Total
Urban Development Boundary (CACUDB) Alpaugh 0 20 0 20 Cutler-Orosi 460 780 100 1,340 Delano 170 0 0 170 Ducor 10 190 0 200 Earlimart 540 50 0 590 East Orosi 0 90 0 90 East Porterville 40 30 0 70 Goshen 710 120 0 830 Ivanhoe 60 270 0 330 Kingsburg 5 210 0 215 Lemon Cove 220 200 10 430 London 110 20 0 130 Patterson Tract 150 0 0 150 Pixley 1,230 0 0 1,230 Plainview 20 40 20 80 Poplar-Cotton Center 490 20 0 510 Richgrove 60 140 0 200 Strathmore 0 340 0 340 Terra Bella 60 650 0 710 Tipton 270 0 0 270 Traver 0 450 0 450 Woodville 270 0 0 270
CACUDB Total 4,875 3,620 130 8,625 Hamlet (HDB) Allensworth 0 180 0 180 Delft Colony 10 30 0 40 East Tulare Villa 0 0 0 0 Lindcove 0 190 0 190 Monson 90 60 0 150 Seville 10 0 0 10 Teviston 400 0 0 400 Tonyville 0 0 0 0 Waukena 80 0 0 80 West Goshen 30 110 0 140 Yettem 0 10 0 10
HDB Total 620 580 0 1,200 City Urban Area Boundary (CACUAB) Dinuba 2,210 1,060 0 3,270 Exeter 1,920 530 0 2,450 Farmersville 880 0 0 880 Lindsay 1,810 3,420 40 5,270 Porterville 2,770 3,760 760 7,290 Tulare 6,620 130 10 6,760 Visalia 20,370 970 80 21,420 Woodlake 570 1,490 210 2,270
CACUAB Total 37,150 11,360 1,100 49,610 TOTAL 42,645 15,560 1,230 59,435
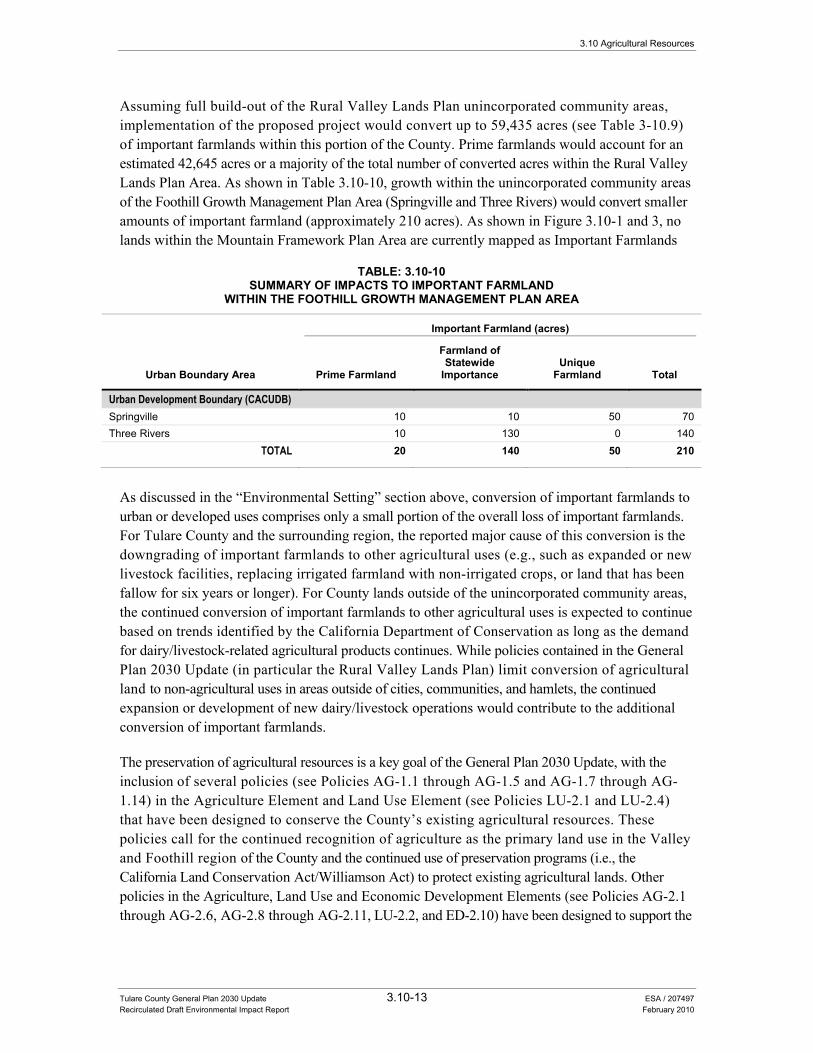
3.10 Agricultural Resources
Tulare County General Plan 2030 Update 3.10-13 ESA / 207497 Recirculated Draft Environmental Impact Report February 2010
Assuming full build-out of the Rural Valley Lands Plan unincorporated community areas, implementation of the proposed project would convert up to 59,435 acres (see Table 3-10.9) of important farmlands within this portion of the County. Prime farmlands would account for an estimated 42,645 acres or a majority of the total number of converted acres within the Rural Valley Lands Plan Area. As shown in Table 3.10-10, growth within the unincorporated community areas of the Foothill Growth Management Plan Area (Springville and Three Rivers) would convert smaller amounts of important farmland (approximately 210 acres). As shown in Figure 3.10-1 and 3, no lands within the Mountain Framework Plan Area are currently mapped as Important Farmlands
TABLE: 3.10-10SUMMARY OF IMPACTS TO IMPORTANT FARMLAND
WITHIN THE FOOTHILL GROWTH MANAGEMENT PLAN AREA
Urban Boundary Area
Important Farmland (acres)
Prime Farmland
Farmland of Statewide
Importance Unique
Farmland Total
Urban Development Boundary (CACUDB) Springville 10 10 50 70 Three Rivers 10 130 0 140
TOTAL 20 140 50 210
As discussed in the “Environmental Setting” section above, conversion of important farmlands to urban or developed uses comprises only a small portion of the overall loss of important farmlands. For Tulare County and the surrounding region, the reported major cause of this conversion is the downgrading of important farmlands to other agricultural uses (e.g., such as expanded or new livestock facilities, replacing irrigated farmland with non-irrigated crops, or land that has been fallow for six years or longer). For County lands outside of the unincorporated community areas, the continued conversion of important farmlands to other agricultural uses is expected to continue based on trends identified by the California Department of Conservation as long as the demand for dairy/livestock-related agricultural products continues. While policies contained in the General Plan 2030 Update (in particular the Rural Valley Lands Plan) limit conversion of agricultural land to non-agricultural uses in areas outside of cities, communities, and hamlets, the continued expansion or development of new dairy/livestock operations would contribute to the additional conversion of important farmlands.
The preservation of agricultural resources is a key goal of the General Plan 2030 Update, with the inclusion of several policies (see Policies AG-1.1 through AG-1.5 and AG-1.7 through AG-1.14) in the Agriculture Element and Land Use Element (see Policies LU-2.1 and LU-2.4) that have been designed to conserve the County’s existing agricultural resources. These policies call for the continued recognition of agriculture as the primary land use in the Valley and Foothill region of the County and the continued use of preservation programs (i.e., the California Land Conservation Act/Williamson Act) to protect existing agricultural lands. Other policies in the Agriculture, Land Use and Economic Development Elements (see Policies AG-2.1 through AG-2.6, AG-2.8 through AG-2.11, LU-2.2, and ED-2.10) have been designed to support the
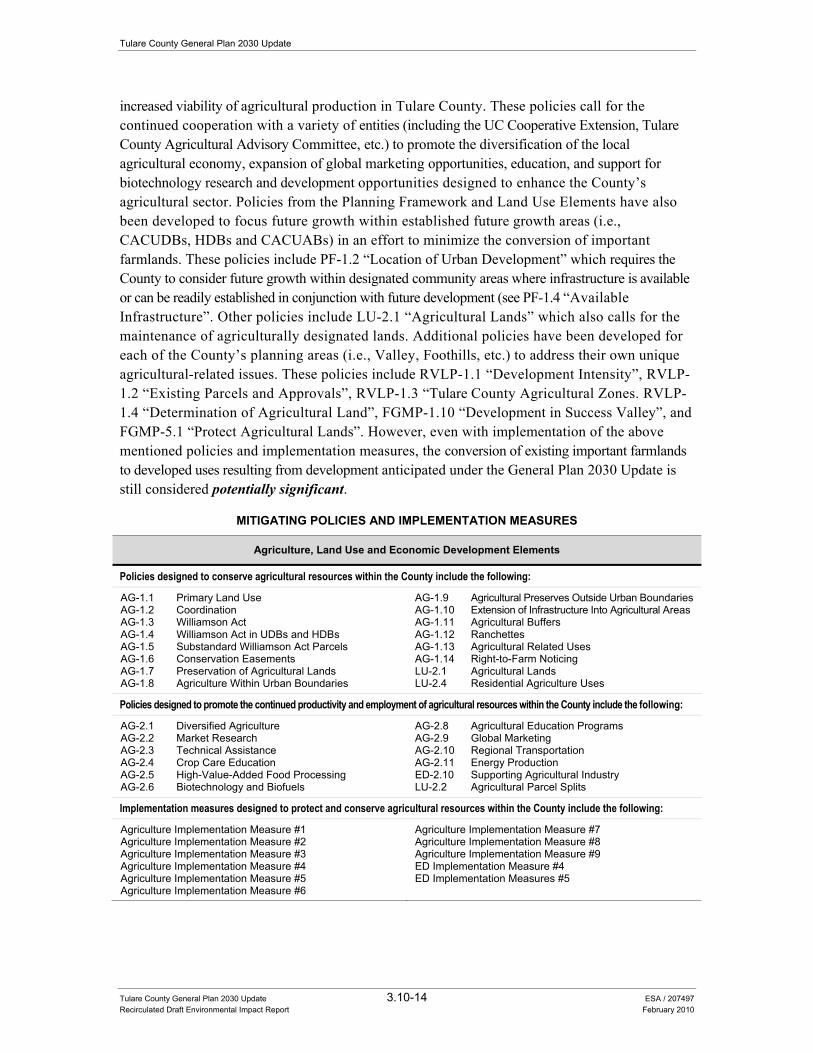
Tulare County General Plan 2030 Update
Tulare County General Plan 2030 Update 3.10-14 ESA / 207497 Recirculated Draft Environmental Impact Report February 2010
increased viability of agricultural production in Tulare County. These policies call for the continued cooperation with a variety of entities (including the UC Cooperative Extension, Tulare County Agricultural Advisory Committee, etc.) to promote the diversification of the local agricultural economy, expansion of global marketing opportunities, education, and support for biotechnology research and development opportunities designed to enhance the County’s agricultural sector. Policies from the Planning Framework and Land Use Elements have also been developed to focus future growth within established future growth areas (i.e., CACUDBs, HDBs and CACUABs) in an effort to minimize the conversion of important farmlands. These policies include PF-1.2 “Location of Urban Development” which requires the County to consider future growth within designated community areas where infrastructure is available or can be readily established in conjunction with future development (see PF-1.4 “Available Infrastructure”. Other policies include LU-2.1 “Agricultural Lands” which also calls for the maintenance of agriculturally designated lands. Additional policies have been developed for each of the County’s planning areas (i.e., Valley, Foothills, etc.) to address their own unique agricultural-related issues. These policies include RVLP-1.1 “Development Intensity”, RVLP-1.2 “Existing Parcels and Approvals”, RVLP-1.3 “Tulare County Agricultural Zones. RVLP-1.4 “Determination of Agricultural Land”, FGMP-1.10 “Development in Success Valley”, and FGMP-5.1 “Protect Agricultural Lands”. However, even with implementation of the above mentioned policies and implementation measures, the conversion of existing important farmlands to developed uses resulting from development anticipated under the General Plan 2030 Update is still considered potentially significant.
MITIGATING POLICIES AND IMPLEMENTATION MEASURES
Agriculture, Land Use and Economic Development Elements
Policies designed to conserve agricultural resources within the County include the following:
AG-1.1 Primary Land Use AG-1.2 Coordination AG-1.3 Williamson Act AG-1.4 Williamson Act in UDBs and HDBs AG-1.5 Substandard Williamson Act Parcels AG-1.6 Conservation Easements AG-1.7 Preservation of Agricultural Lands AG-1.8 Agriculture Within Urban Boundaries
AG-1.9 Agricultural Preserves Outside Urban Boundaries AG-1.10 Extension of Infrastructure Into Agricultural Areas AG-1.11 Agricultural Buffers AG-1.12 Ranchettes AG-1.13 Agricultural Related Uses AG-1.14 Right-to-Farm Noticing LU-2.1 Agricultural Lands LU-2.4 Residential Agriculture Uses
Policies designed to promote the continued productivity and employment of agricultural resources within the County include the following:
AG-2.1 Diversified Agriculture AG-2.2 Market Research AG-2.3 Technical Assistance AG-2.4 Crop Care Education AG-2.5 High-Value-Added Food Processing AG-2.6 Biotechnology and Biofuels
AG-2.8 Agricultural Education Programs AG-2.9 Global Marketing AG-2.10 Regional Transportation AG-2.11 Energy Production ED-2.10 Supporting Agricultural Industry LU-2.2 Agricultural Parcel Splits
Implementation measures designed to protect and conserve agricultural resources within the County include the following:
Agriculture Implementation Measure #1 Agriculture Implementation Measure #2 Agriculture Implementation Measure #3 Agriculture Implementation Measure #4 Agriculture Implementation Measure #5 Agriculture Implementation Measure #6
Agriculture Implementation Measure #7 Agriculture Implementation Measure #8 Agriculture Implementation Measure #9 ED Implementation Measure #4 ED Implementation Measures #5
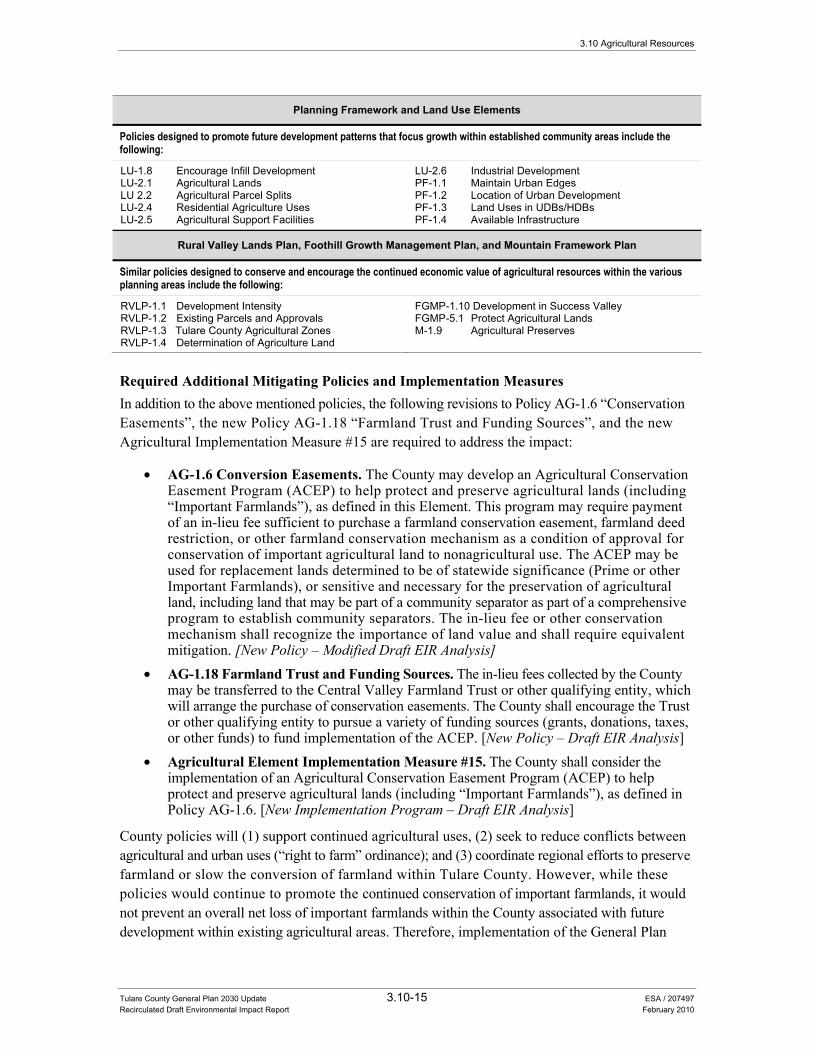
3.10 Agricultural Resources
Tulare County General Plan 2030 Update 3.10-15 ESA / 207497 Recirculated Draft Environmental Impact Report February 2010
Planning Framework and Land Use Elements
Policies designed to promote future development patterns that focus growth within established community areas include the following:
LU-1.8 Encourage Infill Development LU-2.1 Agricultural Lands LU 2.2 Agricultural Parcel Splits LU-2.4 Residential Agriculture Uses LU-2.5 Agricultural Support Facilities
LU-2.6 Industrial Development PF-1.1 Maintain Urban Edges PF-1.2 Location of Urban Development PF-1.3 Land Uses in UDBs/HDBs PF-1.4 Available Infrastructure
Rural Valley Lands Plan, Foothill Growth Management Plan, and Mountain Framework Plan
Similar policies designed to conserve and encourage the continued economic value of agricultural resources within the variousplanning areas include the following:
RVLP-1.1 Development Intensity RVLP-1.2 Existing Parcels and Approvals RVLP-1.3 Tulare County Agricultural Zones RVLP-1.4 Determination of Agriculture Land
FGMP-1.10 Development in Success Valley FGMP-5.1 Protect Agricultural Lands M-1.9 Agricultural Preserves
Required Additional Mitigating Policies and Implementation Measures In addition to the above mentioned policies, the following revisions to Policy AG-1.6 “Conservation Easements”, the new Policy AG-1.18 “Farmland Trust and Funding Sources”, and the new Agricultural Implementation Measure #15 are required to address the impact:
• AG-1.6 Conversion Easements. The County may develop an Agricultural Conservation Easement Program (ACEP) to help protect and preserve agricultural lands (including “Important Farmlands”), as defined in this Element. This program may require payment of an in-lieu fee sufficient to purchase a farmland conservation easement, farmland deed restriction, or other farmland conservation mechanism as a condition of approval for conservation of important agricultural land to nonagricultural use. The ACEP may be used for replacement lands determined to be of statewide significance (Prime or other Important Farmlands), or sensitive and necessary for the preservation of agricultural land, including land that may be part of a community separator as part of a comprehensive program to establish community separators. The in-lieu fee or other conservation mechanism shall recognize the importance of land value and shall require equivalent mitigation. [New Policy – Modified Draft EIR Analysis]
• AG-1.18 Farmland Trust and Funding Sources. The in-lieu fees collected by the County may be transferred to the Central Valley Farmland Trust or other qualifying entity, which will arrange the purchase of conservation easements. The County shall encourage the Trust or other qualifying entity to pursue a variety of funding sources (grants, donations, taxes, or other funds) to fund implementation of the ACEP. [New Policy – Draft EIR Analysis]
• Agricultural Element Implementation Measure #15. The County shall consider the implementation of an Agricultural Conservation Easement Program (ACEP) to help protect and preserve agricultural lands (including “Important Farmlands”), as defined in Policy AG-1.6. [New Implementation Program – Draft EIR Analysis]
County policies will (1) support continued agricultural uses, (2) seek to reduce conflicts between agricultural and urban uses (“right to farm” ordinance); and (3) coordinate regional efforts to preserve farmland or slow the conversion of farmland within Tulare County. However, while these policies would continue to promote the continued conservation of important farmlands, it would not prevent an overall net loss of important farmlands within the County associated with future development within existing agricultural areas. Therefore, implementation of the General Plan
Tulare County General Plan 2030 Update
Tulare County General Plan 2030 Update 3.10-16 ESA / 207497 Recirculated Draft Environmental Impact Report February 2010
2030 Update including the adoption of the policies and implementation measures listed above would still result in a significant impact. No additional feasible mitigation is currently available.
Significance after Implementation of Mitigation for Impact 3.10-1
Outside of the policies included in the General Plan 2030 Update (including the revised Policy AG-1.6 “Conservation Easements”, the recommended new Policy AG-1.18 “Farmland Trust and Funding Sources”, and the recommended new Agricultural Element Implementation Measure #15), no additional technologically or economically feasible mitigation measures are currently available to reduce this impact to a less than significant level. Consequently, this impact is considered significant and unavoidable.
Impact 3.10-2: The proposed project could conflict with the provisions of the Williamson Act contracts through early termination of active Williamson Act contracts.
Impact Summary
LTS Level of Significance Before Mitigation: Less than Significant
Required Additional Mitigating Policies and Implementation Measures: None Required
Resultant Level of Significance: Less than Significant
Impact Analysis
It can be assumed that some future development subsequent to the General Plan 2030 Update will occur on lands currently subject to a Williamson Act contract. Future development subsequent to the General Plan 2030 Update would primarily occur within future growth areas (i.e., CACUDBs, HDBs and CACUABs). It is further assumed that the proper procedures (including minimizing early termination of active contracts), contained within the Williamson Act itself, will be followed as development within the County occurs under the General Plan 2030 Update. As of 2006 the County had 1,094,150 acres of land under Williamson Act Contract and 23,860 acres under non-renewed Williamson Act Contract. According to California Department of Conservation, Division of Land Resource Protection data (2007) of the land under Williamson Act Contract in 2006, 66,510 acres were within the County’s unincorporated community areas. Of the land under non-renewed Williamson Act Contract, 5,150 acres are within unincorporated community areas.
One of the functions of the Williamson Act is to encourage orderly development while discouraging premature development of agricultural lands (with active Williamson Act contracts). This purpose is also reflected in the General Plan 2030 Update, which contains policies to focus future growth within established community areas (including CACUDB and HDB areas) in an effort to minimize the conversion of important farmlands. These policies from the Planning Framework portion of the Goals and Policies Report (Part I of the General Plan 2030 Update) include PF-1.2
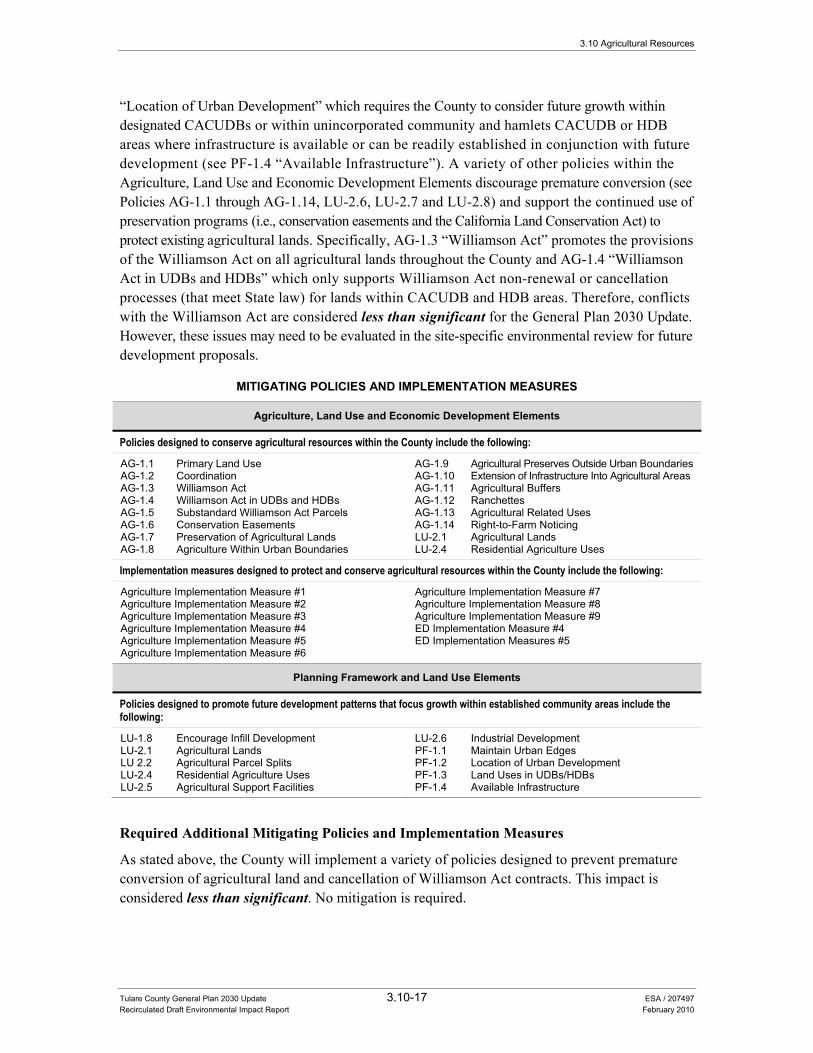
3.10 Agricultural Resources
Tulare County General Plan 2030 Update 3.10-17 ESA / 207497 Recirculated Draft Environmental Impact Report February 2010
“Location of Urban Development” which requires the County to consider future growth within designated CACUDBs or within unincorporated community and hamlets CACUDB or HDB areas where infrastructure is available or can be readily established in conjunction with future development (see PF-1.4 “Available Infrastructure”). A variety of other policies within the Agriculture, Land Use and Economic Development Elements discourage premature conversion (see Policies AG-1.1 through AG-1.14, LU-2.6, LU-2.7 and LU-2.8) and support the continued use of preservation programs (i.e., conservation easements and the California Land Conservation Act) to protect existing agricultural lands. Specifically, AG-1.3 “Williamson Act” promotes the provisions of the Williamson Act on all agricultural lands throughout the County and AG-1.4 “Williamson Act in UDBs and HDBs” which only supports Williamson Act non-renewal or cancellation processes (that meet State law) for lands within CACUDB and HDB areas. Therefore, conflicts with the Williamson Act are considered less than significant for the General Plan 2030 Update. However, these issues may need to be evaluated in the site-specific environmental review for future development proposals.
MITIGATING POLICIES AND IMPLEMENTATION MEASURES
Agriculture, Land Use and Economic Development Elements
Policies designed to conserve agricultural resources within the County include the following:
AG-1.1 Primary Land Use AG-1.2 Coordination AG-1.3 Williamson Act AG-1.4 Williamson Act in UDBs and HDBs AG-1.5 Substandard Williamson Act Parcels AG-1.6 Conservation Easements AG-1.7 Preservation of Agricultural Lands AG-1.8 Agriculture Within Urban Boundaries
AG-1.9 Agricultural Preserves Outside Urban Boundaries AG-1.10 Extension of Infrastructure Into Agricultural Areas AG-1.11 Agricultural Buffers AG-1.12 Ranchettes AG-1.13 Agricultural Related Uses AG-1.14 Right-to-Farm Noticing LU-2.1 Agricultural Lands LU-2.4 Residential Agriculture Uses
Implementation measures designed to protect and conserve agricultural resources within the County include the following:
Agriculture Implementation Measure #1 Agriculture Implementation Measure #2 Agriculture Implementation Measure #3 Agriculture Implementation Measure #4 Agriculture Implementation Measure #5 Agriculture Implementation Measure #6
Agriculture Implementation Measure #7 Agriculture Implementation Measure #8 Agriculture Implementation Measure #9 ED Implementation Measure #4 ED Implementation Measures #5
Planning Framework and Land Use Elements
Policies designed to promote future development patterns that focus growth within established community areas include the following:
LU-1.8 Encourage Infill Development LU-2.1 Agricultural Lands LU 2.2 Agricultural Parcel Splits LU-2.4 Residential Agriculture Uses LU-2.5 Agricultural Support Facilities
LU-2.6 Industrial Development PF-1.1 Maintain Urban Edges PF-1.2 Location of Urban Development PF-1.3 Land Uses in UDBs/HDBs PF-1.4 Available Infrastructure
Required Additional Mitigating Policies and Implementation Measures
As stated above, the County will implement a variety of policies designed to prevent premature conversion of agricultural land and cancellation of Williamson Act contracts. This impact is considered less than significant. No mitigation is required.
Tulare County General Plan 2030 Update
Tulare County General Plan 2030 Update 3.10-18 ESA / 207497 Recirculated Draft Environmental Impact Report February 2010
Significance after Implementation of Mitigation for Impact 3.10-2
A number of policies referenced above in the impact analysis and included in the proposed project were specifically designed to minimize impacts to agricultural lands under Williamson Act contract. With implementation of the above mentioned policies, this impact is considered less than significant.
Impact 3.10-3: The proposed project would involve other land use conflicts between agricultural and urban uses.
Impact Summary
SU Level of Significance Before Mitigation: Potentially Significant
Required Additional Mitigating Policies and Implementation Measures: Revised Existing Policy AG-1.6 “Conservation Easements”, new Policy AG-1.18 “Farmland Trust and Funding Sources”, and new Agricultural Implementation Measure #15
Resultant Level of Significance: Significant and Unavoidable
Impact Analysis
As previously described under Impact 3.10-3, direct impacts to agricultural resources include the conversion of important farmland, which consists of Prime Farmland, Farmland of Statewide Importance, and Unique Farmland, to non-agricultural uses. Indirect changes caused by this development may include a variety of nuisance effects resulting from urban expansion into agricultural areas—also known as “edge effects.” These nuisance effects include noise (from farm equipment and crop dusting), dust, odors, and drift of agricultural chemicals. From the agricultural perspective, conflicts with urban development include restrictions on the use of agricultural chemicals, complaints regarding noise and dust, trespass, vandalism, and damage from domestic animals (such as dogs). These conflicts may increase costs to the agricultural operation, and combined with rising land values for residential development, encourage conversion of additional important farmland to urban or other non-agricultural uses. The potential for “edge effects” may be greater adjacent to the various unincorporated community areas of the County (see Figure 3.10-3).
Similar to Impact 3.10-1, policies and implementation measures included as part of the proposed project would minimize this impact (please see the discussion provided above for Impact 3.10-1 for a complete list of all the policies and measures). However, even with implementation of the above mentioned policies and implementation measures, the potential conversion (both direct and indirect) of additional important farmlands to developed uses resulting from development anticipated under the proposed project is still considered potentially significant due to the potential for “edge effects”.
3.10 Agricultural Resources
Tulare County General Plan 2030 Update 3.10-19 ESA / 207497 Recirculated Draft Environmental Impact Report February 2010
Required Additional Mitigating Policies and Implementation Measures In addition to the above mentioned policies, the following revisions to Policy AG-1.6 “Conservation Easements”, the recommended new Policy AG-1.18 “Farmland Trust and Funding Sources”, and the recommended new Agriculture Element Implementation Measure #15 are required to address the impact:
• AG-1.6 Conversion Easements. The County may develop an Agricultural Conservation Easement Program (ACEP) to help protect and preserve agricultural lands (including “Important Farmlands”), as defined in the Element. This program may require payment of an in-lieu fee sufficient to purchase a farmland conservation easement, farmland deed restriction, or other farmland conservation mechanism as a condition of approval for conservation of important agricultural land to nonagricultural use. The ACEP shall be used for replacement lands determined to be of statewide significance (Prime or other Important Farmlands), or sensitive and necessary for the preservation of agricultural land, including land that may be part of a community separator as part of a comprehensive program to establish community separators. The in-lieu fee or other conservation mechanism shall recognize the importance of land value and shall require equivalent mitigation. [New Policy – Modified Draft EIR Analysis]
• AG-1.18 Farmland Trust and Funding Sources. The in-lieu fees collected by the County may be transferred to the Central Valley Farmland Trust or other qualifying entity, which will arrange the purchase of conservation easements. The County shall encourage the Trust or other qualifying entity to pursue a variety of funding sources (grants, donations, taxes, or other funds) to fund implementation of the ACEP. [New Policy – Draft EIR Analysis]
• Agricultural Implementation Measure #15. The County shall consider implementation of an Agricultural Conservation Easement Program (ACEP) to help protect and preserve agricultural lands (including “Important Farmlands”), as defined in Policy AG-1.6. [New Implementation Program – Draft EIR Analysis]
County policies will (1) support continued agricultural uses, (2) seek to reduce conflicts between agricultural and urban uses (“right to farm” ordinance); and (3) coordinate regional efforts to preserve farmland within Tulare County. However, while these policies would continue to promote the continued conservation of important farmlands, it would not prevent an overall net loss of important farmlands within the County associated with future development within existing agricultural areas. Therefore, implementation of the General Plan 2030 Update including the adoption of the policies and implementation measures listed above would still result in a significant impact. No additional feasible mitigation is currently available.
Significance after Implementation of Mitigation for Impact 3.10-3
Outside of the policies included in the General Plan 2030 Update (including the revised Policy AG-1.6 “Conservation Easements”, the recommended new Policy AG-1.18 “Farmland Trust and Funding Sources”, and the recommended new Agriculture Element Implementation Measure #15), no additional feasible mitigation measures are currently available to reduce this impact to a less than significant level. Consequently, this impact is considered significant and unavoidable.

Tulare County General Plan 2030 Update 3.11-1 ESA / 207497 Recirculated Draft Environmental Impact Report February 2010
SECTION 3.11 Biological Resources
Introduction This section of the recirculated draft Environmental Impact Report (RDEIR) addresses potential impacts to biological resources in Tulare County. The regulatory setting provides a description of applicable State and local regulatory policies. The environmental setting provides a description of biological resources in the County, including special status species and sensitive habitats. A description of the potential impacts of the proposed project is also provided and includes the identification of feasible mitigation (general plan policies) to avoid or lessen the impacts.
The following environmental and regulatory settings were developed from information contained in the 2010 Background Report (see Chapter 9.0 “Biological, Archaeological, and Cultural Resources”), incorporated by reference and summarized below. This document is also attached as Appendix B to this RDEIR.
Regulatory Setting Applicable federal, State, and local regulations specific to biological resources are described below.
Federal Regulations
Clean Water Act - Section 404 Wetlands and other waters of the U.S. are subject to the jurisdiction of the U.S. Army Corp of Engineers (USACE) and U.S. Environmental Protection Agency (EPA) under Section 404 of the Clean Water Act (33 U.S.C. 1251 et seq., 1972). Together, the EPA and the USACE determine whether they have jurisdiction over the non-navigable tributaries that are not relatively permanent based on a fact-specific analysis to determine if there is a significant nexus. These non-navigable tributaries include wetlands adjacent to non-navigable tributaries that are not relatively permanent and wetlands adjacent to but that do not directly abut a relatively permanent non-navigable tributary.
Wet areas that are not regulated by this Act do not have a hydrologic link to other waters of the U.S., either through surface or subsurface flow and include ditches that drain uplands, swales or other erosional features. The USACE has the authority to issue a permit for any discharge, fill, or dredge of wetlands on a case-by-case basis, or by a general permit. General permits are handled through
Tulare County General Plan 2030 Update
Tulare County General Plan 2030 Update 3.11-2 ESA / 207497 Recirculated Draft Environmental Impact Report February 2010
a Nationwide Permit (NWP) process. These permits allow specific activities that generally create minimal environmental effects. Projects that qualify under the NWP program must fulfill several general and specific conditions under each applicable NWP. If a proposed project cannot meet the conditions of each applicable NWP, an individual permit would likely be required from the USACE.
Federal Endangered Species Act The U.S. Fish and Wildlife Service (USFWS) administers the federal Endangered Species Act (16 USC Section 153 et seq.) and thereby has jurisdiction over federally listed threatened, endangered, and proposed species. Projects that may result in a “take” of a listed species or critical habitat must consult with the USFWS. “Take” is broadly defined as harassment, harm, pursuing, hunting, shooting, wounding, killing, trapping, capturing, or collection; any attempt to engage in such conduct; or destruction of habitat that prevents an endangered species from recovering (16 USC 1532, 50 CFR 17.3). Federal agencies that propose, fund, or must issue a permit for a project that may affect a listed species or critical habitat are required to consult with the USFWS under Section 7 of the Federal Endangered Species Act. If it is determined that a federally listed species or critical habitat may be adversely affected by the federal action, the USFWS will issue a “Biological Opinion” to the federal agency that describes minimization and avoidance measures that must be implemented as part of the federal action. Projects that do not have a federal nexus must apply for a take permit under Section 10 of the Act. Section 10 of the act requires that the project applicant prepare a habitat conservation plan as part of the permit application (16 USC 1539).
Under Section 4 of the federal Endangered Species Act, a species can be removed, or delisted, from the list of threatened and endangered species. Delisting is a formal action made by the USFWS and is the result of a determined successful recovery of a species. This action requires posts in the federal registry and a public comment period before a final determination is made by the USFWS.
Habitat Conservation Plans Habitat Conservation Plans (HCPs) are required for a non-federal entity that has requested a take permit of a federal listed species or critical habitat under Section 10 of the Endangered Species Act. HCPs are designed to offset harmful effects of a proposed project on federally listed species. These plans are utilized to achieve long-term biological and regulatory goals. Implementation of HCPs allows development and projects to occur while providing conservation measures that protect federally listed species or their critical habitat and offset the incidental take of a proposed project. HCPs substantially reduce the burden of the Endangered Species Act on small landowners by providing efficient mechanisms for compliance with the ESA, thereby distributing the economic and logistic effects of compliance. A broad range of landowner activities can be legally protected under these plans (County of Tulare, 2010 Background Report, pages 9-6 and 9-7, 2010a). There are generally two types of HCPs, project specific HCPs which typically protect a few species and have a short duration and multi-species HCPs which typically cover the development of a larger area and have a longer duration.
3.11 Biological Resources
Tulare County General Plan 2030 Update 3.11-3 ESA / 207497 Recirculated Draft Environmental Impact Report February 2010
Migratory Bird Treaty and Bald and Golden Eagle Protection Act The Migratory Bird Treaty Act (MBTA, 16 USC Section 703-711) and the Bald and Golden Eagle Protection Act (16 USC Section 668) protect certain species of birds from direct “take”. The MBTA protects migrant bird species from take by setting hunting limits and seasons and protecting occupied nests and eggs. The Bald and Golden Eagle Protection Act (16 USC Sections 668-668d) prohibits the take or commerce of any part of Bald and Golden Eagles. The USFWS administers both acts, and reviews federal agency actions that may affect species protected by the acts.
State Regulations
California Department of Fish and Game The California Department of Fish and Game (DFG) regulates the modification of the bed, bank, or channel of a waterway under Sections 1601-1607 of the California Fish and Game Code. Also included are modifications that divert, obstruct, or change the natural flow of a waterway. Any party who proposes an activity that may modify a feature regulated by the Fish and Game Code must notify DFG before project construction. DFG will then decide whether to enter into a Streambed Alteration Agreement with the project applicant either under Section 1601 (for public entities) or Section 1603 (for private entities) of the Fish and Game Code.
California Endangered Species Act DFG administers the California Endangered Species Act of 1984 (Fish and Game Code Section 2080), which regulates the listing and “take” of endangered and threatened State-listed species. A “take” may be permitted by California Department of Fish and Game through implementing a management agreement. “Take” is defined by the California Endangered Species Act as “hunt, pursue, catch, capture, or kill, or attempt to hunt, pursue, catch, capture, or kill” a State-listed species (Fish and Game Code Sec. 86). Under State laws, DFG is empowered to review projects for their potential impacts to State-listed species and their habitats.
The DFG maintains lists for Candidate-Endangered Species (SCE) and Candidate-Threatened Species (SCT). California candidate species are afforded the same level of protection as State-listed species. California also designates Species of Special Concern (CSC) that are species of limited distribution, declining populations, diminishing habitat, or unusual scientific, recreational, or educational value. These species do not have the same legal protection as listed species, but may be added to official lists in the future. The CSC list is intended by DFG as a management tool for consideration in future land use decisions (Fish and Game Code Section 2080).
All State lead agencies must consult with DFG under the California Endangered Species Act when a proposed project may affect State-listed species. DFG would determine if a project under review would jeopardize or result in taking of a State-listed species, or destroy or adversely modify its essential habitat, also known as a “jeopardy finding” (Fish and Game Code Sec. 2090). For projects where DFG has made a jeopardy finding, DFG must specify reasonable and prudent alternatives to the proposed project to the State lead agency (Fish and Game Code Sec. 2090 et seq.).
Tulare County General Plan 2030 Update
Tulare County General Plan 2030 Update 3.11-4 ESA / 207497 Recirculated Draft Environmental Impact Report February 2010
Natural Communities Conservation Planning Act The Natural Communities Conservation Planning Act allows a process for developing natural community conservation plans (NCCPs) under DFG direction. NCCPs allow for regional protection of wildlife diversity, while allowing compatible development. DFG may permit takings of State-listed species whose conservation and management are provided in a NCCP, once a NCCP is prepared (Fish and Game Code Secs. 2800 et seq.).
Federally and State-Protected Lands Ownership of California’s wildlands is divided primarily between federal, State, and private entities. State-owned land is managed under the leadership of the Departments of Fish and Game (DFG), Parks and Recreation, and Forestry and Fire Protection (CDF). Tulare County has protected lands in the form of wildlife refuges, national parks, and other lands that have large limitations on appropriate land uses. Some areas are created to protect special status species and their ecosystems.
Porter-Cologne Water Quality Control Act The Porter-Cologne Water Quality Control Act regulates the discharge of waste into waters of the State. The Regional Water Quality Control Board (RWQCB) administers this regulation. Water Code Section 13260 requires “any person discharging, or proposing to discharge waste, within any region that could affect the waters of the State to file a report of discharge.” A report of waste discharge (“RWD”) is essentially an application for waste discharge requirements (“WDRs”). WDRs contain conditions imposed on a given discharge by the appropriate RWQCBs for the purpose of protecting the beneficial uses of the waters of the State. Upon receipt of a RWD, the RWQCB may issue WDRs imposing conditions on the proposed discharge, or it may waive the requirement for WDRs.
California Wetlands Conservation Policy The California Wetlands Conservation Policy’s goal is to establish a policy framework and strategy that will ensure no overall net loss and achieve a long-term net gain in the quantity, quality, and permanence of wetlands acreage and values in California. Additionally, the policy aims to reduce procedural complexity in the administration of State and federal wetlands conservation programs and to encourage partnerships with a primary focus on landowner incentive programs and cooperative planning efforts. These objectives are achieved through three policy means: statewide policy initiatives, three geographically based regional strategies in which wetland programs can be implemented, and creation of interagency wetlands task force to direct and coordinate administration and implementation of the policy. Leading agencies include the Resources Agency and the California Environmental Protection Agency (Cal/EPA) in cooperation with Business, Transportation and Housing Agency, Department of Flood and Agriculture, Trade and Commerce Agency, Governor’s Office of Planning and Research, Department of Fish and Game, Department of Water Resources, and the State Water Resources Control Board.
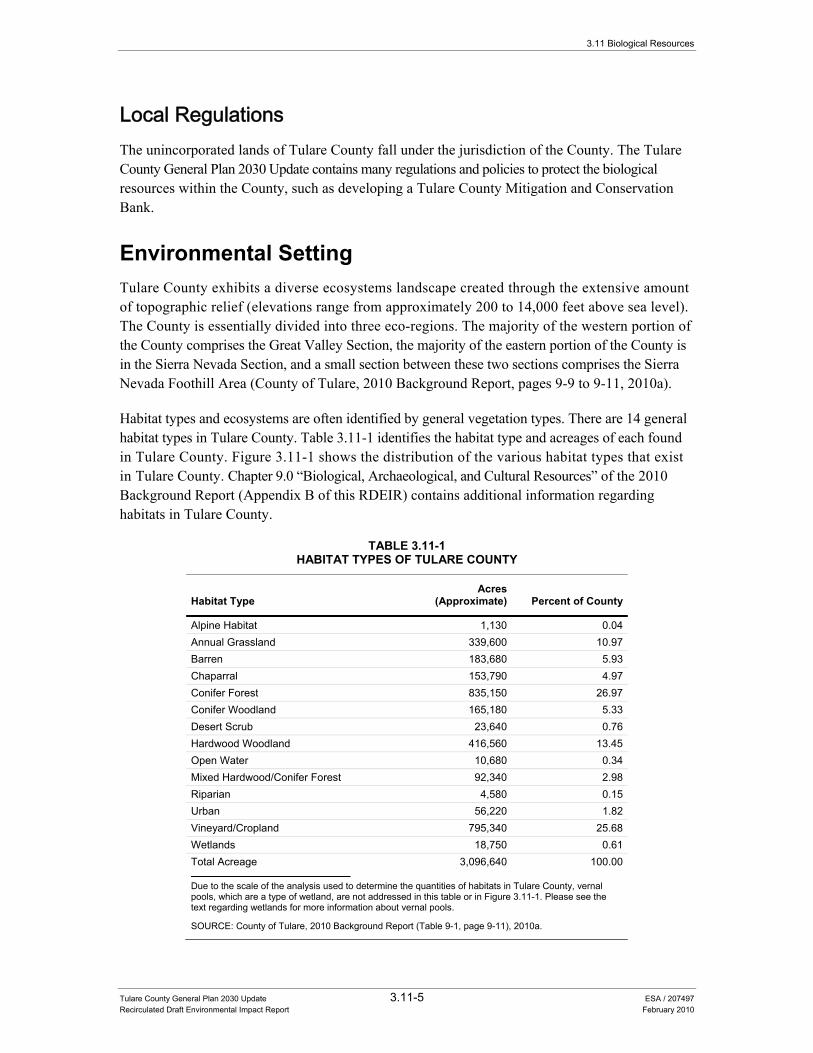
3.11 Biological Resources
Tulare County General Plan 2030 Update 3.11-5 ESA / 207497 Recirculated Draft Environmental Impact Report February 2010
Local Regulations The unincorporated lands of Tulare County fall under the jurisdiction of the County. The Tulare County General Plan 2030 Update contains many regulations and policies to protect the biological resources within the County, such as developing a Tulare County Mitigation and Conservation Bank.
Environmental Setting Tulare County exhibits a diverse ecosystems landscape created through the extensive amount of topographic relief (elevations range from approximately 200 to 14,000 feet above sea level). The County is essentially divided into three eco-regions. The majority of the western portion of the County comprises the Great Valley Section, the majority of the eastern portion of the County is in the Sierra Nevada Section, and a small section between these two sections comprises the Sierra Nevada Foothill Area (County of Tulare, 2010 Background Report, pages 9-9 to 9-11, 2010a).
Habitat types and ecosystems are often identified by general vegetation types. There are 14 general habitat types in Tulare County. Table 3.11-1 identifies the habitat type and acreages of each found in Tulare County. Figure 3.11-1 shows the distribution of the various habitat types that exist in Tulare County. Chapter 9.0 “Biological, Archaeological, and Cultural Resources” of the 2010 Background Report (Appendix B of this RDEIR) contains additional information regarding habitats in Tulare County.
TABLE 3.11-1HABITAT TYPES OF TULARE COUNTY
Habitat Type Acres
(Approximate) Percent of County
Alpine Habitat 1,130 0.04 Annual Grassland 339,600 10.97 Barren 183,680 5.93 Chaparral 153,790 4.97 Conifer Forest 835,150 26.97 Conifer Woodland 165,180 5.33 Desert Scrub 23,640 0.76 Hardwood Woodland 416,560 13.45 Open Water 10,680 0.34 Mixed Hardwood/Conifer Forest 92,340 2.98 Riparian 4,580 0.15 Urban 56,220 1.82 Vineyard/Cropland 795,340 25.68 Wetlands 18,750 0.61 Total Acreage 3,096,640 100.00
Due to the scale of the analysis used to determine the quantities of habitats in Tulare County, vernal pools, which are a type of wetland, are not addressed in this table or in Figure 3.11-1. Please see the text regarding wetlands for more information about vernal pools.
SOURCE: County of Tulare, 2010 Background Report (Table 9-1, page 9-11), 2010a.
Tulare County General Plan 2030 Update
Tulare County General Plan 2030 Update 3.11-6 ESA / 207497 Recirculated Draft Environmental Impact Report February 2010
Tree Dominated Habitats
Conifer Forest Conifer forests are composed of needle-leaved evergreen trees that create uniform canopy coverage, with little gaps in between tree crowns. This habitat covers approximately 835,150 acres within the County. Shrubby vegetation and herbaceous ground cover are generally sparse or lacking, and litter accumulation is typically low. Fallen woody material persists for long periods of time in cold climates. Coniferous forests at high elevations support fewer species of amphibians, reptiles, birds, and mammals than other major forest types in California. Low species diversity may be due to the combination of harsher climate, shorter growing season, lower primary productivity, moisture stress, and lower production of insects and invertebrates that provide a food source to other vertebrates.
Conifer Woodland Conifer woodlands are composed of needle-leaved evergreen trees that form less dense canopy cover compared to conifer forests, allowing more sunlight to penetrate to the ground level. This habitat supports more shrubs and herbs in the understory due to higher levels of sunlight in gaps between trees. Within the County, this habitat covers approximately 165,180 acres in the mid- to high-elevations in the Sierra Nevada in the eastern side of the County. Conifer woodlands typically support similar plant and animal species as conifer forests, but in greater number due to more temperate temperatures and greater abundance of food.
Mixed Hardwood / Conifer Forest Mixed hardwood-conifer forests include both conifers and hardwoods that form a closed forest. This habitat covers approximately 92,340 acres of the County, predominately in the foothill/Sierra Nevada mountain region. Typically, at least one-third of the trees must be conifer and at least one-third must be broad-leaved to be considered a mixed hardwood-conifer forest. The habitat often exhibits a mosaic-like pattern of small pure stands of conifers interspersed with small stands of broad-leaved trees. Species composition within this diverse habitat varies by geographical areas. This habitat is transitional between dense coniferous forests and montane hardwood, mixed chaparral, or open woodlands and savannahs. Mixed hardwood-conifer forests can also provide habitat for a variety of wildlife species.
Hardwood Woodland Hardwood woodland habitat covers approximately 416,560 acres of the County. This habitat extends from annual grassland habitats in low elevations to coniferous habitats in the Sierra Nevada mountain range. Hardwood woodland includes three types of woodlands at various elevations: montane hardwood at high elevations, blue oak woodland at mid elevations, and valley oak woodland at low elevations. These different types of woodlands support a range of plant and wildlife species.
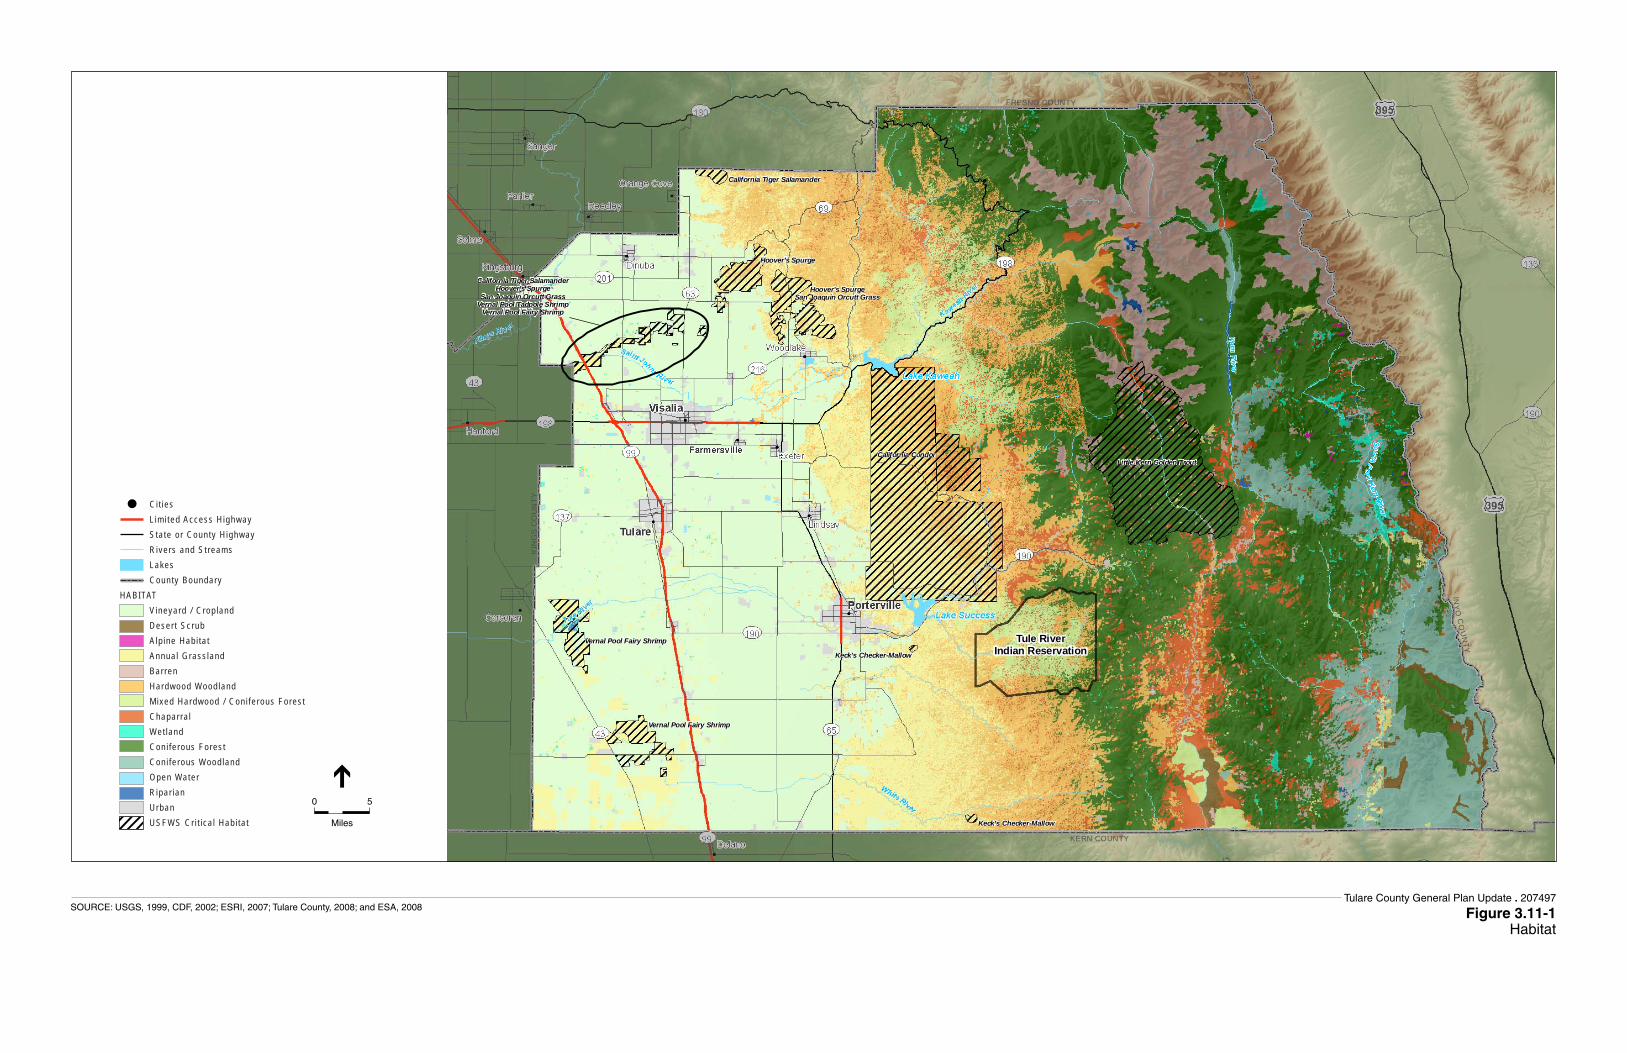
FRESNO COUNTY
INY
OC
OU
NTY
KERN COUNTY
KIN
GS
CO
UN
TY
Little Kern Golden TroutCalifornia Condor
California Tiger SalamanderHoover's Spurge
San Joaquin Orcutt GrassVernal Pool Tadpole Shrimp
Vernal Pool Fairy Shrimp
Hoover's Spurge
Hoover's SpurgeSan Joaquin Orcutt Grass
Vernal Pool Fairy Shrimp
Vernal Pool Fairy Shrimp
California Tiger Salamander
Keck's Checker-Mallow
Keck's Checker-Mallow
Tule RiverIndian Reservation
C i t ies L im i ted Access H ighway Sta te o r County H ighway R ivers and St reams Lakes County BoundaryHABITAT Vineyard / Crop land Deser t Scrub A lp ine Hab i ta t Annua l Grass land Bar ren Hardwood Wood land Mixed Hardwood / Con i fe rous Fores t Chapar ra l Wet land Con i fe rous Fores t Con i fe rous Wood land Open Water R ipar ian Urban USFWS Cr i t i ca l Hab i ta t
0 5
Miles
Tulare County General Plan Update . 207497
Figure 3.11-1Habitat
SOURCE: USGS, 1999, CDF, 2002; ESRI, 2007; Tulare County, 2008; and ESA, 2008

3.11 Biological Resources
Tulare County General Plan 2030 Update 3.11-9 ESA / 207497 Recirculated Draft Environmental Impact Report February 2010
Riparian Riparian habitats typically occur adjacent to rivers, perennial or intermittent streams, seeps, and springs. Riparian habitats are composed of a narrow band of trees, shrubs, and herbs that are adapted to moist soil conditions. Riparian habitats within the County include montane riparian and valley foothill riparian, covering approximately 4,580 acres of the County. Riparian habitats are important as migration corridors and for providing water, thermal cover, nesting and feeding opportunities for wildlife. This habitat can support a rich diversity of animal species.
Shrub-Dominated Habitats
Montane Chaparral and Mixed Chaparral Montane chaparral and mixed chaparral habitats cover approximately 153,790 acres within the northeastern section of the County. Montane habitat type usually occurs on rocky, granitic southern exposures and is characterized by drought-tolerant species. Montane chaparral is adjacent to a wide variety of habitats including montane riparian, mixed chaparral, ponderosa pine, Jeffrey pine, red fir, and lodgepole pine. Montane chaparral provides habitat for a variety of wildlife species; however, no wildlife species are restricted to this habitat.
Desert Scrub Desert scrub habitats are typically open, scattered assemblages of broad-leaved evergreen or deciduous microphyll shrubs between 0.5 and 2 meters (1.5 and 6.5 feet) tall, rarely exceeding 3 meters (10 feet) in height. Desert scrub covers approximately 23,640 acres in the southeast corner of the County. Canopy cover of desert scrub habitats is generally less than 50 percent, with large areas of bare ground in between plants. The dominant plant species within this habitat is the creosotebush (Larrea tridentata). Presence of water during the winter and spring months support growth of herbaceous plants and provide foraging areas and food for a variety of reptiles and rodents.
Herbaceous-Dominated Habitats
Alpine Habitat Alpine habitats are comprised of wetlands and upland habitats that cover approximately 1,130 acres within the County. Wetlands occurring in alpine habitats are freshwater wetlands that are seasonally flooded, semi-permanently flooded, permanently saturated, or seasonally saturated. They occur at the margins of channels, lakes, ponds, overflow areas, streams, and wet meadows. Wet meadows are the most commonly associated habitat type to alpine habitat. Dominant species within wet meadows include sedges, rushes, and tufted hairgrass (Deschampsia cespitosa). Upland habitats within alpine habitats typically occur above the forest line. These habitats include moist sods, steppes, patches of plants, individual plants, shrubs in rock crevices, and talus. Plants and animals that inhabit alpine habitat are adapted to extreme climate and isolation.
Tulare County General Plan 2030 Update
Tulare County General Plan 2030 Update 3.11-10 ESA / 207497 Recirculated Draft Environmental Impact Report February 2010
Annual Grassland Annual grassland constitutes 339,600 acres of the County. Annual grassland habitat is dominated by introduced annual grasses and herbs in the ground layer. Species composition within this habitat is highly dependent on precipitation, fall temperatures, light intensity (affected by shading from plants and litter), and differences in microtopography. Annual grasslands provide foraging for a wide variety of wildlife species when special habitat features are present, such as cliffs, caves, ponds, or habitats with woody plants for breeding, resting, and cover from predators.
Wetlands Wetland habitats are areas of lands where water saturation is the dominant factor determining the nature of soil development and type of plant and animal communities existing on the site. Wetlands cover approximately 18,750 acres within the County. The federal definition of wetlands includes “lands that are transitional between terrestrial and aquatic systems where the water table is usually at or near the surface or the land is covered by shallow water. Wetlands typically have three attributes: (1) at least periodically, the land supports hydrophytes (water-loving plants), (2) the substrate is predominantly undrained hydric soil, and (3) the substrate is non-soil and is saturated with water or covered by shallow water at some time during the growing season of each year.” Wetland types within the County include wet meadows, fresh emergent wetlands, and vernal pools.
Wet meadows consist of a layer of herbaceous plants that form a microstructure ranging between 2 or 3 centimeters (0.812 inch) to one meter or more tall (>3 feet). Wet meadows are generally too wet to provide suitable habitat for small mammals.
Fresh emergent wetlands are characterized by erect, rooted herbaceous hydrophytes. Fresh emergent wetlands have variable vegetation composition and size structure, but all are saturated or flooded frequently enough to support anaerobic soil conditions. Fresh emergent wetlands occur in association with terrestrial and aquatic habitats and are among the most productive wildlife habitats in California providing food, cover, and water to numerous birds, mammals, reptiles, and amphibians.
Vernal pools are seasonally flooded depressions in the landscape that are underlain by an impermeable layer of hardpan, claypan, or volcanic basalt. These pools are typically dry in the summer and inundated during parts of the winter. Vernal pools exist singly or in complexes of pools that occur in close proximity and are hydrologically connected. This wetland supports a specialized biota that includes a large number of threatened and endangered species.
Aquatic Habitats
Open Water Water comprises approximately 10,680 acres of the County. Water habitat within the County is composed of lacustrine and riverine areas. Lacustrine includes lakes, reservoirs, ponds, and ponded areas along streams, while riverine includes rivers, canals, and streams. Water habitats typically support fish species and also provide foraging, cover and breeding habitat for other aquatic species.
3.11 Biological Resources
Tulare County General Plan 2030 Update 3.11-11 ESA / 207497 Recirculated Draft Environmental Impact Report February 2010
Developed Habitats
Urban Land classified as urban area encompasses approximately 56,220 acres of the County. Wildlife species that use urban habitat are variable, depending on the density of development, the surrounding land use, and the types and availability of vegetation and other habitat features available for foraging, nesting, and cover. In general, however, wildlife habitat in urban areas consists of landscaped areas with a mix of both native and exotic ornamental plant species. Species using these areas are conditioned to a greater level of human activity than those in natural and less developed areas. Generally, the more developed an urban area is, the less diversity of species occurring in that area will be.
Vineyard / Cropland Agricultural habitat covers approximately 795,340 acres of the County. Vegetation composition and structure in agricultural habitats are variable, depending on the type of crops grown and the time of year. For these reasons, habitat value for wildlife is also variable. In addition, the types and timing of operational activities of agricultural lands affects habitat suitability for wildlife. Tall and maintained crops such as vineyards will provide different habitat value and likely support different wildlife species than short crops with a lot of exposed bare ground between rows or pasture land. Typical wildlife species that may use agricultural habitat include a variety of rodents and birds. Croplands provide food and water for these species, but do not generally provide long-term shelter due to the frequency of disturbance.
Non-Vegetated Habitats
Barren Barren habitat is defined as any habitat with less than 2% total vegetation cover by herbaceous, desert, or non-wildland species and less than 10% cover by tree or shrub species. Barren habitat constitutes 183,680 acres of the County. Structure and composition of this habitat is largely influenced by the region of the State and surrounding environment. Along rivers, barren habitat includes vertical river banks and canyon walls. Barren habitats in desert environments are areas between widely spaced vegetation. Alpine barren habitats include exposed parent rock, glacial moraines, talus slopes, and any surface permanently covered by snow or ice. Urban environments have barren habitats in the form of pavement and buildings. Barren habitats are found in juxtaposition with many of the other habitats described above.
Sensitive Natural Communities A sensitive natural community is a rare vegetation type that provides important habitat opportunities for wildlife, is structurally complex, or which is of special concern to local, State, or federal agencies.
Tulare County General Plan 2030 Update
Tulare County General Plan 2030 Update 3.11-12 ESA / 207497 Recirculated Draft Environmental Impact Report February 2010
Natural communities that are either known or believed to be of high priority for inventory are listed in the California Natural Diversity Database (CNDDB). The following nine sensitive natural communities are found in Tulare County:
• Big Tree Forest; • Central Valley Drainage Hardhead/Squawfish Stream; • Great Valley Oak Riparian Forest; • Northern Hardpan Vernal Pool; • Southern Interior Cypress Forest; • Sycamore Alluvial Woodland; • Valley Sacaton Grassland; • Valley Saltbush Scrub; and • Valley Sink Scrub.
Critical Habitats The Endangered Species Act (ESA) requires the federal government to designate “critical habitat” for any species it lists under the ESA. Designated critical habitat areas in the County are shown in Figure 3.11-1. Critical habitat designations have been established for the following eight species in Tulare County:
• Vernal pool fairy shrimp (Branchinecta lynchi), • Vernal pool tadpole shrimp (Lepidurus packardi), • Little Kern golden trout (Oncorhynchus aquabonita whitei), • California tiger salamander, central population (Ambystoma californiense), • California condor (Gymnogyps californianus), • Hoover’s spurge (Chamaesyce hooveri), • San Joaquin Valley Orcutt grass (Orcuttia inaequalis), and • Keck’s checker-mallow (Sidalcea keckii).
Vernal Pool Fairy Shrimp and Tadpole Shrimp On August 6, 2003, the USFWS issued a final rule designating critical habitat for four vernal pool crustaceans, including the vernal pool fairy shrimp (Branchinecta lynchi) and the vernal pool tadpole shrimp (Lepidurus packardi). Critical habitat for vernal pool fairy shrimp in Tulare County is generally located south and southwest of the city of Tulare and northwest of the city of Visalia. Critical habitat for vernal pool tadpole shrimp is located northwest of the city of Visalia. The total land area designated as critical habitat for the vernal pool fairy shrimp and vernal pool tadpole shrimp in California and Oregon is 839,460 acres and 459,505. The total area of critical habitat designated for vernal pool fairy shrimp and vernal pool tadpole shrimp within Tulare County is 24,285 acres
3.11 Biological Resources
Tulare County General Plan 2030 Update 3.11-13 ESA / 207497 Recirculated Draft Environmental Impact Report February 2010
and 7,579 acres, respectively. The final rule identified the following threats to the vernal pool fairy shrimp and vernal pool tadpole shrimp:
• Vernal pool species are threatened by invasion of nonnative species. Actions to reduce negative effects of nonnative invasion include managed grazing and prescribed burning.
• Alteration of natural hydrology threatens many vernal pool species, including the two mentioned above. Actions to restore vernal pool hydrology include the removal of dams and ditches, reconstruction or construction of berms or culverts, and modification of grazing regimes.
• Human degradation of vernal pools through activities such as off-road vehicle use, dumping, and vandalism threatens many vernal pool species, including the two mentioned above. Actions to reduce human degradation of vernal pool habitat include fencing, trail building, and posting signs.
Little Kern Golden Trout On April 13, 1978, USFWS issued a final rule designating critical habitat for the Little Kern golden trout (Oncorhynchus aquabonita whitei). Critical habitat for this species in Tulare County is generally located in the eastern portion of the County, within the main channel and all stream tributaries of the Little Kern River above the barrier falls located on the river one mile below the mouth of Trout Meadows Creek. The final rule identified the following threats to the Little Kern golden trout:
• Uncontrolled use of Off Road Vehicles (ORVs), improper road construction, careless logging activities, pollution from mining operations or overgrazing in large portions of the drainage basin could degrade water quality and threaten the survival of the Little Kern golden trout.
• Introduction of rainbow trout into the Little Kern River System in the 1930s has resulted in hybridization between the Little Kern golden trout and the introduced rainbow trout. Introduction of this species has reduced the number of pure populations of Little Kern golden trout.
California Tiger Salamander, Central Population On August 23, 2005, U.S. Fish and Wildlife Service issued a final rule designating critical habitat for the central population of California tiger salamander (Ambystoma californiense). Critical habitat in Tulare County for this species is generally located north and northwest of the city of Visalia (see Figure 3.11-1), and is also found throughout the Central Valley, Southern San Joaquin, East Bay, and Central Coast Regions. A total of approximately 200,000 acres of critical habitat was designated for the central population of California tiger salamander throughout California. Tulare County contains approximately 5,200 acres of designated critical habitat for the central population of the California tiger salamander. The final rule identified the following threats to the California tiger salamander in the County:
• Activities that could disturb aquatic breeding habitats during the breeding season, such as heavy equipment operation, ground disturbance, maintenance projects (e.g., pipelines, roads, powerlines), off-road travel or recreation;
• Activities that impair the water quality of aquatic breeding habitat;
Tulare County General Plan 2030 Update
Tulare County General Plan 2030 Update 3.11-14 ESA / 207497 Recirculated Draft Environmental Impact Report February 2010
• Activities that create barriers impassable for salamanders or increase mortality in upland habitat between extant occurrences in breeding habitat; and
• Activities that disrupt vernal pool complexes’ ability to support California tiger salamander breeding function (50 CFR, Part 17).
California Condor On September 24, 1976, U.S. Fish and Wildlife Service issued a final rule designating critical habitat for the California condor (Gymnogyps californianus). On September 22, 1977, a document of Final Correction and Augmentation of Critical Habitat Reorganization was issued. Critical habitat for this species in Tulare County is generally located between Highway 65, Highway 198, and the western boundary of the Sequoia National Forest. The total area designated as critical habitat for the California condor is approximately 152,000 acres. The final rule and final correction identified the following habitat requirements for the California condor in the County:
• The California condor requires substantial areas of open range, with adequate food, and limited development and disturbance to survive. Condor feeding, nesting, and roosting habitat are restricted to areas listed in the final rule.
Hoover’s Spurge On August 6, 2003, U.S. Fish and Wildlife Service issued a final rule designating critical habitat for the Hoover’s spurge (Chamaesyce hooveri). Critical habitat for this species in Tulare County is generally located northwest and northeast of the city of Visalia. The total area designated as critical habitat for Hoover’s spurge is approximately 23,537 acres in Tulare County and 145,383 acres in California and Oregon. This area is important because it supports almost 20 percent of the known occurrences of Hoover’s spurge. This species, along with other vernal pool species, are threatened by nonnative species, altered hydrology, and habitat degradation through human use. As discussed previously with vernal pool fairy shrimp and vernal pool tadpole shrimp, vernal pool species benefit greatly from conservation actions involving managed grazing and burning, removing or altering man-made structures to restore natural hydrology regimes, and providing means for humans to interact positively with vernal pools.
San Joaquin Valley Orcutt Grass On August 6, 2003, U.S. Fish and Wildlife Service issued a final rule designating critical habitat for the San Joaquin Valley Orcutt grass (Orcuttia inaequalis). Critical habitat for this species in Tulare County is generally located northwest and northeast of the city of Visalia. The total area designated as critical habitat for the species is approximately 15,243 acres in Tulare County and 197,367 acres in California and Oregon. This species, along with other vernal pool species, are threatened by nonnative species, altered hydrology, and habitat degradation through human use. Actions to reduce negative effects of these impacts are discussed above in the vernal pool fairy shrimp and vernal pool tadpole shrimp section.
3.11 Biological Resources
Tulare County General Plan 2030 Update 3.11-15 ESA / 207497 Recirculated Draft Environmental Impact Report February 2010
Keck’s Checker-Mallow On March 18, 2003, USFWS issued a final rule designating critical habitat for the Keck’s checker-mallow (Sidalcea keckii). Critical habitat areas for this species are generally located south of the city of Porterville, in the Mine Hill area, and near the White River in Tulare County. The total area designated as critical habitat for the Keck’s checker-mallow is approximately 575 acres in Tulare County. The final rule identified the following factors that impact the survival of Keck’s checker-mallow:
• Historic loss of habitat that supports this species requires protection of current habitat and seed banks, as well as providing the opportunity for this species to expand its distribution by protecting currently suitable but unoccupied habitat.
Other Sensitive Habitat Areas
Tulare Lake Basin The Tulare Lake Basin is located in Kern, Kings, and Tulare Counties. Historically, Tulare Lake varied in size from 450 to 800 square miles and was known to become completely dry during drought years (County of Tulare, 2010 Background Report, page 9-27, 2010a). The historical seasonal flooding of Tulare Lake and four other smaller lakes created an interconnected patchwork of aquatic, wetland, riparian forest, and valley oak savannah habitats. These wetlands were utilized for wintering or as a migratory stop for waterfowl. Most of the historic Tulare Lake Basin has been converted to agricultural land uses. Portions of the Pixley National Wildlife Refuge are located within the historic Tulare Lake Bed. This 6,000-acre refuge is located in southwestern Tulare County and contains grassland and wetlands habitats. This refuge was established to restore and protect wetland habitat for waterfowl. Approximately 4,392 acres of the refuge provide habitat for three endangered species, the San Joaquin Kit Fox, the Blunt-Nosed Leopard Lizard, and the Tipton Kangaroo rat (County of Tulare, 2010 Background Report, page 9-27, 2010a).
Wetlands Wetlands exist throughout Tulare County. Through the creation of protective regulations, both the federal and State governments have demonstrated the importance of wetlands through the passage of the Clean Water Act and the Porter-Cologne Water Quality Act. Wetlands provide habitat for many plants and animals. They are essential in preserving the quality of surface waters and in recharging groundwater aquifers. Through implementation of the California Wetlands Conservation Policy, DFG has begun to coordinate wetland information for the State. Currently, their efforts have been focused on the Central Valley (County of Tulare, 2010 Background Report, page 9-28, 2010a). Figure 3.11-1 shows the presence of wetlands in Tulare County; although, a focused survey has not been completed of all wetlands in the County.
Tulare County contains a unique and threatened wetland-type known as vernal pools. Vernal pools are seasonally flooded depressions in the landscape that are underlain by subsurface soils that limit
Tulare County General Plan 2030 Update
Tulare County General Plan 2030 Update 3.11-16 ESA / 207497 Recirculated Draft Environmental Impact Report February 2010
drainage. These pools are typically dry in the summer and inundated during parts of the winter. Depending on their depth and the quantities of rainfall, inundation can occur for a week to several months. The surrounding non-pool terrain that divides vernal pools typically exists in higher proportions than the areas that are actually inundated. Historically, vernal pools existed in native grassland prairie areas. Today, vernal pools exist in Tulare County in annual grassland and cultivated areas. It is estimated that 38,530 acres of vernal pools exist in Tulare County. Most of this wetland is not addressed in Figure 3.11-1 or Table 3.11-1 because the habitat types addressed in the figure and table are based on dominant vegetation and the size of an actual vernal pool area would not appear at the scale of the analysis conducted to determine the vegetation-types addressed in the figure and the table. Vernal pools are generally addressed as an ecosystem. Their ecosystem is considered one of the most threatened ecosystems in California. Because this ecosystem often occurs on relatively flat terrain, it is highly vulnerable to destruction from agriculture, heavy grazing, urbanization, brush clearing, and off-road vehicle use. The USFWS has designated critical habitat for several listed vernal pool species that typically protects large tracts of vernal pool areas. The USFWS has designated a total of 36,357 acres in Tulare County as critical habitat for several listed vernal pool species.
Species Recovery Plan The Recovery Plan for Upland Species of the San Joaquin Valley (Williams, et al, 1998), released and adopted by the USFWS in 1998, is a conservation and recovery plan for federally listed species, candidate species, and species of concern. This recovery plan protects 34 species; 11 of which are federally listed as threatened or endangered, and 23 listed as candidate species or species of concern. The ultimate objective of this plan is for the recovery and subsequent de-listing of the 11 endangered or threatened species and for the long-term conservation of the candidate species and species of concern. This plan provides an ecosystem approach to the conservation and recovery of these species. The strategy of the plan is to focus on the recovery of the natural communities and ecosystems where many of the upland species co-occur. One of the key elements of this plan contains economic and social consideration with recommendations to “reduce the [fiscal] cost recovery, impacts of recommended actions on the local economy, and the constraints placed on the citizens of the San Joaquin Valley.”
Federally and State-Protected Lands Within Tulare County, there exist lands which have large limitations on land uses, i.e. wildlife refuges, national parks, etc. These areas generally provide nursery sites, high quality habitat, corridors, and migratory stopping points for biological resources. Many of these areas are created to protect rare species and their ecosystems. Some of the larger sites are described below and depicted in Figure 3.11-2.
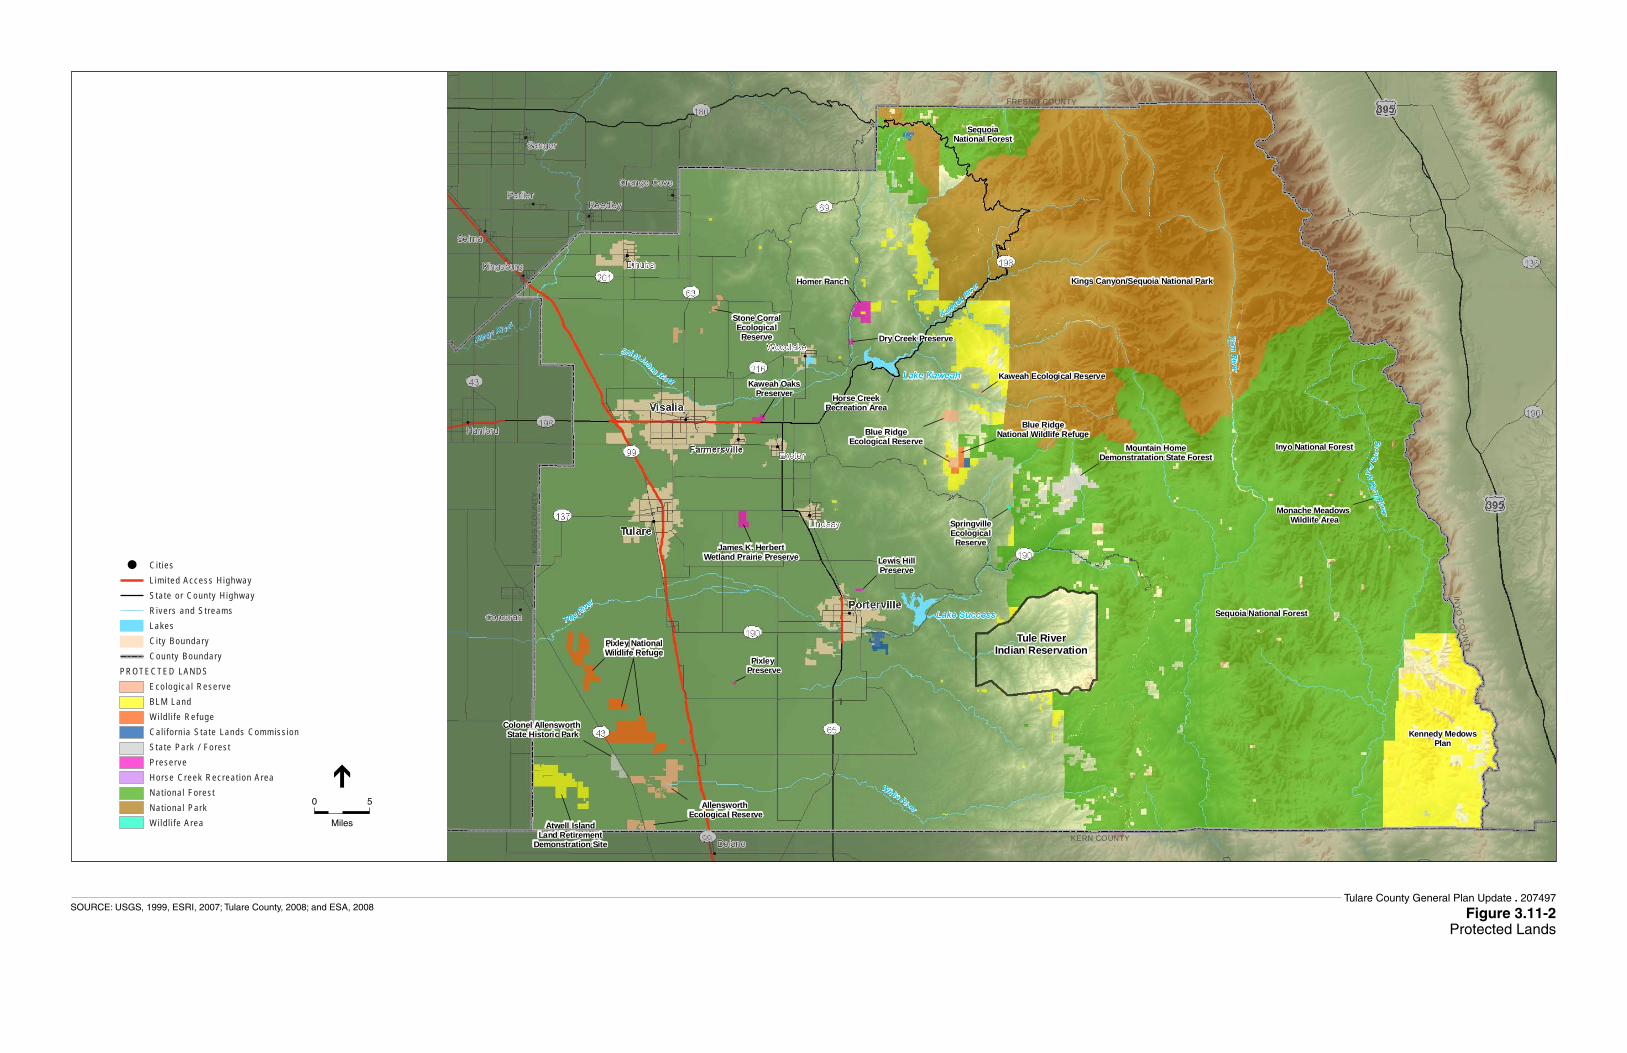
FRESNO COUNTY
INY
OC
OU
NTY
KERN COUNTY
KIN
GS
CO
UN
T Y
AllensworthEcological Reserve
Atwell IslandLand Retirement
Demonstration Site
Blue RidgeEcological Reserve
Blue RidgeNational Wildlife Refuge
Colonel AllensworthState Historic Park
Dry Creek Preserve
Homer Ranch
Horse CreekRecreation Area
Inyo National Forest
Sequoia National Forest
SequoiaNational Forest
James K. HerbertWetland Prairie Preserve
Kaweah Ecological ReserveKaweah Oaks
Preserver
Kings Canyon/Sequoia National Park
Lewis HillPreserve
Monache MeadowsWildlife Area
Mountain HomeDemonstratation State Forest
Pixley NationalWildlife Refuge
PixleyPreserve
SpringvilleEcological
Reserve
Stone CorralEcological
Reserve
Blue RidgeEcological Reserve
AllensworthEcological Reserve
Pixley NationalWildlife RefugePixley NationalWildlife Refuge
Kennedy MedowsPlan
Tule RiverIndian Reservation
C i t ies L im i ted Access H ighway Sta te o r County H ighway R ivers and St reams Lakes C i ty Boundary County BoundaryPROTECTED LANDS Eco log ica l Reserve BLM Land Wi ld l i fe Refuge Ca l i fo rn ia S ta te Lands Commiss ion S ta te Park / Fores t Preserve Horse Creek Recrea t ion Area Nat iona l Fores t Nat iona l Park Wi ld l i fe Area
0 5
Miles
Tulare County General Plan Update . 207497
Figure 3.11-2Protected Lands
SOURCE: USGS, 1999, ESRI, 2007; Tulare County, 2008; and ESA, 2008

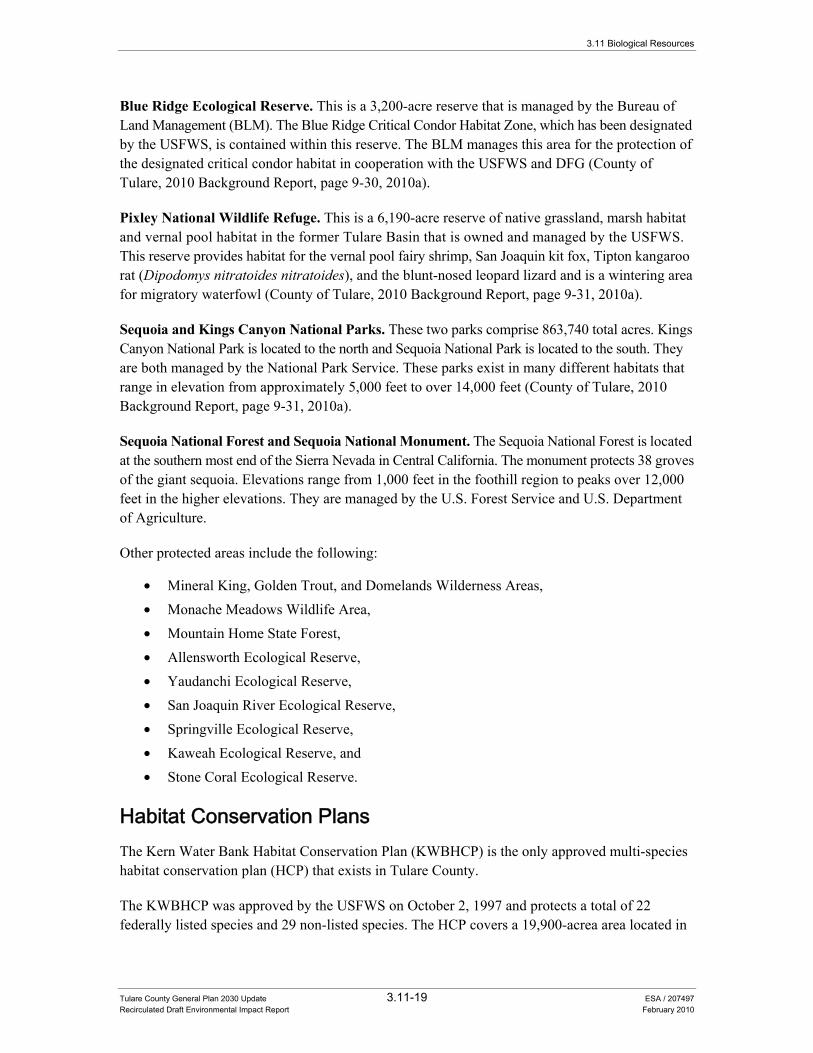
3.11 Biological Resources
Tulare County General Plan 2030 Update 3.11-19 ESA / 207497 Recirculated Draft Environmental Impact Report February 2010
Blue Ridge Ecological Reserve. This is a 3,200-acre reserve that is managed by the Bureau of Land Management (BLM). The Blue Ridge Critical Condor Habitat Zone, which has been designated by the USFWS, is contained within this reserve. The BLM manages this area for the protection of the designated critical condor habitat in cooperation with the USFWS and DFG (County of Tulare, 2010 Background Report, page 9-30, 2010a).
Pixley National Wildlife Refuge. This is a 6,190-acre reserve of native grassland, marsh habitat and vernal pool habitat in the former Tulare Basin that is owned and managed by the USFWS. This reserve provides habitat for the vernal pool fairy shrimp, San Joaquin kit fox, Tipton kangaroo rat (Dipodomys nitratoides nitratoides), and the blunt-nosed leopard lizard and is a wintering area for migratory waterfowl (County of Tulare, 2010 Background Report, page 9-31, 2010a).
Sequoia and Kings Canyon National Parks. These two parks comprise 863,740 total acres. Kings Canyon National Park is located to the north and Sequoia National Park is located to the south. They are both managed by the National Park Service. These parks exist in many different habitats that range in elevation from approximately 5,000 feet to over 14,000 feet (County of Tulare, 2010 Background Report, page 9-31, 2010a).
Sequoia National Forest and Sequoia National Monument. The Sequoia National Forest is located at the southern most end of the Sierra Nevada in Central California. The monument protects 38 groves of the giant sequoia. Elevations range from 1,000 feet in the foothill region to peaks over 12,000 feet in the higher elevations. They are managed by the U.S. Forest Service and U.S. Department of Agriculture.
Other protected areas include the following:
• Mineral King, Golden Trout, and Domelands Wilderness Areas, • Monache Meadows Wildlife Area, • Mountain Home State Forest, • Allensworth Ecological Reserve, • Yaudanchi Ecological Reserve, • San Joaquin River Ecological Reserve, • Springville Ecological Reserve, • Kaweah Ecological Reserve, and • Stone Coral Ecological Reserve.
Habitat Conservation Plans The Kern Water Bank Habitat Conservation Plan (KWBHCP) is the only approved multi-species habitat conservation plan (HCP) that exists in Tulare County.
The KWBHCP was approved by the USFWS on October 2, 1997 and protects a total of 22 federally listed species and 29 non-listed species. The HCP covers a 19,900-acrea area located in
Tulare County General Plan 2030 Update
Tulare County General Plan 2030 Update 3.11-20 ESA / 207497 Recirculated Draft Environmental Impact Report February 2010
Tulare, Kern, and Kings Counties. The species protected in this HCP include the valley elderberry longhorn beetle (Desmocerus californicas dimorphus), California condor (Gymnogyps californianus), Conservancy fairy shrimp (Branchinecta conservation), San Joaquin kit fox, and western snowy plover (Charadrius alexandrinus) (County of Tulare, 2010 Background Report, page 9-32, 2010a).
Conservation and Mitigation Banking A conservation or mitigation bank is land that is managed for its natural resource values. This land is either privately or publicly owned. The bank operator sells habitat credits to developers who need to satisfy legal requirements for compensating environmental impacts of development projects. The bank operator is obligated to permanently protect the land. Conservation banks generally protect threatened and endangered species habitat and are approved by a wildlife agency such as DFG or the USFWS. Mitigation banks are specifically for wetland restoration, creation, and enhancement undertaken to compensate for unavoidable wetland losses and are generally approved by the wildlife agencies and the USACE (County of Tulare, 2010 Background Report, page 9-32, 2010a).
Listed Species and Sensitive Natural Communities Listed species and sensitive natural communities need to be considered when identifying and evaluating biological resources. Table 3.11-2 documents the special status species listed by the USFWS, DFG and California Native Plant Society (CNPS) for Tulare County. The California Natural Diversity Database (CNDDB) and the CNPS lists 182 documented occurrences (of California’s approximately 1,843 listed species) in Tulare County (County of Tulare, 2010 Background Report, pages 9-32 to 9-40, 2010a).
In addition to individual species, the USFWS and DFG are also concerned with sensitive and critical habitat. As previously described, the CNDDB-documented occurrences of sensitive habitat for Tulare County are:
• Big Tree Forest, • Central Valley Drainage Hardhead/Squawfish Stream, • Great Valley Oak Riparian Forest, • Northern Hardpan Vernal Pool, • Northern Claypan Vernal Pool, • Southern Interior Cypress Forest, • Sycamore Alluvial Woodland, • Valley Sacaton Grassland, • Valley Saltbush Scrub, • Valley Sink Scrub, • Blue Ridge Ecological Reserve (Condor Habitat), • Sequoia Riverlands Trust, and • Kaweah Oaks Preserve.
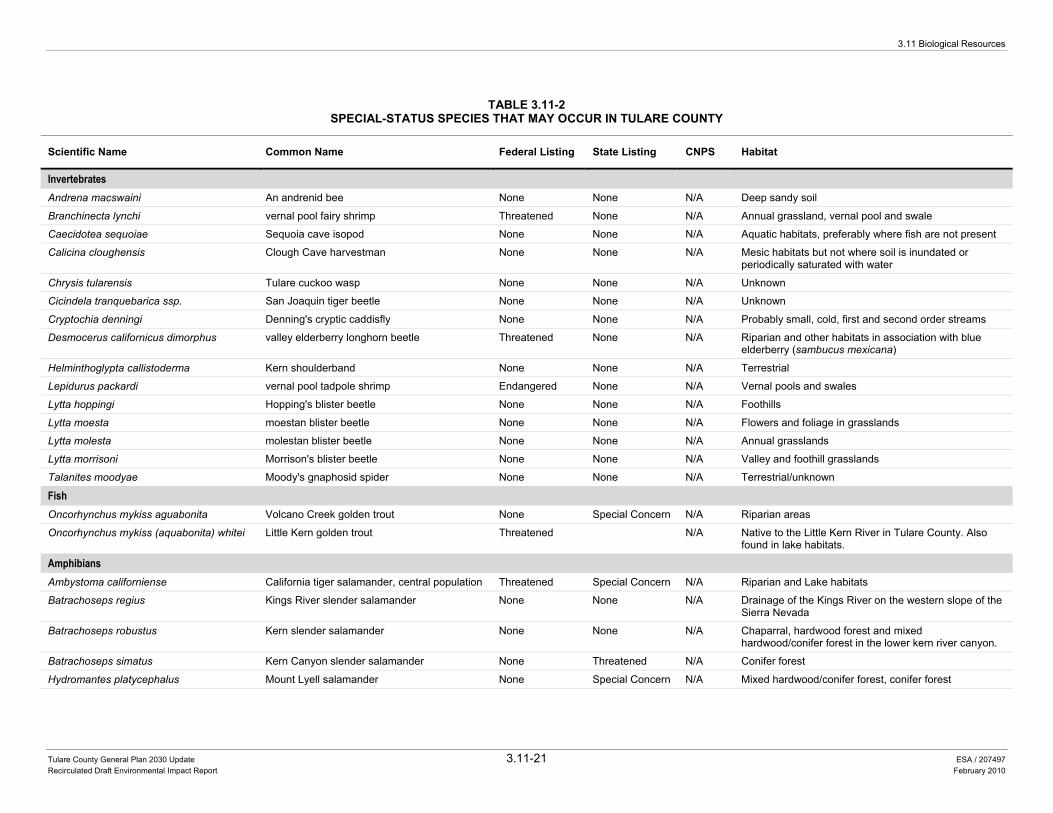
3.11 Biological Resources
Tulare County General Plan 2030 Update 3.11-21 ESA / 207497 Recirculated Draft Environmental Impact Report February 2010
TABLE 3.11-2SPECIAL-STATUS SPECIES THAT MAY OCCUR IN TULARE COUNTY
Scientific Name Common Name Federal Listing State Listing CNPS Habitat
Invertebrates Andrena macswaini An andrenid bee None None N/A Deep sandy soil
Branchinecta lynchi vernal pool fairy shrimp Threatened None N/A Annual grassland, vernal pool and swale
Caecidotea sequoiae Sequoia cave isopod None None N/A Aquatic habitats, preferably where fish are not present
Calicina cloughensis Clough Cave harvestman None None N/A Mesic habitats but not where soil is inundated or periodically saturated with water
Chrysis tularensis Tulare cuckoo wasp None None N/A Unknown
Cicindela tranquebarica ssp. San Joaquin tiger beetle None None N/A Unknown
Cryptochia denningi Denning's cryptic caddisfly None None N/A Probably small, cold, first and second order streams
Desmocerus californicus dimorphus valley elderberry longhorn beetle Threatened None N/A Riparian and other habitats in association with blue elderberry (sambucus mexicana)
Helminthoglypta callistoderma Kern shoulderband None None N/A Terrestrial
Lepidurus packardi vernal pool tadpole shrimp Endangered None N/A Vernal pools and swales
Lytta hoppingi Hopping's blister beetle None None N/A Foothills
Lytta moesta moestan blister beetle None None N/A Flowers and foliage in grasslands
Lytta molesta molestan blister beetle None None N/A Annual grasslands
Lytta morrisoni Morrison's blister beetle None None N/A Valley and foothill grasslands
Talanites moodyae Moody's gnaphosid spider None None N/A Terrestrial/unknown
Fish Oncorhynchus mykiss aguabonita Volcano Creek golden trout None Special Concern N/A Riparian areas
Oncorhynchus mykiss (aquabonita) whitei Little Kern golden trout Threatened N/A Native to the Little Kern River in Tulare County. Also found in lake habitats.
Amphibians Ambystoma californiense California tiger salamander, central population Threatened Special Concern N/A Riparian and Lake habitats
Batrachoseps regius Kings River slender salamander None None N/A Drainage of the Kings River on the western slope of the Sierra Nevada
Batrachoseps robustus Kern slender salamander None None N/A Chaparral, hardwood forest and mixed hardwood/conifer forest in the lower kern river canyon.
Batrachoseps simatus Kern Canyon slender salamander None Threatened N/A Conifer forest
Hydromantes platycephalus Mount Lyell salamander None Special Concern N/A Mixed hardwood/conifer forest, conifer forest
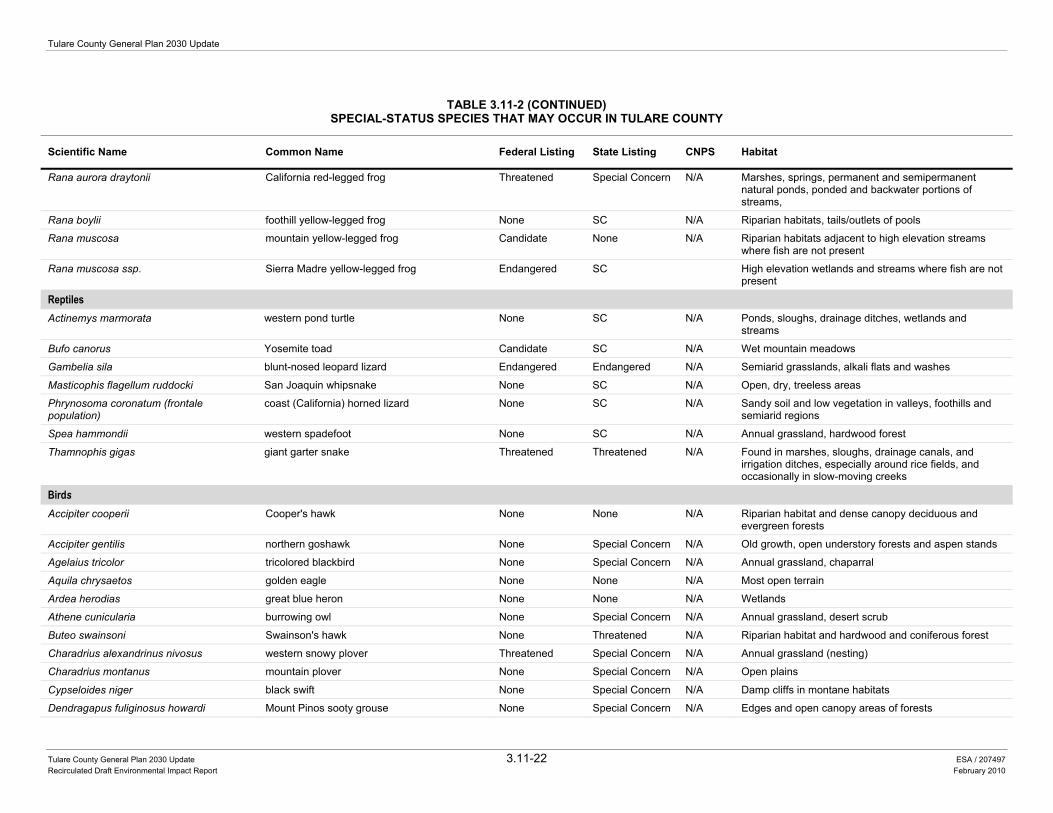
Tulare County General Plan 2030 Update
Tulare County General Plan 2030 Update 3.11-22 ESA / 207497 Recirculated Draft Environmental Impact Report February 2010
TABLE 3.11-2 (CONTINUED)SPECIAL-STATUS SPECIES THAT MAY OCCUR IN TULARE COUNTY
Scientific Name Common Name Federal Listing State Listing CNPS Habitat
Rana aurora draytonii California red-legged frog Threatened Special Concern N/A Marshes, springs, permanent and semipermanent natural ponds, ponded and backwater portions of streams,
Rana boylii foothill yellow-legged frog None SC N/A Riparian habitats, tails/outlets of pools
Rana muscosa mountain yellow-legged frog Candidate None N/A Riparian habitats adjacent to high elevation streams where fish are not present
Rana muscosa ssp. Sierra Madre yellow-legged frog Endangered SC High elevation wetlands and streams where fish are not present
Reptiles Actinemys marmorata western pond turtle None SC N/A Ponds, sloughs, drainage ditches, wetlands and
streams
Bufo canorus Yosemite toad Candidate SC N/A Wet mountain meadows
Gambelia sila blunt-nosed leopard lizard Endangered Endangered N/A Semiarid grasslands, alkali flats and washes
Masticophis flagellum ruddocki San Joaquin whipsnake None SC N/A Open, dry, treeless areas
Phrynosoma coronatum (frontale population)
coast (California) horned lizard None SC N/A Sandy soil and low vegetation in valleys, foothills and semiarid regions
Spea hammondii western spadefoot None SC N/A Annual grassland, hardwood forest
Thamnophis gigas giant garter snake Threatened Threatened N/A Found in marshes, sloughs, drainage canals, and irrigation ditches, especially around rice fields, and occasionally in slow-moving creeks
Birds Accipiter cooperii Cooper's hawk None None N/A Riparian habitat and dense canopy deciduous and
evergreen forests
Accipiter gentilis northern goshawk None Special Concern N/A Old growth, open understory forests and aspen stands
Agelaius tricolor tricolored blackbird None Special Concern N/A Annual grassland, chaparral
Aquila chrysaetos golden eagle None None N/A Most open terrain
Ardea herodias great blue heron None None N/A Wetlands
Athene cunicularia burrowing owl None Special Concern N/A Annual grassland, desert scrub
Buteo swainsoni Swainson's hawk None Threatened N/A Riparian habitat and hardwood and coniferous forest
Charadrius alexandrinus nivosus western snowy plover Threatened Special Concern N/A Annual grassland (nesting)
Charadrius montanus mountain plover None Special Concern N/A Open plains
Cypseloides niger black swift None Special Concern N/A Damp cliffs in montane habitats
Dendragapus fuliginosus howardi Mount Pinos sooty grouse None Special Concern N/A Edges and open canopy areas of forests
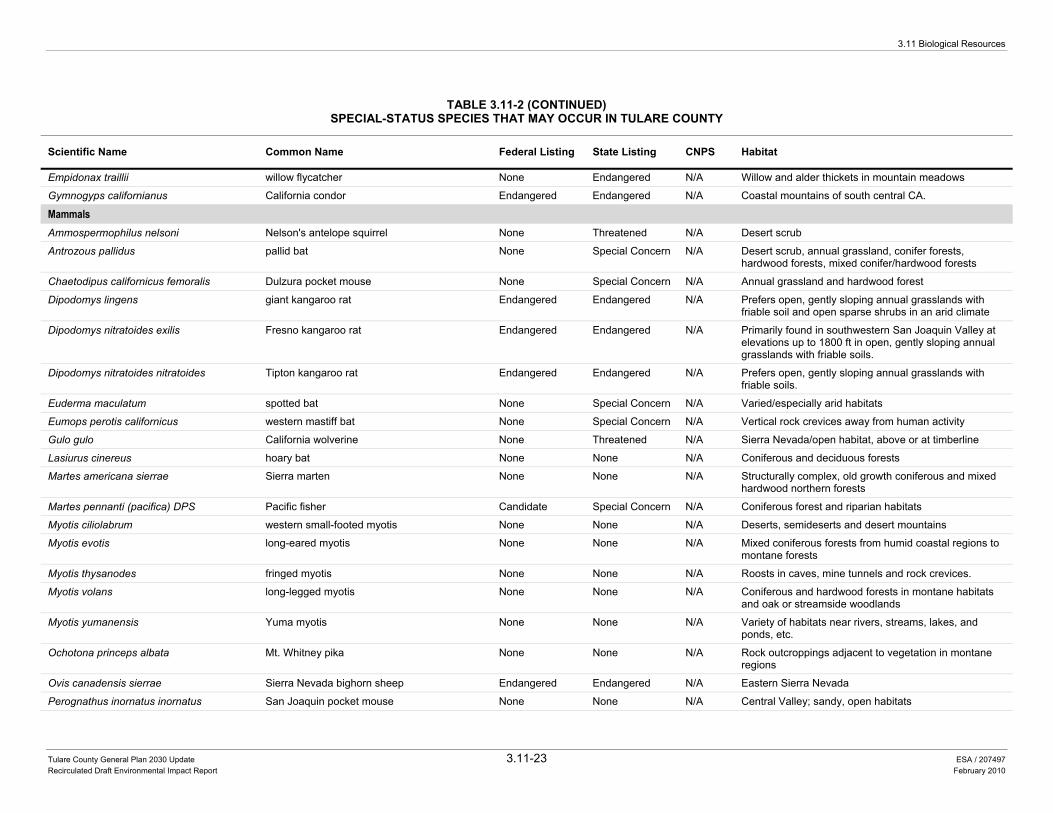
3.11 Biological Resources
Tulare County General Plan 2030 Update 3.11-23 ESA / 207497 Recirculated Draft Environmental Impact Report February 2010
TABLE 3.11-2 (CONTINUED)SPECIAL-STATUS SPECIES THAT MAY OCCUR IN TULARE COUNTY
Scientific Name Common Name Federal Listing State Listing CNPS Habitat
Empidonax traillii willow flycatcher None Endangered N/A Willow and alder thickets in mountain meadows
Gymnogyps californianus California condor Endangered Endangered N/A Coastal mountains of south central CA.
Mammals Ammospermophilus nelsoni Nelson's antelope squirrel None Threatened N/A Desert scrub
Antrozous pallidus pallid bat None Special Concern N/A Desert scrub, annual grassland, conifer forests, hardwood forests, mixed conifer/hardwood forests
Chaetodipus californicus femoralis Dulzura pocket mouse None Special Concern N/A Annual grassland and hardwood forest
Dipodomys lingens giant kangaroo rat Endangered Endangered N/A Prefers open, gently sloping annual grasslands with friable soil and open sparse shrubs in an arid climate
Dipodomys nitratoides exilis Fresno kangaroo rat Endangered Endangered N/A Primarily found in southwestern San Joaquin Valley at elevations up to 1800 ft in open, gently sloping annual grasslands with friable soils.
Dipodomys nitratoides nitratoides Tipton kangaroo rat Endangered Endangered N/A Prefers open, gently sloping annual grasslands with friable soils.
Euderma maculatum spotted bat None Special Concern N/A Varied/especially arid habitats
Eumops perotis californicus western mastiff bat None Special Concern N/A Vertical rock crevices away from human activity
Gulo gulo California wolverine None Threatened N/A Sierra Nevada/open habitat, above or at timberline
Lasiurus cinereus hoary bat None None N/A Coniferous and deciduous forests
Martes americana sierrae Sierra marten None None N/A Structurally complex, old growth coniferous and mixed hardwood northern forests
Martes pennanti (pacifica) DPS Pacific fisher Candidate Special Concern N/A Coniferous forest and riparian habitats
Myotis ciliolabrum western small-footed myotis None None N/A Deserts, semideserts and desert mountains
Myotis evotis long-eared myotis None None N/A Mixed coniferous forests from humid coastal regions to montane forests
Myotis thysanodes fringed myotis None None N/A Roosts in caves, mine tunnels and rock crevices.
Myotis volans long-legged myotis None None N/A Coniferous and hardwood forests in montane habitats and oak or streamside woodlands
Myotis yumanensis Yuma myotis None None N/A Variety of habitats near rivers, streams, lakes, and ponds, etc.
Ochotona princeps albata Mt. Whitney pika None None N/A Rock outcroppings adjacent to vegetation in montane regions
Ovis canadensis sierrae Sierra Nevada bighorn sheep Endangered Endangered N/A Eastern Sierra Nevada
Perognathus inornatus inornatus San Joaquin pocket mouse None None N/A Central Valley; sandy, open habitats
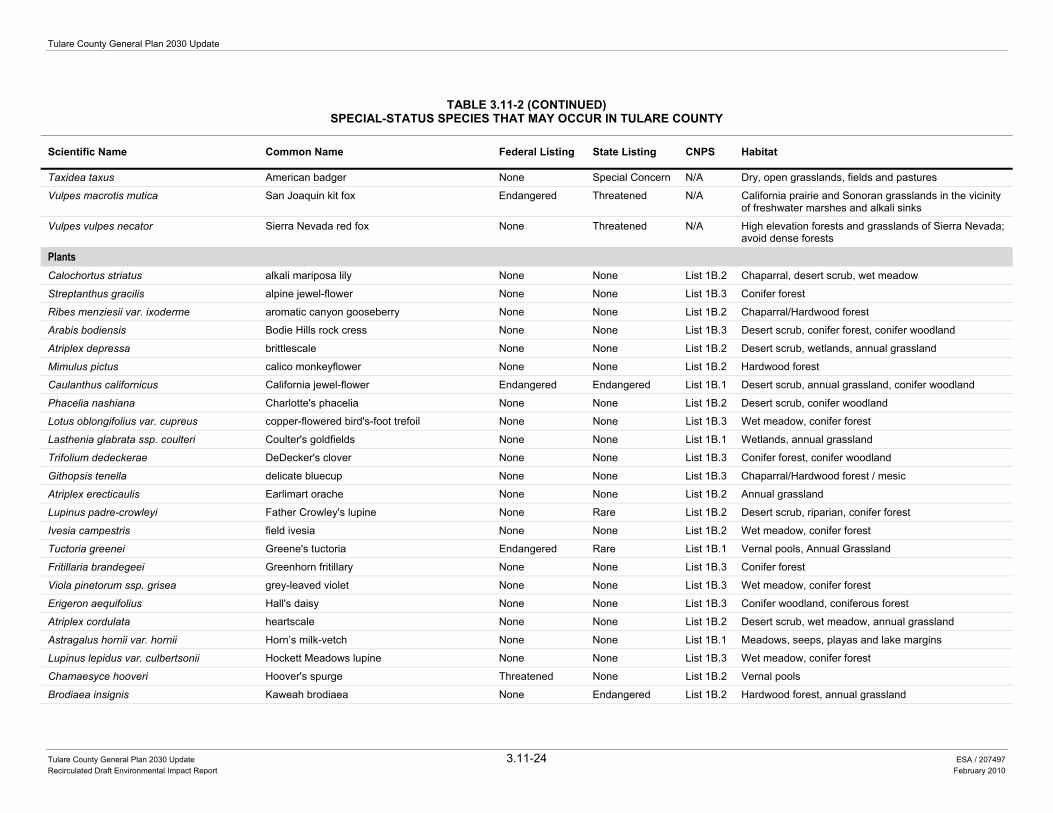
Tulare County General Plan 2030 Update
Tulare County General Plan 2030 Update 3.11-24 ESA / 207497 Recirculated Draft Environmental Impact Report February 2010
TABLE 3.11-2 (CONTINUED)SPECIAL-STATUS SPECIES THAT MAY OCCUR IN TULARE COUNTY
Scientific Name Common Name Federal Listing State Listing CNPS Habitat
Taxidea taxus American badger None Special Concern N/A Dry, open grasslands, fields and pastures
Vulpes macrotis mutica San Joaquin kit fox Endangered Threatened N/A California prairie and Sonoran grasslands in the vicinity of freshwater marshes and alkali sinks
Vulpes vulpes necator Sierra Nevada red fox None Threatened N/A High elevation forests and grasslands of Sierra Nevada; avoid dense forests
Plants Calochortus striatus alkali mariposa lily None None List 1B.2 Chaparral, desert scrub, wet meadow
Streptanthus gracilis alpine jewel-flower None None List 1B.3 Conifer forest
Ribes menziesii var. ixoderme aromatic canyon gooseberry None None List 1B.2 Chaparral/Hardwood forest
Arabis bodiensis Bodie Hills rock cress None None List 1B.3 Desert scrub, conifer forest, conifer woodland
Atriplex depressa brittlescale None None List 1B.2 Desert scrub, wetlands, annual grassland
Mimulus pictus calico monkeyflower None None List 1B.2 Hardwood forest
Caulanthus californicus California jewel-flower Endangered Endangered List 1B.1 Desert scrub, annual grassland, conifer woodland
Phacelia nashiana Charlotte's phacelia None None List 1B.2 Desert scrub, conifer woodland
Lotus oblongifolius var. cupreus copper-flowered bird's-foot trefoil None None List 1B.3 Wet meadow, conifer forest
Lasthenia glabrata ssp. coulteri Coulter's goldfields None None List 1B.1 Wetlands, annual grassland
Trifolium dedeckerae DeDecker's clover None None List 1B.3 Conifer forest, conifer woodland
Githopsis tenella delicate bluecup None None List 1B.3 Chaparral/Hardwood forest / mesic
Atriplex erecticaulis Earlimart orache None None List 1B.2 Annual grassland
Lupinus padre-crowleyi Father Crowley's lupine None Rare List 1B.2 Desert scrub, riparian, conifer forest
Ivesia campestris field ivesia None None List 1B.2 Wet meadow, conifer forest
Tuctoria greenei Greene's tuctoria Endangered Rare List 1B.1 Vernal pools, Annual Grassland
Fritillaria brandegeei Greenhorn fritillary None None List 1B.3 Conifer forest
Viola pinetorum ssp. grisea grey-leaved violet None None List 1B.3 Wet meadow, conifer forest
Erigeron aequifolius Hall's daisy None None List 1B.3 Conifer woodland, coniferous forest
Atriplex cordulata heartscale None None List 1B.2 Desert scrub, wet meadow, annual grassland
Astragalus hornii var. hornii Horn’s milk-vetch None None List 1B.1 Meadows, seeps, playas and lake margins
Lupinus lepidus var. culbertsonii Hockett Meadows lupine None None List 1B.3 Wet meadow, conifer forest
Chamaesyce hooveri Hoover's spurge Threatened None List 1B.2 Vernal pools
Brodiaea insignis Kaweah brodiaea None Endangered List 1B.2 Hardwood forest, annual grassland
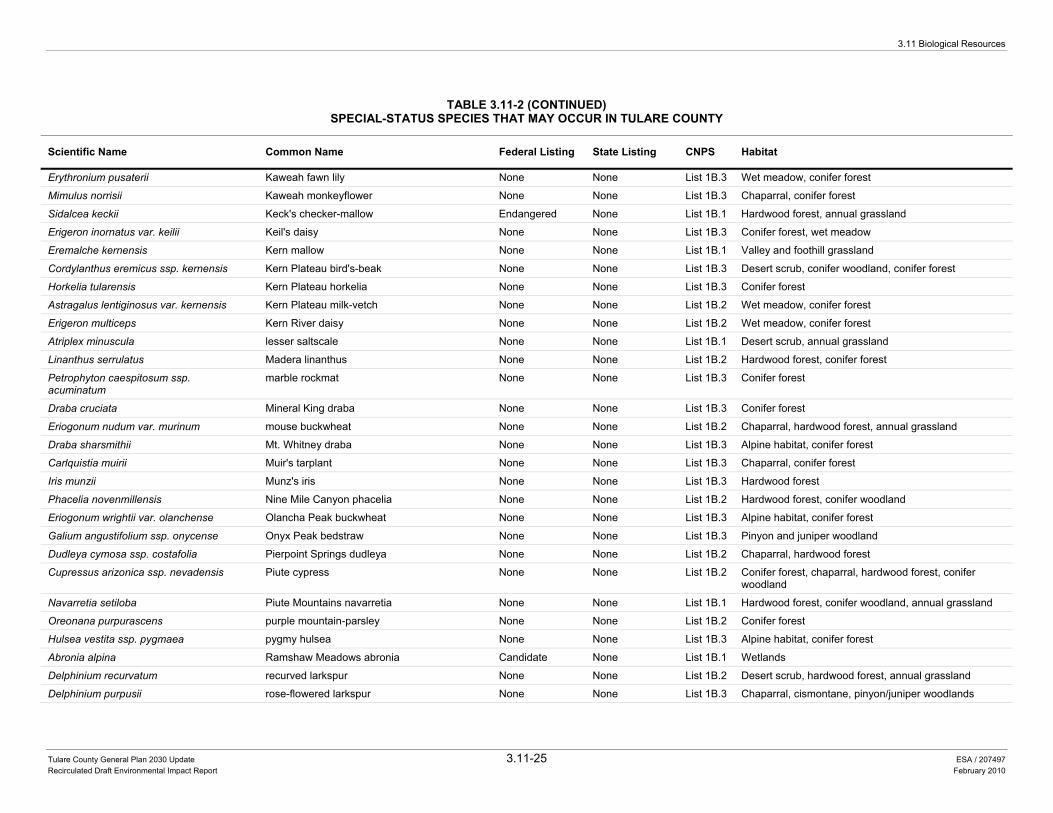
3.11 Biological Resources
Tulare County General Plan 2030 Update 3.11-25 ESA / 207497 Recirculated Draft Environmental Impact Report February 2010
TABLE 3.11-2 (CONTINUED)SPECIAL-STATUS SPECIES THAT MAY OCCUR IN TULARE COUNTY
Scientific Name Common Name Federal Listing State Listing CNPS Habitat
Erythronium pusaterii Kaweah fawn lily None None List 1B.3 Wet meadow, conifer forest
Mimulus norrisii Kaweah monkeyflower None None List 1B.3 Chaparral, conifer forest
Sidalcea keckii Keck's checker-mallow Endangered None List 1B.1 Hardwood forest, annual grassland
Erigeron inornatus var. keilii Keil's daisy None None List 1B.3 Conifer forest, wet meadow
Eremalche kernensis Kern mallow None None List 1B.1 Valley and foothill grassland
Cordylanthus eremicus ssp. kernensis Kern Plateau bird's-beak None None List 1B.3 Desert scrub, conifer woodland, conifer forest
Horkelia tularensis Kern Plateau horkelia None None List 1B.3 Conifer forest
Astragalus lentiginosus var. kernensis Kern Plateau milk-vetch None None List 1B.2 Wet meadow, conifer forest
Erigeron multiceps Kern River daisy None None List 1B.2 Wet meadow, conifer forest
Atriplex minuscula lesser saltscale None None List 1B.1 Desert scrub, annual grassland
Linanthus serrulatus Madera linanthus None None List 1B.2 Hardwood forest, conifer forest
Petrophyton caespitosum ssp. acuminatum
marble rockmat None None List 1B.3 Conifer forest
Draba cruciata Mineral King draba None None List 1B.3 Conifer forest
Eriogonum nudum var. murinum mouse buckwheat None None List 1B.2 Chaparral, hardwood forest, annual grassland
Draba sharsmithii Mt. Whitney draba None None List 1B.3 Alpine habitat, conifer forest
Carlquistia muirii Muir's tarplant None None List 1B.3 Chaparral, conifer forest
Iris munzii Munz's iris None None List 1B.3 Hardwood forest
Phacelia novenmillensis Nine Mile Canyon phacelia None None List 1B.2 Hardwood forest, conifer woodland
Eriogonum wrightii var. olanchense Olancha Peak buckwheat None None List 1B.3 Alpine habitat, conifer forest
Galium angustifolium ssp. onycense Onyx Peak bedstraw None None List 1B.3 Pinyon and juniper woodland
Dudleya cymosa ssp. costafolia Pierpoint Springs dudleya None None List 1B.2 Chaparral, hardwood forest
Cupressus arizonica ssp. nevadensis Piute cypress None None List 1B.2 Conifer forest, chaparral, hardwood forest, conifer woodland
Navarretia setiloba Piute Mountains navarretia None None List 1B.1 Hardwood forest, conifer woodland, annual grassland
Oreonana purpurascens purple mountain-parsley None None List 1B.2 Conifer forest
Hulsea vestita ssp. pygmaea pygmy hulsea None None List 1B.3 Alpine habitat, conifer forest
Abronia alpina Ramshaw Meadows abronia Candidate None List 1B.1 Wetlands
Delphinium recurvatum recurved larkspur None None List 1B.2 Desert scrub, hardwood forest, annual grassland
Delphinium purpusii rose-flowered larkspur None None List 1B.3 Chaparral, cismontane, pinyon/juniper woodlands
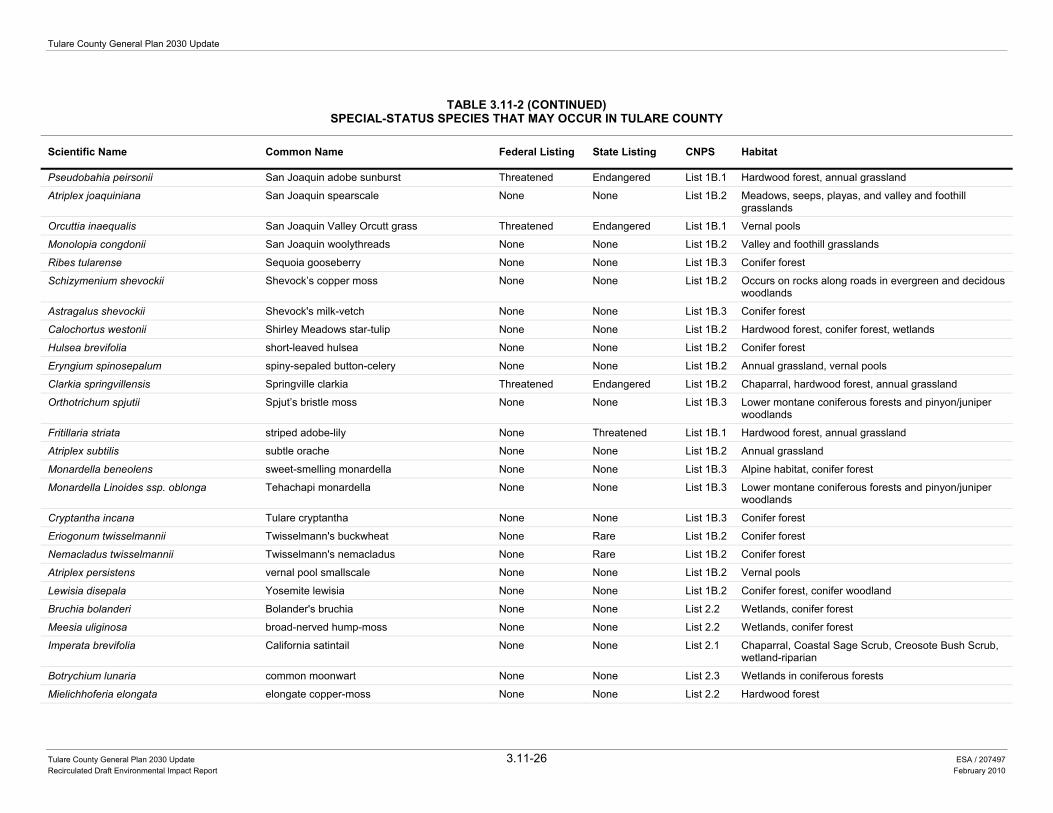
Tulare County General Plan 2030 Update
Tulare County General Plan 2030 Update 3.11-26 ESA / 207497 Recirculated Draft Environmental Impact Report February 2010
TABLE 3.11-2 (CONTINUED)SPECIAL-STATUS SPECIES THAT MAY OCCUR IN TULARE COUNTY
Scientific Name Common Name Federal Listing State Listing CNPS Habitat
Pseudobahia peirsonii San Joaquin adobe sunburst Threatened Endangered List 1B.1 Hardwood forest, annual grassland
Atriplex joaquiniana San Joaquin spearscale None None List 1B.2 Meadows, seeps, playas, and valley and foothill grasslands
Orcuttia inaequalis San Joaquin Valley Orcutt grass Threatened Endangered List 1B.1 Vernal pools
Monolopia congdonii San Joaquin woolythreads None None List 1B.2 Valley and foothill grasslands
Ribes tularense Sequoia gooseberry None None List 1B.3 Conifer forest
Schizymenium shevockii Shevock’s copper moss None None List 1B.2 Occurs on rocks along roads in evergreen and decidous woodlands
Astragalus shevockii Shevock's milk-vetch None None List 1B.3 Conifer forest
Calochortus westonii Shirley Meadows star-tulip None None List 1B.2 Hardwood forest, conifer forest, wetlands
Hulsea brevifolia short-leaved hulsea None None List 1B.2 Conifer forest
Eryngium spinosepalum spiny-sepaled button-celery None None List 1B.2 Annual grassland, vernal pools
Clarkia springvillensis Springville clarkia Threatened Endangered List 1B.2 Chaparral, hardwood forest, annual grassland
Orthotrichum spjutii Spjut’s bristle moss None None List 1B.3 Lower montane coniferous forests and pinyon/juniper woodlands
Fritillaria striata striped adobe-lily None Threatened List 1B.1 Hardwood forest, annual grassland
Atriplex subtilis subtle orache None None List 1B.2 Annual grassland
Monardella beneolens sweet-smelling monardella None None List 1B.3 Alpine habitat, conifer forest
Monardella Linoides ssp. oblonga Tehachapi monardella None None List 1B.3 Lower montane coniferous forests and pinyon/juniper woodlands
Cryptantha incana Tulare cryptantha None None List 1B.3 Conifer forest
Eriogonum twisselmannii Twisselmann's buckwheat None Rare List 1B.2 Conifer forest
Nemacladus twisselmannii Twisselmann's nemacladus None Rare List 1B.2 Conifer forest
Atriplex persistens vernal pool smallscale None None List 1B.2 Vernal pools
Lewisia disepala Yosemite lewisia None None List 1B.2 Conifer forest, conifer woodland
Bruchia bolanderi Bolander's bruchia None None List 2.2 Wetlands, conifer forest
Meesia uliginosa broad-nerved hump-moss None None List 2.2 Wetlands, conifer forest
Imperata brevifolia California satintail None None List 2.1 Chaparral, Coastal Sage Scrub, Creosote Bush Scrub, wetland-riparian
Botrychium lunaria common moonwart None None List 2.3 Wetlands in coniferous forests
Mielichhoferia elongata elongate copper-moss None None List 2.2 Hardwood forest
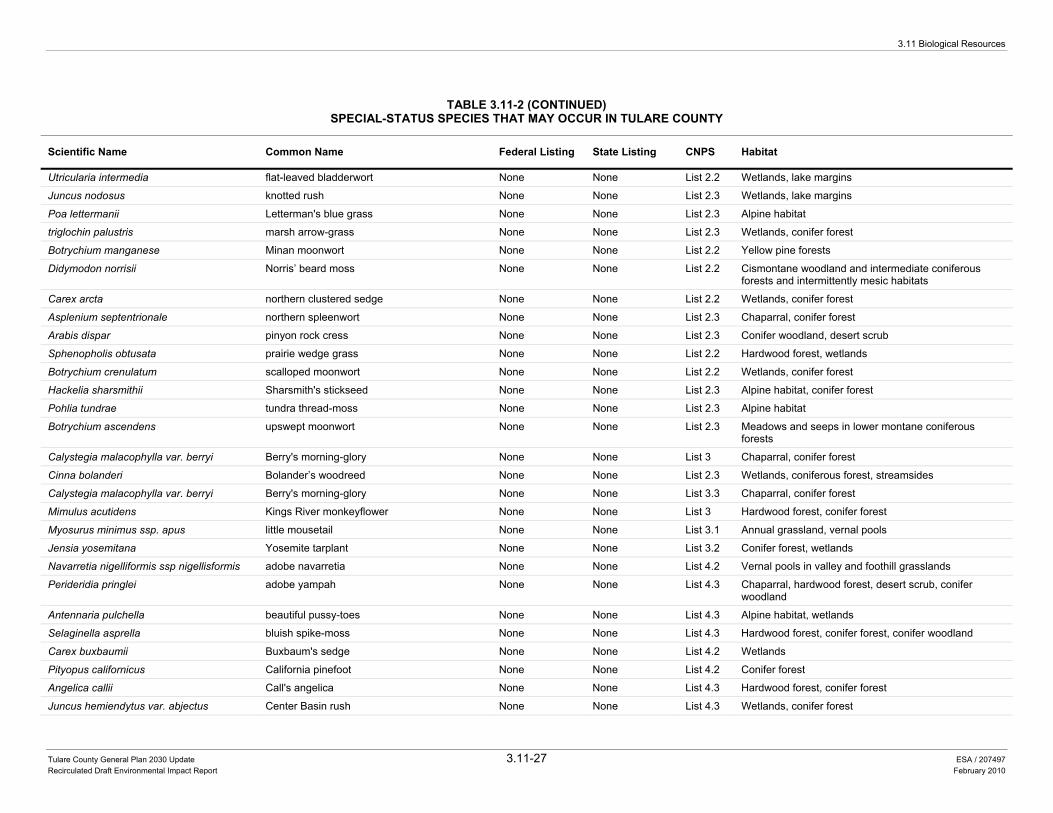
3.11 Biological Resources
Tulare County General Plan 2030 Update 3.11-27 ESA / 207497 Recirculated Draft Environmental Impact Report February 2010
TABLE 3.11-2 (CONTINUED)SPECIAL-STATUS SPECIES THAT MAY OCCUR IN TULARE COUNTY
Scientific Name Common Name Federal Listing State Listing CNPS Habitat
Utricularia intermedia flat-leaved bladderwort None None List 2.2 Wetlands, lake margins
Juncus nodosus knotted rush None None List 2.3 Wetlands, lake margins
Poa lettermanii Letterman's blue grass None None List 2.3 Alpine habitat
triglochin palustris marsh arrow-grass None None List 2.3 Wetlands, conifer forest
Botrychium manganese Minan moonwort None None List 2.2 Yellow pine forests
Didymodon norrisii Norris’ beard moss None None List 2.2 Cismontane woodland and intermediate coniferous forests and intermittently mesic habitats
Carex arcta northern clustered sedge None None List 2.2 Wetlands, conifer forest
Asplenium septentrionale northern spleenwort None None List 2.3 Chaparral, conifer forest
Arabis dispar pinyon rock cress None None List 2.3 Conifer woodland, desert scrub
Sphenopholis obtusata prairie wedge grass None None List 2.2 Hardwood forest, wetlands
Botrychium crenulatum scalloped moonwort None None List 2.2 Wetlands, conifer forest
Hackelia sharsmithii Sharsmith's stickseed None None List 2.3 Alpine habitat, conifer forest
Pohlia tundrae tundra thread-moss None None List 2.3 Alpine habitat
Botrychium ascendens upswept moonwort None None List 2.3 Meadows and seeps in lower montane coniferous forests
Calystegia malacophylla var. berryi Berry's morning-glory None None List 3 Chaparral, conifer forest
Cinna bolanderi Bolander’s woodreed None None List 2.3 Wetlands, coniferous forest, streamsides
Calystegia malacophylla var. berryi Berry's morning-glory None None List 3.3 Chaparral, conifer forest
Mimulus acutidens Kings River monkeyflower None None List 3 Hardwood forest, conifer forest
Myosurus minimus ssp. apus little mousetail None None List 3.1 Annual grassland, vernal pools
Jensia yosemitana Yosemite tarplant None None List 3.2 Conifer forest, wetlands
Navarretia nigelliformis ssp nigellisformis adobe navarretia None None List 4.2 Vernal pools in valley and foothill grasslands
Perideridia pringlei adobe yampah None None List 4.3 Chaparral, hardwood forest, desert scrub, conifer woodland
Antennaria pulchella beautiful pussy-toes None None List 4.3 Alpine habitat, wetlands
Selaginella asprella bluish spike-moss None None List 4.3 Hardwood forest, conifer forest, conifer woodland
Carex buxbaumii Buxbaum's sedge None None List 4.2 Wetlands
Pityopus californicus California pinefoot None None List 4.2 Conifer forest
Angelica callii Call's angelica None None List 4.3 Hardwood forest, conifer forest
Juncus hemiendytus var. abjectus Center Basin rush None None List 4.3 Wetlands, conifer forest
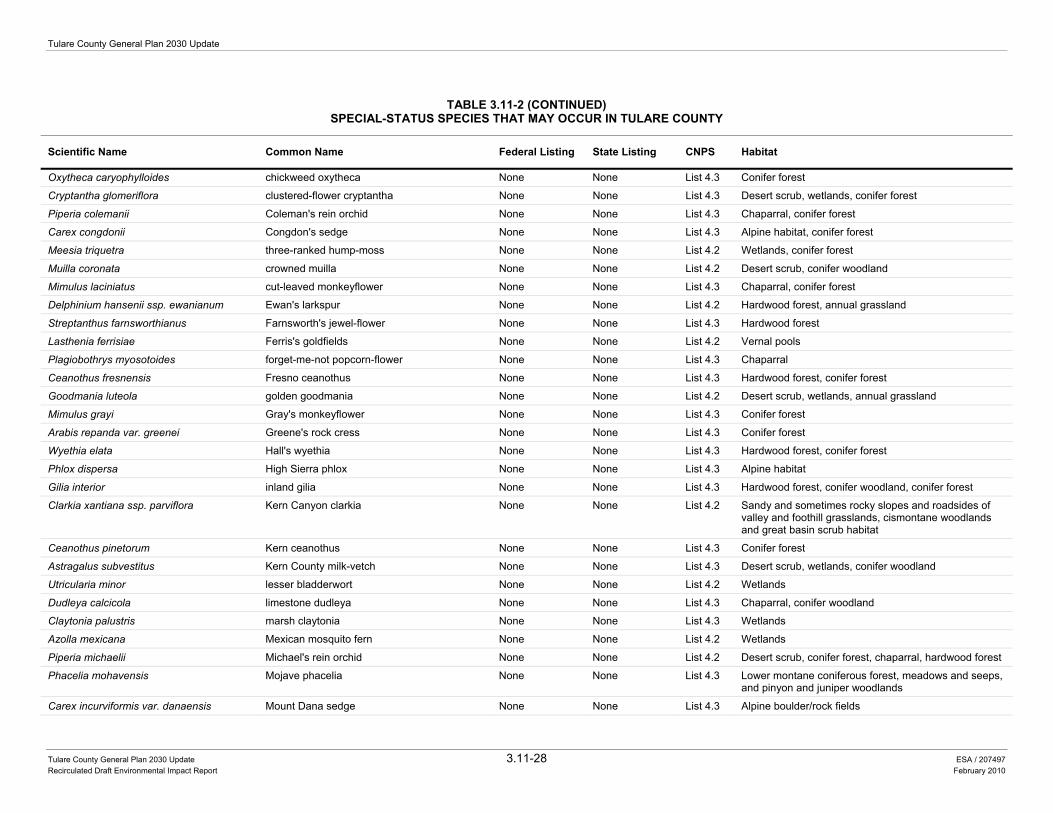
Tulare County General Plan 2030 Update
Tulare County General Plan 2030 Update 3.11-28 ESA / 207497 Recirculated Draft Environmental Impact Report February 2010
TABLE 3.11-2 (CONTINUED)SPECIAL-STATUS SPECIES THAT MAY OCCUR IN TULARE COUNTY
Scientific Name Common Name Federal Listing State Listing CNPS Habitat
Oxytheca caryophylloides chickweed oxytheca None None List 4.3 Conifer forest
Cryptantha glomeriflora clustered-flower cryptantha None None List 4.3 Desert scrub, wetlands, conifer forest
Piperia colemanii Coleman's rein orchid None None List 4.3 Chaparral, conifer forest
Carex congdonii Congdon's sedge None None List 4.3 Alpine habitat, conifer forest
Meesia triquetra three-ranked hump-moss None None List 4.2 Wetlands, conifer forest
Muilla coronata crowned muilla None None List 4.2 Desert scrub, conifer woodland
Mimulus laciniatus cut-leaved monkeyflower None None List 4.3 Chaparral, conifer forest
Delphinium hansenii ssp. ewanianum Ewan's larkspur None None List 4.2 Hardwood forest, annual grassland
Streptanthus farnsworthianus Farnsworth's jewel-flower None None List 4.3 Hardwood forest
Lasthenia ferrisiae Ferris's goldfields None None List 4.2 Vernal pools
Plagiobothrys myosotoides forget-me-not popcorn-flower None None List 4.3 Chaparral
Ceanothus fresnensis Fresno ceanothus None None List 4.3 Hardwood forest, conifer forest
Goodmania luteola golden goodmania None None List 4.2 Desert scrub, wetlands, annual grassland
Mimulus grayi Gray's monkeyflower None None List 4.3 Conifer forest
Arabis repanda var. greenei Greene's rock cress None None List 4.3 Conifer forest
Wyethia elata Hall's wyethia None None List 4.3 Hardwood forest, conifer forest
Phlox dispersa High Sierra phlox None None List 4.3 Alpine habitat
Gilia interior inland gilia None None List 4.3 Hardwood forest, conifer woodland, conifer forest
Clarkia xantiana ssp. parviflora Kern Canyon clarkia None None List 4.2 Sandy and sometimes rocky slopes and roadsides of valley and foothill grasslands, cismontane woodlands and great basin scrub habitat
Ceanothus pinetorum Kern ceanothus None None List 4.3 Conifer forest
Astragalus subvestitus Kern County milk-vetch None None List 4.3 Desert scrub, wetlands, conifer woodland
Utricularia minor lesser bladderwort None None List 4.2 Wetlands
Dudleya calcicola limestone dudleya None None List 4.3 Chaparral, conifer woodland
Claytonia palustris marsh claytonia None None List 4.3 Wetlands
Azolla mexicana Mexican mosquito fern None None List 4.2 Wetlands
Piperia michaelii Michael's rein orchid None None List 4.2 Desert scrub, conifer forest, chaparral, hardwood forest
Phacelia mohavensis Mojave phacelia None None List 4.3 Lower montane coniferous forest, meadows and seeps, and pinyon and juniper woodlands
Carex incurviformis var. danaensis Mount Dana sedge None None List 4.3 Alpine boulder/rock fields
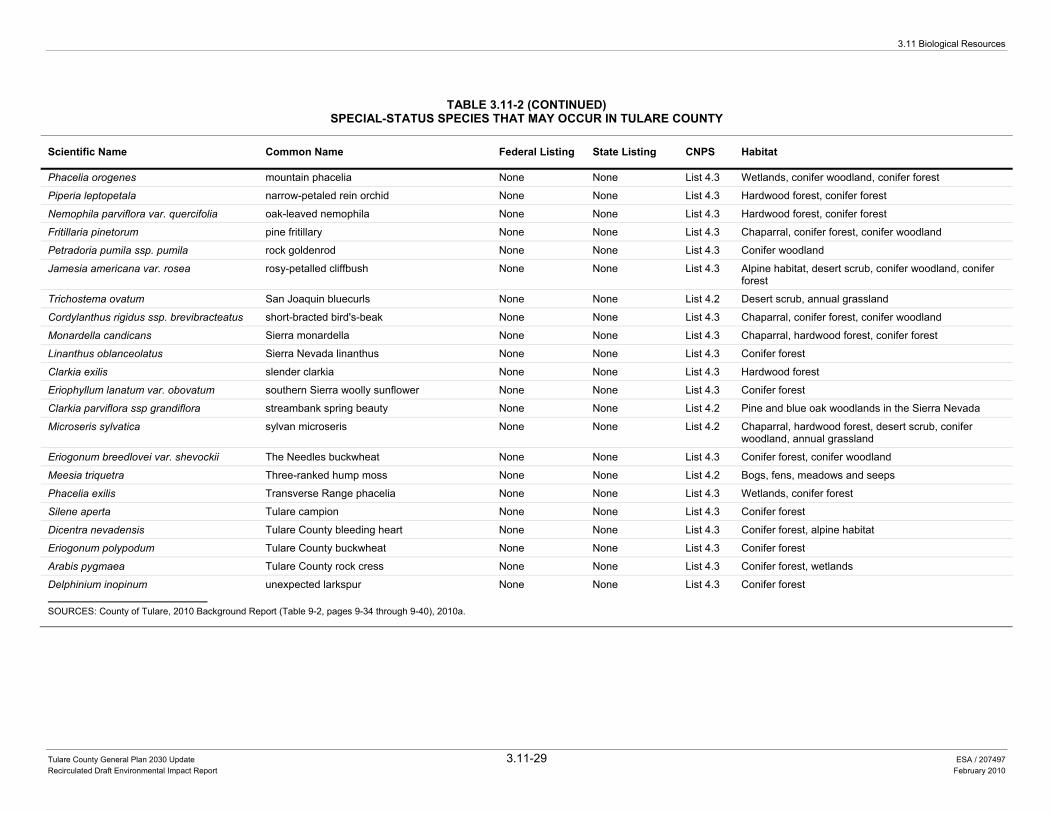
3.11 Biological Resources
Tulare County General Plan 2030 Update 3.11-29 ESA / 207497 Recirculated Draft Environmental Impact Report February 2010
TABLE 3.11-2 (CONTINUED)SPECIAL-STATUS SPECIES THAT MAY OCCUR IN TULARE COUNTY
Scientific Name Common Name Federal Listing State Listing CNPS Habitat
Phacelia orogenes mountain phacelia None None List 4.3 Wetlands, conifer woodland, conifer forest
Piperia leptopetala narrow-petaled rein orchid None None List 4.3 Hardwood forest, conifer forest
Nemophila parviflora var. quercifolia oak-leaved nemophila None None List 4.3 Hardwood forest, conifer forest
Fritillaria pinetorum pine fritillary None None List 4.3 Chaparral, conifer forest, conifer woodland
Petradoria pumila ssp. pumila rock goldenrod None None List 4.3 Conifer woodland
Jamesia americana var. rosea rosy-petalled cliffbush None None List 4.3 Alpine habitat, desert scrub, conifer woodland, conifer forest
Trichostema ovatum San Joaquin bluecurls None None List 4.2 Desert scrub, annual grassland
Cordylanthus rigidus ssp. brevibracteatus short-bracted bird's-beak None None List 4.3 Chaparral, conifer forest, conifer woodland
Monardella candicans Sierra monardella None None List 4.3 Chaparral, hardwood forest, conifer forest
Linanthus oblanceolatus Sierra Nevada linanthus None None List 4.3 Conifer forest
Clarkia exilis slender clarkia None None List 4.3 Hardwood forest
Eriophyllum lanatum var. obovatum southern Sierra woolly sunflower None None List 4.3 Conifer forest
Clarkia parviflora ssp grandiflora streambank spring beauty None None List 4.2 Pine and blue oak woodlands in the Sierra Nevada
Microseris sylvatica sylvan microseris None None List 4.2 Chaparral, hardwood forest, desert scrub, conifer woodland, annual grassland
Eriogonum breedlovei var. shevockii The Needles buckwheat None None List 4.3 Conifer forest, conifer woodland
Meesia triquetra Three-ranked hump moss None None List 4.2 Bogs, fens, meadows and seeps
Phacelia exilis Transverse Range phacelia None None List 4.3 Wetlands, conifer forest
Silene aperta Tulare campion None None List 4.3 Conifer forest
Dicentra nevadensis Tulare County bleeding heart None None List 4.3 Conifer forest, alpine habitat
Eriogonum polypodum Tulare County buckwheat None None List 4.3 Conifer forest
Arabis pygmaea Tulare County rock cress None None List 4.3 Conifer forest, wetlands
Delphinium inopinum unexpected larkspur None None List 4.3 Conifer forest
SOURCES: County of Tulare, 2010 Background Report (Table 9-2, pages 9-34 through 9-40), 2010a.
Tulare County General Plan 2030 Update
Tulare County General Plan 2030 Update 3.11-30 ESA / 207497 Recirculated Draft Environmental Impact Report February 2010
Impacts and Mitigation Measures
Significance Criteria The proposed General Plan 2030 Update will establish development guidelines against which future projects will be judged for consistency. The significance criteria for this analysis were developed from criteria presented in Appendix G “Environmental Checklist Form” of the CEQA Guidelines and based on the professional judgment of the County of Tulare and its consultants. The proposed project would result in a significant impact if it would:
• Have a substantial adverse effect, either directly or through habitat modifications, on any species identified as a candidate, sensitive, or special-status species in local or regional plans, policies, or regulations, or by the California Department of Fish and Game or U.S. Fish and Wildlife Service;
• Have a substantial adverse effect on any riparian habitat or other sensitive natural community identified in local or regional plans, policies, or regulations by the California Department of Fish and Game or U.S. Fish and Wildlife Service;
• Have a substantial adverse effect on federally protected wetlands as defined by Section 404 of the Clean Water Act (including, but not limited to, marshes, vernal pools, coastal wetlands, etc.) through direct removal, filling, hydrological interruption, or other means;
• Interfere substantially with the movement of any native resident or migratory fish or wildlife species or with established native resident or migratory wildlife corridors, or impede the use of native wildlife nursery sites;
• Conflict with any local policies or ordinances protecting biological resources, such as a tree preservation policy or ordinance; or
• Conflict with the provisions of an adopted habitat conservation plan, natural community conservation plan, or other approved local, regional, or State habitat conservation plan.
Methodology The assessment of impacts to biological resources is a qualitative review of the existing biological resource conditions within the County and a determination of whether the General Plan 2030 Update includes adequate provisions to ensure continued protection of these resources. The habitat types mapped in the California Department of Forestry and Fire Protection's Fire and Resource Assessment Program (CDF FRAP) Geographic Information System (GIS) data are based on dominant vegetation within areas roughly 1 kilometer in size. The size of some habitat types, such as vernal pools, do not always appear at the scale of the analysis conducted to determine vegetation-types. Consequently, the habitats shown in Figure 3.11-1 and included in Table 3.11-1 represent the best estimate for the distribution of habitat types in Tulare County. For development anticipated in the County’s unincorporated areas, the extent to which current State and federal regulations and the proposed General Plan policies would protect identified biological resources is evaluated. Evaluation of impacts has been based on the habitat types that have the potential to support the species identified in the 2010 Background Report (Appendix B of this RDEIR). Due to the overall size of the County, the biodiversity of the County, and the programmatic nature of this
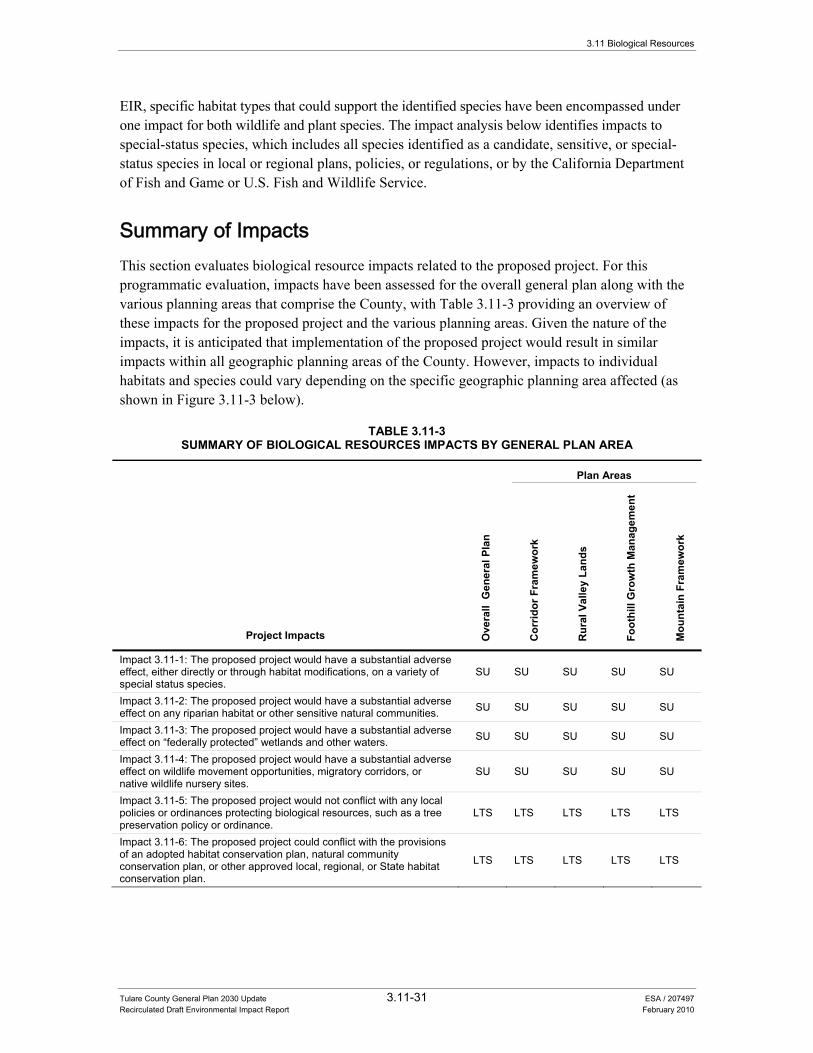
3.11 Biological Resources
Tulare County General Plan 2030 Update 3.11-31 ESA / 207497 Recirculated Draft Environmental Impact Report February 2010
EIR, specific habitat types that could support the identified species have been encompassed under one impact for both wildlife and plant species. The impact analysis below identifies impacts to special-status species, which includes all species identified as a candidate, sensitive, or special-status species in local or regional plans, policies, or regulations, or by the California Department of Fish and Game or U.S. Fish and Wildlife Service.
Summary of Impacts This section evaluates biological resource impacts related to the proposed project. For this programmatic evaluation, impacts have been assessed for the overall general plan along with the various planning areas that comprise the County, with Table 3.11-3 providing an overview of these impacts for the proposed project and the various planning areas. Given the nature of the impacts, it is anticipated that implementation of the proposed project would result in similar impacts within all geographic planning areas of the County. However, impacts to individual habitats and species could vary depending on the specific geographic planning area affected (as shown in Figure 3.11-3 below).
TABLE 3.11-3 SUMMARY OF BIOLOGICAL RESOURCES IMPACTS BY GENERAL PLAN AREA
Project Impacts Ove
rall
Gen
eral
Pla
n Plan Areas
Cor
ridor
Fra
mew
ork
Rur
al V
alle
y La
nds
Foot
hill
Gro
wth
Man
agem
ent
Mou
ntai
n Fr
amew
ork
Impact 3.11-1: The proposed project would have a substantial adverse effect, either directly or through habitat modifications, on a variety of special status species.
SU SU SU SU SU
Impact 3.11-2: The proposed project would have a substantial adverse effect on any riparian habitat or other sensitive natural communities. SU SU SU SU SU
Impact 3.11-3: The proposed project would have a substantial adverse effect on “federally protected” wetlands and other waters. SU SU SU SU SU
Impact 3.11-4: The proposed project would have a substantial adverse effect on wildlife movement opportunities, migratory corridors, or native wildlife nursery sites.
SU SU SU SU SU
Impact 3.11-5: The proposed project would not conflict with any local policies or ordinances protecting biological resources, such as a tree preservation policy or ordinance.
LTS LTS LTS LTS LTS
Impact 3.11-6: The proposed project could conflict with the provisions of an adopted habitat conservation plan, natural community conservation plan, or other approved local, regional, or State habitat conservation plan.
LTS LTS LTS LTS LTS
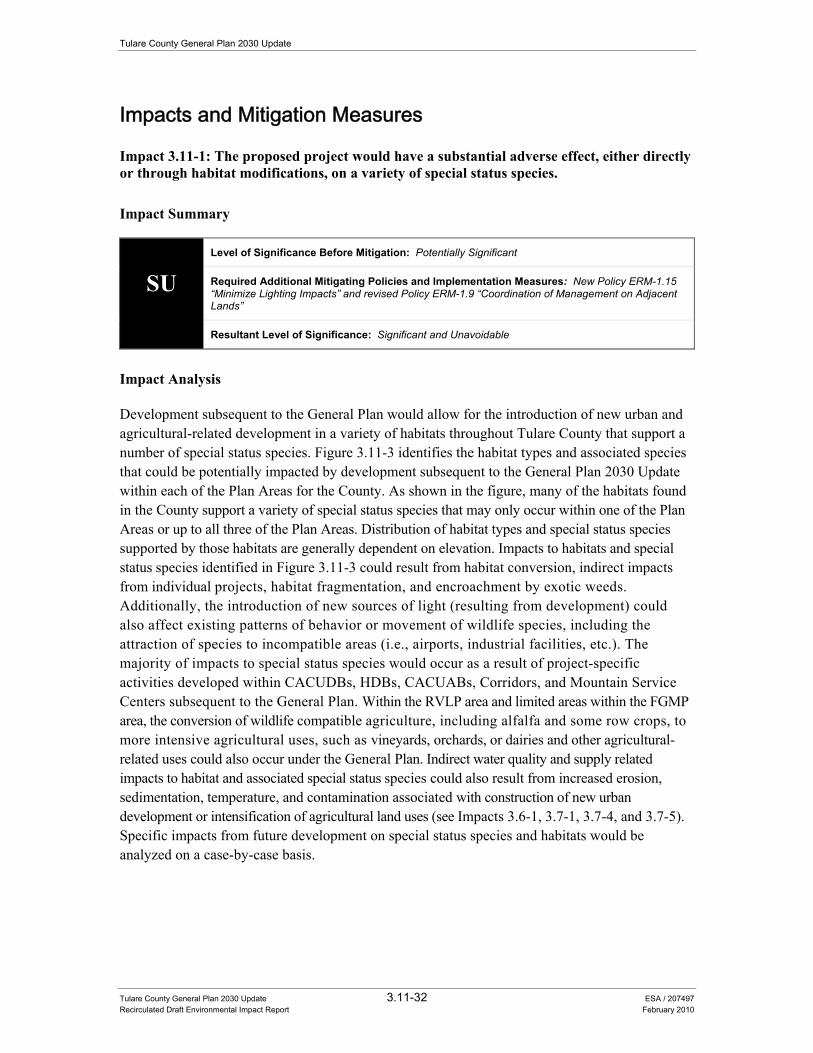
Tulare County General Plan 2030 Update
Tulare County General Plan 2030 Update 3.11-32 ESA / 207497 Recirculated Draft Environmental Impact Report February 2010
Impacts and Mitigation Measures
Impact 3.11-1: The proposed project would have a substantial adverse effect, either directly or through habitat modifications, on a variety of special status species.
Impact Summary
SU Level of Significance Before Mitigation: Potentially Significant
Required Additional Mitigating Policies and Implementation Measures: New Policy ERM-1.15 “Minimize Lighting Impacts” and revised Policy ERM-1.9 “Coordination of Management on Adjacent Lands”
Resultant Level of Significance: Significant and Unavoidable
Impact Analysis
Development subsequent to the General Plan would allow for the introduction of new urban and agricultural-related development in a variety of habitats throughout Tulare County that support a number of special status species. Figure 3.11-3 identifies the habitat types and associated species that could be potentially impacted by development subsequent to the General Plan 2030 Update within each of the Plan Areas for the County. As shown in the figure, many of the habitats found in the County support a variety of special status species that may only occur within one of the Plan Areas or up to all three of the Plan Areas. Distribution of habitat types and special status species supported by those habitats are generally dependent on elevation. Impacts to habitats and special status species identified in Figure 3.11-3 could result from habitat conversion, indirect impacts from individual projects, habitat fragmentation, and encroachment by exotic weeds. Additionally, the introduction of new sources of light (resulting from development) could also affect existing patterns of behavior or movement of wildlife species, including the attraction of species to incompatible areas (i.e., airports, industrial facilities, etc.). The majority of impacts to special status species would occur as a result of project-specific activities developed within CACUDBs, HDBs, CACUABs, Corridors, and Mountain Service Centers subsequent to the General Plan. Within the RVLP area and limited areas within the FGMP area, the conversion of wildlife compatible agriculture, including alfalfa and some row crops, to more intensive agricultural uses, such as vineyards, orchards, or dairies and other agricultural-related uses could also occur under the General Plan. Indirect water quality and supply related impacts to habitat and associated special status species could also result from increased erosion, sedimentation, temperature, and contamination associated with construction of new urban development or intensification of agricultural land uses (see Impacts 3.6-1, 3.7-1, 3.7-4, and 3.7-5). Specific impacts from future development on special status species and habitats would be analyzed on a case-by-case basis.
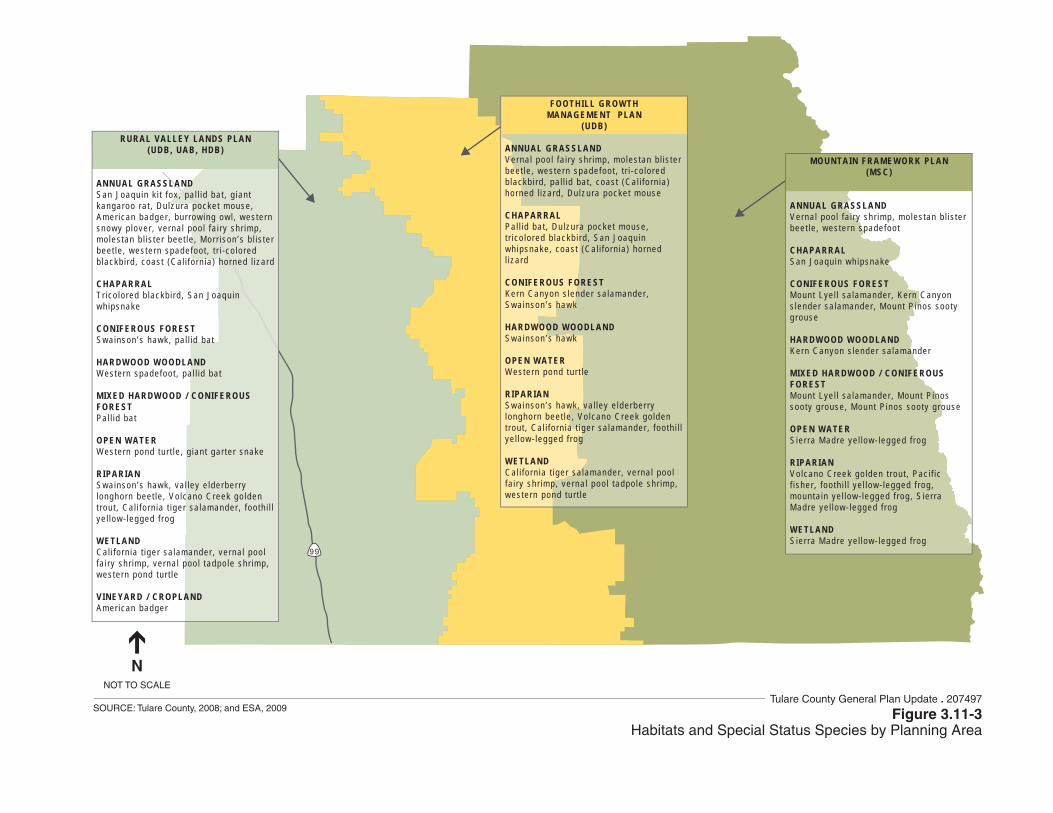
99
RURAL VALLEY LANDS PLAN(UDB, UAB, HDB)
AN NUAL GRASSLANDSan Joaqu in k i t fox , pa l l i d ba t , g ian t kangaroo ra t , Du lzura pocke t mouse, Amer ican badger , bur rowing owl , wes te rn snowy p lover , verna l poo l fa i ry shr imp, mo les tan b l i s te r bee t le , Mor r i son ’s b l i s te r bee t le , wes te rn spadefoo t , t r i - co lo red b lackb i rd , coas t (Ca l i fo rn ia ) horned l i za rd
CHAPARRALTr ico lo red b lackb i rd , San Joaqu in wh ipsnake
CONIFEROUS FORESTSwainson ’s hawk, pa l l id ba t
HARDWOOD WOODLANDWestern spadefoo t , pa l l i d ba t
MIXED HARDWOOD / CONIFEROUS FORESTPal l id ba t
OPEN WATERWestern pond tu r t le , g ian t gar te r snake
RIPARIANSwainson ’s hawk, va l ley e lderber ry longhorn beet le , Vo lcano Creek go lden t rou t , Ca l i fo rn ia t iger sa lamander , foo th i l l ye l low- legged f rog
WETLANDCal i fo rn ia t iger sa lamander , verna l poo l fa i ry shr imp, verna l poo l tadpo le shr imp, wes te rn pond tu r t le
VINEYARD / CROPLANDAmer ican badger
FOOTHILL GROWTHMANAGEMENT PLAN
(UDB)
AN NUAL GRASSLANDVerna l poo l fa i ry shr imp, mo les tan b l i s te r bee t le , wes te rn spadefoo t , t r i - co lo red b lackb i rd , pa l l i d ba t , coas t (Ca l i fo rn ia ) horned l i za rd , Du lzura pocke t mouse
CHAPARRALPal l id ba t , Du lzura pocke t mouse, t r i co lo red b lackb i rd , San Joaqu in wh ipsnake, coas t (Ca l i fo rn ia ) horned l i za rd
CONIFEROUS FORESTKern Canyon s lender sa lamander , Swa inson ’s hawk
HARDWOOD WOODLANDSwainson ’s hawk
OPEN WATERWestern pond tu r t le
RIPARIANSwainson ’s hawk, va l ley e lderber ry longhorn beet le , Vo lcano Creek go lden t rou t , Ca l i fo rn ia t iger sa lamander , foo th i l l ye l low- legged f rog
WETLANDCal i fo rn ia t iger sa lamander , verna l poo l fa i ry shr imp, verna l poo l tadpo le shr imp, wes te rn pond tu r t le
MOUNTAIN FRAMEWORK PLAN(MSC)
ANNUAL GRASSLANDVerna l poo l fa i ry shr imp, mo les tan b l i s te r bee t le , wes te rn spadefoo t
CHAPARRALSan Joaqu in wh ipsnake
CONIFEROUS FORESTMount Lye l l sa lamander , Kern Canyon s lender sa lamander , Mount P inos soo ty g rouse
HARDWOOD WOODLANDKern Canyon s lender sa lamander
MIXED HARDWOOD / CONIFEROUS FORESTMount Lye l l sa lamander , Mount P inos soo ty g rouse , Mount P inos soo ty g rouse
OPEN WATERSier ra Madre ye l low- legged f rog
RIPARIANVolcano Creek go lden t rou t , Pac i f i c f i sher , foo th i l l ye l low- legged f rog , mounta in ye l low- legged f rog , S ie r ra Madre ye l low- legged f rog
WETLANDSier ra Madre ye l low- legged f rog
NNOT TO SCALE
Figure 3.11-3Habitats and Special Status Species by Planning Area
SOURCE: Tulare County, 2008; and ESA, 2009Tulare County General Plan Update . 207497
Tulare County General Plan 2030 Update
Tulare County General Plan 2030 Update 3.11-34 ESA / 207497 Recirculated Draft Environmental Impact Report February 2010
The preservation of open space areas and biological resources is a key goal of the General Plan 2030 Update, with the inclusion of several policies in the Environmental Resources Management Element. Policies ERM-1.1 through ERM-1.6, ERM-1.8, and ERM-1.12 require the County to protect key sensitive habitats (i.e., riparian, wetlands, and oak woodlands, etc.) by encouraging future County growth outside these sensitive habitat areas. Planting native vegetation in order to provide habitat conditions suitable for native vegetation and wildlife is encouraged in Policy ERM-1.7. Policy ERM-1.9 encourages the County to work with other government land management agencies to preserve and protect sensitive habitat areas. Policy ERM-1.14 directs the County to support the establishment and administration of a mitigation banking program. Policy ERM-5.8 requires the County to address development impacts to local waterways through the use of lakefront and river bank vegetation buffers designed to protect habitats and the scenic quality of local lakes and water courses. The Environmental Resources Management Element also includes Implementation Measures #2, #3, #5, #7, #10, #11, #13, #14 and #54, which are designed to protect sensitive habitats and their associated species (i.e., Pixley National Wildlife Refuge, etc.). ERM Implementation Measures #4, #6, #8, and #9 have also been developed to identify and mitigate impacts to affected habitats and species (both plant and wildlife) resulting from the General Plan 2030 Update.
The General Plan 2030 Update also includes a number of similar policies in the Foothill Growth Management Plan (FGMP) (see Policies FGMP-5.1, FGMP-8.1, FGMP-8.5, FGMP-8.12, FGMP-8.13, FGMP-8.14, and FGMP-8.19) that have been developed to address sensitive habitats and species specific to this unique County area. However, even with implementation of the above mentioned policies, this impact is still considered potentially significant.
MITIGATING POLICIES AND IMPLEMENTATION MEASURES
Environmental Resources Management Element
Policies designed to protect sensitive habitats from the impacts of future development in Tulare County include the following:
ERM-1.1 Protection of Rare and Endangered Species ERM-1.2 Development in Environmentally Sensitive Areas ERM-1.3 Encourage Cluster Development ERM-1.4 Protect Riparian Areas ERM-1.5 Riparian Management Plans and Mining
Reclamation Plans ERM-1.6 Management of Wetlands ERM-1.7 Planting of Native Vegetation ERM-1.8 Open Space Buffers ERM-1.9 Coordination of Management on Adjacent Lands
ERM-1.12 Management of Oak Woodland Communities ERM-1.13 Pesticides ERM-1.14 Mitigation and Conservation Banking Program ERM-5.8 Watercourse Development ERM-5.15 Open Space Preservation ERM Implementation Measures #2, #5, #7, #8, #9, #10,
#11, #13, #14, and #54
Implementation Measures designed to identify and mitigate the impact of development on key biological resources include the following:
ERM Implementation Measure #3 ERM Implementation Measure #4 ERM Implementation Measure #6
Foothill Growth Management Plan
Policies designed to preserve and maintain biological resources within the Foothill Growth Management Plan include the following:
FGMP-4.1 Identification of Environmentally Sensitive Areas FGMP-5.1 Protect Agricultural Lands FGMP-8.1 Riparian Area Development FGMP-8.5 Protection of Lakes
FGMP-8.12 Vegetation Removal FGMP-8.13 Use of Native Landscaping FGMP-8.14 Identification of Wildlife FGMP-8.19 Preservation of Unique Features
3.11 Biological Resources
Tulare County General Plan 2030 Update 3.11-35 ESA / 207497 Recirculated Draft Environmental Impact Report February 2010
FGMP-8.9 Removal of Natural Vegetation FGMP Implementation Measures #15, #23, and #26
Required Additional Mitigating Policies and Implementation Measures
In addition to the above mentioned policies and implementation measures, the following new Policy ERM-1.15 “Minimize Lighting Impacts” and revised Policy ERM-1.9 “Coordination of Management on Adjacent Lands” are required to address this impact:
• ERM-1.15 Minimize Lighting Impacts. The County shall ensure that lighting associated with new development or facilities (including street lighting, recreational facilities, and parking) shall be designed to prevent artificial lighting from illuminating adjacent natural areas at a level greater than one foot candle above ambient conditions. [New Policy – Draft EIR Analysis].
• ERM-1.9 Coordination of Management on Adjacent Lands. The County shall work with other government land management agencies (such as the Bureau of Land Management, US Forest Service, National Park Service) to preserve and protect biological resources, including those within and adjacent to designated critical habitat, reserves, preserves, and other protected lands, while maintaining the ability to utilize and enjoy the natural resources in the County [Revised Policy].
Significance after Implementation of Mitigation for Impact 3.11-1
As stated above, the County will adopt and implement a variety of policies and implementation measures designed to address impacts to biological resources (including officially designated endangered, threatened, candidate, or special status species). Although these policies seek to protect a variety of open space resources within the County, implementation of the General Plan 2030 Update would still result in the conversion of some open space and habitat areas, which would result in the overall reduction of a plant or wildlife species habitat. Therefore, implementation of the General Plan 2030 Update including the adoption of the policies and implementation measures (including the new Policy ERM-1.15 “Minimize Lighting Impacts” and revised Policy ERM-1.9 “Coordination of Management on Adjacent Lands”) listed above would still result in a significant and unavoidable impact. No additional feasible mitigation is currently available.
Impact 3.11-2: The proposed project would have a substantial adverse effect on riparian habitats or other sensitive natural communities.
Impact Summary
SU Level of Significance Before Mitigation: Potentially Significant
Required Additional Mitigating Policies and Implementation Measures: New Policy ERM-1.15 “Minimize Lighting Impacts” and revised Policy ERM-1.9 “Coordination of Management on Adjacent Lands”
Resultant Level of Significance: Significant and Unavoidable
Tulare County General Plan 2030 Update
Tulare County General Plan 2030 Update 3.11-36 ESA / 207497 Recirculated Draft Environmental Impact Report February 2010
Impact Analysis
Sensitive natural communities or habitats in Tulare County include Big Tree Forest, Central Valley Drainage Hardhead/Squawfish Stream, Great Valley Oak Riparian Forest, Northern Hardpan Vernal Pool, Northern Claypan Vernal Pool, Southern Interior Cypress Forest, Sycamore Alluvial Woodland, Valley Sacaton Grassland, Valley Saltbrush Scrub, Valley Sink Scrub, Blue Ridge Ecological Reserve, Sequoia Riverlands Trust, and Kaweah Oaks Preserve. Some of these areas as well as other ecological reserves, preserves, and refuges are identified on Figure 3.11-3 above. In general, riparian habitats are considered a sensitive habitat that supports a variety of plant and wildlife species along watercourses or water bodies adaptable to seasonal flooding. Other sensitive habitats in the County include forest, oak woodlands, wetlands, and vernal pool habitats. As more fully described above under Impact 3.11-1, development resulting from implementation of the General Plan 2030 Update may result in both direct and indirect significant adverse impacts to a number of habitats and their associated special status species occurring in the County.
Critical habitat, as defined under the Endangered Species Act, is designated in specific areas of the County (see Figure 3.11-3) for the following species:
• Vernal pool fairy shrimp (Branchinecta lynchi), • Vernal pool tadpole shrimp (Lepidurus packardi), • Little Kern golden trout (Oncorhynchus aquabonita whitei), • California tiger salamander, central population (Ambystoma californiense), • California condor (Gymnogyps californianus), • Hoover’s spurge (Chamaesyce hooveri), • San Joaquin Valley Orcutt grass (Orcuttia inaequalis), and • Keck’s checker-mallow (Sidalcea keckii).
Within these sensitive habitat areas and critical habitat areas, a number of special status plant and wildlife species are known to occur or have the potential to occur in the County. In addition, these sensitive vegetation communities provide important foraging, dispersal, and migratory corridors for many wildlife species. Future growth resulting from implementation of the General Plan 2030 Update will result in both direct and indirect significant adverse impacts to wildlife occurring in the County.
Although focused within the unincorporated communities, hamlets, and established Urban Development Boundaries, some limited population growth associated with the General Plan 2030 Update will allow for the introduction of development (predominately agricultural land uses) into largely undisturbed areas. Such development has the potential to result in a significant impact on sensitive habitats, individual plants, and wildlife species. The primary impact will be the potential for removal of sensitive habitats for building pad development and the construction of buildings, infrastructure and roadways. Additional impacts will result from a continued increased incidence of fire due to human activity, increased erosion from roadways, and the introduction of non-native weed species. The introduction of developed land uses will also result in the elimination of habitat and food resources for wildlife through the removal of vegetative communities. The
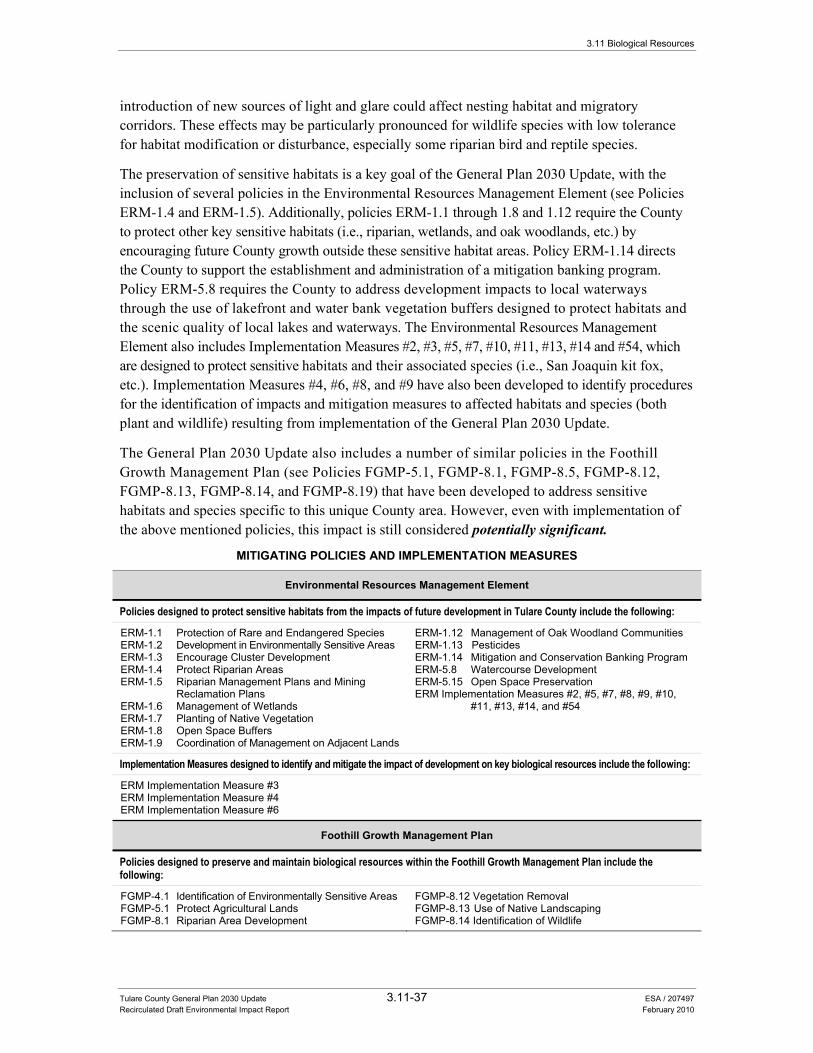
3.11 Biological Resources
Tulare County General Plan 2030 Update 3.11-37 ESA / 207497 Recirculated Draft Environmental Impact Report February 2010
introduction of new sources of light and glare could affect nesting habitat and migratory corridors. These effects may be particularly pronounced for wildlife species with low tolerance for habitat modification or disturbance, especially some riparian bird and reptile species.
The preservation of sensitive habitats is a key goal of the General Plan 2030 Update, with the inclusion of several policies in the Environmental Resources Management Element (see Policies ERM-1.4 and ERM-1.5). Additionally, policies ERM-1.1 through 1.8 and 1.12 require the County to protect other key sensitive habitats (i.e., riparian, wetlands, and oak woodlands, etc.) by encouraging future County growth outside these sensitive habitat areas. Policy ERM-1.14 directs the County to support the establishment and administration of a mitigation banking program. Policy ERM-5.8 requires the County to address development impacts to local waterways through the use of lakefront and water bank vegetation buffers designed to protect habitats and the scenic quality of local lakes and waterways. The Environmental Resources Management Element also includes Implementation Measures #2, #3, #5, #7, #10, #11, #13, #14 and #54, which are designed to protect sensitive habitats and their associated species (i.e., San Joaquin kit fox, etc.). Implementation Measures #4, #6, #8, and #9 have also been developed to identify procedures for the identification of impacts and mitigation measures to affected habitats and species (both plant and wildlife) resulting from implementation of the General Plan 2030 Update.
The General Plan 2030 Update also includes a number of similar policies in the Foothill Growth Management Plan (see Policies FGMP-5.1, FGMP-8.1, FGMP-8.5, FGMP-8.12, FGMP-8.13, FGMP-8.14, and FGMP-8.19) that have been developed to address sensitive habitats and species specific to this unique County area. However, even with implementation of the above mentioned policies, this impact is still considered potentially significant.
MITIGATING POLICIES AND IMPLEMENTATION MEASURES
Environmental Resources Management Element
Policies designed to protect sensitive habitats from the impacts of future development in Tulare County include the following:
ERM-1.1 Protection of Rare and Endangered Species ERM-1.2 Development in Environmentally Sensitive Areas ERM-1.3 Encourage Cluster Development ERM-1.4 Protect Riparian Areas ERM-1.5 Riparian Management Plans and Mining
Reclamation Plans ERM-1.6 Management of Wetlands ERM-1.7 Planting of Native Vegetation ERM-1.8 Open Space Buffers ERM-1.9 Coordination of Management on Adjacent Lands
ERM-1.12 Management of Oak Woodland Communities ERM-1.13 Pesticides ERM-1.14 Mitigation and Conservation Banking Program ERM-5.8 Watercourse Development ERM-5.15 Open Space Preservation ERM Implementation Measures #2, #5, #7, #8, #9, #10,
#11, #13, #14, and #54
Implementation Measures designed to identify and mitigate the impact of development on key biological resources include the following:
ERM Implementation Measure #3 ERM Implementation Measure #4 ERM Implementation Measure #6
Foothill Growth Management Plan
Policies designed to preserve and maintain biological resources within the Foothill Growth Management Plan include the following:
FGMP-4.1 Identification of Environmentally Sensitive Areas FGMP-5.1 Protect Agricultural Lands FGMP-8.1 Riparian Area Development
FGMP-8.12 Vegetation Removal FGMP-8.13 Use of Native Landscaping FGMP-8.14 Identification of Wildlife
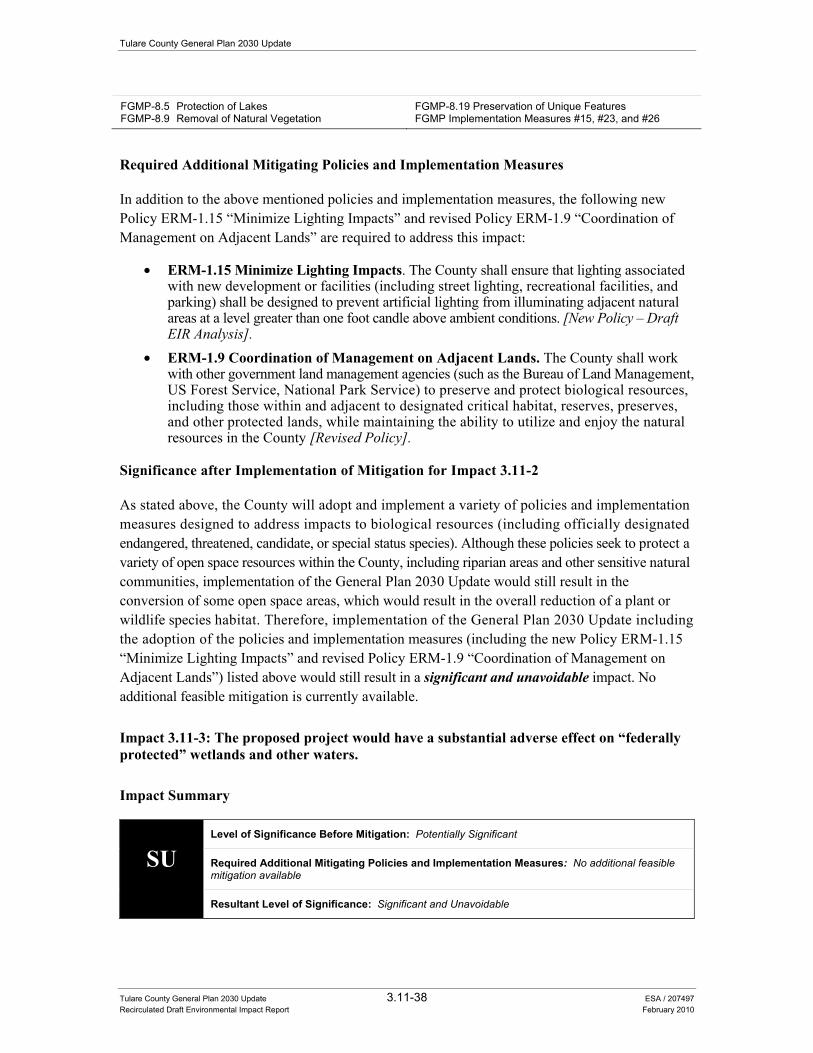
Tulare County General Plan 2030 Update
Tulare County General Plan 2030 Update 3.11-38 ESA / 207497 Recirculated Draft Environmental Impact Report February 2010
FGMP-8.5 Protection of Lakes FGMP-8.9 Removal of Natural Vegetation
FGMP-8.19 Preservation of Unique Features FGMP Implementation Measures #15, #23, and #26
Required Additional Mitigating Policies and Implementation Measures
In addition to the above mentioned policies and implementation measures, the following new Policy ERM-1.15 “Minimize Lighting Impacts” and revised Policy ERM-1.9 “Coordination of Management on Adjacent Lands” are required to address this impact:
• ERM-1.15 Minimize Lighting Impacts. The County shall ensure that lighting associated with new development or facilities (including street lighting, recreational facilities, and parking) shall be designed to prevent artificial lighting from illuminating adjacent natural areas at a level greater than one foot candle above ambient conditions. [New Policy – Draft EIR Analysis].
• ERM-1.9 Coordination of Management on Adjacent Lands. The County shall work with other government land management agencies (such as the Bureau of Land Management, US Forest Service, National Park Service) to preserve and protect biological resources, including those within and adjacent to designated critical habitat, reserves, preserves, and other protected lands, while maintaining the ability to utilize and enjoy the natural resources in the County [Revised Policy].
Significance after Implementation of Mitigation for Impact 3.11-2
As stated above, the County will adopt and implement a variety of policies and implementation measures designed to address impacts to biological resources (including officially designated endangered, threatened, candidate, or special status species). Although these policies seek to protect a variety of open space resources within the County, including riparian areas and other sensitive natural communities, implementation of the General Plan 2030 Update would still result in the conversion of some open space areas, which would result in the overall reduction of a plant or wildlife species habitat. Therefore, implementation of the General Plan 2030 Update including the adoption of the policies and implementation measures (including the new Policy ERM-1.15 “Minimize Lighting Impacts” and revised Policy ERM-1.9 “Coordination of Management on Adjacent Lands”) listed above would still result in a significant and unavoidable impact. No additional feasible mitigation is currently available.
Impact 3.11-3: The proposed project would have a substantial adverse effect on “federally protected” wetlands and other waters.
Impact Summary
SU Level of Significance Before Mitigation: Potentially Significant
Required Additional Mitigating Policies and Implementation Measures: No additional feasible mitigation available
Resultant Level of Significance: Significant and Unavoidable
3.11 Biological Resources
Tulare County General Plan 2030 Update 3.11-39 ESA / 207497 Recirculated Draft Environmental Impact Report February 2010
Impact Analysis
As more fully described above under Impact 3.11-2, development resulting from implementation of the General Plan 2030 Update may result in both direct and indirect significant adverse impacts to wetlands and other sensitive natural communities occurring in Tulare County. Wetlands and vernal pools are scattered throughout the valley area of the County. As described above, many vernal pool habitats are unmapped due to their small size and could be located within areas identified as annual grasslands or vineyard/cropland habitats. Wetland habitats are sensitive to changes in water availability and water quality. These habitats could be indirectly impacted by surface water and groundwater related impacts resulting from increased erosion, sedimentation, temperature, and contamination associated with construction of new urban development or intensification of agricultural land uses. Impacts 3.9-1 and 3.6-1 through 3.6-5 provide more detailed discussions of the impacts to water supply, water quality, and drainage resulting from buildout of the General Plan.
The preservation of wetland (including vernal pool) habitats is a key goal of the General Plan 2030 Update, with the inclusion of several policies in the Environmental Resources Management Element (see Policies ERM-1.4 and ERM-1.6). Additionally, policies ERM-1.1 through 1.4, 1.6, 1.8 and 1.12 require the County to protect key sensitive habitats (i.e., riparian, wetlands, and oak woodlands, etc.) by encouraging future County growth outside these sensitive habitat areas, supporting compatible development, or implementing development controls near these areas. Planting native vegetation in order to provide habitat conditions suitable for native vegetation and wildlife is encouraged through Policy ERM-1.7. Policy ERM-1.14 directs the County to support the establishment and administration of a mitigation banking program. Policy ERM-5.8 requires the County to address development impacts to local waterways through the use of lakefront and water bank vegetation buffers designed to protect habitats and the scenic quality of local lakes and waterways. ERM Implementation Measure #6 is designed to identify wetland resources using USACE protocols in addition to the identification of impacts and mitigation measures to other habitats and species (both plant and wildlife) resulting from implementation of the General Plan 2030 Update. ERM Implementation Measure #9 requires the County to incorporate requirements for the dedication of buffers into the zoning ordinance that would be used for mitigating impacts to riparian and wetland areas. ERM Implementation Measures #2 through #5, #7, and #8 call for the identification through site surveys and preparation of plans for habitat protection as well as utilization of the zoning code and a mitigation banking program in order to minimize the effects of future growth on sensitive habitats, such as wetland and riparian habitats. Implementation Measures #10 and #11 specifically identify measures for the protection of vernal pools and wetlands. Implementation Measures #4, #6, #8, and #9 have also been developed to identify procedures for the identification of impacts and mitigation measures to affected habitats and species (both plant and wildlife) resulting from implementation of the General Plan 2030 Update. ERM Implementation Measure #54 states that the County will collaborate with preservation groups to implement the preservation and mitigation plans and programs of the Environmental Resources Management Element. The General Plan also contains a number of policies that minimize impacts to water supply and water quality (see Policies WR-1.1, WR-1.10, WR-2.1, WR-2.3, WR-2.6, and WR-3.13).
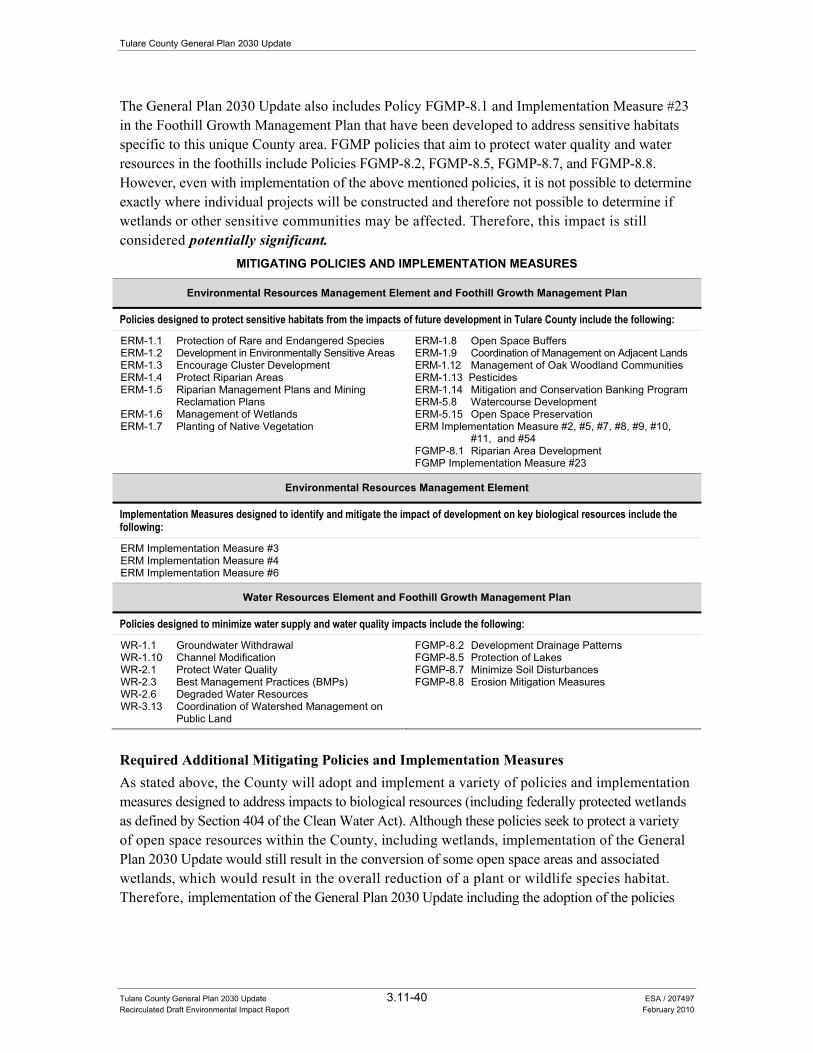
Tulare County General Plan 2030 Update
Tulare County General Plan 2030 Update 3.11-40 ESA / 207497 Recirculated Draft Environmental Impact Report February 2010
The General Plan 2030 Update also includes Policy FGMP-8.1 and Implementation Measure #23 in the Foothill Growth Management Plan that have been developed to address sensitive habitats specific to this unique County area. FGMP policies that aim to protect water quality and water resources in the foothills include Policies FGMP-8.2, FGMP-8.5, FGMP-8.7, and FGMP-8.8. However, even with implementation of the above mentioned policies, it is not possible to determine exactly where individual projects will be constructed and therefore not possible to determine if wetlands or other sensitive communities may be affected. Therefore, this impact is still considered potentially significant.
MITIGATING POLICIES AND IMPLEMENTATION MEASURES
Environmental Resources Management Element and Foothill Growth Management Plan
Policies designed to protect sensitive habitats from the impacts of future development in Tulare County include the following:
ERM-1.1 Protection of Rare and Endangered Species ERM-1.2 Development in Environmentally Sensitive Areas ERM-1.3 Encourage Cluster Development ERM-1.4 Protect Riparian Areas ERM-1.5 Riparian Management Plans and Mining
Reclamation Plans ERM-1.6 Management of Wetlands ERM-1.7 Planting of Native Vegetation
ERM-1.8 Open Space Buffers ERM-1.9 Coordination of Management on Adjacent Lands ERM-1.12 Management of Oak Woodland Communities ERM-1.13 Pesticides ERM-1.14 Mitigation and Conservation Banking Program ERM-5.8 Watercourse Development ERM-5.15 Open Space Preservation ERM Implementation Measure #2, #5, #7, #8, #9, #10,
#11, and #54 FGMP-8.1 Riparian Area Development FGMP Implementation Measure #23
Environmental Resources Management Element
Implementation Measures designed to identify and mitigate the impact of development on key biological resources include the following:
ERM Implementation Measure #3 ERM Implementation Measure #4 ERM Implementation Measure #6
Water Resources Element and Foothill Growth Management Plan
Policies designed to minimize water supply and water quality impacts include the following:
WR-1.1 Groundwater Withdrawal WR-1.10 Channel Modification WR-2.1 Protect Water Quality WR-2.3 Best Management Practices (BMPs) WR-2.6 Degraded Water Resources WR-3.13 Coordination of Watershed Management on
Public Land
FGMP-8.2 Development Drainage Patterns FGMP-8.5 Protection of Lakes FGMP-8.7 Minimize Soil Disturbances FGMP-8.8 Erosion Mitigation Measures
Required Additional Mitigating Policies and Implementation Measures As stated above, the County will adopt and implement a variety of policies and implementation measures designed to address impacts to biological resources (including federally protected wetlands as defined by Section 404 of the Clean Water Act). Although these policies seek to protect a variety of open space resources within the County, including wetlands, implementation of the General Plan 2030 Update would still result in the conversion of some open space areas and associated wetlands, which would result in the overall reduction of a plant or wildlife species habitat. Therefore, implementation of the General Plan 2030 Update including the adoption of the policies
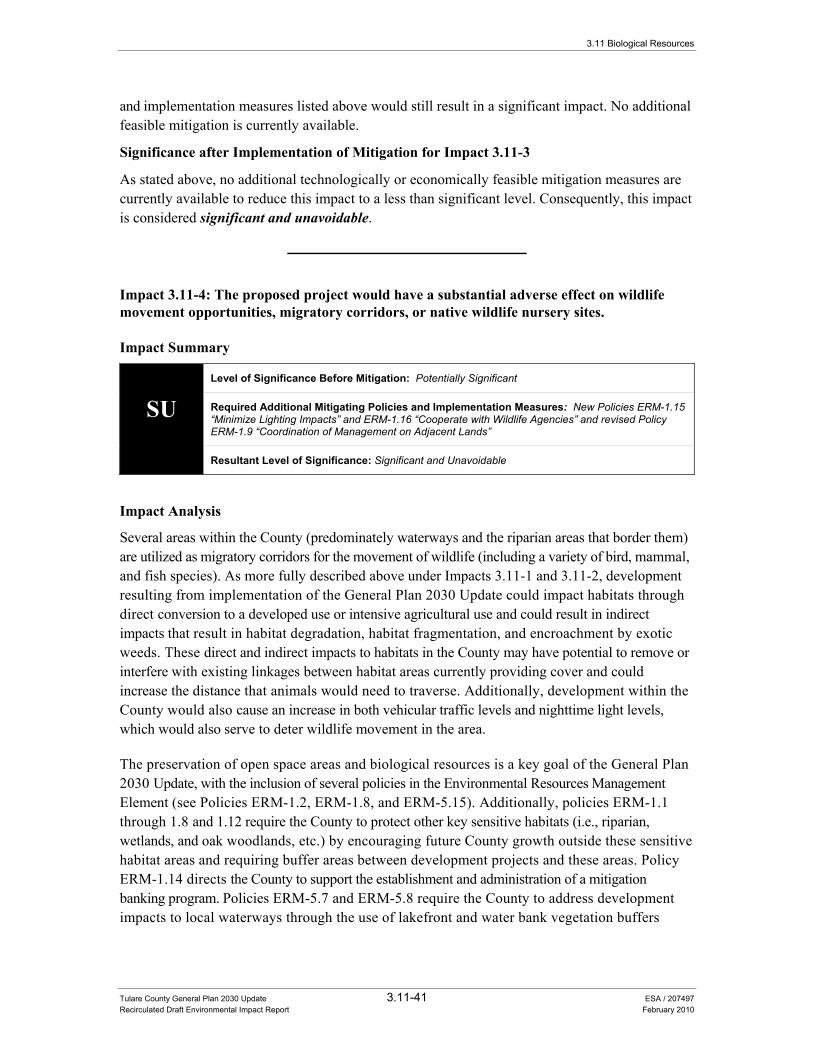
3.11 Biological Resources
Tulare County General Plan 2030 Update 3.11-41 ESA / 207497 Recirculated Draft Environmental Impact Report February 2010
and implementation measures listed above would still result in a significant impact. No additional feasible mitigation is currently available.
Significance after Implementation of Mitigation for Impact 3.11-3
As stated above, no additional technologically or economically feasible mitigation measures are currently available to reduce this impact to a less than significant level. Consequently, this impact is considered significant and unavoidable.
Impact 3.11-4: The proposed project would have a substantial adverse effect on wildlife movement opportunities, migratory corridors, or native wildlife nursery sites.
Impact Summary
SU Level of Significance Before Mitigation: Potentially Significant
Required Additional Mitigating Policies and Implementation Measures: New Policies ERM-1.15 “Minimize Lighting Impacts” and ERM-1.16 “Cooperate with Wildlife Agencies” and revised Policy ERM-1.9 “Coordination of Management on Adjacent Lands”
Resultant Level of Significance: Significant and Unavoidable
Impact Analysis
Several areas within the County (predominately waterways and the riparian areas that border them) are utilized as migratory corridors for the movement of wildlife (including a variety of bird, mammal, and fish species). As more fully described above under Impacts 3.11-1 and 3.11-2, development resulting from implementation of the General Plan 2030 Update could impact habitats through direct conversion to a developed use or intensive agricultural use and could result in indirect impacts that result in habitat degradation, habitat fragmentation, and encroachment by exotic weeds. These direct and indirect impacts to habitats in the County may have potential to remove or interfere with existing linkages between habitat areas currently providing cover and could increase the distance that animals would need to traverse. Additionally, development within the County would also cause an increase in both vehicular traffic levels and nighttime light levels, which would also serve to deter wildlife movement in the area.
The preservation of open space areas and biological resources is a key goal of the General Plan 2030 Update, with the inclusion of several policies in the Environmental Resources Management Element (see Policies ERM-1.2, ERM-1.8, and ERM-5.15). Additionally, policies ERM-1.1 through 1.8 and 1.12 require the County to protect other key sensitive habitats (i.e., riparian, wetlands, and oak woodlands, etc.) by encouraging future County growth outside these sensitive habitat areas and requiring buffer areas between development projects and these areas. Policy ERM-1.14 directs the County to support the establishment and administration of a mitigation banking program. Policies ERM-5.7 and ERM-5.8 require the County to address development impacts to local waterways through the use of lakefront and water bank vegetation buffers
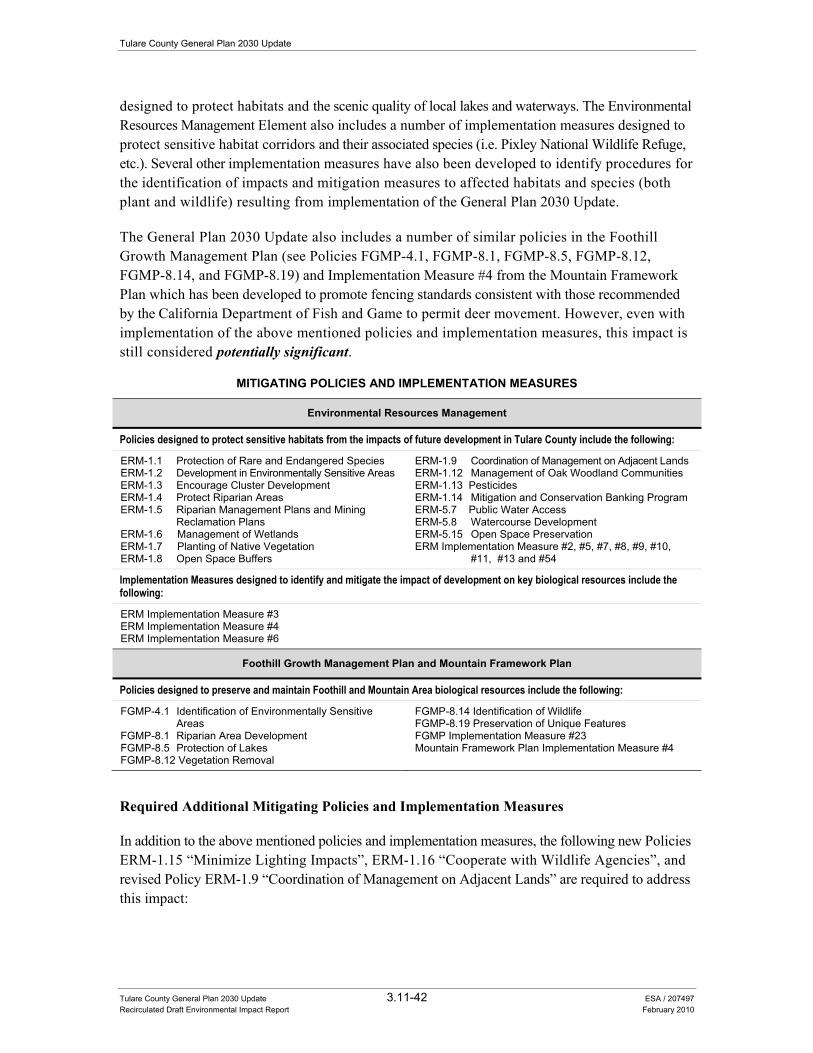
Tulare County General Plan 2030 Update
Tulare County General Plan 2030 Update 3.11-42 ESA / 207497 Recirculated Draft Environmental Impact Report February 2010
designed to protect habitats and the scenic quality of local lakes and waterways. The Environmental Resources Management Element also includes a number of implementation measures designed to protect sensitive habitat corridors and their associated species (i.e. Pixley National Wildlife Refuge, etc.). Several other implementation measures have also been developed to identify procedures for the identification of impacts and mitigation measures to affected habitats and species (both plant and wildlife) resulting from implementation of the General Plan 2030 Update.
The General Plan 2030 Update also includes a number of similar policies in the Foothill Growth Management Plan (see Policies FGMP-4.1, FGMP-8.1, FGMP-8.5, FGMP-8.12, FGMP-8.14, and FGMP-8.19) and Implementation Measure #4 from the Mountain Framework Plan which has been developed to promote fencing standards consistent with those recommended by the California Department of Fish and Game to permit deer movement. However, even with implementation of the above mentioned policies and implementation measures, this impact is still considered potentially significant.
MITIGATING POLICIES AND IMPLEMENTATION MEASURES
Environmental Resources Management
Policies designed to protect sensitive habitats from the impacts of future development in Tulare County include the following:
ERM-1.1 Protection of Rare and Endangered Species ERM-1.2 Development in Environmentally Sensitive Areas ERM-1.3 Encourage Cluster Development ERM-1.4 Protect Riparian Areas ERM-1.5 Riparian Management Plans and Mining
Reclamation Plans ERM-1.6 Management of Wetlands ERM-1.7 Planting of Native Vegetation ERM-1.8 Open Space Buffers
ERM-1.9 Coordination of Management on Adjacent Lands ERM-1.12 Management of Oak Woodland Communities ERM-1.13 Pesticides ERM-1.14 Mitigation and Conservation Banking Program ERM-5.7 Public Water Access ERM-5.8 Watercourse Development ERM-5.15 Open Space Preservation ERM Implementation Measure #2, #5, #7, #8, #9, #10,
#11, #13 and #54
Implementation Measures designed to identify and mitigate the impact of development on key biological resources include the following:
ERM Implementation Measure #3 ERM Implementation Measure #4 ERM Implementation Measure #6
Foothill Growth Management Plan and Mountain Framework Plan
Policies designed to preserve and maintain Foothill and Mountain Area biological resources include the following:
FGMP-4.1 Identification of Environmentally Sensitive Areas
FGMP-8.1 Riparian Area Development FGMP-8.5 Protection of Lakes FGMP-8.12 Vegetation Removal
FGMP-8.14 Identification of Wildlife FGMP-8.19 Preservation of Unique Features FGMP Implementation Measure #23 Mountain Framework Plan Implementation Measure #4
Required Additional Mitigating Policies and Implementation Measures
In addition to the above mentioned policies and implementation measures, the following new Policies ERM-1.15 “Minimize Lighting Impacts”, ERM-1.16 “Cooperate with Wildlife Agencies”, and revised Policy ERM-1.9 “Coordination of Management on Adjacent Lands” are required to address this impact:
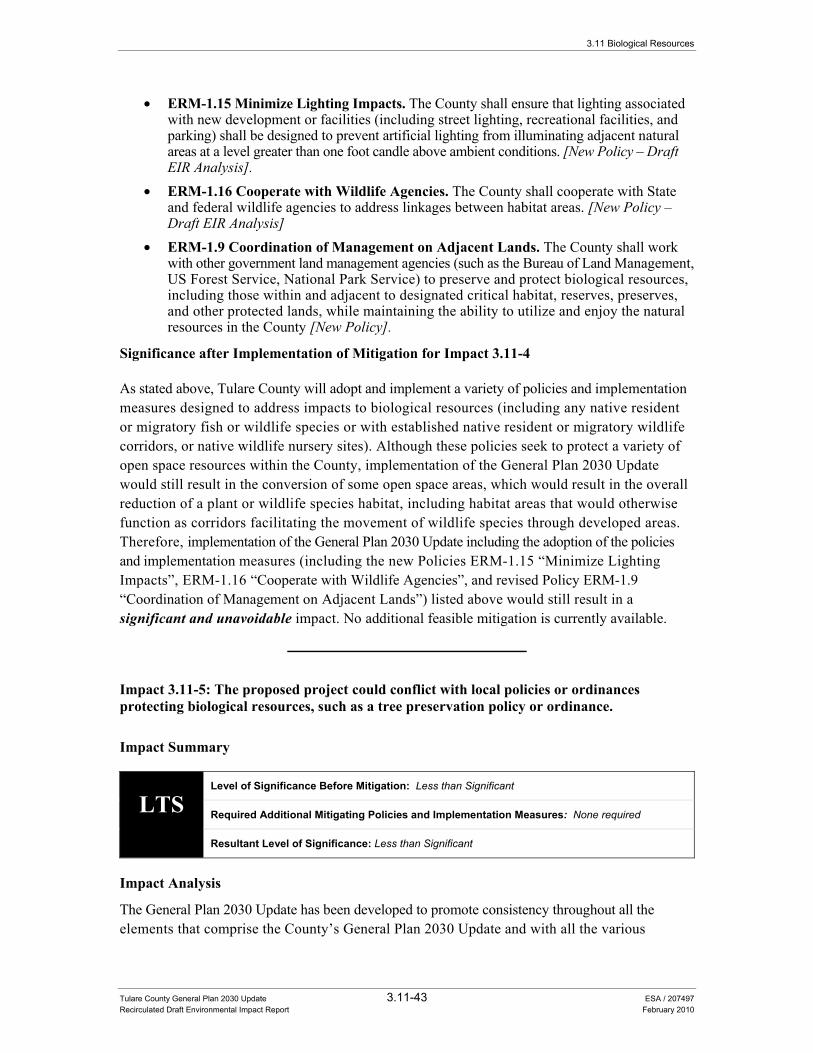
3.11 Biological Resources
Tulare County General Plan 2030 Update 3.11-43 ESA / 207497 Recirculated Draft Environmental Impact Report February 2010
• ERM-1.15 Minimize Lighting Impacts. The County shall ensure that lighting associated with new development or facilities (including street lighting, recreational facilities, and parking) shall be designed to prevent artificial lighting from illuminating adjacent natural areas at a level greater than one foot candle above ambient conditions. [New Policy – Draft EIR Analysis].
• ERM-1.16 Cooperate with Wildlife Agencies. The County shall cooperate with State and federal wildlife agencies to address linkages between habitat areas. [New Policy – Draft EIR Analysis]
• ERM-1.9 Coordination of Management on Adjacent Lands. The County shall work with other government land management agencies (such as the Bureau of Land Management, US Forest Service, National Park Service) to preserve and protect biological resources, including those within and adjacent to designated critical habitat, reserves, preserves, and other protected lands, while maintaining the ability to utilize and enjoy the natural resources in the County [New Policy].
Significance after Implementation of Mitigation for Impact 3.11-4
As stated above, Tulare County will adopt and implement a variety of policies and implementation measures designed to address impacts to biological resources (including any native resident or migratory fish or wildlife species or with established native resident or migratory wildlife corridors, or native wildlife nursery sites). Although these policies seek to protect a variety of open space resources within the County, implementation of the General Plan 2030 Update would still result in the conversion of some open space areas, which would result in the overall reduction of a plant or wildlife species habitat, including habitat areas that would otherwise function as corridors facilitating the movement of wildlife species through developed areas. Therefore, implementation of the General Plan 2030 Update including the adoption of the policies and implementation measures (including the new Policies ERM-1.15 “Minimize Lighting Impacts”, ERM-1.16 “Cooperate with Wildlife Agencies”, and revised Policy ERM-1.9 “Coordination of Management on Adjacent Lands”) listed above would still result in a significant and unavoidable impact. No additional feasible mitigation is currently available.
Impact 3.11-5: The proposed project could conflict with local policies or ordinances protecting biological resources, such as a tree preservation policy or ordinance.
Impact Summary
LTS Level of Significance Before Mitigation: Less than Significant
Required Additional Mitigating Policies and Implementation Measures: None required
Resultant Level of Significance: Less than Significant
Impact Analysis
The General Plan 2030 Update has been developed to promote consistency throughout all the elements that comprise the County’s General Plan 2030 Update and with all the various
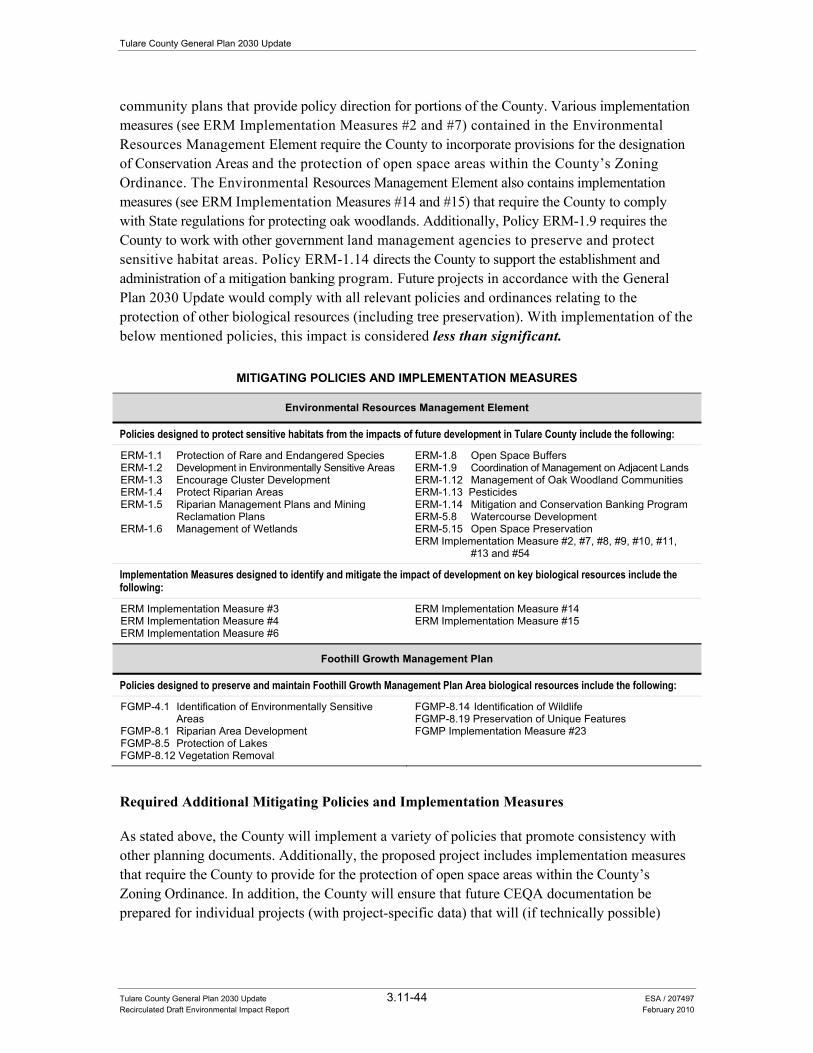
Tulare County General Plan 2030 Update
Tulare County General Plan 2030 Update 3.11-44 ESA / 207497 Recirculated Draft Environmental Impact Report February 2010
community plans that provide policy direction for portions of the County. Various implementation measures (see ERM Implementation Measures #2 and #7) contained in the Environmental Resources Management Element require the County to incorporate provisions for the designation of Conservation Areas and the protection of open space areas within the County’s Zoning Ordinance. The Environmental Resources Management Element also contains implementation measures (see ERM Implementation Measures #14 and #15) that require the County to comply with State regulations for protecting oak woodlands. Additionally, Policy ERM-1.9 requires the County to work with other government land management agencies to preserve and protect sensitive habitat areas. Policy ERM-1.14 directs the County to support the establishment and administration of a mitigation banking program. Future projects in accordance with the General Plan 2030 Update would comply with all relevant policies and ordinances relating to the protection of other biological resources (including tree preservation). With implementation of the below mentioned policies, this impact is considered less than significant.
MITIGATING POLICIES AND IMPLEMENTATION MEASURES
Environmental Resources Management Element
Policies designed to protect sensitive habitats from the impacts of future development in Tulare County include the following:
ERM-1.1 Protection of Rare and Endangered Species ERM-1.2 Development in Environmentally Sensitive Areas ERM-1.3 Encourage Cluster Development ERM-1.4 Protect Riparian Areas ERM-1.5 Riparian Management Plans and Mining
Reclamation Plans ERM-1.6 Management of Wetlands
ERM-1.8 Open Space Buffers ERM-1.9 Coordination of Management on Adjacent Lands ERM-1.12 Management of Oak Woodland Communities ERM-1.13 Pesticides ERM-1.14 Mitigation and Conservation Banking Program ERM-5.8 Watercourse Development ERM-5.15 Open Space Preservation ERM Implementation Measure #2, #7, #8, #9, #10, #11,
#13 and #54
Implementation Measures designed to identify and mitigate the impact of development on key biological resources include the following:
ERM Implementation Measure #3 ERM Implementation Measure #4 ERM Implementation Measure #6
ERM Implementation Measure #14 ERM Implementation Measure #15
Foothill Growth Management Plan
Policies designed to preserve and maintain Foothill Growth Management Plan Area biological resources include the following:
FGMP-4.1 Identification of Environmentally Sensitive Areas
FGMP-8.1 Riparian Area Development FGMP-8.5 Protection of Lakes FGMP-8.12 Vegetation Removal
FGMP-8.14 Identification of Wildlife FGMP-8.19 Preservation of Unique Features FGMP Implementation Measure #23
Required Additional Mitigating Policies and Implementation Measures
As stated above, the County will implement a variety of policies that promote consistency with other planning documents. Additionally, the proposed project includes implementation measures that require the County to provide for the protection of open space areas within the County’s Zoning Ordinance. In addition, the County will ensure that future CEQA documentation be prepared for individual projects (with project-specific data) that will (if technically possible)

3.11 Biological Resources
Tulare County General Plan 2030 Update 3.11-45 ESA / 207497 Recirculated Draft Environmental Impact Report February 2010
mitigate any potential erosion impacts to a less than significant level. This impact is considered less than significant. No mitigation is required.
Significance after Implementation of Mitigation for Impact 3.11-5
A number of policies referenced above in the impact analysis and included in the proposed project were specifically designed to minimize impacts to biological resources. With implementation of the above mentioned policies, this impact is considered less than significant.
Impact 3.11-6: The proposed project could conflict with the provisions of an adopted habitat conservation plan, natural community conservation plan, or other approved local, regional, or state habitat conservation plan.
Impact Summary
LTS Level of Significance Before Mitigation: Less than Significant
Required Additional Mitigating Policies and Implementation Measures: Recommended new Policy ERM-1.17 “Conservation Plan Coordination”
Resultant Level of Significance: Less than Significant
Impact Analysis
Under Section 10 of the Federal Endangered Species Act, the preparation of a habitat conservation plan may be required for a non-federal entity that has requested a take permit for a federally listed species or critical habitat. Similarly, a natural community conservation plan may be required to address State requirements specific to State listed species or critical habitats.
The Kern Water Bank Habitat Conservation Plan is the only approved multi-species habitat conservation plan (HCP) that exists in Tulare County. This HCP was approved by the United States Fish and Wildlife Service on October 2, 1997 and protects a total of 22 federally listed species and 29 non-listed species. The HCP covers a 19,900-acre area located in Tulare, Kern, and Kings Counties. The species protected in this HCP include the valley elderberry longhorn beetle, California condor, Conservancy fairy shrimp, San Joaquin kit fox, and the western snowy plover. Although the HCP represents a regional opportunity to address key biological resource impacts associated with regional development, participation in the HCP is a voluntary activity. Project proponents can choose to address biological resource impacts outside of the HCP program by consulting directly with applicable local, State, and federal agencies.
As previously described above under Impacts 3.11-1 through 3.11-5, the General Plan 2030 Update has been developed to address a variety of impacts to biological resources. Additionally, the General Plan Update has been developed to ensure continued coordination (see Policy ERM-1.9) with a variety of other government land management agencies to preserve and protect sensitive
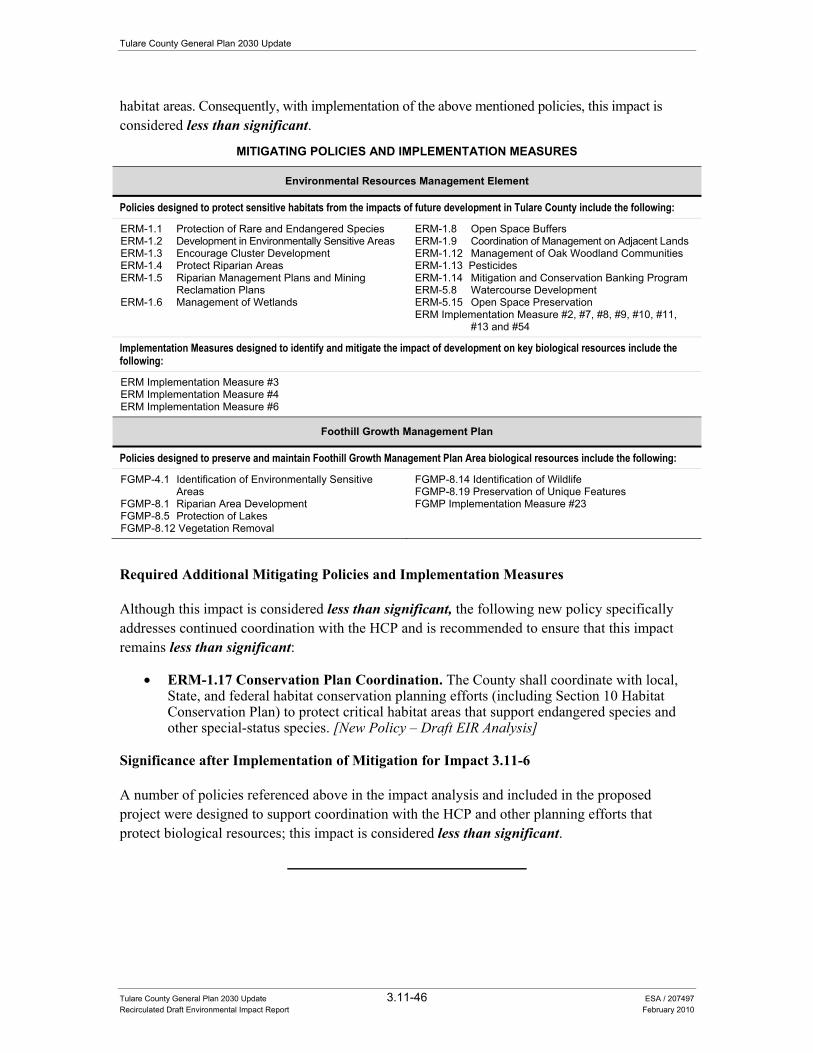
Tulare County General Plan 2030 Update
Tulare County General Plan 2030 Update 3.11-46 ESA / 207497 Recirculated Draft Environmental Impact Report February 2010
habitat areas. Consequently, with implementation of the above mentioned policies, this impact is considered less than significant.
MITIGATING POLICIES AND IMPLEMENTATION MEASURES
Environmental Resources Management Element
Policies designed to protect sensitive habitats from the impacts of future development in Tulare County include the following:
ERM-1.1 Protection of Rare and Endangered Species ERM-1.2 Development in Environmentally Sensitive Areas ERM-1.3 Encourage Cluster Development ERM-1.4 Protect Riparian Areas ERM-1.5 Riparian Management Plans and Mining
Reclamation Plans ERM-1.6 Management of Wetlands
ERM-1.8 Open Space Buffers ERM-1.9 Coordination of Management on Adjacent Lands ERM-1.12 Management of Oak Woodland Communities ERM-1.13 Pesticides ERM-1.14 Mitigation and Conservation Banking Program ERM-5.8 Watercourse Development ERM-5.15 Open Space Preservation ERM Implementation Measure #2, #7, #8, #9, #10, #11,
#13 and #54
Implementation Measures designed to identify and mitigate the impact of development on key biological resources include the following:
ERM Implementation Measure #3 ERM Implementation Measure #4 ERM Implementation Measure #6
Foothill Growth Management Plan
Policies designed to preserve and maintain Foothill Growth Management Plan Area biological resources include the following:
FGMP-4.1 Identification of Environmentally Sensitive Areas
FGMP-8.1 Riparian Area Development FGMP-8.5 Protection of Lakes FGMP-8.12 Vegetation Removal
FGMP-8.14 Identification of Wildlife FGMP-8.19 Preservation of Unique Features FGMP Implementation Measure #23
Required Additional Mitigating Policies and Implementation Measures
Although this impact is considered less than significant, the following new policy specifically addresses continued coordination with the HCP and is recommended to ensure that this impact remains less than significant:
• ERM-1.17 Conservation Plan Coordination. The County shall coordinate with local, State, and federal habitat conservation planning efforts (including Section 10 Habitat Conservation Plan) to protect critical habitat areas that support endangered species and other special-status species. [New Policy – Draft EIR Analysis]
Significance after Implementation of Mitigation for Impact 3.11-6
A number of policies referenced above in the impact analysis and included in the proposed project were designed to support coordination with the HCP and other planning efforts that protect biological resources; this impact is considered less than significant.
Tulare County General Plan 2030 Update 3.12-1 ESA / 207497 Recirculated Draft Environmental Impact Report February 2010
SECTION 3.12 Cultural Resources
Introduction This section of the recirculated draft Environmental Impact Report (RDEIR) addresses potential impacts to a variety of cultural resources (i.e., paleontologic, archaeological, and historic) in Tulare County. The regulatory setting provides a description of applicable federal, State, and local regulatory policies. The environmental setting provides a summary of known resources, in the County, and includes a summary timeline of key events. A description of the potential impacts of the proposed project is also provided and includes the identification of feasible mitigation (general plan policies) to avoid or lessen the impacts.
The following environmental and regulatory settings were developed from information contained in the 2010 Background Report (see Chapter 9.0 “Biological, Archaeological, and Historical Resources”), incorporated by reference and summarized below. This document is attached as Appendix B to this RDEIR.
Regulatory Setting Federal, State, and local regulations pertaining to cultural resources are described below.
Federal Regulations
National Historic Preservation Act (NHPA) and National Environmental Policy Act (NEPA) The majority of applicable federal regulations concerning cultural resources have been established to comply with the National Environmental Policy Act (NEPA) and the National Historic Preservation Act (NHPA) of 1966, as amended (Public Law 102-575). The NHPA established guidelines to "preserve important historic, cultural, and natural aspects of our national heritage, and to maintain, wherever possible, an environment that supports diversity and a variety of individual choice." The NHPA includes regulations specifically for federal land-holding agencies, but also includes regulations (Section 106) which pertain to all projects that are funded, permitted, or approved by any federal agency and which have the potential to affect cultural resources. All projects that are subject to NEPA are also subject to compliance with Section 106 of the NHPA and the NEPA requirements concerning cultural resources. Provisions of NHPA establish a National Register of Historic Places
Tulare County General Plan 2030 Update
Tulare County General Plan 2030 Update 3.12-2 ESA / 207497 Recirculated Draft Environmental Impact Report February 2010
(The National Register) maintained by the National Park Service, the Advisory Councils on Historic Preservation, State Historic Preservation Offices, and grants-in-aid programs.
American Indian Religious Freedom Act and Native American Graves and Repatriation Act The American Indian Religious Freedom Act recognizes that Native American religious practices, sacred sites, and sacred objects have not been properly protected under other statutes. It establishes, as national policy, that traditional practices and beliefs, sites (including right of access), and the use of sacred objects shall be protected and preserved. Additionally, Native American remains on federal lands are protected by the Native American Graves and Repatriation Act of 1990.
Secretary of the Interior’s Standards The Secretary of the Interior is responsible for establishing professional standards and providing guidance related to the preservation and protection of all cultural resources listed in, or eligible for, listing in the National Register of Historic Places. The Secretary of the Interior’s Standards for the Treatment of Historic Properties apply to all grant-in-aid projects assisted through the National Historic Preservation Fund, and are intended to be applied to a wide variety of resource types, including buildings, structures, sites, objects, and districts. The treatment standards, developed in 1992, were codified as 36 CFR 68 entitled, “The Secretary of the Interior’s Standards for Historic Preservation Projects.” The standards address four treatments:
• Preservation focuses on the maintenance and repair of existing historic materials and retention of a property’s form as it has evolved over time (protection and treatment are also considered under this treatment).
• Rehabilitation as a treatment focuses on the repair and replacement of deteriorated features; when alterations or additions to the property are planned for a new or continued use; and when a depiction of a property at a particular point in time is not appropriate.
• Restoration is the act or process of accurately depicting the form, features, and character of a property as it appeared at a particular period of time through the removal of features from other periods in its history and reconstruction of missing features from the reconstruction period.
• Reconstruction addresses those aspects of treatment necessary to re-create an entire non-surviving building with new material.
Certified Local Government Program (CLG) The Certified Local Government (CLG) Program is a national program designed to encourage the direct participation of a local government in the identification, registration, and preservation of historic properties located within the jurisdiction of the local government. A local government may become a CLG by developing and implementing a local historic preservation program based on federal and State standards.
The CLG program encourages the preservation of cultural resources by promoting a partnership among local governments, the State of California, and the National Park Service (NPS). Becoming
3.12 Cultural Resources
Tulare County General Plan 2030 Update 3.12-3 ESA / 207497 Recirculated Draft Environmental Impact Report February 2010
a CLG can provide local staff and commissions with the tools, technical training, and more meaningful leadership roles in the preservation of a community’s cultural heritage. Local interests and concerns are integrated into the official planning and decision-making processes at the earliest possible opportunity.
According to a list provided by the California Office of Historic Preservation dated June 4, 2009, Tulare County is not a Certified Local Government.
Other Federal Legislation Historic preservation legislation was initiated by the Antiquities Act of 1966, which aimed to protect important historic and archaeological sites. It established a system of permits for conducting archaeological studies on federal land, as well as setting penalties for noncompliance. This permit process controls the disturbance of archaeological sites on federal land. New permits are currently issued under the Archeological Resources Protection Act (ARPA) of 1979. The purpose of ARPA is to enhance preservation and protection of archaeological resources on public and Native American lands. The Historic Sites Act of 1935 declared that it is national policy to "preserve for public use historic sites, buildings, and objects of national significance."
State Regulations
California Environmental Quality Act (CEQA) Section 15064.5 of the CEQA Guidelines requires that lead agencies determine whether projects may have a significant effect on archaeological and historical resources. This determination applies to those resources which meet significance criteria qualifying them as a “unique archaeological resources” or a “historically or culturally significant resource”. Although not the sole consideration, if the resource is listed on the California Register of Historical Resources (CRHR), or is eligible for listing on the CRHR, it is presumed be historically significant resource. If the agency determines that a project may have a significant effect on a significant resource, the project is determined to have a significant effect on the environment, and these effects must be addressed. If an archaeological or historical resource is found not to be significant or unique under the qualifying criteria, it need not be considered further in the planning process.
CEQA emphasizes avoidance of archaeological and historical resources as the preferred strategy of reducing potential significant environmental effects resulting from projects. If avoidance is not feasible, an excavation program or some other form of mitigation must be developed to mitigate the impacts. In order to adequately address the level of potential impacts, and thereby design appropriate mitigation measures, the significance and nature of the cultural resources must be determined. The three phases of cultural resource studies under CEQA are:
• Phase I – Inventory of Cultural Resources. At this point, the following is completed: records search through the Regional Archaeological Information Center, field survey, and a written report of findings. It is also recommended that consultation with the Native American Heritage Commission be conducted.
Tulare County General Plan 2030 Update
Tulare County General Plan 2030 Update 3.12-4 ESA / 207497 Recirculated Draft Environmental Impact Report February 2010
• Phase II – Evaluation of Cultural Resources. The purpose of this phase is to determine if a cultural resource is significant. If the resource is not significant according to the criteria outlined in Section 15064.5 of the California Environmental Quality Act, there will be no significant environmental effect, requiring no additional work. If the resource is significant, then impacts to the resource must be mitigated.
• Phase III – Treatment of Impacted, Significant Cultural Resources. If Phases I and II (inventory and evaluation) determine that no significant cultural resources are present within the project area, then no further work is needed. A Negative Declaration can be issued for cultural resources.
If significant resources are identified, there are several ways to treat and mitigate impacts to these resources, including: avoidance; site capping (in those instances where avoidance is not feasible, it is often possible to cover burials or other important discoveries with a protective layer of earth or other material); creation of conservation easements; and/or data recovery.
Section 15064.5 of the CEQA Guidelines states: “Generally, a project that follows the Secretary of the Interior's Standards for the Treatment of Historic Properties with Guidelines for Preserving, Rehabilitating, Restoring, and Reconstructing Historic Buildings or the Secretary of the Interior's Standards for Rehabilitation and Guidelines for Rehabilitating Historic Buildings shall be considered as mitigated to a level of less than a significant impact on the historical resource.”
Native American Consultation Senate Bill 18 (SB 18) requires local governments to consult directly with Native American tribes before making certain planning decisions and to provide notice to tribes at certain key points in the planning process. The purpose of involving tribes at these early planning stages is to allow consideration of cultural places in the context of broad local land use policy, before individual site-specific, project-level, land use designations are made by a local government. The consultation requirements of SB 18 apply to general plan or specific plan processes proposed on or after March 1, 2005. The following are the contact and notification responsibilities of local governments:
Prior to the adoption or any amendment of a general plan or specific plan, a local government must notify the appropriate tribes (on the contact list maintained by the Native American Heritage Commission [NAHC]) of the opportunity to conduct consultations for the purpose of preserving, or mitigating impacts to, cultural places located on land within the local government’s jurisdiction that is affected by the proposed plan adoption or amendment. Tribes have 90 days from the date on which they receive notification to request consultation, unless a shorter timeframe has been agreed to by the tribe (Government Code §65352.3).
Local government must send a notice of a public hearing, at least 10 days prior to the hearing, to tribes who have filed a written request for such notice (Government Code §65092).
Recent consultation with the NAHC, as part of the County’s current update to its General Plan, indicated the presence of cultural places within the Tulare County Planning Area, including the Tulare side of the Williamson, Whitney, Kaweah, and Triple Divide peaks. While the specific
3.12 Cultural Resources
Tulare County General Plan 2030 Update 3.12-5 ESA / 207497 Recirculated Draft Environmental Impact Report February 2010
locations of these or other cultural places in the County are confidential in nature, a copy of all correspondence with the NAHC and Native American representatives is on file with the County.
State Laws Pertaining to Human Remains Section 7050.5 of the California Health and Safety Code requires that construction or excavation be stopped in the vicinity of discovered human remains until the County coroner can determine whether the remains are those of a Native American. If the remains are determined to be Native American, the coroner must contact the California Native American Heritage Commission. CEQA Guidelines (Public Resources Code Section 5097) specify the procedures to be followed in case of the discovery of human remains on non-federal land. The disposition of Native American burials is within the jurisdiction of the Native American Heritage Commission.
Local Regulations At this time, Tulare County does not have a Historical Resources Commission. The City of Visalia has a Historic Preservation Advisory Committee; however, none of the other cities in Tulare County have historic resource commissions. Several cities have historic preservation ordinances or policies in place (Tulare and Visalia are examples), and many communities have historic preservation projects underway at the present time.
Environmental Setting The following section summarizes the paleontologic, prehistoric, ethnographic, and historic settings within Tulare County. Figure 3.12-1 provides a timeline of historic events in Tulare County.
Paleontologic Setting The following description is summarized from “The San Joaquin Valley Through Time,” by Tim Elam (County of Tulare, 2010 Background Report, pages 9-49 through 9-50, 2010a), and the Buena Vista Museum of Natural History, Bakersfield, California website.
During the Tertiary Period (65 to 2 million years ago [mya]), the Sierra Nevada Mountains had eroded to mere hills compared to earlier form, and the Coast Ranges rose. This gave way to the formation of the San Joaquin Valley, which comprises the southern portion of the Great Central Valley, an interior lowland approximately 450 miles long and on average about 40 miles wide. The Great Central Valley is enclosed by the Siskiyou, Sierra Nevada, Tehachapi, and Coast Ranges on the north, east, south, and west, respectively.
The Sierra Nevada is an island arc volcano system that formed about 200 million years ago during the Jurassic Period (144-208 mya). During this time, the area that would become the San Joaquin Valley lay off shore several thousand feet below the surface of the Pacific Ocean. Sediment from the Sierra Nevada, and the movement of the earth’s plates (tectonic action) facilitated the accumulation of material into the Late Cretaceous Period (65-75 mya).
Tulare County General Plan 2030 Update
Tulare County General Plan 2030 Update 3.12-6 ESA / 207497 Recirculated Draft Environmental Impact Report February 2010
The Jurassic and Cretaceous Periods brought flowering plants, early dinosaurs, along with the first birds and mammals. The basic form of the Great Central Valley rose during the Cenozoic period from the Pacific Ocean, first as islands, then as mountains attached to the ocean valleys below them.
The Paleocene Period (58-66 mya) witnessed the extinction of the dinosaur and the development, and later, dominance of the mammal. During the Eocene Epoch (53-39 mya), the western edges of the San Joaquin Valley rose above sea level for the first time. Sedimentation and uplift of geological formations continued until two million years ago.
The Holocene Epoch (10,000 years to present) brought the San Joaquin Valley above sea level, and humans entered the area. Fresh water lakes, rivers, and thousands of feet of rich alluvium formed the valley floor.
According to the University of California Museum of Paleontology (UCMP), 12 paleontological resources have been recorded in Tulare County, generally within the valley portion of the County. These resources primarily consist of invertebrate, vertebrate, and plant fossils (UCMP, 2009).
Prehistoric Setting Although a relatively small amount of information is known concerning the earliest occupants of the Tulare County region, it is clear that much of the San Joaquin Valley and Sierra foothills have been occupied throughout most of the Holocene Epoch (~10,000 B.P. [Before Present] to the present). The reconstruction of cultures inhabiting the subject area during the late Paleo-Indian to early Archaic Periods (~9,000 B.P. to ~3,000 B.P.) has proven difficult based on erosion and depositional patterns of the San Joaquin. Over the millennia, these processes have re-deposited or deeply buried the evidence of much of those early cultures.
A number of investigations into San Joaquin Valley prehistory have been conducted in Tulare County. Much of the literature has supported the notion that the inhabitants of the San Joaquin Valley maintained fairly dense populations situated along the banks of major waterways, wetlands, and streams. Although many sites are more obvious, many of the earliest archaeological records for the region have likely been buried beneath the vast alluvial deposits created by erosion and depositional processes indicative of the valley and Sierra foothills, especially over the last 9,000 years.
Ethnohistoric Setting Tulare County was inhabited by indigenous California Native American groups consisting of the Southern Valley Yokuts, Foothill Yokuts, Monache, and Tubatulabal. Most information regarding these groups is based on Spanish government and Franciscan mission records of the 18th and 19th centuries, and in studies conducted during the 1900s to 1930s by American and British ethnographers. The ethnographic setting presented below is derived from the early works, as compiled by W. J. Wallace, Robert F.G. Spier, and Charles R. Smith (County of Tulare, 2010 Background Report, page 9-51, 2010a), with statistical information provided by the California Native American Heritage Commission.
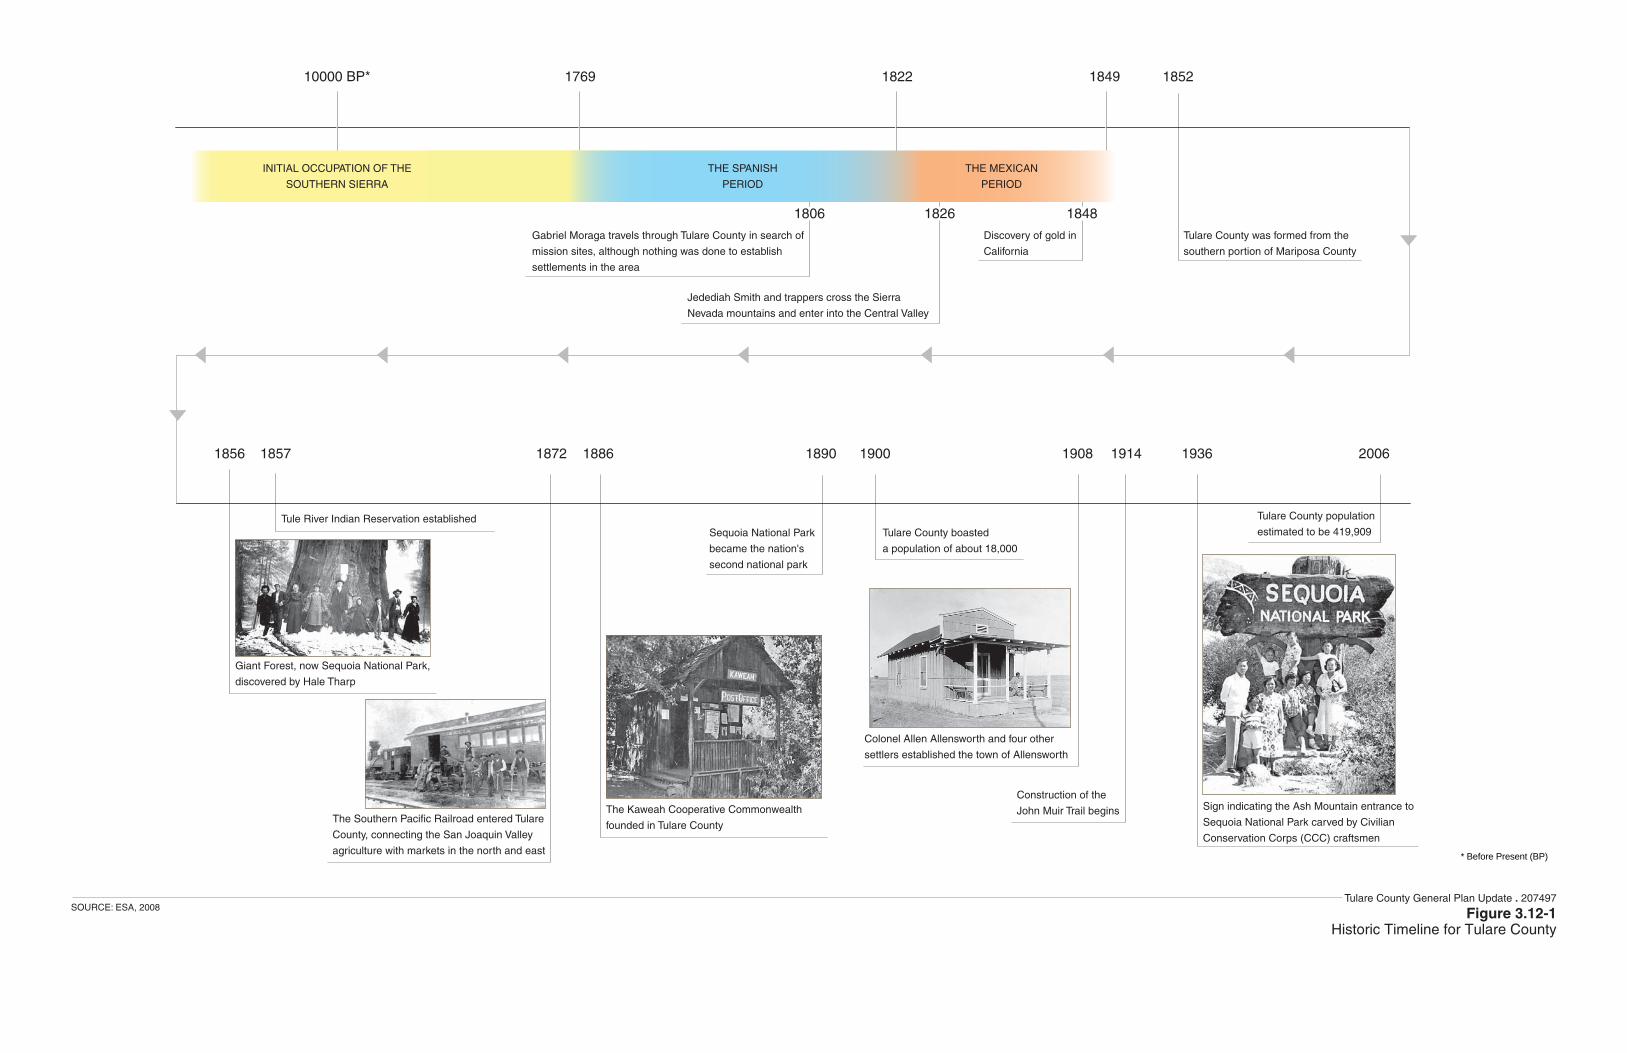
Tulare County was formed from the
southern portion of Mariposa County
Giant Forest, now Sequoia National Park,
discovered by Hale Tharp
Tule River Indian Reservation established
The Southern Pacific Railroad entered Tulare
County, connecting the San Joaquin Valley
agriculture with markets in the north and east
The Kaweah Cooperative Commonwealth
founded in Tulare County
Tulare County population
estimated to be 419,909
Sign indicating the Ash Mountain entrance to
Sequoia National Park carved by Civilian
Conservation Corps (CCC) craftsmen
Construction of the
John Muir Trail begins
Colonel Allen Allensworth and four other
settlers established the town of Allensworth
Tulare County boasted
a population of about 18,000
Sequoia National Park
became the nation's
second national park
Gabriel Moraga travels through Tulare County in search of
mission sites, although nothing was done to establish
settlements in the area
Jedediah Smith and trappers cross the Sierra
Nevada mountains and enter into the Central Valley
Discovery of gold in
California
1856 1857 1872 1886 1890 1900 1908 1914 1936 2006
10000 BP* 1769 1822
1806
1849 1852
1826 1848
INITIAL OCCUPATION OF THE
SOUTHERN SIERRA
THE SPANISH
PERIOD
THE MEXICAN
PERIOD
* Before Present (BP)
Tulare County General Plan Update . 207497
Figure 3.12-1Historic Timeline for Tulare County
SOURCE: ESA, 2008

3.12 Cultural Resources
Tulare County General Plan 2030 Update 3.12-9 ESA / 207497 Recirculated Draft Environmental Impact Report February 2010
Of the four main groups inhabiting the Tulare County area, the Southern Valley Yokuts occupied the largest territory, which is defined roughly by the crest of the Diablo Range on the west and the foothills of the Sierra Nevada on the east, and from the Kings River on the north, to the Tehachapi Mountains on the south. The Foothill Yokuts inhabited the western slopes of the Sierra Nevada, between the Fresno River and Kern River, with settlements generally occurring between the 2,000 to 4,000-foot elevations. The Tubatulabal inhabited the Sierra Nevada Mountains, at the higher elevations, near Mt. Whitney in the east, extending westward along the drainages of the Kern River, and the Kern River-South Fork. The Monache were comprised of six small groups that lived in the Sierras east of the Foothill Yokuts, in locations ranging between 3,000 to 7,000 foot elevations.
Historical Setting California’s coast was initially explored by Spanish and some Russian military expeditions during the late 1500s. However, European settlement did not occur until the arrival into southern California of land-based expeditions originating in Spanish Mexico. The early groups arrived during the 1760s, and consisted of Spanish military, Mexican Indian, Franciscan missionary, and citizen colonists. Thus began what is today known as the Spanish Period (1769-1822). This period includes the establishment of a chain of 21 Franciscan missions, constructed in old California, from San Diego to Sonoma. With the establishment of the missions came the exertion of Spanish religious and military authority over California’s indigenous population, and the development of presidios, civilian ranchos, and pueblos throughout California. Although the region known today as Tulare County did not come under the jurisdiction of a mission proper, periodically small numbers of indigenous tribal members fleeing the control of distant missions would enter the valley.
In 1822, the colonial territory of Mexico won its independence from Spain, and established a republic. Because it lay strategically situated within the new republic’s northern frontier, California remained a territory of Mexico, and home to a new group of ranchers and settlers that arrived to take advantage of large land grants being offered by the new government. During the 1840s, Mexico awarded five grants (known as ranchos) on what later became Tulare County lands. However, in 1860, Kern County was formed from a portion of Tulare County; all five Tulare County ranchos were included within the new Kern County boundaries.
In 1846, hostilities between Mexico and the United States led to war. Two years later (1848), war ended, and the United States and Mexico signed the Treaty of Guadalupe Hidalgo. As part of the post-war arrangements, Mexico ceded California and the Southwest to the United States. In 1848-1849, the discovery of gold in northern California brought tens of thousands of itinerant miners, merchants, and speculators. By 1850, the huge influx of prospective citizens allowed California to skip the usual stage of territorial status, and enter the union as a state. Two years later (1852), Tulare County was formed from the southern portion of Mariposa County. And, although Tulare County is listed today as the seventh largest of California’s 58 counties (containing approximately 4,840 square miles), several other counties were subsequently carved from Tulare, including Fresno (1856), Kern (1860), Inyo (1866), and Kings Counties (1893).
Tulare County General Plan 2030 Update
Tulare County General Plan 2030 Update 3.12-10 ESA / 207497 Recirculated Draft Environmental Impact Report February 2010
Early settlement in the Tulare County area focused on ranching. In 1872, the Southern Pacific Railroad entered Tulare County, connecting the San Joaquin Valley with markets in the north and east. About the same time, valley settlers constructed a series of water conveyance systems (canals, dams, and ditches) across the San Joaquin Valley. With ample water supplies and the assurance of rail transport for commodities such as grain, row, crops, and fruit, a number of farming colonies soon appeared throughout the region. Colonies such as Mt. Whitney, Orosi, Oakview, Holliday, Vina, and McCall’s offered affordable farmland, water, and modern transportation. The colonies grew to become cities such as Tulare, Visalia, Porterville, and Hanford. Visalia, the County seat, became the service, processing, and distribution center for the growing number of farms, dairies, and cattle ranches. By 1900, Tulare County boasted a population of about 18,000. New transportation links such as Highway 99 (completed during the 1950s), affordable housing, light industry, and agricultural commerce brought steady growth to the entire San Joaquin Valley area.
Existing Cultural and Historic Resources Tulare County’s known and recorded cultural resources were identified through historical records, such as those found in the National Register of Historic Places, the Historic American Building Survey/Historic American Engineering Record (HABS/HAER), the California Register of Historic Resources, California Historical Landmarks, and the Tulare County Historical Society list of historic resources.
Due to the sensitivity of many prehistoric, ethnohistoric, and historic archaeological sites, the resources listed in the following table (Table 3.12-1) include only those that are available to the general public. The Information Center at California State University Bakersfield houses records associated with reported cultural resources surveys, including the records pertinent to sensitive sites. Only qualified professionals can access the records and other responsible parties such as selected representatives of the region’s Native American community. Sensitive sites include burial grounds, important village sites, and other buried historical resources protected under State and federal laws. The San Joaquin Valley is rich in such sites, and part of a local government’s cultural resources program should include the education of project participants, agency representatives, and concerned citizens as to the laws, codes, and ordinances that forbid the collecting of items such as grave goods, arrowheads, glass, and pottery associated with archaeological sites of any kind.
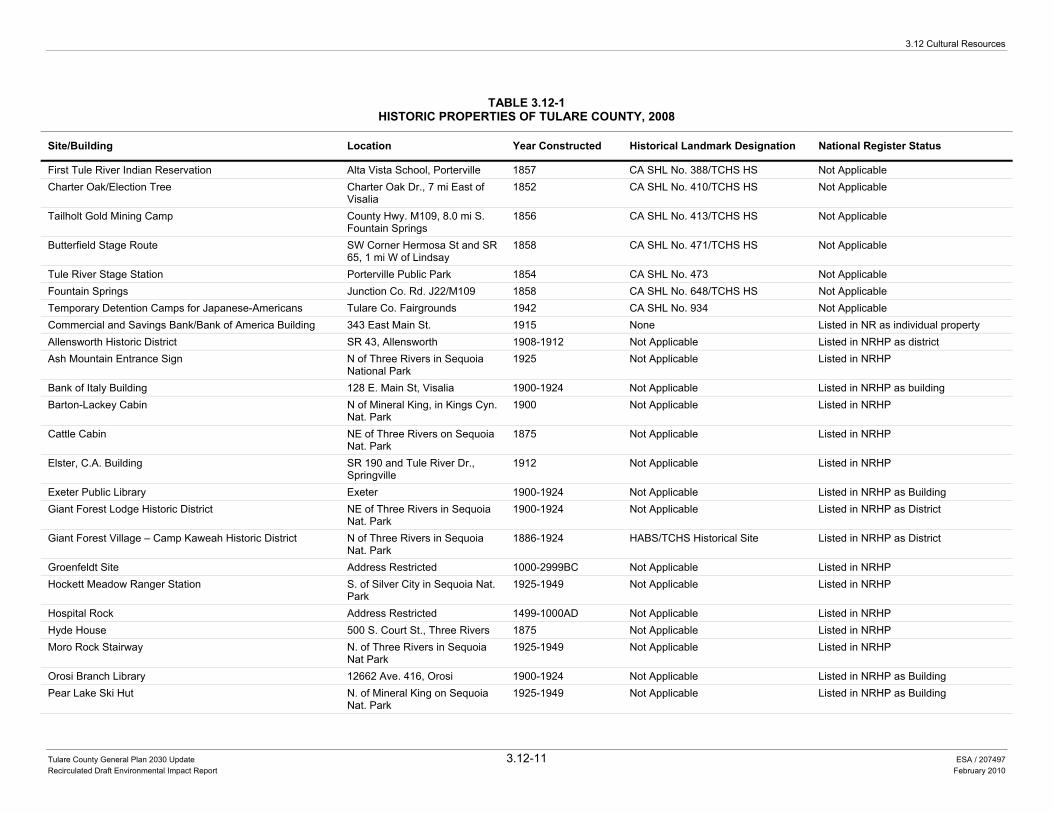
3.12 Cultural Resources
Tulare County General Plan 2030 Update 3.12-11 ESA / 207497 Recirculated Draft Environmental Impact Report February 2010
TABLE 3.12-1HISTORIC PROPERTIES OF TULARE COUNTY, 2008
Site/Building Location Year Constructed Historical Landmark Designation National Register Status
First Tule River Indian Reservation Alta Vista School, Porterville 1857 CA SHL No. 388/TCHS HS Not Applicable Charter Oak/Election Tree Charter Oak Dr., 7 mi East of
Visalia 1852 CA SHL No. 410/TCHS HS Not Applicable
Tailholt Gold Mining Camp County Hwy. M109, 8.0 mi S. Fountain Springs
1856 CA SHL No. 413/TCHS HS Not Applicable
Butterfield Stage Route SW Corner Hermosa St and SR 65, 1 mi W of Lindsay
1858 CA SHL No. 471/TCHS HS Not Applicable
Tule River Stage Station Porterville Public Park 1854 CA SHL No. 473 Not Applicable Fountain Springs Junction Co. Rd. J22/M109 1858 CA SHL No. 648/TCHS HS Not Applicable Temporary Detention Camps for Japanese-Americans Tulare Co. Fairgrounds 1942 CA SHL No. 934 Not Applicable Commercial and Savings Bank/Bank of America Building 343 East Main St. 1915 None Listed in NR as individual property Allensworth Historic District SR 43, Allensworth 1908-1912 Not Applicable Listed in NRHP as district Ash Mountain Entrance Sign N of Three Rivers in Sequoia
National Park 1925 Not Applicable Listed in NRHP
Bank of Italy Building 128 E. Main St, Visalia 1900-1924 Not Applicable Listed in NRHP as building Barton-Lackey Cabin N of Mineral King, in Kings Cyn.
Nat. Park 1900 Not Applicable Listed in NRHP
Cattle Cabin NE of Three Rivers on Sequoia Nat. Park
1875 Not Applicable Listed in NRHP
Elster, C.A. Building SR 190 and Tule River Dr., Springville
1912 Not Applicable Listed in NRHP
Exeter Public Library Exeter 1900-1924 Not Applicable Listed in NRHP as Building Giant Forest Lodge Historic District NE of Three Rivers in Sequoia
Nat. Park 1900-1924 Not Applicable Listed in NRHP as District
Giant Forest Village – Camp Kaweah Historic District N of Three Rivers in Sequoia Nat. Park
1886-1924 HABS/TCHS Historical Site Listed in NRHP as District
Groenfeldt Site Address Restricted 1000-2999BC Not Applicable Listed in NRHP Hockett Meadow Ranger Station S. of Silver City in Sequoia Nat.
Park 1925-1949 Not Applicable Listed in NRHP
Hospital Rock Address Restricted 1499-1000AD Not Applicable Listed in NRHP Hyde House 500 S. Court St., Three Rivers 1875 Not Applicable Listed in NRHP Moro Rock Stairway N. of Three Rivers in Sequoia
Nat Park 1925-1949 Not Applicable Listed in NRHP
Orosi Branch Library 12662 Ave. 416, Orosi 1900-1924 Not Applicable Listed in NRHP as Building Pear Lake Ski Hut N. of Mineral King on Sequoia
Nat. Park 1925-1949 Not Applicable Listed in NRHP as Building
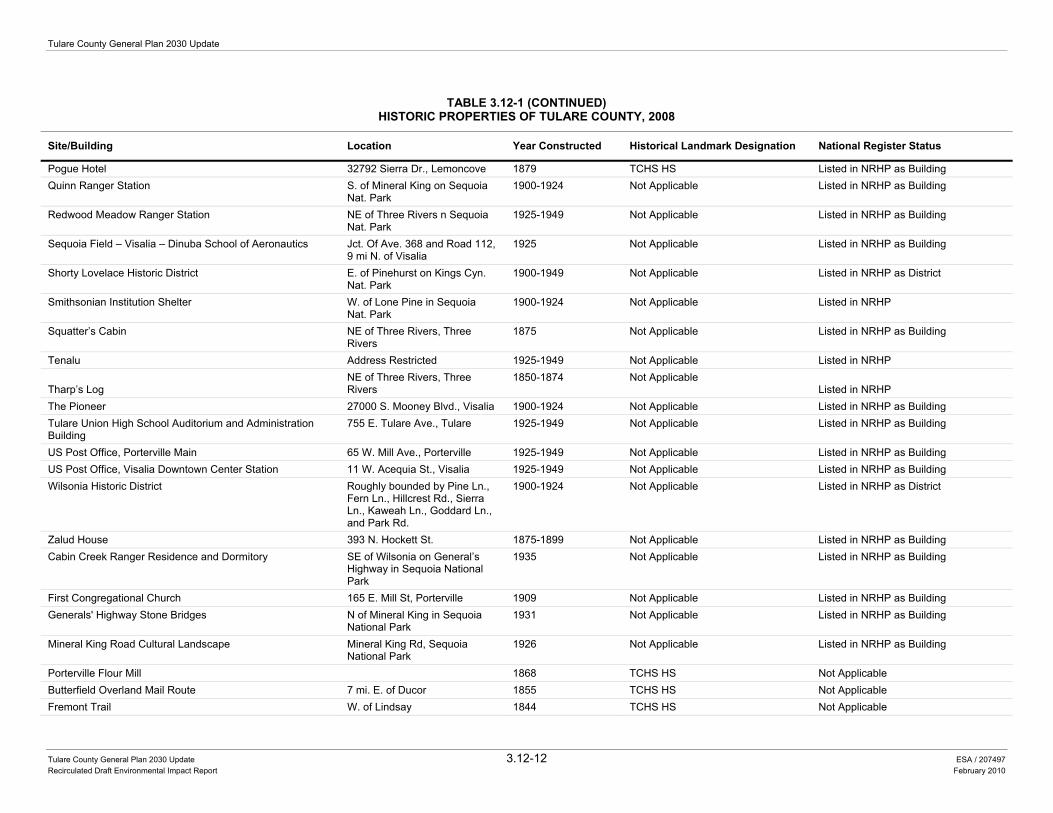
Tulare County General Plan 2030 Update
Tulare County General Plan 2030 Update 3.12-12 ESA / 207497 Recirculated Draft Environmental Impact Report February 2010
TABLE 3.12-1 (CONTINUED)HISTORIC PROPERTIES OF TULARE COUNTY, 2008
Site/Building Location Year Constructed Historical Landmark Designation National Register Status
Pogue Hotel 32792 Sierra Dr., Lemoncove 1879 TCHS HS Listed in NRHP as Building Quinn Ranger Station S. of Mineral King on Sequoia
Nat. Park 1900-1924 Not Applicable Listed in NRHP as Building
Redwood Meadow Ranger Station NE of Three Rivers n Sequoia Nat. Park
1925-1949 Not Applicable Listed in NRHP as Building
Sequoia Field – Visalia – Dinuba School of Aeronautics Jct. Of Ave. 368 and Road 112, 9 mi N. of Visalia
1925 Not Applicable Listed in NRHP as Building
Shorty Lovelace Historic District E. of Pinehurst on Kings Cyn. Nat. Park
1900-1949 Not Applicable Listed in NRHP as District
Smithsonian Institution Shelter W. of Lone Pine in Sequoia Nat. Park
1900-1924 Not Applicable Listed in NRHP
Squatter’s Cabin NE of Three Rivers, Three Rivers
1875 Not Applicable Listed in NRHP as Building
Tenalu Address Restricted 1925-1949 Not Applicable Listed in NRHP Tharp’s Log
NE of Three Rivers, Three Rivers
1850-1874 Not Applicable Listed in NRHP
The Pioneer 27000 S. Mooney Blvd., Visalia 1900-1924 Not Applicable Listed in NRHP as Building Tulare Union High School Auditorium and Administration Building
755 E. Tulare Ave., Tulare 1925-1949 Not Applicable Listed in NRHP as Building
US Post Office, Porterville Main 65 W. Mill Ave., Porterville 1925-1949 Not Applicable Listed in NRHP as Building US Post Office, Visalia Downtown Center Station 11 W. Acequia St., Visalia 1925-1949 Not Applicable Listed in NRHP as Building Wilsonia Historic District Roughly bounded by Pine Ln.,
Fern Ln., Hillcrest Rd., Sierra Ln., Kaweah Ln., Goddard Ln., and Park Rd.
1900-1924 Not Applicable Listed in NRHP as District
Zalud House 393 N. Hockett St. 1875-1899 Not Applicable Listed in NRHP as Building Cabin Creek Ranger Residence and Dormitory SE of Wilsonia on General’s
Highway in Sequoia National Park
1935 Not Applicable Listed in NRHP as Building
First Congregational Church 165 E. Mill St, Porterville 1909 Not Applicable Listed in NRHP as Building Generals' Highway Stone Bridges N of Mineral King in Sequoia
National Park 1931 Not Applicable Listed in NRHP as Building
Mineral King Road Cultural Landscape Mineral King Rd, Sequoia National Park
1926 Not Applicable Listed in NRHP as Building
Porterville Flour Mill 1868 TCHS HS Not Applicable Butterfield Overland Mail Route 7 mi. E. of Ducor 1855 TCHS HS Not Applicable Fremont Trail W. of Lindsay 1844 TCHS HS Not Applicable
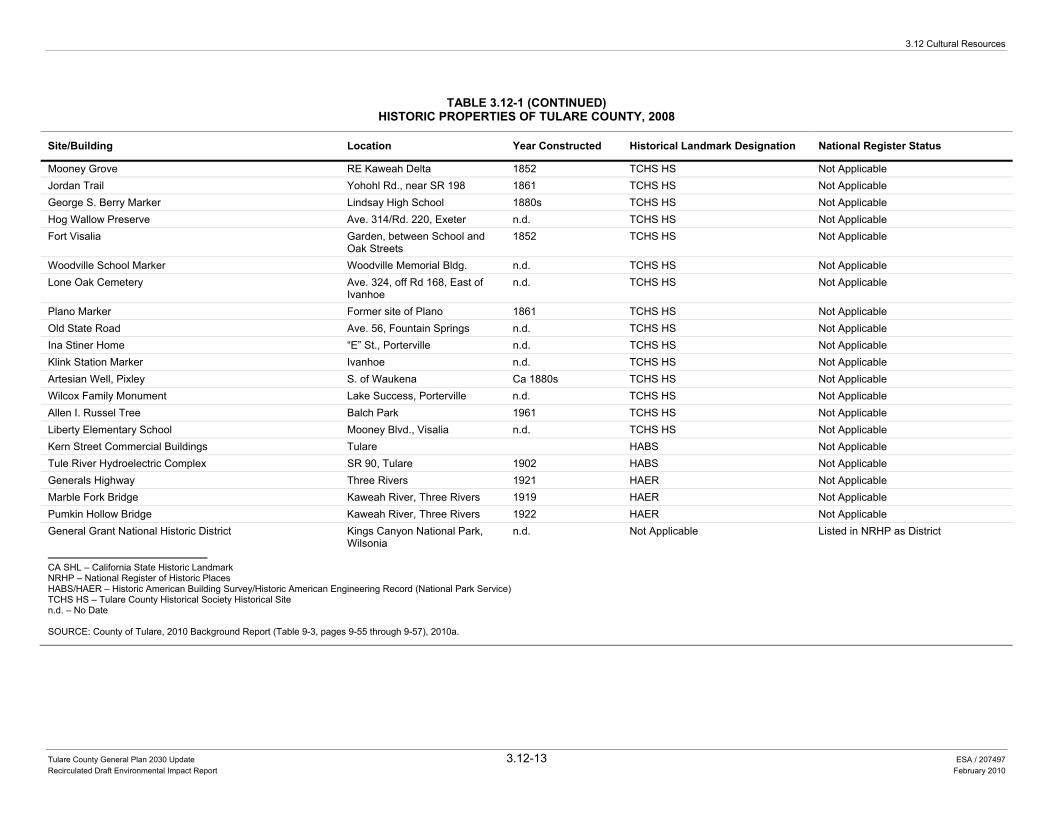
3.12 Cultural Resources
Tulare County General Plan 2030 Update 3.12-13 ESA / 207497 Recirculated Draft Environmental Impact Report February 2010
TABLE 3.12-1 (CONTINUED)HISTORIC PROPERTIES OF TULARE COUNTY, 2008
Site/Building Location Year Constructed Historical Landmark Designation National Register Status
Mooney Grove RE Kaweah Delta 1852 TCHS HS Not Applicable Jordan Trail Yohohl Rd., near SR 198 1861 TCHS HS Not Applicable George S. Berry Marker Lindsay High School 1880s TCHS HS Not Applicable Hog Wallow Preserve Ave. 314/Rd. 220, Exeter n.d. TCHS HS Not Applicable Fort Visalia Garden, between School and
Oak Streets 1852 TCHS HS Not Applicable
Woodville School Marker Woodville Memorial Bldg. n.d. TCHS HS Not Applicable Lone Oak Cemetery Ave. 324, off Rd 168, East of
Ivanhoe n.d. TCHS HS Not Applicable
Plano Marker Former site of Plano 1861 TCHS HS Not Applicable Old State Road Ave. 56, Fountain Springs n.d. TCHS HS Not Applicable Ina Stiner Home “E” St., Porterville n.d. TCHS HS Not Applicable Klink Station Marker Ivanhoe n.d. TCHS HS Not Applicable Artesian Well, Pixley S. of Waukena Ca 1880s TCHS HS Not Applicable Wilcox Family Monument Lake Success, Porterville n.d. TCHS HS Not Applicable Allen I. Russel Tree Balch Park 1961 TCHS HS Not Applicable Liberty Elementary School Mooney Blvd., Visalia n.d. TCHS HS Not Applicable Kern Street Commercial Buildings Tulare HABS Not Applicable Tule River Hydroelectric Complex SR 90, Tulare 1902 HABS Not Applicable Generals Highway Three Rivers 1921 HAER Not Applicable Marble Fork Bridge Kaweah River, Three Rivers 1919 HAER Not Applicable Pumkin Hollow Bridge Kaweah River, Three Rivers 1922 HAER Not Applicable General Grant National Historic District Kings Canyon National Park,
Wilsonia n.d. Not Applicable Listed in NRHP as District
CA SHL – California State Historic Landmark NRHP – National Register of Historic Places HABS/HAER – Historic American Building Survey/Historic American Engineering Record (National Park Service) TCHS HS – Tulare County Historical Society Historical Site n.d. – No Date SOURCE: County of Tulare, 2010 Background Report (Table 9-3, pages 9-55 through 9-57), 2010a.
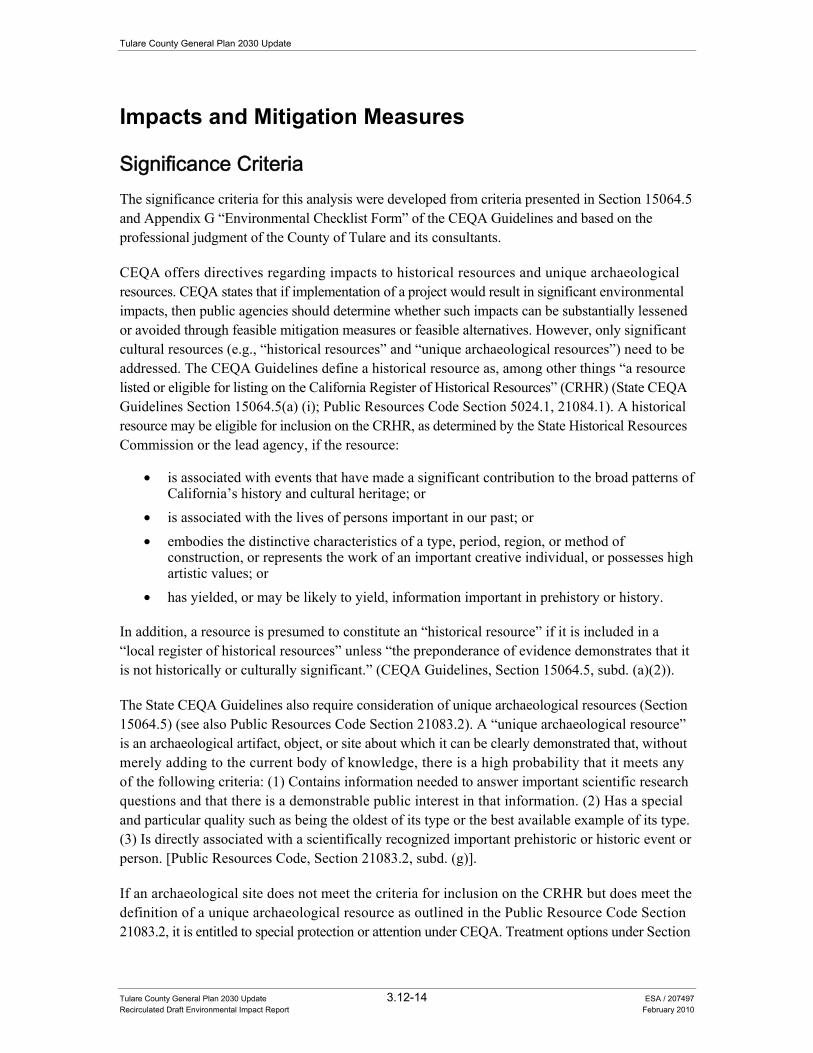
Tulare County General Plan 2030 Update
Tulare County General Plan 2030 Update 3.12-14 ESA / 207497 Recirculated Draft Environmental Impact Report February 2010
Impacts and Mitigation Measures
Significance Criteria The significance criteria for this analysis were developed from criteria presented in Section 15064.5 and Appendix G “Environmental Checklist Form” of the CEQA Guidelines and based on the professional judgment of the County of Tulare and its consultants.
CEQA offers directives regarding impacts to historical resources and unique archaeological resources. CEQA states that if implementation of a project would result in significant environmental impacts, then public agencies should determine whether such impacts can be substantially lessened or avoided through feasible mitigation measures or feasible alternatives. However, only significant cultural resources (e.g., “historical resources” and “unique archaeological resources”) need to be addressed. The CEQA Guidelines define a historical resource as, among other things “a resource listed or eligible for listing on the California Register of Historical Resources” (CRHR) (State CEQA Guidelines Section 15064.5(a) (i); Public Resources Code Section 5024.1, 21084.1). A historical resource may be eligible for inclusion on the CRHR, as determined by the State Historical Resources Commission or the lead agency, if the resource:
• is associated with events that have made a significant contribution to the broad patterns of California’s history and cultural heritage; or
• is associated with the lives of persons important in our past; or • embodies the distinctive characteristics of a type, period, region, or method of
construction, or represents the work of an important creative individual, or possesses high artistic values; or
• has yielded, or may be likely to yield, information important in prehistory or history.
In addition, a resource is presumed to constitute an “historical resource” if it is included in a “local register of historical resources” unless “the preponderance of evidence demonstrates that it is not historically or culturally significant.” (CEQA Guidelines, Section 15064.5, subd. (a)(2)).
The State CEQA Guidelines also require consideration of unique archaeological resources (Section 15064.5) (see also Public Resources Code Section 21083.2). A “unique archaeological resource” is an archaeological artifact, object, or site about which it can be clearly demonstrated that, without merely adding to the current body of knowledge, there is a high probability that it meets any of the following criteria: (1) Contains information needed to answer important scientific research questions and that there is a demonstrable public interest in that information. (2) Has a special and particular quality such as being the oldest of its type or the best available example of its type. (3) Is directly associated with a scientifically recognized important prehistoric or historic event or person. [Public Resources Code, Section 21083.2, subd. (g)].
If an archaeological site does not meet the criteria for inclusion on the CRHR but does meet the definition of a unique archaeological resource as outlined in the Public Resource Code Section 21083.2, it is entitled to special protection or attention under CEQA. Treatment options under Section
3.12 Cultural Resources
Tulare County General Plan 2030 Update 3.12-15 ESA / 207497 Recirculated Draft Environmental Impact Report February 2010
21083.2 include activities that preserve such resources in place in an undisturbed state. Other acceptable methods of mitigation under Section 21083.2 include excavation and curation or study in place without excavation and curation.
CEQA Guidelines Section 15064.5, subdivision (e), requires that excavation activities be stopped whenever human remains are uncovered and that the County coroner be called in to assess the remains. If the County coroner determines that the remains are those of Native Americans, the Native American Heritage Commission must be contacted within 24 hours. At that time, the lead agency shall consult with the appropriate Native Americans as identified by the Native American Heritage Commission. Under certain circumstances, the Native American Heritage Commission may direct the lead agency (or applicant) to develop an agreement with the Native Americans for the treatment and disposition of the remains.
For historical structures, Section 15064.5, subdivision (b) (3), indicates that a project that follows the Secretary of the Interior’s Standards for the Treatment of Historic Properties with Guidelines for Preserving, Rehabilitating, Restoring, and Reconstructing Historic Buildings, or the Secretary of the Interior’s Standards for Rehabilitation and Guidelines for Rehabilitating Historic Buildings (1995), shall mitigate impacts to a level of less than significant. Potential eligibility also rests upon the integrity of the resource. Integrity is defined as the retention of the resource’s physical identity that existed during its period of significance. Integrity is determined through considering the setting, design, workmanship, materials, location, feeling and association of the resource.
In light of this legal background, the proposed project would result in a significant impact if it would:
• Cause a substantial adverse change in the significance of an historical resource as defined in Section 15064.5;
• Cause a substantial adverse change in the significance of a unique archaeological resource pursuant to Section 15064.5;
• Directly or indirectly destroy a unique paleontological resource or site or unique geologic feature; or
• Disturb any human remains, including those interred outside of formal cemeteries.
CEQA Guidelines Section 15064.5 defines “substantial adverse change” as physical demolition, destruction, relocation, or alteration of the resource or its immediate surroundings.
Methodology The assessment of impacts to cultural resources is a qualitative review of the existing cultural resource conditions (including historic, Native American, archaeological and paleontological resources) within the County and a determination of whether the proposed project includes adequate provisions to ensure continued protection of these resources. To identify these impacts, a records search of several relevant databases (including those maintained by the National Register of Historical Places, California Office of Historic Preservation, etc.) was conducted in 2008. Given the programmatic nature of the RDEIR, specific impacts to individual properties or areas are not identified or known at this time. Overall, the preferred approach for reducing impacts to cultural resources is to anticipate and avoid the specific resources if possible.
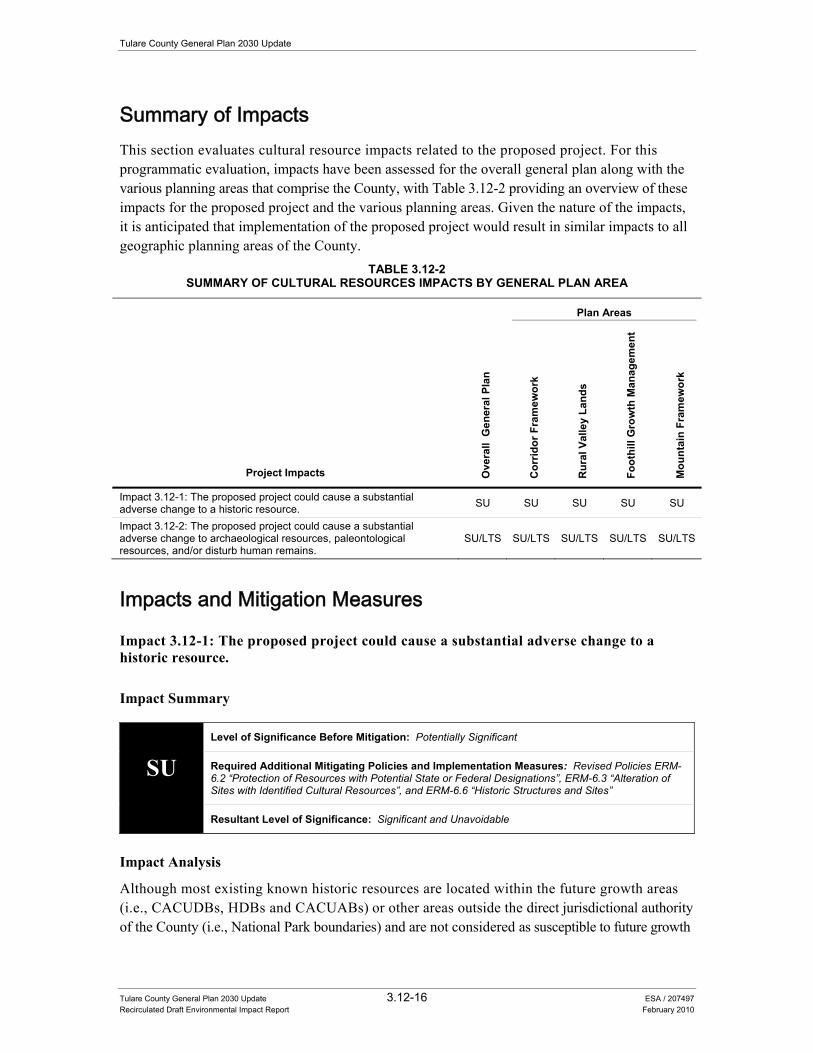
Tulare County General Plan 2030 Update
Tulare County General Plan 2030 Update 3.12-16 ESA / 207497 Recirculated Draft Environmental Impact Report February 2010
Summary of Impacts This section evaluates cultural resource impacts related to the proposed project. For this programmatic evaluation, impacts have been assessed for the overall general plan along with the various planning areas that comprise the County, with Table 3.12-2 providing an overview of these impacts for the proposed project and the various planning areas. Given the nature of the impacts, it is anticipated that implementation of the proposed project would result in similar impacts to all geographic planning areas of the County.
TABLE 3.12-2 SUMMARY OF CULTURAL RESOURCES IMPACTS BY GENERAL PLAN AREA
Project Impacts Ove
rall
Gen
eral
Pla
n
Plan Areas
Cor
ridor
Fra
mew
ork
Rur
al V
alle
y La
nds
Foot
hill
Gro
wth
Man
agem
ent
Mou
ntai
n Fr
amew
ork
Impact 3.12-1: The proposed project could cause a substantial adverse change to a historic resource. SU SU SU SU SU
Impact 3.12-2: The proposed project could cause a substantial adverse change to archaeological resources, paleontological resources, and/or disturb human remains.
SU/LTS SU/LTS SU/LTS SU/LTS SU/LTS
Impacts and Mitigation Measures
Impact 3.12-1: The proposed project could cause a substantial adverse change to a historic resource.
Impact Summary
SU Level of Significance Before Mitigation: Potentially Significant
Required Additional Mitigating Policies and Implementation Measures: Revised Policies ERM-6.2 “Protection of Resources with Potential State or Federal Designations”, ERM-6.3 “Alteration of Sites with Identified Cultural Resources”, and ERM-6.6 “Historic Structures and Sites”
Resultant Level of Significance: Significant and Unavoidable
Impact Analysis
Although most existing known historic resources are located within the future growth areas (i.e., CACUDBs, HDBs and CACUABs) or other areas outside the direct jurisdictional authority of the County (i.e., National Park boundaries) and are not considered as susceptible to future growth
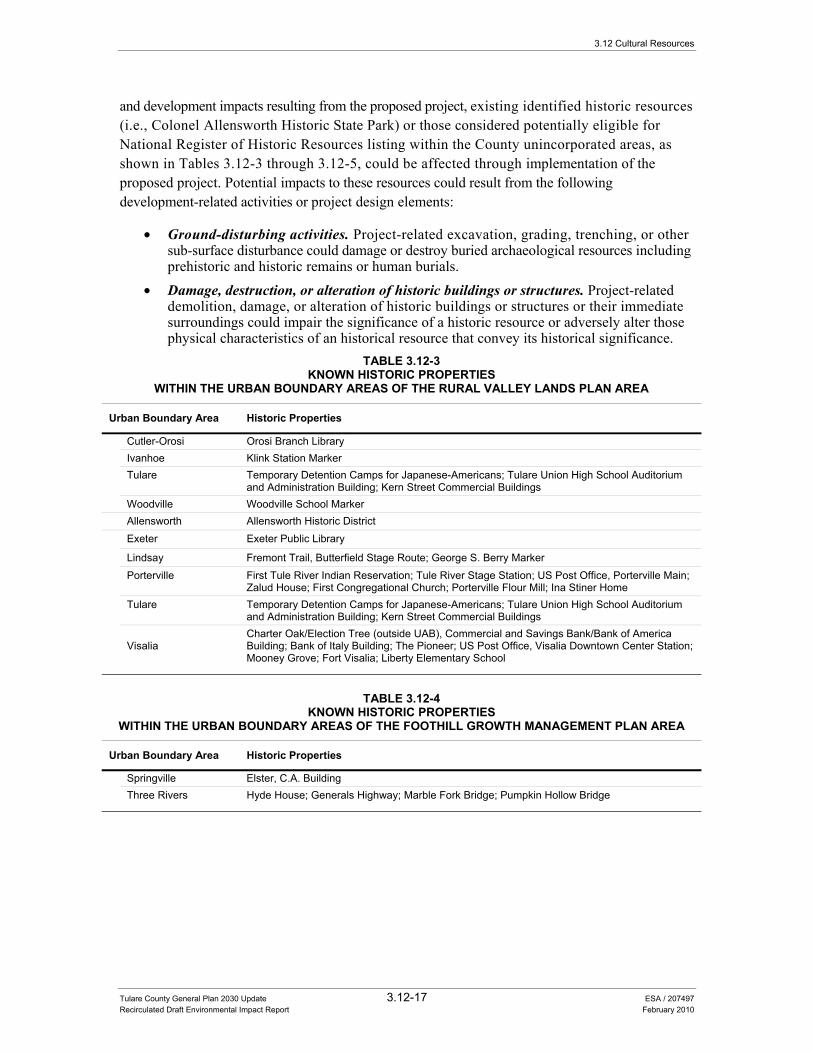
3.12 Cultural Resources
Tulare County General Plan 2030 Update 3.12-17 ESA / 207497 Recirculated Draft Environmental Impact Report February 2010
and development impacts resulting from the proposed project, existing identified historic resources (i.e., Colonel Allensworth Historic State Park) or those considered potentially eligible for National Register of Historic Resources listing within the County unincorporated areas, as shown in Tables 3.12-3 through 3.12-5, could be affected through implementation of the proposed project. Potential impacts to these resources could result from the following development-related activities or project design elements:
• Ground-disturbing activities. Project-related excavation, grading, trenching, or other sub-surface disturbance could damage or destroy buried archaeological resources including prehistoric and historic remains or human burials.
• Damage, destruction, or alteration of historic buildings or structures. Project-related demolition, damage, or alteration of historic buildings or structures or their immediate surroundings could impair the significance of a historic resource or adversely alter those physical characteristics of an historical resource that convey its historical significance.
TABLE 3.12-3KNOWN HISTORIC PROPERTIES
WITHIN THE URBAN BOUNDARY AREAS OF THE RURAL VALLEY LANDS PLAN AREA
Urban Boundary Area Historic Properties
Cutler-Orosi Orosi Branch Library Ivanhoe Klink Station Marker Tulare Temporary Detention Camps for Japanese-Americans; Tulare Union High School Auditorium
and Administration Building; Kern Street Commercial Buildings Woodville Woodville School Marker
Allensworth Allensworth Historic District
Exeter Exeter Public Library
Lindsay Fremont Trail, Butterfield Stage Route; George S. Berry Marker Porterville First Tule River Indian Reservation; Tule River Stage Station; US Post Office, Porterville Main;
Zalud House; First Congregational Church; Porterville Flour Mill; Ina Stiner Home Tulare Temporary Detention Camps for Japanese-Americans; Tulare Union High School Auditorium
and Administration Building; Kern Street Commercial Buildings
Visalia Charter Oak/Election Tree (outside UAB), Commercial and Savings Bank/Bank of America Building; Bank of Italy Building; The Pioneer; US Post Office, Visalia Downtown Center Station; Mooney Grove; Fort Visalia; Liberty Elementary School
TABLE 3.12-4
KNOWN HISTORIC PROPERTIES WITHIN THE URBAN BOUNDARY AREAS OF THE FOOTHILL GROWTH MANAGEMENT PLAN AREA
Urban Boundary Area Historic Properties
Springville Elster, C.A. Building Three Rivers Hyde House; Generals Highway; Marble Fork Bridge; Pumpkin Hollow Bridge
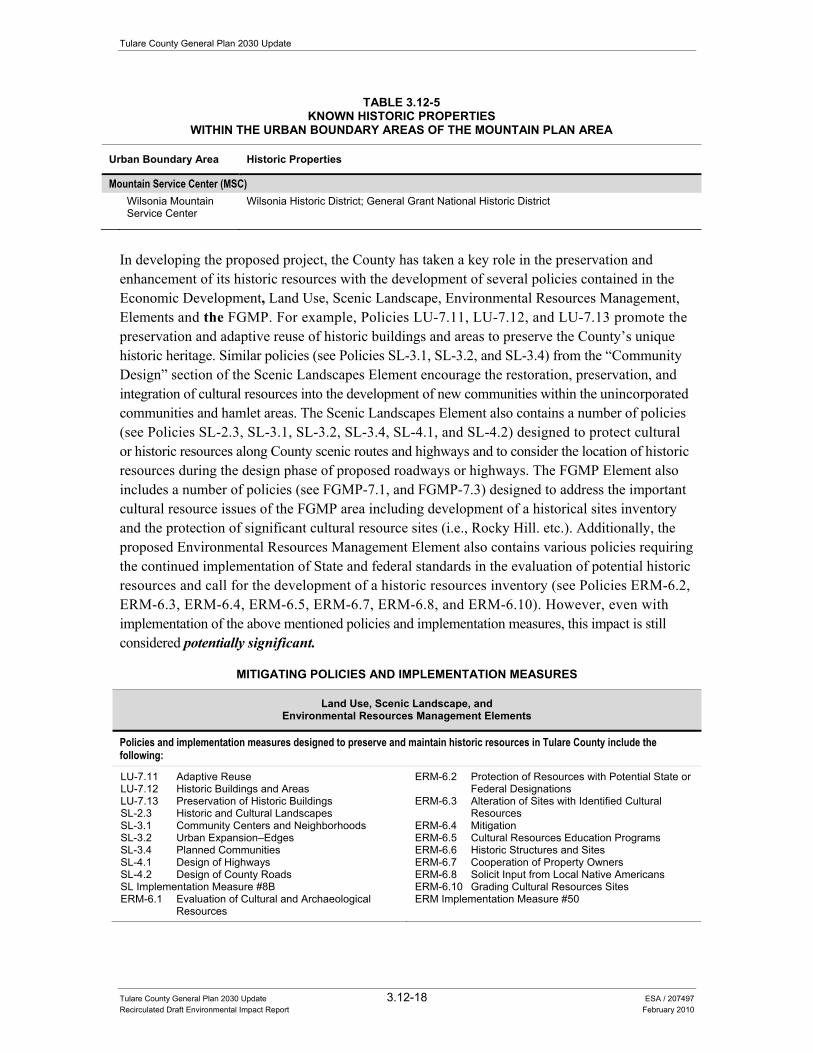
Tulare County General Plan 2030 Update
Tulare County General Plan 2030 Update 3.12-18 ESA / 207497 Recirculated Draft Environmental Impact Report February 2010
TABLE 3.12-5KNOWN HISTORIC PROPERTIES
WITHIN THE URBAN BOUNDARY AREAS OF THE MOUNTAIN PLAN AREA
Urban Boundary Area Historic Properties
Mountain Service Center (MSC) Wilsonia Mountain
Service Center Wilsonia Historic District; General Grant National Historic District
In developing the proposed project, the County has taken a key role in the preservation and enhancement of its historic resources with the development of several policies contained in the Economic Development, Land Use, Scenic Landscape, Environmental Resources Management, Elements and the FGMP. For example, Policies LU-7.11, LU-7.12, and LU-7.13 promote the preservation and adaptive reuse of historic buildings and areas to preserve the County’s unique historic heritage. Similar policies (see Policies SL-3.1, SL-3.2, and SL-3.4) from the “Community Design” section of the Scenic Landscapes Element encourage the restoration, preservation, and integration of cultural resources into the development of new communities within the unincorporated communities and hamlet areas. The Scenic Landscapes Element also contains a number of policies (see Policies SL-2.3, SL-3.1, SL-3.2, SL-3.4, SL-4.1, and SL-4.2) designed to protect cultural or historic resources along County scenic routes and highways and to consider the location of historic resources during the design phase of proposed roadways or highways. The FGMP Element also includes a number of policies (see FGMP-7.1, and FGMP-7.3) designed to address the important cultural resource issues of the FGMP area including development of a historical sites inventory and the protection of significant cultural resource sites (i.e., Rocky Hill. etc.). Additionally, the proposed Environmental Resources Management Element also contains various policies requiring the continued implementation of State and federal standards in the evaluation of potential historic resources and call for the development of a historic resources inventory (see Policies ERM-6.2, ERM-6.3, ERM-6.4, ERM-6.5, ERM-6.7, ERM-6.8, and ERM-6.10). However, even with implementation of the above mentioned policies and implementation measures, this impact is still considered potentially significant.
MITIGATING POLICIES AND IMPLEMENTATION MEASURES
Land Use, Scenic Landscape, and Environmental Resources Management Elements
Policies and implementation measures designed to preserve and maintain historic resources in Tulare County include the following:
LU-7.11 Adaptive Reuse LU-7.12 Historic Buildings and Areas LU-7.13 Preservation of Historic Buildings SL-2.3 Historic and Cultural Landscapes SL-3.1 Community Centers and Neighborhoods SL-3.2 Urban Expansion–Edges SL-3.4 Planned Communities SL-4.1 Design of Highways SL-4.2 Design of County Roads SL Implementation Measure #8B ERM-6.1 Evaluation of Cultural and Archaeological
Resources
ERM-6.2 Protection of Resources with Potential State or Federal Designations
ERM-6.3 Alteration of Sites with Identified Cultural Resources
ERM-6.4 Mitigation ERM-6.5 Cultural Resources Education Programs ERM-6.6 Historic Structures and Sites ERM-6.7 Cooperation of Property Owners ERM-6.8 Solicit Input from Local Native Americans ERM-6.10 Grading Cultural Resources Sites ERM Implementation Measure #50
3.12 Cultural Resources
Tulare County General Plan 2030 Update 3.12-19 ESA / 207497 Recirculated Draft Environmental Impact Report February 2010
Foothill Growth Management Plan
Policies designed to preserve and maintain Foothill Growth Management Plan historical and archaeological sites include the following:
FGMP-7.1 Information on Historical Sites FGMP-7.3 Protection of Historical or Archaeological Sites
FGMP Implementation Measure #22
Required Additional Mitigating Policies and Implementation Measures
In addition to the above mentioned policies and implementation measures, the following revisions to ERM-6.2 “Protection of Resources with Potential State or Federal Designations”, ERM-6.3 “Alteration of Sites with Identified Cultural Resources”, and ERM-6.6 “Historic Structures and Sites” are required to address this impact:
• ERM-6.2 Protection of Resources with Potential State or Federal Designations. The County shall protect cultural and archaeological sites with demonstrated potential for placement on the National Register of Historic Places and/or inclusion in the California State Office of Historic Preservation’s California Points of Interest and California Inventory of Historic Resources. Such sites may be of Statewide or local significance and have anthropological, cultural, military, political, architectural, economic, scientific, religious, or other values as determined by a qualified archaeological professional. [New Policy].
• ERM-6.3 Alteration of Sites with Identified Cultural Resources. When planning any development or alteration of a site with identified cultural or archaeological resources, consideration should be given to ways of protecting the resources. Development can be permitted in these areas only after a site specific investigation has been conducted pursuant to CEQA to define the extent and value of resource, and mitigation measures proposed for any impacts the development may have on the resource. [New Policy].
• ERM-6.6 Historic Structures and Sites. The County shall support public and private efforts to preserve, rehabilitate, and continue the use of historic structures, sites, and parks. Where applicable, preservation efforts shall conform to the current Secretary of the Interior’s Standards for the Treatment of Historic Properties and Guidelines for Preserving, Rehabilitating, Restoring, and Reconstructing Historic Buildings. [Revised Draft EIR Analysis].
Significance after Implementation of Mitigation for Impact 3.12-1
As stated above, the County will continue to ensure that a variety of preservation efforts are implemented (including the revised Policies ERM-6.2 “Protection of Resources with Potential State or Federal Designations”, ERM-6.3 “Alteration of Sites with Identified Cultural Resources”, and ERM-6.6 “Historic Structures and Sites”) under all future development projects to minimize impacts to historic resources (as defined in Section 15064.5). However, implementation of the proposed project may nonetheless result in a “substantial adverse change” (physical demolition, destruction, relocation, or alteration of the resource or its immediate surroundings) through various development activities for which no possible mitigation may be available to maintain the historic integrity of the affected resource or its surroundings. For this reason, impacts to historical resources would still result in a significant and unavoidable impact. No additional technologically or economically feasible mitigation is currently available.
Tulare County General Plan 2030 Update
Tulare County General Plan 2030 Update 3.12-20 ESA / 207497 Recirculated Draft Environmental Impact Report February 2010
Impact 3.12-2: The proposed project could cause a substantial adverse change to archaeological resources, paleontological resources, and/or disturb human remains.
Impact Summary
SU
Level of Significance Before Mitigation: Potentially Significant
Required Additional Mitigating Policies and Implementation Measures: New ERM Implementation Measures 55A “Archaeological Resource Surveys”, 55B “Discovery of Archaeological Resources”, and 55C “Discovery of Human Remains” and revised Policies ERM-6.2 “Protection of Resources with Potential State or Federal Designations” and ERM-6.3 “Alteration of Sites with Identified Cultural Resources”
Resultant Level of Significance: Significant and Unavoidable for “Historical Resources” and Less than Significant for other “Archaeological Resources and Human Remains”
Impact Analysis
Archival research indicates that most prehistoric settlement in the area was focused along major waterways, with most settlements generally occurring below 4,000-foot elevation range. Evidence from previous survey activities and site investigations of the County indicate that most prehistoric sites would consist of the following: bedrock milling stations, petroglyphs, lithic flakes, and projectile points. Due to extensive agricultural development, prehistoric site probabilities would likely be lower in the southern and western portions of the County. It is possible to encounter paleontological and archaeological deposits in almost any location throughout the County. Previously undiscovered paleontological, archaeological resources and/or human remains could be damaged or inadvertently unearthed during ground-disturbing activities such as grading, trenching, or use of staging areas.
In developing the proposed project, the County has taken a key role in addressing archaeological resources. Policies within the FGMP and Environmental Resources Management Element establish protocols to address archaeological resources including pre-project activities (i.e., preparation of an archaeological sensitivity map) and resource protection measures (i.e., impact mitigation, confidentiality policies, and public education, etc.). A variety of resource protection measures are outlined in Policies ERM-6.1, ERM-6.4, and ERM-6.10. Other policies call for the protection of important archaeological sites in both the FGMP area (i.e., Rocky Hill) and other culturally sensitive areas of the County (see Policies FGMP-7.3 and ERM-6.2). Several policies (i.e., ERM-6.5 and ERM-6.7) support continued County involvement in a variety of educational programs designed to encourage continued public support of local cultural and archaeological resources. To address local Native American issues and resources, Policy ERM-6.8 requires that the County consult with representatives of the Native American Heritage Commission at the onset of specific projects. The FGMP also includes a number of policies (see FGMP-7.2 and FGMP-7.3) designed to address the important cultural resource issues of the FGMP area including development of a historical sites inventory, information on archaeologically sensitive areas and the protection of significant cultural resource sites (i.e., Rocky Hill. etc.), as previously noted. However, even with implementation of the above mentioned policies and implementation measures, this impact is still considered potentially significant.
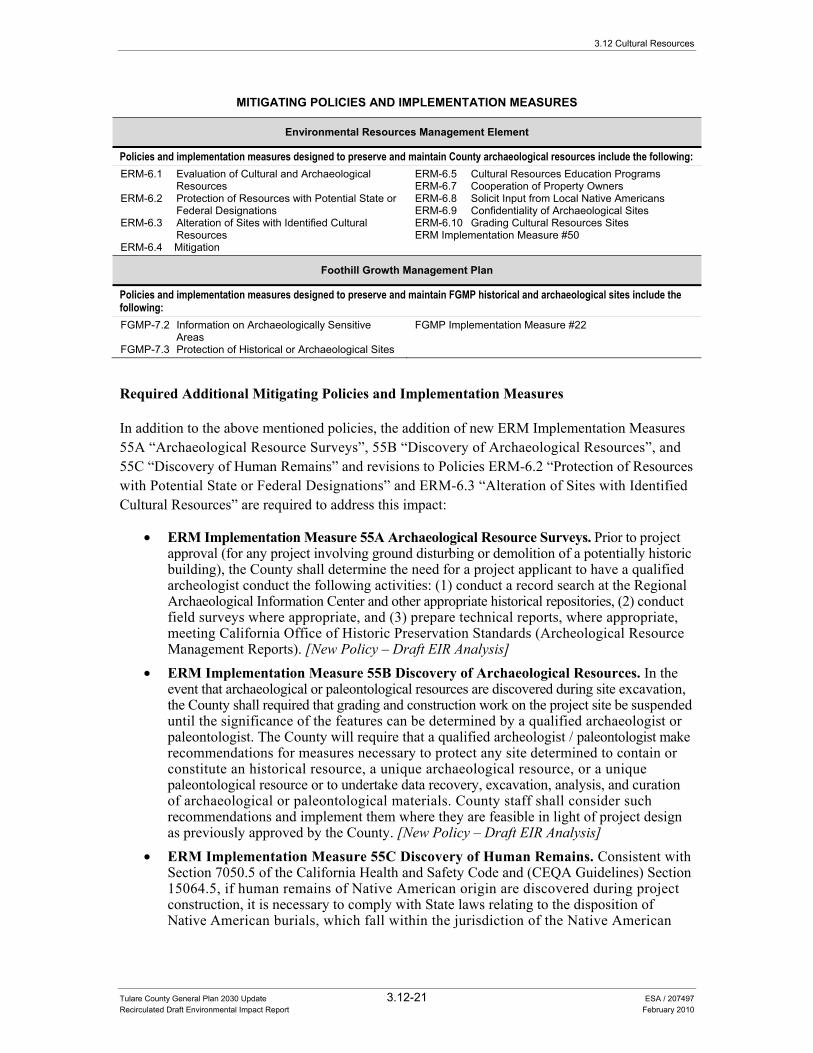
3.12 Cultural Resources
Tulare County General Plan 2030 Update 3.12-21 ESA / 207497 Recirculated Draft Environmental Impact Report February 2010
MITIGATING POLICIES AND IMPLEMENTATION MEASURES
Environmental Resources Management Element
Policies and implementation measures designed to preserve and maintain County archaeological resources include the following:ERM-6.1 Evaluation of Cultural and Archaeological
Resources ERM-6.2 Protection of Resources with Potential State or
Federal Designations ERM-6.3 Alteration of Sites with Identified Cultural
Resources ERM-6.4 Mitigation
ERM-6.5 Cultural Resources Education Programs ERM-6.7 Cooperation of Property Owners ERM-6.8 Solicit Input from Local Native Americans ERM-6.9 Confidentiality of Archaeological Sites ERM-6.10 Grading Cultural Resources Sites ERM Implementation Measure #50
Foothill Growth Management Plan
Policies and implementation measures designed to preserve and maintain FGMP historical and archaeological sites include the following: FGMP-7.2 Information on Archaeologically Sensitive
Areas FGMP-7.3 Protection of Historical or Archaeological Sites
FGMP Implementation Measure #22
Required Additional Mitigating Policies and Implementation Measures
In addition to the above mentioned policies, the addition of new ERM Implementation Measures 55A “Archaeological Resource Surveys”, 55B “Discovery of Archaeological Resources”, and 55C “Discovery of Human Remains” and revisions to Policies ERM-6.2 “Protection of Resources with Potential State or Federal Designations” and ERM-6.3 “Alteration of Sites with Identified Cultural Resources” are required to address this impact:
• ERM Implementation Measure 55A Archaeological Resource Surveys. Prior to project approval (for any project involving ground disturbing or demolition of a potentially historic building), the County shall determine the need for a project applicant to have a qualified archeologist conduct the following activities: (1) conduct a record search at the Regional Archaeological Information Center and other appropriate historical repositories, (2) conduct field surveys where appropriate, and (3) prepare technical reports, where appropriate, meeting California Office of Historic Preservation Standards (Archeological Resource Management Reports). [New Policy – Draft EIR Analysis]
• ERM Implementation Measure 55B Discovery of Archaeological Resources. In the event that archaeological or paleontological resources are discovered during site excavation, the County shall required that grading and construction work on the project site be suspended until the significance of the features can be determined by a qualified archaeologist or paleontologist. The County will require that a qualified archeologist / paleontologist make recommendations for measures necessary to protect any site determined to contain or constitute an historical resource, a unique archaeological resource, or a unique paleontological resource or to undertake data recovery, excavation, analysis, and curation of archaeological or paleontological materials. County staff shall consider such recommendations and implement them where they are feasible in light of project design as previously approved by the County. [New Policy – Draft EIR Analysis]
• ERM Implementation Measure 55C Discovery of Human Remains. Consistent with Section 7050.5 of the California Health and Safety Code and (CEQA Guidelines) Section 15064.5, if human remains of Native American origin are discovered during project construction, it is necessary to comply with State laws relating to the disposition of Native American burials, which fall within the jurisdiction of the Native American
Tulare County General Plan 2030 Update
Tulare County General Plan 2030 Update 3.12-22 ESA / 207497 Recirculated Draft Environmental Impact Report February 2010
Heritage Commission (Public Resources Code Sec. 5097). In the event of the accidental discovery or recognition of any human remains in any location other than a dedicated cemetery, the following steps should be taken: 1. There shall be no further excavation or disturbance of the site or any nearby area
reasonably suspected to overlie adjacent human remains until: a. The Tulare County Coroner/Sheriff must be contacted to determine that no
investigation of the cause of death is required; and b. If the coroner determines the remains to be Native American:
i. The coroner shall contact the Native American Heritage Commission within 24 hours.
ii. The Native American Heritage Commission shall identify the person or persons it believes to be the most likely descended from the deceased Native American.
iii. The most likely descendent may make recommendations to the landowner or the person responsible for the excavation work, for means of treating or disposing of, with appropriate dignity, the human remains and any associated grave goods as provided in Public Resources Code section 5097.98, or
2. Where the following conditions occur, the landowner or his authorized representative shall rebury the Native American human remains and associated grave goods with appropriate dignity on the property in a location not subject to further subsurface disturbance.
a. The Native American Heritage Commission is unable to identify a most likely descendent or the most likely descendent failed to make a recommendation within 24 hours after being notified by the commission.
b. The descendant fails to make a recommendation; or c. The landowner or his authorized representative rejects the recommendation
of the descendent. [New Policy – Draft EIR Analysis] • ERM-6.2 Protection of Resources with Potential State or Federal Designations. The
County shall protect cultural and archaeological sites with demonstrated potential for placement on the National Register of Historic Places and/or inclusion in the California State Office of Historic Preservation’s California Points of Interest and California Inventory of Historic Resources. Such sites may be of Statewide or local significance and have anthropological, cultural, military, political, architectural, economic, scientific, religious, or other values as determined by a qualified archaeological professional. [New Policy]
• ERM-6.3 Alteration of Sites with Identified Cultural Resources. When planning any development or alteration of a site with identified cultural or archaeological resources, consideration should be given to ways of protecting the resources. Development can be permitted in these areas only after a site specific investigation has been conducted pursuant to CEQA to define the extent and value of resource, and mitigation measures proposed for any impacts the development may have on the resource. [New Policy]
3.12 Cultural Resources
Tulare County General Plan 2030 Update 3.12-23 ESA / 207497 Recirculated Draft Environmental Impact Report February 2010
Significance after Implementation of Mitigation for Impact 3.12-2
As stated above, the County will continue to ensure that a variety of preservation efforts are implemented (including the new ERM Implementation Measures 55A “Archaeological Resource Surveys”, 55B “Discovery of Archaeological Resources”, and 55C “Discovery of Human Remains” and revised Policies ERM-6.2 “Protection of Resources with Potential State or Federal Designations” and ERM-6.3 “Alteration of Sites with Identified Cultural Resources”) under all future development projects to minimize impacts to archaeological resources (as defined in Section 15064.5), or human remains. Under CEQA, however, any "substantial adverse change in the significance of a historical resource" (e.g., the destruction of such a resource) is considered a significant environmental effect as a matter of law. Because it is possible that, after County decision-makers have approved a development project, grading activities in an area identified for development reveal an archaeological resource meeting the definition of an historical resource, and that such a previously unknown historical resource cannot be preserved or avoided without substantial redesign at significant cost, the County cannot be sure that impacts on all such historical resources can be mitigated to less than significant levels. For this reason, impacts to historical resources would still result in a significant and unavoidable impact. No additional feasible mitigation is currently available.
Similar considerations do not apply to unique archaeological resources and paleontological resources, which therefore can be fully mitigated through data recovery where avoidance or preservation is infeasible or unnecessary. Therefore, implementation of the proposed project including the adoption of the policies listed above would result in less than significant impacts with respect to human remains and archaeological resources and paleontological resources that do not qualify as historical resources.

Tulare County General Plan 2030 Update 4-1 ESA / 207497 Recirculated Draft Environmental Impact Report February 2010
CHAPTER 4.0 Alternatives to the Proposed Project
4.1 Overview
General CEQA Requirements The purpose of the alternatives analysis in an EIR is to describe a range of reasonable alternatives to the project, or to the location of the project, that could feasibly attain most of the basic objectives of the project, but would avoid or substantially lessen any of the significant effects of the project, and to evaluate the comparative merits of the alternatives (CEQA Guidelines, Section 15126.6[a]). Additionally, Section 15126.6(b) of the CEQA Guidelines requires consideration of alternatives that could reduce to a less-than-significant level or eliminate any significant adverse environmental effects of the proposed project, including alternatives that may be more costly or could otherwise impede to some degree the attainment of the proposed project’s objectives.
It is important to understand, however, that the mere inclusion of an alternative in an EIR does not constitute definitive evidence that the alternative is in fact “feasible.” The ultimate decision regarding the feasibility of alternatives lies with the ultimate decision-maker for a project, which in this case is the County of Tulare Board of Supervisors. Such determinations are to be made in statutorily mandated findings addressing potentially feasible means of reducing the severity of significant environmental effects. One finding that is permissible, if supported by substantial evidence, is that “specific economic, legal, social, technological, or other considerations . . . make infeasible the . . . alternatives identified” in the EIR (Pub. Resources Code, § 21081, subd. [a]; see also CEQA Guidelines, § 15901, subd. [a]). CEQA Guidelines section 15364 defines “feasible” to mean “capable of being accomplished in a successful manner within a reasonable period of time, taking into account economic, environmental, legal, social, and technological factors.” In deciding whether an alternative is feasible or infeasible, a decision-making body may consider the stated project objectives in an EIR, and may balance any relevant economic, environmental, social, and technological factors. (See City of Del Mar v. City of San Diego (1982) 133 Cal.App.3d 410, 417; Sequoyah Hills Homeowners Assn. v. City of Oakland (1993) 23 Cal.App.4th 704, 715.)
4.2 Factors Considered In Selection of Alternatives The CEQA Guidelines recommend that an EIR should briefly describe the rationale for selecting the alternatives to be discussed, identify any alternatives that were considered by the lead agency but were rejected as infeasible, and briefly explain the reasons underlying the lead agency’s
Tulare County General Plan 2030 Update
Tulare County General Plan 2030 Update 4-2 ESA / 207497 Recirculated Draft Environmental Impact Report February 2010
determination [CEQA Guidelines, Section 15126.6(c)]. This section describes the process used in selection of the alternatives. The alternatives addressed in this recirculated draft Environmental Impact Report (RDEIR) were selected in consideration of one or more of the following factors:
• The extent to which the alternative would accomplish most of the basic goals and objectives of the proposed project;
• The extent to which the alternative would avoid or lessen any of the identified significant environmental effects of the project;
• The potential feasibility of the alternative, taking into account site suitability, economic viability, availability of infrastructure, and consistency with various applicable plans and regulatory limitations;
• The appropriateness of the alternative in contributing to a “reasonable range” of alternatives necessary to permit a reasoned choice; and
• The requirement of the CEQA Guidelines to consider a “no project” alternative and, where the “no project” alternative is the environmentally superior alternative, to identify an “environmentally superior” alternative in addition to the no-project alternative [CEQA guidelines, Section 15126.6(e)].
The significant environmental impacts that the County, in identifying alternatives, seeks to eliminate or reduce are:
• Transportation and circulation impacts resulting from substantial increases in vehicular traffic.
• Air quality impacts resulting from increased development and vehicular traffic. • Noise and nuisance effects on adjacent sensitive receptor locations. • Loss of agricultural land. • Biological resources impacts resulting from a loss of habitat. • Viewshed impacts resulting from increased development. • Groundwater impacts and availability of adequate water supply resulting from increased
development.
Alternatives Selection Process The proposed project and the alternatives addressed in this chapter of the EIR are based on several ideas and concepts developed with the public during several community workshops held in Visalia, Lindsay, Goshen, Pixley, Orosi, and Springville along with input from the Technical Advisory Committee (TAC) and County staff during the spring of 2004. As part of this process, several alternative land use scenarios were considered including the following:
• City-Centered Development Scenario – this land use scenario assumes that cities will accept additional population by increasing their density and developing contiguous land. This scenario assumes that the cities would also continue to provide sites for urban commercial services and industry. A Policies Alternative Report was prepared in August 2005, and in that report, several alternatives were given names based on the population assumptions developed at that time. Further analysis actually resulted in the names being considered outdated. However, for consistency, the names have been retained although the population calculations reveal differences from the original 2005 assumptions.
4. Alternatives to the Proposed Project
Tulare County General Plan 2030 Update 4-3 ESA / 207497 Recirculated Draft Environmental Impact Report February 2010
• Rural Community Development Scenario – under this scenario, the cities would build less housing, thereby shifting population to the County. Rural communities would expand by adding housing, commercial, and industrial development. County land use decisions would promote development of new communities and the expansion of existing communities within the foothill areas. It is anticipated that this approach would require the implementation of a major infrastructure expansion program for urbanizing rural communities.
• Proportional Growth Scenario – under this scenario, growth in cities and unincorporated communities is considered proportional to their existing population. Major commercial and industrial development would stay in cities where infrastructure and transit can be supported. Residential development in both the incorporated and unincorporated areas would be developed compactly protecting Tulare County’s agricultural economy. A balanced mix of commercial and institutional services would be developed in unincorporated areas to serve the local population.
• Transportation Corridors Alternative – this scenario assumes that cities and communities along Highways 99 and 65 will accept additional population by increasing the density and developing contiguous land within their CACUDB or CACUAB. These communities and cities would also continue to provide sites for urban commercial services and industry.
The alternative selection process was complimented with background information from the recently updated 2010 Background Report (existing conditions, Appendix B of this RDEIR), identification of community issues of concern, and the development of several project objectives. The process was conducted to incorporate stakeholder input (in the form of workshops) at several key points through-out the alternatives development process. Consistent with CEQA requirements (CEQA Guidelines Section 15126.6(a)), the EIR process reviewed these scenarios and developed a range of alternatives designed to feasibly attain most of the project objectives but also avoid or lessen several significant effects associated with the proposed project. As part of the EIR preparation process another alternative (Confined Growth) was developed by County staff (Fall 2007) to consider the feasibility of establishing “hard” urban boundaries to better protect the County’s important agricultural resources.
Alternatives Eliminated From Further Consideration The following alternative(s) were originally considered during the planning and scoping process for the proposed project, but were determined to not be viable for continued evaluation and were eliminated from further consideration.
• Proportional Growth Alternative. Future growth under the Proportional Growth Alternative would be distributed throughout the County at a rate proportional to current conditions. The ratio of existing population to the total county population would be held constant. Consequently, the cities and communities would maintain the same percentage of the County’s total population in the future. Under this alternative, 30% of future growth would occur in unincorporated areas of the County. This alternative was dropped from further consideration because the growth trend was considered infeasible and the assumed land use patterns would not seek to eliminate or reduce significant environmental impacts associated with the proposed project.
• Alternative Project Location. None of the alternatives includes consideration of an alternative location. The CEQA Guidelines (Section 15126.6(3) (f) (2)) recommend considering an alternative location to reduce potential impacts of a project. However, the goals and policies of the proposed project are specific to the geographic context of the County’s planning area. Build-out consistent with the goals and policies of the proposed project at another location does not make sense for a general plan that applies to all properties
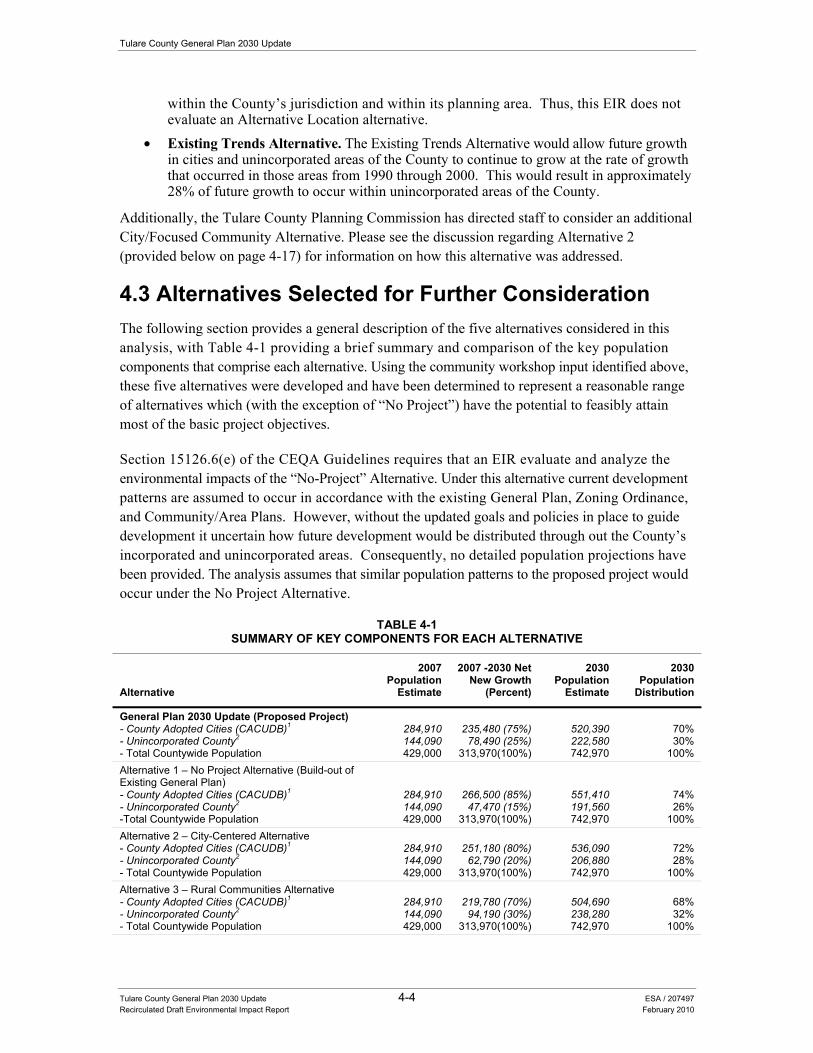
Tulare County General Plan 2030 Update
Tulare County General Plan 2030 Update 4-4 ESA / 207497 Recirculated Draft Environmental Impact Report February 2010
within the County’s jurisdiction and within its planning area. Thus, this EIR does not evaluate an Alternative Location alternative.
• Existing Trends Alternative. The Existing Trends Alternative would allow future growth in cities and unincorporated areas of the County to continue to grow at the rate of growth that occurred in those areas from 1990 through 2000. This would result in approximately 28% of future growth to occur within unincorporated areas of the County.
Additionally, the Tulare County Planning Commission has directed staff to consider an additional City/Focused Community Alternative. Please see the discussion regarding Alternative 2 (provided below on page 4-17) for information on how this alternative was addressed.
4.3 Alternatives Selected for Further Consideration The following section provides a general description of the five alternatives considered in this analysis, with Table 4-1 providing a brief summary and comparison of the key population components that comprise each alternative. Using the community workshop input identified above, these five alternatives were developed and have been determined to represent a reasonable range of alternatives which (with the exception of “No Project”) have the potential to feasibly attain most of the basic project objectives.
Section 15126.6(e) of the CEQA Guidelines requires that an EIR evaluate and analyze the environmental impacts of the “No-Project” Alternative. Under this alternative current development patterns are assumed to occur in accordance with the existing General Plan, Zoning Ordinance, and Community/Area Plans. However, without the updated goals and policies in place to guide development it uncertain how future development would be distributed through out the County’s incorporated and unincorporated areas. Consequently, no detailed population projections have been provided. The analysis assumes that similar population patterns to the proposed project would occur under the No Project Alternative.
TABLE 4-1SUMMARY OF KEY COMPONENTS FOR EACH ALTERNATIVE
Alternative
2007 Population
Estimate
2007 -2030 Net New Growth
(Percent)
2030 Population
Estimate
2030 Population
Distribution
General Plan 2030 Update (Proposed Project) - County Adopted Cities (CACUDB)1 - Unincorporated County2 - Total Countywide Population
284,910 144,090 429,000
235,480 (75%) 78,490 (25%)
313,970(100%)
520,390 222,580 742,970
70% 30%
100% Alternative 1 – No Project Alternative (Build-out of Existing General Plan) - County Adopted Cities (CACUDB)1 - Unincorporated County2 -Total Countywide Population
284,910 144,090 429,000
266,500 (85%) 47,470 (15%)
313,970(100%)
551,410 191,560 742,970
74% 26%
100% Alternative 2 – City-Centered Alternative - County Adopted Cities (CACUDB)1 - Unincorporated County2 - Total Countywide Population
284,910 144,090 429,000
251,180 (80%) 62,790 (20%)
313,970(100%)
536,090 206,880 742,970
72% 28%
100% Alternative 3 – Rural Communities Alternative - County Adopted Cities (CACUDB)1 - Unincorporated County2 - Total Countywide Population
284,910 144,090 429,000
219,780 (70%) 94,190 (30%)
313,970(100%)
504,690 238,280 742,970
68% 32%
100%
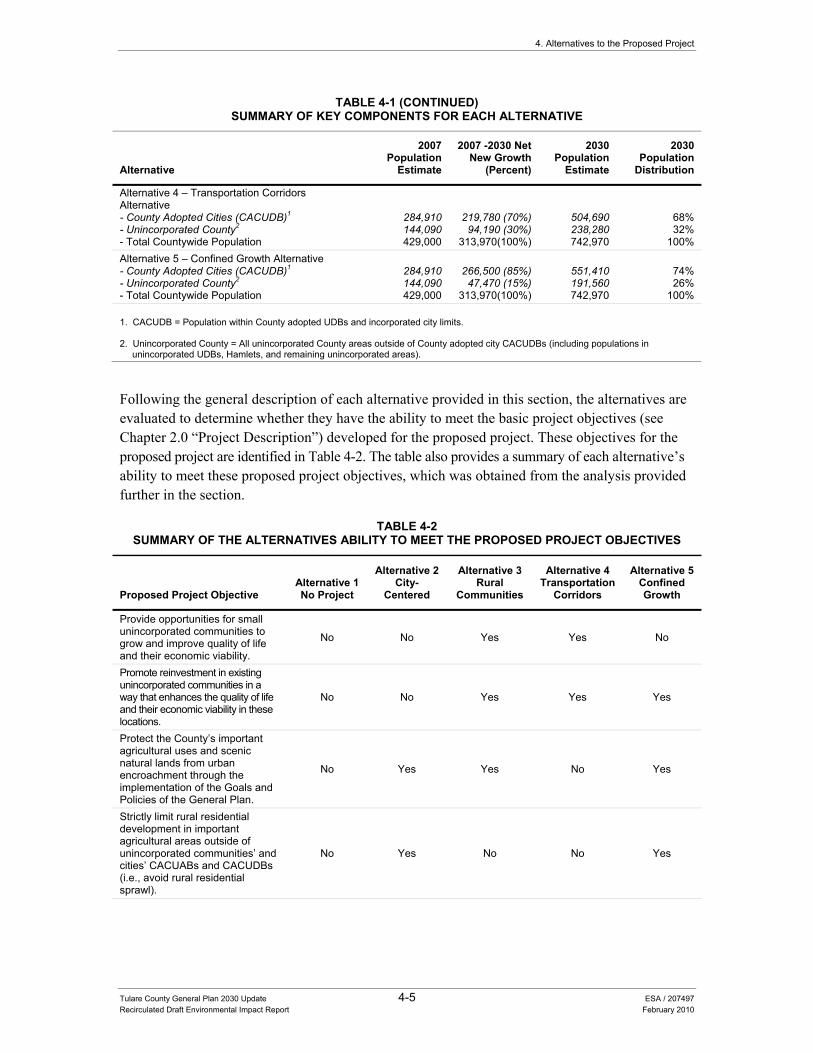
4. Alternatives to the Proposed Project
Tulare County General Plan 2030 Update 4-5 ESA / 207497 Recirculated Draft Environmental Impact Report February 2010
TABLE 4-1 (CONTINUED)SUMMARY OF KEY COMPONENTS FOR EACH ALTERNATIVE
Alternative
2007 Population
Estimate
2007 -2030 Net New Growth
(Percent)
2030 Population
Estimate
2030 Population
Distribution
Alternative 4 – Transportation Corridors Alternative - County Adopted Cities (CACUDB)1 - Unincorporated County2 - Total Countywide Population
284,910 144,090 429,000
219,780 (70%) 94,190 (30%)
313,970(100%)
504,690 238,280 742,970
68% 32%
100% Alternative 5 – Confined Growth Alternative - County Adopted Cities (CACUDB)1 - Unincorporated County2 - Total Countywide Population
284,910 144,090 429,000
266,500 (85%)
47,470 (15%) 313,970(100%)
551,410 191,560 742,970
74% 26%
100% 1. CACUDB = Population within County adopted UDBs and incorporated city limits. 2. Unincorporated County = All unincorporated County areas outside of County adopted city CACUDBs (including populations in
unincorporated UDBs, Hamlets, and remaining unincorporated areas).
Following the general description of each alternative provided in this section, the alternatives are evaluated to determine whether they have the ability to meet the basic project objectives (see Chapter 2.0 “Project Description”) developed for the proposed project. These objectives for the proposed project are identified in Table 4-2. The table also provides a summary of each alternative’s ability to meet these proposed project objectives, which was obtained from the analysis provided further in the section.
TABLE 4-2SUMMARY OF THE ALTERNATIVES ABILITY TO MEET THE PROPOSED PROJECT OBJECTIVES
Proposed Project Objective Alternative 1 No Project
Alternative 2 City-
Centered
Alternative 3 Rural
Communities
Alternative 4 Transportation
Corridors
Alternative 5 Confined Growth
Provide opportunities for small unincorporated communities to grow and improve quality of life and their economic viability.
No No Yes Yes No
Promote reinvestment in existing unincorporated communities in a way that enhances the quality of life and their economic viability in these locations.
No No Yes Yes Yes
Protect the County’s important agricultural uses and scenic natural lands from urban encroachment through the implementation of the Goals and Policies of the General Plan.
No Yes Yes No Yes
Strictly limit rural residential development in important agricultural areas outside of unincorporated communities’ and cities’ CACUABs and CACUDBs (i.e., avoid rural residential sprawl).
No Yes No No Yes
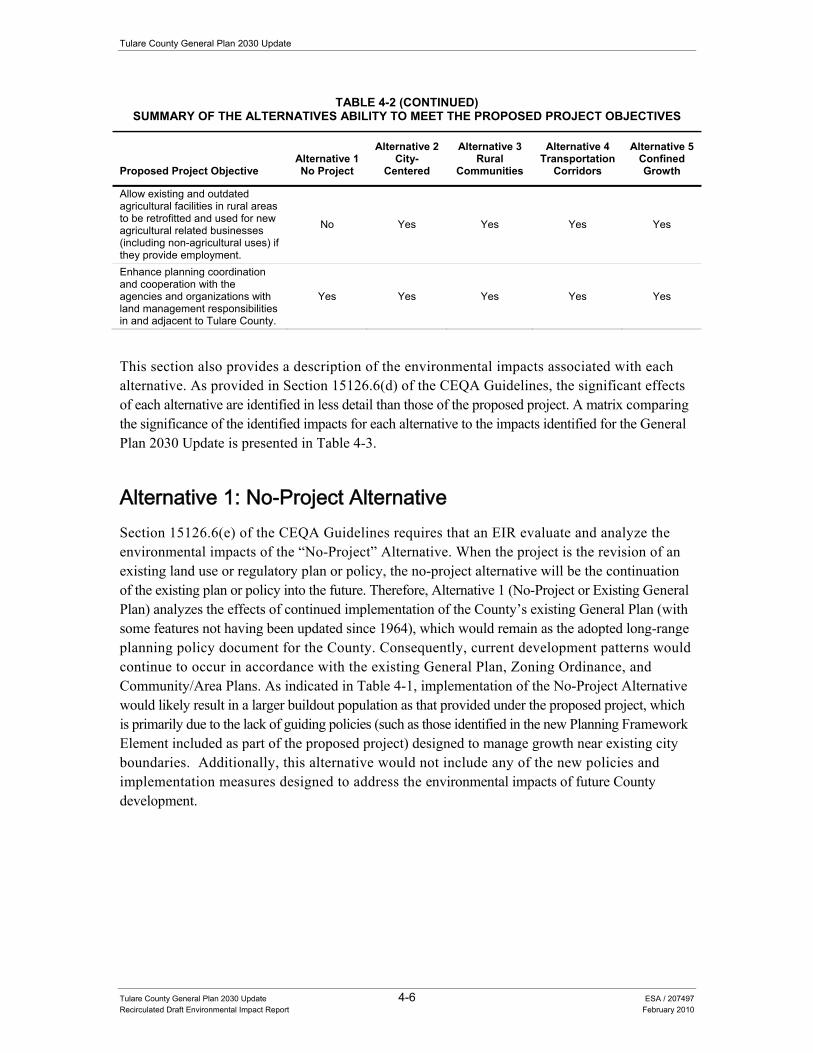
Tulare County General Plan 2030 Update
Tulare County General Plan 2030 Update 4-6 ESA / 207497 Recirculated Draft Environmental Impact Report February 2010
TABLE 4-2 (CONTINUED)SUMMARY OF THE ALTERNATIVES ABILITY TO MEET THE PROPOSED PROJECT OBJECTIVES
Proposed Project Objective Alternative 1 No Project
Alternative 2 City-
Centered
Alternative 3 Rural
Communities
Alternative 4 Transportation
Corridors
Alternative 5 Confined Growth
Allow existing and outdated agricultural facilities in rural areas to be retrofitted and used for new agricultural related businesses (including non-agricultural uses) if they provide employment.
No Yes Yes Yes Yes
Enhance planning coordination and cooperation with the agencies and organizations with land management responsibilities in and adjacent to Tulare County.
Yes Yes Yes Yes Yes
This section also provides a description of the environmental impacts associated with each alternative. As provided in Section 15126.6(d) of the CEQA Guidelines, the significant effects of each alternative are identified in less detail than those of the proposed project. A matrix comparing the significance of the identified impacts for each alternative to the impacts identified for the General Plan 2030 Update is presented in Table 4-3.
Alternative 1: No-Project Alternative Section 15126.6(e) of the CEQA Guidelines requires that an EIR evaluate and analyze the environmental impacts of the “No-Project” Alternative. When the project is the revision of an existing land use or regulatory plan or policy, the no-project alternative will be the continuation of the existing plan or policy into the future. Therefore, Alternative 1 (No-Project or Existing General Plan) analyzes the effects of continued implementation of the County’s existing General Plan (with some features not having been updated since 1964), which would remain as the adopted long-range planning policy document for the County. Consequently, current development patterns would continue to occur in accordance with the existing General Plan, Zoning Ordinance, and Community/Area Plans. As indicated in Table 4-1, implementation of the No-Project Alternative would likely result in a larger buildout population as that provided under the proposed project, which is primarily due to the lack of guiding policies (such as those identified in the new Planning Framework Element included as part of the proposed project) designed to manage growth near existing city boundaries. Additionally, this alternative would not include any of the new policies and implementation measures designed to address the environmental impacts of future County development.
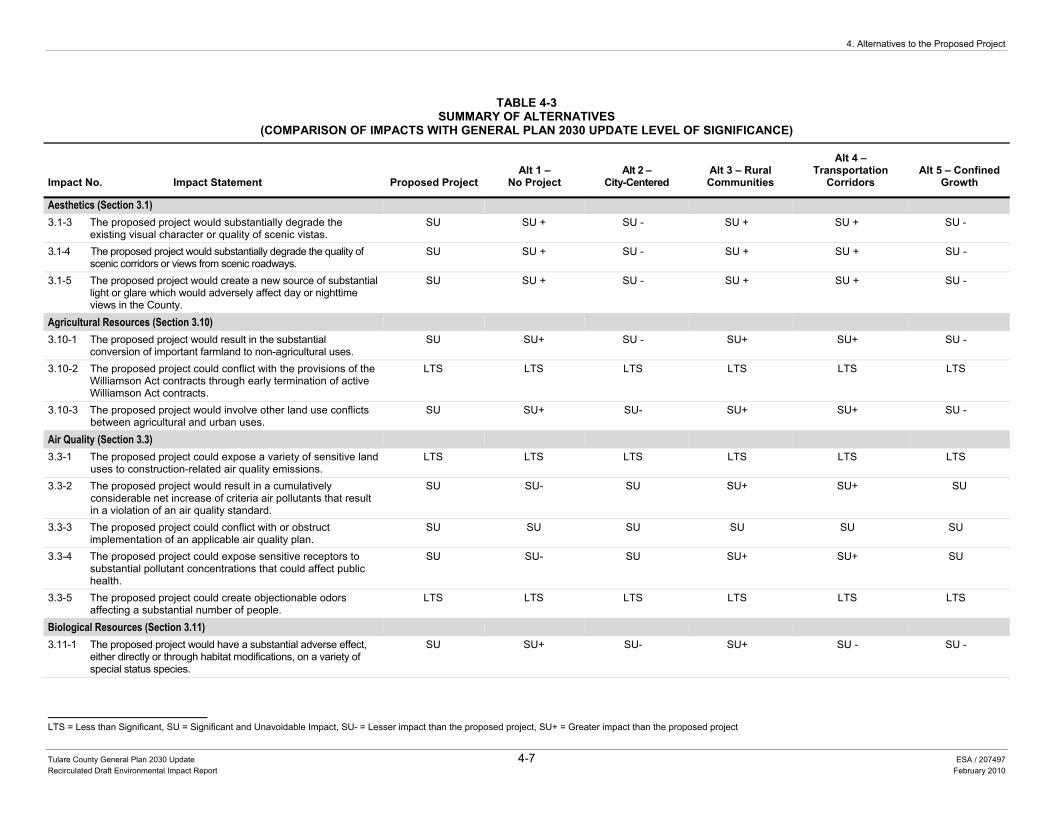
4. Alternatives to the Proposed Project
LTS = Less than Significant, SU = Significant and Unavoidable Impact, SU- = Lesser impact than the proposed project, SU+ = Greater impact than the proposed project
Tulare County General Plan 2030 Update 4-7 ESA / 207497 Recirculated Draft Environmental Impact Report February 2010
TABLE 4-3SUMMARY OF ALTERNATIVES
(COMPARISON OF IMPACTS WITH GENERAL PLAN 2030 UPDATE LEVEL OF SIGNIFICANCE)
Impact No. Impact Statement Proposed Project Alt 1 –
No Project Alt 2 –
City-Centered Alt 3 – Rural Communities
Alt 4 – Transportation
Corridors Alt 5 – Confined
Growth
Aesthetics (Section 3.1) 3.1-3 The proposed project would substantially degrade the
existing visual character or quality of scenic vistas. SU SU + SU - SU + SU + SU -
3.1-4 The proposed project would substantially degrade the quality of scenic corridors or views from scenic roadways.
SU SU + SU - SU + SU + SU -
3.1-5 The proposed project would create a new source of substantial light or glare which would adversely affect day or nighttime views in the County.
SU SU + SU - SU + SU + SU -
Agricultural Resources (Section 3.10) 3.10-1 The proposed project would result in the substantial
conversion of important farmland to non-agricultural uses. SU SU+ SU - SU+ SU+ SU -
3.10-2 The proposed project could conflict with the provisions of the Williamson Act contracts through early termination of active Williamson Act contracts.
LTS LTS LTS LTS LTS LTS
3.10-3 The proposed project would involve other land use conflicts between agricultural and urban uses.
SU SU+ SU- SU+ SU+ SU -
Air Quality (Section 3.3) 3.3-1 The proposed project could expose a variety of sensitive land
uses to construction-related air quality emissions. LTS LTS LTS LTS LTS LTS
3.3-2 The proposed project would result in a cumulatively considerable net increase of criteria air pollutants that result in a violation of an air quality standard.
SU SU- SU SU+ SU+ SU
3.3-3 The proposed project could conflict with or obstruct implementation of an applicable air quality plan.
SU SU SU SU SU SU
3.3-4 The proposed project could expose sensitive receptors to substantial pollutant concentrations that could affect public health.
SU SU- SU SU+ SU+ SU
3.3-5 The proposed project could create objectionable odors affecting a substantial number of people.
LTS LTS LTS LTS LTS LTS
Biological Resources (Section 3.11) 3.11-1 The proposed project would have a substantial adverse effect,
either directly or through habitat modifications, on a variety of special status species.
SU SU+ SU- SU+ SU - SU -
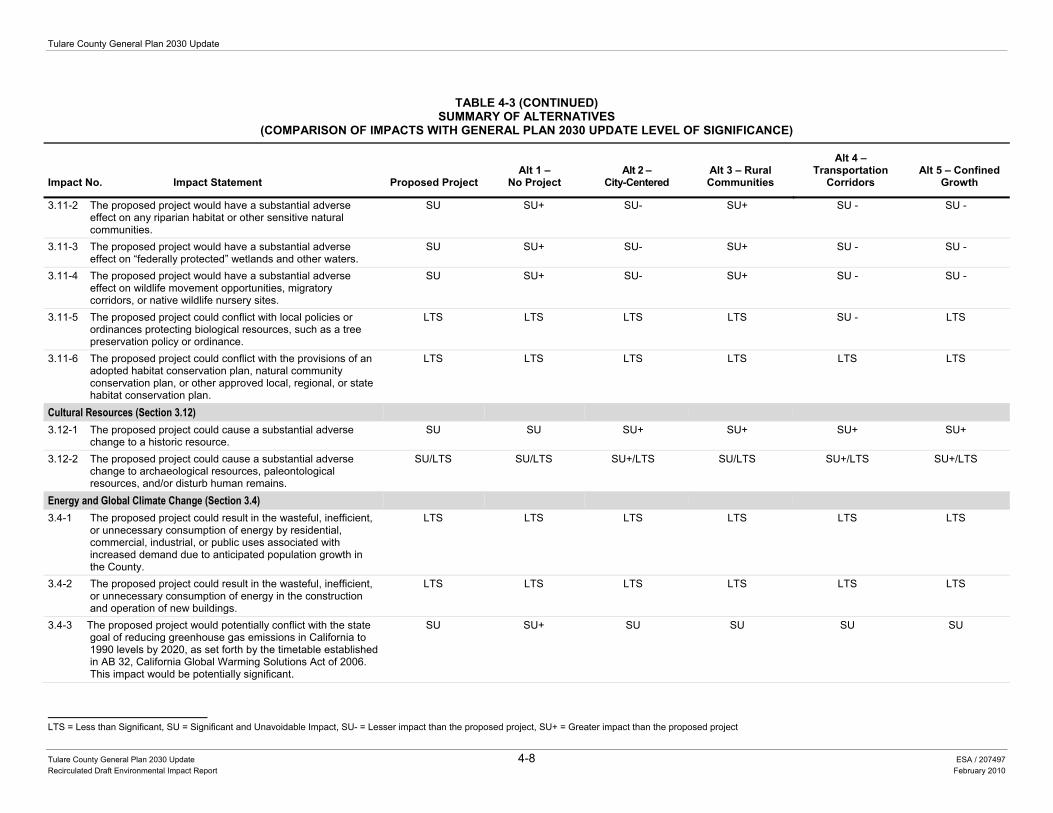
Tulare County General Plan 2030 Update
LTS = Less than Significant, SU = Significant and Unavoidable Impact, SU- = Lesser impact than the proposed project, SU+ = Greater impact than the proposed project
Tulare County General Plan 2030 Update 4-8 ESA / 207497 Recirculated Draft Environmental Impact Report February 2010
TABLE 4-3 (CONTINUED)SUMMARY OF ALTERNATIVES
(COMPARISON OF IMPACTS WITH GENERAL PLAN 2030 UPDATE LEVEL OF SIGNIFICANCE)
Impact No. Impact Statement Proposed Project Alt 1 –
No Project Alt 2 –
City-Centered Alt 3 – Rural Communities
Alt 4 – Transportation
Corridors Alt 5 – Confined
Growth
3.11-2 The proposed project would have a substantial adverse effect on any riparian habitat or other sensitive natural communities.
SU SU+ SU- SU+ SU - SU -
3.11-3 The proposed project would have a substantial adverse effect on “federally protected” wetlands and other waters.
SU SU+ SU- SU+ SU - SU -
3.11-4 The proposed project would have a substantial adverse effect on wildlife movement opportunities, migratory corridors, or native wildlife nursery sites.
SU SU+ SU- SU+ SU - SU -
3.11-5 The proposed project could conflict with local policies or ordinances protecting biological resources, such as a tree preservation policy or ordinance.
LTS LTS LTS LTS SU - LTS
3.11-6 The proposed project could conflict with the provisions of an adopted habitat conservation plan, natural community conservation plan, or other approved local, regional, or state habitat conservation plan.
LTS LTS LTS LTS LTS LTS
Cultural Resources (Section 3.12) 3.12-1 The proposed project could cause a substantial adverse
change to a historic resource. SU SU SU+ SU+ SU+ SU+
3.12-2 The proposed project could cause a substantial adverse change to archaeological resources, paleontological resources, and/or disturb human remains.
SU/LTS SU/LTS SU+/LTS SU/LTS SU+/LTS SU+/LTS
Energy and Global Climate Change (Section 3.4) 3.4-1 The proposed project could result in the wasteful, inefficient,
or unnecessary consumption of energy by residential, commercial, industrial, or public uses associated with increased demand due to anticipated population growth in the County.
LTS LTS LTS LTS LTS LTS
3.4-2 The proposed project could result in the wasteful, inefficient, or unnecessary consumption of energy in the construction and operation of new buildings.
LTS LTS LTS LTS LTS LTS
3.4-3 The proposed project would potentially conflict with the state goal of reducing greenhouse gas emissions in California to 1990 levels by 2020, as set forth by the timetable established in AB 32, California Global Warming Solutions Act of 2006. This impact would be potentially significant.
SU SU+ SU SU SU SU
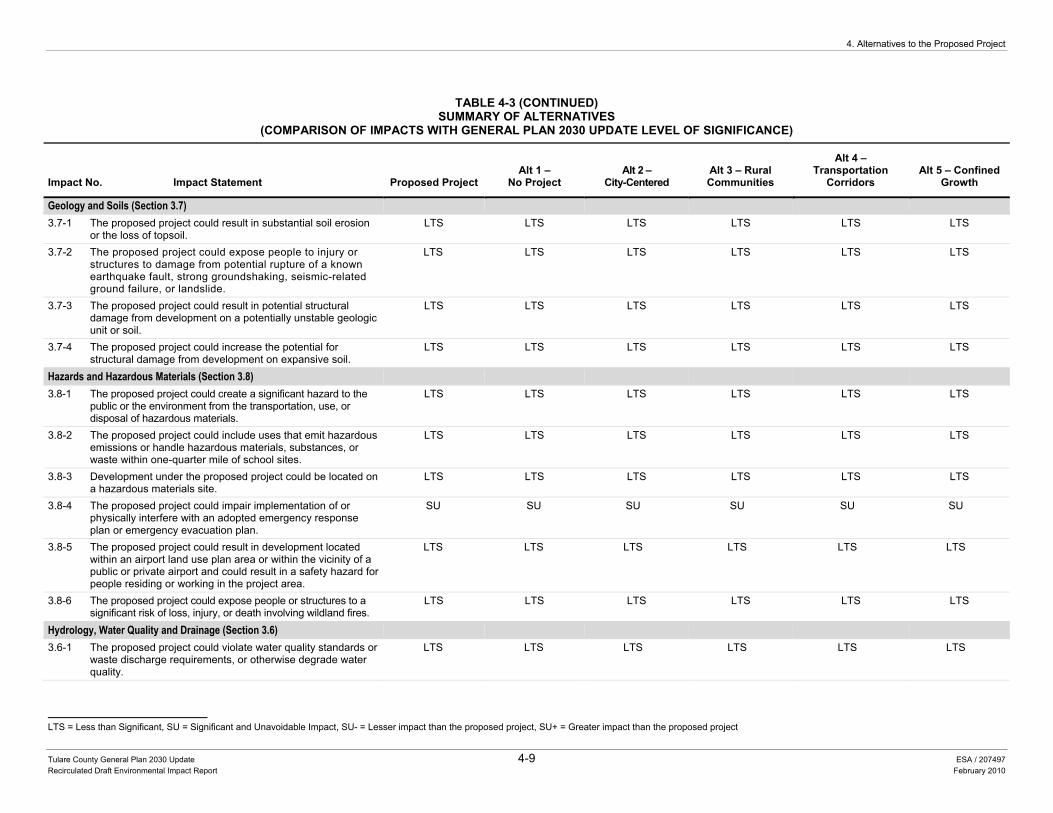
4. Alternatives to the Proposed Project
LTS = Less than Significant, SU = Significant and Unavoidable Impact, SU- = Lesser impact than the proposed project, SU+ = Greater impact than the proposed project
Tulare County General Plan 2030 Update 4-9 ESA / 207497 Recirculated Draft Environmental Impact Report February 2010
TABLE 4-3 (CONTINUED)SUMMARY OF ALTERNATIVES
(COMPARISON OF IMPACTS WITH GENERAL PLAN 2030 UPDATE LEVEL OF SIGNIFICANCE)
Impact No. Impact Statement Proposed Project Alt 1 –
No Project Alt 2 –
City-Centered Alt 3 – Rural Communities
Alt 4 – Transportation
Corridors Alt 5 – Confined
Growth
Geology and Soils (Section 3.7) 3.7-1 The proposed project could result in substantial soil erosion
or the loss of topsoil. LTS LTS LTS LTS LTS LTS
3.7-2 The proposed project could expose people to injury or structures to damage from potential rupture of a known earthquake fault, strong groundshaking, seismic-related ground failure, or landslide.
LTS LTS LTS LTS LTS LTS
3.7-3 The proposed project could result in potential structural damage from development on a potentially unstable geologic unit or soil.
LTS LTS LTS LTS LTS LTS
3.7-4 The proposed project could increase the potential for structural damage from development on expansive soil.
LTS LTS LTS LTS LTS LTS
Hazards and Hazardous Materials (Section 3.8) 3.8-1 The proposed project could create a significant hazard to the
public or the environment from the transportation, use, or disposal of hazardous materials.
LTS LTS LTS LTS LTS LTS
3.8-2 The proposed project could include uses that emit hazardous emissions or handle hazardous materials, substances, or waste within one-quarter mile of school sites.
LTS LTS LTS LTS LTS LTS
3.8-3 Development under the proposed project could be located on a hazardous materials site.
LTS LTS LTS LTS LTS LTS
3.8-4 The proposed project could impair implementation of or physically interfere with an adopted emergency response plan or emergency evacuation plan.
SU SU SU SU SU SU
3.8-5 The proposed project could result in development located within an airport land use plan area or within the vicinity of a public or private airport and could result in a safety hazard for people residing or working in the project area.
LTS LTS LTS LTS LTS LTS
3.8-6 The proposed project could expose people or structures to a significant risk of loss, injury, or death involving wildland fires.
LTS LTS LTS LTS LTS LTS
Hydrology, Water Quality and Drainage (Section 3.6) 3.6-1 The proposed project could violate water quality standards or
waste discharge requirements, or otherwise degrade water quality.
LTS LTS LTS LTS LTS LTS
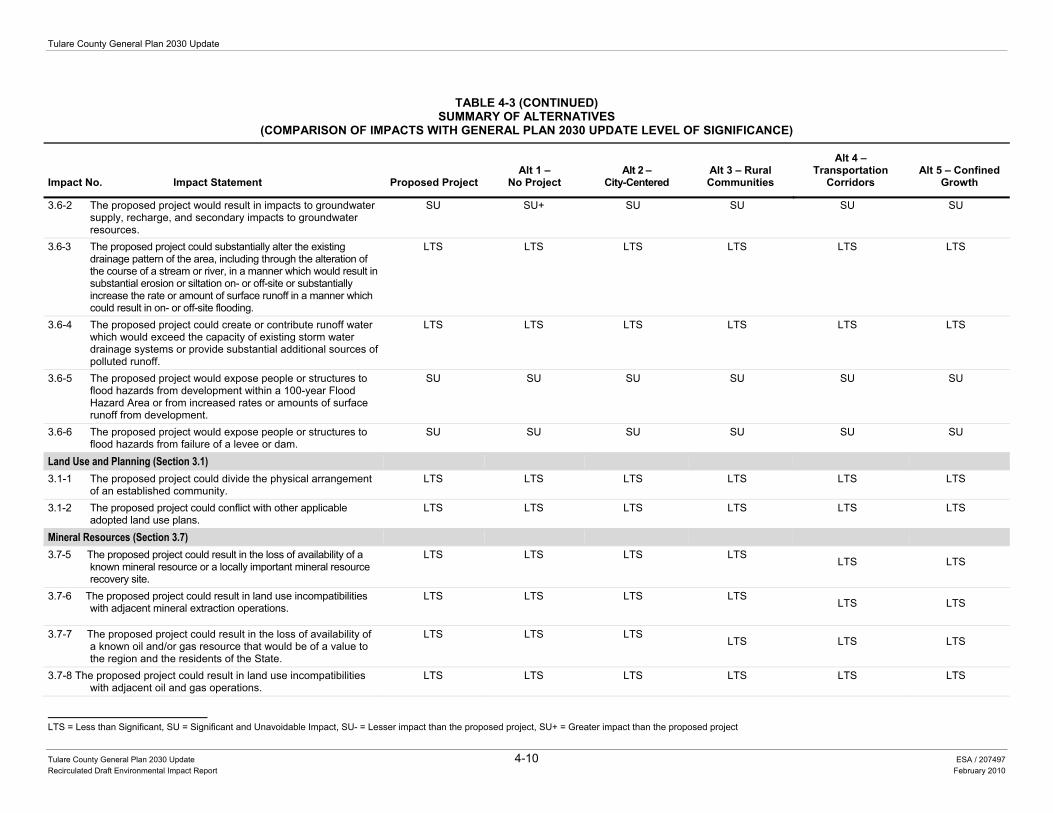
Tulare County General Plan 2030 Update
LTS = Less than Significant, SU = Significant and Unavoidable Impact, SU- = Lesser impact than the proposed project, SU+ = Greater impact than the proposed project
Tulare County General Plan 2030 Update 4-10 ESA / 207497 Recirculated Draft Environmental Impact Report February 2010
TABLE 4-3 (CONTINUED)SUMMARY OF ALTERNATIVES
(COMPARISON OF IMPACTS WITH GENERAL PLAN 2030 UPDATE LEVEL OF SIGNIFICANCE)
Impact No. Impact Statement Proposed Project Alt 1 –
No Project Alt 2 –
City-Centered Alt 3 – Rural Communities
Alt 4 – Transportation
Corridors Alt 5 – Confined
Growth
3.6-2 The proposed project would result in impacts to groundwater supply, recharge, and secondary impacts to groundwater resources.
SU SU+ SU SU SU SU
3.6-3 The proposed project could substantially alter the existing drainage pattern of the area, including through the alteration of the course of a stream or river, in a manner which would result in substantial erosion or siltation on- or off-site or substantially increase the rate or amount of surface runoff in a manner which could result in on- or off-site flooding.
LTS LTS LTS LTS LTS LTS
3.6-4 The proposed project could create or contribute runoff water which would exceed the capacity of existing storm water drainage systems or provide substantial additional sources of polluted runoff.
LTS LTS LTS LTS LTS LTS
3.6-5 The proposed project would expose people or structures to flood hazards from development within a 100-year Flood Hazard Area or from increased rates or amounts of surface runoff from development.
SU SU SU SU SU SU
3.6-6 The proposed project would expose people or structures to flood hazards from failure of a levee or dam.
SU SU SU SU SU SU
Land Use and Planning (Section 3.1) 3.1-1 The proposed project could divide the physical arrangement
of an established community. LTS LTS LTS LTS LTS LTS
3.1-2 The proposed project could conflict with other applicable adopted land use plans.
LTS LTS LTS LTS LTS LTS
Mineral Resources (Section 3.7) 3.7-5 The proposed project could result in the loss of availability of a
known mineral resource or a locally important mineral resource recovery site.
LTS LTS LTS LTS LTS LTS
3.7-6 The proposed project could result in land use incompatibilities with adjacent mineral extraction operations.
LTS LTS LTS LTS
LTS LTS
3.7-7 The proposed project could result in the loss of availability of a known oil and/or gas resource that would be of a value to the region and the residents of the State.
LTS LTS LTS LTS LTS LTS
3.7-8 The proposed project could result in land use incompatibilities with adjacent oil and gas operations.
LTS LTS LTS LTS LTS LTS
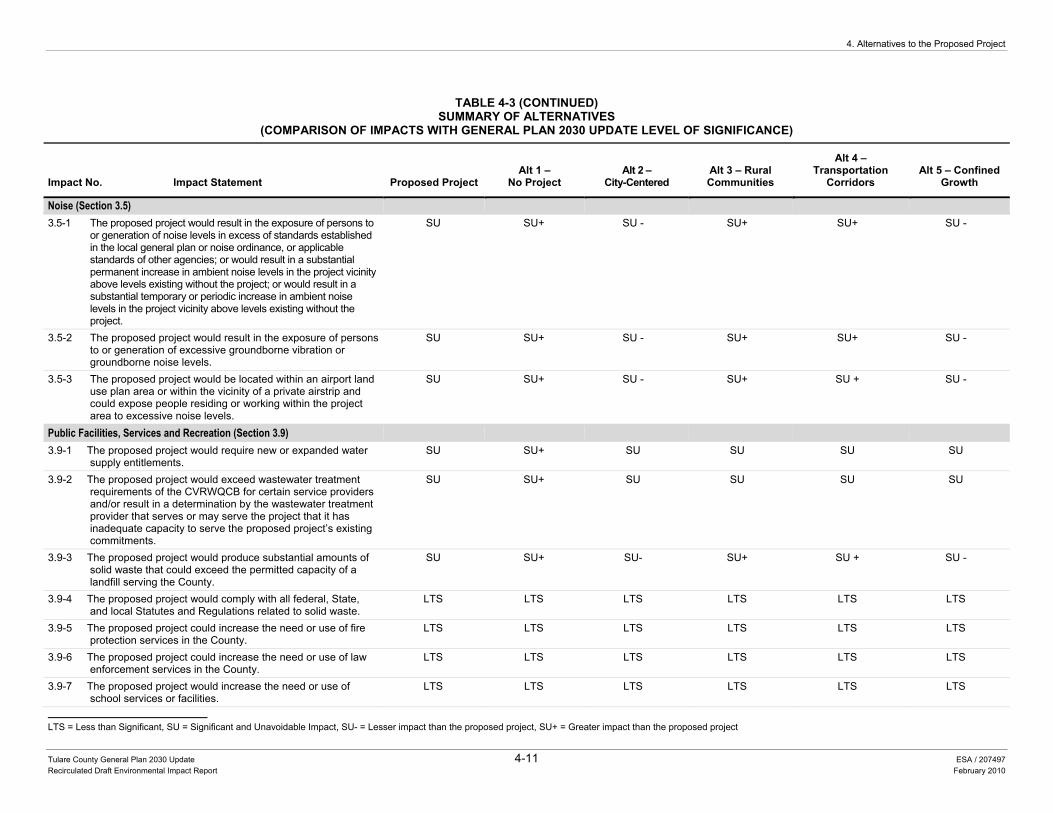
4. Alternatives to the Proposed Project
LTS = Less than Significant, SU = Significant and Unavoidable Impact, SU- = Lesser impact than the proposed project, SU+ = Greater impact than the proposed project
Tulare County General Plan 2030 Update 4-11 ESA / 207497 Recirculated Draft Environmental Impact Report February 2010
TABLE 4-3 (CONTINUED)SUMMARY OF ALTERNATIVES
(COMPARISON OF IMPACTS WITH GENERAL PLAN 2030 UPDATE LEVEL OF SIGNIFICANCE)
Impact No. Impact Statement Proposed Project Alt 1 –
No Project Alt 2 –
City-Centered Alt 3 – Rural Communities
Alt 4 – Transportation
Corridors Alt 5 – Confined
Growth
Noise (Section 3.5) 3.5-1 The proposed project would result in the exposure of persons to
or generation of noise levels in excess of standards established in the local general plan or noise ordinance, or applicable standards of other agencies; or would result in a substantial permanent increase in ambient noise levels in the project vicinity above levels existing without the project; or would result in a substantial temporary or periodic increase in ambient noise levels in the project vicinity above levels existing without the project.
SU SU+ SU - SU+ SU+ SU -
3.5-2 The proposed project would result in the exposure of persons to or generation of excessive groundborne vibration or groundborne noise levels.
SU SU+ SU - SU+ SU+ SU -
3.5-3 The proposed project would be located within an airport land use plan area or within the vicinity of a private airstrip and could expose people residing or working within the project area to excessive noise levels.
SU SU+ SU - SU+ SU + SU -
Public Facilities, Services and Recreation (Section 3.9) 3.9-1 The proposed project would require new or expanded water
supply entitlements. SU SU+ SU SU SU SU
3.9-2 The proposed project would exceed wastewater treatment requirements of the CVRWQCB for certain service providers and/or result in a determination by the wastewater treatment provider that serves or may serve the project that it has inadequate capacity to serve the proposed project’s existing commitments.
SU SU+ SU SU SU SU
3.9-3 The proposed project would produce substantial amounts of solid waste that could exceed the permitted capacity of a landfill serving the County.
SU SU+ SU- SU+ SU + SU -
3.9-4 The proposed project would comply with all federal, State, and local Statutes and Regulations related to solid waste.
LTS LTS LTS LTS LTS LTS
3.9-5 The proposed project could increase the need or use of fire protection services in the County.
LTS LTS LTS LTS LTS LTS
3.9-6 The proposed project could increase the need or use of law enforcement services in the County.
LTS LTS LTS LTS LTS LTS
3.9-7 The proposed project would increase the need or use of school services or facilities.
LTS LTS LTS LTS LTS LTS
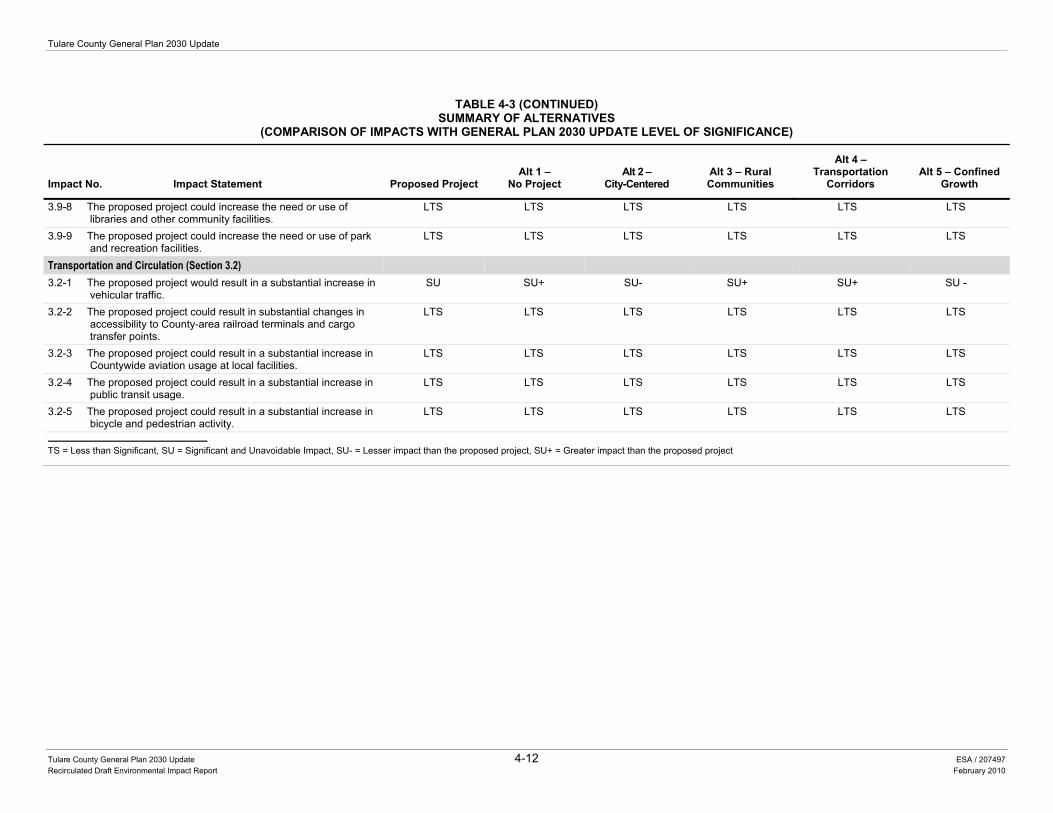
Tulare County General Plan 2030 Update
Tulare County General Plan 2030 Update 4-12 ESA / 207497 Recirculated Draft Environmental Impact Report February 2010
TABLE 4-3 (CONTINUED)SUMMARY OF ALTERNATIVES
(COMPARISON OF IMPACTS WITH GENERAL PLAN 2030 UPDATE LEVEL OF SIGNIFICANCE)
Impact No. Impact Statement Proposed Project Alt 1 –
No Project Alt 2 –
City-Centered Alt 3 – Rural Communities
Alt 4 – Transportation
Corridors Alt 5 – Confined
Growth
3.9-8 The proposed project could increase the need or use of libraries and other community facilities.
LTS LTS LTS LTS LTS LTS
3.9-9 The proposed project could increase the need or use of park and recreation facilities.
LTS LTS LTS LTS LTS LTS
Transportation and Circulation (Section 3.2) 3.2-1 The proposed project would result in a substantial increase in
vehicular traffic. SU SU+ SU- SU+ SU+ SU -
3.2-2 The proposed project could result in substantial changes in accessibility to County-area railroad terminals and cargo transfer points.
LTS LTS LTS LTS LTS LTS
3.2-3 The proposed project could result in a substantial increase in Countywide aviation usage at local facilities.
LTS LTS LTS LTS LTS LTS
3.2-4 The proposed project could result in a substantial increase in public transit usage.
LTS LTS LTS LTS LTS LTS
3.2-5 The proposed project could result in a substantial increase in bicycle and pedestrian activity.
LTS LTS LTS LTS LTS LTS
TS = Less than Significant, SU = Significant and Unavoidable Impact, SU- = Lesser impact than the proposed project, SU+ = Greater impact than the proposed project
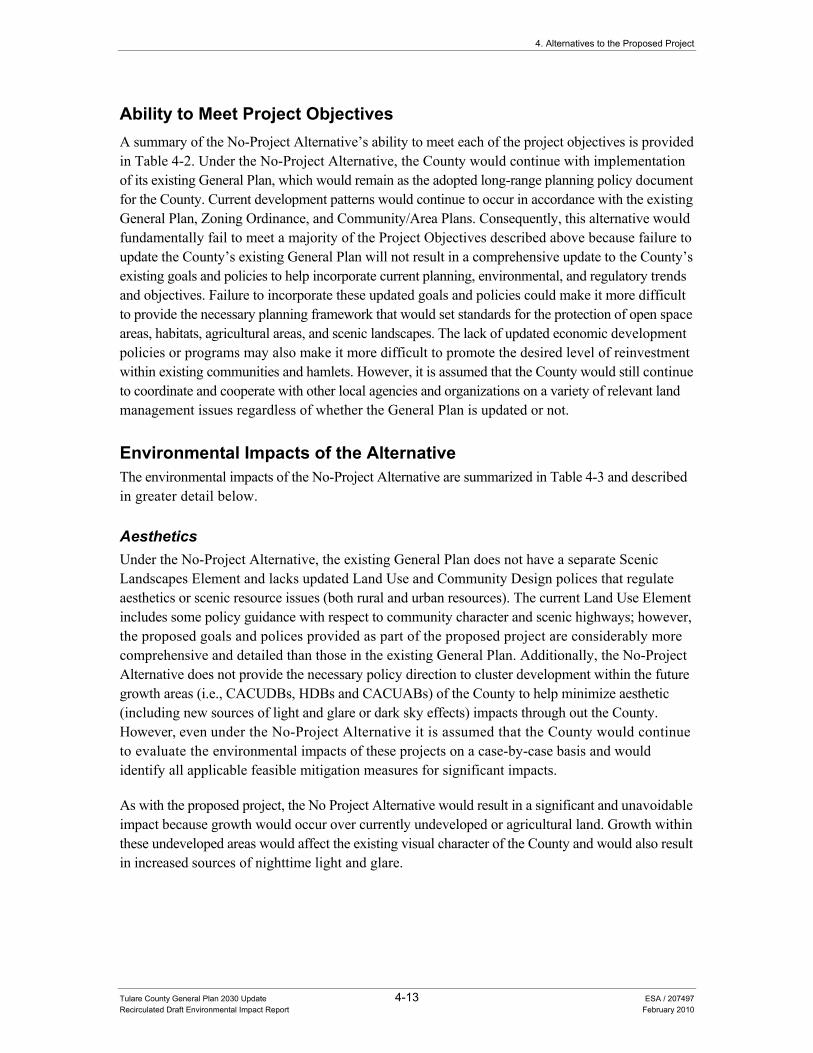
4. Alternatives to the Proposed Project
Tulare County General Plan 2030 Update 4-13 ESA / 207497 Recirculated Draft Environmental Impact Report February 2010
Ability to Meet Project Objectives A summary of the No-Project Alternative’s ability to meet each of the project objectives is provided in Table 4-2. Under the No-Project Alternative, the County would continue with implementation of its existing General Plan, which would remain as the adopted long-range planning policy document for the County. Current development patterns would continue to occur in accordance with the existing General Plan, Zoning Ordinance, and Community/Area Plans. Consequently, this alternative would fundamentally fail to meet a majority of the Project Objectives described above because failure to update the County’s existing General Plan will not result in a comprehensive update to the County’s existing goals and policies to help incorporate current planning, environmental, and regulatory trends and objectives. Failure to incorporate these updated goals and policies could make it more difficult to provide the necessary planning framework that would set standards for the protection of open space areas, habitats, agricultural areas, and scenic landscapes. The lack of updated economic development policies or programs may also make it more difficult to promote the desired level of reinvestment within existing communities and hamlets. However, it is assumed that the County would still continue to coordinate and cooperate with other local agencies and organizations on a variety of relevant land management issues regardless of whether the General Plan is updated or not.
Environmental Impacts of the Alternative The environmental impacts of the No-Project Alternative are summarized in Table 4-3 and described in greater detail below.
Aesthetics Under the No-Project Alternative, the existing General Plan does not have a separate Scenic Landscapes Element and lacks updated Land Use and Community Design polices that regulate aesthetics or scenic resource issues (both rural and urban resources). The current Land Use Element includes some policy guidance with respect to community character and scenic highways; however, the proposed goals and polices provided as part of the proposed project are considerably more comprehensive and detailed than those in the existing General Plan. Additionally, the No-Project Alternative does not provide the necessary policy direction to cluster development within the future growth areas (i.e., CACUDBs, HDBs and CACUABs) of the County to help minimize aesthetic (including new sources of light and glare or dark sky effects) impacts through out the County. However, even under the No-Project Alternative it is assumed that the County would continue to evaluate the environmental impacts of these projects on a case-by-case basis and would identify all applicable feasible mitigation measures for significant impacts.
As with the proposed project, the No Project Alternative would result in a significant and unavoidable impact because growth would occur over currently undeveloped or agricultural land. Growth within these undeveloped areas would affect the existing visual character of the County and would also result in increased sources of nighttime light and glare.
Tulare County General Plan 2030 Update
Tulare County General Plan 2030 Update 4-14 ESA / 207497 Recirculated Draft Environmental Impact Report February 2010
Agricultural Resources As previously described, this analysis assumes that similar population patterns to the proposed project would occur under the No Project Alternative. Additionally, the No-Project Alternative does not provide the necessary policy direction to cluster development within the future growth areas (i.e., CACUDBs, HDBs and CACUABs) of the County to help minimize the conversion of agricultural resource lands. Consequently, quantifying the amount of land conversion that could occur is considered speculative at this point in time. However, implementation of the No-Project Alternative is assumed to result in similar or slightly greater impacts to agricultural resources compared to the proposed project. This is because a greater amount of land designated as Prime, Unique or Farmland of Statewide Importance could be converted to urban uses under the No Project Alternative compared to the amount of farmland that would be converted to urban uses under the proposed project. This conversion of important farmland to urbanized uses is also considered a significant and unavoidable impact.
Air Quality Under the No-Project Alternative, the County would continue to function under the direction of the existing General Plan. Consequently, buildout under the existing General Plan could result in a slightly greater number of jobs, dwelling units (within the County growth areas), and residents in the unincorporated areas to those anticipated under the proposed project. These dwelling units and other types of development would result in slightly increased levels of both mobile and stationary sources of air quality emissions and toxic air contaminants. Consequently, implementation of the No Project Alternative would still result in a significant and unavoidable impact because future development would still contribute to air pollutant emissions that would exceed the annual SJVAPCD thresholds for NOx and ROG.
Energy and Global Climate Change Similarly, under the No-Project Alternative, the County would continue to function under the direction of the existing General Plan, which provides very limited policy direction specific to global climate change and methods to help reduce greenhouse gas emissions. Buildout under the existing General Plan could result in a slightly greater number of jobs, dwelling units (within the County growth areas), and residents in the unincorporated areas to those anticipated under the proposed project. These dwelling units and other types of development would result in slightly increased levels of energy consumption and greenhouse gas emissions from buildings and from mobile and stationary sources. Consequently, implementation of the No Project Alternative would still result in a significant and unavoidable impact because future development would still contribute to an increase in greenhouse gas emissions that may conflict with the goal of the State to reduce up to 174 million metric tons CO2e/year by 2020.
Biological Resources As previously described, the No-Project Alternative does not provide the necessary policy direction to cluster development within the future growth areas (i.e., CACUDBs, HDBs and CACUABs) of the County to help minimize the conversion of existing open space lands to a developed use. This
4. Alternatives to the Proposed Project
Tulare County General Plan 2030 Update 4-15 ESA / 207497 Recirculated Draft Environmental Impact Report February 2010
increased potential to affect open space areas relative to the proposed project could result in greater County-wide development that could result in adverse impacts to sensitive habitats, wetlands, riparian areas, wildlife movement, and tree preservation policies. Additionally, the new goals and policies included as part of the proposed project to protect federal and state listed and threatened species are more comprehensive than those in the existing General Plan. Therefore, the No Project Alternative could result in a slightly greater significant and unavoidable impact because growth would occur over currently undeveloped or habitat land and would result in the overall reduction of a plant or wildlife species habitat.
Cultural Resources Under the No Project Alternative, continued development consistent with the existing General Plan could result in the disturbance of designated local, State, and/or national historical resources. Urbanized areas may also contain a variety of historic resources (i.e., buildings, bridges, etc.). In addition, potential but as of yet undesignated historical resources exist that could be affected by future development.
The existing General Plan does not have the full range of policies designed to address cultural resources. The current Environmental Resource Management Element includes some policy guidance with respect to cultural resources; however, the proposed goals and polices provided as part of the proposed project (including the “Community Design” section of the Land Use Element) are considerably more comprehensive and detailed, including, in particular, those related to historic resources.
Similar to the proposed project, urbanization associated with future growth could damage or destroy a variety of cultural resources during various construction-related activities. Similar to the proposed project this would be a significant impact.
Geology and Soils The No-Project Alternative proposes development that is similar in nature to that anticipated under the proposed project. Current State and federal regulations require specific engineering and design criteria to avoid impacts related to geologic, soils, and seismic hazards, which would apply to both the No-Project Alternative and the proposed project. For this reason, geologic and soils impacts under the No-Project Alternative are considered to be similar to those of the proposed project.
Hazards and Hazardous Materials The No-Project Alternative proposes development that is similar in nature to that anticipated under the proposed project. Similar to the proposed project, implementation of this alternative would involve a decrease in the use of pesticides, herbicides, and other hazardous materials used for agricultural practices. Although hazards related to agricultural uses would be reduced, potential new commercial and industrial uses may introduce new sources of hazardous materials. The No Project Alternative would not include the additional hazardous materials and public safety policies and implementation measure contained as part of the proposed project. However, hazardous materials generation, storage and clean-up are heavily regulated by federal, State and local regulations
Tulare County General Plan 2030 Update
Tulare County General Plan 2030 Update 4-16 ESA / 207497 Recirculated Draft Environmental Impact Report February 2010
that would apply to both the No-Project Alternative and the proposed project. For this reason, hazards and hazardous materials impacts under the No-Project Alternative are considered to be similar to those of the proposed project.
Hydrology and Water Quality Under the No-Project Alternative, development could convert additional amounts of open space land to urban uses than the proposed project. As with the proposed project, the creation of impervious surfaces associated with urbanization would increase the amount of runoff, which could affect water quality. An increase in impervious surfaces could also reduce groundwater recharge potential. The potential reduction in groundwater recharge potential along with the lack of updated policies designed to address water quality, water resource, and water conservation issues could result in a slightly greater significant and unavoidable impact under the No Project Alternative.
The No-Project Alternative also proposes development in areas that are within the 100-year floodplain in a similar manner to the proposed project. Similarly, levees are regulated at the State level with maintenance activities delegated to local flood control and levee districts. The County has no jurisdiction and is limited in terms of alternatives to mitigate for the identified flood risks. Consequently, flood risk impacts are also considered to be significant and unavoidable.
Land Use and Planning Neither the No-Project Alternative nor the proposed project would result in the division or alteration of an existing community. However, under the existing General Plan, the County would have less of an ability to direct specific development changes (as provided in the Planning Framework Element of the updated General Plan) to ensure that new development is well-connected and compatible with surrounding uses. However, similar to the proposed project, development proposed under the No-Project Alternative would still need to be consistent with existing plans and policies. Existing General Plan policies would generally ensure that new development is compatible with surrounding land uses. For these reasons, the land use impacts of the No-Project Alternative are considered to be similar to those of the proposed project.
Mineral Resources The No-Project Alternative would result in similar or slightly greater amounts of development than the proposed project, so there could be greater potential land use incompatibilities and development of land containing local mineral and oil resources. Policy guidance in the existing General Plan is similar to that provided under the proposed project and the overall impacts are considered to be similar to those identified for the proposed project.
Noise Under the No-Project Alternative, the County would continue to function under the direction of the existing General Plan. As previously described, buildout under the existing General Plan could result in a slightly greater number of jobs, dwelling units (within the County growth areas), dwelling units, and residents as the proposed project. These additional dwelling units and other types of
4. Alternatives to the Proposed Project
Tulare County General Plan 2030 Update 4-17 ESA / 207497 Recirculated Draft Environmental Impact Report February 2010
development could result in increased levels of both mobile and stationary noise sources. Consequently, implementation of the No Project Alternative would still result in a significant and unavoidable impact because growth could still contribute additional sources of noise that in some cases could exceed local standards.
Public Services, Facilities and Recreation Build-out under the existing General Plan could result in a slightly greater number of jobs, dwelling units and residents than the proposed project. This increased level of population growth and development could result in similar although slightly greater impacts to the public services and utilities in the County that would be required to adequately serve the levels of development projected under the No-Project Alternative.
Similar to any other development in areas of new growth the construction of future public service and utility facilities could result in some level of permanent conversion of agricultural and open space lands. Without definitive plans, it can not be determined at this time whether such conversion of land would be substantial and would therefore have to be characterized as significant and unavoidable. As with the proposed project, mechanisms to reduce such impacts to less than significant may not exist. Due to this uncertainty, potential impacts resulting from construction and/or expansion of public service and utility facilities are also considered significant and unavoidable at this time.
Transportation/Traffic Build-out of the County’s existing General Plan could result in a slightly greater number of jobs, dwelling units and residents than the proposed project. Total daily vehicle trips generated under this alternative over most roadway segments could be higher under Alternative 1 than the proposed project. Additionally, Alternative 1 may result in similar localized level of service impacts on some roadway segments within the County as those anticipated under the proposed project.
Alternative 2: City-Centered Alternative The City Centered Alternative (Alternative 2) assumes that cities will accept additional population by increasing the density and developing contiguous land in and around incorporated cities. The cities will also continue to provide sites for urban commercial services and industry. This approach would not ignore the needs of unincorporated communities, and would look at policy solutions to address housing, services, and infrastructure needs to meet future growth. Under this alternative, net new growth for the CACUDBs would account for a higher percentage (80%) of the overall net new growth for the entire County (see Table 4-1 above). While this alternative assumes a higher degree of city growth, Alternative 5 (more fully described below) assumes an even higher degree of city directed growth.
Key advantages for this scenario include protecting agricultural land and maintaining the rural character of the county. It also can be more readily supported by a regional transit system.
Tulare County General Plan 2030 Update
Tulare County General Plan 2030 Update 4-18 ESA / 207497 Recirculated Draft Environmental Impact Report February 2010
Similar to the proposed project, Alternative 2 assumes that all of the proposed policies and implementation measures contained in the Goals and Policies Report would be included as part of this alternative. However, unlike the proposed project, the focus of growth under Alternative 2 is within existing urban areas (cities). New development (i.e., residential/commercial growth) would be concentrated in areas already committed to a degree of urban development and have provisions for some utility/road infrastructure or adequate levels of public services. This alternative assumes that incorporated cities would increase the density of development within the city and develop contiguous land adjacent to the city to accommodate growth.
In order to accomplish this land use goal, several revisions to the Goals and Policies Report (Part I of the General Plan 2030 Update) would be required, in particular those included in the Planning Framework Element that are designed to manage growth near existing city boundaries (see Table 4-4). Revised policies would incorporate land use strategies that would require greater land use efficiency standards for development on important farmlands within the CACUDBs (20 year boundary) for unincorporated communities and hamlets. Additional strategies that could be integrated into the policies and implementation measures of the Goals and Policies Report (Part I of the General Plan 2030 Update) to direct growth within existing CACUDBs for the incorporated cities in the County include:
• Cities accept significant growth and accommodate it through infill development, higher densities, and transportation infrastructure.
• County limits rural residential development.
• County continues to improve quality of life and services in unincorporated communities but does not make growth inducing infrastructure improvements.
• County limits commercial development to local serving in unincorporated communities.
• County continues to focus on facilitating/managing agricultural development.
• County and cities need to evaluate revenue-sharing agreement.
• Under this alternative, slower development patterns are assumed to continue through the entire 2030 planning horizon, with the unincorporated population being slightly lower ( 206,880 individuals by 2030 versus 222,580) than that anticipated under the proposed project (see Table 4-1).
It should be noted that during development of the various land use alternative scenarios, the Tulare County Planning Commission directed staff to consider an additional City/Focused Community Alternative. Similar to Alternative 2, this additional City/Focused Community Alternative would direct future population growth toward incorporated cities and selected unincorporated communities (80%). However, one minor difference would occur in how the remaining 20% of County growth would occur, with various shares of population distributed to the communities of Earlimart, Goshen, Pixley, Tipton, and other unincorporated communities or areas of the County. In considering these minor population differences and the programmatic nature of this EIR, it was determined that this suggested alternative scenario was not significantly different than Alternative 2. Therefore this alternative scenario is not discussed further in this EIR.
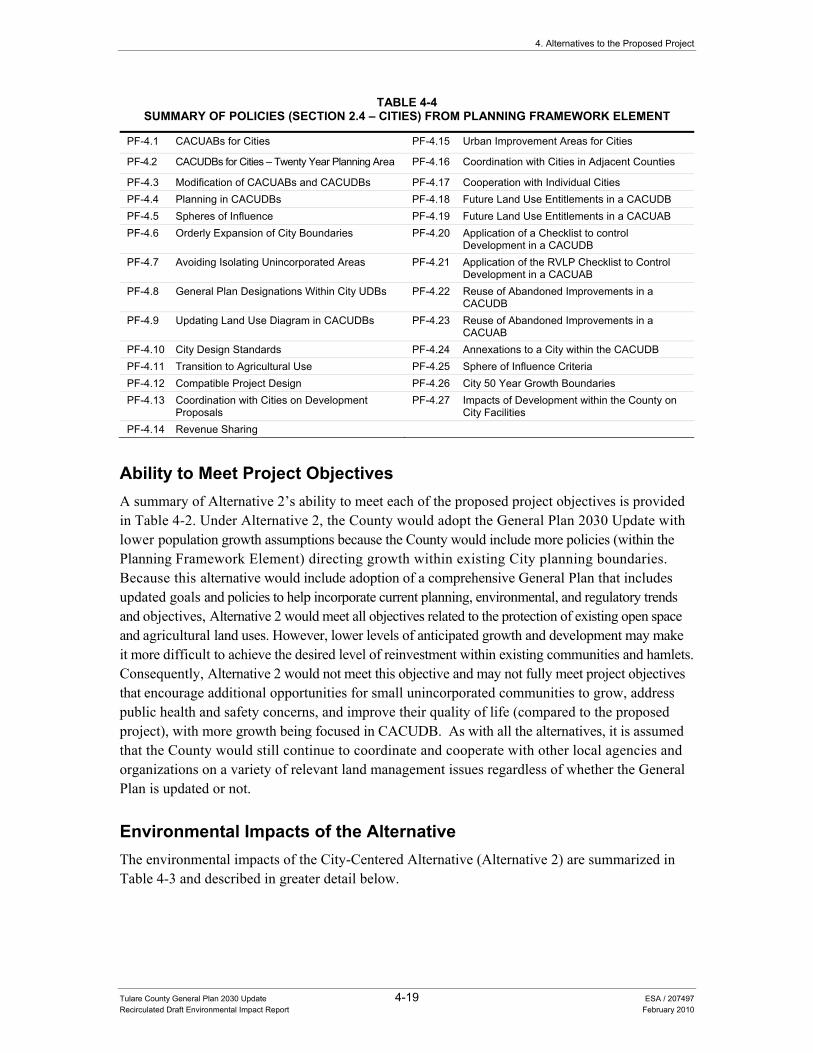
4. Alternatives to the Proposed Project
Tulare County General Plan 2030 Update 4-19 ESA / 207497 Recirculated Draft Environmental Impact Report February 2010
TABLE 4-4 SUMMARY OF POLICIES (SECTION 2.4 – CITIES) FROM PLANNING FRAMEWORK ELEMENT
PF-4.1 CACUABs for Cities PF-4.15 Urban Improvement Areas for Cities
PF-4.2 CACUDBs for Cities – Twenty Year Planning Area PF-4.16 Coordination with Cities in Adjacent Counties
PF-4.3 Modification of CACUABs and CACUDBs PF-4.17 Cooperation with Individual Cities PF-4.4 Planning in CACUDBs PF-4.18 Future Land Use Entitlements in a CACUDB PF-4.5 Spheres of Influence PF-4.19 Future Land Use Entitlements in a CACUAB PF-4.6 Orderly Expansion of City Boundaries PF-4.20 Application of a Checklist to control
Development in a CACUDB PF-4.7 Avoiding Isolating Unincorporated Areas PF-4.21 Application of the RVLP Checklist to Control
Development in a CACUAB PF-4.8 General Plan Designations Within City UDBs PF-4.22 Reuse of Abandoned Improvements in a
CACUDB PF-4.9 Updating Land Use Diagram in CACUDBs PF-4.23 Reuse of Abandoned Improvements in a
CACUAB PF-4.10 City Design Standards PF-4.24 Annexations to a City within the CACUDB PF-4.11 Transition to Agricultural Use PF-4.25 Sphere of Influence Criteria PF-4.12 Compatible Project Design PF-4.26 City 50 Year Growth Boundaries PF-4.13 Coordination with Cities on Development
Proposals PF-4.27 Impacts of Development within the County on
City Facilities PF-4.14 Revenue Sharing
Ability to Meet Project Objectives A summary of Alternative 2’s ability to meet each of the proposed project objectives is provided in Table 4-2. Under Alternative 2, the County would adopt the General Plan 2030 Update with lower population growth assumptions because the County would include more policies (within the Planning Framework Element) directing growth within existing City planning boundaries. Because this alternative would include adoption of a comprehensive General Plan that includes updated goals and policies to help incorporate current planning, environmental, and regulatory trends and objectives, Alternative 2 would meet all objectives related to the protection of existing open space and agricultural land uses. However, lower levels of anticipated growth and development may make it more difficult to achieve the desired level of reinvestment within existing communities and hamlets. Consequently, Alternative 2 would not meet this objective and may not fully meet project objectives that encourage additional opportunities for small unincorporated communities to grow, address public health and safety concerns, and improve their quality of life (compared to the proposed project), with more growth being focused in CACUDB. As with all the alternatives, it is assumed that the County would still continue to coordinate and cooperate with other local agencies and organizations on a variety of relevant land management issues regardless of whether the General Plan is updated or not.
Environmental Impacts of the Alternative The environmental impacts of the City-Centered Alternative (Alternative 2) are summarized in Table 4-3 and described in greater detail below.
Tulare County General Plan 2030 Update
Tulare County General Plan 2030 Update 4-20 ESA / 207497 Recirculated Draft Environmental Impact Report February 2010
Aesthetics Alternative 2 would result in similar types of development with a lower buildout population to that anticipated under the proposed project. City-centered growth would focus a majority of the County’s new growth within existing urban areas and would convert less County open space areas to developed uses. Development of less County open space would result in less impacts to existing County scenic landscapes. However, similar to the proposed project, Alternative 2 would still result in a significant and unavoidable impact, since there would be some level of future development that would affect existing scenic landscapes. Light and glare impacts would also be lessened under this alternative. However the resultant impact would also be similar to the proposed project.
Agricultural Resources City-centered development proposed under Alternative 2 could result in a reduced impact to agricultural resources compared to the proposed project if development in cities is more efficient than development in unincorporated areas. Therefore a fewer number of acres of land designated as Prime, Unique or Farmland of Statewide Importance would be converted to urban uses under this alternative compared to the amount of important farmland that could be converted to urban uses under the proposed project. However, similar to the proposed project, Alternative 2 would also result in a significant and unavoidable impact, since conversion of important farmland to urbanized uses under this alternative would be unavoidable.
Air Quality Under Alternative 2, similar levels of growth would still occur within the County by 2030. City-centered growth may reduce the overall number of vehicle miles driven; however city focused dwelling units and other types of development would still result in similar overall emission levels of both mobile and stationary sources of air quality emissions, toxic air contaminants, and the potential for odor emissions. Consequently, development proposed under Alternative 2 would still result in a significant and unavoidable impact because growth would still contribute to air pollutant emissions that could exceed the annual SJVAPCD thresholds for a variety of air pollutants.
Biological Resources Development proposed under Alternative 2 would result in similar impacts to biological resources (compared to the proposed project) through the conversion of open space lands to developed uses. However, under this alternative, a fewer number of acres of land designated as natural or open space would be converted to urban uses compared to the same types of land uses that would be converted under the proposed project. Alternative 2 would still result in a significant and unavoidable impact because a certain degree of new growth would still occur over currently undeveloped or habitat land and would result in the overall reduction of a plant or wildlife species habitat.
Cultural Resources Development proposed under this alternative would focus new growth within existing City areas, which could result in similar or greater impacts to historic resources located within existing urbanized areas. The intensification of land uses within the existing City limits may result in greater impacts
4. Alternatives to the Proposed Project
Tulare County General Plan 2030 Update 4-21 ESA / 207497 Recirculated Draft Environmental Impact Report February 2010
to the design qualities of individual City neighborhoods and historic districts to those anticipated under the proposed project. However, any undiscovered historical resources located in current agricultural or open space areas that would not be converted to urban development would remain undisturbed. Similar to the proposed project this would also result in a significant impact.
Energy and Climate Change Under Alternative 2, similar levels of growth would still occur within the County by 2030. City-centered growth may reduce the overall number of vehicle miles driven; however, city focused dwelling units and other types of development would still result in similar energy consumption and greenhouse gases from buildings and stationary sources. The lower vehicle miles driven would slightly reduce energy use and greenhouse gas emissions; however, implementation of Alternative 2 would still result in a significant and unavoidable impact because growth would still contribute to an increase in greenhouse gases that may conflict with the goal of the State to reduce up to 174 million metric tons CO2e/yr by 2020.
Geology and Soils Alternative 2 proposes development that is similar in nature to that anticipated under the proposed project. Current State and federal regulations require specific engineering and design criteria to minimize impacts related to geologic, soils, and seismic hazards, which would apply to local geologic/soil conditions under each of the alternatives and the proposed project. Policies and implementation measures included as part of the proposed project incorporate all applicable regulations to minimize these impacts. For this reason, geologic and soils impacts under Alternative 2 are considered similar to those of the proposed project.
Hazards and Hazardous Materials Alternative 2 proposes development that is similar in nature to that anticipated under the proposed project. Similar to the proposed project, implementation of this alternative would involve a decrease in the use of pesticides, herbicides, and other hazardous materials used for agricultural practices. Similar to the proposed project, hazardous materials generation, storage and clean-up are heavily regulated by federal, State and local regulations that would apply to both Alternative 2 and the proposed project. For this reason, hazardous materials impacts under Alternative 2 are considered to be similar to those of the proposed project.
Hydrology and Water Quality Under Alternative 2, development would convert less open space land to urban uses than the proposed project. As with the proposed project, the creation of impervious surfaces associated with urbanization would increase the amount of runoff, which could affect water quality. An increase in impervious surfaces could also reduce groundwater recharge potential. However, because land conversion would be less than the proposed project, fewer impervious surfaces would be developed. Overall, hydrologic and water quality impacts under Alternative 2 are considered to be similar to those of the proposed project.
Tulare County General Plan 2030 Update
Tulare County General Plan 2030 Update 4-22 ESA / 207497 Recirculated Draft Environmental Impact Report February 2010
Alternative 2 also proposes development in areas that are within the 100-year floodplain in a similar manner to the proposed project. Similarly, levees are regulated at the State level with maintenance activities delegated to local reclamation districts. The County has no jurisdiction and is limited in terms of alternatives to mitigate for the identified flood risks. Consequently, flood risk impacts are also considered to be significant and unavoidable.
Land Use and Planning Alternative 2 would result in similar types of development. However, implementation of this alternative could intensify development within City planning areas and would convert less open space areas within the County to developed uses. Consequently, neither the proposed project nor Alternative 2 would divide existing communities and they would both be subject to the same policy direction with regards to ensuring land use compatibility with surrounding uses.
Mineral Resources Alternative 2 would result in slightly less development than the proposed project on lands similar to those affected by the proposed project. Similar to the proposed project, this alternative would result in similar impacts to mineral, timber, and oil resources.
Noise Although Alternative 2 includes a slightly reduced development footprint, development anticipated under this alternative would be similar in nature to that anticipated under the proposed project. Similar to the proposed project, significant noise level increases (3 dBA Ldn or greater) associated with increased traffic and railroad operations would likely occur adjacent to existing noise sensitive land uses during the 30-year planning horizon. Overall, implementation of Alternative 2 would still result in a significant and unavoidable impact because growth could still contribute additional sources of noise and vibration that in some cases could exceed local standards.
Public Services, Facilities and Recreation Alternative 2 would be expected to result in lower levels of development within the County. However, anticipated levels of development would still require the expansion of a variety of local County services (including police, fire, water supply, parks, etc.) in addition to those provided by several local school districts. Overall, public service and utility impacts are also anticipated to be similar.
Transportation/Traffic Alternative 2 would result in the intensification of similar types of development within the planning areas of existing cities. Overall, total daily vehicle trips generated under this alternative would be similar to those anticipated with the proposed project (see Table 4-3). However, Alternative 2 would focus growth and consequently more traffic within existing urban areas, which could see reductions in their local roadway levels of service. Implementation of Alternative 2 would still result in significant and unavoidable traffic impacts.
4. Alternatives to the Proposed Project
Tulare County General Plan 2030 Update 4-23 ESA / 207497 Recirculated Draft Environmental Impact Report February 2010
Alternative 3: Rural Communities Alternative The Rural Communities Alternative (Alternative 3) emphasizes growth in the eleven unincorporated communities that have or are expected to soon have an adopted Redevelopment Project Area (RPA) and Community Plan. Key advantages for this scenario include the utilization of existing infrastructure, services, and community cooperation while protecting agricultural lands and maintaining the rural character of the county.
As shown in Table 4-1, 70 percent of net new population growth is directed to incorporated cities. The remaining 30 percent is directed to the 20 unincorporated communities along with other rural areas of the County. Of the total amount distributed to the County, 80 percent is targeted to the eleven unincorporated communities that have an adopted, or are expected to soon have adopted, a RPA and Community Plan. Distribution of new population is based on each community’s share of total CACUAB/UDB population of the eleven communities in 2000. The eleven communities are Cutler-Orosi, Ducor, Earlimart, Goshen, Ivanhoe, Pixley, Poplar, Richgrove, Terra Bella, Tipton, and Traver. The other 20 percent is allocated to the other nine communities based on each community’s percentage share of total CACUAB/UDB population of those nine communities in 2000.
Alternative 3 assumes that most of the proposed policies and implementation measures contained in the Goals and Policies Report (Part I of the General Plan 2030 Update) would be included as part of this alternative. However, unlike the proposed project, the Goals and Policies Report (Part I of the General Plan 2030 Update – Planning Framework Element) would incorporate some land use strategies to direct growth within existing CACUDBs for the unincorporated communities and hamlets in the County, including:
• County limits rural residential development and concentrates unincorporated growth in communities.
• County commits to providing significant infrastructure improvements in the eleven communities with redevelopment agencies and plans.
• Unincorporated communities provide for more commercial development. • County provides for more job growth in unincorporated communities.
Ability to Meet Project Objectives A summary of Alternative 3’s ability to meet each of the proposed project objectives is provided in Table 4-2. Under Alternative 3, the County would adopt the General Plan 2030 Update with slightly higher population growth assumptions that would focus growth within existing communities and hamlet areas. Because this alternative would include adoption of a comprehensive General Plan that includes updated goals and policies to help incorporate current planning, environmental, and regulatory trends and objectives, Alternative 3 would meet all objectives related to the protection of existing open space and agricultural land uses. Additionally, higher levels of anticipated growth and development would help to promote the desired level of reinvestment within existing communities and hamlets. As with all the alternatives, it is assumed that the County would still continue to coordinate and cooperate with other local agencies and
Tulare County General Plan 2030 Update
Tulare County General Plan 2030 Update 4-24 ESA / 207497 Recirculated Draft Environmental Impact Report February 2010
organizations on a variety of relevant land management issues regardless of whether the General Plan is updated or not.
Environmental Impacts of the Alternative The environmental impacts of the Continued Growth Alternative are summarized in Table 4-3 and described in greater detail below.
Aesthetics Under Alternative 3, the County is expected to continue with similar development patterns within the County’s growth areas which could result in a slightly higher population level (30% of new growth versus 25% under the proposed project) within a development footprint similar to that anticipated under the proposed project. Consequently, this alternative has the potential to result in the use or conversion of slightly more open space land within the proposed County than that anticipated to occur with implementation of the proposed project.
As with the proposed project, Alternative 3 would result in a significant and unavoidable impact because growth would occur over currently undeveloped land. This growth would affect the existing visual character of the County and may result in a slightly greater impact to aesthetic resources due to the larger area that would be developed under this alternative.
Light and glare impacts would also be slightly greater under this alternative due to the increased number of currently undeveloped acres that would be developed with an urban use, such as additional parking lots, building lights, and streetlights.
Agricultural Resources Alternative 3 has the potential to result in a slightly greater impact to agricultural resources compared to the proposed project. This is because an additional number of acres of land designated as Prime, Unique or Farmland of Statewide Importance have the potential to be converted to urban uses under this alternative compared to the amount of farmland that would be converted to urban uses under the proposed project. Similar to the proposed project, Alternative 3 would also result in a significant and unavoidable impact, since there would be some conversion of important farmland to urbanized uses under this alternative.
Air Quality Under Alternative 3, the County is expected to continue with similar development patterns through the 2030 planning horizon, which would result in a slightly higher population level within a development footprint similar to that anticipated under the proposed project. Consequently, build-out under this alternative could result in a slightly greater number of overall jobs, dwelling units, and residents than the proposed project. These additional dwelling units and other types of development would result in increased levels of both mobile and stationary sources of air quality emissions and toxic air contaminants. Similar to the proposed project, development proposed under Alternative 3 would result in a significant and unavoidable air quality impact because
4. Alternatives to the Proposed Project
Tulare County General Plan 2030 Update 4-25 ESA / 207497 Recirculated Draft Environmental Impact Report February 2010
growth would also contribute to air quality emissions that would exceed the annual SJVAPCD thresholds for NOx and ROG.
Biological Resources Development proposed under Alternative 3 would result in similar impacts to biological resources (compared to the proposed project) associated with the conversion of open space lands to developed uses. However, under this alternative, a slightly greater amount of land has the potential to be converted to urban uses compared to the same types of land uses that would be converted under the proposed project. As with the proposed project, this impact is still considered to be significant and unavoidable due to the proposed development on several acres of currently undeveloped land, which would result in the overall reduction of a plant or wildlife species habitat.
Cultural Resources Similar to the proposed project, development associated with future growth could damage or destroy a variety of previously undiscovered cultural resources during various construction-related activities. However, development proposed under this alternative would affect a slightly larger area and could result in potentially greater impacts to additional cultural resources within new development areas.
Energy and Climate Change Under Alternative 3, the County is expected to continue with current development patterns through the 2030 planning horizon, which would result in a slightly higher population level within a development footprint similar to that anticipated under the proposed project. Consequently, build-out under this alternative could result in a slightly greater number of overall jobs, dwelling units, and residents than the proposed project. These additional dwelling units and other types of development would result in increased levels of energy consumption and greenhouse gas emissions. Similar to the proposed project, development proposed under Alternative 3 would result in a significant and unavoidable impact because growth would still contribute to an increase in greenhouse gases that may conflict with the goal of the State to reduce up to 174 million metric tons CO2e/yr by 2020.
Geology and Soils Alternative 3 proposes development that is similar in nature to that anticipated under the proposed project. Current State and federal regulations require specific engineering and design criteria to minimize impacts related to geologic, soils, and seismic hazards, which would apply to local geologic/soil conditions under each of the alternatives and the proposed project. Policies and implementation measures included as part of the proposed project incorporate all applicable regulations to minimize these impacts. For this reason, geologic and soils impacts under Alternative 3 are considered similar to those of the proposed project.
Hazards and Hazardous Materials Alternative 3 proposes development that is similar in nature to that anticipated under the proposed project. Similar to the proposed project, implementation of this alternative would involve a decrease in the use of pesticides, herbicides, and other hazardous materials used for agricultural practices. Although hazards related to agricultural uses would be reduced, potential new commercial and
Tulare County General Plan 2030 Update
Tulare County General Plan 2030 Update 4-26 ESA / 207497 Recirculated Draft Environmental Impact Report February 2010
industrial uses may introduce new sources of hazardous materials. However, hazardous materials generation, storage and clean-up are heavily regulated by federal, State and local regulations that would apply to both Alternative 3 and the proposed project. For this reason, hazardous materials impacts under Alternative 3 are considered similar to those of the proposed project.
Hydrology and Water Quality Under Alternative 3, development has the potential to convert greater amounts of open space land to urban uses as those anticipated under the proposed project. As with the proposed project, the creation of impervious surfaces associated with urbanization would increase the amount of runoff, which could affect water quality. An increase in impervious surfaces could also reduce groundwater recharge potential. For these reasons, hydrologic and water quality impacts under Alternative 3 are considered similar to those of the proposed project.
Alternative 3 also proposes development in areas that are within the 100-year floodplain in a similar manner to the proposed project. Similarly, levees are regulated at the State level with maintenance activities delegated to local reclamation districts. The County has no jurisdiction and is limited in terms of alternatives to mitigate for these identified flood risks. Consequently, flood risk impacts are also considered to be significant and unavoidable.
Land Use and Planning Alternative 3 would result in additional development within the County than that anticipated under the proposed project. However, neither the proposed project nor Alternative 3 would divide existing communities and they would both be subject to the same policy direction with regards to ensuring land use compatibility with surrounding uses. Overall, this alternative would result in similar impacts to land use issues as those anticipated to occur with implementation of the proposed project.
Mineral Resources Alternative 3 would result in a slightly larger development footprint than the proposed project on lands similar to those affected by the General Plan Update. Overall, this alternative would result in similar impacts to mineral, timber, and oil resources as those anticipated to occur with implementation of the proposed project.
Noise Alternative 3 includes slightly higher levels of development that would be of a type similar to that anticipated under the proposed project. Similar to the proposed project, significant noise level increases (3 dBA Ldn or greater) associated with increased traffic and railroad operations would occur adjacent to existing noise sensitive land uses during the 20-year planning horizon (see Table 4-3). Overall, implementation of Alternative 3 would still result in a significant and unavoidable impact because growth would still contribute additional sources of noise and vibration that in some cases could exceed local standards.
4. Alternatives to the Proposed Project
Tulare County General Plan 2030 Update 4-27 ESA / 207497 Recirculated Draft Environmental Impact Report February 2010
Public Services, Facilities and Recreation Alternative 3 would be expected to result in slightly higher levels of development within the County. This development would require the expansion of a variety of local County services (including police, fire, water supply, parks, etc.) in addition to those provided by several local school districts. Because development proposed under this alternative would be similar to that anticipated under the proposed project (although slightly higher), public service and utility impacts are also anticipated to be similar. As described in Section 3.9 “Public Services, Recreation and Utilities”, the County is committed to implementing a variety of policies designed so that the County works with service providers and developers to ensure that adequate levels of service are available to support development within the County’s growth areas.
Transportation/Traffic Alternative 3 would result in slightly higher but similar types of development. Overall, total daily vehicle trips generated under this alternative would be greater than the proposed project for some roadways. However, Alternative 3 would still result in the same type of significant and unavoidable impacts on vehicular traffic as those identified for the proposed project, in that there would be some road segments operating at LOS E or F, and some of the improvements necessary to accommodate each alternative would be outside the County’s control and could not be guaranteed solely through the County’s actions. Because development proposed under this alternative would be similar to that anticipated under the proposed project (although slightly higher), transportation impacts are also anticipated to be greater within the County’s growth areas.
Alternative 4: Transportation Corridors Alternative The Transportation Corridors Alternative (Alternative 4) assumes that cities and communities along Highways 99 and 65 will accept additional population by increasing the density and developing contiguous land within their CACUDB or CACUAB. These communities and cities would also continue to provide sites for urban commercial services and industry.
As shown in Table 4-1, 70 percent of net new population growth is directed to incorporated cities, with the remaining 30 percent directed to the 20 unincorporated communities along with other rural areas of the County. The primary difference between this alternative and Alternative 3 is how the future growth is allocated within the unincorporated communities. Of the total amount distributed to the County, the majority of growth (estimated at 80%) would be allocated to the eight communities located on Highways 99 and 65. These eight communities are Ducor, Earlimart, Goshen, Pixley, Strathmore, Terra Bella, Tipton, and Traver. The remaining growth would be allocated within the other 12 unincorporated communities and County area.
Similar to the proposed project, Alternative 4 assumes that all of the proposed policies and implementation measures contained in the Goals and Policies Report (Part I of the General Plan Update) would be included as part of this alternative. However, policies within the Planning Framework Element would be modified or incorporate a number of strategies that would guide
Tulare County General Plan 2030 Update
Tulare County General Plan 2030 Update 4-28 ESA / 207497 Recirculated Draft Environmental Impact Report February 2010
development within the key communities located along SR 99 and 65. Some of these strategies would include:
• County limits rural residential development and concentrates unincorporated growth in communities.
• County commits to providing higher levels of services in eight transportation corridor communities.
• County provides for more commercial development in unincorporated communities. • County provides for more job growth in unincorporated communities. • County defines growth areas to avoid sprawl along corridors.
Ability to Meet Project Objectives A summary of Alternative 4’s ability to meet each of the project objectives is provided in Table 4-2. Under Alternative 4, the County would adopt the General Plan 2030 Update with slightly higher population growth assumptions that would focus growth within existing cities, communities and hamlet areas adjacent to the major transportation corridors in Tulare County, Highways 99 and 65. Because this alternative would include adoption of a comprehensive General Plan that includes updated goals and policies to help incorporate current planning, environmental, and regulatory trends and objectives, Alternative 4 would meet all objectives related to the protection of existing open space and agricultural land uses. The rural character of the county would be preserved since growth would be primarily focused along transportation corridors. Additionally, higher levels of anticipated growth and development and the opportunity to take advantage of highway commercial opportunities would help to promote reinvestment within existing communities and hamlets adjacent or near to the targeted highways. As with all the alternatives, it is assumed that the County would still continue to coordinate and cooperate with other local agencies and organizations on a variety of relevant land management issues regardless of whether the General Plan is updated or not.
Environmental Impacts of the Alternative The environmental impacts of the Transportation Corridors Alternative are summarized in Table 4-3 and described in greater detail below.
Aesthetics Under Alternative 4, the County is expected to continue with similar development patterns within the County’s growth areas which could result in a slightly higher population level (30% of new growth versus 25% under the proposed project). However, unlike the proposed project, new unincorporated County growth would be focused within the unincorporated communities along Highways 99 and 65. This alternative would only allow very minimal development of open space in rural areas of the County. However, development along transportation corridors would develop some open space and agricultural areas and would eliminate views of open space and agricultural landscapes currently found along these highways. Similar to the proposed project, Alternative 4 would result in a significant and unavoidable impact; however, given that growth is focused within specific areas
4. Alternatives to the Proposed Project
Tulare County General Plan 2030 Update 4-29 ESA / 207497 Recirculated Draft Environmental Impact Report February 2010
around transportation corridors, scenic resource and light and glare impacts would likely be intensified within these growth areas.
Agricultural Resources Data from the 2010 Background Report (Appendix B of this RDEIR) shows that a majority of the areas along Highways 99 and 65 contain a significant amount of important farmland. Consequently, transportation corridor development proposed under Alternative 4 would result in a significant impact to agricultural resources. This is because an additional number of acres of land designated as Prime, Unique or Farmland of Statewide Importance have the potential to be converted to urban uses under this alternative compared to the amount of farmland that would be converted to urban uses under the proposed project. Similar to the proposed project, Alternative 4 would also result in a significant and unavoidable impact, since there would be some conversion of important farmland to urbanized uses under this alternative.
Air Quality Under Alternative 4, slightly higher levels of growth would still occur within the County by 2030. Transportation corridor growth may reduce the overall number of vehicle miles driven; however city and community focused dwelling units and other types of development would still result in similar overall emission levels of both mobile and stationary sources of air quality emissions, toxic air contaminants, and the potential for odor emissions. Consequently, development proposed under Alternative 4 would still result in a significant and unavoidable impact because growth would still contribute to air pollutant emissions that could exceed the daily SJVAPCD thresholds for a variety of air pollutants.
Biological Resources Development proposed under Alternative 4 would result in similar impacts to biological resources (compared to the proposed project) through the conversion of open space lands, primarily cropland, vineyards, and grassland, to developed uses. However, under this alternative, conversion of land designated as natural or open space would be focused around the cities and communities located along Highways 99 and 65. Although a similar amount of natural or open space lands may be converted, Alternative 4 may result in less habitat fragmentation than the proposed project.
Cultural Resources Development proposed under this alternative would focus new growth within existing City and community areas along transportation corridors in the County, which could result in similar or greater impacts to historic resources located within existing urbanized areas than the proposed project. The intensification of land uses within and adjacent to the existing City limits or community boundaries may result in greater impacts to the design qualities of individual City neighborhoods and historic districts to those anticipated under the proposed project.
Tulare County General Plan 2030 Update
Tulare County General Plan 2030 Update 4-30 ESA / 207497 Recirculated Draft Environmental Impact Report February 2010
Energy and Climate Change Under Alternative 4, slightly higher levels of growth would occur within the County by 2030. Transportation corridor growth may slightly reduce the overall number of vehicle miles driven but this would be offset by the slightly higher level of growth accommodated. City and community transportation corridor focused dwelling units and other types of development would result in similar energy use and greenhouse gas emissions compared to the proposed project. Alternative 4 would also result in a significant and unavoidable impact because growth would still contribute to an increase in greenhouse gases that may conflict with the goal of the State to reduce up to 174 million metric tons CO2e/yr by 2020.
Geology and Soils Alternative 4 proposes development that is similar in nature to that anticipated under the proposed project. Current State and federal regulations require specific engineering and design criteria to minimize impacts related to geologic, soils, and seismic hazards, which would apply to local geologic/soil conditions under each of the alternatives and the proposed project. Policies and implementation measures included as part of the proposed project incorporate all applicable regulations to minimize these impacts. For this reason, geologic and soils impacts under Alternative 4 are considered similar to those of the proposed project.
Hazards and Hazardous Materials Alternative 4 proposes development that is similar in nature to that anticipated under the proposed project. Similar to the proposed project, implementation of this alternative would involve a decrease in the use of pesticides, herbicides, and other hazardous materials used for agricultural practices. Similar to the proposed project, hazardous materials generation, storage and clean-up are heavily regulated by federal, State and local regulations that would apply to both Alternative 4 and the proposed project. For this reason, hazardous materials impacts under Alternative 4 are considered to be similar to those of the proposed project.
Hydrology and Water Quality Under Alternative 4, development could convert more agricultural/open space land to urban uses than the proposed project. As with the proposed project, the creation of impervious surfaces associated with urbanization would increase the amount of runoff, which could affect water quality. An increase in impervious surfaces could also reduce groundwater recharge potential. However, because land conversion could be more than the proposed project, more impervious surfaces would be developed. Overall, hydrologic and water quality impacts under Alternative 4 are considered to be similar to those of the proposed project.
Alternative 4 also proposes development in areas that are within the 100-year floodplain in a similar manner to the proposed project. Similarly, levees are regulated at the State level with maintenance activities delegated to local reclamation districts. The County has no jurisdiction and is limited in terms of alternatives to mitigate for the identified flood risks. Consequently, flood risk impacts are also considered to be significant and unavoidable.
4. Alternatives to the Proposed Project
Tulare County General Plan 2030 Update 4-31 ESA / 207497 Recirculated Draft Environmental Impact Report February 2010
Land Use and Planning Alternative 4 would result in similar types of development as the proposed project. Implementation of this alternative would intensify development within and adjacent to city and community planning areas and would convert similar amounts of open space areas within the County to developed uses. Consequently, neither the proposed project nor Alternative 4 would divide existing communities and they would both be subject to the same policy direction with regards to ensuring land use compatibility with surrounding uses. Similar to the proposed project, this alternative would result in similar impacts to land use.
Mineral Resources Alternative 4 would result in about the same amount of development than the proposed project on lands similar to those affected by the proposed project. This alternative would result in similar impacts to mineral, timber, and oil resources.
Noise Development anticipated under Alternative 4 would be similar in nature to that anticipated under the proposed project. Similar to the proposed project, significant noise level increases (3 dBA Ldn or greater) associated with increased traffic and railroad operations would likely occur adjacent to existing noise sensitive land uses during the 20-year planning horizon. Overall, implementation of Alternative 4 would still result in a significant and unavoidable impact because growth could still contribute additional sources of noise and vibration that in some cases could exceed local standards.
Public Services, Facilities and Recreation Alternative 4 would be expected to result in similar levels of development within the County as would occur under the proposed project. Development under Alternative 4 would be directed adjacent to major transportation corridors and within or adjacent to existing cities and communities. However, anticipated levels of development would still require the expansion of a variety of local County services (including police, fire, water supply, parks, etc.) in addition to those provided by several local school districts. Overall, public service and utility impacts are also anticipated to be similar to the proposed project. As described in Section 3.9 “Public Services, Recreation and Utilities”, the County is committed to implementing a variety of policies designed so that the County works with service providers and developers to ensure that adequate levels of service are available to support development within the County’s growth areas.
Transportation/Traffic Alternative 4 would result in development within the planning areas of existing cities and communities adjacent to Highways 99 and 65. Overall, total daily vehicle trips generated under this alternative would be similar to those anticipated with the proposed project (see Table 4-3). However, Alternative 4 would focus growth and consequently more traffic within existing urban areas, which could see reductions in their local roadway levels of service. Implementation of Alternative 4 would still result in significant and unavoidable traffic impacts.
Tulare County General Plan 2030 Update
Tulare County General Plan 2030 Update 4-32 ESA / 207497 Recirculated Draft Environmental Impact Report February 2010
Alternative 5: Confined Growth Alternative Similar to the proposed project, Alternative 5 assumes that all of the proposed policies and implementation measures contained in the Goals and Policies Report (Part I of the General Plan Update) would be included as part of this alternative. The primary objective of this alternative is to minimize significant and unavoidable impacts to open space areas, agricultural lands, and aesthetic resources. Unlike the proposed project, growth under Alternative 5 would be directed to occur only within established CACUDB) and Hamlet Development Boundaries (HDB). A key assumption of Alternative 5 is that boundary expansion would only be allowed under a “no net gain” scenario. A “no net gain” scenario could allow modifications to the “hard boundaries”, which are defined by the CACUDBs and Hamlet Boundaries, only if these are offsetting equivalent deductions in boundaries elsewhere. Another opportunity for adjustments to boundaries could occur through transferring CACUDB capacity between cities and communities. Under this alternative, these growth patterns are assumed to continue through the entire 2030 planning horizon, with total unincorporated population being similar to the anticipated population under the proposed project (see Table 4-1).
Under Alternative 5, the General Plan 2030 Update would incorporate some land use strategies that would require greater land use efficiency standards for development on important farmlands and promote increased densities and mixed use areas within developed areas. These strategies would be integrated into the policies and implementation measures of the Goals and Policies Report (Part I of the General Plan Update) in order to direct growth within existing CACUDBs and Hamlet Boundaries. Elements of the General Plan that could incorporate these strategies include the Planning Framework, Agriculture, Land Use, Environmental Resources Management, and Public Facilities and Services Elements. Expansion of CACUDBs or Hamlet Boundaries without offsets would only be allowed under extenuating circumstances. Criteria for expansions might include:
• Mandatory agriculture impact fees for important farmlands added to Urban Development Boundaries.
• Significant job generation projects or projects of regional importance (such as a four year college).
• Regional growth corridors which involve high density mixed use as well as commercial or industrial opportunities.
• Boundary adjustments where Master Planning efforts demonstrate exemplary land use efficiency standards above and beyond base standards.
• Boundary expansion is consistent with the San Joaquin Valley Regional Blueprint.
However, no boundary adjustments would be permitted unless it can be demonstrated that land use efficiency standards (to be set in the General Plan Update) have been or can be met. No new towns would be allowed on important farmland unless equivalent capacity is transferred from CACUDBs or HDBs through mechanisms such as purchase and transfer of development rights to offset the loss of important farmland.
4. Alternatives to the Proposed Project
Tulare County General Plan 2030 Update 4-33 ESA / 207497 Recirculated Draft Environmental Impact Report February 2010
The hard boundaries concept would link well with the intent of the San Joaquin Valley Regional Blueprint to protect important agricultural resource areas and natural habitats. County cooperation with and input from LAFCo, municipalities, and special districts would be integral in implementing the County’s General Plan and achieving the goals of this alternative.
Ability to Meet Project Objectives A summary of Alternative 5’s ability to meet each of the proposed project objectives is provided in Table 4-2. Under Alternative 5, mechanisms would be put in place that insure the existing capacity for development already present in the existing General Plan is used efficiently and smartly under the General Plan Update. It would meet all the objectives with respect to protection of existing open space and agricultural resources in a more efficient manner than the other alternatives. It would accommodate the high levels of anticipated growth and development and help to promote a greater interest in reinvestment within existing communities and hamlets.
Environmental Impacts of the Alternative The environmental impacts are likely to be most similar to Alternative 2 with the exception that it would result in greater protection of agricultural resources.
Aesthetics Alternative 5 would result in similar types of development with a smaller footprint than that anticipated under the proposed project. City-centered growth would focus a majority of the County’s new growth within existing urban areas and would convert less County open space areas to developed uses. Development of less County open space would result in less impacts to existing County scenic landscapes. However, similar to the proposed project, Alternative 5 would still result in a significant and unavoidable impact, since there would be some level of future development that would affect existing scenic landscapes. Light and glare impacts would also be lessened under this alternative. However the resultant impact would also be similar to the proposed project.
Agricultural Resources Confined growth development proposed under Alternative 5 would result in a reduced impact to agricultural resources compared to the proposed project. Because of “hard boundaries” limiting the outward growth of cities and communities and other land use controls, a fewer number of acres of land designated as Prime, Unique or Farmland of Statewide Importance would be converted to urban uses under this alternative compared to the amount of important farmland that would be converted to urban uses under the proposed project. However, similar to the proposed project, Alternative 5 would also result in a significant and unavoidable impact, since there would be some conversion of important farmland to urbanized uses under this alternative.
Air Quality Under Alternative 5, similar levels of growth would still occur within the County by 2030. Confined growth may reduce the overall number of vehicle miles driven; however city focused dwelling units and other types of development would still result in similar overall emission levels of both mobile
Tulare County General Plan 2030 Update
Tulare County General Plan 2030 Update 4-34 ESA / 207497 Recirculated Draft Environmental Impact Report February 2010
and stationary sources of air quality emissions, toxic air contaminants, and the potential for odor emissions. Consequently, development proposed under Alternative 5 would still result in a significant and unavoidable impact because growth would still contribute to air pollutant emissions that could exceed annual SJVAPCD thresholds for a variety of air pollutants.
Biological Resources Development proposed under Alternative 5 would result in similar impacts to biological resources (compared to the proposed project) through the conversion of open space lands to developed uses. However, because of the “hard boundaries” utilized under this alternative, a fewer number of acres of land designated as natural or open space would be converted to urban uses compared to the same types of land uses that would be converted under the proposed project.
Cultural Resources Development proposed under Alternative 5 would focus new growth within existing City areas, which could result in similar or greater impacts to historic resources located within existing urbanized areas. The intensification of land uses within the existing City limits may result in greater impacts to the design qualities of individual City neighborhoods and historic districts to those anticipated under the proposed project.
Energy and Climate Change Under Alternative 5, confined growth may reduce the overall number of vehicle miles driven; however, city focused dwelling units and other types of development would result in similar energy consumption and greenhouse gas emission levels for buildings and mobile and stationary sources. Consequently, development proposed under Alternative 5 would still result in a significant and unavoidable impact because growth would still contribute to an increase in greenhouse gases that may conflict with the goal of the State to reduce up to 174 million metric tons CO2e/yr by 2020.
Geology and Soils Alternative 5 proposes development that is similar in nature to that anticipated under the proposed project. Current State and federal regulations require specific engineering and design criteria to minimize impacts related to geologic, soils, and seismic hazards, which would apply to local geologic/soil conditions under each of the alternatives and the proposed project. Policies and implementation measures included as part of the proposed project incorporate all applicable regulations to minimize these impacts. For this reason, geologic and soils impacts under Alternative 5 are considered similar to those of the proposed project.
Hazards and Hazardous Materials Alternative 5 proposes development that is similar in nature to that anticipated under the proposed project. Similar to the proposed project, hazardous materials generation, storage and clean-up are heavily regulated by federal, State and local regulations that would apply to both Alternative 5 and
4. Alternatives to the Proposed Project
Tulare County General Plan 2030 Update 4-35 ESA / 207497 Recirculated Draft Environmental Impact Report February 2010
the proposed project. For this reason, hazardous materials impacts under Alternative 5 are considered to be similar to those of the proposed project.
Hydrology and Water Quality Under Alternative 5, development would convert less open space land to urban uses than the proposed project. As with the proposed project, the creation of impervious surfaces associated with urbanization would increase the amount of runoff, which could affect water quality. An increase in impervious surfaces could also reduce groundwater recharge potential. However, because land conversion would be less than the proposed project, fewer impervious surfaces would be developed. Overall, hydrologic and water quality impacts under Alternative 5 are considered to be similar to those of the proposed project.
Alternative 5 also proposes development in areas that are within the 100-year floodplain in a similar manner to the proposed project. Similarly, levees are regulated at the State level with maintenance activities delegated to local reclamation districts. The County has no jurisdiction and is limited in terms of alternatives to mitigate for the identified flood risks. Consequently, flood risk impacts are also considered to be significant and unavoidable.
Land Use and Planning Alternative 5 would result in similar types of development. However, implementation of this alternative would intensify development within City planning areas and would convert less open space areas within the County to developed uses. Consequently, neither the proposed project nor Alternative 5 would divide existing communities and they would both be subject to the same policy direction with regards to ensuring land use compatibility with surrounding uses.
Mineral Resources Alternative 5 would result in slightly less development than the proposed project on lands similar to those affected by the proposed project. Similar to the proposed project, this alternative would result in similar impacts to mineral, timber, and oil resources.
Noise Although Alternative 5 includes a slightly reduced development footprint, development anticipated under this alternative would be similar in nature to that anticipated under the proposed project. Similar to the proposed project, significant noise level increases (3 dBA Ldn or greater) associated with increased traffic and railroad operations would likely occur adjacent to existing noise sensitive land uses during the 20-year planning horizon. Overall, implementation of Alternative 5 would still result in a significant and unavoidable impact because growth could still contribute additional sources of noise and vibration that in some cases could exceed local standards.
Public Services, Facilities and Recreation Alternative 5 would be expected to result in lower levels of development within the County. However, anticipated levels of development would still require the expansion of a variety of local County
Tulare County General Plan 2030 Update
Tulare County General Plan 2030 Update 4-36 ESA / 207497 Recirculated Draft Environmental Impact Report February 2010
services (including police, fire, water supply, parks, etc.) in addition to those provided by several local school districts. Overall, public service and utility impacts are also anticipated to be similar.
Transportation/Traffic Alternative 5 would result in the intensification of similar types of development within the planning areas of existing cities. Overall, total daily vehicle trips generated under this alternative would be similar to those anticipated with the proposed project (see Table 4-3). However, Alternative 5 would focus growth and consequently more traffic within existing urban areas, which could see reductions in their local roadway levels of service. Implementation of Alternative 5 would still result in significant and unavoidable traffic impacts.
4.4 Environmentally Superior Alternative As previously described, Table 4-3 provides a summary of the anticipated impacts resulting from implementation of the alternatives compared to those identified for the proposed project. As summarized in the table, the environmentally superior alternative for this project would be Alternative 5 (Confined Growth Alternative). Other than the No Project Alternative, this is the only alternative that would reduce the severity of most environmental impacts associated with the proposed project. As described above, build-out of Alternative 5 would convert less open space and prime agricultural farmland than the proposed project. This alternative also has the potential to result in fewer impacts to scenic resources. However, as shown in Table 4-3, implementation of Alternative 5 would still result in significant and unavoidable impacts to biological, agricultural, air quality, greenhouse gas emissions, and traffic resources.
Tulare County General Plan 2030 Update 5-1 ESA / 207497 Recirculated Draft Environmental Impact Report February 2010
CHAPTER 5.0 Additional Statutory Considerations
5.1 Introduction CEQA requires analysis of the growth inducing impacts, cumulative impacts, and long-term effects of proposed projects. The following sections address these issues as the relate to implementation of the County’s proposed General Plan Update.
5.2 Growth Inducing Effects of the Proposed Project
Introduction The CEQA Guidelines require that an EIR evaluate the growth-inducing impacts of a proposed action (Section 15126.2[d]). A growth-inducing impact is defined by the CEQA Guidelines as:
[T]he ways in which the proposed project could foster economic or population growth, or the construction of additional housing, either directly or indirectly, in the surrounding environment. Included in this are projects which would remove obstacles to population growth ... It must not be assumed that growth in any area is necessarily beneficial, detrimental, or of little significance to the environment.
A project can have direct and/or indirect growth-inducement potential. Direct growth inducement would result if a project involved construction of new housing. A project can have indirect growth-inducement potential if it would establish substantial new permanent employment opportunities (e.g., commercial, industrial or governmental enterprises) or if it would involve a substantial construction effort with substantial short-term employment opportunities and indirectly stimulate the need for additional housing and services to support the new employment demand. Similarly, under CEQA, a project would indirectly induce growth if it would remove an obstacle to additional growth and development, such as removing a constraint on a required public service. An example of this indirect effect would be the expansion of a wastewater treatment plant, which might allow for more development in service areas.
Potential for Growth-Inducement The purpose of a general plan is to guide the growth and development of a community. Accordingly, the County’s proposed General Plan 2030 Update is premised on a certain amount of growth taking place. Cities within the County, Tulare County, as well as the larger San Joaquin Valley region, have experienced dramatic growth over the past decade and this trend is expected to continue.
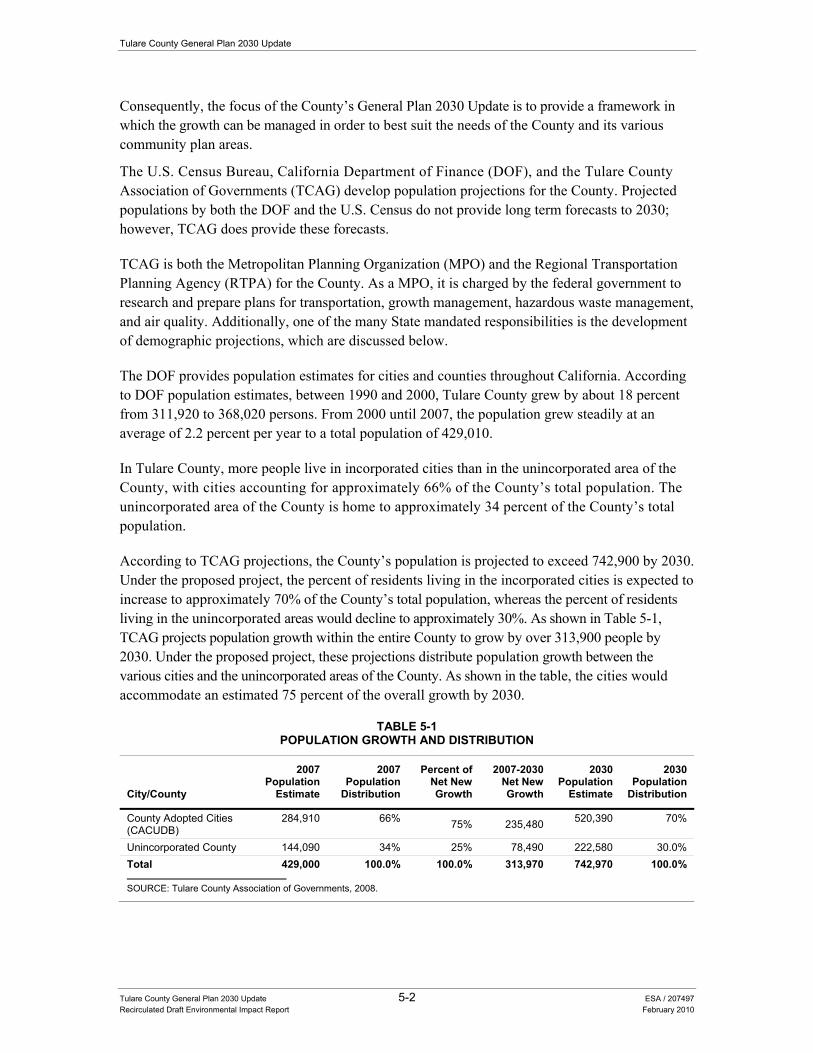
Tulare County General Plan 2030 Update
Tulare County General Plan 2030 Update 5-2 ESA / 207497 Recirculated Draft Environmental Impact Report February 2010
Consequently, the focus of the County’s General Plan 2030 Update is to provide a framework in which the growth can be managed in order to best suit the needs of the County and its various community plan areas.
The U.S. Census Bureau, California Department of Finance (DOF), and the Tulare County Association of Governments (TCAG) develop population projections for the County. Projected populations by both the DOF and the U.S. Census do not provide long term forecasts to 2030; however, TCAG does provide these forecasts.
TCAG is both the Metropolitan Planning Organization (MPO) and the Regional Transportation Planning Agency (RTPA) for the County. As a MPO, it is charged by the federal government to research and prepare plans for transportation, growth management, hazardous waste management, and air quality. Additionally, one of the many State mandated responsibilities is the development of demographic projections, which are discussed below.
The DOF provides population estimates for cities and counties throughout California. According to DOF population estimates, between 1990 and 2000, Tulare County grew by about 18 percent from 311,920 to 368,020 persons. From 2000 until 2007, the population grew steadily at an average of 2.2 percent per year to a total population of 429,010.
In Tulare County, more people live in incorporated cities than in the unincorporated area of the County, with cities accounting for approximately 66% of the County’s total population. The unincorporated area of the County is home to approximately 34 percent of the County’s total population.
According to TCAG projections, the County’s population is projected to exceed 742,900 by 2030. Under the proposed project, the percent of residents living in the incorporated cities is expected to increase to approximately 70% of the County’s total population, whereas the percent of residents living in the unincorporated areas would decline to approximately 30%. As shown in Table 5-1, TCAG projects population growth within the entire County to grow by over 313,900 people by 2030. Under the proposed project, these projections distribute population growth between the various cities and the unincorporated areas of the County. As shown in the table, the cities would accommodate an estimated 75 percent of the overall growth by 2030.
TABLE 5-1POPULATION GROWTH AND DISTRIBUTION
City/County
2007 Population
Estimate
2007 Population
Distribution
Percent of Net New Growth
2007-2030 Net New Growth
2030 Population
Estimate
2030 Population
Distribution
County Adopted Cities (CACUDB)
284,910 66% 75% 235,480 520,390 70%
Unincorporated County 144,090 34% 25% 78,490 222,580 30.0% Total 429,000 100.0% 100.0% 313,970 742,970 100.0%
SOURCE: Tulare County Association of Governments, 2008.
5. Additional Statutory Considerations
Tulare County General Plan 2030 Update 5-3 ESA / 207497 Recirculated Draft Environmental Impact Report February 2010
Direct Impacts As discussed in this recirculated Draft EIR, during the next 20 years, implementation of the proposed project would induce some of the population and housing growth in the County, in part because it directs future development to the cities and future growth areas (i.e., CACUDBs, HDBs, and CACUABs) that comprise the County. As identified in Section 3.1 “Land Use and Aesthetics”, the proposed project provides goals and policies to maintain the character of the County and minimize the environmental impacts of the anticipated growth. Proposed policies are intended to be obtainable and as such, take into account market conditions and realistic growth assumptions that are consistent with the land use principles/concepts of the region and discourage undesirable development in areas with sensitive natural resources, critical habitats and important scenic resources. In addition, the proposed project encourages the orderly growth of new development to occur in areas adjacent to existing urban uses and requires developers to provide service extensions.
As a result, while the proposed project would result in an increase of growth locally, the policies included in the proposed project reduce the potential for negative impacts associated with directly induced growth. However, because this growth resulting from the proposed project would still significantly affect existing resource conditions (including air quality, open space and agricultural land, visual resources, etc.) the direct growth inducing impacts of the General Plan 2030 Update are also considered significant and unavoidable.
Indirect Impacts While the proposed project does allow additional growth, it also includes specific policies that focus growth within existing communities and hamlet areas. The proposed project does this to focus new residential growth within existing areas that currently provide a mixture of housing, shopping and employment opportunities so that as the number of residents increase they do not pressure adjacent rural areas to provide new commercial and employment opportunities. Also, as previously stated in Section 3.9 “Public Services, Recreation and Utilities”, commitments to provide water and sewer infrastructure would be limited to areas within the areas currently served by existing service providers. As a result, the Draft General Plan policies would strive to contain growth within existing community areas. However, the County’s proposed policies would not preclude other surrounding jurisdictions from developing areas adjacent to the County or prevent existing cities from expanding their sphere of influences. Consequently, indirect growth inducing impacts of the General Plan 2030 Update are also considered significant and unavoidable.
5.3 Summary of Cumulative Impacts
Introduction CEQA Guidelines Section 15130(a) requires that an EIR discuss the cumulative impacts of a project when the project’s incremental effect is “cumulatively considerable,” meaning that the project’s incremental effects are considerable when viewed in connection with the effects of past, current, and probable future projects. A consideration of actions included as part of a cumulative impact
Tulare County General Plan 2030 Update
Tulare County General Plan 2030 Update 5-4 ESA / 207497 Recirculated Draft Environmental Impact Report February 2010
scenario can vary by geographic extent, time frame, and scale. They are defined according to environmental resource issue and the specific significance level associated with potential impacts. CEQA Guidelines 15130(b) requires that discussions of cumulative impacts reflect the severity of the impacts and their likelihood of occurrence. The CEQA Guidelines note that the cumulative impacts discussion does not need to provide as much detail as is provided in the analysis of project-only impacts and should be guided by the standards of practicality and reasonableness and focus on the cumulative impact to which the identified other projects contribute rather than the attributes of other projects which do not contribute to the cumulative impacts.
In addition, the CEQA Guidelines Section 15130(b) allows for the use of two alternative methods to determine the scope of projects for the cumulative impact analysis:
• List Method – A list of past, present, and probable future projects producing related or cumulative impacts, including, if necessary, those projects outside the control of the agency.
• Regional Growth Projections Method – A summary of projects contained in an adopted general plan or related planning document or in a prior environmental document which has been adopted or certified, which described or evaluated regional or area wide conditions contributing to the cumulative impact.
The proposed project establishes policy to guide future development within the County, and implementation is long-term in nature. The Regional Growth Projections Method is considered an appropriate methodology for evaluating cumulative impacts because it provides overall growth projections for the region over the long-term.
Cumulative Setting For the purposes of this recirculated draft Environmental Impact Report (RDEIR), the cumulative setting is based on a two-fold approach. For some impact issue areas (i.e., air quality, traffic, and water supply), the cumulative setting is defined by specific regional boundaries (air basin, regional roadway network, etc.) or projected regional or area-wide conditions, contributing to cumulative impacts. For the remaining impact issue areas, the cumulative setting is based on development anticipated within the County and the surrounding counties.
The overall assumption of the analysis in this RDEIR is that the majority (85%) of the net new growth will occur within incorporated city and CACUDBs as opposed to within the unincorporated areas, which will contain a much smaller (15%) portion of the net new growth. This distribution of growth is shown in Table 5-1 and Table 2-11 of Chapter 2 of this RDEIR.
The analysis is based primarily on a summary of projections provided by the Tulare County Association of Governments (TCAG). Projections for the surrounding counties of Fresno, Kings, and Kern as well as the cities of Kingsburg and Delano are based on projections provided by the Department of Finance. Table 5-2 identifies the long range planning efforts for each of the jurisdictions considered in the regional growth projections method of analysis. Cumulative impacts were also evaluated in their respective environmental documents.
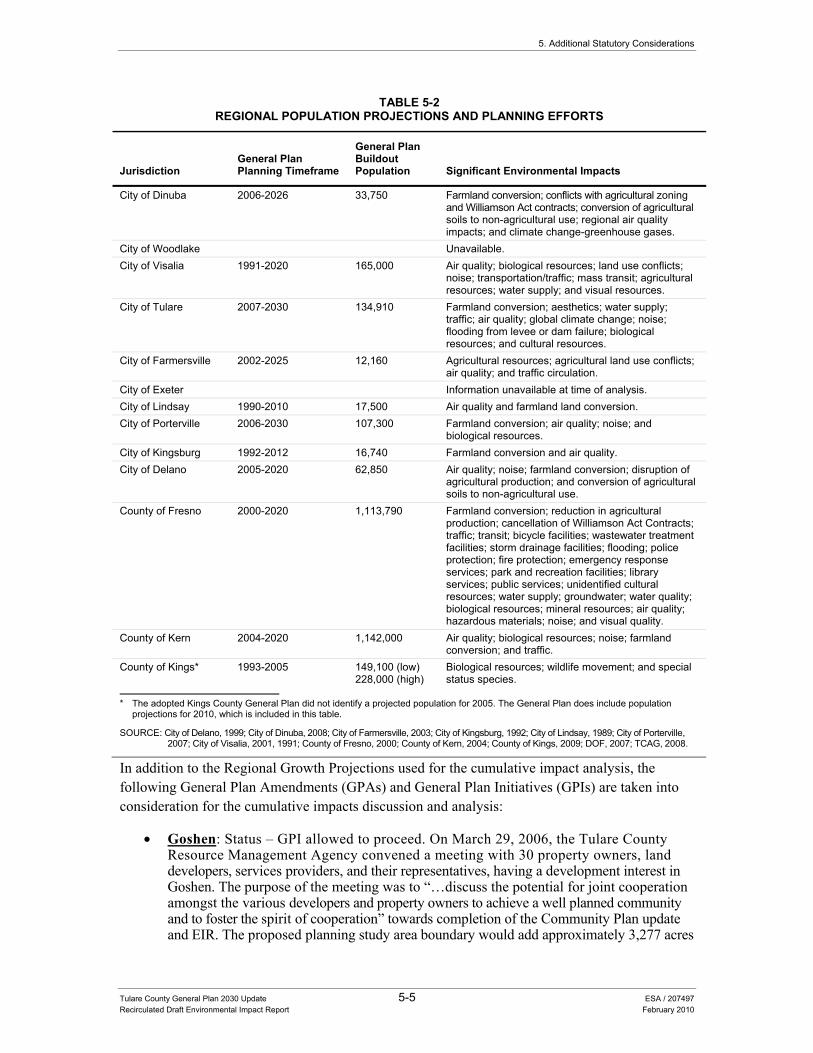
5. Additional Statutory Considerations
Tulare County General Plan 2030 Update 5-5 ESA / 207497 Recirculated Draft Environmental Impact Report February 2010
TABLE 5-2REGIONAL POPULATION PROJECTIONS AND PLANNING EFFORTS
Jurisdiction General Plan Planning Timeframe
General Plan Buildout Population Significant Environmental Impacts
City of Dinuba 2006-2026 33,750 Farmland conversion; conflicts with agricultural zoning and Williamson Act contracts; conversion of agricultural soils to non-agricultural use; regional air quality impacts; and climate change-greenhouse gases.
City of Woodlake Unavailable. City of Visalia 1991-2020 165,000 Air quality; biological resources; land use conflicts;
noise; transportation/traffic; mass transit; agricultural resources; water supply; and visual resources.
City of Tulare 2007-2030 134,910 Farmland conversion; aesthetics; water supply; traffic; air quality; global climate change; noise; flooding from levee or dam failure; biological resources; and cultural resources.
City of Farmersville 2002-2025 12,160 Agricultural resources; agricultural land use conflicts; air quality; and traffic circulation.
City of Exeter Information unavailable at time of analysis. City of Lindsay 1990-2010 17,500 Air quality and farmland land conversion. City of Porterville 2006-2030 107,300 Farmland conversion; air quality; noise; and
biological resources. City of Kingsburg 1992-2012 16,740 Farmland conversion and air quality. City of Delano 2005-2020 62,850 Air quality; noise; farmland conversion; disruption of
agricultural production; and conversion of agricultural soils to non-agricultural use.
County of Fresno 2000-2020 1,113,790 Farmland conversion; reduction in agricultural production; cancellation of Williamson Act Contracts; traffic; transit; bicycle facilities; wastewater treatment facilities; storm drainage facilities; flooding; police protection; fire protection; emergency response services; park and recreation facilities; library services; public services; unidentified cultural resources; water supply; groundwater; water quality; biological resources; mineral resources; air quality; hazardous materials; noise; and visual quality.
County of Kern 2004-2020 1,142,000 Air quality; biological resources; noise; farmland conversion; and traffic.
County of Kings* 1993-2005 149,100 (low) 228,000 (high)
Biological resources; wildlife movement; and special status species.
* The adopted Kings County General Plan did not identify a projected population for 2005. The General Plan does include population
projections for 2010, which is included in this table.
SOURCE: City of Delano, 1999; City of Dinuba, 2008; City of Farmersville, 2003; City of Kingsburg, 1992; City of Lindsay, 1989; City of Porterville, 2007; City of Visalia, 2001, 1991; County of Fresno, 2000; County of Kern, 2004; County of Kings, 2009; DOF, 2007; TCAG, 2008.
In addition to the Regional Growth Projections used for the cumulative impact analysis, the following General Plan Amendments (GPAs) and General Plan Initiatives (GPIs) are taken into consideration for the cumulative impacts discussion and analysis:
• Goshen: Status – GPI allowed to proceed. On March 29, 2006, the Tulare County Resource Management Agency convened a meeting with 30 property owners, land developers, services providers, and their representatives, having a development interest in Goshen. The purpose of the meeting was to “…discuss the potential for joint cooperation amongst the various developers and property owners to achieve a well planned community and to foster the spirit of cooperation” towards completion of the Community Plan update and EIR. The proposed planning study area boundary would add approximately 3,277 acres
Tulare County General Plan 2030 Update
Tulare County General Plan 2030 Update 5-6 ESA / 207497 Recirculated Draft Environmental Impact Report February 2010
to the existing Goshen UDB, as opposed to the Draft Goshen Community Plan UDB which adds 422 acres using a needs-based analysis patterned on historical growth trends extrapolated 20 years into the future. The revised boundary incorporates the GPI applicants’ lands, the hamlet of West Goshen, and additional land to be held in reserve for future growth. The applicant’s land excluding Mangano’s “Westfield” totals 661 acres. The area is bounded in the north by Avenues 320 and 312, taking in West Goshen; in the west by Roads 52 and 56; in the south by State Hwy. 198; and in the east by Camp Road and Road 76 at the City of Visalia Sphere of Influence. This ‘study’ area will be the focus of technical analysis that will set a proposed Urban Development Boundary in which build-out will be contemplated for preparation of the new Goshen Community Plan, EIR and Infrastructure Master Plan. Since the study area involves lands not owned or controlled by the developers, the MOU agreement to be negotiated will contain a provision to reimburse the developers for expenses incurred when development authorized by the new plan occurs.
• Yokohl Ranch: Status – GPI allowed to proceed in February 2007. On September 13, 2005, the Tulare County Resource Management Agency received a request from the J.G. Boswell Company and the Eastlake Company, to initiate the formal process to amend the Tulare County General Plan, including the Foothill Growth Management Plan (FGMP), to change the land use designation for the 36,000 acre Yokohl Ranch property from ‘Extensive Agriculture’ to ‘Planned Community Area’. According to the applicants, the proposed amendment will result in master planned communities that balance the needs for housing, neighborhood commercial uses, recreation, ranching operations and open space. As such, 40% (14,400 acres) of the ranch is proposed for development with 60% (21,600 acres) of the property to remain as untouched open space and ranchlands. The developed portions of the ranch will include the Village of Yokohl Ranch, an active adult community accessible to Yokohl Drive; and a Ranch Resort Lodge Enclave located in the northern reaches of the site, approximately four miles south of Lake Kaweah.
• Rancho Sierra: Status – GPA approved. The project site consists of 114.6 acres. The site was a golf course facility located on both sides of Liberty Avenue (Avenue 264), east of Road 124, south of the city of Visalia. There are 30 existing homes within the golf course area but not a part of this application. The intended use is to subdivide the site into 175 single family residential lots. The project has been approved.
• Earlimart: Status – GPI allowed to proceed January 2006. On September 9, 2005, the Tulare County Resource Management Agency received a request from the Earlimart Development Group, a land development partnership comprised of four business owners with interests in 1,491 acres of private property located both within and outside of the existing Earlimart Urban Development Boundary. The Group is seeking authorization to file an amendment to the Tulare County General Plan, specifically the Earlimart Community Plan (1988). In addition to an updated Community Plan, an Infrastructure Master Plan and Program EIR for the update will also be prepared. The applicants proposed that a 7,680 acre planning study area be established. The area is bounded in the north by Avenue 68 (Deer Creek as a natural boundary), in the south by Avenue 36 (White River as a natural boundary), in the east by Road 144, and in the west by Road 120. This ‘study’ area will be the focus of technical analysis that will set the proposed Community Plan boundary for which the new Community Plan, EIR and Infrastructure Master Plan will be prepared. Since the study area involves lands not owned or controlled by the Development Group, the MOU agreement to be negotiated will contain a provision to reimburse the Development Group for expenses when development authorized by the new plan occurs. The Earlimart Development Group has indicated that they have contracts with the consulting firms of Hogle-Ireland, Inc., Provost & Pritchard Engineering Group, Inc. and TPG Consulting or other environmental consulting firm, to prepare the General Plan amendment. However, it is important that preparation of the EIR be managed by the County as Lead Agency for the project.
5. Additional Statutory Considerations
Tulare County General Plan 2030 Update 5-7 ESA / 207497 Recirculated Draft Environmental Impact Report February 2010
The following section evaluates the potential for the proposed project to contribute significantly to cumulative impacts.
Cumulative Impacts Cumulative Impacts Related to Land Use and Aesthetics Land Use As the primary planning document for the County, the proposed project provides direction for growth and development within the County as well goals and policies that direct the County to coordinate such growth and development so that it does not conflict with other applicable plans and regulations. Therefore, the proposed project would have a less than significant impact in relation to most potential conflicts with other applicable plans, policies and regulations.
Aesthetics As noted previously (see Section 3.1, “Land Use and Aesthetics”), growth associated with implementation of the proposed project along with development within CACUDBs would result in changes to the visual character of the County from a more agricultural/rural setting to one that is more characterized by suburban or urban uses (i.e., streets, homes, and neighborhood shopping centers), with increased light and glare sources. As more fully described in Section 3.1, “Land Use and Aesthetics”, despite the proposed policies and actions incorporated into the proposed project and implementation of adopted State and County regulations that enhance the County’s current community character and preserve open space, development permitted under the proposed project would result in a significant impact to the existing visual identity and character of the County due to the amount of growth allowed.
Similarly, development associated with the anticipated regional growth would result in a substantial change to the visual character of the surrounding area of the County. Continual urbanization of existing agriculture and open space land has the potential to permanently alter the character of the area. State and local regulations, such as the State Scenic Highway guidelines mitigate some potential impacts along scenic corridors by preserving views and open space land. However, the proposed project combined with the overall growth trends in the surrounding counties and the cities that comprise Tulare County would contribute considerably to cumulative aesthetic impacts (including additional sources of light and glare) which would transform the region from an agricultural/rural character to a more suburban setting and thus, would result in a cumulative significant and unavoidable aesthetic impact.
Cumulative Impacts to Traffic and Circulation Cumulative traffic and transportation impacts of the proposed project are more fully described in Section 3.2 “Transportation and Circulation” of this Draft EIR. Section 3.2 describes how the transportation analysis for the proposed project is inherently cumulative in nature, in that implementation of the proposed project would take place over many years and would occur in conjunction with other growth and development throughout the region.
Tulare County General Plan 2030 Update
Tulare County General Plan 2030 Update 5-8 ESA / 207497 Recirculated Draft Environmental Impact Report February 2010
As with the impacts identified in Section 3.2, the physical improvements identified in the proposed project would require cooperation and funding from a variety of entities outside the County, so implementation of the improvements cannot be guaranteed solely through the County’s actions. Thus, for the same reasons as presented in Impact 3.3-1, these cumulative effects are considered significant and unavoidable. The proposed project’s incremental contribution to these impacts will be cumulatively considerable.
Cumulative Impacts Related to Air Quality Cumulative air quality impacts were considered in terms of the various land uses proposed under the proposed project (including residential, commercial, agricultural, etc.) and the traffic projections generated by a cumulative traffic model. The traffic model considered growth under the proposed project in conjunction with projected regional growth for the TCAG jurisdictional boundaries. As more fully described in Section 3.3 “Air Quality”, due to the existing and projected air quality issues in the San Joaquin Valley Air Basin, the proposed project would contribute considerably to a significant and unavoidable cumulative air quality impact.
Cumulative Impacts Related to Energy and Global Climate Change The energy and climate change impacts of the proposed project are discussed in Section 3.4, “Energy and Global Climate Change”. Impacts 3.4.1 and 3.4.2 identify the proposed project’s potential impacts to energy consumption as less than significant impacts. However, the amount of energy potentially consumed subsequent to the proposed project is cumulatively considerable. Implementation of new policies ERM-4.7 “Reduce Energy Use in County Facilities” and ERM-4.8 “Energy Efficiency Standards” along with other General Plan policies that aim to reduce energy consumption would reduce these impacts to a less than significant cumulative impact.
Impact 3.4.3 describes the proposed project’s potential conflict with the stated goal of reducing greenhouse gas emissions in California to 1990 levels by 2020 and identifies this as a potentially significant impact. Climate change impacts are inherently cumulative in nature. The proposed project plans for growth in the County to occur through 2030. Consequently, the proposed project’s greenhouse gas emissions would be cumulatively considerable and would conflict with the greenhouse gas emissions reduction goals of AB 32. While the proposed project would implement a number of policies, including new policies AQ-1.8 “Greenhouse Gas Emissions Reduction Plan/Climate Action Plan”, AQ-1.9 “Support Off-Site Measures to Reduce Greenhouse Gas Emissions”, and new measures AQ Implementation Measure #16 (County development and maintenance of a climate action plan) and #17 (ongoing inspection of County facilities to evaluate energy use, water conservation effectiveness, etc.), that would reduce greenhouse gas emissions and assist in meeting the goals of AB 32, the proposed project’s contribution to climate change would remain cumulatively considerable.
Cumulative Impacts to Noise Traffic-related cumulative noise impacts are considered as part of the noise analysis provided in Section 3.5 “Noise” since the future traffic projections used for the noise analysis were generated by a traffic model that considered growth under the proposed project in conjunction with the projected
5. Additional Statutory Considerations
Tulare County General Plan 2030 Update 5-9 ESA / 207497 Recirculated Draft Environmental Impact Report February 2010
regional growth for the TCAG planning area. As discussed in detail in Section 3.5, future noise level increases related to increases in traffic associated with new or improved roadways facilitated by the proposed project would result in an overall significant and unavoidable noise impact at the project-level and cumulative level.
Cumulative Impacts to Public Services, Recreation and Utilities The following provides a cumulative analysis broken down by each category of service or utility.
Solid Waste Population growth within Tulare County and the greater San Joaquin Valley region would contribute to the need for adequate solid waste disposal facilities. It is assumed that existing waste disposal companies would continue to maximize the use of existing disposal options and plan for future waste disposal opportunities once existing disposal options reach their capacity. However, because of the uncertain availability of where and what these future waste disposal options may be by 2030, this impact remains significant and unavoidable at the project-level and cumulative level.
Fire Protection and Emergency Medical Services Future regional growth would result in increased demand for fire services throughout the County and the greater San Joaquin Valley. As discussed in Section 3.9 “Public Services, Recreation and Utilities”, the County will implement a variety of policies designed to address the adequate provision of a variety of public services as part of the proposed project. The analysis contained in Section 3.9 for the proposed project took into consideration the potential growth within the area that would be provided emergency services by the County and no significant impact was identified in regards to the provision of fire protection and emergency medical services. Therefore, the proposed project would not contribute considerably to a significant cumulative impact associated with fire protection and emergency medical services.
Law Enforcement Service Future regional growth would result in a need for expanded law enforcement service throughout Tulare County and the greater San Joaquin Valley region. As discussed in Section 3.9 “Public Services, Recreation and Utilities”, the County will implement a variety of policies designed to address the adequate provision of a variety of public services as part of the proposed project. The analysis contained in Section 3.9 for the proposed project took into consideration the potential growth within the area that would be provided law enforcement service by the County and no significant impact was identified in regards to the provision of these services. Therefore, the proposed project would not contribute considerably to a significant cumulative impact associated with law enforcement services.
Schools Future regional growth would result in increased demand for schools throughout the County and the greater San Joaquin Valley region. For some of the County’s various school districts, growth within the County would be the primary source of demand for additional school facilities. As with
Tulare County General Plan 2030 Update
Tulare County General Plan 2030 Update 5-10 ESA / 207497 Recirculated Draft Environmental Impact Report February 2010
the project-level analysis, it is unknown exactly where these school facilities would occur to support the cumulative increase in population resulting from growth within and surrounding the County. As specific school facility expansion or improvement projects are identified, additional project-specific, second-tier environmental analysis would be completed on a case by case basis. Additionally, the payment of school impacts fees (pursuant to SB 50), is deemed as a matter of law to help mitigate these potential impacts to school facilities. Therefore, the proposed project would not contribute considerably to a significant cumulative impact associated with schools.
Water Supply and Delivery Future population and industry growth in Tulare County and the greater San Joaquin Valley region would generate an additional demand for water. A portion of this growth would be dependent on the groundwater basin for its primary water source. Most new development throughout the County would be subject to SB 610 and SB 221, which require adequate water supplies be identified prior to approval of the proposed future site specific projects. As a result of these existing regulations, there would not be a cumulative impact associated with water supplies for developments that trigger SB 610 or SB 221 analysis (based on number of units, land area, etc.). Additionally, the proposed project includes several policies, which are intended to clarify the process by which the County will work with local service providers to address the phasing of future development and the availability of an adequate water supply. These policies would apply to all projects, including those that do not trigger SB 610 or SB 221 analysis. However, the uncertainty over long-term availability of water supplies and the minimal amount of County jurisdiction over public water purveyors results in a level of unpredictability about the adequacy of future water supply availability (including long term sustainability) in some of the unincorporated urban areas throughout the County. Consequently, the proposed project would contribute considerably to a significant and unavoidable cumulative impact to water supply and availability.
Wastewater Future regional growth subsequent to the proposed project would result in increased demand for wastewater services throughout Tulare County and the greater San Joaquin Valley region. The proposed project includes several policies and implementation measures designed to ensure that new development would have adequate wastewater services available. The ability of local service providers to provide specific levels of services to meet future development needs varies throughout the region. The County and other service providers will continue to evaluate the levels of service desired and the funding sources available to meet increases in demand for wastewater services on a case-by-case basis. Sound local planning along with implementation of the various policies identified in this RDEIR will reduce cumulative impacts associated with the provision of wastewater services to a less than significant level.
Stormwater As development proceeds within the County and the greater San Joaquin Valley region, impervious surfaces would increase, as would the amount of pollutants in runoff, thereby increasing stormwater drainage rates and potentially impacting surface and groundwater quality. Overall, project-level water
5. Additional Statutory Considerations
Tulare County General Plan 2030 Update 5-11 ESA / 207497 Recirculated Draft Environmental Impact Report February 2010
quality impacts to water resources would be reduced to a less-than-significant level by implementing Best Management Practices (BMPs) in accordance with the NPDES and other applicable regulations, as well as implementation of the water quality policies contained in the proposed project. New development within the County would also result in an increase in runoff, which would also increase impacts to water quality. Regional development would be required to comply with regional, State and federal regulations addressing stormwater runoff and water quality. Therefore, the proposed project would not contribute considerably to a significant cumulative impact associated with stormwater.
Cumulative Impacts to Hydrology, Water Quality and Drainage As development proceeds within the County’s planning boundary (primarily within CACUDBs with a smaller portion in unincorporated rural areas), additional population would also be exposed to the risk of flooding and increase the amount of impervious surfaces which could affect local hydrologic resources. As mentioned in Section 3.6 “Hydrology, Water Quality, and Drainage”, existing regulations and General Plan policies would reduce the risks associated with flooding. However, new development within Tulare County may locate additional population and structures within areas subject to flooding. Although development would be required to comply with regional, State and federal regulations designed to address flooding issues; the proposed project has the potential to contribute considerably to a significant and unavoidable cumulative flooding impact.
Section 3.6 identifies significant unavoidable impacts to groundwater supply, recharge, and secondary impacts to groundwater resources. The proposed project would result in increased demand on groundwater supplies, which come from groundwater basins that are currently in overdraft, have water quality issues, or may be affected by subsidence. The proposed project would contribute considerably to a significant and unavoidable cumulative impact to groundwater supply, recharge, and other secondary impacts to groundwater.
Cumulative Impacts Related to Geology, Soils, Seismicity and Mineral Resources Regional development would increase the number of people and structures subject to geologic- and soils-related risks. The policies included as part of the proposed project, along with compliance with federal, State and local regulations addressing building construction, run-off and erosion, reduce the potential project-level impacts associated with geology and soils to a less-than-significant level. Development in other communities surrounding the County would also be required to comply with federal, State and local regulations that are designed to protect people and structures from increased hazards related to such issues as earthquakes, landslides and soil erosion. As a result, conformance with adopted California building codes, and other measures to protect people and structures from geologic hazards, would reduce this impact to a less than significant level. The proposed project’s incremental contribution to these impacts will be less than cumulatively considerable.
As discussed in Section 3.7 “Geology, Soils, Seismicity, and Mineral Resources”, the proposed project includes specific policies to avoid significant impacts to important mineral, timber, and
Tulare County General Plan 2030 Update
Tulare County General Plan 2030 Update 5-12 ESA / 207497 Recirculated Draft Environmental Impact Report February 2010
oil/gas resources in the County. These policies are in compliance with State laws that require local jurisdictions to take into consideration the continued availability of important natural resources in land use decisions. As a result, the proposed project would not add considerably to any significant cumulative impact on mineral, timber, and oil resources in Tulare County or the larger San Joaquin Valley region.
Cumulative Impacts to Hazards Materials and Public Safety As discussed in Section 3.8 “Hazardous Materials and Public Safety”, the increase in local population and employment under the proposed project would result in the increased use of hazardous household, commercial and industrial materials. In addition, there would be an increase in population that would be exposed to potential wildland fires and hazards associated with aircraft operation. Potential project-level impacts associated with hazards and hazardous materials would be reduced to a less than significant level due to local, regional, State and federal regulations, such as those that control the production, use, and transportation of hazardous materials and waste and control the location of incompatible land uses in airport hazard area. Similarly, as growth occurs throughout the San Joaquin Valley region, additional people would be exposed risks associated with hazardous materials, wastes, wildland fires and airport operations. However, County, regional, State and federal regulations would apply to development countywide, thereby reducing the potential for cumulative impacts associated with hazards and hazardous materials to a less than significant level. The proposed project’s incremental contribution to these impacts would be less than cumulatively considerable.
Cumulative Impacts Related to Agricultural Resources As noted previously (see Section 3.10, “Agricultural Resources”), growth associated with implementation of the proposed project along with development within CACUDBs would result in a loss of some existing agricultural lands within the County. While the proposed project includes policies to minimize this impact, there would still be a project level significant and unavoidable impact. The loss of agricultural land within the County as a result of urban development is part of an overall trend within the San Joaquin Valley and the County will continue to face development pressure in the foreseeable future. As more fully described in Section 3.10, “Agricultural Resources”, the proposed project does include several policies stating that the County will work at a regional level to control the conversion of agricultural uses. However, since the County is projected to continue to urbanize, the loss of agricultural lands as a result of the proposed project would contribute considerably to a significant and unavoidable cumulative impact to agricultural resources.
Cumulative Impacts Related to Biological Resources Development associated with implementation of the proposed project would contribute to the ongoing loss of natural, open space, and agricultural lands in Tulare County, which currently provide habitat for a variety of special status species, as well as other wildlife and plant resources. Development under the proposed project would result in the conversion of existing habitats to urban uses. Impacts to biological resources resulting from buildout of the proposed project would be lessened after implementation of policies included in the proposed project and adherence to regional, State and federal regulations. However, since the County is projected to continue to urbanize at a steady
5. Additional Statutory Considerations
Tulare County General Plan 2030 Update 5-13 ESA / 207497 Recirculated Draft Environmental Impact Report February 2010
rate, the loss of open space areas and habitats as a result of the proposed project would contribute considerably to a significant and unavoidable cumulative impact to biological resources.
Cumulative Impacts Related to Cultural Resources While grading and other construction activities have the potential to impact cultural resources in developing County areas, Draft General Plan policies identified in this RDEIR and compliance with federal and State regulations reduce the project-specific impact to a less-than-significant level. Cultural resources such as historical, archaeological and paleontological resources, throughout the County and the larger San Joaquin Valley region could be cumulatively impacted by future development and related construction activities in the region.
As stated in Section 3.12 “Cultural Resources”, the County will continue to ensure that a variety of preservation efforts are implemented (including the new ERM Implementation Measures 56B “Discovery of Archaeological Resources” and 56C “Discovery of Human Remains”) for all future development projects to minimize impacts to archaeological resources (as defined in Section 15064.5), paleontological resources, or human remains. Under CEQA, however, any "substantial adverse change in the significance of an historical resource" (e.g., the destruction of such a resource) is considered a significant environmental effect as a matter of law. Because it is possible that, after County decision-makers have approved a development project, grading activities in an area identified for development reveal an archaeological resource meeting the definition of an historical resource, and that such a previously unknown historical resource cannot be preserved or avoided without substantial redesign at significant cost, the County cannot be sure that impacts on all such historical resources can be mitigated to less than significant levels. Consequently, the proposed project has the potential to contribute considerably to a significant and unavoidable cumulative impact to these historic resources. However, similar considerations do not apply to unique archaeological resources or paleontological resources, which therefore can be fully mitigated through data recovery where avoidance or preservation is infeasible or unnecessary. Therefore, implementation of the proposed project including the adoption of the policies listed above would reduce the potential cumulative impact to a less than significant level with respect to human remains and archaeological resources that do not qualify as historical resources.
A variety of historic resources (including above ground buildings, etc.) are also present within the County and surrounding area. Because the proposed project and surrounding development could significantly affect these resources, for which no mitigation may be available to replace the resource, the proposed project has the potential to contribute considerably to a significant and unavoidable cumulative impact to historic resources.
5.4 Significant Unavoidable Adverse Impacts which could not be avoided if the Project is Implemented
Public Resources Code section 21100(b) (2) and CEQA Guidelines section 15126.2(b) require that any significant and unavoidable effect on the environment must be identified. In addition, CEQA Guidelines 15093(a) allows the decision-making agency to determine if the benefits of a project outweigh the unavoidable adverse environmental impacts of implementing the project. The County
Tulare County General Plan 2030 Update
Tulare County General Plan 2030 Update 5-14 ESA / 207497 Recirculated Draft Environmental Impact Report February 2010
can approve a project with unavoidable adverse impacts if it prepares and adopts a “Statement of Overriding Considerations” setting forth the specific reasons for making such a judgment. A list of unavoidable adverse impacts identified in this RDEIR is provided below. For each of the unavoidable adverse impacts, the County must prepare and adopt a Statement of Overriding Considerations if the County approves the proposed project.
Unavoidable Adverse Impacts The Executive Summary (Table ES-3) and Chapter 4.0 “Alternatives to the General Plan Update” (Table 4-3) provide detailed summary tables that identify the proposed project’s environmental impacts, proposed mitigation measures, and the level of impact significance after mitigation. This section lists the impacts (by environmental resource topic) which are considered significant after all mitigation is applied. These impacts include the following:
Land Use and Aesthetics As noted previously (see Section 3.1, “Land Use and Aesthetics”), growth associated with implementation of the proposed project along with development within CACUDBs would result in changes to the visual character of the County from a more agricultural/rural setting to one that is more characterized by suburban or urban uses (i.e., streets, homes, and neighborhood shopping centers), with increased light and glare sources. As a result, the following aesthetic impacts are considered significant and unavoidable:
• 3.1-3: The proposed project would substantially degrade the existing visual character or quality of scenic resources or vistas.
• 3.1-4: The proposed project would substantially degrade the quality of scenic corridors or views from scenic roadways.
• 3.1-5: The proposed project would create a new source of substantial light or glare which would adversely affect day or nighttime views in the County.
• Contribute to a cumulative significant and unavoidable aesthetic impact.
Traffic and Circulation Population growth under the proposed project would result in significant and unavoidable impacts to several local and regional roadways. While the proposed project includes several policies developed to minimize these traffic and transportation impacts, the following impacts are considered significant and unavoidable:
• 3.2-1: The proposed project would result in a substantial increase in vehicular traffic. • Contribute to a cumulative significant and unavoidable transportation impact.
Air Quality Construction activities associated with individual development projects in accordance with the proposed project would exceed local air quality district significance thresholds. Operation of future
5. Additional Statutory Considerations
Tulare County General Plan 2030 Update 5-15 ESA / 207497 Recirculated Draft Environmental Impact Report February 2010
projects would also contribute to exceedance of thresholds. While the proposed project includes policies to minimize this impact, the following air quality impacts are considered significant and unavoidable:
• 3.3-2: The proposed project would result in a cumulatively considerable net increase of air pollutants that result in a violation of an air quality standard.
• 3.3-3: The proposed project could conflict with or obstruct implementation of an applicable air quality plan.
• 3.3-4: The proposed project could expose sensitive receptors to substantial pollutant concentrations that could affect public health.
• Contribute to a cumulative significant and unavoidable air quality impact.
Energy and Global Climate Change While the proposed project includes policies to minimize this impact, the following global climate change impact is considered significant and unavoidable:
• 3.4-3: The proposed project would potentially conflict with the State goal of reducing greenhouse gas emissions in California to 1990 levels by 2020, as set forth by the timetable established in AB 32, California Global Warming Solutions Act of 2006.
Noise Future noise level increases related to the additional traffic resulting from the proposed project would result in significant noise impacts. While the proposed project includes several policies developed to minimize this impact, the following noise impacts are considered significant and unavoidable:
• 3.5-2: The proposed project could expose a variety of noise-sensitive land uses to traffic noise.
• 3.5-3: The proposed project could expose a variety of noise-sensitive land uses to railroad noise.
• 3.5-4: The proposed project could expose a variety of noise-sensitive land uses to additional stationary noise sources.
• 3.5-5: The proposed project could expose a variety of noise-sensitive land uses to excessive groundborne vibration or groundborne noise levels.
• 3.5-6: The proposed project would be located within an airport land use plan area or within the vicinity of a private airstrip and could expose people residing or working within the project area to excessive noise levels.
• Contribute to a cumulative significant and unavoidable noise impact.
Hydrology, Water Quality and Drainage Overall, most impacts associated with hydrology and/or water quality would be reduced to a less than significant level. However, while the proposed project includes policies to minimize a majority of these impacts, the following impacts are considered significant and unavoidable:
Tulare County General Plan 2030 Update
Tulare County General Plan 2030 Update 5-16 ESA / 207497 Recirculated Draft Environmental Impact Report February 2010
• 3.6-2: The proposed project would result in impacts to groundwater supply, recharge, and secondary impacts to groundwater resources.
• 3.6-5: The proposed project would expose people or structures to flood hazards from development within a 100-year Flood Hazard Area or from increased rates or amounts of surface runoff from development.
• 3.6-6: The proposed project would expose people or structures to flood hazards from failure of a levee or dam.
• Contribute to a cumulative significant and unavoidable flooding impact.
Hazardous Materials and Public Health Overall, most impacts associated with hazards and hazardous materials would be reduced to a less than significant level due to local, regional, State and federal regulations, such as those that control the production, use and transportation of hazardous materials and waste and control the location of incompatible land uses within an airport hazard area. While the proposed project includes policies to minimize a majority of these impacts, the following impact is considered significant and unavoidable:
• 3.8-4: The proposed project could impair implementation of or physically interfere with an adopted emergency response plan or emergency evacuation plan.
Public Services, Recreation and Utilities Overall, most impacts associated with public services, recreation and utilities would be reduced to a less than significant level. However, while the proposed project includes policies to minimize a majority of these impacts, the following impacts are considered significant and unavoidable:
• 3.9-1: The proposed project would require new or expanded water supply, facilities and entitlements.
• 3.9-2: The proposed project could result in wastewater treatment demand in excess of planned capacity that cannot be met by new or expanded facilities.
• 3.9-3: The proposed project would produce substantial amounts of solid waste that could exceed the permitted capacity of a landfill serving the County.
Agricultural Resources With the implementation of the proposed project there would be a loss of the existing agricultural lands within the County. While the proposed project includes policies to minimize this impact, the following agricultural resource impacts are considered significant and unavoidable:
• 3.10-1: The proposed project would result in the substantial conversion of important farmland to non-agricultural uses.
• 3.10-3: The proposed project could involve other land use conflicts between agricultural and urban uses.
• Contribute to a cumulative significant and unavoidable agricultural resource impact.
5. Additional Statutory Considerations
Tulare County General Plan 2030 Update 5-17 ESA / 207497 Recirculated Draft Environmental Impact Report February 2010
Biological Resources Development associated with implementation of the proposed project would contribute to the ongoing loss of natural and agricultural lands in Tulare County, which currently provide habitat for a variety of federally and State list special status species. While the proposed project includes several policies to minimize this impact, the following biological resource impacts are considered significant and unavoidable:
• 3.11-1: The proposed project would have a substantial adverse effect, either directly or through habitat modifications, on a variety of special status species.
• 3.11-2: The proposed project would have a substantial adverse effect on riparian habitat or other sensitive natural communities.
• 3.11-3: The proposed project would have a substantial adverse effect on “federally protected” wetlands and other waters.
• 3.11-4: The proposed project would have a substantial adverse effect on wildlife movement opportunities, migratory corridors, or native wildlife nursery sites.
• Contribute to a cumulative significant and unavoidable biological resource impact.
Cultural Resources Development associated with implementation of the proposed project could cause a substantial adverse change (i.e., result in the demolition) to a historic resource for which no mitigation may be available to replace the affected resource. While the proposed project includes several policies to minimize this impact, the following cultural resource impacts are considered significant and unavoidable:
• 3.12-1: The proposed project would cause a substantial adverse change to a historic resource.
• 3.12-2: The proposed project would cause a substantial adverse change to archaeological resources, paleontological resources, and/or disturb human remains.
• Contribute to a cumulative significant and unavoidable impact to historic resources impact.
5.5 Significant Irreversible Environmental Changes which would Result from the Proposed Action should it be Implemented
Introduction Public Resources Code section 21100(b) (2) and CEQA Guidelines section 15126.2(b), which apply to projects as specified in CEQA Guidelines section 15127 (e.g., the adoption of a plan), require that any significant effect on the environment that would be irreversible if the project is implemented must be identified. A project would generally result in a significant irreversible impact if:
• Primary and secondary impacts would commit future generations to similar uses;
Tulare County General Plan 2030 Update
Tulare County General Plan 2030 Update 5-18 ESA / 207497 Recirculated Draft Environmental Impact Report February 2010
• The project would involve a large commitment of nonrenewable resources; and/or • The project would involve uses in which irreversible damage could result from any
potential environmental accidents associated with the project.
Significant Irreversible Environmental Changes Significant and irreversible environmental changes associated with the General Plan 2030 Update include the following:
Changes in Land Use that Commit Future Generations Although the majority (75%) of net new growth is planned to occur within existing City areas, a smaller portion of growth (25%) is planned for unincorporated areas. Development under the proposed project would result in the conversion of some vacant and agricultural/open space lands to industrial, commercial and residential uses, and the intensification of underutilized areas. This development would constitute a long-term commitment to residential, commercial, industrial, parking, and other urban uses. The proposed project would result in the commitment of land that is not currently designated for development under the County’s existing General Plan. This commitment of land would be generally tied to TCAG population growth projections (see Table 5-1 above) that are anticipated to occur both locally and regionally throughout the Sacramento/San Joaquin Valley.
Commitment of Resources Development allowed under the proposed project would irreversibly commit nonrenewable resources to the construction and maintenance of buildings, infrastructure and roadways. These non-renewable resources include mining resources such as sand, gravel, steel, lead, copper and other metals. Build-out of the proposed project also represents a long-term commitment to the consumption of fossil fuels, natural gas and gasoline. Increased energy demands would be used for construction, lighting, heating and cooling of residences, and transportation of people within, to and from the County. The proposed project includes several policies and implementation measures promoting waste recycling and energy conservation (see Section 3.4) which would result in some savings in non-renewable energy supplies. Development would also result in an irreversible commitment of limited, renewable resources such as lumber and water. The proposed project also includes several policies and implementation measures promoting resource and water conservation (see Section 3.6, “Hydrology, Water Quality and Drainage” and Section 3.4 “Energy and Global Climate Change”) which would result in some savings of these resources.
Tulare County General Plan 2030 Update 6-1 ESA / 207497 Recirculated Draft Environmental Impact Report February 2010
CHAPTER 6.0 Report Preparation
Introduction Key staff from the County of Tulare and the consulting firms that contributed to preparation of the recirculated draft Environmental Impact Report (RDEIR) are identified below.
The County of Tulare This EIR has been prepared for:
Tulare County Resource Management Agency 5961 South Mooney Boulevard Visalia, CA 93277 (559) 624-7000 Jake Raper, Jr., AICP, Agency Director Fred Brusuelas, Chief Planner, Countywide Planning Dave Bryant, Division Manager, Special Projects, Project Planner Julia Roberts, Chief Deputy, County Counsel Clinton Sims, II, Deputy County Counsel Nina Dong, Deputy County Counsel Chuck Przybylski, Planner II, Special Projects Amy G. Lizarraga, Planner III, Countywide Planning Cynthia Echevarria, Planner III, Countywide Planning
Environmental Science Associates Project management, production staff, and primary technical authors include the following:
• Ray Weiss – Project Director; Land Use; Noise; Traffic and Circulation • Ellen Morales – Project Manager • Jessica Mitchell – EIR Coordinator; Agricultural Resources; Biological Resources;
Energy and Global Climate Change; Geology, Soils, Seismicity, and Mineral Resources; Hazardous Materials and Public Safety; Cultural Resources; Public Services, Recreation and Utilities
• Aaron Hecock – Aesthetics • Matt Morales – Air Quality; Energy and Global Climate Change • Paul Miller – Air Quality and Noise
Tulare County General Plan 2030 Update
Tulare County General Plan 2030 Update 6-2 ESA / 207497 Recirculated Draft Environmental Impact Report February 2010
• Deborah Kruse – Hydrology, Water Quality and Drainage; Public Services, Recreation and Utilities
• Donald Ambroziak – Noise • Claire Early – Greenhouse Gas Emissions Inventory • Brad Allen – Geographic Information Services • Tom Wyatt – Graphics • Logan Sakai – Word Processing and Production
Omni Means • Gary Mills – Transportation and Circulation • Mike Winton – Water, Wastewater and Storm Drainage
Tully and Young • Greg Young, P.E. – Water Supply Assessment
Tulare CountyGeneral Plan 2030 Update 7-1 ESA / 207497 Recirculated Draft Environmental Impact Report February 2010
CHAPTER 7.0 References
Chapter 1. Introduction County of Tulare. 2010a. General Plan Background Report. Tulare, CA.
Chapter 2. Project Description State of California, Department of Finance. Population Projections for California and Its Counties
2000-2050. Sacramento, California. July 2007.
California Department of Finance. E-5 City/County Population and Housing Estimates, Revised, January 1, 2007.
Tulare County Association of Governments (TCAG). 2008. Table 2: Historical City/County Population Estimates, 1991-2007, with 1990 and 2000 Census Counts. Data provided by Mark Hays, TCAG Associate Regional Planner.
Section 3.1 Land Use and Aesthetics County of Tulare. 2010a. General Plan Background Report. Tulare, CA.
Section 3.2 Traffic and Circulation California Department of Transportation (Caltrans). 2004. Route 99 Corridor Enhancement
Master Plan. Updated April 5, 2005. Available online: <http://www.dot.ca.gov/dist6/99masterplan/>
County of Tulare. 2010a. General Plan Background Report. Tulare, CA.
Section 3.3 Air Quality California Air Resources Board. 2001. ARB Fact Sheet: Air Pollution Sources, Effects and
Control. http://www.arb.ca.gov/research/health/fs/fs2/fs2.htm. Page last updated December 2005.
California Air Resources Board. 2005. Air Quality and Land Use Handbook: A Community Health Perspective, April 2005.
California Air Resources Board. 2007a. California Global Warming Solutions Act of 2006, Workshop on Mandatory Reporting of California GHG Emissions. August 15, 2007.
California Air Resources Board. 2007b. Resolution 07-55. December 6, 2007.
Tulare County General Plan 2030 Update
Tulare County General Plan 2030 Update 7-2 ESA / 207497 Recirculated Draft Environmental Impact Report February 2010
California Air Resources Board. 2008a. Ambient Air Quality Standards. Available at http://www.arb.ca.gov/research/aaqs/aaqs2.pdf. Standards last updated June 26, 2008.
California Air Resources Board. 2008b. Summaries of Air Quality Data, 1998 through 2007. http://www.arb.ca.gov/adam/. Site accessed October 21, 2008;
County of Tulare. 2010a. General Plan Background Report. Tulare, CA.
Jones and Stokes. 2006. The Draft Phase I Animal Confinement Facilities Plan Supplemental Program EIR. October 2006.
National Park Service (NPS). 2007. Historical Ozone Exceedances in National Parks, 1982-2006, http://www.nature.nps.gov/air/Monitoring/docs/2006_O3ParkExceedDays.pdf, Site accessed October 22, 2008.
National Research Council (NRC). 2001. Nutrient Requirements of Dairy Cattle. Seventh Revised Edition. Washington DC: National Academy Press.
Natural Resources Conservation Service (NRCS). 2003. Conservation Practice Standard 359: Waste Treatment Lagoon. http://www.nrcs.usda.gov/technical/Standards/nhcp.html, accessed September 17, 2007.
Robert W. Pinder Department of Engineering and Public Policy and Natalie J. Anderson, Ross Strader, Cliff I. Davidson, and Peter J. Adams Department of Civil and Environmental Engineering Carnegie Mellon University (Pinder, et al). 2003. Ammonia Emissions from Dairy Farms: Development of a Farm Model and Estimation of Emissions from the United States. Presented at the 12th International Emission Inventory Conference, 2003.
San Joaquin Valley Air Pollution Control District (SJVAPCD). 2008. Ambient Air Quality Standards and Valley Attainment Status. Available at http://www.valleyair.org/aqinfo/attainment.htm. Accessed June 5, 2009.
San Joaquin Valley Air Pollution Control District (SJVAPCD). 2002. Guide for Assessing and Mitigating Air Quality Impacts. Adopted August 20, 1998. Revised January 10, 2002.
Schmidt, David; L. Jacobson, and K. Janni. 2001. University of Minnesota Extension. Preparing an Odor Management Plan. 2001 Available online: <http://www.extension.umn.edu/distribution/livestocksystems/DI7637.html>
South Coast Air Quality Management District (SCAQMD). 2007. Final 2007 Air Quality Management Plan, Chapter 2 Air Quality and Health Effects. Available online: <http://www.aqmd.gov/aqmp/07aqmp/aqmp/Chapter_2.pdf> Accessed in January 20, 2010.
Tulare County Association of Governments (TCAG). 2007a. Personal communication with Mark Hays, Associate Regional Planner, Tulare County Association of Governments.
Tulare County Association of Governments (TCAG). 2007b. Draft Conformity Analysis for the 2007 Tulare County Federal Transportation Improvement Program and 2007 Tulare County Regional Transportation Plan.
U.S. Environmental Protection Agency (U.S. EPA). 1998. AP-42 Fifth Edition, Chapter 1 (External Combustion Sources), Section 1.4 (Natural Gas Combustion). July 1998. Available online: http://www.epa.gov/ttnchie1/ap42/ch01/index.html
U.S. Environmental Protection Agency (U.S. EPA). 2010. Six Common Air Pollutants. Available online: <http://www.epa.gov/air/urbanair/> Accessed January 20, 2010.
7. References
Tulare County General Plan 2030 Update 7-3 ESA / 207497 Recirculated Draft Environmental Impact Report February 2010
Section 3.4 Energy and Global Climate Change California Air Pollution Control Officers Association (CAPCOA). 2008. CEQA and Climate
Change: Evaluating and Addressing Greenhouse Gas Emissions from Projects Subject to the California Environmental Quality Act.
California Air Resources Board (ARB). 2008a. Climate Change Draft Scoping Plan. June 2008 Discussion Draft.
California Air Resources Board (ARB). 2008b. Climate Change Proposed Scoping Plan. October 2008.
California Air Resources Board (ARB). 2008c. Preliminary Draft Staff Proposal on Recommended Approaches for Setting Interim Significance Thresholds for Greenhouse Gases under the California Environmental Quality Act. October 24, 2008.
California Air Resources Board (CARB), 2008d. California Environmental Protection Agency, Air Resources Board, EMFAC2007 Model. Available at: http://www.arb.ca.gov/msei/onroad/latest_version.htm. Accessed October 8, 2008.
California Air Resources Board (ARB). 2007. Mandatory Reporting of California greenhouse gas Emissions, Presentation in El Monte, California. December 6, 2007.
California Climate Action Team. 2006. Climate Action Team Report to Governor Schwarzenegger and the Legislature. March 2006.
California Department of Water Resources (DWR). 2006. Progress on Incorporating Climate Change into Management of California’s Water Resources. July, 2006 Technical Memorandum Report.
California Energy Commission (CEC). 2006. Inventory of California Greenhouse Gas Emissions and Sinks: 1990 to 2004, Staff Final Report. December, 2006.
Council on Environmental Quality (CEQ). 2009. President Obama signs an Executive Order Focused on Federal Leadership in Environmental, Energy, and Economic Performance. Available online: <http://www.whitehouse.gov/the_press_office/President-Obama-signs-an-Executive-Order-Focused-on-Federal-Leadership-in-Environmental-Energy-and-Economic-Performance> Last accessed December 24, 2009.
County of Tulare. 2010a. General Plan Background Report. Tulare, CA.
Environmental Science Associates (ESA). 2009. Tulare County Greenhouse Gas (GHG) Inventory. Prepare for Tulare County.
Governor’s Office of Planning and Research (OPR). 2009. CEQA Guidelines Sections Proposed to be Added or Amended. April 13, 2009.
Governor’s Office of Planning and Research (OPR). 2008. Technical Advisory – CEQA and Climate Change: Addressing Climate Change Through California Environmental Quality Act (CEQA) Review. June 19, 2008.
Intergovernmental Panel on Climate Change (IPCC). 2001. Climate Change 2001: Working Group I: The Scientific Basis, Section F.5, Table 4; http://www.grida.no/climate/ipcc%5Ftar/wg1/032.htm#f5, Accessed July, 2008.
Tulare County Association of Governments (TCAG). 2007. Personal communication with Mark Hays, Associate Regional Planner, Tulare County Association of Governments.
Tulare County General Plan 2030 Update
Tulare County General Plan 2030 Update 7-4 ESA / 207497 Recirculated Draft Environmental Impact Report February 2010
United States Environmental Protection Agency (USEPA). 2008. Landfill Gas Emissions Model, Version 3.02. Available at: http://www.epa.gov/ttn/catc/dir1/landgem-v302-guide.pdf.
United States Environmental Protection Agency (USEPA). 2009a. Proposed Rulemaking: Light-Duty Vehicle Greenhouse Gas Emissions Standards and Corporate Average Fuel Economy Standards Available online: <http://epa.gov/otaq/climate/regulations.htm> Accessed December 15, 2009.
United States Environmental Protection Agency (USEPA). 2009b. Fact Sheet -- Proposed Rule: Prevention of Significant Deterioration and Title V Greenhouse Gas Tailoring Rule Available online: <http://www.epa.gov/NSR/fs20090930action.html> Accessed December 16, 2009.
Section 3.5 Noise Bolt, Beranek and Newman. 1987. Noise Control for Buildings and Manufacturing Plants.
California Department of Transportation (Caltrans). 2006. Traffic Noise Analysis Protocol for New Highway Construction, Reconstruction, and Retrofit Barrier Projects, August, 2006. Sacramento, CA.
California Department of Transportation (Caltrans). 1998. Traffic Noise Analysis Protocol, Traffic Noise Supplement, October 1998. Sacramento, CA.
County of Tulare. 2010a. General Plan Background Report. Tulare, CA.
State of California, Governor’s Office of Planning and Research (OPR). 2003. State of California General Plan Guidelines 2003. October 2003.
Tulare County Planning and Development Department. 1988. Policy Document: Noise Element of the General Plan. Prepared by the Tulare County Planning and Development Department, with Brown-Bunting Associates, Inc. and Quad Consultants. Approved January 13, 1988, Adopted February 9, 1988.
Section 3.6 Hydrology, Water Quality and Drainage American Planning Association (APA). 2008. Flood Plain Planning Guidance. American
Planning Association, California Chapter.
California Data Exchange Center (CDEC). 2009. Reservoir capacities from the CDEC. http://cdec.water.ca.gov/misc/resinfo.html. Accessed June 8, 2009.
County of Tulare. 2010a. General Plan Background Report. Tulare, CA.
California Department of Water Resources (DWR). 2009a. DWR Bulletin 118-2003 and updated DWR subbasin information found at http://www.groundwater.water.ca.gov/bulletin118/basin_desc/basins_t-y.cfm. Accessed May 31, 2009.
DWR. 2009b. California Water Plan Update 2009, Working Draft. Flood Management Additions for Tulare Lake Regional Report, Table 8-b. Website viewed August 27, 2009 - http://www.waterplan.water.ca.gov/docs/public_comments/update2009/2008/080508-may-tco.pdf
DWR. 2006. DWR Bulletin 118, Kings Subbasin Update, January 20, 2006.
7. References
Tulare County General Plan 2030 Update 7-5 ESA / 207497 Recirculated Draft Environmental Impact Report February 2010
DWR. 2005. California Water Plan 2005. DWR Bulletin 160-2005. Available online: < http://www.waterplan.water.ca.gov/previous/cwpu2005/index.cfm#vol1>
DWR. 2004a. DWR Bulletin 118, Kaweah Subbasin Update. February 27, 2004.
DWR. 2004b. DWR Bulletin 118, Tule Subbasin Update. February 27, 2004.
Faunt, C.C., ed. 2009. Groundwater Availability of the Central Valley Aquifer, California: U.S. Geological Survey Professional Paper 1766.
Keller, Wegley & Associates. 2006. Water Resources General Plan Update County of Tulare.
Tulare Local Agency Formation Commission (LAFCo). 1975. Cities and Special Districts Inventory. October 1975. Revised April 2007.
Tully and Young Engineers. 2009. A Phase I Water Supply Evaluation. June 2009.
Section 3.7 Geology, Soils, Seismicity, and Mineral Resources California Department of Conservation, Division of Oil, Gas, & Geothermal Resources. 2007.
2006 Annual Report of The State Oil & Gas Supervisor. Publication No. PR06.
County of Tulare. 2010a. General Plan Background Report. Tulare, CA.
State of California, Department of Finance (DOF). 2007. Population Projections for California and its Counties 2000-2050, Table 1. Sacramento, California. July 2007.
United States Geological Survey (USGS). 2002. Bulletin 2185: Response Plan for Volcano Hazards in the Long Valley Caldera and Mono Craters Region, California. U.S. Department of the Interior, U.S. Geological Survey.
Section 3.8 Hazardous Materials and Public Safety County of Tulare. 2010a. General Plan Background Report. Tulare, CA.
Section 3.9 Public Services, Recreation and Utilities County of Tulare. 2010a. General Plan Background Report. Tulare, CA.
Keller, Wegley & Associates. 2006. Water Resources General Plan Update County of Tulare.
Omni Means, Engineers and Planners. 2006a. Municipal Service Reviews, Group 1 Cities and Special Districts (includes the Cities of Visalia, Tulare and Farmersville, Goshen CSD, Earlimart PUD, Ivanhoe PUD, Pixley PUD, Teviston CSD, Tipton CSD, Alpaugh JPA), Final Report prepared for the Tulare County Local Agency Formation Commission. Adopted March 1, 2006.
Omni Means, Engineers and Planners. 2006b. Municipal Service Reviews, Group 2 Cities and Special Districts (includes the Cities of Dinuba and Woodlake, Cutler PUD, Orosi PUD, Lemon Cove SD, London CSD), Final Report prepared for the Tulare County Local Agency Formation Commission. Adopted May 3, 2006.
Omni Means, Engineers and Planners. 2007. Municipal Service Reviews, Group 3 Cities and Special Districts (includes the Cities of Exeter, Lindsay and Porterville, Lindsay-Strathmore ID, Poplar CSD, Richgrove CSD, Springville PUD, Strathmore PUD, Terra Bella ID, Terra Bella SMD, Woodville PUD), Final Report prepared for the Tulare County Local Agency Formation Commission. Adopted March 7, 2007.
Tulare County General Plan 2030 Update
Tulare County General Plan 2030 Update 7-6 ESA / 207497 Recirculated Draft Environmental Impact Report February 2010
Tulare County Association of Governments (TCAG). 2008. Table 2: Historical City/County Population Estimates, 1991-2007, with 1990 and 2000 Census Counts. Data provided by Mark Hays, TCAG Associate Regional Planner.
Tully and Young Engineers. 2009. A Phase I Water Supply Evaluation. June 2009.
U.S. EPA. 2006. Municipal Solid Waste Generation, Recycling, and Disposal in the United States: Facts and Figures for 2006. Available online: <http://www.epa.gov/waste/nonhaz/municipal/pubs/msw06.pdf>
Section 3.10 Agricultural Resources County of Tulare. 2010a. General Plan Background Report. Tulare, CA.
Section 3.11 Biological Resources County of Tulare. 2010a. General Plan Background Report. Tulare, CA.
Williams, Daniel F., et al. 1998. Recovery Plan for Upland Species of the San Joaquin Valley, California. Available online: <http://esrp.csustan.edu/publications/pubhtml.php?doc=sjvrp&file=cover.html> Additional authors: Ellen A. Cypher, Patrick A. Kelly, Karen J. Miller, Nancy Norvell, Scott E. Phillips, Cheryl D. Johnson, and Gary W. Colliver.
Section 3.12 Cultural Resources County of Tulare. 2010a. General Plan Background Report. Tulare, CA.
University of California Museum of Paleontology (UCMP) Database website. 2009. Tulare County search page. Available online: <http://ucmpdb.berkeley.edu/cgi/ucmp_query2>. Accessed September 7, 2009.
Chapter 5.0 Additional Statutory Considerations City of Delano. 1999. Delano General Plan Draft Environmental Impact Report. July 1999.
City of Dinuba. 2008. Dinuba General Plan 2026 Final Environmental Impact Report. September 2008.
City of Farmersville. 2003. Farmersville General Plan Update Final Environmental Impact Report. January 2003.
City of Kingsburg. 1992. City of Kingsburg General Plan.
City of Lindsay. 1989. Comprehensive General Plan for the City of Lindsay. July 1989.
City of Porterville. 2007. Porterville Draft Environmental Impact Report, 2030 General Plan. November 2007.
City of Visalia. 2001. City of Visalia General Plan Circulation Element Final Environmental Impact Report. February 26, 2001.
City of Visalia. 1991. Final Environmental Impact Report for the Visalia General Plan Land Use Element Update. July 1991.
7. References
Tulare County General Plan 2030 Update 7-7 ESA / 207497 Recirculated Draft Environmental Impact Report February 2010
County of Fresno. 2000. County of Fresno Final Environmental Impact Report, General Plan Update. August 2000.
County of Kern. 2004. Revised Update of the Kern County General Plan and Amendment of the Kern County and Incorporated Cities Integrated Waste Management Plan Siting Element, Recirculated Draft Program Environmental Impact Report. January 2004.
County of Kings. 2009. 2035 Kings County General Plan EIR. July 2009.
State of California, Department of Finance (DOF). 2007. Population Projections for California and its Counties 2000-2050, Sacramento, California. July 2007.
Tulare County Association of Governments (TCAG). 2008. Table 2: Historical City/County Population Estimates, 1991-2007, with 1990 and 2000 Census Counts, Official State Estimates. October 8, 2008.