Embed Size (px)
Citation preview

Equity and sustainablE growth
twenty years of social Policies, Chile 1990–2009
José Pablo arellano M.December 2011
This book examines social policy in Chile between 1990 and 2009 through the eyes of one of its key actors. Special emphasis is placed on allocation of resources, the relationship between social, fiscal, and macroeconomic policy, and the relationship of these three types of policy with growth and equity.
The book covers each area of social policy: subsidies/monetary transfers, education, housing, pensions and social protection, health care, and income generation. The author analyzes the mechanisms used to prioritize social spending in the allocation of public resources. Within social policies, he ex-amines the main criteria and priorities that guided allocation of resources.
José Pablo Arellano M. was the National Budget Director from 1990 to 1996 and the Minister of Education from 1996 to 2000. He is the author of several publications on social policy.
WB SP Chile cover 6-7-13.indd 1 6/7/13 1:43 PM

Equity and sustainablE growth: twEnty yEars of
social policiEs, chilE 1990–2009
José Pablo Arellano M.
December 2011

This book examines social policy in Chile between 1990 and 2009 through the eyes of one of its key actors. Special emphasis is placed on allocation of resources, the relationship between social, fiscal, and macroeco-nomic policy, and the relationship of these three types of policy with growth and equity.
The book covers each area of social policy: subsidies/monetary transfers, education, housing, pensions and social protection, health care, and income generation. The author analyzes the mechanisms used to pri-oritize social spending in the allocation of public resources. Within social policies, he examines the main criteria and priorities that guided allocation of resources.
José Pablo Arellano M. was the National Budget Director from 1990 to 1996 and the Minister of Education from 1996 to 2000. He is the author of several publications on social policy.
Katherine Baumann translated the original Spanish language text into English.

iii
contEnts
1. Introduction .......................................................................................................................................................... 1
2. Equitable Growth and the Distribution of Growth Benefits .......................................................................... 3
3. Emphasis on Equity and Fiscal Discipline ....................................................................................................... 5
4. Educational Policy and a Growing Emphasis on Investment in Human Capital .....................................15
5. Housing and Water and Sanitation Infrastructure .........................................................................................27
6. Pensions ...............................................................................................................................................................31
7. Health Care .........................................................................................................................................................37
8. Family Income Generation ...............................................................................................................................41
9. Protection Against Losses or Decreases in Family Income .........................................................................43
10. National Social Expenditure .............................................................................................................................45
11. Social Policy Approaches ..................................................................................................................................49
12. Innovations in Social Policy .............................................................................................................................55
13. Professionalizing Social Policy: Designs, Evaluations, Targeting Methods ...............................................57
14. Social Policy’s Political-Legislative Process and Debates ..............................................................................59
Challenges ..................................................................................................................................................................63
References ...................................................................................................................................................................65
Annex ..........................................................................................................................................................................69


1
introduction
During the 1990s, I had the opportunity to take part in the Government’s social policy design, first via the Ministry of Finance’s Na-
tional Budget Office (Dirección de Presupuestos—DIPRES) and then via the Ministry of Education. From the mid 1970s through the 1980s I studied the evolution of social policies in Chile, and have done the same in recent years, by responding to invitations, giving talks and teaching courses, and maintaining an ongoing interest in social policy. This book, in part, brings together the reflections brought on by these experiences.1
Early 2010 saw the end of a 20-year cycle of four administrations of the center-left political coalition, the Concertación (Concert of Parties for Democra-cy). These administrations placed equitable growth at the center of their agenda, and managed to give continuity to a major set of social policies aimed at achieving this goal.
This book summarizes the distinctive and note-worthy aspects of social policy between 1990 and 2009, emphasizing allocation of resources; how so-cial, fiscal, and macroeconomic policies interact; and the relationship of these three policy types to growth and equity.
The text stresses the importance of fiscal poli-cy and economic growth in the sustainability and continuity of social policies over these two decades. It analyzes the mechanisms used to prioritize social spending in public resource allocation. The main priorities and criteria within social policies that guided resource allocation are examined, with spe-cial attention placed on equity in distribution.
The book examines the main features of each social policy area: subsidies or monetary transfers, education, housing, pensions and social protection, healthcare, and income generation. More than a de-tailed analysis of each area, it gives the commonali-ties of the approaches.
As will be shown, there are common threads over this 20-year period that guide social policy strategy and its contribution to equitable development.
The main emphasis of the study is on the mac-ro elements of social policy: its financing and re-source allocation options. This emphasis is not only due to the author’s greater knowledge of the subject, but also to the importance of these fac-tors in the success of the micro aspects of social policy. The amount of resources and the choices made regarding their allocation define the condi-tions under which each program’s specific aspects are implemented. This book will not address other policies that impact equity, like those aimed at the labor market (minimum wage policies, labor and union laws).
To get a comprehensive view of social spend-ing in an economy where private financing plays an important role in complementing government con-tributions, this book introduces the concept of “na-tional social expenditure” and describes its evolu-tion during the period.
1 In a previous study, which served as background re-search for this book, we examined policy in the 1990s. CIEPLAN Socio/Economic Studies No. 26, April 2004.
1

Equity and Sustainable Growth: Twenty Years of Social Policies, Chile 1990–20092
situation, this is intended to strengthen faith in what can be achieved with good policies, in order to address the many aspects that need to be improved.
The descriptions of the policy details and their implementation have been reduced to a minimum in order to focus on the analysis of policy choices and the reflections or lessons that emerge from them.2
It also examines key aspects of the policy de-sign, institutional framework, and political reali-ties that made the ensuing outcomes possible. Poli-cy design, institutional frameworks, and actions of political leaders are ingredients that define “policy quality.” This is a critical aspect when it comes to achieving good results in a country’s development.
The text ends by mentioning some future social policy challenges for Chile. In many cases, these are the results of the policies’ own achievements.
These pages present a positive outlook on what has been achieved in these two decades. Far from constituting complacency toward what has been ac-complished and Chile’s current social and economic
2 The book does not address the internal differences and political negotiations that existed in relation to the different initiatives. This would require a much more detailed analysis than the one presented here. In some cases there will be reference to studies on this topic.

3
EquitablE growth and thE distribution of growth
bEnEfits
Social policies played an important role in the policy of equitable growth, which was inau-gurated in 1990 with the return to democracy
by the administration of President Patricio Aylwin. It included improved conditions for workers, as a result of reforms in the labor market and benefits channeled to the poorest segment of the population with government social spending.
Growth with equity meant growth, first of all. Therefore economic and social policies had to be designed to encourage growth, and in no case put it at risk, as social policy had often done in the past. Risk occurs when public spending initiatives go beyond the viable short-term financing, risking macroeconomic imbalances that can put the econ-omy in a crisis situation, thus jeopardizing the im-plementation of the social policy. In the best-case scenario, when there is no crisis, the growth rate declines and with it goes the possibility of a sol-id resource base for the social effort. Social policy may also jeopardize growth if its design and im-plementation lead to inefficiencies and obstacles to growth. Concern with avoiding both of these risks was very much present in economic and social pol-icy design. In fact, for most of the 20-year period there was a virtuous circle in which growth and eq-uity mutually reinforced each other, as will be seen in the next section.
Sustained Poverty Reduction Through Growth
During this period, poverty fell sharply, from 39 percent of the population in 1990 to 15 percent in 2009 (in 1987 this figure hit 45 percent).3 There is no precedent for a poverty level reduction of this magnitude in Chile, and it is also exceptional on an international level.
This reduction is the result of the increase in in-come for these households, which in turn is a prod-uct of higher salaries and better job opportunities. To a lesser extent, monetary subsidies from the state also played a role.
The orders of magnitude are: for 25 percent of households who overcame poverty between 1990 and 2009, their monetary income rose by about 50 percent in real terms. The majority of this increase
3 Unless otherwise indicated, all information in this sec-tion comes from CASEN surveys (National Socioeco-nomic Characterization Survey); see www.mideplan.cl. Poverty is measured in absolute terms, that is, the number of people or families who do not have the in-come per person needed to purchase goods and servic-es deemed essential to meet basic needs. This income is defined as twice the cost of a basket of food sufficient to meet food needs.
2

Equity and Sustainable Growth: Twenty Years of Social Policies, Chile 1990–20094
came from improvements in family income due to higher salaries and more employed persons per household. As will be seen later, government mone-tary subsidies, despite their significant growth, only account for around a quarter of the increase in these households’ income. That is, over 75 percent of the income increase that allowed families to overcome poverty came from increased work-related income.
Naturally, the total effect of government social spending on poverty is greater, since the above fig-ures only include monetary transfers and one must factor in the benefits of housing and water and sani-tation policies, as well as health and education bene-fits. Moreover, these benefits affect the ability to ob-tain employment and income in the medium term, which is also left out by these figures.
The determining factor in overcoming poverty was the better working conditions resulting from the country’s economic growth during the period. This growth, in turn, was the result of policies that provid-ed the necessary stability and favorable conditions.
The population that remained in poverty also experienced improvements in these years, but the increase in income was not enough given the group’s very low initial income in 1990. However, the pov-erty gap decreased.
An additional factor in poverty reduction was demographic change, which meant a smaller house-hold size and fewer dependents per worker. House-hold size in the two poorest quintiles decreased from 4.6 persons per household in 1990 to 3.8 in 2009.
The purpose here is not to examine the causes of poverty, but it is important to note two salient
characteristics of families that remain in poverty: first, they have low educational levels, and second, their households are comparatively more numerous.
Those between 25–34 years of age in the first quintile studied an average of 10 years; in other words, they dropped out of secondary education be-fore graduating. The same age group from the high-est-income quintile averaged more than 15 years of schooling. Having fewer years of schooling, even without considering the differences in the quality of the education, undoubtedly results in a reduced ability to obtain a good income in the future.
Along with the lower income per worker and the factors associated with this lower earning ca-pacity, a very influential factor in the level of pov-erty in this group is the greater amount of depen-dents per economically active person. The number of economically active persons is slightly lower among the poor than among middle and high-in-come groups. What is much higher in these house-holds is the number of dependents. In the lowest income quintile, for example, there are 2.9 depen-dents (mostly children) for every employed person. In contrast, for the next quintile, which is above the poverty line, this ratio is 2.1 per employed per-son, and in the highest-income quintile it is 0.8 for each employed person.
This shows that policies directed toward the child population are crucial in providing support for the poorest households. Also, increased access to education and a higher quality of education will contribute to reducing poverty and income in-equality in the future.

5
Emphasis on Equity and fiscal disciplinE
The focus on equity via social policy has result-ed, since 1990, in a clear shift of focus and priorities in fiscal policy. Fiscal discipline was
emphasized, and unlike during the second half of the 1980s, when the proceeds of economic growth were used to reduce taxes, beginning in 1990 the proceeds were directed to increasing social spend-ing.4 In this year a tax reform was passed that re-versed the tax cuts of the previous years, and this financed a shift in social spending.
Social policy is built on the basis of fiscal dis-cipline. This was an approach that triumphed and has been a guiding principle of economic and so-cial policy since the beginning of President Ayl-win’s Government, emerging as early as the presi-dential campaign period. During the campaign it was stated that there would be no new government spending without first ensuring that adequate re-sources would be available. This was, on one hand, a reaction to the populist movements of the past, and on the other, a way of instituting the gradual-ism necessary to satisfy unmet social demands. So in 1990, despite unfulfilled social demands, there was no new social spending until the Congress could pass a tax increase with the support of the opposition.
This emphasis on fiscal discipline was a constant during this 20-year period, throughout different macroeconomic realities. This gave social spend-ing policies long-term sustainability, as opposed to the untenability of policies in other countries and in other historical periods in Chile. Fiscal discipline in
the early 1990s was mainly the economic team’s pri-ority, strongly supported by President Aylwin’s po-litical team,5 but gained more and more support as a result of its outcomes.
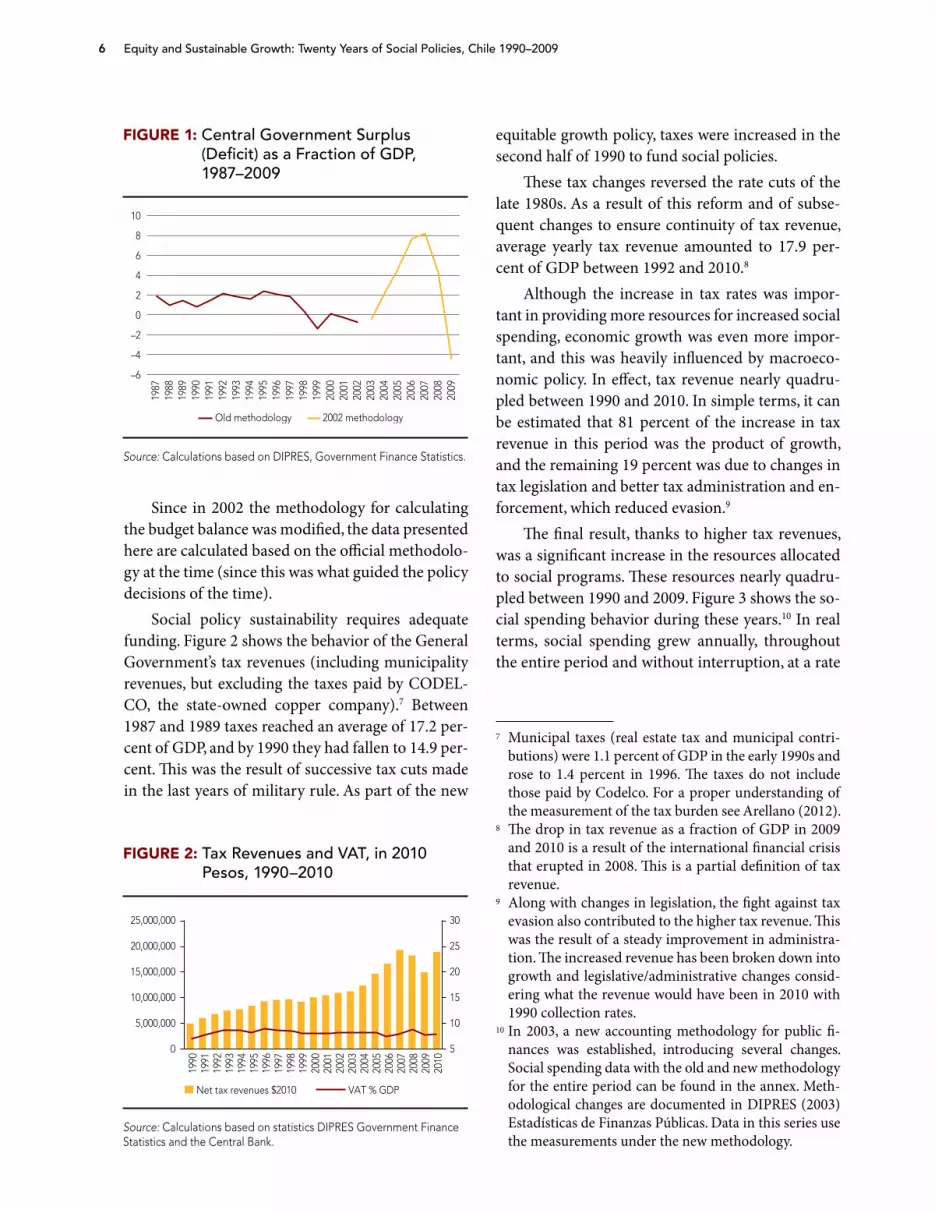
Fiscal policy began embracing new mechanisms to achieve long-term sustainability and responsibility. Unlike in the past, government spending was made independent of variations in copper prices (revenues from copper sales are a major line item in the Chil-ean national budget). In periods of good prices, reve-nue was saved for periods of low prices and income.6 It is not the purpose of this book to analyze the fis-cal policy of these two decades, but Figure 1 provides the fiscal outcome. The government surplus between 1990 and 2009 was 1.7 percent of GDP on average. The years in which deficits were recorded correspond to those of the Asian crisis in the late 1990s and the great financial crisis of 2008–09.
4 Fiscal social spending in 1989 was 11.5 percent lower in real terms than in 1985. The budget approved by the military government in 1990 included a further reduc-tion to the social spending of 1989. This was reversed by the new democratic government.
5 For more on this subject, see the accounts of the poli-tics of the era written by Edgardo Boeninger, Minister Secretary General of the Presidency at the time and a great promoter of the political importance of macro-economic stability. See also the numerous publications of Finance Minister Alejandro Foxley, the Ministry of Finance Annual Budget speeches in October 1990 and 1993, and Foxley (1993).
6 See Arellano (2005), Marcel et al (2001), Velasco et al (2010).
3
Equity and Sustainable Growth: Twenty Years of Social Policies, Chile 1990–20096
Since in 2002 the methodology for calculating the budget balance was modified, the data presented here are calculated based on the official methodolo-gy at the time (since this was what guided the policy decisions of the time).
Social policy sustainability requires adequate funding. Figure 2 shows the behavior of the General Government’s tax revenues (including municipality revenues, but excluding the taxes paid by CODEL-CO, the state-owned copper company).7 Between 1987 and 1989 taxes reached an average of 17.2 per-cent of GDP, and by 1990 they had fallen to 14.9 per-cent. This was the result of successive tax cuts made in the last years of military rule. As part of the new
equitable growth policy, taxes were increased in the second half of 1990 to fund social policies.
These tax changes reversed the rate cuts of the late 1980s. As a result of this reform and of subse-quent changes to ensure continuity of tax revenue, average yearly tax revenue amounted to 17.9 per-cent of GDP between 1992 and 2010.8
Although the increase in tax rates was impor-tant in providing more resources for increased social spending, economic growth was even more impor-tant, and this was heavily influenced by macroeco-nomic policy. In effect, tax revenue nearly quadru-pled between 1990 and 2010. In simple terms, it can be estimated that 81 percent of the increase in tax revenue in this period was the product of growth, and the remaining 19 percent was due to changes in tax legislation and better tax administration and en-forcement, which reduced evasion.9
The final result, thanks to higher tax revenues, was a significant increase in the resources allocated to social programs. These resources nearly quadru-pled between 1990 and 2009. Figure 3 shows the so-cial spending behavior during these years.10 In real terms, social spending grew annually, throughout the entire period and without interruption, at a rate
7 Municipal taxes (real estate tax and municipal contri-butions) were 1.1 percent of GDP in the early 1990s and rose to 1.4 percent in 1996. The taxes do not include those paid by Codelco. For a proper understanding of the measurement of the tax burden see Arellano (2012).
8 The drop in tax revenue as a fraction of GDP in 2009 and 2010 is a result of the international financial crisis that erupted in 2008. This is a partial definition of tax revenue.
9 Along with changes in legislation, the fight against tax evasion also contributed to the higher tax revenue. This was the result of a steady improvement in administra-tion. The increased revenue has been broken down into growth and legislative/administrative changes consid-ering what the revenue would have been in 2010 with 1990 collection rates.
10 In 2003, a new accounting methodology for public fi-nances was established, introducing several changes. Social spending data with the old and new methodology for the entire period can be found in the annex. Meth-odological changes are documented in DIPRES (2003) Estadísticas de Finanzas Públicas. Data in this series use the measurements under the new methodology.
Figure 2: Tax Revenues and VAT, in 2010 Pesos, 1990–2010
1990
1991
1992
1993
1994
1995
1996
1997
1998
1999
2000
2001
2002
2003
2004
2005
2006
2007
2008
2009
2010
0
25,000,000
20,000,000
15,000,000
10,000,000
5,000,000
5
30
25
20
15
10
Net tax revenues $2010 VAT % GDP
Source: Calculations based on statistics DIPRES Government Finance Statistics and the Central Bank.
Figure 1: Central Government Surplus (Deficit) as a Fraction of GDP, 1987–2009
1987
1988
1989
1990
1991
1992
1993
1994
1995
1996
1997
1998
1999
2000
2001
2002
2003
2004
2005
2006
2007
2008
2009
Old methodology 2002 methodology
–6
–4
–2
0
2
4
6
8
10
Source: Calculations based on DIPRES, Government Finance Statistics.

Emphasis on Equity and Fiscal Discipline 7
of over 7 percent. As a fraction of GDP, it rose from 12 percent in 1990 to 17 percent in 2009.
As evidenced by this data, a virtuous circle oc-curred during these two decades. Fiscal discipline contributed to good macroeconomic performance, which created favorable conditions for economic growth. This then translated into the main source of resources to fund social policy. This is the social dividend of fiscal discipline.
Fiscal discipline prevented the economic cy-cles—typical of populist policies—that generate macroeconomic imbalances, which in turn result in higher interest rates and/or inflation and/or ex-ternal account deficits. Thus, greater stability was achieved and the country risk rating was improved, improving financing conditions and increasing in-vestment. The resulting growth increased the re-sources available for social policies.
The sustainability of social policies is deter-mined during periods of prosperity. This is accom-plished, as it was in this case, by saving revenue dur-ing periods of rapid growth and favorable terms of trade for the negative periods of the economic cy-cle. With these savings it is possible to maintain and even expand social programs in times of difficulties, when they become more necessary.
Continuity in social efforts and in policies is, unfortunately, a rare phenomenon in Chile’s history and in the Latin American context. Typically poli-cies are interrupted shortly after they begin, due to a lack of economic sustainability and/or changes in
the principles that guide them. The result is great instability, frustration on the part of the people in-volved, and a very low effectiveness.
Going back to tax policy, this was viewed as an efficient mechanism to raise the resources required for fiscal policy. Thus, the structure was kept as sim-ple as possible and flat tax rates were favored. In particular, the proposed idea of introducing differ-ent VAT rates for redistributive purposes was dis-carded. The prevailing approach was to use a simple and effective tax system to raise resources, where the VAT, which in Chile’s case is the closest thing to a sales tax, acquired a growing importance (again, see Figure 2). For example, when faced with demand to lower or eliminate the VAT on books, it was decid-ed to maintain the VAT and instead increase gov-ernment spending on textbooks and libraries for students in government-subsidized schools and on public libraries.
There were changes in tax composition as a re-sult of successive reductions of tariffs, which were at 20 percent in 1990 and were reduced both uni-laterally and as a result of the free trade agreements that Chile signed with numerous countries. This was offset by the VAT and a higher corporate tax rate, which was 0 percent in 1990, re-established at 15 percent in 1992, and increased to 17 percent in 2006.
Significant changes were made to improve tax administration, reduce evasion, and reduce some tax exemptions, thereby achieving a more efficient and equitable tax system in horizontal terms.
Figure 3: Public Social Spending in 2010 Pesos and as a Fraction of GDP, 1987–2010
1987 1988 1989 1990 1991 1992 1993 1994 1995 1996 1997 1998 1999 2000 2001 2002 2003 2004 2005 2006 2007 2008 2009 20100
2,000,000
4,000,000
6,000,000
8,000,000
10,000,000
12,000,000
14,000,000
16,000,000
18,000,000
0%
2%
4%
6%
8%
10%
12%
14%
16%
18%
Social Spending MM$2009 Social Spending as a Fraction of GDP
Source: Calculations based on DIPRES Government Finance Statistics. MM = millions of 2009 pesos.

Equity and Sustainable Growth: Twenty Years of Social Policies, Chile 1990–20098
It was decided to pursue income redistribution and social policy through the clearer, more effective path of government spending, instead of the less promising option of modifying the tax structure.11
Changes in Budget Priorities Favoring Equity
In addition to increased resources from tax policy and greater growth, there was a redirection of re-sources from the public budget to social programs. Social spending rose from 61 percent of total gov-ernment expenditure in 1989/90 to 67 percent in 2009.
Five factors contributed to this redirection of resources.
First, investments in infrastructure were made with private funds, which freed the state to invest in essential projects for the country’s development. In-vestments in energy (electricity) infrastructure and telecommunications were privately held as a result of the privatizations of the 1980s. As a result of the new concession system created in the 1990s and/or new privatizations, private investors made in-vestments in water and sanitation, roads, ports and airports. This factor’s significant contribution to in-creased social spending is often overlooked. Thanks to the transfer of infrastructure investment to the private sector, the state was able to free up consid-erable resources that traditionally would have gone to financing investments necessary for the country’s growth.
From 1992, the year the new system of public works concessions was implemented, until mid-2010, more than US$11.6 billion was invested in the construction of more than 50 projects.12 At the same time, the state financed infrastructure with high so-cial content that could not be concessioned.
Meanwhile, privatization enabled the establish-ment of a user-pays system for these public services. This way, the state was not only freed from subsidiz-ing investment in these services, but also from un-necessarily subsidizing their operation.
When public services are state-owned, it is common to see the introduction of universal sub-sidies that favor the groups with greater income
and consumption capacity. This has happened in the past in Chile and is a common practice in other countries. In this case, however, users were charged the cost of using these essential utilities, and target-ed subsidies were put in place for needy households who could not afford the services. This was the case with drinking water, where along with introducing fees to cover costs (and as a precursor to privatiza-tion), a new drinking water consumption subsidy was created in 1991 for the most needy families. A targeted subsidy was also established in the case of electricity, as a result of a major fee adjustment made in 2005.
At the same time, in the areas of electricity, telecommunications, roads, water, and infrastruc-ture for small fishermen, the state actively financed investments that directly benefitted low-income rural families.
The fees charged were part of a pricing system, based on marginal costs, that promoted a more effi-cient use of the infrastructure. Ultimately, these fee and investment policies promoted efficiency, which consequently advanced growth and equity.
To grow rapidly, it was clear that the country required massive investment in infrastructure. The mechanism that was used relied on private funding, freeing the public budget from these requirements and thereby eliminating the traditional competition of resources between productive infrastructure and social spending. Strictly speaking, government in-vestment in infrastructure did not decline; on the contrary, it grew, but as has been mentioned, it con-stituted a small fraction of the investments that pro-duced the growth the country experienced.
A second factor that opened up more space for social spending was the relative decrease in defense spending. The conditions of peace allowed this ex-pense to be maintained without growth, causing general government defense spending to drop from
11 See for example the argument presented in the Annual Budget speech for 2003. Studies that demonstrate the wisdom of this choice include Engel, Galetovic, Rad-datz (1998).
12 Details of all of these projects can be found at the fol-lowing link along with a Ministry of Public Works analysis, Sistema de concesiones en Chile 1990–2003.

Emphasis on Equity and Fiscal Discipline 9
2.2 percent of GDP in the late 1980s to 1.2 percent in the 2005–2009 period.13
The third factor that helped expand social spend-ing was also a direct result of fiscal policy. The bud-get surpluses enabled, firstly, a reduction in public debt and secondly, an accumulation of financial as-sets during the 2006–2008 supercycle of high copper prices. First, loans were prepaid, reducing the central government debt from 44 percent of GDP in 1989 to 12.5 percent in 2000 and 6.3 percent in March 2010. Also in March 2010, investments in financial assets were equivalent to 15.7 percent of GDP. This brought government spending on interest down from 3.2 per-cent of GDP in 1990 to 0.5 percent in 2009, and led to net income in 2008–2009.14 See figure 4.
The savings on annual interest payments, thanks to a reduction in public debt, are currently financing an amount equal to half of all government spending on healthcare. This is another clear example of the virtuous circle between fiscal policy, growth and so-cial spending (see Figure 4).
The fourth factor that raised funds for so-cial programs was the mobilization of private re-sources, which added to the public effort. This “le-veraging” of private resources in different social programs took place primarily via the financial sys-tem. For example, a new microcredit system was introduced in which the state pays a subsidy and financial institutions bestow the loans. In housing, subsidies were used to a greater extent than direct contracts by the state. Higher education student
loan refinancing systems were created by CORFO (Development Corporation Agency). Also intro-duced was the so-called CAE (crédito con aval del estado), the state-guaranteed student loan pro-gram—discussed below—where the state is the fi-nal guarantor, reducing the fiscal resources to be disbursed directly.
These systems, apart from amassing additional resources to fund programs, may provide better man-agement and are better able to raise funds than tradi-tional government programs, to the extent that they transfer the loan process to specialized institutions.15
Another example of leveraging private re-sources occurred in rural telecommunications and electrification programs, where the state, via public tenders, only financed the portion of the investment costs required to make private invest-ment profitable. In the case of rural telecommuni-cations, for example, 6,000 public telephones were installed in rural areas for more than 2 million in-habitants between 1995 and 2001. Private com-panies funded a total of 86 percent of the US$161 million invested.16
Finally, the fifth factor that increased social in-vestment was contribution by the beneficiaries. Several programs promoted stakeholder contribu-tions, enabling the state to concentrate its efforts on those most in need and/or broaden the population receiving benefits. Examples of these initiatives are participatory paving programs, where neighbors help finance the paving of their streets, and cost
Figure 4: Paid Interest and Total Debt of the Central Government as a Fraction of GDP
1990
1991
1992
1993
1994
1995
1996
1997
1998
1999
2000
2001
2002
2003
2004
2005
2006
2007
2008
2009
0
Gross debt/GDP Paid interest
5101520253035404550
0.0
0.5
1.0
1.5
2.0
2.5
3.0
3.5
Source: Calculations based on DIPRES Government Finance Statistics.
13 The figures refer to total defense spending, including those financed with CODELCO contributions under the reserved copper law. These are recorded as extra-budgetary expenditures.
14 General government interest payments as a result of fiscal policy during this period have been much lower than the 3.8 percent OECD average in 2000 and the 4.2 percent EU average. They were even lower than the interest payments in the OECD countries with the lowest debt burdens, Korea and Norway, at 1.6 percent of GDP (Atkinson and van den Noord, 2001). Govern-ment interest spending in figures for Chile includes interest on recognition bonds in the pension system; without them, the figures are even lower.
15 One example, in the case of microcredits, can be seen in Arellano and Ochoa (2007).
16 World Bank 2004 Chile New Economy Study.

Equity and Sustainable Growth: Twenty Years of Social Policies, Chile 1990–200910
sharing systems for elementary and secondary edu-cation, which supplement state subsidies with con-tributions from families.
The five factors (use of private resources for in-frastructure, lower defense spending, saving on in-terest payments on public debt, leveraging private resources, and increased contributions from users) provided social policy with more funds for great-er coverage and clearer targeting of the most needy households.
The latter two factors are related to social policy design, unlike the first three, which are associated with budget allocation. Social policy design identi-fied how to leverage private resources and how to incorporate contributions by beneficiaries without distorting the policies’ ultimate goal.
The use of private resources in infrastructure, the leveraging of private resources to finance social policy, and the user contribution system all pose new challenges that will be addressed later.
Criteria for Social Resources Allocation
Along with the increase in resources, certain cri-teria and priorities that were either introduced or brought to the foreground should be noted. The goal here is not to detail resource allocation to dif-ferent programs, but to mention some policy op-tions and focal points.
Priority for those most in need and progressivity of public spendingOne clear objective of social policy was progres-sivity: allocating resources by giving priority to the poorest. Almost without exception, any increase in resources and/or any new program benefitted first and foremost the most needy households. Pension adjustments, for example, gave first priority to the lowest pensions and the oldest pensioners. Increas-es in educational subsidies and/or provision of edu-cational materials have been higher for the poorest students and/or schools, and in the case of housing, resources were directed toward more modest hous-ing programs that assist families with the greatest needs.
Monetary subsidies were highly targetedA clear example of the increased progressivity of so-cial policy is the case of monetary subsidies (non-contributory pensions, family allowances, special family allowances for non-contributing families [subsidio único familiar—SUF], and the drink-ing water subsidy). These subsidies were increased in both amount and coverage and were redirected towards those most in need. The first quintile went from receiving 34 percent of the total allotted re-sources in the late 1980s to more than 44 percent in 1998. Even the first decile saw a sharp increase in the percentage of resources received, from 19 per-cent to 28 percent of spending. In exchange, quin-tiles III-V received a lower proportion and an even lower amount of absolute resources.17 See Table 1.
Table 2 shows the number of beneficiaries and the average amount of the respective subsi-dies. Non-contributory pensions and family al-lowances, precisely those that benefit the poorest population, increased the most in both quantity and value. Indeed, these benefits acquired greater significance as a source of income for the poorest segment of the population. In 2009 monetary sub-sidies represented 32 percent of monthly income for the first quintile and 7.6 percent for the second (see Figure 5).18
This marked increase in the progressivity of monetary subsidies is noteworthy. It is quite excep-tional to see reallocations like the ones achieved in this period, considering that they require clear pol-icy decisions and agreements that make them po-litically feasible. Also needed are benefit allocation
17 The reduction of benefits seen between 1987 and 1990 is partly explained by the disappearance of emergency public employment programs (PEM and POJH), which were discontinued as unemployment went down.
18 Since 2009 was a year of economic crisis, independent incomes remained relatively stagnant, whereas mon-etary subsidies rose. Moreover, the data do not capture the full extent of benefits paid that year: since the Casen survey is during November 2009, it does not include the impact of monetary transfers paid in March and September of that year as part of the countercyclical fiscal policy. When calculating the monthly equivalent of the additional transfers of this year, monetary sub-sidies rise to 51 percent and 14 percent of independent income in quintiles I and II.

Emphasis on Equity and Fiscal Discipline 11
Table 1: Distribution of Monetary Subsidies by Income* Quintile, 1987–2009
Income Quintile 1987 1990 1992 1994 1996 1998 2000 2003 2006 2009
I 33.6 33.7 36.6 38.8 36.2 46.2 45.7 46.7 49.4 44.2
II 22.3 23.8 26.3 26.1 27.7 26.5 27.4 25.7 25.1 24.7
III 17.9 18.5 17.7 17.3 20.5 15.9 15.9 15.7 14.3 16.6
IV 14.9 13.8 12.0 12.1 11.5 8.5 8.4 8.8 8.0 10.3
V 11.3 10.2 7.4 5.7 4.1 2.9 2.6 3.1 3.2 4.3
TOTAL 100.0 100.0 100.0 100.0 100.0 100.0 100.0 100.0 100.0 100.0
Source: MIDEPLAN (Ministry of Planning and Cooperation), Department of Social Information, CASEN surveys from the respective years.Note: Excludes live-in domestic workers and their families. * Per capita.
instruments that are objective and effective in iden-tifying the most disadvantaged families.
It is interesting to note that over 75 percent of households in the poorest quintile receive some sort of monetary subsidy. This high coverage and con-centration of beneficiaries in the poorest segment of the population demonstrates the extremely high effectiveness of these programs in addressing the needs of the most disadvantaged families. Over the years, coverage has been expanded and the selec-tion and benefit-granting mechanisms have been revised. This was done on a basis of objective so-cioeconomic need criteria, without which these achievements would have been impossible.19
Having said that, it should be noted that just over 20 percent of families living in poverty (those that fall
within the lowest 15 percent in the country in terms of income) do not receive any monetary subsidy. This means that, either due to a lack of available capital or because of the benefit-allocation mechanisms, there is still a group of households that does not have ac-cess to these subsidies. However, it is important to emphasize how difficult it is for these programs to cover 100 percent of households, if one takes into ac-count the high mobility and changes experienced by families in the lower income groups.
Although often thought otherwise, there is a high mobility of households across income quintiles. This is clear from data from panel surveys, based on the
19 See the section below on professionalization of social policy.
Figure 5: Monetary Subsidies as a Percentage of Independent Income by Quintile, 1990–2009
1990 1996 2000 2003 2006 20090
5
10
15
20
25
30
35
7.49.0
12.7 13.0 14.0
31.7
2.7 3.3 3.6 3.4 3.4
7.6
1.4 1.7 1.4 1.4 1.33.4
0.7 0.6 0.5 0.5 0.5 1.30.16 0.07 0.05 0.06 0.07 0.190.9 1.0 1.1 1.1 1.2
2.6
Quintile I Quintile II Quintile III Quintile IV Quintile V Total
Source: Based on Mideplan Casen Surveys.

Equity and Sustainable Growth: Twenty Years of Social Policies, Chile 1990–200912
Table 2: Monetary Subsidies, Number and Value 1987–2009 (In December 2009 pesos)
Year
Non-Contributory Pension Family Allowances
Special Family Allowances for Non-Contributing Families
Drinking Water Subsidy
Unemployment Subsidy
Number of ben-
eficiaries (thousands)
Monthly average
($)
Number of ben-
eficiaries (thousands)
Monthly average
($)
Number of beneficiaries (thousands)
Monthly average
($)
Number of ben-
eficiaries (thousands)
Monthly average
($)
Number of ben-
eficiaries (thousands)
Monthly average
($)
(1) (2) (3) (4) (5) (6) (7) (8) (9) (10)
1987 318.7 24,525 4,015 3,107 985 3,400 — — 66.1 21,912
1988 291.0 26,595 3,817 2,581 926 2,952 — — 51.8 19,140
1989 292.3 26,061 3,777 2,367 886 2,990 — — 39.2 17,437
1990 311.4 26,476 3,976 2,379 881 3,185 — — 33.8 14,212
1991 299.3 30,197 4,021 2,444 894 3,359 — — 30.2 16,804
1992 290.6 30,538 3,732 2,615 840 3,527 315.9 967 23.4 17,385
1993 296.2 30,346 3,354 2,782 863 3,631 351.9 1,532 19.1 17,497
1994 312.3 31,445 3,239 2,844 819 3,685 389.7 1,686 20.6 18,074
1995 318.8 32,441 3,239 2,902 779 3,820 399.2 3,441 21.3 18,573
1996 326.5 34,908 3,244 3,028 766 3,939 442.5 3,740 21.3 19,191
1997 339.6 34,849 2,915 3,443 910 4,111 507.8 4,211 22.6 18,282
1998 345.4 38,036 3,053 3,304 984 4,154 507.8 4,487 27.3 16,641
1999 350.7 46,852 2,901 3,363 933 4,314 507.9 4,652 49.0 16,100
2000 358.8 46,242 2,827 3,543 872 4,983 521.6 4,552 46.2 16,496
2001 365.3 51,267 2,906 3,464 888 4,806 485.3 4,672 51.3 14,973
2002 371.9 50,256 2,773 3,606 934 4,711 547.9 4,406 48.5 13,679
2003 372.7 50,957 2,764 3,632 937 4,677 614.7 5,432 51.2 22,480b
2004 372.8 51,653 2,735 3,681 938 4,826 619.1 6,289 71.6 51,809b
2005 398.4 54,931 2,801 3,556 953 4,782 573.0 6,431 82.4 73,287b
2006 424.3 55,805 2,685 3,660 987 5,237 666.3 4,875 99.4 88,635b
2007 452.9 55,696 2,278 4,205 1.051 5,396 684.5 4,877 108.7 96,236b
2008 502.7a 60,637a 2,123 3,960 1.312 6,470 691.5 5,008 119.1 104,473b
2009 581.3a 74,232a 2,131 3,888 1.726 12,270 — — 156.6 115,324b
Source: 1987–2000: (1) and (2), Pension Normalization Institute (INP) Annual Report 2000; (3) and (4), Social Security Supervisory Agency (SUSESO); (5) and (6), Social Security Supervisory Agency; (7) and (8), Administrative, operational and legal background of the subsidy; (9) and (10), Social Security Supervisory Agency. 2000 onwards: (1), (2), (3), (4), (5) and (6), Social Security Supervisory Agency Statistical Bulletins, years 2006, 2007, 2008 and 2009; (7) and (8), Drinking Water Subsidy Report 1996–2006 and 2006–2008, Mideplan; (8) and (9), Pensions Supervisory Agency. 2008 and 2009: (1) and (2), Pensions Supervisory Agency.a PASIS (Non-contributory pension system) includes winter bonuses, holiday bonuses and special bonuses. As of July 2008, the non-contributory pensions benefit was eliminated; Law 20,255 replaced this benefit with Basic Solidarity Pensions (PBS). Between January and June of 2008 the PASIS number is 485,375 and the monthly average in 2009 pesos is $51,137. Between July and December of 2008, the monthly average PBS number is $520,016 and the average monthly value in 2009 pesos is $65,772.b In May 2003 a new unemployment insurance administered by the Pensions Supervisory Agency came into force.

Emphasis on Equity and Fiscal Discipline 13
CASEN, held in the years 1996, 2001 and 2006, with a portion of the households surveyed again later. Ac-cording to these records, only 4.4 percent of house-holds were in a condition of poverty in all three mea-surements, while 34 percent of the population was poor at some point in the ten-year period under study. These data reveal that there is a much great-er degree of social mobility among poor households than is sometimes assumed, while at the same time making it necessary to revise the assumption under-lying some social policy proposals that families in poverty permanently remain in this condition.20
The introduction of these targeted cash trans-fers to the poorest families occurred more than 30 years ago. In 1975 non-contributory pensions were established. Although the amount was roughly equivalent to a third of the minimum pension, for the first time 200,000 people bereft of resources and previously outside the pension system received ben-efits. In 1981, the special family allowances for non-contributing families (SUF) were created. These ex-tended the family allowance benefit to more than
550,000 children of poor families whose parents were outside the system due to a lack of formal em-ployment. Family allowances had been introduced in the 1940s and 1950s for workers employed in the formal sector. After a steady increase in their pur-chasing power, they—along with pensions—suf-fered a severe fall starting in 1972 (see an account of these changes in Arellano, 1985).
These targeted transfers set the precedent for the current conditional cash transfers that have be-come popular in several countries in Latin America since the mid-1990s.21
20 For a very interesting study of the vulnerable situations faced by households, the ways of dealing with them and the role that subsidies play, see Raczynski, Serrano, and Valle (2002).
21 A complete account of the evolution of conditional transfers can be seen in Ferreira Francisco and Da-vid Robalino 2010 Social Protection in Latin America Achievements and Limitations, World Bank.


15
Educational policy and a growing Emphasis on
invEstmEnt in human capital
A second feature of the equitable growth poli-cies was the increasing priority given to edu-cation in the allocation of public resources.
This was consistent with the importance acquired by investment in human capital in the country’s devel-opment. While the government funding channeled to education declined in real terms by 11 percent be-tween 1985 and 1990, thanks to the change of priori-ties, in the next two decades it increased steadily.22 During most of this period funding grew more than 10 percent in real terms per year, so that in 2009 it was more than five times greater the level of 1990.
During the 1990s the expansion rate was greater, first due to the need to replenish the seriously dete-riorated sector and then thanks to the emphasis that President Eduardo Frei Ruiz-Tagle’s administration placed on this goal from the very beginning of his term, increasing the priority on investment in human capital. Frei’s presidency promoted an educational re-form program, which included the extension of the school day among its most significant undertakings. This led to an increase of 25 percent in the average school day, which required more hours from teachers and staff in general, as well as the expansion of school infrastructure that in most cases was being used in two shifts during the shorter day (see Arellano 2000 and Cox 2003 for an account of education reform during this period).23 In the first half of the 2000s the momentum of the expansion of resources declined. It
then gained strength again during President Bache-let’s presidency, due to the expansion of preschool ed-ucation, the creation of a preferential per student sub-sidy,24 and increased funding for higher education.
It is interesting to examine the ways in which the principles that guided social policy materialize in ed-ucational policy. In the allocation of funds for educa-tion, one can see the priority given to equity. Within education, priority was mainly directed at preschool, primary school and secondary school, through re-sources aimed at increasing coverage as well as im-proving quality. In higher education, however, most resources were associated with increasing coverage.
22 Education spending in real terms declined every year between 1985 and 1989, and the budget approved by the military government in 1990 envisaged a new re-duction, which was reversed by Aylwin’s government. Between the early and late 1980s, the subsidy per stu-dent fell by 30 percent in real terms, and the number of textbooks distributed in basic education decreased by over 30 percent in the same period. See information in Cox et al (1997).
23 It is interesting to note that the decision to implement the full school day was made with the explicit purpose of improving the quality of education. International studies demonstrating the importance of time in school for learning were taken into account in this decision.
24 A general account of human capital policies in Presi-dent Michelle Bachelet’s administration can be seen in Velasco (2009), State of the Public Budget Speech.
4

Equity and Sustainable Growth: Twenty Years of Social Policies, Chile 1990–200916
Government, through the JUNJI (National Daycare Agency) and the Integra Foundation, and the expan-sion of the kindergarten and pre-kindergarten en-rollment in government subsidized schools.25 The
Table 3 shows the increase in coverage in pre-school and secondary school, according to the stu-dents’ household income (evolution of primary ed-ucation coverage is not shown in the chart because it was already universalized in the 1980s). It is note-worthy that preschool access for children from the poorest 40 percent of households rose by more than 20 percent, on par with the increase seen by the rest of the households.
Figure 6 presents attendance in daycare or school by age for the poorest quintile. There is a sig-nificant increase in coverage for children 3 to 5 years old. At 6 years of age attendance is almost universal, and at 4 years of age it exceeds 60 percent for chil-dren in the lowest income quintile. This is of great importance because it ends a long-standing problem in less developed countries: late entry to school re-sulting in dropouts and grade repetitions. Moreover, entry into the education system at an early age helps support the development of small children from vul-nerable households at a key stage in their growth. This increase in coverage has been helped by the in-creased enrollment in programs run directly by the
Table 3: Preschool and Secondary School Coverage by Independent Income Quintile,* 1990–2009 (Percentage)
Preschool Education Coverage
Quintiles 1990 1992 1994 1996 1998 2000 2003 2006 2009
I 16.9 19.8 21.1 22.3 23.6 25.5 30.5 38.0 37.8
II 17.5 22.1 22.7 26.8 29.1 29.6 33.7 39.2 41.0
III 20.4 23.9 27.2 30.0 30.5 32.7 35.3 44.3 42.6
IV 27.2 27.9 33.4 36.8 34.8 37.6 35.9 46.4 44.1
V 32.4 44.6 46.0 48.4 44.8 50.2 49.0 52.0 57.0
Total 20.9 24.8 26.9 29.8 30.3 32.4 35.1 42.4 42.6
Secondary Education Coverage
Quintiles 1990 1992 1994 1996 1998 2000 2003 2006 2009
I 73.3 73.6 73.9 75.3 77.4 82.3 87.7 87.7 89.9
II 76.3 77.9 79.8 81.0 84.1 88.0 92.0 90.9 92.6
III 80.5 83.0 86.6 89.3 88.4 92.4 94.2 93.4 94.2
IV 87.2 88.8 90.9 95.3 94.5 96.1 96.9 97.3 95.1
V 94.3 96.7 96.7 97.2 97.7 98.5 98.8 97.6 95.9
Total 80.5 82.4 84.2 85.9 86.9 90.0 92.8 92.4 93.0
Source: Prepared by MIDEPLAN, Social Division. Based on CASEN surveys, respective years. * Excludes live-in domestic workers and their families.Corresponds to household income from the factor market, i.e. the labor and capital markets.
Figure 6: First Income Quintile and Its Evolving School Attendance (Percent), by Age, 1990, 2000 and 2009
1990 2000 2009
020406080
100120
0 1 2 3 4 5 6 7 8 9 10 11 12 13 14 15 16 17 18
% A
tten
danc
e
Age (years)
Source: Calculations based on CASEN.
25 The subsidy per student is the monthly payment made by the government to municipal or subsidized private schools for each student attending classes in the re-spective month.

Educational Policy and a Growing Emphasis on Investment in Human Capital 17
per student subsidy was introduced to the pre-kin-dergarten level in 2001 with a limit on the students who could receive it, a limit that increased every year until it was universalized in 2008 for all subsi-dized education.
During President Bachelet’s term, special prior-ity was given to preschool programs, with resources more than doubling between 2005 and 2009.26 This was part of a wider comprehensive early childhood protection program called Chile Crece Contigo. This is a management model that follows children’s de-velopment from birth until they enter pre-kinder-garten. It offers a number of support services to children from families in vulnerable contexts.
At the secondary school level, participation of students in first-quintile households grew by more than 15 percent. Coverage has exceeded 90 per-cent and has been approaching that of the higher-income youth. This notable expansion in coverage in secondary education was concentrated in tech-nical-professional education. This is in response to demand from parents seeking an education that can best prepare their children for a job. Despite at-tempts to update technical-professional education, and despite trials with more effective methods, such as dual education (in which the student does part of his or her learning at work), there is still much to be done to improve the quality of this form of edu-cation, which largely serves low-income students.27
After decades of efforts to provide education to the entire population, increasing coverage has been disappearing as a concern in K-12 levels. In the coming years, the problem will be the decline in the school-age population. In effect, the population aged 6–13 peaked in 2000, the 14–17 year-old pop-ulation has been declining since at least 2005, and even the population of young adults of the age to at-tend higher education peaked in 2009. This reduc-tion in school-age population poses reorganization and consolidation challenges for primary and sec-ondary schools to be addressed in the coming years.
Table 4 shows the significant growth in resourc-es per student in state-subsidized K-12 education, which quadrupled in real terms.
The increase in resources per student in the school system went almost entirely to raising the sub-sidy per student.28 This enabled an increase in teacher
salaries, which had been severely reduced. The dete-rioration of teacher salaries resulting from the reduc-tion of resources allocated to education in the late 1980s was so serious that it resulted in a strong lack of interest in pursuing an education degree, risking the supply of skilled education professionals. The subsi-dy per student fell by 30 percent during the 1980s.29 In contrast, since 1990 it has steadily increased every year. The average subsidy was $13,500 pesos per stu-dent per month in 1990 in 2009 currency; in 2000, it had risen to $33,200 pesos, and in 2009, to $65,400 pesos. These are average values, with differences by educational level, school hours, rurality and whether or not they receive the preferential subsidy (subven-ción escolar preferencial—SEP).
With the per student subsidy increase, teach-ers’ real salaries more than tripled for the municipal sector and grew even more for those in subsidized private schools (See Table 4).30
In addition to increasing salaries, the teacher compensation policy, via the Teacher Statute for the municipal sector, was aimed at creating earnings for seniority and training. In the following years, this was focused mainly on increasing the minimum salaries for those entering the teaching profession in order to encourage younger teachers. At the same time, major innovations were introduced, such the stimulus for teachers working in areas considered
26 A complete detail of policies and initiatives for early childhood education can be seen in Arenas (2009) In-forme de finanzas públicas proyecto de ley de presu-puestos 2010, Financiamiento e institucionalidad de la educación parvularia en Chile: avances 2006–2010 y de-safíos.
27 An interesting study that favorably portrays the incor-poration of students in technical-professional education into the labor market was conducted by the Department of Economics at the University of Chile (1999).
28 The subsidy per student is the monthly payment made by the government to municipal or subsidized private schools for each student who attended classes in the period.
29 The subsidy per student fell by 30 percent in real terms between the 1980/82 and 1989/90 averages. See Cox et al (1997).
30 There is no information on income averages in this particular sector, but the minimum salary rose by over 500 percent in the period in question.

Equity and Sustainable Growth: Twenty Years of Social Policies, Chile 1990–200918
difficult due to their rurality or marginality. Anoth-er innovation was the teacher performance incen-tive: every two years since 1996 teaching teams at the top 25 percent of schools in terms of education-al progress are selected to receive a quarterly per-formance bonus (SNED). The amount of this bonus as a percentage of salaries has been rising steadily, even exceeding an annual salary. Similarly, in 2006 it expanded to the top 35 percent of schools.31 With
31 In 2008–9 more than 57,000 teachers received an aver-age bonus of $630,000 pesos under this program. An analysis of the topic can be found in Alejandra Mizala and Pilar Romaguera (2002) “Evaluación del desem-peño e incentivos en la educación chilena,” Center for Applied Economics, Department of Industrial Engi-neering, University of Chile. Updated information re-garding its application is found at www.mineduc.cl.
Table 4: Central Government Expenditure per Student in the School System (average, K-12) and Teacher Salaries, 1987–2009 (2009 pesos)
Year
Average Annual Expenditure per
StudentEnrollment K-12
(thousands)
Annual Expenditure on Subsidies per
Student
Monthly Salary for the Municipal Sector
Minimum Monthly Salary for the
Subsidized Private Sector (Minimum)Average Minimum
(1) (2) (3) (4) (5) (6)
1987 183,849 2,767 176,505
1988 187,043 2,779 171,119
1989 184,256 2,758 178,219
1990 180,425 2,738 178,693 343,922 189,136 97,276
1991 193,846 2,709 181,371 361,407 225,635 209,724
1992 214,195 2,742 195,770 422,131 249,761 240,399
1993 239,040 2755 214,637 475,068 264,457 245,506
1994 267,042 2,786 240,175 541,257 306,937 274,523
1995 302,802 2,862 282,301 595,535 338,697 331,676
1996 338,291 2,962 306,875 639,501 372,338 370,729
1997 372,227 2,995 343,049 698,711 408,881 406,775
1998 409,559 3,029 363,109 734,758 445,603 445,278
1999 441,420 3,123 376,942 771,538 475,650 475,650
2000 475,298 3,196 408,066 805,419 503,590 503,590
2001 510,946 3,246 435,685 826,905 510,135 510,135
2002 544,082 3,295 457,689 865,248 511,443 511,443
2003 546,763 3,341 463,989 868,666 511,311 511,311
2004 603,261 3,357 501,428 884,773 512,238 512,238
2005 591,507 3,400 511,551 893,243 508,852 508,852
2006 624,793 3,398 530,863 907,728 510,892 510,892
2007 684,477 3,363 573,312 916,848 514,851 514,851
2008 806,067 3,322 673,931 1,008,819 510,512 510,512
2009 932,436 3,236 764,804 — 554,928 554,928
Sources: (1) Spending on Education: Expenditures in Government Finance Statistics Report 1987–2003, 1997–2006 and 2000–2009. (2) Enrollment K-12 Education Statistics Annual Reports. Types of establishments: Municipal, Subsidized Private and Corporations. Levels: Preschool, Primary and Secondary (including special education). Does not include Paid Private. (3) 1989–2002 Government Finance Statistics, Functional Classification of Expenditure, Expenditure on Subsidies. 2003–2009 Informes de Ejecución Trimestral, DIPRES. (4), (5) and (6) Department of Research and Development, Planning and Budget Division, Ministry of Education. Published in Anuario Estadístico 2008. Teacher salaries are for a 44-hour workweek, monthly average.

Educational Policy and a Growing Emphasis on Investment in Human Capital 19
the introduction of the teacher evaluation system in 2004, performance bonuses associated with out-comes were put in place.
Raising the subsidy per student was not only intended to increase teacher salaries; it was also raised to fund a longer school day. The full school day (jornada escolar completa—JEC) represents an increase of almost 25 percent in hours of study. It meant an increase of 35 percent in the average subsidy per student, plus the expansion and con-struction of educational facilities to accommodate students for the full day. This reform was primarily intended to raise the quality of education, improv-ing student learning by way of increased study time. The available international evidence pre-dicted a clear positive effect from this initiative.32 The only empirical study that sought to measure its impact in Chile was done by Bellei (2009) and concluded that for high school students in schools with the JEC, math and language outcomes im-proved as compared to students in schools that had not yet implemented the JEC.
Table 5 shows the implementation process of the full school day starting in 1997. It was a slow process, due to the necessary expansion of facilities and reorganization of school activities. It turned out to be slower and more difficult than was origi-nally expected, particularly in the oldest and most traditional establishments in consolidated urban areas where it was difficult to obtain land for ex-pansion. However, by 2000, more than 560,000 full-time students had been incorporated into the JEC. In 2010, over 2 million students took part in the full school day, representing more than two thirds of el-igible students. A significant percentage of those who had not been incorporated were special edu-cation students.
Since the JEC represents an ongoing, signifi-cant national expense, the Government proposed and passed the maintenance of the VAT rate, which would otherwise have gone down,33 in keeping with the fiscal discipline that characterized social policy in the period.
In 2008, the preferential per student subsidy was introduced (SEP). This was an initiative that was studied and advocated for several years. It became a reality in the Government of President Bachelet
and provided special support to the most vulner-able students.34 Educational establishments serving students in this situation receive an additional sub-sidy per priority student of more than 50 percent of the general subsidy in the first grades of prima-ry school. This is supplemented with an additional
32 A secondary benefit of the JEC was increased participa-tion of women in the labor force. Dante Contreras, Pau-lina Sepúlveda C and Soledad Cabrera, Department of Economics and Micro Data Center, University of Chile 2010, in The effects of lengthening the school day on female labor supply: Evidence from a quasi-experiment in Chile estimate this effect by separating it from other variables that contributed the increased participation of women in this period. A broad evaluation of the JEC was com-missioned by the Ministry of Education in 2005.
33 In the 1990 tax reform, the government won support for tax increases for four years only, after which they would go down. This increase was renewed in 1993, but the VAT had to be lowered in 1997. Along with the JEC’s approval, it was also approved to maintain the VAT.
34 See a discussion of this topic in, for example, Arellano (2006) and Larrañaga and Peirano (2006).
Table 5: Transition to the Full School Day
Year
Levels of Education Incorporated into
the JEC
Cumulative Enrollment in the JEC (thousands)
1997 15,298 232
1998 3,950 345
1999 2,169 423
2000 3,594 561
2001 4,375 757
2002 4,602 949
2003 4,655 1,146
2004 3,742 1,304
2005 4,547 1,528
2006 2,993 1,640
2007 3,552 1,763
2008 3,276 1,866
2009 3,280 1,968
2010 2,753 2,042
Without JEC 967
Source: Calculated based on MINEDUC data records.Note: Enrollment in 2010 for establishments that transitioned to the JEC in the corresponding years. The schools do not transition to the JEC in full each year, but rather do so by grade levels. Only schools that by law have the right to a JEC subsidy are included.

Equity and Sustainable Growth: Twenty Years of Social Policies, Chile 1990–200920
contribution according to the degree of concentra-tion of priority students in the school. The creation of this preferential subsidy constitutes a major step towards strengthening equity in the school system, directing more state resources towards schools at-tended by students from vulnerable families. This new subsidy is in the first years of implementation and will generate major changes in terms of both equity and educational quality.
In the years before the creation of the preferen-tial subsidy, programs had been developed for the most vulnerable schools and/or schools with the lowest academic results. The P900 program, aimed at subsidized schools in the lowest tenth percentile in terms of SIMCE35 test results, was the first in this vein. A special program to support rural schools was also developed. In the case of secondary edu-cation, the Montegrande school program sought to raise the quality of education of vulnerable students in secondary school. As a general rule, all new pro-grams began by first attending to the most vul-nerable students: the educational online network Enlaces, the full school day, school improvement programs, etc.
At the same time, during these two decades, resources were increasingly spent on support pro-grams for low-income students, such as more school meals, textbooks, teaching materials and support for the most disadvantaged schools (see Arellano 2000 and the studies in Cox 2003 for a detailed account).
One aspect that is rarely emphasized and is very important in terms of equity is the sharp increase in public resources devoted to education of children with special needs. The Ministry of Education ex-penditure item with the most growth is special edu-cation. It has risen by more than 20 times in the last two decades, its relative importance increasing from less than 1 percent to over 4 percent of total expen-diture. This is the result of an increase in coverage for children with disabilities and/or special educa-tional needs and the sharp increase in the subsidy per student for the schools that serve them.
As a way to increase education funding with contributions from parents, in 1994 the cost shar-ing system was modified. This system dictates that schools can charge parents a monthly fee. As the
charge increases, the subsidy provided by the Gov-ernment decreases. Up until 1994, the decrease in the subsidy resulting from charging parents was very costly for schools. After this date, all parent payments of less than $9,000 pesos (2010 currency) went to benefit the school.36 This change resulted in a significant increase in the number of schools cov-ered by the cost sharing system. During the next five years, the number of students who were en-rolled in private schools and whose parents shared costs doubled, accounting for 68 percent of these schools’ enrollment in 1999. This increased to 72 percent in 2010 (equivalent to 41 percent of enroll-ment in all subsidized schools).
To prevent cost sharing from generating prob-lems for families who could not pay the amount charged by the school, in 1997 a mandatory schol-arship system was established in each school for the equivalent of at least 7 percent of total revenue from parental contributions. In 2006 it became manda-tory for at least 15 percent of students in subsidized schools to be from vulnerable economic situations, and it was prohibited to charge these students for cost sharing. Furthermore, the preferential subsi-dy system (SEP), introduced in 2008, released the parents of children receiving the benefit from any payments.
This cost sharing system has helped provide re-sources to the school system. The average payment per student has been just over 20 percent of the con-tribution made by the Government.
In recent years there has been concern regard-ing the degree of segregation in the school system and the influence that this system of financing could have on the matter. Empirical information is insuf-ficient. Apart from specific complaints, there are no studies that follow students when they change
35 SIMCE is the national student learning assessment system.
36 Charges of less than 0.5 educational subsidy units (USE) (the USE value in 2011 was $18,190; in 2010 it was $17,457) do not mean a decrease in the subsidy. Charges between 0.5–1 USE mean a subsidy reduction of 10 percent, charges between 1–2 USE mean a reduc-tion of 20 percent and charges between 2–4 USE mean a reduction of 35 percent. If charges are more than 4 USE the school is not entitled to a subsidy.

Educational Policy and a Growing Emphasis on Investment in Human Capital 21
schools, or information on why parents choose schools..37 No doubt segregation is a major concern that deserves to be addressed and examined in de-tail, given the value of school integration both for education and for building social capital.
With respect to teachers and their key role in ed-ucation, much of the effort of the period was aimed at improving earnings. In the early 1990s this was essential, because the deterioration was creating a growing disinterest in studying education. This situ-ation was corrected little by little and in the second half of the 2000s there was an explosive increase in the number of education students. More remark-able still, entrance scores have improved, which was the goal of a 1998 scholarship encouraging students with good academic performance to obtain educa-tion degrees. This was part of an effort to improve the initial teacher training programs. Also worth noting are the in-service teacher training initiatives, and the introduction and ongoing improvement of assessment tools and individual and collective per-formance recognition tools. Training included an innovative overseas internship program that be-tween 1996 and 2005 gave more than 6,000 class-room teachers (from preschool, primary, second-ary, adult and special education) and administrators scholarships to study 6 to 8 weeks in foreign univer-sities, becoming familiar with the teaching experi-ences of twenty countries from all the continents.38
As seen, policies to raise the quality of educa-tion were aimed at supporting schools, teaching staff, and students with an emphasis on equity. Also, incentives and recognitions were promoted for the best teachers, for establishments with marked im-provements in learning, and so on. Rather than es-tablishing new quality requirements, numerous sup-ports and contributions were implemented (amount of time in school, teaching resources, teacher train-ing and more) to gain a better quality of education.
Only in recent years have new requirements aimed at raising quality been introduced. The new quality assurance system, which underwent legis-lative debate in 2007 and was only recently signed into law in 2011, is the main initiative in this area. Until the enactment of these new laws, the Minis-try of Education had no authority to demand edu-cational outcomes and to question the continuation
of a school if it did not achieve certain results. All existing requirements are either purely administra-tive, or deal with the educational process (condi-tions of the facilities, amount and characteristics of staff, maximum class size, plans and programs, etc.), but not their educational results.39
As a result of the aforementioned efforts, ac-cess to and attendance in the educational system of children from the poorest households has decidedly improved. School conditions in terms of infrastruc-ture, equipment, materials, and learning opportuni-ties have also markedly improved.
There is undeniable progress in the coverage and equity of the system, but can the same be said about the quality of education? The available data deal with measurements of student learning in the school sys-tem, via both SIMCE tests and international tests. A thorough analysis of the issue far exceeds the scope of this text, but it is necessary to cover it briefly.
Chile started taking part in international learn-ing assessment tests in 1996 with the TIMSS test, and since 2000 the OECD has been administering the PISA test to 15-year-old students in 65 countries. In 2009, the fourth time the test was given in Chile, the average scores of Chilean students rose systematical-ly in language and mathematics. The same trend has been observed in all available measurements.40 Not only have scores risen, but Chile was also one of the countries with the greatest improvement on the test.
The improvement seen in the average is due to the fact that students from low-income fami-lies and those who had the lowest outcomes im-proved the most. The test has a level 1 category in which performance is considered insufficient, and
37 Those who have studied segregation compare indi-ces aggregated according to whether or not the school participates in cost sharing, and they believe that this financing policy would indeed generate segregation. There are no results that can define the extent to which segregation originates in the financing or comes from factors such as the spatial segregation of the population.
38 See an account of this in Mireya Arellano and Ana María Cerda (2006).
39 A description of the concepts behind these reforms can be seen in Darville and Rodriguez (2007).
40 Chile did not participate in the second measurement in 2003.
Equity and Sustainable Growth: Twenty Years of Social Policies, Chile 1990–200922
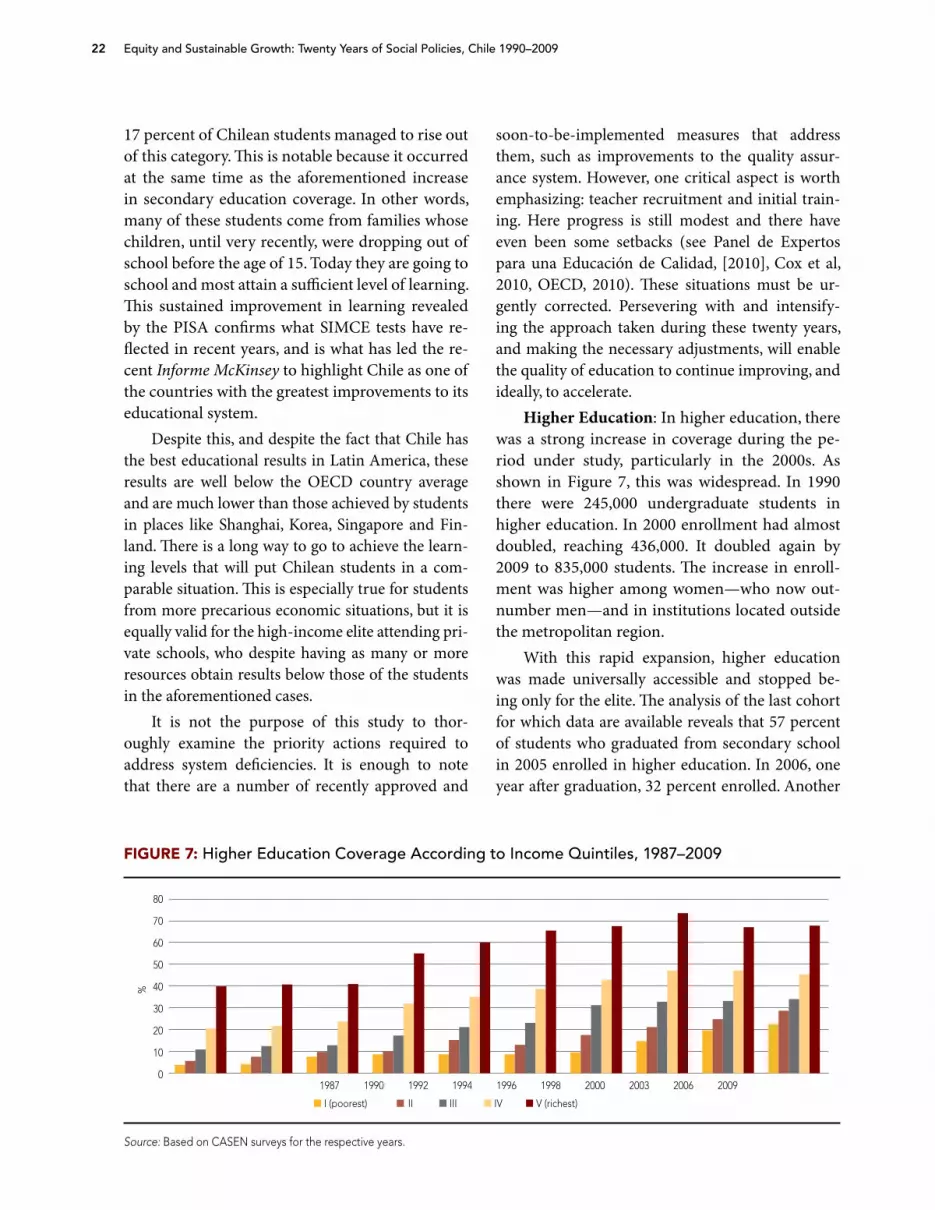
17 percent of Chilean students managed to rise out of this category. This is notable because it occurred at the same time as the aforementioned increase in secondary education coverage. In other words, many of these students come from families whose children, until very recently, were dropping out of school before the age of 15. Today they are going to school and most attain a sufficient level of learning. This sustained improvement in learning revealed by the PISA confirms what SIMCE tests have re-flected in recent years, and is what has led the re-cent Informe McKinsey to highlight Chile as one of the countries with the greatest improvements to its educational system.
Despite this, and despite the fact that Chile has the best educational results in Latin America, these results are well below the OECD country average and are much lower than those achieved by students in places like Shanghai, Korea, Singapore and Fin-land. There is a long way to go to achieve the learn-ing levels that will put Chilean students in a com-parable situation. This is especially true for students from more precarious economic situations, but it is equally valid for the high-income elite attending pri-vate schools, who despite having as many or more resources obtain results below those of the students in the aforementioned cases.
It is not the purpose of this study to thor-oughly examine the priority actions required to address system deficiencies. It is enough to note that there are a number of recently approved and
soon-to-be-implemented measures that address them, such as improvements to the quality assur-ance system. However, one critical aspect is worth emphasizing: teacher recruitment and initial train-ing. Here progress is still modest and there have even been some setbacks (see Panel de Expertos para una Educación de Calidad, [2010], Cox et al, 2010, OECD, 2010). These situations must be ur-gently corrected. Persevering with and intensify-ing the approach taken during these twenty years, and making the necessary adjustments, will enable the quality of education to continue improving, and ideally, to accelerate.
Higher Education: In higher education, there was a strong increase in coverage during the pe-riod under study, particularly in the 2000s. As shown in Figure 7, this was widespread. In 1990 there were 245,000 undergraduate students in higher education. In 2000 enrollment had almost doubled, reaching 436,000. It doubled again by 2009 to 835,000 students. The increase in enroll-ment was higher among women—who now out-number men—and in institutions located outside the metropolitan region.
With this rapid expansion, higher education was made universally accessible and stopped be-ing only for the elite. The analysis of the last cohort for which data are available reveals that 57 percent of students who graduated from secondary school in 2005 enrolled in higher education. In 2006, one year after graduation, 32 percent enrolled. Another
Figure 7: Higher Education Coverage According to Income Quintiles, 1987–2009
I (poorest) II III IV V (richest)
%
0
10
20
30
40
50
60
70
80
1987 1990 1992 1994 1996 1998 2000 2003 2006 2009
Source: Based on CASEN surveys for the respective years.

Educational Policy and a Growing Emphasis on Investment in Human Capital 23
25 percent enrolled in one of the next three years. Factoring in dropouts between 2006 and 2009, ul-timately 42 percent of students who graduated in 2005 stayed enrolled.41 Dropouts are certainly a se-rious problem, as discussed below.
The vast majority of these young people are the first generation in their families to have access to higher education. This is apparent from a nation-al survey of 2005 high school graduates showing that 64 percent of these students had parents who at most completed high school.42
Based on the 2009 CASEN survey, it was esti-mated that in the poorest quintile, heads of house-holds with students in higher education had an av-erage of eight years of schooling, and in the next quintile, they had nine years of schooling. This re-veals the huge increase in access to education oc-curring between one generation and the next.
To fund this increased higher education cover-age, families, young people, and the state have all made a growing effort. See Table 6.
The increase in public resources has mostly gone towards students, both through tuition scholarships and loans. Tuition scholarships did not exist before 1990: they were created in 1991 and multiplied by 10 between 1992 and 2010. As a result, 54 percent of students in the two lowest income quintiles are receiving this benefit (Rodríguez et al 2010). See the growth in student aid in Table 7.
The Government also increased institutional funding for higher education, and has been estab-lishing competitive grants and performance agree-ments since 1999 with the program for improve-ment in the quality and equity of higher education (MECESUP). See Table 6.
An ongoing effort was made to expand and improve loan systems to finance tuition. The ini-tiatives have been aimed at increasing state con-tributions and modifying the loan system both to make it more affordable and equitable and to add financial system resources to complement govern-ment financing. In 1995, the university loan soli-darity funds replaced the previous university loan system.
To stimulate the development of a range of long-term financing options with financial
institutions, in 1995, a CORFO refinancing line was created for long-term loans aimed at gradu-ate school programs. This system was extended to undergraduate studies in 1997. Student loans with and without CORFO refinancing have grown, reaching more than 360,000 undergraduates as of late 2010. In 2010, 48,000 loans were issued, equiv-alent to two-thirds of the increase in enrollment for that year.43
In 2006, a new state-guaranteed loan sys-tem for higher education was added to the gov-ernment-funded loan system. It has experienced much growth, expanding to private universities, professional institutes, and technical training cen-ters.44 These entities, which before this system had virtually no access to government-backed funds, have been its heaviest users, and this has contrib-uted to the sharp rise in their enrollment in recent years.45 The system is administered by the Ingresa Committee.
Despite the increase in government contribu-tions to higher education, the contribution per stu-dent was almost the same in 2009 as in 1990 due to robust growth in enrollment, considering only the universities that make up the Consejo de Rectores, which receive the greatest share of government con-tributions. If all students in higher education are in-cluded, the Government’s contribution per student
41 This reality is very different depending on student background. Graduates of paid private schools tend to enter higher education immediately after graduat-ing from high school. Francisco Meneses, Rodrigo Ro-lando, Manuel Valenzuela and María Antonieta Vega (2010) Ingreso a la Educación Superior: La Experiencia de la Cohorte de Egreso 2005.
42 Francisco Meneses, Rodrigo Rolando, Manuel Valen-zuela and María Antonieta Vega (2010) Ingreso a la Educación Superior: La Experiencia de la Cohorte de Egreso 2005.
43 For more information see the Banks and Financial In-stitution Supervisor surveys from 2004 to 2010.
44 From its launch in 2006 through 2010, more than 170,000 students obtained a state-guaranteed loan for higher education.
45 Strictly speaking, the financing for these loans is pri-vate, from the financial system; the state is the final guarantor. This is why it is a contingent liability for the state and does not appear in the fiscal budget.

Equity and Sustainable Growth: Twenty Years of Social Policies, Chile 1990–200924
is lower than in the early 1990s. See Table 6, col-umns 1 and 3. These figures do not include provi-sions for student loan guarantees that the Govern-ment has assumed.
It follows from the above that an important part of the financing required for the expansion of higher education has come directly from families or from the future payment commitment of students who have gone into debt.
It is important to evaluate the limitations on the contributions to funding higher education that fam-ilies and future professionals are able to make. As
coverage increases, access of low-income youth has been growing and will continue to grow. For them and their families the cost of financing higher ed-ucation represents a very significant proportion of their income, effectively creating a limit on house-hold financial contribution. An estimate by Rodrí-guez et al (2010) suggests that spending on higher education in the lower income quintiles is between 18 to 20 percent of the family budget. This shows that the limits to the financial effort that families are able to make to fund their children’s higher educa-tion have been exceeded.
Table 6: Central Government Expenditure on Higher Education 1987–2009, in Thousands of 2009 Pesos
Year
Average Annual Expenditure per Student in Universities of
the Consejo de Rectores1
Enrollment in Universities of the Consejo de Rectores
(thousands)
Average Annual Expenditure per Student in all Higher
Education Institutions
Total Enrollment in All Higher Education
Institutions (thousands)
(1) (2) (3) (4)
1987 1,686 119 897 225
1988 1,348 116 672 233
1989 1,683 106 772 230
1990 1,365 112 614 249
1991 1,614 118 761 250
1992 1,599 128 714 286
1993 1,491 144 681 316
1994 1,404 152 651 327
1995 1,400 162 657 345
1996 1,411 175 672 367
1997 1,305 184 631 381
1998 1,322 200 650 407
1999 1,356 207 660 425
2000 1,169 215 556 452
2001 1,142 227 537 483
2002 1,120 244 523 522
2003 1,083 247 471 567
2004 1,150 247 485 585
2005 1,146 253 449 646
2006 1,183 262 469 661
2007 1,132 286 424 763
2008 1,192 295 437 805
2009 1,345 303 465 876
Sources: Calculated based on Expenditures in the Government Finance Statistics Report 1987–2003, 1997–2006 and 2000–2009 and the Higher Education Information System (Sistema de Información de la Educación Superior—SIES).1 Universities in existence before 1981.

Educational Policy and a Growing Emphasis on Investment in Human Capital 25
From a governmental point of view, prioritiz-ing the allocation of resources to preschool, prima-ry, and secondary education as compared to higher education had a clear progressive effect. Increased coverage in the preschool and secondary levels pri-marily affected the low-income deciles. (See Tables 4 and 6 and Figure 7.) Even so, the Government continues to invest a higher amount per student in higher education than per student in K-12, although
these differences have declined markedly.46 If the Government had fully funded higher education through a traditional free-of-charge policy, this huge
46 This difference is higher in many developing countries. In Brazil, for example, it is about 10 times greater. In OECD countries, in contrast, what the state spends per student in higher education is about 2.5 times greater than for K-12 students.
Table 7: Higher Education Student Aid, in Million of 2009 Pesos
Loans Tuition Scholarships
(1) (2)
Beneficiaries (thousands) Amount Beneficiaries (thousands) Amount
1989 74 62 0 —
1990 72 302 0 —
1991 71 257 9 43
1992 73 241 15 75
1993 70 243 21 104
1994 71 203 30 140
1995 73 226 32 184
1996 79 261 32 187
1997 82 293 33 199
1998 88 373 37 239
1999 95 423 42 275
2000 110 487 45 302
2001 110 511 54 333
2002 113 555 60 362
2003 117 582 61 366
2004 119 587 63 394
2005 123 634 67 433
2006 140 1.035 73 539
2007 187 1.457 88 664
2008 211 1.971 120 925
2009 260 2.848 150 1.224
Source: MINEDUC.Note: (1) Includes university loan and loan with state guarantee. (2) Includes: Bicentennial Scholarship (Ex-Ministry of Education), Repair Programs, Juan Gómez Millas Scholarship, Education Scholarship, Scholarship for children of Professionals in Education, New Millennium Scholarship, Academic Excellence Scholarship, Indigenous Peoples Scholarships, First Lady Scholarship and President of the Republic Scholarship.

Equity and Sustainable Growth: Twenty Years of Social Policies, Chile 1990–200926
expansion of coverage would simply not have been possible, or would have occurred at the expense of the increased resources for students in preschool, primary, and secondary education.
With all the positive effects of increased cov-erage in higher education, there are also problems that must be urgently addressed. Shortfalls in the efficiency, quality, and governance of the Chilean higher education system are alarming. Dropout and repetition rates are high. For this reason, time spent to graduate is on average three semesters lon-ger than the scheduled amount, 14 semesters versus 10.8 for the cohort that graduated in 2007. Accredi-tation, certification, and quality assurance are very weak and the system does not have even a mini-mum amount of governance.47
Students, their families, the state, and the educa-tional institutions themselves are making a huge ef-fort to meet the demand for higher education, and so it is essential to address these challenges to prevent future frustration and misuse of resources. This is particularly true for the vast majority of young peo-ple who are the first generation in higher education.
Total investment in education: If one looks at the educational system as a whole, there has been robust growth in investment. See Figure 8.
Increased resources from families for their chil-dren’s education has been just as important as the increased resources from the state. Private funds grew even faster than public funds in the 1990s. This was a result of increased coverage in higher ed-ucation and the K-12 cost-sharing system.
Private Expenditure: estimation from the Min-educ Research Department, based on information from the Central Bank of Chile, Department of Na-tional Accounts.
Higher education has been an educational in-vestment area with major growth. It is the most ex-pensive level of education per student and the in-crease in coverage has taken place very quickly. As discussed above, direct government contributions as well as loan systems were increased in order to finance this area.
The amount of educational investment in Chile has grown to exceed that recorded for OECD coun-tries. It is higher than the average of the member countries, with only three having a higher amount of investment in education relative to GDP than Chile. The difference is in the contributions made by the state and families, the latter being significant-ly higher in Chile.48
In short, the data indicate that the allocation of resources to the education sector by the state and by families has not only been very significant, but has also been growing. Public resources were assigned with a clear progressive approach, favoring mainly children from low-income households. This result-ed in increased coverage, lower repetition and drop-out rates, and more classroom hours. At the same time, teacher income rose sharply, which reversed the dropouts from and disinterest in the teaching profession of the 1980s. Lastly, measurements of student learning consistently show improvement in terms of quality.
47 See Brunner, 2009, and OECD, World Bank Higher Education in Chile (2009).
48 See OECD Education at a glance.
Figure 8: Total Expenditure on Education as a Percentage of GDP, 1990–2008
Public Expenditure/GDP Private Expenditure/GDP
0
1
2
3
4
5
6
7
8
1990
1991
1992
1993
1994
1995
1996
1997
1998
1999
2000
2001
2002
2003
2004
2005
2006
2007
2008
2.4
2.4
2.5 2.7
2.8
2.7 3.0 3.2 3.5 3.8
3.9 4.1
4.2
4.1
3.9
3.7
3.3 3.6 4.
2
1.5 1.6 1.7 1.
9 2.0
2.0 2.
2 2.2 2.
6 2.9 2.9 2.9 3.0
3.1
3.0
2.9
2.7 2.5
2.7
Source: Ministry of Education, Research Department, 2003–2008.

27
housing and watEr and sanitation infrastructurE
In housing policy, policy choices similar to those of other social policies have been made. There have been more state resources, better targeting
towards the poor, and a mobilization of private re-sources to complement public efforts, thus multi-plying their impact. This enabled a greater rate of housing construction, concentrating government action where it is most needed.
The Government increased its investment in housing and urban planning from an annual aver-age of $280 billion pesos between 1987 and 1990, to $580 billion pesos between 1996 and 2001, and to $1.3 trillion pesos in 2009, in 2009 currency. Lump sum subsidies for home purchases were allocated through a continual review and better targeting of the housing subsidy programs.
In this case, private resources to supplement the public effort were leveraged through three mecha-nisms: the financial system, which provides comple-mentary mortgage loans; the progressive replace-ment of the Government’s direct contracting of housing (the SERVIU) with lump sum subsidies for home purchases, which are used to purchase private-ly financed and constructed homes; and the transfer to the water and sanitation companies of investment in drinking water and sewage networks required for new housing.
Table 8 shows that the number of completed houses and annually paid lump sum subsidies rose from 62,000 to 76,000 between the late 1980s and late 1990s, and to 162,000 in 2009. Lump sum sub-sidies for home purchase went from comprising 50
percent of the housing program at the beginning of the period to nearly 100 percent at the end. This subsidy mechanism not only enables greater pro-gressivity and leveraging of private resources, but also is a more transparent and easier way of target-ing the most needy households.
A study by the Banks Supervisory Agency49 re-veals that in 2007, two-thirds of housing subsidy beneficiaries had received bank financing. On aver-age, bank debt at the time represented 36 percent of home values. Defaults did not exceed 3 percent of the portfolio (although one-fifth of debtors had been refinanced).
It should be added that, in addition to the afore-mentioned subsidies, a growing number of repair and improvement subsidies have been issued. These reached nearly 80,000 dwellings in 2009. The aver-age value of these subsidies is one-fifth of the tradi-tional subsidy for a newly constructed home.
It should also be noted that the lump sum val-ue of the subsidy issued per household increased steadily during the period in question. In the early 1990s it amounted to 145 UF (unidad de fomento)50 per household, in the late 1990s it was 170 UF, and
49 Banks Supervisory Agency “Financiamiento Bancario De Viviendas Asociadas A Programas De Subsidio Hab-itacional” July 2008.
50 UF is a local accounting unit that is nearly always used for long term contracts, because it is adjusted daily to reflect price inflation. One UF was equivalent to US$45 dollars in 2010.
5

Equity and Sustainable Growth: Twenty Years of Social Policies, Chile 1990–200928
in the late 2000s it exceeded 300 UF. Behind this in-crease in the average value of the subsidy per ben-eficiary is the increase in housing prices, especially land prices, and an effort to improve the size and quality of financed homes. The minimum size of social housing increased from 36 m2 to 50 m2 dur-ing the second half of the 2000s. Prices of land in major cities haven risen considerably. According to data collected by Pablo Trivelli in the Market Bulle-tin, prices for land in Santiago rose 6.6 times on av-erage in 34 districts between 1990 and 2006, while GDP per capita rose slightly more than 2 times. In
districts with strong expansion, the increase was higher: in Quilicura prices rose 18 times, and in Pu-ente Alto, they rose 11 times, in the same period.51
Also noteworthy are the efforts to group sub-sidy recipients through different programs, such as homes for groups of workers. This can reduce costs and promote cooperation, improving community life for future neighbors.
The housing program was also aimed at achiev-ing other objectives, such as densifying the city. To this end, the urban renewal subsidy was created and has enabled, through a special subsidy, the recov-ery of city neighborhoods with untapped housing potential.52
Efforts to target and innovate programs for the poor include the progressive housing program, the rural housing subsidy, and the “Chile Barrio” pro-gram, which aims to eliminate slums.53 More recent-ly, 2002 saw the launch of the dynamic social housing without debt program (Programa de Vivienda Social Dinámica sin Deuda), where the amount of the sub-sidy is equivalent to the total cost of the dwelling, and the housing solidarity fund (Fondo Solidario de Vivienda), both aimed at the poorest families.
The impact of the housing subsidy programs on the most needy families has been evaluated based on data from the CASEN survey. From this data it can be concluded, for example, that be-tween 1990 and 2006, thanks to the housing pol-icy, the percentage of families in the first income quintile that own homes rose from 57 percent to 68 percent. The distribution of housing subsidies in the three-year period between 2004 and 2006 benefitted 38 percent of the poorest quintile and 29 percent of the next quintile.54 The available data
51 Trivelli (2009) Suelo urbano y equidad, journal Men-saje.
52 For a detailed account of the history and evaluation of the urban renewal program from its creation in 1991 to 2006, see Arriagada, Camilo, Juan Cristóbal Moreno, and Enrique Cartier (2007) Evaluación de Impacto del Subsidio de Renovación Urbana.
53 A 2002 assessment of the Chile Barrios program—which was intended to eradicate slums—can be seen at the following link.
54 Estimations done by Acuña, Hernán and Humberto Santos (2008).
Table 8: Paid Subsidies and Completed Homes 1987–2009
Year
Paid Subsidies and Completed Homes
Total Completed Homes
Total Paid Subsidies
Total Housing Programs
(1) (2) (3)
1987 25,711 22,166 47,877
1988 26,285 34,249 60,534
1989 32,139 32,799 64,938
1990 15,899 45,682 61,581
1991 31,142 41,741 72,883
1992 31,064 51,541 82,605
1993 28,018 49,494 77,512
1994 29,573 51,986 81,559
1995 31,053 56,580 87,633
1996 30,169 55,263 85,432
1997 22,581 50,166 72,747
1998 18,118 48,601 66,719
1999 24,515 52,835 77,350
2000 22,674 49,132 71,806
2001 20,301 51,369 71,670
2002 22,517 57,892 80,409
2003 12,347 61,975 74,322
2004 13,206 76,178 89,384
2005 3,030 74,909 77,939
2006 4,032 83,530 87,562
2007 144 103,385 103,529
2008 200 154,972 155,172
2009 96 161,816 161,912
Source: Ministry of Housing, DPH, DITEC.Note:(3) = (1)+(2).

Housing and Water and Sanitation Infrastructure 29
indicate that subsidy distribution became more progressive over time.55
Tables 9 and 10 show the result of investments in drinking water and sewage. During the 1990s, 30 percent of households in the poorest quintile that lacked a potable water supply in the house obtained this amenity; in 2009, 96 percent of households in the poorest quintile had water in their homes.
The sewage system, for its part, extended its networks to serve 73 percent of households in the poorest quintile. Adding in the population segment with septic tanks, the proportion of households with proper sanitary conditions is 86 percent in the poor-est quintile, nearly 40 percent more than in 1987.
For the next quintile, that is, those considered to be living in poverty in the late 1980s and whose income surpassed this critical level in the 1990s, drinking water in the home was a reality for 90
percent of households and sewerage for 80 percent. The expansion in coverage observed for these ser-vices between 1987 and 2009 was similar to that ob-served for the previous quintile.
The significance of these developments for fam-ilies’ everyday lives and for improvement of sanitary conditions and disease prevention is immense.
Progress has been significant not only in the area of housing and sanitation infrastructure; the area of household appliances has also seen much improvement. In 2009, 58 percent of households in the poorest quintile reported having an automat-ic washing machine in their homes,56 84 percent
55 See Simian, José Miguel (2010).56 The percentage of households with a washing machine
was 49 percent in 2006, which shows the rapid growth in access to these goods.
Table 9: Drinking Water Coverage in Lower Income Quintiles, 1987–2009 (percentage by income quintile [*] and potable water system)
Quintile I 1987 1990 1992 1994 1996 1998 2000 2003 2006 2009
Public Network
Faucet inside the home 48.0 52.0 61.7 62.9 63.0 67.3 71.4 75.6 76.4 85.3
Faucet on-site but outside the home
24.1 23.4 15.3 15.0 12.1 10.6 7.2 6.7 6.7 1.9
Carried in 5.1 3.6 4.2 1.8 2.2 1.6 1.7 0.4 0.4 0.7
No Public Network
Faucet inside the home 0.3 1.5 1.6 2.8 5.1 4.8 6.1 7.6 7.2 7.7
Faucet on-site but outside the home
… 1.7 1.4 2.7 3.0 3.2 3.1 2.8 2.6 1.3
Carried in 22.5 17.9 15.9 14.8 14.7 12.5 10.5 7.0 6.7 3.1
Quintile II
Public Network
Faucet inside the home 59.4 643 72.3 74.6 78.0 80.9 82.9 86.3 89.9 91.6
Faucet on-site but outside the home
19.2 17.2 11.1 9.8 7.4 6.7 4.2 3.5 2.0 1.4
Carried in 3.7 2.4 2.9 1.0 0.7 0.9 0.8 0.2 0.2 0.3
No Public Network
Faucet inside the home 0.4 1.9 2.3 3.5 4.2 3.9 5.7 5.4 4.9 4.8
Faucet on-site but outside the home
— 1.1 1.3 1.6 2.1 1.5 1.6 1.5 0.7 0.6
Carried in 17.2 13.2 10.2 9.4 7.6 6.1 4.8 3.2 2.2 1.3
Source: MIDEPLAN, Department of Social Information, from respective CASEN surveys. (*) According to national independent income.

Equity and Sustainable Growth: Twenty Years of Social Policies, Chile 1990–200930
sized social housing and in cities that continue to grow in size.
In sum, for the first time in many decades the country has reduced rather than increased its hous-ing shortage. The state has increasingly concentrat-ed its financial effort on the poorest families. At the same time, there has been significant progress in poor households’ access to safe water and sewerage. Although still insufficient, some progress has been made in urban policy: densification of certain areas in major cities, construction of parks, and improve-ments of the urban road network.
The main challenges are associated with improv-ing the quality, size, and characteristics of housing, and with urban public spaces, which are essential to growing cities and small homes.
reported a refrigerator, and 99.4 percent report-ed access to electricity. In 1990 only 23 percent of households in the first quintile reported having a refrigerator, and an even smaller percentage had a washing machine.
In the field of urban development, a new pro-gram worth mentioning is the Urban Parks pro-gram, launched in 1992. After ten years it had set up 58 parks with a total area of 310 hectares and an in-vestment of over $24 billion pesos. There have also been trials of programs such as Quiero Mi Barrio, aimed at improving public spaces in already estab-lished social housing areas. See for example http://www.minvu.cl/opensite_20061113124729.aspx.
Socially speaking, these common spaces and green areas are very important, especially for small-
Table 10: Sewerage Coverage in Lower Income Quintiles 1987–2009 (Percent of Households by Income Quintile (*) and Type of Excreta Disposal System)
Quintile I Quintile II
Sewerage Septic TankLatrine and Cesspool
Does not have Sewerage Septic Tank
Latrine and Cesspool
Does not have
1987 46.7 3.5 47.0 2.9 58.1 3.7 36.2 2.0
1990 51.5 4.1 40.9 3.6 62.9 5.0 29.5 2.6
1992 53.2 3.9 33.7 9.2 63.8 4.8 24.5 7.0
1994 53.2 5.3 32.1 9.4 64.7 6.1 22.0 7.2
1996 51.4 5.7 35.2 7.7 674 6.3 20.8 5.5
1998 56.5 5.6 30.8 7.1 70.4 6.5 17.9 5.2
2000 61.6 7.3 25.1 6.0 73.1 8.1 14.8 4.0
2003 61.8 9.5 22.7 5.9 75.8 9.1 7.0 1.7
2006 68.1 11.6 16.8 3.5 78.2 11.0 5.7 1.1
2009 72.7 13.0 11.8 2.5 80.8 11.0 6.3 1.9
Source: MIDEPLAN, Department of Social Information, from respective CASEN surveys. (*) According to national independent income.

31
pEnsions
When analyzing pension policy, it is nec-essary to distinguish between two peri-ods: one that ended in June 2008, and the
next that began on that date, when a major reform of the pension system took effect. This is examined separately below.
The contributory pension expenditure, that is, excluding non-contributory pensions (already ana-lyzed as monetary subsidies), is the main outlay of government social spending. Therefore the pension adjustment policy was extremely cautious, due to the strong fiscal impact any increase in this benefit, however small, would have. The situation was even more difficult to address, because during the Mili-tary Government, there was a significant deteriora-tion in the real value of pensions due to the lack of a 10.6 percent adjustment for inflation, which the Democratic Government was committed to restor-ing. This was fully implemented, but to make it con-sistent with the fiscal goals, it was done gradually.
In general the policy was to issue special ad-justments (above the general adjustments to com-pensate for inflation), giving priority to the lowest pensions and those received by pensioners over 70 years old, as well as a new category of over 75 years old created in 2004. During the period, special ad-justments were made to the minimum pensions on numerous occasions. This is reflected in Table 11. The minimum monthly pension amount rose at constant currency from $55,000 pesos in 1989 to $105,000 pesos for those under 70, and somewhat more for those over 70.
These general pension adjustments were given lesser priority than other social policy objectives,
due to their high cost and the lack of selectivity of this expenditure. On this basis, special benefits were created in the form of lump-sum allocations, such as the winter bonus for pensioners, which enabled the issuance of a more progressive bene-fit. However, when examining the minimum pen-sion adjustments throughout the entire period, it is concluded that their real value increased almost as much as the growth of GDP per capita for the same period.
Public pension spending grew less than the GDP, rising from 6.6 percent of GDP in 1990 to 4.7 percent in 2009. Payment of “recognition bonds” (bonds that recognize pension contributions under the old system for those receiving pensions under the new funded system with individual accounts, Administradoras de Fondos de Pensiones—AFP) was the highest-growing outlay of the 1990s. It rose from 0.5 percent of GDP at the beginning of the de-cade to more than 1.1 percent in recent years, grow-ing at the same rate as the GDP up through 2009. This amount is not included in the aforementioned pension expenditure.57 This expenditure is project-ed to continue to grow for some years still. Spend-ing on guarantees for minimum pensions for mem-bers of the AFP system rose by eight times between 1995 and 2003 in real terms, accounting for 0.1 per-cent of GDP. Since the guarantee is triggered when
57 It was not accounted this way until 2003. Following the change in public finances accounting methodology in 2003, spending on recognition bond payments began being accounted as below the line items, as repayment of a liability.
6

Equity and Sustainable Growth: Twenty Years of Social Policies, Chile 1990–200932
the pensioner has exhausted his or her retirement fund, the fiscal outlay for this item has continued to grow steadily.58
Regarding protection for individuals over 65 years of age, in 2009, 84 percent received pension income. This percentage was close to 74 percent in the beginning of the 1990s, and this group’s growth was due to the higher number of beneficiaries of welfare or non-contributory pensions. According to the CASEN survey, the percentage of people over 65 who received a non-contributory pension increased from 8 percent in 1992 to 27 percent in 2009. Im-proving the pension situation helped reduce the number of adults over 60 years of age and under the
poverty line from 20 percent in 1990 to 8 percent in 2009 (CASEN 2009).
In short, even before the 2008 reform, the num-ber of people in the non-working population who received pensions saw a slight increase, and the val-ue of these pensions grew in line with the growth of GDP per capita while pensions received by lower-income seniors grew more. Government spending on pension payments increased as a result of rec-ognition bond payments, which are part of the cost of the transition from a pay as you go system to the fully funded system (AFP), introduced in 1981.
The 2008 Pension System Reform
In this year, a comprehensive reform of the pension system was approved. This was the result of care-ful preparation, which included numerous tech-nical studies and a look back at experience gained since 1981, when the new fully funded pension sys-tem with individual accounts was launched. There was also a valuable consensus building process, for which the Government set up a Presidential Advi-sory Council on Reform. An in-depth review of this reform is beyond the scope of this study,59 but it will examine its general outlines and how it is linked to the social policy approach of these two decades.
The reform was based on a diagnosis of the main weaknesses of the pension system, viewed holistically (both contributory and non-contribu-tory), and clearly established the goals it aimed to achieve.
Conceptually, three pillars of the pension sys-tem were differentiated. First is the contributory
58 See the estimates by Marcel (2001) and updated pro-jections in DIPRES (2010) Informe de Pasivos Contin-gentes.
59 An excellent account of the reform’s preparation as well as its congressional debate and its implementation, and a summary of the major initiatives, can be seen in Are-nas, 2010: Historia de la Reforma Previsional Chilena, ILO. See also Pensions Supervisory Agency Chile 2009: Una Reforma Previsional de Segunda Generación de pensiones. Some of the issues addressed by the reform had been diagnosed at the time the system was intro-duced in 1981; see Arellano (1985).
Table 11: Minimum Pensions in December 2009 Pesos, 1987–2009
YearUnder 70 years
oldOver 70 years
oldOver 75 years
old
1987 54,097 57,565
1988 55,383 59,181
1989 55,117 58,897
1990 59,439 63,002
1991 66,298 69,862
1992 66,253 69,814
1993 67,453 71,079
1994 67,666 71,303
1995 70,342 74,124
1996 75,331 81,705
1997 75,923 84,004
1998 79,915 88,421
1999 91,754 100,326
2000 90,780 99,261
2001 91,631 100,191
2002 92,142 100,750
2003 92,122 100,728
2004 92,143 100,752 105,893
2005 91,718 100,286 105,146
2006 97,932 107,079 114,252
2007 99,211 108,479 115,744
2008 98,164 107,335 114,522
2009 104,960 114,765 122,451
Source: 1987–2002 INP Department of Statistics. 2003–2009 Social Security Supervisory Agency.

Pensions 33
pillar, defined by pensions resulting from manda-tory contributions to the old age, disability and sur-vivor pension system; then the solidarity pillar, with benefits financed by general taxes for those who cannot self-finance a specified pension determined by the Government; and last is the voluntary pillar, with voluntary contributions to supplement com-pulsory savings. A combination of these three pil-lars (which were already present before the reform, but were then modified and integrated) is what de-fines the new system.
The main deficiencies that the reform addressed were insufficient coverage of pension benefits for cur-rent and future pensioners, gender inequalities, and competition and efficiency problems with the AFPs.
With the aforementioned increase in coverage in recent decades, at the time of the reform, 80 per-cent of those over 65 were receiving a pension, 50 percent contributory, and the rest, non-contributo-ry. Contributory pension coverage projections for the coming decades indicated that over 45 percent of contributors would not be able to self-finance the minimum pension and few of them would be eli-gible for the minimum pension government guar-antee.60 It should also be noted that no more than 73 percent of the workforce was covered by the con-tributory system.
The problems mainly affect women, because of their lower participation in the labor force, inter-mittent contributions, early retirement, and lower average earnings. They also affect men with lower earnings and more intermittent contributions and/or who work independently.
The reform was designed to carefully integrate the three pillars, balancing greater protection, costs, and incentives. For those over 65 years of age in the three lowest quintiles, a basic solidarity pension was established as an improvement to the non-contributory pension. A social security soli-darity supplement was introduced to complement the accumulated contributions in individual ac-counts, to ensure at least a minimal pension. Thus, the three pillars were successfully integrated and the solidarity pension supplement was designed so as to reduce the disincentives for contributing once requirements for the minimum pension guarantee were fulfilled.
A subsidy for young people’s contributions was established in order to encourage contributions at early ages, which have a great bearing on the capi-tal that accumulates throughout life. Subsidies of 50 percent of the first 24 contributions made by workers between 18–35 years of age were introduced, for both the worker and his or her employer. Independently from this reform, the youth employment subsidy was improved, with similar effects on future pensions. This subsidy encourages formal employment among young people and improves their future pensions.
The reform also took a very important step to-wards ensuring the incorporation of self-employed workers in the system, and in particular in the con-tributory pillar. This has been gradual, and will be absolutely mandatory in 2015. It is being integrat-ed into the now compulsory contributions to the tax system. Along with providing old age, disabili-ty, and survivor protection, it incorporates self-em-ployed workers into the protection system for oc-cupational accidents.
Similarly, the employer payment of contribu-tions became more stringent and tax incentives for voluntary pension savings, which had been intro-duced during tax modifications in 1990 and 2002, were expanded. Also, voluntary contributions by ec-onomically inactive persons were made easier.
Gender issues were addressed with the design of the solidarity pillar, as women had the least cover-age. In addition, the reform established a per-child bonus for mothers equivalent to 18 months of the minimum salary, which is paid when the mother starts receiving pensions but accrues interest from birth. Also, a cross-subsidy in disability and survi-vors insurance that negatively affected women was corrected, and women’s right to access the balance of the individual account of the spouse in cases of separation was established.
The first result of this reform, a year after its launch, was that the total beneficiaries of the ba-sic solidarity pension exceeded 578,000, 20 per-cent more than those who received pensions in
60 Berstein, Larraín, and Pino (2005) “Cobertura, densi-dad y pensiones en Chile: Proyecciones a 20 años plazo, Documentos de Trabajo” Pension Fund Administrators Supervisory Agency (SAFP).

Equity and Sustainable Growth: Twenty Years of Social Policies, Chile 1990–200934
balance.63 Because costs are so incidental to future pensions, the reform sought to create more compe-tition through a tender every 24 months of the new affiliates portfolio for the next two years. The first tender resulted in the addition of a new AFP to the market, with a significant decrease in costs.
The reform also included a reorganization and modernization of the public institutional structure for administering the pension system. This has cer-tainly been a contributing factor in the success of its implementation.
It is important to examine how the state’s fiscal stability is protected in this reform. This is because (a) fiscal discipline has been a hallmark of social policies during this 20-year period, giving them sus-tainability over time, and (b) in the case of pensions, the risks of generating long-term deficits are high if the proper safeguards are not taken. It is enough to note that pensions and health care together repre-sent about 40 percent of the fiscal budget.
Projections made by the National Budget Of-fice64 indicate that additional costs for solidarity pensions amounted to 62 percent of spending on these pensions in 2009, and 96 percent in 2010, due to both an increase in the amount of the benefit as well as the number of beneficiaries.
The additional cost per year of the reform is es-timated at 0.44 percent of GDP, projected to rise to over 1 percent of GDP by the year 2023. This calcu-lation includes the other increased fiscal costs of the reform, which at that date are predicted to represent about 15 percent of total costs.
Since the resources involved are substantial, a pension reserve fund was created in preparation for the reform. Part of the fiscal surpluses goes towards
early 2008.61 Beneficiary projections for the solidar-ity pension system (basic plus complementary con-tribution) indicate that there will be an increase to about 1,200,000 beneficiaries in 2012 and approxi-mately 2,000,000 in December 2025.62 This reflects the significant growth in coverage of the solidarity pillar due to reform. Costs are discussed below.
Premature pensions are part of the shortcomings in the way the system operates and are not always given the attention they deserve. The vast majority of people begin receiving pensions (i.e., collect their accumulated funds) as soon as they are eligible to do so, which occurs before the legal retirement age, gen-erating very low replacement rates. Each year that the pension is paid in advance implies a reduction of more than 6 percent in the final amount (the cal-culation uses a real annual return of 4 percent and a man retiring one year early, moving the retirement age from 65 to 64 years). Premature or early pensions are not a problem as long as people continue work-ing, but it does become a problem when they lack other sources of income besides the pension. For this reason, efforts have been made to discourage prema-ture pensions. Stricter requirements for retiring early were approved in 2004, and this reform established the age of 65 years as a requirement for obtaining the solidarity supplements to individual savings.
Given the increase in life expectancy, a review of the pension requirements for workers who do not obtain solidarity supplements is pending, in order to assess the timeliness and sufficiency of their pen-sions under the current standards that allow for ear-ly retirement with low replacement rates.
In this industry’s operation, insufficient price competition in the system has historically led to charging relatively high fees to the affiliate. On aver-age, the cost for a middle-income affiliate exceeded 4 percent of taxable income in the first seven years of the system’s operation in the 1980s. After successive attempts to regulate the charging of fees and spend-ing on advertising and sales, costs have fluctuated around 2.5 percent in the last ten years (the mini-mum was 2.42 percent). These costs include disabil-ity and survivors insurance, but even discounting this value, the system administration cost is high. In recent years the industry cost, minus the insurance fee, is estimated at 0.67 percent of the pension fund
61 A detailed description of the diagnosis and formulas adopted to increase coverage can be seen in Pensions Supervisory Agency Chile 2008: Una Reforma Previ-sional de Segunda Generación, capítulo 2.
62 Arenas, Benavides, González, Castillo, Dipres, Public Finance Studies (2008) La Reforma Previsional Chile Proyecciones Fiscales 2009–25.
63 This is a topic that has been heavily examined by nu-merous studies on the system in its almost thirty years of operation, see Pensions Supervisory Agency, El Sistema Chileno de pensiones 2010 p. 181.
64 Arenas et al (2008).

Pensions 35
this fund. The reserve fund was established with an initial amount of US$604 million and is increasing every year at a minimum amount of 0.2 percent of GDP of the previous year. It includes mechanisms for monitoring and screening to determine if it has a sufficient amount. Every three years a highly com-petent team must analyze the sustainability of the fund and issue a report. This is an essential practice for anticipating problems of sustainability. The first report has already been issued. Additionally, actu-arial capabilities in the National Budget Office were strengthened. The first report concludes that, given the obligatory contributions to the reserve fund un-der the law, the prevailing benefit parameters, and demographic and economic projections, the fund is sufficient. It is very important that these projec-tions, which did not exist before in Chile and are essential for assessing the sustainability of the state commitments, be incorporated into the political de-cision-making process.
Pension reform design sought to integrate the three pillars, with a combination of legally defined benefits (the basic solidarity pension, and the pen-sion solidarity contribution for the bottom 60 per-cent of the population in terms of income) and legally defined contributions. The current pillar combination and its potential future changes are very important, both for the long-term sustainability
of the system and for its impact on the soundness of public finances.
A new Pension Advisory Council, designed to assess the evolution of the system and to support its sustainability, is another mechanism included in the reform. It is composed of five experts appointed by the president, four of whom must be ratified by the Senate, and whose function is to advise the minis-ters of labor, social security, and finance on matters related to the solidarity pension system. The coun-cil must produce an annual report for the ministers and the Congress, which will give its opinion on the operation of the system regulations.
Undoubtedly, this reform has addressed many previously identified system deficiencies, and also anticipated problems that would become more critical in the coming decades. The long-term suc-cess and sustainability of a pension system depends on the care taken to safeguard the critical aspects of the system.
In any case, this is a reform that will undoubt-edly go down in history for its careful design, leg-islative-political discussion, and the success in its political and technical implementation. Due to the technical and political complexity of changes to pension systems, reforms that are successfully im-plemented, as in this case, are exceptional.


37
hEalth carE
The health sector received top priority in gov-ernment investment after the restoration of democracy in 1990. A plan was made to ad-
dress the most urgent needs in the public health network. In parallel, the Government began a diag-nosis and medium-term project development pro-cess for the public sector with the participation of the World Bank and the Inter-American Develop-ment Bank. These projects were aimed at improving the infrastructure of the public health sector, which had not received replacement investment for many years. For this reason, investment was what grew the most in the 1990s. It then fell in the first half of the 2000s, and re-grew at the end of the decade.
Initially, priority was given to allocation of re-sources to primary health care in clinics run by mu-nicipalities, making primary care the main destina-tion for funds during the first decade.
Almost without exception, during the twen-ty years in question, public health spending grew more than total social spending, reflecting the pri-ority consistently given to this sector (and the edu-cation sector).
The salaries of health personnel experienced significant increases. These increases largely arose in response to the increase in market wages of health personnel. The demand for personnel in the private health sector grew sharply during this period, raising market wages accordingly. This was compounded by pressures from unions in the sector, who on more than one occasion achieved special adjustments via pressure from activity stoppage, with the serious consequences that this entails. Additionally, staff in-creased in order to manage the new investments.
It is worth mentioning some of the major inno-vations in financing and management that accom-panied the increased resource investment. Thera-peutic diagnostic centers (Centros de Diagnostico Terapéutico—CDT) and reference centers (Centros de Referencia—CRS) were created in order to fill the gap between large hospitals and primary care clin-ics. Emergency primary care services (servicios de atención primaria de urgencia—SAPU) have helped address the ever-present and challenging issue of medical emergencies. Resources have started being allotted to public providers based not only on past budgets, but also on services, and in the case of pri-mary care, based on the assigned population.65
It is important to look at the consequences of these increased resources in terms of coverage, health care, and the health status of the population. During the first half of the 1990s there was a slight decrease in the population covered by the public health system, due to the transfer of beneficiaries to ISAPRES (pri-vate health insurance companies that receive com-pulsory contributions). Strictly speaking, one can see a cycle of strong movement towards ISAPRES in the years of strong economic growth, and a subsequent return to public insurance (FONASA) during peri-ods of lower growth. Since 1996, ISAPRES have not regained their former share; on the contrary, their covered population has been declining even in abso-lute terms. The opposite has happened in the public sector, which covers over 80 percent of the popula-tion (see Table 12). The private insurance industry
65 See many innovative experiences in Montoya ed. El Hospital Público vols. I y II, 2003.
7

Equity and Sustainable Growth: Twenty Years of Social Policies, Chile 1990–200938
is currently facing a critical situation because of the legal and constitutional rulings that prevent it from modifying the price of health plans as insurees age, which has been the practice since its inception. For a discussion of this and other aspects of the sector’s current state of affairs, see the report by the Comisión Presidencial de Salud, 2010.
The population who reported having no cover-age went down, with a consequent improvement in health protection.
As for health care, there was a general increase as a result of a marked increase in frequency of use. Consultations went from 2.8 to over 4 per per-son per year. Laboratory tests increased from 2.3 to more than 6 per person per year. In both cases, the increase was greater among the beneficiaries of the public system than among those affiliated with ISAPRES, partly because the initial level of care per person was lower among the first group. Even the number of tests per person in the public system ex-ceeded that of the ISAPRES.
Hospitalizations per person stayed constant in the 1990s and decreased slightly in the 2000s. This is in contrast with the international trend, which showed a sharp reduction in hospitalizations.66
The amount of resources per beneficiary rose sharply, and this was matched by increasing numbers
and higher unit costs of consultations. The higher costs were due to an increase in health personnel salaries above the average national increase and the greater complexity of many of the services. The surge in spending per beneficiary in the public system was even higher than for those affiliated with private in-surance, and therefore the gap with ISAPRES affili-ates was reduced. Both the spending per beneficiary and service use frequency grew faster in FONASA’s free-choice modality than in the ISAPRES.67
The FONASA expenditure with the most growth was the payment of disability benefits (sub-sidios de incapacidad laboral—SIL). In the 2000s, this sick pay benefit was used and abused, with both the number of sick leaves per contributor and their duration increasing. In ISAPRES, tighter control of this benefit limited its growth.68
As for preventive programs, the increase in cov-erage for certain preventive services is very signifi-cant. During this period, 20 percent more women received preventive examinations (see Table 13).
The slow progress among those who are not covered by any health system is noteworthy, under-scoring the importance of good health coverage for
66 In the OECD, in the last 20 years, the number of hos-pitalization days went down by 2.7 percent per year. However, the daily cost rose by 5 percent annually.
67 A detailed analysis of the period of the 1990s can be seen in Tokman and Rodríguez (2001). For the 2000s, see Sánchez and Labbé (2011).
68 Estimates can be seen in Tokman, Rodríguez and Lar-raín (2004).
Table 12: Population Breakdown by Health Insurance System, 1987–2009
Year
Health Insurance System
Public and Armed Forces ISAPRE
Private, Other Total
1987 77.4 8.7 13.9 100
1990 69.8 15.1 15.1 100
1992 65.2 20.1 14.7 100
1994 66.1 23.7 10.2 100
1996 62.5 24.9 12.6 100
1998 64.6 23.2 12.2 100
2000 68.6 20.8 10.6 100
2003 74.8 16.7 8.5 100
2006 79.5 13.5 7.0 100
2009 81.2 13.1 5.8 100
Source: Based on the CASEN survey for the respective years.
Table 13: Women 25–64 Years Old with a Pap Smear in the Last Three Years: Coverage by Health Insurance System, 1987, 2003, 2009 (Percentage)
Health Insurance System 1987 2003 2009
Publica 48.2 66.3 67.6
ISAPRE 62.5 72.1 74.2
Private 44.6 47.0 51.9
Total 49.9 66.0 67.7
* Excludes live-in domestic workers and their families.a Includes Armed Forces.Source: Based on CASEN surveys from the respective years. Mideplan.

Health Care 39
the achievement of health objectives. The vulnera-bility of those not affiliated with any system is also reflected in the percentage of persons who, having had an illness or accident, turn to the health system. Among those not covered by any system in 2003, only 54 percent visited a healthcare service, while among those who were covered more than 76 per-cent did. Among those without coverage who did not use a healthcare service, 40 percent said this was due to a lack of money. The same reason was cited by around 12 percent of the rest of the population (CASEN 2003).
The number of women who did not receive pre-ventative exams out of ignorance was sharply re-duced, as a result of the educational campaigns car-ried out during these years.
The nutritional status of pregnant women also improved steadily, and the percentage of under-weight pregnant women declined, from 15.5 per-cent to 8.3 percent between 1990 and 2000.
In 2000, the traditional nutritional program for supplying food to mothers and children, the Nation-al Supplemental Feeding Program (Programa Nacio-nal de Alimentación Complementaria—PNAC), ben-efitted 1.08 million children under six years of age. Between 1990 and 2006 this program’s coverage in-creased from 68 percent to 77 percent. The greatest increases benefitted the children belonging to the poorest households and children under two years old.
There was also significant growth in the supply of prescription drugs in the public health system. In 2009, over 80 percent of patients in the poorest quintile who were prescribed medication received it for free. Only 4 percent said they could not buy all the medications prescribed to them. By contrast, over 80 percent of those in the richest quintile who had used medications had to pay for them. In the ef-fort to provide universal coverage, these indicators show steady improvement throughout the period.
In short, health protection has clearly improved, in terms of both access to consultations and testing as well as medical treatments. This is a result of in-creased resources invested in infrastructure, equip-ment, personnel, and supplies.
Furthermore, the health status of the popula-tion has continued to improve, according to various
indicators. The mortality of children under one year of age, for example, dropped from 17 per 1000 live births in the late 1980s to 10 in the late 1990s, and continued to decline until reaching 7.8 in 2008.
Not only was there a significant increase in re-sources, there was also a major reform in the sec-tor’s organization. In 2003 several years of technical and legislative debate culminated in the approval of four laws aimed at improving the regulation of ISA-PRES, reorganizing the public sector (Health Au-thority Act), and establishing a new system of health guarantees.69 This group of laws, better known as the “AUGE” laws, sought to ensure access to care for cer-tain health problems. The guarantee is both in terms of cost (in the Fonasa free-choice system and the pri-vate insurance system), and in the timeliness of care (this is the most important guarantee in the public institutional care system). A limit is set for the copay and for the total costs, and a list is established an-nually with the diseases and/or health problems pro-tected under this guarantee. When the system began, there were 25 health problems protected by guaran-tees (July 2005), and in 2010 the number rose to 69.
The analysis of the reform, its impact, and the extent to which it has achieved its objectives is be-yond the scope of this text. It introduced major changes in the operational dynamics of the system: in how health action is prioritized, in how the usual waiting lists in the public sector can be reduced, and in how to confront the insufficient financial protec-tion of health insurance.70
In keeping with the standard of long-term fis-cal sustainability of reforms that involve significant costs for the state, the Government proposed and passed an increase in the VAT rate along with the health reform.
However, management of the health system has gone through a slow and uneven modernization process. The changes in management proposed by the reform have been partially implemented, and the upgrades that have occurred are primarily the result
69 A detailed description of the legal texts can be seen in Ulises Nancuante and Almonacid Andrés Romero Celedón (2008) La reforma de la salud.
70 See an evaluation of the first four years of reform im-plementation in Inostroza and Riesco (2011).

Equity and Sustainable Growth: Twenty Years of Social Policies, Chile 1990–200940
of initiatives by the professional teams of a specif-ic hospital or service. The system’s organization has not gone through the modifications necessary for the new realities of health care in terms of technol-ogy and diseases of the population. The significant investment in infrastructure and increased resourc-es were not used to modernize the organization and
management of the sector, as would have been de-sirable. The flaws in private insurance and the regu-latory inconsistencies of the system have been only partially fixed. Herein lie the remaining challenges, and they are of major importance and have complex solutions.

41
family incomE gEnEration
The most difficult social policies to success-fully implement are those aimed at improv-ing low-income families’ ability to generate
income. Moving from welfare towards the creation of opportunities and creating spaces for entrepre-neurial activity and for access to quality jobs is the most complex task. Apart from the strong empha-sis on education as an engine of opportunity, what has truly stood out in this period has been, firstly, and as highlighted in the first section of this study, the clear emphasis on economic growth and the job generation that it entails. However, there are several initiatives worth noting that sought to increase ac-cess to employment for the most disadvantaged and vulnerable sections of the population, which, due to their more precarious starting point, run the risk of not reaping the benefits of economic growth.
Among the innovative initiatives that have been successful is the microcredit program, in which financial institutions grant small loans to microentrepreneurs.
In 1992 the Government set up a subsidy for fi-nancial institutions for each loan given to microen-terprises. This subsidy is justified in the high trans-action costs of these operations compared to the amount of the loan and the banks’ lack of prior in-formation on these small businesses. The amount of the subsidy is determined by a bid among the inter-ested financial institutions. The result has been quite remarkable. In 10 years 224,000 credit operations were subsidized; for every peso spent by the Gov-ernment on subsidies, 11.2 pesos were mobilized in loans from financial institutions. The average amount of a subsidized loan was less than US$1,000.
Perhaps even more important is the knowl-edge and ability to serve microentrepreneurs that evolved in the financial system. This initiative has helped promote unsubsidized loans, so much so that in 2002 the total loans given to microentrepre-neurs was three times the number of loans that re-ceived subsidies. At the same time, and as projected, the per-unit subsidy amount decreased to less than half, due to learning on the part of the bank and subsequent cheaper costs.71
One aspect that is as interesting as the expan-sion of coverage in access to credit is the nature of the lending process, which the bank has carried out based on strictly commercial guidelines and on debtors’ economic viability. This approach is quite different from what usually prevails in direct financ-ing by public entities. Recovery is high. Accord-ing to data from the microenterprise subsidiary of Banco del Estado, in operation since 1997 (without access to subsidies), and which has awarded more than 250,000 credits, 70 percent of debtors had nev-er received a loan from a formal institution, and 99 percent of debtors meet the timely payment of in-stallments (US$800 average loan).
A survey by the Bank Supervisory Agency on lending to microbusinesses in the second quarter of 2007 reveals that in the 2000s, the annual growth rate of loans was around 17 percent. This figure far exceeds the rate of expansion of the loans to com-mercial clients (10 percent average in the last two
71 Information based on “La situación de la micro y peque-ña empresa en Chile,” Ministry of Economy, 2003.
8

Equity and Sustainable Growth: Twenty Years of Social Policies, Chile 1990–200942
years) and consumption loans through banks (8 percent on average in the last five years). According to a study using this data, 28 percent of microentre-preneurs had access to bank financing. 85 percent of the microenterprises financed had monthly rev-enues below US$1,800.72
Stimulating microcredits has been a major in-novation in the traditional way in which the state supported funding for productive purposes. The discipline of the financial market is more demand-ing and therefore more likely to unlock the poten-tial of microentrepreneurs. In contrast, the more traditional state programs are more likely to wind up protecting nonviable initiatives and hiding com-mercial flops. What has stood out is the high poten-tial of microentrepreneurs when given opportuni-ties and the responsiveness of financial institutions.
Progress in this microcredit program contrasts with the insufficient upgrading of the credits pro-gram for farmers, which through the agricultural development office (INDAP) maintains the tradi-tional lending practices and their emphasis on wel-fare. See Arellano and Ochoa (2006) for a compari-son of these two credit systems for small farmers.
Another innovative program with positive re-sults has been job training for young people who drop out of school. The program began in 1991 with support from the IDB and continued with do-mestic financing. Between 1991 and 2000 the pro-gram trained around 200,000 young people who had dropped out of school. Program evaluations indi-cate a high success in targeting the programs and a high success in finding employment for participants, when compared to a control group. The satisfaction expressed by participants is also high.73 Young peo-ple who have not had sufficient access to the school system and/or do not smoothly integrate into the la-bor market will suffer the problems of poverty un-less they receive appropriate and timely support, hence the great importance of this program.
In recent years, one of the major training efforts has focused on the training of employees in small businesses and microbusinesses, an area that tradi-tionally had been very limited.74
In June 2009 the youth employment subsidy came into force. This is undoubtedly the measure
with the greatest scope for promoting youth em-ployment and comes from a proposal of the Presi-dential Advisory Council on Labor and Equity in 2008. The subsidy is a monetary contribution for the worker (two thirds of the subsidy) and another for the employer hiring the worker (one third of the subsidy), when it comes to young people between 18 and 24 years old belonging to households in the first four deciles of the population with gross month-ly salaries at or below $360,000 pesos. The subsi-dy grows in the first salary range, rising to 30 per-cent for salaries of $160,000 pesos, staying constant, and then declining slowly in the upper range.75 Al-though there has not yet been an evaluation of this program, during the first nine months of operation 189,950 workers had applied for this benefit.76
These are some successful innovations in the programs aimed at improving income generation opportunities for the poor. However, it is clear that an ongoing search for new mechanisms to provide greater equality of opportunity is required.
The timely induction of young people in the for-mal labor market is extremely important for future job performance. Furthermore, in a funded pension system with individual accounts, it is important for the future pensions of young workers. About 40 per-cent of a pension is determined by contributions from the first ten years of work. Therefore, the state’s formal employment subsidy is not only helping to improve the employability of young people but is also avoiding subsidies in the annuity payout period.
72 See Liliana Morales and Álvaro Yánez Micro finanzas en Chile Resultados de la Encuesta de Colocaciones en Segmentos Micro empresariales.
73 See data from Santiago Consultores asociados, Ex-post evaluation Chile Joven phase II.
74 See an assessment of these innovations in the study commissioned by DIPRES.
75 Chile has been one of the few countries to introduce this type of pro-employment program in the context of the international financial crisis. See an account of the programs that were implemented in different countries in Mackenzie, David and David Robalino (2010).
76 See a detailed description of this and other youth em-ployment and training programs in Cristóbal Huneeus (2010) Balance de los avances y desafíos de las políticas de empleo para jóvenes.

43
protEction against lossEs or dEcrEasEs in family incomE
One cause of poverty and/or significant de-creases in standards of living is associated with job loss, illness, or accidents affecting
the family. At the same time, a characteristic asso-ciated with poverty and/or low income is the high vulnerability and therefore the serious consequenc-es associated with temporary or permanent loss of the ability to generate income.
During this period some initiatives were intro-duced to counter the effects of these situations on income.
In 1992 an individual savings system was estab-lished for domestic employees that serves as sever-ance pay for loss of employment. Under this pro-vision, an employer contribution of 4.11 percent of wages paid was established. These funds can be withdrawn when the employee terminates the con-tract for any reason.
In late 2010 there were over 680,000 of these ac-counts with a positive balance and an average sav-ings of $136,000 pesos. Every month there were more than 200,000 deposits and 7,500 withdrawals averaging $330,000 pesos.
It is an innovative mechanism that offers some protection to workers who until this point were to-tally unprotected from job loss.
In 2002 a new unemployment insurance system came into force. The new system was launched af-ter nearly ten years of discussion and analysis of the necessary features so that the system both provided
protection for dependent workers and did not be-come a disincentive to formal employment and/or a risk to the fiscal budget.
The new insurance is compulsory for all work-ers who signed an employment contract in and af-ter October 2002. It is funded by contributions from the worker for 0.6 percent of their salary in the case of a permanent work contract, by the company for 2.4 percent if the contract is indefinite and by the company for 3 percent if the worker is hired for a fixed term, with treasury contributions in very lim-ited cases. There is a combination of savings in in-dividual accounts and solidarity funds. Withdraw-als can be made from individual savings in cases of contract termination for any reason, including vol-untary resignation, making as many withdrawals as the insured person’s years of contributions, with a maximum of five and in decreasing amounts. If the employee is dismissed by decision of the company, the solidarity fund complements his or her individ-ual savings and allows him or her to withdraw 50 percent of his or her income in the first year, and up to 30 percent in the fifth year, with caps on the amount of the withdrawals.
In late 2009, eight years into the system, the number of insured members exceeded 6 million, of which 3.2 million were contributing. At the same date, 4.7 million members had benefitted from the insurance through withdrawals from their individu-al accounts, but only a minority of 186,000 workers
9

Equity and Sustainable Growth: Twenty Years of Social Policies, Chile 1990–200944
with a permanent contract benefitted from the soli-darity fund.77
Precisely this low use of the solidarity fund and the accumulation of resources in it led to its modi-fication in 2009, allowing workers with fixed-term contracts access. The actuarial estimates and pro-jections of the Pensions Supervisory Agency made by Fajnzylber and Poblete (2010) conclude that this change will improve the insurance’s coverage and benefits without compromising its long-term sus-tainability. This improves the quality of the insur-ance without risking its sustainability or producing a fiscal liability, as has been the case with most un-employment insurance.
This insurance created significant protection against unemployment (which had been practically nonexistent before) and was designed in such a way as to avoid the negative effects that this insurance has had in many countries.78
It is not easy to design and implement an unem-ployment insurance that, while fulfilling its objective, does not become a fiscal liability and/or discourage the job search. In most countries where these sys-tems exist, there is frustration and dissatisfaction with performance, hence the value of this experience. A very good study of policy analyses of the time and the considerations taken into account in their design can be seen in the paper by Ramos and Acero (2010). As in the case of pension reform, unemployment in-surance design is the result of careful study and risk assessment, in order to avoid unintended effects in boosting employment and/or in the national budget.
In the past, in the absence of other mechanisms to support unemployed workers, the state resorted to public employment via funds transferred from the Central Government to municipalities. This is what happened during the declining growth and ris-ing unemployment of 1999 and the following years. Gradually this method was replaced by a subsidy for private employers and/or unemployed worker training, such as the youth employment subsidy of 2009 (mentioned above).
The importance of these emergency programs is huge in situations where there are significant in-creases in unemployment. Even when their produc-tivity is not desirable, their contribution to solving
a social problem makes them indispensable. Fiscal soundness allowed them to continue functioning without problems, despite falling tax revenues.
Finally, there was also significant growth of pri-vate voluntary insurance that offers protection in the event of death. Similarly, microenterprise and consumer loan insurance was established for pro-tection in the case of loss of earning capacity of the debtor.
Life insurance premiums increased from 1.6 percent of GDP in 1990 to 2.7 percent in 2002, and stayed at this rate into 2010. The value of premi-ums per capita grew six times in the period. Tradi-tional life insurance policies grew the fastest. Their total premium rose even faster than the insurance associated with the pension system (annuities and compulsory survivors insurance). This is a safe-guard that will surely continue expanding and will increasingly provide forms of protection to middle and low-income households. The state can contrib-ute with policies that help overcome the market failures typical of insurance, which often limit cov-erage. Self-employed workers are particularly vul-nerable, and mechanisms must be devised for them that, once market failures are overcome, are as vol-untary as possible.
In sum, many new ways of tackling the adverse effects associated with loss in earning capacity (un-employment, disability, death) have emerged. Pro-tection against these risks must continue expanding in the future to avoid economic consequences, and to help prevent serious loss of income and greater poverty. The main gap is the high vulnerability that affects self-employed workers. As mentioned above, the 2008 pension reform set up a phased program to gradually overcome this gap in the area of pensions and occupational accidents. Better healthcare cov-erage is still pending.
77 Information from Eduardo Fajnzylber and Isabel Po-blete (May 2010), A projection model for unemploy-ment insurance, Working Paper Series, Pensions Su-pervisory Agency.
78 A complete description of the insurance can be found in Pensions Supervisory Agency (2010) Seguro de Ce-santía en Chile.

45
national social ExpEnditurE
As has been shown, in recent decades a so-cial policy has been developed with univer-sal objectives, but with selective or targeted
public funding. Instead of funding all social benefits, the state gives preference to those targeting families who need subsidies because of their socioeconomic status. The goal is to achieve a greater progressiv-ity in government social spending and to use taxes and the government budget to finance only those social expenditures for those who cannot afford the costs of health, housing, education, and other social services. The objective is also to leverage private re-sources and seek the contribution of beneficiaries to meet social policy objectives.
At the same time, the state imposes the obliga-tion to participate in certain social services: health, retirement pensions, and life, disability, and unem-ployment insurance, in order to avoid the personal and social consequences of a lack of protection.
Therefore, to understand the evolution of so-cial policy and its financing, it is not enough to ana-lyze government social spending. One should also examine private spending (i.e., spending funded by families and/or leveraged with private resources). It is important to give the appropriate attention to pri-vate participation, as it is a distinctive feature of so-cial policy in Chile.
Another relevant breakdown in social spending is whether the service provider is a public or private entity; the analysis so far has looked at the financing of the services and not the provider. Overall, private provision is greater than private financing, as there are services that are publicly funded and whose pro-viders are private (e.g. subsidized private education,
social housing, school meals, free-choice health care with public insurance (FONASA), etc.).
For this reason it seemed appropriate to intro-duce the concept of national social expenditure. This combines privately financed social spending and public social spending. These private expenditures are, in the case of health and pensions, mostly man-datory spending because the state requires insurance to be taken out and/or mandatory savings for old age. Housing and education have a more voluntary nature; here private expenses consist of savings and loans for housing, supplementary payments in the school system and the cost of higher education paid by families.79 Table 14 presents the first estimates of Chile’s national social expenditure for each of the sectors for the years 1990, 2001 and 2008.
The data in table confirms the importance of privately funded social spending: it is approximate-ly 10 percent of GDP, and national social expendi-ture approaches 27 percent of GDP. In housing80 and health is where one can see the most significant private contributions.
In social security, private financing has been growing in importance and will continue to do so as the new funded pension system with individual accounts matures.
10
79 In the case of education, this excludes textbooks and materials, which are purchased by families. In the case of health, drug purchases by families are excluded.
80 Private spending on housing overestimates social spending, since due to a lack of information, housing investment, including in second homes, made by high-income sectors could not be excluded.

Equity and Sustainable Growth: Twenty Years of Social Policies, Chile 1990–200946
It has been shown that social spending has grown since 1990. Here one can see that private spending has increased even faster than public spending, especially in the areas of social security, health, and education, where there is significant growth in private financing.
In the coming years, private financing on social security will surely continue to rise, along with pri-vate expenditure on health care (according to eco-nomic growth).
This significant private sector participation frees the state from universal funding of certain benefits,
and enables it to concentrate tax revenues on ben-efits for families who cannot self-finance their social protection, thus making social policy more equita-ble. Although the state is freed from funding, this does not guarantee access for all who need the bene-fits or the proper functioning of the benefit systems. In fact, this way of organizing social programs gives rise to new regulatory needs where there are mar-ket failures. Efforts that have been made along these lines will be discussed below.
Moreover, this form of financing provides so-cial service users with a wider offering of provid-ers, creating better conditions for quality improve-ment and services that are more responsive to user needs and demands. If regulatory issues are well resolved, this scheme will be more equitable, since the Government can concentrate on the most needy segment and be more responsive to user requirements.
The method used here for measuring Chile’s national social expenditure has been recently used in the OECD to compare social spending in coun-tries with different policy approaches. These esti-mates, apart from the mandatory contributions to social security and health care that are not part of the public budget, also include voluntary contri-butions (by employers, in many cases). The OECD estimates differentiate between gross social spend-ing, i.e. before taxes, and net social spending, after payment of taxes and tax exemptions. This is im-portant because there are some social benefits that pay taxes (e.g. pensions) and some private contri-butions that are exempt and/or receive tax benefits. The higher the spending, the higher the tax bur-den and therefore the more important the differ-ence between gross spending and spending net of taxes.81 This distinction was not used in the figures for Chile given in this study. On the other hand, the
81 Several OECD studies are available on this topic: Ade-ma (1997) What do countries really spend on social policies? A comparative note, OECD Economic Stud-ies No. 28; Adema, W. and M. Einerhand (1998), “The Growing Role of Private Social Benefits”; Adema, W. and M. Ladaique (2009), “How Expensive is The Wel-fare State?: Gross and Net Indicators in the OECD So-cial Expenditure Database (SOCX).”
Table 14: National Social Expenditure as a Percentage of GDP, 1990, 2001 and 2008
Year 1990 2001 2008
Healtha Public (1) 1.9 2.8 3.3
Private (2) 2.2 3.8 3.6
Total (3) 4.1 6.6 6.9
Housing Public (4) 0.9 0.9 1.3
Private (5) 3.8 3.5 4.0
Total (6) 4.7 4.4 5.3
Social Security
Publicb (7) 6.6 6.1 4.3
Private (8) 0.4 1.4 1.6
Total (9) 7.0 7.5 5.9
Educationd Publicc (10) 2.4 4.1 4.2
Private (11) 1.6 3.2 2.7
Total (12) 4.0 7.3 6.9
Other Social
Public (16) 0.9 1.1 1.2
Private (17) 0.0 0.0 0.0
Total (18) 0.9 1.1 1.2
Total Public (19) 12.7 15.0 14.3
Private (20) 7.9 11.8 11.9
Total (21) 20.7 26.8 26.2
Sources: (1), (4), (7), (10), (13), (14), (16) and (17): Government Finance Statistics 2003 and 2009, Dipres. (2) and (5): National accounts of the Chilean Central Bank, Annual Reports 1999, 2002 and 2009. (8): AFP Supervisor and Social Security Supervisory Agency. a The 2008 health expenditure comes from OECD data. b Public Expenditure on Social Security – Public Expenditure on Recognition Bonds. c Excludes municipal education spending financed with own resources. d Education spending from 1990 onwards comes from data prepared by MINEDUC. Data from previous years come from the national accounts of the Central Bank.

National Social Expenditure 47
measurements used here included public and pri-vate spending on education, which generally is not included in the studies cited.
The conclusion from comparing national social expenditures among OECD countries is that the differences between countries are much lower than when only government social spending is analyzed. Private spending is growing in some countries that
have introduced reforms to encourage it. As not-ed in these studies, “To get a picture of the amount of resources devoted to meeting social needs in a country, both net public and net private social ben-efits should be considered.”82
82 Adema, W. and M. Ladaique (2009) p. 49.


49
social policy approachEs
It is interesting to examine the approaches that, more or less explicitly, characterized social pol-icy during these years. There are several impor-
tant dimensions to these approaches or paradigms. Below is an analysis of six relevant dimensions and how they have characterized the policies of these years.
1. Insurance versus transfersWhen need arises from a situation that is not per-manent (unemployment, sickness, disability, ma-ternity, old age), it can be insured, making room for social insurance. However when the need is permanent due to lack of skills and/or opportu-nities for overcoming poverty, transfers or subsi-dies are used. In many cases both situations occur simultaneously and this makes it difficult to dis-cern the best way to intervene. Social policy has taken both directions in these two decades. Trans-fers were increased both in coverage and benefit amounts, and insurance was improved. Examples of the latter are: compulsory savings for loss of employment for domestic workers (1992); unem-ployment insurance (2002); and the pension re-form (2008), which improved the insurance sys-tem and, in particular, introduced old age and disability insurance for self-employed workers, a very significant and traditionally unprotected sec-tor. The AUGE healthcare plan (2003) expanded public and private insurance coverage to the de-fined health programs made explicit in the plan.83
2. Assistance vs. increase in capacities and opportunities.No one will dispute that the desirable thing to do is support an increase in capacities and opportuni-ties. However, often the urgency of needs and/or the difficulties and time needed to develop capaci-ties necessitate action through assistance or welfare programs. Both types of initiatives were seen in the twenty-year period under discussion, but priority and emphasis have been on initiatives to increase capacities. This can be seen in the priority in re-source allocation given to children and young peo-ple as compared with older people. Resources for education grew much faster than those for pensions.
Apart from this strong priority on education, there were also initiatives facilitating the incorpo-ration of women and young people into the labor market. Support in financing small enterprises and microenterprises has had the same aim, generation of opportunities.
Prevention and promotion of healthy and ef-fective behaviors is similar in nature to the genera-tion of skills and opportunities. In most social pol-icies, people’s behavior is crucial to the outcome. In health and education this relationship is par-ticularly clear. In education, the result depends on the student, with his or her individual self-esteem,
83 There were originally 15 conditions in 2005; currently there are 69.
11

Equity and Sustainable Growth: Twenty Years of Social Policies, Chile 1990–200950
motivation, interest, and effort. In health, it de-pends on the patient, with his or her individual ill-ness prevention habits and motivation to recover when sick. To be effective, policies must consider and prioritize these personal behaviors. In the pe-riod in question, there are some initiatives along this line, but it would be desirable to put much more emphasis on this area. Notable examples are the preventive health care with the care of mothers and newborns, primary care, investment in sanita-tion infrastructure (water supply, sewerage, water treatment), and the strengthening of disease con-trol policy. In the case of education, noteworthy initiatives include the updating of the curriculum and course programs, to make them not only more relevant but also more in line with the interests of young people; the upgrading of textbooks and teacher training programs; and MECE (Improve-ment in the Educational Quality and Equity) pro-grams for young people in secondary education (a stage where motivation is very important). Alco-hol and drug programs and sex education in the school system are some initiatives that were priori-tized during these two decades.
All in all, this is an area where more initiatives should be innovated and tested.
3. The complementary relationship of the pub-lic and private sector in financing and providing services. In almost all areas of social policy, the state, fam-ilies, and provider entities (companies, corpora-tions, foundations) act together in financing and providing services. The extent and manner in which they do so will lead to different results from the point of view of equity and efficiency. A distinc-tion should be made between mandatory private funding (e.g. contributions for pensions, health, and unemployment) and voluntary funding (e.g. medical copayments, voluntary savings for retire-ment, and cost sharing for education). Also, the public provider could be the Central Government or the municipality.
Figure 9 illustrates these combinations.During the 20-year period, there was a diverse
use of these combinations. In general, the state sought to leverage private providers (examples:
microcredit subsidy granted by financial institu-tions, unemployment insurance, housing, electric-ity and communications in rural areas). Also, in education, private providers (subsidized schools and higher education institutions) gained ground where they competed with public providers (mu-nicipal schools and state-owned universities). In contrast, private insurance providers (ISAPRES) lost health insurance participation to the public provider (Fonasa).
The increased involvement of private provid-ers is reflected in the fact that public resources in-creased much more than the government personnel in the ministries in charge of the social policies, as shown in Table 15.
In terms of financing, the public sector in-creased its contribution (strengthened the solidarity pillar) with the pension reform, and also increased its contribution to higher education with the estab-lishment of loans and scholarships for students en-rolled in private institutions, and to the preschool level with the universalization of the pre-kindergar-ten subsidy.
While it is true that in virtually all cases there has been more public funding for social programs, as seen in the previous sections, the above exam-ples are some references to changes in the financing structure of existing programs or the way the new programs were organized.
Figure 9: Financing and Providers in Public and Private Sectors
Financing
Provider
Private
Private
Public
MonetarySubsidies
Public
InstitutionalHealth Care
Microedit
Education
Housing
Free-choiceHealth
UnemploymentInsurance
AFP Pensions

Social Policy Approaches 51
4. In almost all the social services analyzed here, the markets or quasi-markets operate with spe-cial features.It is worth reviewing these features to see how they have been addressed.
There are many situations that can lead to mar-ket failures: externalities exist. There are significant information asymmetry problems between the user and the provider (doctor, teacher, clinic, school, uni-versity, insurance company, bank). In many cases these involve complex decisions that a person makes once or twice in a lifetime and which have high costs if he or she wants to turn back (pension decisions, school and career choices, home purchases). There are possible active selection behaviors the provider (school, insurer) may adopt to avoid the most costly cases, and the insurer for its part faces possible ad-verse selection and moral hazard. There is also un-certainty and underestimation of risks by individuals (illness, accident, death). The special conditions af-fecting the financial and capital markets are also rel-evant, in particular for pension savings and housing
financing. All the realities touched upon here re-quire government action through proper market regulation and/or improved decision making.
These actions can be grouped into several cat-egories and different forms of regulation: improve-ments in information; requirements and standards for providers; increased competition among provid-ers; and user organization. Virtually all of these ini-tiatives have been used over the years to improve market performance. Not including aspects related to the capital84 and financial markets, here are some of the initiatives:• Information: improvement and expansion of
SIMCE tests and participation in international learning assessments; service quality and cost surveys for AFP and ISAPRES; national testing for graduates of medicine and education (Prue-ba Inicia); information on the employment suc-cess of higher education graduates. Informa-tion on quality of service continues to suffer large deficits and should be an important part of the future agenda. There is currently signifi-cant global progress being made on this highly complex issue.
• Requirements and standards: accreditation of university degree programs; quality assurance and the new Education Supervisory Agency; hospital accreditation; residential construction standards. In terms of university degree pro-gram accreditation, medicine and education have been prioritized.
• Competition: System with different pension of-ferings (annuities versus scheduled retirement).85 Tenders for: new members in the AFP; unem-ployment, disability and survivors insurance; ru-ral electrification and telecommunications sub-sidies; microcredit subsidies; and student loans. Competitive funds for social programs.
• Bundling of demand: Applicants for housing subsidies; committees for participatory paving programs; AFP affiliates for bids.
84 For more on the development of the capital market in these years, see a list of the main legal changes in Maz-zo, Rodrigo (2010).
85 This system was introduced in 2004. See an assessment of its effects in Halcartegaray and Miranda (2011).
Table 15: Government Spending Per Employee, Social Ministries Millions of Pesos in 2009 Currency
Year Education Health Social Security Housing
1995 133.9 16.7 416.3 151.0
1996 150.8 18.1 445.1 170.3
1997 1617.0 19.1 453.2 164.0
1998 176.4 20.2 464.1 161.4
1999 196.6 21.0 497.6 186.2
2000 183.5 22.2 449.0 188.0
2001 190.6 23.1 528.3 183.4
2002 202.0 23.4 529.5 186.5
2003 205.4 24.1 538.1 186.2
2004 224.5 25.4 550.6 214.0
2005 222.5 27.1 571.8 249.9
2006 234.3 29.9 576.6 269.0
2007 242.5 32.8 568.3 298.6
2008 260.1 33.7 572.1 352.1
2009 275.1 39.5 594.2 409.1
Sources: Calculations based on:Public Sector Human Resources Statistics, DIPRES. Government Finance Statistics from the respective years, functional classification of expenditure, DIPRES.

Equity and Sustainable Growth: Twenty Years of Social Policies, Chile 1990–200952
• Coordination of service offerings. Often state initiatives have poor coordination and those most in need have difficulties accessing bene-fits, due to a lack of knowledge and conditions needed to meet the requirements. To compen-sate for these difficulties and to support the ef-fort of overcoming extreme poverty, the Chile Solidario program was created (2002).
The fact that the state is not a direct provider does not exempt it from responsibility. Rather it obligates the state to be vigilant and active in finding intelli-gent ways to address potential market failures from their roots. This is a major policy design challenge.
5. Legally defined contributions versus benefits When the state imposes compulsory insurance, it can define contributions and let the resulting cov-erage be determined by the behavior of the relevant variables (in the case of pensions: earnings growth, life expectancy, retirement date, return on invest-ment, etc.), or it can do the opposite, legally define the benefits and/or coverage afforded. In the first case (DC), the state defines the mandatory premi-um, so coverage and benefits are the result of the behavior of risks and other market variables. Alter-natively, with legally defined benefits (DB), the state establishes the coverage and benefits, and the pre-mium is the amount necessary to finance the cov-erage. Although the two systems are considered to have the same cost, risk distribution and the behav-ior of the different actors vary in the two cases.
The choice of scheme produces a very signifi-cant difference, the consequences of which are not always visible. It is therefore useful to analyze these consequences before examining the changes made in this respect during these decades.
It is useful to make a comparison between DB and DC in the case of old age pensions. Under DB, the law defines the pension amount (in UF86 or as a percentage of pay in a given period) and the condi-tions and requirements for obtaining the benefit. In the case of DC, the law establishes compulsory con-tributions and the pension depends on the contri-butions accumulated at the time of retirement. The latter occurs not only in a system where individual
account funds accumulate; it may also occur if the formula for calculating the pension depends on the contributions made and life expectancy at the time of retirement.
In practice, there is not a pure DC or DB sys-tem; the systems are a combination of both schemes. In a DB system benefits are always linked to indi-vidual contributions, and in a DC system there are risk pooling regulations, and therefore the benefits are not linked solely to the contributions and risks of each contributor. The figure below illustrates pos-sible combinations.
What should be emphasized here is that there are differences between the two systems in the way different actors react and behave in response to risks and uncertainties. Therefore, the adjustment to changes in critical variables is different and pro-duces different results.
For example, if life expectancy is raised in the post-retirement stage, under a DB system this in-creased cost is assumed by the state and this will force the state to raise the contributions and/or taxes, and/or reduce other expenses to fund the in-creased pension costs. In contrast, in a DC system, the pensioner will receive a lower pension unless he or she postpones the age at which he or she retires and/or increases his or her savings in anticipation of this increase in life expectancy.
There are also differences in the adjustment to changes in asset returns and wage growth.
Moreover, the DC system requires beneficiaries to make more decisions than the DB system, where the main decisions are made by the authority. For example, in the case of retirement pensions, the ben-eficiary must decide how much additional savings to accumulate, where to invest the funds saved, when to retire, and how to distribute the pension flow over time. These are complex decisions and the benefi-ciary does not always have adequate preparation and advice. In the DC system more risks are transferred to individuals, while in the DB system, the political system must manage these risks.
86 Since the UF (unidad de fomento) is indexed based on the CPI, the pension’s purchasing power is protected from inflation.

Social Policy Approaches 53
It is important to note the differences in the po-litical economy and behavior of the political system under both schemes. For example, when a change in the law increases benefits and coverage, the public perception of the costs is immediate in the case of DC and may be far off in the case of DB; in this case, the cost may even be passed on to the next generation.
For the population, in the DC system the costs of introducing changes to benefits and coverage are much more evident than in the DB system. Benefits under DB tend to be considered entitlements and downward adjustments are much more difficult for the political system.
The quality of the political system, the nature of constitutional procedures for changing the DB and DC, and good information and financial pro-jections regarding these benefits make an important difference in how these systems function.
One can look at the major tensions in Europe’s political system to comprehend the difficulty of mak-ing changes to DB systems. These countries have ex-perienced serious demographic changes (aging popu-lation) and economic changes (unemployment) that have made it necessary to reduce the defined benefits.
The difference between these schemes not only involves differences in political economy and the be-havior of the actors; also behind these schemes is the distinction between responsibilities (DC) and rights (DB). This is part of the argument that underlies the debate on social policy and the welfare state.
During the twenty years under study, there have been changes in the DB/DC combination in the pension system. Changes occurred under the pen-sion reform of 2008 and under the 2003 healthcare reform, and choices between the two mechanisms were made when introducing unemployment insur-ance and severance savings for domestic workers.
An implicit assumption of the 2008 pension re-form was that the system in place since 1980 rested too much on DC and gave very insufficient protec-tion, especially for women. Therefore the DB com-ponent was expanded, thus strengthening the soli-darity pillar.
Originally, unemployment insurance was al-most exclusively DC, but after an assessment of its performance and results, the DB component was
expanded. In the case of severance savings, there is only DC.
Finally, the healthcare reform, with the so-called AUGE Plan, explicitly introduced a DB scheme. This change was designed to give legal guarantees for a plan with benefits explicitly defined by the au-thority. This change significantly transformed the dynamics of the health sector and the way that au-thorities and doctors prioritize health problems. Prioritization is unavoidable in any health system, given the limits on resources and the increasing development of new technologies and medical re-sponses. The health reform, by introducing a DB approach, changed the shape and dynamics of how this prioritization is determined.
Figure 10 illustrates the combinations of these two mechanisms in the policies and the direction of changes that occurred in the period.
In short, the distinction between DC and DB is quite important, though not always correctly per-ceived, and has significant consequences for the dy-namics of social policy performance and the risks to which individuals are exposed.87
Figure 10: Legally Defined Benefits (DB) and Contributions (DC)
DB
DCPrivate employeeseverance
UnemploymentInsurance
Pensions AFP
AUGE
87 At the international level there have been major chang-es in the use of both schemes. For example, in the Unit-ed States, retirement pensions paid by the employer went from being mostly DB to mostly DC. In 1985, 35 percent were DC, a percentage that rose to 61 per-cent in 2009. In addition the funds invested in private pension funds increased by more than four times. See Ryan, Trumbull and Tufano (2010).

Equity and Sustainable Growth: Twenty Years of Social Policies, Chile 1990–200954
6. Public GoodsIn the area of social policies one finds a significant presence of public goods, which are defined as non-excludable goods or services, that is, a person using or consuming them does not prevent others from doing so. These goods and services by their nature are necessarily state-funded and become more im-portant with the growth of cities.
A case in point: in 1992, an urban park invest-ment program was established, and to date thirteen
parks have been created with a total area of 97.5 hectares, located mainly in the peripheral areas of the Metropolitan Region.
Another increasingly important public good that has not been addressed in this study is public safety. The safety of people, particularly in cities, is a typical case of a public good that the state must pro-vide and which receives growing resources. Public safety has also become a critical aspect of quality of life, particularly for the poorest people.

55
innovations in social policy
Since the return to democracy, there has been an effort to innovate with respect to social policy, in order to provide new solutions for
social needs and also to address needs or groups that traditionally have been neglected and/or have emerging needs.88
The spirit of innovation is manifested in the new FOSIS solidarity fund, created in October 1990. One of its objectives was precisely to innovate and develop initiatives that until then the state had not addressed. FOSIS gave rise to the microcredit subsidy project and the microentrepreneur technical assistance proj-ect, which have seen significant subsequent growth.
In 1996 the program ChileBarrio came into be-ing. This program is aimed at addressing the hous-ing situation of families living in slums.
In 2002 the Chile Solidario program was born. This program is aimed at about 230,000 families in extreme poverty and offers personalized support to ensure their incorporation into the network of state social programs. As seen above, there are still a sig-nificant number of households that, despite being in poverty, are unable to access the social network, and suffer all the negative consequences this entails. The program’s efforts to ensure that the social protection network effectively reaches families in extreme pov-erty are worthy of mention. This program systemati-cally identifies all the families in this condition and helps them access all the social programs that apply to them. It also provides extra monetary support for two years, in a temporary and decreasing fashion. An aspect that is just as important as these addition-al financial resources is the personalized psychoso-cial support the family receives, in order to identify
what it needs and to plan how to use the social net-work to overcome its situation (through the FOSIS Programa Puente). The program aims to address the entirety of the situation of poverty and therefore also addresses the entirety of social policy, not just sec-toral policies. The state organizes policies by sector, but the needs of families are comprehensive and not necessarily sectoral. Herein lies the unprecedented value and innovation of this program. At the same time, it serves as a learning opportunity for the state on the flaws and potential of the social network that serves the needs of the poorest segment.89
Another effort to integrate sectoral initiatives is the comprehensive early childhood protection pro-gram, Chile Crece Contigo, launched in 2006. This program united the proposals of the Presidential Advisory Council on the Reform of Child Policies.
Also, a number of initiatives have been created to address specific population segments based on their special needs or characteristics: the indigenous population through CONADI and the Orígenes program, and the disabled population through the FONADIS Disability Fund.
In every area of social policy there have been in-novative initiatives in terms of meeting needs. Some are cited below by way of example. In education, there is the P900 program for the most needy schools, the MECE programs to improve educational quality,
88 The analysis in this section may be complemented with the analysis done by Serrano and Raczynski (2005).
89 See a description at the following link. A network for sharing learning experiences can be accessed at the fol-lowing page.
12

Equity and Sustainable Growth: Twenty Years of Social Policies, Chile 1990–200956
have made room for non-governmental providers in almost all areas of social programs. Competitions for public funds have been held for new initiatives and programs, and these have generated new and increased opportunities for innovation. The greater space resulting from tax exemptions for social do-nations had the same effect. This is how “social en-trepreneurs,” who innovate and seek new solutions to social problems, have been encouraged.
However, there is room and need for greater in-novation in order to respond to continuing social needs and to take advantage of changes in technol-ogy and the successful experiences of other coun-tries. This requires a practice of innovation, where social programs and initiatives are piloted and then assessed. More room must be made in public policy for pilot programs and all that they entail, including evaluation, reform, and closure when needed.
the Enlaces IT network, the preferential per student subsidy for priority students, the capital contribu-tion for the extended school day program, and the new scholarship and college credit systems. In hous-ing, there is progressive housing, the urban densifi-cation subsidy, new housing subsidy initiatives, the participatory paving programs, and drinking water and electricity subsidies for the poorest families. In income generation, there are programs for female heads of household, severance pay for domestic em-ployees, and the unemployment subsidy. In health care, there are the emergency systems of the 1990s (primary emergency care [SAPU] and SAMU 131), the AUGE plan of the 2000s, and self-run, conces-sioned hospitals.
Non-governmental organizations acting as ser-vice providers for the most needy people have been an additional source of innovation. Social policies

57
profEssionalizing social policy: dEsigns, Evaluations,
targEting mEthods
During this period, social policies went through a growing professionalization, in ev-erything from design, implementation, and
assessment to political debate and approval. There has been increasing participation of professionals specialized in these issues who studied best practic-es, and they have applied concepts of economics, so-ciology and public policy design to this area.
This has been important in generating new data and statistics. The CASEN survey is one important example. This national survey has been held every two or three years since 1987, with the specific goal of supporting the study and assessment of socio-eco-nomic reality, poverty, and policies. Also noteworthy are several new surveys of social safety nets and other social surveys done by the new Microdata Center at the Center of Economics at the Universidad de Chile.
The National Budget Office has been promoting efforts to improve management of public programs since 1993. In 1997, it incorporated a systematic assessment, conducted by independent experts, of programs and institutions. This program to date has enabled an assessment of almost every social pro-gram, which in turn has helped improve existing programs and better design new initiatives.
Meanwhile, the methods used to identify the intended beneficiaries of policies have improved, thus better directing resources to the target popula-tion. The CAS card (Ficha de Comités de Asistencia
Social), used to qualify for social assistance and in-troduced in 1987, underwent a refinement process. After some modifications this culminated in the in-troduction of the Social Protection Card (Ficha de Protección Social) in 2007. The CAS card was ap-plied in a decentralized manner by municipalities, responding to direct requests made by families. In late 2005, there were about 2 million families with the CAS card.
In 2007, as mentioned, it was replaced by the Social Protection Card, which aims to go beyond ba-sic needs and address the vulnerability and risk of being in poverty, which necessitates support and so-cial protection. The concept of vulnerability allows for a dynamic notion of poverty as an actual or po-tential condition, and at the same time provides a better characterization of “hard” poverty as those households that consistently have income levels be-low the poverty line.
In 2010 there were 3,670,000 households, 65 percent of the national population, who had this card. The card is used to allocate resources in 60 public programs that accounted for 15 percent of public social spending in the 2010 budget. The need to further refine this instrument led to the establish-ment of an expert committee, which has issued a di-agnostic report and given recommendations aimed at improvement. Similar advances have taken place in educational policy. The SIMCE tests measuring
13

Equity and Sustainable Growth: Twenty Years of Social Policies, Chile 1990–200958
and a comparison of the Chilean reality and policy proposals with international best practices.
A frequent criticism of the social policy of these years is that while at the macro or aggregate level they were adequate, this contrasted with what hap-pened in practice, or at the micro-level. At the pro-gram-specific level, examples of this are numer-ous and are identified in several of the assessments commissioned by the National Budget Office. The problems have to do with the human, management, and organizational capacities. For example, in mu-nicipalities, which have important responsibilities in the implementation of social policies, these defi-ciencies are common. The same is true in many cas-es in the different ministries.
State modernization—the state’s increased ca-pacity to manage and respond to new tasks—has been slower than the increase in financial resources. This has caused the frequently observed difficulties in implementation.
Once the lack of economic resources is over-come, these capacities are the critical variable. This is one more reason that realism and gradualism in social policy objectives are so essential, along with explicit capacity building and development proposals.
In any case, this professionalization is a new re-ality through which the country has developed the capacity to expand and improve their social policies. This new reality is very different from that of thirty years ago, when the first modern studies on the dis-tributional impact and efficiency of social programs were published (Foxley Aninat and Arellano [1980] Las desigualdades económicas y la acción del Estado, Arellano [1985] Políticas Sociales y Desarrollo 1924–1984, Rodriguez Grossi [1985] “La distribución del ingreso y el gasto social en Chile 1983,” ILADES).
student learning have continuously expanded and improved, Chile has begun participating in the in-ternational TIMSS and PISA tests, specialized pro-fessional training programs have been established, and numerous studies and assessments of Ministry of Education programs have been conducted. Sim-ilarly noteworthy is the creation of the MIDEUC center, specializing in the evaluation of student learning and teacher assessment.
The concept of professionalization of social policy design also includes the formation of di-verse committees, made up of relevant actors and specialists, to make policy design recommenda-tions to the authorities. The most significant in-clude the Unemployment Insurance Users Com-mittee (2002), the Presidential Advisory Council on Pension Reform (2006),90 the Presidential Ad-visory Council on Labor and Equity (2007), and several others in the field of education such as the National Commission for the Modernization of Education (1994). Also, technical committees have been created to monitor the performance of certain policies and/or to advise on decision mak-ing. These include, for example, the Pension Fund Investment Technical Council created under the pension reform to produce reports, proposals, and pronouncements concerning these investments, and the Pension Advisory Council to advise the ministers of labor and social security and of fi-nance on matters related to the pension system.
In these multistakeholder committees or coun-cils, efforts focus on finding practical solutions that are effective at achieving the desired objectives, tak-ing into account their second-order effects. This is a way of moving beyond debates that in other circum-stances would be very ideological, and constructing more lasting solutions.
Another worthy contribution is that of the tech-nical teams of the World Bank, IDB and more re-cently the OECD, which through technical missions and/or loans have provided an external perspective
90 Arenas 2010 details how this contributed to the success of pension reform.

59
social policy’s political-lEgislativE procEss and dEbatEs
Naturally, in the creation of the policies de-scribed here, there have been many de-bates and differences among the various ac-
tors involved, which ultimately led to the outcomes that have already been discussed. Without attempt-ing a detailed analysis of this process, some general points should be noted.91
Below is a review, first, of the main debates and differences between political alliances (the govern-ing center-left coalition vis-à-vis its center right op-position), the role of unions, and the new debate on the middle class and social benefit coverage, that explores how and why differences were over-come. Last is an analysis of the role that institutional framework, i.e. the legal and constitutional rules of the game, has played throughout this debate.
The main political differences centered around financing the benefits of social programs.
The opposition has consistently opposed tax in-creases. In 1990 the Government deemed that any improvement in benefits was conditional on ap-proval of the tax reform, which in the end was ob-tained temporarily. This approval of tax increases for short periods—a few years—was repeated. This forced the Government to re-discuss funding every few years. (It is contradictory that in the case of tax exemptions, where there are very good reasons to approve temporary changes, numerous exemptions have been permanently approved).
The other major conflict between the Govern-ment and the opposition has revolved around the
role of the state and the market, or more precisely, of private providers in social programs. This has been an ongoing topic of dispute and debate in all social program reforms. Here, ideological differences have dominated, even though, as in the case of financ-ing, agreements were reached to introduce regula-tions promoting behavior that would produce the desired results while maintaining the role of private providers.
Apart from the Government and the opposi-tion, trade unions and business associations have also played a role in the debate. Since the Teach-er Statute in 1990, the teachers union, the medical doctor association, and public service employee as-sociations have, in most cases, opposed reforms in the interest of obtaining greater benefits for their members. This has limited their professional input, given that their proposals have been almost exclu-sively dominated by union and profession-specific interests, weakening not only their potential contri-bution but also their support from public opinion.
For their part, private provider organizations have also been resistant to change and to regulation of the markets in which they operate. The extreme example is that of the ISAPRES, which have been very averse to the change that has, albeit slowly, been imposed.
14
91 An interesting and documented analysis of this issue can be found in Boeninger Edgardo 2007, Políticas públicas en democracia, Uqbar Editores.

Equity and Sustainable Growth: Twenty Years of Social Policies, Chile 1990–200960
and therefore have been forced to reach agreements with at least part of the opposition. Thus priority was placed on the search for state policies, i.e. poli-cies with broad support. Pluralistic political and technical committees with a high level of prestige played an important role in reaching agreements with solid foundations based on good institutional and policy design.
This has all contributed to the stability of poli-cies and reforms introduced in this period, and this stability has been the root of their effectiveness. Typ-ically, in other historical contexts and in other coun-tries, there are permanent changes in policy from one administration to the next, generating strong conflicts and weak impact due to high instability.
To achieve these agreements and results, con-stitutional and fiscal institutions have been very important. This institutional framework has several important aspects worth mentioning. Agenda con-trol is in the hands of the president, who has the exclusive right to propose tax and pension changes and can take the lead in the legislative process via urgency bills. Only the executive branch has the ini-tiative in spending, taxes and changes in state or-ganization. These powers, enshrined in the present constitution, are the result of a long learning process regarding the enormous dangers involved in an in-stitutional structure where Congress has the spend-ing initiative and can compete for granting social benefits regardless of the fiscal consequences. It was after the insistence of all the presidents since Juan Antonio Ríos in 1943 that President Frei Montal-va managed to pass a constitutional change in 1970 ending the congressional initiative on pension ben-efits and the like. This had generated competition for providing social benefits and ultimately bank-rupted the old pension system, leading to ongoing national budget deficits. The current institutional structure places administrative responsibilities with the president of the republic and grants him or her power in negotiations with the legislature. (A more detailed analysis of this issue can be seen in Arel-lano 2005, Del déficit al superávit estructural: Ra-zones para una transformación estructural en Chile, CIEPLAN).
The executive branch also has extensive pow-ers in the approval and implementation of the
In recent years there has been increasing de-bate and tension between targeting of benefits and the needs of the middle class. In the early years, there were virtually no voices questioning the tar-geting of benefits to the poor. Over the years the protest against the so-called “abandonment of the middle class” has been growing in importance in the discussion of social policy, and in fact has slowed the increase in progressivity achieved in the 1990s (although some new programs, target-ed by definition, were introduced in the 2000s). Behind this argument is the successful reduction of poverty from over 40 percent to less than 15 percent, reducing the population benefitting from programs for the poor and increasing the number of people who do not receive these benefits. Sig-nificant challenges in managing targeted benefits arise when families must leave programs because they no longer meet the requirements to qualify as beneficiaries. Moreover, the middle class has to help finance many services that were either highly subsidized or free when they were created. This is the case in education and health care, where fees have been raised in real terms or relative to wages, increasing the burden for the middle class.
Undoubtedly, this tension will continue in the future, putting limits on progressivity. Limits on the degree of progressivity do not mean that replacing the current progressivity with state-fi-nanced universal benefit systems must be consid-ered as an option. Rather, the goal is to continue the work started during this 20-year period, fund-ing fiscal transfers to the poorest segment but en-suring that for the rest of the population there are properly regulated public goods, services, and in-surance, in a way that allows equitable access, ef-fective coverage, and equal opportunity.
Despite the differences described above, con-sensus building prevailed. This was helped along by a strong emphasis on good governance, start-ing with Aylwin’s administration, as a key to the successful transition to democracy. This objective remained strong in subsequent governments and resonated with the opposition, which also sought a successful transition. This search for consensus has been indispensable to achieving results, as no governments have had parliamentary majorities

Social Policy’s Political-Legislative Process and Debates 61
annual budget. This, along with the other afore-mentioned constitutional provisions, has facilitat-ed the solid fiscal results that characterized the pe-riod. In addition, the budget has been a valuable tool for experimenting with and introducing new social programs without having to wait for a full legal framework. In education, for example, the MECE programs and almost all new programs be-gan as part of the annual budget, and then, based on how they evolved, became permanent legisla-tion or were subject to revisions and adjustments. The same happened with housing subsidies, em-ployment and training programs, new health pro-grams, municipal and regional administration programs, and so forth. There is high flexibility for introducing new programs, innovating and experi-menting. Strictly speaking the new programs have a one-year life span, like the budget law, but if they work, they can continue and where applicable be converted to permanent law.
Finally, managing people’s expectations is an important issue. It is not enough to have institutional rules to control the political competition that could trigger public spending or take it to unsustainable levels: the expectations and demands being encour-aged are highly important. The needs far exceed the short-term solutions, hence the necessary gradual-ism. This concept implies a high degree of respon-sibility, unlike populism, which is characterized by raising expectations via the state instead of adapt-ing expectations to reality. The rejection of populism and the promotion of gradualism in satisfying social needs and fulfilling goals has been a crucial, constant factor in the achievements described herein.
In short, this road, which emphasizes good gov-ernance, aims for consensus, and rejects populism, has been possible thanks to a political class that has managed to generate quality policies. Without po-litical actors willing to seek a state policy, it would have been difficult to arrive at the outcomes de-scribed here.


63
challEngEs
With all that has been achieved, the chal-lenges are still numerous. Two types of challenges deserve to be analyzed in
greater depth: quality of services and new problems. As new demands and challenges arise due to the
progress made during this 20-year period, it is valu-able to examine how these actions project into the future.
Quality of Service Challenges First of all, there are challenges associated with the still low quality and lack of equity in social servic-es paid for with public financing. This is particular-ly true in health care and education. In both cases, almost universal coverage has been achieved (pro-fessional prenatal and postnatal care, child health monitoring, basic and secondary education), but the quality of the services is still unsatisfactory. Sig-nificant efforts have been made to improve quality, particularly in the case of education, where much of the effort has been directed at improving equity and quality. However, the quality challenge remains un-solved, in a social and economic context that increas-ingly demands both more education and more from education. Health care is in a similar situation, where thanks to technological advances, there are more and more options for addressing health problems.
In the case of housing, quality issues are also present, but take a different shape. They have to do with construction quality, the size of homes, and, in particular, urban problems, such as congestion and public transport deficiencies that increase com-mutes, lack of public spaces, and so forth.
Service quality challenges depend as much on management as on the amount of resources invest-ed. It could be said that while the coverage chal-lenge is mainly a question of resources, the qual-ity challenge is mainly a question of management, regulation, proper incentives, capacity building, and system organization. Capacity building incor-porates top-level professionals: teachers, healthcare personnel, and the corporate governance of servic-es providers (schools, universities, hospitals) in or-der to create institutions that are more competent in providing quality solutions to increasingly com-plex demands.
In addition to capacities and management, the information, control, and quality assurance sys-tems must also be improved, thus the increasing importance of instruments such as the education-al quality measurements (SIMCE), international learning tests, and institutional accreditation of educational and health programs. The CASEN survey is an instrument that helps assess the ef-fectiveness of the state’s social policy. These are examples of the trend towards enhanced quality measurements.
Of course, issues of quality are not the only challenges; there are still problems of coverage and access. Among the most important are preschool care and elderly care.
All recent evidence underscores the crucial role of preschool in an individual’s future develop-ment in the school system, in the working world, and in society in general. Good early childhood development is a key factor in combating poverty and social exclusion. The country still has a long
15

Equity and Sustainable Growth: Twenty Years of Social Policies, Chile 1990–200964
This was a phenomenon of only minor importance in the late 1980s that social policies have had to be-gin addressing.
Issues of public safety have become of increas-ing concern to the population, as they affect the quality of life. The public agenda and social policies must include these issues among their objectives.
The family is undergoing significant changes and new demands. Between 1987 and 1990 there were 100,000 marriages annually, whereas between 2005 and 2009 there were only 56,500 per year. The proportion of married women in the 25–34 year-old age group has fallen by more than 20 percent in the last 20 years. The marriage rate dropped from 8.0 in 1989 to 3.3 in 2008. Pregnancy has increased among teenagers, the only age group for which the fertil-ity rate has not been reduced. Two-thirds of children born in 2009 were born to unmarried mothers.94
Women will undoubtedly see a growing par-ticipation in the labor market, following the trends in other countries. Social policy must consider how to incorporate these changes and what sup-port the families will need in addressing these new challenges.95
New challenges like these can be addressed with a thorough analysis of the best public policy options and a clear priority in implementation. The signifi-cant progress made by the country in this period is proof that a country can move forward when there is clarity of purpose and determination. We hope that the information given here contributes to this analysis and the search for new solutions.
way to go in supporting parents in the develop-ment of children under three years old.92
Challenges Associated with New ProblemsThe second type of social policy challenge arises from the new realities and new problems facing Chilean society. Some of the most important chal-lenges are listed below.
First is the aging population. In 1950 there were 18 people over 60 years old for every 100 children un-der 15 years old. In 2000 there were 36, and by 2020 there will be 70 people over 60 for every 100 children under 15. In other words, the change of the last 50 years is being repeated in a period of only 20 years. This rapid aging is occurring in a context where so-ciety is not sufficiently prepared to deal with the new kinds of problems it entails, either from the familial point of view or the public policy point of view.
Just looking at the health sector, one can see that the new requirements will be enormous. The healthcare cost per beneficiary over 65 years old in FONASA is 2.6 times that of the rest of the popula-tion. In the OECD countries it is 3 to 5 times higher. A World Bank on Chile study estimated that health-care costs over the next 15 years, with the current FONASA technology and level of use, will rise by 2 percent per year just for the aging population.
Other issues are the lack of care for adults who cannot care for themselves, poor housing conditions for families to care for their elders, a lack of profes-sionals trained in the care of the elderly, and more.
Another challenge has to do with changing ep-idemiological patterns related to aging and the ap-pearance of new conditions. Among children, for example, malnutrition has virtually disappeared, coming in at 0.7 percent in the last measurement, while extra weight and obesity have more than dou-bled.93 Among adults the change is seen in chronic and infectious diseases: diabetes, hypertension, can-cer, and others that are common to the epidemiologi-cal patterns of most developed countries. This means that health policy must be adapted, but also has much broader implications that must be addressed through education, housing and urban planning.
The infiltration of drug traffic and consump-tion and the ensuing damage is another challenge.
92 See the work of Heckman (2006) and (2007) on the impact of preschool care and Esping-Andersen (2010) on different policies in OECD countries to address pre-school care.
93 Casen survey, see also Estudio de la JUNAEB. The prob-lem of obesity is a growing problem in OECD countries, as seen for example in OECD, “Health at a glance 2001.”
94 Only after 30 years of age were the majority of births to married mothers. See statistics: http://www.ine.cl/canales/chile_estadistico/demografia_y_vitales/esta-disticas_vitales/2011/Vitales_2009_21102011.pdf.
95 See an interesting analysis of this issue in Gosta Esping-Andersen (2010), who analyzes the impact of changes in women and family roles and implications for social policy.

65
rEfErEncEs
Acuña, Hernán and Humberto Santos (2008), “Dis-tribución del Gasto Social en Vivienda,” MIDE-PLAN, Departamento de Estudios División Social.
Adema, Willem (1997), What do countries real-ly spend on social policies? A comparative note, OECD Economic Studies No. 28.
Adema, W. and M. Einerhand (1998), “The Grow-ing Role of Private Social Benefits,” OECD La-bour Market and Social Policy Occasional Pa-pers, No. 32, OECD.
Adema, W. and M. Ladaique (2009), “How Expen-sive is The Welfare State?: Gross and Net Indi-cators in the OECD Social Expenditure Data-base (SOCX),” OECD Social, Employment and Migration Working Papers, No. 92, OECD Pub-lishing, ©OECD.
Arellano, José Pablo (1985), “Políticas sociales y De-sarrollo. Chile 1924–84,” CIEPLAN, Santiago.
Arellano, José Pablo (2000), “Reforma Educacional: Prioridad que se consolida.”
Arellano, José Pablo (2004), Políticas Sociales para el crecimiento con equidad Chile 1990–2002. Estudios Socio/Económicos Nº 26 de CIEPLAN.
Arellano, José Pablo (2005), Prioridades estratégicas para mejorar la calidad de la educación en Chile, Estudios Socio/Económicos Nº 28 de CIEPLAN.
Arellano, José Pablo (2006), “Del déficit al superávit estructural: Razones para una transformación es-tructural en Chile,” Estudios Públicos, 101, CEP.
Arellano, José Pablo and Fernando Ochoa (2007), Cómo ser efectivos en el crédito a microem-presas, Estudios Socio/Económicos N° 30 de CIEPLAN.
Arellano, José Pablo (2012), Consideraciones sobre la carga tributaria en Chile, CIEPLAN.
Arellano, Mireya and Ana María Cerda (2006), “Formación continua de docentes: un camino para compartir” pages 175 ff. http://www.oei.es/quipu/chile/formacioncontinuadedocentes.pdf
Arenas, Alberto and Pamela Gana (2001), “Protec-ción Social, pensiones y género en Chile,” OIT.
Arenas, Benavides, González and Castillo (2008), “La Reforma Previsional Chile Proyecciones Fis-cales 2009–25” DIPRES, Estudios de Finanzas Publicas.
Arenas (2009), “Informe de finanzas públicas proyec-to de ley de presupuestos 2010, Financiamiento e institucionalidad de la educación parvularia en Chile: avances 2006–2010 y desafíos.”
Arenas (2010), “Historia de la Reforma Previsional Chilena,” OIT.
Arriagada, Camilo, Juan Cristóbal Moreno, Enrique Cartier (2007), Evaluación de Impacto del Sub-sidio de Renovación Urbana (Estudio del Área Metropolitana del Gran Santiago 1991–2006), Ministerio de Vivienda y Urbanismo http://www.minvu.cl/opensite_20070411164455.aspx
Atkinson, Paul and Paul van den Noord, (2001), “Managing Public Expenditure: Some Emerg-ing Policy Issues and A Framework for Analysis,” OECD Economics Department Working Pa-pers 285, OECD Publishing.
World Bank (2004), “Chile New Economy Study.”Bellei, Cristián (2009), “Does Lengthening The
School Day Increase Students’ Academic Achieve-ment? Results From A Natural Experiment In Chile.” Qualifying Paper Harvard University School of Education Economics of Education

Equity and Sustainable Growth: Twenty Years of Social Policies, Chile 1990–200966
cuentas en educación, Estudios de Finanzas Públicas, DIPRES.
Departamento de Economía Universidad de Chile (1999), “Evaluación de la educación media téc-nico-profesional, Santiago.”
DIPRES, Ministerio de Hacienda, “Estadísticas de las Finanzas públicas.” Various issues.
DIPRES, Ministerio de Hacienda (2010), Informe de Pasivos Contingentes.
Engel, Galetovic, Raddatz (1998), Reforma tributaria y distribución del ingreso en Chile, Departamen-to de Ingeniería Industrial, Facultad de Ciencias Físicas y Matemáticas, Universidad de Chile.
Esping-Andersen, Gosta (2010), Families and the Revolution in Women’s Roles,
http://dcpis.upf.edu/~gosta-esping-andersen/materi-als/families.pdf
Fajnzylber, Eduardo and Isabel Poblete (2010), “Un modelo de proyección para el seguro de cesantía,” Serie Documentos de Trabajo, Superintenden-cia de Pensiones.
Ferreira, Francisco and David Robalino (2010), “So-cial Protection in Latin America Achievements and Limitations,” World Bank
Foxley, Alejandro, Eduardo Aninat and José Pablo Arellano (1980), “Las desigualdades económi-cas y la acción del Estado,” Fondo de Cultura Económica.
Foxley, Alejandro (1993), Economía Política de la Transición, Dolmen Ediciones.
Halcartegaray, Juan Esteban and Jorge Miranda (2011), Efectos del SCOMP sobre la Elección in-dividual de Modalidad de Pensión, Documen-to de trabajo, Superintendencia de Pensiones. http://www.spensiones.cl/redirect/files/doctrab/DT00052.pdf
Heckman, James J. (2006), The technology and neuroscience of capacity formation, The Na-tional Academy of Sciences of the US. http://jenni.uchicago.edu/human-inequality/papers/tech-skill-pnas_2col_all_2007-03-22a_mms.pdf
Heckman, James J., and Dimitriy V. Masterov (2007), The Productivity Argument for Invest-ing in Young Children http://jenni.uchicago.edu/human-inequality/papers/Heckman_final_all_wp_2007-03-22c_jsb.pdf
Huneeus, Cristóbal (2010), “Balance de los avances y desafíos de las políticas de empleo para jóvenes.”
Review Volume 28, Issue 5, October 2009, Pag-es 629–640.
Berstein, Larraín and Pino (2005), “Cobertura, den-sidad y pensiones en Chile: Proyecciones a 20 años plazo,” Documentos de Trabajo Superin-tendencia de Administradoras de Fondos de Pensiones.
Boeninger, Edgardo (2007), “Políticas Públicas en Democracia,” Uqbar Editores.
Bravo et al (2006), “Estudio sobre la Sustentabilidad del Fondo de Reserva de Pensiones,” Centro de Microdatos, Facultad de Economía y Negocios, Universidad de Chile.
Brunner (2009), “Educación Superior en Chile: Insti-tuciones, Mercados y Políticas Gubernamentales (1967–2007).”
Contreras, Dante, Ryan Cooper and Christopher Neilson (2008), “Crecimiento pro pobre en Chile,” El trimestre económico, vol. LXXV (4), No. 300, Oct.-Dec. 2008.
Contreras, Dante, Paulina Sepúlveda and Soledad Cabrera (2010), “The effects of lengthening the school day on female labor supply: Evidence from a quasi-experiment in Chile,” Departamento de Economía y Centro de Microdatos, Universi-dad de Chile.
Comisión Presidencial de Salud (2010), “Informe Comisión Presidencial De Salud Diciembre 2010.”
Comité de Expertos Ficha de Protección Social (2010), “Informe Final del Comité de Expertos Ficha de Protección Social.”
Cox, Cristian (2003), “Políticas educacionales en el cambio de siglo,” Editorial Universitaria, Santiago.
Cox Cristian, Pablo González, Iván Núñez, Fredy Soto (1997), “160 años de Educación Pública, Historia del Ministerio de Educación”, Ministe-rio de Educación Chile.
Cox, Cristian, Lorena Meckes, and Martín Bascopé (2010), “La institucionalidad formadora de pro-fesores en Chile en la década del
2000: Velocidad del mercado y parsimonia de las políticas.” Revista Pensamiento Educativo, PUC. http://mt.educarchile.cl/mt/jjbrunner/archives/PENSAMIENTO%20EDUCATIVO%20BICEN-TENARIO.pdf
Darville, Paula and Rodríguez Jorge (2007), In-stitucionalidad, financiamiento y rendición de

References 67
Instituto de Políticas Públicas y Gestión, Salud y Futuro-UNAB.
OECD (2001), “Health at a glance 2001.”OECD, “Education at a glance,” various issues.OECD and World Bank (2009), “La Educación Su-
perior en Chile.” OECD (2010), “Chile: climbing on giants’ shoulders:
better schools for all Chilean children,” Econom-ics Department Working Papers No. 784 Nicola Brandt.
Panel de Expertos para una Educación de Calidad (2010), “Propuestas para fortalecer la Profesión Docente en el Sistema Escolar Chileno.”
Raczynski, Dagmar, Claudia Serrano and Manuela Valle (2002), “Eventos de quiebre de ingreso y mecanismos de protección social. Estudio en hog-ares de ingreso medio y bajo.”
Raczynski, Dagmar and Claudia Serrano (2000), “Nuevos y viejos problemas en la lucha contra la pobreza en Chile.”
Ramos, Joseph and Carlos Acero (2010), “El seguro de desempleo” in Larrañaga and Contreras eds. (2010).
Rodríguez, Grossi Jorge (1985), “La distribución del ingreso y el gasto social en Chile 1983,” ILADES.
Rodríguez, J. and Tokman, M. (2001), “Análisis del Gasto en Subsidios por Incapacidad Laboral y sus Determinantes”. Estudios de Finanzas Públi-cas, Dirección de Presupuestos, Ministerio de Hacienda.
Rodríguez, C. Jorge, et al (2010), “Inversión Pública en Educación Superior en Chile: Avances 2006–2010 y desafíos” http://www.dipres.gob.cl/572/articles-60597_doc_pdf.pdf
Ryan, Trumbull and Tufano (2010), A Brief Postwar History of US Consumer Finance, Harvard Busi-ness School Working Paper.
Sánchez, Héctor ed. (2011), La salud del bicentena-rio, Chile 2011–2020, Instituto salud y futuro, Universidad Andrés Bello.
Sánchez, Héctor and Javier Labbé (2011), “Princi-pales indicadores Financieros y de Prestaciones del último decenio del sistema de salud chileno e implicancias, 1999–2009,” in Sánchez Héctor ed. (2011).
Serrano, Claudia and Dagmar Raczynski (2005), “Las políticas y estrategias de desarrollo social, aportes de los años 90 y desafíos futuros,” in
Inostroza, Manuel and Ximena Riesco (2011), “La reforma de salud en Chile a cuatro años de su implementación,” in Sánchez, Héctor ed. (2011).
Larrañaga, Osvaldo and Claudia Peirano (2006), Impacto Distributivo de la Subvención Prefer-encial, Universidad de Chile, http://www.econ.uchile.cl/uploads/publicacion/36490ffd-9f9a-462b-8a9e-2e0ac94247df.pdf
Larrañaga, Osvaldo and Dante Contreras, eds. (2010), “Las nuevas políticas de protección social en Chile,” Uqbar, PNUD.
Marcel, Mario (2001), “Aspectos macroeconómicos del presupuesto del 2002.”
Marcel, M., Tokman, M., Valdés, R. and Benavides, P. (2001), “Balance Estructural del Gobierno Central Metodología y Estimaciones para Chile: 1987–2000,” Estudios de Finanzas Públicas, September.
Mazzo, Rodrigo (2010), El Mercado de Capitales, Biblioteca del Congreso Nacional.
McKenzie, David and David Robalino (2010), Labor market interventions in the crisis and beyond: What has been done and where to from here?*
Meneses, Francisco, Rodrigo Rolando, Manuel Va-lenzuela and María Antonieta Vega (2010), “In-greso a la Educación Superior: La Experiencia de la Cohorte de Egreso 2005.”
Ministerio de Economía (2003), “La situación de la micro y pequeña empresa en Chile.”
Ministerio de Obras Públicas (2003), “Sistema de Concesiones en Chile 1990–2003.”
Mizala, Alejandra and Pilar Romaguera (2002), “Evaluación del desempeño e incentivos en la educación chilena,” Centro de Economía Apli-cada, Departamento de Ingeniería Industrial Universidad de Chile.
Montoya (2003), “El Hospital Público” vols. I and II.Morales, Liliana and Álvaro Yáñez (2007), “Micro-
finanzas en Chile Resultados de la Encuesta de Colocaciones en Segmentos Microempresariales”, Serie Técnica de Estudios - N° 011, SBIF.
Mourshed, Mona, Chinezi Chijioke and Michael Barber (2010), “How the world’s most improved school systems keep getting better,” McKinsey.
Nancuante, Almonacid Ulises and Andrés Rome-ro Celedón (2008), “La reforma de la salud,”

Equity and Sustainable Growth: Twenty Years of Social Policies, Chile 1990–200968
Superintendencia de Pensiones (2010), “Seguro de Cesantía en Chile.”
Trivelli, Pablo (2009), “Suelo urbano y equidad,” Re-vista Mensaje, Santiago.
Tokman, M., J. Rodríguez and F. Larraín (2004), “Subsidios de Incapacidad Laboral 1991–2002: Incentivos Institucionales, Crecimiento del Gasto y una Propuesta de Racionalización.” Es-tudios Públicos N°93, CEP.
Velasco, Andrés (2009), “Exposición del Estado de la Hacienda Pública.”
Velasco, Andrés, A. Arenas, J. Rodríguez, M. Jorratt, and C. Gamboni (2010), El Enfoque de balance estructural en la política fiscal en Chile: Resulta-dos metodología y aplicación al periodo 2006–09.
Patricio Meller, ed. La paradoja Aparente, Equ-idad y eficiencia: Resolviendo el dilema, Taurus, 2005.
Simian, José Miguel (2010), “Logros y desafíos de la política habitacional en Chile,” Estudios Públi-cos, 117.
Superintendencia de Bancos (2008), “Financiamien-to Bancario De Viviendas Asociadas A Program-as De Subsidio Habitacional.”
Superintendencia de Pensiones (2009), “Chile 2009: Una Reforma Previsional de Segunda Gener-ación de pensiones.”
Superintendencia de Pensiones (2010), “El Sistema Chileno de pensiones.”
69
annEx
Social Spending with Different Methodologies
Since 2003, government finance statistics informa-tion has been recorded with a new methodology.
For purposes of comparison, the two sets of data available for the period are shown.

Equity and Sustainable Growth: Twenty Years of Social Policies, Chile 1990–200970
Soci
al E
xpen
dit
ure
1987
–200
9 in
bill
ions
of
2009
pes
os
Met
hodo
logy
Hea
lth C
are
Hou
sing
Educ
atio
nSo
cial
Sec
urity
Oth
erTo
tal
Old
New
Old
New
aO
ldN
ewO
ldN
ewb
Old
New
cO
ldN
ew
1987
540
521
240
244
818
767
1804
2086
512
411
3914
4470
1988
629
629
240
290
813
755
1851
2154
456
381
4046
4209
1989
632
629
298
286
805
760
1904
2302
380
287
4007
4265
1990
603
600
286
300
778
735
1939
2130
353
273
3968
4038
1991
710
705
295
339
874
810
2015
2273
382
301
4334
4428
1992
830
827
352
400
1004
907
2137
2368
421
326
4786
4828
1993
931
924
392
458
1090
1016
2318
2497
478
357
5248
5252
1994
1026
1064
431
486
1189
1101
2397
2533
509
372
5571
5557
1995
1069
1117
471
512
1328
1240
2541
2642
566
409
5975
5921
1996
1162
1217
526
573
1500
1433
2736
2809
627
460
6551
6492
1997
1231
1289
498
551
1652
1563
2863
2861
674
495
6918
6760
1998
1332
1385
513
557
1841
1764
3035
2988
724
534
7445
7227
1999
1373
1453
504
618
1969
1966
3352
3197
828
563
8026
7798
2000
1488
1561
481
603
2139
2049
3519
3351
891
629
8517
8193
2001
1611
1690
512
588
2319
2210
3699
3407
912
694
9053
8589
2002
1691
1773
522
605
2497
2358
3719
3463
917
717
9347
8917
2003
—18
79—
593
—23
92—
3526
—71
3—
9103
2004
—20
19—
684
—25
76—
3609
—71
3—
9601
2005
—21
97—
771
—25
75—
3780
—77
1—
1009
6
2006
—24
88—
825
—27
34—
3884
—82
7—
1075
7
2007
—28
13—
965
—30
42—
3880
—93
4—
1163
5
2008
—30
12—
1198
—35
13—
3920
—10
66—
1270
9
2009
—36
72—
1441
—40
61—
4312
—15
35—
1502
1
Sour
ce: D
IPRE
S, F
unct
iona
l cla
ssifi
catio
n of
exp
endi
ture
, Gov
ernm
ent F
inan
ce S
tatis
tics
for t
he re
spec
tive
year
s a T
his
is c
ompo
sed
of th
e cl
assi
ficat
ion
of e
xpen
ditu
re o
n ho
usin
g an
d co
mm
unity
ser
vice
s gi
ven
by D
IPRE
S pl
us th
e “H
ousi
ng”
item
from
the
soci
al p
rote
ctio
n ex
pend
iture
. b T
his
is c
ompo
sed
of th
e ex
pend
iture
on
soci
al p
rote
ctio
n fo
r the
eld
erly.
c T
his
is c
ompo
sed
of th
e ex
pend
iture
on
soci
al p
rote
ctio
n (m
inus
exp
endi
ture
on
the
elde
rly a
nd e
xpen
ditu
re o
n ho
usin
g in
soc
ial p
rote
ctio
n) a
nd re
crea
tiona
l act
iviti
es, c
ultu
re a
nd re
ligio
n


Equity and sustainablE growth
twenty years of social Policies, Chile 1990–2009
José Pablo arellano M.December 2011
This book examines social policy in Chile between 1990 and 2009 through the eyes of one of its key actors. Special emphasis is placed on allocation of resources, the relationship between social, fiscal, and macroeconomic policy, and the relationship of these three types of policy with growth and equity.
The book covers each area of social policy: subsidies/monetary transfers, education, housing, pensions and social protection, health care, and income generation. The author analyzes the mechanisms used to prioritize social spending in the allocation of public resources. Within social policies, he ex-amines the main criteria and priorities that guided allocation of resources.
José Pablo Arellano M. was the National Budget Director from 1990 to 1996 and the Minister of Education from 1996 to 2000. He is the author of several publications on social policy.
WB SP Chile cover 6-7-13.indd 1 6/7/13 1:43 PM


