Embed Size (px)
Citation preview

LETTER Communicated by Charles J Wilson
Two-State Membrane Potential Fluctuations Driven by WeakPairwise Correlations
Andrea BenucciandreaskiorgPaul FMJ VerschurepfmjviniphysethzchPeter Konigpkoeniguni-osnabrueckdeInstitute of Neuroinformatics University and ETH Zurich 8057 Zurich Switzerland
Physiological experiments demonstrate the existence of weak pairwisecorrelations of neuronal activity in mammalian cortex (Singer 1993) Thefunctional implications of this correlated activity are hotly debated(Roskies et al 1999) Nevertheless it is generally considered a widespreadfeature of cortical dynamics In recent years another line of research hasattracted great interest the observation of a bimodal distribution of themembrane potential defining up states and down states at the single celllevel (Wilson amp Kawaguchi 1996 Steriade Contreras amp Amzica 1994Contreras amp Steriade 1995 Steriade 2001) Here we use a theoreticalapproach to demonstrate that the latter phenomenon is a natural con-sequence of the former In particular we show that weak pairwise cor-relations of the inputs to a compartmental model of a layer V pyramidalcell can induce bimodality in its membrane potential We show how thisrelationship can account for the observed increase of the power in the γ -frequency band during up states as well as the increase in the standarddeviation and fraction of time spent in the depolarized state (AndersonLampl Reichova Carandini amp Ferster 2000) In order to quantify the rela-tionship between the correlation properties of a cortical network and thebistable dynamics of single neurons we introduce a number of new in-dices Subsequently we demonstrate that a quantitative agreement withthe experimental data can be achieved introducing voltage-dependentmechanisms in our neuronal model such as Ca2+- and Ca2+-dependentK+ channels In addition we show that the up states and down statesof the membrane potential are dependent on the dendritic morphologyof cortical neurons Furthermore bringing together network and singlecell dynamics under a unified view allows the direct transfer of resultsobtained in one context to the other and suggests a new experimentalparadigm the use of specific intracellular analysis as a powerful tool toreveal the properties of the correlation structure present in the networkdynamics
Neural Computation 16 2351ndash2378 (2004) ccopy 2004 Massachusetts Institute of Technology
2352 A Benucci P Verschure and P Konig
1 Introduction
In this study we address the relationship of two experimentally observedphenomena At the network level correlated spiking activity between en-sembles of neurons has been described in recent years At the cellular levelthe observation that the membrane potential dynamics of single neuronscan show distinct up states and down states has received a lot of attention
Regarding the first phenomenon multielectrode recordings in cat visualcortex have demonstrated that pairs of neurons sharing similar orientationtuning properties tend to have synchronized spiking activity (Singer 1993)This finding has been confirmed in different species (Bair 1999) and differ-ent cortical areas (Salinas amp Sejnowski 2001) The synchronization pattern isdependent on the properties of the stimulus For example when coherentlymoving gratings or randomly moving dots are used as visual stimuli theyelicit cortical activity that displays pairwise correlations of different degree(Gray Engel Konig amp Singer 1990 Usrey amp Reid 1999) Moreover cross-correlation analysis shows that rather than having a precise synchroniza-tion optimally driven neurons lead over suboptimally driven ones (KonigEngel amp Singer 1995a) (see Figure 1B) This suggests that under realisticconditions cortical dynamics is highly structured in the temporal domain(Roskies et al 1999)
The impact of a large number of randomly timed or synchronized inputson the subthreshold dynamics of single neurons has been studied in simula-tions (Salinas amp Sejnowski 2000 Bernander Koch amp Usher 1994 Destexheamp Pare 1999 Shadlen amp Newsome 1998 Softky amp Koch 1993) Howevertaking into account our current knowledge of the correlation structure ofcortical activity we have little insight into the cellular dynamics under re-alistic conditions (Singer 1993 Lampl Reichova amp Ferster 1999 DouglasMartin amp Whitteridge 1991 Stern Kincaid amp Wilson 1997 Agmon-Snir ampSegev 1993 Mel 1993 Destexhe amp Pare 2000 Singer amp Gray 1995)
Regarding the second phenomenon a number of intracellular studieshave shown that the membrane potential of neurons does not take on anyvalue between rest and threshold with equal probability but rather that itassumes either a depolarized state associated with spiking activity or aresting state where the cell is silent (see Figures 2A and 2B right panels)This behavior has been observed in different animals and brain structures(Anderson Lampl Reichova Carandini amp Ferster 2000 Stern Jaeger ampWilson 1998 Steriade Timofeev amp Grenier 2001) This bistability of themembrane potential is referred to as up states and down states and its bio-physical properties have been characterized (Wilson amp Kawaguchi 1996Lampl et al 1999 Douglas et al 1991 Stern et al 1997 Lewis amp OrsquoDonnell2000 Wilson amp Groves 1981 Kasanetz Riquelme amp Murer 2002) (see Fig-ures 2A and 2B right panels) The origin of up states and down states hasbeen related to presynaptic events (Wilson amp Kawaguchi 1996) howeverthe underlying mechanisms have not yet been identified
High-Order Correlations in Neural Activity 2353
Figure 1 Model neuron and the temporal structure of its input (A) Recon-structed layer 5 pyramidal cell (left) with a schematic of five input spike trainssharing weak pairwise correlations (right) For every pair of spike trains thereare moments in time when the probability of firing together is high and pairs ofsynchronized spikes occur Due to the high level of input convergence higher-order events emerge statistically and are shown as triplets in the example (Be-nucci et al 2003) (B) Cross-correlation analysis of paired extracellular record-ings from cat area 17 while using moving bars as visual stimuli (data taken fromKonig et al 1995a) The peak size is proportional to the strength of the corre-lation The shift of the peak indicates a phase lag of the firing of one neuronrelative to the other In general optimally driven cells tend to lead over subop-timally driven ones Solid line Gabor fit for parameters estimation (C) Cross-correlogram of the synthetic data Solid line Gabor fit of the cross-correlogram
Here we take a theoretical approach to examine the dynamics of themembrane potential in single neurons given a physiologically constrainedrepresentation of the temporal properties of its afferent signals
2 Materials and Methods
In the following we describe a detailed model of a cortical neuron and a pro-cedure to produce synthetic input spike trains with physiologically realisticfirst order (ie firing rates) and second-order statistical properties (ie pair-wise correlations) Subsequently our methods of analysis are introduced
2354 A Benucci P Verschure and P Konig
High-Order Correlations in Neural Activity 2355
21 The Cellular Model A morphologically detailed layer 5 pyramidalcell (Bernander Koch amp Douglas 1994 Bernander Koch amp Usher 1994Destexhe amp Pare 2000) is simulated using the NEURON simulation envi-ronment (Hines amp Carnevale 2001) (see Figure 1A) (The original anatomicaldata are kindly made available by J C Anderson and K A C Martin) Wedeliberately keep the cell as simple as possible to avoid the introductionof strong a priori hypotheses Nevertheless the resulting simulated neuronis of considerable complexity The parameters for the passive propertiesHH-like channels in the soma and the synapses (4000 AMPA 500 GABAa500 GABAb) are selected according to the available literature and previouscomputational studies (Bernander Koch amp Douglas 1994 Agmon-Snir ampSegev 1993 Bernander Koch amp Usher 1994 Mel 1993 Destexhe amp Pare2000) The parameter sets used are reported in Tables 1 through 3 (see theappendix) The files used to implement voltage-dependent mechanisms asindicated in the tables are freely available online from the NEURON webpage (httpwwwneuronyaleedu) For the cell as a whole we tune theparameters to obtain a consistent input-output firing-rate transfer function
Figure 2 Facing page Intracellular somatic recordings (A) The membrane po-tential of the model neuron is shown during optimal stimulation (left panel)Spiking episodes (burst-like behavior) are associated with the depolarized statesof the membrane potential (up states) Following spiking activity there are pe-riods in which the simulated cell is in a more hyperpolarized state and silent(down states) The pairwise correlation strength of the input spike trains hasbeen set to 01 and the mean input firing rate to 85 Hz The alternation betweenup states and down states has also been found in several experimental studiesusing intracellular recordings (right panel) (B) Histogram of the distribution ofthe membrane potential recorded under the conditions as shown in a after re-moval of the action potentials The membrane potential does not take any valuebetween the up states and down states with equal probability but the histogramshows two peaks (left panel) Similarly the biphasic behavior in the membranepotential has been experimentally observed (right panel) (C) If the cell in thesimulation is stimulated solely by uncorrelated background activity (6 Hz) thebimodality disappears (left panel) The corresponding trace of the membranepotential is shown in the inset Similar ldquoshapesrdquo in the histograms of the mem-brane potential under similar stimulation conditions have also been observedexperimentally (right panel) Note that when not using visual stimulation An-derson et al (2000) found bimodal as well as nonbimodal distributions of themembrane potential A nonbimodal example is shown here (see also section 4)(D) The duration of the up states has been increased 10 times with respect toFigure 2A due to the introduction of Ca2+ and Ca2+-dependent K+ channelsin the modeled L5 pyramidal cell (E) Relationship between the firing rate inthe up states and the mean membrane potential with Ca2+ and Ca2+-dependentK+currents The input pairwise correlation strength is 01 and the mean inputfiring rate is 30 Hz
2356 A Benucci P Verschure and P Konig
Tabl
e1
Sim
ulat
ion
Para
met
ers
for
the
Act
ive
Mec
hani
sms
Ere
vG
u 12
(mV
)k
Ion
Cur
rent
Plac
e(m
V)
(mS
cm2 )
pq
τ act
(ms)
(act
ive
inac
tive
)(a
ctiv
ein
acti
ve)
File
Na+
I Na
Som
a50
500
21
005
minus47
minus42
3minus
3ia
spec
mod
Den
dri
tes
5010
21
005
minus32
minus37
3minus
3ia
pm
odC
a2+I L
Api
cal
115
51
20
212
minus35
4ic
alm
odK
+I K
Som
aminus7
750
20
15
minus47
3ia
pspe
cm
odI C
Api
cal
minus77
302
020
02
17ic
mod
I ASo
ma
minus66
101
12
minus24
5minus
723
169
minus5
9ia
new
mod
Den
dri
tes
minus66
101
12
minus22
9minus
831
162
minus6
5iA
mod
I MD
end
rite
sminus7
730
10
221
minuskm
mod
I hA
pica
lminus5
0L
IV2
52
02
24minus6
89
minus65
IHm
odL
III
72
26L
II2
2L
I32
High-Order Correlations in Neural Activity 2357
Table 2 Synaptic Parameters
Type g (nS) er (mV) τ1 (ms) τ2 (ms) τpeak (ms)
GABAa 1 minus70 45 7 56GABAb 01 minus95 35 40 374AMPA 20 0 03 04 035NMDA 269 0 4 120 14
Table 3 Passive Properties
Erest minus65 mVCm 1 microFGm 007 mScm2
Ri 90 cmT 36C
22 Input Stage First-Order Statistics The input stage reproduces mea-sured anatomical and physiological conditions (Douglas amp Martin 1990)Layer 5 neurons in catrsquos visual cortex do not receive significant input fromthe lateral geniculate nucleus the overwhelming majority of inputs arecortico-cortical afferents (Gabbott Martin amp Whitteridge 1987) The dis-tributions of orientation preferences of the afferent excitatory signals to ourmodel neuron are graded and match the experimentally observed speci-ficity of intra-areal corticocortical connections (Kisvarday Toth Rausch ampEysel 1997 Salin amp Bullier 1995) 57 of the inputs originate from neu-rons with similar (plusmn30 degrees) orientation preference and 30 and 13 ofafferents originate from neurons with a preferred orientation differing bybetween 30 and 60 degrees and 60 and 90 degrees respectively from theneuron under consideration This connectivity automatically provides thecell with a feedforward mechanism for its orientation tuning Whether thismechanism correctly describes the origin of orientation-selective responsesin primary visual cortex is still unresolved (Sompolinsky amp Shapley 1997)and not within the scope of this study To take into account these physio-logical conditions we separate the total of 5000 afferents of the simulatedneuron according to the localization of the respective synapse in layer 1 tolayer 5 into five groups This gives the flexibility to make selective changesin the correlation properties of inputs targeting different cortical layersEach of the five groups was subdivided into 36 subpopulations of affer-ents with similar orientation preference resulting in a discretization of plusmn5degrees This mimics the situation of input spike trains from cells havingdifferent tuning properties than the target neuron The size of the subpop-ulations ranged linearly from 25 to 100 cells for orthogonally tuned inputsto identically tuned inputs respectively The firing rates of the inputs aredetermined with a ldquotypicalrdquo visual stimulus in mind (ie an oriented grat-
2358 A Benucci P Verschure and P Konig
ing) The maximum input firing rate of the optimally stimulated neurons isset to 85 Hz Nonoptimally stimulated cells are assumed to have an orien-tation tuning of plusmn30 degrees half width at half height and the firing rateis reduced accordingly In addition background activity is simulated withuniform uncorrelated 6 Hz activity Inhibitory inputs are implemented witha broader orientation tuning than excitatory inputs
23 Input Stage Second-Order Statistics The rationale behind the syn-thetic spike train generation algorithm is that for each pair of spike trainsthere are intervals in time when the probability of correlated spiking activityis increased The method used closely resembles other published algorithmsto produce correlated spike trains (Stroeve amp Gielen 2001 Feng amp Brown2000) and the source code is available from the authors upon request Thestatistical properties of the synthetic spike trains conform to known physi-ological constraints such as average strength and precision of correlationand for this reason we will refer to them as physiologically realistic in-puts We do not introduce a dependence of the strength of correlation onthe orientation tuning of the neurons This conforms to the hypothesis thatthe synchronization patterns induced in the network reflect global stimu-lus properties and are not a fixed property of the network (Singer amp Gray1995) In particular when only a single stimulus is presented the strength ofsynchronization of neuronal activity in the primary visual cortex over shortdistances is found not to depend on the orientation tuning of the neuron(Engel Konig Gray amp Singer 1990)
The details of the algorithm are as follow within the overall time win-dow of analysis T (typically 10 seconds) time epochs are selected duringwhich the probability of spiking is increased for all 5000 cells in the popula-tion afferent to the simulated neuron Nevertheless neurons spike only incorrespondence to a subset of these epochs (randomly chosen) and for anytwo given cells there is always a nonzero overlap between such subsetsThe total number of possible overlaps depends in a combinatorial way onthe size of the subsets which is a controlled parameter of the simulation Itis the number and amount of these overlaps that determines the pairwisecorrelation strength and the different degrees of temporal alignments ofthe spikes The epochs are time intervals centered on specific points in timewhose duration and distribution are controlled parameters of the algorithm
We used a Poisson process to distribute these points in time and theirfrequency was fixed at 75 Hz The duration of the time epochs was 10 msThe algorithm is very flexible choosing a distribution other than a Pois-son one (exponential or gamma of any order) would allow the creationof correlations with or without overall oscillatory activity (Gray amp Vianadi Prisco 1997 Engel et al 1990) The duration of the time epochs deter-mines the precision of the correlations and it can be changed to affect theoverlaps between the epochs within the same spike train The frequencyof the time epochs is itself a free parameter Spikes are assigned within the
High-Order Correlations in Neural Activity 2359
epochs according to a distribution whose skewness and integral is para-metrically controlled The skewness controls the shape of the peaks in thecross-correlograms with the possibility of creating very ldquosharprdquo or ldquobroadrdquocorrelation peaks without changing the correlation strength itself In all thesimulations we used a gaussian distribution The integral of the distribu-tion controls the correlation strength Thus the absolute fraction of spikesassigned to the epochs changed depending on the desired pairwise corre-lation strength The rest of the unassigned spikes are randomly distributedaccording to a Poisson process with constraints related to refractoriness (2ms in the simulation) This ensures that the coefficient of variation (CV) ofeach spike train ranges around one (Dean 1981) A key point of the simu-lation is that by varying the frequency and the duration of the time epochsit is possible to create pairwise correlations in the population with differ-ent degrees of high-order correlation events (see the following section formore details) The temporal dynamics of the input stage thus reproduce ina controlled fashion the correlation strengths and time lags that have beenobserved experimentally
In the following the temporal precision of the correlations will be heldconstant with the width of the peaks in the cross-correlograms always on theorder of 10 ms Furthermore the time lags of the correlations are determinedby a parameter that is kept fixed in all simulations (Konig Engel amp Singer1995b) We vary only the correlation strength that is the height of the peaksin the cross-correlogram We will refer to these dynamical features as to thecorrelation structure of the inputs (Konig Engel amp Singer 1995a Roskies etal 1999) (see Figures 1B and 1C) In our model the inhibitory inputs followthe same correlation structure as the excitatory inputs All simulations areanalyzed in epochs of 10 s duration For the quantitative evaluation of ourdata we use a five-parameters Gabor fit of the cross-correlograms (Konig1994) We calculate the pairwise correlation strength as the area of the peakof the Gabor function divided by the area of the rectangular portion of thegraph under the peak delimited by the offset
24 Higher-Order Correlations Neuronal interactions in the cortex aremeasured solely in terms of correlations of the activity of pairs of neuronsHence the algorithm used here synthesizes spike trains with a specifiedpairwise correlation that satisfies those observed in the neuronal interac-tions in the cortex (see Figures 1B and 1C) Nevertheless due to the highlevel of convergence observed in the cortex higher-order statistical eventsmust and do appear This holds even for the low values of the experimentallyobserved pairwise correlations (Benucci Vershure amp Konig 2003 Destexheamp Pare 2000 Bothe Spekreijse amp Roelfsema 2000 Grun Diesmann amp Aert-sen 2001) Accordingly the above-described algorithm not only generatesweak pairwise correlations between the input spike trains but also createshigh-order correlations in the presynaptic population of neurons Higher-
2360 A Benucci P Verschure and P Konig
order events indicate episodes of the presynaptic dynamics characterizedby spiking activity from a large fraction of afferent neurons occurring al-together in a small time window on the order of a few milliseconds Howthese nearly synchronized events naturally emerge from the pairwise corre-lations constraint has been formally investigated (Benucci et al 2003 Botheet al 2000) It can be intuitively understood considering that the numberof pairwise coincidences rises quadratically with the number of afferentsand that the number of spikes available to generate such coincidences risesonly linearly with the number of afferents It follows that spikes have to beldquousedrdquo multiple times to generate coincidences that is higher-order cor-relations must appear With an increasing number of inputs the effect isamplified This is important when considering realistic values for the num-ber of afferent inputs to a given cortical cell typically of the order of 104At this level of convergence the statistical effect explained above becomesdominant and higher-order events are a prominent feature of the dynamics(Mazurek amp Shadlen 2002)
25 Analysis of Intracellular Dynamics The intracellular dynamics isevaluated using different measures in the time and frequency domain Theup states and down states of the subthreshold membrane potential are deter-mined as in Anderson et al (2000) using two thresholds A sliding windowof 50 ms is used to find segments in which the membrane potential is abovethe up threshold for more than 60 of the time We use a similar proce-dure for identifying the down states (ie the membrane potential is belowa down threshold) For the cumulative probability distribution of the mem-brane potential any section where the membrane potential exceeds the upthreshold is included in the analysis To eliminate the spikes and check forthe inverse relationship between the spike threshold and the slope of therising phase of the action potential we use the same procedure as in Azouzand Gray (2000) Furthermore we compute a number of indices characteriz-ing the relation of subthreshold dynamics with observable measures Theseindices are defined in section 3
26 Control Simulations To verify the scope and robustness of the re-sults found we ran several simulations varying the values of the parame-ters The rationale is that if a small change in the value of a given parametercauses a dramatic change in the results then the mechanisms the parameterrefers to should be considered critical for the emergence of the phenomenonstudied But if the changes are minor and smoothly affect the results theassociated mechanism is considered to be relevant for the modulation andquantitative features of the phenomenon but not for the emergence of theeffect per se
We changed the width of the tuning curves of the inhibitions and ex-citations by a factor of plusmn 10 without noticing significant changes in thedegree of bimodality We also checked for the robustness of the results in
High-Order Correlations in Neural Activity 2361
respect to changes in the time constants and conductance peak amplitudesof AMPA and GABA synapses In the extreme cases of long time constants(NMDA synapses) and large (twice the mean) conductance amplitudes ofAMPA synapses (see the tables for mean values) the cell was driven to anepileptic-like state In case of GABA the cell would be totally silenced Inbetween these extremes the cell was showing smooth changes in the degreeof bistable dynamics We used exactly the same principles when performingcontrols with voltage-dependent mechanisms such as calcium and sodiumvoltage-dependent currents muscarinic channels or anomalous rectifyingcurrents (see the tables for complete listings of mechanisms used) We var-ied the values of the parameters around their means (as reported in thetables) and noticed only smooth modulatory effects These controls confirmthe generality of the phenomena as reported below
Finally for controls regarding the neuronal morphology we used twostrategies we took a different cell model and we reduced the whole cellor part of the dendritic tree to single equivalent compartments while keep-ing the electrotonic properties unaffected (Destexhe 2001) The second cellmodel (a spiny stellate neuron) was kindly made available by Y Banitt and ISegev It includes active mechanisms such as Ca2+ dynamics fast repolariz-ing K+ currents Ca2+-dependent K+ currents spike frequency adaptationand Na+ channels (parameters as in Banitt amp Segev personal communica-tion 2003) The input spike trains are generated with the MATLAB softwarepackage
3 Results
31 Emergence of Up and Down States When we provide the modelneuron with correlated inputs as explained the membrane potential at thesoma is characterized by up and down states of the dynamics (see Figures2A and 2B left panels) However when the cell is stimulated with uncorre-lated background activity this bistability of the dynamics disappears (seeFigure 2C left panel) Indeed in physiological recordings in primary visualcortex using stimulation paradigms that are not associated with correlationstructures (awake cats during spontaneous activity) up and down statesare not observed (Anderson et al 2000 Steriade et al 2001 see Figure 2C)When comparing the results of the simulation to recently published data(Azouz amp Gray 2003) the similarities are obvious Compared to other exper-imental studies however a remarkable difference in timescales is apparent(see Figure 2A) In the purely passive model the duration of the up states istypically around 30 ms which is at least a factor of 10 lower than the exper-imental value As discussed in Wilson and Kawaguchi (1996) the durationof the up and down states is mainly determined by the kinetic propertiesof Ca2+ and Ca2+-dependent K+ currents Including these active mecha-nisms in our model shows that this also holds true in the simulation (seeFigure 2D) In comparison to the passive model the duration of up states
2362 A Benucci P Verschure and P Konig
increases by a factor of 10 It reaches a duration of 300 ms resulting in animproved match to the experimental results
32 Quantification of Intracellular Dynamics To analyze the relation-ship between network and single cell dynamics in a more quantitativeway we compare a number of characteristic measures of the simulatedneuron to known physiological results (Anderson et al 2000) First asreported in the literature we find a significant correlation between themembrane potential in the up state and the spiking frequency (see Fig-ures 2E and 3A) In Figure 2E the calcium dynamics exerts its modulat-ing effect by compressing the dynamic range for the firing frequency ofthe up states The range is reduced from 10 to 220 Hz as in the passivecase (see Figure 3A) to 5 to 50 Hz when calcium is introduced (see Fig-ure 2E) Second we find an increase of the standard deviation of the mem-brane potential in the up-state that matches that observed in the visualcortex (see Figure 3B) This is a large (more than twofold) and highly sig-nificant effect The significance holds also in the comparison between thevariability of the membrane potential during a simulated visual stimulation
Figure 3 Facing page Characteristic features of up states and down states (A)The firing rate in the up state (vertical axis) is shown as a function of the mem-brane potential in the up state (horizontal axis) for both the simulation of apassive model (left) and the experimental data (right) In both cases the av-erage membrane potential in the up state is correlated with the firing rate ofthe cell in the up state The difference in the scale between the left and rightpanels depends on the mean input-firing rate chosen for this specific data setThe input correlation strength is 01 and the mean firing rate of the input is85 Hz See Figures 2D and 2E for a comparison of the active model with theexperimental data (B) The standard deviation (STD) of the membrane potentialof the simulated neuron is increased in the up state as compared to the downstate (left) The inset shows the subthreshold dynamics during stimulation andspontaneous background activity respectively The corresponding experimen-tal data are shown to the right In both cases stimulation increases the varianceof the subthreshold membrane potential (C) The plot of the power spectra inthe 20ndash50 Hz frequency band of the membrane potential for the optimal stim-ulation condition (left panel) shows an increase in the up state as compared tothe down state The same phenomenon is visible in the plot of the experimen-tal data (right panel) Because no information is available on the normalizationused for the power spectra in Anderson et al (2000) we use arbitrary units anda comparison of the absolute scale in the two panels is not possible The verticaland horizontal dotted lines indicate the median for each corresponding axis thelight gray circle is the center of gravity of the distribution for a better comparisonwith the result of the simulation as shown in the left panel The input pairwisecorrelation strength is 01 in Figures 3A and 3C and 02 in Figure 3B while themean input rate is always 85 Hz
High-Order Correlations in Neural Activity 2363
and spontaneous activity (see the Figure 3B inset and right panel) Finallywe observe an increase of the power in the 20 to 50 Hz frequency band in theup state versus the down state (see Figure 3C) This is a smaller effect butit is still statistically significant and is comparable to reported experimentalfindings (see Figure 3C right panel) These three results match experimentalfindings that some consider to be some of the central characteristics of upand down state dynamics (see Figures 3A to 3C right side) Our resultsshow that these characteristics emerge naturally in a detailed model of acortical neuron when exposed to realistically structured input
2364 A Benucci P Verschure and P Konig
As a next step we investigate measures of intracellular dynamics andrelate them to the properties of the networkrsquos activity We define a set ofindices to capture different aspects of the subthreshold activity
The first of these quantifies the strength of the correlations in the networkactivity and the bimodality of the membrane potential histogram This a-dimensional index S accounts for the dependence of the bimodality on theinput correlation strength S = VmaxminusVmin
|Vmax| where Vmax and Vmin are the loca-tion of the peaks in the membrane potential histograms (see Figures 2A and2B) Increasing the correlation strength from its typically reported value ofabout 01 as used above (Konig et al 1995a Salinas amp Sejnowski 2000 KockBernander amp Douglas 1995) leads to an enhancement of the bimodality ofthe membrane potential histogram resulting in a sharpening of the twopeaks (see Figure 4A) This index is a monotonically increasing function ofthe correlation strength (see Figure 4B)
The next index represents the fraction of the total time spent in the upstate (TUS) For each simulation the total time the membrane potentialsurpassing the up threshold is divided by the total simulation time Thisindex is related to the integral of the peaks in the histograms as explainedin Anderson et al (2000) The results indicate that this measure is stronglydependent on the input correlation strength The TUS index is measuredto be 7 13 and 42 for the correlation strengths of 001 01 and 02respectively
Figure 4 Facing page Sensitivity of the membrane potential to the input corre-lation strength (A) Histograms of the distribution of the membrane potentialfor three different conditions The input correlation strength is increased fromleft to right 001 01 and 02 respectively Bimodality emerges and the hyper-polarized peak gets further away with increasing correlation strength (B) TheldquoSrdquo index (see section 2) which quantifies the increasing separation of the peaksin the membrane potential histograms is shown for five choices of correlationstrengths Note that the data points are connected by lines simply to improvevisualization We have no a priori hypotheses about specific functional rela-tionships (C) Cumulative probability distribution of the time intervals duringwhich the membrane potential dwells above the up threshold It is shown for sixtrials at two levels of correlation strength each (D) For each action potential ofthe simulated neuron the maximum slope of the rising phase of the membranepotential and the threshold potential for the spike generation are shown in ascatter plot (E) The identical measure used in an experimental study demon-strates an inverse relationship as well (F) The slope of the corresponding linearfit (solid line in Figure 4D) provides an index that is related to the input correla-tion strength (G) To perform a reverse correlation analysis for every transitionfrom down states to up states a time window was centered in the correspondingpopulation (PSTH) at the input stage to identify presynaptic events associatedto the transition The plot shows the average population activity in the temporalvicinity of a down-to-up transition
High-Order Correlations in Neural Activity 2365
2366 A Benucci P Verschure and P Konig
The third measure relates the correlation strength of the inputs and thecumulative probability (CUP) distribution of the up state (Anderson et al2000) The cumulative probability distributions of the time intervals duringwhich the membrane potential is above the up threshold are computed fordifferent values of the input correlation strengths Though it is not indepen-dent from the TUS index it is a refinement of the previous index in that itcontrols for possible artifacts due to the spike-cutting procedure (see Fig-ure 4C) The CUP measure can easily separate the diverse input correlationstrengths that is 001 pairwise correlation strength (black lines) from 02pairwise correlation strength (light gray lines)
Finally the fourth index measures the slope at threshold (SAT) and thuscharacterizes the relationship between the input correlation structure andthe dependence of the voltage threshold for the spike generation on themaximum slope of the rising phase of an action potential (see Figures 4D and4E) Indeed Azouz and Gray (2000) have observed an inverse relationshipbetween the maximum slope of the rising phase of an action potential andthe voltage threshold for the generation of the spike (see Figure 4E) A similarinverse relationship also appears in the simulated neuron (see Figure 4D)More important we find that the slope of the fit quantifying the relationshipbetween the maximum slope of the rising phase of an action potential andthe voltage threshold for the generation of the spike provides a measure ofthe input correlation strength (see Figure 4F) This result indicates that thisindex tends to decrease with increasing correlation strength
These analyses in the simulation data suggest that these four indicesbased on the membrane potential measurable within a single neuron canbe used to extract the correlation strength within the network activity fromthe intracellular dynamics
We focus now on the mechanisms of the observed bimodality An im-portant result comes from performing reverse correlation analysis of thetransition from down to up states with respect to the population activityOn average the total presynaptic activity around the transition from downto up states shows a sharp peak (see Figures 4G and 5A) This indicatesthat the switch of the intracellular dynamics between up and down statesis induced by short lasting highly correlated input events This confirmsthat up states are induced by presynaptic higher-order events When thepairwise correlation strength is lowered the amplitude of these sharp cor-relation peaks decreases and the bimodality smoothly disappears This istrue for the passive L5 pyramidal cell as well as for the model with voltage-dependent mechanisms As shown before the quantitative features differin the two cases (duration of up states or mean firing rate for example)but the bimodality itself is not affected Moreover there is no intrinsic bi-modality in the modeled neuron the dynamics is fully input driven Whenhigh-order correlation events disappear following a decrease in the pair-wise correlations the bimodality is destroyed even though the mean inputfiring rate to the neuron is kept constant
High-Order Correlations in Neural Activity 2367
33 Simulating Network Effects According to the above findings upand down state fluctuations could manifest themselves in a large-scale co-herent fashion if all the neurons in the population experience the same cor-related dynamics (as for up and down fluctuations observed in slow-wavesleep states or in anesthetized conditions see section 4) Instead groups ofneurons exposed to different network correlation structures would undergodifferent subthreshold dynamics We tested this idea by running 11 differentsimulations of a neuron exposed to a corresponding number of different setsof input spike trains While the mean firing rate and pairwise correlationstrength were kept constant the timing of the epochs used to generate thecorrelations was linearly changing from identical for the first set to com-pletely different for the last set In other words the timing of high-ordercorrelation events as highlighted by the reverse correlation analyses wasgetting more and more dissimilar from set to set For the first six sets weobserve a significant correlation between the membrane potentials of thesimulated neurons (p lt 0001) When the afferent signals are only slightlyoverlapping the membrane potentials are no longer significantly correlatedHigh values of correlation as experimentally described are observed onlywhen pairs of cells share a large fraction of synaptic inputs (see Figure 5B)
34 Cell morphology An important question is whether the detailedmorphology of a neuron contributes to the emergence of up and down statesand if so what the key properties involved are We manipulate the grossmorphological structure of the pyramidal cell in a series of experimentsFirst we delete all morphological specificity of the pyramidal neuron bymorphing the cell into a spherical single compartment of equal surfacewhile keeping the firing-rate transfer function unchanged This reduces thecell to a conductance-based integrate-and-fire (IF) model This procedurehas been done with and without Ca2+ and Ca2+-dependent K+ currentsSecond we morph the cell into a three-compartment model (basal dendritictree plus soma proximal-apical dendritic tree and distal-apical dendritictree) that preserves dendritic voltage attenuation (Destexhe 2001) Third wemorph only the basal part into an equivalent compartment while preservingthe apical dendritic tree in detail In all these cases when exposed to thesame inputs used in the simulation experiments described above the upand down dynamics disappear (see Figure 5D)
Interestingly when exposing the IF model to the same input statistics andusing a parameter choice for the Ca2+ currents that was eliciting long-lastingbistability in the L5 pyramidal cell we do not find any up and down statesNote that this does not imply that it is not possible to find a choice of pa-rameters and input statistics such that bimodality would emerge Howeverwhen we keep the morphology of the basal dendritic tree unchanged andreduce the apical part to a single equivalent compartment the qualitativeaspects of the bimodal intracellular dynamics are preserved (see Figure 5E)Thus we find that in the passive model an intact basal dendritic tree is the
2368 A Benucci P Verschure and P Konig
High-Order Correlations in Neural Activity 2369
Figure 5 Facing page (A) Somatic intracellular recordings of the membrane po-tential showing up-down fluctuations The modeled cell incorporates calciumdynamics The raster plot of the corresponding input activity is shown in thebottom panel High-order correlation events (darker vertical stripes) of a fewtens of milliseconds duration induce transitions to the up states The distributionin time of these correlated events is according to a Poisson process Up-statesrsquoduration can be prolonged by increasing the frequency of high-order events asit happens in the time window of 2 to 25 seconds The same effect is obtainedby increasing the calcium peak conductance and time constants (see controlsin section 2) with the result of eventually merging all the up states shown inthe figure into a single long-lasting up state (B) Decorrelating the subthresholddynamics a template set of points in time (in the raster plot shown in panel Asuch a set of points would correspond to the moments in time when the verticalstripes occur) has been used to generate 10 other different sets of points whosenumeric values differ more and more from the original one The first set is aperfect copy of the original template the second one has 10 difference and soon The last one is 100 different This group of 11 sets is then used to generate11 corresponding different ensembles of 5000 correlated inputs These 11 pop-ulations have increasingly different degree of correlations between them sincethey share fewer and fewer time epochs for generating pairwise correlations(see section 2) We run the simulations and recorded the voltage traces for 10seconds of simulation time The subthreshold dynamics of the second trace isidentical to the first one (the template) while the following traces differ moreand more (C) To quantify the degree of decorrelation we windowed each volt-age trace using a 1 second time window and for each segment we computedthe linear correlation coefficients between the reference trace and the followingones By using the windowing procedure we could get 10 different estimates ofthe correlation coefficients for every couple of voltage traces thus deriving anestimate of the mean correlation values and standard deviations ldquoSeedsrdquo in theabscissa refers to the points in time used to create the correlations (see section 2)(D) The histogram of the membrane potential for a single spherical compart-ment preserving the original input-output firing-rate transfer function shows acentral predominant peak and two small satellite peaks The more depolarizedone is an effect of the spike-cutting procedure and the more hyperpolarized oneis a result of the after-spike hyperpolarization (E) Histogram of the membranepotential with intact basal morphology and a reduced apical one substitutedby a single cylinder of equivalent surface (F) Histogram of the membrane po-tential of a spiny stellate cell with active mechanisms included (see the text fordetails) (G) Bimodality in the histogram of the membrane potential of an IFneuron with modified EPSPsrsquo rising and decaying time constants 1 ms and 12ms respectively
2370 A Benucci P Verschure and P Konig
minimal condition necessary for the emergence of up and down states Theinteresting observation here is that the parameter set that robustly producesbistability in an L5 pyramidal cell does not produce the experimentallyobserved bistability for a point neuron
As a further test of the hypothesis that the cable properties of the basaldendritic tree are essential for the generation of up and down states wetest a model of a spiny stellate cell developed by Banit and Segev (personalcommunication 2003) From the point of view of the gross morphologi-cal structure this spiny stellate cell can be considered as a pyramidal cellwithout an apical dendritic tree It thus resembles the morphological charac-teristics of the cell used in the latter control It is as if instead of an equivalentcylindrical compartment the apical part had been ldquocut offrdquo Furthermorethis model contains a number of active mechanisms (see section 2) BecauseBanit and Segev used this model for a different purpose we extended it withAMPA and GABA synapses supplying correlated afferent input as describedabove In this simulation using an alternative detailed model neuron withseveral voltage-dependent mechanisms (see section 2) the same bimodalityappears (see Figure 5F) This demonstrates that the basal dendritic tree is animportant morphological compartment for the induction of up and downstates
In order to investigate the role of the basal dendritic tree we separate theeffects of the interaction of many excitatory postsynaptic potentials (EPSPs)in the dendrites and the effects of electrotonic propagation on individualEPSPs by developing a neuron model which retains some aspects of den-dritic processing but radically simplifies others We increased the durationof the EPSPs in an IF model without any detailed morphology (ie a pointneuron) We kept the total charge flow and the input correlation structureunchangedmdasha correlation strength of 01 and a modification of the rise anddecay time constants and peak amplitude of the conductance change g(t)mdashto keep the integral constant Also in this simulation up and down statesemerge (see Figure 5G) It should be emphasized that the quantitative mis-match in the bimodality between Figure 5G and Figure 2B is not surprisingsince the models used are completely different an L5 pyramidal cell with de-tailed morphology and a single geometrical point IF neuron The intuitiveexplanation is that in the real neuron as well as in the detailed simulationswhen a barrage of EPSPs occurs synchronously in several basal dendritesthese long thin cables quickly become isopotential compartments each si-multaneously depolarizing the soma Moreover the temporal filtering prop-erties of these cables have the net effect of prolonging the effective durationof the EPSPs Note that this temporal broadening is effective even thoughthe intrinsic dendritic time constant τ is lowered by the arrival of massiveexcitations which increases the conductance (Pare Shink Gandreau Des-texhe amp Lang 1998) The overall effect is a strong sustained current to thesoma We conclude that for the passive model higher-order events whichnaturally result from weak pairwise correlations in the network combined
High-Order Correlations in Neural Activity 2371
with physiologically realistic electrotonic dendritic properties explain thebimodal distribution of the membrane potential and that active conduc-tances shape its detailed temporal properties
4 Discussion
Here we show in a detailed model of a pyramidal neuron that weak pairwisecorrelations in its inputs in combination with the electrotonic properties ofits basal dendritic tree cause up and down states in its membrane potentialdynamics Furthermore several experimental characterizations of up anddown states such as an increase in gamma power and standard deviationof the membrane potential can be explained in terms of presynaptic corre-lation structures By introducing several statistical indices we demonstratea way to derive the correlation strength of the inputs and thus in the ac-tivity of the network from the subthreshold dynamics of a single neuronIn this sense correlated activity in the network and the bimodality of themembrane potential are different views on one and the same phenomenon
Previous explanations of up and down states have focused on a presy-naptic origin and have suggested that synchronous barrages of excitationsmay be the major agents involved (Wilson amp Kawaguchi 1996) What kind ofmechanism in the cortex could be responsible for their generation is an issuethat has not been fully resolved Here we show that no additional hypothe-sis other than the well-described weak pairwise correlations is required tofill this gap However we also show in our model that such a presynap-tic source can account for the bimodality in the membrane potential of thepostsynaptic neuron only when it is complemented by temporal filtering ofthe input spike trains by the basal dendtrites Active intracellular mecha-nisms sustain the triggered transitions to up states Importantly the neuronexhibits bimodality in its membrane potential with as well as without in-sertion of voltage-dependent mechanisms The key effect of K+-dependentCa2+ or Na+ channels is their strong modulation of the quantitative proper-ties of the subthreshold dynamics This includes a sixfold compression of thedynamics range of the up statersquos mean firing rates Potassium-dependentcalcium and sodium channels can stretch the up-state duration from 25 to300 ms providing a better match with electrophysiological data Howeverthey are not responsible for the emergence of the phenomenon per se
The differential impact of the morphology of the basal and apical den-drites on the response properties of pyramidal cells has been pointed outin other experimental (Larkum Zhu amp Sakmann 1999 Berger Larkumamp Luscher 2001) and theoretical studies (Kording amp Konig 2001) In thesestudies properties of the inputs play a key role in the interaction of apicaland basal dendritic compartments In another study it has been shown thatthe dynamic regulation of the dendritic electrotonic length can give rise tohighly specific interactions in a cortical network that can account for thedifferential processing of multiple stimuli (Verschure amp Konig 1999)
2372 A Benucci P Verschure and P Konig
41 The Scope of the Model In our simulations we do not reconstructa complete visual system but approximate the first- and second-order sta-tistical structure of the afferent inputs to a single neuron derived from ex-perimental results This approximation can be experimentally verified byintracellular recordings in area 17 of an anesthetized cat using full fieldgratings as visual stimuli This setup has been used in a fair number oflaboratories to demonstrate the existence of weak pairwise correlations inneuronal activity (Bair 1999) Such synchronized activity has been observedover a spatial extent of several millimeters roughly matching the scale ofmonosynaptic tangential connections in the cortex (Singer 1993) Thereforea pyramidal neuron in visual cortex samples mainly the activity of a regionwhere neuronal activity is weakly correlated Furthermore the pyramidalcell reconstructed and simulated in this study has been recorded from andfilled in primary visual cortex Pyramidal cells are the predominant neu-ronal type in the whole cortex and weak pairwise correlations have beenfound in many other cortical areas and species as well (Bair 1999) Thusour simulations apply to widely used experimental paradigms
Another important question pertaining to our study and the physiolog-ical data it relates to is whether the phenomena studied here generalizeto the awake behaving animal The impact of the behavioral state on thecortical dynamics is not fully understood and the bulk of physiologicalexperiments are performed under anesthesia Electroencephalogram datashow marked differences in the neuronal dynamics between different be-havioral states (Steriade et al 2001) and we can expect that the detaileddynamics of neuronal activity are affected Furthermore it is known thatanesthetics influence the dynamics of up and down states during spon-taneous activity (Steriade 2001) However whether the subthreshold dy-namics is influenced by anesthetics when visual stimuli are applied is yetunknown Furthermore in the few studies where awake cats are used (Grayamp Viana di Prisco 1997 Siegel Kording amp Konig 2000) correlated activityon a millisecond timescale has been observed compatible with the resultsobtained with the anesthetized preparation Interestingly a bimodality inthe subthreshold dynamics has been observed in slow-wave sleep (Steriadeet al 2001) This raises the question of how the correlation structure of neu-ronal activity during sleep matches that observed under anesthetics Hencewhether the assumptions made in our study and the data they are based ongeneralize to awake or sleeping animals has to be further investigated Thefew results available suggest however that the relationship reported herebetween network dynamics and up down states could be valid for differentbehavioral states
42 Simplifications and Assumptions The simulations presented inthis study incorporate a number of assumptions and simplifications Al-though within the framework of the simulation it is possible to use statis-tical indices to quantify the relationship between membrane potential dy-
High-Order Correlations in Neural Activity 2373
namics and the statistical structure of the inputs a full quantitative matchbetween experimental and simulation results is difficult to achieve To un-derstand the reasons behind these differences (for standard deviation seeFigure 3B for slope see Figures 4D and 4E) it has to be considered that weinvestigated detailed compartmental models where many known channelsand currents (Wilson amp Kawaguchi 1996) have been omitted In particularvoltage-dependent currents with long time constants are known to play animportant role in stabilizing and prolonging up and down states (Wilson ampKawaguchi 1996) Once the upward or downward transition has occurredactive currents contribute to stabilizing the membrane potential in eitheran up state or a down state Their duration is related not only to the in-put dynamics but also to the kinetic properties of such active mechanismswhich essentially implement a bistable attractor of the dynamics Withoutthat the passive filtering properties of the dendrites would simply be re-sponsible for the emergence of stretched-in-time envelopes of the coherentpresynaptic events Up and down states would be triggered but not main-tained for prolonged periods These considerations have been validatedby a tenfold increase in the duration of the up states as soon as Ca2+ andK+-dependent Ca2+ currents have been included in the model The rela-tive importance of voltage-dependent mechanisms and presynaptic eventsin inducing and maintaining a bistable neuronal dynamics seems to varyconsiderably depending on the animal and brain area In view of this thetemptation to include a much larger number of active mechanisms to cap-ture this complexity arises However it is quickly obvious that the dataneeded to specify the precise distribution and strength of each mechanismare not available Therefore the number of free parameters of the modelto be fitted by reaching a consistent input-output firing rate and other con-straints is dramatically increased and surpasses the number of constraintsavailable
An interesting alternative to the above scenario can be envisioned In-stead of increasing the complexity of the modeled cell it is possible to lowerthe complexity of the real cell Essentially an experiment can be designedin which the focus shifts from an investigation of the cellular properties ofthe recorded neuron as such to using the neuron as a probe to investigatethe correlation structure in the network The main guidelines of the exper-iment should be to record intracellularly from a neuron in primary visualcortex while presenting different visual stimuli that will induce differentcorrelation structures Gratings are known to induce pairwise correlationswhile randomly moving dots lead to weak or no correlations (Usrey amp Reid1999 Brecht Goebel Singer amp Engel 2001 Gray et al 1990) Alternativelysynchronous network activity could be simulated by using an intracorticalelectrode and applying short lasting depolarizing current pulses Apply-ing blockers of voltage-dependent channels or hyperpolarizing the neuronstrongly affects the membrane conductance and simplifies the dynamicswithin the real neuron The aim is to reduce as much as possible the impact
2374 A Benucci P Verschure and P Konig
of active mechanisms so that the real cell becomes simply a passive receiverof the input spike trains and their higher-order correlation statistics Re-ducing the number of parameters that can vary in a real experiment to thesmaller set of controlled parameters employed in the simulation study al-lows further validation of the conclusions derived from our model againstphysiological reality This makes it possible to infer the correlation strengthof the activity in the cortical network from the subthreshold dynamics asquantified by the indices described above In this sense the simulation studyfacilitates a new experimental approach using a neuron under nonphysi-ological conditions as a passive probe to investigate the dynamics of thenetwork
Appendix
The tables describe parameter values used in the NEURON simulationldquoPlacerdquo (in Table 1) refers to the dendritic location of the inserted mecha-nism ldquodendritesrdquo indicates both basal and apical dendrites while G (andg for synaptic mechanisms) indicate the peak conductance values For Ihchannels the peak conductance varies according to the dendritic location asreported by Berger et al (2001) The parameters m and n refer to the kineticscheme of the Hodgkin- and Huxley-like formalism used to describe theactivation and inactivation properties of voltage dependent mechanismsaccording to the following equation
IA = GA times mpA times nq
A(u minus EA)
where A is a generic ionic type The parameters k and u12 refer to theBoltzman equation that describes the steady-state conductance behavior ofthe ionic mechanisms inserted according to the equation
f (u) = 1
1 + exp(
u12minusuk
)
Finally the time course of the synaptic conductance (AMPA and GABA seeTable 2) follows an alpha function behavior
f (t) = exp(
minus tτ1
)minus exp
(minus t
τ2
)
NMDA channels have been used solely in control experiments (see sec-tion 26)
Acknowledgments
This work was supported the Swiss National Fund (31-6141501) ETHZurich and EUBBW (IST-2000-28127010208-1)
High-Order Correlations in Neural Activity 2375
References
Agmon-Snir H amp Segev I (1993) Signal delay and input synchronization inpassive dendritic structures J Neurophysiol 70 2066ndash2085
Anderson J Lampl I Reichova I Carandini M amp Ferster D (2000) Stimulusdependence of two-state fluctuations of membrane potential in cat visualcortex Nature Neurosci 3 617ndash621
Azouz R amp Gray C M (2000) Dynamic spike threshold reveals a mechanismfor synaptic coincidence detection in cortical neurons in vivo PNAS 978110ndash8115
Azouz R amp Gray C M (2003) Adaptive coincidence detection and dynamicgain control in visual cortical neurons in vivo Neuron 37 513ndash523
Bair W (1999) Spike timing in the mammalian visual system Curr Opin Neu-robiol 9 447ndash453
Benucci A Vershure P F amp Konig P (2003) Existence of high-order correlationsin cortical activity Phys Rev E 68 (4 Pt 1) 041905
Berger T Larkum M E amp Luscher H R (2001) High I(h) channel density inthe distal apical dendrite of layer V pyramidal cells increases bidirectionalattenuation of EPSPs J Neurophysiol 85(2) 855ndash868
Bernander O Koch C amp Douglas R J (1994) Amplification and linearizationof distal synaptic inputs to cortical pyramidal cells J Neurophysiol 72 2743ndash2753
Bernander O Koch C amp Usher M (1994) The effects of synchronized inputsat the single neuron level Neural Computation 6 622ndash641
Bothe S M Spekreijse H amp Roelfsema P R (2000) The effect of pair-wise andhigher order correlations on the firing rate of a post-synaptic neuron NeuralComputation 12 153ndash179
Brecht M Goebel R Singer W amp Engel A K (2001) Synchronization of visualresponses in the superior colliculus of awake cats Neuroreport 12 43ndash47
Contreras D amp Steriade M (1995) Cellular basis of EEG slow rhythms Astudy of dynamic corticothalamic relationships J Neurosci 15 604ndash622
Dean A F (1981) The variability of discharge of simple cells in the cat striatecortex Exp Brain Res 44(4) 437ndash440
Destexhe A (2001) Simplified models of neocortical pyramidal cells preservingsomatodendritic voltage attenuation Neurocomputing 38ndash40 167ndash173
Destexhe A amp Pare D (1999) Impact of network activity on the integrativeproperties of neocortical pyramidal neurons in vivo J Neurophysiol 81 1531ndash1547
Destexhe A amp Pare D (2000) A combined computational and intracellularstudy of correlated synaptic bombardment in neocortical pyramidal neuronsin vivo Neurocomputing 32ndash33 113ndash119
Douglas R J amp Martin K A C (1990) Neocortex In G M Shepherd (Ed)The synaptic organization of the brain (pp 389ndash438) Oxford Oxford UniversityPress
Douglas R J Martin K A C amp Whitteridge D (1991) An intracellular analysisof the visual responses of neurons in cat visual cortex J Physiol (London) 440659ndash696
2376 A Benucci P Verschure and P Konig
Engel A K Konig P Gray C M amp Singer W (1990) Stimulus-dependentneuronal oscillations in cat visual cortex Inter-columnar interaction as de-termined by cross-correlation analysis Eur J Neurosci 2 588ndash606
Feng J amp Brown D (2000) Impact of correlated inputs on the output of theintegrate-and-fire model Neural Comput 12 671ndash692
Gabbott P L Martin K A C amp Whitteridge D (1987) Connections betweenpyramidal neurons in layer 5 of cat visual cortex (area 17) J Comp Neurol259 364ndash381
Gray C M Engel A K Konig P amp Singer W (1990) Stimulus-dependent neu-ronal oscillations in cat visual cortex Receptive field properties and featuredependence Eur J Neurosci 2 607ndash619
Gray C M amp Viana di Prisco G (1997) Stimulus-dependent neuronal oscilla-tions and local synchronization in striate cortex of the alert cat J Neurosci17 3239ndash3253
Grun S Diesmann M amp Aersten A (2001) Unitary events in multiple single-neuron spiking activity I Detection and significance Neural Computation 1443ndash80
Hines M L amp Carnevale N T (2001) NEURON A tool for neuroscientistsNeuroscientist 7 123ndash135
Kasanetz F Riquelme L A amp Murer M G (2002) Disruption of the two-statemembrane potential of striatal neurones during cortical desynchronizationin anesthetized rats J Physiol 543 577ndash589
Kisvarday Z F Toth E Rausch M amp Eysel U T (1997) Orientation-specificrelationship between populations of excitatory and inhibitory lateral connec-tions in the visual cortex of the cat Cerebral Cortex 7 605ndash618
Kock C Bernander O amp Douglas R J (1995) Do neurons have a voltage ora current threshold for action potential initiation J Comput Neurosci 2 63ndash82
Konig P (1994) A method for the quantification of synchrony and oscillatoryproperties of neuronal activity J Neurosci Meth 54 31ndash37
Konig P Engel A K amp Singer W (1995a) How precise is neuronal synchro-nization Neural Computation 7 469ndash485
Konig P Engel A K amp Singer W (1995b) Relation between oscillatory activityand long-range synchronization in cat visual cortex PNAS 92 290ndash294
Kording K P amp Konig P (2001) Supervised and unsupervised learning withtwo sites of synaptic integration J Comput Neurosci 11 207ndash215
Lampl I Reichova I amp Ferster D (1999) Synchronous membrane potentialfluctuations in neurons of the cat visual cortex Neuron 22 361ndash374
Larkum M E Zhu J J amp Sakmann B (1999) A new cellular mechanism forcoupling inputs arriving at different cortical layers Nature 398 338ndash341
Lewis B L amp OrsquoDonnell P (2000) Ventral tegmental area afferents to the pre-frontal cortex maintain membrane potential ldquouprdquo states in pyramidal neu-rons via D1 dopamine receptors Cerebral Cortex 10 1168ndash1175
Mazurek M E amp Shadlen M N (2002) Limits to the temporal fidelity ofcortical spike rate signal Nature Neurosci 5 463ndash471
Mel B W (1993) Synaptic integration in an excitable dendritic tree J Neuro-physiol 70 1086ndash1101
High-Order Correlations in Neural Activity 2377
Pare D Shink E Gaudreau H Destexhe A amp Lang E J (1998) Impactof spontaneous synaptic activity on the resting properties of cat neocorticalpyramidal neurons in vivo J Neurophysiol 79 1450ndash1460
Roskies A et al (1999) Reviews on the binding problem Neuron 24(1) 7ndash110
Salin P A amp Bullier J (1995) Corticocortical connections in the visual systemStructure and function Physiological Rev 75 107ndash154
Salinas E amp Sejnowski T J (2000) Impact of correlated synaptic input onoutput firing rate and variability in simple neuronal models J Neurosci 206193ndash6209
Salinas E amp Sejnowski T J (2001) Correlated neuronal activity and the flowof neural information Nat Rev Neurosci 2 539ndash550
Shadlen M N amp Newsome W T (1998) The variable discharge of corticalneurons Implications for connectivity computation and information codingJ Neurosci 18 3870ndash3896
Siegel M Kording K P amp Konig P (2000) Integrating top-down and bottom-up sensory processing by somato-dendritic interactions J Neurosci 8 161ndash173
Singer W (1993) Synchronization of cortical activity and its putative role ininformation processing and learning Annu Rev Physiol 55 349ndash374
Singer W amp Gray C M (1995) Visual feature integration and the temporalcorrelation hypothesis Annu Rev Neurosci 18 555ndash586
Softky W R amp Koch C (1993) The highly irregular firing of cortical cellsis inconsistent with temporal integration of random EPSPs J Neurosci 13334ndash350
Sompolinsky H amp Shapley R (1997) New perspectives on the mechanisms fororientation selectivity Current Opinion in Neurobiol 7 514ndash522
Steriade M (2001) Impact of network activities on neuronal properties in cor-ticothalamic systems J Neurophysiol 86 1ndash39
Steriade M Contreras D amp Amzica F (1994) Synchronized sleep oscillationsand their paroxysmal developments Trends Neurosci 17 199ndash208
Steriade M Timofeev I amp Grenier F (2001) Natural waking and sleep statesA view from inside neocortical neurons J Neurophysiol 85 1968ndash1985
Stern E A Jaeger D amp Wilson C J (1998) Membrane potential synchronyof simultaneously recorded striatal spiny neurons in vivo Nature 394 475ndash478
Stern E A Kincaid A E amp Wilson C J (1997) Spontaneous subthresholdmembrane potential fluctuations and action potential variability of rat corti-costriatal and striatal neurons in vivo J Neurophysiol 77 1697ndash1715
Stroeve S amp Gielen S (2001) Correlation between uncoupled conductance-based integrate-and-fire neurons due to common and synchronous presy-naptic firing Neural Comput 13 2005ndash2029
Usrey W M amp Reid R C (1999) Synchronous activity in the visual systemAnnu Rev Physiol 61 435ndash456
Verschure PF amp Knig P (1999) On the role of biophysical properties of corticalneurons in binding and segmentation of visual scenes Neural Comput 111113ndash1138
2378 A Benucci P Verschure and P Konig
Wilson C J amp Groves P M (1981) Spontaneous firing patterns of identifiedspiny neurons in the rat neostriatum Brain Res 220 67ndash80
Wilson C J amp Kawaguchi Y (1996) The origins of two-state spontaneousmembrane potential fluctuations of neostriatal spiny neurons J Neurosci16 2397ndash2410
Received September 4 2003 accepted April 7 2004
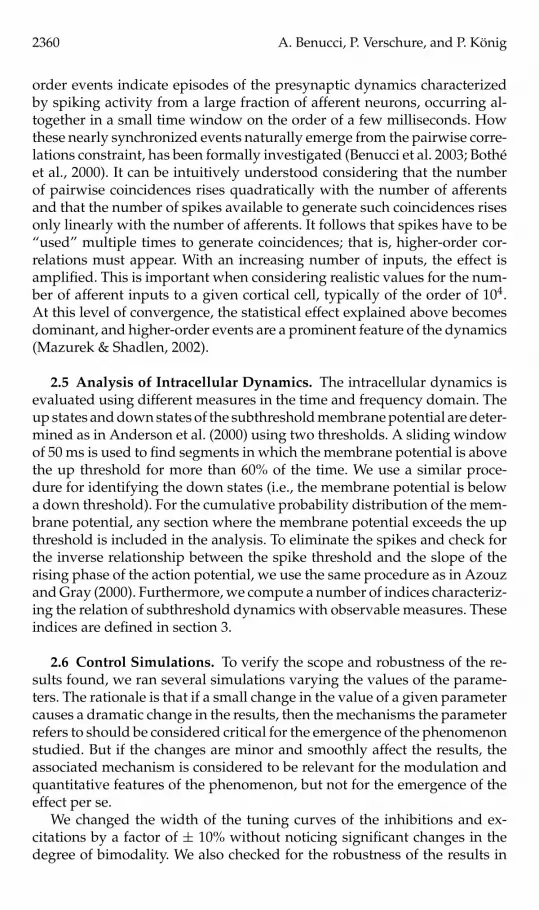
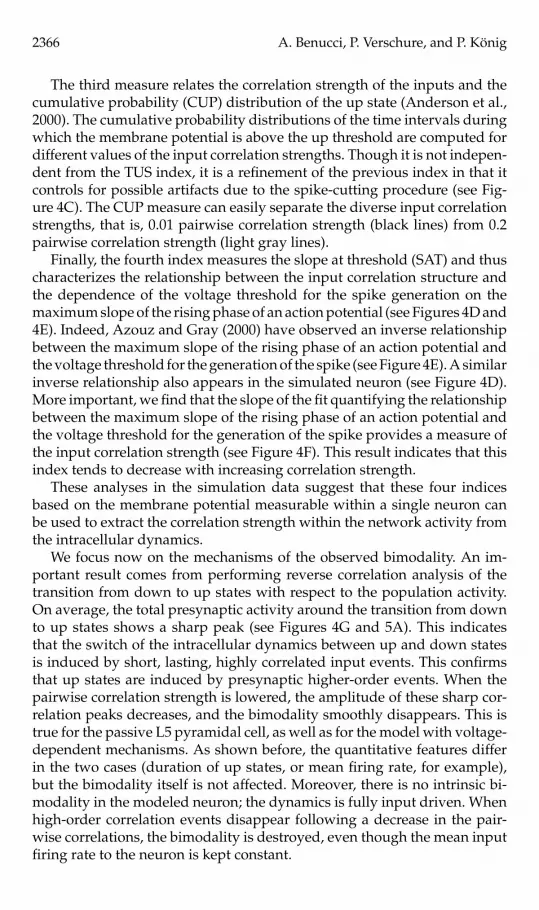