Embed Size (px)
Citation preview
Two ubiquitin ligases, APC/C-Cdh1 and SKP1-CUL1-F(SCF)-β-TrCP, sequentially regulate glycolysisduring the cell cycleSlavica Tudzarovaa, Sergio L. Colomboa, Kai Stoebera,b, Saul Carcamoa, Gareth H. Williamsa,b,1,and Salvador Moncadaa,1
aWolfson Institute for Biomedical Research and bResearch Department of Pathology and UCL Cancer Institute, University College London, London WC1E 6BT,United Kingdom
Contributed by Salvador Moncada, February 9, 2011 (sent for review January 4, 2011)
During cell proliferation, the abundance of the glycolysis-promotingenzyme, 6-phosphofructo-2-kinase/fructose-2,6-bisphosphatase, iso-form 3 (PFKFB3), is controlled by the ubiquitin ligase APC/C-Cdh1 viaa KEN box. We now demonstrate in synchronized HeLa cells thatPFKFB3, which appears in mid-to-late G1, is essential for cell divisionbecause its silencing prevents progression into S phase. In cellsarrested by glucose deprivation, progression into S phase afterreplacement of glucose occurs only when PFKFB3 is present or issubstituted by the downstream glycolytic enzyme 6-phosphofructo-1-kinase. PFKFB3 ceases to be detectable during late G1/S despitethe absence of Cdh1; this disappearance is prevented by proteaso-mal inhibition. PFKFB3 contains a DSG box and is therefore apotential substrate for SCF-β-TrCP, a ubiquitin ligase active during Sphase. In synchronized HeLa cells transfected with PFKFB3 mutatedin the KEN box, the DSG box, or both, we established the break-down routes of the enzyme at different stages of the cell cycle andthe point at which glycolysis is enhanced. Thus, the presence ofPFKFB3 is tightly controlled to ensure the up-regulation of glycolysisat a specific point in G1. We suggest that this up-regulation ofglycolysis and its associated events represent the nutrient-sensi-tive restriction point in mammalian cells.
Cell division is a finely coordinated process in which the timelyfunctioning and degradation of cell cycle progression proteins
play a fundamental role. Two ubiquitin ligase complexes—SCF(SKP1/CUL-1/F-box protein) and APC/C (anaphase-promotingcomplex/cyclosome)—control the sequential degradation ofthese proteins (1). SCF is active mainly in G1, S, and early Mphases, whereas APC/C regulates mitosis and G1. These com-plexes recognize specific amino acid motifs (e.g., the KEN box, Dbox, or DSG box) in their substrates through the action of acti-vator proteins such as SKP2, β-TrCP and Fbw7 in the case ofSCF or Cdc20 and Cdh1 in the case of APC/C (2–4).APC/C-Cdh1 maintains normal cells in G1, thus preventing
their uncoordinated entry into a new cell cycle (5). This is ach-ieved through the degradation of a number of proteins involved inprogression into S phase (6). Initiation of the cell cycle leads tothe eventual decrease in APC/C-Cdh1 activity and the consequentappearance of S/M cyclins responsible for entry into S phase—thebiosynthetic step of the cycle. The point in G1 at which theavailability of key exogenous nutrients is required, and after whichthe cells become independent of growth factors, was describedmany years ago as the restriction point (7, 8). However, the me-chanisms underlying the provision of the substrates necessaryfor a cell’s commitment to proliferate have remained elusive.We have recently found that PFKFB3 is regulated during cell
proliferation by APC/C-Cdh1 and that silencing this enzymeprevents cells from entering S phase (9, 10). These findings sug-gest that there is close coordination between cell cycle progressionand provision of the raw materials required for its completion.We have now monitored the expression of PFKFB3 during thecell cycle in HeLa cells synchronized by double thymidine block(DTB) and nocodazole. We have located its appearance during
the cell cycle, identified its degradation routes, and establishedits significance for the regulation of glycolysis and cell cycleprogression.
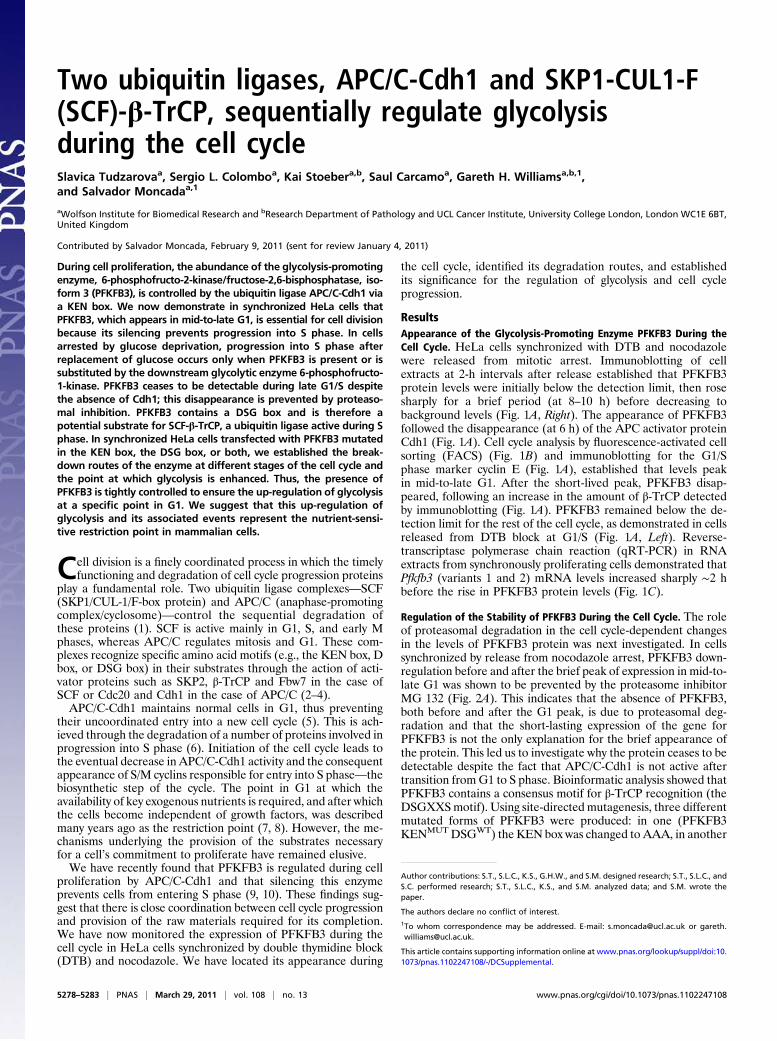
ResultsAppearance of the Glycolysis-Promoting Enzyme PFKFB3 During theCell Cycle. HeLa cells synchronized with DTB and nocodazolewere released from mitotic arrest. Immunoblotting of cellextracts at 2-h intervals after release established that PFKFB3protein levels were initially below the detection limit, then rosesharply for a brief period (at 8–10 h) before decreasing tobackground levels (Fig. 1A, Right). The appearance of PFKFB3followed the disappearance (at 6 h) of the APC activator proteinCdh1 (Fig. 1A). Cell cycle analysis by fluorescence-activated cellsorting (FACS) (Fig. 1B) and immunoblotting for the G1/Sphase marker cyclin E (Fig. 1A), established that levels peakin mid-to-late G1. After the short-lived peak, PFKFB3 disap-peared, following an increase in the amount of β-TrCP detectedby immunoblotting (Fig. 1A). PFKFB3 remained below the de-tection limit for the rest of the cell cycle, as demonstrated in cellsreleased from DTB block at G1/S (Fig. 1A, Left). Reverse-transcriptase polymerase chain reaction (qRT-PCR) in RNAextracts from synchronously proliferating cells demonstrated thatPfkfb3 (variants 1 and 2) mRNA levels increased sharply ∼2 hbefore the rise in PFKFB3 protein levels (Fig. 1C).
Regulation of the Stability of PFKFB3 During the Cell Cycle. The roleof proteasomal degradation in the cell cycle-dependent changesin the levels of PFKFB3 protein was next investigated. In cellssynchronized by release from nocodazole arrest, PFKFB3 down-regulation before and after the brief peak of expression in mid-to-late G1 was shown to be prevented by the proteasome inhibitorMG 132 (Fig. 2A). This indicates that the absence of PFKFB3,both before and after the G1 peak, is due to proteasomal deg-radation and that the short-lasting expression of the gene forPFKFB3 is not the only explanation for the brief appearance ofthe protein. This led us to investigate why the protein ceases to bedetectable despite the fact that APC/C-Cdh1 is not active aftertransition fromG1 to S phase. Bioinformatic analysis showed thatPFKFB3 contains a consensus motif for β-TrCP recognition (theDSGXXSmotif). Using site-directed mutagenesis, three differentmutated forms of PFKFB3 were produced: in one (PFKFB3KENMUTDSGWT) the KEN box was changed to AAA, in another
Author contributions: S.T., S.L.C., K.S., G.H.W., and S.M. designed research; S.T., S.L.C., andS.C. performed research; S.T., S.L.C., K.S., and S.M. analyzed data; and S.M. wrote thepaper.
The authors declare no conflict of interest.1To whom correspondence may be addressed. E-mail: [email protected] or [email protected].
This article contains supporting information online at www.pnas.org/lookup/suppl/doi:10.1073/pnas.1102247108/-/DCSupplemental.
5278–5283 | PNAS | March 29, 2011 | vol. 108 | no. 13 www.pnas.org/cgi/doi/10.1073/pnas.1102247108
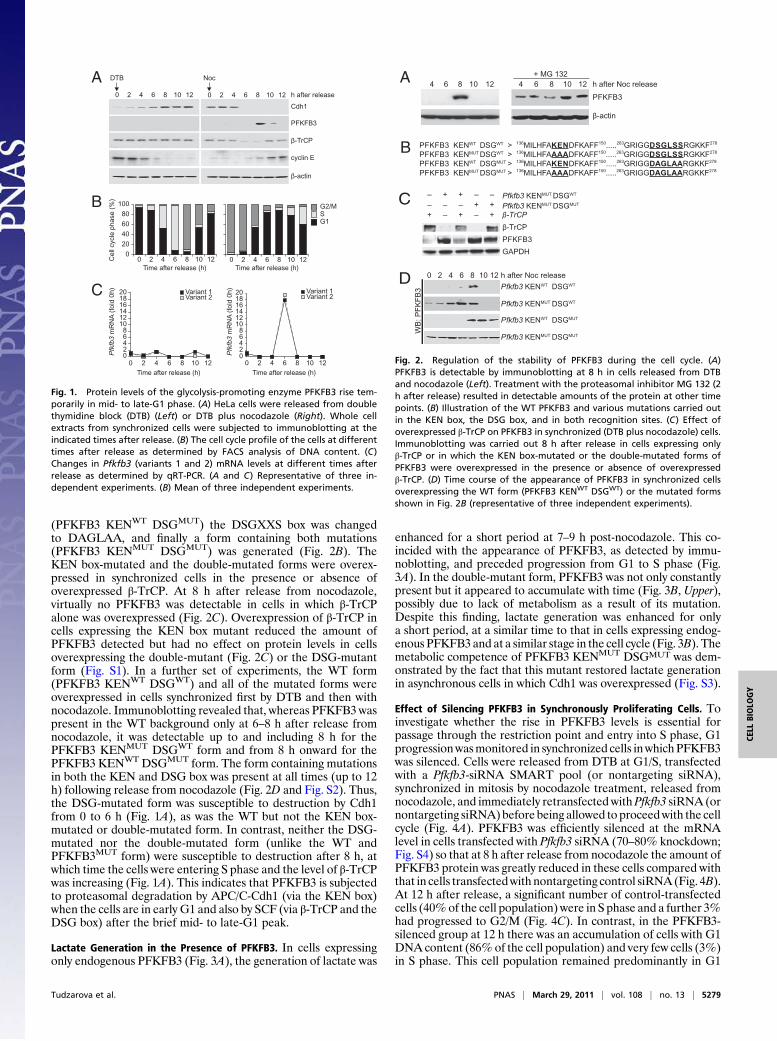
(PFKFB3 KENWT DSGMUT) the DSGXXS box was changedto DAGLAA, and finally a form containing both mutations(PFKFB3 KENMUT DSGMUT) was generated (Fig. 2B). TheKEN box-mutated and the double-mutated forms were overex-pressed in synchronized cells in the presence or absence ofoverexpressed β-TrCP. At 8 h after release from nocodazole,virtually no PFKFB3 was detectable in cells in which β-TrCPalone was overexpressed (Fig. 2C). Overexpression of β-TrCP incells expressing the KEN box mutant reduced the amount ofPFKFB3 detected but had no effect on protein levels in cellsoverexpressing the double-mutant (Fig. 2C) or the DSG-mutantform (Fig. S1). In a further set of experiments, the WT form(PFKFB3 KENWT DSGWT) and all of the mutated forms wereoverexpressed in cells synchronized first by DTB and then withnocodazole. Immunoblotting revealed that, whereas PFKFB3 waspresent in the WT background only at 6–8 h after release fromnocodazole, it was detectable up to and including 8 h for thePFKFB3 KENMUT DSGWT form and from 8 h onward for thePFKFB3 KENWT DSGMUT form. The form containing mutationsin both the KEN and DSG box was present at all times (up to 12h) following release from nocodazole (Fig. 2D and Fig. S2). Thus,the DSG-mutated form was susceptible to destruction by Cdh1from 0 to 6 h (Fig. 1A), as was the WT but not the KEN box-mutated or double-mutated form. In contrast, neither the DSG-mutated nor the double-mutated form (unlike the WT andPFKFB3MUT form) were susceptible to destruction after 8 h, atwhich time the cells were entering S phase and the level of β-TrCPwas increasing (Fig. 1A). This indicates that PFKFB3 is subjectedto proteasomal degradation by APC/C-Cdh1 (via the KEN box)when the cells are in early G1 and also by SCF (via β-TrCP and theDSG box) after the brief mid- to late-G1 peak.
Lactate Generation in the Presence of PFKFB3. In cells expressingonly endogenous PFKFB3 (Fig. 3A), the generation of lactate was
enhanced for a short period at 7–9 h post-nocodazole. This co-incided with the appearance of PFKFB3, as detected by immu-noblotting, and preceded progression from G1 to S phase (Fig.3A). In the double-mutant form, PFKFB3 was not only constantlypresent but it appeared to accumulate with time (Fig. 3B, Upper),possibly due to lack of metabolism as a result of its mutation.Despite this finding, lactate generation was enhanced for onlya short period, at a similar time to that in cells expressing endog-enous PFKFB3 and at a similar stage in the cell cycle (Fig. 3B). Themetabolic competence of PFKFB3 KENMUT DSGMUT was dem-onstrated by the fact that this mutant restored lactate generationin asynchronous cells in which Cdh1 was overexpressed (Fig. S3).
Effect of Silencing PFKFB3 in Synchronously Proliferating Cells. Toinvestigate whether the rise in PFKFB3 levels is essential forpassage through the restriction point and entry into S phase, G1progressionwasmonitored in synchronized cells inwhich PFKFB3was silenced. Cells were released from DTB at G1/S, transfectedwith a Pfkfb3-siRNA SMART pool (or nontargeting siRNA),synchronized in mitosis by nocodazole treatment, released fromnocodazole, and immediately retransfected withPfkfb3 siRNA (ornontargeting siRNA)before being allowed to proceedwith the cellcycle (Fig. 4A). PFKFB3 was efficiently silenced at the mRNAlevel in cells transfected with Pfkfb3 siRNA (70–80% knockdown;Fig. S4) so that at 8 h after release from nocodazole the amount ofPFKFB3 protein was greatly reduced in these cells compared withthat in cells transfectedwith nontargeting control siRNA(Fig. 4B).At 12 h after release, a significant number of control-transfectedcells (40%of the cell population) were in S phase and a further 3%had progressed to G2/M (Fig. 4C). In contrast, in the PFKFB3-silenced group at 12 h there was an accumulation of cells with G1DNA content (86%of the cell population) and very few cells (3%)in S phase. This cell population remained predominantly in G1
B
C
Ce
ll cycle
ph
ase
(%
)
Time after release (h) Time after release (h)
0
20
40
60
80
100
121086420
G2/MSG1
121086420
Time after release (h) Time after release (h)
Pfk
fb3
mR
NA
(fo
ld 0
h)
Pfk
fb3
mR
NA
(fo
ld 0
h)
0 2 4 6 8 10 1202468
101214161820
0 2 4 6 8 10 1202468
101214161820 Variant 1
Variant 2Variant 1Variant 2
0
DTB
2 4 6 8 10 12 0 2 4 6 8 10 12 h after release
PFKFB3
β-TrCP
Cdh1
cyclin E
β-actin
A Noc
Fig. 1. Protein levels of the glycolysis-promoting enzyme PFKFB3 rise tem-porarily in mid- to late-G1 phase. (A) HeLa cells were released from doublethymidine block (DTB) (Left) or DTB plus nocodazole (Right). Whole cellextracts from synchronized cells were subjected to immunoblotting at theindicated times after release. (B) The cell cycle profile of the cells at differenttimes after release as determined by FACS analysis of DNA content. (C)Changes in Pfkfb3 (variants 1 and 2) mRNA levels at different times afterrelease as determined by qRT-PCR. (A and C) Representative of three in-dependent experiments. (B) Mean of three independent experiments.
B PFKFB3 KENWT DSGWT > 136MILHFAKENDFKAFF150.....263GRIGGDSGLSSRGKKF278
PFKFB3 KENMUT DSGWT > 136MILHFAAAADFKAFF150.....263GRIGGDSGLSSRGKKF278
PFKFB3 KENWT DSGMUT > 136MILHFAKENDFKAFF150.....263GRIGGDAGLAARGKKF278
PFKFB3 KENMUT DSGMUT > 136MILHFAAAADFKAFF150.....263GRIGGDAGLAARGKKF278
C
GAPDH
β-TrCP++ – +–
+ +– – – Pfkfb3 KENMUT
++–– – Pfkfb3 KENMUT DSGMUT
PFKFB3
β-TrCP
4 6 8 10 124 6 8 10 12
PFKFB3
β-actin
h after Noc release
+ MG 132A
Pfkfb3 KENWT DSGWT
Pfkfb3 KENMUT DSGWT
Pfkfb3 KENWT DSGMUT
Pfkfb3 KENMUT DSGMUT
0 2 4 6 8 10 12 h after Noc releaseD
WB
: P
FK
FB
3
DSGWT
Fig. 2. Regulation of the stability of PFKFB3 during the cell cycle. (A)PFKFB3 is detectable by immunoblotting at 8 h in cells released from DTBand nocodazole (Left). Treatment with the proteasomal inhibitor MG 132 (2h after release) resulted in detectable amounts of the protein at other timepoints. (B) Illustration of the WT PFKFB3 and various mutations carried outin the KEN box, the DSG box, and in both recognition sites. (C) Effect ofoverexpressed β-TrCP on PFKFB3 in synchronized (DTB plus nocodazole) cells.Immunoblotting was carried out 8 h after release in cells expressing onlyβ-TrCP or in which the KEN box-mutated or the double-mutated forms ofPFKFB3 were overexpressed in the presence or absence of overexpressedβ-TrCP. (D) Time course of the appearance of PFKFB3 in synchronized cellsoverexpressing the WT form (PFKFB3 KENWT DSGWT) or the mutated formsshown in Fig. 2B (representative of three independent experiments).
Tudzarova et al. PNAS | March 29, 2011 | vol. 108 | no. 13 | 5279
CELL
BIOLO
GY
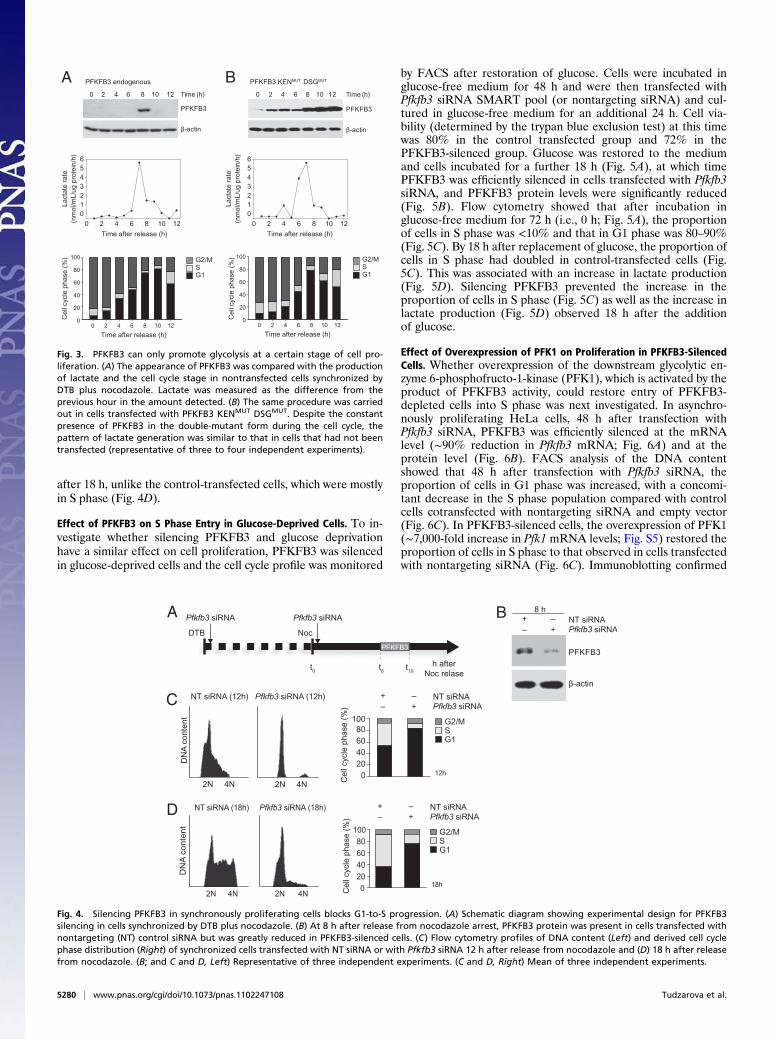
after 18 h, unlike the control-transfected cells, which were mostlyin S phase (Fig. 4D).
Effect of PFKFB3 on S Phase Entry in Glucose-Deprived Cells. To in-vestigate whether silencing PFKFB3 and glucose deprivationhave a similar effect on cell proliferation, PFKFB3 was silencedin glucose-deprived cells and the cell cycle profile was monitored
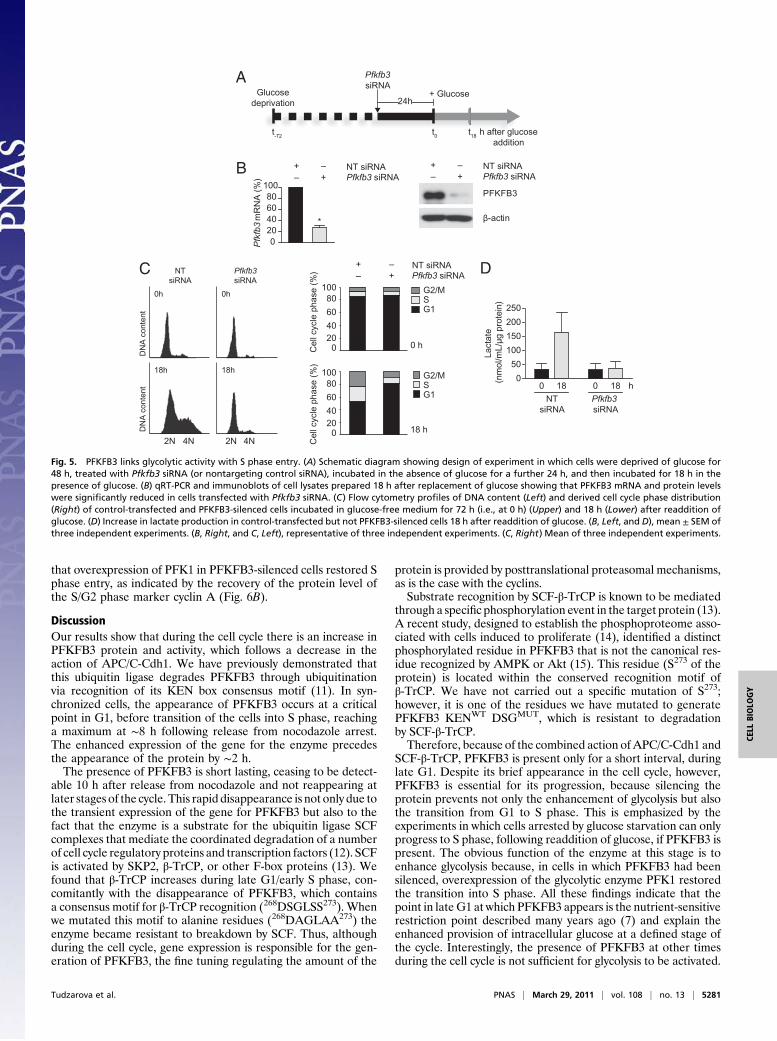
by FACS after restoration of glucose. Cells were incubated inglucose-free medium for 48 h and were then transfected withPfkfb3 siRNA SMART pool (or nontargeting siRNA) and cul-tured in glucose-free medium for an additional 24 h. Cell via-bility (determined by the trypan blue exclusion test) at this timewas 80% in the control transfected group and 72% in thePFKFB3-silenced group. Glucose was restored to the mediumand cells incubated for a further 18 h (Fig. 5A), at which timePFKFB3 was efficiently silenced in cells transfected with Pfkfb3siRNA, and PFKFB3 protein levels were significantly reduced(Fig. 5B). Flow cytometry showed that after incubation inglucose-free medium for 72 h (i.e., 0 h; Fig. 5A), the proportionof cells in S phase was <10% and that in G1 phase was 80–90%(Fig. 5C). By 18 h after replacement of glucose, the proportion ofcells in S phase had doubled in control-transfected cells (Fig.5C). This was associated with an increase in lactate production(Fig. 5D). Silencing PFKFB3 prevented the increase in theproportion of cells in S phase (Fig. 5C) as well as the increase inlactate production (Fig. 5D) observed 18 h after the additionof glucose.
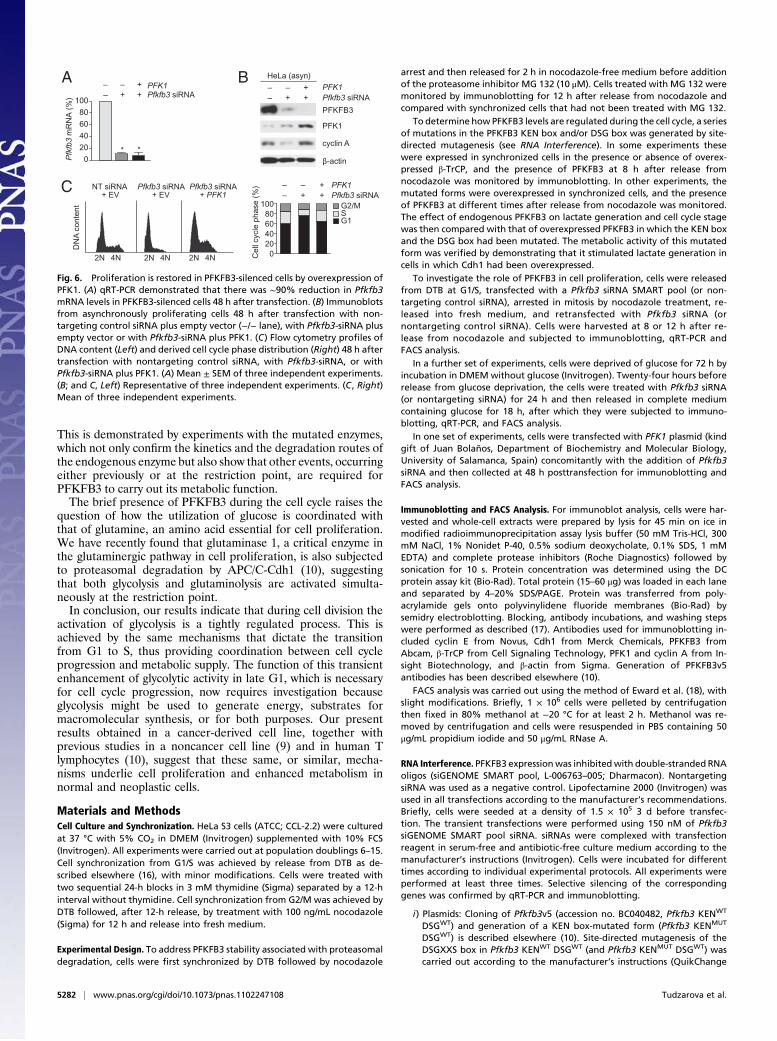
Effect of Overexpression of PFK1 on Proliferation in PFKFB3-SilencedCells. Whether overexpression of the downstream glycolytic en-zyme 6-phosphofructo-1-kinase (PFK1), which is activated by theproduct of PFKFB3 activity, could restore entry of PFKFB3-depleted cells into S phase was next investigated. In asynchro-nously proliferating HeLa cells, 48 h after transfection withPfkfb3 siRNA, PFKFB3 was efficiently silenced at the mRNAlevel (∼90% reduction in Pfkfb3 mRNA; Fig. 6A) and at theprotein level (Fig. 6B). FACS analysis of the DNA contentshowed that 48 h after transfection with Pfkfb3 siRNA, theproportion of cells in G1 phase was increased, with a concomi-tant decrease in the S phase population compared with controlcells cotransfected with nontargeting siRNA and empty vector(Fig. 6C). In PFKFB3-silenced cells, the overexpression of PFK1(∼7,000-fold increase in Pfk1 mRNA levels; Fig. S5) restored theproportion of cells in S phase to that observed in cells transfectedwith nontargeting siRNA (Fig. 6C). Immunoblotting confirmed
A
PFKFB3
DTB
t0
t8
t10
Pfkfb3 siRNA Pfkfb3 siRNA
Noc
h after
Noc relase
C
D
2N 4N
Pfkfb3 siRNA (12h)NT siRNA (12h)
DN
A c
on
ten
t
2N 4N
B
PFKFB3
β-actin
NT siRNAPfkfb3 siRNA
8 h–
+–
+
NT siRNAPfkfb3 siRNA
–
+–
+
NT siRNAPfkfb3 siRNA
–
+–
+
G2/MSG1
G2/MSG1
Ce
ll cycle
ph
ase
(%
)C
ell
cycle
ph
ase
(%
)
0
20
40
60
80
100
NT siRNA (18h)
2N 4N
Pfkfb3 siRNA (18h)
DN
A c
onte
nt
2N 4N0
20
40
60
80
100
18h
12h
Fig. 4. Silencing PFKFB3 in synchronously proliferating cells blocks G1-to-S progression. (A) Schematic diagram showing experimental design for PFKFB3silencing in cells synchronized by DTB plus nocodazole. (B) At 8 h after release from nocodazole arrest, PFKFB3 protein was present in cells transfected withnontargeting (NT) control siRNA but was greatly reduced in PFKFB3-silenced cells. (C) Flow cytometry profiles of DNA content (Left) and derived cell cyclephase distribution (Right) of synchronized cells transfected with NT siRNA or with Pfkfb3 siRNA 12 h after release from nocodazole and (D) 18 h after releasefrom nocodazole. (B; and C and D, Left) Representative of three independent experiments. (C and D, Right) Mean of three independent experiments.
PFKFB3
β-actin
0 2 4 6 8 10 12 Time (h)
BA PFKFB3 endogenous
PFKFB3
β-actin
0 2 4 6 8 10 12 Time (h)
PFKFB3 KENMUT DSGMUT
Time after release (h)
0 2 4 6 8 10 12
Cell
cycle
phase (
%)
0
20
40
60
80
100 G2/MSG1
Lacta
te r
ate
(nm
ol/m
L/u
gpro
tein
/h)
Time after release (h)
0 2 4 6 8 10 12
0
1
2
3
4
5
6
Time after release (h)
Lacta
te r
ate
(nm
ol/m
L/u
gpro
tein
/h)
0 2 4 6 8 10 12
0
1
2
3
4
5
6
Time after release (h)
0 2 4 6 8 10 12
Cell
cycle
ph
ase (
%)
0
20
40
60
80
100 G2/MSG1
Fig. 3. PFKFB3 can only promote glycolysis at a certain stage of cell pro-liferation. (A) The appearance of PFKFB3 was compared with the productionof lactate and the cell cycle stage in nontransfected cells synchronized byDTB plus nocodazole. Lactate was measured as the difference from theprevious hour in the amount detected. (B) The same procedure was carriedout in cells transfected with PFKFB3 KENMUT DSGMUT. Despite the constantpresence of PFKFB3 in the double-mutant form during the cell cycle, thepattern of lactate generation was similar to that in cells that had not beentransfected (representative of three to four independent experiments).
5280 | www.pnas.org/cgi/doi/10.1073/pnas.1102247108 Tudzarova et al.
that overexpression of PFK1 in PFKFB3-silenced cells restored Sphase entry, as indicated by the recovery of the protein level ofthe S/G2 phase marker cyclin A (Fig. 6B).
DiscussionOur results show that during the cell cycle there is an increase inPFKFB3 protein and activity, which follows a decrease in theaction of APC/C-Cdh1. We have previously demonstrated thatthis ubiquitin ligase degrades PFKFB3 through ubiquitinationvia recognition of its KEN box consensus motif (11). In syn-chronized cells, the appearance of PFKFB3 occurs at a criticalpoint in G1, before transition of the cells into S phase, reachinga maximum at ∼8 h following release from nocodazole arrest.The enhanced expression of the gene for the enzyme precedesthe appearance of the protein by ∼2 h.The presence of PFKFB3 is short lasting, ceasing to be detect-
able 10 h after release from nocodazole and not reappearing atlater stages of the cycle. This rapid disappearance is not only due tothe transient expression of the gene for PFKFB3 but also to thefact that the enzyme is a substrate for the ubiquitin ligase SCFcomplexes that mediate the coordinated degradation of a numberof cell cycle regulatory proteins and transcription factors (12). SCFis activated by SKP2, β-TrCP, or other F-box proteins (13). Wefound that β-TrCP increases during late G1/early S phase, con-comitantly with the disappearance of PFKFB3, which containsa consensus motif for β-TrCP recognition (268DSGLSS273). Whenwe mutated this motif to alanine residues (268DAGLAA273) theenzyme became resistant to breakdown by SCF. Thus, althoughduring the cell cycle, gene expression is responsible for the gen-eration of PFKFB3, the fine tuning regulating the amount of the
protein is provided by posttranslational proteasomal mechanisms,as is the case with the cyclins.Substrate recognition by SCF-β-TrCP is known to be mediated
through a specific phosphorylation event in the target protein (13).A recent study, designed to establish the phosphoproteome asso-ciated with cells induced to proliferate (14), identified a distinctphosphorylated residue in PFKFB3 that is not the canonical res-idue recognized by AMPK or Akt (15). This residue (S273 of theprotein) is located within the conserved recognition motif ofβ-TrCP. We have not carried out a specific mutation of S273;however, it is one of the residues we have mutated to generatePFKFB3 KENWT DSGMUT, which is resistant to degradationby SCF-β-TrCP.Therefore, because of the combined action ofAPC/C-Cdh1 and
SCF-β-TrCP, PFKFB3 is present only for a short interval, duringlate G1. Despite its brief appearance in the cell cycle, however,PFKFB3 is essential for its progression, because silencing theprotein prevents not only the enhancement of glycolysis but alsothe transition from G1 to S phase. This is emphasized by theexperiments in which cells arrested by glucose starvation can onlyprogress to S phase, following readdition of glucose, if PFKFB3 ispresent. The obvious function of the enzyme at this stage is toenhance glycolysis because, in cells in which PFKFB3 had beensilenced, overexpression of the glycolytic enzyme PFK1 restoredthe transition into S phase. All these findings indicate that thepoint in late G1 at which PFKFB3 appears is the nutrient-sensitiverestriction point described many years ago (7) and explain theenhanced provision of intracellular glucose at a defined stage ofthe cycle. Interestingly, the presence of PFKFB3 at other timesduring the cell cycle is not sufficient for glycolysis to be activated.
G2/MSG1
G2/MSG1
D
Lacta
te
(nm
ol/m
L/µ
g p
rote
in)
0
50
100
150
200
250
Pfkfb3siRNA
NT
siRNA
0 18 0 18 h
A
t0
t-72
t18
h after glucose
addition
Pfkfb3siRNA
Glucose
deprivation+ Glucose
24h
C NT siRNAPfkfb3 siRNA
–
+–
+
18 h
0 h
Cell
cycle
phase (
%)
Cell
cycle
phase (
%)
020
40
60
80
100
020
40
60
80
100
NT
siRNA
Pfkfb3siRNA
2N 4N2N 4N
0h
DN
A c
on
ten
tD
NA
co
nte
nt
0h
18h 18h
B NT siRNAPfkfb3 siRNA
PFKFB3
β-actin
–
+–
+NT siRNAPfkfb3 siRNA
–
+–
+
0
20
40
60
80
100
Pfk
fb3
mR
NA
(%
)
*
Fig. 5. PFKFB3 links glycolytic activity with S phase entry. (A) Schematic diagram showing design of experiment in which cells were deprived of glucose for48 h, treated with Pfkfb3 siRNA (or nontargeting control siRNA), incubated in the absence of glucose for a further 24 h, and then incubated for 18 h in thepresence of glucose. (B) qRT-PCR and immunoblots of cell lysates prepared 18 h after replacement of glucose showing that PFKFB3 mRNA and protein levelswere significantly reduced in cells transfected with Pfkfb3 siRNA. (C) Flow cytometry profiles of DNA content (Left) and derived cell cycle phase distribution(Right) of control-transfected and PFKFB3-silenced cells incubated in glucose-free medium for 72 h (i.e., at 0 h) (Upper) and 18 h (Lower) after readdition ofglucose. (D) Increase in lactate production in control-transfected but not PFKFB3-silenced cells 18 h after readdition of glucose. (B, Left, and D), mean ± SEM ofthree independent experiments. (B, Right, and C, Left), representative of three independent experiments. (C, Right) Mean of three independent experiments.
Tudzarova et al. PNAS | March 29, 2011 | vol. 108 | no. 13 | 5281
CELL
BIOLO
GY
This is demonstrated by experiments with the mutated enzymes,which not only confirm the kinetics and the degradation routes ofthe endogenous enzyme but also show that other events, occurringeither previously or at the restriction point, are required forPFKFB3 to carry out its metabolic function.The brief presence of PFKFB3 during the cell cycle raises the
question of how the utilization of glucose is coordinated withthat of glutamine, an amino acid essential for cell proliferation.We have recently found that glutaminase 1, a critical enzyme inthe glutaminergic pathway in cell proliferation, is also subjectedto proteasomal degradation by APC/C-Cdh1 (10), suggestingthat both glycolysis and glutaminolysis are activated simulta-neously at the restriction point.In conclusion, our results indicate that during cell division the
activation of glycolysis is a tightly regulated process. This isachieved by the same mechanisms that dictate the transitionfrom G1 to S, thus providing coordination between cell cycleprogression and metabolic supply. The function of this transientenhancement of glycolytic activity in late G1, which is necessaryfor cell cycle progression, now requires investigation becauseglycolysis might be used to generate energy, substrates formacromolecular synthesis, or for both purposes. Our presentresults obtained in a cancer-derived cell line, together withprevious studies in a noncancer cell line (9) and in human Tlymphocytes (10), suggest that these same, or similar, mecha-nisms underlie cell proliferation and enhanced metabolism innormal and neoplastic cells.
Materials and MethodsCell Culture and Synchronization. HeLa S3 cells (ATCC; CCL-2.2) were culturedat 37 °C with 5% CO2 in DMEM (Invitrogen) supplemented with 10% FCS(Invitrogen). All experiments were carried out at population doublings 6–15.Cell synchronization from G1/S was achieved by release from DTB as de-scribed elsewhere (16), with minor modifications. Cells were treated withtwo sequential 24-h blocks in 3 mM thymidine (Sigma) separated by a 12-hinterval without thymidine. Cell synchronization from G2/M was achieved byDTB followed, after 12-h release, by treatment with 100 ng/mL nocodazole(Sigma) for 12 h and release into fresh medium.
Experimental Design. To address PFKFB3 stability associated with proteasomaldegradation, cells were first synchronized by DTB followed by nocodazole
arrest and then released for 2 h in nocodazole-free medium before additionof the proteasome inhibitor MG 132 (10 μM). Cells treated with MG 132 weremonitored by immunoblotting for 12 h after release from nocodazole andcompared with synchronized cells that had not been treated with MG 132.
To determine how PFKFB3 levels are regulated during the cell cycle, a seriesof mutations in the PFKFB3 KEN box and/or DSG box was generated by site-directed mutagenesis (see RNA Interference). In some experiments thesewere expressed in synchronized cells in the presence or absence of overex-pressed β-TrCP, and the presence of PFKFB3 at 8 h after release fromnocodazole was monitored by immunoblotting. In other experiments, themutated forms were overexpressed in synchronized cells, and the presenceof PFKFB3 at different times after release from nocodazole was monitored.The effect of endogenous PFKFB3 on lactate generation and cell cycle stagewas then compared with that of overexpressed PFKFB3 in which the KEN boxand the DSG box had been mutated. The metabolic activity of this mutatedform was verified by demonstrating that it stimulated lactate generation incells in which Cdh1 had been overexpressed.
To investigate the role of PFKFB3 in cell proliferation, cells were releasedfrom DTB at G1/S, transfected with a Pfkfb3 siRNA SMART pool (or non-targeting control siRNA), arrested in mitosis by nocodazole treatment, re-leased into fresh medium, and retransfected with Pfkfb3 siRNA (ornontargeting control siRNA). Cells were harvested at 8 or 12 h after re-lease from nocodazole and subjected to immunoblotting, qRT-PCR andFACS analysis.
In a further set of experiments, cells were deprived of glucose for 72 h byincubation in DMEM without glucose (Invitrogen). Twenty-four hours beforerelease from glucose deprivation, the cells were treated with Pfkfb3 siRNA(or nontargeting siRNA) for 24 h and then released in complete mediumcontaining glucose for 18 h, after which they were subjected to immuno-blotting, qRT-PCR, and FACS analysis.
In one set of experiments, cells were transfected with PFK1 plasmid (kindgift of Juan Bolaños, Department of Biochemistry and Molecular Biology,University of Salamanca, Spain) concomitantly with the addition of Pfkfb3siRNA and then collected at 48 h posttransfection for immunoblotting andFACS analysis.
Immunoblotting and FACS Analysis. For immunoblot analysis, cells were har-vested and whole-cell extracts were prepared by lysis for 45 min on ice inmodified radioimmunoprecipitation assay lysis buffer (50 mM Tris-HCl, 300mM NaCl, 1% Nonidet P-40, 0.5% sodium deoxycholate, 0.1% SDS, 1 mMEDTA) and complete protease inhibitors (Roche Diagnostics) followed bysonication for 10 s. Protein concentration was determined using the DCprotein assay kit (Bio-Rad). Total protein (15–60 μg) was loaded in each laneand separated by 4–20% SDS/PAGE. Protein was transferred from poly-acrylamide gels onto polyvinylidene fluoride membranes (Bio-Rad) bysemidry electroblotting. Blocking, antibody incubations, and washing stepswere performed as described (17). Antibodies used for immunoblotting in-cluded cyclin E from Novus, Cdh1 from Merck Chemicals, PFKFB3 fromAbcam, β-TrCP from Cell Signaling Technology, PFK1 and cyclin A from In-sight Biotechnology, and β-actin from Sigma. Generation of PFKFB3v5antibodies has been described elsewhere (10).
FACS analysis was carried out using the method of Eward et al. (18), withslight modifications. Briefly, 1 × 10⁶ cells were pelleted by centrifugationthen fixed in 80% methanol at −20 °C for at least 2 h. Methanol was re-moved by centrifugation and cells were resuspended in PBS containing 50μg/mL propidium iodide and 50 μg/mL RNase A.
RNA Interference. PFKFB3 expressionwas inhibitedwith double-stranded RNAoligos (siGENOME SMART pool, L-006763–005; Dharmacon). NontargetingsiRNA was used as a negative control. Lipofectamine 2000 (Invitrogen) wasused in all transfections according to the manufacturer’s recommendations.Briefly, cells were seeded at a density of 1.5 × 10⁵ 3 d before transfec-tion. The transient transfections were performed using 150 nM of Pfkfb3siGENOME SMART pool siRNA. siRNAs were complexed with transfectionreagent in serum-free and antibiotic-free culture medium according to themanufacturer’s instructions (Invitrogen). Cells were incubated for differenttimes according to individual experimental protocols. All experiments wereperformed at least three times. Selective silencing of the correspondinggenes was confirmed by qRT-PCR and immunoblotting.
i) Plasmids: Cloning of Pfkfb3v5 (accession no. BC040482, Pfkfb3 KENWT
DSGWT) and generation of a KEN box-mutated form (Pfkfb3 KENMUT
DSGWT) is described elsewhere (10). Site-directed mutagenesis of theDSGXXS box in Pfkfb3 KENWT DSGWT (and Pfkfb3 KENMUT DSGWT) wascarried out according to the manufacturer’s instructions (QuikChange
C
B
PFK1–
+
–
– +
+
Pfkfb3 siRNA
Cell
cycle
phase (
%)
0
20
40
60
80
100 G2/MSG1
Pfkfb3 siRNA+ EV
Pfkfb3 siRNA+ PFK1
NT siRNA + EV
DN
A c
onte
nt
2N 4N 2N 4N2N 4N
AP
fkfb
3 m
RN
A (
%) –
PFK1–
+
–
+
+
Pfkfb3 siRNA
0
20
40
60
80
100
PFKFB3
β-actin
PFK1
cyclin A
HeLa (asyn)
PFK1–
–
–
+ +
+
Pfkfb3 siRNA
* *
Fig. 6. Proliferation is restored in PFKFB3-silenced cells by overexpression ofPFK1. (A) qRT-PCR demonstrated that there was ∼90% reduction in Pfkfb3mRNA levels in PFKFB3-silenced cells 48 h after transfection. (B) Immunoblotsfrom asynchronously proliferating cells 48 h after transfection with non-targeting control siRNA plus empty vector (−/− lane), with Pfkfb3-siRNA plusempty vector or with Pfkfb3-siRNA plus PFK1. (C) Flow cytometry profiles ofDNA content (Left) and derived cell cycle phase distribution (Right) 48 h aftertransfection with nontargeting control siRNA, with Pfkfb3-siRNA, or withPfkfb3-siRNA plus PFK1. (A) Mean ± SEM of three independent experiments.(B; and C, Left) Representative of three independent experiments. (C , Right)Mean of three independent experiments.
5282 | www.pnas.org/cgi/doi/10.1073/pnas.1102247108 Tudzarova et al.
II; Stratagene) using the primer ATCGGGGGCGACGCAGGCCTGGCCGCC-CGGGGCAAGAAG (and its reverse and complementary primer; Invitro-gen). Underscored nucleotides indicate the mutated amino acids(DSGLSS→DAGLAA). β-TrCP was obtained from Addgene (plasmid10865) (19). All plasmid DNAs used for transfection were prepared us-ing an EndoFree Plasmid Maxi kit (Qiagen) following the manufac-turer’s protocol and confirmed by sequencing.
ii) Cell transfection of HeLa cells: In one set of experiments (Fig. 2C),synchronized cells were transfected using lipofectamine LTX reagent(Invitrogen) following the manufacturer’s instructions at the time ofnocodazole treatment. The total amount of DNA transfected in eachexperiment was 2 μg, comprising 0.4 μg Pfkfb3 KENMUT DSGWT (orPfkfb3 KENMUT DSGMUT) plasmid DNA and 1.6 μg β-TrCP plasmid DNA(or empty vector). Cells were harvested for protein extraction 8 h post-nocodazole release. In another set of experiments (Fig. 2D), synchro-nized cells were transfected using lipofectamine 2000 reagent(Invitrogen) at the time of nocodazole treatment. The total amountof Pfkfb3 DNA transfected in each experiment was 0.1 μg. Cells wereharvested for protein extraction every 2 h from 0 to 12 h post-nocoda-zole release.
RNA Extraction and qRT-PCR. To evaluate the efficiency of transfection withPfkfb3 siRNA, the level of Pfkfb3 mRNA was quantified by qRT-PCR. TotalRNA was isolated using a PureLink Micro-to-Midi kit (Invitrogen) accordingto the manufacturer’s instructions. Reverse transcription reactions using
40 ng of total RNA in a final reaction volume of 20 μL were carried out usingSuperScript III Platinum SYBR Green One-Step qRT-PCR kit (Invitrogen).Relative quantitation data were obtained using the comparative Ct methodwith Realplex software according to the manufacturer’s protocol (Eppen-dorf). Glyceraldehyde-3-phosphate dehydrogenase (GAPDH) was used tonormalize each of the extracts for amplifiable human DNA. Primers (TableS1) were provided by Eurofins MWG Operon. Cycle conditions are availableupon request.
Lactate Determination. Cell-free supernatant samples were analyzed intriplicate using a lactate kit (Trinity Biotech) adapted for a 96-well platereader. Briefly, 10 μL of sample or standard were incubated with 100 μLlactate reagent solution for 10 min, after which the absorbance was mea-sured at 540 nm. Lactate production (per μg protein) was expressed either asthe hourly change in the accumulated amount or as the amount measuredat the specified time.
Statistics. Statistical significance was determined using a two-tailed t test. P <0.05 was considered significant.
ACKNOWLEDGMENTS. We thank Annie Higgs for editorial help in thepreparation of this manuscript, Alex Wollenschlaeger for help in preparationof the figures, Ayona Dey for experimental assistance, and Miriam Palaciosfor technical support and advice. The work was supported byWellcome TrustGrant 086729 (to S.M. and S.L.C.) and Cancer Research UK Scientific ProgramGrant C428/A6263 (to K.S., G.H.W., and S.T.).
1. Vodermaier HC (2004) APC/C and SCF: Controlling each other and the cell cycle. Curr
Biol 14:R787–R796.2. Pagano M (1997) Control of the cell cycle by the ubiquitin system. FASEB J 11:
1067–1075.3. Pfleger CM, Kirschner MW (2000) The KEN box: An APC recognition signal distinct
from the D box targeted by Cdh1. Genes Dev 14:655–665.4. Li M, Zhang P (2009) The function of APC/CCdh1 in cell cycle and beyond. Cell Div 4:2.5. Skaar JR, Pagano M (2008) Cdh1: A master G0/G1 regulator. Nat Cell Biol 10:755–
757.6. King RW, et al. (1995) A 20S complex containing CDC27 and CDC16 catalyzes the
mitosis-specific conjugation of ubiquitin to cyclin B. Cell 81:279–288.7. Pardee AB (1974) A restriction point for control of normal animal cell proliferation.
Proc Natl Acad Sci USA 71:1286–1290.8. Pederson T (2003) An energy reservoir for mitosis, and its productive wake. Trends
Biochem Sci 28:125–129.9. Almeida A, Bolanos JP, Moncada S (2010) E3 ubiquitin ligase APC/C-Cdh1 accounts for
the Warburg effect by linking glycolysis to cell proliferation. Proc Natl Acad Sci USA
107:738–741.10. Colombo SL, et al. (2010) Anaphase-promoting complex/cyclosome-Cdh1 coordinates
glycolysis and glutaminolysis with transition to S phase in human T lymphocytes. Proc
Natl Acad Sci USA 107:18868–18873.
11. Herrero-Mendez A, et al. (2009) The bioenergetic and antioxidant status of neurons iscontrolled by continuous degradation of a key glycolytic enzyme by APC/C-Cdh1. NatCell Biol 11:747–752.
12. Cardozo T, Pagano M (2004) The SCF ubiquitin ligase: Insights into a molecularmachine. Nat Rev Mol Cell Biol 5:739–751.
13. Frescas D, Pagano M (2008) Deregulated proteolysis by the F-box proteins SKP2 andβ-TrCP: tipping the scales of cancer. Nat Rev Cancer 8:438–449.
14. Mayya V, et al. (2009) Quantitative phosphoproteomic analysis of T cell receptorsignaling reveals system-wide modulation of protein-protein interactions. Sci Signal2:ra46.
15. Hue L, et al. (2002) Insulin and ischemia stimulate glycolysis by acting on the sametargets through different and opposing signaling pathways. J Mol Cell Cardiol 34:1091–1097.
16. Krude T, Jackman M, Pines J, Laskey RA (1997) Cyclin/Cdk-dependent initiation ofDNA replication in a human cell-free system. Cell 88:109–119.
17. Kingsbury SR, et al. (2005) Repression of DNA replication licensing in quiescence isindependent of geminin and may define the cell cycle state of progenitor cells. ExpCell Res 309:56–67.
18. Eward KL, et al. (2004) DNA replication licensing in somatic and germ cells. J Cell Sci117:5875–5886.
19. Zhou P, Bogacki R, McReynolds L, Howley PM (2000) Harnessing the ubiquitinationmachinery to target the degradation of specific cellular proteins. Mol Cell 6:751–756.
Tudzarova et al. PNAS | March 29, 2011 | vol. 108 | no. 13 | 5283
CELL
BIOLO
GY


