Embed Size (px)
Citation preview
Karlsruhe Reports in Informatics 2016,13 Edited by Karlsruhe Institute of Technology, Faculty of Informatics
ISSN 2190-4782
Ubiquitäre Systeme (Seminar) und
Mobile Computing (Proseminar) SS 2016
Mobile und Verteilte Systeme Ubiquitous Computing
Teil XIV
Herausgeber:
Martin Alexander Neumann, Anja Exler, Andrei Miclaus, Antonios Karatzoglou, Long Wang, Michael Beigl
2016
KIT – University of the State of Baden-Wuerttemberg and National Research Center of the Helmholtz Association

Please note: This Report has been published on the Internet under the following Creative Commons License: http://creativecommons.org/licenses/by-nc-nd/3.0/de.

Ubiquitare Systeme (Seminar)und
Mobile Computing (Proseminar)SS 2016
Mobile und Verteilte SystemeUbiquitous Computing
Teil XIV
HerausgeberMartin Alexander NeumannAnja Exler, Andrei Miclaus
Antonios KaratzoglouLong Wang, Michael Beigl
Karlsruhe Institute of Technology (KIT)Fakultat fur Informatik
Lehrstuhl fur Pervasive Computing Systems (PCS) und TECO
Interner Bericht 2016-13ISSN 2190-4782
KIT – Universitat des Landes Baden-Wurttemberg und nationales Forschungszentrum der Helmholtz-Gesellschaft www.kit.edu

ii
Vorwort
Die Seminarreihe Mobile Computing und Ubiquitare Systeme existiert seit dem Winter-semester 2013/2014. Seit diesem Semester findet das Proseminar Mobile Computing amLehrstuhl fur Pervasive Computing System statt. Die Arbeiten des Proseminars werdenseit dem mit den Arbeiten des zweiten Seminars des Lehrstuhls, dem Seminar UbiquitareSysteme, zusammengefasst und gemeinsam veroffentlicht.
Die Seminarreihe Ubiquitare Systeme hat eine lange Tradition in der ForschungsgruppeTECO. Im Wintersemester 2010/2011 wurde die Gruppe Teil des Lehrstuhls fur Per-vasive Computing Systems. Seit dem findet das Seminar Ubiquitare Systeme in jedemSemester statt. Ebenso wird das Proseminar Mobile Computing seit dem Wintersemester2013/2014 in jedem Semester durchgefuhrt. Seit dem Wintersemester 2003/2004 werdendie Seminararbeiten als KIT-Berichte veroffentlicht. Ziel der gemeinsamen Seminarreiheist die Aufarbeitung und Diskussion aktueller Forschungsfragen in den Bereichen Mobileund Ubiquitous Computing.
Dieser Seminarband fasst die Arbeiten der Seminare des Sommersemesters 2016 zusam-men. Die Themen der hier zusammengefassten Aufsatze umfasst Benutzermodellierungund Privatsphare in ubiquitaren Systemen, Sicherheits- und Geschaftsmodelle im Inter-net der Dinge sowie Mobile Sensing. Wir danken den Studierenden fur ihren besonderenEinsatz, sowohl wahrend des Seminars als auch bei der Fertigstellung dieses Bandes.
Karlsruhe, den 01. Oktober 2016 Martin Alexander NeumannAnja Exler
Andrei MiclausAntonios Karatzoglou
Long WangMichael Beigl
iii

Inhaltsverzeichnis
Lennart GilbertHealth monitoring based on smart devices . . . . . . . . . . . . . . . . . . . . . . . . . . . . . . . . . . . . . . . 1
Niklas SangerHealth Monitoring based on Smart Devices . . . . . . . . . . . . . . . . . . . . . . . . . . . . . . . . . . . . . 30
Dominik KohlerSemantics support location-aware systems – Semantic trajectory mining . . . . . . . . 47
Jasper ZimmerVergleich der Standortprognose auf Basis von geografischen Trajektorien und seman-tisch annotierten Trajektorien . . . . . . . . . . . . . . . . . . . . . . . . . . . . . . . . . . . . . . . . . . . . . . . . . . 61
David KrenzInterruptibility-Detektierung auf Smartphones . . . . . . . . . . . . . . . . . . . . . . . . . . . . . . . . . . 78
Maximilian DietzUsable Security Models for the Internet of Things and Hybrid Cloud Solutions . .92
Margarita AsenovaIDEs for Creating Mobile Exp erience Sampling Apps for Non-Programmers . . . 111
Nick Newill Tchouante KembePrivacy Issue In User Modeling In Pervasive Systems . . . . . . . . . . . . . . . . . . . . . . . . . . 123
Marcus GallKeystrokes recognition using different sensing modalities . . . . . . . . . . . . . . . . . . . . . . 145
v
Aleksandar KostovBusiness Models for the Internet of Things and the Cloud in an Industrial Environ-ment . . . . . . . . . . . . . . . . . . . . . . . . . . . . . . . . . . . . . . . . . . . . . . . . . . . . . . . . . . . . . . . . . . . . . . . . . . 175
Denis GausMethoden des Experience Sampling mit Mobilgeraten . . . . . . . . . . . . . . . . . . . . . . . . . 185
Florian LeicherProximity and Velocity Recognition of External Objects on a Mobile Observer .202
vi
Health monitoring based on smart devices
Lennart Gilbert∗
Advisor: Long Wang†
Karlsruhe Institute of Technology (KIT)Pervasive Computing Systems � TECO∗[email protected]
Abstract. A collection of state of the art approaches to monitor healthrelated vital signs and behaviours based on smart devices are presented.To make informed decisions and an accurate diagnosis, medical expertsneed to monitor the patients symptoms and health. This requires re-peated clinical sessions for statistical signi�cant ratings, as traditionalmeasuring techniques have to be carried out by an expert (e.g. to op-erate the monitoring devices). The available mobile measuring devicesare expensive, bulky and usually obtrusive to use. Considered an an-noyance self monitoring su�ers from low adherence, preventing the earlydetection of declining health. The ubiquity of smart devices is used toraise the frequency of self measurements, thereby lowering the rate ofclinical checkups by the possibility of remote assessment. Furthermorethey are used to raise the users awareness of their state of health. Whichhelps them to make changes to their unhealthy behaviours and supportsthem during their exercise. Techniques presented monitor amongst oth-ers respiration function, heart rate, eating behaviour. As well as o�eringsupport for food logging and exercise feedback.
Keywords: health monitoring, smartdevice, breathing, food logging,heart rate, exercise
1 Introduction
Monitoring the health of a person or di�erent indicators thereof is an essentialpart of medical studies, but also during and after medical procedures to ensurea proper rehabilitation process. Outside the clinical area it is an integral part inbattling widespread diseases like obesity and their likes. O�ering easy, low-costways to monitor ones own health helps to prevent these diseases by tracking theown health development and adjusting the lifestyle accordingly.A major obstacle in achieving good adherence and widespread use of health mon-itoring are the monitoring devices themselves. Traditionally to track the wantedvital signs specialized, expensive hardware is needed, which has to be operatedand evaluated by a trained medical technician. For long term monitoring a pa-tient has to regularly visit the clinic to either perform monitoring tests or drop ofa mobile device for its evaluation. As such devices are expensive, only few people
Health monitoring based on smart devices 1
can be supplied or a�ord them. Their measuring methods are intrusive and taketime and training to properly set up. Although they are considered mobile, theyare an annoyance to carry around due to size and form. In some cases peopleare ashamed to be seen with them in public, exposing their health problems.Outside these clinical settings with acute medical reasons, where these regularcheckups are not a necessity, their price, ease of use and intrusiveness into theeveryday life are a major hindrance for more people to start using them.Therefore a new group of devices is needed, capable of health monitoring whilebeing easy to use and adapt to. For proper tracking sensors are needed capableof measuring vital signs. Evaluation requires either a data storage, as the saveddata has to make its way to the medical sta�. Or on-device processing, evalua-tion and presentation of the results.Such a group has been found in smart devices. They o�er processing power andthe needed storage, as well as ways to connect to other devices not bound to alocation. The built-in multitude of sensors, programmability and ubiquity allowsthe implementation of diverse monitoring techniques. Additionally they are inmost cases socially accepted and a large portion of the population already ownssuch a device, mitigating both the price point and intrusiveness. Therefore mon-itoring could achieve higher adherence, since no new advice is needed and it canrun in the background without further interaction.The challenge is to utilize the available sensors to create systems comparable inmonitoring quality to dedicated devices or manual monitoring. In the followingwe present a diverse selection of state of the art proposals and systems coveringvital signs including heart rate and breathing as well as secondary health aspectsof eating habits and exercise monitoring.
2 Respiration
Breathing can be considered as the most obvious vital sign, o�ering a lot ofinformation about a subjects health. Primarily related to the respiratory system,but also �tness level and exercise intensity. A major problem for assessing lungfunctionality is the sparsity of symptoms during short in-lab monitoring sessions.Long term studies are needed to capture statistically signi�cant estimates. Asself reported symptoms vary wildly from the ground truth, automated systemare preferred to capture relevant events. Those can be realised with commoditysmart devices in an unobtrusive manner.
2.1 Cough sensing
In [9] Larson et al. propose a mobilephone based system that accurately trackscough frequency, while preserving the privacy of people in system range. Sincecoughing is a clear symptom to consider seeking medical advice, it su�ers froma lack of accurate description of severity and frequency. The existing guidelinesfor cough monitoring systems led to advances in its automation. As Larson et al.discovered current systems don't ful�l all requirements, especially audio bases
2 Lennart Gilbert
methods regarding privacy of recorded speech. For example if extracted soundfeatures are transmitted to a server for classi�cation, conversations can be re-constructed from them. Sending non-invertible features does protect the privacy,but prevents experts from listening to cough sounds to remove false positives.The proposed system is able to prevent a breach of privacy, while keeping theoption to manually remove false positives. They achieve this goal by transmittingcomponent weights instead of extracted features, from which only the cough au-dio can be reconstructed intelligible. The algorithm consists of four steps. Firsta cough model is generated from a manually annotated training fold. To do thisa principle component analysis (PCA) is run on 40 randomly selected coughsounds, speci�cally on the �rst 150ms as they are generally consistent acrosssubjects. The N components with the largest eigenvalue then build the modelXN . The spectrograms are reconstructed with the model resulting in N projec-tion weights and a residual error as features. Additionally three energy meansover the FFT are calculated, therefore N + 4 features are available for classi�-cation.Following the model creation is a preprocessing step for event extraction. Foreach feature the threshold is set to retain 98% of all coughs in the trainings set.All audio that has to be classi�ed is pruned by the �ve thresholds with the low-est false positive rates. This retains 96% of coughs and lets through 5% − 16%of other audio. Once the events are extracted the cough classi�cation begins.A random forest classi�er is trained on all features from the extracted trainingevents putting more weight into cough errors. The classes are cough- and non-cough sound with the majority votes balanced 1 : 3. The tree parameters weren'tcompletely investigated, only a few variations were tested on a small data subset.The last optional step is the reconstruction of cough sounds. An optimal PCAreconstruction is used to minimize the mean-square error between original andreconstruction. The resulting spectrogram estimation is then transformed backto the time domain. For this to work three additional values besides the thecomponent weights have to be transmitted to the server. Fortunately they don'tincrease intelligibility, as they have little use in speech recognition.The classi�cation performance is evaluated on a �ve-fold cross validation, eachfold containing all audio from 3-4 participants totalling in 72 hours and 2500annotated coughs. A true positive is de�ned as any cough sound containing twoconsecutive classi�er identi�cations in a 300ms window. A false positive are anyconsecutive identi�cations outside a 10 second window around an actual coughsound. The best performance is considered to be the highest recall with falsepositive rate below 1% . Across all folds they achieve am mean recall of 92%and a 0.5% false positive rate. Due to di�erent sizes of sampling windows for theaudio data, false alarms per hour are preferred as comparison metric over falsepositive rate. The analysis also showed that the most common false positiveswere either noise or speech (56%, respectively 43% of all false positives).To evaluate the privacy aspect, volunteers had to write down the words theyunderstood from reconstructed speech signals at N ∈ {5, 10, 15, 25, 50} compo-nents. The word error rate was calculated compared to the baseline from the
Health monitoring based on smart devices 3
original signal. With 15 components or less the WER is greater than 95% , itstarts dropping with more components reaching 76% at N = 50 as only key-words can be spotted. In order to balance this with the �delity of reconstructedcoughs, the volunteers were tasked to rate two cough sounds based on similarityfrom dissimilar to indistinguishable. The ratings show that N = 15 is on theon the border between dissimilar and similar, with the �delity growing if morecomponents are used. All in all the results reveal that an automated cough detec-tion with recall greater 90% is possible, while keeping coughs at a good �delitybut almost all speech unintelligible. Incorporated into a telemedicine system itallows medical personal to assess the symptoms without the patient having tovisit the clinic.
2.2 Low cost mobile spirometry
With SpiroSmart [8] Larson et al. developed a smartphone application capableof reliable, low cost home spirometry, reaching a mean error of 5.1% compared toa clinical spirometer. Spirometry is an objective measurement of lung function,used to diagnose and monitor chronic lung diseases. During a test session �owand the cumulative volume of a patients exhalation are measured. Traditionallyperformed at clinics or with expensive portable home devices about the size of alaptop. These home devices o�er the possibility for more frequent testing to de-tect changes early on which may need medical attention. But they lack a trainedtechnician for coaching the patient in the device usage, as well as evaluatingthe test results. To raise the test quality and patient compliance SpiroSmart isrun on a smartphone utilizing the built-in microphone, while guiding the patientthrough the test visually on the screen. The patient has to exhale their full lungvolume at the phones screen while holding it at arms length. The exhalation isrecorded and sent to a server to calculate the �ow rate and graphs from whichthe air�ow limitation can be quanti�ed.To transform the digital audio samples from the microphone to measures ofair�ow at the patients lips, a processing pipeline is introduced. The �rst stagehas to compensate for the pressure drop between mouth and microphone andre�ections that occur. A transfer function based on arm length and head cir-cumference, both inferred from patients height, is applied to the audio resultingin an estimate for the pressure at the lips. These pressure values are convertedto a �ow rate with an estimated mouth opening. Since the estimations for armlength and head circumference weren't tested on their performance comparedto real values, all three measures raw, lip pressure and �ow rate are sent tothe feature extraction. To calculate the volumetric �ow rate from these highfrequency signals, three di�erent transformations are applied each resulting inan approximation of the �ow rate. The �rst one calculates the signal envelope,which measures the overall signal power corresponding to the �ow rate. The nexttransformation detect resonances in the spectrogram. As they can be assumedto be re�ections in the vocal tract, the �ow rate should be proportional to theiroccurrences. The last transformation uses the concept of linear prediction, mean-ing a signal can be split into source and shaping �lter. In this case the �lter is
4 Lennart Gilbert
a vocal tract estimation and the source the white noise exciting the �lter equalto the �ow rate power.In the machine learning stage of the pipeline, the �ow rate approximations areused as features in two regressions. One uses the values to calculate the lungfunction quantities and directly regress on the results with a bagged decisiontree. The second regression creates the �ow vs. volume-curve, which needs to in-tegrate the �ow. Flow and volume are estimated in two separate decision trees.The dataset for training and testing was gathered from 52 volunteers with selfreported no or only mild lung conditions. As gold standard for comparison aclinical spirometer was used. After the volunteers were trained how to use thedevices, three baseline e�orts were recorded for each session . With SpiroSmartfour usage con�gurations were evaluated: a sling to keep the arm length steady,a mouthpiece to keep the mouth opening steady, both and neither extra uten-sil. 10 participants were selected for subsequent sessions after several days tomeasure test consistency. Totalling in 248 gold standard and 864 SpiroSmarte�orts. Because both devices can't be used at the same time the explicit groundtruth for each e�ort is unknown. Therefore each e�ort was associated with anacceptable gold standard. The data was folded into several training subsets, eachused to create a di�erent regression model. These models form a global modelfor decision making with k-mean clustering. Larson et al. evaluate based on theerror between actual and predicted value of the lung function quantities. For all4 measures they reach without personalization of models a mean of less than7%, performing best on subjects with normal lung functionality. Abnormal sub-jects pro�t greatly from personalized models lowering the mean error to lessthan 5%. Each lung function quantity has an allowed limit of variability whenmeasured. SpiroSmart has an accuracy of at least 80% to stay in those limitsfor normal subjects and 60% for abnormal. With these accuracies an e�ectivediagnose for obstructed lungs is possible. It was also found that neither �xed armlength nor a mouthpiece decrease the error enough for them to be necessary. 10generated �ow-vs.-volume curves were evaluated in an online survey for pulmo-nologists. Regardless which device created the curves, a general agreement wasfound regarding lung obstructiveness. Thus showing the feasibility of low-costhome spirometry without a dedicated device and the possibility of spirometryvia telemedicine.
2.3 Respiratory symptom tracking
SymDetector [15] is a lightweight, pervasive monitoring app to track respiratorysymptoms. A smartphone is used to continuously sample its environmental au-dio, recognize potential symptoms, log and categorize them. classi�cation is doneon the �y to ensure privacy by not saving or transmitting raw audio data. Itshows high accuracy at detecting the four symptoms sneeze, cough, sni�e andthroat clearing in various indoor settings. To detect symptoms unobtrusivelythe system adapts to the phones location, tested for desk, pocket and backpackplacement.The audio is sampled at 16kHz and segmented into non overlapping 50ms frames.
Health monitoring based on smart devices 5
A preliminary data set of symptom lengths showed that symptoms last for severalframes. Therefore 80 frames are grouped together as a window for the detectionstep with 1 second overlap. The detector selects windows with potential respi-ratory symptoms by �ltering out as many non-symptom windows as possible.Speci�cally ambient noise and continuous acoustic events, the two most com-mon non-symptoms. 3 time domain features are calculated to do so. Root meansquare (RMS) of a frame to measure the energy in a frame, which is used for theother two window based features. Above α-mean ratio (AMR) denotes the ratioof frames with an energy above α, to distinguish between discrete, continuousand noise acoustic events. Average of top k RMSs (ATR) is the RMS average ofthe k highest energy frames, to distinguish high and low energy events. Basedon these features AMR �lters out continuous events like background noise. TheAMR values don't change much depending on context, therefore it is robust todistinguish categories regardless of the phones context. Since ATR re�ects theevent energy, it is used in the next step to distinguish events caused by the userand more distant events (e.g. bystander coughing). A dynamic ATR threshold γis used, which adapts according to the phones context due to energy loss whenrecording in a pocket/backpack. γ is calculated and updated from every windowclassi�ed as talking and saved as intensity level.For classi�cation additional features are extracted to better distinguish the re-maining acoustic events. Symptom length (SL) is the largest frame set coveredby the event, built by region growing from the maximum RMS frame fm. Leftto right ratio is the length ratio of frames before and after fm to distinguishsneeze/sni�e and cough/throat clearing. Relative maximum RMS (RMR) usesnormalized RMS and intensity γ to compare event energy regardless of the con-text. Thus splitting the 4 symptom events into two groups sneeze/cough andsni�e/throat clearing. The zero crossing rate (ZCR) of a frame to detect per-cussive sounds. From the fast Fourier transformation of frame f the spectralcentroid (SC) is calculated measuring the spectral energy distribution and thebandwidth to evaluate spectrum �atness, as well as λ-percentile spectral roll o�(SR). SR tells up to which frequency bin λ % of the spectral energy is contained.At window level mean and variance from these frame spectral features are calcu-lated. To prevent strong class imbalance a pre-classi�er is used to split events byRMR into the mentioned categories. Then SL and ZCR are used to remove non-symptom sounds from both categories and SR to remove high frequency eventsfrom group sneeze/cough. After this coarse classi�cation SVMs are trained foreach category with one-against-one to also discern the non-symptom class. Clas-si�ed symptoms are logged with the start and end time from SL. The preliminarystudy for feature engineering collected sounds from 5 users over 7 days in total105 hours audio. The participants labelled their symptoms themselves to pre-serve privacy.For the evaluation study with 16 participants, a data collection scheme was used.With the AMR threshold only discrete audio events were recorded, reducing thelabelling work to 15 hours for 204 days monitored. The classi�cation was eval-uated with cross validation and leave one participant out, reaching a recall for
6 Lennart Gilbert
symptoms of at least 82% and 99% for non-symptoms. Precision was also over82%, meaning few events were misclassi�ed. Since sni�es are short and havelow energy, they produce the lowest TPR and PPR. These results con�rm thatreliable and accurate automated detection of respiratory symptoms is possiblewith smart devices, extending the state of the art from only cough sensing bythree symptoms (sni�e, sneeze, throat clearing). Whether the severity of thesymptoms can be derived or the symptom can be reconstructed from extractedfeatures wasn't elaborated. Which would be useful for automated long distanceassessment.
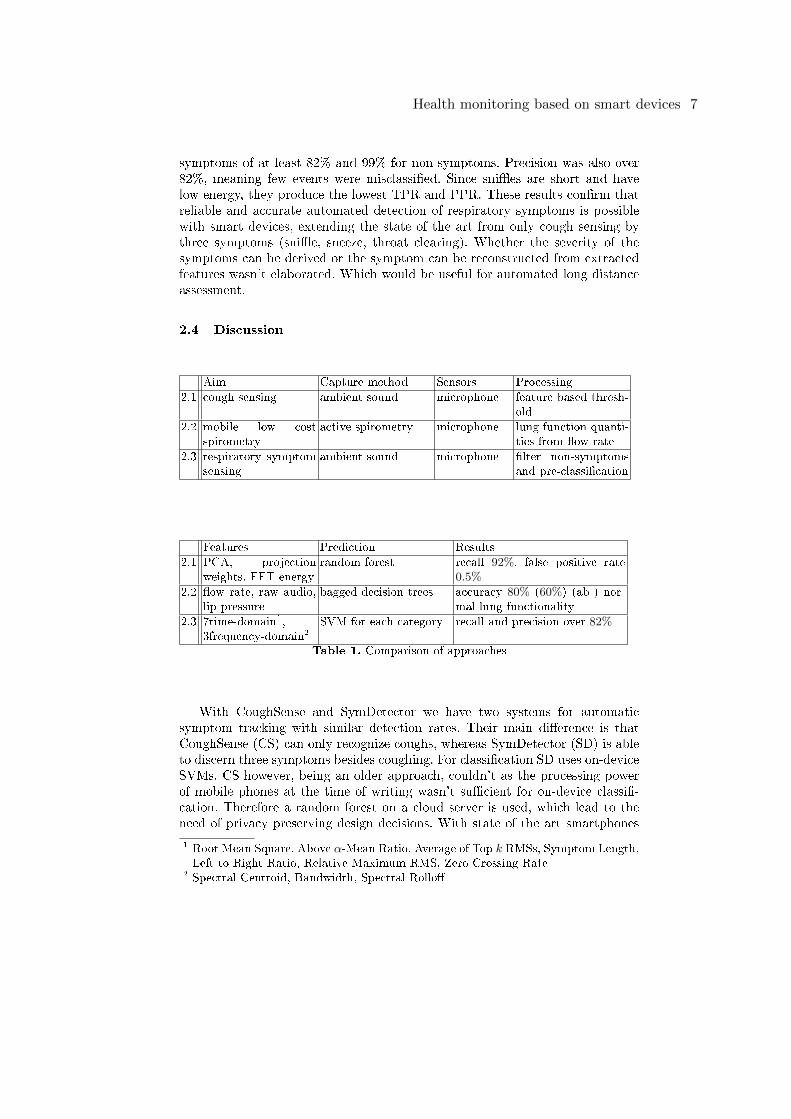
2.4 Discussion
Aim Capture method Sensors Processing
2.1 cough sensing ambient sound microphone feature based thresh-old
2.2 mobile low costspirometry
active spirometry microphone lung function quanti-ties from �ow rate
2.3 respiratory symptomsensing
ambient sound microphone �lter non-symptomsand pre-classi�cation
Features Prediction Results
2.1 PCA, projectionweights, FFT energy
random forest recall 92%, false positive rate0.5%
2.2 �ow rate, raw audio,lip pressure
bagged decision trees accuracy 80% (60%) (ab-) nor-mal lung functionality
2.3 7time-domain1,3frequency-domain2
SVM for each category recall and precision over 82%
Table 1. Comparison of approaches
With CoughSense and SymDetector we have two systems for automaticsymptom tracking with similar detection rates. Their main di�erence is thatCoughSense (CS) can only recognize coughs, whereas SymDetector (SD) is ableto discern three symptoms besides coughing. For classi�cation SD uses on-deviceSVMs. CS however, being an older approach, couldn't as the processing powerof mobile phones at the time of writing wasn't su�cient for on-device classi�-cation. Therefore a random forest on a cloud server is used, which lead to theneed of privacy preserving design decisions. With state of the art smartphones
1 Root Mean Square, Above α-Mean Ratio, Average of Top k RMSs, Symptom Length,Left to Right Ratio, Relative Maximum RMS, Zero Crossing Rate
2 Spectral Centroid, Bandwidth, Spectral Rollo�
Health monitoring based on smart devices 7
it should be possible to realize the CS classi�cation on the device. But sinceSD performs better, the only advantage of using CS is the possibility to recon-struct symptom audio. A reasonable consideration is using the CS componentextraction on symptoms recognized by SD, thus they can be transmitted andreconstructed for remote assessment as intended by CS. As SD has to bu�er afew seconds of raw audio, the PCA can be run after symptom recognition onextracted events by only slightly increasing the overall bu�ered raw audio. It isto evaluate how many components are needed per symptom to reach good audio�delity and whether speech is intelligible.
3 Heart rate
The heart rate reveals plenty about health and �tness, but also about the emo-tional state and stress level. It is used to estimate exercise intensity to ensuree�ective training and prevent early exhaustion. The heart rate is an integral partof assessing the overall patient health and monitoring heart diseases. Making themeasuring easy to use and available on commodity devices, lowers the e�ort andcost needed.
3.1 Smartphone based PPG
Grimaldi et al. proposed a system [3] capable of detecting photoplethysmogra-phy (PPG) signals with a smartphone. PPG monitors the changes in intensityof light scattered in tissue, either by transmission or re�ection. Common de-vices are either attached to a �nger or earlobe, emitting red and infrared lightinto the skin. A photodiode in close proximity can infer the heart rate based onthe properties of the re�ected light. Such special devices are useful in a clinicalor stationary setting, but are cumbersome to carry around. Since smartphonescontain everything needed for PPG and o�er the wanted mobility, they are theperfect platform for this approach.The system utilizes the phones camera and the neighbouring LEDs. A �nger isplaced �rmly on both, covering them completely. The LEDs are the light sourceilluminating the �nger tissue. The camera records changes in illumination causedby the blood �ow. To ensure wrong usage won't deteriorate the result, each frameis evaluated for proper �nger placement. A frame is considered proper if the av-erage intensity of red pixels is high enough and the intensity of green and bluepixels low enough. As their evaluation showed, red pixels carry the best PPGsignal across di�erent smartphone models. The PPG signal is then calculated bycounting the amount of pixels higher than a threshold. The threshold can't beconstant due to the fact that cameras and the �nger placement di�er betweenuses, users and phones. Instead it is calculated from the average minimum andmaximum of red pixels over a 5 second calibration window. During the mea-surement the center of pulsations is calculated. If its locations or width-heightratio changes, the PPG computation should be restarted. This prevents wrongreadings due to movements of the �nger.
8 Lennart Gilbert
They evaluated their system with di�erent smartphone models compared to acommercial �nger pulse oximeter. Video data from one �nger was recorded onthe phone while the oximeter was on a di�erent �nger of the same hand at restand after 1 minute of squatting. For processing and better comparison the videodata was transferred to a pc. They present two calculated heart rate curveswhich show high correlation between actual and estimated pulse. Unfortunatelynot enough data is given to actually draw conclusions on precision and accuracy.
3.2 Workload estimation during walking
In [14] Sumida et al. manage to reliably estimate the physical load of a walkingperson from the accelerometer and GPS sensor of a smartphone. Keeping anexercising person at an appropriate load, prevents injuries and loss of motiva-tion due to a non-e�ective training. The physical load is expressed as a variationof the normalized heart rate, as the absolute heart rate varies depending onthe subject. Wearing a dedicated heart rate sensor lowers the convenience of awalking workout and smart device applications that need interaction with thedevice are complicated to use during walking. Therefore a system is proposedthat monitors the acceleration and GPS sensor during the exercise, with thesmartphone somewhere on the person.The main goals are to measure the physical load and its variation during thewalk, as well as making the system adaptable to a user. The adaptation is nec-essary, because the heart rate at rest and its change over time depend on userfactors like age and their exercise habits. The estimation therefore depends ona shared database to predict the heart rate from uploaded walking data. Thiswalking data is used during training for model creation. The acceleration am-plitude is used to derive the walking speed from distance and time walked. Thedistance is estimated from a relative location with stride length and step count.Additionally the variation of oxygen uptake is estimated periodically from walk-ing speed and gradient of the route, calculated by sampling the GPS heightvalue. The oxygen uptake is used in the model for the estimation of workloadchange, as it correlates better with the variation of exercise intensity.The prediction model is based on a neural network with one hidden layer and thedescribed walking data as parameters for the input layer. Given the data from asampling window the output layer delivers the estimated heart rate for the startof the next sampling window. The recorded heart rate data was normalized, totrain the network only on heart rate variation not on subject depending heartrate levels. For adaptation to a subjects speci�c �tness, characteristic param-eters are added to the oxygen uptake formula. They are used to minimize theaverage error between estimation and real oxygen uptake, for di�erent subjectgroups without the need for a new model.The evaluation dataset was gathered from 18 subjects on 5 di�erent routes. Thesubjects categorized themselves in groups of either frequent exercise, almost noexercise or neither (5, 2, 11 subjects each). The models were trained with thefolds leave one subjects out, leave one route out, leave one subject and route out
and leave one subject-route combination out. The results for the mean absolute
Health monitoring based on smart devices 9
error between predicted and actual heart rate never exceeds 7bpm, even for theworst case of subject and route fully unknown. Surprisingly leaving only onecombination out is only 0.37 bpm better. Deeper analysis shows most error isintroduced at a high heart rate, likely due to GPS errors or low granularity ofsubject categories. Furthermore training a subject(-category) is more importantthan training a route, as a route training also su�ers from the low granular-ity of categories. Overall the estimation is accurate enough to keep the neededworkload for an e�ective training. The application relies on GPS and a cloudbased prediction server, both increasing drain on the battery. Furthermore thephysical load estimation and resulting exercise advice are only given visually onthe phones screen. Adapting an eyes-free feedback system would increase theexercise bene�t during the walk, as the user doesn't need to turn their attentionto the phone to check the physical load.
3.3 Heart and breathing rate measured at the wrist
With Biowatch [6] Hernandez et al. created a reliable system to recover heart andbreathing rate from motion sensors worn at the wrist. Their research goals wasto determine how precise built-in motion sensors of smart watches can measureheart rate (HR) and breathing rate (BR) compared to traditional approaches.Furthermore they tested performance of HR measurement in real-life sleep set-tings. The method used is based on ballistocardiography (BCG). The blood �owinduced by the pumping heart causes minor movements due to the shifting mass.Those can be captured by motion sensors and depending on their location evenlung activity is picked up. The presented approach uses 3-axis accelerometer andgyroscope from a smart watch to extract HR and BR from the sensor data. Eachcomponent is normalized to z-scores to even their relevance. HR and BR are es-timated from pulse and respiratory waves. The pulse wave is estimated by �rstapplying a averaging �lter with window length 1/7 second. This removes signalshifts and trends caused by body motion, but preserves BCG signals. Then abandpass Butterworth �lter with range 4-11Hz is applied. Sensor components xiare aggregated by x =
√∑(xi)2 lowering the in�uence of di�erent body pos-
tures. A second band pass BW �lter with cuto� frequencies 0.66Hz and 2.5Hzlimits the resulting pulse wave to a reasonable range of 40 to 150bpm. For therespiratory wave an averaging �lter is used with window length equal to onebreathing cycle at 40 breaths per minute, thus eliminating cardiac motions. Themost periodic component signal is selected as the wave, here the signal withmaximal amplitude within 0.13Hz and 0.66Hz (8-40 breaths per minute).For comparison a HR gold standard was recorded with a chest ECG sensor.Additionally a wrist worn PPG sensor representing state of the art devices asbaseline was used. The BR gold standard was recorded with a commercial chestbelt sensor. Di�erent sensor were combined for analysis whether it would yieldbetter results than single sensors. Two validation studies were conducted. The�rst in a lab with 12 participants in 3 di�erent body positions (standing, sit-ting, lying) each at rest and after 1 minute of exercise. Each recording lasting 1minute. The second was a in-situ study of HR during sleep. 3 participants wore
10 Lennart Gilbert
the smart watch and the ECG sensor for two nights of which 6 hours each wererecorded. To not alter sleeping behaviour, no BR gold standard was recordeddue to the cables of the needed chest belt. Participants got two non-recordednights to adapt to sleeping with the applied sensors.The lab data was split into 20 second windows at 75% overlap, with average HR76.7 (standard deviation 14.26) and BR 16.6 (std dev 4). The mean absoluteerror (ME) of the combination accelerometer-gyroscope was with 1.27 less thaneach sensor on its own (1.39/2.01) but worse than PPG (0.95). The combinationof all 3 performed best with a ME of 0.88bpm, meaning the body motions containinfo about the HR the PPG can't capture and each (gyroscope/accelerometer)contain parts of it. For BR gyro outperformed accelerometer and the combina-tion of both with 0.38 compared to 0.97/0.55. As the estimation extracts themost periodic signal, adding more data isn't always bene�cial, especially whenestimates are already that good. The same BR results showed for di�erent pos-tures, gyro outperformed both other options. The HR while sitting and lying wasbest with the PPG sensor, but almost the worst for standing since the deviceloses its needed tight skin contact when the arms are hanging down. Combinedwith the accelerometer it improves to the best estimate. Overall the gyro aloneperformed worst, followed by the accelerometer. But the combination of all threeyielded the best result. Of 21 mean error values 17 were less than 1.5bmp com-pared to a precise ECG sensor using electrode gel. Therefore the estimation canbe considered accurate.The sleep experiment delivered 31.5 hours of data, which was segmented in 20second windows at 95% overlap. Additionally segments containing non BCGbody movements were removed by applying a threshold to the accelerometerdata, retaining 85.9% of the windows. The mean absolute errors are comparableto the lab results. Again the combination of all sensors yielded the best esti-mate, closely followed by gyro/PPG combo. The gyro ME improved by 1bmpcompared to the lab setting. This shows that motion sensors are a viable sourcefor heart and breathing rate, compared to PPG sensors. Furthermore they canbe used to increase the precision of PPG based heart rate sensors, while enablingsuch devices to capture breathing rate as an additional vital sign.
3.4 Intermittent smartphone based PPG
BayesHeart [2] is a blood volume pulse monitor based on video from cam-era phones. Able to measure heart rate and phases of the cardiac cycle accu-rately even for intermittent and noisy signals, its main advantage compared toother commodity camera based techniques. They su�er from illumination di�er-ences, motion noise from the region of interest and the cameras low samplingrate ( 30Hz), which prevents the use of common noise cancelling algorithms.The observable PPG signal contains all 4 phases of the cardiac cycle, thereforeBayesHeart uses a 4-state hidden Markov model to segment the signal and esti-mate HR from the phase segments. Due to extrinsic noise the third phase can'talways be segmented, leading to a two phase cycle. This problem is eliminated
Health monitoring based on smart devices 11
by using a 2/4 state model which chooses either 4- or 2-state HMM for segmen-tation.Instead of absolute observations, which are noise sensitive, local trends for eachsample are used as features (in/de-creasing observation, local min/maxima) toencode phase speci�c regularities. The model is trained o�ine using BaumWelchfor parameter estimation. The online HR estimation is done in 4 stages. Firstthe Bayesian information criterion is used with the �rst 5 seconds of observa-tions to select the HMM to use (2 or 4 states). The Viterbi algorithm generatesthe most likely state sequence to create the observed signal for both HMMs toreduce latency from model selection.In the selected sequence a new cycle is marked as the state transition from lastto �rst state. The duration between two adjacent marks estimates the instantHR. Outliers are reduced by dropping HR outside the 30-300bpm range andchanges between two estimates greater 5bpm. To correctly estimate HR fromintermittent signals (Region of interest appears not continuously in front of thelens) three problems have to be dealt with. To detect a covered lens they'veused a linear classi�cation model with global mean and standard deviation offrame pixels, resulting in sequences of covering actions. The next problem isnoise caused by these covering actions, primarily �nger movements and pressurechanges. Therefore covering sequences less than 2 seconds are fully discardedand the �rst second of sequences longer than 2 seconds. The last problem ishow to estimate HR from the now fragmented signal. To utilize as much signalas possible, they concatenate adjacent sequences by joining the last valid peakin the tail second of a sequence with the �rst peak in the �rst second of thefollowing sequence. As valid peak chosen is the local maximum in each secondlong window.They investigated their design choices with a study featuring 20 subjects and two10 minute monitoring sessions (static and intermittent lens covering). Patientscovered the lens fully with their �ngertip, for intermittent every 5-10 secondsthey removed their �nger for 1-3 seconds. The phone was operated with onehand, while a pulse oximeter measured the gold standard on the other hand.Each sessions data was split evenly on training and test set. Reported metricsare mean error rate (MER), estimation latency which is the time an algorithmneeds for the �rst accurate HR estimation (±5%). As well as utilization rate,ratio between samples used for estimation and total samples. The HMM selec-tion chose 4-state for 14 subjects and 2-state for the other 6. The MER wasbetter overall with 3.66% for normal covering (5.34% intermittent) comparedto only 4-state 4.08% (5.84%) and only 2-state 4.84% (6.9%). This shows bothstate models improve the MER. The impact of the used post-processing waseven bigger, lowering the MER from 10.86% to 5.34% for intermittent covering,while reducing the utilization slightly by 11.2percentage points to 68%.A second study was conducted to compare state of the art noise reduction andpulse counting techniques. The noise reduction methods are red channel only(R),brightness (Y) only, independent component analysis (ICA) of RGB and PCA ofRGB. Pulse counting was temporal domain counting by heuristic, FFT frequency
12 Lennart Gilbert
domain counting and BayesHeart, resulting in 12 tested combinations. Comparedto R all noise reduction techniques improved the estimation. BayesHeart resultedin a lower error rate than the other pulse counting measures. For intermittentcovering the combination Y and BayesHeart worked best with an MER of 5.23%and for normal covering ICA with BayesHeart 3.44%. R with FFT performedworst in both cases (normal 6%, intermittent 12%). With the achieved accuracyit is possible to use smartphone based PPG from intermittent camera coveringactions during normal use. The estimated heart rate can then be applied to otherapplications for context sensitive usages.
3.5 Ballistocardiography from wrist motion
Haescher et al. [4] used a wrist worn accelerometer for ballistocardiography(BCG) at rest, to infer heart rate (HR), breathing rate (BR) and muscle vi-bration (MV). The accelerometer captures motions caused by breathing, blood�ow and muscle �bres grinding against each other. These motions happen ata frequency equal to their respective vital sign (e.g. blood �ow ∼ heart rate).The 3 axis raw sensor signal is converted into its magnitude signal, reducingdimensionality and in�uence of the devices orientation.BR is extracted by low pass �ltering the magnitude signal. For MV a high pass isapplied to the raw magnitude signal, removing gross body motions like breath-ing. The resulting signal is low pass �ltered and squared and the HR can beestimated. On each feature signal a FFT is performed to extract the actual fre-quencies. The frequency with the highest amplitude in the spectrum is selected.The approach was evaluated with data from 15 participants. A pulse oximeterwas attached to the right hand and a IMU to the wrist to capture accelerations.On the left arm a blood pressure monitor and a smart watch with PPG sensorwere attached. BR was recorded by chest belt and microphone on the head. Dur-ing the recording participants lay as calm as possible on a blanket on the ground.Gold standard for HR was the oximeter and for BR the recorded audio. The IMUperformed best for HR with a mean error of 1.63% followed by the blood pres-sure monitor at 2.32%, both showing no statistical signi�cant di�erence to thegold standard. The smart watch performed worse than both devices at 5.58%mean error. The chest belt delivered the exact same BR as the gold standard.Oximeter and IMU performed signi�cantly worse (mean 12.47%/16.6%). In ac-tual values the biggest percentage errors form the IMU were 4bpm for the HRand 5bpm for BR. This shows acceleration data can be used to measure HR atrest accurately and BR good enough. In [5] they present a one participant studyon IMU estimation quality of the three vital signs, based on IMU location onthe body. Measuring at 12 positions they created a heat map for each vital signdepicting the peak signal to noise ration of the feature signal. Overall the resultsshow that most smart devices with a built-in accelerometer can reliably estimatethese vital signs.
Health monitoring based on smart devices 13
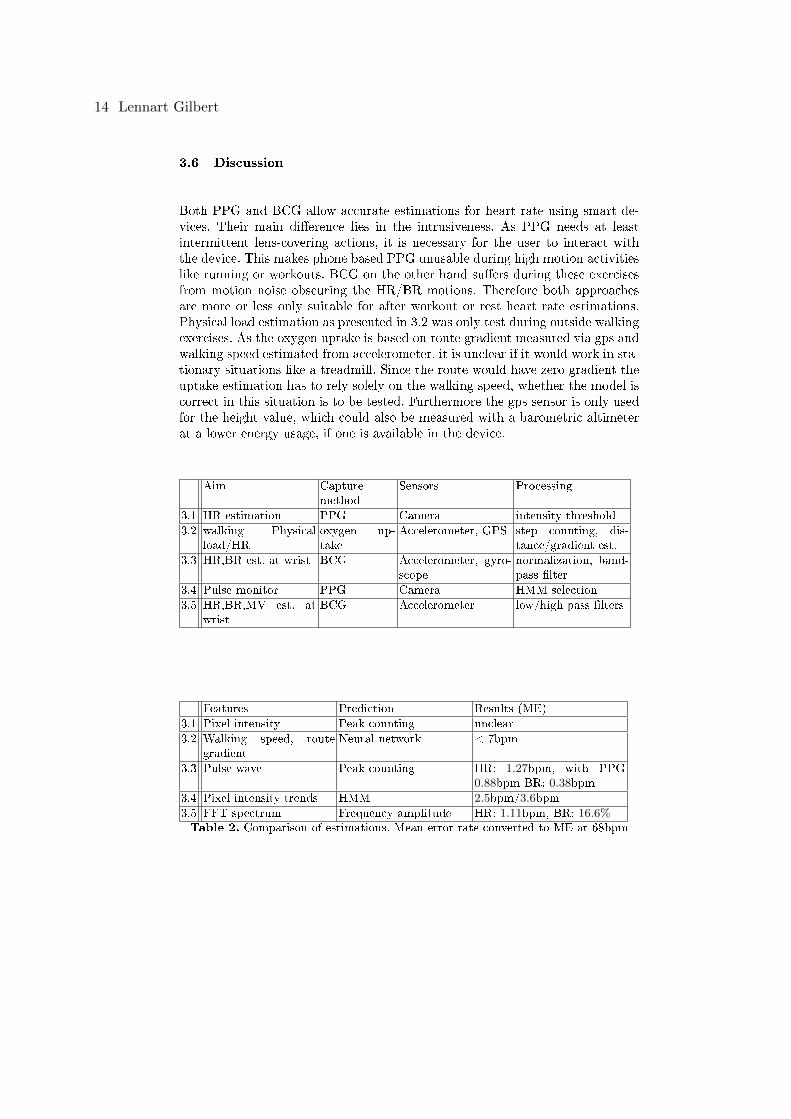
3.6 Discussion
Both PPG and BCG allow accurate estimations for heart rate using smart de-vices. Their main di�erence lies in the intrusiveness. As PPG needs at leastintermittent lens-covering actions, it is necessary for the user to interact withthe device. This makes phone based PPG unusable during high motion activitieslike running or workouts. BCG on the other hand su�ers during these exercisesfrom motion noise obscuring the HR/BR motions. Therefore both approachesare more or less only suitable for after workout or rest heart rate estimations.Physical load estimation as presented in 3.2 was only test during outside walkingexercises. As the oxygen uptake is based on route gradient measured via gps andwalking speed estimated from accelerometer, it is unclear if it would work in sta-tionary situations like a treadmill. Since the route would have zero gradient theuptake estimation has to rely solely on the walking speed, whether the model iscorrect in this situation is to be tested. Furthermore the gps sensor is only usedfor the height value, which could also be measured with a barometric altimeterat a lower energy usage, if one is available in the device.
Aim Capturemethod
Sensors Processing
3.1 HR estimation PPG Camera intensity threshold
3.2 walking Physicalload/HR
oxygen up-take
Accelerometer, GPS step counting, dis-tance/gradient est.
3.3 HR,BR est. at wrist BCG Accelerometer, gyro-scope
normalization, band-pass �lter
3.4 Pulse monitor PPG Camera HMM selection
3.5 HR,BR,MV est. atwrist
BCG Accelerometer low/high pass �lters
Features Prediction Results (ME)
3.1 Pixel intensity Peak counting unclear
3.2 Walking speed, routegradient
Neural network < 7bpm
3.3 Pulse wave Peak counting HR: 1.27bpm, with PPG0.88bpm BR: 0.38bpm
3.4 Pixel intensity trends HMM 2.5bpm/3.6bpm
3.5 FFT spectrum Frequency amplitude HR: 1.11bpm, BR: 16.6%Table 2. Comparison of estimations. Mean error rate converted to ME at 68bpm
14 Lennart Gilbert
4 Eating
As obesity is a massive health problem in many countries, people usually are notaware how many calories they consume during their normal meals. Food loggingapplications can be used to raise the users awareness of how much they've eatenduring the day. This allows them to counteract and not exceed their recom-mended daily calorie limit. Furthermore eating behaviour and speed has in�u-ence on how meals are processed in the body, when satiation kicks in and howmuch is eaten. These can be monitored to identify possible starting points tochange the eating behaviour.
4.1 Chew counting from in-ear sounds
Nishimura and Kurroda [11] turned a bluetooth earpiece into an in-ear micro-phone for accurate counting of chewing. As monitoring eating habits can beachieved with a multitude of sensors in di�erent ways, many of them are in-vasive and need long setup time, causing low adherence. An earpiece is smallenough to be mobile, easy to use and in socially accepted to wear publicly. Fortesting a commercial bluetooth headset was used, with the speaker internally re-placed by the microphone. The headset is worn as usual, but now recording andtransmitting the sounds from inside the ear canal. Besides chewing and othermouth sounds, head scratching and swallowing can be observed in the audiosignal. Whereas the earplug lowers environmental noise, hereby keeping it fromin�uencing the signal.A single chewing sound consists of two characteristic parts, the bite when upperand lower jaw meet and the jaw opening in preparation for the bite. The seriesof chewing sounds after the �rst bite start at high energy as the food is crushedinto smaller chunks. The energy gradually falls as the chunks are ground intoa �ne paste for swallowing. The average occurrence rate of chewing sounds isbetween 1 and 2Hz.The chewing recognition algorithm �rst detects chew like events in the audiosignal. The signal is windowed and �ltered with a low pass Butterworth �lter.With adjacent windows the regression coe�cient for one window is calculated.A chew like sound is detected when the regression gradient crosses zero and theLP �lter output exceeds a threshold. For veri�cation a chewing sound model wastrained with MFCCs extracted from 100 chews from 10 di�erent food samples.Other detected chew-like sounds like humming or coughing were used to trainthe non-chewing class.Only characteristic chews for each food are used, o raise classi�cation quality,by �ltering out chews that only yield common feature vectors. At 90% true pos-itive rate (Sensitivity) the use of only characteristic sounds drastically lowersthe false positive rate from 65% to 2%. Detection performance was evaluatedon the chewing sounds from 5 di�erent food types, at average 516 chews pertype. The average error rate was 1.93%, with 0% the lowest for salad and 3.45%the highest for wafers. In conclusion in-ear sounds are an accurate detectionmethod for chewing counts, that can be recorded with minimal intrusion. At the
Health monitoring based on smart devices 15
need of a special in ear microphone, the bene�ts of high accuracy and minimalintrusiveness are reduced by low adherence to extra single-purpose devices.
4.2 Eating activities from throat sounds
Bi et al. present a system [1] for recognizing eating related events like chewing.Their aim was to create a low cost device for eating monitoring that is convenientto use and not interfering. The system consists of a throat mounted microphoneand audio processing unit, that sends audio signals to a smartphone for recog-nition.A sound event is detected if a sample value exceeds a prede�ned threshold. Start-ing with the current one, 100 samples are grouped to a single complete event.10 statistical features are extracted each from the time and frequency domainof an event. All features are normalized to zero mean and Relief-F is used forfeature selection. As recognition model K-nearest neighbours and support vectormachines were used. The training data was recorded in a quiet lab from a singlesubject. 30 annotated events were registered for breathing, chewing, swallowingand no-event (microphone hanging in the air) each. Folds are created using the�rst k ∈ {1, ..., 20} sorted features and for each one KNN and SVM model istrained. For KNN the optimum is at k = 11 features with a recognition accu-racy of 87%. With precision and recall of chewing the lowest at 70% respectively80%. The SVM jumps to over 95% accuracy if more than 10 features are used,with the maximum 98% at 17 to 19 features. All single recognitions reach withthat many features at least 95% recall and precision. Even though these resultsindicate good detection rates and an improvement to the multi class eating ac-tivity detection problem, their training and test data was too small for statisticalsigni�cant evaluation.
4.3 Eating activities from head movements
Rahmann et al. used head movements to recognize eating activities [13]. Utilizingthe built in sensors and display of google glass, they've created an unintrusiverecognition and feedback system for monitoring of eating activities. The headmovements consist of sensor data from accelerometer, gyroscope, magnetometerand processed values for gravity, linear acceleration and rotation (device orien-tation). The raw data was split into minute long windows for feature extraction.The window length was chosen to capture periodic head movements at a gran-ularity that allows onset activity detection. From each sensor value and axis 5statistical, 3 spectral and 2 temporal measures are calculated, resulting in a 180element feature vector per window labelled with the ground truth activity. Crossvalidation folds were created using leave one participant out (LOPO), leave halfparticipant out (LHPO) and leave one window out (LOWO). For LHPO thelabelled activities of one test person were halved, one part was the test data theother was added to the training data.As classi�cation models Gaussian naive Bayes (NB), k-nearest neighbours (kNN)with k=1, C4.5 decision tree and Random Forest were evaluated. NB and kNN
16 Lennart Gilbert
were trained only on the 10 most informative features, chosen by a not speci�edinformation gain criterion. Besides area under curve (AUC) a F0.5 score is re-ported as performance metric. The F score weights precision higher than recall,because in a feedback system false positives cause falsely logged events and highprecision is preferred.The dataset was collected from 38 participants over a 2 hours period each. Duringwhich start-, end time and label of each performed activity was marked inde-pendently by two researchers. With eating detection as main goal, participantsate a meal wit a short break in between and performed other daily activitieslike walking stairs, reading, drinking or doing homework. This resulted in a classimbalance of only 12% eating but 72% homework/free time samples. Tree basedclassi�ers performed better than the other two and improved with more data,LOWO RF performing best (F-score 67.55%, AUC 0.922). For 9 participants(23% of all part.) no eating was detected of which 2 often adjusted their glasses,in�uencing the sensors and one moved abruptly in their chair. On the other handfor 11 participants 100% precision was achieved. For detected events the averagerecall was 30%. The completely undetected meals are most likely due to themassive class and in-class imbalance, as participants were allowed to bring theirown food the meals varied in length and food type. In a food logging scenario theprecision is more important than recall. In case of a false positive a wrong eatingevent would be logged or the user annoyed by a wrongly timed reminder. A falsenegative on the other hand is only relevant for the given sampling window, oneof many during an actual meal. It is to assume the detection rate will rise withmore meals in the training set. Given the uncertain future of the Google glass,any broad use of this system in the foreseeable future is unlikely. But the �ndingson eating recognition from head movements can be applied to other head worndevices with accelerometer.
4.4 Unintrusive food intake and habit monitoring
Zhou et al. present a non obtrusive sensing platform [19] to monitor food intakeand recognize various dining motions. They've combined a fabric based pressurematrix from their previous work on pressure sensitive surfaces with tactile forcesensors and a dining tablet, into a mobile non invasive monitoring platform.They are able to detect low level eating actions without body worn sensors orspecial dinnerware outside of special lab settings. Furthermore they can assessfood weight and arbitrary content.The used smart-tablecloth is a resistive force distribution sensor matrix witha spatial resolution of 1cm2 and 24bit real time accuracy. Externally appliedforce changes the resistance at intersections between column and row electrodes,transforming the force into an electric signal. The sensor matrix is attached to anormal dining tablet and covered with a layer of cloth and plastic to protect itagainst heat and dirt. A force sensitive resistor (FSR) is attached at each tabletcorner and connected with the matrix to the sampling IC underneath the tablet.The IC transmits the sensor data via USB to a computer for further process-ing. Matrix and FSR are sampled at 40Hz. Both sensor systems track pressure
Health monitoring based on smart devices 17
change of di�erent spatial resolution. The matrix is used to di�erentiate betweenplates and pressure distribution on them and the FSR measures the weight athigh accuracy.During the experimental stage the focus was on actions performed with com-mon western cutlery, like cutting, poking, scooping. 7 action classes for di�erentmain-, side dish and drinks were distinguished and a 8th no-action class. 5 par-ticipants ate 8 meals, each containing one main and side dish and a drink, withvarying food type for the action class. They had free reign over how to eat, howlong and whether they would socialize during the meal. The experiments wererecorded for manual labelling of the data. The raw sensor data undergoes severalsteps until a classi�cation model is created.First the matrix output is conditioned by applying image processing methods.After being up scaled, background nodes are removed from each matrix by a dy-namic threshold. Using the most common bin of a 10 bin histograms the framesare converted to binary frames. 40 consecutive frames are summed to a singlenon binary frame. The biggest circle in that frame is detected (phase coding byAtherton and Kerbyson) as the main dish and removed from the frame. Side dishand drink are the best remaining circles in the left/right half of the frame. Thissimpli�ed localization is used as dynamic localization isn't focus of their work.With these 3 circles the raw sensor data is segmented into subframe P1,P2,P3each representing one dish/glass on the tablet. The background is removed againsame as before. The FSR data is mean �ltered to R4.For feature extraction the average value of a frame is calculated as weight andits center on x and y axis as center-x respectively center-y. All three values arenormalized. 68 statistical features are then calculated, 48 from weight and cen-ter, 20 from the 4 channels in R4. The classi�cation model was created withcon�dence based AdaBoost and decision trees using 10 fold cross validation forparticipant dependant and leave one participant out for independent evaluation.To extract actions for classi�cation from raw data a spotting algorithm is eval-uated. The normalized data for feature calculation is used to create two binaryframe masks. One based on the standard deviation threshold extracts continu-ous activities like cutting from the data. Abrupt activities like removing a glassfor drinking are di�cult to spot and group together. Therefore the second masktracks the overall trend of the data. The masks are combined by bitwise or. Asequence of ones is considered a spotted action.This algorithm reaches a F1 score of 87% for participant dependent folds. In thiscase recall and precision look at matched and extracted actions. An action isconsidered matched, if it overlaps by 40% with a ground truth label of the sameclass. For patient independent classi�cation the accuracy drops below 80% aseating habits vary between patients. Most miss classi�cation happens for classeswith the same location or softness. Scooping soup is sometimes classi�ed as noevent, when the spoon didn't expel force onto the dish. Using action class andspotted activities for majority voting, the contents of 30 out of 40 meals couldbe successfully estimated. Even if food classes are much bigger in reality, thedining actions aren't as diverse. Therefore good estimations should be possible
18 Lennart Gilbert
with adequately trained classi�cator. The R4 values showed a non random corre-lation to the food weight (error ratio of 17%), hence good estimates can be givenfor the actual weight. The tablet o�ers a good recognition rate, but is limitedin its application area due to cost and mobility. Furthermore the �ne grainedevaluation capabilities are only needed in some special cases, making the systemideal for stationary rehabilitation of patients with eating disorders.
4.5 Eating detection from ambient sounds
Thomaz et al. conducted a feasibility study [16] to recognize eating activitiesfrom sounds recorded with smart devices. Instead of fully automated food track-ing, which takes away the bene�t of self re�ection from tracking meals, they aimat semi-automated food logging. The system recognizes eating activities and re-minds the user to note the contents of the consumed meal. Thereby reducing thee�ort needed, but preserving the re�ection aspect of food logging. Their maingoal was a system capable of doing so without any additional hardware besidesa smart-phone or -watch and minimal intrusiveness. Additionally the system issupposed to infer eating activities not only from eating sounds, but also fromenvironmental sounds depicting the context of the meal.As the focus lies in the feasibility of recognition from ambient sounds theyrely on proven previous works for their implementation. Audio is sampled at11025Hz and 50ms long frames are extracted with a Hanning �lter at 50% over-lap. For each frame 50 features are calculated, amongst others Zero Crossingrate, loudness, energy, envelope shape statistics, linear predictive coding(LPC),line spectral pairs as well as spectral-�atness, -�ux,-roll-o�, -shape, -statisticsand variation. As frames are shorter than most characteristic ambient sounds,400 consecutive ones are clustered together by applying a sliding window with50% overlap. Mean and variance of all 50 features from the clustered frames areused in a Random Forest for classi�cation. The length of a cluster is 10 secondsto capture both short and long sounds of interest at an adequate granularity.For the study 20 participants wore a wrist mounted audio recorder between 4and 7 hours on a single day, capturing at least one meal (lunch or dinner). Theparticipants were students, scientists, designer and other professionals, to cover amultitude of environments for ambient sounds. They were allowed to review theircaptured audio and cut segments for privacy. To label ground truth for eatingactivities, participants had to remember their activities start and end time whilegoing through the audio with a researcher. Then two authors independently re-viewed these times. There was a strong class imbalance towards the non-eatingactivity class. A person dependent 10-fold cross validation achieved an F-score of79.8% on the RF classi�er, which is comparable to state of the art systems usingbody worn sensors. With a leave one participant out cross validation the F-scoredrops to 28.7% most likely due to the diverse ambient situations the participantswere in during their meals. As the dataset mostly contained only one meal perparticipant the classi�er didn't have enough similar meal context training data.Furthermore self reported eating activity ground truth depends on the partici-pants memory and varies for correct start/end times recollection. Besides that
Health monitoring based on smart devices 19
the di�erent eating habits for participants made it di�cult to precisely labeleating activities (some meals lasted an hour due to long conversations). Fromall eating detection systems listed here it is the least physical intrusive one. Butdue to di�cult to obtain ground truth and overall highly diverse ambient soundsof dining locations, performing worst for participant independent testing. Witha know location the detection rate is high enough for actual use of the system,meaning more and better training data is necessary to capture most ambientdining sounds.
4.6 Eating detection with hand to mouth gestures
Ye et al. used head and wrist worn smart devices to detect eating from motions[17]. They used two di�erent approaches depending on sensor location, both uti-lizing the built-in accelerometer. As head mounted device Google glass was usedto detect chewing sessions from the head movement. A session starts when abite of food was taken until the �rst swallow. As a session consists of bite, chewand swallow, they are repetitive and sequential which provides good features forclassi�cation. The sampling rate was set at 50Hz grouped to 4 second windows.The magnitude of the 3-axis accelerometer data was used, as the accelerometeralignment, therefore its orientation, is user speci�c. A Butterworth low pass �l-ter with cut o� frequency 5Hz was applied to remove noise outside the 1-2.5Hzchewing frequency range. From this 17 mostly statistical time and frequencydomain features were calculated.The wrist worn smartwatch was used to detect hand to mouth (HtM) ges-tures of the dominant hand. Hereby a gesture consists of ascending-, biting-and descending-period. As 30% of the acceleration data is only gravitationalduring HtM gestures, it is used to calculate the orientation of the hand in roll,pitch and yaw. From the orientation the HtM periods can be inferred (e.g. handinside faces the body when biting). 12 orientation and 9 magnitude features arethen extracted.Evaluation data was gathered from 10 participants in two sessions. Each split intoa 5 minute jogging/rest cycle, 10 minutes walking, followed by a 5 minute read-ing/rest cycle and eating a meal. The meal was made up of 4 dished from di�erentsoftness food categories (soft solids easy/hard to chew, semi-solid, crunchy). Itwas consumed in front of an observer, who recorded start and end time of eachHtM gesture and chewing cycle. SVMs were created with 10-fold cross validationand leave one participant out (in-person/cross-person validation). Head motionsalone reached an accuracy of 95.1% in- and 89.5% cross-person. For HtM ges-tures in-person precision and recall greater 94% are reported, cross-person itdrops slightly to 90%. Without orientation features only 72% respectively 59%are possible, this shows the importance of the orientation features. The com-bination of head motions and HtM reached a cross-person accuracy of 97%.Furthermore they use the combined classi�cation result in a HMM to estimatethe duration of the eating session, for which they achieve an error of ±105 sec-onds.
20 Lennart Gilbert
They used the HtM gesture detection in a second �eld study [18], to test ad-herence for a semi automated food logging system. For a two week study period7 participants were given a smartwatch running a food logging application. Ifthe app would recognize HtM gestures it would show a prompt remembering theuser to log their meal. They could decline, ignore or accept the prompt, in thelast case a photo and note taking app would open for logging the meal.As participants may have forgotten to log meals, actual ground truth is unknownand recall can't be calculated. Precision was 31%, calculated from total num-ber of reminders, positive/negatives responses and the lack of a response (8% ofprompts were ignored). As detection prompts can happen every 20 seconds, at37% precision only 7 false detections per user per day occurred. Participants re-ported false positives as disturbing only during driving, other occurrences weree.g. yawing, washing he face. 3 participants reported FPs during driving andone while running. The low accuracy might stem from the fact that none of theparticipants where part of the trainings set in the �rst study and neither wereactivities like driving. Participants further reported delayed prompts a the endof their meal.The correlation between reminder and note taking had a R-value of 0.76. Forpositive responses 0.91 and for negative responses 0.59. Correct detected mealsare almost always followed by food logging and in some cases FPs remind theuser to log an eating activity. Overall participants accepted the smartwatch asa commodity device and made heavy use of the logging app. With a successful�eld study the system has been proven useful at raising adherence and overallnumbers of food logs.
4.7 Discussion
The results show that most of the presented systems are usable for automatedeating detection, with suitable accuracy for meal logging applications. At the costof di�erent levels of intrusiveness and device requirements. The three stand-alonedevices allow more in-depth monitoring compared to the systems using smartdevices, which have the main goal of just eating detection. From these 3 thesmart tablet is the least intrusive with no privacy issues, opposed to soundbased approaches, but also its results are most di�cult to evaluate. Hence thebest application area for it would be stationary rehab, where it o�ers a lowpriced solution for automated eating habit monitoring. This frees up sta� fromevaluating patients manually. The two other devices don't o�er the granularityand need too much setup time, making them less useful in this situation. Theother systems can be applied to self evaluation and as part of a meal loggingapp, due to their physical non-invasive monitoring methods.
5 Exercise
For exercise purposes the use of smart devices has two major goals. One is tomotivate the user to exercise and track their progress to a better health and
Health monitoring based on smart devices 21
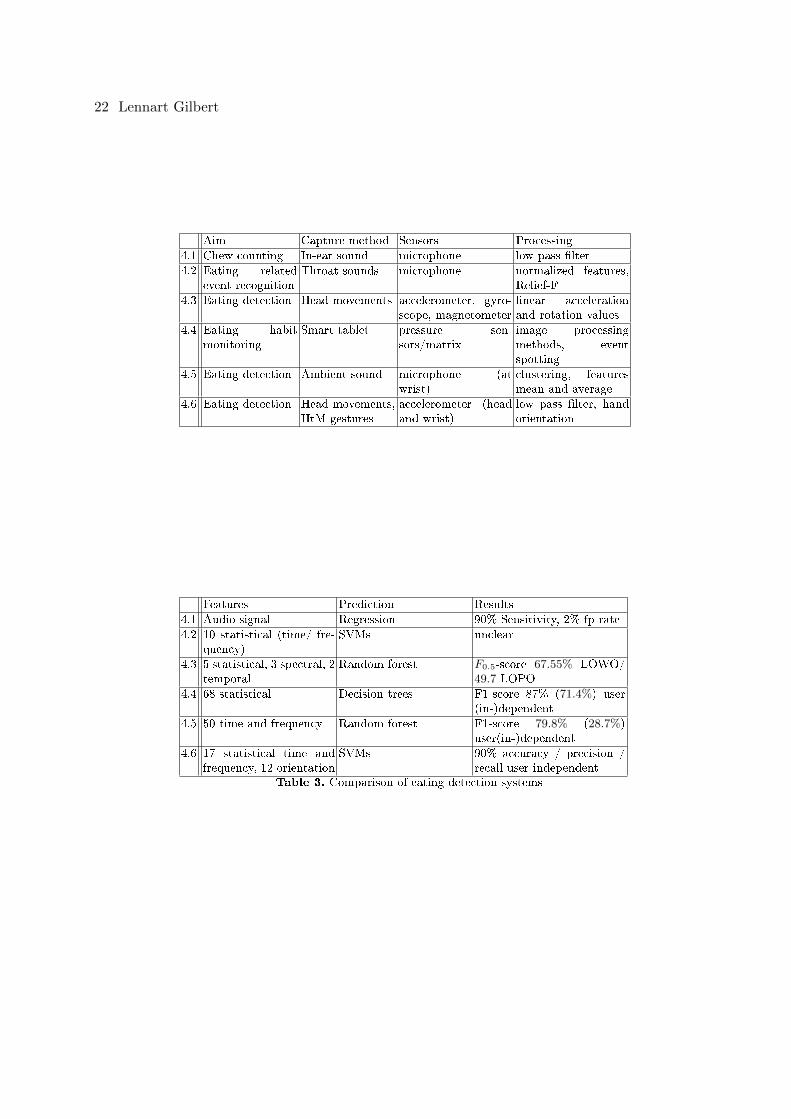
Aim Capture method Sensors Processing
4.1 Chew counting In-ear sound microphone low pass �lter
4.2 Eating relatedevent recognition
Throat sounds microphone normalized features,Relief-F
4.3 Eating detection Head movements accelerometer, gyro-scope, magnetometer
linear accelerationand rotation values
4.4 Eating habitmonitoring
Smart tablet pressure sen-sors/matrix
image processingmethods, eventspotting
4.5 Eating detection Ambient sound microphone (atwrist)
clustering, featuresmean and average
4.6 Eating detection Head movements,HtM gestures
accelerometer (headand wrist)
low pass �lter, handorientation
Features Prediction Results
4.1 Audio signal Regression 90% Sensitivity, 2% fp rate
4.2 10 statistical (time/ fre-quency)
SVMs unclear
4.3 5 statistical, 3 spectral, 2temporal
Random forest F0.5-score 67.55% LOWO/49.7 LOPO
4.4 68 statistical Decision trees F1-score 87% (71.4%) user(in-)dependent
4.5 50 time and frequency Random forest F1-score 79.8% (28.7%)user(in-)dependent
4.6 17 statistical time andfrequency, 12 orientation
SVMs 90% accuracy / precision /recall user independent
Table 3. Comparison of eating detection systems
22 Lennart Gilbert
�tness. For example by keeping score of their e�orts or through gami�cation ofthe exercises. The other goal aims to optimize the exercise execution. A correctperformed exercise raises training e�ciency and prevents injuries from wrongtraining methods.
5.1 Unobtrusive gait assessment
Postolache et al. present two approaches [12] for gait assessment based on wire-less sensor units. Their aim is to create low cost smart sensing devices to trackthe gait rehabilitation progress of patients undergoing physiotherapy. Tradition-ally movement is monitored in gait laboratories with camera systems, pressuresensitive �oors and EMG to track muscle activity. Those set-ups aren't applica-ble for physiotherapists in their normal rehabilitation sessions. To evaluate gaitpatterns for therapeutic measures, they are interested in forces, acceleration andvelocities acting on joints and muscles. They present two non invasive hardwareset-ups to gather this data. One is a so called inertial measurement unit (IMU), abody worn network of smart wireless sensors. The second one is a smart walkingaid with built in Doppler radar to monitor the gait of its user.An IMU consists of a tri-axis gyroscope, an accelerometer and magnetometeras sensors. The IMU is connected to a micro controller which reads the sensorvales periodically, packs them and transmits the package wireless to a gate-way coordinator. Such a compact end-node is attached to each foot to monitorthem separately. The network coordinator is connected via USB to a computer,where the sensor data will be evaluated by an expert. It is also used to con�gureend-nodes remotely, without �rmware updates. Their prototype uses the ZigBeeIEEE 802.15.4 wireless protocol, but their aim is to use WiFi or bluetooth inthe future to make the hardware gateway unnecessary.The smart walker encapsulates a Doppler radar array, processing power andcommunication hardware to WiFi devices. An array of Doppler radar antennasis mounted on the walker, oriented at the patients legs. Using frequency modu-lated continuous wave (FMCW), a know continuous wave with in- or decreasingfrequency is sent out from the transmission antenna. The receiving antenna picksup the signal re�ected by the patient and it is demodulated into in-phase I andquadrature component Q. The resulting Doppler shift signal is proportional tothe distance between sensor and patient. A short time Fourier transformationis applied to the in-phase components I1 and I2. The resulting frequency spec-trograms are transmitted to a tablet running visualization software used by aphysiotherapist for evaluation. The spectral analysis shows the di�erences be-tween healthy and abnormal gait in power and frequency band. Using thesesystems basic gait analysis can be reduced in cost and e�ort, making it moreaccessible and raising the frequency of it being used in day-to-day practice.
5.2 Live walking feedback
Komninos et al. present their �ndings [7] on eyes free live feedback for walk-ing exercise. For optimal exercise e�ect walking should be performed at an in-
Health monitoring based on smart devices 23
creases pace to raise the metabolic rate. Target rates are expressed in multiplesof Metabolic Equivalent of a resting Task (MET), for walking 3 or higher isadvised. Their prototype test system aims at people wanting to exercise but failat �nding the right pace.They implemented a music player app for smartphones, that reduces the audioquality if the users walking speed drops below a steps per minute threshold.Instead of using pure audio feedback to teach the correct walking pace, it allowsthe user to listen to their own music for added motivation, while the qualityreduction is less intrusive than adding sound cues to the music. Their goal forthe app was to provide fast, eyes-free feedback with minimal intrusiveness. tomeasure the walking speed, they utilized the accelerometer as step counter byapplying a peak detection algorithm to the sensor data.They've tested di�erent e�ects to degrade the music quality, such that the reduc-tion can be perceived on di�erent music genres and headphones. The prototypeuses equalizer e�ects the Android Media AudioFx SDK o�ers. Removing fre-quencies from high, mid and low frequency bands leaves only the main bass lineand parts of the melody and was noticeable on all tested genres. But as the e�ectwas only subtle at best, pink noise was added to emulated bad radio reception.To evaluate the e�ectiveness of the feedback system, 20 participants performed 4walks on 2 routes around a pedestrian only zone. Their hypotheses were whethermaintaining correct pace is easier with the feedback player and will there be alearning e�ect for correct cadence. The shorter route ( 300meter) was used fortwo training walks. The �rst one to record the normal walking pace while lis-tening to music of each participant. Which was used to calculate the individualMET rate for exercising, capped at 5 MET. During the second walk the par-ticipants listened to a metronome beat of their target pace and were tasked toremember and match their walking pace to the beat. For the two walks on thelong route ( 800m) participants were split into two equal groups. Group P useda normal music player �rst, then on the second walk a player with degradingaudio quality. The other group D started with the degrading player and usedthe normal player on the second walk. For both walks the metronome playerthe �rst 16 seconds as a reminder of the correct pace. After each walk partic-ipants completed a questionnaire to asses their perceived workload. Overall ittook group P more time to complete the route with the normal player than withthe degrading, the time of group D was almost the same in both walks. Lookingat the steps taken, group P and D had the same amount with the normal player.Group P raised their step count with the degrading player, Ds count stayedthe same. With the normal player both groups stayed below their MET ratesfor around 38% of their steps, group P more than D. With the audio feedbackgroup P reduced that ratio from 41% to 15%. As group D started with the feed-back, their rate rose slightly from 28% to 35% when walking without it. Theseresults indicate that group D learned to some extend their correct pace and thatthe system helped group P to better achieve their correct pace, reassuring bothhypotheses. The questionnaire results imply that participants felt no di�erencein their performance or frustration using either player. But they worked harder
24 Lennart Gilbert
and felt under time pressure using the degrading player and felt it was easier towalk at the right pace.
5.3 Muscle activation detection with accelerometers
MyoVibe [10] is a wearable sensor network to measure muscle activation from mi-cro vibrations. Common techniques to track muscle activations like electromyo-graphy (EMG) su�er from motion induced noise, therefore aren't reliable inreal-world settings to monitor heavy exercises. A reliable monitoring device iswanted to ensure proper muscle activations during training which increases sportperformance and reduces injury risk.MyoVibe uses several small accelerometer attached to the to be monitored mus-cle region. When the muscles contract small vibrations are produced by frictionbetween the individual muscle �bres. These vibrations have low amplitude andare in the frequency band of 5-100Hz, the exact range depending on the partic-ular muscle. The accelerometers are able to capture these vibrations and withsome processing they are used to measure and identify muscle activity, so calledmechanomyography (MMG). Due to the low amplitude, it is di�cult to �ndthem during heavy exercise because of high impact/motion noise. Lightweight3-axis accelerometers are attached to the body either with �exible texture strapsor sewn in form-�tting pants, ensuring consistent orientation of the sensors. Viaa common data bus several sensors are connected to an aggregator node, whichsaves and transmits the sensor data to a back-end computing device for process-ing and evaluation.To detect muscle activation, two steps for reduction of motion artefacts areapplied to the raw sensor data. A high pass �lter with cut o� frequency 5Hzremoves low frequency noise like gross body motion. To remove the remaininghigh amplitude, high frequency noise they propose the k-EVA algorithm. Us-ing extreme value analysis (EVA) the distribution of extreme sensor values ismodelled to selectively remove this high motion noise. Before each exercise 20seconds low-motion (Motlow) sensor data calibrates the distribution model. Ex-treme values in that time frame estimate the scale parameter δMot−Low of thetype I Gumble distribution. k · δ is used as threshold to separate low and highmotion distributions, e�ectively identifying muscle vibration and motion noise.Every data window exceeding this threshold is discarded. The parameter k hasto be chosen cautiously as it balances the trade o� between false alarm rate andrecognition rate, by including more or less muscle activation data with motionnoise.Afterwards �ve frequency domain features are extracted with a DFT and 500mssliding window. {25, 50, 75, 90}th frequency percentile to localize frequency shiftsinto speci�c bands. Area under curve of the cumulative distribution function(CDF), which shows how frequencies are distributed in a given window. A de-cision tree is used to classify whether a muscle is active or inactive for a givenaccelerometer feature matrix (N × 15, N the amount of used accelerometers onthe muscle). The DT is trained on labelled feature matrices, labels are obtained
Health monitoring based on smart devices 25
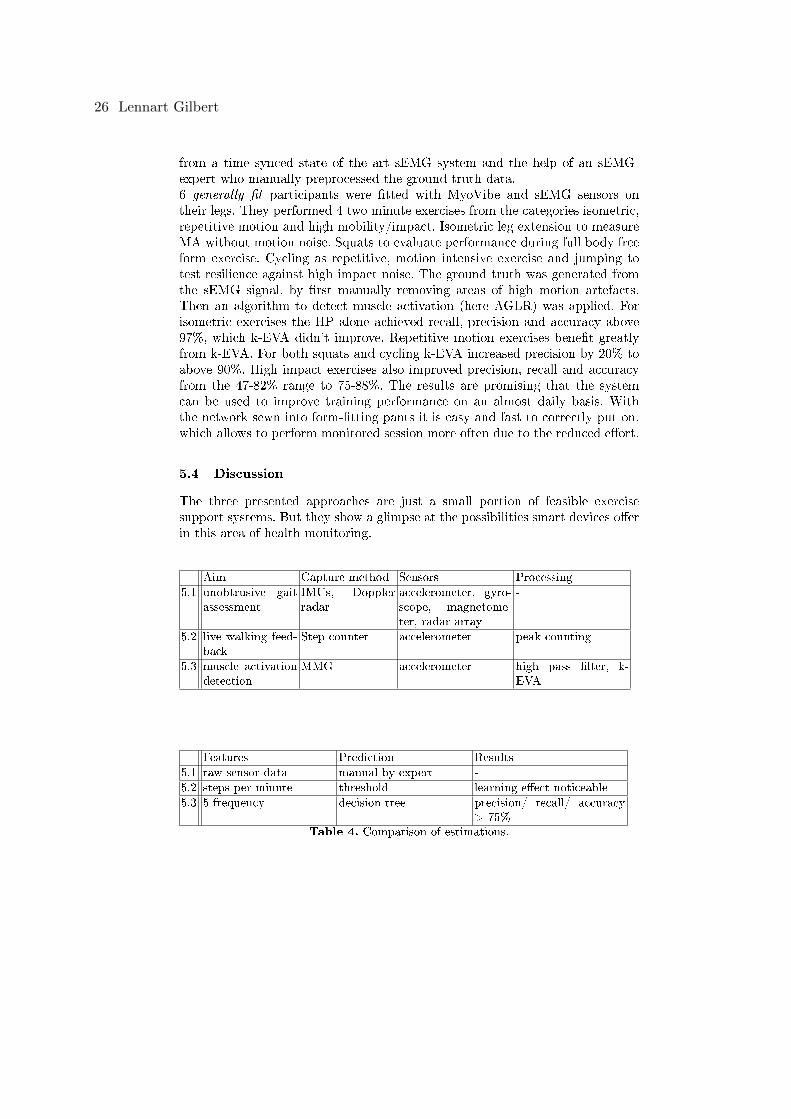
from a time synced state of the art sEMG system and the help of an sEMG-expert who manually preprocessed the ground truth data.6 generally �t participants were �tted with MyoVibe and sEMG sensors ontheir legs. They performed 4 two minute exercises from the categories isometric,repetitive motion and high mobility/impact. Isometric leg extension to measureMA without motion noise. Squats to evaluate performance during full body freeform exercise. Cycling as repetitive, motion intensive exercise and jumping totest resilience against high impact noise. The ground truth was generated fromthe sEMG signal, by �rst manually removing areas of high motion artefacts.Then an algorithm to detect muscle activation (here AGLR) was applied. Forisometric exercises the HP alone achieved recall, precision and accuracy above97%, which k-EVA didn't improve. Repetitive motion exercises bene�t greatlyfrom k-EVA. For both squats and cycling k-EVA increased precision by 20% toabove 90%. High impact exercises also improved precision, recall and accuracyfrom the 47-82% range to 75-88%. The results are promising that the systemcan be used to improve training performance on an almost daily basis. Withthe network sewn into form-�tting pants it is easy and fast to correctly put on,which allows to perform monitored session more often due to the reduced e�ort.
5.4 Discussion
The three presented approaches are just a small portion of feasible exercisesupport systems. But they show a glimpse at the possibilities smart devices o�erin this area of health monitoring.
Aim Capture method Sensors Processing
5.1 unobtrusive gaitassessment
IMUs, Dopplerradar
accelerometer, gyro-scope, magnetome-ter, radar array
-
5.2 live walking feed-back
Step counter accelerometer peak counting
5.3 muscle activationdetection
MMG accelerometer high pass �lter, k-EVA
Features Prediction Results
5.1 raw sensor data manual by expert -
5.2 steps per minute threshold learning e�ect noticeable
5.3 5 frequency decision tree precision/ recall/ accuracy> 75%
Table 4. Comparison of estimations.
26 Lennart Gilbert
6 Conclusion
The presented techniques showed that state of the art smart devices can accu-rately track vital signs and the results are accurate enough to make the similarassessments as from clinical devices. Furthermore they can be used to reducehealth risks or utilize them in context sensitive approaches, like recognizing stressand change workload accordingly.In chapter 2 systems to track lung functionality and respiration symptoms werepresented. Used for automated unintrusive assessment they lower the risk ofunnoticed decline in health. Monitoring heart rate is examined in chapter 3,explaining di�erent sensing modalities like Ballistocardiography that can be re-alised with smart devices. Chapter 4 covers methods for semi-automated food-logging and eating behaviour analysis, like eating detection and chew counting.Last but not least a small selection of exercise support systems are discussedin 5. Representing the methods for live exercise feedback and in-depth exerciseevaluation.As the results from ambient sounds eating detection and food logging in the wildhave shown, some conducted studies could bene�t from bigger sample sizes espe-cially when machine learning is used. The logical next step would be to developapplications that make use of these monitoring and supporting abilities to raisethe overall health and lower its cost.
References
1. Bi, Y., Xu, W., Guan, N., Wei, Y., Yi, W.: Pervasive eating habits monitoringand recognition through a wearable acoustic sensor. In: Proceedings of the 8thInternational Conference on Pervasive Computing Technologies for Healthcare.pp. 174�177. PervasiveHealth '14, ICST (Institute for Computer Sciences, Social-Informatics and Telecommunications Engineering), ICST, Brussels, Belgium, Bel-gium (2014), http://dx.doi.org/10.4108/icst.pervasivehealth.2014.255423
2. Fan, X., Wang, J.: Bayesheart: A probabilistic approach for robust, low-latencyheart rate monitoring on camera phones. In: Proceedings of the 20th InternationalConference on Intelligent User Interfaces. pp. 405�416. IUI '15, ACM, New York,NY, USA (2015), http://doi.acm.org/10.1145/2678025.2701364
3. Grimaldi, D., Kurylyak, Y., Lamonaca, F., Nastro, A.: Photoplethysmography de-tection by smartphone's videocamera. In: Intelligent Data Acquisition and Ad-vanced Computing Systems (IDAACS), 2011 IEEE 6th International Conferenceon. vol. 1, pp. 488�491 (Sept 2011)
4. Haescher, M., Matthies, D.J.C., Trimpop, J., Urban, B.: A study on measuringheart- and respiration-rate via wrist-worn accelerometer-based seismocardiography(scg) in comparison to commonly applied technologies. In: Proceedings of the 2NdInternational Workshop on Sensor-based Activity Recognition and Interaction. pp.2:1�2:6. WOAR '15, ACM, New York, NY, USA (2015), http://doi.acm.org/10.1145/2790044.2790054
5. Haescher, M., Matthies, D.J., Trimpop, J., Urban, B.: Seismotracker: Upgrade anysmart wearable to enable a sensing of heart rate, respiration rate, and microvibra-tions. In: Proceedings of the 2016 CHI Conference Extended Abstracts on Human
Health monitoring based on smart devices 27
Factors in Computing Systems. pp. 2209�2216. CHI EA '16, ACM, New York, NY,USA (2016), http://doi.acm.org/10.1145/2851581.2892279
6. Hernandez, J., McDu�, D., Picard, R.W.: Biowatch: Estimation of heart andbreathing rates from wrist motions. In: Proceedings of the 9th InternationalConference on Pervasive Computing Technologies for Healthcare. pp. 169�176.PervasiveHealth '15, ICST (Institute for Computer Sciences, Social-Informaticsand Telecommunications Engineering), ICST, Brussels, Belgium, Belgium (2015),http://dl.acm.org/citation.cfm?id=2826165.2826190
7. Komninos, A., Dunlop, M.D., Rowe, D., Hewitt, A., Coull, S.: Using degradedmusic quality to encourage a health improving walking pace: Beatclearwalker. In:Proceedings of the 9th International Conference on Pervasive Computing Technolo-gies for Healthcare. pp. 57�64. PervasiveHealth '15, ICST (Institute for ComputerSciences, Social-Informatics and Telecommunications Engineering), ICST, Brus-sels, Belgium, Belgium (2015), http://dl.acm.org/citation.cfm?id=2826165.2826174
8. Larson, E.C., Goel, M., Boriello, G., Heltshe, S., Rosenfeld, M., Patel, S.N.: Spiros-mart: Using a microphone to measure lung function on a mobile phone. In: Pro-ceedings of the 2012 ACM Conference on Ubiquitous Computing. pp. 280�289.UbiComp '12, ACM, New York, NY, USA (2012), http://doi.acm.org/10.1145/2370216.2370261
9. Larson, E.C., Lee, T., Liu, S., Rosenfeld, M., Patel, S.N.: Accurate and privacypreserving cough sensing using a low-cost microphone. In: Proceedings of the13th International Conference on Ubiquitous Computing. pp. 375�384. UbiComp'11, ACM, New York, NY, USA (2011), http://doi.acm.org/10.1145/2030112.2030163
10. Mokaya, F., Lucas, R., Noh, H.Y., Zhang, P.: Myovibe: Vibration based wearablemuscle activation detection in high mobility exercises. In: Proceedings of the 2015ACM International Joint Conference on Pervasive and Ubiquitous Computing. pp.27�38. UbiComp '15, ACM, New York, NY, USA (2015), http://doi.acm.org/10.1145/2750858.2804258
11. Nishimura, J., Kuroda, T.: Eating habits monitoring using wireless wearable in-earmicrophone. In: Wireless Pervasive Computing, 2008. ISWPC 2008. 3rd Interna-tional Symposium on. pp. 130�132 (May 2008)
12. Postolache, O., Ribeiro, M., Girão, P.S., Dias Pereira, J.M., Postolache, G.: Un-obtrusive sensing for gait rehabilitation assessment. In: Proceedings of the 8thInternational Conference on Pervasive Computing Technologies for Healthcare.pp. 386�389. PervasiveHealth '14, ICST (Institute for Computer Sciences, Social-Informatics and Telecommunications Engineering), ICST, Brussels, Belgium, Bel-gium (2014), http://dx.doi.org/10.4108/icst.pervasivehealth.2014.255364
13. Rahman, S.A., Merck, C., Huang, Y., Kleinberg, S.: Unintrusive eating recogni-tion using google glass. In: Proceedings of the 9th International Conference onPervasive Computing Technologies for Healthcare. pp. 108�111. PervasiveHealth'15, ICST (Institute for Computer Sciences, Social-Informatics and Telecommuni-cations Engineering), ICST, Brussels, Belgium, Belgium (2015), http://dl.acm.org/citation.cfm?id=2826165.2826181
14. Sumida, M., Mizumoto, T., Yasumoto, K.: Estimating heart rate variation dur-ing walking with smartphone. In: Proceedings of the 2013 ACM InternationalJoint Conference on Pervasive and Ubiquitous Computing. pp. 245�254. UbiComp'13, ACM, New York, NY, USA (2013), http://doi.acm.org/10.1145/2493432.2493491
28 Lennart Gilbert
15. Sun, X., Lu, Z., Hu, W., Cao, G.: Symdetector: Detecting sound-related respira-tory symptoms using smartphones. In: Proceedings of the 2015 ACM InternationalJoint Conference on Pervasive and Ubiquitous Computing. pp. 97�108. UbiComp'15, ACM, New York, NY, USA (2015), http://doi.acm.org/10.1145/2750858.2805826
16. Thomaz, E., Zhang, C., Essa, I., Abowd, G.D.: Inferring meal eating activities inreal world settings from ambient sounds: A feasibility study. In: Proceedings ofthe 20th International Conference on Intelligent User Interfaces. pp. 427�431. IUI'15, ACM, New York, NY, USA (2015), http://doi.acm.org/10.1145/2678025.2701405
17. Ye, X., Chen, G., Cao, Y.: Automatic eating detection using head-mount and wrist-worn accelerometers. In: 2015 17th International Conference on E-health Network-ing, Application Services (HealthCom). pp. 578�581 (Oct 2015)
18. Ye, X., Chen, G., Gao, Y., Wang, H., Cao, Y.: Assisting food journaling with au-tomatic eating detection. In: Proceedings of the 2016 CHI Conference ExtendedAbstracts on Human Factors in Computing Systems. pp. 3255�3262. CHI EA'16, ACM, New York, NY, USA (2016), http://doi.acm.org/10.1145/2851581.2892426
19. Zhou, B., Cheng, J., Sundholm, M., Reiss, A., Huang, W., Amft, O., Lukowicz, P.:Smart table surface: A novel approach to pervasive dining monitoring. In: PervasiveComputing and Communications (PerCom), 2015 IEEE International Conferenceon. pp. 155�162 (March 2015)
Health monitoring based on smart devices 29
Health Monitoring based on Smart Devices
Niklas Sänger∗
Advisor: Long Wang†
Karlsruhe Institute of Technology (KIT)Pervasive Computing Systems � TECO∗[email protected]
Abstract. With gaining popularity of smart devices and the increasedamount of sensors, there arise new possibilies to help the user to monitorhis health using a smart device. This research describes the approachesand their performance on exercise monitoring, heartrate monitoring andlung function monitoring. It will also give an overview of basic sensorsand algorithms which are used for analyzing and classifying the inputdata. Exercise monitoring is able to detect the users repetitions, exe-cution and the exercise itself. It can deliver the user feedback in orderto improve his performance. Heartrate monitoring detects the heartrateutilizing sensors provided by a smart device. Lung function monitoringis able detect features which are used to assess a patients lung function.
Keywords: Health Monitoring, Smart Devices, Exercise Monitoring
1 Introduction
With more than 1.4 billion Smartphones sold worldwide and smart devices likesmart watches or smart wristbands becomming more popular, there is a largepotential for new applications usings sensors provided by smart devices[9]. Evenentry level smart devices inlcude a basic amount of sensors, this is especiallyimportant since they are often sold in emerging countries with the strongestgrowing smartphone markets of up to 18% growth in sales. (Hier fehlt die Quelle)
Another important business sector is the eFitness market. It is a stronggrowing market creating a revenue of up to $3.495B in 2015 [8] and is expectedto grow further over the next years. This demonstrates how interested users arein tracking their sports exercises with their smart devices. Smart devices can notonly bring a bene�t to users by tracking their activities, but also by analyzingtheir performance and give them feedback right on the spot. This can lead toan improved exercise performance creating a higher training e�ect. Hence theuser's motivation rises and potentially results in more frequent exercise sessions.
The above mentiond factors can also raise the awareness of the user's healthsituation and improve it. Especially in emerging countries with low medicalsupply and greate distances to the next hospital. Smart devices can not justdeliver a �rst diagnosis (e.g. detecting the lung function of a user[4]) but also
30 Niklas Sanger
give the user exercises to treat his condition (e.g. [5]). This does not only savecosts and e�ort, but gives people who can not a�ord meddical care a slightinsight on their wellbeing and even a way to treat it. Additionally, smart devicescan automatically send information gatherd to the users doctor for review, whichsaves time and costs. Since medical care using smart devices is in the early stages,it is far from being perfect. Results are not as reliable as professional machinesbecause the user has to execute the task without any professional advice andcan thereby create falsi�ed data.
This research has been done to give the reader an insight on exercise monitor-ing and medical healthcare based on smart devices. For a better understanding,the following chapter will descirbe the fundamental terms and de�nitions and thebasic data analysis methods used in the considered papers. The chapterMonitor-ing will consider the di�erent methods to gather data and compare their resultswith each other. At last the reader will receive a short overview and conclusionabout exercise monitoring using smart devices.
2 Fundamentals
This chapter will de�ne the basic terms and common data analyzing algorithmsused in this research.
2.1 Sensors
Smart devices, especially smartphones, have gained sensors over the past years.In comparision to the current iPhone 6s using 8 Sensors, the �rst generationiPhone used only 3 di�erent types of sensors, excluding camera and microphone.Sensors have also become more accurate not only by improving the technologiebut also by combining them (e.g. GPS).
Accelerometer An Accelerometer is a mechanical device that will meassure ac-celeration forces. The force meassured by an accelerometer can either be static ordynamic. If the force is static the device is not moving. Otherwise dynamic forcesare caused by vibration or movement. By analyzing the amount of static acceler-ation the angle of the accelerometer with respect to the earth can be calculated.Analyzing dynamic acceleration results in information about the movement ofthe device.
Camera Cameras used in smart devices are digital. Light falling through theirlenses are �ltered by a mosaic �lter. This creates red, green or blue signals whichare then captured by an electronic pickup device and saved to memory.
GPS GPS is a synonym for Global Positioning System. It is a naviagtion systemproviding location and time information based on satelite positioning. In orderto calculate the position of the GPS sensor, at least four satelites must be visible
Health Monitoring based on Smart Devices 31
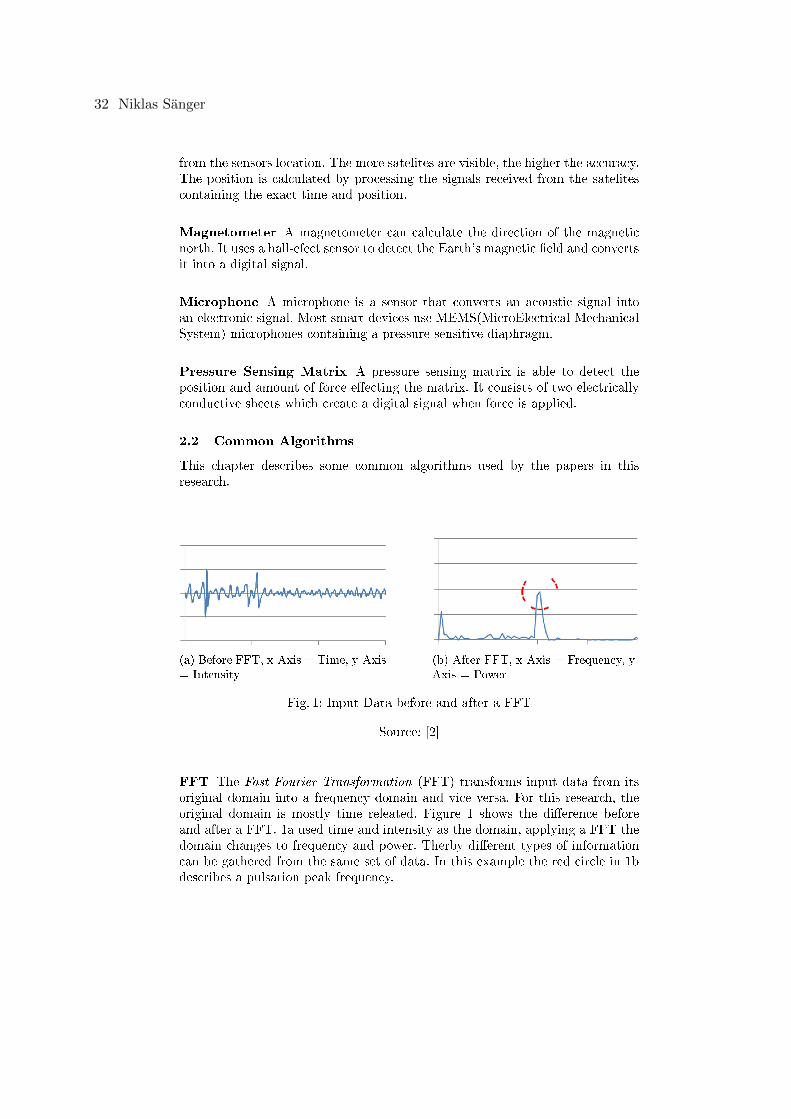
from the sensors location. The more satelites are visible, the higher the accuracy.The position is calculated by processing the signals received from the satelitescontaining the exact time and position.
Magnetometer A magnetometer can calculate the direction of the magneticnorth. It uses a hall-efect sensor to detect the Earth's magnetic �eld and convertsit into a digital signal.
Microphone A microphone is a sensor that converts an acoustic signal intoan electronic signal. Most smart devices use MEMS(MicroElectrical-MechanicalSystem) microphones containing a pressure-sensitive diaphragm.
Pressure Sensing Matrix A pressure sensing matrix is able to detect theposition and amount of force e�ecting the matrix. It consists of two electricallyconductive sheets which create a digital signal when force is applied.
2.2 Common Algorithms
This chapter describes some common algorithms used by the papers in thisresearch.
(a) Before FFT, x-Axis = Time, y-Axis= Intensity
(b) After FFT, x-Axis = Frequency, y-Axis = Power
Fig. 1: Input Data before and after a FFT
Source: [2]
FFT The Fast Fourier Transformation (FFT) transforms input data from itsoriginal domain into a frequency domain and vice versa. For this research, theoriginal domain is mostly time releated. Figure 1 shows the di�erence beforeand after a FFT. 1a used time and intensity as the domain, applying a FFT thedomain changes to frequency and power. Therby di�erent types of informationcan be gathered from the same set of data. In this example the red circle in 1bdescribes a pulsation peak frequency.
32 Niklas Sanger
Peak Detection Algorithms Peek detection algorithms try to �nd peaksand remove noise in a given set of data. A peak is larger than both elementsnext to it. In Fig 1b the red circle marks one of many peeks. Another part ofpeak detection algorithms is meassuring the distance between two peeks. Forexample, the amount of peaks can equal the amount of repetions of an exercise.The same can be done with the distance between peaks, those might equal thetime between repetitions.
Filter A �lter is applied to a set of data and removes elements which are notful�lling the criteria used. There are several �lters used by the papers in thisresearch. The Savitzky-Golay �lter, is a �lter used to smooth data points. Thiscan be used to smoothen data gathered from a gps sensor by removing noisecreated during location calculation. A low pass �lter removes elements which arebelow a certain limit, this can be used vice versa or in other di�erent variations.
3 Monitoring
This chapter will consider the di�erent types of monitoring and compare themwith each other. It will look into the techniques used to gather information andhow they are evalutaed. An important aspect for the evaluation is the groundtruth,it has to be manually protocolled and evaluated. The comparison betweenthe ground truth and the results gained by the teqchniques described, deter-mines the accuray and the success. In the following the nine papers used inthis researched are categorized into three di�erent groups, exercise monitoring,heartrate monitoring and lung function diagnosing.
3.1 Exercise Monitoring
This section will regard exercise monitoring for free weight lifting or resistancetraining and running rythm monitoring. In order to monitor free weights orresistance training, there are three di�erent aspects which can be monitored.The ground truth and testing environment can be found in Table 3.
� Repetition Detection to detect valid repetitions� Exercise Execution to detect the execution of an exercise and give feedbackto the user.
� Exercise Recognition to detect the exercise and process the incomming datacorrect.
Beginning with exercise recognition, Pernek et al. [6] use a smartphone and itssensors to detect repetitions on di�erent exercises. Their work should provide asimple user interface that can suggest training exercises and give feedback dur-ing the exercise [6]. They use resistance exercises that can be done in an closedenvironment like a gym (e.g. constraind exercises) or in an outdoor environment
Health Monitoring based on Smart Devices 33
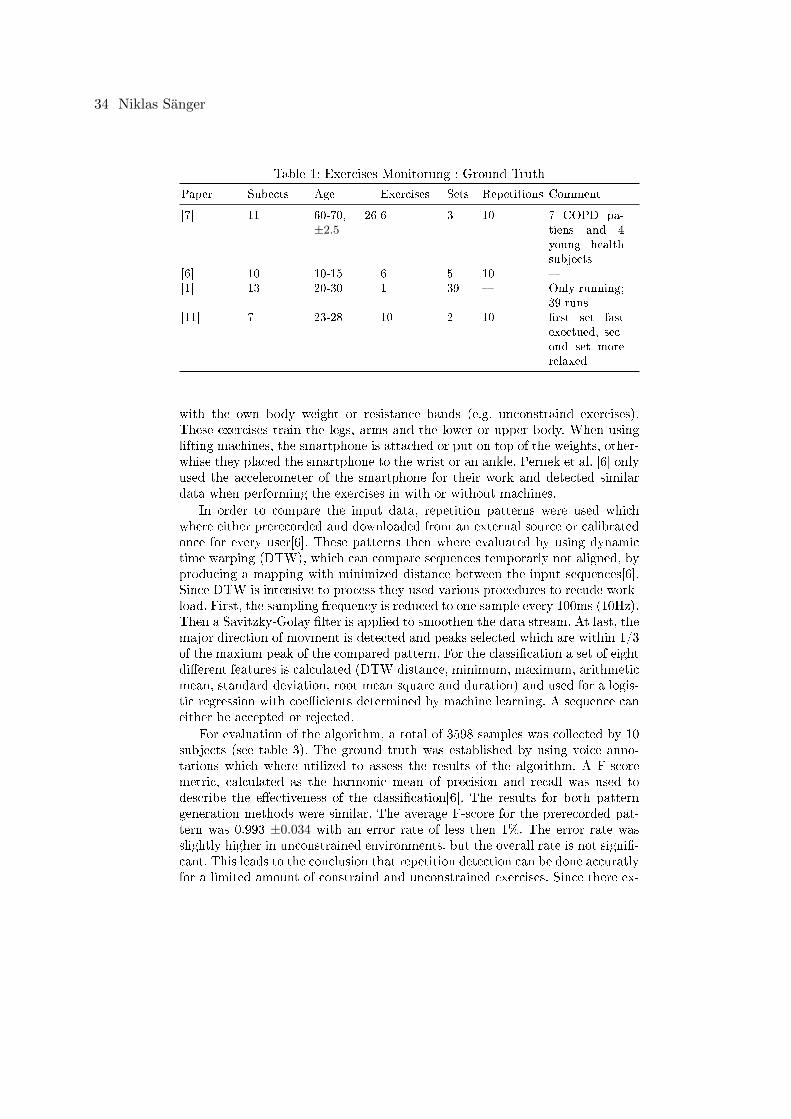
Table 1: Exercises Monitorung : Ground Truth
Paper Subects Age Exercises Sets Repetitions Comment
[7] 11 60-70, 26±2.5
6 3 10 7 COPD pa-tiens and 4young healthsubjects
[6] 10 10-15 6 5 10 �[1] 13 20-30 1 39 � Only running;
39 runs[11] 7 23-28 10 2 10 �rst set fast
exectued, sec-ond set morerelaxed
with the own body weight or resistance bands (e.g. unconstraind exercises).These exercises train the legs, arms and the lower or upper body. When usinglifting machines, the smartphone is attached or put on top of the weights, other-whise they placed the smartphone to the wrist or an ankle. Pernek et al. [6] onlyused the accelerometer of the smartphone for their work and detected similardata when performing the exercises in with or without machines.
In order to compare the input data, repetition patterns were used whichwhere either prerecorded and downloaded from an external source or calibratedonce for every user[6]. These patterns then where evaluated by using dynamictime warping (DTW), which can compare sequences temporarly not aligned, byproducing a mapping with minimized distance between the input sequences[6].Since DTW is intensive to process they used various procedures to recude work-load. First, the sampling frequency is reduced to one sample every 100ms (10Hz).Then a Savitzky-Golay �lter is applied to smoothen the data stream. At last, themajor direction of movment is detected and peaks selected which are within 1/3of the maxium peak of the compared pattern. For the classi�cation a set of eightdi�erent features is calculated (DTW distance, minimum, maximum, arithmeticmean, standard deviation, root mean square and duration) and used for a logis-tic regression with coe�cients determined by machine learning. A sequence caneither be accepted or rejected.
For evaluation of the algorithm, a total of 3598 samples was collected by 10subjects (see table 3). The ground truth was established by using voice anno-tations which where utilized to assess the results of the algorithm. A F-scoremetric, calculated as the harmonic mean of precision and recall was used todescribe the e�ectiveness of the classi�cation[6]. The results for both patterngeneration methods were similar. The average F-score for the prerecorded pat-tern was 0.993 ±0.034 with an error rate of less then 1%. The error rate wasslightly higher in unconstrained environments, but the overall rate is not signi�-cant. This leads to the conclusion that repetition detection can be done accuratlyfor a limited amount of constraind and unconstrained exercises. Since there ex-
34 Niklas Sanger
ist a lot of similar exercises, the approach should be able to work for a greatervariety of exercises with only small modi�cations.
For exercise execution, Spina et al. [7] describe an application called COPDTrainerin their paper. This application is developed for COPD (chronic obstructive pul-monary disease) patients to help them execute exercises and give them feedbackin a non-clinical environment. It should be used in coordination with a therapist.The feedback consists of information about exercise speed and correct execution(e.g. move the arm higher/lower). They attach a smartphone with a holster tothe wrist for upper body exercises and to an ankle for lower body exercises. Theapplication has a teach and a train mode. During the teach mode, any exercise ismonitored under a supervising therapist with a speci�ed amount of repetitions.Thus no audio feedback is provided. The train mode is unsupervised but spec-i�es an amount of repetitions for the user and gives him audio feedback. Thephone collects data using an accelerometer, a magnetometer and the Androidorientation API.
After the train mode, COPDTrainer processes the gathered data to receivemodel parameters. At �rst a moving average �lter is applied, using the windowsize proportional to the amount of data[7]. Then the exercise repetitions werecounted by estimating the position of positive and negative peaks using a hillclimbing algorithm with a peak threshold. A repetition was counted if bothsides (uphill and downhill from the minimum/maximum) were greater then thepeak threshold. Since the peaks can be lost during the peak detection, a peakcorrection algorithm was applied to add missing peaks or to remove addtionalpeaks. It works, by �rst removing redundant peaks and then insert peaks thatwere missed during the �rst iteration [7]. After the analysis, �ve parameters(number of repetitions, mean and standard deviation of repetition duration,mean and standard deviation of range of motion) were estimated. In trainmode,the incomming data stream was compared to the parameters estimated in teachmode. A sliding window was used to cover two average repetitions with an overlapof 75% [7]. The hill-climbing and peak correction algorithm was again appliedlike in the teach mode. To give the user in-time feedback, the �rst half of therepetition was evaluated for feedback. The di�erence between the �rst half andthe total repetition length was insigni�cant. Repetitions can be classi�ed intonine categories including too fast, too slow, too small, too large, the combinationfrom the previous four and correct. By this classi�cation, a simple feedbackinstruction can be given.
For the validation of the system, Spina et al. [7] used four healthy subjectsand eleven COPD patients performing six exercises a �ve sets with ten rep-etitions each (see table 3). Every test subject did one exercise supervised inteach mode and afterwards unsupervised in train mode. A therapist judged eachrepetition during train mode according to the de�ned categories for compari-sion. The ground truth was established by manually categorizing the raw sensordata. Among healthy subjects, the average classi�cation accuracy is 96.7%. Thelowest accuracy is in the categorie too slow and too small with 92% which is
Health Monitoring based on Smart Devices 35
mostly generated by Leg Lifts with an average accuracy of 77.5%. In order todetermine the accuracy for COPD patients, six sets of di�erent exercises havebeen removed because of recording issues. Another exercise repetition had tobe removed because the subject felt pain, leaving 1176 exercise repetitions. Theoverall average counting accuracy was 96.7% and average classi�cation accuracywas 87.5%. In 119 cases the audio feedback caused a change, in 79 cases thefeedback was ignored and in only 8 cases the feedback caused no change. Thisleads to the conclusion that COPDTrainer can improve the exercise executionand provide an accurate system to perform a special set of exercises at homeafter a supervised instruction.
Sundholm et al. [11] describe a pressure sensing matrix in their paper. This sens-ing matrix, called Smartmat, is utilized for counting repetitions and detectingdi�erent exercises. This matrix can be implemented easily in di�erent objects(e.g. gym mat). They focus on exercises which can be performed anywhere withfree weights or the bodyweight, since there is no practical application with ex-ercise machines. For their work, they only used the pressure sensing matrix.
Before analyzing the incomming data, they preprocess the data stream intoframes. In those frames, DC (direct current) and calibration noise are removedwith a median �lter and a compensation term. In order to identify the activityand count the repetitions, several features are needed. Therefore the area, theweight, the pressure and Hu's Seven Moments were calculated as the feature setfor each frame. Hu's seven moments are invariants with respect to translation,scale and rotation. The area is the sum of all pixel above a treshold. Weightis the sum of all pixels within an area. Finally pressure is weight divieded byarea. Hu's seven moments are used to describe the shape of the contact area. Toclassify the exercise categorie of a frame, mean, standard deviation, maximum,minimum, maximum - minimum, were determined. Then a k-nearest-neighbourclassi�er was applied to the feature set to determine an exercise. To evaluatethe incomming data stream, templates are needed for each exercise. Sundholmet al. [11] calculate templates for each exercise by recording di�erent instancesof an exercise, up and downsample it, to create equal length and calculate themean between all instances. When an exercise is recorded, it might be timeshifted to allign better with the exercise template. The recording is shifted tothe position where the cross-correlation between the recording and the templateis maximized. Recordings are also weighted in respect to their alignment withthe di�erent templates. To compare the incoming data stream with the createdtemplates, DTW is used to determine the Euclidian distance norm for all ten di-mensions. The exercise template with the smallest euclidian distance is selected.Exercises are counted when they are above a static threshold by using a peakdetection algorithm.
Sundholm et al. [11] evaluated two di�erent performances. First they usedseven subjects, performing ten prede�ned exercises with two sets a ten repeti-tions each, to evaluate the classi�cation (see table 3. When they used the �rst setof each subject for training and the second for testing, they reached an average
36 Niklas Sanger
of 88.7% for all exercises. Then they used one subject for testing and six subjectsfor training and reached an average accuracy of 82.5%, which showed that thesystem works with di�erent users. The slightly worse performance for multipleusers is connected to the di�erent execution styles for each user. For repetitiondetection, [11] also used a F1-score. This revealed that biceps curl has the lowestrecognition with 66% on average while lunges have 100% average detection. Thelow recognition rate of biceps curls can be explained through the subtle changein pressure since the exercise is performed standing. On the oterside, lunges haveonly a low variation in execution. The average F1 score for all exercises is 82.8%.In order to achieve better results for many user types, a better template foreach user is needed. In conclusion, Smartmat can detect changes is pressure andthereby identify exercises and repetitions. Although some exercises (e.g. bicepscurl) were hard to determine, the average rate of identi�cation makes it usablefor day to day use.
Another approach to monitor exercise execution is Runbuddy. Hao et al. [1]try to improve a users running rythm by giving him usefull feedback (e.g. runfaster/slower, play a special song, etc.) and thereby increase his motivation. Run-Buddy measures running rythm using a physiological metric called LocomotorRespiratory Coupling (LRC)[1]. It can be calculated as strides within each breathcycle and therefore Runbuddy needs to access a smartphones accelerometer andmicrophone. A humans LRC is two strides for each breath. To protect privacyand provide real time feedback, the incomming data has to be processed in realtime and should not be stored.
In order to detect breaths, the large incomming data from the microphonewith a samplerate of 16kHz is �lterd through a low pass �lter because the soundfrequency of a breath is in the range of 500 to 3500 Hz. Then the accustic signalis framed using a moving window which contains 40ms of acoustic signal with30ms overlapp. A feature set of the �rst seven mel-frequency cepstral coe�cantsare used for detection. At �rst use, training data has to be gathered in a quite en-vironment to ensure breathing can be captured with little noise. For each frame,the likelihood of containing a breath will be determined in comparison to thetraining data by calculating the cosine similarity. The cosine similarity reachesfrom -1 to 1 representing the minimum and the maximum degree of similarity.Stride detection utilizes the incomming datastream from the accelerometer. Haoet al. [1] project the incomming data onto a global coordinate system. A peakdetection algorithm with a short time window is applied to �nd peaks in verticalacceleraction. Since one stride contains one left step and one right step, a stridehas two peaks. The degree of correlation between breath and stride is calculatedby using generated LRC ratios and the detected strides to provide a more reli-able indicator of rythm changes. It is needed since breath detection is in�uencedby envrionmental noise which might have similar features to the users breath.The LRC ratio with the highest degree of correlation is chosen to represent theLRC ratio. Since runners tend to switch their running rythm more frequently, a10-second moving window was used.
Health Monitoring based on Smart Devices 37
For evaluation 13 subjects completed 39 runs which were about 526.1 min-utes. They used di�erent Bluetooth headset models to investigate the di�erenceof breath detection. The di�erent models performed similar. For the groundtruth, an inline mic was used to capture better recordings. Then a threadhold-based peak detection algorithm was applied. This was used in 34 of 39 runs. Forthe rest, the ground truth was established by manually labeling the recordinggathered by the bluetooth mic. Runners were classi�ed into Non-runner, Occa-sional runner and Regular runner. Test subjects were allowed to wear the phonewhereever they liked. The detected stride accuracy for all subjects was over 99%.The overall correct detection rate for indoor runs was 93.3% with the lowest of87.3% and the highest of 95.2%. The indoor testing resulted in di�erent trends.Female subjects tend to worse detection run through their lower breathing inten-sity. Also, subjects, who are non-runners are below the average because of theirinconsistent breathing. Indoor running has a slightly higher average accuracyof 93.5% in comparision to outdoor running with 91.4%. Even though the bestresult was achieved outdoors in a quite neighborhood with 95.2% because therewas only little ambient sound and no operating treadmills. In conclusion, Haoet al. [1] created a system that can robustly detect exercise execution and helpthe user to improve his performance by giving him valuable feedback.
The presented papers all leveraged a smartphone and its very basic sensors inorder to monitor exercise recognition, execution and repetition. The �rst threepapers all detected repetitions with similar techniques, the di�erence is whathappend after recognizing repetitions. While Pernek et al. [6] only recongnizedrepetitions, Sundholm et al. [11] also detected the exercise and Spina et al. [7]monitored the exercise execution. It is worth to mention, that all papers ap-proached their problem in the same way. At �rst they �ltered the incommingdata stream to a level they were comfortable with. Then they searched for fea-tures that they could use in order to classify the data and applied di�erentalgorithms. Amongst others, all of them used peak detection algorithms withtime-windows and �lters. In conclusion, they all used the same type smart de-vice and they all used similar techniques for evaluation but the results and theapplications were di�erent.
3.2 Heartrate Monitoring
Heart rate is the speed of the heartbeat. It is measured in beats per minute(bpm). The normal resting heartrate is inbetween 60-100bpm, although it de-pends on various factors like age, gender, weight, etc. Hearbeats lead to a slightincrease of the chest. This section will regard estimating the heart rate with-out the help of traditional devices. In order to estimate the heart rate, GPS,an accelerometer and a camera are used. Three di�erent approaches will be in-truduced. The ground truth and testing environment can be found in Table 2
� During Walking by utilizing incomming data and utilizing the oxygen uptakeand the physical load
38 Niklas Sanger
� Infront of a Camera by determining properties of the skin
Table 2: Heartrate Monitoring : Ground Truth
Paper Subects Activity GroundTruth
Comment
[10] 5 each subject walk on 5routes
wrist wir-less heartmonitor
subjects divided in 3 groups
[2] 10 perform cyclic motioninfront of camera
belt bandheart ratemonitor
�
[3] 43 � ECG mea-surements
measurements performed byprofessinal
Sumida et al. [10] describe a system that can estimate heart rate vartitionsduring walking. They only use an accelerometer and GPS sensors. In order tocalculate the heartrate, they estimate the physical load, the oxygen uptake andthe gradient since changes in those factors generate a change in heartrate. Tocalculate the heart rate, they focus on three requirements. Frist they measurethe physical load. Second they estimate the temopral changes of physical load.Lastly they need to adapt to di�erence depending on the user[10].
As feature set, they used the input data of the accelerometer (X-, Y-, Z-axesand the composition of all axes), oxygen uptake, walking speed and the gradient.Acceleration data is �rst �ltered using a FFT to remove DC compontents andthen split into �xed sized windows which contain the average amplitude. Walkingspeed is calculated by using dead reckoning which utilizes the accelerometersand gyro sensor. It is walking distance divided by walking speed. The distancesbetween two points are selected in a �xed time window. The gradient is thedi�erence in elevation between two points detected by the gps sensors. The twopoints are selected in a �xed time window. The oxygen demand is calculated asthe sum of
� Uptake at rest: set to 3.5,� Horizontal component of walking speed: speed and� Vertical component of walking speed: di�erence of elevation
in a �xed time window because walking speed and the gradient can changeunexpectedly. Then the trend of oxygen demand is determined in order to cal-culate the oxygen uptake. . The feature set is then used as input layer for amultilayered neuronal network which has an input layer, a middle layer and anoutput layer (see Figure 2). The network uses supervised learning and therbylearns the correlation by using training data. The computation is not done onthe smartphone, the user sends the data needed to a server which calculates
Health Monitoring based on Smart Devices 39
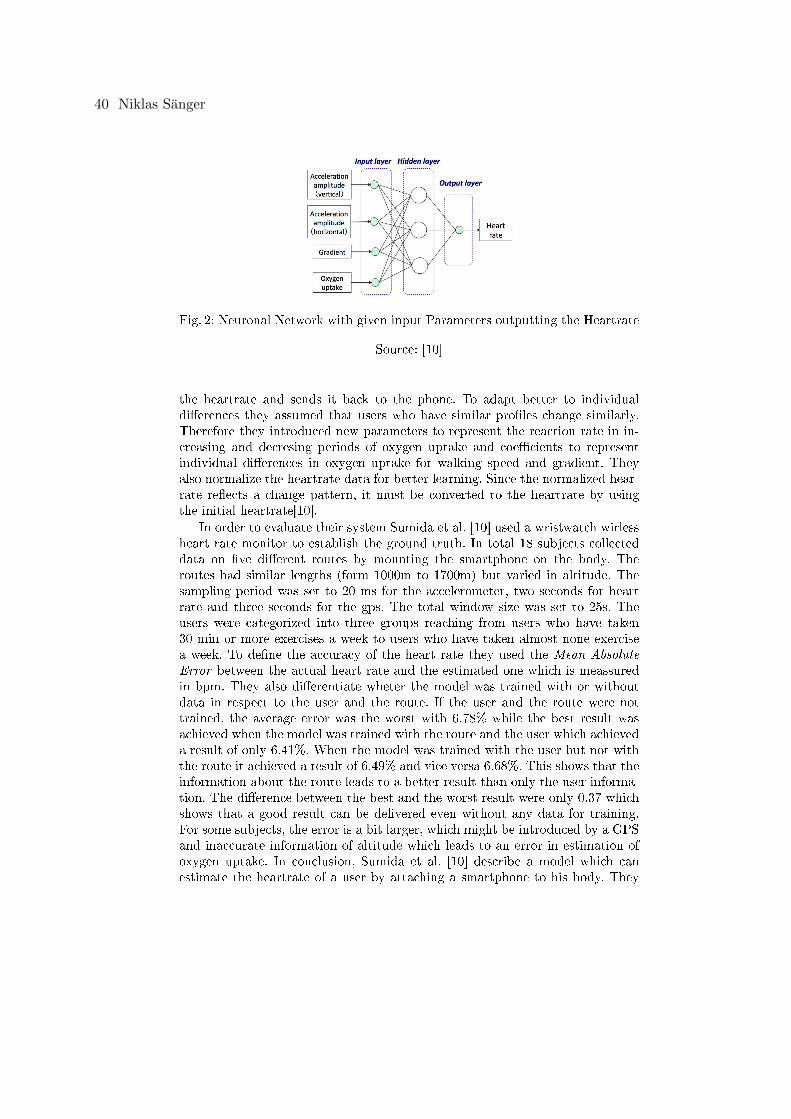
Fig. 2: Neuronal Network with given input Parameters outputting the Heartrate
Source: [10]
the heartrate and sends it back to the phone. To adapt better to individualdi�erences they assumed that users who have similar pro�les change similarly.Therefore they introduced new parameters to represent the reaction rate in in-creasing and decresing periods of oxygen uptake and coe�cients to representindividual di�erences in oxygen uptake for walking speed and gradient. Theyalso normalize the heartrate data for better learning. Since the normalized hear-rate re�ects a change pattern, it must be converted to the heartrate by usingthe initial heartrate[10].
In order to evaluate their system Sumida et al. [10] used a wristwatch wirlessheart rate monitor to establish the ground truth. In total 18 subjects collecteddata on �ve di�erent routes by mounting the smartphone on the body. Theroutes had similar lengths (form 1000m to 1700m) but varied in altitude. Thesampling period was set to 20 ms for the accelerometer, two seconds for heartrate and three seconds for the gps. The total window size was set to 25s. Theusers were categorized into three groups reaching from users who have taken30 min or more exercises a week to users who have taken almost none exercisea week. To de�ne the accuracy of the heart rate they used the Mean AbsoluteError between the actual heart rate and the estimated one which is meassuredin bpm. They also di�erentiate wheter the model was trained with or withoutdata in respect to the user and the route. If the user and the route were nottrained, the average error was the worst with 6.78% while the best result wasachieved when the model was trained with the route and the user which achieveda result of only 6.41%. When the model was trained with the user but not withthe route it achieved a result of 6.49% and vice versa 6.68%. This shows that theinformation about the route leads to a better result than only the user informa-tion. The di�erence between the best and the worst result were only 0.37 whichshows that a good result can be delivered even without any data for training.For some subjects, the error is a bit larger, which might be introduced by a GPSand inaccurate information of altitude which leads to an error in estimation ofoxygen uptake. In conclusion, Sumida et al. [10] describe a model which canestimate the heartrate of a user by attaching a smartphone to his body. They
40 Niklas Sanger
do this by utilizing various sensors which create input data for their neuronalnetwork which estimates the heartrate with an average error of 6.78 to 6.49 bpm.
Another approach to estimate the heartrate was done by Lagido et al. [3]. Theyuse a smartphone camera and an accelerometer to determine the users heartrate.Thereby a �nger has to be put on the camera lense with the �ashlight turnedon. They try to obtain a Photoplethysmogram signal (PPG), which is an opticalsignal that meassures changes within an organ. In this case, changes in lightabsorption over time need to be detected because each cardiac cycle pumpsblood through the body resulting in a peak in the PPG.
In order to meassure the PPG, a frame equals an image. The PPG is measuredby summing up each pixel of a frame where the red component of a pixelishigher than a treshold. The treshold is established by calculating the mean ofthe 90% percentile of the red color over �ve seconds. If the treshold is too high,signals might be lost and if it is too low there might be false peaks. Therefore,the treshold is continously validated by saving the ratio between treshold andthe average of red pixels for every frame in a time window. Then the meanvalue of those ratios must be within a �xed range. To check if the �nger iscorrectly aligned, a simple analysis of a frame is done. When a �nger is onthe camera sensor, the amout of colors for each pixel, ranging from 0 to 255,must be inbetween a certain range. Otherwhise there might be colors, whichare not similar to the human skin (e.g. blue, yellow). Sudden movements candistort the monitoring. Therefore the accelerometer is used to detect movementsby comparing the detected value to a pre de�ned maximum and to stop themeasurement if the maximum is reached. To detect the heartrate, the PPGsignals are �ltered with a rectangular smoothing function before applying apeak detection algorithm with a window size of �ve seconds. To detect heartrate variability, �ve criteria were extracted and interpreted.
For evaluation purposes, 43 heart failure patients performed heart rate mea-surement over a period of 60 seconds. Simultaneously a ECG measurement wastaken in a hospital to establish the ground truth. The average error rate amongthe patients was 4.75% with an average standard deviation of 2.61 beats perminute. Lagido et al. [3] describe relaible method to detect the heart rate byonly applying the �nger onto a camera lense.
Kitajima et al. [2] also try to estimate the heartrate by utilizing a camera.However, they do not need the user to put his �nger onto a camera. Instead theycan estimate the heartrate from a distance of up to six meters by analyzing theface of a user. They focus on the blood oxygenated hemoglobin which detects theintensity of green light. The intensity changes within each cardiac cycle whichcreates detectable peaks.
Before the intensity of green light can be calculated, the face of the user needsto be detected. When the face is detected, an area with small amount of motion(the area between eyes and mouth) is selected to calculate the green light. Todetect motion, the change in brightness is detected between consecutive images.
Health Monitoring based on Smart Devices 41
If there was a large amount of movement, the di�erence in brightness will behigh and vice versa. They applied a moving average �lter to the sections withhigh amount of motion and subtracted the average green light intensity. Thisresulted in the variation corresponding to the heartrate (See Figure 1a). Then aFFT was applied where the peak frequency multiplied with 60 equals the heartrate in beats per minute (Figure 1b).
To evaluate the heartrate, they had ten subjects which performed a cyclicmotion infront of a camera. The distance between the camera and the subjectwas set between two meters up to six meters. The light intensity also varied from30 lux up to 2000lux. To establish the ground truh, a belt band heart rate mon-itor was used. In a normally lit room (∼1000lux), the average error upto fourmeter distance to the camera was two bpm. Between four and six meters, theerror increased to three bpm. When the luminance in the room was less then 500lux, the average error rate was arround four bpm. In between 500 and 1000 luxthe average error was arround three bpm and beyond that it was only two bpm.In case of lateral motion the average error was within three bpm while verticalmotion had an average error of �ve bpm which is connected to the greater e�ectsin lighting.
The presented papers measure the heart rate with di�erent approaches. Thelast one is performing the best with an average error of only two to three bpmeven though it uses a similar technuiqe as presented by Lagido et al. [3]. Besidesdetecting red or green pixels, the main di�erence between the last two papers wasthe handling of motion. While the last paper tried to determine the heartratewhile sensing motion, the second one stopped calculating until the phone wasbelow a certain limit of movement. In comparison to the last two papers, the �rstone also utilizes certain correlations regarding the heartrate, but estimates thecorrelations based on di�erent input data. This shows that di�erent combinationof sensors and analysing techniques can lead to almost the same results eventhough their area of application is completley di�erent.
3.3 Lung Function Diagnosing
This section will regard the detection of the lung function. Lung function is mostcommonly tested with medical devices like a spirometer. These devices measureinstantaneous �ow and cumulative volume while the user forcefully exhales. Allthe papers presented will detect the following lung features :
� Forced Vital Capacity (FVC) the total expelled volume,� Forced Expiratory Volume in one Second (FEV1) the volume exhaled in the�rst second,
� FEV1/FVC and� Peak Expiratory Flow (PEF) the maximum �ow during the test.
. Therefore they all will utilize a microphone which is provided by a smartphone.
42 Niklas Sanger
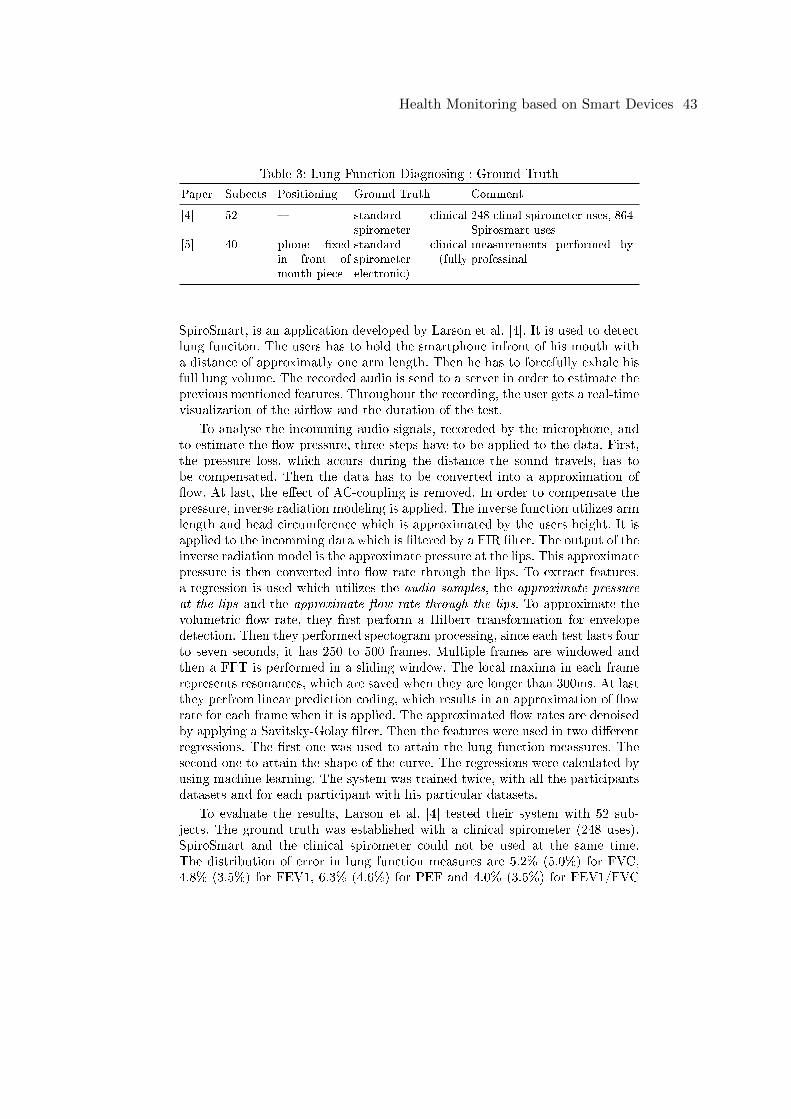
Table 3: Lung Function Diagnosing : Ground Truth
Paper Subects Positioning Ground Truth Comment
[4] 52 � standard clinicalspirometer
248 clinal spirometer uses, 864Spirosmart uses
[5] 40 phone �xedin front ofmouth piece
standard clinicalspirometer (fullyelectronic)
measurements performed byprofessinal
SpiroSmart, is an application developed by Larson et al. [4]. It is used to detectlung funciton. The users has to hold the smartphone infront of his mouth witha distance of approximatly one arm length. Then he has to forcefully exhale hisfull lung volume. The recorded audio is send to a server in order to estimate theprevious mentioned features. Throughout the recording, the user gets a real-timevisualization of the air�ow and the duration of the test.
To analyse the incomming audio signals, recoreded by the microphone, andto estimate the �ow pressure, three steps have to be applied to the data. First,the pressure loss, which accurs during the distance the sound travels, has tobe compensated. Then the data has to be converted into a approximation of�ow. At last, the e�ect of AC-coupling is removed. In order to compensate thepressure, inverse radiation modeling is applied. The inverse function utilizes armlength and head circumference which is approximated by the users height. It isapplied to the incomming data which is �ltered by a FIR �lter. The output of theinverse radiation model is the approximate pressure at the lips. This approximatepressure is then converted into �ow rate through the lips. To extract features,a regression is used which utilizes the audio samples, the approximate pressureat the lips and the approximate �ow rate through the lips. To approximate thevolumetric �ow rate, they �rst perform a Hilbert transformation for envelopedetection. Then they performed spectogram processing, since each test lasts fourto seven seconds, it has 250 to 500 frames. Multiple frames are windowed andthen a FFT is performed in a sliding window. The local maxima in each framerepresents resonances, which are saved when they are longer than 300ms. At lastthey perfrom linear prediction coding, which results in an approximation of �owrate for each frame when it is applied. The approximated �ow rates are denoisedby applying a Savitsky-Golay �lter. Then the features were used in two di�erentregressions. The �rst one was used to attain the lung function meassures. Thesecond one to attain the shape of the curve. The regressions were calculated byusing machine learning. The system was trained twice, with all the participantsdatasets and for each participant with his particular datasets.
To evaluate the results, Larson et al. [4] tested their system with 52 sub-jects. The ground truth was established with a clinical spirometer (248 uses).SpiroSmart and the clinical spirometer could not be used at the same time.The distribution of error in lung function measures are 5.2% (5.0%) for FVC,4.8% (3.5%) for FEV1, 6.3% (4.6%) for PEF and 4.0% (3.5%) for FEV1/FVC
Health Monitoring based on Smart Devices 43
when the system was trained with all (personalized) datasets. Accuracy can im-prove when a personalized test ist used, especially for patients with abnormallung function. SprioSmart tends to slightly over-estimate the actual value forabnormal patients, which is due to two patients where inconsistent results wererecorded. Those patients can be considerd outliers. They also looked at sometrends. Thereby they found out that using a mouthpiece can decrese the errorrate for FEV1 about 0.5% and for PEF about 1.0% on average. Also, a �xeddistance to the microphone lead to no signi�cant changes. Larson et al. [4] alsocreated a survey for pulmonologists to evaluate cruves created by SpiroSmart.Thereby they could compare their results with professional results. Eight out often graphs were determined the same as by SpiroSmart. In the other two cases,the result was either classi�ed as restrictive or as false negative which would leadto a more detailed professional analysis. In conclusion, SpiroSmart is not able toreplace a clinical spirometer but it can compete to handheld spirometers whichdeliver similar results. This makes SpiroSmart a usefull tool for home monitoringin addition to clinical diagnosis.
Laure and Paramonov [5] describe a system called mCOPD. It is made for COPDevaluation and can determine the previously mentioned lung features. The cal-culation is completley done on the smartphone and needs no communication toa server. It also gives the patient guidance to perform breathing exercises whichare playfully supported by two small games.
Before the incomming audio signal, which is recorded by the smartphonemicrophone, can be preprocessed, natural �ow turbulances are eliminated byapplying generated wind noise. Then the data is preprocessed in a frequencydomain model by �rst applying a low-pass �lter and then a FFT. This resultsin the air�ow speed. After that, a machine learning regression is applied in thefrequency response domain. It uses training samples and historic research. Thisoutputs the wind speed. In post-processing the wind speed will be used to calcu-late the lung features. Laure and Paramonov [5] provide two games to performbreathing exercises. Both games have a ball that needs to be hold in an specialarea in order to win the game. The position of the ball varries with the strengthof the patients breath. The �rst game requires the user to breath slow and evenlyfor as long as possible through their pursed lips. The second game requires theuser to train diaphgramatic breathing, which strengthens the diphagram andabdominal muscles by breathing without using the chest muscles[5].
Laure and Paramonov [5] used 40 subjects in order to evaluate their results.The ground truth was established by using a clinal spirometer. When comparingthe results of mCOPD to a clinical spriometer, the smartphone was behind thespriometer, so both devices mesaured the lung function during the same testrun. The distance to the device was very close and there was no resistance inthe mouth piece which would have resulted in decrease of air�ow. This resultedin a average deviation of 6.5% in FVC, 3.6% in FEV1 and 3.9% in FEV1/FVC.In conclusion. mCOPD provides a simple solution to determine the LUNG fea-tures and can help the user to perform breathing exercises. It does that with the
44 Niklas Sanger
average deviation for all features of less than 6.5%.
When comparing the previously presented approaches to meassure and to esti-mate lung function, both deliver relativly similar error rates. Although it hasto be noted that SpiroSmart has more ground truth data. SpiroSmart uses afar more complicated algorithm to determine the lung function which can bepersonalized even better that mCOPDs.
4 Conclusion
Smart devices are becomming more popular and the technology is becommingmore powerfull which will not only increase the computational power of a smartdevice but also the accuracy of its sensors. There might even be new sensorswhich will open completely new �elds in monitoring.
In this research almost only smartphone were used to monitor exercises,heartrate or lung functions. Besides the lack of computational power o�ered bysmartwatches or wristbands, most of the researches presented were publishedover one year ago, but smartwatches and wristbands have just started to gainpopularity over the last two years. It is possible to combine multiple smartdevices. For example, a smart wristband can send data to the smartphone viabluetooth. The smartphone then processes the data with its more powerfullprocessor. With that beeing said, combining not only the sensors and devices,but also the techniques used can lead to more powerfull feature exertraction andmore accurate results.
The presented techniques in exercise monitoring are able to detect repetitons,execution and the actual exercise. They can perform exercise monitoring witha low error rate while having a reasonably high amount of ground truth data.The feedback they supply can really help the user to improve his �tness leveland general training results. Heartrate monitoring can be done in di�erent wayswithout special hardware. The detected heartrate, wheter it was detected witha camera or by utilizing an accelerometer, is not as accuracte as a professionalclinical device, but it has only a small error rate of less then �ve bpm on average.This makes it usuable for home monitoring and detecting trends. Lung functionmonitoring is similar to heartrate monitoring. The results have an average errorof less than 7% for all features, this is only suitable for home monitoring, per-forming exercises and especially detect trends which can lead to treatment or aprofessional review.
Health monitoring on smart devices is obviously not as accurat as on clinicaldevices. But this is not the point in monitoring. Although smart devices try toreceive as good and accurate results as possible, the main idea is to detect trendsand give the user a simple tool to check his health condition and improve it. Thepresented techniques are able to do so for a great amount of people withoutany professional calibration or help. The short term goal for monitoring withsmart devices should be providing accurate information about trends (e.g. lungfunction) and in the long term they should provide exact information.
Health Monitoring based on Smart Devices 45
Bibliography
[1] Hao, T., Xing, G., Zhou, G.: Runbuddy: A smartphone system for runningrhythm monitoring. In: UbiComp'15 (2015)
[2] Kitajima, T., Choi, S., Murakami, E.A.Y.: Heart rate estimation based oncamera image. Tech. rep., Samsung (2014)
[3] Lagido, R.B., Lobo, J., Leite, S., Sousa, C., Ferreira, L., Silva-Cardoso, J.:Using the smartphone camera to monitor heart rate and rhythm in heartfailure patients. Tech. rep., Associacao Fraunhofer Portugal Research andFaculdade de Medicina da Universidade do Porto (2014)
[4] Larson, E.C., Goel, M., Boriello, G., Heltshe, S., Rosenfeld, M., Patel, S.N.:Spirosmart: Using a microphone to measure lung function on a mobilephone. In: UbiComp'12 (2012)
[5] Laure, D., Paramonov, I.: mcopd: Mobile phone based lung function diag-nosis and exercise system for copd. Tech. rep., University of California, LosAngeles (2013)
[6] Pernek, I., Hummel, K.A., Kokol, P.: Exercise repetition detection for resis-tance training based on smartphones. In: Pers Ubiquit Comput. Springer-Verlag London (2013)
[7] Spina, G., Huang, G., Vaes, A., Spruit, M., Amft, O.: Copdtrainer: Asmartphone-based motion rehabilitation training system with real-timeacoustic feedback. In: UbiComp'13 (2013)
[8] Statista: Fitness worldwide. Website (2015), online :https://de.statista.com/outlook/313/100/fitness/weltweit#market-revenue
[9] Statista: Smartphones sales worldwide. Website (2016),online :http://www.statista.com/statistics/263437/global-smartphone-sales-to-end-users-since-2007/
[10] Sumida, M., Mizumoto, T., Yasumoto, K.: Estimating heart rate variationduring walking with smartphone. In: UbiComp'13 (2013)
[11] Sundholm, M., Cheng, J., Zhou, B., Sethi, A., Lukowicz, P.: Smart-mat:Recognizing and counting gym exercises with low-cost resistive pressuresensing matrix. In: UbiComp'14 (2014)
46 Niklas Sanger
Semantics support location-aware systems �
Semantic trajectory mining
Dominik Köhler∗
Betreuer: Antonios Karatzoglou†
Karlsruher Institut für Technologie (KIT)Pervasive Computing Systems � TECO
Zusammenfassung. Standortvorhersagen �nden häu�g Anwendung inmobilen Assistenten, Werbung oder sozialen Netzwerken. Klassische An-sätze zur Standortvorhersage, wie die Anwendung von Markov Modellen,beachten jedoch nur geogra�sche und vernachlässigen dabei semantischeEigenschaften einer Trajektorie. Ein Verfahren, dass durch Anwendungvon semantischen Trajektorien eine bessere Standortvorhersage bietenwill, wird in Ying [4] vorgestellt. Dieses Verfahren ermöglicht beispiels-weise Standortvorhersagen für einen Benutzer in einer bisher unbekann-ten Stadt.Zu Beginn der Arbeit wird ein klassischer Ansatz mit Markov Model-len beschrieben. Im weiteren Verlauf wird das neuartige Verfahren vonYing [4] vorgestellt sowie mögliche Probleme mit diesem erläutert. Dabeiwerden Ähnlichkeiten und Unterschiede beider Verfahren aufgezeigt.
Schlüsselwörter: Standortvorhersage, Trajektorien, Semantische Tra-jektorien, Markov Modelle, Data mining
1 Einleitung
Mobile Assisten wie Google Now oder Siri haben das Ziel unseren Alltag zu ver-einfachen. Solche Systeme verwenden kontextbasierte Informationen, um Vor-hersagen über den nächsten Aufenthalt zu tätigen und dabei für den Benutzerrelevante Informationen anzuzeigen. Zwei wichtige kontextbasierte Informatio-nen sind Ort und Zeit. Diese Daten werden gesammelt und können für zukünftigekontextbasierte Vorhersagen ausgewertet werden. Beispiele für kontextbasierteVorhersagen sind der nächste Aufenthalt des Benutzers sowie damit verbundenenInformationen wie Ö�nungszeiten, Wetterdaten etc. Es ist also notwendig einemöglichst genaue Standortvorhersage tre�en zu können. Eine solche Vorhersagebasiert auf kontextbasierten Informationen, die in der Vergangenheit liegen.Es gibt verschiedene Ansätze um Standortvorhersagen zu tre�en. Ein klassischesVerfahren, welches Markov Modelle verwendet um die Wahrscheinlichkeiten einesnächsten Standortes des Benutzers zu bestimmen, wird in Ashbrook [1] beschrie-ben. Solche Verfahren gehören zur Kategorie der sogenannten "general-pattern-based"Verfahren und basieren meist auf häu�ges und ähnliches Verhalten eines
Semantics support location-aware systems – Semantic trajectory mining 47
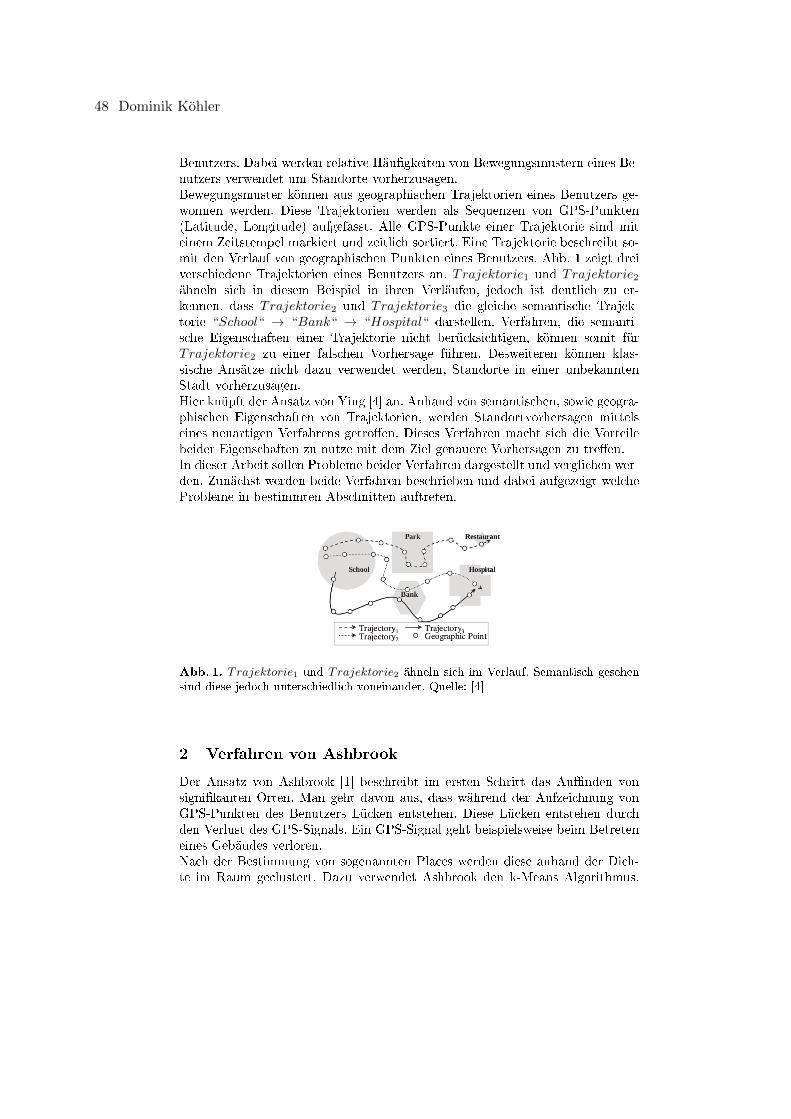
Benutzers. Dabei werden relative Häu�gkeiten von Bewegungsmustern eines Be-nutzers verwendet um Standorte vorherzusagen.Bewegungsmuster können aus geographischen Trajektorien eines Benutzers ge-wonnen werden. Diese Trajektorien werden als Sequenzen von GPS-Punkten(Latitude, Longitude) aufgefasst. Alle GPS-Punkte einer Trajektorie sind miteinem Zeitstempel markiert und zeitlich sortiert. Eine Trajektorie beschreibt so-mit den Verlauf von geographischen Punkten eines Benutzers. Abb. 1 zeigt dreiverschiedene Trajektorien eines Benutzers an. Trajektorie1 und Trajektorie2ähneln sich in diesem Beispiel in ihren Verläufen, jedoch ist deutlich zu er-kennen, dass Trajektorie2 und Trajektorie3 die gleiche semantische Trajek-torie “School“ → “Bank“ → “Hospital“ darstellen. Verfahren, die semanti-sche Eigenschaften einer Trajektorie nicht berücksichtigen, können somit fürTrajektorie2 zu einer falschen Vorhersage führen. Desweiteren können klas-sische Ansätze nicht dazu verwendet werden, Standorte in einer unbekanntenStadt vorherzusagen.Hier knüpft der Ansatz von Ying [4] an. Anhand von semantischen, sowie geogra-phischen Eigenschaften von Trajektorien, werden Standortvorhersagen mittelseines neuartigen Verfahrens getro�en. Dieses Verfahren macht sich die Vorteilebeider Eigenschaften zu nutze mit dem Ziel genauere Vorhersagen zu tre�en.In dieser Arbeit sollen Probleme beider Verfahren dargestellt und verglichen wer-den. Zunächst werden beide Verfahren beschrieben und dabei aufgezeigt welcheProbleme in bestimmten Abschnitten auftreten.
Abb. 1. Trajektorie1 und Trajektorie2 ähneln sich im Verlauf. Semantisch gesehensind diese jedoch unterschiedlich voneinander. Quelle: [4]
2 Verfahren von Ashbrook
Der Ansatz von Ashbrook [1] beschreibt im ersten Schritt das Au�nden vonsigni�kanten Orten. Man geht davon aus, dass während der Aufzeichnung vonGPS-Punkten des Benutzers Lücken entstehen. Diese Lücken entstehen durchden Verlust des GPS-Signals. Ein GPS-Signal geht beispielsweise beim Betreteneines Gebäudes verloren.Nach der Bestimmung von sogenannten Places werden diese anhand der Dich-te im Raum geclustert. Dazu verwendet Ashbrook den k-Means Algorithmus.
48 Dominik Kohler
Die entstandenen Cluster werden Locations genannt. Einer Location wird dabeider Mittelwert aller enthaltenen GPS-Koordinaten von Places als geographischesAttribut zugewiesen. Um Sublocations zu erhalten wird k-Means wiederholt aufeine Location angewandt. Wurde zum Beispiel eine University Location geclus-tert, so kann diese den ganzen Campus repräsentieren. Möchte man jedoch auchdie einzelnen Gebäude der Universität berücksichtigen, können durch Anwen-dung von k-Means auf diese Location weitere Sublocations geclustert werden.Dies ermöglicht das Erstellen von dichten Locations.Am Ende des Verfahrens wird für alle gefundenen Locations eines Benutzers einMarkov Modell erstellt. Jeder Knoten im Markov Modell reprästentiert dabeieine Location und jede Kante die Wahrscheinlichkeit eines Übergangs des Be-nutzers von Location A zu Location B. Verwendet man Markov Modlle n-terOrdnung so werden die Wahrscheinlickeiten präziser, da schon besuchte Locati-ons mit in die Wahrscheinlichkeiten eines Übergangs einbezogen werden.
2.1 Places
Ashbrook geht davon aus, dass während der Aufzeichnung von GPS-Punkten,Lücken entstehen. Dies wird durch Signalabbrüche des aufzeichnenden GPS-Gerätes begründet. Betritt man zum Beispiel ein Gebäude, geht das Signal ver-loren. Dadurch sollen sich signi�kante Orte bzw. sogenannte Places �nden lassen.Das bedeutet wiederum, dass Orte wie Freibäder und Parks nicht als signi�kanteOrte erkannt werden.Zur Festlegung eines signi�kanten Ortes muss die Di�erenz der GPS-Punkte,nach und vor dem Signalverlust, mindestens einem Schwellenwert entsprechen.Dieser Parameter darf nicht zu klein ausfallen, da ansonsten bei kurzen Signalver-lusten fälschlicherweise ein Place erkannt wird. Kürzere Signalverluste in Städ-ten, sind aufgrund von Störfaktoren nicht zu vermeiden. Auÿerdem benötigt dasGerät eine gewisse Zeit bis es wieder ein Signal erfassen kann.Diese Art der Bestimmung von signi�kante Orten ist stark auf den von Ashbrookverwendeten Datensatz angepasst. Dieser wurde wiederum anhand eines einzi-gen Benutzers erstellt. Der genaue Ablauf der Aufzeichnung und die Strukturdes Datensatzes waren also im Voraus bekannt. In Datensätzen ohne Vorkennt-nis der Vollständigkeit muss jedoch garantiert sein, dass Benutzer kontinuierlichGPS-Daten aufzeichnen. Unter realen Bedingungen kann es vorkommen, dassdas aufzeichnende Gerät ausgeschaltet oder die Aufzeichnung gestoppt wird.Dadurch würden Lücken entstehen die fälschlicherweise als Places erkannt wer-den. Eine mögliche Vor�lterung von �falschen� Lücken ist schwer, da nachträglichnicht nachvollzogen werden kann aus welchem Grund eine Lücke entstanden ist.
2.2 Locations
Die festgelegten Places können noch nicht zur Vorhersage verwendet werden.Aufgezeichnete GPS-Punkte können sich um mehrere Meter unterscheiden, ob-wohl der Benutzer den gleichen Ort besucht hat. Dadurch würden verschiedeneVorhersagen für gleich Orte getro�en werden.
Semantics support location-aware systems – Semantic trajectory mining 49
Zur Behebung des Problems wird ein Clustering Algorithmus verwendet, derPlaces aufgrund ihrer Dichte clustert. Solche Cluster werden als Location be-zeichnet. Dieser Schritt stellt einen wesentlichen Unterschied zum Ansatz vonYing dar. Dieser clustert Places nicht nur anhand ihrer Dichte sondern auchanhand der �Popularität� eines Places. Ein Place wird als populär betrachtet,sobald eine Mindestanzahl verschiedener Personen ihn besucht hat. Places, dienicht als populär erkannt werden können, markiert der von Ying verwendete Al-gorithmus als Rauschen.Ashbrook verwendet den k-Means Algorithmus, welcher kein Rauschen erzeugt.Dadurch bleiben persönliche Places erhalten und werden einer Location zuge-teilt. Es können jedoch auch Locations enstehen, welche eine geringe Signifkanzbesitzen und wenig zur Vorhersage beitragen.Im nächsten Schritt werden zudem potenzielle Sublocations gefunden. Ein zugroÿ gewählter Radius des k-Means Algorithmus kann dafür sorgen, dass nahe-liegende Locations zusammengefasst werden. Ein zu klein gewählter Radius kannhingegen zu vielen Locations mit nur einem Place führen. Doch selbst bei derrichtigen Wahl des Radius wird die Dichte von Places teilweise missachtet. Sokönnen Locations aus mehreren dichten Bereichen entstehen, welche aufgrundvon Ausreiÿern miteinander in Verbindung gebracht werden. Ziel ist es Subloca-tions in Locations einzufügen. Dafür wird k-Means auf eine Location angewandt.
2.3 Vorhersage
Zur Vorhersage wird ein Markov Modell der Locations erstellt. Dazu wird derVerlauf der Places eines Benutzers in eine Liste von Locations umgewandelt.Dadurch kann nachvollzogen werden in welcher Reihenfolge bestimmte Locati-ons besucht wurden. Es können relative Häu�gkeiten ermittelt und damit dieWahrscheinlichkeit für den nächsten Aufenthalt berechnet werden. Ein Knotenim Markov Modell entspricht dabei einer Location. Eine Kante zwischen Knotengibt die Wahrscheinlichkeit an, mit der die Person diese Location besuchen wird.Hat sich ein Benutzer noch nie zwischen zwei Locations bewegt, ist die entspre-chende Wahrscheinlichkeit null. Markov Modelle n-ter Ordnung ermöglichen andieser Stelle genauere Wahrscheinlichkeiten und somit bessere Vorhersagen. DerGrund liegt darin, dass schon besuchte Locations in die Wahrscheinlichkeitenmiteinbezogen werden. Dabei sollte die Ordnung entsprechend der Gröÿe desDatensatzes gewählt werden.Zur Vorhersage werden die aktuellen Übergänge eines Benutzers zwischen Lo-cations betrachtet und mit denen im Markov Modell abgeglichen. Stimmen dieÜbergänge kann die nächste Location mit der höchsten relativen Wahrschein-lichkeit vorhergesagt werden.Desweiteren können nur Locations vorhergesagt werden die bereits einmal be-sucht wurden. Unbekannte Orte können nicht zur Vorhersage verwendet werden.Genau aus diesen Gründen beschreibt Ying ein neuartiges Verfahren, dass dieseProbleme lösen soll.
50 Dominik Kohler
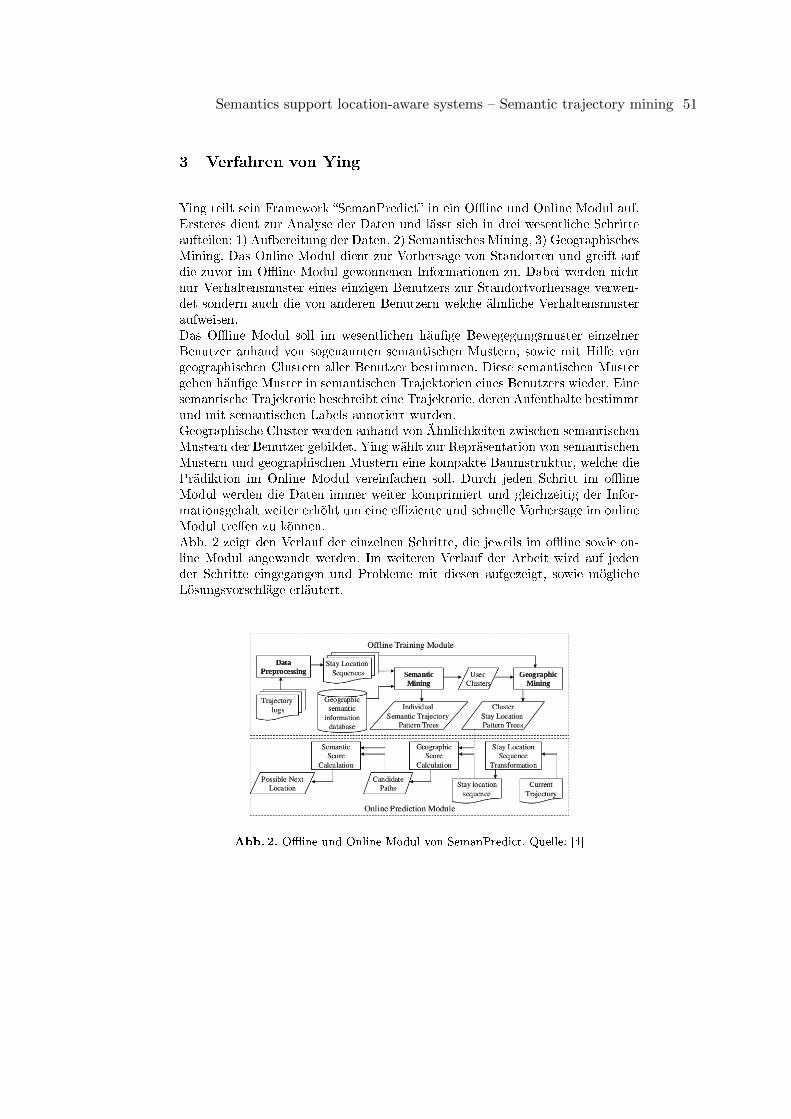
3 Verfahren von Ying
Ying teilt sein Framework �SemanPredict� in ein O�ine und Online Modul auf.Ersteres dient zur Analyse der Daten und lässt sich in drei wesentliche Schritteaufteilen: 1) Aufbereitung der Daten, 2) Semantisches Mining, 3) GeographischesMining. Das Online Modul dient zur Vorhersage von Standorten und greift aufdie zuvor im O�ine Modul gewonnenen Informationen zu. Dabei werden nichtnur Verhaltensmuster eines einzigen Benutzers zur Standortvorhersage verwen-det sondern auch die von anderen Benutzern welche ähnliche Verhaltensmusteraufweisen.Das O�ine Modul soll im wesentlichen häu�ge Bewegegungsmuster einzelnerBenutzer anhand von sogenannten semantischen Mustern, sowie mit Hilfe vongeographischen Clustern aller Benutzer bestimmen. Diese semantischen Mustergeben häu�ge Muster in semantischen Trajektorien eines Benutzers wieder. Einesemantische Trajektorie beschreibt eine Trajektorie, deren Aufenthalte bestimmtund mit semantischen Labels annotiert wurden.Geographische Cluster werden anhand von Ähnlichkeiten zwischen semantischenMustern der Benutzer gebildet. Ying wählt zur Repräsentation von semantischenMustern und geographischen Mustern eine kompakte Baumstruktur, welche diePrädiktion im Online Modul vereinfachen soll. Durch jeden Schritt im o�ineModul werden die Daten immer weiter komprimiert und gleichzeitig der Infor-mationsgehalt weiter erhöht um eine e�ziente und schnelle Vorhersage im onlineModul tre�en zu können.Abb. 2 zeigt den Verlauf der einzelnen Schritte, die jeweils im o�ine sowie on-line Modul angewandt werden. Im weiteren Verlauf der Arbeit wird auf jedender Schritte eingegangen und Probleme mit diesen aufgezeigt, sowie möglicheLösungsvorschläge erläutert.
Abb. 2. O�ine und Online Modul von SemanPredict. Quelle: [4]
Semantics support location-aware systems – Semantic trajectory mining 51
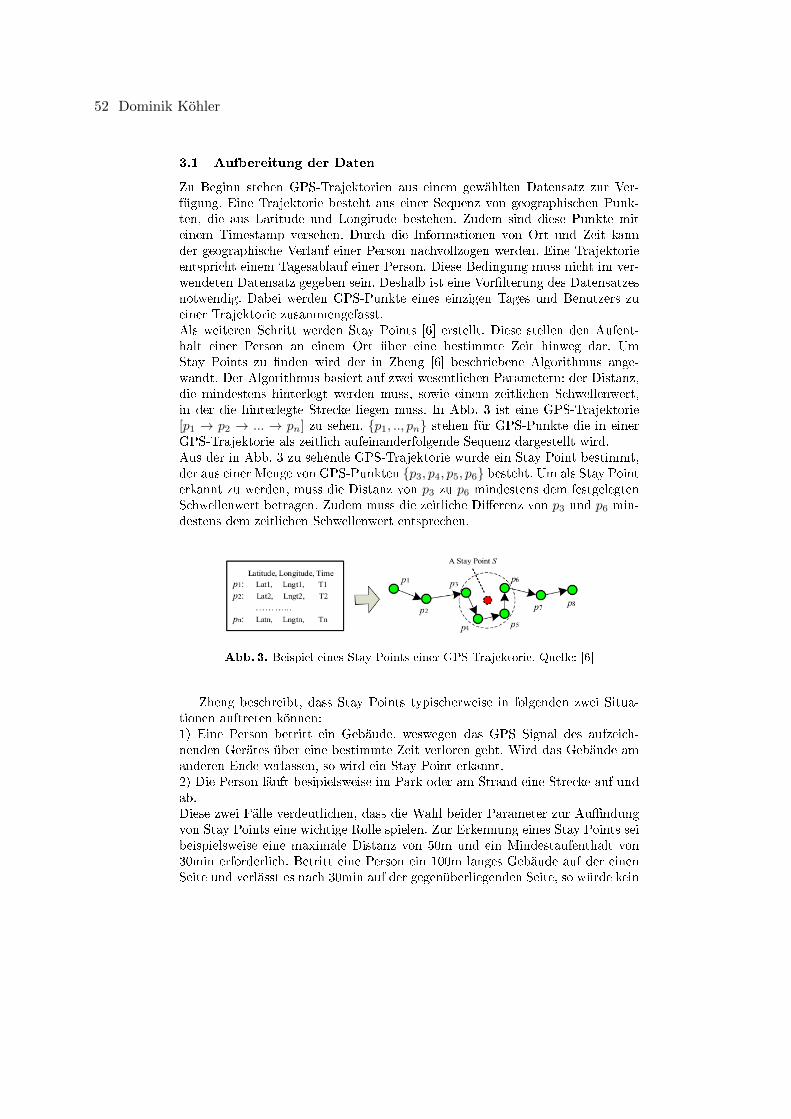
3.1 Aufbereitung der Daten
Zu Beginn stehen GPS-Trajektorien aus einem gewählten Datensatz zur Ver-fügung. Eine Trajektorie besteht aus einer Sequenz von geographischen Punk-ten, die aus Latitude und Longitude bestehen. Zudem sind diese Punkte miteinem Timestamp versehen. Durch die Informationen von Ort und Zeit kannder geographische Verlauf einer Person nachvollzogen werden. Eine Trajektorieentspricht einem Tagesablauf einer Person. Diese Bedingung muss nicht im ver-wendeten Datensatz gegeben sein. Deshalb ist eine Vor�lterung des Datensatzesnotwendig. Dabei werden GPS-Punkte eines einzigen Tages und Benutzers zueiner Trajektorie zusammengefasst.Als weiteren Schritt werden Stay Points [6] erstellt. Diese stellen den Aufent-halt einer Person an einem Ort über eine bestimmte Zeit hinweg dar. UmStay Points zu �nden wird der in Zheng [6] beschriebene Algorithmus ange-wandt. Der Algorithmus basiert auf zwei wesentlichen Parametern: der Distanz,die mindestens hinterlegt werden muss, sowie einem zeitlichen Schwellenwert,in der die hinterlegte Strecke liegen muss. In Abb. 3 ist eine GPS-Trajektorie[p1 → p2 → ... → pn] zu sehen. {p1, .., pn} stehen für GPS-Punkte die in einerGPS-Trajektorie als zeitlich aufeinanderfolgende Sequenz dargestellt wird.Aus der in Abb. 3 zu sehende GPS-Trajektorie wurde ein Stay Point bestimmt,der aus einer Menge von GPS-Punkten {p3, p4, p5, p6} besteht. Um als Stay Pointerkannt zu werden, muss die Distanz von p3 zu p6 mindestens dem festgelegtenSchwellenwert betragen. Zudem muss die zeitliche Di�erenz von p3 und p6 min-destens dem zeitlichen Schwellenwert entsprechen.
Abb. 3. Beispiel eines Stay Points einer GPS Trajektorie. Quelle: [6]
Zheng beschreibt, dass Stay Points typischerweise in folgenden zwei Situa-tionen auftreten können:1) Eine Person betritt ein Gebäude, weswegen das GPS Signal des aufzeich-nenden Gerätes über eine bestimmte Zeit verloren geht. Wird das Gebäude amanderen Ende verlassen, so wird ein Stay Point erkannt.2) Die Person läuft besipielsweise im Park oder am Strand eine Strecke auf undab.Diese zwei Fälle verdeutlichen, dass die Wahl beider Parameter zur Au�ndungvon Stay Points eine wichtige Rolle spielen. Zur Erkennung eines Stay Points seibeispielsweise eine maximale Distanz von 50m und ein Mindestaufenthalt von30min erforderlich. Betritt eine Person ein 100m langes Gebäude auf der einenSeite und verlässt es nach 30min auf der gegenüberliegenden Seite, so würde kein
52 Dominik Kohler
Stay Point erkannt, da die Distanz den erlaubten Wert überschreitet. Auÿerdemkann eine zu klein gewählte maximal erlaubte Distanz zu falschen Stay Pointsführen. In Fall 2) würden so fälschlicherweise mehrere Stay Points erkannt wer-den.Da sich die Aufenthalte von Benutzern innerhalb von Städten auf kleinem Raumbei kurzem zeitlichem Intervall abspielen, sollte ein zu groÿer Schwellenwert fürdie Distanz vermieden werden. Somit empfehlen sich für Städte nicht zu groÿeaber auch nicht zu kleine Schwellenwerte für die Distanz. Welche Schwellenwerteletztenendlich gewählt werden hängt jedoch individuell vom vorliegenden Daten-satz ab. Da sich Yings Vorhersagen innerhalb einer Stadt bewegen, verwendeter die in Zheng [6] verwendeten Schwellenwerte von 200 Meter und 30 Minuten.Ashbrooks [1] Vorhersagen gehen jedoch über die Grenzen einer Stadt hinaus,weshalb er Schwellenwerte von 300 Meter und 10 Minuten benutzt.Die Wahl des richtigen Schwellenwertes für die Mindestdauer eines Aufenthal-tes innerhalb der Distanz ist auch kritisch zu betrachten. Wählt man diesenSchwellenwert zu klein so kann es dazu führen, dass zuviele unwichtige StayPoints erkannt werden. Bleibt eine Person zum Beispiel im Stadtverkehr an ei-ner Ampel zu lange stehen, wird dort ein Stay Point erkannt. Demnach sollte einzu kleiner Schwellenwert vermieden werden. Umgekehrt werden zu wenige StayPoints erkannt, falls die Wahl des Wertes zu groÿ ausfällt.
3.2 Stay Locations und Stay Location Sequenz
Nach Bestimmung aller Stay Points folgt die Extraktion von Stay Locations.Eine Stay Location ist de�niert als Cluster von Stay Points, die sich in einembestimmten Radius zueinander be�nden. Zusätzlich muss ein gefundenes Clustermindesten Stay Points von k verschiedenen Personen enthalten. Zum Clusternvon Stay Points kann demnach kein Algorithmus wie k-Means verwendet wer-den, der auf Basis der Dichte im Raum Stay Point Cluster bildet. Es muss einAlgorithmus verwendet werden, der es ermöglicht Stay Points denen kein Clusterzugewiesen werden konnte, als Rauschen zu markieren.
3.2.1 P-DBSCAN Ying verwendet hierfür P-DBSCAN [3] als Algorithmuszum clustern von signi�kanten Orten. Dabei wird ein Ort als signi�kant erachtet,falls von mindestens k verschiedenen Personen Stay Points im Cluster vorhan-den sind. Bei k > 1 werden demnach Orte die von nur einer Person besuchtwurden, vom Algorithmus als nicht signi�kant erachtet und markiert. Das zuvorgenannte Problem ist die Generalisierung von persönlichen Orten. Entsprechen-de Stay Points persönlicher Orte wurden zwar zuvor berechnet, werden jedochdurch P-DBSCAN als unrelevant aufgefasst. Dadurch gehen wichtige persönlicheStay Locations verloren und man erhält eine stark generalisierte Menge von StayLocations. Es können also nur Vorhersagen über Orte getätigt werden, die als si-gni�kant erachtet wurden. Selbst wenn ein Benutzer regelmäÿig einen relevantenOrt besucht, dieser jedoch von keiner anderen Person besucht wurde, wird dieser
Semantics support location-aware systems – Semantic trajectory mining 53
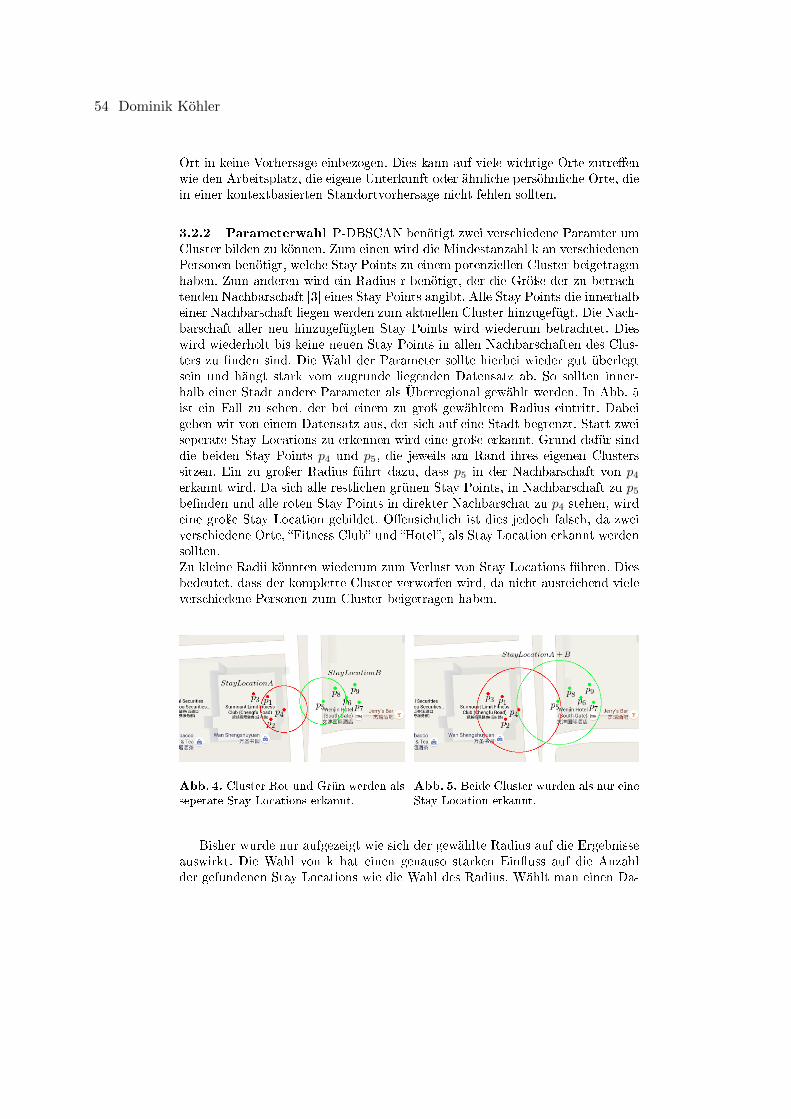
Ort in keine Vorhersage einbezogen. Dies kann auf viele wichtige Orte zutre�enwie den Arbeitsplatz, die eigene Unterkunft oder ähnliche persöhnliche Orte, diein einer kontextbasierten Standortvorhersage nicht fehlen sollten.
3.2.2 Parameterwahl P-DBSCAN benötigt zwei verschiedene Paramter umCluster bilden zu können. Zum einen wird die Mindestanzahl k an verschiedenenPersonen benötigt, welche Stay Points zu einem potenziellen Cluster beigetragenhaben. Zum anderen wird ein Radius r benötigt, der die Gröÿe der zu betrach-tenden Nachbarschaft [3] eines Stay Points angibt. Alle Stay Points die innerhalbeiner Nachbarschaft liegen werden zum aktuellen Cluster hinzugefügt. Die Nach-barschaft aller neu hinzugefügten Stay Points wird wiederum betrachtet. Dieswird wiederholt bis keine neuen Stay Points in allen Nachbarschaften des Clus-ters zu �nden sind. Die Wahl der Parameter sollte hierbei wieder gut überlegtsein und hängt stark vom zugrunde liegenden Datensatz ab. So sollten inner-halb einer Stadt andere Parameter als Überregional gewählt werden. In Abb. 5ist ein Fall zu sehen, der bei einem zu groÿ gewähltem Radius eintritt. Dabeigehen wir von einem Datensatz aus, der sich auf eine Stadt begrenzt. Statt zweiseperate Stay Locations zu erkennen wird eine groÿe erkannt. Grund dafür sinddie beiden Stay Points p4 und p5, die jeweils am Rand ihres eigenen Clusterssitzen. Ein zu groÿer Radius führt dazu, dass p5 in der Nachbarschaft von p4erkannt wird. Da sich alle restlichen grünen Stay Points, in Nachbarschaft zu p5be�nden und alle roten Stay Points in direkter Nachbarschat zu p4 stehen, wirdeine groÿe Stay Location gebildet. O�ensichtlich ist dies jedoch falsch, da zweiverschiedene Orte, �Fitness Club� und �Hotel�, als Stay Location erkannt werdensollten.Zu kleine Radii könnten wiederum zum Verlust von Stay Locations führen. Diesbedeutet, dass der komplette Cluster verworfen wird, da nicht ausreichend vieleverschiedene Personen zum Cluster beigetragen haben.
Abb. 4. Cluster Rot und Grün werden alsseperate Stay Locations erkannt.
Abb. 5. Beide Cluster wurden als nur eineStay Location erkannt.
Bisher wurde nur aufgezeigt wie sich der gewählte Radius auf die Ergebnisseauswirkt. Die Wahl von k hat einen genauso starken Ein�uss auf die Anzahlder gefundenen Stay Locations wie die Wahl des Radius. Wählt man einen Da-
54 Dominik Kohler
tensatz, welcher viele räumlich dichte Stay Points liefert, so kann die Anzahl kgröÿer gewählt werden. In Kisilevich [3] werden beispielsweise Werte von k > 10genommen, was in anbetracht von räumlich verteilten Stay Points sehr hoch ist.Kisilevich [3] verwendet zur Optimierung der Suche von dichten Points und derschnelleren Konvergenz des Algorithmus hin zu Clustern einen sich anpassendenSchwellenwert der Dichte. Diese Optimierung wird von Ying jedoch nicht ver-wendet. Ohne Optimierung wird die Nachbarschaft von Stay Points geprüft, diesich am Rande eines Clusters aufhalten. Da die Dichte am Rande eines Clustersfür gewöhnlich abnimmt und dieser Bereich für das gesamte Cluster eher uninter-essant ist, sollten diese nicht weiter betrachtet werden. Ohne diese Optimierungkönnen Fälle auftreten wie in Abbildung 5. Stay Points am Rande eines Clusterssorgen dafür, dass das Cluster immer weiter wächst, obwohl die Dichte abnimmt.Es entstehen somit groÿe und verteilte, anstatt kleine und dichte Cluster.
3.2.3 Stay Location Sequenz Nach Au�nden aller Stay Locations werdensogenannte Stay Location Sequenzen erstellt. Eine solche Sequenz spiegelt denTagesablauf einer Person wieder und gibt Aufschluss darüber an welchen si-gni�kanten Orten sich dieser aufgehalten hat. Aus einer Stay Point Trajektoriewird die Stay Location Sequenz gewonnen. Zunächst werden alle Stay Points,welche durch P-DBSCAN als Rauschen markiert wurden, aus der Trajektoriegenommen. Alle verbleibenden Stay Points werden durch ihre zugehörige StayLocation substituiert und man erhält eine Stay Location Sequenz. Dieser Schrittkann jedoch zu unbrauchbaren Sequenzen führen. Hat ein Benutzer eine StayPoint Trajektorie [StayPoint1 → StayPoint2 → StayPoint3 → StayPoint4]und gehören {StayPoint1, StayPoint3, StayPoint4} keiner Stay Location an,so wird die Stay Location Sequenz [StayLocation1] erzeugt.StayLocation1 besteht dabei aus StayPoint2 und weiteren ihr zugewiesenenStay Points. Eine solche Stay Location Sequenz spiegelt jedoch nicht den tat-sächlichen Tagesablauf einer Person wieder. Es wurde nur der Aufenthalt aneinem für den Algorithmus signi�kanten Ort erkannt. Ein weiteres mal kommtdas Generalisierungsproblem zum tragen. Trajektorien einer Person werden hier-durch auf stark generalisierte Tagesabläufe heruntergebrochen.
3.3 Semantic Trajectory Pattern Tree
In diesem Abschnitt wird erklärt wie aus den zuvor bestimmten Stay Locati-on Sequenzen ein Semantic Trajectory Pattern Tree entsteht. Dieser Teil be-steht im wesentlichen aus zwei Schritten: zuerst werden Labels für Stay Loca-tions gefunden und alle Stay Location Sequenzen eines Nutzers in semantischeTrajektorien umgewandelt. Eine solche semantische Trajektorie kann die Form[School → Park → Restaurant] wie in Abb. 1 besitzen. Es können auch se-mantische Trajektorien der Form [School → Bank → {Market,Restaurant}]vorkommen. Da der letzten Stay Location in der Sequenz mehrere semantischeLabel zugewiesen wurden.Jede Person besitzt demnach ein Menge an semantischen Trajektorien. Der Un-
Semantics support location-aware systems – Semantic trajectory mining 55
terschied zur normalen Trajektorie ist die Unabhängigkeit von der geographi-schen Eigenschaft. Eine semantische Trajektorie ist somit in einer beliebigenStadt gültig, da diese den Verlauf von Aufenthalten an allgemein bezeichnetenOrten beschreibt. Es ist nun möglich, häu�ge Verhaltensmuster eines Benutzersaus seinen semantischen Trajektorien zu bestimmen. Hierfür wird der Pre�x-Span [2] Algorithmus auf allen semantischen Trajektorien eines Benutzers ange-wandt. Im zweiten Schritt werden aus den erhaltenen Mustern eines Benutzers,ein Semantic Trajectory Pattern Tree (kurz STP-Tree) erstellt. Dieser STP-Treeist eine kompakte Schreibweise aller semantischen Muster. Jeder Pfad zu einemKnoten im Baum kann als Entscheidungsregel aufgefasst werden. Durch die kom-pakte Form des Baumes können die Verhaltensmuster in der Prädiktionphasee�zent ausgewertet werden.
3.3.1 Semantische Trajektorie Über Reverse Geocoding ist es möglich,eine semantische Annotation zu einem gegebenen geographischen Punkt zu er-halten. Es gibt verschiedene APIs wie die Google Maps API oder FoursquareAPI, welche Reverse Geocoding unterstützen. Solche APIs geben Informationenüber die umliegende Umgebung und falls vorhanden konkrete Informationen, wieName, Straÿe und Beschreibungen über den angegeben Ort, preis. Die einzigeInformation die jedoch von Interesse ist, ist die Kategorie eines Ortes wie z.B.Park,Bar,Restaurant,Krankenhaus. Demnach wird eine möglichst allgemei-ne und übergeordnete Beschreibung eines Ortes verwendet. Konkrete Namen vonOrten wie �Oxford Pub� oder �Stövchen� werden nicht benötigt. Diese Art desAnnotieren von Stay Locations ist von Nöten, falls der verwendete Datensatzkeine Label angibt. Aufgrund von Ungenauigkeiten der erfassten GPS-Punktenkann nicht garantiert werden, dass richtige Labels gefunden werden. Vielmehr istdieser Schritt abhängig von der Korrektheit der verwendeten Reverse GeocodingAPI. Idealerweise sollte ein Benutzer manuell labeln, um oben genannte Fehlerbei der Annotation zu vermeiden.Ein semantisches Label wird vorerst einem Stay Point zugewiesen. Da eine StayLocation nichts weiter als eine Menge von Stay Points ist und diese möglicherwei-se Stay Points mit unterschiedlichen Labels enthält, können Ihr mehrere Labelszugewiesen werden. In Abbildung 4 sieht man rechts, in unmittelbarer Nähe zumgrünen Cluster, eine Bar. Der Stay Point p7 könnte das Label �Bar� erhalten wo-hingegen das Label �Hotel� den Punkten p5, p6, p8 und p9 zugewiesen wird. DieStay Location würde somit das Label {Hotel, Bar} erhalten.
3.3.2 Home Stay Location Aufgrund der in 3.2.1 beschriebenen Generali-sierung von sigini�kanten Orten, sind persönliche Stay Locations wie die eigeneUnterkunft verloren gegangen und somit auch deren Label Home. Ein idealesVerfahren sollte jedoch einen derart wichtigen Ort in seine Standortvorhersa-ge miteinbeziehen. Eine mögliche Lösung wäre, Stay Points nach Uhrzeiten zudurchsuchen und nachträglich das Label anzupassen. Wir nehmen an, dass sichdie meisten Menschen zwischen 0 und 6 Uhr morgens in ihrer Wohnung aufhal-ten. Durch diese Annahme können wir Stay Points �nden, die zwischen diesen
56 Dominik Kohler
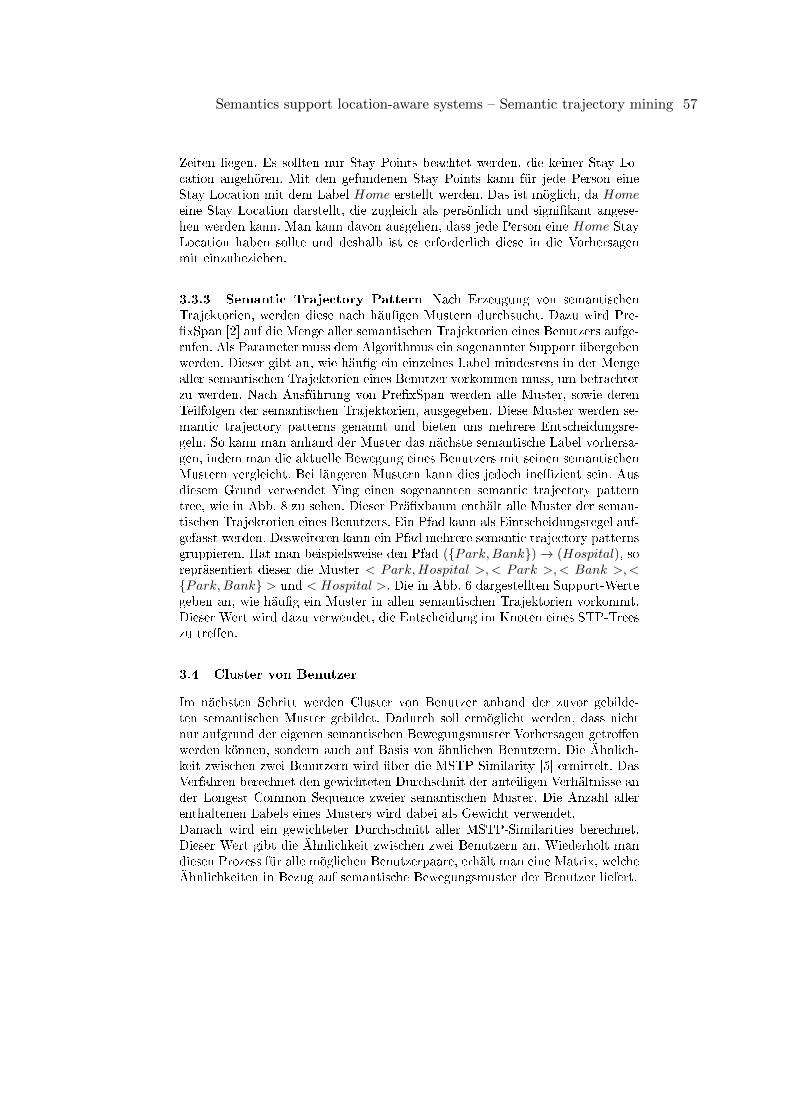
Zeiten liegen. Es sollten nur Stay Points beachtet werden, die keiner Stay Lo-cation angehören. Mit den gefundenen Stay Points kann für jede Person eineStay Location mit dem Label Home erstellt werden. Das ist möglich, da Homeeine Stay Location darstellt, die zugleich als persönlich und signi�kant angese-hen werden kann. Man kann davon ausgehen, dass jede Person eine Home StayLocation haben sollte und deshalb ist es erforderlich diese in die Vorhersagenmit einzubeziehen.
3.3.3 Semantic Trajectory Pattern Nach Erzeugung von semantischenTrajektorien, werden diese nach häu�gen Mustern durchsucht. Dazu wird Pre-�xSpan [2] auf die Menge aller semantischen Trajektorien eines Benutzers aufge-rufen. Als Parameter muss dem Algorithmus ein sogenannter Support übergebenwerden. Dieser gibt an, wie häu�g ein einzelnes Label mindestens in der Mengealler semantischen Trajektorien eines Benutzer vorkommen muss, um betrachtetzu werden. Nach Ausführung von Pre�xSpan werden alle Muster, sowie derenTeilfolgen der semantischen Trajektorien, ausgegeben. Diese Muster werden se-mantic trajectory patterns genannt und bieten uns mehrere Entscheidungsre-geln. So kann man anhand der Muster das nächste semantische Label vorhersa-gen, indem man die aktuelle Bewegung eines Benutzers mit seinen semantischenMustern vergleicht. Bei längeren Mustern kann dies jedoch ine�zient sein. Ausdiesem Grund verwendet Ying einen sogenannten semantic trajectory patterntree, wie in Abb. 8 zu sehen. Dieser Prä�xbaum enthält alle Muster der seman-tischen Trajektorien eines Benutzers. Ein Pfad kann als Eintscheidungsregel auf-gefasst werden. Desweiteren kann ein Pfad mehrere semantic trajectory patternsgruppieren. Hat man beispielsweise den Pfad ({Park,Bank}) → (Hospital), sorepräsentiert dieser die Muster < Park,Hospital >,< Park >,< Bank >,<{Park,Bank} > und < Hospital >. Die in Abb. 6 dargestellten Support-Wertegeben an, wie häu�g ein Muster in allen semantischen Trajektorien vorkommt.Dieser Wert wird dazu verwendet, die Entscheidung im Knoten eines STP-Treeszu tre�en.
3.4 Cluster von Benutzer
Im nächsten Schritt werden Cluster von Benutzer anhand der zuvor gebilde-ten semantischen Muster gebildet. Dadurch soll ermöglicht werden, dass nichtnur aufgrund der eigenen semantischen Bewegungsmuster Vorhersagen getro�enwerden können, sondern auch auf Basis von ähnlichen Benutzern. Die Ähnlich-keit zwischen zwei Benutzern wird über die MSTP-Similarity [5] ermittelt. DasVerfahren berechnet den gewichteten Durchschnit der anteiligen Verhältnisse ander Longest Common Sequence zweier semantischen Muster. Die Anzahl allerenthaltenen Labels eines Musters wird dabei als Gewicht verwendet.Danach wird ein gewichteter Durchschnitt aller MSTP-Similarities berechnet.Dieser Wert gibt die Ähnlichkeit zwischen zwei Benutzern an. Wiederholt mandiesen Prozess für alle möglichen Benutzerpaare, erhält man eine Matrix, welcheÄhnlichkeiten in Bezug auf semantische Bewegungsmuster der Benutzer liefert.
Semantics support location-aware systems – Semantic trajectory mining 57
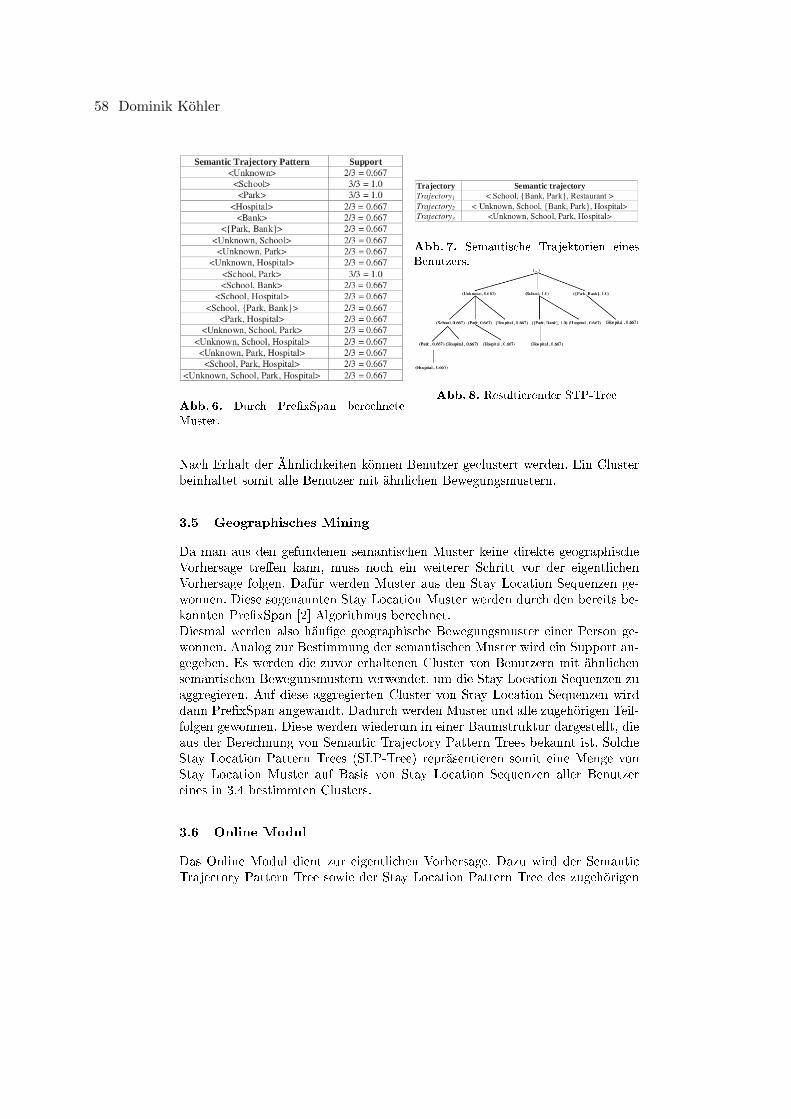
Abb. 6. Durch Pre�xSpan berechneteMuster.
Abb. 7. Semantische Trajektorien einesBenutzers.
Abb. 8. Resultierender STP-Tree
Nach Erhalt der Ähnlichkeiten können Benutzer geclustert werden. Ein Clusterbeinhaltet somit alle Benutzer mit ähnlichen Bewegungsmustern.
3.5 Geographisches Mining
Da man aus den gefundenen semantischen Muster keine direkte geographischeVorhersage tre�en kann, muss noch ein weiterer Schritt vor der eigentlichenVorhersage folgen. Dafür werden Muster aus den Stay Location Sequenzen ge-wonnen. Diese sogenannten Stay Location Muster werden durch den bereits be-kannten Pre�xSpan [2] Algorithmus berechnet.Diesmal werden also häu�ge geographische Bewegungsmuster einer Person ge-wonnen. Analog zur Bestimmung der semantischen Muster wird ein Support an-gegeben. Es werden die zuvor erhaltenen Cluster von Benutzern mit ähnlichensemantischen Bewegunsmustern verwendet, um die Stay Location Sequenzen zuaggregieren. Auf diese aggregierten Cluster von Stay Location Sequenzen wirddann Pre�xSpan angewandt. Dadurch werden Muster und alle zugehörigen Teil-folgen gewonnen. Diese werden wiederum in einer Baumstruktur dargestellt, dieaus der Berechnung von Semantic Trajectory Pattern Trees bekannt ist. SolcheStay Location Pattern Trees (SLP-Tree) repräsentieren somit eine Menge vonStay Location Muster auf Basis von Stay Location Sequenzen aller Benutzereines in 3.4 bestimmten Clusters.
3.6 Online Modul
Das Online Modul dient zur eigentlichen Vorhersage. Dazu wird der SemanticTrajectory Pattern Tree sowie der Stay Location Pattern Tree des zugehörigen
58 Dominik Kohler
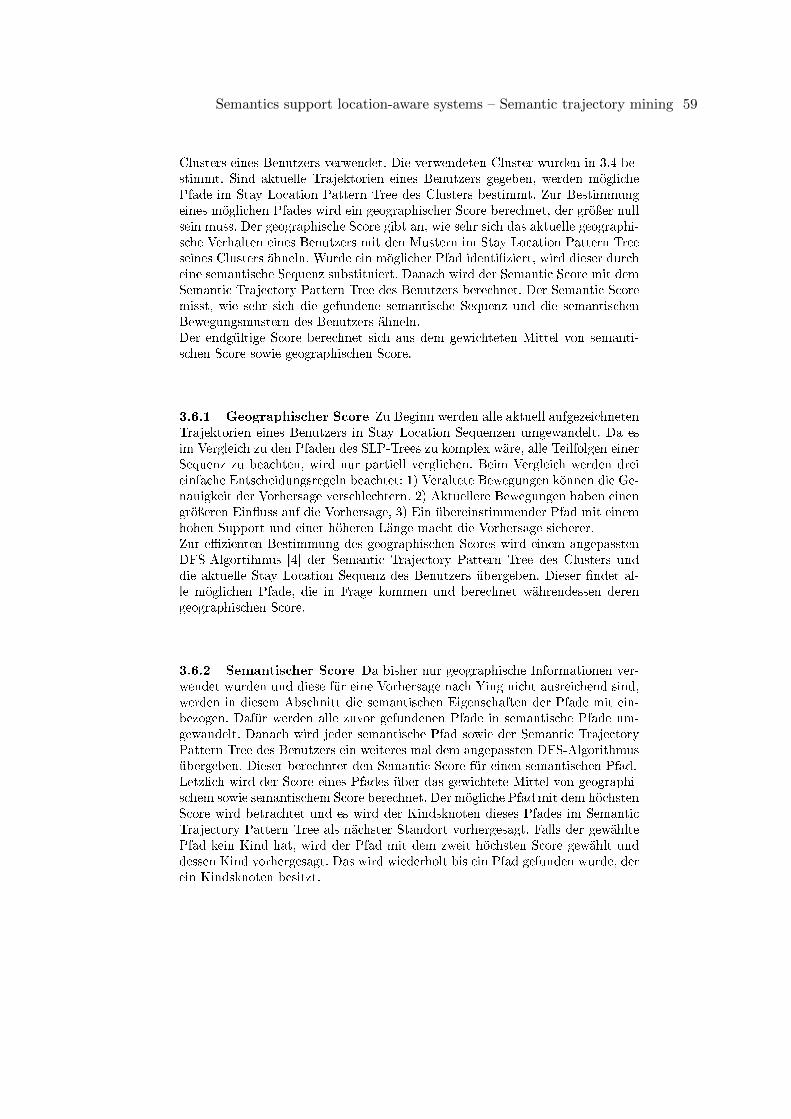
Clusters eines Benutzers verwendet. Die verwendeten Cluster wurden in 3.4 be-stimmt. Sind aktuelle Trajektorien eines Benutzers gegeben, werden möglichePfade im Stay Location Pattern Tree des Clusters bestimmt. Zur Bestimmungeines möglichen Pfades wird ein geographischer Score berechnet, der gröÿer nullsein muss. Der geographische Score gibt an, wie sehr sich das aktuelle geographi-sche Verhalten eines Benutzers mit den Mustern im Stay Location Pattern Treeseines Clusters ähneln. Wurde ein möglicher Pfad identi�ziert, wird dieser durcheine semantische Sequenz substituiert. Danach wird der Semantic Score mit demSemantic Trajectory Pattern Tree des Benutzers berechnet. Der Semantic Scoremisst, wie sehr sich die gefundene semantische Sequenz und die semantischenBewegungsmustern des Benutzers ähneln.Der endgültige Score berechnet sich aus dem gewichteten Mittel von semanti-schen Score sowie geographischen Score.
3.6.1 Geographischer Score Zu Beginn werden alle aktuell aufgezeichnetenTrajektorien eines Benutzers in Stay Location Sequenzen umgewandelt. Da esim Vergleich zu den Pfaden des SLP-Trees zu komplex wäre, alle Teilfolgen einerSequenz zu beachten, wird nur partiell verglichen. Beim Vergleich werden dreieinfache Entscheidungsregeln beachtet: 1) Veraltete Bewegungen können die Ge-nauigkeit der Vorhersage verschlechtern, 2) Aktuellere Bewegungen haben einengröÿeren Ein�uss auf die Vorhersage, 3) Ein übereinstimmender Pfad mit einemhohen Support und einer höheren Länge macht die Vorhersage sicherer.Zur e�zienten Bestimmung des geographischen Scores wird einem angepasstenDFS-Algortihmus [4] der Semantic Trajectory Pattern Tree des Clusters unddie aktuelle Stay Location Sequenz des Benutzers übergeben. Dieser �ndet al-le möglichen Pfade, die in Frage kommen und berechnet währendessen derengeographischen Score.
3.6.2 Semantischer Score Da bisher nur geographische Informationen ver-wendet wurden und diese für eine Vorhersage nach Ying nicht ausreichend sind,werden in diesem Abschnitt die semantischen Eigenschaften der Pfade mit ein-bezogen. Dafür werden alle zuvor gefundenen Pfade in semantische Pfade um-gewandelt. Danach wird jeder semantische Pfad sowie der Semantic TrajectoryPattern Tree des Benutzers ein weiteres mal dem angepassten DFS-Algorithmusübergeben. Dieser berechntet den Semantic Score für einen semantischen Pfad.Letzlich wird der Score eines Pfades über das gewichtete Mittel von geographi-schem sowie semantischem Score berechnet. Der mögliche Pfad mit dem höchstenScore wird betrachtet und es wird der Kindsknoten dieses Pfades im SemanticTrajectory Pattern Tree als nächster Standort vorhergesagt. Falls der gewähltePfad kein Kind hat, wird der Pfad mit dem zweit höchsten Score gewählt unddessen Kind vorhergesagt. Das wird wiederholt bis ein Pfad gefunden wurde, derein Kindsknoten besitzt.
Semantics support location-aware systems – Semantic trajectory mining 59
4 Fazit
In dieser Arbeit wurden zwei unterschiedliche Ansätze zu Standortvorhersagendurch Markov Modelle sowie semantischen Trajektorien vorgestellt, wobei derFokus auf mögliche Probleme in den jeweiligen Verfahren lag. Hierbei wurde auf-gezeigt, dass ein komplexeres Verfahren wie das von Ying zwar Probleme einesrein geographischen Verfahrens wie das von Ashbrook löst, jedoch auch weitereverursacht. Beispielhaft wurde das Generalisierungsproblem in Yings Ansatz be-schrieben, welches durch das Clustern mit P-DBSCAN entsteht. Des Weiterenwurde auf mögliche Probleme bei der Wahl von Paramatern hingewiesen. DieWahl dieser musste häu�g auf den verwendeten Datensatz des beschriebenenVerfahrens angepasst sein. Das durch Ashbrook beschriebene Verfahren basiertauf Datensätze, welche durch ihre Art der Aufzeichnung bestimmte Eigenschaf-ten erfüllen. Diese sind jedoch unter realen Bedingungen nicht notwendigerweisegegeben, da die Art der Aufzeichnung nicht garantiert ist.Yings Ansatz arbeitet hingegen auf Datensätze von denen keine Vorkenntnisseexistieren müssen. Zudem ist das Verfahren aufgrund der Aufteilung in O�ineund Online Modul praktikabler, da e�ziente Auswertungen und damit Vorher-sagen möglich sind.
Literatur
1. Ashbrook, D., Starner, T.: Using gps to learn signi�cant locations and predict mo-vement across multiple users. Personal and Ubiquitous Computing 7(5), 275�286(2003)
2. Han, J., Pei, J., Mortazavi-Asl, B., Pinto, H., Chen, Q., Dayal, U., Hsu, M.: Pre�x-span: Mining sequential patterns e�ciently by pre�x-projected pattern growth. In:proceedings of the 17th international conference on data engineering. pp. 215�224(2001)
3. Kisilevich, S., Mansmann, F., Keim, D.: P-dbscan: a density based clustering algo-rithm for exploration and analysis of attractive areas using collections of geo-taggedphotos. In: Proceedings of the 1st international conference and exhibition on com-puting for geospatial research & application. p. 38. ACM (2010)
4. Ying, J.J.C., Lee, W.C., Weng, T.C., Tseng, V.S.: Semantic trajectory mining forlocation prediction. In: Proceedings of the 19th ACM SIGSPATIAL Internatio-nal Conference on Advances in Geographic Information Systems. pp. 34�43. ACM(2011)
5. Ying, J.J.C., Lu, E.H.C., Lee, W.C., Weng, T.C., Tseng, V.S.: Mining user similarityfrom semantic trajectories. In: Proceedings of the 2nd ACM SIGSPATIAL Interna-tional Workshop on Location Based Social Networks. pp. 19�26. ACM (2010)
6. Zheng, Y., Zhang, L., Ma, Z., Xie, X., Ma, W.Y.: Recommending friends and loca-tions based on individual location history. ACM Transactions on the Web (TWEB)5(1), 5 (2011)
60 Dominik Kohler
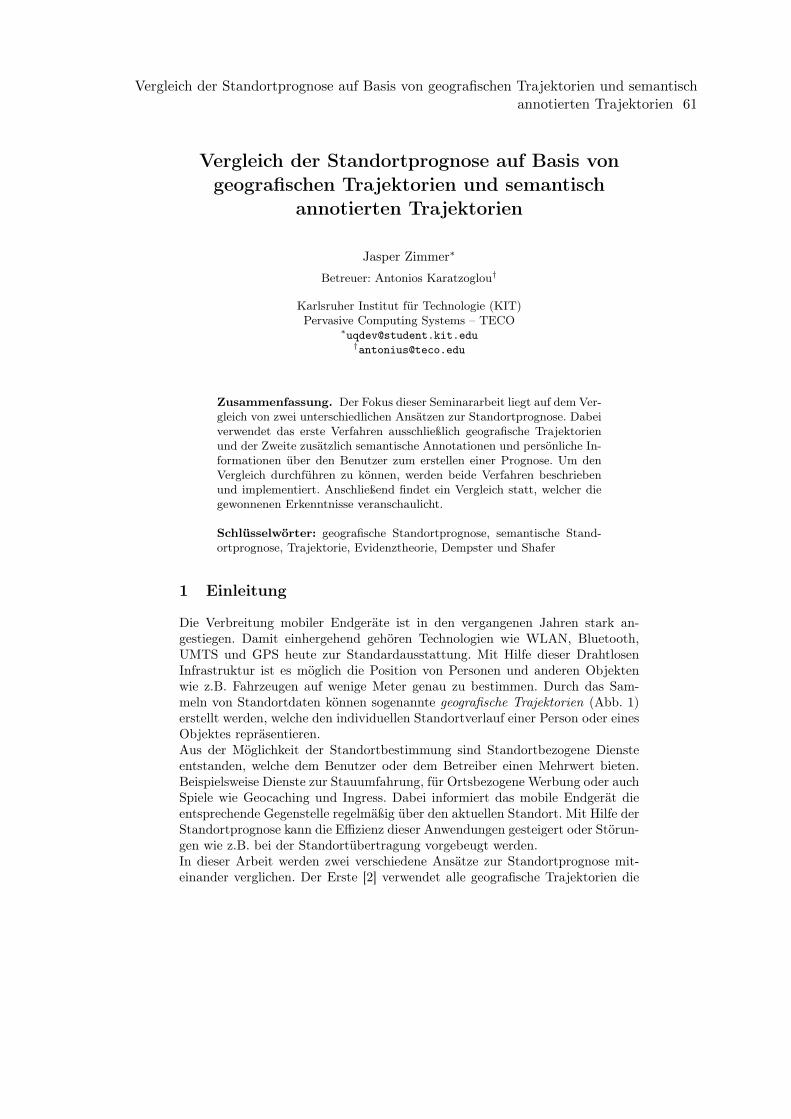
Vergleich der Standortprognose auf Basis vongeografischen Trajektorien und semantisch
annotierten Trajektorien
Jasper Zimmer∗
Betreuer: Antonios Karatzoglou†
Karlsruher Institut für Technologie (KIT)Pervasive Computing Systems – TECO
∗[email protected]†[email protected]
Zusammenfassung. Der Fokus dieser Seminararbeit liegt auf dem Ver-gleich von zwei unterschiedlichen Ansätzen zur Standortprognose. Dabeiverwendet das erste Verfahren ausschließlich geografische Trajektorienund der Zweite zusätzlich semantische Annotationen und persönliche In-formationen über den Benutzer zum erstellen einer Prognose. Um denVergleich durchführen zu können, werden beide Verfahren beschriebenund implementiert. Anschließend findet ein Vergleich statt, welcher diegewonnenen Erkenntnisse veranschaulicht.
Schlüsselwörter: geografische Standortprognose, semantische Stand-ortprognose, Trajektorie, Evidenztheorie, Dempster und Shafer
1 Einleitung
Die Verbreitung mobiler Endgeräte ist in den vergangenen Jahren stark an-gestiegen. Damit einhergehend gehören Technologien wie WLAN, Bluetooth,UMTS und GPS heute zur Standardausstattung. Mit Hilfe dieser DrahtlosenInfrastruktur ist es möglich die Position von Personen und anderen Objektenwie z.B. Fahrzeugen auf wenige Meter genau zu bestimmen. Durch das Sam-meln von Standortdaten können sogenannte geografische Trajektorien (Abb. 1)erstellt werden, welche den individuellen Standortverlauf einer Person oder einesObjektes repräsentieren.Aus der Möglichkeit der Standortbestimmung sind Standortbezogene Diensteentstanden, welche dem Benutzer oder dem Betreiber einen Mehrwert bieten.Beispielsweise Dienste zur Stauumfahrung, für Ortsbezogene Werbung oder auchSpiele wie Geocaching und Ingress. Dabei informiert das mobile Endgerät dieentsprechende Gegenstelle regelmäßig über den aktuellen Standort. Mit Hilfe derStandortprognose kann die Effizienz dieser Anwendungen gesteigert oder Störun-gen wie z.B. bei der Standortübertragung vorgebeugt werden.In dieser Arbeit werden zwei verschiedene Ansätze zur Standortprognose mit-einander verglichen. Der Erste [2] verwendet alle geografische Trajektorien die
Vergleich der Standortprognose auf Basis von geografischen Trajektorien und semantischannotierten Trajektorien 61
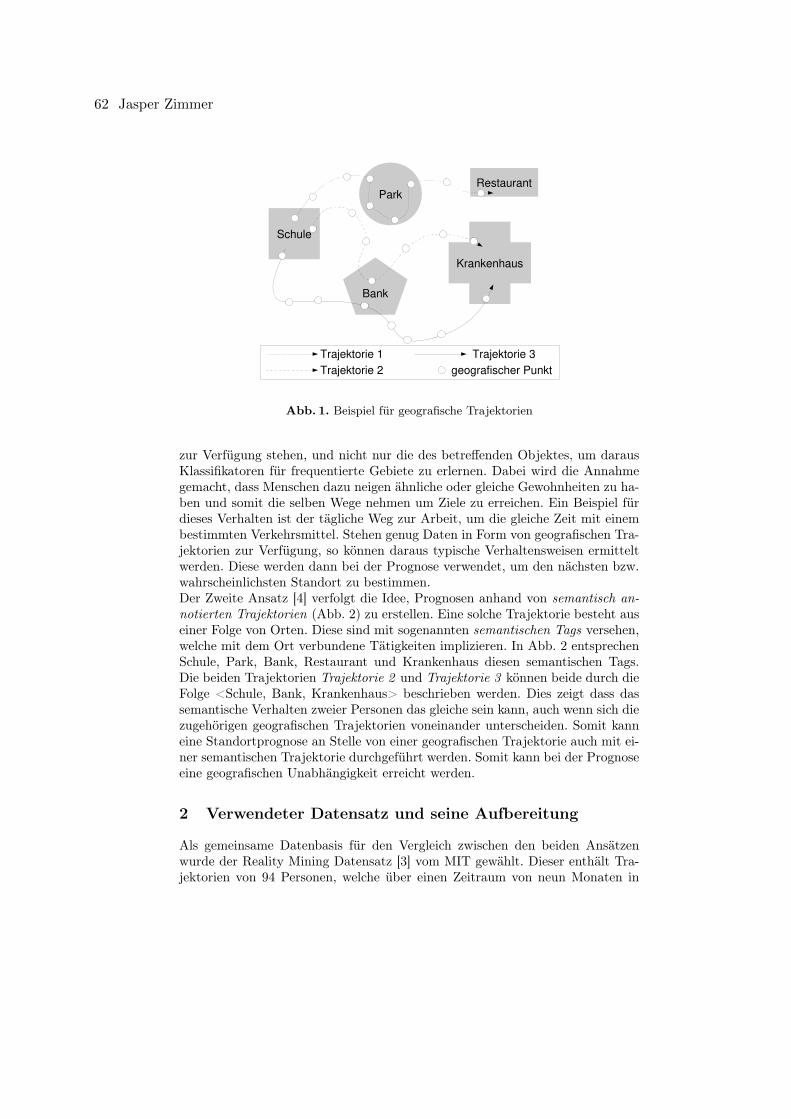
Schule
Park
Bank
Restaurant
Krankenhaus
Trajektorie 1Trajektorie 2
Trajektorie 3geografischer Punkt
Abb. 1. Beispiel für geografische Trajektorien
zur Verfügung stehen, und nicht nur die des betreffenden Objektes, um darausKlassifikatoren für frequentierte Gebiete zu erlernen. Dabei wird die Annahmegemacht, dass Menschen dazu neigen ähnliche oder gleiche Gewohnheiten zu ha-ben und somit die selben Wege nehmen um Ziele zu erreichen. Ein Beispiel fürdieses Verhalten ist der tägliche Weg zur Arbeit, um die gleiche Zeit mit einembestimmten Verkehrsmittel. Stehen genug Daten in Form von geografischen Tra-jektorien zur Verfügung, so können daraus typische Verhaltensweisen ermitteltwerden. Diese werden dann bei der Prognose verwendet, um den nächsten bzw.wahrscheinlichsten Standort zu bestimmen.Der Zweite Ansatz [4] verfolgt die Idee, Prognosen anhand von semantisch an-notierten Trajektorien (Abb. 2) zu erstellen. Eine solche Trajektorie besteht auseiner Folge von Orten. Diese sind mit sogenannten semantischen Tags versehen,welche mit dem Ort verbundene Tätigkeiten implizieren. In Abb. 2 entsprechenSchule, Park, Bank, Restaurant und Krankenhaus diesen semantischen Tags.Die beiden Trajektorien Trajektorie 2 und Trajektorie 3 können beide durch dieFolge <Schule, Bank, Krankenhaus> beschrieben werden. Dies zeigt dass dassemantische Verhalten zweier Personen das gleiche sein kann, auch wenn sich diezugehörigen geografischen Trajektorien voneinander unterscheiden. Somit kanneine Standortprognose an Stelle von einer geografischen Trajektorie auch mit ei-ner semantischen Trajektorie durchgeführt werden. Somit kann bei der Prognoseeine geografischen Unabhängigkeit erreicht werden.
2 Verwendeter Datensatz und seine Aufbereitung
Als gemeinsame Datenbasis für den Vergleich zwischen den beiden Ansätzenwurde der Reality Mining Datensatz [3] vom MIT gewählt. Dieser enthält Tra-jektorien von 94 Personen, welche über einen Zeitraum von neun Monaten in
62 Jasper Zimmer
Schule
Park
Bank
Restaurant
Krankenhaus
Trajektorie 1Trajektorie 2
Trajektorie 3Aufenthaltsort
Abb. 2. Beispiel für semantische Trajektorien
den Jahren 2004 und 2005 aufgezeichnet wurden. Dabei variiert die Länge sowiedie Vollständigkeit zwischen den einzelnen Teilnehmern der Studie stark. EineAufbereitung der vorliegenden Daten ist notwendig, um einen Vergleich durch-führen zu können.Die enthaltenen Trajektorien sind geografische Trajektorien welche anstatt GPS-Koordinaten die Position als Aufenthaltsbereich (engl. Location Area Code kurzLAC) und Mobilfunkzellenidentifikation (engl. Cell ID kurz CID) innerhalb desMobilfunknetzes beinhalten. Diese müssen im Verlauf der Aufbereitung in GPS-Koordinaten umgewandelt werden. Zusätzlich beinhaltet der Datensatz Anno-tationen zu Orten in der Trajektorie, welche die Teilnehmer im Rahmen derStudie angefertigt haben. Diese sind allerdings sehr inkonsequent gewählt undunterscheiden sich für die selben Orte zwischen den Teilnehmern stark. Deshalbmüssen neue Annotationen erzeugt bzw. gefunden werden.
2.1 Datensatz Konvertierung
Da der Datensatz als MATLAB-Datei vorliegt wurde zunächst ein Skript 1 er-stellt, um die Daten in das CSV-Dateiformat zu überführen. Dabei wird fürjeden Teilnehmer aus dem Datensatz ein Ordner mit der zugehörigen ID alsBezeichnung angelegt, welcher die Personenspezifischen Daten enthält.
2.2 Teilnehmer Profile erstellen
Im nächsten Schritt wurden Profile für alle Teilnehmer der Studie erstellt, welchedie Trajektorie, Annotationen der Teilnehmer zu Orten, die Forschungsgruppe1 https://github.com/JasperZ/semantic-location-prediction/blob/master/reality_mining_to_csv.m
Vergleich der Standortprognose auf Basis von geografischen Trajektorien und semantischannotierten Trajektorien 63
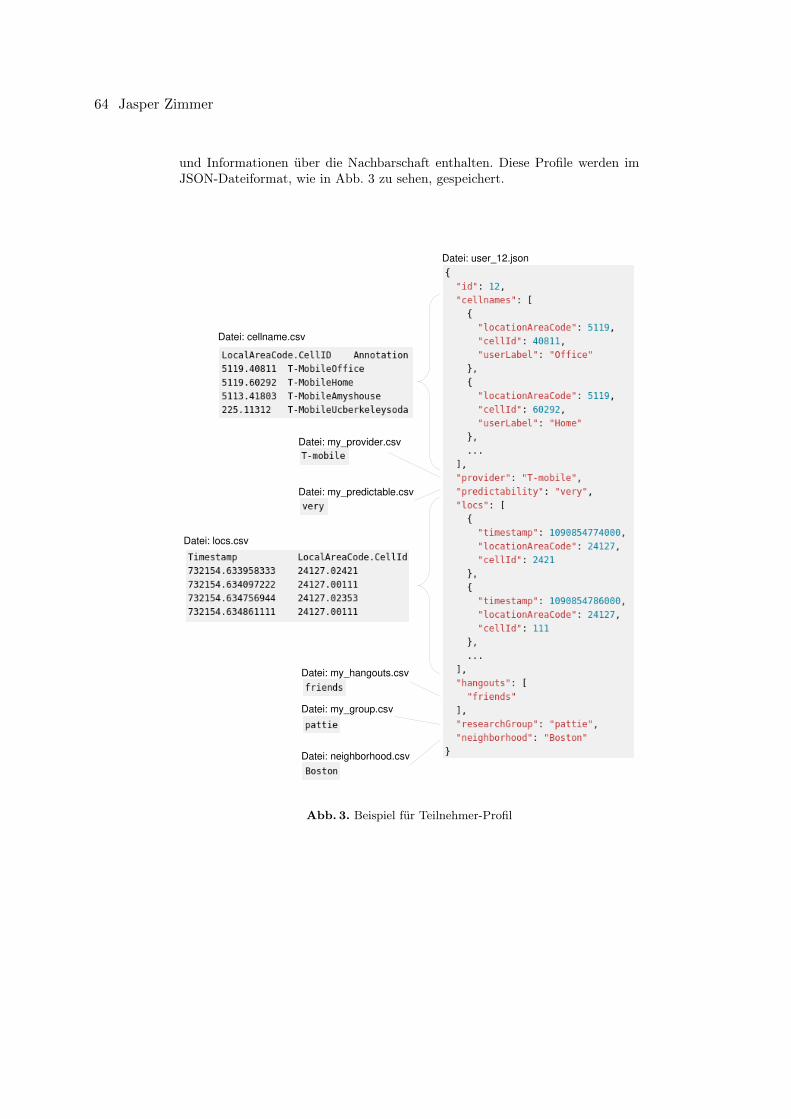
und Informationen über die Nachbarschaft enthalten. Diese Profile werden imJSON-Dateiformat, wie in Abb. 3 zu sehen, gespeichert.
Datei: cellname.csv
Datei: locs.csv
Datei: my_provider.csv
Datei: my_predictable.csv
Datei: my_hangouts.csv
Datei: my_group.csv
Datei: neighborhood.csv
Datei: user_12.json
Abb. 3. Beispiel für Teilnehmer-Profil
64 Jasper Zimmer
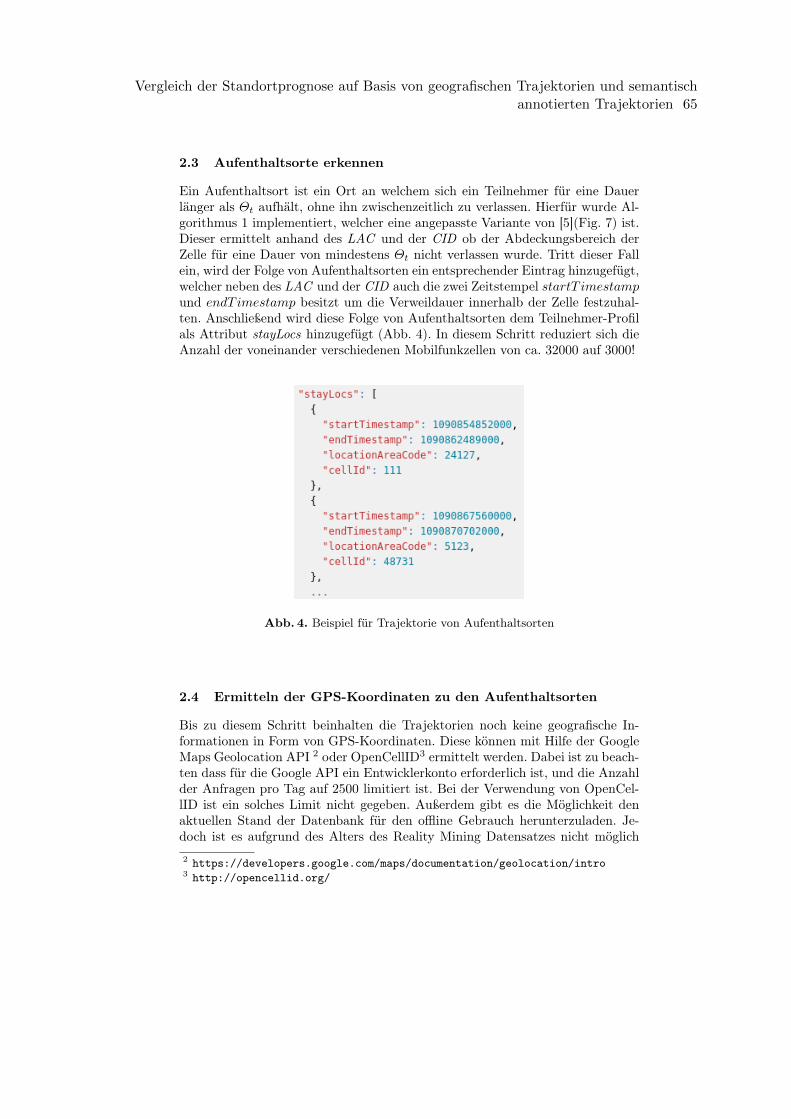
2.3 Aufenthaltsorte erkennen
Ein Aufenthaltsort ist ein Ort an welchem sich ein Teilnehmer für eine Dauerlänger als Θt aufhält, ohne ihn zwischenzeitlich zu verlassen. Hierfür wurde Al-gorithmus 1 implementiert, welcher eine angepasste Variante von [5](Fig. 7) ist.Dieser ermittelt anhand des LAC und der CID ob der Abdeckungsbereich derZelle für eine Dauer von mindestens Θt nicht verlassen wurde. Tritt dieser Fallein, wird der Folge von Aufenthaltsorten ein entsprechender Eintrag hinzugefügt,welcher neben des LAC und der CID auch die zwei Zeitstempel startT imestampund endT imestamp besitzt um die Verweildauer innerhalb der Zelle festzuhal-ten. Anschließend wird diese Folge von Aufenthaltsorten dem Teilnehmer-Profilals Attribut stayLocs hinzugefügt (Abb. 4). In diesem Schritt reduziert sich dieAnzahl der voneinander verschiedenen Mobilfunkzellen von ca. 32000 auf 3000!
Abb. 4. Beispiel für Trajektorie von Aufenthaltsorten
2.4 Ermitteln der GPS-Koordinaten zu den Aufenthaltsorten
Bis zu diesem Schritt beinhalten die Trajektorien noch keine geografische In-formationen in Form von GPS-Koordinaten. Diese können mit Hilfe der GoogleMaps Geolocation API 2 oder OpenCellID3 ermittelt werden. Dabei ist zu beach-ten dass für die Google API ein Entwicklerkonto erforderlich ist, und die Anzahlder Anfragen pro Tag auf 2500 limitiert ist. Bei der Verwendung von OpenCel-lID ist ein solches Limit nicht gegeben. Außerdem gibt es die Möglichkeit denaktuellen Stand der Datenbank für den offline Gebrauch herunterzuladen. Je-doch ist es aufgrund des Alters des Reality Mining Datensatzes nicht möglich
2 https://developers.google.com/maps/documentation/geolocation/intro3 http://opencellid.org/
Vergleich der Standortprognose auf Basis von geografischen Trajektorien und semantischannotierten Trajektorien 65
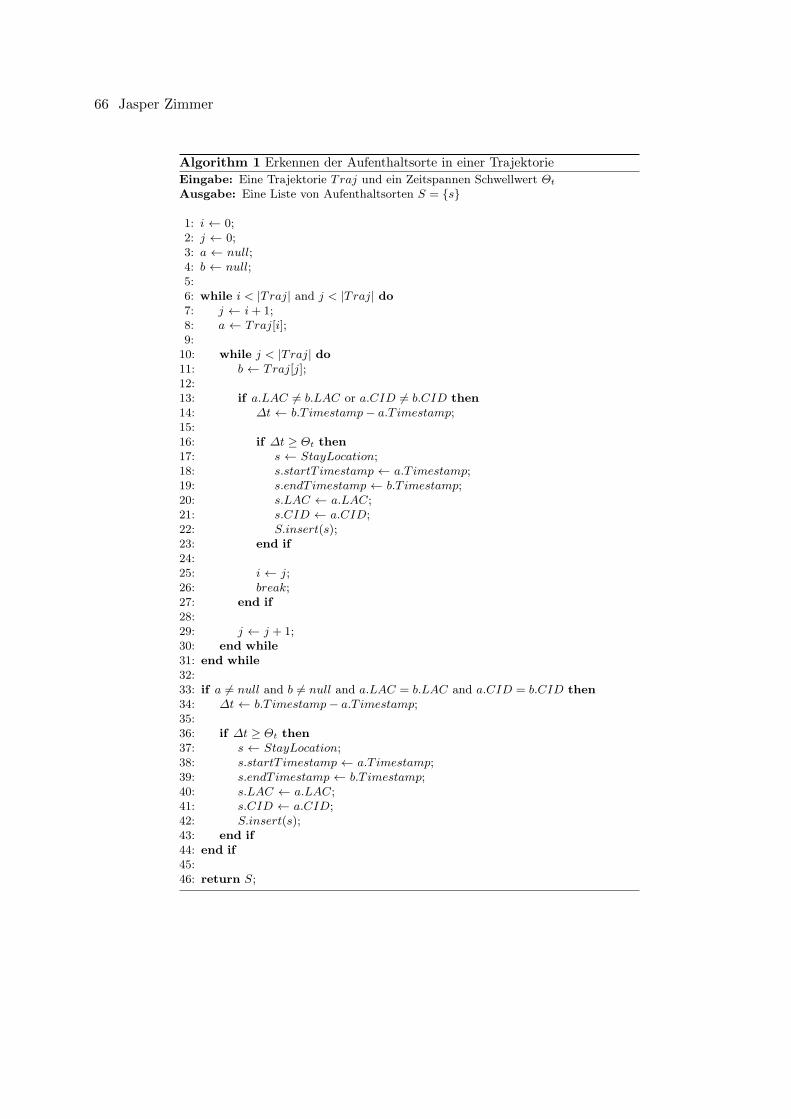
Algorithm 1 Erkennen der Aufenthaltsorte in einer TrajektorieEingabe: Eine Trajektorie Traj und ein Zeitspannen Schwellwert Θt
Ausgabe: Eine Liste von Aufenthaltsorten S = {s}
1: i ← 0;2: j ← 0;3: a ← null;4: b ← null;5:6: while i < |Traj| and j < |Traj| do7: j ← i+ 1;8: a ← Traj[i];9:10: while j < |Traj| do11: b ← Traj[j];12:13: if a.LAC 6= b.LAC or a.CID 6= b.CID then14: ∆t ← b.T imestamp− a.T imestamp;15:16: if ∆t ≥ Θt then17: s ← StayLocation;18: s.startT imestamp ← a.T imestamp;19: s.endT imestamp ← b.T imestamp;20: s.LAC ← a.LAC;21: s.CID ← a.CID;22: S.insert(s);23: end if24:25: i ← j;26: break;27: end if28:29: j ← j + 1;30: end while31: end while32:33: if a 6= null and b 6= null and a.LAC = b.LAC and a.CID = b.CID then34: ∆t ← b.T imestamp− a.T imestamp;35:36: if ∆t ≥ Θt then37: s ← StayLocation;38: s.startT imestamp ← a.T imestamp;39: s.endT imestamp ← b.T imestamp;40: s.LAC ← a.LAC;41: s.CID ← a.CID;42: S.insert(s);43: end if44: end if45:46: return S;
66 Jasper Zimmer
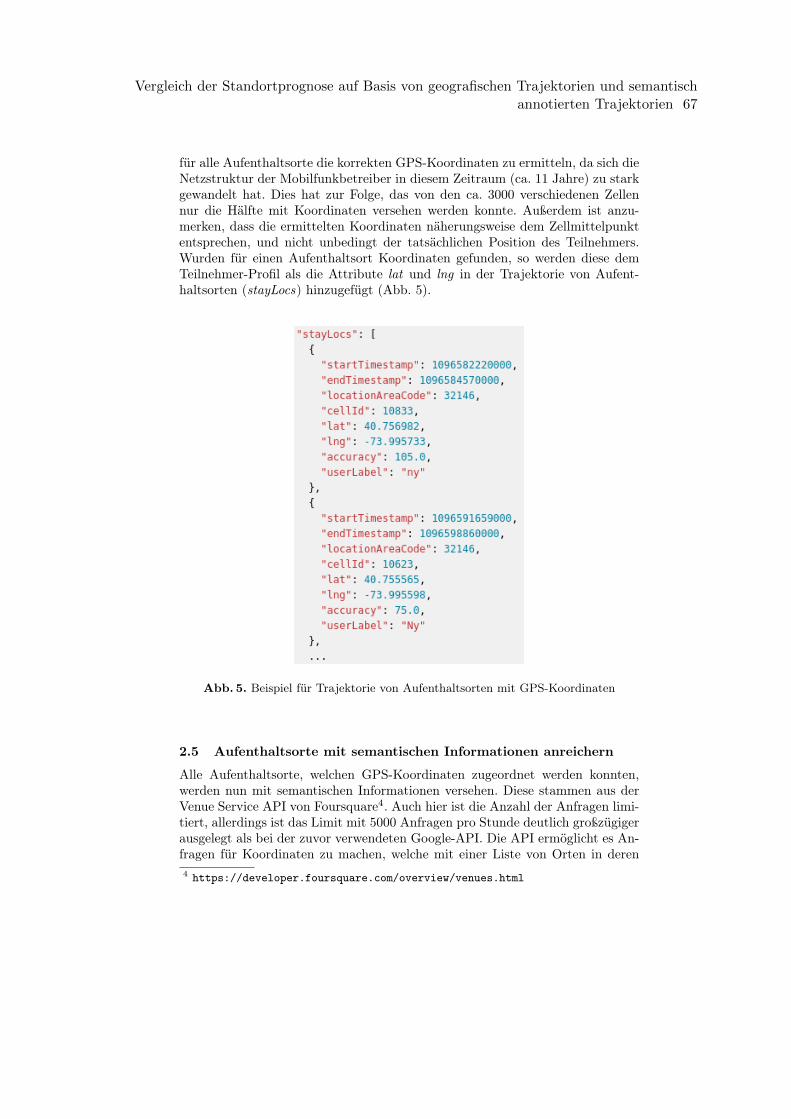
für alle Aufenthaltsorte die korrekten GPS-Koordinaten zu ermitteln, da sich dieNetzstruktur der Mobilfunkbetreiber in diesem Zeitraum (ca. 11 Jahre) zu starkgewandelt hat. Dies hat zur Folge, das von den ca. 3000 verschiedenen Zellennur die Hälfte mit Koordinaten versehen werden konnte. Außerdem ist anzu-merken, dass die ermittelten Koordinaten näherungsweise dem Zellmittelpunktentsprechen, und nicht unbedingt der tatsächlichen Position des Teilnehmers.Wurden für einen Aufenthaltsort Koordinaten gefunden, so werden diese demTeilnehmer-Profil als die Attribute lat und lng in der Trajektorie von Aufent-haltsorten (stayLocs) hinzugefügt (Abb. 5).
Abb. 5. Beispiel für Trajektorie von Aufenthaltsorten mit GPS-Koordinaten
2.5 Aufenthaltsorte mit semantischen Informationen anreichern
Alle Aufenthaltsorte, welchen GPS-Koordinaten zugeordnet werden konnten,werden nun mit semantischen Informationen versehen. Diese stammen aus derVenue Service API von Foursquare4. Auch hier ist die Anzahl der Anfragen limi-tiert, allerdings ist das Limit mit 5000 Anfragen pro Stunde deutlich großzügigerausgelegt als bei der zuvor verwendeten Google-API. Die API ermöglicht es An-fragen für Koordinaten zu machen, welche mit einer Liste von Orten in deren4 https://developer.foursquare.com/overview/venues.html
Vergleich der Standortprognose auf Basis von geografischen Trajektorien und semantischannotierten Trajektorien 67
Umgebung beantwortet wird. Teil dieser Antwort ist die Kategorie in der ein Orteingeordnet werden kann, wie z.B. Hotel, Food, Movie Theater und viele mehr.Diese Kategorien werden als semantische Annotation für die Aufenthaltsorteverwendet.
2.6 Profile der Teilnehmer in Tagesprofile aufteilen
Der Letzte Schritt in der Datenaufbereitung besteht darin, die Profile der Teil-nehmer zu unterteilen, sodass diese jeweils den Zeitraum von einem Tag ab-decken. Somit sind anschließend ca. 1450 Tagesprofile vorhanden, welche eineTrajektorie von Aufenthaltsorten beinhalten. Wobei jeder Aufenthaltsort dieMobilfunkzelle, GPS-Koordinaten, Kategorie und den Zeitpunkt der Ankunftsowie des Verlassens beinhaltet.
3 Standortprognose auf Basis von T-Pattern Mining
Der erste Ansatz zur Standortprognose welcher implementiert wurde, stammtvon Monreale u. a. [2]. Dabei wird die Annahme gemacht, das verschiedeneMenschen die gleichen oder zumindest ähnlichen Bewegungsabläufe haben. Da-durch wird es möglich, die Trajektorien aller Personen zu betrachten und darausgemeinsamem Bewegungsmuster (T-Pattern) zu bestimmen. Das Verfahren um-fasst drei Schritte um zu einer Prognose zu gelangen.
1. Bewegungsmuster extrahieren → T-Pattern2. Entscheidungsbaum aufbauen → T-Pattern Tree3. Prognose unter Zuhilfenahme des Entscheidungsbaums
3.1 Bewegungsmuster extrahieren - T-Pattern Mining
Die Bewegungsmuster werden aus allen Trajektorien extrahiert, welche zeitlichvor der Prognose aufgezeichnet wurden. Dabei werden aufgrund der Annahme,das Menschen sich gleich oder ähnlich verhalten, nicht nur die Standortverläu-fe einer einzelnen Person betrachtet, sondern auch all diejenigen, welche nichtGegenstand der aktuellen Prognose sind. Dafür wird sogenanntes T-Pattern Mi-ning betrieben, welches von Giannotti u. a. [1] beschrieben wird. Dabei dienenzeitlich annotierte Sequenzen der Form:
T = s0α1−→ s1
α2−→ . . .αn−−→ sn (1)
als Eingabe für das Verfahren. Diese können auch als T = (S,A) mit der Se-quenz S = 〈s0, s1, . . . , sn〉 und den zeitlichen Annotationen A = 〈α1, α2, . . . , αn〉geschrieben werden. Im Fall von Trajektorien entspricht die Sequenz S den Auf-enthaltsorten und die zeitlichen Annotationen A den Übergangszeiten zwischendiesen. Ein Beispiel dafür ist in Abb. 6 zu sehen. Im Verlauf des T-Pattern Miningwerden alle Sequenzen extrahiert, welche Teilsequenzen der Eingabe sind. Dabeimuss die Zeitliche Ordnung der auftretenden Orte übereinstimmen. Allerdings
68 Jasper Zimmer
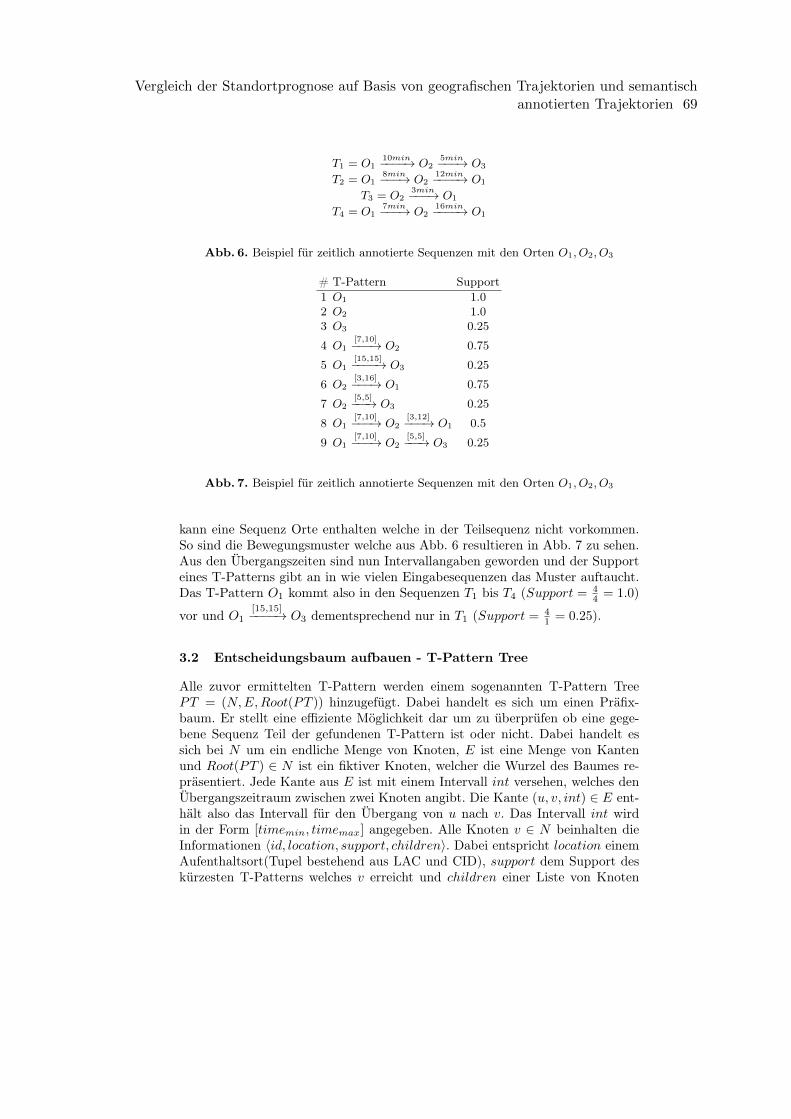
T1 = O110min−−−−→ O2
5min−−−→ O3
T2 = O18min−−−→ O2
12min−−−−→ O1
T3 = O23min−−−→ O1
T4 = O17min−−−→ O2
16min−−−−→ O1
Abb. 6. Beispiel für zeitlich annotierte Sequenzen mit den Orten O1, O2, O3
# T-Pattern Support1 O1 1.02 O2 1.03 O3 0.25
4 O1[7,10]−−−→ O2 0.75
5 O1[15,15]−−−−→ O3 0.25
6 O2[3,16]−−−→ O1 0.75
7 O2[5,5]−−−→ O3 0.25
8 O1[7,10]−−−→ O2
[3,12]−−−→ O1 0.5
9 O1[7,10]−−−→ O2
[5,5]−−−→ O3 0.25
Abb. 7. Beispiel für zeitlich annotierte Sequenzen mit den Orten O1, O2, O3
kann eine Sequenz Orte enthalten welche in der Teilsequenz nicht vorkommen.So sind die Bewegungsmuster welche aus Abb. 6 resultieren in Abb. 7 zu sehen.Aus den Übergangszeiten sind nun Intervallangaben geworden und der Supporteines T-Patterns gibt an in wie vielen Eingabesequenzen das Muster auftaucht.Das T-Pattern O1 kommt also in den Sequenzen T1 bis T4 (Support = 4
4 = 1.0)
vor und O1[15,15]−−−−→ O3 dementsprechend nur in T1 (Support = 4
1 = 0.25).
3.2 Entscheidungsbaum aufbauen - T-Pattern Tree
Alle zuvor ermittelten T-Pattern werden einem sogenannten T-Pattern TreePT = (N,E,Root(PT )) hinzugefügt. Dabei handelt es sich um einen Präfix-baum. Er stellt eine effiziente Möglichkeit dar um zu überprüfen ob eine gege-bene Sequenz Teil der gefundenen T-Pattern ist oder nicht. Dabei handelt essich bei N um ein endliche Menge von Knoten, E ist eine Menge von Kantenund Root(PT ) ∈ N ist ein fiktiver Knoten, welcher die Wurzel des Baumes re-präsentiert. Jede Kante aus E ist mit einem Intervall int versehen, welches denÜbergangszeitraum zwischen zwei Knoten angibt. Die Kante (u, v, int) ∈ E ent-hält also das Intervall für den Übergang von u nach v. Das Intervall int wirdin der Form [timemin, timemax] angegeben. Alle Knoten v ∈ N beinhalten dieInformationen 〈id, location, support, children〉. Dabei entspricht location einemAufenthaltsort(Tupel bestehend aus LAC und CID), support dem Support deskürzesten T-Patterns welches v erreicht und children einer Liste von Knoten
Vergleich der Standortprognose auf Basis von geografischen Trajektorien und semantischannotierten Trajektorien 69
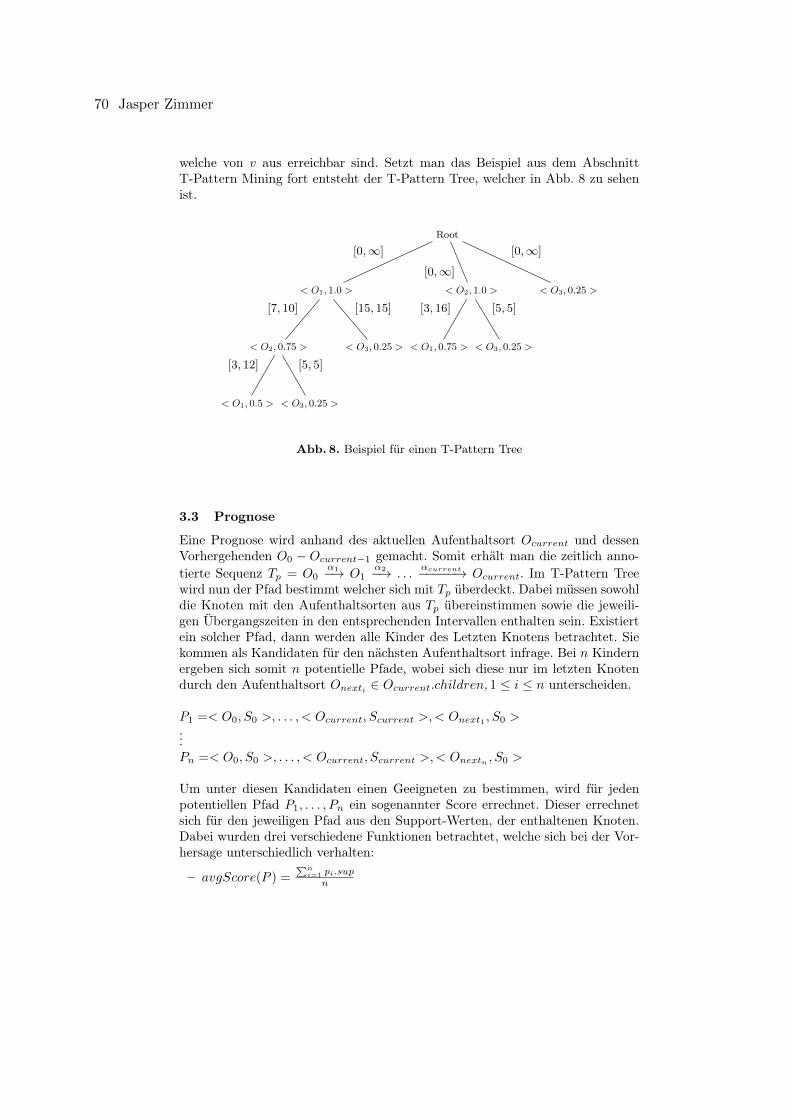
welche von v aus erreichbar sind. Setzt man das Beispiel aus dem AbschnittT-Pattern Mining fort entsteht der T-Pattern Tree, welcher in Abb. 8 zu sehenist.
Root
< O3, 0.25 >< O2, 1.0 >
< O3, 0.25 >< O1, 0.75 >
[3, 16] [5, 5]
< O1, 1.0 >
< O3, 0.25 >< O2, 0.75 >
< O3, 0.25 >< O1, 0.5 >
[3, 12] [5, 5]
[7, 10] [15, 15]
[0,∞]
[0,∞]
[0,∞]
Abb. 8. Beispiel für einen T-Pattern Tree
3.3 Prognose
Eine Prognose wird anhand des aktuellen Aufenthaltsort Ocurrent und dessenVorhergehenden O0 − Ocurrent−1 gemacht. Somit erhält man die zeitlich anno-tierte Sequenz Tp = O0
α1−→ O1α2−→ . . .
αcurrent−−−−−→ Ocurrent. Im T-Pattern Treewird nun der Pfad bestimmt welcher sich mit Tp überdeckt. Dabei müssen sowohldie Knoten mit den Aufenthaltsorten aus Tp übereinstimmen sowie die jeweili-gen Übergangszeiten in den entsprechenden Intervallen enthalten sein. Existiertein solcher Pfad, dann werden alle Kinder des Letzten Knotens betrachtet. Siekommen als Kandidaten für den nächsten Aufenthaltsort infrage. Bei n Kindernergeben sich somit n potentielle Pfade, wobei sich diese nur im letzten Knotendurch den Aufenthaltsort Onexti ∈ Ocurrent.children, 1 ≤ i ≤ n unterscheiden.
P1 =< O0, S0 >, . . . , < Ocurrent, Scurrent >,< Onext1 , S0 >...Pn =< O0, S0 >, . . . , < Ocurrent, Scurrent >,< Onextn , S0 >
Um unter diesen Kandidaten einen Geeigneten zu bestimmen, wird für jedenpotentiellen Pfad P1, . . . , Pn ein sogenannter Score errechnet. Dieser errechnetsich für den jeweiligen Pfad aus den Support-Werten, der enthaltenen Knoten.Dabei wurden drei verschiedene Funktionen betrachtet, welche sich bei der Vor-hersage unterschiedlich verhalten:
– avgScore(P ) =∑n
i=1 pi.sup
n
70 Jasper Zimmer
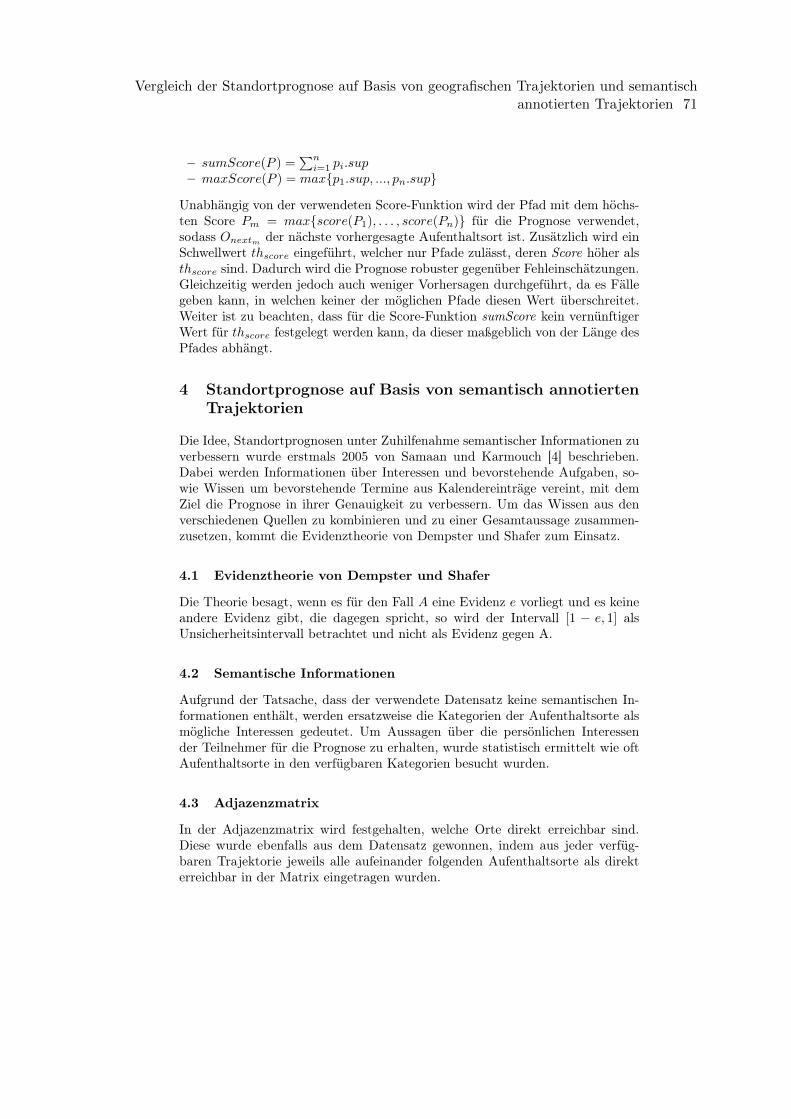
– sumScore(P ) =∑ni=1 pi.sup
– maxScore(P ) = max{p1.sup, ..., pn.sup}
Unabhängig von der verwendeten Score-Funktion wird der Pfad mit dem höchs-ten Score Pm = max{score(P1), . . . , score(Pn)} für die Prognose verwendet,sodass Onextm der nächste vorhergesagte Aufenthaltsort ist. Zusätzlich wird einSchwellwert thscore eingeführt, welcher nur Pfade zulässt, deren Score höher alsthscore sind. Dadurch wird die Prognose robuster gegenüber Fehleinschätzungen.Gleichzeitig werden jedoch auch weniger Vorhersagen durchgeführt, da es Fällegeben kann, in welchen keiner der möglichen Pfade diesen Wert überschreitet.Weiter ist zu beachten, dass für die Score-Funktion sumScore kein vernünftigerWert für thscore festgelegt werden kann, da dieser maßgeblich von der Länge desPfades abhängt.
4 Standortprognose auf Basis von semantisch annotiertenTrajektorien
Die Idee, Standortprognosen unter Zuhilfenahme semantischer Informationen zuverbessern wurde erstmals 2005 von Samaan und Karmouch [4] beschrieben.Dabei werden Informationen über Interessen und bevorstehende Aufgaben, so-wie Wissen um bevorstehende Termine aus Kalendereinträge vereint, mit demZiel die Prognose in ihrer Genauigkeit zu verbessern. Um das Wissen aus denverschiedenen Quellen zu kombinieren und zu einer Gesamtaussage zusammen-zusetzen, kommt die Evidenztheorie von Dempster und Shafer zum Einsatz.
4.1 Evidenztheorie von Dempster und Shafer
Die Theorie besagt, wenn es für den Fall A eine Evidenz e vorliegt und es keineandere Evidenz gibt, die dagegen spricht, so wird der Intervall [1 − e, 1] alsUnsicherheitsintervall betrachtet und nicht als Evidenz gegen A.
4.2 Semantische Informationen
Aufgrund der Tatsache, dass der verwendete Datensatz keine semantischen In-formationen enthält, werden ersatzweise die Kategorien der Aufenthaltsorte alsmögliche Interessen gedeutet. Um Aussagen über die persönlichen Interessender Teilnehmer für die Prognose zu erhalten, wurde statistisch ermittelt wie oftAufenthaltsorte in den verfügbaren Kategorien besucht wurden.
4.3 Adjazenzmatrix
In der Adjazenzmatrix wird festgehalten, welche Orte direkt erreichbar sind.Diese wurde ebenfalls aus dem Datensatz gewonnen, indem aus jeder verfüg-baren Trajektorie jeweils alle aufeinander folgenden Aufenthaltsorte als direkterreichbar in der Matrix eingetragen wurden.
Vergleich der Standortprognose auf Basis von geografischen Trajektorien und semantischannotierten Trajektorien 71
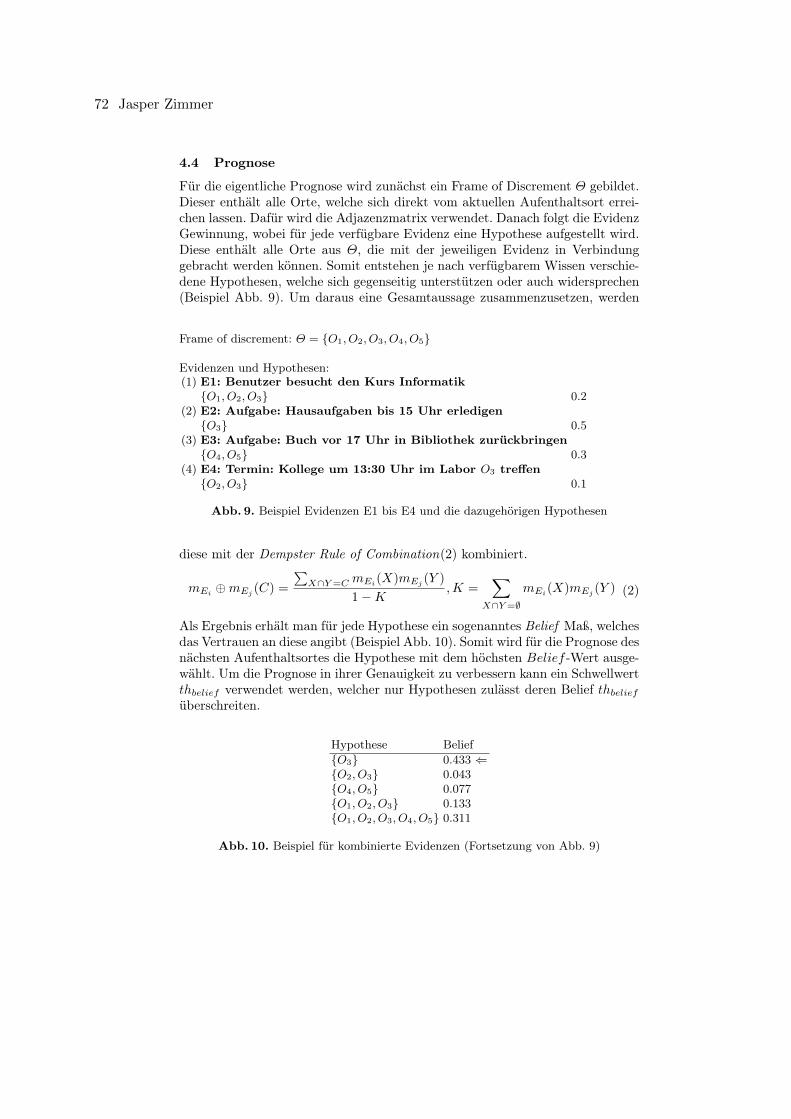
4.4 Prognose
Für die eigentliche Prognose wird zunächst ein Frame of Discrement Θ gebildet.Dieser enthält alle Orte, welche sich direkt vom aktuellen Aufenthaltsort errei-chen lassen. Dafür wird die Adjazenzmatrix verwendet. Danach folgt die EvidenzGewinnung, wobei für jede verfügbare Evidenz eine Hypothese aufgestellt wird.Diese enthält alle Orte aus Θ, die mit der jeweiligen Evidenz in Verbindunggebracht werden können. Somit entstehen je nach verfügbarem Wissen verschie-dene Hypothesen, welche sich gegenseitig unterstützen oder auch widersprechen(Beispiel Abb. 9). Um daraus eine Gesamtaussage zusammenzusetzen, werden
Frame of discrement: Θ = {O1, O2, O3, O4, O5}
Evidenzen und Hypothesen:(1) E1: Benutzer besucht den Kurs Informatik{O1, O2, O3} 0.2
(2) E2: Aufgabe: Hausaufgaben bis 15 Uhr erledigen{O3} 0.5
(3) E3: Aufgabe: Buch vor 17 Uhr in Bibliothek zurückbringen{O4, O5} 0.3
(4) E4: Termin: Kollege um 13:30 Uhr im Labor O3 treffen{O2, O3} 0.1
Abb. 9. Beispiel Evidenzen E1 bis E4 und die dazugehörigen Hypothesen
diese mit der Dempster Rule of Combination(2) kombiniert.
mEi ⊕mEj (C) =
∑X∩Y=C mEi
(X)mEj(Y )
1−K ,K =∑
X∩Y=∅mEi
(X)mEj(Y ) (2)
Als Ergebnis erhält man für jede Hypothese ein sogenanntes Belief Maß, welchesdas Vertrauen an diese angibt (Beispiel Abb. 10). Somit wird für die Prognose desnächsten Aufenthaltsortes die Hypothese mit dem höchsten Belief -Wert ausge-wählt. Um die Prognose in ihrer Genauigkeit zu verbessern kann ein Schwellwertthbelief verwendet werden, welcher nur Hypothesen zulässt deren Belief thbeliefüberschreiten.
Hypothese Belief{O3} 0.433 ⇐{O2, O3} 0.043{O4, O5} 0.077{O1, O2, O3} 0.133{O1, O2, O3, O4, O5} 0.311
Abb. 10. Beispiel für kombinierte Evidenzen (Fortsetzung von Abb. 9)
72 Jasper Zimmer
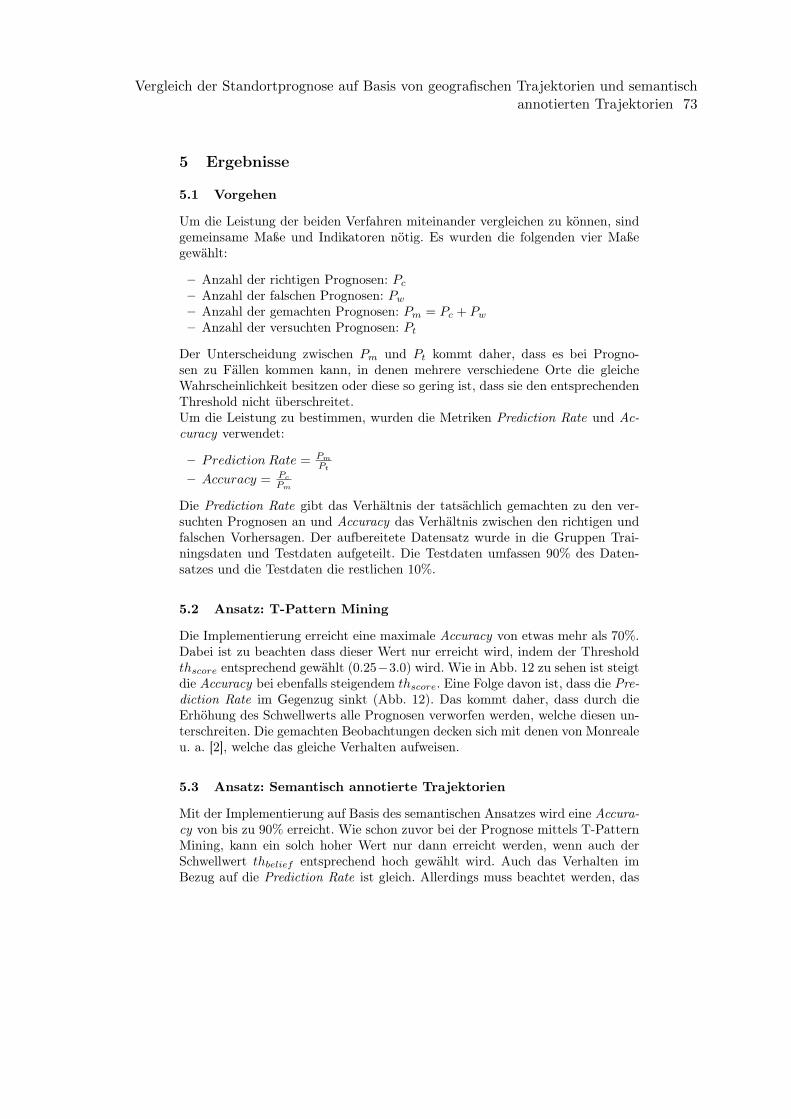
5 Ergebnisse
5.1 Vorgehen
Um die Leistung der beiden Verfahren miteinander vergleichen zu können, sindgemeinsame Maße und Indikatoren nötig. Es wurden die folgenden vier Maßegewählt:
– Anzahl der richtigen Prognosen: Pc– Anzahl der falschen Prognosen: Pw– Anzahl der gemachten Prognosen: Pm = Pc + Pw– Anzahl der versuchten Prognosen: Pt
Der Unterscheidung zwischen Pm und Pt kommt daher, dass es bei Progno-sen zu Fällen kommen kann, in denen mehrere verschiedene Orte die gleicheWahrscheinlichkeit besitzen oder diese so gering ist, dass sie den entsprechendenThreshold nicht überschreitet.Um die Leistung zu bestimmen, wurden die Metriken Prediction Rate und Ac-curacy verwendet:
– Prediction Rate = Pm
Pt
– Accuracy = Pc
Pm
Die Prediction Rate gibt das Verhältnis der tatsächlich gemachten zu den ver-suchten Prognosen an und Accuracy das Verhältnis zwischen den richtigen undfalschen Vorhersagen. Der aufbereitete Datensatz wurde in die Gruppen Trai-ningsdaten und Testdaten aufgeteilt. Die Testdaten umfassen 90% des Daten-satzes und die Testdaten die restlichen 10%.
5.2 Ansatz: T-Pattern Mining
Die Implementierung erreicht eine maximale Accuracy von etwas mehr als 70%.Dabei ist zu beachten dass dieser Wert nur erreicht wird, indem der Thresholdthscore entsprechend gewählt (0.25−3.0) wird. Wie in Abb. 12 zu sehen ist steigtdie Accuracy bei ebenfalls steigendem thscore. Eine Folge davon ist, dass die Pre-diction Rate im Gegenzug sinkt (Abb. 12). Das kommt daher, dass durch dieErhöhung des Schwellwerts alle Prognosen verworfen werden, welche diesen un-terschreiten. Die gemachten Beobachtungen decken sich mit denen von Monrealeu. a. [2], welche das gleiche Verhalten aufweisen.
5.3 Ansatz: Semantisch annotierte Trajektorien
Mit der Implementierung auf Basis des semantischen Ansatzes wird eine Accura-cy von bis zu 90% erreicht. Wie schon zuvor bei der Prognose mittels T-PatternMining, kann ein solch hoher Wert nur dann erreicht werden, wenn auch derSchwellwert thbelief entsprechend hoch gewählt wird. Auch das Verhalten imBezug auf die Prediction Rate ist gleich. Allerdings muss beachtet werden, das
Vergleich der Standortprognose auf Basis von geografischen Trajektorien und semantischannotierten Trajektorien 73
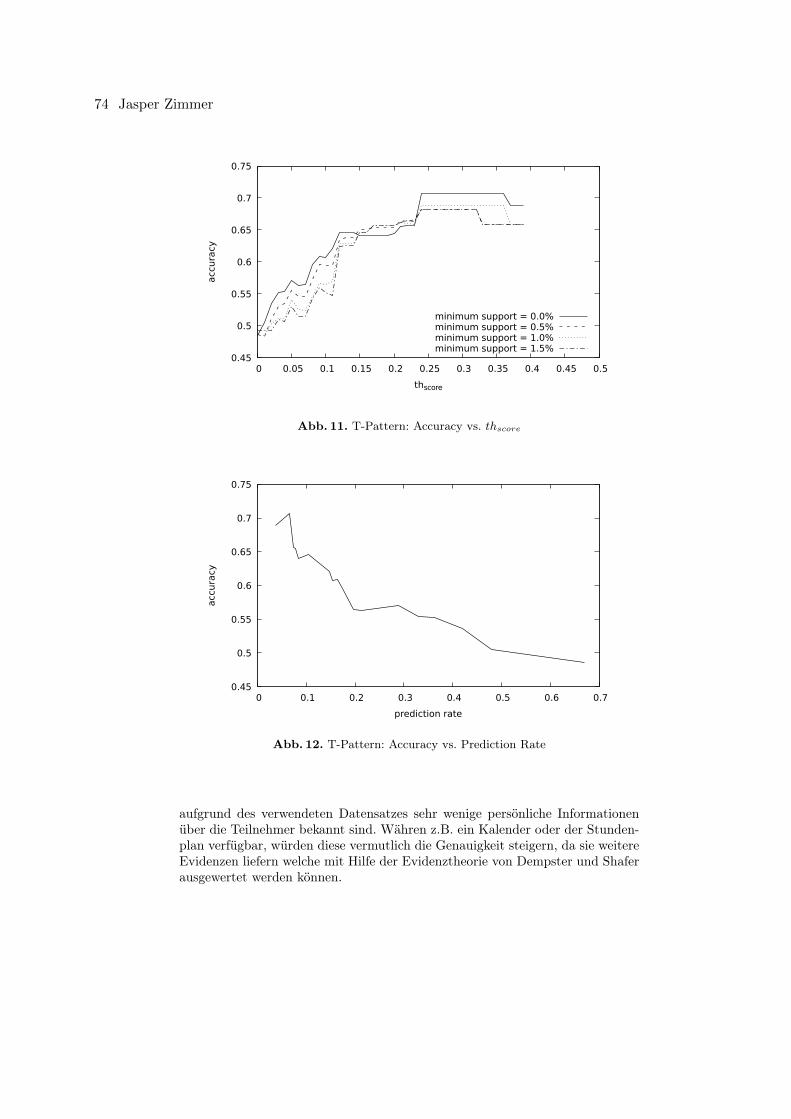
0.45
0.5
0.55
0.6
0.65
0.7
0.75
0 0.05 0.1 0.15 0.2 0.25 0.3 0.35 0.4 0.45 0.5
acc
ura
cy
thscore
minimum support = 0.0%minimum support = 0.5%minimum support = 1.0%minimum support = 1.5%
Abb. 11. T-Pattern: Accuracy vs. thscore
0.45
0.5
0.55
0.6
0.65
0.7
0.75
0 0.1 0.2 0.3 0.4 0.5 0.6 0.7
acc
ura
cy
prediction rate
Abb. 12. T-Pattern: Accuracy vs. Prediction Rate
aufgrund des verwendeten Datensatzes sehr wenige persönliche Informationenüber die Teilnehmer bekannt sind. Währen z.B. ein Kalender oder der Stunden-plan verfügbar, würden diese vermutlich die Genauigkeit steigern, da sie weitereEvidenzen liefern welche mit Hilfe der Evidenztheorie von Dempster und Shaferausgewertet werden können.
74 Jasper Zimmer
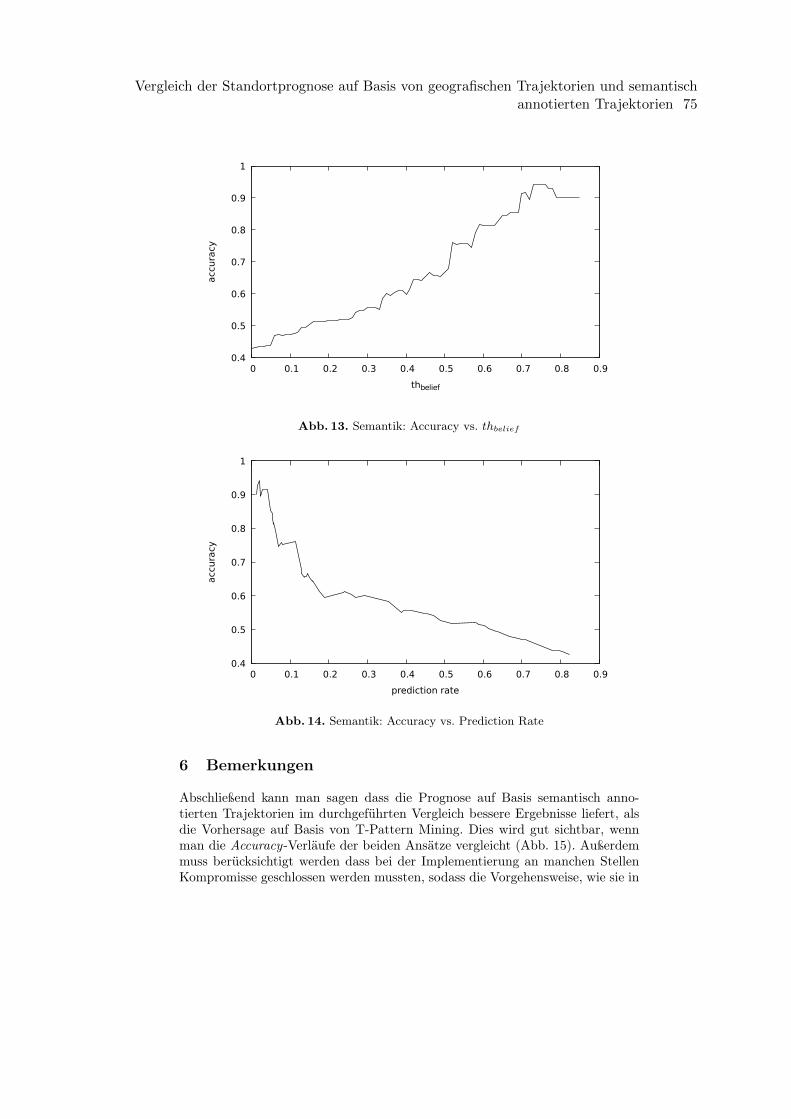
0.4
0.5
0.6
0.7
0.8
0.9
1
0 0.1 0.2 0.3 0.4 0.5 0.6 0.7 0.8 0.9
acc
ura
cy
thbelief
Abb. 13. Semantik: Accuracy vs. thbelief
0.4
0.5
0.6
0.7
0.8
0.9
1
0 0.1 0.2 0.3 0.4 0.5 0.6 0.7 0.8 0.9
acc
ura
cy
prediction rate
Abb. 14. Semantik: Accuracy vs. Prediction Rate
6 Bemerkungen
Abschließend kann man sagen dass die Prognose auf Basis semantisch anno-tierten Trajektorien im durchgeführten Vergleich bessere Ergebnisse liefert, alsdie Vorhersage auf Basis von T-Pattern Mining. Dies wird gut sichtbar, wennman die Accuracy-Verläufe der beiden Ansätze vergleicht (Abb. 15). Außerdemmuss berücksichtigt werden dass bei der Implementierung an manchen StellenKompromisse geschlossen werden mussten, sodass die Vorgehensweise, wie sie in
Vergleich der Standortprognose auf Basis von geografischen Trajektorien und semantischannotierten Trajektorien 75
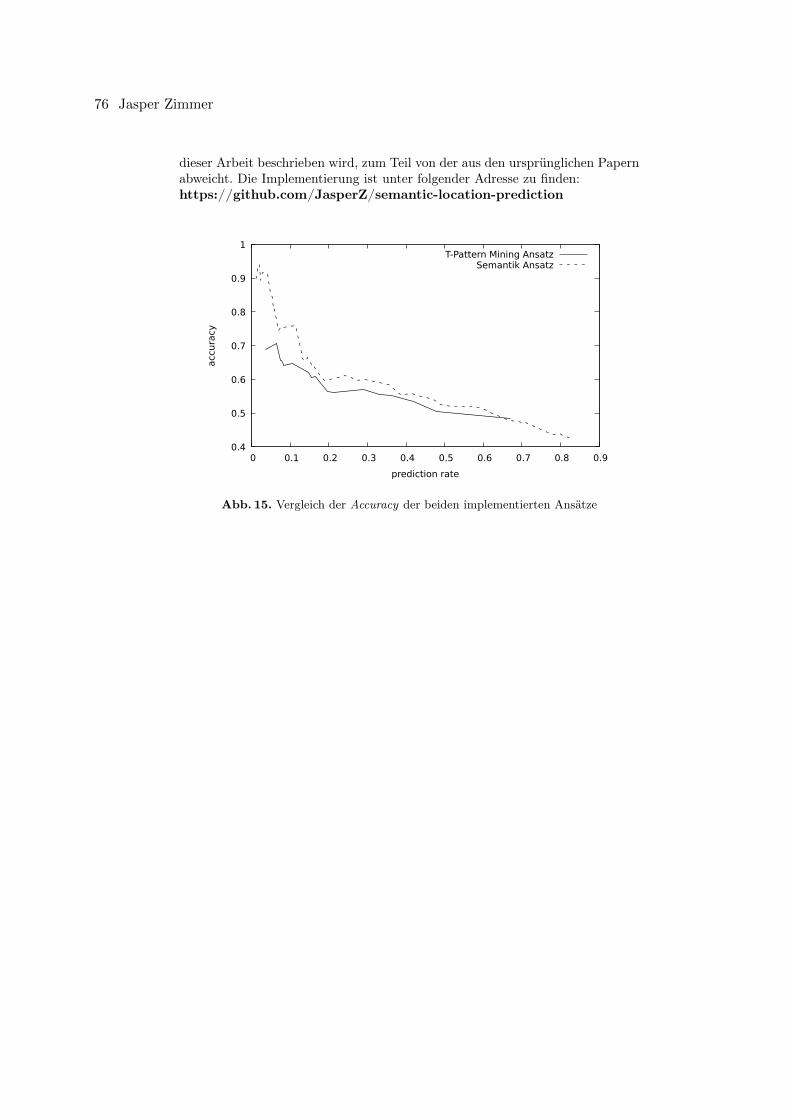
dieser Arbeit beschrieben wird, zum Teil von der aus den ursprünglichen Papernabweicht. Die Implementierung ist unter folgender Adresse zu finden:https://github.com/JasperZ/semantic-location-prediction
0.4
0.5
0.6
0.7
0.8
0.9
1
0 0.1 0.2 0.3 0.4 0.5 0.6 0.7 0.8 0.9
acc
ura
cy
prediction rate
T-Pattern Mining AnsatzSemantik Ansatz
Abb. 15. Vergleich der Accuracy der beiden implementierten Ansätze
76 Jasper Zimmer
Literatur
1. Giannotti, F., Nanni, M., Pinelli, F., Pedreschi, D.: Trajectory pattern mining. In:Proceedings of the 13th ACM SIGKDD International Conference on KnowledgeDiscovery and Data Mining. pp. 330–339. KDD ’07, ACM, New York, NY, USA(2007), http://doi.acm.org/10.1145/1281192.1281230
2. Monreale, A., Pinelli, F., Trasarti, R., Giannotti, F.: Wherenext: A location predic-tor on trajectory pattern mining. In: Proceedings of the 15th ACM SIGKDD Inter-national Conference on Knowledge Discovery and Data Mining. pp. 637–646. KDD’09, ACM, New York, NY, USA (2009), http://doi.acm.org/10.1145/1557019.1557091
3. Pentland, A., Eagle, N., Lazer, D.: Inferring social network structure using mobilephone data. Proceedings of the National Academy of Sciences (PNAS) 106(36),15274–15278 (2009)
4. Samaan, N., Karmouch, A.: A mobility prediction architecture based on contextualknowledge and spatial conceptual maps. IEEE Transactions on Mobile Computing4(6), 537–551 (Nov 2005), http://dx.doi.org/10.1109/TMC.2005.74
5. Zheng, Y., Zhang, L., Ma, Z., Xie, X., Ma, W.Y.: Recommending friends and lo-cations based on individual location history. ACM Trans. Web 5(1), 5:1–5:44 (Feb2011), http://doi.acm.org/10.1145/1921591.1921596
Vergleich der Standortprognose auf Basis von geografischen Trajektorien und semantischannotierten Trajektorien 77
Interruptibility-Detektierung auf Smartphones
David Krenz∗
Betreuer: Anja Bachmann†
Karlsruher Institut für Technologie (KIT)Pervasive Computing Systems – TECO
∗[email protected]†[email protected]
Zusammenfassung. Der Fokus dieser Seminararbeit liegt auf der The-matik der Unterbrechbarkeit eines Smartphone Benutzers. Wann sollteman ihn auf neue Mitteilungen aufmerksam machen? Wie soll man ihndarauf aufmerksam machen? Es soll ein Eindruck und eine gewisse Über-sicht in diesem Bereich geschaffen werden. Es werden Aspekte bespro-chen die Einfluss in das Konzept von solch Software haben. Es ist dabeiwichtig die Psyche des Benutzers zu verstehen und mit einzubringen. Au-ßerdem werden einige Ideen beziehungsweise Ansätze genannt. Die The-matik bewegt sich vor allem, immer in Richtung besserer Möglichkeitenzur Erfassung des Umfelds eines Benutzers, das eine ausschlaggebendeRolle besitzt.
Schlüsselwörter: Interruptibility, Aspekte, Probleme, Strategien, Ver-fahren, Attention-Awareness
1 Einleitung
Aufmerksamkeit. In unserer heutigen Gesellschaft dreht sich alles um Aufmerk-samkeit. Unser Umfeld bestimmt oder gestaltet unseren Grad an Aufmerksam-keit, den wir Dingen widmen, ausschlaggebend mit. Zwischen Arbeit und Privat-leben halten uns Mitteilungen auf dem laufenden und zwingen uns gleichzeitigTätigkeiten zu unterbrechen oder nieder zu legen. In Zeiten des mobilen digita-len Zeitalters ist die Thematik von Aufmerksamkeit im Bezug auf Mitteilungen(engl. „notifications“) empfangen durch Smartphones aktueller denn je. Es stelltsich durch den immer größer werdenden kognitiven Einfluss, der auf uns lastet,hervorgerufen durch eine immer größer werdende Menge an Mitteilungen bezie-hungsweise Unterbrechungen durch unsere mobilen Begleiter, die Fragen, wann,wo und ob wir diese Mitteilungen eigentlich entgegennehmen müssen beziehungs-weise entgegennehmen wollen. Die folgende Arbeit versucht, diese Thematik zuerfassen. Dabei ist bei Unterbrechungen durch Smartphone Nachrichten vor al-lem der richtige Zeitpunkt des Eintreffens einer Mitteilung der entscheidendeFaktor und das Ziel der Forschung im Bereich Interruptibility-Detektion. DurchAnalyse diverser Sensordaten, die von Nutzern durch Smartphones gesammeltwerden können, ist es möglich, mit neuen Verfahren und Algorithmen präzise-re Zeitpunkte für eine geeignete Unterbrechung für die Benutzer ausfindig zu
78 David Krenz
machen. Oft werden diese Verfahren weiter durch gesammelte Daten und ma-schinellen Lernens in der Praxis verbessert. Dementsprechend ist es wichtig dasUmfeld eines Benutzers so genau wie möglich zu erfassen, um geeignete Zeit-punkte zu filtern. Ist dieser gerade beschäftigt? In einem Meeting? Hier spielenunter anderem Sensordaten, die aus Ort, Zeit und Bewegungsaktivitäten gewon-nen werden, eine Rolle. Nur das Nutzen von Sensordaten reicht meist alleinenicht aus. Auch psychologische Aspekte wie die momentane Stimmung einesBenutzers während des Eintreffens einer Benachrichtigung spielen eine gravie-rende Rolle und können meist nur durch zeitnahe Fragebögen, auch sogenannten„Surveys“, ermittelt werden. In dieser Arbeit wird dem Leser zunächst versucht,eine allgemeine Definition und Erklärung des Begriffs „Interruptibility“ klar zumachen. Des Weiteren folgt ein Abschnitt, der einfließende Aspekte und Proble-me in dieser Thematik erfassen soll. Aspekte, die eine Rolle in der Forschungund Entwicklung von Smartphone Interruption spielen. Anbindend die damitverbundenen Probleme. Darauf folgend soll eine Übersicht von Verfahren undMethoden derzeitiger Interruptibility-Detektierung aufgezeigt werden. Letztend-lich soll eine Diskussion im Bereich dieser Thematik geführt werden, mit einerabschließenden Zusammenfassung.
2 Definition
2.1 Interruptibility - Was ist das?
Aus dem engl. für „Unterbrechbarkeit“ beschreibt der Begriff der Unterbrechungeine Störung eines gewissen Prozesses oder einer Tätigkeit. Im Rahmen dieserThematik, die Störung eines bestimmten Prozesses oder einer Tätigkeit einerPerson. Der Zustand, an dem diese Person am empfänglichsten für eine neueintreffende Störung ist. Diese Person ist im Besitz beziehungsweise in Benut-zung eines Smartphones, von dem auch die eigentliche Störquelle ausgeht. DasZiel der Forschung, die in den folgenden Abschnitten vorgestellt wird, ist fürjede neue Störung den geeignetsten Zustand des Benutzers zu finden, um ihnso weit wie möglich nicht bei seiner momentanen Tätigkeit oder gar in seinermomentanen Stress- oder Gefühlslage zu stören. Die Intention ist eine so ge-nannte „Attention-Awareness“ bereitzustellen. Optimale Momente, oftmals auchbestimmte Anhaltspunkte, sogenannte „Breakpoints“, sind Unterbrechungen desBenutzers selbst (z.B. ein Wechsel zwischen Tätigkeiten), sind das Ziel. Gera-de die Fähigkeit physisch das Augenmerk von einer Tätigkeit auf eine andereTätigkeit zu wechseln und der eigentlich folgende Effekt auf die Tätigkeit, be-schreiben was es bedeutet unterbrechbar zu sein.[16] Diese Arten von Störungen,die von der Störquelle Smartphone ausgehen können, sind unter anderem Mit-teilungen in Form von neuen E-Mails, Chat-Nachrichten, App-Meldungen, Sys-temnachrichten oder auch Update-Nachrichten (etc.)[17]. Des Weiteren könnendiese Störungen in Form von „Push-Notifications“(„aufploppen“ auf dem Bild-schirm), Ruftönen, Led-Benachrichtigungsleuchten oder Vibrationen hervorge-rufen werden[17]. Um Berechnungen für geeignete Momente zu gewährleisten,wird der Kontext eines Benutzers zur Analyse hinzugezogen.
Interruptibility-Detektierung auf Smartphones 79
2.2 Kontext - Was ist das?
Turner et al.[16] nennt Einflüsse eines Kontext:
1. Charakteristiken des Benutzers(Fühlt sich der Benutzer zurzeit belastet?)2. Eigenschaften der Unterbrechung(Worüber handelt die Nachricht? Von wel-
cher Quelle geht sie aus?)3. Das nahe Umfeld(Wo befindet sich der Benutzer und ist er aktiv?)
Der Kontext eines Benutzers beschreibt sein Umfeld. Der Kontext selbst sindInformationen die durch das Smartphone gesammelt werden. Durch Sensorenkönnen Informationen wie der momentane Ort (GPS), ob die Person sich geradein Bewegung befinden (Beschleunigungssensor) oder Geräuschkulissen (Mikro-fon) gesammelt werden. Diese sensorbasierenden Daten werden meisten in be-stimmten Vektoren bestehend aus den entsprechenden Variablen gespeichert[15].Diese können dann zur weiteren Verarbeitung für die Interruptibility-Softwaregenutzt werden. Dabei werden diese oftmals als Trainingsdatensätze verwendetdie weitere Anwendung in Modellen des maschinellen Lernens finden. Mit ma-schinellen Lernmethoden können Beziehungen in Datensätze entdeckt werden,um Prognosen für geeignete Momente zu berechnen. Dabei unterscheidet manzwischen Offline-Machine-Learning, der ganze gesammelte Datensatz wird ein-malig zu Berechnung genutzt und Online-Machine-Learning, welches ein immerweiteres Aktualisieren mit neuen Datensätzen zulässt. Doch Informationen ei-nes Kontextes bestehen in diesem Feld meist nicht nur aus sensorbasierendenDaten, sondern auch aus Daten die aus Experience-Sampling gewonnen werden.Die Experience-Sampling-Methode (ESM) ist ein Verfahren das den Benutzeran Ort und Stelle - in situ - dazu auffordert, ein Feedback zu geben[9]. Dasheißt, zum Zeitpunkt der Unterbrechung können zum Beispiel Informationender momentanen Verfassung des Benutzers, in Form von kurzen Fragebögen oderApp-Reglern[12] in Erfahrung gebracht werden. ESM ermöglicht das Sammelnvon Daten der momentanen Gedanken-, Gefühls- oder Stresslage eines Benut-zers(Pejovic et al.[12]) und gibt somit auch Aufschluss auf sein Verhalten.
2.3 Kognitive Belastung - Was ist das?
Im Englischen auch als „cognitive overload“ oder „cognitive load“ bezeichnet, istdie Belastung die der Benutzer bei der Aufnahme von Informationen erfährt.Aufmerksamkeit wird hierbei als eine begrenzte Ressource angesehen[5][11]. EinMensch ist bei der Aufnahme von und zu vielen Informationen, in unserem Falldurch den Nachrichteneingang eines Smartphones, nicht in der Lage den vollenUmfang entgegen zu nehmen. Im Nachhinein müssen diese gedanklich verarbeitetwerden und lösen einen Lerneffekt auf das Gedächtnis aus[5]. Der wachsendeInformationsfluss zwingt den Benutzer zu einem Multi-Tasking verhalten dasin Stress resultieren kann[10][11]. Damit ist eine solche Belastung in Pervasive-Computing-Bereichen allgegenwärtig.
80 David Krenz
3 Aspekte & Probleme
Dieser Abschnitt behandelt einfließende Aspekte im Bereich der InterruptibilityForschung. Was ist zu beachten, wenn man sich mit dem Benutzer und sei-nen Smartphone Störungen beschäftigt? Womöglich handelt der Benutzer nichtimmer wie zu erwarten, was zur Beeinflussung eines verfälschten Resultats inder Analyse der Daten führen kann. Viele Studien setzen sich auch mit sol-chen Punkten auseinander und versuchen diese zu kategorisieren. Es sind nebenden technischen Aspekten, deren Möglichkeiten und Anpassungen, also auch diepsychologischen Komponenten zu betrachten. Auf beiden Seiten herrschen auchgewisse Problemaspekte. Da diese Punkte meist eng verflochten beziehungsweisemiteinander einhergehen, liegt eine Schwierigkeit vor hier eine klare Gliederungaufzuweisen, wir widmen uns zunächst dem psychologischen Aspekt und demVerhalten des Benutzers und betrachten dann den technischen Standpunkt.
3.1 Psychologische Perspektive
Das Hauptziel beziehungsweise der Hauptaspekt ist hierbei den Stress, den einBenutzer erfährt, möglichst zu vermindern oder wenn möglich zu vermeiden. Sa-hami Shirazi et al.[14] behaupten, dass es in der Natur von Mitteilungen liegt zustören. Durch jegliche Art einer Mitteilung des Smartphones wie SMS, InstantMessages, Anrufe, E-Mails, soziale Netzwerke, Spiele, Werbung, System- oderUpdatemitteilungen, kann eine Störung aufkommen und beim Benutzer Stressauslösen. Dabei kann die Ursache schon in der Einschätzung seiner Handlungs-fähigkeit selbst liegen. Funktionen, mit denen man in einen Modus wechselt, diekeine Störung mehr zulassen oder gar nur personalisierte Störungen durchlassenvon bestimmten Smartphoneapplikationen, sind inzwischen schon lange etabliertfür Android und iOS. Nach Yoon et al. [17] sind es nämlich schon die Benachrich-tigungseinstellungen, die zu einem höheren Stresslevel bei den Nutzern führenkönnen. Dabei kristallisierten sich auch bestimmte Typen von Benutzern herausdie wenig Stress erfuhren, durch die Kenntnis und das Einstellen der Benachrich-tigungsfunktionen. Oft fehlt den Nutzern auch einfach die Bereitschaft dazu, einePersonalisierung ihrer Einstellungen durchzuführen. Dennoch gab es eine Grup-pe die sich den Funktionen bewusst war und diese genutzt hat aber dennoch einerhöhtes Stresslevel aufzeigte. Gründe hierfür sind [17]:
1. Unter anderem das Nachholen von langen Chatverläufen vor allem ausgelöstdurch Gruppenchats in Messenger Diensten.
2. Bei den Benutzern kommt die Angst auf etwas zu verpassen und führt nahe-zu zu einem zwangsmäßigen Verhalten das Smartphone zu überprüfen. BeiBefragung der Teilnehmer der Studie, zeigte sich ein Verhalten von halluzi-ninierenden Zuständen und sie hatten das Gefühl sie bekämen Nachrichten.
3. Ein Missverständnis unter zwei kommunikativen Parteien, die sich mitein-ander über Chatdienste austauschten. Die einen nutzten den Dienst wie einEchtzeitdienst (sofortige Antwort) andere wie ein E-Mail Programm, dasseinem erlaubt zeitversetzt zu antworten.
Interruptibility-Detektierung auf Smartphones 81
4. Weitere Punkte die zu Stress führen, sind unter anderem auch Formen vonSpam die als Werbung und Angebote, als Nachrichten auftreten.
5. Des Weiteren falls der Benutzer gerade nicht seine eingehenden Nachrichtenüberprüfen kann oder will und diese durch Vibration oder Töne auf sichtrotzdem aufmerksam machen. Es kommt Stress auf, da er sich des Inhaltesdennoch bewusst sein möchte.
Unter anderem Sahami Shirazi et al.[14] fanden heraus, dass die Relevanzvon Mitteilungen variiert, je nach Inhalt. Das heißt mehr Aufmerksamkeit wirdNachrichten gewidmet die einen sozialen Bezug haben (Instant Messenger Diens-te, soziale Netzwerke) gegenüber Systemmeldungen. Natürlich kann auch derDrang immer den neuesten Stand in einer Sache zu erzielen eine Ursache sein.Aber genau diese Zurechnung von einer höheren Priorität hat Folgen in Stress,ausgelöst durch „Social Pressure“, d.h. Druck ausgeübt durch Erwartungen vonsozialen Kontakten. Denn bei solchen Nachrichten wird mehr Verantwortung vonseinen Kommunikationspartnern erwartet. Punkte 2 und 3 finden sich hier wie-der, wobei Pielot et al.[13] eine mögliche Ursache für das zwanghafte Verhaltendamit erklären, dass genau diese Erwartungen die man seinem Gegenüber zu-kommen lässt, schnell zu antworten, im Endeffekt, im nicht eintreffenden Fallzu ständiger Kontrolle des Smartphones führt. Pielot et al.[13] beschreiben aberauch, Auslöser für sozialen Druck sind Dienste die die Verfügbarkeit seines Chat-partners preisgeben die Unsicherheiten bei den Benutzern, sowie Probleme beider Beibehaltung ihrer Privatsphäre auslösen. Der Benutzer wird dadurch unterDruck gesetzt auf eine Nachricht schnell zu Antworten, da er seinen Chatpartnerim Glauben lässt, ignoriert zu werden[13].
Wo auch immer wir mit unserem Smartphone agieren, es kann zu einemmöglichen Störfaktor werden. Durch mehr Apps, die wir zu benötigen glauben,entsteht auch eine wachsende kognitive Belastung. Okoshi et al.[10][11] beschrei-ben hierbei, dass das steigende Informationsangebot und konstante Aufbringenvon Aufmerksamkeit einen Flaschenhals seitens Mensch erzeugt. Physische undpsychische Belastungen denen der Benutzer nicht nachkommt.
3.2 Technologische Perspektive
Aus vorherigem Abschnitt kennen wir nun einige Probleme, die durch die Psy-che eines Smartphone-Besitzers auftreten können und die bei dem Design vonInterruptibility-Software zu berücksichtigen sind. Dementsprechenden gibt esauch Punkte, die auf technischer Seite anzusprechen sind.
Wie zu Beginn erwähnt, liegt schon eine Problematik in den Einstellungender Apps die Mitteilungen an den Benutzer senden. Yoon et al.[17] kategori-sieren hier noch mal drei Faktoren, die softwaretechnischer Sicht berücksichtigtwerden sollten: Inhalt, Updatezeiten und Art der Benachrichtigung. Dabei be-schreibt ersterer Punkt die Tendenz zu mehr Eingrenzung der Nachrichten inAbhängigkeit des Inhalts. Es ist schwer auf semantischer Ebene den eigentlichenInhalt einer z.B. Chatnachricht zu nutzen, aber in dieser Hinsicht zumindestautomatisch wichtige Nachrichten von Spam zu trennen oder eine Möglichkeit
82 David Krenz
wie am Beispiel Google Mail, dass E-Mails aufteilt nach Werbung, sozialem In-halt und weiteren Themen. Des Weiteren die Punkte periodisch Mitteilungenstumm stellen zu können, dem Nutzer flexiblere Möglichkeiten zu geben sichtemporär vor Störungen nach seinem belieben schützen zu lassen. Letztlich istauch noch die Art, wie eine Nachricht auf sich aufmerksam macht, ein wichtigerFaktor, je nach Umstand des Benutzers möchte der Nutzer keinerlei Anzeigenerhalten in den Phasen, in denen er nicht unterbrochen werden möchte oderzumindest keine akustischen Benachrichtigungselemente. Durch LED-Anzeigenkann er immer noch nach seiner Phase erinnert werden zu antworten und durchFarbauswahl dieser sogar sich Prioritäten legen, ob noch eine wichtige Nachrichtvorherrscht[7][17].
Auf Ebene der Verarbeitung von Kontextdaten gibt es auch Dinge zu beach-ten, denn diese sind womöglich nicht immer zuverlässig. Einzelne Sensordatenspiegeln nicht immer konsistente Verhaltensweisen wieder[6]. Es ist wichtig zubeachten, welche Datensätze zusammen einen zuverlässigen Kontext repräsen-tieren können, um Verhaltensweisen bewertbar zu machen. Des Weiteren könnenProbleme auch bei einer genauen Bewertung von Kontextinformationen auftre-ten. Zur Analyse der Interruptibility des Benutzers werden auch Informationenwie Reaktionszeit, Antwortzeit und entsprechende Verhaltensweisen zu Reakti-on, Antwort und etc. genutzt[12]. Was ist also, wenn der Benutzer auf eine Nach-richt reagiert aber den Antwortprozess abbricht? Turner, Allen und Whitaker[16]weisen darauf hin, dass „Black-Box“ Methoden (z.B. ein Event das unterbricht,folgt nur zu dem resultierenden Zustand ob eine Antwort folgte oder nicht, ohnezu wissen „wie“) keinen Unterschied feststellen können, ob im gesamten Unter-brechungsprozess ein Erfolg erzielt wurde. Dementsprechend teilten sie diesen inmehrere Phasen ein, die zur Bewertung beitragen sollten. Daraus folgend auchein genaueres Resultat im Entscheidungskontext.
Ein weiterer und sehr wichtiger Faktor in der Interruptibility-Entwicklungist die Nutzung von Smartphone Ressourcen. Welche Kapazitäten herrschenvor und wie viel stehen mir zur Verfügung? Es ist zu beachten das ein konti-nuierlicher Sensorbetrieb höhere Leistungsansprüche und somit Akkuverbrauchbesitzt[2][12]. Da diese Systeme auf Smartphones agieren und Kapazitäten einge-schränkter als z.B. auf PCs sind, ist ein schonender Betrieb ein wichtiger Aspekt,um einen nicht zu hohen Nachteil aufzuwerfen. Eine Möglichkeit wäre hierbeiabzuwägen welche Sensoren und wann welche Sensoren genutzt werden. WieSchonende öfters einzusetzen, um dafür Verbrauchende nur in seltenen Fällen zunutzen[1].
3.3 Sicherheitstechnische Perspektive
Letztendlich gibt es auch noch den Aspekt beim Design von Interruptibility-Software, die Privatsphäre des Benutzers zu wahren. Gerade zu dem angespro-chenen Punkt aus dem psychologischen Abschnitt, die Verfügbarkeit seinemKommunikationspartner preiszugeben. Nehmen wir den „last-seen“-Status vonWhatsApp als Beispiel, welches den Zeitpunkt anzeigt, wann der Chatpartner
Interruptibility-Detektierung auf Smartphones 83
zuletzt verfügbar war (des Weiteren auch ob eine Nachricht schon gesehen wur-de und den momentanen Online-Status). Der Empfänger fühlt sich womöglichin seinem Verhalten beobachtet. Daraus können falsche Annahmen und Inter-pretationen im Verhalten des Empfängers geschaffen werden[3]. Zeitpunkte, andenen er mit dem Smartphone interagiert und nicht interagiert geben anderenSendern womöglich Aufschluss darauf. Der Trend von Apps die Dienste anbietendiese Funktionen zu unterdrücken zeigen auch die Abneigung und die Absichtendes Benutzers gegenüber solchen Diensten[13]. Pielot et al.[13] zeigen außerdem,dass solche Dienste keine guten Indikatoren für eine bessere Interruptibility Vor-aussage darstellen. Es ist zu beachten, ob solche Funktionen im Resultat Vorteilebieten.
4 Methoden, Verfahren und Möglichkeiten
Im Folgenden wollen wir uns nun einer Übersicht von Methoden und Verfahrenim Bereich der Interruptibility-Detektierung widmen. Welche Verfahren wurdenbisher realisiert und mit welchen Methoden? Was für Möglichkeiten stehen zurVerfügung? Dies soll weitgehendst erfasst und an einigen Beispielen erläutertwerden.
4.1 Methoden
Der Hauptbestandteil, einen geeigneten Moment zu erfassen oder im Allgemei-nen zur Reduzierung von Störungen und kognitiver Belastung beizutragen, be-steht darin, den Kontext des Benutzers zu ermitteln. Wie schon in vorherigenAbschnitten erwähnt sind die dafür gängigen Methoden, das Sensorsampling(sammeln von Sensordaten) sowie die Experience-Sampling-Method (sammelnvon Benutzerfeedback, z.B. momentane Stimmung). Es gibt Verfahren, die dieseMethoden unabhängig voneinander nutzen, aber auch welche die ein Hybridver-fahren darstellen und beide verwenden. Letztendlich werden gesammelte Datenin maschinellen Lernmethoden für ein intelligentes Unterbrechungsverfahren wei-terverarbeitet.
4.2 Strategien
Während die Erfassung selbst eine große Rolle spielt, sind Strategien zum An-setzen eines Verfahren auch wichtig. Wie gelangt man zu einer zuverlässigenPrognose eines geeigneten Moments? Wie reagiert das System? Wann sprichtman von einer erfolgreichen Unterbrechung? Vor allem woran orientiert mansich, um einen geeigneten Moment zu erkennen? Pejovic und Musolesi[12] nen-nen 3 Punkte, die zur Bewertung eines erfolgreichen Moments entscheidend seinkönnen:
1. Die Reaktionsfreudigkeit2. Die Gefühlslage
84 David Krenz
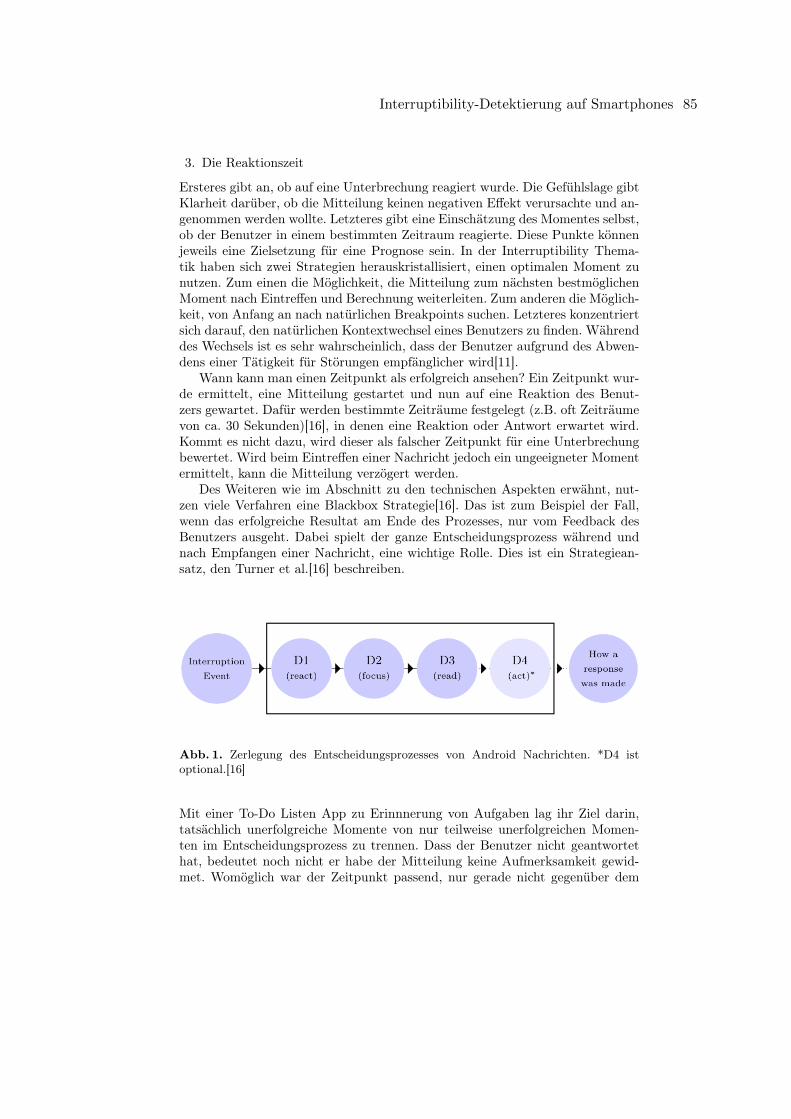
3. Die Reaktionszeit
Ersteres gibt an, ob auf eine Unterbrechung reagiert wurde. Die Gefühlslage gibtKlarheit darüber, ob die Mitteilung keinen negativen Effekt verursachte und an-genommen werden wollte. Letzteres gibt eine Einschätzung des Momentes selbst,ob der Benutzer in einem bestimmten Zeitraum reagierte. Diese Punkte könnenjeweils eine Zielsetzung für eine Prognose sein. In der Interruptibility Thema-tik haben sich zwei Strategien herauskristallisiert, einen optimalen Moment zunutzen. Zum einen die Möglichkeit, die Mitteilung zum nächsten bestmöglichenMoment nach Eintreffen und Berechnung weiterleiten. Zum anderen die Möglich-keit, von Anfang an nach natürlichen Breakpoints suchen. Letzteres konzentriertsich darauf, den natürlichen Kontextwechsel eines Benutzers zu finden. Währenddes Wechsels ist es sehr wahrscheinlich, dass der Benutzer aufgrund des Abwen-dens einer Tätigkeit für Störungen empfänglicher wird[11].
Wann kann man einen Zeitpunkt als erfolgreich ansehen? Ein Zeitpunkt wur-de ermittelt, eine Mitteilung gestartet und nun auf eine Reaktion des Benut-zers gewartet. Dafür werden bestimmte Zeiträume festgelegt (z.B. oft Zeiträumevon ca. 30 Sekunden)[16], in denen eine Reaktion oder Antwort erwartet wird.Kommt es nicht dazu, wird dieser als falscher Zeitpunkt für eine Unterbrechungbewertet. Wird beim Eintreffen einer Nachricht jedoch ein ungeeigneter Momentermittelt, kann die Mitteilung verzögert werden.
Des Weiteren wie im Abschnitt zu den technischen Aspekten erwähnt, nut-zen viele Verfahren eine Blackbox Strategie[16]. Das ist zum Beispiel der Fall,wenn das erfolgreiche Resultat am Ende des Prozesses, nur vom Feedback desBenutzers ausgeht. Dabei spielt der ganze Entscheidungsprozess während undnach Empfangen einer Nachricht, eine wichtige Rolle. Dies ist ein Strategiean-satz, den Turner et al.[16] beschreiben.
Abb. 1. Zerlegung des Entscheidungsprozesses von Android Nachrichten. *D4 istoptional.[16]
Mit einer To-Do Listen App zu Erinnnerung von Aufgaben lag ihr Ziel darin,tatsächlich unerfolgreiche Momente von nur teilweise unerfolgreichen Momen-ten im Entscheidungsprozess zu trennen. Dass der Benutzer nicht geantwortethat, bedeutet noch nicht er habe der Mitteilung keine Aufmerksamkeit gewid-met. Womöglich war der Zeitpunkt passend, nur gerade nicht gegenüber dem
Interruptibility-Detektierung auf Smartphones 85
Inhalt dieser Nachricht oder Anwendung. Die Abb. 1 zeigt Zwischenschritte wiedas Lesen, Fokussieren und Reagieren, wobei der Benutzer den Prozess vor-her schon unterbrechen kann. Durch Überfliegen der Push-Notification, erhälter schon einen Eindruck der Situation. Diese sollten später auch berücksichtigtwerden und nicht nur das Endresultat. Das Ergebnis schuf eine Verbesserung derGenauigkeit gegenüber „Null-Responses“[16], also fehlgeschlagenen Nachrichten.Anknüpfend kategorisieren auch Pejovic und Musolesi[12] verschiedene Kontext-stadien:
1. Benachrichtigungskontext2. Antwort-Kontext3. Benachrichtigungs-Antwort Kontextwechsel4. Benachrichtigungskontext-Varianz
Erstens legt den Erfolg einer Unterbrechung im Kontext einer gesendeten Nach-richt fest. Zweitens den Erfolg einer Unterbrechung im Kontext einer Reaktion.Im dritten Punkt wechselt der Kontext bei einer erfolgreichen Unterbrechungvon der Benachrichtigung zur Reaktion. Der letzte Punkt beschreibt den Erfolgeiner Unterbrechung in der Variation des Kontextes (verschiedene Kontexte, ver-schieden zu bewerten). Auch bei reinen ESM Vorgehen, sind Strategien zu be-rücksichtigen. Wird die Befragung unterbrochen oder falsch beantwortet? Auchhier kann es dazu führen, dass es zu unehrlichen Angaben kommt[9][16]. Um sichnicht nur auf einseitiges Feedback zu verlassen und Möglichkeiten für Studienund bessere Datensätze zu schaffen, kategorisieren Mehrotra et al.[9] hier diezwei Strategien für Momente ein Survey zu veranlassen, zum Erfassen von:
1. täglicher Erfahrung2. Erfahrung zu einem Event
Ersteres befragt den Benutzer periodisch in seinem Alltag und knüpft die gewon-nenen Informationen zu seinem momentanen Kontext. Der zweite Punkt konzen-triert sich auf das Eintreffen eines Events, dafür muss aber der Kontext schonvorher beobachtet werden um zum Auftreten des Events das Survey zu starten.Im Allgemeinen ist der Kontext oftmals kategorisiert in physischen Daten wiepsychischen Daten mit den gängigen genannten Methoden. Doch es gibt auchanderweitige Ansätze den Kontext eines Benutzers auszumachen. Mehrotra[8]stellt hierbei das Konzept vor, gerade Informationen bezüglich der Stimmungdurch Online-Social-Networks (OSN) zu ermitteln. Der Benutzer generiert durchAktivitäten in sozialen Medien (Posts, Kommentare, teilen von Inhalten) Infor-mationen selbst, die der Kontext Erfassung hinzugezogen werden können. Daskönnen Aktivitäten sein wie das Posten und Teilen von Inhalten, Kommentaresetzen oder Stimmungen zum Ausdruck (siehe Facebook) bringen. Zusammenmit dem physischen Kontext können Informationen des Benutzers ohne direktesmanuelles Feedback gesammelt werden.
4.3 Möglichkeiten
Softwaretechnische Umsetzungen sind oftmals realisiert in Frameworks, APIsoder in Middleware. Möglichkeiten um neue Anwendungen mit entsprechen-
86 David Krenz
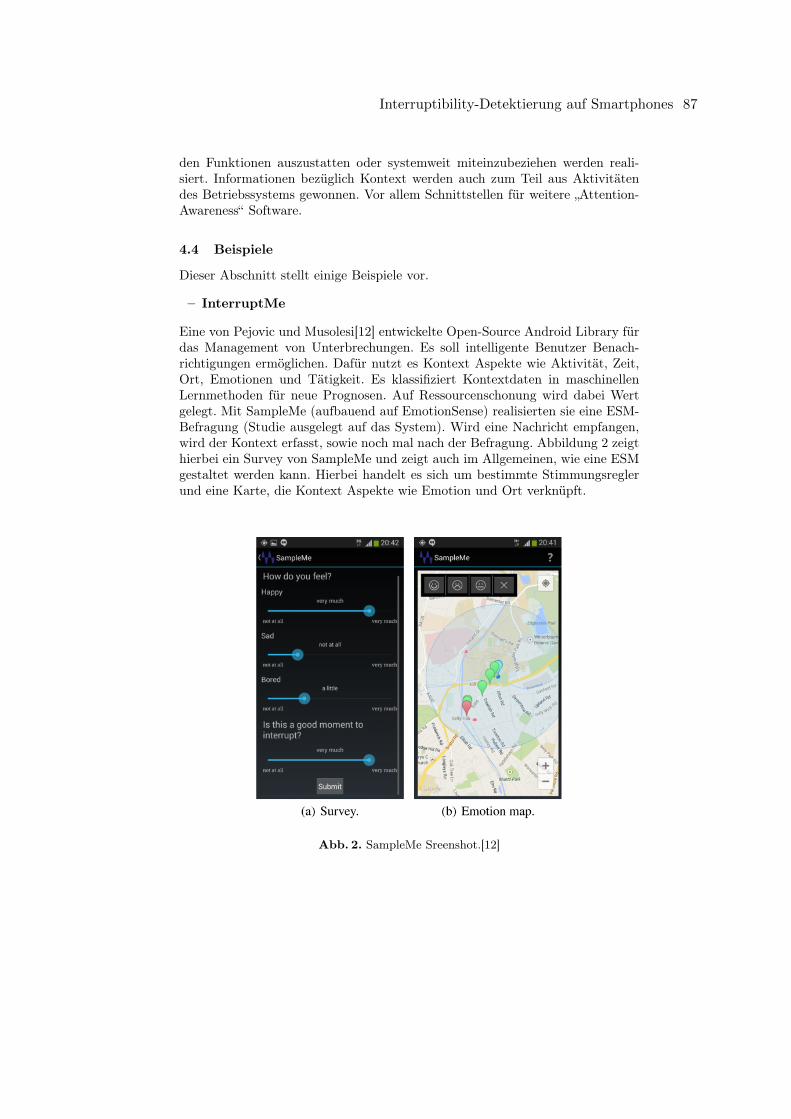
den Funktionen auszustatten oder systemweit miteinzubeziehen werden reali-siert. Informationen bezüglich Kontext werden auch zum Teil aus Aktivitätendes Betriebssystems gewonnen. Vor allem Schnittstellen für weitere „Attention-Awareness“ Software.
4.4 Beispiele
Dieser Abschnitt stellt einige Beispiele vor.
– InterruptMe
Eine von Pejovic und Musolesi[12] entwickelte Open-Source Android Library fürdas Management von Unterbrechungen. Es soll intelligente Benutzer Benach-richtigungen ermöglichen. Dafür nutzt es Kontext Aspekte wie Aktivität, Zeit,Ort, Emotionen und Tätigkeit. Es klassifiziert Kontextdaten in maschinellenLernmethoden für neue Prognosen. Auf Ressourcenschonung wird dabei Wertgelegt. Mit SampleMe (aufbauend auf EmotionSense) realisierten sie eine ESM-Befragung (Studie ausgelegt auf das System). Wird eine Nachricht empfangen,wird der Kontext erfasst, sowie noch mal nach der Befragung. Abbildung 2 zeigthierbei ein Survey von SampleMe und zeigt auch im Allgemeinen, wie eine ESMgestaltet werden kann. Hierbei handelt es sich um bestimmte Stimmungsreglerund eine Karte, die Kontext Aspekte wie Emotion und Ort verknüpft.
Abb. 2. SampleMe Sreenshot.[12]
Interruptibility-Detektierung auf Smartphones 87
– Attelia
Okoshi et al.[11] stellen eine Middleware vor, zur Reduzierung kognitiver Belas-tung, die natürliche Breakpoints in Echtzeit finden soll und dementsprechendUnterbrechungen starten. Dafür werden die gesammelten Informationen auch inmaschinellen Lernmethoden weiterverarbeitet. Sie stellt eine weitreichende Funk-tion auf, da sie auf viele Applikationen auf dem Smartphone angewendet werdenkann. Sie fungiert ohne psychische oder physische Sensoren. Stattdessen wirddie Aktivität und Interaktion mit Applikationen beobachtet. Informationen zurBerechnung können gesammelt werden: auf statischer Seite durch ein Stadiumeiner bestimmten App, wie z.B das Menü eines Spieles (muss von Spielentwicklerintegriert); auf dynamischer Seite können Informationen zur Laufzeit, wie Eventsdes Betriebssystems (UI-Events: z.B. tap, click, scroll) oder der Anwendung, ge-sammelt und verarbeitet werden. Offline, online und manuelles Aktivieren vonInformationsverarbeitungen sind möglich.
– SenSocial
Mehrotra [8] präsentiert eine Middleware die physische Kontextdaten mit psychi-sche Kontextdaten, entstammend aus Sozialen Netzwerk Aktivitäten, verknüpft.Es ist eine Android Library die von einem Server aus fungiert. Informationen,die über soziale Netzwerke entnommen werden können, z.B. wie das Liken undKommentieren von Dingen, aktivieren das Sensorsampling und knüpfen diesezwei Datenpfade aneinander. Aus sozialen Netzwerken besteht das Potential In-formationen zu Gedanken und Gefühle zu sammeln ohne explizite ESM. DurchEinstellen von Filtern bestimmter Daten und Berechtigungsfreigabe soll Privat-sphäre ermöglicht werden. Sie stellen hier 2 Prototypen vor: „Facebook SensorMap“ und „ConWeb“. Es wird die Facebook-Aktivität beobachtet und an denKontext des Ortes und anderen physischen Daten gebunden. Zweites ist einWebbrowser der den Inhalt von Webseiten generiert und ändert in Abhängigkeitdes Kontextes des Benutzers.
5 Diskussion
Im Folgenden soll eine kurze Diskussion einige Aspekte noch mal aufwerfen.Wir haben uns eine gewisse Übersicht der Thematik geschaffen, doch da diesesehr durchwachsen von neuen Studien und Ergebnissen ist, ist sie im ganzenschwer zu fassen. Der Trend zum Smartphone schafft einen Gegensatz, zum einenschaffen wir es schneller und mehr Aufgaben denn je, z.B. am Arbeitsplatz zuerledigen[4]. Auf der anderen Seite ergibt sich durch ständige Unterbrechungen,kein produktiver Arbeitsfluss[12]. Die Interruptibility-Forschung sucht hier neueWege unsere Aufmerksamkeit unter Kontrolle zu behalten.
Ein wichtiger Punkt, der noch zu erwähnen wäre, es bestehen auch ausnah-men für Unterbrechungen. Nicht jede Unterbrechung benötigt einen optimalenMoment, es gibt Mitteilungen, deren Wichtigkeit gerade im Moment selbst be-stand haben. Anwendungen, die zu Katastrophenwarnung benutzt werden oder
88 David Krenz
auch einfache Erinnerungen die auf Medikamenteinnahmen aufmerksam machen.Inhalt ist und bleibt der entscheidende Punkt in diesem Bereich.
Des Weiteren, auch wenn Studien sich nicht immer gegenseitig bestätigen,zeigen sie doch einige Probleme auf, die in der ganzen Thematik bestand ha-ben. Diese zeigten oft, dass Benutzer mehr eigene Kontrolle über ihre Mittei-lungen haben wollen. D.h. Einstellungen selbst übernehmen. Diesbezüglich aberoft ein Missstand entsteht. Benutzer resignieren, die fehlende Bereitschaft oderkein Know-how führen dazu diese Funktionalitäten dennoch nicht zu nutzen[17].Dennoch ist gerade die Zielsetzung von Smartphonesystemen, mehr Intuitivitätzu schaffen.
Vor- und Nachteile finden sich auch in den Methoden zur Datenerfassungwieder. Während sich einige auf die Zuverlässigkeit von ESM verlassen, abermeistens auch nur unter den richtigen Umständen, distanzieren sich einige auchbewusst davon. Da hier auch Missstände in Form von falschen Ergebnissen auf-kommen können. Ist der Feedbackbogen im falschen Moment erschienen, könnenwiederum Unehrlichkeit und der Mangel an Bereitschaft Probleme aufwerfen.Dennoch gibt es in dieser Hinsicht nicht viele zuverlässige Ansätze Stimmun-gen des Benutzers mit ein zu berechnen. Ansätze mit schon vorhandenen Daten,wenn sie denn vorhanden sind, aus sozialen Netzwerk Inhalten, scheinen Poten-zial diesbezüglich zu haben. Auf der anderen Seite bietet das mobile Assessmentbessere Möglichkeiten denn je für Sozialwissenschaftler, überall und einfach Be-fragungen zu tätigen.
Aufseiten des Sensorsamplings gibt es natürlich auch Kritik. Wie schon er-wähnt, können dies Inkonsistenz oder die Frage der Zuverlässigkeit sein. Auchdie Frage, ob die benötigten Sensoren immer zu Verfügung stehen. In Verbin-dung mit all dem steht natürlich die Frage der Privatsphäre. Metadaten könnenunseren Alltag rekonstruieren. Es ist wichtig, Berechtigungen dem Benutzer zuüberlassen oder ihn zumindest zu informieren. Aber das Preisgeben von Infor-mationen hat wahrscheinlich auch Einfluss auf das gesellschaftliche Verhaltenselbst, siehe „last-seen“-Status. Sozialer Druck lenkt uns in gewisse Verhaltens-schemen. Im Großen und Ganzen bietet diese Thematik noch viel Potenzial vorallem im Bezug auf neu erscheinende Hardware. Sie schafft Schritte in die richtigeRichtung, in einem Umfeld, das immer mehr von den negativen Effekten neuermobiler Technik geprägt ist. Gerade der Trend von mobiler Kontexterfassungwill unseren Alltag auch einfacher gestalten.
6 Zusammenfassung
Die Ausweitung von Smartphones und deren mit sich bringende Probleme ha-ben einen großen Einfluss auf unser Leben. Aber nicht nur das, sie bieten auchviele Vorteile und bringen einen großen Raum an Komfort. Die Ziele der In-terruptibility Forschung sind recht klar, das Nutzen von Smartphone einfacherzu gestalten und Inhalte aufnahmefähiger zu machen. Einfacher vor allem imSinne, einer Abnahme von Lasten. Stress und kognitive Belastung sind Pro-bleme, die durch Nutzung von Smartphones aufkommen können. Diese sollen
Interruptibility-Detektierung auf Smartphones 89
gerade durch Einfangen und nutzen geeigneter Momente, diese Belastungen mi-nimieren. Psychische Aspekte, die man beim Benutzer ins Spiel kommen sindalso zu beachten. Den die Bereitschaft Nachrichten entgegen zu nehmen odergenerell unterbrochen zu werden ist abhängig vom Inhalt dieser. Es gibt da-bei auch verschieden Verhaltensmuster, die beim Unterbrechen entstehen, zubeachten. Aber auch Technische und vor allem hinsichtlich von Ressourcennut-zung, da Interruptibility-Anwendungen auf Dauer kostspielig werden können.Des Weiteren bleibt nichtsdestotrotz dem Potenzial und den Vorteilen dieserTechnik der Aspekt der Sicherheit und Privatsphäre eines Nutzers ein kritischzu betrachtender Punkt. Konzepte, wie das stufenweise Analysieren von Unter-brechungsprozessen, führt in diesem Bereich der Forschung zu genaueren Er-gebnissen. Software, die daraus entsteht, will eine Erweiterung für existierendeProgramme oder auch Ansätze für neue Anwendungen, schaffen. Letzten Endeszeigen auch Trends zu immer mehr „in-the-wild“-Studien, die gerade durch Mo-bilität und Leistung solcher Geräte profitieren, das Potenzial dieser Thematikenthalten[15].
Literatur
1. Abdesslem, F.B., Phillips, A., Henderson, T.: Less is more: energy-efficient mobilesensing with senseless. MobiHeld pp. 61–62 (2009), http://dl.acm.org/citation.cfm?id=1592621
2. Balan, R.K., Lee, Y., Wee, T.K., Misra, A.: The challenge of continuous mobilecontext sensing. 2014 6th International Conference on Communication Systemsand Networks, COMSNETS 2014 (2014)
3. Church, K., de Oliveira, R.: What’s up with whatsapp?: comparing mobile in-stant messaging behaviors with traditional SMS. 15th international conference onHuman-computer interaction with mobile devices and services (MobileHCI’13) pp.352–361 (2013)
4. Garrett, R.K., Danziger, J.N.: IM = Interruption management? instant messagingand disruption in the workplace. Journal of Computer-Mediated Communication13(1), 23–42 (2007)
5. Haapalainen, E., Kim, S., Forlizzi, J.F., Dey, A.K.: Psycho-Physiological Measuresfor Assessing Cognitive Load. Proceedings of the 12th ACM international con-ference on Ubiquitous computing pp. 301–310 (2010), http://portal.acm.org/citation.cfm?doid=1864349.1864395
6. Lathia, N., Rachuri, K.K., Mascolo, C., Rentfrow, P.J.: Contextual dissonance:Design bias in sensor-based experience sampling methods. UbiComp ’13 Procee-dings of the 2013 ACM international joint conference on Pervasive and ubiquitouscomputing pp. 183–192 (2013), https://www.cl.cam.ac.uk/{~}cm542/papers/ubicomp2013.pdf
7. Mashhadi, A., Mathur, A., Kawsar, F.: The myth of subtle notifications. Procee-dings of the 2014 ACM International Joint Conference on Pervasive and Ubiqui-tous Computing Adjunct Publication - UbiComp ’14 Adjunct pp. 111–114 (2014),http://dl.acm.org/citation.cfm?doid=2638728.2638759
8. Mehrotra, A.: SenSocial : A Middleware for Integrating Online Social Networksand Mobile Sensing Data Streams. Middleware 2014 pp. 205–216 (2014)
90 David Krenz
9. Mehrotra, A., Vermeulen, J., Pejovic, V., Musolesi, M.: Ask, but don’t inter-rupt. Proceedings of the 2015 ACM International Joint Conference on Perva-sive and Ubiquitous Computing and Proceedings of the 2015 ACM Internatio-nal Symposium on Wearable Computers - UbiComp ’15 pp. 723–732 (2015),http://dl.acm.org/citation.cfm?id=2800835.2804397
10. Okoshi, T., Nozaki, H., Nakazawa, J., Tokuda, H., Ramos, J., Dey, A.K.: Towardsattention-aware adaptive notification on smart phones. Pervasive and Mobile Com-puting 26, 17–34 (2016), http://dx.doi.org/10.1016/j.pmcj.2015.10.004
11. Okoshi, T., Ramos, J., Nozaki, H., Nakazawa, J., Dey, A.K., Tokuda, H.: Attelia:Reducing user’s cognitive load due to interruptive notifications on smart phones.2015 IEEE International Conference on Pervasive Computing and Communicati-ons, PerCom 2015 pp. 96–104 (2015)
12. Pejovic, V., Musolesi, M.: InterruptMe: Designing Intelligent Prompting Mecha-nisms for Pervasive Applications. Proceedings of the 2014 ACM International JointConference on Pervasive and Ubiquitous Computing (UbiComp ’14) pp. 897–908(2014), http://doi.acm.org/10.1145/2632048.2632062
13. Pielot, M., de Oliveira, R., Kwak, H., Oliver, N.: Didn’t You See My Message? Pre-dicting Attentiveness to Mobile Instant Messages. Proceedings of the 32nd annualACM conference on Human factors in computing systems - CHI ’14 pp. 3319–3328(2014), http://dl.acm.org/citation.cfm?doid=2556288.2556973
14. Sahami Shirazi, A., Henze, N., Dingler, T., Pielot, M., Weber, D., Schmidt, A.:Large-scale assessment of mobile notifications. Proceedings of the 32nd annualACM conference on Human factors in computing systems - CHI ’14 pp. 3055–3064(2014), http://doi.acm.org/10.1145/2556288.2557189$\backslash$nhttp://dl.acm.org/ft{\_}gateway.cfm?id=2557189{\&}type=pdf$\backslash$nhttp://dl.acm.org/citation.cfm?doid=2556288.2557189
15. Turner, L.D., Allen, S.M., Whitaker, R.M.: Interruptibility prediction for ubiqui-tous systems. In: Proceedings of the 2015 ACM International Joint Conferenceon Pervasive and Ubiquitous Computing - UbiComp ’15. pp. 801–812 (2015),http://dl.acm.org/citation.cfm?doid=2750858.2807514
16. Turner, L.D., Allen, S.M., Whitaker, R.M.: Push or Delay ? Decomposing Smart-phone Notification Response Behaviour (2015)
17. Yoon, S., Lee, S.s., Lee, J.m., Lee, K.: Understanding notification stress of smart-phone messenger app. Proceedings of the extended abstracts of the 32nd annualACM conference on Human factors in computing systems - CHI EA ’14 pp. 1735–1740 (2014), http://dl.acm.org/citation.cfm?doid=2559206.2581167
Interruptibility-Detektierung auf Smartphones 91
Usable Security Models for the Internet of Thingsand Hybrid Cloud Solutions
Maximilian Dietz∗
Advisor: Andrei Miclaus†
Karlsruhe Institute of Technology (KIT)Pervasive Computing Systems – TECO∗[email protected]
Abstract. Diese Ausarbeitung soll grundlegende Sicherheitsmodelle fürden Einsatz im Internet der Dinge oder bei hybriden Cloud-Lösung vorstellen.Nach einer Einführung in die Welt der Dinge und deren Reichweite, sowiedem Phänomen des Cloud Computing sollen konkrete Angriffsszenar-ien und Ansätze für deren Verhinderung aufgezeigt werden. Auch sollenBeispiel aus der Praxis namhafter Onlineunternehmen verdeutlichen, wiedie vorgestellten Sicherheitskonzepte einen Mehrwert für die Sicherheitder noch jungen Technologien bewirken können. Dabei soll auf die Im-plementierbarkeit und die Vor- und Nachteile der verschiedenen Modelleeingegangen werden, um einen Überblick zu schaffen, welche Technolo-gien sich für den Einsatz im Unternehmen empfehlen würden.
Keywords: Internet der Dinge, Hybrid Cloud, Security, Single Sign-On
1 Einleitung
Viele Unternehmen nutzen bereits Technologien wie das Internet der Dinge undhybride Cloud-Lösungen, da sie deren großes Potential erkannt haben, sind sichallerdings nicht über die Risiken bewusst. Die Nutzung verursacht neue, un-bekannte Sicherheitslücken, welche von Angreifern sofort ausgenutzt werden.Durch den gezielten Angriff auf solche ungeschützen Systeme kann es nebendem wirtschaftlichen Schaden auch zu physischem Schaden kommen.
2 Grundlagen
Zunächst sollen die Besonderheiten des Internet der Dinge bzw. von hybri-den Cloudlösungen herausgearbeitet werden. Beide Konzepte bieten aus un-ternehmerischer Sicht große Chancen, eröffnen allerdings auch neue Schlupflöcherfür Angreifer. Im Hinblick auf die Sicherheit sollen vor allem die Herausforderun-gen und mögliche Lösungsansätze für die Umsetzung beider Technologien imUnternehmen herausgearbeitet werden.
92 Maximilian Dietz
2.1 Internet of Things
Der Gedanke des Internets hat sich in den letzten Jahren grundlegenden Verän-derungen unterzogen, verglichen mit dem Konzept aus den Anfangszeiten. EineZukunftsannahme aus dem Jahr 2006 schätze die Anzahl der Endgeräte bis zumJahr 2017 auf 7 Billionen, die dann von 7 Milliarden Menschen bedient werdensollten [1]. Wenngleich diese Prognose nur zu Teilen eingetreten ist, erleben wirdennoch Jahr für Jahr einen dramatische Anstieg an Nutzern und Endgeräten.Dieser führt zugleich auch zu einer stärkeren Vernetzung.
Wenn wir von Endgeräten sprechen, gehen wir meist davon aus, dass diesevon Menschen bedient werden, um miteinander zu kommunizieren. Genauso sindinzwischen auch andere - alltägliche bis industrielle Dinge mit dem Internet ver-bunden. Das Internet der Dinge oder auch Industrielle Internet befasst sich mitder Verbindung verschiedenster Dinge miteinander, wobei der Grad der Vernet-zung in mehrere Wellen unterteilt worden ist.
1. Welle Diese Geräte aus der Informationstechnik (IT), welche im Geschäfts-und Wirtschaftsleben von Unternehmen häufig im Zusammenhang mit Geschäft-prozessen eingesetzt werden, sind meist verdrahtet mit dem Internet verbundensind. Demnach sind IT-Technologien vorwiegend in der Rubrik "Business" zuverorten.
2. Welle Operationale Technologien (OT), die in den industriellen Produktion-umgebungen der Unternehmen zu finden sind und bisher einen abgeschlosse-nen Bereich innerhalb eines Unternehmens dargestellt haben, sind inzwischenauch oft verdrahtet mit dem Internet verbunden, wie z.B.: Steuerungseinheiten,Prozessleittechnik und Medizinische Apparaturen.
3. Welle Darunter fallen die Verbrauchergeräte aus der IT. Diese werden vonKonsumenten bzw. Mitarbeitern gekauft, sind meist durch eine oder mehreredrahtlosen Verbindungsarten mit dem Internet verbunden sind, z.B. Smart-phones und Tablets.
4. Welle Zuletzt gibt es noch die Single-Purpose Devices, die sowohl von IT-/OT-Experten sowie Konsumenten gekauft werden und meist durch nur einedrahtlosen Verbindungsform mit dem Internet verbunden ist. Hierzu zählen vorallem die Embedded Systems, wodurch so gut wie Alles die Möglichkeit hat eineVerbindung zum Internet aufzubauen.
Vor allem letztere Kategorie trifft aktuell die herrschende Vorstellung desInternet of Things. Viele Dinge aus diesem Feld waren bereits zuvor schon miteingebetteter Soft- und Hardware ausgestattet, wobei nun der Faktor der Interne-tanbindung hinzugekommen ist. Genau hier liegt auch eine der größten Gefahren
Usable Security Models for the Internet of Things and Hybrid Cloud Solutions 93
des Internet der Dinge. Was vorher nach außen hin abgeschlossene Systemewaren, bieten Angreifer jetzt die Möglichkeit, das Unternehmen über die ergänzteSchnittstelle des Internets anzugreifen. Deshalb ist für viele Unternehmen auchdieser Bereich hinsichtlich der Security-Aspekte von immer größere werdenderBedeutung. Allerdings sind viele Unternehmen noch nicht auf die Sicherheit-sanforderungen des Internet der Dinge vorbereitet oder besitzen nicht die fach-lichen Kapazitäten, um eine solche Umstellung selbst durchzuführen. Auch derGedanke, dass ein großer Teil der Verantwortung erst einmal bei den Herstellernder solcher Geräte liegt, wird laut [2].
Die speziellen Herausforderungen für die Sicherheit dieser Dinge verglichenmit herkömmlichen Systemen sind vielseitig. Vieles was in den Kontext des Inter-net der Dinge fällt, ist nicht zwangsläufig der IT bzw. OT zuzuordnen, sondernfällt eher in den Bereich des individuellen Gebrauchs. Vor dem Hintergrund derverschiedenen Klassen von Geräten innerhalb der Welt des Internet der Dinge,haben sich aufgrund der unterschiedlichen Anforderungen was die Sicherheit be-trifft auch zwei Begrifflichkeiten für IT und OT herausgebildet - Security undSafety [3].
Safety Der Ausdruck Safety kommt aus der OT und meint den "Schutz vorphysischen Schäden von Mensch und Maschine" in einer industriellen Umgebun-gen. Die beiden zentralen Aspekte der OT sind hierbei die Verfügbarkeit unddie Verlässlichkeit. Hinsichtlich der Produktion soll zunächst garantiert werden,dass diese verfügbar ist. Dementsprechend soll die Fertigung störungsfrei undohne Ausfälle ablaufen, da Unterbrechungen bzw. ein Stillstand rasch sehr teuerwerden können. Ein weiteres Ziel unter dem Begriff Safety ist die Verlässlichkeit.Im Hinblick auf die zu fertigenden Güter soll ein gleichbleibendes qualitativesNiveau sichergestellt werden.
Security In der IT-Sicherheit beschäftigt sich der Begriff Security mit derÜberwachung und Kontrolle von Zugriffen und ferner mit der Vermeidung vonmissbräuchlichen Zugriffsberechtigungen. Neben der Sicherheit, sind die primärenZiele der Security: Die Verfügbarkeit, Vertraulichkeit, Integrität und Authentiz-ität der Datenzugriffe. Ein System ist verfügbar, wenn dessen Funktionen demNutzer zur Verfügung stehen, wenn er diese benötigt. Hierbei können Datenver-lust und funktionale Problem mit Software bzw. Hardware die Verfügbarkeitwährend des Zugriffs einschranken. Desweiteren soll die Integrität eine Ver-fälschung von Daten, Programmen oder Hardware verhindern, um eine Ver-lässlichkeit der Daten sicherstellen zu können. Bei der Vertraulichkeit geht esin erster Linie um den Zugriff auf Daten, der ausschließlich durch autorisierteNutzer erfolgen sollte. Deshalb soll hier ein Zugriff durch Unbefugte vermiedenwerden. Letzlich sorgt sich die Authentizität um den echten Urheber und diekorrekten Herkunft der Daten. Diese Echtheitsprüfung muss vorallem bei derelektronischen Übertragung von Dokumenten durchgeführt, um etwaige Zweifel
94 Maximilian Dietz
beseitigen zu können.
Aufgrund der besonderen Eigenschaften waren beide technische Klassen bisherdurch die Netzwerkarchitektur getrennt. Betrachtet man die Wartungshäufigkeitder verschiedenen Infrakstrukturen in der Vergangenheit, so lassen sich obengenannte Anforderungen auch hier wiederfinden. Während die IT versucht durcheine hohe Frequenz an Patches sich vor neuen Sicherheitslücken und Angriffs-möglichkeiten zu schützen, laufen Geräte der OT meist mehrere Jahrzente zu-verlässig mit der selben Soft- und Hardware. Wegen des Risikos von Ausfällenwerden hier selten Änderung am System vorgenommen, was im Zuge der steigen-den Vernetzung auf lange Sicht gesehen zu einem Intressenkonflikt führen könnte.Dabei liegt die Entscheidung zwischen Patching auf Kosten der Verlässlichkeitund Systemstabilität mit dem Risiko eines Angriffs wegen einer nicht behobe-nen Schwachstelle. Denn durch die höhere Erreichbarkeit der OT-Umgebungenlassen sich oben genannte Sicherheitsbegriffe so nicht mehr uneingeschränkt aufdas Internet der Dinge anwenden.
Allerdings stellen die Geräte, welche eingebettete Betriebssysteme oder an-dere Software enthalten, die Betreiber vor die Aufgabe der ständigen Fehlerko-rrektur und der Konfiguration der Sicherheitmaßnahmen. Eine Sicherheitslückeim System kann zu Konsequenzen in der realen Welt führen und kann Einflussauf Bereiche wie Strategie und Finanzen eines Unternehmens haben.
2.2 Hybrid Cloud Solutions
Mit Cloud Computing wird eine serviceorientierte, verteilte und visualisierte IT-Lösung bezeichnet, die sich in den letzten Jahren immer mehr in der Gesellschaftetabliert hat. Der Begriff zielt auf die Auslagerung von Rechenleistung auf Cloud-Infrastrukturen im Internet ab, die als Substitut für das lokale "Computing" di-enen sollen. Allerdings umfasst Cloud Computing weit mehr als nur den FaktorRechenleistung. Diese Form, welche zusätzlich noch die Inanspruchnahme vonexternem Speicherplatz beinhaltet, wird als Infrastructure-as-a-Service (IaaS)bezeichnet. Weiterhin wird unter Platform-as-a-Service ein Angebot einer Web-plattform mit Mehrwert für deren Nutzer verstanden. Außerdem ist mit Software-as-a-Service die Bereitstellung von verschiedenster Anwendungen gemeint. Wasals Anything-as-a-Service betitelt wird, meint in erster Linie das Auslagern vonServices an externe Anbieter. Cloud-Dienste kennzeichnen sich durch die ver-schiedene Arten der Bereitstellung.
Public Cloud Die "öffentlichen" Cloud-Dienste sind für jedermann im Internetfrei zugänglich. Die Bandbreite reicht von kostenlosen Angeboten, wie beispiel-sweise der Office-Anwendungen Google Docs bis hin zur kostenpflichtigen LösungOffice365 von Microsoft.
Private Cloud Aus Unternehmenssicht wird diese Form der Cloud wegen ihrerVorteile hinsichtlich Datenschutz und Sicherheit bevorzugt. Demnach werden die
Usable Security Models for the Internet of Things and Hybrid Cloud Solutions 95
Dienste weiterhin vom Unternehmen ausgeführt, wobei sich der Personenkreis,der Zugriff darauf hat auf die eigene Belegschaft beschränkt. Allerdings werdenebenso die Vorzüge einer Cloud-Lösung genutzt, was zum Beispiel die Skalier-barkeit betrifft. Jedoch erreicht diese Infrastruktur ihre Ziele häufig nicht inselbem Maße als freizugängliche Cloud-Dienste.
Community Cloud Das gemeinsame Nutzen eines Cloud-Dienstes von mehrerenUnternehmen im Rahmen von Projekten nennt man Community Cloud. DieseCloud-Lösung ist nur dem bestimmten Personenkreis der beteiligten Unternehmenzugänglich.
Hybrid Cloud Als hybride Cloud-Lösung ist es möglich bestimmte Diensteüber öffentlichen Cloud-Dienstleister im Internet und Dienste mit strengeren An-forderungen hinsichtlich Datenschutz und Sicherheit über unternehmensinterneWege laufen zu lassen. Besonders die Entscheidung der Wegewahl der verschiede-nen Anwendungen markiert den kritischen Punkt dieser Cloud-Form.
Im Folgenden soll vor allem die Frage geklärt werden, welche Methoden imRahmen von Cloud-Lösungen angewendet werden können. Hierbei geht es vorallem um die Sensibilität der Daten, in Abhängigkeit derer entschieden werdenmuss inwiefern ein besonderer Schutz notwendig ist.
3 Threats and Attacks
Größere Angriffe auf Geräte und Benutzer werden nicht erst seit dem Beginn desInternet der Dinge verübt. Allerdings erlaubt das Internet der Dinge durch denAnstieg der Vernetzung bzw. der Steigerung der Anzahl vernetzter Geräte einevöllig neue Dimension von Cyber-Attacken. Größtenteils geht es wohl um diedatenschutzrechtlichen Folgen dieser Angriffe, allerdings befindet sich mit demEintritt ins Zeitalter des Internet der Dinge auch eine neue Klasse an Gerätenonline, die auch sicherheitsrelevante Fragen in den Vordergrund stellen könnte.
Die Attacken sind meist nicht von besonders komplexer Struktur und arbeitenhäufig nach dem selben Schema. Doch durch die Vielzahl an beteiligten Gerätenkönnen sie inzwischen häufig größere Effekte erzielen. Desweiteren werden nunfünf der bekanntesten Angriffsszenarien im Internet der Dinge vorgestellt [5].
3.1 Botnetze
In diesem Szenario wird durch die Summe an verbundenene Geräten ein Net-zwerk erzeugt, um das Ausüben größerer Angriffe zu ermöglichen. Den unfrei-willigen Zusammenschluss einer Vielzahl an Systemen, die für bösartige Zweckemissbraucht werden, nennt man Botnetze. Gesteuert werden diese Netze zentralüber sogenannte Command-and-Control Server von deren jeweiligen Betreiber.
96 Maximilian Dietz
Diese Netzwerke verüben erheblichen Schaden durch millionenfache Anfragen aufbestimmte Systeme zur selben Zeit, welche von der Last überfordert werden undmeist zusammenbrechen. Im Zusammenhang mit dem Internet der Dinge nenntman diese Art von Netzen auch Thingbots, da häufig unabhängige vernetzteGeräte bzw. Dinge unter den Opfern der Botnetzbetreiber zu finden sind. Diesemachen sich immer öfter Geräte aus dem alltäglichen Leben wie zum Beispiel ausder Haushalts- und Unterhaltungselektronik zu Eigen. Meist werden dabei derenniedrige Sicherheitsanforderungen ausgenutzt, denn viele der mit dem Internetder Dinge vernetzen Geräte sind sehr schwach oder überhaupt nicht geschützt.Daher sollten auch für dies Klasse ähnliche Sicherheitsmaßstäbe angesetzt wer-den, wie beispielsweise für Online-Banking Geschäfte und Ähnliches. Den häufiggelingt es den Betreibern von derartigen Botnetzen mithilfe der Vielzahl un-gesicherter Geräte an private Information und unter anderem auch an Online-Banking Accounts zu gelangen. Neben Distributed Denial of Service Attackenwerden auch das massenweise Versenden von Spam- und Phishing-Mails durchBotnetze verübt [6].
3.2 Man-in-the-Middle
Eine Art von Angriff, bei der ein Angreifer versucht die Kommunikation zwischenzwei Geräten mitzuhören und zu übernehmen, nennt man Man-in-the-Middle.Daraufhin wird auf Angreiferseite meist versucht die Originalnachrichten abzu-fangen und in veränderter Form an den eigentlichen Empfänger zu übermitteln.So wird diesem System vorgetäuscht, dass er immer noch mit dem ursprünglichenGesprächspartner kommuniziert. Der Angreifer erlangt so die Gewalt über dasGerät, was für einige Geräte aus dem Spektrum des Internet der Dinge vonerheblichem Risiko sein kann. Wenn es einmal nicht um Kühlschränke son-dern beispielsweise um gehackte Fahrzeuge geht, kann dieses Szenario für diebeteiligten Personen schnell lebensgefährlich werden. Auch sind Steuerungsein-heiten in der industriellen Produktion ein beliebtes Ziel für Man-in-the-Middle-Angriffe, da hier schnell enorme finanzielle und materielle Schäden entstehenkönnen [7].
3.3 Diebstahl von Daten und Identitäten
Durch das Aufkommen von sozialen Netzwerken und der Vielzahl an internet-fähigen Endgeräten haben es Angreifer einfacher an die persönlichen Daten her-anzukommen. Jeder Verwender solcher Geräte bewahrt dort eine große Mengean sehr privaten Informationen auf. Der Identitätsdiebstahl dient zunächst derreinen Ansammlung von benutzerbezogenen Daten. Im weiteren Verlauf wirdentweder versucht den Besitzer der Daten zu manipulieren oder dessen Iden-tität komplett zu übernehmen. Dann sind ebenfalls die Personen, die mit demOpfer des Identitätsdiebstahls in Kontakt stehen durch gefälschte Anfragen desAngreifers bedroht. Häufig kommt es dabei zu großen finanzielle Forderung, die
Usable Security Models for the Internet of Things and Hybrid Cloud Solutions 97
mit dem Vertrauen zur Identität des Opfers gedeckt werden. Vor diesem Hinter-grund sollte die Preisgabe von personenbezogenen Informationen wohl überlegtgeschehen [8].
3.4 Social Engineering
Um Benutzern vertrauliche Informationen zu entlocken, werden die Methodenaus dem Social Engineering angewandt. Dabei versuchen die Angreifer ihre Opferzu täuschen, um Zugang zu dessen privaten Daten zu erlangen. Meist wird zurManipulation der Benutzer eine vertraute Oberfläche eines Dienstes verwendet,bei dem sie sich registrieren sollen. Fällt dieser darauf herein, erhält der AngreiferZugang zu dessen Anmeldedaten, kann die Kontrolle über das Benutzerkontoübernehmen und im Namen des Opfers Transaktionen ausführen. Meist kön-nen Social Engineering Maßnahmen mit den oben beschriebenen Methoden desDaten- und Identitätsdiebstahls einhergehen, da beide Angriffsarten ähnlicheZiele verfolgen [9].
3.5 Denial Of Service
Was im Zusammenhang von Botnetzen bzw. Thingbots als (Distributed) Denialof Service Attacke schon beschrieben wurde, meint üblicherweise die Belastungeines Dienstes mit so vielen Anfragen, dass dieser für eine gewissen Zeitraumnicht mehr erreichbar ist. Häufigerweise sind dafür eine große Menge an gle-ichzeitig geschalteten Systemen notwendig, weshalb ein solcher Angriff ausgeze-ichnet von Botnetzen ausgeübt werden kann. Der Erfolg bzw. der Zweck einersolchen Attacke bedeutet meist ein Verlust von Ansehen und Geld für die Be-troffenen. Allerdings werden Denial of Service Angriffe immer häufiger mit ide-alisierten und ideologischen Zielen begründet, was sie in gewisser Weise auch zueinem politischen Druckmittel macht. Der Anteil an Geräten bei diesem Angriff-sszenario, der aus dem Internet der Dinge kommt, liegt bei 21%, was die vorhergeäußerten Sicherheitsbedenken noch bekräftigt [10].
4 Security Models
4.1 Authentication/Authorization
Wo auch immer Menschen, Maschinen oder Dinge mit dem System interagieren,sind die beiden zentralen Konzepte Authentifizierung und Autorisierung, wasdie Sicherheit betrifft unentbehrlich. Beim Versuch auf das System zuzugreifen,übernimmt die Authentifizierung die Prüfung der zugreifenden Seite auf Echtheit.Prinzipiell kann eine Entität d.h. eine Person bzw. ein Gerät online mehrereIdentitäten haben, genauso wie die Identität in der Familie und im Beruf in derRealwelt oft nicht dieselbe ist. Es wird also die Identität verifiziert z.B. durch dieAbfrage von Benutzernamen und Passwort, ob die Entität, welche eine Anfragesendet, die ist, welche sie vorgibt zu sein. Ferner gilt die Annahme, dass nur sie
98 Maximilian Dietz
Zugriff auf das System hat, weshalb deren Echtheit garantiert werden muss. Wieschon zuvor angemerkt, muss es sich bei dieser Entität nicht um einen Menschenhandeln, denn auch Dinge können auf das System zugreifen [11].
Nach der erfolgreichen Authentifizierung der Identität wird mithilfe der überihn bekannten Information entschieden, welche Rechte dieser auf dem Systemhat. In einem Unternehmen kann zum Beispiel je nach Rang bzw. Abteilungunterschieden werden, für welche Handlung die jeweilige Person autorisiert ist.Hier ist abzuwägen, ob wie feingranular die Autorisierung sein muss, um die ver-schiedenen Rollen im Unternehmen abbilden zu können. Meist ist eine grobereSegmentierung und besser als eine Abbildung für jeden einzelnen Geschäft-sprozess. Anders als bei Systemen mit monolithischer Architekur, wo sich meistdie Anwendung selbst um Authentifizierung und Autorisierung kümmert, ist inder Welt des Internet der Dinge oder auch bei Cloud-Lösungen ein dediziertesModell notwendig [12].
4.2 Single Sign-On
Vor allem wegen der gegebenen Dezentralität solcher Systeme ist ein Ansatznötig, mit dem ein Login nicht für jedes einzelne System notwendig ist. Hiersind unter dem Überbegriff Single Sign-On mehrere Lösungen zusammengefasst.Das Ziel ist hier die Anzahl der notwendigen Logins für alle Systeme zu re-duzieren bzw. zusammenzufassen. Das heißt, letztendlich muss sich der Nutzernur bei einem Dienst anmelden, um auch Zugriff auf alle anderen Dienste zuerhalten.
Die Authentifizierung für einen bestimmten Dienst findet mithilfe eines soge-nannten Idenity Providers statt. Nach dessen erfolgreichen Zustimmung, müssendie Daten sicher an den Anbieter des Dienstes übermittelt werden. Letzterer hatdann immer noch die Möglichkeit über die Autorisierung zu entscheiden. Hiergilt es wie im Fall der Hybrid Cloud abzuwägen, wann ein öffentlicher oder ein in-terner Identity Provider genutzt werden soll. Dabei sind kommerzielle Lösungenwie z.B. die von Google in der Unternehmenswelt vermutlich weniger geeignet,um mit sensiblen Login-Daten umzugehen, als eine hauseigene Lösung. Nebendem Identity Provider wird ein Directory Service benötigt, um die verschiedenenRollen der einzelnen Benutzer zu verwalten. Beide Dienste werden meist zusam-mengefasst, können jedoch auch als jeweils eigenständige Lösungen implentiertsein. In der Praxis gibt es eine Vielzahl möglicher Implementierungen, die sichwas Komplexität und Benutzerfreundlichkeit angeht, stark unterscheiden [12].
SAML Ein in der Unternehmenswelt weitverbreiteter Ansatz ist die SecurityAssertion Markup Language (SAML), eine auf XML basierenden Architektur.Diese wurde 2002 von der Organization for Advancement of Structured Infor-mation Standards (OASIS) ins Leben gerufen. Es gilt als das Standardprotokollfür den Transport von Identitätsdaten über das Internet. [14]
Usable Security Models for the Internet of Things and Hybrid Cloud Solutions 99
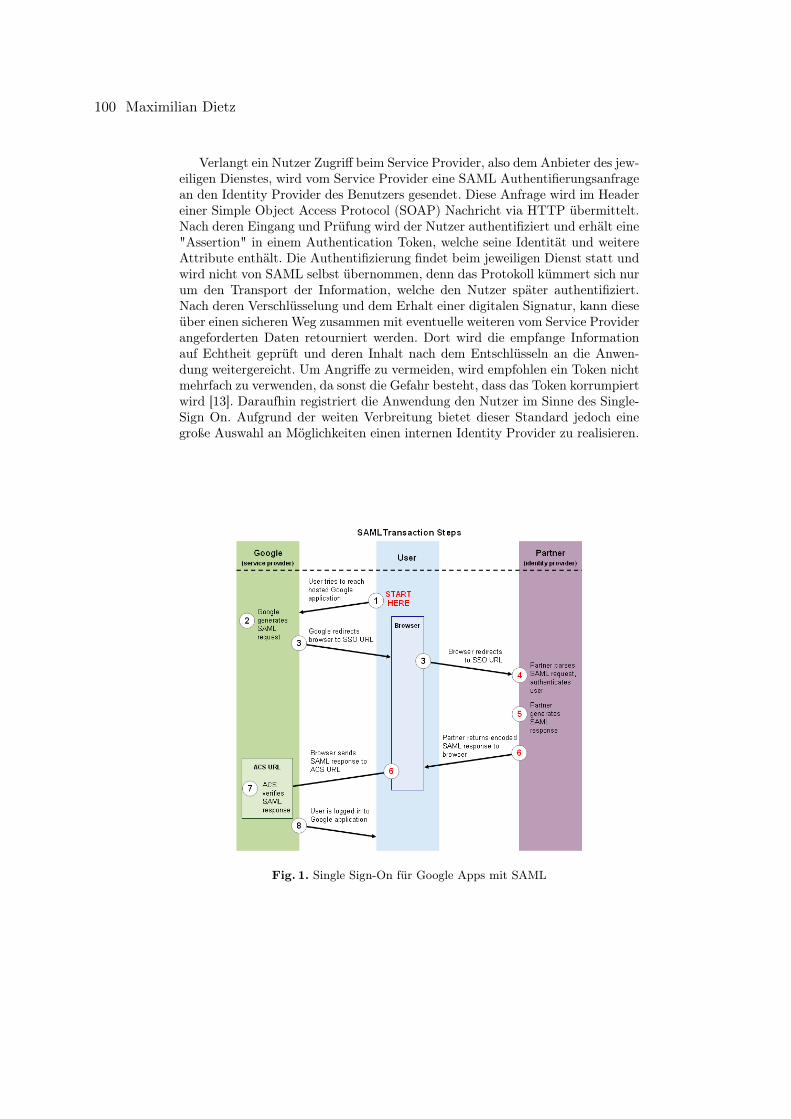
Verlangt ein Nutzer Zugriff beim Service Provider, also dem Anbieter des jew-eiligen Dienstes, wird vom Service Provider eine SAML Authentifierungsanfragean den Identity Provider des Benutzers gesendet. Diese Anfrage wird im Headereiner Simple Object Access Protocol (SOAP) Nachricht via HTTP übermittelt.Nach deren Eingang und Prüfung wird der Nutzer authentifiziert und erhält eine"Assertion" in einem Authentication Token, welche seine Identität und weitereAttribute enthält. Die Authentifizierung findet beim jeweiligen Dienst statt undwird nicht von SAML selbst übernommen, denn das Protokoll kümmert sich nurum den Transport der Information, welche den Nutzer später authentifiziert.Nach deren Verschlüsselung und dem Erhalt einer digitalen Signatur, kann dieseüber einen sicheren Weg zusammen mit eventuelle weiteren vom Service Providerangeforderten Daten retourniert werden. Dort wird die empfange Informationauf Echtheit geprüft und deren Inhalt nach dem Entschlüsseln an die Anwen-dung weitergereicht. Um Angriffe zu vermeiden, wird empfohlen ein Token nichtmehrfach zu verwenden, da sonst die Gefahr besteht, dass das Token korrumpiertwird [13]. Daraufhin registriert die Anwendung den Nutzer im Sinne des Single-Sign On. Aufgrund der weiten Verbreitung bietet dieser Standard jedoch einegroße Auswahl an Möglichkeiten einen internen Identity Provider zu realisieren.
Fig. 1. Single Sign-On für Google Apps mit SAML
100 Maximilian Dietz
Nachfolgend werden zwei mögliche Single-Sign On Lösungen von Googlebeschrieben. Im Schaubild [A] ist die Variante zu sehen in der Google als ServiceProvider auftritt. Die Idenitäten werden durch einen Drittanbieter verwaltet.Dazu muss zunächst ein Private und Public Key zusammen mit einem X.509Zertifikate welches Letzteren enthält generiert werden. Nach dem Erstellen durcheinen von Google vorgegebenen Algorithmus für Signaturen, wird dieser Schlüs-sel durch den Upload bei Google registriert. Falls der Nutzer nun eine Dienst vonGoogle aufruft, wird eine verschlüsselte SAML-Authentifizierungsanfrage zusam-men mit der URL des Partnerdienstes an den Browser des Nutzers weitergeleitet.Beim Partner wird der Nutzer so entweder mit den Anmeldedaten des Nutzersoder durch gültige Cookies für die Sitzung authentifiziert. Daraufhin wird eineSAML Antwort mit dem Nutzernamen und dem signierten Schlüsselpaar wiederan den Browser des Nutzers übermittelt. Worauf die Antwort von Google’s As-sertion Consumer Service anhand des öffentlichen Schlüssels überprüft wird. Miterfolgreicher Verifizierung des Nutzers wird dieser an die Ziel-URL weitergeleitetund für die Google Apps (G-Suite) angemeldet. [15]
Google bietet für Entwickler auch einen Identitäts- und Zugriffsverwaltungs-dienst an, um die Authentifizierung und Autorisierung ihrer Benutzer mithilfevon SAML zu erleichtern (siehe Abb. 1). Das hat den Vorteil einer zentralisiertenBenutzerdatenverwaltung der unterschiedlichen Cloudanwendungen. Dabei meldetsich ein Benutzer über einen Single Sign-On mit den Anmeldedaten der G-Suitebei einem der unterstützten Diensten an. In diesem Fall tritt Google als Iden-tiy Provider auf, wobei die Konfiguration einer Vielzahl an Service Providernmöglich ist. [16]
Ein großer Nachteil dieses Protokolls liegt in der Flexibilität. SAML ist wederfür den Umgang mit mobilen Anwendungen, noch für den Einsatz mit Program-mierschnittstellen gedacht. Nur über Umwege ist eine Nutzung von SAML fürdiese Anwendungsgebiete möglich, wodurch andere Lösungen im Internet derDinge an Bedeutung gewinnen.
OpenID Connect Im Hinblick auf die Bedienbarkeit ist der Standard OpenIDConnect deutlich simpler [17]. Da OpenID Connect auf OAuth 2.0 basiert, nutztes die dort definierten JSON/REST-Nachrichten um Informationen für die Iden-titätsprüfung auszutauschen. Es dient zur Authentifizierung für Benutzer aufverschiedenen Webseiten und Diensten, ohne dass die Dienstbetreiber dabeidie Passwortdaten ihrer Nutzer verwalten müssen. Trotzdem wird die Identitätdesjenigen klar, der die Anwendung bzw. den Browser benutzt. Dazu vergibtOpenID Connect sogenannte ID Tokens, die Aussagen über die Identität einesBenutzers treffen. Dieses Konzept wurde mit OpenID Connect eingeführt umdie Nachahmung von Nutzern zu vermeiden, da OAuth selbst das Konzept derverschiedenen Identitäten nicht berücksichtigt. Der Gebrauch von OpenID Con-nect mit dem Browser funktioniert auf allen Mobilgeräten, wobei Androidgeräte
Usable Security Models for the Internet of Things and Hybrid Cloud Solutions 101
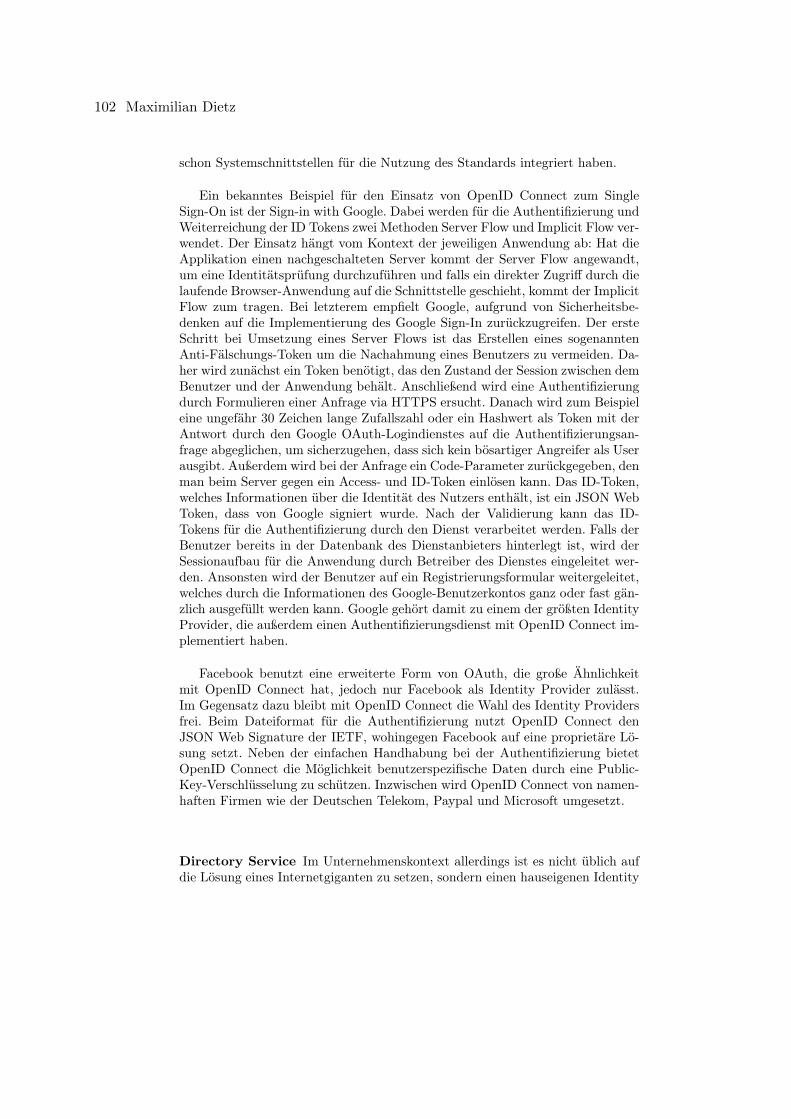
schon Systemschnittstellen für die Nutzung des Standards integriert haben.
Ein bekanntes Beispiel für den Einsatz von OpenID Connect zum SingleSign-On ist der Sign-in with Google. Dabei werden für die Authentifizierung undWeiterreichung der ID Tokens zwei Methoden Server Flow und Implicit Flow ver-wendet. Der Einsatz hängt vom Kontext der jeweiligen Anwendung ab: Hat dieApplikation einen nachgeschalteten Server kommt der Server Flow angewandt,um eine Identitätsprüfung durchzuführen und falls ein direkter Zugriff durch dielaufende Browser-Anwendung auf die Schnittstelle geschieht, kommt der ImplicitFlow zum tragen. Bei letzterem empfielt Google, aufgrund von Sicherheitsbe-denken auf die Implementierung des Google Sign-In zurückzugreifen. Der ersteSchritt bei Umsetzung eines Server Flows ist das Erstellen eines sogenanntenAnti-Fälschungs-Token um die Nachahmung eines Benutzers zu vermeiden. Da-her wird zunächst ein Token benötigt, das den Zustand der Session zwischen demBenutzer und der Anwendung behält. Anschließend wird eine Authentifizierungdurch Formulieren einer Anfrage via HTTPS ersucht. Danach wird zum Beispieleine ungefähr 30 Zeichen lange Zufallszahl oder ein Hashwert als Token mit derAntwort durch den Google OAuth-Logindienstes auf die Authentifizierungsan-frage abgeglichen, um sicherzugehen, dass sich kein bösartiger Angreifer als Userausgibt. Außerdem wird bei der Anfrage ein Code-Parameter zurückgegeben, denman beim Server gegen ein Access- und ID-Token einlösen kann. Das ID-Token,welches Informationen über die Identität des Nutzers enthält, ist ein JSON WebToken, dass von Google signiert wurde. Nach der Validierung kann das ID-Tokens für die Authentifizierung durch den Dienst verarbeitet werden. Falls derBenutzer bereits in der Datenbank des Dienstanbieters hinterlegt ist, wird derSessionaufbau für die Anwendung durch Betreiber des Dienstes eingeleitet wer-den. Ansonsten wird der Benutzer auf ein Registrierungsformular weitergeleitet,welches durch die Informationen des Google-Benutzerkontos ganz oder fast gän-zlich ausgefüllt werden kann. Google gehört damit zu einem der größten IdentityProvider, die außerdem einen Authentifizierungsdienst mit OpenID Connect im-plementiert haben.
Facebook benutzt eine erweiterte Form von OAuth, die große Ähnlichkeitmit OpenID Connect hat, jedoch nur Facebook als Identity Provider zulässt.Im Gegensatz dazu bleibt mit OpenID Connect die Wahl des Identity Providersfrei. Beim Dateiformat für die Authentifizierung nutzt OpenID Connect denJSON Web Signature der IETF, wohingegen Facebook auf eine proprietäre Lö-sung setzt. Neben der einfachen Handhabung bei der Authentifizierung bietetOpenID Connect die Möglichkeit benutzerspezifische Daten durch eine Public-Key-Verschlüsselung zu schützen. Inzwischen wird OpenID Connect von namen-haften Firmen wie der Deutschen Telekom, Paypal und Microsoft umgesetzt.
Directory Service Im Unternehmenskontext allerdings ist es nicht üblich aufdie Lösung eines Internetgiganten zu setzen, sondern einen hauseigenen Identity
102 Maximilian Dietz
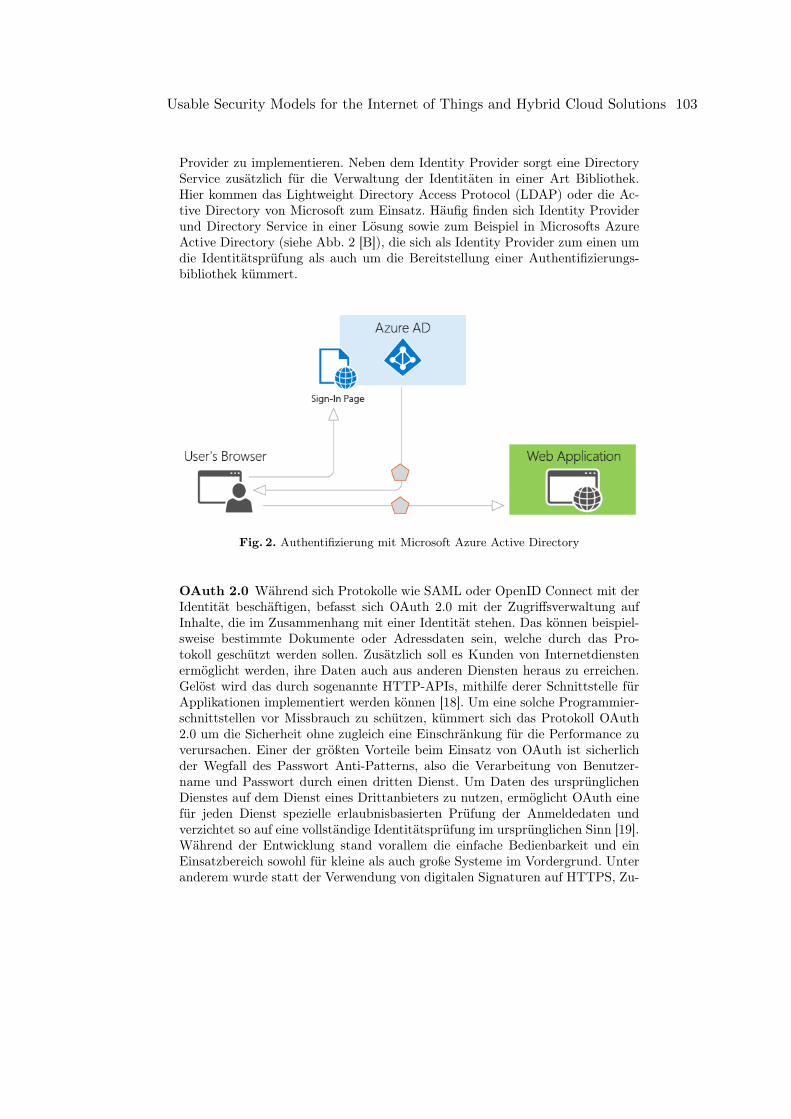
Provider zu implementieren. Neben dem Identity Provider sorgt eine DirectoryService zusätzlich für die Verwaltung der Identitäten in einer Art Bibliothek.Hier kommen das Lightweight Directory Access Protocol (LDAP) oder die Ac-tive Directory von Microsoft zum Einsatz. Häufig finden sich Identity Providerund Directory Service in einer Lösung sowie zum Beispiel in Microsofts AzureActive Directory (siehe Abb. 2 [B]), die sich als Identity Provider zum einen umdie Identitätsprüfung als auch um die Bereitstellung einer Authentifizierungs-bibliothek kümmert.
Fig. 2. Authentifizierung mit Microsoft Azure Active Directory
OAuth 2.0 Während sich Protokolle wie SAML oder OpenID Connect mit derIdentität beschäftigen, befasst sich OAuth 2.0 mit der Zugriffsverwaltung aufInhalte, die im Zusammenhang mit einer Identität stehen. Das können beispiel-sweise bestimmte Dokumente oder Adressdaten sein, welche durch das Pro-tokoll geschützt werden sollen. Zusätzlich soll es Kunden von Internetdienstenermöglicht werden, ihre Daten auch aus anderen Diensten heraus zu erreichen.Gelöst wird das durch sogenannte HTTP-APIs, mithilfe derer Schnittstelle fürApplikationen implementiert werden können [18]. Um eine solche Programmier-schnittstellen vor Missbrauch zu schützen, kümmert sich das Protokoll OAuth2.0 um die Sicherheit ohne zugleich eine Einschränkung für die Performance zuverursachen. Einer der größten Vorteile beim Einsatz von OAuth ist sicherlichder Wegfall des Passwort Anti-Patterns, also die Verarbeitung von Benutzer-name und Passwort durch einen dritten Dienst. Um Daten des ursprünglichenDienstes auf dem Dienst eines Drittanbieters zu nutzen, ermöglicht OAuth einefür jeden Dienst spezielle erlaubnisbasierten Prüfung der Anmeldedaten undverzichtet so auf eine vollständige Identitätsprüfung im ursprünglichen Sinn [19].Während der Entwicklung stand vorallem die einfache Bedienbarkeit und einEinsatzbereich sowohl für kleine als auch große Systeme im Vordergrund. Unteranderem wurde statt der Verwendung von digitalen Signaturen auf HTTPS, Zu-
Usable Security Models for the Internet of Things and Hybrid Cloud Solutions 103
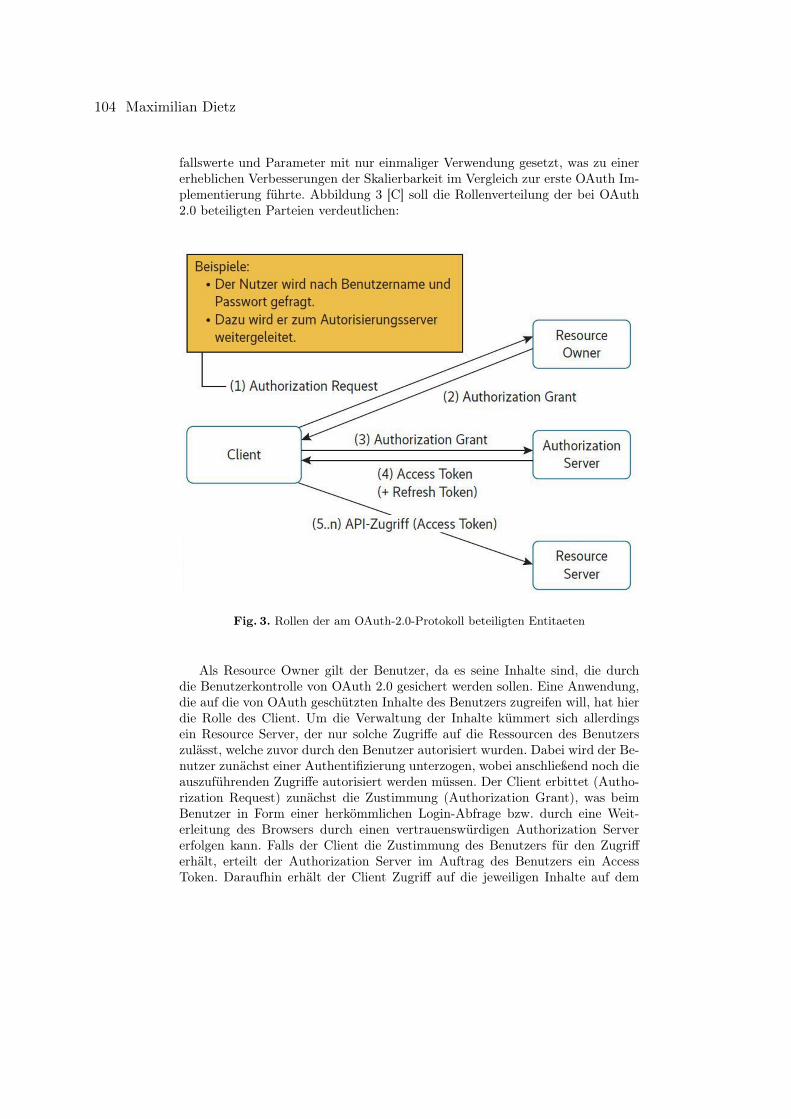
fallswerte und Parameter mit nur einmaliger Verwendung gesetzt, was zu einererheblichen Verbesserungen der Skalierbarkeit im Vergleich zur erste OAuth Im-plementierung führte. Abbildung 3 [C] soll die Rollenverteilung der bei OAuth2.0 beteiligten Parteien verdeutlichen:
Fig. 3. Rollen der am OAuth-2.0-Protokoll beteiligten Entitaeten
Als Resource Owner gilt der Benutzer, da es seine Inhalte sind, die durchdie Benutzerkontrolle von OAuth 2.0 gesichert werden sollen. Eine Anwendung,die auf die von OAuth geschützten Inhalte des Benutzers zugreifen will, hat hierdie Rolle des Client. Um die Verwaltung der Inhalte kümmert sich allerdingsein Resource Server, der nur solche Zugriffe auf die Ressourcen des Benutzerszulässt, welche zuvor durch den Benutzer autorisiert wurden. Dabei wird der Be-nutzer zunächst einer Authentifizierung unterzogen, wobei anschließend noch dieauszuführenden Zugriffe autorisiert werden müssen. Der Client erbittet (Autho-rization Request) zunächst die Zustimmung (Authorization Grant), was beimBenutzer in Form einer herkömmlichen Login-Abfrage bzw. durch eine Weit-erleitung des Browsers durch einen vertrauenswürdigen Authorization Servererfolgen kann. Falls der Client die Zustimmung des Benutzers für den Zugrifferhält, erteilt der Authorization Server im Auftrag des Benutzers ein AccessToken. Daraufhin erhält der Client Zugriff auf die jeweiligen Inhalte auf dem
104 Maximilian Dietz
Resource Server. Hier kann festgestellt werden von welchem Benutzer und fürwelche Rechte die Client-Anwendung autorisiert wurde. Da das Token nichtdauerhaft gültig bleibt, hat der Client neben einer erneuten Benutzeranfragedie Möglichkeit ein Refresh Token zu verwenden, dass zwar für längere Zeit Zu-griff gewährt, desweiteren aber jederzeit vom Benutzer entzogen werden kann.Diese Form der Authentifizierung nennt man auch token-basiert [19]. Häufig wirdOAuth für den Login auf Webseiten verwendet, was die eigentliche Intention desProtkolls verfehlt. Es ist als Autorisierungsprotokoll gedacht und soll nach demWunsch der IETF den herkömmlichen Authentifizierungsprozess ergänzen. AlsErweiterung von OAuth 2.0 gilt das JSON Web Token.
JSON Web Tokens Dieser Standard für ein Sicherheitstoken kümmert sichum die sichere Austausch von Javascript Object Notiation (JSON) Objekten,was sogar über ungesicherte Verbindungen wie z.B. HTTP möglich ist [20].Der JSON-Standard wiederum ist ein leichtgewichtiges Format für den Aus-tausch von Daten, das nicht an eine bestimmte Programmiersprache gebundenist. Der Header des Tokens besteht aus nur zwei Schlüsseln, nämlich dem Typalso JWT und dem Algorithmus, mit dem es verschlüsselt. Das Token selbstenthält neben der für die Verarbeitung erforderlichen Informationen, wie Her-ausgeber und Gültigkeitsdauer auch Daten, die vom Benutzer bestimmt werdenkönnen. Als Herzstück gilt allerdings die digitale Signatur des JWT. Schließlichwerden Header und Inhalt verschlüsselt und zusammen mit einem Secret signiert,das auf Sender- und Empfängerseite bekannt sein muss. Dadurch ist es nur denam Austausch beteiligten Parteien möglich die Identität des Senders und Daten-integrität der Nachricht zu überprüfen. Letztendlich besteht das Token aus dreiBase64-kodierte Strings und enthält bis auf das Secret alle relevanten Informatio-nen eines Benutzers in sich selbst, was weitere Datenbankanfragen einspart. Eingroßer Vorteil von JWT liegt in der Kompaktheit durch den Einsatz von JSON,was verglichen mit XML-basierten Single Sign-On-Ansätzen wie SAML. Ger-ade deshalb ist der Standard für das Webumfeld (HTTP und HTML) sehr gutgeeignet. Neben einer schnelleren Übertragung durch den relativ geringen Over-head, sind auch die Signatur und anschließende Weiterverarbeitung einfacher zubewältigen als mit XML-Lösungen (Abbildung 4 [D]). Ein JSON Parser bildet einDokument direkt auf ein Objekt ab und ist den meisten Programmiersprachenbekannt. Daraus ergibt sich ein weiterer Vorteil gegenüber SAML, da XML einesolches Mapping nicht benutzt.
Usable Security Models for the Internet of Things and Hybrid Cloud Solutions 105
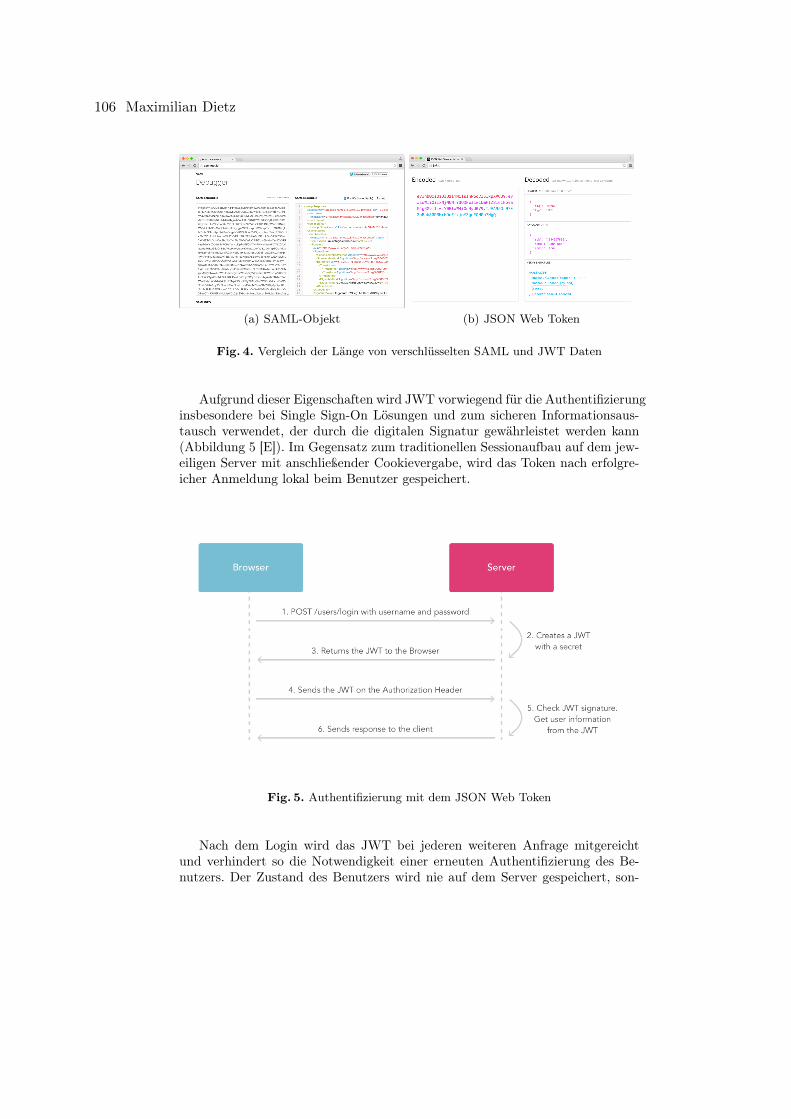
(a) SAML-Objekt (b) JSON Web Token
Fig. 4. Vergleich der Länge von verschlüsselten SAML und JWT Daten
Aufgrund dieser Eigenschaften wird JWT vorwiegend für die Authentifizierunginsbesondere bei Single Sign-On Lösungen und zum sicheren Informationsaus-tausch verwendet, der durch die digitalen Signatur gewährleistet werden kann(Abbildung 5 [E]). Im Gegensatz zum traditionellen Sessionaufbau auf dem jew-eiligen Server mit anschließender Cookievergabe, wird das Token nach erfolgre-icher Anmeldung lokal beim Benutzer gespeichert.
Fig. 5. Authentifizierung mit dem JSON Web Token
Nach dem Login wird das JWT bei jederen weiteren Anfrage mitgereichtund verhindert so die Notwendigkeit einer erneuten Authentifizierung des Be-nutzers. Der Zustand des Benutzers wird nie auf dem Server gespeichert, son-
106 Maximilian Dietz
dern das JWT wird im Header der Autorisierung vom Server auf Korrektheitüberprüft. Woraufhin das Token seinem Benutzer den Zugriff auf die für ihnautorisierten Pfade, Dienste und Ressourcen erlaubt. Was die Sicherheit anbe-lagt, kann ein Token nur von beiden Seiten mittels eines gemeinsamen Secretsunter Verwendung des HMAC Algorithmus signiert werden. Abgesehen davonbesteht auch die Möglichkeit der Signatur mit einem X.509 Zertifikat, welchesein Public und Private Key Paar verwendet. Allerdings besteht hier im Vergleichzur JSON-Signatur ohne vorherige Überlegung die Gefahr massiver Sicherheit-slücken. Nicht zuletzt wegen der einfachen Verarbeitbarkeit kommt der Standardauch für mobile Plattformen und das Internet der Dinge in Betracht.
4.3 SCIM
Im Kontext der Identitätsverwaltung bei Cloudanwendungen befindet sich einProvisioning-Protkoll, das 2011 unter dem Namen Simple Cloud Identity Man-agement Protocol (SCIM) Protokoll entstand. Als die IETF sich der Weiteren-twicklung des Prokoll annahm, wurde dieses jedoch umbenannt in System forCross-domain Identity Management (SCIM). Der Entwurf ist relativ schlank unddient zur Identitäts- und Zugriffsverwaltung für die Menge an Cloudanwendun-gen für die sich ein bestimmter Benutzer registriert hat. Zur Verwaltung dienteine Schnittstelle mit einer REST-Architektur, welche direkte Operationen zurBenutzerverwaltung an den Anbieter seines Clouddienstes ausführen kann. DieErstellung der Identitäten erfolgt just-in-time, d.h. im Zuge des ersten SingleSign-Ons wird ein Account für den jeweiligen Benutzer erstellt. Hierfür wird imZusammenspiel mit SAML festgelegt, welche SCIM-Benutzerinformationen indie SAML-Assertion gepackt werden sollen. Vor allem in der Unternehmenswelt,bei der eine Vielzahl von Aufgaben an SaaS-Provider verlagert wird, kann einsolches Protokoll von erheblicher Bedeutung sein [21] .
4.4 Multi-factor Authentication
Neben dem Single Sign-On lassen sich noch weitere Konzepte für die Sicher-heit im Internet der Dinge bzw. in Cloudanwendungen verwenden. Dazu gehörtauch die Authentifizierung der Identität mit mehr als nur einem Faktor. Bisherhaben wir im Single Sign-On meist von der Authentifizierung mittels Benutzer-name und Passwort gesprochen. Durch den Ansatz der multifaktoriellen Au-thefizierung soll der Login um ein oder mehrere Elemente erweitert werden.Neben einem bloßen Gegenstand wie etwa einem speziellen Schlüsselanhänger,kommen wegen der immer größeren Verbreitung Mobilgeräte für eine erweiterteIdentitätsprüfung in Frage. Diese ersetzen die alte Hardware wegen der Vorteiledes kostengünstigerem Einsatzes, der einfacheren Implementierbarkeit und derMöglichkeit, diese in bestehende Single Sign-On Lösungen einzubinden. Ein weit-erer wichtiger Grund ist die Allgegenwärtigkeit von mobilen Endgeräten und diesteigenden Erfahrung mit deren Umgang innerhalb der Gesellschaft, was den Ein-satz im Kontext der Multi-factor Authentication begünstigen könnte. Denkbarsind zum Beispiel Apps oder Benarichtungen auf dem mobilen Endgerät welche
Usable Security Models for the Internet of Things and Hybrid Cloud Solutions 107
den Nutzer auffordern eine bestimmte Geste auszuführen oder einen bestimmtenCode einzugeben. Nach der erfolgreichen Anwendung des zweiten Faktors ist derBenutzer authentifiziert. In Verbindung mit herkömmlichen Single Sign-On Ver-fahren könnte dieses Authentifizierungsmethode die Sicherheit um ein Vielfachessteigern [22].
5 Conclusion
Die vorgestellten Angriffsszenarien zeigen, dass sich das Internet der Dinge undTeile des Cloud Computing weiterhin mit dem Thema Sicherheit auseinander-setzen müssen, um einen angemessenen Security-Standard zu erreichen. Weit-erhin sollen die aufgezeigten Sicherheitskonzepte darlegen, dass es auch hierMöglichkeiten gibt, Identitätsdaten zu schützen bzw. sicher zu übertragen. Nebender unterschiedlichen Beliebtheit, unterscheiden sich diese Ansätze meist in Kom-plexität und Architektur. Dennoch werden alle Ansätze von großen Internetfir-men implementiert und existieren Bestrebungen das Thema Sicherheit auch imUmfeld der Cloud bzw. der Dinge voranzutreiben. Vor allem die steigende Ver-netzung stellt Entwickler wie Benutzer gleichermaßen vor die Herausforderungeine angemessene Lösungen für den Umgang mit personenbezogenen Daten zufinden.
108 Maximilian Dietz
References
[1] Babar, Sachin, et al. "Proposed security model and threat taxonomy for the Inter-net of Things (IoT)." International Conference on Network Security and Applica-tions. Springer Berlin Heidelberg, 2010.
[2] Pescatore, John and Shpantzer, G "SANS Institute, January: Securing the internetof things survey" 2014.
[3] Infosec "Operational Technology vs. Information Technology"https://www.infosec.ch/faelle/fall10105.htm.
[4] Fraunhofer-Allianz Cloud Computing "Public, Private und Hybrid Cloud?"http://www.cloud.fraunhofer.de/de/faq/publicprivatehybrid.html.
[5] GlobalSign "5 häufige Cyber-Attacken im IoT – Bedrohungen im großen Stil"https://www.globalsign.com/de-de/blog/fuenf-haeufige-cyber-attacken-iot/.
[6] GlobalSign "Wie aus Botnetzen Thingbots werden"https://www.globalsign.com/de-de/blog/thingbots/.
[7] GlobalSign "Man-in-the-Middle-Angriffe im IoT" https://www.globalsign.com/de-de/blog/man-in-the-middle-attacke-im-iot/.
[8] GlobalSign "Vorsicht! Diebstahl von Daten & Identitäten im IoT"https://www.globalsign.com/de-de/blog/identity-theft-in-the-iot/.
[9] GlobalSign "Die Bedrohung der Sicherheit durch Social Engineering im IoT"https://www.globalsign.com/de-de/blog/social-engineering-iot/.
[10] GlobalSign "Heute geschlossen - Denial of Service Angriffe im IoT"https://www.globalsign.com/de-de/blog/denial-of-service-im-iot/.
[11] Nat Sakimura "Identity, Authentication + OAuth = OpenID Connect"https://www.youtube.com/watch?v=Kb56GzQ2pSk.
[12] Newman, Sam. Building Microservices. " O’Reilly Media, Inc.", 2015.[13] InformationWeek "SAML: The Secret to Centralized Identity Management"
http://www.informationweek.com/software/information-management/saml-the-secret-to-centralized-identity-management/d/d-id/1028656?.
[14] OneLogin "SAML Single Sign-On (SSO)" https://www.onelogin.com/saml.[15] Google "Einmalanmeldung (Single Sign-On – SSO) für G Suite-
Konten mithilfe von Identitätsanbietern von Dritten einrichten"https://support.google.com/a/answer/60224?hl=de.
[16] Google "SAML-basierte, föderierte Einmalanmeldung (SSO)"https://support.google.com/a/answer/6087519?hl=de.
[17] OpenID "OpenID Connect FAQ and Q & As" http://openid.net/connect/faq/.[18] Lodderstedt, Thorsten et al. "Flexible und sichere Internetdienste mit OAuth
2.0". http://www.heise.de/developer/artikel/Flexible-und-sichere-Internetdienste-mit-OAuth-2-0-2068404.html.
[19] Bell, Gavin. Building social web applications. " O’Reilly Media, Inc.", 2009.[20] AuthO "Introduction to JSON Web Tokens" https://jwt.io/introduction/.[21] Ping Identity "SAML 101" https://www.pingidentity.com/content/dam/pic/downloads/resources/white-
papers/en/saml-101-white-paper.pdf.[22] Ping Identity "Ultimate Guide to SSO: Chapter 7 - Multi-Factor Au-
thentication" https://www.pingidentity.com/en/ultimate-guides/ultimate-guide-to-sso/chapter-7.html.
[A] "Single Sign-On für Google Apps mit SAML"http://virtuallyhyper.com/2013/05/set-up-simplesamlphp-as-an-idp-to-be-used-in-an-sp-initiated-sso-with-google-apps/.
Usable Security Models for the Internet of Things and Hybrid Cloud Solutions 109

[B] "Authentifizierung mit Microsoft Azure Active Directory"https://azure.microsoft.com/de-de/documentation/articles/active-directory-authentication-scenarios/.
[C] "Rollen der am OAuth-2.0-Protokoll beteiligten Entitaeten"http://www.heise.de/developer/artikel/Flexible-und-sichere-Internetdienste-mit-OAuth-2-0-2068404.html.
[D] "Vergleich der Länge von verschlüsselten SAML und JWT Daten"https://jwt.io/introduction/.
[E] "Authentifizierung mit dem JSON Web Token" https://jwt.io/introduction/.
110 Maximilian Dietz
IDEs for Creating Mobile Experience Sampling
Apps for Non-Programmers
Margarita Asenova∗
Advisor: Anja Bachmann†
Karlsruhe Institute of Technology (KIT)Pervasive Computing Systems � TECO
∗[email protected]†[email protected]
Abstract. Experience Sampling Methode ist eine Befragungstechnikzum Erfassen von Gefühlen, Stimmungen und Gedanken der Menschenmithilfe von täglichen Umfragen, die entweder per Hand, durch Audio-,Videoaufzeichnung oder einfach auf dem Smartphone ausgefüllt werden.Diese Seminararbeit beschäftigt sich mit dem Thema Experience Sam-pling Methode, deren Einsatzgebiete und Entwicklungsumgebung. Eswerden bereits vorhandene IDEs und Tools vorgestellt und verglichen.Im Zuge diesen werden auch die meistbenutzten Sensoren und Event-Triggers vorgestellt. Zum Abschluss wird ein Überblick zum aktuellenForschung ausgegeben.
Keywords: Experience Sampling Method, ESM Tools, Einsatzgebiete,Smartphones, Ambulatory Assessment
1 Einleitung
Experince Sampling Methode( ESM ) ist inzwischen eine weitverbreitete Be-fragungstechnik und wird oft auch von Leuten ohne grundlegenden Program-mierkenntnisse genutzt. Diese Methode zielt darauf ab bestimmte Informationüber Gefühle, Gedanken, Stimmungen usw. im Alltag der Probanden zu er-fassen. Wegen der schnellen Verbreitung von Smartphones ist ESM sehr leichteinzusetzen, ohne dass dafür zusätzliche Kenntnisse erforderlich wären. Es sindauch keine Schulungen für die Benutzer notwendig, denn heutzutage kann jederein Smartphone benutzen. Im Vergleich zu der Vergangenheit, als diese Befra-gungen mit Kugelschreiber und Papier durchgeführt wurden, ist heutzutage nurein Smartphone notwendig und diese können sogar wegen der aufgenommenenDaten von Sensoren während bestimmten Zeiten oder zwischen bestimmten Zeit-intervallen durchgeführt werden. Genau dann, wenn solche Ereignisse eintreten,die für den Forscher interessant und relevant für die Studie sind. Wie genau eineStudie mit ESM durchgeführt wird, wird mithilfe von dem folgenden Beispielveranschaulicht. Der Benutzer bekommt eine Benachrichtigung auf dem Handy,wenn ein für die Studie relevantes Ereignis eintritt. Ein solcher Ereignis können
IDEs for Creating Mobile Exp erience Sampling Apps for Non-Programmers 111
die Änderungen der Wettertemperaturen sein. Immer wenn die Temperatur über30, zwischen 20-30 und unter 20 Grad Celsius ist, bekommt der Befragte eineBenachrichtigung zum Ausfüllen einer Befragung. Wie er sich bei dieser Tem-peratur fühlt? Hat das irgendeinen Ein�uss auf seine Arbeit? .... Die Antwortkann in Textform eingegeben oder eine aus vorgeschlagenen Möglichkeiten aus-gewählt werden. So kann beispielsweise eine Studie durchgeführt werden zumThema �Welche Temperatur der Benutzer als angenehmste bei seiner Arbeit imBüro emp�ndet�. Nach dieser Studie kann eine Schlussfolgerung zum Thema�Sind Klimaanlagen bei der Arbeit im Büro notwendig¾` gezogen werden. Als er-stes wird in dieser Seminararbeit die Experience Sampling Methode vorgestelltund erklärt was hinter dieser Methode steckt. In welchen Bereichen diese ammeisten verbreitet ist und ein paar Beispiele dazu gegeben. Wie werden die un-terschiedlichen Sensoren von Smartphones hier eingesetzt und was für Arten vonTriggers existieren. Als letztes werden einige von den bekanntesten und meist-benutzten ESM-Tools vorgestellt und einen Vergleich zwischen ihnen gezogen.
2 Grundlagen
2.1 De�nition von dem Experience Sampling Methode
Die Experience Sampling Methode wird von Schallberger als `Be�ndenstagebuch`oder `Erlebnisstichprobenmethode` de�niert. Diese Methode ist eine Befragung-stechnik, mit deren Hilfe die Stimmungen, Gedanken und Gefühle einer Personim Echtzeit gemessen werden. Dabei werden die Daten direkt in der Situation, inder sie erlebt werden gesammelt. Diese Situationen entsprechen bestimmten Pe-rioden im Alltag der Befragten beispielsweise beim sonnigen Wetter, dem Aufen-thalt an irgendeinem Ort, nach dem Essen usw. Nach Barett und Barett wurdedieses Verfahren früher auf Papier während festgelegten Uhrzeiten durchgeführt.Heutzutage erleichtert die Benutzung von Smartphones diese Methode erhe-blich, denn der Proband soll sich bis auf das eigentliche Ausfüllen der Befragungum fast nichts kümmern. Wenn es notwendig ist, eine Umfrage auszufüllen, er-scheint eine Benachrichtigung auf dem Handy. So eine Situation ist zum Beispielder Zeitpunkt nach dem täglichen Sport. Der Befragte bekommt immer nacheiner Sporttätigkeiten eine Benachrichtigung. Die Antwort kann in Textformeingegeben oder eine aus vogeschlagenen Möglichkeiten ausgewählt werden.
2.2 Hintergrund
Die Experience Sampling Methode spielt heutzutage besonders groÿe Rolle dankder sehr stark steigenden Entwicklung von Smartgeräte, mithilfe von denen kannman diese Methode sehr leicht benutzen, ohne dass irgendwelche Vorkenntnisseauÿer normalem Bedienen vom Smartphone verlangt zu werden. Dieses Ver-fahren verlässt sich nicht auf Erinnerungen und künstlicher Kontext, sondern aufden exakten Augenblick, wo die Beteiligten an dieser Befragung die benötigteBeschreibung von ihren vorübergehenden Gedanken, Gefühlen und ihrer Verhal-tensweise in den zahlreichen alltäglichen Situationen liefern. Die Teilnahme von
112 Margarita Asenova
Smartgeräten an ESM lässt den Forschern die Möglichkeit, diese Befragung inunterschiedlichen Umgebungen, wie z.B. zu Hause, im Urlaub, bei der Arbeit,durchzuführen und unter bestimmten Ereignissen wie Sport, Urlaub, schönesoder schlechtes Wetter usw. auszulösen.
Die Experience Sampling Methode kann entweder täglich auf bestimmte In-tervalle auftreten(Interval contingent), als Reaktion zu bestimmten Ereignissen,für die sich der Forscher interessiert(Event Contingent), oder täglich zu einemzufällig ausgewählten Zeitpunkt(Signal Contingent). Mehr über diese Trigger-methoden wird im Kapitel 4 erläutert. Die heutige Experience Sampling Meth-ode, die mit der Teilnahme von Smartgeräte durchgeführt wird, reduziert deut-lich die Verwendung von der alten Methode, die mithilfe von Papier und Stiftdurchgeführt wird. Experience Sampling Methode verlangt keinen Abruf undWiederaufbau der Daten im Gedächtnis, sondern bringt den Zugang und präzisenBericht von der momentanen Information im Gedächtnis.
Das Experience Sampling Verfahren nicht nur verringert die Nachteile vonalter Befragungstechnik, sondern hat auch deutliche Vorteile. Diese Technik er-laubt dem Forscher, einen Probanden mithilfe von der gegründeten vom Web-plattform Applikation zu beschreiben, wo der Probande die Befragung auf seinHandy ausgefüllt hat und weder der Forscher oder der Probande Program-mierkenntnisse brauchen.
Als etwas Positives kann man auch bezeichnen, dass die Befragten sich inihren natürlichen Umgebung be�nden. Die Umgebung, in der man sich währendder Befragung be�ndet, spielt sehr groÿe Rolle, denn so sind die Antworte vonden Befragten objektiver, da sie sich nicht auf vergangenen Erinnerungen, Sit-uationen oder Umgebungen verlassen, sondern genau auf diesen Augenblick.Ein anderer Vorteil ist, dass die Befragungen jeder Zeit und mehrmals pro Tagdurchgeführt werden können oder z. B. während einem bestimmten Ereignis, diemithilfe von Sensoren erkannt werden kann, aber die unterschiedlichen Sensorenwerden später im Kapitel 4 aufgezählt.
3 Einsatzgebiete von ESM
Die Entwicklung von der Experience Sampling Methode fängt im Bereich derPsychologie an und heutzutage ist sie da ammeisten verbreitet. Trotzdem gewinntdiese Technik immer mehr an Bedeutung und sie wird in letzten Jahren inzahlreichen Gebieten verwendet. Demzufolge werden hier einige von den Bekan-ntesten aufgezählt, und einige Beispiele dazu gegeben, wie diese Methode inunterschiedlichen Bereichen angewendet wird.
3.1 Psychologie
Die ESM �ndet weitgehend Verwendung in diesem Bereich. Die Existenz vonzahlreichen ESM-Umfragen in diesem Feld ist einen Beweis wie oft diese Meth-ode in der Psychologie benutzt wird. Psychlog ist ein Tool, das genutzt wird,
IDEs for Creating Mobile Exp erience Sampling Apps for Non-Programmers 113
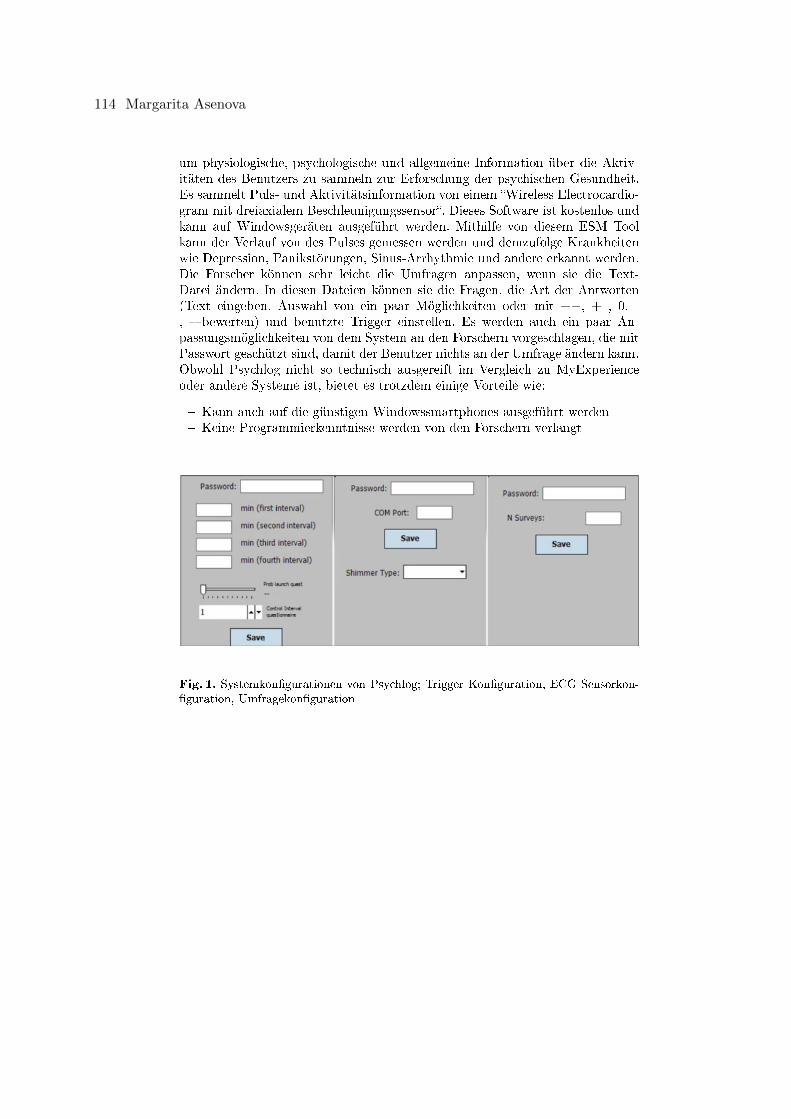
um physiologische, psychologische und allgemeine Information über die Aktiv-itäten des Benutzers zu sammeln zur Erforschung der psychischen Gesundheit.Es sammelt Puls- und Aktivitätsinformation von einem �Wireless Electrocardio-gram mit dreiaxialem Beschleunigungssensor�. Dieses Software ist kostenlos undkann auf Windowsgeräten ausgeführt werden. Mithilfe von diesem ESM Toolkann der Verlauf von des Pulses gemessen werden und demzufolge Krankheitenwie Depression, Panikstörungen, Sinus-Arrhythmie und andere erkannt werden.Die Forscher können sehr leicht die Umfragen anpassen, wenn sie die Text-Datei ändern. In diesen Dateien können sie die Fragen, die Art der Antworten(Text eingeben, Auswahl von ein paar Möglichkeiten oder mit ++, + , 0, -, � bewerten) und benutzte Trigger einstellen. Es werden auch ein paar An-passungsmöglichkeiten von dem System an den Forschern vorgeschlagen, die mitPasswort geschützt sind, damit der Benutzer nichts an der Umfrage ändern kann.Obwohl Psychlog nicht so technisch ausgereift im Vergleich zu MyExperienceoder andere Systeme ist, bietet es trotzdem einige Vorteile wie:
� Kann auch auf die günstigen Windowssmartphones ausgeführt werden� Keine Programmierkenntnisse werden von den Forschern verlangt
Fig. 1. Systemkon�gurationen von Psychlog; Trigger Kon�guration, ECG Sensorkon-�guration, Umfragekon�guration
114 Margarita Asenova
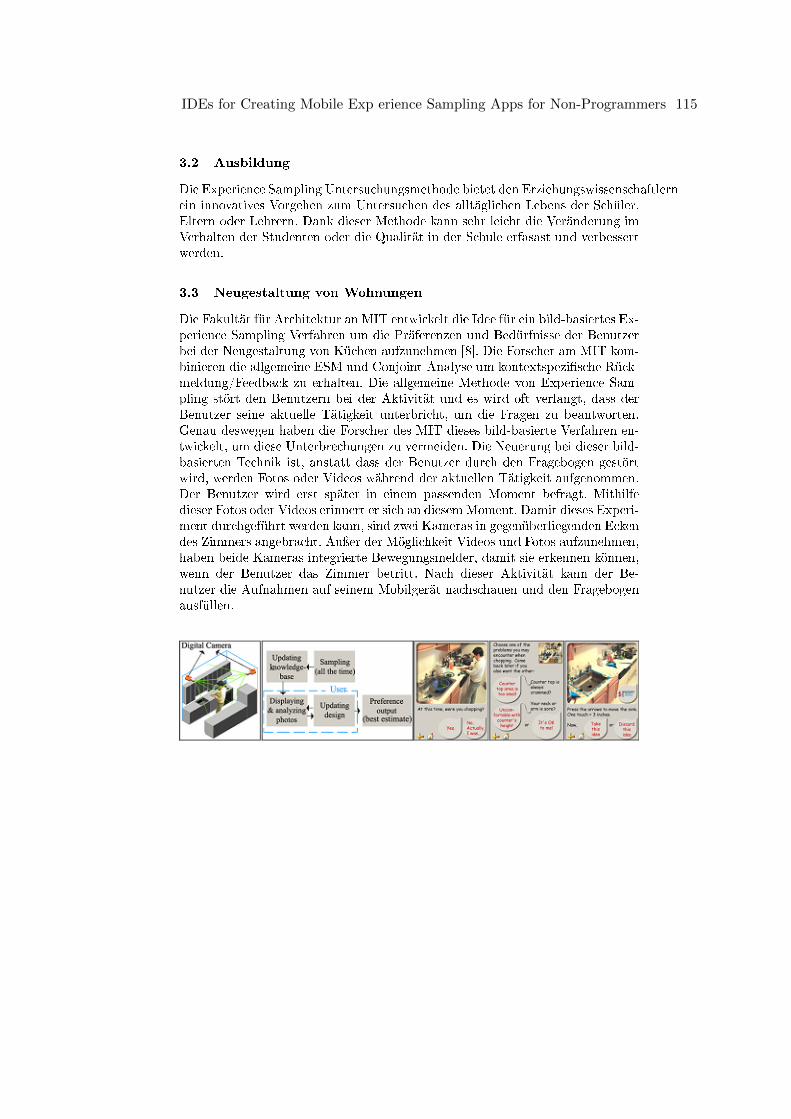
3.2 Ausbildung
Die Experience Sampling Untersuchungsmethode bietet den Erziehungswissenschaftlernein innovatives Vorgehen zum Untersuchen des alltäglichen Lebens der Schüler,Eltern oder Lehrern. Dank dieser Methode kann sehr leicht die Veränderung imVerhalten der Studenten oder die Qualität in der Schule erfasast und verbessertwerden.
3.3 Neugestaltung von Wohnungen
Die Fakultät für Architektur an MIT entwickelt die Idee für ein bild-basiertes Ex-perience Sampling Verfahren um die Präferenzen und Bedürfnisse der Benutzerbei der Neugestaltung von Küchen aufzunehmen [8]. Die Forscher am MIT kom-binieren die allgemeine ESM und Conjoint-Analyse um kontextspezi�sche Rück-meldung/Feedback zu erhalten. Die allgemeine Methode von Experience Sam-pling stört den Benutzern bei der Aktivität und es wird oft verlangt, dass derBenutzer seine aktuelle Tätigkeit unterbricht, um die Fragen zu beantworten.Genau deswegen haben die Forscher des MIT dieses bild-basierte Verfahren en-twickelt, um diese Unterbrechungen zu vermeiden. Die Neuerung bei dieser bild-basierten Technik ist, anstatt dass der Benutzer durch den Fragebogen gestörtwird, werden Fotos oder Videos während der aktuellen Tätigkeit aufgenommen.Der Benutzer wird erst später in einem passenden Moment befragt. Mithilfedieser Fotos oder Videos erinnert er sich an diesemMoment. Damit dieses Experi-ment durchgeführt werden kann, sind zwei Kameras in gegenüberliegenden Eckendes Zimmers angebracht. Auÿer der Möglichkeit Videos und Fotos aufzunehmen,haben beide Kameras integrierte Bewegungsmelder, damit sie erkennen können,wenn der Benutzer das Zimmer betritt. Nach dieser Aktivität kann der Be-nutzer die Aufnahmen auf seinem Mobilgerät nachschauen und den Fragebogenausfüllen.
IDEs for Creating Mobile Exp erience Sampling Apps for Non-Programmers 115
4 Sensorik und Event-Triggers bei ESM
Wegen der ständig wachsenden Benutzung von sensorreichen Smartphones wirddie Anwendung von ESM weiter erleichtert, denn diese Sensordaten können alsHilfsmittel zur Durchführung von ESM-Studien benutzet werden. Der Schwer-punkt einer sensorbasierten ESM Untersuchung liegt in der Entscheidung überdas Design und wann oder unter welche Bedingungen eine Benachrichtigungverschickt werden soll, damit der Benutzer die Umfrage ausfüllt. Bei dem Ein-richten des Triggers kann der Benutzer seine Präferenzen äuÿern, nach denen sichdie Trigger richten sollen, zum Beispiel wie oft pro Tag eine Benachrichtigungausgelöst werden darf, zwischen welche Uhrzeiten und wie lange diese Umfragedauern soll.[1].
Bei dieser Befragungstechnik werden drei Grundmethoden benutzt, damitdie Benachrichtigung ausgelöst wird:
� Zeit-basierter Trigger:• Die Benachrichtigungen werden täglich an den Beteiligten um eine fest-gestellte Uhrzeit geschickt,die jeden Tag unverändert bleibt.
• Die Benachrichtigungen werden nur innerhalb von bestimmten zeitlichenIntervallen geschickt. Zum Beispiel: zwischen 08:00 - 20:00
� Signal-basierter Trigger - Die Benachrichtigungen werden immer um zufälligausgewählte Uhrzeit geschickt
� Ereignis-basierter Trigger - Die Benachrichtigungen werden nur dann geschickt,während ein bestimmter Ereignis auftritt.
Auÿer der drei Grundtypen können die ESM Untersuchungen auch durch eineKombination von den oben aufgezählten Typen ausgelöst werden. Ein Beispieldafür ist die folgende ESM Studie. Die Auslösung von der Benachrichtigungenwird hier eine Kombination zwischen zeit-basierten und ereignis-basierten Trig-gers. Der Erste wird benutzt um ein Zeitintervall yu bestimmen, innerhalb dessender Beschleunigungssensor abgefragt werden kann und der zweite Trigger wirddann benutzt, wenn die Sensordaten zeigen, dass es keine Bewegung gibt.Dannsoll eine Umfrage durchgeführt werden.
Bei der Sensoren kann man auch zwischen zwei Oberarten einen Unterschiedmachen.
� Physikalischen Sensoren - Sensoren, die aktiv nach den Daten befragt werdensollen (Android Betriebssystem)• Beschleunigungssensor• Mikrofon• Näherungssensor• Bluetooth• GPS• Wi-Fi
� Software Sensoren - Sensoren, die die Daten mithilfe von dem SmartphoneHardware übertragen.• Telefonanrufe
116 Margarita Asenova
• Bildschirm ein/aus• SMS• und andere
Die Speicherung und das Hochladen von Sensordaten wird von zwei unter-schiedlichen Komponenten durchgeführt, wobei das Hochladen normalerweisenur unter existierende Wi-� Verbindung ausgeführt wird. Mithilfe von diesemautomatisierten Speichern und Hochladen von Daten wird die Beteiligung vonden Benutzern an der Studie noch mehr erleichtert. Das System kann auch soeingerichtet werden, dass es sich automatisch aktualisiert ohne die Beteiligungvom Benutzer daran.
5 Programmierumgebungen für Experience Sampling
5.1 Bekannte Programmierumgebungen
Die Experience Sampling Methode ist sehr schnell populär geworden, besondersin den letzten Jahren mit der Entwicklung von Smartgeräten. Consolvo undWalker haben die ESM zur Auswertung von dem Inter Research System, die Per-sonal Server genannt wird, benutzt. Bezogen auf diese zunehmende Beliebtheitist die Entwicklung von Tools, um diese Methode zu unterstützen, notwendig. In-tille et al. ....(Referenz hinzufügen) hat eine Software entwickelt, die den Forsch-ern ermöglicht, eine Rückmeldung nur in bestimmten Situationen zu bekommen,die mithilfe von den Sensoren, die mit einem PDA verbunden sind, erkannt wer-den. Froehlich entwickelt MyExperience (Referenz hinzufügen), ein System zumErfassen von objektiven und subjektiven in situ Daten von den Aktivitäten desHandys.
IDEs for Creating Mobile Exp erience Sampling Apps for Non-Programmers 117
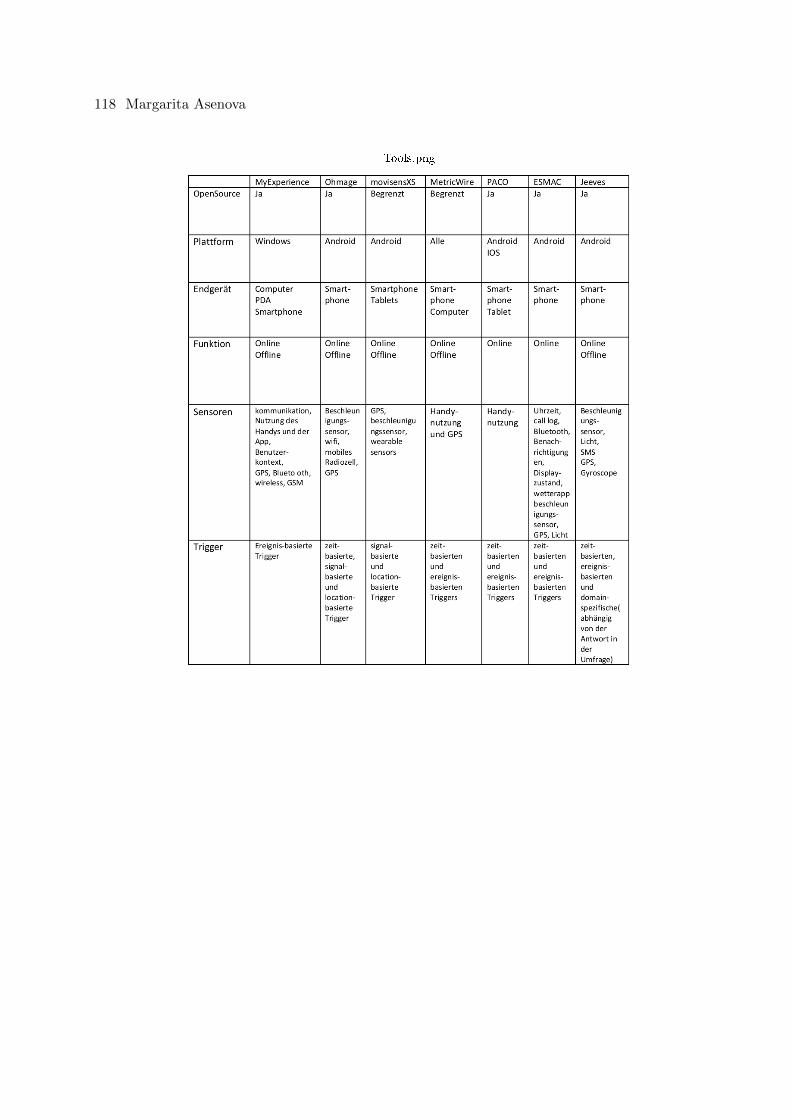
Tools.png
118 Margarita Asenova
5.2 Vergleich zwischen den unterschiedlichen
Programmierumgebungen
Um den Forschern ihre Arbeit zu erleichtern, sind einige kommerzielle und einigeopen source EMS Tools entwickelt worden, so entfällt die Notwendigkeit des Ler-nens einer Programmiersprache. In der Tabelle ist eine kleine Übersicht über diemeist benutzten Tools dargestellt. Im Normalfall setzen sich diese Tools aus einerWebschnittstelle, die die Spezi�kationen von dem Studie aktiviert/freischaltetund aus zeitlichen Frameworks zur Aufstellung von diesen Umfragen zusammen.Nachdem wir schon einen Überblick über die aktuellen EMS-Tools bekommenhaben, können wir die Schwachstellen von diesen Tools zeigen und ein paar Lö-sungen für diese Schwachstellen vorstellen.
Klare Unterschiedsgrenze bei den Software Tools[4]:
� Benutzerober�äche� Kommerzielles und kostenloses Software� Mangel an Sensorverwendung� Störung der Nutzer während der Umfrage
Eines des hervorragendsten ESM Tools heutzutage ist MyExperience. DiesesTool ist nur für Windows Smartphones geeignet und verlangt die Installationvon Microsoft SQL Datenbank, da die Information lokal auf dem Handy gespe-ichert wird. Dieses System wurde speziel für Handys entwickelt, um die Vorteileder zahlreichen Sensoren auszunutzen. Es unterstützt 50 integrierte Sensoren ein-schlieÿlich GPS, GSM basiertes Bewegungssensor und Information der Gerätenutzung.Die Sensorereignisse können zum benutzerde�nierten Aktionen wie Synchronisa-tion von der Datenbank, Senden eines SMS an Forschungsteam oder Darstellungvon Selbstbeurteilungsumfragen in situ genutzt werden. Trotz aller Vorteilenund Neuigkeiten von MyExperience ist das System nicht komplett perfekt, dennes werden Grundprogrammierkenntnisse in XML verlangt um eine Umfrage zuerstellen[12].Im Vergleich zu MyExperience werden bei MovisensXS keine Programmierkennt-nisse verlangt, denn die Benutzerober�äche von diesem Tool ist mithilfe von einergra�schen Programmiersprache erstellt. Momentan ist das eine der besten Be-nutzerober�ächen. MovisensXS ist inspiriert von MyExperience, aber es ist nichtfür Windows Smartphones geeignet, sondern für Android und es sind signal-basierte und begrenzte sensor-basierte Trigger wegen des Sparens von Akkuen-ergie erlaubt. Hier können die Umfragen online erstellt und danach von dem demAndroid Client heruntergeladen werden. Hauptnachteil dieses Systems ist , dasses nicht kostenlos und frei zugänglich ist.PACO ist ein Tool, das sehr gut auf seiner Server und Client Seite dokumentiertist, um die Integration mit anderen Anwendungen zu erleichtern. Beim Nutzenvon PACO ist eine Anmeldung nicht erforderlich, damit der Befragte die Appnutzen kann oder an der Umfrage teilnimmt. PACO verbindet sich automatischmit dem Google Account des Benutzer. Allerdings kann dieses System nur dannbenutzt werden, wenn Internetverbindung besteht und es verfügt nur über zeit-basierte Trigger[9].
IDEs for Creating Mobile Exp erience Sampling Apps for Non-Programmers 119
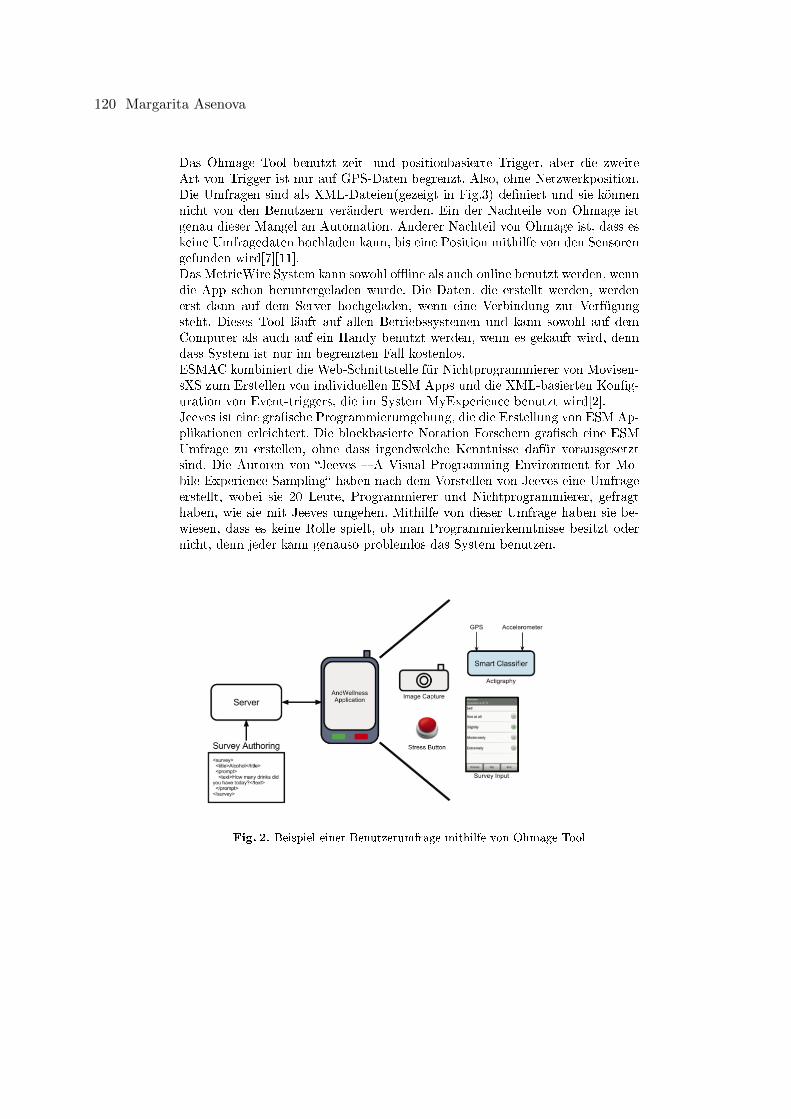
Das Ohmage Tool benutzt zeit- und positionbasierte Trigger, aber die zweiteArt von Trigger ist nur auf GPS-Daten begrenzt. Also, ohne Netzwerkposition.Die Umfragen sind als XML-Dateien(gezeigt in Fig.3) de�niert und sie könnennicht von den Benutzern verändert werden. Ein der Nachteile von Ohmage istgenau dieser Mangel an Automation. Anderer Nachteil von Ohmage ist, dass eskeine Umfragedaten hochladen kann, bis eine Position mithilfe von den Sensorengefunden wird[7][11].Das MetricWire System kann sowohl o�ine als auch online benutzt werden, wenndie App schon heruntergeladen wurde. Die Daten, die erstellt werden, werdenerst dann auf dem Server hochgeladen, wenn eine Verbindung zur Verfügungsteht. Dieses Tool läuft auf allen Betriebssystemen und kann sowohl auf demComputer als auch auf ein Handy benutzt werden, wenn es gekauft wird, denndass System ist nur im begrenzten Fall kostenlos.ESMAC kombiniert die Web-Schnittstelle für Nichtprogrammierer von Movisen-sXS zum Erstellen von individuellen ESM Apps und die XML-basierten Kon�g-uration von Event-triggers, die im System MyExperience benutzt wird[2].Jeeves ist eine gra�sche Programmierumgebung, die die Erstellung von ESM Ap-plikationen erleichtert. Die blockbasierte Notation Forschern gra�sch eine ESMUmfrage zu erstellen, ohne dass irgendwelche Kenntnisse dafür vorausgesetztsind. Die Autoren von �Jeeves � A Visual Programming Environment for Mo-bile Experience Sampling� haben nach dem Vorstellen von Jeeves eine Umfrageerstellt, wobei sie 20 Leute, Programmierer und Nichtprogrammierer, gefragthaben, wie sie mit Jeeves umgehen. Mithilfe von dieser Umfrage haben sie be-wiesen, dass es keine Rolle spielt, ob man Programmierkenntnisse besitzt odernicht, denn jeder kann genauso problemlos das System benutzen.
Fig. 2. Beispiel einer Benutzerumfrage mithilfe von Ohmage Tool
120 Margarita Asenova
6 Fazit
Ein ideales Tool soll über eine zahlreiche Anzahl an Sensoren und Triggersverfügen[9], mithilfe von denen eine Umfrage zeit-, event-, signal- und position-basiert ausgelöst werden kann. Das System soll intuitiv und benutzerfreundlichsein, ohne irgendwelche Kenntnisse zu verlangen und möglichst energiesparend,denn die Verfügbarkeit aller dieser Sensoren und das aktive Programm auf demSystem im Background wirkt sehr stark auf die Akkulaufzeit des Gerätes aus. DieExistenz einer Client/Server Architektur spielt auch sehr groÿe Rolle, damit dieApp auch o�ine benutzt werden kann und wenn eine Wi-� Verbindung bestehtdie Daten an dem Server geschickt werden können. Welches ESM-Tool kommtdem Ideal nahe?
References
1. Bachmann, A., Zetzsche, R., Riedel, T., Beigl, M., Reichert, M., Santangelo, P.,Ebner-Priemer, U.: Identi�cation of relevant sensor sources for context-aware esmapps in ambulatory assessment. In: Adjunct Proceedings of the 2015 ACM Interna-tional Joint Conference on Pervasive and Ubiquitous Computing and Proceedingsof the 2015 ACM International Symposium on Wearable Computers. pp. 265�268.ACM (2015)
2. Bachmann, A., Zetzsche, R., Schankin, A., Riedel, T., Beigl, M., Reichert, M.,Santangelo, P., Ebner-Priemer, U.: Esmac: A web-based con�gurator for context-aware experience sampling apps in ambulatory assessment. In: Proceedings of the5th EAI International Conference on Wireless Mobile Communication and Health-care. pp. 15�18. ICST (Institute for Computer Sciences, Social-Informatics andTelecommunications Engineering) (2015)
3. Barrett, L.F., Barrett, D.J.: An introduction to computerized experience samplingin psychology. Social Science Computer Review 19(2), 175�185 (2001)
4. Fischer, J.E.: Experience-sampling tools: a critical review. Mobile living labs 9, 1�3(2009)
5. Froehlich, J., Chen, M.Y., Consolvo, S., Harrison, B., Landay, J.A.: Myexperience:a system for in situ tracing and capturing of user feedback on mobile phones. In:Proceedings of the 5th international conference on Mobile systems, applicationsand services. pp. 57�70. ACM (2007)
6. Gaggioli, A., Pioggia, G., Tartarisco, G., Baldus, G., Corda, D., Cipresso, P., Riva,G.: A mobile data collection platform for mental health research. Personal andUbiquitous Computing 17(2), 241�251 (2013)
7. Hicks, J., Ramanathan, N., Falaki, H., Longsta�, B., Parameswaran, K., Monibi,M., Kim, D.H., Selsky, J., Jenkins, J., Tangmunarunkit, H., et al.: ohmage: An openmobile system for activity and experience sampling. Los Angeles: UCLA Centerfor Embedded Network Sensing (2011)
8. Intille, S., Kukla, C., Ma, X.: Eliciting user preferences using image-based experi-ence sampling and re�ection. In: CHI'02 Extended Abstracts on Human Factorsin Computing Systems. pp. 738�739. ACM (2002)
9. Kini, S.: Please take my survey: compliance with smartphone-based ema/esm stud-ies (2013)
IDEs for Creating Mobile Exp erience Sampling Apps for Non-Programmers 121
10. Lathia, N., Rachuri, K.K., Mascolo, C., Rentfrow, P.J.: Contextual dissonance:Design bias in sensor-based experience sampling methods. In: Proceedings of the2013 ACM international joint conference on Pervasive and ubiquitous computing.pp. 183�192. ACM (2013)
11. Ramanathan, N., Alquaddoomi, F., Falaki, H., George, D., Hsieh, C.K., Jenkins, J.,Ketcham, C., Longsta�, B., Ooms, J., Selsky, J., et al.: Ohmage: an open mobilesystem for activity and experience sampling. In: 2012 6th International Confer-ence on Pervasive Computing Technologies for Healthcare (PervasiveHealth) andWorkshops. pp. 203�204. IEEE (2012)
12. Rough, D., Quigley, A.: Jeeves-a visual programming environment for mobile expe-rience sampling. In: Visual Languages and Human-Centric Computing (VL/HCC),2015 IEEE Symposium on. pp. 121�129. IEEE (2015)
13. Schallberger, U., P�ster, R., Venetz, M.: Qualität des erlebens in arbeit und freizeit.theoretische rahmenüberlegungen zum erlebens-stichproben-fragebogen (esf) undzu den operationalisierungen. Arbeitsberichte Aus Dem Projekt QualitäT Des Er-lebens in Arbeit Und Freizeit (1999)
122 Margarita Asenova
Privacy Issue Of User Modeling In PervasiveSystems
Nick Newill Tchouante Kembe∗
Advisor: Antonios Karatzoglou†
Karlsruhe Institute of Technology (KIT)Pervasive Computing Systems – TECO
∗[email protected]†[email protected]
Abstract. The most widely used notion of privacy is that of control overpersonal information. The importance of social network sites and serviceshave been increasing since some years. The introduction of ubiquitoussystems, wearable computing and “Internet of Things” technologies inour digital society results in a large-scale data generation. In the sametime there were an increasing number of socially intelligent agents whogather, manage and maintain the data. In this paper we will focus on twoaspects: the location and user modeling. We learn about some techniquesor methods used for providing privacy to the users. These methods areinteresting, but not perfect. It’s why we also take a look semantic-basedmethods, in order to have more reliable methods providing privacy.
Keywords: Privacy, Transparency, Anonimity, user modelling, location-based services
1 Introduction
It has been tacitly acknowledged for many years that personalized interactionand user modeling have significant privacy implications, due to the fact that per-sonal information about users needs to be collected for performing personaliza-tion. The personalization is based on user models. Some user model dimensionscan typically be observed by the system directly, some user model dimensionsmay require additional acquisition and inference steps, again others are enteredinto the system by self-reports by the users. The categorization of user modelin figure 1 classifies several groups of user dimensions that can be identified. [3]contains more information about this ontology. The motion, location and ori-entation are important for the user model, so it’s difficult to think about usermodel without location, since both are intrinsically intertwined. Computing andonline services are increasingly being consumed through mobile devices, includ-ing smartphones and tablets. Location-based services (LBS) have become anintegral part of users’ experiences and an increasingly important market. Theydeliver to users targeted, relevant and highly convenient information, such as
Privacy Issue In User Modeling In Pervasive Systems 123
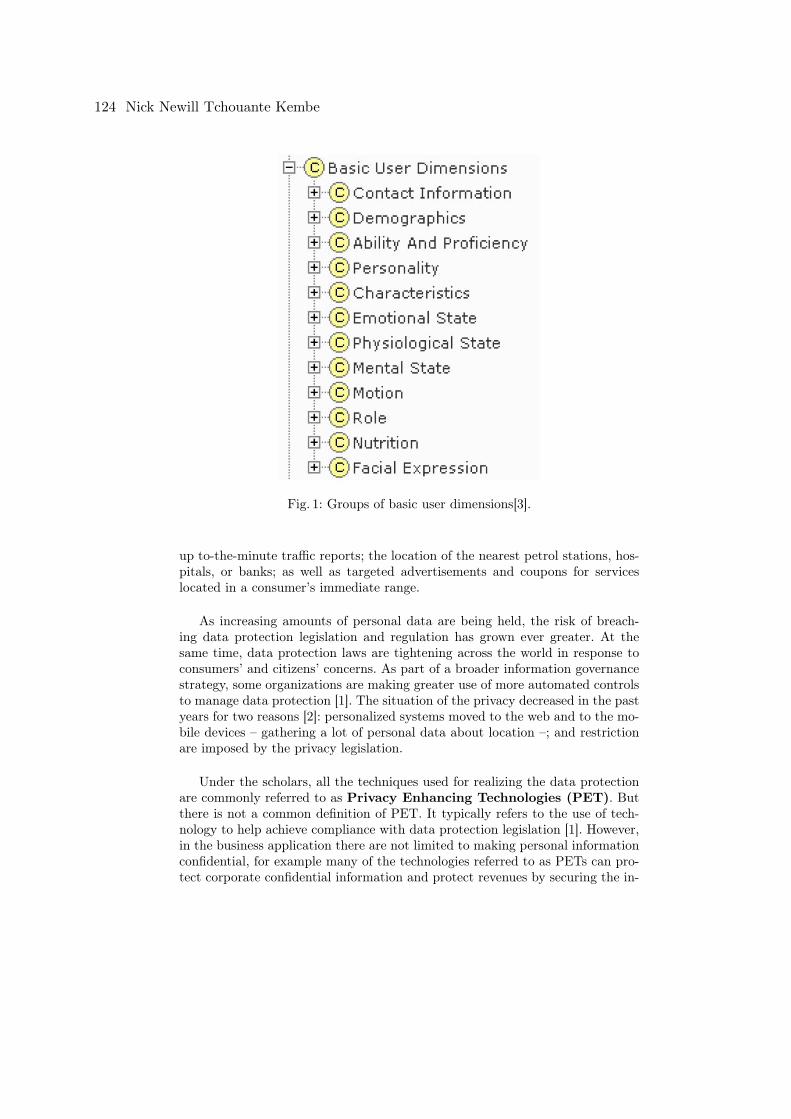
Fig. 1: Groups of basic user dimensions[3].
up to-the-minute traffic reports; the location of the nearest petrol stations, hos-pitals, or banks; as well as targeted advertisements and coupons for serviceslocated in a consumer’s immediate range.
As increasing amounts of personal data are being held, the risk of breach-ing data protection legislation and regulation has grown ever greater. At thesame time, data protection laws are tightening across the world in response toconsumers’ and citizens’ concerns. As part of a broader information governancestrategy, some organizations are making greater use of more automated controlsto manage data protection [1]. The situation of the privacy decreased in the pastyears for two reasons [2]: personalized systems moved to the web and to the mo-bile devices – gathering a lot of personal data about location –; and restrictionare imposed by the privacy legislation.
Under the scholars, all the techniques used for realizing the data protectionare commonly referred to as Privacy Enhancing Technologies (PET). Butthere is not a common definition of PET. It typically refers to the use of tech-nology to help achieve compliance with data protection legislation [1]. However,in the business application there are not limited to making personal informationconfidential, for example many of the technologies referred to as PETs can pro-tect corporate confidential information and protect revenues by securing the in-
124 Nick Newill Tchouante Kembe
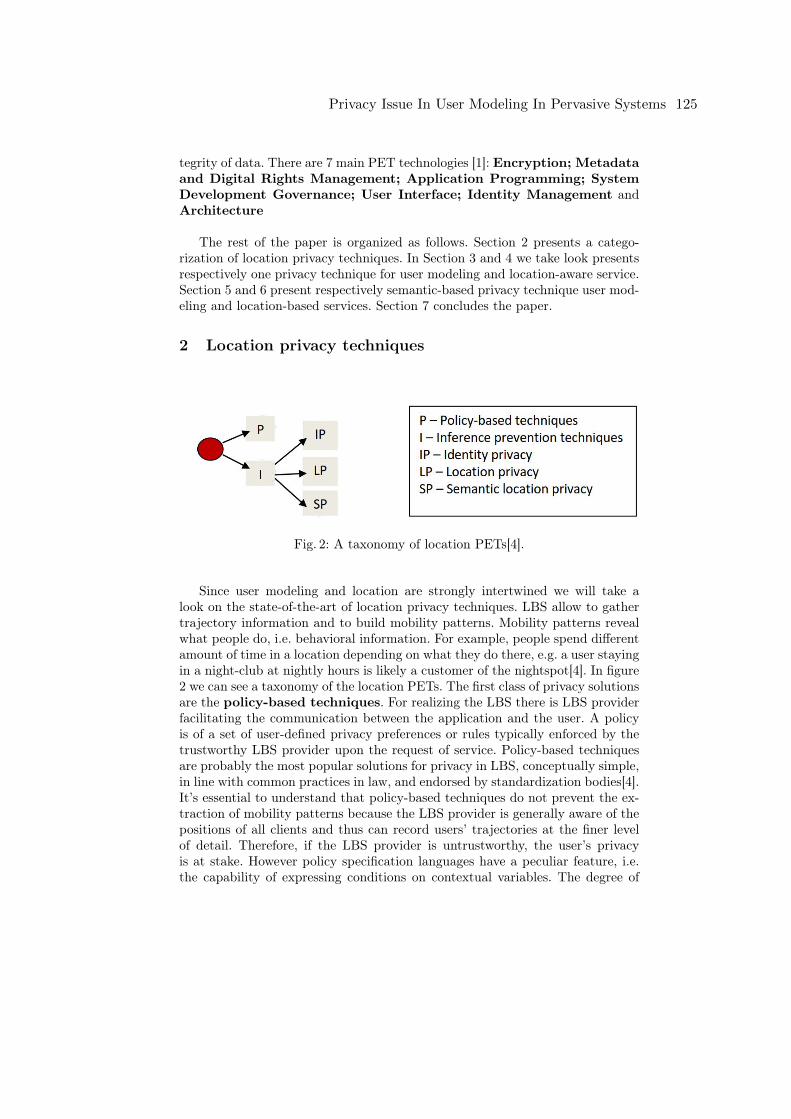
tegrity of data. There are 7 main PET technologies [1]: Encryption; Metadataand Digital Rights Management; Application Programming; SystemDevelopment Governance; User Interface; Identity Management andArchitecture
The rest of the paper is organized as follows. Section 2 presents a catego-rization of location privacy techniques. In Section 3 and 4 we take look presentsrespectively one privacy technique for user modeling and location-aware service.Section 5 and 6 present respectively semantic-based privacy technique user mod-eling and location-based services. Section 7 concludes the paper.
2 Location privacy techniques
Fig. 2: A taxonomy of location PETs[4].
Since user modeling and location are strongly intertwined we will take alook on the state-of-the-art of location privacy techniques. LBS allow to gathertrajectory information and to build mobility patterns. Mobility patterns revealwhat people do, i.e. behavioral information. For example, people spend differentamount of time in a location depending on what they do there, e.g. a user stayingin a night-club at nightly hours is likely a customer of the nightspot[4]. In figure2 we can see a taxonomy of the location PETs. The first class of privacy solutionsare the policy-based techniques. For realizing the LBS there is LBS providerfacilitating the communication between the application and the user. A policyis of a set of user-defined privacy preferences or rules typically enforced by thetrustworthy LBS provider upon the request of service. Policy-based techniquesare probably the most popular solutions for privacy in LBS, conceptually simple,in line with common practices in law, and endorsed by standardization bodies[4].It’s essential to understand that policy-based techniques do not prevent the ex-traction of mobility patterns because the LBS provider is generally aware of thepositions of all clients and thus can record users’ trajectories at the finer levelof detail. Therefore, if the LBS provider is untrustworthy, the user’s privacyis at stake. However policy specification languages have a peculiar feature, i.e.the capability of expressing conditions on contextual variables. The degree of
Privacy Issue In User Modeling In Pervasive Systems 125
usability of these languages is generally assessed by involving users in the exper-imentation. The second class are the inference-prevention techniques. Theybasically aim at preventing the LBS provider from drawing sensitive informationfrom exact positional data[4] and are further categorized in the following classes:
– Identity privacy techniques attempt to forestall the re-identification ofusers (deprived of their real identity) in LBSs providing anonymous services.
– Location privacy techniques apply to forestall the transmission of exactusers’ positions to the LBS provider. Knowing precisely the positions inwhich individuals are located (or not located) jeopardizes their privacy andphysical safety.
– Semantic location privacy techniques aim at preventing the disclosureof the places in which users stay because those locations can reveal sensitivedata and behavioral information.
Anonymization enables organizations to protect their data and systems froma diverse set of attacks and preserve privacy. Assertion about the quality ofanonymization can only be made with some anonymization metrics. The tech-niques enumerated in this section are all based on some anonymity metrics; [6]gives an overview of the state-of-the-art anonymization metrics.
In the next section we’ll take a look on a framework for privacy-aware usermodeling in ubiquitous social networks.
3 User modeling privacy
The authors of [10] propose a framework for analyzing privacy requirements andfor analyzing privacy-related data. They outline a combination of requirementsanalysis, conflict-resolution techniques, and a P3P1. The Platform for PrivacyPreferences Project (P3P) enables Websites to express their privacy practicesin a standard format that can be retrieved automatically and interpreted easilyby user agents. P3P user agents allow users to be informed of site practices (inboth machine- and human-readable formats) and to automate decision-makingbased on these practices when appropriate. Thus users need not read the privacypolicies at every site they visit.
3.1 Privacy Challenges
There is a huge amount of knowledge that can be discovered by investigatingpeople’s textual/multimedia contributions to SN2 and the links they set to their“friends”– in this sense, social network analysis is an important topic for Knowl-edge Discovery for Ubiquitous User Modeling. The most common use of thisuser data is targeted marketing. The very essence of social media is that user-profile information is public. The data can be classified in confidentiality levels,1 P3P: https://www.w3.org/P3P/2 Social Network
126 Nick Newill Tchouante Kembe
where the concrete details and the application of the confidentiality levels todata depends on the SNS3 implementation[10]:
- Private data: is disclosed to the SNS operator for its internal purposesonly.
- Group data: is disclosed to the SNS operator and can be accessed by otherusers of the same SNS that are also in the same group as the user.
- Community data: has been disclosed to the SNS operator and is availableto all registered and logged-in users of the SNS.
- Public data: has been disclosed to the SNS operator and is made accessiblefor all SNS visitors, including anonymous visitors.
There is a problem with the privacy dependency. As an example, the friend ofa friend can see my data. In addition, problems arise when systems support theinteraction with the world outside the system. For example, Google Mail (Gmail)users consent to their emails’ data being analyzed by Google; however, all in-coming mails of a Google Mail account (whether sent by another Gmail user orby somebody else) are also analyzed. Thus, A’s treatment of his privacy also hasdirect external effects on the privacy of C, who is a non-user of the system[10].The distinction between “in the system”and “outside the system”vanishes in caseof loosely coupled networks where members may engage in relationships sponta-neously and without a central authority. So the potential privacy conflicts thatarise by social-network interaction must be identified; privacy preferences and re-quirements must be formalized sufficiently such that software can automaticallydetect problems, alert the user, and assist her.
3.2 Privacy conflict detection
This princip is based on MSRA4 method. The first step is to discover all thestakeholders and subsume all their privacy interests. We note that stakeholderare more than just the users but all the person who interact with the system.Once the requirement – privacy interests – are specified there is requirementinteraction management in order to identify the privacy conflicts. That’s thesecond step. A requirement R is satisfied by a component C if the componentexhibits all the properties specified in the requirement. There may be degrees ofsatisfaction of a requirements and this can be mapped to a range:
Definition 1. SatR : C −→ [0, 1]
Requirements interaction can then be defined as follows:
- Perceived interaction: Two requirements, labeled R1 and R2 interact ifand only if the satisfaction of one requirement affects the satisfaction of theother.
3 Social Network Service4 Multilateral Security Requirements Analysis: http://vasarely.wiwi.hu-berlin.de/UKDU06/Proceedings/UKDU06-proceedings.pdf
Privacy Issue In User Modeling In Pervasive Systems 127
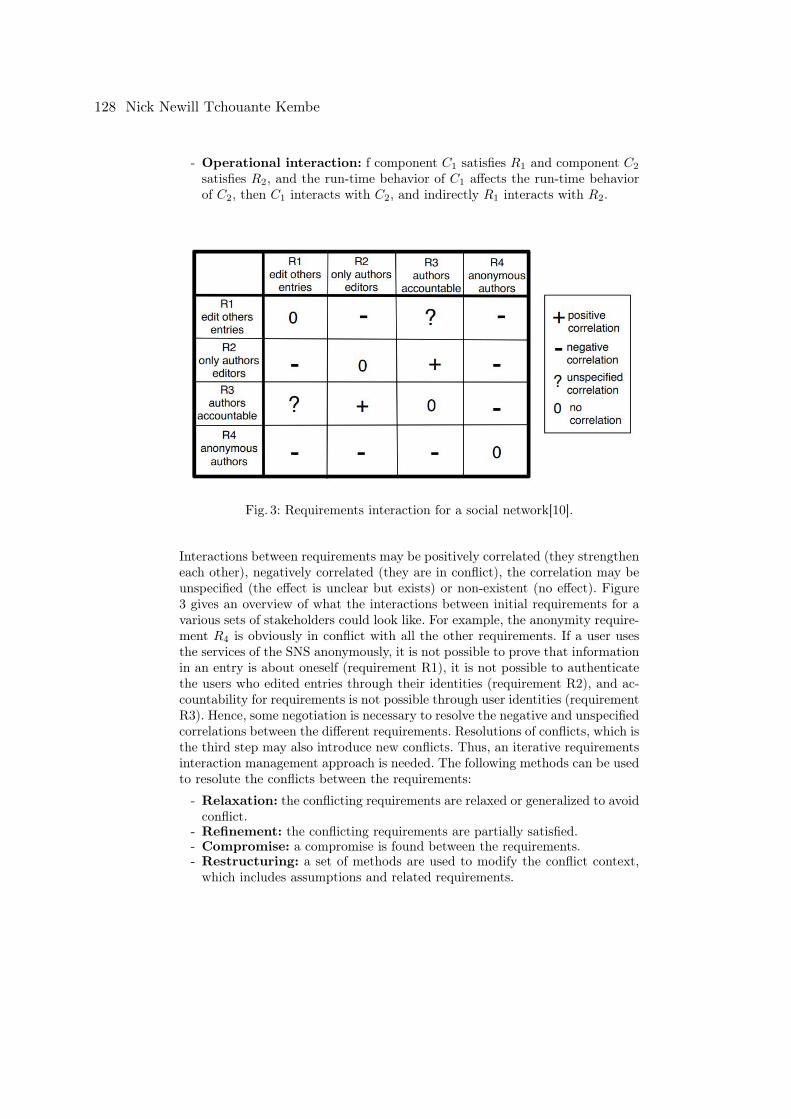
- Operational interaction: f component C1 satisfies R1 and component C2
satisfies R2, and the run-time behavior of C1 affects the run-time behaviorof C2, then C1 interacts with C2, and indirectly R1 interacts with R2.
Fig. 3: Requirements interaction for a social network[10].
Interactions between requirements may be positively correlated (they strengtheneach other), negatively correlated (they are in conflict), the correlation may beunspecified (the effect is unclear but exists) or non-existent (no effect). Figure3 gives an overview of what the interactions between initial requirements for avarious sets of stakeholders could look like. For example, the anonymity require-ment R4 is obviously in conflict with all the other requirements. If a user usesthe services of the SNS anonymously, it is not possible to prove that informationin an entry is about oneself (requirement R1), it is not possible to authenticatethe users who edited entries through their identities (requirement R2), and ac-countability for requirements is not possible through user identities (requirementR3). Hence, some negotiation is necessary to resolve the negative and unspecifiedcorrelations between the different requirements. Resolutions of conflicts, which isthe third step may also introduce new conflicts. Thus, an iterative requirementsinteraction management approach is needed. The following methods can be usedto resolute the conflicts between the requirements:
- Relaxation: the conflicting requirements are relaxed or generalized to avoidconflict.
- Refinement: the conflicting requirements are partially satisfied.- Compromise: a compromise is found between the requirements.- Restructuring: a set of methods are used to modify the conflict context,which includes assumptions and related requirements.
128 Nick Newill Tchouante Kembe
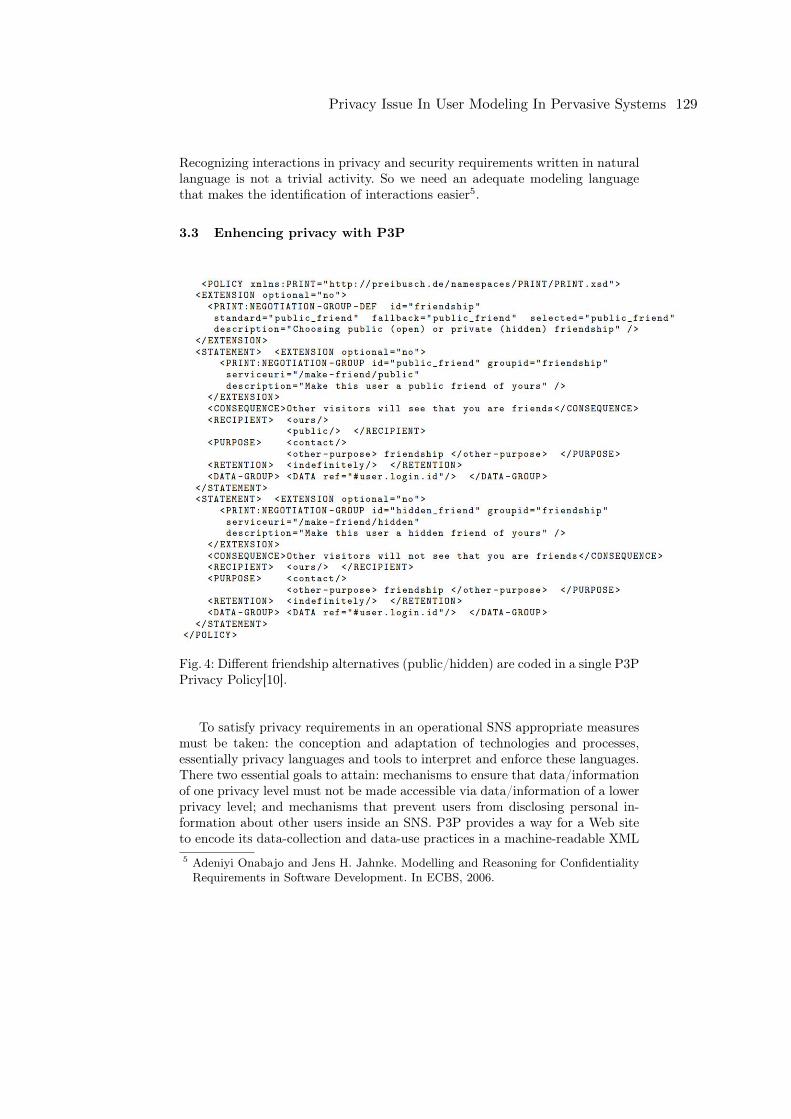
Recognizing interactions in privacy and security requirements written in naturallanguage is not a trivial activity. So we need an adequate modeling languagethat makes the identification of interactions easier5.
3.3 Enhencing privacy with P3P
Fig. 4: Different friendship alternatives (public/hidden) are coded in a single P3PPrivacy Policy[10].
To satisfy privacy requirements in an operational SNS appropriate measuresmust be taken: the conception and adaptation of technologies and processes,essentially privacy languages and tools to interpret and enforce these languages.There two essential goals to attain: mechanisms to ensure that data/informationof one privacy level must not be made accessible via data/information of a lowerprivacy level; and mechanisms that prevent users from disclosing personal in-formation about other users inside an SNS. P3P provides a way for a Web siteto encode its data-collection and data-use practices in a machine-readable XML5 Adeniyi Onabajo and Jens H. Jahnke. Modelling and Reasoning for ConfidentialityRequirements in Software Development. In ECBS, 2006.
Privacy Issue In User Modeling In Pervasive Systems 129
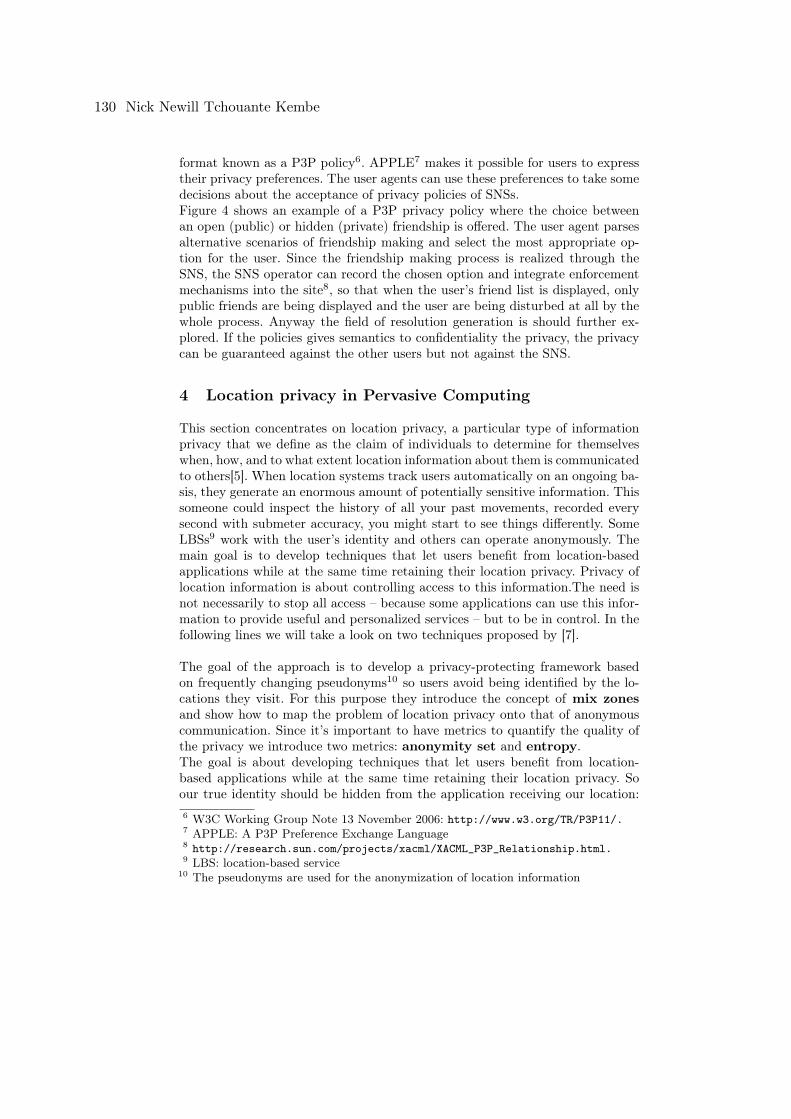
format known as a P3P policy6. APPLE7 makes it possible for users to expresstheir privacy preferences. The user agents can use these preferences to take somedecisions about the acceptance of privacy policies of SNSs.Figure 4 shows an example of a P3P privacy policy where the choice betweenan open (public) or hidden (private) friendship is offered. The user agent parsesalternative scenarios of friendship making and select the most appropriate op-tion for the user. Since the friendship making process is realized through theSNS, the SNS operator can record the chosen option and integrate enforcementmechanisms into the site8, so that when the user’s friend list is displayed, onlypublic friends are being displayed and the user are being disturbed at all by thewhole process. Anyway the field of resolution generation is should further ex-plored. If the policies gives semantics to confidentiality the privacy, the privacycan be guaranteed against the other users but not against the SNS.
4 Location privacy in Pervasive Computing
This section concentrates on location privacy, a particular type of informationprivacy that we define as the claim of individuals to determine for themselveswhen, how, and to what extent location information about them is communicatedto others[5]. When location systems track users automatically on an ongoing ba-sis, they generate an enormous amount of potentially sensitive information. Thissomeone could inspect the history of all your past movements, recorded everysecond with submeter accuracy, you might start to see things differently. SomeLBSs9 work with the user’s identity and others can operate anonymously. Themain goal is to develop techniques that let users benefit from location-basedapplications while at the same time retaining their location privacy. Privacy oflocation information is about controlling access to this information.The need isnot necessarily to stop all access – because some applications can use this infor-mation to provide useful and personalized services – but to be in control. In thefollowing lines we will take a look on two techniques proposed by [7].
The goal of the approach is to develop a privacy-protecting framework basedon frequently changing pseudonyms10 so users avoid being identified by the lo-cations they visit. For this purpose they introduce the concept of mix zonesand show how to map the problem of location privacy onto that of anonymouscommunication. Since it’s important to have metrics to quantify the quality ofthe privacy we introduce two metrics: anonymity set and entropy.The goal is about developing techniques that let users benefit from location-based applications while at the same time retaining their location privacy. Soour true identity should be hidden from the application receiving our location:6 W3C Working Group Note 13 November 2006: http://www.w3.org/TR/P3P11/.7 APPLE: A P3P Preference Exchange Language8 http://research.sun.com/projects/xacml/XACML_P3P_Relationship.html.9 LBS: location-based service
10 The pseudonyms are used for the anonymization of location information
130 Nick Newill Tchouante Kembe
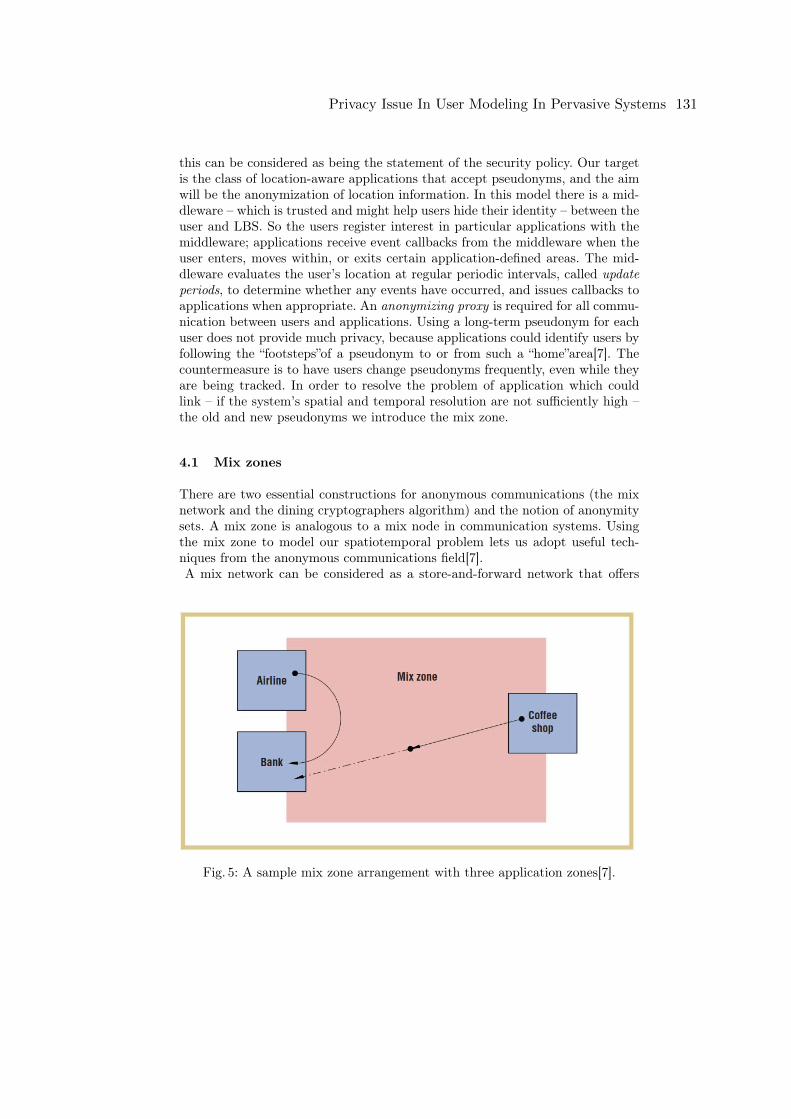
this can be considered as being the statement of the security policy. Our targetis the class of location-aware applications that accept pseudonyms, and the aimwill be the anonymization of location information. In this model there is a mid-dleware – which is trusted and might help users hide their identity – between theuser and LBS. So the users register interest in particular applications with themiddleware; applications receive event callbacks from the middleware when theuser enters, moves within, or exits certain application-defined areas. The mid-dleware evaluates the user’s location at regular periodic intervals, called updateperiods, to determine whether any events have occurred, and issues callbacks toapplications when appropriate. An anonymizing proxy is required for all commu-nication between users and applications. Using a long-term pseudonym for eachuser does not provide much privacy, because applications could identify users byfollowing the “footsteps”of a pseudonym to or from such a “home”area[7]. Thecountermeasure is to have users change pseudonyms frequently, even while theyare being tracked. In order to resolve the problem of application which couldlink – if the system’s spatial and temporal resolution are not sufficiently high –the old and new pseudonyms we introduce the mix zone.
4.1 Mix zones
There are two essential constructions for anonymous communications (the mixnetwork and the dining cryptographers algorithm) and the notion of anonymitysets. A mix zone is analogous to a mix node in communication systems. Usingthe mix zone to model our spatiotemporal problem lets us adopt useful tech-niques from the anonymous communications field[7].A mix network can be considered as a store-and-forward network that offers
Fig. 5: A sample mix zone arrangement with three application zones[7].
Privacy Issue In User Modeling In Pervasive Systems 131
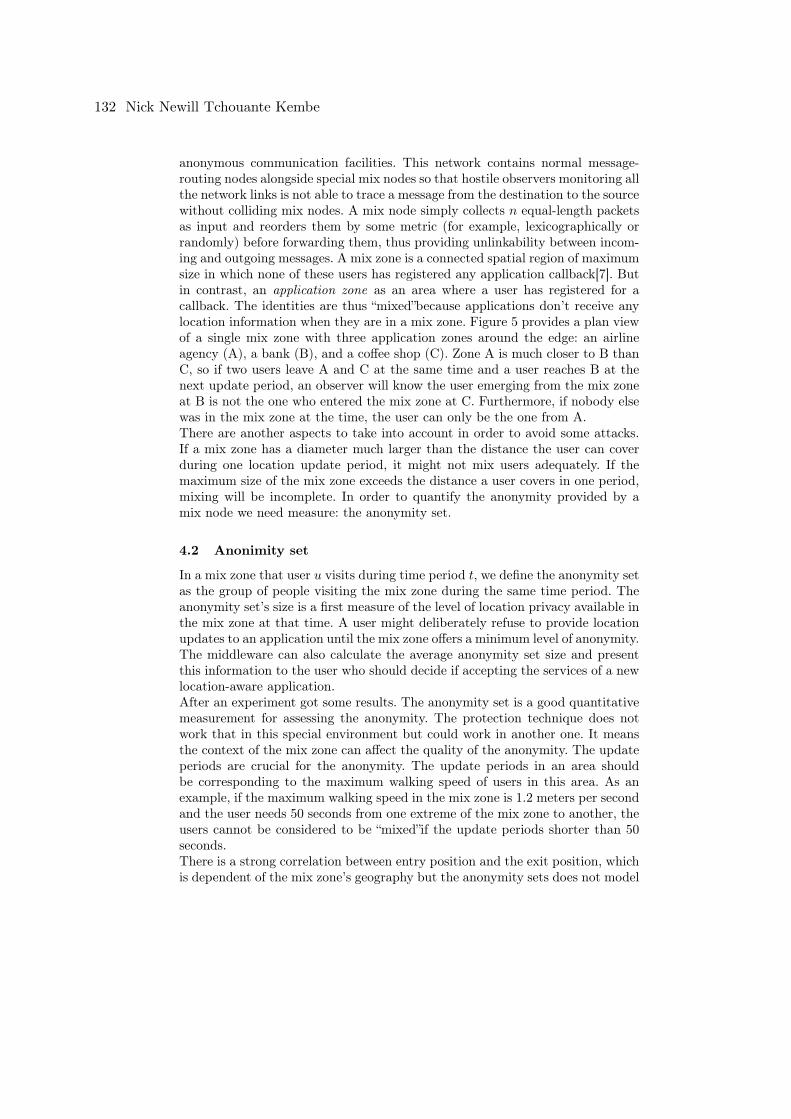
anonymous communication facilities. This network contains normal message-routing nodes alongside special mix nodes so that hostile observers monitoring allthe network links is not able to trace a message from the destination to the sourcewithout colliding mix nodes. A mix node simply collects n equal-length packetsas input and reorders them by some metric (for example, lexicographically orrandomly) before forwarding them, thus providing unlinkability between incom-ing and outgoing messages. A mix zone is a connected spatial region of maximumsize in which none of these users has registered any application callback[7]. Butin contrast, an application zone as an area where a user has registered for acallback. The identities are thus “mixed”because applications don’t receive anylocation information when they are in a mix zone. Figure 5 provides a plan viewof a single mix zone with three application zones around the edge: an airlineagency (A), a bank (B), and a coffee shop (C). Zone A is much closer to B thanC, so if two users leave A and C at the same time and a user reaches B at thenext update period, an observer will know the user emerging from the mix zoneat B is not the one who entered the mix zone at C. Furthermore, if nobody elsewas in the mix zone at the time, the user can only be the one from A.There are another aspects to take into account in order to avoid some attacks.If a mix zone has a diameter much larger than the distance the user can coverduring one location update period, it might not mix users adequately. If themaximum size of the mix zone exceeds the distance a user covers in one period,mixing will be incomplete. In order to quantify the anonymity provided by amix node we need measure: the anonymity set.
4.2 Anonimity set
In a mix zone that user u visits during time period t, we define the anonymity setas the group of people visiting the mix zone during the same time period. Theanonymity set’s size is a first measure of the level of location privacy available inthe mix zone at that time. A user might deliberately refuse to provide locationupdates to an application until the mix zone offers a minimum level of anonymity.The middleware can also calculate the average anonymity set size and presentthis information to the user who should decide if accepting the services of a newlocation-aware application.After an experiment got some results. The anonymity set is a good quantitativemeasurement for assessing the anonymity. The protection technique does notwork that in this special environment but could work in another one. It meansthe context of the mix zone can affect the quality of the anonymity. The updateperiods are crucial for the anonymity. The update periods in an area shouldbe corresponding to the maximum walking speed of users in this area. As anexample, if the maximum walking speed in the mix zone is 1.2 meters per secondand the user needs 50 seconds from one extreme of the mix zone to another, theusers cannot be considered to be “mixed”if the update periods shorter than 50seconds.There is a strong correlation between entry position and the exit position, whichis dependent of the mix zone’s geography but the anonymity sets does not model
132 Nick Newill Tchouante Kembe
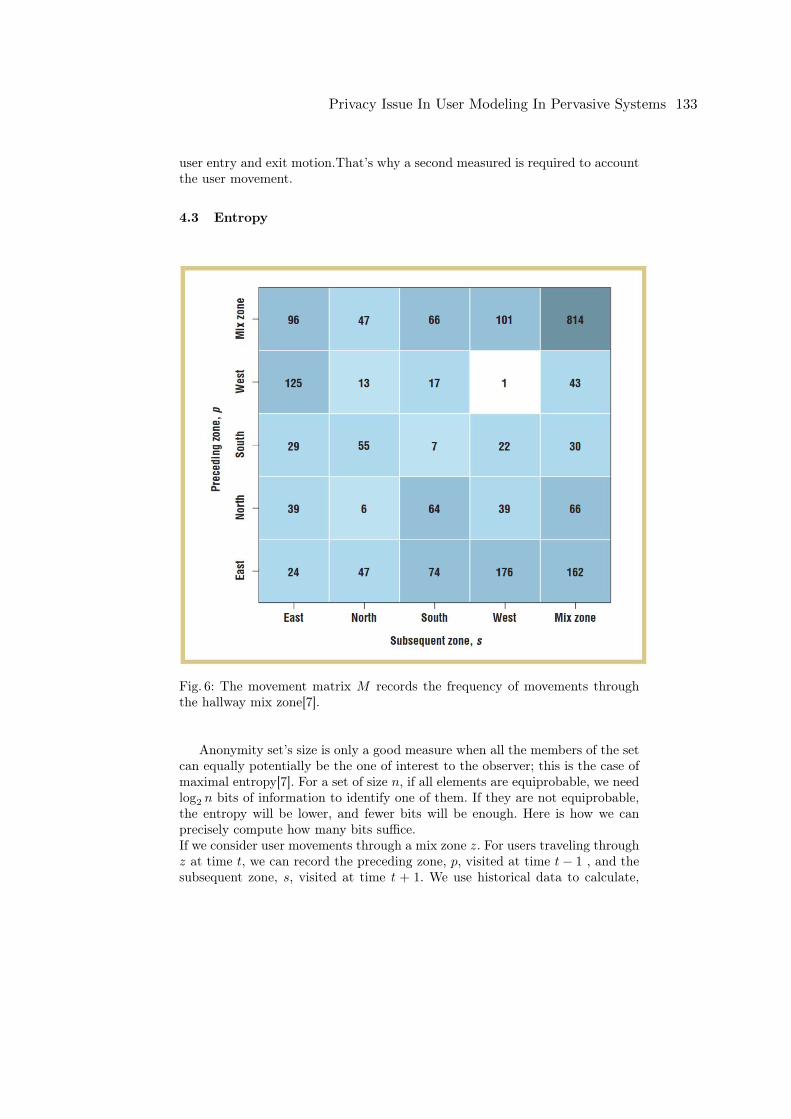
user entry and exit motion.That’s why a second measured is required to accountthe user movement.
4.3 Entropy
Fig. 6: The movement matrix M records the frequency of movements throughthe hallway mix zone[7].
Anonymity set’s size is only a good measure when all the members of the setcan equally potentially be the one of interest to the observer; this is the case ofmaximal entropy[7]. For a set of size n, if all elements are equiprobable, we needlog2 n bits of information to identify one of them. If they are not equiprobable,the entropy will be lower, and fewer bits will be enough. Here is how we canprecisely compute how many bits suffice.If we consider user movements through a mix zone z. For users traveling throughz at time t, we can record the preceding zone, p, visited at time t− 1 , and thesubsequent zone, s, visited at time t + 1. We use historical data to calculate,
Privacy Issue In User Modeling In Pervasive Systems 133
for all users visiting zone z, the relative frequency of each pair of preceding andsubsequent points (p, s) and record it in a movement matrix M . M records, forall possible (p, s) pairs, the number of times a person who was in z at t was inp at t − 1 and in s at t + 1. The entries of M are proportional to normalized11
joint probability:
P (prec = p, subs = s) =M(p, s)∑i,j M(j, i)
The conditional probability of coming out through zone s, having gone in throughzone p, follows from the product rule:
P (subs = s, prec = p) =M(p, s)∑j
M(p, j)
. The Shannon’s classic measure of entropy12 can now be applied to this problem:
= −∑
i
pi · log pi
We get a set of possible outcome with probability pi and the higher it is, themore uncertain a hostile observer will be about the true answer, and thereforethe higher the anonymity will be. Figure 6 shows M , the frequency of all pos-sible outcomes for users entering a mix zone, for a location update period of 5seconds. It shows it is unlikely that the preceding zone, p, is the same as thesubsequent zone, s, for a location period of 5 seconds, except in one case.
The entropy measurement shows a more pessimistic picture – in which the userhas less privacy – because it models a more powerful adversary who might usehistorical data to de-anonymize pseudonyms more accurately.
This section and the previous one show example with simple techniques. Inthe following sections we will take a look semantic-based techniques.
5 Semantic-based user modeling: multimodal mobiledevice footprints
The actual mobile devices – smartphones and tablets – collect a wide varietyof information about their environments and record “digital footprints”13 aboutthe location and activities of their owners. These devices are equipped with em-bedded sensors such as GPS, Bluetooth, WiFi, accelerometer, touch, light, and11 Normalization: https://en.wikipedia.org/wiki/Normalization\_(statistics)12 C.E. Shannon, “A Mathematical Theory of Communication,”Bell System Tech. J.,
vol. 27, July 1948, pp. 379–423, and Oct. 1948, pp. 623–656.13 Digital footprint: https://www.smore.com/6pbw-what-s-your-digital-footprint
134 Nick Newill Tchouante Kembe
many others. The new gathered information have stimulated people-centered mo-bile applications. The traditional usage of the mobile footprints is to infer dailyactivities like driving/running/walking, etc. and social contexts such as person-ality traits and emotional states. For these the applications need the data itself.mFingerprint is a framework that does not use the data itself but statisticsabout the data to model the user. Multimodal mobile usage data is analyzedto extract simple effective statistics that can uniquely represent mobile users.mFingerprint computes high-level statistical features that do not disclose sen-sitive information from the phone, such as raw location, browser history, andapplication names. Therefore, applications can share, transmit, and use thesedescriptive privacy-preserving feature vectors to enable personalized services onmobile devices with fewer privacy concerns. There are some problems to solve inorder to achieve the goal of mFingerprint such as how to choose sources – whichsensor data are suitable – to construct effective mobile fingerprints and avoiddisclosing sensitive mobile data[15], ...
5.1 mFingerprint system overview
As showed in figure 7 the mFingerprint framework has four layers. The bottomlayer collects various sensor readings using hardware sensors that trace location(e.g., GPS, WiFi, and cell tower), proximity (Bluetooth and microphone). Fur-thermore, soft sensor data such as application usage and web browser historyare also recorded. The second layer of mFingerprint computes a set of privacy-preserving statistical features from these digital footprints. Here we particularlyfocus on designing frequency and entropy based statistical features to capturemobile device usage patterns[15]. Such features flow up to the third layer for userlearning, which includes building user models via the feature vectors, identify-ing users via classification methods, and grouping users into meaningful clustersvia unsupervised learning. The forth layer is the application layer where variousapplications can be established, such as inferring user profile, logging mobilebehaviors, and creating personalized services and user interfaces.
5.2 Feature computation and user identification
Frequency based Footprint Features. The number of devices and cell tow-ers that are observed by a phone throughout the day provides information aboutthe owner’s environment. For example, a phone in a busy public place will likelyobserve many wireless devices while a phone in a moving car observes differentcell towers over time. Meanwhile, a user’s app usage patterns throughout theday tell us something about his or her daily routine. We thus propose simplefrequency-based features that measure how much activity of four different types(Wifi, Cell towers, Bluetooth, and App usage) is observed at different time in-tervals throughout the day.If we divide the time into T -minute time periods and observe the phone’s stateevery M minutes, with M < T so that there are multiple observations per timeperiod. In the i-th observation of time period t, we record: the number of Wifi
Privacy Issue In User Modeling In Pervasive Systems 135
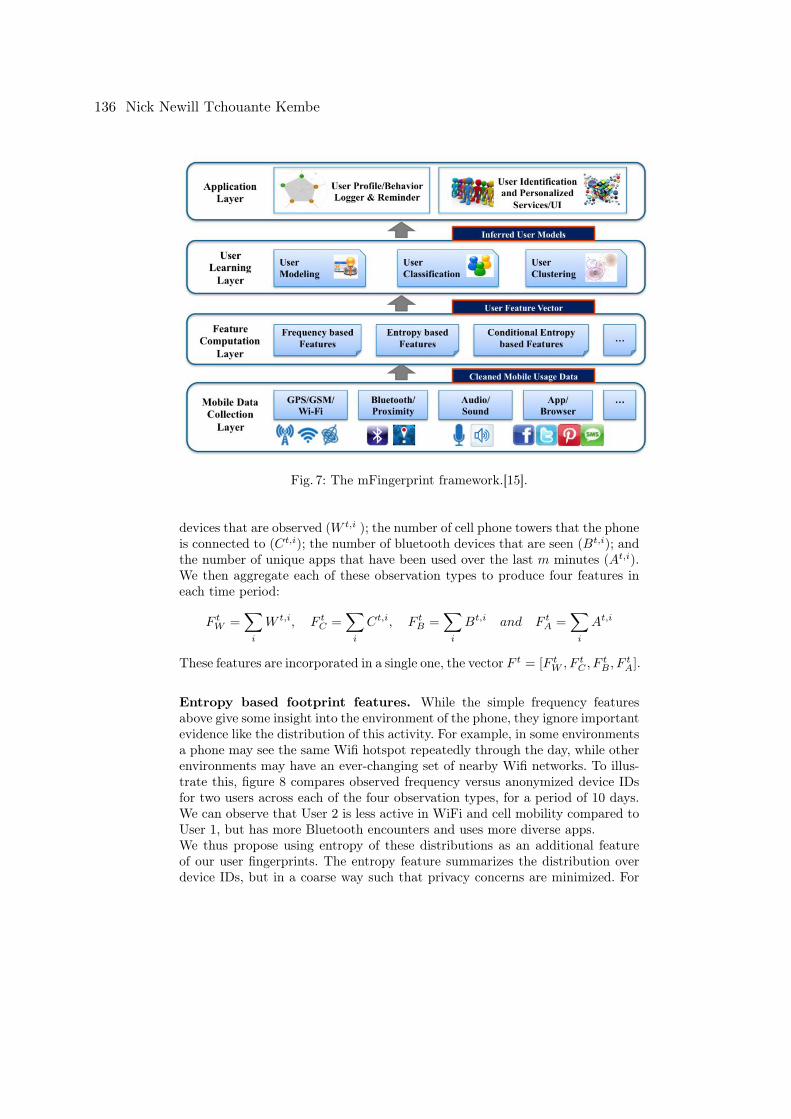
Fig. 7: The mFingerprint framework.[15].
devices that are observed (W t,i ); the number of cell phone towers that the phoneis connected to (Ct,i); the number of bluetooth devices that are seen (Bt,i); andthe number of unique apps that have been used over the last m minutes (At,i).We then aggregate each of these observation types to produce four features ineach time period:
F tW =
∑
i
W t,i, F tC =
∑
i
Ct,i, F tB =
∑
i
Bt,i and F tA =
∑
i
At,i
These features are incorporated in a single one, the vector F t = [F tW , F t
C , FtB , F
tA].
Entropy based footprint features. While the simple frequency featuresabove give some insight into the environment of the phone, they ignore importantevidence like the distribution of this activity. For example, in some environmentsa phone may see the same Wifi hotspot repeatedly through the day, while otherenvironments may have an ever-changing set of nearby Wifi networks. To illus-trate this, figure 8 compares observed frequency versus anonymized device IDsfor two users across each of the four observation types, for a period of 10 days.We can observe that User 2 is less active in WiFi and cell mobility compared toUser 1, but has more Bluetooth encounters and uses more diverse apps.We thus propose using entropy of these distributions as an additional featureof our user fingerprints. The entropy feature summarizes the distribution overdevice IDs, but in a coarse way such that privacy concerns are minimized. For
136 Nick Newill Tchouante Kembe
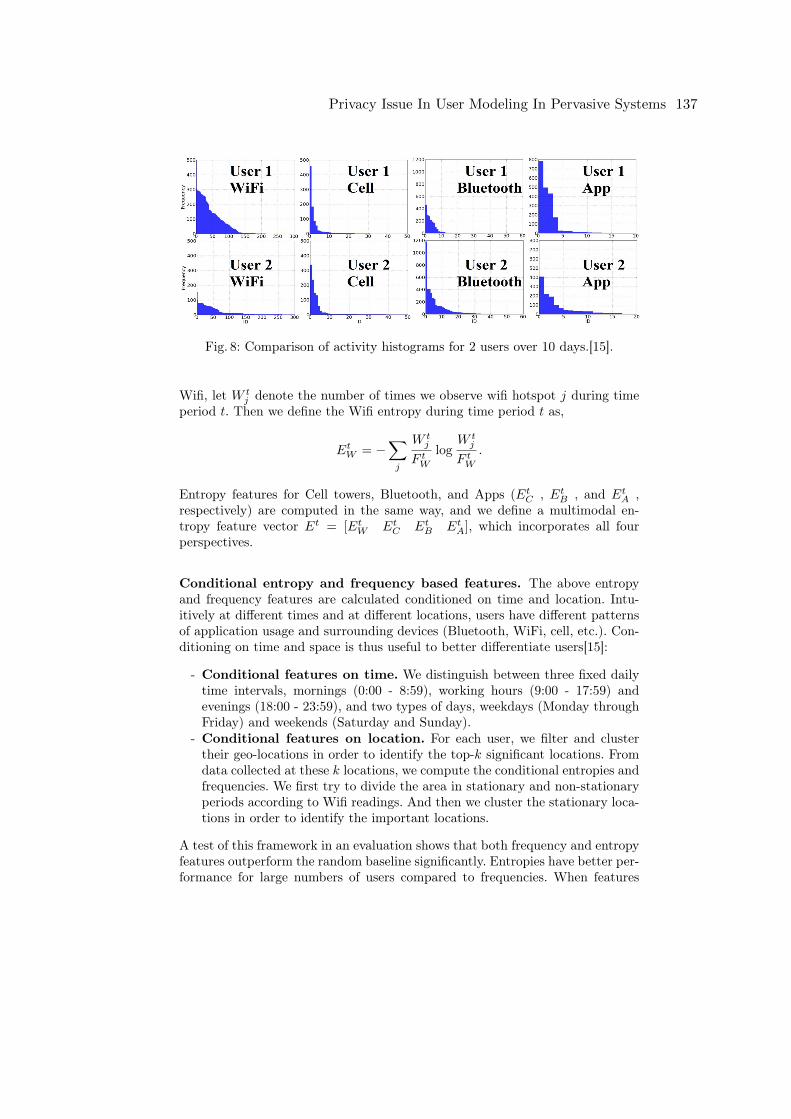
Fig. 8: Comparison of activity histograms for 2 users over 10 days.[15].
Wifi, let W tj denote the number of times we observe wifi hotspot j during time
period t. Then we define the Wifi entropy during time period t as,
EtW = −
∑
j
W tj
F tW
logW t
j
F tW
.
Entropy features for Cell towers, Bluetooth, and Apps (EtC , Et
B , and EtA ,
respectively) are computed in the same way, and we define a multimodal en-tropy feature vector Et = [Et
W EtC Et
B EtA], which incorporates all four
perspectives.
Conditional entropy and frequency based features. The above entropyand frequency features are calculated conditioned on time and location. Intu-itively at different times and at different locations, users have different patternsof application usage and surrounding devices (Bluetooth, WiFi, cell, etc.). Con-ditioning on time and space is thus useful to better differentiate users[15]:
- Conditional features on time. We distinguish between three fixed dailytime intervals, mornings (0:00 - 8:59), working hours (9:00 - 17:59) andevenings (18:00 - 23:59), and two types of days, weekdays (Monday throughFriday) and weekends (Saturday and Sunday).
- Conditional features on location. For each user, we filter and clustertheir geo-locations in order to identify the top-k significant locations. Fromdata collected at these k locations, we compute the conditional entropies andfrequencies. We first try to divide the area in stationary and non-stationaryperiods according to Wifi readings. And then we cluster the stationary loca-tions in order to identify the important locations.
A test of this framework in an evaluation shows that both frequency and entropyfeatures outperform the random baseline significantly. Entropies have better per-formance for large numbers of users compared to frequencies. When features
Privacy Issue In User Modeling In Pervasive Systems 137
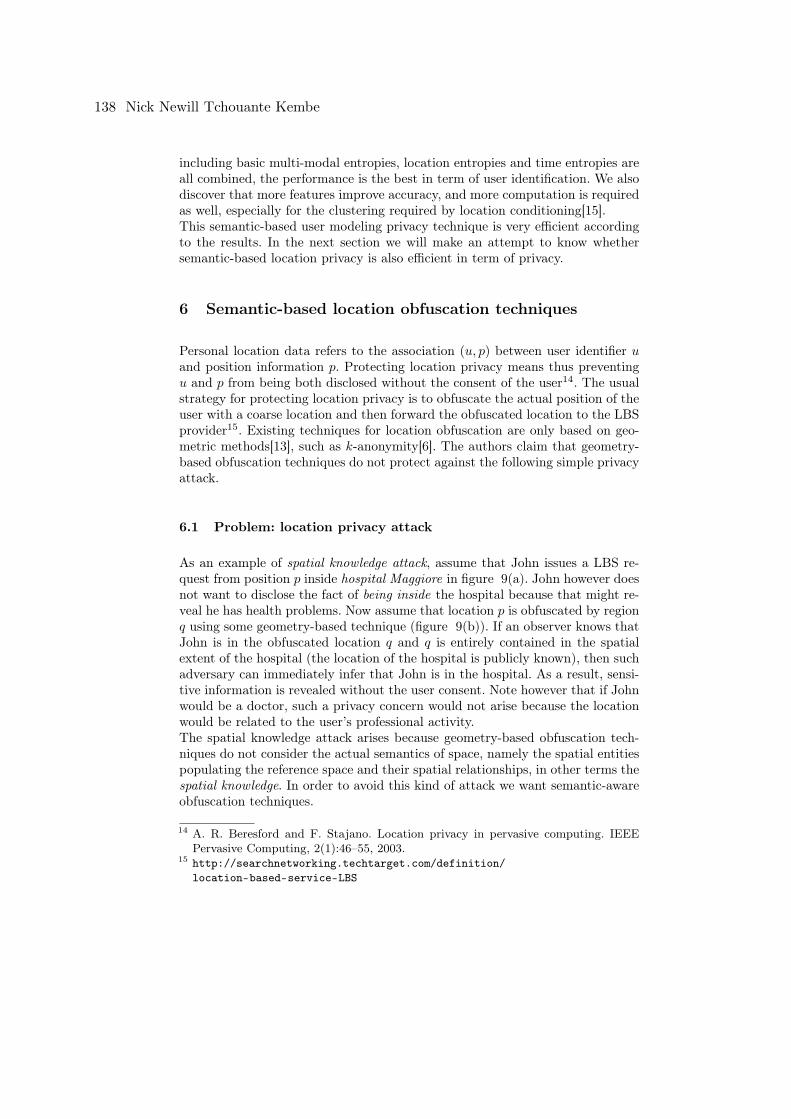
including basic multi-modal entropies, location entropies and time entropies areall combined, the performance is the best in term of user identification. We alsodiscover that more features improve accuracy, and more computation is requiredas well, especially for the clustering required by location conditioning[15].This semantic-based user modeling privacy technique is very efficient accordingto the results. In the next section we will make an attempt to know whethersemantic-based location privacy is also efficient in term of privacy.
6 Semantic-based location obfuscation techniques
Personal location data refers to the association (u, p) between user identifier uand position information p. Protecting location privacy means thus preventingu and p from being both disclosed without the consent of the user14. The usualstrategy for protecting location privacy is to obfuscate the actual position of theuser with a coarse location and then forward the obfuscated location to the LBSprovider15. Existing techniques for location obfuscation are only based on geo-metric methods[13], such as k-anonymity[6]. The authors claim that geometry-based obfuscation techniques do not protect against the following simple privacyattack.
6.1 Problem: location privacy attack
As an example of spatial knowledge attack, assume that John issues a LBS re-quest from position p inside hospital Maggiore in figure 9(a). John however doesnot want to disclose the fact of being inside the hospital because that might re-veal he has health problems. Now assume that location p is obfuscated by regionq using some geometry-based technique (figure 9(b)). If an observer knows thatJohn is in the obfuscated location q and q is entirely contained in the spatialextent of the hospital (the location of the hospital is publicly known), then suchadversary can immediately infer that John is in the hospital. As a result, sensi-tive information is revealed without the user consent. Note however that if Johnwould be a doctor, such a privacy concern would not arise because the locationwould be related to the user’s professional activity.The spatial knowledge attack arises because geometry-based obfuscation tech-niques do not consider the actual semantics of space, namely the spatial entitiespopulating the reference space and their spatial relationships, in other terms thespatial knowledge. In order to avoid this kind of attack we want semantic-awareobfuscation techniques.
14 A. R. Beresford and F. Stajano. Location privacy in pervasive computing. IEEEPervasive Computing, 2(1):46–55, 2003.
15 http://searchnetworking.techtarget.com/definition/location-based-service-LBS
138 Nick Newill Tchouante Kembe
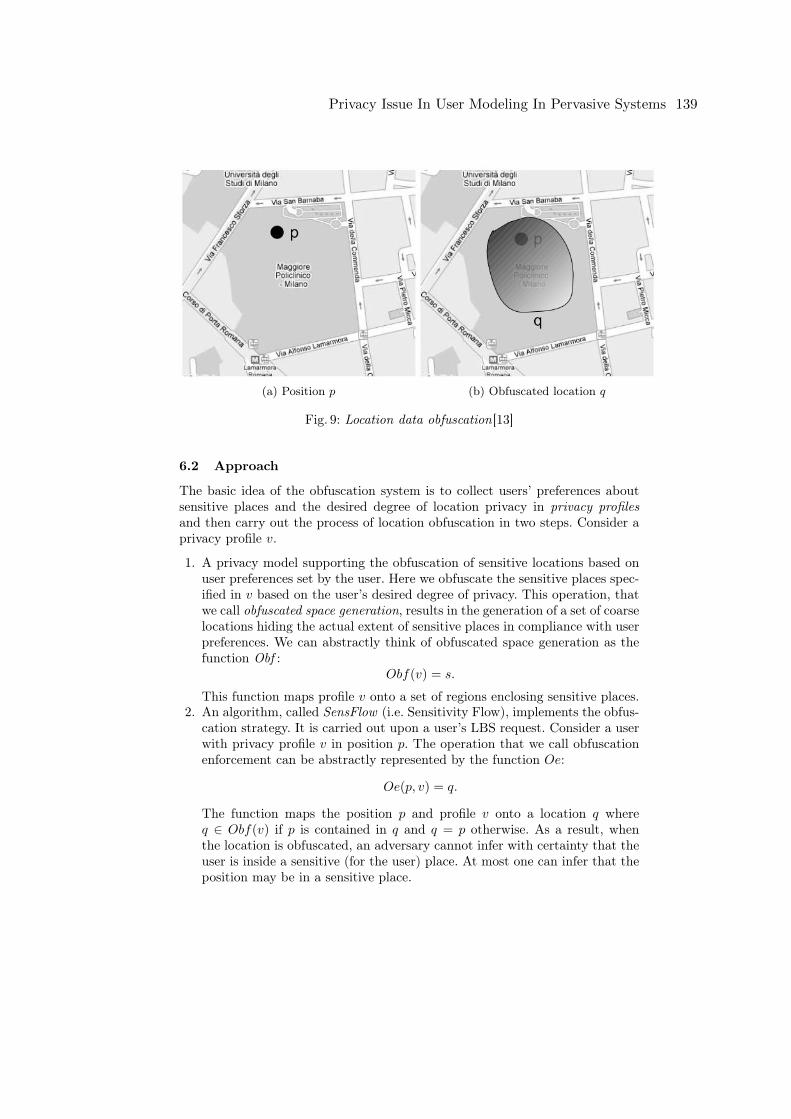
(a) Position p (b) Obfuscated location q
Fig. 9: Location data obfuscation[13]
6.2 Approach
The basic idea of the obfuscation system is to collect users’ preferences aboutsensitive places and the desired degree of location privacy in privacy profilesand then carry out the process of location obfuscation in two steps. Consider aprivacy profile v.
1. A privacy model supporting the obfuscation of sensitive locations based onuser preferences set by the user. Here we obfuscate the sensitive places spec-ified in v based on the user’s desired degree of privacy. This operation, thatwe call obfuscated space generation, results in the generation of a set of coarselocations hiding the actual extent of sensitive places in compliance with userpreferences. We can abstractly think of obfuscated space generation as thefunction Obf :
Obf(v) = s.
This function maps profile v onto a set of regions enclosing sensitive places.2. An algorithm, called SensFlow (i.e. Sensitivity Flow), implements the obfus-
cation strategy. It is carried out upon a user’s LBS request. Consider a userwith privacy profile v in position p. The operation that we call obfuscationenforcement can be abstractly represented by the function Oe:
Oe(p, v) = q.
The function maps the position p and profile v onto a location q whereq ∈ Obf(v) if p is contained in q and q = p otherwise. As a result, whenthe location is obfuscated, an adversary cannot infer with certainty that theuser is inside a sensitive (for the user) place. At most one can infer that theposition may be in a sensitive place.
Privacy Issue In User Modeling In Pervasive Systems 139
Each region is subdivided in cells where each cell has a sensitivity which de-pends on the user preferences in the privacy profile. Each cell is thus obfuscatedseparately through an obfuscation algorithm. To represent user preferences, wedefine a privacy model, called obfuscation model. In the next we will take a lookon the privacy model.
6.3 The obfuscation model
A position is a point in a two-dimensional space S; region is a polygon; loca-tion broadly denotes a portion of space containing the user’s position. Placesare represented as simple features and a feature has just a name. FT and Frespectively the set of features types and the set of corresponding feature. Theprivacy model is based on three concepts[13]: properties of places, their levelof sensitivity and the obfuscated space. The pair (FT, F ) is the geographicaldatabase of an application.
Properties of places. Places as classified into types. Users specify in theirprivacy profiles which types of places are sensitive, non-sensitive or unreachable.A place is sensitive when the user does not want to reveal to be in it; a placeis unreachable when the user cannot be located in it; a place is non-sensitiveotherwise.
Level of sensitivity. This the degree of sensitivity of a region for a user. Forexample a region entirely occupied by a hospital has a high level of sensitivity,if hospital is sensitive for the user. We emphasize that the level of sensitivitydepends on the extent and nature of the objects located in the region as well asthe privacy concerns of the user.Formally, the score of feature type ft is defined by the function Score(ft) rangingbetween 0 and 1: value 0 means that the feature type is not sensitive or unreach-able while a value 1 means that the feature type has the highest sensitivity. Theconcept of score captures the subjective perception of the degree of sensitivity.The sensitivity level (SL) of a region r, written as SLReg(r), quantifies howmuch sensitive r is for the user. The weighted sensitive area is the surface in roccupied by sensitive features weighted with respect to the sensitivity score ofeach feature type. The relevant area of r is the portion of region not occupiedby unreachable features.
Obfuscated space. This is a set of obfuscated locations associated with aprivacy profile. Specifically, the locations of an obfuscated space have a levelof sensitivity less or equal than a sensitivity threshold value. The sensitivitythreshold value (θsens) is the maximum acceptable sensitivity of a location forthe user. Its value ranges in the interval (0, 1]. A value equal to 1 means that theuser does not care of location privacy in any point of space Since the thresholdvalue is user-dependent, its value is specified in the privacy profile. The thresholdvalue is another parameter specified in the privacy profile.
140 Nick Newill Tchouante Kembe
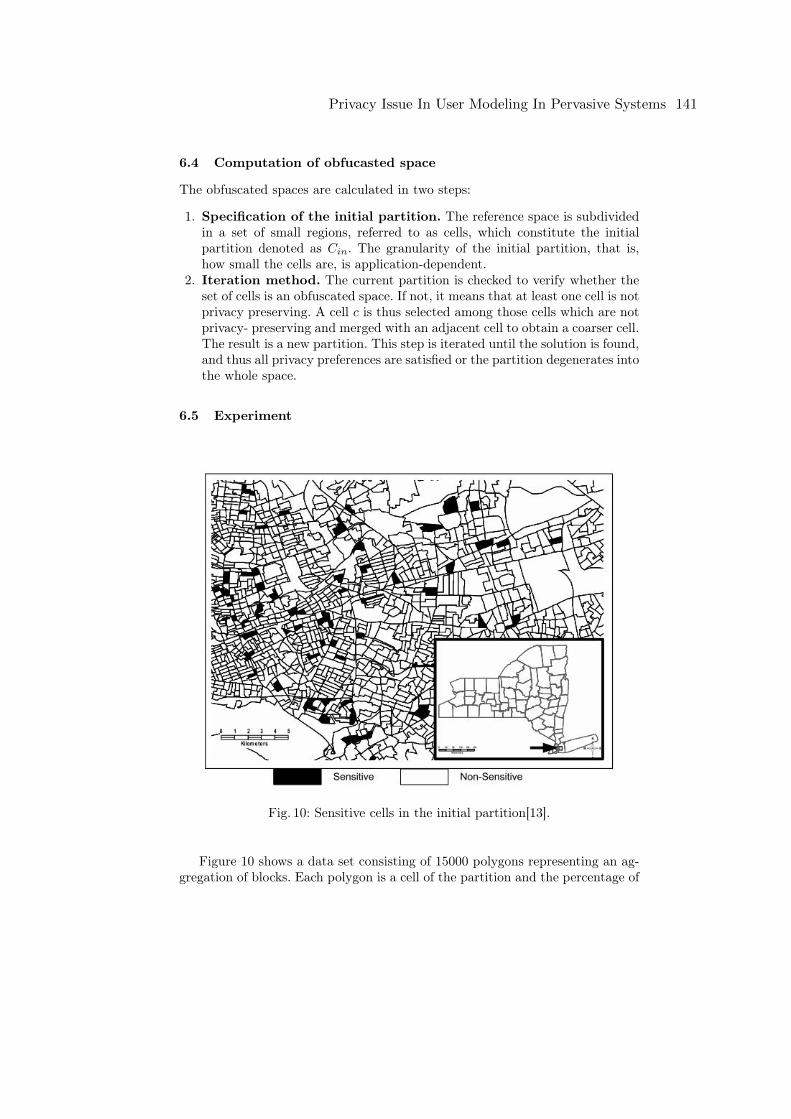
6.4 Computation of obfucasted space
The obfuscated spaces are calculated in two steps:
1. Specification of the initial partition. The reference space is subdividedin a set of small regions, referred to as cells, which constitute the initialpartition denoted as Cin. The granularity of the initial partition, that is,how small the cells are, is application-dependent.
2. Iteration method. The current partition is checked to verify whether theset of cells is an obfuscated space. If not, it means that at least one cell is notprivacy preserving. A cell c is thus selected among those cells which are notprivacy- preserving and merged with an adjacent cell to obtain a coarser cell.The result is a new partition. This step is iterated until the solution is found,and thus all privacy preferences are satisfied or the partition degenerates intothe whole space.
6.5 Experiment
Fig. 10: Sensitive cells in the initial partition[13].
Figure 10 shows a data set consisting of 15000 polygons representing an ag-gregation of blocks. Each polygon is a cell of the partition and the percentage of
Privacy Issue In User Modeling In Pervasive Systems 141
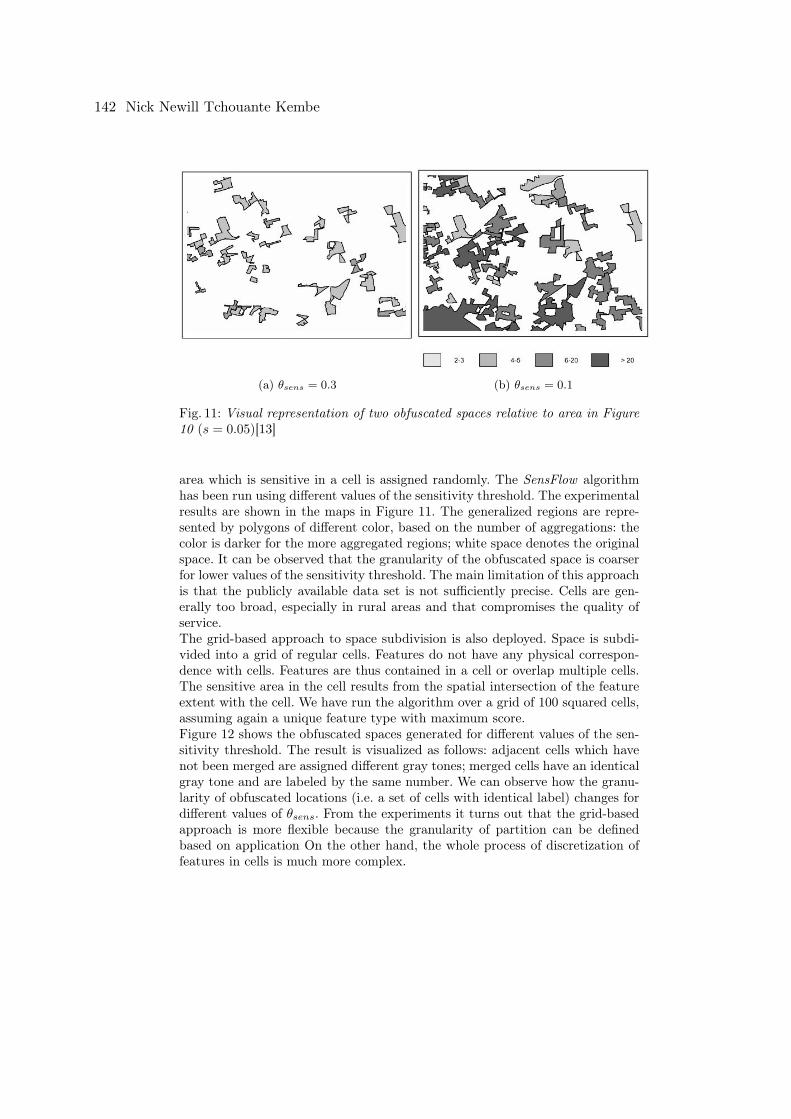
(a) θsens = 0.3 (b) θsens = 0.1
Fig. 11: Visual representation of two obfuscated spaces relative to area in Figure10 (s = 0.05)[13]
area which is sensitive in a cell is assigned randomly. The SensFlow algorithmhas been run using different values of the sensitivity threshold. The experimentalresults are shown in the maps in Figure 11. The generalized regions are repre-sented by polygons of different color, based on the number of aggregations: thecolor is darker for the more aggregated regions; white space denotes the originalspace. It can be observed that the granularity of the obfuscated space is coarserfor lower values of the sensitivity threshold. The main limitation of this approachis that the publicly available data set is not sufficiently precise. Cells are gen-erally too broad, especially in rural areas and that compromises the quality ofservice.The grid-based approach to space subdivision is also deployed. Space is subdi-vided into a grid of regular cells. Features do not have any physical correspon-dence with cells. Features are thus contained in a cell or overlap multiple cells.The sensitive area in the cell results from the spatial intersection of the featureextent with the cell. We have run the algorithm over a grid of 100 squared cells,assuming again a unique feature type with maximum score.Figure 12 shows the obfuscated spaces generated for different values of the sen-sitivity threshold. The result is visualized as follows: adjacent cells which havenot been merged are assigned different gray tones; merged cells have an identicalgray tone and are labeled by the same number. We can observe how the granu-larity of obfuscated locations (i.e. a set of cells with identical label) changes fordifferent values of θsens. From the experiments it turns out that the grid-basedapproach is more flexible because the granularity of partition can be definedbased on application On the other hand, the whole process of discretization offeatures in cells is much more complex.
142 Nick Newill Tchouante Kembe
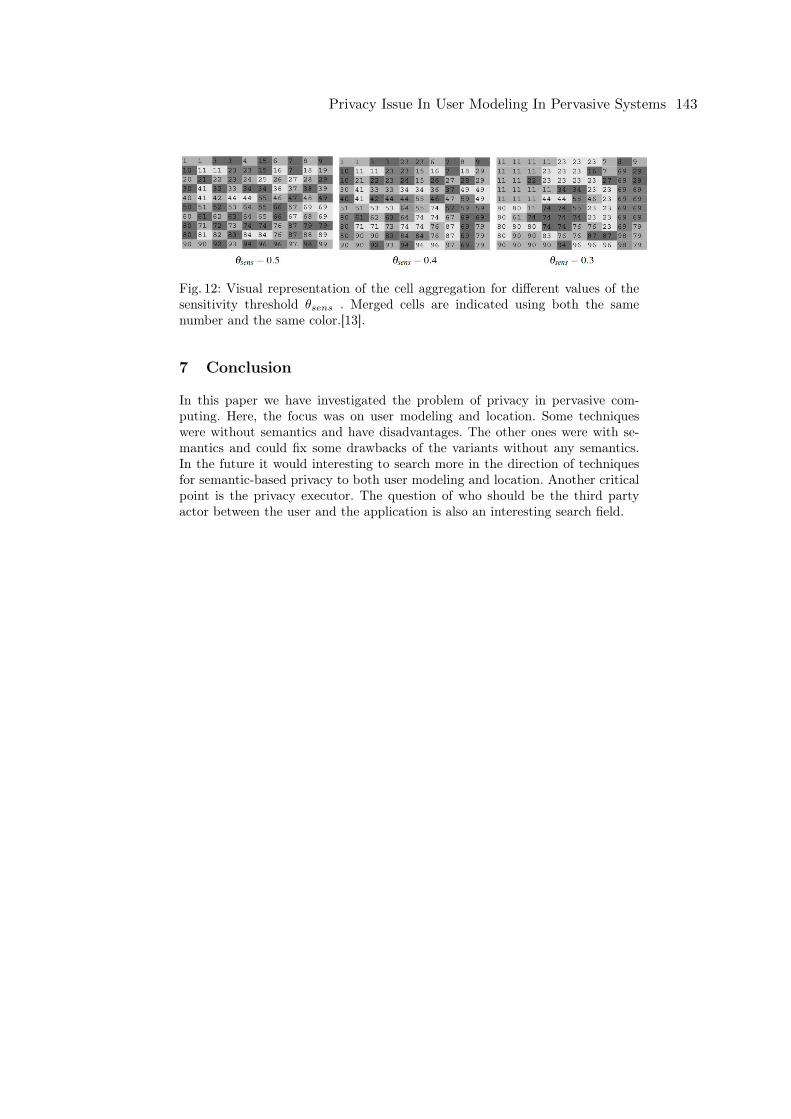
Fig. 12: Visual representation of the cell aggregation for different values of thesensitivity threshold θsens . Merged cells are indicated using both the samenumber and the same color.[13].
7 Conclusion
In this paper we have investigated the problem of privacy in pervasive com-puting. Here, the focus was on user modeling and location. Some techniqueswere without semantics and have disadvantages. The other ones were with se-mantics and could fix some drawbacks of the variants without any semantics.In the future it would interesting to search more in the direction of techniquesfor semantic-based privacy to both user modeling and location. Another criticalpoint is the privacy executor. The question of who should be the third partyactor between the user and the application is also an interesting search field.
Privacy Issue In User Modeling In Pervasive Systems 143

References
1. Steve Kenny. An Introduction to Privacy Enhancing Technologieshttps://iapp.org/news/a/2008-05-introduction-to-privacy-enhancing-technologies/
2. Alfred Kobska. Privacy-Enhanced Personalizationhttp://www.ics.uci.edu/ kobsa/papers/2006-CHI-kobsa.pdf
3. Dominikus Heckmann. Ubiquitous User Modeling http://d-nb.info/978586085/344. Maria Luisa Damiani. Privacy enhancing techniques for the pro-
tection of mobility patterns in LBS: research issues and trendshttps://air.unimi.it/retrieve/handle/2434/207836/242074/damiani-cpdp-revision.pdf
5. Maria Luisa Damiani. Location privacy models in mobile applications: conceptualview and research directions https://www.researchgate.net/publication/271095287
6. Douglas J., Kelly Rusty O., BaldwinRichard A., Michael R., Grimail-aBarry E. Mullins . A Survey of State-of-the-Art in Anonymity Metricshttp://dl.acm.org/citation.cfm?id=1456453
7. Alastair R. Beresford and Frank Stajano. Location Privacy in Pervasive Computing8. Osman Abul, Francesco Bonchi, Mirco Nanni. Never Walk Alone: Uncertainty for
Anonymity in Moving Objects Databases9. Meiko Jensen. Towards Privacy-Friendly Transparency Services in Inter-
Organizational Business Processes10. Sören Preibusch, Bettina Hoser, Seda Gürses, Bettina Berendt . Ubiquitous So-
cial Networks: Opportunities and Challenges for Privacy-Aware User Modellinghttps://www.diw.de/documents/publikationen/73/59994/dp698.pdf
11. Byoungyoung Lee, Jinoh Oh, Hwanjo Yu, and JongKim. Protecting Location Privacy Using Location Semanticshttp://www.cc.gatech.edu/ blee303/paper/locPriv.pdf
12. Anna Monreale, Roberto Trasarti, Chiara Renso. Preserving Privacy in Semantic-Rich Trajectories of Human Mobility http://dl.acm.org/citation.cfm?id=1868481
13. Maria Luisa Damiani, Elisa Bertino, Claudio Silvestri. ProtectingLocation Privacy through Semantics-aware Obfuscation Techniqueshttp://download.springer.com/static/pdf/707/chp
14. Arif Tumer, Asuman Dogac, and Hakki Toroslu. A Semantic-Based User Privacy Protection Framework for Web Serviceshttp://download.springer.com/static/pdf/767/chp
15. Haipeng Zhang, Zhixian Yan, Jun Yang, Emmanuel Munguia Tapia, and David J.Crandall. mFingerprint: Privacy-Preserving User Modeling with Multimodal MobileDevice Footprints http://download.springer.com/static/pdf/454/chp
144 Nick Newill Tchouante Kembe
Keystrokes recognition using di�erent sensing
modalities
Marcus Gall∗
Advisor: Long Wang†
Karlsruhe Institute of Technology (KIT)Pervasive Computing Systems � TECO
∗[email protected]†[email protected]
Abstract. This document gives an overview over already researchedapproaches to sense �nger-based keystrokes on physical or virtual key-boards. Since the typical way of �nger-based input-methods measuresthe press of a key or use electric discharges on touch sensitive surfaces,there are also other information released during a keystroke, which canbe used alternatively. On the following pages, some promising methodsare introduced and discussed with respect to their advantages and disad-vantages as a replacement for common text input methods. Hereby, thedocument focuses on keystroke sensing by device accelerations, acousticemanations, video and wi�-based approaches.
As we will see, methods of acoustic sensing reaches already very accurateand robust solutions, but also other techniques have remarkable solutionsand results.
Keywords: keystroke recognition, inference, text input method, sens-ing, acceleration, wi�, video, acoustic, motion
1 Introduction
Nowadays, the mainly used text-input methods for computers and smart-devicesare the physical keyboard and touchscreens. Although the technology is mature,robust, and foolproof, it su�ers from drawbacks in certain situations, whichmakes it hard to use then.
Physical keyboards are well-known for decades, but their appearance is boundto their bulky form factor, which makes it hard to use in mobile scenarios.Touchscreen-equipped devices like smartphones come with a virtual on-screenkeyboard. This keyboard has only limited haptic feedback, which makes typ-ing long texts tiring and reduces the e�ectively usable screen size for the maincontent a lot. On top, the need for smaller screens in the currently smaller andsmaller demanded smart devices like smartwatches sets a new challenge, sincesmall virtual keyboards are hardly manageable without a pen. As we can see,both of the main input methods have drawbacks in certain situations. This could
Keystrokes recognition using different sensing modalities 145
be resolved by exploiting domain knowledge for each device and switch to alter-native sensing modalities.
Typically, �nger-based keystrokes on a physical keyboard are sensed as anelectric signal triggered from the pressed key while on touch sensitive screens,the electric discharge of the glass is measured. But other than we might as-sume, interactions with an input device causes much more diverse interactionswith the surrounding environment. Keystroke actions on keyboards or touchscreens release information such as sound, vibrations, accelerations and �ngermotions. These information leaked as side e�ects can be sensed and interpretedas keystrokes alternatively to the common sensing methods. Depending on thescenario, some sensing approaches work better than others. Although scientistsare on that topic for over 20 years now, the results improved more and more inthe recent years, since smart-devices are getting equipped with di�erent sensor-types having increasingly higher resolutions.
In this work we want to focus on papers dealing with microphones, accelera-tion and gyroscope sensors, video material and WiFi channel strength variations.Derived data from these sensors were used to develop new input methods or toattack the used input method on a side channel and then evaluated in respectof their capabilities and dangers of using it in either case.
In the following sections, latest-state-of-the-art papers of alternative inputmethods are compared by their sensing type.
The beginning focuses on external sensor sensing: Section 2 carries out acous-tic methods, section 3 is about video approaches, section 4 is about WiFi signalbased sensing. The content in section 5 deal with possibilities by mostly sensinginternal acceleration. Finally, section 6 gives a summary.
2 Acoustic emanations sensing methods
From an early point on, scientists were interested in the possibility to use soundemanations released from mechanic keyboards to reconstruct keystrokes. Thebasic assumption is, that pressing a mechanic key always creates the same ema-nation, since the conditions are the same. Due to that, the emanation's charactercan be used for latency triangulation or training classi�ers, which match sensedfeatures to keys.
In [1] from 2004, IBM researchers attacked mechanical keyboards using itsacoustic emanations from pressing keys sensed by a microphone. A keystrokeemanation consists of a touching, pressing, holding and releasing-phase of thekey. As it turns out, the �rst emanation part, when the �nger touches the key,contains the most separable information. This part can be windowed into a 2-3ms part and features from its frequency distribution can be calculated by FFT(Fast Fourier Transformation). For 20kHz buckets from 0-4kHz 200 features werecalculated and fed into a multi-layer neural network (MLP) and trained by back-propagation. The MLP has 6-10 hidden nodes and the number of output nodeswere set on the number of keys, which should be recognized (up to 30). The
146 Marcus Gall
output nodes are, as usual for neural networks, activated from 0 to 1 dependingon its certainty.
In a two-keys-recognition scenario, the net did in average only 0,5 incorrectrecognitions per 20 keystrokes, resulting in a 97,5% hit rate. Altering the sensingfrom a simple microphone at distance of 0,5m to a parabolic microphone at 15mincluding background noise didn't decrease the recognition quality.
In a 30-keys-recognition scenario, keys were recognized correctly with thelargest output value in 79% of keystrokes, additional 7% in the second largestoutput and 2% in the third largest output. So in total, the pressed key was notfound among the three largest candidates in 12% of the tests.
The latter testing was done on the same keyboard, where also the trainingsamples were recorded. Switching the test keyboard to a di�erent one of sametype, recognition rate drops to 52% among the �rst four candidates (28%, 12%,7%, 5%). This shows, that text recognition quality is turning bad, but still givesa valuable information gain during password snooping.
Other tests focused on the net's recognition rate when varying the test data.Changes in typing style like forceful typing and typing with many �ngers insteadof one had negative in�uence on the recognition rate. Same e�ect can be provedwhen di�erent people take part in the test set. But adding these variation pro�lesto the training set improved the recognition rate, which ended up at 1 incorrectclassi�cations out of 20 (5%) in a two-keys-recognition test.
As additional discovery, the biggest variance in the input features can beseen in the 300-3400Hz band, which also is sensable by a telephones standardmicrophone. Although proposed, an attack scenario on eavesdropping keystrokesby telephone was not carried out.
While the latter paper by IBM assumed labeled training data, which can beseen as a case of known-plaintext attack, researchers from the University of Cal-ifornia Berkeley (UCB) extended the scenario in [2] by not using labeled data,but unlabeled one from only listening typing sounds for 10min. The assumptionis, that the typed text is always based on the same natural language (English),which can be exploited by using the language's language model to create a strongrecognizer. The continuous audio stream is segmented by its signal energy andfeatures are calculated from 2,5ms shifted 10ms windows from the touch-phasepart using Mel-Frequency-Cepstral Coe�cients (MFCCs). Those features are k-means clustered for K = 50, although only 30 keys should be recognized. Havingmore clusters than keys let's keep the clusters have more precision, but alsodoesn't allow a one-to-one mapping. Therefore, each cluster just stands for acertain key probability distribution, instead of a key, what makes it possible touse them in a Hidden Markov Model (HMM). While the transition matrix de-pends on the English language, the output matrix, which links observations withk-means clusters needs to be calculated by the randomly-working ExpectationMaximization (EM) algorithm. After EM found the set of weights which maxi-mizes the likelihood and Viterbi optimized the best sequence of keys, the HMMis trained. Now a spelling and grammar checking corrects remaining spelling mis-takes from the incorrect HMM classi�cation. The completely correct recognized
Keystrokes recognition using different sensing modalities 147
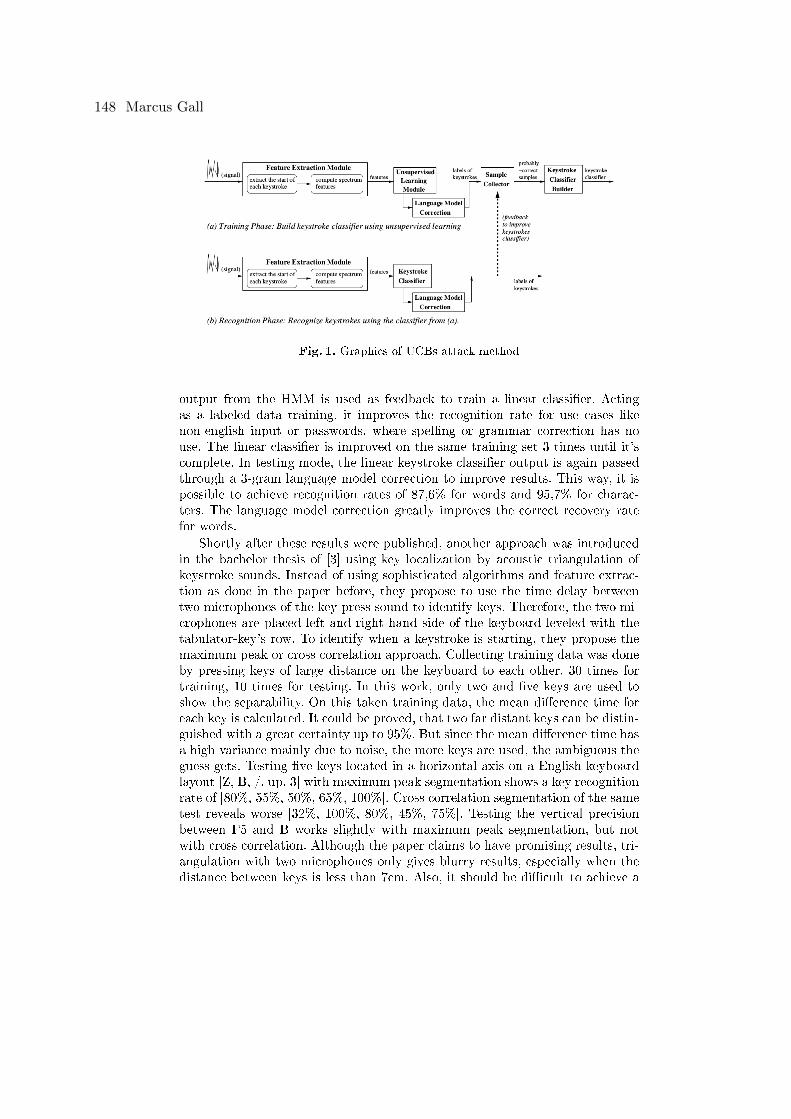
Fig. 1. Graphics of UCBs attack method
output from the HMM is used as feedback to train a linear classi�er. Actingas a labeled data training, it improves the recognition rate for use cases likenon-english input or passwords, where spelling or grammar correction has nouse. The linear classi�er is improved on the same training set 3 times until it'scomplete. In testing mode, the linear keystroke classi�er output is again passedthrough a 3-gram language model correction to improve results. This way, it ispossible to achieve recognition rates of 87,6% for words and 95,7% for charac-ters. The language model correction greatly improves the correct recovery ratefor words.
Shortly after these results were published, another approach was introducedin the bachelor thesis of [3] using key localization by acoustic triangulation ofkeystroke sounds. Instead of using sophisticated algorithms and feature extrac-tion as done in the paper before, they propose to use the time delay betweentwo microphones of the key-press sound to identify keys. Therefore, the two mi-crophones are placed left and right hand side of the keyboard leveled with thetabulator-key's row. To identify when a keystroke is starting, they propose themaximum peak or cross correlation approach. Collecting training data was doneby pressing keys of large distance on the keyboard to each other. 30 times fortraining, 10 times for testing. In this work, only two and �ve keys are used toshow the separability. On this taken training data, the mean di�erence time foreach key is calculated. It could be proved, that two far distant keys can be distin-guished with a great certainty up to 95%. But since the mean di�erence time hasa high variance mainly due to noise, the more keys are used, the ambiguous theguess gets. Testing �ve keys located in a horizontal axis on a English keyboardlayout [Z, B, /, up, 3] with maximum peak segmentation shows a key recognitionrate of [80%, 55%, 50%, 65%, 100%]. Cross correlation segmentation of the sametest reveals worse [32%, 100%, 80%, 45%, 75%]. Testing the vertical precisionbetween F5 and B works slightly with maximum peak segmentation, but notwith cross correlation. Although the paper claims to have promising results, tri-angulation with two microphones only gives blurry results, especially when thedistance between keys is less than 7cm. Also, it should be di�cult to achieve a
148 Marcus Gall
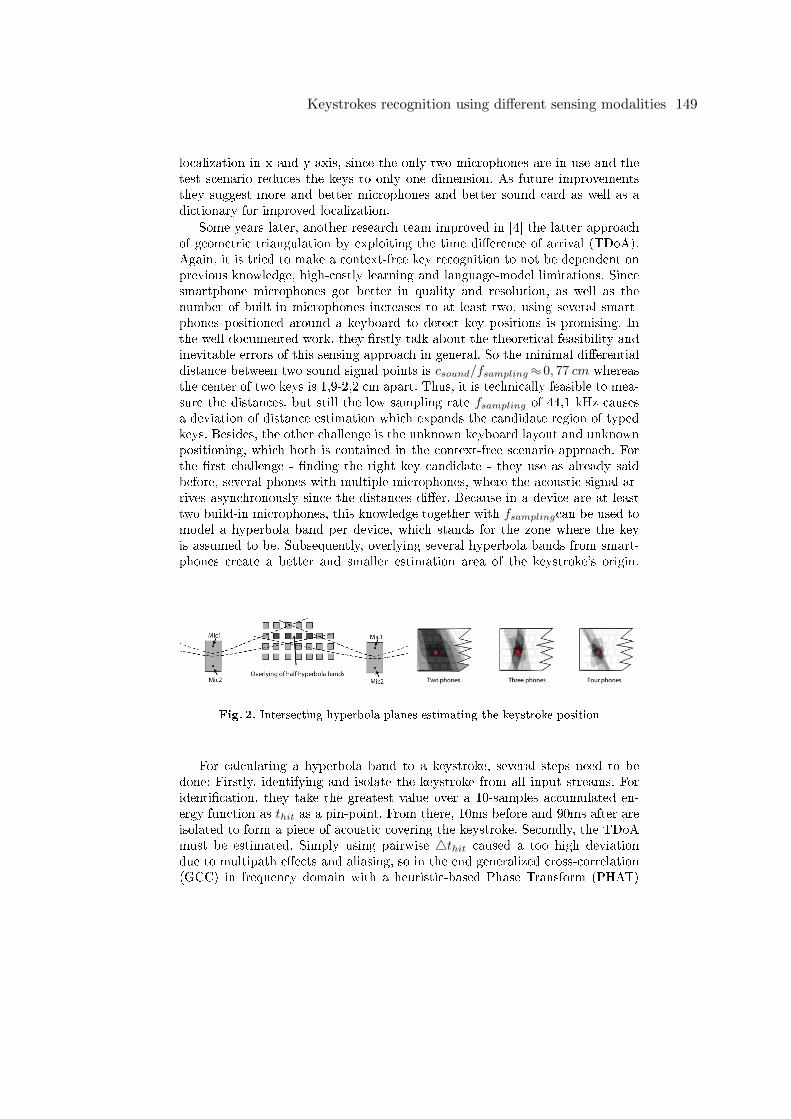
localization in x and y axis, since the only two microphones are in use and thetest scenario reduces the keys to only one dimension. As future improvementsthey suggest more and better microphones and better sound card as well as adictionary for improved localization.
Some years later, another research team improved in [4] the latter approachof geometric triangulation by exploiting the time di�erence of arrival (TDoA).Again, it is tried to make a context-free key recognition to not be dependent onprevious knowledge, high-costly learning and language-model limitations. Sincesmartphone microphones got better in quality and resolution, as well as thenumber of built-in microphones increases to at least two, using several smart-phones positioned around a keyboard to detect key positions is promising. Inthe well-documented work, they �rstly talk about the theoretical feasibility andinevitable errors of this sensing approach in general. So the minimal di�erentialdistance between two sound signal points is csound/fsampling :: 0, 77 cm whereasthe center of two keys is 1,9-2,2 cm apart. Thus, it is technically feasible to mea-sure the distances, but still the low sampling rate fsampling of 44,1 kHz causesa deviation of distance estimation which expands the candidate region of typedkeys. Besides, the other challenge is the unknown keyboard layout and unknownpositioning, which both is contained in the context-free scenario approach. Forthe �rst challenge - �nding the right key candidate - they use as already saidbefore, several phones with multiple microphones, where the acoustic signal ar-rives asynchronously since the distances di�er. Because in a device are at leasttwo build-in microphones, this knowledge together with fsamplingcan be used tomodel a hyperbola band per device, which stands for the zone where the keyis assumed to be. Subsequently, overlying several hyperbola bands from smart-phones create a better and smaller estimation area of the keystroke's origin.
Fig. 2. Intersecting hyperbola planes estimating the keystroke position
For calculating a hyperbola band to a keystroke, several steps need to bedone: Firstly, identifying and isolate the keystroke from all input streams. Foridenti�cation, they take the greatest value over a 10-samples accumulated en-ergy function as thit as a pin-point. From there, 10ms before and 90ms after areisolated to form a piece of acoustic covering the keystroke. Secondly, the TDoAmust be estimated. Simply using pairwise 4thit caused a too high deviationdue to multipath e�ects and aliasing, so in the end generalized cross-correlation(GCC) in frequency domain with a heuristic-based Phase Transform (PHAT)
Keystrokes recognition using different sensing modalities 149
weighting function was applied pairwise on each piece of acoustic to get a moreprecise pin-point tgcc for calculating the di�erences. Having the timing di�er-ences and the deviation error, the hyperbola bands can be set. This procedureis repeated with all keystrokes. In the end, there will be a heatmap of sets ofhyperbola bands, which forms a keyboard-layout-like pattern. This clustering isused by an optimization algorithm to derive the keyboard's position and thus themapping from clusters to characters. This approach was tested by two volunteerstyping about 3300 characters of a text and over 72,2% of keystrokes could berecovered successfully. The robustness test in some noisy surroundings revealsan detection accuracy of at least 64% in a noise conference room and better.Other challenges they had to face were intra-, inter- and external clock-drift ofsensors and optimization of smartphone positioning / rotation. A limitation oftheir approach was the exclusion of certain keys (e.g. CapsLock). Concluding,the combination of this context-free method with a context-based approach toincrease the recognition rate is suggested.
The next work [5] comes up with the idea to build a virtual keyboard formobile devices, which is called UbiK. They propose an input method like typ-ing with �ngers (including nail margins) on any solid surface with a printedkeyboard layout attached onto it. This input method o�ers 10-�nger writing onlarge workspaces, saves precious touchscreen area and is insensitive to gentle tapsand touches. In the initial setup, the mobile device need to be placed very closelynext to the typing area, whereby the user types all the printed keys (56 keysin this paper) at least once to generate training sounds. While touching soundsin previous works are used to extract energy- or FFT-features, this paper usesamplitude spectrum density (ASD), which allows more �ne-grained centimeter-scale granularity and is insensitive to waveform ambiguities and unpredictablestretches. The thought behind UbiK is, that the audio waves from a sound sourceundergo a complex multipath re�ection pattern on the surface and also the bodyof the smartphone as they propagate towards the microphone. These pattern ofsound re�exion and cancellation can be characterized by the ASD. The ASD ofdi�erent keystroke locations are highly distinguishable pro�les and can be usedas location signatures. Within a short distance of several millimeters, these signa-tures exhibit a certain level of correlation, which fades monotonically as distanceincreases. The presence of two microphones per device in modern smartphonesmakes it possible to access another feature set of the same event, what gains ad-ditional information for the decision process. Unfortunately, by default, Androidallows only access to one of two microphones. To bypass this restriction, theapp needs to load the tinyalsa driver, which gives access to both microphonesat fsampling of 48 kHz. The teams developed virtual keyboard consists of threecomponents: detection, localization and adaption. (See Fig. 3 for detailed archi-tecture.) In the detection component, for detecting touching sounds, an adaptivethreshold on the signal energy is used to separate noise �oor from keystrokes byapplying the Constant False Alarm Rate algorithm (CFAR). Thus, only signalshaving energy over a certain moving-average-window-plus-margined-value canpass. Additionally, loud environment noises are �ltered out, when they not also
150 Marcus Gall
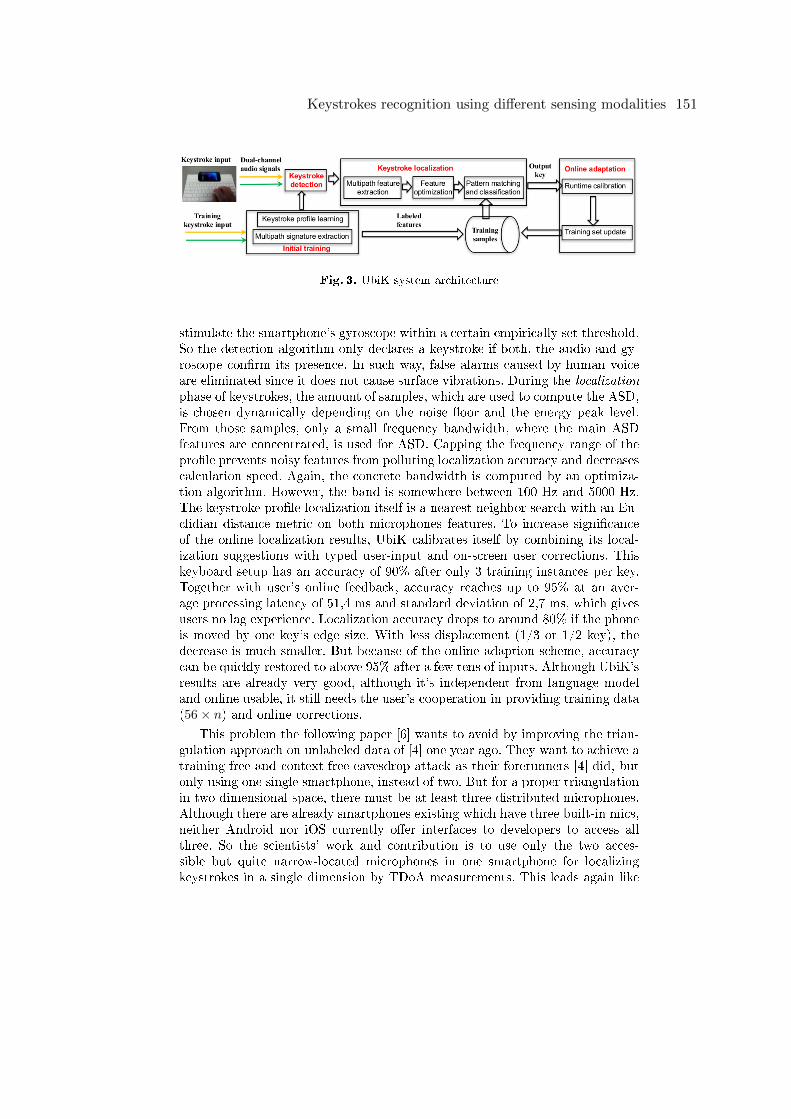
Fig. 3. UbiK system architecture
stimulate the smartphone's gyroscope within a certain empirically set threshold.So the detection algorithm only declares a keystroke if both, the audio and gy-roscope con�rm its presence. In such way, false alarms caused by human voiceare eliminated since it does not cause surface vibrations. During the localizationphase of keystrokes, the amount of samples, which are used to compute the ASD,is chosen dynamically depending on the noise �oor and the energy peak level.From those samples, only a small frequency bandwidth, where the main ASDfeatures are concentrated, is used for ASD. Capping the frequency range of thepro�le prevents noisy features from polluting localization accuracy and decreasescalculation speed. Again, the concrete bandwidth is computed by an optimiza-tion algorithm. However, the band is somewhere between 100 Hz and 5000 Hz.The keystroke pro�le localization itself is a nearest-neighbor search with an Eu-clidian distance metric on both microphones features. To increase signi�canceof the online localization results, UbiK calibrates itself by combining its local-ization suggestions with typed user-input and on-screen user corrections. Thiskeyboard setup has an accuracy of 90% after only 3 training instances per key.Together with user's online feedback, accuracy reaches up to 95% at an aver-age processing latency of 51,4 ms and standard deviation of 2,7 ms, which givesusers no lag experience. Localization accuracy drops to around 80% if the phoneis moved by one key's edge size. With less displacement (1/3 or 1/2 key), thedecrease is much smaller. But because of the online adaption scheme, accuracycan be quickly restored to above 95% after a few tens of inputs. Although UbiK'sresults are already very good, although it's independent from language modeland online usable, it still needs the user's cooperation in providing training data(56× n) and online corrections.
This problem the following paper [6] wants to avoid by improving the trian-gulation approach on unlabeled data of [4] one year ago. They want to achieve atraining-free and context-free eavesdrop-attack as their forerunners [4] did, butonly using one single smartphone, instead of two. But for a proper triangulationin two dimensional space, there must be at least three distributed microphones.Although there are already smartphones existing which have three built-in mics,neither Android nor iOS currently o�er interfaces to developers to access allthree. So the scientists' work and contribution is to use only the two acces-sible but quite narrow-located microphones in one smartphone for localizingkeystrokes in a single dimension by TDoA measurements. This leads again like
Keystrokes recognition using different sensing modalities 151
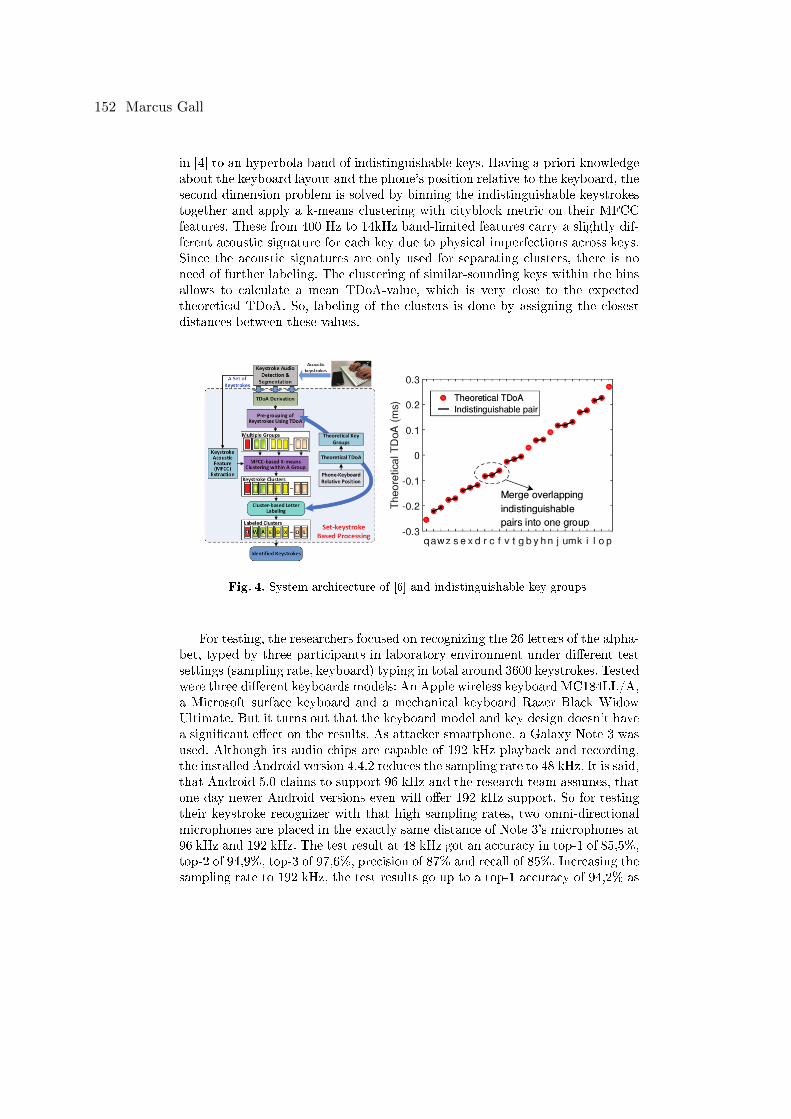
in [4] to an hyperbola band of indistinguishable keys. Having a-priori knowledgeabout the keyboard layout and the phone's position relative to the keyboard, thesecond dimension problem is solved by binning the indistinguishable keystrokestogether and apply a k-means clustering with cityblock metric on their MFCCfeatures. These from 400 Hz to 14kHz band-limited features carry a slightly dif-ferent acoustic signature for each key due to physical imperfections across keys.Since the acoustic signatures are only used for separating clusters, there is noneed of further labeling. The clustering of similar-sounding keys within the binsallows to calculate a mean TDoA-value, which is very close to the expectedtheoretical TDoA. So, labeling of the clusters is done by assigning the closestdistances between these values.
Fig. 4. System architecture of [6] and indistinguishable key groups
For testing, the researchers focused on recognizing the 26 letters of the alpha-bet, typed by three participants in laboratory environment under di�erent testsettings (sampling rate, keyboard) typing in total around 3600 keystrokes. Testedwere three di�erent keyboards models: An Apple wireless keyboard MC184LL/A,a Microsoft surface keyboard and a mechanical keyboard Razer Black WidowUltimate. But it turns out that the keyboard model and key design doesn't havea signi�cant e�ect on the results. As attacker smartphone, a Galaxy Note 3 wasused. Although its audio chips are capable of 192 kHz playback and recording,the installed Android version 4.4.2 reduces the sampling rate to 48 kHz. It is said,that Android 5.0 claims to support 96 kHz and the research-team assumes, thatone day newer Android versions even will o�er 192 kHz support. So for testingtheir keystroke recognizer with that high sampling rates, two omni-directionalmicrophones are placed in the exactly same distance of Note 3's microphones at96 kHz and 192 kHz. The test result at 48 kHz got an accuracy in top-1 of 85,5%,top-2 of 94,9%, top-3 of 97,6%, precision of 87% and recall of 85%. Increasing thesampling rate to 192 kHz, the test results go up to a top-1 accuracy of 94,2% as
152 Marcus Gall
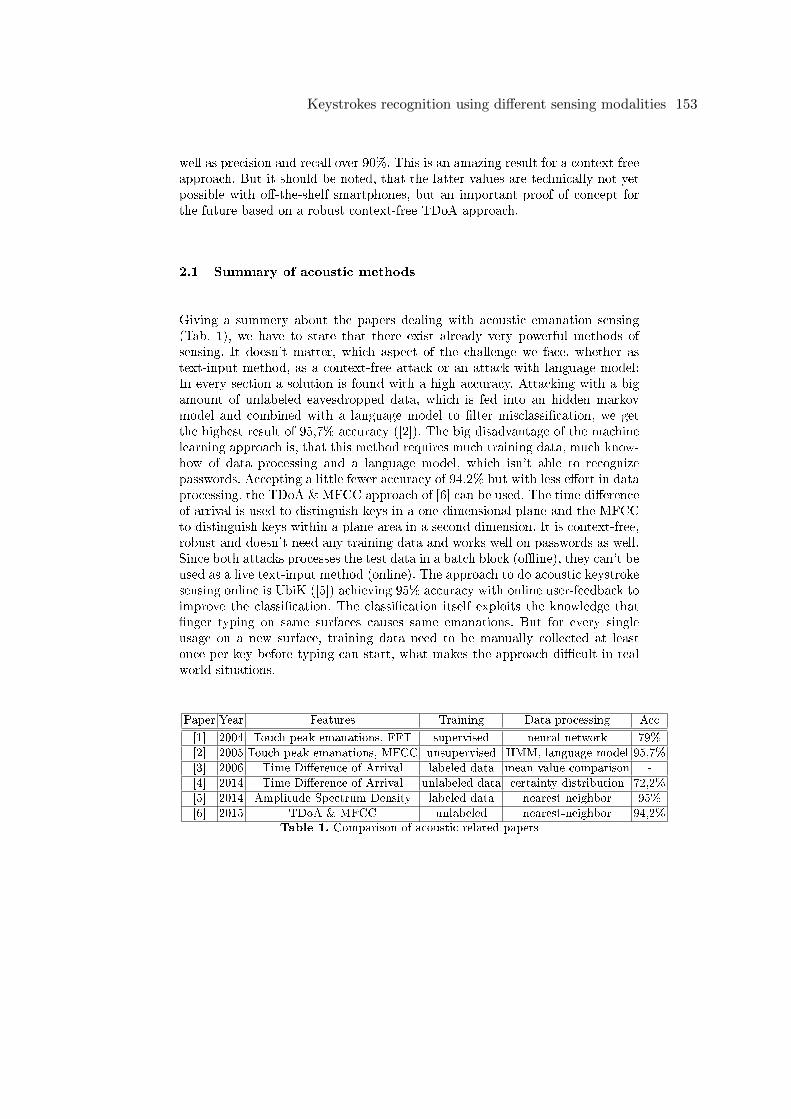
well as precision and recall over 90%. This is an amazing result for a context-freeapproach. But it should be noted, that the latter values are technically not yetpossible with o�-the-shelf smartphones, but an important proof of concept forthe future based on a robust context-free TDoA approach.
2.1 Summary of acoustic methods
Giving a summery about the papers dealing with acoustic emanation sensing(Tab. 1), we have to state that there exist already very powerful methods ofsensing. It doesn't matter, which aspect of the challenge we face, whether astext-input method, as a context-free attack or an attack with language model:In every section a solution is found with a high accuracy. Attacking with a bigamount of unlabeled eavesdropped data, which is fed into an hidden markovmodel and combined with a language model to �lter misclassi�cation, we getthe highest result of 95,7% accuracy ([2]). The big disadvantage of the machinelearning approach is, that this method requires much training data, much know-how of data processing and a language model, which isn't able to recognizepasswords. Accepting a little fewer accuracy of 94,2% but with less e�ort in dataprocessing, the TDoA & MFCC approach of [6] can be used. The time di�erenceof arrival is used to distinguish keys in a one dimensional plane and the MFCCto distinguish keys within a plane area in a second dimension. It is context-free,robust and doesn't need any training data and works well on passwords as well.Since both attacks processes the test data in a batch block (o�ine), they can't beused as a live text-input method (online). The approach to do acoustic keystrokesensing online is UbiK ([5]) achieving 95% accuracy with online user-feedback toimprove the classi�cation. The classi�cation itself exploits the knowledge that�nger typing on same surfaces causes same emanations. But for every singleusage on a new surface, training data need to be manually collected at leastonce per key before typing can start, what makes the approach di�cult in realworld situations.
Paper Year Features Training Data processing Acc
[1] 2004 Touch peak emanations, FFT supervised neural network 79%
[2] 2005 Touch peak emanations, MFCC unsupervised HMM, language model 95,7%
[3] 2006 Time Di�erence of Arrival labeled data mean value comparison -
[4] 2014 Time Di�erence of Arrival unlabeled data certainty distribution 72,2%
[5] 2014 Amplitude Spectrum Density labeled data nearest-neighbor 95%
[6] 2015 TDoA & MFCC unlabeled nearest-neighbor 94,2%Table 1. Comparison of acoustic related papers
Keystrokes recognition using different sensing modalities 153
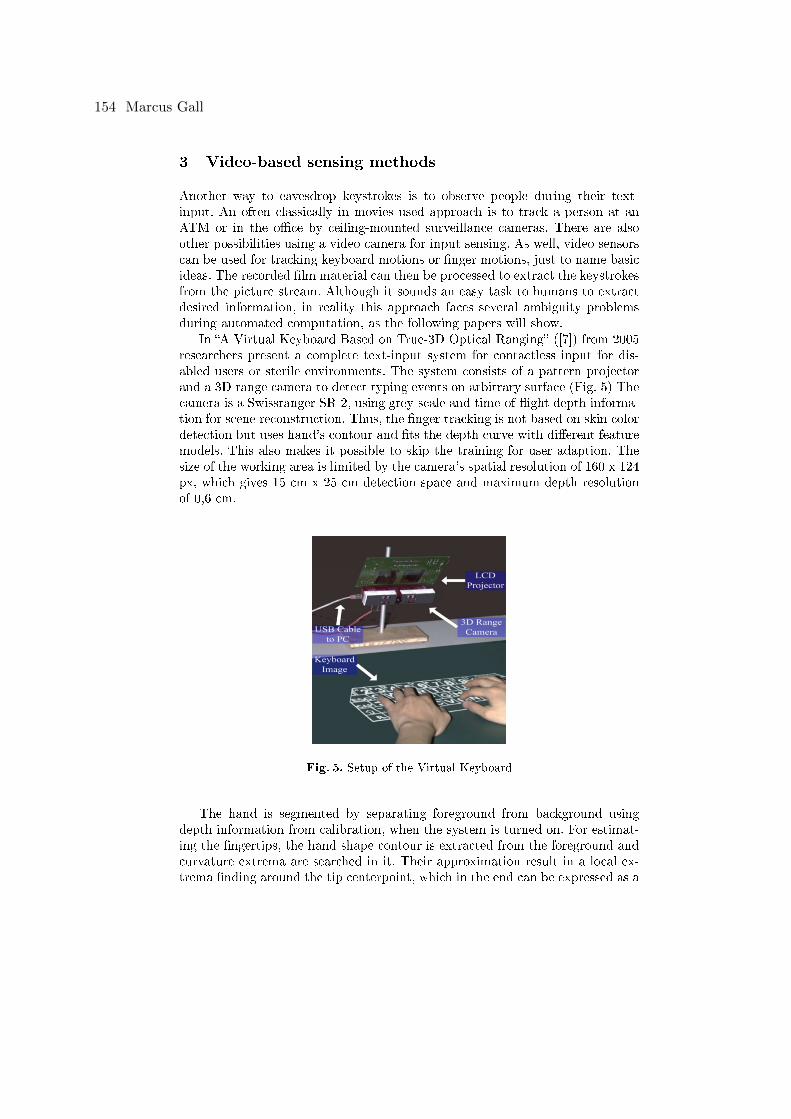
3 Video-based sensing methods
Another way to eavesdrop keystrokes is to observe people during their text-input. An often classically in movies used approach is to track a person at anATM or in the o�ce by ceiling-mounted surveillance cameras. There are alsoother possibilities using a video camera for input sensing. As well, video sensorscan be used for tracking keyboard motions or �nger motions, just to name basicideas. The recorded �lm material can then be processed to extract the keystrokesfrom the picture stream. Although it sounds an easy task to humans to extractdesired information, in reality this approach faces several ambiguity problemsduring automated computation, as the following papers will show.
In �A Virtual Keyboard Based on True-3D Optical Ranging� ([7]) from 2005researchers present a complete text-input system for contactless input for dis-abled users or sterile environments. The system consists of a pattern projectorand a 3D range camera to detect typing events on arbitrary surface (Fig. 5) Thecamera is a Swissranger SR-2, using grey-scale and time-of-�ight depth informa-tion for scene reconstruction. Thus, the �nger tracking is not based on skin colordetection but uses hand's contour and �ts the depth curve with di�erent featuremodels. This also makes it possible to skip the training for user adaption. Thesize of the working area is limited by the camera's spatial resolution of 160 x 124px, which gives 15 cm x 25 cm detection space and maximum depth resolutionof 0,6 cm.
Fig. 5. Setup of the Virtual Keyboard
The hand is segmented by separating foreground from background usingdepth information from calibration, when the system is turned on. For estimat-ing the �ngertips, the hand shape contour is extracted from the foreground andcurvature extrema are searched in it. Their approximation result in a local ex-trema �nding around the tip centerpoint, which in the end can be expressed as a
154 Marcus Gall
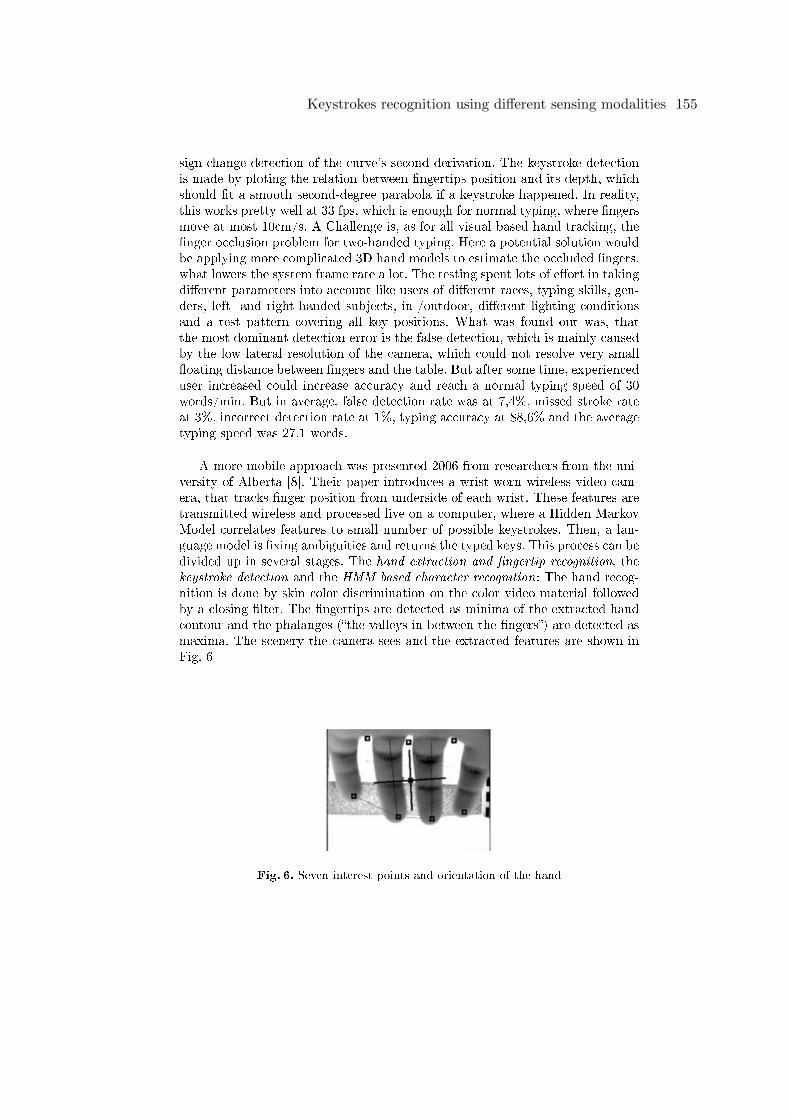
sign change detection of the curve's second derivation. The keystroke detectionis made by ploting the relation between �ngertips position and its depth, whichshould �t a smooth second-degree parabola if a keystroke happened. In reality,this works pretty well at 33 fps, which is enough for normal typing, where �ngersmove at most 10cm/s. A Challenge is, as for all visual based hand tracking, the�nger occlusion problem for two-handed typing. Here a potential solution wouldbe applying more complicated 3D hand models to estimate the occluded �ngers,what lowers the system frame rate a lot. The testing spent lots of e�ort in takingdi�erent parameters into account like users of di�erent races, typing skills, gen-ders, left- and right-handed subjects, in-/outdoor, di�erent lighting conditionsand a test pattern covering all key positions. What was found out was, thatthe most dominant detection error is the false detection, which is mainly causedby the low lateral resolution of the camera, which could not resolve very small�oating distance between �ngers and the table. But after some time, experienceduser increased could increase accuracy and reach a normal typing speed of 30words/min. But in average, false detection rate was at 7,4%, missed stroke rateat 3%, incorrect detection rate at 1%, typing accuracy at 88,6% and the averagetyping speed was 27,1 words.
A more mobile approach was presented 2006 from researchers from the uni-versity of Alberta [8]. Their paper introduces a wrist-worn wireless video cam-era, that tracks �nger position from underside of each wrist. These features aretransmitted wireless and processed live on a computer, where a Hidden MarkovModel correlates features to small number of possible keystrokes. Then, a lan-guage model is �xing ambiguities and returns the typed keys. This process can bedivided up in several stages. The hand extraction and �ngertip recognition, thekeystroke detection and the HMM based character recognition: The hand recog-nition is done by skin color discrimination on the color video material followedby a closing �lter. The �ngertips are detected as minima of the extracted handcontour and the phalanges (�the valleys in between the �ngers�) are detected asmaxima. The scenery the camera sees and the extracted features are shown inFig. 6
Fig. 6. Seven interest points and orientation of the hand
Keystrokes recognition using different sensing modalities 155
The keystroke detection uses the feature-set of four �ngertips and three pha-langes, which are moving relatively to each other during a keystroke. A keystrokeis detected, if one or more �ngers deviates from the rest position above a distanceand speed threshold within 30 frames. For smoothing the noisy position readings,a �rst order low-pass �lter is used to avoid spurious keystroke detections.
In the HMM-based character recognition stage, an Hidden Markov Model isused to correlate the feature-sets to possible keystrokes. So the HMM observa-tions consist of a set of vectors that describe the position (in polar coordinatesrelative to the resting position) and the speed of the �ngertip. The hidden statesdescribe characters and the transition model is based on letter bigram probabil-ities and word unigram model. The observation model is learned during trainingby correlating each character in the training set with the output vector observedduring its corresponding keypress. The implemented prototype system had acamera with a frame rate of 30 fps and a resolution of 320 x 240 px. During thetraining and test, which was run in a well-lit indoor environment, a person wasleft-handed trained on a 300 word test set over a period of one hour. Each char-acter was typed in the training about approximately 25 times, and the mean andvariance for each �nger movement vector was calculated for the Gaussian prob-ability distribution for the observation. Afterwards, the test having 200 wordswas used to measure recognition accuracy and speed, where false positives wereclassi�ed as errors and undetected keystrokes were retyped. In the end, withoutany language model, the recognition accuracy reached 67%, with letter bigramsupport 84% and with both, letter and word model 90%. Since in the latter re-sult also the word model is used, sometimes the word kept being misspelled untilthe last letter and then switch over to the correct one. Because this test onlyincluded the left hand, no space bar was de�ned, so the bar was pushed withthe free right hand to indicate a words end. The typing speed was 14 words/mindue to smoothing �lter which adds 0,1s lag and the retyping of characters, whenthe detection was missed. To increase their results, the team suggests for thefuture an adaptive skin-color segmentation, deformable templates or dynamiccontours for tracking the edges of �ngers more accurately, Conditional DensityPropagation algorithm to track contours in cluttered environments or HoughTransformation for �ngertip tracking. Also �tting the observed hand contour toa 3D physical model of the hand could increase robustness.
The last of the most promising papers regarding video sensing, is a proposedanalysis tool, which should supports analysts in transcribing text from a camerasource, which observes somebody typing on a keyboard. �ClearShot� ([9]) from2008 operates on an image stream produced by an o�-the-shelf web cam whichrecords the typing activity of a user. The tools consists of two main phases (seeFig.7) : The �rst phase is the computer vision analysis, where the recorded videois analyzed frame by frame and computes a set of keys that were likely pressed,certainly not pressed and the position of space characters. Because the resultsof this phase are noisy, another phase, called text analysis is required. The goalis to remove errors using language and context-sensitive techniques. The resultof this phase is the reconstructed text, where each word is represented by a
156 Marcus Gall
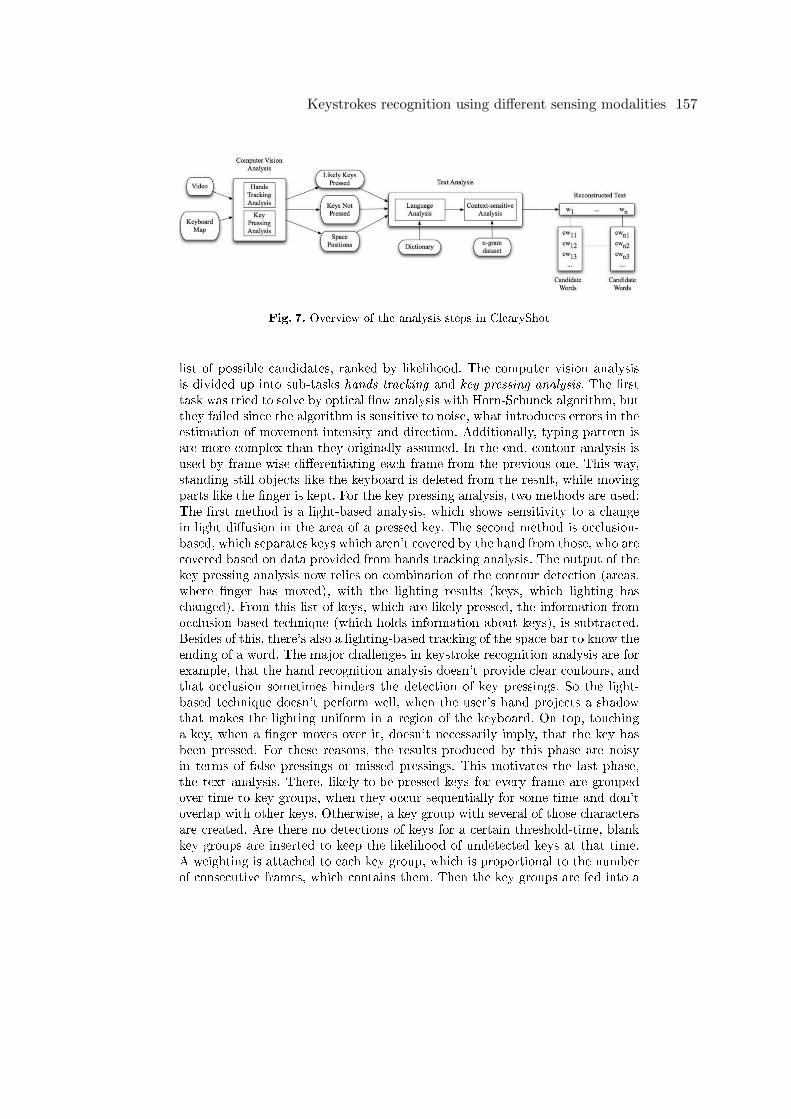
Fig. 7. Overview of the analysis steps in ClearyShot
list of possible candidates, ranked by likelihood. The computer vision analysisis divided up into sub-tasks hands tracking and key pressing analysis. The �rsttask was tried to solve by optical �ow analysis with Horn-Schunck algorithm, butthey failed since the algorithm is sensitive to noise, what introduces errors in theestimation of movement intensity and direction. Additionally, typing pattern isare more complex than they originally assumed. In the end, contour analysis isused by frame-wise di�erentiating each frame from the previous one. This way,standing still objects like the keyboard is deleted from the result, while movingparts like the �nger is kept. For the key pressing analysis, two methods are used:The �rst method is a light-based analysis, which shows sensitivity to a changein light di�usion in the area of a pressed key. The second method is occlusion-based, which separates keys which aren't covered by the hand from those, who arecovered based on data provided from hands tracking analysis. The output of thekey pressing analysis now relies on combination of the contour detection (areas,where �nger has moved), with the lighting results (keys, which lighting haschanged). From this list of keys, which are likely pressed, the information fromocclusion-based technique (which holds information about keys), is subtracted.Besides of this, there's also a lighting-based tracking of the space bar to know theending of a word. The major challenges in keystroke recognition analysis are forexample, that the hand recognition analysis doesn't provide clear contours, andthat occlusion sometimes hinders the detection of key pressings. So the light-based technique doesn't perform well, when the user's hand projects a shadowthat makes the lighting uniform in a region of the keyboard. On top, touchinga key, when a �nger moves over it, doesn't necessarily imply, that the key hasbeen pressed. For these reasons, the results produced by this phase are noisyin terms of false pressings or missed pressings. This motivates the last phase,the text analysis. There, likely-to-be-pressed-keys for every frame are groupedover time to key groups, when they occur sequentially for some time and don'toverlap with other keys. Otherwise, a key group with several of those charactersare created. Are there no detections of keys for a certain threshold-time, blankkey groups are inserted to keep the likelihood of undetected keys at that time.A weighting is attached to each key group, which is proportional to the numberof consecutive frames, which contains them. Then the key groups are fed into a
Keystrokes recognition using different sensing modalities 157
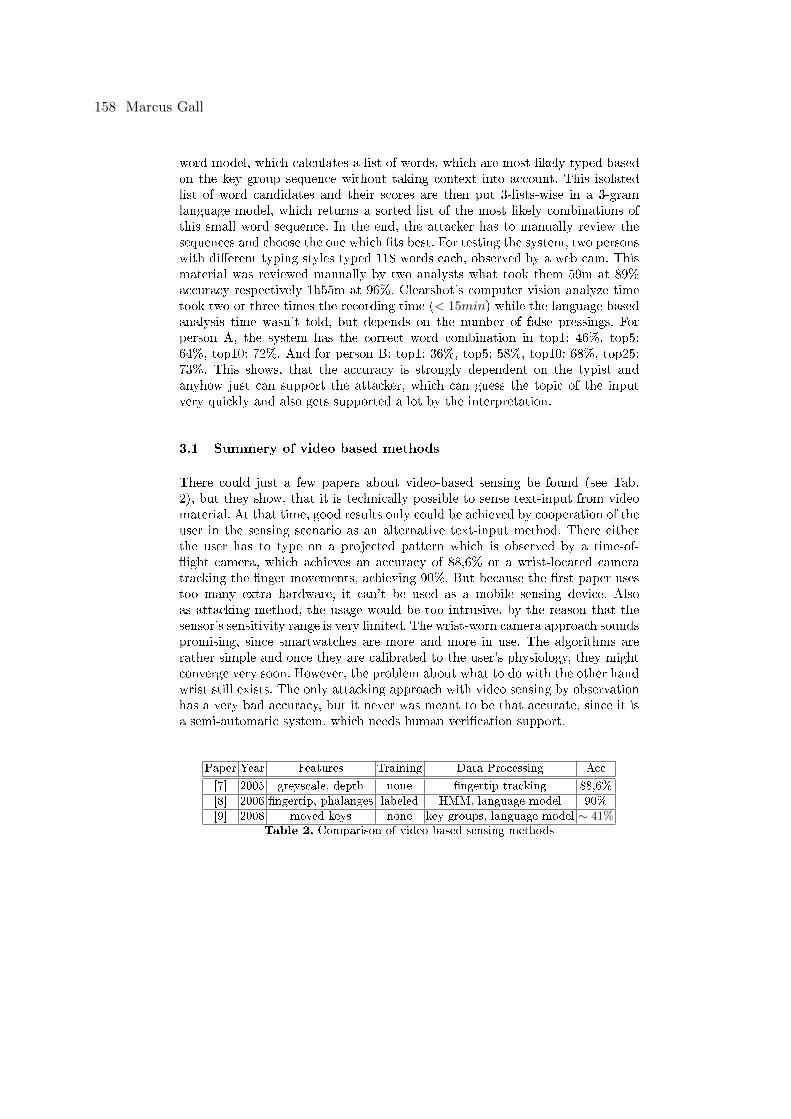
word model, which calculates a list of words, which are most likely typed basedon the key group sequence without taking context into account. This isolatedlist of word candidates and their scores are then put 3-lists-wise in a 3-gramlanguage model, which returns a sorted list of the most likely combinations ofthis small word sequence. In the end, the attacker has to manually review thesequences and choose the one which �ts best. For testing the system, two personswith di�erent typing styles typed 118 words each, observed by a web cam. Thismaterial was reviewed manually by two analysts what took them 59m at 89%accuracy respectively 1h55m at 96%. Clearshot's computer vision analyze timetook two or three times the recording time (< 15min) while the language basedanalysis time wasn't told, but depends on the number of false pressings. Forperson A, the system has the correct word combination in top1: 46%, top5:64%, top10: 72%. And for person B: top1: 36%, top5: 58%, top10: 68%, top25:73%. This shows, that the accuracy is strongly dependent on the typist andanyhow just can support the attacker, which can guess the topic of the inputvery quickly and also gets supported a lot by the interpretation.
3.1 Summery of video based methods
There could just a few papers about video-based sensing be found (see Tab.2), but they show, that it is technically possible to sense text-input from videomaterial. At that time, good results only could be achieved by cooperation of theuser in the sensing scenario as an alternative text-input method. There eitherthe user has to type on a projected pattern which is observed by a time-of-�ight camera, which achieves an accuracy of 88,6% or a wrist-located cameratracking the �nger movements, achieving 90%. But because the �rst paper usestoo many extra hardware, it can't be used as a mobile sensing device. Alsoas attacking method, the usage would be too intrusive, by the reason that thesensor's sensitivity range is very limited. The wrist-worn camera approach soundspromising, since smartwatches are more and more in use. The algorithms arerather simple and once they are calibrated to the user's physiology, they mightconverge very soon. However, the problem about what to do with the other handwrist still exists. The only attacking approach with video sensing by observationhas a very bad accuracy, but it never was meant to be that accurate, since it isa semi-automatic system, which needs human veri�cation support.
Paper Year Features Training Data Processing Acc
[7] 2005 greyscale, depth none �ngertip tracking 88,6%
[8] 2006 �ngertip, phalanges labeled HMM, language model 90%
[9] 2008 moved keys none key groups, language model ∼ 41%Table 2. Comparison of video based sensing methods
158 Marcus Gall
4 WiFi signal based sensing methods
The maybe most surprising sensing approach of text-input is the use of WiFisignals. Some years ago, there were experiments about exploiting the variationof WiFi signal strength to sense movements in an apartment, which are magni-tudes bigger than caused from text-input: one approach was to detect drops ofold persons on the �oor and the other approach was hand gesture recognition[10][11]. The idea behind WiFi signal sensing is to use modern WiFi's channelstate information (CSI), which are used in IEEE 802.11n/ac standard to controlthe multiple receive antennas for MIMO. The WiFi devices need to continuouslymonitor the state of the wireless channel to e�ectively perform transmit powerallocations and rate adaptions for each individual MIMO stream such that theavailable capacity of the wireless channel is maximally utilized. These devicesquantify the state of the channel in terms of CSI values. The CSI values charac-terize the Channel Frequency Response (CFR) for each subcarrier between eachtransmit-receive antenna pair. So when the number of subcarriers Sc = 30, thenumber of transmit antennas MT = 3 and number of receive antennas MR = 2,the total amount of data in a single CSI is Sc x MT x MR = 180 values.
The key idea, what the paper �WiKey - Keystroke recognition using WiFiSignals� [12] from 2015 proposes to use is the interpretation of CSI time-series.CSI values quantify the aggregate e�ect of wireless phenomena such as fading,multi-paths, and Doppler shift on the wireless signals in a given environment.Since CSI vectors are changing when the environment is changing, the same canbe observed during typing: a certain key press forms a unique hand formationand thus a unique pattern in CSI time-series. This so called CSI-waveform canbe sensed by normal o�-the-shelf WiFi devices and distinguished in a trainedclassi�er. All those devices need to do causing permanently tra�c to produceenough CSI values within a keystroke to construct a high resolution waveform.The greatest possible sampling rate on this hardware was about 2500 samples/s.The challenges to overcome in this paper were keystroke segmentation, featureextraction of 37 keys, feature comparison and evaluation. For the keystroke seg-mentation, �rstly the big amount of raw data (time-series of all subcarriers)need to pass a Butterworth low-pass �lter. Due to observations, the importantfrequencies are between 3 Hz and 80 Hz, which were additionally set as cut-o�frequencies in the �lter. Because hand and �nger movements result in corre-lated changes in the CSI-waveform, after normalization, principal componentanalysis (PCA) is applied to remove uncorrelated noise and returns hand and�nger related movement data. From observation it was stated, that the �rstprincipal component captures the majority of correlated noise and thus can bedropped while the next three components contains useful features for furthersegmentation. Keystrokes can be observed in the CSI-waveform as increasingand decreasing trends in rate of change, what can be found by using a mov-ing window approach which calculates the mean absolute deviation (MAD) foreach of the three time series. After evaluating variances and applying energy-thresholds on the sliding window results, start- and endpoints of a keystrokecan be identi�ed. For feature extraction, these points are taken to cut relevant
Keystrokes recognition using different sensing modalities 159
data from the original CSI-waveform, which is again processed with PCA for thesame reasons like before during keystroke segmentation. To reduce the amountof data points, but keeping the waveform shapes in time and frequency domain,Discrete Wavelet Transformation (DWT) is applied three times, what generatesapproximation coe�cients which can be used as keystroke features. The amountof keystroke features in total is 3 x MT x MR. To compare keystroke shape fea-tures in a classi�er, the researchers choose dynamic time warping (DTW) withEuclidean distance as a comparison metric to determine minimal distance be-tween two waveforms. This metric is used in a k-nearest neighbor classi�er forall transmit-receive antenna pairs, what makes in total 3 x MT x MR classi�ers.The �nal result is calculated through majority voting of all kNN classi�ers. Toevaluate the accuracy, training and testing data from 10 users were collected.Nine of them provided 30 sample keystrokes for each of the 37 keys and typedan example sentence �ve times. The 10th user provided more training data: 80sample keystrokes each, and �ve times �ve sentences. The training data weretyped slowly with 1 second delay. WiKey's keystroke detection rate on that datawas 97,5%, but they promised that the rate could be further improved by param-eter tuning. The missed keystrokes are usually those, where �ngers move verylittle when typing. For building classi�ers, two sets of experiments were tested:The �rst set of classi�ers consisted of classi�ers for each of the 10 users using30 samples for 10-fold cross validation accuracy. The second set was a classi�erfor the 10th user using 80 samples to see what impact more training data hason the accuracy. For the kNN classi�er k was set to 15. The overall accuracyfor 30 samples recognizing 37 keys was 82,8%, while reducing keys to 26 resultsin 83,5%. Testing the classi�ers on real sentences gives 77,43%. Increasing thetraining samples by having the 80 samples set results in 85,95% accuracy for 37keys and 89,7% for 26 keys. Testing the classi�er on the real sentences of the10th user ends with 93,47%. This is a very good result, but also the limitations ofWiFi sensing must be seen. Stable results only can be achieved under controlledenvironments. During the test, only two persons were present and nothing wasmoved in the room during data collection. So the CSI-data is mainly catchingvariations caused by keystrokes, what improves �nding clear features. For usingWiKey in di�erent settings, training must always be repeated because parame-ters are highly scenario dependent. Researchers found out, that linear distancechanges towards the access point lets the waveform's shape diverge as well aschanging orientation or even measuring on a di�erent day. Those easily fadingfeatures makes it hard to keep quality in open environments. In the end, it canbe stated, that WiKey is a user-dependent supervised classi�er method, whichworks under very limited conditions.
4.1 Summary of WiFi based methods
The only WiFi sensing paper, which is really able to sense keystrokes, strikeswith a very high accuracy. It could be used as an attack, as well as an text-inputmethod. What clearly has to be said is, that the features are prone to any changein the environment after training, what changes CSI-based features and hence
160 Marcus Gall
decreasing accuracy. Although a cooperative user would be best to generate agood accuracy, also an attack can be successful with an attack vector like: achat conversation with the victim, while the victim is observed in his room via ahacked router to train the classi�er. To conclude, this is a remarkable approachwhich should be taken into account as a possible attack method, but lacks inrobustness what makes it hard to use in reality.
Paper Year Features Training Data Processing Acc
[12] 2015 Channel State Information supervised DWT, DTW, kNN 93,47%Table 3. Overview of WiFi based sensing method
5 Acceleration and motion sensing methods
Coming from the external sensing methods like acoustics, video or WiFi signalinterferences, also already existing gyroscope and acceleration sensors in mobiledevices itself can considered as text-input sensing or at least information gain.Smartphones as well as smartwatches are usually equipped with both sensortypes: gyroscopes for sensing spin acceleration and accelerators for sensing linearacceleration. Because every touch-device experiences vibrations and accelerationfrom the �nger pressing a button, researchers want to �nd out what can bereconstructed through sensed acceleration data.
The �rst papers, interested in this topic is �TouchLogger� [13] which waspublished in 2011. This paper wants to make aware of the underestimated prob-lem, that acceleration data is not protected well by rights management in modernsmartphones, which can be exploited by malicious apps. Motion of a smartphoneduring typing depends on several factors: 1) striking force of the typing �nger, 2)resistance force of the supporting hand, 3) the landing location of the typing �n-ger and 4) location of supporting hand on the smartphone. The �rst two factorsmainly a�ect the shift of the phone, while the latter two mainly a�ect rotation.The scientists observed, that just the latter two factors are user-independent andthus can be used as feature source. Also they observed gyroscope data containssenses the desired rotation data better although with a lower sampling rate.Androids motion data can be requested by a listener, which provides motiondata in rotation angles for each axis as α, β, γ. Touchlogger discards the azimathangle α and only calculates features from the other two axis. Keystroke segmen-tation is done by calculating Peak-to-Average ratios of β and γ, which are muchlarger during typing. Their feature extraction approach is, motions caused bykeystrokes do not reach their peaks regarding pitch and roll angle simultaneously.This vector path further abstracted into lobes, which can be seen as unique pat-tern (see 8). From this, two features can be extracted, expressing the angle ofthe direction of the upper lobe and the x-axis (AUB), as well as from the lowerlobe (ALB). These features are used to model probability density functions in
Keystrokes recognition using different sensing modalities 161
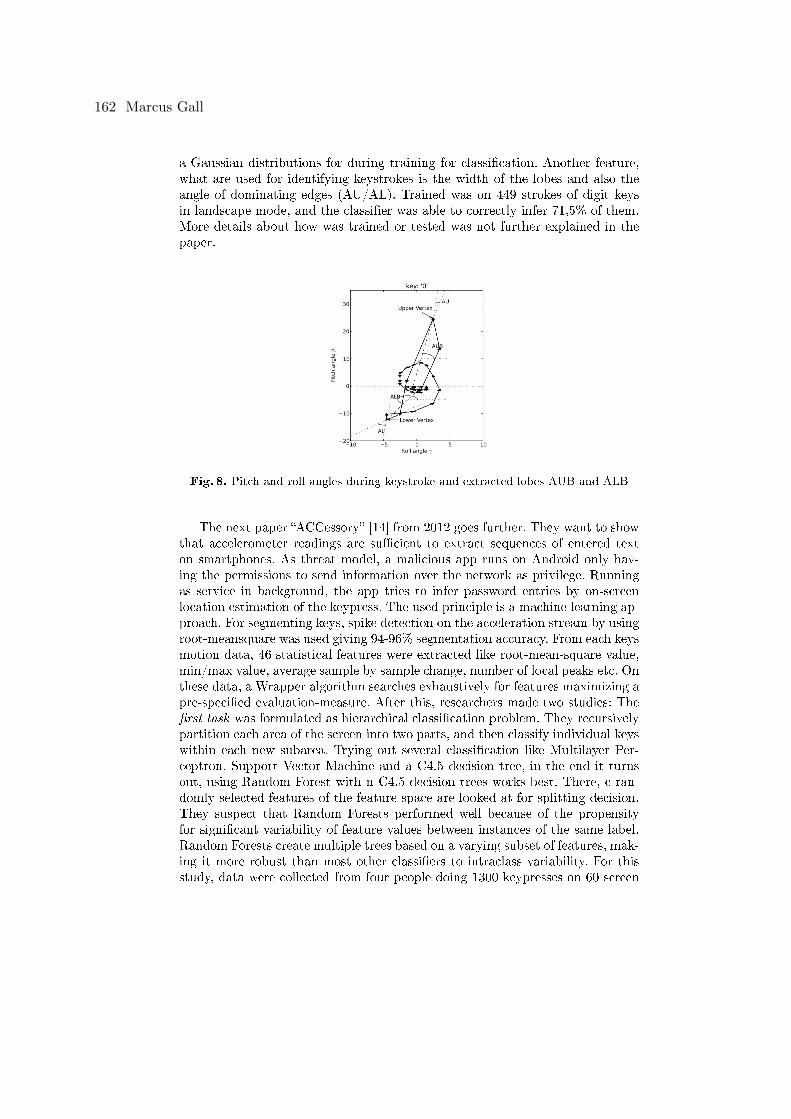
a Gaussian distributions for during training for classi�cation. Another feature,what are used for identifying keystrokes is the width of the lobes and also theangle of dominating edges (AU/AL). Trained was on 449 strokes of digit keysin landscape mode, and the classi�er was able to correctly infer 71,5% of them.More details about how was trained or tested was not further explained in thepaper.
Fig. 8. Pitch and roll angles during keystroke and extracted lobes AUB and ALB
The next paper �ACCessory� [14] from 2012 goes further. They want to showthat accelerometer readings are su�cient to extract sequences of entered texton smartphones. As threat model, a malicious app runs on Android only hav-ing the permissions to send information over the network as privilege. Runningas service in background, the app tries to infer password entries by on-screenlocation estimation of the keypress. The used principle is a machine learning ap-proach. For segmenting keys, spike detection on the acceleration stream by usingroot-meansquare was used giving 94-96% segmentation accuracy. From each keysmotion data, 46 statistical features were extracted like root-mean-square value,min/max value, average sample by sample change, number of local peaks etc. Onthese data, a Wrapper algorithm searches exhaustively for features maximizing apre-speci�ed evaluation-measure. After this, researchers made two studies: The�rst task was formulated as hierarchical classi�cation problem. They recursivelypartition each area of the screen into two parts, and then classify individual keyswithin each new subarea. Trying out several classi�cation like Multilayer Per-ceptron, Support Vector Machine and a C4.5 decision tree, in the end it turnsout, using Random Forest with n C4.5 decision trees works best. There, c ran-domly selected features of the feature space are looked at for splitting decision.They suspect that Random Forests performed well because of the propensityfor signi�cant variability of feature values between instances of the same label.Random Forests create multiple trees based on a varying subset of features, mak-ing it more robust than most other classi�ers to intraclass variability. For thisstudy, data were collected from four people doing 1300 keypresses on 60 screen
162 Marcus Gall
areas with having approximately 20 samples per area. Testing was done usingk-fold cross validation and test results predictions have an accuracy of 80% ina concentration within an error of 0 or 1 key distance. Furthermore, 91%, 96%,and 99% of their predictions are within 2, 3, 4 keys neighborhood. The secondtask was about infering simulated password entries from motion data. Classi�-cation in this task is done by a conditional probability mass distribution on thestatistical features mentioned before followed by a maximum likelihood searchfor this feature. For training the conditional probability distribution, 2700 key-presses from sentences and 99 6-character ([0-z]) passwords are collected. Fromthis data, their model was able to correctly deduce 6 of the 99 passwords in amedian 4,5 trials. A brute force attack on a 6 character length password takesapproximately 228 trials on average. The model presented here cracked 59 of 99passwords in approximately 215median trials. From these results it can be con-cluded that accelerometers can be used to signi�cantly reduce the search spacefor text entered on smartphones. To reduce the risk of snooping accelerationdata, the researcher propose decreasing sampling rate for untrusted applications,what can substantially mitigate predictive accuracy to keystroke inference. Theresults of this paper is signi�cantly better than from the previous, since it candistinguish 29-60 areas in a sequence instead of only 10 single digits.
Some years later, in 2015, another attack on number pads was researchedbased on accelerometer and magnetometer in smartphones. The magnetometeris used here, because in Android 4.4.x, accelerometer and magnetometer dataare used to calculate the value of �orientation sensor�. Again the idea is a ma-licious app as attack vector and was tested in three di�erent real-life scenariosas the reader will see in the test results. The raw 3-axis accelerometer valuesare Kalman �ltered to remove the mixed in gravitational component. Then themagnitude of external force on the touchscreen F 2 = Ax
2+Ay2+Az
2is measuredas squared value of the three axis. It can be seen, that the magnitude curveof a keystroke correspond to a three-stage process: 1) the smartphone movesdownward with increasing acceleration when a �nger touches the screen; 2) thesmartphone moves upward; 3) the hand holding the smartphone returns to ini-tial position. From this process model, measures can be statistically extractedlike maximum value of the �rst/second/third �uctuation, time di�erences be-tween them, etc. for every tap action. Given the statistical analysis by usingkernel density estimation method, the probability density function (PDF) forthose values shows roughly normal distributed curves. The tap segmentationchallenge is now solved by applying thresholds from the previous de�ned mea-sures on the F 2data. The features, needed for key recognition can be extractedfrom three axes of acceleration and two axes of orientation. Again the statisticalappraoch is choosen: A single tap event can be represented by the mean, median,mode, skewness, kurtosis and standard deviation extracted from the 5D sensordata. These features were used to train four classi�cation algorithms for com-parison reasons. The researchers used four types of two-class classi�ers. RandomForest, Support Vector Machine (SVM), Neural Network and Nearest neighborto construct inference models. The input inference task was regarded as a multi-
Keystrokes recognition using different sensing modalities 163
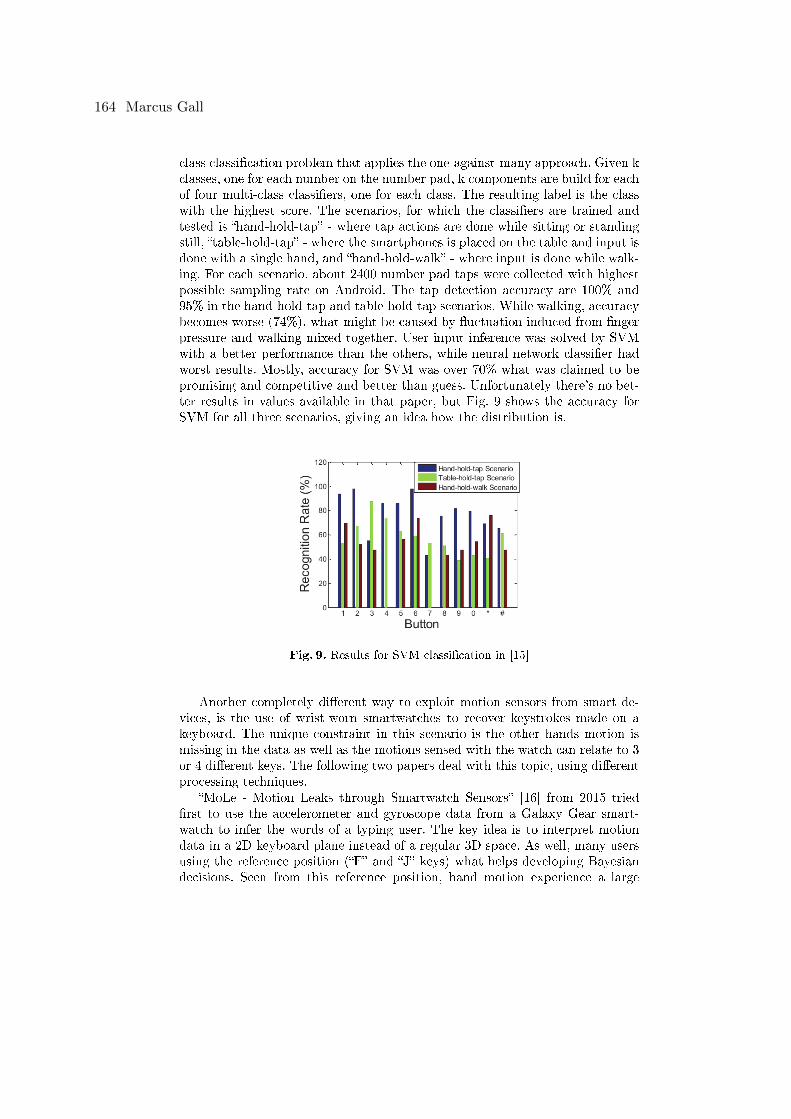
class classi�cation problem that applies the one-against-many approach. Given kclasses, one for each number on the number pad, k components are build for eachof four multi-class classi�ers, one for each class. The resulting label is the classwith the highest score. The scenarios, for which the classi�ers are trained andtested is �hand-hold-tap� - where tap actions are done while sitting or standingstill, �table-hold-tap� - where the smartphones is placed on the table and input isdone with a single hand, and �hand-hold-walk� - where input is done while walk-ing. For each scenario, about 2400 number pad taps were collected with highestpossible sampling rate on Android. The tap detection accuracy are 100% and95% in the hand-hold-tap and table-hold-tap scenarios. While walking, accuracybecomes worse (74%), what might be caused by �uctuation induced from �ngerpressure and walking mixed together. User input inference was solved by SVMwith a better performance than the others, while neural network classi�er hadworst results. Mostly, accuracy for SVM was over 70% what was claimed to bepromising and competitive and better than guess. Unfortunately there's no bet-ter results in values available in that paper, but Fig. 9 shows the accuracy forSVM for all three scenarios, giving an idea how the distribution is.
Fig. 9. Results for SVM classi�cation in [15]
Another completely di�erent way to exploit motion sensors from smart de-vices, is the use of wrist-worn smartwatches to recover keystrokes made on akeyboard. The unique constraint in this scenario is the other hands motion ismissing in the data as well as the motions sensed with the watch can relate to 3or 4 di�erent keys. The following two papers deal with this topic, using di�erentprocessing techniques.
�MoLe - Motion Leaks through Smartwatch Sensors� [16] from 2015 tried�rst to use the accelerometer and gyroscope data from a Galaxy Gear smart-watch to infer the words of a typing user. The key idea is to interpret motiondata in a 2D keyboard plane instead of a regular 3D space. As well, many usersusing the reference position (�F� and �J� keys) what helps developing Bayesiandecisions. Seen from this reference position, hand motion experience a large
164 Marcus Gall
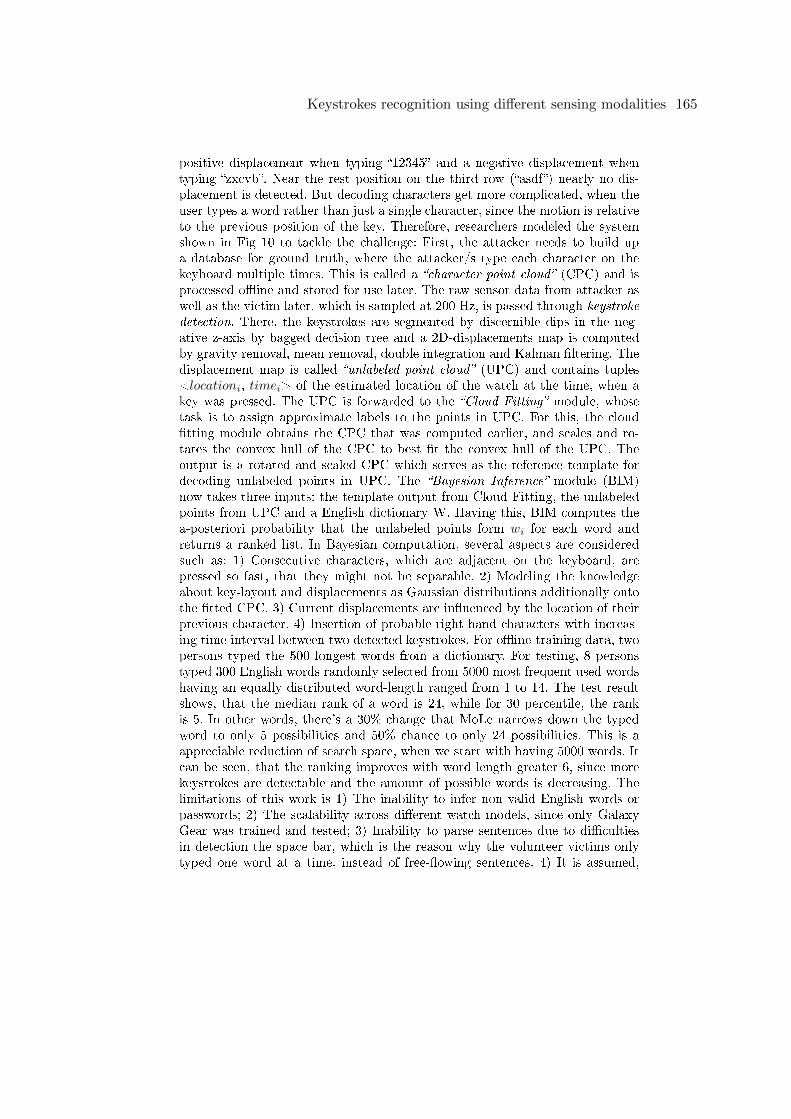
positive displacement when typing �12345� and a negative displacement whentyping �zxcvb�. Near the rest position on the third row (�asdf�) nearly no dis-placement is detected. But decoding characters get more complicated, when theuser types a word rather than just a single character, since the motion is relativeto the previous position of the key. Therefore, researchers modeled the systemshown in Fig 10 to tackle the challenge: First, the attacker needs to build upa database for ground truth, where the attacker/s type each character on thekeyboard multiple times. This is called a �character point cloud� (CPC) and isprocessed o�ine and stored for use later. The raw sensor data from attacker aswell as the victim later, which is sampled at 200 Hz, is passed through keystrokedetection. There, the keystrokes are segmented by discernible dips in the neg-ative z-axis by bagged decision tree and a 2D-displacements map is computedby gravity removal, mean removal, double integration and Kalman �ltering. Thedisplacement map is called �unlabeled point cloud� (UPC) and contains tuples<locationi, timei> of the estimated location of the watch at the time, when akey was pressed. The UPC is forwarded to the �Cloud Fitting� module, whosetask is to assign approximate labels to the points in UPC. For this, the cloud�tting module obtains the CPC that was computed earlier, and scales and ro-tates the convex hull of the CPC to best �t the convex hull of the UPC. Theoutput is a rotated and scaled CPC which serves as the reference template fordecoding unlabeled points in UPC. The �Bayesian Inference�-module (BIM)now takes three inputs: the template output from Cloud Fitting, the unlabeledpoints from UPC and a English dictionary W. Having this, BIM computes thea-posteriori probability that the unlabeled points form wi for each word andreturns a ranked list. In Bayesian computation, several aspects are consideredsuch as: 1) Consecutive characters, which are adjacent on the keyboard, arepressed so fast, that they might not be separable. 2) Modeling the knowledgeabout key-layout and displacements as Gaussian distributions additionally ontothe �tted CPC. 3) Current displacements are in�uenced by the location of theirprevious character. 4) Insertion of probable right hand characters with increas-ing time interval between two detected keystrokes. For o�ine-training data, twopersons typed the 500 longest words from a dictionary. For testing, 8 personstyped 300 English words randomly selected from 5000 most frequent used wordshaving an equally distributed word-length ranged from 1 to 14. The test resultshows, that the median rank of a word is 24, while for 30 percentile, the rankis 5. In other words, there's a 30% change that MoLe narrows down the typedword to only 5 possibilities and 50% chance to only 24 possibilities. This is aappreciable reduction of search space, when we start with having 5000 words. Itcan be seen, that the ranking improves with word length greater 6, since morekeystrokes are detectable and the amount of possible words is decreasing. Thelimitations of this work is 1) The inability to infer non valid English words orpasswords; 2) The scalability across di�erent watch models, since only GalaxyGear was trained and tested; 3) Inability to parse sentences due to di�cultiesin detection the space bar, which is the reason why the volunteer victims onlytyped one word at a time, instead of free-�owing sentences. 4) It is assumed,
Keystrokes recognition using different sensing modalities 165
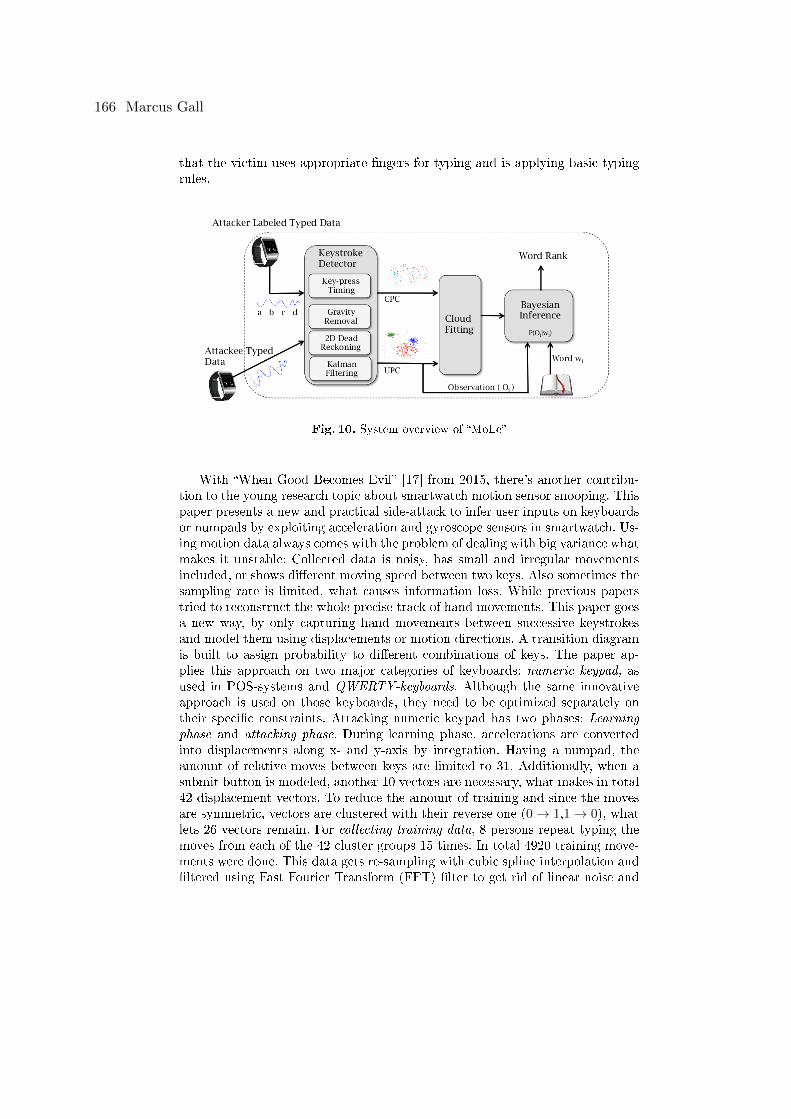
that the victim uses appropriate �ngers for typing and is applying basic typingrules.
Fig. 10. System overview of �MoLe�
With �When Good Becomes Evil� [17] from 2015, there's another contribu-tion to the young research topic about smartwatch motion sensor snooping. Thispaper presents a new and practical side-attack to infer user inputs on keyboardsor numpads by exploiting acceleration and gyroscope sensors in smartwatch. Us-ing motion data always comes with the problem of dealing with big variance whatmakes it unstable: Collected data is noisy, has small and irregular movementsincluded, or shows di�erent moving speed between two keys. Also sometimes thesampling rate is limited, what causes information loss. While previous paperstried to reconstruct the whole precise track of hand movements. This paper goesa new way, by only capturing hand movements between successive keystrokesand model them using displacements or motion directions. A transition diagramis built to assign probability to di�erent combinations of keys. The paper ap-plies this approach on two major categories of keyboards: numeric keypad, asused in POS-systems and QWERTY-keyboards. Although the same innovativeapproach is used on those keyboards, they need to be optimized separately ontheir speci�c constraints. Attacking numeric keypad has two phases: Learningphase and attacking phase. During learning phase, accelerations are convertedinto displacements along x- and y-axis by integration. Having a numpad, theamount of relative moves between keys are limited to 31. Additionally, when asubmit button is modeled, another 10 vectors are necessary, what makes in total42 displacement vectors. To reduce the amount of training and since the movesare symmetric, vectors are clustered with their reverse one (0→ 1,1→ 0), whatlets 26 vectors remain. For collecting training data, 8 persons repeat typing themoves from each of the 42 cluster groups 15 times. In total 4920 training move-ments were done. This data gets re-sampling with cubic spline interpolation and�ltered using Fast Fourier Transform (FFT) �lter to get rid of linear noise and
166 Marcus Gall
high frequent noise. Then training data gets segmented by using the magnitudeof external force F 2 ( on page 19). From this points, where the threshold issurpassed, displacement vectors are calculated, optimized and stored in a statetransition. In testing phase, the smartwatch continuously records the accelera-tions, covering the movement of typing 6-digit PINs and the �Enter� key. Threepersons created in this scenario in total 300 6-digit-long test data. This data issegmented by a heuristic, that searches for a 6 times repeating pattern. After re-sampling and FFT-�ltering, displacement vectors are extracted the same way asin the training. The Classi�cation on displacement vectors was tried with severaltechniques including Random Forest, kNN, Support Vector Machine and NeuralNetwork. It turns out, that k-Nearest Neighbor was the most accurate havingup to 65% top3 accuracy, respectively 80% top10 accuracy. For performing anEnglish text inference attack against QWERTY keyboards, for the �rst timeacoustic signals and acceleration data from embedded smartwatch sensors areused. Using both input sources limits the negative impact of various noises, thusmaking attack more robust. The system was designed in three phases: keystrokesegmentation, keystroke modeling and word matching. Keystroke segmentation issolved by using thresholds on the energy level of the DFT-�ltered acoustic signal.For keystroke modeling, keypress events in this paper are clustered into �L� and�R� letters, dividing them up into left-hand and right-hand pressed keys. Hittingboth letter types will produce noticeable sound, but only �L� letters introduceshuge z-axis acceleration. �L� letters can be further divided into subclasses, de-pending whether the y-axis acceleration is positive, negative, or close to zero.This label [+1,0,-1] relates to whether the left hand moves towards a key onthe keyboard, which is vertically a row higher, in the same row or a row lower.As an example, the word �quick� can be expressed as �L,R,R,L,R� or �+1,R,R,-1,R�. This way, the whole English dictionary can be translated into that spellingscheme. In reality, user's left hand might also move to type a �R� letter. To makethe scheme more robust, additional word pro�les are added, having some �L-R��ips, when the word contains letters, which also could be typed with the otherhand. To check, whether those transcription pattern are unique enough to inferwords with high accuracy, a �corncob� wordlist was transformed to its taggedform: From 58110 words, 34121 tags were generated, while 26554 tags are associ-ated with only one word. This shows, that the proposed tagging creates enoughentropy to classify words well. Finally the system could be tested with 5 personstyping 27 test words, having a length from 7 to 13 characters out of �corncob�dictionary. The result was a top10 accuracy of in average 63%. To test the systemin a context-aware approach, 5 persons typed some random sentences from fourBBC-news articles and the related word dictionary was constructed using thecontext of the related articles. The dictionary contains 672 tags from 765 wordsand 615 tags were only associated with one word. Inferring accuracy was testedon 20 random sentences with 463 words in total. 57% of the words are correctlyranked top1 in the candidate list. If taking the top three candidates into con-sideration, the accuracy was raised to 88%. But from this 20 random sentences,only the words having not less than 4 characters were taken for this statistics,
Keystrokes recognition using different sensing modalities 167
since they contain more valuable information for guessing the meaning of thetext. The advantages of this attack is the non-intrusiveness of to-attacking de-vices. Once the smartwatch is hacked, all input can be inferred. Additionally, byusing acoustic signals and acceleration, high entropy is produced which improvesaccuracy compared to previous works. Limitations of this approach is the likelybad performance on words having less than 4 characters, which might be relatedto ambiguous tags, as well as inability of password or foreign language wordrecognition. Further improvements, the team plans to investigate is combiningsensor data from smartwatch and smartphone, or using another noise �lter toimprove energy-level based keystroke detection.
With �(Smart)Watch your Taps� from 2015, there's another contribution onsmartwatch motion data, but attacking a smartphone: This paper formulatesan attack approach, which employs supervised learning techniques on linear ac-celeration data from smartwatches to infer typing on a smartphone's numerictouchscreen keypad. Additionally, the paper also uses smartphone's accelerationdata as well, to infer typing on itself as other papers did already, but mainfocus is on smartwatch attacks smartphone. Two scenarios should be investi-gated: 1) Non-Holding Hand Typing (NHHT) - Wearing smartwatch and holdingsmartphone in one hand, typing with the other hand's index �nger; 2) HoldingHand Typing (HHT) - Wearing smartwatch and smartphone in one hand, typingwith its thumb. For training data collection, 12 persons typed 400 keystrokes ofuniformly distributed random numbers in NHHT as well as HHT. During typ-ing, linear acceleration is recorded on smartwatch and smartphone, additionally,keystroke ground-truth for labeling purposes is saved. Training data reveals,that keystroke events are clearly separated from one another with small butclear inactive time regions in both typing scenarios. A keystroke movement �n-ishes after approximately 350 ms, what makes 18 samples at a sampling rateof 50 Hz. Samples from both the smartphone and the smartwatch are dissectedinto individual keystrokes, based on peaks in their linear acceleration on eachaxis individually. Then the sample with the highest magnitude is mapped as thefourth time sample in each keystroke segment. After a script removes erroneoustraining samples, 30 samples per key remained, which were divided up into 20samples for training, 10 for testing. As features for classi�cation, the researcherschoose to build a 54-dimensional feature vector, consisting of the 18 samples'accelerometer magnitudes over 3 axes. So to say, they used all data they couldget. The keystroke inference problem is modeled as a multi-class classi�cationproblem and three di�erent classi�cation algorithms are used: Simple linear re-gression (SLR), random forest (RF) and k-nearest neighbor (kNN). SLR trainingis optimized using LogitBoost, in kNN was k = 1 and linear search algorithmwith distance and weight inversely proportional to each other. In RF, the depthof the tree is left unrestricted, number of random trees is set to 100, and num-ber of features in each tree is chosen to be 6. Not only multiple classi�cationalgorithm were tested, but also three types of training datasets: �One vs. One�,where the classi�er is trained on the subjects training data (100 vs. 200), �Onevs. Rest�, where the classi�er is trained on the other subjects training data (100
168 Marcus Gall
vs. 2220) and �All vs. All�, where all subjects training data is used to train theclassi�er (1200 vs. 2400). In evaluation of the attack using only smartwatch data,SLR has high �One vs. One� classi�cation accuracy of more that 90%, but lessaccurate in �One vs. Rest� with 70%. RF in �One vs. One� and �One vs. Rest�was around 70%, but higher in �All vs. All� having more than 80%. �One vs.One� and �All vs. All� accuracy of k-NN is high (close to 90%) while �One vs.Rest� classi�cation accuracy is moderate (close to 80%). Because �One vs. Rest�refers to an attack scenario, when no training data from the attackee is avail-able, the best overall accuracy on smartwatch data is kNN close to 80%. Keep inmind, that also smartphone acceleration data was recorded before: Working onthese data the same way, the best accuracy was achieved on kNN as well, hav-ing better than 70%. It can be observed, that NHHT results have much betterclassi�cation accuracy, while HHT classi�cation results are mixed.
The last one of the promising paper about keystroke sensing is �spiPhone�from 2011. In this paper, scientists of MIT face an attack vector, which nobodyused before and after: Their approach uses iPhones placed nearby a computerkeyboard to sense keystrokes with the iPhone's accelerometer. Normally, ac-celerometers in smartphones have a quite low sampling rate, near at the Nyquistrate, what makes many traditional classifying techniques of unworkable. Theirapproach instead decodes keystrokes by measuring the relative physical positionand distance between each vibration, processed by neural network. Then theymatch the abstracted words against candidate dictionaries. A system overviewas introduction for the follwing explanations can be seen in Fig. 11. For theirwork, researchers used an iPhone 4, �rst time equipped with an 100 Hz accel-eration sensor, what introduces the possibility of this attack for the �rst time.Lower sampling rates deliver results which aren't processable meaningfully, andanyway, 100 Hz is far lower than other papers (like Asonov [1] in the begin-ning) starting with 44 kHz. The interesting way how the scientists tackle thelow sampling rate is de�ning a keypress event model stating the relation be-tween two keystrokes. This model contains a keys horizontal location relative toa �central-line� dividing the keyboard into left (L, along t,g,b) and right (R) par-titions. Also a certain distance α between two consecutive keypresses is modeled,what can be either near (N) or far (F). So two consecutive keystrokes is mod-eled as loc(Pi)‖loc(Pj)‖dist(Pi,Pj). Therefore, the word �canoe� is expressed asLLN.LRF.RRF.RLF. These abstract words can be processed for all words in aEnglish dictionary. For training phase, all letters in the English alphabet aretyped 150 times each. From this data, keystrokes are segmented in 100ms longparts and features are extracted from time-domain, frequency domain and cep-stral features. The �nal feature-vector corresponding to x, y, z accelerations of akeypress is denoted as <mean, kurtosis, variance, min, max, energy, rms, mfccs,�ts>, so in the end each letter has a set of 150 feature-vectors. Each word in thetraining dictionary is broken down into its characters and character-pairs. Foreach character, randomly 100 feature vectors from the letters set is taken andlabeled as left (�L�) or right (�R�) according to its position. The same is donefor character-pairs , where 100 random vectors from the �rst, and 100 random
Keystrokes recognition using different sensing modalities 169
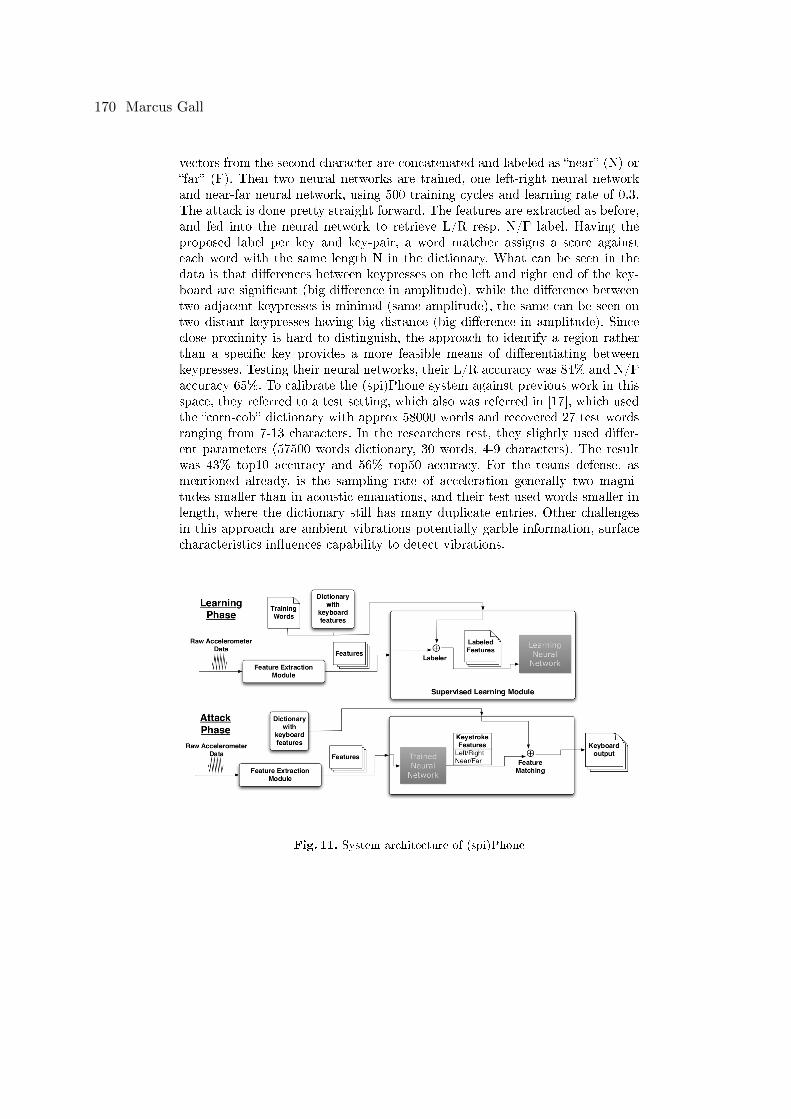
vectors from the second character are concatenated and labeled as �near� (N) or�far� (F). Then two neural networks are trained, one left-right neural networkand near-far neural network, using 500 training cycles and learning rate of 0.3.The attack is done pretty straight forward. The features are extracted as before,and fed into the neural network to retrieve L/R resp. N/F label. Having theproposed label per key and key-pair, a word matcher assigns a score againsteach word with the same length N in the dictionary. What can be seen in thedata is that di�erences between keypresses on the left and right end of the key-board are signi�cant (big di�erence in amplitude), while the di�erence betweentwo adjacent keypresses is minimal (same amplitude), the same can be seen ontwo distant keypresses having big distance (big di�erence in amplitude). Sinceclose proximity is hard to distinguish, the approach to identify a region ratherthan a speci�c key provides a more feasible means of di�erentiating betweenkeypresses. Testing their neural networks, their L/R accuracy was 84% and N/Faccuracy 65%. To calibrate the (spi)Phone system against previous work in thisspace, they referred to a test setting, which also was referred in [17], which usedthe �corn-cob� dictionary with approx 58000 words and recovered 27 test wordsranging from 7-13 characters. In the researchers test, they slightly used di�er-ent parameters (57500 words dictionary, 30 words, 4-9 characters). The resultwas 43% top10 accuracy and 56% top50 accuracy. For the teams defense, asmentioned already, is the sampling rate of acceleration generally two magni-tudes smaller than in acoustic emanations, and their test used words smaller inlength, where the dictionary still has many duplicate entries. Other challengesin this approach are ambient vibrations potentially garble information, surfacecharacteristics in�uences capability to detect vibrations.
Fig. 11. System architecture of (spi)Phone
170 Marcus Gall
5.1 Summary of motion based methods
Summarizing the previous section, we saw several ways, how to exploit the gainedinformation from motion sensors. Many papers emphasized the problem, that notprivileged access of motion data on smartphones could be used to infer text-inputfrom the user on the smartphone itself and developed an attack to proof it. Butalso, motion data from smartwatches can be used to infer keyboard, smartphoneor numpad input, which was a second major topic of interest. Last but not least,one paper tried to use smartphone acceleration data to sense keystrokes madeon a nearby keyboard. No paper could be found dealing with motion data as aalternative text-input method, which is related to the fact that todays motionsensor's sampling rate in smart devices is not su�cient for sensing input accu-rately in high resolution: Devices' motion sensor sampling rates vary from 30- 100 Hz, but still 100 Hz is too less to catch high frequencies (e.g. emanatedfrom keyboards) which carries important information. Another problem whatmake good results as alternative text-input di�cult is the high dependency onhow a user types. Only with lots of training data from the speci�c person on aspeci�c device allows satisfying results for that speci�c person, since data frommany users induce high variance, what generalizes bad. Formal typing rules,like which key has to be typed with which �nger, could narrow down searchspace thus make classi�cation results more reliable, but it is hard to formulatethis as a precondition, because a user not always follows the rules. This way,strong assumptions, which would make sensing more reliable are not makableand thus, attacks on smartphone input stay on level around 70% accuracy forinferring a single entered digit on a touchscreen. On the other hand, for attacks,the sampling rate is su�cient to extract enough information, which reducessearch space for brute-force attacks tremendously. For example [14] could �nd 6character long [0-z] passwords in 215 trials instead of 228. Mostly the extractedfeatures on motion data were statistical data about the keystroke pattern tocalculate probabilities in Gaussians or kNN classi�ers. Attacking text-input byleaked smartwatch motions tries to interpret acceleration in the hand wrist to in-put on a keypad. Because the hand has more degrees of freedom, wrist's motiondata carries only limited information about �nger-tip movement, which can notbe used with a strong con�dence of which key was pressed. Also information ofthe right hand's typing can't be sensed directly. To reduce this downsides, mostpapers use a word model to increase accuracy by dictionary look-up. Unfortu-nately every paper dealing with word model couldn't take a language modelas well, since they can not reliably track the space bar. By this limiting fac-tor, an attack by smart-watch sensing can't process free-�owing text-input andcan deliver 63% accuracy in the top10 guesses per word ! Some papers use anintermediate dictionary to translate relative movements on the keyboard intokeys. This intermediate dictionary works great on longer workds, but has lots ofsimilar taggings on short words below 4 characters. These words have been leftout in tests to raise accuracy, since �they don't have much information�, what isbothersome in some way.
Keystrokes recognition using different sensing modalities 171
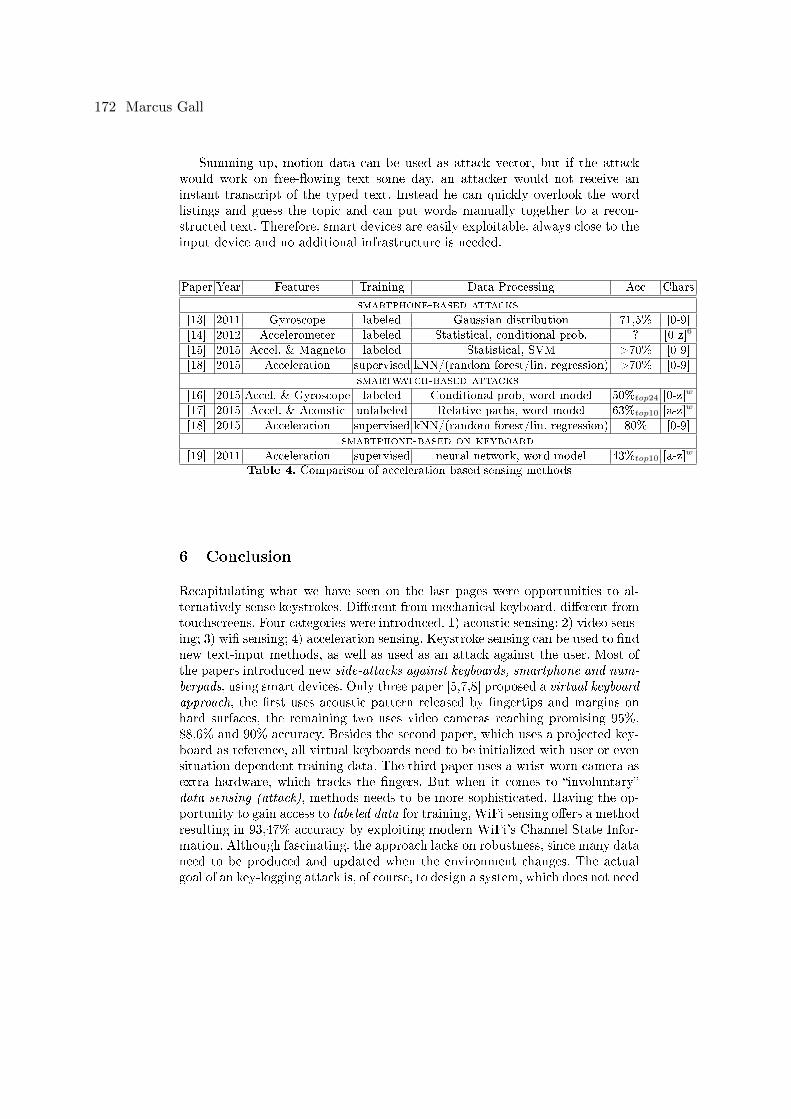
Summing up, motion data can be used as attack vector, but if the attackwould work on free-�owing text some day, an attacker would not receive aninstant transcript of the typed text. Instead he can quickly overlook the wordlistings and guess the topic and can put words manually together to a recon-structed text. Therefore, smart devices are easily exploitable, always close to theinput device and no additional infrastructure is needed.
Paper Year Features Training Data Processing Acc Chars
smartphone-based attacks
[13] 2011 Gyroscope labeled Gaussian distribution 71,5% [0-9]
[14] 2012 Accelerometer labeled Statistical, conditional prob. ? [0-z]6
[15] 2015 Accel. & Magneto labeled Statistical, SVM >70% [0-9]
[18] 2015 Acceleration supervised kNN/(random forest/lin. regression) >70% [0-9]
smartwatch-based attacks
[16] 2015 Accel. & Gyroscope labeled Conditional prob, word model 50%top24 [0-z]w
[17] 2015 Accel. & Acoustic unlabeled Relative paths, word model 63%top10 [a-z]w
[18] 2015 Acceleration supervised kNN/(random forest/lin. regression) 80% [0-9]
smartphone-based on keyboard
[19] 2011 Acceleration supervised neural network, word model 43%top10 [a-z]w
Table 4. Comparison of acceleration based sensing methods
6 Conclusion
Recapitulating what we have seen on the last pages were opportunities to al-ternatively sense keystrokes. Di�erent from mechanical keyboard, di�erent fromtouchscreens. Four categories were introduced. 1) acoustic sensing; 2) video sens-ing; 3) wi� sensing; 4) acceleration sensing. Keystroke sensing can be used to �ndnew text-input methods, as well as used as an attack against the user. Most ofthe papers introduced new side-attacks against keyboards, smartphone and num-berpads, using smart devices. Only three paper [5,7,8] proposed a virtual keyboardapproach, the �rst uses acoustic pattern released by �ngertips and margins onhard surfaces, the remaining two uses video cameras reaching promising 95%,88,6% and 90% accuracy. Besides the second paper, which uses a projected key-board as reference, all virtual keyboards need to be initialized with user or evensituation dependent training data. The third paper uses a wrist-worn camera asextra hardware, which tracks the �ngers. But when it comes to �involuntary�data sensing (attack), methods needs to be more sophisticated. Having the op-portunity to gain access to labeled data for training, WiFi sensing o�ers a methodresulting in 93,47% accuracy by exploiting modern WiFi's Channel State Infor-mation. Although fascinating, the approach lacks on robustness, since many dataneed to be produced and updated when the environment changes. The actualgoal of an key-logging attack is, of course, to design a system, which does not need
172 Marcus Gall
any labeled data (unlabeled attack) from the victim to minimize the adaption ef-forts and generalize the attack as much as possible. There, acoustic attacks witho�ine-procession exist, o�ering an accuracy of 95,7% using HMM and languagemodel [2], as also 95% of accuracy using Time Di�erence of Arrival (TDoA) andMel Frequency Cepstrum Coe�cients (MFCC) [6] only needing a smartphonenearby and no need of a dictionary. No need of dictionaries is always �better�,since dictionary-based approaches only can recognize words, which are includedin the language model. Especially foreign language words and passwords can'tbe inferred successfully. Other paper in the section of unlabeled data attacks farbelow the previously mentioned accuracies. The approach [17] using smartwatchacceleration in combination with acoustic signal has the best results under allmotion based approaches having 63% accuracy, �nding a typed word in top10suggestions. But this requires as well a word dictionary. The best dictionary-lessmotion approach using relative motions between keystrokes in a kNN-classi�errecognizes only numbers with an accuracy of 80%. As the reader might havealready recognized throughout the report, a big problem is the comparabilityof results between paper of di�erent scientists, also because every paper looksat the topic with a di�erent angle or di�erent preconditions, making it hard tocompare. Only three times, a paper tried to adapt their testing in regard totheir predecessor. Generally, acoustic approaches need either massive trainingdata to extract the key's speci�c sound, or three microphones try to triangulatethe signal. A combination of both techniques can work with fewer microphones,but need to be placed on known positions. Video data has the challenge of handsegmentation, where often complex hand models are necessary to solve the prob-lem of hidden �ngers. Also, keypresses are di�cult to identify, when no sound istaken into account. The video results are very type-style dependent. WiFi-basedsensing senses very sensitively, but senses also lots of noise, which has di�erentvariability. Once an item in proximity of the typist is changed, all features of thetiny �nger movements are expired. Acceleration-based techniques sense close tothe typist, but have the lowest sampling rate of all, what is problematic havingfeatures close to the Nyquist-frequency.
Finally, it can be said, referring to the introduction question of �nding alter-native sensing methods: There are very good sensing approaches already existingfor users as virtual keyboard with and without online-feedback, as well as forattackers. The attacks with the highest results based on o�ine-calculation, whatis the reason why no labeled data is needed. Because of the same reason, thosehigh accurate approaches aren't applicable as virtual keyboard. Further accu-racy improvements are very hard reachable, because many combinations arealready researched (motion and acoustic) and only minor changes in keystrokesegmentation or classi�cation seems to improve results.
References
1. Dmitri Asonov and Rakesh Agrawal. Keyboard acoustic emanations. Proc. - IEEESymp. Secur. Priv., 2004:3�11, 2004.
Keystrokes recognition using different sensing modalities 173
2. Li Zhuang, Feng Zhou, and J. D. Tygar. Keyboard acoustic emanations revisited.Proc. 12th ACM Conf. Comput. Commun. Secur. - CCS '05, (November):373,2005.
3. A.H.Y. Fiona. Keyboard Acoustic Triangulation Attack. pages 1�40, 2006.4. Tong Zhu, Qiang Ma, Shanfeng Zhang, and Yunhao Liu. Context-free Attacks
Using Keyboard Acoustic Emanations. Proc. 2014 ACM SIGSAC Conf. Comput.
Commun. Secur. - CCS '14, pages 453�464, 2014.5. Junjue Wang, Kaichen Zhao, Xinyu Zhang, and Chunyi Peng. Ubiquitous keyboard
for small mobile devices. Proc. 12th Annu. Int. Conf. Mob. Syst. Appl. Serv. -
MobiSys '14, pages 14�27, 2014.6. Jian Liu, Yan Wang, Gorkem Kar, Yingying Chen, Jie Yang, and Marco Gruteser.
Snooping Keystrokes with mm-level Audio Ranging on a Single Phone. Proc. 21stAnnu. Int. Conf. Mob. Comput. Netw., pages 142�154, 2015.
7. Huan Du, Thierry Oggier, Felix Lustenberger, and Edoardo Charbon. A VirtualKeyboard Based on True-3D Optical Ranging. Proc. Br. Mach. Vis. Conf., 1:220� 229, 2005.
8. Farooq Ahmad and Petr Musilek. A keystroke and pointer control input interfacefor wearable computers. Proc. - Fourth Annu. IEEE Int. Conf. Pervasive Comput.
Commun. PerCom 2006, 2006:2�11, 2006.9. Davide Balzarotti, Marco Cova, and Giovanni Vigna. ClearShot: Eavesdropping
on keyboard input from video. Proc. - IEEE Symp. Secur. Priv., pages 170�183,2008.
10. Qifan Pu, Sidhant Gupta, Shyamnath Gollakota, and Shwetak Patel. Whole-homegesture recognition using wireless signals. Acm Mobicom, pages 485�486, 2013.
11. Rajalakshmi Nandakumar, Bryce Kellogg, and Shyamnath Gollakota. Wi-Fi Ges-ture Recognition on Existing Devices.
12. Kamran Ali, Alex X Liu, Wei Wang, and Muhammad Shahzad. Keystroke Recog-nition Using WiFi Signals. Proc. ACM MobiCom, pages 90�102, 2015.
13. Liang Cai and Hao Chen. TouchLogger: inferring keystrokes on touch screen fromsmartphone motion. Proc. 6th USENIX Conf. Hot Top. Secur., pages 1�6, 2011.
14. Emmanuel Owusu, Jun Han, Sauvik Das, Adrian Perrig, and Joy Zhang. AC-Cessory: Password Inference Using Accelerometers on Smartphones. Proc. TwelfthWork. Mob. Comput. Syst. Appl., pages 9:1�9:6, 2012.
15. Chao Shen, Shichao Pei, Tianwen Yu, and Xiaohong Guan. On motion sensorsas source for user input inference in smartphones. 2015 IEEE Int. Conf. Identity,
Secur. Behav. Anal. ISBA 2015, 2015.16. He Wang, Ted Tsung-Te Lai, and Romit Roy Choudhury. MoLe: Motion Leaks
through Smartwatch Sensors. Proc. 21st Annu. Int. Conf. Mob. Comput. Netw. -
MobiCom '15, pages 155�166, 2015.17. Xiangyu Liu, Zhe Zhou, Wenrui Diao, Zhou Li, and Kehuan Zhang. When Good
Becomes Evil: Keystroke Inference with Smartwatch. Proc. 22nd ACM SIGSAC
Conf. Comput. Commun. Secur. - CCS '15, pages 1273�1285, 2015.18. Anindya Maiti, Murtuza Jadliwala, Jibo He, and Igor Bilogrevic. (Smart) Watch
Your Taps : Side-Channel Keystroke Inference Attacks using Smartwatches. ISWC
'15 - Proc. 2015 ACM Int. Symp. Wearable Comput., pages 27�30, 2015.19. Philip Marquardt, Arunabh Verma, Henry Carter, and Patrick Traynor. (sp)
iPhone: decoding vibrations from nearby keyboards using mobile phone accelerom-eters. Proc. 18th . . . , pages 551�562, 2011.
174 Marcus Gall
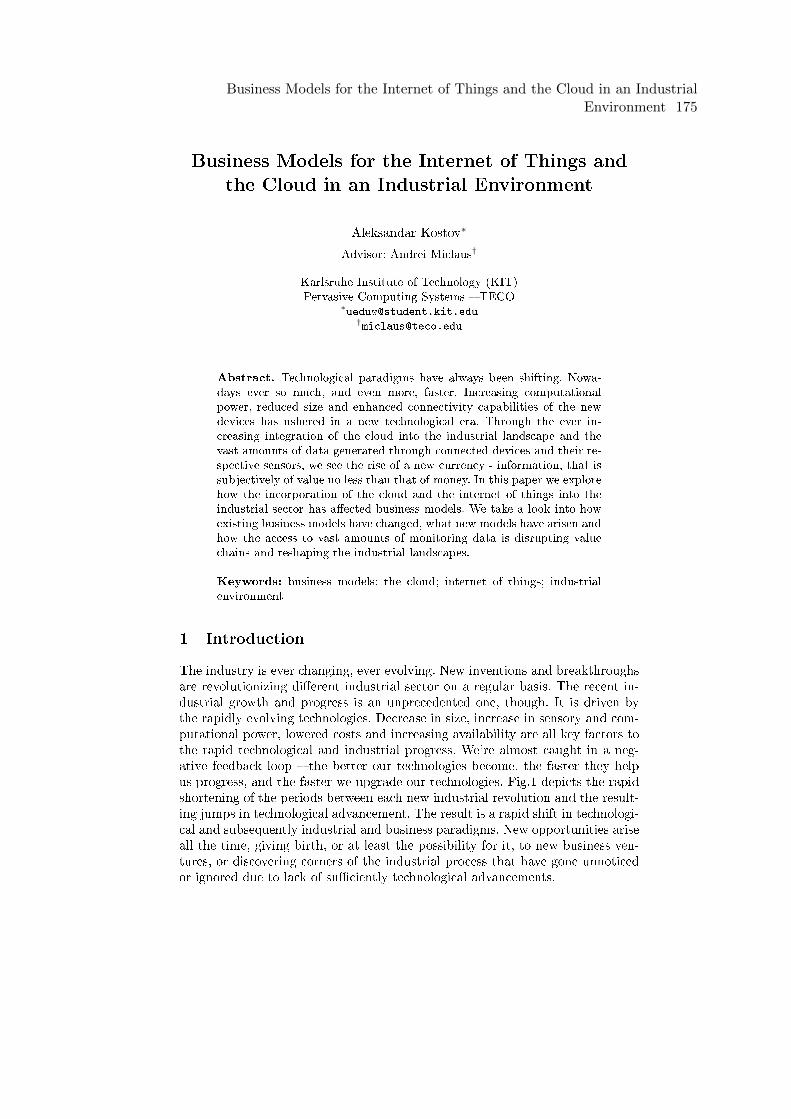
Business Models for the Internet of Things and
the Cloud in an Industrial Environment
Aleksandar Kostov∗
Advisor: Andrei Miclaus†
Karlsruhe Institute of Technology (KIT)Pervasive Computing Systems � TECO
∗[email protected]†[email protected]
Abstract. Technological paradigms have always been shifting. Nowa-days ever so much, and even more, faster. Increasing computationalpower, reduced size and enhanced connectivity capabilities of the newdevices has ushered in a new technological era. Through the ever in-creasing integration of the cloud into the industrial landscape and thevast amounts of data generated through connected devices and their re-spective sensors, we see the rise of a new currency - information, that issubjectively of value no less than that of money. In this paper we explorehow the incorporation of the cloud and the internet of things into theindustrial sector has a�ected business models. We take a look into howexisting business models have changed, what new models have arisen andhow the access to vast amounts of monitoring data is disrupting valuechains and reshaping the industrial landscapes.
Keywords: business models; the cloud; internet of things; industrialenvironment
1 Introduction
The industry is ever changing, ever evolving. New inventions and breakthroughsare revolutionizing di�erent industrial sector on a regular basis. The recent in-dustrial growth and progress is an unprecedented one, though. It is driven bythe rapidly evolving technologies. Decrease in size, increase in sensory and com-putational power, lowered costs and increasing availability are all key factors tothe rapid technological and industrial progress. We're almost caught in a neg-ative feedback loop � the better our technologies become, the faster they helpus progress, and the faster we upgrade our technologies. Fig.1 depicts the rapidshortening of the periods between each new industrial revolution and the result-ing jumps in technological advancement. The result is a rapid shift in technologi-cal and subsequently industrial and business paradigms. New opportunities ariseall the time, giving birth, or at least the possibility for it, to new business ven-tures, or discovering corners of the industrial process that have gone unnoticedor ignored due to lack of su�ciently technological advancements.
Business Models for the Internet of Things and the Cloud in an IndustrialEnvironment 175
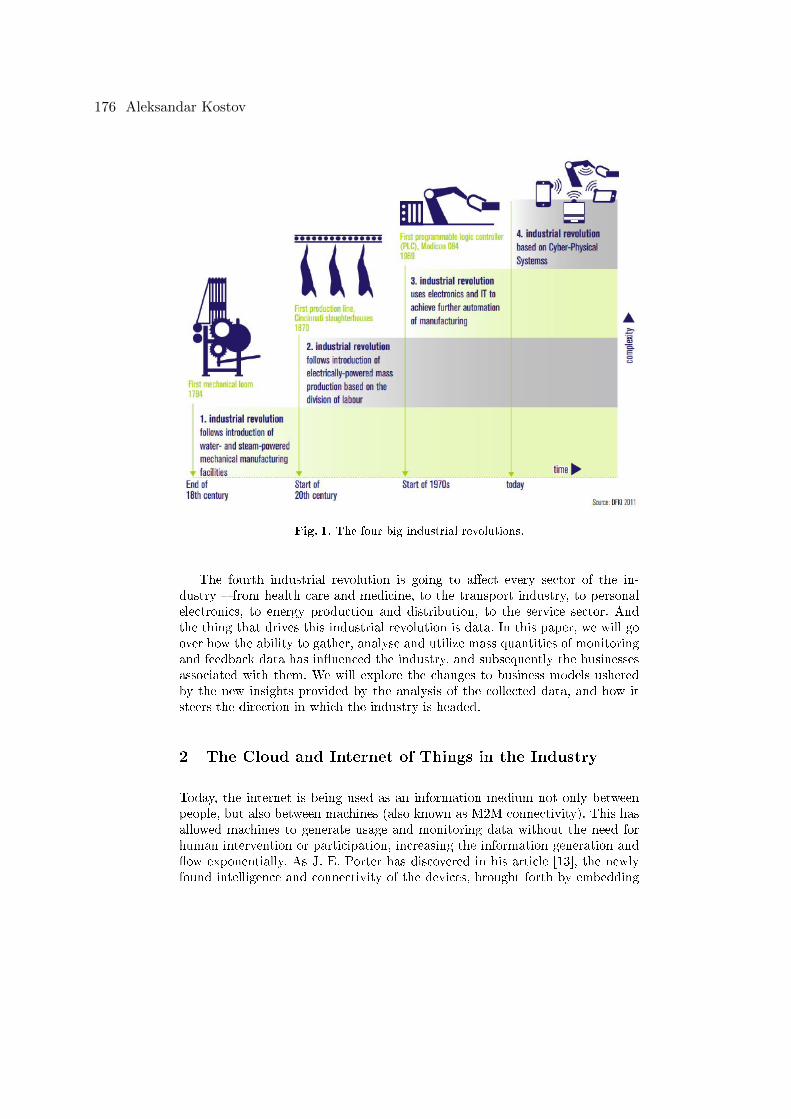
Fig. 1. The four big industrial revolutions.
The fourth industrial revolution is going to a�ect every sector of the in-dustry � from health care and medicine, to the transport industry, to personalelectronics, to energy production and distribution, to the service sector. Andthe thing that drives this industrial revolution is data. In this paper, we will goover how the ability to gather, analyse and utilize mass quantities of monitoringand feedback data has in�uenced the industry, and subsequently the businessesassociated with them. We will explore the changes to business models usheredby the new insights provided by the analysis of the collected data, and how itsteers the direction in which the industry is headed.
2 The Cloud and Internet of Things in the Industry
Today, the internet is being used as an information medium not only betweenpeople, but also between machines (also known as M2M connectivity). This hasallowed machines to generate usage and monitoring data without the need forhuman intervention or participation, increasing the information generation and�ow exponentially. As J. E. Porter has discovered in his article [13], the newlyfound intelligence and connectivity of the devices, brought forth by embedding
176 Aleksandar Kostov
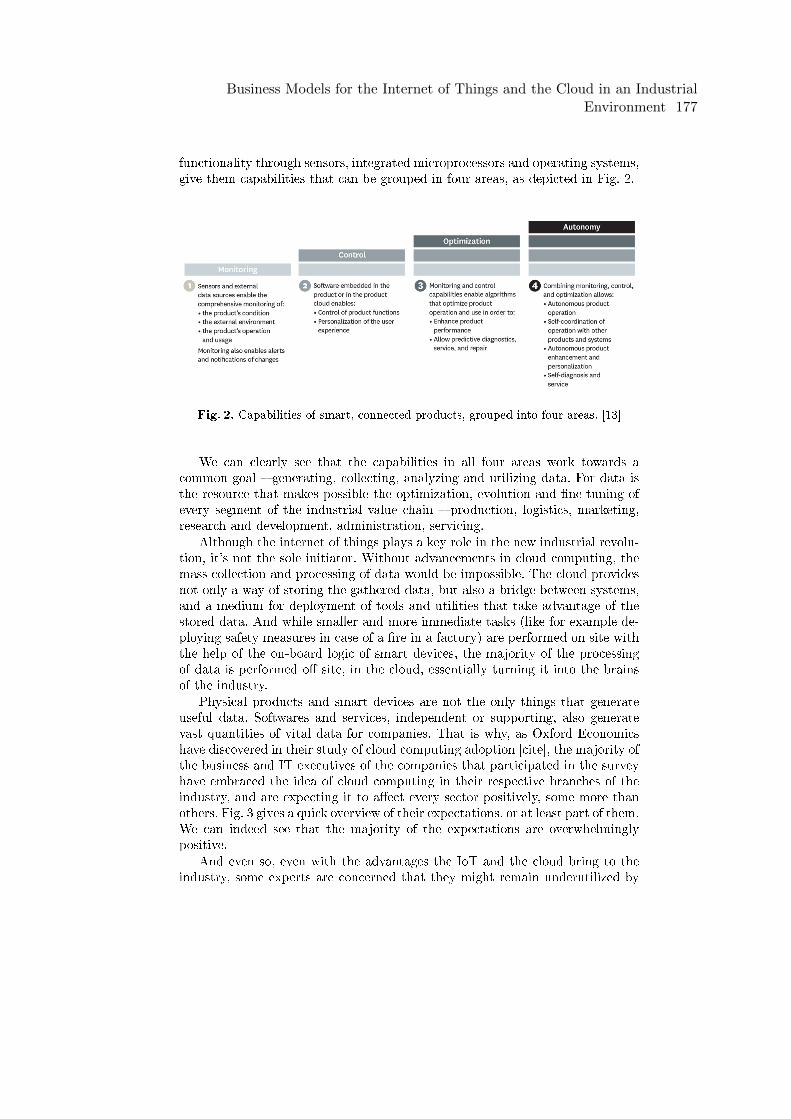
functionality through sensors, integrated microprocessors and operating systems,give them capabilities that can be grouped in four areas, as depicted in Fig. 2.
Fig. 2. Capabilities of smart, connected products, grouped into four areas. [13]
We can clearly see that the capabilities in all four areas work towards acommon goal � generating, collecting, analyzing and utilizing data. For data isthe resource that makes possible the optimization, evolution and �ne-tuning ofevery segment of the industrial value chain � production, logistics, marketing,research and development, administration, servicing.
Although the internet of things plays a key role in the new industrial revolu-tion, it's not the sole initiator. Without advancements in cloud computing, themass collection and processing of data would be impossible. The cloud providesnot only a way of storing the gathered data, but also a bridge between systems,and a medium for deployment of tools and utilities that take advantage of thestored data. And while smaller and more immediate tasks (like for example de-ploying safety measures in case of a �re in a factory) are performed on site withthe help of the on-board logic of smart devices, the majority of the processingof data is performed o� site, in the cloud, essentially turning it into the brainsof the industry.
Physical products and smart devices are not the only things that generateuseful data. Softwares and services, independent or supporting, also generatevast quantities of vital data for companies. That is why, as Oxford Economicshave discovered in their study of cloud computing adoption [cite], the majority ofthe business and IT executives of the companies that participated in the surveyhave embraced the idea of cloud computing in their respective branches of theindustry, and are expecting it to a�ect every sector positively, some more thanothers. Fig. 3 gives a quick overview of their expectations, or at least part of them.We can indeed see that the majority of the expectations are overwhelminglypositive.
And even so, even with the advantages the IoT and the cloud bring to theindustry, some experts are concerned that they might remain underutilized by
Business Models for the Internet of Things and the Cloud in an IndustrialEnvironment 177
the big companies. In his article about IoT business model innovation [19], AlexScroxton describes how, even though the IoT o�ers clear advantages, it getslargely underused, especially for the development of new business models. Asrestructuring and reorganization are expensive and time consuming processes,the internet of things is largely used for optimization of performance, cost andexpenses reduction and predictive maintenance. This is not to criticise, but it
raises a challenge in how the IoT is sold. As a result, movement to innovative
business models is slow.
However, there are more factors concerning the incorporation and utilizationof the cloud and IoT than just costs and time. A general concern is securityand privacy on multiple levels. Privacy and security breaches a�ect not only thecompanies, but the citizens as well. With an ever increasing quantity of data,both monitoring, operative and personal circulating the internet, it is becom-ing imperative that data, sensitive information and intellectual property get theproper security so they do not prove the downfall of the new technological age.Interestingly enough, as the majority of cloud service providers are big compa-nies such as Google, Microsoft, Amazon and SAP, companies aren't generallyconcerned with the safety of the data. Priorities have shifted towards aspectssuch as API and interface security, IP security and cibercrimes (see [12]).
Fig. 3. The cloud's enduring promise. Source: http://www.oxfordeconomics.com/SAPcloudperformance
178 Aleksandar Kostov
3 Business Models
The term business model is broad in the sense we want to explore it. It generallydescribes the organisation and inner workings of a company. A more apropriateterm for our purposes would be revenue model, but let's stick to the originalterm.
To be able to better understand the business models in the industry, T.Kaufmann [8] describes their four dimentions, and namely:
- Who are our clients?- What do we o�er our clients?- How do we produce and deliver?- How do we pro�t?These four key points are the core elements of every business model pattern.
The clients are the ones who we will be trading with, and hopefully pro�tingfrom, so they make the basis for every business model, and as such need tobe clearly identi�ed and de�ned. The products and services that we will o�ercomprise our value proposition. How we produce and deliver is essentially thelinchpin of the company, since the market is saturated with products and servicesof every kind. As such, it is essential for a company to stand out, if not witha unique product, then with an interesting and appealing ecosystems aroundexisting products, making them more desirable. And �nally, the way we actuallygenerate pro�t from the goods and services we o�er. While this is mostly �netweaking of prices, picking the best and most pro�table partnerships and collab-orations, we can essentially point out which aspect of our product or service ismost beni�tial, and how it will bring increases in pro�ts.
And because, as we've said before, the new wave of business model innovationis spurred on by the availability of data, and because their success lies more orless on the proper utilization of the data, we can safely de�ne the new businessmodels as datacentric.
Since a business model is a pretty broad de�nition, everything can warranta new business model. Even something as simple as turning a normal productinto a smart product can give old business models new �avor by improvingperformance, reducing cost and allowing predictive maintenance based on pastand present data. A basic example would be out�tting a washing machine withsensors that allow for optimization of water and electricity usage.
But smart devices by themselves do not yet make the category of new orinnovative business models, though. A step up from it would be the actual net-working of smart devices, say through a centralized local hub. A good examplewould be more advanced home automation. Having a device by itself be smartis just the �rst step. Creating a system of smart devices o�ers a wider rangeof possibilities, such as more advanced monitoring, analytics and metrics, whichpave the way for software solutions and services.
As the data is allowing companies to more e�ectively utilize their availableresources, especially machinery, it is getting increasingly popular to buy insteadof rent equipment. It may not seam like much, but this strategy has profoundimplications. Firstly, the responsibility for the maintenance of the equipment
Business Models for the Internet of Things and the Cloud in an IndustrialEnvironment 179
shifts from the customer to the company itself. That way, customers are moreinclined to use a certain product, as the costs of maintenance and the possibilityof failure of equipment and the resulting repair costs can be a deterrent. Withincreased capabilities for analytics, metrics and data collection, companies cannow more reliably predict the life cycles, eventual failure possibilities and there-fore reduce the risk they take by leasing rather than selling equipment. This alsodrives costs down, and increases customer satisfaction.
Leasing instead of buying can have some e�ects of questionable beni�t aswell. Leasing or renting means that the usage cycles for each piece of equipmentbecomes shorter, and customers do not get locked in so easily (most of thetimes). This leads from one side to customers being more inclined to try outnew products, as they do not have to make such a long term investment aswith buying the equipment itself. Companies have to be careful, though, asshorter usage cycles means more opportunities for customers to switch theirpreferred supplier. Simply put, with every set of advantages come also a numberof disadvantages that have to be considered before deciding on a business model.
As data can be gathered from every connected device and every customer,and the data can then in turn be used to optimize or innovate any part of thevalue chain of a given company, it is safe to assume that the possibilities forbusiness models are enormous. From models like Add-On (the automobile in-dustry, cheap �ight companies), Freemium (Skype, Spotify, Dropbox), Lock-In,Razor and Blade (Gillette) to Hidden-Revenue (Google AdSense), LeveragingCustomer Data (Amazon, Google, Facebook, Twitter) and Layer Player (Pay-Pal), every company �nds it's place in the industrial scene and selects a properbusiness model. That is why we will focus ourselves on only a couple of cases,and how they have been a�ected by the technological revolution.
3.1 Platform-as-a-Service (PaaS)
The PaaS business model has been adopted by a number of large companies,such as Google, Amazon and SAP. PaaS companies provide their clients withthe means to develop, run and manage their software without having to buildand maintain a complex infrastructure.
This has some distinct advantages, such as allowing the developers to focus onthe applications, solutions and the data, while the PaaS provider takes care of theinfrastructure (runtime, middleware, operating systems, virtualization, servers,storage and networking). PaaS o�erings may also include facilities for applicationdesign, application development, testing and deployment, as well as services suchas team collaboration, web service integration, and marshalling, database inte-gration, security, scalability, storage, persistence, state management, applicationversioning, application instrumentation, and developer community facilitation.Besides the service engineering aspects, PaaS o�erings include mechanisms forservice management, such as monitoring, work�ow management, discovery andreservation.
In cases like SAP, they have taken it one step further, and o�er not only theplatform itself as a service, but also the means to distribute your applications
180 Aleksandar Kostov
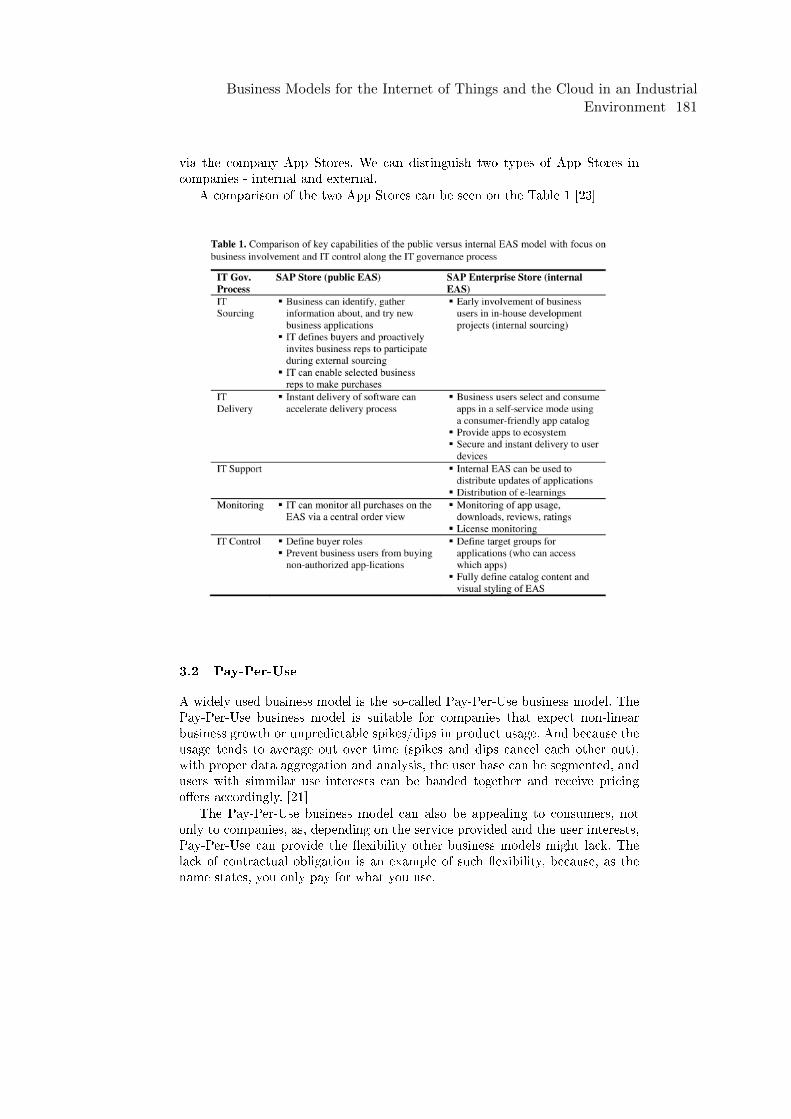
via the company App Stores. We can distinguish two types of App Stores incompanies - internal and external.
A comparison of the two App Stores can be seen on the Table 1 [23]
3.2 Pay-Per-Use
A widely used business model is the so-called Pay-Per-Use business model. ThePay-Per-Use business model is suitable for companies that expect non-linearbusiness growth or unpredictable spikes/dips in product usage. And because theusage tends to average out over time (spikes and dips cancel each other out),with proper data aggregation and analysis, the user base can be segmented, andusers with simmilar use interests can be banded together and receive pricingo�ers accordingly. [21]
The Pay-Per-Use business model can also be appealing to consumers, notonly to companies, as, depending on the service provided and the user interests,Pay-Per-Use can provide the �exibility other business models might lack. Thelack of contractual obligation is an example of such �exibility, because, as thename states, you only pay for what you use.
Business Models for the Internet of Things and the Cloud in an IndustrialEnvironment 181
An example of a good Pay-Per-Use implementation would be Amazon's EC2service. As the majority of applications and services require servers, Amazon hasfound a way to o�er an attractive perspective for developers. Like we mentionedabove, equipment is being rented or leased instead of bought more and morewidely, and that is what Amazon are doing with their EC2 service. Instead ofbuying, maintaining and managing servers themselves, clients can rent serversfrom Amazon. The renting itself is �exible, as developers can rent as much serverunits as they need, with options for increasing/decreasing of server numbers de-pending on current demand for computational power. This means, Amazon o�ersthe opportunity to use their already deployed equipment and infrastructure, asmuch as you need. Consumers pay according to the hours of usage and numberof server instances, without any contractual obligations.
But while Amazon is a huge company with the means of deploying andmaintaining infrastructure with attractive o�ers, smaller companies might nothave the same success initially. Smaller or starting service providers will have todistribute their costs over a smaller base, which means higher costs and lowerinitial discounts.
3.3 Subscription
The Subscription based business model is viable for businesses with linear andrelatively predictable growth, and a predictable consumer base behavior. Imple-menting a subscription based business model requires a fair amount of �ne tun-ing, as an unbalanced subscription model can quickly lead a company to failure.Things such as proper pricing and a hardware bu�er to handle an unexpectedover�ow of demand have to be taken into consideration.
According to KineticD[21] there are three di�erent type of subscription basedrevenue models: per-user; per-device and per-enterprise. These three basicallyregulate what access a certain user or user group has to the software or solutionbased on the license they have received. A per-enterprice license can allow forexample anywhere from 10 to 100 or even more users access to the softwareor utility if they are company members (Antivirus software companies), whilea per-user license would allow only a single user or a single account with asmaller number of concurrent users (a good example would be Net�ix and theirsubscription model).
4 Conclusion
In this paper, we have given an overview of how the interconnectivity of thenew smart devices and the opportunities the cloud gives for interoperability,cooperation and collaboration, as well as mass monitoring and operational datagathering, analytics and processing is changing not only the industrial, but alsothe business landscape. As the emerging technologies and the advancements inexisting ones allow us to better utilize the vast amounts of data devices produceevery day, it is up to the companies to �nd business models that suit them best.
182 Aleksandar Kostov
For many of them, this would not be just one business model. It might be acombination of existing models, or it might be an entirely new model they havedeveloped through innovative ideas. Whatever the case, technology is movingforward in an incredible pase, and business models have to keep up in order tomake best use of the emerging opportunities.
References
1. Ballon, P., Walravens, N., Spedalieri, A., Venezia, C.: An Advertisement-basedPlatform Business Model for Mobile Operators. Constellations (NOVEMBER)(2008)
2. Chen, N., Lin, J., Hoi, S., Xiao, X., Zhang, B.: AR-miner: mining informativereviews for developers from mobile app marketplace. Icse (2014), 767�778 (2014),http://www.cais.ntu.edu.sg/{~}nchen1/AR-Miner/icse14-preprint.pdf
3. Cramer, H., Rost, M., Belloni, N., Bentley, F., Chincholle, D.: Research in thelarge. using app stores, markets, and other wide distribution channels in Ubicompresearch. Proceedings of the 12th ACM international conference adjunct paperson Ubiquitous computing - Ubicomp '10 p. 511 (2010), http://www.scopus.com/inward/record.url?eid=2-s2.0-78650022798{\&}partnerID=tZOtx3y1
4. Emmrich, V., Döbele, M., Bauernhansl, T., Paulus-Rohmer, D., Schatz, A.,Weskamp, M.: Geschäftsmodell-Innovation durch Industrie 4.0. Dr.Wieselhuber &Partner GmbH und Fraunhofer IPA p. 56 (2015)
5. Fleisch, E., Weinberger, M., Wortmann, F.: Business Models and the In-ternet of Things. Bosch IoT Lab White Paper (SEPTEMBER), 19(2014), http://cocoa.ethz.ch/downloads/2014/10/2090{\_}EN{\_}Bosch$\
backslash$nLab$\backslash$nWhite$\backslash$nPaper$\backslash$nGM$\
backslash$nim$\backslash$nIOT$\backslash$n1{\_}2.pdf
6. Helmrich, K., Siemens: On the Way to Industrie 4.0 � The Digital Enterprise.Industry4.0 (2014)
7. Hillis, D.: The new world order for open-source and com-mercial software (2016), https://techcrunch.com/2016/06/13/
the-new-world-order-for-open-source-and-commercial-software/?ncid=
rss&utm_source=feedburner&utm_medium=feed&utm_campaign=Feed%3A+
Techcrunch+%28TechCrunch%29&sr_share=twitter
8. Kaufmann, T.: Geschäftsmodelle in Industrie 4.0 und dem Internet der Dinge,vol. 53 (2013)
9. Kim, J., Park, Y., Kim, C., Lee, H.: Mobile application service networks: Apple'sApp Store. Service Business 8(1), 1�27 (2013), http://link.springer.com/10.1007/s11628-013-0184-z
10. Kimbler, K.: App store strategies for service providers. 2010 14th Int. Conference onIntelligence in Next Generation Networks: "Weaving Applications Into the NetworkFabric", ICIN 2010 - 2nd Int. Workshop on Business Models for Mobile Platforms,BMMP 10 pp. 1�5 (2010)
11. Lindgardt, Z., Reeves, M., Stalk, G., Deimler, M.S.: Business Model Innovation:When the Game Gets Tough, Change the Game. Boston Consulting Group (De-cember), 9 (2009)
12. Louis Columbus, Oxford Economics, S.: 55 percent of Enterprises Pre-dict Cloud Computing Will Enable New Business Models In ThreeYears (2015), http://www.forbes.com/sites/louiscolumbus/2015/06/08/
Business Models for the Internet of Things and the Cloud in an IndustrialEnvironment 183
55-of-enterprises-predict-cloud-computing-will-enable-new-business-models-in-three-years/
#ceaba01c0b27
13. Michael E. Porter, J.E.H.: How Smart, Connected ProductsAre Transforming Competition (2014), https://hbr.org/2014/11/
how-smart-connected-products-are-transforming-competition#
14. M&M, S.: Industrial internet of things und cloud � strategien, lösungen und praxis07. (April) (2016)
15. Mobile, V.: The European App Economy. Vision Mobile (2014), www.
visionmobile.com/product/the-european-app-economy/
16. Müller, R.M., Kijl, B., Martens, J.K.J.: A comparison of inter-organizational busi-ness models of mobile app stores: There is more than open vs. closed. Journal ofTheoretical and Applied Electronic Commerce Research 6(2), 63�76 (2011)
17. Oxford Economics: The new engine of business 1(1), 16 (2015)18. Pagano, D., Maalej, W.: User feedback in the appstore: An empirical study. 2013
21st IEEE International Requirements Engineering Conference, RE 2013 - Pro-ceedings pp. 125�134 (2013)
19. Scroxton, A.: Internet of things needs more innovative businessmodels (2016), http://www.computerweekly.com/news/4500278603/
Internet-of-things-needs-more-innovative-business-models
20. Smith, M.: Milions of sensitive services exposed onthe internet reveal most hackable countries (2016),http://www.networkworld.com/article/3080003/security/
millions-of-sensitive-services-exposed-on-internet-reveal-most-hackable-countries.
html
21. Summary, E.: Sustainability is the Key : Cloud Computing Business Models22. Wee, D., Kelly, R., Cattel, J., Breunig, M.: Industry 4.0 - how to navigate digiti-
zation of the manufacturing sector. McKinsey & Company pp. 1�62 (2015)23. Wenzel, S.: App store models for enterprise software: A comparative case study of
public versus internal enterprise app stores. Lecture Notes in Business InformationProcessing 182 LNBIP, 227�242 (2014)
24. Xia, R., Rost, M., Holmquist, L.E.: Business models in the mobile ecosystem. ICMBand GMR 2010 - 2010 9th International Conference on Mobile Business/2010 9thGlobal Mobility Roundtable pp. 1�8 (2010)
184 Aleksandar Kostov
Methoden des Experience Sampling mitMobilgeräten
Denis Gaus∗
Betreuer: Anja Bachmann†
Karlsruher Institut für Technologie (KIT)Pervasive Computing Systems – TECO
∗[email protected]†[email protected]
Zusammenfassung. Die rasante Verbreitung und Entwicklung der Mo-bilgeräte in den letzten Jahren hat den Sozialwissenschaften neue Mög-lichkeiten zur Datenerhebung an die Hand gegeben. Die in diesem Papervorgestellte Mobile Experience Sampling Methode erfasst in der natür-lichen Umgebung des Probanden vielerlei Daten ohne jegliches Zutundessen, unterstützt von gelegentlichen Befragungen des Benutzers, womiteine möglichst detailgetreue und unverfälschte Beobachtung von Verhal-ten, Gedanken und Gefühlen des Teilnehmers erreicht werden soll, ohneauf dessen Erinnerungen angewiesen zu sein. Sie stellt eine Weiterent-wicklung der klassischen Experience Sampling Methode dar, die bereitsseit Jahrzehnten in den Sozialwissenschaften zum Einsatz kam, und wur-de erst durch die neuen technischen Möglichkeiten von vor allen DingenSmartphones möglich gemacht.
Schlüsselwörter: mobile sensing, ESM, mESM, BCI
1 Einleitung
Sozialwissenschaftler waren seit je her interessiert daran, das menschliche Ver-halten zu beobachten und aufzuzeichnen, ohne es zu verfälschen, also Einflussdarauf zu nehmen. Die Verfügbarkeit und Allgegenwärtigkeit von Smartphonesbietet Forschern dabei die Möglichkeit, dies in einer Art und Weise zu tun, wiees vorher nicht möglich war. Fortschritte in Wissenschaft und Technologie ge-hen sehr häufig Hand in Hand. Dabei können Smartphones mit all den in ihnenverbauten Sensoren nicht nur zur Datenaufzeichnung dienen, sondern dank ihrererheblichen Rechenkraft auch einen großen Teil der Vorverarbeitung überneh-men.
2 Technischer Fortschritt
Es gab in den letzten Jahren eine Vielzahl an technologischen Entwicklungen,vor allem bei den Smart-Wearables, die völlig neue Möglichkeiten im Bereich
Methoden des Experience Sampling mit Mobilgeraten 185
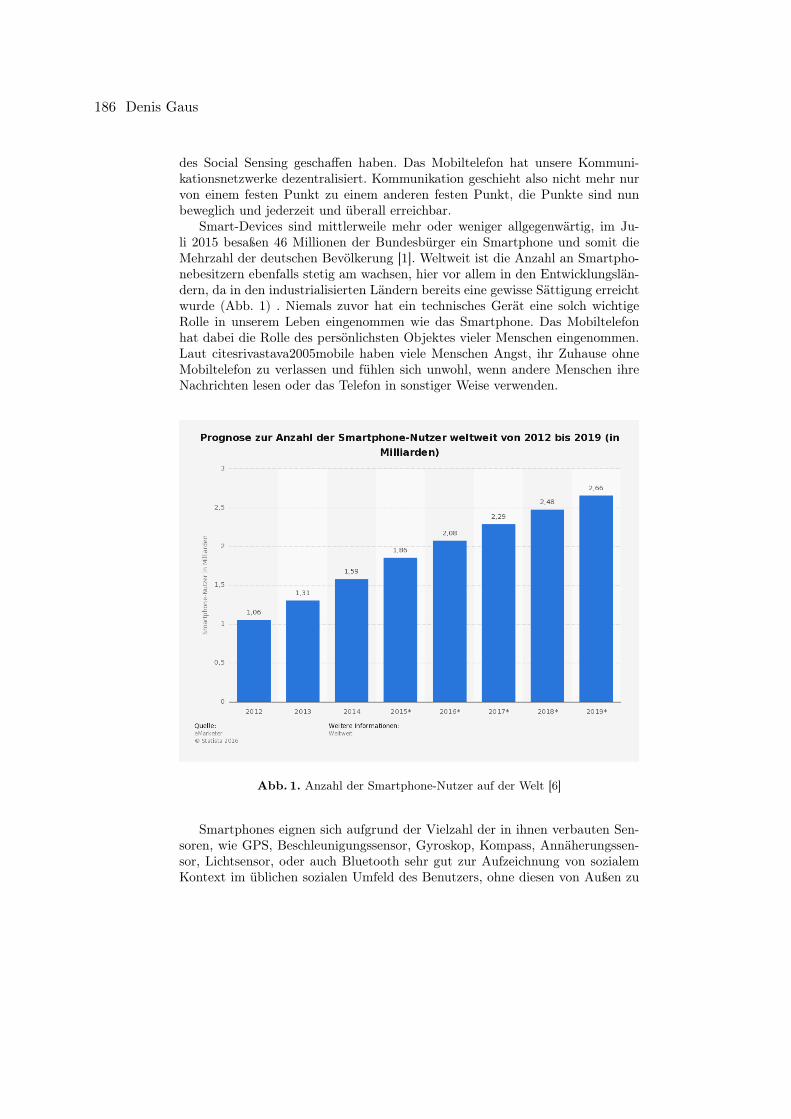
des Social Sensing geschaffen haben. Das Mobiltelefon hat unsere Kommuni-kationsnetzwerke dezentralisiert. Kommunikation geschieht also nicht mehr nurvon einem festen Punkt zu einem anderen festen Punkt, die Punkte sind nunbeweglich und jederzeit und überall erreichbar.
Smart-Devices sind mittlerweile mehr oder weniger allgegenwärtig, im Ju-li 2015 besaßen 46 Millionen der Bundesbürger ein Smartphone und somit dieMehrzahl der deutschen Bevölkerung [1]. Weltweit ist die Anzahl an Smartpho-nebesitzern ebenfalls stetig am wachsen, hier vor allem in den Entwicklungslän-dern, da in den industrialisierten Ländern bereits eine gewisse Sättigung erreichtwurde (Abb. 1) . Niemals zuvor hat ein technisches Gerät eine solch wichtigeRolle in unserem Leben eingenommen wie das Smartphone. Das Mobiltelefonhat dabei die Rolle des persönlichsten Objektes vieler Menschen eingenommen.Laut citesrivastava2005mobile haben viele Menschen Angst, ihr Zuhause ohneMobiltelefon zu verlassen und fühlen sich unwohl, wenn andere Menschen ihreNachrichten lesen oder das Telefon in sonstiger Weise verwenden.
Abb. 1. Anzahl der Smartphone-Nutzer auf der Welt [6]
Smartphones eignen sich aufgrund der Vielzahl der in ihnen verbauten Sen-soren, wie GPS, Beschleunigungssensor, Gyroskop, Kompass, Annäherungssen-sor, Lichtsensor, oder auch Bluetooth sehr gut zur Aufzeichnung von sozialemKontext im üblichen sozialen Umfeld des Benutzers, ohne diesen von Außen zu
186 Denis Gaus
beeinflussen. Mit ihrer Hilfe kann festgestellt werden wo sich jemand aufhält undwas derjenige gerade macht, oder auch wer sich sonst in der Umgebung befindet.
Ebenfalls gab es wesentliche Fortschritte im Bereich der Funktechnologien,so sind bereits heute im deutschen Mobilfunknetz mit LTE Advanced Cat-6bis zu 300Mbit/s im Download und 50Mbit/s im Upload möglich. Im Gegen-satz dazu waren Anfang dieses Jahrhunderts mithilfe des damals verbreitetenGPRS nur Übertragungsgeschwindigkeiten von um die 56Kbit/s möglich, beigleichzeitig höheren Kosten für die Mobilfunktarife, insbesondere was die Da-tenübertragung angeht. Ein weiterer Ausbau der Geschwindigkeiten ist seitensder Provider angekündigt und in Erprobung, während auch die LTE-Abdeckungdurch den fortwährend stattfindenden Ausbau der Telekommunikationsanbietersich weiter verbessert. Somit ist, wenn nötig, auch eine Übertragung der Datenin Echtzeit oftmals machbar.Rechenleistung und Speichermengen von Smartphones sind weiter im Begriff zuwachsen, so das die für die Aufzeichnung und Auswertung der Daten notwendigeRechenleistung üblicherweise gegeben ist und auch das Speichern dieser Datenauf den im Smartphone verbauten Speicher eine kleinere Hürde darstellt.
3 Verhaltensbeobachtung
Das Menschliche Verhalten ist üblicherweise vom Kontext abhängig in dem mansich befindet. Der Kontext wird beschrieben durch die physische Umgebung, al-so dem Ort an dem man sich befindet, wie etwa der Arbeitsplatz, die Schuleoder das Zuhause, unserem physischen Zustand also ob wir beispielsweise laufenoder schlafen und unserem inneren Zustand. Das menschliche Verhalten ist sehrkomplex und drückt sich auf vielfältige Art und Weise aus. Für Psychologen istes wünschenswert, dieses Verhalten fortwährend aufzuzeichnen, um es verstehenund ergründen zu können. Frühe Studie bestanden daraus, Teilnehmer entwe-der künstlichen Situation im Labor auszusetzen, um sie dabei zu beobachtenoder auch aus nachträglichen Interviews, in denen Teilnehmer über vergangeneErfahrungen befragt werden. Da das menschliche Verhalten aber stark vom Kon-text abhängig ist, welches niemals komplett in einem Labor nachgestellt werdenkann, sind diese Arten von Studien wenig geeignet um natürliches Verhaltennachzustellen.
Die Experience Sampling Method (ESM) ist eine sozialwissenschaftliche Me-thode, die aus gelegentlicher Befragung des Benutzers besteht. Das Ziel ist es,eine unmittelbare Antwort auf gestellte Fragen zu erhalten, das menschliche Ver-halten also aufzuzeichnen, während es passiert. Diese Vorgehensweise vermeidetsowohl die Notwendigkeit von direktem Kontakt mit dem Untersuchenden, alsauch künstlich erschaffene Laborumgebungen.
Die Daten werden im gewöhnlichen Kontext des Probanden erhoben, ohneBeeinflussung von Außen. Außerdem werden die Daten unmittelbar nach demGeschehen abgefragt, so dass bis dahin noch wenig für die retrospektive Da-tenerhebung übliche Wahrnehmensverschiebung stattgefunden hat, die für dienachträgliche Datenerhebung symptomatisch ist. ESM erlaubt darüber hinaus
Methoden des Experience Sampling mit Mobilgeraten 187
langfristige Untersuchungen und Analysen der Studienteilnehmer und könnteauch Aufzeichnungen von selten vorkommenden Ereignissen hervorbringen.
Anfangs wurden für das ESM programmierbare Pager in Kombination mitPapiertagebüchern verwendet. Der Pager benachrichtigt dabei den Probandendurch ein Klingeln, wenn es an der Zeit ist, einen Eintrag im Tagebuch vorzuneh-men. Dabei kamen in älteren Studien unterschiedliche Formen der Datensamm-lung und Befragung zum Einsatz, wie beispielsweise ein Anrufen der Teilneh-mer auf ihrem Mobiltelefon oder Benutzung eines PDA zur Datenaufzeichnung.All diese Studien haben die Benutzung von nicht alltäglichen und vielen auchnicht vertrauten Geräten wie beispielsweise Pagern, PDAs und Tagebüchern ge-mein und erfordern ein trainieren des Benutzers zur korrekten Benutzung dieser.Außerdem erlaubten diese Geräte nicht die Erkennung und Aufzeichnung vontatsächlich relevanten Momenten, da sie allesamt kontextunanhängig arbeiten.Darüber hinaus verlassen sich diese klassischen ESM-Ansätze auf die Ehrlichkeitder Benutzer, was einen großen Nachteil darstellt.
Im Laufe des letzten Jahrzehnts wurden Mobilgeräte wie Smartphones undauch immer mehr Verbreitung findende Wearables wie Smartwatches ein Teil un-seres Alltags. Die feste Verankerung dieser Geräte in den Alltag vieler Menschen,ihre mittlerweile beträchtliche Rechenkraft und die Vielzahl der in ihnen verbau-ten Sensoren eröffnen den sozialwissenschaftlichen Studien völlig neue Möglich-keiten um persönliche Daten von einer Vielzahl an Individuen zu erhalten. DieVerfügbarkeit dieser Daten hat zur Erschaffung eines neues Forschungsgebie-tes beigetragen, der rechnerbasierten Sozialwissenschaften (engl. computationalsocial science).
3.1 Smartphonebasiertes ESM
Mobilgeräte sind in der Lage, das Experience Sampling in der Verhaltenspsy-chologie grundlegend zu verändern. Einfachere Teilnehmerrekrutierung, Daten-sammlung und die wesentlich größere Anzahl an tatsächlich gewonnenen Daten,als bei traditionellen ESM Ansätzen.
Grundsätzliche Vorgehensweise: Eine smartphonebasierte mobile ESM-Applikation(mESM), die beispielsweise aus einem der Appstores bezogen werden kann, ver-waltet die von den Sensoren aufgezeichneten Daten und verarbeitet diese, um in-teressante Momente zu entdecken, in denen Benutzerdaten aufgezeichnet werdensollten. Wird ein solcher Moment erkannt, wird der Benutzer dazu aufgefordert,einen Fragebogen auf dem Smartphone auszufüllen. Diese vom Benutzer eingege-benen Daten werden gemeinsam mit den sonstigen Sensordaten des Mobilgerätesan einen Datenserver zur weiteren Analyse übergeben.
mESM-Studien sind in einigen entscheidenden Punkten besser, als traditio-nelle ESM-Studien mit Pager und Tagebuch. Der wohl wichtigste Vorteil ist, dasSmartphones bereits fest zum Alltag der meisten Menschen gehören, im Gegen-satz zu den bei der klassischen Methode eingesetzten Hilfsmitteln. Es wird somitvermieden, das der Benutzer mit einem ihm ungewohnten Gerät umgehen muss.Somit muss auch kein zusätzliches Gerät mit sich herumgetragen werden als üb-lich. Gleichzeitig führt das auch zu einer Kostenreduzierung der Studie, da man
188 Denis Gaus
ein für gewöhnlich beim Benutzer bereits vorhandenes Smartphone verwendenkann. Laut [24] schämen sich Teilnehmer auch weniger auf bestimmte Fragenzu antworten, wenn sie ein ihnen gewohntes Gerät zur Beantwortung benutzenkönnen.
Ein wichtiger technologischer Unterschied von Smartphones zu anderen Mo-bilgeräten ist die so gut wie immer vorhandene Datenverbindung, um fortwäh-rend mit dem Untersuchenden kommunizieren zu können.
Jede ESM-Studie kann des Weiteren als unabhängige Applikation auf einerVielzahl von Geräten über die verschiedenen Appstores der Smartphonebetriebs-systeme ausgerollt werden. Darüber hinaus, sind moderne Mobiltelefone mit ei-ner Vielzahl an Sensoren ausgestattet. Somit lassen sich Rückschlüsse auf dieUmgebung der Testperson ziehen, was bei klassischen Ansätzen nicht möglichwar. Ziel von ESM-Studien ist es oftmals, Benutzererfahrungen zu bestimmtenSituationen zu sammeln, zB. wenn der Teilnehmer einen Ort betritt oder ver-lässt.
Pager benutzen dagegen vordefinierte Zeiten und machen somit die Erfassungvon Ereignissen, die zeitlich nicht exakt vorhergesagt werden können, unmöglich.Im Gegensatz dazu, sind Smartphones in der Lage, den Kontext in dem sichder Benutzer befindet mithilfe der Sensoren zu erkennen und ihn aufzufordern,den Fragebogen auszufüllen, noch während das gewünschte Ereignis stattfindet.Ortsbasierte Erinnerungen sind dabei bereits heute in vielen Applikationen inVerwendung, unter anderem bietet Google Now diese Funktionalität im am wei-testen verbreiteten mobilem Betriebssystem Android bereits von Hause aus an.Der größte Nachteil der Pager-Methode ist, das man vollständig abhängig istvon der Ehrlichkeit und Zuverlässigkeit der Benutzer bei ihren Tagebucheinträ-gen. Beim mESM dagegen ist vieles mithilfe der Sensoren bekannt, ohne das derBenutzer es eingeben muss, wie beispielsweise der Aufenthaltsort des Smartpho-nes, was der Benutzer gerade macht und wer sich sonst noch in der Umgebungbefindet. Somit können einige der vom Benutzer verursachten Fehler und Falsch-angaben vermieden werden.
Ältere Studien versuchten oftmals, Tagebucheinträge mit Körperdaten wieBlutdruck und Herzschlagfrequenz zu verknüpfen [7]. Die beim mESM aus denSensoren gewonnenen Daten können für eine Bewertung sowohl des körperlichenals auch des psychischen Zustandes des Benutzers verwendet werden. Geräte wieSmartwatches sind in der Lage, unter anderem Herzschlag und elektrodermaleAktivität des Benutzers messen. Zur Messung der elektrodermalen Aktivitätwird dabei der elektrische Leitungswiderstand der Haut ermittelt. Emotionenoder auch Stress verändern die Hautleitfähigkeit [5]. Diese Messungen ermögli-chen ein besseres Einschätzen des Situation, in der sich der Benutzer befindet.
Moderne Smartphones besitzen eine Vielzahl an Sensoren, was sie zusam-men mit ihrer mittlerweile beträchtlichen Rechenkraft attraktiv macht für eineKontexterkennung und Auswertung in Echtzeit. Mobiltelefone werden von ei-nem Großteil der Benutzer die meiste Zeit bei sich getragen. Die von ihnenermittelten Sensordaten geben somit die tatsächlichen Aktivitäten und das Ver-halten ihres Besitzers oder auch Veränderungen in seiner Umgebung wieder.
Methoden des Experience Sampling mit Mobilgeraten 189
GPS-Daten werden unter anderem von Google Now bereits seit längerem dazugenutzt, um beispielsweise pünktlich zur üblichen Feierabendzeit die Dauer desNachhauseweges zu berechnen und auf eventuelle Beeinträchtigungen auf derStrecke hinzuweisen.
Der Beschleunigungsmesser kann dafür verwendet werden um körperliche Ak-tivitäten des Benutzers zu erkennen. Vom eingebauten Mikrofon aufgezeichneteTöne können dazu verwendet werden, um zu ermitteln, ob eine Unterhaltung inder Umgebung stattfindet oder aber sogar wie gestresst der Benutzer gerade istoder auch seine sonstige allgemeine Gefühlslage [18,22]. Mithilfe von Bluetoothist es möglich, weitere Smartphonebesitzer in der Umgebung durch co-locationpattern zu identifizieren [21]. Darüber hinaus kann auch einiges an Daten ausder Kombination der unterschiedlichen Sensordaten gewonnen werden, unter an-derem auch Kontextinformation aus Sozialen Netzwerken [16,19].
ESM-Forscher sind dank Smartphones nun erstmals in der Lage, kontext-sensitive Studien entwerfen zu können. Auch der Empfang von Studiendaten inEchtzeit ist dank dauerhafter Internetverbindung und der immer besser werden-den Mobilfunknetze möglich und somit auch ein Anpassen der Datenerhebung“on the fly”.
3.2 Moderne mESM Software Frameworks
Das Design, die Implementierung und der Einsatz von Experience Samplingmithilfe von Mobilgeräten benötigt weitergehende technische Kenntnisse als dieklassische Sozialwissenschaftslehre.
Eine auf Mobiltelefone aufbauende mESM-Studie macht einiges an Program-mieraufwand notwendig um die Applikation zu erstellen, die Sensordaten zuerfassen und auszuwerten. Ebenso ist die Erstellung anspruchsvoller Maschi-nenlernmodelle für die Kontextermittlung Voraussetzung. Darüber hinaus musssichergestellt werden, dass ein zuverlässiger Datenfluss vom Smartphone zumzentralen Server gewährleistet ist. Diese Aufgaben gehen nicht nur üblicherweiseüber das Fachwissen von Psychologen hinaus, sondern führen zu unnötigem, sichwiederholendem Aufwand bei jeder neuen Studie. Die ersten ESM-Frameworksgab es bereits vor dem Aufkommen der Smartphones und wurden unter ande-rem für PDAs entwickelt. Diese verfügten aber über eine sehr eingeschränkteKontexterkennung, da diesen Geräten die notwendige Sensorik fehlte. GroßerVorteil gegenüber der klassischen Pager und Tagebuchmethode war hierbei, dassowohl die Benachrichtigung, dass eine Benutzerinteraktion notwendig ist, alsauch die Datensammlung, nun auf dem selben Gerät stattfinden konnten. Einesder Hauptproblem war hierbei aber, das PDAs niemals große Verbreitung fan-den und somit groß angelegte ESM-Studien nicht möglich waren, ohne enormeKosten für die den Studienersteller zu verursachen. Das Erkennen von Kontextwar das am meisten vermisste Feature der traditionellen ESM-Untersuchungen.Das Aufzeichnen von Daten während bestimmter Ereignisse ist dabei von ganzbesonderem Interesse für Psychologen [23]. Insbesondere wenn das gewünschteGeschehnis eher selten vorkommt, nur von kurzer Dauer ist, oder zeitlich nicht
190 Denis Gaus
vorhersehbar, ist es ohne Kontexterkennung recht wahrscheinlich, gar nichts,oder nur sehr wenig davon zu erfassen.
Spätere Frameworks lieferten wesentlich bessere Ergebnisse, da mithilfe derin den Mobilgeräten verbauten Sensoren eine Kontexterkennung möglich wur-de. Dabei gibt es entweder die Möglichkeit die Sensordaten nur aufzuzeichnen,um sie anschließend zur Analyse auf einen zentralen Server hochzuladen, oderaber sie werden unmittelbar auf dem Gerät verarbeitet. Die Weiterverarbeitungermöglicht dabei, die Situation zu erkennen, in der sich der Benutzer gerade be-findet. Anschließend kann dem Benutzer der passenden Fragebogen ausgeliefertwerden, falls die Situation als relevant erkannt wird.
Mit aufkommen der Smartphones und den neuen Möglichkeiten die ihre Viel-zahl an Sensoren bieten, kam auch immer mehr freie und quelloffene mESMSoftware auf den Markt, aber auch eine Vielzahl an kommerziellen Produkten.Die reinen Sensordaten die mit dem Verhalten des Benutzers in Zusammenhangstehen, sind oftmals schwierig unmittelbar zu interpretieren. Man nehme dieFortbewegung als Beispiel. Man sieht den Sensordaten für sich einzeln genom-men nicht unbedingt direkt an, um welche Art der Fortbewegung es sich dabeihandelt. Deswegen ist es notwendig, das mESM-Frameworks in der Lage sind,die in diesem Fall dafür notwendigen Sensordaten zu kombinieren und darausabzuleiten, ob jemand beispielsweise geht, rennt, oder Auto fährt.
Einige Frameworks wie Psychlog [10] und Open Data Kit [12] bieten auchUnterstützung für externe Sensoren, die die Benutzbarkeit von ESM für Ambu-lantes Assessment verbessern.
Ein gutes mESM-Framework sollte dabei sowohl einfach vom jeweiligen Stu-dienentwickler zu bedienen sein, als auch trotzdem noch genügend Möglichkeitenbieten, so dass eine Vielzahl an unterschiedlichen Studien unterstützt werdenkann.
Dabei gibt es einige unterschiedliche Ansätze. MyExperience beispielsweise,ein für Pocket PC noch vor dem aufkommen der Smartphones geschriebenesFramework, nutzt eine auf XML basierende Oberfläche. In dieser kann der Stu-dienersteller unter anderem festlegen welche Sensordaten benutzt werden sollen,den Inhalt der jeweiligen Fragebögen und wann der Benutzer aufgefordert wer-den soll, diese Fragebögen auszufüllen [9].
Das später für Android-Smartphones entwickelte Framework OpenDataKit,hatte zum Ziel, eine möglichst einfache Erstellung von Studien zu ermöglichen.Damit kann sich ein Studienersteller per drag-and-drop eine Applikation zu-sammenstellen. Darüber hinaus unterstützt es auch noch den automatischenDatenupload und die Speicherung der Daten [12].
Auch Soziale Netzwerke können als Sensor genutzt werden, um das menschli-che Verhalten besser zu verstehen. Ein immer größerer Teil an sozialer Interakti-on findet über diese statt, wie über 1,5 Milliarden monatlich aktive Benutzer aufFacebook zeigen [4]. Die Beobachtung und Auswertung von Daten aus sozialenNetzwerken gewinnt dadurch immer mehr an Bedeutung in sozialwissenschaftli-chen Studien. Die Informationen der sozialen Netzwerke können mit den Senso-ren des Smartphones verknüpft werden, um so mehr über den Beziehungsstatus
Methoden des Experience Sampling mit Mobilgeraten 191
der Personen in der Umgebung, oder auch über Einträge des Telefonbuches desjeweiligen Mobiltelefons zu erfahren. Von dieser Art der Informationsverknüp-fung in Echtzeit wird in SenSocial Gebrauch gemacht. Dabei handelt es sich umeine verteile Middleware, die sowohl auf den Smartphones der Benutzer, als auchauf einem zentralen Server verweilt und dafür sorgt, das aus sozialen Netzwer-ken gewonnene Daten mit den Daten der Smartphonesensoren verknüpft werden[19].
4 Herausforderungen bei der Datenaufzeichnung mitMobilgeräten
Mobilgeräte haben das traditionelle ESM grundlegend verändert und revolu-tioniert. Sie ermöglichten eine kontextabhängige Datenerhebung, schnelle Ent-wicklung von Prototypen, eine bessere Skalierbarkeit von Studien und auch einezum Großteil automatische Ergebnisanalyse. Jedoch gibt es immer noch einigeEinschränkungen, die bereits in der traditionellen Methode vorhanden waren.Es stellt sich zum einen die Frage, wie man bestimmte Erlebnisse aufzeichnenkann, ohne auf den Alltag des Teilnehmers Einfluss zu nehmen. Außerdem istes schwierig, Daten eines wichtigen Geschehens aufzuzeichnen, wenn sich derLebensstil des Probanden als wechselhaft und schwierig vorherzusagen erweist.
Benutzer für die mESM-Applikation zu rekrutieren gestaltet sich oftmalsschwierig, schließlich kann man die Applikation potenziell an Millionen von Be-nutzern testen. Mehr Teilnehmer bedeutet auch bessere Studienergebnisse, dieseaber oft schwierig zu finden. Außerdem kamen auch neue technische Herausfor-derungen dazu, die Einfluss darauf nehmen, wie Studien erstellt werden sollten.
4.1 Rekrutierung und langfristige Motivation von Teilnehmern
Das Internet gab Sozialwissenschaftlern einen relativ einfachen Zugriff auf einegroße und vielfältige Menge an potenziellen Teilnehmern. Es schwächte somitdas Problem ab, das man sozialwissenschaftliche Studien größtenteils mit einerkleinen Gruppe an Studenten als Probanden durchführen musste [11].
Die ersten mESM-Studien hatten trotz Nutzung des Internets Probleme mitder Rekrutierung, da eine Teilnahme an diesen weiterhin durch eine geringe Ver-breitung der benötigten Hardware beschränkt war, in diesem Fall die PocketPCs, die bei den ersten mESM-Studien zum Einsatz kamen. Mit Aufkommenund immer weiterer Verbreitung von Smartphones mit geschätzten 1.86 Milli-arden Smartphone-Nutzern weltweit im Jahre 2015 und immer noch steigen-der Tendenz [6], hat man nun so zuvor nicht vorstellbare Möglichkeiten zurAusrollung von Studien. Diese kann relativ einfach über die auf allen größerenSmartphonebetriebssystemen vorhandenen Appstores geschehen und erhöht dieStudienreichweite wesentlich. Die Teilnehmerrekrutierung über das Internet istdarüber hinaus auch noch repräsentativer für die tatsächliche Bevölkerung, alses mit den traditionellen Methoden der Fall war [11].
192 Denis Gaus
Darüber hinaus bietet ein smartphonesbasiertes mESM zusätzliche Anony-mität, da der Benutzer weder verpflichtet ist seinen richtigen Namen zu nennen,wenn er es nicht wünscht, noch mit irgendjemandem von denjenigen, die dieStudie betreiben, direkt in Kontakt treten muss.
Einer der Nachteile davon, das es keine direkte Kontrolle über Studienteilneh-mer gibt, besteht darin, das man nur schwierig kontrollieren kann, das tatsäch-lich nur berechtigte, bzw. gewünschte Probanden an einer Studie teilnehmen.Beispielsweise könnte es durch Falschangaben zu einer unerwünschte Teilnah-me von Minderjährigen an Studien die ausschließlich für für Erwachsene ge-dacht sind kommen. Das Problem von bewussten Falschangaben wird ein Stückweit dadurch abgeschwächt, dass die Applikation einiges an Informationen überden Teilnehmer liefert. Unter anderem seine Aktivitäten, Aufenthaltsorte, sei-ne Beweguns- und Kommunikationsmuster und weitere Eigenschaften. Mithilfedieser aus der Studie gewonnen Daten können Rückschlüsse gezogen werdenin Bezug auf Alter, Geschlecht und sogar zu einem gewissen Teil den sozialenStatus des Probanden [8]. Dieses Wissen kann außerdem auch dazu verwendetwerden, um gezielt eine demographische Gruppe auszuwählen, oder Studien anunterschiedliche Gruppen jeweils anzupassen. Beispielsweise kann die Zeit derStichprobennahme an die üblichen lokalen Gewohnheiten angepasst werden oderauch unterschiedliche Fragen zu stellen, in Abhängigkeit der sozialen Gruppe desTeilnehmers.
Die Teilnahme an einer Studie kann vom Benutzer jederzeit ohne weiteresbeendet werden, indem er entweder die Applikation entfernt oder auch einfachnur ignoriert. Deswegen ist es oftmals relativ schwierig, die Benutzer zur aktivenTeilnahme, vor allem auch über längere Zeiträume zu bewegen. Um das akti-ve Teilnehmen attraktiver zu gestalten, geben manche Applikationen bestimmteInformation an die User zurück. Die mESM Applikation Emotion Sense zeich-net Gefühlszustände der Benutzer und kontextabhängige Sensordaten auf undversucht dabei, ihre Benutzer durch Gamification und Anzeige von einigen ausder Teilnahme gewonnenen Erkenntnissen über den Benutzer zu motivieren [17].Teilnehmer können neue Teile der Applikation freischalten, indem sie aktiv mit-machen und neue Daten liefern.
4.2 Zeitpunkt der Befragungen
Smartphones gehören fest zum Alltag der Teilnehmer. Deswegen ist es wichtig,dass Benutzerinteraktionen zu einem passenden Zeitpunkt angefordert werden.Das Ziel sollte sein, sowohl nicht all zu störend auf den Benutzer zu wirken,als auch seine eigentliche Aufgabe der Datensammlung zu erfüllen und das indiesemMoment Erlebte aufzuzeichnen. Ein Benutzer der momentan nicht gestörtwerden will oder auch kann, wird nämlich mit hoher Wahrscheinlichkeit nichtunmittelbar auf die ihm gestellten Fragen antworten, was wiederum zu einerVerfälschung des Erlebten bei einer späteren Beantwortung oder auch zu einemAusbleiben dieser führen kann [3].
Darüber hinaus werden Benutzer üblicherweise zum Ausfüllen eines Fragebo-gens zum Erlebten aufgefordert, indem sie eine Benachrichtigung auf das Smart-
Methoden des Experience Sampling mit Mobilgeraten 193
phone erhalten, so wie sie es auch sonst im Umgang mit dem Smartphone ge-wohnt sind, wenn das Smartphone eine neue Interaktion bereit hält. Ein Benutzerwird eher dann schnell auf die Benachrichtigung reagieren und sich in dem, waser gerade tut unterbrechen lassen um den Fragebogen zeitig auszufüllen, wenndie Benachrichtigung in einem günstigen Moment ausgeliefert wird.
Einige Untersuchungen befassten sich damit, wie man einen guten Zeitpunktfür eine Unterbrechung erkennt und stellten fest, das es größtenteils von der Si-tuation abhängt in der sich der Benutzer gerade befindet [14,15]. Beispielsweisekann mithilfe des Beschleunigungssensors der Wechsel von einer Tätigkeit in dienächste festgestellt werden. Während dieses Übergangs reagieren Benutzer fürgewöhnlich wohlwollend, wenn sie vom Smartphone gestört werden [14]. Laut derStudie InterruptMe können diese guten Momente für eine Unterbrechung des Be-nutzers aber nicht isoliert für sich alleine betrachtet werden, sie sind wesentlichvon der ansonsten in letzter Zeit aufgetretenen Menge an Unterbrechungen ab-hängig [20]. Das ganze spielt eine immer wichtigere Rolle, je mehr Applikationenbeim Benutzer in Benutzung sind und somit auch mehr Benachrichtigungen umAufmerksamkeit wetteifern.
4.3 Technische Herausforderungen beim mESM
Bei Smartphones handelt es sich nicht mehr wie bei den klassischen Mobiltelefo-nen um ein reines Kommunikationsgerät. Es sind heutzutage Allzweckgeräte mitdenen sowohl in jeglicher Form kommuniziert werden kann, aber auch Sachenwie Surfen im Internet, Terminverwaltung, der morgendliche Wecker, Gaming,Navigation und viele weitere Aufgaben erledigt werden.
Diese ganzen Aufgaben limitieren die Ressourcen, die für die Datenerhebungzur Verfügung stehen. Darüber hinaus muss eine mESM-Applikation auch immeraktiv auf dem Gerät laufen. Sie kann nicht, wie bei den meisten Apps üblich, inder Zeit in der sie nicht genutzt wird in den Schlafmodus versetzt werden, dasie dann die Situation, in der sich der Benutzer befindet, nicht erkennen kann,ihm somit auch nicht die richtigen Fragen zu seinen Erlebnissen zum richtigenZeitpunkt vorlegen kann und somit ihre eigentliche Aufgabe nicht wie gewünschtausführen könnte.
Eine der problematischsten Ressourcen für viele mobile sensing Applikatio-nen ist die beschränkte Batteriekapazität von Mobilgeräten. Viele der in Smart-phones verbauten Sensoren sind nicht für das fortlaufende Messen gedacht undverbrauchen bei häufiger Aktivität eine Menge an Energie. Viele Smartphone-besitzer sehen es als Voraussetzung an, das ihr Gerät den ganzen Tag über miteiner Akkuladung durchhält, bevor es dann Nachts zum Laden angesteckt wird,um für den nächsten Tag bereit zu sein. Oftmals ist tagsüber auch gar keine La-demöglichkeit gegeben, oder aber wird als unkomfortabel angesehen. Die aktivenSensoren, die im Vordergrund laufende mESM-Applikation und von ihr getätigteDatenverarbeitung können den Energieverbrauch entscheidend erhöhen und zueiner Ablehnung bei potenziellen Benutzern führen.
Dem wird häufig versucht durch adaptives Messen entgegenzuwirken, alsoentweder seltenere Messvorgänge oder aber Messen mit einer geringeren Genau-
194 Denis Gaus
igkeit. Oftmals kann es ausreichend sein, anstatt der genauen GPS-Koordinatendes Benutzers nur die Cell-ID der verbundenen Basisstation zu ermitteln unddamit seinen ungefähren Standort, um dadurch Energie zu sparen.
Das AndWellness Framework ermöglicht es Studienerstellern beispielsweisedas Verhältnis zwischen Messgenauigkeit und Energieverbrauch zu verändernund implementiert die hierarchische Sensoraktivierung um den Energieverbauchnoch weiter reduzieren zu können [13]. Dabei werden sparsame, aber dafür nichtso exakte Sensoren verwendet um herauszufinden, ob die genaueren, aber dafürauch energiehungrigen Sensoren aktiviert werden sollen, weil genauere Informa-tionen benötigt werden.
Wenn das Mobilgerät sich beispielsweise mit einem neuen Access Point ver-bindet oder den Kontakt verliert, wird angenommen, dass der Benutzer sichfortbewegt und das GPS schaltet sich hinzu um eine genauere Aufzeichnung derFortbewegung zu ermöglichen. Ziel ist aber weiterhin, trotz Anpassen der Ab-tastrate mit adaptivem Messen oder Benutzung der hierarchischen Aktivierungvon Sensoren sicherzustellen, keine wichtigen Ereignisse zu verpassen und derzeitGegenstand aktueller Forschungsarbeiten.
Für die Datenspeicherung und die Datenanalyse, die Visualisierung von Da-ten und auch zum Verändern von Einstellungen der mESM-Applikation auf denaufzeichnenden Mobilgeräten kommen zentrale Server zum Einsatz. Dabei kannes eine entscheidende Rolle für die Leistungsfähigkeit einer mESM-Applikationspielen, wo welche Funktionalität im Einzelnen beheimatet ist, also welche Funk-tionalität auf dem Server liegt und welche auf dem Mobilgerät. Dies beeinflusstsowohl die Performanz als auch die Möglichkeiten die der Applikation zur Ver-fügung stehen.
Serverseitige Verarbeitung von Daten hat die Vorteile von hoher Rechenleis-tung im Vergleich zu den einzelnen Mobilgeräten. Der Server verfügt darüberhinaus über eine globale Sicht auf das gesamte System und ist somit in der La-ge, bessere Rückschlüsse zu ermöglichen als es mit einer rein lokalen Sicht derFall ist, da auch die Daten anderer Nutzer zur Auswertung verwendet werdenkönnen.
Außerdem kann es zu Energieeinsparungen auf Seiten der Mobilgeräte kom-men, da diese die für die Datenverarbeitung nötige Energie einsparen. Da dasSenden von Daten aber auch wiederum einiges an Energie verbraucht, kann esvorkommen, dass die durch die Datenverarbeitung stattgefundene Komprimie-rung der Daten wiederum Energie beim Senden einspart, dabei hängt es imeinzelnen Fall davon ab, welche Art der Vorverarbeitung auf Seiten des Mobil-gerätes stattfindet und kann sich von Fall zu Fall unterscheiden, auch abhängigvon der Netzqualität des Mobilgerätes.
Andererseits kann aber der Datentransfer von großen Mengen an Sensordatenzum Server ohne Vorverarbeitung teuer, oder auch einfach nicht machbar sein,insbesondere wenn die Datenübertragung über das Mobilfunknetz geschieht.
Der Mobilfunkempfang ist immer noch nicht flächendeckend, selbst in indus-trialisierten Ländern und vor allem nicht innerhalb von Gebäuden, insbesonderewas die schnellen 4G-Netze angeht. Die Netzabdeckung ist dabei auch relativ
Methoden des Experience Sampling mit Mobilgeraten 195
stark vom jeweiligen Netzbetreiber abhängig, bei dem man unter Vertrag steht.Der Ausbau der Mobilfunknetze und die Kosten der Mobilfunktarife unterschei-den sich erheblich zwischen unterschiedlichen Ländern. Insofern also häufigesVersenden von größeren Datenmengen nötig ist, kann das zu einem großen Pro-blem werden.
Aus diesem Grund bieten einige der Frameworks Appentwicklern die Mög-lichkeit an, Richtlinien für die Datenübertragung festzulegen. Beispielsweise dasder Sendevorgang der Daten zum Server nur bei vorhandener WiFi-Verbindunggeschehen soll, oder auch das bei niedrigem Batteriestand keine Daten hochge-laden werden sollen.
Ein weiterer Faktor der noch hinzukommt, warum ein ausgewogenes Ver-hältnis zwischen lokaler- und serverseitiger Datenverarbeitung vorhanden seinsollte ist die Privatsphäre. Viele potenzielle Studienteilnehmer sorgen sich beieiner solchen Rundumüberwachung natürlich um die Wahrung und Sicherstel-lung dieser. Es muss sichergestellt werden, das Daten nicht an unbefugte Drittegelangen können. Verschlüsselung und Anonymisierung von personenbezogenenDaten sind in diesem Kontext unerlässlich.
Insbesondere durch die NSA-Affäre und zuletzt auch der gerichtlichen Aus-einandersetzung um das Entsperren eines iPhones zwischen Apple und dem FBI,die sich über Wochen hinzog und medial stark begleitet wurde [2], ist das The-ma Datenschutz und Privatsphäre stärker in das öffentliche Interesse gerücktworden.
Aufenthaltsorte und Stimm- oder Videoaufnahmen sind Privatsache und soll-ten entsprechend geschützt werden. Eine Möglichkeit dies zu erreichen bestehtdarin, für ein ausgewogenes Verhältnis zwischen serverseitiger- und lokaler Da-tenverarbeitung zu sorgen.
Bei Sprachaufnahmen muss beispielsweise nicht das gesamte Audiofile anden Server gesendet werden, sondern es genügt, Eigenschaften des Sounds zuextrahieren die für die Sprachklassifizierung relevant sind, der Mel-Frequenz-Cepstrum-Koeffizient wäre eine Möglichkeit. Diese extrahierten Eigenschaftenkönnen für die Analyse an den zentralen Server gesendet werden. Somit ist si-chergestellt, dass die Audiodatei nicht wieder hergestellt werden kann, solltendiese Daten in die Hände Unbefugter gelangen.
Anstatt die vollständigen GPS-Koordinaten an den Server zu versenden, kanndie Applikation auch einen internen Klassifizierer für den Aufenthaltsort desBenutzers ermitteln und weitergeben, beispielsweise wären Zuhause und Arbeitzwei mögliche solcher Ortsklassifizierer. Diese werden nach Ermittlung durchdie Applikation anstatt der tatsächlichen Koordinaten an den Server gesendet,und minimieren die Menge an Daten die über den Nutzer ohne weiteres Wissengewonnen werden können.
Smartphonenutzer tragen das Gerät nicht immer durchgehend bei sich oderschalten es auch mal komplett aus. Weitere Probleme mit der Verfügbarkeit undGenauigkeit einiger Sensoren unter bestimmten Bedingungen existieren. Übli-cherweise ist kein GPS Empfang in Gebäuden gegeben und GPS-Sensoren nei-gen je nach Smartphonemodell dazu, nicht völlig exakt zu arbeiten und einen
196 Denis Gaus
auch mal eine Straße weiter zu positionieren, als es tatsächlich der Fall ist, trotzAufenthalt im Freien. Bluetooth hat eine stark begrenzte Reichweite. GPS undBluetooth werden auch gerne aus Gründen der Akkuschonung und zur Wah-rung der Privatsphäre ausgeschaltet. Weitere Sensoren, wie die Pulsmessungvon Smartwatches stellen sich immer wieder als nicht völlig zuverlässig heraus.
All diese Faktoren führen zu teilweise verfälschten Messungen und können zufalschen Schlussfolgerungen führen.
4.4 Einbau von Verhaltensintervention
Der nächste logische Schritt, nachdem man das menschliche Verhalten relativgenau beobachten und auswerten kann ist es, diese Informationen zu nutzen umzukünftige Handlungsweisen positiv zu beeinflussen. Behaviour change interver-tions (BCIs) bestehen aus dem Sammeln von Informationen über die Zielperson,setzen von Zielen, Beobachtung des Verhaltens vom Benutzer und das Gebenvon Feedback.
Später wurde das Konzept der digital BCIs (dBCIs) entwickelt, dabei han-delt ist sich um die Verhaltensintervention über das Internet. Damit wurde esmöglich Inhalte der Intervention wesentlich schneller zur Teilnehmer zu bringenund dabei die Kosten zu reduzieren, da man keinen direkten Kontakt zum Be-nutzer mehr braucht. Inhalte können damit auch automatisch auf die jeweiligeZielperson zugeschnitten werden. Es wurde in einer Studie zur Selbstbehandlungvon kleineren Krankheitsberschwerden wie Husten, Fieber und Halsschmerzengezeigt, das Patienten noch besser auf je nach Krankheitssymptome maßge-schneiderte Inhalte reagieren, als auf eine statische Webseite mit Ratschlägenzu Krankheiten, für welche zuvor gezeigt wurde, das sie Arztbesuche reduzierenund das Zutrauen des Patienten zur Eigenbehandlung steigern kann. DiejenigenPatienten die auf der nach krankheitssymptomen angepassten Seite mit aus-schließlich für sie relevantem Inhalt nach Hilfe suchten, fühlten sich sicherer imselbstständigen Umgang mit ihrer Krankheit und wollten auch weniger häufigweitergehende gesundheitliche Hilfe, wie einen Doktor in Anspruch nehmen, alsdies bei der statischen Webseite der Fall war [25].
Da Smartphones mittlerweile solch allgegenwärtige Geräte geworden sind undihre Besitzer sie auch so gut wie nie aus den Augen lassen, eignen sie sich natür-lich auch hervorragend für Versuche der Verhaltensveränderung des Besitzers.Es gibt mittlerweile einige Projekte, in denen versucht wurde dBCIs aus demInternet auf die Smartphones zu verfrachten. Leanne G. Morrison et al. entwi-ckelten eine hybride Web- und Appbasierte Intervention die Benutzern bei derGewichtsabnahme helfen soll [39].
Teilnehmer bekamen dabei Zugriff auf die webbasierte Gewichtsmanagement-Intervention “POWeR” und in 2 alternierendenWochen auf die Gewichtsmanagement-Applikation “POWeR Tracker”. Die Benutzer waren sich in den Wochen mit Nut-zung der Applikation dessen, was sie aßen und auch ihrer Ziele für körperlicheAktivitäten merklich bewusster, als dies in den Wochen ohne Zugang zu derApp der Fall war. Aufgezeichnete Daten über die Nutzungsdauer zeigten dabei,das die Nutzungsdauer der Webseite sich in den Wochen mit und ohne Zugriff
Methoden des Experience Sampling mit Mobilgeraten 197
kaum voneinander unterschieden. Der POWeR Tracker wurde dabei üblicherwei-se für kurze Zeitspannen von um die 3 Minuten verwendet, üblicherweise wennes gerade einen gut passenden Moment gab, wenn der Teilnehmer meinte das dievon der App angebotenen Tools gerade hilfreich wären oder weil er gerade eineautomatische Benachrichtigung der Applikation erhalten hatte. Wie die Studiezeigt, lassen sich Smartphones dazu nutzen den Benutzer sich seiner gestecktenZielen mit Bezug auf die Gesundheit mehr verbunden zu fühlen und als eineMotivationshilfe.
5 Fazit
Die Allgegenwärtigkeit von Smartphones verändert momentan die Möglichkeitender Sozialwissenschaften enorm. Der technische Fortschritt beim mobile compu-ting führte zur Entwicklung von mobile ESM, was Sozialwissenschaftler in dieLage versetze, das Verhalten und Handeln einer vorher so nicht denkbar großenMenge an Menschen beobachten und Analysieren zu können, ohne teure tech-nische oder sonstige Anschaffungen tätigen zu müssen. Auch die Qualität, undGranularität der Daten die man mithilfe der Smartphonesensoren und sonstigerInteraktion des Benutzers mit dem Mobilgerät erhält, versetzt Forscher in dieLage, sehr genau über das Verhalten des Benutzers Bescheid zu wissen.
Jedoch gibt es immer noch Probleme im Umgang mit den Benutzern. Auchwenn mESM durch die Integration ins Smartphone bereits deutlich weniger Auf-wand für den Teilnehmer bedeutet, als es beim klassischen ESM der Fall war,liefern sie doch immer noch häufig falsche Informationen oder Beantworten dieFragen nicht rechtzeitig, wenn sie sich von ihnen in ihrem Alltag gestört fühlen.
Es muss mehr Wert gelegt werden auf Applikationen, die auf den Benutzer sowenig wie möglich störend wirken und der Teilnehmer muss einen tatsächlicheneindeutigen Nutzen für sich feststellen können, um sich die Mühe zu machen aktivteilzunehmen. Denn die Langzeitmotivation ist sehr schwierig und es scheintnoch niemand einen wirklich wirksamen Weg gefunden zu haben, Teilnehmerlangfristig erfolgreich zu motivieren, um auch länger andauernde Beobachtungenvon Teilnehmern zu ermöglichen.
Aus den traditionellen Sozialwissenschaften hat sich ein neues, interdiszipli-näres Wissenschaftsfeld gebildet. Aus vom Benutzer generierten Inhalten wirddabei unter Einsatz von unter anderem Statistik und Maschinenlernmethodenversucht, sozialwissenschaftliche Konzepte zu erklären.
Insbesondere was die Beeinflussung von Verhalten des Teilnehmers betrifft,steckt die Forschung noch in den Kinderschuhen und es kann auf Grund vonfehlenden größer angelegten Studien relativ wenig zur Effektivität von mobiledBCIs gesagt werden.
In Zukunft wird es immer mehr smarte Geräte geben, ob es nun der Fernse-her, der Kühlschrank, die Waschmaschine oder die Kaffeemaschine ist. Es werdensich somit noch eine ganze Reihe an neuen Möglichkeiten zur Datengewinnungergeben, als es jetzt schon der Fall ist und es bleibt eine Menge für die Wis-
198 Denis Gaus
senschaftler zu tun, um noch besser beobachten und das menschliche Verhaltenverstehen und analysieren zu können.
Literatur
1. Anzahl der Smartphone-Nutzer in Deutschland in den Jahren 2009 bis 2015(in Millionen). In Statista - Das Statistik-Portal. Zugriff am 16. Dezember2015, von http://de.statista.com/statistik/daten/studie/198959/umfrage/anzahl-der-smartphonenutzer-in-deutschland-seit-2010/
2. Apple versus FBI - iPhone-Streit zwischen Apple und US-Behörden beendetaus Focus Online von http://www.focus.de/digital/apple-versus-fbi-iphone-streit-zwischen-apple-und-us-behoerden-beendet_id_5389574.html
3. Ask, but Don’t Interrupt: The Case for Interruptibility-aware Mobile ExperienceSampling. In: Adjunct Proceedings of the 2015 ACM International Joint Confe-rence on Pervasive and Ubiquitous Computing and Proceedings of the 2015 ACMInternational Symposium on Wearable Computers. UbiComp/ISWC’15 Adjunct
4. Facebook. (n.d.). Anzahl der monatlich aktiven Facebook Nutzer welt-weit vom 3. Quartal 2008 bis zum 4. Quartal 2015 (in Millionen). In Statista - Das Statistik-Portal. Zugriff am 10. März 2016, vonhttp://de.statista.com/statistik/daten/studie/37545/umfrage/anzahl-der-aktiven-nutzer-von-facebook/
5. Prof. Dr. Tanja Schultz: Cognitive Systems Lab, KIT (TH), Fakultät für In-formatik, Vorlesung WS 2012/2013, Biosignale und Benutzerschnittstellen, Elek-trodermale Aktivität (EDA), http://csl.anthropomatik.kit.edu/downloads/vorlesungsinhalte/BSBS1213_E_ElectroDermalActivity.pdf
6. Prognose zur Anzahl der Smartphone-Nutzer weltweit von 2012 bis 2019 (inMilliarden). In Statista - Das Statistik-Portal. Zugriff am 16. Dezember 2015,von http://de.statista.com/statistik/daten/studie/309656/umfrage/prognose-zur-anzahl-der-smartphone-nutzer-weltweit/
7. Fahrenberg, J., Myrtek, M.: Ambulatory assessment: Computer-assisted psycholo-gical and psychophysiological methods in monitoring and field studies (1996)
8. Frias-Martinez, V., Virseda, J.: On the Relationship Between Socio-economic Fac-tors and Cell Phone Usage. In: Proceedings of the Fifth International Conference onInformation and Communication Technologies and Development. pp. 76–84. ICTD’12, ACM, New York, NY, USA (2012), http://doi.acm.org/10.1145/2160673.2160684
9. Froehlich, J., Chen, M.Y., Consolvo, S., Harrison, B., Landay, J.A.: MyExperience:A System for in Situ Tracing and Capturing of User Feedback on Mobile Phones. In:Proceedings of the 5th International Conference on Mobile Systems, Applicationsand Services. pp. 57–70. MobiSys ’07, ACM, New York, NY, USA (2007), http://doi.acm.org/10.1145/1247660.1247670
10. Gaggioli, A., Pioggia, G., Tartarisco, G., Baldus, G., Corda, D., Cipresso, P., Ri-va, G.: A mobile data collection platform for mental health research. Personaland Ubiquitous Computing 17(2), 241–251 (2011), http://dx.doi.org/10.1007/s00779-011-0465-2
11. Gosling, S.D., Vazire, S., Srivastava, S., John, O.P.: Should we trust web-based stu-dies? A comparative analysis of six preconceptions about internet questionnaires.American Psychologist 59(2), 93 (2004)
Methoden des Experience Sampling mit Mobilgeraten 199
12. Hartung, C., Lerer, A., Anokwa, Y., Tseng, C., Brunette, W., Borriello, G.: OpenData Kit: Tools to Build Information Services for Developing Regions. In: Procee-dings of the 4th ACM/IEEE International Conference on Information and Com-munication Technologies and Development. pp. 18:1–18:12. ICTD ’10, ACM, NewYork, NY, USA (2010), http://doi.acm.org/10.1145/2369220.2369236
13. Hicks, J., Ramanathan, N., Kim, D., Monibi, M., Selsky, J., Hansen, M., Estrin,D.: AndWellness: An Open Mobile System for Activity and Experience Sampling.In: Wireless Health 2010. pp. 34–43. WH ’10, ACM, New York, NY, USA (2010),http://doi.acm.org/10.1145/1921081.1921087
14. Ho, J., Intille, S.S.: Using Context-aware Computing to Reduce the Perceived Bur-den of Interruptions from Mobile Devices. In: Proceedings of the SIGCHI Confe-rence on Human Factors in Computing Systems. pp. 909–918. CHI ’05, ACM, NewYork, NY, USA (2005), http://doi.acm.org/10.1145/1054972.1055100
15. ter Hofte, G.H.H.: Xensible Interruptions from Your Mobile Phone. In: Proceedingsof the 9th International Conference on Human Computer Interaction with MobileDevices and Services. pp. 178–181. MobileHCI ’07, ACM, New York, NY, USA(2007), http://doi.acm.org/10.1145/1377999.1378003
16. Lane, N., Miluzzo, E., Lu, H., Peebles, D., Choudhury, T., Campbell, A.: A surveyof mobile phone sensing. Communications Magazine, IEEE 48(9), 140–150 (Sept2010)
17. Lathia, N., Rachuri, K.K., Mascolo, C., Rentfrow, P.J.: Contextual Dissonance:Design Bias in Sensor-based Experience Sampling Methods. In: Proceedings ofthe 2013 ACM International Joint Conference on Pervasive and Ubiquitous Com-puting. pp. 183–192. UbiComp ’13, ACM, New York, NY, USA (2013), http://doi.acm.org/10.1145/2493432.2493452
18. Lu, H., Frauendorfer, D., Rabbi, M., Mast, M.S., Chittaranjan, G.T., Campbell,A.T., Gatica-Perez, D., Choudhury, T.: StressSense: Detecting Stress in Uncons-trained Acoustic Environments Using Smartphones. In: Proceedings of the 2012ACM Conference on Ubiquitous Computing. pp. 351–360. UbiComp ’12, ACM,New York, NY, USA (2012), http://doi.acm.org/10.1145/2370216.2370270
19. Mehrotra, A., Pejovic, V., Musolesi, M.: SenSocial: A Middleware for IntegratingOnline Social Networks and Mobile Sensing Data Streams. In: Proceedings of the15th International Middleware Conference. pp. 205–216. Middleware ’14, ACM,New York, NY, USA (2014), http://doi.acm.org/10.1145/2663165.2663331
20. Pejovic, V., Musolesi, M.: Interruptme: designing intelligent prompting mechanismsfor pervasive applications. In: Proceedings of the 2014 ACM International JointConference on Pervasive and Ubiquitous Computing. pp. 897–908. ACM (2014)
21. Rachuri, K.K., Mascolo, C., Musolesi, M., Rentfrow, P.J.: SociableSense: Explo-ring the Trade-offs of Adaptive Sampling and Computation Offloading for SocialSensing. In: Proceedings of the 17th Annual International Conference on MobileComputing and Networking. pp. 73–84. MobiCom ’11, ACM, New York, NY, USA(2011), http://doi.acm.org/10.1145/2030613.2030623
22. Rachuri, K.K., Musolesi, M., Mascolo, C., Rentfrow, P.J., Longworth, C., Aucinas,A.: EmotionSense: A Mobile Phones Based Adaptive Platform for ExperimentalSocial Psychology Research. In: Proceedings of the 12th ACM International Con-ference on Ubiquitous Computing. pp. 281–290. UbiComp ’10, ACM, New York,NY, USA (2010), http://doi.acm.org/10.1145/1864349.1864393
23. Reis, H.T., Gable, S.L.: Event-sampling and other methods for studying everydayexperience. Handbook of research methods in social and personality psychologypp. 190–222 (2000)
200 Denis Gaus

24. Trull, T.J., Ebner-Priemer, U.: Ambulatory assessment. Annual review of clinicalpsychology 9, 151 (2013)
25. Yardley Lucy, Joseph Judith, Michie Susan, Weal Mark, Wills Gary, LittlePaul: Evaluation of a Web-based Intervention Providing Tailored Advice for Self-management of Minor Respiratory Symptoms: Exploratory Randomized Control-led Trial. Journal of Medical Internet Research 12(4), e66 (Nov 2010), http://www.ncbi.nlm.nih.gov/pmc/articles/PMC3056528/
Methoden des Experience Sampling mit Mobilgeraten 201
Proximity and Velocity Recognition of External
Objects on a Mobile Observer
Florian Leicher∗
Advisor: Prof. Dr. Michael Beigl†
Karlsruhe Institute of Technology (KIT)Pervasive Computing Systems � TECO
∗[email protected]†[email protected]
Abstract. The TECO institute is working on an enhancement for itsproject ProximityHat, an electronic travel aid (ETA). This paper is astate of the art analysis about new possible sensors for the Proximi-tyHat. The following sensor types are being analyzed: laser range de-tection, ultrasonic range detecting, Doppler velocity measurement andimage processing with a stereo camera. These sensors are used for gath-ering proximity and velocity data of external objects. Relevant works foreach sensor type mounted on a mobile observer (human or robot) arediscussed with a special focus on ETAs.
Keywords: Mobile Sensor, HumanMounted Sensor, ProximityHat, Elec-tronic Travel Aid, ETA, Velocity Sensor
1 Introduction
There is a huge number of electronic devices tested in science (and some also onthe market) that are designed to help handicapped persons to cope with certaintasks in their lives [1]. When talking about aiding the blind, one important �eldis vision substitution � representing visual clues a healthy person could perceivefrom the outside world in another way. The majority of such vision substitutiondevices use auditory or tactual (mostly vibration) stimuli as a replacement [2].
Farcy et al. name two categories of such substitution devices, ElectronicTravel Aids (ETA) and Electronic Orientation Aids (EOA) [3]. ETAs �transforminformation about the environment that would normally be relayed through vi-sion into a form that can be conveyed through another sensory modality� [2]and as such help a user e.g. avoiding obstacles. EOAs help the user to �nd aroute in an unknown environment. While for EOAs the environment is usuallyprepared in some way (e.g. there are beacons placed on a prede�ned route tosend location clues to the sensors [4], there is a map provided for GPS location[3], or the experiment assumes that navigational clues are provided [5]), ETAsusually work only with the sensory data gathered on the blind person. As theProximityHat and our proposed extensions are in the category of ETAs, thiswork will mostly focus on such aids.
202 Florian Leicher
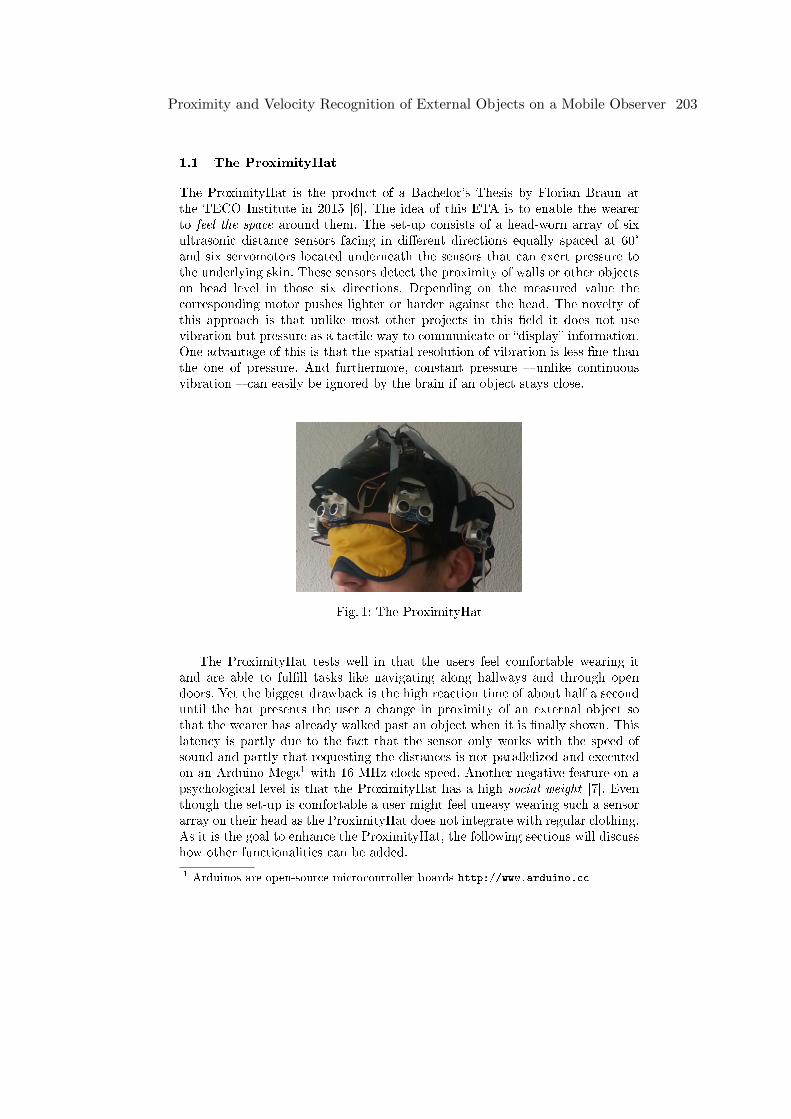
1.1 The ProximityHat
The ProximityHat is the product of a Bachelor's Thesis by Florian Braun atthe TECO Institute in 2015 [6]. The idea of this ETA is to enable the wearerto feel the space around them. The set-up consists of a head-worn array of sixultrasonic distance sensors facing in di�erent directions equally spaced at 60°and six servomotors located underneath the sensors that can exert pressure tothe underlying skin. These sensors detect the proximity of walls or other objectson head level in those six directions. Depending on the measured value thecorresponding motor pushes lighter or harder against the head. The novelty ofthis approach is that unlike most other projects in this �eld it does not usevibration but pressure as a tactile way to communicate or �display� information.One advantage of this is that the spatial resolution of vibration is less �ne thanthe one of pressure. And furthermore, constant pressure � unlike continuousvibration � can easily be ignored by the brain if an object stays close.
Fig. 1: The ProximityHat
The ProximityHat tests well in that the users feel comfortable wearing itand are able to ful�ll tasks like navigating along hallways and through opendoors. Yet the biggest drawback is the high reaction time of about half a seconduntil the hat presents the user a change in proximity of an external object sothat the wearer has already walked past an object when it is �nally shown. Thislatency is partly due to the fact that the sensor only works with the speed ofsound and partly that requesting the distances is not parallelized and executedon an Arduino Mega1 with 16 MHz clock speed. Another negative feature on apsychological level is that the ProximityHat has a high social weight [7]. Eventhough the set-up is comfortable a user might feel uneasy wearing such a sensorarray on their head as the ProximityHat does not integrate with regular clothing.As it is the goal to enhance the ProximityHat, the following sections will discusshow other functionalities can be added.
1 Arduinos are open-source microcontroller boards http://www.arduino.cc
Proximity and Velocity Recognition of External Objects on a Mobile Observer 203
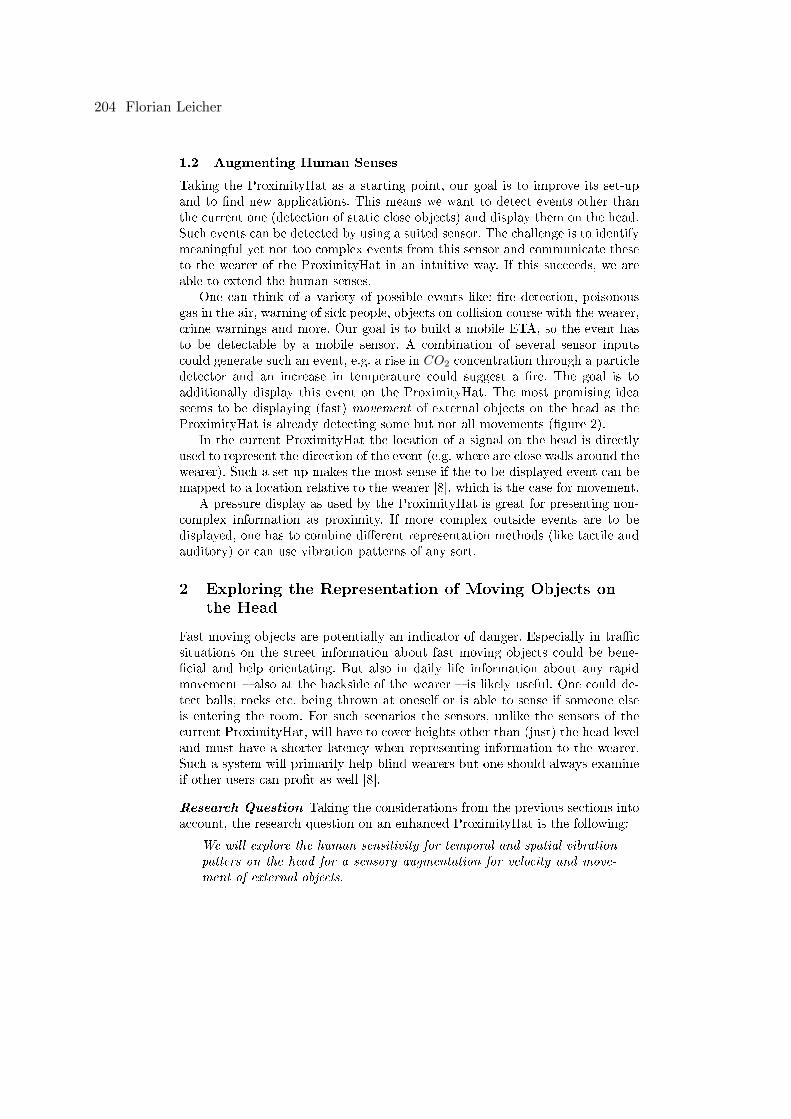
1.2 Augmenting Human Senses
Taking the ProximityHat as a starting point, our goal is to improve its set-upand to �nd new applications. This means we want to detect events other thanthe current one (detection of static close objects) and display them on the head.Such events can be detected by using a suited sensor. The challenge is to identifymeaningful yet not too complex events from this sensor and communicate theseto the wearer of the ProximityHat in an intuitive way. If this succeeds, we areable to extend the human senses.
One can think of a variety of possible events like: �re detection, poisonousgas in the air, warning of sick people, objects on collision course with the wearer,crime warnings and more. Our goal is to build a mobile ETA, so the event hasto be detectable by a mobile sensor. A combination of several sensor inputscould generate such an event, e.g. a rise in CO2 concentration through a particledetector and an increase in temperature could suggest a �re. The goal is toadditionally display this event on the ProximityHat. The most promising ideaseems to be displaying (fast) movement of external objects on the head as theProximityHat is already detecting some but not all movements (�gure 2).
In the current ProximityHat the location of a signal on the head is directlyused to represent the direction of the event (e.g. where are close walls around thewearer). Such a set-up makes the most sense if the to-be-displayed event can bemapped to a location relative to the wearer [8], which is the case for movement.
A pressure display as used by the ProximityHat is great for presenting non-complex information as proximity. If more complex outside events are to bedisplayed, one has to combine di�erent representation methods (like tactile andauditory) or can use vibration patterns of any sort.
2 Exploring the Representation of Moving Objects on
the Head
Fast moving objects are potentially an indicator of danger. Especially in tra�csituations on the street information about fast moving objects could be bene-�cial and help orientating. But also in daily life information about any rapidmovement � also at the backside of the wearer � is likely useful. One could de-tect balls, rocks etc. being thrown at oneself or is able to sense if someone elseis entering the room. For such scenarios the sensors, unlike the sensors of thecurrent ProximityHat, will have to cover heights other than (just) the head leveland must have a shorter latency when representing information to the wearer.Such a system will primarily help blind wearers but one should always examineif other users can pro�t as well [8].
Research Question Taking the considerations from the previous sections intoaccount, the research question on an enhanced ProximityHat is the following:
We will explore the human sensitivity for temporal and spatial vibration
patters on the head for a sensory augmentation for velocity and move-
ment of external objects.
204 Florian Leicher
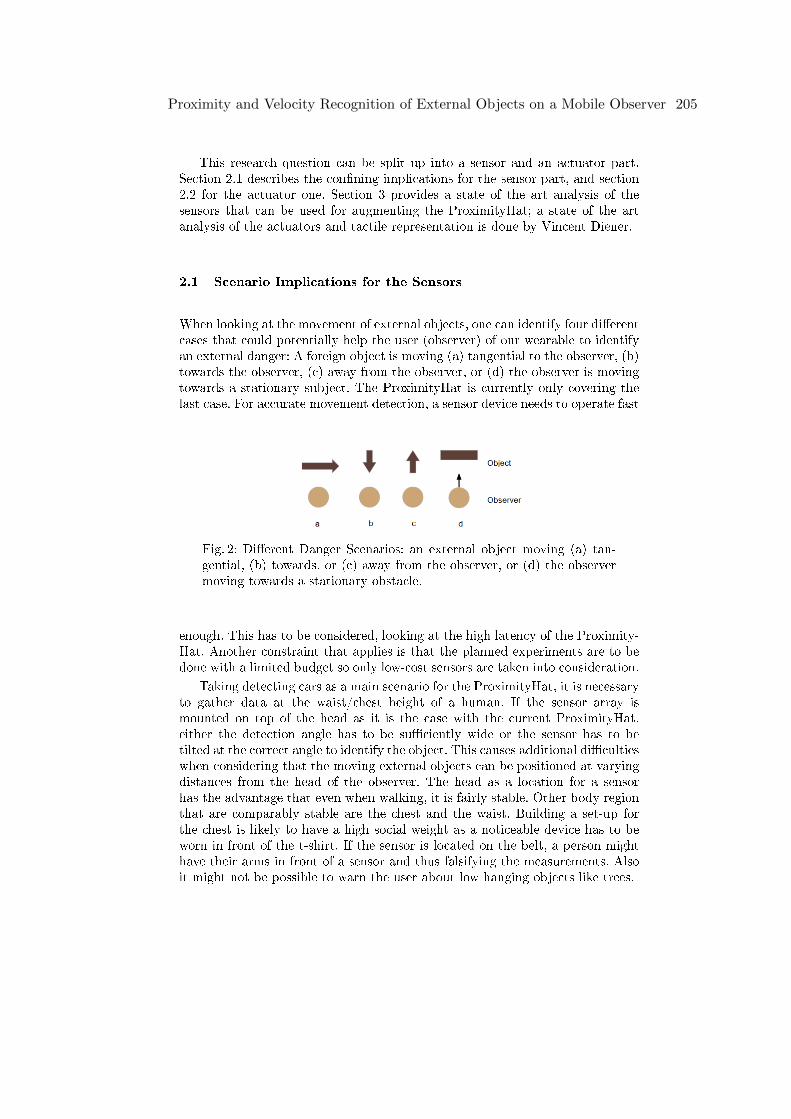
This research question can be split up into a sensor and an actuator part.Section 2.1 describes the con�ning implications for the sensor part, and section2.2 for the actuator one. Section 3 provides a state of the art analysis of thesensors that can be used for augmenting the ProximityHat; a state of the artanalysis of the actuators and tactile representation is done by Vincent Diener.
2.1 Scenario Implications for the Sensors
When looking at the movement of external objects, one can identify four di�erentcases that could potentially help the user (observer) of our wearable to identifyan external danger: A foreign object is moving (a) tangential to the observer, (b)towards the observer, (c) away from the observer, or (d) the observer is movingtowards a stationary subject. The ProximityHat is currently only covering thelast case. For accurate movement detection, a sensor device needs to operate fast
Fig. 2: Di�erent Danger Scenarios: an external object moving (a) tan-gential, (b) towards, or (c) away from the observer, or (d) the observermoving towards a stationary obstacle.
enough. This has to be considered, looking at the high latency of the Proximity-Hat. Another constraint that applies is that the planned experiments are to bedone with a limited budget so only low-cost sensors are taken into consideration.
Taking detecting cars as a main scenario for the ProximityHat, it is necessaryto gather data at the waist/chest height of a human. If the sensor array ismounted on top of the head as it is the case with the current ProximityHat,either the detection angle has to be su�ciently wide or the sensor has to betilted at the correct angle to identify the object. This causes additional di�cultieswhen considering that the moving external objects can be positioned at varyingdistances from the head of the observer. The head as a location for a sensorhas the advantage that even when walking, it is fairly stable. Other body regionthat are comparably stable are the chest and the waist. Building a set-up forthe chest is likely to have a high social weight as a noticeable device has to beworn in front of the t-shirt. If the sensor is located on the belt, a person mighthave their arms in front of a sensor and thus falsifying the measurements. Alsoit might not be possible to warn the user about low hanging objects like trees.
Proximity and Velocity Recognition of External Objects on a Mobile Observer 205
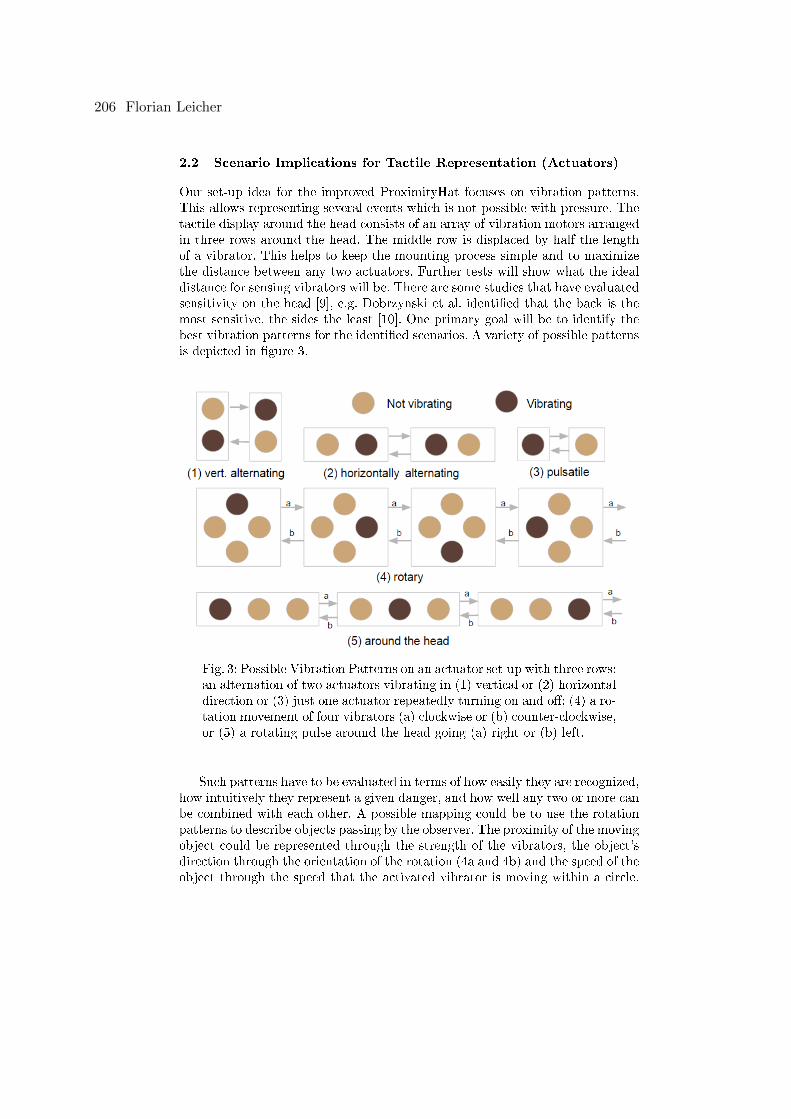
2.2 Scenario Implications for Tactile Representation (Actuators)
Our set-up idea for the improved ProximityHat focuses on vibration patterns.This allows representing several events which is not possible with pressure. Thetactile display around the head consists of an array of vibration motors arrangedin three rows around the head. The middle row is displaced by half the lengthof a vibrator. This helps to keep the mounting process simple and to maximizethe distance between any two actuators. Further tests will show what the idealdistance for sensing vibrators will be. There are some studies that have evaluatedsensitivity on the head [9], e.g. Dobrzynski et al. identi�ed that the back is themost sensitive, the sides the least [10]. One primary goal will be to identify thebest vibration patterns for the identi�ed scenarios. A variety of possible patternsis depicted in �gure 3.
Fig. 3: Possible Vibration Patterns on an actuator set-up with three rows:an alternation of two actuators vibrating in (1) vertical or (2) horizontaldirection or (3) just one actuator repeatedly turning on and o�; (4) a ro-tation movement of four vibrators (a) clockwise or (b) counter-clockwise,or (5) a rotating pulse around the head going (a) right or (b) left.
Such patterns have to be evaluated in terms of how easily they are recognized,how intuitively they represent a given danger, and how well any two or more canbe combined with each other. A possible mapping could be to use the rotationpatterns to describe objects passing by the observer. The proximity of the movingobject could be represented through the strength of the vibrators, the object'sdirection through the orientation of the rotation (4a and 4b) and the speed of theobject through the speed that the activated vibrator is moving within a circle.
206 Florian Leicher
A �rst prototype with four actuators mounted on a �exible cotton head bandwas built(�gure 4). This showed that displaying such patterns on the head isfeasible.
Fig. 4: The �rst test prototype containing four vibrating motors
2.3 A Possible Set-Up
Taking these considerations into account the following set-up is proposed. Theuser will wear a headband with around 30 actuators placed in three rows aroundtheir head. The actuators are �xed to the headband by weaving small �exiblepockets onto the outside of the headband. The �exible cotton of the pocketspresses the actuators towards the head, since the pocket is stretched more atthe outside (see �gure 5). For testing purposes it is also very easy to insert andremove the actuators from these pockets. In general the �exible cotton used inthe �rst test proved to be very well suited for the headband as it �ts on di�erenthead shapes and is air permeable so a wearer is less likely to sweat.
The actuators are connected to three thin Lilypad Arduinos2 in groups of tenvibrators each (input restriction of this Arduino). Small coin cells weaved uni-formly (for a good weight balancing) around at the bottom of the headband willpower these Arduinos. In a later stage the headband with its attached actuatorsand thin Arduinos on top can be easily covered by a second layer of said cottonmaterial. Such a prototype has a low social weight as it is hardly distinguishablefrom a regular headband e.g. worn by sportsmen as the cables etc. are covered.
The question what sensors will be used for the improved ProximityHat issubject of section 3. In this sample set-up we assume that they send their signalsto an Arduino and can be placed at waist height. In this case all three LilyPadscan be connected via cable along the wearers back to a main Arduino in a trouserpocket. (A wireless communication would also be possible.) The communication
2 https://www.arduino.cc/en/Main/ArduinoBoardLilyPad
Proximity and Velocity Recognition of External Objects on a Mobile Observer 207
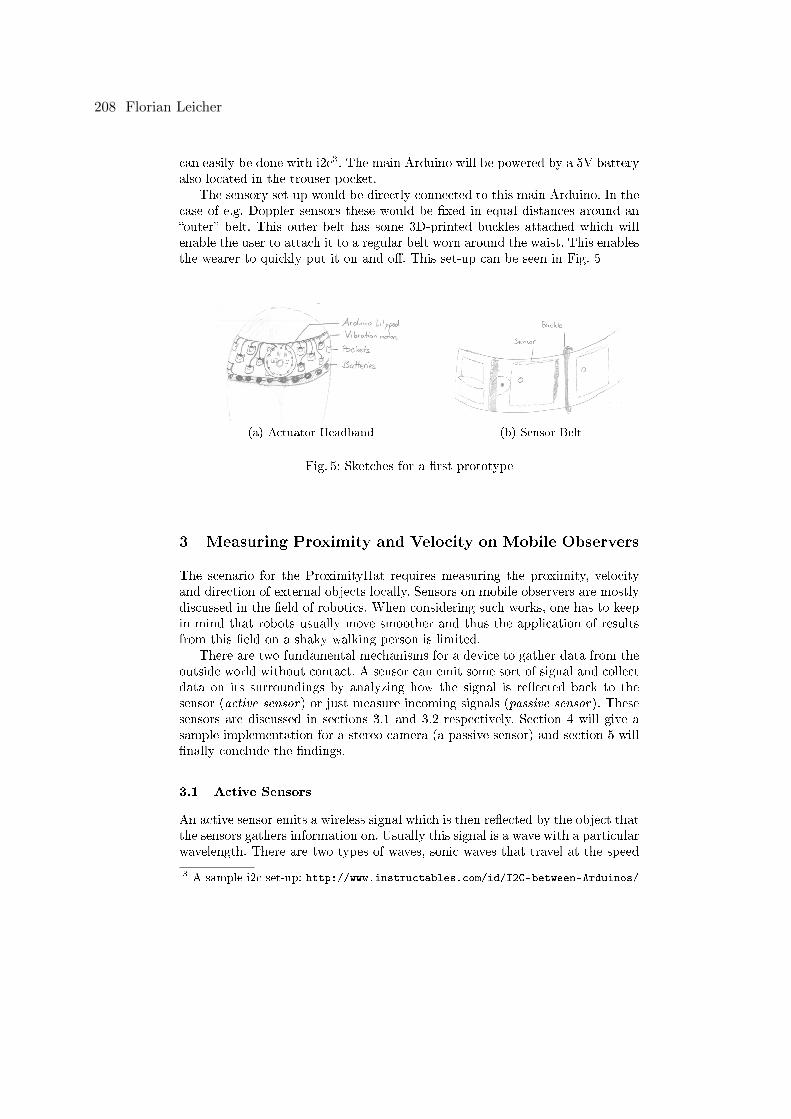
can easily be done with i2c3. The main Arduino will be powered by a 5V batteryalso located in the trouser pocket.
The sensory set-up would be directly connected to this main Arduino. In thecase of e.g. Doppler sensors these would be �xed in equal distances around an�outer� belt. This outer belt has some 3D-printed buckles attached which willenable the user to attach it to a regular belt worn around the waist. This enablesthe wearer to quickly put it on and o�. This set-up can be seen in Fig. 5
(a) Actuator Headband (b) Sensor Belt
Fig. 5: Sketches for a �rst prototype
3 Measuring Proximity and Velocity on Mobile Observers
The scenario for the ProximityHat requires measuring the proximity, velocityand direction of external objects locally. Sensors on mobile observers are mostlydiscussed in the �eld of robotics. When considering such works, one has to keepin mind that robots usually move smoother and thus the application of resultsfrom this �eld on a shaky walking person is limited.
There are two fundamental mechanisms for a device to gather data from theoutside world without contact. A sensor can emit some sort of signal and collectdata on its surroundings by analyzing how the signal is re�ected back to thesensor (active sensor) or just measure incoming signals (passive sensor). Thesesensors are discussed in sections 3.1 and 3.2 respectively. Section 4 will give asample implementation for a stereo camera (a passive sensor) and section 5 will�nally conclude the �ndings.
3.1 Active Sensors
An active sensor emits a wireless signal which is then re�ected by the object thatthe sensors gathers information on. Usually this signal is a wave with a particularwavelength. There are two types of waves, sonic waves that travel at the speed
3 A sample i2c set-up: http://www.instructables.com/id/I2C-between-Arduinos/
208 Florian Leicher
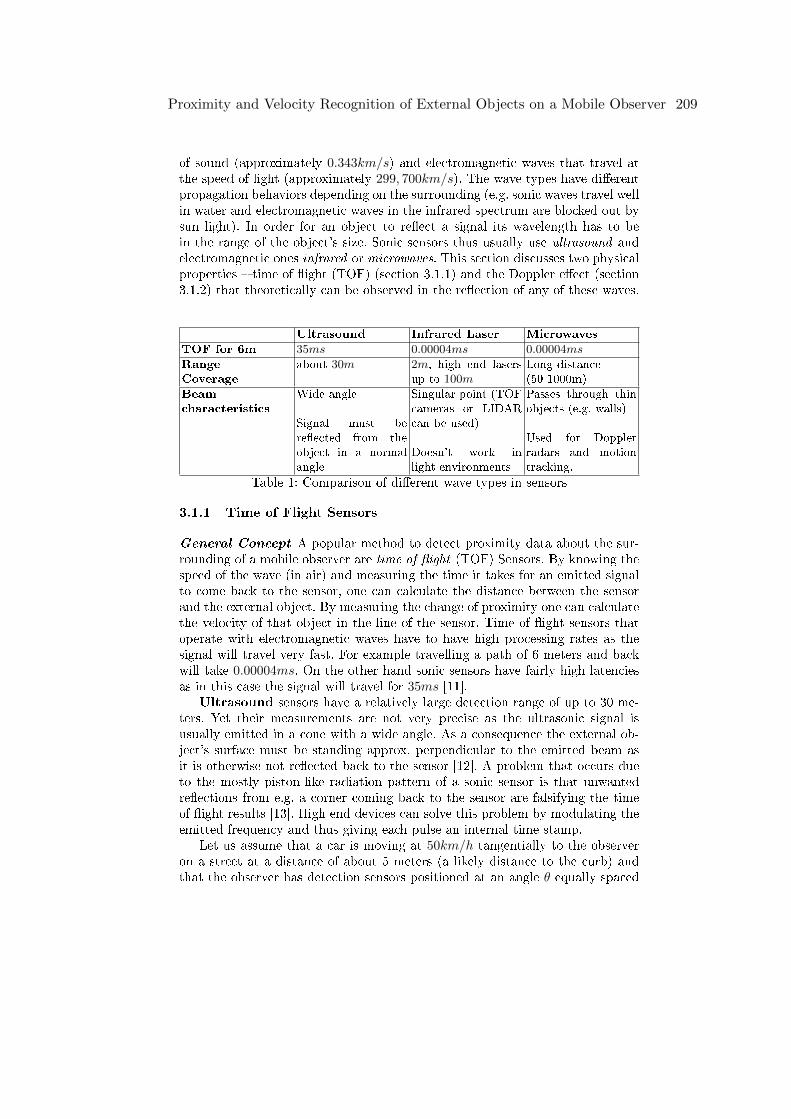
of sound (approximately 0.343km/s) and electromagnetic waves that travel atthe speed of light (approximately 299, 700km/s). The wave types have di�erentpropagation behaviors depending on the surrounding (e.g. sonic waves travel wellin water and electromagnetic waves in the infrared spectrum are blocked out bysun light). In order for an object to re�ect a signal its wavelength has to bein the range of the object's size. Sonic sensors thus usually use ultrasound andelectromagnetic ones infrared or microwaves. This section discusses two physicalproperties � time of �ight (TOF) (section 3.1.1) and the Doppler e�ect (section3.1.2) that theoretically can be observed in the re�ection of any of these waves.
Ultrasound Infrared Laser Microwaves
TOF for 6m 35ms 0.00004ms 0.00004ms
Range
Coverage
about 30m 2m, high end lasersup to 100m
Long distance(50-1000m)
Beam
characteristics
Wide angle
Signal must bere�ected from theobject in a normalangle
Singular point (TOFcameras or LIDARcan be used)
Doesn't work inlight environments
Passes through thinobjects (e.g. walls)
Used for Dopplerradars and motiontracking.
Table 1: Comparison of di�erent wave types in sensors
3.1.1 Time of Flight Sensors
General Concept A popular method to detect proximity data about the sur-rounding of a mobile observer are time of �ight (TOF) Sensors. By knowing thespeed of the wave (in air) and measuring the time it takes for an emitted signalto come back to the sensor, one can calculate the distance between the sensorand the external object. By measuring the change of proximity one can calculatethe velocity of that object in the line of the sensor. Time of �ight sensors thatoperate with electromagnetic waves have to have high processing rates as thesignal will travel very fast. For example travelling a path of 6 meters and backwill take 0.00004ms. On the other hand sonic sensors have fairly high latenciesas in this case the signal will travel for 35ms [11].
Ultrasound sensors have a relatively large detection range of up to 30 me-ters. Yet their measurements are not very precise as the ultrasonic signal isusually emitted in a cone with a wide angle. As a consequence the external ob-ject's surface must be standing approx. perpendicular to the emitted beam asit is otherwise not re�ected back to the sensor [12]. A problem that occurs dueto the mostly piston-like radiation pattern of a sonic sensor is that unwantedre�ections from e.g. a corner coming back to the sensor are falsifying the timeof �ight results [13]. High end devices can solve this problem by modulating theemitted frequency and thus giving each pulse an internal time stamp.
Let us assume that a car is moving at 50km/h tangentially to the observeron a street at a distance of about 5 meters (a likely distance to the curb) andthat the observer has detection sensors positioned at an angle θ equally spaced
Proximity and Velocity Recognition of External Objects on a Mobile Observer 209
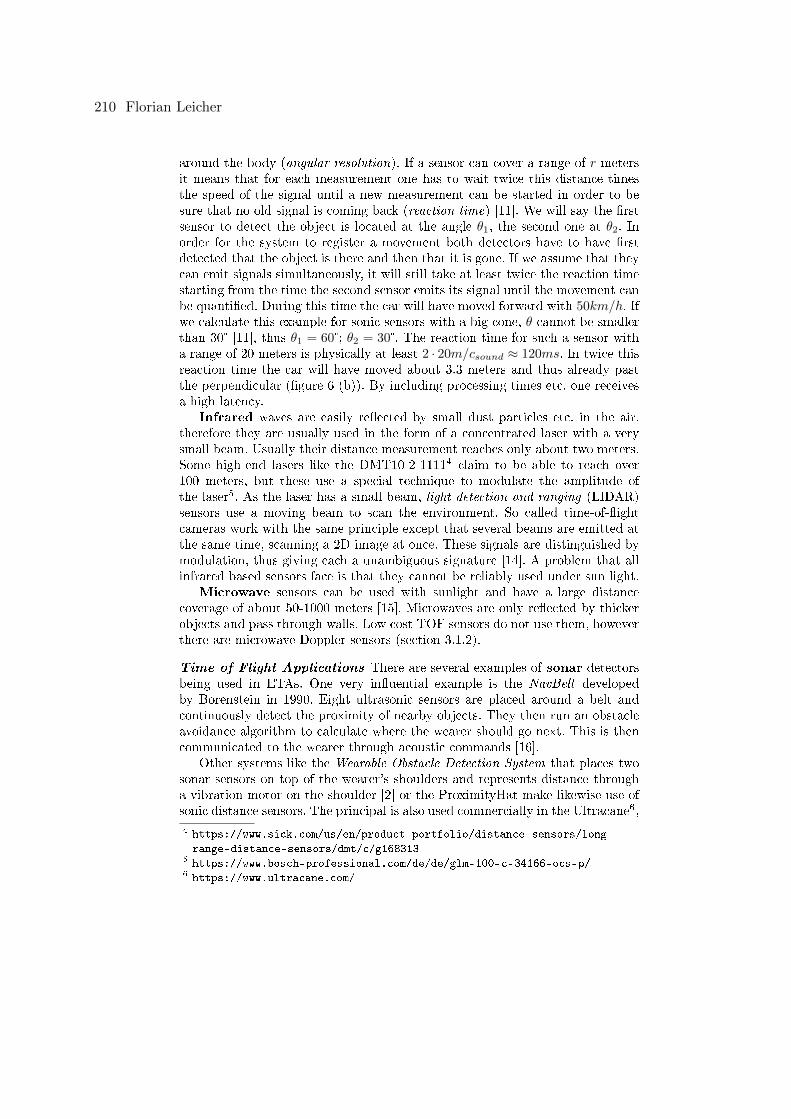
around the body (angular resolution). If a sensor can cover a range of r metersit means that for each measurement one has to wait twice this distance timesthe speed of the signal until a new measurement can be started in order to besure that no old signal is coming back (reaction time) [11]. We will say the �rstsensor to detect the object is located at the angle θ1, the second one at θ2. Inorder for the system to register a movement both detectors have to have �rstdetected that the object is there and then that it is gone. If we assume that theycan emit signals simultaneously, it will still take at least twice the reaction timestarting from the time the second sensor emits its signal until the movement canbe quanti�ed. During this time the car will have moved forward with 50km/h. Ifwe calculate this example for sonic sensors with a big cone, θ cannot be smallerthan 30° [11], thus θ1 = 60°; θ2 = 30°. The reaction time for such a sensor witha range of 20 meters is physically at least 2 · 20m/csound ≈ 120ms. In twice thisreaction time the car will have moved about 3.3 meters and thus already pastthe perpendicular (�gure 6 (b)). By including processing times etc. one receivesa high latency.
Infrared waves are easily re�ected by small dust particles etc. in the air,therefore they are usually used in the form of a concentrated laser with a verysmall beam. Usually their distance measurement reaches only about two meters.Some high-end lasers like the DMT10-2-11114 claim to be able to reach over100 meters, but these use a special technique to modulate the amplitude ofthe laser5. As the laser has a small beam, light detection and ranging (LIDAR)sensors use a moving beam to scan the environment. So called time-of-�ightcameras work with the same principle except that several beams are emitted atthe same time, scanning a 2D image at once. These signals are distinguished bymodulation, thus giving each a unambiguous signature [14]. A problem that allinfrared based sensors face is that they cannot be reliably used under sun light.
Microwave sensors can be used with sunlight and have a large distancecoverage of about 50-1000 meters [15]. Microwaves are only re�ected by thickerobjects and pass through walls. Low cost TOF sensors do not use them, howeverthere are microwave Doppler sensors (section 3.1.2).
Time of Flight Applications There are several examples of sonar detectorsbeing used in ETAs. One very in�uential example is the NavBelt developedby Borenstein in 1990. Eight ultrasonic sensors are placed around a belt andcontinuously detect the proximity of nearby objects. They then run an obstacleavoidance algorithm to calculate where the wearer should go next. This is thencommunicated to the wearer through acoustic commands [16].
Other systems like the Wearable Obstacle Detection System that places twosonar sensors on top of the wearer's shoulders and represents distance througha vibration motor on the shoulder [2] or the ProximityHat make likewise use ofsonic distance sensors. The principal is also used commercially in the Ultracane6,
4 https://www.sick.com/us/en/product-portfolio/distance-sensors/long-
range-distance-sensors/dmt/c/g1683135 https://www.bosch-professional.com/de/de/glm-100-c-34166-ocs-p/6 https://www.ultracane.com/
210 Florian Leicher
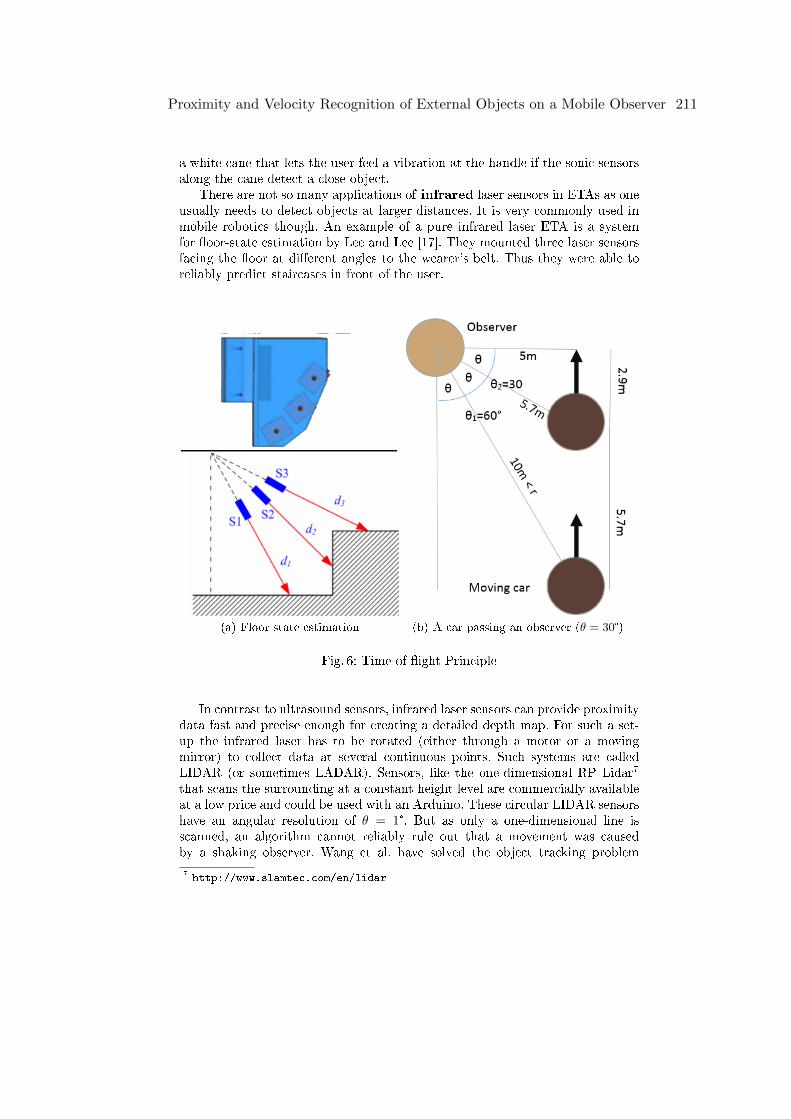
a white cane that lets the user feel a vibration at the handle if the sonic sensorsalong the cane detect a close object.
There are not so many applications of infrared laser sensors in ETAs as oneusually needs to detect objects at larger distances. It is very commonly used inmobile robotics though. An example of a pure infrared laser ETA is a systemfor �oor-state estimation by Lee and Lee [17]. They mounted three laser sensorsfacing the �oor at di�erent angles to the wearer's belt. Thus they were able toreliably predict staircases in front of the user.
(a) Floor state estimation (b) A car passing an observer (θ = 30°)
Fig. 6: Time of �ight Principle
In contrast to ultrasound sensors, infrared laser sensors can provide proximitydata fast and precise enough for creating a detailed depth map. For such a set-up the infrared laser has to be rotated (either through a motor or a movingmirror) to collect data at several continuous points. Such systems are calledLIDAR (or sometimes LADAR). Sensors, like the one-dimensional RP Lidar7
that scans the surrounding at a constant height level are commercially availableat a low price and could be used with an Arduino. These circular LIDAR sensorshave an angular resolution of θ = 1°. But as only a one-dimensional line isscanned, an algorithm cannot reliably rule out that a movement was causedby a shaking observer. Wang et al. have solved the object tracking problem
7 http://www.slamtec.com/en/lidar
Proximity and Velocity Recognition of External Objects on a Mobile Observer 211
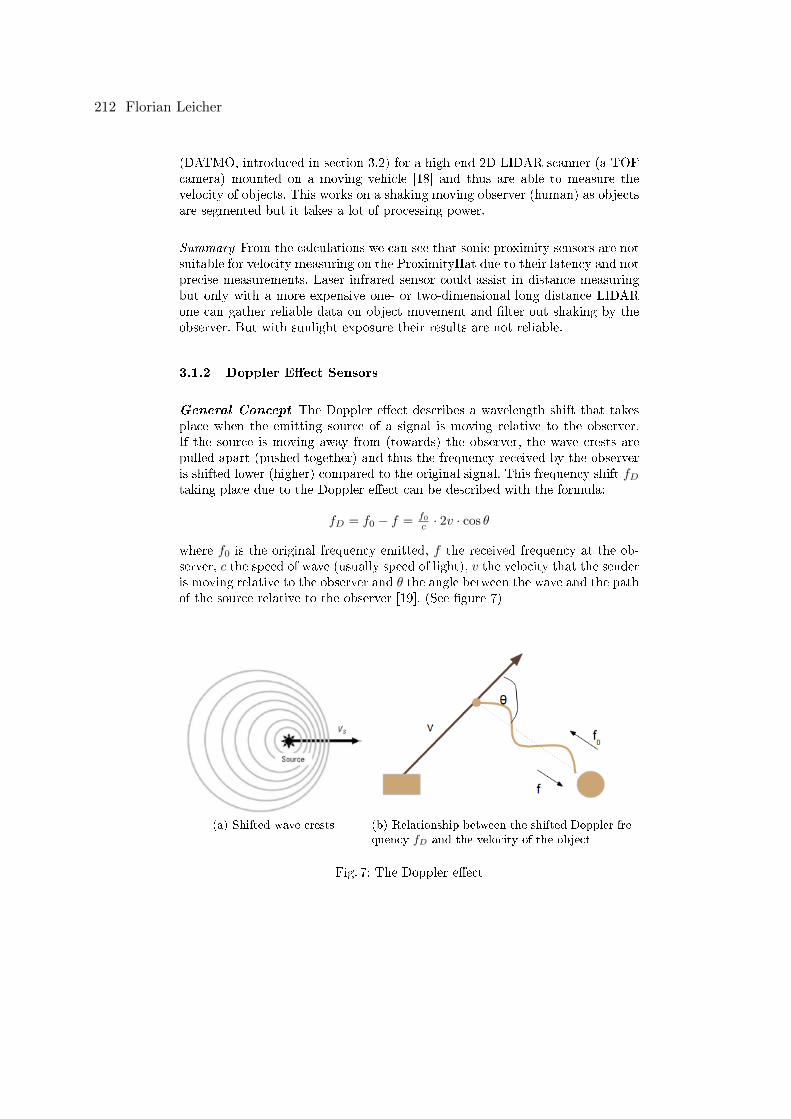
(DATMO, introduced in section 3.2) for a high-end 2D LIDAR scanner (a TOFcamera) mounted on a moving vehicle [18] and thus are able to measure thevelocity of objects. This works on a shaking moving observer (human) as objectsare segmented but it takes a lot of processing power.
Summary From the calculations we can see that sonic proximity sensors are notsuitable for velocity measuring on the ProximityHat due to their latency and notprecise measurements. Laser infrared sensor could assist in distance measuringbut only with a more expensive one- or two-dimensional long distance LIDARone can gather reliable data on object movement and �lter out shaking by theobserver. But with sunlight exposure their results are not reliable.
3.1.2 Doppler E�ect Sensors
General Concept The Doppler e�ect describes a wavelength shift that takesplace when the emitting source of a signal is moving relative to the observer.If the source is moving away from (towards) the observer, the wave crests arepulled apart (pushed together) and thus the frequency received by the observeris shifted lower (higher) compared to the original signal. This frequency shift fDtaking place due to the Doppler e�ect can be described with the formula:
fD = f0 − f = f0c · 2v · cos θ
where f0 is the original frequency emitted, f the received frequency at the ob-server, c the speed of wave (usually speed of light), v the velocity that the senderis moving relative to the observer and θ the angle between the wave and the pathof the source relative to the observer [19]. (See �gure 7)
(a) Shifted wave crests (b) Relationship between the shifted Doppler fre-quency fD and the velocity of the object
Fig. 7: The Doppler e�ect
212 Florian Leicher
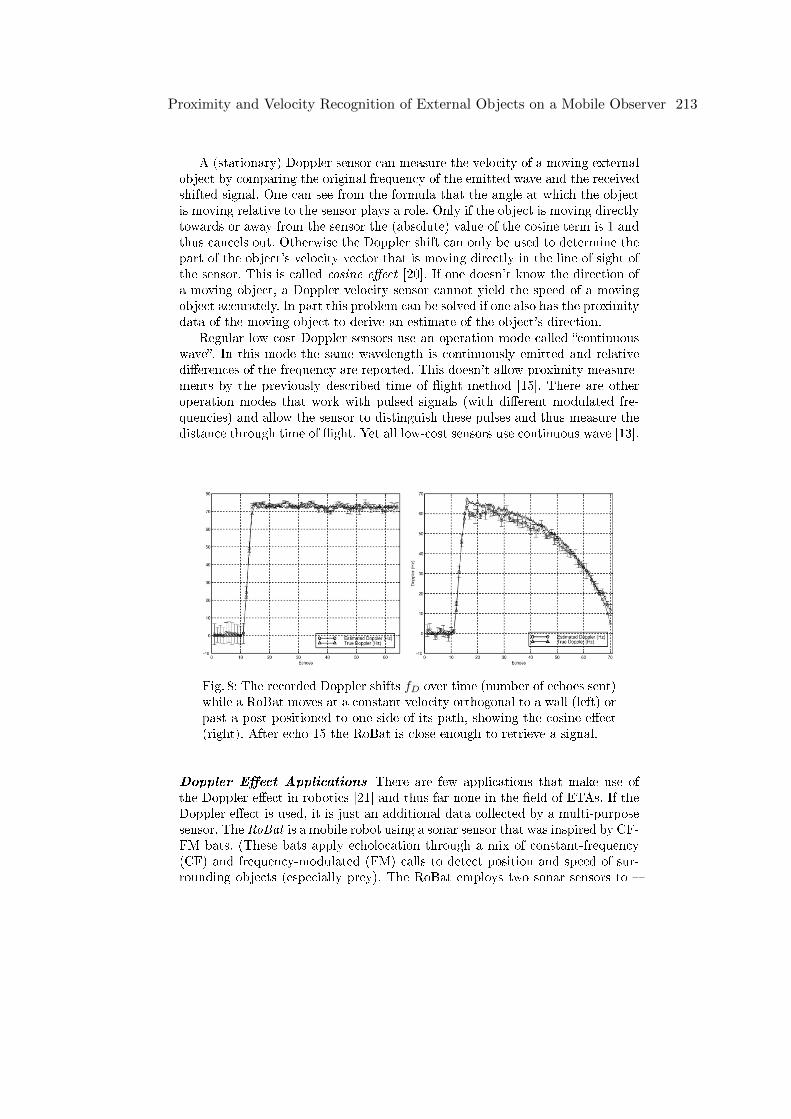
A (stationary) Doppler sensor can measure the velocity of a moving externalobject by comparing the original frequency of the emitted wave and the receivedshifted signal. One can see from the formula that the angle at which the objectis moving relative to the sensor plays a role. Only if the object is moving directlytowards or away from the sensor the (absolute) value of the cosine term is 1 andthus cancels out. Otherwise the Doppler shift can only be used to determine thepart of the object's velocity vector that is moving directly in the line of sight ofthe sensor. This is called cosine e�ect [20]. If one doesn't know the direction ofa moving object, a Doppler velocity sensor cannot yield the speed of a movingobject accurately. In part this problem can be solved if one also has the proximitydata of the moving object to derive an estimate of the object's direction.
Regular low cost Doppler sensors use an operation mode called �continuouswave�. In this mode the same wavelength is continuously emitted and relativedi�erences of the frequency are reported. This doesn't allow proximity measure-ments by the previously described time of �ight method [15]. There are otheroperation modes that work with pulsed signals (with di�erent modulated fre-quencies) and allow the sensor to distinguish these pulses and thus measure thedistance through time of �ight. Yet all low-cost sensors use continuous wave [13].
Fig. 8: The recorded Doppler shifts fD over time (number of echoes sent)while a RoBat moves at a constant velocity orthogonal to a wall (left) orpast a post positioned to one side of its path, showing the cosine e�ect(right). After echo 15 the RoBat is close enough to retrieve a signal.
Doppler E�ect Applications There are few applications that make use ofthe Doppler e�ect in robotics [21] and thus far none in the �eld of ETAs. If theDoppler e�ect is used, it is just an additional data collected by a multi-purposesensor. The RoBat is a mobile robot using a sonar sensor that was inspired by CF-FM bats. (These bats apply echolocation through a mix of constant-frequency(CF) and frequency-modulated (FM) calls to detect position and speed of sur-rounding objects (especially prey). The RoBat employs two sonar sensors to �
Proximity and Velocity Recognition of External Objects on a Mobile Observer 213
additionally to range information � detect velocity through the Doppler shift [13].As the signal will reach one sensor slightly before the other one, the directionthe signal is coming from can also be determined (binaurality). With this ad-ditional information the researchers developed an obstacle avoidance algorithmthat incorporates predicted future positions of other robot. Due to the cosinee�ect this only works well, if the other robot is coming at a suitable angle closeto 0°, that is in the line of the sensor. This can be seen in the left experiment of�gure 8.
Summary From this we see that a Doppler sensor works well for detectingvelocities coming towards the observer (Situations (b) and (c) in �gure 2). Butone cannot use this raw data, as it is not clear if the object is actually movingin the line of the sensor or at some angle to it. It might be possible to use othersensors to identify the object's direction.
3.2 Passive Sensors � Image Processing
A passive sensor is only receiving (but not emitting) signals of a certain typeand processing them. For example a video camera detects all visible light comingto its lens, a thermal camera detects incoming infrared waves and a microphonedoes so with sound waves. In the low cost segment one generally uses webcamsthat have a high enough resolution to analyze the video stream with a suitedalgorithm. These are discussed in the remainder of this section but the algorithmswould likewise work with expensive thermal cameras.
General Concept There are several applications that utilize cameras to detectmotion of objects. A very basic method to detect if there is motion is to compareany two frames of a video stream and see if the pixel by pixel di�erence is abovea threshold. But this only works if the camera is stable (a Gauÿ mixture distri-bution can help to neglect small movements). Detection and Tracking of Moving
Objects (DATMO) algorithms usually want to �nd a desired object (e.g. a hu-man, usually done through machine learning [22]) in an image and then track itsmotion. Since the important objects in the video stream are segmented, DATMOcan give relative movements and thus also works if the camera is shaking.
With the technique Detection by Tracking one can then analyze where certainfeatures of an object appear in the next camera frames and thus interpolatethe line of movement of this object. With model based tracking it is possibleto predict where an object is likely to appear next. The calculated hypothesisis then checked with reality. This has the advantage that objects can also betracked if the object recognition doesn't work precisely enough or if an object istemporarily hidden (e.g. behind a light pole). For such operations one can useparticle �lters (most popular the Kayman �lter). Such models are often used forpredictable movement like that of planes or cars.
In order to get positions and velocities a stereo camera can be used. If anobject is detected in both cameras one can � knowing the distance and orientationof the two cameras � triangulate its absolute position and velocity [23].
214 Florian Leicher
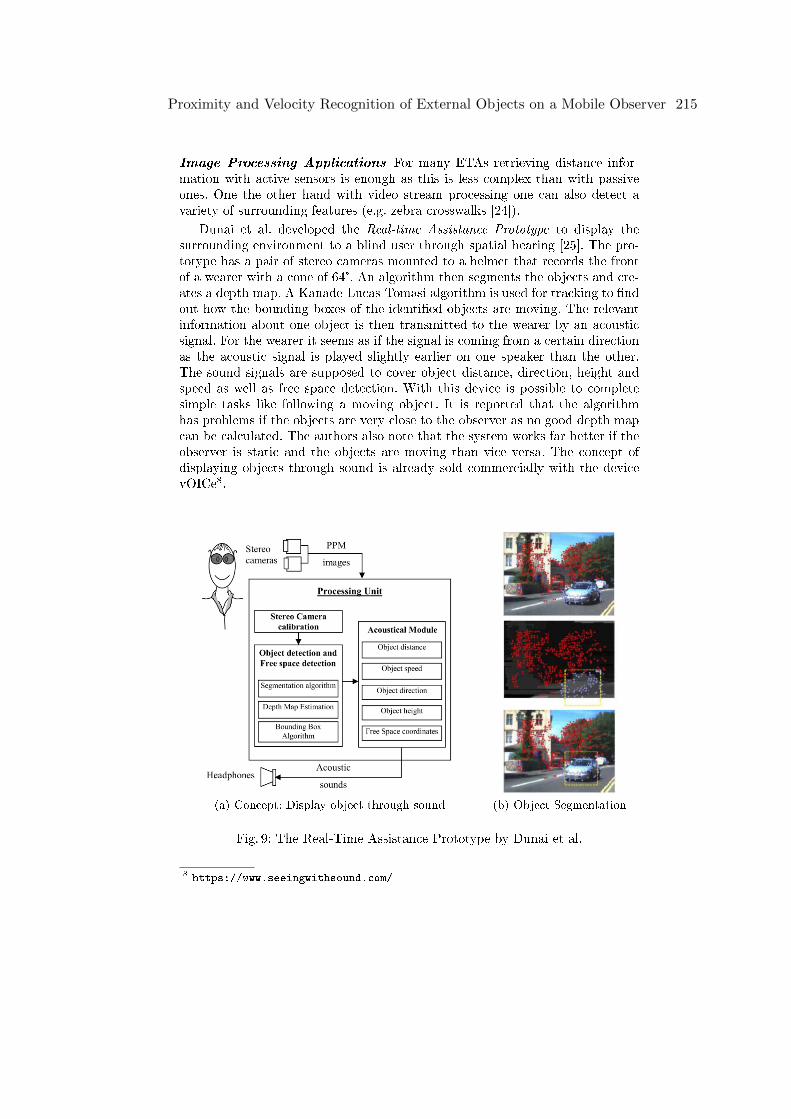
Image Processing Applications For many ETAs retrieving distance infor-mation with active sensors is enough as this is less complex than with passiveones. One the other hand with video stream processing one can also detect avariety of surrounding features (e.g. zebra crosswalks [24]).
Dunai et al. developed the Real-time Assistance Prototype to display thesurrounding environment to a blind user through spatial hearing [25]. The pro-totype has a pair of stereo cameras mounted to a helmet that records the frontof a wearer with a cone of 64°. An algorithm then segments the objects and cre-ates a depth map. A Kanade-Lucas-Tomasi algorithm is used for tracking to �ndout how the bounding boxes of the identi�ed objects are moving. The relevantinformation about one object is then transmitted to the wearer by an acousticsignal. For the wearer it seems as if the signal is coming from a certain directionas the acoustic signal is played slightly earlier on one speaker than the other.The sound signals are supposed to cover object distance, direction, height andspeed as well as free space detection. With this device is possible to completesimple tasks like following a moving object. It is reported that the algorithmhas problems if the objects are very close to the observer as no good depth mapcan be calculated. The authors also note that the system works far better if theobserver is static and the objects are moving than vice versa. The concept ofdisplaying objects through sound is already sold commercially with the devicevOICe8.
(a) Concept: Display object through sound (b) Object Segmentation
Fig. 9: The Real-Time Assistance Prototype by Dunai et al.
8 https://www.seeingwithsound.com/
Proximity and Velocity Recognition of External Objects on a Mobile Observer 215
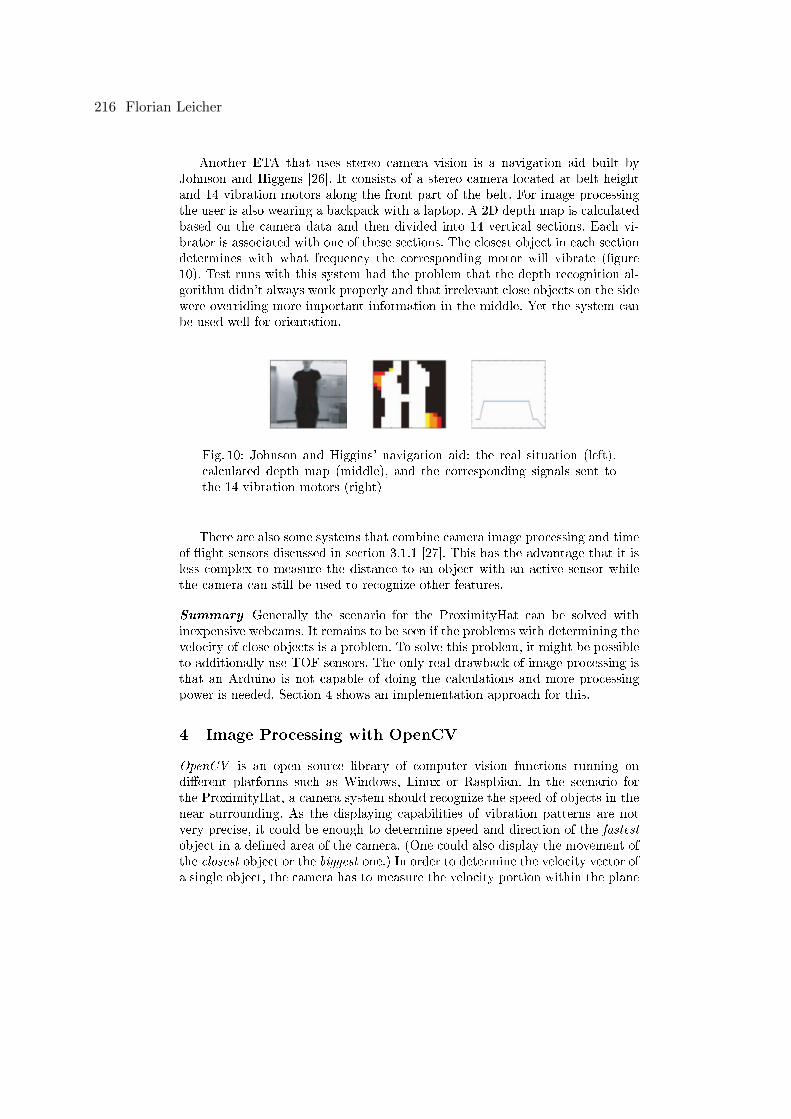
Another ETA that uses stereo camera vision is a navigation aid built byJohnson and Higgens [26]. It consists of a stereo camera located at belt heightand 14 vibration motors along the front part of the belt. For image processingthe user is also wearing a backpack with a laptop. A 2D depth map is calculatedbased on the camera data and then divided into 14 vertical sections. Each vi-brator is associated with one of these sections. The closest object in each sectiondetermines with what frequency the corresponding motor will vibrate (�gure10). Test runs with this system had the problem that the depth recognition al-gorithm didn't always work properly and that irrelevant close objects on the sidewere overriding more important information in the middle. Yet the system canbe used well for orientation.
Fig. 10: Johnson and Higgins' navigation aid: the real situation (left),calculated depth map (middle), and the corresponding signals sent tothe 14 vibration motors (right)
There are also some systems that combine camera image processing and timeof �ight sensors discussed in section 3.1.1 [27]. This has the advantage that it isless complex to measure the distance to an object with an active sensor whilethe camera can still be used to recognize other features.
Summary Generally the scenario for the ProximityHat can be solved withinexpensive webcams. It remains to be seen if the problems with determining thevelocity of close objects is a problem. To solve this problem, it might be possibleto additionally use TOF sensors. The only real drawback of image processing isthat an Arduino is not capable of doing the calculations and more processingpower is needed. Section 4 shows an implementation approach for this.
4 Image Processing with OpenCV
OpenCV is an open source library of computer vision functions running ondi�erent platforms such as Windows, Linux or Raspbian. In the scenario forthe ProximityHat, a camera system should recognize the speed of objects in thenear surrounding. As the displaying capabilities of vibration patterns are notvery precise, it could be enough to determine speed and direction of the fastestobject in a de�ned area of the camera. (One could also display the movement ofthe closest object or the biggest one.) In order to determine the velocity vector ofa single object, the camera has to measure the velocity portion within the plane
216 Florian Leicher
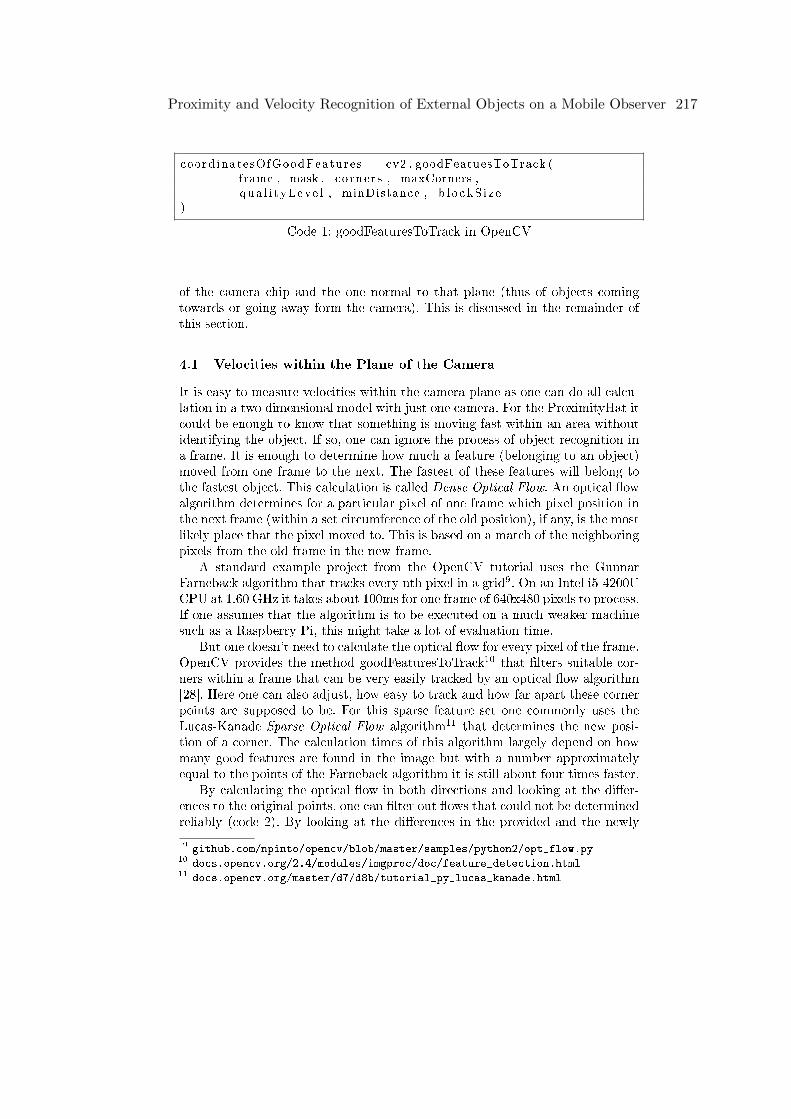
coordinatesOfGoodFeatures = cv2 . goodFeatuesToTrack (frame , mask , corners , maxCorners ,qua l i tyLeve l , minDistance , b l o ckS i z e
)
Code 1: goodFeaturesToTrack in OpenCV
of the camera chip and the one normal to that plane (thus of objects comingtowards or going away form the camera). This is discussed in the remainder ofthis section.
4.1 Velocities within the Plane of the Camera
It is easy to measure velocities within the camera plane as one can do all calcu-lation in a two dimensional model with just one camera. For the ProximityHat itcould be enough to know that something is moving fast within an area withoutidentifying the object. If so, one can ignore the process of object recognition ina frame. It is enough to determine how much a feature (belonging to an object)moved from one frame to the next. The fastest of these features will belong tothe fastest object. This calculation is called Dense Optical Flow. An optical �owalgorithm determines for a particular pixel of one frame which pixel position inthe next frame (within a set circumference of the old position), if any, is the mostlikely place that the pixel moved to. This is based on a match of the neighboringpixels from the old frame in the new frame.
A standard example project from the OpenCV tutorial uses the GunnarFarneback algorithm that tracks every nth pixel in a grid9. On an Intel i5-4200UCPU at 1.60 GHz it takes about 100ms for one frame of 640x480 pixels to process.If one assumes that the algorithm is to be executed on a much weaker machinesuch as a Raspberry Pi, this might take a lot of evaluation time.
But one doesn't need to calculate the optical �ow for every pixel of the frame.OpenCV provides the method goodFeaturesToTrack10 that �lters suitable cor-ners within a frame that can be very easily tracked by an optical �ow algorithm[28]. Here one can also adjust, how easy to track and how far apart these cornerpoints are supposed to be. For this sparse feature set one commonly uses theLucas-Kanade Sparse Optical Flow algorithm11 that determines the new posi-tion of a corner. The calculation times of this algorithm largely depend on howmany good features are found in the image but with a number approximatelyequal to the points of the Farneback algorithm it is still about four times faster.
By calculating the optical �ow in both directions and looking at the di�er-ences to the original points, one can �lter out �ows that could not be determinedreliably (code 2). By looking at the di�erences in the provided and the newly
9 github.com/npinto/opencv/blob/master/samples/python2/opt_flow.py10 docs.opencv.org/2.4/modules/imgproc/doc/feature_detection.html11 docs.opencv.org/master/d7/d8b/tutorial_py_lucas_kanade.html
Proximity and Velocity Recognition of External Objects on a Mobile Observer 217
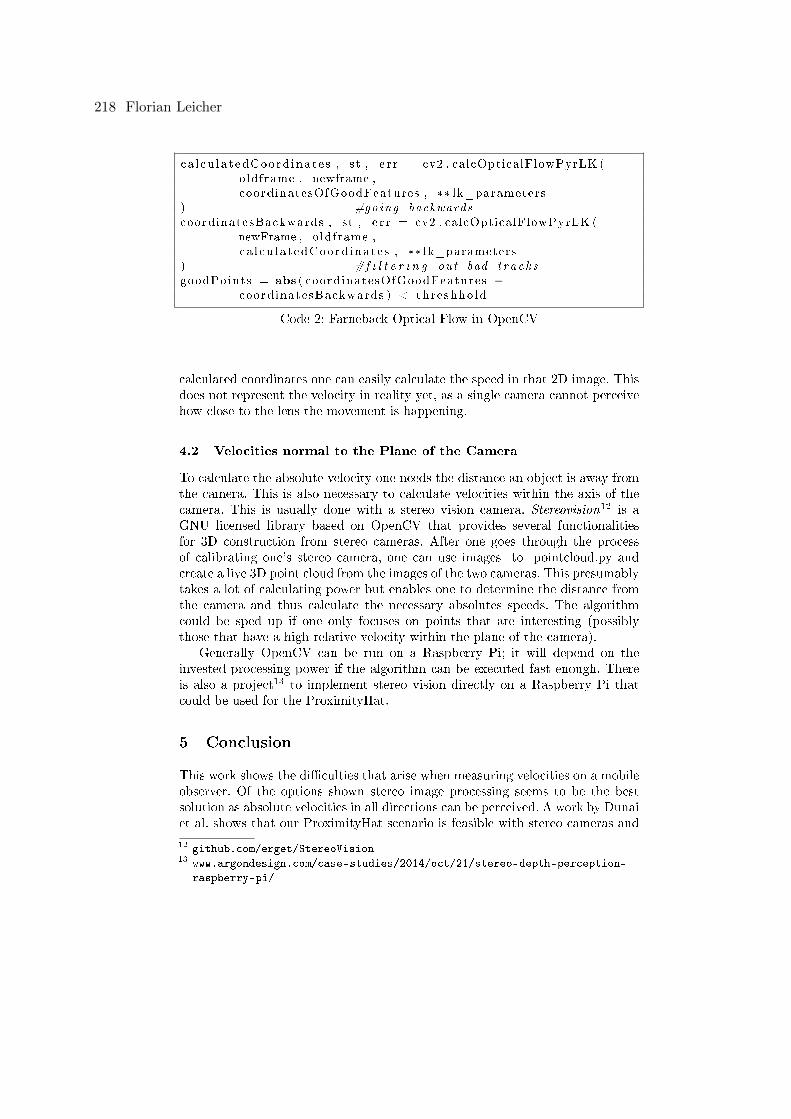
ca l cu la t edCoord inate s , st , e r r = cv2 . calcOpticalFlowPyrLK (oldframe , newframe ,coordinatesOfGoodFeatures , ** lk_parameters
) #going backwardscoordinatesBackwards , st , e r r = cv2 . calcOpticalFlowPyrLK (
newFrame , oldframe ,ca l cu la t edCoord inate s , ** lk_parameters
) #f i l t e r i n g out bad t r a c k sgoodPoints = abs ( coordinatesOfGoodFeatures −
coordinatesBackwards ) < threshho ld
Code 2: Farneback Optical Flow in OpenCV
calculated coordinates one can easily calculate the speed in that 2D image. Thisdoes not represent the velocity in reality yet, as a single camera cannot perceivehow close to the lens the movement is happening.
4.2 Velocities normal to the Plane of the Camera
To calculate the absolute velocity one needs the distance an object is away fromthe camera. This is also necessary to calculate velocities within the axis of thecamera. This is usually done with a stereo vision camera. Stereovision12 is aGNU licensed library based on OpenCV that provides several functionalitiesfor 3D construction from stereo cameras. After one goes through the processof calibrating one's stereo camera, one can use images_to_pointcloud.py andcreate a live 3D point cloud from the images of the two cameras. This presumablytakes a lot of calculating power but enables one to determine the distance fromthe camera and thus calculate the necessary absolutes speeds. The algorithmcould be sped up if one only focuses on points that are interesting (possiblythose that have a high relative velocity within the plane of the camera).
Generally OpenCV can be run on a Raspberry Pi; it will depend on theinvested processing power if the algorithm can be executed fast enough. Thereis also a project13 to implement stereo vision directly on a Raspberry Pi thatcould be used for the ProximityHat.
5 Conclusion
This work shows the di�culties that arise when measuring velocities on a mobileobserver. Of the options shown stereo image processing seems to be the bestsolution as absolute velocities in all directions can be perceived. A work by Dunaiet al. shows that our ProximityHat scenario is feasible with stereo cameras and
12 github.com/erget/StereoVision13 www.argondesign.com/case-studies/2014/oct/21/stereo-depth-perception-
raspberry-pi/
218 Florian Leicher
that there are only minor problems measuring objects in the range of up to �vemeters. The biggest drawback is that a high processing power is necessary forprocessing the algorithm, especially to determine the most dangerous velocitiesthat are in the line of the camera (coming towards or going away from it).
One-dimensional LIDAR TOF sensors allow velocity detection in the line ofthe sensor and to some extent tangential to it. But because only a small range iscovered, no object segmentation is possible which makes the measurements ona moving human unreliable. This could only be solved by using more expensiveTOF cameras that will also need more processing power. Sonar TOF sensorsas used in the current ProximityHat cannot be used for the proposed scenario.Doppler sensors don't need a lot of calculating power and can be connected toan Arduino but one faces the problem that the data e�ectively can only be usedin combination with another sensor.
For some scenarios a LIDAR and a Doppler sensor could work but it is likelythat an image processing solution as shown in section 4 will provide the bestresults for displaying velocities through a tactile display based on vibration. Forthe �nal decision which set-up to use and where to position the sensors it hasto be decided how to chose which object's movement (the fastest, the closest,the one on collision course, etc.) shall be displayed. For this it is necessary to dofurther tests what is the most intuitive and the most helpful for the users.
References
1. D. Dakopoulos and N. G. Bourbakis, �Wearable Obstacle Avoidance ElectronicTravel Aids for Blind: A Survey,� APPLICATIONS AND REVIEWS, vol. 40,no. 1, 2010.
2. S. Cardin, D. Thalmann, and F. Vexo, �Wearable Obstacle Detection System forvisually impaired People,� VR Workshop on Haptic and Tactile Perception of De-formable Objects, pp. 50�55, 2005.
3. R. Farcy, R. Leroux, A. Jucha, R. Damaschini, C. Grégoire, and A. Zogaghi, �Elec-tronic Travel Aids and Eletronic Orientation Aids,� in Conference & Workshop onAssistive Technologies for People with Vision & Hearing Impairments, 2006.
4. D. Bin, Y. Haitao, L. Jiang, and Z. Xiaoning, �The research on blind navigationsystem based on RFID,� 2007 International Conference on Wireless Communica-tions, Networking and Mobile Computing, no. 070416277, pp. 2058�2061, 2007.
5. K. Tsukada and M. Yasumura, �ActiveBelt : Belt-Type Wearable Tactile Display,�pp. 384�399, 2004.
6. M. Berning, F. Braun, T. Riedel, and M. Beigl, �ProximityHat,� Proceedings of the2015 ACM International Symposium on Wearable Computers - ISWC '15, no. April2016, pp. 31�38, 2015.
7. A. Toney, B. Mulley, B. H. Thomas, and W. Piekarski, �Social weight: Designingto minimise the social consequences arising from technology use by the mobileprofessional,� Personal and Ubiquitous Computing, vol. 7, no. 5, pp. 309�320, 2003.
8. H. Z. Tan and A. Pentland, �Tactual Displays for Sensory Substitution and Wear-able Computers,� Fundamentals of Wearable Computers and Augmented Reality,pp. 579�598, 2001.
9. K. Myles, �Vibrotactile Sensitivity of the Head,� Engineering, no. January, 2009.
Proximity and Velocity Recognition of External Objects on a Mobile Observer 219
10. M. K. Dobrzynski, S. Mejri, and S. Wischmann, �Quantifying information transferthrough a head-attached vibrotactile display: Principles for design and control,�IEEE Transactions on Biomedical Engineering, vol. 59, no. 7, pp. 2011�2018, 2012.
11. G. Benet, F. Blanes, J. Simó, and P. Pérez, �Using infrared sensors for distancemeasurement in mobile robots,� Robotics and Autonomous Systems, vol. 40, no. 4,pp. 255�266, 2002.
12. T. Mohammad, �Using Ultrasonic and Infrared Sensors for Distance Measurement,�Academy of Science, engineering and Technology, vol. 3, no. 3, pp. 273�278, 2009.
13. J. M. Carmena and J. C. T. Hallam, �The use of Doppler in Sonar-based mobilerobot navigation: Inspirations from biology,� Information Sciences, vol. 161, no. 1-2, pp. 71�94, 2004.
14. F. Chiabrando, R. Chiabrando, D. Piatti, and F. Rinaudo, �Sensors for 3D Imaging:Metric Evaluation and Calibration of a CCD/CMOS Time-of-Flight Camera.,�Sensors (Basel, Switzerland), vol. 9, pp. 10080�96, jan 2009.
15. J. Fang, H. Meng, H. Zhang, and X. Wang, �A low-cost vehicle detection and clas-si�cation system based on unmodulated continuous-wave radar,� IEEE Conferenceon Intelligent Transportation Systems, Proceedings, ITSC, pp. 715�720, 2007.
16. S. Shoval, J. Borenstein, and Y. Koren, �Mobile robot obstacle avoidance in a com-puterized travel aid for\nthe blind,� Proceedings of the 1994 IEEE InternationalConference on Robotics and Automation, pp. 2023�2028, 1994.
17. M. Lee and S. Lee, �Design and analysis of an infrared range sensor system for�oor-state estimation,� Journal of Mechanical Science and Technology, vol. 25,no. 4, pp. 1043�1050, 2011.
18. C. C. Wang, C. Thorpe, and A. Suppe, �LADAR-based detection and tracking ofmoving objects from a ground vehicle at high speeds,� IEEE Intelligent VehiclesSymposium, Proceedings, pp. 416�421, 2003.
19. V. Chen, The Micro-Doppler E�ect in Radar. Artech House, 2011.20. Charvat, Small and Short Range Radar Systems. CRC Press, 2014.21. I. Amundson, X. Koutsoukos, and J. Sallai, �Mobile sensor localization and navi-
gation using RF doppler shifts,� Proc. of the �rst ACM intl. workshop on Mobileentity localization and tracking in GPS-less environments, pp. 97�102, 2008.
22. T. Lindeberg, �Edge detection and ridge detection with automatic scale selection,�Computer Vision and Pattern Recognition, 1996. Proceedings CVPR '96, 1996IEEE Computer Society Conference on, vol. 30, no. 2, pp. 465�470, 1996.
23. N. Slesareva, A. Bruhn, and J. Weickert, �Optic Flow Goes Stereo: a VariationalMethod for Estimating Discontinuity-Preserving Dense Disparity Maps,� Dagm,vol. 42, pp. 267�282, 2009.
24. M. Uddin and T. Shioyama, �Bipolarity and Projective Invariant-Based Zebra-Crossing Detection for the Visually Impaired,� IEEE Computer Society Conferenceon Computer Vision and Pattern Recognition Workshops, pp. 22�22, 2005.
25. L. Dunai, G. P. Fajarnes, V. S. Praderas, B. D. Garcia, and I. L. Lengua, �Real-timeassistance prototype- A new navigation aid for blind people,� IECON Proceedings(Industrial Electronics Conference), pp. 1173�1178, 2010.
26. L. A. Johnson and C. M. Higgins, �A navigation aid for the blind using tactile-visualsensory substitution,� Annual International Conference of the IEEE Engineeringin Medicine and Biology - Proceedings, pp. 6289�6292, 2006.
27. A. Kumar, R. Patra, M. Manjunatha, J. Mukhopadhyay, and A. K. Majumdar,�An electronic travel aid for navigation of visually impaired persons,� 2011 3rd IntlConference on Communication Systems and Networks, COMSNETS, 2011.
28. Jianbo Shi and C. Tomasi, �Good features to track,� Proceedings of IEEE Confer-ence on Computer Vision and Pattern Recognition CVPR-94, pp. 593�600, 1994.
220 Florian Leicher


