Embed Size (px)
Citation preview

UNIVERSITY OF LONDON
THESIS SUBMITTED FOR A PH.D. DEGREE IN ARCHITECTURE
COMPARATIVE STUDY OF CONVENTIONAL URBAN HOUSES IN THREE REGIONS IN AFRICA
FRIEDRICH WILHELM SCHWERDTFEGER
SCHOOL OF ENVIRONMENTAL STUDIES UNIVERSITY COLLEGE LONDON

ProQuest Number: 11010417
All rights reserved
INFORMATION TO ALL USERS The qua lity of this reproduction is d e p e n d e n t upon the qua lity of the copy subm itted.
In the unlikely e ve n t that the au tho r did not send a co m p le te m anuscrip t and there are missing pages, these will be no ted . Also, if m ateria l had to be rem oved,
a no te will ind ica te the de le tion .
uestProQuest 11010417
Published by ProQuest LLC(2018). C opyrigh t of the Dissertation is held by the Author.
All rights reserved.This work is protected aga inst unauthorized copying under Title 17, United States C o de
M icroform Edition © ProQuest LLC.
ProQuest LLC.789 East Eisenhower Parkway
P.O. Box 1346 Ann Arbor, Ml 4 81 06 - 1346

IK /3>/7£

ABSTRACT 1
This study is concerned with traditional houses in three selected cities of West and North Africa. The author has been studying the organization of domestic groups and the way in which these groups acquire, build, maintain and finance their houses. Special attention has been devoted to study the relationship between the composition of domestic groups and the lay-out and size of the houses they occupy. The material on which this research is based was collected in Zaria, Ibadan and at
Marrakech between December 19&7 the enc February 19&9* Altogether 215 houses or compounds with 676 households containing 3»2*f8 persons were studied.
The questionnaire used in this enquiry produced a wide range of information on the structure and changes of co-residential kinship groups, household patterns, availability and allocation of living space, on income distributions and expenditures, land tenure as well as on the construction, improvement and maintenance of traditional urban houses and the way in which these building activities were financed. Much of these data and other relevant material are presented below in the form of tables, graphs and diagrams together with a descriptive commentary for each of the three communities studied.
This research has produced some interesting analysis on the relationship between traditional forms of housing and the organization of the domestic groups. It has also shown how these groups have built, financed and maintained their houses largely without official help. However, this study does not seek to supply ready solutions for the urban housing problems in Africa, but rather to produce information which architects and townplanners may find of some practical use when searching for better housing particularl; for the indigenous population of Zaria, Ibadan and Marrakech or towns of similar background.

CONTENTS 2
ACKNOWLEDGEMENTS
LIST OF TABLES, PLANS AND DIAGRAMS
INTRODUCTION . 19
27
38
46
P A R T I Z A R I A '
CHAPTER 1 BACKGROUND INFORMATION Environmental Setting Historical Background Economic Development
CHAPTER 2 LAND TENURE AND LAND USE.IN ZARIA WALLED CITY Historical Notes on Land Tenure Land Tenure and Transfer Today Land Use in Zaria Walled City
CHAPTER 3 DEMOGRAPHYGeneral Characteristics ZariaSample Survey
CHAPTER k DOMESTIC GROUPINGS The CompoundSocial Structure and Kinship Organization Distribution of Floor Area
CHAPTER 3 . OCCUPATION AND INCOME Nigeria / Zaria Sample Survey
CHAPTER 6 BUILDING MATERIAL AND THE PRODUCTION OF HOUSES 104Nigeria: Building Material and the Construction Industry Zaria: Type of Construction Sample Survey
CHAPTER 7 COST OF CONSTRUCTION AND THE FINANCING OF PRIVATE HOUSES 124Nigeria: Cost of Building Zaria: Sample Survey
38
89

CHAPTER 8
CHAPTER 9
CHAPTER
CHAPTER 1
CHAPTER
CHAPTER
CHAPTER
CHAPTER
CHAPTER
P A R T II I B A D A NBACKGROUND INFORMATION 148Environmental Setting Historical BackgroundLAND TENURE IN IBADAN 1^6Historical Notes on Land Tenure Land Tenure and Transfer Today Land Use in Ibadan City
) DEMOGRAPHY . 163
IbadanSample Survey
l DOMESTIC GROUPINGS 174The CompoundSocial Structure and Kinship Organization Distribution of Floor Area
> OCCUPATION AND INCOME 207Occupational Pattern and Income Distribution in Ibadan Sample Survey
5 THE PRODUCTION OF HOUSES IN IBADAN . 216
IbadanSample Survey
f COST OF CONSTRUCTION AND THE FINANCING OF PRIVATE HOUSES 229IN IBADANCost of BuildingThe Financing of Private Houses in Ibadan
P A R T III M A R R A K E C H? MOROCCO: BACKGROUND INFORMATION -243
Environmental Setting Historical Background Economic Development
S LAND TENURE AND LAND USE IN MARRAKECH . 258
Historical Notes on Land Tenure Land Tenure and Transfer TodayLand Use in the Walled City or Medina of Marrakech

CHAPTER
CHAPTER
CHAPTER
CHAPTER
CHAPTER
CHAPTER
17 DEMOGRAPHYGeneral CharacteristicsMarrakechSample Survey
18 DOMESTIC GROUPINGS The Courtyard HouseSocial Structure and Kinship Organization Distribution of Floor Area
19 OCCUPATION AND INCOME Morocco / Marrakech Sample Survey
20 BUILDING MATERIAL AND THE PRODUCTION OF HOUSES Morocco: Building Material and the Construction Industry Marrakech: Type of ConstructionSample Survey
21 COST OF CONSTRUCTION AND THE FINANCING OF PRIVATE HOUSES Morocco: General Level of House-Building Cost Marrakech: Sample Survey
22 COMPARISON AND CONCLUSION
APPENDICES
BIBLIOGRAPHY

ACKNOWLEDGEMENTS
I wish to express my sincere gratitude to my teacher and supervisor, Professor D.A. Turin of University College London, whose kind support and constructive criticism have been invaluable at every stage of this thesis.To Professor O.H. Koenigsberger (UCL), who in the course of many years has kindly helped me to clarify my thoughts on buildings in the tropics, and who has given me valuable advice for my work, I owe the warmest appreciation and thanks. I am especially indebted to Professor M.G. Smith of University College London, who first introduced me to Social Anthropology, and who has given so freely of his time, guidance and encouragement for this research.
During the course of my fieldwork in Africa, I was generously helped by Professor K.M. Barbour, Professor A.L. Mabogunje, Department of Geography, at the University of Ibadan, and Professor W.J. Kidd, at the time Head of Faculty of Architecture at the Ahmadu Bello University in Zaria. I owe a very considerable debt to Alhaji Muhammadu Aminu, C.M.G.,C.F.R., the Emir of Zaria, and to the many officials in his administration for their friendliness which was always combined with a genuine desire to help wherever possible.
In Marrakech, I received the assistance from Monsieur A. Masson, Chef de la Division Technique, Ministere d'Intlrieur Rabat, and from Monsieur Michel de Leenheer, Head of the Ministry’s local architects' and townplanning office, who provided me with plans, maps and aerial photographs, and whose kind help and friendship made my stay in Marrakech very pleasant indeed.I would also like to thank Monsieur Papini, Ministere de l'lntSrieur, who, after I lost my camera on my journey across the Sahara, came all the way from Rabat to take some pictures in Marrakech, six of which are given on
.pages 288 and 237.

I am further indebted to Mr D.M. Stewart whose kind assistance never failed throughout my survey in Africa, and to my interpreters Yah&ya Ahmed Jere in Zaria, Sylvanus Nzesi in Ibadan and Aitra Hammed. Mohammed Miki in Marrakech.
My greatest debt is of course to the many citizens of Zaria, Ibadan and Marrakech who welcomed us into their homes and devoted much valuable time to answering my questions with courtesy and good humour. I hope I have not betrayed their trust.
I wish to acknowledge the help received by the library staff of the School of Oriental and African Studies, the Institute of Commonwealth Studies, University of London; the Commonwealth Society and the British Library of Political and Economic Science at the London School of Economic and Political Science.
This research was generously financed by the German Academic Exchange Service in Bonn. Mr. George Martin kindly read the whole MS, and for help in typing the text, I am grateful to Miss J. Browne.

LIST OF TABLES, PLANS AND DIAGRAMS 7
In each chapter some tables and diagrams are included in the text, whereas the main bulk of the tables and diagrams can be found in the appendices. The tables and diagrams in the main text bear the number of the chapter and of the table itself, i.e. Table 3.1 means table number 1 in chapter 3- Tables and diagrams in the appendices are numbered from 1 to 22 according to the number of chapters, and are signified with aletter A, i,,e. Table A.1.1 means table number 1, chapter 1.
PART I ZARIAList of Tables
Table 3*1. Population Increase in Different Parts of Zaria City 52Table 3.2 Population Distribution by Age Groups in Percentage 55Table 4.1 Survey Sample Population by Sex, Age and Marital Status 69Table 4.2 Distribution of Wives per Married Man 70Table 4.3 Age of Compound Heads by Stages of Kinship Development 77Table 4.4 Structure of Strangers’ Families 78Table 4.5 Average Floor Area per Household and Person in sq.m. 86Table 5.1 Occupational Pattern of 191 Household Heads 92Table 5.2 How Household Heads are Employed 93Table 5*3 Household Income and Expenditure 1967/8 , Budget No.10 97Table 5-^ Household Income and Expenditure 19&7/8, Budget No . 63 98Table 5*5 Household Income and Expenditure 19&7/8, Budget No . 67 99Table 5*6 Income Distribution 101Table 6.1 Distribution of Cement Area in Four Groups of Compounds 119Table 7-1 Maturation Rates of Commercial Bank Loans 135Table 7*2 Costs of Construction in 77 Surveyed Compounds 1963-8 138
Table 7*3 Breakdown of Cost by Element of Building in Percentage 140
Table 7 A Actual Maintenance Cost by Element of Building 1966-8 141
Table 7 .5 Type of Creditors of Private Building Loans 143

8List of Diagrams
Diagram 4.1 Number of Persons per Compound in Percentage 66
Diagram 4.2 Number of Persons per Household in Percentage 67Diagram 4.3 Survey Sample Population by Sex, Age and Marital Status 69Diagram 4.4 Stage 1 Kinship Development 72Diagram 4.5 Stage 2 Kinship Development 72
Diagram 4.6 Stage 3 Kinship Development 73Diagram 4-.7 Stage 4 Kinship Development 73Diagram 4.8 Stage 5 Kinship Development 74
Diagram 4.9 Stage 6 Kinship Development 75Diagram 4.10 House 68 81
Diagram 4.11I House 71 83Diagram 7.1 Distribution of Internal Subsidy 147
List of GraphsGraph 4.1 Average Floor and Sleeping Area per Household 88
Graph 4.2 Average Floor and Sleeping Area per Person in sq.m. 88
Graph 6.1 Age Distribution of Rooms 121
List of Plans/MapsPlan 4.1 House 39 60
Plan 4.2 House 78 60
List of PicturesPicture 6.1 • Corrugated Iron Roof on Top of Existing Building 110
Picture 6.2 Brick Manufacturing 110
Picture 6.3 Construction of Mud Walls 110
Picture 6.4 Underside of a Conical Thatched Roof Construction 113
Picture 6.5 Underside of Flat Mud Roof Construction 113
Picture 6 .6 Underside of Vaulted Mud Roof Construction showing Ribs 113
9PART II IBADAN
List of Tables
Table 10.1 Ethnic Composition of Ibadan Division Census 1952/3 in Percentage
Table 10.2 Population Distribution by Sex and Age Groups inIbadan in Percentage
Table 11.1 Distribution of Wives per Married ManTable 11.2 Age of Compound Heads by Stages of Kinship DevelopmentTable 11'.3 Structure of Tenant HouseholdsTable 11.4 Age Distribution of Tenant Household Heads and Compound
Heads in PercentageTable 11.5 Average Floor. Area per Household and Person in sq.m.
Table 11.6 Survey Sample Population by Sex, Age and Marital StatusTable 12.1 Occupational Pattern of 295 Household Heads in IbadanTable 12.2 How Household Heads are EmployedTable 14.1 Cost of Construction in 63 Surveyed Compounds 1963-8
Table 14.2 Maintenance Cost by Element of Building 1966-8
Table 14.3 Type of Creditors of Private Building Loans
List of Diagrams Diagram 11.1 Yoruba Kinship and DescentDiagram 11.2 Number of Persons per Compound in PercentageDiagram 11.3 Number of Persons per Household in PercentageDiagram 11.4 Survey Sample Population by Sea, Age and Marital Status ’Diagram 14.1 Distribution of Internal Subsidy and Investment
List of GraphsGraph 11.1 Average Floor and Sleeping Area per Household in sq.m.Graph 11.2 Average Floor and Sleeping Area per Person in sq.m.Graph 13-1 Age Distribution of Rooms
169
170
187 191
193194
203
188
209
211
232 235 237
.183184186
188
239
205205225

List of Plans/MapsPlan 10.1 Ibadan Stages of Growth 1830-1968 167
Plan 11.1 Traditional Compound in Ibadan ' - 175Plan 11.2 A Courtyard in a Traditional Compound in Ibadan 176Plan 11.3 House 9 178Plan 11. House 3*t 178
Plan 11.5 House 23 179Plan 11.. 6 House 5 196Plan 11.7 Development House 5 197Plan 11.8 House 53 198
Plan 11.9 Development House 53 201
List of PicturesPicture 13.1 One-Storey House in Ibadan City 217Picture 13.2 Two-Storey House with Reinforced Concrete Balcony 217Picture 13*3 Construction of Mud Walls 217Picture 13. A Kiln Ready for Firing 220Picture 13«5 One-Storey House built with Sun-Baked Bricks 220Picture 13.6 Roof Construction 220
PART III MARRAKECHList of Tables ,
Table 17.1 Population Distribution by Age and Sex Groups in 282Percentage
Table 18.1 Survey Sample Population by Sex, Age and Marital Status 297Table 18.2 Age of Compound Head by Stages of Kinship Development 300Table 18.3 Structure of Tenant Households 303Table 18.4 Age Distribution of Tenant Household Heads and Compound 30^
Heads in PercentageTable 18.5 Average Floor Area per Household and Person in sq.m. 313

11
Table 19*1 Percentage Distribution of Occupational Groups in 3^9Marrakech
Table 19*2 Occupational Pattern of 190 Household Heads 321. Table 19.3 How Household Heads are Employed 322
Table 19-4 Income Groups 3^4Table 21.1 The Financing of Buildings from 1962-72 3^7Table 21.2 Investment Plan in Housing 1973-7 3^9Table 21.3 Cost of Construction in 73 Surveyed Houses 1964—9 334-Table 21.4 Actual Maintenance Cost by Element of Building 1966-9 357
. Table 21.5 Type of Creditors of Private Building Loans 359Table 21.6 Type of Creditors of Institutional Building Loans 360
Table 22.1 Related Households-by Stages of Development in 368Percentage
Table 22.2 Total Floor Area and Area of New Construction 368Built between 1963-9
Table 22.3 Type of Building Expenditure in Percentage 368
Table 22.4 Average Area per Person in sq.m. 368
Table 22.5 The Use of Floor Area in Percentage 368
Table 22.6 Distribution of Income in Percentage 368
Table 22.7 Source of Housing Funds in Percentage 368
List of DiagramsDiagram 18.1 Number of Persons per House-in Percentage 294Diagram 18.2 Number of Persons per Household in Percentage 295Diagram 18.3 Survey Sample Population by Sex, Age and Marital Status 297.Diagram 21.1 Distribution of Internal Subsidy and Investment 362
•
List of GraphsGraph 18.1 Average Floor and Sleeping Area per Household in sq.m. 3^5Graph 18.2 Average Floor and Sleeping Area per Person in sq.m. 3^5

12List of Plans/Maps
Plan 17.1 Marrakech Stages of Growth 1070-1970 277Plan 18.1 House 2b Riad 287Plan 18.2 House 22 Dar 287Plan 18.3 House 75 Fondouk 290Plan 18.4 House 12 306Plan 18.5 House 28 308
Plan 18.6 House 19 309Plan 18.7 Development House 66 311
List of PicturesPicture 18.1 Narrow ,Street in Marrakech 288
Picture 18.2 Interior Garden of Courtyard House (Riad) 288
Picture 18.3 Room of Courtyard House 288
Picture 20.1 Construction of Walls 337Picture 20.2 Underside of Flat Mud Roof Construction 337Picture 20.3 Underside of Ceiling Constructed of Sawnwood 337
APPENDICES PART I ZARIA
List of Tables -
Table A.1.1 List of Fulani Rulers of Zaria ' 381Table A.1.2 Gross Domestic Product at 1962 Factor Cost in
£N. million382
Table A.1.3 Gross Domestic Product at 1962 Factor Cost in Percentage
382
Table A.1.4 Export of Principal Products in £N. million 382
Table A.1.5 Export of Principal Products in Percentage 382
Table A.1.6 Value of External Trade and Visible Balance 382
Table A.1.7 Import of Principal Products in £N. million 383
Table A.1.8 Import of Principal Products in Percentage 383Table A.1.9 Gross Fixed Capital Formation at 1962/3 Constant 3^3............. Prices- in-£Ni million......................................

13Table A.1.10 Gross Fixed Capital Formation at 1962/3 Constant 383
Prices in PercentageTable A.2.1 Type of Tenure of 77 Compounds in Zaria Walled City 384
1968Table A.2.2 Use of Land within the Walled City of Zaria, 19^3 384Table A.3«1 Reported Age Distribution, 19&3 Census and Sample 387
Population in PercentageTable A.4.1 Land Use Inside Compounds (Open Area) 392Table A.4.2 Rooms and Floor Area per Household 393Table A.4 .3 Male Members of 77 Compounds by Relationship to 39^
the Compound HeadTable A.4.4 Female Members of 77 Compounds by Relationship to 394
the' Compound HeadTable A.4.3 Distribution of Household Sizes 395Table A.4.6 Age of Household Heads 392Table A.4 .7 Household Composition 392Table A.4.8 Average Floor Area per Household and Person according 395
to Household SizeTable A.3-1 Ibadan Consumer Price Index 397Table A.5 .2 Kaduna Consumer Price Index 397Table A.5«3 Occupational Pattern Survey Sample 398Table A.3*^ Number of Valid and Omitted Households 399Table A.5*5 Income Distribution of Valid Households 399Table A.3 .6 Distribution of Income for Different Size Households 399Table A.6.1 Production, Export and Consumption of Sawnwood 404
in NigeriaTable A.6.2 Consumption of Sawnwood by End Uses in Percentage 401Table A.6.3 Production and Import of Cement in Tons 401Table A.6.4 Steel Import and Consumption 1965 and 1970 401Table A.6.5 Steel Processing from Imported Material in 1970 401Table A.6.6 Estimated Consumption of Steel Products by Main 402
Nigerian Industries in 1970Table A.6.7 Federal Work Register for Building and Civil Engineering 402
Contractor in 1970

14Table A.6.8 Structural Development of 77 Surveyed Compounds from - **02
17th December 1963 1st November 1968
Table A.6 .9 What Improvement do you Think the Compound Most Needs? **03Table A.6 .10 Age Distribution of Rooms ** 3Table A.7.1 Breakdown of Cost by Element of Building, Lagos 1961 ****Table A.7-2 Institutional Savings in Nigeria from December 1962 **05
to December 1970? Cumulative (£Nfs thousand)Table A.7»3 Analysis of Current Level of Loans and Advances **05
Classified by Purpose from December 1961 to December 1970Table A.7.** Costs of Construction in Zaria Walled City, October 1968 **06Table A.7*5 Number of Azara Beams Needed for Mud Roof Construction **07Table A.7-6 The Financing of Houses **08Table A D i r e c t i o n and Distribution of Internal Subsidy **08
iList of Diagrams
Diagram A.1.1 Climatic Data 3&0Diagram A.3»1 Age and Sex Distribution 3^8
Diagram A.7.1 Construction of Vaulted Mud Roof **07
List of GraphsGraph A.3.1 Population Trends and Projections in Zaria 3^9Graph A.5*1 Distribution of Household Income in Zaria **00Graph A.5»2 Income Distribution (Lorenz Curve) in Zaria **01
List of Plans/MapsMap A.2.1 Use of Land in the Walled City of Zaria 3^5Map A.3-1 Nigeria Population Intensity by Provinces in 1963 ^86
Map A.3»2 Administrative Division of Nigeria 3^6Map A.3*3 Administrative Division of Zaria 390Plan A.4.1 House 68 . 396
— Plan A. 4.2 House 71 396
List of PicturesPicture A.4.1 Charm for the Protection of Houses and their ...............Inhabitants.......................
391

APPENDICES PART II IBADAN15
List of TablesTable A.8.1 Important Rulers of Ibadan 413Table A.9*1 Type of Land Tenure of 63 Compounds in Ibadan 1968
Table A.9-2 Land Use in Ibadan City 1965
Table A. 10.1 Population Growth of Ibadan City ^15Table A.10.2 Area, Population and Number of Houses in Ibadan City 415Table A.10.3 Ethnic Composition and Birthplace of Household Heads 419Table A.11.1 Land Use: Open Area 420Table A.11.2 Distribution of Household Size ^20Table A.11.3 Marital Status of Household Population 421Table A.11.4 Male Members of 63 Compounds by Relationship to 421
Compound HeadTable A.11.5 Female Members of 63 Compounds by Relationship to 422
Compound HeadTable A.11.6 Household Composition 423Table A.11.7 Number of Rooms and Floor Area per Household 424Table A.11.8 Average Floor Area per Household and Person according 423
to Household SizeTable A.12.1 Occupational Pattern Survey Sample 426Table A.12.2 Number of Valid and Omitted Households 427Table A.12.3 Income Distribution of Valid Households 427Table A.12.4 Distribution of Incomes for Different Size Households 427Table A.12.5 Distribution of Incomes for Different Size Households 427
(Total Households)Table A.13*1 Classification and Structure of the Western State 430
Building Industry in 1971Table A.13«2 Age Distribution of Rooms 431Table A.13-3 Structural Development of 63 Surveyed Compounds in 430
Ibadan from 1st May 19&3 to 30th April 1968
Table A.13*4 What Improvement do you Think the House most Needs? 431

16Table A.1*+.1 Construction of New Buildings between 1963-8 *+32
Table A.1*+.2 Cost of Construction, House Number 6 *+33Table A.1*+.3 Cost of Construction, House Number 12 *+33Table A.1*+.*+ The Cost of Construction of Rural Buildings in *+33
Western NigeriaTable A.1*+.3 Who Built the Core or Main Part of the House? *+32Table A.1*+.6 The Financing of Houses in Ibadan *+32
List of DiagramsDiagram A.8.1 Climatic Data *+09Diagram A.10.1 Age and Sex Distribution Ibadan Division 1963 *^8Diagram A.10.2 Age and Sex Distribution Survey Sample 1968 *+18
List of GraphsGraph A.12.1 Distribution of Household Income in Ibadan *+28Graph A.12.2 Income Distribution (Lorenz Curve) Ibadan *+28
List of Plans/MapsMap A.8.1 Ibadan-: Relief and Drainage *+11Map A.8.2 Ibadan: Principal Localities *+11Map A.8 .3 The Oyo and Ibadan Empires in the 18th & 19th Centuries *+12Map A. 10.1 Ibadan Division into Wards *+17Map A. 10.2 Population Density in Ibadan *+17Plan A.13-1 Low Cost 2-Bedroom House, Bodija Housing Estate *+29
Ibadan Western State Housing Corporation 1968
Plan A.1*+.1 " House 6 *+3*Plan A.1*+.2 House 12 ~ *+3*+
List of PicturesPicture A.8.1 Church and Mission House at Ibadan in c. 1858 *+”10

APPENDICES PART III MARRAKECH
List of Tables
Table A.15*1 Gross Domestic Product at i960 Factor Cost in .^37Dirhams Million
Table A.15*2 Cross Domestic Product at i960 Factor Cost in ^37Percentage
Table A.13.3 Export of Principal Products in DH. million ^37
Table A.13-^ Export of Principal Products in Percentage ^37
Table A.13-5. Value of External Trade and Visible Balance ^37
Table A.19*6 Import of Principal Products in DH. million ■ ^38
Table A.15*7 Import of Principal Products in Percentage ^38
Table A. 13*8 Gross Fixed Capital Formation at Current Prices in ^38DH. million
Table A.13*9 Gross Fixed Capital Formation at Current Prices in ^38Percentage
Table A.16.1 Type of Land Tenure of 73 Houses in Marrakech 1969 ^39
Table A.16.2 Land Use Inside the Walled City of Marrakech 19&9 ^39
Table A.18.1 Distribution of Household Size ^ 5
Table A.18.2 Marital Status of Household Population ^ 6
Table A.18.3 Male Members of 73 Houses by Relationship to ^ 8Compound Head
Table A.18. + Female Members of 75 Houses by Relationship to ^ 7Compound Head
Table A.18.5 Household Composition ^ 7
Table A.18.6 Number of Rooms and Floor Area per Household ^ 8
Table A.18.7 Average Floor Area per Household and Person according ^ 5to Household Size
Table A.19-1 Structure of Economically Active Population, ^ 9Distribution by Occupational Groups in 1971
Table A.19.2 Consumer Price Indices for Casablanca M+9
Table A.19-3 Distribution of Consumption Expenditure Among Urban ^49Households in Morocco 1937~60
Table A.19»*+ Occupational Pattern Survey Sample' ^50
Table A.19-5 Number of Valid and Omitted Households
Table A.19-6 Income Distribution of Valid Households ^3^

18
Table A. 19-7 Distribution of Income for Different Size 451Households (Total Households)
Table A.19-8 Distribution of Income for Different Size 451Households
Table A.20.1 The Production of Building Materials 453
Table A.20.2 Wood and Steel Import 453
Table A,20.3 Issue of Building Permits for Type of House, 454Area, jCost and Number of Dwellings
Table A. 20.4 Structural Changes in 73 Surveyed Houses 455
Table A.20.5 Basic Ancillary Facilities in Urban Dwellings 455in Morocco
Table A.20.6 What Improvement do you Think the House Most Needs? 455
Table A.21.1 Investment of Technical Deserves by all Insurance 457Companies in Morocco in 1967
Table A.21.2 Construction of New Rooms between 1964-9 ^37
Table A.21.3 The Financing of ’’Second Hand” Houses ^37
Table A.21.4 The Financing of Houses 458
List of Diagrams
Diagram A.15«1 Climatic Data
Diagram A.17*1 Age and Sex Distribution 444
List of Graphs
Graph A.17»1 Population Trends and Projections in Marrakech 441
Graph A.19.1 Distribution of Household. Income in Marrakech 452
Graph A.19-2 Income Distribution (Lorenz Curve) Marrakech 432
List of Plans/Maps
Map A.17«1 Morocco Population Density by Provinces in 197^ ^ 0
Map A.17.2 Administrative Division of Morocco 440
Plan A.17.3 Marrakech Principal Localities and Administrative 442Divisions
Plan A. 17*9 Population Density in the Walled City of Marrakech in 197^ ^ 3Plan A.21.1 Modern Low Cost House in Marrakech Ministere de 456
l ’Interieur, Direction de l'Urbanisme et de 1 'Habitat, i960
Questionnaire 459

INTRODUCTION 19
Preface
Traditional urban houses have hitherto received very little attention,
yet they provide shelter for the overwhelming majority of the urban
population in Africa and Asia. Most countries in Africa have made genuine
efforts to increase the production of modern houses constructed with
permanent building materials, but this effort, though often and widely
publicized has benefited only a relatively small section of the community,
whereas the rest of the population still has to rely for their housing
j almost entirely on traditional building materials and techniques, onilocally trained labour, and on their own meagre financial resources. It is
the houses and people of this latter group that will be analysed in the
following study.
The towns chosen for this research were Zaria, a Hausa city of Northern
Nigeria, the Yoruba metropolis of Ibadan in Western Nigeria, and Marrakech
the ancient capital of Morocco. These three non-European cities have under
gone parallel changes linked first with colonization at the start of this
century and then with the emergence of independent states in Morocco and
Nigeria during the last two decades. The predominantly Moslem population of
all three towns has grown rapidly during the last 50 years, but the physical expansion associated with this growth has taken place outside the traditional
cities, leaving their central areas virtually untouched. The only modern
industry at the time of my study in these three towns was a few food-
processing factories in Ibadan and Marrakech.
Main Characteristics of Towns
The city of Zaria was founded as the capital of the Hausa stated with
that name in the fifteenth century and has been the seat of the Emir or
chief for the last four centuries. The city is both the cultural, the
economic and the political centre of the Emirate, its people are mainly

INTRO. 20
engaged in subsistence farming handicrafts and trade. In the early 1970'sVthe population of the city and its suburbs was estimated at around 120,000
Ibadan was established as a Yoruba army camp early in the nineteenth
century. From this unusual beginning, the city has grown rapidly due mainly
to large-scale immigration from the northern parts of Yoruba land. By 1900, '
It idan was the largest native city in sub-Saharan Africa, and after the
First World War, Ibadan became the commercial centre for the cocoa-growing
region of western Nigeria. Its inhabitants derive their wealth and livelihood
mainly from cash-crop cultivation, craft production and trading. It has beeni ‘ •I estimated that the population of the city reached a million in the early 1970's.
, Marrakech was founded by Berber tribesmen in the late eleventh century,
and served as capital of the Moroccan Empire for over three centuries. During
the Middle Ages the city was one of the most important northern entrepots
for the long-distance caravan trade across the Sahara. As the regional
capital of southern Morocco, contemporary Marrakech retains some of its
former economic importance, and its inhabitants are mainly engaged in trade,
crafts activities and local administration. According to the 1971 census
report the city then had a population of 3331000.
Aims and Objectives
The primary aims of this study are firstly, to provide some information
on the housing situation of the native populations of three selected African
towns; secondly, to investigate the relations between traditional forms of
housing and the organization of the domestic groups and finally to find out
how these groups build, finance and maintain their houses.
—■* UNITED NATIONS Demographic Yearbook 1971 New York 1972, p. 33^• The urban population of Zaria is given as 1^6,170. This figure represents the urban population of Zaria Province and not the population of Zaria t own •

INTRO. 21
As most houses or compounds included in my survey were constructed in several stages according to the needs of its inhabitants, I have devoted special attention to domestic groups and their kinship organization in order to determine what relationship exists between the development of co-residential kinship groups and the lay-out and size of their compounds or houses. This is an essential part of my study and stems from the belief that we cannot understand the construction, use, abandonment and decay of traditional urban compounds, let alone plan new houses to supplement or replace them, unless we have a sound understanding of the structure and development of co-residential kinship groups that have built and developed these compounds in order to meet their housing need.
It is hoped that this study will provide useful information on the social and economic aspects of domestic groups as well as on the physical and financial aspects of housing. Such information may be of some relevance when we seek to identify areas which are in need of improvement, and to analyse past failures in the modern housing sector. Furthermore, this research was undertaken to develop a method and to collect the data which are essential to study the various aspects of the relationship between co- residential kinship groups and their houses.
However, this study cannot provide solutions for housing problems encountered in the three towns under investigation, nor does it attempt to formulate a housing policy ready for use by planning authorities. Instead I merely try to provide a more comprehensive view of the urban housing problems by including the often neglected development of co-residential kinship groups which, as we will see in this study, play a decisive part in determining the lay-out and size of compounds.

INTRO. 22
PROBLEM AND METHOD CF STUDY
Selection of Towns
Selection of the above-mentioned towns was guided by three broad principles. First, to ensure that the towns studied represented distinct cultures, it was'necessary that they should be established before colonial rule. Second, each town had to have a largely undisturbed central area in which the pattern of domestic groups and their building activities could be studied; and finally, to exclude problems that might arise due to differences of religion, I decided to restrict the study to towns having a predominantly Moslem population.
Sampling Procedure
Non-existence or incompleteness of the housing lists in all three towns chosen for study meant that the selection of houses had to be based on aerial samples. A standard procedure was adopted for all three towns.The first step was to define the central area of the town, i.e., the area surrounded by the old city wall. It was then decided to exclude all planned modern residential areas, any fallow land, parks and land used for agriculture, as well as non-residential areas and markets. The territory defined by this procedure was then divided into 80 contiguous plots of identical size marked out on a large-scale map. Once these plots were transferred onto an aerial photograph, they were carefully examined and one house, typical for houses in each plot, was selected and marked on the photograph. The photographs were then taken to the area and with the help of the ward head, the selected house was identified and listed. On completion of the list for all 80 areas, each ward head was asked to approach the owner of the houses in his area and to obtain the compound heads1 permission to survey the house and its occupants. This procedure provided me with a sponsorship and

INTRO. 23
official introduction; and although some compound heads did have misgivings about the investigations they seldom refused the ward head’s request that I should be allowed to survey the house.
Demographic Factors
The three samples chosen in this way varied in absolute size and in proportions of the universes which they represent. Thus, the sample taken in Zaria included 77 compounds with 1,067 inhabitants, and represented about 2.6 per cent of the total population living in the walled city. In Ibadan the sample consisted of only 63 houses with 1,283 persons or about 0.2 per cent of the city's total population; while at Marrakech the sample included 73 houses with 896 inhabitants or about 0 .3 per cent of the population in the Medina or walled city. In spite of their varying representativeness the three samples have equivalent status because they were chosen, studied and analysed by a uniform method.
Unit of Analysis
The units of analysis throughout this study are the inhabitants of a house or compound, divided into households or economic units. However, as household data alone are insufficient to explain satisfactorily the various changes which frequently occur in domestic groups, some additional kinship data based on a common reference point - in our case relation with the compound head - were collected and analysed for everyone in these samples.
Method of Survey
The first draft of my personally administered questionnaire, setting out all major fields of investigation, was drawn up in London. However, on arrival in Ibadan the questionnaire was found to be too cumbersome to administer and with the helpful guidance of Professor A. Mabogunje at

INTRO.
Ibadan University, it was then redesigned. A pilot survey of five houses was next conducted in order to find out whether the new questionnaire could produce the required information. This resulted in a few additional questions being added and alteration of some others and the revised questionnaire was then used with only minor alterations in all three samples. (See pages ^39-^6 3) •
The first part of the questionnaire was designed to obtain basic information on the number of people living in the house, their relationships to the compound head, then ages, birthplaces, ethnic groups, length of residence in the town and house, educational standards and occupations.The second part of the questionnaire began with more detailed questions on family history, the occupations of all adult males and females in these households, followed by questions about household consumption of food, hygiene, children, extended kinship links, expenditures on food, clothing, other consumer goods, and finally I calculated annual, monthly, weekly and/or daily incomes. The third part of the questionnaire dealt in detail with the house, its construction, improvements and maintenance, seeking information on actual expenditures over the past five years. Costs of these building activities were calculated with the help of the compound head, who was also questioned on the method and sources of finance. As only a few informants could speak either English or French as fluently as needed for the interview, I used interpreters who were trained for about two weeks preceding the date of the first interview in each town.

INTRO. 25
FIELD WORK
General Notes
On ray arrival in Nigeria in November 19&7* civil war with Biafra in the Eastern Region of the country was at its height. Although not directly involved in the war, the people of Ibadan and to a lesser degree those of Zaria were understandably suspicious of strangers at this time, particularly of those who came to probe into their personal affairs. In spite of repeated official explanations of the nature of our inquiry and repeated efforts and personal persuasion, some compound heads were not convinced of the good faith of the inquiry and refused to co-operate.One compound head, a soldier’, actually went so far as to report us to his superior officer, and told him that we were spies engaged in collecting information which could be used by enemy aircrafts for air-raids against the town. While such wild accusations could be dealt with relatively easily and satisfactorily, there were other obstructions which were less immediately evident but more persistent and severe. Having agreed to let us survey their houses, some compound heads tried with considerable skill to lead me systematically astray by giving deliberately false information about their income and expenditure. To overcome these difficulties I decided to base my financial enquiry on reports of the regular daily, weekly and monthly expenditures of household heads, a subject about which
most informants were quite willing to speak freely. Only after all major items of expenditure were listed was income investigated. Income and expenditure were then compared and only when they balanced within about 10 per cent was the budget accepted as sufficiently accurate for inclusion in the analysis.

INTRO. 26
The Survey of Houses
The survey of compounds and houses followed a systematic pattern throughout my investigation. After the compound head had agreed to permit a survey of his house, I visited the house at a pre-arranged time, often accompanied by the ward head. Following a detailed explanation of the aim and purpose of my survey, I encouraged the compound head to ask questions in order to clear up any possible misunderstandings. This informal discussion before each investigation proved invaluable on both sides as it put the compound head at ease and aquainted me with the man.
The first part of my inquiry started by measuring the house and all its rooms and interior spaces, the size of doors and windows within it, the height of rooms and the thickness of walls. The contents of all rooms were then recorded on a specially-prepared list. (See page Inquiries werethen made about the use of rooms and the number of occupants. In the course of this inventory, new construction, improvements and recent repairs carried out by the compound head or any other household head were easily detected and marked on the plan. Depending on the size of the house the first part of the enquiry lasted on average between one and three hours.
This first part of a compound survey supplied a wealth of useful •information by direct observation which proved invaluable during the following interviews. The distribution of radios, sewing machines, record- players, bicycles and even television sets found in the houses surveyed, gave a fair indication of the economic positions of their occupants. The state of repair of the house and the use of traditional or. expensive modern building materials supplied another set of useful information, which served as a check on some of the compound head's answers and as a reminder when enquiries into the cost of new construction, improvements and repairs were carried out.

PAST I ZARIA CHAPTER 1 BACKGROUND INFORMATION 27
ENVIRONMENTAL SETTING
Geography and Climate
Nigeria is the largest country on the west coast of Africa. It is
sited entirely within the tropical zone between latitudes k° 20' to
13° 53’ north and longitudes 2° fO1 to 1*f° *t0' east and covering an
area of 923*737 sq.km. (356,669 sq.miles).
The main features of the country's topography are the valleys and
flood-plains of the Niger and Benue rivers, which, together with the
coastal region and the Chad Basin in the north-east of the country, are
less than 300 m. above sea-level. The greater part of northern Nigeria
lies between 300 and 1,200 m. above sea-level, but the Jos plateau situated approximately in the centre of the country and the Cameroon
highlands on the south-east border rise up to 1,780 m. and 2,020 m. respectively.
The vegetation of the country may be roughly divided into three 1/zones.— First the swamp and tropical rainforest of the coastal belt,
second the high forest of the humid south and third the Guinea and Sudan
savannah of the north. The forest and the southern part of the savannah
are suitable for growing cocoa, kola, rubber plants, palm trees, yam and
cassava, while in the northern part of the savannah there is herding of
cattle and sheep with cultivation of cotton, groundnuts, millet and guinea corn.
The climate of Nigeria is conditioned by the seasonal shifting of
pressure belts, the continental air masses blowing southwards from the
1/ KEAY, R.W.J. An Outline of Nigerian Vegetation Lagos 19^9? PP» 33“6» Keay distinguishes between Forest Region and Savannah Region which are divided into three sub-groups each

PART I CH 1 28
north-east from November to March, which is the dry or harmattan season, while the equatorial maritime air masses blow northwards from the southwest from May to September to create the rainy season.
In Zaria the temperatures vary from an average maximum of 35-S°C. in April to an average minimum of 14.0° C. in January. The mean annualrainfall (1928-1967) i-s 1*11 and most of it falls between May and
2/September.— (See also Diagram A.,1.1 on page 380).However, the local people in Hausaland distinguish four seasons as follows. First bazara from mid-February to mid-May the hot dry season of the harmattan, second, damina from mid-May to the end of August the rainy season, third, kaka from the beginning of September to the end of November the harvest season, and fourth rani from the end of November to mid-February the cold dry season of the harmattan which is also the building season.
Human Pattern
Over 90 per cent of the various linguistic and cultural groups found3/in Nigeria belong to the Sudanic language family.— According to Buchanan,
K.M. et al. three divisions of the Sudanic language family are recognisedVtoday.— There are, first the Negro languages, second the Semi-Bantu
languages and third the Inner Sudanic languages. The kwa language group, a subdivision of the Negro languages, is further divided into a northern section including Nupe, Jukun and Gwari and a southern section including Yoruba, Ibo, I.jaw and Edo.* The Semi-Bantu language group stretches in a
2/— WALTER, M.W. Observation on Rainfall at the Institute for Agricultural Research Samaru Miscellaneous Paper No.15* Ahmadu Bello University, Zaria 1967? pp- 3~5
3/— BAUMANN, H. and WESTERMANN, D. Les Peuples et les Civilisation de lf Afrique Paris 19* 8, pp» 449-6>8BUCHANAN, K.M. et al. Land and People in Nigeria, London 1933» P» 82
* See Ethnic Composition on page 48

PART I CH 1 29
broken semi-circle to the north of the Yoruba-Ibo speaking area and5/include the Ibibio, Tiv and Fulani.— The Inner Sudanic languages which
are subdivided into the Hausa-Kotoko and Kanuri groups are spoken in all northern states of Nigeria.
HISTORICAL BACKGROUND
The recorded history of Hausalana can be divided into four periods: the Habe kingdoms, the Fulani empire 180*+-1900, the colonial period 1900-1960 followed by independence. The origin and early history of the Hausa people is obscured, but it seems probable that during the ninth and tenth cneturies A.D. several waves of immigrants from the east came intothe area which is now part of north-western Nigeria including the former
6/ n/Provinces of Sokoto, Katsina, Kano and Zaria.— Daura makas sarki —' alegend probably written in the eleventh century A.D. speaks of a Hausakingdom in Daura (80 km north of Kano) which was ruled by a queen. Atraveller named Ba'ijidda, son of Abdullah, Sultan of Baghdad, came toDaura and killed the snake (sarki) which was living in the town's mainwell preventing people from drawing water. For this he was chosen by thequeen as her husband and their descendants became the first kings andqueens of seven Hausa kingdoms (Hausa bakwa)• One of these kingdoms wasZazzau or Zaria. In their early history the seven Hausa kingdoms formed aloose collection of culturally related units and it is reported that Zaria,
^ BAUMANN, H. et al. op cit., p. ^57* Baumann includes the Fulani in the Semi-Bantu language group, although this has been disputed by other scholars
^ SMITH, M.G. "The Beginning of Hausa Society A.D. 1000 to 1500", in Vansina, J. et al., The Historian in Tropical Africa, London I96T"PP. 339-5^
7/— ARNETT, E.J. "A Hausa Chronicle" in Journal of the Royal African Society, Vol. IX, London 1909-10 pp. 161-67

PARC I CH 1 30
due to her position to the south, had the task of capturing and supplyingslaves to her northern neighbours. The chronicle of the history of theHausa kingdom of Zaria mentions queen Bakwa who ruled Zaria from 1^92-1322. It is further reported that Bakwa was the last queen who ruled inTurunku, a place 23 km south of Zaria, and that her second daughter Zariabuilt the last of the five capitals of Zaria in its present position findgave it her name. According to Arnett, Islam was introduced to Kano inthe first half of the fourteenth century A.D. by Arab traders and reached
o /Zaria in the 1^30’s.— The new religion seems to have spread rapidly among the nobility in the capital, but until the early eighteenth century the occasional pagan ruler appears on the list of local chiefs.
The Fulani cattle nomads first mentioned as peul, sing, pullo in the eleventh century A.D. were a small group living in what is now known as Senegal. Over the years they wandered eastwards and crossed the border of Hausaland in the early sixteenth century. There they were generally welcomed by the Hausa kings and either continued as pastoralists or settled in towns as Filanih gida. By the middle of the eighteenth century wars and corruption had weakened the political and administrative organization of the Hausa kingdoms. But it was the impurity of Islam as practised by the Hausa elite which compelled Uthman dan Fodio, a Fulani religious leader and clan-head, to preach his holy war (.jihad) against the Hausa king of Gobir during the last years of the eighteenth century, thus initiating developments which led to a holy war in l80*f-10 which caused the downfall of the Hausa dynasties.
After the victory over Makau, the last Hausa king of Zaria in c. 1307 Mallam Musa was appointed by Uthman dan Fodio to rule Zaria. The new Fulani rulers of Hausaland who enjoyed a great measure of autonomy, recognised the
§/ ARNETT, E.J. "A Hausa Chronicle" in Journal of the Royal African Society, Vol. IX, London 1909“"i0 p. 163

PART I CH 1 31
Sultan of Sokoto as their spiritual and political head and paid him an annual tribute. Emirates in difficulties could appeal to the Sultan for help, who, in case peace was threatened, did intervene in the political administration of the state concerned. The Emirate of Zaria which extended southwards to the bank of the river Benue in the middle of the nineteenth century, was divided into a number of areas and vassal-states controlled by the Emir who either appointed Fulani noblemen as fiefs or installed locally chosen heads after they had sworn allegiance bo him.
In the second half of the nineteenth century the Royal Niger Company which traded along the Niger and Benue entered into a number of commercial treaties with the Emirs of the Fulani Empire in order to protect their trade and trading establishments. These agreements, it was later argued, gave the company and its successor^ the British Government, the right over large areas of land particularly alongside the above-mentioned rivers and some undefined political power over the Emirates. How wrong this assumption was, was shown by the tough resistance of most Emirs to the British occupation which started under the command of Frederick Lugard (later Lord Lugard) at the beginning of 1900 from Lokoya and was only firmly established after the battle of Burmi in July 1903 where Attahiru the last independent Fulani Sultan died with over 700 of his followers.
With the advance of British forces Zaria came under British rule in 1902. The colonial administration deposed Kwassau, Emir of Zaria and replaced him with Aliyu, a grandson of Mallam Musa, the Galadima Suleiraaun acting as regent for a six months' period. (See Table A.1.1, page 381)* After the battle of Burmi, Zaria Enirate was reduced in size and its former vassal states of Keffi, Nassarawa and Jema'a were removed as independent chiefdoms. Slavery was gradually abolished and in the following years the foundation of a modern economy with its infrastructure, new laws, an educational system and a health service were gradually laid down, leading
to independence in September 1960.

PART I CH 1 32
ECONOMIC DEVELOPMENT
General Situation
The overall performance of the Nigerian economy between 1962 and 1966, as reflected in the changes in Gross Domestic Product, was one of unsteady expansion. In 1962 the G.D.P. at 1962/3 factor cost was £N. 1,299 million and rose to £N. 1,352 million in 1966 —^ giving a per caput income of approximately £N. 28 and £N. 31 respectively.* (See Table A.1.2 on page 382 ). The average annual rate of growth of G.D.P. was about 5 per cent between 1962-66 and that of per caput G.D.P. was 2.5 per cent.After the outbreak of an already simmering political crisis in early 1966
followed by open hostility in July 19&7 the G.D.P. fell by about 17 per cent to £N. 1,286 million. After the decline in 1967 and stagnation in 1968 the economy adjusted to the war situation in the country and started to pick up again in 19&9 ) a trend which has become even more pronounced after the fighting had stopped in January 1970. In November of the same year the Second National Development Plan was launched with the prime economic target of achieving an average annual growth rate of over 6 per cent of G.D.P. between 1970-*+.— ^
Natural Resources, Agriculture and Industry
Nigeria has a great wealth of natural resources which include inter alia crude petroleum, coal, natural gas, tin, columbite, a great variety of timber and limestone. Nevertheless, agriculture still occupies a dominant position in the country's economic development and accounted for about
9/- FEDERAL OFFICE OF STATISTICS, NIGERIA Annual Abstract of Statistics 1971 Lagos 1972, p. 1*+1
* The estimated population of Nigeria was about *+7.0 million in 1962 and5 2 .0 million in 1966.
10/ - - - • ...FEDERAL MINISTRY OF INFORMATION, NIGERIA Second National Development Plan1970-*+ Lagos 1970? P- 36

PART I CH 1 33
£N. 764 million or 48 per cent of G.D.P. and .about 43 per cent of total overseas export earnings in 1989- (See Table A.1.5 on page 382). Approximately one third or 32-2 million hectares (79*3 million acres) of Nigeria's total land area is arable land or land under cultivation, and is worked by over 70 per cent of the country's total labour force. Nigeria produces all its basic staple food as well as cocoa, groundnuts, rubber and various palm produce e.g. palm kernels and palm oil for the export market. For example, cocoa and groundnuts accounted for over 16 per cent each, palm produce for 3*2 per cent* of the total domestic export in 1969--^ It is estimated that agricultural output grew at an average rate of about two per cent per annum from 1962-8 , but with the fast growth of the non-agricultural sector particularly the mining industry (crude petroleum), the relative position of agriculture as a major foreign exchange earner has been declining from 73 per cent or £N. 123 million of the total domestic export in 1962 to 19 per cent or £N. 121 million in 1 9 7 1 (See Table A.1.4 and Table A.1.5 on page 382 ). However, it must be stressed that agricultural produce will continue to be an important export commodity.
The production of crude petroleum has come to play a vital role in the country's economic development. The export of crude petroleum rose from £N. 4.4 million (2.7 per cent of the total domestic export) in i960 to £N. 92 million (33 per cent) in 1966. During the above-mentioned national crisis the export fell to £N. 72 million in 1967 and still further to
*The export of palm produce was severely affected by the civil war. In 1965 it was as high as 13*2 per cent of the total domestic export.
FEDERAL OFFICE OF STATISTICS, NIGERIA Digest of Statistics Vol.20 No.2Lagos 1971 P* 50
12/— Ibid. Annual Abstract of Statistics 1971 op cit., pp. 84-6

PART I CH 1
£N. 37 million (18 per cent of the total export value) in 1968. In 19&9 export of crude petroleum increased again reaching £N. 477 million or 74.4 per cent of the total domestic export in 1971• The share of crude petroleum and mining in G.D.P. at 1962/3 factor cost rose from 1.2 per cent in i960 to 6 .9 per cent in 1966 and fell to 3 -3 per cent in 1968, only to rise again to 7»9 per cent in 1989- Known reserves of crude petroleum are estimated at about 200 million tons which, at the present rate of exploitation, would last until the early 1990’s. However, probable aggregate estimation ranges between 600 and 1,200 million tons. Although mining is a very important sector of the economy, the substantial investments in oil installation have been made by foreign-owned private companies, but the Nigerian Government is now increasingly participating in the exploration for, and exploitation of, crude petroleum because of the crucial role which this commodity is expected to play henceforth in the national economy.
Until quite recently, Nigeria’s manufacturing industry consisted ofsmall processing plants mainly producing consumer goods such as textiles,canned food, paints, beer and soft drinks, flour, car tyres and cement.However, industry is being diversified and steps are taken to introducenew production plants. About 60 per cent of the 625 industrial establishments
13/included in the 1968 Industrial Survey were built after i960.— • The contribution of the manufacturing industry (including crafts) to the G.D.P. amounted to £N. 60 million or 4.8 per cent in i960. By 19&9, the value added had risen to £N. 132 million or 8.2 per cent of G.D.P. During this period the average rate of growth was about 10 per cent per annum. Approximately one quarter of the contribution of these industries to G.D.P.
^ FEDERAL OFFICE OF STATISTICS, NIGERIA Digest of Statistics op cit., p. 19

PART I CH 1 35
came from the semi-processing of primary raw materials for export such as palm-oil processing, rubber creping and saw-milling, while industrial production accounted for the rest. In addition there are a great number of indigenous small-scale enterprises run by local craftsmen and artisans e.g. weaving, traditional building construction, smithing and leather working, the contribution of which are not included in the G.D.P.
Other important sectors of the national economy are distribution with £N. 206 million or 12.8 per cent of G.D.P., Government and other services e.g. education, health, electricity and water supply with £N. 2^1 million or 15 per cent, crude oil and mining with £N. 127 million or 7«0 per cent, building construction with £N. 70 million or per cent and transport and communication with £N. 6k million or *f.O per cent of G.D.P. in 19&9- (See Table A.1.2 on page 382).
External Transactions
From i960 to 19&5 Nigeria had a trade deficit which led to various legislative steps taken in 196^/65 to restrain consumer demand by imposing higher customs duties on a wide range of imported consumer goods as well as higher taxes. As the result of these measures and later the increasing revenue from crude oil export, the balance of trade showed a surplus of
1 2l /£N. 27 million in 19&6, which increased to £N. 107 million in 197^-—(See Table A.1.6 on page 382). Agricultural goods and crude petroleum have already been mentioned as the main export earning commodities, both contributing over 90 per cent to the total domestic export value in 1971*In the same year the major items of imported goods were machinery and
• transport equipment with 39-9 per cent, manufactured goods 29*7 per cent,15/- chemicals 11.3 per cent and food with 8.2 per cent.— The import of
'[k/— 7 FEDERAL OFFICE OF STATISTICS, NIGERIA Annual Abstract of Statistics 1971 op cit., p. 68ibid.' p. 69' ............................... .

PART I CH 1 36
capital and consumer goods nearly doubled in 1970 when compared with the • level of import in 19^5•
Capital Formation
According to the Annual Abstract of Statistics of 1971? the totalGross Fixed Capital Formation at 1962/3 prices rose from £N. 176 millionor .13.6 per cent of G.D.P. in 19&2, to £N. 273 million or 17*7 per centof G.D.P. in 1966. After the outbreak of open hostilities in 19&7»capital formation fell to £N. 231 million or 18 per cent of G.D.P. and to
16/£N. 222 million in 19&9-— Closer examination of total capital formation by type of asset shows that the value of investment in buildings increased
from £N. 6*+.9 million in i960 to £N. 9^*3 million in 19^3? and decreased to £N. 65 .3 million in 19&9- The percentage distribution in building works fell from ^0 .+ per cent in i960 to 29*3 per cent in 19&9) while- civil engineering works increased from 16.9 per cent to 2 9 .0 per cent over the same time. (See Table A.1.9 and Table A.1.10on page 383). It has been estimated that between 1962 and 19&7 the share of privately financed
17/dwellings accounted for 16 to 20 per cent of total investment in buildings.—
During the second National Development Plan 1970-7^» the amount spent on private housing construction is expected to rise from an estimated £N. 10.3 million in 1970 to £N. 12.0 million in 197^.“ ^
FEDERAL OFFICE OF STATISTICS, NIGERIA Annual Abstract of Statistics 1971 op cit., p. 1^2
FEDERAL MINISTRY OF INFORMATION, NIGERIA Second National Development Plan 1970-^ op cit., pp. 273-80

PART I CH 1
In conclusion, gross fixed capital formation accounts for 13*0 to 19-0 per cent of G.D.P. at 1962/3 factor cost and about half of it goes into construction. From 1964 to 19&9 total building investment represents about 30*0 P®r cent of which privately financed dwellings accounted for only 3«0 to 7*0 per cent, of gross fixed capital formation in both cases. Most of these privately financed dwellings are located in urban centres, while the overwhelming majority of dwellings in rural and semi-urban areas, where over 80 per cent of the total population live, are constructed in the non-monetary sector of the economy and never appear in any National Accounts.

PART I ZARIA CHAPTER 2 LAND TENURE AND LAND USE IN ZARIA WALLED CITY 33
HISTORICAL NOTES ON LAND TENURE
The present Land Tenure Law passed by the legislature of Northern Nigeria in 1962 contains three diverse and often contradictory elements; first, the customary law (al*ada). second, the Moslem land law (shari*a) based on the Malikite school or rite which was introduced after the Fulani jihad* from 1804-1810 and third, colonial land legislation following the establishment of the Protectorate of Northern Nigeria in 1900,
It is difficult to give a definite account of the customary land lav/1/in the pre-Fulani state of Zaria. According to C.K. Meek — most of the
land was communally owned. The ultimate authority on land matters v/as the local chief. He was the trustee of.the group and distributed land among his people who enjoyed usufractuary rights during occupancy against any other member of the community. Fallow land remained with its occupant until no longer needed when it reverted to the general pool for reallocation. The formal sale of land was unknown though long and shortterm loan of land were practised.
After the Fulani conquest of Zaria in 1807 the new rulers recognized2/most of the customs relating to land.— The land was divided into
two broad categories following the customary division: First dead land; this is land which has not been brought under cultivation, and second, living land which has either been cleared, cultivated or inhabited.—^ Living land was further sub-divided into tithe land and
* See History on pages 30-1.
1/ MEEK, C.K. Land Tenure and Land Administration in Nigeria and the Cameroons. London 1957 PP* 113-117
2/— SMITH, M.G. MHausa Inheritance and Succession”, in Derrett, J.D.M. et al., Studies in the Laws of Succession in Nigeria. O.U.P. 1965- p- 2^5
3/— MEEK, C.K. op cit. p. 16A. Meek, discussing the different land types, mentioned wakf land as a third category, but according to Ruxton, F.H. Maliki Law London 1916 p. 216 wakf land as a separate sub-category did
, . not. exist. in northern.Nigeria. However the term ."territorial wakf". was. used by the Fulani rulers to describe conquered land in general.

PART I CH 2 39
kharaj land. Tithe land farmed by Muslims on which the statutory tithe (zakka) was payable, while kharaj land was cultivated by heathens who paid the kharaj a tribute levied on the vanquished in return for the privilege of being allowed to remain in possession of their land.After the Fulani had conquered the former Hausa Kingdoms, they divided the territory and allotted land to Fulani noblemen as fiefs in return
Vfor their active support during the jihad.— The Moslem land law3 /(shari1 a) which is based on the Maliki law — was gradually introduced
by the Fulani rulers into the Hausa courts. However, the new law wasseldom applied in practice because the majority of people settled theirland transactions and inheritance disputes informally amongst themselves,but land disputes brought before the courts would be settled according to
6/'the rule of Maliki law.—' Nevertheless, "Hausa courts", as M.G. Smithobserved in Zaria, "administer a variable mixture of Maliki law andHausa custom", which coexisted and functioned side by side during nearly
7/one hundred years of independent Fulani rule in Zaria.-17The Protectorate of Northern Nigeria was created on January 1st, 1900,
but it was not until the fall of Kano and Sokoto in the first half of8/1903 that colonial rule was finally established over the whole territory.—
V—' SMITH, M.G. The Economy of Hausa Communities of Zaria, London 1933 p. 103
^ RUXTON, F.H. Maliki Law, London 1916—'f MICHIE, C.W. "Notes on Land Tenure in the Northern Districts of Zaria
Emirate", in Cole, C.W. Report on Land Tenure Zaria Province Kaduna, 1932 p-72. "The case of Ibrahim versus Musa (before the native court in Zaria walled City on the 23rd Dec. 1937) is a case in point. Two brothers and two sisters failed to live amicably and the alkali gave each brother one-third of the compound and the two sisters the remaining third."
7/— SMITH, M.G. "Hausa Inheritance and Succession", op cit., p. 2*t68 /— COLONIAL OFFICE Annual Report, Northern Nigeria, London 1902-03

PART I CH 2 *tO
The most important land legislation introduced by the British Government included inter alia, first the Land Proclamation No. 8 of 1900 which enacted that the title to land, which was formerly vested in the Emirs, henceforth passed to the colonial Government and that a non-Nigerian could not acquire land without written consent from the High Commissioner. Second, the Crown Land Proclamation No. 16 of 1902 which dealt with land acquired from the Royal Niger Company, while the Public Land Proclamation No. 13 of the same year dealt with the land which was the property of conquered or deposed rulers or land not actually occupied. In 1908 the Government appointed a committee to advise on land policy for the protectorate. The report of the committee, which was later approved and embodied in the Land and Native Rights Proclamation No. 9 of '19 0» recommended that all land should be declared "Native Land" and that the earlier distinction between Public Land (Government administered) and Crown Land (Government owned) should be abandoned.-^ By analysing land legislation in the first decade of colonial rule, two important factors emerge: namely the Government's determination to preserve local forms of land tenure and its ban on land alienation have helped to preserve precolonial patterns of landholding to an astonishing degree.-^/ It should be remembered that in practice the Governor's power regarding land legislation has for the most part been delegated to the Native Authorities or Emirs who have thus continued to exercise their executive control of land dispossil and revocation. Thus despite or because of colonial land legislation, it can be said that the majority of people living in the walled city of Zaria continue to hold and use land in much the same way as their forefathers.
^ COLONIAL OFFICE C.D. 5^02 Report of the Northern Nigeria Land Committee, London, 1910 p.23COLONIAL OFFICE Land and Native Rights Ordinance No.1 of 1916 Preamble; "And whereas it is expedient that existing native, customs, with regard, to the use and occupation of land should, as far as possible, be preserved.

PART I CH 2 *t1
LAND TENURE AND TRANSFER TODAY
The main features of land tenure in Zaria Province were studied byC.W. Cole in 19* 8, and the situation has not changed substantially since
11/then.— ( However, Cole concentrated on rural land tenure and has only a12/brief description of the situation within the walled city of Zaria.—
The investigation of ownership and acquisition of land described below is based on my 1968 survey of 77 compounds situated in the walled city.The following three types of land holdings were found: first Community Holdings; this land belongs to the Native Authority and includes sites for its offices and departments of the administration, the main city market, all roads, rivers, public footpaths, as well as rock outcrops and borrow- pits. Second Family Holdings; this is land owned by a family or lineage, and third, Individual Holdings, i.e. privately owned land which has usually been acquired by the present owner, and which becomes family land when inherited.
Permanent Transfers of Land
Inheritance of Land (gado) accounted for 65.0# of compounds surveyed. Inheritance is by far the most important mode of land transfer and the "normal" means of acquisition. On the death of its compound head, the family compound is not normally subdivided among the inheritors, but passes undivided into the care of the senior resident male agnate.However, if the heirs cannot agree division of the agricultural land and other items among themselves, which is extremely rare, the alkali or judge,
11/— COLE, C.W. Report on Land Tenure Zaria Province op cit., Kaduna 1952 12/— Ibid. op cit. pp. *t6-V7

PABT I CH 2
if called on, will sub-divide the land as required by Maliki law.Farmland, is generally divided equally among the resident male heirs.Any surplus of unapportioned land is usually worked as a gandu or joint farm by all the adult males and their families in the compound,*
Purchase of Land (saye) accounted for 2k.6% of compounds surveyed.The sale of suitable building sites in Zaria walled city is now common practice and plays an important role particularly in the densely populated areas of the walled city. By contrast farmland is normally not sold, though it may be transferred on a temporary basis, as mentioned later.The price'of a plot of land varies enormously, between £N. 2 and £N. 80, and depends not only on the size and location, but also on the relationship between the parties involved.
Allocation of Land is made by the Native Authority normally to employees of the Emir’s administration but also to other families in need.This category accounted for 6.5% of the compounds surveyed. These building sites, which often include small adjacent farm plots, are usually located in or near the Emir's palace. Land allocated by the Emir is held on usufructuary rather than proprietary bases though it is heritable, and, if the grant is not revoked progressively acquires the status of family land.
Gift of Land (kyauta) between private individuals accounts for 2.6% of compounds surveyed. Land may be given, for example, by a compound head to his adult son, to a cognatic kinsman, a client or a good friend of the family.
* See discussion on page 65

PART I CH 2
Reclaiming of Land occurred in 1.3% of compounds surveyed. Such reclaiming of land for building purpose is done by filling in disused borrow-pits. This was undertaken by several compounds surveyed, but only in one case of the sample was a new compound built entirely on such reclaimed land. (See Table A.2.1 on page 38*0.
Temporary Transfers of Land
The temporary transfer of land is restricted to farm land. Two types of temporary land transfer are recognised today:
Pledge of Land (.jingina or dangana) Pledging is a customary transaction by which one person or group obtains temporary rights to farm a plot of land as security for a loan made to its proprietor. Pledged land remains perpetually redeemable by the pledgor on repayment of the loan. However, adequate notice must be given and the pledgee must be allowed to harvest his crops. While the loan made to the owner of the land varies and does not necessarily bear any relationship to the value of the land, it is normally free of interest (ushra) as required by Muslim lav/. Pledging is an increasingly important feature of the local economy used for short and long term land conveyance, and for raising money to finance trading activities, marriage payments and building construction or improvements.
Loan of Land (aro) Renting of farm land is widely practiced in the walled city and usually takes place when the holder is unable to work all his fields. The rent for the land consists either of galla*, a token payment from the crop, e.g. one or two bundles of guinea corn or millet, or an annual cash payment (suhuri). The latter form of payment was unknown in
* This term was also used in pre-colonial times to denote the slave or serf's payment to the land-owner, his owner. This was at least one third, often one half, of the crop.

PART I CH2
pre-colonial times and developed only after the introduction of the13/money-economy.— ■
LAND USE IN ZARIA WALLED CITY
The study of land use given below is based partly on an air survey carried out in December 1963 and partly on a large scale map at 1:2.400 published by Northern Nigerian Survey, Kaduna, in 1964. The walled city has a total area of 16,577i670 sq. metres or 1,638 hectares (4,097 acres).The circumference of its wall is 14.9 km. long. The diameter of the walled city varies between 4.080 m. in the North-South direction and 3-000 m. in the East-West direction. The total area has been divided into six categories:
Cultivated Land is 66.2$ of the total area within the city walls. Cultivated land is by far the most important category and comprises upland farms on light sandy soil farmed in the wet season, and lowland farms (fadama) characterized by heavier soil worked only during the dry season. (See Map A.2.1 page 385). Upland farms, 93*3$ of the total cultivated land, are planted in rotation with millet, sorghum, guinea- corn and groundnuts, while on irrigated lowland farms (fadama), 6.7$ of the total, cultivated land, which are situated alongside river banks and in well-watered depressions, cash-crops such as sugar-cane, tobacco, rice and vegetables are produced.
Building-sites account for 18.6$ of the total area within the city walls if we include the narrow footpaths between compounds in the densely built-up areas. Land use within compounds is separately discussed on pages 61 and 62.
13/— ROWLING, C.W. Report on Land Tenure Kano Province, Kaduna 1949 p- 51

PART I CH 2 k3
Waste Land represents 9»1% of the enclosed area. Most of this land is uncultivable and consists of stony plots, land liable to irregular flooding, gullies and stretches of erosive slopes bordering the dilapidated town wall.
Roads If we define this to include all roads and tracks wide enough to carry motor vehicles, then 2.1% of the enclosed area is appropriated to these ends.
Rock Surfaces are 2.1% of the total area inside the walls. This includes patches of flat solid rock surface as well as two major areas of granite outcrops in the North-East area of the walled city.
Borrow-pits and Brooks account for 1.9% of the total area. However, this proportion represents the area under water in December 1963 which changes with the seasons. The many borrow-pits, created by the excavation of building material (mud), that contain stagnant water are typical of all Hausa towns and still constitute a large public health problem.(See Table k.2.2 on page 38*0.

PAR! I ZARIA CHAPTER 3 DEMOGRAPHY
GENERAL CHARACTERISTICS
Nigeria: The Demographic Situation
In 1972 the United Nations Statistical Office estimated the population of Africa at about 36'*+ million or 9*6 per cent of the world’s total population.-^ According to the 1973 census, Nigeria had apopulation of 77•8 million representing about one fifth of the population
2/on the African continent.-* Although this figure has been disputed,Nigeria is by far the most populous country in tropical Africa followedby Zaire with an estimated 23 million people in the early 1970's, theSudan with 17 million, Tanzania 14 million, Kenya 12 million and Ugandawith about 10 million.—^ In spite of four national censuses taken inNigeria during the last 20 years (1932/3? 1962, 19&3? 1973), it isstill impossible to give even a reasonably accurate estimate of the sizeof the total population in the country. This is mainly due to theconfusion of political with statistical issues particularly in thenational censuses taken after i960.—
Crude population estimates with limited statistical value wereconducted by the British colonial administration in 1911, 1921 and 1931giving a total population of 16.0 million, 18.7 million and 20.0 million
5/respectively.— The first and still most detailed census was taken in
■2/ UNITED NATIONS Demographic Year Book 1972 New York 1973, P- 119y AFRICA RESEARCH Ltd. Africa Research Bulletin Vol.11 No.7 197^
Exeter, England 197^ p. 329^^ UNITED NATIONS Demographic Year Book 1972 op.cit., pp. 120-1V — ALUKO, S.A. "How Many Nigerians? An Analysis of Nigeria's Census
Problems, 1901-63" in The Journal of Modern African Studies Vol. 3 No. 3 1963, Cambridge 1963, PP» 371-92
^ DAILY TIMES Nigeria Year Book 1971 Lagos 1971, p. 21 JACOB, S.M. Census of Nigeria 1931 London 1933,’ P» 93

PART I CH 3 b7
1952/3» counting a total population of 31*1 million including the Nigerian-Cameroons under U.K. trusteeship.^ During this census a broad system of age recording was adopted and included the age groups of 0-1, 2-6, 15-^9 and over 50. Further data were collected onethnic groupings, occupations, literacy and religious beliefs. A national census taken in 1962 was never officially published, but unofficial sources give between b2 and 52 million as the country's total population.-^ A new census taken in 1963 yielded a population of
O /55*6 million.— This result was regarded by leading demographers as at
/ 9/least 10 per cent too high when compared with the 1952/3 census.—In spite of the confused situation an attempt was made by the
United Nations Statistical Office in 19&3> to project the population ofNigeria on the basis of a 2.4 per cent annual increase to 91*2 million
10/in 1980.— However, it should be remembered that the census data onwhich these calculations were based are open to criticism. The reasonsbeing the manipulation of the 1962- and 19&3 census results mainly forpolitical gains, the lack of vital statistics such as mortality andfertility rates, and until an improved census has taken place thepublished demographic material on Nigeria must be considered with the
11/utmost caution.-—-'
y DEPARTMENT OF STATISTICS NIGERIA Population Census of Nigeria 1952/3 Lagos 1958, p. 1
^ ALUKO, S.A. op cit., pp. 383-4^ FEDERAL OFFICE OF STATISTICS, NIGERIA Population Census of Nigeria 1963
Vol. 3 Lagos 1968, p. 7 (Mimeo)9/— BRASS, W. et al. The Demography of Tropical Africa Princeton U.P.
1968, pp. 6 & 515
UNITED NATIONS World Population Prospects as Assessed in 19&3 New York 1965, ST/SOA/Series A/41 p. 142
11/— ' WALLE, van de E. "Fertility in Nigeria" in Brass, W. et al. op cit., pp. 515-27

PART I CH 3 b8
Regional Distribution and Density
Until the creation of the 12 new states in May 19&7» Nigeria was divided into three major regions. First, the Northern Region with a population of 29-8 million or 53*6 per cent of the total in 1963; second, the Western Region including the Colony with Lagos as well as the Mid-Western Region created in 1963, with 13» + million or 2^.1 per cent, and. third the Eastern Region with 12.3 million or 11.3 per cent.
The density of population per square mile in the 26 provinces, as found in 1963» summarised in Map A.3«1 on page 3 8 6. The map clearly shows three densely populated provinces which coincide with "key areas" in the country's cultural and economic geography. First,Kano Province in the former Northern Region with a density of 350 persons per sq.m.*which is the centre of Nigeria's groundnut, cotton as well as hide and skin processing industries; second, the Western Region reaching 7^0 persons per sq.m.*in Ibadan Province which is regarded as the central area of the cocoa producing belt, and third Owerri Province in the Eastern Region with a density of about 850 persons per sq.m.* situated in the heart of the palm-tree belt. Central Nigeria including the former provinces of Adamawa, Benue, Ilorin, Kaba, Niger, Plateau and Sardauna show a remarkably low overall density of about 80 persons per sq.m.*which still reflects tribal wars and slave-raiding activities by the Fulani Knirates in the last century.
Ethnic Composition
Nigeria is composed of a heterogeneous population of over 35 major ethnic groups recorded in the 19&3 census, of whom 13 accounted for over
— one per cent of the country's total population. They are: Hausa 20.9 per cent, Yoruba 20.3 per cent, Ibo 16.7 per cent, Fulani 8.6 per cent, Kanuri
* square mile

PART I CH 3
•.0 per cent, Ibibio 3*6 per cent, Tiv 2.5 per cent, Ijaw 1.9 per cent,Edo 1.7 per cent, Annang 1.2 per cent, Nupe 1.2 per cent, Urhcbo 1.1 percent and Igala with 1.0 per cent. The non-African population was
12/represented only with 0.08 per cent of the total in Nigeria.— ■The ethnic composition of the population in the three former regions
give a much cleaner picture of the distribution of the major ethnic groups. According to the 1952/3 census report, no detailed data are available for 1963» the Hausa-Fulani group in the Northern Region was represented with 5^«0 Pe** cent, the Yoruba in the Western Region with71.0 per cent and the Ibos in the Eastern Region with 68.0 per cent of the total regional population.
Age and Sex Distribution
In the 1963 census the distribution of age was recorded in five-yearintervals and showed as many as kj.O per cent of the total population tobe under the age of 15* (See Table A.3.1 on page 3 8 7)* This largeproportion of young people is a salient feature of all rapidly developingcountries in Africa and indicates a decreasing infant mortality ratecombined with a high fertility rate in the recent past. The GrossReproduction Rate (total number of live female births per woman) was
13/estimated at 3*2 for Nigeria.—The sex distribution taken from the 1952/3 census was 957 males to
1.000 females or ^9»0 per cent to 5^*0 per cent, and in 19&3 %020 males to 1,000 females or ^0,6 per cent to kty.k per cent respectively.
— ^ FEDERAL OFFICE OF STATISTICS, NIGERIA Population Census of Nigeria 1963 op <?it., p. 10
13/— WALLE, van de E. op cit., p. 527

PART I CH 3 50
Level of Urbanization
According to the 19&3 census report, no detailed data are availablefor the 1973 census, nearly 11.0 million people or 19-2 per cent wereliving in urban centres of 20,000 or more inhabitants. The level ofurbanization varies considerably from region to region. The censusfigures for 19&3 show the ratio of urbanization as high as 45.8 per centin the former Western Region, increasing to 53*9 per cent in Yorubalandwhich includes the former provinces of Oyo, Ibadan, Abeokuta, Ijebu,Ondo and the Colony, 11.4 per cent in the former Eastern Region and
14/10.3 per cent in the former Northern Region.— ■
ZARIA
Population Distribution15/Zaria with an estimated 70?000 inhabitants in 19&3 can he divided
into four main areas. First, the walled Hausa city with about 35*000 inhabitants or 30.0 per cent of the city's total population; second, the Sabon Gari or new town with c. 16,000 inhabitants or 22.8 per cent occupied by immigrants from southern Nigeria; third, Tudun Wada with about 14,000 inhabitants or 20.0 per cent the majority of whom are traders from other parts of northern Nigeria, and fourth the former European Township area with an estimated 5*000 inhabitants or 7*2 per cent of the total population at Zaria.
^ FEDERAL OFFICE OF STATISTICS, NIGERIA Annual Abstract of Statistics 1971 Lagos 1972 pp. 10, 12-4
— 7 UNITED NATIONS Demographic Year Book 1971 New York 1972 p. 354. Thefigure of 166,200 given as the population for Zaria in 19&3* comprises the total urban population of Zaria Province

PART I CH 3 51
Population Growth
The population at Zaria increased by about 2.5 per cent per annum over the last 20 years from 1950 to 1970. But there are marked differences in the pattern of growth between the walled city and the new urban areas which developed after the British occupation at the beginning of this century.
. Both the Sabon Gari and Tudun Wada are typical immigrant communities with the characteristically rapid growth from a few hundred families in 1915? to 19,000 inhabitants in 1952/3 , and an estimated 30,000 inhabitants in 1963* This represents an average growth rate of 3*5 to A.O per cent per annum. This development was interrupted when, after the disturbances in May and September 1966, nearly all Ibos left for the Eastern Region from where some have returned since the end of the civil war in January 1970.
The walled city after a decrease of population in the early days of colonial rule has grown rather slowly mainly through natural growth reaching a total population of 32,600 in 1952/3 , 3^,900 in 1963 and about A0,600 in 1968. The last figure was obtained from the population files of the four ward heads in the walled city and is most likely an underestimation. This also applies to the 1952/3 census figures which, when compared with the latest figures, showed an average growth rate of approximately 1.A per cent per annum. This relatively slow increase is due to the still high infant mortality, the absence of any sizeable immigration and the emigration of young persons to new urban centres such as Kaduna and Jos which offer better employment opportunities. Assuming that this very modest growth rate will continue over the next 10 years, the population of the wailed city will reach about 50,000 in 1980. (See Graph A.3.1 on page 389).
A comparison between the 1952/3 and the 1963 census results in different parts of Zaria City illustrates not only the various pattern of growth

PART I CH 3
discussed above, but also the areas where the 19°3 census figures had been manipulated,
TABLE 3.1 Population Increase in Different Parts of Zaria City
E2 «/ 1963 , /Census — •
Annual growth in per cent
Walled City 32,560 34,870 0 .62
Sabon Gari 10,720 15,870 3.61
Tudun Wada 8,420 37,360 14.55Township Area 2,280 5,970 9.15Total 53,980 94,070
The Township Area and particularly Tudun Wada show a very large increase, and more realistic figures are most likely in the region of3,000 and 12 to 14,000 inhabitants respectively."
Ethnic Composition
The ethnic composition of the Zaria City District which includes Tudun Wada and other nearby hamlets but not the Sabon Gari and the former European township area, is given in the 1952/3 census as follows:Hausa 74.5 per cent, Fulani 18.9 per cent, other northern Nigerian tribes 3.8 per cent, other Nigerian tribes 2.7 per cent and non-Nigerians 0.02 per cent.— /
The ethnic composition of the Sabon Gari District was as follows:Hausa 48.7 per cent, Ibo 20.6 per cent, Yoruba 12.1 per cent, Fulani 8.9per cent, other northern Nigerian tribes 4.1 per cent, other Nigerian
i 19/tribes 4.9 per cent, and non-Nigerians 0.7 per cent.— -
■2 / DEPARTMENT OF STATISTICS, NIGERIA Population Census of Nigeria 1952/3 op cit., p.- 37
■22/ FEDERAL OFFICE OF STATISTICS, NIGERIA Population Census Northern Region 1963 Vol. 1 Lagos 1968, p. 235 (Mimeol
•2 / DEPARTMENT OF STATISTICS, NIGERIA Population Census of Northern Nigeria 1952 Bulletin No.4 Zaria Province, Kaduna 1956, p. 12.
■22/ ibid. p . 1 2 .......................................................

PART I CH 3 53
Administrative Division
Zaria is divided into two administrative units, the new Township Area which could best be described as a municipal enclave within the Native Authority territory to which all other parts of the town belong.
The new Township Area was set up under the provision of the enlargedand amended Township Ordinance of 19&3, under the control of-a
20/governing body known as Local Authority.— It is run by an advisoryboard with its members drawn from a cross-section of the local communityunder the chairmanship of an administrative officer appointed by the
Central Government.The walled city, on the other hand, is governed by the Native
Authority, which was introduced by F.D. Lugard in the first decade of the twentieth century. It consists of a Chief-in-Council, the Emir of Zaria, who presides over all meetings of the council which is composed of appointed and traditional members of the local community.
The walled city, the other areas do not concern us here, is subdivided into four wards (anguwa) each administered by a ward head known as mai-anguwa. (See Map A.3-3 cm page 390)- I*1 ^968, the population of the four wards were as follows: Kwarbi 14.670 or 36.1 per cent of the total population in the walled city, Kaura 13,860 or 34.2 per cent, Ija 6,170 or 15-2 per cent and finally Juma with 5,900 or 14.3 per cent. These population figures were obtained from the tax and population files of the ward heads.
^2/ NORTHERN STATES OF NIGERIA Local Government Year Book 1968 Kaduna 1968 p. 33

PART I CH 3 5^
SAMPLE SURVEY
The results of the sample survey regarding the age and sex distribution,ethnic composition and migration are discussed below. The number of peopleincluded in my survey was 1,067 or about 2,6 per cent of the total population in the walled city in 1968. However, a number of problems encountered during the collection of the demographic data must be briefly mentioned first.
Age and Sex Distribution
MA11 African demographic surveys share the problem of trying to recordthe ages of. people who do not know their exact ages and are not fundamentally
21/interested in knowing them,"— In order to overcome this problem, the so- called "Historical Calendar Method" was used. In this method, the age of people is linked to well-known historical events, thus older persons were asked to give their ages according to the reigns of local Emirs, or other widely known events such as the British occupation in 1902 and the outbreak of the Second World War. The ages of women could be further clarified by investigating the number and duration of her marriages as well as the ages of her first and last born child. However, it must be stressed that the age composition of people obtained in this way can never be accurate, but is probably better than could be achieved by any other known method.
BRASS, W. et al, op cit., p. 13

PART I CH 3 53
In the following table the age distribution of the sample population is compared with the divisional census returns for Zaria Division in
1952/3 and 1963.
TABLE 3.2 Population Distribution by Age Groups in Percentages
Zaria Div.1952/3 Tot.Pop. 795,900
Zaria Div.1963 Tot.Pop.1,183,100
Survey 1968 Tot.Pop.1,067
0 - 14 44.6 45.9 46.815 - 49 45.7 47.7 44.350 + 9.7 6.4 8.9Male 48.6 49.6 45.2Female 51.4 50.4 54.8Total 100.0 100.0 100.0
The divisional census data as well as my own survey data show thetypical high proportion of young people. There was also an excess offemales over males particularly in my survey data.
The amount of distortion which frequently occurs in African demographicdata - including my own - can be linked to specific cultural conditions.For example, the tendency to under-report females in the age group 10 to14, whereas the age groups 15 to 29 are correspondingly inflated. Anexplanation for this bias has been given in a number of census reports allof which agree that in countries where girls marry at an early age, usuallybetween the age of 10 to 14,* married girls under the age of 13 are ..unconsciously graded upwards, thus causing a serious imbalance in the sex
22/ratio of the affected age groups.—
* In the sample population all females over the age of 15 were married
DEPARTMENT OF STATISTICS, NIGERIA Population Census of the Northern Region of Nigeria 1952 Kaduna 195& pp. 8-9ZANZIBAR PROTECTORATE Report on the (1958) Census of the Population of Zanzibar Protectorate Zanzibar 1960, P« 27-SERVICE DE STATISTIQUE HAUTE-VOLTA La situation demographique en Haute-Volta, Resultats partiels de l'Enquete demographique 1960-61, Paris 1962, p. 29
' BOUTILLIER; J.L. et Al; La Mdyenrte Vallee' du Senegal ' Paris' 1962 p.' 26

PART I CH 3 56
The sex and age distribution of the sample population is shown in Diagram A.3-1 on page 388 . As indicated on the bar-chart, the distorted sex ratio of the sample population is due to three main reasons. First, in spite of careful age recording there is a certain amount of differential age misreporting in both sexes but more noticeably so in the female age groups 10 to 29* Second, the excess of females over males in the age groups 20 to 29 may be partly caused by the large number of polygamous marriages recorded in the sample,* and third part of the imbalance may be caused by the emigration of males in the age group 20 to 2*+ to new urban centres such as Kaduna and Jos which offer better employment opportunities•
Ethnic Composition
The ethnic composition of the survey population showed the expected close resemblance to the figures given for Zaria City District on page and were as follows: 79*6 per cent Hausa, 16.8 per cent Fulani, 'l.b per cent other northern Nigerian tribes and 2.5 per cent other Nigerian tribes.
Immigration has been of limited importance in the sample population.Only 125 persons, 55 males and 70 females or 11.7 per cent of the sample were born outside the walled city. Most of these came as children or in their early teens. By far the most important group of immigrants were wives. Altogether *+6 female were counted of whom the majority came from Zaria and other northern provinces, but several came from farther afield including 6 from Ibadan and one from Fort-Lamy in the Republic of Chad. A second
* See page 70

PART I CH 3 57
group consisted of 22 male and female children who had been adopted by their relatives in the walled city. A total of 13 compound heads born outside the city are of interest, 6 came from Zaria Province, 3 from Kano Province, 2 from Plateau Province and one each from Katsina and Ibadan. Their average age was 39*7 years, while the average number of years spent in the walled city was 26.8 .
Only 7 adult males including 4 mallams, 2 traders and one embroiderer had immigrated in the last 10 years. The motivation given for coming to Zaria was in the case of the mallams better teaching opportunities, the rest gave economic reasons.
In conclusion, contemporary Zaria contains two contrasting types of urban settlements; first, the traditional pre-industrial, walled city, where all the houses included in my survey were chosen from, and second, a new technological advanced urban area. The new town has grown rapidly mainly due to large-scale immigration from the southern part of Nigeria, whereas the population of the wailed city has increased rather slowly.The age distribution of the sample population showed with 46.8 per cent a high proportion of young people under the age of 15• The absence of any sizeable male immigration combined with the slow integration of newcomers into the community, has preserved the traditional urban community in the walled city more or less intact.

PART I ZARIA CHAPTER k DOMESTIC GROUPINGS 58
THE COMPOUND
Lay-out and Organization
The following description of the lay-out and organization of compounds in Zaria walled city is a necessary introduction of the discussion on domestic groupings.
The Moslem religion has had a considerable influence on the lay-out of compounds, particularly in the urban areas of Hausaland. Polygamy and the different modes of religious marriages, of which auren kulle and auren tsare lay great emphasis on complete or partial seclusion of women respectively, require a high degree of privacy which, combined v/ith the genuine desire for security in pre-colonial times, has produced the present day compound with several courtyards surrounded by high mud walls.
A compound (gida, pi. gida.je) is usually divided into a forecourt (kofar gida) and the central courtyard (cikin gida) which contains several huts inhabited by a family or group of families which are descended from common ancestors. The only access into the compound is through a zaure or entrance hut which is the domain of the compound head (maigida). Here he entertains his visitors and friends, takes his meals and, if possible, pursues his craft such as weaving, tailoring or teaching the Koran. The entrance hut may also be used as a sleeping room for students and other overnight guests. The door leading from here into the interior is always covered with a straw mat to prevent male visitors from looking into thev.forecourt. No male stranger is normally allowed further into the compound, but all females and boys under the age of puberty are free to enter the house.

PART I CH k 59
The forecourt (kofar gida) functions as an intermediate zone between the outside world and the centre of the compohnd. The huts found here house the compound’s adolescent unmarried sons. If the compound head possesses a horse it is usually tethered in the forecourt. The second entrance hut (shigifa) which gives access to the centre courtyard of the compound is sometimes divided into a larger room which is often used as an additional sitting room, and a smaller interior one Which is always used as a storeroom for mortars, large pots and other heavy kitchen equipment.
The centre courtyard of the compound (cikin gida) contains the compound head's hut (turaka), the rooms of his wife or wives grouped around an open area with a wet season kitchen (dakin girki), one or two general store-rooms and the huts of any other related family group or groups. Poultry pens and granaries (if any) are always located in the cikin gida. Since the women's quarters are segregated, nearly everycompound in Zaria walled city has at least one pit-latrine, a washing
\place and a well. (See House No. 39 on page 60).
This is the usual lay-out of a compound but there are great variations in size, number of rooms and type of construction depending on the wealth and status of its inhabitants. A poor man's compound may. not have a second entrance hut, no wet season kitchen and no separate room for the compound head, while a well-to-do man may have a compound with several entrance huts', a two storey building (bene- the upper storey) covered with a corrugated iron roof and richly decorated outside wails. In areas where building space is limited the forecourt may be replaced by a succession of small rooms which give access to the cikin gida, while in some compounds the wives' rooms are built around a central hall which serves as a common working, sitting and storage place. (See House No. 78 on page 60).

FART I CH k 60PLAN *1.1 House 39HOUSE K* 39
y~-J y\
adfids r '
cikm gida i r.
turska
katangakofar gida
zaure
PLAN 4.2 House 78
wcme:
> IV' . ' I- /l, , - ' up -J^ZZZ22ZZUZ22^ cikin gidf;;
21 ft
zaure

PART I CH 4 61
Most rooms are sparsely furnished. People are accustomed to sit and work on grass mats or goatskins which cover part of the floor, and the only built-in equipment is a raised earthen bed. Better off people may have an additiona wooden or iron bed. A typical woman's room may also contain an upright loom, a low round wooden stool, a small table and a collection of various pots, baskets and calabashes. A cement platform in front of the room is used as an outside working place for food preparation, cooking and handicrafts, as well as to dry rice and/or pepper.
Land Use Inside the Compound
The data on land use given below derive from measurements taken in 77 compounds surveyed in the walled city. These compounds have a total area of *+7,552 sq.m. which is divided into the open area of 3^»28*+ sq.m. or 65 .8 per cent, and the built-up area of 16,268 Sq.m. or 3^*2 per cent. The average size of these compounds was about 620 sq.m. or 6,670 sq.ft.
The open area of 31»28*f sq.m. is sub-divided into five categories. First, the general courtyard area which accounted for 76.*+ per cent of the total open area. This includes all unpaved areas not used for any particular purpose. In 65 compounds about one quarter of this area has been set aside for further construction should the need arise, whereas in 12 compounds with an average open area of only about 9*0 sq.m. per person no expansion was possible without demolishing an old building.
Second, cultivated land accounted for 13*1 per cent of the total open area. Cultivated land found in *+*+ compounds was almost exclusively used for growing hemp (cannabis sativa). The average area per compound was 9 3 .0 sq.m., but in six compounds .over 300*0 sq.m. were found under _cultivation, some areas concealed behind specially built high mud walls.

PART I CH 4 62
Third, cement platforms accounted for 6 .8 per cent of the open area.The use of cement platforms particularly in front of rooms has already been mentioned earlier. In 63 compounds at least one cement platform was found, the average area being 34.0 sq.m.
Fourth, pit-latrines and personal washing places covered 3*2 per cent of the total open area. Pit-latrines and personal washing places are usually located behind sleeping rooms. These areas, which are specially screened off with mud walls or zana matting, accounted for an average of 14.0 sq.m. per compound; the average number of pit-latrines was 2 .3
per compound.Fifth, storage space accounted for only 0.3 per cent of the total open
area. The most frequently stored items were building materials, firewood and old clay pots, the average area per compound was 4.3 sq.m. (See Table A.4.1 onpage392 ).
Type and Size of Rooms
The built-up area in 77 compounds contained 1,284 rooms or 16.8 per compound. The total floor area of 10,473 sq.m. was divided into four categories.
First, living area which accounted for 67 .6 per cent of the total floor area. This category includes all sleeping and sitting rooms, as well as store-rooms used for personal articles. With a total of 883 rooms, this is by far the most important group.
Second, commonly used rooms accounted for 16.1 per cent of the total floor area. This category includes 71 main entrance huts,* 91 second entrance huts (shigifa), and all staircases and passages.
* Seven entrance huts were used for sleeping, and one compound has two entrance huts.

PART I CH k 63
Third, basic ancillary facilities covered 12.5 per cent of the total floor area. This includes 97 kitchens, 6k general store-rooms and 29 toilets and/or bathrooms.
Fourth, commercially used rooms accounted for 3-8 per cent of the total floor area. This includes 9 shops or workshops, 9 storage rooms used for trading commodities, 3 garages and 19 permanent stables for horses, donkeys, goats and sheep. (See Table A.k.2. on page 393).
SOCIAL STRUCTURE AND KINSHIP ORGANIZATION
In the following pages the social structure of the sample populationwill be analysed in order to show the principles which govern thedevelopment of co-residential kinship groups in Zaria walled city. Themain features of Hausa kinship organization and marriage was investigatedby M.G. Smith in various rural and urban communities in the Emirate ofZaria in 19^9-50» and provided the basis for my own investigation as well
1/as an excellent opportunity for cross-checking.—In this study the unit of analysis is the population of a compound
divided into households or economic units. However, as household data alone are insufficient to explain the changes which frequently occur in co-residential groups, some additional kinship data, based on a common reference point - in our case relations with the compound head - are essential. This will enable us later to illustrate the cyclic tendency which regulates the development of co-residential kinship groups.
The first essential step in the study of kinship organization is the identification of the compound head by uniform criteria. In the Hausa- Fulani community at Zaria, the status and role of the compound head is clearly defined and receives explicit socio-political recognition and
1/— SMITH, M.G. The Economy of the Hausa Communities of Zaria London 1955j pp. k-k8

PAST I CH k Gk
support. In the absence of house-numbers, a compound in the walled city of Zaria is generally known by the name of its present head who is usually the senior resident male in age and status. He is responsible for the payment of tax due from all male residents and is consulted by the Authority in all matters concerning the compound and its inhabitants.To identify the head of a chosen compound these external criteria were used even though they did not always reflect the internal distribution of authority which, in a few cases lay with younger brothers of the head, or was divided between full or half brothers living in the same compound. Changes in headship which always occur after the death of the compound head and are accompanied by a re-definition of the relations between members of a kinship group may thus lead to a split of the old group and the establishment of a new one elsewhere by the secession of some households.
Before going into these matters it is necessary to define the terms ’’individual family” and ’’household” as used in this analysis. The term individual family (iyali) denotes both monogamous and polygamous families consisting of a man, his wife or wives, and .their children real or adopted; but in 19 cases of the sample the man’s widowed mother was also included.A household, on the other hand, is a separate unit of domestic economy consisting of all persons who eat together from the same pot (tukunya) dwell together in one part of the compound known as sassa, and who contribute in.kind, labour and/or money to the household budget. A further distinction should be made between the compound head (maigida) and his immediate household, and the heads of all other dependent or semi-dependent households living in the compound. The compound head is clearly distinguished by his capacity to take independent action which may include the building of new rooms or the accommodation of other family members,

PART I CH ^ 65
whereas dependent or semi-dependent household heads cannot make these decisions independently without infringing on the compound head's authority.
If the inhabitants of a compound depend largely on agriculture as a means of livelihood, they may form a single work-unit known as gandu which then consists of all the adult males and.their families. During the rainy season from May to September, individual families within a gandu farm a common field and cook together, their common meals being prepared in turn by each of the members' wives until the harvest is over. In the dry season each household head may pursue his own occupation such as weaving, embroidery, trading or teaching the Koran, and at this time each household operates a separate domestic economy. However, at Zaria walled city only four compounds each with one gandu were found although the survey was carried out during the* rainy season. In all other compounds surveyed, the various household heads farmed their plots independently either with the help of an unmarried son or with paid labour (kodago). In the majority of cases the commercial or subsistence crops are essential income which is supplemented by non-agricultural activities that are also pursued during the rains at reduced rates, and often exclusively after the harvest. It is evident, that the gandu as a work-unit for the common production and consumption of food, plays a far less important role in the walled city than in the rural areas, but the basic idea remains. For example, in some compounds token exchanges of cooked food amongst the different branches of the family are practised, and all will co-operate to repair the compound wall, and to rebuild commonly used rooms. Before the first marriage of a young male compound member all resident household heads sire expected to contribute towsirds the bride-price and later towards the construction of the new hut for the young couple.

PART I CH 4 66
Population and Household Data
The population distribution of 77 compounds surveyed in Zaria is given below.
DIAGRAM 4.1 Number of Persons per Compound in Percentages
4o % __ ______ _____________ _____________
30 % ------------- --------------------------------------
20 % ---------------------------
10 %_________________________________________________
o % — ........ rzz_0-4 5-9 10-14 15-19 20-24 25-29 30+ Pers.per Comp.
The majority of the sample compounds (8 3.0 per cent) have populations that range between 5 and 19 persons, the average being 13»8 per compound. However, there were 3 compounds which had 34,38 and 39 persons respectively, the largest containing the family of a former District Head.

PART I CH k 67
The following diagrams compare the size of compound heads' households with those of all other dependent or semi-dependent households found in the compounds surveyed.
DIAGRAM k.2 Number of Persons per Household in Percentagesa. Compound Heads' Households (77)
30 % _________
20 % : !--
10 % 1. ■■
0 96________ ______ ______ ______ _____________ ________1-2 3-*f 5~6 7-8 9” 10 11-12 Over 12 Pers.per EH.
b. Dependent or Semi-Dependent Households (11*0% _____________
30 % - -----------------------------------------------
20 % ---------------------------------------------------
10 % ___________________________________________________
0 % L — ■, ■ ■ , ■ ■__l l..... J _____1-2 3-b 5-6 7-8 9-10 11-12 Pers.per EH.
The remarkable differences in household size are important, particular!the high proportion 57»2 per cent of compound heads' households with morethan 6 persons. Dependent or semi-dependent households of the same sizeare represented only by 12.k per cent. The average size of compound heads'households was found to be 7*8 persons, whereas dependent or semi-dependenthouseholds had on average only *f.1 persons. (See Table A.*+.5 on page 3 95).These differences in household size are partly due to the fact that thelatter type consists mainly of "young households". For example, only 5*1

PART I CH 4 68
per cent of all wives of dependent household heads have passed childbearing age (40 plus), as against 24.3 per cent of all compound heads' wives.(For the age distribution of compound and dependent household heads see
Table A.4.6 oh page 392). Furthermore, the generally lower income of dependent household heads, a topic which will be discussed in the next chapter, tends to limit, at least temporarily, the number of children in these households.
The age and sex distribution as well as the marital status of.the sample population are given in Diagram 4*3 and Table 4.1 on page 69 .The bar-chart indicates that females marry early. About 36*0 P-r cent of all females between the age of 10 and 14 were already married, and there were no unmarried females over the age of 15. Males, on the other hand, marry on average later normally between the age of 20 and 29•
The number of 51 resident divorced and/or widowed females is noteworthy. Further study shows that of these females, 19 were the widowed mothers of compound heads, while 4 were widowed mothers of compound heads' half brothers and one the compound head's grandmother. The majority of these females will probably stay with their next of kin, whereas a large proportion of the remaining 27 females will marry again and leave the compound. (For more detailed information see Table A.4.4 on page 394 )•

PART I CH 4 69
DIAGRAM 4*5 Survey Sample Population by Sex, Age and Marital Status
MALE FEMALE
120 110 100 90 60 70 60 50 AO 30 20 10 0 0 10 20 30 40 50 60 70 60 90 100 110 120 PERSONS
SINGLE M ARRIED DIVORCED OR WIDOWED
TABLE 4«1 Survey Sample Population by Sex, Age and Marital Status
Male Fejnale G.—Age ■ pi nd”t-'—*-*•0 Mar * Div. Vid. Total Sing' Mar • Div.'Vid. Total Total'O- 4 98 96 122 122 2205- 9 94 94 91 91 185
10—14 55 55 25 14 59 9415-19 50 5 55 48 1 49 8220-24 11 15 26 66 2 68 9425-29 6 55 41 66 1 67 10850-54 1 25 24 50 5 5 56 6055-59 25 2 25 25 1 2 28 5540-44 1 25 26 17 1 18 4445-49 16 16. 11 2 5 16 5250-54 18 18 9 8 17 5555-59 7 7 5 9 14 2160-64 6 6 5 9 14 2065-69 5 5 1 1 6704- 8 8 5 5 15Total 296 184 2 482 238 296 11 40 565 1,067

PART I CH 4 70
The following table gives the number of wives per.compound head (maigida) and all other dependent or semi-dependent household heads (mai-iyali).
TABLE 4.2 Distribution of Wives per Married ManColumn 1 2 3Type of Household Com. Head Dep. HH.* Total HH.
No. % No. % No. %
Male with 1 wife 23 32.9 90 78.9 115 60 .5
Male with 2 wives 32 VI. 1 19 16.7 31 26.9Male with 3 wives 12 13.8 5 4.4 17 8.9Male with 4 wives 7 9-2 7 3-7Total 76** 100.0 11V 100.0 190 100.0
No. of wives 133 143 296* * *Percent, of males in polygamous fam. 67.1 21.1 39 .3
Percent, of females in polygamous fam. 83 .7 37-1 61.1
Av. no. of wives per married man 2 .0 1.3 1 .6
*Includes strangers1 households**0ne compound head was a widowed female***Eight wives were temporarily absent
The differences between the number of wives married by compound heads and all other dependent household heads is noteworthy and show the dominant economic positions of compound heads as well as the prestige of polygamous marriage. The 3 dependent household heads with three wives each directed economically independent households whose cash income exceeded that of their compound heads.
As shown in Table A.4.3 and A.4.4 on page 39/4.* adoption (tallafi) is widely practised in Zaria, but generally restricted to children of members of the kinship group including the kinship group of wives. Women usually
PART I CH ^ 71
adopt girls and men boys. Of the 88 adopted children (AA boys and girls) in 77 compounds surveyed, 75 children were adopted by the compound head and his wife or.wives. The male children most commonlyadopted were sons of the compound heads' brothers (20), and the sonsof compound heads' sisters (5)» The most commonly adopted female children were the daughters of compound heads' wives' brothers (15)» followed by the daughters of the compound heads' brothers (5), and the daughters of compound heads' sons (5)»
Family Groupings
In the following pages I will analyse the structure, size and developmen of co-residential kinship groups. I will also show how certain changes inthe structure and size of kinship groups affect the lay-out and occupationalpatterns of compounds in the walled city of Zaria. The majority of kinship - groups surveyed, are based on agnatic descent. The development of these kinship groups can best be illustrated by a succession of simplified diagrams that describe successive stages in. the growth of agnatic kinship groups among the Hausa. For exposition, the kinship diagrams shown below are given in their simplest' essentials, whereas in real life we often find a compound head with up to four wives, more than one married son with two or more wives, several married full and/or half brothers, their wives and children, as well as various cousins and their descendant? living together in one compound. In the following diagrams, the compound head (CH) has two wives and two or three children, while other married men have only one wife and one or two children apiece. The aim of these diagrams is to illustrate the cyclic tendency which regulates the development of agnatic kinship groups, and to expose the factors that limit the expansion of these groups.

PART I CH ^ 72
DIAGRAM k.k Stage 1 Kinship Development
A = O v/ I
Kinship groups of this type were found in 31 compounds containing 31 households or 17-2 per cent of all related households included in the sample. However, strangers' and clients' households which do not influence nor contribute to the development of co-residential kinship groups are
The second stage of kinship development is reached when one or more sons of the compound head have married and form, as shown in the diagram, two or more semi-dependent households under the leadership of their father. The compound head's daughter will have left the house on her marriage.In rural areas this type of family grouping provides the natural basis for a gandu under the guidance of the compound head who normally will pay the tax for his sons. Kinship groups of this type were found in 9 compounds containing 27 households or 13»0 per cent of all related households.
omitted here but will be analysed separately later.
DIAGRAM k.5 Stage 2 Kinship Development
▲ ©
' r i ' \ I '!o a! \ a/ ___ ■/ \ — —/

DIAGRAM *+.6 Stage 3 Kinship Development
/ / i l l5 k / i<X:
The death of the compound head gives rise to the third stage in the development of co-residential units by converting it into a grouping of collateral agnates and their families, with the older brother usually succeeding as compound head. After the mourning period is over, barren and junior widows of the dead compound head will normally leave the house for re-marriage. This type of kinship group was found in 17 compounds with 41 households or 22.8 per cent of all related households.
DIAGRAM k.7 Stage k Kinship Development

PART I CH k
The fourth stage in the development of co-residential kinship groups is reached when the new compound head’s son and/or one of the full or half brothers' sons have married. As always, since women move to their husbands' homes, the marriage of girls reared in the compound does not affect the structure of agnatic kinship groups. As shown in the diagram, the two daughters have left their fathers' house on marriage. "Stage- four-groups" are usually large co-residential groups with complex kinship networks and average a population of 2*t.2 persons per compound. These extended collateral families are of particular interest because their internal structure normally generates a split of the old kinship group and the establishment of a new residential unit, which then begins the cycle at stage one as shown-above. Co-residential kinship groups of this type were found in 11 compounds containing 57 households or 31.6 per cent of all related households.
DIAGRAM *1.8 Stage 5 Kinship Development
A = ®iT. _i r r o V ° = o;
"i; y L = 0 / ! A /\ / ^
A t OO , / A
After the death of the compound head his senior surviving brother takes over the responsibility for the co-residential kinship group. At this stage, divergence of interest and ensuing friction amongst the various household heads may result in the split of the kinship group. Groups of this type were found in one compound with 5 households or 2.8 per cent of all related households included in the sample. However, it must be stressed here, that a division of a co-residential kinship group can occur at
PART I CH 75
earlier stages when, for example, the compound head has built a new compound for his eldest son, or if one of the dependent household heads has become economically independent and wishes to build a compound of his own.
DIAGRAM *t,9 Stage 6 Kinship Development
Stage six shows a relatively rare combination of parallel agnatic cousins and their families living together in one compound. The two household heads are related through agnates in the second degree of kinship, and this was the widest span of kinship that formed a basis for a co-residential group observed in the survey. Groups of this type were found in one compound with 3 households or 1.7 per cent of all related households included in my survey.
To summarize, a total of 3^ households or 17-2 per cent of all related households included in the survey lived in kinship groups at stage 1, i.e. the compound head, his wife or wives and their own unmarried children, whereas 133 households or 73-9 per cent lived in composite co-residential kinship groups which had developed under the rules of patrilineal descent; but there were 7 compounds with 16 households or 8.9 per cent which did not. These 7 compounds contained 9 households which had joined these compounds and increased their populations by immigration and not by natural growth.
A ©
A ©

PART I CH 4 76
Except for the last discussed category, the individual family as a separate residential unit represents the first and simplest stage in the developmental cycle that gives rise to composite co-residential kinship groups which often contains three or more generations of males linked in direct line of descent. In the second stage these kinship groups consist of the families of the compound head and his son or sons. As time passes and the compound head dies, this re-constitutes the residential unit as a kinship group composed of siblings, whose deaths in due course redefines
the unit as one of paternal cousins. This development has been further illustrated by tabulating the ages of compound heads at each stage of development in Table 4.3 on page 77 .
As expected, heads of compounds in stage 1, 3 and 6 tend to be generally younger than their counterparts in stage 2 , 4 and 5- In the second part of the table the average number of households per compound increases from 1 household in stage 1 to 5*2 households in stage 4 and 5- The same upward tendency can be observed in the average number of persons per compound which rises from 7*7 persons in stage 1 to 24.2 persons in stage 4 and 5- The average number of persons per household, on the other hand, shows the reverse tendency by falling from 7-7 persons in stage 1
to 4.7 persons in stage 4 and 3- This fall in the number of persons per household is clearly due to the emigration of larger dependent households. The number of households in stage 6 are too small for generalization although the 3 households found in this category do not basically depart from the earlier observed patterns.
As has been shown above, the death of the compound head, lack of space for new construction, internal tension between group members and ^differential economic success achieved by junior heads of dependent or semi-dependent households are the major reasons for emigration of

TABLE
4.3
Age of
Compound Hea
ds by
Stages
of
Kinship
Development
PART I C H 4 77
o -cti
-PO
EH
'VO ON LA fA OJ CT\ IN V O fA VO fA
oj-d-
fA
A -
LA
VO
W
W
-Pfj•HO
•■o
OJ o j VO LAO O
f A ;Ioj ;
ro <j;
OJ
fA«
LA
l A VO
o
fA 00O J
O
fA OOOJ
fA«
ON
00_j-<3
p O j—o»J ©_TO<i l O
LA
+-d-
in O0 _ j - < 3
f A O J f A OJ OONOJ
OJ
LA
OJ
-d-oja -
-4"On — © _
4 ~
n<3Q - j r <JA •— "»
fA f A f A f A f A f A OJ -d-
OJ
o
-d-
-d-
ON
LAo £ < ]
OJ O J O J f A ON O '
f A 1A -
LA
OJtLA
I I io _ r So _ r <3
i • . ! [!o j f A - d - o o LA OJ i OJ f A ^
fA fAO !
A -
A -
IN
O j - O
£ 3
Oo
•w
0
0 ObncO 0
-p bnto <
-d- : o j
IOOJi
i !
ON-d* ON-d" ON-d* ON-d" ON OJ f A fA -d - -d - LA A VO VO I I I I I I I I I +L A O i A O l A O L A O L A O OJ i f A fA - d - -d- LA LA VO VO A -
ft6O
O
o•o
S
TJ Sd • 3jd o 0 ft
o o W • u> 0 <d ft
$d3ofteo0 o
f t • p> 0 < ft
to ^d s 0 o to to 3 p o 0 K ft • P > 0 < ft
toft S• r l CO -Cd SL, CO bO

TABLE
k.k
Structure
of Strangers
f Families
PART I CH k 78
ON
d§ 3d -P
CD O Eh
O J 1 0 ON LTN KN . KN
OOI
<\l j KN
i s1 i
VO
1—1ccJ coPS CDd •rl•rHrH> •rl•rH Pd CO&
ftKN OO ' KN
! K N • -J-oII—
:<3r °”<3
UN
COCO CO<d o
i—I rHd ft H PS H O U6
OJOJ
CO
r d } § - p•H -P £ d
CD<D CO
3 3§ ftft a o
- p
O JOJ
ox.i— <5X ' J
K Nd•H15 :0■ 11
4
OJ>
•Hft oj oj
b Od•rlCO
PSrHOO
COdI—Ior docoP$ow
«Ho0ft
EH
COdctf0)wr d<0COPSo M . •u- pCO
o(0bo<
ONI
LTN
-J -O JIo
ONOJ1 KN ONKNI -J--J-|1UNOJ OKN1UNIfN
1O1
On -J* On -J - : LTN UN I I i IUN . O ! UN
-J - s UN UN
-J" . ON VO ■ VO I I O UN VO : VO+oo-
%sr HCCS-poEH
codr HOrd<DCOPSOW«HodoaPSs
COdoCOdcdft<+Hodox>aPS
dcd(OPSotdda>ftCOdoCOdCl)ft>
dbOa
•rlftft
•r lsiCOd•H

PART I CH 4 79
dependent households which can occur at any stage of the kinship development described above but particularly in stage 4. However, such centrifugal tendencies are counterbalanced to some degree by adoption, the mode of land tenure (commonly owned land), and, especially in poorer lineages, by the need to live and work together to ensure at least some degree of economic security.
Thus far we have discussed those co-residential kinship groups which contained the compound head and other related dependent or semi-dependent households but we must now briefly consider the 11 client* and strangers' households which were found in 8 out of 77 compounds surveyed. All of these household heads had immigrated to Zaria. In Table 4.4 on page 78 these 11 households have been divided into 4 main categories based on kinship organization. The first category (column 1-3) has heads who are either single, divorced or widowed, the second category contains female heads whose husbands have been absent for more than one month preceding the time of the interview, the third category consists of couples without children including those whose children were away, while the fourth category contains individual families. As can be seen, there were one divorced household head, one wife whose husband was temporarily absent and one childless couple. The remaining 8 households consisted of individual families.
Compound and Kinship Organization
In the following pages I will relate some of the facts which emerged from the discussion on household pattern and kinship organization to a number of compounds surveyed in Zaria. Altogether, two case studies
*The head of a client household is an unrelated servant who joined the compound in his early teens and for whom the compound head has provided a wife and free shelter.

PART I CH k SO
have been chosen from the sample to illustrate various stages in the development of co-residential agnatic kinship groups and the repercussions of these developments on the lay-out and size of compounds.
The first example represents a compound situated in the southern parts of the walled city which has belonged to a family of weavers for several generations. With the help of the compound head and the older kinsmen, the history of this compound and its inhabitants was traced backwards to the turn of this century when the present compound head was born. The kinship pattern and the architectural development of the compound were compiled independently for the given time span and then compared, all apparent inconsistencies found being discussed with the compound head to make whatever corrections were necessary.
According to the compound head, his father had rebuilt the compound around 1900 shortly before the British occupation. There the old man lived with his wives and children in three double-round huts, (adada) which are indicated in the plan by dotted lines. There was also some uncertainty about the father’s second wife and the number of children by this marriage. The plan and the kinship diagrams are therefore incomplete for the early stages of the compound’s history. Nevertheless, from the data collected it was possible to produce a series of plans showing the development of this compound from about 1920 to 1968.
After the First World war the compound was occupied by one individual family, it illustrated stage 1 in the kinship development discussed above. In 1926 when the first born son of the compound head married, the co- residential kinship group had reached stage 2. Following an extension of the compound area, a hut with two rooms was built for the young couple.The marriage of the compound head’s second son in 1933 led to the construction of a new hut. Between 1935 s^d 1937 three more rooms were
PART I CH 4
/R t a -»© - © - O 7 A" 7 o O -•
12,13 1,2 1.2 3.9 1.2 1.9
1920C H
t A 7 ,Q
#_Q_ q t A- 0 O 7 A - o - ©__________ 5 J 3 l 12,D 1.9 XU1 TJ1 I l i
AAAcU'.U 6A66 ioA 6AA1,2 1,2 V12flM B,lT 1,2 1t,Htyi14
1933CM
O 7 A - ©
• - O 11,10 11,10
1937
Or y - •
12,13 H 1,9
See also Plan A.^.1 on page 396
©- © - O 7 & 7 O O 7 A 7 o - •12.13 I 12,13 0.9 10 J1 10,11 I 11
£££II kotttb koi 6lk17,16 12,13 1.9 tTJfiittl.n H.J1 X
tt.*8
*17
1986-56
O - •
19,11
PART I CH 4 82
built to house the compound head's sons' newly married additional wives. After the death of that compound head in 1946, the oldest son resumed responsibility for the compound and its inhabitants. As a result of this move the co-residential kinship group had reached stage 3 in the kinship development. With the marriage of the compound head's brother's oldest son in 1958 the group changed to stage 4. In the same year a new hut was built for the young couple. Further rooms were built in 1963 and 1965/6 to house the then rapidly expanding family.
However, as already mentioned above, composite kinship groups are liable to changes at any stage of kinship development which may not proceed progressively from stage 1 to stage 6 but is frequently interrupted This has been shown in the second example.
This compound is situated near the market in the walled city and has belonged to a family of butchers for at least three generations. In the late 1920's when the compound was occupied by the families of the compound head and his son, it illustrated stage 2 in the kinship developcen discussed earlier. However, after the compound head's death in 1939» the compound was occupied by only one individual family, thus representing a reversal to stage 1. With the marriage of the new compound head's son in 1948, stage 2 was reached again. The death of that compound head in 1963
again reduced the residential kinship group to stage 1; but with the marriage of the new compound head's half brother in 1964 the group reached stage 3 in the development cycle. In 1965 when the compound head's second half brother married his first wife, a hut with two rooms was built to accommodate the young couple. As the group could not expand further due to the lack of adequate building sites within the compound, the two remaining half brothers moved out. One half brother married in 1966 and has since ■built a compound of his own elsewhere.

I CH k 83
Diagram 4.11 House 71
MESEIT CJ.
j m x x
0 * 0 ,” A ,0 O.-A A TC211 ItH9 16116 Ul issnxi&a A
See also Plan A.4.2 on page 396

PART I CH 4 84
This brief account identifies three events that changed the kinship pattern of co-residential groups. These are successively: first, the death of the compound head, second, first marriages of males in each agnatic kinship category and generation, and third withdrawal due to lack of space.
Before the architectural development of these compounds can be related fully to the growth of the co-residential kinship groups, an old Hausa custom, which influenced building development-in many compounds, should be noted. This custom which is no longer universal and probably harks back to pre-Moslem times enjoins the burial of dead persons in or next to his or her hut which is then abandoned and left to collapse. After its roof and part of the walls have disintegrated, the roofing poles of deleb palm stems or bamboo are removed for use in new construction or as fire-wood. The remaining walls will then disintegrate quickly to form a small mound of earth which is left to mark the site of the former hut for several years. However, when new rooms are needed, this earth will be used again to make bricks for the new building, thus re-cycling the basic raw materials needed for the construction of houses. As can be seen from the simplified diagrams this practice was followed in both compounds.
In the first example on page 81 a total floor area of 105-5 sq.m. was constructed between 1926 and 1966. Of these 100.3 sq.m. or 95-1 per cent were built as a direct response to provide living and sleeping rooms for newly wedded couples or for additional wives, whereas only 5-2 sq.m. or 4.9 per cent of the total area was built as a wet-Season kitchen.Over the same period three double-round huts and one store-room used by the compound head's late father disappeared.

PART I CII 4
The second example on page 83 shows a slightly different distribution. Of the total floor area of 127.8 sq.m. built between 1928 and 1967j 88.6 sq.m. or 69 .3 per cent were constructed to provide living and sleeping rooms for newly married couples, or for the rapidly growing family of the present compound head, while 22.8 sq.m. or 17-9 per cent were built to provide such ancillary facilities as kitchens and kitchen stores. Only one commonly used room with 16.4 sq.m. or 12.8 per cent of the total floor area was built between 1928 and 19&7.
DISTRIBUTION OF FLOOR AR3A
The distribution of the floor area among the sample population may be studied from two points of view; first, the average floor area per ..household and person classified by their relationship to the compound head, and second, the average floor area per household and person according to the number of persons per household. The first approach may tell us something about differential treatment of related and strangers1 households regarding the allocation of space, whereas the second approach will indicate the compound head's ability to provide shelter for. the growing family.
Floor Area and Household .
The survey in Zaria walled city covered 191 households containing 1,0o7 persons in 77 compounds. Table 4.5 below compares the total average floor • area and the average sleeping area available to each household and its members, these households being classified by their relationship of their heads to the’ compound head.

PART I CH 4 86
TABLE 4.5 Average Floor Area per Household and Person in so.m.
Column 1 2 3No. of No. of Total av.Area Av.Sleep. AreaHouseh. Persons p.Hh. p.Pers. p.Hh. p.Pers.
Compound Head's Househ. 7 7 603 100.6 12.8 37.7 4.8CH's F+H Brs1 Househ. 39 172 31 .0 7.0 18.1 4.1CH's Sons' Households 29 106 •0OJ 5.5 14.3 3-9CH's F+H Brs' Sons' Hh. 25 118 21.4 4.5 16.0 3.4Other Related Househ. 10 29 23.8 8.2 12.1 4.2Sub-Total Dep. Househ. 105 425 24.9 6.0 16.0 3.9Strangers' Households 11 39 15-1 4.3 13.5 3-8Total Househ. and Pers. 191 1,067Av. all Househ. + Pers. 54.8 9.8 24.5 4.4
The substantial difference between the total average area occupied by compound heads' households (100.6 sq.m.) and the total average area of all other dependent or semi-dependent households (24.9 sq.m.) is noteworthy. These differences are due to the greater size of compound heads' households which contain an average of 7»8 persons as against 4.1 persons in all other households. Moreover, the total average area of 100.6 sq.m. occupied by compound heads' households include all rooms which are directly under the control of the compound head, including the various entrance huts, workshops and corridors in the compound, even though these are available for general use by other residents. Dependent or semi-dependent household heads, on the other hand, are normally only responsible for their immediate sleeping and living rooms, plus the occasional kitchen and store-room.Thus, the average floor areas cited above illustrate the differential distribution of responsibilities among households' heads within these compounds, rather more precisely than the allocation of floor area between the households themselves. Furthermore, the differences in the average

PART I cri 4 87
sleeping area available to individuals only fluctuate between 4.8 sq.m. for the members of the compound head's household and 3*9 sq.m. for persons belonging to all other dependent or semi-dependent households. However, it must be noted, that the average sleeping area per person for households of compound heads is slightly inflated by the fact that 50
compound heads have their own private quarters (turaka).The following two Graphs are based on Table A.4.8 on page 395 •
Graph 4.1 on page 88 shows the average floor area and the average sleeping area per household according to the number of persons per household. As can be seen, the average floor area per household increases from 17*2 sq.m. in households with 1 to 2 persons to 118.4 sq.m. in households having 11 to 12 persons. At the same time the average sleeping area per household also increases from 9-2 sq.m. for households with 1 to 2 persons to 50-9 sq.m. for 11 to 12 person households.
Graph 2 on page 88 shows the average floor area per person and the average sleeping area per person according to the number of persons per household. The average floor area increases only marginally from 9*0 sq.m. for households with 1 to 2 persons to 10.4 sq.m. for households having 11-12 persons, while the average sleeping area per person remains almost stable between 4.8 sq.m. per person for households with 1 to 2 persons and 4.5 sq.m. for households having 11 to 12 persons. This finding confirms a preceding observation that new huts are built for nearly all women who enter the compound on marriage, and that further rooms are constructed to house the expanding family. It is evident that the lack of suitable building sites within compounds rather than overcrowding of existing rooms precipitates decisions of dependent household heads to leave the house and to establish independent new compounds elsewhere•

PART I CH. k 8S
GRAPH 4*1 Average Floor and Sleeping Area per Household in sq.m.
PERSOHS PER HOUSEHOLDLine 1 Average Floor Area. Line 2 Average Sleeping Area
GRAPH 4.2 Average Floor and Sleeping Area per jrerson in sq.m.
az
0 1 2 3 L 5 6 7 8 9 10 11 12PERSONS PER HOUSEHOLD
:rr
Line 1 Average Floor Area. Line 2 Average Sleeping Area See Table A.4.8 on page 3 95.

PART I ZARIA CHAPTER 5 OCCUPATION AND INCOME 89
NIGERIA / ZARIA
Occupational Pattern
The most significant feature of the occupational pattern in Nigeriais the predominance of agriculture. However, detailed data on thepercentage distribution of the main occupational groups are confusing.According to the 1992/3 census report, about 78.0 per cent of thecountry's total labour force was engaged in agriculture, 13*0 per centin trade, clerical work and services, J>.0 per cent in crafts, 2.0 percent in administrative, professional and technical work, and *t.0 percent in miscellaneous occupations.-^ The 19&3 census report, on the otherhand, gave about 37-0 per cent of the country's total labour force asbeing engaged in agriculture, 21.0 per cent in trade, 1A.0 per cent incrafts, 3-0 P©r cent in administration and 5-0 per cent in other
2/occupations.— Unfortunately,, no detailed data for the 1973 census are available yet.
According to the 19&3 census report, the urban labour force in ZariaProvince was in the region of 38,000 persons.* Agriculture, crafts andtrade accounted each for about 3 0 »0 per cent of the urban working population,whereas persons engaged in administrative, professional and technical work
3/accounted for c. 6.0 per cent and other occupations for 3-0 per cent.—
^ DEPARTMENT OF STATISTICS, NIGERIA Population Census of Nigeria 1932/3 Lagos 1958, p. 1
-/ FEDERAL OFFICE OF STATISTICS, NIGERIA Population Census of Nigeria 1963 Combined National Figures Vol. Ill Lagos 1968, p. 39
* Includes-towns with 20,000 or more inhabitants^ FEDERAL CENSUS OFFICE Population Census of Nigeria, Northern Region
Vol. II Lagos 1988, p. 391 (Mimeo)

PART I CH 5
In 1968 the largest single employer in Zaria Province was the NativeVAuthority with about 2,350 employees.— The 11 industrial establishments
in Zaria City which participated in the 19&7 Industrial Survey had a5/total of 1,500 Nigerian employees.— Local factories then included inter
alia a cotton mill, a cigarette factory, a printing press, an oil-seed processing plant and the Nigerian Railway engineering works.
Income
In 1970 the average per caput income for Nigeria was estimated atover £N. 30 per annum, and was expected to increase by about to b percent during the period of the Second National Development Plan from 1970
to 197^^ According to the Industrial Surveys of 19&3 ^96 71 theaverage annual wages for Nigerian employees increased by over 30.0 per
7 /cent from £N. 151 in 19&3 to £N. 201 in 1967* A substantial increase of over 12 per cent was awarded after the Morgan Commission on wages and
o tsalaries had published its findings in early 196 .— In its report the commission recommended a new wage structure and a minimum wage rate that
9/ranged from £N. 6-10 sh. to £N. 12 per month according to location.—
^ AHMADU BELLO UNIVERSITY ZARIA, INSTITUTE OF ADMINISTRATION Northern States of Nigeria Local Government Year Book 1968 Zaria 1968, p. 87FEDERAL OFFICE OF STATISTICS, NIGERIA Industrial Survey of Nigeria 1967 Lagos 1970, p. bO
^ FEDERAL MINISTRY OF INFORMATION, NIGERIA Second National Development Plan 1970/A Lagos 1970, p. bO
7/M FEDERAL OFFICE OF STATISTICS, NIGERIA Industrial Survey of Nigeria 1963 and 1967 Lagos 19&5 19&8
-/ FEDERAL MINISTRY OF INFORMATION, NIGERIA Report of the Commission on the Review of Wages, Salaries and Conditions of Service of the Junior Employees of the Government of the Federation and in Private Establishments 1963 to 196^ Lagos 196^
9/ Ibid. pp. 20-21

PART I CH 5 91
In a White Paper the Government adopted some of these recommendationsand raised the minimum wages accordingly.-^^
In 1967 the average income by occupational groups in Nigerianindustrial establishments of 10 or more employees was £N. 124 per annumfor unskilled labourers, £N. 191 per annum for semi-skilled and skilledworkers, £N. JOO per annum for clerical workers, and £N. 1,073 per annumfor professional and managerial staff. In this context it should bementioned that non-Nigerian employees with an average income of £N. 2,660per annum accounted for only 2.6 per cent of the industrial labour force
11/but consumed 34.4 per cent of the total labour cost.— In Northern Nigeria the average income of employees in industry was for unskilled labourers £N. 104 pfex* annum, for semi-skilled and skilled workers £N. 170 per annum, for clerical workers £N. 230 per annum and for professional and managerial staff £N. 7^0 per annum.
Cost of Living
Nigeria has experienced inflation since 19^1* and as the cost of livingrose so did wages and salaries. The general cost of living indices forIbadan and Kaduna are given in Table A.3*1 and A.3-2 on page 397. Over thelast ten years from 1961 to 19715 the average annual increase in the generalconsumer price index for Ibadan and Kaduna was 3-1 and 3*8 per centrespectively, whereas between i960 and 19&5 the increase at Zaria was only
12/1.4 per cent per annum.— ' By contrast, the sharp rise in the cost of
10/— < FEDERAL MINISTRY OF INFORMATION, NIGERIA Conclusion of the Federal
Government on the Report of the Morgan Commission on the Review of Wages, Salaries and Condition of Service of the Junior Employees of the Government in the Federation and Private Establishment 1963-19^4 Sessional Paper No. 3 Lagos 1964 !FEDERAL OFFICE OF STATISTICS, NIGERIA Industrial Survey of Nigeria 1967 op cit., pp. 62-97
— '/ DEPARTMENT OF STATISTICS, NORTHERN NIGERIA Statistical Yearbook 1966 Kaduna 19&7» P« 212

PAPT I CH 5 92
living from 1968 to 197*1 indicates the inflationary pressures that developed towards the end of the civil war as the result of increasing expenditure on arms and some import restrictions on civilian consumer goods.
SAMPLE SURVEY
Occupational Pattern
Occupational patterns and the division of labour within the sample population are discussed below. Broadly speaking, men work in trade, crafts, agriculture and various other wage-earning occupations, and contribute mainly such goods as food, clothing and shelter to the household economy, while women contribute services and pursue low-paid crafts or petty trade on their own accounts. The main occupations of the 191 household heads included in my sample are given in the following table.
TABLE 9*1 Occupational Pattern of 191 household Heads
Compound Head Dep.Househ.H. Total Househ.H.No. % No. % No. %
Crafts 21 2.7-3 ^9 ^3.0 70 36.7Trade 26 33.7 32 28.1 58 30.4Service 22 28 .6 18 15-8 *K) 20.9Agriculture 2 2.6 8 7-0 10 5.2Misc. 6 7.8 7 6.1 13 6.8Total 77 100.0 11*f 100.0 191 100.0
As shown in the table, about one third or 33*7 per cent of the 77 compound heads interviewed were engaged in trade, textiles and food produce being among the most frequently traded commodities. Services including persons employed by the local and regional Government as well as by the army accounted for 28.6 per cent. Such arts and crafts as weaving, tailoring, building or teaching the Koran together accounted for 2 7 .3 per cent of the sample, and full-time agriculture for only 2.6 per cent. Six compound heads or 7-8 per cent had retired and received

PAST I CH 5 93
some financial support from their next of kin* (For more detailed information see Table A.5*3 on page 3 9 8).
The occupational distribution of the 114 dependent or semi-dependent household heads revealed a slightly different pattern. Here craftwork with 43.0 per cent was the most important occupation, followed by trade with 28.1 per cent, services with 13*8 per cent, farming with 7*0 per cent and miscellaneous occupations with 6 .1 per cent.
A total of 104 household heads or 34*3 per cent derived some additional income in cash from agricultural activities, while another 3
compound heads received galla or rent in kind from their farmland. Nearly half of the 31 compound heads directly engaged in farming, employed paid labour (kodago) on their farms, whereas the majority of dependent household heads farmed themselves or with the help of their unmarried sons (See Table A.3*3 on page 398).
TABLE 3*2 How Household Heads are EmployedCompound Head Dep.Househ.H. Total louseh.H.No. % No. % No. %
Self-Empl. 46 39 *7 44 38.6 90 47.1Empl.Publ.Sect• 19 24.7 17 14.9 36 .18.8
Bnpl.Priv.Sect. 4 3*2 7 6.1 11 5-8Helps Fam.Memb. 2 2.6 39 34.2 41 21 .3
Retired 6 7*8 1 0.9 7 3*7Misc. - - 6 5*3 6 3*1Total 77 100.0 114 100.0 191 100.0
As shown above, nearly 60.0 per cent of the compound heads are self- employed, 24.7 per cent were employed in the public sector and only 5*2 per cent worked in private firms. About 40.0 per cent of all dependent
household heads were self-employed, 34.2 per cent helped a senior family

PART I CH 5 9^
member, 1A.9 per cent were employed by the public sector and 6.1 per cent in private firms.
As most married women among the Moslem Hausa are largely confined to the compound, only older women and those who live in auren jahilai (marriage of the ignorant) are seen trading in the market. Out of 3^7 married, widowed and/or divorced females, living in the compounds surveyed, nearly 60 .0 per cent were engaged in spinning, weaving country cloths known as gwadaye on the vertical loom or embroidering caps and pillow cases for sale by the household head or through commission agents in the city market. Another 15-0 per cent of these housewives prepared food which was hawked by young girls through the city market and streets, and about13.0 per cent were primarily engaged in petty trading. Of the remaining 41 women, 23 or 6.6 per cent had no gainful occupation, and for 18 women or 3*2 per cent I obtained no information. As women always pursue their crafts or trading activities independently of their husbands, their profits are their own. While no systematic attempt was made to collect information on women's incomes during the survey, the few incomplete data available suggest profit margins that varied from 1 to 6 shillings per week.
Household Budget
Any useful analysis of family budgets must be prefaced by a brief description of the method used in collecting the relevant economic information as well as a critical.discussion on the reliability and shortcomings of the data. The aim of my budgetary enquiries was to establish the annual cash income of the compound head and that of all other dependent or semi-dependent household heads who lived in the compound surveyed.

PART I CH 5 95
During a pilot survey of five compounds, which are not included in thesample, useful information on the current and fluctuating market prices forfood, clothing, other consumer goods and building material was collected,together with wage levels, turnover and profit margins for the mostimportant trading commodities. Data available from the socio-economicsurvey of the Hausa communities in Zaria by M.G. Smith, the Urban ConsumerSurvey for Zaria and Kaduna, the Industrial Surveys and the Zaria marketretail prices which the Federal Office of Statistics collected regularly
13/proved most helpful.—^ Seasonal variations in economic activities, food prices and supplies were noted in order to evaluate price-movements linked with these fluctuations. Such seasonal variations were always discussed separately during interviews since information obtained from only one month or season could not serve as a sound basis for an annual expenditure/ income calculation.
The financial enquiry started with an investigation in the household heads' regular daily, weekly and monthly expenditure on food and drinks, firewood, transport and accommodation where outlays for rent, new construction, improvements and maintenance were clearly distinguished.This was followed by irregular expenditure on clothing, cash gifts or loans to family members and friends as well as outlays for religious and public festivals, childbirth, marriages and/or funerals. After all major items of expenditure were listed income was investigated. To reduce cumulative errors, the daily, weekly, monthly or seasonal incomes from
13/— SMITH, M.G. The Economy of Hausa Communities of Zaria H.M.S.O. London 1955, Reprint 1971FEDERAL DEPARTMENT OF STATISTICS, NIGERIA Urban Consumer Survevs in7 -- — — ... 1,Nigeria Report on Enquiries into the Income and Expenditure Patterns of Wage-Earner Households in Kaduna and Zaria 1955/6, Lagos 1959FEDERAL OFFICE OF STATISTICS, NIGERIA Industrial Surveys of Nigeria 1965 to 1968 op cit.DEPARTMENT OF-STATISTICS,-NORTHERN NIGERIA Statistical' Yearbook 1966 op cit., p. 209

PART I CH 5 96
agriculture, art and crafts, trade, services and other professions were calculated. Further inquiries were made on income from cash gifts, loans and other financial transactions. Income and expenditure were then compared and only when it balanced by about 10 per cent was the budget accepted as valid for inclusion in the analysis. Major mistakes caused by forgetfulness or deliberate misinformation were in most cases found out and could be corrected by discussing the discrepancy with the household heads concerned. Inaccuracies were further reduced by comparing the statements of cost and profit margins made independently by men practising the same trade or craft at previous interviews, and in the case of wage- earners by checking with the employers. Nevertheless, it is highly unlikely that the data collected are free of inaccuracies and omissions, though they are sufficiently detailed and close to the truth to illustrate the patterns of domestic economy and provide a valuable guide to current levels of cash income and expenditure. The records of three representative budgets are given below. The household heads chosen to illustrate prevailing budgetary variations include a farmer who was also a farm-labourer, a barber-doctor (wanzami) and a trader.
Before proceeding with the analysis some additional remarks on the limitations of the collected budgetary data are necessary. The first and obvious one is the size of the sample which include only 1^7 successfully interviewed household heads. Another problem arises from the relatively large number of dependent household heads who did not respond (38.5 per cent), of whom about half were absent at the time of interview, while the rest either refused to co-operate or deliberately gave misleading information and so had to be omitted from the sample. Fortunately all compound heads participated fully in the budgetary enquiry and none had to be omitted.

PART I CH 5
BUDGET To. 10 / uAM O/ : sCh'4o
* A 2J== O: \n
itT 9'
I
n~~ra «r»r« f~,’k f n 'x@ A A A iA A a A A # ! A ' A A 'v O',i J,*2; >V4 ) i- age
4+2 r- B O O M Mo.
Total Population 6 Males, 4 Fe malesOccupation of household Head ai d Farm Labourer
TABLE S.B household Incone and Fxren iiture 1967/68
CALK IhCOME xN CASE EXPENDITURE ti;
Rainy leaser. FoodHousehold head v/orhs in the The harvest of guinea cornmorning as a farm-labourer and millet lasted about 5gets 5/- per day; total to 6 months. During thisincome in season c. 18. C.O time he buys only stew inIn the afternoon he works gredients 7d• per day andon his own .farm'sons help him.
meat Cd., 5 cr 4 times perweek. Expenditure c. • >
fells groundnut harvest. 7.10.0 Buys extra staple food forand two goats 3.12.0 c. € months 2/- per dayTry Season plus stew ingredients and
meat. Expenditure c. 28.10.:household head helps builder for c. 7 weeks gets 6/- Stimulants and Drinksper day. Total income c. 12. 0.0 Spends f-4d. on kola nutsHousehold head goes to vil per day, total ~ • i , • G
lage to cut and sell fire wood and grass. Pr°fit made Fire Tooa and lightingafter two months was 9. 5.0 Spends 6d per day butLuring the time of absence sometimes collects firehis mother ,.slped with c. wood on farm or in village*5/~ Per week to buy food; 2. 0.0 plus 1d kerosene per day. c . ...she spins and receives some money from her brother Clothingwho he says is a rich r.an. Bought some clothing withhousehold head borrowed 5 . o . o money given by father'snot paid back yet. brother. 9Received some gifts from V/ard I ead and friends c. 3 . o . o
AccomodationFather's brother gave him Maintenance: roof repair 1.1C.Csome money to buy clothes but he can't remember how Other Expendituremuch Moslem festivals
Tax paid last year according to v/ard-'.ead ' s tax file; but Household head insists he paid £H1.10.0
3.13.1
1. c . '
Total known cash income Total known expenditureper annum C o . 7 . 0 per annum c c . 1c • 'Average monthly ir,come 100.6 smiling s

PART I CH 5 98
BUDGET No. 63 Q -
A = C oSib£a '
, 58'0 \ n \
\CH.42 2S\A = 0,>s+ii ; s+ioJASt 10
Total Population 2 Kales, 3 FemalesOccupation of I ousehold ■ ead : Barber-Doctor (wansami)Household Head has small Farm
TABLE 5.k ousel.old Income ana Expenditure 19^7/-S
CASH INCOME fsNAll o a c c n
Household head has on average S to 10 customers a day, shave 2-3d,haircut 3d. Income per month c.PN3*10.0: per annum c.He spends about 7 days on his farm during the farming season, brother’s son helps him. He says this does not affect his craft income much, has more business before the Moslem festivals, can’t say hew much.Household head performs approximately 3-4 circumcisions per month.Average earning over the last 2 months was 9/- per circumcision, but gives his helper 1/- each time; Annual income c.One customer paid PH 1.10. he says, also gets food, clothing and some extra money as gifts, but does not know how much.Attends 2-3 naming ceremonies per month, shaves the child's head and makes any tatoos the father requests, gets on average 9/- P&r ceremony. Gets also some food and cash does not knowhow much.Total known cash income per annumAverage monthly•income 118.3
42. 0.0
20. 0.0
0.0
71.crV*!
CASH EXPENDITURE PN
0 .0
.1 lings
FoodThe harvest of guinea corn and millet lasted about 3 months. During this time he buys only stew ingredients 5-£d per day and 6d meat 4 times per week.Buys extra staple food for c. 9 months 1/— per day plus stew ingredients and meat. Expenditure c.Stimulants and Drinksfpends no money on kola nuts as he gets them free from customers.Fire Wood and lightingFire wood 4d and kerosene 1d per day.ClothingBought clothing for himself His wife and child at Lesser Beiram, total c.Ac c omm o d at i onImprovement: nevr cement floor.Maintenance: roof repair, white-wash on walls, totalOther ExpenditureExpenses at Moslem festivals, does not know precisely tut thinks about Tax paid last yearTotal known expenditure per annum
10 .0
23. 10.0
7.11.0
9 .10.0
15.C2. 5.0
17.2.
0.0.
6 8 . 1.0
o o
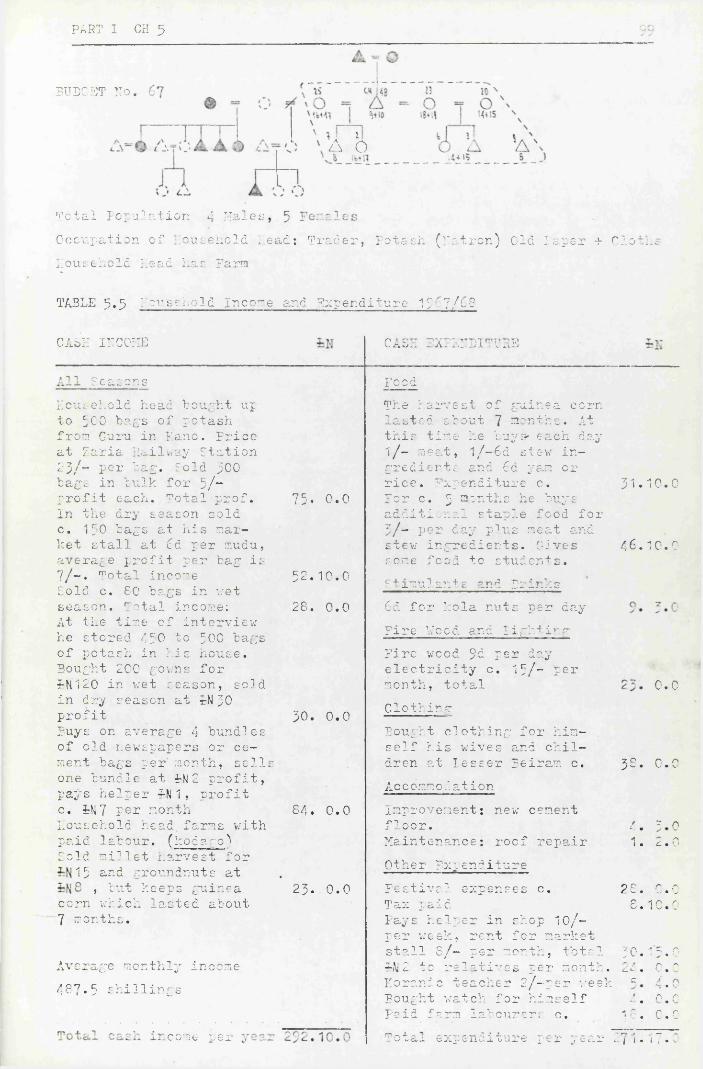
PmRT i ch 5
BUDGET 170
A 0L _Y
Tctal Population 4 MalesOccupation of : ousehold 2ead: Tracer, Potash (Matron) Old Paper + Clo- household head has Farm
TABLE 5*5 household Inco-.e and Expenditure IS -7/d-2
CASE IPCOME C a . ^ ; . _ A 1 . _j X T f . l E
E'easonsHousehold head ‘bought up to 500 bogs of potash from Guru in Kano. Price at Paris. Railway station 23/- per hapa "old 300 bags in bulk for 5/“ profit eacbi. "otal prof.In the dry season sold c. 150 bags at his market stall at £d per mudu, average profit per tag is 7/-. Total income gold c. 80 bags in vet season. motal income;At the time of interview he stored 450 to 500 tags of potash in his house. Bought 200 gowns for PN120 in v;et season, sold in dry season at PN 30 profitBuys on average 4 bundles of old newspapers or cement bags per month, sells one bundle at PN2 profit, pays helper FN1. profit c. HN 7 per month Household head farms with paid labour, (kodaro) gold millet harvest for
15 ar-d groundnuts at , but keeps guinea
corn which lasted about 7 months.
Average monthly income 4e?.5 shillings
75. 0.0
5 2 . 1 0 . 0
28. 0.0
3 0 . 0 . 0
8 4 . 0 . 0
2 3 . ■ 0 . 0
FoodThe harvest of guinea corn lasted about 7 aonths. At this time he buys' each day 1/- meat, l/-6d stev; ingredients and £d yam or rice. Expenditure c.For c. 5 months he buys additi r.al staple food for 3/- per day plus meat and stev/ ingredients. Gives some food to students.c +imuJant+..e md p r i m s
6d for kola nuts per dayFire V.'ccd and light!nrFire wood 9b per day electricity c. 15/- per month, totalCloth in gBought clothing for himself his wives and ch.il-
31.10.0
4 6 . 1 0 . 0
c - . c
Lcome uer
dren at lesser Beiram c. 32. 0.0AccommodationImprovement; new cementfloor. f—7 •
dt r \
Maintenance; roof repair 1. 2.0Other ExpenditureFestive 1 expenses c. 2 S. c . c
Tax paid 6. 10.0Fays helper in shop 10/-per week, rent for marketstall S/~ per- month, tot'1 30. ■*c . 0FA! 2 to relatives per month. c.*-. • c . c
Koranic teacher 2/-per week c / 0• V.Bought watch for himself A m 0 0Paid farm labourers c. 1c. 0.0~0wa-i. expsnaivure per year u I i » 17 •

pant i ch 5 103
The last point to make is that no attempt was made to check informationon income in kind which derived mainly from farming activities and othernon-monetary transactions such as rent in kind (galla) or from banter,the informant's statements on this subject being normally accepted.For most households the additional income from agricultural producewas important, though variably so. The proportion of kind income aspercentage of gross income can vary from as much as 70 per cent in thecase of a subsistence farmer to zero for a full-time trader, craftsman,
1*t/or wage-earner with no farmlands— •
Income Groups
The first consumer surveys conducted in Nigeria in 1953 to 1955 were limited to wage-earning households with an income not exceeding £N. 350 per annum. This limit was later raised to £N. 400 per annum in the Zaria- Kaduna survey of 1955/6* In the early 1960's a new division into lower income households not exceeding £N. V?0 per annum and middle income households between £N. ^50 and £N. 1,200 per annum was adopted. For my own survey these income categories proved unsuitable due to the large proportion of the non-wage earning households in the sample with very low incomes particularly among the dependent or semi-dependent households.The income distribution given in Table 5*^ below represents a more
1C/realistic classification and permits useful comparisons with other studies.—^
SMITH, M.G. op cit., p. 13915/— LUBEGA, A. Financing and Production of Private Houses in Urban Districts
of Kampala (Uganda) Unpublished Ph.D. Thesis London 1970, p. 60
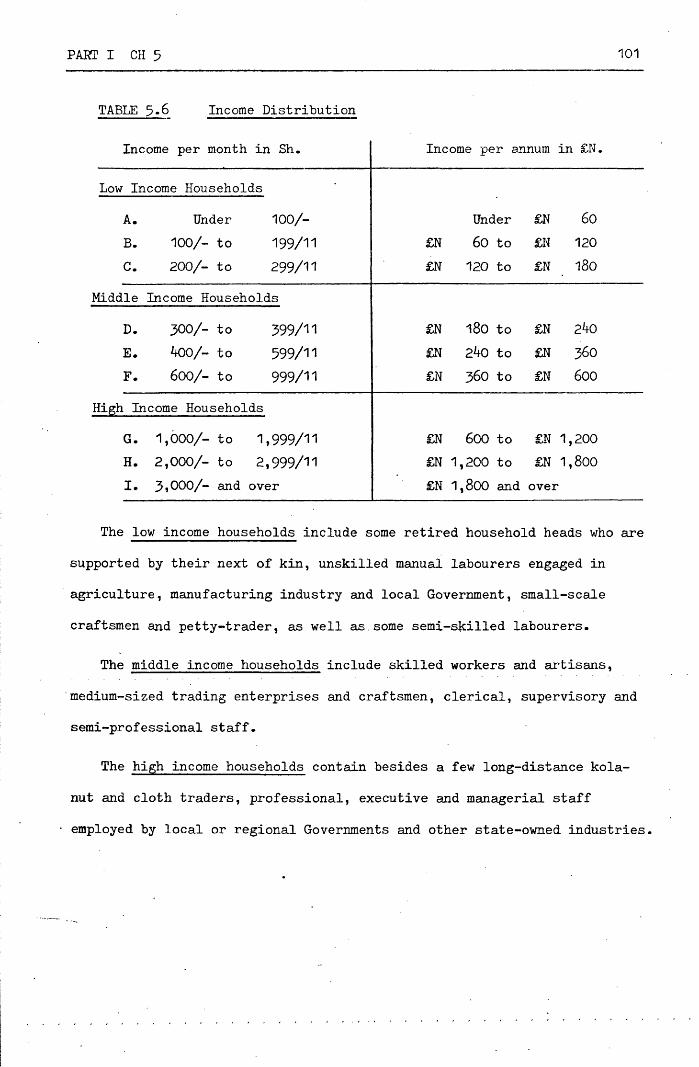
PART I CH 5 101
TABLE 5.6 Income Distribution
Income per month in Sh. Income per annum in £N.
Low Income HouseholdsA. Under 100/- Under £H 60
B. 100/- to 199/11 £N 60 to £N 120C. 200/- to 299/11 £N 120 to £N 180
Middle Income HouseholdsD. 300/- to 399/11 £N 180 to £N 240E. 400/- to 599/11 £N 240 to £N 360
F. 600/- to 999/11 £N 360 to £N 600
Ugh Income HouseholdsG. 1,000/- to 1,999/11 £N 600 to £N 1,200H. 2,000/- to 2,999/11 £N 1,200 to £N 1,800I. 3,000/- and over £N 1,800 and over
The low income households include some retired household heads who are supported by their next of kin, unskilled manual labourers engaged in agriculture, manufacturing industry and local Government, small-scale craftsmen and petty-trader, as well as.some semi-skilled labourers.
The middle income households include skilled workers and artisans, medium-sized trading enterprises and craftsmen, clerical, supervisory and semi-professional staff.
The high income households contain besides a few long-distance kola- nut and cloth traders, professional, executive and managerial staff employed by local or regional Governments and other state-owned industries.

PAST I CH 5 102
Income Distribution
Of the 191 household heads interviewed, 44 or 23*0 per cent either refused to co-operate or gave such grossly misleading information about their incomes and expenditures that they had to be excluded from the following analysis. Of the remaining 147 valid household budgets, 101 or 68.7 per cent were in the low income group (up to £N. 180 per annum),42 or 28.6 per cent in the middle income group (£N. 180 to £N. 600 per annum) and only 4 or 2.7 per cent in the high income group (above £N. 600
per annum). The income distribution for compound heads and all other dependent or semi-dependent household heads is given separately in Table A.3*4 on page. 399* As can be seen compound heads have on average the highest income, with 53-2 per cent of them in the low income group,41.6 per cent in the middle and 3*2 per cent in the high income group. Dependent household heads, on the other hand, have 83 .8 per cent in the low, 14.2 per cent in the middle and none in the high income group.
The income distribution by household size for all households is set out in Table A.3 .6.C on page 399* This Table shows the predominance of small households with 1 to 6 persons in the low income group. However, as the number of persons per household increases, income tends to increase as well. This is clearly shown by the diagonal pattern of concentration which holds for households with up to 11 to 12 persons and with incomes of between 300 and. 999 shillings per month. From there onwards, the few remaining households are scattered so widely that their distribution has uncertain statistical values.
While the average monthly income per household increased from about 137 shillings in households with 1.-2 persons to 402 shillings in households with 9 “ 30 persons, the per caput income decreased from about 80 shillings per month in households with 1 - 2 persons to c. 42 shillings in households with 9 - 10 persons.

PAJRT I CH 5 103
On Graph A.5.1 page 00 the cumulative income distribution of 1^7 household heads are plotted on logarithmic probability paper in order to show the relationship of incomes between the compound head and all other dependent or semi-dependent household heads as well as their median income. The slightly curved line of the cumulative income distribution for all households indicates a log-normal distribution. The two types of households are distinguished by separate curves. Except for the dependent household heads in the middle income group, these curves show an approximately equal percentage change but differing incomes. As a result the curve representing the income distribution of dependent household heads, who have generally lower incomes, shift leftwards. The median income of compound and dependent household heads is 290 and 150
shillings per month respectively. However, part of the higher income of compound heads which derive from farm produce and other financial benefits which are associated with the headship, is spent on new construction, • improvements and repair of the compound as well as on help given to other family members in need.
From the budgetary data collected a Lorenz Curve was constructed.Graph A.5»2 on page bOO revealed the inequality in the distribution of income with about 50 per cent of the 147 household heads earning c. 25 per cent of the total recorded annual income.
In conclusion, this study has shown that nearly 70 per cent of all household heads included in this analysis had cash income of less than 300
shillings per month or £N. 180 per annum. The median cash income of all compound heads was with 290 shillings per month nearly double the income of dependent household heads which reached only 150 shillings per month. In the following two chapters I intend to show how domestic groups with such limited financial resources can successfully build, improve and maintain their compounds..

PART I ZARIA CHAPTER 6 BUILDING MATERIAL AND THE PRODUCTION OF HOUSES 10*f
NIGERIA: BUILDING MATERIAL AND THE CONSTRUCTION INDUSTRY
The aim of this chapter is first, to examine the range of traditional and modern building materials which are available for the production of houses in Nigeria, second to describe the type of construction found in Zaria walled city, and third to analyse some structural changes which affected the 77 compounds surveyed. A search to collect systematic information on the age of buildings surveyed will be discussed at the end of this chapter.
The construction of houses in Zaria walled city rests almost entirely with their occupants. Public initiative is unknown except for the delegation of• building sites by the Emir's administration discussed in Chapter 2 and for the occasional building loans allotted to better-paid local Government employees. As shown in Chapter 4, the construction of residential buildings in the walled city of Zaria is a continuous process. Hence the availability of cheap building materials and labour are essential for co-residential kinship groups to meet their demand for housing which is governed by changes in their size and composition. However, the
increasing use of expensive modern building materials such as sawnwood, cement and corrugated iron sheets indicates the rising standard of living which accompanies the changes from a subsistence economy to a monetary system.
Information on the production and consumption of building material in Nigeria is haphazard and incomplete. However, some indication of the general trend can be obtained from data published by the Federal Office of Statistics and from various other studies carried out by Universities and by commercial firms.
The demand for and the supply of traditional and modem building materials varies within Nigeria, since it depends on the type of construction and the level of building technology used in different parts

PART I CH 6 105
of the country, Nigeria has an adequate supply of sill major raw materials required for the rapid development of industries to produce building materials both traditional and modern.
Earth and Clay
Earth and clay have been used since time immemorial for constructionof walls and, in some areas, to cover the wooden structure of roofs.Today, the majority of houses in Nigeria are still built with mud wallscarried out by locally trained craftsmen. Hence the demand for burnedclay products is very small indeed. In 19&9» the Industrial Survey ofNigeria listed only 9 establishments with a total of 702 employees that
1/specialized in this work.—' Over half of the industry’s gross output* of £N. 35^ 1000 consisted of tiles, while bricks and pipes accounted for the rest. Other ceramic products such as sanitary porcelain ware and glazed tiles are imported.
Timber and Wood Products
Nigeria's wealth in timber is well known. Of the country's total landarea of 923*7 +0 sq.km. about one-third is good forest land, but only c.10 per cent or 87,550 sq.km. is classified as forest reserves. Theseforest reserves are sub-divided into Savannah Forest with 6 8,760 sq.km.or 79-0 per cent, and High or Equatorial Forest with 18,790 sq.km. or 21.0
2/per cent.— It has been estimated that the volume of Nigeria's commercial timber totals about 70 million cu.m., while the current removal of
1/-/ FEDERAL OFFICE OF STATISTICS, NIGERIA Annual Abstract of Statistics,1971 Lagos, 1973, p. 41. Only establishment with 10 or more employees
* Gross output is the sum of the values of sales of products plus receipts for resale of goods, value of contract work, value of assets produced for own use, and work in process.
2/— OKIGBO, L. Sawmill Industry in Nigeria Fed. Department of Forest Research, Ibadan, 1964, p. 13

PART I CH 6 106
industrial wood stands at c. 1.*+ million cu.m. per annum.^In 1969 there were 65 sawmills with a total of 7,68*+ employees operating
*+/in the country.— The total production of lumber by the industry was estimated at 226,560 cu.m. in 1967i of which 52,520 cu.m. or 2 3 .0 per cent were exported. Other exports that year included 3311570 cu.m. of logs and 1*1,810 cu.m. of plywood and veneers. (See Table A.6.1 on pagei+01 )• In 1967
the total export value of Nigerian timber was in the order of £N. *+.3 million. Between 1963 and 19&7 the average annual consumption of lumber within Nigeria was 176,000 cu.m. of which about 1*+0,000 cu.m. or 80 .0 per cent were used by the construction industry. (See Table A.6.2 on page *+01 ).
Cement and Cement Products
Effectively the Nigerian cement industry began in December 1957 Between i960 and 1966 the annual production of cement increased more than sixfold from l6*+,000 tons to 986,000 tons, while at the same time imports fell from 626,000 tons to 151,000 tons. Following the outbreak of the civil war in mid-1967 cement production fell to 5(>5iOOO tons in 1968; but with the restoration of peace in early 1970 demand for cement increased so sharply that *+59,000 tons were imported that year. (See Table A.6.3 on pagei*01 )• According to the Industrial Survey of 1969 there were then three major cement plants in operation which together employed a total of 1,300
persons. Their total gross output was around £N. 6.1 million in 1969* Such associated industries as cement products were served by 9
2/ FEDERAL MINISTRY OF INFORMATION, NIGERIA Second National Development Plan 1970/7*+ Lagos, 1970, p. 61
*+/ FEDERAL OFFICE OF STATISTICS, NIGERIA Annual Abstract of Statistics. 1971 op cit., p. *+1. Only establishments with 10 or more employees
^ ORGANIZATION FOR ECONOMIC CO-OPERATION AND DEVELOPMENT (OECD) Tropical Timber Paris, 19&9 P* 132
^ UGOH, S.U. "The Nigerian Cement Industry” in The Journal of Economic . and Social. Studies .Ibadan, .1966, .Vol. 8 No.. 1 pp.. 9.7—11,1 ........
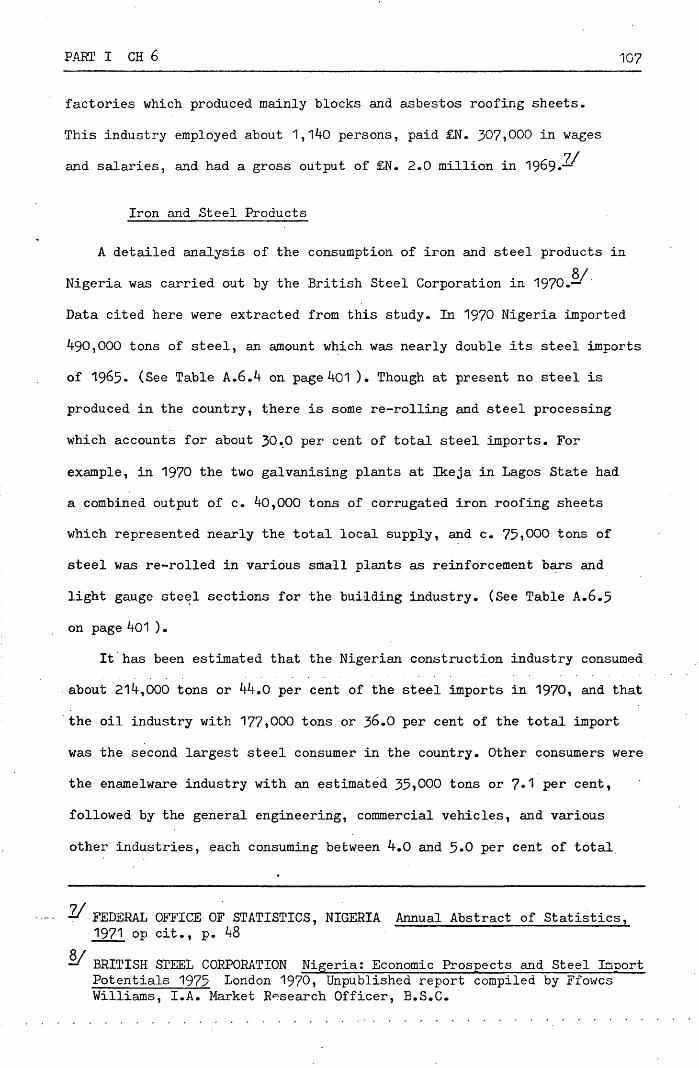
PART I CH 6 10 7
factories which produced mainly blocks and asbestos roofing sheets.This industry employed about 1,140 persons, paid £N. 307,000 in wages
7 /and salaries, and had a gross output of £N. 2.0 million in 1969*-
Iron and Steel Products
A detailed analysis of the consumption of iron and steel products ino /
Nigeria was carried out by the British Steel Corporation in 1970.—Data cited here were extracted from this study. In 1970 Nigeria imported490,000 tons of steel, an amount which was nearly double its steel imports of 19^5- (See Table A.6 .4 on page 401 ). Though at present no steel is produced in the country, there is some re-rolling and steel processing which accounts for about 30.0 per cent of total steel imports. For example, in 1970 the two galvanising plants at Ikeja in Lagos State had a combined output of c. 40,000 tons of corrugated iron roofing sheets which represented nearly the total local supply, and c. 75,000 tons of steel was re-rolled in various small plants as reinforcement bars and light gauge steel sections for the building industry. (See Table A.6 .5 on page 401 ).
It has been estimated that the Nigerian construction industry consumed about 214,000 tons or 44.0 per cent of the steel imports in 1970, and that the oil industry with 177*000 tons or 36 .0 per cent of the total import was the second largest steel consumer in the country. Other consumers were the enamelware industry with an estimated 35*000 tons or 7*1 per cent, followed by the general engineering, commercial vehicles, and various other industries, each consuming between 4.0 and 5*0 per cent of total
- 2/ FEDERAL OFFICE OF STATISTICS, NIGERIA Annual Abstract of Statistics, 1971 op cit., p. 48
—^ BRITISH STEEL CORPORATION Nigeria: Economic Prospects and Steel Import Potentials 1975 London 1970, Unpublished report compiled by Ffowcs Williams, I.A. Market Research Officer, B.S.C.

PART I CH 6 108
steel import in 1970. Altogether iron and steel products formed the largest single item of imported building materials. (See Table A.6 .6
on page 402).
The Construction Industry
The construction industry of Nigeria plays an important part in theeconomic development of the country. The contribution of building andconstruction to GDP at 1962 factor cost rose from £N. 50.0 million or4.0 per cent in 1960/1 to £N. 70.0 million or 4.4 per cent in 1969/70,
9/averaging 4.3 per cent over the ten-year period from i960 to 1969.Gross Fixed Capital Formation (GFCF) at 1962 factor cost also rose from £N. 160.5 million in 196O/I to £N. 221.6 million in 1969/70.— ^ The contribution of construction to GFCF, is divided into buildings and civil engineering works, and rose from £N. 92.1 million or 57 «3 per cent of GFCF in 1960/1 to £N. 129*6 million or 5 8 .5 per cent in 1969/70. The percentage contribution of residential and non-residential buildings to GFCF fell from 40.4 per cent in 1960/1 to 29-5 per cent in 1969/70 averaging about 34.0 per cent over the ten-year period. (See Table A.1.9 and A.1.10 on page 383).
The modern construction industry in Nigeria is still dominated by non-Nigerian firms and personnel. In 1970 the Federal Works Register in Lagos listed 1,036 building and 69 civil engineering contractors/ (See Table A.6.7 on page 402). An analysis of these firms revealed that although only 3*3 per cent of them were expatriate, 48.7 per cent of firms registering for contracts over £N. 100,000 were foreign-based. However, what really matters is the distribution of work. A study of the distribution of building and civil engineering contracts awarded by the Federal Ministry of Works in Lagos from 1962 to 1970 shows that of the
FEDERAL OFFICE OF STATISTICS, NIGERIA Annual Abstract of Statistics• -1971 op ci-t.-, p.- 140- .........................................10/ Ibid. p. 142

PART I CH 6 109
total contract value of about £N. 13-9 million for buildings, 58.0 percent were'carried out by expatriate firms and -2.0 per cent by Nigeriancontractors. The distribution of civil engineering contracts is even morein favour of foreign-based firms. Of the total contract value of £N. 50.1million over 95*0 per cent were carried out by expatriate firms while the
11/rest went to Nigerian contractors.—Employment in the construction industry is difficult to obtain.
According to a survey carried out by the Federal Ministry of Labour, employment in the construction sector represented 15»5 per cent of
12/employment in all recorded sectors, a total of about 88,000 in 19&5 -—
However, these figures are incomplete because the survey included only establishments which employed more than 10 persons, thus eliminating not only those in the traditional building sector, but also the many one-man construction firms which employ no permanent labour force.
ZARIA: TYPE OF CONSTRUCTION
The construction of residential buildings in Zaria walled city is carried out by locally trained craftsmen who mainly use indigenous materials and traditional building techniques. The use of such modern building materials as corrugated iron roofing sheets and cement is largely employed for the protection and improvement of existing buildings rather than for the production of new and more permanent types of buildings.(See Picture 6.1 on page 11(j>.
11/— PEARSON, R. Limitations on the Choice of Techniques in the Construction Industry in Developing.Countries: A Case Study of Nigeria. Unpublished MA Dissertation, University of Sussex, 1972 pp.
— FEDERAL MINISTRY OF LABOUR, NIGERIA The Employment Market Information Survey Lagos 1965

PART I CH 6 110
PICTURE 6.1Corrugated Iron Roof on Top of Existing Building
PICTURE 6.2Brick Manufacturing
PICTURE 6.3Construction of Mud Walls

PART I CH 6 111
Mud Walls
The building season which starts when the rains have ceased in October lasts until the beginning of March when water needed for house construction becomes increasingly scarce. Construction of a house will begin with the excavation of a sufficient quantity of earth from the nearest borrow-pit, unless this can be obtained from a collapsed hut within the compound to save the labour and transport costs. Near the building site the earth is stacked in heaps about one metre high, water is added and the earth is trampled several times until it has the consistency of mortar. This material is then moulded into bricks (tubali) having the shape and size of half a rugby football, which are left to dry in the sun for at least two weeks. (See Picture 6.2 on page 110). Meanwhile the foundations of the building are dug to about half a metre deep to penetrate below the loose top soil. The dried bricks are then laid in courses each of which is covered with a layer of specially prepared mud mortar until the walls reach the required height. (See Picture 6.3 on page 110).At ground floor level the thickness of walls varies between 0.5 and 0.7 m. for one-storey buildings, and one metre or more for two-storey buildings.
Roof Construction
There are basically two types of roof construction used in the walled, city today: a thatched roof, and a mud roof which may be either flat or dome-shaped. Households in the upper income groups may also cover their mud roofs with corrugated iron sheets to protect the mud roof and walls from damage by rain. I shall denote structures of this latter type as corrugated iron roofs.

PART I CH 6 112
The rafters of a thatched roof consist either of bamboo or raphia palm stems in situ or, if the roof is small, of guinea corn stalks tied together on the ground with bands of straw and locally woven rope (igiya) before being lifted and placed in position. The thatch is bought in bundles approximately 1m. wide, but when unrolled, they are at least 7 to 8 m. long. These grass mats are then wrapped around the frame of the roof, each layer being set 0.10 to 0 .1 5 above the previous one and bound to the rafters with a rope. The roof is then completed by tying a network of rope over the thatch to secure it from high winds. (See Picture 6.*f on page 113).
The beams needed for the construction of flat or vaulted mud roofsare cut by local craftsmen from the stem of the deleb palm (BorassusAethiopum, Hausa giginya) which is selected because of its resistance totermites and white ants. The average size of these beams is 0.05 x 0.10 x2. +0 m. Flat mud roofs are constructed mainly for rectangular rooms notlarger than 3*0 x ^.0 metres. To this end the roof beams of deleb-palmare set side by side diagonally across'the corners of the wall, andextended progressively inward until the roof is closed. (See Picture 6.5on page 113). A grass mat is spread over the beams and covered first witha layer of mud mortar c. 0 .0 5 m. thick, and then by another layer of earthabout 0.10 to 0.15 m. deep. The external surface of the roof and wallsare finished with a thin layer of waterproofing plaster made of mud mortarmixed with katsi which is a binding substance produced by the dyeingtrade, or with makuba made from the fruit pod of the locust bean tree(Parkia Filicoidea, Hausa dorowa)• Either plaster will keep the roof
13/and walls reasonably waterproof for at least one year.— —
13/— DALDY, F.A. Temporary Buildings in Northern Nigeria Technical Papep No. 10, Public Works Department, Lagos 19^5, PP* 20-22
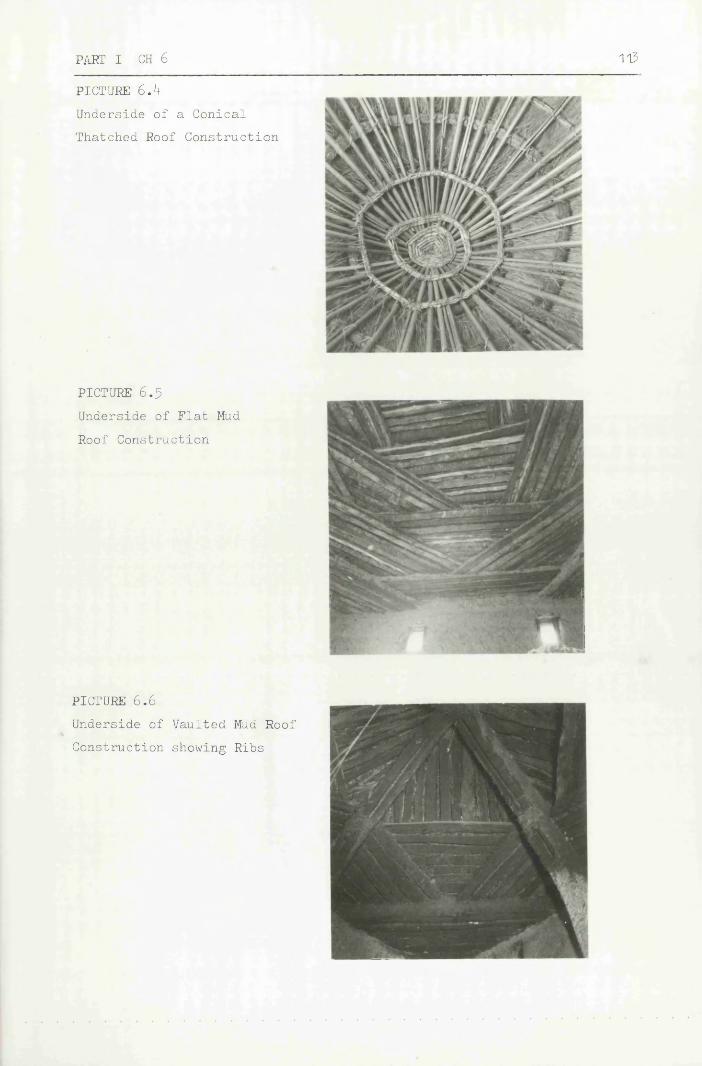
PART I CH 6 113
PICTURE 6.*tUnderside of a Conical Thatched Roof Construction
PICTURE 6.5Underside of Flat MudRoof Construction
PICTURE 6.6Underside of Vaulted Mud Roof Construction showing Ribs

PART I CH 6 114
Larger rooms are covered with mud domes supported by wooden archessprung from opposing walls. After the arches have been erected, the openbays are laid out with beams and covered with mud as described above.(See Picture 6.6 on page 113). All mud roofs are drained by spouts madefrom old petrol tins which project down and outwards sufficiently tothrow the rainwater well away from the base of the walls.
The internal walls of rooms are finished with an additional layer ofsmooth mud plaster overlaid by a layer of red mud mixed with fine sandwhich provides a good base for whitewash. The floor of a room islevelled, and compacted. In about half of the rooms surveyed the floorwas finished with a layer of cement screed or soil-cement between 0 .03
14/and 0.03 m. thick.— • Window openings average 0.40 x 0.40 m., and are covered with wooden shutters fixed with leather strips to the frame, while doors usually consist of planks or wooden frames covered with a sheet of corrugated iron.
The Building Trade
The building trade in the walled city of Zaria has an establishedtradition and status. It is reported that Muhammadu Durungu, a localcraftsman, who built the mosque in Zaria in the reign of Abdulkarimsometime between 1834 and 1846, was subsequently invited to build a mosquein Birnin Gwari about 100 km. west of Zaria, on completion of which thelocal Emir had him seized and executed so that no other mosque would ever
15/be built to equal the one in Birnin G w a r i T o this day the descendants of Muhammadu Durungu are the leading family of builders in the walled city and the chief builder Sarkin Magina is elected from among them..
' ' 1 —" ' —■ — ■■■ , —14/— 7 DEPARTMENT OF ECONOMIC AND SOCIAL AFFAIRS, TJ.N. Soil-Cement, its use
in Building New York 1964, pp. 43-49 .13/— This information was given to me by Madauchi Ibrahim Bagudu in Zaria.
The violent death ,of, Muhammadu. Durungu. has. been disputed-by other scholar-

PART I CH 6 115
According to the 1968 local tax file there were 1*t0 builders living in the walled city of Zaria. The majority of them still see the construction of houses as an inherited craft and instruct only their own children.
The most common way of building a house is to employ one of these builders who will recruit several assistants and labourers from the walled city or nearby villages according to the size of the contract. Self-help in house-building is rarely practised in the city, although family members frequently assist with the transport of building material and the finishing of interior walls and floors.
The construction of a building with one or two rooms is normally completed within one building season. For example, out of 227 rooms built between 19^3 and 1968 in the compounds surveyed, *17^ rooms or 77*0 per cent were completed within one building season, 53 rooms or 23-0 per cent, all of which had a mud roof, took a second year to complete. Such improvements as an additional corrugated iron roof or the rendering of mud walls with cement plaster was carried out after the household head has saved or borrowed some money to buy the required building materials. Table A.6 .8
on page *t02 shows that of 109 corrugated iron roofs built between 19&3
1968, 75 or 69.O per cent were constructed on mud-roofed rooms which had been completed at least two building seasons earlier. The survey included 6 compounds built entirely between 19&3 1968. In all these compoundsthe stages of construction were carried out according to a similar pattern. It took on average one building season to build at least two rooms for the owner to live in. Other rooms were later added as the need arose.

PART I CH 6 116
SAMPLE survey ,
The type of construction discussed in the first part of this chapter and the quantitative use of modern building material such as corrugated iron roofing sheets and cement in 77 surveyed compounds will be analysed below. Furthermore I want to illustrate some structural changes which occurred in these compounds between December 19&3 November 1968. This discussion will combine data from the aerial survey of.the walled city carried out on 17th Dec. 19&3i and on my own survey of May to November 1968. Each individual compound selected for study was examined carefully on the aerial photographs before a skeleton ground-plan 1:100 was drawn with the help of an epidiascope. These plans provided the base for measurements that were subsequently made within the compounds. Any changes which had occurred in these compounds were thus immediately noticed and discussed with the compound head. This procedure enabled me to obtain a complete picture of structural changes in these compounds over a period of 5 years.
Structural Changes of Compounds
The 77 compounds selected for study contained 1,227 rooms with a total of 10,164 sq.m.* All 1,227 rooms had mud walls. Between 17th December 1963 and 1st November 1968 which marks the end of the survey in Zaria, a total of 227 new rooms were built in these compounds, while at the same time 144 rooms in use in 19&3 had disappeared or were abandoned and decaying at the time of the interviews. Thus the total net increase of
* This does not include 28 animal pens with 157*1 sq.m. and 29 lavatories and/or bathrooms with 132.3 sq.m.

PART I CH 6 117
rooms over nearly 5 years was 83 or 7*3 per cent which represents an overall growth rate of 1.5 per cent per annum.
As shown in Table A.6.8 on page *+02 the difference between the palace area and the market area is striking.* It appears that in the former area the annual growth rate was 3.2 per cent between December 19&3 November 1968, while in the latter area there was hardly any change at all with 69 rooms decaying and 7^ new ones, the annual growth rate being merely 0.2 per cent. Perhaps the simplest explanation is the lack of suitable land for further development in the densely populated market area, while the palace area contains ample land for further building.
The roof is an important structural part of any building. The local use of thatch, mud or corrugated iron sheets reflects to some extent the economic position of its owner. 698 rooms or 57-0 per cent of the total rooms surveyed were covered with mud roofs. This was thus by far the most common type of roof. In the 5 years preceding my survey, 133 new rooms with mud roofs had been built, while another *+0 rooms had their roof structure converted from thatch to mud'. A further 75 mud-roofed rooms were covered with corrugated iron roofing sheets, and 7 mud roofs were converted to ceilings on the construction of upstairs rooms. Only 13 rooms with mud roofs had disappeared or were decaying at the time of my study. Thus the total net increase of mud-roofed rooms over the 5 year period was 78 or 12.6 per cent which represents an annual growth rate of 2.6 per cent
The total number of rooms with thatched roofs was 361 or 29-*+ per cent in 1968. From 1963 to 1968 60 new rooms roofed with thatch were built, while at the same time 131 rooms with such roofs had disappeared and bO
* I divided the walled city into two districts. First the area surrounding the palace and second the area around the market. Both areas together contained between 80 and 90 per cent of all compounds in the walled city

PART I CH 6 118
rooms already mentioned earlier were converted from thatch into mud roofs. This gives a net decline of 111 thatch-roofed rooms or 23»5 per cent over these years, averaging a decrease of k.S per cent per annum.
The number of corrugated iron roofs increased nearly four-fold from 39 rooms in 19&3 to 1^8 rooms in 19&8, giving an average annual growth rate of 57*3 per cent, which is remarkably clear evidence of changing local building standards and techniques. Although the corrugated iron roof was by far the most rapidly increasing type of roof within the walled city, it is still restricted to the middle and high income groups. (For more detailed information see Table A.6 .8 on page A02).
There are other indications that the corrugated iron roof, which is still regarded by the community as a status symbol, will continue to increase in the near future. When asked ’'what improvement do you think the compound most needs?”, 31 out of 77 compound heads or A-0 .0 per cent answered spontaneously ”a corrugated iron roof”, followed by 15 compound heads or 19.0 per cent who cited more sleeping rooms, 9 or 12.0 per cent who favoured the rendering of mud walls with cement plaster, and 7 or8.0 per cent who wanted to change thatched into mud roofs. Another 12 compound heads gave various other answers, while 2 did not respond and 1
was satisfied. (See Table A.6 .9 on page ^03). A more detailed study of the 31 compound heads who wanted corrugated iron roofs revealed that the majority belonged to the middle income group with incomes of 300 to 999 sh. per month, and lived in compounds with predominantly mud-roofed rooms.
The use of cement for interior floors and for outside working platforms had also increased. Between 19&3 19&8 the area of cement floors nearlydoubled from 2,852 sq.m. to 5*^77 sq.m. At the same time outdoor working platforms in these compounds increased by 58-5 per cent from a total of 1,339 sq.m. to 2,122 sq.m., while the number of rooms rendered with cement

TABT/fl
6.1
Distribution
of Cement Are
a in
k Groups
of Compounds
PART I CH 6 119
9
Co
m.A
rea
• p
er
Pe
rso
n
in
sq
.m.
VO•CM
i11
v~ | •
lA |
- 4•
A
v~•
r-
V•
[A
to |f t c!o o !
oo to A OO ! VO - 4 tN-• d VO vo i VO vo VO
o <D A ! v- CM OS f t !
I * -
f t ;rH d O o - ! OO A Oos o ctj a • • ; • • •
n -p a oj • OO v- i OO O AO <D d cr* cs CM ; VO A A
EH C 3 <4 CO V- A | A A A•* r*CM ! *“ CM tA
-P ' j£3 1 CO •
VO <D f t g & A CM i - 4 V- VOa cs u • • • i • • •0J H O t f o r - ! CM O- r-
O <H (0 ON oo O - 4 CMtN- i - 4 OO
rH I ».CCS CM
" UJ +>-p to o jd EH d _ !
A <D d O CCS VO A i A Aa O f t O CD • . • • •CD O O rH d vo -4- j - 4 oo A
O h C r - -=!■ I VO VO Aft !
p ■d d • V" A - 4 - 4 -4"
-4" 0) O g • • • t .a o cj • O VO ACD rH -H CT OO -4" vo OO
O h (0 C” r - o -4"»»■ *-CM v CM A
dH d -H •css o a A O VO O
A -P O CCS • • • • • •O rH CD CT* A A O- -4" -4"
Eh f t d CO CM O A A VO< IA oo O- o r~
- 4 v - A OVft
O toa
CM • OO O O- r— VO A D -
S f t vo O - 4 CMVO CM A CM
T—to
TSf t sO 3
o VO -4" A CM [>-• ft A r- CM O -
o ss o
o
' + di Od ^ ; rd d >s d t s d-P O ! -P P rH p d *h-H O ‘ -r^ •h d •H a'5? i > + 5 O £ 'd
to - CDn3 ^3 d tS <H T3 ft ' d d pCD <D . CD CD O CD O cd (D asd d , d d O d O d d hoto o i cO o d CCS d aS o d to rHf t -P ! f t -P ft f t p d f t as£l a ccj rH : a d 'd a ' d B d d O p
§ o d d i o d d O d o d o o od O . - p o i o p a o a O P O d EHo • • • •o V CM A -4"
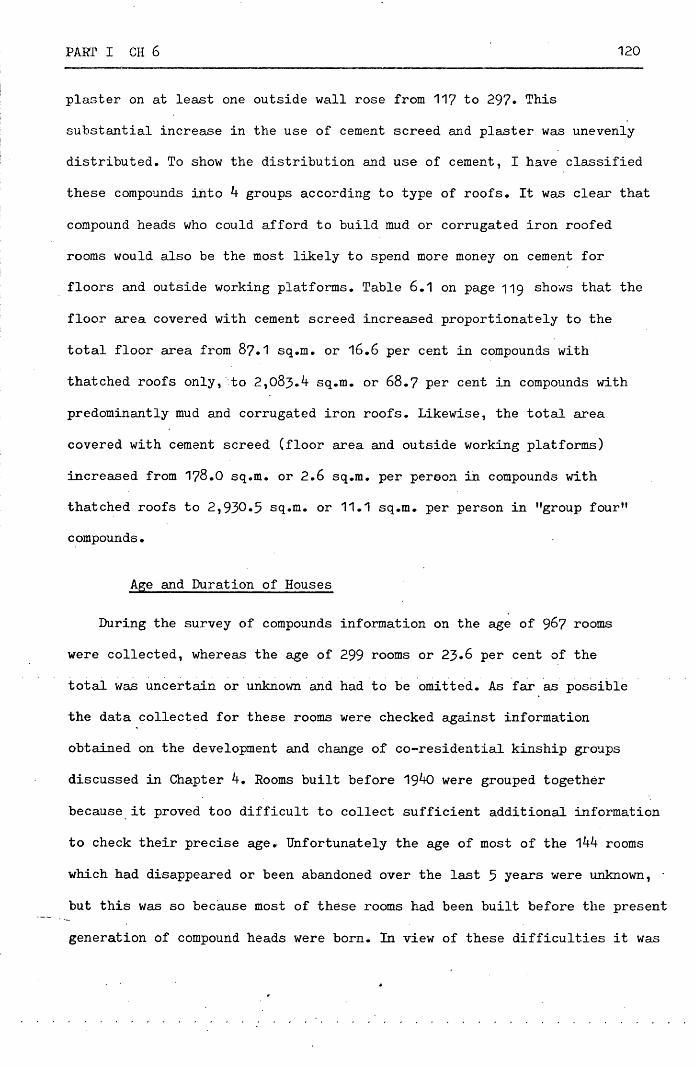
PART I CH 6 120
plaster on at least one outside wall rose from 117 to 297* This substantial increase in the use of cement screed and plaster was unevenly distributed. To show the distribution and use of cement, I have classified these compounds into k groups according to type of roofs. It was clear that compound heads who could afford to build mud or corrugated iron roofed rooms would also be the most likely to spend more money on cement for floors and outside working platforms. Table 6.1 on page 119 shows that the floor area covered with cement screed increased proportionately to the total floor area from 87.1 sq.m. or 16.6 per cent in compounds with thatched roofs only, to 2 ,083.^ sq.m. or 6 8 .7 per cent in compounds with predominantly mud and corrugated iron roofs. Likewise, the total area covered with cement screed (floor area and outside working platforms) increased from 178.0 sq.m. or 2.6 sq.m. per person in compounds with thatched roofs to 2 ,930*5 sq.m. or 11.1 sq.m. per person in "group four" compounds.
Age and Duration of Houses
During the survey of compounds information on the age of 9&7 rooms were collected, whereas the age of 299 rooms or 23*6 per cent of the total was uncertain or unknown and had to be omitted. As far as possible the data collected for these rooms were checked against information obtained on the development and change of co-residential kinship groups discussed in Chapter *f. Rooms built before 19 )0 were grouped together because it proved too difficult to collect sufficient additional information to check their precise age. Unfortunately the age of most of the rooms which had disappeared or been abandoned over the last 3 years were unknown, • but this was so because most of these rooms had been built before the present generation of compound heads were born. In view of these difficulties it was

CUM. PERCENTAGE
PART I CK 6 121
not possible to construct life tables for buildings, since the data needed
for such life tables include not only a census of the age distribution of
occupied rooms but also records of the ages and numbers of rooms which
had disappeared over a given period of time. Lack of the latter information
is regrettable because life tables of various types of buildings could
supply much needed data on the life expectancy for a given house occupied
for a known numbeb of years. It is hoped that in future the collection of
more detailed information may provide the data necessary for the
construction of such life tables.
The following graph presents the age distribution of 9&7 rooms plotted
against their cumulative percentage.
GRAPH 6.1 Age Distribution of Rooms
100
ROOMS SURVIVED
0 2 1 6 8 10 12 U 16 16 20 22 2C 26 26 30AGE OF ROOMS

PART I CH 6 122
The graph shows that about one-fifth of the occupied rooms are older than 30 years and that the median age of these rooms, which is marked on the graph, is 11.8 years. The curve indicates that during the first years after completion, the chance of a room being abandoned or even demolished is relatively small. However, in later years the risk naturally increases as more sleeping rooms are abandoned and collapse following their owner's death, until only those remain such as entrance huts (zaure and/or shigifa) or other commonly used rooms which serve the whole compound population. These latter rooms, being repaired frequently, have much longer life-spans and accordingly account for the majority of rooms at the tail end of the curve. (See also Table A.6.10 on page 403).
Thus far we have confined our attention almost exclusively to the age distribution of rooms and little has been said about the various environmental and social factors which influence the lifetime of rooms. The impermanence of earth used for the construction of walls and roofs and the tropical climate are the most important environmental factors which determine the lifetime of rooms. Averages for the durability of various roof types given below are tentative figures, based on information obtained from several local building contractors and my own observations in the surveyed compounds. The lifetime of a thatched roof is between 3 sund 3 years unless it is eaten by termites. Regular annual maintenance may prolong its useful life by one or two years. A mud roof, on the other hand, may last for 20 or even JD years, depending in the first place on the soundness of its construction and on the care taken to replace the plaster that waterproof it regularly. A corrugated iron roof set on top of a mud roof will prolong the lifetime of the latter type even further. However, it must be stressed again that by the very nature of the building materials and the tropical climate regular annual maintenance is decisive in determining the lifetime of any part of a building.

PART I CH 6 123
Among the social factors which influence the lifetime of buildings, the most important is no doubt the custom that obliges Hausa families to abandon a room after the owner's death. The dead man's hut, no longer maintained, collapses within two or three years thereby providing space and raw material (earth) for new development. However, the age of abandoned huts is not decisive here, as one example shows. Thus after the death of one compound head's mother, her hut, which was then only 3 years old, was abandoned and left to collapse. But there were also a number of cases where the lifetime of a deceased person's hut has been prolonged by adapting it to new functional uses such as kitchen, general store room or animal pen. It was also observed that in these compounds 96 rooms or 7»2 per cent of the total were empty at the time of my survey. Most of these rooms had formerly been occupied by the divorced wives of the compound heads, all of whom left their compounds on divorce. Thus although in 1968 the majority of these rooms were in good repair and suitable for new wives, failing re-marriage many compound heads would probably allow these rooms to decay or replace them with new huts for other family members.

PARC I ZARIA CHAPTER 7 COST OF CONSTRUCTION AND THE FINANCING OF PRIVATE HOUSES 12^
NIGERIA: COST OF BUILDING
The object of this chapter is to analyse the pattern of construction cost and the financing of modern and traditional private houses in Nigeria. The chapter, which is divided into two parts, discusses in the first part house-building costs and the most important institutions which finance and/or build modern houses in Nigeria, while the second part concentrates on the results obtained from my survey of 77 compounds in the walled city of Zaria.
General Level of House-Building Cost
The cost of modern residential buildings in Nigeria varies enormously and depends not only on the building materials, technology and techniques of construction used, but also on location, the complexity of the design and the socio-economic background of the client. The available information on building costs is almost exclusively for modern residential houses built by the Federal, Regional or Local Governments, Housing Corporations and Building Societies which provide accommodation for their employees, and for the high income groups among the public. Unfortunately, only a limited amount of information on the construction cost and financing of traditional houses is available, although an estimated 90 per cent of the total population in Nigeria still depends on and lives in predominantly traditional housing. The modern buildings, which concern us here, illustrate the influence of Western models and are not directly comparable with traditional types of houses discussed in the second part of this chapter. However, it may be useful to review the most salient features regarding the construction and financing of modern houses in order to show which section of the population has most benefited from the services offered.

PART I CI-I 7 125
Unlike the compounds in the walled city of Zaria modern houses areconstructed with permanent building materials such as cement blocks forload bearing walls, covered with corrugated iron or asbestos cementroofing sheets on wooden trusses or purlins. Most houses have fibreboardceilings. Floors usually consist of cement screed or tiles, while thewalls are rendered with cement plaster either painted or whitewashed.Such houses also have wooden doors and windows, which are either whollyor partly glazed, set in wooden or light gauge steel frames. Most modernhouses have a W.C., a shower, one or more washbasins and/or sinks, and aminimum of electrical installations.
Leaving aside regional price differences of building materials andlabour for the time being, the average cost per sq.m. for modern housesof that type described above was between £ 12 and £ 18 in the early1960’s . F o r example, houses built by the Lagos Executive DevelopmentBoard varied in cost from £ 12.5 to £ 14.3 per sq.m. for low-incomeoccupants and from £ 14.4 to £ 17*8 per sq.m. for the middle-income
2/group.— In 1968 costs of similar houses built by the Western Nigeria Housing Corporation in Ibadan had risen to about £23 per sq.m. for a four-roomed single-storey detached house with a total floor area of 86.6 sq.m., and slightly more than £ 28 .0 per sq.m. for a two-storey house with a total floor area of 144.4 sq.m.—^
The breakdown of cost by element of building for houses built in Lagos is given in Table A.7*1 on page 4o4* The estimated proportions of the total cost for the sub- and super-structure of one-storey buildings including the roof were between 50 and 60 per cent, for doors and windows
-/ UNITED NATIONS Housing in Africa E/CN/l4/HOU/7/Rev. New York, 1965 p. 95 -/ Ibid. p. 94■2/ WESTERN NIGERIA HOUSING CORPORATION These figures were calculated from
information supplied by the Secretary of the Corporation in a letter - of 16th -May - 1 9 6 8 ...................................................

PART I CH 7 126
slightly over 10 per cent, for minimum sanitary and electrical installation between 10 and 15 per cent, and for finishes around 20 per cent.
Unfortunately, no breakdown of cost by element of cost are available. However, it has been estimated that for comparable buildings in other African countries proportionate costs by element of cost v/ere as follows: for materials between 50 and 60 per cent, on-site labour between 25 and 35 per cent, and overheads and profit between 10 and 20 per cent of the total.-/
Financing of Modern Houses
The financing of modern houses in Nigeria can be roughly divided into two main categories: first, the public sector which embraces all Governments' direct involvement in providing housing; and second, the private sector. In the following discussion I will review Nigerian Government expenditure on housing either directly through its Ministry of Works or through such Government-financed institutions as the Lagos Executive Development Board and Housing Corporations. However, I made no attempt to cover the private housing finance agencies, and although they may well be important for individuals and household heads in need of additional funds to finish a building, not enough is known about these agencies to allow us to calculate the size of their contribution to the housing sector.
Public Sector
The majority of houses in this sector were built for staff-housing for employees of the Federal, Regional and Local Governments, educational institutions and other public services. These houses are financed from special budgetary funds, from general tax revenues and by long-term
L/— UNITED NATIONS Housing in Africa op cit., p. 9&

PAST I CH 7 12?
Government-guaranteed loans. It has been estimated that in the first fiveyears of independence, an average annual sum of well over £ 1.0 millionwas spent by Government on staff housing alone through its Federal and
5/Regional Ministries of Works.—
Private Sector
The financial resources which are available to the general public andto institutions which either build houses and/or administer loans forprivate house-builders in Nigeria vary considerably. For the sake ofclarity, a distinction will be drawn between personal resources whichinclude personal income and savings, contributions from family membersor friends, and grants from social security, and institutional resourceswhich are distributed by institutions such as the former Regional (nowState) Housing Corporations, by Building and Co-operative Housing Societies,commercial banks, or by finance and insurance companies.
Unfortunately, no information on the volume of personally financedconstruction of modern private houses in Nigeria is available. However,in his study on Kampala A. Lubega found that about 88.0 per cent of
household heads interviewed financed their houses entirely with their 6/own money.—
In the following pages I shall examine the most important institutions that provide loans for private house-builders and/or houses for the general public.
^ GOVERNMENT EXPENDITURE FOR RESIDENTIAL BUILDINGS see Northern Nigeria, Statistical Yearbook 1966, Kaduna 1967 p. 58
Annual Statistical Digest 19&5 Eastern Nigeria, Enugu, 1966 pp. 89-92Western State of Nigeria, Statistical Abstract 19&9i Ibadan 1970, p- 35Mid-Western Statistical Note Book No. 1 Benin 1970, p. 28LUBEGA,. A. Financing and Production of Private Houses in Urban Districts of Kampala Unpublished Fn.D. Thesis, London 1970, p. 112
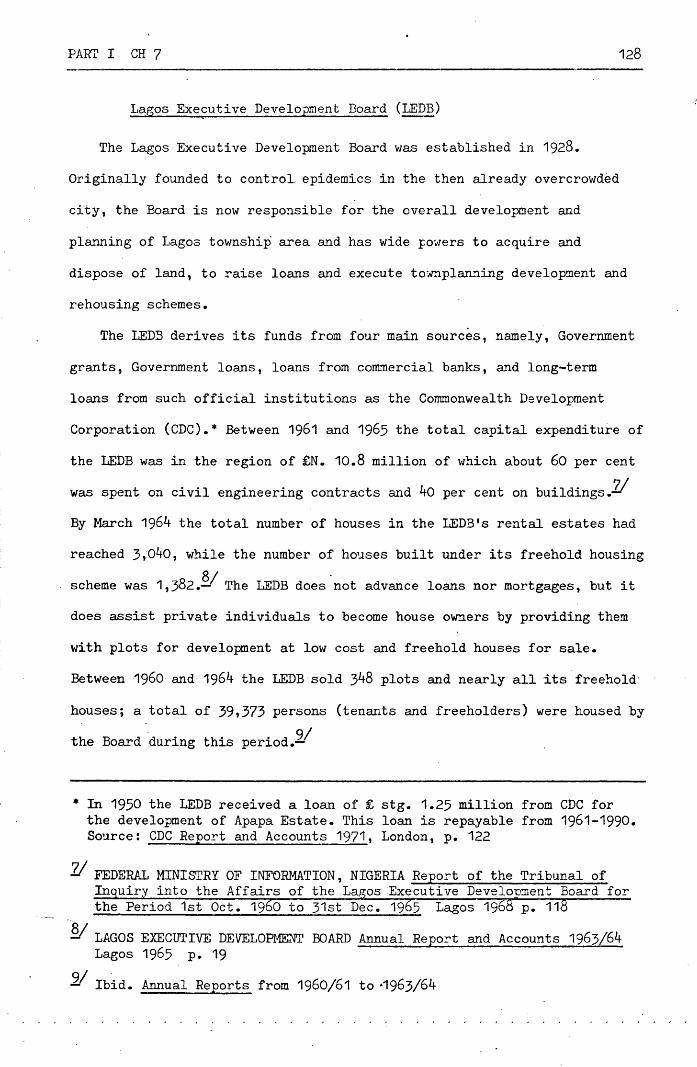
PART I CH 7 128
Lagos Executive Development Board (LEDB)
The Lagos Executive Development Board v/as established in 1928. Originally founded to control, epidemics in the then already overcrowded city, the Board is now responsible for the overall development and planning of Lagos township area and has wide powers to acquire and dispose of land, to raise loans and execute townplanning development and rehousing schemes.
The LEDB derives its funds from four main sources, namely, Government grants, Government loans, loans from commercial banks, and long-term loans from such official institutions as the Commonwealth Development Corporation (CDC).* Between 1961 and 1965 the total capital expenditure of the LEDB was in the region of £N. 10.8 million of which about 60 per cent was spent on civil engineering contracts and *f0 per cent on buildings.-^By March 196*t the total number of houses in the LEDB's rental estates had reached 3»0^0, while the number of houses built under its freehold housing
O /scheme was 1,3^2.— The LEDB does not advance loans nor mortgages, but itdoes assist private individuals to become house owners by providing themwith plots for development at low cost and freehold houses for sale.Between i960 and 196*t the LEDB sold J>k8 plots and nearly all its freeholdhouses; a total of 39»373 persons (tenants and freeholders) were housed by
9/the Board during this period.—
* In 1930 the LEDB received a loan of £ stg. 1.25 million from CDC for the development of Apapa Estate. This loan is repayable from 1961-1990. Source: CDC Report and Accounts 197^ London, p. 122
7/U FEDERAL MINISTRY OF INFORMATION, NIGERIA Report of the Tribunal of Inquiry into the Affairs of the Lagos Executive Development Board for the Period 1st Oct. i960 to 31st Dec. 1965 Lagos 19o8~p. 11$
^ LAGOS EXECUTIVE DEVELOPMENT BOARD Annual Report and Accounts 1963/6 Lagos 1965 p. 19
0 /— Ibid. Annual Reports from 1960/61 to *1963/6^

PART I CH 7 129
Nigeria Housing Corporation
The establishment of four regional based Housing Corporations in the late 1950’s and early 1960's marks the beginning of Government sponsored attempts to provide modern houses and mortgage loans for a section of the population hitherto unable to generate enough capital to build their own houses. After a promising start it soon became clear that the successful operation of all these Housing Corporations were seriously hampered by their lack of adequate funds, and by the political unrest that preceded the civil war in 1967* After the creation of the 12 States in 1967 each State has now its own Housing Corporation.
Western Nigeria Housing Corporation
The Western Nigeria Housing Corporation was established in Ibadan in 1958. To enable household heads to build their own houses or to buy a house built by the Corporation, a mortgage loan service as well as a saving scheme was introduced. In its first five years the Corporation approved 887 mortgage loans for corporation and non-corporation houses.These totalled £N.1,790*823 and averaged £N.2,019 per individual borrower.— ^ On average the corporation loans 80 per cent of the cost of a house subject to a maximum of £N. 4,000, and charges interest at 7r per cent per annum for negotiable periods of repayment that vary between 5 and 20 years. According to one official of the corporation, applicants for mortgage loans of say £N. 1,000 must have regular incomes of not less than £N. 400 per annum. The monthly repayment should not exceed a quarter of the borrower’s monthly income. This automatically excludes well over half of the household
WESTERN NIGERIA HOUSING CORPORATION Annual Report for the Year Ended 31st March 1963 Ibadan 1964 p. 10
PART I CH 7 130
heads living in Ibadan, so that only the upper middle and high income groups have any chance of securing mortgage loans from the corporation.(See Chapter 12).
Between i960 and 1963-the corporation built and sold *+24 houses of different types at costs that ranged from £N. 1,000 for a detached three- roomed house to £N. 4,100 for a two-storey house with 5 rooms, separate servants' quarters and a garage.
Northern Nigeria Housing Corporation
The Northern Nigeria Housing Corporation was founded in 1961 with itsheadquarters in Kaduna. In 1962 the corporation started issuing mortgageloans to applicants with regular incomes of at least £N. 180 per annum.The amount an individual could borrow was restricted to £N. 3*000 or the
11/equivalent of the applicant's salary for 30 months, whichever was less.—The annual interest rate was 8% per cent, and repayments were limited toa maximum of 33*0 per cent of the borrower's income.
Until March 1966, 922 mortgage loans totalling £N. 1,044,910 had beenissued, averaging £N. 1,133 per individual borrower. Of the total mortgageloans 217 or 23 per cent were under £N. 500, most of them advanced toborrowers with incomes not above £N. 200 per annum, 365 loans or 39 percent of sums ranging from £N. 500 to £N. 999 were made to borrowers withincomes of up to £N. 400 per annum, and 340 loans or 36 per cent for sumsexceeding £N. 1,000. The repayment period for 601 loans or 65 per centwas 15 years, for 48 loans or 5 per cent it varied between 11 and 14 years,
12/and for 273 loans or 30 per cent it was 10 years or less.—
O f NATIVE AUTHORITY HOUSING CORPORATION First Annual Report and Accounts for the Period 18th May, 1961 to 31st March, 1962 Kaduna 19o2, Appendix C, Housing Loan R u l e s 5 b p. 36 and ^ 9-1 P- 37
12/— NORTHERN NIGERIA HOUSING.CORPORATION.Fifth Annual Report and Accounts for the Year ended 31st March 1966 Kaduna 1966 p. T8

PART I CH 7 131
By March 1965 the corporation had completed 611 houses, while 38
were at an advanced stage of construction and another 183 in the initial 13/stages.— ■ The total funds received by the corporation until its merger
with the New Nigerian Development Company Ltd. in 1968 amounted to £N. 9^3,218.— /
Eastern Nigeria Housing Corporation
The Eastern Nigeria Housing Corporation started operating in early 1962, with initial loans of £N. 70,000 from the Government of the former
'ic/Eastern Region, and £N. 60,000 from Shell-BP.—'- In its first two yearsthe corporation built 30 houses, and followed this with 60 houses in 1964,all 90 being handed over to employees of the Regional Government andcommercial firms. By mid 1964 a further 62 dwellings were under constructionand over 100 houses were in the planning stage. The first 13 mortgage loans
16/totalling £N. 14,000 were distributed in 1964.— It was envisaged that during the First National Development Plan 1962-68 a total of £N. 2.0 million would have been made available to the corporation, but the events of 1966 and following civil war interrupted the corporation's activities.
Mid-Western Housing Corporation
Unfortunately, no information is available on the activities of the Mid-Western Housing Corporation which was established in 1964.
— / NORTHERN NIGERIA HOUSING CORPORATION Fourth Annual Report 196V 63 p. 10 14/— MINISTRY OF INFORMATION, KADUNA Inquiry into the Affairs of the Northern
Nigeria Housing Corporation 1967 Kaduna 1967 P« 215/— EASTERN NIGERIA HOUSING CORPORATION Annual Report and Audited Accounts
1961/62 Enugu 1964 p. 3Ibid. Annual Report 1963/64 Enugu 1964 p. 12

PART I CH 7 132
Nigeria Housing Development Society Ltd. (Nigeria Building Society)
The Nigeria Building Society was founded in 1957- By the end of 197*1 the society had advanced a total of more than £N. 10.0 million as mortgage loans during its 1A years of operation. In 197*1 its Director's annual report revealed that its mortgage asset totalled £N. 6,1A9,703i an increase of more than 20 per cent on the previous year, while the total
17 /sum deposited under the society's saving scheme had reached £N. 1,^5 6,302.—A' The society charges an interest rate of 8-g- per cent for their loans which are repayable over a period of between 13 and 25 years. The society concentrates its operations in the metropolitan area of Lagos and, although no detailed statistical data about its financial transactions are available an almost casual remark in its 1970 annual report throws some light on the type of customer for which the society caters: themajority of the mortgage business done in 1970 was in respect of houses which, on completion, were to be rented out by their owners.'1 / In 1970 the society made an agreement with the Commonwealth Development Corporation (CDC) for a loan of £ stg. 500,000 available to the society at the beginning of 197 »
Nigeria Co-operative Housing Societies
The co-operative movement in Nigeria has been increasingly successful since its creation in 193&. As most Nigerians are farmers it is understandable that the most important co-operative societies are concerned with agricultural produce. In 1961 there were A,019 registered co-operative societies having a total membership of 251,868, and of these 2,299 were
■22/ NIGERIA HOUSING DEVELOPMENT SOCIETY LTD. Report and Accounts 1971 Lagos 1972 p. 1
18 /— Ibid. Report and Accounts 1970 Lagos 197*1 P- 2

PART I CH 7 133
marketing co-operatives that handled together well over 20 per cent of the country's agricultural produce. The remaining 1,720 were saving and credit
19/co-operative societies which had accumulated over £N. 1.5 million in 1961.—^Within this framework, the co-operative housing societies did not
thrive at all. In 1964/65 there were only 11 housing societies* whose20/927 members shared a working capital estimated at about £N. 150,000.—
By comparison with North African countries for example Tunisia and the21/United Arab Republic,— the contribution of the Nigerian Co-operative
housing societies to ease the housing shortage in urban areas by making mortgage loans available to their members, is negligible. For example, the Lagos Building and Housing Co-operative Society Ltd. was registered
in 1957 and had 220 members in 19^5* Between 1961 and 19&5 the average annual amount issued by the society to its members was in the region of £N. 12,000 at 6 per cent interest rate; but in 1966 this amount dropped to £N. 6,100 and in 1967 to £N. 4,000.~^ In 1961 the former Eastern Region had two housing co-operative societies with 3^2 members and a total capital of £N. 64,700.** By the end of 1964 this had increased to 5
^ FEDERAL MINISTRY OF INFORMATION, NIGERIA Handbook of Commerce and Industry in Nigeria Fifth Edition 1962, Lagos 1962, pp. 235-239
* This excludes the former Northern Region because the available statistical data does not permit the distinction of housing and building co-operative societies which are included in Thrift and Loan or Thrift and Credit co-operative societies.
— ^ FEDERAL MINISTRY OF LABOUR, NIGERIA Annual Renorts of the Co-operative Division, 1963/64 and 1965/66. Published by the Fed. Ministry of Information, Lagos
21/— UNITED NATIONS E.C.A. Conference on Co-operative Housing in Africa.Addis Ababa 1969 E/CN/14/H0U/20FEDERAL MINISTRY OF LABOUR, NIGERIA Annual Reports of the Co-operative Division, 1960 to 1967.pp.cit._____ -
** The first Nigerian Housing co-operative society was the "Old Paulines" registered in Enugu in 1999- The society started with 103 members and a total working capital of £N. 4»05I» Source: Annual Report of the Co-operative Department of ihe Eastern Region cf Nigeria for the Year
. . 1955/56. .Enugu/1957, -p* 2 6 . ’ ’ - V . ! ! ! ! " ! ’ ' ' ' ' ' — . .

PART I CH 7
housing societies with 617 members and a working capital of £N. 110,120.—"In the former Western Region the number of co-operative building societieshad dropped from 8 in 1960/61 to 4 in 1963/64 with 77 and 71 members
24/respectively,— • while the former Mid-Western Region had only one housing25/society with 19 members and a total capital of £N. 901 in
Banking and Insurance
Commercial Banks
The banking business of Nigeria expanded rapidly during the lastdecade. The total assets of the Central Bank of Nigeria rose from£N. 9^-5 million in December 1962 to £N. 226.2 million in December 1970,“ ^while all other commercial banks increased their assets from £N. 142.6
27 /million to £N. 576.0 million over the same period.—Total institutionalized savings showed a similar upward trend from
£N. 45.7 million or 3*5 per cent of GDP in December 1962 to £N. 205.9million or 11.8 per cent of GDP in December 1970. (See Table A.7.2 on page 405). As a result of this development, commercial bank loans and advances to industry and commerce increased from £N. 60.0 million in December 1961 to £N. 149*0 million in December 1966. Though this upward movement was interrupted during the civil war (1967-70), it resumed immediately thereafter, and was especially pronounced in the second half
23/£2* ECONOMIC PLANNING COMMISSION FOR EASTERN NIGERIA Annual Statistical
Digest 1965 Enugu 1966, p. 140.24/— ' MINISTRY OF ECONOMIC PLANNING AND SOCIAL DEVELOPMENT, IBADAN Western
Nigeria Statistical Bulletin Nos. 1 and 2 Vol. VII 1966, pp. 169-172MID-WESTERN STATE Statistical Note Book No. 1 Benin 1969 p. 38
CENTRAL BANK OF NIGERIA Annual Report and Statement of Accounts 1963 and 1970, Lagos
^2/ FEDERAL OFFICE OF STATISTICS, NIGERIA Digest of Statistics Vol. 20 No.2 Lagos 1971, p. 100
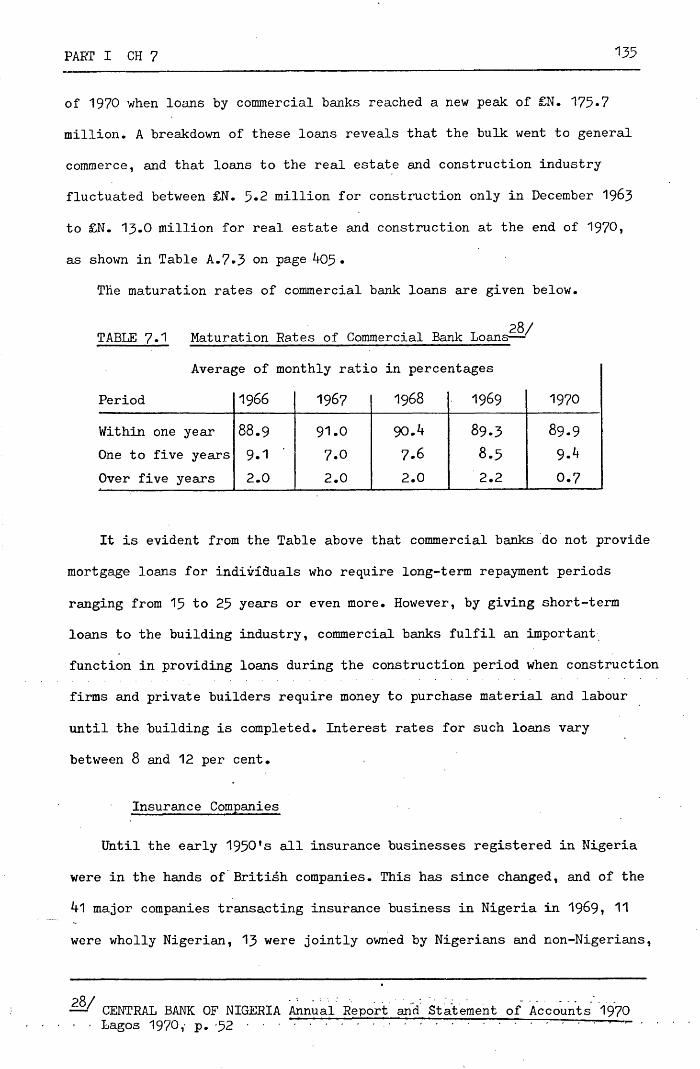
PART I CH 7 135
of 1970 when loans by commercial banks reached a new peak of £N. 175*7million. A breakdown of these loans reveals that the bulk went to generalcommerce, and that loans to the real estate and construction industry fluctuated between £N. 5*2 million for construction only in December 1963 to £N. 13.0 million for real estate and construction at the end of 1970,as shown in Table A.7-3 on page kO5 •
The maturation rates of commercial bank loans are given below.
pO /TABLE 7*1 Maturation Rates of Commercial Bank Loans-—
Average of monthly ratio in percentagesPeriod 1966 1967 1968 1969 1970Within one year 88.9 91.0 90.^ 89.3 89.9One to five years 9.1 ‘ 7.0 7*6 8.5 9-^Over five years 2.0 2.0 2.0 2.2 0.7
It is evident from the Table above that commercial banks do not provide mortgage loans for individuals who require long-term repayment periods ranging from 15 to 25 years or even more. However, by giving short-term loans to the building industry, commercial, banks fulfil an important function in providing loans during the construction period when construction firms and private builders require money to purchase material and labour until the building is completed. Interest rates for such loans vary between 8 and 12 per cent.
Insurance Companies
Until the early 1950's all insurance businesses registered in Nigeria were in the hands of British companies. This has since changed, and of the 41 major companies transacting insurance business in Nigeria in 1969* 11 were wholly Nigerian, 13 were jointly owned by Nigerians and non-Nigerians,
CENTRAL BANK OF NIGERIA Annual Report and Statement of Accounts 1970 - Lagos 1970,' p. '52 ' ■ ■ ” 1 1 : 1 : 1 : 1 1 : : : : : : 1 ! ’ "

PART I CH 7 136
and 17 were foreign companies. However, companies of this third group,which is dominated by the Royal Exchange, the Northern Assurance andthe Royal Group, still control between 70 and 80 per cent of the
29 /Nigerian insurance market.— Betv/een 19&3 ^965 the total premiumincome for life and non-life insurance rose from £N. 6.0 million to£N. 9*3 million. In 1968 there was a temporary setback when the totalpremium income was only £N. 7•'I million of which £N. 3-*| million werereinsured outside Nigeria.— ^
Unlike Europe, where insurance, and life insurance in particular,31/has been a major source of housing finance,— the life insurance
business in Nigeria has only marginally contributed to the housing sector,* although premium income has steadily increased from £N. 1.3 million in 1963 to £N. 2.8 million in 1965 and £N. 3-0 million in 1968.-^/
— “ Author not given. ’’Insurance Market in Nigeria 1969”, in Federation of Afro-Asian Insurers and Reinsurers Review Cairo 197^ P« 9
^ Ibid. p. 10UNITED NATIONS The Role of Insurance in Housing and Proposals for its Application in Africa E/CN/1A/HOU/29 Addis Ababa 19&9
* Only one put of six British dominated insurance companies in Nigeria had some marginal interest in housing.
32/— FEDERAL OFFICE OF STATISTICS, NIGERIA Annual Abstract of Statistics 1969 Lagos 1970 p. 133

PART I CK 7 137
ZARIA SAMPLE SURVEY
In the second part of this chapter I will first discuss the level of construction cost and then the method of housing finance, based on data obtained from my survey of 77 compounds in the walled city of Zaria*
Cost of Building
The cost of building covers a whole range of different activities which may be divided into five major categories as follows:
1* Cost of construction (completed 1963-8 )2. Cost of buildings under construction3- Cost of improvement4. Cost of maintenance and repair and3* Cost of such miscellaneous constructions as granaries, and wells.As mentioned elsewhere, the construction of new huts inside compounds
is a continuous process which reflects the growth or decline of co- residential kinship groups. This pattern of development made it necessary to restrict my investigation on building cost within the compounds surveyed to a five-year period from December 1963 to November 1968. During this period a total of 227 new rooms were constructed within these compounds while 113 rooms were entirely re-roofed with different materials, a change I have classified as improvement.
Table 7*2 on page 138 shows that of the total adjusted building *
expenditure of about 180,000 shillings or £N. 9»000, 44.4 per cent was spent on new construction, 27-7 per cent on improvements of existing buildings, 23.6 per cent on repair, 2.4 per cent on buildings under construction and 1 .9 per cent on miscellaneous construction.
Cost of New Construction
During the five-year period from 1963-8 , 277 rooms with a total floor area of 1,772 sq.m. were built in 52 out of 77 compounds surveyed.

FART I CH 7 138
TABLE 7*2 Costs of Construction in 77 Surveyed Compounds 1963-1968
Column 1 2 3 *+Pj
5Llot Sc
6
heme**7
No. of Rooms
SquareMetre
Cost in shillings
Shs.persq.m.FloorArea
PerCentofCostAdjusted
MaterialCostonlysq.m.
Materialand
LabourCostsq.m.
New Construction (completed)Thatch-roofed Rooms Mud-roofed Rooms C. iron-roofed Rooms Compound WallsSub-total
60133
3*+*+26 .0990.0356.5
10,175*+0 ,2*+*+27,9301,565
23.9*+0 .67 8 .3
17.7 30.256.7
38.25*+.089.7
227 1,772.5 79,91^ *+*+.*+Improvement on Existing BuildingsChange Thatch to Mud Rf C.I. Rf on Top of Mud Rf Cement Floor & Platforms Electricity InstalledC16) Pipe Borne Water Installed (8)
Sub-total
*+075
309.8663.9
5,893 2 2, *+*+1 13,602 5,1632 ,8*+5
19.033 .8
>
16.026.5
2*+.9 35.7
115 973.7 *+9,9*+*+ 27.7
Maintenance and RepairIncludes inter alia Roofs, Walls, Doors, Windows,Cement Plaster, Painting, etc.Sub-total. (1.96.6-8 , Actual) Adjusted S-total 1963-6811
For Details see Tsible 7 .5 on page
25,*+93*+2 , *+88 23 .6
Buildings under ConstructionRooms Walls Completed Rooms Mud Rf Completed Rooms Corr.I.Rf Compd.Sub-total
17139
129.5106.772.*+
7072,697929
39 308.6 ^,333 2.*+Miscellaneous Constrn.Includes inter alia Wells, Pit-latrines, Bth- rooms,Stables & Granaries Sub-total 3,392 1.9Total Expenditure Actual 163,076Total Expendr. Adjusted 180,071 100.0 !* 2^*21 x 5 = ^2 ^ 8 8 shs- ■ • ** See Table k.7.k on page 4o6
3

PART I CH 7 139
The recorded cost of construction for these rooms was 79,900 shillings (£N. 3,995) or per cent of the total expenditure on buildings.As shown in column k on Table 7-2 the average cost per sq.m. for a room with a thatched roof was 23-9 shillings, for one with a mud roof kO.6 shillings, and for rooms with corrugated iron roofs set on top of domed mud roofs 78-3 shillings.
Detailed studies of construction costs for a typical two-roomed house (16.0 sq.m. floor area) with mud walls and three different roof types, i.e. thatch, mud, and corrugated iron sheets set on top of a domed or flat mud roof, were made with the help of two local builders. (See Table A.7-^ on page kOS)• Two sets of figures were collected, first for the cost of materials only expressed in shillings per sq.m., the minimum cost, (see column 6), and second the total cost for materials!and labour per sq.m., which represents the maximum cost (see column 7)- Comparison; of the data obtained from the survey and from this independent case study revealed that the survey data tabulated in column A are lower than the maximum cost per sq.m. established by the case study. This confirms a well known fact that most compound heads assist the builder throughout the construction period in order to keep their labour costs down.
A breakdown of cost by element of building for the typical two-roomed house discussed above is given in Table 7-3- That table presents costs for three different types of roof, the doors, windows and finishings being of the same standard.
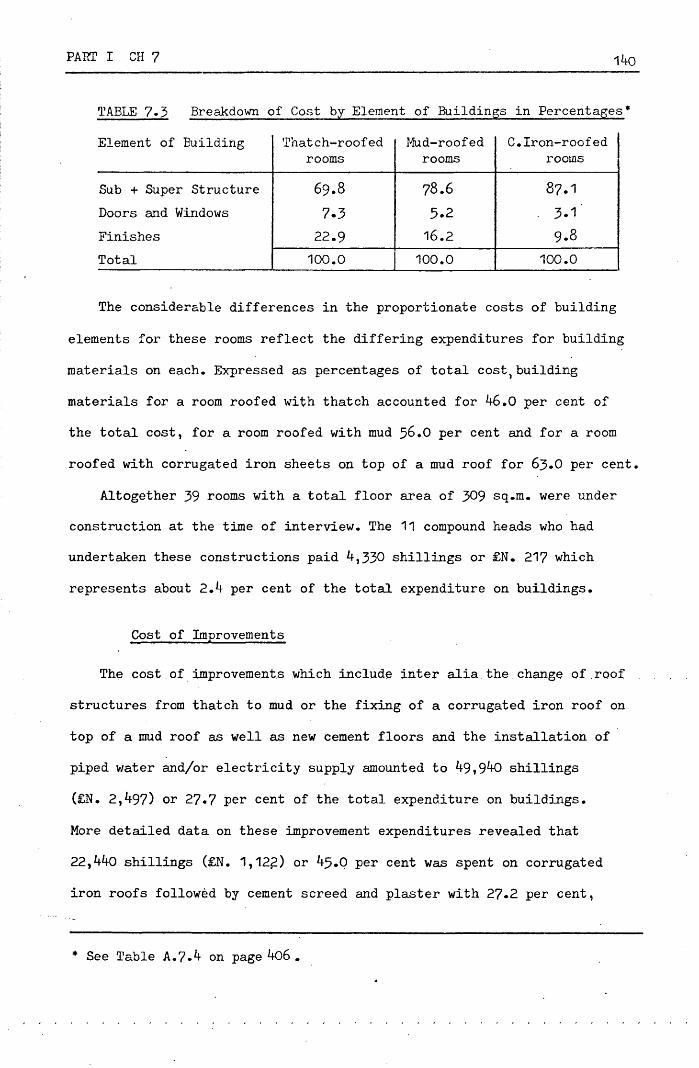
PART I CH 7
TABLE 7.3 Breakdown of Cost by Element of Buildings in Percentages*Element of Building That ch-roofed
roomsMud-roofedrooms
C.Iron-roofed rooms
Sub + Super Structure 69.8 78.6 87.1Doors and Windows 7.3 5.2 • 3.1Finishes 22.9 16.2 9-8Total 100.0 100.0 100.0
The considerable differences in the proportionate costs of building elements for these rooms reflect the differing expenditures for building materials on each. Expressed sis percentages of total cost>building materials for a room roofed with thatch accounted for 46.0 per cent of the total cost, for a room roofed with mud 5 6 .0 per cent and for a room roofed with corrugated iron sheets on top of a mud roof for 63*0 per cent.
Altogether 39 rooms with a total floor area of 309 sq.m. were under construction at the time of interview. The 11 compound heads who had undertaken these constructions paid 4,330 shillings or £N. 217 which represents about 2.4 per cent of the total expenditure on buildings.
Cost of Improvements
The cost of improvements which include inter alia the change of roof structures from thatch to mud or the fixing of a corrugated iron roof on top of a mud roof as well as new cement floors and the installation of piped v/ater and/or electricity supply amounted to 49,940 shillings (£N. 2,497) or 27*7 per cent of the total expenditure on buildings.More detailed data on these improvement expenditures revealed that 22,440 shillings (£N. 1,122) or 45.0 per cent was spent on corrugated iron roofs followed by cement screed and plaster with 27.2 per cent,
* See Table A.7.4 on page 406 .

PART I CH 7 141
changes from thatched to mud roofs 11.8 per cent, and the installation of piped water and electricity supply 10.3 and 5-7 pan cent respectively.
Cost of Maintenance and Repair
The adjusted cost of maintenance and repair accounted for 42,490 shillings (£N. 2 ,215) or 23-6 per cent of the total building expenditure. In spite of repeated efforts, it proved impossible to collect enough reliable data on maintenance and repair costs for the years 1964 and 1965} simply because most household heads could not remember the details. In contrast such expenditures for the three years from 1966 to 1968 were recalled with confidence. The detailed data collected on this item shows clearly the recurrent tendency of this kind of expenditure. Thus, after checking all available information I have assumed that repair and maintenance costs for the two incompletely documented years, 1964 and 1965
were not substantially different from the last 3 years and have made the necessary adjustments to cover the whole period from 1963 to 1968.
Because of its importance, the total actual maintenance and repair costs of 25,500 shillings or £N. 1,275 merit further attention.
TABLE 7.4 Actual Maintenance Cost by Element of Building 1966-8
Element of Building Shillings Per CentCompound Walls 8,243 32.4Mud Roofs 5,766 22.6Thatched Roofs 5,486 21.5Mud Plaster on Housewalls 3,979 15.6Cement Platforms and Plaster 943 3-7Painting and Whitewash 554 2.2Doors and Shutters 411 1.6Other Repairs 111 0.4Total 25,493 100.0

PART I CH 7 142
It is noteworthy that slightly under one third of the total maintenance cost was absorbed by repair work on compound walls. Repair cost for mud roofs which represent over half of all roof types in the compounds surveyed, was 22.6 per cent of the total maintenance cost, while repairs to thatched roofs account for 21.5 per cent. The relatively high maintenance cost of thatched roofs is of interest, since in contrast with mud roofs, the number of thatched roofs has steadily declined from 472 rooms or 41.3 per cent of total roof types in December 19&3 to 361 rooms or 29.4 per cent in November 1968. Thus these data suggest that, while the thatched roof is relatively cheap to build, it is also rather expensive to maintain.
Financing of Private Houses in the Walled City of Zaria
The following analysis is intended to show how houses included in the sample survey were financed. The investigation is again limited to the five year period from December 1963 to November 1968. The two main sources of housing finance already mentioned earlier are personal sources and institutional sources.
Personal Sources
Personal sources can be divided into three interrelated groups:a. Self-financing from income and savings,b. Contribution from family members and friends, andc. Funds from Social Security, such as gratuities or pensions.Contribution from family members and friends were further sub-divided
into .gifts and loans. Out of the 227 rooms built during the period under study, 182 or 80 .2 per cent were either partly or wholly financed by 50
compound heads (maigida) in whose compound they were built, while the remaining 45 rooms or 19*8 per cent were financed by 23 dependent or semidependent household heads (mai-iyalai). -

PART I CH 7 143
Self financing from income and savings played an important part in house-building at Zaria. As shown in Table A.7*6 on page 408 about84.0 per cent of the total expenditure on building between 19&3 19^8
came from personal income and savings of household heads. Altogether 45 compound heads or 58.4 per cent of the total, had at one time or another saved amounts that ranged from £N. 15 to £N. 95 to finance building, while 29 compound heads or 37*7 per cent had never saved for this end, and 3 or 3*9 per cent did not respond.
As mentioned earlier, contribution from family members and friends have been sub-divided into gifts and loans. During the five-year period from 1963 to 1968, 11 loans totalling 8,170 shillings or £N. 409 were made by private persons or private saving societies to 11 compound heads who used the money mainly for new construction. The creditors of these loans were in order of importance.
TABLE 7»5- Type of Creditors of Private Building LoansNo. of Loans Shillings Per Cent
Personal Friends of Comp. Head 5 4,850 59.4Priv. Saving Societies 4 2,200 26.9Close Relatives of Comp. Head 2 1,120 13.7Total 11 8 .170 100.0
Gifts received to finance either new construction, improvements or repairs amounted to 17,820 shillings or £N. 891 and came mainly from close relatives and friends of the compound head. All 25 contributors lived outside the compound concerned. However, it is highly unlikely that this represents all instances of such help, as several compound heads were rather reluctant to speak freely on this topic and only admitted having received some aid when pressed hard. The sum received from family members and friends including gifts and loans amounted to 25,990 shillings (£N. 1,300) or 14.4 per cent of the total building expenditure from
1963 to '1968. ...........................

PART I CH 7
Contributions from social security encountered in my survey were relatively small and involved only 3 compound heads, all of whom wereformer employees of the Local Government. These 3 compound headsreceived gratuities totalling £N. 333 which was partly used for theconstruction of new buildings or to improve old ones.
The private saving societies (adashi) mentioned above sire worth citing because they are of general interest. The modern form of these saving societies probably originated among Ibo and Yoruba immigrants employed in Northern Nigeria by Government, industry and commerce.Most of these private saving societies have only a few members who, in return for a regular weekly or monthly subscription, each receive in turn the total contributions, and often use this to buy household goods, meet emergencies, pay debts, or, as here, to finance new buildings as well as improvements on old buildings.
Institutional Sources
Institutional sources of funds for housing include all building loansand grants made either by the Local Government, Housing Corporations andbanks. From 1963 to 19&8 only two compound heads received building loanstotalling £N. 139- The two loans in question were made by the ZariaNative Authority to two members of its staff at the generous interest
«
rate of 2-g- per cent. These are obviously special loans which are not available to the general public but closely tied to the position and influence of the beneficiary. One additional grant of £N. Ik was given to one employee of the local police force who used the money to start the construction of a hut for himself. The two loans and one grant listed above covered about 1.7 per cent of the total building expenditure between 1963 and 1968.

PART I CH 7
It is not surprising that loans from financial institutions discussedin the first part of this chapter are conspicuously absent in the walledcity of Zaria. This is due to three reasons: first, the insistence of allNigerian finance institutions, modelled on Western prototypes, that theborrower should have a clear title to the land intended for development.Land owned by lineages or section of lineages is, in case of mortgagedefault, regarded as a security risk.— ^ (Most land in Zaria walled cityis in the hands of lineages.) Second, the demand of such agencies that themortgagee should use only such permanent building materials as concreteblocks and corrugated iron or asbestos cement roofing sheets for any
3Wconstruction financed by a mortgage loan,— - and third, the low average income of household heads in Zaria walled city. For example, as about69.O per cent of the sample households earned less than £N. 180 per annum, they are automatically excluded from funds distributed by the Northern Nigeria Housing Corporation. Hence housing loans from institutional sources are generally not available to the inhabitants of the walled city, who are thus left entirely to their own meager financial resources as far as housing is concerned.
In short, between 19&3 1968, a total sum of about £N. 9»000 wasspent by 77 compound heads and various other dependent or semi-dependenthousehold heads on new construction, improvement and maintenance of their compounds. About 84.0 per cent of this money came from the personal savingsand income of household heads, over 14.0 per cent came from loans and giftsmade by family members and friends, while the rest of about 2 .0 per cent came from official loans and/or grants.
^2/ NATIVE AUTHORITY HOUSING CORPORATION First Annual Report 1961. Housing Loan Rules, No. 38 of i960 §7 Section a. p. 12
34/— Ibid. Second Annual Report 1962/65 p. 13

PART I CH 7 146
Internal Subsidy
Thus far we have confined our attention almost exclusively to private and institutional resources for housing finance which may be available to compound heads for building purposes, and little has been said about internal subsidy. By internal subsidy I mean the provision of money, building materials or new rooms for close relatives living inside the compound concerned. This may include rooms built by a compound head for his newly-married son or for any other dependent individual or semidependent family in need, as well as the opposite, for example, the construction of a room by a well-to-do son for his ageing father. In these terms, of the 182 rooms* built between December 19&3 November 1968, 42 rooms or 18.5 per cent were either fully or partly subsidized by the compound head and given to dependent families living in the compound concerned, while another 6 rooms were either fully or partly subsidized by 5 dependent or semi-dependent household heads and given to 3 compound heads and 2 dependent families. (See Table A.7*7 on page 408).
The following diagram illustrates the main characteristics of internal subsidies towards new construction made by various household heads during the 5 year period from December 19^3 to November 1.96.8 .
It will be noted that 12 rooms costing a total of 3i920 shillings were built and paid for by compound heads for their newly-married sons.In addition, two compound heads also built 3 rooms for the families of full brothers1 sons. Of the remaining 6 fully subsidized rooms 4 went to various other relatives, while 2 rooms were paid for by the son and full brothers’ son of two compound heads.
* 45 rooms were built and paid for by dependent or semi-dependent household heads and were not subsidized by the compound head. See Table A.7«7 Section C on page 408 • *■
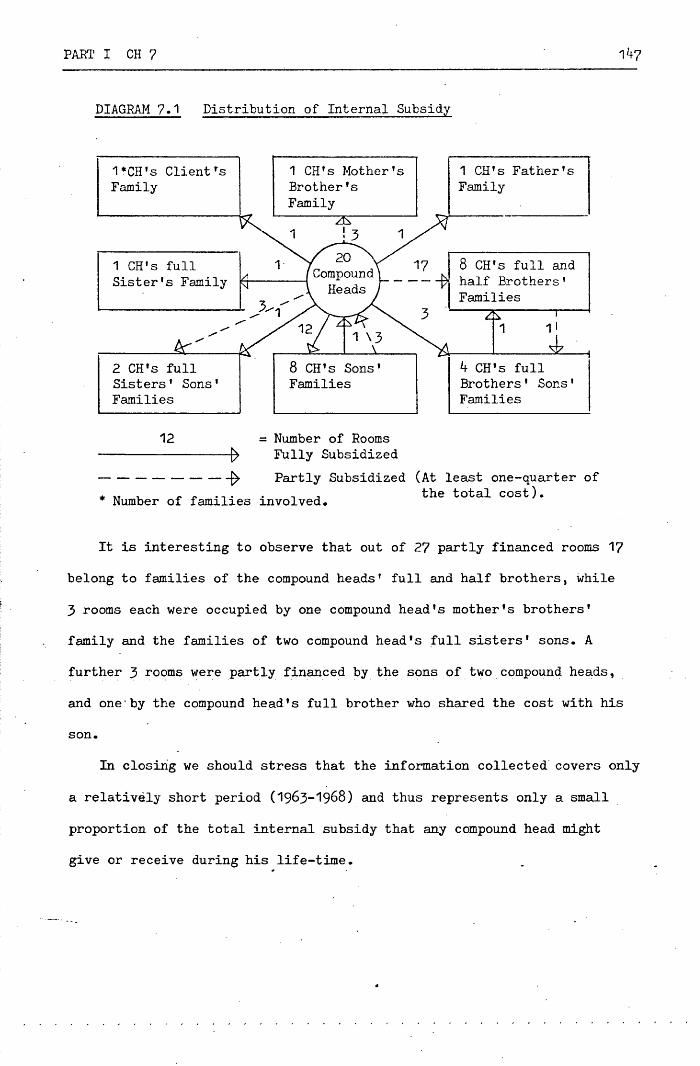
PART I CH 7
DIAGRAM 7.1 Distribution of Internal Subsidy
1*CH's Client rs Family
1 CH's full Sister's Family
1 CH's Mother's Brother's Family
1320
Compound Heads
1 CH's Father's Family
8 CH's full and half Brothers' Families
ksr''
" / 1 2 1 \3 \
3 2k i 1 11
2 CH's full 8 CH's Sons' k CH)
's fullSisters' Sons' Families Brothers' Sons'Families Families
= Number of Rooms Fully SubsidizedPartly Subsidized (At least one-quarter of
the total cost).involved.
It is interesting to observe that out of 27 partly financed rooms 17 belong to families of the compound heads' full and half brothers, while 3 rooms each were occupied by one compound head's mother's brothers' family and the families of two compound head's full sisters' sons. A further 3 rooms were partly financed by the sons of two compound heads, and one by the compound head's full brother v/ho shared the cost with his son.
In closing we should stress that the information collected covers only
a relatively short period (1963-1968) thus represents only a small proportion of the total internal subsidy that any compound head might give or receive during his life-time.
12 »---------------- b"* Number of families
PART II IBADAN CHAPTER 8BACKGROUND INFORMATION 1it8
ENVIRONMENTAL SETTING
Geography and Climate
Ibadan, latitude 7° 26' north, longitude 3° 5^' east, and about 200 mabove sea level, lies within the humid high forest zone of Nigeria. Due tothe prevalent system of shifting cultivation, in which bush is cleared byfire, virtually no virgin forest remains around Ibadan. The crops grown byfarmers in the region include inter alia cocoa and oil-palm produce forexport, kola, yams, maize, cassava, rice, oranges, bananas, pepper and
1/various vegetables for the home market.—Temperatures in Ibadan vary from an average daily maximum of 33»9°C in
February and March to an average daily minimum of 20.6°C in August andDecember. Relative humidity is high throughout the year, ranging from anaverage daily maximum of 98.0 per cent at 6.30 a.m. GMT in October, to an
2 /average daily minimum of ^9.0 per cent in February at 12.30 p.m. GMT.—The mean annual rainfall over the period 1903 to 1932 was 1.23 m and most of it falls between March and October. However, there is a slight break in rainfall at mid-summer which is called the ’’little dry season”, and in August rainfall averages 7^ mm, as against 132 mm for July and 170 mm for September.—^ (See Diagram A.8.1 on page ^09).
For most of the year, the prevailing winds blow from the south-west, but in the harmattan season, December to February, as the tropical continental air mass moves south, they blow from the north and create a dry season.
1/— H0DDER, B.W. ’’The Markets of Ibadan" in Lloyd, P.C. et al., The City ofIbadan Cambridge University Press, 1967, pp. 173“190*
2/— METEOROLOGICAL OFFICE Tables of Temperature, Relative Humidity andPrecipitation for the World Part IV H.M.S.0. London 19^, P» 121
3/— BRITISH WEST AFRICAN METEOROLOGICAL SERVICES, NIGERIA Preliminary Notes on Rainfall of Nigeria Meteorological Notes No. 2 Lagos 1953BUCHANAN, K.M. et al. Land and People in Nigeria London 1966 p. 28*

PART II CH 8 149
Topographical Features*
Ibadan is dominated by a range of hills that run from north to south. The highest point on this range, the Eleiyele Hill, stands over 2?0 m above sea level and about 60 m above the surrounding countryside. The contemporary city of Ibadan is built around the southern slope of the Aremo ridge and stretches down to the flood plains of the Ogunpa and Kudeti streams, a position which no doubt had strategic advantages that attracted the early settlers. (See Map A.8.1 on page 411).
HISTORICAL BACKGROUND
Unlike Zaria, Ibadan is a city of comparatively recent origin, and began as a war encampment for the Yoruba military forces in the early nineteenth century.
According to legend the first knownxinhabitants in the area were refugees from neighbouring communities and only after Lagelu, a chiefand warrior from Ile-Ife, joined them, was the first settlement called
4/Eba-Odan (near the grassland) founded.— This settlement was soon 5/destroyed;— but Lagelu, who survived the event, built a new village on
a site near the central city market at Oje Iba.By the beginning of the nineteenth century, the Oyo Empire which
covered an area reaching from Oyo lie (old Oyo) in the north to the Bight of Benin in the south, and which had enjoyed peace and stability
* The main topographical features of Nigeria have been sketched in Chapter 1 on page 27 •
4/— AKINYELE, I.B. The Outlines of Ibadan History Lagos 1946 pp. 28-40 5/— Ibid. According to legend the first settlement situated near the campus
of the University of Ife at Ibadan was destroyed because the inhabitants of Ibadan violated Yoruba customs by accidentally allowing women to see exposed Egungun masquerades, who were regarded as representatives of ancestors on eartji.

PART II CH 8 150
for about 200 years, was tottering to its end. (See Plan A.8.3 on page -12 ).Its subsequent collapse was due to internal rebellion, inter-tribal wars,and invasions of Fulani horsemen from the north who finally capturedIlorin in the early 1820’s and then used it as their headquarters forattacks on other Yoruba settlements.—^
Many Yoruba towns in the northern part of the Oyo empire weredestroyed by the Fulani forces, for example Oyo Iba in 1837 and anincreasing flood of refugees fled south, with the result that theremaining part of the empire was soon' plunged into civil war. Slaveraiding between the various independent Yoruba kingdoms in the south,
7 /encouraged by Ijebu, sparked off the Owu war in c. 1813- The combinedforces of the Ife and Ijebu,- joined by Yoruba refugees from Oyo to the
8 /north completely destroyed the town of Owu in c. 1823. After its victory the army routed many Egba towns which gave active support to Owu.It was during this campaign that the allied army chose Ibadan, an Egba
9/village, sis their camp.— What began as a war encampment in the middle 1820's soon became a permanent settlement, and so the present city of Ibadan came into existence.
JOHNSON, S. The History of the Yorubas Lagos i960 pp.197“202^ SMITH, R.S. Kingdoms of the Yoruba London 19&9 P« 1 1
MABOGUNJE, A.L. and OMER-COOPER Owu in Yoruba History Ibadan 1971 pp. 63-69 and 77
■2/ JOHNSON, S. op cit., pp. 223-225

PART II CH 8
Pre-colonial Ibadan 1829-1893
The allied army that settled at Ibadan comprised the Yoruba from Ifeand Oyo who occupied the area around Oje Iba central market and Oke Mapo,the Ijebu who built their houses in an area known today as Isale Ijebu,
10/and the remaining Egba who resided at lye Osa.—This heterogeneous population was soon at loggerheads. Open hostilities
broke out among the chiefs of these segments and resulted in expulsion of Maye, the Ife army commander who had so far dominated the town, by the numerically stronger Oyo under Oluyole who thence forward ruled the city,-rthus identifying Ibadan as a predominantly Oyo-Yoruba town which recognized
11/the Alafin of Oyo as their overlord.— With Oluyole in power, an evengreater number of Oyo refugees flocked to the city. By 1840 the Ibadanarmy under Balogun* Oderinlo was strong enough to inflict a decisivedefeat on the Fulani forces at Oshogbo, which effectively checked their
12/advances into Yoruba land.— The rapidly growing military power of Ibadan during the following two decades promoted an expansionist policy under Balogun Ibikunle who duly brought the Ekiti country, south of the city, under the control of Ibadan. (See Plan A.8 .3 on page4l2).
Much of the evidence of Ibadan’s history for this period is based on journals and letters written by the Reverend David Hinderer of the Church
1 •z/Missionary Society (CMS) who arrived in the city in 1851.— By 1858 Ibadan
10/— ■ AWE, B.A. ’’Ibadan, its Early Beginnings” in Lloyd, P.C. et al., The City of Ibadan op cit., p.14
11/— JOHNSON, S. op cit., pp. 238-242 Johnson gives a detailed account of these events.
* Title of the commander-in-chief of the Ibadan army.^ JOHNSON, S. op cit., pp. 285-289
13/— HINDERER, D. The reports and letter of David Hinderer can be found in the Church Missionary Archives at 4 Salisbury Sq. London E.C.4 under the serial number CA2/0.HINDERER, A. Seventeen Years in the Yoruba Country London 18/3

PART II CH 8 152
had so expanded that it was necessary to build a new town wall, and this14/extension is known today as Ibikunle's wall.— ( The new wall, which had
four main gates, measured about 17*8 km in circumference and enclosed anarea of approximately 2,240 hectares.
With the Ekiti and their country under Ibadan's control its onlyremaining challenger for effective leadership of the Oyo Yoruba was Ijaye,a town which had so far shared with Ibadan the burden of defending thesouthern Oyo territories. But with the destruction of Ijaye by a Yorubaarmy in 1862, Ibadan emerged as the leading military power in Yoruba
15/land.—^ Other independent Yoruba kingdoms, particularly the Ijebu andEgba of Abeokuta due south of Ibadan, were alarmed by these developmentswhich upset the balance of power in Ibadan's favour. Fear of Ibadan'sgrowing military and economic power prompted the Egba and Ijebu kingdoms,which were ideally situated between Ibadan and the coast, to cut Ibadan'strade routes and block its supply of arms from Porto Novo and Lagos, thusinitiating a war which lasted over 16 years and which was only resolved bythe intervention of the British Colonial Government at Lagos, when a peacetreaty was signed in August 1893*
Before discussing the city under British rule it is necessary tooutline.briefly the political system of pre-colonial Ibadan, as this is
16/relevant to the city's later development.—Following the fierce power struggle in its early days, Oluyole, who
ruled Ibadan for about 20 years until his death in 1847, established a system of government which persisted until the British occupation in 1893
14/— f JOHNSON, S. op cit., p. 327
Ibid. pp. 336-34516/— AWE, B.A. The Rise of Ibadan as a Yoruba Power in the 19th Century
Unpublished Ph.D. Thesis Oxford,1964

PART II CH 8 153
and beyond. (See Table A.8.1 on page *t13 )• At the head of the governmentwas the Bale* (lit. father of the town) and the Balogun (commander-in-chief of the army). The former was responsible for the civil administrationof the town, while the latter was in charge of all major military operations.Both men had equal status and each was assisted by an Otun Bale or OtunBalogun, that is, his right-hand man, and an Osi or lefthand man, who wasfollowed by the third, fourth and fifth in command. Ranked below theBalogun was the Seriki, a junior military leader, who was likewise assistedby an Otun and Osi. Women's interests were represented by the Iyalode whois described by Anna Hinderer in as "a sort of queen, a person of
17/much influence and looked upon with much respect".— It is especially noteworthy that none of these chieftainship titles was hereditary. In fact any free born male citizen could become a mogaji or head of his patrilineage and most junior title-holders were chosen from these lineage-heads. Chiefs of either division, the military or civil, moved up the social ladder to more prestigious and influential senior titles on the death of a senior title holder. Every patrilineage in town was attached to one important chief who directed the public affairs of the group concerned, but each mogaji could select the chief he preferred and was free to change his allegiance at will. It is clear that the political system of nineteenth century Ibadan was characterized by intense competition for power and influence both among the various lineage groups and among the leading warriors and title-holders.
* A Bale ranks generally under an Oba or king
-12/ HINDERER, A. op cit., p. 110

PART II CH 8
Ibadan under British Rule 1893-19^0
The agreement which the chiefs of Ibadan and G.C. Denton the Acting Governor of the Colony of Lagos signed in 1893 restored peace and stability to Yoruba land, but it also incorporated Ibadan and its vassal towns into the British Einpire. In the same year Captain Bower became the first Resident in the city.
The British colonial administration established its base on the northeastern outskirts of the town, and the railroad which reached Ibadan in .1901 had its headquarters and repair-shops at the west of the town, thus setting the pattern for Ibadan’s future development. With the railroad came a modern business community, with the result that the area around the station soon developed into the new commercial centre of Ibadan with warehouses, wholesale and retail-shops mainly for goods imported from Europe.— ■ These three institutions, i.e. the colonial administration, the railroad and thfe modern business community, were the new elements wrhich had the most decisive effectson the growth of the city. The rapid expansion of trade and sharp increase in%the number of immigrants to the city were among the first signs of change.
Among the earliest immigrants under colonial rule were the Hausa who already had traditional trading links with the Yoruba, and gradually settled in an area known today as Sabon Gari or new town on the northern outskirts of the city.-^/ They were closely followed by the Ijebu, Egba and Ijesha who settled in wards known as Agbeni, Amunigun, Idikan, Oke Foko and Oke Padre. (For the location of these areas, see Map A.8.2 on page ifll).
— ^ MABOGUNJE, A.L. Urbanization in Nigeria London 1968 pp. 209-213*AKINOLA, R.A. Ibadan: a Study in Urban Geography Unpublished Ph.D. Thesis, University of London, 19^3 PP* 139-137
19/— COHEN, A. "The Hausa" in Lloyd, P.C. et al., The City of Ibadan op cit.,pp. 117-127
COHEN, A. Custom and Politics in Ibadan A Study of Hausa Migrants in • - Yoruba. Towns. .London 19&9 -P* 31 • ' " .................. ...........

PAST II CH 8 155
The increasing influx of non-Yoruba traders from Lagos, Benin and Eastern Nigeria after 1920 duly led to the establishment of the suburb of Ekotedo just north of the railway station; but it was not until the early 1930's that the influx of educated young Nigerians to Ibadan to work as clerical staff in administration and commerce began. Most of these immigrants settled along the newly constructed Lagos by-pass in the southwestern part of the city.
In 19^6 Ibadan became the headquarters of the V/estern Region of Nigeria and six years later the capital of a semi-autonomous region. Both events brought new waves of Nigerian and European administrators, businessmen and technicians into the city, and most of these nev/comers settled in the rapidly growing western and northern suburbs. Since Nigeria became independent in i960, Ibadan has continued to attract a large number of people of all walks of life, until its population exceeded a million in the early 1970's.

PART II IBADAN CHAPTER 9 LAND TENURE IN IBADAN 156
HISTORICAL NOTES ON LAND TENURE
In the previous chapter we have seen how Ibadan developed from anencampment of several groups of marauding soldiers in the early 1820's,
1/into a Yoruba Metropolis of c. 100,000 inhabitants by 1893- The various war chiefs who settled in Ibadan took whatever land they needed for their compounds which were closely surrounded by the houses of their followers. Land granted by these chiefs to their followers or refugees was generally not recoverable by them and thus belonged to the head of the family and his heirs in perpetuity. However, serious crimes or rebellion against the chiefs were often punished by wholesale expulsion of the offending lineage, the destruction of their compounds, and the reallocation of their land to new-comers.
With the rapid increase of Ibadan's population the shortage of farmlandaround the city was soon apparent, and this situation forced people to movefurther away in order to find enough virgin bushland for cultivation. Landalready cultivated or cleared was later seldom allocated to strangers, butnew-comers were able to rent farms and grow food crops. However, sucheconomic trees as oil palms and later cocoa trees, belonged to the ownerof the land unless covered by special arrangements. It must be stressedthat before the British occupation, land in towns had no market value, and
2/therefore was not sold or bought.—
—' MILLSON, A. The Yoruba Country, West Africa, Proceedings of the Royal Geographical Society, Vol.13, No.10, Oct.1891 p. 5^3 • Mills on who visited Ibadan in 1891 estimated its population of 120,000.CARTER, Sir G. Report o’f the Lagos Interior Expedition 1893 Lagos 1893, p. V7, c 7 227. Carter estimated the number of houses in Ibadan at13,000 and its population at about 150,000. It is believed that this estimate was probably too high but it was accepted at the time as the official figure.
^ WARD PRICE, H.L. Land Tenure in the Yoruba Provinces Lagos 1939 P- ^2

PART II CH 9 157
During the first twenty years of colonial rule in southern Nigeria, three important laws relating to land were introduced by the British Government. They are: first the Native Lands Acquisition Proclamation No.1 of 1900 which was designed to control the purchase of land by non-Nigerians; second, the Land Registration Ordinance No.15 of 1907 which instituted compulsory registration of all sales of land with the colonial Government; and third, the Crown Lands Ordinance No.13 of 190& which regulated the management, control and disposal of Crown Land.— However, it is true to say that none of these laws affected the majority of the Yoruba who continued to hold, transfer and use their land in much the same way as their ancestors did. With the development of an economy based on money, transfers of farms and building land for cash instead of the customary gifts which consisted mainly of palm wine, gin and kola nuts, increased steadily and in spite of the opposition of the traditional and colonial authorities
Valike.— As one consequence of this development, outright sale of land has now become the most frequent mode of acquisition for building in the cities of Yoruba land.
3/— MEEK, C.K. Land Tenure, and Land Administration in Nigeria and the Cameroons London 1957 PP» 323“25» Crown land consisted of landacquired from the Royal Niger Company in 1900 and land bought by theGovernment from individuals, chiefs and obas. Crown land was sometimes leased to European commercial firms.WARD PRICE, H.L. op cit., p.61. In 1903 a Public Note was issued in Ibadan making the sale of land under the supervision of the bale. Seealso Native Court Rule 1918

PART II CPI 9 158
LAND TENURE AND TRANSFER TODAY
The main features of Yoruba land tenure were investigated by H.L. Ward5/Price in 1933 and by P.C. Lloyd between 19>6-59- three basic categories
of land tenure already identified in Chapter 2 apply fully to Ibadan. They are: first, community or public land; second, family land; and third, individually owned land. Community or public land includes inter alia land occupied by administrative buildings, most tarred roads, public markets, forest reserves and reservoirs. Family land (ile ebi) is inherited land which is owned corporately by a lineage and cannot be alienated outside the descent group without the consent of all adult male members of the lineage or section concerned; while individually owned land is usually acquired by purchase and the owner is free to sell or bequeath the land without the restrictions imposed on family land.-^
Let us now consider in more, detail the various types of land tenure which can be found in Ibadan city and the rights held in land by an individual or descent group. This analysis is based on interviews with 63 compound heads in the older parts of the city and is restricted to land on which the interviewee's compound was built.
Permanent Transfers of Land
Inheritance of compounds and compound-sites accounted for 57 «1 per cent of the compounds surveyed, and is by far the most important type of landtransfer. (See Table A.9»1 on page 1*0. However, we should distinguish here
5/—• WARD PRICE, H.L. op cit.LLOYD, P.C. Yoruba Land’ Law O.D.P. 1962. I did not carry out an investigationof Yoruba land law apart from the 63 household heads interviewed. ThisParagraph owes much to P.C. Lloyd’s outstanding research on the subject.ROWLING, C.W. Land Tenure in Ijebu Province Ibadan 1956ELIAS, T.O. For a pure legal view of Land Tenure see Nigerian Land Lawand Custom London 1951 PP» 88-16**COKER, J.O. Family Property Among the Yoruba London 1958 pp. 16-57
& -LLOYD-, P.C. Yoruba Land -Law • op cit.-, pp-. 7 6 - 8 6 ............................

PAST II CH 9 159
between the inheritance of the houses (50.8 per cent) and inheritance of land (6 .3 Per cent) on which the new owner has since built a house. The first category consists mainly of "family compounds" to which all the restrictions discussed earlier under family land apply. The second category is more difficult to define because it includes two different types of land; first, corporately owned family land, for example, the sites of ancestral compounds; and second, land bought by the owner’s father and inherited from him. Land of the first category cannot be sold without the consent of the grantor, though all improvements on it, such as, a house built by the present occupant, may in theory be sold by him provided he has notified the lineage head of his intention well in advance. In the second case the land and any house on it can be freely sold by the heir without any restrictions. Thus, inherited land includes some in which the present occupier has only usufructuary rights, and some which can be alienated by the heir without any obstruction.
As regards inheritance, after a man's death his rights in suchproperty as land or a house usually remain with his own omo iya*, agroup comprising his immediate family together with his remaining full
7/siblings and their children.—
Purchase of house-sites accounted for 22.2 per cent of the compounds surveyed. Purchase of land to build on is a relatively recent phenomenon in Ibadan and only developed during-the last 50 years. Purchase as contrasted with the customary modes of land transfer in pre-colonial Ibadan requires that a relatively large cash payment should be made to the
* For definition of this term see Chapter 11, page 183. 7/— LLOYD, P.C. Yoruba Land Law op cit., pp. 296-8

PART II CH 9 160
vendor, substantially above the value of the customary gifts. There seemsto be no simple correlation between the size of a building plot and theprice paid for it. For example, five compound heads paid so little fortheir land that these sums probably represented money substitutes for the
o /traditional gifts presented in return for a customary grant,— while one compound head paid £ 250 in 1965 for a plot measuring about 20 x 30 m.
Allocation of family land is usually made by a land holding descent group to its members in need. This may consist of farmland or land for building, which accounted for 17»5 per cent of the sites surveyed. Land granted for house building is heritable, but cannot be sold by its present owner without the grantor’s consent. However, any improvement made by the grantee on the land may be sold by him without the interference of his lineage group.
Temporary Transfers of Land
Temporary transfers of land are mainly restricted to farmland and fruit-bearing trees, and may take two forms: first, the pledging or pawning of land in order to obtain a loan; and second, the renting of land for a fixed monthly or annual rent in kind or cash (ishakole). These alternatives have already been discussed in Chapter 2 on pages - M+. However, the sample included two cases in which houses were rented as units to their present occupiers. In both cases, long-term arrangements had been made between the owner and tenant, which gave the tenant the right to sublet rooms•
8/— LLOYD, P.C. Yoruba Land Law op cit., p. 327 • Lloyd lists three points in which sale differs from customary grant.I. The land cannot be recovered by the vendor group.II. The land does not revert to the group if it is merely abandoned by
the purchaser or his heir.III. The purchaser gains by the sale not only a usufructuary right in
perpetuity but also a right to alienate the land.

PART II CH 9
In conclusion, some facts which have changed the traditional mode ofland tenure at Ibadan over the last 50 years should be considered. Thereis little doubt that the concept introduced by the British colonialadministration of land as a saleable commodity has substantially changedthe attitudes of people towards their land. Historically, sale of land formoney was regarded by the Yoruba as immoral and repugnant, and it was even
9/declared illegal in some areas.— However, over the past 50 years sales of building land on the perimeters of larger cities have steadily increased.
Many a household head seized this opportunity to free himself of the dependence on his descent group entailed by the traditional mode of land tenure, and built his house on purchased land well away from his ancestral compound in the old city.
In contrast, transfers of corporately owned land by succession or allocation are still in most cases conducted in accordance with the customary law which has changed little over the last 50 years. Hence the great number of families in the older parts of the city only hold usufructuary rights to the land they occupy.
LAND USE IN IBADAN CITY
The following summary of data on land use in Ibadan is based on the10/researches, of J.O. Oyelese at the University of Ibadan.— Using a set of
aerial photographs from 19&5i Oyelese measured and described 12 different categories of land use in the city area.* For convenience these categories have been reduced to five groups. They are:
9/—? LLOYD, P.C. Yoruba Land Law op cit., p. 528. According to Lloyd the sale of land in Ondo rural area was illegal. See also pp. 97-135•OYELESE, J.O. ’’The Growth of Ibadan City and its Impact on Land-use Patterns, 1961-1965" in The Journal of Tropical Geography, Vol. 32 June 1971i Singapore, pp. ^9-55
* The total city area given as 10,380 hectares (25,651 acres) was slightly above the area of the *t0 city wards, 9 ,763 hectares being
' Controlled by the ToWnplannin'g Authority.' ' .......................

PART II CH 9 162
Cultivated land which accounts for 39»0 per cent of the total city area. Cultivated land includes field-crop farms (35«2 per cent), private or government-owned experimental farms (3*2 per cent) and tree-crop farms (0.6 per cent). (See Table A.9»2 on page 414).
The built-up area represents 33*4 per cent of the city area andincludes roads as well as open spaces between houses. This category hasbeen further sub-divided into the traditional housing area 14.3 per centwith an average density of about 23 compounds per hectare in the core of
11/the city;— and the modern low and high density housing area (9-4 per cent), which, except for five former European housing reservations and some houses along the Lagos by-pass, were built after the Second Y/orld War mainly in the western and northern suburbs of the city. The density of these areas is between four and twelve houses per hectare. A third subgroup comprises all public, educational, industrial and commercial buildings including markets, and accounts for 9»7 per cent of the total city area.
Fallow and Woodland areas account for 18.8 per cent of the city area and include floodplains alongside the Ogunpa and Kudeti streams. According to Oyelese this area has been reduced from 4,219 hectares in 1961 to 1,934 hectares in 19&5- The reclaimed land is now partially used.for food growing and new housing developments.
Forest reserves. There are three major forest reservations or fuel plantations in the immediate neighbourhood of the town which cover about 780
hectares or 7*3 per cent of the city area; and, there are three main lakes and reservoirs covering c. 123 hectares, or 1.2 per cent of the total area.
11/— OYELESE, J.O. "The Growth of Ibadan City and its Impact on Land-UsePatterns, 1961-1965’1- in The-Journal of Tropical Geography op cit., p.

PART II IBADAN CHAPTER 10DEMOGRAPHY ^
IBADAN
The demographic situation of Nigeria has already been sketched in Chapter 3 and here I wish to concentrate on the population growth and accompanying developments at Ibadan. This is followed by some data obtained from my survey in the city and include inter alia age and sex distribution, ethnic composition and rural-urban migration.
The Growth of Ibadan's Population
From its beginning, Ibadan's population increased rapidly, mainly dueto the influx of refugees and free-lance soldiers from northern Yorubaland.Thus within the first three decades of its existence Ibadan grew remarkablyand by the second half of the nineteenth century, it had already become alarge city by any standards. According to David Hinderer, who was the firstmissionary to arrive in the city, in 1851 Ibadan had an estimated population
1 /of about 60,000 inhabitants.— Other missionaries who visited Ibadan in the2/early 1850's made similar estimates.—7
About forty years later, on the eve of colonial rule, British Government officials estimated the population of Ibadan as between 120,000 and 150,000
1/— HINDERER, D. Journals, Church Missionary Society (CMS) Archives, CA2/ 0^9 London Sep. 1851
^ TUCKER, A.W. Abeokuta or Sunrise within the Tropics London 1853» PP« 231-34. Miss Tucker estimated the population of Ibadan at 60,000. It is not clear if this is an estimate arrived at independently or simply a repetition of Hinderer's earlier figure.BOWEN, T.J. Central Africa: Adventures and Missionary Labors in Several Countries in the Interior of Africa, from 1849-1856. Charleston, South- Carolina, p.218. Bowen ‘estimated the population ofIbadan at 70,000

PART II CH 10
inhabitants^ Official estimates of Ibadan’s population conducted in 1911k/gave totals of 175,000, in 1921 238,000, and in 1931 3^7,000 inhabitants.-/
No population estimate was made in 19^1. (See Table A.10.1 on page *f15)*The first census with a house-to-house count was conducted in 1952 and
5 /gave a total of ^59,000.— A second census in 1962 was never published, butanother attempt one year later showed that the urban population of Ibadan had
risen to about 627,000 yielding a growth rate of 2 .9 per cent per annum overthe preceding 11 years.—^ Today, tentative projections indicate that the
7/population of Ibadan reached the one-million mark by the early 1970's.— However, all these estimates and census returns, which suggest an
impressive and uninterrupted population growth, are somewhat misleading.One reason for this uncertainty lies in the perpetual movement of people which takes place between Ibadan and its rural hinterland. It is well known that a large proportion of families who have houses in the older parts of the city spend most of their time working on their farms, some up to kO km away. While some of these people visit Ibadan quite regularly, normally
^ MOLONEY, A. Notes of Yoruba land and the Colony and Protectorate ofLagos, Proceedings of the Royal Geographical Society, New Series No. 10 Vol. 12 London 1890, p. 596. Moloney estimated the population of Ibadan at 150,000.MILLS0N, A. The Yoruba Country, West Africa, Proceedings of the Royal Geographical Society, No. 10 Vol. 13* 1891 p. 563- Millson estimated the population of Ibadan at 120,000CARTER, G. Dispatch from Sir Gilbert Carter furnishing a General Report of the Lagos Interior Expedition C.7227, London 1893 P- ^7- Carter estimated the population of Ibadan at 150,000
—^ COLONIAL OFFICE Official Report on the Southern Nigeria Census 1911i Southern Nigeria Annual Report 1912, pp. 629-56.COX, H.B. Census of the Southern Provinces, Vol. 3 of the Census of Nigeria, 1931 London 1932
- V DEPARTMENT OF STATISTICS, NIGERIA Population Census of the Western Region of Nigeria 1952, Lagos 1956,”p. 23
^ FEDERAL OFFICE OF STATISTICS, NIGERIA Population Census of Nigeria 1963 Western Region, Vol. 2 Lagos 1968, p. 26
^ MABOGUNJE, A.L. Urbanization in Nigeria London 1968 p. 236

PART II CH 10 165
once a week, others may only return for the big festivals such as OkeBadan in March, the Egungun festival in June, and other important family
8 /occasions.— It has been estimated that at times v/hen agriculturalactivities are reduced, and during the above mentioned festivals, the
1 9/population of Ibadan may increase by as much as 30 to W per cent.—That such a substantial population fluctuation should occur frequently in the city raises an important question namely: what population was counted in the censuses of 1952 and 19&3 i "the city's permanent residents, those who return regularly to the city, and those who live in surrounding villages and hamlets but nonetheless regard Ibadan as their home, and would probably come to the city in an event such as elections or censuses? Obviously, a clear definition of its various categories of residents is urgently needed at Ibadan, and until this has been done, any census of Ibadan's population will be highly ambiguous.
MITCHELL, N.C. Some Comments on the Growth and Character of Ibadan's Population, Research Notes No.4 Dep. of Geography, University College Ibadan 1953 PP- 9“10. Mitchell reports that farmers who live in the immediate surrounding rural area spend on average four nights on their farms and three in Ibadan during any one week.MORGAN, W.B. The Change from Shifting to Fixed Settlements in Southern Nigeria Research Notes No.7 Dep. of Geography, University College Ibadan 1955> pp.14-25- Morgan found that in spite of permanent residence in the villages, farmers return to Ibadan for the big festivals.MILLSON, A. op cit., p. 583* Millson mentioned that "Ibadan counts over200,000 souls while within the wall of the city itself at least 120,000 people are gathered." The remaining people live in villages and work on their farms.LLOYD, P.C. Yoruba Land Law Oxford University Press 1962 p. 55- Based on the 1952 census, Lloyd estimated that the "sociological population" of Ibadan is c.700,000.of which approximately 459»000 or 66 per cent were living in Ibadan city.

PART II CH 10 166
The Growth of Ibadan City
Ibadan's growth and the development of its residential districts have10/been described in detail by A.L. Mabogunje.— As the result of the
population growth sketched above, the development of Ibadan can be broadly
divided into three periods:
First the pre-colonial period, 1820 to 1893;
second the colonial period, 1893 to 1952*; and
third the period after independence.
Each of these periods has left its mark on the city by creating an
area with distinguished patterns of population density, house types,
socio-economic and cultural characteristics.
Developments during the pre-colonial period from the early 1820's to
1893 established two similar areas, namely, the "core region" an area11/which S. Johnson described as "about half a mile around Oje Iba market",—
and second, a surrounding built-up area which stretched in 1893 as far as
Agbeni and Foko in the west, Kudeti in the south, Elekuro and Aremo in
the east, and Agodi in the north-east. (See Plan 10.1 on page 167)- Today,
these areas house about half of Ibadan’s population and are by far the
most densely populated parts of the city. Present levels of population
density are attributed by A.L. Mabogunje to "growth by fission", that is
"the replacement of simple large structures (i.e. the traditional Yoruba
compound built around one more more spacious courtyards) by more complex
MABOGUNJE, A.L. "The Growth of Residential Districts in Ibadan" in Geographical Review, Vol. 52 pp. 56-57*
MABOGUNJE, A.L. "The Morphology of Ibadan" in The City of Ibadan ed. Lloyd, P.C. et al., Cambridge 19&7 PP« 35~56MABOGUNJE, A.L. Urbanization in Nigeria op cit., pp. 205-37
* In 1952 Ibadan became the capital of a semi-autonomous Western Region with the transfer of political power from the British Colonial Government to the nationals of the region. The political independence
• • of-Nigeria-came in-October -1960......................................22/ JOHNSON, S. The History of the Yorubas Lagos i960 p.
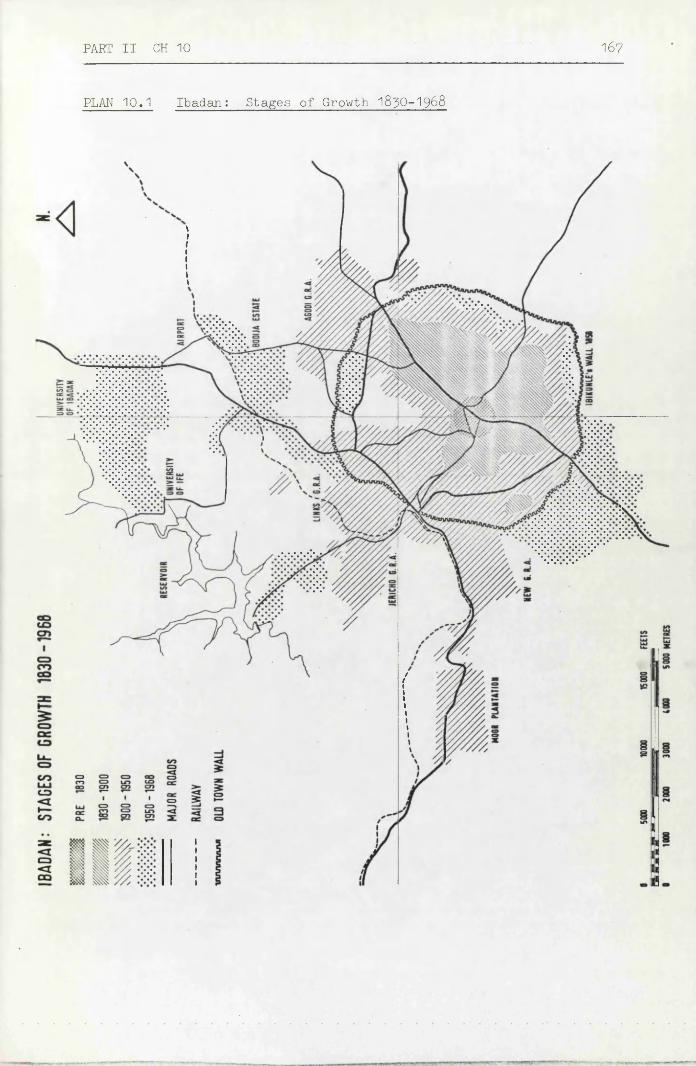
PART II CH 10 167
PLAN 10.1 Ibadan: Stages of Growth 1830-1968

PART II CH 10 168
and more numerous smaller units.’*— ' (See Table A.10.2 Group I and II column h on page A-15 )• Nearly all houses built in this central area have mud walls covered with corrugated iron roofs.
The colonial period from about 1893 to 1952 was marked by a rapid expansion of the city. Most immigrants to Ibadan during this period settled to the west and north of the old city. Some of the houses built in these areas have mud walls rendered with cement plaster and covered with corrugated iron roofs, while others are constructed with modern building materials and include such amenities as piped water and electricity. The steady increase of European administrators, technicians and businessmen from 38 in 1921 to over 2,000 in 1952 led to the construction of five residential reservations in the city. Until 1952 these reservations were exclusively occupied by Europeans, but since the transfer of political power that year, the Europeans have gradually been replaced by Nigerians of similar rank and income.
Since 1952 Ibadan's development has largely been initiated by a new class of Nigerian professionals who took over the administration of the region. Their demand for modern and more spacious houses equipped with all necessary sanitary and household amenities sparked off new developments in the south-western suburbs beyond the nineteenth century town wall and to a lesser extent in the northern parts of the city including the Bodija Housing Estate. In the early 1960's the spatial expansion of the city was indeed impressive. For example, in 1961 Ibadan's total built-up area was c. 2 ,630 hectares, but by 19&5 "this had increased to c. 3 i 70 hectares, that is by about 30.0 per cent in only four years. Of this expansion,
MABOGUNJE, A.L. "The Growth of Residential Districts in Ibadan" inGeographical Review op cit., p. 60. (Words in parenthesis are mine.)
PART II CH 10 169
traditional and modern housing arean accounted for c. 530 hectares, whilepublic, industrial, commercial and educational building areas increased by
13/about 310 hectares.—^
Ethnic Composition
The ethnic composition of Ibadan Division as shown in Table 10.1 below
is derived from the 1952/3 and 1963 census reports.
TABLE 10.1 Ethnic Composition of Ibadan Division Census 1932 + 63in Percentages --
1952— 7 1963^/Yoruba 96.2 95.0Other Southern Nigerian Tribes 1.7 3.7Northern Nigerian Tribes 1.6 0.9Non-Nigerians 0.1 0.2Unspecified 0.4 0.2Total 100.0 100.0
According to the 19&3 census only about 5 per cent of the total divisional population were non-Yoruba. The largest group of these non- Yoruba immigrants were Ibo from Eastern Nigeria, who increased from 7*800 in 1952 to Cm 26,000 in 1963* Unfortunately none of these censuses provide us with a breakdown of the various Yoruba sub-groups such as the Egba, Ijebu and Oyo, to name only the most important groups, who together form the largest immigrant group in Ibadan. However, data cited below give some indication of the proportion of non-indigenous Yoruba within my sample population.
-— f OYELESE, J.O. "The Growth of Ibadan City and its Impact on Land-use Patterns, 1961-1965” in The Journal of Tropical Geography Vol. 32 June 1971> Singapore, pp. 49-55
14/— ' DEPARTMENT OF STATISTICS, NIGERIA Population Census of the Western
Region of Nigeria 1952 op cit., p. 18— FEDERAL OFFICE OF STATISTICS,' NIGERIA-Population Census of Nigeria 19o3 •
op cit., Vol. 2, p. 70

PART II CH 10 170
SAMPLE SURVEY
Data from the sample survey regarding the age and sex distribution, ethnic composition and some aspects of the rural-urban immigration are given below.
The sample population covered 1,285 persons representing about 0.2 per cent of the total population of Ibadan.
Age and Sex Distribution
The age composition of the sample population was collected with the help of the so-called "historical calendar method" by which individual ages are estimated by reference to past events that give their approximate date of birth. However, it must be stressed again that while this method generally restricts errors within somewhat narrower limits, it does not entirely exclude misinformation.
The following table gives the age and sex ratios of the sample population, for comparison with the census returns for Ibadan Division in 1952 and 19&3-
TABLE 10.2 Population Distribution by Sex and Age Groups in Ibadan in Percentages
Ibadan Div. 1952 Total Pop.796,900
Ibadan Div. 19^3 Tot.Pop.1,258,600
Sample Surv. 1968 Total Pop. 1,285
0-1*+ 50.9 31.9 *+1 .2
l5-*+9 *+1 .0 62.3 ^9.950+ 8 .1 5.8 • 8.9Male 51.*+ 55.9 *+8.1
Female *+8 .6 *+6 .1 51.9Total 100.0 100.0 100.0

PART II CH 10 171
A more detailed bar-chart on page4l8 shows comparative percentage distribution for male and female at five-year intervals for Ibadan Division in 1963 ^or the sample survey population. As can be seen in Diagram A. 10.1 on page 418 , the sex and age distributions in 19&3 was seriously affected by age-selective immigration which resulted in a substantial excess of males and females in the age-groups 20 to 29- This pattern of age distribution, which has been widely accepted as "normal11 for rapidly growing urban centres in Africa, is far less pronounced in
the survey sample population, as shown in Diagram A.10.2 on page 418 •Two likely explanations for these differences in age distribution are the smallness of the sample coupled with the fact that only 26 compounds or 40 per cent of the sample were situated in predominantly immigrant areas of the city.
The sex ratio given in Table 10.2 on page 170 shows an excess of males over females in both the 1952 and 1963 census, while there are slightly more females than males in the sample population. However, it is interesting to note that for tenant households in the sample, most of whom are immigrants, the sex ratio is reversed with 53•2 per cent male and 46.8 per cent female. There is also a notable increase of males and females in the age groups between 25 and 34. (See Table A.11.3 on page 421).
Ethnic Composition
The ethnic composition of the sample population closely resembles the figures given in Table 10.1 on page 169 and is as follows: Yoruba94.0 per cent; other southern Nigerian tribes 3*7 per cent; northern Nigerian tribes with 2.3 per cent.

PART II CH 10 172
Migration
As we have seen, migration has always played an important part in Ibadan’s population growth. It was the large number of immigrants who came to the city in the late 1830’s and early 1840's who helped to establish Ibadan as the leading military power in Yoruba land; and, after the first years of British rule, it was again a never-ending stream of immigrants from all over Nigeria who contributed to the economic growth and wealth of the city.
It is thus not surprising that in all 330 persons, 164 males and 166 females, or together 25«7 per cent of the sample population were born outside Ibadan. Most male immigrants in this group came to Ibadan in search for work or better trading opportunities, while nearly two thirds of the females came as wives.
Some distinction must be made here between the long-range migration of people coming from other parts of the country, and the short distance population movements mentioned above that take place between Ibadan and its surrounding countryside. In this section we are concerned only with
people of the first category.As already shown in Table 10.1 on page 169 r only about 5 per cent of
the population in Ibadan Division are not Yoruba. This relatively small proportion, which roughly corresponds with my own findings, c. 6 per cent, indicates that the majority of immigrants must have come from other Yoruba sub-groups and for this reason were not separately counted among the immigrants in the censuses of 1952 and 19^3* Table A.10.3 on page 419 tries to answer this question for the household heads in the sample.Of the 295 household heads who replied, 135 or 45-8 per cent were born outside Ibadan. Of these latter 115 or 39*0 per cent belonged to one of

PART II CH 10 173
several Yoruba sub-groups, 1*f or *f.8 per cent were members of various other South Nigerian tribes such as Ibo and Edo, and 6 or 2.0 per cent came from northern Nigeria. The largest tribal sub-group among the 115 Yoruba household heads were Egba of Abeokuta, with 29 or 9*8 per cent’, followed by Ijebu with 15 or 5-1 per cent, and Oyo with 11 or 3*7 per cent.
Since over ^5»0 per cent of all household heads are immigrants, what, one may ask, happens to newcomers when they move to Ibadan. Do they still group themselves according to their’ethnic origin? In the past immigrants of the same tribal group tended to congregate in certain areas. Thus when the first Ijebu and Egba arrived at the beginning of this century they settled at the western outskirts of the built-up area in districts now known as Agbeni, Idikan, Amu'nigun and Oke Foko. (See Map A.8.2 on page Hausa and Nupe from the North built their houses in the SabonGari or new town, and at Mokola on the northern fringe of the city, while Ibo, Edo, Ibibio and the people from Lagos are mainly found in Ekotedo and the neighbouring Inalende. This general pattern has not substantially changed.
Informants among the sample of household heads who immigrated to Ibadan agreed on the central role played by kinsfolk, town or village unions and associations in assisting newcomers in their search for employment in town; and immediate kin, or in their absence people from the same village, town or ethnic group provided the necessary shelter. Such close contact with his own group provided the newcomer with a sense of belonging and security which greatly helped him to adapt more easily to the new urban environment. However, there are indications that after this initial stage of adaptation, well-to-do household heads often prefer to settle among people of their ownstatus and income group, rather than in areas dominated by their own ethnic
16/ group .— ■
SKINNER, E.P. "Strangers in West African Societies" in Africa Vol. XXXIII 1963 pp. 307-20

PART II IBADAN CHAPTER 11 DOMESTIC GROUPINGS 17*t
The following discussion of domestic groupings is divided into three parts. The first part gives a brief description of various house-types found in the older districts of the city; the second deals with Yoruba household and kinship patterns based on my survey of 63 compounds in Ibadan; while the last part analyses the distribution of floor area in various kinds of households.
THE COMPOUND
Lay-Out and Organization
Most compounds found in the older districts of the city can be grouped into two major categories; first, the traditional Yoruba compound built around one or more spacious courtyards; and second, a much smaller house with fewer rooms grouped around a central hall or corridor.
The traditional Yoruba compound (agbo-ile) is inhabited by a lineageor section of a lineage consisting of a group of patrilineally relatedfamilies (ara-ile, lit., residents of the house) descended through malesfrom a common ancestor. The compound head (bale) usually has his roomswhere he receives visitors and entertains his friends opposite the mainentrance. Strangers, clients and more distant relatives usually have their
1/rooms near the entrance gate.— Nearly all rooms in the compound face the courtyard(s), and each has a covered veranda or portico in front where most of the daily housework including cooking is done. Today, only a few such compounds have survived in Ibadan, and only one was studied by the author, though'not included in the survey. (See Plan 11.1 and 11.2 on pages 173-176).
^ LLOYD, P.C. "The Yoruba Lineage" in Africa, vol. XXV, No. 3 P« 238

TRAD
ITION
AL
COMP
OUND
PART II CH 11
.dittonal Compound in Ibaaan
v
o q tn £= <3 =>s: S 2

PART II CH 11 176T R A D IT IO N A L COMPOUND PLAN 11.2 A Courtyard in a Traditional Compound
in 'Ibadan
{722/77.2.2/ 77722.27///77-1//777///// 2777//7
T O U! (l; 15 ZZZZZZZZZZZ3— ZZ77T77/2 vr/n/tn/nn/ / / / / / /
7-0E2ZZZ3
z z z Z z z z z z z z z z 9 jV77//77,
F I R E p PLACE0
'tm z zrZA
0 IP !^ z z z z z z zzzzzzzzz
2 C OURT YARD 0 .
<jp>| B A T H R M . ?
77777 7277/77
O liLs o0,0 ^ d"77777777/0 0 Irr, o / P d P J L jP
//ZZZZZZZZ/ ZZZZ23
/p V //i- Z727ZZ7r~7Z77p-~J7*-----
7777/ 77/7 7 2777^/777777T7/T77 f22/22127/2//77~?777777/777777/ 7 /7 / /> 7 7 7 7I Tf ////7/ZZZ77
05 1 210 15 20
7 M E T R E S
F E ETS
ORIS U N ( F O U N D E R )
AM O M O O U O S U N O I N A d. 1 8 6 2
_ _ _ _ _ _ _ _ _ _ IIPB A K A R I d . 1 8 5 6
, 1 , .RAJI d. 1911
A M I N U BAL DCUN d. 1 9 3 5
N E Y
C H . C O M P O U N D H E A DA“0 M A R R I E D 1 A R O O M N U M B E Rm1 A#< 1
T W I N S
C H I L D R E N
D E A D A C E D I E D
C > A
S T R A N G E R S
A L I V I N G O U T S I D E
O D I V O R C E D

PART II CH 11 177
The second house-type mentioned above consists of a double row ofrooms which open onto a common hall or passage. The central hall is ofgreat importance for the running of the house and serves not only as acommon place for working, sitting and storage, but also as an additionalsleeping area for overnight guests from the village. (See Plan 11.3 onpage 1 78). In more recently built houses, the spacious central hall hasbeen replaced by a central corridor or passage which leads onto a back-yardwhich usually contains a common kitchen, bathroom, pit-latrine, and one ortwo storage rooms. (See Plan 11.4 on page 178). This latter type, whichhas on average between six and eight rooms, is by far the most frequently
built house-type in the city today. In predominantly immigrant areas suchas Ekotedo, Inalende, Mokola and Molete, this type of house may have manymore rooms and even a second floor which is sometimes occupied by theowner and his family, while all other rooms are rented out to immigrantfamilies. (See Plan 11.5 on page 179).
Another clearly recognizable house-type is the modern self-containeddwelling built with permanent building materials and including all thenecessary sanitary installations such as water and electricity. Thesehouses are normally designed by Architects for the Government, for HousingCorporations, Housing Societies and wealthy individuals; they are described
2/in various publications and have not been included in my survey.—Finally, the so-called "Brazilian Houses" must be mentioned. Originally
reserved for houses built in the second half of the nineteenth century in Lagos and other West African coastal towns by former slaves returning from South America, the term is now very loosely used to denote any two-storey house with a central corridor, a decorated street elevation, and brightly
?/- UNITED NATIONS Housing in Africa E/CH/14/HOU/7/Rev. New York, 1965
OFFICE OF INTERNATIONAL HOUSING Housing in Nigeria Washington 1964, HHFA, Country Report Series

PART II CH 11 178
PLAN 11,*t House 3^
i - i1 2 x 1 11 S < J " 1
PLAN 11.3 House 9
30 noLL\\\\\x

PART II CH 11 179
HOUSE N2 23 PLAN 11.5 House 23
7n z m m w m w 7zzm mBATHRMr/
KITCHEN
7ZZZZZZZZZ
t7ZZZZ
oflzzzzzzzzz
a 0 i «
......7Z2///////7
36LXJ 0 o' 777/////
2222S
TENANT HOUSEHOLDS
NUMBER OF HOUSEHOLDS
NUMBER OFPERSONS
PERSONS PERHOUSEHOLD77//////
ZZZ2Z2Zzzzzzzz
LL//U/J
n i n i l i i n i iO A A 6 A A O A A A O O O O□ .
CP^OC/ X7777///////7ZZ /777,A
29 29 28ONE OOMESTIC UNIT
77777777//VyZ72Z7/7L/-
a; a ? • " kr? vz2zt/////nz/.777/277/7/ /7777////L'/m /U J J Z 7
i O n
i— do u mFIRST FLOOR
0 5 1 2 3 I 5fits i&rw’K i4' M‘k 5 10 B
E 7 METRESStlwa 20 FEETS
PART II CH 11 180
coloured balustrades. To the best of my knowledge there is no original ’’Brazilian House” found in Ibadan, but a few have survived in Lagos.
Land Use
Data on land use given below derive from measurements taken in 63
compounds in Ibadan. The compounds surveyed cover a total area of 18,125 sq.m.* divided between the built-up area of 12,379 sq.m. or 68.2 per cent and the open area of 5i733 sq.m. or ^1,8 per cent, the average size per compound being 288.0 sq.m. or 3i100.0 sq.ft. The open area can be subdivided into four categories.
Unpaved areas in courtyards and around compounds. These covered 31878
sq.m. or 67 .2 per cent of the total open area.Cement platforms which covered 1,5^9 sq.m. or 26.8 per cent of the
open area. Cement platforms found in courtyards are used as outdoor working areas, while those in front of compounds are occasionally occupied by traders to display their goods.
Pit-latrines and washing places covered 162 sq.m. or 2.8 per cent of the open area; and
Storage space occupied l8*f sq.m. or 3*2 per cent of the total open area. The items most frequently stored there included such building materials as sundried bricks and cement blocks as well as firewood and old clay pots.No cultivated land was found in any compound. (See Table A. 11.1 on page *+20).
* The total area includes the built-up area, *+7 courtyards average size 6 2 .5 sq.m. and other open areas surrounding the compound which are exclusively used by the inhabitants of the house. Public or semi-public footpaths and other open areas alongside the house are excluded. The area given above does not necessarily correspond with the total area owned by the family concerned.

PART II CH 11 181
Type and Size of Rooms
The built-up area in all the 63 compounds surveyed contained a total of 1,099 rooms, averaging 17 per compound. The total floor area of 9,322 sq.m. is divided into four categories.
Living areas accounted for 7,953.6 sq.m. or 83.6 per cent of the total floor area. This category includes 578 rooms with an average size of 8.0 sq .m. which are used for sleeping; 50 sitting rooms or parlours with an average size of 10.9 sq.m.; 86 central halls with an average size of Zb.7 sq.m.; 5^ storage rooms for personal belongings with an average size of 6 .3 sq.m.; and 5*1 temporarily empty living and/or sleeping rooms. With a total of 814 rooms this is by far the most important group.
Common rooms accounted for 5^*9 sq.m. or 5*7 per cent of the total floor area. This category includes 66 entrance lobbies with an average size of 5 .8 sq.m. and 19 passages and staircases.
Basic ancillary facilities accounted for 728.3 sq.m. or 7-6 per cent of the total floor area. This includes 57 kitchens with an average size of 7.1 sq.m., 35 store rooms with an average size of *t.6 sq.m., and 69
toilets and bathrooms.Commercially used rooms accounted for 290-5 sq.m. or 3»1 per cent of
the total floor area. This category comprised 35 shops and/or workshops with an average size of 7*^ sq.m., two storage rooms for trade goods and two permanent stables. (See Table A.11.7 on page ^2*0.

PART II CH 11 182
SOCIAL STRUCTURE AND KINSHIP ORGANIZATION
In the following pages I first summarize some categories of Yoruba social structure and kinship organization, and then relate these ideas to the compounds surveyed and their inhabitants. Among many distinguished scholars who have studied the Yoruba of south-western Nigeria, the works of W.R. Bascom, W.B. Schwab and P.C. Lloyd were of particular interest for my study.
As already mentioned the Yoruba of Nigeria* are an urban people who have lived in large urban communities for several centuries.—^ Today, over half of the total Yoruba population in Nigeria live in urban settlements having 20,000 and more inhabitants.
The kinship organization of the northern Yoruba, which includes the4/people of Ibadan, is based on agnatic kinship groups.— The Yoruba
patrilineage (idi'le) is defined by reference to the lineage founder (orisun)and consists of all recognized agnatic descendants of that ancestor. Theknown history of a patrilineal descent group may be several generations indepth, and is often preserved in ritual chants (rara) and praise songs(oriki). In Ibadan the lineage founder is usually 3 to 5 generations remotefrom the oldest living member of the group. According to B. Lloyd some largelineage groups contain more than one thousand living members who o c c u p y
5/several adjoining compounds.—
* There are small groups of Yoruba living in Togo and Dahomay.3/ BASCOM, W.R. "Urbanization Among the Yoruba" in American Journal of
Sociology, vol. LX No. 5 1955» PP- 446-54V— LLOYD, P.C. "Agnatic and Cognatic Descent Among the Yoruba" in Man,
The Journal of the Royal Anthropological Institute, Vol. I No. 4 1966, pp. 484-500LLOYD, P.C. Yoruba Land Law op cit., p. 56
SCHWAB, W.B. "Kinship and Lineage Among the Yoruba" in Africa, vol. XXV No. k 1955, pp. 352-7^
q/. ...................................................................— LLOYD, B. "Indigenous Ibadan" in The City of Ibadan ed. Lloyd, P.C. at al.op cit., pp. 59-83

PART II CH 11 183
Within each lineage there are divisions into segments known as igun or origun. Each segment may occupy the rooms around one courtyard, or it may occupy a separate compound which is the base of a co-residential kinship group and the unit of analysis in this study. The population of a compound may be further divided into various related individual families. The individual family which consists of the male head, his wife or wives and his own children, is known among the Yoruba as oba kan.* As Yoruba are polygamous, an oba kan may be sub-divided into the children of each of the head's wives. These groups sire known as omo iya, lit., children of the same mother. Hence, an oba kan group contains as many omo iya as the male head has wives with children. This pattern is illustrated in the diagram below.
DIAGRAM 11.1 Yoruba Kinship and Descent
oba kan
omo iya
However, like the Yoruba, we have to extend an omo iya group beyond the limit of the individual family. Unless all his full siblings are dead, the family head who is normally male is a member of the omo iya group into which he was born; and with his own children these persons will be regarded as part of a wider close-knit kinship group, which may form the base of a co-residential kinship group.
* Oba kan and omo iya are terms which describe the relationship between children and their parents. I will follow here F.C. Lloyd in extending both terms to denote a group of people so related.

PART II CH 11 18^
So fax we have briefly discussed the various kinds of kinship groups recognized by the Yoruba and we must now turn to the division of the compound population into economic units or households. As already pointed out in Chapter k on page 63, the compound population is not necessarily divided into economic units along kinship lines and a household mayinclude several other related or unrelated persons.
The 63 compounds surveyed in Ibadan contained a total of 293households which fall into three categories. First, there is the compoundhead's household; second, there are all other related households which are dependent or semi-dependent; and third there are tenant households which pay a weekly or monthly rent for their rooms.
In the following pages I intend to examine these three different categories of households before discussing the various forms of family groupings and the cyclic tendency which regulates their growth, decline and size.
Population and Household Data
The population distribution of these 63 compounds is given below.
DIAGRAM 11.2 Number of Persons per Compounds in Percentages
30#
20%
10#
0%
No. of Persons
i.
0-if 5-9 • 10-14 15-19 20-24 25-29 30-3^ 35-39 ^0+

PART II CH 11 185
Over two thirds or 69.8 per cent of the sample compounds have populations that range between 5 and 24 persons, the average being 20.4 persons per compound. However, 11 or 17.4 per cent of these compounds contained between 30 and 49 persons, while 2 or 3*2 per cent had 32 and 76 persons respectively. The two largest compounds are "tenement-houses" situated in predominantly immigrant areas west of the old city.
Variations in the size of the three types of households distinguished above are compared in Diagram 11.3 on page 186. The three diagrams reveal some interesting features. Nearly three quarters of all compound heads’ households have populations that range between 3 to 10 persons, whereas, nearly half of all dependent households have populations of 3 to 4, and over 50 per cent of tenant households only 1 to 2 persons. The average size of households decreases from 7«2 persons per households in the first category to 4.2 persons in dependent households and 3 -0 persons in tenant households. These differences in household size sire partly due to the fact that the two latter types of households consist mainly of "young households".* For example, only 14.9 per cent of wives of dependent household heads and 4.3 per cent of wives of tenant household heads have passed childbearing age (40 plus), as against 41.8 per cent of all compound heads' wives. Furthermore, the lack of cheap and suitable accommodation as well as the generally lower income of the heads of these dependent and tenant households, a topic discussed in the next chapter, tends to limit, at least temporarily, the number of children in these families.
In the following table a preliminary discrimination is made among men in each of these three households according to the numbers of their wives.
* For the age of household heads see Table A.11.3 and A.11.4 on page 421.

PART II CI-I 11 186
DIAGRAM 11,3 Number of Persons per Household in PercentagesA. Compound Heads' Households (63)30 % _.------------ ------------- ------ ------ ------ ►—
20 % = ^ ^ =8 ---------------
10 % : : = —
0 % -------- i- - - - - - - - - - - - - - - - - - !- - - - - - - - - -1-2 3-A 5 -6 7 -8 9-10 11-12 12+ Persons
B. Related Dependent or Semi-Dependent Households (108)
50 % — |------------ ------------- ------ ---------------
bO % ------------------------------------------ -
30 % ____________________________________________________
20 % -------------------------
10 % ----------------------
0 % J I *______ ______ ________1-2 3-A 5 -6 7-8 9-10 Persons
C. Tenant Households (12A)
60 % T
50 % ~
bo
30 % ~
20 % ~
10 %-
0 % -. . . . 1-2 . -3-A- - 5-6 . 7-8. - 9-a0 - .11.-1-2 . . . . Persons .
T
\

PART II CH 11 187
TABLE 11.1 Distribution of Wives per Married Man
Column 1 2 3 4Type of Househ. Com.Head Dep.H.H. Tenant H.H. Total
No. % No. % No. % No. %
Male with 1 wife 28 46.7 70 70.7 83 89.5 183 72 .0 !Male with 2 wives 19 31.6 23 23.2 10 10.3 52 20 .5 IMale with 3 wives 10 16.7 6 6 .1 - - 16 s.?Male with 4 wives 3 5.0 - - - - 3 1 .2 |Total 60 100.0 99 100.0 95 100.0 254* 10*0.0 ' jNo. of wives 108 134 105 347
I
% of males inpolygamousfamilies
33.3 29 .3 10.5 27 .9
% of females inpolygamousfamilies
74.1 47.8 19.0 47 .3
Average no. of wives per married man
1.8 1.3 1.1 1.4
This table shows clearly the dominant economic position of the compound head and the prestige generally associated with polygamous marriages among both the Christian and Moslem communities in Ibadan,
The age and sex distribution as well as the marital status of the sample population is given on page 188. The bar-chart indicates that young persons of both sexes but particularly females marry on average at a later age than their counterparts in Zaria. About half of the 49 widowed females who lived in the compounds surveyed are former wives of deceased compound heads. Some widows, who are no longer able to work, were supported by
* There were 41 households whose head was either single, divorced or widowed.

PART II CH 11 188DIAGRAM 1 1 .4 Survey Sample Population by Sex, Age and Marital Status
MALE FEMALE
ZZ
120 110 100 90 80 70 60 50 AO 30 20 10 0
Z
0 10 20 30 L0 50 60 70 80 90 100 110 120 PERSONS
SINGLE MARRIED DIVORCED OR W100WED
TABLE 1 1 .6 Survey Sample Population by Sex , Age and ?■arital StatusMale Female G
Age Sing' Mar ■ Div Wid Total Sing Mar ’ Div Vid Total Total0- 4 125 125 105 105 228
.5- 9 91 91 93 93 18410-14 65 65 52 1 53 11815-19 40 40 30 20 50 9020-24 52 10 42 6 61 1 68 11025 -29 19 54 2 55 1 70 3 74 12950-54 5 45 1 49 55 1 1 • 57 10635-59 2 45 45 48 1 4 53 9840-44 1 21 1 25 18 1 6 25 4845-49 1 29 50 20 7 27 5750-54 16 1 17 15 4 19 3655-59 9 9 7 1 3 11 2060—64 10 1 11 4 8 12 2365-69-1 9 2 11 1 2 3 1470+ 5 2 7 3 14 17 24Total 579 229 5 5 618 287 323 8 49 667 1,285

PART II CII 11 189
their next of kin, while the younger widows will leave the compound on re-marriage. (For more detailed information see Table A.11.9 on page 422).
Family Grouping
The following discussion on family groupings is partly based on household data; but as we cannot fully understand the principles that govern the constitution and changes of family grouping by reference to household data alone, some additional kinship data having a common reference point are necessary. For this purpose, compound headship provides the natural focus, since by systematically classifying the sample population in terms of their individual relationship to the compound head, we are able to expose the internal fabric of kinship structure. (See Tables A.11.4 and A.11.5 on pages **21 -422). As already shown elsewhere, kinship groups are liable to constant changes due to marriage, migration and death of their male members. How such changes affect co-residential kinship groups and so modify the lay-out and size of compounds in Ibadan will be the subject of the following analysis.
We may begin by recalling some earlier findings on the development of co-residential kinship groups at Zaria. There, most co-residential kinship groups are based on agnatic descent. We also found that the individual family was the first and simplest stage in a development cycle that gave rise to composite co-residential kinship groups. In the six such stages we identified, the last was that of a compound which housed paternal cousins and their descendants.
The majority of compounds surveyed in Ibadan also contained family groups based on agnatic kinship. We may therefore apply a similar mode of analysis to the kinship data collected there. However, one important difference must be briefly discussed first. Unlike Zaria, at Ibadan our sample included a total of 124 households containing 378 unrelated persons who lived as tenants in about half of the compounds surveyed.

PART II CH 11 190
Thess tenant households, which neither contribute to nor influence the development of complex co-residential kinship groups are omitted from the next table and analysed separately later.
The top part of Table 11.2 on page 191 gives the age distribution of the 63 compound heads, according to the composition of the co- residential kinship groups. These age distributions, when compared with the simplified kinship diagrams in the lower part of the table, clearly show that compound heads in stages 1, 3 and 6? which result either from migration or the death of a former compound head, are on average younger than their counterparts in stage 2, and 5* A similar observation has already been made for the sample studied at Zaria. Column 6 lists 9 compounds the population of which increased by the immigration of 13
related families.rather than by natural growth.The centre of the table deserves special attention. It can be seen,
that the average number of households per compound increases from one household with an average of 6.8 persons in stage one to 6 households having an average total of 27.7 persons in stage six. The average number of persons per household on the other hand decreases from 6.8 persons in stage one to A.6 persons in stage six. This decrease in the number of persons jper household is partly due to the emigration of larger dependent family units in search for more spacious accommodation, while other dependent household heads, responsible for large units, may become compound heads. It is also of interest to note that none of the 63
compounds surveyed contained co-residential kinship groups which developed beyond stage six, that is, to include paternal parallel cousins and their unmarried children. It is obvious that at this stage lack of space, the
— limited lifespan of these houses built of mud, tensions between groupmembers, the differential economic success of junior household heads, and the death of the compound head combine to split the lineage segment into smaller units. (See Table A.11.6 on page 423).

TABLE
11 * 2
Afi‘6
of Compound
Heads
by Stapes
of i Ki
nship
Deve
lopm
ent
PART II CH 11 191
C V JV O C D C V J.C V JV O C Q L rvC O v O- P
CVJ LTV
«-<CVJ K V ON CVJ
CVJ
CVJ : VO : VO VO : rev \o V O
VO
c/t
CT\CO CTv ! K \ CTV
CVJ
VO < - CO t- ; CVJ
■ Cm
CVJ
— <1i n cvj v o
: VOLTV
CVJ
in cr\ o \ o co
CD Pi O Picvj r n m ^ - ^ i n i n ' O ' Or H I A O L A O I A O l A O LTV O
CVJ m K V -«q- V i n b"\v£) VJD c ■0 0 0 0 jx, S
CO
< P i < Pi

PART II CH 11 192
So far we have discussed those co-residential kinship groups which contained the compound head and other related dependent or semi-dependent households, but we must now consider the 124 tenant households who live in rented accommodation in 32 out of 63 compounds surveyed. Only six of these tenant household heads were born in Ibadan,* while the rest are of a group of first-generation immigrants. In Table 11.3 on page 193 these 124 tenant households have been divided into four main categories based on kinship organization to reveal the structure of this group. The first category (column 1-3) has heads who are either single, divorced or widowed, while the second category contains 18 female heads whose husbands have been absent for more than one month preceding the time of the interview (column 4). However, in 10 cases there was considerable doubt if the women in question were still married. The third category consisted of couples without children including those whose children were away (column 5), while the fourth category contained individual families (column 6). Among the couples without resident children (column 5) 12 women were temporarily absent. Three women were away on childbirth, while the rest were living with their parents until their husbands could secure suitable jobs. Thus 19 or 15-3 Per cent of all tenant households consisted of single persons, 35 or 28.2 per cent contained widowed, divorced and married persons who lived alone (excluding those households with wives away on childbirth), and 70 or 36.3 Per cent contained couples without resident children and individual families.
Another comment on this table is appropriate. In the 124 tenant households with 378 membe.rs, 25 or 6.6 per cent were dependent single relatives belonging either to the husband's or wives' kin group. For comparison, the households of compound heads contained 124 such persons or 27-3 per cent of their total population.
* Four household heads were born in Ibadan but brought up by their mothers on the family farm; while two household heads had quit their fathers' compounds after a family dispute.

TA
BLE
1
1.3
S
tru
ctu
re
of
Te
na
nt
Ho
us
eh
old
sPART II CH 11 195
ON G.
To
tal
OJ'v— v O 'C 'r— Q t— C— W W t- r r CM 00 C\I r r
^ j co ! oCM | i— 1 • T— j KN | KN
i i
COo •1—1c3 •
r—\
.
r— CO t— ■!— ON O O VO t— v— i 1 . Cvj CM -c- r- x- ON
ON
\|i
i)t|
c -*
C ^ <D •
t- KN UN (CN CO r~ r~ t— t— r — UNCM
vo
Ind
ivid
ua
l P
am
*
: : j
• i ! : •
t— C— ^ 'vj' UN UN ^ T— V-j T— T— i
; 1 : : : = ! ■ iI ;
| |
j i i i
ij ' !
CM i t- i O UN ; VO ! •
CM i UN1 . 1 ! i! ! i
ti
O p O
UN
Ch
ild
les
sC
ou
ple
s
' ' ' ' ' i
VO UN UN UN CM ji , : !
1 ' ;
C— 1 VO CM ; -=T
jI
i
r—•
o
4 3
Fe
ma
les
w
ith
T
em
p,
ab
se
nt
Hu
sb
an
d
j j ; i ; ; :
1 : ! ; ; i ■ ■
CM KN CM CO r - T- t-
| | -i' ■ I ■“ ' ^
’
CO ON T KN
j'
CM•
CM
'
o ____-
X ' ' - -
KN•
d•H M ■' M M ^
CM CM O
159- <
CVJ
•f>
•Hn
N r- CM CVI x— VO o c—T— ■ *
T-J g ___ < ,
-hac•r|CO
C M S O r - r -
19
20 '
1.0 4 ? v
i—1Oo
Typ
e
of
H.K
.
•k—, IM-» (•
• ON ON -sf ON -ST ON ON ON EH T -C M CM KNKN '^-'srUNUNNO NO
1 1 1 1 1 1 1 I 1 1 1 +<H U N O U N O U N O U N O U N O U N O O T - C M C M K N K N ^ ’ - U N U N O V O r —
©ha<5 . .
• o . d X C r-Jo o co o co ca £ A 3 P o ©O 0) CO CO P i SP H 2
© o<H «H P| ;P0 o
• pO O r* ©P i M '*3I Pi
B2Pi E 02
•H o3-P P PCO to oj P d g
•H *H ci> p i fP Pi

PART II CH 11
Finally, comparison of the age distributions of tenant household heads and compound heads provides some indication of the age distribution-of first generation immigrants within the sample population.
TABLE 11.4 Age Distribution of Tenant Household Heads and Compound Heads in Percentages
Age Group 15-2*+ 25-39 kQ-yh 55-69 70+ Total No. of! Hh. H.I
Tenant Household Heads 10.5 62.1 22 .6 k.Q 0 .8 100.0 . * -if, ! I £-T ;Compound Heads - 25 . 31.8 33.3 9.5 100.0 6 3 ;
The table shov/s that nearly three quarters of the tenant household heads are under the age of kO as against only one-quarter of the compound heads.
In conclusion, the main differences between the households of compound heads and their tenants may be outlined briefly. The most obvious differencesare the higher average.population, 7*2 in the households of compound heads
\
compared with 3»0 for their tenants. The number of dependents from their wider kinship groups in compound head households was 12*+ persons* or 27*3 per cent of their number, and greatly exceeds that in tenant households with 25 persons or 6.6 per cent. Budgets taken from both types of households indicate that one factor associated with the smaller number of dependent persons in tenant households may be economic.
The different structure of the two types of households is perhaps even more important. A compound head's household is usually part of a co- residential kinship group which may include his married son or sons and their dependents, and his collateral agnates and their issue. This kinship group for which the compound head is partly responsible provides a certain amount of social stability as well as economic security for all its members. Tenant households on the other hand seem to be less stable groups, and 35 or 28.2 per cent of their heads are single and either divorced, widowed
* This does not include 7 married daughters and one married son of compound heads who live in their fathers' compounds but do not form separate households.
%
PART II CH 11 195
or separated. As recent immigrant’s into the city, most tenants had suffered economic hardship until they established themselves.
This brief comparison clearly shows the considerable variety in the structure and size of these three household types. It has also indicated the danger of using data on households indiscriminately without taking into account their respective backgrounds and positions within co- residential groups.
Compound and Kinship Organization
In the following pages I will relate some of the facts which emerged from the discussion on household and kinship organization to a number of compounds surveyed in Ibadan. Two case studies have been chosen from the sample to illustrate various stages in the development of co-residential agnatic kinship groups and the repercussions of these developments on the compounds.
The first example represents a compound situated on the north-eastern outskirts of the city. The land on which the house stands was given to the present compound head's late father by his mother's family shortly after the First World War. The core of the house was built between 1920 and 1922. In 1923 or 1924 the compound head's first child was born. The family who then occupied the house illustrated stage one in the kinship diagram discussed earlier. (See page 72 , and Plan 11.7a on page 197 )• In 1930* the compound head's mother and younger full brother came to live in the house, and anticipating his marriage to a second wife, the compound head built two additional rooms plus a small shop to accommodate the newcomers. (Plan 11.7b). Following the marriage of the compound head's full brother in 1933, a new house with 4 rooms was added. The enlarged compound then contained a "stage-three-type” kinship group of two full brothers and their families. (Plan 11.7c). The next two additions to the compound were

PART II CH 11 196
HOUSE N° 5 77771— 77777»o O
7777/772— ZZZ2
0 — 1 fflTCHEH00^ n nB A T H R M . COURTYARQ
'/Z72 g777//J--CTpzZh-1ZZZZZSZZZZ2ZZZZZZZZ/ZZ2222ZZ3~ZZZ2ZZZZZZ3
n o
C E I T R A L HALL@ B o zni/7rn:nw~7izmn
a O l— 1 / ' t ^ l O ^ 1 IJ In r,!T \Q 22z j u j 7 / / 1177 > ///7 J //j\ ------Z 7 ^ /7 I7 7 7 /jj/j2 2 /Z Z n — 1
.1 .11
/yZ7-/777^/7/2//2//7j in.’. :iJQ — OU SHOP o
D Q lZZ2ZZZZ2— 7ZZLr-~-mZZZ2— ,— E ZZ3
lA j l A j
0 5 1 2 3 4 5 6 7 M E T R E S' ££ztrHT1 k-n A a5 1 0 1 5 2 0 F E E T S

05
{MillIfl-IHI)

PART II CH 11 198
constructed between 1947 and 1954 to house the rapidly growing group.(Plan 11.7d & e). In 1949 the eldest son of the compound head married hisfirst wife, thus moving the co-residential kinship group into stage four.The premature death of the compound head's younger brother in 1964 gave rise to a "stage-five-type" kinship group without affecting the headship. (Plan 11.7f). With the death of the compound head tv/o years later his oldest son assumed responsibility for his late father's and father's brothers' wives and their unmarried children. As a result of this latest death, the co-residential kinship group moved to stage six, which consists of several paternal parallel cousins and their unmarried children. At the time of my visit in 1968, the inhabitants of the compound discussed among themselves the possibility of constructing an upper floor. They told me that unless something was done some family members would be forced to lookfor alternative accommodation elsewhere, a step of which the compound headdid not approve.
The second example shows a compound occupied by a co-residential kinship group which changed over a ten-year period (1958-68) from stage three, when it contained full or half brothers' families with unmarried children, into stage four containing full or half brothers1 families with married children and their descendants. As the result of these changes including the death of the compound head in 1961, several rooms changed hands, following certain principles generally observed by the Yoruba.
According to its compound head, the house was built on family land in the first decade of this century. A family dispute in the late 1940's led to the division of the compound into two separate units, marked by closing its only internal passage. (See Plan 11.8 on page 199)- 1958 the roomswere distributed among the three half-brothers and their families who lived in the house as follows: the compound head and his family occupied the front rooms numbered 1-4, while each jof his two half brothers and their

PART II CH 11 199
K 77773 . $
COURTYARD , , i , H ,
ZZZZ%ZZZZZZZ2y;
^ a „
ifcL JR; T Z2Z| 3 ' p i
/ZZZZZ&T,
piV jlr r j—— O j Vy 1 , /
ZZZZZZZZ/ T / 7 / y y / / /
P 7 Z Z Z Z Z Z Zi?~n tm~]
Y/ Z M Z*
^Z2ZZ77/X
^ v- / ' ‘u2J.ZYZZ//.u oZZZZZZZZZ
□ □ a
I ; □ o U ^ 1— - 2ZZZ2——zzzzizzzzz O' f/ZZZZZZ3—ZZZZZzl
PLAN 11.8 House 33
HOUSE N2 53
T
0.5 1 2 3 C 5 6 7 METRES

PART II CH 11 200
families occupied the rooms to the left and right of the courtyard respectively. (See Plan 11.9 on page 201 ). In the late 1950'si two marriages, the youngest brothers' third and the compound head’s oldest
son’s first, sparked off the construction of two new rooms which were completed in 19&0. (See Plan 11.9b). Following the death of the compound head in 19&1, and the succession of the senior surviving half-brother to the headship, several rooms changed hands. The new compound head moved into rooms 1 and 2, while the late compound head's oldest son occupied room no. 3- This move was made in recognition of the young man’s increasing wealth as a successful craftsman and a future contender for the headship. In 196^ he built a room for his wife. (See Plan 11.9c).The distribution of rooms in 1968 still reflected the pattern of occupancy laid down in i960 with the oldest son of the new compound head remaining in the room formerly occupied by his father. (See Plan 11.9d).
It was observed throughout my survey in Ibadan that at least one front room in each compound was always occupied by the compound head, and that any other room facing the main street or footpath was given to some important member of the house.
It is probably true to say that in the past a sizeable proportion of Ibadan's population lived in large compounds. These compounds were divided into segments known among the Oyo-Yoruba as igun or origun, i.e., people who live in the same courtyard. My investigation has shown that today kinship groups of this type live in smaller self-contained houses which are often built on corporately owned family land. Apart from the large number of immigrant households and some well-educated household heads with above average income, there is little evidence to support the view that the Yoruba co-residential kinship group is breaking up into still smaller
units. On the contrary it seems that the social and economic strains associated with rapid urban growth ol towns such as Ibadan may serve to bind kinship groups even closer together.
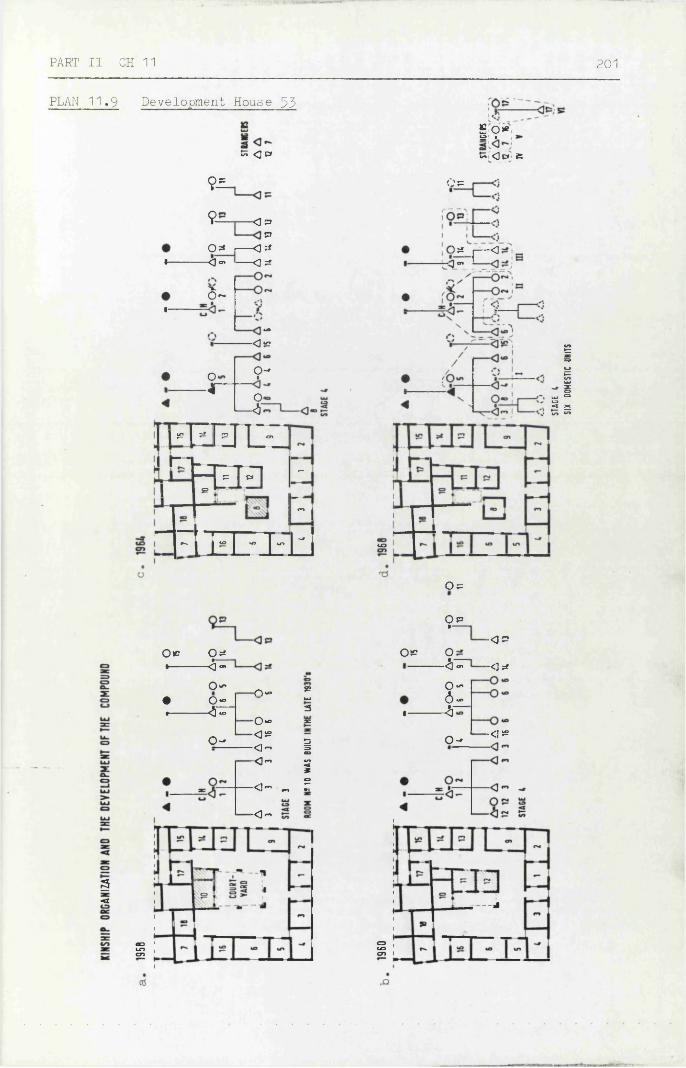
PART II CH 11 201
PLAN 11.9 Development House D3
5■c
£ <]P
?i9— < 3 p
p
1- O * f <J S*-<3®* O ^
1-•vo~
0‘4T
CO
-<] JCO-Io«1— 4“
1 1 p 1 * 31131 t - "
1 033 1-j 3 j
" * T liu IS UIM
O p O*•---»---- O ~o-
• o^_>-■■■■— ■ - -| to
o-
-0“* *Ui3- o - *-<3js■<l" I— m wi5
o-<i" ~ r-o«
COLf>cn
£ o p .S' • 1U <]c* e
O p
)-_p-a I"-
co
O p
1-
O p
0 p 1-
9—-<3 cn
O-6--5”o-*
-<jp-<J
■<JJB
— di
CDCOco
STAG
E I
SIX
DOME
STIC
UNITS

PART II CH 11 20 2
DISTRIBUTION OF FLOOR AREA
The distribution of the floor area among the population of compounds may be studied in two ways. First, we can examine the average floor area per household and person classified by their relationship to the compound head; and second, we may study the average floor area per household and person according to the number of persons per household. The first approach may tell us something about preferential treatments of certain household heads regarding the allocation of rooms, while the second will indicate the steps taken by compound heads to build new, or to adapt available space for the growing number of people in compounds.
The survey in Ibadan included 295 households with 1,285 persons in 63 compounds. Table 11.5 on page 203 compares the total average floor area (column 2) and the average sleeping area (column 3) available to each household and members classifying these households by the relationship of their head to the compound head. As can be seen in the table, the substantial difference between the total average floor area occupied by the compound head's own household (9^*8 sq.m.) on the one hand, and the total average floor area of other related dependent or semi-dependent households (17*8 sq.m.) and tenant households (l4.6 sq.m.) on the other, is noteworthy.
These differences sire partly due to the larger average size of the compound head's household, 7»2 persons, as against k.2. and 3*0 persons for all other dependent and tenant households respectively. Furthermore, the area occupied by the compound head's own household includes sill rooms such as central halls, entrance lobbies, common kitchens and stores for which he is directly responsible, although these rooms are normally available for general use by all other resident households. Therefore, the average floor area given below illustrates the differential distribution

TABLE
11.5
Average
Floor
Are
a per Household
and Per
son
in sq.m
PART II CH 11
IA
cd<u
i•ft
too
•tob<uft•ft
A -■
-d"
OJ•
IA
NO•
OJ
-d -•
rA
rA•
rA
-d “•
OJ
Ot
IA
NO•
rA
o o•
rA
I—I • 0 0 A - ON NO -d - -d* NO O A -CO a • • • • • • • • •• a rA -d - OJ OJ IA r~ OJ * - NO
> • IA V V * - V“ r - r - V< A
cd•
to<D B A - *— r~ ON O ON O l o o -d -B <D • • • • • • • • •roft OJ -d- LA -d - -d - rA -d" -d - A -• * r~> f t
O l (0
I—I • CO O ON O rA O c o NO IAcd -B • • • • 1 • • • • •
•p a V" ON -d~ o o NO -d “ (A -d - OJo • cjn K~ OJ V " V" v~ v~ rA
Eh ftCO
<h b -d - LA -d - CO ON rA OO LAO o l a ON LA -d- NO CO LA A - OO
to -d- * - -d* rA OJ» B •*
o <0 t -s f t
V**•
<H ao <1) rA OJ -d " IS -d - CO -d- LA
to NO -d - V O l O OJ ON• 3 OJ
o oa a
• • • •s io • a - S •
•s i
COB
•CO
CO s i s i o O B3 <D •> — <D to f t oo to • co to CO 3 f t
a 3 s i B B 3 O CQ TiO <D O O o a T3 d +
CO a to w C/0. a rH 3 •3 • O a— O » •- T3 ft a • <0
cd to a to CO <1> co CD a to<u B B B -P « to o 3
a a a a cd 3 CO oto i—i 1—1 o 3 a
T> a 3 a CO <D cd a OB + ' O + *■ ft -p a r—i
B 3 ft CO ft f t o -p i—ig o B EH B i—i cd3 f t to CO CO co CD 1 cd cd
r H 6 *- m. Si S> B -p •O o a a a a -P 3 0 o >
O o o o o o O co EH Eh

PART II CH 11 20*+
of responsibilities among household heads within the compound rather more precisely than the allocation of living space between the households themselves.
The average sleeping area per person fluctuates between *+.7 sq.m. for members of the compound head's household and 2.*+ sq.m. for other related households, the total average being 3-8 sq.m. or *+1.0 sq.ft. However, the average sleeping area per person in the compound heads' households is slightly inflated by the fact that some compound heads have their own sleeping rooms, a luxury not enjoyed by most other household heads•
The two following graphs derive from Table A. 11.8 on page *+25.Graph 11.1 on page 205 shows the average floor area (line 1) and the average sleeping area (line 2) per household of differing sizes. As may be seen, the average floor area per household increases from 13«6 sq.m. in households with 1 to 2 persons to 106.*+ sq.m. in households having 11 to 12 persons. At the same time the average sleeping area per household also increases from 8.*+ sq.m. for households with 1 to 2 persons to *+6.8 sq.m. for 11 to 12 person households.
Graph 11.2 on page 205 shows the average floor area per person (line 1) and the average sleeping area per person (line 2) in households of differing size. As can be seen the average floor area per person decreases from 8.8 sq.m. for households with 1 to 2 persons to 6.1 sq.m. for households with 3 to *+ persons but increases steadily to 9*9 sq.m. for households having 9 to 10 persons. The same trend can be observed for the average sleeping area per person which decreases from 5*^ sq.m. per person in households with 3 to *+ persons but remains fairly stable between 3*7 sq.m. and *+.1 sq.m. per person for all larger households. The total average floor area of 7»^ sq.m. (8 0 .0 sq.ft.) and the average sleeping

PART II CH 11
GRAPH 11*1 Average Floor and Sleeping Area per Household in sc.ni.
110
100
908070BO50
302010
0 9 10 11 120 1 2 3PERSONS PEP HOUSEHOLD
5 6 7 8
Line 1 Average Floor Area. Line 2 Average Sleeping Area.
GRAPH 11.2 Average Floor and Sleeping Area per rerson in sc.ci.
cd
0 1 2 3 1PERSONS PER HOUSEHOLD
6 75 8 9 10 11 12
Line 1 Average Floor Area, Li-ne 2 Average Sleeping Area See Table A.11.8 on page

PART II CH 11 206
area of 3-8 sq.m, (*f1.0 sq.ft.) available per person in households surveyed in Ibadan, indicates no serious problem of overcrowding.—1 It is obvious that most compound heads were able to build new rooms or make old rooms available for the growing kinship groups, while some of the larger dependent households left their father’s or brothers’ houses and established their own independent households elsewhere.
— LUBEGA, A. Financing and Production of Private Houses in Urban Districts of Kampala Unpublished Ph.D. Thesis, London 1970 pp. 152-58. The extent of overcrowding is usually measured by the ratio of persons per habitable room. It has been fairly widely accepted that an occupancy rate of more than two persons per habitable room can be regarded as overcrowded.In the 63 compounds the occupancy rate of the 81A- habitable rooms was 1.6 person per room. See also Table A.11.7 on page .

PART II IBADAN CHAPTER 12 OCCUPATION AND INCOME 207
Occupational patterns and income distribution for Nigeria has already been dealt with in Chapter 5- In this chapter I shall first discuss the information available on occupational patterns and income distribution in Ibadan, before proceeding to the analysis of the data obtained from my survey of 63 compounds containing 293 households in that city.
OCCUPATIONAL PATTERN AND INCOME DISTRIBUTION IN IBADAN
So far few scholars have worked on the present-day occupationalpattern in Nigeria. One of the first systematic investigations into thecraft activities of Ibadan's population was carried out by K.M. Buchananin 19^9“50. According to Buchanan there were then 2,700 small-scaleindustrial enterprises in the city. The most important of these industrieswas tailoring with 3^-0 per cent of the total, followed by carpentry with17.7 per cent, dyeing with 13«5 per cent and mechanical work, i.e. cycle
1/repairing and motor mechanics, with 12.8 per cent.— The number of persons employed by these enterprises are not given. Further investigations into craft activities in Ibadan city were conducted by A. Callaway in 1961 and 1963 and M. Koll in 1967.-^
—/ BUCHANAN, K.M. and PUGH, J.C. Land and People in Nigeria sixth edition London 1966, p. 200
2/— CALLAWAY, A. "From Traditional Crafts to Modern Industry" in The City of Ibadan ed. by Lloyd, P.C. et al. Cambridge 1967, PP- 153-71*Callaway carried out a complete survey of all crafts and smallindustries with permanent premises in Ibadan in 19&3» ^ 5?135establishments were counted and divided into 15 categories, the most important being tailors with 26 .3 per cent, carpenters 12.5 per cent, mechanics 10.1 per cent and photographers with 7*7 per cent. The total number of persons employed by these establishments were 14,500 persons or 2.9 per unit including apprentices, journeymen and proprietors.
—^ KOLL, M. Crafts and Cooperation in Western Nigeria Freiburg i.B. 19&9ipp. 20 + 124. Koll took an area sample which covered approximately 10per cent of all small industrial establishments in the city. After calculating the standard error, the probable min. number of units was estimated to be 12,200 the probable max. 16,400. The total number of persons employed in the craft sector was estimated to be approximately 4-2,000 or 5 per cent Of the total population in the city. The most
. . important, units, were tailprs with.29.2 per cent, carpenters .12.6. per. . cent and mechanics with 8.0 per cent.

PART II CH 12 208
Despite its many shortcomings, the 1952 census provided the first comprehensive set of detailed data on the occupational structure of
VIbadan’s population.— The occupational distribution of the city’s malepopulation was then as follows: agriculture, 21.6 per cent; crafts,13*4 pen cent; trade, 12.0 per cent; administrative and professionalworks 5»3 per cent; miscellaneous occupations, 9*6 per cent; andunspecified 38.1 per cent. An analysis of the occupational pattern in39 city wards based on the 1952 census returns was carried out by A.L.
5/Mabogunje.— Mabogunje shows that agriculture is especially important in the eastern parts of the city, while craft activities were more frequently found in immigrant areas to the west and north of the old city, with marked concentrations around Bere Square (N.1) and Ogunpa (S.W.6).(See _Map A.8.2 on page 411 and Plan 10.1 on page 167). On the other hand, trade was more evenly distributed throughout the city with concentrations between the Gebaji business district, the Oje Iba market and Mokola.-^/
The 1963 census return on occupational groups in Ibadan Provincemakes a distinction between urban and rural areas. These figures are lessdetailed, and as far as the city is concerned, they are probably lessaccurate than those for 1952 and so do not permit a direct comparison with
7/the earlier census.—
y DEPARTMENT OF STATISTICS, NIGERIA Population Census of the Western Region of Nigeria 1952 Lagos 1956, PP» 16-17■
5/— MABOGUNJE, A.L. Urbanization in Nigeria London 1968, pp. 221-3^ Ibid. p. 222■2/ FEDERAL OFFICE OF STATISTICS, NIGERIA Population Census Western Region
of Nigeria 1963 Lagos 1968, Vol.2 p. 160 (mimeo). The occupational structure of the male population in the urban areas of Ibadan Province was as follows: Agriculture 31*5 per cent, crafts 27»9 per cent, trade14.7 per cent, administrative and professionals 9*9 per cent, other occupation 11.4 per cent and unemployed 4.6 per cent.
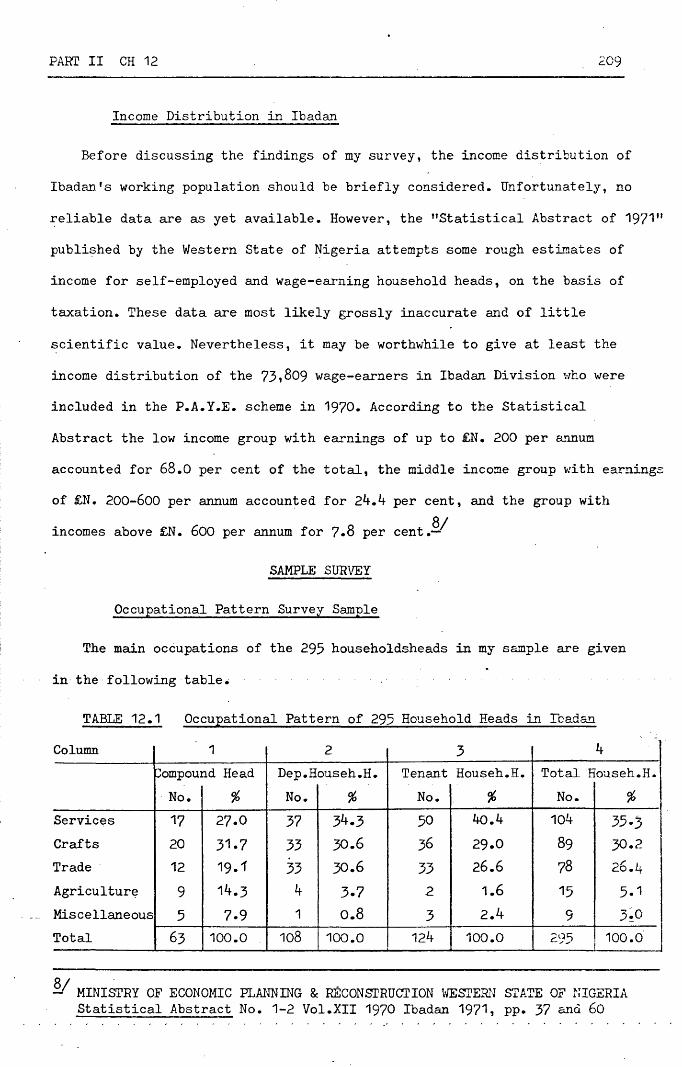
PART II CH 12 209
Income Distribution in Ibadan
Before discussing the findings of my survey, the income distribution of Ibadan's working population should be briefly considered. Unfortunately, no reliable data are as yet available. However, the "Statistical Abstract of 1971" published by the Western State of Nigeria attempts some rough estimates of income for self-employed and wage-earning household heads, on the basis of taxation. These data are most likely grossly inaccurate and of little scientific value. Nevertheless, it may be worthwhile to give at least the income distribution of the 73i809 wage-earners in Ibadan Division who were included in the P.A.Y.E. scheme in 1970. According to the Statistical Abstract the low income group with earnings of up to £N. 200 per annum accounted for 68 .0 per cent of the total, the middle income group with earnings of £N. 200-600 per annum accounted for 24.4 per cent, and the group with
o Iincomes above £N. 600 per annum for 7-8 per cent.—
SAMPLE SURVEY
Occupational Pattern Survey Sample
The main occupations of the 295 householdsheads in my sample are given in the following table.
TABLE 12.1 Occupational Pattern of 295 Household Heads in IbadanColumn 1 2 3 4
Compound Head Dep.Househ.H. Tenant Househ.H. Total 5ouseh.H.No. % No. % No. % No. %
Services 17 27.0 37 34.3 50 ko.k 104 35.3Crafts 20 31.7 33 30.6 36 29 .0 89 30.2
Trade 12 19.1 33 30 .6 33 26.6 78 26.Agriculture 9 14.3 3.7 2 1.6 15 5.1Miscellaneous 5 7.9 1 0 .8 3 2.4 9 3.0Total 63 100.0 108 100.0 124 100.0 295 100.0
MINISTRY OF ECONOMIC PLANNING & RECONSTRUCTION WESTERN STATE OF NIGERIA Statistical Abstract No. 1-2 Vol.XII 1970 Ibadan 1971? pp. 37 ana 60
PART II CH 12 210
From this table it can be seen that services, which include inter alia clerks, teachers and police officers, are the most important occupational group among these household heads. Then follow the traditional and modern crafts, trade and agriculture. This order applies for the 108 dependent as well as the 12*+ tenant household heads. However, the occupations of the 63 compound heads differ slightly from these patterns. Here, crafts is the most important occupation followed by services, trade and agriculture.
The involvement in agriculture of the 63 compound heads must be further discussed. Apart from the 9 full-time farmers already listed in Table A.12.1 column 1 on page *+26, another 8 compound heads gave farming as their second occupation. A further 21 compound heads had some share in the proceeds from the family farm, but did not farm themselves. Among the 18 compound heads born outside Ibadan Province, 10 maintained active interests in the family farm at their home towns. Thus *+8 compound heads or 76.2 per cent were either actively working on or had some vital interest in farm land, while the rest did not.
The 89 household heads employed in traditional or modern crafts deserve some notice. Table A.12.1 on page *+26 shows that among the most frequent occupations in this category are 19 tailors, 12 mechanics and 11
carpenters. This distribution corresponds with those reported by the earlier surveys of crafts in Ibadan which featured these three occupations at the top of their lists. Table A.12.1 also shows that only 39 household heads or 13«2 per cent of the total had more than one occupation, which no doubt reflects the increasing specialization of work in Ibadan.
The next table shows*how household heads in the sample are employed.

PART II CH 12 211
TABLE 12.2 How Household Heads are EmployedColumn 1 2 3 h
CompouNo.
nd Head %
Dep.HNo.
ouseh.H.%
TenantNo.
Househ.H.%
TotalNo.
Househ.E.%
Self-employedEmpl.Priv.SectorEmpl.Public SectorHelps Family MemberRetiredMiscellaneousTotal
3710
11
3
38.713.9
17.3
7.9
58
35
13
1
1
53.732.5
12.0
0.9
0.9
5638
26
k
^5-230.6
21.0
3.2
131
83
50
1
.55
51.2
28.1
17.0
0.31.71.7
63 100.0 108 100.0 12*f 100.0 295 100.0
Over. 50 per cent of all compound heads and dependent household heads are self-employed, while per cent of the tenant household heads had their own businesses. This reflects the substantial number of tenant household heads who were employed in Government and private firms.
The unique role played by Yoruba women in retail trade throughout the country is widely recognized, and the findings of my survey support this observation. In fact, 78.0 per cent of the 381 married, divorced or widowed women in my sample, including one single female household head, are so employed. The kind of goods these women trade varies widely, and includes provisions, cigarettes and kola-nuts, sold by 233 women or 61.2 per cent of the total; textiles traded by 36 women or 9*^ per cent; fire wood, crockery, mats, native medicine, shoes and livestock was handled by 28 women or 7*^ per cent. Such crafts as the design and dyeing of cloth, weaving and embroidery were practised by 18 women or ^ .7 per cent of the sample. Another 1*+ women or 3*7 per cent who engaged in services,

PAST II CH 12 212
included inter alia 2 primary school teachers, 3 hairplaiters and k prostitutes. Of the remaining 52 women, 37 or 9*7 per cent were housewives with no gainful occupation,* 13 or per cent had retired and were supported by their next of kin, and for 2 women or 0,5 per cent I lack information.
Except for 3 female compound heads and 25 female tenant household heads no systematic attempt was made to collect data on the monthly cash income of married women. However, the 18 completed budgets of female household heads show cash incomes that range from about 10 shillings per week to as much as £N. 50 per month for one well-to-do cloth trader who had recently made the pilgrimage to Mecca. It must be emphasized here that profit made from their trade and crafts work belongs to the women who earned it, and also that they are generally not obliged to contribute to the housekeeping costs. However, during my interviews it became quite obvious that many a household head would find himself in financial difficulties without the help of his wife or wives. Most women will also try to set aside at least some money for their families and/or daughter’s dowery; but except for wealthy female traders, this amount is probably small.
Income Distribution Sample Surveyl
The aim of my budgetary inquiries was to establish the annual cash incomes of the compound heads and that of other dependent and tenant household heads who lived in the compound surveyed. In spite of painstaking inquiries, the data on household cash income and expenditure
* Most of these women had only recently been married and most will starttrading once they have settled down and their husbands have given themthe capital they need to buy their initial stock.
■^MAEJRIS, P. Family and Social Change in an African City A Study ofRehousing in Lagos London 19&1, PP» 7&-&1

PART II CH 12 213
presented below must be treated with caution. The reasons for this caution may be mentioned briefly. During my investigation at Ibadan from January to May 1968, the civil war in Eastern Nigeria, then approaching its climax, had created a general slump in the country's economy. An almost stagnant industry and increasing unemployment, some of which was absorbed by the army, forced many local families to live, at least temporarily, on reduced incomes, which had in some cases to be subsidized by the household head's wife or wives or from savings. Other household heads relied on financial help from more fortunate family members. The various import restrictions imposed by the Military Government had also stimulated sharp increases in the prices for foreign goods and substantial profit margins for some traders, who were understandably unwilling to disclose their incomes.
Under these circumstances it may be seen why my questions regarding income and to a lesser extent expenditure were met with suspicion, and in spite of repeated personal and official assurance as well as exhaustive explanation about the nature and aims of my survey 68 household heads or 23*1 per cent of the total sample remained evasive or gave grossly misleading answers that their budgets had to be omitted from the final analysis. (See Table A.12.2 on page 27). Hence of the total of 295 households covered by the survey only 227 are included in the following analysis. Of these, 122 households or 53-8 per cent were in the low income group (up to £N. 180 per annum), 93 or *f0.9 per cent in the middle income group (£N. 180 to £N. 600 per annum), and only 12 or 3*3 P®r cent in the high income group (above £N. 600 per annum). (See Table A.12.3 on page *+27 ). Table A. 12.*+ on page *+27 gives the income distribution for compound heads, dependent or semi-dependent and tenant household heads separately. It shows that compound heads have the highest average income, with 32-8 per

PART II CH 12 21*+
cent of them in the low income group, 50*0 per cent in the middle and17.2 per cent in the high income group. This is followed by tenant household heads with 58 .7 per cent in the lowest bracket, 39*1 per cent in the middle, and only 2.2 per cent in the high income group. Dependent or semi-dependent household heads have still lower average incomes, but similar distributions, though none of these household heads are in the high income group.
The combined distribution of incomes by household size is given in Table A.12.5 on page *+27 and shows the predominance of small size households (1-*+ persons) in the low income group. As the number of persons per household increase income tends to increase as well. This is illustrated by the diagonal pattern of concentration up to households with 9-10 persons and income of 1,000 to 1,999 shillings per month. From there onwards the small number of households involved scatter so widely that the distribution has little statistical value.
The per caput income of households with 1 to 2 persons was found to be 130 shillings per month. This sura decreases to 81, 76, and 55 shillings per month for households with 3-^1 5“6, and 7-8 persons respectively. However, the per caput incomes of households with more than 9 persons increased to 75 shillings per month. This upward movement reflects the high proportion of large households of compound heads with general higher income.
On Graph A.12.1 on page ^28 the cumulative income distribution of the 227 households are plotted on logarithmic probability paper in order to show the relationship between the median income and the type of households. The nearly straight line of the cumulative income distribution curve for all 2.27 households indicates a lognormal distribution. All three types of households distinguished by separate curves show an approximately equal

FART II CH 12 215
percentage change, which in the case of the dependent and tenant households are based on lower incomes. As a result, the curves of these two latter types of households shift leftwards but do not substantially alter their shape. The median incomes as shown on the graph are koQ shillings per month for the households of the compound heads, 265 shillings per month for tenant household heads, and 255 shillings per month for dependent or semi-dependent household heads. However, part of the higher incomes of the compound heads derives from rent and other financial benefits which are associated with the headship'; and some of this is spent on improvements and repair of the family compound, and on financial help given to other family members in need, neither of which are generally expected from other compound members.
On page *t28 a Lorenz Curve was constructed from the collected data and illustrates clearly the inequality in distribution of income among the 227
household heads included in this analysis. The ’’area of inequality” is41.7 per cent and shows that c. 50 per cent of all households earn about 25 per cent of the total recorded average monthly income.
The above analysis has shown that over 50 per cent of the household heads interviewed have cash incomes of less than £N. 180 per annum. To what extent these income levels and distributions were influenced by the civil war is difficult to say but the general slump in the country’s economy during the period of field study no doubt had some dampening effect on the retail-trade and on other economic activities which were felt by nearly all household heads interviewed.

PART II IBADAN CHAPTER 13 THE PRODUCTION OF HOUSES IN IBADAN 216
Over the last two decades private houses built in Ibadan ranged in type from the semi-traditional one-storey mud house covered with corrugated iron sheets in the older parts of the city, to multistorey dwellings of reinforced concrete which are equipped with such modern amenities as piped water and electricity. These modern houses were mainly built in the south-western and .northern suburbs of the city. (See Plan A 13*1 on page 429). In the following pages I will be mainly concerned with houses of the semi-traditional type which are still being built in large numbers in the older parts of the city. This type of house is characterized by varying mixtures of traditional and modern building materials and techniques. Unfortunately, no quantitative assessment of the construction of houses over the last two decades is available, but since 1950 the major expansion of Ibadan has taken place in areas beyond the nineteenth-century- city wall, leaving the centre almost untouched. (See Plan 10.1 on page ^7).
Building MaterialsMost houses built in the older parts of the city today require a
limited number of basic building materials. These include earth for walling, forest timber for the roof frame, corrugated iron roofing sheets, sawnwood for doors and windows, cement for rendering the walls and floors, and asbestos-cement or fibreboard sheets for ceilings. (See Picture 13.1
on page 217)* A prosperous man may also use stone for the foundations, cement blocks for walling, glazed, windows and paint for walls, ceilings and joinery. He may also build a two-storey house with or without a reinforced concrete balcony and richly decorated balustrades. (See Picture13.2 on page 217 ) •
The increasing use of modern building materials entails a corresponding increase in the capital cost of housing, which, should the owner overrate his financial resources, may result in prolonging the period of construction

PART II CH 13 217
PICTURE 13«1 One-Storey House in Ibadan City
PICTURE 13.2 Two-Storey House with Reinforced Conc.ete Balcony
PICTURE 13.3 Construction of Mud Walls

PART II CH 13 218
for several years. For example, of 25 houses surveyed which were built by their present owners, two required about 6 years to construct, while one was finished within k months, and the average building time for all 25 houses wras 3-2 years. The variable lengths of the construction period parsly reflects differences in the income of these compound heads, but it also depends on their individual abilities to raise money from family members and friends or by loan for completion of the house. In most cases ceilings are fixed and flc- and walls are cemented several years after the owner had moved into the house
The Construction of Walls
In 1962 an estimated 22,000 houses or 90 per cent of the city's total1/housing stock had mud walls.—' These walls were either made of several
layers of mud work or with square mud bricks often manufactured on the building site. The preparation of earth for wall-building has already been described in some detail in Chapter 6 on page 111 . However, the Yoraba method of constructions differs somewhat from the technique used at Zaria, and may take one of two forms. First, the house walls may be raised by several layers of mud work usually 0 .30 to 0 .5 0 m high, depending largely on the clay content of the earth. In this process, each new layer can only be added after the one below is sufficiently hard to bear its weight. (See Picture 13»3 on page 217 ). This method of construction is relatively slow and can only be carried out during the relatively short dry season which lasts from the beginning of November to the middle of March. (See Graph A.8.1 on page 409)- The alternative method consists of manufacturing mud bricks with the help of a rectangular wooden mould. The moulded blocks of
1/— IBADAN CITY COUNCIL These data were supplied to me by the Ibadan City Council in 1968
FEDERAL OFFICE OF STATISTICS, NIGERIA Ibadan Housing Enquiry unpublished MS. Lagos 1963, p. 6. The survey was carried out in October 1962. A total of 350 houses containing 800 hous'eholds were investigated. It was found that about 10 per cent of these houses had cement block or brick walls,
• -the-majority- being-situated in-the-south-western -part- of -the city. - - -

PART II CH 13 219
earth are then dried in the air for several days before being piled toform a simple kiln. The kiln is then lit and kept burning for one or twodays after which it is broken down, and the walls of the house are built
2 /with the help of using specially prepared mud or cement mortar.— (See Picture 13.^ and 13*5 on page 220 )• However, brick firing is not regarded as absolutely essential, and many houses are built with sun-baked bricks.
The Roof
The roof frame of a house is usually constructed from round, uncutforest timber or bamboo and covered with corrugated iron sheets. (SeePicture 13*6 on page 220). Use of sawnwood for a roof frame is stillrather rare, and is normally restricted to modern houses built by well-to-do compound heads. Ceilings fixed to the underside of the roof frameconsist either of hand-woven straw-mats, of asbestos-cement or fibreboairdsheets. The use of corrugated iron sheets as a roofing material is no newthing in.Nigeria, and was introduced by European merchants at the beginning
/of the twentieth century.—' Although not recommended by the colonial administration as ideal roofing material,* the change from thatch to corrugated iron roofs, known locally as "pan", was almost complete at
—' Author not given "Yoruba Brickmaking" in Nigeria Journal No. 23 Ibadan 19^6, pp. 297-8
^ HINDEKER, A. Seventeen Years in Yoruba Country London 1873, pp. 99-100and 188. The first corrugated iron roof was introduced by missionaries to Ibadan in 183 . In a letter dated from 1*fth May 185 , Anna Hinderer wrote: "Our new house, after all the toil in building it promises to possess all the comfort we could expect or desire in this country, it is water-tight I has a-good sized sitting and bedroom, white washed walls,and a good iron roof.....11 But in a letter dated from 28th December 1838she wrote: "Our house is very comfortable now, a light grass roof over the iron makes it cooler....."
* Early colonial houses in Ibadan used tiles as roofing material.

PART II CH 13 220
PICTURE 13.4 A Kiln Ready Firing
PICTURE 13.5 One-Storey Houseril Built with Sun-Baked Bricks
PICTURE 13*6 Roof Construction

PART II CH 13 221
4/Ibadan by the late 1920's.-7 This rapid change was made possible by the increasing demand for cocoa on the world market.—7 In the absence of alternative imported building materials, the relatively high prices received by cocoa-farmers at this date prompted many to change the roofing material of their town-houses from thatch to corrugated iron sheets. Moreover, although this change did substantially worsen the climatic condition inside the house due to the intense heat radiation from the roof, it was regarded as a status symbol, and did after all reduce the risk of fire which in the last century periodically devastated large parts of the city.—^
The kinds of construction described above are usually carried out by a wall builder or bricklayer who recruits several helpers to prepare the earth and to assist him in building the walls. After the walls are completed, a carpenter is asked to construct the roof frame and affix the corrugated iron sheets. He usually makes the window shutters•and doors as well. In recent years increasing numbers of houses have been built by indigenous contractors who undertake all construction work and charge a lump-sum for the whole house.
4/— COLONIAL OFFICE, GREAT BRITAIN Blue Book Colony and Protectorate of Nigeria, Lagos 1914, 1915, 1920, 1925, 1930, 1935 and 1938. Import of flat and corrugated iron sheets into Nigeria. Between 1914 and 1938 a total of 200,7b3 tons of corrugated iron sheets were imported into Nigeria. The pattern of the imports was as follows: in 1914 a total of 7,378 tons were imported; this amount dropped to a mere 447 tons in 1917, hut rose again with some fluctuation to 16,971 tons in 1928.Imports then declined to 6,912 tons in 1934 and rose sharply to a new level of 19,283 tons in 1937- In 1938 the imports again fell to 3,741 tons. Of the total of 200,763 tons imported, over 60 per cent were imported between 1914' and 1930*
5/— GALLETTI, R. Nigerian Cocoa Farmers Oxford CLP. 1956 pp. 1 and 253~56. Production of cocoa in Nigeria expanded twelvefold from a mere 4,100 tons in 1914 to 28,200 tons in 1930* By then the country produced about 10 per cent of the world supply. Galletti found a direct correlation between the price of cocoa paid to farmers and the amount of money spent by farmers on housing.
—^ BARBER, J. Journals Church Mission Society London, CA2/021, 1857*. .In January 1857 not -less, than four, fires. destroyed .large .parts .of. the. city. .

PART II CK 13 222
The Local Building Industry
Very little is known about the size, performance and output of thelocal building industry. Among the various independent crafts which enterinto this industry, only carpenters are included in all three craftscensuses carried out by various scholars in Ibadan since 1950* (SeeChapter 12, page 207). The investigation conducted by M. Koll in 19&7irevealed that an estimated 2,000 carpenters worked in the city. Othercraftsmen engaged in construction, such as wall-builders, bricklayers,plasterers, glass cutters, plumbers, painters and electrical wiremen were
7/excluded from Kollfs study, since they had no "visible workshop".-*-'It is interesting to note that the traditional groupings of Yoruba
craftsmen into cult units do not include builders as a separate occupation,0 /
and so there is no builders’ cult.— This may be largely due to the fact that in the past the construction of houses was traditionally carried out on a communal basis known as owe. Under this arrangement a man wishing to build a house would call on all his relatives, friends and/or neighbours for manual help, while he provided the necessary building materials, refreshments and food for all who helped. With the emergence of an urban society in Yoruba land and later the introduction of an economy based on money in the early twentieth century, this practice of communal help was gradually abandoned in large towns like Ibadan, and building then became a paid and specialized occupations
—' KOLL, M. Crafts and Cooperation in Western Nigeria Freiburg i. Br. 1969 pp. 118-2*1- ^ :
0/— CROOKE, P. "Rural Settlement and Housing Trends in a Developing
Country: an Example in Nigeria" in International Labour Review Vol. 96 No. 3 Geneva 1967, pp. 280-91

PART II CH 13
In the mid-1950's the emerging building industry experienced a major boom9 /due to an extensive schoolbuilding programme at Ibadan.— Hence the number ot
contractors registered by the Government of the former Western Region increasedsharply. The official register* groups building and civil engineering firmsinto a number of categories (ten in 1971)» distinguished in terms of theirpast experience, plant and equipment, the number of permanent employees andfinancial resources available to each firm. However, these criteria were neverstrictly applied in practice with the result that some contractors were placed
10/in the wrong category while other contractors existed only on paper.— InTable A.13.1 on page A30 an attempt is made to group contractors registeredby the Government of the Western State in mid-19?1i into three major groups
11/based on the contract values each was thought capable of handling.— The first group consists of small firms whose contract values do not exceed £N. 10,000, the second of medium-size firms able to carry out contracts of £N. 10,000 to £N. 100,000, and the third of large firms whose contracts may exceed £N. 100,000. The table reveals that of the 271 building, ^9 civil engineering and 37 electrical contractors then registered at Ibadan, 73-8,28.6 and 81.1 per cent respectively belonged to the smallest category. Only among the registered civil engineering contractors did ^6 .9 per cent or nearly one half belong to the medium-sized group. Most 01 the small contractors who
9/ WESTERN STATE OF NIGERIA MINISTRY OF ECONOMIC PLANNING & RECONSTRUCTION Statistical Abstract Nos. 1 and 2 Vol. XII Ibadan 1970, p. 3^«The capital expenditure of the former Western Region now Western State of Nigeria between i960 and 1970 was £N. 92.8 million. Of this £N. 12.3.' million or 13-3 per cent was spent on buildings which includes, inter alia, schools, offices and residential buildings for civil servants, while another £N. 16.8 million or 18.1 per cent was spent on roads and bridges. Over 70 per cent of these projects wrere carried out by private builders and civil engineers by contract.
* Now the Ministry of Works Register of the Western State of Nigeria10/— 0GUNP0LA, G.A. "The Pattern of Organization in the Building Industry -
A Westqrn Nigerian Case Study" in Nigerian Journal of Economic and Social Studies Vol. 10 No. 3 Ibadan 19&8, pp. 339“bOWESTERN STATE OF' NIGERIA'Gazette No. 'Vf Vol. '20 Ibadan Aug. 1'971 pp. 333-37'*

PART II CH 13
are still in business have no office or work-yeard besides their living quarters. They are notoriously undercapitalized, have no access to shortterm credit and seldom have enough work to keep busy throughout the year.This is also true for a large proportion of the medium-sized firms. On the other hand, the 23 large firms, accounting for 6.5 per cent of thelocal building contractors, are dominated by expatriates who concentrate
12/on large public and private building projects.— • Most of these firms are foreign-based and operate sophisticated machinery. They all have access to credit facilities and. make sufficient profit to enable them to sustain long periods without work.
SAMPLE SURVEY
For the rest of this chapter I intend to discuss some changes of structure and building materials observed in 63 compounds surveyed. Ky investigation of their histories was limited to a five-year period from May 1963 to April 1968, because it proved impossible to collect reasonably accurate information beyond this period. Two sets of aerial photographs of the city taken in 1961 and 1965 were used to select the compounds for study and to identify the structural changes which had taken place in the compounds surveyed.
. Age Composition of Rooms
I shall first examine the age composition of the rooms surveyed. This deserves special attention not only because it indicates the needs to replace old and obsolete structures but also because it reveals the type and quantity of new constructions, improvements and maintenance which are necessary to the survival of any compound.
OGUNPOLA, G.A. op cit., p. 3^8. Between i960 and 1966 over 90 per cent of the large firms with over 100,000 contract value were in the hands of expatriates.
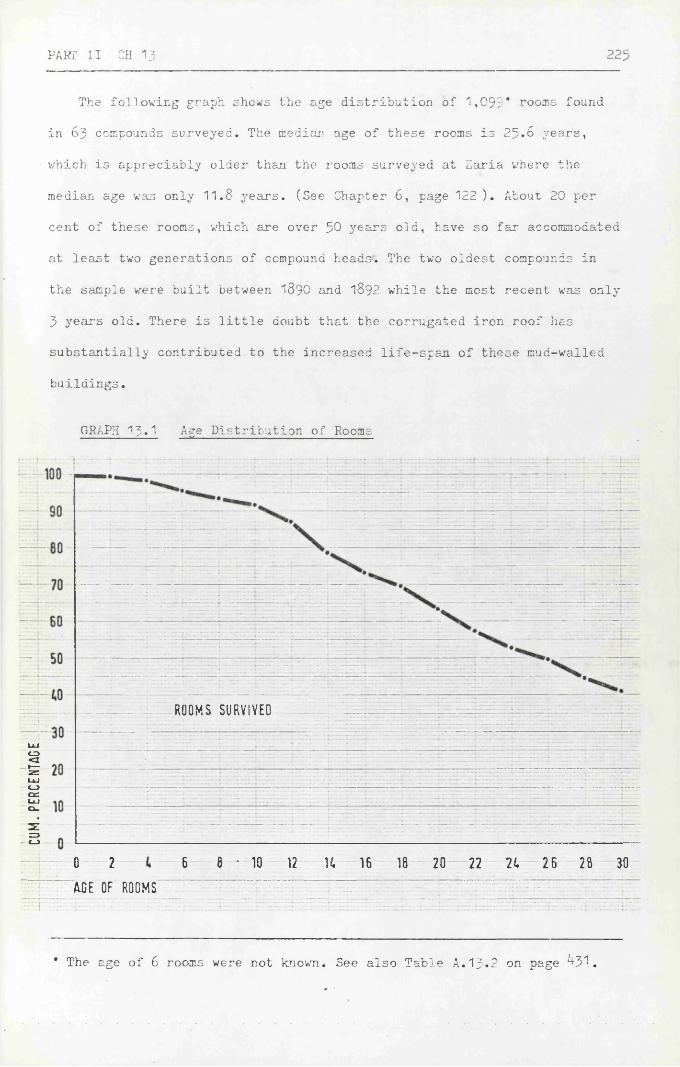
CUM. PERCENTAGE
PART II CH 13
The following graph shows the age distribution of 1,099* rooms found
in 63 compounds surveyed. The median age of these rooms is 25.6 years, which is appreciably older than the rooms surveyed at Zaria where the
median age was only 11.8 years. (See Chapter 6, page 122 ). About 20 per
cent of these rooms, which are over 50 years old, have so far accommodated at least two generations of compound heads. The two oldest compounds in
the sample were built between 1890 and 1892 while the most recent was only 3 years old. There is little doubt that the corrugated iron roof has
substantially contributed to the increased life-span of these mud-walled
buildings.
GRAPH 13.1 Age Distribution of Rooms . . . . .
ROOMS SURVIVED
6 8 - 10 12 K 16 18 2 0 - 22 2 6 2 6 28 300 2ACE OF ROOMS
* The age of 6 rooms were not known. See also Table .4.13.2 on page ^3^.

PART II CH 13 22b
Structural Changes of Compounds
The 63 compounds surveyed in Ibadan contained 1,099 rooms with a total are of 9,522 sq.m. Between the 1st Kay, 1963 30th April, 1968 when my survey in Ibadan concluded, only 69 new rooms were built in these compounds, while 12 rooms had disappeared or were decaying at the time of interview. Thus.the total net increase over the five-year period was 57 rooms or 5*2 per cent which yields an average growth rate of about 1.0 per cent per annum. This very modest growth rate reflects the fact that all major housing developments over the last two decades (1950-68) have taken place in areas beyond the nineteenth century city wall, whereas the older parts of the city, to which this survey was confined, were little affected by this expansion for lack of suitable building space.*
Although about 80 per cent of the 69 rooms built between 1963 and 1968 had mud walls, there is some evidence that the use of cement blocks is increasing. A further indication of changes in local building practice and standards is the increased use of cement for rendering walls and internal floors. For example, on my data the total area of cement floor in these compounds increased from about 5 ,600 sq.m. in 1963 to 6,260 sq.m. in 1968, that is, by 11.8 per cent and the use-of cement for outdoor working platforms and terraces increased from 1,200 sq.m. to 1,550 sq.m., that is, by 29»2 per cent over the same period. (See Table A.13*3 on page *130).
Amenities
In the following pages I shall examine the availability of such basic amenities as kitchens, bathrooms, toilets, electricity and piped water in the 63 compounds surveyed accommodating 295 households.
* The only exception was the encroachment of some houses on the flood- plains of the Ogunpa and Kudeti streams which caused a disastrous flood in 1963, and the loss of many lives and property.
PART II CH 13 227
Kitchens were found in 43 compounds which together accommodated 218 households. Of these only 7 households had their own private kitchens while the remaining 211 households shared 30 kitchens, giving an average of one kitchen per 4.2 households. The remaining 77 households (26.1 per cent) living in 20 compounds had no kitchen at all but cooked their meals either in the central halls or on verandas of their compounds.
A total of 42 covered bathrooms were counted in 24 compounds and shared by 133 households. In 20 compounds having 91 households, sheltered cement platforms were available, whereas in 19 compounds with 69 households various unpaved areas inside and outside the house were used for personal washing.
The 27 covered toilets found in 20 compounds were shared by 114 households. Another 19 compounds with 76 households had at least one pit-latrine in or near the house, while 2k compounds with 103 households or 35*6 per cent of the sample, had no toilets at all. The inhabitants of these compounds either used a public lavatory or the lavatory of a neighbour or friend.
Electricity supply had been installed in 30 compounds, but of the 174 households living in these compounds, only 126 had an electric bulb in their rooms, while 169 households or 37-3 per cent of the total had no electricity supply at all.
Finally, 13 compounds with 86 households had a water tap in their courtyards, whereas 209 households or 70.8 per cent used a public stand-pipe in one of the streets nearby.
In.short, 26.1 per cent of all households surveyed had no kitchen, 33*6 per cent had no toilet, 5k.2 per cent, had no bathroom, 37•3 per cent had no electric light, and 70.8 per cent had to fetch their water at a public stand-pipe^
13/-21 FEDERAL OFFICE OF STATISTICS, NIGERIA Ibadan Housing Enquiry op cit.,p. 10. Out of 800 households surveyed 96 or 12.0 per cenc had no kitchen, 71 or 8 .9 per cent had no bathrooms, 116 or 14.5 per cent had no toilets, 508 or 63.5 per cent had no electricity supply, 625 or 78.1 per cent had no.private water supply.

PART II CH 13 228
In spite of the appalling shortage of basic amenities, compound heads were not unduly disturbed about this situation. When asked, what improvement they thought their compounds needed most, 19 or 30.2 per cent answered spontaneously "an upstairs", 11 or 17»5 per cent wanted to paint or repaint the house, and another 3 or 7»9 per cent were keen on having ceilings in their rooms. Only k or 6 .3 per cent felt the need for a lavatory or bathroom, while another k were generally dissatisfied and said they would prefer to demolish and rebuild the house. Three compound heads opted for piped water, more bedrooms, electricity supply and roof repair,3 had various other needs, two did not respond, and one was undecided.(See Table A.13«^ on pagei+31 ). It is interesting to note that nearly half of the compound heads interviewed wanted to build "an upstairs" and paint the house, whereas such improvements as a new lavatory, bathroom, piped water and electricity only ranked fourth and fifth in their collective list of needs.

PART II IBADAN CHAPTER 1*+
COST 0? CONSTRUCTION AND THE FINANCING OF PRIVATE HOUSES LN IBADAN 229
The general level of house-building costs and the financing of modern private houses in Nigeria have already been discussed in Chapter 7 on pages 124-6. it was shown there that the average cost per sq.m. for modern buildings is substantially higher than for the traditional buildings surveyed in Zaria. Further investigations revealed that financial help from official institutions, Housing Corporations, Building Societies and Insurance Companies were conspicuously absent in the sample of traditional compounds, perhaps because of the average low incomes of these household heads, the use of traditional building materials and techniques in their compounds, and the mode of urban land tenure in northern Nigeria. In fact, only two compound heads were able to secure a building loan from the Local Authority, while the rest had to rely entirely on their personal incomes, their savings and on contributions from their families and friends.
The object of this chapter is to examine the costs of house construction, improvements and maintenance and the method of financing these activities at Ibadan. The discussion is based on results obtained from my survey of 63
compounds in that city. The period for which 'the costs of construction and improvements was studied was five years, from the beginning of May 19&3 to the end of April 19^8, whereas the study on maintenance cost was further limited to the three years immediately preceding the date of the interview. These time limits were necessary as most compound heads could not remember all expenditure on building activities as accurately as needed for longer periods. As far as expenditure on maintenance is concerned, the very detailed annual data obtained for this period of three years enables me to adjust the spending on this item to cover the five-year period under study.

PART II CH 14 230
THE COST OF BUILDING
Cost of Building Materials and Labour
During the first half of 1968 prices for imported building materials rose sharply, due mainly to import restrictions imposed by the Military Government during the civil war. As one result of these measures, building activities slowed down and almost came to a standstill at Ibadan. The prices quoted below for a number of basic building materials are average prices changed by building material merchants in late 1967 before these price increases of 1968 took effect. In 19&7i cement prices ranged from 14 to 15 shillings per 50 kg. bag; sheets of corrugated iron for roofing usually sold in bundles of 20 from £N. 4..75 to £N. 5*0; and asbestos-cement sheets 1.20m x 1.20m for ceilings at 6 or 7 shillings.
Daily wages paid to building workers then ranged* from 3 shillings 6 pence for unskilled labourers to 10 shillings or more for skilled assistants, while payments made by the household head to skilled craftsmen were normally on a job basis. For example, a common unit of charge is for the construction of the mud walls for a single room, of 9 to 12 sq.m. in area. Job-prices quoted to me for this work ranged from £N. 7«0 to £N. 10.0. If the building material has to be transported, an additional charge is made. Carpenters normally use the bundle of corrugated iron sheets as the unit-basis of their charge. Work done by carpenters include construction of the roof frame, the timber necessary being supplied by the household head, and the fixing of the corrugated iron sheets. For a single-storey house their charge varies between £N. 1.50 to £N. 2.00 per bundle*, while for two-storey houses the charge rises to about £N. 3-00 due to the greater risks involved. Doors and windows were quoted to me as costing between £N. 1.50 for a very
* The roof of a six-roomed house requires on average 11 bundles.

PARJ! II CH 231
simple internal door to over £N. 5»00 for a good quality external door. Windows and window-shutters fluctuated on a similar scale. All materials required are supplied by the household head but ready-made doors and windows-are also available. Other prices charged by tradesmen include £N. 1.00 to £N. 1.30 for laying the cement floor for an average sized room and £N. 3»00 for fixing a ceiling of asbestos-cement sheets. All pricesquoted here are average prices charged for "one-off” work.
Cost of Construction
Expenditure on building covers a range of different activities and may be divided into five major groups, as follows:
1. Cost of construction completed between 1963-68
2. Cost of buildings still under construction at April 30th, 1968
3* Cost of improvements, 1963-68
4. Cost of maintenance and repair, and5« Cost of such miscellaneous constructions as wells, pit-latrines
or stables.The following table reveals that of the total adjusted building
expenditure of about 104,000 shillings or £N. 5*200 , 48.5 Per cent were • spent on new construction, 26 .3 per cent on maintenance and repair, 22.1
per cent on improvements, and 3»1 per cent on miscellaneous constructions. There was no expenditure for buildings still under construction at April 30th, 1968, although five compound heads had already bought seme buildingmaterials such as bricks, cement blocks, cement and sawnwood for future useat a total cost of c. 4,500 shillings.
In the five-year period under study, 1963-6 8, 67 rooms* with an areaof 559.3 sq.m. were built in 15 of the compounds surveyed. (See Table 14.1 on page 232)* Thextotal recorded cost for building these rooms was 50*410
* This excludes two permanent stables which were grouped in Table 14.1 on page 232 under miscellaneous' construction.'

PART II CH 14 232
TAELE 1^.1 Cost of Construction in 65 Surveyed Compounds 1963-1968
ColUTJl 1 | 2I
3 4 5No. of Rooms
sq.m. Cost in sh.
Cost per sq.m.
Per centi
Rev Construction (Completed) Corrugated Iron roofed rooms Living area, Common and Commercial roomsEasic Ancillary Facilities Sub-total
4918
473.186.2
4 6 ,4 6 0
3,95098.2 '
Ij
48.567 559.3 50,41CImprovements on Existing BuildingsCement Floors and plaster Electricity Installed Piped. Water Installed CeilingsOther Improvements Sub-total
11,9662,920
9755,6281 ,5 06
'
22.122,595Maintenance and Repair Mud WallsPainting and/or Whitewash Corrugated Iron Roof Cement Plaster and Screed Sub-total (1966-6 8, Actual) Sub-total Adjusted 1963-68+
For Ee-tails see Table 1t .2 on pagi:
e
16,38926.327,315
Buildings under Constructior.•Walls completed
Roof completed Sub-total - - -Miscellaneous Construction Includes Wells, pit-latrines Bathrooms and Stables, (2) Sub-total
3,26o3,260 3.1
Total Actual Expenditure 93,054100.0Total Adjusted Expenditure 103,980
- - - v 5 = 27i315’ Shillings

PART II CH 1*+ 233
shillings or £N. 2,520. The average cost per sq.m. is 98.2 shillings for
49 comparable living and sleeping rooms with a total area of 473*1 sq.m.Only 3 houses were entirely constructed within this period, and details for two of these are given in the Appendix on pages ^33- Another 3 compounds had major extensions including one upper storey. In the remaining 9 compounds, only a few rooms and such basic ancillary facilities as kitchens, stores, bathrooms and toilets were added.
A break-down of cost by element of building has been attempted for thetwo newly constructed compounds and is given on page 433. The firsthouse, see Plan A.14.1 on page 434, wras built in 1963-65 at a total costof about 9*930 shillings or £N. 497*00. The superstructure which includesthe mud walls and roof accounted for 61.2 per cent of the total cost,whereas finishes, i.e., all doors and windows, ceilings, cementing of floorsand walls as well as painting together accounted for 38 .8 per cent. The costby element of cost was divided between materials 64.3 per cent and labour35-7 per cent. The builder's overall profit-margin, which is believed to be
1/in the region of about 10 to 15 per cent,— is hidden in the cost of materials and labour, and could not be calculated separately for this house.
The second new house, see Plan A. 14.2 on page 434, was built by two brothers, one of whom was a bricklayer and the other a trained carpenter, at a total cost of about 6,310 shillings or £N. 3^6.00 in 1964/65. The percentage distribution of the superstructure and finishes in this case were 59*9 per cent and 40.1 per cent respectively, which is very similar to the above mentioned example, whereas the cost by element of cost differed sharply, being 93-5 per cent for materials and only 6 .5 per cent for labour as the two brothers built the house themselves.
1/- UNITED NATIONS Housing in Africa E/CN/l4/HOU/7/Rev. New York 1965, p. 104

PART II CH 14
The only data on Yoruba house construction costs available for comparisonare for houses built in rural areas of western Nigeria. These were collectedby R. Galletti and P. Crooke in 1951 and 19&5 respectively. Using thesedata, Table A.14.4 on page 435 shows that the construction cost for anaverage room of 10 to 12 sq.m. had risen from £N. 12.2 in 1920-24, to £N.32.50 in 1951 and £N. 37-3 in 19&5- Galletti interprets the temporary fallin construction costs which occurred in the early 1930's and again duringthe Second World War by correlations with the exceptionally low cocoa pricesand correspondingly low incomes for cocoa farmers who could not afford tobuild expensive houses. The rapid recovery of the cocoa market after 1945yielded record incomes and is clearly reflected in the rising costs of
2/construction of houses.— These increases were partly due to a gradual replacement of the traditional type of rural house with its long front room leading on to a row of smaller rooms at the rear, by an essentially urban house having a central corridor with rows of rooms on either side; but these changes of design were accompanied by increased use of expensive modern building materials such as corrugated iron roofing sheets, cement and better finishes.—^ Nevertheless, comparison of these data with those I gathered in 1968 suggests that houses built in Ibadan city were on average twice as expensive as their counterparts built in the rural areas of western Nigeria. The higher cost of house building in urban areas was mainly due to the increased use of modern building materials and appreciably higher labour costs.
2/— GALLETTI, R. et al. Nigerian Cocoa Farmers Oxford U.P. 195& PP- 252-59- 3/— CROOKE, P. "Sample Survey of Yoruba Rural Building" in Odu, University
of Ife Journal of African Studies. Vol.2 No.2 Ibadan i960, pp- 41-71

PART II CH 235
Cost of Maintenance and Repair
The adjusted cost of maintenance and repair v/as the second largest item of expenditure on building in the compounds surveyed, namely 27,315 shillings or 26.3 per cent of the total. This relatively high maintenance cost to some extent reflects the median age of 25.6 years for 1,093 rooms in the sample. (See Graph 13*1 on page 225). However, it must be stressed that, unlike those for new construction and major improvements, maintenance and repair costs are very difficult to check, and in consequence I normally accepted each compound head's statements of these outlays after comparing his annual expenditures for each item with those of others. Given its importance I have broken down the total actual maintenance costs of 16,339 shillings into 6 categories for presentation in the table below.
TABLE 14.2 Maintenance Cost by Element of Building 1966-68
Element of Building Shillings Per CentMud Walls 5 ,88^ 35.9Painting and/or Whitewash 3,589 21.9Corrugated Iron Roof 3 ,179 19.^ ’Cement Plaster and Screed 2 ,147 13.1Doors and Windows 639 3-9Other Repairs 951 5.8Total Actual Maintenance Cost 16,389 100.0
It is interesting to note that mud walls absorbed over one-third of the total maintenance cost, followed by painting and/or whitewash with 21.9 per cent, and corrugated iron roofs 19.^ per cent, cement screed and plaster 13.1 per cent, while outlays for doors and windows and for miscellaneous repairs were only 3.9 and 5.8 per cent respectively. Maintenance costs for mud walls and roofs deserve additional comment. During the heavy downpours which sometimes occur in June and September, unprotected house corners tend to collapse and the necessary repair work

PAPT II CH 1 236
is generally expensive. Damage to the roof is normally caused by high winds which may blow away parts or even the whole roof including its frame.
Cost of Improvements
By improvements I mean all building activities other than maintenance which are carried out after an owner has moved into a nev; house. A total of 22,995 shillings was spent on improvements in the compounds under study between 1963-68. In order of importance, cementing of walls and floors accounted for 52 .0 per cent of this total, the fixing of ceilings for 2^.5 per cent, installation of electricity and piped water for 12.7 and h.2 per cent respectively, and miscellaneous improvements such as insertion of bigger windows for 6.6 per cent of the total cost.
THE FINANCING OF PRIVATE HOUSES IN IBADAN
In the first part of this chapter, I examined the types and costs of various building activities carried out in the compounds surveyed. In the following pages I wish to show how these building activities v/ere financed by the various household heads. As has already been discussed in Chapter 7 the two main sources of funds for housing are personal and institutional.
Personal Sources
Personal sources of building funds include self-finance from personal income and savings, contributions from family members and friends, and such social security funds as pensions or gratuity. Contributions from family members and friends were further sub-divided into gifts and loans.
While 23 compound heads in the sample had built their own houses, only 3 had done so between 1963 and 1968. Another 3 compound heads had added major extensions to their compounds during the period under study. These

PART II CH 237
6 compound heads had together built a total of 56 rooms with an area of 507*0 sq.m., while the remaining 13 rooms covering 68.1 sq.m. and including 2 permanent stables were built by 7 compound heads and 2 heads of dependent households. As noted above major improvements such as the cementing of walls and floors, the fixing of asbestos-cement ceilings and the installation of electricity and piped water supply had also been carried out by 37 compound heads at a total cost of about 23,000 shillings or £N. 1,150.
During the five-year period from 19&3 to ^968 loans totalling 4,460 shillings (£N. 223) were made by private persons to four compound heads who used the money as follows: 2 loans having a total of 3,500 shillings for new construction, and 2 loans totalling 960 shillings were spent on various improvements. The creditors of these loans were in order of importance as shown below.
TABLE 14.3 Type of Creditors of Private Building LoansNo. of Loans Shillings Per Cent
Close Relatives of Compound Head 1 3,000 67.3Esusu * 2 900 20.2
Personal Friend of Compound Head 1 560 12.5Total 4 4,460 100.0
* Private Saving Society
There were three recorded gifts having a total of 1,995 shillings X£N. 100). These gifts were made by close relatives of the compound heads who used the money partly to pay for new construction and partly for improvements of their houses.
The 4 loans listed above as well as the 3 cash gifts covered about 10.6 per cent of the total costs of new construction and 4.8 per cent of the expenditure on improvements.

PART II CH 14 238
In short, between 1963 and 1968 a total of 103,980 shillings (£N.3,200) was spent by 63 compound heads on new construction, and on the improvement or maintenance of their houses. Slightly less than 94.0 per cent of this money came from the personal savings and income of compound heads, while about 6.0 per cent came from loans and gifts made by family members and friends. (See Table A.'Ik.6 on page 432). None of the interviewed compound heads received a loan or grant from such official institutions as Building Societies, Housing Corporations, banks or other Government- sponsored agencies.
Given the lack of commercial and Government-aided loans or subsidies for housing to the lower income groups of the population in Ibadan, independent savings are extremely important for the building activities of the urban Yoruba. In my sample 41 compound heads or 6 3.1 per cent had at one time or another saved amounts that ranged from £N. 23 to over £N. 300 to finance building, while 17 or 27*0 per cent had never saved for this end, and 3 or 7-9 per cent did not respond. Savings were carried out either with the help of commercial banks, or more often through the traditional
4/saving societies called esusu already mentioned above.— These savingsocieties or clubs are believed to be of Yoruba origin and date back atleast to the first half of the nineteenth century. The esusu is describedby Shirley Ardener as: "An association formed upon a core of participantswho agree to make regular contributions to a fund which is given, in whole
5/or part, to each contributor in rotation.
BASCOM, W.R. "The Esusu: A Credit Institution among the Yoruba" in Journal of the Royal Anthropological Institute of Great Britain and Ireland. Vol. LXXII London 1932, pp. 33-70.
5/— ARDENER, S. "The Comparative Study of Rotating Credit Associations" in J.R.A.I. Vol. XCIV No.2 London 1964, pp. 201-29

PAST II CH 14 239
Private money-lenders are very much in evidence all over Yoruba land.However, in interviews, it became obvious that most compound heads wererather reluctant to use their services, one reason being their exorbitant
rates of interest which may range from 30 to 50 per cent per annum andover, a rate that makes such loans impracticable for private house buildingexcept perhaps as finance for tenant accommodation with relatively quick returns•
Internal Subsidy and Mutual Help
By internal subsidy, I mean the financing of new rooms for close relatives living in the same compound. This includes help given by a compound head to his newly-married son or any other dependent family member in need of shelter. In these terms, of rooms built between May 19&3 and April 19&8, 10 or 14.5 per cent were either fully or partly subsidized by 3 compound heads. Another 3 compound heads invested some money in tenant accommodation. Diagram 14.1 illustrates the main characteristics of internal subsidy and investment made by these six compound heads from 19^3 to 1968.
DIAGRAM 14.1 Distribution of Internal Subsidy and Investment
Internal Subsidy
v ^ — / Compound A .— -A Heads 22 Investment
1 CH’s unmarried Son
2 CHfs full Brs1 Families
12 Tenant Families
1 CH's Father’s Brothers1 Sons1 Family
22 = Number of Rooms :----^ Fully Subsidized------------Partly Subsidized, at least one-quarter of
the total cost.

PART II CH 14 2 t0
As shown in the diagram, a total of 8 rooms were partly subsidized by the compound head and allocated to the families of 2 full brothers’ sons.Of the other 2 fully subsidized rooms, one went to the compound head's father's brothers' sons' family, the other to an unmarried son of the compound head.
Although mutual help in the form of labour is no longer practised in such towns as Ibadan, many a compound head finds it difficult to build a new house independently because of the rapidly rising cost for building materials and labour. Hence, in all three new houses built between 19^3 and 1968, two full brothers had pooled their financial resources to construct the building.* While this coincidence does not have statistical significance, it indicates a general trend among the lower income groups to share the burden and costs of house-building with one or more close relatives.
Enquiries into the financing of maintenance costs showed that about half of the dependent or semi-dependent household heads were themselves responsible for any improvements and/or repairs they undertook in their rooms, while maintenance costs for the roof and outside walls were usually met from a general fund collected annually by the compound head from lineage kin in Ibadan and the surrounding villages. Such funds to cover the external maintenance cost applied only to family compounds, i.e. compounds which belonged to a lineage or section of a lineage, and were found in 18 cases.
Investment in Building
Investment to provide accommodation for rental is fairly widespread in Ibadan, and particularly in areas to the north and southwest of the
* Two of these compounds are given in the Appendix on page 33 .

PAHT II CH 241
old city. Several compound heads in the sample had built houses in different parts of the city and rented them out either to one trustworthy tenant or more often to a number of people, most of whom occupied one or two rooms. Alternatively, some compound heads had simply built a few rooms for rental in their back-yard. As shown on Diagram 14.1 on page 239 »3 compound heads had built 22 rooms for rental. The rent paid for an average room at Ibadan in 1968 ranged from £N. 1.50 to £N. 2.50 per week. Such relatively high rents guarantee owners quick returns for their investments, especially when the average building cost of about £N. 5*00 per sq.m. is considered.
To conclude, although only a small number of rooms were built in the sample compounds between 1963-68, it can be shown that the average cost of these rooms was then around £N. 5*00 per sq.m., which is considerably cheaper, in fact between 4 and 5 times less than the cost of houses built by the Western State Housing Corporation at Ibadan. This substantial difference is partly due to the exclusive use of modern building materials, the installation of piped water and electricity supply, and the higher labour cost in houses constructed by the Corporation. It could also be shown that the financing of private houses built during the period under investigation was left entirely to the household heads concerned. Of the 50 compound heads who undertook new construction and/or major improvements between 1963 and 1968, not one received financial help of any kind from the banks, Insurance Companies, Building Societies and Housing Corporations. Some reasons for this lack of commercial and official support already identified for Zaria apply equally to Ibadan. (See Chapter 7 on page 145 )• These include the low average income of household heads, their use of traditional building materials and techniques, and the mode of urban land tenure, under which large areas of land belong to extended family groups which may only transfer usufructuary rights of occupancy to their members.

PART II CH 2k2
As such conditions are generally regarded by modern financial institutions as high credit risks, the lack of commercial funds for the poorer section of the population most in need of help is easy to understand.

PART III MARRAKECH CHAPTER 13 MOROCCO BACKGROUND INFORMATION
ENVIRONMENTAL SETTING
Geography and Climate
Morocco or al-Mamlaka al-Maghrebia (the kingdom of the west), as it is known among the Arabic-speaking people, is located at the northwestern corner of Africa between latitudes 27° AO1 to 33° 53' north and longitudes 1° 00' to 13° 10' west. The country is over 1,200 km. (730 miles) long and about 300 km. (310 miles) wide at its greatest inland depth, and has an area of approximately ^ 5*300 sq.km. or 17^,000 sq. miles.
The main features of the country's topography are the Rif and Atlas Mountains. They are the result of extensive movements which took place in the geologically recent Tertiary Era when sediments of Liassic and Jurassic limestone were forced up and folded. The mountains, which rise to a height of over A,100 m (13i300 feet), are roughly aligned in a chain from northeast to south-west and are divided into four distinctive massifs; The Rif, the Middle, the High and the Anti Atlas.
The contrast between the fertile Atlantic lowlands situated to the west of the mountain range and the barren desert plains of Saharan Morocco to the east is very striking. The western slopes are covered by forests which consist mainly of cedars, cork and evergreen oak, aleppo pine and various kinds of cypresses, whereas the eastern slopes consist of bare sun-baked rocks giving way to almost waterless stony plateaux trenched by valleys from which cultivated palm-groves extend like green fingers into the desert.
The vegetation found in the Atlantic coastal plains (0-200 m above sea level), include fruit-bearing trees and crops, asphodels, fennel and dwarf palms, while on the Meseta Plateau further east (200-1,000 m above sea level) shrubs and alfa grass dominate the landscape. The main crops

PART III CH 15
grown by farmers in the Atlantic lowlands and on irrigated plots elsewhereinclude inter alia such cereals as wheat, barley and corn as well aspulses, citrus fruits, vegetables, sugar-beets, cotton, oil-producingplants, potatoes and rice.
Morocco's climate is determined by the Atlas Mountains which act as abarrier and watershed between the western and eastern parts of the country.North and central Morocco enjoy a Mediterranean type of climate with hotdry summers, which are largely the result of anti-cyclones centred nearthe Azores, and warm wet winters. Further south, as the rainfall graduallydecreases, this climate gives way to semi-arid and eventually to desertconditions. For example, Tangier with 897 mm. (35-3 inches) average annualrainfall is one of Morocco's wettest towns, followed by Fez with 536 mm(21.1 in.), Marrakech with 239 mm (9-4 in.), Quarzazate with 107 mm (4.2in.), while Tabelbala just inside Algerian territory has a mere 20 mm or
1/0.8 inches.— The only exceptions to this gradient sire found in the highridges of the Rif and Atlas Mountains where the rainfall averages over
2/800 mm per annum.—The city of Marrakech, at 30° 37' latitude north, 8° 00' longitude east,
stands about 460 m. .above sea level in the western foot-hills of the High Atlas Mountains. Temperatures in the city vary from an average daily maximum of 45.3° C. (114° F.) in July to an average daily minimum of 0° C. (32° F.) in January. The mean annual rainfall (1923-1958) is only 239 mm., and mostly coming between November and April.—^ (See Diagram A.15*1 on page 436 ).
1/— METEOROLOGICAL OFFICE, GREAT BRITAIN Tables of Temperature, Relative Humidity and Precipitation for the World Part IV Africa etc. H.M.S.O. London 1964, pp. 106-9, 10, 165.
2/— HANCE, W. The Geography of Modern Africa New York 1964, p. 78
METEOROLOGICAL OFFICE, GREAT BRITAIN op cit., p. 108

PART III CH 15 245
Human Pattern
Since late Paleolithic times North Africa has been inhabited by people of Caucasoid race. When the Phoenicians, Greeks and later the Romans colonized the coast from the first millenium B.C. until the fourth century A.D., they found the region occupied by people known collectively as Berbers (L. barbarus). After the conquest of Morocco by an Arab army at the beginning of the eighth century, Arabs and Berbers mixed freely and are today no longer distinguishable particularly in towns and the Atlantic lowlands.
According to Greenberg, the languages of Morocco belong to the Afro- Asiatic group, also known as Hamito-Semitic, which includes inter alia
4/both Berber and Arabic.— The spread of the Arabic language in Morocco since the eighth century, and especially after large-scale Bedouin/Arab immigration in the eleventh and fifteenth century, has resulted in the survival of Berber languages only in mountainous regions inaccessible to Arab power. Today, an estimated 60 per cent of the total population, most of whom live in urban areas, the Atlantic lowlands and the Taza Corridor, speak Arabic, whereas the rest of the population, particularly those in
5/the mountainous regions, speak one of several Berber languages.—
HISTORICAL BACKGROUND*
While many outstanding medieval and modern scholars have contributed to our knowledge of Morocco's history, the following summary is mainly
4/— GREENBERG, J.H. Languages in Africa The Hague 19&6, pp. 4-2-65—^ MONTAGNE, R. La Vie Sociale et la Vie Politique des Berbers Paris
1931• Trans, by Seddon, D. MThe Berbers: Their Social ana Political Organization" London 19731 P« 4
* Spelling of Arabic names is based on the Encyclopaedia of Islam ed. by Houtsma, M.J. et al., Vol. 1-4 Leyden-London 1913-34

PART III CH 15 246
based on the researches carried out by Henri Terrasse, Charles-Andre Julien and Gaston Deverdun whose works enables us to follow the turbulent history of Marrakech from its foundation in the late eleventh century A.D. to the present day.—^
The conquest of North Africa by an Arab array began in the middle of the seventh century A.D. and was almost completed when Musa b. Nusair conquered the western parts of the Maghrib between 704-11. Spain, except the far north, was in the hands of an Arab-Berber army by 7^3 • The history of the v/estern Maghrib after the successful Arab invasion until the middle of the eleventh century is one of confusion. The beginning of this period was characterized by tough Berber resistance against the Arab invaders.This was followed by the rise and fall of successive Arab and Berber states such as the Kharidjites, Idrisids, Aghlabids and Fatimids dynasties and massive invasions by two waves of nomads, the Banu Hilal who were Arab and the Sanhadja Berbers, who invaded Morocco in the early eleventh century.It is the invasion of the latter group which merits further attention.
Both the Almoravid and Almohad dynasties, which lasted for.over 200years from the middle of the eleventh to the middle of the thirteenthcentury, started as reformist religious movements. The Almoravid dynastywas founded by Sanhadja Berbers, a nomadic people, who roamed the westernSahara, trading mainly salt for gold in the Sudan. Islam had spread amongthe Sanhadja since about the ninth century, but it is alleged that their
7/knowledge of the new religion remained rather rudimentary.— Around 1035
— ' JULIEN, C.A. Histoire de l’Afrique du Nord Paris 195&, 2 Vol. Trans, by Petrie, J. "History of North Africa" London 1970TERRASSE, H. Histoire du Maroc des Origines a IfEstablissement du Protectorat Franpais Casablanca 1949-50 2 Vol.DEVERDUN, G. Marrakech des Origines a 1912 Rabat 1959 and ^966, 2 Vol.
7/— JULIEN, C.A. op cit., p. 77

PART III CH 15 2V7
Abd Allah b. Yasin, a religious scholar from the Sous, appeared among theSanhadja to preach the tenents of Islam. However, his mission was notsuccessful and he left with a few followers and built a fortifiedmonastery (ribat) the inhabitants of which were called al-murabitun,hence the name Almoravids. In the early 10bQ's having assembled a sizablearmy of warrior-monks, Abd Allah b. Yasin launched a successful jihad or holywar against the surrounding tribes. By 1060 large parts of southern andcentral Morocco as well as the western trading routes to the Sudan were
9/in the hands of the Sanhadja Berbers.—' Yusuf b. Tashfin, a militaryleader, who gained control of the Sanhadja army in 1061, became the first
10/Almoravid sultan. He founded the city of Marrakech about 1070,— • and made11/it the capital of a new empire.— Under Ibn Tashfin's son fAli b. Yusuf
(1107-^3) the Almoravid empire was at its height. Territorially, it then included Muslim Spain, the Balearic Isles, the Mediterranean Coast as far east as Algiers and the western trading routes to the Sudan.
Marrakech, which was first established by Yusuf b. Tashfin as an army camp for the Sanhadja Berber, soon became a permanent settlement. But it was not until 1126-27 when the city was seriously threatened by an army
12/under Ibn Tumart, the religious leader and founder of the Almohad movement,—
ABUN-NASR, J.M. A History of the Maghrib Cambridge 1971» P» 939/— ABOU-OEEID-EL-BEKRI Kitab al-Hasalik Trans, by Mac Guckin de Slane
"Description de l’Afrique Septentrionale" Paris 19^35 PP- 309~18DEVERDUN, G. op cit •, pp. 59-64
^ TERRASSE, H. op cit., pp. 222-23GOLDZIHER, I. Mohammed Ibn Toumert et la Theologie de 1*Islam dans le Nord de l'Africue au Xie Siecle Algiers 19^3* pp« 5^-71

PART III CH 15 248
13/that Marrakech was surrounded by a defensive wall.— (See Plan 17.1 on page 2 7 7)* However, 'Ali b. Yusuf's successors, Tashfin b.'Ali and Ishak b.'Ali b. Yusuf, could not prevent the already crumbling empire from falling into the hands of the Almohads. The city of Marrakech was taken after an eleven months' siege in spring 1147 by an army under Abd al- Mu'min (1133-63) the first Almohad sultan, and then became again the capital of Morocco where the sultan and his successors resided when they were in the country. 'Abd al-Mu'min vigorously pursued further conquests along the Mediterranean Coast of Morocco and beyond, and when he died at Ribat al-Fath (Rabat) in 1163, left his son Abu Ya'kub Yusuf (1163-84) an empire which comprised the whole of the Maghrib from the Atlantic coast to Tripoli and the greater part of Muslim Spain.
Under the Almohads Marrakech grew rapidly and became one of the most prosperous cities in the Maghrib. Ya'kub al-Mansur (1184-99), the third
']li /Almohad sultan and the most renowned builder of the dynasty,— ordered the construction of the Casba, an extension of the city to the south.(See Plan 17*1 on page 277) • Many important public buildings such as the Mosquee al Mansour situated in the Casba, a hospital, several schools (medersas), aquaducts and magnificent gardens were laid out and constructed ■during his reign. However, his successors Muhammed al-Nasir (1199-1213) and Yusuf al—Mustansir (1214-24) rapidly lost most of their influence in Muslim Spain. Eastern and central Maghrib governed by the Hafsids and Zayamids slipped out of Almohad control, and the last four decades of the dynasty (1224-69) were disturbed by rivalries between the descendants of ' Abd al-Mu'min and Ibn Tumart which made it relatively easy for the Merinids to seize control of the country.
13/ — DEVERDUN, G. op cit., pp. 109-10 14/— MOULINE, M.R. The Era of al-Mansur the Almohad, or the Political,
Intellectual and Religious Life of the Maghrib from the Year ^bO to the Year 393 (1183-1199) Rabat 1946

PART III CH 15 2^9
The occupation of Marrakech by an Merinid army in September 1269,not only brought the Almohad dynasty to an end but also the politicalunity of the Maghrib. The three Muslim states which succeeded theAlmohads - the Merinids centred in Fez, the Zayanids in Tlemsen, andthe Hafsids in Tunis - were, unlike their predecessors, politically
15/oriented states rather than religiously inspired empires.— The first Merinid sultan Abu Yusuf Ya’kub (1258-86) ordered the construction of his new capital overlooking the old town of Fez which was founded by the Idrisids in the early ninth century; and during the two and a half centuries of Merinid rule Fez remained the capital of the dynasty, while Marrakech was administered by Governors appointed by the reigning sultan. Abu1 1-Hasan 'Ali (1286-1307) was the only Merinid sultan to build a mosque and a school there, but by the 1*+3 0's the city seems to have become de facto an independent kingdom ruled by Hintata Emirs from the south of Morocco.
By the end of the fifteenth century the Moroccan system of government based on exclusive domination by one or two tribal groups was declining. Two new types of grouping, first, a powerful urban class of merchants and artisans who were passionately interested in stability and order, and second, a popular religious Sufi Movement, were emerging. These groupings, and a professional army founded by Ahmad al-Mansur in the late sixteenth century, played increasingly important parts in the political affairs of the Sa'dian and later the Alawite dynasties.
Ahmad al-A'radj the first Sa'dian sultan (1517-^1) established himself peacefully in Marrakech,, and made it the capital of the new dynasty.
15/— ABUN-NASR, J.M. op cit., pp. 119-20

PART III CH 15 250
Abd Allah al-Ghalib (1557-7*0 and his brother Ahmad al-Mansur (1578-1603)—
restored the city to its former splendour. Several mosques, schools and a new palace (al-Badi) were built by them. The Jewish population of the city were rehoused in the Mellah, an area they still occupy today. (For names of location see Plan A.17-3 on page 442). However, after al-Kansur's death in 1603, anarchy spread throughout the country. The struggle for power between his sons split Morocco into the kingdom of Marrakech under Abu Faris Abdallah and the kingdom of Fez under Zidan. This division hastened the decline of the Sa'dian dynasty which came to an end when Mawlay al-Rashid (1659-71) the first Alawid sultan occupied Marrakech in 1668.22/
During the long reign of Mawlay Isma'il (1672-172?) peace and order was restored. The sultan made Meknes the capital of the Alawid dynasty and improved it by building a palace and several mosques there. He took little interest in Marrakech and destroyed most of its famous palaces in search for valuable building materials to speed up his building at Meknes. However, Muhammad b. 'Abd Allah (1757-90) restored Marrakech and some of its palaces and made it his residence. His successors Abd al-Rahman (1822-59) and Muhammad b. Abd al-Rahman (1859-73) continued to take an active interest in the city by repairing some of its religious buildings, aquaducts and water-storage basins, although both sultans seldom stayed in Marrakech. _
It is interesting to note that none of the Sa'dian and Alawid sultans were able to rule the whole country which was then effectively divided into
BOVILL, E.W. "The Moorish Invasion of the Sudan" in Journal de la Societie des Africanistes Vol. XXVI Paris 1927, pp. 2^5-93 and Vol. XXVII pp. **7-56DE CASTRIES, H. "La conquete du Soudan" in Hesperis Vol. 1923i pp. 433-88
• 2/ LE TOURNEAU, R. "La decadence Sa'dienne et 1'Anarchie Marocaine au XII© siecle" in Annales de la Faculte des Lettres d'Aix .XXXII,.I 960 ,' p p . ' 187-225

PART III CH 15 251
the bled al-makhzan, the areas in which the sultan exercised his supreme religious and secular authority, and the bled es-siba (land of the dissidents) whose inhabitants were hostile to the secular authority of the central Government, though they usually recognized the sultan’s authority
-lO/as imam or religious leader.— The size of the area under the control of the central Government (bled al-makhzan) varied from sultan to sultan and depended not only on his military strength but also on his ability and standing as a national leader.
The European struggle for influence in the Maghrib started with the occupation of Algeria by the French in 1830. This invasion forced the country out of her self-chosen isolation. It soon became clear that Morocco's independence could only be preserved as long as the European powers were prepared to check each other's colonial ambitions in this region. However, after protracted bargaining which involved the colonial interests of France, Great Britain, Spain, Germany and Italy, Morocco became a Franco-Spanish protectorate in early 1912.
After the defeat of Al-Eiba's army at Sidi bu-Uthman,* French forces under Colonel Mangin occupied Marrakech on 7th September 1912. Louis Lyautey, the first French Resident General (1912-25) restored El Hadj Thamis, one of the influential Kaids**in southern Morocco, to his old post as Pasha of Marrakech*** which he held until 1955 • General de Lamothe
— ^ MONTAGNE, R. op cit., pp. 12-17HART, D.M. "The Tribe in Modern Morocco: Two Case Studies" in Arabs and Berbers ed. by Gellner, E. et al., London 1973? PP- 27-8
* Al-Hiba was a marabout or holy man from Mauritania who had himself proclaimed sultan and established his headquarters at Marrakech in 1912.
** Tribal Chief*** Mayor of Marrakech

PART III CH 15 252
who assumed control over the region, built a fort and several barracks at the foot of Jbel Gueliz about three km. south of the walled city. A modern European township, situated between the fort and the walled city was laid out and developed rapidly after the First World War. In 1928 the railroad reached Marrakech and linked the town with Casablanca.
In the French zone of Morocco, the colonial Government embarked on a programme of introducing a modern economic infrastructure. From 1912 to 1956 a total of 1,600 km. of railroad4^ and over *+9*000 km. of highways,
20 /15,000 km. of which were all-weather roads, were constructed by the French.—
Special efforts were made to exploit the country's mineral wealth and Introduce modern agricultural methods. The French educational system as well as medical facilities were introduced and gradually extended to the Moroccan population. After the Second World War mounting resistance to the colonial regime spread throughout the country; and after skirmishes between the Moroccan National Movement and the colonial forces, which reached their height in mid-1955, the French Government granted Morocco its independence in March 1956.
ECONOMIC DEVELOPMENT
General Situation
The performance of the Moroccan economy between i960 and 1970, expressed in the changes in Gross Domestic Product at current factor cost, was one of steady expansion. For example: The G.D.P. rose from DH* 9,090 million in 1960 to DH 16,960 million in 1970 or DH 13,5^ million at i960 prices,— ^
19/ GOUVERNEMENT CHERIFIEN SERVICE CENTRAL. DES STATISTIQUES Annuaire Statistique de la Zone Fran^aise du Maroc Rabat 1952, p. 262
■— ^ ENCYCLOPEDIE MENSUELLE D f OUTEE-MER Morocco 5^ Special Issue, Paris 195^, P. 189
* The Dirham (DH) is the unit of currency in Morocco and was introducedin October 1959* The exchange rate was 100 Moroccan francs for 1 dirham.
21/ MINISTERE DU DEVELOPFEMENT ROYAUME DU MAROC Annuaire Statisticue du Maroc1964-1965 and 1971 Rabat 1966 and 1972, pp. 250 and 198

PART III CH 15 253
yielding a per caput income of approximately DH 780 and DH 940 respectively.During this period the estimated average annual growth rate of G.D.P. wasin the region of 3*9 per cent, while the per caput incomes rose by slightly
22/over 1.0 per cent per annum.— (See Table A.15*1 on page 437).Since i960 three Development Plans have been implemented (1960-1964,
1969-67 and 1968- 72 ) . During the last Five-Year Plan, for which no final figures are yet available, the projected 4.3 per cent average annual increase in G.D.P. at i960 prices was probably achieved. For the first three years of this plan, 1968-70 we know that the average growth rate of G.D.P. was with 5-8 per cent per annum well above the projected average.A new Five-Year Plan was launched in 1973*
Natural Resources, Agriculture and Industry
Although Morocco is rich in mineral resources, noticeably phosphates,agriculture provides the basis of the countryfs economy, contributing 27.3
per cent of G.D.P. and about 30 per cent of the total export earnings in1970. About two-thirds of the active labour force of approximately 6.0million people are engaged in agriculture and livestock-raising. It hasbeen estimated that around 7 .8 million hectares (19.3 million acres) or18.0 per cent of Morocco's total land area is arable land, of which about
23/two-thirds were under cultivation in 197*1 •—^ The modern agricultural sector accounts for between 13 and 20 per cent of the total cultivated area, while the remainder is still farmed with traditional methods. Approximately 60 per cent of Moroccan farmers own less than one hectare of farming land. Wheat, barley, corn, sugar beet and pulses are mainly grown for the home market, while most of the citrus fruits, tomatoes and wine are exported.
22/— UNITED NATIONS Yearbook of National Accounts Statistics 1971 New York 1973, Vol. 2 p. 90
23/— / MINISTERE DU DEVELOPPEMENT ROYAUME DU MAROC Annuaire Statistioue du Maroc 197*1 op cit., p. 52

PART III CH 15
Livestock-raising is a major occupation in the traditional sector andcontributed over kO per cent of the total agricultural income in 197'! •According to the 1970 livestock census there were I**! million cattle,
24 /13.1 million sheep and 6 .4 million goats in the country,— ■ ‘The estimated area of permanent pasture occupies an additional 7-6 million hectares
25/(18.9 million acres) or 17*0 per cent of the country's total land area.—
Although mining contributes only about 5 per cent of G.D.P., minerals accounted for over 30 per cent of total export earnings in 1971* (See Table A.15«2 on page 437 ). Morocco's known deposits of phosphates, which are by far its most important mineral, are estimated at 2 1 .0 milliards tons. The bulk of this product, some 12.0 million tons in 19711 was exported unprocessed^
The manufacturing industry in Morocco consists mainly of small and medium-sized processing plants producing such consumer goods as textiles, canned food, soft drinks, flour, sugar, motor car tyres and cement. The few heavy industrial plants are largely limited to petroleum refining, chemical fertilizers and automobile assembly (12,300 motor cars in 1970). The contribution of the manufacturing industry including crafts to theG.D.P. was 12.5 per cent in 1971* However, in the two years, 19&9 aud 1970* the growth rate in manufacturing industry was estimated at 7*6 per cent, almost double the increase for the economy.as a whole. The total projected investment in industry during the last Five-Year Plan (1968-72) was DH 1,420 million, of which DH 1,130 million or 79*6 per cent was spent by the private sector, and DH 290 million or 20.4 per cent by the public
2k/ UNITED. NATIONS, ECONOMIC COMMISSION FOR AFRICA Summaries of Economic Data, Morocco 1971 Addis Ababa 1972, p. 7
25/— NYROP, R.F. et al. Area Handbook for Morocco Washington D.C. 1972, Table 8 p. 247
26 /— MINISTERE DU DEVELOPPEMENT ROYAUME DU MAROC Annuaire Statistioue du Maroc 1971 op cit., p. 142

PART III CH 15 255
27 /sector.-1- Exports of manufactured goods rose substantially from DH 132 million or 6.1 per cent of total export value in 19&5 to DH 393 million or 15-6 per cent in 1971- (See Table A.15-3 and A.15*4 on page 437 )•In the early 1970's the major industrial projects under construction wereinter alia a cellulose factory (DH 102 million), a chemical plant for phosphate fertilizer (DH 3^3 million), a sugar refinery (DH 125 million), and an integrated textile complex near Fez, costing about DH 102 million.
Tourism has become Morocco's fastest growing industry in recent years. The number of tourists has increased from about half a million in 1965 to an estimated one million in 1972. During the last Five-Year Plan (1968-72) the Government alone has invested a total of DH 760 million mainly in new hotels. As a result of this boom, revenue derived from tourism has increased from DH 406 million in 1968 to DH 333 million in 1972. This and the growing transfer payments by Moroccan workers abroad (DH 250,000 in 1970), has greatly helped to convert the balance of payment deficit of DH 144 million in 1968 to an overall surplus of DH 131 million in 1969 DH 170 million in 1970, in spite of a substantial trade deficit of over DH 1,000 million in 1970* (See Table A.15.5 on page ^37)•
Other important sectors of the national economy are commerce withDH .2,840 million or 20.0 per cent of G.D.P., transport and non-government services DH 2,300 million or 16.2 per cent, Government services DH 1,630
million or 11.5 per cent, and construction with DH 730 million or 5-1 per cent of G.D.P. in 1971-
External Transactions
Morocco's major trading partners are the E.E.C. countries which took about 57*0 per cent of the country's exports and supplied approximately
UNITED NATIONS E.C.A. op cit., pp. 9-12

PART III CH 15 256
50.0 per cent of its imports in 197'!• Between 1965 and 1971 imports have risen at an average annual rate of 1 .b per cent from DH 2,295 million to DH 5,553 million, while exports over the same period only increased by2,5 per cent annually from DH 2,171 million to DH 2,526 million, leaving a trade deficit of over DH 1,000 million in 1970 and 1 9 7 1 ^
Agricultural goods and phosphates, already mentioned as the major export earning commodities, together contributed over 78 .0 per cent of the total domestic export value in 1971• In the same year the major items of import were capital and semi-manufactured goods with 22,3 and 22.b
per cent respectively, foodstuffs 19»9 pen cent, consumer goods 15*- pen cent and raw materials 13*2 per cent. (See Table A.15-7 on page *+38).Imports of capital and consumer goods increased by as much as 90•3 per cent in 1971 when compared with the level of imports in 1965*
Capital Formation
Morocco’s Gross Fixed Capital Formation at current prices rose fromDH 1,370 million or 12.3 per cent of G.D.P. in 196*+ to DH 2,880 million
29/or 15-5 per cent of G.D.P. in 1971*— More detailed examinations of Fixed Capital Formation by type of asset shows that the share of investment in residential and non-residential buildings remained with around 20 .0
per cent fairly stable over the last 8 years (196*+-71). Public works such as dams, roads and bridge construction accounted for c. 37-0 per cent over the same period, while the rest was invested in equipment and machinery. (For more detailed information see Table A.15*8 and A.15*9 on page*+3 8 )* During the last Five-Year Plan (1968-72) Government investment
UNITED NATIONS E.C.A. op cit., pp. 16-17 29/ ' * __^ MINISTERE DU DEVELOPPEMENT ROYAUME DU MAROC op cit., Table VI p. 203
PART III CH 15 257
in housing and water mains* was DH 76^ million while the recorded private investment in housing over the same period was estimated to have reached DH 500 million by 1972.
In conclusion, Gross Fixed Capital Formation accounted for 12.3 to15.5 per cent of G.D.P. at current factor cost and about 55»0 per cent goes into construction. The total investment in buildings represents about20.0 per cent while residential buildings may account for an estimated 6-8 per cent both of Gross Fixed Capital Formation. As observed elsewhere, most private and Government financed dwellings are located in cities and in a few selected rural development areas, while the majority of houses built in the rural and suburban areas where an estimated 70*0 per cent of the country's total population live are constructed outside the money sector and never appear in any National Account.
* In the Statistical Yearbook the total amount of expenditure for these two items are lumped together

PART III MARRAKECH CHAPTER 16 LAND TENURE AND LAND USE IN MARRAKECH 258
HISTORICAL NOTES ON LAND TENURE
Before turning our attention to the various types of land tenure which can be found in Marrakech today, a few introductory words should be said about the system of land ownership that existed in Morocco before 1912.
Broadly speaking, land ownership was divided into four majorcategories: first, there was makhzen land, or land which belonged to thestate, i.e. the sultan, who had the right to retain these lands or granttheir use to important individuals in which case it was known as azib land,or to tribal communities who were usually of Arab origin in return formilitary service. Under the latter type of arrangement, often referredto as guich, the land was granted in perpetuity and consisted mainly ofagricultural and pasture land situated in the vicinity of large cities or
1/near important strategic points.— A second category of tenure is represented by habous land.* This consisted mainly of urban and agricultural lands left by pious people for the benefit of religious and/or charitable organizations. These lands were held and used by mosques, medersas (institutes of higher Muslim learning), or zaouia (religious brotherhoods) and administered by nadirs** who were officials appointed by the reigning
BIDWELL, R. Morocco under Colonial Rule London 1973* P« 207* There are two kinds of habous land, first family habous and second
public habous. The characteristic feature of the first category is that, before passing to the society or the establishment stipulated, they are enjoyed by a series of intermediate beneficiaries, in the order prescribed by the donor, while the second category is constituted for the direct and immediate benefit of the charitable or social association.
** Traditionally there Was one nadir in each mosque or zaouir chosen by notables of the quarter, town or district. However, towards the middle of the nineteenth century, Abd er-Rahman (1822-59), abolished private nadirs and replaced them with officially appointed civil servants.

PART III CH 16 259
2/sultan.— Habous land was considered inalienable but could be rented or exchanged for parcels of equal value. The third category of tenure was melk or freehold land. Melk land was either inherited, bequeathed or purchased and was owned by an individual, or more often by groups of related persons. The bulk of melk land was located in and around towns. Finally, there were collective tribal lands known as arch which belonged by traditions of continous occupancy to a tribe as a whole. The bulk of this land, which consisted mainly of pasture-grounds, was situated in the mountainous regions of the country and lay outside the sultan's authority in the bled es-siba.
After the Treaty of Fez which marks the beginning of the French Protectorate in Morocco was signed in March 1912, it took the occupying forces over 20 years to pacify the territory. In the meantime, LouisH.G. Lyautey the first French Governor General, introduced a number of important land legislations which were designed to give some land to the newly-arrived French immigrants (colons) while protecting the indigenous Moroccan farmers.-^ The first step was a Circular issued by the Grand Vizir on the 1st November 1912. In it were listed all property which could not be alienated such as roads, rivers, beaches, forests, as well as collective tribal, habous and makhzen land.
yIn early 1913 Lyautey appointed a Commission.d'Etudes to advise him on land policy in the protectorate.. The commission's report, which was based on the "Australian Torrens Act of 1858"*, recommended the voluntary
2/— BIDWELL, R. Morocco under Colonial Rule op cit., p. 206. The amount of habous land seems to have been considerable, particularly in towns. Bidwell reports that according to an early French survey in Taza, not less than 3^9 shops in the city or about 60 .0 per cent of the total were designated as habous land. Unfortunately there are no comparative figures available for Marrakech.
—^ SCHAM, A. Lyautey in Morocco Berkeley, U.S.A. 1970, pp. 191-205* The Real Property Act No.15 of 1857-8 was first introduced on the
recommendation of Sir Robert Torrens in S. Australia, in 1857- This act, with its simplified procedure of registration became Australia's most important contribution in land legislation to the world as a whole.

PARI' III CH 16 260
registration of land-ownership and laid down procedures therefore. Most of the commission's recommendations were approved by Lyautey and embodied in the Dahir of 12th August 1913** The new law decreed that registration of land was optional, except in the case of exchange, purchase or alienation of makhzen, habous and collective tribal land (arch). All land registered was placed under the jurisdiction of French courts, although these courts, either the Tribunaux de Premiere Instance or the Cour d'Appel, could request Muslim legal consultants to give evidence should the need arise. As expected, the registration of land proved extremely slow and hazardous and Rene Besuard remarked somewhat bitterly: "Depuis le grand
4/Vizir jusqu'au plus petit Caid, on se disputa l'honneur de les tromper.ll-/In spite of these difficulties a total of over 116,000 registrations of land-ownership (32,000 by Europeans and 84,000 by Moroccans) were requested, checked and registered by the administration between 1914 and
1956.-/During his first year in office, Lyautey ordered a survey of all
habous and makhzen or Government land, and sifter having successfully completed this, he recovered some of these lands from persons who obtained them irregularly shortly before 1912. In a Dahir of 1st August 1914, makhzen land was divided into the Domaine Public de l'Etat which was controlled by the Administration des Travaux Public, and the Domaine Prive which was run by the Service des Domaine. Land controlled by the Administration des Travaux Public was inalienable, while land administered by the Service des Domaine was available to those "colons" who wished to purchase it and settle in Morocco. In 1913 approximately 73*000 hectares (180,000 acres)
* A dahir or statutory decree was drawn up by the French administration andapproved by the Resident Governor General before it was submitted to the sultan for his seal. The dahir of 12th August 1913 was modified by others of Oct.27th 1916, May 2nd 1917, Sept. 24th 1917, June 10th 1918, March 10th 1921 and Feb. 23rd 1924.
4/— BESNARD, R. L*Oeuvre Franpaise au Maroc Paris 1914, p. 194
^ BIDWELL, R. op cit., p. 204

PARI' III CH 16 261
were under cultivation by Europeans, and this steadily increased to over1,000,000 hectares (2,500,000 acres) or about 10 per cent of Morocco’s
6/total cropland in 1953- This total was farmed by about 5i900 Europeans,with an average of c. 170 hectares or *+20 acres per farm.
In 1915 Lyautey placed the administration of habous land under Muslimauthority by creating a Conseil Superieur des Habous which was assistedby a French councillor. As already mentioned, habous land was inalienable,
7/but a Dahir of 21st July 19"I3 allowed such land to be let to ’’colons”.—Collective tribal land (arch) was protected against alienation by a
Dahir of 15th July 191*+, but this decree law was partly revised by aDahir of 27th April 1919 ■> which placed collective tribal land under thecontrol of the Conseil de Tutelle. The newly-appointed council used itspower freely to confiscate large parts of this land often against the
8 /wishes of its lawful owners and sold it to French settlers.—Melk or freehold land, apart from the dahir which permitted its
registration, was not affected by the land policy of the protectorate.Hence the transaction in urban land and houses among the indigenous population was conducted in much the same way as before the French occupation in 1912.
In conclusion, all land in pre-protectorate Morocco belonged at least in theory to the reigning sultan. In practice however, there were four clearly distinguishable types of land holding, namely, makhzen, habous, melk and arch or collective tribal land. The bulk of the latter was situated in inaccessible mountainous regions and therefore outside the sultan’s authority (bled es-siba). After the French occupation, the colonial
—1• FAZY, H. Agriculture Marocaine et Protectorat Paris 19*+$, p« 62 7/— MICHAUX-EELLAIEE, E. ”Le biens habous et biens du makhzen au point de vue
de leur location et de leur alienation”. In Revue du Monde Musulman V.No.7 Paris 1908, p. *+39SCRAM, A. op. cit., pp. 118-26

PAET III CH 16 262
Government was, unlike their British counterpart in Nigeria, keen to provide some land for French settlers. This policy was regarded by the French Government in Paris, as an important prerequisite for the. successful pacification of the country.-^ Lyautey realized that the question of land was of the most important and delicate he had to solve in order to establish a successful and lasting French presence in Morocco. There is little doubt that during his 13 years as Governor-General (1912-23)? Lyautey tried to protect the Moroccan interest. That his policy failed in the long run was largely due to the open hostility of the "colons" against his careful approach and to the lack of responsibility of his successors,
particularly Theodore Steeg (1925-29), Lucien Saint (1929-33), Henri Ponsot (1933-36) and Marcel Peyrouton (1936), who did absolutely nothing to prevent the best agricultural land from passing into the hands of the. land- grabbing "colons".
In urban areas the approach by Lyautey towards the question of land- ownership was similar to the policy pursued by Lugard in Northern Nigeria. The ownership of melk or privately owned land, which includes houses and gardens, was not affected by the new land law of the protectorate. Land^ disputes and inheritance cases, unless settled amicably by the parties involved, were tried by qudis in local courts (chraa) according to Maliki Law.
In Marrakech, parts of the land required for the construction of a new suburb to the west of the walled city, was already in Government hands (makhzen land), while the rest was acquired from local people who were compensated for the loss of their lands.
9/ '— BAEETY, L. La France au Maroc Paris 1932, p. 231* Barety who v/as a French Minister and leader of the Moroccan Lobby wrote: "Le peuplement! voila la base fondamentale de la reussite et de la longevite de notre oeuvre au Maroc. Veillons a accroitre la-bas notre population fran^aise".

PART III CH 16 263
LAND TENURE AND TRANSFER. TODAY
The investigation of land ownership and the transfer of land and houses described below is based on my survey of 75 houses at Marrakech in 1969* Before dealing with the results of this survey, the three main types of land holding found in the medina of Marrakech must be briefly discussed* These are first, makhzen or Government-owned land which includes all roads, markets, public parks, Government buildings, palaces, and at least one public housing estate; second, habous land which is owned by religious or charitable organizations and which was then administered by a Government Ministry. Habous land includes all mosques, religious schools, some public buildings, semi-public parks as well as some private houses and shops. The third category consists of melk or freehold land and may be divided into family holdings, i.e., land and houses owned by a group of related people, and land held by one person or individual holdings.
Permanent Transfer of Land
In my survey, purchase of land and houses accounts for ^5.3 Per cent of the total sample, and is by far the most important mode of land transfer (See Table A.16.1 on page ^39). Compound heads* in need of more rooms normally sell their houses and buy larger ones, as the only way of increasing the floor area of houses in the tightly packed medina is to build an additional storey, which, for structural reasons, is not always possible* A total of 29 purchased houses in the survey were owned by one individual, who was usually the compound head, while another 5 purchased houses were owned by a group of related persons who pooled their resources in order to buy the house.
* I retain the term compound head to distinguish him from all other household heads who may be living in the same house.

PART III CH 16 zGk
Inheritance of houses accounted for 18.7 Ver cent of the total number of houses surveyed. Following the owner’s death, a house or plot of landwill pass to his children, or if there are none, to the care of the nextsenior agnatic relative. If the house is not required by the heirs, it maybe rented or sold and the proceeds divided among them according to Maliki
10 /Law.— • Among the 1^ inherited houses found in the sample, 9 were owned by a group of related persons while 5 were owned by one individual.
Houses built on squatter-land accounted for 8.0 per cent of the unitssampled. All of these houses are located in the Douar Sidi Youssef b. Ali, an area situated south-west of the walled city. (See Plan 17.1 on page 277). The first inhabitants of this area arrived shortly after the Second World War. As the police were unwilling to evict the squatters, popular beliefs that they were permitted to settle there gradually strengthened. Hence the number of squatters and the area they occupied steadily increased until the townplanning authority put a stop to this development in the early sixties.At that point, the sole owner of the land was compensated by the Government, which is now reclaiming the money from the occupants at a rate of DH 20 per sq.m. According to my information only a few people had actually paid this amount to the Government, a fact which caused us considerable difficulties when surveying this area.
The Renting of Houses
Unlike Zaria and Ibadan, renting of houses accounted for 20.0 per cent of the total sample in Marrakech. Of the 15 houses found in this category,11 were let by absentee.landlords, while k were habous property. The rent paid for these houses ranged from DH 60 per month for a small house with k rooms and one kitchen having a total floor area of 68.0 sq.m., to DH 200
10/— RUXTON, F.H. Maliki Law London 1916, Chapter LV, Succession (fara’id) pp. 373-97

PART III CH 16 265
per month for a house with 8 rooms, one kitchen, 4 stores, and a total floor area of 166.0 sq.m. Rent paid for an average-sized room on the other hand, was in the region of DH 15 per month in 1969*
An additional arrangement which was found in 3 houses involved the payment of a deposit of between DH 1,000 and 2,000 per room by a tenant to the owner of the house. Once such a contract has been signed the tenant pays no further rent, and there is usually no time-limit on the right of occupancy which is heritable. However, the.right of occupancy can Tbe sold by the tenant subject to the house-owner’s approval. The owner can revoke the contract only after the refund of the deposit to the tenant. This type of arrangement, which plays an important role in the local economy, guarantees some security for the tenant, and provides the owner of the house with a substantial lump-sum which he may use to pay for trading activities, marriage or funeral expenditures, building construction and improvements.
LAND USE IN THE WALLED CITY OR MEDINA OF MARRAKECH
The study of land use given below is based on an aerial survey of Marrakech carried out in i960, and on a large-scale map, scale 1:2,000 published by the Sous-Secretariat d’Etat a 1 'Agriculture, Service Topographique, Rabat 1963- Excluding the Jardin de l’Aguedal to the south, the walled city of Marrakech covers a total area of 6,319,790 sq.m. or632.O hectares (1,562 acres). The circumference of the wall is 13,000 m. long. The diameter of the walled city varies between 2,930 m. from east to west and 4,300 m. from north to south. The area of the walled city has been divided into 7 categories of land. These are:

PART III CH 16 266
1. Building sites, i.e. houses and courtyards which account for 6^.1 per cent of the total area. (See Table A.16.2 on page4^9 )• This is by far the most important category and comprises all private and public buildings, as well as narrow alleyways and footpaths between houses unsuited to motor traffic. Land use within houses, i.e. courtyards etc., will be discussed separately in Chapter 18 on page 289 •
2. Parks and Public Gardens account for 12.6 per cent of the total enclosed area and include inter alia the Jardin de la Koutoubia, and the Arset el Bahia.
3. Waste Lands cover 7«2 per cent of the total walled city. These lands consist mainly of dilapidated buildings, uncultivated stony areas alongside the city wall, and land cleared for redevelopment.
*f. Roads. If we define this category to include all roads and tracks wide enough to carry motor vehicles, then 7«1 per cent of the walled city area is appropriated to these ends.
3* Cultivated areas in the walled city accounted for 3*7 per cent of the total area and consists mainly of olive-groves and irrigated gardens.
6. There are 3 Moslem, 1 small Christian and 1 Jewish cemeteries within the walled city covering about 2.7 per cent of the total walled city area.
7. Other land accounts for 38,9&0 sq.m. or 0.6 per cent of the total city area. This includes 3^200 sq.m. used mainly for leather tanning and two reservoirs covering 7i7&0 sq.m.

PART III MARRAKECH CHAPTER 17 DEMOGRAPHY 267
GENERAL CHARACTERISTICS
The following chapter is divided into three parts. The first part is concerned with the general demographic situation in Morocco, while the second part examines population growth in Marrakech and the subsequent development in and around the walled city. The final part analyses some data from the sample survey on age and sex distribution, as well as- migration, and compares these findings with the relevant census data.
Morocco: The Demographic Situation
In 1971, Morocco had a total population of about 15.^ million, that1/is, approximately b.5 per cent of the total population in Africa.— It is
the most populous of the Maghreb countries followed by Algeria with 1A.52/million, Tunisia with 5*2 million and Libya with about 1.9 million.—'
Earlier estimates indicate that the population of Morocco has trebled3/during the last 50 years from an estimated 5*0 million in 1921— to 15*
million in 1971. During the 11 years from i960 to 1971, the average annual growth rate of its population was in the region of 2.6 per cent. If present trends continue, the population of the country will reach an estimated27.0 million by the mid-1980fs.—'(
1/— DIRECTION DE LA STATISTIQUE ROYAUME DU MAROC Annuaire Statistique du Maroc 1971 Rabat 1972, pp. 13-15UNITED NATIONS Demographic Yearbook 1971 New York 1972, pp. 111-112
2/— Ibid. op cit., pp. 112-1133/ ' ✓— COMTTE DE L’AFRIQUE FRAN^AISE LfAfrique Franqai.se Bulletin Mensuel
du Comite de l'Afrique Fran^aise et du Comite du Maroc Paris 1921,No. 3 P* 156
V— 3MANI, A. ’The Family Planning Programme in Morocco" in Population Growth and Economic Development in Africa Ed. Ominde, S.E. and Ejiogu, C.N* London 1972, pp. 365-8 ' .

PART III CH 17 268
In the former French Protectorate of Morocco, which covered about 90per cent of the territory, crude population counts of limited statisticalvalue were conducted in 1921, 1926 and 1931* All three estimates sufferedfrom extremely poor enumerating techniques and from the crude guesseswhich they included for the populations in unpacified areas. Accordingto these estimates, the population rose from approximately 4.3 million
5 /in 1921 to about 5*4 million in 1931*~ An improved population estimatein 1936 which, for the first time, included the pacified areas of theformer French Protectorate, gave a population of about 6,2 million.—^
The first post-war census carried out in 1947 was even less reliablebecause it consisted of a count of ration cards, a procedure whichresulted in an over-estimation of the population. The 1951/52 census, thelast that the French conducted in their zone, is undoubtedly the mostreliable count taken during the period of the protectorate, and yielded
7 /a total population of approximately 8 .1 million.—For the former Spanish Protectorate including the Province of Tarfaya
estimates were made in 1930? 1940 and 1950 and yielded populations of O.75, 1.0 and 1.03 million respectively. The International Zone of Tangerincreased its population from an estimated 60,000 in 1927 to about .......183,000 in 1954 .-^
Both the i960 and 1971 census were national censuses which included the former French and Spanish Protectorates as well as the International Zone of Tanger and gave totals of 11.6 and 15*4 million respectively.
SERVICE CENTRAL DES ST AT 1ST IQUES ROYAUME DU MAROC Resultats du Recensement de 1960 Rabat 1964, Vol. 1 p . 8
— —^ Ibid. p. 8
7/ / /— Ibid. Recensement Generale de la Population de la Zone Frangaise 1951/52 Rabat 1954, Vol. 1 to 4 '
8/— Ibid. Resultats du Recensement de i960 Vol. 1 op cit., p. 8

PART III CH 17 269
Population Distribution and Densities
During the period of the Protectorate, 1912-1956, Morocco was divided into three political units: first, the French Protectorate with a population of approximately 8 .1 million or 87*0 per cent of the country's total population in 1952; second, the Spanish Protectorate including the Province of Tarfaya in the south, with about 1.06 million or 11.0 per cent; and finally, the International Zone of Tanger with c.172,000 inhabitants in 1952 or about 2.0 per cent of the total.. Following reunification in 1956, the Province of Tarfaya was returned by Spain in April 1958, the country was then administratively divided into 16 Provinces and two Prefectures. By a reorganization in mid-1970, 19 Provinces were formed, while the two Prefectures of Casablanca and Rabat- Sale remained unaltered.
According to the "Annuaire Statistique du Maroc 1971" the country's1 9/overall population density then was y\ per sq.km.,— but there were wide
regional variations. Map A.17.1 on page MtO shows the differing population densities per sq.km. of the 19 Provinces and two Prefectures in 1971*As can be seen, there are three broad areas with different population densities which roughly coincide with the-country's social and economic geography. First, there are 6 coastal provinces stretching from Nador in the north to Safi in the south with densities that range between 60 and 100 persons per sq.km. The only exception here is the Province of Tanger with 590 persons per sq.km., and the Prefectures of Rabat-Sale and Casablanca with 1,210 and 1,^30 persons per sq.km. respectively. The Province of Settat on the other hand, with an overall density of only 55 persons per sq.km., falls slightly below the lower limit of the coastal range. However, near the coast the population density rises to an estimated
9/z/ DIRECTION DE LA STATISTIQUE ROYAUME DU MAROC Annuaire Statistique du Maroc 1971 op cit.,, p. 13........................................
PART III CH 17 270
80 persons per sq.km. The concentration of population in these coastal Provinces, and particularly in the highly-urbanized and industrialized areas around Casablanca and Rabat-Sale, where most of the country's manufacturing industries are located, has been created by the French colonial administration which initially developed these coastal towns.This was followed by an increasing stream of Moroccan immigrants into Casablanca and Rabat which started in earnest in the mid-1920rs.
The second area comprises a group of 5 Provinces with densities between J>0 and 60 persons per sq.km. These are located almost in the geographical centre of the country, and include the Meseta Plateau and the western slopes of the Middle and High Atlas. The population in this area secures a living from live-stock raising, agriculture made possible by irrigation, and to some extent from phosphate-mining. Three of the four old imperial cities, i.e. Fez, Meknes and Marrakech with their traditional art and crafts industry as well as trading activities, are located in this belt.
The third group of 6 Provinces with densities of up to 30 persons per sq.km., lie in the mountainous and cis-Saharan region of the country.This area is populated mainly by nomadic people of predominantly Berber stock. The only exception is the Taza Corridor where Arabic-speaking people dominate. Live-stock raising and some cultivation on irrigated plots or alongside river-beds are the main occupations of the people there.
Ethnic Composition
The two major ethnic groups in Morocco - Berber and Arabs - are distinguished mainly by language. As already mentioned in Chapter 15 on page 2h5 311 estimated 9»0 million people or approximately 60 .0 per cent of the country's total population speak Arabic, while the rest speaks one of several Berber dialects. However, a steady flow of people from the Berber-dominated mountainous regions into the Atlantic lowlands and the

PART III CH 17 2?1
urban centres, where newcomers and their descendants are progressively-integrated into the Arabic-speaking community, blurs the di'/isicn between
10/the two ethnic groups.—Although significant in the economic life of colonial Morocco, the
Jewish community was never large. In the 195^/52 census the Jewish'population numbered about 218,000 or 2 .3 per cent of the country's totalpopulation. However, with independence in 1956 and the second Arab-IsraeliWar in 1967, the number of Jews in the country fell significantly to162,400 or 1.4 per cent in i960 and below 40,000 or 0 .2 per cent of the
11/total population in 1971*—According to the 1951/52 census there were about 5**0 ,COO Europeans
in the country or 5*8 per cent of the total population. They controlledover 80 per cent of all industrial and/or commercial enterprises, about10 per cent of the arable land, and produced roughly one-third of thecountry's entire tax revenue. However, following independence their numberdeclined to 396,000 or per cent in i960 and to little more than
12/110,000 or 0 .7 per cent of the total population in 1971*—
• Level of Urbanization
The urban population of Morocco* has increased progressively from an estimated 300,000 or c. 8 per cent of the country's total population around the turn of the century to 544,000 or 12.5 per cent in 1921, 984,000 or 15*8 per cent in 1936, 1.8 million or 22.8 per cent in 1952, 3*4 million or 29*3 per cent in i960 and 5«^ million or 35*2 per cent in 1971*
10/ - — ADAM, A. "Berber Migrants in Casablanca" in Arabs and Berbers zd. byGellner, E. and Micand, C. London 1972, pp. 325-43African Research Bulletin. London 1971 p. 1902
— / DIRECTION DE LA STATISTIQUE ROYAUME DU MAROC Annuaire Statistioue du Maroc 1971 op cit., pp. 13-14
* Cities with 20,000 or more inhabitants.

PART III CH 17 272
Between i960 and 1971, the overall annual growth rate of the country'stotal population was in the region of 2.6 per cent, while at the sane time
1x/the urban population grew by as much as k.J> per cent per annum.—^ The most rapidly growing towns were in order of importance Rabat-Sale with an average annual growth rate of 5*1 per cent, followed by Casablanca vrith *+.2 per cent, Fez 3*8 per cent, Meknes 3*2 per cent and Marrakech with only 2.9 per cent.
MARRAKECH
Population Growth
Marrakech with a total population of 332,700 in mid-1971, is Morocco'sthird largest town.* It is the regional capital of southern Morocco and acentre of administration, small-scale industry and tourism. Early estimatesof the city's population are extremely sketchy and most likely inaccurate.Nevertheless, it may be useful to quote at least some of these figures inorder to give a rough indication of demographic trends at Marrakech fromthe late seventeenth to the early twentieth century.
✓ 14/Diego de Torres (1667)— estimated the population of Marrakech at 20,0C0, while Pidou de Saint Olon (1693)“^ quoted 25,000, and Chenier
—^ DAVIS KINGSLEY World Urbanization 1930-1970 Population Monograph, Series No. b Berkeley 1969 Vol.1 p. 141. Davis Kingsley gives the annual growth rate for urban areas in Morocco as 5*0 per cent between 1930-1960 and *+.9 per cent between 1960-1970
* Casablanca had 1,506,400 and Rabat-Sale 523*200 inhabitants in 197114/ *— TORRES, D. DE Relation de 1 'Origins et Succez des Cherifs. et de
l'Estat des Royaumes de Marroc, Fez and Tarudanr, ez au~res Provinces. Paris 1667, p. 81SAINT OLON, P. DE Relation de 1'Empire de Maroc "Estat Present de 1 'Empire de Maroc" Paris 1693 P* 16

PART III CH 17 273
16/(1787)— gave 30,000 inhabitants. At the beginning of the nineteenth^7/century Ali Bey el Abbassi (1816)-— also estimated 30,000, while most
*\ & /other visitors in this century i.e. Graberg di Hamso (183^),~ Richardson(i860),—^ Gat ell (186A),— ^ Lambert (1868),^-^ Miege (1870),— ^ Lenz(118A),^^ and Aubin (190A)” ^ reckoned it at between AO and 50,000
23/inhabitants. Higher estimates were made by Erckmann (1885) 55,000
inhabitants, Beaumier (1868)^^ and Balbi (1839)~// between 60 and 7 0,000,pO/
Washington (1831)— 80 to 100,000, while Jackson's estimate of 270,0C02q/inhabitants in 181A) was obviously exaggerated.—2 On the eve of the French
16/ '— CHENIER, L. DE Recherches Historiaues sur les Maures et Histoire de1'Empire de Maroc Paris 1787, Vol. 3 P» 30ALI BEY EL ABBASSI Travels of Alj 1807 London 1816, Vol. 1 p. IA9
— ALI BEY EL ABBASSI Travels of Ali Bey in Morocco.... between 1603 and
— CRABERG DI HAMSO, J. Specchio Geografico e Statistico dell1 Imuerio di Marocco Genova I83A, p. 68
RICHARDSON, J. Travels in Morocco London i860, Vol. 2 p. 13020/— ' GAVIRA, J . El Via.jero Espanol por Marruecos, Don Joaouin Gatell
Madrid I9A9 , p. 11ALAMBERT, P. "Notice sur la ville de Maroc" in Bulletin de la Soc. de Geogr. Paris 1868 No. 107 p« AA1
— ^ MIEGE, J.L. "Note sur l'Artisanat Marocain en 1870" in BulletinEconom. et Social du Maroc Rabat 1953, No. 2 p. 91
23/ LENZ, 0. Reise durch Marokko die Sahara und den Sudan Vol. 1 Leipzig1884, p. 238
AUBIN, E . Le Maroc d'Au.jourd'hui Paris 190A, p • 37ERCKMANN, J. Le Maroc Moderne Paris 1885, p. 38
BEAUMIER, A. Description Sormraire du Maroc Paris 1868 p. 23BALBI, A. Abrege de Geographie Paris 193A, pp. 885-6
WASHINGTON, R.N. "Geographical Notice of the Empire of Morocco" in Journal of the Royal Geographical Society Londcn 193^, Vol. 1 p. 138
JACKSON, J.G. An Account of the Empire of Morocco and the District of Suse and Tafilet London I81A, p. 25

PART III CH 17
0/occupation of Marrakech, Cousin and Saurin (1905)*1- estimated the.population of the city at about 65,000, while Baraon (1912)4"^ Cornet(191*0 and Piquet set the number of people at 75,000,80,000 and 118,000 respectively.
The first population count carried out by the French administration3*+/in May 1921 gave the city a total of 102,000.^ Other improved estimates
were made in 1926,22/ 1931,— / and 1936^ and yielded 1*+9,000, 192,000 and 190,000 inhabitants respectively. However in 19^7, the count was based on the issue of ration-cards and resulted in an over-estimation of the city's population (238,000).22/ The first census with a house to house
3 0/count was conducted on 15th April 1951 and revealed a population of 216,000.^*f0/ *+1 /The following two censuses carried out in i960— and 1971— enumerated
23*+,000 and 332,700 inhabitants respectively.
22/ COUSIN, A. and SAURIN, D. Le Maroc Paris 1905, p. 37*+22/ BARDON, H. "Les deux capitales du Maroc: Fez et Marrakech", in Bulletin
de la Soc. de Geograrhie de Marseille XXXVI. No. 2 1912 p. 13*+2^/ CORNET, Capt. A la Conouete du Maroc-Sud, Avec la Colonne Man.gin 1912-13
Paris 191*+, p. 19222/ PIQUET, V. Le Maroc Paris 1920, 3rd Ed. p. 2152^/ C0MIt£ DE L'AFRIQUE FRANCAISE L ’Afrioue Franqaise Bulletin Mensuel
du Comite de l'Afrique Franqaise et du Comite du Maroc. Paris 1921,No. 5 p. 156
22/ Ibid. No. 2 Paris 1927, p» 59 __ .... .. ........2^ Author not given. Bulletin de la Societe de Geographie d'Alger et de
l'Afrique du Nord Paris 1933, Vol. 3*+ No. 133 p. 30 - -COMITE DE L ’AFRIQUE FRANQAISE op cit. , No. 5 Paris 1931, p. 362
22/ Ibid. No. 7 Paris 1937, p. 3$622/ SECRETARIAT g£n£rALE DU PROTECTORAT, SERVICE DES STATISTIQUES, ROYAUME
DU MAROC De Nombrement Generale de la Population de la Zone Franqaisede 1'Empire Cherifien 19^7- Paris 19^8, Vol. 1 p. 6 and Vol. 2 pp. *t-5
22/ SERVICE CENTRAL DES STATISTIQUZS, ROYAUME DU MAROC Recensement Generale de la Population de la Zone Franqaise de 1'Empire Ch§rifien 1951/52 Rabat 195*+, Vol. 1 p. 17, Vol. 2 p. 15 and Vol. 3 P» 22
i+0/ Ibid. Resultats du Recenserr.en-t de- 196O Rabat 196*+, Vol. -1 pp.81-2 and -22. -11/ Ibid. Population legale du Maroc 1971 Rabat 1971, P« 6

PART III CH 17
Based on these data Graph A.17.1 on page *+ 1 illustrates the population growth pattern, of Marrakech over the last >C0 years. As can ce seen on the graph the population increase has been very slight throughout the eighteenth and nineteenth centuries. However, with the beginning of the twentieth century and the establishment of the French Protectorate in 1912, this pattern changed drastically. From an estimated 70-bO,OCO inhabitants at the turn of the century', the population of the city has doubled twice during the last 70 years or so, to reach a total of 332,700 in nid "'97 »If this rate of increase continues, Marrakech is expected to reach the half-million mark well before the turn of the century.
The Growth of Marrakech
The growth of residential areas in Marrakech have been described byb2/ 43/G. Deverdun— ' and more recently by A. Kandleur.— ' As the result of the
population increases outlined above, the development of Marrakech can bebroadly divided into three periods: first the pre-Protectorate period,which may be sub-divided into the epochs of the five dynasties that ruledthe city from the end of the eleventh century until the beginning 01 thetwentieth century. Second, the period of the Protectorate from 1912 to1956; and third, the period since independence.
The Pre-Protectorate Period from 1070 to 1912
During the reign of Ali b. Yusufj the second Almoravid Sultan whoruled from 1107 to 11^3 i the built-up area vtithin the city wall* concentratedaround the Mosque of Ben Yusuf (D.jema Ben Youssef) and the central market(souk). According to local tradition, the built-up area extended from BabFaz (the gate leading to Fez) the modern Bab el Khenis in the north, to the
L p /— DEVZRDUN, G. Marrakech des Origines a 1912 Rabat 1959 and 2 Vcl.^3/— MAHDLEUR, A. "Croissance et urbanisation de Marrakech" in Revue de . . Geograohie du .Maroc - Ho.. 22 Rabat 1972-, pp. 31-60.....................* The first city wall was built in 112o-27

PART III CH 17 276
Place D.jemaa el Fna in the south, and from Bab ad Dabbagin in the east to a line west of the quarter of Riad al Arous.— (See Plan 17.1 on page 277
and Plan A.17-3 on page A^2).The Almohad Sultans and in particular Ya'kub al-Mansur ( H 8*t to 1199)
added the quarter (derb) known today as Mouassine, the area around Bab Aylan and, most important of all, the Casba, an extension of the walled city to the south.
The Merinid Sultans (1269 to 1^70), who chose Fez as their capital, did not take much interest in the city, the population of which is believed to have decreased during the first century of their rule.
The decline of Marrakech was halted by the first Sa'dien Sultan Ahmadal-A'radj (1517 to 15**1) who made the city again the capital of the country.His successors, noticeably Abd Allah al-Ghalib (1557-157*0 and Ahmad al-Mansur (1578 to 1603)1 also known as al-dhahaci, the golden, restored thecity to its former splendour. The area around Bab Tashzout in the north,the quarters of Sidi Ben Sliman and Arsat Ben Chebli in the west, Dabachiand Kennaria in the south, and part of Bab Hailen in the east were developedby them. (For place names see Plan A.17.3 on page^^2 ). In addition a newquarter to rehouse the city's Jewish population (mellah) was built alongside
Z4.5/the eastern wall of the Casba.Although Mawlay Isma'il the second Alaouide Sultan chose Meknes as the
capital of the new dynasty, and only Muhammad b. 'Abd Allah (1757 to 1790) lived in Marrakech for any length of time, the city grew slowly after assuming the status of the regional capital of southern Morocco. The new quarters built during the Alaouide dynasty include Kaa el Mechra in the north, most of the southern quarters between Sidi Mimoun in the west and
DEVERDUN, G. op cit., pp. 1^2-3B^NECH, J. Essai d'explication d'un Mellah, un des Aspects du JudaismeParis 1950, p. 1-7
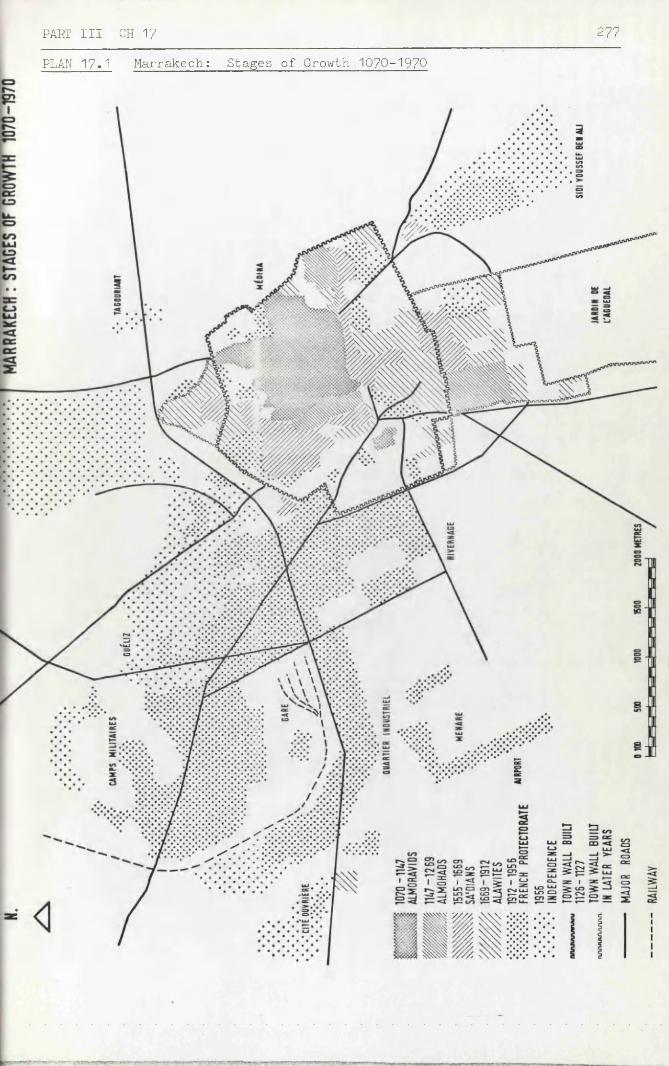
PART III CH 17 277PLAN 17.1 Marrakech: Stages of Growth 1070-1970
9

PART III CH 1? 278
D.jenan bou Zerki in the east as well as the area around Bab Ah mar in the south. On the eve of the French occupation nearly all open areas within the walled city, except the private gardens and parks were occupied, leaving precious little space for further development.
The Protectorate Period 1912 to 195&
No doubt, the period of the French Protectorate has had the greatestimpact on the city since its foundation in the eleventh century. After theFrench occupation of Marrakech in September 1912, the military administrationunder General Lyautey embarked on an ambitious plan to demarcate severalareas for European township development outside the major cities of Morocco.The task of planning these new towns was given to H. Prost v/ho came to
bG/Morocco in 1913*— In capacity as head of the planning mission inMorocco, Prost designed new township areas at Fez, Marrakech, Rabat, Heknesand Casablanca. The basic ideas which guided the design of these strictlysegregated township areas was to establish an undisputed French, presence,to limit the conflict between the French and Moroccan communities, and to
bl /preserve the character of the ancient walled cities.— A Dahir of 16th April 191^ provided the legal base for the acquisition of makhzen and/or habous land for this purpose, while a Dahir of 12th November 1917 created the "Associations Syndicates Urbaines" to organize and undertake part of the new construction.
At Marrakech, the initial construction work on the European township area started in 1913* By 1923, when Prost left Morocco, the core of the new township area consisting of a camps Militaire and a residential-area
bG/— MARRAST, J. "Maroc" in L'Oeuvre de Henri Prost Academie d'Architecture Paris i960 pp. 107-15
ij.7 / ^ ^— L LYAUTEY, H.G. "... le respect de l'integratite artistique et morale des
villes anciennes." Quoted by.Mandleur, A. op cit. , p. b2

PART III CH 17 279
with shops, administrative buildings, hotels, cinemas and sport facilities was almost complete. In 1930, the Quartier Industrial and the Hivernage, a ■low-density living area, came into existence. Thus on the eve of independence the European township area, including Gueliz, Hivernage and the Quartier Industriel but excluding the camps militaires, had an estimated population of over 13*000 inhabitants or about 6 per cent of the total population at Marrakech.
The population of the wailed city on the other hand almost doubled froman estimated 100,000 in 1921 to nearly 180,000 in 1951* This rapidpopulation increase which was mainly due to immigration, was not matched byan equally extensive building programme. Between 1921 and 1956, only about33 hectares or c. 10 per cent of the total built-up area within the walledcity was re-developed as residential area,* while most nev/comers had tosettle in already overcrowded old quarters. Hence the overall populationdensity in the walled city reached over 300 persons per hectare or 200persons per acre in the early 1930's. (For more detailed information seePlan A.17.4 on page 443 ). With such increases of population inside thewalled city, newcomers were forced to settle elsewhere. The new suburb ofSidi Youssef ben Ali proved to be the most popular area for immigrants. Asa result, the settlement grew unplanned from a few hundred families inthe mid-1940's to an estimated 13*000 people in 1956. Most of the inhabitantsof this area live in self-built houses, which are often sub-standard and
48/without basic sanitary facilities.—
* The districts built between 1921 and 1936 include inter alia Arset Ihiri and Arset ben Chebli in the west, Arset Maach in'the south and Arset el Hacuta as well as A~set Baraka in the south-west
48/— LEENHEER, M. de "L’habitat Precaire a Marrakech et dans sa ZonePeripherique" in Revue de Geography du Maroc No. 17 Rabat 1970 pp* 43-51

PART III CH 17 280
The Period since Independence
Since 195&1 Marrakech has increased its urban population from an estimated 230,000 to 332,700 inhabitants by July 197^• There were two main areas outside the walled city where the bulk of the immigrants settled; first, in the already mentioned area of Sidi Youssef ben Ali which increased rapidly to 5^,000 inhabitants in 197"!; secondly, in the Cit& Mohammedia, formerly the Extension Nord, a well-planned suburb,
which was laid out in the early 1960's and housed about 25,000 inhabitants
in 1971.The area of Gueliz which, after the reduction of its French population
that followed independence, increased to over 22,000 inhabitants in 197"!,jtoday houses the Moroccan Elite, the remaining Europeans and some Jews
who have quit their traditional quarters in the walled city for better accommodation.
In spite of its already very densely populated quarters, the walled city or medina increased its population slightly from about 180,000 in 195"! to 208,000 in 197"!, that is, by an average of 0 .7 per cent per annum.
Administrative Division
The walled city of Marrakech, where most of the houses surveyed, discussed below, were located, is governed by a pasha or mayor and is divided into four arrondissements, administered by khalifas or deputies. These are: the arrondissement Nord with ^5,850 inhabitants, the Ouest or Bab Dukkala with 3"!,860, the Centre with 66,620 and the Sud with 63,960
inhabitants in 197"! ■ These arrondissements are further sub-divided into 32 quarters (derb) looked after by mukaddimins. (See Plan A.17.3 cm page V+2 )•

PART III CH 17 281
Migration
Although Arabic-speaking, the indigenous population of Marrakech is almost entirely composed of Berber stock. According to the i960 census, no data for the 197 census being yet available, slightly under half of
^9/all household heads who took part in the census were born outside Marrakech.— <LThis represents by far the lowest proportion of immigrant household headsfor any other Moroccan city over 100,000 inhabitants. The age of thesehousehold heads when immigrating to Marrakech was given as between 15 and29 years. This relatively restrained rate of immigration* is most likely dueto the severely restricted employment opportunities in the city which hasonly a small-scale food-processing industry employing about 5*0 per cent
50/of its total labour force.^
Age and Sex Distribution
The age composition of the sample population in Marrakech was collected with the help of the so-called ’’Historical Calendar Method”. The advantages and limitations of this method have already beer* discussed in some detail in Chapter 3 on page 5 .
The following table gives the age and sex ratios of the sample population for comparison with the census return for Marrakech in i960. (No detailed data for the 1971 census are yet available).
49/ . . .— NOIN, D. et al. La Population Rurale du Maroc Publication de l'Universit de Rouen, Paris 1970, Vol.2 pp. 2 76-79
* In Casablanca about 80 per cent of all household heads were born outside the city.
MANDLEUR, A. "Les Industries Alimentaires de Marrakech" in Revue de Geographie du Maroc No. 17 Rabat 1970, pp. 33-89
va>

PART III CH 1? 282
TABLE 17.I Population Distribution by Age and Sex Groups in Percentages
Age and Sex Groups Marrakech 1960^—^ Pop. 2*+3,13*+
Sample Survey 1969 Pop. 896
0-1*+ *+1 .*+ *+*+.9. 15-^9 *+6 .6 *+0 .8
50+ 12.0 1*+. 3
Male *+9.0 ^5.5Female 51 .0 5*+.5Total 100.0 100.0
In i960 the proportion of the population under the age of 15 was high, namely *+1.*+ per cent and *+*+.9 per cent for the sample population studied in 1969* This large proportion.of young people, which is a widely accepted feature for most African countries, is the result of high fertility and declining infant mortality. Diagram A.17.1 on page *+*+*+ shows comparative percentage distribution for male and female at five-year intervals for the total population of Morocco in 197^» Tor the city of Marrakech in i960, and for the sample population studied in .1969* As may be seen from the bar-chart for Marrakech, the population in the city was only slightly affected by age-selective immigration among the male population aged 2.5 to *+*+ and females aged 25 to J>b. The sample population, on the other hand, shows a slight excess of females between the age of 30 to 3 9» while the male population aged 30 to J>k were under-estimated in all probability due to some mis-information and the smallness of the sample.
The sex ratio given at the lower part of Table 17»1 shows an excess of females over males in the i960 census and even more so in the sample populat
This may be partly due to the generally higher number of female immigrants
52/ SERVICE CENTRAL DES STATISTIQUES, ROYAUME DU MAROC R^sultats du Recensement de i960 op cit., Vol. 1 p. 108

PART III CH 17 283
(1*t 1 females against 98 males), and to the substantially larger number of divorced and widowed females (69) as against only 3 divorced and no widowed males observed in the sample. (See Table 18.1 on page 5 ).
Migration
While the total population of Morocco increased by about 2.6 per cent per annum between i960 and 1971, the population of Marrakech increased by 2.9' per cent per annum over the same period. Thus the theoretical influx of immigrants into the city may be estimated at 0.3 per cent per annum.This increase is relatively modest when compared with Rabat-Sale with an overall annual increase of 5*1 per cent and Casablanca with b,2 per cent per annum between i960 and 1971* The majority of immigrants who came to Marrakech are Berber either from the surrounding countryside, or from other southern and eastern Provinces.
Of the sample population, 239 persons, namely' 98 males and 1*f1 females, or 26 .7 per cent of the total were born outside the city. Of 68 compound heads,* 27 or 39-7 per cent immigrated to Marrakech, while 62 or 50.8 per cent of the dependent and tenant household heads in the sample came to the city in their early manhood. The main reasons for coming to Marrakech were given by these household heads as economic, though some stressed the city's superior educational facilities for their children. In order cf numerical importance the birthplaces of all 89 immigrant household heads (including immigrant compound heads) was the Province of Marrakech with *f0 household heads or ^5*0 per cent followed by the Provinces of Quarzazate with 20 or 22.5 per cent, Safi 9 or 10.1 per cent and Beni Kellal, 5 or 5*6 per cent. The remaining 15 household heads came from further away including the Provinces of Settat, Mekn^s, Agadir, El Jadida, Taza and Fez. (For the location of these Provinces see Map A.17.2 on page VtO). .
* There were 7 tenement houses without compound heads included in the survey

PART III CH 17 28
The majority of the 1*f1 immigrant females came as vives to Marrakech. The birthplaces of these 83 wives was in order of numerical importance, the Province of Marrakech with 31 or 37*3 per cent, Quarzazate 16 or 19.3 per cent, Safi 11 or 13»2 per cent and Beni Mellal 3 or 6.0 per cent. The remaining 20 wives came from various other Moroccan Provinces, two came from Oran and one from Austria.

PART III MARRAKECH CHAPTER 18 DOMESTIC GROUPINGS 285
The following chapter on domestic groupings discusses the house and its inhabitants, and is divided into three main parts. The first part gives a brief description of the conventional urban house type found in many traditional Moroccan cities followed by an analysis of the mode of kinship organization and domestic groupings based on my survey of 75 houses in the walled city or medina of Marrakech. I intend then to illustrate the effect that changes in the composition and kinship organization of the inhabitants may have on the lay-out, size and occupational pattern of the house. In the final section I am concerned with the distribution of floor area among the various kinds of households in the sample.
.THE COURTYARD HOUSE
Lay-Out and Organization
Historically speaking, the courtyard house is probably one of the oldestknown urban house types in the western hemisphere. Early examples excavated
1/in present-day Turkey date from the seventh millennium B.C.— It is interesting to observe that in the Moslem dominated countries of the Middle East and North Africa the basic pattern of the courtyard house has survived almost unchanged over the centuries. At least three factors have contributed to its apparently unchanged popularity,; first, the relatively economic use of land, as this house type does.not require large building sites; second, the courtyard house guarantees even in crowded urban conditions a maximum of privacy, which is of paramount importance where "purdah" is imposed by the household head; and third, this house type, which frequently has a planted courtyard, is well adapted to the conditions of hot-dry climates.
1/—' LAMPL, P. Cities and Planning in the Ancient Near East New York 1968, pp. 21-2 and p. 3^

PART III CH 18 286
Today, the Moroccan urban population distinguishes between two typesof courtyard houses: the dar which has a small paved courtyard (oust-ad-dar),and its larger counterpart, the riad, which always has an interior garden.As can be seen on page 287 in basic lay-out and organization, the plans ofthese two house types are very similar. However, compared with a dar, theriad has on average more rooms, better quality finish and more expensivefurniture. It goes without saying that the inhabitants of a riad' usuallybelong to the upper income groups.
As shown in the two examples all rooms open onto the central courtyardor garden. The rooms are usually long and narrow, their width beingdetermined by the length of timber beams available on the local buildingmaterial market for the construction of roofs and/or ceilings.* The positionsof the various types of rooms grouped around the courtyard is fairly uniform.
The main living, sleeping and reception rooms are always placed alongsidethe courtyard or interior garden, while the corners of the house are reservedfor such rooms as kitchens, stores, toilets, bathrooms, entrance halls and
2/staircases.-^ The plain nearly windowless elevations of most houses that face the narrow alleyways or streets contrast pleasantly with the enchanting atmosphere of their interior. (See Picture 18.1, 18.2 and 18.3 on page 288 )•In Marrakech, as in many other traditional Moroccan cities, courtyard houses vary greatly in size and appearance, but their basic characteristics, described above, are always the same.
* The length of wooden roof beams rarely exceeds J>.0 metres.
^ GALLOTTI, J. Le Jardin et la Maison Arabes au Maroc Paris 1926, Vol. 1 pp.>13.

PART III CH 18 287
PLAN 18.1 House Zk (Riad)
CNI01
CO
I7r^77.Z77ZZ Z Z
/Li
n nob
/
rO ~Ox
/
— o°» — <3p'4 — O"---------CM
• <3***
PLAN 18.2 House 22 (Dar)
T— -— I
01
kijco=3O3=
I—
//o*°X -
— < « j — < 3 - i•<3 “>
— 0- 1
— o- L-o- ON
E DO
MEST
IC UN
IT I
I 1
1 I
1 i
J. »"E
DO
MEST
IC UN
IT

PART III CH 18 288
PICTURE 18.1 Narrow Street in Marrakech
PICTURE 18.2 Interior Garden of Courtyard House (Riad)
PICTURE 18.3 Room of Courtyard House

PART III CH 18 289
In contrast to a dar or riad, fondonks are large courtyard houses which contain many rooms. Originally used as enterpots or warehouses for the caravan trade to and from West Africa, these courtyard houses were adapted for permanent habitation soon after the trade across the Sahara came to an end at the turn of this century. Since then, the rooms have been hired out for a monthly rent to less well-off families and immigrants. Overcrowding, poor sanitary facilities and lack of regular maintenance are the main features of the few remaining fondouks.-^ (See Plan 18.3 on page 290).
The modern houses situated in the western suburbs of the city most of which were built or influenced by the French were not investigated and are therefore excluded from this study.
Land Use
The data on land use given below derive from measurements taken in 75 houses in the walled city of Marrakech.* The houses surveyed covered a total area of 11,089 sq.m.** which may be divided into the built-up area of 8,809
sq.m. or 79»^ per cent, and the open area of 2,280 sq.m. or 20.6 per cent. The average size of the surveyed houses is 1^8.0 sq.m. or 1,593 sq.ft.The open area of courtyards can be sub-divided into two basic categories: first, the areas paved either with cement screed or ceramic tiles which accounted for 2,062 sq.m. or 90 * per cent of the total open area, and second, the planted areas with 218.0 sq.m. or 9*6 per cent.
LEENHEER, M. de ML ’habitat Precaire a Marrakech et dans sa zone Peripherique" in Revue de Geography du Maroc No. 17 Rabat 1970, pp. ^3-51
* There were 10 houses situated in Sidi Youssef ben Ali a suburb just outside the walled city to the south-east
** The total area includes only the house and the internal courtyard.Public or semi-public footpaths and other open areas alongside the house are excluded.

HOUSE N*
PLAN
PART III CH 1818.3 House 73
Fondouk
»• ■ » imiwimmmin ■. i' mngpgrt

PART III CH 18 291
Type and Size of Rooms
The built-up area of the 75 houses surveyed contained a total of 776rooms, averaging 10.3 per house. The total floor area of 8,326.0 sq.m. is divided into four categories:
Living area accounted for 5>901 sq.m. or 70.9 per cent of the total floor area. This includes 289 rooms with an average size of 12.0 sq.m. used for sleeping, 35 sitting rooms or parlours with an average size of 1*+.6 sq.m., 36 storage rooms used for personal belongings with an average size of 6.7 sq.m. and 55 empty.rooms, some of them under repair. A total of 11 verandahs were also included in the living area. With a total of *+15 rooms this is by far the most important group of rooms.
Common rooms accounted for 1,273 sq.m. or 15*3 per cent of the totalflcor area. This category includes 78 entrance lobbies as well as allpassages and staircases.
Basic ancillary facilities accounted for 1,030 sq.m. or 12.3 per cent of the total floor area. This includes 86 kitchens having an average size of 6.1 sq.m., 80 general store rooms and 10*+ toilets and/or bathrooms.
Commercially used rooms accounted for a mere 123.0 sq.m. or 1.5 per cent of the total floor area in these houses and comprises 13 shops and/ or work shops. (See Table A.18.6 on pa,ge 1+1+8).
SOCIAL STRUCTURE AND KINSHIP ORGANIZATION
As already mentioned earlier* slightly over one third of Morocco's, total population are now city-dwellers, while the rest live in rural areas where they are organized in various kinds of tribal groups. The following
* See Chapter 17 on page 271 •

PART III CH 18 292
brief description of the social structure and kinship organization of these tribal groups is thus necessary to introduce the discussion of the mode of kinship organization in urban areas and particularly among the people covered by the survey in Marrakech.
All Moroccan tribes whether Arabic- or Berber-speaking are agnatic and segmentary in character. Thus each tribe (kabila in Arabic; taobllt in Berber) is divided into several clans though seldom more than five.— Each of these clans are again segmented into a number of sub-clans, which in turn are further divided into agnatic or patrilineal lineages. At this level of segmentation, the group usually refers to a -widely known male ancestor, the lineage founder, who may be 3 to 5 generations removed from the oldest living member. All lineages are further divided into several patrilineal extended families (adam or ighs in Arabic; tigemmi or adouar in Berber) which for example may consist of a compound head’s family, together with the families of his married son or sons, their descendants and/or collateral agnates and their dependents. As each patrilineal extended family may occupy a common house, it is the basic kinship unit which will be analysed below. While in rural areas the patrilineal extended family is firmly embedded in the social structure of the larger kinship units described above, in the cities its affiliation to wider kinship groups is less important and is partly replaced *>y the ties of its members to occupational associations or guilds and other urban socio-economic institutions.
However, before analysing the various types of co-residential kinship groups found in my sample we must once again turn our attention to the division of these groups into units of domestic economy or households.
h/— HART, D.M. "Segmentary Systems and the Role of 'five fifths' in tribal Morocco” in Revue de 1'Occident Musulman et de la M^diterranee No. 3 Aix-En-Provence 19&7 PP* 63-93

PART III CH 18 293
As already observed, the inhabitants of a house or compound are not necessarily divided into economic units along kinship lines. A household may contain, besides a nuclear or individual family (kanoun in Arabic; taka in Berber) consisting of a man, his wife and their own unmarried children, several single, divorced and/or widowed relatives and one or more unrelated persons. Some households may therefore contain several fragmented families, i.e. divorced or widowed persons and their children, . while yet others may contain only a single person or persons.
The 73 houses surveyed in Marrakech contained a total of 190 households which fall into three categories mentioned above; first, the compound head’s household,* second, all other related dependent or semi-dependent households; and finally, tenant households who pay a monthly rent for their room or rooms. In the following pages I will examine some aspects of these three different categories of households before discussing the various forms of kinship groupings and organizations found within them.
Population and Household Data
The population distribution of 73 houses surveyed is given below. As is shown in diagram 18.1, nearly three-quarters or 73•3 per cent of the sample houses have populations that range between 3 and 19 persons, the average being 11.9 per house. Of the three largest houses, two with h2 and 67 persons respectively were ’’tenement-houses" with absentee landlords, while the largest house with a total or 69 inhabitants was a f or.dcuk. **
* For definition of this term see Chapter ** on page 6k .** For the description of a fondouk see page 289 •

PART III CH 18 29*+
DIAGRAM 18.1 Number of Persons per House in Percentages
50 %
*10 %
30 %
20 %
10 %
0 %0-k 5 -9 10-1^ 13-19 20-2*f 25-29 30+ Persons
The sizes of the three types of households mentioned above are shown in Diagram 18.2 on page 295 • When compared, diagrams 18.2 A to 18.2 C reveal some interesting patterns. The compound head's household (first diagram) . shows the smallest number of 1 to 2 person households (6 or 8 .8 per cent), while the majority of these households (72.1 per cent) have between 3 and 8
persons. Over one third of the related dependent or semi-dependent households on the other hand have 3 and k persons. As expected, tenant households contain the largest number of households with one or two persons. -The average size of households decreases from 6 .0 persons in the compound head's household to *f.7 persons in dependent households and 3«7 persons in tenant households. It is interesting to observe that a very similar distribution of households by size, and status has already been reported from Ibadan, the only other sample which had a sizeable tenant population.* It seems that the relatively "young households" among the. dependent or semi-dependent households, the lack of cheap and suitable accommodation for tenant households and generally lower incomes of both these categories may be responsible for the smaller size of these households.
* See Chapter- 1-1 on- page 186.

PART III CH 18 295
DIAGRAM 18.2 Number of Persons per Household in PercentagesA. Compound Head's Households (68)50 % .
20 %
10 %
0 %1-2 3-k 5-6 7-8 9-10 11-12 12+ Persons
B. Related Dependent or Semi-Dependent Households (31) hO % .
30 %
20 %
10 %
0 %1-2 5-b 5-& 7-8 9-10 Persons
C. Tenant Households (91) kO %
30 %
20 %
10 %
0 %1-2 5-k 5-6 7-8 9-10 Person;

PART III CH 18 296
Although permitted by Muslim law, polygamy is practised infrequently at Marrakech, and did not play an important part in the sample population.Only two of 68 compound heads* and one of 9 , tenant household heads had more than one wife. In all three cases the second wife did net live in the house surveyed. No case of polygamy was found among the related dependent or semi- dependent household heads.
The age and sex distribution as well as the marital status of the sample population is shown on page 297 . The bar-chart indicates quite clearly that young persons of both sexes, but particularly females, marry on average at the same age as their counterparts in Ibadan but generally later than in Zaria.** Among the A08 males included in the sample population, or 62.2 per cent were single, 131 or 37*0 per cent were married and 3 or C .8
per cent were divorced. There were no widowed males among the sample population. On the other hand, the female population of persons was divided into 263
or 5^*0 per cent single persons, 136 or 32-0 per cent married and 69 or 1^.0 per cent were either divorced or widowed females. (For more detailed information see Tables A.18.2 , A.18.3 and A.l8.*f on pages A46-7*
As can be seen in Table A.18.4 on page Mf7 , a total of widowed females were found in the sample population* Ten of these women were compound heads?1*f were eighter mothers of compound heads or mothers of compound heads' wives. Another 13 widowed females were tenant household heads, while 7 females were mothers of unrelated household heads. The remaining 10 females belonged either, to the compound head's or to tenant households. Sight out of 15 divorced females included in the table were tenant household heads. The remainder included 1 compound head and several other related kin. Some widows who were no longer able to work were supported by their next of kin, while younger
widowed and/or divorced females will most likely leave the house on remarriage.
* There were 7 "tenement-houses" without compound heads** See Chapter k on page 69

PART XII CH 1.8 ...................................... 297
DTA.01 AM 18.5 Survey Sample Population by Sex, A£e and Marital Status
MALE FEMALE
100 90 00 70 60 50 10 30 20 10 0 0 10 20 30 L0 50 60 7 0 6 0 90 100 PERSONS
SINGLE MARRIED DIVORCED OR WIDOWED
TABLE 18.1 Survey Sample Population by Sex, Age and Marital StatusMale Femal G.
Age Sing Mar, Div. Wid. Total Sing Mar. Div. Wid. Total TotalO- 4 69 69 73 73 1425- 9 60 60 73 73 133
10-14 62 62 64 64 12615-19 38 1 39 41 11 2 54 9320-24 14 9 23 9 23 2 34 5725-29 I 7 10 3 “1 20 1 23 1 25 45
_5Q=14 1 9 10 26 1 1 28 3835-39 1 23 24 1 27 1 29 5340-44 1 17 18 17 2 6 25 4345-49 20 20 11 1 5 17 3750-54 17 17 7 3 n
i 17 3455-59 1 11 12 3 8 11 . 2360-64 10 10 5 7 12 226 5 -69 14 14 3 8 11 2570+ 10 10 1 2 12 15 25Total 254 151 3 - 408 263 156 15 54 488 896
9

PART III CH 18 293
Family Groupings
Before discussing the various modes of co-residential family groupings found in the 75 houses surveyed, I must briefly refer to some of the earlier findings regarding kinship patterns observed in the sample populations at Ibadan and Zaria. As already mentioned, household data alone are insufficient to explain satisfactorily the various changes which frequently occur in co-residential groups, and some additional kinship data, based on a common reference point - in our case relations with the compound head - are essential. Most changes that effect the structure of co- residential kinship groups are either due to the marriage, migration and/or death of one of its male members, and particularly of the compound head.How such changes may effect the co-residential kinship group and consequently modify the lay-out, size and occupational pattern of courtyard houses wall be the subject of the following analysis.
We may recall that in Zaria and Ibadan the survey data clearly showed that most co-residential kinship groups were based on agnatic descent. It could be established that the individual family consisting of a can, his wife or wives and their own unmarried children was the first stage in a development cycle that gave rise to composite co-residential kinship groups. Altogether six such stages were identified, the last being that of a compound which housed paternal cousins and their descendants. However, it must be stressed again that at each stage of development co-residential kinship groups are liable to split into two or more independent units. The most important reasons for such splits were in order of importance: the death of the compound head, the differential economic success of some dependent or semi-dependent household heads, and family quarrels. A preliminary examination of the data collected in Marrakech revealed that the majority of co- residential kinship groups were based on agnatic descent. We cay therefore apply a similar mode of analysis*as for the kinship data collected in Zaria
and Ibadan................................................................

PART III CH 18 299
Let us begin with a few remarks about co-residential groups at Marrakech. Although the rule of patrilocal residence by which married daughters go to live with their husband’s'family is widely practised in Morocco, the survey revealed that not less than 8 compounds, contained the families of the compound head's daughters, as against two in Zaria and none in Ibadan. Investigation of these families suggests that one reason for the daughters' residence in their fathers' hcuse is economic. At 38.8 per cent, the proportion of tenants living in the 75 houses at Marrakech was considerably larger than in Ibadan where they reached only 23.0 per cent of the sample population. As these tenant families generally do not influence the development of the co-residential kinship groups of their compound heads, they are omitted from the following table and will be analysed separately later.
Table 18.2 on page 300 shows the age distribution of the 68 compound heads, grouped according to the composition of their respective co- residential kinship groups. As indicated in the simplified kinship diagrams at the foot of the table, column 1 lists all compound heads responsible only for individual families. Column 2 lists those compound heads whose co-residential kinship groups contained the compound head's family together with the families of his sons and/or daughters; while column 3 contains two paternal full brothers and their unmarried children; and column k in the table lists 5 houses whose population had increased by the immigration of 7 related families rather than by natural growth. (See also Table A.18.5
on page kk7 ).These three types of co-residential kinship groups (column 1-3)
represent the first three stages in the development of domestic groups based on agnatic kinship and virilocal residence that were discussed in some detail in Chapter on pages 72 - 3 . It is interesting to note that none of the houses surveyed contains composite co-residential kinship groups beyond .the third stage when. a. unit includes,paternal full or half

PART III CH 18 300
TABLE 18.2 Age of Compound Heads by Stages of Kinship Development
ColumnStage Joint Eouseh TotalAge of C.H.
2 5-29
30-3435-3940-4445-4950-5455-596 0-64
65-6970+
10
1386
965
No•of C. H. No.of H.H. No.of Pers
4848297
1334
172
25
27
512
57
6899
553
Av.Househ. per Comp.Av.Pers. per Comp.Av.Pers. per Househ
1 .0
6.2
6.2
2.6
1 3 .2
5.1
2.5
13.5
5.4
2.4
11.4
4.8
1.5
8.1
5.6
KinshipDiagrams
c H C H _A'ChO

PART III CH 18 301
brothers and their married children. As expected, the modal age of compound heads in stage 2 are generally greater than their counterparts in stage 1 and 3i an observation already made for the sample population in Ibadan and - Zaria.
The centre of the table deserves special attention. It shows clearly that the average number of households per compound increases frcm one household with an average of 6.2 persons in stage one to 2.6 households having an average total of 13*2 persons in stage two. The average number of persons per household on the other hand decreases frcm 6.2 persons in stage one to 5*1 persons in stage two. The number of ’’stage three households" is too small to yield any meaningful averages. Quantitatively speaking, the 68 compound heads interviewed had a total of 38 married sons, of whom only 10 or 2 6 .3 per cent lived in their father’s house, and the rest elsewhere. While the number of compound head's married brothers recorded is believed to be incomplete, the total indicates that less than 3*0 per cent lived together in the same house.
The data presented in Table 18.2 indicate that the division of composite co-residential kinship groups normally occurs during their second developmental phase when the compound head's family includes his married children and their descendants. This poses at least two important questions. First,, is the process of division which occurs at this relatively early stage due to the lack of suitable space in the rather inflexible urban courtyard house? or, second, does the break-up occur because young dependent household heads regard their father's house as a valuable asset which can be readily turned into cash to provide them with the capital they need to lease, buy or even build their own houses? If the latter suggestion is correct, it would partly explain why there are at Marrakech such a large number of divided courtyard houses owned by unrelated parties. However, in his study of the traditional rural society in Morocco, B.G. Hoffman has shown that patrilineal extended

PART III CH 18 302
families are most likely to split up when reaching "stage three" in the5 /development of composite co-residential kinship groups,— thus indicating
that the pattern of division noted above are not entirely due to conditions which previal in urban areas. We shall reconsider these questions further after discussing the structure and size of the 9 tenant households which were not included in Table 18.2.
In Table 18.3 on page 303, the 91 tenant households have been divided into four main categories based on kinship organization in order to reveal their internal fabrics and their differences. The first category, column 1-3, has heads who are either single, divorced or widowed, while the second category, column 4, contains female heads whose-husbands were absent for more than one month preceding the date of interview. The third category, column 5» consists of couples without resident children, but includes some whose children were av/ay, while the last category, column 6, contains individual families with married and/or unmarried children. As the table shows, 22 or 24.2 per cent of all tenant households consisted either of single, divorced or widowed persons or of females whose husbands were away, while 69 or 75 • 8 per cent contained childless couples or couples without resident children, and individual families with married and/or unmarried children. Of 9”1 tenant household heads in these houses 38 or 41.8 per cent were born in Marrakech, while the remaining 53 or 58.2 per cent had immigrated to the city mainly from villages situated in southern Morocco. Furthermore, it is interesting to observe that with a total of 3^3 members, these 91 tenant households financially supported 25 persons or 7*3 per cent who were either single, divorced and/or widowed relatives of the husbands or his wife’s kinship group, and 3 unrelated persons. By comparison, the
^ HOFFMAN, B.G. The Structure of Traditional Moroccan Rural Society The Hague .1987, p- 45. "If this common ancestor (the lineage founder) is still living he heads the extended family and represents it on social and public occasions; if not his place is taken by his elder brother.
. If-this brother dies -the extended, family splits, up into.units.under.each of the other brothers."

TABLE
18*3
Structure
of Tenant
Hous
ehol
dsPAJRT III CH 18 303
C\ G.To
tal r- C'-OV'ttf-C\J KA GO C— C— CM KA CO ON KAAj-KA
CO•KA
coMa
leH.H. T— -C'- sJ-CMOAVOVOUACMOA'M-T~
OAsO
f- • •a wQ) •Ph W
KN CM CM n— CM ^ 22
•art
vo
rHaJ*01•H?>•daM
CM KA OS t— IT'S KA CO CM 0UA 1— VO CMCM•UA JrG
ua
Chil
dles
sCo
uple
s
t— CM t— K> CM t- K\ r C\l f C\J OAT~ VO■<sr 2.4 0
Females
with
temp,
absent
Husb
and
r- t— CM vf O»CM?-<!
KA Wid. t- CM r- CM ^ K\ KA 24
CO• 5 0
CM•t>•HQ r- T— y— T— T- - VO c— CM•
1•tjOa•H03
- r— - O• -3<!
Colu
mnType
of H-H.
Age
of T.H.
H.
ov^OA^ov'^ov^rav^j-ON t— CM CM KAKA 'sj-LTAUAVOvO 1 1 1 1 1 1 1 1 1 1 1 +UAOOAOUAOUAOOAOUAOt- CM CM KVKA^-^-tnUAvOVO
No.of
Hous
eh.
No.of
Pers
ons 'd i- 1 <Q O £ -C O O gq m
® s.• U> © C P. Ki
nshi
pDi
agra
ms
Rema
rks

PART III CH 18
compound head’s households contained 64 such persons who represented '55*7 per cent of heir total population. Table A.18.5 on page 447, reveals yet another interesting feature of these tenant households. In 4 out of 7 "tenement-houses", seme tenant families had formed composite co-residential kinship groups either through natural growth or by bringing related families to join them when a room became vacant in the house. This formation of extended kinship groups among tenant families, which was not found in the Ibadan sample, suggests a certain degree of stability as well as the need for mutual help among this group.
Finally, Table 18.4 compares the age distributions of tenant household heads and compound heads. The table shows, that, apart from a slightly larger proportion of.younger tenant household heads- these age distributions do not differ markedly.
TABLE 18.4 Age Distribution of Tenant Household Heads and Ccmrour.d Heads in Percentages
Age Group 15-24 25-39 40-54 55-69 70+ Total !No. Cf -r .Heads' ;
Tenant Househ.H. 8 .8 27.5 30.7 24.2 8 .8 1 00 . 0 91 !Compound Heads - 16.2 45.6 30.9 7.3 1CO.O OO
The age distribution of these tenant household heads and the substantial number of years that most of them have spent in rented accommodations indicate that the renting of rooms in Marrakech is a long-established practice which has helped immigrants and poorer local families to find suitable homes.
House and Kinship Organization
In the following pages I apply some conclusions that emerged from the preceding discussion on household and kinship organization to a number of

PART III CH 18 305
the houses surveyed. Altogether, four case-studies have been chosen from the sample to illustrate the various stages in the development of co- residential kinship groups, their patterns of occupancy, and the inodes of transferring real estate.
The first example is a house situated in the northern parts of the medina or walled city. (See Plan 18. on page J>0& ). This house was bought for 850,COO Moroccan francs (8,500 dirhams) in 195** by the father of the present compound head. About three-quarters of the money was raised by selling the old house, which, according to the compound head, had become too small, while the rest was given by the oldest son. Shortly after moving to the house the compound head built a new toilet (room no.10) which has so far remained his only alteration to the house. During the mid-1950's the house contained a kinship group in the second stage of development and had the following pattern of occupancy. The compound head occupied two rooms numbered 8 and 9 on the plan on page 306 , while his first born son lived with his wife in room no.7 on the same floor. The head's four unmarried sons shared two rooms on the ground floor until in 1957 when two of them married. The elder of the two already had a bookshop in Gueliz and moved there with his wife, while the younger was given room no.2 on the ground floor. The two remaining sons, one of whom is now married, moved out of the house in the early 1960's. In late 19&5i when the compound head suffered a stroke, and was unable to carry out his responsibilities, he asked his first-born son to take over the headship. With this change of its headship the inhabitants of the house entered the third stage of its development as a co-residential kinship group. At the time of my interview in 19&91 the young compound head was the only member of the group with a regular income and supported his invalid father and partly his younger brother.

PART III CH 18 306
kllCHgN
' Z Z Z & Z Z Z ^
n^i — d J /
V_2.//FZ2,
7Z 77r V 7 T//_/J/ym
PLAN 18.4 House 12HOUSE N2 12
6R0UM0 FLOOR _ FIRST FLOOR
Of CV A-O0 - 9 8 -9
1 A r O I t O 1 1 A H I7 7 3 2 2 2
n o
1957
m 'o A
▲ - •
cCm Aa- 9 t O8-9
ioii7 74
I-0 A-o A A2 2 3 5
O
1965
8 - 9 1 8-9.'
TWO DOMESTIC UNITS
PART III CH 18 307
The second example, sketched on page 308* is of some interest because it illustrates a very common mode of dividing a courtyard house into two or more self-contained dwellings and the financial implications of this partition. This house is inhabited by the compound headfs family and two of his married sons with their wives and children, as well as two individual tenant families. The present compound head and his younger full brother inherited the house from their father in 193&. After the Second World War, part of the upper floor was converted into two small self- contained dwellings. In 1952 a quarrel between the brothers resulted in- the younger one moving out and demanding compensation for his share of the house. Obliged to pay, the compound head sold the two self-contained dwellings, and adding to this his own savings, paid his brother the sum of DH. 5*000. Unfortunately, I did not investigate occupancy pattern of this house between 193^ and 1952, but since the younger brother and his family moved out there seem to be few changes. In 19&9 the compound head lived with his wife and two grand-children in room no.9 on the first floor, while his two sons and their families occupied all rooms on the ground floor and room no.8 on the first floor. The two self-contained dwellings which were sold in 1952 have been rented out to stranger families by their present owner.
The division of houses into two or more self-contained dwellings illustrated by this example represents but one of two methods which are frequently found. The next example on page 309 illustrates the second mode of division, which is achieved by building a dividing wall through the courtyard of the house. The two individual families who now occupy this house are only casual acquaintances. According to the compound head who occupied section "B", his grand-father bought the already divided house shortly after the First World War, and his neighbour bought the other section for DH. ^,300 in 1955- Neither of these two compound heads knew how

PART III CH 18 308
PLAN 18,5 House 28
1968 £ .7# - Q entrance b'
'I -|H |H , C ]o ^ c y o - oHif O,L15 J
ONE DOMESTIC UNIT
1968 N ENTRANCE *C*/ 1» \/ \/NH/ ^-6 \/ 19 19 \
/ N
\\
m r n n ' i01 _l* _ 1111 j? 19;ONE OOMESTIC UN IT
ENTRANCE ’A '
“"'i
77///// '.V W . yvwu* j
HOUSE N® 28
FIRST FLOORGROUND FLOOR
THREE OOMESTIC UNITS

PART III CH 18 309PLAN 18.6 House 19
O<--O,'/?
— i_0 —
4 o=4
O p x 5-V <|p; 1K]= “
cn01
cnr=>CD
Lfe£
1 & ■ IS
1—
<j ✓,'b4s4
/ 0~! '1— o ~ \' V " 'v<J |
I— t"<1
i
t O °
O-;
£-[“ • i — 0°
■■t s w s;
TWO
OOME
STIC
UNITS

PAET III CH 18 310
old the house was nor when the dividing wall was built. In both cases the family history and pattern of occupancy before the present compound heads’ generation was not studied. The kinship diagrams beneath the house plans show the occupancy patterns of both families in 19&9* Although not found among the houses surveyed, Jean Gallotti in her book on ”Le Jardin et la Maison Arabes au Maroc” gives an example of two small houses being joined together presumably to cater for the needs of an expanding family.—^
The last example on page 311 is situated in the. suburb of Sidi Youssef ben Ali which stands just outside the walled city to the south-east. It is one of six houses included in the sample which were built by the present compound head. In 1952, the compound head bought the land for 13,000 Moroccan francs (DH. 150) from a man who claimed to own it. However, this transaction, which was undertaken without exchanging a written contract, proved to be invalid as the whole area then belonged to a well-to-do merchant and had been taken over without his consent by squatters and self- styled property speculators. The compound head, himself a construction worker, built a wall around the plot and completed the first room in the second half of 1953* After moving into the house he built a second room for his wife and completed this a year later. Following a break of about one year in which he repaid at least some of the money he had borrowed, a third room was finished in 195& and was immediately rented out to a tenant family. A kitchen, an entrance lobby and a store-room took him over two years to build and were completed in 1959* In 19&5 the compound head was able to lease one room for a lump sum of DH. 500. This kind of transaction, which is based on a contract asking for no further payment from the tenant but which is repayable to him in full when he leaves the house, has been
GALLOTTI, J. op cit., Vol. 1 p. 11

PART III CH 18 311
PLAN 18.7 Development House 66
£
TT
r O ~
O -4"\( "1
COCO
CO ! iSC;/ — O/
/ - O/
2 /“ /*“ 1 O -.~N , -
— O
- O. AX * ' 1 V
'— - . >-i—O -1-0 -;-• | —<C »-|_<] J
/ o. I-
hO~,
<
Sfcsssscvrssi SSS_£Sfc*SS3-
p «I* — O'z — — G
= ? -= «*•■=<]-(-♦— O
o~ ___<4
4"
THRE
E DO
MEST
IC UN
ITS

PART III CH 18 312
described in some detail in Chapter 16 on page 265. This loan enabled the compound head to buy some building materials and to start the construction of a large upstairs room which was completed in 1987* On moving into the new room the compound head was able to rent out his old room (number 3 on the plan) for DH. 15»0 per month.
The four examples given above indicate that most houses in Marrakech are regarded as a capital investment made by an individual or a group of individuals who may exchange them for something more suitable if the occasion arises. Hence as shown in the last example the construction of rooms need no longer reflect the requirements of a growing family but may illustrate the owner's ability to invest his money for a profitable return.
DISTRIBUTION OF FLOOR AR5A
The distribution of the floor area among the sample population has been studied from two points of view; first, the average floor areas per household and person classified by their relationship to the compound head have been calculated, and second, the average floor area per household and person according to the number of persons per household. As already argued in Chapter 11 on page 202 the first approach may tell us something about differential treatment of related and tenant households regarding the allocation of space, while the second approach will indicate the compound head's ability either to buy a bigger house or to adapt already available space for a growing family.
Type of Floor Area and Household
The sample of houses surveyed in Marrakech included 190 households with a total of 896 persons. Column 2 and 3 of Table 18.5 on page 313 shows the total average floor area and the average sleeping area available to each household for its members, these households being classified by their

TABLE
18.5
Average
Floor
Area
per Household
and Per
son
in sq.
'PART III CH 18
A
UOf t
00P<
toc
Person VO•
-4 " 2.8 IN
•A
CV•
A
V•A
-d-•A
A•A
*Hft0 •0 X A A OO -d" VO VO A1—1 0 • • • • t • •0 to O - -d- -4- A -4" OO OO• c 00 * - V" V V> 0
< EC
p C0 O 00 00 -4 - V l> - -4 - Af t CO • • • • • • •
p -4" A A OO -4* A A0 0 r~0 ftJH<
00•>(0 «xi V 00 OO O *- -4" 0 0rH 0 1 • • • • • •0 CO A O *— ON OJ O AP c 00 00 00 00 00 00 -4"
O 0EH EC
to<W CO Oto 00 LA 00 00 A A VO• P O ON A r~ -4 " -4" AO 0 -4" v A COft ft
v-•«H X0 0
CO 00 OO OO A V O• c VO A ON A0 0 v~f t EC.
0C
CO O• • c 0• EC EC • • 0 PEC • • EC EC 0 0p EC . • u ftto xi EC EC 0•- to to • ft +TJ 0 P 73 f t0 0 CO 0 O + •0 « •H P Q • EC
EC + CO 0 EC ■ •0 + 1—1 1—1 • EC EC
T ) c to 0 0 EC •c 0 u ft P EC 1—1c CQ « O P 1—1
g 0 Eh P C 1—I ctfC f t CO to 0 1 0 0
r H s — — xi O c P •O 0 EC EC p C 0 O >
O 0 O O 0 CO EH EH <

PART III CH 18
relationship of their heads to the compound head. As shown in the table, there is a substantial difference between the average floor area occupied by the households of compound head's (85.1 sq.m.), and the average floor area of all other related dependent or semi-dependent households (22.1 sq.m.) and tenant households (20.4 sq.m.).
In part these differences are due to the larger average size of the compound head's households with 6.0 persons as against 4.7 and 3*8 persons for all dependent and tenant households respectively. As explained above, the area occupied by the compound head's own household includes all rooms such as entrance lobbies, passages, staircases, common kitchens and stores for which he is directly responsible, even though these rooms are available for use by all other resident households. Hence the average floor area given above may illustrate the different distribution of responsibility among household heads within the house rather more precisely than the allocation of space between the households themselves.
The average sleeping area per person, as shown in column 3 fluctuates between 4.6 sq.m. for members of the compound head's household, 3»1 sq.m. for all other related households and 3*4 sq.m. for tenant households, the average for the sample being 3*9 sq.m. or 42.0 sq.ft. However, the average sleeping area per person in the compound head's household is slightly inflated by the fact that some compound heads have their own sleeping quarters, while most other household heads have to share their bedrooms with others in their family.
The two following graphs on page 3 1 3 derive from Table A.18.7 on page 443 . The first graph shows the average floor area (curve 1) and average sleeping area (curve 2) per household of differing sizes. As may be seen, the average floor area per household increases from 27*7 sq.m. in households with 1 to 2 persons to 69 .3 sq.m. in households having 9 to 10 persons. At the same

PAPT III CH 18 315
GRAPH 18.1 Average Floor and Sleeping Area per Household in sr..-..
100
8 9 10 11 120 1 2 3 L 5PERSONS PER HOUSEHOLD
6 7
Line 1 Average Floor Area Line 2 Average Sleeping Area
GRAPH 18.2 Average Floor and Sleeping Area per Person in sc.r.
0 52 3 9 10 11 12PERSONS PER HOUSEHOLD: :rrt : - . . : ;.. : . ■.; •.:: .
Line 1 Average Floor Area Line 2 Average Sleeping Area See Table A. 16.7 on page

PART III CH 18 316
time the average sleeping area per household also increases from 10.1
sq.m. for households with 1 to 2 persons to 30.6 sq.m. for 9 to 10 person' households.
The second graph shows the average floor area per person (curve 1) and the average sleeping area per person (curve 2) in households of differing size. At 17-1 sq.m., the average floor area per person for households of 1 to 2 persons is relatively high when compared with 9*5 sq.m. per person for households of 3 to persons, and 7 * sq.m. per person for households having 9 to 10 persons. Average sleeping area on the other hand fluctuates between 6 .2 sq.m. per person in households with 1 to 2 persons and 3*3
sq.m. per person in households having 9 to 10 persons, the sample average being 3*9 sq.m. It will be noted on graph 18.2 that the average sleeping area per person decreases from c. 6 .0 sq.m. in 1 to 2 person households to about 3*0 sq.m. in households of 5 to 6 persons, but remains almost stable for all larger households.
In conclusion, apart from a few very densely populated "tenement- houses" including the fondouk, overcrowding is not worse at Marrakech than at Ibadan. For example, in Marrakech the total average floor area per person was 9-3 sq.m. and the total average sleeping area 3*9 sq.m., while at Ibadan the comparable figures were 7*^ and 3*8 sq.m. respectively. Thus the available floor and sleeping areas per person at Marrakech is very similar to the areas found at Ibadan, and may not be a decisive factor in the early division of co-residential kinship groups as proposed at the beginning of this chapter on page 301 . It is also interesting to observe that the high degree of residential mobility of the population is partly illustrated .by the reluctance of many a compound head to undertake the majo building operations required to enlarge a house, preferring instead to sell it and to buy a more suitable one elsewhere in the city. Furthermore, the

PART III CH 18 31?
economic value of urban houses and the possibility of compound heads to sell part of it and to give the money to their son or sons has no doubt enabled many of them to leave their father's homes and establish their own independent households elsewhere.

PART III MARRAKECH CHAPTER 19 OCCUPATION AND INCOME 318
The first part of this chapter deals with occupational patterns and income distribution in Morocco and Marrakech, while the second analyses the data obtained in my survey of 73 houses containing a total of 190
households in the walled city or medina of Marrakech.
• MOROCCO / MARRAKECH
Occupational Pattern
According to the 1971 census report about *+.0 million people or 26 .3
per cent of the total Moroccan population was classified as belonging to1/the economically active population.— The division into sexes shows that
3 . million or V +.5 per cent of the total male population were economically active, while only 0 .6 million or 8 .0 per cent of the total female population belonged to this group. It is thus obvious that the latter figure does not include an estimated 2 .0 million females who are engaged in various kinds of unpaid agricultural and/or crafts activities mainly in the rural areas of the country.
A broad division of the total working population into five majoroccupational groups revealed that agriculture employed 5 1 per cent of thecountry's total labour force, followed by crafts and industry with 19*2 percent, services including professional and administrative staff with 15»2 percent, and finally miscellaneous occupations and the unemployed with 8 .6 per
2/cent in 1971 •*" The substantial differences between the occupational patterns in the rural and urban areas of the country* are noteworthy. As expected,
1/ / J ySECRETARIAT D'ETAT AU PLAN ET AU DEVELOPPEMENT REGIONAL, ROYAUME DU MAROC / ;Recensement General de la Population et de 1'Habitat 1971 Vol. 2 "Population Active" Rabat 1973* p. 18Ibid. p. 119
* Urban areas include all towns with 20,000 or more inhabitants.
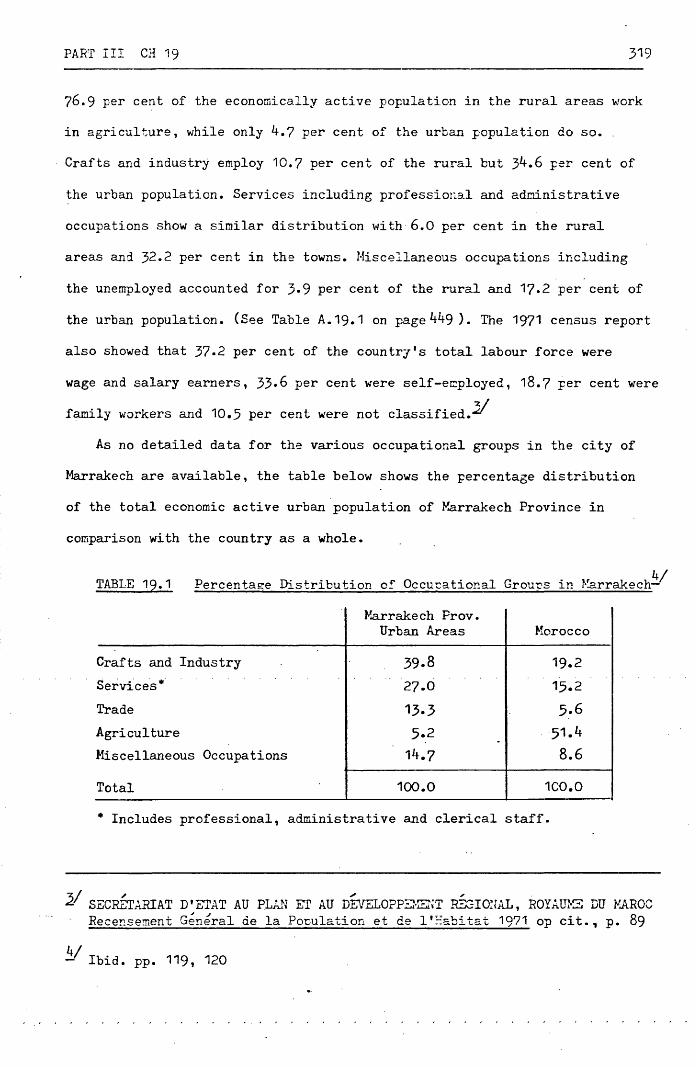
PART III CH 19 3^9
76.9 per cent of the economically active population in the rural areas workin agriculture, while only 4.7 per cent of the urban population do so. .Crafts and industry employ 10.7 per cent of the rural but 34.6 per cent ofthe urban population. Services including professional and administrativeoccupations show a similar distribution with 6.0 per cent in the ruralareas and 32.2 per cent in the towns. Miscellaneous occupations includingthe unemployed accounted for 3-9 per cent of the rural and 17*2 per cent ofthe urban population. (See Table A.19.1 on page 449 ). The 1971 census reportalso showed that 37-2 per cent of the country's total labour force werewage and salary earners, 33*6 per cent were self-employed, 18.7 per cent were
■*/family workers and 10.5 per cent were not classified.^As no detailed data for the various occupational groups in the city of
Marrakech are available, the table below shows the percentage distribution of the total economic active urban population of Marrakech Province in comparison with the country as a whole.
b/TABLE 19«1 Percentage Distribution of Occupational Grours m Marrakech—Marrakech Prov. Urban Areas Morocco
Crafts and Industry 39.8 19.2Services* 27.0 15.2Trade 13.3 5-6Agriculture 51.4Miscellaneous Occupations 14.7 8.6
Total 100.0 1C0.0* Includes professional, administrative and clerical staff.
^ SECRETARIAT D'ETAT AU PLAN ET AU DEVELOPPEMENT REGIONAL, ROYAUME DU KAROO Recensement General de la Population et de 1'Habitat 1971 op cit., p. 89
4/— Ibid. pp. 119i 120

PART III CH 19
The table shows that persons employed in crafts and industry together form 39*5 per cent of the total economically active population in the urban areas of Marrakech Province. They are followed by persons employed in services 27.0 per cent, traders 13*3 per cent, full-time farmers with 3*2 per cent and finally miscellaneous occupations and the unemployed with 1k.7 per cent.
Income
r 5/Minimum wage rates have been in operation in Morocco since 1936.In 1971» the lowest established minimum wage per hour in industry andcommerce was DH. 0.5kk for females between 1k and 13 years of age, and DH.
6/0.956 for an adult man.— Since 1960, these minimum wages have been linkedto a cost of living index, but wage increases have usually lagged behindthe rise of prices. However, actual wages are often above the quoted minimumwages, and there are substantial variations between unskilled caHCl highlyskilled workers. Unfortunately, no reliable data for wage and incomedistribution among Moroccan workers is available except for the late 1950's
7/and early 1960's.— Nevertheless, estimates for the early 1970's suggest that the average monthly income of unskilled and semi-skilled workers in manufacturing industry ranged from DH. 300 to DH. 500, while highly skilled workers, clerks and teachers were earning between DH. 500 and DH. SCO per couth.
Cost of Living
The consumer price index for Casablanca is shown on Table A.19.2 on page kk9 . Unfortunately no index is available for Marrakech. Column 1 in the
ROYAUME DU KAROC Dahir of 18 June 1936SERVICE CENTRAL DES STATISTIQUES, ROYAUME DU KAROC Annuaire Evatismioue du Maroc 1972 Rabat 1973» p. 15k
^ INTERNATIONAL LABOUR OFFICE Labour Survey of North Africa Geneva i960 Appendix II p. k63LA2RAQ, A. ’"L'e Salaires dans le’Revenu National'de 1955’a ’1966" i^Bulletin Economioue et Social du Maroc Vol.XXIX No.lCo-7 Rabat 1967, pp. 05-139

PART III CH 19 321
table gives the general consumer price index, whereas columns 2 to 4 gives separate figures for food including drinks, for clothing and finally for rent, which also contains fuel and lighting as well as the cost of kitchen utensils. As shown in the table the increase of the general index was only 20.6 per cent over the last 10 years :(1963-73) which represents a very modest average annual increase of 1.7 per cent.
SAMPLE SURVEY
Occupational Pattern
The occupational pattern and income distribution of the 190 household heads interviewed will be analysed below. The main occupations of these household heads are given in the following table.
TABLE 19*2 Occupational Pattern of 190 Household Heads
Column 1 2 3 4Type of Househ. Compound Head Dep. H.H. Ten. H.H. Tot a1 H.H.
No. % No. % No. % No. %
Crafts & Industry 20 29 .4 12 38.7 39 42.8 71 37.4Services* 23 33.8 9 29.0 15 16.5 47 24.7Trade 13 19.1 5 16.1 15 16.5 33 17.4Agriculture 2 3.0 2 6.3 9 9-9 13 6.8Miscellaneous 10 14.7 3 9.7 13 14.3 26 13.7Total 68 100.0 31 100.0 91 100; 0 190 100.0
* Includes professional, administrative and clerical staff.
Among compound heads, the service category, which includes inter alia teachers, as well as professional, administrative and clerical staff, represents the most important group followed by crafts, trade and agriculture. Dependent and tenant household heads on the other hand, worked more frequently

PART III CH 19 322
in occupations related to crafts and industry followed by services and trade. The number of interviewed household heads v/ho engaged in full-time agriculture was relatively small. (For comparison with Marrakech Province urban area see Table 19-1 on page 449).
As shown in Table A.19*4 on page 450 , 27 or 14.2 per cent of the 190 household heads had some income from a secondary occupation. Twelve of these household heads worked in agriculture, 7 pursued some crafts, and 8 worked in several other occupations.
The following table shows how the household heads included in the survey were employed.
TABLE 19»3 How Household Heads are Employed
Column 1 2 3 4Type of Household Compound Head Dep. H.H. Tenant H.H. Total H.H.
No. % No. % No. % No. %
Self-Employed 34 50 .0 11 33.3 31 34.1 76 40.0Enpl. by Priv.Sector 13 19.1 6 19.4 45 49.4 64 33.7Empl. by Publ.Sector 11 16.2 8 25 .8 1 1.1 20 10.5Helps Sen.Fam.Member - - 3 9.7 1 1.1 4 2.1
Retired 7 10.3 1 3.2 8 8 .8 16 8.4Miscellaneous 3 4.4 2 6.4 3 3-5 10 5.3Total 68 100.0 31 100.0 91 100.0 190 100.0
As shown above, 30.0 per cent of the compound heads are self-employed, 19«1 per cent were employed by private firms and 16.2 per cent in the public sector. Slightly over one third of the dependent household heads were self- employed but compared with the compound heads, a larger proportion was employed in the public sector. It is noteworthy that only one of 9^ tenant household heads was employed in the public sector, while 45 or 49.4 per cent worked for private firms, and y\ or 34.1 per cent were self-employed.It seems that tenant household heads, 58 .2 per cent of whom are immigrants,

PART III CH 19 323
had little chance of gaining employment from the local administration, and had to rely on private firms for employment or establish their own businesses.
Finally, the occupation of 2k0 women* (156 married, 15 divorced, 5^ widowed and 15 single) in the sample population must be briefly discussed.A total of 37 female household heads have already been included in the two previous tables.** Of the remaining 203 females, 119 or 5 8 .6 per cent were housewives with no gainful occupation, *tO or 19-7 per cent practised handicrafts, 2h or 11.8 per cent were in services, 3 engaged in part-time
agriculture and one was a beggar. A total of 1A women or 7*9 per cent had retired from active life and were supported by their next of kin. It is interesting to observe that none of the females interviewed were engaged in full-time trade, although 5 women, 3 embroidered pillow-cases and two who baked bread, also sold their products in the local market.
Income Groups
The following division of households into low, middle and high income categories is based on Table 3*6 on page 101 which guided my classification of the sample households in Zaria and Ibadan. In 1971 the official con-
0 /
version rate was about 1A dirhams to one Nigerian pound.— The converted income groups are given in the table below.
* This does not include single female children of household heads or any other female children under the age of 15-
** Fourteen of these women practised crafts, 7 were in services, 3 each were in part-time agriculture and semi-retired, A were housewives and 2 were beggars.
2/ INTERNATIONAL LABOUR OFFICE Yearbook of Labour Statistics 19?3 Geneva 197^, PP. 762-3

PART III CH 19 324
TABLE 19.4 Income GroupsIncome per Month in Dirhams Income per Year in DirhamsLow Income Households
A. Under 70.0 Under 840.0B. 70 .0 - 139.9 840.0 - 1,679.9
C. 140.0 - 209.9 1,680.0 - 2,519.9Middle Income Households
D. 210.0 - 279.9 2 ,520.0 - 3,359.9E. 280.0 - 419.9 3 ,360.0 - 5,049.9F. 420.0 - 699.9 5 ,050.0 - 8,399.9
High Income HouseholdsG. 700.0 - 1,399.9 8,400.0 - 16,799.9H. 1,400.0 - 2,099.9 16,800.0 - 25,199.9I. 2,100.0 and over 25,200.0 and over
The upper limit of the low income households (C) was found to beDH. 209.9 per month. As this is just above the minimum wage of DH. I9S .85
per month fixed by the Government for an adult unskilled labourer inindustry or commerce, it may serve as a convenient boundary between the low
9/and middle income households.— The minimum wage cited above is based on a 52-hour week, but with serious problems of underemployment some labourers may not reach even the minimum level and will thus receive a lower monthly income. Household heads in the middle income group are mainly skilled workers, teachers, administrative and clerical staff, while those in the high income groups are well-to-do traders, successful craftsmen, high- ranking Government officials and managers of private or public industries. (For more detailed description of the occupational groups in these income categories, see Chapter 5, on page 101).
-2/ SERVICE CENTRAL DES STATISTIQUES, ROYAUME DU MAROC Annuaire Statistique du Maroc 1972 op cit., p. 154

FART III CH 19 325
As explained above, the aim of my budgetary inquiries was to establish the annual cash income of compound heads and that of all other dependent and tenant household heads who lived in the houses surveyed.However, the cash income of women other than female household heads and the cash value of non-monetary transactions such as barter, gifts of agricultural produce or earnings in kind are not included in this account.The incomes and expenditures of household heads were systematically investigated over a period of one year preceding the time of the interview.For purposes of inquiry, income was divided into six major categories; first, income from agriculture; second, from arts and crafts; third, from trade; fourth, from services and professional or clerical occupations; fifth, income from rent and cash gifts; and finally, other financial receipts, including such as unearned incomes. However, before income could be investigated, household heads were asked to give a detailed account of their cash expenditures, a subject on which most were far less reluctant to speak than about their income. In order of importance, the major items of expenditure investigated were: first, expenditure on food ana drink; second, on accommodation; third, on clothing; fourth, on transport, firewood and lighting; fifth, help given to relatives and friends; and finally, miscellaneous expenditures such as outlays for religious and public festivals, childbirth, marriages or funerals. To the amount of regular daily, weekly and monthly cash expenditure were added the reported irregular outlays, and only when this balanced within 10 per cent of the household head's reported cash income was the budget accepted as valid for inclusion in data analysed here. This method worked fairly well particularly for the low and middle
income households where small sums of money are in constant use and relatively few chances for saving and investment exist. However, in the high income households I had to rely to a far greater extent on the household heads'
PART III CH 19 326
willingness to co-operate. It must be stressed yet again that in spite of all precautions taken, it is unlikely that the budgetary data cited below are free from inaccuracies and omissions. Nevertheless they are sufficiently detailed to provide a valuable guide to the levels of cash incomes and expenditures among the household heads interviewed in Marrakech.
Table A.19-3 on page 449 indicates the pattern of household consumption10/and expenditure in urban areas of Morocco.— The table shows clearly that
between 1937 and i960 food and drinks, accommodation, clothing, fuel and lighting accounted for 83 per cent of the household expenditures in the traditional towns in Morocco. Hence particular attention was paid to these four items together with the financial help given to family members and friends. The table also shows that expenditure on food and drinks decreases from 68 per cent of the total in households with incomes of less than DH.1,442 per year to 34.1 per cent in households with over DH. 5*977 per year. Clothing on the other hand increases from 4.1 per cent of the total in the lowest to 9-4 per cent in the highest income group.
With these preliminary explanations, I now examine the income distribution of the 190 household heads interviewed in Marrakech. A total of 6 household heads refused to co-operate in this inquiry, while another 11 gave such grossly misleading information regarding their incomes and expenditures that they had to be excluded from the following analysis. Of the remaining 173 household heads, 95 or 54.9 per cent belonged to the low income group with monthly incomes of DH. 209.9 or lessi 66 or 3^.2 per cent belonged to the middle income group with incomes that ranged between DH. 210.0 and DH. 699*9 per month; and only 12 household heads or 6 .9 per cent belonged to the high income group with incomes exceeding DH. 700.0 per month. (For more detailed information see Table A.19^5 and Table A.19*6 on page 451).
10/— INTERNATIONAL LABOUR OFFICE .Household, Income and Expenditure Statistics 1950-64 Geneva 19^7* pp» 97* ^30

PART III CH 19 327
Table A.19-8 on page 431 gives the income distribution for compound heads, dependent and tenant household heads separately. As expected, compound heads have the highest average monthly income, and only 23 per cent of them fell in the low income group, while 57-8 per cent were in the middle and 17-2 per cent in the high income groups. This pattern is followed broadly by dependent or semi-dependent household heads 36 P^r cent of whom fall in the low income group, and 60 per cent and 4 per cent in the middle and high income groups respectively. By contrast, tenant household heads have an astonishing 83-3 per cent in the low income group, 16-7 per cent in the middle and none in the high income groups.
The income distribution by household size for all households is set out in Table A.19-7 on page 431. This table shows the predominance of small households with 1 to 4 persons in the low income group. However, as the number of persons per household increases, income tends to increase as well. This is clearly illustrated by the diagonal pattern of concentration which holds for households with up to 9 to 10 persons and v/ith incomes of between DH. 210.0 and DH. 699-9 per month. From these points onwards, the few remaining households are scattered so widely that their distribution has uncertain statistical values.
The average per caput income of all households classified according to
their size was for households with 1 to 2 persons DH. 102*3 per month, this decreased to DH. 64.6 for households with 3 to 4 persons, and DH. 43-3 per month for households consisting of between 3 and 6 persons. Thereafter the per caput income for households with 7 to 8 persons increased slightly to DH. 53-3 per month and further to DH. 76.8 per month for households with 9 to 10 persons. A similar upwards movement, which has already been observed in Ibadan, reflects to some extent the higher frequency of these larger households under compound heads who have generally higher incomes.

PART III CH 19 328
On Graph A.19*1 on page 52 the cumulative income distribution of 173 households are plotted on logarithmic probability paper in order to show first, the relationship of incomes between the three types of households cited above, and second, their median income. The almost straight line of the cumulative income distribution curve for all households indicates a log-normal distribution. All three types of households are distinguished by separate curves that show approximately equal percentage change but differing incomes. Hence the curves representing the income distributions of dependent and tenant household heads, who have generally lower incomes, shift leftwards. The median income for compound heads is DH. 3SO.O per month and for dependent and tenant household heads DH. 2^5.0 and DH. 120.0per month respectively. However, it must be remembered that part of thehigher income of compound heads derives from rent and other financial benefits which are associated with compound headship. Some of this money is spent on improvement and repair of the house as well as on help given to other family members in need.
Finally, on page 52 a Lorenz Curve was constructed from the collecteddata and illustrates clearly the considerable inequality in distribution of income among the 173 household heads included in this analysis. With a total of *f6.1 per cent, the 'area of inequality1 is by far the largest calculated so far and shows that about 50 per cent of all households earn only c. 20 per cent of the total recorded average monthly income of about DH. 51*00G.
In conclusion, this analysis has shown that about 55 per cent of all household heads had cash incomes of less than DH. 209.9 per month.Despite the country's minimum wage legislation, a considerable number of small family enterprises are either unwilling or unable to pay their workers a minimum wage, and the high level of unemployment and underemployment, particularly in traditional cities such as Marrakech, keeps

PART III CH '19 3^9
wage demands relatively low. In the two chapters that follow I try to show how household heads with such low incomes can manage to rent, buy, maintain and even improve their houses.

PART III MARRAKECH CHAPTER 20BUILDING MATERIAL AND THE PRODUCTION OE HOUSES 330
In the first part of this chapter I will examine the range cf traditional and modern building materials which are available for the production of houses in Morocco. This is followed by a brief description of the type of construction most frequently found in the medina or wailed city of Marrakech. Finally, I intend to analyse some of my data on the age cf distribution of rooms, structural changes and basic amenities found in the 73 houses which were included in my survey.
MOROCCO: BUILDING MATERIAL AND THE CONSTRUCTION INDUSTRY
According to the 1970 industrial survey, the building materialindustry in Morocco consisted of 61 firms with c. 6,300 employees whoproduced a wide range of building materials having a value of about DH.
1 /233-3 million in 1970.— Over the last 'Ik years the building materialproduction index has risen from 100 in 193& to 139 in 972, which
2/represents an average annual increase of about 6 . A per cent.— During the present Five-Year-Plan, 1973~77i the industry is expected to increase its annual production by more than 10 per cent.—' Morocco has adequate resources of all basic raw materials for the development of its building material industry, with the exception of steel and timber most of which has to be imported. (See Tables A.20.1 and A.20.2 on page 33)-
U BANQUE MAROCAINE DU COMMERCE EXTERIEUR (B.M.C.E.) Bulletin Mensuel d1Informations No. 123 Casablanca 1972, pp. 16-17
& SERVICE CENTRAL DES STATISTIQUES, ROYAUME DU MAROC Annuaire Statisticue du Maroc 19^0-72 Rabat 1961-73
^ B.M.C.E. Bulletin Bimestriel d*Informations No. 128 Casablanca 1973 P-

PART III CH 20 331
Earth and Clay
Locally burned bricks and rammed earth mixed with lime have been usedsince time immemorial for the construction of walls and ramparts in thewalled cities of Morocco, Roof tiles, sanitary porcelain and glass,although widely known in urban areas have only been used in largequantities since the French colonial administration began to cofistructseveral new European township areas soon after 1912.
The production of burned bricks and roof tiles has varied considerablyduring the last decade. For example, in i960 a total of 119,000 metrictons were produced by the country's brick and tile industry. This amountrose steadily to 138,000 tons in 19&3- However, during the followingthree years the production fell to 90,000 tons in 1966, rising again to anall-time high of 180,000 tons in 1972. Production of fire-proof bricks was
if/in the region of 9,000 tons in 1970.— In the same year, the ceramicindustry with 18 firms and about 9&0 workers produced sanitary porcelainand glazed tiles having a total value of DH. 10.9 million and supplied
5/about half the country's needs, the remainder being imported.—
Timber and Wood Products
According to the 1972 Annuaire Statistique du Maroc, the country's forest area was estimated at 5*2 million hectares or 11.3 per cent of the total land area.—^ This forest area includes 2.9 million hectares or 33*8
SERVICE CENTRAL DES STATISTIQUES:, ROYAUME DU MAROC Annuaire Statistique du Maroc 1960-72 op cit., Tables: "Ceramique-Materioux de Construction"
5/— B.M.C.E. Bulletin Mensuel d1Informations No. 123 op cit., pp. 16-17-/ SERVICE CENTRAL DES SIATISTIQUES, ROYAUME DU MAROC Annuaire Statisticue
du Maroc 1972 Rabat 1973, P»
PART III CH 20 332
per cent under broad-leaved trees, 1.5 million hectares or 28 .8 per centunder 'conifers, and 0 .8 million hectares or 15«*+ per cent of mixed
7/secondary growth.— In 1970 Morocco produced about 97*000 cu.m. ofindustrial timber* which represented between 15 and 20 per cent of thecountry's industrial timber consumption, the rest being imported.** Otherinformation reveals that in 1970 agriculture consumed about 253i000 cu.m.or ^3 .1 per cent of the available timber mainly for packing material,followed by the construction industry which used 182,000 cu.m. or 31*0
per cent, other industries and artisans taking 73*000 cu.m. or 12 .per cent,*** the mining industry 60,000 cu.m. or 10.2 per cent and finally
8/other consumers 18,500 cu.m. or 3*2 per cent.— The annual consumption of fire wood over the last decade has remained almost stable around an average of 1 .5 million cu.m. per year.
Cement and Cement Products
Over the last 12 years the annual production of cement in Morocco hasincreased nearly three fold from 5^0 ,000 metric tons in i960 to 1,5^5*000
9/tons in 1972.— Imports of cement were restricted to special kinds of cement, and were estimated at 36,000 tons in 1970 or 2 .3 per cent of the local production. In 1970 Morocco had five cement plants which employed a total of 1,190 persons. In the same year the gross output of the industry reached DH. 117*1 million. The price of cement on the home-market was then in the region of DH. 90.0 per ton.
7 /— B.M.C.E. Bulletin Mensuel d'Informations No. 118 "Le Bois au Maroc" Casablanca 1971 P* 3
* This excludes 160,000 cu.m. of pulp wood** In 1969* the country's imports of wood and wood-based products were
valued at DH. 152-5 million, while its export, consisting mainly of cork and pulp wood, stood at DH. 6^.0 million. B.M.C.E. No.118 p. 10
*** This consisted mainly of high-grade lumber and wood-based panels.^ Ibid. p.-10......................................................9/ UNITED NATIONS The Growth of World Industry 1971 Vol. 2 "Commodity
Production Data 1962-71" New York 1973* P* 3^7

PART III CH 20 333
Associated industries producing concrete blocks, asbestos-cement sheetsand pipes were served by 16 firms. These firms employed a total of 2,830
10/persons and produced goods valued at DH. million in 1970.—
Iron and Steel Consumption
The Moroccan iron and steel producing industry is in its infancy.In 1970 the industry produced about 8,000 metric tons of pig-iron and
11/c. 1,000 tons of crude steel for casting.— ■ However, with the recentrapid expansion of the country's industry, an increasing amount of .imported steel (some 325*000 tons in 1970) is being re-rolled and processedin Morocco. Over the last decade the annual steel consumption of Moroccohas risen from 16^,000 tons or 14.0 kg. per caput in i960 to 33^*000 tons
12/or 22.0 kg. per head in 1970.— For comparison the per caput steel consumption for Nigeria was about 12.0 kg. in 1970. Of Morocco's total steel imports of c. 325*000 tons in 1970, an estimated 110,000 tons or about 35*0 per cent was consumed by various branches of the construction industry.— ^
The Construction Industry
As mentioned above, the construction industry of Morocco plays an important part in the economic development of the country. In 1971 the contribution of construction to Gross Domestic Product (GDP) at i960 factor cost had reached DH. 730 million or 5»1 Per cent of the total. In the same year, the contribution of construction to Gross Fixed Capital Formation
10/— B.M.C.E. Bulletin Mensuel d'Informations No. 123 op cit., pp. 16-17 — '/ UNITED NATIONS Statistical Yearbook 1972 New York 1973* pp. 30^-5
Ibid. Statistical Yearbook 19&3 1972 p. 3&5* P- 3391^/— Ibid. Yearbook of International Trade Statistics 19&9 New York 1971*
p. 579. This figure was estimated from the imports of various steel products mainly used by the construction industry. See also table
. . A«20.2,on page . . . . . . .......................................
PART III CH 20
(GFCF) was in the region of DH. 1,^90 million, divided into public works*with DH. 900 million or jM.b per cent of GFCF and residential and non-residential buildings with DH. 590 million or 22.5 per cent of GFCF.Plant, machinery and equipment accounted for DH. 1,130 million or kj.'lper cent, of GFCF in.1971- (See Tables A. 15*1 and A.15*2 on page ^37 andTables A.15*8 and A.15-9 on page *08). It is a fast growing industry,which, according to the 1971 census report, employed some 171,700 persons?*
i yor b.3 per cent of the country's total active labour-force,— comparedwith only 65,800 persons or 2.2 per cent of the total active labour-force
15/in 1980.— A breakdown of the industry's labour-force into categories of employment revealed that 138,070 persons or 80 .5 per cent were v/age and/or salary earners, 26,230 or 15*3 par cent were self-employed, 3»1o0 or 1.8 per cent were classified as employers, 2,750 or 1.6 per cent were family workers, 250 or 0.1 per cent were apprentices and 1,2^0 or 0.7 per cent were unclassified.
Building Activities
Building activities in Morocco have been estimated from the building permits issued by all the town councils. According to official statistics the issue of building permits for residential and non-residential buildings increased from an estimated 12,300 dwellings with 1.2 million sq.m. in
* This includes civil engineering works as well as land, agricultural and mining development.
** This figure includes also workers employed in the building material industry
— / SECRETARIAT D'ETAT AU PLAN, AU DEVELOPPEMENT REGIONAL ET A LA FORMATION DES CADRES ROYAUME DU MAROC Recensement General de la Population et de 1'Habitat 1971 Vol. 2 Serie "S" "Population Active", Rabat 1972, p. 5^SERVICE CENTRAL DES STATISTIQUES, ROYAUME DU MAROC Resultats du Recensement de i960 Vol. 2 "Population Active" Rabat 1965 P* ^12

PART III CH 20 335
16/1962, to 17,200 dwellings with 2.4 million sq.m. in 1972.— (See TableA.20.3 on page 4^4 ). Between 19&2 and 1972 the authority approved a totalfloor area of 18.9 million sq.m. Of these ’’habitats Marocain" accountedfor 7«3 million sq.m. or 38.8 per cent of the total. This was followed by"immeubles" (apartment buildings) with 5-1 million sq.m. or 27.1 per cent,"villas" and commercial buildings each with 2 .6 million sq.m. or 14.1 percent, administrative buildings with 1.0 million sq.m. or 5«1 per cent, and
17/finally miscellaneous buildings with 0 .3 million sq.m. or 0 .9 per cent.—The number of dwellings approved between 1962 and 1972 reached 143,700
18/and represented about 15 per cent of the country's total urban housing stock.—In spite of increasing Government and private efforts to ease the urban
housing shortage, the population living in Morocco's bidonvilles has19/steadily increased from an estimated 600,000 in 19^5“ to 940,000 or about
21.5 per cent of the total urban population in 1968.20/ By 1971, this figurehad most likely passed the million and was closer to 25 per cent of thetotal urban population. Taking the average size of an urban household in
21/Morocco as about 5 persons,— ■ c. 250,000 dwellings may be needed to re-house the inhabitants of bidonvilles. This estimate substantially exceeds the number of dwellings approved between 19&2 and 1972. However, this indicates only part of the problem the Government and its housing
^SERVICE CENTRAL DES STATISTIQUES, ROYAUME DU MAROC Annuaire Statistique du Maroc 19&2 and 1972 op cit.., pp. 99-105 and pp. 79-84. See also Table A.20.3 on page
H / Ibid. Edition 1962 to 197218/ UNITED NATIONS Statistical Yearbook 1972 op cit., p. 752
NYROP, R.F. et al. Area Handbook for Morocco 1972 Washington 1972, p. 24920/— • B.M.C.E. Bulletin Mensuel d'Informations No. 117 "Le secteur batiment et
travaux publics au Maroc" Casablanca 1971, p* 8UNITED NATIONS Statistical Yearbook 1972 op cit., p. 752

PART III CH 20 336
agencies have to face. As most financial help from official or other sources is directed towards new housing developments mainly outside the v/alled cities, precious little money is left for housing improvements in the already overcrowded medinas which face the grim prospect of a steady decline in housing standards.
MARRAKECH: TYFS OF CONSTRUCTION
The type and method of construction prevalent in the walled city of Marrakech will be discussed briefly below. The majority of extensions, improvements and maintenance work on houses is still carried out by locally trained craftsmen who mainly use indigenous materials and building techniques, except for the increasing use of cement. Such kinds of building activities are normally not recorded in any Government statistics, and its overall volume is unknown. However, as the more modern type of houses built in the former French township areas and more recently in the northern parts of the city were not investigated, they are therefore not included in the following account.
Vails
Most houses within the walled city were built either with locally manufactured burned bricks laid in lime mortar, or with rammed earth. .The latter method, which is still used today, requires description. Following decision to build a house or room, a sufficient quantity of laterite earth is excavated and brought to the building-site. Here the earth is mixed with lime and wet slightly before being rammed into prepared shutters. (See Picture 20.1 on page 337 ). It is then left to dry sufficiently in order to carry the load of the next layer, each layer being on average one metre high. This process is repeated until the wall

PART III CH 20 337
PICTURE 20.1 Construction of Mud Wall
PICTURE 20.2 Underside of Flat Mud Roof Construction
PICTURE 20.3 Underside of Ceiling Constructed of Sawnwood

PART III CH 20 333
has reached its required height. The thickness of both types of walls (brick and rammed earth) may reach naif a metre for a one-storey dwelling and frequently exceeds a metre for a two-storey house. Walls facing the inside of the house are usually rendered with lime, gypsum or cement plaster and whitewashed. In more expensive houses courtyard walls are usually covered with brightly coloured glazed tiles to a height of one and a half metres. Floors are finished with a lime or cement screed and sometimes covered with tiles.
Roof and Ceilings
The traditional Moroccan town house has a flat roof. As mentioned above, rooms are usually long and narrow, their width seldom exceeding 2.5 metres or about 8 feet. A ceiling or a roof is constructed from beams of forest timber which are laid across the top of the wall at intervals of about 0.50 metre or one foot. These beams are covered first with bamboo and then with grass-matting. (See Picture 20.2 on page337 ). The wooden roof structure is then covered with about 0.20 m. of mud and finished with several layers of specially prepared lime mortar which keeps the roof reasonably waterproof for at least one year. The underside of roofs are normally plastered, whitewashed and occasionally painted. A more elaborate and expensive roof made from sawnwood can be seen in Picture 20.3 on page 337 • However, the last example can only be found in the: more expensive houses of the relatively prosperous.
The Local Building Industry
As no detailed data for the 197*1 census is yet available, the only information regarding the local building industry in Marrakech dates back to the i960 census report. According to this report, an estimated 2,700 persons or 3*6 per cent of the active labour-force were engaged in the

PART III CH 20 339
industry. Of these, 95*1 per cent were Moroccan Muslims, 1.9 per centFrench, 1.5 per cent Moroccan Jews and 1.5 per cent belonged to various
22/other nationalities.— In the late 1960's it was estimated that the number of persons employed by the building industry had nearly doubled due to the construction of a new suburb in the northern parts of the city.
SAMPLE SURVEY
Data from the sample survey analysed below include the age distribution of rooms, the structural changes of houses over the five-year period from February 196^ to January 19^9» the distribution of such amenities askitchens, lavatories, electricity and piped water in the houses under investigation.
Age Composition of Rooms
The inquiry into the age distribution of rooms was only partly successful. Despite much effort, I could only establish the age of 79 rooms or 10.2 per cent of the total number of rooms in the 73 houses surveyed. To account for the apparent lack of knowledge among compound heads regarding the age of their houses, we have to go back to Table A.16.1 on page 39. That table shows that a total of houses or A 5 .3
per cent of the sample were bought by their present inhabitants. Of the 1*t inherited houses in the sample, another 10 were purchased by their previous owners, and the history of the remaining four was uncertain.All 6 houses listed under 'others' were also bought by their present owners. The remaining 15 houses were rented by occupants who had no knowledge of their age.* On this information, it seems likely that most
— ^ SERVICE CENTRAL DES STATISTIQUES, ROYAUME DU MAROC Resultats du Recensement de i960 Vol. 2 op cit., pp. 300, 3 ^
* I did not interview the owners of these houses.

PART III CH 20 3*+0
of the houses studied had changed hands several times over the last >0 years or so, thus making it virtually impossible to establish their age with reasonable accuracy. However, existing historic records indicate that about 63 per cent of all houses included in my survey were built before 1920, and that nearly 27 per cent were over 100 years old. A total of 6 houses (8 per cent of the sample), having 50 rooms, were constructed by their present compound heads, while another 7 houses v/ere found to which their compound heads had added 29 rooms. The age of these 79 rooms ranged between 1 and 30 years.
Structural Changes of Houses
The 75 courtyard houses surveyed contained 776 rooms with a total area of 8,326 sq.m. Between February 196*+ and January 1969, when my survey in Marrakech was concluded, only 19 rooms with a total area of 22*+.*+ sq.m. were built by 12 compound heads. Over the five-year period no rooms were destroyed or disintegrated, thus the increase was 19 rooms or 2.5 per cent which yielded an average growth rate of about 0.6 per cent per annum.*(See Table A.20.*+ on page *+55)* This very slow growth rate reflects the fact that the extension of houses in the tightly packed medina is partly restricted by the lack of space, partly by the structural limitations of existing mud walls, and by lack of adequate financial help, a subject we shall discuss in some detail in the next chapter. Moreover, this minimal increase confirms that major housing developments during the last two decades (1950-70) have taken place in areas beyond the twelfth century city wall, particularly in the suburbs of Sidi Youssef b. Ali and Cite Mohammedia. (For their location see Plan 17*1 on page 277). About three
* The population of the medina grew from 180,000 in 195^ to 208,000 in 197^• This represents an average annual increase of 0.7 per cent over the last 20 years.

PART III CH 20
quarters of the 19 rooms built between 1964 and 19&9 were constructed from locally manufactured burned bricks, the rest were built with cement blocks.
Amenities
The existence of basic amenities in the houses surveyed will be examined below. Kitchens were found in 73 houses that accommodated 150 households. Of these, 42 households, mostly those of the compound heads had their own private kitchens, ivhile the remaining 108 households shared bb kitchens, yielding an average of one kitchen to 2,4 households. The remaining 40 households or 21 per cent who lived in the two biggest tenement houses surveyed had no kitchen at all and cooked their meals on verandahs or other covered places in front of their rooms.
A total of only 11 bathrooms shared by 20 households was counted in 9 houses. Members of the remaining 170 households or 89 .5 per cent in 66 houses used either the toilet, the courtyard or their rooms for personal washing.
All houses surveyed had at least one toilet. A total of 92 households, mainly the households of compound heads, had their own private toilet, while 98 households had to share a toilet with other people. The worst situation was found in the two tenement houses where 16 households with 67 persons and 24 households with 69 persons respectively had to share, two tiny toilets, one in each house. (See Plan 18.3 on page 290).
Electricity had been installed in 69 houses; but of the 175 households living in these houses, only 131 had at least one electric bulb in their
rooms, while 59 households or 31 cent of the total had no electricity supply at all.
PART III CH 20 3k2
Finally, 37 houses containing 72 households had piped water in their courtyards, kitchens or toilets, whereas 118 households or 62.1 per cent in J>8 houses used a public stand-pipe in one of the streets nearby.
In short, 21 per cent of all households surveyed had no kitchen at all, 31 per cent had no electric light, 62.1 per cent had to fetch water from public stand-pipes, and 89.5 per cent of all households, had no bathrooms of their own. (For official statistics see Table A.20.3 on page 433
In spite of such lack of basic amenities most compound heads had other problems to worry about. When asked: ”What improvement do you think the house most needs?’1, a total of 18 compound heads or 2k per cent replied spontaneously that the repair of leaking roofs and damage done by rain water to ceilings and walls was most urgently needed. There were also constant complaints about rising damp in walls due to the lack of any damp course. Connected with this problem were the answers of 5 compound heads or 6 .7 per cent who felt that a proper drainage system in the courtyard connecting their pit-latrines to the municipal sewage system would help to get rid of the damp in the house. Thus nearly one third of the compound heads interviewed were seriously concerned about leaking roofs and* damp conditions in their houses. As my survey was carried out in winter, this indicates a serious recurrent problem, particularly common in traditional urban houses.
In reply to this question, another 15 compound heads or 20 per cent said they needed more living and sleeping rooms for their families. Another
4 compound heads or 3»3 per cent wanted to sell their houses to buy larger ones, while 2 or 2.7 per cent thought it would be better to demolish the house and build a new and bigger one on the site. Thus 21 compound heads or 28 per cent needed more rooms, though their approaches to this objective varied greatly.

PART III CH 20
A third group of 12 compound heads or 16 per cent wanted to improve
their houses either by decorating the courtyards and rooms with glazed
tiles or by plastering and painting the whole or part of the house.
The need for piped water in the house was felt by 7 compound heads or
9*3 per cent, while another 7 compound heads made various other suggestions,
including two who said they needed a bathroom. Of the remaining 9 compound heads k were satisfied, while one did not respond. (For more detailed
information see Table A.20.6 on page *+55).
Due to pagination error, page is omitted.

PART III MARRAKECH CHAPTER 21 COST OF CONSTRUCTION AND THE FINANCING OF PRIVATE HOUSES 3A5
The aim of this chapter is to analyse the costs of building and the financing of modern and traditional private houses in Morocco and Marrakech. The chapter, which is divided into two parts, deals in the first with the costs of construction and the most important institutions which finance and/or build modern houses in the urban areas of Morocco, while the second part concentrates on data obtained from my survey of 79 conventional urban houses in the walled city or medina of Marrakech.
MOROCCO: GENERAL LEVEL OF HOUSE-BUILDING COST
As expected, the cost of construction in Morocco varies widely and depends not only on the location of the building, the type of materials and the technique of construction used, but also on the complexity of the design and on the status of the client. While some information regarding the construction costs of Government-built modern houses is available, the costs of privately built conventional houses, and particularly for those in the walled cities, have never been systematically collected.
In the late 19^0's the construction costs of one-storey houses builtby the Government varied between DH. 200.0 and DH. 400.0 per sq.m., whileapartment buildings (immeubles) ranged from DH. 600.0 per sq.m. for anaverage dwelling to as much as DH. 900.0 per sq.m. for a luxury flat.Villas on the other hand ranged from DH. 490.0 per sq.m. to over DH.1,000.0 per sq.m., depending on the design and the use of expensive
1/imported building materials.—'In the early 1960's about 2,000 one-storey houses measuring 6 x 8 m.
(48.0 sq.m.) were built by the Ministere des Travaux Public in the northern .
U BANQUE MAROCAINE DU COMMERCE EXTERIEUR (B.M.C.E.) Bulletin Mensuel d 1Informations No. 117 "Le secteur batiment et travaux publics au Maroc" Casablanca 1971 p- 21

PART III CH 21 3^6
parts of Marrakech. These houses consisted of one room (13»0 sq.m.), a toilet (1.0 sq.m.) and an enclosed courtyard. There were provisions for one additional room (16.2 sq.m.) to be added later on demand.(See Plan 21.1 on page ). These houses were constructed with a prefabricated concrete frame filled v/ith cement blocks. The roofs were assembled from pre-fabricated concrete elements. The internal walls were rendered with cement plaster while floors had a cement finish. All doors and the glazed window frames were made from sawnwood. Each house was connected to the municipal sewage system and had piped water as well as electricity. The total cost of these houses was around DH. 3*000 or aboutDH. 210 per sq.m. of floor area, and they were rented at a very modest
2/sum of DH. 13-0 per month.—A breakdown of cost by element of building revealed that the structure
of these houses consisting of foundations, walls and the roof accounted for about 55 per cent of the total cost, sanitary and electrical installations for 15 per cent, doors and windows for c. 8 per cent and finishes for 22 per cent. A breakdown of cost by element of cost showed that roughly 60 per cent were spent on materials, 30 per cent on labour and slightly less than 10 per cent on overheads including the architect's fee
The Financing of Modern Houses
As already mentioned in Chapter 7 on page 126 * the financing of modern houses derive from two broad sources. First, the public sector including all direct and indirect Government actions to provide or finance housing; and second, the private sector. However, it must be
2/ >- MINISTERE DES TRAVAUX PUBLICS CIRCONSCRIPriON DE L'UREANISME ET DE L'HABITAT, ARRONDISSEMENT T.P. MARRAKECH Marrakech Resorption des Bidonvilles Promotion Nationale Marrakech 1$b*t, unpublished report P. 33

PART III CH 21 347
stressed that the financing of modern houses is not directly comparable with the financing of traditional buildings discussed in the second part of this chapter. This is partly due to the reluctance of the Government and its various housing agencies to get involved in the construction and improvement of traditional urban houses. Nevertheless it may be useful to mention at least some of the most important institutions which help to finance modern houses in Morocco.
The State
According to the Annuaire Statistique du Maroc, the estimated contribution of the public and private sectors to the financing of housing during the ten years from 19o2-72 was as follows.
TABLE 21.1 The Financing of Buildings from 1962-72^/'Sectors Million DH. Per CentPrivate SectorPrivate Capital 2,879-2 74-9Private Societies 513-8 13-4Sub-total Private Sector 3,395-0 88.3
Public SectorService de 1'Habitat 6 0 .5 1 .6
Other Administrations 314.9 8 .2
Mixed Societies* 30.4 00•0
Others 43.2 1.1
Sub-total Public Sector** 449-0 11.7Grand Total 3,844.0 100.0
* Societies with Government participation** This sum includes an unknown amount of private money
SERVICE CENTRAL DES STATISTIOUES, ROYAUME DU MAROC Annuaire Statistique du Maroc 1962-72 op cit. These figures are based on authorized building construction and give only a very rough indication of the expenditure on buildings.
PARI' III CH 21 348
While the table above does not provide a clear-cut division between the public and private sector, it indicates the overwhelming predominance of the private sector in housing finance. However, it shouldL.be noted that the involvement of the state in all levels of housing finance is far more important than appears at first sight, since various loans, mortgages and grants listed as private capital in the table are partly Governmental in origin. It has been estimated that the Government's financial contribution was most likely between 15 and 20 per cent of the total investment in housing during the ten-year period from 19&2-72.
Under the present Five-Year Plan from 1973“7 the Government intends to construct 262,000 urban dwellings at an estimated cost of DH. 1,125 million. The Government's budgetary contribution to this programme will be in 'the region of DH. 327 million or about 29 per cent of the total cost. This represents a substantial increase of Government help for the housing sector and stems from the realization that far too little has been done in the past to ease the urban housing shortage.
The following table outlines the Government's financial help to the housing sector during the present Five-Year-Plan.
The table reveals that the Government's contribution increases sharply from 4.7 per cent of the total investment for houses built by persons with incomes above DH. 350 per month, to 20 per cent for persons with incomes between DH. 175-0 and DH. 350.0 per month, 63.9 per cent'for persons earning between DH. 80.0 and DH. 175-0 per month, and finally to66.7 per cent for persons receiving less than DH. 80.0 per month. As members of this last income group clearly cannot afford to build their own houses, the Government, through the Ministbre des Travaux Publics, has been building on average between 2,000 and 2,500 dwellings per year for them. The majority of these dwellings are situated in urban areas of the country and are available for rental at about 6 per cent of their cost.
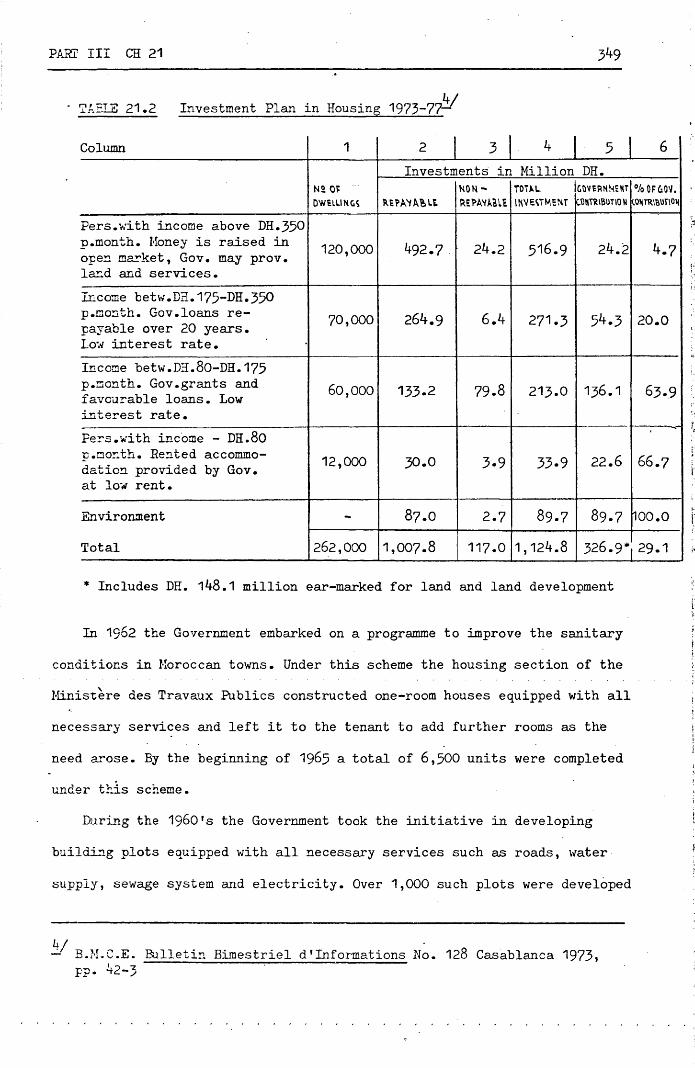
PART III CH 21 349
4/TArlE 21.2 Investment Plan in Housing 1973~77
Column 1 2 3 | 4 | 3 | 6
OFDWELLINGS
Investments in Million DH.R E P A 'f
U O N -REPAVttlE
TOTAL.INVESTM ENT
GOVERNMENTCONTRIBUTION
% OF 60V .tONTR'.BUnON
Pers.with income above DH.330 p.month. Money is raised in open market, Gov. may prov. land and services.
120,000 *+92.7 24.2 316.9 24.2 4.7
Income betw.DH.173~DH.350 p.month. Gov.loans repayable over 20 years.Low interest rate.
70,000 264.9 6.4 271.3 54.3 20.0
Income betw.DH.80-DH.173 p.month. Gov.grants and favourable loans. Low interest rate.
60,000 133-2 79.8 213.0 136.1 63.9
Pers.with income - DH.80 p.month. Rented accommodation provided by Gov. at low rent.
12,000 30.0 3.9 33.9 22.6 66.7
EnvironmentTotal
- 87 .0 2.7 89.7 89.7 100.0262,000 1,007.8 117.0 1,124.8 326.9* 29.1
* Includes DH. 148.1 million ear-marked for land and land development
In 1562 the Government embarked on a programme to improve the sanitary conditions in Moroccan towns. Under this scheme the housing section of the Ministere des Travaux Publics constructed one-room houses equipped with all necessary services and left it to the tenant to add further rooms as the need arose. By the beginning of 1963 a total of 6,500 units were completed under this scheme.
During the 1960's the Government took the initiative in developing building plots equipped with all necessary services such as roads, water supply, sewage system and electricity. Over 1,000 such plots were developed
4/— B.M.C.E. Bulletin Bimestriel d 1 Informations No. 128 Casablanca 1973* pp. 42-3

PART III CH 21 350
and leased or sold at modest prices to individuals and housing societies during 1966 and 19&7 alone.
Other Housing Agencies
The financial contribution of various private and semi-private building societies (Societes immobilieres), housing corporation and co-operative societies over the last 10 years v;as in the region of DH.550*0 million or about 15 per cent of the total investment in the housing sector. Unfortunately I did not carry out a detailed study of their contribution to the housing sector.
Banking
As we have seen, the Government either finances housing directlythrough the Ministere des Travaux Publics, or indirectly through variousbanking institutions which advance loans and mortgages to industry,commerce, building societies and to private house-builders.*
One of the most important Government-sponsored credit schemes for theprivate and public housing sector alike is the "Credit Immobilier etHotelier" (C.I.H.). Under this programme, the bank finances between 60 and75 per cent of the estimated construction cost, by loans repayable within10 years at an annual interest rate of 8.75 per cent. In 1970, of 494mortgage applications for a total of DH. 46.6 million were registered, anincrease of 45 per cent on the previous year, 442 mortgages were approvedand a total sum of DH. 36.9 million paid to the applicants. An estimated70 per cent of these mortgages were used to construct houses that cost
5/less than DH. 150,000.—
* The Caisse de Depot et de Gestion, Credit Immobilier et Hotelier and the Caisse Marocaine des Marches finance the bulk of the housing construction in the country.
5/— B.M.C.E. Bulletin Mensuel d*Informations No. 117 op cit., p. 11

PART III CH 21 351
The Banque Populaire, with the help of the Government, advancedmortgages for persons with incomes not exceeding DH. 1,000.0 per month.These mortgages cover between 80 and 90 per cent of the constructioncosts and are repayable within 15 years at a modest interest rate ofk per cent per annum. In 1970, the bank advanced a total sum of DH.20.*+ million to finance private houses. Until December 1970 the bankhad raised DH. 296.0 million for loans and mortgages and had financed
6 /the construction of some 11,710 dwellings.—
Insurance
The first modern insurance companies in Morocco were established by the French soon after the occupation of 1912. After independence in 1956, an effort by the Ministry of Finance to consolidate the insurance business brought the number of companies down from 191 (17 Moroccan, 17*+ foreign) with a total premium income of DH. 187*2 million in 1962, to 28 companies (12 Moroccan, 16 foreign) with a total premium income of DH. 389*3 million in 1972.2/
With their substantial reserves, insurance companies could play an important role in the development of the public and private housing sector. Alas, detailed information shows that of their technical reserves* which amounted to DH. 153*1 million in 1967i about DH. 8 .5 million or 5*6 per cent were invested in buildings and these were mainly office buildings, while only DH. 0.*+ million or 0.3 per cent had been loaned on first mortgages for house-buyers. The remaining DH. 1*+*+.2 million were invested in state loans,
—2 B.M.C.E. Bulletin Mensuel d*Informations No. 117 op cit., p. 11 7/ SERVICE CENTRAL DES STATISTIQUES, ROYAUME DU MAROC Annuaire Statistique
du Maroc 1962 & 1972 p. 181 and p. 136
* The capital of insurance companies derives from three sources: first, the capital and initial operating funds of all exploitations, second liquid reserves and profits, and third, reserves necessary to meet their obligations towards the assured and the beneficiaries of their policies called technical reserves.. Of these latter reserves, about 50 per cent must be invested in Government-guaranteed securities while the rest may be invested in mortgages and other loans. ___

PART III CH 21
treasury and development bonds, other loans guaranteed by the Governmentand some shares. (See Table A.21.1 on page *+57).
Of the total accumulated assets of the 28 insurance companies whichamounted to DH. 660.0 million in December 1967? roughly 60 per cent weretied up in domestic loans, 20 per cent were held in cash and bank accounts,
8/17 per cent were invested in buildings and 3 per cent in quoted shares.—
MARRAKECH: SAMPLE SURVEY
In the second part of this chapter I shall discuss some aspects of the expenditure on and the financing of conventional urban houses in Marrakech. The analysis is based on my survey of 75 houses in that city. The period over which the costs of construction and improvements were studied extended for five years from the beginning of February 196*+ to the end of January 1969; whereas my study on maintenance and repair costs was limited to the three years immediately preceding the date of the interview. However, before going into these matters, the cost of building materials and labour must be briefly discussed.
• The Cost of Material and Labour
Over the five-year period from 196*+ to 1968 the index of costs of building material in Morocco rose from 1*+3 to 168* or about *+.1 per cent per annum. A number of basic building materials such as cement and steel bars did not increase during the period under study, and the price of burned bricks actually fell from DH. 160.0 per thousand in 196*+ to DH.150.0 in 1968. On the other hand, the cost of plaster increased from DH.65.0 per ton to DH. 70.0, and the cost of cedar* wood also rose from DH.350.0
8 /— B.M.C.E. Bulletin Mensuel d*Informations No. 93 Casablanca 1969? PP» 7~8* 100 = 1958

PART' III CH 21 353
9 /per cu.m. to DH. 361.0 per cu.m.— In Marrakech the price of timber beams normally used for the construction of ceilings and roofs fluctuated between DH. 1.5 and DH. 2.0 per beam, depending on the quality and length.
In 1968, daily wages paid to building workers ranged from DH. 5*0 for unskilled labourers to DH. 10.0 and more for skilled builders. Usually, labourers and some builders v/ere paid daily, while the client provided all necessary building materials.
The Cost of Building
As shown in the following list, expenditures on building made by the compound heads and other household heads in my sample, covers a wide range of activities and have been divided into five major groups.
Cost of Construction completed between 1964 and 1969?cost of buildings still under construction on January 31st 1969;cost of improvements;cost of maintenance and repair; andcost of such miscellaneous construction as wells and pit-latrines.Table 21.3 on page 354 shows that of about DH. 94,300 the adjusted
total expenditure on buildings by these men, 41.7 per cent was spent on improvements of existing buildings, 24.8 per cent on maintenance and repair, 24.7 per cent on new construction, and 8.8 per cent on buildings still under construction at the time of interview.
Cost of Construction
During the five-year period from 1964-9 only 19 rooms having a total floor area of 224.4 sq.m. were built in 7 out of 75 houses surveyed.(See Table A.21.2 on page 437). The recorded cost of construction for
9/- SERVICE CENTRAL DES STATISTIQUES, ROYAUME DU MAROC Annualre Statistioue du.Maroc 1964-1968 op cit., Table ’’Indices de la Production Induszrielle”

PART III CH 21 35^
TABIE 21.3 Cost of Construction in 75 Surveyed Houses 1964-1969
Column 1 2 3 4 5 'Ho. of Rooms s q • m *
Cost in DH.
Cost per sq.m# Per cent
lev Construction (Completed) Living area, Common and Commercial roomsBasic Ancillary Facilities Sub-Total
172
2 1 7 .3
7 .1
22,755567
104.7
24.719 2 24 .4 23 ,322
Improvements on Existing BuildingsVails and Floor Tiles (Glazed) Cement Plaster on Vails Piped Water Installed Link with Kun. Sewage System Cement Screed on Floors Electricity Installed Other Structural Improvements Sub-Total
13,0054,0112,7852,7552,4591,443
12,82041.739,278
Maintenance and RepairRepair on RoofsPaintingRepair on VailsRepair on Cement PlasterRepair on Boors and WindowsOther RepairsSub-Total (1964-69» Actual) Sub-Total Adjusted 1964-69+
For I)etailes £see Table 21.4 on page
2 4 .8
14,05023,417
Buildings under Construction Valise completed Roof Completed Sub-Total
24
34.287.1
8007,450
23.485.5
8.86 121.3 8,250Miscellaneous Construction
Grand Total
— — — —
94,267 100.0
IL iSDSL x 5 = 23,£17 Dirhams

PART III CH 21 355
these rooms was about DH. 23,300 or 24.7 per cent of the total expenditure on buildings. The average cost per sq.m. is DH. 104.7 for 17 comparable living, sleeping and commercially used rooms having a total floor area of 217-3 sq.m. None of the houses surveyed had been built entirely during the period under study, and only two had major extension added to them.*In the remaining 5 houses only a few rooms - not more than two at a time - were built between 1964-9- Given this small number of new rooms, as well as the different mode of constructing these rooms,** no attempt was made to calculate the cost by element of building, nor the cost by element of cost. Tentative comparison of my data with those for houses built by the Minist&re des Travaux Publics in the northern parts of the city, indicate that the Government-built houses were on average about twice as expensive as those under investigation.
Only 6 rooms with a total area of 121.3 sq.m. were under construction at the time of interview. The 4 compound heads who had undertaken these constructions paid DH. 8,250 which represents 8.8 per cent of the total expenditure on buildings.
• Cost of Improvements
The cost of improvements which covers inter alia the installation ofpiped water and electricity supply as well as the tiling and cementing ofwalls and floors amounted to DH. 39,300 or 41.7 per cent and was the mostimportant item of expenditure. Compared with expenditures on improvements in Zaria and Ibadan, only in the Marrakech sample does the cost of improvements surpass expenditures on new construction. This may be explained
* By ^major’, I mean extensions of more than 50 per cent of the original floor area
** Two rooms were built by one compound head who was also a builder, 6 rooms by the brother of a compound head, and the rest were either constructed with the help of relatives ’or by local craftsmen.

PART III CH 21 356
partly by the lack of space at Marrakech and partly by the mode of existing construction in the tightly packed medina which often makes it impossible to extend a house.* Eence too, the frequent sale of old houses in order to buy more suitable ones. The nev/ly bought houses are then improved according to the compound heads' financial ability.
More detailed data on these improvement expenditures reveal that DH. 13,000 or 33-1 per cent of the total was spent on glazed tiles,DH. 4,100 or 10.2 per cent on the rendering of walls with cement plaster,7*1 and 7 per cent respectively for the installation of piped water and sewage channels, 6.3 per cent on new cement screeds in rooms and courtyards,3.7 per cent on electricity supplies, and finally DH. 12,800 or 32.6 per cent on various other structural improvements.
Cost of Maintenance and Renair-- — - — - - a
At DH. 23,400 the costs of maintenance and repair was 24.8 per cent of the total building expenditure, and its second largest item. However, the cost of maintenance and repair was only collected for a three-year period preceding the date of the interview. This time-limit was necessary as most compound heads could not remember accurately their expenditures on this head beyond the three-year period. Nevertheless, the detailed annual data collected on this topic shows clearly the recurrent tendency of this kind of expenditure, and enabled me to adjust the costs of maintenance and repair to cover the five-year period of study. Nonetheless, it must be borne in mind that the costs for this item is rather difficult to check; and in doing so I accepted the compound head's statement on these counts after comparing his annual expenditure for each item with those of others. Any apparent discrepancy was discussed with the informant and corrected as necessary.
* Old mud walls are often not designed to carry the load of another floor.

PART III CH 21 357
For more detailed analysis I have broken down the total actual maintenance cost of DH. 14,000 into 6 categories as shown in the following table.
TABLE 21.4 Actual Maintenance Cost by Element of Building 1966-9
Element of Building Dirhams Per CentRepair to Roof 4,434 31.5Painting and Whitewash 3,596 25.6
Repair to Walls 3,075 21.9Repair to Cement Plaster and Screed 1,993 14.2Repair to Doors and Windows 615 4.4Miscellaneous Repairs 337 2.4Total 14,030 100.0
The table shows that repairs on the roof absorbed nearly one third of the total maintenance cost, followed by painting and/or whitewash with 25*6 per cent, repairs to walls, 21.9 per cent, and cement screeds and plaster, 14.2 per cent, while outlays for repairs to doors and windows and for miscellaneous items was 4.4 and 2.4 per cent respectively. It is of interest, that maintenance work on roofs was carried out most frequently and usually involved only relatively small sums of money. However, if neglected for any length of time, the roof structure tends to deteriorate quickly and its replacement is usually expensive. Damage to walls including the plaster was in the majority of cases caused by rising damp and leaking roofs which occurs periodically during the winter months.
The Financing of Private Houses
The financing of private houses has been divided into two sections: first, finance for the purchase of old houses; and second, finance for the various building activities described above.

PART III CH 21 358
The Purchase of Houses
During the five years from 1964-9 13 houses or 17-3 per cent of the sample were bought by their present owners. In value, these houses ranged from DH. 3»^50 for a one-storey house of 4 rooms to DH. 32,000 for a two- storey house with 14 rooms. How, one may ask, was the money raised to pay for these houses? Seven compound heads raised the money by selling an old house. However, 3 of these compound heads had to borrow additional money from close relatives to pay for the bigger and more expensive house.Another 3 compound heads sold some animals and received financial help from relatives; 2 compound heads saved for 5 to 8 years before purchasing the house; and one compound head refused to reply to this question. It is of interest that all the compound heads who required additional funds to meet the cost of the new house turned for such help to their next of kin. The only compound head who received a Government grant of DH. 2,500 towards building cost* used about half of it to purchase a house for DH. 7*000.0, while spending the rest on various improvements. (See Table A.21.3 on page 457 ).
Financing of Building Activities
On the previous pages I have examined in some detail the type and cost of various building activities carried out in 75 houses surveyed. I now wish to show how these building activities were financed by the compound heads concerned. As indicated at the beginning of this chapter, the two main sources of funds for housing are personal and institutional.
* The compound head is a teacher in primary education with a monthly income of DH. 530.0
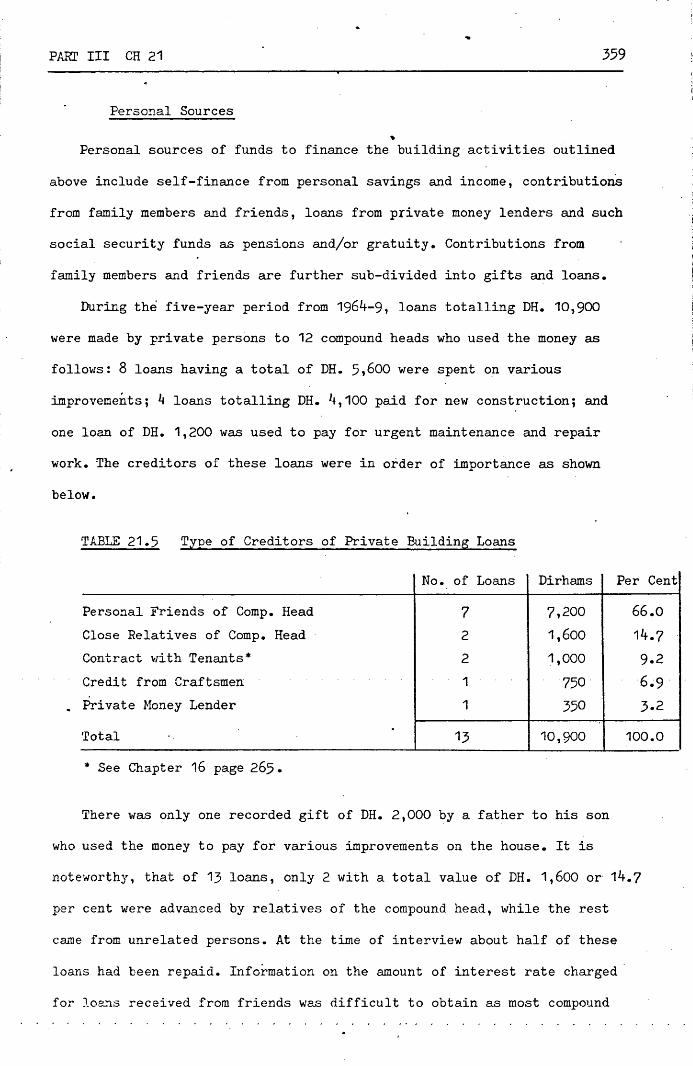
I PART III CH 21 ' 359
|Personal Sources
%Personal sources of funds to finance the building activities outlined
above include self-finance from personal savings and income, contributions from family members and friends, loans from private money lenders and such social security funds as pensions and/or gratuity. Contributions from family members and friends are further sub-divided into gifts and loans.
During the five-year period from 196*t-9, loans totalling DH. 10,900 were made by private persons to 12 compound heads who used the money sis follows: 8 loans having a total of DH. 5*600 were spent on various improvements; k loans totalling DH. *+,100 paid for new construction; and one loan of DH. 1,200 was used to pay for urgent maintenance and repair work. The creditors of these loans were in order of importance as shown below.
TABLE 21.9 Type of Creditors of Private Building Loans
No. of Loans Dirhams Per CentPersonal Friends of Comp. Head 7 7,200 66.0Close Relatives of Comp. Head 2 1,600 1*t.7Contract with Tenants* 2 1,000 9.2Credit from Craftsmen 750 6.9Private Money Lender 1 350 3-2Total 13 10,900 100.0
* See Chapter 16 page 2 6 5*
There was only one recorded gift of DH. 2,000 by a father to his son who used the money to pay for various improvements on the house. It is noteworthy, that of 13 loans, only 2 with a total value of DH. 1,600 or 1*+.7 per cent were advanced by relatives of the compound head, while the rest came from unrelated persons. At the time of interview about half of these loans had been repaid. Information on the amount of interest rate charged for loans received from friends was difficult to obtain as most compound

PARI III CH 21 360
heads were rather evasive on this point. However, interest rates charged by private money lenders are known to be high, between 30 and 50 per cent per annum; but the compound head who had received such a loan refused to comment.
The 13 loans listed above covered about 17.6 per cent of the total costs for new construction, 1^.3 per cent of the expenditure on improvements and 5* 1 per cent on the outlays for maintenance and repair. The rest of these expenditures, amounting to DH. 83,370 or about 88 per cent, was met either from the compound headsf personal savings and income, by gifts from
close relatives some DH. 2,000 and from institutional sources discussed below.
Institutional Sources
Institutional sources of funds for housing include all building loans and grants made directly by the Government through its Ministere des Travaux Publics or indirectly through the various Government-sponsored agencies, the banks and/or state-owned industries to their employees.
From 196^ to 1969 two compound heads received building loans from institutional sources totalling DH. 5,000. These loans were used for the following building activities: one loan of DH. 2,000 was for the construction of two additional rooms, another of DH. 3tO(X) for the improvement of an existing building. The creditors of these loans were in order of importance:
TABLE 21.6 Type of Creditors of Institutional Building LoansNo. of Loans DH. Years Interest
RateElectricity Board to Employee 1 3,000 5 3-0Food Prod. Industry to Employee 1 2 ,000 k 3.0Total 2 3,000

PART III CH 21 361
One Government grant of DH. 2,500 was given to a primary school teacher who used about half of it to purchase a house and the other half for housing improvements. These two loans together with the above mentioned grant covered about 8.6 per cent of the total expenditure on new construction and 10.8 per cent of the money was spent on improvements.
In short, between 196^ and 19^9? a total of c. DH. 9^1300 was spent by 75 compound heads on new construction, improvements and maintenance of their houses. Slightly less than 80 per cent of this money came from the personal savings and income of the compound heads. Nearly 1*f per cent came from loans and gifts made by family members, friends and one money-lender, while the rest, or 6 per cent, came from official loans and grants.(For more detailed information see Table A.2 1 . on page 58 ). It is noteworthy that official loans and mortgages for the purchase of ’second hand houses’ were conspicuously absent in my survey.
Internal Subsidy and Investment
Thus fair we have examined the financial help given by official agencies and private persons living outside the houses surveyed to assist compound heads either to build additional rooms or to improve and maintain their houses. In the following pages I discuss internal subsidies and investment, by which I mean funds used to provide new or improved rooms either for close relatives who live inside the houses surveyed or for tenants. As internail subsidy, I include help given by the compound head to his newly- married son or daughter or to any other married, divorced or widowed family member in need of shelter, while expenditures on new or improved rooms for renting are listed as investment.
Under these terms, of the 19 rooms built between 196^ and 19^9 one waus fully subsidized and given to his son by a compound head, while another

PART III CH 21 362
room was rented to a tenant family. The' following diagram illustrates the main characteristics of internal subsidy and investment on new construction made by these two compound heads during the last five years from 196^-9-
DIAGRAM 21.1 Distribution of Internal Subsidy and Investment
Internal Subsidy Investment1 CH's unmarried 1 Tenant FamilySon 3---1 — ( Compound)— — 1 —
V Heads J
1 = Number of Rooms----------------^ Fully Subsidized-------------------Partly Subsidized
As shown in the diagram one room costing DH. 1,^70 was fully financed by the compound head and given to his son who was expecting to marry, while a second room costing about DH. 900 was rented to a tenant family after completion.
Improvements to k rooms that cost about DH. 850 were carried out by two compound heads. Two of these rooms were given to the compound head's daughter and her family, while the other two were rented to a stranger's family.
To conclude, in the first part of this chapter it was shown that private capital dominated the modern housing sector in Morocco. The Government through its Ministere des Travaux Publics and other agencies has contributed an estimated 15 to 20 per cent of all housing investments in the form of loans, mortgages and grants over the last 10 years from 1962 to 1972. During the present Five-Year Plan, the Government has undertaken to increase its contribution to nearly JO per cent. This increase
-- is designed to benefit particularly the middle and low income groups in the country. Private and semi-private building societies and corporations have

PART III CH 21 363
contibuted about 15 per cent to the housing sector, while the rest came either from personal incomes and savings of compound heads or from loans made by private persons and commercial banks.
My survey of 75 traditional houses in the walled city of Marrakech has revealed that of the total of DH. 9^300 spent on new construction, improvements and maintenance during a period of five years, DH. 6,250 or 6.6 per cent was in the form of Government loans and grants, DH. 12,900 or 13-7 per cent in the form of private loans and gifts, while the rest, amounting to 79*7 per cent, derived from private savings and incbmes of the compound heads concerned. During the five-year period under study, only 19 rooms were built by 7 compound heads in the sample. Preliminary data indicate that the cost of construction for these rooms was in the region of DH. 105.0 per sq.m., which is about one half the costs of the modern "low cost houses" built by the Ministere des Travaux Publics in the northern parts of the city.

CHAPTER 22 COMPARISON AND CONCLUSION 36A
In preceding chapters I have analysed the survey data collected at Zaria, Ibadan and Marrakech independently. In this chapter I intend first to compare some of my data collected in these towns and second to summarize the conclusion that emerged from this research.
We may recall that the aim of this study was to investigate traditional, urban housing in three different pre-industrial Muslim African cultures, and to determine the relationship between the size and composition of co-residential kinship groups and the type and lay-out of houses. It was also intended to find out how these houses were built, maintained, transferred and financed.
Economic Condition: Nigeria/Morocco
At least three quarters of the population in Nigeria and about half of that in Morocco work on the land. In Nigeria, agriculture accounts for about 50 per cent of Gross Domestic Product (GDP). Until 1968 agricultural
produce generated more than half of the country's overseas export earnings followed by crude petroleum, metal ore and timber. However, in 1970 export of crude oil overtook agricultural produce, and reached nearly 75 per cent of the country's total export earnings in 1971• In Morocco, agriculture accounted for about 28 per cent of GDP and provided slightly less than half of overseas export earnings in 1971- This was followed by minerals mainly phosphate and manufactured products. Over the last decade 1960-70, the GDP increased by about ^0 per cent in Nigeria and nearly doubled in Morocco. The contribution of construction to GDP averaged *f.6 per cent in Nigeria and *f.5 per cent in Morocco over the period i960 to 1970. The percentage contribution of construction to Gross Fixed Capital Formation (GFCF) averaged 5^ per cent in Nigeria and about 65 per cent in Morocco over the same period. Residential and non-residential buildings together accounted for one quarter to one third of GFCF in Nigeria and Morocco. However, a

CH 22 365
large volume of traditional houses is constructed in urban and rural areas of both countries outside the monetary sector and never occurs in their national economic accounts.
Growth of Population: Towns
By the early 1970's Zaria had an estimated population of about 120,000, Ibadan had over one million inhabitants and Marrakech 333»000. Over the last two decades, 1950-70, the population of Zaria increased by about 2.5 per cent per annum, Ibadan by over 3 per cent and Marrakech by 2.2 per cent. The population of the walled cities in Zaria and Marrakech on the other hand, had a much lower growth rate and increased by only 1.4 per cent and0.7 per cent per annum respectively during this period.
Type of Buildings
In Chapter 4, 11 and 18 I briefly described the traditional types of urban houses most frequently found in the three cities under investigation.On the following page I will summarize some of the most salient features of these houses.
In Zaria the lay-out and organization of compounds with several courtyards surrounded by high mud walls was designed to provide a high degree of security and privacy for the compound head and his wife or wives, many of whom were living in complete or partial seclusion. Normally, each adult member of the compound has his own room or rooms which are usually abandoned after his or her death and in many cases are allowed to collapse. Each new generation of compound heads usually rebuilds part of their compounds according to the need of their families and dependents.
In Ibadan most houses consist of a double row of rooms which open onto a central hall or passage way. Doors and windows are usually open at daytime to allow for some cross-ventilation essential for the comfort of its

CH 22 366
inhabitants in this warm and humid climate. Women are net restricted by ’'purdah” and play active parts in the economic life of the city.
At Marrakech the most common house type is the two-storey central courtyard house. All rooms in these houses open onto the central courtyard or garden. This house type is well adapted to the hot and dry summer months, needs comparatively little space, and provides a high degree of privacy and seclusion even in such a densely populated placed as the medina of Marrakech.
All houses included in my survey were constructed with locally manufactured building materials except for corrugated iron sheets used as roofing material in Ibadan, and all building was carried out by locally trained labourers with the help of family members or small indigenous building contractors.
Composition of Domestic Groups
Throughout this study the units of analysis are the occupants of a house or compound divided into households. As units of domestic economy, households consist of all related or unrelated persons who occupy a common domicile, eat together for most of the year and who contribute in kind, labour and/or money to the household budget. However, as data on household composition alone are insufficient to explain the growth and decline of co-residential kinship groups, all persons living within a house or compound were classified for analysis by their relationship to the compound head. This procedure enabled me to discern and trace the cyclical tendency which regulates the development of co-residential agnatic groups. As we have seen, the individual family consisting of a man, his wife or wives, and their unmarried children is the first and simplest stage in a development cycle which often gives rise to composite

co-residential kinship groups. Altogether six stages in the developmental cycle of such domestic groups were identified, the last being that of a compound which housed paternal first cousins and their descendants.However, it must be remembered that at any stage these groups are liable to constant changes due either to the marriage and death of one of their male members, particularly the compound head, or to the emigration of dependent households caused by differential economic success, the lack of space, and tension or disagreements among these households.
Table 22.1 on page 368 compares differences in percentage distributions of households related to the compound heads that illustrated each of these developmental stages in the samples at Zaria, Ibadan and Marrakech. It is of interest that domestic groups at the first two stages of development,i.e., the compound head with his wife or wives and their own unmarried and married children respectively, accounted for only 18.1 per cent of all households surveyed at Ibadan, while at Marrakech the corresponding figure was 82.8 per cent. It is obvious that at Marrakech kinship groups split at an early stage, with only 5*1 per cent of all households found in houses with kinship groups at stage 3* whereas at Ibadan large co-residential kinship groups are the norm and account fore.69 per cent of all households interviewed. The population surveyed at Zaria lies somewhat between these two extremes, with 32.2 per cent of all related households in the first two stages of the developmental cycle, and 3 8 .9 per cent of the sample househol in stages 3 to 6.
Households related to the compound head which had joined their compounds of residence in recent years accounted for 8.9 per cent in Zaria, 12.9 per cent in Ibadan and 12.1 per cent in Marrakech. These households were listed separately because their immigration into their host compounds neither influences nor contributes to the natural development of

CH 22 368
TABLE 22,1 Related Households by Stages of Development In PercentagesNo. of Household Stage 1 Stage 2 Stage 3 Stage 4 -5 Stage 6 Joint HH Total
ZARIA 180 17.2 15.0 22.8 34.4 1.7 a.9 100 .0IBADAN 171 11.1 7.0 25.7 2 2 .2 21.1 12.9 100 .0MARRAKECH 99 48.5 34.3 5.1 - - 12.1 100 .0
TABLE 22.2 Total Floor Area and Area of New Construction Built between 1965-69ZARIA IBADAN MARRAKECH
Total m2 in 1968
Built1963-8
56 of T.Area
O'Total m in 1968
Built1963-8
% of T.Area
Total m2 in 1969
Built1964-9
ofT.Area
Floor Area 10,473.4 1,772.5 16.9 9,522.3 575.1 6 .0 8,326.0 224.4 2.7
TABLE 22. 3 Tj[££_of_Bu^ldlng_Bcpenditiire_in_Percenta£eZARIA IBADAN MAHRAKECH
Cost of New Construction 44.4 48.5 24.7Cost of Improvements 27.7 22.1 41.7Cost of Repair 2 3.6 26.5 24.8" of Build.Under Constr. 2.4 _ 8 .8
Cost of Kisc. Constructions 1.9 3-1 -Total Percentage 100 .0 100 .0 100 .0
TABLE 22.4 Average Area per Persons In eq.m.ZARIA IBADAN MARRAKECH
Type of Household Comp.H. Dep.H.H. Comp.H. Dep.H.H. Ten.H.H. Comp.H. Dep.H.H. Ten.H.H.Average Sleeping Area in m* 4.8 3.9 4.7 3.0 3.6 4.6 3.1 3.4Total Av. Floor Area in m2 12.8 5.9 12.7 4.2 4.8 14.2 4.7 5.4
TABLE 22.5 The gee of Floor Area In PercentageZARIA IBADAN MARRAKECH
Living Area 6 7 .6 8 3 .6 70.9Commonly Used Rooms 16.1 5.7 15.3-Basic Ancillary Facilities 12.5 7.6 12.3Commercially Used Rooms 3.8 3.1 1.5Total 100 ,0 1 00 .0 100 .0
TABLE 22.6 Distribution of Income In PercentageZARIA IBADAN MARRAKECH
Comp.H.' Dep.H.H, Comp.H. Dep.H.K. Ten.H.H. Comp.H. Dep.H.H. Ten.H.H.Low Income Group * 53.2 8 5 .8 3 2 .8 6 3 .6 58.7 25-0 36.0 83.3Middle Income Group** 41.6 14.2 50.1 36.4 39.1 57.8 6 0.O 16.7High Income Group*** 5.2 - 17.1 2 .2 17.2 4.0 -Total 100.0 100 .0 100 .0 1 00 .0 100 .0 100 .0 100.0 100.0
* Under sh. 300 or DH. 210 per month •* Under sh. 1,000 or DH. 700 per month *** Over eh. 1,000 or DH. 700 per month
TABLE 22.7 Source of Housing*Funds in PercentageZARIA IBADAN MARRAKECH
Comp.H. Pers. Income 83.9 93.8 79.7Loans + Gifts from Family 14.4 6 .2 13.7Loans + Grants f.Instltut. 1.7 _ 6 .6
Total 100 .0 100 .0 100 .0

CH 22 369
co-residential kinship groups.We may now ask why domestic families divide at a relatively early
stage at Marrakech and much later if at all in Zaria and Ibadan? To what extent does the lay-out and structure of the house or compound, the mode of land tenure and differing incomes of dependent household heads, to cite only some important factors, impede or promote the division of co-residential kinship groups in the three samples? I will examine these questions in the light of my survey data and with the additional historic, social and economic background information given earlier on.
However, before pursuing these questions, we should briefly discuss the 226 unrelated households included in the three surveys. Of these, 215 or per cent paid a weekly or monthly rent for their room or rooms.Together these households accounted for one third of the total sample of households. As they do not belong to the kinship group of the compound head, they were listed and analysed separately. The differing incidence of these unrelated households in the three samples is noteworthy. At Zaria, only 5*8 per cent of all households surveyed were unrelated, while at Ibadan and Marrakech these figures rose to bZ per cent and V7.9 per cent respectively. Most of these stranger households are small and consisted of single, divorced and widowed persons, childless couples, or individual families. The ratio of immigrants among the heads of stranger households was 100 per cent in Zaria, 95-2 per cent in Ibadan and 58 .2
per cent in Marrakech. While the varying distribution of tenant households within these three samples suggest different rates and volumes of immigration in these areas, the proportion of first generation immigrants among these household heads indicate that these cities have recently experienced different patterns of growth.

CH 22 370
The Building of Houses
The volume of new construction in the three samples of compounds differ widely. Table 22.2 on page 368 shows the total area and the area which was constructed during the five-year period that preceded the date of each survey. In Zaria construction in this period accounted for 1,773 sq.m. or 16.9 per cent of the total floor area of the sample compounds, whereas at Ibadan and Marrakech these figures dropped to 573 sq.m. or 6 per cent,, and 22b sq.m. or 2.7 per cent respectively. As we have seen in Zaria most new rooms were built as a direct response to the housing-needs of expanding domestic families, while at Ibadan and Marrakech, increasing demand for rented accommodation motivated some compound heads to build more rooms. However, it should be stressed that the lay-out and organization of compounds at Zaria are relatively flexible by comparison with those of Ibadan and Marrakech, while construction costs are also much lov/er. These conditions enable compound heads to add more rooms as the need arose.By comparison with Zaria the cities of Ibadan and Marrakech have much higher population densities per hectare, and as building plots become increasingly scarce, building activities are naturally more restricted and costs tend to rise.
Directly connected with these different volumes of new construction in the three samples are differences in the median age of sample rooms. AtZaria for example, the median age of rooms is around 12 years, whichindicates that nearly all living and sleeping rooms are replaced at eachnew generation of compound heads. In other words, a room lasts as long asits occupants are alive. Such periodic rebuilding of rooms at short intervals requires low construction costs and the recycling of building materials such as mud used for the construction of walls and roof beams.

CH 22 371
At Ibadan the median age of rooms was found to be about 26 years. The increased 'life-expectancy1 of these Yoruba houses may be primarily due to their corrugated iron roofs which protect the mud wa.lls much better than traditional thatched roofs. The survey at Ibadan also revealed that a large number of inherited houses were used almost unaltered by the second and even third generation of their compound heads. Unfortunately, the median age of rooms in Marrakech could not be calculated as most compound heads did not know the age of their houses. However, historic data suggest that the median age of houses surveyed exceeded 50 years1 During the five-year period from 196 to 1969 only 2.7 per cent of the total floor area were built by 13 out of 68 interviewed compound heads. This was partly due to the lack of building plots, the mode of existing construction, and to the relatively high building costs in the Medina.
Expenditure on Housing
Expenditures on housing in the three cities follows closely the pattern of building activities discussed above. Table 22.3 on page 3o8 compares the percentage distribution of the various types of expenditure on housebuilding. In Zaria and Ibadan the cost of new construction was the most important item of housing expenditure, while in Marrakech expenditure on improvements rank first. This indicates that in Zaria and to a lesser extent in Ibadan land for new construction is still available, whereas in Marrakech the lack of suitable building land forces many compound heads to sell their houses and to buy bigger ones which are then improved according to the compound heads1 financial abilities.

CH 22 372
Distribution of Floor Area
The distribution of floor area within the populations of the sample houses was studied in two ways. First, I calculated the average floor area per person classified by their relationship to the compound head; and second, I calculated the average floor area per person according to the number of persons per household. However, as these calculations of average floor area per person include all rooms including entrance halls, store-rooms, kitchens, bathrooms and workshops, it seems that the area of rooms used for sleeping provides a more useful measure of space standards among the populations in the houses surveyed. Table 22.4 on page 3^8 sets out the average sleeping areas for members of compound heads' households, of dependent households and of tenant households separately. As can be seen, the average sleeping areas of members of the compound heads' households was very similar in all three samples, namely, 4.8 sq.m. in Zaria, 4.7 sq.m. in Ibadan and 4.6 sq.m. in Marrakech. This convergence is especially significant, given the wide differences in the house types and in the composition of co-residential kinship groups in the three samples. The average sleeping area per person belonging to dependent or semidependent households was 3*9 sq.m. in Zaria, 3*0 sq.m. in Ibadan and 3*1 sq.m. in Marrakech, which is lower than comparable figures for compound heads' households. The average sleeping area per person belonging to tenants' households was 3-6 sq.m. in Ibadan and J>.k sq.m. in Marrakech.
It is interesting to recall that in all three samples the average sleeping area per person fell slightly as the number of persons per household increased, but levelled off in households c o n t a i n i n g 3 to 4 persons and remained almost stable for all larger households. This suggests that in Zaria and to some extent in Ibadan, new rooms were constructed as the need arose, whereas at Marrakech dependent households had to emigrate when the compound head was unable to provide the extra accommodation

CH 22 373
required. This procedure enabled resident households to maintain a minimum space standard in spite of an increasing household population. The inquiry into the sleeping area per person revealed that in spite of differences in these cultures, in the type of houses surveyed and in the composition of co-residential kinship groups, a striking convergence of the space standards obtains in all three samples. This may indicate that a common minimum space standard is unconsciously observed by the urban populations from which these samples were drawn.
The Use of Space
For analysis, the floor area of all houses surveyed was divided into four main categories: first., living area, which includes all sitting and sleeping rooms; second, such common rooms as entrance lobbies and corridors; third, such basic ancillary facilities as kitchens, bathrooms and storerooms; find fourth, rooms used commercially. Table 22.5 on page 368 shows that at Zaria and Marrakech the percentage distribution of the first three categories, namely, living area, common rooms and basic ancillary facilities, represented about 70 per cent, 15 per cent and 12 per cent of total floor area respectively. Commercially used rooms accounted for 3*8 per cent of the total floor area surveyed at Zaria, and 1.5 per cent of that in Marrakech. By contrast, in Ibadan nearly 84 per cent of the total floor space was living area, common rooms accounted for 5*7 per cent, basic ancillary facilities for 7.6 per cent and commercially used rooms for 3*1 per cent. It is interesting to note that 8.2 per cent of the total floor area in Zaria consisted of empty rooms, 3*6 per cent in Ibadan and 9-2 per cent in Marrakech. These empty rooms are frequently used by the compound head to accommodate newly-married wives or relatives in need of shelter. Hence houses were most economically used in Ibadan where 84 per cent of the floor area represented the living area, as compared with about 70 per cent in Zaria and Marrakech.

CH 22 3 7b
Land Tenure
Besides housing itself, two other factors also influence the size and composition of domestic groups in these samples. One is the mode of land tenure which is an important part in structuring the composition of co-residential kinship groups. For example, as we have seen in the walled city of Zaria and in the centre of Ibadan most land is held by agnatic descent groups. Normally, these groups distribute their lands among their members who all enjoy usufructuary rights but cannot alienate the plots they occupy without the consent of all adult male members of the descent group. In spite of such restrictions some land is nonetheless sold, but the bulk of it including 'family compounds' still passes down within the lineage or lineage segment, unaffected by modern developments. If anything the increasing cash value of urban land and its growing scarcity, as the urban population increases, have probably strengthened the role of the descent group as a corporate landholder. In consequence, descent groups tend to congregate in ancestral family compounds and on their corporately owned lands, thus ensuring the development of those large and complex co-residential kinship groups I found in Zaria and Ibadan. At Marrakech on the other hand, most houses included in my sample were owned by individuals. With few exceptions, these individuals are free to sell the house in whole or part. This situation has enabled many a compound head to sell part of the house in order to provide his son or sons with the necessary funds to buy, lease or even to build their own houses elsewhere, often outside the old city walls.

CH 22 375
Income Distribution
The level and distribution of income among the various categories of household heads is the second factor which influences the size and composition of domestic groups. As shown in Table 22.6 on page 3681
while compound heads have on average the highest incomes in all three samples, most heads of dependent and tenant households were in the low income category. The major exception to this pattern is found among the heads of dependent households in Marrakech, 60 per cent of whom belonged to the middle income group, and were thus financially in a better position to leave their father's or brothers' house and establish their own independent households elsewhere should the need arise. However, it seems likely that the very low overall incomes of most heads of dependent and tenant households included in the sample severely restrict their mobility and above all their choice of residence.
The Financing of Houses
As mentioned above, the financial resources used for housing construction and other building activities derive from three main sources. First, there are the personal savings and incomes of the compoundheads; second, gifts or loans from family members and friends; and third, loans or grants from Government-sponsored housing agencies, from building societies or from banks. Table 22.7 on page 368 compares the percentage distribution of funds drawn from these alternative sources for three samples. The table shows that in Zaria, Ibadan and Marrakech between 80 and 9^ per cent of the total cash expenditure on buildings over a five-year period preceding my surveys came from the personal incomes and savings of compound heads and any other dependent household heads engaged in building activities. Gifts and loans from family members and friends accounted for about per cent of these expenditures at Zaria and Mabrakech, but only for 6.2 per cent in Ibadan.

CH 22
Financial help received from institutional sources accounted for 6.6 per cent of the total cash expenditure on housing at Marrakech, as against 1.7 per cent in Zaria and zero in Ibadan. Thus in these three surveys, institutional aid for house-building is absent or marginal.
This lack of official support particularly in Zaria and Ibadan may be due to three reasons. First, the mode of land tenure may discourage financial institutions modelled on Western prototypes from investment, as these agencies insist on clear titles to land and regard corporately owned land as a security risk in case of litigation and mortgage default; second, most institutions that lend for housing require borrowers to use only permsnent building materials for the construction of houses that they finance, and third, the low average cash income of most compound heads frustrates provision of credit. My sample at Marrakech has shown that most houses were owned by individuals who had a clear title to the land which is also registered in the Municipality's land .registrar's office. If required, these titles could be used as security to obtain housing loans either from the Government or frcm the compound heads' employers.
Cost of Traditional Buildings
The cost per 'unit-area' in the traditional housing sector was found to be roughly one third of the cost of modern houses constructed by building societies, housing corporations and Government agencies in Zaria and Ibadan, and about half the cost of modern buildings in Marrakech. This is mainly due to the use of relatively inexpensive building materials and cheap labour, as well as to the lack of such services as piped water, sewerage and electricity supply which are normally provided in modern houses.

CH 22 377
The Relationship betv/een Domestic Groupings and the Lay-out of Houses
It was shown in Zaria and Ibadan that the majority of the households surveyed lived in compounds having large and complex co-residential kinship groups, whereas at Marrakech small domestic groups predominate. It was also shown that at Zaria construction of new rooms and abandonment of old ones correspond closely with events that marked stages in the growth and decline'of these co-residential kinship groups. Hence the physical development of compounds at Zaria could be explained in detail when the development of the co-residential kinship group was known, and vice versa. Moreover, the adaptability of the lay-out of most compounds in Zaria walled city with their spacious arrangements of detached huts, and the relatively low costs of construction which is partly assured by recycling such building materials as roof beams, and mud for the construction of walls, enables compound heads to provide adequate accommodation .for the changing requirements of their families at the right time. So far, changes affecting the design and construction of compounds in the walled city of Zaria have been limited, and the few.modern building materials such as cement and corrugated iron roofing sheets available at the local market have been used to protect existing buildings rather than to construct new and more durable houses.In spite of many shortcomings the great asset of the present building practice is undoubtedly the flexibility of the traditional compound which enables each generation of compound heads to provide new accommodation according to the needs of their families. Any further development which does not take into account the changing needs of the developing family groups, as well as the most effective and economic utilisation of new and traditional building materials will not succeed.
At Ibadan and Marrakech the relationship between domestic groupings and the lay-out of houses is more complex. This is partly due to the lack of

CH 22 373
suitable building sites which may restrict the construction of new rooms, and partly to the large number of tenant households living in rented accommodation. Once these tenant households are established, some com^ ;und heads may find it increasingly difficult to house their growing families. Hence at Ibadan, compound heads faced with a rapidly expanding family try to build new rooms where space is available, distribute existing accommodation more economically and re-allocate rooms of dead family members. Failing these, family members have to look for alternative accommodation elsewhere. In the medina of Marrakech, where space for new construction is even more restricted, houses which have become too small for their owners’ families were being sold and replaced by bigger ones.
The different system of land tenure in Zaria and Ibadan on the one hand and Marrakech on the other, has no doubt influenced the size and composition of domestic groups. Particularly in Zaria and Ibadan traditional modes of land tenure by which most land is owned corporately by agnatic descent groups, has promoted the development, of large and complex co- residential groups based on kinship, whereas at Marrakech individual holdings and freehold properties tend to facilitate the division of co- residential kinship groups into smaller independent units..
Interest in modern building materials and new construction techniques is increasing particularly among the urban population in Africa. However, capital investments needed to employ these new materials and techniques effectively are out of reach for most compound heads. Furthermore, the rapidly increasing urban population and the inability of Governments, building societies and other financial institutions to provide at least some building funds for the poorer section of the community, has led to the deteriorating housing conditions which can be found in many African towns. Only sustained economic growth can create an environment in which the State and its citizen can improve the urban housing situation.

APPENDICES

APPENDIX IDIAGRAM- A.1.1 Climatic Data Zaria- ----------
TEMPERATURE AVERAGE DAILY MAX, MIN 1936-1967
DEC.NOV.JUN.APRJAN. FEB. MAR.
35335* C
3U . , 30.730.730* C y'Y/Y'Y 7 7 7 '
4U 15.7
RELATIVE HUMIDITY AVERAGE IAIIV AM, VM111 H3I -196?
100*/.
10*/.
GOV.
40*/.
20V.
79.104.5 06,5 02.4
r w ~7 / : , 71.9
'/✓ >-— ^-^7
70.8b / z T ’
—54.1— b ' y yr / / / / > ; 50.9—«/r~l--- -64,3- y ////
yM 39.1
25.7/// / / 23.1
_ 31.9'' .7 7 , [7 V ..J
?7q
—4t,7 41,97 7 27.0
V7?77?
13.9Y //' v
11.9 R.921.7 16,3
RAINFALL AVERAGE MONTHLY
30,48cn.23.622-9.39*-
------------- rtTBTT6,54"
32,470
m m10,16 cn L
3,505T.16*
3,556±£*- " W0.05*
TT6T0 .3 0 ‘
0,0250.01*SUNSHINE HOURS DAILY MEAN HOURS <2> 195A - 1957
10k.
9k. 77
Ok.
(h.5 h.
WIN0 DIRECTION prevailing WINO 01RECTION
OCT. NOV. DEC.AUG. SEP.JUL.MAY. JUN.FEB. MAR. API.JAN.ia.EI.E
s.w.(1) BEFORE 1953 OBSERVATION TAKEN AT 06 " ANO 13" G.M.T. AFTER AT 09" AND 15" G.M.T.(2) SUNSHINE RECOROS FROM CAMPBELL STOKES RECORDER
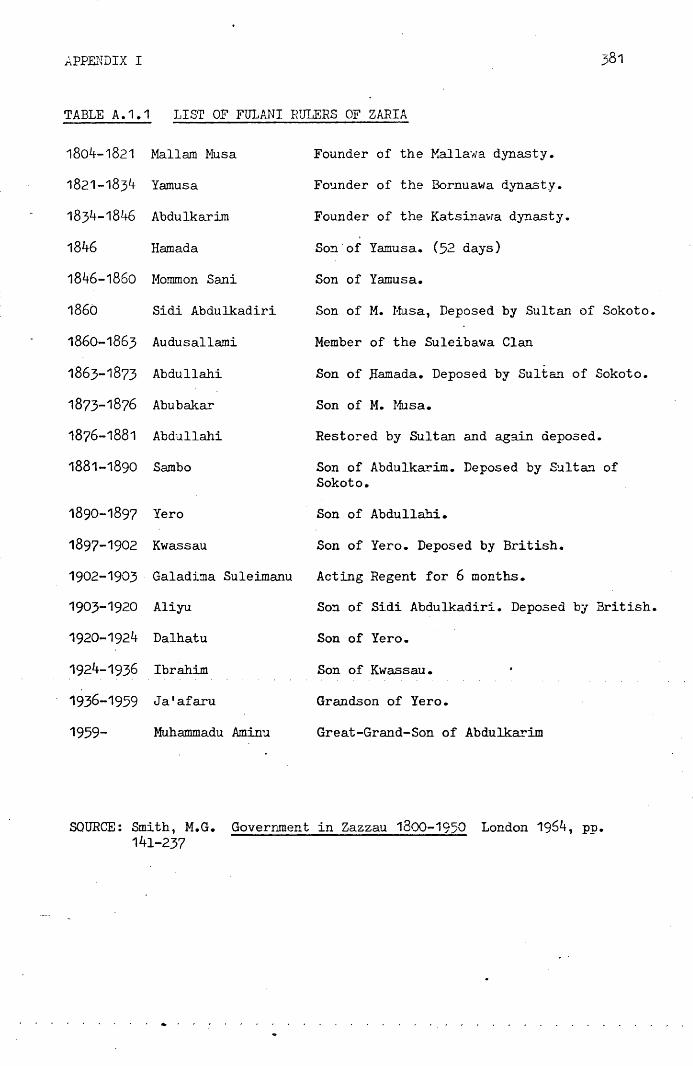
APPENDIX I
TABLE A.1.1 LIST OF FULANI RULERS OF ZARIA
180*+-1821 Mallara Musa Founder of the Mai lav/a dynasty.1821-183*+ Yamusa Founder of the Bornuav/a dynasty.183*+-18*+6 Abdulkarim Founder of the Katsinawa dynasty.l8*+6 Hamada Son of Yamusa. (32 days)l8*+6-l86o Mommon Sani Son of Yamusa.i860 Sidi Abdulkadiri Son of M. Musa, Deposed by Sultan of Sokoto.1860-1863 Audusallami Member of the Suleibawa Clan
1863-1873 Abdullahi Son of Ramada. Deposed by Sultan of Sokoto.1873-1876 Abubakar Son of M. Musa.1876-1881 Abdullahi Restored by Sultan and again deposed.1881-1890 Sambo Son of Abdulkarim. Deposed by Sultan of
Sokoto.
1890-1897 Yero Son of Abdullahi.1897-1902 Kwassau Son of Yero. Deposed by British.
1902-1903 Galadima Suleimanu Acting Regent for 6 months.1903-1920 Aliyu Son of Sidi Abdulkadiri. Deposed by British1920-192*+ Dalhatu Son of Yero.192*+-1936 Ibrahim Son of Kwassau.
1936-1939 Ja'afaru Grandson of Yero.
1959- Muhammadu Aminu Great-Grand-Son of Abdulkarim
SOURCE: Smith, M.G. Government in Zazzau 1800-1930 London 196*+, pp.HU-237

APPENDIX I 382
TABLE A.1.2 Gro--s Domestic Product at 1062 Factor Cost In £N. Million1960 1961 1962 1963 1964 1965 1966 1967 1968 1069 1970 1971
Agriculture Distribution Manufacturing and Crafts Transport and Communication Building Construction
798.9158.859.856.9 5°-P
774.9153.965.164.1 52.7
802.9156.573.262.756.4
868.9180.9 85.O 65.5 59.2
865.7199.190.574.6 64.0
871.1209.2 110.573.181.1
790.9194.9 110.871.080.1
679.0166.595.056.767.9
669.0166.1100.2 62.8 58.5
763.9205.8131.763.870.0Crude Oil and Mining
General Government Education HealthElectricity and Water Supply Other Services
14.939.9 32.06 .24.025.3
21.738.635.1 7..1 4.8
28.1
27.038.838.98.45.8
28.2
29.k38.9 41.48.96.827.9
39.844.846.7 10.17.830.7
7^.948.448.5 11.39.136.2
105.249.655.4 13.1 10.041.4
81.942.344.9 10.07.534.4
42.569.5 45.99.58.739.2
127.0119.952.113.6 10.444.7
Total 1,246.7 1,246.1 1,298.8 1,412.8 1,473.8 1,573-8 1,552.4 1,286.1 1,271.9 1,602.9G.D.P. at Current Factor Cost 1,123.7 1,179.8 1,298.8 1,372.9 1,447.2 1,555.0 1,687.4 1,376.3 1,328.1 1,752.0
Source: Federal Office of Statistics, Nigeria, Annual Abstract of Statistics 1971, Lagos 1972 pp. 140-1
TABLE A.1.3 Gross Domestic Product at 1962 Factor Cost In Percentage1960 1961 1962 1963 1964 1965 1966 1967 1968 1969 1970 1971
Agriculture Distribution Manufacturing and Crafts Transport and Communication Building Construction
64.112.74.84.64.0
62.212.45-25-14.2
61.812.05.64.84.4
61.512.86 .04.64.2
58.713.56.15.14.4
55-313.37.04.65.2
51.912.87.3 4.75.3
52.812.97.44.4 5-3
52.613.17.94.9 4.6
47.712.8 8.2 4.0 4.4Crude Oil and Mining
General Government Education HealthElectricity and Water Supply Other Services
1.23.22 .60 .50.32 .0
1.7 3.12.8 0 .6 0.4 2.3
2.13-03-00.70.42.2
2.12 .82.90 .60.52 .0
2.73.0 3.2 0.7 0.52.1
4.83.13-10.70 .62.3
6.93.23-60.90.72.7
6.33-33.50 .80 .62.7
3.35-53.60.70.73-1
7.97.53.30.80.62.8
Total 100.0 100.0 100.0 100.0 100.0 100.0 100.0 100.0 100.0 100.0
TABLE A.1.4 Export of Principal Products In £N. Million1960 1961 1962 1963 1964 1965 1966 1967 1968 1969 1970 1971
AgricultureCrude Petroleum . . .Metal OreTimberMiscellaneous
133.2 . 4.4 8.3 8 .1
11.6
133.611.58.17.99.0
123.216.79.37.07.9
135.120.211.27.8
10.6
143.132.114.18.912.3
156.268.116.17.515.3
139.79 2.016.66.723.7
128.072.114.1 4.219.7
127.637.0.14.34.123-5
134.8131.0
10.25-133.5
136.3254.99.63-933.8
120.6476.58.53.431.4
Total Domestic Export 165.6 170.1 164.0 184.9 210.5 263.2 278.7 238.1 206.5 314.6 438.5 640.4
Source' Federal Office of Statistics, Nigeria, Annual Abstract of Statistics, 1971, Lagos 1972, pp.84-6
TABLE A.1.5 Export of Principal Products In Percentage1960 1961 1962 1963 1964 1965 1966 1967 1968 1969 1970 1971
Agriculture 80.4 78.5 75.0 73.1 68.0 59.3 50.1 53.7 61.8 42.9 31.1 18.9Crude Petroleum 2.7 6 .8 10.2 10.9 15.3 25-9 33.0 30.3 17.9 41.6 58.1 74.4Metal Ore 5.0 4.8 5.7 6.1 6.7 6.1 6 .0 5.9 6.9 3.2 2 .2 1.3Timber 4.9 4.6 4.3 4.2 4.2 2.9 2.4 1.8 2 .0 1.6 0.9 0.5Miscellaneous 7-0 5-3 4.8 5-7 5-8 5-8 8.5 8.3 11.4 10.7 7-7 4.9Total Domestic Export 100.0 100.0 100.0 100.0- 100.0 100.0 100.0 100.0 100.0 100.0 100.0 100.0
TABLE A.1.6 Value of External Trade and Visible Balance In £N. Mlllio1960 1961 1962 1963 1964 1965 1966 1967 1968 1969 1970 1971
Merchandise Import 215.9 222'.5 203.2 207.6 253.9 275-4 257.0 223.5 192.6 248.7 373.2 539.5Domestic Export 165.6 170.1 164.0 134.9 210.5 263.2 278.7 238.1 206.5 314.6 433.5 640.4He-Export 4.1 3.6 . 4.5 4.8 4.2 5.0 5 .4 3 .7 4.6 3-5 4.2 6 .2Total Export 169.7 173.7 163.5 189.7 214.7 268.2 284.1 241.8 211.1 318.1 442.7 646.6Visible Balance - 46.2 - 48.9 - 34.7 - 17.9 - 39.2 - 7.1 + 27.1 1- 13.3 + 18.5 + 69.5 ♦•64.5 +107.2Source: Federal Office of Statistics, Nigeria, Annual Abstract of Statistics, 1971, Lagon 1972, p. 68

APPENDIX I
TABLE A«1.7 Import of Principal Products In £N. Million1960 1961 1962 1963 1964 1965 1966 1967 1968 1969 1970 1971
Manufactured Goods 81.1 87.5 73.1 74.2 89.6 90.0 79.3 72.? 54.7 72.0 113.0 159.7Machinery 51.6 50.5 48.3 50.6 74.9 92.4 95.4 71.6 59.9 73.2 141.3 214.4Food 23-9 22.7 23.5 21.9 20.6 23.0 25.8 21.3 14.2 20.9 28.8 43.9Manufactured Articles 23.9 23.7 21.6 21.3 22.5 20.5 18.8 17.4 14.0 13.4 19.7 35-3Chemicals 12.2 12.6 12.3 14.5 17.1 20.2 20.8 21.3 22.4 30.4 44.2 6 1 .0Minerals and Fuels 11.3 13.4 14.1 15.5 19.5 17o 3.8 8.8 14.5 15.6 11.0 4.5Crude Materials 2.1 2.4 2.4 3.1 3-7 6.6 7.2 5.8 5-3 5-7 8.3 10.3Beverages and Tobacco 6.1 6.1 4.8 2.9 2.9 2.0 2.3 1.8 1.2 0.8 2.0- 2.2Animal & Veg. Oils & Fats 0.0 0.0 0.0 0.0 0.1 0.2 0.2 0.3 0.3 0.2 0.4 0.4Other Transactions 3-*fr 3.4 3.1 3-5 2.9 3-1 3 .4 3.0 6.1 16.4 7.3 5-8Total 215.9 222.5 203.2 207.6 253.9 275.4 257.0 223.5 192.6 248.7 376.3 537-5Source; Federal Office of Statistics, Nigeria, Annual Abstract of Statistics, 1971, Lagos 1972, p.69
TABLE A.1.8 Import of Principal Products In Percentage1960 1961 1962 1963 1964 1965 1966 1967 1968 1969 1970 1971
Manufactured Goods 37-6 39-3 36.0 35-7 35-3 32.7 30.9 32.4 28.4 29.0 30.0 29-7Machinery 23.9 22.7 23.8 24.4 29.5 33.6 37.1 32.0 31.1 29.4 37.6 39-9Food 11.1 10.2 11.6 10.5 8.1 8.4 10.0 9 .5 7.4 8.4 7.7 8.2Manufactured Articles 11.1 10.7 10.6 10.3 8.9 7.4 7.3 7.8 7.3 5.4 5.2 6.6Chemicals 5.7 5.7 6 .0 7.0 6.7 7.3 8.1 9-5 11.6 12.2 11.8 11.3Minerals and Fuels 5-2 6 .0 6.9 7.5 7.7 6 .3 1.5 3.9 7.5 6 .3 2.9 0.8Crude Materials 1.0 1.1 1.2 1.5 1.5 . 2.4 2.8 2.6 2.8 2.3 2.2 1.9Eeverages and Tobacco 2.8 2 .8 2.4 1.4 1.1 0.7 0.9 0 .8 0.6 0.3 0.5 0.4Animal & Veg. Oils & Fats 0.0 0 .0 0.0 0.0 0.0 0.1 0.1 0.1 0.1 0.1 0.1 0.1Other Transactions 1.6 1.5 1.5 1.7 1.2 1.1 1.3 1.4 3.2 6.6 2.0 1.1Total 100.0 100.0 100.0 100.0 100.0 100.0 100.0 100.0 100.0 100.0 100.0 100.0
TABLE A.1.9 Gross Fixed Capital Formation at 1962/5 Constant Prices In £N. Million1960 1961 1962 1963 1964 1965 1966 1967 1968 1969 1970 1971
Buildings.................. 64.9 67*1 70.8 71.1 76.4 94.3 89.2 65.O 61.1 65-3Civil Engineering Works 27.2 30.1 34.3 39-3 42.5 55-7 58.9 61.1 47.5 64.3Land Improvements 11.5 31.0 25.6 33.1 32.1 34.1 32.4 29.7 21.4 17.4Transport Equipment 24.0 20.9 12.0 16.6 26.1 28.1 26.1 24.9 21.4 30.3Machinery and Equipment 32.9 36.0 33-3 34.2 73.5 80.3 68.4 55-3 49.4 44.3Total 160.5 185.1 176.0 194.3 250.6 292.5 275.0 231.0 200.8 221.6G.F.C.F. at Current Fact.Cost 159.4 173.3 176.0 196.5 251.5 307.6 300.8 241.8 217.0 263.8
Source: Federal Office of Statistics, Annual Abstract of Statistics 19711 Lagos 1972 p.142
TABLE A.1 .10 Gross Fixed Capital Formation at 1962/3 Constant Prices In Percentage1960 1961 1962 1963 1964 1965 1966 1967 1968 1969 1970 1971
BuildingsCivil Engineering Works Land Improvements Transport Equipment Machinery and Equipment Total
40.4 16.97.215.020.5
36.316.3
16.711.3
19.4
40.219.514.6 6.8
18.9
36.6
20.2 17.0 8.6
17.6
30.517.0
12.810.429.3
3 2 .2
19.011.79.627-5
32.421.4 11.89.525.8
28.1
26.5
10.710.8
23-9
30.423.6
10.710.724.6
29.529.0
7.813.720.0
100.0 100.0 100.0 100.0 100.0 100.0 100.0 100.0 100.0 100.0

APPENDIX II
Table A.2.1 Type of Tenure of 77 Compounds in Zaria Walled City, 1968
Compounds Percentage of Total
Inherited 50 6 5 .0
Purchased 19 24.6Allotted 5 6.5Gift 2 2.6Reclaimed land 1
Total 77 100.0
Table A.2.2 Use of Land Within the Walled City of Zaria, 19&3Sq. metres Percentage of Total
Cultivated Land 10,982,660 66.2Building Sites 3 ,077,6to 18.6
Waste Land 1,502,620 9.1Roads 353, too 2.1Rock Surfaces 3^7 ,7to 2.1Borrow-pits and Brooks 313,610 1.9
Total Area 16,577,670 100*. 0

APPENDIX II
MAP A.2.1 Use of Land in the Walled City of Zaria
385
8° 1 Z
v y r\ \m- V \ - - > v ••<>> ~- I V ' - v L - v _
® : _ J\:v < ^ ' / S /ajffig;-...4,I *— *'p f ]'ZZZ:-Zp:„ -
< V - f #S-j' fcarJS >;**. .-~y ■ -• ,r* '-^ '■ JlP.'jf* ■VVrT,'**-
z
jutrtWlD!
CULTIVATED UPLAND FARMS
’ FADAMA. CULTIVATE: LOWLAND FARMS
FALLOW LAND, ARE* LIABLE TO"FLOOD—
COMPOUNDS
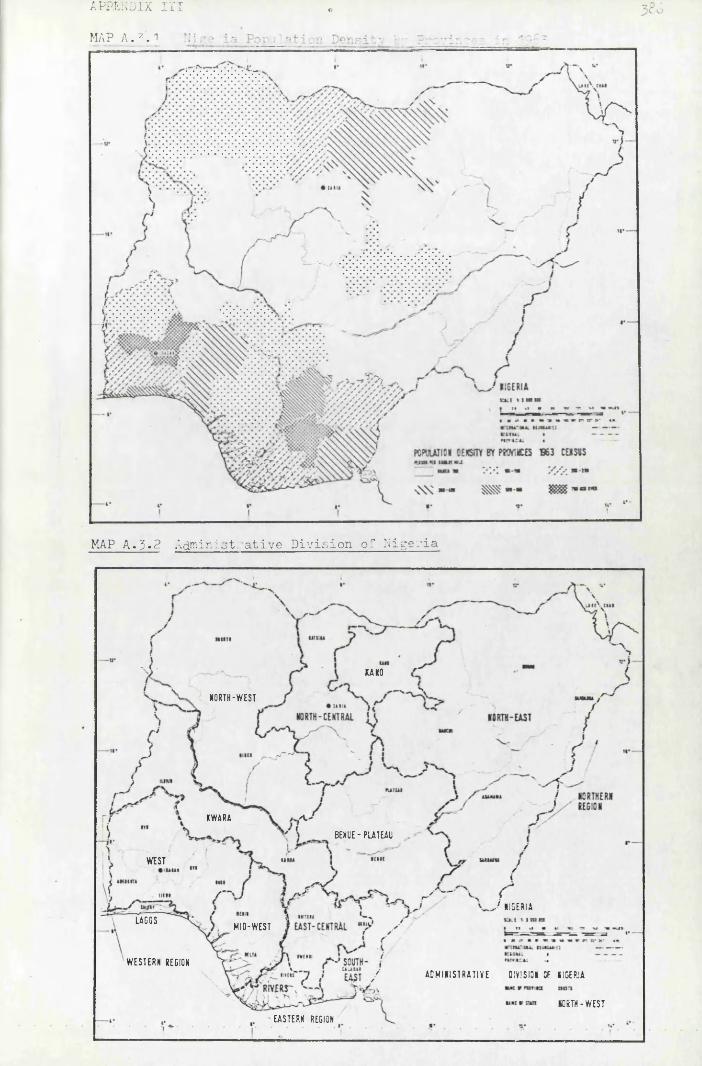
APPENDIX III O
MAP A ■ 5 • i ' '■
—7l‘
MAP A»3»2 Adrniniot ative Division of frigei'ia
KANO
N O RTH-W EST
KWARA AB ENUE- PLATEAU
W E S T
J N IG ERIALAGOS
M ID -W E S T
W ESTER N REGIONA D M IN IS T R A T IV E D IV ISIO N OF NIGERIA
E R T H - W E S TEASTERN REGION

•APPENDIX III
<1)bCa
-p£<uouoftd
• r l
$4O•H-Pai—i3ftofto
r-Hftw
-d
codcodoo
AVOOn
dO•H-Pd.o•Hd-PCO
•Hft<1>bC
'd<D
- puoft0>ft
A
$pq<4EH
> AH V£)ft<4 5 M ftN
8AVO
S Eh O
M< coH H
§ 5esq ft
ft
ft
ft
ft
AVO
pq
ft<4
AVOOn
ft<4SOH
§
S
* 3CD<4
ft
ft
f t
-3- LTV VO • • •
r OO KN
CM OO OJ• t •
OVOO A
O O LA » « •
0 0 0 4 -
O ON VO • • •O CO LA
OO -4- ON • • •A -V O A
VO LAOO• • t(A VO LA
O OO OJ • • •O A - -4 "
A A A - • • •OVOO LA
O LAOO • • •
On A -4-
A - r * ON • • •0 0 0 0 LA
CM A A • • •A -V O -4-
v- -4" VO• I •
A -V O LA
A - A CO • • •CO A - 4 "
LA ONOO ...OO A - LA
nj--4- Q\ v I I I
O LA O
A
v o-4"
A-4"
c oLA
CJv
LA-4-
-4--4"
A
AA
A-4-
IO
VO -4- A - 4 - VO A - LA • • • • • • •
-4" VO v o fA o j
v - -4- OO fA L A -4- i a • • • • • • •
IA OJ f A OJ f\J OJ v -
A - O VO A - LA VO VO • • • • • • •VO A 4 - fA r - r o
OO VO 0 4 r O Ov • • • • • • •
r A -4 - fA i A f \ l o j o
OO O CAOO (A Q OO • • • • • • •LA VO -4* IA v OJ O
-4- r - LAOO fA VO A • • • • • • •-4 - A -V O -4- A OJ r -
VO ON (A IA VO A -V O • • • • • • •VO VO -4- A v~ v O
ON ON OJ VO OJ c - O• • • t • • «
A - 4 - 4 " A OJ OJ c -
O OO A O O O ON • • • • • • •
A VO L A -4 - OJ CM O
A OJ A A - A A OJ • • • • • • •
-4 - A - 4 - A OJ OJ c -
IA C O VO ON H ON ON
4 v O lA A tM r Q
4 OVO 1A 044 • • • • • • •A CO V04 ACM r
ONCO A O O O O n • • • • • • •-4 - VO A - 4 " CM CM O
A A - A -C O -4- -4- OJ • • • • • • •-4 - A - 4 - A O J C\| r -
ON~4- ON J - ON-4- ON OJ OJ A A - 4 - -4"
I I I I I I IA O A O A O A v - OJ CM A A - 4 - -4-
A
-4-4-
VO-4"
CM
AA
A-4"
AON-4-
AA
VO
OA
ON-4-
IA
VO A A v - A• • « I •
r- O O OON
A- A- VO A A-• • I I I
v- O O O O
CO
-4"A
OJ
A-4~
O N A A r v o • • • • •o o o o o OJ
vo
(\J4CO A r• i • • •v“ O O O v-
O•v-A
ON-4"
OJ -4- A - VO • » • • •
o o o o CO
VO
A VO OO A CO • • • • •v- O O O O
A
VO-4"
AA
ON A A CM A • • • • •o o o o o
VOCM A CO A O • • • • •
O O O V-
oA
VO
ON
O AvO OJ A • • • • •o o o o
vo
CM A ON A O • • • • •
v- O O O v-
oA
ON
ON-4-
On A A OJ vo • • • • •o o o o o
A
A
OJ A A- CM vO ■ • • • •
o o o o
VO-4-
VO
AA
O A VO CM VO • • • • •
v- O O O O
VO
CM A CO A ON • • • • •o o o o
ON-4-
VO
OA
-4" ON-4- ON A AvO VO I I I I +O A O A O A AVO VO A
+OA
ft<4EhOEH
ft
387
Oo
ooo
oo
oo
oo
oo
oo
ft<oEH
SOURCE:
Federal
Office of
Statistics,
Nigeria, Population
Census
19&
3 Vol
. 3
(Mimeo)

APPENDIX III DIAGRAM A.3.1 Age and Sex Distribution
7 0 *
65-6S --
i-4 9
io-u35-39
30-31
388NIGERIA TOTAL POPULATION 1 9 6 3
MALE FEMALE
1 M 10 3 1 7 6 5 1 3 2 1 % 1 % 2 3 1 5 6 7 8 9 1 0 1 1 1 2 %
SURVEY SAMPLE POPULATION 1968MALE FEMALE
1 2% Tl 10 9 0 7 6 5 4 3 2 I V . 1 % 2 3 4 5 5 7 I 9 10 11 1 2 V .
ZARIA DIVISION TOTAL POPULATION 1963MALE FEMALE
in n 10 9 S 7 6 5 4 3 2 1% 1% 2 3 4 5 6 7 I 9 10 11 12%

APPENDIX III
GRAPH A.3«1 Population T. ends and Projections in Zaria
POPULATION
9 0000 —
80 000 —
70 000
60000 —
50000 - -
30000 —
20 000 - -
10000 —
5 000 —
1910 1920 1930 1940 1950 1960 1370 1980 1990 2000 YEAR
— -- - - - - - ZARIA TOTAL
ZARIA WALLED CITY ONLY
m in i PROJECTED INCREASE WALLED CITY ONLY

APPENDIX III 390
MAP A.3.3 Administrative Division of Zaria
■&> ** : - MA TOWN S HIP A } -SABONv ^ ,G A R [ . . ..-Ai- a a ?
W ALIED CITY
hk-Y^E kwarbai
, A • V A V S > v „! :A a A ”\N-, . A " . dr _AA;.AA/%* . .
. A ? i K ' s t e v & fKMA., T A ■’*\"■ ! ’ ■ ' ' ■• V •' ;,r 5/4 ; A f e

APPENDIX IV 391
PICTURE A.^.1 Charm for the Protection of Houses and their Inhabitants
UoUaiU?!&sas0K
S g | g § g § ^— W , "V ,-
eaEasasharm was found concealed in a small leather bag hung over the ntrance door of a compound. It is believed to ward off evil s and to protect the house and its inhabitants from every vable mishap.

TABLE
AJ+.1
Land
Use
Inside
Compounds
(Open
Area)
APPENDIX IV 392
r* *a o j v£, a 'r- r f \ j CM
rh£>f\J
cn.) N \ fv. K \ NOV*) r - rg -4
'tV O T- ~ t I/O
N 4- N \ <r~-T1
< VJ
O O M Q CO N 0 t^ v £ > -4 C Q C O r- OJ r - r - NO Oj NO r \ j t - [N.
OJ
c -OJ e CO ia^
o j 1 f\J<\j 0 0 vo vn o j — r - r - r - rg
OjCTn
Cn.00
a a
'£> -3- VO NCM
0NO
vO OJ C/O -T O-OJ
f\J O l CQ \£> NO•4
UOCN-OO UONOGO UOaO SO N \ t oI/O
VO
rNO K , K \ rvj K \ f y rvj r j
qv
O f\J -T r - A- - ■ 00
2 - - - - - «- NO
X - - -
- ) - - -
1*; - - -
*"d OJ OJ r - 00 UO
M J - -4- r - Ov «- r - OJ r - 00 -4-
S3 OJ o j |
O OJ oj !
fn OJ OJ r - rOrOCXJ t - 4 r r * 00 - «- - - 0OJ
M vO OO ■4- OJ OJ <- T- <- OJ r - 0 * - * - UOOJ
Q - - «-
O < - « - OJ OJ
CQ r-OOO -4- 1-£
r - t- NO r - t - NO 0 NO avOJ
< OJ OJ r -NO
IO J - r - r - ON vO -4- -4- OJ t “ O- r r r r r f ^ r r r r r ” r_ r " «- r - r - r - r - r - r - Cv.C .
i f * - OJ NO NO OJ NO 1/0-4- r \ j NO OJ NO NO lA C N .0 0 LJO NO -4- 1/0 CO SO NO 00 vO N>
...f\J rvj K \ co f \ j
( aX D O O
v 0 OJ Oj r * OJ NO
NO J - t - r - av vX) -4- -4- OJ r - £N-
CNtN
WO
Sco
2 ^_ OJ i - < O O O Eh + H- + O
< < < < Eh
OJ
WO<EhCO
OJCn ^
OJ -3- + < CQ CQ OQ CQ Eh + + + + O
< < < < Eh A+
E
A+
E2
A+
I
A+
I2
A+
I+L
TOT
AL
ST
AG
E
3
01 8 NO NO U, + 2 <
h ^ OJ + f i « + Eh + + t ^ CQ t Ol CQ
CQ CQ NO + OJ + NO *"D + - f-C Q C Q C i.U ^t-H C Q
+ + + -f + + + + + + 0 < < < < < < < < < < E H
uo
WO <
2 Eh + CQ
£*«
CQ g
< Eh
vO
WO<EhCQ
* k-3
l i< Eh JO
INT
C
OM
P.
A+
F+
D
A+
C
A+
C+
0
A+
G
A+
G+
H
A+
H
A+
M
TO
TA
L
<
SEh
Q220
u, to u) o o eU Li L, (0•I) 0> CQ CQ U, •10 +» Efc« W W (0 to - (0<U H -H - - to u.
CO CO fc, ^ 4J0> C -X 0) CO■’J "H f-43 3 O O rH 0;u_ 2; X O ttf)
10 CO (0 (0 10 CO §K X X I S XO O O O O O CQO U 2 »-3 X 2 O
l*« co U i CO
CO (0 CO (0 t. Ci t. co- E +> +> +J P TJr, O O O O l f l l OCJ U. In l( In Ci * • 0; CQ CQ CQ CQ U U2 - a> o10 H H «M «H ^ J3 T5 C H H H H - P VC O 3 3 c d 0 3 ( T 5 c COP,CQ(0(0CQ(0CG<002222X2200000000<CQWf M*-3Q«
& O ' no
OJ NO NO
-4* r - OO o j
\D NO vD NO
f\J 00 c\j o j
IA 4 N
N •? IA KN N -T vo C'- NO
CO 2 <0 <1) 2ox:<uco3o3:
o

TABLE
k.b.2
Rooas and Floor Area per Household
APPENDIX IV 393
U) (H
(0
o f\j-* r- KvcO -3- r*CO CN -4T
r- -d-OO r\J r- \0 r\j naoo
S
VO C*-vO lT\ r- K\ r- OJO O O
t- OJ OJ <\J T- ON C VO
CO OOKN QO vo! J>00 r-
N rA O C M A r ‘^6 0 0IT\ OJ C\J N-UMAO
| vo rvj o Oi oO Ovo vOvO Ov *- O v VO C'- oj
O- O- (\J N _OJ_____tA 00 *4* VOvO \f\ l/V-3-On r* r* LT\ co oo oj o
0> 00 CTs \o iTvcO <M ON
00 vO Cn-d n oN vO voCO r* LA <- CMN
lf\COIN
oj O o oon kSO tr\
-t IO\ N <“ vOIN N- O (\j Onr* LA f\l t- -4* f OO CN
N O N N M vo r- VO U> v£> r ( A r
Cn. O -4- On ON OJ -3- rvj
oo vo -4- vo
00 LAOO rvj On iA-4-
to o 0) orH (4
4> 4> i-t 0>rH O CC rH(0 C 10+ Ou to +
Vj v 10 W t o 3e?< I oi
h 0)O O 4> rH +> -P .C *rt
(8 X3 o Tl H

TABLE A.4.3
Hale Members of 77 Compounds by Relationship to the Compound Head
TABLE
A.4.4 Female Members of 77 Compounds By Relationship to the compound Eead
APPENDIX IV 39k
m°,i
+oZ 69-SS.*j£-0*r
*7l--£
*7-0
A- oj oj vp vr> lA IAVO fA fAO,
0O -3* OJ OJ OJ OJ
J- O AJ o ia fA <v£> r-OJr ^ CTn -d" OJ oo <
lA lA r- HO
quasqy *dui9£pSMOp t f\ PSOJOAXQ patJjHH dl3uxg
*3uts paqdopvoj OJ
OJ IA lA-d* fA r- fA OJ
Q U © k 4> k 4) 4*0) +> X•g>!p) 3 to
24> (0
•O 3 d 3C (0 O OJ3QWOp, CO 10 to SU O O O i
(0 Qas a
co w to w m
x xx x x pO O O Eh
»2 3 £XXX(Q(0(0(0<(0(0(0<
-P CQ CO k(0 (0 - *H k C/3
co [Q CO (0 <
3 *H - * >as to X 10 10 -H
(0 to 4) H <H tok -H > H H CCQ CO-H 3 OS O3 £ x c/3
(0 CO 4) 4> 4)
OJ KN -3* lANO A-COOnO r- OJ fA«4". LA VO OJ OJ OJ OJ OJ OJ
> ‘H CQ
a> co u
o to ia« m
x x X X X X O O XON O PU fA -4* fA fA fAOJ fA
Q (0 'd
k X &h : d +>> X Ogg
T*no;L+0
69-SS*?£~0*76£-ft!
*7U-S
*7-0
NOIA
fAO IA OJ *-t- vo OJOJ
fA OJ OJ LA r-lAAJr LA r-
■d* OJ OJ OJ
fA O r-
-d- O IA fA r-OnnO *
quasqy ‘dnai OJ oi oj *paAopxA.paoaoAiapaijj
9jSuzs •Sutg paqdopy
OO r- OJ r-OJ OJ vo <“
; -*■ LA
J - t ON CO
3 to CO P° HOi to to to *xQ . . . f-,o x x x OO O O O bH r- OJ fAJ-
k k k (0 to4) 4> 4> k kx i x x a* a+J 4-> 4-> P 4->o o o w tok k k ’«H <HCQ CQ w C/) t/J
. 'I'Ui ICQ < CO to to tQCO-4
H| o O O O O I VOA-COOnO r- OJ IOJ-
a a x id
k X © co4) 4> k k XX* XX4-> <P U)O O 4) rH *m■a *aX X
to to to to <- . - H«X X X X OO O O o Eh
-P p c0 nt Uh k« I to CQ 10 «jc •
3 3CJ u,to w *c q to a» a* 4> -jC- to < - - ! • x x jc t*. x ■ ~xxp xx-p P-PplUOObHOOOOOfeHj
H H tj I 4) 4> < !
LA VD A- OO On

APPENDIX IV 395
TABLE A.*4.5 Djstribution of Hou<‘hold Si/.eii
Compound Head's Household Dependent Households Total HouseholdsNo. of pers. per household
HouseholdGroups
No. of households
Per cent of
HouseholdGroups
Total No.of
personNo. of households
Per cent of
HouseholdGroups
Total No. of
personNo. of households
Per cent . of
householdgroups
Total No. of
person
11 - 2
13.9
1 227.2
2 317.8
32 2 4 29 58 31 623 3 - 4 5
14.315 25
36.775 30
27.890
4 6 2k 17 68 23 925
5 - 610
24.650 17
23 -785 27
24.0135
6 9 5k 10 60 19 1147
7 - 86
16.9kz 6
6.2kz 12
10.584
8 7 56 1 8 8 649
9 -106
15.65k 5
5-345 11
9.499
10 6 60 1 10 7 70
1111 -12
715.6
77 10.9
11 86.8
88
12 5 60 5 60
OVER 12 OVER 12 7 9.1 106 7 3.7 106
TOTAL 77 100.0 603 114 100.0 464 191 100.0 1,067
AVERAGE 7.8 4.1 5.6
TABLE A.4.8 Average Floor Area per Household and Person According to Household SizeTotal Floor Area Sleeping Area
No. of person No. of No. of Average person Total Average area in Sleeping Average sleepingper household households person per household floor p m2- per area in area in perarea m household person m2 household person
1- 2 31* 65 1.91 586.7 17.2 9-0 312.8 9.2 4.83- if 53 182 3.^3 1*614.5 30.5 8.9 836.3 15.8 .4.65- 6 46 249 5.41 2 ,369.6 51.5 9.5 1,098.6. 23.9 4.4
OO1 20 148 7.k0 1,35^.2 67.7 9.1 598.3 29-9 4.19-10 18 169 9.39 1,745-5 97.0 10.3 682.0 37-9 4.0
11-12 13 148 11.38 1,538.8 118.4 10.4 661.5 50.9 k.5
12+ 7 106 15.14 1,264.1 180.6 11.9 498.3 71.2 4.7
Total 191 1,067 10,473.4 4,687.8
Average 5.59 54.8 9.8 24.5 4.4

APPENDIX IV 396
PLAN A.*f.1 House 68
fsssxx:
S s
PLAN A.k.2 House ?1

TABLE
A*5*1
Ibadan Consumer Pri
ce Ind
ex Base:
Average
1953
= 100
Ar rxA'iDxA V
CO 73 COoou<u o •H > u uO <0 X3 CQ
PO 03PUOftCO
EHbOS3•HX3-POi—Io
ooo tj d d d i~cx i 3 oO S*J E-i
73 73 S3 O J4 -H O 3 t, ft «-pS3 Xo ho
•H •H-P Hcd73 73o §o 1—1o <Do< fiCOS0)-pM
rvj
vo
A
v oLA
CO-PXIto•H<1)
v - A - lA O Q LA A A - A r - O A - fA A f A f A rA f A A - 4 - VO A CO
r- VO A- fAoo A O VO v VO fA OOOrrr(\|tv.i^J-4-
A O fA fA A V O A-4" A CO A O rAJ- 4-4- -t A U ' A O M S r-r*s— r-r-*r*-r- v- r*
ANVO r N O O f^ONONCO-4- -4- -4- -4" oj A A A OJ OJ OJ
v- A A A ^ - O O A A OJ -4- A A-4* oj OJ A A-4" A-4- A- A r- r- v- r- v- r~ v~ r~ r* OJ
r O J O V C O O O f O C O N N OJOJr-r-OJOJOJOJOJ A-4"
A I N O O A r- vO v- vo oo VO A OJ A OJ OJ A-4- -4- A-4- VO A r* r~ r- r- r- v *— r-
v- OJ A-4- A V O A-OO O O r V O V O V O V O V O V O V O V O V O A- A- A A A A A A A A A A A
OO
AAAa)bOcdShCD><
•OJA|<aFQ<Eh
<0<DC)
3 9 7
-P *HS >o S-i *f t 73 <DCO 5 CQ A CO O A O O O c - o O r A v O
v - A A A - 4 - A OJ A - 4 - p J-3 j-t V V - r - V - V - f V - V - * - * -S-I <D
EH X-PO
CO73oO
OVO O O O O v O J A A O A A
S r - ^ - O r - r - v - - 4 - i r \ A-O O0) r - v v - r - r - r - T - r - v c~
X3-Pa
b0HH*H A CO A -V O A O O O O O O VOX V OJ OJ A A A - 4 - A - O A A- p v - r “ r ~ v - O J * - r -o
i—1O
c& -PX A V O O O O OJ OJ A A -----d- OJrH b0 -4 -V O -4 - A A A A A A r -
CD - r l r- r* r- v r~ v~ OJ
Ooo 73 cd A O J - 4 - O J - 4 - v - r - 0 O A - 4 * A5 Q H A A A r- r- r- r- oj v OJ
x i 3 o r- r~ r- r- r- r-r~ r- vo w
EH
COv o OO O A A -V O OJ A A -4- -4-
S3 OJ A A - 4 - A - 4 - A V O A - 4 *•H v - r - r - r - r - r - r - r - v- vSh
«
73o O O r- A - A A OJ r - A A OO A C J r O r A O J r A A O
f t v— x~ v r- r- v r - r*OJ
S3o
•H *Pcd
73os OO O J O J O J O J O J O J O J O J OJOJB r~ r- r- r- r* r~ r- v r-O r* r- r- r- r- r- r* r* r- r*oo<u
COsa>
p O A OJ A O O OJ r OO O A - A-OOH o r OJ r r OJ A f\J A - 4 - A v O
v~ r- r- r- r- r- r- r-«— r~ r- v(— I<—1<
COp r- OJ A - 4 - A v O A -C O A O r-X3 V O V O V O V O V O V O V O V O V O A Ab0 A A A A A A A A A A A•H v- r- r- r- r- r*<D So
urce:
Federal
Office of
Statistics,
Nigeria
Annual Abstract of
Statistics
1971, Lag
os 1973,
PP-
106-7

APPENDIX V 398
■A3IS A.3-3 Occupational Pattern Survey Samplem a mOccupationCE DEE T.
Secondary OccupationCompound HeadAgr. S K T T-T
Dependent Eh.EeadAgr,
K T M GT.AGEIGUISURE Parmers or Farmlab. 1C 10ARE ai:d craftsTailor Embroiderer Mailam Builder Y/eaver, Dyer Butcher Barber, Baker Other Crafts Sub-Total
1811742
2 41 411
63129
1010142
1010
242
21 4 9 7 0 16 3 1 3 5
1 512463119
5 1TRADETextilesProv.+ cooked Food Potash (Patron) kola Puts Miscellaneous Sub-Total
109322
1112
144
2121466
26 32 55 11 21 1 5 17
1 41 4442
SERVICE P.A. Police ArmyP.A. Clerk Gen. Lab. Watchmen P.A. Messenger Car Driver P.A. Vet. Assistant Gov. Produce Exam. Station Master P.R. Sub-Total
1045654321
22 40 1 5 21
KISCBILAPEQUSRetiredInvalidStudent A.3.U. Kano i.'o Response Sub-TotalGrand Total
4 17 7 1 1 4 1 9 1 26 2 5 5 8 5 1 6 7
4
1
T1 2 5
CH = DEH = T. = Agr. =
Compound EeadDependent Household HeadTotalAgriculture
S = K = C = T = M = GT. =*
Agriculture SelfAgriculture kodago (Paid Labour)CraftsTradeMi s c ellane ous Grand Total

TA3I.B
A.
5* 4
I.u-Tiber of
Valid and Omitted
Households
TAI B
A.' .
6 BiCTOI'PUTIOR
OF I!TCCr
3S FOR
DIFFBRE''^
APPENDIX V 399
W I CNJ r— CM rr\v*> V - r- o F 6
'A6\A
NT f — U \ o O
v ^ ir\ c\j t— t- -sj- n m
c
o
o
o o o
31knC\J oo
rHcJP •O OEh » 147 ON
VO o©CO VO COKN ooXc. o© S3 Q
oc— ■r■sf ■*y
X33ncd©
oO Io
oo
p , •5 Oo ;. o
77 c—t"—
Valid ©pp•H
tlo
X©013o;u
t\jpo£-»
CO CO C\J
cnj \o w
pt ”3 P
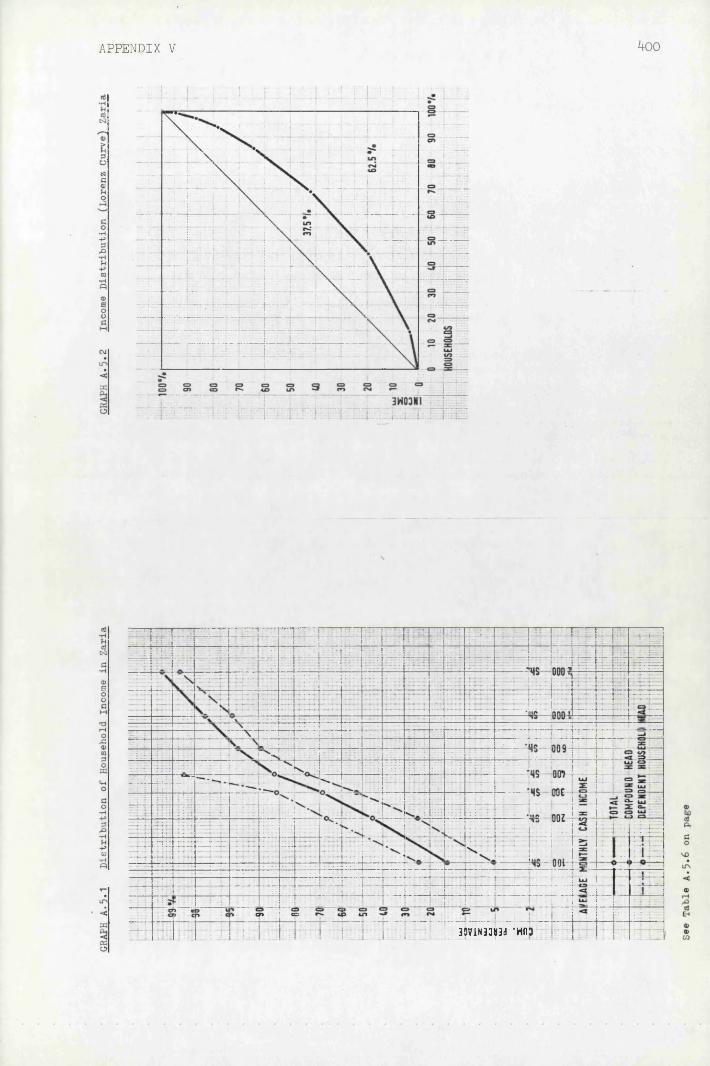
30V1H33B3d 'W ID
APPENDIX V

TABLE
A.6.1
PRODUCTION,
EXPORT
AND CONSUMPTION
OF SAW
NWOOD
IN NIG
ERIA
TABLE
A.6.3
Production and Imp
ort of
Cement
in
Tons
APPENDIX VI 401
) -J- T- CO <- 00nO <“ K\ fA fA lA lA vO -00 00 00 00*“ CO VO v£> O
AJ lA fA CN-3- O K>C^Cn-VO ON On LA
00 lA C'- fAvO O A- rA fAJ- c-O -3* CO rAOO lA vO -3* VO J- vO AJ -3* lAvO C'-OOOOOOOOOO lA
fA-3- LA VO O' OnCn-iAUMA
O *“ <M fA-3- lA NO I>-O0 ON O VOVDVOVOVOVOVOVOVOVD Cv- ON ON ON ON ON On On On On On ON
ao
§
ao•HPep(0(3OOs
<4->*4OP3
VO<a
bC
<0 <P O ♦H ft. «m r*t. O H fw 4) ft Onbo a >**- •H H ,0 CN.?* rH TJ 0,7 4) 4) 0) VO- 4) H W rfl *H O W ft •• •a a piPT3 Q O ft (d c O T3ft (0 lAO On
10 B -M to Oft U 0<hP tt W ft
18 3 8Ht3H
o >> u >»3 ft 60 3 4) 4)C T3<3,9
bo ft,
+> ON ,Q ON& I <0 »H i a +>i *3 u>
)5 H fl)ft* 4 a v 0 d<p

APPENDIX VI k02
TABLE A.6 .6 Estimnted Consumption of Steel Products by Main Nigerian Industries In 1970 •000tons
Type of Industry
Tubes & Pipes
Bars & Rods
Sections Sheets Corrugated Iron Roofing
SheetsPlate Tin
PlateWire Other
SteelTotal Percentage
Construction .Oil Industry .Enamelware .Commercial Vehicles
.General Engineering
.Other Industries
65.O160.0 .
5.0
70.0
5.0
27.010.0
10.0
5.0
4.035.05.02.0
2 .0
'+0 .0 8 .07.0
5.06 .0
6 .0 6 .0 7.0
214.0177.035.020.0
23.0
21.0
43.736.17.14.14.74.3
Total 230.0 75.0 52.0 48.0 40.0 20.0 12.0 6 .0 7.0 490.0 100.0
Percentage 46.9 15.3 10.6 9.8 8 .2 4.1 2.4 1.3 1.4 100.0 -
Source: British Steel Corporation, Marketing Service (Export) "Nigeria Economic Prospects and Steel ImportPotentials in 1975" Compiled by Ifor A. Ffowcs Williams London, Sep. 1970 (unpublished Report) p. 15.
TABLE A.6.7 Federal Work Register for Building and Civil Engineering Contractor in 1970Category A Category B Category C Category D
Up to £N.10,000 £N.10,000-£N.50,000 £N.50,000-£N.100,000 Over £N.100,000BuildingContr.
Civil Eng. Contr.
BuildingContr.
Civil Eng. Contr.
BuildingContr.
Civil Eng. Cintr.
BuildingContr.
Civil Eng. Contr.
Expatriate - - - - - - 17 20Indigenous 778 9 198 20 21 3 22 17Total 778 9 198 20 21 3 39 37Source: Pearson, R. Limitations of the Choice of Techniques in the Construction Industry in Developing Countries:
A CASE STUDY of Nigeria. Unpublished M.A. Dissertation University of Sussex 1972 p.
TABLE A.6 .8 Structural Development of 77 Surveyed Compounds from 1?th December 1963 to 1st November 1968
Toted number of Rooms 1st Nov. 1968
No. of Rooms built between1963 - 1968
No. of Rooms disappeared between
1963 - 1968
No. of Rooms with Roof- structure converted between
1963-1968
Total No. of Rooms 17th Dec. 1963
No. of Rooms Decreased1963 - 1968
No. of Rooms Increased 1963 - 1968
Total Growth Rate % 1963-1968
Annual Growth Rate %
A. PALACE AREA 35 COMP. No. 2m No. 2m No. 2m No. 2m No. 2m - +
Thatched Roof Mud Roof Corrugated I.Rf Ceil.Gd.Flr.Rm.Total
181322
616
1,419.62,746.4567.7
60.8
438219
311.8609.0194.1
606
•25323
197.6272.336.3
223256
103
» 426651
3
- 18.8 25.8
510.0 100.0
- 3-95.3104.5
570 4,794.5 144 1,114.9 66 60 506.2 492 -42 +120 15.8Increase 't8~ ' -+ 3.25B. MARKET AREA 42 COMP.Thatched Roof Mud Roof Corrugated I.Rf Ceil.Gd.Flr.Rm.Total
1803768714
1,444.42,985.8815.9123.4
175115
114.2381.0162.4
717 15
434112.2391.6
31.0
2493642910
6912584
- 27.7 3.3
200.0 40.0
- 5.70.741.0
657 5,369.5 83 657.6 78 62 534.8 652 -69 +74 0 .8Increase ~5 + 0.16
C. COMBINED AREA
36169814820
2,864.05,732.21,383.6184.2
6013334
426.0990.0 356.5
13113 40
757
309.8663.9 67.3
4726203913
11178
1097
- 23.5 12.6
279.553.8
- 4.82 .657.3
77 COMP.Thatched Roof Mud Roof Corrugated I.Rf Ceil.Gd.Flr.Rm.Total 1,227 10,164.0 227 1,772.5 144 122 1,041.0 1,144 -111 +194 7.2
83 + 1.47* Not known.

APPENDIX VI
TABLE A.6 .9"What Improvement do you Think the Compound most Needs?’1
Answers:Number of Compound Heads Percentage
1 Corrugated Iron Roof 31 40.22 More Sleeping Rooms 15 19-53 Cement Plaster on Walls 9 11.74 Change Thatch to Mud Roof 7 9.13 If New Rooms, Walls in Concrete Blocks 6 7.86 Cement Floors 1 1.37 Outdoor Working Platform from Cement 1 . 1.38 Electricity 1 1.39 Bathroom 1 1.310 Other Improvement 2 2 .611 No Response 2 2 .612 Satisfied 1 1.3
Total Compound Heads 77 100.0
TABLE A. 6 .10 Age Distribution of Rooms1 2 3 4 5
Year Age No. of No. of Cum. PerRooms Rooms centageBuilt Survived
1968/69 < 1 48* 967 100.01966/67 1- 2 119 919 95.01964/65 3- 4 99 800 82.71962/63 5- 6 70 701 72.-51960/61 7- 8 80 631 62.61958/59 ' 9-10 73 551 57.01956/57 11-12 79 478 49.41954/55 13-14 54 399 41.31952/53 15-16 40 345 35-71950/51 17-18 37 305 31.51948/49 19-20 34 268 27-71946/47 21-22 16 234 24.21944/45 23-24 7 218 22.51942/43 25-26 17 211 21.81940/41 27-28 14 194 20.1
1940 +29 180 180 18.6
Subtotal 967UnknownAge 299Total 1,266
*Includes 39 rooms under construction

TABLE A.7«1 Breakdown of Cost by Element of Building Lagos 1961
I In PercentagesRehousingSinglestorey
FreeholdSinglestorey
RehousingTwo-storey
FreeholdTwo-storey
Foundations and Walls 38.6 33-1 37.1 28.9Roof 20.3 16.9 7.8 7.0Doors and Windows 11.2 9.^ 9.7 11.6
Sanitary + Electrical Installation 10.*+ 6.1 9.2 6.9Finishes to Walls,Floors+Ceilings 8 .2 21.8 1*+.3 23.1External Services and Drainage 11.3 10.6 10.5 8 .1
Stairs and First Floor - - 11.*+ 1*+.3
Source: United Nations Housing in Africa E/CN/1*+/H0U/7/Rev. New York,19o5 Table *+.15 p. 106 (Information supplied by Government)

APPENDIX VII 405
TAME A.7.2 Institutionalised Savings in Nigeria from Dec. 1962 to Dec. 1970. Cumulative (f.N's thousand)Dec.1962
Dec.1963
Dec.1964
Dec.1965
Dec.1966
Dec.1967
Dec.1968
Dec. .1969
Dec.1970
Savings and Time Deposits at Commercial Banks
41,644 47,135 5k,214 70,509 81,258 65,621 91,776 107,703 168,359
National Provident Fund 1,092 4,453 8,893 13,664 18,556 21,769 25,442 29,298 33,690
Post Office Savings 2,978 2,96k 2,949 2,745 2,657 2,424 2,465 2,534 2,155Savings with the Nigeria Building Society - 2k 2 387 481 587 689 883 1,007* 1,320
Premium Bonds, Savings Certs. & Savings Stamps<=
8 56 88 134 183 211 94 90 67
Total Institutionalized Savings 45,722 54,850 66,531 87,533 103,241 90,714 120,660 140,632 205,891
Gross Domestic Product at Curr. Factor Costa
1,315,400 1,403,200 1,457,000 1,540,300 1,605,000 1,383,300 1,570,400b1,639,100b1,742,900
Total Institutionalized Savings as Percentage of GDP
3.5 3.9 4.6 5.7 6.4 6 .6 7.7 8 .6 11.8
SOURCE: Central Bank of Nigeria, Annual Report and Statement of Accounts 1970 Table 33 P* 65a. Annual Abstract of Statistics, Nigeria 1969, Table 13*1 P* 142 'b. Estimates, Second National Development Plan 1970-74, Table 5 P« 5”!c. The issues of Premium Bonds, Savings Certificates and Savings Stamps have discontinued since Jan. 1968d. Data for June 1967 to Dec. 1969 excludes the eastern states.e. From Feb. 1969, figures have been revised to exclude deposits repayable on demand
TABLE A.7.3 Analysis of Current Level of Loans and Advances classified by purpose from Dec.1961 to Dec.1970 (£N*s thousand)
Category of Borrower
Dec.1961
Dec.1962
Dec.1963
Dec.1964
Dec.1965
Dec.1966
Dec.1967
Dec.1968
Dec.1969
Dec.1970
General Commerce 20,552 30,834 37,526' 36,214 30,633 91,684a 82,471 58,868 63,293 83,771Manufacturing 3,296 5,857 9,535 13,131 14,500 19,560 19,802 18,516 20,948 38,194Real Estate and Construction 5,541 5,185 6,444 5,760 6,469 12,767* 11,182 9,932 8,836 12,978Transport and Cozmunication - - - - - 5,137 4,361 4,580 4,914 9,487Personal and Professional - - - - - ■ - 3,636 3,607 5,750 11,630
Agriculture, Forestry and Fishing 12,614 18,039 19,672 42,527 53,412 2,423a 1,851 1,924 2,185 3,496Credit andFinancial Institutions 2,432 868 1,324 3,648 1,618 3,788° 4,569 4,565 2,368 1,361Government 851 737 694 933 990 629 836 1,433 2,445 648Mining and Quarrying 474 526 577 577 644 734 996 607 1,542 3,292Public Utilities 102 178 980 779 1,644 579 1.743 1,192 838 339Miscellaneous 14,128 14,811 12,716 18,837 25,118 11,744° 6,038 7,635 8,246 10,479Total 59,990 77,035 89,468 122,4o6 135,028 149,045 137,485 112,859 121,365 175,675
SOURCE: Central Bank of Nigeria, Annual Reports and Statement of Accounts 1963-1970a. Revised to include loans for financing export of agricultural products which wehe formerly classified as "agricultural
loans".b. Includes call money outside Central Bankc. Loans to fishing undertakings and real estate formerly included in this category have been reclassified as shown above.d. Includes loans for real estate; before Dec. 1966 construction only.

APPENDIX VII 406
TABLE A 7.4. COSTS OF CONSTRUCTION IN ZARIA WALLED CITY OCT. 1968. 6.95m
PLAN v V / / / Z /// // ///777777)rV77I77y
8.0 m" 8.0 m'____/ Eartlien
In Shillings Two-roomed Building with 3 different roof types. Height of mud walls 2.80m.
f 0.40m
ELEMENT OF BUILDINGWALLS ( 26.3 m^ mud)a Lintels11 + Shear Reinforcement
+*?■ 0 .35mThatched Roof Mina Max*3 ^lax
Mud Roof Min 1 Max ' $ Max
Corr.Iron Roof Min ! Max : Max
14 192-31.338 ; 220 2 5 .5 38 220
ROOFBeams, Thatch + Rope Azara Beams
” + Corr.Iron Sheets163 235 38.5
DOOR ALP WINDOWS1 Door 0.85 x 2.00 m2 Windows 0.4 x 0.4 m 45 45
338 459 53.1
15.3
762 1,030 71.8
7.3 45 45 l 5.2 45 45
FINISHESFloor Cement Screed Int. Walls Whitewash Out.Waterproof.Plaster
62 140 22.9 62 ; 140 1 6 .2
3.1
62 i 140 ! 9.8
TOTAL 284 612 100 .0 483 I 864 100 .0
COST PER sa.m. in Sh.
jo OF MATERIAL COST OF LABOUR COST
17.7 38.2 30.2 I 54.0
46.453.6
55.844.2
907 1,435 100.056.7 89.7
. j. • 63.1< I; 36.9
IMPROVEMENTSFlat Mud Roof^ Corr.Iron RoofTOTAL in Sh.
S256 ; 398
420
256 : 398 I 420
571.571
COST PER sq.m. in Sh. 16 ,0 I 24.93* tMaterial Cost only Material and Labour Cost
26.5 '35.7
Labour Cost, experienced builder c. 10 shillings per day, assistant builder 6 shillings per day and unskilled labourer c. 3 shillings per day. ^ Material for mud walls are taken from a dilapidated hut inside the compoundj Extras will have to be allowed if mud is carried from borrow-pit to the compound.See page f PChange thatch into mud roof. 0 Corr.iron sheets on top
of Mud roof.

APPENDIX VII *+07
O£4->Waoo(mOo«TJ£
•O4)T34)4)Z(0
Co
ITS
JrI
co Stag
* 4
Stag
* 5
Sta
g*
33
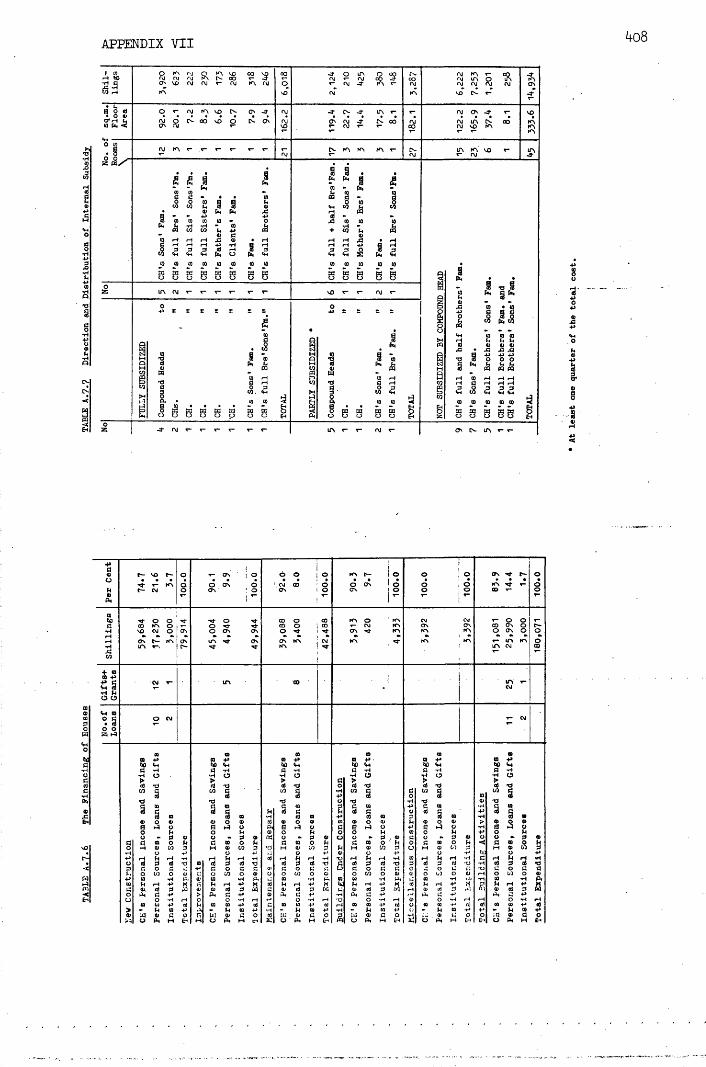
TABLE A.7.6
The
Financing
of Houses
TABLE
A.7«7
Direction
and Distribution of
Intern
al Subsidy
APPENDIX VIII tf) W tos-a
O Kn r.j QM ry Aj K\O' r\l (\JCO vO ft
SO f-
o r- r\j K\ VOgj 00 SO ■J C- -J- lA i-£ f\j £ p- oo
ryj On -?■ r-f\l lA N 00
o w. §o ov U v—Z
^ K> KN ITS K*\ SO r-
• - -PW 10 CO -
<H <f-i *W Ph O 01 <*HCO to to » to CO CO8 B B 6 8 8 B
o td w k tc wo o o o o o
Pm ^ CO *
■ a *
<h «h £ Pm <h5 B 8 8 8
IIA A4-> -Uo om m
os tv lA «-
t- NN
o oCO WS O 1ON C— NN ON
H © CO
0>. rt 3 ^
o 0i h e-*
CO<0 P ©CO Pto <mg *h to CmG -hTj ^ C ► *t ^
•HP 5 §G <0 4 G g 1 sffl a 4) O 0) P<0 rt© o0 ^ 0OO ~ 3 ©
Coo6 ^ Oo *»
a co o uW © tO 2 n G « M ©rl P H -H rH Gid 3 rt 3G O G C o co o o g C O o toCQ *H H M rH -H * CQ UG r-t^ c PO *H rH •M'U Hi g o(0 (0 +» rtPh a ptu a> g ot> ' 0i M fr«
rH•H&
M ©- U;g ©CJ> Gi
At lea
st one qua
rter
of the tot
al cost

APPENDIX VIII DIAGRAM A.8.1 Climatic Data Ibadan
TEMPERATURE AVERAGE OAILV M A X , M IX 1 3 4 0 - 1 9 5 1
RELATIVE HUMIDITY AVERAGE OAILV AM. P M ^ 1 9 1 9 -1 9 5 1
1 0 0 V .
m7B.0
107.10JL00*/. ttit
5 1 050.0 56.05 1 .0
uv.
RAINFALL AVERAGE M O ITH LV 1 9 4 0 - 1 3 5 4
300m m
250 mm
200mm170 .2
144.0150mm
76 .2 73 .7
10.2
SUNSHINE HOURS OAILV M E A I HOURS
1 0 OJTA AVAILABLE
WIND DIRECTION P R E V A IL IN G w in d D IR E C T IO N
*
JAN. FEB. M A R . A P I , M AY. JUN. JUL. AOG. SEP. OCT, NOV. DEC.
10 0 iTA AVAIt A IL E
( I ) OBSERVATION TAKEN AT 1 .3 0 ANO 1 2 .3 0 O.M.T.

APPENDIX VIIIPICTURE A.8.1
410
CH
UR
CH
AN
D M
ISSI
ON
H
OU
SE
AT
IEA
DA
N.
C. 1B5
B

APPENDIX VIII *f11
MAP A.8♦1 lbs dan: Relief and Drainage\ \IBADAN: RELIEF AND DRAINAGE
/L
m ;
o
A.8 .2 Ibadan: Principal Localities
IBADAN: PRINCIPAL LOCALITIES
HNWm IMMK
jsm
tim
am

APPENDIX ' VIIIPLAN A.8.3
Vl2
THE OYO AND IBADAN EMPIRES IN THE 18th.AND 19th. CENTURIES
N I 6 E R I AOLD OYO
R. NIGER
R.BENUEQpnaso, “ • ? OYO *a 0SH0GB0 j]
y^ • IFE
° ° O a n a o c ADO-EKITI
^*°»o«.OBOoooaONDO AKURE
ABEOKUTA> oooi aaaeaga
PORTO NOVO
BADAGRI LAGOS
APPROXIMATE LIMITS OF THE OYO EMPIRE
AT THE END OF THE 16 th . CENTURY
lu a a a a a APPROXIMATE LIMITS OF THE IBAOAN EMPIRE
1660* 1880
- - - - - - - - - - - APPROXIMATE LIMITS OF YORUBA SPEAKING PEOPLE
- - - - - - - - - - - INTERNATIONAL BOUNDARY
Source: Awe, B. "Ibadan, its Early Beginnings" in The City of Ibadan ed. Lloyd, P.C. Cambridge 19&7, P« 12

APPENDIX VIII 413
TABLE A.8.1 Important Rulers of Ibadan
Bashorun* Oluyole Early 1 8 3 0 ' s - 1 8 4 7
Balogun Ibikunle i r 1 8 5 0 ' s - 1 8 6 4
Otun Balogun/Bashorun Ogunmola i t 1 8 5 0 ' s - 1 8 6 7
Are Onakakanfo* Latosa 1 8 7 2 1 8 8 5
Balogun Osungbekun 1 8 8 5 1 8 9 3
Source: Awe, B.A. "The Rise of Ibadan as a Yoruba Power in the19th Century" Ph.D. Oxford, 19&4, p. 36
* Bashorun and Are Onakakanfo are titles which combine the military and civil leadership of the town. These are imperial titles which can only be taken with the consent of the Alafin of Oyo.

APPENDIX IX
TAELE A. 9.1 Type of Land Tenure of 63 Corr.rounds in Ibadan 1968
Number Percentage1. Inheritance
Houses 32Land 4Total 36 57.1
2. PurchaseHouses 1Land 13Total 14 22.2
3. AllottedHouses -
Land 11Total 11 17.3
4. Long Lease (Rent)Houses 2Land -
Total 2 3.2
Grand Total 63 100.0
TABLE A.9.2 Land Use in lbadan City 19^5
Hectares Percentage
1. Cultivated Land 4,049 39.02. Built-up Area 3,471 33.43. Fallow and Woodland 1,954 18.8
4. Forest Reserves 780 7.35- Lakes and Reservoirs 125 1.2
Total 10,380 100.0
Source: OYZLESE, J.O. "The Growth of Ibadan City and its Impact onLand-use Patterns, 196l-6pM in The Journal of Tropical Geography, Vol. 32, Singapore 197^• This Table represents an extract of Table 1 and 3 on pages 51 and 5h.

TABLE
A. 10.
1 Population Gro
wth Jpb
adan
jlit
g TAB
LE A.P
.2
Area.
Population
and Uumber
of Houees In
Ibadan
City
APPENDIX X
*1--P*• 4)o; tou a4) O ^ U4
KNW r r * r - r ( \ j r r r r ON VUN^CVJSO O UN O CM CO GO NN CM NNi-i-rC\Jr(\jr<\|rrrWCJW CO SO CJs On O *“ CM O On vo 00 ON M r O l W C N J ^ O O r t- CONN NN CM CO vr vr cm ii
«
SO
i ouBei p.
Hect
are
O^OOOrOr*incsjOCOOJ CO KN rr\ r- cvj CVI r- CM N\ r- CM r<NCM MO O CO vj" v- r^-UNf-M'M'OQNM-r- »- r C\J r- CM t- CM CM CM CM VO VO r* NN UN NN VO NN CO C“- NNCM rtNJ | | 1 UNCM
LTV
i;o.
of
Hous
es
t"*- CO IT\ ON CO v O ITS NN O ON CO NN t"- UN O CM NN OS GO NN UN ON UN NN C— NN (— SO C— UN 6,597
i
ON o O O O CM t-UNttUNONCMC— O NN f*- vf NN UN CM CM CO M3 t—- UN NN r* VO wo un un on t- r- UNO T~NOC—OS
O O CM t— ON O CO VO O O UN ON UN t**“ UN UN UN t— C“— O CO CO SO v/ NN NN UN SO M- M-
0£6‘S I
— CM UN so ON xr | o r*- un 1 OvCOoCM
Pers.
p.
Hect
are O m~\ t- \o y- un vo c— on cm vrir\(VJ ON r* W M) f-< VO -U r- t'— OS^i-NNvrNNNNNNNNNNKN
r csfr !
O O CO CO O UN NO O NN CD CO NN ON vr O C— -CM CM CO NNO SO N\0 CM CM V CM 1“ CM NT NO UNCMCM
M-ajr^i-M-^OCOT-r-r* UN r- NN C* O ON CO ONNSO^C y- r - r- UN NN r-
CMnn ON r— CO CM UN ON UN COvrSO
NS
Popu
la
tion
t— t-t'-OOSOUNi-t'- OCMUN NN O -stf- CM UN ON ON ON O KN UN NN CD 00 UN NN CO CM r-T-VO VO ONO CM C— t*— UN CO
CDNNONNCM
CM CO O UNUNvO NN O UN NN NS ON CO ONCMCMUNCM-sT^OCMOT-vrC-'UNUN r- O CD CO OOONi-NNOsr— r*OCOON r— ON ON CM CO C— UN r- O NN CM NS O r- i- r- CM i“ t- f (M
1 9L£‘8il
1
KNm -OSO CO M- V O OJ O O O J O O U N r O O r a O UN ON Vf CM CD VO CM SO OS ON OOUNOONP^r UNOSONNUN CM CM f- UN f—
UNONCMCM
■vt t— CM CM O CD so NN ON O NN OUN NN UN P- ^ NN *-
UNOCMo
oUNCMNNO
CM
Area
Eect. CO CM ON CM CM CM CO UN OS
UNf- NN ONO UN O CM i“ «*- UN v-NNCMv-NNCMNNCM^-CMUNCMosCM
C— ON T- f—SO TVO OONVOsOKN^NNON NO O r- f-OVtfNT- t- CO CM SO ▼- C*— NN [■— tj- *— VO i-KNCMKN^J-UNCMCM vj-ovj*00
UNO T- UN NN vf -sf M} r - CMNN UN f- ON UN UN *— ON CM UN CD NN NN *— CM C"— CM CM CM UNO i- T- i- O t- r- CM t-
NNor-
NN UN CM■r o cm ««*• CO vr vr UN C— NN Os CO
t- NN
Vi’f—CMONO
NNOr-os
-
Ward
r-Wr-CNJt-T-^T-CvjT-CNJ
ft to CO
1 Total
1
NN UN O f -CO NN J*nO NN UN CM NN W W H W W W o! o! ^ J j( > >
W CO CO « £4 Total
J
NN vr UN ON UN t*-NO f-M'LAO
W W s £3cC+»o£h
M.6
S.V.
B2.
W.9
Abad
ina
Total
|CRAHD
TOTAL
|
Column
I
GROUP
I
GROUP
IGROUP
II
GROUP
IIGROUP
III
GROUP
III
GROUP
IV
GROUP
IV
OJ

developed
during
the colonial per
iod up
to the Sec
ond Wor
ld War
, whi
le the
APPENDIX X 416
half of the nineteenth century prior to the British occupation in 1893'

APPENDIX XMAP
MAP
A.10.1 Ibadan: Division into WardsIBADAN: WARD DIVISIONS
N 6
N 5NW6
N3NW5
E9ABADINA
E8
NW3E5 E 7
N2
NW2 N1! SW6
E6SW9 SW7 NW1
SW5 C 2E2 E3
SW1
SW2
S3 s ;
SW3
SW8S5
S7 S6
A. '1C .2 Population Density in Ibadan
4 2 0 PERS.PES HECTARE 2 1 0 PERS. PER HECTARE BO PERS.PER HECTARE 15 PERS.PER HECTARE23 HOUSES PER HECTARE t th f lU S k S HER HECTARE i. HOUSES PER H E J A rit 1.5 HOUSES PER HECTARE

APPENDIX X
DIAGRAM A.10.1 Age and Sex Distribution
IBADAN DIVISION TOTAL POPULATION 1963FEMALEMALE
6 5 - 6 9
p 5 5 - 5 9
3 5 - 3 9
3 0 - 3 4
1 5 -1 9
1 0 - 1 4
1 2 1 1 10 9 8 7 6 5 1 3 2 1 PER CENT 1 2 3 4 5 6 7 8 9 D 1 1 1 2
DIAGRAM A.10,2 Age and Sex Distribution
SURVEY SAMPLE POPULATION 1968MALE FEMALE
7 0 + %6 5 - 6 9
6 0 - 6 4 15 5 - 5 915 0 - 5 4 1//114 5 - 4 9 At4 0 - 4 4 P411i3 5 - 3 9 P4IY611 13 0 - 3 4 P%1i///P2 5 - 2 9 P4P1PjiI 2 0 - 2 4 11 1 ' • //11P1 5 - 1 9 P11P%1t%f1 0 - 1 4%I11%4%f%%P 5 - 9PPPP4 %%4%1P 0 - 4
//,Ya ?/<
// \12 11 10 9 8 7 6 5 4 3 2 1 PER CENT 1 2 3 4 5 6 7 8 9 10 11 12

APPENDIX X
TABLE A .10.3 Ethnic Corn-cosi tion and Birth-place of Household Heads
Number PercentageHousehold Head Yoruba born in Ibadan 160 54.2Household Head Yoruba born outside Ibadan
Abeokuta 29 - 9-8Ijebu 15 5.1 •Oyo 11 3.7Lagos 10
Ilesha 9 3.0Ilorin 6 2-0
Ekiti 6 2 .0
Ede k 1.3Ondo k 1.3Owo 3 1.0
Oshogbo 3 1.0
Other Yoruba towns and villages 14 4.8Unknown 1 0.3
Total Yoruba H.H. born outside Ibadan 115 39.0Total Yoruba Household Heads 275 93.2H.H. from other southern Nigerian Tribes 14 4.8H.H. from northern Nigeria 6 2 .0
Total Household Heads I295 100.0

APPENDIX XI *+20
TABLE A. 11.1 L.ind UGet Open Area
Category of Land Ko.of Corjp. sq.:n. per cent Av.Area sq.m.1 Unpaved Area 63 3,678 6 7 .2 61.52 Cement Platforms 54 1,549 2 6 .8 28.73 Plt-lat. + V/ashplaces 3'5 162 2 .8 4.64 Storage Space 38 164 3.2 4.8Total Open Area 63 5,773 100 .0 9 1 .6
1
TABLE A.11.2 Distribution of Household Size
Comp. Head's Househ. Dependent Househ. Tenant Househ. Total Househ.IJO.OfPerson
Hh.Group
Ko.ofEh.
Percent
Ko.ofPerson
Ko.ofHh.
Percent
Ho.of Person
Ko.ofHh.
Percent
No.of Person
No. of Kh.
Percent
Ko.ofPerson
1 1- 2 9*5 1 16.7 1 40 53.2 40 41 30.5 412 6 12 17 34 26 52 49 983 3- 4 4 2 0 .6 12 25 44.4 75 12 2 5 .8 36 41 31.6 1234 9 36 23 92 20 80 52 20856
5- 6 56
17.5 2536 ""
237
27 .8 115_ _ _ _ _ 9 11.3 4530
3718
18.6 185108
7 7- 86 2 0 .6 42 3 10.2 21 8 6 .5 56 17 10.9 119
8 7 56 8 64 15 120
9 9 -10 5 1 5 .9 45 1 0.9 9 2 2.4 18 8 4.7 7210 5 50 1 10 6 6011 11-12 2
6 .422 1 0 .8 11 3 1.7 33
12 2 24 2 2412+ 12+ 6 9.5 94 6 2 .0 96
Total 63 100 .0 454 108 100 .0 453 124 100 .0 378 ' 295 100 .0 1,285Av. I 7.2 j 4.2 j j 3.0 j 4.4

TABLE A.11.3
Marital Statue of I Household Population
TABLE A.11.4
Male Members of 65 Compounds by Relationship to Compound rea
k2'\APPENDIX XI
• f— kv 04 c\j
M-5S ►S CK
\Q v- CM
VDCO C\J r-
► -0 t"-VO CM LT\ i— <M
ONM 1- rr- CM
UV r- NV CM K\
CJ+•I
o wOT - 'COco m p 0 0- « OOQfico co p o• - - COB CO CQ CO » 0 U U <0ID Cl O O M 0 0 0 0 Ol P P P P Po o o o w h h h M <hrt W fl W
co m 0 o o >
<0 fl C 3 3B CO CD fl) 0 0PO
60 CO CO CO 00
Co o a co co oco co <n - U U U (aQ) QJ di u 0 0 0 O) p .p +» +JO O O 60
<H <H «m —I H rH Hd d d drH00 CQ 00 €0 <0
0) <D O 0 0 COP P -
« C0 0 o0 o co01 CO - ■ • - CQ01 CO FH POD- - -P
<0 COO CQ P 1) CQ f>M fH fH W U *H «H W W f l P i O W ?
CQCOBCQC&CaCOCO< D < U O O < P < D < D D0 0 " 0 0 0 0 0 p-p-p-pp-p+j-p dddddddd
rHQCQCDBCOCQOCOd
CO CDG C O a o o 0 0) CQ CO o > - - CO *H(Q (Q * pU U 0 « d41 HI O MH0 0 co a> a>p p - p «o o <Q w -M H u« r4 pq coCQ CQ CQ CO CQh 0 0 0O O <D <D D0 0 0 0 0•P -P P ^ +)o o o o oCO 00 CQ CQ d - - - - p0 00000uu.ouoe*
0 Q> O 0CO P
(0 (Q (0 w .w• • P ^ P oO O £h o fr*
O O <D <l> <DP P P P PH rl rl rH (U d) a> d U U U P .,..-.0000 p p £n p p p g-tH P 0 O& £-*
▼“CMKVd'UV sor-coo\o ^CMK>^* iA vOC^COQnO i- w
(HO
VO lovONO SO UV1 -
1 I ! ! ■ : 10«-t-irttvi oON'J'om'-v-CNJ SM C\J CM CNJ T-T-T-T-t\li n
CMm co1mirrv®CM
i l l 1 •O t“— <TV OV ® VO CM C*— t- CM lA,^ KV KV 1- r- r-1 1 1 : 1 ■
, ' 1 ! ■KV o O m CM <r\ ITVCM K-m co m cm cm ;cm m <sr kv^ ' i l l ! : '
I 1 '■ 1 1 1O CM ® ICM|KV,CM.f-T : 1 1 1 1
®r-KV
1 Female
1 rHdpoEHK\CM KV KVCM r~-M3 CO lA^lAt— CD CT\ mCM l f \ r— cmKVCM
COKVCM oCM kv kv t— o ® <yv •*- m r-KV,CM CM CM t-i : ; ! ■
KV CM ,KV On'KV <7N KV t- CO m KV CM T“ r- KV CM V- CM II! ! ' : ! : ■1
CM CM
i i
CM .- i- r-t-
•H»j 1 . !T- 'oa KM<M- c\j CM xr m cM t-
! ! | ; i 1 : 1
r. 1cm ;
! i ■ i ■ i i ! ;
J
'~ *r r
>**HP. V- If-
i i ' ■ H iCM i j | { l-i ■ i-
1 M ! 1 '
\
■ j1
i- i • , • r i'0 :’-;
!i :
vO
Md| ^
inKM^lf»K\pjlo\0'OWT-K\' ; ! ■ i i !
O-CM-KV
1 I : :KVOC— VD KVf- T-T- CM CM T” 1t | : 1 ; :
rCM |
: ! io O CDr! ! ! j ;
y- CM r_ i CMOV
*>0•HCOr<\|<M WKNr' ' * 1 j ' || |kvkvcvi T- i ' I i. ; [ : :
1r- CM1® O 'CJ-KVJ o V'"i i
’ l i . . iI I ; - :
t- CM r- KV! 1 ■ ; 1 ! KM^ CVJ jw, 1 I ! 1 ! i i
mr-
L Male
____
1
| Total]
mKVc*~ t— m m on ocomcMM>r— cdctnKV CM ,CM r* , ; r-,-i : : :
sO c- of-r- CMcm ;
!CM ® c— ■■<-a3,a3a)coirii-CM»-t-1 • :
O O K v O O N O W r C\O O N O rO M C\l r- i- CM CV t- ,i- r- j.CM 1 , , 1 ; 1 ■ 1 •r- r-j oCM
•h! ..j i
: ! :
! | T- KV | j it
I! ! *" ' ' i j : ’ l ^
i 1 )T"I
-
►•rlf=*
! 1 : L i 'J i.i : ! : ! ■ 1
T-! 1! 1 ■
ool»dlKV rHoi I 1 ! | i i : aTd
: ! : ; r, | i ! i i; j -
ud \ CM VO ;00 KV «— irvf- -co m: 1 !! 1 • !
DCM SSI NO OJ j ovovco f-®:® irvr- cm ▼- o® 5 ® a>
03P
, ,1-ICIOMO O O VOi-r I
^ 1 ! ■ : I
avc—
to0iHCO
: ’ 1 ' jm f — f— KVUVNO ’**' T“ t—1 • j , KV KV CM CM i- 1 [: ; ; : I(T\ alj o c— cm ^ rOI CM CM0 i . d|
; • ; i ’ ®®!^r| .i-ii, o wp ^ §
..... .... . : [ " 1 1 i"CQ C*-® OVCVOVT- T-; j 1 1
■ i 1 ! i, j i ioCM
®1*0<1ov ov on -vr cjv Ov (T\T“ t“ c J OJ W\lt\M UNU^^'J’1 1 1 1 1 1 1 1 1 1 1 1 1 1 + Oi rv oi^s o m o m o m o m o| 'r;i- C1 CvJ tAKNM’M’m.lAvQvQ:f—
rH d| ON^t<7N^’C?V*« -dV'«3-OV' ,OV»3'OV d l-H , t- T- CM CM rr\ uv M'UNUVvii >l)P |i 1 I I I 1 II 1 1 1 1 1 1 +O » oim, o m o m o m o m o m o m o t-t fA | t- r CM CM K\K\*3-mmvo vo r*-
rH D<d Ir* PO *in O
J-CV tCJN'r ON' OV M’OV^ ONM OV 1“ T- CM NNNKVM-vrUNUVsQ^| l 1 1 I I 1 1 I I 1 1 1 1 +,o m o m o m o m o m o m o u-vo1 i f“ 1- (VJ c\j KN KV sf M- uv m ® ® C Total
i:ot counted in total population.
1 Cl 1s Son is acting conpound head

APPENDIX XI
TABLE A. 11.5 Female Members of 63 Compound n by Relationship to Comp, Lead
Marital Status Age Group
30w*ss
Oms *0 3 - 5 r” -
1 *35 2 ? 5 "■ tn -r * O
1 Compound Head 1 2 1 1 1 3,2 CH's Laughters 76 7 27 39 13 3 1 033 CH's Sons'Daughters 21 6 15 2 214 CK's Daughters1 Daughters 6 1 5 65 CL's Daughters'Sons'Da. 1 1 1Total 104 8 2 33 37 13 3 2 1 1 114
6 CH's Full Sisters 1 5 1 1 1 6 1 87 CH's Full Sisters'Daughters 2 1 1 28 CK's Full Sisters'Dac'Da. 1 1 19 CH's Full Brothers' Daughters 32 2 13 17 2 1 1 3410 CH's Full Brs'Daughters'Da. 1 1 111 CH's Full Brs'Das'Das'Da. 1 1 112 CK's Full Brs'Sons'Daughters 6 4 2 6
Total 44 7 1 1 18 23 2 2 7 1 3313 Ch's Half Sisters 7 5 1 5 3 3 1214 CH's Half Sisters'Daughters 4 1 1 2 415 CH's Half Brothers'Daughters 12 1 4 8 1 1316 CH's Half Brs'Das'Daughters 2 1 1 217 CH's Half Brs'Sons'Daughter 1 1 1
Total 26 6 8 15 5 4 3218 CK's Mother 2 12 1 5 6 1419 CH's Father's Wives 1 11 2 7 2 1 12
Total 3 i 23 2 8 7 9 2620 CK's Mother's Sisters 1 3 4 421 CK's Mother's Sis'Helatives 1 1 1 1 222 CH's Mother's 3rs'Daughters 3 2 1 323 CH's Mother's Brs'Das'Da. 1 1 1
Total 5 2 3 1 3 1 1 4 1024 CH's Father's Sister 1 1 125 CH's Father's Sis'Das'Da. 1 1 126 CH's Father's Sis'Sons'Da. 1 1 127 CH's Father's Brs'Daughters 3 1 3 1 428 CH's Father's Brs'Sons'Das. 17 9 5 3 1729 CH's Father's Brs'Das'Sos'Das. 2 2 2
Total 24 2 10 11 3 1 1 26"30 CH's Wives 91 13 1 14 36 29 6 1 9131 CH's Wives'Brs' Wife 1 1 132 CH's Sons'Wives 16 4 8 7 1 1633 CH's Daughters'Sons'Wife 1 1 134 CH's Full Brothers'Wives 46 2 2 12 25 9 2 4835 CK's Full Brs'Sons'Wives 9 1 5 4 936 CH's Half Brothers'Wives . 10 3 2 2 10 1 1337 CH's Half Brs'Rons'Wives 5 2 4 1 538 CK's Father's Wives'Brs'Wife 1 1 139 CE's Father's Wives'Brs'So'Wives 2 1 1 240 CH's Father's Brothers'Wives 4 1 1 2 441 CH's Father's Brs'Sons'Wives 15 1 4 7 7 2 1642 CE's Father's Sis'Sons'Wives 2 1 1 243 CH's Father's Brs'Das'Sos'Wive s 2 2 244 CK's Mother's Brothers'Wives 1 1 2 3 1 445 CH's Mother's Brs'Sons'Wives 2 1 1 246 CH's Mother's Sis'Sons'Wife 1 1 ! 1
Total 204 1 13 30 1 56 100 47 13 1 21847 CH's Wives'Relatives 4 1 3 448 CK's Wives'Relatives 2 i r t 249 CH's Father's Brs'Sos'Wives Rel.1 ■ 1 150 CL'S Mother's Brs'Wives'Rel. 1 1
Total 7 1 1 3 3 151 CI-'s Father's ;-,rs'Eos'Concubine 1 ! j -11 152 CH's Concubines'Daughter 1 ! 1 ! ! 1
Total 2 1 1
53 Unrelated Males'Wives 91 5 1 16 20 71 3 2 1 9754 Unrelated Hales'Full Brs'Wife 1 1 1
Total 92 5 1 21 71 3 2 1 9855 Unrelated Males'Daughters 63 31 30 2 63
Total i 31 30 2 6356 Unrelated Males'Full Brs'Da. 1 1 157 Unrelated ales'Full Lister 1 1 1
Total 2 , ii 158 Unrelated j .ales'Mother 1 i 1Total 1 1 1
59 Unrelated Males'Wives'Rel. 6 1 2 1 1 4 1 1 1 9Total 6 1 2 1 ! 1 4 1 1 1 9
60 Other Unrelated Females 4 1 4 1 5Total 4 1 ' 4 1 5Grand Total 267 ?23 8 49 46 105 i146 118 184 71 26 17 667

TABLE
A.11
.6 Household
Composition.
K.ET
TO TAB
LE A.
11.6
Household
Compos
itio
n
APPENDIX XI .. 2,,
rHH dlT» (0 *FM (/) U
a q « aO «H *0 -PO C J»a
i
as» ■ss 9
aa f
3Ph CQ R oCQi
cdPH CQ OCQ *33 irH CO o CQ R 2 2 2 a
iPh2 2 a a
9 - nPh - - 33 33 33 0) q 33 33 a a u
Ph 2 u U n M M i o O o a CQ a O O a a 33B
iJQ 33 A 33 33 33 Ph m pq R CQ - B R R CQ CQ O
*d g o O o o O a Q a a a n CO a a a a RBn « PQ « « pq pq h M h h 4* CQ 7c 7< 34 74 -
B iH rH rH <H <H 33 33 33 33 33 f <H 33 33 33 pC a
1 OCQ 2 2 2 <dW a)W cd33 cd cdPh cdPh cdPh cdPh cdR cd34 O o O o ■HQ* a CD a a a OQ CD a a a a a a a O a a a aOo ma wo 3 wu 33o Wo O COo P3O Ro 33O P3O «O 33O Wo 33CJ 33O 33O 33C
■ M Ph » W R AOTMrtca &
<w aj MCO +> 3 3 O O 4> o 33 o ida aCM *M rH 33 d B O 4* cd » R 33e »d h»0) >> 4)BJ fi U
B rt •rl O VO rH HP • ■ H H fi t- 0 O Ot- <4 -H• <H B 4*< a <dh 3 u a) «h o OH 0) x -H R 33 S d 4» © §
CM.-sT K\ CM CVJ C\J
o co vo co t- r-
;CM cm vo irvr— o vo
53
ir\ tr \ + + t-H cvi> + 04 +c* hj o> r< w p +•
M ■ < ^ fc-«

TA3LE
A.11.
7 Humber of
Rooms
and Flo
or Are
a -per Household-
APPENDIX XI
m p- t— KN KN VO VO O P- r— j CM UN VU so CD KV O(0 M CO UN CM KN KN KN NJ UN j V o P- CM 6 NN oTj 0) to'. a- CM CO oO —HX uv r- P- OS to UN VO CM P« ON ; 03 KN CM o KN %r UN KN01 OJ(0 CsJ a so o *- CO o NT 3" KS VO CO CD CM O CM3 r- KN CM K3- UN to vo ^p . G 1 t J UN CM UN KN UN CMo a* SO UN «- KN KN os KN UN ^ I P- CM CM UNw • D » 1X CM t— 1 OSrH Wd . ----- - —r — --- ---- 1. —■p us <0 CO O VO OS VO OS UN r- %- OS UN OS OSO Ov a p- UN CO NT UN SO CO U. | KS VO VO KN KN ONEi CMa UN oo i o
!03 • ; os cm KN T- ON KN P- UN ; NN K\ 1 ^ i •v*T3 03rH M UN T- T- O o vo o O O o ; O O 1 o O Oso o>A ' • _L |0> OS *3“ CO CO KN o TM CM CM UN CO 1 ^ NN VO(0 CO3 r—a CO ^ o CM GO o UN UN O KN p- UNO kn CM T“ N KN o <4 VO KS NN o NN KNW o' KS vo (HGQ■P X I
# IG ^r (0 kn , p- UN C— p- CM ON CD JvO UN Os UN UN O0) CJ a VO ca 1 CM KNEH T- a J_ CM
CSJ **■ p- KN CM CM UNA M CSJ o o o NN o o o O H\a n0)T3 At0> CSI UN OS CO vo so«p p-d co a ^ I r— UN UN UN 1 ^ UN SOrH KN [VO KN0) a* CM 1 KN KNpci a
- 1-U •v a # -jq K a O KN «- UN P-■p ^ a KN KN KNO CSJa 1
1 t- UN CO T»A to OSa n 1 CSJ o o o CM o o- Q) i CMto A«C/3 i- ON o o : vo UN OO CD OSCO soSh a KN OS ' CD CM VOpq Os 1 ^ VO p*“o' CM CMto a fPh • -----1
aa a a UN t- j CM ON KN KN CMS CM CM KN
« p- a 1O T-1 c** CM KN NN CM UN
A • ■tf. O I o O CM O o O o CMa to« 0)a a O ^ p» KN CO o CO CM KN UN VOo *CO CO a OS CM KN CM VO o VO UN VO ^r• VO CM KNto o4 CM CMU a« •n a a KN KN ON T- CM KN CMw ^ e CM i CM KNO T- a
I KN ^ CO SO t- OS• • •* | *“ o o © CM O O o o CMa• <D
xj a* VO OS VO o UN UN KN KN vO KS NN UNa• a I P- UN UN O Os ! NN OS OSCO UN CVJ KN P- UN t—G o' CM CMO oCO ♦ I
a go a w P“ M- KN CM vo KN CMa t- a CM ! KNO T- a f ■ •UN ▼" - T- 1- i- CM
t , ■v& VO O T- 3 co o o d \ c d COA coa h- oCO a 1 KN o o UN CM o o CO ! O e- UN t-u I • 1 •a un a i OS OS OS UN C— o o UN COOS KN ON vo CM OSa *- cJ1 SO r- p-+ aPh •aco a a CM KN VO KN CM CM CM CM KN P- CMa cm a CO ON ou ^ a 1
j ON CM <D VO CM P- CM KN UN UN CM CM CM KN p-A Ua ^ ! d KN P— CM KN r- KN xj- KN O VO CM o CM o01CO At i 00 T" 3- 1 \Q
! VO OS CM CSI KN CM O O O KN KN r- CM ON t- UN VOcd UN0> a . CSJ UN VO a KN CO ■r NN OS CM 00 OS CM UNa < ON O ON O O CM NN KN CM o r- Os KN KN COO' ! Os KN SO CM KN UN KN rrs UN CM c—a !§ . , ■»“ j ’ UNo a \ ‘ 'p« a a i O UN VO Os UN UN CM NT VO NN t— OS ! 00 CM CMa n l NT CM vO KN UN VD 3* I CM 4* i w t KN KNO NNa i w j VOO VO 1 1
L3 : Ui O 1 (/)

TABLE
A»11
.8 Average
Floor
Area
per
Household
and
Person
According
to Household
Size
APPENDIX XI
Gj
bj 0 G iG ft o ■vf: "d" C—■ in o V“ CO CO•H CO • ; • ■ • • • • •Pi • G u> KN KN KN ■vi ■Vi KN KN0 E 0 id Q • ft jO ■—1 02 ftWG
< 0 G •bQ W •H ftG d 0 CV ON vf vo co vt" ft1•H G d CO • • • • • • • •ft 0 0 G CO T— ON vo ft- vo ON VO0 > G o T" T~ CM KN Vi in \—o <J ftrHCO
toG G KN in KN KN T— co ■*3- ft-•H • • • • • • • •• VO crv CM vo KN vo T—0 d c in o ON Vf CM KN in CM0 0 • C— r- O CO m CM KN ONrH G ft •k •k •kCO < w \— vi-
GG•H o02 GO T— vo in ON KN vo vf
G0
• • • • • • • •d CO VO VO ON ON C— c—0 f tud d G<D0todG0>
0G<
f t •ft VO• vo
•CM•
o•
'M'• • •
KN•
tj•
E•ft
002GO
kn r- in vo KN VO ON CMHOO
T~ CM KN in ON ox -
T- KNrH < 02 rnfaiHd CM ■sj- CM T— O V v}- KN■P i fi 0 •CO •
O•00 •CM •
r -•CM •
vi-•CMo I Id
-PM d
0CM T— KN ON o KN — CMfcH o
o CM otk ON•t ft-•k KN•k in C— in•ko£-irHft G T" CM T“ r— T— ON
• •ftCO 0G 02 vt- VO KN C— KN o ft- in0 G in LTV KN 'si- ■vi- ■Vf vo KNft o • • • • • • • •• ft r~ kn in ft- ON r— in v f
> •’ ■ ■ *— v—< ft
IQG ON KN ON CM ft- vt" ino KN KN ON KN KN in ON COO co T- KN CM CM T“ CM• G «kO 0 T—
G5 ft
•ft o KN.in CM 'Sf in VO in
<H 0 ON on in KN T— ONO 0 CM• GO o525 ft
•f t 0
• CM vo CO o CM i—i bDG f t 1— T— d d<H o 0 1 1 1 1 1 I + -p G
O 0 02 T“ K\ in ft- ON V— CM o 0• G G T— f- EH >O 0 o <4J2i ft 5G

APPENDIX XII
TABLE A.12.1 Occupational Pattern Survey Sample
Column 1 2 3 4 5 6 7 8Main Occupation Sec.Occ.CH. Sec .Occ,D.HH. Sec. o o o T.HHCH. DHH THH 70TU
H-H. 1 2 3 4 5 * T 1 2 3 4 5 TOTAL 1 2 3 4 5 T GRMIDTOTALAGRICULTURE
Farmer 9 4 2 15 2 2 4 1 1 2Total 9 4 2 15 2 2 4 1 1 2 6
ART AND CRAFTSTailor 4 7 8 19 1 1 2 1 1 2Mechanic 1 7 4 12 1 1 1 1Carpenter 1 5 5 11 1 1Skilled Worker 2 1 6 9 1 1Bricklayer 2 5 2 9 1 1 1 1Building Cont. 5 2 7 1 1Printer 1 2 3 6Barber 1 1 2 4 1 1Goldsmith 1 2 3 1 1Painter 1 1 2Butcher 1 1 2 1 1Other Crafts 1 2 2 5 1 1Total 20 33 36 89 4 1 2 1 8 2 1 3 3 1 4 15
TRADEFood+Provisions 6 16 18 4o 2 1 3 1 1 2 2Textiles 1 4 4 9Cooked Food 2 3 5Motor Spare Parts 5 5 1 1Shoes 4 4 1 1Livestock 1 1 1 3Timber4Fire Wood 1 2 3 1 1Mats 2 2Other Trade 3 3 1 7Total 12 33 33 78 2 2 4 1 1 2 2 1 3 9
SERVICESClerk 7 9 15 31 1 1Transport 1 15 10 26Unskilled Labour 13 13Police,Army 5 3 8 1 1 I 1 2
Teachers 1 3 2 6Church Minister 3 1 4 1 1Washerman/Dry Cl. 3 1 4 1 1Mallaras 1 1 1 3 1 1Night Watchmen 2 1 3 1 1Musicians 2 2 1 '1Other Services 2 2 4Total 17 37 50 104 2 1 3 1 1 .1 3 5 9
MISCELLANEOUSRetired 5 5Temp.out of Work 1 1D.K. 1 2 3Total 5 1 3 9Grand Total 63 108 124 295 8 2 4 5 19 2 3 1 2 8 1 3 7 1 12 39
1 = Agriculture 4 = Services CH = Compound Head2 = Art and Crafts 5 = Miscellaneous DHH = Dependent Househ.Head3 = Trade THE = Tenant Househ.HeadT *» Total

TABLE A.
12.2
Kmnber of
Valid
and Omitted
Households
~ TABLE
A.12.A
.Distrlbntion
of Incomes
for Different
Size
Kouseholda
APPENDIX XII 1+27
m•orHO•GW?O«CQ*drto>w
«
I (OHO<DCOS*o«+>c0)G0)pa>I•Htn<uCOo-pG0)T3G0>PQJh-Jo
ON 00 "*J j kn ON UN I
OAQ>MGow
ON j ON ON ON I ON ON
A
T“ <VJ
NN UN r-
CO ON KN KN O UN
O O Oo o• 1- CNJ
ON KN C—CO CNJ ON
ON ON CN ON ON ON KN UN ONO O oo o oKN VO
ON ON ON ON ON ONO O Oo o oO O O

GRAPH
A»12.1
Distribution
of Household
Income
in Ibadan
GRAPH
A.12.£
Income
Distribution
(Lorenz
Curve) Ib
adan
APPENDIX XII A28
000 1
009
* = E_ * .s * s
ooz
30V1N33W3d ‘HR3 See
Tabl
es
A.1
2.4
and
A.1
2.5
on pa
ge

APPENDIX XIII 929
PLAN A.'I3«"* Low Cost 2-Bedroom House, 5odi;ja Housing Estate Ibadan Western State Housing Corporation ’9^9
*
e
V
4-.

APPENDIX XIII
TABLE A.13.1 Clasrlflcatlon and Structure of the Western State Building Industry In 1971
Building Contractors Civil Engineering Contractors
Electrical Contractori All Contractors
WesternState
Based inIbadan
WesternState
Based in Ibadan
WesternState
Based in Ibadan
WesternState Based in
IbadanNo. % No. % No. No. oj, No. f No. lio. 36 No. *
Small-size Contractors Category A-C 200 73.8 61 58.1 14 28.6 6 22.2 30 81.1 16 72.7 244 6 8 .3 65 53.9Medium-size Contractors Category D-F 62 22.9 37 35*2 23 46.9 14 51.9 5 13.5 4 18.2 90 2 5 .2 55 37.5Large Cortractors Category G+ 9 3*3 7 6.7 12 24.5 7 25.9 2 5.4 2 9.1 23 6.5 16 10.4Total 271 100.0 105 100.0 49 100.0 27 100.0 37 100.0 22 100.0 357 100.0 154 100.0Percentage of Firms Based In Ibadan 38.7 55.1 59.5 4 3 .1
Sourcet Western State of Nigeria Gazette Ibadan Aug. 1971 Vol.20 No. 44
TABLE A.13.3 Structural Development of 65 Surveyed Compounds in Ibadan from 1st of May 1963 to 30th April 1968
Total No. of Rooms on the 30th April 1968
No. of Rooms built between 1963 and 1968
No. of Rms. Disappeared 1963-1968
Rns.converted from earth to cement floor
Total on the1963
No. of Rms. 1st May
No. sq.m. No. sq.m..#1968 No. sq.m. No. sq.m. No. sq.m.Living Areas 814 7,958.6 44 445.2 5-6 10 86.0 780 7,599-4Communally used Rooms .85 . 544-9. . k 23.6 4.3 . 81 521.3Basic Ancillary Facilities 161 728.3 18 86.2 11.8 2 11.7 145 653.8Commercially used Rooms 39 290-5 3 20.1 6.9 36 270.4Total 1,099 9,522.3 69 575-1 6 .0 12 97-7 1,042 9,044.9
Cement Floor 761 6,255.6 39 300.1 4.8 46 342.9 676 5,612.6Rammed Earth Floor 242 2,343.6 22 173-3 7.4 12 97.7 278 2,610.9Wooden Floor 96 923.1 8 101.7 11.0 88 821.4Total 1,099 9,522.3 69 575-1 6 .0 12 97.7 46 342.9 1,042 9,044.9

TABLE
A»13.2
Age Distribution of
Rooms
TABLE
A.13.*
fAPPENDIX XIII
?•-3
P3►>Opa4>a4)t»OKnPiP03
IS J- (Tn \0 (7><7* co us ks r-ON On ON O' (J' 00
oo J J co no ruoovoS NO NO lA lT\
KSO' VOIN. 3 KSf\l<Jr*
O o ot-
oc-
f\J KS VO ON vO O' (NJ N J- OO J s s \ o v o i r » i r \ 4 4KS <VJ oo VO
KS -d* oo vo O vo Qn fv NO lA CNJ VO 00 ^
( S j - ^ s o o o o o j - d - v o o oKS lA N (A
0 O IM-tNOCOCQCOCOCOoO - rvj oj rsj rxj rvj rA us vo vo1 J. I I I l 1 I I I TJN O' O'
O' S lA K\ r O' S lA KN r (A N 1A fA r ON <?n CTvNO no NO NO no lA lA LA IA IA ^ J- ^ ^ J “ KS r\J r- \ \ \ \ \ N N \ \ N \ \ \ \ O n On Onin J1 rvi fN no vft -rf rvi o m in *+ fti q r r r- -? I I IOn ON p o or r (A (\i rON ON ONOO NO

TABLE
A.1.1
Construction of
New Bui
ldings Bet
ween
1963-1968
APPENDIX XIV 432
+ »a -p ■+J d
a<DO5j a>0 H<0 3 +»rH *HOj T* 3 d 0 a> CO-pc•H P«“5 $ +»
O)ea)>•tH »H■p rtCO 4* 0p.d 0 H 6h 6H
w <u co
O P4 H EH
ON 00 CM VO -tf* Cn- KN (NJ
ON ITS <M -4- ITN r if\ N
to to O V)
§ SPU CO ■P w —l3 ft w
0)CO3ow*4o
&
uoa>bou
•H
o§
<
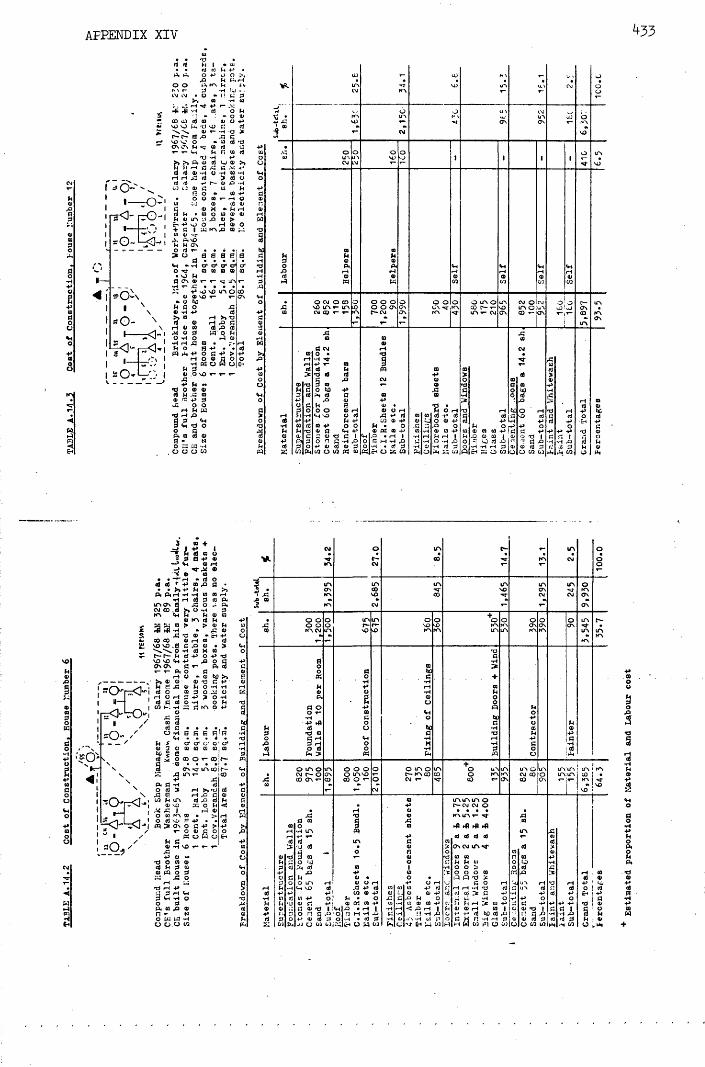
APPENDIX XIV **33
H P
*T* *His o (i) a vao f-*-, 'c<
«0 ra 't3p* a> rt u a> ;*»
4> ir> ;E*i 4* vjI U4 K>
fl C \ «) r -i- -C■POVD f l ) \D r
m o
•H W O
O CO O CD - VO IT\ r- U"\ ; CM© r r f
, a o a w
a> « «h +* « u tl C Io n 5 *h p+» 4> 03 a> PO O 03 u
OlAOi co r-T-v tr> t- oo i
O S H - H . O
r H tlO
O rP 4) <0 M -P Ifi <U CQ | Onixi H H 3 I <D£n Pi O wio
O T3 I " fl -P O <ti 3
4 l
X3
■ o .0)(0poKao• H•Pug+»(0coo<Mo+»COoo
o 0.0 CQ
pH • rf O
•H a) X CO ‘ -P O 4» *0
•* <0 feO >»« -o c +»■M O *H *H P O.M O ? -P » O <H
E E
O t- CD C—O O Oo m o CO o
1"Ml 41
di « w V-»|,Q • H O] n M *H 'oh • aJ JO U (/J Oil lCi O W C/J
K\ u->41 41 a) aSO n C O
o o o co
M 0) CO -P h H > W -P 0) »—I CO |-p <tJ bo a) rQH R H H f3W c/3 frtl O 03
<D T3n p .a> (4O 03 U) I
Estimated
proportion
of Material and
Labour
coBt

APPENDIX XIV
PLAN A.1^.2 House 12
0 7 °ooi ^ o ^ >o i n o t o o W ^0O : 1 V " N ' ' I s U© O - — - [ 15 ° I \ V = 4 = ; ' / C T klZ
PLAN A.1 .1 House 6

APPENDIX XIV 3;
rH o o o o o o o o O Od • • * • • « • # • •-p o o o o o o o o o oo o o o o o o o o o oEh T- T~ r~ T- T— T“ T~ T—
*- v»V- vO T v> o o CvJ f — «C"O • • • t • * • • •X! UN KN CJ KN o 00 CO UN ON-P T— t— t— i— T—
-p OCOoo i
rHrH d CJ KN CVI UN VO CJ o CO KN COd •P P • • • • • • • • • •
-P O o VO UN [— VO UN UN UN UN NNO V- > CJEh
<H -O
p© O CO KN CO T— o T— C— o UNkjj £ • • • • • • • • •a TO KN UN ON ON CO CO ON c— CO■p O CJ CJ CJ CJ CJ CJ CJ CJc o©op©
CO UN vo KN v— CO ON VO CO«H • • « • . • • • • • •o o t— CO CJ UN KN ON T— c— CJo CJ CJ CJ CJ CJ CJ CJ KN CJ 3"K
00 o o T“ o T- vo KN VO UN ■vrrH • • • • • • • • • •rH ■*T o CJ CO 1— UN c— o ON KNd T“ CJ CJ CJ KN KN CJ KN CJ KN
! Ui y-igS; OJ
!_ a-:
z o —■*1/ 5
CJ x~ CJ CJ CJ• • • • •CJ c*- U N CO v oT~ T~ r ~ T “ T~ VOCJ
UNCVIKN
COO CO
C\JCJKN
C ■ CJco cn co r- a ) i n
CJ
•** ~sI tJI ut ut: cj X. \ ul O'2 8
; p
t"~- r— £■— u n u n t ~ • • • • • •
I vo vo vo UN vo
CJC J O C— -sf v o T - oLTV CO VO o VO ON
v oKN
LTVVO
r-oovo
o vrCJ CJ
=> CN 1(O T— ov/> • CJui CN■=> <D T—
O V ON CN ON r-CJIUNCJ
KN KNI IO UNKN KN
vrIO■M"
*3"IU N
UNI
oUNCN CN CN ON ON ON ON
KN•C—KN
C\JC\J
oVO
u^UNVOON
•P©«
HEh=h
»Ht-q<»{O
UNUNC J
t— - r un UN UN UN CJ CJ CJ
Pt pH At pHO N V O C—
CDrHA3aEH
voUNCN
©rH&Pc~>
Oi—I © dtH
or HGEh
P>O
o V D ■v o• C N> T—t Hp Pi=> d'O- P I d-Ao | J HP C J•
o£ a ;toc CVJ• H •Ti r H1— 1 O• H >P« •»
ar H od - HP •oP PrH -p00cJ GP dP oo -H>H P
O>» oo> r Hp Gp AC O P
Po Or H •”5P he ©cj P00 Ms
• • •
•P i
K '-./»T O TJ O•H •H *H Or© r© r— 4J H J H J H o
• • • •CJ K N *3- U N
oVO
Pr Oiov»
2T
JO
u>£=>3

APPENDIX XV DIAGRAM A.13»1 Climatic Data Marrakech
TEMPERATURE AVERAGE DAILY M A X, M IN 1929 - 1 96 1
JAN. FEB. MAR. APR. JUN. AUG. SEP, OCT.MAY. JUL. NOV. DEC.
97.1----P p T T T : 313
10* c33.3
3 0 *C23.3 22.620.0
20.019.4 17.215.7
o*c
RELATIVE HUMIDITY AVERAGE 0AILY AM, PM(1> 1961 -1 9 6 4
100*/. 90.0 88.0 87.0 03.0 8 0 .0i l l10*/. 69.0 69.0
63.0 S8.0 53 .040.037.036.0
20*/.
RAINFALL AVERAGE MONTHLY 1935 - 1964
50 mm
30.5 30.530m m
22.920 mm 15.2
10.2
SUNSHINE HOURS DAILY M EAN HOURS
NO IATA A V /IIA B L E
WIND DIRECTION PRE V A ILING w in d d i r e c t i o n
JAN. FEB. M AR. APR. MAV. JUN. JUL. AUG. SEP. OCT. NOV. DEC.
10 0 tTA AVAI .ABLE
| 1 ) OBSERVATION TAXER AT 5 .3 0 ANO 1 1 .30 6 .M .T .

APPENDIX XV 437
TABLE A.15.1 CroBB Doniestlo Product at 1960 Factor Coat In Blrhams Million1960 1961 1962 1963 1964 1965 1966 1967 1968 1969 1970 1971+
Agriculture 2,650 2,?6o 2,870 3,060 2,990 3,150 2,780 3,070 3,980 3,650 3,720 3,940Commerce 1,910 1 .880 2 ,060 2,180 2,150 2,130 2,140 2 ,280 2,440 2,550 2,730 2,840Transp.-f Non-Gov. Services 1,500 1,530 1 ,600 1,660 1,720 1,780 1,820 1,890 2 ,0 1 0 2,090 2,190 2,300Manufacturing and Crafts 1,100 1,150 1 ,210 1,290 1,330 1,320 1,370 1,420 1,4 90 1,560 1,700 1,780Government Services 890 940 1,010 1,020 1,090 1 ,100 1,140 1.250 1,380 1,430 1,530 1,630Mining 540 570 540 550 590 590 580 580 580 620 620 630Construction 320 370 420 460 450 470 500 580 570 610 700 730fcnergy 180 180 220 230 250 260 280 280 310 330 350 370Total 9,090 8 ,8 8 0 9,930 10,430 10,570 10,800 10,610 11,330 12,760 12,860 13,540 14,220G.D.P.at Current Fact.Cost 9,090 9,040 10,620 11,860 12,490 13,160 12,840 13,600 15,310 15,920 16,960 18,530
TABLE A.15.2 Gross Domestic Product at 1960 Factor Coat In Percentages1960 1961 1962 1965 1964 1965 1966 1967 1968 1969 1970 1971 +
Agriculture 29.2 2 5 .5 28.9 29.3 28.3 29.2 26.2 27.1 3 1 .2 28.4 27.5 27.7Commerce 2 1 .0 2 1 .2 20.7 20.9 20.3 19.7 2 0 .2 20.1 19.1 19.8 20.1 2 0 .0Transp.-f uon-Gov. Services 16.5 17.2 16.1 15.9 16.3 16.5 17.2 16.7 15.8 16.3 1 6 .2 1 6 .2Manufacturing and Crafts 12.1 12.9 12.2 12.4 12.6 12.2 12.9 12.5 1 1 .7 12.3 12.5 12.5Government Services 9.8 1 0 .6 1 0 .2 9.8 10.5 10.2 10.7 10.9 10.8 11.1 11.3 11.5Mining 5-9 6 .4 5-4 5-1 5-6 5.5 5.5 5.1 4.5 4.8 4.6 4.4Construction 3.5 4.2 4.3 4.4 4.3 4.3 4.7 5.1 4.5 4.7 5.2 5.1Energy 2 .0 2 .0 2 .2 2 .2 2.3 2.4 2 .6 2.5 2.4 2 .6 2 .6 2 .6Total 100 .0 1 00 .0 1 00 .0 100 .0 100 .0 100.0 1 00 .0 100.0 100 .0 100 .0 . 100 .0 1 0 0 .0
Source: Annuaire Statistique du Maroc 1965 and ''972+ Provisional Figures
TABLE A.15.5 Export of Principal Products In Blrhams Will ion1960 1961 1962 1963 1964 1965 1966 1967 1968 1969 1970 1971
Food, Brink + Tobacco Fuel and Energy Rav-Materials + Minerals Other Rav-Materials Manufactured Products
1.04913
982
132
1.0527
777174158
1 ,06211
754141179
1,16916
738134221
1,1858
768238256
1,25010
784167261
1 ,2 0 69
762153395
Total Export 2*176 2,168 2,147 2 ,2 7 8 2,455 2,472 2,525
TABLE A.15.4 Export of Principal Products In Percentages1960 1961 1962 1963 1964 1965 1966 1967 1968 1969 1970 1971
Food, Brink -f Tobacco Fuel and Energy Raw-ftaterials + Minerals Other Raw-Materials Manufactured Products
4 8 .20 .645.1
6 .1
48.50.335.9
8 .07-3
49.50.535.1
6 .68.3
51.3 0.732.4 5.9 9.7
48.3 0.331.3 9.710.4
50.6 0.431.7 6.7
1 0 .6
4 7 .80 .3
30.26 .1
1 5 .6
Total Export 100 .0 100 .0 100 .0 100.0 100 .0 1 00 .0
TABLE A.15.5 Value of External Trade and Visible Balance In Birhams Million1960 1961 1962 1963 1964 1965 1966 1967 1968 1969 1970 1971
Merchandise Import Domestlo Export
2,3442,194
2,2952,177
2,4182 ,1 6 8
2,6202,146
2,7902 ,278
2,8442,455
5,4712,470
3,5332 ,5 2 6
Visible Balance - 150 - 118 - 250 - 474 - 512 - 389 -1,001 -1,007Source: Annuaire Statistique du Maroc 1965 end 1972

APPENDIX XV
TABLB A.15.6 Import of Principal Products
' ^38
In Blrhams Million1960 1961 1962 1963 1964 1965 1966 1967 1968 1969 1970 1971
Food, Brinks and Tobacco Fuel and Energy Primary Materials Semi-Manufactured Products Capital Goods Consumer Goods Other Goods
68811932344835334812
660117318516385416
6
723127291550529397
3
619166363616588433
5
452165342731663484
7
583189427864833567-8
7012364677907895455
Total Import 2,291 2,418 2,620 2,790 2,844 3,471 3,533
TABLE A.15.7 Import of Principal Products In Percentages1960 1961 1962 1963 1964 1965 1966 1967 1968 1969 1970 1971
Food, Brinks and Tobacco Fuel and Energy Primary Materials Semi-Manufactured Products Capital Goods Consumer Goods Other Goods
30.05.214.1 19.6 15.415.2 0.5
27.34.813.221.3 15.9 17.20.3
2 7 .64.811.121.020.215.20.1
22.25.913.022.1 21.1 15.50.2
15.95.812.025.723.317.00.3
16.85.512.3 24.9 24.016.3 0.2
19.96.713.222.422.315.4 0.1
Total Import 100.0 100.0 100 .0 100.0 100.0 100.0 100.0
Source: Annuaire Statistique du Maroc 1965 and 1972
TABLE A.15.8 Gross Fixed Capital Formation at Current Pricee In Dlrhama Million1960 1961 1962 1963 1964 1965 1966 1967 1968 1969 1970 1971
Plant, Machinery + Equipment 360 400 410 570 550 580 600 780 860 980 1,210 1,130Public Works 310 370 470 510 480 540 590 750 730 790 890 900Buildings 250 280 270 330 340 320 340 360 380 310 510 590Total 920 1,050 1,150 1,410 1.370 1,440 1,530 1,890 1,970 2,080 2,610 2,620
TABLE A.15.9 Gross Fixed Capital Formation at Current Prices In Percentages1960 1961 1962 1963 1964 1965 1966 1967 1968 1969 1970 1971
Plant,Machinery + Equipment 39.1 38.1 35.6 40.4 40.2 40.3 39.2 41.3 43.6 47.1 46.4 43.1Public Works 31.7 35.2 40.9 36.2 35-0 37.5 38.6 39.7 37.1 38.0 34.1 34.4Buildings 27.2 26.7 23.5 23.4 24.8 22.2 22.2 19.0 19.3 14.9 19.5 2 2 .5
Total 100.0 100.0 100.0 100.0 100.0 100.0 100.0 100.0 100.0 100.0 100.0 100.0
Source: Annuaire Statistique du Maroc 1965 and 1972“

APPENDIX XVI
TABLE A.16.1 Type of Land Tenure of 75 Houses in Karrakech 1969
No. Per CentPurchased Houses 34 45.3Rented Accommodation 15 20.0Inherited Houses 14 18.7Eouses Built on Squatter Land 6 8.0Others 6 8.0Total 75 100.0
TABLE A.16.2 Land Use Inside the Walled City of Marrakech 1969
Sq.m, Per CentBuilt-up Area 4,053,396 64.1Parks and Public Gardens 7 98 ,16 6 1 2 .6
Wasteland 452,319 7.2Roads 450,755 7.1Cultivated Land 356,940 5.7Cemeteries 169,250 2.7Other Lands 38,960 0 .6
Total 6 ,319 ,786 1 00 .0

APPENDIX XVIIMAP A. 17.1 Morocco: Population Density by Provinces in " ? ■' ■
POPULATION DENSITY BY PROVINCES 1971 CENSUS
MAP A.17.2 Administrative Division of Morocco
TANGER
TETOUAN
CUJCA
PREF. RABAT-SALE /sPREF. C A S A B L A N C A ^ X / ^ r •1
/ \ S E n A T
Av JADIDA
BENI MELLAL (
MARRAKECH ^
Q UAR2AZATE
AGAOIR
A D M IN IS T R A TIV E D IV IS IO N GF MOROCCO
MEKNES-x

APPENDIX XYII
GRAPH A.17»1 Population Trends and Projection in Marrakech
POPULATION 500 000
LOO 000
300000
200000
100000
N \ '\ s 'N\ \ ss '\s, SNs\ \ vs '\ s \ NS\N N
I \ N \! s 'k\ *| ' 1 s f t| 1 s 'i V
v\
5
|
c>u
15
<>
o
4<5
1** ec ••
1•
1
1600 1700 1800 1900 2000
O OFFICIAL ESTIMATES AND CENSUS RESULTS • ESTIMATES MADE 3YINDIVIDUALS

APPENDIX XVII 4A2
PLAN A.17-3 Marrakech: Principal Localities and Administrative Divisions
MARRAKECH: PRINCIPAL LOCALITIES
KAA ELm m
ABESSIA
RHALEM_- ^ ZAOUIA r r
ARSAT IH IR I
BAB KHEMIS
KHEMIS
ASSOUEL
BAB OOUKKALAy ARSAT BEH CHEBLh q | bouAMEOr ' ^ '
LA PQTEIHE
BAB OOUKKAIAr
T T ZAOIJIAT ’ A - f - s LAHOAR
JARO II OE LA KOUTOUBIA
I RIAO EL , - \• i
'• ' 'O E R B TIZOUGAMNE ^ ltlS S A ,,IA ,
RMILA \ } S M I
M HOUASSINE \
ri^ ' 1 U«8» .I IEDIMA./
EL KSOKR
t HART E S I , - ' - n ,S 0UR A \• i L _ BAB 0EBA6H
fl‘1*f ERA
b a b a c h i
/— V\ /■"l/ v\\ / V n*n 7iTftii«'.
BAB DEBA6H
BAB H A ILE I
\ ARSAT BARAKA
, DJEHAH BOO
i v . ^ „
^ KAAT BENAHID' ' ISSEPTIHE; /
AZBEZT / \ >J BEH SALAh V * ’
' X
BAB ATLEH
SI Dt VOUB
ARSAT EL HOUTA
^ \ r"'f 'i i
RA B J0I0
RIAD ZITOUI ^ KEDIMA 17., L--*
V ____ — —tRIAO ZITOUN OJEOIOARSAT MOUIAV ,sI
IA B CHEMATDJEHAH BEN'%alu
\REDUIACHEGRA
ARSAT EL MAACHS1DI_M.IM0MM ; ^ ^ MELLA W
iTOUARES BE (ACASBA*
BAB ROBB J IA IE EL AFIAMOULAY LYAZID,
OAR EL MAGHZEI. OAR EL
r - \ BED IABOUNDARY OF ARROHDISSEMENTSBAB AHMAR
BAB AHMARBOONDARY OF WARDS
A d PU C E NAMES MENTIONED IN THE TEXT ARE UNDERLINED DERB CHTOUKA
DAB IRHLI
IAROIN BE I AC DEDAL

APPENDIX XVII
I r - ! I A • ' '. I • •' • • : r. '/M.ed C1 * y of v.-= m k-~--*:: i n ■
APRQNDISSEMENT NORD
ARRONDISSMENTyouf.stM s:
ARRQ WDISSEMENT V CENTRE
ARRONDISSEMEHT l SUD
PERSON PER HECTARE
Taken frorn^A. Mandleur, "Croissar.ce et urbanisation de Marrakech" inRev.ue de .rteographie du -Ma-roc No-. 22-, -1972...........................

APPENDIX XVII
DIAGRAM A.17.1 Age and Sex Distribution
MOROCCO TOTAL POPULATION 1971HALE FEMALE
H D 10 S I 7 1 5 4 3 2 1 PERCENT 1 2 34 5 0 7 I S 10 11 12
MARRAKECH TOTAL POPULATION 1960MALE FEMALE
\i 70 +
65-09
60-64
55-59
50-54
45-49
40-U
35-39
30-34
25-29
20-24
15-19
10-14
5-9
0-4
I 1I mI /J i
¥ 1 yJVz
w iI k ii 0. m ki ¥> I 'Afi ft1 m' § 4 i 11
f i m AJ I f m # m 1 m %
J i f w , # m w / $1# w m m 0 1 # % m m 4 iV I I 101 I 7 I S 4 3 1 1 PERCENT 1 2 3 4 5 0 7 0 9 10 11 12
SURYEY SAMPLE POPULATION 1969HALE FEMALE
s-s0-4
12 11 10 9 0 7 0 5 4 32 1 PERCENT 1 2 34 5 0 7 0 9 1 0 1 1 1 2

APPENDIX XVIII
TABLE A.18.1 Distribution of Household Slae
Comp. Hoad1a Houaeh. Dependent Bouaeh. Tenant Houaeh. Total Househ.Bo. of Person
Hh.Group
Bo. of Hh.
ParCent
No. of Person
NO. of Hh.
PerCent
No. of Person
No. of Hh.
PerCent
No. of Person
No. of Hh.
PerCent
No. of Person
1 1- 2 1 8 .8 1 1 22.6 1 15 35.1 15 17 23.7 172 5 10 6 12 17 34 28 563 3- 4 6 29.4 18 6 35-5 18 14 30.8 42 26 31.0 784 14 56 5 20 14 56 33 1325 <5_ £ 5 17.7 25 2 19.3 10 11 20.9 55 18 19.5 906 7 42 4 24 8 48 19 1147 7- 8 12 25.0 84 2 9.7 14 6 11.0 42 20 15.8 1408 5 40 1 8 4 32 10 809 9-10 6 13.2 54 2 12.9 18 1 2.2 9 9 7 .9 8110 3 30 2 20 1 10 6 60
11 11-12 1 4.4 11 1 1.6 1112 2 24 2 2412+ 12+ 1 1.5 13 1 0.5 13
Total 68 100.0 408 31 100.0 145 91 100.0 343 190 100.0 896At . 6.0 4.7 3.8 4.7 '
Table 18.7 ATerage Floor Area per Household and Person According to Household Size
No. of Person p Househ.
No. of Househ.
Total Floor Area Sleeping AreaNo. of Persons
At .Pers. p.Househ.
Total Floor Area v?
Atsrage Area In sq.m. per
Sleeping Area In sq.m.
ATerage Sleeping Area In sq.m. per
Househ. Person Houaeh* Person1- 2 45 73 1.62 1,247-3 27.7 17.1 455.5 10.1 6.23- 4 59 210 3-56 1,989.7 33-7 9.5 901.2 15.3 4.35- 6 37 204 5.51 1,525.5 41.2 7.5 675.0 18.2 3.57- e 30 220 7.33 1,807.1 6 0 .2 . 8.2 768.6 2 5 .6 3.59-10 15 141 9.40 1,040.1 69.3 7.4 458.9 30.6 3.311-12 3 35 11.67 644.6 214.9 18.4 173.8 57.9 5.012+ 1 13 13.00 71.7 71.7 5.5 36.5 36.5 2.8Total 190 896 8,326.0 3,469.5At . 4.72 43.8 9.3 18.3 3-9

TABLE
A.16.
2 Marital
Status of
Household
Population
TABLE
A.18.3
Mala
Meabers
of 75
Houses by
Bslatlonship
to Compound
Head
APPENDIX XVIII
1 Affe
Crou
ps1*101 \0 NNvO UN UN: CM r- f- oCM
vo kn in•«cj- - lAr © r in - »o r— in CMCMCVI r r COo♦ 01 ■ i in
t-**CM e- KN
----ovoKN8VSS P NO
20 16
I
- «- ------vs-oy V© CM CM 00CM - *" cm kn in I 20 L minK-Sl CD LTV NNCM a- a- a-KN ON KN CMCM CMCMCM CM inw-sv 0\ CMCM NN in kn KN CM 4 14 CD CM - - CMVOyy*s v© c— oLTV r-KNfr cm kn in ’■ KN KN KN CMCMy -o s- ON KN CM iesKS CM CM 1 28 CMKN T-*- ONVO
tt4»aPWHtfPfca£
JNH0* 4W3J. - - - - CM VOaa/v'Odiw 1031MMO KN nn KN
Q31UW Kf Oin n- voCM CM T*in co «-'t *" O KNSO KNVO *- T- CMCMCM - *- in310NIS CM]OM> UNK\<<KVifVCM ’■ CM t— in ^t— OOn CM CM r-KN inCM
aaoCOa a<d a m a o aa w +»» - X m a ho*o a a a q oot)3 CO 03 PQ rHp, a a a a B - - - 4»o m pi n oO U W V Eh
CM KS r 5 CH'
s Pul
l Brothers
6 CH'
s Ful
l Brothers'S
ons
7 CH'
s Ful
l Slsters'Sona
Total
8 CH'
s Father
Total
•aa 3o x co a a att -O M
Tl H S Oa a x p a x a x x p a bo o a m a a^«- a a • o a- x - a a a a m a p p a a x x P - bo boo a a a •h «h a a © o l P Q rHa a a a a— — — PS f C K M Ou u o o e o\ o cm 13
CH's
Wives'Brother
14 CH'
s Wives'Brothers'S
on15
CH's
WiveB'Sisters'So
n Total
Unrelated
Persons
16 Unrelated
Males
H.H.
17 Unrelated
HHs'Sons
18 Unrelated
HHs'Sons'Sons
19 Unrelated
HHs'Daughte'
Sons
Total
aoCOa
u P® -£X bop a o aM Ppq .aiH P rH U£ COa aP4 «(34 W*0 t3a a-p pa arH rH Ha a aM k 4» (3 fl o PPtiO r- CM CM 22
Unrelated
HHb' Father's Brs'Son|
23 Unrelated
HKs' Fa'
s Brs'Sons'Sor
24 Unrelated
HHb' Mo'
s Brs'Son
125
Unrelated
HHs' Mo'
s Brs'Sons'Brl
Total
I a*o9Aaama*pXboaa«a3333•Oa+»arH rH9 aM P G 0 (=> EhvOCM 27
Unrelated
HHs'Wives'Brothers
128
Unrelated
HHs'Wivs'Sisters'Son
|29
Unrelated
HHs' Ws'Sists'Sons'Sor
Total
|Gra
nd Tot
al Mal
e |
1 *1*0 1
t-jin fr- invo vo i-^!kNOvO\UNCVI r* t- 7-
1
i lC— fr- Os o m QD ]KN COo
| Total] o \CM C— UN KN KNVO KN CM r -
UNO o o «- O t- KN00 voCMCM
*akH> - KN KNin n n cm o OKN
►■HP ■CM - fr-
•«W |
VO UN CM O KN UN r N ri
min
bDa*»HCO
Iovifr- in CM KN KN^ fr-i r - CM - KN
a+»ofeHCMCM CO KN CM KNCM r-
CO KN in C— »- 00 k co n; in CMGO
| Wid.
i1
>P
1
1L. i
| KN
i 1cm inO r* © KN CD UN UN Klin
apCOCM CO KN CM CM KN1
T“CM «“!!
UNCM
5^ ON K Ov K CV K OV i- 1 t- CM CM KN KNI I I I 1 1 1 1OiinOiino un o in j 1- |t- CM.CM KN KN
K ON M1 ON (TV rHi f ^ iai/nvo o ai i i i i i + po UN o I UN o UN o O KKlT\ilA\D Olfr^ gH
r CVI i- K\ KNiCM CM ,t- «-CMCD
t*>S6 KMAKN^-KVCVJ
KNKNt— KN f-. CVI
KN KN f—KN I CM
*,ON O CM UN- KNVO CM ITV KNKN
LTV CM KNVO CM KN K>K>Kj- C7N O CM CMON Ml (TSM^ 1
t- y- CM CMKNKN-tUNlinvOvO 1 1 1 1 11 1 11 11 11 1 1+ OtnoiAOicvoinOirvolino(/'':0I «- CM,CM KVKViM UNjUNsO V© Ifr-
ovoi-ONOUNKNt- 7- t- o in r—‘T-VO nr KN jCM CM ,CU r CVI CM t- t-| t- p
| 343 |fr— KN CD CM CM vo KN f— crv CD CM t- m 5 3 8 7 CMo>j 3 2 2 KN CM VO VO CM
CM 7- 7-7-7-
j■ u fr-
O O UN ON CO 00 (D CMT I
CM t- CM :l1 t-‘ * ! hKNOOrr 1CM CM t- t- o00
KN KN ON KN CM 7-KN t— CD “KNONVOvOUNCM ON vo
\ ; ! j 11
. 1 ; i ; i 1i-fr*a,CSIONNOVOU>WOV
i !o\vo
KN KNON CM KN T- T- KN CM i- t- CMONM- M-dN ONKOvM-CNM- KCN rH
7- T- CM CM KNKN-J-UNUNvOVO a* 11 »• 1 1 1 1 1 1 II 1 + ^Oin omouNomouNOinoino o1 7- .7- CM CM KNNN.M K WNUNV©

TABLB A.
18.4
Female Members
of 75
Houses by
Kelatlonshlp
to Compound Hea
d TAB
LE A.
16.5
Household
Comp
osition
APIENDIX XVIII
*anr- «
UN P— 4 LT\4 4 T" 4CM UNKN4 co c— on os »- so noCM k- KN CM T- 4 t- OONr- NO r-CM KN r- <D ON W r f- <0 UN UN 00 CM P- ON T- T- KN CM 4 NO NOsoCM
SOON00j - iE # " a
<0 CM KN CM KN r- r -LfNU)NO 4 UN 4 4 CO KN 4 CD CM KNir 4 KN 4 CM KN CM 4 VO r— OM> 4 T“ r- CM ONtO oON
O V© CM ON C— (M 1- r-4" «" - CM KNSO f-f-MN Ot- CM ovO CMCOCSJ T~ f- *->* e- i-> e- T- i-> T- t“ r-EhE
T- *“T" 1- f-
* *- r-O T- *- CM r- CM UN SOW T- f CM 1“ KNp •E-0 r r ^ r r a> CM CM O
m KN KN CM T- T- o t- CM KN KN
•4 CO SO *- KN KN CD4 KNT~T"^r-Xj-^^ KN CM W r r i - UN CONO*=r9 >
T* CM KN 4 CM4UN44CMHN4 CM KN CM KN 4 CM CM -SO 4 r- r- CM*£S 3
OvO r NN KN a>4 KN^VT-T-^f-T- KN CM W*-i-r- UN ^ *" CM UNt—
•CM KN bO0 0 0 4^ + + + 4*M * H 4 to
CM eg 0 O CM O + + ++ O O O £h © KN CM + + + + bOpqrtfapqcqyoa 4+ + + + + + + +4* 4 4 4 4 4 4 4 4 C 0
KNP «+ beM S3 4+ + 4*-4 4 03
M• m45 >4» 0)i o + 4» fl ©I + CM fl •H P O O O ^ Ho o, + + + + o •-» P3( 4 4 4 4
na•
CM5 V+ w « p5►h fp + + • + + UN O C
cm knno r— c— «- cm © O O O O O O O E h
rH44*O£hO
|J ft, « hPm - 0 fl « rH« 4 « © <H• p Pm x a a■ © 4-> O <0fl «P - 4 CO Pmo .g ® PmW bo fl ' O• 4 C/3 3• P « fl - fl« - « yqfl +» © A 4) jG • ©,fl bO © 4* +> 3 «h ®
n - A •© <m H ♦» H H © > «H
ac p :* cn p bo « u a n a « 3...... >4w t c s w n w 4 * O U U U O U (D
4 Pm © -• 4* A Ppq - 43 «CD bO 43 rH4 fl 3 «H Hfl O 4 4 03 to A Pm fcoPiOlfl Ba - - - -o w w a s o u o o oV 03
| Age
Groups
|
Itiu 12 121 20 1 17 t-CM O 4 *-c-CMO e- e-CMUN f O CM UN t- CDO 4 NO OK\rr rr4 KNNO P-o 71 1 3 UNP-CM e~KNp—r- 4 COCO4| *- 4 t- UN - *“ UN UN KNir\ UN
ii*ss i4*( 4 O M>4 *- UN- CM P- UN CM - -hNN"\ -- 4KNys-otUN tONO NO UN UNKN KN CO P— f- rP-CM - r ONUNeS-J7 KN KN O4 4 O UN CM KN t—KN KNON e- CM 4KN *- CMCO►T-iV KN CM 4 KN o>K>T- T- CM 4 VO UN - - CM NO ON CM T- t- CMCM- COCOyv-5 57 11 9r*-r- UN CM f- r" 1 1 1 1 4 P- r-COP- rKN OONN CM r—KNV -o C— t— i- 4CM ONKN 4 r-UN CM CM KN T- CM CM oCM *" KNr—
afl+»44»COrH44*Hfl£
aM'.W i'-ili KN CM UNo o KN KNOn •»- O - -UN UN KN r- t-UN CM CMP-r— .4UNt- CM KNCM r KN - - CO a> UNT*- CO T- Oso NO 4 O CM UN t-
OvO CM CM O KN r- T- t- NO COVOCM CM NOUN315nlS l-ONl-f-CO4r- O KN rUN T" t- KN KNVO 69 1 3 <N CMKNNOCM
Compound Head
CH's
Daughters
CH's
Daughters'Daughters
CH's
Daughters' Daughts'Daughts.
CH's
Sonb
'Daughters
Sub-Total
CE's
Full
Sisters
CH's
Full
Sisters'Daughters
CH's
Full
Brothers'Daughters
CH's
Full
Brs'Daughters'Daught.
rH4**0
T0CO CH's
Mother
CH's
Mother's Sister
CH's
Mo's
Sist
s'Sons'Daughter
»H4•P0 CH1flCO CH's
Wives
CH’s
Father's Wife
CH's
Sons'
Wives
CH's
Brothers'
Wives
Sub-Total
CH's
Wives'Mother
CH's
Wivs'Mo's
Sisters'Daughter
CH's
Ws'Mo's
Brs'Daughts'Daught.
CH’s
Wives'Sister
CH's
Wives'Brs'Daughter
CH's
Wives'Brs'Sons'Daughters
CH's
Wives'Brs'Sona'Wife
CH's
Sist
ers'
Husb
and's Mother
Sub-Total
Unrelated
Persons
Unrelated
Females
Unrelated
EHs'Wives
Unrelated
HHs'Sons'Wives
Unrelated
KHs'Brothers'Wife
Unrel.KHs'Mother's Brs'Wife
Unrel.HHs'Mo's Br
s'Sons'Wife
Unrel.KHs'Fa's Brs'Sons'Wife
UnreI.HHs'Brs'Sons'Wives'Relat.
Sub-Total
Unre
1.HH
s1Daughters
Unre
l.HHs
'Dau
ghte
rs'Daughter
Unre
l.HH
s'Sons'Daughters
Sub-Total
bOfl4Po4*'S%pa a fl fl © ©-H 4»© a4 *HCO COA Q
m npq pqrH rH © © fl U fl fl P o Sub-Total
1Un
rel.
HHs1 Mother's
Sub-Total
Unrel.HHs'Wife's Sister
Unrel.HHs'Ws*Sisters'Sons'Wife
Unre
l.KH
s'W s
'Brs
'Daughter
Unrel.HHs'Ws'Mother
Sub-Total
Grand
Total
|
*- CM KN 4 UN so e— CD ON O *-CM KN4UNSO O * ® O N O t* W K N ^ tfN'O p- © ON o *- CM KN4UN so t— co o \ o ^ nT- »- r- T“ »- T- t- *“t-i-CMCMCMCMCM CMCMCvlCMCMKNKNHN KNNNHN KN KN KN KN 4 4 4
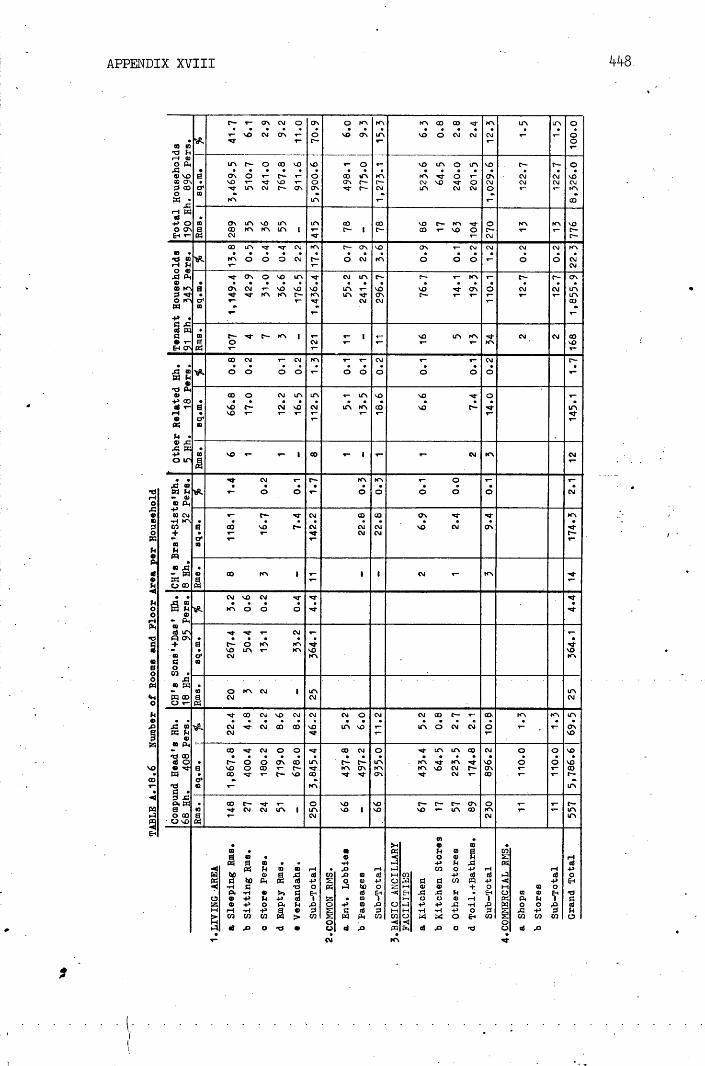
TABL
E A
»18.
6 Ku
rabe
r of
Room
a an
d Fl
oor
Ar»a
pe
r H
ouB
ehol
d
APPENDIX XVIII
r — T“ ON CM O ON O KN KN KN CO CO KN UN UN o
NO CM ON T“* o VO ON UN VO o CM CM CM or - c - T ". o
00 03h
i-H 0)O PH UN O co VO NO 4— O T“ VO UN o UN VO C— t" - o
.d • • « •4) VO a ON o 4— r- - 1— o 00 UN KN KN o r— ON CM CM voCQ ON vo VO T~ o ON c— c— CM vo O CM CM CM CM0 CO o* ■d* UN CM C— ON ON C— CM UN CM CM o KNo mw • KN UN CO
JhrH Md
+> o 01 ON LfN VO UN UN 00 00 VO r - KN o KN KN VOO O n a CD KN KN UN 1 r — t CO VO o c— C—Eh *“ 03 CM ’d ' CM r -
CO UN *•4* CM KN c— ON vo ON CM CM CM CM KNB •
^ CQ "sR. KN o O o CM O CM KN O o O t— O O CMrH pH T“ CM
-S PH ON o vo UN ■d* CM UN C*- £*■"- KN j - r - C— ON© • • •e k n a ON CM T— NO VO VO UN T— VO VO ON o CM CM UNd ^ •*4* KN KN r - KN UN * * ON c - T— T” UNO KN o ' CM CM GOw CO •
-p •C *cS m •G CO t — C— KN l 1 vo UN KN CM CM GO© i“ a o CM T“ KN VOEh Os 03 T“ T~
03 CM T - CM KN <r- r - CM T - T~ CM C—•
S hO O o O *“ O O o o o O
©•d PH© GO O CM UN UN r— UN vo vO O
«P GO • •t f T " S vO c— CM NO CM UN KN CO vo t - UN
rH VO T“ T“• u 1P3 n
h .0) £
rd « •+» B VO T * 1 GO 1 r • CM KN CMO IT
5
. . CM C “ KN KN T“ o T -.C co • •03 U T " o o T “ O O o O O CM- «a PM
-pCO CM t — CM GO CO ON KN
■H K \cn a GO vo r - CM CM CM VO CM ON+ m r - CM CM r -
cr r *CO nMm
co & •- W oo GO KN l 1 1 CM KN03 au OO 3
. . CM VO CMr t CQ
3 m KN O O o ■*t *4-
- PMmd irs ■d" CMO a s • •+ a t— o KN KN
vO UN KN vo VOCO Cf* CM KN KNC ooom •
Aa 03
B O KN CM 1 UN UN03 CO a CM CM CMU r - 3
GO CM VO CM CM CM O CM CM CO C— a y KN KN UN
0 ! CO CM CM GO GO VO UN VO T - UN o CM CM O 1 - T“ ON03 h CM T“ VO
a>co PM— co CM O O 00 CM o UN UN GO CM o o VO•d ooa) o • t — o O ON GO UN t*— r - UN KN KN VO o o VO« <sr a v o o 00 C— KN ON KN KN VO CM r*« ON GO03 CO C— VO GO ■d- ON CM GO r—
o *00 KN UN
a •3 -Cf t 03 CO t — O VO VO r - c— r - ON O r—S 00 CM CM UN 1 UN VO 1 VO v o UN GO KN UNo oo a CM CM UNU S£> 04
ID •a 03U n© abo A.
c•H © >»-P U .p-P o p <•H -p aC/3 CQ S£> o 'O
#80 rH
© CQ«3 •P A.O (K
§ T &U o O© g> 03 gO© o
CM
03 #© ©« U a a© o © Pi•H -p M 43r© rH hA CO O -P rHo o d M CQ -P d do © -p o W a d CQ ■pA3 bo o HH © © + od £h E-» 5 £h03 I o o © rH I-P © o a A] -p -p •H Oq d M M •H **H -P o dw PH CQ C/3CO O EH CO■dd rO Ph d rO o 'd
KN
© E-»U IO O -P d CO CO
*
i

APPENDIX XIX ^ 9
TABU A. 19-1 Structure of Economically Active Population, Distribution by Occupational Groups in 1971
MoroccNumber
3 Total Per Cent
Morocco Ur Number
ban AreaE Per Cent
MoroccoNumber
Rural Areas Per Cent
MarrakechNumber
Prov. Urban Per Cent
Agriculture 2,047,210 51.4 65,370 4.7 1,981,840 76.9 5,580 5.2Crafts and Industry 762,440 19-2 483,780 34.6 274,660 10.7 42,590 39.8Services/Army 327,200 8.2 248,350 17.7 78,848 3.1 17,040 15.9Trade 222,980 5.6 157,970 11.3 65,010 2.5 14.180 13.3Prof.Tech.Scient.Staff 158,010 4.0 98,030 7.0 59,980 2.3 6,990 6.6Administration 119,170 3.0 104,310 7*5 14,850 0.6 4,850 4.5Miscellaneous 343,510 8.6 241,560 17.2 101,950 3-9 15,740 14.7Total 3,980,520 100.0 1,403,370' 100.0 2,577,150 100.0 106,970 100.0
Source: SECRETARIAT D'ETAT AU PLAN ET AU DEVELOPPEMENT REGIONAL, ROYAUME DO MAROC "Recensement General de la Population et d e L'Habitat 1971" Rabat 1973i Vol. II Serie "S".
TABLE A.19.2 Consumer Price Indices for Casablanca
Column 1 2 ' 3 4Year Gen. Index Food Index Clothing Index Rent Index1963 100.0 100.0 100.0 100.01964 104.1 105.8 103.0 99.21965 107.6 109.5 106.1 101.2
. 1966 106.5 106.4 111.2 102.01967 105.7 105.2 110.9 101.01968 . 106.2 •105.5 110.3 103.61969 109.3 108.9 111.4 105.51970 110.7 110.1 112.3 106.81971 115.3 117.0 114.2 108.01972 119.6 123.0 114.6 113.11973 120.6 123.7
Source: INTERNATIONAL LABOUR OFFICE Yearbook of Labour Statistics 1973 Geneva 197*1, pp. 700,705,714,719
TABLE A.19«3 Distribution of Consumption and Expenditure Among Urban Households in Morocco 1957-1960
All Urban AreasAverage Income per Year Month
DH 1,442.02.242.02.705.03.233.05.977.0 Traditional Towns only3.414.0 I
120.0187.0225.0 270.0 493.0
285.0
AVERAGE
PERSON! PER
HOUSEHOLD
6.15.95.45.05.1
5.7
o rHOUSEHOLDS
SURVEYED
392346324340553
583
Percentage of Consumption Expenditure
FOOD AND DRINKS
68.065.864.164.954.1
57.6
r e n t a n d
HOUSING
IN TEN D It OH
12.712.411.311.3 11.1
11.9
4.15.06.4 6.99.4
8.0
FUEL AND UGUTINC
6.86.9 6.85.9 5.1
5.5
HOUEHOLD
E&UtpttEMI
AND
OPEtAPOUS
1.91.9 2.2 2.3 2.8
2.6
6.58.09.28.717.5
14.4
These letters refer to income groups shown in Table 19.4 on page
Source: INTERNATIONAL LABOUR OFFICE Household, Income and Expenditure Statistics 1950-64 Geneva 1967

APPENDIX XIX k50
TABLE A.19.4 Column
Occupational Pattern Survey Sample
1 2 3 4 5 6Main OccupationCH. DHH THH TOTAL
Sec.Occ.CH.T 2 I3 4 T
Sec.Occ.D.HH1 2 3 4 5 T.
Sec.Occ.T.HH1 2 3 4 5 T.
1. AGRICULTUREParmerOlive Picking Sub-Total
2. ART AND CRAFTS (IMP?BuilderSpinn.Veav.Embroy.TailorsBaker •Mechanic etc.ElectricianLeatherworkerCarpenterGen. LabourerPhotographerStore KeeperjPorem.Other CraftsSub-Total_________
1315842
211874223 24 1 25
20 12 -22. 11 1 113. TRADE
Pood + ProvisionsTextiles.CarpetsLivestockBooksShoesPerfumesSub-Total
1864221
13 15 33'4 * SERVICES
Teachers Transport Watchmen Waiter, Cook BarberAdmin. OfficeWasher women (men)Gen. Labourer ( Serv.)Petrol St.AttendantEntertainerProstituteMoney LenderLawyerPoliceSub-Total 23 15 47
5. MISCELLANEOUSRetiredBeggersHousework (women) Sub-Total
1664
10 13 "2oGrand Total 68 31 91 190 11 2 1 1 4 4 4 2 1 1 12 27
1 ■* Agriculture 42 » Art and Crafts 53 ■ Trade
ServicesMiscellaneous
CH - Compound Head DHH - Dependent Household Head TEH - Tenant Household Head

APPENDIX XIX
iTV © 1 ON P*— CD ‘ f— O ;
CDHOX9mPo»a•9ct9«43§QP,aoo
CM : CM ^VO I C O
i CM CM | P— m
V•oHOX4)OPom
uo (TSONON, ON ON ON! ON ON
• ► Oo * s:
ON }
O43pH
Si*.w
on in r
CM in r
> 43 to
«rlOX4>0)J3Om

GRAPH
A.11
Distribution
of Household
Income
in Marrakech
GRAPH
A.19.
2 Income
Distribution
(Lorenz
Curve) Ma
rrak
ech
APPENDIX XIX +52
3W03NI
HQ—0Oi
m-oiz
no-oz
3 0 VLM33U3d WIJ3 See
Tables
A.1?«7
and
A«19»B
on pa
ge

a p p e n d i x XX
TABLE A.20.1 The Production of Building MaterialsUnits 1960 1961 1962 1963 1964 1965 1966 1967 1968 1969 1970 1971 1972
Bricks and Tiles ^ 1,000 t. 119 124 134 138 115 96 90 101 120 126 151 167 180Pulp Wood 1,000cu.m 125 130 150 160 180Savnwood,Veneere,Sleepers n 72 60 79 84 54 48 89 68 70 67 70 56Mine Wood (Pitprops) M 4 5 6 5 2 9 9 12 15 16 5Other Indusrial WoodTotal Industial Wood Product.-'
n 15 10 10 11 30n 181 165 227 217 222 242 257 271
Cement Production 1,000 t. 579 638 701 769 832 788 856 875 1011 1165 1421 1481 1545Cement Pipes It 42 35 14 24 18 21 30 35 41 42 46ABbestos-Cement Sheets It 20 23 19 25 21 25 18 18 24 25 30 26Pig-Iron Production -2/ Crude Steel Production 2/
It
n
6 7 71
71
61
71
71
81
81 1
Building Material Index 100-1958 110 118 123 137 143 159 145 145 168 186 224 239
Soursest 1. Annualre Statistique du Maroc2. UN. F.A.O. Yearbook of Forest Products 1960-713. UN. Statlsical Yearbook 1972
TABLE A.20.2 Vood and Steel Import ^Year 1966 1967 1968 1969 3970 1971Weight and Value 1000t M.DH 1000t M.DH 1000t M.DH 1000t M.DH i1000t M.DH 1000t M.DHWood and Wood Products
Wood rough or roughly squ. 106.4 27.9 103.7 27.0 95.8 26.3 118.3 3 2 .8Sawnwood, Veneer, Logs 54.5 16.7 51.4 15.9 55.6 17.4 71.7 23. 1Wood shaped or simple worked 130.1 48.9 106.6 42.9 140.3 54.7 124.9 52.7Lumber 111.1 46.2 101.1 40.8 137.0 39.6 118.7 49.8
Total Wood 402.1 139.7 362.8 126.6 428.7 138.0 4 3 3 .6 158.4Iron and Steel Products
Iron + Steel bars, rods 87.6 A8.7 98.9 52.1 111.8 61.8 1 32 .5 76.6Other barn and rods etc. 54.3 28.2 55.7 29.1 69.4 39.8Angles,Sections 80mm + 7.4 4.4 12.3 7.4Plates and Sheets 43.0 43.0 57.7 59.7 58.8 57.1 83.7 85.6Sheets coated - 3mm 23.0 28.1 34.1 44.7Steel wire excl. wire rods 6.3 6.4 7.7 7.7 8.3 8.8 8 .4 9.0Tubes, pipes and Fittings 10.9 14.0 15.8 21.1 17.7 20.0 18.3 20.9Building Fixtures + Fittings 2.6 8.9 3.3 9.7 3.5 10.7 4.1 14.0
Total Iron and steel 235.3 181 .7 285.6 231.5
Sourest 1. mi. Yearbook of International Trade Statlstlos 1969 p.579

TABLE
A*20.
3 Iosue
of Building Permits
for Typ
e of
Houses,
Area,
Cost
and Number
of Dwellings
APPENDIX XXst ON C— UN VO St UN T- ON ON CM O O r- T~ VO CM CM 9“• • 9 9 9 9 9 CM st ON 00 VO UN vo co CM 9— O CM
rH KN r- ON UN o o c GO UN ON st ON 9— ON 9— UN st vo C—a CVI o UN UN c— p- co 9k 9k 9k 9k 9k 9k 9k 9k 9k 9 9 9-p KN VO VO ON 1— co KN vo UV St St CO KN ON 00 KN CM KNo 9 9 9 9k 9k KN CO KN UN ON KN st C'- st 9— stEH C - UN CM CM CD 1—^ o VO vo CM co 9—
V 9—~ T-" K V~ T- CO st 9 st o CO P- vo sj- KN C— CM ON o o KN 00 9—
• • 9 • 9 9 9 r~- ON r— ON 00 r— ON o KN ON KN VDC\J ON VO c~- CM 9— CM CD vo ON ON T— o St KN UN st O 9— 9“c— CO o st ON CD KN st 9k 9k 9k 9k 9k 9k 9k 9k 9k • 9o\ ON 00 CVI CM st p- o C>~ C— T“ o UN ON VO 9— C -T— 9k ON UN CO co KN 9— vo 9—
CM l— CM VOUN CM T- KN O ON O UN VO T- UN VO CO CM CM O co o o• • 9 9 9 9 9 C— ON T— \— KN vo o UN UN KN 9— UN9“ CVI 9— KN 9— o KN CM co O CM CM CM 00 UN ON UN KN UN
c~- t— UN o KN 9— st 9k 9k 9k 9k 9k 9k 9k 9k 9k 9 9ON c— c— KN KN 9— KN ON T- vo VO KN KN o C— UN 9— UNl— 9k KN ON O co UN CO 9—
CM l— H- UVKN UN C— C— O KN St CM o CM CM UN UN KN St• • 9 9 9 9 9 UN vo CM st f— KN CM 00 KN CM ON KN
O T~ vo VO t— St Sf UN t— T— 00 oo KN r— VO O st 9— 9—t- T“ 9— CVI r— CO CM KN 9k 9k . 9k 9k 9k 9k 9k 9k 9k 9 9o n c— vo KN KN 9— "t vo o T— KN st 9— C— UN 9— stT~ 9k CM c— o o KN st 9“
CM i— T“ k— UN
GO O ON VO T- r- vo CM 1— ON. t~- KN CO st st o ON c—• « 9 9 9 9 9 ON O UN KN 9— 9— 9-- VO 00 ON O St
o n KN UN o CO 9— st ON 00 VO CVI f- 9— 9— UN 9— 9— ove ON st CVI 1— 9— CM 9— . 9 9k 9k 9k 9k 9k 9k 9k 9k 9 9o n V O st KN KN T- ON KN K N ON o CM st UN t~- KN 9— CM9— 9k O ON vo UN CM St 9—
T_ T- KN
St o O ON 9 co U N VO vo E— st U N K N CM o UN K N o• • 9 9 9 9 9 KN sj- o CO CO St O CO 9— T~ st U N
CO VO ON o o VO KN UN CM CM UN ON KN st- 00 ON St o 9 UNVO co o UN VO c~- T— ON 9k 9k 9k 9k 9k 9k 9 9 9ON U N K N CVI CM st KN r - ON T CM CM vo U N CM T- ON9“ GO sj- st VO CM VO
T~ CM
C— VO CVI vo co VO UN st O C~- — O 9— KN KN VO KN CO O• • 9 9 9 9 9 CM KN UN CVI i— 9— UN UN KN CM UN C—C— K N UN C"— ON KN 00 GO CM KN T— CM T— KN KN f~ st o 9— KNvO l— T- co c— ON ON 9 9k 9k 9k 9k 9k 9k 9k 9 9ON VO •st T“ CM UN CM o o U N o 9— ON VO K N 9— 9—9~ 9k ON vo st C~ KN ON 9—T— CM
CVI CVI KN VO CM CO KN sj- VO 00 K N UN O CO O UN UN 00• • 9 9 9 9 9 ON UN UN r— GO C— sf st KN O 9— ON
VO o f— KN VO 9— ON GO CM GO KN CM O VO UN VO UN 9— st VOVO r— vo r— 9— VO KN 9k 9k 9k 9k 9k 9k 9k 9k 9k 9 9ON r- KN 9— CM U N VO - CM o T— ON c— st 9— K N1— 9k o LTV K N vo 9— vo T—
9— T“ CM
VO st ON VO ON GO CM ON CO C— ON r~- t^ o T— st CM• • 9 9 9 9 9 VO ON KN CD o ON ON CM UN ON ON UN
U N st UN UN T— CM ON o r— VO UN KN UN vo KN 9— 9— 9— GOVO KN UN ON CM VO 9k 9k 9k . 9k 9k 9k 9k 9k 9k 9 9ON vo CVI t— CM KN st VO CO K N CM KN r— K N 9— 9—9“ 9k GO KN KN vo 9— st 9—
9~ CM
St VO KN st VO CM UN CM vo CO UN CM ON CM ON st t— St• • 9 9 9 9 9 GO i— sfr ki— r— VO O t— UN CM st o
st ON CVI VO St CO ON o VO KN VO ON vo VO ON ON VO CM KN CMVO O r - ON ON o ON 9k 9k 9k 9k 9k 9k 9k 9k 9 9 9ON U N K N 9— T— CM St t— r~- UN st 9— 9- UN St Y“ CMT“ 9k VO UN K N 9— CM o 9—
9~ CMT— l>- O st UN UN CM ON T— o C— GO KN 00 CM ON OO o• • 9 9 9 9 9 ON CM VO T VO VO CM UN KN 00 st CM
KN U N C— . f - . St 9— KN ON KN CM VO U N KN UN C— C— CM st KN COvo CO KN KN t-- co T~ CM 9k 9k 9k 9k 9k ’ 9k 9k '9 9k '■ 9 9ON UN st CM T~ UN CM GO vo VO o CM VO VO UN 9“ K N9 9k t" VO sj- CM CM KN 9~
■»“ CM
KN o ■st CM co st e— VO t - O KN UN CO o t— st ON o9 9 9 9 9 9 9 9— CM c^ ON 00 O ON UN o CM st KN
CVI t— 9— CO CM T— st UN ON CO — o 9— 9“ CM VO KN T— CM KNvo — — vo KN ON KN 9k 9k 9k. 9k 9k 9k 9- 9k 9 9 9ON U N K N k— i— CM KN 1-- oo o r— CM KN vo S t 9— CMr~ 9k vo U N CM CM CM ON 9—
r- 9—
o PiCD •H
aJO oo oo M* ci
S m4)
-P r—1sH a a CD
-p cda tH <D iHa> g i—In cd § •Hs»! a M >
b-pmGT*a
ard<
a c<D n t H
aS< o Oo o
n o fHo 9 aJo 9— Xr—1
a -P•H a)
i—1 H-><A -P •H-P to rOo O rtEH O a
b+>nd rta o Gw •H tH-P+ a) -Pm CQ0) 0) -p Oi—I o CQ aa IQ n tH CQ
ai <J) d h i— i4) rH g tH a> (da i—1 g a a +>a •H o ■o -p oH > o s»! o Eh
tdoouas-pcd-p•Hacd»
CQ0)a
-Po
SERVICE
CERTRAL
BES STATISTIQUES,
ROYAUME
DU MAROC
Annuaire Statistique
du Maroc
1962
to 1972

TA3LE_
A.20.4
Structural„Cha
nges
,i*J5 Surveyed Houses
■ TAB
LE A.20.
6 "Wh
at Improvement
do you
Think
the House
Most
Needs"
APPENDIX XX 455
W ftl »- r r
r C\l K\ inPn S C/3 CO C/3r W K> ^
in cm
in so t—
No.of
Rms.
1.2.
1964
acjtt 5,
716.
7
1.25
B.3
1,02
2.5
104.
1 int-CMCO
0a 401 76 268 12 c -ITNC—
4»iH CT\ •H VO■?-; m t- S KN « 1<H VO O * • 04 O •a «-
e'O'CQ
ON 03 «- VOKN ^ P— 00 00 4“ r- CMCM
Oa
^ CM CM r ON
ON• NOa on B t- .« •V4 • O 4*• COO *"a kn
Bo*0
\o f“ vo c—0 KN ON CVI O C*- CM CM ON CM O t-in 1- f-
OVOCMKNCD
0a 415 78 270 13 NOt-C"-
Living Area
Common Booms
Basic Ancillary
Fao.
Commercially
used
Rms.
Total
( \ l O \0 ON
o cm on
ffl ON r K\ ^
4» M *(0 »d4» cd NM O ^
asked
the oldest resident household
head.
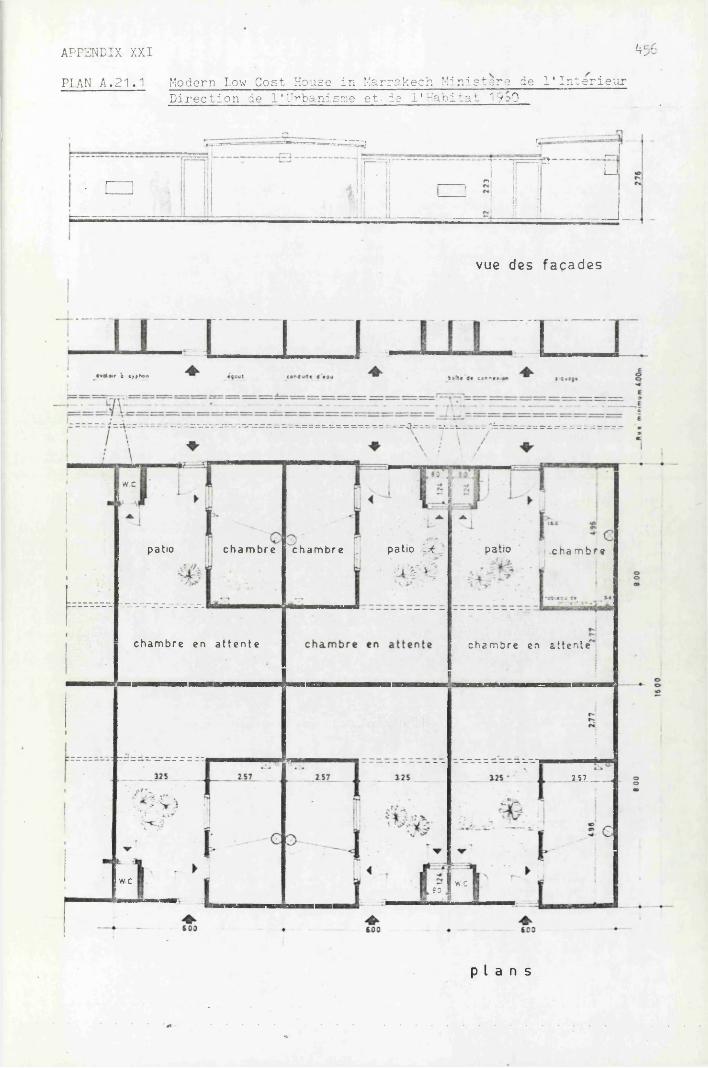
APPENDIX XXI ^PLAN A.21.1 Modern Low Cost House in Marrakech Ministere de I'Inter!eur
Direction de 1' !>banis:r.e et- de l'-'abitat '9S0
ji t — — :— = = a 5 5
rt • i 1 t\
n r nli ' i 1 i-- U !.
b g
....
vue des f a c a d e s
O SyfbOi
wc
p a t i o V *•;] W :
patiopatio c h a m b r c c h a m b r e c h a m b r ?
c h a m b r e cn a t t c n t e c h a m b r e en a t t c n t e
2 S 7
* V
w c wc8 9
p l a n s

TABL
E A.2
1.1
Inve
stm
ent
of
Te
chn
ica
l R
eser
ves
by a
ll In
sura
nce
Companies
ip Mor
occo
in 1967
TABLE
A+21«3
Th
e Financing of
MSeco
nd Hand11 Houses
APPENDIX XXI ^57
sa£3
O 4> _ (0 TJ 3 >~i O O H
C ^ C ^ r ^ O O L T N C ^ C ^ - O Oj
N t f M T N r rvj C^ VO K W IAO r-'
IT \-d “ r \ j
00 O (\J
•H <0<HCm fcfl U)O C3 4>w to U. 4-> ro(ft U J2to o o 3■H *0 oH 9] P i
(3 h 3> tS
a s
i|V o
S' 3(3 ts
v o « - rg o
O C '-vo O CTs r\l so
U (04-> (0£<s IIo as

AFFSiDIX XXITABTE A.21.4 The Financing of Houses
No. of Loans
Gifts+Grants Dirhams Per Cent
New Construction CH's Personal Income and Savings Personal Sources, Loans and Gifts Institutional SourcesTotal Expenditure
41
17,222
4,100 2,000
73.817.68 .6
23,322 100.0
ImprovementsCH's Personal Income and Savings Personal Sources, Loans and Gifts Institutional Sources*Total Expenditure
81
11
27,4287,600
^,250
69.819.410.8
39,278 100.0
Maintenance and Repair CH's Personal Income and Savings Personal Sources, Loans and Gifts Institutional SourcesTotal Expenditure
122,217
1,200
94 .9
5 .1
23,417** 100.0
Under Construction CH's Personal Income and Savings Personal Sources, Loans and Gifts Institutional SourcesTotal Expenditure
8,250 100.0
8,250 100.0
Total Building Activities CH's Personal Income and Savings Personal Sources, Loans and Gifts Institutional SourcesTotal Expenditure
132
11
75,11712,900
6,250
79 .7
13.7
6.6
94,267 '100.0
* Excluding DH 1,250 Gov. Grant used for buying a second-hand house** Adjusted expenditure,-actual expenditure DH 14,050

URBAN
HOUSIN
G SURVEY
APPENDIX XXII 459
5 in
[House
a §0) otH E*
Mat.
Stat
Rel.
Eth.
Gr.
1
Birthplace
and Age
Sane Pot
Relationship
to Com
pound
H.
ii
House
Member
No. - <\l K\ UN VO C>- 00 On O - OJ KN -r lA VO ev. oo ON a OJ R1 KNOJ J*<\J LT\OJ VOOJ OJ ooOJ ONOJ £ KN

Birthpl
APPENDIX XXII

F3»11
List
aninal
s belonging
to you
r household
APPENDIX XXII 461

APPENDIX XXII 462
H2.2
Did you emp
loy pai
d lab
our?
Or a contractor?

APPENDIX XXII

APPENDIX XXII k6k
H5 E Q U I P M E N T House No.Room No. 1 2 3 k 3 6 7 8 9 10 11 12 13 1A 13 16 17 18 19 20 21 22 23 2k 25 26 27 28
Walls mudB. bricksCone, blockPlasteredPaintedRoof mudRoof cementRoof tiles ICorrug. ironCeiling mats !Hardboard i
iFloor cement i |Rammed earth iLine i
.. tCarpetBed I/W IMosquito Net | ICupboards iTables i yStoolsBench !'ChairsEasy chairsCouch sofa *BoxesCurtain
CarMotorbikeT.V .
RadioRadiogramHec. playerSew-machineRefrigeratorFanIronElectric bulbClockBicyclesShelf/RackMirrors i \

BIBLIOGRAPHY
A3GU-OBBID-EL-BEKRI Kitab al-Masilik Paris 1965
ABUN-NASR, J.K. A History of the Maghrib Cambridge 1971ADAM, A. "Berber Migrants in Casablanca" in Arabs and Berbers London 1972AFRICA RESEARCH LTD Africa Research Bulletin, Vol. II Exeter, England 1974AEMADU BELLO UNIVERSITY, ZARIA, INSTITUTE OF ADMINISTRATION Northern
States of Nigeria Local Government Year Book 1968 Zaria 1968
AKINOLA, R.A.. Ibadan: a Study in Urban Geography London 1963 Unpublished Ph.D.thesis
AXINYELE, I.B. The Outlines of Ibadan History Lagos 1946ALI BEY EL ABBASSI Travels of Ali Bey in Morocco between 1805 and 1807
London 1816
ALUXO, S.A. "How Many Nigerians? An Analysis of Nigeria's Census Problems, 1901- 63” in The Journal of Modern African Studies Vol. Ill Cambridge 1965
AEEZNER, S. "The Comparative Study of Rotating Credit Associations" in Journal of the Royal Anthropological Institute Vol. XCIV London 1964
ARirSTT, E.J. "A Eausa Chronicle" in Journal of the Royal African Society Vol. IX London 1909-10
AU3IN, E. Le Maroc d'Aujourd'hui I&ris 1904AUTHOR NOT KNCVTN Bulletin de la Societe de Geogranhie d'Alger et de l'Afrique
dn Nord Faris 1933"Insurance Market in Nigeria 1969'' in Federation of Afro-Asian Insurers
Cairo 1971"Yoruba Brickmaking" in Nigeria Journal No. 25 Ibadan 1946
A’JE, 3.A.. The Rise of Ibadan as a Yoruba Fewer In she 19th CenturyUnpublished Fh.D. Thesis Oxford, 1964"Ibadan, its Early Beginnings" in Lloyd, P.C. et al. The City of Ibadan Cambridge 196?
BA.L3I, A. Abrege de Geographic Paris 1934BANJUL MAROCAINE DU COMMERCE (B.M.C.S.) Bulletin Bimestriel d'Informations
La sab lane a 1973
Bulletin Mensuel d'Informations Casablanca 1972 BARBER, J. Journals Church Missionary Society London 1857

k66
BARDON, H. "Les deux capitales du Karoc: Fez et Marrakech" in Bulletin de la Societe de Geograph!e de Marseille Vol. XXXVI 1912
BARSTY, L. La France au Karoc Paris 1932 ~BASCOM, W.R. "The Esusu: A Credit Institution among the Yoruba" in
Journal of the Royal Anthropological Institute of Great Britain and Ireland Vol. LXXII London 1932"Urbanization Among the Yoruba" in American Journal of Sociology Vol. LX 1955
BAUMANN, H. and WESTERMANN, D. Les Peuples et les Civilisation de l’Afrique Baris 19^8
fBENECH, J. Essai d1explication d'un Hellah, un des Aspects du Judaisme Paris 1950
BESNAED, R. L1 Oeuvre Frangaise au Maroc Baris 191^BILWELL, R. Morocco under Colonial Rule London 1973ECUTILLIZR, J.L. et al la Moyehne Valles du Senegal Paris 1962
BOVILL, E.W. "The Moorish Invasion of the Sudan" in Journal de la Societe des Africanistes Vols. XXVI and XXVII I^ris 1927
BOWEN, T.J. Central Africa; Adventures and Missionary labors in SeveralCountries in the Interior of Africa, from 18A9--I636 Charleston, South-.Carolina
BRASS, W. et al. The Demography of Tropical Africa Princeton University Press 1968
BRITISH STEEL CORPORATION Nigeria: Economic Prospects and Steel ImportPotentials 1975 London 1970 Unpublished Report
BRITISH WEST AFRICAN METEOROLOGICAL SERVICES, NIGERIA Preliminary Notes on Rainfall of Nigeria Lagos 1955
BUCHANAN, K.M. and PUGH, J.C. Land and People in Nigeria London 1955 and 1966CALLAWAY, A. "From Traditional Crafts to Modern Industry" in The City of
Ibadan ed. Lloyd, P.C. et al. Cambridge 19^7CARTER, Sir G. Reoort of the Lagos Interior Expedition 1893 Lagos 1893CENTRAL BANK OF NIGERIA Annual Report and Statement of Accounts Lagos
fCHENIER, L. de Recherches Historicues sur les Maures et Histoire de l1Empire de Maroc Paris 1787
COHEN, A. Custom and Politics in Ibadan London 1969
"The Hausa" in The City of Ibadan, ed. Lloyd, P.C. et al. Cambridge 19&7COKER, J.O. Family Property among the Yoruba London 1958
k&7
COLE, C.W. Report on Land Tenure Zaria Province Kaduna 1952 COLONLAL OFFICE Annual Report Northern Nigeria London 1902-03
Blue Book IagosLand and Native Rights Ordinance No. 1 of 1916Official Rersort on the Southern Nigeria Census 1911 I^gos 1912
COLONIAL OFFICE C.D. 5102 Report of the Northern Nigeria Land Committee London 1910
COMITE DE L’AFRIQUE FRAN^AISE L'Afrique Fran^aise Paris 1921CORNETr CAPT. A La Conouete du Maroc-Sud Avec la Colonne Mangin 1912-13
Baris 191^COUSIN, A. and SAURIN, D. Le Faroe Baris 1905
COX, H.B. Census of the Southern Provinces London 1932CROOKE, P. "Rural Settlement and Housing Trends in a Developing Country:
an Example in Nigeria" in International Labour Review Geneva 1967
"Sample Survey of Yoruba Rural Building" in Odu, University of Ife Journal of African Studies Ibadan 1966
DAILY TII-SS Nigeria Year Eook 1971 Lagos 1971DALDY, F.A. Temporary Buildings in Northern Nigeria Lagos 19^5DAVIS KINGSLEY World Urbanization 1950-1970 Berkeley 1969
DE CASTRIES, H. "Ia conquete du Soudan" in Hesperis Vol. 1923DEPARTMENT OF.ECONOMIC AND SOCIAL AFFAIRS, UNITED NATIONS Soil-Cement, its
use in Building New York 196*+DEPARTMENT OF STATISTICS, NIGERIA Population Census of Nigeria 1952/53
Lagos 1956Population Census of Northern Nigeria 1952 Zaria Province Kaduna 1956Population Census of the Western Region of Nigeria 1952 Lagos 1956
DEPARTMENT OF STATISTICS, NORTHERN NIGERIA Statistical Yearbook 1966 Kaduna 1967
DEVERDUN, G. Marrakech des Origines a 1912 Rabat 1959 and 1966
DIRECTION DE LA STATISTIQUE, ROYAUME DU MAROC Annualre Statistique du Maroc 1971 Rabat 1972

A68
EASTERN NIGERIA EOUSING CORPORATION Annual Report and Audited Accounts 1961/o2 Enugu 196^
ECONOMIC PLANNING CO HUSSION FOR EASTERN NIGERIA Annual Statistical Digest 1963 Enugu 1966
ELIAS, T.O. Nigerian land law and Custom London 1951ENCYCLOPSDIE MZNSUELLE D 1OUTRE-MER Morocco 195** Paris 195**ERCKMANN, J. Le Maroc Moderne Paris 1885
FAZY, H. Agriculture Marocaine et Protectorat Paris 19^8FEDERAL CENSUS OFFICE Population Census of Nigeria Northern Nigeria Lagos 1968
FEDERAL DEPARTMENT OF STATISTICS, NIGERIA Urban Consumer Surveys in Nigeria jIagos 1959 /
FEDERAL MINISTRY OF INFORMATION Conclusion of the Federal Government on the ;Report of the Morgan Commission on the Review of V.ages, Salaries and IConditions ci Service of the Junior Employees of the Government in the iFederation and Private Establishment 1963-6* * Iagos 196*+ fHandbook of Commerce and Industry in Nigeria Iagos 1962
Report of the Commission on the Review of Wages, Salaries and Conditions of j,Service of the Junior Employees of the Government of the Federation and in ;Private Establishments 1965 to 19p** Lagos 196** *Report of the Tribunal of Inquiry into the Affairs of the Lagos Executive iBoard for the Period 1st Cct.~ 196Q to 31st Dec. 1965 Iagos 1968
Second National Development Plan 1970-** Iagos 1970 |FEDERAL MINISTRY OF LABOUR, NIGERIA • Annual Reports of the Co-operative Division j
. 1963/6** and 1965/66 Iagos ........... IThe Employment Market Information Survey Iagos 1965 j
FEDERAL OFFICE OF STATISTICS, NIGERIA Annual Abstract of Statistics Iagos Ij
Digest of Statistics Vol. 20 No. 2 Iagos 1971 Ibadan Housing Enquiry Lagos 1963
Industrial Survey of Nigeria Iagos 1970 Population Census of Nigeria 1963 Iagos 1968
GALLETTI, R. Nigerian Cocoa Farmers O.U.P. 1956GALLOTTI, J. le Jardin et la Maison Arabes au Maroc Paris 1926GAVIRA, J. El Via.jero Espanol por Marruecos, Ton Joaquin Gatell Madrid 19**9

**69
GOLDZIHER, I. Mohammed Ibn Toumert et la Theologie de I1 Islam dans le Nord de 1'A.frioue an XIe siecle Algiers 1903
G0UVZRXE]IENI CHERIFIEN SERVICE CENTRAL DES STATISTIQUES Annuaire Statistique de la Zone Francaise du Maroc I&bat 1952a 1 " " 1
GOVERNMENT EXPENDITURE FOR RESIDENTIAL BUILDINGS Annual Statistical Digest 1965 Eastern Nigeria, Enugu 1966
Mid-Western Statistical Note Book No. 1 Benin 1970Northern Nigeria, Statistical Yearbook 1966 Kaduna 1967
Western State of Nigeria, Statistical Abstract 1969 Ibadan 1970GRABERG DI HAMSO, J. Specchio Geografico e Statistlco dell* Imperio di
Marocco Genova 183**GRSH\BERG, J.A. languages in Africa The Hague 1966
HANCE, W. The Geography of Modern Africa New York 196**HART, D.M. "Segmentary Systems and the Role of 'five fifths' in tribal Morocco"
in Revue de 1'Occident Musulman et de la Mediterranee Aix en Provence 19&7"The Tribe in Modern Morocco: Two Case Studies" in Arabs and Berbers London 1973
HINDSRER, A. Seventeen Years in the Yoruba Country London 1873HINDERER, D. Journals Church Missionary Society 1851
The reports and letter of David Hinderer can be found in the Church Missionary Archives at *+ Salisbury So., London EC** under the serial number CA2/0
BODDER, B.W. "The Markets of Ibadan" in The City of Ibadan, ed. Lloyd, P.C. et al. Cambridge 1967
HOFFMAN, B.G. The Structure of Traditional Moroccan Rural Society ThO Hague 1967
IMANI, A. "The Family Planning Programme in Morocco" in Population Growth and Economic Development in Africa London 1972
INTERNATIONAL LABOUR OFFICE Household, Income and Expenditure Statistics 1950-6** Geneva 1967
Labour Survey of North Africa Geneva i960
Yearbook of labour Statistics 1973 Geneva 197**

*+70
JACKSON, J.G. An Account of the Empire of Morocco and the District of Suse and Tafilet London 181*+
JACOB, S.M. Census of Nigeria 1931 London 1933JOHNSON, S. The History of the Yorubas Iagos i960
JULIEN, C.A. Histoire de l'Afrique du Nord Paris 1956
KEAY, R.W.J. An Outline of Nigerian Vegetation Lagos 19*+9KOLL, M. Crafts and Cooperation in Western Nigeria Freiburg i.B. 19&9
LAGOS EXECUTIVE DEVELOPMENT BOARD Annual Reports from 1960/61 to 1963/6*+Annual Report and Accounts 1963/6*+ Lagos 1965
LAMBERT, P. "Notice sur la ville de Maroc" in Bulletin de la Societe de .Geographie Paris 1868
LAMFL, P. Cities and Planning in the Ancient Near East New York 1968
LAZRAQ, A. "Le Salaires dans le Revenu National de 1955 a- 1966" in Bulletin Economicue et Social du Karoc Rabat 1967
LEENHEER, M. de "L'habitat Precaire a Marrakech et dans sa Zone Peripherique’! in Revue de Geography du Maroc Rabat 1970
LENZ, 0. Reise durch Marokko die Sahara und den Sudan Vol. I Leipzig 188*+0LE TOURNEAU, R. "La decadence Sa'dienne et l'Anarchie Marocaine au XII siecle"
in Annales de la Faculte des Lettres d'Aix Vol. XXXII 1960LLOYD, B. "Indigenous Ibadan" in The City of Ibadan, ed. Lloyd, P.C. et al.
Cambridge 1967
LLOYD, P.C. Yoruba Land Law O.U.P. 1962"Agnatic and Cognatic Descent Among the Yoruba" in Man. The Journal of the Royal Anthropological Institute 1966
"The Yoruba Lineage" in Africa Vol. XXV 1955LUBEGA, A . Financing and Production of Private Houses in Urban Districts of
Kampala (Uganda) London 1970 Unpublished Ph.D. Thesis "LYAUTEY, H.G. ".... le respect de l1integratite artistique et morale des
villes anciennes" Quoted by Mandleur, A.
MA30GUNJE, A.L. Urbanization in Nigeria London 1968
"The Growth of Residential Districts in Ibadan" in Geographical Review Vol. 52"The Morphology of Ibadan" in The City of Ibadan, ed. Lloyd, P.C. et al. Cambridge 1967

*f71
MAEOGUNJE, A.L. and OMER-COOPER Owu in Yoruba History Ibadan 1971
KANDLSUR, A. "Croissance et urbanisation de Marrakech” in Revue de Geographie du Faroe Rabat 1972
MAEHAST, J. "!‘hroc" in L*Oeuvre de Henri Prost Ffeiris i960
KARRIS, P. Family and Social Change in an African City London 1961
MEEK, C.K. Administration in Nigeria and the Cameroons London 1957METEOROLOGICAL OFFICE Tables of Temperature, Relative Humidity and
Precipitation for the W o r l d London 196^ !MICHIE, C.W. "Notes on Land Tenure in the Northern Districts of Zaria Emirate"
in Cole, C.W. Report on land Tenure Zaria Province Kaduna 1952MID-WESTERN STATE Statistical Note Book Benin 19^9MI^GS, J.L.' "Note sur l'Artisanat Marocain en 1870" in Bulletin Economique et •
Social du Maroc Rabat 1953KILLSON, A. The Yoruba Country, West Africa Proceedings of the Royal
Geographical SocietyMINISTERS DES TRAVAUX PUBLICS CIRCONSCBIPTION DE L'URBANISME ET DE L»HABITAT
ARRONDISSEMHNT T.P. MARRAKECH Marrakech Resorption des Bidonvilles Marrakech 196 Unpublished Report
MINISTERS DU DEVELOPPEKENT, ROYAUME DU MAROC Annuaire Statistique du Maroc 196^-1965 and 1971 Rabat 1966 and 1972
MINISTRY OF ECONOMIC PLANNING AND SOCIAL DEVELOPMENT, IBADAN Western Nigeria State Bulletin
MINISTRY CF ECONOMIC PLANNING AND RECONSTRUCTION, WESTERN STATE OF NIGERIAStatistical Abstract Ibadan 1971
MINISTRY OF INFORMATION, KADUNA Inquiry into the Affairs of the Northern Nigeria Housing Corporation 1 9 & 7 Kaduna 19&7
MITCHELL, N.C. Some Comments on the Growth and Character of Ibadan’s Population University College Ibadan 1953
MOLONEY, A. Notes of Yoruba Land and the Colony and Protectorate of Lagos Proceedings of the Royal Geographical SocietyLondon 1 8 9 0 .
KONTAGNE, R. La Vie Sociale et la Vie Politique des Berbers Paris 1931MORGAN, W .B . The Change of Shifting to Fixed Settlements in Southern Nigeria
University College Ibadan 1955 *MOULINE, M.R. The Era of al-Mansur the Almohad, or the Political, Intellectual
and Reliefous Life of the Maghrib from the Year 3S0 to the Year 395 (1185~1199) Rabat 19ho
k?2
NATFAE AUTHORITY HOUSING CORPORATION First Annual Report and Accounts for the Period 18th May 1961 to 31st March, 1962 Kaduna 1962
NIGERIA. SOUSING DEVELOPMENT SOCIETY LTD Report and Accounts 'NORTHERN NIGERIA HOUSING CORPORATION Fifth Annual Report and Accounts for the
Year Ended 31st March 1966 Kaduna 1966
NORTHERN STATES OF NIGERIA Local Government Year Book 1968
NOIN, D. et al La Population Rurale du Maroc Baris 1970NIRO?, R.F. et al Area Handbook for Morocco Washington, D.C. 1972
OFFICE OF INTERNATIONAL HOUSING Housing in Nigeria Washington 196*fOSUNPOLA, G.A. "The Pattern of Organization in the Building Industry - A
Western Nigerian Case Study" in Nigerian Journal of Economic and Social Studies Vol. 10 Ibadan 1968
GKIG30, L. Sawmill Industry in Nigeria Ibadan 196*fORGANIZATION FOR ECONOMIC CO-OPERATION AND DEVELOPMENT (OECD) Tropical Timber
Paris 1969OYELESS, J.O. "The Growth of Ibadan City and its Impact on Land-use Patterns,
19o1-1965M in The Journal of Tropical Geography Vol. 32 Singapore 1971
FSARSCN, R. Limitations on the Choice of Techniques in the Construction Industry in Developing Countries: A Case Study of Nigeria University of Sussex 1972 unpublished M.A. Thesis
PIQUET, V. Le Maroc Paris 1920
RICHARDSON, J. Travels in Morocco London i860ROWLING, C.W. land Tenure in liebu Province Ibadan 1956
R e p o rt on la n d Tenure Kano Province Kaduna 19^9RCTAUKE TtJ MAROC Dahir of 18 June 1936
EUXICN, F.H. Maliki law London 1916
SAIMT-OLON, P. de Relation de lfEmpire de Maroc "Estat Present de 1*Empire de Maroc" Paris 1893
SCHAK, A. lyautey in Morocco Berkeley, U.S.A. 1970SCHWAB, W.B. "Kinship and Lineage Among the Yoruba" in Africa Vol. XXV 1955

^73
SECRETARIAT D’ETAT AU PLAN ET AU DEVELOPPEMENT REGIONAL, ROYAUME DU MAROC Bulletin Nensuel d1 Informations Casablanca 1971Recensement General de la Population et de l1Habitat 1971 Rabat 1973
SECRETARIAT AU PLAN AU DEVELOPPEMENT REGIONAL ET A LA FORMATION DES CADRES, ROYAUME DU KAROC Recensement General de la Population et de lfHabitat 1971 Rabat 1972
SECRETARIAT GENERALS JDU PROTECTORAT, SERVICE DES STATISTIQUES, ROYAUME DU MAROC De Nombrement Generale de la Population de la Zone Franchise de 1*Empire Cherifien 1947 Paris 194-8
SERVICE CENTRAL DES STATISTIQUES, ROYAUME DU MAROC Annuaire Statistique du MarocRecensement Generale de la Population de la Zone Francaise de 1'Empire Cherifien 1951/52 Rabat 1954-"Resultats du Recensement de 19&Q Rabat 19&4 and 19&5
SERVICE DE STATISTIQUE HAUTE-VOLTA La Situation demographioue en Haute-Volta Paris 1962
SKINNER, E.P. "Strangers in West African Societies" in Africa Vol. XXXIII 19&3SMITH, M.G. The Economy of Hausa Communities of Zaria London 1955
"Kausa Inheritance and Succession" in Derrett, J.D.M. et al Studies in theLaws of Succession in Nigeria O.U.P. 19&5"The Beginning of Hausa Society AD 1000 to 1500" in Vansina, J. et al The Historian in Tropical Africa London 1964-
SMITH, R.S. Kingdoms of the Yoruba London 19&9
' v TERRASSE, H. Histoire du Maroc des Origines a l’Establissement du ProtectoratFran^ais Casablanca 1949-50 .............................................
TORRES, D. de Relation de I’Origine et Succez des Cherifs, et de l’Estat des Royaumes de Marroc, Fez and Tarudant, et autres Provinces Paris 1667 •
TUCKER, A.W. Abeokuta or Sunrise within the Tropics London 1853
TJGOH, S.U. "The Nigerian Cement Industry" in The Journal of Economic and Social Studies Ibadan 1966
UNITED NATIONS Demographic Yearbook New York 1972Housing in Africa New York 19&5Statistical Yearbook 1972 New York 1973The Growth of World Industry 1971 New York 1973The Role of Insurance in Housing and Proposals for its Application in Africa Addis Ababa 1972

b?b
UNITED NATIONS World Population Prospects as Assessed in 19^3 New York 19&5 Yearbook of International Trade Statistics 19&9 New York 1971 Yearbook of National Accounts Statistics 1971 New York 1973
UNITED RATIONS, ECONOMIC COMMISSION FOR AFRICA Summaries of Economic Data, Morocco 1971 Addis Ababa 1972
WALLS, van de E. "Fertility in Nigeria" in Brass, W. et al. The Demography ofTropical Africa Princeton University Press 1968
WALTER, M.W. Observation on Rainfall at the Institute for Agricultural Research Ahmadu Bello UniversityZaria 1967
WARD PRICE, H.L. Land Tenure in the Yoruba Provinces Lagos 1939WASHINGTON, R.N. "Geographical Notice of the Empire of Morocco" in Journal of
the Royal Geographical Society London 1931WESTERN NIGERIA HOUSING CORPORATION Annual Report for the Year Ended 31st
March 1963 Ibadan 196bWESTERN STATE OF NIGERIA Gazette Ibadan 1971WESTERN STATE OF NIGERIA, MINISTRY OF ECONOMIC PLANNING AND RECONSTRUCTION
Statistical Abstract Ibadan 1970
ZANZIBAR PROTECTORATE Report on the (1938) Census of the Population of Zanzibar Protectorate Zanzibar i960


