Embed Size (px)
Citation preview

www.elsevier.com/locate/carbon
Carbon 45 (2007) 662–667
Unambiguous atomic structural determination of single-walledcarbon nanotubes by electron diffraction
Hua Jiang a,*, Albert G. Nasibulin b, David P. Brown b, Esko I. Kauppinen a,b,*
a VTT Technical Research Center of Finland, Biologinkuja 7, P.O. Box 1000, FIN-02044 VTT, Finlandb NanoMaterials Group, Laboratory of Physics and Centre for New Materials, Helsinki University of Technology,
P.O. Box 1000, FIN-02044 VTT, Finland
Received 16 June 2006; accepted 18 July 2006Available online 11 December 2006
Abstract
We introduce a novel non-dimensional ‘‘intrinsic layer-line spacing’’ concept for electron diffraction analysis of single-walled carbonnanotubes (SWCNTs). Accordingly, we develop a unique method for direct determination of chiral indices (n,m) of the carbon nano-tubes from their electron diffraction patterns (EDPs). The new method is totally calibration-free. Errors due to the nanotube inclinationare specified. The tilt angle of the carbon nanotube with respect to the incident electron beam is simultaneously evaluated, thus the effectof the tube tilting is compensated for in the (n,m) determination. Several effective procedures are proposed to cross-check the results byusing abundant information contained in the diffraction patterns. The efficiency of the method is demonstrated on both simulated andexperimental diffraction patterns from single-walled nanotubes. The technique can be extended to structural analysis of nanotubes ofstructure similar to carbon nanotubes, such as boron nitride nanotubes.� 2006 Published by Elsevier Ltd.
1. Introduction
A fundamental problem in both basic and appliedresearch on single-walled carbon nanotubes (SWCNTs)exists because many physical properties of nanotubes areextremely sensitive to their atomic structure [1]. The struc-ture of a SWCNT can be conveniently described by a pairof integers known as the chiral indices (n,m) [2]. A well-known example of the sensitivity of structure to propertiesis that a carbon nanotube can be metallic if (n � m) is divis-ible by 3, otherwise they are semiconducting [1,2]. A slightchange in the value n or m can, thus, dramatically alter theelectronic properties of a nanotube. For instance, a (13, 1)tube is metallic while a (14,1) tube is semiconductingthough they are geometrically very similar to each other[3]. Therefore, unambiguous (n,m) determination of indi-
0008-6223/$ - see front matter � 2006 Published by Elsevier Ltd.doi:10.1016/j.carbon.2006.07.025
* Corresponding authors. Tel.: +358 20 5942367; fax: +358 20 7227021.E-mail addresses: [email protected] (H. Jiang), [email protected]
(E.I. Kauppinen).
vidual SWCNTs is of crucial value for progressing CNT-based nanotechnology.
Current efforts for structural characterization ofSWCNTs can be categorized into two broad classes, i.e.,optical and non-optical. Optical spectroscopy includes,for example, resonant Raman scattering [3,4] and photolu-minescence [5], where (n,m) are identified by using thecharacteristic optical transition energies and photon fre-quencies (in Raman scattering) or optical absorption andemission energies (in photoluminescence). Optical measure-ments are usually limited in that they require a range oflaser wavelengths for detecting a variety of tubes and theyare only valid for a limited range of tube diameters. Labo-rious tasks are usually involved for both measurement anddata interpretation. Photoluminescence has an additionaldrawback since the method can only detect semiconductingnanotubes. In addition, the insufficient spatial resolution ofoptical measurements makes it impossible to probe individ-ual SWCNTs for analysis without considering effects fromthe tube environment. Moreover, there is no known cali-bration technique to correlate the intensity of excitations

Fig. 1. A simulated electron diffraction pattern from a (12,7) SWCNT in
H. Jiang et al. / Carbon 45 (2007) 662–667 663
for tubes of given chiral indices to their concentrations,thus it is difficult to accurately map the chirality distribu-tion in a SWCNT sample with optical measurements.
In the non-optical communities, the chiral indices areusually assigned by first determining the characteristic tubediameter D0 and chiral angle a by means of direct imagingtechniques in real space (e.g., scanning tunneling micros-copy (STM) [6,7] and high-resolution transmission electronmicroscopy (HRTEM) [8]), or in reciprocal space by theelectron diffraction technique [9–19]. Direct imaging tech-niques are faced with the problem that the tubes are usuallynot stable enough for acquiring high-quality images withatomic-resolution at a high magnification.
Electron diffraction was the first technique to be used tocharacterize SWCNTs at the time of their discovery [9] andhas remained one of the most powerful means for theirstructural analysis. Advanced nanobeam electron diffrac-tion techniques uniquely allow direct probing of individualnanotubes and characterization of their structure [12–14].However, the measurements are typically made by assum-ing a normal incidence condition [13,18] or a small tubetilting angle, e.g., less than 6� [16]. In contrast, it is not rarefor a nanotube to have a tilt angle of 20� from the horizon-tal plane.1 In practice, it is difficult to establish an experi-mental setup to ensure such small tilt angle requirements.Although determination of the chiral angle a from electrondiffraction patterns (EDPs) was shown to be independentof tube inclination [12], evaluation of the tube diametermay rely on the tilt of the tube unless the diffraction pat-terns are actually calibrated by internal standard materials,which are in practice unavailable in the measurement. Inthe absence of such standards, absolute calibration of anEDP of a SWCNT depends on the value of the carbon–carbon (C–C) bonding distance, which has uncertaintybetween 0.142 nm and 0.144 nm [16]. Additionally theC–C bond can be stretched when the tube diameter is small[17]. Also, calibration of the EDP by using the C–C bond-ing distance is either tilt sensitive or complicated by thecurvature of the tube. In order to take into account the tilt-ing effect of the tube on the determination, a tedious trial-and-error simulation procedure has to be applied [14–16].
Moreover, when D0 and a are required to be determinedprior to (n,m) assignment, as by previous methods [9–17],they must both be determined with high accuracy in orderto determine chiral indices n and m unambiguously. Forinstance, the metallic (13,1) tube where D0 = 1.06 nm anda = 3.7�, is very similar to the semi-conducting (14,1) tubewhere D0 = 1.14 nm and a = 3.4�. Obviously, a slight errorin either D0 or a easily leads to an ambiguity in indexing aSWCNT.
Recently an approach for direct (n,m) determinationwas reported based on Bessel function analysis of the dif-fraction layer-lines in the EDPs [18,19]. However, it hasbeen shown that the intensity distribution along a non-
1 Meyer JC. Private communication 2006.
equatorial layer-line is sensitive to the tilt of the tube[19]. Thus, a confident structural determination ofSWCNTs requires an accurate determination of the tiltangle of the nanotube with respect to the electron beam.
In this paper, we introduce a new concept of ‘‘intrinsic
layer-line spacing’’ for electron diffraction analysis ofSWCNTs. Based on this novel concept, we develop an effi-cient and unambiguous method for direct determination of(n,m) chiral indices of SWCNTs from their EDPs. The pro-posed method is absolutely calibration-free. Uniquely,errors in (n,m) determination due to the nanotube inclina-tion are specified. The tilt angle of the carbon nanotubewith respect to the incident electron beam is simultaneouslyevaluated, thus the effect of the tube inclination is totallycompensated for in the determination of the chiral indices.In addition, several independent procedures are proposedto cross-check the results based on the new perceptionsof the electron diffraction from carbon nanotubes. The effi-ciency of the method is convincingly demonstrated on bothsimulated and experimental diffraction patterns of single-walled carbon nanotubes. The technique can be readilyextended to structural analysis of nanotubes of other mate-rials with structure analog to carbon nanotubes, such asboron nitride nanotubes [20].
2. Method
Fig. 1 shows a simulated EDP from a (12,7) SWCNT in normal inci-dence. The diffraction pattern is composed of many separate layer-linesparallel to each other but perpendicular to the tube axis. Discrete hexa-gons can be constructed as schematically illustrated in Fig. 1. Accordingto the kinematical diffraction theory of carbon nanotubes [21–24], theintensity profile along a certain layer-line is described by the sum of aseries of squared Bessel functions. In particular, along the equatorial line
normal incidence (s = 0�); discrete hexagons are constructed from layer-lines as schematically illustrated. Layer-line spacings are specified by di. ais the chiral angle of the nanotube.

664 H. Jiang et al. / Carbon 45 (2007) 662–667
at the center, the dominant Bessel function is J0(pD0R), where R is theradial distance measured along the equatorial line from the diffractioncenter.
Mathematically, Bessel functions have an infinite number of zeros(roots) pseudo-periodically spaced. In practice, when x = pD0R� 0, thezeroth-order Bessel function J0(pD0R) or simply J0(x), can be approxi-
mated by J 0ðxÞ ¼ffiffiffiffi2px
qcos x� p
4
� �[23], of which the roots are given by
xj ¼ pD0Rj ¼ j� 14
� �p, where j is an integer greater than 1, and the interval
between the neighboring roots is xj+1 � xj = p. By this approximation wehave then
D0 � d ¼ 1; where d ¼ Rjþ1 � Rj: ð1Þ
It is worth remarking that the intensity profile on the equatorial line istotally independent of tube tilting [24], and thus so is the measurement ofthe value d.
The spacing di (Fig. 1) of each non-equatorial layer-line measured from
the equatorial line is subject to scaling by a tilt factor1
cos s, where s rep-
resents the tilt angle of the nanotube with s = 0� in the normal incidencecondition. di of the three layer-lines for the first-order hexagons areassigned d1, d2, d3 and d4, d5, d6 for the second-order hexagons.
Now let us introduce a new term, the intrinsic layer-line spacing (ni),corresponding to each non-equatorial layer-line, which is defined by
ni ¼ D0 � di: ð2Þ
By geometrical considerations, expressions for ni of the six most impor-tant layer-lines corresponding to di(i = 1,2, . . .,6) can be derived2 as
n1 ¼n� mffiffiffi
3p
p; n2 ¼
nþ 2mffiffiffi3p
p; n3 ¼
2nþ mffiffiffi3p
p;
n4 ¼ffiffiffi3p
mp
; n5 ¼ffiffiffi3p
np
; n6 ¼ffiffiffi3pðnþ mÞp
: ð3Þ
ni are non-dimensional parameters and they are functions of only thechiral indices (n,m). On the other hand, ni can be readily measured fromthe diffraction pattern by ni ¼ di
d if Eqs. (1) and (2) are combined. It is obvi-ous that the measured values of the intrinsic layer-line spacings ðns
i Þ arescaled by 1
cos s.The simultaneous solution of any two expressions of ni from Eq. (3)
will give chiral indices (n,m). For instance, the solution of n and m fromn2 and n3 is
n ¼ pffiffiffi3p � ð2n3 � n2Þ; m ¼ pffiffiffi
3p � ð2n2 � n3Þ: ð4Þ
Or equivalently from n3 and n6, we have
n ¼ pffiffiffi3p � ð3n3 � n6Þ; m ¼ pffiffiffi
3p � ð2n6 � 3n3Þ: ð5Þ
In more general cases, when the tilt angle s is non-zero, the actual mea-sured results (ns,ms) are given by
ns ¼ n � 1
cos s¼ nþ en; ms ¼ m � 1
cos s¼ mþ em; ð6Þ
where en and em are tilt-effect errors, which are positive numbers. It is cal-culated that ei < 2 (i = n or m) for nanotubes with n or m �30 at a tilt angleof s = 20�. When the tilt angle is small, so that 0 6 ei < 1, then,
n ¼ TRUNCðnsÞ or m ¼ TRUNCðmsÞ; ð7Þ
when the tilt angle becomes relatively large, so that 1 6 ei < 2, then,
n ¼ TRUNCðnsÞ � 1 or m ¼ TRUNCðmsÞ � 1: ð8Þ
Here, TRUNC is a function to truncate a number into an integer byremoving the fractional part of that number.
2 For example, since D0 ¼ffiffiffiffiffiffiffiffiffiffiffiffiffiffiffiffiffin2þm2þnmp
p � a, d3 ¼ 1d010� cos a, where d010 ¼ffiffi
3p
2 a, and cos a ¼ 2nþm2ffiffiffiffiffiffiffiffiffiffiffiffiffiffiffiffiffin2þm2þnmp , we have n3 ¼ D0 � d3 ¼ 2nþmffiffi
3p
p: (a is known to
be the graphite lattice constant.)
After (n,m) is determined, the tilt angle s can be calculated from Eq.(6) by cos s ¼ n
ns or cos s ¼ mms. Since the intrinsic layer-line spacings ni
are more sensitive to the tube tilting, the tilt angle is more robustly eval-uated by cos s ¼ ni
nsi, for instance,
cos s ¼ n3
ns3
¼ 2nþ mffiffiffi3p
p � ns3
¼ n6
ns6
¼ffiffiffi3pðnþ mÞp � ns
6
: ð9Þ
With the tilt angle s taken into account, the absolute calibration of thediffraction pattern can be carried out a posteriori by any of the layer-linespacings di, for example,
d3 ¼2ffiffiffi3p
3a� cos a
cos s: ð10Þ
Here, the graphite lattice constant a is known to be 0.246 nm [1].
3. Results
In order to test the proposed method, we simulate a tilt-series of EDPs of a (12,7) SWCNT. Two of them areshown in Fig. 2. By applying the (n3,n6) set of equations,chiral indices (n,m) and the tilt angles s are determinedas summarized in Table 1, in which 2ns
i ði ¼ 3 or 6Þ aremeasured from the simulated patterns; 2ni (n,m) are calcu-lated from Eq. (3). The tilt angles, si(i = 3 or 6), are deter-mined by using the intrinsic layer-line spacings based onEq. (9).
It is clearly seen that, when the tilt angle is less than 20�,the chiral indices can be directly measured without ambigu-ity. The error for the case when the tilt is 5� (Fig. 2(a)) anden = �0.02 < 0 is due to the pixel resolution limitation,which can be avoided by improving the pixel resolutionof the EDP.
As the tilt angle increases as large as 25�, en = 1.21 > 1,while em = 0.74 < 1. When the tilt angle reaches 30�, bothen and em become larger than 1. In such situations, onemust be cautious when calculating (n,m) from Eq. (7) orEq. (8). This will be discussed later in more detail.
To apply the method to real problems, high-qualityEDPs of individual SWCNTs are essential but in realitydifficult to obtain because of their weak scattering powerand the tendency for the tubes to be easily modified bythe electron beam. An optimized electron micro-diffractiontechnique has been developed on a conventional transmis-sion electron microscope (TEM) with the aim of enhancingsignal-to-noise ratio of the diffraction pattern.3 Fig. 3shows (a) a high-resolution TEM image of an individualSWCNT and (b) its corresponding EDP, both of whichwere taken by a Philips CM200-FEG TEM operating atthe highest possible accelerating voltage of 200 kV toreduce the Ewald sphere curvature effect. The microscopeis equipped with a Gatan 794 multiscan CCD camera(1k · 1k) for digital recording. The sample of carbon nano-tubes was synthesized by a novel aerosol method usingethanol as carbon precursor, and iron aerosol nanoparti-cles as catalysts [25].
3 To be published elsewhere.
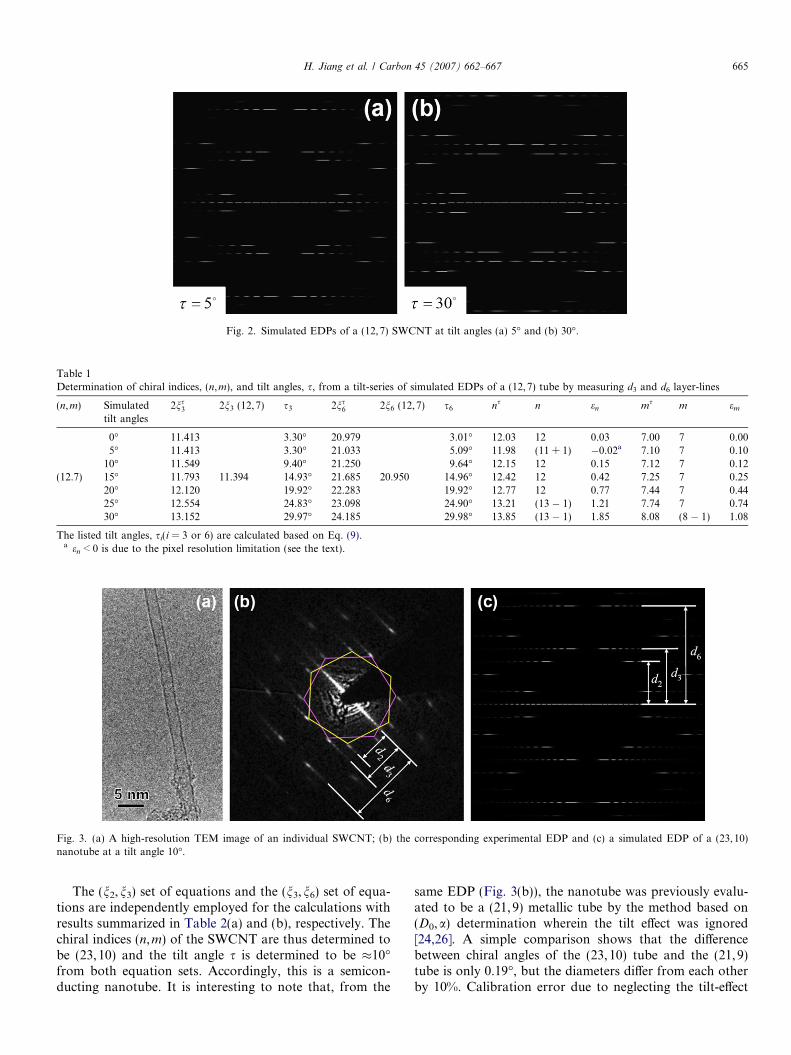
Fig. 2. Simulated EDPs of a (12,7) SWCNT at tilt angles (a) 5� and (b) 30�.
Table 1Determination of chiral indices, (n,m), and tilt angles, s, from a tilt-series of simulated EDPs of a (12,7) tube by measuring d3 and d6 layer-lines
(n,m) Simulatedtilt angles
2ns3 2n3 (12,7) s3 2ns
6 2n6 (12,7) s6 ns n en ms m em
0� 11.413 3.30� 20.979 3.01� 12.03 12 0.03 7.00 7 0.005� 11.413 3.30� 21.033 5.09� 11.98 (11 + 1) �0.02a 7.10 7 0.10
10� 11.549 9.40� 21.250 9.64� 12.15 12 0.15 7.12 7 0.12(12.7) 15� 11.793 11.394 14.93� 21.685 20.950 14.96� 12.42 12 0.42 7.25 7 0.25
20� 12.120 19.92� 22.283 19.92� 12.77 12 0.77 7.44 7 0.4425� 12.554 24.83� 23.098 24.90� 13.21 (13 � 1) 1.21 7.74 7 0.7430� 13.152 29.97� 24.185 29.98� 13.85 (13 � 1) 1.85 8.08 (8 � 1) 1.08
The listed tilt angles, si(i = 3 or 6) are calculated based on Eq. (9).a en < 0 is due to the pixel resolution limitation (see the text).
Fig. 3. (a) A high-resolution TEM image of an individual SWCNT; (b) the corresponding experimental EDP and (c) a simulated EDP of a (23,10)nanotube at a tilt angle 10�.
H. Jiang et al. / Carbon 45 (2007) 662–667 665
The (n2,n3) set of equations and the (n3,n6) set of equa-tions are independently employed for the calculations withresults summarized in Table 2(a) and (b), respectively. Thechiral indices (n,m) of the SWCNT are thus determined tobe (23,10) and the tilt angle s is determined to be �10�from both equation sets. Accordingly, this is a semicon-ducting nanotube. It is interesting to note that, from the
same EDP (Fig. 3(b)), the nanotube was previously evalu-ated to be a (21, 9) metallic tube by the method based on(D0,a) determination wherein the tilt effect was ignored[24,26]. A simple comparison shows that the differencebetween chiral angles of the (23, 10) tube and the (21,9)tube is only 0.19�, but the diameters differ from each otherby 10%. Calibration error due to neglecting the tilt-effect

Table 2Determination of chiral indices, (n,m), and the tilt angle, s, from an experimental EDP (Fig. 3(b)) and a simulated EDP of a (23,10) tube at a 10� tilt(Fig. 3(c)) by (a) measuring d2 and d3 layer-lines and (b) measuring d3 and d6 layer-lines
2ns2 2n2 (23,10) s2 2ns
3 2n3 (23,10) s3 ns n en ms m em
(a)Experiment 16.049 15.805 10.01 20.895 20.583 9.92 23.34 23 0.34 10.16 10 0.16Simulation 16.092 10.84 20.881 9.70 23.28 23 0.28 10.25 10 0.25
2ns3 2ns
3 (23,10) s3 2ns6 2n6 (23,10) s6 ns n en ms m em
(b)Experiment 20.895 20.583 9.92 37.002 36.388 10.46 23.29 23 0.29 10.27 10 0.27Simulation 20.881 9.70 36.973 10.21 23.28 23 0.28 10.25 10 0.25
The listed tilt angles, si(i = 2, 3, or 6), are calculated based on Eq. (9).
666 H. Jiang et al. / Carbon 45 (2007) 662–667
accounts for the large error in the earlier determination ofthe tube diameter.
With the tilt angle s = 10� taken into account, we canaccurately calibrate the diffraction pattern by using, for
instance, d3 ¼2ffiffiffi3p
3a� cos a
cos s¼ 4:554 nm�1; hence the tube
diameter is determined to be 2.29 nm from the EDP basedon Eq. (1), which accurately matches the (23,10) tube.
A simulated EDP of the (23,10) nanotube at a tilt of 10�is presented in Fig. 3(c), on which a similar measurement isperformed. The corresponding results are also listed inTable 2(a) and (b) for comparison. Again, there is an excel-lent match between results from the simulated diffractionpattern and the experimental pattern.
4. Discussion
Let us now discuss the error analysis, validity, advanta-ges and limitations of the proposed method. The majorsources of error in the method arise from the intrinsic mea-surement errors of d = Rj+1 � Rj and di, especially the rel-atively small magnitude of d as a divisor to calculate theintrinsic layer-line spacing ns
i . Actually this has been a com-mon difficulty faced by other methods involved in electrondiffraction analysis of SWCNTs. High-resolution CCDcameras or Imaging Plate recorders which enable a highcamera-length for the diffraction pattern would be usefulin minimizing such errors.
Another error source arises when the tilt angle is large sothat there is no confident criterion in practice to make acorrect selection between Eq. (7) or Eq. (8) to determine(n,m). In order to stay in the range where Eq. (7) is valid(i.e., so as not to invoke Eq. (8)), we introduce the toleratedtilt angle smax for nanotubes of different (n,m). Theoreti-cally smax for a certain n can be estimated by cosðsmaxÞ ¼
limemax!1�n
nþ emax
� �. As the integer n increases,the toler-
ated tilt angle smax decreases. For instance, supposingemax = 0.9, the tolerated tilt angle is allowed to be as largeas 20� for n = 15. In addition, based on Eq. (6), an intrinsicindex ratio A which is a function of (n,m) is introduced
where A ¼ mn¼ mþ em
nþ en¼ em
en6 1, hence em 6 en. It can be
seen that the method allows equal or higher tilt angle to
be tolerated when determining m than n. In other words,it is favorable to first calculate m based on Eq. (7). n canthen be more reliably derived by applying the intrinsicindex ratio A, since A can be tilt-independently measured
by A ¼ mn¼ 2n2 � n3
2n3 � n2
according to Eq. (4); or by
A ¼ mn¼ 2n6 � 3n3
3n3 � n6
according to Eq. (5).
By this procedure, in general situations when the tiltangle is not larger than 20�, SWCNTs with chiral indices(n,m) (n P 15 P m) can be directly measured withoutambiguity by using Eq. (7) to first derive m. As before, n
can be calculated by using the parameter A. If m or n isincorrectly determined due to, for example, pixelationerrors, the mistake should be recognized easily from theresultant unreasonable tilt angle; or the results can becross-checked by the n measurement based on Eq. (7) orEq. (8). For example, from Fig. 2(a) (s = 5�), if m is incor-rectly determined to be 6, n then should be 10 by applyingthe parameter A. The resultant tilt angle is then�33�, whichis too large to be a normal case. On the other hand, if n isincorrectly calculated to be 11, while m is correctly deter-mined to be 7, this will signal a serious mismatch of theintrinsic ratio A between the measured value from ns
i andthe calculated value by m
n. Determination of the tube diam-eter D0 after calibration of the EDP based on Eq. (10) canalso be independently employed to verify the results. Ofcourse, the results can further be cross-checked by measur-ing different layer-lines separately. When the tilt angle isbeyond the tolerated limit, in addition to the above-men-tioned cross-checking procedure, a trial-and-error proce-dure around all adjacent (n,m) candidates can be applied.
It is worth noting that this method is also applicable for(n,m) determination of achiral nanotubes (i.e., armchairand zigzag tubes), with d1 = 0, d2 = d3 = d4 = d5, d6 = 2d2
for an armchair nanotube; and d1 = d2, d3 = 2d1, d4 = 0,d5 = d6 = 3d1 for a zigzag tube.
Since only the layer-line spacings di and the interval dbetween the zeros along the equatorial line are involvedin the measurement, the present method has no significantlimitations. In contrast, the method has a high degree offlexibility and verifiability in that (n,m) can be determinedby using many combinations of layer-line spacings. Oneimportant remark is that the EDP is required to resolve

H. Jiang et al. / Carbon 45 (2007) 662–667 667
the zeros on the equatorial line so that d can be measuredwith confidence.
5. Conclusions
In conclusion, we have introduced a novel concept of anon-dimensional ‘‘intrinsic layer-line spacing’’ to perceivenew insights into electron diffraction of SWCNTs. Accord-ingly a unique calibration-free method for unambiguousdetermination of the structural indices (n,m) of SWCNTshas been developed. By this method, the tilt angle of thecarbon nanotube is simultaneously evaluated, thus the tilteffect is automatically compensated for in the (n,m) deter-mination. When needed, a precise approach was proposedfor absolute calibration of the EDP by using the axial C–Cbonding distance with the tilting effect fully considered.
The method has been tested using tilt-series simulatedEDPs of a (12, 7) SWCNT, and has also successfully beenapplied to the analysis of experimental electron diffractionpatterns from individual SWCNTs produced by an aerosolsynthesis process. A carbon nanotube, which was previ-ously evaluated to be a (21, 9) metallic tube by a primitivemethod based on (D0,a) determination wherein tiltingeffects were neglected, has now unambiguously been deter-mined to be a (23, 10) semiconducting nanotube accordingto the presented method.
Sources of measurement errors as well as the validity ofthe proposed method are carefully analyzed in detail.Uniquely, the error due to the tube inclination is specifiedin the error analysis. Based on the new perceptions of elec-tron diffraction from SWCNTs, several independent proce-dures are proposed for cross-checking the results by takingfull advantage of abundant information contained in theEDPs. Therefore, the determination is free of ambiguity.
The technique is readily extended to structural analysisof nanotubes of other materials with structures analogousto carbon nanotubes, such as boron nitride nanotubes.
Acknowledgements
Prof. Ph. Lambin is kindly acknowledged for providingus with the FORTRAN code of their DIFFRACT simula-tion program. Hua Jiang is grateful to Dr. M. Kociak forfruitful discussions. This work is supported by the TEKES,VTT and Academy of Finland.
References
[1] Saito R, Dresselhaus G, Dresselhaus MS. Physical properties ofcarbon nanotubes. London: Imperial College Press; 1998.
[2] Hamada N, Sawada SI, Oshiyama A. New one-dimensional conduc-tors: graphitic microtubules. Phys Rev Lett 1992;68(10):1579–81.
[3] Maultzsch J, Telg H, Reich S, Thomsen C. Radial breathing mode ofsingle-walled carbon nanotubes: Optical transition energies andchiral-index assignment. Phys Phys B 2005;72:205438-1–15.
[4] Jorio A, Saito R, Hafner JH, Lieber CM, Hunter M, McClure T,et al. Structural (n,m) determination of isolated single-wall carbonnanotubes by resonant Raman scattering. Phys Rev Lett 2001;86(6):1118–21.
[5] Bachilo SM, Strano MS, Kittrell C, Hauge RH, Smalley RE,Weisman RB. Structure-assigned optical spectra of single-walledcarbon nanotubes. Science 2002;298:2361–5.
[6] Wildoer JWG, Venema LC, Rinzler AG, Smalley RE, Dekker C.Electronic structure of atomically resolved carbon nanotubes. Nature1998;391:59–62.
[7] Odom TW, Huang JL, Kim P, Lieber CM. Atomic structure andelectronic properties of single-walled carbon nanotubes. Nature 1998;391:62–4.
[8] Hashimoto A, Suenaga K, Urita K, Shimada T, Sugai T, Bandow S,et al. Atomic correlation between adjacent graphene layers in double-wall carbon nanotubes. Phys Rev Lett 2005;94:045504-1–4.
[9] Iijima S, Ichihashi T. Single-shell carbon nanotubes of 1-nm diameter.Nature 1993;363:603–5.
[10] Cowley JM, Nikolaev P, Thess A, Smalley RE. Electron nano-diffraction study of carbon single-walled nanotube ropes. Chem PhysLett 1997;265:379–84.
[11] Qin L-C, Ichihashi T, Iijima S. On the measurement of helicity ofcarbon nanotubes. Ultramicroscopy 1997;67:181–9.
[12] Gao M, Zuo JM, Twesten RD, Petrov I, Nagahara LA, Zhang R.Structure determination of individual single-wall carbon nanotubesby nanoarea electron diffraction. Appl Phys Lett 2003;82(16):2703–5.
[13] Liu Z, Zhang Q, Qin L-C. Determination and mapping of diameterand helicity for single-walled carbon nanotubes using nanobeamelectron diffraction. Phys Rev B 2005;71:245413-1–6.
[14] Meyer JC, Paillet M, Duesberg GS, Roth S. Electron diffractionanalysis of individual single-walled carbon nanotubes. Ultramicros-copy 2006;106:176–90.
[15] Colomer JF, Henrard L, Launois P, Van Tendeloo G, Lucas AA,Lambin Ph. Interpretation of electron diffraction from carbonnanotube bundles presenting precise helicity. Phys Phys B 2004;70:075408-1–5.
[16] Kociak M, Hirahara K, Suenaga K, Iijima S. How accurate can thedetermination of chiral indices of carbon nanotubes be? Eur Phys J B2003;32:457–69.
[17] Hirahara K, Bandow S, Kataura H, Kociak M, Iijima S. Stretching ofcarbon–carbon bonds in a 0.7 nm diameter carbon nanotube studiedby electron diffraction. Phys Rev B 2004;70:205422-1–7.
[18] Liu Z, Qin LC. A direct method to determine the chiral indices ofcarbon nanotubes. Chem Phys Lett 2005;408:75–9.
[19] Jiang H, Brown DP, Nasibulin AG, Kauppinen EI. A robust Bessel-function-based method for (n,m) chiral index determination of single-walled carbon nanotubes by electron diffraction. Phys Rev B 2006;74:035427-1–8.
[20] Golberg D, Bando Y, Bourgeois L, Kurashima K, Sato T. Insightsinto the structure of BN nanotubes. Appl Phys Lett 2000;77(13):1979–81.
[21] Qin LC. Electron diffraction from cylindrical nanotubes. J Mater Res1994;9(9):2450–6.
[22] Lambin Ph, Lucas AA. Quantitative theory of diffraction by carbonnanotubes. Phys Rev B 1997;56:3571–4.
[23] Amelinckx S, Lucas AA, Lambin Ph. Electron diffraction andmicroscopy of nanotubes. Rep Prog Phys 1999;62:1471–524.
[24] Lucas AA, Lambin Ph. Diffraction by DNA, carbon nanotubes andother helical nanostructures. Rep Prog Phys 2005;68:1181–249.
[25] Nasibulin AG, Moisala A, Brown DP, Jiang H, Kauppinen EI. Anovel aerosol method for single walled carbon nanotube synthesis.Chem Phys Lett 2005;402:227–32.
[26] Jiang H, Nasibulin AG, Moisala A, Kauppinen EI. Proceedingsof the 13th European Microscopy Congress, vol. II. Antwerp(Belgium): European Microscopy Society; 2004. p. 235–6.