Embed Size (px)
Citation preview

This page intentionally left blank
Understanding Environmental Pollution
Third Edition
Understanding Environmental Pollution delivers a concise overview of global and indi-vidual environmental pollution for undergraduate courses, presenting the tools for studentsto assess environmental issues. This edition contains more than 30% newmaterial, assessingpollution from an international perspective, including air and water pollution, globalwarming, energy, solid and hazardous waste, and pollution at home. Both the sources andimpacts of pollution are addressed, as well as governmental, corporate, and personalresponsibility for pollution. Pollution prevention is emphasized throughout.
* Non-technical language encourages greater understanding of sometimes complex issues.* “Delving deeper” exercises enable students to apply their learning.* New chapter on the chemistry basics of pollution.* Introduces toxicology and risk assessment, assisting students in understanding why
chemicals are of concern and how they are regulated.
Marquita Hill is currently Adjunct Professor of Urban Affairs and Planning at VirginiaPolytechnic Institute and State University. Formerly of the University of Maine, shedeveloped a number of environmental courses during her time there, including “Issues inEnvironmental Pollution,” an interdisciplinary introductory course. For seven years she wasa visiting scholar in Environmental Health at the Harvard School of Public Health, and was afounding member and first president of the Green Campus Consortium of Maine, anorganization devoted to finding sustainable means of management for the state’s higher-education institutions.

Understanding Environmental
Pollution
Third edition
Marquita K. HillAdjunct Professor, Virginia Polytechnic Institute and State University
and formerly of the University of Maine
CAMBRIDGE UNIVERSITY PRESS
Cambridge, New York, Melbourne, Madrid, Cape Town, Singapore,
São Paulo, Delhi, Dubai, Tokyo
Cambridge University Press
The Edinburgh Building, Cambridge CB2 8RU, UK
First published in print format
ISBN-13 978-0-521-51866-6
ISBN-13 978-0-521-73669-5
ISBN-13 978-0-511-90782-1
© Marquita K. Hill 1997, 2010
2010
Information on this title: www.cambridge.org/9780521518666
This publication is in copyright. Subject to statutory exception and to the
provision of relevant collective licensing agreements, no reproduction of any part
may take place without the written permission of Cambridge University Press.
Cambridge University Press has no responsibility for the persistence or accuracy
of urls for external or third-party internet websites referred to in this publication,
and does not guarantee that any content on such websites is, or will remain,
accurate or appropriate.
Published in the United States of America by Cambridge University Press, New York
www.cambridge.org
Paperback
eBook (EBL)
Hardback

This book is dedicated to Dr. Stanley J. Idzerda of Saint Joseph, Minnesota.
Dr. Idzerda, a renowned LaFayette scholar, was the first Director
of the Honors College at Michigan State University when as a student I came to
know him. I owe him everlasting thanks for his contributions to my life. He was
unfailingly helpful, seemed never to notice my faults, and always
accentuated my positive attributes.

Contents
Preface page ixAcknowledgements xiiList of abbreviations and acronyms xiii
1 Understanding pollution 1
2 Reducing risk, reducing pollution 34
3 Chemical toxicity 57
4 Chemical exposures and risk assessment 89
5 Air pollution 117
6 Acid deposition 155
7 Global climate change 170
8 Stratospheric ozone depletion 213
9 Water pollution 236
10 Drinking-water pollution 286
11 Solid waste 311
12 Hazardous waste 348
13 Energy 374
14 Persistent, bioaccumulative, and toxic 410
15 Metals 425
16 Pesticides 456
17 Pollution at home 483
18 Zero waste, zero emissions 511
19 Chemistry: some basic concepts 539
Index 562

Preface
In the early 1990s, I could not find a textbook from which to teach an Issues inEnvironmental Pollution course. So began the writing of class notes, added to by studentconcerns, misunderstandings, questions, and an ever-increasing volume of information onthe issues. The result was the text, Understanding Environmental Pollution. It summarizesthe basics of many pollution issues, using language understandable to those with a limitedscience background, while remaining useful to those with more. Four questions areaddressed for each pollutant or category of pollutants: what is the pollutant of concern?Why is it of concern? What are its sources? What is being done to reduce, or sometimeseliminate, its emissions into the environment? The impact of pollution on environmentalhealth receives frequent attention with case descriptions posing reflective questions to thereader. Policy issues are often interwoven into the text, as are guidelines on what we, asindividuals can do to reduce pollution. This text is not technical, yet provides the basics and,for a number of issues, much detail.
This third edition ofUnderstanding Environmental Pollution has been updated and muchrevised. On the basis of requests, a short chapter on chemistry basics has been added. Thisedition places greater emphasis on pollutant movement among water, air, soil, and food, andpollutant transformation and degradation. The movement of pollutants across humanboundaries is addressed, as are the problems that pollution events can sometimes bring tosites far removed from points of origin. Edition three also places greater emphasis onpollution problems in less-developed nations. China is used to illustrate the major environ-mental downsides of rapid industrialization occurring with few controls on pollution. Theinteraction between pollution and poverty is often noted. Most references include Internetaddresses, except for those websites not open to the general reader. Many are easily accessedgovernment sites.
A framework: Chapters 1 through 4 provide basic information on pollution and the issuesthat it poses, and on reducing pollution.
* Chapter 1 addresses the striking ways in which humans are impacting their environmentand its ability to provide natural services. It asks us to define pollution for ourselves: highpollutant levels are obviously of concern, but how do we address those that are verysmall? And, how does an increasing population or large-scale technology impact theenvironment?
* Chapter 2 introduces comparative risk assessment and society’s attempts to lower risksincluding major US laws passed to lower pollution. The chapter moves on to concepts tobe used in the rest of the book: the waste management hierarchy with its stress onpollution prevention; and industrial symbiosis: treating wastes as resources.
* Chapter 3 introduces toxicity and factors affecting whether a chemical will have adverseeffects. It presents the paradoxes with which we must grapple as we think about how oreven, in some cases, whether to lower the emissions of a pollutant.
* Chapter 4 examines chemical risk assessment. Again, the issue of paradoxes is raised associety systematically, but often inadequately works to understand and describe the riskof particular chemicals and the more difficult problems of the risks associated withmixtures of chemicals.
Basics of pollution issues: Chapters 5 through 12 overview specific pollution issues,especially those starting with emissions into air or water, but in which the pollutants oftenmove on to other environmental media.
* Chapter 5 delves into the principal pollutants in ambient air, the concerns they raise, theirsources, and our efforts to reduce emissions. Movements across the globe of massiveamounts of pollutants such as dust and smoke are reviewed. So are less prevalent airpollutants.
* Chapters 6, 7, and 8 examine global change issues that originate with air pollutants. InChapter 6, acid deposition and our success in curbing it is explained, as are somecontinuing problems, which include increasing levels of acid deposition in Asia.Chapter 7 addresses global climate change, which receives greater emphasis in thisedition, although the many relevant issues are difficult to cover in one chapter. The textoverviews not just government efforts to lower greenhouse gas emissions, but also thoseof businesses, cities, and states. Experience gained with the Kyoto Protocol is noted,while simultaneously looking forward to a more robust treaty. In Chapter 8, the MontrealProtocol is lauded for its success in eliminating major pollutants involved in stratosphericozone depletion; remaining problems are also noted.
* Chapters 9 and 10 examine water pollution and drinking-water pollution, respectively.Chapter 9 emphasizes nonpoint source pollution, and the difficulties in reducing suchemissions as compared to point sources. The nitrogen glut is examined along with deadzones, now a problem of global dimensions. Chapter 10 inspects drinking-water con-taminants and drinking-water purification and the conundrums raised by disinfectingwater. Problems relating to pathogenic organisms in drinking water are emphasized,especially in less-developed countries. The tragedy of arsenic poisoning in Bangladesh isalso examined.
* Chapters 11 and 12 summarize just two of the many wastes that society produces,municipal solid waste and hazardous waste, respectively. Chapter 11 looks at the enor-mous quantities of solid waste that we produce, and the increasing difficulties that it posesto societies working to deal with it, especially those of less-developed countries. Theincreasingly prominent role of plastics as a damaging waste is discussed. Chapter 12summarizes hazardous waste, its sources and treatment, and hazardous waste sites. Itshows too how non-hazardous wastes such as discarded computers can, improperly dealtwith, become hazardous.
Specific pollutants and pollution issues: Chapters 13 through 17
x Preface
* Chapter 13 is devoted to the pervasive pollution produced by fossil fuel production anduse. It reviews the ways in which many of the issues examined in earlier chapters areenergy related. Alternative sources of energy are examined along with the environmentalpluses and minuses associated with each.
* Chapters 14 and 15 introduce persistent, bioaccumulative, toxic (PBTs) pollutants. Theproblems caused by PBTs are out of all proportion to their environmental concentrations.Organic PBTs and metal PBTs are examined in Chapters 14 and 15, respectively.
* Chapter 16 summarizes pesticides and pollution related to the use of pesticides.Alternatives to the use of synthetic pesticides are reviewed, as are the differingapproaches and philosophies involved in using pesticides in conventional agriculture ascompared to organic and integrated pest management.
* Chapter 17 brings us to home settings, focusing on pollutants within our homes. Manypollutants are often found at higher levels inside our homes than outside. How can wereduce, or even eliminate, many of them? The chapter also discusses the hazardousproducts that we use.
Hope for meaningful change: Chapter 18
* Chapter 18 addresses the ideal of zero waste, zero emissions using two major approaches,dematerialization and detoxification. The tools we use in moving toward these ends areexamined. The chapter also introduces some businesses, cities, and even whole countriesthat are making zero waste, zero emissions their goal.
Chemistry: Chapter 19
* Chapter 19 introduces some basics of chemistry. It was written in response to requests toprovide more information on why pollutants act as they do. Several elementary explan-ations of pollution events using chemistry are provided.
xi Preface
Acknowledgements
I continue to extend warm gratitude to my husband, Professor John C. Hassler, who hasfaithfully and with much patience over three editions of this text cared for my computerhardware and software. Professor Hassler, a Ph.D. physical chemist, also reviewed the newchapter on chemistry.
Abbreviations and acronyms
(Chemical abbreviations listed separately below)
ADI Acceptable daily intakeAIDS Acquired Immune Deficiency SyndromeATSDR Agency for Toxic Substances Disease Registry (a US agency)BOD Biochemical oxygen demandBt Bacillus thuringiensis (a bacterium)Btu British thermal unit (a unit of energy)CAA Clean Air Act (a US law)CDC Centers for Disease Control and Prevention (a US agency)CDM Clean Development MechanismCERCLA Comprehensive Environmental Response, Compensation, and Liability Act
(Superfund) (a US law relating to hazardous waste sites)CPSD Consumer Product Safety Division (a US agency)CRT Cathode ray tubesCSO Combined sewer overflowCWA Clean Water ActDBP Disinfection by-productDfE Design for the environmentDOE Department of Energy (a US agency)EMF Electromagnetic fieldEPA Environmental Protection Agency (a US agency)EPR Extended producer responsibility (also called take-back)ETS Environmental tobacco smokeEU European UnionEV Electric vehicleFAO Food and Agriculture Organization (a UN agency)FDA Food and Drug AdministrationFFDCA Federal Food Drug and Cosmetics Act (a US law)FFV Flexibly fueled vehicleFIFRA Federal Insecticide Fungicide and Rodenticide Act (a US law)GCM General Circulation ModelGEO Genetically engineered organismGHG Greenhouse gasGI GastrointestinalHAP Hazardous air pollutant, also referred to as toxic air pollutant
HEPA High-efficiency particulate air (filter)HHW Household hazardous wasteHW Hazardous wasteINDOEX Indian Ocean ExperimentIPCC Intergovernmental Panel on Climate ChangeIPM Integrated pest managementIR InfraredKWh Kilowatt-hourLCA Life-cycle assessmentMACT Maximum available control technologyMCL Maximum contaminant levelMCLG Maximum contaminant level goalMEI Maximally exposed individualMIC Methylisocyanateµg /dl Micrograms per deciliter (a concentration)µg /l Micrograms per liter (a concentration)MOPITT Measurements of Pollution in the TroposphereMPG Miles per gallonMSW Municipal solid wasteMTD Maximum tolerated doseNAPAP National Acid Precipitation Assessment Program (program evaluating acidic
deposition)NAS National Academy of Sciences (US body of scientists formed by a
Congressional act)NASA National Aeronautic and Space Administration (a US agency)NICAD Nickel–cadmium batteriesNIMBY Not in my backyardNOAA National Oceanic and Atmospheric Administration (a US agency)NOAEL No observed adverse effect levelNPL National Priority List (a US list of high-priority hazardous waste sites)NRC National Research Council (an arm of the US NAS)NTP National Toxicology Program (a US program evaluating chemical toxicity)ODP Ozone-depletion potentialOECD Organization for Economic Cooperation and Development (organization of
30 prosperous nations)P2 Pollution preventionPBT Persistent, bioaccumulative, toxicpCi/l Picocuries per liter (a unit of concentration for radioactive substances)PM Particulate matterPM10 Particulate matter that is less than 10 microns in diameterPM2.5 Particulate matter that is less than 2.5 microns in diameterPNGV Partnership for a New Generation of VehiclesPOP Persistent organic pollutantppb Parts per billion (a unit of concentration)
xiv Abbreviations and acronyms
ppm Parts per million (milligrams per liter, a unit of concentration)ppt Parts per trillion (a unit of concentration)PSC Polar stratospheric cloudPV PhotovoltaicRCRA Resource Conservation and Recovery Act (a US law)RDF Refuse-derived fuelRfD Reference doseSDWA Safe Drinking Water Act (a US law)SS Suspended solidsSUV Sports utility vehicleTRI Toxic Release Inventory (US list of chemicals released into environment)TSCA Toxic Substances Control Act (a US law)TUR Toxics use reductionUN United NationsUNDP UN Development ProgramUNEP UN Environmental ProgramUNICEF UN International Children’s Emergency FundUSDA US Department of AgricultureUSGS US Geological Survey (a US agency)UV UltravioletWHO World Health Organization (a UN agency)WMH Waste management hierarchyWMO World Meteorological Organization (a UN agency)ZEV Zero-emission vehicle
Chemical abbreviations and formulas
BaP Benzo[a]pyrene (a PAH formed during combustion)14C Carbon-14 (a radioactive form of carbon)CCA Chromated copper arsenate (used to protect wood against decay)CCl2F2 Freon-12 (the best-known CFC)CFC Chlorofluorocarbon (an ozone-depleting chemical)CFC-12 Freon (the best-known CFC)CH4 Methane (a greenhouse gas)ClO Chlorine monoxide (in the stratosphere it promotes ozone depletion)CO Carbon monoxide (a toxic chemical formed by incomplete combustion)CO2 Carbon dioxide (a greenhouse gas)DDE Dichlorodiphenyldichloroethene (a DDT degradation product)DDT Dichlorodiphenyltrichloroethane (a once common, but now banned,
insecticide)DEHP Di(2-ethylhexyl) phthalate (used in plastic to make it flexible)DES Diethylstilbestrol (a potent synthetic estrogen)Dioxin 2,3,7,8-TCDD (sometimes refers to the whole dioxin family)DMSO Dimethyl sulfoxide (chemical promoting transport of chemicals across skin
into body)
xv Abbreviations and acronyms
DNA Deoxyribonucleic acid (genetic material)H+ Acid hydrogen ion (an ion that makes water acid)HCFC Hydrochlorofluorocarbon (a substitute for CFCs)HCHO Formaldehyde (a chemical found in many household products, often as a
residual)HCl Hydrochloric acid (a common acid)HFC Hydrofluorocarbon (a substitute for CFCs)40K Potassium-40 (a radioactive form of potassium)MIC Methylisocyanate (responsible for massive Bhopal explosion)MTBE Methyl tertiary butyl ether (a chemical added to gasoline to provide oxygen)N NitrogenN2 Nitrogen (diatomic nitrogen, the form found in the atmosphere)N2O Nitrous oxide (a greenhouse gas, also used as anesthetic, known as “laughing
gas”)NO2 Nitrogen dioxide (a common air pollutant, which also leads to acid deposition)NOx Nitrogen oxides (common air pollutants that contain nitrogen)O Single oxygen atomO2 Oxygen (diatomic oxygen, the form found in the atmosphere)O3 Ozone (triatomic oxygen, a common air pollutant)PAH Polycyclic aromatic hydrocarbon (common pollutants formed during
combustion)PBDE Polybrominated diphenyl ether (a fire-retardant chemical which is persistent
and bioaccumulative)PCB Polychlorinated biphenyl (now banned chemicals once commonly used in
electrical equipment to prevent fires)PERC Tetrachloroethylene (perchloroethylene, a dry-cleaning solvent)PET Polyethylene terephthalate (a common plastic often used to make soft-drink
bottles)PFC Perfluorocarbon (a greenhouse gas)PFOS Perfluorooctane sulfonates (stain repellants and fire-fighting chemicals,
environmentally persistent and bioaccumulative)Po Polonium (a naturally found radioactive element)PVC Polyvinylchloride (a plastic)Rn Radon (a naturally found radioactive gas)SF6 Sulfur hexafluoride (a potent greenhouse gas)SO2 Sulfur dioxide (a common air pollutant, which also leads to acid deposition)TBT Tributyltin (biocide used to coat maritime ships to prevent growth of fouling
organisms)TCDD 2,3,7,8-tetrachlorodibenzo-p-dioxin (most toxic form of dioxin commonly
called “dioxin”)238U Uranium-238 (a radioactive isotope of uranium)VOCs Volatile organic compounds (or volatile organic chemicals)
xvi Abbreviations and acronyms
1 Understanding pollution
“The very basis for life on earth is declining at an alarming rate.”Former UN Secretary, General Kofi Annan
Chapter 1 asks some basic questions: what is pollution and why is it important? What causespollution? Is it always harmful? How do pollutants change once in the environment? Section Iemphasizes the major impacts we humans exert on Earth’s natural systems while reminding usof our profound dependence on the services provided by those systems. Section II asks whypollution happens. What substances pollute and where do they come from? We look at whathappens to pollutants once released, and the effects exerted, sometimes at great distances fromtheir point of release. Section III examines the catastrophic 1984 explosion in Bhopal, India. Italso considers the opposite extreme: should we be concerned about very low levels of pollu-tants? We then move to impoverished parts of the world where pollution sometimes devastateshuman health. Section IV introduces root causes of pollution – growing human populations,growing consumption, and large-scale technology. Section V asks us to face ourselves, to seethat our actions have environmental consequences, sometimes in ways we don’t suspect.
SECTION I
Humans are massively changing the Earth
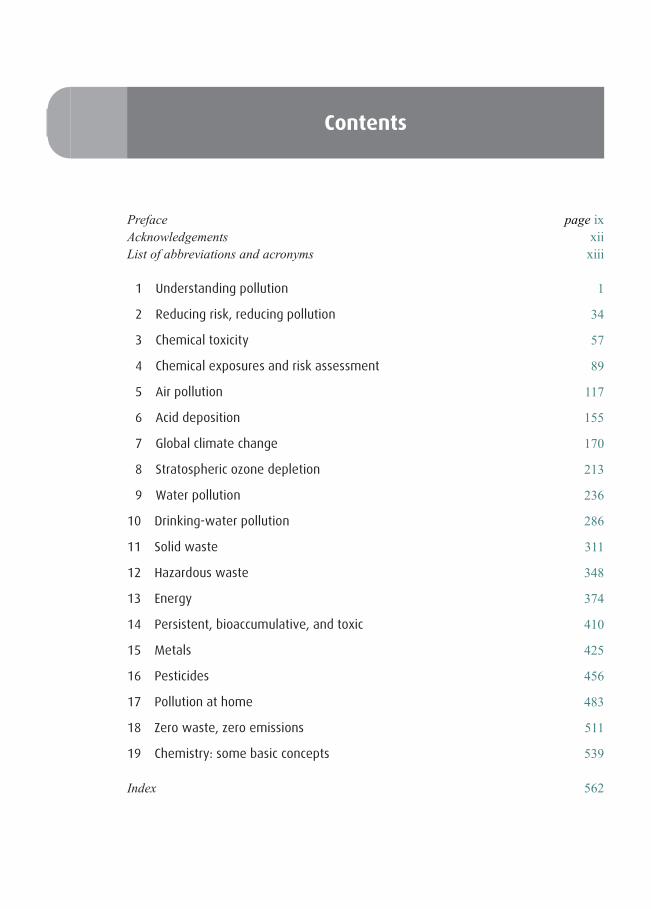
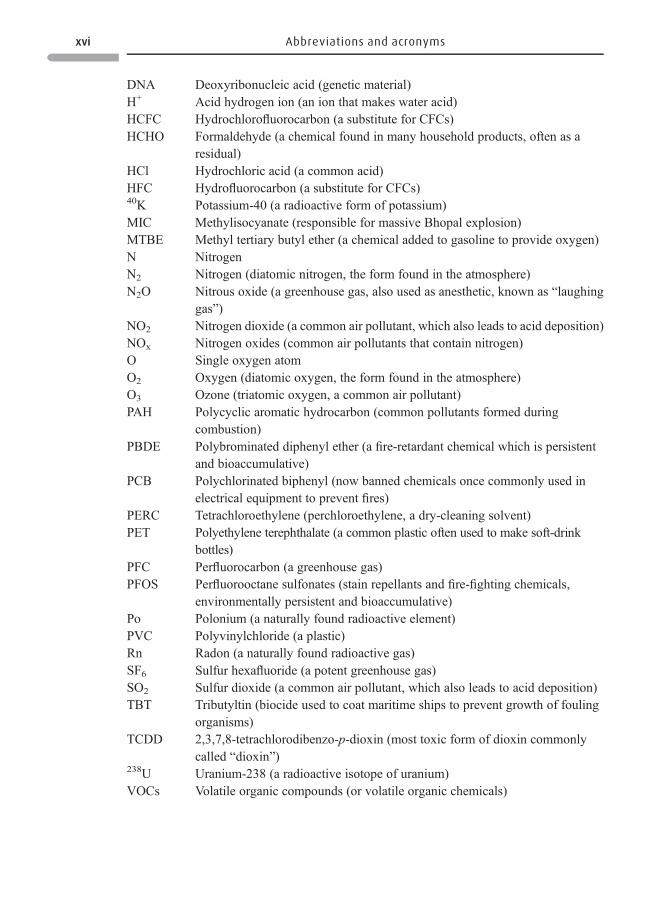
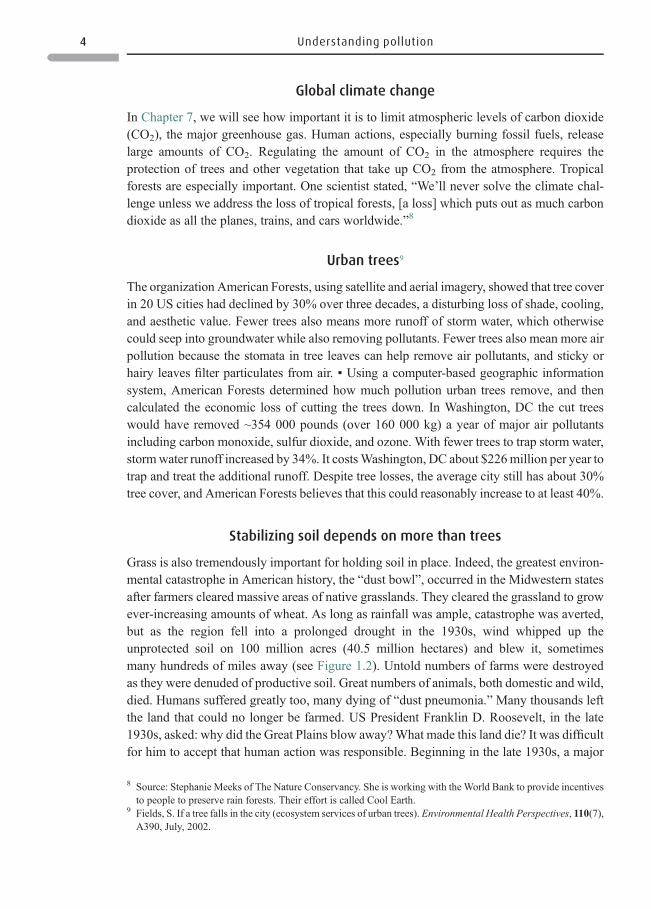
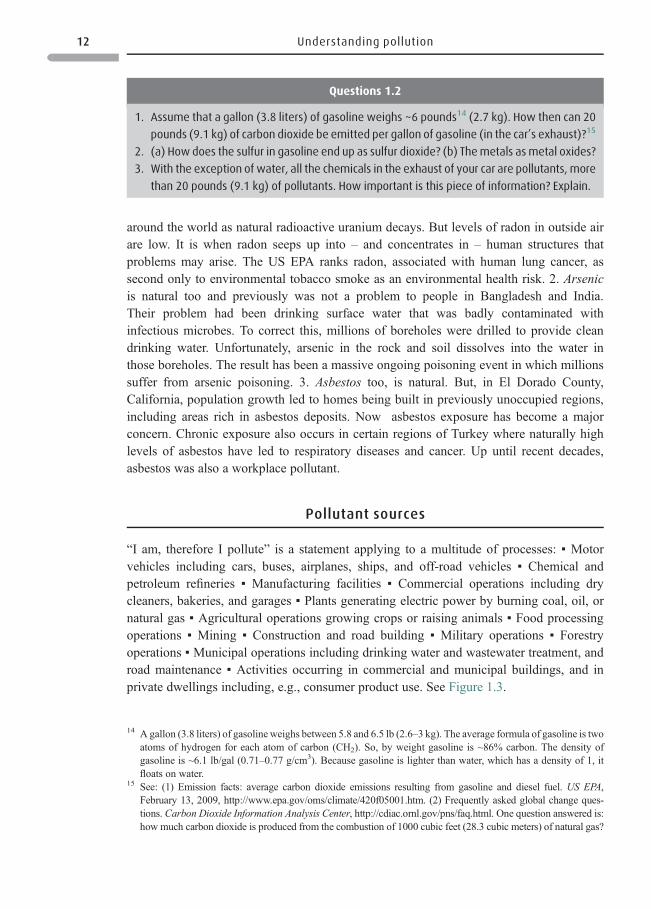
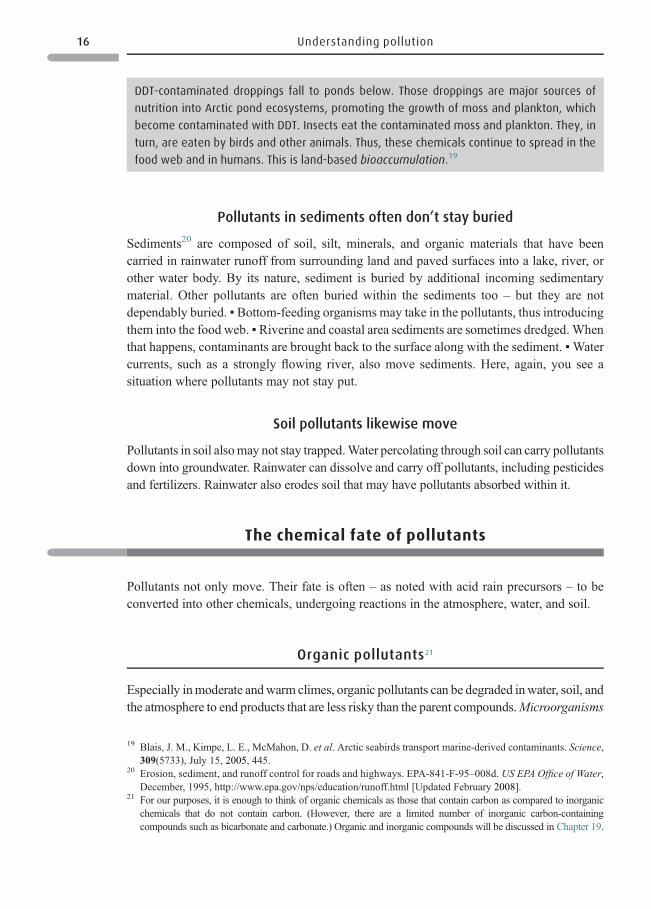
A 1997 article in the journal, Science, “Human domination of Earth’s ecosystems”, spoke ofhumanity’s impact on the environment.1 See Figure 1.1 from left to right. (1) Up to one half ofEarth’s land surface has been transformed by human action. (2) The percentage of theconcentration of the atmospheric greenhouse gas, carbon dioxide, that results from humanaction. (3) The percentage of accessible surface fresh water on Earth being put to use byhumanity. (4) The percentage of nitrogen fixation caused by humans is more than all naturalterrestrial sources combined. (5) The percentage of plant species in Canada that humanity hasintroduced from elsewhere, i.e., invasive or exotic species. (6) The percentage of bird specieson Earth that became extinct in the past two millennia (largely) from human activity. (7) Thepercentage of major marine fisheries that are fully exploited, overexploited, or depleted.
Ten years after the article, human domination has continued to increase. A 2007 reportfrom the United Nation’s Environmental Program (UNEP) stated: “The human population is
1 Vitousek, P. M., Mooney, H. A., Lubchenco, J., and Melillo, J. M. Human domination of Earth’s ecosystems.Science, 277, July 25, 1997, 494–499, http://mk.geog.uu.nl/homepages/Peter/teaching/Themes/Vitousek.pdf.
living far beyond its means and inflicting damage on the environment that could pass pointsof no return.”2 One example: as much as one-third of ocean fisheries are in collapse, two-thirds may be so in 2025, and all major ocean fisheries may be gone by 2048. As the “HumanDomination” article stated: “The rates, scales, kinds, and combinations of changes occurringnow are fundamentally different from those at any other time in history; we are changingEarth more rapidly than we are understanding it. In a very real sense, the world is in ourhands and how we handle it will determine its composition and dynamics, and our fate.”
To the student: Chapter 1 describesmajor and discouraging problems. However, the chapter’spurpose is to provide the background from which we can consider solutions. Solutions areassuredly difficult, but human willingness and energy can lead to surprising changes.
Nature’s services
We may ignore pollution if its source is a local factory that provides employment. “That’sthe smell of money”we might say. Many of us still fail to recognize our total dependence onour environment or recognize that all human employment depends on nature’s services. Fora summary of nature’s services, see Table 1.1.
Examples of nature’s services (ecosystem services3,4)
Protecting drinking water
New York City spent hundreds of millions of dollars to buy ~70 000 acres (~28 000hectares) of land along streams and rivers in the Catskill Mountains to the city’s
100
80
60
40
20
Landtransformation
Per
cen
tag
e ch
ang
e
CO2concentration
Nitrogenfixation
Wateruse
Plantinvasion Bird
extinction
Marinefisheries
0
Figure 1.1 Human domination of Earth’s ecosystems. Credit: Reprinted with permission from AAAS
2 Kanter, J. UN issues “final wake-up call” on population and environment. International Herald Tribune,October 25, 2007, http://www.iht.com/articles/2007/10/25/europe/environ.php.
3 Daily, G. C.Nature’s Services, Societal Dependence on Natural Ecosystems. Washington DC: Island Press, 1997.4 Ecosystem Services: A Primer, Ecological Society of America, 2000–2005, http://www.actionbioscience.org/environment/esa.html [August 2008].
2 Understanding pollution
north – the watershed5 that provides its drinking water.6 It then restricted use of that land,forbidding activities such as the application of pesticides and fertilizers that would pollutewatershed streams and rivers. ▪ The city also protected the land from development, leavingtrees and grasses in place. Roots of grasses and trees hold the soil in which they grow,preventing it from eroding and running off into streams during rainstorms. Rooted vegetationalso slows the rain falling through its foliage down into the soil. Leaf and other vegetationlitter on the ground absorb and slowwater too. These factors lessen the risk of flooding duringheavy rains. And, as water seeps downward to groundwater, the soil traps pollutantscontained in the rainwater. Because groundwater is in contact with surface water, keepinggroundwater clean helps to provide clean surface water. The rainwater allowed to seep intogroundwater replenishes it. ▪ By protecting the Catskills’ from pollution and recognizing thenatural water filtration capability of undeveloped land, the City avoided having to build a $6billion treatment plant to purify its drinking water, plus the $300 million a year it would havecost to run the plant. The City saved billions of dollars by protecting natural services – alsocalled ecosystem services. Other American cities are following New York City’s example,e.g., Austin Texas has purchased 20 000 acres (~8000 hectares) of land around its EdwardsAquifer.
Preventing floods
China is taking similar action to help curb flooding there. Lester Brown described the major1998 floods along the Yangtze River basin in China, floods continuing for many weeks, andcausing many billions of dollars in damage.7 Afterwards, the Chinese government tracedpart of the flooding to deforestation along the Yangtze River, so they banned tree cutting inthe upper reaches of the basin. They calculated that the value of living trees is three times thevalue of cut trees.
Table 1.1 What are nature’s services?
Type Examples
Provisioning Food (plants and animals), water, fuel (such as wood and dung)Regulating Climate (including temperature and precipitation), water purification and waste treatment,
pollination, preventing soil erosion (as with grasses and trees), storm protection (as withmangroves and coral reefs)
Supporting Services necessary to produce other ecosystem services including soil formation, nutrient cycling,production of oxygen (from photosynthesis)
Cultural Spiritual values, a “sense of place,” recreation and ecotourism
Nature’s services, also called “ecosystem services” are the benefits people obtain from the natural world. Theseservices directly affect people and also support services needed to maintain the other services.” (See MillenniumEcosystem Assessment, http://www.millenniumassessment.org/en/Framework.aspx.)
5 To get a sense of a watershed, see Figure 9.3.6 Carlton, J. Cities spending millions on land to protect water supplies. The Wall Street Journal, January 4, 2006.7 Brown, L. Eco-economy, building an economy for the earth. Chapter 8, Protecting Forest Products and Services.Earth Policy Institute, 2001, http://www.earth-policy.org/index.php?/books/eco/eech8_intro.
3 Nature’s services
Global climate change
In Chapter 7, we will see how important it is to limit atmospheric levels of carbon dioxide(CO2), the major greenhouse gas. Human actions, especially burning fossil fuels, releaselarge amounts of CO2. Regulating the amount of CO2 in the atmosphere requires theprotection of trees and other vegetation that take up CO2 from the atmosphere. Tropicalforests are especially important. One scientist stated, “We’ll never solve the climate chal-lenge unless we address the loss of tropical forests, [a loss] which puts out as much carbondioxide as all the planes, trains, and cars worldwide.”8
Urban trees9
The organization American Forests, using satellite and aerial imagery, showed that tree coverin 20 US cities had declined by 30% over three decades, a disturbing loss of shade, cooling,and aesthetic value. Fewer trees also means more runoff of storm water, which otherwisecould seep into groundwater while also removing pollutants. Fewer trees also mean more airpollution because the stomata in tree leaves can help remove air pollutants, and sticky orhairy leaves filter particulates from air. ▪ Using a computer-based geographic informationsystem, American Forests determined how much pollution urban trees remove, and thencalculated the economic loss of cutting the trees down. In Washington, DC the cut treeswould have removed ~354 000 pounds (over 160 000 kg) a year of major air pollutantsincluding carbon monoxide, sulfur dioxide, and ozone. With fewer trees to trap storm water,stormwater runoff increased by 34%. It costsWashington, DC about $226million per year totrap and treat the additional runoff. Despite tree losses, the average city still has about 30%tree cover, and American Forests believes that this could reasonably increase to at least 40%.
Stabilizing soil depends on more than trees
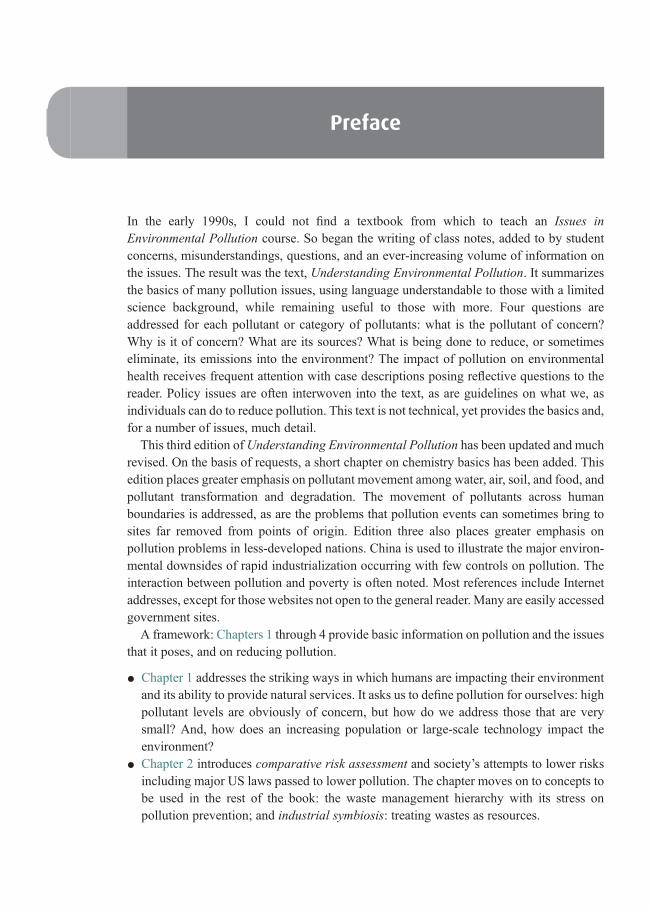
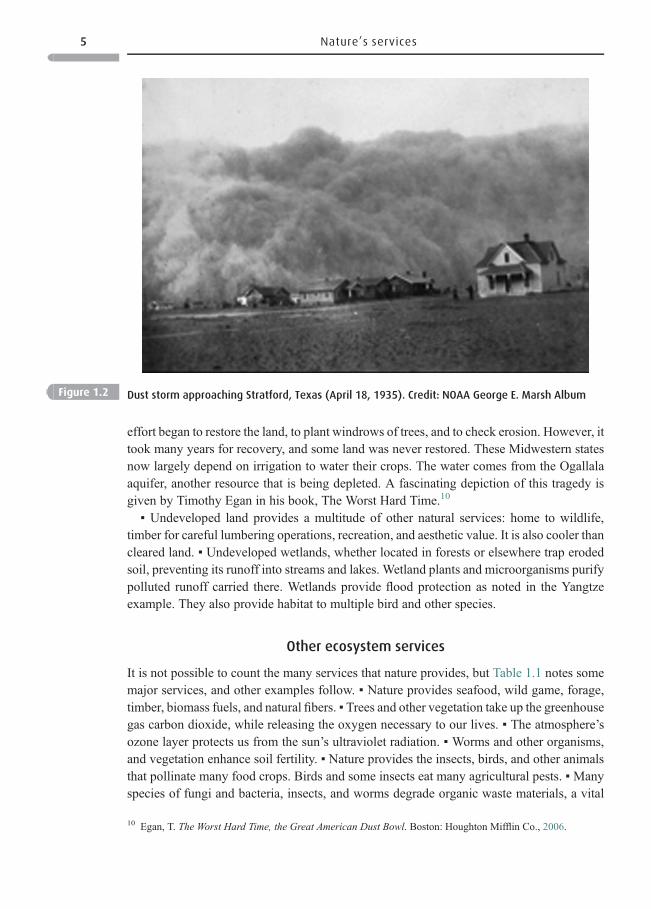
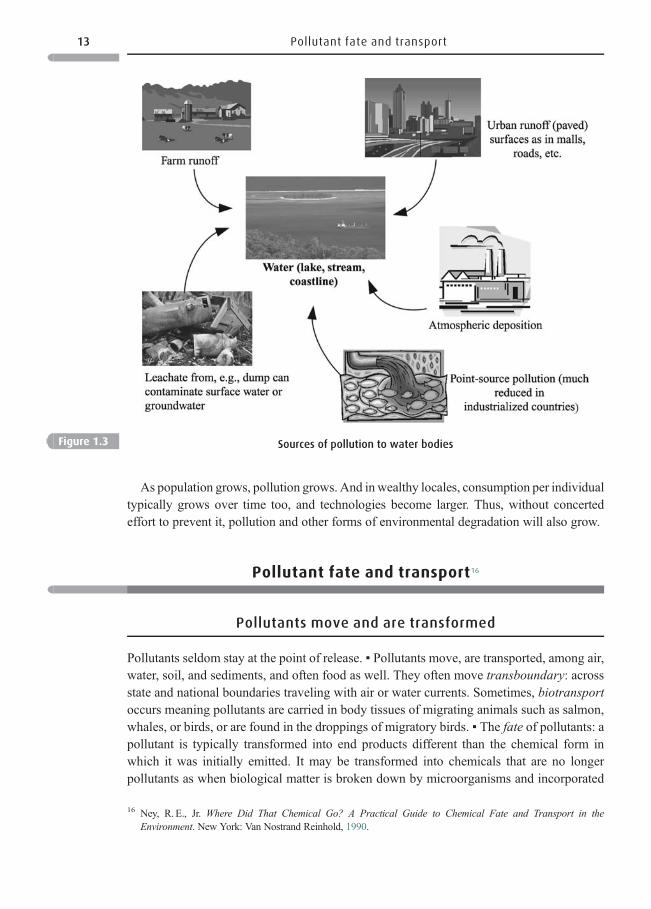
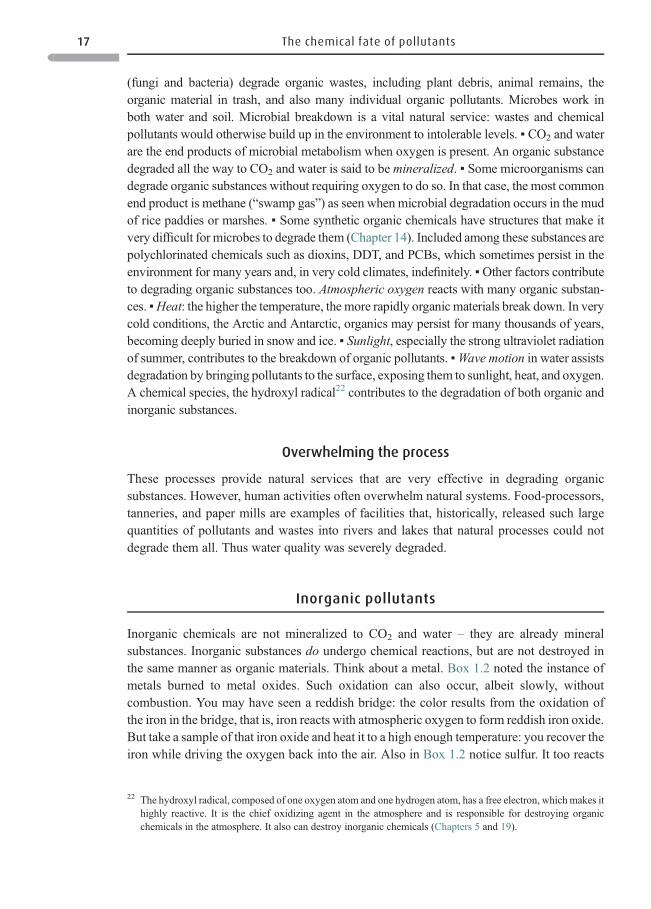
Grass is also tremendously important for holding soil in place. Indeed, the greatest environ-mental catastrophe in American history, the “dust bowl”, occurred in the Midwestern statesafter farmers cleared massive areas of native grasslands. They cleared the grassland to growever-increasing amounts of wheat. As long as rainfall was ample, catastrophe was averted,but as the region fell into a prolonged drought in the 1930s, wind whipped up theunprotected soil on 100 million acres (40.5 million hectares) and blew it, sometimesmany hundreds of miles away (see Figure 1.2). Untold numbers of farms were destroyedas they were denuded of productive soil. Great numbers of animals, both domestic and wild,died. Humans suffered greatly too, many dying of “dust pneumonia.” Many thousands leftthe land that could no longer be farmed. US President Franklin D. Roosevelt, in the late1930s, asked: why did the Great Plains blow away?What made this land die? It was difficultfor him to accept that human action was responsible. Beginning in the late 1930s, a major
8 Source: Stephanie Meeks of The Nature Conservancy. She is working with the World Bank to provide incentivesto people to preserve rain forests. Their effort is called Cool Earth.
9 Fields, S. If a tree falls in the city (ecosystem services of urban trees). Environmental Health Perspectives, 110(7),A390, July, 2002.
4 Understanding pollution
effort began to restore the land, to plant windrows of trees, and to check erosion. However, ittook many years for recovery, and some land was never restored. These Midwestern statesnow largely depend on irrigation to water their crops. The water comes from the Ogallalaaquifer, another resource that is being depleted. A fascinating depiction of this tragedy isgiven by Timothy Egan in his book, The Worst Hard Time.10
▪ Undeveloped land provides a multitude of other natural services: home to wildlife,timber for careful lumbering operations, recreation, and aesthetic value. It is also cooler thancleared land. ▪ Undeveloped wetlands, whether located in forests or elsewhere trap erodedsoil, preventing its runoff into streams and lakes. Wetland plants and microorganisms purifypolluted runoff carried there. Wetlands provide flood protection as noted in the Yangtzeexample. They also provide habitat to multiple bird and other species.
Other ecosystem services
It is not possible to count the many services that nature provides, but Table 1.1 notes somemajor services, and other examples follow. ▪ Nature provides seafood, wild game, forage,timber, biomass fuels, and natural fibers. ▪ Trees and other vegetation take up the greenhousegas carbon dioxide, while releasing the oxygen necessary to our lives. ▪ The atmosphere’sozone layer protects us from the sun’s ultraviolet radiation. ▪ Worms and other organisms,and vegetation enhance soil fertility. ▪ Nature provides the insects, birds, and other animalsthat pollinate many food crops. Birds and some insects eat many agricultural pests. ▪Manyspecies of fungi and bacteria, insects, and worms degrade organic waste materials, a vital
Figure 1.2 Dust storm approaching Stratford, Texas (April 18, 1935). Credit: NOAA George E. Marsh Album
10 Egan, T. The Worst Hard Time, the Great American Dust Bowl. Boston: Houghton Mifflin Co., 2006.
5 Nature’s services
function. Organic wastes include sewage, dead vegetation, and animal matter, and natural aswell as anthropogenic organic pollutants. Some larger creatures eat wastes too – vultures areessential to scavenge dead animals in some places. Waste-degrading creatures could livewithout humans, but we cannot live without them.
Among services that you might not think of, consider glaciers, many of which are nowmelting as the climate warms. Glaciers provide water to many of the world’s major rivers,which in turn provide drinking water, and water used for agriculture, hydroelectric dams,industry, and, of course, water for the countless other species that live on Earth. Or thinkabout the soil that, in many places around the world is undergoing desertification, con-version into deserts. Desertification lessens the land available for human habitation, foragriculture, or habitat for our fellow species. Moreover, as land undergoes desertification wesee increasing numbers of dust storms, often badly impacting people, plants, and animalsliving hundreds, even thousands of miles from those storms.
Vital species
We do not know which species are absolutely vital to life on Earth, but we know that a greatmany are needed tomaintain themultitudes of ecosystem services (see Box 1.1).We also knowthat humanity is destroying and disrupting habitat, and producing pollution. In the process,species are going extinct at a rate perhaps 100 times greater than the natural rate. ▪ Coral is oneexample of a vital species. Coral reefs play an irreplaceable role in the marine environment.They provide habitat formarine species that are integral to the ocean’s food chain. They providea livelihood to a hundredmillion people in less-developed countries in jobs such as fishing andtourism. Beyond the marine environment, coral reefs protect the coastline from flooding andcoastal erosion. But coral reefs are being lost through pollution from eroded soil carried inrunoff along with chemical pollutants; global warming is also playing a deadly role.
Questions 1.1
1. In a paragraph, describe how protecting land from development, as New York City did,
helps to provide clean water.
2. Coral reefs are a vital living resource that is being destroyed. What is another?
3. What did Harvard biologist, E. O. Wilson mean by saying “We need invertebrates but they
don’t need us”?
4. What natural services do the following provide? (a) Grasslands (b) Estuaries
(c) Microorganisms.
5. When you think about vital species, what are two species (other than domestic animals)
that come to mind? What services do these species provide?
6. How can pollution result from: (a) Deforestation? (b) Grassland loss? (c) Wetland loss?
7. Technology can mimic some natural services such as purifying water, albeit often at high
cost. What technology – one that is already known or one that you can envision – can:
(a) Provide clean drinking water at a reasonable cost? (b) Rebuild agricultural soil damaged
by erosion? (c) Rebuild soil damaged by salt buildup? (c) Produce adequate food in the
absence of fertile soil?
6 Understanding pollution
What is happening to Earth’s ecosystems?
Keeping in mind our absolute dependence on Earth’s ecosystems and the major stresses onthem, how well are they still providing their natural goods and services? The first systematicexamination of this question was a four-year $20 million study, the Millennium EcosystemAssessment (MEA).12 Carried out by 1400 scientists worldwide under the aegis of the UN
Box 1.1 “Less forgiving than our planet”
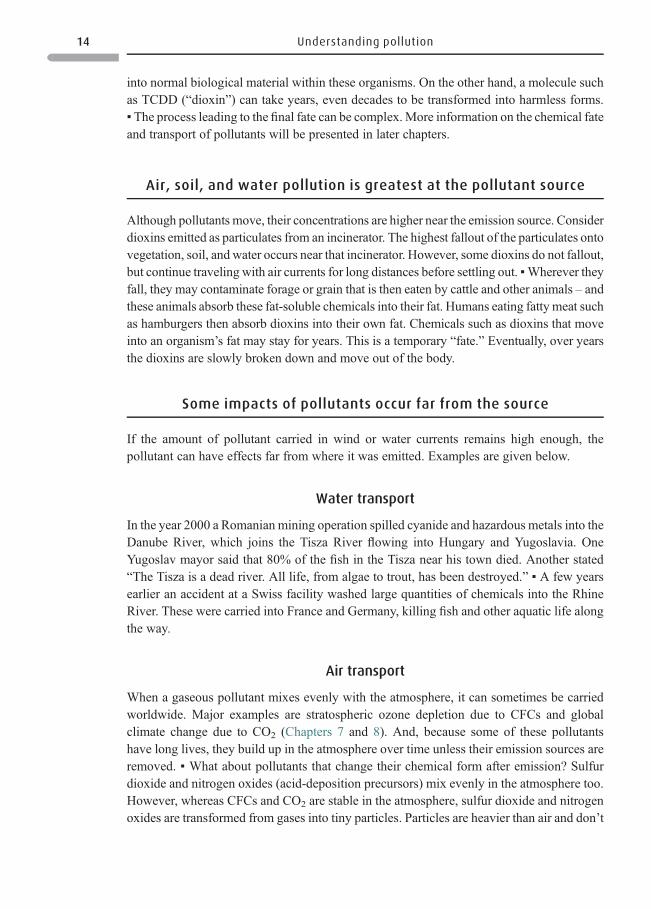
A facility known as Biosphere 2was designed to test a supposition oftenmade by economists –
that technology can substitute for natural life support systems. Biosphere 2 was to model a
spacecraft that could allow humans to travel in space indefinitely. Within the structure,
everything was to be sustainable. Built in the State of Arizona at a cost of $200 million, the
3.2 acres (1.3 hectares) of Biosphere 2 are a closed-off mini-Earth containing tiny biomes – a
marsh from the Florida Everglades, an equatorial rain forest, a coastal desert, a savanna with a
stream and grasses from three continents, an artificial mini-ocean with a coral reef, plus an
orchard and intensive agricultural area. Its underbelly holds a maze of plumbing, generators,
and tanks. In 1991, eight people started living in Biosphere 2 to test its ability to support life.
They lived within the facility for two years. The first year went well, but in the second, crops
failed, and people grew thin. They became dizzy as atmospheric oxygen levels fell from 21%
to 14% – a level typical of a 14 000 feet (4270 m) elevation. This occurred because excessive
organic matter in the soil absorbed oxygen from the air as did the type of concrete used.
Atmospheric carbon dioxide “spiked erratically,” while nitrous oxide rose to levels hazardous
to brain function. Vines and algal mats overgrew other vegetation. Water became polluted.
The Biosphere initially had 3800 plant and animal species. Among the 25 introduced verteb-
rate species 19 died out over the two years, and only a few birds survived. All the Biosphere’s
pollinators – essential to sustainable plant communities – became extinct. Excitable “crazy”
ants destroyed most other insects. ▪In 1997, Columbia University took over Biosphere 2 for use
as an educational facility designed to teach Earth stewardship, a place to “build planetary
managers of the future.” Its research efforts included studying the effects of various levels of
the greenhouse gas carbon dioxide on plant communities. That effort ended and the University
of Arizona is now in charge. ▪ Someone noted that Biosphere 2 is less forgiving than our planet.
But Earth is a closed system too. History records many examples of civilizations that failed or
grew weak after severely impacting their local environments.11 But survivors often moved on
to other environments. Today, many people still struggle to “move on,” but there are fewer
and fewer fresh locales into which Earth’s huge population can move.
The technical problems of Biosphere 2 could probably be solved. But for the whole Earth, or
major parts of it, can we substitute technology for nature’s services, for breathable air, or for
fertile clean soil?
11 Diamond, J. Collapse, How Societies Choose to Fail or Succeed. New York City: Viking, 2004.12 (1) Stokstad, E. Taking the pulse of Earth’s life-support systems. Science, 308 (5718), April 1, 2005, 41–43. (2)
Global Economic Growth Continues at Expense of Ecological Systems. Worldwatch Institute, January, 2008,http://www.worldwatch.org/node/5456.
7 Nature’s services
Environment Program’s (UNEP), the MEA evaluated the health of the planet’s forests,coastlines, inland waters, shrub lands, dry lands, deserts, agricultural lands, and otherecosystems vital to human and natural welfare. Helping investigators to envision whatwas happening were 16 000 photographs donated by the US National Aeronautics andSpace Administration (NASA). Taken from space by satellite, these showed changesoccurring in the 1990s in biomes such as coastlines, mountains, and agricultural land.
In 2005MEA provided some answers as to what is happening to ecosystem services. Theirreport revealed that at least 60% of services supporting life on Earth including fresh water,fisheries, and many other services are being used unsustainably. The report, Living BeyondOurMeans: Natural Assets andHumanWell-being,13 has shown that we are using about 1.25Earths’ worth of resources, even while human population and consumption continues toincrease. Consequences of environmental degradation could becomemore obvious in comingyears. Although results were extremely worrisome, the study pointed towardmeans bywhichwe can improve ecosystem management, a topic that we will examine throughout this text.
SECTION II
Pollution
When pollution is obvious
If you read that a pollutant is “any substance introduced into the environment that adverselyaffects the usefulness of a resource” you may yawn. But pollution literally hits you if youlive in a city where emissions from cars, trucks, and motorbikes sting your eyes, congestyour nose, cause your head to ache, or tighten your breathing. ▪ In the 1960s and ’70s,pollution in the United States, a wealthy country, was often blatant. Some rivers wereobviously polluted by industries operating on their banks. Oil floating on the surface ofOhio’s Cuyahoga River caught on fire more than once. One fire in 1959 burned for 8 days.▪Air pollution was obvious too. In industrial cities soot drifted onto streets and clothing, andinto homes. Severe air pollution episodes increased hospital admissions killing sensitivepeople. Trash burned in open dumps. ▪ Heavy pesticide use killed fish, birds, and otheranimals. ▪ The new century finds the environment in industrialized countries improved. Butcontinuing population growth in the United States, and unremitting, indeed accelerated, landdevelopment may be reversing some of that progress. And the United States, once anenvironmental leader, abandoned that role in the first decade of the twenty-first century.
Just as a weed is “a plant out of place,” a pollutant is “a chemical out of place.” Oilenclosed within a tanker is not a pollutant. Spilled into the environment, it is. However,doing harm often involves more than being out of place. A small oil spill may go unnoticed,
13 See http://millenniumassessment.org/en/index.aspx, home page of the MEA, which links to the report’s sum-mary and other reports including Living Beyond Our Means. Also see the World Resources Institute’sEarthTrends at http://earthtrends.wri.org/ for more useful information on Earth’s ecosystems.
8 Understanding pollution
but a large one can be disastrous. Circumstances are important too. If the oil is of a typeeasily degraded, or one that evaporates easily, or if wind blows the spill quickly away from ashoreline, there may be little harm. But, coming ashore, oil may devastate animals, birds,and other shore-dwelling organisms.
Almost any substance, synthetic or natural, can pollute. However, it is synthetic and otherindustrial chemicals that are emphasized here. If we learn that industrial chemicals in a waterbody are obviously impairing the ability of birds to reproduce, or are associated with fishtumors we all agree that the water is polluted. But what if only tiny amounts of industrialchemicals are present and living creatures are apparently unaffected? Is the water polluted?Some would say “yes,” arguing that chronic effects could result, i.e., adverse effectsresulting from long-term exposure to even very low concentrations of a substance. ▪ Theword waste differs from pollutant, although a waste can be a pollutant too. Waste refers tomaterial such as garbage, trash, construction debris: materials that have reached the end oftheir useful life. ▪ See Table 1.2 for a description of how pollutant concentrations aredescribed.
Pollution is often less obvious if you live in a wealthy country where the twentieth centurybrought cleaner air and drinking water, sewage treatment, safe food laws, and food refrig-eration. But it took many years and many billions of dollars to reach those results. Andwealth does not guarantee an unspoiled environment. For example, parts of the AmericanAppalachian Mountains suffer destruction and pollution resulting from mountaintop-removal mining (described later). Or think about wealthy Hong Kong. In the 1990s, thebeaches of this island were too polluted for swimming. High concentrations of hazardousindustrial metals, livestock waste, and human waste polluted its rivers, and large amounts oftrash polluted the harbor. However, between 1993 and 2000, hazardous metal discharges
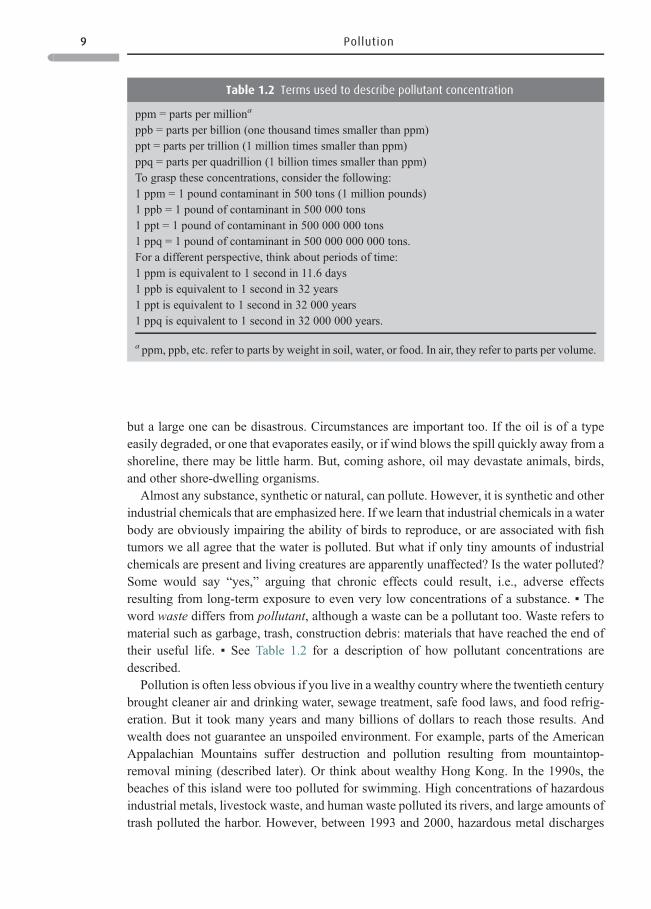
Table 1.2 Terms used to describe pollutant concentration
ppm = parts per milliona
ppb = parts per billion (one thousand times smaller than ppm)ppt = parts per trillion (1 million times smaller than ppm)ppq = parts per quadrillion (1 billion times smaller than ppm)To grasp these concentrations, consider the following:1 ppm = 1 pound contaminant in 500 tons (1 million pounds)1 ppb = 1 pound of contaminant in 500 000 tons1 ppt = 1 pound of contaminant in 500 000 000 tons1 ppq = 1 pound of contaminant in 500 000 000 000 tons.For a different perspective, think about periods of time:1 ppm is equivalent to 1 second in 11.6 days1 ppb is equivalent to 1 second in 32 years1 ppt is equivalent to 1 second in 32 000 years1 ppq is equivalent to 1 second in 32 000 000 years.
a ppm, ppb, etc. refer to parts by weight in soil, water, or food. In air, they refer to parts per volume.
9 Pollution
were reduced from 15 432 lb/day (7000 kg/day) to 4409 lb/day (2000 kg/day). And, HongKong increasingly collects and treats sewage before releasing it into the harbor. However, airpollution remains critical. In the mid-1990s, exhausts from motor vehicles resulted in 25%of the population suffering from respiratory problems. Today, despite better air pollutioncontrols, heavy smog often blankets Hong Kong. Up to half of this enters Hong Kong fromnearby Chinese cities in Guangdong Province. But part of the imported pollution comesfrom facilities owned by Hong Kong companies – operating on the mainland with poorpollution controls.
Why does pollution happen?
Unless you assume that people and industry deliberately pollute, why does pollution occur?It happens because no process is 100% efficient. Consider your own body – it cannot use100% of the food you eat. ▪ The gastrointestinal (GI) tract does not break down the fiber inthe food you eat, and this is excreted from the body as solid waste. ▪ Enzymes in the gut dobreak down other foods intomolecules that can cross the GIwall into the bloodstream, whichcarries the nutrition throughout your body. But the body cannot use 100% of the nutrientvalue, and a portion is excreted into urine as water-soluble waste. ▪ Also, your body cannotconvert all the potential energy in food into useful energy – part becomes waste energy.
As with your body, no other process, natural or human, such as manufacturing orfuel burning, is 100% efficient: each produces pollution and waste, and waste energy.See Box 1.2. Lack of prevention, carelessness, unwillingness to invest in good technology,or lack of appropriate technology aggravates the waste and pollution produced. ArchitectWilliam McDonough and chemist Michael Braungart observe, “Pollution is a symbol ofdesign failure.” In other words, wastes need not be wastes and pollutants need not bepollutants. We should be able to return these to the manufacturing process, or else makesure the wastes involved are able to biodegrade harmlessly in the environment. We willreturn to this later.
What substances pollute?
Almost any chemical or material from either human or natural sources can pollute. SeeTable 1.3. Also see Pollutant Sources below.
Natural pollutants
This text emphasizes anthropogenic pollutants (i.e., pollutants produced by human activity),but natural chemicals can also pollute. This happens dramatically when an erupting volcanospews out huge quantities of rocks, ash, chlorine, sulfur dioxide, and other chemicals. Othernatural chemicals can pollute too, but sometimes human actions allow natural substances toreach dangerous levels as in the following illustrations: 1. Radon is a naturally radioactivechemical, a gas that arises from transformations occurring in underlying rocks and soil
10 Understanding pollution
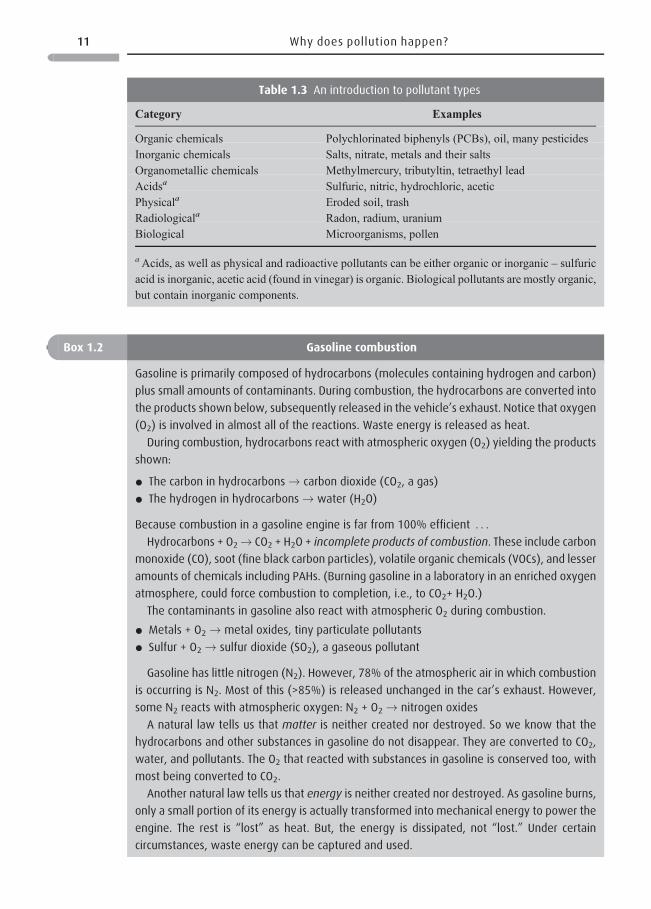
Box 1.2 Gasoline combustion
Gasoline is primarily composed of hydrocarbons (molecules containing hydrogen and carbon)
plus small amounts of contaminants. During combustion, the hydrocarbons are converted into
the products shown below, subsequently released in the vehicle’s exhaust. Notice that oxygen
(O2) is involved in almost all of the reactions. Waste energy is released as heat.
During combustion, hydrocarbons react with atmospheric oxygen (O2) yielding the products
shown:
* The carbon in hydrocarbons → carbon dioxide (CO2, a gas)
* The hydrogen in hydrocarbons → water (H2O)
Because combustion in a gasoline engine is far from 100% efficient . . .
Hydrocarbons + O2→ CO2 + H2O + incomplete products of combustion. These include carbon
monoxide (CO), soot (fine black carbon particles), volatile organic chemicals (VOCs), and lesser
amounts of chemicals including PAHs. (Burning gasoline in a laboratory in an enriched oxygen
atmosphere, could force combustion to completion, i.e., to CO2+ H2O.)
The contaminants in gasoline also react with atmospheric O2 during combustion.
* Metals + O2 → metal oxides, tiny particulate pollutants
* Sulfur + O2 → sulfur dioxide (SO2), a gaseous pollutant
Gasoline has little nitrogen (N2). However, 78% of the atmospheric air in which combustion
is occurring is N2. Most of this (>85%) is released unchanged in the car’s exhaust. However,
some N2 reacts with atmospheric oxygen: N2 + O2 → nitrogen oxides
A natural law tells us that matter is neither created nor destroyed. So we know that the
hydrocarbons and other substances in gasoline do not disappear. They are converted to CO2,
water, and pollutants. The O2 that reacted with substances in gasoline is conserved too, with
most being converted to CO2.
Another natural law tells us that energy is neither created nor destroyed. As gasoline burns,
only a small portion of its energy is actually transformed into mechanical energy to power the
engine. The rest is “lost” as heat. But, the energy is dissipated, not “lost.” Under certain
circumstances, waste energy can be captured and used.
Table 1.3 An introduction to pollutant types
Category Examples
Organic chemicals Polychlorinated biphenyls (PCBs), oil, many pesticidesInorganic chemicals Salts, nitrate, metals and their saltsOrganometallic chemicals Methylmercury, tributyltin, tetraethyl leadAcidsa Sulfuric, nitric, hydrochloric, aceticPhysicala Eroded soil, trashRadiological a Radon, radium, uraniumBiological Microorganisms, pollen
aAcids, as well as physical and radioactive pollutants can be either organic or inorganic – sulfuricacid is inorganic, acetic acid (found in vinegar) is organic. Biological pollutants are mostly organic,but contain inorganic components.
11 Why does pollution happen?
around the world as natural radioactive uranium decays. But levels of radon in outside airare low. It is when radon seeps up into – and concentrates in – human structures thatproblems may arise. The US EPA ranks radon, associated with human lung cancer, assecond only to environmental tobacco smoke as an environmental health risk. 2. Arsenicis natural too and previously was not a problem to people in Bangladesh and India.Their problem had been drinking surface water that was badly contaminated withinfectious microbes. To correct this, millions of boreholes were drilled to provide cleandrinking water. Unfortunately, arsenic in the rock and soil dissolves into the water inthose boreholes. The result has been a massive ongoing poisoning event in which millionssuffer from arsenic poisoning. 3. Asbestos too, is natural. But, in El Dorado County,California, population growth led to homes being built in previously unoccupied regions,including areas rich in asbestos deposits. Now asbestos exposure has become a majorconcern. Chronic exposure also occurs in certain regions of Turkey where naturally highlevels of asbestos have led to respiratory diseases and cancer. Up until recent decades,asbestos was also a workplace pollutant.
Pollutant sources
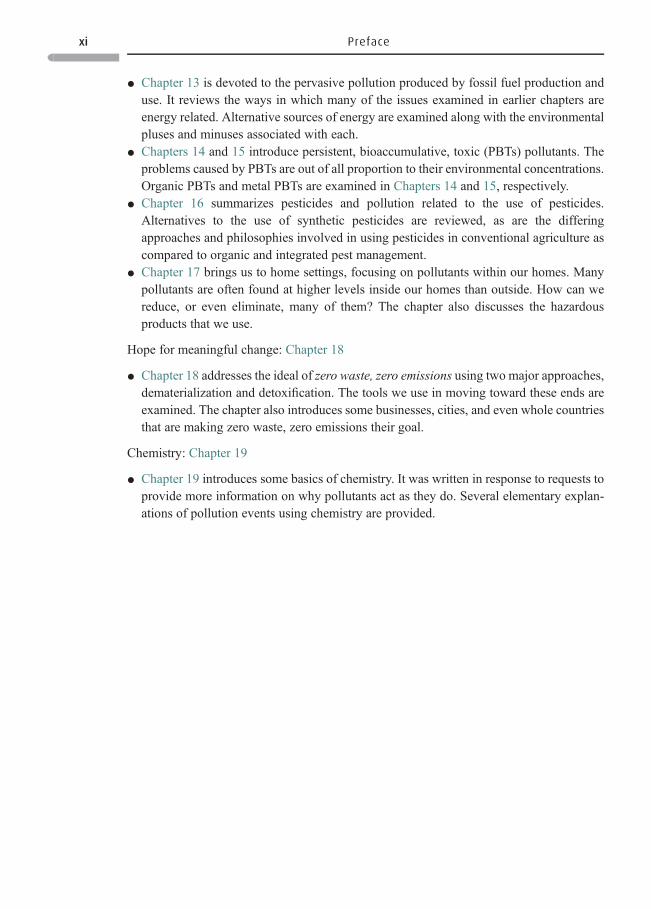
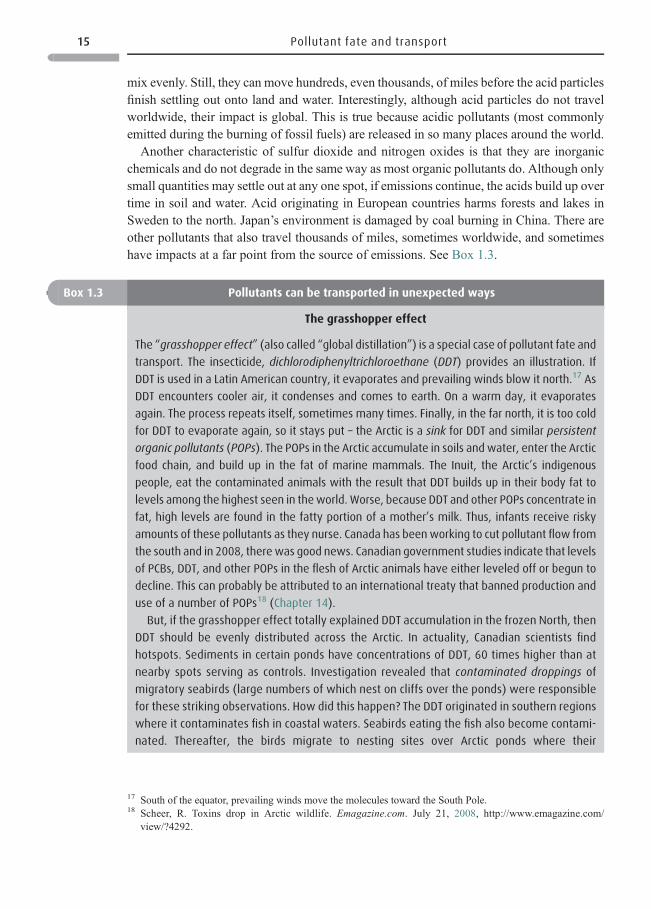
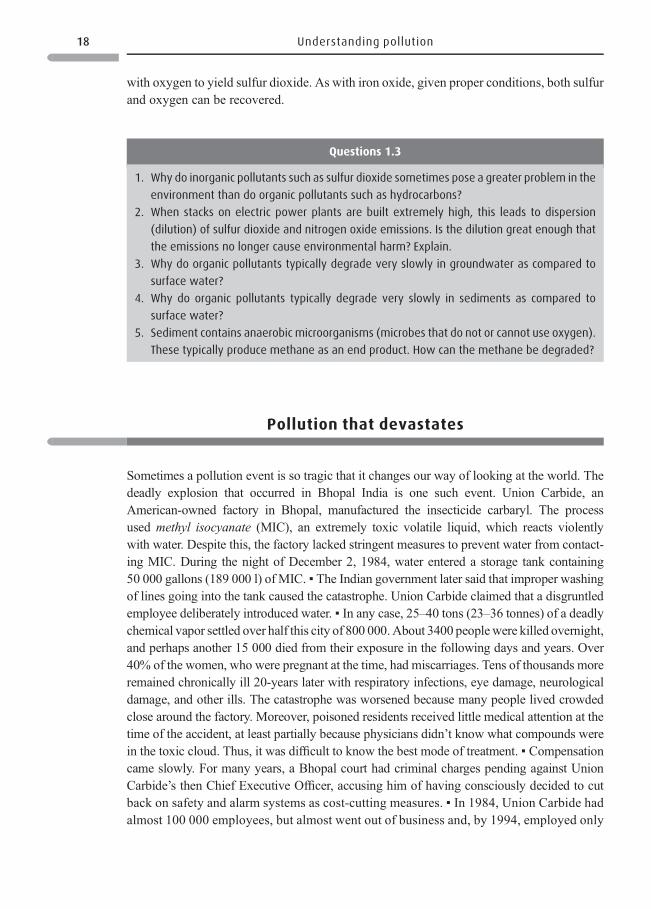
“I am, therefore I pollute” is a statement applying to a multitude of processes: ▪ Motorvehicles including cars, buses, airplanes, ships, and off-road vehicles ▪ Chemical andpetroleum refineries ▪ Manufacturing facilities ▪ Commercial operations including drycleaners, bakeries, and garages ▪ Plants generating electric power by burning coal, oil, ornatural gas ▪ Agricultural operations growing crops or raising animals ▪ Food processingoperations ▪ Mining ▪ Construction and road building ▪ Military operations ▪ Forestryoperations ▪ Municipal operations including drinking water and wastewater treatment, androad maintenance ▪ Activities occurring in commercial and municipal buildings, and inprivate dwellings including, e.g., consumer product use. See Figure 1.3.
Questions 1.2
1. Assume that a gallon (3.8 liters) of gasoline weighs ~6 pounds14 (2.7 kg). How then can 20
pounds (9.1 kg) of carbon dioxide be emitted per gallon of gasoline (in the car’s exhaust)?15
2. (a) How does the sulfur in gasoline end up as sulfur dioxide? (b) Themetals asmetal oxides?
3. With the exception of water, all the chemicals in the exhaust of your car are pollutants, more
than 20 pounds (9.1 kg) of pollutants. How important is this piece of information? Explain.
14 A gallon (3.8 liters) of gasoline weighs between 5.8 and 6.5 lb (2.6–3 kg). The average formula of gasoline is twoatoms of hydrogen for each atom of carbon (CH2). So, by weight gasoline is ~86% carbon. The density ofgasoline is ~6.1 lb/gal (0.71–0.77 g/cm3). Because gasoline is lighter than water, which has a density of 1, itfloats on water.
15 See: (1) Emission facts: average carbon dioxide emissions resulting from gasoline and diesel fuel. US EPA,February 13, 2009, http://www.epa.gov/oms/climate/420f05001.htm. (2) Frequently asked global change ques-tions. Carbon Dioxide Information Analysis Center, http://cdiac.ornl.gov/pns/faq.html. One question answered is:how much carbon dioxide is produced from the combustion of 1000 cubic feet (28.3 cubic meters) of natural gas?
12 Understanding pollution
As population grows, pollution grows. And in wealthy locales, consumption per individualtypically grows over time too, and technologies become larger. Thus, without concertedeffort to prevent it, pollution and other forms of environmental degradation will also grow.
Pollutant fate and transport16
Pollutants move and are transformed
Pollutants seldom stay at the point of release. ▪ Pollutants move, are transported, among air,water, soil, and sediments, and often food as well. They often move transboundary: acrossstate and national boundaries traveling with air or water currents. Sometimes, biotransportoccurs meaning pollutants are carried in body tissues of migrating animals such as salmon,whales, or birds, or are found in the droppings of migratory birds. ▪ The fate of pollutants: apollutant is typically transformed into end products different than the chemical form inwhich it was initially emitted. It may be transformed into chemicals that are no longerpollutants as when biological matter is broken down by microorganisms and incorporated
Figure 1.3 Sources of pollution to water bodies
16 Ney, R.E., Jr. Where Did That Chemical Go? A Practical Guide to Chemical Fate and Transport in theEnvironment. New York: Van Nostrand Reinhold, 1990.
13 Pollutant fate and transport
into normal biological material within these organisms. On the other hand, a molecule suchas TCDD (“dioxin”) can take years, even decades to be transformed into harmless forms.▪The process leading to the final fate can be complex.More information on the chemical fateand transport of pollutants will be presented in later chapters.
Air, soil, and water pollution is greatest at the pollutant source
Although pollutants move, their concentrations are higher near the emission source. Considerdioxins emitted as particulates from an incinerator. The highest fallout of the particulates ontovegetation, soil, and water occurs near that incinerator. However, some dioxins do not fallout,but continue traveling with air currents for long distances before settling out. ▪Wherever theyfall, they may contaminate forage or grain that is then eaten by cattle and other animals – andthese animals absorb these fat-soluble chemicals into their fat. Humans eating fatty meat suchas hamburgers then absorb dioxins into their own fat. Chemicals such as dioxins that moveinto an organism’s fat may stay for years. This is a temporary “fate.” Eventually, over yearsthe dioxins are slowly broken down and move out of the body.
Some impacts of pollutants occur far from the source
If the amount of pollutant carried in wind or water currents remains high enough, thepollutant can have effects far from where it was emitted. Examples are given below.
Water transport
In the year 2000 a Romanian mining operation spilled cyanide and hazardous metals into theDanube River, which joins the Tisza River flowing into Hungary and Yugoslavia. OneYugoslav mayor said that 80% of the fish in the Tisza near his town died. Another stated“The Tisza is a dead river. All life, from algae to trout, has been destroyed.” ▪ A few yearsearlier an accident at a Swiss facility washed large quantities of chemicals into the RhineRiver. These were carried into France and Germany, killing fish and other aquatic life alongthe way.
Air transport
When a gaseous pollutant mixes evenly with the atmosphere, it can sometimes be carriedworldwide. Major examples are stratospheric ozone depletion due to CFCs and globalclimate change due to CO2 (Chapters 7 and 8). And, because some of these pollutantshave long lives, they build up in the atmosphere over time unless their emission sources areremoved. ▪ What about pollutants that change their chemical form after emission? Sulfurdioxide and nitrogen oxides (acid-deposition precursors) mix evenly in the atmosphere too.However, whereas CFCs and CO2 are stable in the atmosphere, sulfur dioxide and nitrogenoxides are transformed from gases into tiny particles. Particles are heavier than air and don’t
14 Understanding pollution
mix evenly. Still, they can move hundreds, even thousands, of miles before the acid particlesfinish settling out onto land and water. Interestingly, although acid particles do not travelworldwide, their impact is global. This is true because acidic pollutants (most commonlyemitted during the burning of fossil fuels) are released in so many places around the world.
Another characteristic of sulfur dioxide and nitrogen oxides is that they are inorganicchemicals and do not degrade in the same way as most organic pollutants do. Although onlysmall quantities may settle out at any one spot, if emissions continue, the acids build up overtime in soil and water. Acid originating in European countries harms forests and lakes inSweden to the north. Japan’s environment is damaged by coal burning in China. There areother pollutants that also travel thousands of miles, sometimes worldwide, and sometimeshave impacts at a far point from the source of emissions. See Box 1.3.
Box 1.3 Pollutants can be transported in unexpected ways
The grasshopper effect
The “grasshopper effect” (also called “global distillation”) is a special case of pollutant fate and
transport. The insecticide, dichlorodiphenyltrichloroethane (DDT) provides an illustration. If
DDT is used in a Latin American country, it evaporates and prevailing winds blow it north.17 As
DDT encounters cooler air, it condenses and comes to earth. On a warm day, it evaporates
again. The process repeats itself, sometimes many times. Finally, in the far north, it is too cold
for DDT to evaporate again, so it stays put – the Arctic is a sink for DDT and similar persistent
organic pollutants (POPs). The POPs in the Arctic accumulate in soils andwater, enter the Arctic
food chain, and build up in the fat of marine mammals. The Inuit, the Arctic’s indigenous
people, eat the contaminated animals with the result that DDT builds up in their body fat to
levels among the highest seen in theworld. Worse, because DDT and other POPs concentrate in
fat, high levels are found in the fatty portion of a mother’s milk. Thus, infants receive risky
amounts of these pollutants as they nurse. Canada has beenworking to cut pollutant flow from
the south and in 2008, there was good news. Canadian government studies indicate that levels
of PCBs, DDT, and other POPs in the flesh of Arctic animals have either leveled off or begun to
decline. This can probably be attributed to an international treaty that banned production and
use of a number of POPs18 (Chapter 14).
But, if the grasshopper effect totally explained DDT accumulation in the frozen North, then
DDT should be evenly distributed across the Arctic. In actuality, Canadian scientists find
hotspots. Sediments in certain ponds have concentrations of DDT, 60 times higher than at
nearby spots serving as controls. Investigation revealed that contaminated droppings of
migratory seabirds (large numbers of which nest on cliffs over the ponds) were responsible
for these striking observations. How did this happen? The DDT originated in southern regions
where it contaminates fish in coastal waters. Seabirds eating the fish also become contami-
nated. Thereafter, the birds migrate to nesting sites over Arctic ponds where their
17 South of the equator, prevailing winds move the molecules toward the South Pole.18 Scheer, R. Toxins drop in Arctic wildlife. Emagazine.com. July 21, 2008, http://www.emagazine.com/
view/?4292.
15 Pollutant fate and transport
Pollutants in sediments often don’t stay buried
Sediments20 are composed of soil, silt, minerals, and organic materials that have beencarried in rainwater runoff from surrounding land and paved surfaces into a lake, river, orother water body. By its nature, sediment is buried by additional incoming sedimentarymaterial. Other pollutants are often buried within the sediments too – but they are notdependably buried. ▪Bottom-feeding organisms may take in the pollutants, thus introducingthem into the food web. ▪Riverine and coastal area sediments are sometimes dredged.Whenthat happens, contaminants are brought back to the surface along with the sediment. ▪Watercurrents, such as a strongly flowing river, also move sediments. Here, again, you see asituation where pollutants may not stay put.
Soil pollutants likewise move
Pollutants in soil alsomay not stay trapped.Water percolating through soil can carry pollutantsdown into groundwater. Rainwater can dissolve and carry off pollutants, including pesticidesand fertilizers. Rainwater also erodes soil that may have pollutants absorbed within it.
The chemical fate of pollutants
Pollutants not only move. Their fate is often – as noted with acid rain precursors – to beconverted into other chemicals, undergoing reactions in the atmosphere, water, and soil.
Organic pollutants21
Especially inmoderate andwarm climes, organic pollutants can be degraded inwater, soil, andthe atmosphere to end products that are less risky than the parent compounds.Microorganisms
DDT-contaminated droppings fall to ponds below. Those droppings are major sources of
nutrition into Arctic pond ecosystems, promoting the growth of moss and plankton, which
become contaminated with DDT. Insects eat the contaminated moss and plankton. They, in
turn, are eaten by birds and other animals. Thus, these chemicals continue to spread in the
food web and in humans. This is land-based bioaccumulation.19
19 Blais, J. M., Kimpe, L. E., McMahon, D. et al. Arctic seabirds transport marine-derived contaminants. Science,309(5733), July 15, 2005, 445.
20 Erosion, sediment, and runoff control for roads and highways. EPA-841-F-95–008d. US EPA Office of Water,December, 1995, http://www.epa.gov/nps/education/runoff.html [Updated February 2008].
21 For our purposes, it is enough to think of organic chemicals as those that contain carbon as compared to inorganicchemicals that do not contain carbon. (However, there are a limited number of inorganic carbon-containingcompounds such as bicarbonate and carbonate.) Organic and inorganic compounds will be discussed in Chapter 19.
16 Understanding pollution
(fungi and bacteria) degrade organic wastes, including plant debris, animal remains, theorganic material in trash, and also many individual organic pollutants. Microbes work inboth water and soil. Microbial breakdown is a vital natural service: wastes and chemicalpollutants would otherwise build up in the environment to intolerable levels. ▪ CO2 and waterare the end products of microbial metabolism when oxygen is present. An organic substancedegraded all the way to CO2 and water is said to be mineralized. ▪ Some microorganisms candegrade organic substances without requiring oxygen to do so. In that case, the most commonend product is methane (“swamp gas”) as seen when microbial degradation occurs in the mudof rice paddies or marshes. ▪ Some synthetic organic chemicals have structures that make itvery difficult for microbes to degrade them (Chapter 14). Included among these substances arepolychlorinated chemicals such as dioxins, DDT, and PCBs, which sometimes persist in theenvironment for many years and, in very cold climates, indefinitely. ▪Other factors contributeto degrading organic substances too. Atmospheric oxygen reacts with many organic substan-ces. ▪Heat: the higher the temperature, the more rapidly organic materials break down. In verycold conditions, the Arctic and Antarctic, organics may persist for many thousands of years,becoming deeply buried in snow and ice. ▪ Sunlight, especially the strong ultraviolet radiationof summer, contributes to the breakdown of organic pollutants. ▪Wave motion in water assistsdegradation by bringing pollutants to the surface, exposing them to sunlight, heat, and oxygen.A chemical species, the hydroxyl radical22 contributes to the degradation of both organic andinorganic substances.
Overwhelming the process
These processes provide natural services that are very effective in degrading organicsubstances. However, human activities often overwhelm natural systems. Food-processors,tanneries, and paper mills are examples of facilities that, historically, released such largequantities of pollutants and wastes into rivers and lakes that natural processes could notdegrade them all. Thus water quality was severely degraded.
Inorganic pollutants
Inorganic chemicals are not mineralized to CO2 and water – they are already mineralsubstances. Inorganic substances do undergo chemical reactions, but are not destroyed inthe same manner as organic materials. Think about a metal. Box 1.2 noted the instance ofmetals burned to metal oxides. Such oxidation can also occur, albeit slowly, withoutcombustion. You may have seen a reddish bridge: the color results from the oxidation ofthe iron in the bridge, that is, iron reacts with atmospheric oxygen to form reddish iron oxide.But take a sample of that iron oxide and heat it to a high enough temperature: you recover theiron while driving the oxygen back into the air. Also in Box 1.2 notice sulfur. It too reacts
22 The hydroxyl radical, composed of one oxygen atom and one hydrogen atom, has a free electron, which makes ithighly reactive. It is the chief oxidizing agent in the atmosphere and is responsible for destroying organicchemicals in the atmosphere. It also can destroy inorganic chemicals (Chapters 5 and 19).
17 The chemical fate of pollutants
with oxygen to yield sulfur dioxide. As with iron oxide, given proper conditions, both sulfurand oxygen can be recovered.
Pollution that devastates
Sometimes a pollution event is so tragic that it changes our way of looking at the world. Thedeadly explosion that occurred in Bhopal India is one such event. Union Carbide, anAmerican-owned factory in Bhopal, manufactured the insecticide carbaryl. The processused methyl isocyanate (MIC), an extremely toxic volatile liquid, which reacts violentlywith water. Despite this, the factory lacked stringent measures to prevent water from contact-ing MIC. During the night of December 2, 1984, water entered a storage tank containing50 000 gallons (189 000 l) of MIC. ▪ The Indian government later said that improper washingof lines going into the tank caused the catastrophe. Union Carbide claimed that a disgruntledemployee deliberately introduced water. ▪ In any case, 25–40 tons (23–36 tonnes) of a deadlychemical vapor settled over half this city of 800 000.About 3400 peoplewere killed overnight,and perhaps another 15 000 died from their exposure in the following days and years. Over40% of the women, who were pregnant at the time, had miscarriages. Tens of thousands moreremained chronically ill 20-years later with respiratory infections, eye damage, neurologicaldamage, and other ills. The catastrophe was worsened because many people lived crowdedclose around the factory. Moreover, poisoned residents received little medical attention at thetime of the accident, at least partially because physicians didn’t know what compounds werein the toxic cloud. Thus, it was difficult to know the best mode of treatment. ▪ Compensationcame slowly. For many years, a Bhopal court had criminal charges pending against UnionCarbide’s then Chief Executive Officer, accusing him of having consciously decided to cutback on safety and alarm systems as cost-cutting measures. ▪ In 1984, Union Carbide hadalmost 100 000 employees, but almost went out of business and, by 1994, employed only
Questions 1.3
1. Why do inorganic pollutants such as sulfur dioxide sometimes pose a greater problem in the
environment than do organic pollutants such as hydrocarbons?
2. When stacks on electric power plants are built extremely high, this leads to dispersion
(dilution) of sulfur dioxide and nitrogen oxide emissions. Is the dilution great enough that
the emissions no longer cause environmental harm? Explain.
3. Why do organic pollutants typically degrade very slowly in groundwater as compared to
surface water?
4. Why do organic pollutants typically degrade very slowly in sediments as compared to
surface water?
5. Sediment contains anaerobic microorganisms (microbes that do not or cannot use oxygen).
These typically produce methane as an end product. How can the methane be degraded?
18 Understanding pollution
13 000. In 2001, Dow Chemical bought the remains of Union Carbide and, not surpris-ingly, found that it was now held responsible for this continuing tragedy.23
Tiny levels of contaminants
Bhopal represents horrendous pollution. Its opposite, levels of pollutants so low that they arebarely detectable, presents a quandary – are such levels risky?Modern analytical chemistry isso sensitive that synthetic organic chemicals can be detected almost anyplace – in soil, water,air, food, animals, plants, and in our own bodies. As one scientist commented, “The analyticalscience has advanced just astronomically.” So how are we to think about such situations?
A hypothetical contaminated lake
Assume that tiny amounts of 20 different synthetic chemicals have been detected in a locallake. Each is present in an amount so tiny that it alone is highly unlikely to cause a problem,certainly not in the short run. Many of these chemicals are also found, likewise in tinyamounts in our bodies. Should we be concerned?
Possibilities that could increase your concern
1. Among the 20 contaminants are chemicals that are very similar to one another. Similarchemicals may exert toxic effects in similar ways and the levels of each, if addedtogether, could potentially pose a problem. Organophosphate pesticides are one example.There are many different organophosphates, but each exerts toxicity in a similar way. So,if several of the contaminants are organophosphates, the total concentrations addedtogether may cause concern.
2. Even if none of the chemicals act similarly in the body, perhaps some combination ofthem could exert a synergistic effect, that is, one chemical could magnify the effect ofanother chemical out of all proportion to its concentration. Testing for synergistic effectsamong 20 chemicals is almost impossible because we could not reasonably test them inall possible combinations.
3. Species differ widely in their sensitivity to toxicants. One species may be many timesmore sensitive than another. And within any individual species, including humans, thereis also a range of sensitivity.
Possibilities that could decrease your concern
1. Two chemicals may be antagonists, i.e., one may inhibit the toxicity of another, lesseningthe chance of an adverse effect. Basically, one chemical acts as an antidote to the other.
23 Crabb, C. Revisiting the Bhopal tragedy. Science, 306(5702), December 3, 2004, 1670–1671.
19 Tiny levels of contaminants
2. Hundreds or thousands of chemicals are naturally present in the water; some or manymay be similar chemically to the synthetic contaminants.
3. Animal and human bodies deal with contaminants using biochemical pathways thatevolved over millions of years to break down natural poisons in the environment. Ourbodies have no way of knowing if a given chemical is natural or synthetic.
4. A quarter century ago, chemists probably couldn’t even have detected many of thesechemicals. Only now with sophisticated analytical methods can we even know if thereare chemicals that might be of concern.
Questions 1.4
1. (a) Possibilities that might increase your concern. Did any of these points increase your
concern? Explain. (b) Possibilities that could decrease your concern. Did any of these points
lessen your concern? Explain.
2. Even testing a few chemicals in mixtures for possible toxicity is complicated and expensive.
However, it is possible to examine the effect of the contaminated water itself on aquatic
life. This is called whole effluent toxicity.24 Does whole effluent toxicity reassure you as a
logical way to test toxicity? Why?
3. With which of the following conclusions do you most tend to agree and why? (a) It is
alarming that many synthetic chemicals are detected. Our health, our children’s health, and
wildlife are likely affected. Let’s find the sources of the chemicals and stop further
emissions. (b) We cannot worry about every low-level contaminant. We cannot reduce
emissions to zero and it would be prohibitively expensive to even reduce them to near zero.
And, quite often a synthetic chemical also occurs in nature as a natural chemical. Animals
and plants have evolved protective means over eons of dealing with natural poisons, and
most probably can manage the chemicals in this lake too. Taking a chemical off the market
could pose other problems – the chemical that replaces it in an industrial process may also
pose problems that are now unknown. Let’s devote our limited resources to higher-risk
problems.
4. Think about air pollution in an agricultural setting and ponder a situation that occurs with
increasing frequency as people move into areas previously devoted to farming. New
residents may complain about farm odors when farmers spread sewage sludge on their
fields as a fertilizer or soil amendment. Both State and US environmental agencies support
spreading carefully treated sludge. But one complaining resident said, “The human body
knows when something is not good for you. Sludge must be bad. It smells so bad, it can
make you nauseous.” (a) Does the fact that sludge smells bad mean that airborne
substances are present at a harmful level? Explain. (b) Before you can decide whether
concerns are legitimate, what questions would you want answers to?
5. Another resident said, “When someone spreads sludge, you get flies in your house . . . It’s
awful.” Do flies present a potential danger? Explain.
24 Whole effluent toxicity. US EPA, http://www.epa.gov/waterscience/methods/wet/ [updated July 2008].
20 Understanding pollution
SECTION III
Degradation of global environmental health
* At the Earth Summit held in Rio de Janeiro, Brazil, in 1992, the heads of 120 govern-ments met together. Their mission was to decide how to deal with Earth’s environmentalproblems including climate change, air and water pollution, deforestation, and loss ofbiodiversity (extinction of species). One result was Agenda 21, a strategy for sustainabledevelopment or, as one participant phrased it, “a blueprint for how humankind mustoperate in order to avoid environmental devastation.”
* In 1997, 158 governments gathered for an Earth Summit+5 to discuss progress, but theyfound that environmental conditions were worse. A Malaysian delegate exclaimed,“Five years from Rio we face a major recession . . . a recession in spirit. We continue toconsume resources, pollute, and spread and entrench poverty as though we are the lastgeneration on Earth.”
* Yet again in 2002, governments gathered for a World Summit on SustainableDevelopment. Despite a continuing grim environmental picture, participants took adifferent approach: they recognized that environmental sustainability is not possiblewhen great numbers of people lacked even basic amenities such as safe drinking waterand sanitary facilities. One major outcome was that all 191 UN member states pledged tomeet eight Millennium Development Goals by 2015.25 One goal was to cut extremepoverty in half while “ensuring” environmental sustainability. As you read this section,notice that gross pollution often goes hand in hand with gross poverty.
Pollution in less-developed countries
Environmental degradation in impoverished countries, often called less-developedcountries is, according to the Asia Development Bank, “pervasive, accelerating, andunabated” (see Table 2.1). In an Atlantic Monthly article, William Langewiesche
6. If you were thinking of moving into a rural area: (a) What questions would you want to ask?
(b) Should sellers be required to provide you with information on sludge-spreading or
similar operations around their homes?
7. Consider that you already live in a rural setting. (a) How would you react if a large
industrial farm (one with thousands of pigs, cattle, or poultry crowded into a limited
space) moved into your rural neighborhood? What would your environmental and health
concerns be?
25 End poverty 2015, Millennium Development Goals.UNDepartment of Public Information, 2008, www.un.org/millenniumgoals.
21 Degradation of global environmental health
describes one city, New Delhi, India, where “ . . . the pollution . . . seemed apoca-lyptic. The streams were dead channels trickling with sewage and bright chemicals,and the air on the street barely breathable.”26 Rivers in some cities are describedas “open stinking sewers.” ▪ The World Health Organization (WHO) tells us that2.6 billion people have no access to hygienic toilets. They use buckets, bushes,ditches, or rivers; if lucky, they have latrines. More than a billion lack safe drinkingwater. The WHO estimates that at least 1.6 million lives are lost each year throughlack of access to sanitation and clean drinking water. Millions more are left chroni-cally ill from the water they must drink. ▪ Millions of deaths result yearly frominfections caused by eating contaminated food. ▪ Just by breathing the air, children ina heavily polluted city such as New Delhi inhale the equivalent of two packs ofcigarettes each day. ▪ Living in rural areas may be worse: up to 3 million deaths resultworldwide each year from air pollution; about half of these arise from intolerableindoor air pollution. This occurs because almost 90% of impoverished householdsburn straw, wood, or dried manure inside their homes for cooking and often forheating, with very poor ventilation. Women and children are most affected. ▪ Theeffects of pollution go beyond deaths to impacting people’s ability to live healthylives. One illustration: almost half the world’s population, especially small children,may suffer from waterborne diseases.
Pollution with worldwide impact: China27
China, with its 1.3 billion people (about 20% of the world’s population), will be used in thistext to illustrate the environmental problems confronting rapidly developing countries.India, nearly as populous, also has severe environmental problems as it undergoes rapidindustrialization and increasing consumption.28
China’s environment
As China works to bring its people out of poverty, its economy has been growing enormouslywith ever more heavy industry, cities, and coal-burning power plants. Moreover, historically,the Chinese have emphasized human dominance over nature. Animals and plants are seen as
26 Langewiesche, W. The shipbreakers. Atlantic Monthly, 286(2), August, 2000, 31–49.27 (1) Fu, B., Zhuang, X., Jiang, G., Shi, J., Lu, Y. Environmental problems and challenges in China.
Environmental Science and Technology, 41(22), November 15, 2007, 7597–7602. (2) Lorenz, A. andWagner, W. China’s boom and doom. Der Spiegel, February 12, 2007, http://www.salon.com/news/feature/2007/02/12/china_pollution/. (3) Global warming: China says: Et tu? Seattle Post-Intelligencer,November 16, 2007, http://seattlepi.nwsource.com/opinion/339989_carboned.html. (4) Yardley, J. China’sturtles, emblems of a crisis (impacts of pollution, hunting, and rampant development). New York Times,December 5, 2007.
28 Sharma, D. C. By order of the court: environmental cleanup in India. Environmental Health Perspectives, 113(6),June, 2005, A394–397.
22 Understanding pollution
useful for medicine or food, not as important in themselves. Nearly 40% of mammal speciesare endangered and, for plant species, the percentage is higher still. Half of China’s wetlandshave been destroyed. This environmental degradation is so extreme that it is leading to socialunrest,29 presenting an “acute political challenge to the ruling Communist Party.” The WorldBank estimates that pollution has already cut China’s gross national product by 8–12%.
* Air in some cities is barely breathable. By European standards, only 1% of the Chinesepeople breathe safe air. Observers note that “Chinese cities often seem wrapped in a toxicgray shroud.”30 The pollutants responsible are emitted by coal-burning power plants,smelters, and chemical factories. Emissions of sulfur dioxide and nitrogen dioxide haveincreased greatly in the past decade. China has an ever-increasing number of motorvehicles burning low-grade gasoline, so cars and trucks have become the leading sourceof the heavy haze hanging over many large cities. Burning fossil fuels is a major cause ofair pollution worldwide and, not surprisingly, this is true in China too, which meets abouttwo-thirds of its energy needs by burning coal. It already burns more coal than the UnitedStates, Europe, and Japan combined. That coal is burned inefficiently resulting in greaterpollutant emissions.
* Hundreds of millions of China’s 1.3 billion people lack access to safe drinking water. Youcan see why when you realize that less than half the cities have sewage treatment plantsand a great many factories dump untreated waste into surface water. Water in about a thirdof China’s rivers is so degraded that it cannot be used for agriculture or even industry.A State Environmental Protection Administration (SEPA) official has said that “Severewater pollution has become a threat to public health and is affecting social stability.”A SEPA official referred to the Hai river as “dark green and stinking,” a water body whereaquatic life is extinct, demonstrating “that the traditional industrial growth mode hasstrained China’s resources and environment to an unbearable extreme.”31 Pollution hasled to whole villages being designated “cancer villages,” and pollution is now blamed as aleading cause of death in China.
* Gross pollution goes beyond harming people. The air pollutant ozone damages cropsand other vegetation, as do sulfur dioxide and nitrogen oxides emitted from coal-firedpower plants; these are converted in the atmosphere to acidic pollutants which, afterfalling to earth, damage aquatic life and terrestrial vegetation. The haze gives rise to aphenomenon known as global dimming, meaning a decrease in the amount of sunlightreaching Earth. This means less light for photosynthesis, thus a lowered yield of cropsand other plants. Dimming is observed in other places around the planet too, not justChina.
* Transboundary transport of pollutants. Air pollutant particles formed in one locale areoften chemically distinctive; they have a specific chemical signature: it is often possible todiscover the sources of pollutants by chemical analysis. Thus, we can see that China’s
29 Buckley, C. China environment chief says pollution fuelling unrest. Reuters, July 5, 2007, http://www.alertnet.org/thenews/newsdesk/SP250873.htm.
30 Kahn, J. and Yardley, J. As China roars, pollution reaches deadly extremes. New York Times, August 26, 2007,http://www.nytimes.com/2007/08/26/world/asia/26china.html?_r=2&oref=slogin&oref=slogin.
31 Lorenz, A. Interview with China’s Deputy Minister of the Environment. Spiegel Online, March 7, 2005, http://service.spiegel.de/cache/international/spiegel/0,1518,345694,00.html.
23 Pollution with worldwide impact: China
pollution spreads far beyond its borders. Polluted air is wind-blown to South Korea andJapan where it irritates eyes and throats, so much so that now some cities issue warningsabout the health danger. In Europe, a brown haze traced to China stretches from Germanyto the Mediterranean Sea. Soot particles in increasing amounts are carried across thePacific Ocean to far-away California. The US EPA reports days when up to 25% of theparticulate matter in the skies above Los Angeles can be traced to China.32 ▪ Water alsotransports pollutants across boundaries: the sewage from 65 million people livingalong the Songhua River has greatly contaminated that river. This is carried into fareastern Russia where “the river has been stinking since 1997” and where impacts arefelt by the 4 million inhabitants on the Russian side. They report: “For the past 12 years,the fish have smelled like chemicals.”Amuch publicized incident occurred in November2005 when a chemical plant exploded on the Chinese side spilling large quantities ofbenzene into the Songhua River. First the benzene impacted the local city of Harbin,which had to cut off water supplies to its 9 million inhabitants for four days, then movedon into Russia slowly being diluted as it traveled.
China’s economic growth and the environment
Economic growth is tremendously important to China. Unfortunately, studies show thatwhen economic growth rates are adjusted for the economic damage caused by pollution,they fell to almost zero in some provinces. Deputy Minister of the Environment, Pan Yue,believes that severe environmental degradation will bring the country’s economic miracle toan end. He notes that “acid rain is falling on one-third of Chinese territory, half the water inour seven largest rivers is completely useless, while one-quarter of our citizens do not haveaccess to clean drinking water. One-third of the urban population is breathing polluted air,and less than 20% of the trash in cities is treated and processed in an environmentallysustainable manner.” Yue also pointed out that China has five of the ten most pollutedcities in the world. China’s SEPA has a limited number of employees to serve a country of1.3 billion.
The difficulty in being optimistic
Optimists believe that it is still possible to build a “green economy,” even avoid some of thehistorical bad experiences of industrialized countries. Steps that China is taking includeworking to rein in motor vehicle emissions; requiring new buildings to halve the energy usedfor heating, lighting, and air conditioning; and to halve the energy needed to generate eachunit of gross domestic product (GDP). Although China is largely fueled by coal now, it iscommitted to renewable energy, and is making major investments in renewable energyprojects. Still, there is pessimism because of the tremendous environmental destructionalready evident, and because local officials often ignore environmental mandates coming
32 Herro, A. Chinese air pollution crosses Pacific, reaches Western United States. Eye on Earth (a joint project ofthe Worldwatch Institute and the Blue Moon Fund) March 26, 2007, http://www.worldwatch.org/node/4985.
24 Understanding pollution
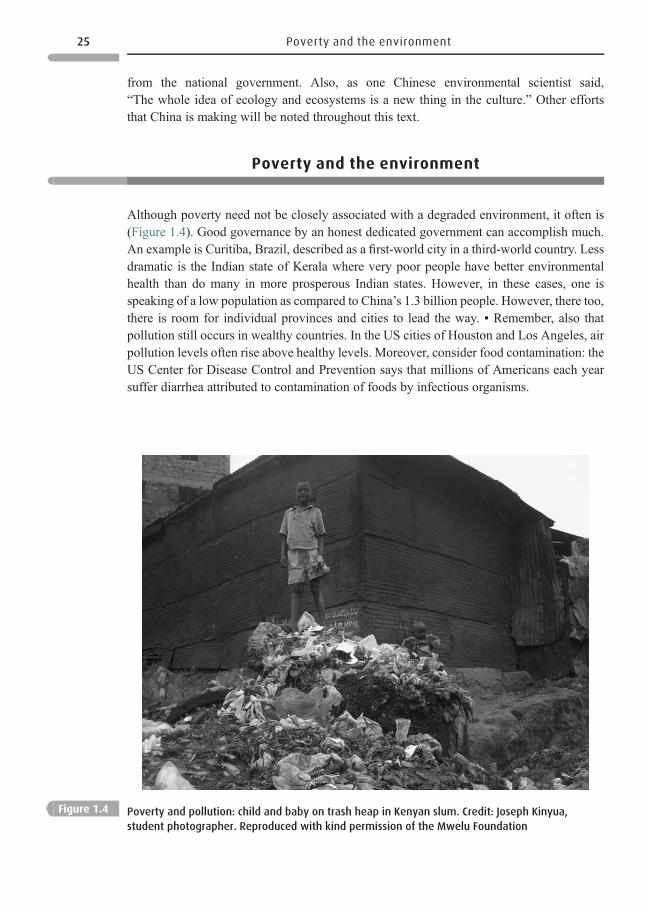
from the national government. Also, as one Chinese environmental scientist said,“The whole idea of ecology and ecosystems is a new thing in the culture.” Other effortsthat China is making will be noted throughout this text.
Poverty and the environment
Although poverty need not be closely associated with a degraded environment, it often is(Figure 1.4). Good governance by an honest dedicated government can accomplish much.An example is Curitiba, Brazil, described as a first-world city in a third-world country. Lessdramatic is the Indian state of Kerala where very poor people have better environmentalhealth than do many in more prosperous Indian states. However, in these cases, one isspeaking of a low population as compared to China’s 1.3 billion people. However, there too,there is room for individual provinces and cities to lead the way. ▪ Remember, also thatpollution still occurs in wealthy countries. In the US cities of Houston and Los Angeles, airpollution levels often rise above healthy levels. Moreover, consider food contamination: theUS Center for Disease Control and Prevention says that millions of Americans each yearsuffer diarrhea attributed to contamination of foods by infectious organisms.
Figure 1.4 Poverty and pollution: child and baby on trash heap in Kenyan slum. Credit: Joseph Kinyua,
student photographer. Reproduced with kind permission of the Mwelu Foundation
25 Poverty and the environment
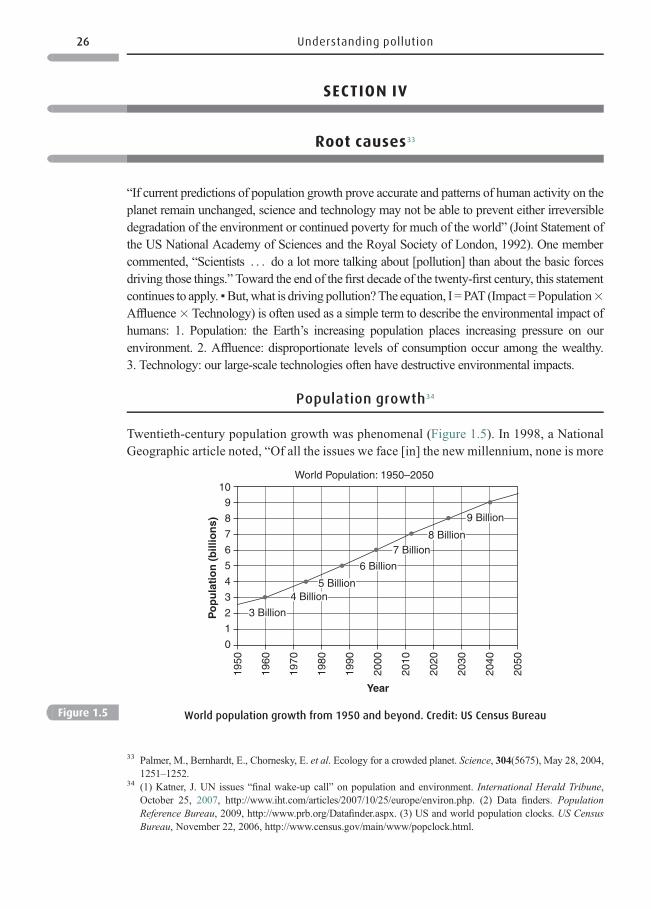
SECTION IV
Root causes33
“If current predictions of population growth prove accurate and patterns of human activity on theplanet remain unchanged, science and technology may not be able to prevent either irreversibledegradation of the environment or continued poverty for much of the world” (Joint Statement ofthe US National Academy of Sciences and the Royal Society of London, 1992). One membercommented, “Scientists . . . do a lot more talking about [pollution] than about the basic forcesdriving those things.”Toward the end of the first decade of the twenty-first century, this statementcontinues to apply. ▪But,what is driving pollution?The equation, I = PAT (Impact =Population×Affluence× Technology) is often used as a simple term to describe the environmental impact ofhumans: 1. Population: the Earth’s increasing population places increasing pressure on ourenvironment. 2. Affluence: disproportionate levels of consumption occur among the wealthy.3. Technology: our large-scale technologies often have destructive environmental impacts.
Population growth34
Twentieth-century population growth was phenomenal (Figure 1.5). In 1998, a NationalGeographic article noted, “Of all the issues we face [in] the new millennium, none is more
World Population: 1950–2050
910
8
7
6
Po
pu
lati
on
(b
illio
ns)
5
4
3
Year
3 Billion
4 Billion5 Billion
6 Billion
7 Billion8 Billion
9 Billion
2
1
0
1950
1960
1970
1980
1990
2000
2010
2020
2030
2040
2050
Figure 1.5 World population growth from 1950 and beyond. Credit: US Census Bureau
33 Palmer, M., Bernhardt, E., Chornesky, E. et al. Ecology for a crowded planet. Science, 304(5675), May 28, 2004,1251–1252.
34 (1) Katner, J. UN issues “final wake-up call” on population and environment. International Herald Tribune,October 25, 2007, http://www.iht.com/articles/2007/10/25/europe/environ.php. (2) Data finders. PopulationReference Bureau, 2009, http://www.prb.org/Datafinder.aspx. (3) US and world population clocks. US CensusBureau, November 22, 2006, http://www.census.gov/main/www/popclock.html.
26 Understanding pollution
important than population growth.” In 2008, a UN report marking World Population Dayestimated that world population will grow from 6.7 billion to 9.2 billion by 2050. Today,with some exceptions, parents around the world are having fewer children. Diseases –AIDS most prominently – have lowered populations in some countries. Because of AIDS,a number of countries in sub-Saharan Africa have an average life span less than 40 years.Populations in Western European countries have stabilized; some are decreasing.However, US population is increasing rapidly, especially through immigration, and thefact that immigrants have more children than natives. US population may double in thenext half-century. And, as a 2007 UN report warned us, even if world population growthceased today, the current population is not environmentally sustainable without majorchanges in how we live. See Box 1.4.
Box 1.4 Mega-cities
Almost all population growth is occurring in “explosively growing” cities. By 2015, according to
UN estimates, the world will have 23 mega-cities, those with populations greater than 10
million; all but four are in less-developed countries. These include Bombay, Lagos, Dhaka, Sao
Paulo, Karachi, and Mexico City. Already, half or more of the world’s people live in cities, which
grow much faster than a country’s overall population. Many have very young populations.
Harvard biologist Edward Wilson observed, “The people . . . are far younger than those in the
industrial countries . . . The streets of Lagos, Manaus, Karachi, and other cities in the devel-
oping world are a sea of children. To an observer fresh from Europe or North America, the
crowds give the feel of a gigantic school just let out.”35 ▪ Just one garbage dump, Payatas in
Manila, a Philippine city of ten million receives 3000 tons (2722 tonnes) of garbage a day.
Dumps get trash off the streets, but most poor cities cannot pick up all their trash, leaving
streets littered with paper, plastic, bottles, and scraps of all kinds. The common practice of
open burning of trash fouls city air. ▪ Only a small percentage of residents in less-developed
countries own motor vehicles, but their uncontrolled emissions make the air difficult to
breathe. ▪ Cities can hurt the health of their own people and, moreover, “Modern high density
settlements appropriate the ecological output and life support functions of distant regions
through trade and commerce, the generation and disposal of wastes, and the alteration of
nature’s cycles.” As cities become ever larger, according to a Johns Hopkins’ report, they
become “black holes” soaking up the ecological output of entire regions.36 At the same time,
cities have environmental benefits including a smaller per capita consumption than is the case
with less dense settlements.37
35 Sloan, J. D. The bottleneck (excerpt from Wilson, E. O., The Future of Life, UK: Alfred A. Knopf with Little,Brown). Scientific American, February 2002, http://www.mnforsustain.org/wilson_e_o_bottleneck.htm.
36 Hinrichsen, D., Blackburn, R., and Robey, B. Cities will determine living standards for mankind. PopulationReports (Special Istanbul+5 edition), June, 2001.
37 Diamond, J. What’s your consumption factor? New York Times. January 2, 2008, http://www.nytimes.com/2008/01/02/opinion/02diamond.html?_r=1&oref=slogin.
27 Root causes
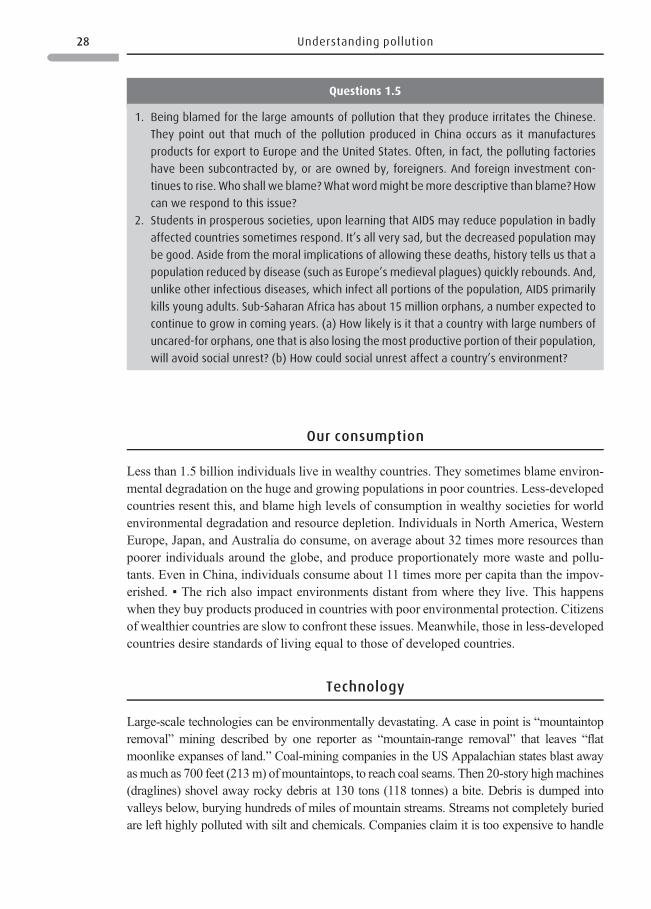
Our consumption
Less than 1.5 billion individuals live in wealthy countries. They sometimes blame environ-mental degradation on the huge and growing populations in poor countries. Less-developedcountries resent this, and blame high levels of consumption in wealthy societies for worldenvironmental degradation and resource depletion. Individuals in North America, WesternEurope, Japan, and Australia do consume, on average about 32 times more resources thanpoorer individuals around the globe, and produce proportionately more waste and pollu-tants. Even in China, individuals consume about 11 times more per capita than the impov-erished. ▪ The rich also impact environments distant from where they live. This happenswhen they buy products produced in countries with poor environmental protection. Citizensof wealthier countries are slow to confront these issues. Meanwhile, those in less-developedcountries desire standards of living equal to those of developed countries.
Technology
Large-scale technologies can be environmentally devastating. A case in point is “mountaintopremoval” mining described by one reporter as “mountain-range removal” that leaves “flatmoonlike expanses of land.” Coal-mining companies in the US Appalachian states blast awayasmuch as 700 feet (213m) ofmountaintops, to reach coal seams. Then 20-story highmachines(draglines) shovel away rocky debris at 130 tons (118 tonnes) a bite. Debris is dumped intovalleys below, burying hundreds of miles of mountain streams. Streams not completely buriedare left highly polluted with silt and chemicals. Companies claim it is too expensive to handle
Questions 1.5
1. Being blamed for the large amounts of pollution that they produce irritates the Chinese.
They point out that much of the pollution produced in China occurs as it manufactures
products for export to Europe and the United States. Often, in fact, the polluting factories
have been subcontracted by, or are owned by, foreigners. And foreign investment con-
tinues to rise. Who shall we blame?What wordmight bemore descriptive than blame? How
can we respond to this issue?
2. Students in prosperous societies, upon learning that AIDS may reduce population in badly
affected countries sometimes respond. It’s all very sad, but the decreased population may
be good. Aside from the moral implications of allowing these deaths, history tells us that a
population reduced by disease (such as Europe’s medieval plagues) quickly rebounds. And,
unlike other infectious diseases, which infect all portions of the population, AIDS primarily
kills young adults. Sub-Saharan Africa has about 15 million orphans, a number expected to
continue to grow in coming years. (a) How likely is it that a country with large numbers of
uncared-for orphans, one that is also losing themost productive portion of their population,
will avoid social unrest? (b) How could social unrest affect a country’s environment?
28 Understanding pollution
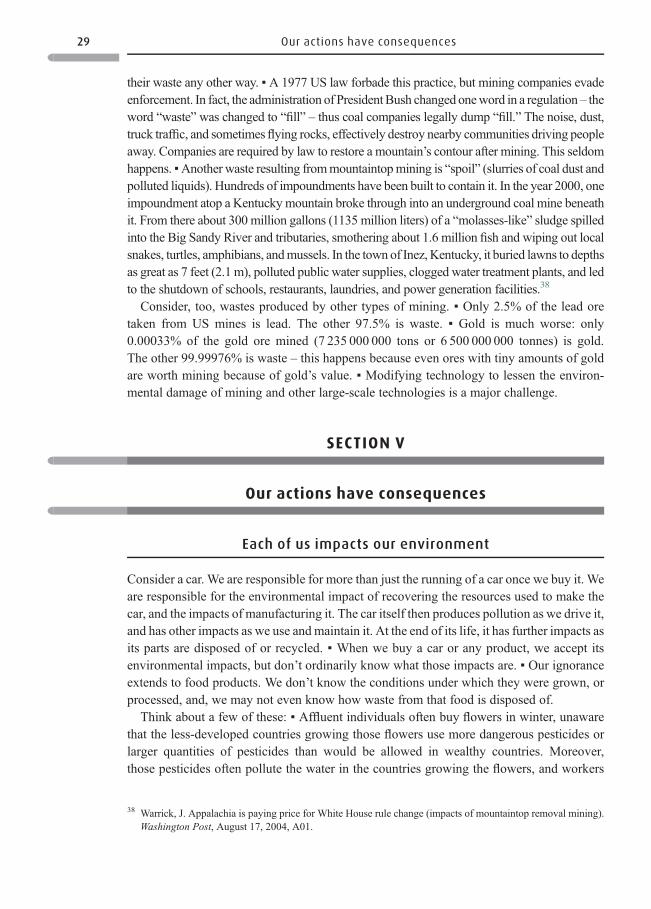
their waste any other way. ▪ A 1977 US law forbade this practice, but mining companies evadeenforcement. In fact, the administration of PresidentBush changed oneword in a regulation – theword “waste” was changed to “fill” – thus coal companies legally dump “fill.” The noise, dust,truck traffic, and sometimes flying rocks, effectively destroy nearby communities driving peopleaway. Companies are required by law to restore a mountain’s contour after mining. This seldomhappens. ▪Another waste resulting frommountaintopmining is “spoil” (slurries of coal dust andpolluted liquids). Hundreds of impoundments have been built to contain it. In the year 2000, oneimpoundment atop a Kentucky mountain broke through into an underground coal mine beneathit. From there about 300 million gallons (1135 million liters) of a “molasses-like” sludge spilledinto the Big Sandy River and tributaries, smothering about 1.6 million fish and wiping out localsnakes, turtles, amphibians, andmussels. In the town of Inez,Kentucky, it buried lawns to depthsas great as 7 feet (2.1 m), polluted public water supplies, clogged water treatment plants, and ledto the shutdown of schools, restaurants, laundries, and power generation facilities.38
Consider, too, wastes produced by other types of mining. ▪ Only 2.5% of the lead oretaken from US mines is lead. The other 97.5% is waste. ▪ Gold is much worse: only0.00033% of the gold ore mined (7 235 000 000 tons or 6 500 000 000 tonnes) is gold.The other 99.99976% is waste – this happens because even ores with tiny amounts of goldare worth mining because of gold’s value. ▪ Modifying technology to lessen the environ-mental damage of mining and other large-scale technologies is a major challenge.
SECTION V
Our actions have consequences
Each of us impacts our environment
Consider a car. We are responsible for more than just the running of a car once we buy it. Weare responsible for the environmental impact of recovering the resources used to make thecar, and the impacts of manufacturing it. The car itself then produces pollution as we drive it,and has other impacts as we use andmaintain it. At the end of its life, it has further impacts asits parts are disposed of or recycled. ▪ When we buy a car or any product, we accept itsenvironmental impacts, but don’t ordinarily know what those impacts are. ▪ Our ignoranceextends to food products. We don’t know the conditions under which they were grown, orprocessed, and, we may not even know how waste from that food is disposed of.
Think about a few of these: ▪ Affluent individuals often buy flowers in winter, unawarethat the less-developed countries growing those flowers use more dangerous pesticides orlarger quantities of pesticides than would be allowed in wealthy countries. Moreover,those pesticides often pollute the water in the countries growing the flowers, and workers
38 Warrick, J. Appalachia is paying price for White House rule change (impacts of mountaintop removal mining).Washington Post, August 17, 2004, A01.
29 Our actions have consequences
may be heavily exposed. ▪ Coffee drinkers typically don’t know that they are drinking “suncoffee.” Growing coffee in full sun enhances bean yields. However, “sun plantation” coffeelacks the tree canopy around shaded trees, so fewer insect-eating birds and spiders findshelter among them. Thus, more pesticides must be used to destroy insects. And lacking atree canopy, less tree litter is produced so more synthetic fertilizer is needed. ▪ Most of theshrimp eaten in North America is imported so diners don’t see the pollution and environ-mental degradation produced by shrimp farms in the less-developed world. ▪ Even whenagricultural products are grown within a wealthy country, buyers often don’t know howthey are produced. Think about the excreta produced by the animals we eat. The US Senatesponsored a study that showed that the United States produces 130 times more animalwaste each year than human waste. But there are no sewage treatment plants for animalwaste. Instead facilities housing, for instance, thousands of pigs store their urine and fecesin open-air lagoons, and later spray the waste onto fields. When amounts sprayed aregreater than the soil can absorb, rain washes those pollutants into nearby water bodies.
Evaluating life-cycle impacts
There is a method to evaluate the environmental impacts of products including agriculturalproducts. It is life-cycle assessment (LCA). LCA evaluates a product’s impact at each stageof its life including the pollution and waste produced and energy used in: ▪ Recovering,processing and transporting the resources used to make it. ▪ Manufacturing, use, andmaintenance. ▪ Recycling, reusing, or disposing of it. We will come back to LCA later.
The “tyranny of small decisions”
You and I impact our environment in many ways. “One of the more intimate ways . . . istaking a pill or washing (your) hair.”Breakdown products ofmedicines leave the body in urineand feces and enter the sewage system. Also going down the drain are shampoos, cosmetics,toiletry products, laundry detergents, and other household chemicals. ▪ Because wastewatertreatment plants do not remove all these substances, some enter rivers and their sediment, andgroundwater. Many pharmaceuticals including antibiotics are detected in rivers. Some aredetected in drinking water, although at very low levels. ▪Wildlife has the highest exposure tothe substances from toilets, laundry rooms, and kitchens, especially fish and other aquatic lifeliving below the effluent pipes of municipal and other wastewater treatment plants.
Antibiotics and hormones
Although present at low concentrations, some chemical wastes from households pose realconcerns. ▪ Exposing aquatic life and bacteria to even low levels of antibiotics can promotethe development of resistance. Resistance means bacteria develop means to “fight back,” tofend off the antibiotics used to treat humans and animal disease. ▪ Hormones, such as those
30 Understanding pollution
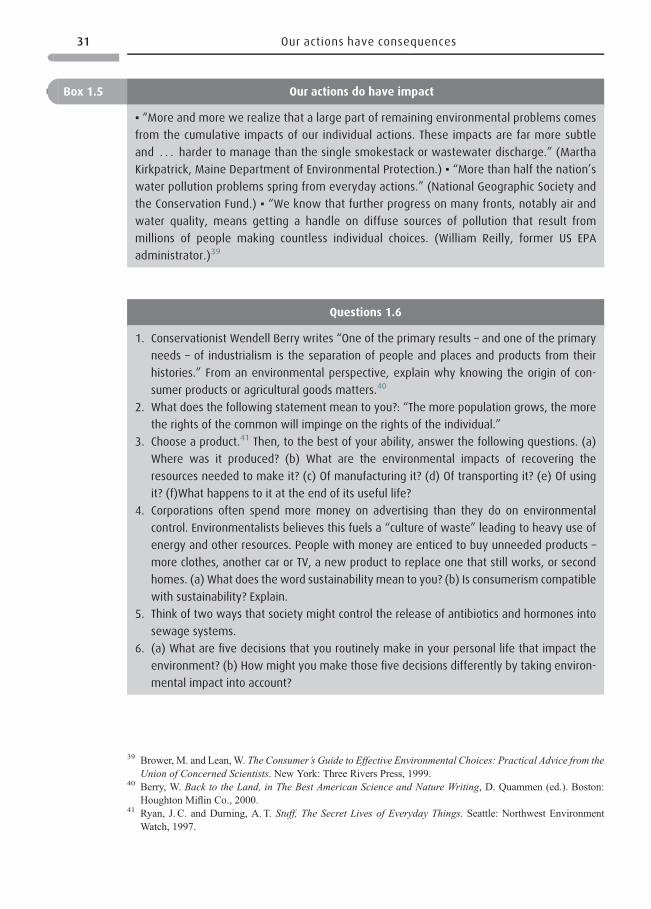
Box 1.5 Our actions do have impact
▪ “More and more we realize that a large part of remaining environmental problems comes
from the cumulative impacts of our individual actions. These impacts are far more subtle
and . . . harder to manage than the single smokestack or wastewater discharge.” (Martha
Kirkpatrick, Maine Department of Environmental Protection.) ▪ “More than half the nation’s
water pollution problems spring from everyday actions.” (National Geographic Society and
the Conservation Fund.) ▪ “We know that further progress on many fronts, notably air and
water quality, means getting a handle on diffuse sources of pollution that result from
millions of people making countless individual choices. (William Reilly, former US EPA
administrator.)39
Questions 1.6
1. Conservationist Wendell Berry writes “One of the primary results – and one of the primary
needs – of industrialism is the separation of people and places and products from their
histories.” From an environmental perspective, explain why knowing the origin of con-
sumer products or agricultural goods matters.40
2. What does the following statement mean to you?: “The more population grows, the more
the rights of the common will impinge on the rights of the individual.”
3. Choose a product.41 Then, to the best of your ability, answer the following questions. (a)
Where was it produced? (b) What are the environmental impacts of recovering the
resources needed to make it? (c) Of manufacturing it? (d) Of transporting it? (e) Of using
it? (f)What happens to it at the end of its useful life?
4. Corporations often spend more money on advertising than they do on environmental
control. Environmentalists believes this fuels a “culture of waste” leading to heavy use of
energy and other resources. People with money are enticed to buy unneeded products –
more clothes, another car or TV, a new product to replace one that still works, or second
homes. (a) What does the word sustainability mean to you? (b) Is consumerism compatible
with sustainability? Explain.
5. Think of two ways that society might control the release of antibiotics and hormones into
sewage systems.
6. (a) What are five decisions that you routinely make in your personal life that impact the
environment? (b) How might you make those five decisions differently by taking environ-
mental impact into account?
39 Brower, M. and Lean, W. The Consumer’s Guide to Effective Environmental Choices: Practical Advice from theUnion of Concerned Scientists. New York: Three Rivers Press, 1999.
40 Berry, W. Back to the Land, in The Best American Science and Nature Writing, D. Quammen (ed.). Boston:Houghton Miflin Co., 2000.
41 Ryan, J. C. and Durning, A. T. Stuff, The Secret Lives of Everyday Things. Seattle: Northwest EnvironmentWatch, 1997.
31 Our actions have consequences
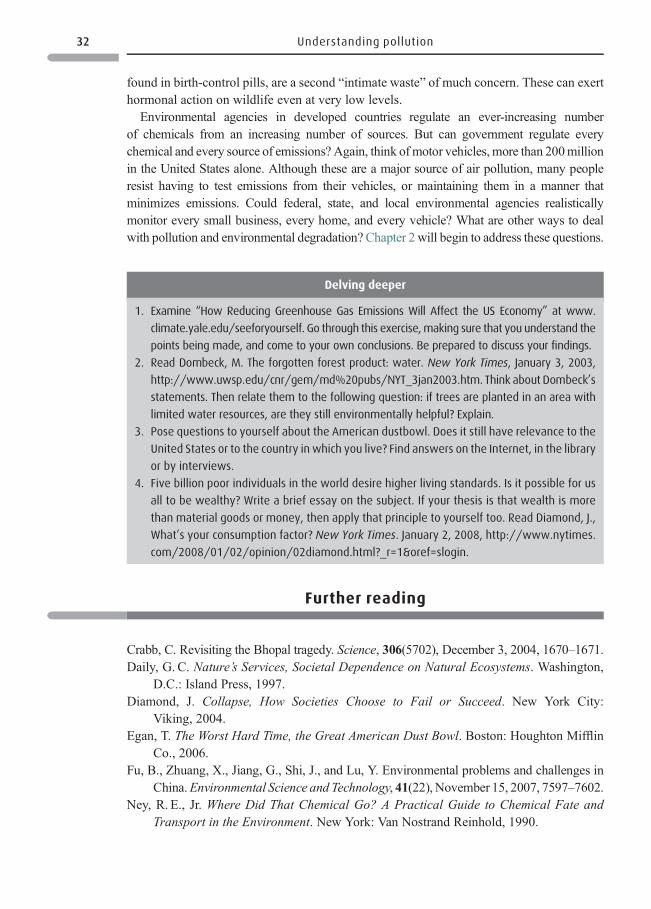
found in birth-control pills, are a second “intimate waste” of much concern. These can exerthormonal action on wildlife even at very low levels.
Environmental agencies in developed countries regulate an ever-increasing numberof chemicals from an increasing number of sources. But can government regulate everychemical and every source of emissions? Again, think of motor vehicles,more than 200millionin the United States alone. Although these are a major source of air pollution, many peopleresist having to test emissions from their vehicles, or maintaining them in a manner thatminimizes emissions. Could federal, state, and local environmental agencies realisticallymonitor every small business, every home, and every vehicle? What are other ways to dealwith pollution and environmental degradation? Chapter 2 will begin to address these questions.
Further reading
Crabb, C. Revisiting the Bhopal tragedy. Science, 306(5702), December 3, 2004, 1670–1671.Daily, G. C. Nature’s Services, Societal Dependence on Natural Ecosystems. Washington,
D.C.: Island Press, 1997.Diamond, J. Collapse, How Societies Choose to Fail or Succeed. New York City:
Viking, 2004.Egan, T. The Worst Hard Time, the Great American Dust Bowl. Boston: Houghton Mifflin
Co., 2006.Fu, B., Zhuang, X., Jiang, G., Shi, J., and Lu, Y. Environmental problems and challenges in
China.Environmental Science and Technology, 41(22), November 15, 2007, 7597–7602.Ney, R. E., Jr. Where Did That Chemical Go? A Practical Guide to Chemical Fate and
Transport in the Environment. New York: Van Nostrand Reinhold, 1990.
Delving deeper
1. Examine “How Reducing Greenhouse Gas Emissions Will Affect the US Economy” at www.
climate.yale.edu/seeforyourself. Go through this exercise,making sure that you understand the
points being made, and come to your own conclusions. Be prepared to discuss your findings.
2. Read Dombeck, M. The forgotten forest product: water. New York Times, January 3, 2003,
http://www.uwsp.edu/cnr/gem/md%20pubs/NYT_3jan2003.htm. Think about Dombeck’s
statements. Then relate them to the following question: if trees are planted in an area with
limited water resources, are they still environmentally helpful? Explain.
3. Pose questions to yourself about the American dustbowl. Does it still have relevance to the
United States or to the country in which you live? Find answers on the Internet, in the library
or by interviews.
4. Five billion poor individuals in the world desire higher living standards. Is it possible for us
all to be wealthy? Write a brief essay on the subject. If your thesis is that wealth is more
than material goods or money, then apply that principle to yourself too. Read Diamond, J.,
What’s your consumption factor? New York Times. January 2, 2008, http://www.nytimes.
com/2008/01/02/opinion/02diamond.html?_r=1&oref=slogin.
32 Understanding pollution
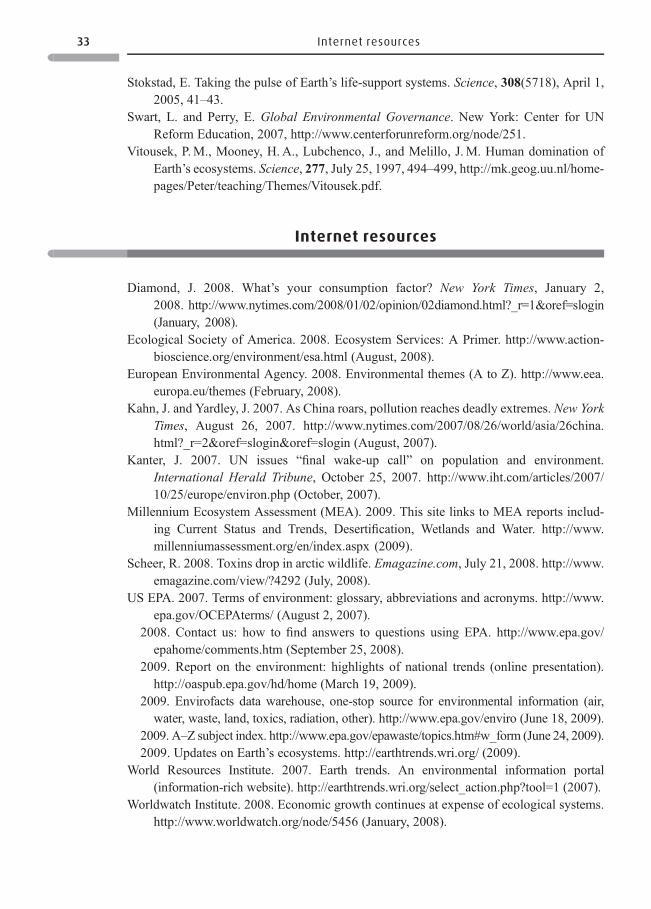
Stokstad, E. Taking the pulse of Earth’s life-support systems. Science, 308(5718), April 1,2005, 41–43.
Swart, L. and Perry, E. Global Environmental Governance. New York: Center for UNReform Education, 2007, http://www.centerforunreform.org/node/251.
Vitousek, P.M., Mooney, H. A., Lubchenco, J., and Melillo, J.M. Human domination ofEarth’s ecosystems. Science, 277, July 25, 1997, 494–499, http://mk.geog.uu.nl/home-pages/Peter/teaching/Themes/Vitousek.pdf.
Internet resources
Diamond, J. 2008. What’s your consumption factor? New York Times, January 2,2008. http://www.nytimes.com/2008/01/02/opinion/02diamond.html?_r=1&oref=slogin(January, 2008).
Ecological Society of America. 2008. Ecosystem Services: A Primer. http://www.action-bioscience.org/environment/esa.html (August, 2008).
European Environmental Agency. 2008. Environmental themes (A to Z). http://www.eea.europa.eu/themes (February, 2008).
Kahn, J. and Yardley, J. 2007. As China roars, pollution reaches deadly extremes. New YorkTimes, August 26, 2007. http://www.nytimes.com/2007/08/26/world/asia/26china.html?_r=2&oref=slogin&oref=slogin (August, 2007).
Kanter, J. 2007. UN issues “final wake-up call” on population and environment.International Herald Tribune, October 25, 2007. http://www.iht.com/articles/2007/10/25/europe/environ.php (October, 2007).
Millennium Ecosystem Assessment (MEA). 2009. This site links to MEA reports includ-ing Current Status and Trends, Desertification, Wetlands and Water. http://www.millenniumassessment.org/en/index.aspx (2009).
Scheer, R. 2008. Toxins drop in arctic wildlife. Emagazine.com, July 21, 2008. http://www.emagazine.com/view/?4292 (July, 2008).
US EPA. 2007. Terms of environment: glossary, abbreviations and acronyms. http://www.epa.gov/OCEPAterms/ (August 2, 2007).
2008. Contact us: how to find answers to questions using EPA. http://www.epa.gov/epahome/comments.htm (September 25, 2008).
2009. Report on the environment: highlights of national trends (online presentation).http://oaspub.epa.gov/hd/home (March 19, 2009).
2009. Envirofacts data warehouse, one-stop source for environmental information (air,water, waste, land, toxics, radiation, other). http://www.epa.gov/enviro (June 18, 2009).
2009. A–Z subject index. http://www.epa.gov/epawaste/topics.htm#w_form (June 24, 2009).2009. Updates on Earth’s ecosystems. http://earthtrends.wri.org/ (2009).
World Resources Institute. 2007. Earth trends. An environmental information portal(information-rich website). http://earthtrends.wri.org/select_action.php?tool=1 (2007).
Worldwatch Institute. 2008. Economic growth continues at expense of ecological systems.http://www.worldwatch.org/node/5456 (January, 2008).
33 Internet resources
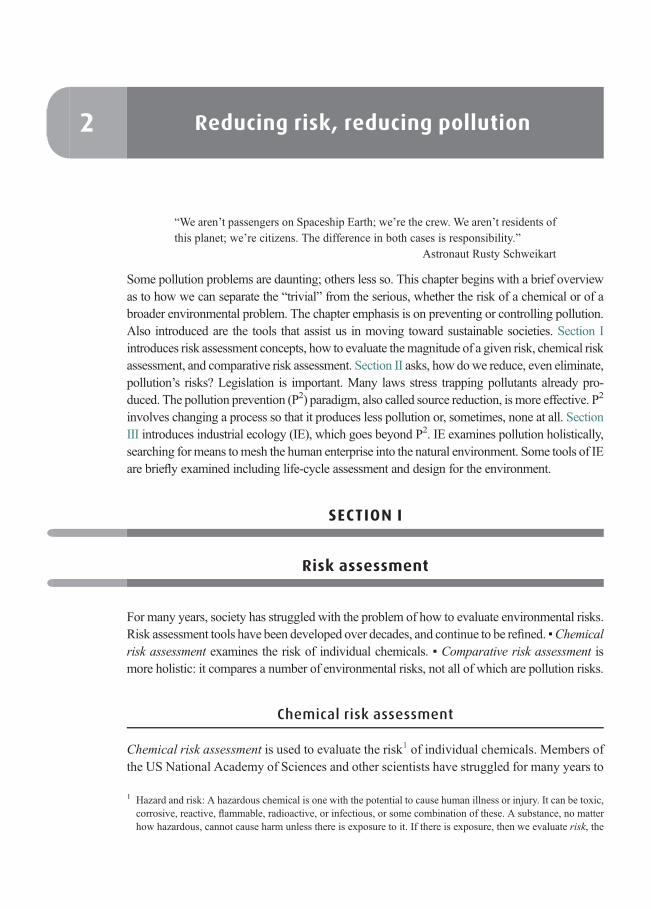
2 Reducing risk, reducing pollution
“We aren’t passengers on Spaceship Earth; we’re the crew. We aren’t residents ofthis planet; we’re citizens. The difference in both cases is responsibility.”
Astronaut Rusty Schweikart
Some pollution problems are daunting; others less so. This chapter begins with a brief overviewas to how we can separate the “trivial” from the serious, whether the risk of a chemical or of abroader environmental problem. The chapter emphasis is on preventing or controlling pollution.Also introduced are the tools that assist us in moving toward sustainable societies. Section Iintroduces risk assessment concepts, how to evaluate themagnitude of a given risk, chemical riskassessment, and comparative risk assessment. Section II asks, how dowe reduce, even eliminate,pollution’s risks? Legislation is important. Many laws stress trapping pollutants already pro-duced. The pollution prevention (P2) paradigm, also called source reduction, is more effective. P2
involves changing a process so that it produces less pollution or, sometimes, none at all. SectionIII introduces industrial ecology (IE), which goes beyond P2. IE examines pollution holistically,searching formeans tomesh the human enterprise into the natural environment. Some tools of IEare briefly examined including life-cycle assessment and design for the environment.
SECTION I
Risk assessment
For many years, society has struggled with the problem of how to evaluate environmental risks.Risk assessment tools have been developed over decades, and continue to be refined. ▪Chemicalrisk assessment examines the risk of individual chemicals. ▪ Comparative risk assessment ismore holistic: it compares a number of environmental risks, not all of which are pollution risks.
Chemical risk assessment
Chemical risk assessment is used to evaluate the risk1 of individual chemicals. Members ofthe US National Academy of Sciences and other scientists have struggled for many years to
1 Hazard and risk: A hazardous chemical is one with the potential to cause human illness or injury. It can be toxic,corrosive, reactive, flammable, radioactive, or infectious, or some combination of these. A substance, no matterhow hazardous, cannot cause harm unless there is exposure to it. If there is exposure, then we evaluate risk, the
develop chemical risk assessment into a useful tool. ▪ Let’s consider a hazardous waste sitein which a number of chemicals have been identified: we need to know the hazard of eachchemical present, i.e., what is the potential for the chemical to cause illness or injury.2 ▪ Buthazard is different than risk. For there to be a risk, there must be exposure to the chemical.Thus, we analyze the site for evidence as to whether there is now, or in the future may be,exposure to the chemical. If there is exposure to one or more chemicals, then we need toknow which of the chemicals pose the greatest risks, and we must concentrate on the high-risk chemicals. ▪ In Chapter 4 we will see that risk assessment raises questions that sciencealone cannot answer: scientists may rate a chemical as being a low risk. But a risk that isacceptable to one person may be unacceptable to another. However, applied consistently,chemical risk assessment is trusted within its limitations.
Certain characteristics of a chemical can warn us that chemical may pose a problem.
1. Does the chemical persist in the environment and within living creatures? Metals arechemicals that cannot be broken down, they are persistent. But some synthetic organicchemicals are persistent too because microbes, plants, or animals have difficulty degrad-ing them. Among such chemicals are dioxins and DDT.
2. Does the chemical bioaccumulate, build up in plants and animals to concentrationshigher than in the environment? Again, dioxins and DDT are examples of chemicalsthat bioaccumulate.
3. Is the chemical toxic?
If the answer to all three questions is yes, then we refer to the chemical as persistent,bioaccumulative, and toxic (PBT). Even a low level of a PBT chemical warns us to treat itrespectfully. Chapter 14 will address organic chemicals that are PBTs; Chapter 15 deals withmetals, including PBT metals.
Comparative risk assessment
Comparative risk assessment is used to compare environmental problems. It aims todistinguish high-priority risks from medium- and low-priority risks. It can compare onecomplicated environmental issue such as acid deposition to another such as stratosphericozone depletion (Tables 2.1 and 2.2). It can also be used to compare a pollution issue to anon-pollution issue. ▪ Even imperfect answers help us decide which issues will receive moreattention and resources. ▪ Comparative risk assessment is often used in making environ-mental policy: are we spending more dollars on high-risk than low-risk problems? At thesame time, a criticism of comparative risk assessment is that “low-risk” problems may bedealt with inadequately or not at all. If you think about this criticism, you can see thatcomparative risk assessment, like chemical risk assessment, goes beyond questions that
probability of harm. The risk can range from low to high.Many questions are asked during an evaluation, such as:how much exposure occurred? How did exposure occur – through air, water, soil, food?
2 The US EPA uses an exhaustive procedure to analyze a site for the chemicals it contains and whether it poses ahigh enough risk to place it on the National Priority List (NPL). NPL sites receive federal attention, whereasindividual states are left to clean up less risky sites.
35 Risk assessment
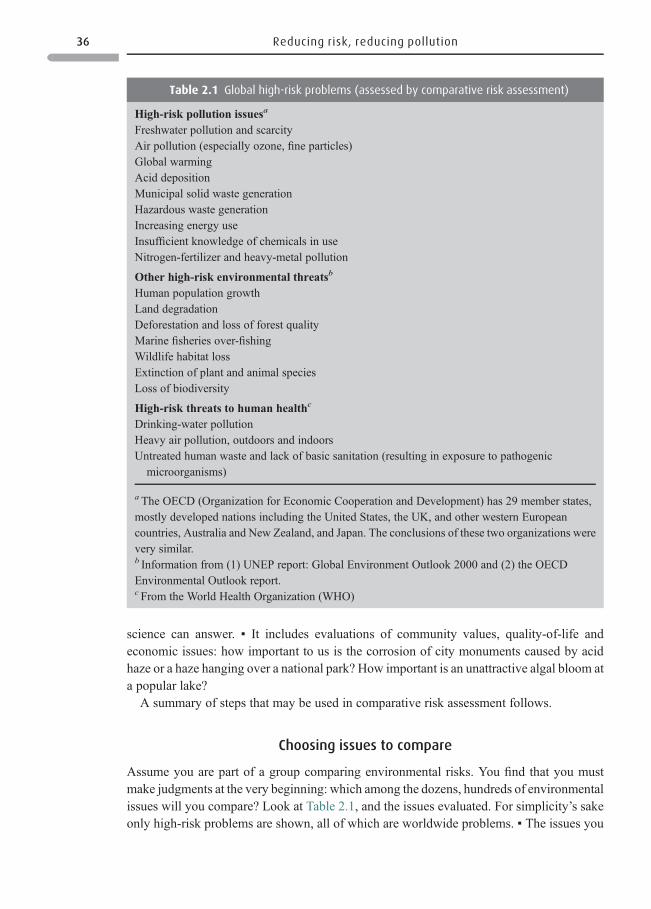
science can answer. ▪ It includes evaluations of community values, quality-of-life andeconomic issues: how important to us is the corrosion of city monuments caused by acidhaze or a haze hanging over a national park? How important is an unattractive algal bloom ata popular lake?
A summary of steps that may be used in comparative risk assessment follows.
Choosing issues to compare
Assume you are part of a group comparing environmental risks. You find that you mustmake judgments at the very beginning: which among the dozens, hundreds of environmentalissues will you compare? Look at Table 2.1, and the issues evaluated. For simplicity’s sakeonly high-risk problems are shown, all of which are worldwide problems. ▪ The issues you
Table 2.1 Global high-risk problems (assessed by comparative risk assessment)
High-risk pollution issues a
Freshwater pollution and scarcityAir pollution (especially ozone, fine particles)Global warmingAcid depositionMunicipal solid waste generationHazardous waste generationIncreasing energy useInsufficient knowledge of chemicals in useNitrogen-fertilizer and heavy-metal pollution
Other high-risk environmental threatsb
Human population growthLand degradationDeforestation and loss of forest qualityMarine fisheries over-fishingWildlife habitat lossExtinction of plant and animal speciesLoss of biodiversity
High-risk threats to human health c
Drinking-water pollutionHeavy air pollution, outdoors and indoorsUntreated human waste and lack of basic sanitation (resulting in exposure to pathogenicmicroorganisms)
aThe OECD (Organization for Economic Cooperation and Development) has 29 member states,mostly developed nations including the United States, the UK, and other western Europeancountries, Australia and New Zealand, and Japan. The conclusions of these two organizations werevery similar.b Information from (1) UNEP report: Global Environment Outlook 2000 and (2) the OECDEnvironmental Outlook report.c From the World Health Organization (WHO)
36 Reducing risk, reducing pollution
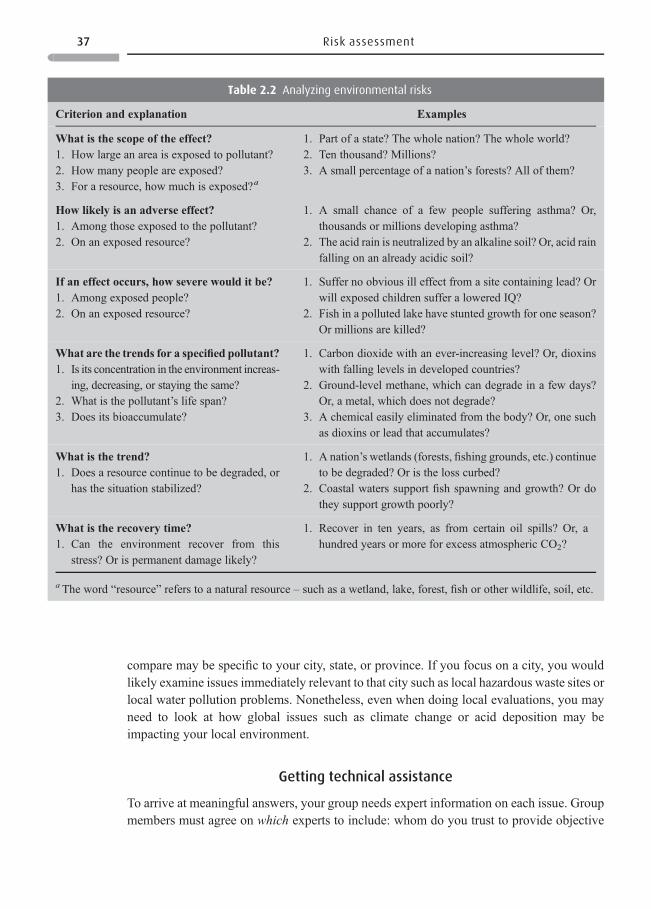
compare may be specific to your city, state, or province. If you focus on a city, you wouldlikely examine issues immediately relevant to that city such as local hazardous waste sites orlocal water pollution problems. Nonetheless, even when doing local evaluations, you mayneed to look at how global issues such as climate change or acid deposition may beimpacting your local environment.
Getting technical assistance
To arrive at meaningful answers, your group needs expert information on each issue. Groupmembers must agree on which experts to include: whom do you trust to provide objective
Table 2.2 Analyzing environmental risks
Criterion and explanation Examples
What is the scope of the effect?1. How large an area is exposed to pollutant?2. How many people are exposed?3. For a resource, how much is exposed? a
1. Part of a state? The whole nation? The whole world?2. Ten thousand? Millions?3. A small percentage of a nation’s forests? All of them?
How likely is an adverse effect?1. Among those exposed to the pollutant?2. On an exposed resource?
1. A small chance of a few people suffering asthma? Or,thousands or millions developing asthma?
2. The acid rain is neutralized by an alkaline soil? Or, acid rainfalling on an already acidic soil?
If an effect occurs, how severe would it be?1. Among exposed people?2. On an exposed resource?
1. Suffer no obvious ill effect from a site containing lead? Orwill exposed children suffer a lowered IQ?
2. Fish in a polluted lake have stunted growth for one season?Or millions are killed?
What are the trends for a specified pollutant?1. Is its concentration in the environment increas-
ing, decreasing, or staying the same?2. What is the pollutant’s life span?3. Does its bioaccumulate?
1. Carbon dioxide with an ever-increasing level? Or, dioxinswith falling levels in developed countries?
2. Ground-level methane, which can degrade in a few days?Or, a metal, which does not degrade?
3. A chemical easily eliminated from the body? Or, one suchas dioxins or lead that accumulates?
What is the trend?1. Does a resource continue to be degraded, or
has the situation stabilized?
1. A nation’s wetlands (forests, fishing grounds, etc.) continueto be degraded? Or is the loss curbed?
2. Coastal waters support fish spawning and growth? Or dothey support growth poorly?
What is the recovery time?1. Can the environment recover from this
stress? Or is permanent damage likely?
1. Recover in ten years, as from certain oil spills? Or, ahundred years or more for excess atmospheric CO2?
aThe word “resource” refers to a natural resource – such as a wetland, lake, forest, fish or other wildlife, soil, etc.
37 Risk assessment
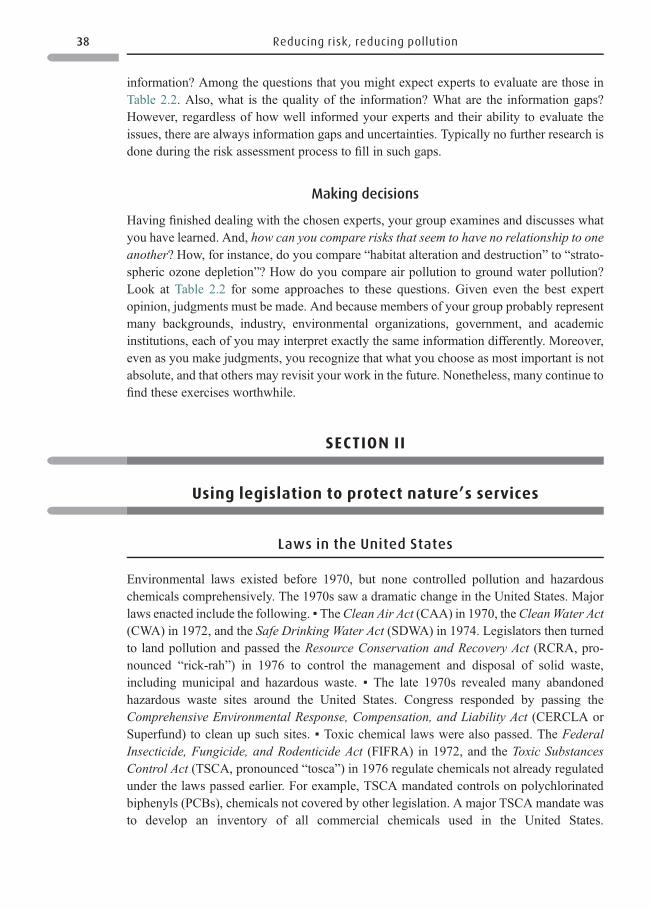
information? Among the questions that you might expect experts to evaluate are those inTable 2.2. Also, what is the quality of the information? What are the information gaps?However, regardless of how well informed your experts and their ability to evaluate theissues, there are always information gaps and uncertainties. Typically no further research isdone during the risk assessment process to fill in such gaps.
Making decisions
Having finished dealing with the chosen experts, your group examines and discusses whatyou have learned. And, how can you compare risks that seem to have no relationship to oneanother? How, for instance, do you compare “habitat alteration and destruction” to “strato-spheric ozone depletion”? How do you compare air pollution to ground water pollution?Look at Table 2.2 for some approaches to these questions. Given even the best expertopinion, judgments must be made. And because members of your group probably representmany backgrounds, industry, environmental organizations, government, and academicinstitutions, each of you may interpret exactly the same information differently. Moreover,even as you make judgments, you recognize that what you choose as most important is notabsolute, and that others may revisit your work in the future. Nonetheless, many continue tofind these exercises worthwhile.
SECTION II
Using legislation to protect nature’s services
Laws in the United States
Environmental laws existed before 1970, but none controlled pollution and hazardouschemicals comprehensively. The 1970s saw a dramatic change in the United States. Majorlaws enacted include the following. ▪ TheClean Air Act (CAA) in 1970, theCleanWater Act(CWA) in 1972, and the Safe Drinking Water Act (SDWA) in 1974. Legislators then turnedto land pollution and passed the Resource Conservation and Recovery Act (RCRA, pro-nounced “rick-rah”) in 1976 to control the management and disposal of solid waste,including municipal and hazardous waste. ▪ The late 1970s revealed many abandonedhazardous waste sites around the United States. Congress responded by passing theComprehensive Environmental Response, Compensation, and Liability Act (CERCLA orSuperfund) to clean up such sites. ▪ Toxic chemical laws were also passed. The FederalInsecticide, Fungicide, and Rodenticide Act (FIFRA) in 1972, and the Toxic SubstancesControl Act (TSCA, pronounced “tosca”) in 1976 regulate chemicals not already regulatedunder the laws passed earlier. For example, TSCA mandated controls on polychlorinatedbiphenyls (PCBs), chemicals not covered by other legislation. A major TSCA mandate wasto develop an inventory of all commercial chemicals used in the United States.
38 Reducing risk, reducing pollution
Subsequently, any chemical not on the inventory would be subject to scrutiny by the EPAbefore it could be used commercially or imported. ▪ Passing TSCAwas an attempt to “closethe circle,” to ensure that all chemical issues were addressed. However, the 1984 tragedy inBhopal, India resulted in the “right-to-know” legislation, the Emergency Planning andCommunity Right-to-Know Act (EPCRA) in 1986. ▪ Important international treaties havebeen passed too. TSCA comes up again in Chapter 4, Section V.
End-of-pipe regulations
The laws just noted produced many so-called command-and-control and end-of-piperegulations, which can be very effective when applied to large facilities. The Clean WaterAct can illustrate this. ▪ When passed in 1972, only 30% of American waters were judgedfishable and swimmable. By 1994, this figure was about 60%. Fishablemeans that fish fromthe water are safe to eat or that the quality of the water is good enough for fish to live in it.Swimmable means the water can be used for swimming without fear that infectiousorganisms or other contaminants are present at levels potentially harmful to health. ▪ Afterpassage of the CWA, many treatment plants were built by industries and cities to recoverhazardous components from their wastewater before the water was released into a receivingbody: those pollutants were removed end-of-pipe. ▪ In response to the Clean Air Act, airemissions were trapped end-of-pipe. End-of-pipe controls were also placed onmotor vehicleemissions. ▪ Hazardous wastes were treated before disposal. ▪Municipalities and industriesdesigned and built secure landfills to replace old leaking uncovered dumps. End-of-pipeaccomplished a lot.
Laws in less-developed countries
Less-developed countries may have excellent environmental laws on the books, but oftenenforce laws poorly. This happens because governments are weak or corrupt, or becausegovernments lack money or power to enforce them.
Controlling pollution by command-and-control
End-of-pipe refers to capturing pollutants after they are formed, but before release.▪ Consider sulfur dioxide, a major pollutant produced by burning coal in electric powerplants. A power plant may capture much of that sulfur dioxide from its stack to prevent itfrom entering the air. ▪ Or consider chromium, a metal often found in the wastewater ofmetal-plating firms. Chromium is removed from the wastewater to prevent its release into ariver. ▪ In both these instances, the pollutant still exists, but it has been captured so that it canbe disposed or reused responsibly.
39 Controlling pollution by command-and-control
Box 2.1 The struggle to reduce pollution in China3
China has excellent laws on its books nationally, but has been unable to get local officials to
enforce them. Local officials are more eager to generate revenue and jobs than to control
pollution. In 1983, China included environmental protection as a basic national policy, but
pollution and environmental degradation continued. In 1994, China developed a strategy to
achieve sustainable development. Nonetheless, as factories, mines, power and industrial
plants continued their “frantic growth,” the situation continued to worsen. Consider one
illustration: China tried to reduce sulfur dioxide emissions between 2001 and 2005; instead
emissions increased 28%.
China has environmental organizations and activists. However, although the government
approves of environmental advocacy, it is hostile to “political agitation.” So, despite China’s
dire environmental problems, some environmental organizers are prosecuted. “Pollution has
reached epidemic proportions in China, in part because the ruling Communist Party still treats
environmental advocates as bigger threats than the degradation of air, water, and soil that
prompts them to speak out.” However, activists continue to emerge. One is Ma Jun, whose
observations led him to believe that the reason companies in developed countries pollute less
than those in China is because corporations are sensitive to public pressure. In developed
countries, the people can publicly criticize poorly performing companies in a number of ways
and, if necessary, boycott companies. So Ma Jun decided that pressure must be exerted on
Chinese companies too. He and other knowledgeable volunteers formed a non-governmental
organization (NGO), the Institute of Public and Environmental Affairs. This institute finds
needed information by examining reports on major polluters put out by municipal, provincial,
and national environmental agencies. They also follow news reports of interviews with
environmental officials. They have details on 8000 companies officially cited for exceeding
discharge standards into China’s rivers and lakes. ▪The Institute’s database shows which
companies are polluting rivers and lakes. They place the information on the China Water
Pollution Mapwebsite (http://www.ipe.org.cn), an online Chinese-language searchable data-
base. It discloses details of about 10 000 water violations, about a quarter of them by foreign
firms. More recently, it developed the China Air Pollution Map (http://air.ipe.org.cn).
People are paying attention. Fifty companies have asked to have their names removed from
the list. For this to happen, they must show compliance with standards as shown by a third-
party audit. The Chinese media also pay attention to the database. The media have become
sharply critical of the fact that the government, notwithstanding its promises to clean up highly
polluted air and water, has not done so. Moreover, above and beyond the already bad
everyday emissions, major spills also continue to occur.
Ma Jun is working to gain the attention of foreigners who buy Chinese goods. His NGOwants
to push for improved environmental performance of multinational corporations (MNC) that
operate in China. The Institute has found several hundred multinational corporations (MNC)
3 China Environment Forum. Woodrow Wilson International Center, 2009, http://www.wilsoncenter.org/index.cfm?topic/id=1421&fuseaction=topics.documents&doc/id=496229&group_id=233293.
40 Reducing risk, reducing pollution
Limitations of command-and-control5
End-of-pipe controls cannot recover 100% of a pollutant. An industry or electric utility mayremove thefirst 80% fromawaste streamefficiently and cost-effectively.Removing the last 20%may cost 10 times more than the first 80%, and yet a small amount of the pollutant still remains.
A specially designed incinerator may destroy 99.99% of the hazardous materials that itburns. For pollutants of special concern, a more costly technologically sophisticated incin-erator can destroy 99.9999%. But the incinerator cannot destroy that last tiny amount. Even
violating water and air pollution laws. Some are well-known corporations such as Pepsi,
Dupont, and 3M, which have good environmental records in developed countries. Why do
they behave less well in China? Fines for violations are very low compared to the costs of
controlling emissions; local governments often shield MNCs because they provide employ-
ment, pay taxes, and contribute to local growth; and the public is often unaware of the
violations. So although better performance would be expected, it’s very easy for MNCs to
violate laws. Ma Jun’s organization has begun work to name and shame them.
A positive project of the Institute is the Green Choice Initiative, undertaken cooperatively
with 20 other NGOs. Its purpose is to inform the public about environmentally responsible
products. At the same time, it provides consumers with the names of companies cited for
violations of environmental laws. These malefactors are major consumer-goods companies,
about half of them foreign.
As “traditional industrial growth . . . strains China’s resources and environment to an
unbearable extreme,” the government is struggling to get away from economic growth
regardless of environmental costs. It is spending many billions to control water and air
pollution, and solid waste. And, very importantly, in 2007 government officials rejected the
building of factories that would have beenworth billions of dollars because they failed to meet
standards. The national government too has begun using the “name and shame” technique on
major polluters.4
4 Further reading on China: (1) Buckley, C. China environment chief says pollution fuelling unrest. Reuters, July 5,2007, http://www.alertnet.org/thenews/newsdesk/SP250873.htm. (2) China punishes cities for polluting rivers.Reuters, July 4, 2007. (3) Kahn, J. Choking on growth. Part III. In China, a lake’s champion imperils himself. NewYork Times, October 14, 2007, http://www.nytimes.com/2007/10/14/world/asia/14china.html?_r=1& oref=slogin.(4) Liu, Y. Stronger regulation needed to improve corporate pollution record in China. Eye on Earth (WorldwatchInstitute and Blue Moon Fund), February 6, 2008, http://www.worldwatch.org/node/5601. (5) Nakanishi,N. Chinese group says to name-and-shame air polluters. Reuters, December 13, 2007. (6) Vidal, J. The loomingfood crisis.Guardian, August 29, 2007, http://www.polarisinstitute.org/the_looming_food_crisis. (7) Tremblay, J. F.China releases new cleanup plan. Chemical & Engineering News, 85(49), December 2, 2007, 12. (8) Tremblay, J. F.Talks with Ma Jun, tireless environmental activist seeks to nurture China’s environmental conscience. Chemical &Engineering News, 85(40), October 1, 2007, 26. (9) Tremblay, J. F. Free trade or fair trade.Chemical & EngineeringNews, 86(1) January 7, 2008, 16.
5 (1) Greening industry, new ideas in pollution regulation. The World Bank, 2009, http://go.worldbank.org/TFGRCF3JJ0. (2) What is green engineering. US EPA, September 13, 2007, http://www.epa.gov_oppt_greenengineering_pubs_whats_ge.html (this paper shows a figure, “Proliferation of environ-mental laws and regulations,” which is worth examining).
41 Controlling pollution by command-and-control
to capture the amount they were designed to remove takes careful monitoring and ongoingequipment maintenance.
* Another problemwith end-of-pipe is what to dowith the pollutants recovered? The recoveredpollutants must sometimes be treated themselves. An organic waste may need to be incin-erated. A metal waste, if not recyclable, may need burial in a hazardous waste landfill.Moreover, the cost of pollution control – recovering, treating, and disposing of recoveredwastes – continues to rise as do the costs of managing municipal wastes and sewage.
* Another limitation of command-and-control regulations that industry verymuch dislikes is“one-size-fits-all.” A regulation tells industrial facilities not only to limit the release ofspecific pollutants, but also tells them exactly how theymust accomplish that reduction: allfacilities must reduce emissions in the same way. But no two facilities are identical, andfrequently there is more than one way to reach the same end. ▪ Years ago, a Wall StreetJournal article told the following story. The AMOCO refinery of Yorktown, Virginia, wasrequired to install a $41 million system using a specific (one-size-fits-all) technology tocapture benzene emissions. However, AMOCO, working with the EPA, found anothermethod that could capture five times more benzene for only $11 million. But, the law wasinflexible so the EPA could not modify the requirements. Thus, a greater amount of moneywas spent to capture less pollutant. ▪Recounting another such instance, in 1995, a ScientificAmerican article described regulations intended to ensure the safe handling of hazardouswastes. The automotive industry produced a sludge containing zinc. In earlier years,factories sent the sludge to smelters to recover and reuse the zinc. However, in the1980s, the zinc sludge was listed as a hazardous waste, so smelters no longer acceptedit. Instead, now deemed hazardous, the sludge had to be treated and disposed of inaccordance with strict regulations. Clearly, in both the examples just given, the resultswere unintended consequences. Most agree that such problems arise becausewe try to dealwith environmental problems one at a time – bit by bit – instead of looking at issuesholistically. ▪ Given the huge number of detailed regulations that have resulted fromcomplex environmental laws, some counterproductive results are inevitable. The USEPA has been working to develop regulations that take these problems into account, andto find ways to modify “one-size-fits-all”when it is logical to do so. Nevertheless, the EPAmust exercise flexibility within the constraints of the laws.
* Complicating the situation further is that some believe that the only acceptable amount ofa pollutant is zero. This gives rise to the problem of the vanishing zero. Analyticalchemists devise ever more sensitive methods to detect a pollutant. So, even if essentiallyall a pollutant has seemingly been removed, newer more-sensitive detection methods maydetect it again. Thus, a chemical undetected and unregulated in one year could be detectedand regulated the next.
A right-to-know law6
The world reacted with horror to the Bhopal disaster described in Chapter 1. Then, UScitizens discovered that a Union Carbide plant in Institute, West Virginia, used the same
6 ScoreCard, the pollution locator. Environmental Defense, 2005, http://www.scorecard.org/env-releases/us-map.tcl.
42 Reducing risk, reducing pollution
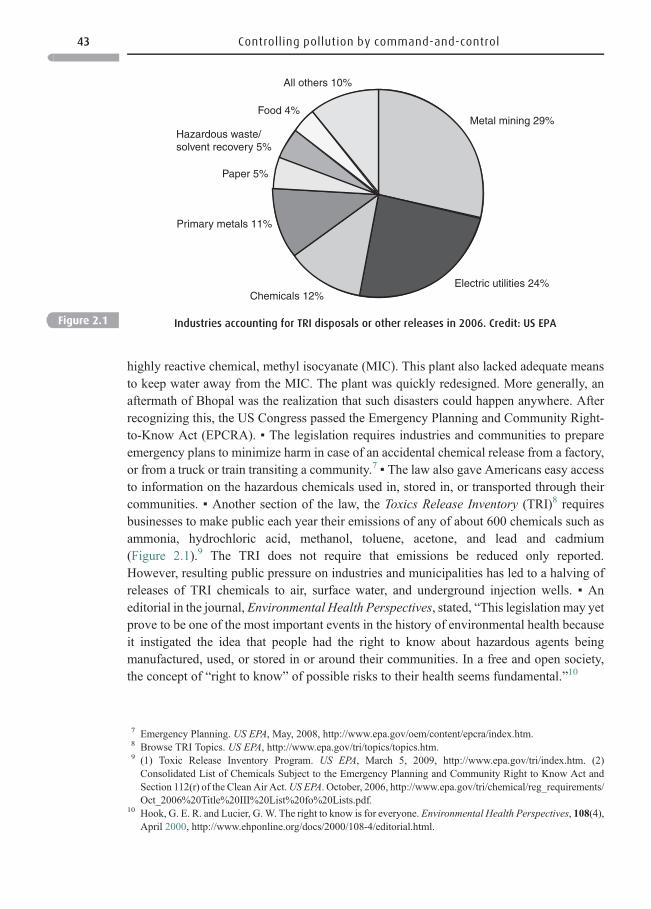
highly reactive chemical, methyl isocyanate (MIC). This plant also lacked adequate meansto keep water away from the MIC. The plant was quickly redesigned. More generally, anaftermath of Bhopal was the realization that such disasters could happen anywhere. Afterrecognizing this, the US Congress passed the Emergency Planning and Community Right-to-Know Act (EPCRA). ▪ The legislation requires industries and communities to prepareemergency plans to minimize harm in case of an accidental chemical release from a factory,or from a truck or train transiting a community.7 ▪ The law also gave Americans easy accessto information on the hazardous chemicals used in, stored in, or transported through theircommunities. ▪ Another section of the law, the Toxics Release Inventory (TRI)8 requiresbusinesses to make public each year their emissions of any of about 600 chemicals such asammonia, hydrochloric acid, methanol, toluene, acetone, and lead and cadmium(Figure 2.1).9 The TRI does not require that emissions be reduced only reported.However, resulting public pressure on industries and municipalities has led to a halving ofreleases of TRI chemicals to air, surface water, and underground injection wells. ▪ Aneditorial in the journal, Environmental Health Perspectives, stated, “This legislation may yetprove to be one of the most important events in the history of environmental health becauseit instigated the idea that people had the right to know about hazardous agents beingmanufactured, used, or stored in or around their communities. In a free and open society,the concept of “right to know” of possible risks to their health seems fundamental.”10
Electric utilities 24%Chemicals 12%
Primary metals 11%
Paper 5%
Hazardous waste/solvent recovery 5%
Food 4%
All others 10%
Metal mining 29%
Figure 2.1 Industries accounting for TRI disposals or other releases in 2006. Credit: US EPA
7 Emergency Planning. US EPA, May, 2008, http://www.epa.gov/oem/content/epcra/index.htm.8 Browse TRI Topics. US EPA, http://www.epa.gov/tri/topics/topics.htm.9 (1) Toxic Release Inventory Program. US EPA, March 5, 2009, http://www.epa.gov/tri/index.htm. (2)Consolidated List of Chemicals Subject to the Emergency Planning and Community Right to Know Act andSection 112(r) of the Clean Air Act.US EPA. October, 2006, http://www.epa.gov/tri/chemical/reg_requirements/Oct_2006%20Title%20III%20List%20fo%20Lists.pdf.
10 Hook, G. E. R. and Lucier, G. W. The right to know is for everyone. Environmental Health Perspectives, 108(4),April 2000, http://www.ehponline.org/docs/2000/108-4/editorial.html.
43 Controlling pollution by command-and-control
Criticisms of the TRI
▪Amajor criticism of TRI is that it merely reports the amount of a chemical released. It doesnot tell us how toxic the chemical is nor whether humans and wildlife are actually exposed toit. That is, TRI tells us the hazard of a chemical emission, but not its risk. ▪ EnvironmentalDefense, an environmental organization, points out that TRI emissions11 only account for4% of the total cancer risk nationwide. It is emissions from mobile sources such as cars andtrucks that contribute 88% of the cancer risk. Diesel exhaust poses an especially high risk.Nonetheless, motor vehicle emissions are not reported. Thus, the question is raised: would adifferent form of disclosure provide more useful information? A recent approach may beable to do this.12 ▪ Other critics note that TRI releases tell us very little about a facility’soverall environmental performance.
TRI laws in other countries
* Europeans, too, see disclosures as a powerful and low-cost means of informing thepublic, which may then pressure companies to reduce emissions. The European Union(EU) version of “right-to-know” legislation is the EPER (European Pollutant EmissionRegister). It registers releases of 50 pollutants which, in aggregate, account for 90% oftotal chemical emissions from about 10 000 industrial facilities. Categories include heavymetals, pesticides, industrial chemicals, and dioxins. Unlike the US version, it alsoincludes greenhouse gases such as carbon dioxide.13
* Egypt, the Czech Republic, and Mexico have similar programs too, but only for chem-icals deemed especially hazardous. China, until 2008, had no TRI at all. How does thisaffect pollution? Take Hong Kong, which suffers from air pollution coming across theborder from mainland China’s Guangdong province where companies didn’t need topublicly report their emissions. Two factors made this frustrating: Guangdong’s govern-ment monitors air quality and had information on the identity of the major polluters, butwouldn’t expose those companies. Secondly, many Guangdong facilities known topollute Hong Kong are owned by Hong Kong residents.
11 ScoreCard, the pollution locator. Environmental Defense, 2005, http://www.scorecard.org/env-releases/us-map.tcl.
12 This approach compares the toxicity of any chemical with that of a reference chemical using a Toxic EquivalencyPotential (TEP). There are two reference chemicals in the TEP approach. If “Chemical X” is a carcinogen, thereference chemical is the carcinogen, benzene. If “Chemical X” is a non-carcinogen the reference chemical istoluene. This allows us to compare release of “Chemical X” pound for pound with the reference chemical.▪ Using toxicity equivalencies, it was found that, among the carcinogens emitted to air, those that pose thegreatest hazard to human health are carbon tetrachloride and lead (and lead compounds). This is true although,e.g., styrene and acetaldehyde, are released in the greatest amounts. ▪ For non-carcinogens, toluene and carbondisulfide are released to the air in the largest quantities. However, although lower amounts of mercury and leadcompounds are released, it is they that pose the greatest hazards; in particular, they pose major concerns becausethey can adversely affect human development and reproduction. Commission for Environmental Cooperation,Report profiles data on industrial releases and children’s health, May 17, 2006, http://www.cec.org/news/details/index.cfm?varlan=ENGLISH&ID=2704.
13 What is EPER, the European pollutant emission register? European Environment Agency, 2003, http://eper.eea.europa.eu/eper/introduction.asp?i=.
44 Reducing risk, reducing pollution
Can we completely control pollution?
TRI requires industrial facilities to report many legal chemical emissions. In 1988, the firstyear TRI emissions were divulged, people were concerned to learn that industry hadreleased nearly 2.6 billion pounds (1.2 billion kg) of chemicals into the air the previousyear. But this was only the beginning of the story: at about the same time a nationwide studywas done on all volatile organic chemical (VOC) emissions into air. The study concludedthat 47 billion pounds (21.3 billion kg) of VOCS were released to the air each year –18-times greater than 2.6 billion. Where did these VOCs come from? ▪ A portion came fromindustries not then required to report TRI emissions including mining operations, sewagetreatment plants, landfills, and hundreds of thousands of small businesses such as drycleaners, printers, painters, shops maintaining motor vehicles, and even bakeries and food-processing operations.14 ▪ But the striking point was: half of the 47 billion pounds (21.3billion kg) came from motor vehicles, driven billions of miles a year. And, remember, motorvehicle emissionsmay pose amuch greater risk than TRI chemicals. A new car pollutes muchless than one made in 1970, but each year more people drive more vehicles more miles. Andmany drivers do not maintain their vehicles to run as cleanly as they were designed to run.
You and I, on a smaller scale, also contribute VOC emissions when using paints,pesticides, and other aerosol sprays. Emissions for which one person is responsible aresmall. However, multiply yourself by hundreds of millions of people and some of theseemissions become significant. ▪ Environmental agencies regulate an increasing number ofchemicals from a great many sources. But can government regulate each and everyemission? Again, remember motor vehicles are a major source of air pollution. Yet manypeople resist testing, and reducing emissions from personal vehicles, or do so only underduress. Could federal, state, and local environmental agencies monitor every small businessoperation, every home, and every vehicle? What other approaches are available?
The waste management hierarchy (WMH)15
End-of-pipe control means capturing the pollutant after it is formed, but before its releaseinto the environment. End-of-pipe control has been called first-generation thinking, veryimportant but limited. ▪ A second-generation concept is pollution prevention (P2), whichmeans producing less of the pollutant or waste in the first place or, sometimes eliminating it.P2 is at the top of a waste management hierarchy (WMH) (Table 2.3). Valuable as they are,reuse and recycling are a step below P2 on the WMH. ▪ Treatment, the third step is usedwhen a material can no longer be reused or recycled. The purpose of treatment is to reduce
14 As one example, about 44 million pounds (20 million kg) of the VOC hexane are released into US air each year.The largest source of hexane releases is from its use as an organic solvent to extract millions of tons a year of foodoil from soybeans, and to extract millions of tons more from other seeds and grains.
15 Pollution prevention and recycling links. California Department of Environmental Control, http://www.dtsc.ca.gov/InformationResources/resources.cfm#PPR.
45 The waste management hierarchy (WMH)
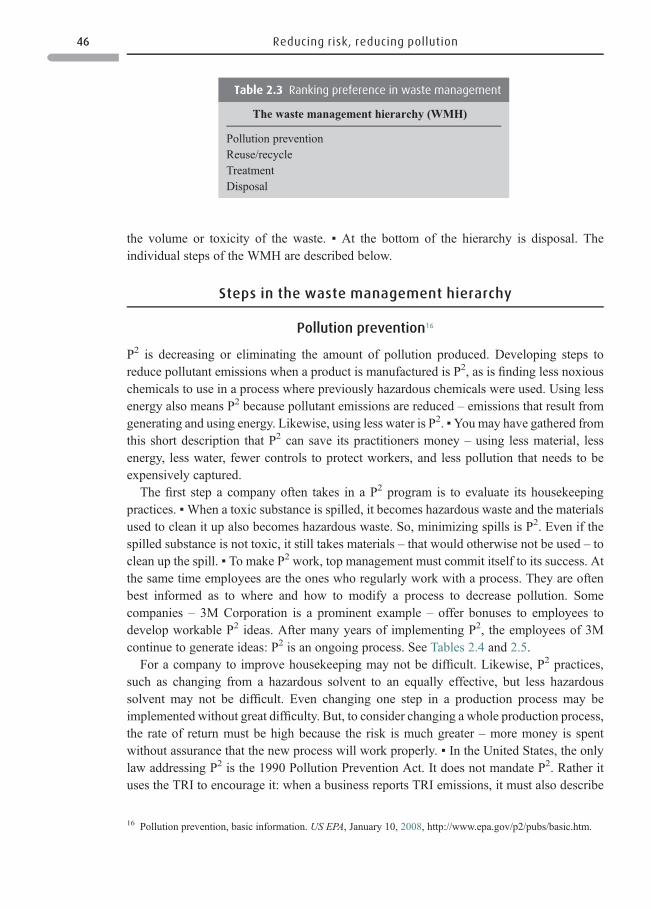
the volume or toxicity of the waste. ▪ At the bottom of the hierarchy is disposal. Theindividual steps of the WMH are described below.
Steps in the waste management hierarchy
Pollution prevention16
P2 is decreasing or eliminating the amount of pollution produced. Developing steps toreduce pollutant emissions when a product is manufactured is P2, as is finding less noxiouschemicals to use in a process where previously hazardous chemicals were used. Using lessenergy also means P2 because pollutant emissions are reduced – emissions that result fromgenerating and using energy. Likewise, using less water is P2. ▪Youmay have gathered fromthis short description that P2 can save its practitioners money – using less material, lessenergy, less water, fewer controls to protect workers, and less pollution that needs to beexpensively captured.
The first step a company often takes in a P2 program is to evaluate its housekeepingpractices. ▪When a toxic substance is spilled, it becomes hazardous waste and the materialsused to clean it up also becomes hazardous waste. So, minimizing spills is P2. Even if thespilled substance is not toxic, it still takes materials – that would otherwise not be used – toclean up the spill. ▪ To make P2 work, top management must commit itself to its success. Atthe same time employees are the ones who regularly work with a process. They are oftenbest informed as to where and how to modify a process to decrease pollution. Somecompanies – 3M Corporation is a prominent example – offer bonuses to employees todevelop workable P2 ideas. After many years of implementing P2, the employees of 3Mcontinue to generate ideas: P2 is an ongoing process. See Tables 2.4 and 2.5.
For a company to improve housekeeping may not be difficult. Likewise, P2 practices,such as changing from a hazardous solvent to an equally effective, but less hazardoussolvent may not be difficult. Even changing one step in a production process may beimplemented without great difficulty. But, to consider changing a whole production process,the rate of return must be high because the risk is much greater – more money is spentwithout assurance that the new process will work properly. ▪ In the United States, the onlylaw addressing P2 is the 1990 Pollution Prevention Act. It does not mandate P2. Rather ituses the TRI to encourage it: when a business reports TRI emissions, it must also describe
Table 2.3 Ranking preference in waste management
The waste management hierarchy (WMH)
Pollution preventionReuse/recycleTreatmentDisposal
16 Pollution prevention, basic information. US EPA, January 10, 2008, http://www.epa.gov/p2/pubs/basic.htm.
46 Reducing risk, reducing pollution
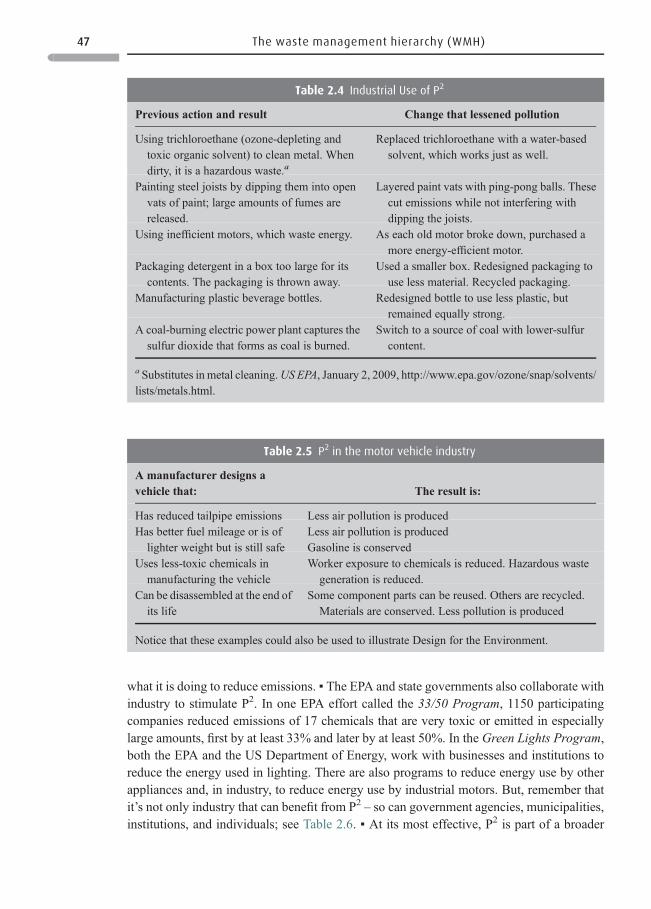
what it is doing to reduce emissions. ▪ The EPA and state governments also collaborate withindustry to stimulate P2. In one EPA effort called the 33/50 Program, 1150 participatingcompanies reduced emissions of 17 chemicals that are very toxic or emitted in especiallylarge amounts, first by at least 33% and later by at least 50%. In the Green Lights Program,both the EPA and the US Department of Energy, work with businesses and institutions toreduce the energy used in lighting. There are also programs to reduce energy use by otherappliances and, in industry, to reduce energy use by industrial motors. But, remember thatit’s not only industry that can benefit from P2 – so can government agencies, municipalities,institutions, and individuals; see Table 2.6. ▪ At its most effective, P2 is part of a broader
Table 2.4 Industrial Use of P2
Previous action and result Change that lessened pollution
Using trichloroethane (ozone-depleting andtoxic organic solvent) to clean metal. Whendirty, it is a hazardous waste. a
Replaced trichloroethane with a water-basedsolvent, which works just as well.
Painting steel joists by dipping them into openvats of paint; large amounts of fumes arereleased.
Layered paint vats with ping-pong balls. Thesecut emissions while not interfering withdipping the joists.
Using inefficient motors, which waste energy. As each old motor broke down, purchased amore energy-efficient motor.
Packaging detergent in a box too large for itscontents. The packaging is thrown away.
Used a smaller box. Redesigned packaging touse less material. Recycled packaging.
Manufacturing plastic beverage bottles. Redesigned bottle to use less plastic, butremained equally strong.
A coal-burning electric power plant captures thesulfur dioxide that forms as coal is burned.
Switch to a source of coal with lower-sulfurcontent.
a Substitutes in metal cleaning.USEPA, January 2, 2009, http://www.epa.gov/ozone/snap/solvents/lists/metals.html.
Table 2.5 P2 in the motor vehicle industry
A manufacturer designs avehicle that: The result is:
Has reduced tailpipe emissions Less air pollution is producedHas better fuel mileage or is oflighter weight but is still safe
Less air pollution is producedGasoline is conserved
Uses less-toxic chemicals inmanufacturing the vehicle
Worker exposure to chemicals is reduced. Hazardous wastegeneration is reduced.
Can be disassembled at the end ofits life
Some component parts can be reused. Others are recycled.Materials are conserved. Less pollution is produced
Notice that these examples could also be used to illustrate Design for the Environment.
47 The waste management hierarchy (WMH)
concept –Design for the Environment (DfE). In DfE, from the moment that a new product isconceived, designers work to make its environmental impact as low as possible. DfE aimsfor a product with a longer life, fewer environmentally harmful effects, and a product thatcan be easily disassembled at the end of its life for reuse or recycling. We will see examplesof DfE in later chapters.
Other forms of P2
▪Another term with similar meaning to P2 is source reduction, using less of a raw materialwhen making a product. This can involve a change in the design, manufacture, purchase,or use of a material or product (including packaging). ▪ Reuse of a product or material isalso source reduction (as is conservation). So is using less energy. ▪ Reducing workerexposure to toxic chemicals during product manufacture has another term, toxics usereduction, also a form of P2.
Recycling and reuse17
Most people are familiar with recycling common materials such as paper, glass, andaluminum cans. ▪ Aluminum recycling offers dramatic advantages. Recycling saves 95%of energy as compared to mining aluminum from scratch and then making new containers; italso reduces air and water pollution by 95%. Recycling also conserves aluminum resources(source reduction). ▪ Recycling other metals offers savings in energy, resources, andpollution although less dramatically than for aluminum. ▪ Reusing a product is often closelyrelated to P2 – fewer resources are needed and less pollution is produced. As an illustration,
Table 2.6 Individual examples of using P2
How is each of the following an example of P2? You:
Purchase a car with better fuel economy than your former car had. Maintain the car so that its fueleconomy remains high
Avoid buying disposable batteries for trivial purposesBuy energy-efficient appliances, electronics, and light bulbs and turn them off when not in useTurn down the thermostat at nightPractice water conservation in your home and yardPurchase durable consumer goodsRepair appliances and electronics rather than buying new onesBuy products with as little packaging as possibleDrink tap water or beverages prepared at homeEat less meat: this means less land, energy, water, pesticides, and fertilizers are used because grainis eaten directly rather than fed to livestock
17 Reduce, reuse, and recycle. US EPA, February 18, 2009, http://www.epa.gov/epawaste/conserve/rrr/index.htm.
48 Reducing risk, reducing pollution
about one-third less energy is needed to clean and refill glass bottles than to recycle them.However, glass is heavy and the energy saved would be lost if the bottles were transported toa distant market so local bottling plants would need to be used – local bottlers were oncetypical, not unusual. See Table 2.7 for industrial recycling and reuse examples, and Table 2.8for examples of individual efforts.
Recycling can be problematic. ▪ Recycling produces waste, sometimes a great deal.Consider paper. Coatings and fillers amount to as much as 50% of the paper’s weight, andmust be recovered during the recycling process. Then, because they have no practical use,they are disposed of in a landfill. ▪ And, although metal and glass can be recycled indef-initely, paper or plastic can be recycled only a few times before losing quality. ▪ For someproducts, if recycling is not done responsibly major problems can result as you will see inChapter 12’s discussion of computers and other electronics taken to less-developed coun-tries for “recycling.”
Table 2.7 Examples of industrial recycling and reuse
Reuse
Awelding plant returns empty wire spools to the supplier, who reuses themParts from auto engines are refurbished and reused (this is remanufacturing)Recycle and reuseAn oil refinery refines motor vehicle oil for reuseA paint manufacturer reprocesses waste household paint for reuseA factory cleans a metal with a solvent, reusing the solvent several times. When it becomes dirty, itpurifies and reuses it – it doesn’t becomes waste
A factory recovers and reuses water used in manufacturing its productRecycleA paper manufacturer uses post-consumer paper – paper already once used by consumers – to makemore paper.
A manufacturer produces products from used glass, metal, or plastic (such as bottles, cans, packaging)A manufacturer stamps each plastic piece used as to what kind of plastic it is (so plastics can beseparated after use for recycling into products)
Table 2.8 Individual recycling and reuse
You:
Thoughtfully recycle every household item that you canRecycle aluminum cans, and also clean foil and other Al items for subsequent recyclingFind an organization to use your leftover paints rather than disposing of themTake used oil and antifreeze to a service or recycling stationCompost grass clippings and leaves rather than placing them in the trashReuse paper and plastic bags many times over, or, buy fabric bags
49 The waste management hierarchy (WMH)
Treatment
When a material cannot be recycled or reused, the third step on the waste managementhierarchy is treatment. There are two important reasons to treat a pollutant or solid waste –to reduce its volume or to reduce its toxicity (or other hazard). ▪ The major reason municipalsolid waste (MSW) is burned – considered a treatment – is to reduce its volume. ▪ The majorreason hazardous waste is treated is to reduce its toxicity. Other than incineration, there aremany ways to treat hazardous waste. Table 12.1 provides examples. Treatment of hazardouswaste is required before it can be disposed of.
Disposal
Disposal is at the bottom of the waste management hierarchy, but responsible disposal is ofmajor importance. A municipality must dispose of its MSW and sewage sludge in wayscarefully defined by law in developed societies. Both industry and municipalities sometimesproduce huge amounts of waste, which makes responsible disposal especially important.Landfills are carefully regulated. ▪ But, as we will see in Chapter 11, responsible disposal isoften a challenging task. Laws do not ordinarily tell individual citizens how they mustdispose of their waste. However, public policy sometimes makes it costly to citizens if theydo not remove recyclables first before disposing of the rest as waste. Information can beobtained from a town recycling office or library to aid disposing of household hazardouswastes like paint or oil. In the future, if society moves toward industrial ecology (definedbelow) at least some wastes may become resources.
Questions 2.1
1. Do the hazardous chemicals transiting your community pose a risk? How?
2. Companies are only required to report their TRI emissions, not to reduce them. Citizens do
pressure them to reduce emissions. Other than using laws and regulations to require
reductions, what are other possible actions that government could take?
3. (a) One company replaced the organic solvent, trichloroethane with a water-based solvent.
How is this P2? (b) Consider another company that used trichloroethane to cleanmetals, but
used it only one time and then discarded it. The company discovered that it could reuse
trichloroethane several times before it becomes too dirty to perform effectively. Could this
reuse also be considered P2? Explain.
4. Why is reuse ordinarily environmentally preferable to recycling?
5. A packaging manufacturer develops more compact packaging for its client’s product,
packaging that is also lighter in weight. What are three ways that this represents P2?
6. (a) Unilever Corporationmakes the detergent, All. It developed a 32-ounce bottle of All that
washes as many loads as 100 ounces did before.18 How is this source reduction (or P2)?
(b) How is it P2 to use a detergent that works just as well in cold water as in hot?
18 McCoy, M. Going green, the cleaning products industry embraces sustainability. Chemical & EngineeringNews, 85(5), January 23, 2007, 13–19.
50 Reducing risk, reducing pollution
SECTION III
Pollution prevention is not enough21
Industrial symbiosis22
Pollution prevention is tremendously attractive, but we cannot avoid all waste and pollution.Moreover, P2 alone cannot accomplish other critical environmental aims such as preservingspecies biodiversity or saving land. What if we could legitimately redefine the word“waste”? Kalundborg, a city in Denmark, is a model of treating wastes as useful by-products in a process called industrial symbiosis: by-products, whether material, energy,or water are sold or given to nearby facilities, which use or reuse them (Figure 2.2).
* Asnaes is Kalundborg’s coal-burning electric power plant. Asnaes uses the high-temperature steam obtained from burning coal to generate electricity. Lower temperature
7. In addition to examples in Table 2.6, what are two P2 steps that you as a vehicle owner
could take?
8. After thinking about it: what are two steps that you could easily take at home?19
9. There are many more examples of individual recycling than seen in Table 2.8 – what are
two of these?
10. A researcher finds a simple inexpensive means to remove arsenic from drinking water.
What step in the WMH does this represent? Explain.
11. Energy is a resource too: which step in the WMH is being used in the cases below? Explain.
If unsure of what a case refers to, go to the Internet for an explanation. (a) Heat is
recovered from sewage effluent.20 (b) Heat is recovered from a power plant’s air
emissions. (c) Methane is collected from a landfill for use as a fuel. (d) Regenerative
braking is used in a hybrid car. (e) Incandescent light bulbs are replaced with compact
fluorescent bulbs.
12. Emissions from livestock are a major source, 18%, of global greenhouse gases. That’s
more than the transportation sector generates. (Greenhouse gases are those that con-
tribute to global warming.) What are two ways to reduce greenhouse gases coming from
livestock?
19 Pollution prevention at home.US EPA, January 14, 2009, http://www.epa.gov/p2/ [info for greening at a numberof places].
20 Doyle, A. Oslo’s sewage heats its homes. Reuters, April 10, 2006, http://www.planetark.com/dailynewsstory.cfm/newsid/35952/story.htm.
21 Greening industry, new ideas in pollution regulation. The World Bank, 2009, http://go.worldbank.org/TFGRCF3JJ0.
22 Gertler, N. and Ehrenfeld, J. R. A down-to-earth approach to clean production. Technology Review, Feb/Mar,1996, 50–54.
51 Pollution prevention is not enough
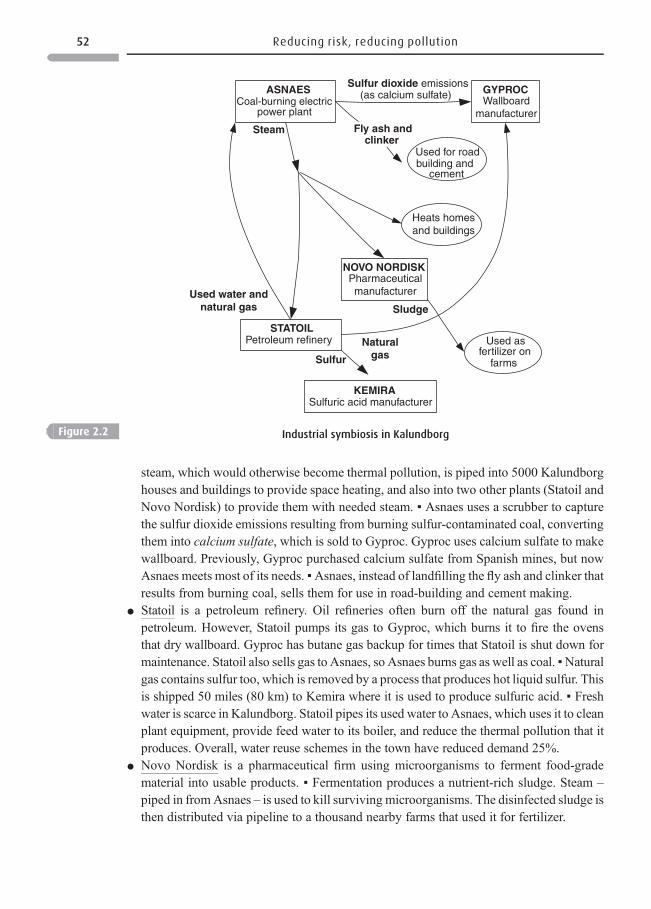
steam, which would otherwise become thermal pollution, is piped into 5000 Kalundborghouses and buildings to provide space heating, and also into two other plants (Statoil andNovo Nordisk) to provide them with needed steam. ▪ Asnaes uses a scrubber to capturethe sulfur dioxide emissions resulting from burning sulfur-contaminated coal, convertingthem into calcium sulfate, which is sold to Gyproc. Gyproc uses calcium sulfate to makewallboard. Previously, Gyproc purchased calcium sulfate from Spanish mines, but nowAsnaes meets most of its needs. ▪Asnaes, instead of landfilling the fly ash and clinker thatresults from burning coal, sells them for use in road-building and cement making.
* Statoil is a petroleum refinery. Oil refineries often burn off the natural gas found inpetroleum. However, Statoil pumps its gas to Gyproc, which burns it to fire the ovensthat dry wallboard. Gyproc has butane gas backup for times that Statoil is shut down formaintenance. Statoil also sells gas to Asnaes, so Asnaes burns gas as well as coal. ▪Naturalgas contains sulfur too, which is removed by a process that produces hot liquid sulfur. Thisis shipped 50 miles (80 km) to Kemira where it is used to produce sulfuric acid. ▪ Freshwater is scarce in Kalundborg. Statoil pipes its used water to Asnaes, which uses it to cleanplant equipment, provide feed water to its boiler, and reduce the thermal pollution that itproduces. Overall, water reuse schemes in the town have reduced demand 25%.
* Novo Nordisk is a pharmaceutical firm using microorganisms to ferment food-gradematerial into usable products. ▪ Fermentation produces a nutrient-rich sludge. Steam –
piped in fromAsnaes – is used to kill surviving microorganisms. The disinfected sludge isthen distributed via pipeline to a thousand nearby farms that used it for fertilizer.
STATOILPetroleum refinery
ASNAESCoal-burning electric
power plant
NOVO NORDISKPharmaceuticalmanufacturer
GYPROCWallboard
manufacturer
Sulfur dioxide emissions(as calcium sulfate)
Fly ash andclinker
Steam
KEMIRASulfuric acid manufacturer
Used for roadbuilding and
cement
Heats homesand buildings
Used asfertilizer on
farms
Naturalgas
Used water andnatural gas
Sulfur
Sludge
Figure 2.2 Industrial symbiosis in Kalundborg
52 Reducing risk, reducing pollution
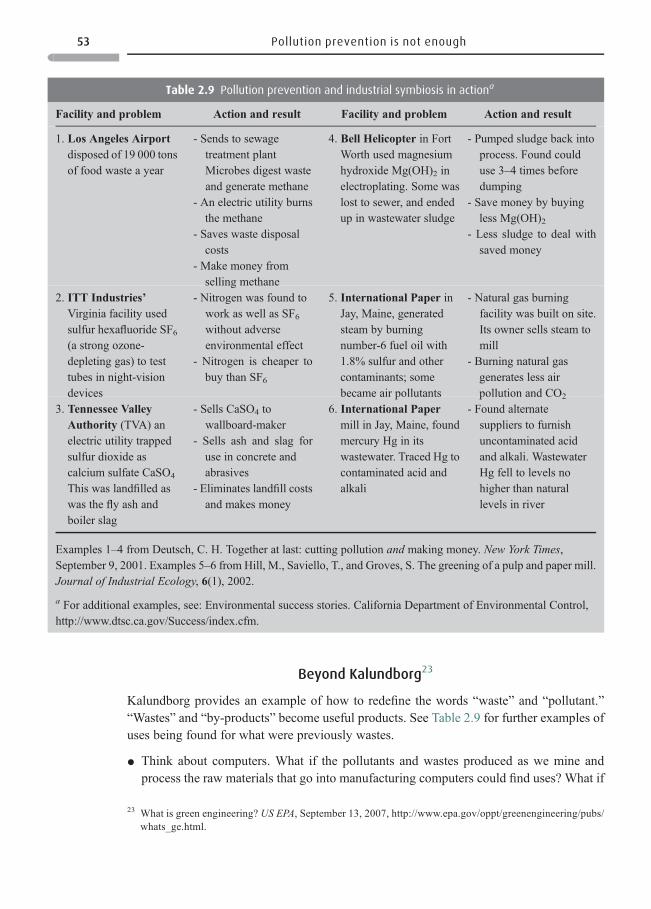
Beyond Kalundborg23
Kalundborg provides an example of how to redefine the words “waste” and “pollutant.”“Wastes” and “by-products” become useful products. See Table 2.9 for further examples ofuses being found for what were previously wastes.
* Think about computers. What if the pollutants and wastes produced as we mine andprocess the raw materials that go into manufacturing computers could find uses? What if
Table 2.9 Pollution prevention and industrial symbiosis in actiona
Facility and problem Action and result Facility and problem Action and result
1. Los Angeles Airportdisposed of 19 000 tonsof food waste a year
- Sends to sewagetreatment plantMicrobes digest wasteand generate methane
- An electric utility burnsthe methane
- Saves waste disposalcosts
- Make money fromselling methane
4. Bell Helicopter in FortWorth used magnesiumhydroxide Mg(OH)2 inelectroplating. Some waslost to sewer, and endedup in wastewater sludge
- Pumped sludge back intoprocess. Found coulduse 3–4 times beforedumping
- Save money by buyingless Mg(OH)2
- Less sludge to deal withsaved money
2. ITT Industries’Virginia facility usedsulfur hexafluoride SF6(a strong ozone-depleting gas) to testtubes in night-visiondevices
- Nitrogen was found towork as well as SF6without adverseenvironmental effect
- Nitrogen is cheaper tobuy than SF6
5. International Paper inJay, Maine, generatedsteam by burningnumber-6 fuel oil with1.8% sulfur and othercontaminants; somebecame air pollutants
- Natural gas burningfacility was built on site.Its owner sells steam tomill
- Burning natural gasgenerates less airpollution and CO2
3. Tennessee ValleyAuthority (TVA) anelectric utility trappedsulfur dioxide ascalcium sulfate CaSO4
This was landfilled aswas the fly ash andboiler slag
- Sells CaSO4 towallboard-maker
- Sells ash and slag foruse in concrete andabrasives
- Eliminates landfill costsand makes money
6. International Papermill in Jay, Maine, foundmercury Hg in itswastewater. Traced Hg tocontaminated acid andalkali
- Found alternatesuppliers to furnishuncontaminated acidand alkali. WastewaterHg fell to levels nohigher than naturallevels in river
Examples 1–4 from Deutsch, C. H. Together at last: cutting pollution and making money. New York Times,September 9, 2001. Examples 5–6 from Hill, M., Saviello, T., and Groves, S. The greening of a pulp and paper mill.Journal of Industrial Ecology, 6(1), 2002.
a For additional examples, see: Environmental success stories. California Department of Environmental Control,http://www.dtsc.ca.gov/Success/index.cfm.
23 What is green engineering? US EPA, September 13, 2007, http://www.epa.gov/oppt/greenengineering/pubs/whats_ge.html.
53 Pollution prevention is not enough
the wastes and pollutants generated during computer manufacture could be used? Andconsider end-of-life computers and other electronics. In Chapter 12, you will see thehavoc when they are improperly recycled. What if at the end of their useful lives,electronics could be efficiently disassembled and all components used again?
* Think more ambitiously. What if we could meld most human-made products, wastes, andpollutants into the natural ecosystem – without harming it? For this exercise to be morethan a fantasy we must make DfE a reality: develop systems in which all inorganic wastesand pollutants go back into industrial processes or, at worst, are separated for safekeep-ing; and in which all biological wastes (including sewage) become “food” for processesthat produce useful products (or else be assimilated into ecosystems when this can bedone without overloading them). In such a world human-made systems could blend intonature, not deplete nature’s ability to provide services. Chapters 11 and 18 furtherexamines these possibilities.
Questions 2.2
1. Why is it important that facilities involved in industrial symbiosis be near one another?
2. What is a case in Table 2.9 that goes beyond P2? Explain.
3. Review Figure 2.2. Then consider industrial, municipal, or other facilities in your locale.
(a) What is one possibility that exists for industrial symbiosis? (b) What factors – physical
location, financial, liability, public policy – could favor such symbiosis? (c) How could waste
materials produced or collected by municipal operations (recyclables, sewage) fit into the
symbiosis? (d) How about local agricultural wastes?
4. Many people believe that Western lifestyles are unsustainable, that per capita resource use
is too high by as much as 10-fold. What is an instance where a technology evolved in a way
that reduced its material input by at least 10-fold?
5. What are four products in your own life that you could reduce your consumption of two-fold
without affecting your life style?
6. (a) What are five wastes that you throw away on a typical day in your home? (b) At work?
(c) On trips (including travel, lodging, meals, etc.)?
7. (a) What are five wastes you generate indirectlywhen you purchase products from grocery
stores, gasoline stations, auto maintenance shops, dry cleaners, doctors’ and dentists’
offices, restaurants, and retail stores? (b) What responsibility do you bear for these?
Delving deeper
1. After learning the characteristics of hazardous chemicals, contact (if possible visit) your
local fire department. Ask to see a list of what hazardous chemicals are used in your
community. Local facilities having hazardous chemicals will have submitted MSDSs
(Material Safety Data Sheets) for them. Do you recognize the names of any of these
chemicals? Are there any that surprise you? Concern you? If you are surprised, you may
want to contact the facility using the chemical and ask what they use it for.
54 Reducing risk, reducing pollution
Further reading
Gertler, N. and Ehrenfeld, J. R. A down-to-earth approach to clean production. TechnologyReview, February/March, 1996, 50–54.
Hook, G. E. R. and Lucier, G.W. The right to know is for everyone. Environmental HealthPerspectives, 108(4), April 2000, A160, http://www.ehponline.org/docs/2000/108 – 4/editorial.html.
2. Recall that TRI information does not tell us the actual risk of a chemical. Nor does it tell us if
the risk is high compared to other chemical risks in our environment. What public policy
could you envision that would provide disclosures that would give you a greater under-
standing of chemical risk than provided by TRI?
3. There is major action nowadays to generate biofuels – fuels derived from corn, sugar cane,
soybeans, switchgrass, and other crops – to replace petroleum fuels. (a) CO2 is the major
greenhouse gas contributing to global climate change. Grown sustainably, biofuel crops
would not increase the amount of CO2 in the atmosphere. Why? (b) Life-cycle assessment
(LCA) is a process that examines all the environmental impacts that products (from
computers to corn) can have: the impact of obtaining the necessary raw materials needed,
and its manufacture, use, and end of life impacts (whether recycling or disposal). Diagram
the factors you’d have to consider when analyzing the impacts of a biofuel. Include social
impacts in your consideration. (c) What factors could contribute to preventing biological
sources from being grown sustainably?
4. Think about a clothing detergent. (a) Diagram the impacts of a detergent over the four
phases of its lifetime. (Your current state of knowledge will be adequate.) (b) What are four
ways that the impact of using detergent could be minimized?
5. Green chemistry works to find safer chemical for industrial processes and for everyday
products such as those used in cleaning (see Figure 2.3). Go to http://www.cleanproduc-
tion.org/Greenscreen.php and choose a subject of interest to you such as Extended
Producer Responsibility. Develop a brief report on the subject you have chosen, note why
it is important and how it is used.
SCRE EN
GFO
RS
AFER CH EM
I CA
LS
REEN
Figure 2.3 Green Screen for Safer Chemicals. Credit: US EPA
55 Further reading
McCoy, M. Going Green, the cleaning products industry embraces sustainability.Chemical &Engineering News, 85(5), January 23, 2007, 13–19.
Service, R. F. A newwave of chemical regulations just ahead? Science, 325, August 7, 2009,692–693.
Tremblay, J. F. China’s environmental conscience. Chemical & Engineering News, 85(40),October 1, 2007, 26.
Tremblay, J. F. Talks with Ma Jun, tireless environmental activist. Chemical & EngineeringNews, 85(40), October 1, 2007, 26.
Internet resources
Pollution locator, toxic chemical releases in the US. 2005. Environmental Defense. http://www.scorecard.org/env-releases/us-map.tcl (2005).
European Environment Agency. What is EPER, the European pollutant emission register?http://eper.eea.europa.eu/eper/introduction.asp?i=2003.
US EPA. 2006. Toxic Release Inventory report. http://www.epa.gov/tri/tridata/tri06/brochure/brochure.htm (November 5, 2006).
2007. What is green engineering. See figure: “Proliferation of environmental lawsand regulations.” http://www.epa.gov/oppt/greenengineering/pubs/whats_ge.html(September 13, 2007).
2008. Pollution Prevention, basic information. http://www.epa.gov/p2/pubs/basic.htm(January 10, 2008).
2009. Pollution prevention at home. http://www.epa.gov/p2/ (January 14, 2009).2009. Reduce, reuse, and recycle. http://www.epa.gov/epawaste/conserve/rrr/index.htm(February 18, 2009).
2009. Browse TRI (Toxic Release Inventory) topics. http://www.epa.gov/tri/topics/topics.htm (May 15, 2009).
World Bank. 2009. Greening industry, new ideas in pollution regulation. http://go.world-bank.org/TFGRCF3JJ0 (October, 2009).
56 Reducing risk, reducing pollution
3 Chemical toxicity
For a better understanding of whether a pollutant may be harmful to living creatures, weneed to understand some basic principles of toxicology. Section I introduces “the dosemakes the poison,” acute and chronic toxicity, systemic and local effects, and how the bodystores chemicals. We follow a chemical through the body via absorption, distribution,metabolism, and excretion. Section II examines factors affecting toxicity including gender,age, and poor nutrition and looks at how organs such as the liver, kidneys, and skin areaffected by toxicants. Section III considers some of the greatest worries that people haveregarding toxic substances – impacts on children and the fetus, and the ability of somechemicals to cause cancer. Environmental hormones, pollutants that mimic natural hor-mones, are also considered. The chapter also addresses topics such as bisphenol A,pesticides, and pollution’s toll on health in China.
SECTION I
All substances are toxic1
Paracelsus, a controversial sixteenth-century physician, was faulted for treating his patientswith arsenic and mercury, substances known to be toxic. Paracelsus responded with astatement still repeated 500 years later. “All substances are poisons. There is none, whichis not a poison. The right dose differentiates a poison and a remedy.” That is to say, a “non-toxic” substance can be toxic at a high enough dose, and a very toxic substance can be safe ifthe dose is low enough. “The dose makes the poison” is a convenient rule (Figure 3.1).However, as we will see, there are exceptions to this rule. In any case, many factors affecttoxicity in addition to dose.
Terminology
Table 3.1 provides some definitions of words used for toxic substances. Sometimes the term“toxic chemical” is used almost as one word, but toxicity is not that straightforward
1 Newman, C., Pick your poison:12 toxic tales. National Geographic, 207(5), May, 2005, 2–31.
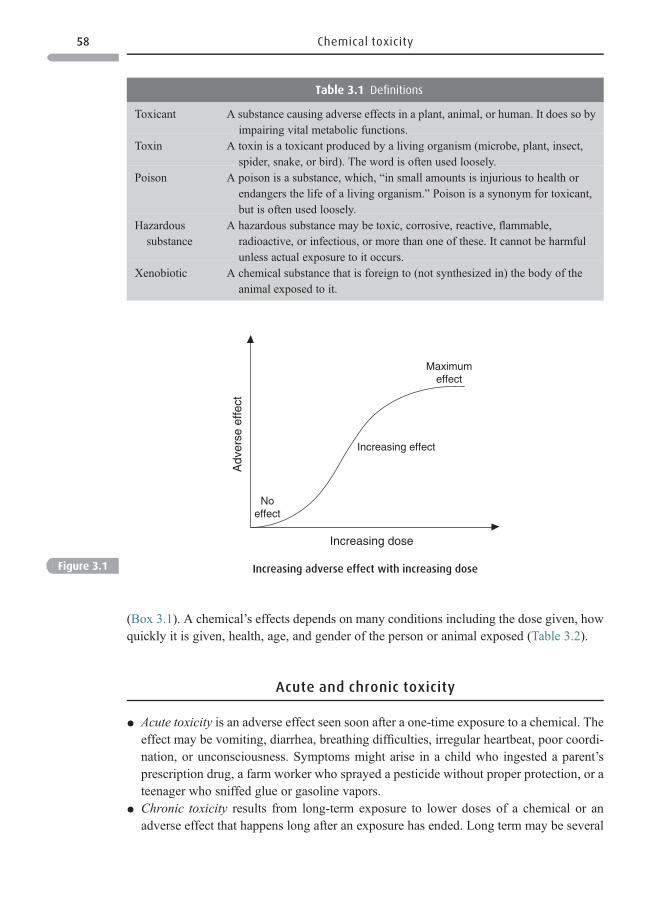
(Box 3.1). A chemical’s effects depends on many conditions including the dose given, howquickly it is given, health, age, and gender of the person or animal exposed (Table 3.2).
Acute and chronic toxicity
* Acute toxicity is an adverse effect seen soon after a one-time exposure to a chemical. Theeffect may be vomiting, diarrhea, breathing difficulties, irregular heartbeat, poor coordi-nation, or unconsciousness. Symptoms might arise in a child who ingested a parent’sprescription drug, a farm worker who sprayed a pesticide without proper protection, or ateenager who sniffed glue or gasoline vapors.
* Chronic toxicity results from long-term exposure to lower doses of a chemical or anadverse effect that happens long after an exposure has ended. Long term may be several
Increasing dose
Adv
erse
effe
ct
Noeffect
Increasing effect
Maximumeffect
Figure 3.1 Increasing adverse effect with increasing dose
Table 3.1 Definitions
Toxicant A substance causing adverse effects in a plant, animal, or human. It does so byimpairing vital metabolic functions.
Toxin A toxin is a toxicant produced by a living organism (microbe, plant, insect,spider, snake, or bird). The word is often used loosely.
Poison A poison is a substance, which, “in small amounts is injurious to health orendangers the life of a living organism.” Poison is a synonym for toxicant,but is often used loosely.
Hazardoussubstance
A hazardous substance may be toxic, corrosive, reactive, flammable,radioactive, or infectious, or more than one of these. It cannot be harmfulunless actual exposure to it occurs.
Xenobiotic A chemical substance that is foreign to (not synthesized in) the body of theanimal exposed to it.
58 Chemical toxicity
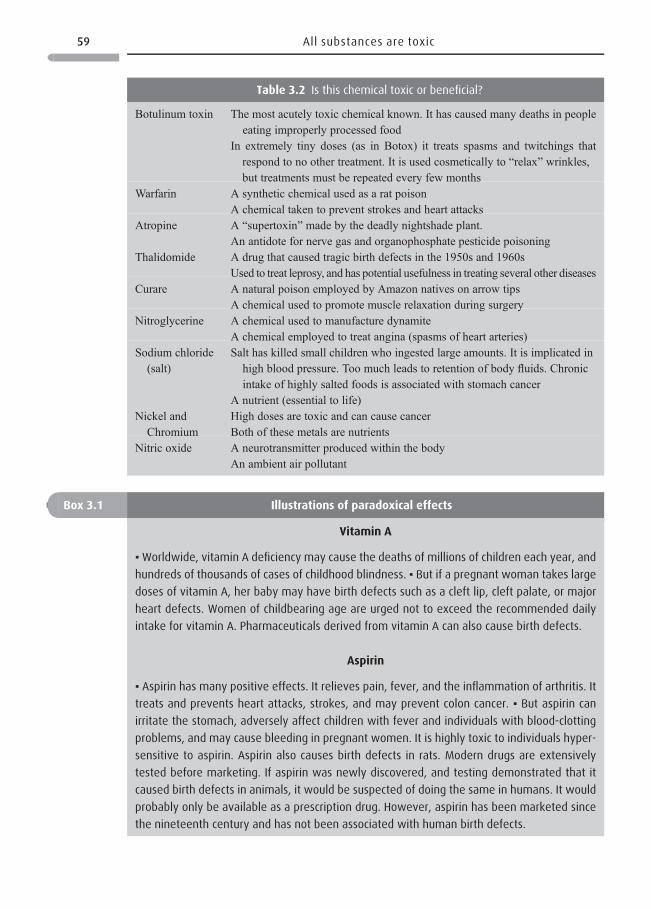
Box 3.1 Illustrations of paradoxical effects
Vitamin A
▪Worldwide, vitamin A deficiency may cause the deaths of millions of children each year, and
hundreds of thousands of cases of childhood blindness. ▪ But if a pregnant woman takes large
doses of vitamin A, her baby may have birth defects such as a cleft lip, cleft palate, or major
heart defects. Women of childbearing age are urged not to exceed the recommended daily
intake for vitamin A. Pharmaceuticals derived from vitamin A can also cause birth defects.
Aspirin
▪ Aspirin has many positive effects. It relieves pain, fever, and the inflammation of arthritis. It
treats and prevents heart attacks, strokes, and may prevent colon cancer. ▪ But aspirin can
irritate the stomach, adversely affect children with fever and individuals with blood-clotting
problems, and may cause bleeding in pregnant women. It is highly toxic to individuals hyper-
sensitive to aspirin. Aspirin also causes birth defects in rats. Modern drugs are extensively
tested before marketing. If aspirin was newly discovered, and testing demonstrated that it
caused birth defects in animals, it would be suspected of doing the same in humans. It would
probably only be available as a prescription drug. However, aspirin has been marketed since
the nineteenth century and has not been associated with human birth defects.
Table 3.2 Is this chemical toxic or beneficial?
Botulinum toxin The most acutely toxic chemical known. It has caused many deaths in peopleeating improperly processed food
In extremely tiny doses (as in Botox) it treats spasms and twitchings thatrespond to no other treatment. It is used cosmetically to “relax” wrinkles,but treatments must be repeated every few months
Warfarin A synthetic chemical used as a rat poisonA chemical taken to prevent strokes and heart attacks
Atropine A “supertoxin” made by the deadly nightshade plant.An antidote for nerve gas and organophosphate pesticide poisoning
Thalidomide A drug that caused tragic birth defects in the 1950s and 1960sUsed to treat leprosy, and has potential usefulness in treating several other diseases
Curare A natural poison employed by Amazon natives on arrow tipsA chemical used to promote muscle relaxation during surgery
Nitroglycerine A chemical used to manufacture dynamiteA chemical employed to treat angina (spasms of heart arteries)
Sodium chloride(salt)
Salt has killed small children who ingested large amounts. It is implicated inhigh blood pressure. Too much leads to retention of body fluids. Chronicintake of highly salted foods is associated with stomach cancer
A nutrient (essential to life)Nickel andChromium
High doses are toxic and can cause cancerBoth of these metals are nutrients
Nitric oxide A neurotransmitter produced within the bodyAn ambient air pollutant
59 All substances are toxic
weeks or 30 to 40 years. Examples are liver cirrhosis resulting from chronic alcoholingestion, or a damaged nervous system resulting from chronic mercury exposure. ▪ Awell-known chronic effect is cancer. Leukemia, a cancer of white blood cells, may resultfrom long-term exposure to benzene. Lung cancer may result from chronic exposure tocigarette smoke. The typical latency period for cancer (the time of initial exposure to thetime that cancer is diagnosed) is 15 to 25 years.
* A given substance may not cause acute effects, but may show chronic toxicity: if youbreak a mercury thermometer, your onetime exposure to elemental mercury vapor isunlikely to hurt you, but chronic exposure to mercury vapor in a work place can seriouslyaffect the nervous system. ▪ Conversely, an acutely-toxic substance may not have chroniceffects. The foul-smelling gas, hydrogen sulfide, is acutely toxic. However, long-termexposure to levels of hydrogen sulfide found naturally in “sulfur waters” is not known tohave adverse chronic effects.
Dose
* Anything is toxic at a high enough dose. Figure 3.1 shows a dose–response curve, i.e., asthe dose increases, the adverse impact increases too. Even water, drunk in very largequantities, may kill people by disrupting the osmotic balance in the body’s cells. ▪ As thedose of a toxicant increases there are many possible effects. Examples: an enzyme maysuffer increasing loss of its activity, or nerves become unable to conduct impulses.Table 3.3 illustrates several mechanisms by which substances exert toxic effects.
* LD50 is the dose that is lethal to half of the animals exposed to it. Determining an LD50 iscrude, many consider it cruel, and it provides little information as to how a chemicalexerts its toxic effects. However, people continue to ask how toxic is this chemical?In 2001, an alternative test was announced that uses as few as 6 to 9 rats instead of the
Table 3.3 How do substances exert their toxic effects?
There are many ways that a toxic substance can exert adverse effects. Three examples follow.Carbon monoxide. The blood protein hemoglobin picks up oxygen in the lungs, and transports itto the tissues where it releases the oxygen. When carbon monoxide (CO) is inhaled, it binds tohemoglobin much more strongly than oxygen and so blocks the oxygen binding, lowering theamount of oxygen available to the body. Too much blocking of hemoglobin by CO can lead todeath. Smaller doses can cause headache, nausea, and other flu-like symptoms. Chronicexposure is implicated in the development of heart disease.
Botulinum toxin. This powerful bacterial toxin binds to nerve endings at the points where they joinmuscles, thereby blocking release of the neurotransmitter acetylcholine, which is ordinarilyreleased by nerve fibers. With no stimulus, the muscles are paralyzed. Paralysis of respiratorymuscles leads to death.
A nerve gas or organophosphate pesticide. These agents do not block acetylcholine release.Rather, they prevent acetylcholine from being degraded. The result is that this neurotransmitteraccumulates leading to uncontrolled firing of the nerves.
60 Chemical toxicity
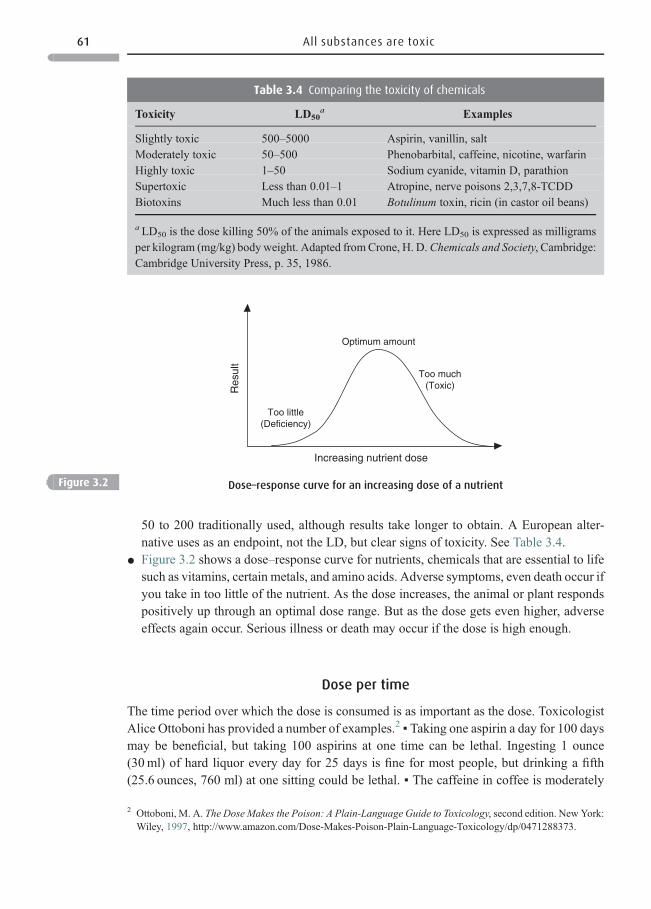
50 to 200 traditionally used, although results take longer to obtain. A European alter-native uses as an endpoint, not the LD, but clear signs of toxicity. See Table 3.4.
* Figure 3.2 shows a dose–response curve for nutrients, chemicals that are essential to lifesuch as vitamins, certain metals, and amino acids. Adverse symptoms, even death occur ifyou take in too little of the nutrient. As the dose increases, the animal or plant respondspositively up through an optimal dose range. But as the dose gets even higher, adverseeffects again occur. Serious illness or death may occur if the dose is high enough.
Dose per time
The time period over which the dose is consumed is as important as the dose. ToxicologistAlice Ottoboni has provided a number of examples.2 ▪ Taking one aspirin a day for 100 daysmay be beneficial, but taking 100 aspirins at one time can be lethal. Ingesting 1 ounce(30ml) of hard liquor every day for 25 days is fine for most people, but drinking a fifth(25.6 ounces, 760 ml) at one sitting could be lethal. ▪ The caffeine in coffee is moderately
Table 3.4 Comparing the toxicity of chemicals
Toxicity LD50a Examples
Slightly toxic 500–5000 Aspirin, vanillin, saltModerately toxic 50–500 Phenobarbital, caffeine, nicotine, warfarinHighly toxic 1–50 Sodium cyanide, vitamin D, parathionSupertoxic Less than 0.01–1 Atropine, nerve poisons 2,3,7,8-TCDDBiotoxins Much less than 0.01 Botulinum toxin, ricin (in castor oil beans)
aLD50 is the dose killing 50% of the animals exposed to it. Here LD50 is expressed as milligramsper kilogram (mg/kg) bodyweight. Adapted fromCrone, H. D.Chemicals and Society, Cambridge:Cambridge University Press, p. 35, 1986.
Optimum amount
Too little(Deficiency)
Too much(Toxic)R
esul
t
Increasing nutrient dose
Figure 3.2 Dose–response curve for an increasing dose of a nutrient
2 Ottoboni, M. A. The Dose Makes the Poison: A Plain-Language Guide to Toxicology, second edition. New York:Wiley, 1997, http://www.amazon.com/Dose-Makes-Poison-Plain-Language-Toxicology/dp/0471288373.
61 All substances are toxic
toxic, but to be lethal, the dose of caffeine in a cup of strong coffee would need to be 100 timeshigher than it is. ▪ Anyone who has chewed a piece of raw rhubarb knows the effect of oxalicacid (also found in spinach) on themouth. However, youwould need to eat 20 pounds (9.1 kg)of spinach or rhubarb at one sitting to ingest a lethal dose of oxalic acid. ▪ Potatoes make theinsecticide, solanine. But to ingest a lethal dose of solanine would require eating 100 pounds(45.5 kg) of potatoes at one sitting. However, certain potato varieties – not on the market –make enough solanine to be toxic to human beings. Potato skin is a nutritious part of thepotato, but pare away any green skin as green indicates exposure to sunlight and a higheramount of solanine. Bruised potatoes and potato sprouts also contain higher solanine levels.▪ Generally, potentially toxic substances are found in anything that we eat or drink.
Does the dose always make the poison?
“The dose makes the poison” is a useful concept, but consider environmental hormones.3
Hormones are natural chemicals produced in the thyroid, ovaries or testes, pituitary, andother glands. Carried in the bloodstream to target tissues, each hormone exerts specificeffects. At natural levels, hormones exert actions vital to an animal’s well being. Estrogenproduced in the ovaries is transported to specific target tissues where it stimulates andmaintains changes that make an animal female. The estrogen exerts its effects by reactingwith specific receptor molecules within target tissues. It is this hormone–receptor complexthat elicits a response.Only a tiny dose of a hormone is needed to turn on the receptor. Up toa point the response does increase with dose. However, if the dose continues to increase, afeedback comes into play, which can turn off the effect. So what will happen if an environ-mental hormone (pollutant) mimics a hormone? Fortunately, pollutants ordinarily show veryweak hormonal effects as compared with the real hormone. Nonetheless, wildlife is oftendirectly exposed to such pollutants and sometimes serious effects are seen. Could humandevelopment also be affected? This question will be discussed later in this chapter.
Exposure to multiple chemicals
Persons, animals, and plants are exposed to more than one chemical at a time, in fact, oftenmany chemicals. What is the result of multiple exposures?
* The most common effect is additive. This commonly happens when the chemicals inquestion exert their effects in a similar manner, as when a person is exposed to severalorganophosphate pesticides at a time: each inhibits the activity of a specific enzyme. Thechemicals do not interact.
* In synergism the combined effect of two chemicals are greater, sometimes much greaterthan additive, i.e., one plus one equals much more than two ▪ Carbon tetrachloride andethyl alcohol are both toxic to the liver, but exposure to both at the same time leads to
3 Several terms are used to describe pollutants that have hormonal activity: environmental hormone, hormone mimic,and endocrine disrupter. It can be confusing.
62 Chemical toxicity
much greater injury than the sum of their individual effects. ▪ Smokers, exposed toasbestos, have a magnified risk of lung cancer as compared to exposed non-smokers.
* In antagonism one chemical interferes with the action of another – it acts as an antidote. ▪Consider a child who has ingested a household product or a person who ingested poisonin a suicide attempt. Emergency-room personnel may administer ipecac to inducevomiting, ridding the system of the poison, although some of the substance likely hasalready crossed the intestinal wall into the bloodstream. Or charcoal may be given toabsorb the poison, so that it is not bioavailable. ▪ A person poisoned by methanol can betreated with ethanol to lessen the effect of the methanol. ▪ Two chemicals may react withone another to produce a less toxic product such as happens when a person poisoned witha metal is treated with dimercaprol (BAL); BAL binds to the metal ion preventing it fromexerting its toxic effect.
Systemic and local effects
When speaking of toxic effects, typically systemic effects are being referred to – effectsoccurring at a point distant from where a chemical enters the body. For example, cyanide,arsenic, and other toxicants exert their poisonous effects after being absorbed into the body.▪However, we need to be aware of local effects too – effects occurring at the point of contactwith skin, eyes, lungs, or gastrointestinal (GI) tract. Aweak acid for instance is an irritant atthe point of contact; it shows a local effect. A reactive gas such as formaldehyde also showslocal effects such as irritating the eyes. ▪ But, absorbed into the body formaldehyde can havesystemic effects too. Or, the metal nickel irritates the skin, but absorbed into the body canexert systemic effects. Some plants exert local effects at the point of contact too; considerpoison ivy.
Box 3.2 One chemical at a time
Almost all of our knowledge of xenobiotics (foreign chemicals) comes from testing chemical
toxicity one chemical at a time. This presents a problem because living creatures are exposed
to mixtures of chemicals. However, we cannot routinely study chemical mixtures, nor dissect
out what each chemical in themixture is doing. ▪ Onemethod to look at the toxicity of mixtures
is to examine whole effluent toxicity,4 the toxicity of an effluent flowing from a facility into
a river. The need is to see if that effluent impacts the organisms living in the water body: is the
effluent, whatever its chemical composition harmful to the life forms that it contacts?
▪ However, we still typically need to understand the impacts of individual chemicals.
Consider air pollution: we need to know the impact of ozone and other air pollutants individ-
ually. We learn a lot “one chemical at a time.” But remember the limitation of this approach.
4 Whole effluent toxicity. US EPA, July 25, 2008, http://www.epa.gov/waterscience/methods/wet/.
63 Systemic and local effects
Absorption, distribution, metabolism, and excretion
The acronym ADME may help you to remember what happens to a chemical. A chemicalnormally enters the body via the lungs, the GI tract, or the skin. After entry, it may beabsorbed (A) into the bloodstream, distributed (D) throughout the body, metabolized5 (M)by the body’s tissues into different chemicals, and finally excreted (E) from the body.
Absorption
Up to this point the word exposure has been used as if you could suffer an adverse effect justby having a chemical in the environment around you. But, to have an adverse effect, youmust have contact with it. For a systemic effect to occur, it must be absorbed into the body.This can happen when you inhale it into the lungs, ingest it into the digestive tract, or absorbit across the skin. ▪ Sometimes a chemical gains entry in non-ordinary ways as when injectedinto a vein or under the skin. Some xenobiotics are toxic only by one route of entry whereasothers are toxic in two or three ways. ▪ Formaldehyde can act as a carcinogen only byinhalation. ▪ Asbestos is also a carcinogen by inhalation. ▪ However, arsenic is toxic by allthree routes: skin absorption, ingestion, and inhalation.
Inhalation
Unless you deliberately inject a chemical into the body, inhalation is the fastest means bywhich a toxicant entering the body can exert an effect. Think about inhaling a gaseousanesthetic such as ethyl ether. Anesthesia results very rapidly after the inhaled gas passesfrom the lung’s alveoli into the bloodstream. Many other substances can also be inhaled –
consider the particulates in smoke, the aerosol droplets from a spray can, or fumes fromheated metal. Because effects often occur so rapidly, exposures occurring in enclosed spacescan be especially dangerous.
Ingestion
Anything taken into the body by drinking or eating is ingested. In the digestive tract, asubstance is digested into molecules, many of which may be absorbed across the wall of thesmall or large intestine into the bloodstream. Most absorption occurs through the smallintestine and, from there a chemical enters a portal blood system that carries it directly to theliver. Because the liver is the first organ a toxicant contacts – before it has been diluted by thebloodstream – the liver receives the highest dose of an ingested toxicant.
5 Metabolism refers to all the biochemical processes that occur within living creatures. It includes anabolism (thesynthesis of substances) and catabolism (the breakdown of substances). The term often refers to the breakdown offood and its transformation into energy.
64 Chemical toxicity
Skin absorption
By stopping or slowing the absorption of most chemicals, the skin protects us from theoutside world. Nonetheless fat-soluble and a few other small chemicals are absorbed acrossthe skin to varying extents, but sometimes efficiently. The pesticide parathion is absorbed asrapidly through the skin as when ingested or inhaled. The chemical, dimethyl sulfoxide(DMSO) enhances absorption of chemicals across the skin, chemicals that skin does nototherwise efficiently absorb. When thinking about skin absorption, remember:
* The larger the area of skin exposed to a chemical, the more that is absorbed.* The longer a chemical remains in contact with skin, the more that is absorbed.* Thin skin such as found on the abdomen or scrotum is more permeable to chemicals than
the thicker skin on the soles of the hands or feet.
Chemicals such as acids, alkalis, or some metals needn’t be absorbed as they can exertlocal effects. However, if the skin is damaged, systemic effects can also occur.
Distribution (D)
After absorption, a chemical is distributed throughout the body by the blood and takenup, to varying extents, by different organs. A specific chemical may show the mostpronounced effects on one or more target organs. To be toxic, a chemical must reach themost sensitive tissue at a high enough dose to exert an adverse effect – this is the dosethat is important. ▪ The nervous system is a major target organ of lead and mercury.However, these metals can affect other organs too as the dose or time of exposureincreases. ▪ The petrochemical, benzene can cause acute effects, narcosis in the brain, atarget organ. It also can cause chronic effects, anemia, or leukemia in a different targettissue, bone marrow. ▪ Oftentimes, substances are stored in the body in ways that interferewith potential toxic effects; when this happens, they don’t ordinarily show toxic effects(Box 3.3).
Metabolism (M)
To rid their bodies of an absorbed xenobiotic, animals and humans often biotransform it –metabolize it into chemicals that they can excrete. The liver and kidney are especially activein this process. Usually, a xenobiotic is converted into a less toxic chemical. ▪Unfortunately,on occasion, the xenobiotic is converted into a more toxic chemical as when the liverconverts the pollutant benzene into benzene oxide, a reactive chemical that damages bonemarrow. ▪ The biotranformation system that evolved to deal with xenobiotics is ancientbecause animals have always had natural poisons in their environment. From this perspec-tive, modern synthetic toxicants may be no worse than the toxins that living creatures havedealt with for millions of years. One major exception is those synthetic chemicals that thebody has difficulty degrading such as PCBs and dioxins.
65 Absorption, distribution, metabolism, and excretion
Box 3.3 More concepts: bioavailability, storage, bioaccumulation, and biomagnifcation
Bioavailability
For a nutrient to be helpful, it must be in a physical and chemical form that the creature can
access, it must be bioavailable. Likewise, to be toxic a xenobiotic must be bioavailable.
* Physical factors Recall the example given above of charcoal administered to a poisoning
victim; the charcoal absorbs the poison making it biologically unavailable. Likewise in the
environment, certain chemicals including dioxins, PCBs, and PAHs bind tightly to soil or
sediment particles. The chemicals may move into, and become trapped within a particle’s
interior. There they are largely inaccessible, i.e., they are not bioavailable. An animal may
ingest these particles, but the chemicals bound to them are not absorbed across the GI tract.
▪ Another physical property is volatility. Elemental mercury (Hg0) is volatile even at room
temperature. If inhaled, about 80% can be absorbed through the lung’s alveoli into the
blood stream. Breathing in the vapor from a broken thermometer is unlikely to cause harm,
but chronic exposure, as in some work sites in less-developed countries, can lead to serious
mercury poisoning. Also, think about a person breaking a mercury thermometer and
ingesting a tiny amount of elemental mercury. Because Hg0 is not soluble, most passes
through the GI tract into the feces. This makes an adverse health impact less likely.
* Chemical factors Think about a different chemical form of mercury, methylmercury
(CH3Hg+). Methylmercury is often ingested as a fish contaminant. It is easily absorbed
across the intestine into the blood stream. It is thus much more dangerous. Chronically
ingested, even tiny amounts can lead to health problems especially in small children.
* Storage A portion of a xenobiotic distributed in the bloodstream around the body may be
stored for short or long periods. As long as a chemical remains bound, it does not exert
adverse effects; it is not bioavailable.6 ▪ Even blood can store chemicals by binding them to
blood proteins. ▪ In an animal that is chronically exposed to mercury (and certain other
metals), a portion becomes bound to a protein, metallothionin in the kidney and is not
bioavailable. ▪ However, when exposure is reduced, or eliminated, the amount stored
begins to decrease too. Release may be slow, but sometimes it is rapid, as demonstrated
in several examples. ▪ Lead Lead is stored in bones and teeth from which it is ordinarily,
released only slowly. However, during pregnancy, a mother’s bones release calcium into
the blood to meet the needs of her fetus. And the stored lead is released too, exposing the
fetus as the lead circulates in the blood. ▪ DDT The bodies of animals, birds, and humans
have great difficulty transforming persistent fat-soluble chemicals, such as DDT into water-
soluble forms. Thus, these chemicals survive stored in fat, from which they are only slowly
released. To increase DDT’s rate of release, an experiment was done. Laboratory rats were
fed large amounts of DDT daily for 3 months. Although high levels of DDT accumulated in
their fat, they suffered no ill effect. Then, their food intake was cut in half, forcing their
6 An exception to this protective effect is shown by radionuclides (radioactive substances). A radionuclide canundergo radioactive decay whether or not it is stored, and potentially cause harm. Consider strontium-90, aradioactive element found in the fallout of nuclear bombs tested in the atmosphere in the 1950s. Once absorbedinto the body, strontium-90 is stored in bones, and increases the risk of bone cancer.
66 Chemical toxicity
Excretion (E)
After exposure decreases or ceases, the concentration of an absorbed xenobiotic can begin todecrease. The rate of excretion depends on a number of factors including how it has beenstored in the body (Box 3.3). Chemicals are excreted in a number of ways.
* Urine Water-soluble chemicals such as salt or sodium cyanide are largely excreted inurine. If a xenobiotic is not already water soluble, the body attempts to transform it intoone that is.
bodies to use stored fat for energy. The fat-stored DDT was rapidly released, and the rats
showed visible symptoms of poisoning. ▪ Famine, hibernation and nursing Wild animals go
through periods when they use stored body fat. Famine is one instance. It happens too
when nursing animals use body fat for the energy needed to produce milk, as after a
hibernating bear gives birth in the winter. At these times, pollutants stored in fat may be
rapidly released.
Bioaccumulation
A pollutant is said to bioaccumulate when it reaches a concentration within a creature that is
higher than found in the environment. ▪ Illustrations PCBs and dioxins bioaccumulate in fat;
strontium (a metal), fluoride, and lead bioaccumulate in bones; metals such as cadmium bind
to proteins and bioaccumulate in the liver, kidney, and other soft tissues.
Biomagnification
When a pollutant reaches progressively higher concentrations as it moves through the food
web it is said to biomagnify. ▪ Notice in Figure 3.3 that the organic pollutants, PCBs biomagnify
in the Great Lakes food web. At each step the PCBs concentration grows higher: phytoplank-
ton,7 one-celled plants at the base of the food chain, bioaccumulate PCBs. Zooplankton, small
invertebrate animals eat enough phytoplankton to accumulate PCBs to levels higher than
those in phytoplankton. In turn, smelt (small fish) eat enough zooplankton to raise their PCBs
level above that of zooplankton. Lake trout eating the smelt have higher levels still. The eggs
of herring gulls that eat the fish have a PCB concentration higher than lake trout, and
dramatically greater than in the phytoplankton. Not only gulls, but other predators including
humans may eat the contaminated fish, and also show very high PCB levels in their fatty
tissues. ▪ DDT and dioxins are other well-known examples of chemicals that undergo bio-
magnification. ▪ Methylmercury provides an important illustration of biomagnification
(Chapter 15). Bacteria in sediment convert elemental mercury to methylmercury, which
then strongly biomagnifies through the food web. Methylmercury can biomagnify a million-
fold in birds and mammals (eagles, gulls, seals, minks).
7 Phytoplankton are tiny, often microscopic, plants found drifting near the surface of freshwater and salt water.Zooplankton are tiny animals that include corals, rotifers, sea anemones, and jellyfish.
67 Absorption, distribution, metabolism, and excretion
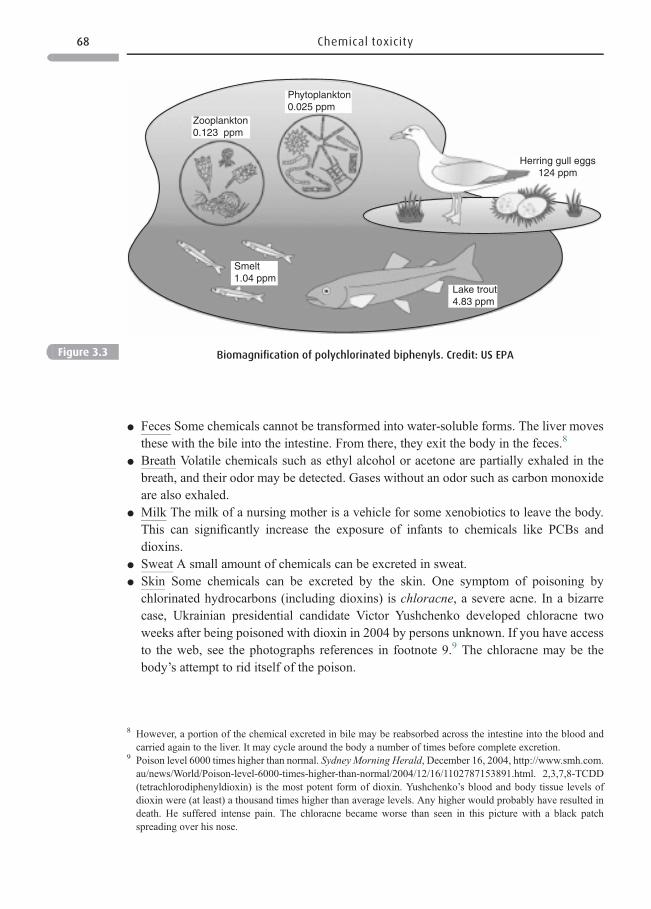
* Feces Some chemicals cannot be transformed into water-soluble forms. The liver movesthese with the bile into the intestine. From there, they exit the body in the feces.8
* Breath Volatile chemicals such as ethyl alcohol or acetone are partially exhaled in thebreath, and their odor may be detected. Gases without an odor such as carbon monoxideare also exhaled.
* Milk The milk of a nursing mother is a vehicle for some xenobiotics to leave the body.This can significantly increase the exposure of infants to chemicals like PCBs anddioxins.
* Sweat A small amount of chemicals can be excreted in sweat.* Skin Some chemicals can be excreted by the skin. One symptom of poisoning by
chlorinated hydrocarbons (including dioxins) is chloracne, a severe acne. In a bizarrecase, Ukrainian presidential candidate Victor Yushchenko developed chloracne twoweeks after being poisoned with dioxin in 2004 by persons unknown. If you have accessto the web, see the photographs references in footnote 9.9 The chloracne may be thebody’s attempt to rid itself of the poison.
Zooplankton0.123 ppm
Herring gull eggs124 ppm
Lake trout4.83 ppm
Smelt1.04 ppm
Phytoplankton0.025 ppm
Figure 3.3 Biomagnification of polychlorinated biphenyls. Credit: US EPA
8 However, a portion of the chemical excreted in bile may be reabsorbed across the intestine into the blood andcarried again to the liver. It may cycle around the body a number of times before complete excretion.
9 Poison level 6000 times higher than normal. Sydney Morning Herald, December 16, 2004, http://www.smh.com.au/news/World/Poison-level-6000-times-higher-than-normal/2004/12/16/1102787153891.html. 2,3,7,8-TCDD(tetrachlorodiphenyldioxin) is the most potent form of dioxin. Yushchenko’s blood and body tissue levels ofdioxin were (at least) a thousand times higher than average levels. Any higher would probably have resulted indeath. He suffered intense pain. The chloracne became worse than seen in this picture with a black patchspreading over his nose.
68 Chemical toxicity
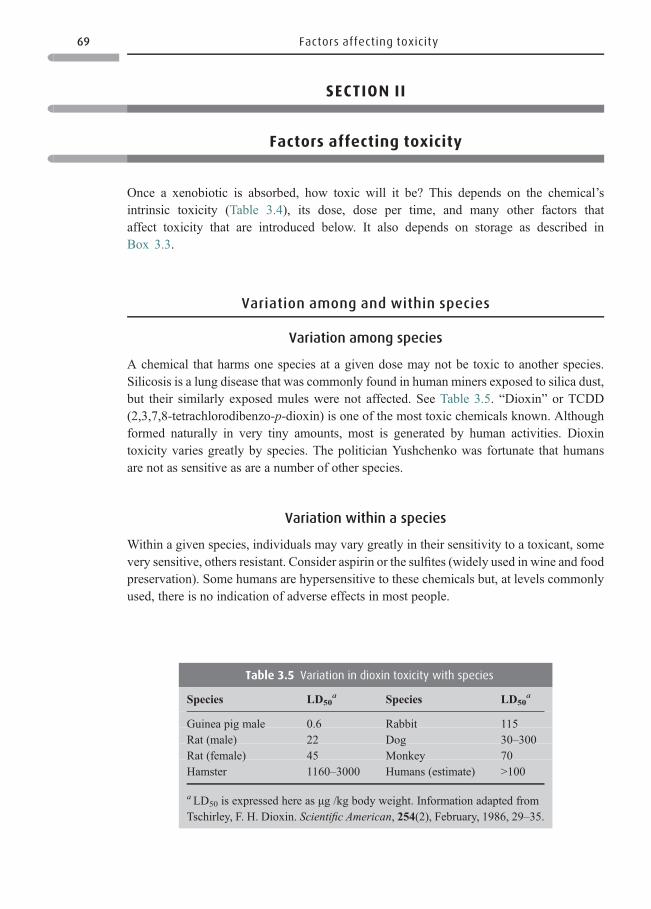
SECTION II
Factors affecting toxicity
Once a xenobiotic is absorbed, how toxic will it be? This depends on the chemical’sintrinsic toxicity (Table 3.4), its dose, dose per time, and many other factors thataffect toxicity that are introduced below. It also depends on storage as described inBox 3.3.
Variation among and within species
Variation among species
A chemical that harms one species at a given dose may not be toxic to another species.Silicosis is a lung disease that was commonly found in human miners exposed to silica dust,but their similarly exposed mules were not affected. See Table 3.5. “Dioxin” or TCDD(2,3,7,8-tetrachlorodibenzo-p-dioxin) is one of the most toxic chemicals known. Althoughformed naturally in very tiny amounts, most is generated by human activities. Dioxintoxicity varies greatly by species. The politician Yushchenko was fortunate that humansare not as sensitive as are a number of other species.
Variation within a species
Within a given species, individuals may vary greatly in their sensitivity to a toxicant, somevery sensitive, others resistant. Consider aspirin or the sulfites (widely used in wine and foodpreservation). Some humans are hypersensitive to these chemicals but, at levels commonlyused, there is no indication of adverse effects in most people.
Table 3.5 Variation in dioxin toxicity with species
Species LD50a Species LD50
a
Guinea pig male 0.6 Rabbit 115Rat (male) 22 Dog 30–300Rat (female) 45 Monkey 70Hamster 1160–3000 Humans (estimate) >100
aLD50 is expressed here as μg /kg body weight. Information adapted fromTschirley, F. H. Dioxin. Scientific American, 254(2), February, 1986, 29–35.
69 Factors affecting toxicity
Gender, age, and nutrition
Below are several of the factors that can impact sensitivity to a pollutant or food contam-inant. To guard against these variations, national health-based standards are often set toprotect the “most sensitive” populations such as the very young and very old.
Gender
The sex hormones, androgens and estrogens, affect animal anatomy, physiology, andmetabolism in many ways. Thus, it is not surprising that the two genders can react differ-ently to xenobiotics. ▪ Women, for example, have less alcohol dehydrogenase (an enzymeinvolved in metabolizing alcohol) than do men. Thus, a woman can become intoxicatedmore rapidly than a man of the same weight.
Age
The immune system in babies and small children is less well developed than in adults. Theyoften – but not always – are more sensitive to toxicants than adults. See Section III for more onchildren. ▪ Likewise, the immune systems of elderly persons function less efficiently than inyounger adults. Thus, they may react more strongly to a drug or pollutant than younger adults.
Nutrition
Good nutrition helps to maintain a healthy immune system, which provides protection againstxenobiotics and infectious (pathogenic) microorganisms. ▪ Alcoholics are an example of apoorly nourished population more likely to be affected by xenobiotics and pathogens. ▪ Othersusceptible populations are people whose diets have insufficient calories or insufficientnutrients (see Questions 3.1). ▪ Overweight rats and other animals develop more cancers thando animals fed a well-balanced, but low-calorie diet. Obese people have a greater risk ofcardiovascular diseases and of a number of cancers. ▪ Individuals who consume high-fat dietshave a greater risk of colon and skin cancer. ▪ For more examples, see the discussion questions.
Questions 3.1 Lead and cadmium: two toxic metals
1. Cadmium is not a nutrient, and can be toxic at low doses. Years ago, a poisoning occurred in
Japan that affected only poor elderly women living in one locale. Most had several children.
Their diet consisted primarily of rice grown in cadmium-contaminated paddies. They
developed itai itai (pain-pain), a disease characterized by kidney damage and brittle,
painful bones. Others eating the same diet were not adversely affected. What factors
may have caused only these individuals to be adversely affected?
2. Lead presents special risks to small children in a contaminated environment as they are
most likely to ingest contaminated soil during play or inhale contaminated dust. The US
Centers for Disease Control and Prevention believes that children with blood lead levels
70 Chemical toxicity
How toxicants affect organs
Toxicants can affect any tissue or organ within the body. However, a specific toxicant oftenhas a target organ, which is especially sensitive.
Liver
One of the liver’s many vital functions is to break down xenobiotics. The liver is the firstorgan that a xenobiotic encounters after being absorbed into the blood from the small
greater than 10micrograms per 100 milliliters (10 μg/100 ml) are at risk of lead poisoning.
As you read the following two cases, recall the term, comparative risk, from Chapter 1.
Case 1: Smuggler Mountain
The area around Smuggler Mountain, Colorado, was mined for metals until the early twentieth
century. Mining operations left behind large areas contaminated with lead and cadmium. Soil
tests in 1982 showed such high levels of lead that the US EPA listed Smuggler Mountain as a
Superfund site – a hazardouswaste site posing special risk to human health.10 The EPA proposed a
$12 million cleanup that involved excavating and removing contaminated soil. However, despite
the high lead levels around them, lead levels in children’s blood averaged only 2.6 μg/100 ml. ▪Typically, communities near Superfund sites are anxious to have sites thoroughly cleaned.
However, the EPA’s planned excavations could destroy their community, and considering that
their children had low blood levels, citizens protested the cleanup plan. An independent expert
panel evaluated the situation and made recommendations. It noted that only a few hot spots in
Smuggler Mountain had soil containing high lead levels. Grass in summer and snow in winter
covered themost heavily contaminated areas. Residents had diets high in iron and calcium,which
mitigate exposure to lead. The panel recommended a more limited remediation at a cost of only
$400 000. One panelist observed: “Lead is not lead is not lead: trying to devise a single clean-up
value for soil lead is not practical to use at all sites; each site must be analyzed individually.”
Case 2: Lead paint in poorly maintained old houses
Many houses in older US cities were built before the 1970s, and often leaded paint was used
inside and out. ▪ Homes in older inner cities are often poorly maintained, and have peeling
leaded paint. ▪ Once peeled or chipped, the paint crumbles to dust, which children inhale.
▪ Small childrenmay eat the sweet-tasting paint chips or lick the lead-painted sills of windows.
▪ Inner city inhabitants often have low incomes and poor diets.
Think about these two cases. (a) What are the routes of exposure to lead in old lead-painted
houses? Consider air, water, soil, and food. (b) What are the routes of exposure in Smuggler
Mountain? (c) Which children are at greater risk? Explain.
10 Superfund Program, Smuggler Mountain. US EPA, http://www.epa.gov/region08/superfund/co/smuggler/[August, 2008].
71 Factors affecting toxicity
intestine – thus the liver is exposed to higher toxicant levels than organs that are not reacheduntil the bloodstream has diluted it. ▪ The liver usually detoxifies xenobiotics, but sometimesit converts a chemical into a more toxic substance as when converting benzene into benzeneoxide. ▪When exposed to large amounts of a toxicant, as after a person drinks large amountsof alcoholic beverage, the liver may be unable to detoxify it all. ▪ Chemicals toxic to theliver, hepatotoxicants, include organic solvents such as chloroform and carbon tetrachloride▪ Most of us are familiar with the acute effects of excessive alcohol intake. Alcohol (ethylalcohol) has chronic effects too; it is a well-known hepatotoxicant. Chronic effects on theliver of excessive alcohol intake include cirrhosis, and cancer. ▪Most liver cancer should bepreventable but, worldwide, half a million die each year from this disease. Prevention can bevery difficult (Box 3.4).
Kidneys
Like the liver, kidneys detoxify xenobiotics. However, their major function is to filter theblood, eliminating waste products into the urine while retaining water and nutrients such asglucose. Remember that kidneys concentrate waste substances before they excrete them:thus the kidneys may create their own high doses of toxicants. Nephrotoxicants includesome antibiotics and metals such as mercury, cadmium, and lead.
Immune system
The immune system11 recognizes the difference between self and foreign substances andworks to rid itself of the latter including microorganisms, cancer cells, and xenobiotics.Immunotoxic substances can cause damage by suppressing immune activity, or by causing itto overreact. ▪ Corticosteroid drugs are among the chemicals that can suppress the immunesystem, damage its ability to fight infections, or to remove cancer cells. These drugs aredeliberately given to people who receive organ transplants to prevent the body fromrejecting the new organ. Some environmental pollutants including PCBs also suppress theimmune system. Individuals with poor immune system function are particularly vulnerableto infectious microorganisms and chemicals. These include the elderly, the sick (especiallypeople with AIDS), and those undergoing chemotherapy ▪ You are probably familiar withimmune-system overreactions – allergies. Responsible agents include tree and flowerpollens. Certain chemicals cause allergy-like reactions too. Autoimmune diseases such aslupus erythematosus and rheumatoid arthritis also result from overreactions.
The central nervous system
The brain requires high levels of oxygen to function normally. Thus any substance thatlowers oxygen supply is neurotoxic. Carbon monoxide is a well-known neurotoxin
11 The immune system is a complex system of tissues, organs, and cells, which includes bone marrow, thymus,lymph nodes, and spleen. It destroys foreign substances using cells that it produces, such as lymphocytes andmacrophages.
72 Chemical toxicity
(Table 3.3). Some pesticides including malathion and parathion, nerve gases, and manydrugs (legal and illegal) are neurotoxic as are certain metals, in particular, lead andmercury (Chapter 15), and PCBs (Chapter 14). Especially in children, neurotoxiceffects may be expressed in behavior such as attention deficit disorder. Behavioralproblems are studied today as a sensitive means to detect an adverse effect of aneurotoxic chemical.
Skin
Local effects
An irritant can cause local effects on eyes, mucous membranes, and skin. Many substancesmay irritate the skin – a weak acid, such as vinegar, a detergent or other cleaning product,nickel in jewelry, or chemicals in certain plants. The skin may redden, swell, or itch.Sunlight is a non-chemical irritant. Skin exposed to an irritating chemical may react. Theirritation subsides when exposure ceases. However, an irritant that is also an allergen ismore serious. When an allergic person is exposed for the first time to an allergenicchemical the skin reacts and then recovers when exposure ceases just as with a non-allergenic person. However, if the sensitive person suffers repeated exposures, the reactiongrows in severity, and reactions occur with much lower doses: an allergy has developed.Formaldehyde, a chemical found in many household products, is an irritant, and also anallergen.
Systemic effects
Some chemicals affect the skin after they have been absorbed into and distributed around thebody. Such indirect effects may be caused by the antibiotic neomycin, which, after ingestion,can irritate the skin, sometimes severely. Arsenic can have both local and systemic effects onthe skin. Systemic effects of arsenic include skin cancer.
Lungs
Local effects
▪ Reactive gases such as ozone (in smog), formaldehyde, or chlorine (in householdproducts) can directly damage the lungs and mucous membranes in the nose, and eyes.▪ Airborne particles breathed in – including silica, asbestos, coal or cotton dust, and evenpowder applied too liberally – can directly damage the lungs, and often are not completelyexpelled by the lungs. Adverse effects can be acute or chronic. Dust inhalation in the shortrun may only irritate, but chronic exposure can damage lung function: cotton dustexposure over years may give rise to brown lung disease, coal dust to black lung disease,and silica dust to silicosis. ▪ A number of substances increase the risk of lung cancer.These include solid substances such as asbestos, as well as some gases such as radon.Chemicals in tobacco smoke include both solid particles and gases. ▪ Organic solvents
73 Factors affecting toxicity
may damage the lungs. ▪ Accidental aspiration of a liquid solvent or of gasoline canseverely damage lungs or cause death.
Systemic effects
Lungs can serve as the entry point for toxicants. Volatile organic chemicals that evaporatefrom motor-vehicle or other household products are breathed in and enter the bloodstreamthrough the lung’s alveoli. The alveoli are tiny air sacs deep within the lungs at the end of thebronchiole tubes. Their normal function is to provide for an exchange between oxygen andcarbon dioxide, but other chemicals also use this route.
Box 3.4 Reducing liver cancer12
For Westerners, chronic alcohol ingestion is the biggest risk factor for liver cancer. But much
higher liver cancer rates are found in many poor African and Asian countries. The major risk
factors there are aflatoxins (potent liver carcinogens) and infection with the hepatitis B virus.
* Aflatoxins are produced by molds especially Aspergillus flavus, which grows on peanuts,
corn, rice, and other crops.13 Aflatoxins contaminate the meat and milk of livestock that
have eaten aflatoxin-contaminated foods. No person can completely avoid aflatoxins.
▪ People eating a Western diet ingest an average 19 ng aflatoxins per day, but those eating
a Far Eastern diet may consume more than 100 ng. If all foods in which aflatoxins are
detected were banned, a significant portion of our food supply would disappear. So, food is
removed from the market only if aflatoxins are detected above an action level. In India the
action level is 30 parts per billion (ppb), in Canada and the United States, 15–20 ppb, and in
France and the Netherlands, 4 ppb. However, if India used such stringent standards, already
malnourished people would have even less food. Poor countries could reduce aflatoxins on
foods by improved farming and food storage practices or by using pesticides to destroy the
molds producing aflatoxins, but these can be expensive.
* Now consider a second risk factor, a synergism: The risk of liver cancer in people eating
aflatoxins increases about 60-fold if they are infected with the hepatitis B virus.14 There is a
vaccine for hepatitis B. Why not use it and lower liver cancer incidence? Vaccines are
expensive in impoverished countries. Think about some of the implications of this story. A
microorganism, in this case the hepatitis B virus can cause cancer. Aflatoxins and the
hepatitis B virus have a synergistic effect on liver cancer risk. The risk is accentuated by
the malnutrition from which the poor more often suffer. Malnourished persons often
receive higher doses of contaminants than do better nourished individuals.
12 Henry, S. H., Bosch, F. X., Troxell, T. C., and Bolger, P. M. Reducing liver cancer: global control of aflatoxin.Science, 286(5449), December, 1999, 2453–2454.
13 Oniang’o, R. The never-ending story of Africa’s hunger tragedy: where lies food safety? AJFAND online, 9(1),2009, http://www.ajfand.net/Issue22/Issue22editorial.htm.
14 Aflatoxin and liver cancer. National Institute of Environmental Health, November 9, 2007, http://www.niehs.nih.gov/health/impacts/aflatoxin.cfm.
74 Chemical toxicity
SECTION III
In utero and children’s exposure
Toxic effects on the developing embryo or fetus, baby or tiny child are of profound concern.Quite aside from obvious birth defects, scientists express concern that even very lowexposures to some chemicals may have major impacts later in life. The diethylstilbestrolexample noted below is an obvious example, but many other chemicals could also affectdevelopment.15 One public health expert has said, “the vulnerability of children [is] one ofthe central public health problems for our time.”16 Children are often more sensitive thanadults to polluted environments.
Prenatal and post-natal exposures
A teratogen17 is a xenobiotic, which can damage the embryo or fetus,18 resulting in birthdefects like mental retardation or deformed organs. Preventing exposure to xenobiotics isespecially important for the developing embryo and fetus, and the baby. Normal develop-ment requires a multitude of precise steps carefully coordinated. Environmental healthspecialists comment on “the exquisite sensitivity of prenatal and postnatal periods.”Adverse effects on the embryo or fetus may not cause obvious defects at birth, but can beresponsible for diseases including cancer that develop later – see account of diethylstilbes-trol below. There are also concerns that an increase in testicular cancer seen in young menmay be due to prenatal chemical exposures. Because environmental hormones (below) mayact at extremely low concentrations, even tiny exposures in utero leave us uneasy. Althoughxenobiotics are not the cause of most birth defects, major concerns remain.
Timing as important as dose
A teratogen is most likely to cause damage during the first eight weeks of pregnancy whenorgans are forming. Most damage cannot be repaired.
15 Among the substances of concern are the pesticides DDT, atrazine, methoxychlor, and vinclozolin; the metalsmercury, lead, arsenic, and organotins; bisphenol A, phthalates, and PCBs; and carbon monoxide, fine partic-ulates, environmental tobacco smoke, and alcohol. Weinhold, R. Consensus reached on prenatal exposures.Environmental Science & Technology, 41(15) August 1, 2007, 5171–5172.
16 Kiewra, K. Brain pollution (impact of chemicals on children’s brains). Harvard Public Health Review (online),Winter, 2007, http://www.hsph.harvard.edu/review/winter07/brain.html.
17 Diav-Citrin, O. and Koren, G. Human teratogens: a critical evaluation. The Motherisk Program, Hospital forSick Children, Toronto, Ontario, Canada, http://www.nvp-volumes.org/p2_4.htm.
18 The word, embryo, refers to the first eight weeks of pregnancy, whereas fetus refers to eight weeks until delivery.
75 In utero and children’s exposure
* Think about thalidomide,19 a drug taken in the 1950s and 1960s by pregnant women inEurope and Canada to prevent nausea. At the dose ingested, thalidomide didn’t harm thewomen taking it. However, those women who took thalidomide when arms and legs werebeginning to form had babies born with major defects such as stumps instead of arms orlegs. Taken later in pregnancy, thalidomide caused no harm. Even later in pregnancy, ateratogen may cause harm, although less obvious, e.g., rather than causing observablestructural anomalies it could retard the continuing growth and function of an organ.
* Because of the embryo’s sensitivity in early weeks, pregnant women are advised to avoidalcohol, tobacco, and almost all drugs. Even the nutrient, vitamin A can cause birthdefects if taken in above-recommended doses. Because the sensitive development phasemay have begun before a woman even realizes she is pregnant, young women are advisedto avoid suspect substances whenever a pregnancy is possible. Poor health in the mothercan also adversely affect fetal health; so can malnutrition.
* Exposure of fathers to certain xenobiotics can damage their germ cells. In the 1970s, theinsecticide dibromochloropropane (a soil fumigant used as a nematocide) was foundto damage sperm chromosomes and lead to sterility.20 The metal lead can producemalformed sperm.
Why children’s sensitivity is often greater
Babies and small children often, but not always, show greater sensitivity to a toxicant thanadults. This is because their immune systems are incompletely developed, and are less wellable to fend off toxic insults than those in more-mature persons. Children tend to detoxifyxenobiotics more slowly than do adults. Children are also developing rapidly, and thegenetic material, DNA, rapidly replicates at the same time. This gives rise to more possi-bilities for mutations to occur.
Why is children’s exposure greater?
Children are oftenmore highly exposed to toxicants than adults.Why? ▪They eat more food perpound of body weight. Thus, if a food is contaminated, they ingest more toxicant. Pound-for-pound they also ingest more foods such as fruits treated with pesticides. ▪ Children often ingestthings that adults would not, such as sweet-tasting leaded paint. They ingest soil too, whichmaybe contaminated. ▪Babies and children breathe more rapidly than adults. So if air, including thehome’s air is polluted, they inhale a greater volume of contaminant. And, children crawling onor playing near the floor stir up contaminants, which they breathe. Think about an infant in acity. On average each day that infant takes in 110 ng of benzo benzo[a]pyrene pyrene, BaP,21 an
19 Center for the Evaluation of Risks to Human Reproduction (CERHR), Thalidomide, http://cerhr.niehs.nih.gov/common/thalidomide.html.
20 Glass, R. I., Lyness, R. N., Mengle, D. C., Powell, K. E., and Kahn, E. Sperm count depression in pesticideapplicators exposed to dibromochloropropane. American Journal of Epidemiology, 109(3), 1979, 346–351,http://aje.oxfordjournals.org/cgi/content/abstract/109/3/346.
21 B(a)P is the most toxic of a family of chemicals called PAHs (Box 7.4). PAHs are emitted during all types ofcombustion, outside and inside the home. Family members track PAHs and other chemicals into the home ontheir shoes – these can transfer onto and into carpets, sofas, chairs, and other surfaces.
76 Chemical toxicity
amount equivalent to smoking three cigarettes each day. The small child is also exposed tometals such as lead and other contaminants in house dust. Carpets are “deep reservoirs” forchemicals, microorganisms, and allergens (animal dander, dust mites, and mold). This isespecially true of old carpets, even regularly vacuumed ones.22
More generally, indoor air pollution can be much greater than outside air pollution,especially in wealthy countries where outside air pollution may be well controlled. Indoorpollution may be a cause of increased rates of childhood asthma and allergies in urban areasof developed countries, especially as children spend so much time indoors.
Children of the poor
Children in wealthy nations are at risk from environmental exposures, but the situation isoften much worse for children in less-developed countries (Chapter 17). Those living incities are often exposed to highly polluted outside air. In rural areas, cooking fuels (wood,manure, or other biomass) are often burned inside the home, with poor or no ventilation.Children and their mothers most typically have the highest exposures to smoke. ▪ They arealso commonly exposed to polluted drinking water too – although the infectious micro-organisms in water usually pose a greater risk than chemicals. Pesticide exposure is also anissue (Box 3.5). In less-developed, but industrialized countries such as China unregulatedchemical releases and unregulated sewage discharges pose problems.
Box 3.5 Pesticide exposure
Children
Farmers in Mexico’s Sonora Yaqui Valley applied pesticides 45 times per crop cycle, and often
grew two crops a year. Many Yaqui Indian families also regularly used insecticides at home.
Babies were further exposed to pesticides through their mothers’ milk. Thus, it was not
surprising that investigators found detectable levels of many pesticides in the blood of babies
born to these families. Dr. Elizabeth Guillette and colleagues23 examined the behavior of 33
heavily exposed children. They compared them to 17 Yaqui children from nearby foothills,
whose only major pesticide exposure was to DDT that the government sprayed to kill malarial
mosquitoes. Figure 3.4 shows the astonishing difference between these two groups of small
children when they were asked to draw pictures of people.
Heavily exposed children were impacted in other ways. They showed less stamina than
unexposed children when asked to jump up and down as long as possible, catch balls, or
perform simple tasks. Their memories were also impaired. One scientist said, themagnitude of
the observed changes “is incredible . . . and may prove irreversible.” In the United States and
22 To greatly lower exposure, avoid plush and shag rugs, which trap more contaminants. If babies or small childrenare in the home, use wood or tile flooring. Ask people to wipe their shoes at the door. Removing shoes can reducethe lead in a carpet six-fold.
23 (1) Guillette, E. A. et al., An anthropological approach to the evaluation of preschool children exposed topesticides in Mexico. Environmental Health Perspectives, 106(6), June 1998, 347–353. (2) Raloff, J. Picturingpesticides’ impacts on kids. Science News, 153(23), June 6, 1998, 358.
77 In utero and children’s exposure
Cancer
Cancer is a group of diseases. The word cancer refers to cells growing abnormally, multi-plying in the absence of the usual controls.25 Liver cancer is associated with chronic alcoholingestion and with exposure to aflatoxins produced by molds growing on grains. Lungcancer is often associated with smoking tobacco. Leukemia, a cancer of the white-bloodcells, has been associated with chronic benzene exposure in the workplace. ▪ How can acarcinogen (cancer-causing agent) lead to cancer? A chemical that reaches the cell’s nucleusmay react with the genetic material (DNA) causing a mutation. But, before a cancerdevelops, the DNA may suffer many mutations, which are normally repaired by DNA-repair enzymes. Repair enzymes are a natural defense system that evolved over eons.Enzymes do not distinguish between mutations caused by synthetic carcinogens and naturalcarcinogens, they just repair the mutations. Sometimes trace amounts of a carcinogen cancause cancer, but it is typically higher doses of carcinogens that overwhelm repair mecha-nisms. The higher the dose the greater is the likelihood of damage.
other industrialized countries, there is continuing concern about children’s exposure to pesti-
cides, particularly farm children and children of migrant agricultural workers. The US General
Accounting Office recommends educating farm-worker parents about how agricultural pesti-
cides can affect young children. Pesticide labels should specify the period of time that children
should stay out of fields after spraying. Currently, in the United States there are also efforts to
reduce or, when possible, eliminate the use of pesticides in and around schools.
Flowers
Adults can suffer also. Several South American countries grow flowers in great quantities for
shipment to North America and Europe. Large numbers and quantities of pesticides are used,
including many banned in the United States and Europe. Fumigants used within enclosed
greenhouses are often given little time to dissipate before workers return inside. More than
half have headaches, dermatitis, and irritated eyes as well as respiratory and neurological
symptoms. Women of child-bearing age are among these workers. Some socially conscious
farm owners are working toward growing “green” flowers. One farmer uses a quarter of the
pesticides he used 20 years ago and endeavors to use biological means to control pests. Such
farms attract more birds, bees, and butterflies than those heavily treated with pesticides. For
these farms to be viable, consumers must accept small blemishes on the flowers they buy.24
24 Bergman, C. A rose is not a rose (toxicity to workers from pesticide treated flowers). Audubon 110(1), 2008,46–53.
25 Cancer: the news behind the numbers. Berkeley Wellness Letter, 23(4), January 2007, 1–2.
78 Chemical toxicity
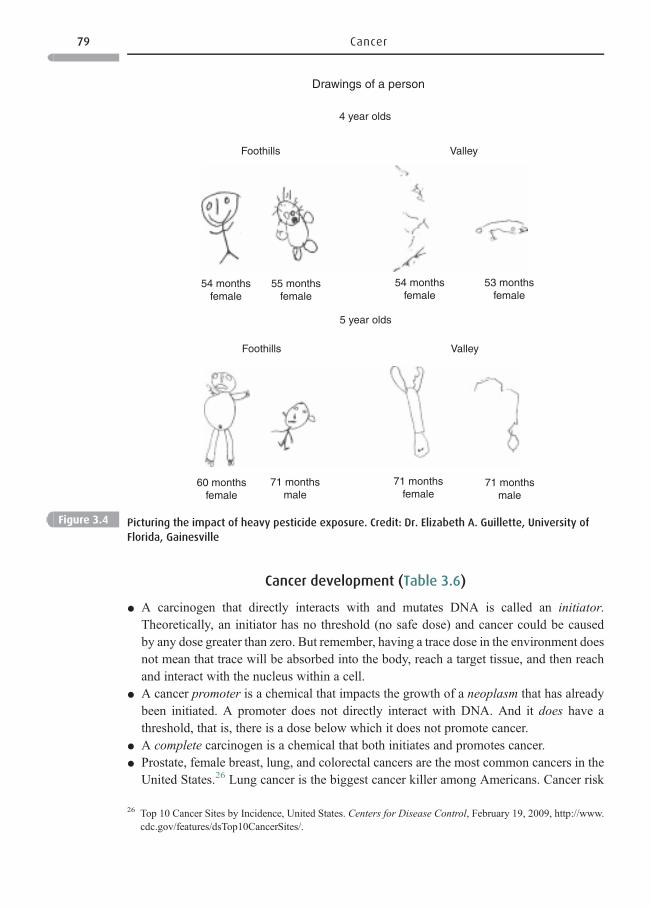
Cancer development (Table 3.6)
* A carcinogen that directly interacts with and mutates DNA is called an initiator.Theoretically, an initiator has no threshold (no safe dose) and cancer could be causedby any dose greater than zero. But remember, having a trace dose in the environment doesnot mean that trace will be absorbed into the body, reach a target tissue, and then reachand interact with the nucleus within a cell.
* A cancer promoter is a chemical that impacts the growth of a neoplasm that has alreadybeen initiated. A promoter does not directly interact with DNA. And it does have athreshold, that is, there is a dose below which it does not promote cancer.
* A complete carcinogen is a chemical that both initiates and promotes cancer.* Prostate, female breast, lung, and colorectal cancers are the most common cancers in the
United States.26 Lung cancer is the biggest cancer killer among Americans. Cancer risk
Drawings of a person
4 year olds
5 year olds
ValleyFoothills
ValleyFoothills
54 monthsfemale
60 monthsfemale
71 monthsmale
71 monthsfemale
71 monthsmale
55 monthsfemale
54 monthsfemale
53 monthsfemale
Figure 3.4 Picturing the impact of heavy pesticide exposure. Credit: Dr. Elizabeth A. Guillette, University of
Florida, Gainesville
26 Top 10 Cancer Sites by Incidence, United States. Centers for Disease Control, February 19, 2009, http://www.cdc.gov/features/dsTop10CancerSites/.
79 Cancer
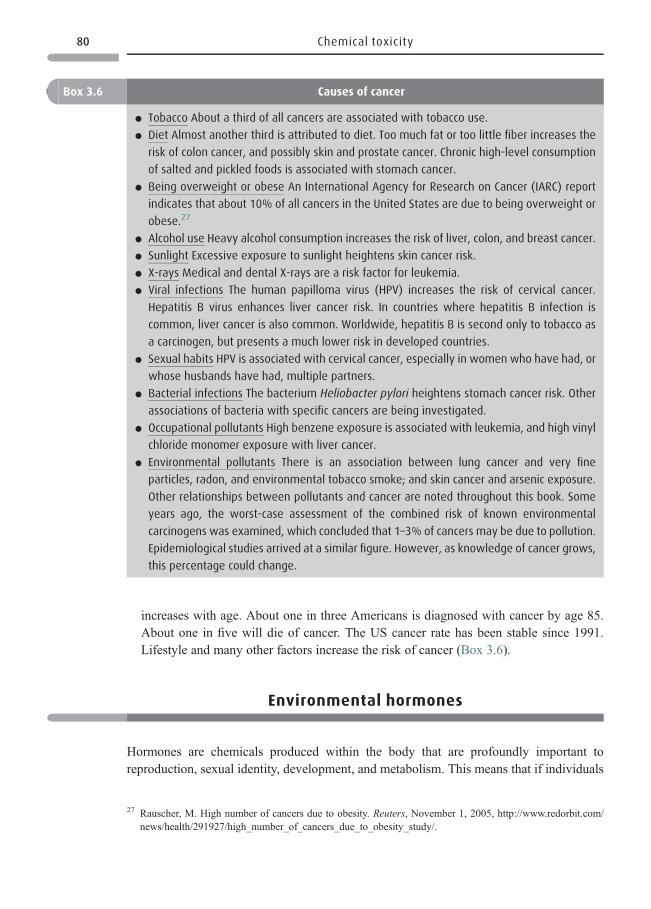
increases with age. About one in three Americans is diagnosed with cancer by age 85.About one in five will die of cancer. The US cancer rate has been stable since 1991.Lifestyle and many other factors increase the risk of cancer (Box 3.6).
Environmental hormones
Hormones are chemicals produced within the body that are profoundly important toreproduction, sexual identity, development, and metabolism. This means that if individuals
Box 3.6 Causes of cancer
* Tobacco About a third of all cancers are associated with tobacco use.
* Diet Almost another third is attributed to diet. Too much fat or too little fiber increases the
risk of colon cancer, and possibly skin and prostate cancer. Chronic high-level consumption
of salted and pickled foods is associated with stomach cancer.
* Being overweight or obese An International Agency for Research on Cancer (IARC) report
indicates that about 10% of all cancers in the United States are due to being overweight or
obese.27
* Alcohol use Heavy alcohol consumption increases the risk of liver, colon, and breast cancer.
* Sunlight Excessive exposure to sunlight heightens skin cancer risk.
* X-rays Medical and dental X-rays are a risk factor for leukemia.
* Viral infections The human papilloma virus (HPV) increases the risk of cervical cancer.
Hepatitis B virus enhances liver cancer risk. In countries where hepatitis B infection is
common, liver cancer is also common. Worldwide, hepatitis B is second only to tobacco as
a carcinogen, but presents a much lower risk in developed countries.
* Sexual habits HPV is associated with cervical cancer, especially in women who have had, or
whose husbands have had, multiple partners.
* Bacterial infections The bacterium Heliobacter pylori heightens stomach cancer risk. Other
associations of bacteria with specific cancers are being investigated.
* Occupational pollutants High benzene exposure is associated with leukemia, and high vinyl
chloride monomer exposure with liver cancer.
* Environmental pollutants There is an association between lung cancer and very fine
particles, radon, and environmental tobacco smoke; and skin cancer and arsenic exposure.
Other relationships between pollutants and cancer are noted throughout this book. Some
years ago, the worst-case assessment of the combined risk of known environmental
carcinogens was examined, which concluded that 1–3% of cancers may be due to pollution.
Epidemiological studies arrived at a similar figure. However, as knowledge of cancer grows,
this percentage could change.
27 Rauscher, M. High number of cancers due to obesity. Reuters, November 1, 2005, http://www.redorbit.com/news/health/291927/high_number_of_cancers_due_to_obesity_study/.
80 Chemical toxicity
are exposed to hormone-mimicking pollutants in the environment – environmental hor-mones – damage could ensue.32 Some industrial pollutants and some pharmaceuticals havehormonal activity. Moreover, natural environmental hormones exist too: some plantsproduce phytoestrogens, which mimic human female hormones. Environmental hormonesmay be active at very low doses. Worse, if harm occurs, it may not be apparent until manyyears later at which time it is very difficult to trace back to causes.
Box 3.7 Pollution’s toll on China’s environmental health28
China’s environmental degradation is exacting a mounting toll on its citizens.
* Air China burns coal for about two-thirds of its energy, often with little control on emissions.
An OECD report estimated that air levels of fine particulates resulting from burning coal
result in 50 000 premature deaths and 500 000 new cases of chronic bronchitis each year.
The World Bank has a much higher estimate. The problem is growing: a Chinese report
predicts that deaths due to outdoor air pollution will reach several hundred thousand a year
in the near future without pollution controls. In 2006, Beijing’s average particulate level was
141 μg/m3 of air, whereas in the EU the health-based standard is 40 μg/m3.
* Water Those monitoring China’s waters say that a third of its rivers and most of its large
lakes have water so polluted that it is unfit for industrial, let alone agricultural use. About
300 million people lack access to safe drinking water, although that figure may be improv-
ing. Many thousands of premature deaths a year result from drinking pollutedwater, mostly
in rural areas. The cause of death is severe diarrhea, for which microbial contamination can
be blamed.
* Cancer Moreover, dozens of “cancer villages”29 exist, so-called because they have such high
numbers of cancer deaths as compared to less polluted parts of China. The Ministry of Health
says that, due to pollution, stomach, liver, and bladder cancers are China’s leading causes of
death.
* Pollution’s toll Using Chinese information, the World Health Organization (WHO) and the
World Bank estimate total yearly deaths due to water and air pollution at 750 000 a year.
Moreover, heavy metal (cadmium, lead, and copper) contamination of food30 and soil has
been reported. Due to fears of social unrest, the government bans or downplays public
reporting of statistics on pollution’s adverse health effects; however, much unrest is
occurring anyway. Meanwhile, health care costs continue to climb. China is, however,
making a continuing effort to clean up its environment.31
28 (1) Kahn, J. and Yardley, J. As china roars, pollution reaches deadly extremes.New York Times, August 26, 2007,http://www.nytimes.com/2007/08/26/world/asia/26china.html?_r=2&oref=slogin&oref=slogin. (2) McGregor,R. 750,000 a year killed by Chinese pollution. The Financial Times Limited, July 2, 2007, http://www.ft.com/cms/s/0/8f40e248-28c7-11dc-af78-000b5df10621.html.
29 Tremblay, J. -F. China’s cancer villages. Chemical & Engineering News, 85(44), October 23, 2007, 1821.30 Zamiska, N. and Spencer, J., China faces a new worry: heavy metals in the food. Wall Street Journal, July 2,
2007.31 Tremblay, J. -F., China releases new cleanup plan. Chemical & Engineering News, 85(49), 3 December,
2007, 12.32 Environmental hormones are also called hormonally active agents, endocrine disrupters, or hormone mimics.
81 Environmental hormones
Impacts on fish and other wildlife
Only animals are known to have suffered harm from environmental hormones. Wildlife,both animals and plants, actually lives within the environment where such pollutants arefound, and several are known to have harmed wildlife reproduction and development.▪ A notorious example is the impact of the once widely used insecticide, DDT. BecauseDDT persists in the environment, its concentration built up over the years that itcontinued in use. Eagles, osprey, and other birds exposed to DDT produced thin egg-shells, often crushed before they could hatch. This greatly reduced the populations ofthese birds by the 1960s. ▪ In a different way, DDT led to a major population drop inWestern seagulls: the gulls laid eggs that produced sterile males, or else male birds withfeminized reproductive tracts or other feminine characteristics. ▪ Another infamous caseresulted from a large spill of the pesticide dicofol into Florida’s Lake Apopka in 1980.The dicofol was found to contain 15% DDT. Later observation showed that, compared toa normal hatch rate of 70–80%, only 5% of Lake Apopka’s alligator eggs were hatching,and many of these died within weeks. Many survivors had feminine characteristics.These effects were traced to p,p’-DDE, a breakdown product of DDT. Although otherlakes had not suffered a spill, many were found with high levels of DDT and otherorganochlorine pesticides (chlordane, toxaphene, dieldrin) due to agricultural runoff. Inthese lakes too, fewer alligator eggs were hatching. After two decades the hatching ratehas much improved to about 50%, much better but alligator reproduction is still affected.Moreover, scientists fear that not only alligators, but turtles and frogs are also being
Table 3.6 Cancer development
Cancer initiation–inducing mutationAn initiator – benzopyrene is an example – reaches the DNAwithin a cellIt forms an adduct with DNA, i.e., becomes chemically bonded with the DNAIt is genotoxic, i.e., damages the DNAFor a tumor to grow, a number of mutations are necessaryMany mutations are repaired by DNA-repair enzymesBut if not repaired then, when the cell divides, the mutation replicates tooThe US EPA treats a cancer initiator as having no threshold: no safe dose. European agencies mayassume the carcinogen does have a threshold
Cancer promotionNot all mutations are repaired. The tumor (neoplasm) grows from the cells containing thesemutations
A promoter – chloroform is an example – enhances tumor growth, but does not damage DNAA complete carcinogen can both initiate and promote tumor growth
Cancer progressionAs the tumor grows, there are additional changes in the DNAIf the tumor is benign, it does not invade other tissuesIf the tumor is malignant, it may spread (metastasize) to other tissues
82 Chemical toxicity
affected.33 ▪ Industrialized countries banned DDT in the 1970s, and many bird popula-tions slowly recovered as these chemicals have slowly degraded.34
Millions of women deliberately take estrogenic pharmaceuticals – birth control pills andhormone replacement therapy (although the number in this latter group has muchdecreased). These women excrete a portion of the hormones and their metabolites intotoilets. Sewage treatment plants do not remove them so the estrogens are found in concen-trations up to about 10 parts per trillion (ppt) in plant effluent. This is an extremely lowconcentration, but fish can be affected by human estrogens at levels as low as 1 ppt. ▪ In oneinstance, male fish beneath the outflow of a wastewater treatment plant emptying intoBoulder Creek, Colorado, underwent a sex change into female fish. The same thing couldbe observed experimentally by exposing male fish contained in tanks to water from the plantoutflow. The fish most likely to be affected were those closest to the outflow of the plant ▪ Incases occurring elsewhere, males don’t undergo a complete change in gender, but do exhibitfemale sexual traits such as having immature eggs in their testes. One of the places that these“intersex fish” have been observed is in the Potomac River in the Eastern United States.Female fish were not affected in any obvious way.35
Impacts on humans
The potent synthetic estrogen, diethylstilbestrol (DES) was a pharmaceutical prescribed topregnant women in the first trimester of pregnancy (the embryo phase) between 1948 and1971 to prevent miscarriages. DES caused no harm to the women taking it. But, 15 to 25years later, an epidemic of a rare cancer of the vagina occurred among young women.Because so much time had passed, it was difficult to discern the cause but the epidemic waseventually traced to the women’s mothers who had taken DES when pregnant. Somewhatless than one in 1000 daughters developed cancer. This was a major and disturbing finding:cancer in adults could develop as a result of in utero exposure many years before. ▪However,remember that DES is more potent than natural human estrogens, whereas environmentalhormones are typically very weak. And DES is a pharmaceutical deliberately taken in largedoses as compared to typically very low exposures to environmental hormones.
Is human health being harmed by exposure to bisphenol A?
It is reasonable to hypothesize that environmental hormones may be affecting humans.There is much concern now that the chemical, bisphenol A (BPA) – which is structurally
33 Chatterjee, R. Florida gators battle pesticides, the poor survival rates of alligator eggs are linked to lingeringtoxic chemicals in lakes. Environmental Science & Technology, 41(15), June 27, 2007, 5173–5174.
34 DDT is still used to “paint” the insides of homes in malaria-prone areas in Africa and elsewhere, and also to treatbed nets. In both cases, mosquitoes are repelled or killed by the DDT.
35 (1) Dickinson, B. and Neff, T. Effluent changes gender of fish. Scripps Howard News Service, December 12,2006, http://www.trib.com/articles/2006/12/12/news/regional/87a0a21fccb3d8a587257241006d1666.txt. (2)Barakat, M. More “Intersex Fish” Found in Potomac. Associated Press, September 07, 2006, http://lists.dep.state.fl.us/pipermail/pharmwaste/2006-September/000624.html.
83 Environmental hormones
similar to DES – may also have insidious effects.36 Billions of pounds are produced eachyear, used to make polycarbonate plastic baby bottles, sippy cups, and sports drinkcontainers, and BPA-based resin is used to line many food cans.37 BPA is found inhuman blood and urine at levels known to adversely impact mice. BPA is also verycontroversial: when a hazard assessment of BPA was done, two very different conclu-sions emerged.38
* High concern One group of 38 scientists, studying research on the issue concluded that, inrodents, low doses of BPA cause breast cancer, enlarged prostates, penis abnormalities,reduced sperm counts, early onset of puberty in females, type 2 diabetes, and neurologicaleffects.39 They pointed out that human exposure is within the range that brings aboutnegative effects in lab animals, and expressed concern about human exposure to BPA.These scientists examined all animal studies no matter whether BPA administration wasby mouth, skin absorption, or injection.
* Low concern Another group of scientists expressed fairly low concern about BPA.However, they discounted all studies except for those in which BPA was given bymouth. They justified this by saying that injecting BPA under the skin or into thebloodstream is invalid because, for exact doses to be determined, oral administrationwas necessary.
* Clarifying the controversy? Recently scientists in the high concern category carriedout a study concluding that the route of administration made no difference in fetusesand newborn mice: exposure by any means can cause adverse effects. Thus all thestudies, regardless of the route by which BPA was administered needed to beconsidered.
* The US Food and Drug Administration (FDA) The FDA considers BPA to be safe for usein food and beverage containers. However, several members of the US Congress haveexpressed concern. They asked the FDAwhat studies it used to determine that BPA is nota health risk to children or adults and also urged the FDA to reconsider its decision onBPA safety. Further, some members of Congress have requested that four manufacturersvoluntarily remove BPA from infant bottles and related products.40
36 Hileman, B. Bisphenol A safety: research results may call into question conclusions of a federal report.Chemical & Engineering News, 86(05), February 4, 2008, 9.
37 Bisphenol A (BPA) is a monomer used to make the polymer, polycarbonate. However, reactions are not 100%efficient, so not all the BPA is incorporated into polycarbonate. Some BPA remains free, able to leach out duringuse especially when heated, as when warming a baby’s bottle of milk.
38 (1) Hileman, B. Bisphenol A safety: research results may call into question conclusions of a federal report.Chemical & Engineering News, 86(05), February 4, 2008, 9. (2) Hileman, B. Bisphenol A vexations, twogovernment-convened panels reach nearly opposite conclusions on compound’s health risks. Chemical &Engineering News, 85(36), September 3, 2007, 31–33.
39 (1) Murray, T. J. et al. Induction of mammary gland ductal hyperplasia and carcinoma in situfollowing fetal bisphenol A exposure. Reproductive Toxicology, 23(3), April/May, 2007, 383–390.(2) Thacker, P. D. Plastics chemical alters female brains. Environmental Science & Technology, 40(13), July1, 2006, 4044.
40 Congress urges removal of BPA from packaging. Chemical & Engineering News, 86(19) May 12, 2008, 30.
84 Chemical toxicity
Is human health being harmed by exposure to phthalates?41
Another category of synthetic chemicals posing much concern as to possible impacts onhumans is the phthalate family. Well over a billion pounds of phthalates are manufacturedworldwide every year. Phthalates are used as plasticizers (softening agents) in children’spolyvinyl chloride toys and teething rings, in medical products, in paints and varnishes, andin many cosmetic and toiletry products including nail polish, soaps, shampoos, and perfumes.
* Human exposure Depending on the product being considered, and the particular phtha-late it contains, people ingest phthalates that leach from plastic products into food, inhalephthalates that become airborne, or absorb phthalates across the skin. The US Centers forDisease Control (CDC) confirmed that phthalates do get into the body. The CDC foundphthalates and their metabolites in human blood and urine. It is believed that most do notpose a health threat, but two phthalates were detected at levels higher than would beexpected on the basis of their production volume.42
* Animal studies Recent work indicates that when pregnant rats are exposed to even tinyamounts of certain phthalates,43 their male pups suffer adverse effects. Sperm-producingcells develop poorly in the pups and, at puberty, many are infertile. The higher the dosegiven to the dams, the greater the adverse effects observed in the pups.
* Human concerns The abnormalities seen in rats are relevant to how human testicularcancer is thought to develop. The question is asked, do phthalates in the blood of humanmothers affect their embryos?44 Moreover, it has been demonstrated that nursing babiesreceive phthalates from their mothers’ milk.45 Whether these are impacting health is stillnot definite, but the European Union and the US State of California has banned phthalatesfrom toys.
Questions 3.2
1. Should regulatory action be taken to limit human exposure to BPA? Why?
2. What would the precautionary principle recommend? Explain.
3. Some recommend going back to glass baby bottles or else that a different plastic be used.
What would you want to know about an alternative plastic before deciding whether it was
a good replacement?
41 ATSDR ToxFaqs. Oregon Health & Science University, 2001–2009, http://www.ohsu.edu/xd/research/centers-institutes/croet/outreach/toxfaq.cfm. This site offers short summaries of three phthalates: diethyl phthalate, di-n-butyl phthalate, and di-n-octylphthalate (DNOP).
42 Erickson, B. Risk from phthalates. Chemical & Engineering News, 86(51) December 22, 2008, 9.43 Not all individual chemicals in the phthalate family are equally problematic. A California law bans the
manufacture, sale, and distribution of – not all phthalates – but any toy or childcare product thatcontains more than 0.1% of di-(2-ethylhexyl) phthalate (DEHP), dibutyl phthalate (DBP), or benzyl butylphthalate (BBP).
44 Hileman, B. Chemical exposures: unusual cross-disciplinary meeting explores effects of environmental com-pounds on human development and reproduction. Chemical & Engineering News, 85(11) March 12, 2007,29–32.
45 Lubick, N. Plasticizers go from breast milk to baby. Environmental Science & Technology, 40(17) September 1,2006, 5166–5167.
85 Environmental hormones
Other hormone mimics
Estrogen mimics are the best-known environmental hormones, but there are others.
* In addition to human-produced pollutants that mimic estrogens, humans are exposed tophytoestrogens, natural plant estrogens. Phytoestrogens are found in soy-based babyformula used to feed infants unable to tolerate milk. These infants are exposed to doses ofisoflavones 6 to 11 times greater than levels known to show hormonal effects in adults.Effects may not be adverse, but soy-based infant formula is under suspicion and beingstudied for possible long-term effects especially because as many as 20% of infants arefed the soy formula. It is now recommended that soy be used only as a last resort.
* Many young men deliberately take androgens (male sex hormones) to accentuate theirphysiques and athletic abilities.
* In addition to estrogens and androgens, other pharmaceutical hormones are widely used.A major one is synthetic thyroid hormone.
* Thus millions of people deliberately take hormones. This makes it difficult to sort outhow industrial environmental hormones may fit into the picture.
Are environmental hormones impacting humans?
We know that animals have been affected by chemicals in the environment with hormonalproperties. It is hard to say at this point if humans are being affected. However, as you sawabove for phthalates and bisphenol A, many are seriously worried as to whether humans arebeing harmed.46,47 The University of Florida’s Louis J. Guillette Jr., who did much of thework that exposed DDT’s effects on alligators, warns that we must also look carefully forimpacts on humans.
Delving deeper
1. Look at the list of ingredients in liquid hand soaps (and an increasing number of other
products found in US stores). You will find a chemical called triclocarban. It is used as an
antiseptic. Most of this triclocarban ends up going down our sewers and is not destroyed by
sewage treatment plants, so it ends up contaminating water bodies. And because treated
sewage sludge is often spread on farmland, triclocarban is found on farm fields. Go to the
Internet and examine issues associated with trichlocarban. Does it serve a useful purpose?
Do we really need it? What problems could it cause? What does Dr. Stuart Levy of Tufts
University think of the way we use this chemical?
46 Colborn, T., Dumanoski, D., and Myers, J. P. Our Stolen Future. New York: Plume/Penguin, 1996.47 Collins, T. J. Persuasive communication about matters of great urgency: endocrine disruption. Environmental
Science & Technology, 42(20) October 15, 2008, 7555–7558.
86 Chemical toxicity
Further reading
Cancer: The news behind the numbers. Berkeley Wellness Letter, 23(4), January, 2007.Colborn, T., Dumanoski, D., andMyers, J. P.Our Stolen Future. NewYork: Plume/Penguin,
1996.Collins, T. J. Persuasive communication about matters of great urgency: endocrine disrup-
tion. Environmental Science & Technology, 42(20) October 15, 2008, 7555–7558.Hileman, B. Chemical exposures: cross-disciplinary meeting explores effects of environ-
mental compounds on human development and reproduction. Chemical &Engineering News, 85(11), March 12, 2007, 29–32.
Newman, C. Pick your poison: 12 toxic tales. National Geographic, 207(5), May,2005, 2–31.
Ottoboni, M.A. The Dose Makes the Poison: A Plain-Language Guide to Toxicology,second edition. New York: Wiley, 1997.
Raloff, J. Picturing pesticides’ impacts on kids. Science News, 153(23), June 6, 1998, 358.Tremblay, J. -F. China’s cancer villages. Chemical & Engineering News, 85(44), October
23, 2007, 18–21.Weinhold, R. Consensus reached on prenatal exposures (conclusion: it time to take action).
Environmental Science & Technology, 41(15) August 1, 2007, 5171–5172.
Internet resources
Diav-Citrin, O. and Koren, G. 2009. Human teratogens: a critical evaluation. MotheriskProgram, Hospital for Sick Children, Toronto, Ontario, Canada. http://www.nvp-volumes.org/p2_4.htm (June, 2009).
Dickinson, B. and Neff, T. 2006. Effluent changes gender of fish. Scripps Howard NewsService. http://www.trib.com/articles/2006/12/12/news/regional/87a0a21fccb3d8a587257241006d1666.txt (December 12, 2006).
Kiewra, K. 2007. Brain Pollution (impact of chemicals on children’s brains).Harvard Public Health Review. http://www.hsph.harvard.edu/review/winter07/brain.html (Winter, 2007).
2. Smuggler Mountain may not have left a “toxic legacy” to the children there. However, lead
may be having a much more serious impact in an African town. Examine the following
Reuter’s article: Shacinda, S. Mining leaves toxic legacy in Zambian town. June 21, 2007,
http://www.reuters.com/article/latestCrisis/idUSL19513545. Write or present a brief
report on your findings and conclusions.
87 Internet resources

Oniang’o, R. 2009. Africa’s hunger tragedy: where lies food safety? http://www.mayfield.co.nz/article.php?story=20090322080015686 (March 22, 2009).
National Institute of Environmental Health. 2007. Aflatoxin and liver cancer. http://www.niehs.nih.gov/health/impacts/aflatoxin.cfm (November 9, 2007).
US Fish &Wildlife Service. 2009. Environmental Contaminants Program. http://www.fws.gov/contaminants/index.cfm (June 29, 2009).
88 Chemical toxicity
4 Chemical exposures and risk assessment
“Ordinary risk analysis asks, How much environmental damage will be allowed?But the precautionary principle asks, “How little damage is possible?”
Thomas Prugh, WorldWatch Institute
How can we decide what is or is not safe? How much ozone should we allow in the air thatwe breathe? Howmuch arsenic in drinking water is safe?What level of dioxin in soil or foodis acceptable? These and similar questions regularly arise. Because we seldom have theluxury of answering “zero,” we must determine what level above zero is safe or essentiallysafe. The useful albeit imperfect tool of chemical risk assessment assists us in this effort.
Section I of this chapter points out that a chemical cannot be a risk unless there is exposureto it. Also discussed are body burdens. Section II reviews epidemiological studies –
investigations designed to detect relationships between exposure to a chemical and adversehealth effects. Section III introduces the four steps of chemical risk assessment, both forchemicals that do not cause cancer and for carcinogenic chemicals. Section IV brieflyexamines risk assessment for non-humans and in less-developed countries. Section Vexplores what practices are used to reduce a chemical’s risk, risk management. Theseinclude non-regulatory as well as regulatory approaches. Section VI looks at how chemicalrisk assessment is changing and how the regulation of chemicals may also be changed.
SECTION I
A hazardous chemical is only a potential risk. It becomes a risk only if you are exposed to it.So, no matter how hazardous a chemical is, it is not a risk without exposure.
Risk ¼ Hazard� Exposure
If there is exposure, we need to evaluate both the hazard of the chemical (its inherenttoxicity) and how much exposure there is.
Exposure1,2
There are thousands of hazardous chemicals. Many could pose a risk. To determine if thereis risk, ask yourself – is there exposure to it? If so, to what amounts? What is the route of
1 Evaluating exposure pathways. Chapter 6: Exposure evaluation. ATSDR. Public Health Assessment GuidanceManual, http://www.atsdr.cdc.gov/HAC/PHAManual/ch6.html.
2 EPA’s report on the environment: human exposure and health. US EPA, January 21, 2009, http://oaspub.epa.gov/hd/home#26.
exposure – is it through air, water, soil, or food (or more than one of these)? You havealready seen illustrations of exposures to hazardous chemicals: ▪ Exposure of children tolead at Smuggler Mountain and in houses with crumbling lead paint. ▪ Exposure of babiesto benzo[a]pyrene through contaminated carpets. ▪ Exposure of Yaqui Indian children topesticides through inhalation of sprayed pesticides, or eating food or drinking water con-taminated with pesticides.
Dioxins3
Think about chemicals in the dioxin family,4 and how exposure to dioxins can occur.▪ Combustion Dioxins form during poorly controlled combustion in municipal-wasteincinerators and other combustion sources – they are products of incomplete combustion.Dioxin particles released into air settle onto vegetation, and are eaten by cattle and otheranimals. Animals concentrate dioxins in their fat. Humans receive about 90% of their totalexposure to dioxins when they eat contaminated fatty meat such as hamburgers and fattydairy products. ▪ Chlorine-using processes A pulp mill using elemental chlorine to bleachpulp releases trace amounts of dioxins into their effluent. Released into a river, most dioxinis not soluble; most attaches to sediment particles. Bottom-feeding creatures ingest dioxinsas they eat the tiny organisms living there. From there, dioxins biomagnify in the food web(Figure 3.3). Fish that eat the contaminated organisms concentrate dioxin in their fat andlarger fish concentrate still more. Birds of prey, large mammals, and humans are exposedwhen they eat these fish. Several other industrial processes can produce dioxins as unin-tended by-products including the manufacture of chlorinated pesticides. Both the pulpbleaching process and the making of chlorinated pesticides have been modified to preventthe formation of chlorinated dioxins – P2.
Questions 4.1
Exposure to a substance can occur through air, water, soil, and food.
1 In thinking about how you can be exposed to pesticides, explain how exposure could
happen through each of these.
2 (a) People living in homes with peeling lead paint could be exposed to lead in what ways?
(b) If there was lead in the plumbing how would exposure occur?
3 What is a likely way that a baby or small child could be exposed to chemicals in toys?
4 When you use cosmetics or toiletry items, are you exposed to synthetic chemicals? Explain.
5 Would exposures to natural chemicals necessarily be safer? Explain.
3 Toxicity assessment (non-cancer and cancer effects for dioxins and PCBs). Region 8 US EPA, August 20, 2008,http://www.epa.gov/region8/r8risk/hh_toxicity.html.
4 Dioxins and furans are a family of chemicals. The most toxic is 2,3,7,8-tetrachlorodibenzo-p-dioxin (2,3,7,8-TCDD, often just called dioxin). The largest releases of dioxins today come from the open burning of householdtrash, municipal trash combustion, landfill fires, and agricultural and forest fires. See 2,3,7,8-tetrachlorodibenzo-p-dioxin. US EPA, http://www.epa.gov/ttn/atw/hlthef/dioxin.html [November 2007].
90 Chemical exposures and risk assessment
Body burden
Humans are exposured to chemicals in air, water, food, and soil. But what does exposureactually mean? Remember that, unless a chemical can act directly on skin or mucousmembranes, it must be absorbed into the body, become a body burden, before it can exerta toxic effect (Chapter 3). One health scientist gave the example: “What you really want toknow is notwhether asbestos is in the environment, but whether it’s in your lungs. If it didn’tget into your body, you don’t need to worry about health effects.” Once it is in your body, achemical or its metabolites may be measured in blood samples; it can also be measured inurine or feces after excretion. Such measuring is referred to as biomonitoring. In 2005 theUS Centers for Disease Control and Prevention (CDC) released its third National Report onHuman Exposure to Environmental Chemicals with results from biomonitoring 145 chem-icals in human blood and urine.5 ▪ Many of these chemicals were being monitored for thefirst time in this study, whereas others had been studied in earlier years too. Personnel doingthe CDC study traveled in a convoy of tractor-trailers to 30 locations around the UnitedStates. They interviewed 2500 adults and children and took samples of blood and urine.People monitored were selected as being representative of the entire US population includ-ing age, gender, race, and ethnicity. Box 4.1 summarizes the results for some chemicals.CDC will continue to collect new samples in upcoming years and to test for additionalchemicals not yet examined.
5 Third National Report on Human Exposure to Environmental Chemicals. CDC, 2005, http://www.cdc.gov/exposurereport.
6 The word metabolite refers to a substance produced when a living organisms converts a chemical into some otherchemical(s).
7 The US EPA is following CDC’s work. For EPA the problem is that the disciplines of toxicology andepidemiology are not nearly as advanced as is biomonitoring. So, whether one should be concerned or not istruly not known. However, a very ambitious study is addressing this concern. The National Children’s Study isfollowing 100 000 American children as they grow up. It monitors levels of environmental chemicals and looksfor any associations with disease. However, it will be a long time before the results are in.
Box 4.1 Some of the chemicals that CDC found in our bodies
* Cotinine is a nicotine metabolite.6 If found in blood or urine, it indicates exposure to tobacco
smoke. Compared to the early 1990s, the body burden of cotinine dropped 75% in adults,
probably due to regulations restricting smoking. It dropped only 58% in children and
cotinine levels were twice as high in children as in adults, probably because no regulations
apply to smoking at home.
* Pesticide metabolites7 ▪ CDC detected metabolites of the organophosphate pesticides,
chlorpyrifos and diazinon in urine. This is a concern because, although these metabolites
have short lives in the body, almost every person tested had them. This means people were
exposed shortly before testing, and indicates too that exposures are probably frequent.
Children had greater body burdens than adults perhaps because they metabolize these
pesticides differently than adults or because, pound per pound they take in more when
breathing, eating, and drinking. These two pesticides have been banned for household use,
91 Exposure
and the CDC will, in future studies, watch to see if levels in urine go down. ▪ DDE (the major
metabolite of DDT) had declined compared to pre-1990. This was expected because DDT
production was banned in 1973. However, even people born after DDTwas banned retained
small body burdens. Because of its long life, DDT persists in the environment, and may also
be entering the United States in imported food. Blood levels of DDE were about three times
higher in Mexican-American immigrants than in other immigrants, but it is not known
whether they were exposed in Mexico or in the United States.
* Phthalate metabolites8 Phthalates are chemicals used in plastic products such as children’s
toys to make them more flexible. They are also used in cosmetics, toiletry items, and
industrial solvents. Seven phthalate metabolites were found in urine. Investigators were
surprised that the metabolites found in the highest amounts did not come from the
phthalates used in the highest amounts. One phthalate found at higher than expected
amounts was diethyl phthalate used in soaps, perfumes, and shampoos. The CDC hypothe-
sized that direct skin contact with these products may explain this, if absorption across the
skin occurs. See discussion of phthalates in Chapter 3.
* Dioxins The CDC was encouraged to see that blood levels of dioxins, furans, and PCBs were
below detection limits. These chemicals were detectable in studies done in the 1980s.
Emissions from industrial sources have fallen about 80% since then, so decreased body
burdens are probably due to a fall in environmental levels.
* Twelve hazardous metals ▪ Because one of these metals, lead (Pb) has long been a major
children’s health concern, blood levels have been measured for decades. In 1990 (com-
pared to the late 1970s) children’s levels had dropped significantly, presumably because Pb
was banned from gasoline. In 1991–94, only 4.4% of children aged one to five still had
elevated blood lead levels. This has fallen to 2.2%. Children living in old lead-painted homes
are still at risk. The CDC believes blood levels of Pb greater than 10 μg /100 ml presents an
unacceptable health risk. ▪ Body burdens of cadmium (Cd) have remained steady. Even very
low levels may be associated with subtle kidney injury and increased risk of low bone
mineral density, and 5% of people aged 20 years or older had urinary Cd levels in their urine
near the level of concern. Cigarette smoking is considered the most likely source. More
research is needed into possible health effects of exposure to low levels of Cd. ▪ Mercury
(Hg) can adversely affect neurodevelopment in the developing fetus. Tests on women of
childbearing age showed all had blood levels of Hg below 5.8 ppb (5.8 μg/L) – the level
associated with adverse effects on the fetus. This could be considered good news except
5.7% of the women had levels within a factor of 10 of those associated with adverse effects
on the fetus; another report says up to 10%were in this category. Thus, close monitoring of
Hg is needed because we still don’t know what level of Hg can be considered safe. Eating
mercury-contaminated fish, primarily large fish, is the primary source of exposure. To lower
Hg levels in fish, the CDC recommends that society make more effort to lower Hg emissions
from electric power plants, waste incinerators, and chlorine production facilities. ▪ Otherhazardous metals detected by the CDC included cobalt, tungsten, and uranium.
8 Spotlight on phthalates, CDC’s Third National Report on Human Exposure to Environmental Chemicals. CDC,July, 2005, http://www.bhsj.org/eh/EnvHaz/factsheet_phthalates.pdf.
92 Chemical exposures and risk assessment
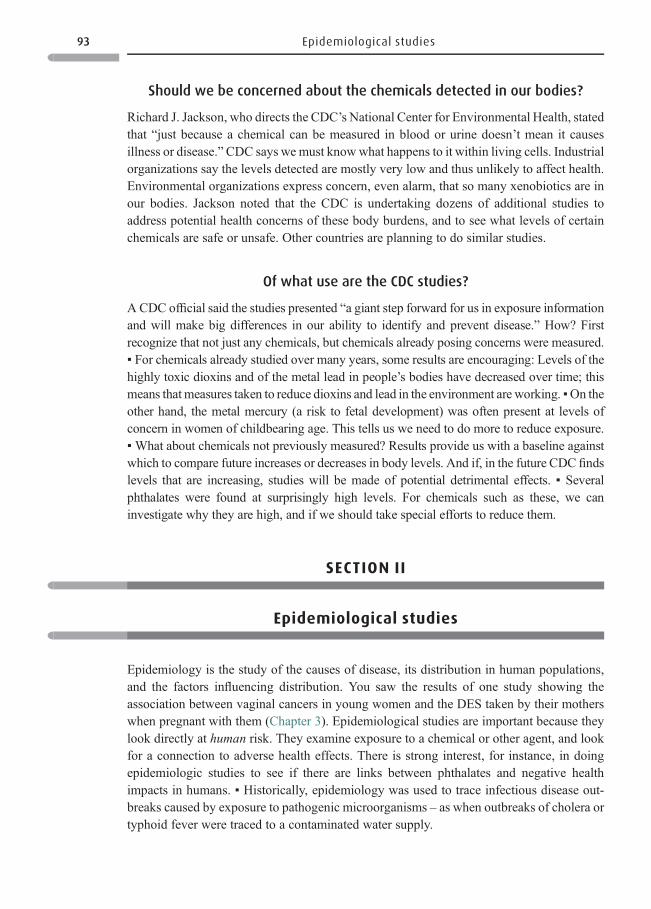
Should we be concerned about the chemicals detected in our bodies?
Richard J. Jackson, who directs the CDC’s National Center for Environmental Health, statedthat “just because a chemical can be measured in blood or urine doesn’t mean it causesillness or disease.”CDC says we must knowwhat happens to it within living cells. Industrialorganizations say the levels detected are mostly very low and thus unlikely to affect health.Environmental organizations express concern, even alarm, that so many xenobiotics are inour bodies. Jackson noted that the CDC is undertaking dozens of additional studies toaddress potential health concerns of these body burdens, and to see what levels of certainchemicals are safe or unsafe. Other countries are planning to do similar studies.
Of what use are the CDC studies?
ACDC official said the studies presented “a giant step forward for us in exposure informationand will make big differences in our ability to identify and prevent disease.” How? Firstrecognize that not just any chemicals, but chemicals already posing concerns were measured.▪ For chemicals already studied over many years, some results are encouraging: Levels of thehighly toxic dioxins and of the metal lead in people’s bodies have decreased over time; thismeans that measures taken to reduce dioxins and lead in the environment are working. ▪On theother hand, the metal mercury (a risk to fetal development) was often present at levels ofconcern in women of childbearing age. This tells us we need to do more to reduce exposure.▪What about chemicals not previously measured? Results provide us with a baseline againstwhich to compare future increases or decreases in body levels. And if, in the future CDC findslevels that are increasing, studies will be made of potential detrimental effects. ▪ Severalphthalates were found at surprisingly high levels. For chemicals such as these, we caninvestigate why they are high, and if we should take special efforts to reduce them.
SECTION II
Epidemiological studies
Epidemiology is the study of the causes of disease, its distribution in human populations,and the factors influencing distribution. You saw the results of one study showing theassociation between vaginal cancers in young women and the DES taken by their motherswhen pregnant with them (Chapter 3). Epidemiological studies are important because theylook directly at human risk. They examine exposure to a chemical or other agent, and lookfor a connection to adverse health effects. There is strong interest, for instance, in doingepidemiologic studies to see if there are links between phthalates and negative healthimpacts in humans. ▪ Historically, epidemiology was used to trace infectious disease out-breaks caused by exposure to pathogenic microorganisms – as when outbreaks of cholera ortyphoid fever were traced to a contaminated water supply.
93 Epidemiological studies
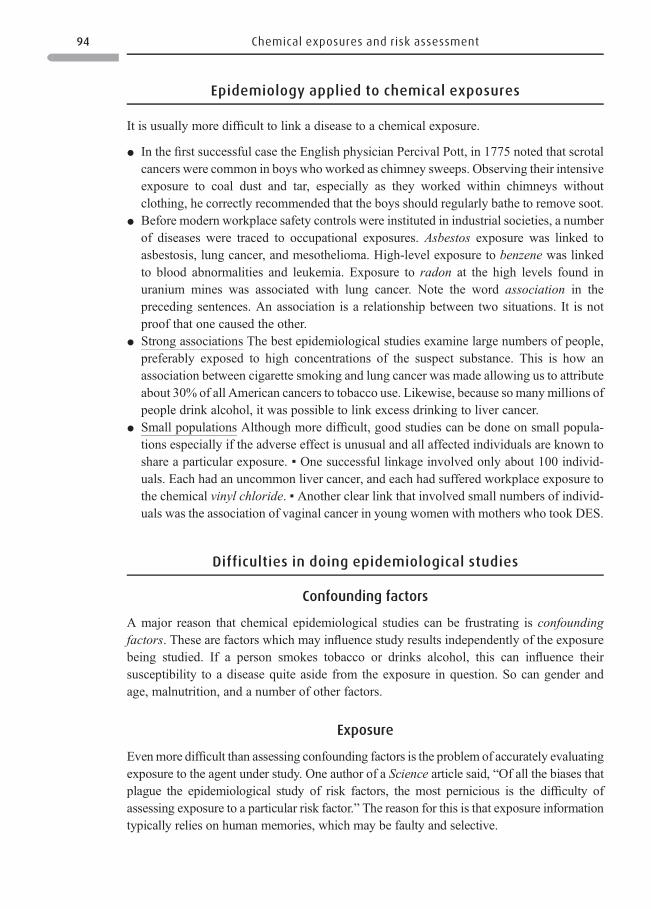
Epidemiology applied to chemical exposures
It is usually more difficult to link a disease to a chemical exposure.
* In the first successful case the English physician Percival Pott, in 1775 noted that scrotalcancers were common in boys who worked as chimney sweeps. Observing their intensiveexposure to coal dust and tar, especially as they worked within chimneys withoutclothing, he correctly recommended that the boys should regularly bathe to remove soot.
* Before modern workplace safety controls were instituted in industrial societies, a numberof diseases were traced to occupational exposures. Asbestos exposure was linked toasbestosis, lung cancer, and mesothelioma. High-level exposure to benzene was linkedto blood abnormalities and leukemia. Exposure to radon at the high levels found inuranium mines was associated with lung cancer. Note the word association in thepreceding sentences. An association is a relationship between two situations. It is notproof that one caused the other.
* Strong associations The best epidemiological studies examine large numbers of people,preferably exposed to high concentrations of the suspect substance. This is how anassociation between cigarette smoking and lung cancer was made allowing us to attributeabout 30% of all American cancers to tobacco use. Likewise, because so manymillions ofpeople drink alcohol, it was possible to link excess drinking to liver cancer.
* Small populations Although more difficult, good studies can be done on small popula-tions especially if the adverse effect is unusual and all affected individuals are known toshare a particular exposure. ▪ One successful linkage involved only about 100 individ-uals. Each had an uncommon liver cancer, and each had suffered workplace exposure tothe chemical vinyl chloride. ▪ Another clear link that involved small numbers of individ-uals was the association of vaginal cancer in young women with mothers who took DES.
Difficulties in doing epidemiological studies
Confounding factors
A major reason that chemical epidemiological studies can be frustrating is confoundingfactors. These are factors which may influence study results independently of the exposurebeing studied. If a person smokes tobacco or drinks alcohol, this can influence theirsusceptibility to a disease quite aside from the exposure in question. So can gender andage, malnutrition, and a number of other factors.
Exposure
Evenmore difficult than assessing confounding factors is the problem of accurately evaluatingexposure to the agent under study. One author of a Science article said, “Of all the biases thatplague the epidemiological study of risk factors, the most pernicious is the difficulty ofassessing exposure to a particular risk factor.” The reason for this is that exposure informationtypically relies on human memories, which may be faulty and selective.
94 Chemical exposures and risk assessment
Community studies
So-called community studies are usually very unsatisfying. These are carried out in com-munities that appear to have an excessive rate or cluster of a particular disease. Almost anycommunity, by chance, will have excess rates of some diseases, but people may suspect thatthe disease results from a common exposure, perhaps a drinking-water contaminant,chemicals in a community hazardous waste site, or air emissions from a manufacturingfacility. To follow up on community concerns, epidemiologists must first determine if thereis indeed a cluster. This is difficult. For instance, how do they decide on a boundary aroundthe area where the suspect disease occurs? If the cluster appears real or, sometimes even if itdoesn’t, epidemiologists look for an exposure shared by the individuals who have thedisease. However, the population is usually too small to make successful statistical con-nections. It’s especially difficult to evaluate exposure if individuals knowwhy they are beingstudied – bias creeps into the study. But community studies continue to be demanded byanxious and suspicious residents. Because it is so difficult to reach conclusions for a singlecommunity, some investigators take a multi-site approach, i.e., results from a number ofsimilar sites are pooled (such as a number of communities with similar hazardous wastesites). The data are analyzed to see if more definitive results are obtained than for onecommunity alone. These studies too are controversial.
Judging epidemiological studies
Harvard epidemiologist, Professor D. Trichopoulos, observed that epidemiologists can be “anuisance to society. People don’t take us seriously anymore, and when they do take usseriously, we may unintentionally do more harm than good.” This can happen if studyresults are reported with fanfare in the news media. This makes it difficult for the personreceiving the information to judge how seriously to take it. Here are some questions to ask tohelp judge a study.
* Is this the first study on this agent, or have there been several studies all showing fairlyconsistent results? Exposure to very fine particulate matter in the air is a case in whichmany studies have shown that, as air levels of particulates increase, so do hospitaladmissions for respiratory diseases and some heart problems.
* How many people were studied –many thousands, just a few hundred, or even fewer? Inone case several small studies indicated an association between a high-fat diet andincreased breast cancer risk. But a careful study of 121 000 nurses followed for 20years showed no association. However, although respected, this study did not close thediscussion of an association between fat intake and breast cancer as other studies continueto be performed.
* Were confounding variables, such as age, smoking, diet, or other lifestyle factorsconsidered? In the case of the 121 000 nurses mentioned above, their backgroundswere well known. This allowed correction for confounding factors
* Is the disease rare? This may allow it to be more easily linked to a risk factor. Was it forexample an increase in a specific rare cancer or a general increase in all cancers?
95 Epidemiological studies
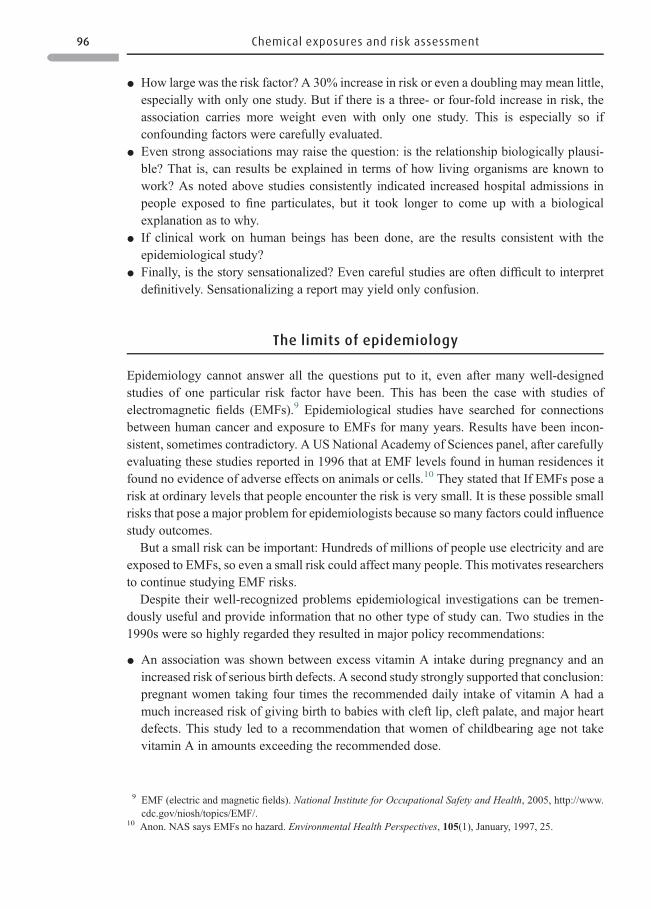
* How large was the risk factor? A 30% increase in risk or even a doubling may mean little,especially with only one study. But if there is a three- or four-fold increase in risk, theassociation carries more weight even with only one study. This is especially so ifconfounding factors were carefully evaluated.
* Even strong associations may raise the question: is the relationship biologically plausi-ble? That is, can results be explained in terms of how living organisms are known towork? As noted above studies consistently indicated increased hospital admissions inpeople exposed to fine particulates, but it took longer to come up with a biologicalexplanation as to why.
* If clinical work on human beings has been done, are the results consistent with theepidemiological study?
* Finally, is the story sensationalized? Even careful studies are often difficult to interpretdefinitively. Sensationalizing a report may yield only confusion.
The limits of epidemiology
Epidemiology cannot answer all the questions put to it, even after many well-designedstudies of one particular risk factor have been. This has been the case with studies ofelectromagnetic fields (EMFs).9 Epidemiological studies have searched for connectionsbetween human cancer and exposure to EMFs for many years. Results have been incon-sistent, sometimes contradictory. A US National Academy of Sciences panel, after carefullyevaluating these studies reported in 1996 that at EMF levels found in human residences itfound no evidence of adverse effects on animals or cells.10 They stated that If EMFs pose arisk at ordinary levels that people encounter the risk is very small. It is these possible smallrisks that pose a major problem for epidemiologists because so many factors could influencestudy outcomes.
But a small risk can be important: Hundreds of millions of people use electricity and areexposed to EMFs, so even a small risk could affect many people. This motivates researchersto continue studying EMF risks.
Despite their well-recognized problems epidemiological investigations can be tremen-dously useful and provide information that no other type of study can. Two studies in the1990s were so highly regarded they resulted in major policy recommendations:
* An association was shown between excess vitamin A intake during pregnancy and anincreased risk of serious birth defects. A second study strongly supported that conclusion:pregnant women taking four times the recommended daily intake of vitamin A had amuch increased risk of giving birth to babies with cleft lip, cleft palate, and major heartdefects. This study led to a recommendation that women of childbearing age not takevitamin A in amounts exceeding the recommended dose.
9 EMF (electric and magnetic fields). National Institute for Occupational Safety and Health, 2005, http://www.cdc.gov/niosh/topics/EMF/.
10 Anon. NAS says EMFs no hazard. Environmental Health Perspectives, 105(1), January, 1997, 25.
96 Chemical exposures and risk assessment
* Birth defects were also the subject of another study. In this case the problem was too littlefolic acid, a B vitamin, in pregnant women’s diets. See Figure 3.2. A lack was stronglyassociated with serious birth defects such as spina bifida (in which the spinal cord is notcompletely encased in bone) and anencephaly (in which a major part of the brain does notdevelop). The association was so clear that it too led to action: producers of flour andcereals began adding folic acid to assure that women of childbearing age had a sufficientintake.
Questions 4.2
1 Think about the sentence, “Alternative products are available to substitute for DEHP.” If you
were responsible for examining alternatives for this phthalate, what would you want to
know? As you think about this, consider problems that can arise with alternatives as seem in
the following two cases. (a) The metal, lead, used for many years as an antiknock agent in
gasoline, is particularly dangerous to the fetus and small child. Lead in gasoline was finally
replaced by the chemical, benzene. However, benzene is a known human carcinogen. (b)
An oxygen-containing chemical is added to gasoline to promote its cleaner burning. In the
United States, methyl tertiary butyl ether (MTBE) was widely used for this purpose.
However, MTBE proved more water soluble than expected, and became a widespread
water contaminant. Now, it is being replaced, often with ethanol. So, should such cases
dissuade you from looking for alternatives? Explain.
2 (a) In those countries that have not yet banned lead in gasoline, how could small children be
exposed to the lead? (b) How do they continue to be exposed years after lead has been
banned from gasoline?
3 Epidemiological studies of potential effects of phthalates on humans are needed, but
getting good results could take many years. What action should society take now? Explain.
4 You read that a careful study of 121 000 nurses did not show an association between fat
intake and breast cancer. Why would additional studies on this question be continuing?
5 A few years ago, two professors in the Chemistry Department of the University of Maine
died within several years of each other of the same rare brain cancer. The situation was
investigated by CDC staff to no avail. What might CDC have looked for? Why couldn’t they
come to a conclusion?
6 Examine Box 5.6, which reports on the relationship between disease and tiny particulates in
the air. What criteria for successful epidemiological studies did these studies fulfill?
7 Studies show that about 60 of about 4000 substances in tobacco smoke are carcinogens in
laboratory animals including tar, nicotine, formaldehyde, and benzene. In humans, 24 of 30
epidemiological studies support the conclusion that non-smokers exposed to secondhand
smoke have a greater lung cancer risk than do unexposed people. (Secondhand smoke is
the side stream smoke emitted between puffs of a cigarette plus the smoke exhaled by the
smoker.) (a) Do these results indicate to you that secondhand smoke is a cancer risk?
Explain. (b) What circumstances might increase the risk of developing cancer as a result of
exposure to secondhand smoke?
97 Epidemiological studies
SECTION III
Chemical risk assessment
Risk is defined as the probability of suffering harm from a hazard. A hazard is the source of therisk – not the risk itself. For a hazard to pose a risk to you, you must be exposed to it. ▪ To helpyou make the distinction, look at Questions 3.1, which compared lead at Smuggler ’sMountainto lead in peeling paint in old houses. Lead is the hazard in both cases, but its risk differs in the
8 American farmers have higher rates of non-Hodgkin’s lymphoma as compared to the
general population. Think about the lifestyle of farmers. What environmental exposures
other than pesticides might contribute to their increased cancer rate?
9 Weigh the pros and cons of a study done to see if there was an association between nitrate
levels in drinking water and bladder cancer. In the Midwestern US state of Iowa, large
amounts of nitrogen fertilizer have been used on agricultural fields for many years. Nitrate
runoff from these fields has reached the drinking water of many municipalities; it is in
drinking water at greater than 5 ppm inmany cases. In 2001, University of Iowa researchers
reported the results of a study on 21 977 women in Iowa. The women studied had drunk
from the same water supply for more than ten years, and only communities where at least
90% of the water supply came from a single source were included in the study. Each
woman’s nitrate exposure was estimated on the basis of the level in the water she drank.
Results were adjusted for confounding factors (smoking, age, education, physical activity,
and quantities of fruits and vegetables consumed). Researchers found a statistical link
between nitrate in drinking water and an increased risk of bladder cancer. Women who
drank water containing more than 2.5-ppm nitrate had a risk factor of 2.8 – they were
almost three times more likely to develop bladder cancer than women whose drinking
water contained less than 0.36-ppm. One author of the study noted that because therewere
only 47 cases of bladder cancer among the 21 977 women, the association must be
considered moderate. Still, the authors believed that the results are biologically plausible
as the body can convert nitrate into N-nitroso compounds, known carcinogens. The results
raised concern because they associated bladder cancer with nitrate levels as low as 2.5-ppm
whereas the US EPA standard for nitrate in drinking water is 10-ppm. The 10-ppm standard
was set 50-years ago to avoid cases of blue baby syndrome.11 At that time, possible chronic
effects of nitrate such as cancer were not considered. Based on these results, some persons
suggest that EPA should lower its drinking-water standard for nitrate. However, other
epidemiologists evaluating the study did not believe that the study showed a meaningful
association between nitrate at the levels studied and bladder cancer. If you had to come to a
tentative conclusion as to whether there is an association between nitrate in drinking water
at 2.5 ppm and bladder cancer, what would you conclude? Explain.
11 Blue baby syndrome. Wikipedia, February 25, 2009, http://en.wikipedia.org/wiki/Blue_baby.
98 Chemical exposures and risk assessment
two situations. ▪ Similarly, think about walking into a cotton field sprayed with a hazardousinsecticide. Your exposure to the insecticide, and your risk, differs if the field was sprayed1 hour previously as compared to 24 hours previously. ▪ The word hazard goes beyondchemical hazards: infectious disease organisms are biological hazards. Ionizing radiation andhot water are examples of physical hazards. ▪ Chemical risk assessment is a process thatsystematically examines the nature and magnitude of a risk from a chemical. A risk has aprobability from zero to one. Zero indicates no risk at all, and one indicates definite harm.
Why do we do chemical risk assessments?
Risk assessment provides answers to questions such as, what is the risk to my child’s healthof drinking water containing 3 parts per billion of atrazine (an herbicide). What is my risk if Ieat meat containing 1 part per billion of the carcinogen, benzopyrene? What is the risk to aworker who is breathing air containing 1 ppm of the carcinogen, benzene? Howmuch of thecarcinogen, dioxin can safely be left in the soil of a hazardous-waste site, which is beingcleaned up?What should be the standard (the limit) for ozone in city air? What should be thestandard for arsenic in drinking water?
▪ A situation in which chemical risk assessment is often used is in analyzing the risks ofhazardous waste sites. However, such sites often have too many chemicals to evaluate eachchemical individually. Instead, investigators first determine which chemicals are present andin what amounts. Then they do risk assessments on indicator chemicals, those that might posethe greatest likelihood of risk to nearby populations. ▪ In Chapter 2 you read of comparativerisk assessment, where one environmental risk is compared to another as whenwe ask, what isthe risk of stratospheric ozone depletion as compared to the risk of acid deposition? Manyenvironmental risks such as ozone depletion and acid deposition also involve chemicals; thus,chemical risk assessment is sometimes important in comparative risk assessment too.
• How do we decide when a risk assessment is warranted? First, we must answer thequestion: is there exposure? If so, then the chemicals of most concern are the most toxicones, or the ones to which we have high exposure. Chemicals on which risk assessments areoften done include pesticides. A pesticide’s purpose is to kill, and it may harm species otherthan those it was intended to kill. So we do a risk assessment on any new pesticide. ▪ Foodadditives will be ingested, so exposure will definitely occur. So risk assessment is done onnew additives. ▪ However, there are many chemicals already in use that we are exposed to,but whose risk has not been systematically studied. More and more people want thesesubjected to risk assessments too.
The answers that chemical risk assessment provides are important. However, as you studythe section below, notice that risk assessment is not, and cannot be, precise because we veryseldom have enough information. Indeed, risk assessment helps to compensate for a lack ofinformation. As a US Occupational Safety and Health Agency (OSHA) official stated,“People need to understand that we do risk assessment because we don’t have conclusivescientific evidence available. Risk assessment is not science; it is a set of decision tools tohelp us make informed decisions in the absence of definitive scientific information.” Thetools of risk assessment do help us evaluate environmental risks and set priorities among
99 Chemical risk assessment
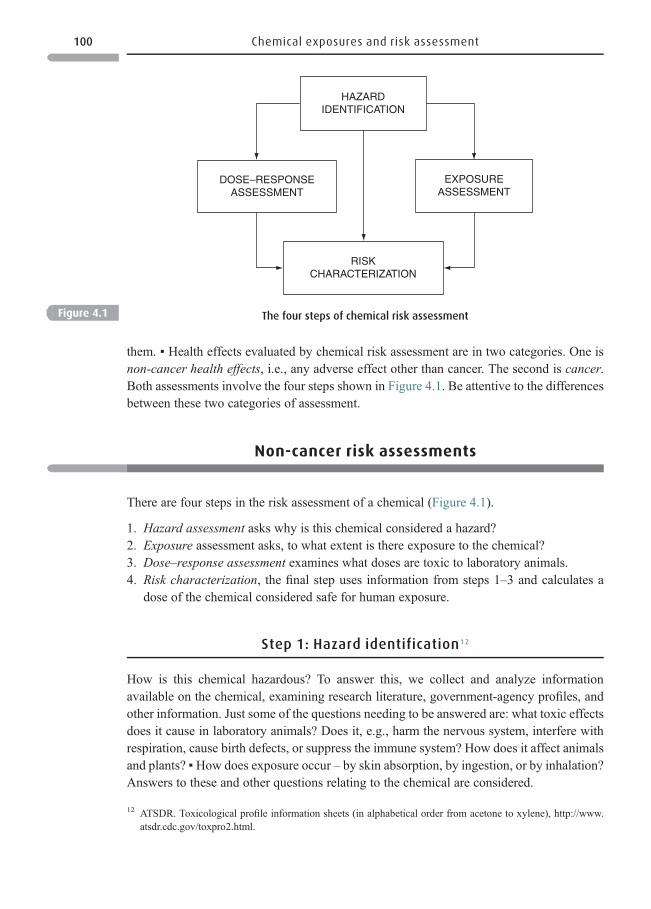
them. ▪ Health effects evaluated by chemical risk assessment are in two categories. One isnon-cancer health effects, i.e., any adverse effect other than cancer. The second is cancer.Both assessments involve the four steps shown in Figure 4.1. Be attentive to the differencesbetween these two categories of assessment.
Non-cancer risk assessments
There are four steps in the risk assessment of a chemical (Figure 4.1).
1. Hazard assessment asks why is this chemical considered a hazard?2. Exposure assessment asks, to what extent is there exposure to the chemical?3. Dose–response assessment examines what doses are toxic to laboratory animals.4. Risk characterization, the final step uses information from steps 1–3 and calculates a
dose of the chemical considered safe for human exposure.
Step 1: Hazard identification12
How is this chemical hazardous? To answer this, we collect and analyze informationavailable on the chemical, examining research literature, government-agency profiles, andother information. Just some of the questions needing to be answered are: what toxic effectsdoes it cause in laboratory animals? Does it, e.g., harm the nervous system, interfere withrespiration, cause birth defects, or suppress the immune system? How does it affect animalsand plants? ▪How does exposure occur – by skin absorption, by ingestion, or by inhalation?Answers to these and other questions relating to the chemical are considered.
RISKCHARACTERIZATION
HAZARDIDENTIFICATION
DOSE–RESPONSEASSESSMENT
EXPOSUREASSESSMENT
Figure 4.1 The four steps of chemical risk assessment
12 ATSDR. Toxicological profile information sheets (in alphabetical order from acetone to xylene), http://www.atsdr.cdc.gov/toxpro2.html.
100 Chemical exposures and risk assessment
Step 2: Dose–response assessment
* Find a dose safe to laboratory animals. Expose separate groups of animals to increasingdoses of the chemical. Observe the response to each dose over days, weeks, months, orlonger. A control group does not receive the test chemical. A second group receives a lowdose. A third group receives a larger dose. A fourth group receives a yet larger dose. ▪ Thehighest dose that animals tolerate without showing ill effect is the no observed adverseeffect level (NOAEL). See Figure 3.1. But, what we really want to determine is a dose thatis safe to humans exposed to it, even a lifetime of exposure. So, we divide the NOAEL bya safety factor.
* Determine a safety factor. To do this, assume a human is 10 times more sensitive than testanimals. ▪ Also, assume that some humans are 10 times more sensitive than the leastsensitive. This means multiplying 10 by 10 to yield a safety factor of 100. ▪ If the animaldose–response study is not of high quality, introduce another multiple of 10 to increasethe safety factor to 1000. If children are exposed to the chemical, then even if the data areof good quality, increase the safety factor to 10 000 (Box 4.3).
* Determine the reference dose. Divide NOAEL by the safety factor. This gives thereference dose, RfD. The reference dose is considered to be safe for humans over alifetime of exposure. The smaller the RfD, the more toxic is the chemical. Example: whatis the RfD of a chemical with a NOAEL in rats of 1mg/kg/day (1 milligram per kilogramof animal body weight per day), and for which the animal data are good. To calculate,divide 1mg/kg/day by 100. This yields an RfD of 0.01mg/kg/day. (The RfD is some-times also called the acceptable daily intake, ADI.)
Box 4.2 Reducing exposure of male infants to phthalates
Chapter 3 brought up the potential dangers of chemicals capable of acting as hormones. In
particular, how might such chemicals impact the rapidly developing organs of fetuses, babies,
and tiny children? Think about di(2-ethylhexyl) phthalate (DEHP), a phthalate known to
adversely affect laboratory animals. Using DEHP as a plastic softener in intravenous (IV) bags
and tubing is a major issue because DEHP can leach from the bags into the fluid within them –
and then directly enter the blood stream. There is concern that DEHP poses special risks to the
developing reproductive tracts of critically ill male infants who sometimes have prolonged
exposure through IV bags. Newborns, with developing testicles are believed to be at greatest
risk. ▪ Phthalates (including DEHP) are already banned from plastic toys for children under
three in Europe. Europe also banned DEHP use in cosmetics. An earlier European evaluation of
DEHP for use in medical devices concluded that the benefit outweighed the risk; but, as more
information accumulates, the EU’s decision may change. Health Canada issued a strong
warning that medical devices containing DEHP should not be used to treat infants, young
boys, pregnant women, and nursing mothers. The US FDA expressed concern, saying precau-
tions should be taken to limit exposure of the developing male. Environmental organizations
call for hospitals to use alternatives, which are available.
101 Non-cancer risk assessments
Box 4.3 Why use factors of 10?
Sulfonamides, the first antibiotic drugs, came into use in the 1930s. In 1937 a US drug company
dissolved sulfonamides in a sweet-tasting organic chemical, diethylene glycol (an antifreeze).
Its sweet taste made it attractive to children. The drug company sold this elixir of sulfonamide–
diethylene glycol without first testing the toxicity of the glycol in animals. Subsequently, about
120 people around the United States died, many of them children. This event led directly to the
1938 passage of an amended Federal Food Drug and Cosmetics Act (FFDCA) to assure that such
a tragedy would not occur again.
After discovering the illnesses and deaths, US Food and Drug Administration personnel
traveled the country by train collecting information on the amount of diethylene glycol that
each affected individual drank. From this information, agency personnel calculated an approx-
imate LD50 for human beings – the dose killing about half of the people exposed to it. They
observed about a 10-fold variation in human sensitivity to the chemical. Returning to their
laboratories, they tested the toxicity of diethylene glycol in animals. They found that animals
too had about a 10-fold variation in sensitivity. Beginning at this time FDA began the practice
of dividing a chemical’s NOAEL by 100 (10 × 10) to provide a margin of safety for humans:
humans should not be exposed to more than a hundredth of the dose that shows no adverse
effects in animals. In recent years, if good information on a particular chemical is available, the
US EPA determines a safety factor more specific to that chemical which may be greater than or
less than 100. However, in 1996 after the US Congress passed the Food Quality Protection Act13
another factor of 10 was introduced for chemicals to which children are exposed, especially
pesticides. This means dividing the NOAEL by 1000 (at least) to obtain a safe dose.
Although the elixir of sulfonamide provided a dreadful lesson, not everyone learned it. In the
1990s, a Chinese company shipped medicinal glycerin syrup to Haiti – it contained diethylene
glycol. Eighty-six Haitian children who consumed the syrup died of kidney failure.14 More
recently, yet other cases have occurred.
Human subjects Years ago human volunteers were used in chemical testing, a practice
discontinued because of ethical concerns. More recently, pesticide manufacturers did 15
studies using paid adult human volunteers. The volunteers ingested doses of pesticides
expected to be below the human NOAEL. Companies performed human tests with the hope
of proving the pesticides safety in humans at the doses used. Having human information
would allow one factor of 10 – the one used to account for differences between humans and
animals – to be dropped. This would lead to higher RfD values for pesticides if humans were
less sensitive than test animals. Manufacturers say that such tests are similar to those done to
test the toxicity of a new pharmaceutical. The EPA sought guidance about whether to allow the
use of human data. In response, a National Research Council panel called for the EPA “to set up
a safety and ethics system similar to the US Food and Drug Administration’s oversight of
human drug testing.” The panel concluded that such testing might be justified when there is
enough known to ensure no long-term harm to participants. However, several US legislators
13 Food Quality Protection Act, Children and Consumers. US EPA, October 2000, http://www.epa.gov/oecaagct/factsheets/epa-305-f-00-005.pdf.
14 Diethylene glycol. Wikipedia, March 5, 2009, http://en.wikipedia.org/wiki/Diethylene_glycol.
102 Chemical exposures and risk assessment
Step 3: Exposure assessment17
A number of questions arise relating to human exposure to a chemical.
* Source What are sources of the chemical? Are emissions from an industrial facility?Motor vehicle exhaust? Awaste dump leaching chemicals into groundwater? Are emis-sions to air or water?
* Route of exposure How does exposure occur? ▪ If through drinking water, what is itsconcentration? How much does an average person drink? ▪ If exposure is through food,what foods? What is the concentration in each food, and how much of each is eaten? ▪ Ifthrough soil, what is its concentration, and howmuch soil is ingested or inhaled (as dust)?▪ If through air, what is its concentration in air, and how much is inhaled? ▪ And howeverexposure occurs, for how long does it continue?
* Most highly exposed population ▪ Some Native Americans eat large amounts of fish, withresulting high exposure to chemicals that concentrate in fish such as PCBs or methyl-mercury. ▪ Children are most likely to ingest soil, and are at special risk from soilcontaminants. ▪ Small children living in houses with deteriorated lead paint have highlead exposures. ▪ Urban dwellers may have the highest exposure to motor vehicleexhaust. ▪Urban people drinking disinfected water are likely to have the highest exposureto disinfection by-products. ▪ Rural people drinking well water may have the highestexposure to radon, nitrate, and arsenic. ▪ Individuals living near a hazardous waste sitewill likely have the highest exposures to chemicals released from that site.
* Children Give special consideration to children’s exposure.* Worst-case assumptions There is seldom enough information for a good exposure
evaluation. To compensate, worst-case assumptions are often used. This refers to thehighest possible exposure that could occur.
and many others called any human testing immoral and illegal and asked the EPA not to allow
it. Later, the US Congress passed legislation preventing EPA from relying on tests that expose
pregnant women, infants, and children to pesticides as it considers permits for pesticides.15
• Thereafter the EPA issued a different type of guidelines not for the type of industry studies
just noted, but for the studies of US EPA scientists who monitor exposures that occur when
people are exposed to chemicals during their usual daily activities.16
15 EPA’s latest human pesticide testing rule called illegal, immoral. Environment News Service, January 25, 2006,http://www.ens-newswire.com/ens/jan2006/2006-01-25-05.asp. (2) Renner, R. Human pesticide testing getsqualified OK. Environmental Science & Technology, 38(10), May 15, 2004, 175A–176A. (3) Taylor,A. Congress banning use of data from pesticide tests on pregnant women, newborns, infants and fetuses.Associated Press, July 29, 2005, http://www.ahrp.org/infomail/05/07/28.php.
16 Exposure Research, Scientific and Ethical Approaches for Observational Exposure Studies.US EPA, September8, 2008, www.epa.gov/nerl/sots/.
17 Exposure Factors Handbook. National Center for Environmental Assessment,US EPA, December 4, 2008,http://cfpub.epa.gov/ncea/cfm/recordisplay.cfm?deid=12464.
103 Non-cancer risk assessments
Step 4: Risk characterization
Risk characterization brings together everything learned about the chemical’s hazards,dose–response data, and human exposure. This information is used to calculate its risk, itshazard quotient. ▪ If more than one chemical is being evaluated (as when evaluating severalchemicals at a hazardous waste site) the hazard quotients are added together to yield a higherrisk. ▪ If there are multiple pathways of exposure to a chemical (food plus water, forexample) these are added together to yield a higher risk. ▪ Remember from dose–responsestudies that an RfD is the dose considered safe over a lifetime of exposure. So, if achemical’s hazard quotient is less than its RfD, it is not considered a risk (Box 4.4).
Cancer risk assessment
To do a risk assessment on a chemical that may cause cancer takes four to six years, and costsseveral million dollars. These factors limit the number of chemicals tested. Only a chemicalfor which there are strong reasons to suspect that it is a carcinogen is tested. Only about 500chemicals have been so evaluated. There are four steps of cancer risk assessment.
Step 1: Hazard identification
Hazard identification is particularly important when considering a possible carcinogen.What are the reasons to suspect the chemical is a carcinogen? For instance, is it chemically
18 EPA’s definition of pesticide tolerance is “the amount of pesticide residue allowed by law to remain in or on aharvested crop. EPA sets these levels well below the point where the compounds might be harmful to consumers.”
19 Pesticides: regulating pesticides, tolerance reassessment. US EPA, February 12, 2009, http://www.epa.gov/oppsrrd1/tolerance/reassessment.htm.
Box 4.4 A giant risk assessment
In 1996 the US Congress passed the Food Quality Protection Act (FQPA). Congress gave the US EPA
a giant task. ▪ The EPA had to review all its current tolerances for 470 pesticides (many of which
havemore than one tolerance level depending on the particular food).18 All together the EPA had
to review 9700 tolerances set in earlier years. ▪ The EPA was instructed to determine not just the
risks of one pesticide at a time, but to determine the cumulative risk fromall pesticides that shared
a common mechanism of toxicity. Thirty organophosphate pesticides and a dozen carbamate
pesticides share a commonmode of toxicity. Adding all these risks together was expected to yield
a higher risk than any calculated in the past. ▪ The EPA also needed to consider all possible routes
of exposure not just exposure from food, but also drinking water, and any indoor uses. ▪ And, insetting new tolerance levels, the EPA was instructed to pay particular attention to children.
Without compelling evidence that children are protected, the EPA must apply an additional 10-
fold safety factor. The EPA’s jobwas to finish all these determinations by 2006. It did actually finish
in 2007. Afterwards the EPA stated that, “Completing tolerance reassessment ensures that all
pesticides used on food in the United States meet the FQPA’s more stringent safety standard. This
is an enormous milestone in US food safety and human health protection.”19
104 Chemical exposures and risk assessment
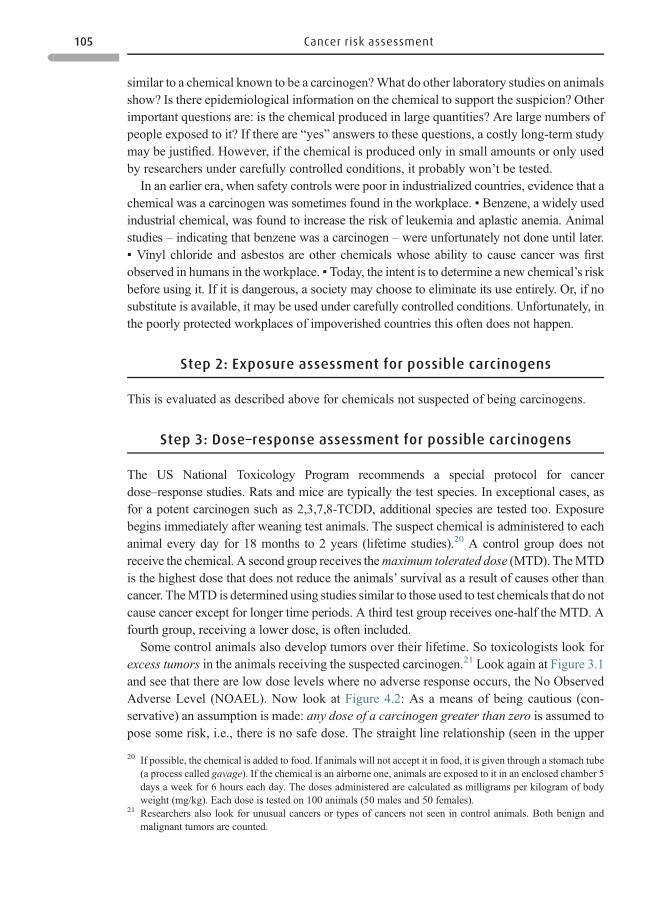
similar to a chemical known to be a carcinogen?What do other laboratory studies on animalsshow? Is there epidemiological information on the chemical to support the suspicion? Otherimportant questions are: is the chemical produced in large quantities? Are large numbers ofpeople exposed to it? If there are “yes” answers to these questions, a costly long-term studymay be justified. However, if the chemical is produced only in small amounts or only usedby researchers under carefully controlled conditions, it probably won’t be tested.
In an earlier era, when safety controls were poor in industrialized countries, evidence that achemical was a carcinogen was sometimes found in the workplace. ▪ Benzene, a widely usedindustrial chemical, was found to increase the risk of leukemia and aplastic anemia. Animalstudies – indicating that benzene was a carcinogen – were unfortunately not done until later.▪ Vinyl chloride and asbestos are other chemicals whose ability to cause cancer was firstobserved in humans in the workplace. ▪ Today, the intent is to determine a new chemical’s riskbefore using it. If it is dangerous, a society may choose to eliminate its use entirely. Or, if nosubstitute is available, it may be used under carefully controlled conditions. Unfortunately, inthe poorly protected workplaces of impoverished countries this often does not happen.
Step 2: Exposure assessment for possible carcinogens
This is evaluated as described above for chemicals not suspected of being carcinogens.
Step 3: Dose–response assessment for possible carcinogens
The US National Toxicology Program recommends a special protocol for cancerdose–response studies. Rats and mice are typically the test species. In exceptional cases, asfor a potent carcinogen such as 2,3,7,8-TCDD, additional species are tested too. Exposurebegins immediately after weaning test animals. The suspect chemical is administered to eachanimal every day for 18 months to 2 years (lifetime studies).20 A control group does notreceive the chemical. A second group receives themaximum tolerated dose (MTD). TheMTDis the highest dose that does not reduce the animals’ survival as a result of causes other thancancer. TheMTD is determined using studies similar to those used to test chemicals that do notcause cancer except for longer time periods. A third test group receives one-half the MTD. Afourth group, receiving a lower dose, is often included.
Some control animals also develop tumors over their lifetime. So toxicologists look forexcess tumors in the animals receiving the suspected carcinogen.21 Look again at Figure 3.1and see that there are low dose levels where no adverse response occurs, the No ObservedAdverse Level (NOAEL). Now look at Figure 4.2: As a means of being cautious (con-servative) an assumption is made: any dose of a carcinogen greater than zero is assumed topose some risk, i.e., there is no safe dose. The straight line relationship (seen in the upper
20 If possible, the chemical is added to food. If animals will not accept it in food, it is given through a stomach tube(a process called gavage). If the chemical is an airborne one, animals are exposed to it in an enclosed chamber 5days a week for 6 hours each day. The doses administered are calculated as milligrams per kilogram of bodyweight (mg/kg). Each dose is tested on 100 animals (50 males and 50 females).
21 Researchers also look for unusual cancers or types of cancers not seen in control animals. Both benign andmalignant tumors are counted.
105 Cancer risk assessment
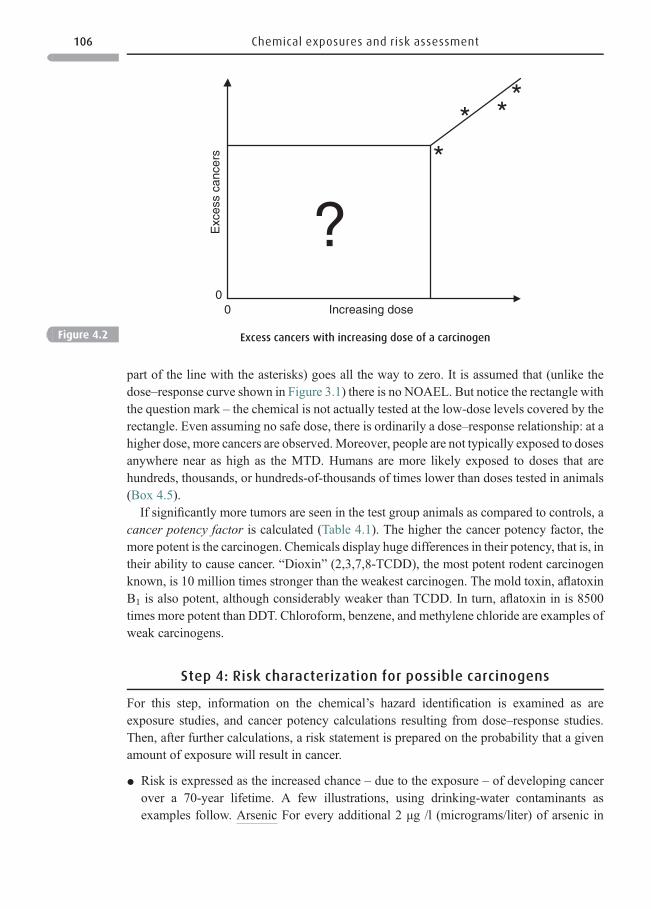
part of the line with the asterisks) goes all the way to zero. It is assumed that (unlike thedose–response curve shown in Figure 3.1) there is no NOAEL. But notice the rectangle withthe question mark – the chemical is not actually tested at the low-dose levels covered by therectangle. Even assuming no safe dose, there is ordinarily a dose–response relationship: at ahigher dose, more cancers are observed.Moreover, people are not typically exposed to dosesanywhere near as high as the MTD. Humans are more likely exposed to doses that arehundreds, thousands, or hundreds-of-thousands of times lower than doses tested in animals(Box 4.5).
If significantly more tumors are seen in the test group animals as compared to controls, acancer potency factor is calculated (Table 4.1). The higher the cancer potency factor, themore potent is the carcinogen. Chemicals display huge differences in their potency, that is, intheir ability to cause cancer. “Dioxin” (2,3,7,8-TCDD), the most potent rodent carcinogenknown, is 10 million times stronger than the weakest carcinogen. The mold toxin, aflatoxinB1 is also potent, although considerably weaker than TCDD. In turn, aflatoxin in is 8500times more potent than DDT. Chloroform, benzene, and methylene chloride are examples ofweak carcinogens.
Step 4: Risk characterization for possible carcinogens
For this step, information on the chemical’s hazard identification is examined as areexposure studies, and cancer potency calculations resulting from dose–response studies.Then, after further calculations, a risk statement is prepared on the probability that a givenamount of exposure will result in cancer.
* Risk is expressed as the increased chance – due to the exposure – of developing cancerover a 70-year lifetime. A few illustrations, using drinking-water contaminants asexamples follow. Arsenic For every additional 2 μg /l (micrograms/liter) of arsenic in
Increasing dose
Exc
ess
canc
ers
?0
0
Figure 4.2 Excess cancers with increasing dose of a carcinogen
106 Chemical exposures and risk assessment
drinking water, risk increases by 1 in 100 000. That is, for every 100 000 people, oneadditional case of cancer is projected. Tetrachloroethylene (TCE) For every additional 2.4μg /l of TCE, cancer risk increases by 1 in a million. Radon Drinking water containing300 picoCuries/liter of radon results in an increased cancer risk of 2 in 10 000.
* These numbers are specific, but no one really knows the exact risk. US regulatoryagencies routinely add a caveat to their assessments: “These estimates represent an
Table 4.1 Cancer potency of selected chemicals
Chemical Cancer potency factora
2,3,7,8-TCDD 100 000Aflatoxin B1 2900Ethylene dibromide 41Arsenic 15Benzo[a] pyrene 5.8Cadmium 6.1PCBs 4.34Nickel 1.05DDT 0.34Chloroform 0.081Benzene 0.029Methylene chloride 0.014
aExpressed as mg/kg per day
Box 4.5 Making assumptions in cancer risk assessment
To calculate the cancer risk resulting from exposure to a chemical, assumptions are made.
1. A chemical that causes cancer in animals can also cause cancer in humans.
2. It is legitimate to extrapolate from the high doses used in animal studies to the (ordinarily)
much lower doses to which humans are exposed.
3. All carcinogens are initiators (Table 3.6.), although it is known that some are promoters.
4. A chemical is a carcinogen even if it promotes tumors only at MTD, or if there are excess
tumors only in one sex, one species, or one strain of that species. (Rodent strains prone to
develop cancer are often deliberately used.)
Trichloroethylene was classified as a carcinogen because, given at MTD to a strain of cancer-
prone mice, the males showed excess tumors. Assumptions are made because regulatory
agencies want to err on the safe side. A US FDA administrator said, “When science fails to
provide solutions, FDA applies conservative assumptions to ensure that its decisions will not
adversely affect the public health.” Some countries including England, Denmark, and the
Netherlands believe that safe doses (thresholds) of carcinogens do exist. They believe that
the dose–response curve is as seen in Figure 3.1, not the straight line response going to zero
seen in Figure 4.2
107 Cancer risk assessment
upper bound of the plausible risk and are not likely to underestimate the risk. The actualrisk may be lower, and in some cases, zero” (Box 4.5). In other words, a risk assessmentproduces a theoretical number. Compare a theoretical risk to a known risk such as driving.Each year about 40 000 Americans are killed in driving accidents. Given this number anaccurate calculation can be made as to the risk of death that each person faces whendriving.
SECTION IV
Risks to non-humans
Chemical risk assessment is also used to examine risks to natural resources – animals, plants,whole ecosystems, resources such as lakes, or stratospheric ozone. Many chemical riskshave been identified over the years. Among these are impacts attributed to DDT in the 1960sincluding thinning of bird eggshells (resulting in eggs crushed before they could hatch) andother impacts on bird reproduction; damage to water life, e.g., some paper mill or municipalwastewater treatment plant effluents impair the reproductive development of downstreamfish; acid rain damages aquatic creatures and forests; chlorofluorocarbons (CFCs) reducestratospheric ozone resulting in increased ultraviolet radiation reaching the Earth; nutrientsrunning off into water bodies can cause abnormal algal growth and subsequently too littleoxygen for aquatic animals; or carbon dioxide’s impacts as a greenhouse gas and as an oceanacidifier.
Risks to wildlife
It is wildlife that is typically most vulnerable to chemical pollution. Fish and other aquaticlife live in, and many creatures drink from, polluted water bodies. On land, it is worms andother organisms living there that are impacted by contaminated soil.22 Laws also poorlyprotect wildlife. Some protections exist. ▪ In the United States and other industrializedcountries, many facilities discharging into receiving streams must routinely test the toxicityof their effluents to demonstrate that aquatic life is not being harmed. ▪Hazardous waste sitesmust be cleaned to specifications that include protecting wildlife. ▪ Sometimes regulationsthat protect humans also protect wildlife as when regulations limiting air emissions reduceanimal, tree, and plant exposure as well.
22 In many less-developed countries, human beings also lack protection. Instances are children or adults exposed tohigh levels of pesticides on farms; exposure to high levels of lead when this metal is recovered through unsaferecycling techniques; or impure drinking water. There are, unfortunately, many other examples.
108 Chemical exposures and risk assessment
Risks in impoverished countries
“It is a truism . . . that the major predictor of ill health is poverty because poor people are theleast able to obtain uncontaminated water and food . . . and obtain the knowledge necessaryto avoid [the contamination].”
* Sewage Pollution of water and food with infectious agents is rampant in many impov-erished countries, typically more serious than chemical contamination. More than abillion people worldwide lack access to clean drinking water. Children under five areparticularly impacted. Infection leads to diarrhea which, untreated, often leads to death. InAsia alone an estimated 4 million infants and small children die each year from diarrhea.Contributing to infections is a lack of toilets and other sanitary measures.
* Chemical pollutants Children in less-developed countries are often heavily exposed tochemical pollution. Consider urban motor vehicle exhaust, or surface water into whichindustrial waste has been dumped. High pollution levels can suppress children’s immunesystems making them more susceptible to infectious diseases.
* Occupational exposure Children and adults often labor in risky occupations. Amongmany examples is scavenging among trash in dumps, or working unprotected in battery-recycling operations exposing them to lead-fumes as batteries are melted. Whole familiesoften live at or near work sites, so all are exposed.
Officials may see environmental protections as a “Western agenda” not relevant to themand some suspect that such protections will lower economic opportunity for their citizens.Can the risk assessment and risk management tools developed in wealthy countries havemeaning in such conditions? Pollution-limiting laws may be on the books, but lack ofresources and corrupt officials often prevent enforcement. Public officials who care aboutthe laws may lack resources to enforce them or the education to use laws knowledgeably.Workers and others may accept dangerous exposures as the way life is. But if the will exists,risk management tools can be developed and enforced even in very poor locales. The Indianstate of Kerala works to protect its environment.23 AndMexico City, where air pollution is amajor problem, is implementing policies restricting when cars can be driven and mandatingthat new motorcycles emit 50% fewer pollutants; the same is true of Sao Paulo.24
Back to the developed world
Pointing to poor conditions in less-developed countries is easy, but high exposures stilloccur in industrialized countries too. Nitrogen oxides pollution from heavy motor-vehicletraffic in New York, Paris, Tokyo, and Los Angeles is among the highest in the world.
23 Kerala reassessing the environment. India Together, March 27, 2007, http://indiatogether.org/2007/mar/env-keralenv.htm.
24 Barclay, E. Clearing the smog: fighting air pollution in Mexico City, Mexico, and São Paulo, Brazil.World BankGroup, June 23, 2007, http://www.dcp2.org/features/47.
109 Risks in impoverished countries
Particulate pollution frommotor vehicles is also often high in American and European cities.Environmental justice issues continue, as when dumps and other polluting facilities aredisproportionately located in neighborhoods occupied by the poor or people of color.Roxbury, an inner city neighborhood in Boston, Massachusetts, has within its borders 80auto repair shops in a 1.5-square-mile (388 hectare) area, trash transfer stations, heavy trucktraffic (often idling as the trucks wait to take on or drop off materials), food processingfacilities with bad odors, furniture stripping sites, pervasive dust arising from many sources,hazardous waste sites, and many houses with leaded paint.
SECTION V
Managing risk
Scientists carry out the four steps in a chemical risk assessment. After risk characterization,results are given to non-scientists, risk managers. It is they who decide how to lower risk.Risk managers are often employed in agencies such as the US EPA or the World HealthOrganization. Law makers, legislators, can be risk managers too. The goal of risk managersis to make the risk of a carcinogen negligible. An excess cancer risk of one in a million isconsidered negligible (virtually safe dose, or de minimis). An FDA commissioner stated,“When FDA uses the risk level of one in a million, it is confident that the risk to humans isvirtually nonexistent.” Some believe that cancer risk assessment is so conservative that anexcess risk of 1 in 100 000 or 10 000 is acceptable, especially if the chemical has been shownto be a carcinogen only in animals. Others are less sure. ▪ The major reason for riskmanagement is to reduce risk, but other factors must be considered. ▪ Statutory require-ments: what does the law require? Technology: is the technology available to control thechemical or pollutant in question? ▪ Cost: the cost of risk reduction is always a factor.▪ Public concerns: an aroused public can push risk-reduction measures. ▪ Political concerns:politics affect decision-making. ▪Although there are often many ways to lower a risk, not allwill be feasible or cost effective. Laws and regulations are often the first possibilityconsidered, but risks can be lowered in a number of ways. In addition to laws with regulatorycomponents, legislators may appropriate money for education as one approach to riskmanagement, or provide incentives (not just monetary), to citizens and industry to changetheir ways. Several of these are seen below.
Laws and regulations
Especially after Earth Day in 1970, laws were passed in many countries mandating reductionsin pollutant emissions. Not just federal, but state (or province), and sometimes city laws areimportant in reducing emissions. Past regulations depended on facilities capturing a pollutantend-of-pipe, but other legislative tools are increasingly available. ▪ Emissions-trading is one.
110 Chemical exposures and risk assessment
In this process, a facility which, for whatever reason, cannot or does not want to reduce itsemissions is allowed to buy emission rights from a facility that has reduced its own emissionsmore than necessary. The buyer of emission rights pays less than it would cost to install ormodernize their technology. The low-emitting facility makes money by selling a portion of itsemission rights. ▪ An emerging and important risk management tool is take-back laws: the EUmandates that producers take back cars and electronic equipment so these don’t pollute at theend of their useful lives.
Regulating chemicals
The U n ited Sta tes ha s p asse d a n umb er of laws to r egu late ch em ic als (Chap ter 2). The mostcomprehensive was the Toxic Substances Control Act (TSCA) passed in 1976. TSCA author-iz ed th e E PA to ob tain i nfo rm atio n on all ne w and exi sting – alre ad y m or e t ha n 70 000 at thetim e – c hemic al su bsta nc es. 25 TSCA’s purpose was to ensure that the health and environmentaleffects of a new chemical were known before it was marketed, and that the US EPA hada uth ority to c on trol c he mica ls tha t “cause unreasonable risk to public health or the environ-me nt. ” This was to include, if necessary, banning particularly risky chemicals. Unfortunately, inpractice, the EPA is almost powerless to regulate problematic substances, and even has hadma jor d iffic ulty g ettin g ind ust ry to fu rnis h tox icity in for matio n on c hem icals . Fin ally, in 20 09 ,the US Congress has become serious about legislation to reform chemical control.26 Other USla ws ha ve, ove r t he yea rs, b ee n pa sse d tha t par tially fille d in th e ga ps.
Meanwhile the European Union enacted a law in 2007, Registration, Evaluation andAuthorization of Chemicals (REACH)27 that deals with high-production chemicals – themore than 30 000 chemicals produced in a volume of greater than 1 metric tonne (1.1 tons) peryear. REACH requires manufacturers to register and provide toxicological information for allsuch substances. A new agency has power to ban chemicals deemed to present significanthealth threats. And, industry will need to demonstrate the safety of their chemical products –this is an example of the use of the precautionary principle (see below). Under REACH, anychemical posing a “very high concern” will be phased out of production. Exceptions will bemade for essential chemicals if good alternatives are not available. However, such chemicalswould be clearly labeled, so consumers can themselves decide whether to buy the product.28
▪ Canada is updating its regulation of the 23 000 chemicals on its market.
Non-regulatory tools to manage risk
Described here are some approaches used to reduce risk.
* Educate the public. Let people know useful actions they can take for certain chemicals,e.g., how to reduce radon in their home, or how to safely use, or eliminate the use ofpesticides.
25 TSCA statute, regulations and enforcement (this site also provides information on other chemical-control laws).US EPA, January 2, 2009, http://www.epa.gov/compliance/civil/tsca/tscaenfstatreq.html.
26 Hogue, C. Revisiting chemical control law Chemical & Engineering News, 87(10) March 9, 2009, 24–25.27 Short, P. Kick off time for REACH. Chemical & Engineering News , 86 (29), July 21, 2008, 27–29.28 For an overview of REACH see Q&A: Reach chemicals legislation. British Broadcasting Company, November
28, 2005, http://news.bbc.co.uk/2/hi/europe/4437304.stm.
111 Managing risk
* Governm ent a nd indus try can develo p agreements to fost er emi ssions reductionstogether. This often happen s in Europe. ▪ In some US states, envir onmen tal agenc iescollaborat e with industry to find cost- effective ways to reduce emissi ons.
* There are many cases of indus tries volunt arily taki ng action, albeit often with proddi ng.One large acti on is the US EPA’s High Product ion Volum e (HPV ) Challe nge Program . AnHPV chemi cal is o ne produce d in, or imp orted into , the United State s in quantiti es of 1million pounds (~450 000 kg) or more per year. The EPA chall enged chemical manufac-turers and imp orters to make health and envir onmen tal effects data on HPV chemica lspublicly available. Compani es agreed to take on 2200 (out of 2400) HPV chemi cals. 29
However, 2200 is small compa red with the 30 000 chemicals in the REAC H p rogram,which is regul atory. None theless, the EPA has infor mation available that it also makesavailable to the publi c.
* Environ mental organizations and other groups often exert press ure on indus try to reduceemissi ons or becom e better environmen tal stewards . That is beginn ing to happen inChina too ( Box 2.1 ).
* Governm ents work together. ▪ One testing progra m invol ves a coopera tive effort amongUnited State s, Japanes e, and European scientis ts to evalua te not just HPV, but all 87 000commerci al chemi cals to determin e whi ch o nes are enviro nmental ho rmones. ▪ Anotherjoint effort among the United State s, Canada, and Mexi co is to develop a North Ame ricanframewo rk to manag e risks of comm on chemicals . These countries believe this programmay be even a bett er means of manag ing chemi cals than the REA CH program.
* Think of risk reduction in the longer term: society suppor ts resear ch by indus try, govern-ment, and univer sities aim ed at better unders tanding chemic al risk and finding betterways to reduce it. One imp ortan t progra m is to develop “ green ” chemi cals (see Delvingdeeper, below) and to develo p envir onmental techno logi es to contr ol or reduce emi ssions.
Using the precautionary principle to lower risk 30
In the Uni ted State s, usually a substance must first be show n to be dangero us before it can becontro lled. Many believe that this approac h has “ failed to adequat ely protect human healthand the enviro nment. ” Compar e this to the precautionary princ iple . Its prem ise is, “ When anactivity raises threats of harm to human h ealth or the environmen t, precaut ionary measuresshould be taken even if some cause and effect relations hips are not fully estab lishedscienti fically.” Later, if restrictions prove to be ov er strict, they can be relaxed. The princ ipleis used in the EU more widely than the United States; see the REA CH progra m de scribedabove. This difference has led to a quandary for retailers and manufacturers. When oneregion of the world requires the precautionary principle be applied to chemicals, but anotherdoes not, with which do they choose to comply? Companies increasingly choose the morerestrictive rules.
29 A summary of the High Production Volume Challenge is at http://www.epa.gov/HPV/pubs/general/basicinfo.htm.
30 Müller-Herold, U., Morosini, M., and Schucht, O. Choosing chemicals for precautionary regulation: a filterseries approach. Environmental Science & Technology, 39(3), February 1, 2005, 683–691.
112 Chemical exposures and risk assessment
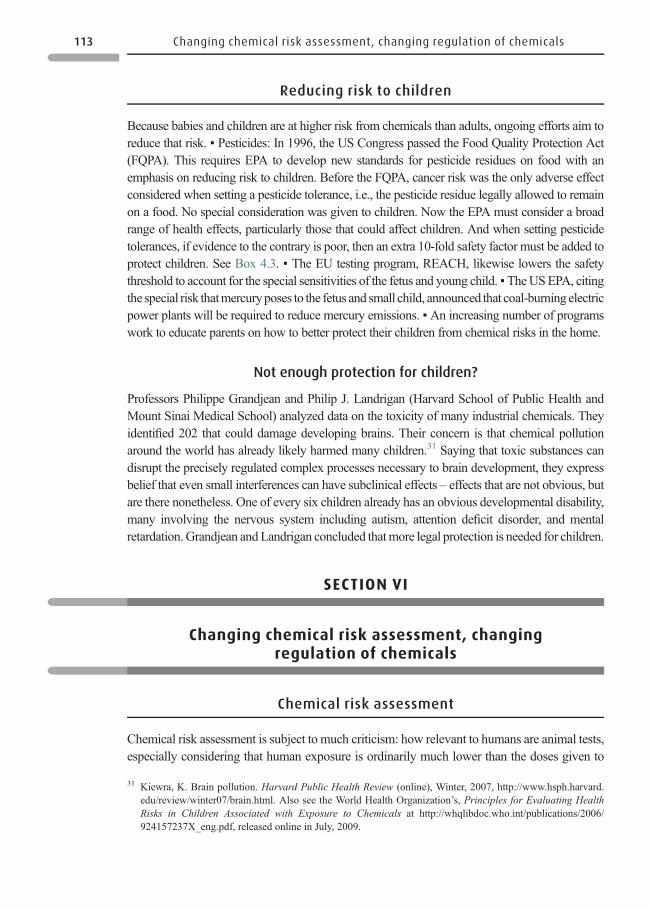
Reducing risk to children
Because babies and children are at higher risk from chemicals than adults, ongoing efforts aim toreduce that risk. ▪ Pesticides: In 1996, the US Congress passed the Food Quality Protection Act(FQPA). This requires EPA to develop new standards for pesticide residues on food with anemphasis on reducing risk to children. Before the FQPA, cancer risk was the only adverse effectconsidered when setting a pesticide tolerance, i.e., the pesticide residue legally allowed to remainon a food. No special consideration was given to children. Now the EPA must consider a broadrange of health effects, particularly those that could affect children. And when setting pesticidetolerances, if evidence to the contrary is poor, then an extra 10-fold safety factor must be added toprotect children. See Box 4.3. ▪ The EU testing program, REACH, likewise lowers the safetythreshold to account for the special sensitivities of the fetus and young child. ▪TheUSEPA, citingthe special risk thatmercuryposes to the fetus and small child, announced that coal-burning electricpower plants will be required to reduce mercury emissions. ▪An increasing number of programswork to educate parents on how to better protect their children from chemical risks in the home.
Not enough protection for children?
Professors Philippe Grandjean and Philip J. Landrigan (Harvard School of Public Health andMount Sinai Medical School) analyzed data on the toxicity of many industrial chemicals. Theyidentified 202 that could damage developing brains. Their concern is that chemical pollutionaround the world has already likely harmed many children.31 Saying that toxic substances candisrupt the precisely regulated complex processes necessary to brain development, they expressbelief that even small interferences can have subclinical effects – effects that are not obvious, butare there nonetheless. One of every six children already has an obvious developmental disability,many involving the nervous system including autism, attention deficit disorder, and mentalretardation.Grandjean andLandrigan concluded thatmore legal protection is needed for children.
SECTION VI
Changing chemical risk assessment, changingregulation of chemicals
Chemical risk assessment
Chemical risk assessment is subject to much criticism: how relevant to humans are animal tests,especially considering that human exposure is ordinarily much lower than the doses given to
31 Kiewra, K. Brain pollution. Harvard Public Health Review (online), Winter, 2007, http://www.hsph.harvard.edu/review/winter07/brain.html. Also see the World Health Organization’s, Principles for Evaluating HealthRisks in Children Associated with Exposure to Chemicals at http://whqlibdoc.who.int/publications/2006/924157237X_eng.pdf, released online in July, 2009.
113 Changing chemical risk assessment, changing regulation of chemicals
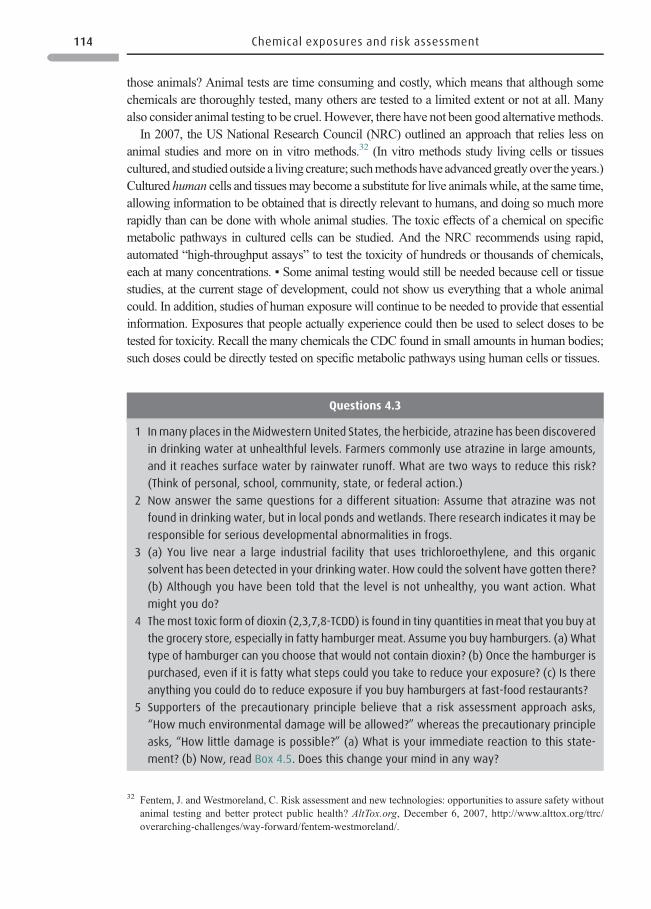
those animals? Animal tests are time consuming and costly, which means that although somechemicals are thoroughly tested, many others are tested to a limited extent or not at all. Manyalso consider animal testing to be cruel. However, there have not been good alternativemethods.
In 2007, the US National Research Council (NRC) outlined an approach that relies less onanimal studies and more on in vitro methods.32 (In vitro methods study living cells or tissuescultured, and studiedoutside a living creature; suchmethodshave advancedgreatly over theyears.)Cultured human cells and tissuesmay become a substitute for live animals while, at the same time,allowing information to be obtained that is directly relevant to humans, and doing so much morerapidly than can be done with whole animal studies. The toxic effects of a chemical on specificmetabolic pathways in cultured cells can be studied. And the NRC recommends using rapid,automated “high-throughput assays” to test the toxicity of hundreds or thousands of chemicals,each at many concentrations. ▪ Some animal testing would still be needed because cell or tissuestudies, at the current stage of development, could not show us everything that a whole animalcould. In addition, studies of human exposure will continue to be needed to provide that essentialinformation. Exposures that people actually experience could then be used to select doses to betested for toxicity. Recall the many chemicals the CDC found in small amounts in human bodies;such doses could be directly tested on specific metabolic pathways using human cells or tissues.
Questions 4.3
1 Inmany places in theMidwestern United States, the herbicide, atrazine has been discovered
in drinking water at unhealthful levels. Farmers commonly use atrazine in large amounts,
and it reaches surface water by rainwater runoff. What are two ways to reduce this risk?
(Think of personal, school, community, state, or federal action.)
2 Now answer the same questions for a different situation: Assume that atrazine was not
found in drinking water, but in local ponds and wetlands. There research indicates it may be
responsible for serious developmental abnormalities in frogs.
3 (a) You live near a large industrial facility that uses trichloroethylene, and this organic
solvent has been detected in your drinking water. How could the solvent have gotten there?
(b) Although you have been told that the level is not unhealthy, you want action. What
might you do?
4 Themost toxic form of dioxin (2,3,7,8-TCDD) is found in tiny quantities inmeat that you buy at
the grocery store, especially in fatty hamburger meat. Assume you buy hamburgers. (a) What
type of hamburger can you choose that would not contain dioxin? (b) Once the hamburger is
purchased, even if it is fatty what steps could you take to reduce your exposure? (c) Is there
anything you could do to reduce exposure if you buy hamburgers at fast-food restaurants?
5 Supporters of the precautionary principle believe that a risk assessment approach asks,
“How much environmental damage will be allowed?” whereas the precautionary principle
asks, “How little damage is possible?” (a) What is your immediate reaction to this state-
ment? (b) Now, read Box 4.5. Does this change your mind in any way?
32 Fentem, J. and Westmoreland, C. Risk assessment and new technologies: opportunities to assure safety withoutanimal testing and better protect public health? AltTox.org, December 6, 2007, http://www.alttox.org/ttrc/overarching-challenges/way-forward/fentem-westmoreland/.
114 Chemical exposures and risk assessment
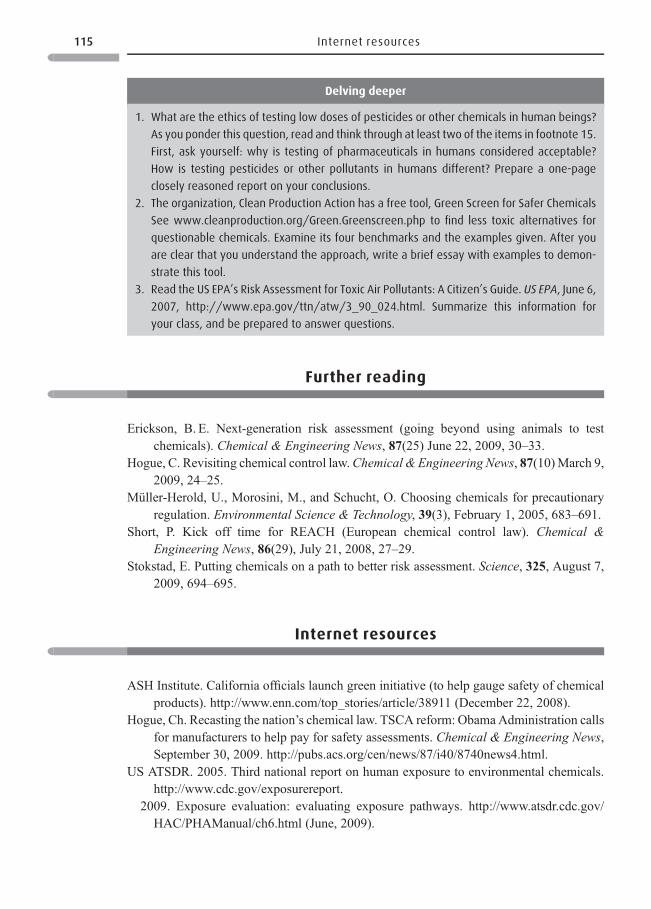
Further reading
Erickson, B. E. Next-generation risk assessment (going beyond using animals to testchemicals). Chemical & Engineering News, 87(25) June 22, 2009, 30–33.
Hogue, C. Revisiting chemical control law.Chemical & Engineering News, 87(10)March 9,2009, 24–25.
Müller-Herold, U., Morosini, M., and Schucht, O. Choosing chemicals for precautionaryregulation. Environmental Science & Technology, 39(3), February 1, 2005, 683–691.
Short, P. Kick off time for REACH (European chemical control law). Chemical &Engineering News, 86(29), July 21, 2008, 27–29.
Stokstad, E. Putting chemicals on a path to better risk assessment. Science, 325, August 7,2009, 694–695.
Internet resources
ASH Institute. California officials launch green initiative (to help gauge safety of chemicalproducts). http://www.enn.com/top_stories/article/38911 (December 22, 2008).
Hogue, Ch. Recasting the nation’s chemical law. TSCA reform: ObamaAdministration callsfor manufacturers to help pay for safety assessments. Chemical & Engineering News,September 30, 2009. http://pubs.acs.org/cen/news/87/i40/8740news4.html.
US ATSDR. 2005. Third national report on human exposure to environmental chemicals.http://www.cdc.gov/exposurereport.
2009. Exposure evaluation: evaluating exposure pathways. http://www.atsdr.cdc.gov/HAC/PHAManual/ch6.html (June, 2009).
Delving deeper
1. What are the ethics of testing low doses of pesticides or other chemicals in human beings?
As you ponder this question, read and think through at least two of the items in footnote 15.
First, ask yourself: why is testing of pharmaceuticals in humans considered acceptable?
How is testing pesticides or other pollutants in humans different? Prepare a one-page
closely reasoned report on your conclusions.
2. The organization, Clean Production Action has a free tool, Green Screen for Safer Chemicals
See www.cleanproduction.org/Green.Greenscreen.php to find less toxic alternatives for
questionable chemicals. Examine its four benchmarks and the examples given. After you
are clear that you understand the approach, write a brief essay with examples to demon-
strate this tool.
3. Read the US EPA’s Risk Assessment for Toxic Air Pollutants: A Citizen’s Guide. US EPA, June 6,
2007, http://www.epa.gov/ttn/atw/3_90_024.html. Summarize this information for
your class, and be prepared to answer questions.
115 Internet resources
2009. Toxicological Profile Information Sheets (alphabetical order: acetone to xylene).http://www.atsdr.cdc.gov/toxpro2.html (May 27, 2009).
US EPA. 2000. Food quality protection act, children and consumers. http://www.epa.gov/oecaagct/factsheets/epa-305-f-00 – 005.pdf (October, 2000).
2007. Risk assessment for toxic air pollutants: a citizen’s guide. http://www.epa.gov/ttn/atw/3_90_024.html (June 6, 2007).
2008. Exposure factors handbook. http://cfpub.epa.gov/ncea/cfm/recordisplay.cfm?deid=12464 (December 4, 2008).
2009. Pesticides: regulating pesticides: tolerance reassessment. http://www.epa.gov/oppsrrd1/tolerance/reassessment.htm (February 12, 2009).
2009. Report on the environment: human exposure and health. http://oaspub.epa.gov/hd/home#26 (January 21, 2009).
2009. TSCA statute, regulations & enforcement (Site also provides information on otherchemical-control laws). http://www.epa.gov/compliance/civil/tsca/tscaenfstatreq.html(January 2, 2009).
US Fish &Wildlife Service. 2009. Environmental Contaminants Program. http://www.fws.gov/contaminants/index.cfm, (June 29, 2009).
116 Chemical exposures and risk assessment
5 Air pollution
“Wind, rain, and radioactivity do not stop at the border for passport control, butgo where they will. Pollution? Coming soon to a place near you . . . We’re allDown-winders now.”
David Nyhan (Boston Globe)
The reality of outdoor air pollution is more than the words “ambient air pollution” can convey(Box 5.1). It is the eye-stinging pollution surrounding us in a city crowdedwithmotor vehicles,1
the odor of ozone on a hot hazy day, the choking of a heavy dust storm, the smoke fromwood orcoal fires on a winter day, the fumes from an uncontrolled industrial facility, odor fromuncontrolled sewage or an open dump. Many living in wealthy countries are spared the worstof these. Not so for the many living in less-developed countries, who are increasingly exposed.
In this chapter, Section I examines six principal air pollutants – the criteria (or priority)pollutants. Section II introduces Volatile Organic Chemicals (VOCs), which together withcriteria pollutants account for the large majority of air pollution. Section III introducesHAPS (hazardous air pollutants, also called air toxics). HAPS are not ordinarily as pervasiveas criteria pollutants, but can be very important in specific locales. Section IV describesmassive movements of criteria air pollutants that can be directly observed from space –
traveling combustion pollutants, major dust storms, and smoke from massive fires. SectionV briefly examines pollution in less-developed countries. For each criteria pollutant, and forVOCs and HAPS, we ask the following questions: • What is this pollutant? • Why does itconcern us? • What are its sources and its environmental fate? The environmental fatequestion was first raised in Chapter 1 and will be briefly answered for many pollutants inChapter 5 and beyond. • How can its emissions be reduced?
SECTION I
Criteria (or principal) air pollutants2
The higher the dose of a substance to which a living creature is exposed the greater thepossibility of an adverse effect. Now, apply this principle to the six criteria (or principal)
1 Tait, R. As the crow flies: birds flee Tehran’s polluted air. guardian.co.uk, January 13, 2009, http://www.guardian.co.uk/environment/2009/jan/13/crows-pollution-iran-environment-wildlife.
2 (1) Six principal pollutants (through 2006).US EPA, January 22, 2008, http://www.epa.gov/air/airtrends/2007/report/sixprincipalpollutants.pdf. (2) What are the six common air pollutants? US EPA, http://www.epa.gov/air/urbanair/.
air pollutants. They are produced in large amounts. We and other living creatures areoften exposed to them at levels high enough to exert adverse effects. Air pollution inHouston, Mexico City, Istanbul, and many other cities, often causes painful breathing,eye irritation, and headaches. Trees and plants are also adversely affected. Because ofthis, each criteria pollutant has an ambient air standard set for it, a standard that is basedon its risk. Each criteria pollutant is described below. ▪ Combustion, especially fossilfuel combustion, produces all six of these major air pollutants. Exhaust from motorvehicles accounts for about half of these emissions. When you examine Table 5.1, noticethe words “particulate” and “aerosol”.6 These words are relevant for several of theprincipal pollutants.
Box 5.1 Air pollution terms
* Ambient air pollution This is found in the air around us (tropospheric air pollution). The
troposphere is the lower layer of the atmosphere (starting at the Earth’s surface).
* Criteria air pollutants The term criteria air pollutants originated with the US 1970 Clean Air
Act.3 That law required EPA to set standards (National Ambient Air Quality Standards,
NAAQS4) to protect human health and welfare from pollutants in ambient air. Before
setting standards, the EPA had to identify the most serious pollutants. To do so it used
specific criteria (characteristics of the pollutants, and their potential health and welfare
effects). The six pollutants that the EPA identified account for the large majority of air
pollution, both in the United States and worldwide. These are carbon monoxide (CO),
sulfur dioxide (SO2), nitrogen oxides (NOx), ozone (O3), and particulates or particulate
matter (PM10). Lead (Pb), the sixth, was included at a time when it was being emitted in
dangerous amounts. The US EPA now calls these pollutants, the six principal pollutants or
six common pollutants.
* Volatile organic pollutants (VOCs) VOCs, as a group, are also emitted in large amounts,
especially the hydrocarbons from mobile sources. VOCs are often grouped with criteria
pollutants.5
* Hazardous air pollutants (HAPS) Legislation was the source of the term, hazardous air
pollutants – also commonly called toxic air pollutants.
3 The plain English guide to the Clean Air Act (EPA-456/K-07–001). US EPA, April, 2007, http://epa.gov/air/caa/peg/peg.pdf.
4 Primary standards set limits to protect public health, including the health of the most sensitive populationsincluding children and asthmatics. Secondary standards are set to protect “public welfare” such as impactson visibility, harm to animals, crops, vegetation, and buildings and statuary. See http://epa.gov/air/criteria.html.
5 Canada, e.g., includes VOCs among its Criteria Air Contaminants, but not lead, http://www.ec.gc.ca/cleanair-airpur/Pollutants/Criteria_Air_Contaminants_and_Related_Pollutants-WS7C43740B-1_En.htm.
6 The gaseous pollutants sulfur dioxide and nitrogen oxides, can be chemically transformed in the atmosphere intotiny particles, aerosols. Aerosols are a gaseous suspension of fine solid or liquid particles. A number of volatileorganic pollutants also form aerosols. Metals are directly emitted as particulates, although a portion of mercuryemissions are gaseous.
118 Air pollution
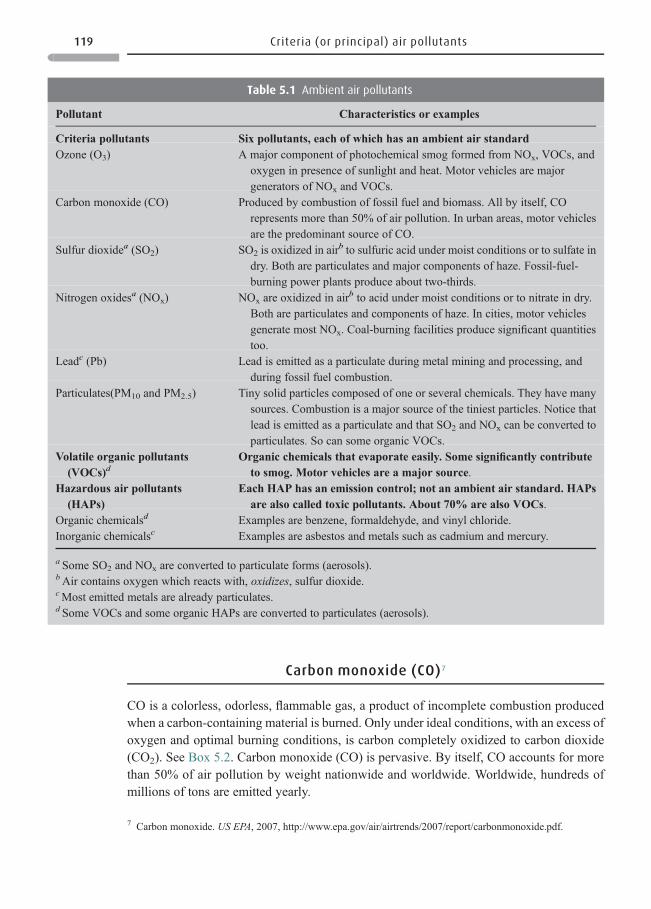
Carbon monoxide (CO)7
CO is a colorless, odorless, flammable gas, a product of incomplete combustion producedwhen a carbon-containing material is burned. Only under ideal conditions, with an excess ofoxygen and optimal burning conditions, is carbon completely oxidized to carbon dioxide(CO2). See Box 5.2. Carbon monoxide (CO) is pervasive. By itself, CO accounts for morethan 50% of air pollution by weight nationwide and worldwide. Worldwide, hundreds ofmillions of tons are emitted yearly.
Table 5.1 Ambient air pollutants
Pollutant Characteristics or examples
Criteria pollutants Six pollutants, each of which has an ambient air standardOzone (O3) A major component of photochemical smog formed from NOx, VOCs, and
oxygen in presence of sunlight and heat. Motor vehicles are majorgenerators of NOx and VOCs.
Carbon monoxide (CO) Produced by combustion of fossil fuel and biomass. All by itself, COrepresents more than 50% of air pollution. In urban areas, motor vehiclesare the predominant source of CO.
Sulfur dioxide a (SO2) SO2 is oxidized in air b to sulfuric acid under moist conditions or to sulfate in
dry. Both are particulates and major components of haze. Fossil-fuel-burning power plants produce about two-thirds.
Nitrogen oxides a (NOx) NOx are oxidized in air b to acid under moist conditions or to nitrate in dry.
Both are particulates and components of haze. In cities, motor vehiclesgenerate most NOx. Coal-burning facilities produce significant quantitiestoo.
Lead c (Pb) Lead is emitted as a particulate during metal mining and processing, andduring fossil fuel combustion.
Particulates(PM10 and PM2.5) Tiny solid particles composed of one or several chemicals. They have manysources. Combustion is a major source of the tiniest particles. Notice thatlead is emitted as a particulate and that SO2 and NOx can be converted toparticulates. So can some organic VOCs.
Volatile organic pollutants(VOCs) d
Organic chemicals that evaporate easily. Some significantly contributeto smog. Motor vehicles are a major source.
Hazardous air pollutants(HAPs)
Each HAP has an emission control; not an ambient air standard. HAPsare also called toxic pollutants. About 70% are also VOCs.
Organic chemicals d Examples are benzene, formaldehyde, and vinyl chloride.Inorganic chemicals c Examples are asbestos and metals such as cadmium and mercury.
a Some SO2 and NOx are converted to particulate forms (aerosols).bAir contains oxygen which reacts with, oxidizes, sulfur dioxide.cMost emitted metals are already particulates.d Some VOCs and some organic HAPs are converted to particulates (aerosols).
7 Carbon monoxide. US EPA, 2007, http://www.epa.gov/air/airtrends/2007/report/carbonmonoxide.pdf.
119 Criteria (or principal) air pollutants
Why CO is of concern
Levels of CO found in city traffic are often high enough to aggravate heart problems. Carbonmonoxide causes up to 11% of hospital admissions for congestive heart failure in olderpeople. Knowing how CO works will clarify how it adversely affects the heart, and causesother adverse effects: (a) The blood protein hemoglobin contains an iron atom, whichnormally picks up oxygen in the lungs and transports it to the body’s cells. There oxygenis released and exchanged for the waste gas, carbon dioxide (CO2). (b) Hemoglobin carriesCO 2 back to the lungs, releases it, and once more picks up oxygen. (c) Carbon monoxide isso toxic because it has about 250 times greater affinity for the iron atom in hemoglobin thanoxygen does – so CO displaces oxygen. (d) This means less oxygen reaches the heart. Evenrelatively small displacements affect heart function in sensitive people. The brain toodemands a steady oxygen concentration for optimum functioning, so a lowered level ofoxygen can cause headache, dizziness, fatigue, and drowsiness. ▪ Higher doses of CO, suchas found in enclosed spaces with improperly operating combustion appliances, may lead tocoma and death (Chapter 17). ▪ The US ambient air standard for carbon monoxide is 9 ppmaveraged over 8 hours; if this is exceeded more than once a year, an area is violating thestandard.
Sources and environmental fate of CO
Carbon monoxide is formed anywhere that a carbon-containing material is burned. Thus,CO exposure happens anywhere that combustion occurs. • Major sources In urban areas,motor vehicles emit up to 95% of CO. Drivers stalled in traffic or driving in highly congestedareas can have high CO exposure. So can traffic control personnel, mechanics workinginside garages, and parking garage attendants. • Lesser sources Cigarette smoke containsCO. Individuals exposed to CO on the job who also smoke, increase their risk of adverseeffects. ▪ Facilities burning coal, natural gas, or biomass are CO sources. ▪ Burning biomass(wood, dried manure, other dried vegetation) for cooking, heating, and light is a CO source.These lesser sources can be significant in certain locales or situations. • Environmental fateCO can persist in the atmosphere for one to two months before it is converted to CO2 – thusCO contributes to CO2 in the atmosphere.
Reducing CO emissions
▪ Consider what happened when oxygen-containing fuel additives were added to gasolinein 20 US cities to enhance its burning in winter, a season when engines run less efficiently.
Box 5.2
Don’t confuse carbon monoxide with carbon dioxide. Carbon monoxide (CO) is an incomplete
product of combustion, and is very toxic. Carbon dioxide (CO2) is a complete product of
combustion, and much less toxic. (Carbon dioxide will be discussed in Chapter 7.)
120 Air pollution
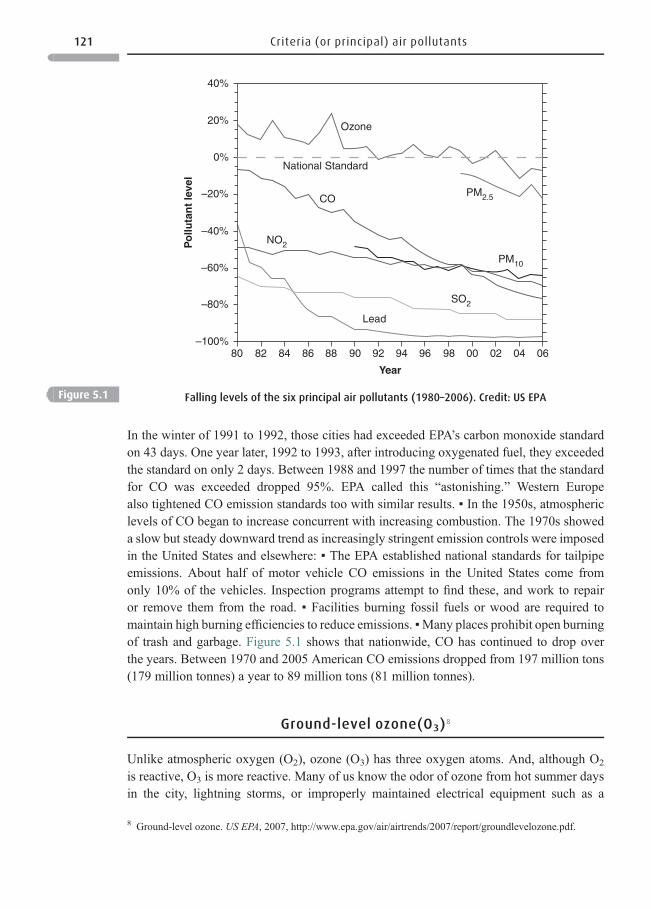
In the winter of 1991 to 1992, those cities had exceeded EPA’s carbon monoxide standardon 43 days. One year later, 1992 to 1993, after introducing oxygenated fuel, they exceededthe standard on only 2 days. Between 1988 and 1997 the number of times that the standardfor CO was exceeded dropped 95%. EPA called this “astonishing.” Western Europealso tightened CO emission standards too with similar results. ▪ In the 1950s, atmosphericlevels of CO began to increase concurrent with increasing combustion. The 1970s showeda slow but steady downward trend as increasingly stringent emission controls were imposedin the United States and elsewhere: ▪ The EPA established national standards for tailpipeemissions. About half of motor vehicle CO emissions in the United States come fromonly 10% of the vehicles. Inspection programs attempt to find these, and work to repairor remove them from the road. ▪ Facilities burning fossil fuels or wood are required tomaintain high burning efficiencies to reduce emissions. ▪Many places prohibit open burningof trash and garbage. Figure 5.1 shows that nationwide, CO has continued to drop overthe years. Between 1970 and 2005 American CO emissions dropped from 197 million tons(179 million tonnes) a year to 89 million tons (81 million tonnes).
Ground-level ozone(O3)8
Unlike atmospheric oxygen (O2), ozone (O3) has three oxygen atoms. And, although O2
is reactive, O3 is more reactive. Many of us know the odor of ozone from hot summer daysin the city, lightning storms, or improperly maintained electrical equipment such as a
80 82 84 86 88 90
Year
Po
lluta
nt
leve
l
92 94 96 98 00 02 04 06
40%
Ozone
National Standard
CO
Lead
PM2.5
PM10
SO2
NO2
20%
0%
–20%
–40%
–60%
–80%
–100%
Figure 5.1 Falling levels of the six principal air pollutants (1980–2006). Credit: US EPA
8 Ground-level ozone. US EPA, 2007, http://www.epa.gov/air/airtrends/2007/report/groundlevelozone.pdf.
121 Criteria (or principal) air pollutants
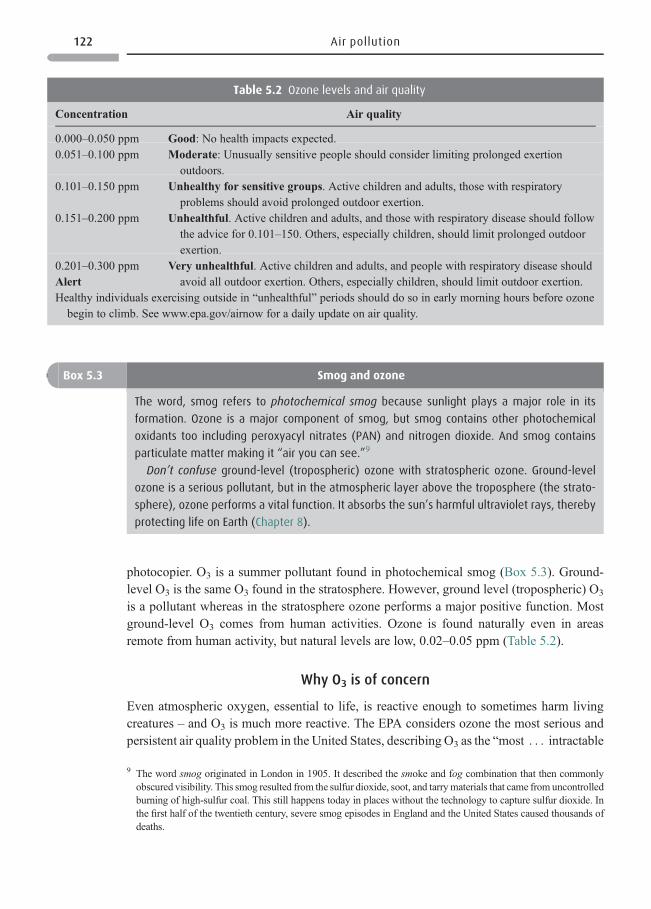
photocopier. O3 is a summer pollutant found in photochemical smog (Box 5.3). Ground-level O3 is the same O3 found in the stratosphere. However, ground level (tropospheric) O3
is a pollutant whereas in the stratosphere ozone performs a major positive function. Mostground-level O3 comes from human activities. Ozone is found naturally even in areasremote from human activity, but natural levels are low, 0.02–0.05 ppm (Table 5.2).
Why O3 is of concern
Even atmospheric oxygen, essential to life, is reactive enough to sometimes harm livingcreatures – and O3 is much more reactive. The EPA considers ozone the most serious andpersistent air quality problem in the United States, describing O3 as the “most . . . intractable
Box 5.3 Smog and ozone
The word, smog refers to photochemical smog because sunlight plays a major role in its
formation. Ozone is a major component of smog, but smog contains other photochemical
oxidants too including peroxyacyl nitrates (PAN) and nitrogen dioxide. And smog contains
particulate matter making it “air you can see.”9
Don’t confuse ground-level (tropospheric) ozone with stratospheric ozone. Ground-level
ozone is a serious pollutant, but in the atmospheric layer above the troposphere (the strato-
sphere), ozone performs a vital function. It absorbs the sun’s harmful ultraviolet rays, thereby
protecting life on Earth (Chapter 8).
Table 5.2 Ozone levels and air quality
Concentration Air quality
0.000–0.050 ppm Good: No health impacts expected.0.051–0.100 ppm Moderate: Unusually sensitive people should consider limiting prolonged exertion
outdoors.0.101–0.150 ppm Unhealthy for sensitive groups. Active children and adults, those with respiratory
problems should avoid prolonged outdoor exertion.0.151–0.200 ppm Unhealthful. Active children and adults, and those with respiratory disease should follow
the advice for 0.101–150. Others, especially children, should limit prolonged outdoorexertion.
0.201–0.300 ppmAlert
Very unhealthful. Active children and adults, and people with respiratory disease shouldavoid all outdoor exertion. Others, especially children, should limit outdoor exertion.
Healthy individuals exercising outside in “unhealthful” periods should do so in early morning hours before ozonebegin to climb. See www.epa.gov/airnow for a daily update on air quality.
9 The word smog originated in London in 1905. It described the smoke and fog combination that then commonlyobscured visibility. This smog resulted from the sulfur dioxide, soot, and tarrymaterials that came from uncontrolledburning of high-sulfur coal. This still happens today in places without the technology to capture sulfur dioxide. Inthe first half of the twentieth century, severe smog episodes in England and the United States caused thousands ofdeaths.
122 Air pollution
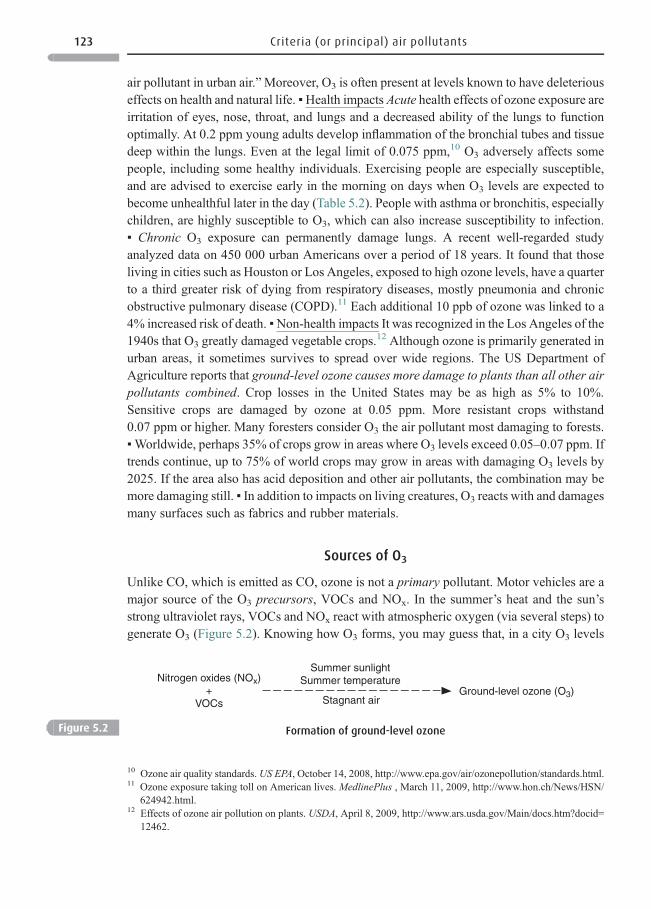
air pollutant in urban air.”Moreover, O3 is often present at levels known to have deleteriouseffects on health and natural life. ▪Health impacts Acute health effects of ozone exposure areirritation of eyes, nose, throat, and lungs and a decreased ability of the lungs to functionoptimally. At 0.2 ppm young adults develop inflammation of the bronchial tubes and tissuedeep within the lungs. Even at the legal limit of 0.075 ppm,10 O3 adversely affects somepeople, including some healthy individuals. Exercising people are especially susceptible,and are advised to exercise early in the morning on days when O3 levels are expected tobecome unhealthful later in the day (Table 5.2). People with asthma or bronchitis, especiallychildren, are highly susceptible to O3, which can also increase susceptibility to infection.▪ Chronic O3 exposure can permanently damage lungs. A recent well-regarded studyanalyzed data on 450 000 urban Americans over a period of 18 years. It found that thoseliving in cities such as Houston or Los Angeles, exposed to high ozone levels, have a quarterto a third greater risk of dying from respiratory diseases, mostly pneumonia and chronicobstructive pulmonary disease (COPD).11 Each additional 10 ppb of ozone was linked to a4% increased risk of death. ▪Non-health impacts It was recognized in the Los Angeles of the1940s that O3 greatly damaged vegetable crops.12 Although ozone is primarily generated inurban areas, it sometimes survives to spread over wide regions. The US Department ofAgriculture reports that ground-level ozone causes more damage to plants than all other airpollutants combined. Crop losses in the United States may be as high as 5% to 10%.Sensitive crops are damaged by ozone at 0.05 ppm. More resistant crops withstand0.07 ppm or higher. Many foresters consider O3 the air pollutant most damaging to forests.▪Worldwide, perhaps 35% of crops grow in areas where O3 levels exceed 0.05–0.07 ppm. Iftrends continue, up to 75% of world crops may grow in areas with damaging O3 levels by2025. If the area also has acid deposition and other air pollutants, the combination may bemore damaging still. ▪ In addition to impacts on living creatures, O3 reacts with and damagesmany surfaces such as fabrics and rubber materials.
Sources of O3
Unlike CO, which is emitted as CO, ozone is not a primary pollutant. Motor vehicles are amajor source of the O3 precursors, VOCs and NOx. In the summer’s heat and the sun’sstrong ultraviolet rays, VOCs and NOx react with atmospheric oxygen (via several steps) togenerate O3 (Figure 5.2). Knowing how O3 forms, you may guess that, in a city O3 levels
Nitrogen oxides (NOx)+
VOCs
Summer sunlightSummer temperature
Stagnant airGround-level ozone (O3)
Figure 5.2 Formation of ground-level ozone
10 Ozone air quality standards. US EPA, October 14, 2008, http://www.epa.gov/air/ozonepollution/standards.html.11 Ozone exposure taking toll on American lives. MedlinePlus , March 11, 2009, http://www.hon.ch/News/HSN/
624942.html.12 Effects of ozone air pollution on plants. USDA, April 8, 2009, http://www.ars.usda.gov/Main/docs.htm?docid=
12462.
123 Criteria (or principal) air pollutants
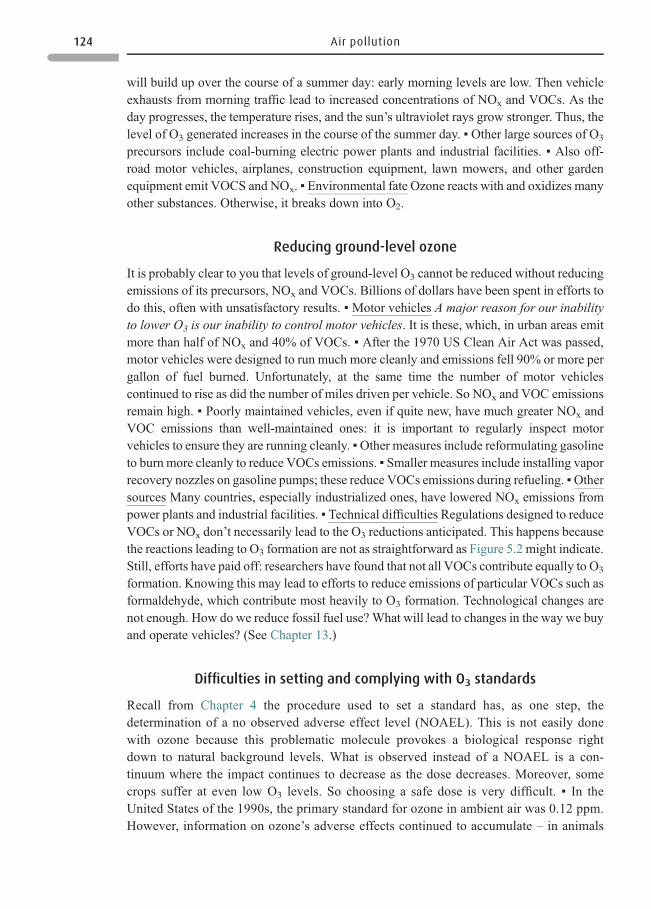
will build up over the course of a summer day: early morning levels are low. Then vehicleexhausts from morning traffic lead to increased concentrations of NOx and VOCs. As theday progresses, the temperature rises, and the sun’s ultraviolet rays grow stronger. Thus, thelevel of O3 generated increases in the course of the summer day. ▪ Other large sources of O3
precursors include coal-burning electric power plants and industrial facilities. ▪ Also off-road motor vehicles, airplanes, construction equipment, lawn mowers, and other gardenequipment emit VOCS and NOx. ▪ Environmental fate Ozone reacts with and oxidizes manyother substances. Otherwise, it breaks down into O2.
Reducing ground-level ozone
It is probably clear to you that levels of ground-level O3 cannot be reduced without reducingemissions of its precursors, NOx and VOCs. Billions of dollars have been spent in efforts todo this, often with unsatisfactory results. ▪ Motor vehicles A major reason for our inabilityto lower O3 is our inability to control motor vehicles. It is these, which, in urban areas emitmore than half of NOx and 40% of VOCs. ▪ After the 1970 US Clean Air Act was passed,motor vehicles were designed to run much more cleanly and emissions fell 90% or more pergallon of fuel burned. Unfortunately, at the same time the number of motor vehiclescontinued to rise as did the number of miles driven per vehicle. So NOx and VOC emissionsremain high. ▪ Poorly maintained vehicles, even if quite new, have much greater NOx andVOC emissions than well-maintained ones: it is important to regularly inspect motorvehicles to ensure they are running cleanly. ▪Other measures include reformulating gasolineto burn more cleanly to reduce VOCs emissions. ▪ Smaller measures include installing vaporrecovery nozzles on gasoline pumps; these reduce VOCs emissions during refueling. ▪Othersources Many countries, especially industrialized ones, have lowered NOx emissions frompower plants and industrial facilities. ▪ Technical difficulties Regulations designed to reduceVOCs or NOx don’t necessarily lead to the O3 reductions anticipated. This happens becausethe reactions leading to O3 formation are not as straightforward as Figure 5.2 might indicate.Still, efforts have paid off: researchers have found that not all VOCs contribute equally to O3
formation. Knowing this may lead to efforts to reduce emissions of particular VOCs such asformaldehyde, which contribute most heavily to O3 formation. Technological changes arenot enough. How do we reduce fossil fuel use? What will lead to changes in the way we buyand operate vehicles? (See Chapter 13.)
Difficulties in setting and complying with O3 standards
Recall from Chapter 4 the procedure used to set a standard has, as one step, thedetermination of a no observed adverse effect level (NOAEL). This is not easily donewith ozone because this problematic molecule provokes a biological response rightdown to natural background levels. What is observed instead of a NOAEL is a con-tinuum where the impact continues to decrease as the dose decreases. Moreover, somecrops suffer at even low O3 levels. So choosing a safe dose is very difficult. ▪ In theUnited States of the 1990s, the primary standard for ozone in ambient air was 0.12 ppm.However, information on ozone’s adverse effects continued to accumulate – in animals
124 Air pollution
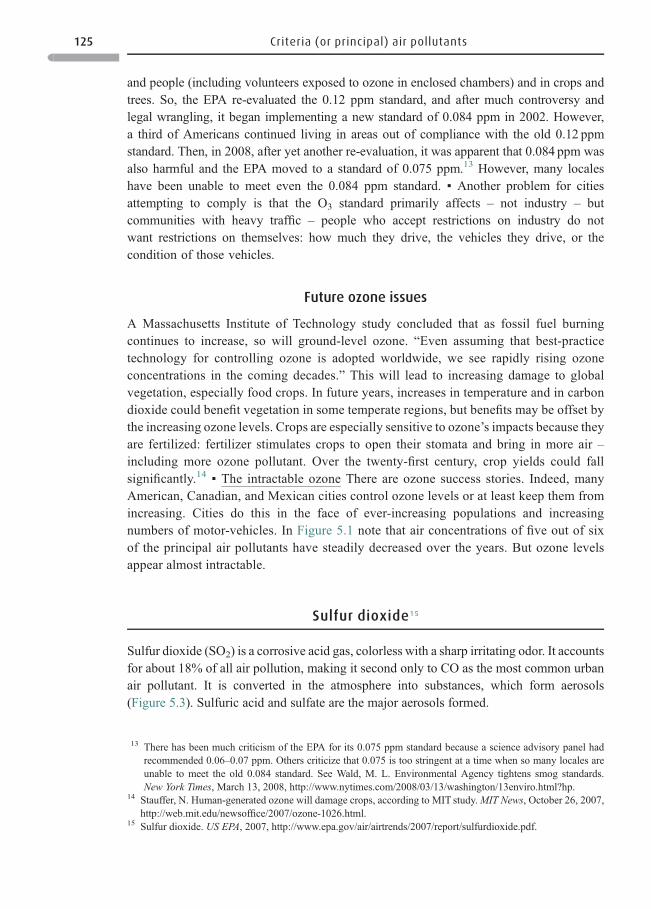
and people (including volunteers exposed to ozone in enclosed chambers) and in crops andtrees. So, the EPA re-evaluated the 0.12 ppm standard, and after much controversy andlegal wrangling, it began implementing a new standard of 0.084 ppm in 2002. However,a third of Americans continued living in areas out of compliance with the old 0.12 ppmstandard. Then, in 2008, after yet another re-evaluation, it was apparent that 0.084 ppm wasalso harmful and the EPA moved to a standard of 0.075 ppm.13 However, many localeshave been unable to meet even the 0.084 ppm standard. ▪ Another problem for citiesattempting to comply is that the O3 standard primarily affects – not industry – butcommunities with heavy traffic – people who accept restrictions on industry do notwant restrictions on themselves: how much they drive, the vehicles they drive, or thecondition of those vehicles.
Future ozone issues
A Massachusetts Institute of Technology study concluded that as fossil fuel burningcontinues to increase, so will ground-level ozone. “Even assuming that best-practicetechnology for controlling ozone is adopted worldwide, we see rapidly rising ozoneconcentrations in the coming decades.” This will lead to increasing damage to globalvegetation, especially food crops. In future years, increases in temperature and in carbondioxide could benefit vegetation in some temperate regions, but benefits may be offset bythe increasing ozone levels. Crops are especially sensitive to ozone’s impacts because theyare fertilized: fertilizer stimulates crops to open their stomata and bring in more air –including more ozone pollutant. Over the twenty-first century, crop yields could fallsignificantly.14 ▪ The intractable ozone There are ozone success stories. Indeed, manyAmerican, Canadian, and Mexican cities control ozone levels or at least keep them fromincreasing. Cities do this in the face of ever-increasing populations and increasingnumbers of motor-vehicles. In Figure 5.1 note that air concentrations of five out of sixof the principal air pollutants have steadily decreased over the years. But ozone levelsappear almost intractable.
Sulfur dioxide15
Sulfur dioxide (SO2) is a corrosive acid gas, colorless with a sharp irritating odor. It accountsfor about 18% of all air pollution, making it second only to CO as the most common urbanair pollutant. It is converted in the atmosphere into substances, which form aerosols(Figure 5.3). Sulfuric acid and sulfate are the major aerosols formed.
13 There has been much criticism of the EPA for its 0.075 ppm standard because a science advisory panel hadrecommended 0.06–0.07 ppm. Others criticize that 0.075 is too stringent at a time when so many locales areunable to meet the old 0.084 standard. See Wald, M. L. Environmental Agency tightens smog standards.New York Times, March 13, 2008, http://www.nytimes.com/2008/03/13/washington/13enviro.html?hp.
14 Stauffer, N. Human-generated ozone will damage crops, according to MIT study.MIT News, October 26, 2007,http://web.mit.edu/newsoffice/2007/ozone-1026.html.
15 Sulfur dioxide. US EPA, 2007, http://www.epa.gov/air/airtrends/2007/report/sulfurdioxide.pdf.
125 Criteria (or principal) air pollutants
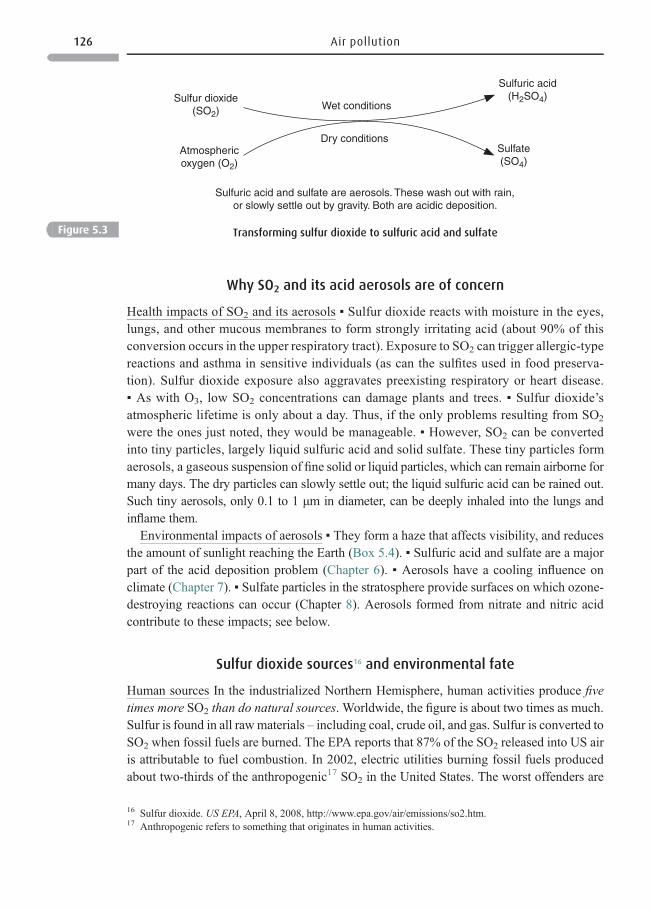
Why SO2 and its acid aerosols are of concern
Health impacts of SO2 and its aerosols ▪ Sulfur dioxide reacts with moisture in the eyes,lungs, and other mucous membranes to form strongly irritating acid (about 90% of thisconversion occurs in the upper respiratory tract). Exposure to SO2 can trigger allergic-typereactions and asthma in sensitive individuals (as can the sulfites used in food preserva-tion). Sulfur dioxide exposure also aggravates preexisting respiratory or heart disease.▪ As with O3, low SO2 concentrations can damage plants and trees. ▪ Sulfur dioxide’satmospheric lifetime is only about a day. Thus, if the only problems resulting from SO2
were the ones just noted, they would be manageable. ▪ However, SO2 can be convertedinto tiny particles, largely liquid sulfuric acid and solid sulfate. These tiny particles formaerosols, a gaseous suspension of fine solid or liquid particles, which can remain airborne formany days. The dry particles can slowly settle out; the liquid sulfuric acid can be rained out.Such tiny aerosols, only 0.1 to 1 μm in diameter, can be deeply inhaled into the lungs andinflame them.
Environmental impacts of aerosols ▪ They form a haze that affects visibility, and reducesthe amount of sunlight reaching the Earth (Box 5.4). ▪ Sulfuric acid and sulfate are a majorpart of the acid deposition problem (Chapter 6). ▪ Aerosols have a cooling influence onclimate (Chapter 7). ▪ Sulfate particles in the stratosphere provide surfaces on which ozone-destroying reactions can occur (Chapter 8). Aerosols formed from nitrate and nitric acidcontribute to these impacts; see below.
Sulfur dioxide sources16 and environmental fate
Human sources In the industrialized Northern Hemisphere, human activities produce fivetimes more SO2 than do natural sources. Worldwide, the figure is about two times as much.Sulfur is found in all rawmaterials – including coal, crude oil, and gas. Sulfur is converted toSO2 when fossil fuels are burned. The EPA reports that 87% of the SO2 released into US airis attributable to fuel combustion. In 2002, electric utilities burning fossil fuels producedabout two-thirds of the anthropogenic17 SO2 in the United States. The worst offenders are
Atmosphericoxygen (O2)
Sulfur dioxide(SO2)
Sulfuric acid(H2SO4)
Sulfate(SO4)
Wet conditions
Dry conditions
Sulfuric acid and sulfate are aerosols. These wash out with rain,or slowly settle out by gravity. Both are acidic deposition.
Figure 5.3 Transforming sulfur dioxide to sulfuric acid and sulfate
16 Sulfur dioxide. US EPA, April 8, 2008, http://www.epa.gov/air/emissions/so2.htm.17 Anthropogenic refers to something that originates in human activities.
126 Air pollution
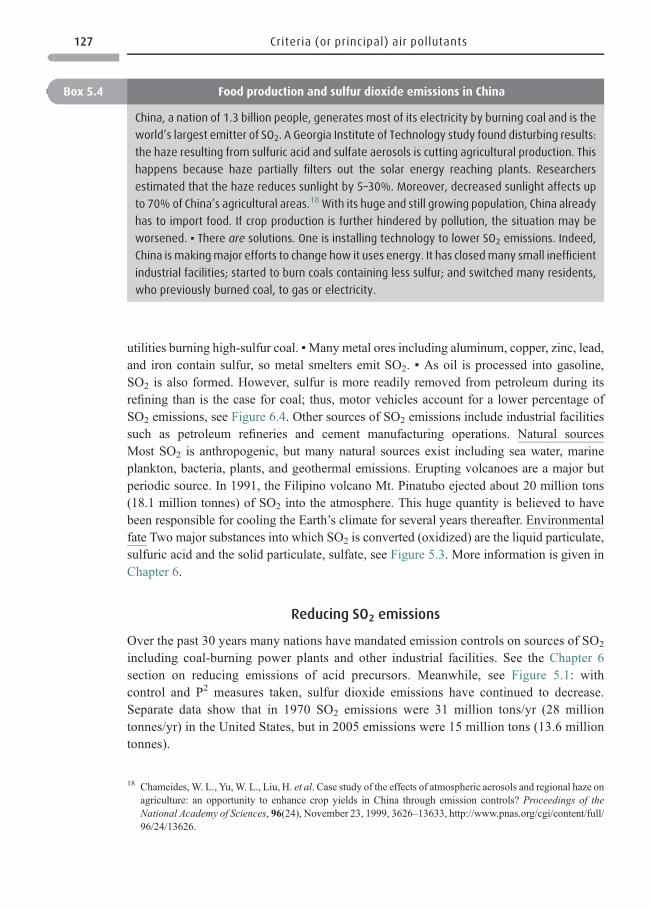
utilities burning high-sulfur coal. ▪Many metal ores including aluminum, copper, zinc, lead,and iron contain sulfur, so metal smelters emit SO2. ▪ As oil is processed into gasoline,SO2 is also formed. However, sulfur is more readily removed from petroleum during itsrefining than is the case for coal; thus, motor vehicles account for a lower percentage ofSO2 emissions, see Figure 6.4. Other sources of SO2 emissions include industrial facilitiessuch as petroleum refineries and cement manufacturing operations. Natural sourcesMost SO2 is anthropogenic, but many natural sources exist including sea water, marineplankton, bacteria, plants, and geothermal emissions. Erupting volcanoes are a major butperiodic source. In 1991, the Filipino volcano Mt. Pinatubo ejected about 20 million tons(18.1 million tonnes) of SO2 into the atmosphere. This huge quantity is believed to havebeen responsible for cooling the Earth’s climate for several years thereafter. Environmentalfate Two major substances into which SO2 is converted (oxidized) are the liquid particulate,sulfuric acid and the solid particulate, sulfate, see Figure 5.3. More information is given inChapter 6.
Reducing SO2 emissions
Over the past 30 years many nations have mandated emission controls on sources of SO2
including coal-burning power plants and other industrial facilities. See the Chapter 6section on reducing emissions of acid precursors. Meanwhile, see Figure 5.1: withcontrol and P2 measures taken, sulfur dioxide emissions have continued to decrease.Separate data show that in 1970 SO2 emissions were 31 million tons/yr (28 milliontonnes/yr) in the United States, but in 2005 emissions were 15 million tons (13.6 milliontonnes).
Box 5.4 Food production and sulfur dioxide emissions in China
China, a nation of 1.3 billion people, generates most of its electricity by burning coal and is the
world’s largest emitter of SO2. A Georgia Institute of Technology study found disturbing results:
the haze resulting from sulfuric acid and sulfate aerosols is cutting agricultural production. This
happens because haze partially filters out the solar energy reaching plants. Researchers
estimated that the haze reduces sunlight by 5–30%. Moreover, decreased sunlight affects up
to 70% of China’s agricultural areas.18 With its huge and still growing population, China already
has to import food. If crop production is further hindered by pollution, the situation may be
worsened. ▪ There are solutions. One is installing technology to lower SO2 emissions. Indeed,
China is makingmajor efforts to change how it uses energy. It has closedmany small inefficient
industrial facilities; started to burn coals containing less sulfur; and switched many residents,
who previously burned coal, to gas or electricity.
18 Chameides,W. L., Yu,W. L., Liu, H. et al. Case study of the effects of atmospheric aerosols and regional haze onagriculture: an opportunity to enhance crop yields in China through emission controls? Proceedings of theNational Academy of Sciences, 96(24), November 23, 1999, 3626–13633, http://www.pnas.org/cgi/content/full/96/24/13626.
127 Criteria (or principal) air pollutants
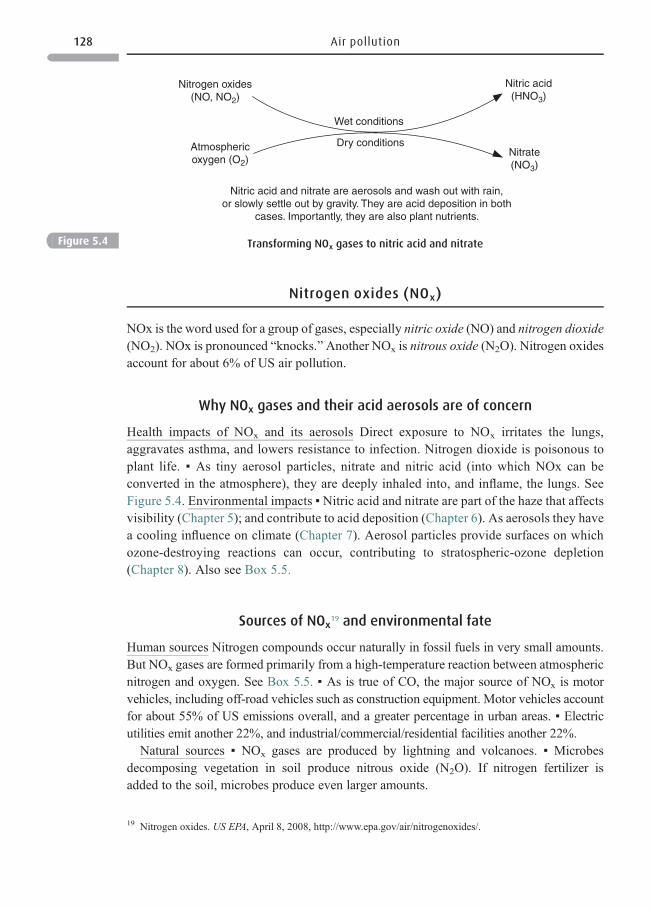
Nitrogen oxides (NOx)
NOx is the word used for a group of gases, especially nitric oxide (NO) and nitrogen dioxide(NO2). NOx is pronounced “knocks.”Another NOx is nitrous oxide (N2O). Nitrogen oxidesaccount for about 6% of US air pollution.
Why NOx gases and their acid aerosols are of concern
Health impacts of NOx and its aerosols Direct exposure to NOx irritates the lungs,aggravates asthma, and lowers resistance to infection. Nitrogen dioxide is poisonous toplant life. ▪ As tiny aerosol particles, nitrate and nitric acid (into which NOx can beconverted in the atmosphere), they are deeply inhaled into, and inflame, the lungs. SeeFigure 5.4. Environmental impacts ▪ Nitric acid and nitrate are part of the haze that affectsvisibility (Chapter 5); and contribute to acid deposition (Chapter 6). As aerosols they havea cooling influence on climate (Chapter 7). Aerosol particles provide surfaces on whichozone-destroying reactions can occur, contributing to stratospheric-ozone depletion(Chapter 8). Also see Box 5.5.
Sources of NOx19 and environmental fate
Human sources Nitrogen compounds occur naturally in fossil fuels in very small amounts.But NOx gases are formed primarily from a high-temperature reaction between atmosphericnitrogen and oxygen. See Box 5.5. ▪ As is true of CO, the major source of NOx is motorvehicles, including off-road vehicles such as construction equipment. Motor vehicles accountfor about 55% of US emissions overall, and a greater percentage in urban areas. ▪ Electricutilities emit another 22%, and industrial/commercial/residential facilities another 22%.
Natural sources ▪ NOx gases are produced by lightning and volcanoes. ▪ Microbesdecomposing vegetation in soil produce nitrous oxide (N2O). If nitrogen fertilizer isadded to the soil, microbes produce even larger amounts.
Atmosphericoxygen (O2)
Nitrogen oxides(NO, NO2)
Wet conditions
Dry conditions
Nitric acid(HNO3)
Nitrate(NO3)
Nitric acid and nitrate are aerosols and wash out with rain,or slowly settle out by gravity. They are acid deposition in both
cases. Importantly, they are also plant nutrients.
Figure 5.4 Transforming NOx gases to nitric acid and nitrate
19 Nitrogen oxides. US EPA, April 8, 2008, http://www.epa.gov/air/nitrogenoxides/.
128 Air pollution
Table 5.3 Sulfur dioxide, nitrogen oxides, and global change
Issue Role of sulfur dioxideAcid deposition Sulfur dioxide emissions are converted in the atmosphere to sulfate
and sulfuric acid – major contributors to acid deposition(Chapter 6).
Stratospheric ozone depletion Volcanic eruptions inject sulfur dioxide into the stratosphere where it isconverted to particles. Analogous to ice particles at the poles, theseprovide surfaces on which ozone depleting reactions occur(Chapter 8).
Global climate change Sulfur dioxide is converted to sulfate or sulfuric acid particles. Thesehave an “anti-greenhouse” effect. They do so by absorbing part of thesun’s radiation, preventing it from reaching and warming the Earth’ssurface (Chapter 7).
Issue Role of nitrogen oxides (NOx)Acid rain, stratospheric ozone
depletion, and climate changeNOx emissions are converted in the atmosphere to nitrate and nitric acid,which contribute to the problems shown on the left.
Ground-level ozone NOx, but not sulfur dioxide, is converted to ground-level ozone(Chapter 5).
Nutrient pollution NOx is converted to nitrate and nitric acid. After deposition to earth andwater, these can “over-fertilize” waters leading to eutrophication(Chapter 9).
Box 5.5 How NOx is formed and impacts specific to NOx
Formation of NOx
Atmospheric nitrogen, N2 is a very stable chemical. However, burning fossil fuels at a high
temperature promotes a reaction between atmospheric N2 and atmospheric oxygen, O2. It is
this reaction that results in NOx formation when fossil fuels are burned. So, nitrogen oxide
gases are emitted almost anywhere that high-temperature combustion occurs. This is unfor-
tunate because high temperatures otherwise promote efficient combustion, thus lowering
emissions of carbon monoxide, PAHs, and other incomplete products of combustion (Box 1.2).
Many impacts of NOx and its particulates are sharedwith SO2, and with aerosols of sulfate and
sulfuric acid (Table 5.3).
Impacts specific to NOx
Nitrogen oxide gases have important impacts not shared with SO2. (1) NOx gases are
precursors of ground-level ozone. (2) Deposited onto earth or into water, these nitrogen
compounds serve as plant nutrients. They can benefit plant life, but high concentrations
have adverse even devastating consequences. (3) Nitrous oxide (N2O) is often considered a
NOx. It is a strong greenhouse gas, but fortunately emitted in fairly small quantities.
129 Criteria (or principal) air pollutants
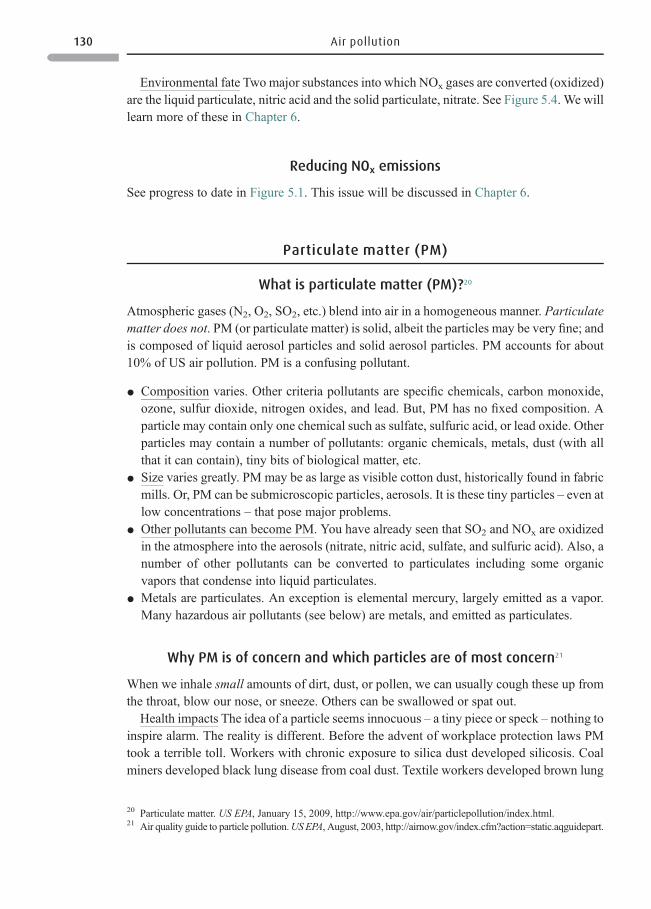
Environmental fate Two major substances into which NOx gases are converted (oxidized)are the liquid particulate, nitric acid and the solid particulate, nitrate. See Figure 5.4. We willlearn more of these in Chapter 6.
Reducing NOx emissions
See progress to date in Figure 5.1. This issue will be discussed in Chapter 6.
Particulate matter (PM)
What is particulate matter (PM)?20
Atmospheric gases (N2, O2, SO2, etc.) blend into air in a homogeneous manner. Particulatematter does not. PM (or particulate matter) is solid, albeit the particles may be very fine; andis composed of liquid aerosol particles and solid aerosol particles. PM accounts for about10% of US air pollution. PM is a confusing pollutant.
* Composition varies. Other criteria pollutants are specific chemicals, carbon monoxide,ozone, sulfur dioxide, nitrogen oxides, and lead. But, PM has no fixed composition. Aparticle may contain only one chemical such as sulfate, sulfuric acid, or lead oxide. Otherparticles may contain a number of pollutants: organic chemicals, metals, dust (with allthat it can contain), tiny bits of biological matter, etc.
* Size varies greatly. PM may be as large as visible cotton dust, historically found in fabricmills. Or, PM can be submicroscopic particles, aerosols. It is these tiny particles – even atlow concentrations – that pose major problems.
* Other pollutants can become PM. You have already seen that SO2 and NOx are oxidizedin the atmosphere into the aerosols (nitrate, nitric acid, sulfate, and sulfuric acid). Also, anumber of other pollutants can be converted to particulates including some organicvapors that condense into liquid particulates.
* Metals are particulates. An exception is elemental mercury, largely emitted as a vapor.Many hazardous air pollutants (see below) are metals, and emitted as particulates.
Why PM is of concern and which particles are of most concern21
When we inhale small amounts of dirt, dust, or pollen, we can usually cough these up fromthe throat, blow our nose, or sneeze. Others can be swallowed or spat out.
Health impacts The idea of a particle seems innocuous – a tiny piece or speck – nothing toinspire alarm. The reality is different. Before the advent of workplace protection laws PMtook a terrible toll. Workers with chronic exposure to silica dust developed silicosis. Coalminers developed black lung disease from coal dust. Textile workers developed brown lung
20 Particulate matter. US EPA, January 15, 2009, http://www.epa.gov/air/particlepollution/index.html.21 Air quality guide to particle pollution.USEPA, August, 2003, http://airnow.gov/index.cfm?action=static.aqguidepart.
130 Air pollution
disease from cotton dust. Workers inhaling airborne asbestos developed asbestosis, lungcancer, or mesothelioma. All these are disabling or deadly diseases. Many workers inhaledlarge quantities of all sizes of particles, overwhelming their respiratory systems. ▪ In thetwenty-first century, workplaces in developed countries have been cleaned up. Nonetheless,we are left with a major particulate problem – the very tiniest of particulates. The US EPAregulates particles with diameters of 10 μm or less (PM10). The more dangerous category isparticles with diameters of 2.5 μm or less (0.1–2.5 μm or PM2.5), which are also regulated.See Figure 5.5. The diameter of PM2.5 is barely one-fortieth the width of a human hair.▪ Sulfate particles, and some soot and dust particles are as small as 0.01 μm. These particles,the ultrafines, <0.1 μm may be most dangerous. Deeply inhaled, fine and ultrafine particlescan reach and inflame the lung’s alveoli (tiny air sacs where oxygen is exchanged withcarbon dioxide). The ultrafine may pass into the bloodstream and exert effects elsewhere inthe body.22 The relationship between PM2.5 and disease is remarkable (Box 5.6).
Environmental impacts ▪ Fine particles (PM2.5) strongly contribute to the haze or smogseen in many cities, which often spreads far into rural areas. Sulfate and sulfuric acidaerosols in US parks illustrate this. Visibility reduced by haze in western national parks isup 50% compared to earlier years. In eastern parks, which are exposed to a greater number ofemission sources, haze has reduced visibility by 80% compared to the 1940s. Just in the1980s, the Shenandoah and Great Smoky Mountains parks in Virginia and North Carolinasaw a 40% increase in sulfate particles. Instead of blue sky, one often sees pale white haze orgray fog composed of dilute sulfuric acid. These increases in sulfuric acid and sulfate hazesin the 1980s happened as sulfur dioxide emissions nationwide were decreasing. There ismuch that we don’t yet understand. ▪ Particulates also contribute to a variety of otherproblems, depending on what they contain.
HUMAN HAIR50–70 µm
(microns) in diameter
PM 2.5Combustion particles, organic
compounds, metals, etc.< 2.5 µm (microns) in diameter
PM10Dust, pollen, mold, etc.
< 10 µm (microns) in diameter
90 µm (microns) in diameterFINE BEACH SAND
Figure 5.5 How big is particle pollution? Credit: US EPA
22 Nel, A. Air pollution-related illness: effects of particles. Science, 308(5723), May 6, 2005, 804–806.
131 Criteria (or principal) air pollutants
Sources of PM10 and PM2.5 and environmental fate
* PM10 The major source of PM10 or “coarse” particles is dust and dirt raised by vehiclesor wind from farms (fertilizer, dried manure, or dried crop residues), from roads, unpaved
Box 5.6 A relationship to cancer and death
Epidemiological studies continue to indicate relationships between fine-particle pollution,
PM10 and PM2.5 and death rates among sensitive individuals. Studies reported that more
deaths from heart and lung diseases occurred in a given locale on days with high levels of fine
particles in the air, even levels that were in compliance with the pre-1997 standard. The
particles believed to be most responsible, PM2.5, consist of sulfate or nitrate, soot, and other
chemicals resulting from burning fossil fuels in coal-burning power plants, manufacturing
facilities, and motor vehicles. You are probably not surprised that inhaled PM can cause
respiratory problems or lung cancer. However, reputable studies also report increases in
heart disease, vascular disease, and stroke after long-term exposure to PM2.5.
The strongest work supporting a connection to lung cancer was reported in 2002.23
Researchers tracked 500 000 people from 1982 through 1998. They reported the causes of
all the deaths that occurred in these people over these years, and looked at levels of PM2.5
in the air of locales where those individuals had lived. They corrected results for con-
founding factors including occupational exposure, age, sex, race, smoking, drinking, obe-
sity, type of diet (fat, vegetable, fruit, and fiber intake) and used improved statistical
techniques. They found that every 10 μg/m3 increase in airborne PM2.5 resulted in a 6%
increase in the risk of death by heart or lung disease, and an 8% increase for lung cancer.
Risk was especially great in Los Angeles, but also in Chicago and New York City, and in rural
areas with coal-burning power plants. The elderly were at greatest risk, as were those
already suffering from heart or lung diseases such as asthma and bronchitis. One study
leader commented, “This study provides the most definitive epidemiological evidence to
date that long-term exposure to air pollution in the United States is associated with lung
cancer.”
But how can PM cause disease? For a long time PM epidemiologic studies were criticized
because many particles contain more than one chemical, raising the question: which
chemical(s) cause diseases? The same criticism was earlier made of relationships found
between second-hand tobacco smoke (among people living with a smoker) and lung cancer.
But, in both cases the particles contain a number of carcinogens such as PAHs (see Box 5.7)
as well as toxic metals bound to the particulates. In both cases, tiny particles are trapped
and retained in the lungs. However, we do need more research. What PM chemicals are
most responsible for the effects observed? How do they promote lung cancer and heart
disease?24
23 Pope, C. A., Burnett, R. T., Thun,M. J. et al. Lung cancer, cardiopulmonarymortality, and long-term exposure tofine particulate air pollution. Journal of the American Medical Association, 287(9), March 6, 2002, http://jama.ama-assn.org/cgi/content/full/287/9/1132.
24 Schoor, J. L. Carol Browner’s legacy: PM2.5.Environmental Science&Technology, 40(15), August 1, 2006, 4530.
132 Air pollution
and paved. Construction sites release large amounts of dust. PM10 also includes pollen.Only about 6% of PM10 comes from burning fossil fuels. A natural PM source found incoastal areas is sea salts, which have high levels of chloride and can corrode localbuildings and statuary.
Box 5.7 The ubiquitous PAHs25
Benzene is both a VOC and a HAP. We spoke of benzene as near ubiquitous in the
environment because of its widespread emissions. Even more widespread pollutants,
classed as a HAP are the PAHs (polycyclic aromatic hydrocarbons). They form as partic-
ulates, as products of incomplete combustion (Box 1.2). PAHS are polycyclic (many-ringed)
hydrocarbons. They cling to sediments and soil, are difficult to degrade, can bioaccumulate
in fat, and are toxic.
* Toxicity Breathed into the lung as fine particulates, PAHs can cause respiratory distress.
Several are known human carcinogens: among these, benzopyrene is the most potent.
Recall (Chapter 4) that an excess risk of no more than one in a million is the goal for
exposure to carcinogens. However, even rural soils (away from major highways) some-
times pose an excess risk close to one in a million, and PAH levels in urban soils pose a
risk that is much higher. Fortunately, PAHs are often not bioavailable: they can be
detected in soil, but are bound so firmly that even if the soil is ingested, absorption is
limited.
* Sources More than 4 million tons (3.6 million tonnes) of PAHs are emitted into US air each
year. They are found wherever any carbon-containing material is burned, wood, fossil fuel,
plastic, cotton, a browned oven roast, or char-grilled food. Natural sources include forest
and grass fires, petroleum, and volcanic eruptions. But it is coal burning and motor-vehicle
exhausts that have greatly increased environmental levels. Burning of agricultural wastes
and wood burning can be significant in certain locales.
* Exposure Airborne PAHs settle into water. They have very low water solubility and
instead concentrate in sediment. There they are protected from the sunlight, warmth,
and oxygen that could help destroy them. Airborne PAHs also settle onto soil, food
crops, and other vegetation. In homes with smokers, tobacco smoke is a primary route
of PAH exposure. Otherwise, foods are the route of 90% of human exposure, especially
leafy vegetables and unrefined grains. We also ingest PAHs when eating charcoal-grilled
foods or browned, especially very brown meats, baked goods, and toast. Smoking one
or more packs of cigarettes a day can double, in some cases quintuple, a person’s PAH
exposure.
* Reducing emissions PAHs are particulates, so proper controls can capture a large portion of
emissions from, e.g., fossil-fuel burning facilities. Using conditions that promote more
complete combustion is an important P2 means of lowering PAH formation. Becoming
less dependent on fossil fuels is another.
25 ToxFAQsTM for polycyclic aromatic hydrocarbons. ATSDR, September, 1996, http://www.emla.hu/prtr/chems/tfacts69.html.
133 Criteria (or principal) air pollutants
* PM2.5 Most PM2.5 and the even tinier ultrafines originate from fossil-fuel combustion,especially diesel motor vehicles, electric power plants, and industrial operations suchas steel mills emitting sulfur dioxide. ▪ Power plants and other incinerators alsoproduce fly ash, whose fine particles contain carbon, hydrocarbons, metal oxides,and silicon dioxide. Silicon dioxide in window glass is benign, but in fly ash or fineblowing sand, it is dangerous. Fly ash particles also trap dioxins formed duringcombustion. ▪ Locales with large numbers of inefficiently burning wood stoves con-tribute to particle levels. Rural areas generate airborne particles when burning biomass.Recall that with efficient combustion, most organic material is converted to carbondioxide and water, with little particulate matter and soot. More particles form whencombustion is inefficient.
Environmental fate There are many types of PM, so the fate depends on the particularchemical composition of the PM being considered. Those that are organic may bedestroyed or transformed into other chemicals while in the atmosphere by the hydroxylradical (see Section II VOCs). Many others settle onto earth and water and are transformedthere by microorganisms or by a number of other reactions.
Reducing PM emissions
* In 1997, the US EPA set new standards for particulates and, at the same time, forozone. As happened with ozone, it was only in 2002 that the new PM standardwithstood court appeals and its implementation allowed. ▪ The old PM10 standard of50 μg/m3of air was retained. ▪ A new PM standard specific to PM2.5 was added, 15 μg/m3/m3. Note, in Figure 5.1.that PM10 measurements didn’t begin until 1990 and PM2.5
not until 1999.* Combustion By now you see that reducing emissions from combustion sources produc-
ing PM2.5 is a major need. Remember – the same is true for carbon monoxide, ozone,sulfur dioxide, and nitrogen oxides. In addition to controls, Americans need to commit tolessened dependence on fossil fuels. So do many other countries. The European Union isalso focusing attention on reducing ozone and PM. When the EU adopted its Clean Airfor Europe (CAFE) program in 2001, these two were targeted as “the air pollutants ofgreatest concern.”
* But PM2.5 poses quandaries as we contemplate reducing emissions. Despite excellentepidemiological information on its dangers, major questions need answers beforePM2.5 emissions can most effectively be reduced. ▪ Example The chemical composi-tion of PM2.5 differs between the East Coast and the West Coast of the United States.Moreover, although PM2.5 clearly has adverse health effects, we don’t know whatPM2.5 component is most responsible – sulfate, nitrate, elemental carbon, carboncompounds, metal oxides, or? If we determine which PM2.5 chemicals are mostdangerous, we could design controls specific to those chemicals. This could reducerisk more efficiently than attempting to stringently control every fine-particulatesource.
134 Air pollution
Lead26
Lead is an important pollutant that will be more completely described in Chapter 15. In the1970s, when EPAdesignated lead as a criteria air pollutant, leadwas still added to gasoline in theUnited States, and incinerators were less well controlled than today. More generally, leademissions were less well controlled. ▪ Since the late 1970s, lead has been eliminated fromgasoline and from paint used indoors. In developed countries, lead emissions from industrialfacilities have been lessened. Coal-burning power plants have been controlled, but still emitsome lead along with other metals. ▪Developed countries A major problem remains: as a metal,lead is not degraded. Thus lead mobilized into the environment many years ago, remains asignificant pollutant today. Lead is found in paint of old houses, often in the soil outside thosehomes, and in the solder of oldwater pipes. It is still found in roadside soil that was contaminatedfrom car exhaust. ▪ Less-developed countries Although leaded gasoline has been eliminatedfrom gasoline inmost countries, some still use it. Coal-burning power plants are typically poorlycontrolled. Recycling of lead-acid batteries in impoverished countries remains an occupationalexposure even to children. Leaded tableware, sometimes unsafe to eat off of, is still made.
Questions 5.1
1 Think about a warm sunny summer day in an urban area. People who exercise outdoors are
advised to do so early in the morning on such a day. Explain why.
2 Where might you personally be exposed to: (a) carbon monoxide; (b) ozone; (c) particulate
matter; (d) sulfur dioxide; (e) nitric oxides; (f) lead?
3 How would the way you may be exposed to sulfuric acid and sulfate be different from
possible exposure to sulfur dioxide?
4 Environmental improvements can involve cost. Assume that you want to convince your
employer to conserve fossil fuels. (a) Outline your reasons for doing so. (b) What kind of
changes could be done at no cost? (c) Which involve short-run costs? (d) Long-run costs?
(e) What benefits would your employer see?
5 Often, your highest exposure to particulate matter occurs inside your home. Does this mean
we can lessen our emphasis on regulating particulates in outside air? Explain.
6 What criteria air pollutant(s) would most concern you in the following instances? Explain in
each case. (a) You are a garage attendant or a traffic officer in a large city. (b) Air pollution
from a nearby urban center reaches your farm. (c) A truck is parked near an air intake of the
motel where you are spending the night. Because the truck contains perishables, its motor is
left idling. (d) You are a park ranger in the Great Smoky Mountain National Park.
7 What have you learned about ozone and particulates that made it reasonable that they
would be considered together when new standards were set?
8 Consider: “The more the population grows, the more the rights of the common will impinge
on the rights of the individual.” How is this statement relevant to regulating motor vehicle
emissions?
26 Lead in air. US EPA, October 16, 2008, http://www.epa.gov/air/lead/.
135 Criteria (or principal) air pollutants
SECTION II
Volatile organic chemicals (VOCs) 27
As volatile organic chemical implies, these are compounds of carbon,28 and compoundsthat readily evaporates into the air. A great many organic chemicals are volatile.29 Benzeneand other volatile hydrocarbons found in gasoline are well-known examples. Another ismethylene chloride, a paint stripper. We typically like the smell of VOCs emitted inside newcars, but the odor of VOCs emitted from new carpets, clothing, or drapes may irritate eyesand noses. You can get a sense of the many types of VOCs in our environment by examiningVOC sources.
Why VOCs are of concern?
Health impacts Because there are so many individual VOCs, it is hard to generalize asto their health impacts. However, many drivers and pedestrians develop headaches andother symptoms if heavily exposed to volatile hydrocarbons in motor vehicle exhausts.Sensitive individuals may react with attacks of asthma or other respiratory problems.▪ Individual VOCs vary in specific health impacts. As you would expect, high concen-trations of a chemical such as benzene may cause dizziness, nausea, and other symptoms.Lower-level exposures, over longer time periods can lead to ill health effects that dependon the particular VOC. ▪Many VOCs are also hazardous air pollutants (HAPs), which willbe discussed below. ▪ Ozone formation Remember from Figure 5.2 that VOCs play a majorrole in the formation of ground-level ozone.
Sources and fate of VOCs30
* Combustion Hydrocarbons are the most common VOCs, and motor vehicles are thelargest VOC source. These emit up to half of all VOCs in the United States. Lookagain at Box 1.2: internal-combustion engines burn hydrocarbon VOCs inefficiently,emitting large amounts as incomplete products of combustion. Hydrocarbons alsoevaporate as gas tanks are filled, and when vehicles are running, idling, or cooling.Combustion engines are pervasive, used not just in cars, trucks, and buses, but in
27 Definition of Volatile Organic Chemicals (VOC). US EPA, November 26, 2007, http://www.epa.gov/ttn/naaqs/ozone/ozonetech/def_voc.htm.
28 Excluded from the category of VOCs are carbon monoxide, carbon dioxide, carbonic acid, metallic carbides orcarbonates, and ammonium carbonate.
29 The US EPA refers to VOCs as organic gases, http://www.epa.gov/iaq/voc.html.30 Volatile organic compounds. US EPA, October 21, 2008, http://www.epa.gov/air/emissions/voc.htm.
136 Air pollution
airplanes, construction, farm and forestry equipment, gasoline-powered lawn andgarden equipment.
* Non-combustion Petroleum refineries, chemical plants, and electric-power plants canbe important local sources, but less so overall as compared to the pervasive VOCemissions of motor vehicles. A great variety of facilities including gasoline stations,auto maintenance shops, paint and print shops, dry cleaners, wood-drying, or wood-painting operations emit VOCs. Restaurants and bakeries emit pleasant-smelling VOCs,but large bakeries emit large amounts of ethanol formed by the action of yeast. Sewagetreatment plants and composting operations emit VOCs too, often with odors that weconsider objectionable.
* Natural sources Trees and plants are a large natural source of hydrocarbons, especiallyin hot weather. Trees may be significant VOC sources, even in large cities. In Maine,a heavily forested state, trees produce more than 90% of the state’s VOCs. The VOCsresponsible for the smell of pines are terpenes which, although pleasant smelling, cancontribute to ozone formation. Natural VOCs are not by themselves a problem, but mustbe figured into strategies to reduce ozone formation. However, trees do not emit the NOx
that interact with VOCs to form ozone.* Homes and offices Although we don’t produce large quantities of VOCs in our homes
or offices, they can be a large source of human exposure. Sources of VOCs within thehome are freshly painted walls, household solvents, charcoal broiler starters, aerosolsprays, even deodorants and cosmetics (Chapter 17).
Fate of VOCs Many break down in the atmosphere through a series of chemical reactionsthat start with hydroxyl radicals. The hydroxyl radical (▪OH), often referred to as anatmospheric cleanser, is a highly reactive free radical.31 See Chapter 19.
Reducing VOC emissions
By 1985, VOC emissions had dropped about 30% compared to 1970 in the United States,presumably due to regulations enacted in the 1970 Clean Air Act (CAA) and its 1977amendments. In 1990, CAA amendments mandated further reductions in motor vehicleemissions. ▪ Southern California was especially aggressive in reducing not just VOCemissions from motor vehicles, but all vehicle pollutants. California took measures thatincluded switching to less polluting fuels, and mandating that motor vehicle manufacturerssell a specified numbers of low-polluting vehicles. ▪ Other locales have taken actionssuch as highway lanes that can be used only by vehicles carrying more than one passenger,or requiring that tolls be paid by those who drive in peak-traffic hours. Sometimes employerspay employees to take alternative forms of transportation to work. Chapter 13 has moreinformation on reducing motor vehicle emissions. In 1970, US VOC emissions were34 million tons (31 million tonnes), which slowly dropped over the years to 16 milliontons in 2005.
31 A free radical is an atom or molecule that has one or more unpaired electron. See free radical. Answers.com,http://www.answers.com/topic/free-radical.
137 Volatile organic chemicals (VOCs)
SECTION III
Hazardous air pollutants (HAPS)32,33
HAPS are often called toxic air pollutants or just air toxics. Exposure to HAPS can causeserious health and environmental problems. The 1970 Clean Air Act had authorized the EPAto list and regulate HAPS emitted into air. However, the process was so slow that Congressitself chose 188 chemicals to include in the 1990 US Clean Air Act Amendments. ▪ Seeexamples of HAPS in Table 5.4. Many additional chemicals could qualify as HAPS, butthese 188 were considered as higher priority. HAPS are not unique to the United States, butoccur around the world. ▪Many VOCs are HAPS; so are many metals. Remember the ToxicRelease Inventory, TRI from Chapter 2. Many of the 188 HAPS are also TRI chemicals.
Do not conclude from the fact that they are called “hazardous” or “toxic” that HAPSpose greater problems than do criteria air pollutants. Criteria pollutants are hazardous – andtoxic – too, and are typically produced in much larger quantities than HAPS. Our exposure isalso usually greater. However, HAPS are important in a circumstances specific to eachchemical.
Why HAPS are of concern
The risk of adverse effects of a particular HAP depends upon its intrinsic toxicity andthe level of exposure to it. It is not feasible to consider all HAPS here, so only a fewexamples follow.
Questions 5.2
The EPA reports that 200 million tons (181 million tonnes) of five criteria pollutants (sulfur
dioxide, nitrogen dioxide, carbon monoxide, lead, and particulate matter) plus VOCs were
emitted in the United States in 1997.
1 Ozone is a criteria pollutant – why wasn’t it on this list?
2 What chemical changemust sulfur dioxide and nitrogen oxides undergo before either is able
to deposit onto water and soil?
3 What criteria pollutants can deposit to water and land without chemical conversions?
4 Large quantities of VOCs are emitted by motor vehicles. Chemically speaking, these VOCs
can be described by one word. What word?
5 What is the eventual fate of most VOCs in the environment?
32 About air toxics. US EPA, January 15, 2009, http://www.epa.gov/ttn/atw/allabout.html.33 National air toxic assessment. US EPA, 2002, http://www.epa.gov/ttn/atw/nata/.
138 Air pollution
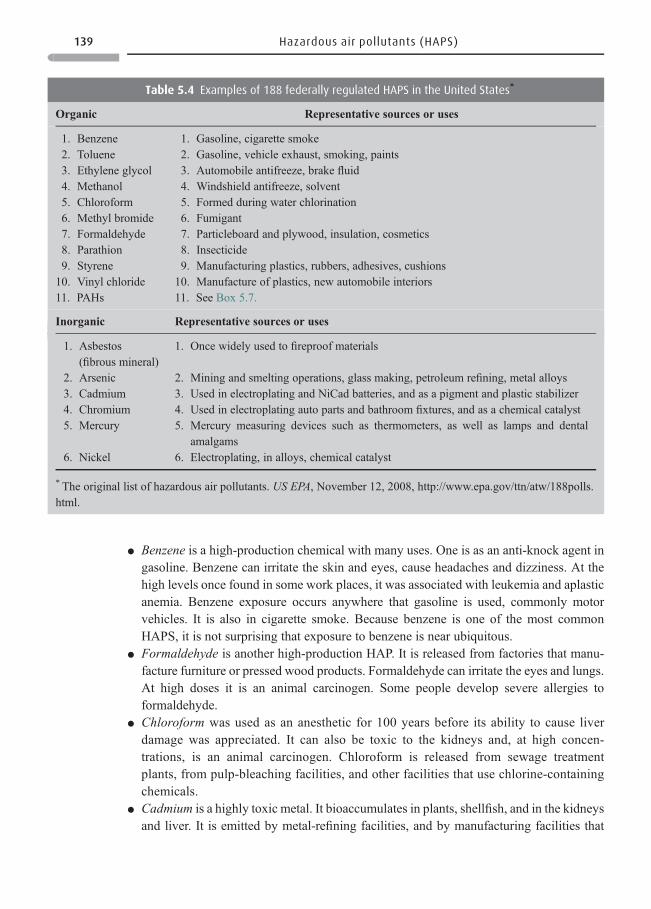
* Benzene is a high-production chemical with many uses. One is as an anti-knock agent ingasoline. Benzene can irritate the skin and eyes, cause headaches and dizziness. At thehigh levels once found in some work places, it was associated with leukemia and aplasticanemia. Benzene exposure occurs anywhere that gasoline is used, commonly motorvehicles. It is also in cigarette smoke. Because benzene is one of the most commonHAPS, it is not surprising that exposure to benzene is near ubiquitous.
* Formaldehyde is another high-production HAP. It is released from factories that manu-facture furniture or pressed wood products. Formaldehyde can irritate the eyes and lungs.At high doses it is an animal carcinogen. Some people develop severe allergies toformaldehyde.
* Chloroform was used as an anesthetic for 100 years before its ability to cause liverdamage was appreciated. It can also be toxic to the kidneys and, at high concen-trations, is an animal carcinogen. Chloroform is released from sewage treatmentplants, from pulp-bleaching facilities, and other facilities that use chlorine-containingchemicals.
* Cadmium is a highly toxic metal. It bioaccumulates in plants, shellfish, and in the kidneysand liver. It is emitted by metal-refining facilities, and by manufacturing facilities that
Table 5.4 Examples of 188 federally regulated HAPS in the United States *
Organic Representative sources or uses
1. Benzene2. Toluene3. Ethylene glycol4. Methanol5. Chloroform6. Methyl bromide7. Formaldehyde8. Parathion9. Styrene
10. Vinyl chloride11. PAHs
1. Gasoline, cigarette smoke2. Gasoline, vehicle exhaust, smoking, paints3. Automobile antifreeze, brake fluid4. Windshield antifreeze, solvent5. Formed during water chlorination6. Fumigant7. Particleboard and plywood, insulation, cosmetics8. Insecticide9. Manufacturing plastics, rubbers, adhesives, cushions
10. Manufacture of plastics, new automobile interiors11. See Box 5.7.
Inorganic Representative sources or uses
1. Asbestos(fibrous mineral)
2. Arsenic3. Cadmium4. Chromium5. Mercury
6. Nickel
1. Once widely used to fireproof materials
2. Mining and smelting operations, glass making, petroleum refining, metal alloys3. Used in electroplating and NiCad batteries, and as a pigment and plastic stabilizer4. Used in electroplating auto parts and bathroom fixtures, and as a chemical catalyst5. Mercury measuring devices such as thermometers, as well as lamps and dental
amalgams6. Electroplating, in alloys, chemical catalyst
* The original list of hazardous air pollutants. US EPA, November 12, 2008, http://www.epa.gov/ttn/atw/188polls.html.
139 Hazardous air pollutants (HAPS)
make cadmium-containing products. Incinerators emit cadmium in small amounts, as dopower plants and other facilities that burn fossil-fuels.
* Mercury, another highly toxic metal, is a neurotoxin. Elemental mercury is the onlyliquid metal. It is volatile and is emitted by coal-burning power plants. It becomesespecially toxic after bacteria convert it to methylmercury, which biomagnifies in thefood web.
Potential for exposure
An individual HAP poses the most concern of possible exposure at or near its pointof emission because that is where its concentration is the highest.34 However, windcurrents can carry a HAP far from its source, albeit in progressively more dilutedform.
* Chloroform emissions are primarily important only near facilities that use chlorine-containing chemicals, such as municipal wastewater treatment or pulp-bleaching facilities.
* Several HAPS – benzene is a major case – are more widespread. Each benzene sourcemay be local, but sources are ubiquitous.
* Metal HAPS pose special problems because they persist in the environment. Metals havebuilt up in soil and sediment in certain locations. ▪Because every motor vehicle that burnsgasoline emits HAPS, there are many millions of small metal-emitting sources. On alarger scale, every fossil fuel-burning power plant, and many industrial facilities emit atleast trace amounts of metals.
* In Chapter 17 you will see that the greatest source of human exposure to HAPS such asbenzene, formaldehyde, and others is often in our own homes.
Reducing emissions of HAPS
Each of the six criteria pollutant has its own ambient air standard, a standard based on itsrisk. However, setting standards is both time consuming and costly. Moreover, once stand-ards are set, a whole area must decide how to go about reducing emissions of those criteriapollutants. ▪ HAPS were handled by an alternative approach. The 1990 Clean Air ActAmendments mandated maximum available control technology (MACT) to reduce emis-sions of a particular HAP from individual facilities. ▪ Other ways, in addition to regulationscan be used to reduce HAP emissions. ▪Before 1990, more than 1000 companies engaged ina voluntary program to reduce emissions of 17 air toxics produced in large quantities or thatposed special risks. ▪ Also, HAPS are among the chemical emissions that must be reportedon the Toxic Release Inventory. Such public declarations have led many facilities to workharder to reduce them.
34 Risk assessment for toxic air pollutants. US EPA, http://www.epa.gov/ttn/atw/3_90_024.html.
140 Air pollution
Europe
European countries have the same air pollutants as the United States and show similarimpacts of smog and particulates on human health, as well as ozone damage to vegetation,and acid deposition impacts on soils, trees and waters. ▪ In late 1999 European countriesadopted a cooperative protocol to aggressively address these pollutants under the UNConvention on Long-Range Transboundary Air Pollution. Each signatory country wasassigned ceilings on its emissions of sulfur dioxide, nitrogen oxides, VOCs, and ammonia.Ceilings for each pollutant were individualized to the circumstances of each country. By2006, sulfur dioxide emissions in 15 EU countries had declined 65%. Although NOx fellonly 30%, and VOCs only 38%, there were nonetheless fewer high ozone episodes. PMAlthough Europe had a cap of 40 μg/m3on PM10, it was not until 2007 that the EuropeanParliament approved a limit on PM2.5 of 25 μg/m3.35 This was part of a strategy to reduce
Questions 5.3
Before answering these questions, make sure you understand how criteria air pollutants differ
from HAPS.
1 What actions can you take within your household to lower your PAH exposure?
2 (a) What if the 188 HAPS were called the risky air pollutants – how would the meaning
change? Explain. (b) Consider the chemicals reported on the Toxic Release Inventory – what
if it was called the Risky Chemical Release Inventory?
3 (a) What HAPS are likely to be emitted in your community? (b) In what ways could you
personally be exposed to these?
4 Burning gasoline in 200 million motor vehicles is the single largest source of ambient air
pollution in the United States. At the same time, motor vehicles consume over half of the
petroleum used in the United States. This high consumption is a national security issue. (a) Does
this knowledge increase the likelihood youmight think carefully about fuel economywhen you
buy a motor vehicle, or affect how you drive andmaintain it? Explain. (b) If knowledge alone is
not enough,what could change your behavior? (c) Underwhat circumstances do youwalk, take
public transportation, or bike? (d) What would cause you to use these options more often?
5 (a) Social critics observe that the United States regulates pollutant emissions and encour-
ages P2, but remains blind to the root causes of environmental damage – growing pop-
ulation and growing consumption. Do you agree? Explain.
6 VOCs along with four criteria pollutants (carbon monoxide, sulfur dioxide, nitrogen oxides,
and particulates), account for about 98% of all air pollution. Fossil fuel combustion is amajor
source of all five. (a) Assume you believe that society should do more than it does now to
reduce fossil fuel dependence. After reflection, note three steps that you would recommend
society take. (b) How could those steps be relevant to you as an individual in terms of
reducing your own dependence on fossil fuels?
35 Burke, M. EU contemplates first-ever limit for PM2.5. Environmental Science & Technology, 40(1), January 1,2006, 11.
141 Hazardous air pollutants (HAPS)
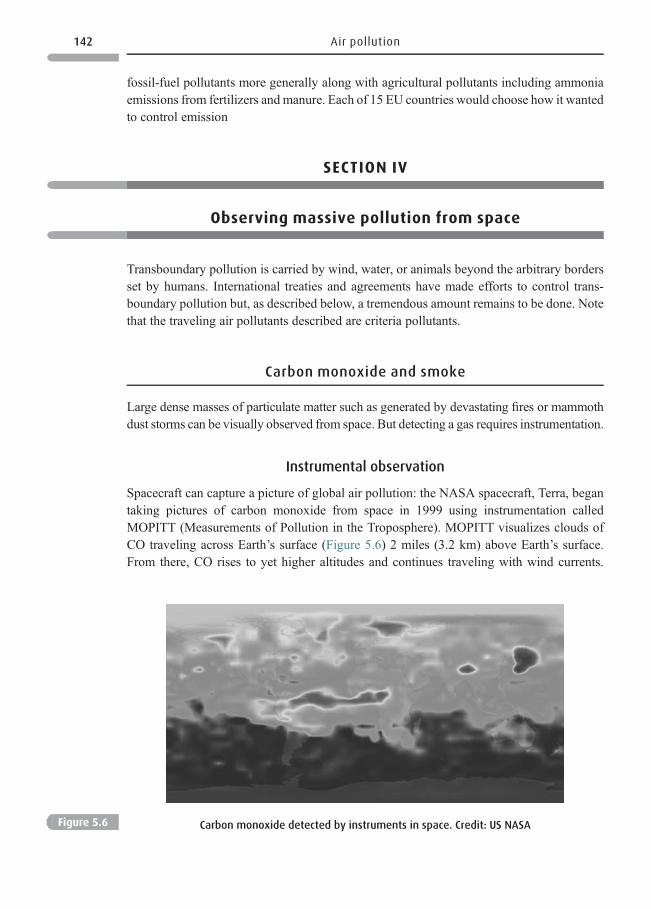
fossil-fuel pollutants more generally along with agricultural pollutants including ammoniaemissions from fertilizers andmanure. Each of 15 EU countries would choose how it wantedto control emission
SECTION IV
Observing massive pollution from space
Transboundary pollution is carried by wind, water, or animals beyond the arbitrary bordersset by humans. International treaties and agreements have made efforts to control trans-boundary pollution but, as described below, a tremendous amount remains to be done. Notethat the traveling air pollutants described are criteria pollutants.
Carbon monoxide and smoke
Large dense masses of particulate matter such as generated by devastating fires or mammothdust storms can be visually observed from space. But detecting a gas requires instrumentation.
Instrumental observation
Spacecraft can capture a picture of global air pollution: the NASA spacecraft, Terra, begantaking pictures of carbon monoxide from space in 1999 using instrumentation calledMOPITT (Measurements of Pollution in the Troposphere). MOPITT visualizes clouds ofCO traveling across Earth’s surface (Figure 5.6) 2 miles (3.2 km) above Earth’s surface.From there, CO rises to yet higher altitudes and continues traveling with wind currents.
Figure 5.6 Carbon monoxide detected by instruments in space. Credit: US NASA
142 Air pollution
Under different meteorological conditions CO sinks to Earth’s surface and adds to ground-level pollution. Carbon monoxide is the only combustion pollutant that MOPITT candirectly detect, but CO in turn serves as a tracer for NOx and other combustion pollutantsproduced with the CO. MOPITT can observe emissions emanating from a city, but cannotprecisely pinpoint the source. It can observe the enormous CO clouds produced by forestand grassland fires in Africa and South America. Such clouds of CO and other combustionpollutants travel across the Southern Hemisphere as far as Australia during the dry season.Because MOPITT can follow the pathways and determine concentrations, it is useful inmapping the distribution of CO pollution around the globe. It is expected to be helpful insetting international environmental policy.
Direct observation
Orbiting satellites can directly observe the smoke clouds resulting from heavy fires. Anexample was the mammoth fires in Indonesia’s rain forests observed in 1997. These fireswere described as a planetary disaster, “one of the most broad-ranging environmentaldisasters of the century.” Humans deliberately set them to clear rainforests in order toplant rubber, palm oil, rice, and timber plantations. For weeks, a smoky haze fell overIndonesia, Malaysia, Singapore, Thailand, Brunei, and Australia. Smoke aggravated orcaused lung and other health problems. Factories and schools closed. Shipping was dis-rupted. Airports closed and tourismwas hard hit. Crop yields fell as a perpetual twilight hazesettled over the region, a major example of global dimming. The damage was calculated at$6 billion, quite aside from long-term environmental and health damage, and the displace-ment of the forests’ indigenous peoples and animals. Despite the world’s appalled reactionto these fires, they have been set again repeatedly. In 2006, fire impact on Indonesia andSoutheast Asia was more severe than seen since 1997. Environmental ministers fromaffected countries have been unable to develop a strategy to attack this ongoing catastrophe.An Indonesian stated that “It is affecting the people and the economy of Indonesia muchmore than the other countries . . . It’s a . . . shared responsibility.” Non-governmentalorganizations have called for naming those responsible with the hope of shaming them,and also prosecuting them. They stated “There needs to be a concrete plan and politicalwill.”36 Mammoth fires occur elsewhere on the globe too, often in the Amazon rain forests.
Investigating observations
The ability to observe carbon monoxide, smoke, and dust from space is impressive.However, it sometimes takes major efforts to trace traveling pollutant clouds, their origins,routes of travel, and environmental impacts. ▪ One problem was to trace the origin ofpollutants, especially NOx which lead to smog in the New England States. Much was tracedback to the US Midwest where there is a concentration of coal-burning power plants.▪ Another question was: can the precursors of acid deposition arising in the EasternUnited States cross the Atlantic Ocean to reach Western Europe? Yes, but whether amounts
36 Khoo, H. C. Civic groups call for name and shame on Asia’s haze.Reuters News Service, Singapore, October 20,2006, http://www.reliefweb.int/rw/RWB.NSF/db900SID/YAOI-6UR5BZ?OpenDocument.
143 Observing massive pollution from space
transported significantly increase acid deposition in Europe is less clear. ▪ Or, what is theorigin of the springtime haze seen in the Arctic? This haze of metals and other particulatescovers an area equivalent to 9% of the Earth’s surface. It was tentatively attributed toindustrial emissions in Europe, Asia, and North America. However, a recent trackingdown of the haze’s origin indicates that much is from forest and agricultural fires inSiberia and Kazakhstan.37 ▪ Struggling to understand the journeys of wind-borne pollutants,researchers ask increasingly complex questions. International teams work from aircraft,ships, ground-based stations, and satellites. Using sophisticated instruments, scientistsfollow pollution over Asia, Africa, Europe, North and South America, Australia, andAntarctica. The data gathered allow them to piece together pictures of how pollutantsmove with the wind. The final destination of a traveling pollutant varies with seasonalstorm conditions, and with the winds prevailing at different times of the year.
Mammoth quantities of PM
Giant dust storms
Billions of tons of dust move through the atmosphere every year. ▪ One example ofmomentous dust storms are the great yellow clouds – observable from space – created bygiant dust storms (sand storms) in Mongolia’s and China’s expanding Gobi Desert. Tracingthis dust over thousands of miles, it was seen being borne across the Pacific Ocean into theUnited States. There, after crossing San Francisco on the western coast, it moved east toColorado. After one large Gobi storm in 2001, the dust reaching Boulder Colorado reducedsunlight over the city by about 25% before moving onward further east. This dramatic effectoccurred although the dust, by the time it reached Boulder, had been traveling over a weekspreading out and being diluted as it went. See Box 5.8. ▪ Transboundary dust pollution canbecome routine. The US EPA reports that, on some days a quarter of the PM above LosAngeles can be traced to China, a figure that it is believed could increase to a third.38
Transporting disease Think about dust originating in the Sahara and Sahel regions ofNorth African deserts. This dust can be blown across the Atlantic to the Caribbean Islandsand to Florida. On some Miami summer days, the dust contributes upwards of 100 μg/m3 ofPM. Now, consider that the US EPA standard for PM10 is 50 μg/m3 over a 24-hour period(or 150 maximum for any single hour). Policy makers have noticed this pollution from afar,and are gathering data that may be useful in the future when setting air standards. ▪ Thesetraveling dust storms carry bacteria and fungi, some infectious. It is possible to culturepathogenic bacteria, viruses, and fungi collected in the Caribbean that originate in Africa.Much larger numbers of infectious agents are found on days when much dust blows in fromAfrica than on days bringing little dust. Coral researchers were able to link a fungus blown infrom Africa to a major disease of the Caribbean Sea Fan. ▪ Fungal spores, transported from
37 Perkins, S. Plumes of Arctic haze traced to Russia, Kazakhstan. Science News, 175(96), March 14, 2009, http://www.sciencenews.org/view/generic/id/40872/title/Plumes_of_arctic_haze_traced_to_Russia,_Kazakhstan.
38 Yardley, J. China’s next big boom could be the foul air. New York Times, October 30, 2005, http://www.nytimes.com/2005/10/30/weekinreview/30yardley.html?_r=1&oref=slogin
144 Air pollution
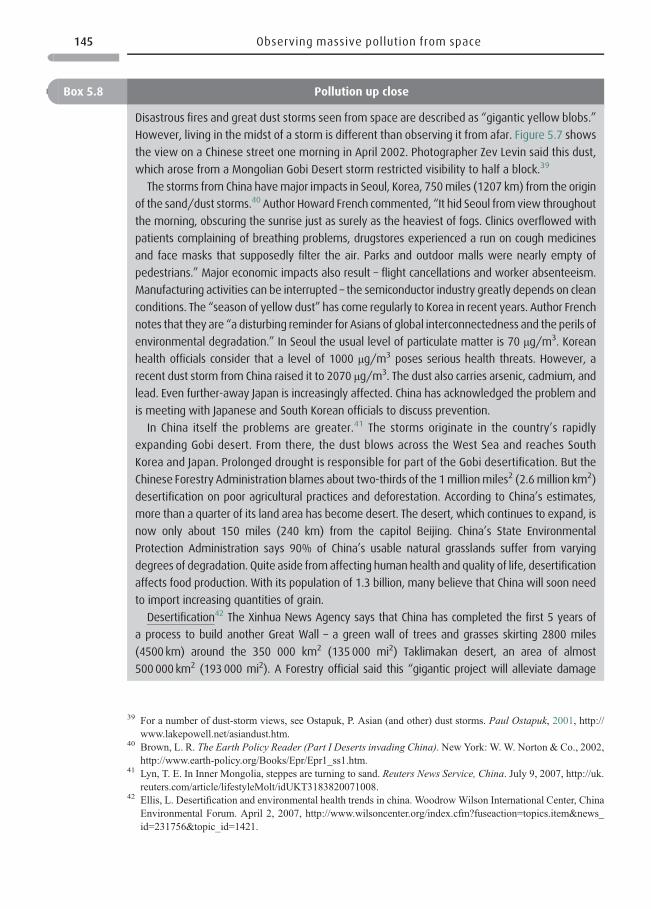
Box 5.8 Pollution up close
Disastrous fires and great dust storms seen from space are described as “gigantic yellow blobs.”
However, living in the midst of a storm is different than observing it from afar. Figure 5.7 shows
the view on a Chinese street one morning in April 2002. Photographer Zev Levin said this dust,
which arose from a Mongolian Gobi Desert storm restricted visibility to half a block.39
The storms from China havemajor impacts in Seoul, Korea, 750miles (1207 km) from the origin
of the sand/dust storms.40 Author Howard French commented, “It hid Seoul fromview throughout
the morning, obscuring the sunrise just as surely as the heaviest of fogs. Clinics overflowed with
patients complaining of breathing problems, drugstores experienced a run on cough medicines
and face masks that supposedly filter the air. Parks and outdoor malls were nearly empty of
pedestrians.” Major economic impacts also result – flight cancellations and worker absenteeism.
Manufacturing activities can be interrupted – the semiconductor industry greatly depends on clean
conditions. The “season of yellow dust” has come regularly to Korea in recent years. Author French
notes that they are “a disturbing reminder for Asians of global interconnectedness and the perils of
environmental degradation.” In Seoul the usual level of particulate matter is 70 μg/m3. Korean
health officials consider that a level of 1000 μg/m3 poses serious health threats. However, a
recent dust storm from China raised it to 2070 μg/m3. The dust also carries arsenic, cadmium, and
lead. Even further-away Japan is increasingly affected. China has acknowledged the problem and
is meeting with Japanese and South Korean officials to discuss prevention.
In China itself the problems are greater.41 The storms originate in the country’s rapidly
expanding Gobi desert. From there, the dust blows across the West Sea and reaches South
Korea and Japan. Prolonged drought is responsible for part of the Gobi desertification. But the
Chinese Forestry Administration blames about two-thirds of the 1millionmiles2 (2.6million km2)
desertification on poor agricultural practices and deforestation. According to China’s estimates,
more than a quarter of its land area has become desert. The desert, which continues to expand, is
now only about 150 miles (240 km) from the capitol Beijing. China’s State Environmental
Protection Administration says 90% of China’s usable natural grasslands suffer from varying
degrees of degradation. Quite aside fromaffecting human health and quality of life, desertification
affects food production. With its population of 1.3 billion, many believe that China will soon need
to import increasing quantities of grain.
Desertification42 The Xinhua News Agency says that China has completed the first 5 years of
a process to build another Great Wall – a green wall of trees and grasses skirting 2800 miles
(4500km) around the 350 000 km2 (135000 mi2) Taklimakan desert, an area of almost
500000km2 (193000 mi2). A Forestry official said this “gigantic project will alleviate damage
39 For a number of dust-storm views, see Ostapuk, P. Asian (and other) dust storms. Paul Ostapuk, 2001, http://www.lakepowell.net/asiandust.htm.
40 Brown, L. R. The Earth Policy Reader (Part I Deserts invading China). New York: W. W. Norton & Co., 2002,http://www.earth-policy.org/Books/Epr/Epr1_ss1.htm.
41 Lyn, T. E. In Inner Mongolia, steppes are turning to sand. Reuters News Service, China. July 9, 2007, http://uk.reuters.com/article/lifestyleMolt/idUKT3183820071008.
42 Ellis, L. Desertification and environmental health trends in china. WoodrowWilson International Center, ChinaEnvironmental Forum. April 2, 2007, http://www.wilsoncenter.org/index.cfm?fuseaction=topics.item&news_id=231756&topic_id=1421.
145 Observing massive pollution from space
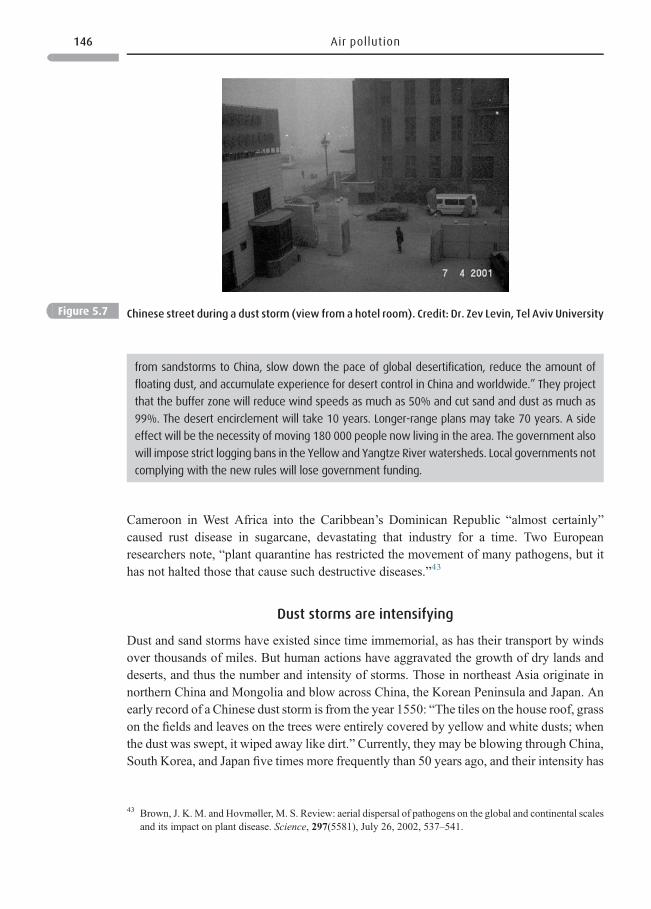
Cameroon in West Africa into the Caribbean’s Dominican Republic “almost certainly”caused rust disease in sugarcane, devastating that industry for a time. Two Europeanresearchers note, “plant quarantine has restricted the movement of many pathogens, but ithas not halted those that cause such destructive diseases.”43
Dust storms are intensifying
Dust and sand storms have existed since time immemorial, as has their transport by windsover thousands of miles. But human actions have aggravated the growth of dry lands anddeserts, and thus the number and intensity of storms. Those in northeast Asia originate innorthern China and Mongolia and blow across China, the Korean Peninsula and Japan. Anearly record of a Chinese dust storm is from the year 1550: “The tiles on the house roof, grasson the fields and leaves on the trees were entirely covered by yellow and white dusts; whenthe dust was swept, it wiped away like dirt.” Currently, they may be blowing through China,South Korea, and Japan five times more frequently than 50 years ago, and their intensity has
from sandstorms to China, slow down the pace of global desertification, reduce the amount of
floating dust, and accumulate experience for desert control in China and worldwide.” They project
that the buffer zone will reduce wind speeds as much as 50% and cut sand and dust as much as
99%. The desert encirclement will take 10 years. Longer-range plans may take 70 years. A side
effect will be the necessity of moving 180 000 people now living in the area. The government also
will impose strict logging bans in the Yellow and Yangtze River watersheds. Local governments not
complying with the new rules will lose government funding.
Figure 5.7 Chinese street during a dust storm (view from a hotel room). Credit: Dr. Zev Levin, Tel Aviv University
43 Brown, J. K. M. and Hovmøller, M. S. Review: aerial dispersal of pathogens on the global and continental scalesand its impact on plant disease. Science, 297(5581), July 26, 2002, 537–541.
146 Air pollution
also increased.44 Japan is concerned about these dust storms from China and has started toaid China in monitoring this “yellow sand.”45
Expanding deserts46
The world’s expanding deserts (desertification) represent a major and urgent environmentalissue. To varying extents, desertification already impacts nearly over 40% of the Earth’s landarea and 1 billion people. There is concern that the number of affected people may double,leading to increasing poverty and food insecurity.
Causes of desertification
Desertification can be natural as when it results from a long-lasting drought. However,growing human populations increasingly stress the world’s dry lands by land misuseincluding poor irrigation practices, livestock overgrazing, over-cultivation of soils, anddeforestation. Desertification is most pronounced in Africa where 65% of the agriculturalland may be degraded. It is an increasing problem in Latin America and Asia. In Mexico,85% of the land is threatened by desertification, a situation that may contribute to theimmigration of nearly 1 million Mexicans a year to the United States as people move offland that is becoming unusable. There is major concern that desertification will become anincreasing security threat.47
Dried-up water bodies
One obvious cause of increasing dry and desert lands is loss of water bodies. ▪ NorthAfrica’s Lake Chad was once as large as Lake Erie in North America, but 50 years ofdrought combined with over-pumping of lake water for irrigation has reduced the lake’ssize to 5% of its 1960 size. The lake’s now dry bed is “pumping dust everywhere, all yearlong, almost every day.” It is blown, depending on the season, to Europe, the United Statesand elsewhere. ▪ The Aral Sea was the world’s fourth largest water body until the Sovietsdiverted its waters for farm irrigation. Now a huge portion of the lakebed is exposed to the
44 Kim, J. Asian sandstorms intensifying, response far off. Reuters News Service, April 1, 2004, http://www.planetark.com/avantgo/dailynewsstory.cfm?newsid=24531.
45 Japan gave China 5.12 million euros to set up this monitoring system, which also monitors acid rain at 50locations around China. Japan also promotes the Acid Deposition Monitoring Network in East Asia, whichcollects data to use in combating air pollution and acid rain.
46 Desertification is a process that occurs when land has been over-cropped, over-grazed, improperly irrigated, ordeforested. As the land degrades, the soil becomes increasingly unproductive, and vegetation thins or disappears.The rate of desertification in the world is speeding up. Africa is the worst-affected continent; two thirds of its landis either desert or dry lands. The US is also affected – almost a third of its land is affected by desertification. InLatin America and the Caribbean the proportion is one quarter and, in Spain, one fifth.
47 See Doyle, A. Desertification threat to global stability: UN study. Reuters News Service, June 28, 2007, http://www.planetark.org/dailynewsstory.cfm/newsid/42845/story.htm.
147 Expanding deserts
wind. ▪ In the State of California, Owens Lake, a hundred years ago, was the size of the Seaof Galilee. Then, its waters were diverted to Los Angeles for use there. Owens Lake driedup exposing thousands of hectares of salty silt, now “the biggest single dust source in theUnited States.”
Reducing desertification
Halting desertification is not impossible. It does require major effort and money to set upand maintain anti-desertification programs. Such efforts integrate the best of traditionalagricultural practices including terracing and water harvesting. They also include verymodern techniques, such as satellite imagery to follow how effectively programs are work-ing. Genetic engineering of animals and crops better able to live in these arid areas may alsoplay an important role. When desertification has been caused naturally, by a long drought, itmay be reversed by normal rainfall over a period of time.
SECTION V
Air pollution in less-developed countries
The World Bank reports48 that urban air pollution is a leading cause of premature deaths inSouth Asian cities. TheWorld Health Organization (WHO) attributes 3 million deaths a yearto outdoor air pollution. This figure is expected to worsen unless major efforts are taken toreduce emissions. ▪ Cities with worsening pollution are largely found in poor countries.Twelve of the world’s most polluted cities are in Asia. Breathing the air in New Delhi isestimated to be equivalent to smoking two packs of cigarettes a day. Coal burning is themajor source of air pollution in some less-developed countries, but more and more motorvehicles increasingly aggravate the problem.
What are the impacts on children?
Many millions of children in less-developed countries suffer exposure to gross air pollution.In a 1999 publication, Drs. Devra Davis and Paulo Saldiva reported49 that children in 200cities are exposed to PM, nitrogen dioxide, and sulfur dioxide at levels 2–8 times greaterthan the maximum that the WHO considers acceptable. This gross pollution impairs therespiratory system and lowers resistance to infection. About 80% of all infections induced
48 Kogima, M. and Lovei, M. Coordinating transport, environment, and energy policies for urban air qualitymanagement. World Bank Perspectives, 2001, http://www.giteweb.org/csd/masami.pdf.
49 Davis, D. L. and Saldiva, P. Urban Air Pollution Risks to Children: A Global Environmental Health Indicator.Washington, DC: World Resources Institute, 1999.
148 Air pollution
by pollution in these countries occur in children under 5 years old. Reasons for youngchildren’s susceptibility were discussed in Chapter 3. Air pollution is also responsible for atleast 50 million cases of chronic cough in children under age 14 in less-developed countries.Children at highest risk live in the megacities of Mexico, India, China, Brazil, and Iran,50 butsmaller cities can be highly polluted too. ▪ Children in more-developed countries also some-times suffer exposure to high pollutant levels. Indeed, some of the highest nitrogen dioxidelevels in the world are found in New York, Paris, Tokyo, and Los Angeles. Moreover, theWHO determined that PM2.5 pollution causes 7–10% of respiratory infections in Europeanchildren, and as many as 21% in the most-polluted European cities.
Brown Asian hazes51,52
During January to March each year, an Asian atmospheric brown cloud (ABC) overliesmuch of the Indian Ocean and the land areas of South Asia, an area equivalent to the size ofthe continental United States. About 75% of the aerosols in the haze are of human origin:burning biofuels (wood, dung, and agricultural wastes) and forest fires. Burning fossil fuelsin motor vehicles and other petroleum-based combustion sources also contribute. ▪ The hazeis darker than usually seen in Western countries because incomplete combustion of biofuelsyields more black carbon (soot). The haze also contains fly ash, sulfates, nitrates, mineraldust, and gases such as carbon monoxide. The aerosol hazes most common in westerncountries are whitish due to a predominance of sulfate and nitrate aerosols; these reflectsunlight and cool the atmosphere. Conversely, a sooty aerosol absorbs sunlight and warmsthe atmosphere, and may contribute significantly to global warming.53 ▪ Also, because thehaze absorbs sunlight it reduces sunlight reaching the ocean and agricultural fields, andalters rainfall. This would reduce photosynthesis by ocean plankton and by plants such asrice on land. Some other scientists don’t believe the relationship is straightforward, and thebrown haze continues as an active area of investigation.
Air pollution in Calcutta
A six year study by a respected Indian cancer institute concluded that 70% of theinhabitants in Calcutta, a city of 18 million suffer from respiratory disorders such asasthma caused by air pollution.54 They reported a strong correlation between high airpollution and lung cancer incidence: Calcutta has the highest lung-cancer rate of anyIndian city (18.4 cases per 100 000 people). Its choking air pollution is largely attributed to
50 A city with a population of 10 million or more is designated a megacity.51 Atmospheric brown cloud (quick facts; brown haze composition; cause; effects). Asia Development Bank, 2009,
http://www.adb.org/vehicle-emissions/General/Environment-cloud.asp.52 Casey, M. Pollution haze over the Indian Ocean contributes to the melting of glaciers. Associated Press, August
2, 2007, http://www.irrawaddy.org/article.php?art_id=8085.53 Gustafsson, O. et al. Brown clouds over South Asia: biomass or fossil fuel combustion? Science 323(5913),
January 23, 2009, 495–498.54 Bhaumik, S. Air pollution suffocates Calcutta. BBC News, http://news.bbc.co.uk/2/hi/south_asia/6614561.stm.
149 Air pollution in less-developed countries
motor vehicle emissions of which the worst offenders are the 50 000 auto rickshawsthat use a fuel made out of kerosene and gasoline. ▪ The government seems incapable ofreducing emissions. A previous deadline ordered all vehicles manufactured before 1990 tobe taken off the roads or else converted to burn propane, a clean fuel. However, removingpolluting vehicles would have eliminated most of the city’s transportation, buses andtrucks, and also taxis and auto-rickshaws. Indeed, only about 20% of the city’s registeredvehicles have reported for emission tests. Calcutta is far from alone in suffering fromgrossly polluted air. The WHO reports that air pollution in major Southeast Asian andChinese cities contributes to 500 000 deaths a year.
Air pollution in Shenzhen, China – what is the true cost of productsimported from China?
Researchers from several universities studied what proportion of major air pollutants inthe PRD region on China’s south coast were attributable to the goods manufactured therefor export to North America, Europe, and other parts of Asia.55 Their careful studyexamined the manufacturing facilities themselves, and also power plants generatingelectricity for them, trucks transporting raw materials to and finished goods away fromfacilities, and ports and ships. In one city of 11 million, Shenzhen, they found that 89% ofthe sulfur dioxide, 91% of the nitrogen oxides, 71% of PM and 75% of VOCs emitted bythe industrial sector were due to manufacturing goods for export. Other areas had smaller,but still significant percentages. ▪ The products produced are inexpensive and one reasonis that factories use few environmental controls. As one study author stated, “we get thebenefits of the cheap goods, and they absorb the air pollution.” Researchers examinedpollution-control technologies that could limit emissions, and found air quality could beimproved 5–30% depending on the controls used at a cost of only 0.3–3.0% of the value ofthe goods produced. A spokesperson for Environmental Defense, an advocacy groupnoted that this study illustrates “how the global economy links all of us in terms ofenvironmental impacts.”
How can air pollution be lessened?
Reducing gross pollution in less-developed countries is a daunting task. However, smallsteps taken incrementally and consistently can make a difference.
* Mexico City,56 like Calcutta, has at least 18 million residents. But by 2006, an activistwas able to note “We are still among the 10 most-polluted cities in the world, but . . .
better than New Delhi or Bangkok. We used to be in first place.” In the past two decades,the city has very slowly improved its air. It ridded the city of older inefficiently operating
55 Christen, K. Linking China’s air pollution to exports. Environmental Science & Technology, 40(7), April 1, 2006,2073–2074.
56 Bradley, T. Once world’s smoggiest, Mexico City cuts pollution. Forecast Earth, December 30, 2008, http://climate.weather.com/articles/mexicocity122901.html.
150 Air pollution
cars, made only unleaded gas available, and required motor vehicles to have catalyticconverters. Now the city is setting up lanes dedicated to buses only. And Mexico passeda law to halve the level of sulfur dioxide and PM that cars could emit. Also helpingMexico City was a World Bank investment of $1.1 billion to promote clean energy andtransportation. Public outrage is also given credit: beyond just public health personnelspeaking about unhealthy air, “The interesting thing was the public alarm.” And,Mexico’s gradual democratization made public outrage something that was allowedwhich, albeit sluggishly, gets a response.
* Beijing:57 temporary or permanent improvement? Beijing, the 2008 host of the SummerOlympics made major efforts to improve its air quality, which was among the worst in theworld. It moved polluting factories away from the city or closed them. Coal-burningfacilities converted to natural gas. Laws regulating car emissions became the tightest inChina. New clean taxis replaced older vehicles. Subway lines were expanded to lessen theneed for autos. Millions of trees were planted. However, the question is: how well willthese improvements hold as the city moves further from the Olympics, especially as thecity uses more and more cars and construction continues unabated?
* Cities with two-stroke vehicles. The World Bank points out that two-stroke engines arecommonly used in less-developed countries. These emit large quantities of PM2.5.Because totally banning two-stroke vehicles is not practical, the Bank suggests strategiesto get drivers to maintain vehicles better to reduce emissions, which also saves driversmoney. The Bank urges governments to adopt policies pushing a switch to less-pollutingfour-stroke engines
* Citizen activists. Many believe that the problem of severe air pollution is too great toleave to the government. An active citizenry needs to promote environmental steward-ship. ▪ India is reported to have a quarter-million citizens’ organization and grassrootsmovements working on environmental and other issues. ▪ Likewise, citizens in othercountries increasingly involve themselves in environmental action – note Mexico Cityabove. ▪ However, in countries with corrupt governments, citizens’ actions place them indanger of retaliation.
Reducing pollution in Eastern Europe
Outside motivation sometimes stimulates environmental cleanup. Many Eastern Europeancountries wanted to join the European Union (EU). To do so, they needed environmentallaws equivalent to existing EU countries. The “Black Triangle” is a region overlapping theborders of Poland, the Czech Republic, and Germany, which gained its name from notoriousair pollution. These countries began reducing emissions in various ways including shuttingdown many old factories and power plants. Between 1989 and 1999 sulfur dioxide emis-sions decreased 92%, nitrogen oxide emissions 80%, and total particulates 96%. Thishappened at the same time that road traffic greatly increased. The region now has air qualitycomparable to the rest of the EU.
57 Stone, R. China’s environmental challenges: Beijing’s marathon run to clean foul air nears finish line. Science,321(5889) August 1, 2008, 636–637.
151 Air pollution in less-developed countries
Transboundary pollution: “air pollution knowsno borders”
Asian pollutants don’t stop at the American West coast. As first seen in 2004, they canproceed much further. Dark, sooty clouds, containing ozone and fine particles, werediscovered far above Portsmouth, New Hampshire, and other cities on the East coast byteams of scientists, working aboard a dozen aircraft.58 Working as part of the InternationalConsortium for Atmospheric Research on Transport and Transformation (ICARTT) thescientists collected air samples through probes inserted through airplane windows. Thepollutants studied were traveling too high to impact ground-level air quality although airmixing could happen under some circumstances or pollutants could impact climate if theirlevels continue to increase. Scientists further tracked the pollutants across the AtlanticOcean to Europe. This study was examining Asian pollution. However, future results mayfind that North American-produced pollution may reach and impact European countries.One environmentalist noted that, “I think the most profound thing that you draw from this[study] is that the globe is one air shed.”
Reducing transboundary pollution: past and current efforts
Transboundary pollution travels by air and water beyond borders drawn by humans.International treaties and agreements partially control such transboundary air pollution.
▪ Canada and the United States have agreements on a number of shared pollutants. Onelimits the movement of acid rain pollutants between the two countries. ▪Many other treatieshave been developed under the aegis of the United Nations Environmental Program(UNEP). As part of the Convention on Long-Range Transboundary Air Pollution,European countries adopted a Protocol in 1999 leading to major emission cuts for sulfurdioxide, nitrogen oxides, VOCs, and ammonia. ▪ Countries in the European Union havestrict emission standards.
Additional countries joining the EUmust meet the same standards – this increases the areawithin which pollutants are well controlled. ▪Many other nations are also party to environ-mental treaties. In recent years, the POPS treaty banned or severely limited 12 persistent,bioaccumulative and toxic organic pollutants. Other well-known international agreementsinclude the Montreal Protocol on substances responsible for depleting the ozone layer, andthe Kyoto Protocol to reduce greenhouse gases. Some treaties provide technical assistanceand money to poor countries to enable them to live up to the agreements. ▪ As time passes,the international community deals with increasingly complex issues. Think about theimplications of the major dust and sand storms or of the particulates resulting from themammoth Indonesian forest fires, which affect many countries.
58 Ebbert, S. Asian grit aloft in New England, Pollutants found to travel globally. Boston Globe, August 9, 2004,http://www.boston.com/news/local/new_hampshire/articles/2004/08/09/asian_grit_aloft_in_new_england/.
152 Air pollution
Future efforts
The ICARTT scientists, noted above, commented that pollution moving inter-continentallymay lead to a need for more international agreements to control pollutants at their source.59
At some future point, say if American air quality is threatened by pollution fromAsia, it maybe cheaper to help the less-developed countries producing it to control their emissions than itwould be accentuate efforts being made in the United States.
Further reading
Christen, K. Linking China’s air pollution to exports. Environmental Science & Technology,40(7), April 1, 2006, 2073–2074.
Davis, D. L. and Saldiva, P.Urban Air Pollution Risks to Children: A Global EnvironmentalHealth Indicator. Washington, D.C.: World Resources Institute, 1999.
Hogue, C. Reining in brown clouds (cutting black carbon emissions). Chemical &Engineering News, 87, August 24, 2009, 26–27.
Questions 5.4
1 Future policy makers in one country may need to confront problems that go beyond their
own borders. One possible instance: they may need to set ambient air standards specific to
different locales in their country – depending on how much pollution from other countries
those locales receive – rather than using one nationwide standard. (a) How can countries
respond if pollution at distant sites continues to worsen? (b) What responsibility does an
impoverished nation have to control pollution originating within its borders? (c) What
responsibility do wealthy nations have to assist them?
Delving deeper
1. The world’s response to desertification “must be equal to that demanded by global
warming, the destruction of the ozone layer, and the loss of biodiversity.” So said Klaus
Toepfer, former Director of UNEP. Do you believe that China’s efforts to set up a tree wall to
combat desertification are likely to be successful? Why? Explore web resources as to what
else is being done around the world to halt or slow desertification.
2. Consider products manufactured for export in China in facilities with poor pollution controls.
What can we, as individuals, do about this? What should our government be doing? What
should the local and national governments in China be doing?
3. Do you believe that we could lower our consumption while still maintaining what you
personally would consider good living standards? How would you go about doing this?
59 Swart, L. and Perry, E. Global Environmental Governance: Perspectives on the Current Debate. New York:Center for UN Reform Education, 2007, http://www.centerforunreform.org/node/251.
153 Further reading
Internet resources
Doyle, A. 2007. Desertification threat to global stability – UN study. Reuters News Service,http://www.planetark.org/dailynewsstory.cfm/newsid/42845/story.htm (June 28,2007).
Ebbert, S. 2004. Asian grit aloft in New England, pollutants found to travel globally. BostonGlobe, http://www.boston.com/news/local/new_hampshire/articles/2004/08/09/asian_grit_aloft_in_new_england/ (August 9, 2004).
Ostapuk, P. 2001. Dust storm photographs. http://www.lakepowell.net/asiandust.htm.US EPA. 2004. International transport of air pollution.
http://www.epa.gov/airtrends/2008/report/InternationalTransport.pdf.2008. National Emissions Inventory: air pollutant emissions trends data. http://www.epa.gov/ttn/chief/trends/ (December 2, 2008).
2008. National Emission Inventory Database (for criteria and hazardous air pollutants).http://www.epa.gov/air/data/neidb.html (November 6, 2008).2008. The plain English guide to the Clean Air Act. http://www.epa.gov/oar/oaqps/peg_caa/pegcaain.html#index (August 29, 2008).
2009. About air toxics. http://www.epa.gov/ttn/atw/allabout.html (April 21, 2009).2009. Definition of volatile organic chemicals (VOCs). http://www.epa.gov/ttn/naaqs/ozone/ozonetech/def_voc.htm (March 31, 2009).
2009. National ambient air quality standards (primary and secondary standards). http://epa.gov/air/criteria.html (February 20, 2009).
2009. Report on the environment: highlights of national trends. (See air chapter) http://oaspub.epa.gov/hd/downloads (March 11, 2009).
2009. What are the six common air pollutants? http://www.epa.gov/air/urbanair/ (May26, 2009).
154 Air pollution
6 Acid deposition
“A thing is right when it tends to preserve the integrity, stability, and beauty of thebiotic community. It is wrong when it tends otherwise.”
Aldo Leopold
Chemical fate and transport is a concept now familiar to you: how chemicals move in theenvironment and change into other chemicals. You have seen pollutants that travelhundreds or thousands of miles and those that end up in unexpected places. Now, followthe story of acid deposition (acid rain). The precursors of acid rain are gases, sulfurdioxide and nitrogen oxides. But these gases are converted into aerosols, and it is thesethat actually deposit onto, and acidify, soil and water. And that is not the end of theirjourney.
In this chapter, Section I identifies the major acid precursors that lead to acid deposition,and overviews a major study carried out in the United States, and still ongoing to betterunderstand acid deposition. Section II examines the adverse effects of acid deposition onaquatic life, and on forests and their soils. Section III looks at the emission sources of acid-forming pollutants, and reducing those emissions. It points out that emissions, althoughlowered are not eliminated; thus, consequences linger. Section IV examines the partialrecovery of systems as emissions are reduced. Section V moves on to acid deposition inthe international scene.
SECTION I
Acid pollutants1
Sulfur dioxide (SO2) and nitrogen oxides (NOx) are the major precursors of acid deposi-tion. After emission, these gases react with oxygen2 in the atmosphere to form acidchemi cals – review Figure s 5.3 and 5.4. 3 ▪If moistur e is presen t, SO2 and NOx convertto sulfuric and nitric acids, aerosols, which deposit with rain, snow, and fog. Sometimesacidic fog directly contacts – and damages – trees growing at high elevations or in coastal
1 Acid rain and the facts. Environment Canada, March 29, 2005, http://www.ec.gc.ca/acidrain/acidfact.html.2 The reaction also includes “oxidants” such as the very reactive hydroxyl radicals, so more than oxygen isinvolved.
3 These are simplifications. Nitrogen and sulfur oxides are undergoing many reactions in the atmosphere.
regions. ▪ In dry conditions, SO2 and NOx are converted to tiny aerosols of sulfate salts andnitrate salts, which slowly settle out by gravity. About half of acid deposition is dry. Drydeposition is more likely near emission sources. ▪ Other chemicals contribute to aciddeposition too, although in much lower amounts. In particular, carbon dioxide in a moistatmosphere is converted to carbonic acid (H2CO3). Small amounts of organic acids such asformic and acetic acids are often present in the atmosphere too, emitted by naturalprocesses and industrial activity. But sulfur and nitrogen aerosols present the majorproblem.
Background4
Acid deposition was first described in 1852. In the first half of the twentieth century, severedamage to trees and vegetation was seen near smelters,5 which often emit large quantities ofSO2. SO2 emissions from electric power plants also sometimes damaged local vegetationand water. It was not until the late 1950s that the existence of acidic lakes in North Americaand Europe was established. And it took nearly another two decades to recognize acid’simpact on fish. ▪To protect local communities, the 1970 US Clean Air Act required powerplants and smelters to build emission stacks 1000 feet (305 m) above ground level. Theexpectation was that pollutants released at this height would become so diluted in theatmosphere that they could cause no harm. After high stacks were built, local damage didabate. However, a different problem began to emerge: stack emissions of SO2 and NOx arecarried long distances by the wind. As they travel, these gases are converted to acid aerosolsin the atmosphere; the wet aerosols rain out, and the dry aerosols settle out by gravity onto
Box 6.1 Atmospheric deposition
Atmospheric deposition goes beyond the deposition of acid pollutants. It is a phenomenon
in which airborne chemicals or particles – be they acids, metals, organic chemicals,
microbes, or pollens – deposit from air onto land and water. Acids are among many
pollutants deposited. Rain can wash them out of the atmosphere. Dry particulates can
settle out on their own. Consider an example not involving acid: there is no record that DDT
or PCBs were used in the forests of New Hampshire, but both are found in soils there,
presumably airborne from other locations. Supporting this interpretation is the fact that
their concentrations are higher at higher elevations than lower, especially on slopes facing
prevailing winds. The levels of DDT and PCBs found do not appear to threaten forest health.
Unfortunately, in other cases, as is often true with acid deposition, damaging quantities of
air pollutants can be deposited.
4 Acid rain, atmospheric deposition and precipitation chemistry.USGS, National Atmospheric Deposition Program(no date), http://bqs.usgs.gov/acidrain/.
5 A smelter is a facility that melts or fuses ores that contain metals in order to separate out the metals contained inthe ores. Metal ores are often rich in sulfur.
156 Acid deposition
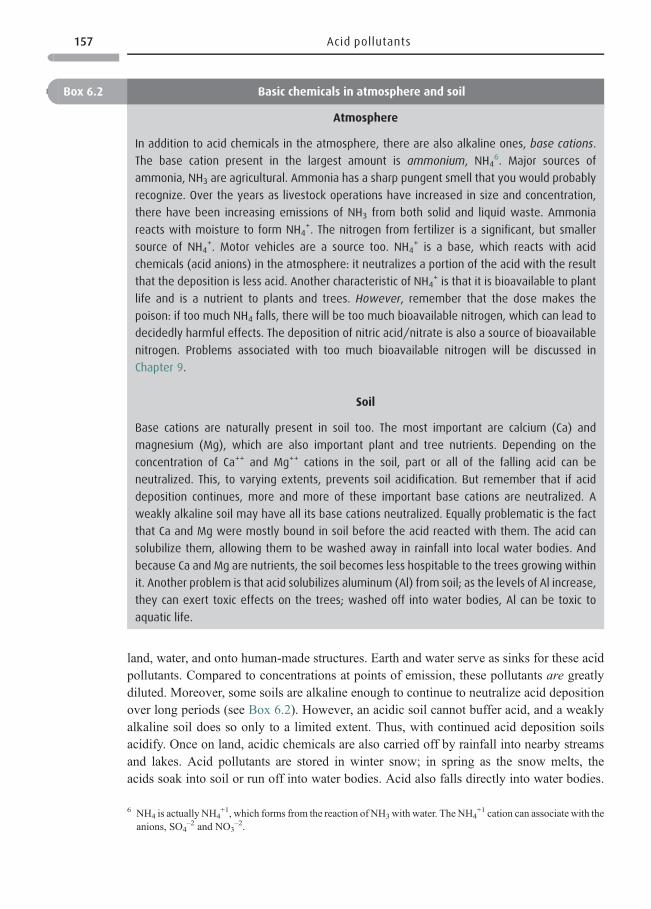
land, water, and onto human-made structures. Earth and water serve as sinks for these acidpollutants. Compared to concentrations at points of emission, these pollutants are greatlydiluted. Moreover, some soils are alkaline enough to continue to neutralize acid depositionover long periods (see Box 6.2). However, an acidic soil cannot buffer acid, and a weaklyalkaline soil does so only to a limited extent. Thus, with continued acid deposition soilsacidify. Once on land, acidic chemicals are also carried off by rainfall into nearby streamsand lakes. Acid pollutants are stored in winter snow; in spring as the snow melts, theacids soak into soil or run off into water bodies. Acid also falls directly into water bodies.
Box 6.2 Basic chemicals in atmosphere and soil
Atmosphere
In addition to acid chemicals in the atmosphere, there are also alkaline ones, base cations.
The base cation present in the largest amount is ammonium, NH46. Major sources of
ammonia, NH3 are agricultural. Ammonia has a sharp pungent smell that you would probably
recognize. Over the years as livestock operations have increased in size and concentration,
there have been increasing emissions of NH3 from both solid and liquid waste. Ammonia
reacts with moisture to form NH4+. The nitrogen from fertilizer is a significant, but smaller
source of NH4+. Motor vehicles are a source too. NH4
+ is a base, which reacts with acid
chemicals (acid anions) in the atmosphere: it neutralizes a portion of the acid with the result
that the deposition is less acid. Another characteristic of NH4+ is that it is bioavailable to plant
life and is a nutrient to plants and trees. However, remember that the dose makes the
poison: if too much NH4 falls, there will be too much bioavailable nitrogen, which can lead to
decidedly harmful effects. The deposition of nitric acid/nitrate is also a source of bioavailable
nitrogen. Problems associated with too much bioavailable nitrogen will be discussed in
Chapter 9.
Soil
Base cations are naturally present in soil too. The most important are calcium (Ca) and
magnesium (Mg), which are also important plant and tree nutrients. Depending on the
concentration of Ca++ and Mg++ cations in the soil, part or all of the falling acid can be
neutralized. This, to varying extents, prevents soil acidification. But remember that if acid
deposition continues, more and more of these important base cations are neutralized. A
weakly alkaline soil may have all its base cations neutralized. Equally problematic is the fact
that Ca and Mg were mostly bound in soil before the acid reacted with them. The acid can
solubilize them, allowing them to be washed away in rainfall into local water bodies. And
because Ca and Mg are nutrients, the soil becomes less hospitable to the trees growing within
it. Another problem is that acid solubilizes aluminum (Al) from soil; as the levels of Al increase,
they can exert toxic effects on the trees; washed off into water bodies, Al can be toxic to
aquatic life.
6 NH4 is actually NH4+1, which forms from the reaction of NH3with water. The NH4
+1 cation can associate with theanions, SO4
–2 and NO3–2.
157 Acid pollutants
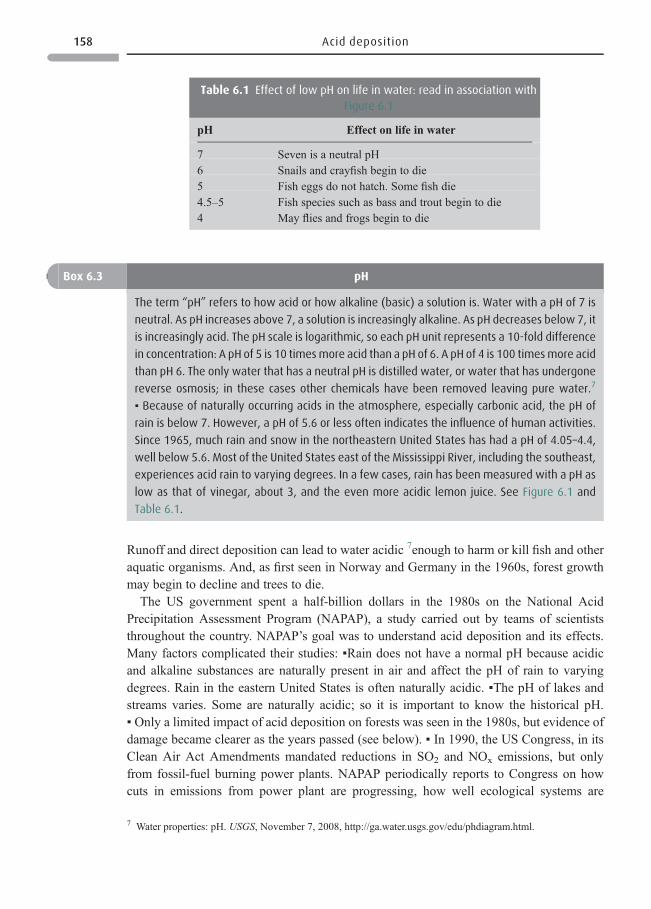
Runoff and direct deposition can lead to water acidic 7enough to harm or kill fish and otheraquatic organisms. And, as first seen in Norway and Germany in the 1960s, forest growthmay begin to decline and trees to die.
The US government spent a half-billion dollars in the 1980s on the National AcidPrecipitation Assessment Program (NAPAP), a study carried out by teams of scientiststhroughout the country. NAPAP’s goal was to understand acid deposition and its effects.Many factors complicated their studies: ▪Rain does not have a normal pH because acidicand alkaline substances are naturally present in air and affect the pH of rain to varyingdegrees. Rain in the eastern United States is often naturally acidic. ▪The pH of lakes andstreams varies. Some are naturally acidic; so it is important to know the historical pH.▪ Only a limited impact of acid deposition on forests was seen in the 1980s, but evidence ofdamage became clearer as the years passed (see below). ▪ In 1990, the US Congress, in itsClean Air Act Amendments mandated reductions in SO2 and NOx emissions, but onlyfrom fossil-fuel burning power plants. NAPAP periodically reports to Congress on howcuts in emissions from power plant are progressing, how well ecological systems are
Box 6.3 pH
The term “pH” refers to how acid or how alkaline (basic) a solution is. Water with a pH of 7 is
neutral. As pH increases above 7, a solution is increasingly alkaline. As pH decreases below 7, it
is increasingly acid. The pH scale is logarithmic, so each pH unit represents a 10-fold difference
in concentration: A pH of 5 is 10 timesmore acid than a pH of 6. A pH of 4 is 100 timesmore acid
than pH 6. The only water that has a neutral pH is distilled water, or water that has undergone
reverse osmosis; in these cases other chemicals have been removed leaving pure water.7
▪ Because of naturally occurring acids in the atmosphere, especially carbonic acid, the pH of
rain is below 7. However, a pH of 5.6 or less often indicates the influence of human activities.
Since 1965, much rain and snow in the northeastern United States has had a pH of 4.05–4.4,
well below 5.6. Most of the United States east of the Mississippi River, including the southeast,
experiences acid rain to varying degrees. In a few cases, rain has been measured with a pH as
low as that of vinegar, about 3, and the even more acidic lemon juice. See Figure 6.1 and
Table 6.1.
Table 6.1 Effect of low pH on life in water: read in association with
Figure 6.1
pH Effect on life in water
7 Seven is a neutral pH6 Snails and crayfish begin to die5 Fish eggs do not hatch. Some fish die4.5–5 Fish species such as bass and trout begin to die4 May flies and frogs begin to die
7 Water properties: pH. USGS, November 7, 2008, http://ga.water.usgs.gov/edu/phdiagram.html.
158 Acid deposition
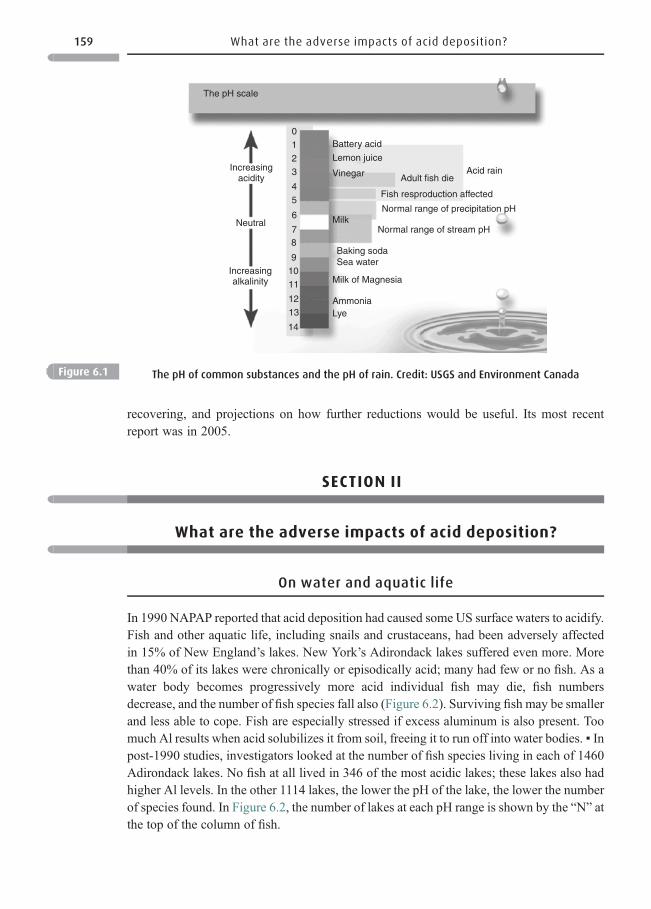
recovering, and projections on how further reductions would be useful. Its most recentreport was in 2005.
SECTION II
What are the adverse impacts of acid deposition?
On water and aquatic life
In 1990 NAPAP reported that acid deposition had caused some US surface waters to acidify.Fish and other aquatic life, including snails and crustaceans, had been adversely affectedin 15% of New England’s lakes. New York’s Adirondack lakes suffered even more. Morethan 40% of its lakes were chronically or episodically acid; many had few or no fish. As awater body becomes progressively more acid individual fish may die, fish numbersdecrease, and the number of fish species fall also (Figure 6.2). Surviving fish may be smallerand less able to cope. Fish are especially stressed if excess aluminum is also present. Toomuch Al results when acid solubilizes it from soil, freeing it to run off into water bodies. ▪ Inpost-1990 studies, investigators looked at the number of fish species living in each of 1460Adirondack lakes. No fish at all lived in 346 of the most acidic lakes; these lakes also hadhigher Al levels. In the other 1114 lakes, the lower the pH of the lake, the lower the numberof species found. In Figure 6.2, the number of lakes at each pH range is shown by the “N” atthe top of the column of fish.
The pH scale
Increasingacidity
Neutral
Increasingalkalinity
Battery acid
Lemon juice
Vinegar Adult fish die
Fish resproduction affected
Normal range of precipitation pH
Normal range of stream pHMilk
Baking sodaSea water
Milk of Magnesia
AmmoniaLye
Acid rain
0
1
2
3
4
5
6
78
9
10
11
12
13
14
Figure 6.1 The pH of common substances and the pH of rain. Credit: USGS and Environment Canada
159 What are the adverse impacts of acid deposition?
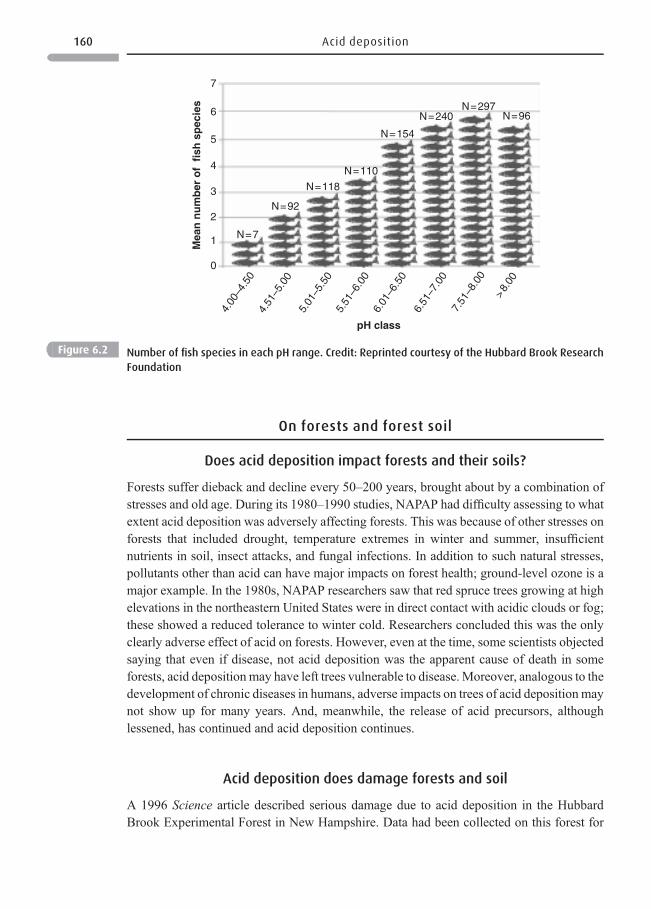
On forests and forest soil
Does acid deposition impact forests and their soils?
Forests suffer dieback and decline every 50–200 years, brought about by a combination ofstresses and old age. During its 1980–1990 studies, NAPAP had difficulty assessing to whatextent acid deposition was adversely affecting forests. This was because of other stresses onforests that included drought, temperature extremes in winter and summer, insufficientnutrients in soil, insect attacks, and fungal infections. In addition to such natural stresses,pollutants other than acid can have major impacts on forest health; ground-level ozone is amajor example. In the 1980s, NAPAP researchers saw that red spruce trees growing at highelevations in the northeastern United States were in direct contact with acidic clouds or fog;these showed a reduced tolerance to winter cold. Researchers concluded this was the onlyclearly adverse effect of acid on forests. However, even at the time, some scientists objectedsaying that even if disease, not acid deposition was the apparent cause of death in someforests, acid deposition may have left trees vulnerable to disease.Moreover, analogous to thedevelopment of chronic diseases in humans, adverse impacts on trees of acid deposition maynot show up for many years. And, meanwhile, the release of acid precursors, althoughlessened, has continued and acid deposition continues.
Acid deposition does damage forests and soil
A 1996 Science article described serious damage due to acid deposition in the HubbardBrook Experimental Forest in New Hampshire. Data had been collected on this forest for
7
6
5
4
3
2
1
0
Mea
n n
um
ber
of
fis
h s
pec
ies
4.00
–4.5
04.
51–5
.00
5.01
–5.5
05.
51–6
.00
6.01
–6.5
0
6.51
–7.0
07.
51–8
.00
> 8.00
pH class
N=240N=297
N=96
N=154
N=110
N=118
N=92
N=7
Figure 6.2 Number of fish species in each pH range. Credit: Reprinted courtesy of the Hubbard Brook Research
Foundation
160 Acid deposition
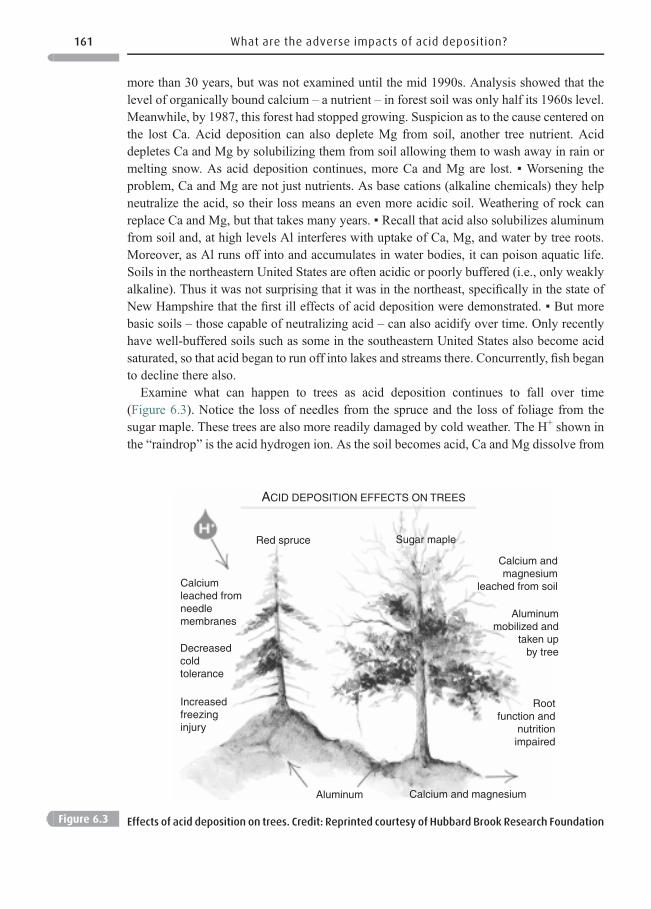
more than 30 years, but was not examined until the mid 1990s. Analysis showed that thelevel of organically bound calcium – a nutrient – in forest soil was only half its 1960s level.Meanwhile, by 1987, this forest had stopped growing. Suspicion as to the cause centered onthe lost Ca. Acid deposition can also deplete Mg from soil, another tree nutrient. Aciddepletes Ca and Mg by solubilizing them from soil allowing them to wash away in rain ormelting snow. As acid deposition continues, more Ca and Mg are lost. ▪ Worsening theproblem, Ca and Mg are not just nutrients. As base cations (alkaline chemicals) they helpneutralize the acid, so their loss means an even more acidic soil. Weathering of rock canreplace Ca and Mg, but that takes many years. ▪ Recall that acid also solubilizes aluminumfrom soil and, at high levels Al interferes with uptake of Ca, Mg, and water by tree roots.Moreover, as Al runs off into and accumulates in water bodies, it can poison aquatic life.Soils in the northeastern United States are often acidic or poorly buffered (i.e., only weaklyalkaline). Thus it was not surprising that it was in the northeast, specifically in the state ofNew Hampshire that the first ill effects of acid deposition were demonstrated. ▪ But morebasic soils – those capable of neutralizing acid – can also acidify over time. Only recentlyhave well-buffered soils such as some in the southeastern United States also become acidsaturated, so that acid began to run off into lakes and streams there. Concurrently, fish beganto decline there also.
Examine what can happen to trees as acid deposition continues to fall over time(Figure 6.3). Notice the loss of needles from the spruce and the loss of foliage from thesugar maple. These trees are also more readily damaged by cold weather. The H+ shown inthe “raindrop” is the acid hydrogen ion. As the soil becomes acid, Ca and Mg dissolve from
ACID DEPOSITION EFFECTS ON TREES
Red spruce
Calciumleached fromneedlemembranes
Decreasedcoldtolerance
Increasedfreezinginjury
Sugar maple
Calcium andmagnesium
leached from soil
Aluminummobilized and
taken upby tree
Rootfunction and
nutritionimpaired
Calcium and magnesiumAluminum
Figure 6.3 Effects of acid deposition on trees. Credit: Reprinted courtesy of Hubbard Brook Research Foundation
161 What are the adverse impacts of acid deposition?
soil, and are lost to rain runoff (as indicated by the lower-right arrow). Also, not all the Aldissolved from soil runs off. That remaining, if its level is high enough, can inhibit theuptake of essential nutrients and water into the trees.
Other impacts of acid deposition
Acid deposition can strikingly increase the erosion rate of stone and metal structures. SomeEuropean monuments have been badly damaged, as have some stained glass windows andother cultural resources. ▪ Acid aerosols produce hazes that reduce visibility. ▪ Chapter 5noted the health impacts on humans of acid aerosols.
SECTION III
What are the sources of acid precursors?8
Sources of SO2 and NOx are seen in Figure 6.4. Coal-burning electric power plants generatethe majority of SO2, about two-thirds, but only about a fifth of NOx. The 1990 Clean Air ActAmendments mandated emissions reductions only from fossil fuel-burning power plants.For SO2, that may be reasonable, but less so for NOx. It is transportation, motor vehicles, thatemit more than 50% of NOx.
How can emissions of acid-precursors be reduced?
Sulfur dioxide
Sulfur dioxide emissions peaked in the United States at about 31 million tons (28.1 tonnes)in 1970. With increasingly strict controls mandated by the first Clean Air Act (1970),emissions fell and continued to do so. In 2005, SO2 emissions from all sources in theUnited States, not just power plants, were 50% lower than in 1970. Expectations from the1990 Clean Air Act Amendments were that emissions should fall to 15 million tons(13.6 million tonnes) in 2010; they met that goal by 2005. ▪ Power plants can cut SO2
emissions in several ways. One is to burn coal with low sulfur content, a P2 method. Anotheris to use effective technologies to capture the SO2 formed. ▪ A different type of legislativetool, emissions trading (also called cap and trade), started after 1990, uses market incen-tives: an individual utility has a SO2 emission allowance. If it emits less than its allowance, itcan sell the unused portion to a utility emitting more than its allowance. Thus, a facilityunable or unwilling to reduce its emissions for whatever reason buys emission rights from a
8 (1) Air emission sources, sulfur dioxide. US EPA, October 21, 2008, http://www.epa.gov/air/emissions/so2.htm.(2) Air emission sources, nitrogen oxides. US EPA, October 21, 2008, http://www.epa.gov/air/emissions/nox.htm.
162 Acid deposition
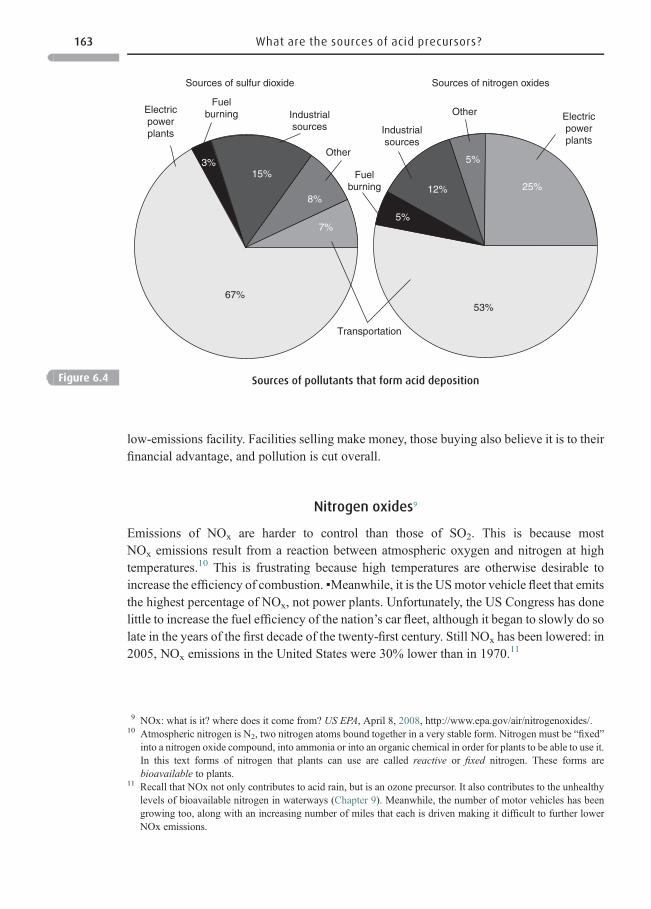
low-emissions facility. Facilities selling make money, those buying also believe it is to theirfinancial advantage, and pollution is cut overall.
Nitrogen oxides9
Emissions of NOx are harder to control than those of SO2. This is because mostNOx emissions result from a reaction between atmospheric oxygen and nitrogen at hightemperatures.10 This is frustrating because high temperatures are otherwise desirable toincrease the efficiency of combustion. ▪Meanwhile, it is the USmotor vehicle fleet that emitsthe highest percentage of NOx, not power plants. Unfortunately, the US Congress has donelittle to increase the fuel efficiency of the nation’s car fleet, although it began to slowly do solate in the years of the first decade of the twenty-first century. Still NOx has been lowered: in2005, NOx emissions in the United States were 30% lower than in 1970.11
Fuelburning Industrial
sources
Other
Other Electricpowerplants
Fuelburning
Industrialsources
Sources of sulfur dioxide Sources of nitrogen oxides
Electricpowerplants
Transportation
12% 25%
5%
15%3%
8%
7%
67%53%
5%
Figure 6.4 Sources of pollutants that form acid deposition
9 NOx: what is it? where does it come from? US EPA, April 8, 2008, http://www.epa.gov/air/nitrogenoxides/.10 Atmospheric nitrogen is N2, two nitrogen atoms bound together in a very stable form. Nitrogen must be “fixed”
into a nitrogen oxide compound, into ammonia or into an organic chemical in order for plants to be able to use it.In this text forms of nitrogen that plants can use are called reactive or fixed nitrogen. These forms arebioavailable to plants.
11 Recall that NOx not only contributes to acid rain, but is an ozone precursor. It also contributes to the unhealthylevels of bioavailable nitrogen in waterways (Chapter 9). Meanwhile, the number of motor vehicles has beengrowing too, along with an increasing number of miles that each is driven making it difficult to further lowerNOx emissions.
163 What are the sources of acid precursors?
SECTION IV
Recovering from acidic deposition
The first step needed was to lower emissions of SO2 and NOx which, as just noted, has beenaccomplished to a degree. Lowered emissions lead to less acid deposition, which – overtime – leads to less acidic water and soil. Recovery would mean a return to the conditionsthat existed perhaps 100 years ago.
US lakes and streams
Acid deposition can impair lakes and streams in three ways: acidify their waters, i.e.,lower their pH; decrease their ability to neutralize incoming acid; and increase Alconcentrations. As levels of Al continue to increase, they, in combination with increasedacidity, have a toxic impact on aquatic life. ▪ After the Clean Air Act Amendments werepassed in 1990, some reductions in acidity were noticed as early as 1993. The USGeological Survey reported that, at 9 of 33 sites monitored precipitation was less acidicthan in 1980, and sulfate was down at 26 sites. But the pH of rain in US northeastern statesremained acid, with a pH of 4.4 in 1997 (more than 10 times more acid than backgroundpH). A positive finding in the year 2000 was that the number of acidic lakes in theAdirondack Mountains of New York had decreased by one third, compared to 1990.▪However, despite lowered SO2 and NOx emissions, and thus, lowered levels of aciddeposition, a 2005 NAPAP report states that many lakes and streams remain acidified,12
and their fish and other aquatic life continue to suffer. Effects in some locations may not bereversible at all.
Also, keep in mind that although acid emissions are reduced, emissions still con-tinue albeit at a lower level, and so acid deposition continues too. The acids areinorganic and continue to accumulate in soils and waters. Moreover, once soil andwater chemistry are perturbed, they are slow to revert to former conditions. NAPAPconcluded that further cuts in SO2 and NOx from power plants and from motorvehicles were needed in order to further reduce the number of acidic lakes and streamsin the United States.13
12 National Acid Precipitation Assessment Program Report to Congress: An Integrated Assessment, 2005,http://stinet.dtic.mil/cgi-bin/GetTRDoc?AD=ADA465644&Location=U2&doc=GetTRDoc.pdf.
13 An excellent summary of acid deposition is found at Acid Rain Revisited, Update II: Advances in ScientificUnderstanding Since the Passage of the 1970 and 1990 Clean Air Act Amendments. Hubbard Brook ResearchFoundation, http://www.hubbardbrookfoundation.org/article/view/12940/1/2076/.
164 Acid deposition
SECTION V
Transboundary issues14
Within the continental United States, SO2 and NOx emissions from large coal-burningpower plants in Midwestern states are blown, with prevailing northeasterly winds to NewYork, New England, and Canada. To a lesser extent, acid pollution moves from Canada intothe United States. ▪ Some members of the European Union (EU) such as Norway andSweden had been harmed by transport of acid pollutants blown into them from Central andEastern Europe, countries including Poland and Bulgaria. However, these latter two coun-tries before joining the EU had to improve their environmental performance to meet thesame standards as other EU countries, including greater limitations on SO2 and NOx
emissions. As each new country joins the EU, its borders are enlarged, thus controllingpollution over an increasingly large area. Because of international agreements to limitemissions of SO2 and NOx, acid deposition in European countries is expected to continueto decrease in the coming years. ▪ See Box 6.4 for movement of China’s emissions of acidprecursors into Korea and Japan.
Questions 6.1
When answering these questions, recall the toxicology concepts in Chapter 3. Think about how
interacting factors – chemical and otherwise – can cause adverse effects.
1. Explain how bioavailable nitrogen – essential to plant life – can adversely impact growing
trees.
2. What does the following statement made by Professor William Smith of Yale’s School of
Forestry and Environmental Studies mean to you? “The integrity, productivity, and value
of forest and other wild systems are intimately linked to air quality. We must elevate
considerations of environmental health to the same level as concerns for human
health.”
3. In 1990 the US EPA’s Science Advisory Panel rated acid deposition as a medium environ-
mental risk (as opposed to a high or low risk). Consider the additional information now
available. How would you now rate acid deposition? Explain.
14 International transport of air pollution. US EPA, 2008, http://www.epa.gov/airtrends/2008/report/InternationalTransport.pdf.
165 Transboundary issues
The international picture
Europe15
Damage from acid deposition was more severe in Central and Eastern Europe than in theUnited States. Waters and soils suffered three times greater acidification. Forest death wasmore obvious. Norway and Sweden, especially hard hit with transboundary acid, sufferedwidespread acidification of lakes and streams. Fish such as trout disappeared fromthousands of lakes and salmon from many rivers. ▪ And in one locale of Germany, astudy indicated that the bioavailable nitrogen resulting from the nitrogen in acid deposi-tion was a greater problem than the acid sulfur. Bioavailable nitrogen is often the limitingfactor in tree growth with trees absorbing and using all they receive. However, as aciddeposition continued over the years, the trees could not use all the nutrient nitrogendeposited. Many believe that excess bioavailable nitrogen in forest soil was responsiblefor the forest deaths seen in Germany. ▪Their explanation follows: trees responded toincreased bioavailable nitrogen by growing faster than usual. Rapid growth furtherweakened trees already weakened by ozone and other pollutants. Trees eventually becameunable to handle natural stresses such as weather extremes or insect attacks. A situationsimilar to that at Hubbard Brook occurred: excess acid leached Ca and Mg from the soil,which were then carried off by rainwater. A vicious circle ensued: with loss of the alkalinecalcium and magnesium, soils become progressively less able to neutralize acid deposi-tion, and tree roots become more damaged. ▪ This study is relevant to the United Statestoo where until recently, sulfur in acid deposition was the major concern. As SO2
emissions are controlled albeit imperfectly, the less well-controlled nitrogen oxides poseincreasing concerns.
Working on recovery
Because acid pollutants disrespect borders, an international solution was needed for aciddeposition. In 1979, more than 30 European countries agreed to the Convention on Long-Range Trans-boundary Air Pollutants; this obligated countries to reduce SO2 emissions 30%below 1980 levels by 1993. Countries used a number of approaches to accomplish this suchas burning natural gas (a fuel containing smaller amounts of sulfur than coal). Their effortsled to SO2 emissions being lowered by about 50% and NOx emissions by 20%. Some signsof recovery were seen with, for instance, some waters becoming less acidic, but more wasneeded. ▪Another agreement, signed in 1999, called for an 80% reduction in sulfur emis-sions and 50% reduction in nitrogen emissions by 2010 (relative to 1980). As of 2005, aciddeposition had declined by 60% and more signs of recovery in lakes and streams have beenseen. However, complete recovery may take many years, although one model simulation
15 Exposure of ecosystems to acidification: assessment. European Environmental Agency, February, 2008, http://www.eea.europa.eu/themes.
166 Acid deposition
predicted that by 2016 most waters, except those in southernmost Norway, will haverecovered. Nevertheless, one group of investigators noted that this does not mean that thewaters will have returned to their pre-acidification “natural” state. Moreover, forest soils stillhave reduced capacity to neutralize acid deposition because of decades of acid deposition.16
Asia
During January toMarch each year, a brown haze overlies much of the Indian Ocean and theland areas of South, Southeast, and East Asia (Chapter 5). Then during the summer rains, theacidic pollutants contained within the haze fall, damaging food crops. Thirteen Asiancountries are now working together and with the UN to assess the impacts of acid deposi-tion, how to lower acid emissions, and lower the movement of a country’s emissions intoother nations.17 One early step taken was to set up an acid deposition monitoring network inIndia, Thailand, and Nepal. Local people are trained to measure acidity and operatemonitoring stations.
Box 6.4 Acid deposition in China18
Most of China’s many coal-burning power and industrial plants do a poor job of controlling SO2
and NOx emissions. And, concurrent with very rapid ongoing industrial growth, China is
building about one new power plant each week, almost all of which burn coal, which is
relatively cheap and plentiful. In 2004, coal accounted for 69% of China’s energy with coal
consumption increasing a phenomenal 20% a year.19 ▪ Emissions of SO2 continue to increase.20
Coal-burning power plants emit less NOx than SO2, but as more and more are built, NOx
emissions also continue to increase. Moreover, NOx emissions are increasing in tandem with
a rapidly increasing car fleet – up from 6.2 million vehicles in 1990 to 36 million in 2003, and
still rapidly growing. Ammonia emissions from intensive agriculture are also high, three times
greater than NOx emissions.
Xinhua, China’s news agency, citing a parliamentary report, reported that a third of China
receives rainfall with pH values lower than 5.6, i.e., rain more acidic than natural rain.21 More
than half of 696 cities and counties monitored received acid deposition. Xinhua further noted
16 Wright, R. F. et al. Recovery of acidified European surface waters. Environmental Science & Technology, 39(3),February 1, 2005, 49A–72A.
17 Overview of EANET (Acid Deposition Monitoring Network in East Asia), January, 2008, http://www.iiasa.ac.at/rains/meetings/10thMICS-Asia//Ueda.pdf. Countries participating in EANET are Cambodia, Laos, Myanmar,China, Indonesia, Japan, Malaysia, Mongolia, Philippines, Republic of Korea, Russia, Thailand, and Vietnam.EANET is now one of a number of regional monitoring networks in the world.
18 Larssen, T. Acid rain in China. Environmental Science & Technology, 40(2) January 15, 2006, 418– 425.19 China’s coal contains, on average, 1.1% sulfur, but in some areas it is as high as 4%.20 Third of China “hit by acid rain.” BBCNews, August 27, 2006, http://news.bbc.co.uk/2/hi/asia-pacific/5290236.
stm.21 Acid rain affects large swathes of China.Reuters (Xinhua news agency), August 28, 2006, http://www.planetark.
org/dailynewsstory.cfm/newsid/37849/story.htm.
167 The international picture
Further reading
Kahl, J. S. et al.. Have US surface waters responded to the 1990 CAAA Clean Air ActAmendments? Environmental Science & Technology, 38(24), December 15, 2004484A–490A.
Larssen, T. Acid rain in China. Environmental Science & Technology, 40(2), January 15,2006, 418–425.
that SO2 emissions rose 27% between 2000 and 2005 to 27.5 million tons (25 million tonnes).
This makes China the world’s top SO2 emitter. The deposition of acidic sulfur compounds is at
least as high as seen in central Europe’s “Black Triangle” in the early 1980s, an area that was
particularly hard hit by acid deposition. Higher levels of acid deposition have been seen in
China’s industrial cities as compared to its forests.22
In the most polluted areas of China’s forests, pines have suffered severe needle loss.
However, these forests are also impacted by other stresses. Thus, the role of acid deposition
is not clear, but it is known from other countries’ experience that soil acidificationwill negatively
impact forests. And large amounts of aluminum have been released from forest soil, high
enough to damage tree roots. However, deposition of large amounts of calcium (from dust
storms)23 may counter the aluminum impact. ▪Surface water acidification is not now seen as a
large problem. However, too few investigations have been carried out to really know.
Despite realizing that significant potential damage to both forests and water bodies may be
occurring, little is known about specific impacts. More studies are needed on forests and whole
ecosystems before an effective strategy can be developed. China, cooperating with a
Norwegian group, set up five sites around the country: the Integrated Monitoring Program
on Acidification of Chinese Terrestrial Systems. This program is carefully monitoring and
studying air pollution, precipitation, and effects on soil, water, and vegetation in areas
considered to be vulnerable to acid deposition.
The Chinese government now considers acid deposition and, more generally, air pollution as
among high-priority issues that must be addressed.24 At the same time, the need for electricity
continues to grow. China has begun requiring electric power plants and large industrial
facilities to capture part of their SO2 emissions. The government is also asking households to
switch to gas or electricity when possible or use lime-containing coal briquettes that capture
SO2. Analysts believe that acid deposition will cause increasingly serious effects unless China
and other Asian countries reduce SO2 and NOx emissions.
22 There is uncertainty in this statement as Chinese monitoring programs focus on urban areas and on the pH ofprecipitation.
23 This alkaline dust neutralizes part of acid deposition, as does ammonium. However, as noted earlier in thechapter, the ammonium, once deposited can be chemically converted to acidic compounds. Moreover, thesenitrogen compounds contribute to problems of too much bioavailable nitrogen in some locales.
24 Fu, B., Zhuang, X., Jiang, G., Shi, J., and Lu, Y. Environmental problems and challenges in China.Environmental Science & Technology, 41(22), November 15, 2007, 7597–7602.
168 Acid deposition
Mascarelli, A. L. Sulfur controls alone won’t curb soil acidification in China. EnvironmentalScience & Technology, 43, September 30, 2009, 8005.
Wright, R. F. et al. Recovery of acidified European surface waters. Environmental Science &Technology, 39(3), February 1, 2005, 49A–72A.
Internet resources
Hubbard Brook Research Foundation. 2009. Acid rain revisited, advances in understandingsince the passage of the 1970 and 1990 Clean Air Act Amendments, Links to Acid RainUpdates I and II. (Excellent summary). http://www.hubbardbrookfoundation.org/article/view/12940/1/2076/ (2009).
Ueda, H. Overview of EANET (Acid deposition monitoring network in East Asia). http://www.iiasa.ac.at/rains/meetings/10thMICS-Asia/Ueda.pdf (January 15, 2008).
US EPA. 2008. Acid rain program. http://www.epa.gov/airmarkets/progsregs/arp/index.html (August 25, 2008).
2009. Frequently asked questions about atmospheric deposition. http://epa.gov/oar/oaqps/gr8water/handbook/index.html (June 12, 2009).
2009. Lake and stream acidity. http://cfpub.epa.gov/eroe/index.cfm?r=188197& fuseaction=detail.viewInd&ch=47&subtop=200&lv=list.listByChapter (June 23, 2009).
US Geological Survey. 2009. Water properties: pH. http://ga.water.usgs.gov/edu/phdiagram.html (May 13, 2009).
169 Internet resources
7 Global climate change
“Anyone who has kids must be . . . concerned about the climate future we’releaving behind for them. The choices that we make today on the “what to do”about climate change will have long lifetimes . . . Our actions are changing theclimate on a global scale. It’s happening now. We can’t pretend it’s not there.”
Ben Santer, climate modeler at the US Departmentof Energy’s Lawrence Livermore National
Laboratory
Climate change is nothing new. About 18 000 years ago, Earth was experiencing the last ofmany ice ages, fromwhich it only emerged about 10 000 years ago.1More recently, between theyears 1430–1850 portions of the Earth passed through a little ice age. The role of greenhousegases, especially water vapor and carbon dioxide (CO2), in warming the Earth is also ancient,and indeed has long served life on Earth well. Figure 7.1 shows a representation of thisphenomenon. Radiation from the sun reaches and warms the Earth’s surface. In turn, Earthemits radiant heat (infrared radiation) back toward space, part of which is captured by heat-trappingwater vapor and greenhouse gases.Without the “greenhouse effect” to trap thiswarmth,the Earth could be colder by 95ºF (35ºC), and not support life as we know it. However, the lastcentury has brought greater warming beyond that which can be accounted for by natural causes,and warming is occurring at a faster rate.2 It is this, which we examine in this chapter.
In an 1896 publication, Swedish chemist Svante Arrhenius noted that, “We are evaporatingour coal mines into the air.” He stated a novel thought: Earth’s climate would warm as wecontinued to burn coal, which would increase the level of atmospheric CO2. An American,P. C.Chamberlain came to similar conclusions also in the 1890s. They believed this because theyknew that CO2 absorbs and traps the infrared radiation emitted from the Earth. So, increasinglevels of atmospheric CO2 would lead to increasing temperatures. Living in a very cold climateArrhenius relished the possibility, and believed it might prevent the onset of another ice age.
In this chapter, Section I asks, what pollutants are involved in global warming? Section IIexplores why increasing levels of greenhouse gases concern us. Section III goes into sourcesof greenhouse gases and their environmental fate. Section IV briefly examines internationalagreements to reduce greenhouse gas emissions, especially the Kyoto Protocol. Section V
1 Glacial cycles, each about 100 000 years long, are controlled by “shakes, wobbles, and tilts” in the Earth’s orbitwhich, in turn, determine the amount of sunlight falling on and warming the planet as it moves around the sun. Ineach of eight cycles of atmospheric change over 800 000 years, when CO2 and methane reached peak levels, theworld experienced warm, inter-glacial periods. (1) Brook, E. J. Tiny bubbles tell all. Science, 310(5752),November 25, 2005, 1285–1287. (2) British Antarctic Survey, Natural Environment Research Council, 2007,http://www.antarctica.ac.uk/indepth/icecore/page1.php.
2 For a brief overview of warming trend, see: Gribbin, J. and Gribbin, M. Genesis of Eden. New Scientist, July 13,1996, http://www.dhushara.com/book/diversit/co2.htm.
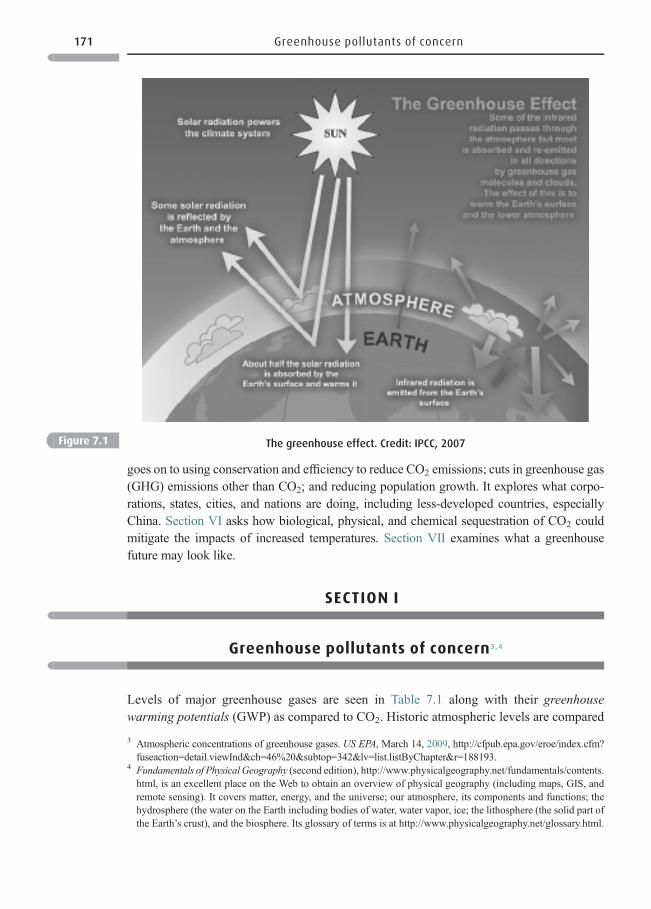
goes on to using conservation and efficiency to reduce CO2 emissions; cuts in greenhouse gas(GHG) emissions other than CO2; and reducing population growth. It explores what corpo-rations, states, cities, and nations are doing, including less-developed countries, especiallyChina. Section VI asks how biological, physical, and chemical sequestration of CO2 couldmitigate the impacts of increased temperatures. Section VII examines what a greenhousefuture may look like.
SECTION I
Greenhouse pollutants of concern3,4
Levels of major greenhouse gases are seen in Table 7.1 along with their greenhousewarming potentials (GWP) as compared to CO2. Historic atmospheric levels are compared
Figure 7.1 The greenhouse effect. Credit: IPCC, 2007
3 Atmospheric concentrations of greenhouse gases. US EPA, March 14, 2009, http://cfpub.epa.gov/eroe/index.cfm?fuseaction=detail.viewInd&ch=46%20&subtop=342&lv=list.listByChapter&r=188193.
4 Fundamentals of PhysicalGeography (second edition), http://www.physicalgeography.net/fundamentals/contents.html, is an excellent place on the Web to obtain an overview of physical geography (including maps, GIS, andremote sensing). It covers matter, energy, and the universe; our atmosphere, its components and functions; thehydrosphere (the water on the Earth including bodies of water, water vapor, ice; the lithosphere (the solid part ofthe Earth’s crust), and the biosphere. Its glossary of terms is at http://www.physicalgeography.net/glossary.html.
171 Greenhouse pollutants of concern
to current levels. The warming potential of CO2 is low compared to the other gasesshown: nonetheless it is the major greenhouse gas because major quantities are emitted.Second in importance is methane, present in much smaller amounts, but with a high GWP.Molecule for molecule, methane has about 25 times the warming potential of CO2. Watervapor is also an important greenhouse gas, but is almost all natural and not a result ofindustrialization. Soot from incomplete combustion is also considered a greenhouse “gas,”which we’ll come back to later.
In Figure 7.2, notice that most of CO2 in the world is emitted by natural systemsand absorbed by natural systems (atmosphere, water, vegetation, and soils). More than6.6 billion tons (6 billion tonnes) of CO2 are emitted by human actions each year, a smallquantity compared to natural amounts. However, natural systems are absorbing lessthan half of anthropogenic emissions meaning that human actions are adding more than3.3 billion tons (3 billion tonnes) each year to the atmosphere. The result is that atmosphericCO2 has built up from 280 ppm in the pre-industrial world to 387 ppm in May, 2008.A striking record of increasing CO2 concentration is seen in Figure 7.3. The see-saw effect inthe figure shows Earth’s respiration. In the cold season, plants in the northern hemisphere
Box 7.1 IPCC – an important organization
Interspersed within Chapter 7 is information from the IPCC (Intergovernmental Panel on
Climate Change), a scientific body, which evaluates climate change. Established in 1988 by
the UN organizations, the World Meteorological Organization and the UN Environment
Program, IPCC does not itself do research. Rather it analyzes the work of thousands of
established climate scientists whose work has been peer reviewed and published in scientific
journals. The IPCC has provided four major assessment reports (1990, 1995, 2001, 2007). Its
reports are widely cited and respected, establishing “what is considered the gold standard of
consensus on climate change science.” The IPPC’s 2007 report represents six years of work
using input from 1200 authors and 2500 scientific expert reviewers from more than 130
countries. As part of its considerations the IPCC also tracks 20 climate models from all over the
world.
There is a growing awareness: in its 1990 report, the IPCC was careful in how it stated
whether the Earth was warming and whether, if it was warming, humanity was
primarily responsible, “The observed increase could be largely due to natural variability”.
In 1995, the IPCC’s statement was stronger, “The balance of evidence suggests a
discernible human influence on global climate.” By 2001, it stated, “There is new and
stronger evidence that most of the warming over the last 50 years is attributable to
human activities.” Then, most recently, in its 2007 report, it reports with 90% certainty
that human activities, especially the burning of fossil fuels, have caused global warming
this past 50 years.5
5 Coauthors of the 2007 report are Rajendra K. Pachauri, IPCC Chairman, and Susan Solomon, NOAA atmosphericscientist who says, “The work is several steps beyond what was possible with the third report.” See: Ekwurzel,B. Findings of the IPCC Fourth Assessment Report: Climate Change Science, a summary. Union of ConcernedScientists summary, July, 2007, http://www.ucsusa.org/global_warming/science/ipcc-highlights1.html.
172 Global climate change
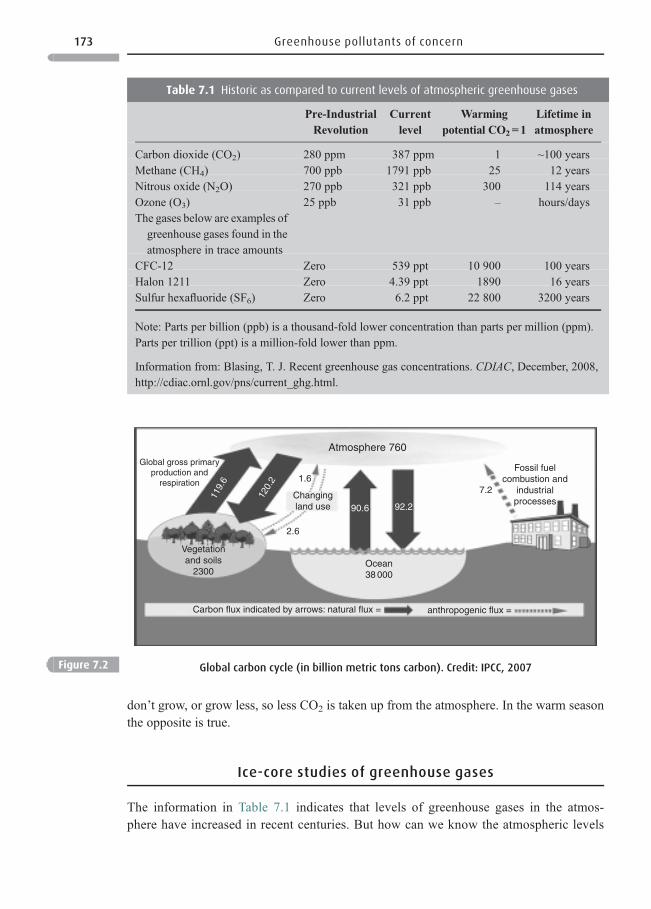
don’t grow, or grow less, so less CO2 is taken up from the atmosphere. In the warm seasonthe opposite is true.
Ice-core studies of greenhouse gases
The information in Table 7.1 indicates that levels of greenhouse gases in the atmos-phere have increased in recent centuries. But how can we know the atmospheric levels
Table 7.1 Historic as compared to current levels of atmospheric greenhouse gases
Pre-IndustrialRevolution
Currentlevel
Warmingpotential CO2=1
Lifetime inatmosphere
Carbon dioxide (CO2) 280 ppm 387 ppm 1 ~100 yearsMethane (CH4) 700 ppb 1791 ppb 25 12 yearsNitrous oxide (N2O) 270 ppb 321 ppb 300 114 yearsOzone (O3) 25 ppb 31 ppb – hours/daysThe gases below are examples ofgreenhouse gases found in theatmosphere in trace amounts
CFC-12 Zero 539 ppt 10 900 100 yearsHalon 1211 Zero 4.39 ppt 1890 16 yearsSulfur hexafluoride (SF6) Zero 6.2 ppt 22 800 3200 years
Note: Parts per billion (ppb) is a thousand-fold lower concentration than parts per million (ppm).Parts per trillion (ppt) is a million-fold lower than ppm.
Information from: Blasing, T. J. Recent greenhouse gas concentrations. CDIAC, December, 2008,http://cdiac.ornl.gov/pns/current_ghg.html.
Atmosphere 760Global gross primary
production andrespiration
Changingland use
1.6
2.6
119.
6
120.
2
90.6 92.2
Ocean38 000
Vegetationand soils
2300
7.2
Fossil fuelcombustion and
industrialprocesses
Carbon flux indicated by arrows: natural flux = anthropogenic flux =
Figure 7.2 Global carbon cycle (in billion metric tons carbon). Credit: IPCC, 2007
173 Greenhouse pollutants of concern
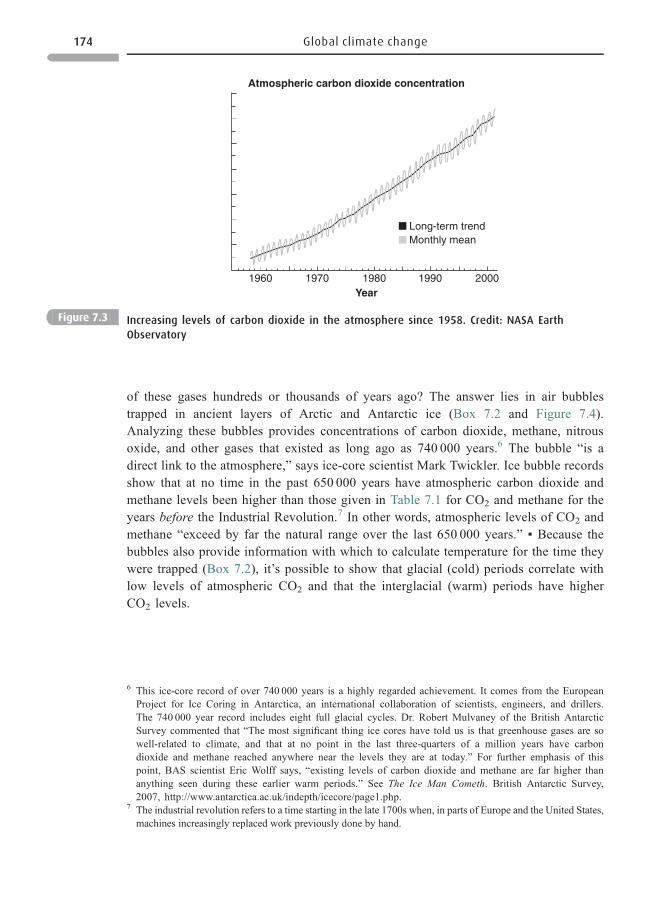
of these gases hundreds or thousands of years ago? The answer lies in air bubblestrapped in ancient layers of Arctic and Antarctic ice (Box 7.2 and Figure 7.4).Analyzing these bubbles provides concentrations of carbon dioxide, methane, nitrousoxide, and other gases that existed as long ago as 740 000 years.6 The bubble “is adirect link to the atmosphere,” says ice-core scientist Mark Twickler. Ice bubble recordsshow that at no time in the past 650 000 years have atmospheric carbon dioxide andmethane levels been higher than those given in Table 7.1 for CO2 and methane for theyears before the Industrial Revolution.7 In other words, atmospheric levels of CO2 andmethane “exceed by far the natural range over the last 650 000 years.” ▪ Because thebubbles also provide information with which to calculate temperature for the time theywere trapped (Box 7.2), it’s possible to show that glacial (cold) periods correlate withlow levels of atmospheric CO2 and that the interglacial (warm) periods have higherCO2 levels.
Long-term trend
Atmospheric carbon dioxide concentration
Year1960 1970 1980 1990 2000
Monthly mean
Figure 7.3 Increasing levels of carbon dioxide in the atmosphere since 1958. Credit: NASA Earth
Observatory
6 This ice-core record of over 740 000 years is a highly regarded achievement. It comes from the EuropeanProject for Ice Coring in Antarctica, an international collaboration of scientists, engineers, and drillers.The 740 000 year record includes eight full glacial cycles. Dr. Robert Mulvaney of the British AntarcticSurvey commented that “The most significant thing ice cores have told us is that greenhouse gases are sowell-related to climate, and that at no point in the last three-quarters of a million years have carbondioxide and methane reached anywhere near the levels they are at today.” For further emphasis of thispoint, BAS scientist Eric Wolff says, “existing levels of carbon dioxide and methane are far higher thananything seen during these earlier warm periods.” See The Ice Man Cometh. British Antarctic Survey,2007, http://www.antarctica.ac.uk/indepth/icecore/page1.php.
7 The industrial revolution refers to a time starting in the late 1700s when, in parts of Europe and the United States,machines increasingly replaced work previously done by hand.
174 Global climate change
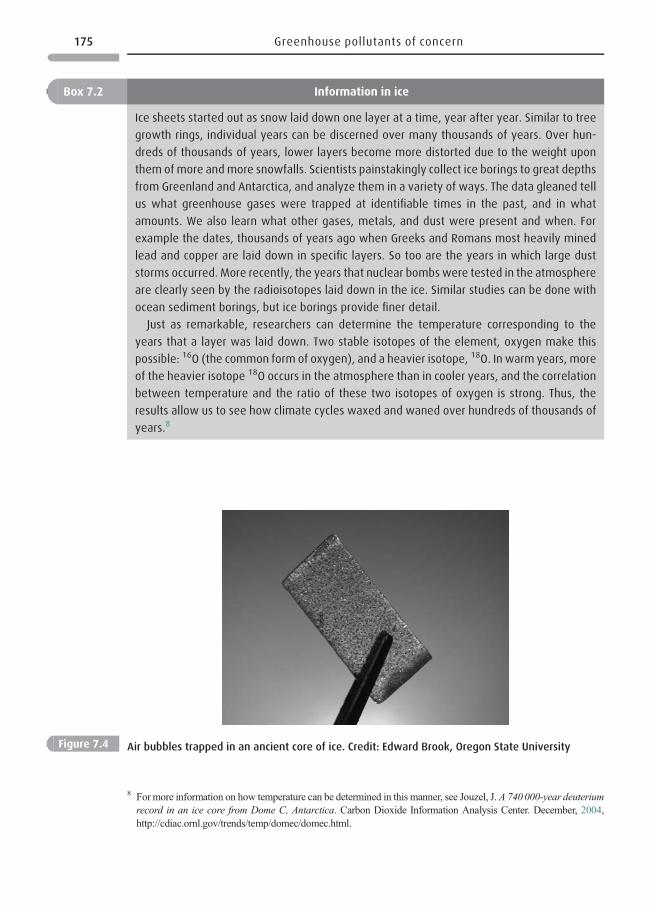
Box 7.2 Information in ice
Ice sheets started out as snow laid down one layer at a time, year after year. Similar to tree
growth rings, individual years can be discerned over many thousands of years. Over hun-
dreds of thousands of years, lower layers become more distorted due to the weight upon
them of more and more snowfalls. Scientists painstakingly collect ice borings to great depths
from Greenland and Antarctica, and analyze them in a variety of ways. The data gleaned tell
us what greenhouse gases were trapped at identifiable times in the past, and in what
amounts. We also learn what other gases, metals, and dust were present and when. For
example the dates, thousands of years ago when Greeks and Romans most heavily mined
lead and copper are laid down in specific layers. So too are the years in which large dust
storms occurred. More recently, the years that nuclear bombs were tested in the atmosphere
are clearly seen by the radioisotopes laid down in the ice. Similar studies can be done with
ocean sediment borings, but ice borings provide finer detail.
Just as remarkable, researchers can determine the temperature corresponding to the
years that a layer was laid down. Two stable isotopes of the element, oxygen make this
possible: 16O (the common form of oxygen), and a heavier isotope, 18O. In warm years, more
of the heavier isotope 18O occurs in the atmosphere than in cooler years, and the correlation
between temperature and the ratio of these two isotopes of oxygen is strong. Thus, the
results allow us to see how climate cycles waxed and waned over hundreds of thousands of
years.8
Figure 7.4 Air bubbles trapped in an ancient core of ice. Credit: Edward Brook, Oregon State University
8 For more information on how temperature can be determined in this manner, see Jouzel, J. A 740000-year deuteriumrecord in an ice core f rom D ome C , Antarctica. C arbon Dioxide Informa tion Ana lysis C enter. Decembe r, 2004,http://cdiac.ornl.gov/trends/temp/domec/domec.html.
175 Greenhouse pollutants of concern
SECTION II
Why increasing levels of greenhouse gases are of concern
Earth is warming
Temperature measurements over more than 100 years between the early twentieth centuryand now indicate that Earth’s average surface temperature has risen about 0.8°C (about1.44°F); moreover, it has risen 0.6°C (1.08°F) in the past three decades.10 The increase hasnot been smooth (Figure 7.5), but the steady upward trend is clear. The year 2005 was thewarmest in more than 100 years, and very similar to 1998, the warmest previous year.NASA’s John Hansen states that it is no longer correct to say that “most global warmingoccurred before 1940.” Rather, global warming was slow, with large fluctuations, in thecentury leading up to 1975; subsequently it has warmed almost 0.2°C (0.36°F) per decade.▪ An increase of 1.4°F seems modest. But consider that the average temperature at Earth’ssurface is only 15°C (59°F). During the last major ice age, ending about 10 000 years ago,temperatures were only about 5°C colder than today. Temperature has varied only about 2°Csince then. As will be noted below, profound effects have occurred with this “small”increased temperature.
One major complication in determining the reality of warming has been the heat islandeffect. Many early recording stations were located where cities subsequently grew up.A city, with its paving and buildings, absorbs more heat than a rural area, sometimesdramatically more. Thus, rising temperatures were to be expected in urban locales.
Box 7.3 Questions and answers on global climate change9
* 33 frequently asked Global Change Questions. CDIAC, Oakridge National Laboratory. http://
cdiac.ornl.gov/faq.html#Q22.
* 11 frequently asked Global Warming Questions. National Oceanic and Atmospheric
Administration, National Climatic Data Center. http://www.ncdc.noaa.gov/oa/climate/
globalwarming.html, May, 2008.
* Global Warming, Questions & Answers. NASA Earth Observatory. http://earthobservatory.
nasa.gov/Study/GlobalWarmingQandA/.
* Greenhouse gases, frequently asked questions. National Oceanic and Atmospheric
Administration, National Climatic Data Center. http://www.ncdc.noaa.gov/oa/climate/
gases.html#wv.
9 You may also like to examine the website http://gristmill.grist.org/skeptics, How to Talk to a Climate Skeptic, aseries by Coby Beck containing responses to the most common skeptical arguments on global warming.
10 Hansen, J., Ruedy, R., Sato, M., and Lo, K. GISS Surface Temperature Analysis. NASA Goddard Institutefor Space Studies and Columbia University Earth Institute, December 15, 2008, http://data.giss.nasa.gov/gistemp/2005/.
176 Global climate change
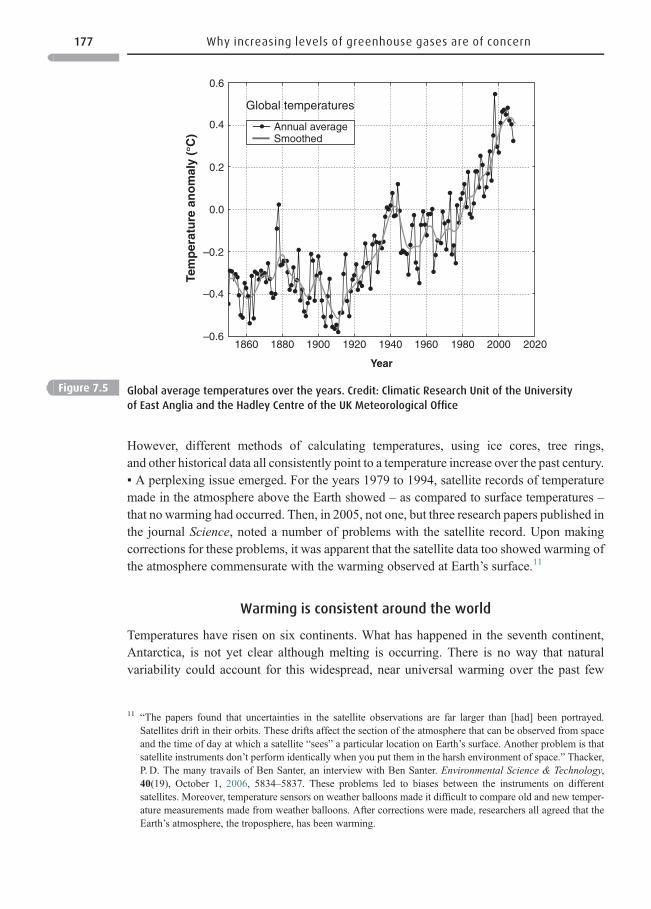
However, different methods of calculating temperatures, using ice cores, tree rings,and other historical data all consistently point to a temperature increase over the past century.▪ A perplexing issue emerged. For the years 1979 to 1994, satellite records of temperaturemade in the atmosphere above the Earth showed – as compared to surface temperatures –that no warming had occurred. Then, in 2005, not one, but three research papers published inthe journal Science, noted a number of problems with the satellite record. Upon makingcorrections for these problems, it was apparent that the satellite data too showed warming ofthe atmosphere commensurate with the warming observed at Earth’s surface.11
Warming is consistent around the world
Temperatures have risen on six continents. What has happened in the seventh continent,Antarctica, is not yet clear although melting is occurring. There is no way that naturalvariability could account for this widespread, near universal warming over the past few
0.6
0.4
0.2
0.0
Tem
per
atu
re a
no
mal
y (°
C)
–0.2
–0.4
–0.61860 1880 1900 1920
Year
1940 1960 1980 2000 2020
Global temperatures
Annual averageSmoothed
Figure 7.5 Global average temperatures over the years. Credit: Climatic Research Unit of the University
of East Anglia and the Hadley Centre of the UK Meteorological Office
11 “The papers found that uncertainties in the satellite observations are far larger than [had] been portrayed.Satellites drift in their orbits. These drifts affect the section of the atmosphere that can be observed from spaceand the time of day at which a satellite “sees” a particular location on Earth’s surface. Another problem is thatsatellite instruments don’t perform identically when you put them in the harsh environment of space.” Thacker,P. D. The many travails of Ben Santer, an interview with Ben Santer. Environmental Science & Technology,40(19), October 1, 2006, 5834–5837. These problems led to biases between the instruments on differentsatellites. Moreover, temperature sensors on weather balloons made it difficult to compare old and new temper-ature measurements made from weather balloons. After corrections were made, researchers all agreed that theEarth’s atmosphere, the troposphere, has been warming.
177 Why increasing levels of greenhouse gases are of concern
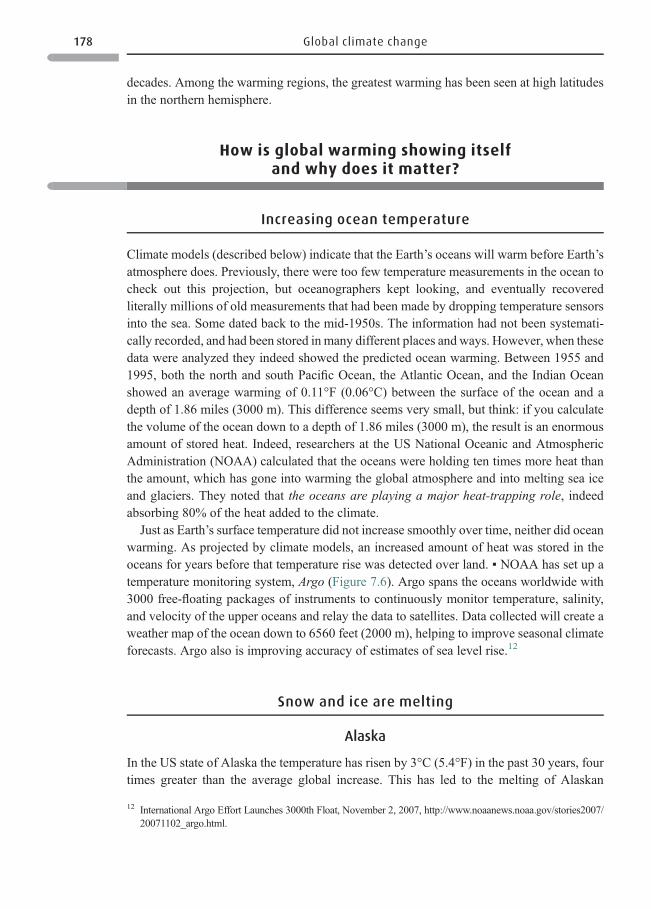
decades. Among the warming regions, the greatest warming has been seen at high latitudesin the northern hemisphere.
How is global warming showing itselfand why does it matter?
Increasing ocean temperature
Climate models (described below) indicate that the Earth’s oceans will warm before Earth’satmosphere does. Previously, there were too few temperature measurements in the ocean tocheck out this projection, but oceanographers kept looking, and eventually recoveredliterally millions of old measurements that had been made by dropping temperature sensorsinto the sea. Some dated back to the mid-1950s. The information had not been systemati-cally recorded, and had been stored in many different places and ways. However, when thesedata were analyzed they indeed showed the predicted ocean warming. Between 1955 and1995, both the north and south Pacific Ocean, the Atlantic Ocean, and the Indian Oceanshowed an average warming of 0.11°F (0.06°C) between the surface of the ocean and adepth of 1.86 miles (3000 m). This difference seems very small, but think: if you calculatethe volume of the ocean down to a depth of 1.86 miles (3000 m), the result is an enormousamount of stored heat. Indeed, researchers at the US National Oceanic and AtmosphericAdministration (NOAA) calculated that the oceans were holding ten times more heat thanthe amount, which has gone into warming the global atmosphere and into melting sea iceand glaciers. They noted that the oceans are playing a major heat-trapping role, indeedabsorbing 80% of the heat added to the climate.
Just as Earth’s surface temperature did not increase smoothly over time, neither did oceanwarming. As projected by climate models, an increased amount of heat was stored in theoceans for years before that temperature rise was detected over land. ▪ NOAA has set up atemperature monitoring system, Argo (Figure 7.6). Argo spans the oceans worldwide with3000 free-floating packages of instruments to continuously monitor temperature, salinity,and velocity of the upper oceans and relay the data to satellites. Data collected will create aweather map of the ocean down to 6560 feet (2000 m), helping to improve seasonal climateforecasts. Argo also is improving accuracy of estimates of sea level rise.12
Snow and ice are melting
Alaska
In the US state of Alaska the temperature has risen by 3°C (5.4°F) in the past 30 years, fourtimes greater than the average global increase. This has led to the melting of Alaskan
12 International Argo Effort Launches 3000th Float, November 2, 2007, http://www.noaanews.noaa.gov/stories2007/20071102_argo.html.
178 Global climate change
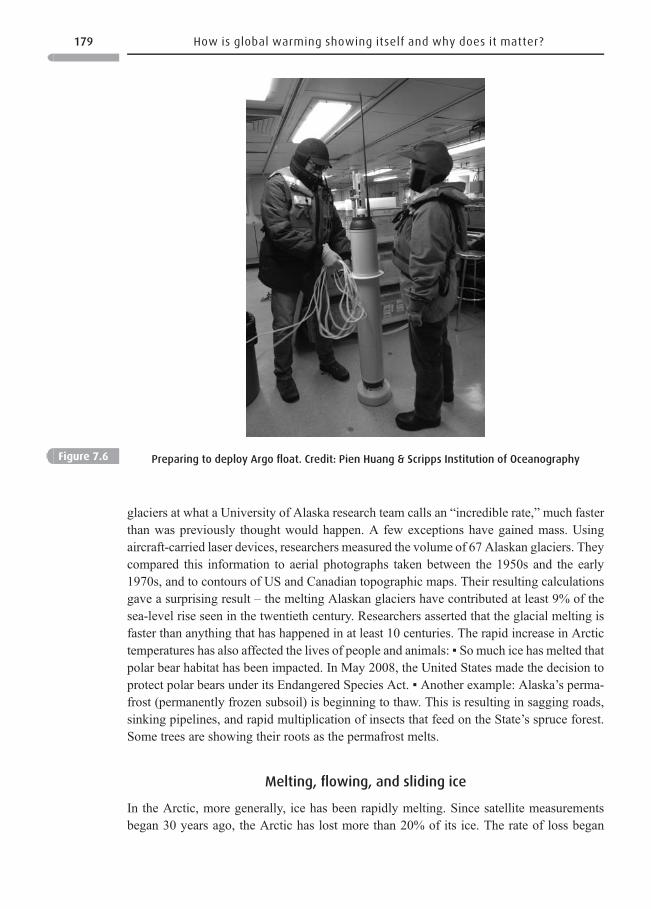
glaciers at what a University of Alaska research team calls an “incredible rate,” much fasterthan was previously thought would happen. A few exceptions have gained mass. Usingaircraft-carried laser devices, researchers measured the volume of 67 Alaskan glaciers. Theycompared this information to aerial photographs taken between the 1950s and the early1970s, and to contours of US and Canadian topographic maps. Their resulting calculationsgave a surprising result – the melting Alaskan glaciers have contributed at least 9% of thesea-level rise seen in the twentieth century. Researchers asserted that the glacial melting isfaster than anything that has happened in at least 10 centuries. The rapid increase in Arctictemperatures has also affected the lives of people and animals: ▪ So much ice has melted thatpolar bear habitat has been impacted. In May 2008, the United States made the decision toprotect polar bears under its Endangered Species Act. ▪ Another example: Alaska’s perma-frost (permanently frozen subsoil) is beginning to thaw. This is resulting in sagging roads,sinking pipelines, and rapid multiplication of insects that feed on the State’s spruce forest.Some trees are showing their roots as the permafrost melts.
Melting, flowing, and sliding ice
In the Arctic, more generally, ice has been rapidly melting. Since satellite measurementsbegan 30 years ago, the Arctic has lost more than 20% of its ice. The rate of loss began
Figure 7.6 Preparing to deploy Argo float. Credit: Pien Huang & Scripps Institution of Oceanography
179 How is global warming showing itself and why does it matter?
accelerating in 2002 to the extent that, in summer 2007 the Northwest passage across the topof Canada became fully navigable. If the current rate of melting continues, the summertimeArctic could be totally free of ice by 2030.13 ▪ In Greenland, glacial ice is being lost to the seathrough melting. But there is also an increased rate of flow of the ice itself into the sea, atleast in the summer. This happens because as meltwater accumulates in surface lakes on theice, its weight opens cracks, through which water drains to the base of the ice. There, incontact with bedrock, the water lubricates the rock surface, allowing a “speed-up” of theice’s sliding into the ocean. However, it appears that the speed of flow of the outlet glacier(the tongues of ice sheets penetrating into the ocean) is more important; this also could beaffected by warming. 14
Around the world
Glaciers and permafrost have decreased in both hemispheres. Mountain glaciers and snowcover have declined worldwide. ▪ The phenomenon of glaciers sliding into the ocean is alsohappening in the Antarctic. ▪ Mountain glaciers in places as far apart as Peru and Tibet aremelting – in the Alps, Himalayas, and Andes. Moreover, runoff from melting begins earlierin the year. Figure 7.7 shows Peru’s Qori Kalis. This glacier shrank 33 times faster betweenthe years 1998 and 2000 than it did between 1963 and1978. The bottom photograph in thefigure shows how much of the glacier melted and the 10-acre lake formed from the melt.15
▪ In Nepal and Bhutan, many lakes around melting glaciers are dangerously full. If theyoverflow, their contents may flood the narrow valleys below where the country’s populationlives. ▪ At the location of the world’s highest peak in the Himalayas, people climbingthe mountain must now walk for 2 hours from base camp to reach ice whereas in 1953Sir Edmund Hillary stepped directly onto ice from the base camp. ▪ Many other glaciersaround the world are melting too, more rapidly than before.
Communities below mountain glaciers use water from normal glacial melting for drink-ing and farming, and the meltwater also keeps water levels high in rivers that supporthydroelectric dams. When the glaciers begin to melt more rapidly, communities and riversbelow would initially have plenty of water. But, as melting continues, critical water short-ages would arise. Moreover, if rivers no longer support hydroelectric dams, people may usemore oil or coal to generate electricity leading to even more greenhouse gas emissions. ▪ InKashmir (India and Pakistan) where many small glaciers have disappeared from the westernHimalayas, water levels in most streams and rivers have fallen by about two-thirds in
13 Adam, D. Loss of Arctic ice leaves experts stunned. Guardian Unlimited. September 4, 2007, http://www.guardian.co.uk/environment/2007/sep/04/climatechange.
14 (1) Kerr, R. A. A worrying trend of less ice, higher seas. Science, 311(5768), March 24, 2006, 1698–1701.(2) Kerr, R. A. Greenland ice slipping away but not all that quickly. Science, 320(5874), April 18, 2008, 301.(3) King, M. Meltwater speeds up ice sheet slippage. NewsLink Newcastle University, April 23, 2008, http://www.ncl.ac.uk/press.office/newslink/index.html?ref=1208936591.
15 Loss of the glacier is not as simple as ice melting due to warmer temperatures. It has to do with any given year’sbalance of ice and snow. If there is more snow in a particular year, the glacier is whiter and brighter and thusreflects sunlight, and has reduced melting, even if it’s warmer. Other factors are also at play, but increasedwarming over the years does lead to more melting. Engelhaupt, E. Peru’s glacier meltdown threatens drinkingwater supplies. Environmental Science & Technology, 41(20), 6880, October 15, 2007.
180 Global climate change
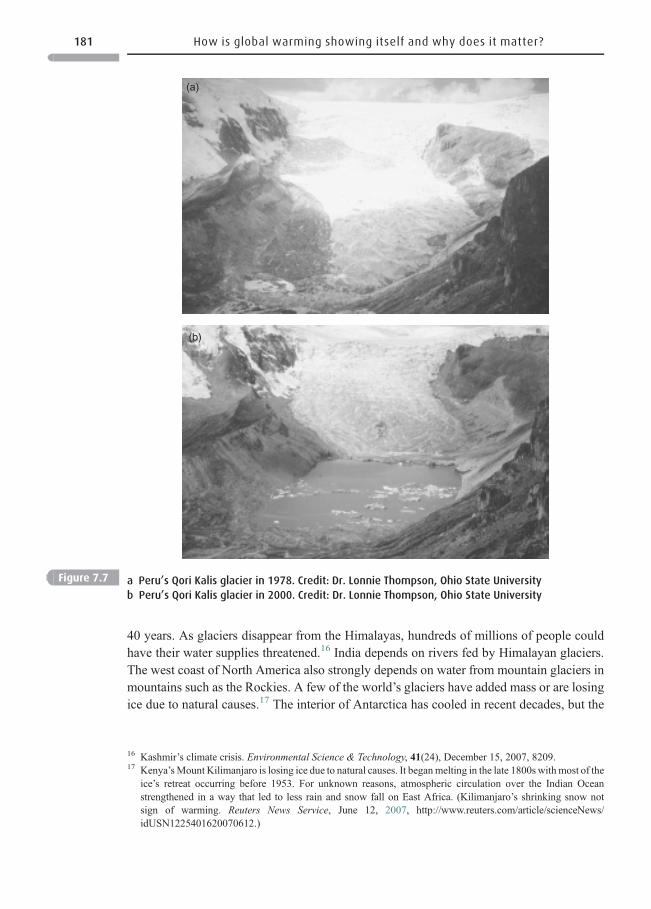
40 years. As glaciers disappear from the Himalayas, hundreds of millions of people couldhave their water supplies threatened.16 India depends on rivers fed by Himalayan glaciers.The west coast of North America also strongly depends on water from mountain glaciers inmountains such as the Rockies. A few of the world’s glaciers have added mass or are losingice due to natural causes.17 The interior of Antarctica has cooled in recent decades, but the
(a)
(b)
Figure 7.7 a Peru’s Qori Kalis glacier in 1978. Credit: Dr. Lonnie Thompson, Ohio State University
b Peru’s Qori Kalis glacier in 2000. Credit: Dr. Lonnie Thompson, Ohio State University
16 Kashmir’s climate crisis. Environmental Science & Technology, 41(24), December 15, 2007, 8209.17 Kenya’sMount Kilimanjaro is losing ice due to natural causes. It beganmelting in the late 1800s with most of the
ice’s retreat occurring before 1953. For unknown reasons, atmospheric circulation over the Indian Oceanstrengthened in a way that led to less rain and snow fall on East Africa. (Kilimanjaro’s shrinking snow notsign of warming. Reuters News Service, June 12, 2007, http://www.reuters.com/article/scienceNews/idUSN1225401620070612.)
181 How is global warming showing itself and why does it matter?
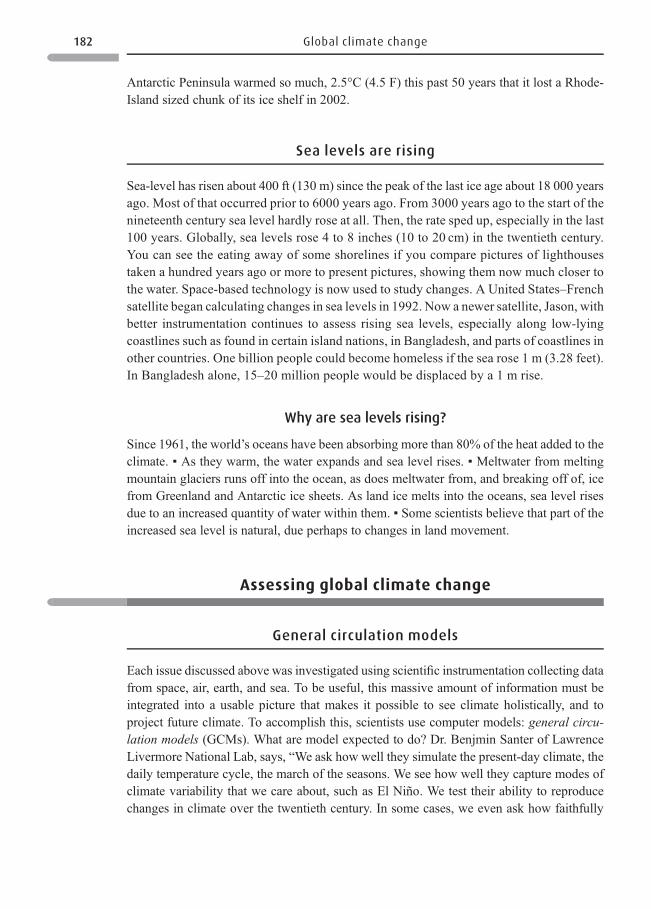
Antarctic Peninsula warmed so much, 2.5°C (4.5 F) this past 50 years that it lost a Rhode-Island sized chunk of its ice shelf in 2002.
Sea levels are rising
Sea-level has risen about 400 ft (130 m) since the peak of the last ice age about 18 000 yearsago. Most of that occurred prior to 6000 years ago. From 3000 years ago to the start of thenineteenth century sea level hardly rose at all. Then, the rate sped up, especially in the last100 years. Globally, sea levels rose 4 to 8 inches (10 to 20 cm) in the twentieth century.You can see the eating away of some shorelines if you compare pictures of lighthousestaken a hundred years ago or more to present pictures, showing them now much closer tothe water. Space-based technology is now used to study changes. A United States–Frenchsatellite began calculating changes in sea levels in 1992. Now a newer satellite, Jason, withbetter instrumentation continues to assess rising sea levels, especially along low-lyingcoastlines such as found in certain island nations, in Bangladesh, and parts of coastlines inother countries. One billion people could become homeless if the sea rose 1 m (3.28 feet).In Bangladesh alone, 15–20 million people would be displaced by a 1 m rise.
Why are sea levels rising?
Since 1961, the world’s oceans have been absorbing more than 80% of the heat added to theclimate. ▪ As they warm, the water expands and sea level rises. ▪ Meltwater from meltingmountain glaciers runs off into the ocean, as does meltwater from, and breaking off of, icefrom Greenland and Antarctic ice sheets. As land ice melts into the oceans, sea level risesdue to an increased quantity of water within them. ▪ Some scientists believe that part of theincreased sea level is natural, due perhaps to changes in land movement.
Assessing global climate change
General circulation models
Each issue discussed above was investigated using scientific instrumentation collecting datafrom space, air, earth, and sea. To be useful, this massive amount of information must beintegrated into a usable picture that makes it possible to see climate holistically, and toproject future climate. To accomplish this, scientists use computer models: general circu-lation models (GCMs). What are model expected to do? Dr. Benjmin Santer of LawrenceLivermore National Lab, says, “We ask how well they simulate the present-day climate, thedaily temperature cycle, the march of the seasons. We see how well they capture modes ofclimate variability that we care about, such as El Niño. We test their ability to reproducechanges in climate over the twentieth century. In some cases, we even ask how faithfully
182 Global climate change
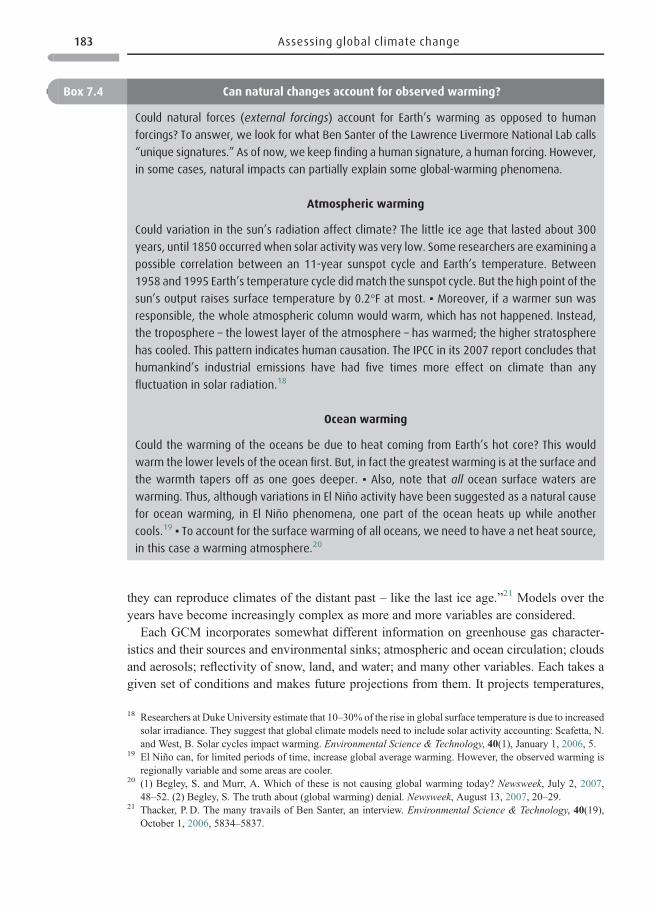
they can reproduce climates of the distant past – like the last ice age.”21 Models over theyears have become increasingly complex as more and more variables are considered.
Each GCM incorporates somewhat different information on greenhouse gas character-istics and their sources and environmental sinks; atmospheric and ocean circulation; cloudsand aerosols; reflectivity of snow, land, and water; and many other variables. Each takes agiven set of conditions and makes future projections from them. It projects temperatures,
Box 7.4 Can natural changes account for observed warming?
Could natural forces (external forcings) account for Earth’s warming as opposed to human
forcings? To answer, we look for what Ben Santer of the Lawrence Livermore National Lab calls
“unique signatures.” As of now, we keep finding a human signature, a human forcing. However,
in some cases, natural impacts can partially explain some global-warming phenomena.
Atmospheric warming
Could variation in the sun’s radiation affect climate? The little ice age that lasted about 300
years, until 1850 occurred when solar activity was very low. Some researchers are examining a
possible correlation between an 11-year sunspot cycle and Earth’s temperature. Between
1958 and 1995 Earth’s temperature cycle didmatch the sunspot cycle. But the high point of the
sun’s output raises surface temperature by 0.2°F at most. ▪ Moreover, if a warmer sun was
responsible, the whole atmospheric column would warm, which has not happened. Instead,
the troposphere – the lowest layer of the atmosphere – has warmed; the higher stratosphere
has cooled. This pattern indicates human causation. The IPCC in its 2007 report concludes that
humankind’s industrial emissions have had five times more effect on climate than any
fluctuation in solar radiation.18
Ocean warming
Could the warming of the oceans be due to heat coming from Earth’s hot core? This would
warm the lower levels of the ocean first. But, in fact the greatest warming is at the surface and
the warmth tapers off as one goes deeper. ▪ Also, note that all ocean surface waters are
warming. Thus, although variations in El Nino activity have been suggested as a natural cause
for ocean warming, in El Nino phenomena, one part of the ocean heats up while another
cools.19 ▪ To account for the surface warming of all oceans, we need to have a net heat source,
in this case a warming atmosphere.20
18 Researchers at DukeUniversity estimate that 10–30% of the rise in global surface temperature is due to increasedsolar irradiance. They suggest that global climate models need to include solar activity accounting: Scafetta, N.and West, B. Solar cycles impact warming. Environmental Science & Technology, 40(1), January 1, 2006, 5.
19 El Niño can, for limited periods of time, increase global average warming. However, the observed warming isregionally variable and some areas are cooler.
20 (1) Begley, S. and Murr, A. Which of these is not causing global warming today? Newsweek, July 2, 2007,48–52. (2) Begley, S. The truth about (global warming) denial. Newsweek, August 13, 2007, 20–29.
21 Thacker, P. D. The many travails of Ben Santer, an interview. Environmental Science & Technology, 40(19),October 1, 2006, 5834–5837.
183 Assessing global climate change
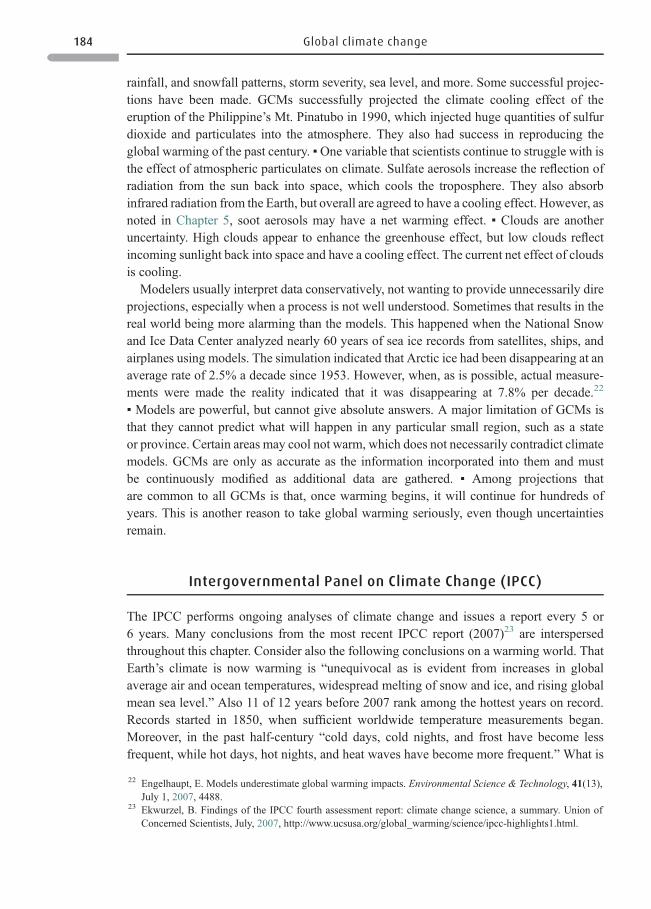
rainfall, and snowfall patterns, storm severity, sea level, and more. Some successful projec-tions have been made. GCMs successfully projected the climate cooling effect of theeruption of the Philippine’s Mt. Pinatubo in 1990, which injected huge quantities of sulfurdioxide and particulates into the atmosphere. They also had success in reproducing theglobal warming of the past century. ▪One variable that scientists continue to struggle with isthe effect of atmospheric particulates on climate. Sulfate aerosols increase the reflection ofradiation from the sun back into space, which cools the troposphere. They also absorbinfrared radiation from the Earth, but overall are agreed to have a cooling effect. However, asnoted in Chapter 5, soot aerosols may have a net warming effect. ▪ Clouds are anotheruncertainty. High clouds appear to enhance the greenhouse effect, but low clouds reflectincoming sunlight back into space and have a cooling effect. The current net effect of cloudsis cooling.
Modelers usually interpret data conservatively, not wanting to provide unnecessarily direprojections, especially when a process is not well understood. Sometimes that results in thereal world being more alarming than the models. This happened when the National Snowand Ice Data Center analyzed nearly 60 years of sea ice records from satellites, ships, andairplanes using models. The simulation indicated that Arctic ice had been disappearing at anaverage rate of 2.5% a decade since 1953. However, when, as is possible, actual measure-ments were made the reality indicated that it was disappearing at 7.8% per decade.22
▪ Models are powerful, but cannot give absolute answers. A major limitation of GCMs isthat they cannot predict what will happen in any particular small region, such as a stateor province. Certain areas may cool not warm, which does not necessarily contradict climatemodels. GCMs are only as accurate as the information incorporated into them and mustbe continuously modified as additional data are gathered. ▪ Among projections thatare common to all GCMs is that, once warming begins, it will continue for hundreds ofyears. This is another reason to take global warming seriously, even though uncertaintiesremain.
Intergovernmental Panel on Climate Change (IPCC)
The IPCC performs ongoing analyses of climate change and issues a report every 5 or6 years. Many conclusions from the most recent IPCC report (2007)23 are interspersedthroughout this chapter. Consider also the following conclusions on a warming world. ThatEarth’s climate is now warming is “unequivocal as is evident from increases in globalaverage air and ocean temperatures, widespread melting of snow and ice, and rising globalmean sea level.” Also 11 of 12 years before 2007 rank among the hottest years on record.Records started in 1850, when sufficient worldwide temperature measurements began.Moreover, in the past half-century “cold days, cold nights, and frost have become lessfrequent, while hot days, hot nights, and heat waves have become more frequent.” What is
22 Engelhaupt, E. Models underestimate global warming impacts. Environmental Science & Technology, 41(13),July 1, 2007, 4488.
23 Ekwurzel, B. Findings of the IPCC fourth assessment report: climate change science, a summary. Union ofConcerned Scientists, July, 2007, http://www.ucsusa.org/global_warming/science/ipcc-highlights1.html.
184 Global climate change
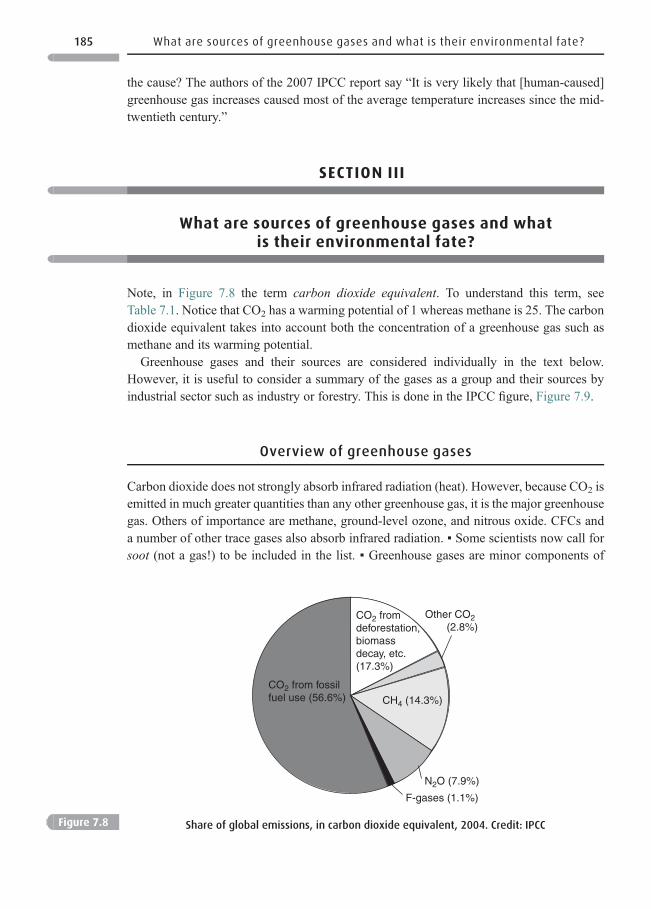
the cause? The authors of the 2007 IPCC report say “It is very likely that [human-caused]greenhouse gas increases caused most of the average temperature increases since the mid-twentieth century.”
SECTION III
What are sources of greenhouse gases and whatis their environmental fate?
Note, in Figure 7.8 the term carbon dioxide equivalent. To understand this term, seeTable 7.1. Notice that CO2 has a warming potential of 1 whereas methane is 25. The carbondioxide equivalent takes into account both the concentration of a greenhouse gas such asmethane and its warming potential.
Greenhouse gases and their sources are considered individually in the text below.However, it is useful to consider a summary of the gases as a group and their sources byindustrial sector such as industry or forestry. This is done in the IPCC figure, Figure 7.9.
Overview of greenhouse gases
Carbon dioxide does not strongly absorb infrared radiation (heat). However, because CO2 isemitted in much greater quantities than any other greenhouse gas, it is the major greenhousegas. Others of importance are methane, ground-level ozone, and nitrous oxide. CFCs anda number of other trace gases also absorb infrared radiation. ▪ Some scientists now call forsoot (not a gas!) to be included in the list. ▪ Greenhouse gases are minor components of
CO2 fromdeforestation,biomassdecay, etc.(17.3%)
CO2 from fossilfuel use (56.6%)
Other CO2 (2.8%)
CH4 (14.3%)
N2O (7.9%)
F-gases (1.1%)
Figure 7.8 Share of global emissions, in carbon dioxide equivalent, 2004. Credit: IPCC
185 What are sources of greenhouse gases and what is their environmental fate?
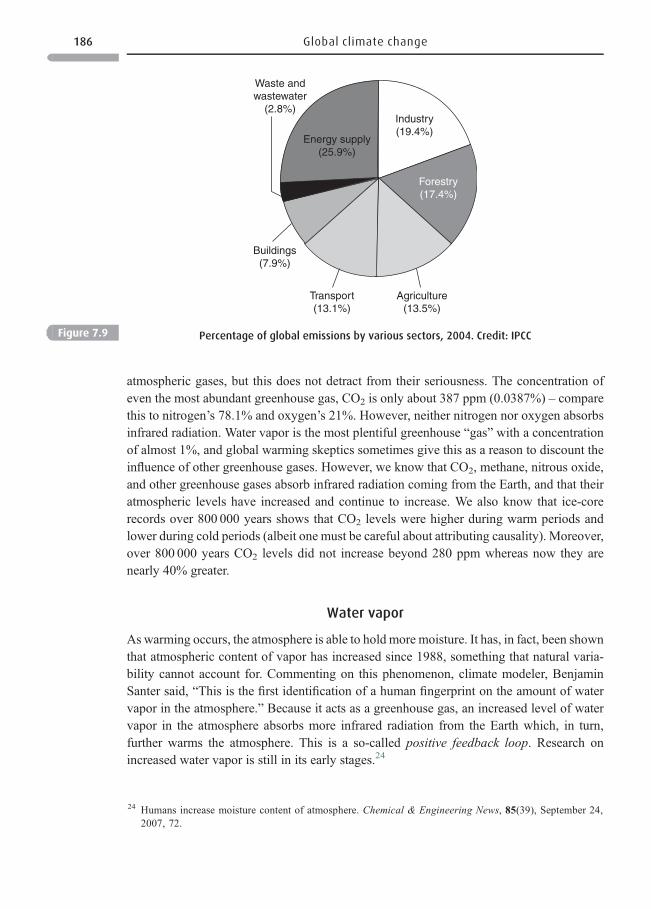
atmospheric gases, but this does not detract from their seriousness. The concentration ofeven the most abundant greenhouse gas, CO2 is only about 387 ppm (0.0387%) – comparethis to nitrogen’s 78.1% and oxygen’s 21%. However, neither nitrogen nor oxygen absorbsinfrared radiation. Water vapor is the most plentiful greenhouse “gas” with a concentrationof almost 1%, and global warming skeptics sometimes give this as a reason to discount theinfluence of other greenhouse gases. However, we know that CO2, methane, nitrous oxide,and other greenhouse gases absorb infrared radiation coming from the Earth, and that theiratmospheric levels have increased and continue to increase. We also know that ice-corerecords over 800 000 years shows that CO2 levels were higher during warm periods andlower during cold periods (albeit one must be careful about attributing causality). Moreover,over 800 000 years CO2 levels did not increase beyond 280 ppm whereas now they arenearly 40% greater.
Water vapor
Aswarming occurs, the atmosphere is able to hold more moisture. It has, in fact, been shownthat atmospheric content of vapor has increased since 1988, something that natural varia-bility cannot account for. Commenting on this phenomenon, climate modeler, BenjaminSanter said, “This is the first identification of a human fingerprint on the amount of watervapor in the atmosphere.” Because it acts as a greenhouse gas, an increased level of watervapor in the atmosphere absorbs more infrared radiation from the Earth which, in turn,further warms the atmosphere. This is a so-called positive feedback loop. Research onincreased water vapor is still in its early stages.24
Industry(19.4%)
Energy supply(25.9%)
Waste andwastewater
(2.8%)
Buildings(7.9%)
Transport(13.1%)
Agriculture(13.5%)
Forestry(17.4%)
Figure 7.9 Percentage of global emissions by various sectors, 2004. Credit: IPCC
24 Humans increase moisture content of atmosphere. Chemical & Engineering News, 85(39), September 24,2007, 72.
186 Global climate change
Carbon dioxide
CO2 accounts for about 75% of the current warming. ▪Worldwide, the major human sourceof CO2 is fossil fuel combustion (coal, petroleum, and natural gas). Fossil fuels areresponsible for ~80% of anthropogenic CO2 emissions. Coal has the greatest carbon content,and thus emits more CO2 when burned than petroleum does. Natural gas, with the lowestcarbon content among the three, emits the least. Worldwide, electric power plants are themajor source of CO2 emissions including the United States and China. Globally, trans-portation is second. In the United States, petroleum-fueled motor vehicles contribute about25% of CO2 emissions. ▪Deforestation (especially tropical deforestation) is second to fossil-fuel burning as a CO2 source. This happens because when felled trees are burned, theirstored carbon is released as CO2 to the atmosphere. Worsening this situation, deforestationleaves fewer growing trees to take up atmospheric CO2. ▪ Trees grown on a sustainable basismake no net contribution to CO2 levels. Sustainable growth occurs when – on a long-termbasis – no more tree biomass is harvested than what grows. ▪Natural CO2 emissions sourcesare large (Figure 7.2), releases from oceans and land; these include plant respiration;microbe respiration as they decompose dead plant and animal matter; and animal expiration,including human expiration. Volcanoes are, periodically, a large natural source.
Only in recent decades have we considered CO2 in outside air as a pollutant. CO2 is, afterall, vital to life. ▪ Trees, plants, phytoplankton, and photosynthetic bacteria, capture CO2
from air and through photosynthesis make carbohydrates, proteins, lipids, and other bio-chemicals. Almost all biochemicals found within living creatures derive directly or indi-rectly from atmospheric CO2. Likewise, the hydrocarbons in coal, petroleum, and naturalgas, were first formed as biochemicals in living creatures. ▪ Moreover, CO2 is a waste gasrespired by animals, plants, and many bacteria.25
CO 2sinks
CO2 is a fairly inert chemical and thus about 45% of the CO2 emitted by human activitiessurvive 100 years, some considerably longer. Strikingly, the 2007 IPCC report indicates that20% of the 2007 fossil fuel emissions of carbon dioxide are expected to remain in theatmosphere for thousands of years. ▪ The remaining CO2 enters two major sinks. One isoceans, which contain about 50 times more carbon than does the atmosphere. The second isterrestrial biomass including trees and grasses, which store about three times more CO2 thanthe atmosphere (see Figure 7.2). ▪ Together, terrestrial ecosystems and oceans absorb up tohalf the CO2 generated by human activities. These sinks have slowed the rate of increase inatmospheric CO2, but they do not assimilate all the human-generated CO2. ▪ Because of thelong atmospheric lifetime of CO2 levels continue to increase as more and more is emitted.Moreover, oceans may become less dependable sinks: CO2 is less soluble in warmer water,so oceans will be less able to absorb it. This may already be happening in the Southern
25 Students sometimes think that atmospheric CO2 level is increasing due to an increasing human populationexpiring CO2. This is not true. See Frequently Asked Global Change Questions. CDIAC, http://cdiac.ornl.gov/faq.html#Q22.
187 What are sources of greenhouse gases and what is their environmental fate?
(Antarctic) Ocean.26 Also, as water becomes more acidic, it is less able to absorb CO2. ▪ Thefate of CO2 Absorbed into a terrestrial sink, much CO2 is incorporated into biochemicals inplants and trees; the same is true of CO2 taken up by photosynthetic bacteria in oceans.▪ However, when CO2 enters ocean waters, its fate can be different (Box 7.5).
Box 7.5 “The other CO2 problem”: affecting the pH of the oceans27
Calcium carbonate shells
To examine “the other CO2 problem,” look first at life in the oceans and the chemical, calcium
carbonate, which is critical to building the shells of myriads of tiny creatures at the base of the
oceans’ food chains, coral, plankton, some protozoa, and algae. Their calcium carbonate
(CaCO3) shells have been stable in ocean water because the oceans’ higher layers are super-
saturated with CaCO3 – there is always enough to build andmaintain the shells. Supersaturated
waters are what one researcher called “shell friendly.”
Fate of CO2 in the oceans
When CO2 reacts with water, carbonic acid, a weak acid is formed. Carbonic acid contributes
little to acid deposition on land. But Earth’s oceans are a major sink for CO2 and they have
absorbed ~550 billion tons (500 billion tonnes) over the past 200 years, and continue to absorb
about 2.2 billion tons (2 billion tonnes) a year, about 30% of the CO2 emitted to the
atmosphere from the combustion of fossil fuel. So – although carbonic acid is weak and oceans
hold massive quantities of water – carbonic acid has initiated the process of ocean acid-
ification. The ocean’s pH has decreased by about 0.1 pH unit, about a 30% rise in acidity.
Why does acidification matter?
More CO2 in the oceanmeanswaters of a lower pH, less able to hold carbonate. This means less
carbonate with which to build shells. Many studies have begun examining what happens
under these circumstances. One active investigator is Ulf Riebesell, who examined coccolitho-
phores (a class of phytoplankton). In experimental tanks he found a clear relation between
rising CO2 levels and the ability of these organisms to make normal shells. In another study
actually done in the ocean, Riebesell used large sacks of ocean water in a fjord near Bergen,
Norway; these bags held many types of shell-building creatures. Again, he saw that increased
levels of CO2 led to less calcification.28
26 LeQuere, C. Saturation of the Southern Ocean CO2 sink due to recent climate change. Science, 316(5832),June 22, 2007, 1735–1738.
27 (1) Zeebel, R. E., Zachos, J. C., Caldeira, K., and Tyrrell, T. Oceans: carbon emissions and acidification. Science,321(5885), July 4, 2008, 51–52. (2) Petkewich, R. Off-balance ocean: acidification from absorbing atmosphericCO2 is changing the ocean’s chemistry.Chemical & Engineering News, 87(8) February 23, 2009,Web Exclusivehttp://pubs.acs.org/cen/science/87/8708sci2.html. (3) Hansson, L. Coral reefs may start dissolving when atmos-pheric CO2 doubles. European Project on Ocean Acidifi cation, March 13, 2009, http://oceanacidi fication.wordpress.com/.
28 Ruttimann, J. Sick seas (the rising level of carbon dioxide in the ocean). Nature, 442(31), August, 2006,978–980. http://perso.crans.org/pruvost/442978a.pdf.
188 Global climate change
Methane
Methane (CH4), a simple hydrocarbon gas, accounts for about 20% of the greenhouseeffect, second in importance only to CO2. Its atmospheric concentration is only 1720 ppb,a level more than 200 times lower than that of CO2, butmolecule for molecule, methane has~25 times greater global warming potential (GWP, ability to absorb Earth’s infraredradiation) than does CO2. Fortunately, its atmospheric lifetime, 12 years or less is muchshorter. As is the case for CO2, the atmospheric CH4 level “exceeds by far the natural rangeover the last 650 000 years.”Also like CO2, levels of methane have increased at a rate “verylikely . . . unprecedented in more than 10 000 years.” ▪ Surprisingly, starting in 1980,methane’s atmospheric levels almost stabilized. However, in 2007 they sharply increased,possibly because of increasing emissions from Arctic wetlands and rapid industrializationin Asia.29
Methane sources30
* Anthropogenic sources About half of methane emissions result from human activity. 31 Inthe United States, three major methane sources are the production, distribution, and use ofenergy; waste management; and agriculture. ▪ Energy: methane escapes during coalmining; natural gas (mostly methane) production and use; and from the flaring of naturalgas from oil wells. ▪Waste management: decomposition of organic solid waste in landfills(food, paper, wood, and plant debris) is a large source of US emissions. US landfills bythemselves emit about 7% of the world’s methane. ▪ Agriculture: a dairy cow belches upto 53 gallons (200 l) a day; methane is also produced during manure management. Ricepaddies are a major agricultural source, especially considered worldwide. ▪Hydroelectricdams can be large sources too as vegetation rots beneath their reservoirs.
* Natural sources: When microbial action occurs with little or no oxygen, there is likely tobe methane generation. ▪ Worldwide, natural wetlands release about three-quarters ofnaturally emitted methane. ▪ Tropical termites release another 11% as a result of theirsymbiotic relationship with microorganisms. Tropical insects or those living indoors, forinstance, cockroaches, produce especially large amounts. ▪ Oceans emit perhaps 8% ofglobal methane. ▪Ofmuch interest is the recent confirmation that methane is emitted by atleast some living plants, which may change some of the percentages just given.32
* An unusual natural source: Methane hydrates are solid “cages” of water moleculescontaining methane, which currently emit only a little methane. These clathrates are
29 Carbon dioxide, methane rise sharply in 2007, April 24, 2008, http://yubanet.com/usa/Carbon-Dioxide-Methane-Rise-Sharply-in-2007.php.
30 Methane, sources and emissions. US EPA, 2006, http://www.epa.gov/methane/sources.html.31 First note that aerobic bacteria, those using oxygen, metabolize organic material to CO2 and water. However, the
end product of anaerobic bacteria (bacteria not using oxygen) is methane.Methane is generated under conditionswith little or no oxygen as when vegetation rots underground or underwater as in swamps, bogs, or rice paddies,landfills and open dumps, and in the stomachs of ruminant livestock and termites.
32 Chatterfee, R. Methane-making plants in Inner Mongolian steppe. Environmental Science & Technology, 42(1),January 1, 2007, 4–8.
189 What are sources of greenhouse gases and what is their environmental fate?
found deep underground in polar regions and in ocean sediments of the world’s outercontinental margin. When recovered in icy chunks and lit, they will ignite. There is greatinterest in exploiting methane clathrates for fuel. Geologist Arthur Johnson states “thequestion now is not whether industry will exploit hydrates but how soon.” Others areconcerned about methane being released by clathrates.33
* Aworrisome methane source: Permafrost in Siberia and Alaska contain immense quanti-ties of organic material, much stored since the last ice age. Average temperatures inAlaska, western Canada, and eastern Russia are 4–7°F (3–4ºC) warmer than 50 years ago.Some permafrost has begun thawing, and its organic material is being metabolized byanaerobic microbes. In some Siberian lakes formed by melting permafrost, methane isbubbling to the surface. These are circumstances posing great concern.34
Fate of methane
Through reactions that begin with the hydroxyl radical, methane is oxidized to CO2 andwater. This reaction provides a major source of water vapor to the upper stratosphere. ▪ Soilsthat are well aerated do absorb some methane too as the soils contain “methanotrophs,”bacteria using methane as food and oxidizing it to CO2.
Ozone35 and ozone sources
Ground-level ozone (O3) is a GHG whose levels have increased about 25% as compared tothe pre-industrial era. The IPCC now considers ozone to be the third most importantgreenhouse gas after carbon dioxide and methane, accounting for about a seventh of globalwarming. However, ozone is more difficult to study because its lifetime is so short in hotsunny weather that there is not time for it to mix well in the atmosphere or be transportedlong distances. Thus, ozone-induced warming takes place where the ozone is generated inwestern North America, Eastern Europe, and Central Asia. ▪ The story changes in the winterand spring: cool conditions allow ozone to last long enough to be transported to the Arcticfrom its sources. There its heat-absorbing properties become especially important: a NASAstudy concluded that tropospheric ozone accounts for one-third to a half of the observed
33 Bohannon, J. Weighing the climate risks of an untapped fossil fuel. Science, 319(5871), March 28, 2008,1753.
34 (1) Markey, S. Thawing permafrost could supercharge warming, study says. National Geographic News,June 15, 2006, http://news.nationalgeographic.com/news/2006/06/060615-global-warming.html. (2) Walter,K.M., Zimov, S. A., Chanton, J. P., Verbyla, D., and Chapin, III, F. S., Methane bubbling from Siberian thawlakes as a positive feedback to climate warming. Nature, 443, September 7, 2006, 71–75. (3) Zimov, S. A.,Schuur, E. A. G., and Chapin, F. S. Permafrost and the global carbon budget. Science, 312(5780), June 16, 2006,1612–1613.
35 In the stratosphere, ozone absorbs ultraviolet light from the sun, preventing harmful radiation from reaching theEarth. When stratospheric ozone is destroyed by free radicals (produced from CFCs), a cooling effect is exerted.This partially offsets the warming effect of ground-level ozone. However, as CFCs are eliminated from thestratosphere, less ozone will be destroyed and there will be less offsetting of ground-level ozone’s warmingeffect.
190 Global climate change
warming in the Arctic winter and spring.36 This remarkable finding needs further study. Ifconfirmed, it provides yet another reason to reduce ground-level ozone.
Ozone’s fate
Ozone (O3) is a very reactive chemical, much more so than ordinary oxygen, O2. Ozone“prefers” to become the more stable O2. So, as youmight expect, O3 is easy to destroy. ▪ Twoozone molecules can react with one another to yield three molecules of O2. ▪ High-energyradiation from the sun can photolyze O3 (cause it to decompose). ▪ O3 coming in contactwith many other substances – your lungs, your eyes, your sweater, or other materials – reactsin such a way that one of its oxygen atoms can be stripped away.
Nitrous oxide
Nitrous oxide (N2O) accounts for about 5% of the greenhouse effect. Although its atmos-pheric concentration is only 320 ppb, it has 300 times greater ability to absorb infraredradiation than CO2 does. Its atmospheric lifespan, over 100 years, is similar to that of CO2.▪ The major natural sources of N2O emissions are microbes that breakdown nitrogenchemicals in soil – especially wet tropical forest soils – and in the oceans. Such bacterialaction is nothing new. ▪However, when humans add nitrogen-containing fertilizers or till thesoil, it stimulates growth, and the microbes convert the fertilizer to other chemicals includingN2O. ▪ Fossil-fuel burning in motor vehicles and in electric power plants also produces someN2O. ▪ In Box 7.6, below, see that the livestock sector may have replaced transportation asthe largest source of N2O.
▪ Nylon and nitric-acid production produce a small amount.37
Fate of N2O
As you may surmise from its long lifetime, N2O is fairly inert in the atmosphere. However, itcan move from the troposphere to the stratosphere, where it is converted to the nitric oxideradical (NO·), capable of destroying stratospheric ozone. Thus nitrous oxide is a naturallyoccurring regulator of stratospheric ozone.
36 Cole, S. NASA study links “smog” to Arctic warming. Goddard Space Flight Center, March 14, 2006, http://www.nasa.gov/centers/goddard/news/topstory/2006/troposphere_ozone.html.
37 Recall from Chapters 5 and 6 that nitrate and nitric acid are deposited to earth and water including oceans. And,as seen in Chapter 9, nitrogen fertilizer running off with rainwater also reaches the oceans. Together theserepresent a significant portion of the bioavailable (fixed) nitrogen reaching the ocean. There they fertilize marineplant life, which, as it grows, is able to take up more atmospheric CO2, removing as much as 10% ofanthropogenic CO2. However, some of the nitrogen compounds are then converted into N2O, which is releasedto the atmosphere. And, because N2O is such a powerful greenhouse gas, this cancels out about two-thirds of theplants removal of CO2. This study indicates that human-produced nitrogen compounds that reach the sea lead toa significant increase of the greenhouse gas, nitrous oxide, to the atmosphere. Atmosphere threatened bynitrogen pollutants entering ocean. ScienceDaily, May 16, 2008, http://www.sciencedaily.com/releases/2008/05/080515145350.htm.
191 What are sources of greenhouse gases and what is their environmental fate?
Other greenhouse gases
Looking at Table 7.1 you see that the last three gases are examples of very potent greenhousegases, CFC-12, halon-1211, and SF6 (sulfur hexafluoride). Together along with othermembers of their respective families they represented about 2% of US greenhouse gasemissions in 2006. None have natural sources. ▪ Sulfur hexafluoride (SF6) is used inmagnesium smelting and as an insulator in electrical equipment. ▪ The synthetic chemicals,CFCs and halons, are potent greenhouse gases, but the Montreal protocol has banned them,and it’s possible these two categories of chemicals may disappear. We will return to CFCs inChapter 8.
Soot as a greenhouse “gas”
Prior to 2001, Western scientists had been familiar only with North American and Europeansulfate hazes. These cool the atmosphere by reflecting sunlight back into space, and also(when present in clouds) make clouds more reflective. ▪ But the brown Asian hazes(Chapter 5) contain more soot than most Western hazes. Soot appears to absorb sunlightand heat the atmospheric layers in which it is found. A recent study indicated that the IPCChas underestimated the impact of black carbon on global warming.39
Box 7.6 Livestock and greenhouse gas emissions
The UN’s FAO (Food and Agriculture Organization) has reported on the massive environ-
mental impact of the livestock industry.38 It examined the worldwide impacts both of
raising and feeding livestock, and demonstrated its environmental impact. The livestock
sector contributes to major water pollution problems, and to pollution resulting from land
degradation. It also contributes an estimated 18% of all anthropogenic greenhouse gas
emissions worldwide calculated as CO2 equivalents: this is as much as the transportation
sector. For individual gases, this breaks down to 9% of CO2 emissions, 37% of methane, and
65% of nitrous oxide. Raising livestock is also responsible for about two-thirds of anthro-
pogenic ammonia emissions which contribute to acid deposition. In addition to pollution,
the livestock sector is also a major source of land and water degradation. Although the
report is somber, the authors make recommendations as to how to reduce the environ-
mental impact of livestock production including how to better grow feed for livestock.
Senior author, FAO’s Henning Steinfeld noted, “Urgent action is required to remedy the
situation.”
38 Steinfeld, H., Gerber, P., Wassenaar, T. et al. Livestock’s long shadow, environmental issues and options. UNFood and Agriculture Organization, 2006, ftp://ftp.fao.org/docrep/fao/010/a0701e/a0701e00.pdf.
39 Service, R. F. Study fingers soot as a major player in global warming. Science, 319(5871), March 28,2008, 1745.
192 Global climate change
Questions 7.1
1 How does the eruption of a volcano such as Mt. Pinatubo lead to a temporary cooling of the
climate?
2 Some still are not sure if the climate warming that we see is (a) due to natural cycles or (b) is
human induced. What actions should humans take if scenario (a) is correct? If scenario (b) is
correct?
3 Consider the following: energy usage generates the greatest amount of greenhouse gases;
energy generation and usage, quite aside from greenhouse gases, produces major envi-
ronmental damage; energy availability is a national security issue for many nations. Given
such facts, do you still see amajor difference in howwe should respond to scenario (a) and
scenario (b) in question 3?
4 What does the following statement mean: Sustainably-grown trees and other biomass
make no net contribution to carbon dioxide?
5 The expiration of CO2 by more than 6 billion people on Earth doesn’t make a net contribu-
tion to atmospheric CO2. Nonetheless, there is an association between growing population
and greenhouse gas emissions. (a) How does a growing human population lead to
increased CO2 emissions? (b) To increased methane emissions? (c) To increased nitrous
oxide emissions?
6 Why does increasing industrialization in poor nations increase CO2 emissions more than if
that increasing industrialization was occurring in well-to-do countries?
7 Other than reducing greenhouse gas emissions, what are three additional environmental
reasons to reduce fossil fuel use?
8 Trees, especially young rapidly growing trees, serve as an important terrestrial sink for CO2
by taking it up from the atmosphere. What are three other environmental reasons to avoid
deforestation?
9 Review the uncertainties related to global climate change. Which among them do you
consider most legitimate? Explain.
10 Climate warming is expected to increase ground-level air pollution. Why?
11 Think about a college campus. What steps could be taken, without cost, to reduce green-
house gas emissions? What steps would cost only a little money? Which would have longer
pay back times?
12 What is the meaning of the word (verb), project as used by the IPCC?
13 The IPCC believes that 75% of the warming expected in the twenty-first century will be due to
CO2. What does this tell you about the predominating fuel that the world’s people will be
burning?
14 Go to the Climate change calculator at American Forests, http://www.americanforests.
org/resources/ccc/. Use the calculator to determine how much your household contrib-
utes to atmospheric CO2. Based on your finding at this site: (a) What steps could you take
to reduce your personal greenhouse gas emissions? (b) Which are you most likely
to take?
193 What are sources of greenhouse gases and what is their environmental fate?
SECTION IV
Using international agreements to reduce greenhousegas emissions
The Rio agreement
In 1992 at the UN Earth Summit in Rio de Janeiro, many countries signed an agreementunder the UN Framework Convention on Climate Change. Its objective was to stabilize“greenhouse gas concentrations . . . at a level that would prevent dangerous anthropogenicinterference with the climate system.”About 150 countries ratified the Convention, agreeingto return their greenhouse gas emissions to 1990 levels by 2000. However, emissions in theUnited States and many other countries continued to climb. Obviously, stronger measureswere needed: a plan that clearly specified exactly what reductions in greenhouse gasemissions would occur and by when.
Kyoto Protocol
In the Kyoto Protocol adopted in late 1997, industrialized countries agreed to reduce GHGemissions at least 5.2% below 1990 levels between the years 2008 and 2012. The EuropeanUnion is committed to an 8% reduction. The treaty was in effect once it had been ratified by atleast 55 nations producing more than 55% of the developed world’s greenhouse gases. It islegally binding to those that ratify it. If a country fails to make the cuts, it will need to makeboth the initial promised cuts and 30% more. The US Administration of President GeorgeBush in 2001 refused to ratify this “fatally flawed” document.40 The Obama Administration,on the contrary, is becoming active in reducingGHG emissions. Amajor BushAdministrationobjection to Kyoto was that it does not require less-developed countries to reduceGHG emissions, even those that ratify the treaty. They were exempted because industrializedcountries were largely responsible for current levels of atmospheric greenhouse gases andare better able, financially and technically, to lead the way to reductions. Nonetheless,rapidly increasing emissions from less-developed countries could overwhelm reductionsmade in industrial countries. China and India plan to build hundreds of new coal-poweredelectric power plants. This presents a serious problem relative to future world emissions.
40 A full six years later the Bush administration called on the world’s major emitters of greenhouse gases, 15nations to reach a consensus on an emissions goal, but left it up to each nation to decide how to meet that target.Most other nations did not react kindly to this belated proposal. Under this plan, the USwould have to cut carbonintensity, that is, GHG emissions per dollar of economic output. Some less-developed countries may also like thisas it may be less strict than caps on emissions.
194 Global climate change
Making Kyoto work: emissions trading or tax
* Recall from Chapter 6 emissions trading as applied to power plants emitting sulfurdioxide. Analogously, in Greenhouse Gas Trading, a company reducing GHG emissionsmore than required by a cap and trade (emissions trading) law could sell that amount to acompany emitting too much CO2. The buyer receives credit just as if it had made thereduction. ▪ The European Union sees this as the most cost-effective way to meet the 8%reduction in GHG emissions required byKyoto. It has set up a market under which 12 000power plants and energy-intensive industries (e.g., steel making) are given carbondioxide quotas. If they overshoot their quota, they buy allowances in the market or paya financial penalty. If they emit less, they can sell the quotas.
* Another approach is a carbon tax, a fee levied on the carbon content of a fuel, or on theamount of CO2 that a facility releases; thus there is no limit on emissions so long as the taxis paid. However, regulators could raise the tax over time, providing an incentive to cutemissions more.
* A different type of carbon “tax” is in effect in the province of British Columbia (Canada).Both businesses and residents pay a carbon tax on their gasoline, diesel, natural gas, coal,propane, and home heating fuel. The tax starts at $10 per metric tonne of carbon emittedand rises by $5 each year until it reaches $30 a tonne. The tax is actually revenue neutralas its income will be returned via tax cuts and other means. The tax is expected to cut CO2
emissions 5–10% over the first decade, but if the tax keeps increasing, the expectedreductions will be greater. The measure has received considerable support in BritishColumbia and there is hope other locales will follow suit.41
Making Kyoto work: flexibility mechanisms
Flexibility mechanisms are one means a nation can use to get credit for reducing emissions.These were set up to provide flexibility in how countries can pursue GHG reductions. ▪ Inthe Clean Development Mechanism, a rich nation finances projects in less-developedcountries and receives credit (carbon offsets) as if it had made the cuts itself. It may planta forest to take up atmospheric CO2, pay for renewable energy projects such as solar roofs orwind farms (to provide electricity without producing CO2), help countries build energy-efficient factories, or to capture and use methane from landfills. Hundreds of such projectsare already in operation around the world. ▪ These mechanisms are intended to supplementnot replace direct actions by a country or company such as reducing fossil fuel use.
Kyoto Protocol reductions but a small beginning
If industrialized countries ratifying the treaty fulfill their commitments, they will need tohave reduced GHG emissions (primarily CO2 and methane) about 5.2% below 1990
41 (1) Pelley, J. Carbon cap or tax? Environmental Science & Technology, 42(8), April 15, 2008, 2214. (2) Pelley,J. First sweeping carbon tax in North America. Environmental Science & Technology, 42(8), March 17, 2008,2215.
195 Using international agreements to reduce greenhouse gas emissions
emission by the year 2012. This is indeed amodest reduction considering that cuts of 60% ormore are deemed necessary to stabilize climate, so Kyoto can be but one small step towardmuch more ambitious cuts. However, Kyoto is stimulating the research and developmentnecessary to more ambitious reductions in emissions while also bringing alternativeand sustainable energy sources to fruition. This happened in the United States too as,even under the Bush administration many states, cities, and corporations chose to moveforward on their own. Before 2012 the world may be better able to move to more ambitiousreductions.
SECTION V
What measures are being used to reduce GHG emissions?
International agreements set up what final results need to be, but how do individuals,businesses, cities, states, and nations actually make reductions in GHG emissions?
Conservation and efficiency to reduce CO2 emissions42
Remember the concept of pollution prevention from earlier chapters, conservation. Use lessfossil fuel and use it more efficiently – produce more energy per amount used. ▪ As of now,buildings account for 72% of US electricity consumption and also emit 38% of human-generated CO2.
43 So we need to make all new construction energy efficient and retrofit olderbuildings for energy efficiency. ▪ Have utilities use “co-generation,” which allows more ofthe energy produced to be captured and used. ▪ Use more energy-efficient industrial motorsand household appliances. ▪ Greatly improve the efficiency of motor vehicles. ▪ Work onwidespread adoption of energy sources that don’t emit greenhouse gases including wind,solar, and, more controversially, nuclear power. ▪ Emphasize individual and businessconservation including simple measures such as replacing all incandescent lights withmuch more efficient compact fluorescent lights (CFLs). Improve appliance circuits sothey don’t draw current after being turned “off.” ▪ To promote conservation by industry,
42 To provide a sense of how much efficiency improvements could accomplish, see the report: Reducing USgreenhouse gas emissions: how much at what cost? McKinsey & Company and The Conference Board,December, 2007, www.mckinsey.com/greenhousegas. The authors did a detailed analysis of opportunities toreduce CO2 and other GHG emissions. They concluded that the US could reduce emissions 40% by 2030 at“manageable” costs. Almost 40% of the reductions are options that would pay for themselves over theirlifetimes. Examples are improving energy efficiency in buildings, appliances, and industry. The costs wouldbe about one trillion dollars, that is about 1.5% of the $77 trillion in investments the US economy expects tomake over this period. Also: Gardner, T. US lifestyle won’t have to change in CO2 cut. Reuters News Service,December 3, 2007.
43 Green building research. US Green Building Council, 2008, http://www.usgbc.org/DisplayPage.aspx?CMSPageID=1718.
196 Global climate change
tax carbon emissions as the Scandinavian countries started doing nearly 20 years ago.▪ Conserving forests, especially tropical forests, is critical as these sequester large amountsof carbon. Deforestation now accounts for 20% or more of current anthropogenic CO2
emissions. Moreover, there is the concurrent need to conserve forest habitat.
Reducing population growth
AUSNational Academy of Sciences report stated that population growth is the major singledriver of atmospheric pollution. ▪ A growing population leads to growing use of fossil fuelsand greater pressures to cut forests, which both enhance CO2 emissions. ▪ As populationincreases, so does agricultural activity, both more cattle and more rice paddies leading toenhanced methane emissions. ▪ The United States lacks a population policy and populationis growing ~1% a year. Not surprisingly, CO2 emissions have increased almost in lock step.
Industry action to reduce GHG emissions
Just before the Bali climate change conference (December, 2007), 150 major transnationalcorporations endorsed mandatory cuts in GHG emissions. Among them were Coca-Cola,General Electric, Shell, Nestlé, Nike, DuPont, Johnson & Johnson, British Airways, andShanghai Electric.44 They stated that the scientific evidence for climate change is “nowoverwhelming,” and believe a legally binding agreement will “give business the confidenceto make those long-term investments in lower-carbon technologies.” What are the otherreasons that businesses could choose to support reductions in GHG emissions?
* Some have financial stakes, e.g., those making energy-efficient products and environ-mental controls. ▪ Many insurance companies work to combat global warming. Theyinsure against climatic events such as severe storms and fear the increased incidence ofextreme events that warming can bring. These could lead to major financial losses.
* Some US companies feared the economy would be harmed if the United States is not partof the Kyoto protocol because European companies will get a head start in developing“climate-friendly technologies.” That may be occurring. Others believe that emissioncontrols will be mandated, and want to get a head start.
* Many recognize that projects to reduce CO2 emissions also result in energy conservationmeaning less is spent on energy.
A number of global corporations have pledged to reduce greenhouse gas emissions at alltheir facilities. Some also provide technical advice to other businesses. Those voluntarilyreducing GHG emissions provide examples for others. But most observers believe thatvoluntary cooperation is not enough. After the Kyoto protocol entered into force, businessesin countries that ratified it must adhere to specific reductions. ▪ Many energy conservation
44 Eilperin, J. 150 global firms seek mandatory cuts in greenhouse gas emissions.Washington Post, November 30,2007, A03.
197 What measures are being used to reduce GHG emissions?
and efficiency measures are appropriate to almost all companies. General Electric in itsEcoimagination program, started in 2004, committed to reducing its GHG emissions 1% by2012 and to improve energy efficiency 30% by the end of 2012 (compared to 2004). Onepercent is modest, but without this action, GHG emissions would likely have grown byabout 30% by 2012 based on GE’s projected growth. As of 2007, GE’s GHG emissions fromoperations were reduced 8% compared to 2004, and its energy intensity reduced by 33%.However, many industries oppose mandatory cuts in GHG emissions: these include many ofthe oil and coal industries, as well as those manufacturing motor vehicles.
Reductions in specific greenhouse gases
Most of the GHG reductions noted under Industry action relate to carbon dioxide. Othergreenhouse gases must also be reduced.
Reducing greenhouse gases with high GWP
* Some of DuPont’s facilities release the high GWP N2O and the very high GWP fluo-rochemicals. See Table 7.1. By 2010, DuPont plans to reduce emissions of these by 65%compared to 1990. Also, DuPont pledges not to increase energy use as compared to 1990,but to increase its use of renewable energy, enough to provide 10% of its energy needs by2010.
* Motorola uses the strong infrared absorbers, perfluorocarbons (PFC) to etch and cleansemiconductors. It aims to half their use by 2010 by finding other means of cleaning. TheWorld Semiconductor Council urged its members to reduce PFC emissions 10% by 2010as compared to 1995.
* Twelve magnesium-producing companies formed a partnership to find means to reduceemissions of the potent GHG sulfur hexafluoride (SF6) which has a GWP 23 000 timesthat of CO2. SF6 is used to produce magnesium and magnesium parts and, as societal useof magnesium increases so will SF6 use unless steps are taken.
Reducing CFCs
CFCs have a very high GWP. Adoption of the Montreal Protocol (Chapter 8) has alreadyresulted in major reductions in these human-made gases. It is calculated that the MontrealProtocol had more impact in reducing greenhouse gas emissions than the first phase targetsof the Kyoto Protocol, which specifically addressed heat-trapping gases.45
Reducing methane emissions
The US EPA has a number of voluntary programs directed toward reducing methaneemissions. Each differs depending on the source of the methane. ▪ Landfills Between
45 Chatterjee, R. Sharing sustainable solutions.Environmental Science&Technology, 41(10),May 10, 2007, 3398–3399.
198 Global climate change
40–60% of the gases emitted from landfills is methane. The EPA encourages capturing themethane and burning it for energy. ▪ Livestock Large facilities maintain lagoons and holdingtanks filled with liquid manure. These generate methane.46 The EPA encourages technolo-gies to recover and burn the methane for on-farm energy. ▪Animal belchingWork is ongoingto change animal diets so that they generate less methane. ▪ Coal mining An emphasis isput on recovering and using the methane trapped in coal deposits instead of venting it tothe atmosphere. ▪ Natural gas and oil industry The EPA has programs to reduce methaneemissions during production, transmission, and distribution of natural gas (methane).▪ Growing rice The level of methane emission varies with soil conditions, productionpractices, and climate. Methane emissions are reduced by drying out rice paddies whennot in use.47 Agricultural techniques are being developed, which may have lower methaneemissions. ▪Municipal and industrial wastewater treatment plantsWastewater can be treatedto remove organic material that would otherwise be available to the anaerobic bacteria.
Reducing nitrous oxide emissions
The major human-generated emissions of N2O come from agriculture, mostly from fertil-izing soils with nitrogen fertilizers. American farmers often use too much fertilizer on farmcrops. So, to reduce N2O emissions, it is important to reduce applications of nitrogenfertilizer. For several reasons farmers often don’t want to do this.
Reducing soot
Soot has a much shorter atmospheric life than any of the greenhouse gases: it can be rainedout of the atmosphere within a week or two. Thus, if soot production was significantlyreduced, an impact would be quickly seen. However, reducing soot means that burningfossil fuels – and burning wood, dung, and other natural materials – needs to be moreefficient. As addressed in earlier chapters, efficient combustion can greatly reduce, eveneliminate, soot. However, in less-developed countries that burn biofuels, it is difficult tomake burning efficient – picture a woman cooking over an open fire. Nonetheless, there isongoing effort to provide efficient wood-burning stoves to people who must cook this way.There is also pressure on governments of less-developed countries to ban inefficient two-stroke engines from vehicles.
City, state, and national efforts to reduce greenhouse gases
In the absence of federal action in the first 8 years of this century, many US states andcities began to take steps voluntarily. Many committed themselves to deep cuts in GHGemissions.
46 Manure deposited directly onto pastures, or handled when it is dry, generates very little methane.47 Flooded rice paddies produce methane as conditions are ideal for anaerobic bacteria that produce methane: wet
soil, organic compounds, and little oxygen.
199 What measures are being used to reduce GHG emissions?
State GHG reductions
* A group of Midwestern US states from Ohio west to Kansas – together representing theworld’s fifth largest producer of GHG (behind the whole of the United States, Russia,China, and India) developed a climate change accord. Governors of the 19 US states inthe Western Governors’ Association likewise formed a consortium to reduce GHGemissions; so did the northeastern States.
* None went so far as California,48 which, by itself, is the world’s sixth largest economywith the highest population of any US state. It is particularly concerned by studiesshowing the risk of climate change to California including coastal flooding, beacherosion, and loss of wetlands. California already had a head start in reducing GHGemissions because of energy policies passed many years ago: California already usesonly 7000 kilowatt-hours of electricity per capita a year, whereas the average in other USstates is 12 000. This happened because of policies taking such actions as mandatingenergy-efficient appliance standards, codes reducing energy use in new-home construc-tion, and tax credits that assist alternative energy sources such as solar and wind. In 2006California went much further: Governor Arnold Schwarzenegger issued an executiveorder committing California to lowering GHG emissions 11% by 2010 (as compared to2000 levels), 25% by 2020, and 80% by 2050. The 2050 target is particularly notablebecause climate scientists say that reductions as much as 80% below 1990 levels areneeded to avert dangerous global warming. ▪ As just noted, California already had aframework to assist in its ambitious new program. Other examples of ongoing stateprograms are a voluntary program to encourage solar roofs for new homes; a mandate thatutilities derive 20% of their power from renewable sources by 2010; and a law requiringcars to lower their CO2 emissions – something strongly opposed by car manufacturers.Meanwhile, a 2006 University of California study found that capping carbon emissions,far from dragging the state’s economy down, is expected to boost business while alsocreating 17 000 jobs. ▪ Indeed, Senator Timothy Wirth (Colorado) believes that if theUnited States ratified Kyoto (or more likely now, its follow up treaty) this wouldencourage intensive research and development in technologies that would “create jobsand launch an era of economic growth akin to the start-up phase of the Internet.”
Cities49
Cities have also become active. Greg Nickels, the mayor of Seattle, a city of 575 000launched the US Mayors Climate Protection Agreement. Within a year he recruited 275mayors representing 48 million Americans. Their goal is to match the targets of the KyotoProtocol and reduce GHG emissions 7% by 2012. In Seattle, Nickels took novel initiatives
48 (1) Pelley, J. California’s Schwarzenegger does heavy lifting on global warming. Environmental Science &Technology, 39(5) August 1, 2005, 318A. (2) California confronts climate change. Environmental Science &Technology, 40(20), October 15, 2006, 6189–6191.
49 (1) Milliken, M. and Wakabayashi, D. Seattle’s green mayor brings Kyoto to the backyard. Reuters, August 4,2006, http://www.enn.com/top_stories/article/4807. (2) Gardner, T. World mayors to meet in NY to fight globalwarming. Reuters, May 14, 2007.
200 Global climate change
such as urging residents to build rental units in their yards to help prevent sprawl, whilegiving new residents the opportunity to walk to work. Seattle provided its meter readers withSegways with which to get around the city, not automobiles. Its public electric plant, SeattleCity Light, became the first major US utility to achieve zero net emissions of greenhousegases. Mayor Nickels pledged that, “We will come up with a menu of things that other citiesand states and ultimately the country can use as a menu for howwe achieve this goal.”Manyother mayors, in the United States and internationally are also taking, sometimes bold, stepsto reduce emissions. ▪ Another organization of cities around the United States and interna-tionally was Cities for Climate Protection. Each city calculates its GHG emissions, sets atarget for reducing them, and develops plans to meet its target. Boston, Massachusetts,committed itself to reducing municipal energy use 10%. Boston is taking efforts such asreducing energy use by streetlights, buildings, and transportation. Boston and other citiessee reducing GHG emissions as also saving money through increased energy efficiency,while reducing local air pollution, and developing new jobs that involve creating, installing,and maintaining new technologies.
Nations
New Zealand pledged to become a zero-waste nation (Chapter 18). This included becomingcarbon-neutral.50 Germany, despite planning more coal-burning power plants is on trackto meet its obligations to reduce GHG emissions, under the Kyoto accord. Moreover,Germany – despite the fact that coal currently provides more than 60% of its energy – haslegislation to cut GHG emissions by 36%.51 To do so, it is increasing use of renewablepower sources, wind and geothermal, from less than 6% to at least 25%, and requiring thatnew buildings, including homes, be 30% more energy efficient. It wants to raise taxes oncars with poor gas mileage and require that emissions from new cars be reduced by half,which the auto industry strongly protests.
Less-developed countries
It was difficult for those negotiating Kyoto to get nations to agree to reduce GHG emissions5% below 1990 levels. Even 5% is difficult because energy production increases each yearin much of the world: it is difficult to produce more energy from burning more fossil fuelswhile also working to reduce GHG emissions, although Germany is taking that route.A major reason the United States gave when refusing to ratify Kyoto is that less-developedcountries were not required to reduce GHG emissions, However, the United States has ~17times greater emissions per capita than does India. And the tiny emissions of impoverishednations such as those in sub-Saharan Africa are much lower still. These countries are andwill be impacted by climate change, but did not contribute to the GHG burden. This situation
50 It will commit to practices that don’t add more CO2 to the atmosphere: some CO2 will be emitted by motorvehicles and power plants. However, it will ensure that it has enough trees, and take other measures, to offsetthose emissions.
51 Germany takes dramatic step on climate change in Bali. Christian Science Monitor, December 5, 2007, http://www.csmonitor.com/2007/1205/p10s01-woeu.html.
201 What measures are being used to reduce GHG emissions?
led most developed countries to conclude that they must lead: find means to lower their ownGHG emissions, develop new technologies, and transfer those technologies to poor nations.Thus, only industrialized nations are formal parties to the Kyoto Protocol. Some less-developed countries did decide to sign the treaty. Although they have no target to reduceemissions, they become eligible to receive assistance from developed nations. For instance,some coal-burning utility companies fund reforestation or energy-efficiency projects inpoorer nations. They have found that they can accomplish GHG reductions more cheaplyby doing these projects than by making major modifications to their own facilities, and they
Box 7.7 China’s CO2 emissions
China has recently become the world’s largest emitter of CO2. However, on a per capita basis US
emissions remainwayaboveChina. China, evenmore than theUnitedStates, is amajor user of coal:
in 2005Chinaburned2.23billion tons (2 billion tonnes) up from1.3billion tons (1.18billion tonnes)
in 2000. Eighty percent of its electricity generation is from coal. In 2006, it built, on average, about
two large coal power plants a week. Even as China plans to double its efficiency of energy use,
you can see the immense problem that CO2 emissions pose. ▪ The United States in 2005 used
1.13 billion tons (1.03 billion tonnes) in 2005 and generated half of its electricity from coal.
Meanwhile, India another large and growing user of coal consumes considerably smaller
amounts than does China: 360 million tons (327 million tonnes) in 2000 up to 460 million tons
(417 million tonnes) in 2005. About 68% of India’s CO2 emissions are from coal.
China’s GHG emissions: ▪ Per capita emissions still remain low in comparison to the United
States. ▪ China is a major manufacturer of consumer goods – which lead to large quantities of
GHG emissions – because it exports somany goods to the United States andWestern Europe, so
the West is, in a very real sense, responsible for significant amounts of China’s emissions. In
fact, 5.3 million tons (4.81 million tonnes) of its carbon emissions go into international trade –
almost 20% of the total global emissions accounted for by international trade.52 ▪ It has
avoided emissions: recall that growing trees serve as a sink for atmospheric CO2. China has
massive reforestation projects. One is intended to stop desertification: forest cover in 1980
was 12%, in 2005 it was 18%, and is still growing. Its strict population-control policy could also
be considered avoided emissions; its population is about 300 million fewer than without
population control. ▪ China’s Gross Domestic Product grew, on average, 9.5% a year over
27 years, but CO2 emissions grew only 5.4% a year. So, during this intensive industrial growth,
carbon intensity (carbon emissions per unit of GDP) decreased (probably because the govern-
ment is emphasizing energy efficiency).53 ▪ China is developing renewable energy projects
even more rapidly than it is building coal-fired plants – hydroelectric, nuclear, biomass, wind,
and solar. China is a top manufacturer of solar equipment and wind turbines. ▪ Still, thereremains cause for major concern.
52 Chatterjee, R. Carbon embodied in international trade. Environmental Science & Technology, 42(5), March 1,2008, 1391–1392.
53 (1) Zeng, N., Climate change: the Chinese challenge. Science, 319(5864), February 8, 2008, 730–731. (2) Saltsurge puts crops in peril. The National, March 11, 2009, http://www.enn.com/top_stories/article/39441.
202 Global climate change
receive credit for emissions reduction. For its part, the less-developed country receives aworthwhile project.
SECTION VI
Can we mitigate the impacts of increased temperaturesand of continuing GHG emissions?
Reductions in GHG emissions resulting from Kyoto won’t halt warming, but rather willslow the increase in atmospheric CO2 concentration and then, if we continue the reductions,eventually level them off.Meanwhile, because the CO2 already added to the atmosphere willremain there for many years, our first choice, pollution prevention, is not possible. So, whatcan we do to control the impact of this CO2, i.e., to mitigate the impacts of climate changealready “within the system?”
Adapting to climate change
What are feasible ways to halt the intrusion of salt water moving into groundwater and intodrinking-water systems in New York and other coastal cities? In Bangladesh, salt waterintrusion from a rising sea is already making soil more saline and reducing agriculturalyields.54 Many farmers switch to growing shrimp, but that has its own problems includingunemployment for former farm workers. Are there actual mitigation actions can they take?▪ Mitigation is alleviating the impacts of climate change. One is to erect seawalls toprevent coastal flooding as seas levels rise. New Bedford, Massachusetts has long had arocky hurricane barrier. Or a seawall may help to stop salt water intrusion into ground-water and into drinking water. ▪ In Italy, the city of Venice introduced adjustable barriers toprevent tidal flooding. The Netherlands – which could see all its land eventually be belowsea level – has constructed barricades to regulate the inward flow of the sea, and is workingon measures such as houses that bob up and down as the seas come and go. ▪ But whatabout poor countries such as low-lying Bangladesh mentioned above? Research isongoing to develop crops adapted to saline soil and to warmer climates. Currently, riceyields drop ~15% for each 1oC (1.8oF) rise in temperature, and salty soils reduceagricultural yields.55 For those raising animals, finding breeds able to tolerate warmertemperatures would be a welcome mitigation measure.
54 Bangladesh rising sea levels threaten agriculture. IRIN, March 14, 2009, http://www.irinnews.org/Report.aspx?ReportId=75094.
55 Aglay, D. Scientists breed rice to defy climate change. Reuters, April 12, 2006, http://www.planetark.com/dailynewsstory.cfm/newsid/35978/story.htm.
203 Can we mitigate the impacts of increased temperatures
Adapting to continuing releases of CO2
by sequestration
Onemeasure to prevent some of the consequences of climate change is to prevent a portionof CO2 emissions from entering the atmosphere, by biological, physical, or chemicalmeans.
* Biological sequestration A growing forest, especially a tropical one, very effectivelytakes up CO2 from the atmosphere. Protect existing forests and practice reforestation.56
Another approach is introducing biochar into soil to enhance its ability to store CO2whilealso benefiting soil quality.57
* Carbon capture and storage (CCS) Physical methods can be used to capture CO2
emissions at their source – most often coal-burning power plants – and store them ina way that prevents their return to the atmosphere. The captured CO2 can be injectedinto deep geological formations or into aquifers under sea or land.58,59 If pumped to agreat depth CO2 would be subjected to enough pressure that it becomes viscous, asviscous as honey. Several industrial-scale sequestration projects are under way. NorwayThe best known of these is in Norway where CCS has been used since 1998. Trappingand sequestering CO2 emissions is expensive. Norway has had a carbon tax since 1991,about $50 per ton of CO2 emitted. This tax stimulated oil and gas companies to considerhow to minimize CO2 emissions. Statoil, Norway’s state-owned oil company recoversnatural gas, which is contaminated with 9.5% CO2. They must reduce this to 2.5%, thelimit for commercial natural gas. Thus Statoil had to trap CO2 anyway, so it costthe company relatively little to do the following: since 1998, it has pumped about10 million tons (9.1 million tonnes) of CO2 into an immense offshore aquifer 2625 feet(800 m) below the floor of the North Sea. This process adds about 1% to the cost ofnatural gas production, small compared to the carbon tax. The storage aquifer is aporous sandstone formation filled with salt water; Norway’s Petroleum Research groupbelieves the storage is permanent and safe, even in an earthquake. Statoil says thatcalculations show that “enough capacity exists in North Sea aquifers to sequester CO2
emissions from all EU power plants for hundreds of years.”Modeled results indicate itwould take over 10 000 years before even small amounts of the CO2 would escape up to
56 Careful planning is needed for reforestation projects because planting large numbers of trees can reduce thewater available for other purposes, drinking, irrigation, etc. Jackson, R. B. Trading water for carbon withbiological carbon sequestration. Science, 310(5756), 1944–1947, December 23, 2005.
57 Laird, D. The charcoal vision: a win–win scenario for simultaneously producing bioenergy, permanentlysequestering carbon, while improving soil and water quality. Agronomy Journal, 100(1), 2008, http://terrapreta.bioenergylists.org/lairdcharcoalvision0408.
58 (1) Doyle, A. Petrify, liquefy: new ways to bury greenhouse gas. Reuters, May 8, 2008, http://www.enn.com/pollution/article/35968. (2) Australia begins burying carbon dioxide underground. Toronto Globe and Mail,April 2, 2008. (3) Hileman, B. and Johnson, J. Driving CO2 underground. Chemical & Engineering News,85(39), September 24, 2007, 74–81, http://pubs.acs.org/cen/government/85/8539gov1box.html. (4) Engelhaupt,E. What to do with greenhouse gases? Environmental Science & Technology, 41(17), September 1, 2007,5925–5926.
59 McCoy, M. and Johnson, J. Climate change, dealing with CO2, technologies to capture greenhouse gas advance.Chemical & Engineering News, 87(14), April 6, 2009, 5.
204 Global climate change
the floor of the ocean. Norway sees carbon-sequestration as a major project – their“moon landing.” Prime Minister Jens Stoltenberg stated, “It is our vision that within7 years we will have put in place capture and storage technology.” Indeed, done withcareful safety and environmental precautions, and if affordable, the project could beas significant as a moon landing.60 ▪ Although Norway believes that CO2 from anysource including coal-burning power plants could be so stored, currently, nocommercial-scale power plants sequester CO2. United States Within the United Stateslegal and safety worries are major hindrances. Half of US electricity and a third of itsanthropogenic CO2 come from 1500 coal-fired plants, many approaching 40 years ofage. To retrofit these for CO2 capture would be exceedingly expensive. IPCC estimatesa carbon emissions tax would need to be $25–30 a tonne (1.2 ton) to be economicallyviable; this would significantly increase the cost of electricity. And, for many plants, itwould be physically impossible as equipment for a 500-MW (megawatt) plant can take6 acres (2.4 hectares) of space. CCS worries A big worry is possible leakage fromunderground sites:61 what if a CO2 storage site was disturbed by an earthquake? A leakcould kill nearby life while also increasing atmospheric levels of CO2. ▪ So, sequester-ing is of great interest and is being intensively researched, but is still far from beingpractical.
* Chemical sequestration Ideally CO2 would be used as a feedstock to make usefulchemicals,62 but there are major difficulties. CO2 has such a long life in the atmos-phere because it is not a reactive chemical. Its lack of reactivity hinders its easyconversion to other chemicals. But most intimidating is that human activities, espe-cially fossil-fuel burning, produces 26.5 billion tons (24 billion tonnes) a year ofCO2 – of this amount currently about 127 million tons (115 million tonnes ) are put touse. So it is staggering to ponder capturing all that CO2, let alone putting it all to useonce captured. One product remains a possibility and a subject of research: captureCO2 and convert it, via the molecule CO (carbon monoxide), into hydrocarbons. Burnthe hydrocarbons for energy, as one does gasoline.63 This would close the cycle–fuelto CO2 and back to fuel. Unfortunately, as currently carried out the process requires agreat deal of energy. A potentially better variation on this scheme is to developa system of artificial photosynthesis – use solar energy and CO2 to produce (througha series of reactions) immense quantities of burnable hydrocarbons. Research on thispossibility is in very early stages. It is very far from reality. For the foreseeable futurecapturing CO2 and physically sequestering a portion of it will be a more likely wayto manage CO2.
60 Leonard, A. Norway’s moon shot. Salon, March 5, 2008, http://www.salon.com/tech/htww/2008/03/05/norways_moon_shot/.
61 The worst known example was a natural eruption of CO2 from Lake Nyos (Cameroon) in 1986, which killedmore than 1700 people and many animals. CO2 is not a chemical toxicant, but when concentration is highenough it displaces oxygen so that suffocation occurs.
62 Ritter, S. K.What can we do with carbon dioxide? (finding ways to convert CO2 into fuels and other value-addedproducts). Chemical & Engineering News, 85(18), April 30, 2007, 11–17.
63 Chang, K. Scientists would turn greenhouse gas into gasoline. New York Times, February 19, 2008, http://www.nytimes.com/2008/02/19/science/19carb.html?_r=1&oref=slogin.
205 Can we mitigate the impacts of increased temperatures
SECTION VII
What does a greenhouse future hold?64,65
To get a sense of the scope of the 2007 IPCC report, see http://www.ipcc.ch/.66
Or, see a summary of IPCC’s report prepared by the Union of Concerned
Questions 7.2
1 Eastern European countries decreased their greenhouse emissions since 1990 whereas
Western European countries did not. Check the Internet to find the reason for this difference.
2 (a) What is your reaction to the Statoil project? (b) More generally, what is your reaction to
physically sequestering CO2?
Delving deeper
1. Yale’s School of Forestry and Environmental Studies has a new website. In an easily
understood way, it synthesizes the results of thousands of policy simulations from 25
models being used to predict the economic impacts of reducing US carbon emissions. See
http://www.climate.yale.edu/seeforyourself. The site identifies the seven key assump-
tions accounting for most of the differences in the projections of the 25 models. It shows
the US economy growing strongly even as carbon emissions are reduced. Under more
favorable assumptions, the economy would even grow more rapidly as GHG reductions
occur than if they continue to increase as is now happening. Access this site, think through
the issues involved, prepare for and do a brief presentation, or write a short essay.
2. Notice important missing points in the discussion of clean-coal technology. They seldom
include the damagingways thatwemine coal, especially extrememethods such asmountain-
top removal. Nor do discussions often include bettermanagement of the immense amounts of
several different types of waste ash produced when coal is burned. Do a brief research paper
on clean coal technology that includes a life-cycle assessment of the subject (not just CCS).
Present your conclusion on what clean coal actually means and how, if at all we can attain it.
3. CO2 is “nontoxic, nonflammable, and essentially free for the taking.” Why then is it so
difficult to make use of this gas? See Ritter, S. K. What can we do with carbon dioxide?
Chemical & Engineering News, 85(18), April 30, 2007, 11–17. Come to a conclusion that you
are willing to defend on the likely future for the use of CO2.
64 Kintisch, E. Global warming: projections of climate change go from bad to worse, scientists report. Science, 323(5921), March 2009, 1546–1547.
65 Kolbert, E. Field Notes from a Catastrophe: Man, Nature, and Climate Change. London: BloomsburyPublishing, 2006.
66 IPCC’s four 2007 reports are at http://www.ipcc.ch/. (1) The physical science basis; (2) Impacts, adaptation, andvulnerability; (3) Mitigation of climate change; (4) AR4 synthesis report. Start with the Synthesis Report.
206 Global climate change
Scientists.67 It is difficult to briefly summarize what greenhouse future we can expectas that depends upon, among other things future levels of heat-trapping gas emissionswill be. In turn, particular levels give rise to different future scenarios. The IPCCbased its projection of climate change scenarios in the second half of the twenty-firstcentury on six possible GHG emission scenarios. ▪ Its best estimate is that globalaverage temperatures will rise 1.8 to 4.0°C (3.1 to 7.2°F) by 2100 (relative to 2000).68
▪ Because of a lag in response to levels of greenhouse gases in the atmosphere, it isprojected that even if humanity could hold atmospheric levels of greenhouse gases atcurrent levels, Earth would still warm about 0.1°C (0.18°F) per decade for the nextfew decades.
What are the implications of temperature increases? The exact degree to which we canexpect the following will, of course depend on temperature increases.
Not all implications are listed here. There are many others such as loss of biodiversity astemperatures rise, and the impacts of earlier springs.
* Loss of sea ice in both the Arctic and Antarctic will continue.* By the end of this century, the global average sea-level will rise between 7 and 23 inches
(17.8 cm and 58.4 cm) above the 1980–1999 average. The Atlantic Ocean meridionaloverturning circulation may be 25% slower.69 Despite this, Atlantic regional temper-atures are projected to rise overall due to increases in heat-trapping emissions. ▪ Coastalflooding will increasingly occur with rising sea level. People, already poor and over-crowded, may be forced from homes in low-lying countries such as Bangladesh. Evenprosperous nations such as the Netherlands, long accustomed to fighting back the sea,may lose land. Even in less critically affected regions a rising sea-level can do greatdamage. Beaches will erode, harming beach-front property. Storm surges along coast-lines may increase. A higher sea level means salty water can infiltrate fresh ground waterin coastal areas, making it undrinkable. Infiltration of ocean water can also destroycoastal ecosystems, and the species they support. Inland wetlands and ecosystems arealso at risk.
* Storms of increased severity are expected because trapped heat energy drives atmos-pheric air and oceanic water circulation. Such circulation has been a positive forcebecause it distributes heat energy more evenly around the world making Earth, onaverage, a more moderate place to live. Hurricanes and typhoons also feed on this warmthso, as the energy in air and water increases, storms may grow in intensity.
* There will be more extreme heat, heat waves, and heavy precipitation. Rainfall patternswould be altered with some areas getting more rainfall, and others suffering more
67 Ekwurzel, B. Findings of the IPCC Fourth Assessment Report: Climate Change Science. Union of ConcernedScientists Summary, July, 2007, http://www.ucsusa.org/global_warming/science/ipcc-highlights1.html.
68 The full range of possible temperature increases range between 1.4 and 5.8 °C (34.5 and 42.4°F). The reason forthis wide spread of temperatures depends on which GCM is used, and the information entered into it. In otherwords, there are still many unanswered questions as to how much temperature will rise.
69 The termmeridional overturning circulation (MOC) is also called thermohaline circulation. It refers to the oceancirculation driven by differences in water density due to heat content (thermo) and salt content (haline). TheMOC is an important means of bringing heat to polar regions. If it slows down this heat transfer would slowdown.
207 What does a greenhouse future hold?
droughts. How this works: on warmer days more water evaporates into the air leading tomore clouds and rainfall. But moisture can also evaporate from dry soils, depriving themof already limited moisture.
* Higher temperatures would worsen air quality – recall how photochemical smogincreases on hot summer days.
* Diseases now restricted to already warm regions may move into newly warming regions.An illustration is malaria, a major disease spread by mosquito vectors, which infects,sickens, and kills millions each year in warm climates. And, indigenous disease organ-isms previously killed by winter cold will be better able to survive milder winters.70
* Coral reefs have limited tolerance for warm waters. They compensate in the short run, butongoing warming kills them. Because coral reefs are a source of great biodiversity, thatdiversity will be damaged.
* Atmospheric CO2 will continue to acidify the ocean with negative impacts on shell-forming species and their ecosystems. The implications of a change in pH are only nowunfolding.
* Regions for growing crops and trees will change. However, increased CO2 and warmertemperatures may have positive effects in some locales. Agricultural crops may respondwith increased growth as the concentration of the nutrient CO2 increases. However,if other nutrients are limited, increased growth may not occur and plants could bestressed.
Taking action beyond Kyoto
Despite these forecasts, GHG emissions have increased in a number of countries. Includedamong these are countries, formerly in the Soviet Union, that experienced revived economicgrowth. And, US emissions are projected to be 26% above 1990 levels by 2012. Morepositively, it is predicted that because of their commitment to Kyoto, about 40 nations willcut GHG emissions 11% below 1990 levels. A strong belief has emerged that if humans areto limit the degree of damage done, they must reduce GHG emissions much more quicklythan is now the case and to start doing so quickly. The International Energy Agency (IEA)released a report in 2008 predicting that CO2 emissions could double in the next 40 yearsunless governments around the world seriously undertook a massive investment in a “globalenergy technology revolution” to curb GHG emissions. IEA urged that less-developedcountries, especially China and India plan to also meet emissions targets. Some say wealready have the technologies to make the major reductions necessary to stop irreversiblewarming.71
70 Diseases are already spreading for other reasons, especially due to massive increases in international trade andtravel. The West Nile virus in the US may be an example of these latter reasons.
71 Pacala, S. and Socolow, R. Stabilization wedges: solving the climate problem for the next 50 years with currenttechnologies. Science, 305(5686), August 13, 2004, 968–972, http://www.sciencemag.org/cgi/content/full/sci;305/5686/968.
208 Global climate change
Further reading
Begley, S. The truth about (global warming) denial. Newsweek, August 13, 2007, 20–29.and Murr, A. Which of these is not causing global warming? Newsweek. July 2, 2007,48–52.
Bohannon, J. Weighing the climate risks of an untapped fossil fuel (methane hydrates).Science, 319(5871), March 28, 2008, 1753.
Chatterjee, R. Carbon embodied in international trade. Environmental Science &Technology, 42(5), March 1, 2008, 1391–1392.
Cooney, C.M. Montreal Protocol beats Kyoto on climate controls. EnvironmentalScience & Technology, 41(10), May 10, 2007, 3395.
Engelhaupt, E. Models underestimate global warming impacts. Environmental Science &Technology, 41(13), July 1, 2007, 4488. (Models can underestimate warming.)
Hileman, B. and Johnson, J. Driving CO2 underground. Chemical & Engineering News,85(39), September 24, 2007, 74–81.
Delving deeper
Beyond Kyoto: first ponder what has happened recently. At the UN’s climate change confer-
ence in Bali (December 2007), 180 nations started negotiations for a second phase of
mandatory cuts in GHG emissions. As of early 2009 negotiators from around the world were
continuing efforts to come to a common agreement that would supersede the Kyoto proto-
col.73 The EU stated its plans to cut GHG emissions at least 20% below 1990 levels by 2020, and
US President Obama also desires significant emission cuts in the United States. Because the
United States never became part of the Kyoto Protocol, its active participation is especially
important. Among barriers to a new treaty as of early 2009 are somemajor US legislators who
won’t endorse a treaty unless China and other less-developed nations also limit emissions.
Japan may set ambitious goals, but only with assurances that the United States, China, and
other less-developed countries make meaningful commitments this time around. However,
less-developed countries fear their economic growth will be inhibited if they cut GHG emis-
sions. To participate, they would expect major help with clean “climate-friendly” technologies.
China says it would lower its energy intensity, but wants countries that import its products to
take responsibility for helping China cut its emissions proportionate to the level of products
they import. Brazil, with its immensely important Amazon rain forests, has stated awillingness
to much reduce deforestation rates.
▪ Clearly, many barriers must be overcome if a post-Kyoto agreement is to be reached. Your
assignment: as of the time you are reading this chapter, find out the current state of a post-
Kyoto agreement. How likely is humanity to be successful in making meaningful cuts in GHG
emissions? Explain why you have come to your conclusion.
73 Hogue, C. A climate of change.Chemical & Engineering News, 87(14), April 6, 2009, http://pubs.acs.org/cen/government/87/8714gov2.html.
209 Further reading
Hogue, C. Reining in brown clouds (cutting black carbon emissions). Chemical &Engineering News, 87, August 24, 2009 87, 26–27.
Jackson, R. B. Trading water for carbon with biological carbon sequestration. Science,310(5756), December 23, 2005, 1944–1947.
Kintisch, E. Projections of climate change go from bad to worse. Science, 323(5921), March2009, 1546–1547.
Kolbert, E. Field Notes from a Catastrophe: Man, Nature, and Climate Change. London:Bloomsbury Publishing, 2006.
Laird, D. The charcoal vision: simultaneously producing bioenergy, permanently sequester-ing carbon, while improving soil and water quality. Agronomy Journal, 100(1), 2008,http://terrapreta.bioenergylists.org/lairdcharcoalvision0408.
Pacala, S. and Socolow, R. Stabilization wedges: solving the climate problem for the next50 years with current technologies. Science, 305(5686), August 13, 2004, 968–972.
Parks, N. Is regulation on ocean acidification on the horizon? Environmental Science &Technology, 43, June 24, 2009, 6118–6119.
Petkewich, R. Off-balance ocean; acidification from absorbing atmospheric CO2 is chang-ing the ocean’s chemistry. Chemical & Engineering News, 87(8) February 23, 2009.Web Exclusive, http://pubs.acs.org/cen/science/87/8708sci2.html.
Ritter, S. K. What can we do with carbon dioxide? (Converting CO2 into fuels and othervalue-added products.) Chemical & Engineering News, 85(18), April 30, 2007, 11–17.
Ruttimann, J. Sick seas, rising level of CO2 making world’s oceans more acidic. Nature,442(31), August, 2006, 978–980, http://perso.crans.org/pruvost/442978a.pdf.
Scafetta, N. andWest, B. Solar cycles impactwarming. (Does increased solar irradiance enhanceglobal warming?) Environmental Science & Technology, 40(1), January 1, 2006, 5.
Service, R. F. Study fingers soot as a major player in global warming. Science, 319(5871),March 28, 2008, 1745.
Thacker, P. D. The many travails of Ben Santer (as target for global warming skeptics).Environmental Science & Technology, 40(19), October 1, 2006, 5834–5837.
Wuebbles, D. J. Atmosphere: nitrous oxide: no laughing matter (impact in global warmingand in stratospheric ozone depletion). Science, 326, October 2, 2009, 56–57.
Zeebel, R. E., Zachos, J. C., Caldeira, K., and Tyrrell, T. Oceans: carbon emissions andocean acidification. Science, 321(5885), July 4, 2008, 51–52.
Internet resources
BBC Weather Centre. Climate Change (evidence, impacts, adaptation, policies, links andchat). http://bbc.co.uk/climate.
Environmental Defense Fund. Get tips to fight global warming. http://www.fight globalwarming.com/.
Grist Magazine. 2009. How to talk to a climate skeptic. http://gristmill.grist.org/skeptics.ScienceDaily. 2007. Increase in atmospheric moisture tied to human activities. http://www.
sciencedaily.com/releases/2007/09/070918090803.htm (September 19, 2007).
210 Global climate change
Intergovernmental Panel on Climate Change. http://www.IPCC.ch/.2007. Ekwurzel, B. Findings of the IPCC Fourth Assessment Report: Climate change
science, a summary. Union of Concerned Scientists. http://www.ucsusa.org/global_warming/science/ipcc-highlights1.html (July, 2007).
2007. Reports (1) The Physical Science Basis (2) Impacts, Adaptation and Vulnerability(3) Mitigation of Climate Change (4) AR4 Synthesis Report. http://www.ipcc.ch/.
Markey, S. Thawing permafrost could supercharge warming. National Geographic News.http://news.nationalgeographic.com/news/2006/06/060615-global-warming.html(June 15, 2006).
McKinsey & Company. Reducing US greenhouse gas emissions, how much at what cost?http://www.mckinsey.com/clientservice/ccsi/greenhousegas.asp.
2009. A must-read: U.S. can meet entire 2020 emissions target with efficiency andcogeneration while lowering the nation’s energy bill $700 billion! Climate Progress,http://climateprogress.org/2009/07/29/mckinsey-energy-efficiency-report/ (July 29,2009).
Pew Center on Global Climate Change. EU Emissions Trading System in perspective,valuable lessons for policymakers on cap and trade. www.pewclimate.org.
Pidwirny, M. Fundamentals of Physical Geography (Second edition). (1999–2008). http://www.physicalgeography.net/fundamentals/contents.html.
Pidwirny, M. Atmospheric composition. The Encyclopedia of Earth. http://www.eoearth.org/article/Atmospheric_ composition (November 29, 2007).
Real Climate, Climate Science from Climate Scientists. (Summarizes new scientific infor-mation as it becomes available) http://www.realclimate.org.
Reuters. 2007. Kilimanjaro’s shrinking snow not a sign of warming. http://www.reuters.com/article/scienceNews/idUSN1225401620070612) (June 12, 2007).
UN FAO. 2006. Steinfeld, H. et al. Livestock’s long shadow, environmental issues andoptions. http://www.virtualcentre.org/en/library/key_pub/longshad/A0701E00.htm.
US Carbon Dioxide Information Analysis Center (CDIAC) representing the US Departmentof Energy (DOE) and including the World Data Center for Atmospheric Trace Gases.http://cdiac.esd.ornl.gov/home.html.
2004. Jouzel, J. A 740 000-year deuterium record in an ice core fromDome C. Antarctica.http://cdiac.ornl.gov/trends/temp/domec/domec.html (June 26, 2004).
2009. Frequently asked global change questions. http://cdiac.ornl.gov/faq.html#Q22.US DOE. 2007. EIA. What are greenhouse gases and what is the energy connection? http://
www.eia.doe.gov/bookshelf/brochures/greenhouse/greenhouse.pdf.2007. Increase in atmospheric moisture tied to human activities. https://www-pls.llnl.gov/
?url=science_and_technology-earth_sciences-moisture (September 18, 2007).US EPA. 2009. Atmospheric concentrations of greenhouse gases, the trends. http://cfpub.
epa.gov/eroe/index.cfm?fuseaction=detail.viewInd&ch=46%20&subtop=342&lv=list.listByChapter&r=188193 (June 24, 2009).
Climate Change (with links to EPA sites on many aspects of climate change). http://www.epa.gov/climatechange/index.html (2008).
Climate Science. http://www.epa.gov/climatechange/science/index.html.
211 Internet resources
Global Warming Resource Center (This site has slides to be used in presentations onclimate science, greenhouse gas emissions and climate impacts). http://yosemite.epa.gov/OAR/globalwarming.nsf/content/ResourceCenterPresentations.html.
Methane sources. http://www.epa.gov/methane/sources.html.Nitrous oxide website http://www.epa.gov/nitrousoxide/sources.html.Non-CO2 Greenhouse Gas Emissions from Developed Countries: 1990–2010. http://www.epa.gov/methane/pdfs/fulldocumentofdeveloped.pdf.
World Resources Center. Climate Analysis Indicators Tool (CAIT provides a comprehen-sive and comparable database of greenhouse gas emissions data including all majorsources and sinks) and other climate-relevant indicators. http://cait.wri.org/.
Worldwatch. 2009. Climate Change Reference Guide. The one-stop resource of essentialfacts on Climate Change (E-book free download). http://www.worldwatch.org/node/6058?emc=el&m=277083&l=9&v=180132f227.
212 Global climate change
8 Stratospheric ozone depletion
“If all the ozone in the atmosphere were compressed to a pressure correspond-ing to that at the Earth’s surface, the layer would be only 3mm [1/8 inch]thick . . . The thin ozone lafyer has proved to be an Achilles heel that may beseriously injured by apparently moderate changes in the composition of theatmosphere.”
Swedish Academy of Sciences, announcing the1995 Nobel Prize in chemistry to Mario Molina,
F. Sherwood Rowland, and Paul Crutzen
You are aware of the major pollution problems resulting from combustion, especially offossil fuels. In this chapter we see a global issue – destruction of stratospheric ozone –whichresults from CFCs and halons, synthetic chemicals. Depletion of stratospheric ozone led tothe 1987 Montreal Protocol, the first worldwide agreement to protect the environment.1 Theban on ozone-depleting chemicals is largely working, and the ozone layer is expected torecover, albeit slowly. Before starting Chapter 8, see Table 8.1 An ozone-depletion snap-shot.2 ▪ Section I looks at the atmosphere, and reactions in the stratosphere including CFCdestruction, and ozone creation and destruction. It examines ultraviolet (UV) radiation, andasks if all ozone-depleting pollutants are equally potent. And does ozone depletion result inmeasurable increases in UV radiation reaching Earth? After a brief history of ozonedepletion, Section II asks: what are the pollutants of concern, how do they destroy ozone,and what is their environmental fate? Over what sections of Earth does ozone depletionoccur? Why is the Antarctic particularly susceptible? What other factors impact ozonedepletion? Section III asks: why are we concerned if more UV radiation reaches theEarth? What is the harm to Earth’s life? Section IV examines the Montreal Protocol: whathas the world been doing to eliminate ozone-depleting chemicals? It looks at assisting less-developed countries and, briefly at CFCs and halons smuggling. Section V takes us to CFCsubstitutes, why they were not ideal and why we are now moving toward alternatives to theinitial substitutes. It briefly looks at the future.
1 Scientific assessment of ozone depletion (executive summary). Scientific Assessment Panel of the MontrealProtocol on Substances that Deplete the Ozone Layer. US EPA, July 31, 2002, http://www.epa.gov/ozone/strathome.html.
2 Stratospheric ozone home site. National Oceanic and Atmospheric Administration (NOAA), 2008, http://www.ozonelayer.noaa.gov/index.htm.
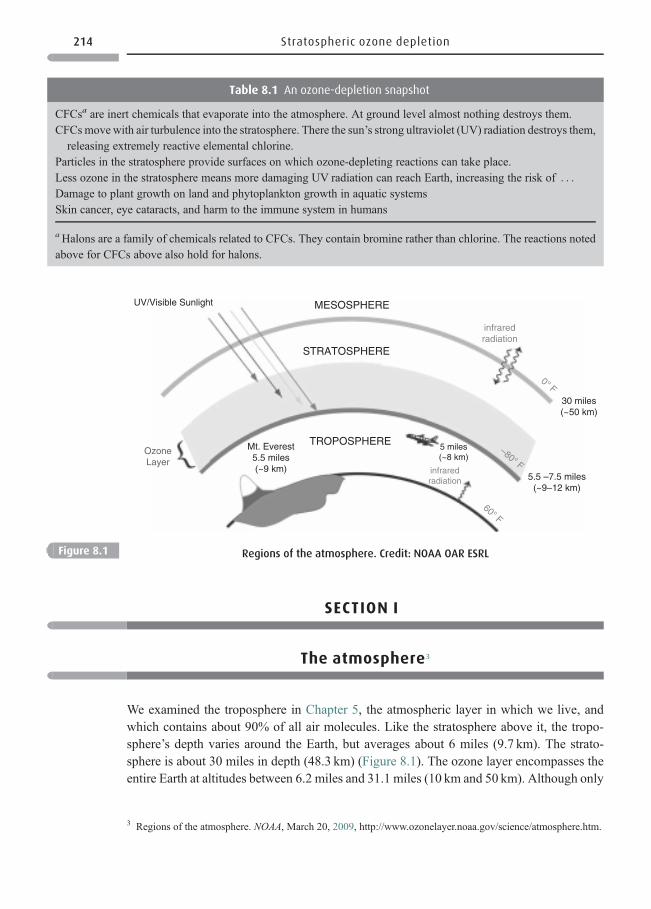
SECTION I
The atmosphere3
We examined the troposphere in Chapter 5, the atmospheric layer in which we live, andwhich contains about 90% of all air molecules. Like the stratosphere above it, the tropo-sphere’s depth varies around the Earth, but averages about 6 miles (9.7 km). The strato-sphere is about 30 miles in depth (48.3 km) (Figure 8.1). The ozone layer encompasses theentire Earth at altitudes between 6.2 miles and 31.1 miles (10 km and 50 km). Although only
Table 8.1 An ozone-depletion snapshot
CFCsa are inert chemicals that evaporate into the atmosphere. At ground level almost nothing destroys them.CFCsmove with air turbulence into the stratosphere. There the sun’s strong ultraviolet (UV) radiation destroys them,releasing extremely reactive elemental chlorine.
Particles in the stratosphere provide surfaces on which ozone-depleting reactions can take place.Less ozone in the stratosphere means more damaging UV radiation can reach Earth, increasing the risk of . . .
Damage to plant growth on land and phytoplankton growth in aquatic systemsSkin cancer, eye cataracts, and harm to the immune system in humans
aHalons are a family of chemicals related to CFCs. They contain bromine rather than chlorine. The reactions notedabove for CFCs above also hold for halons.
UV/Visible Sunlight MESOSPHERE
STRATOSPHERE
TROPOSPHEREOzoneLayer
Mt. Everest5.5 miles(~9 km)
5 miles(~8 km)
infraredradiation 5.5 –7.5 miles
(~9–12 km)
30 miles(~50 km)
0° F
–80° F
60° F
infraredradiation
Figure 8.1 Regions of the atmosphere. Credit: NOAA OAR ESRL
3 Regions of the atmosphere. NOAA, March 20, 2009, http://www.ozonelayer.noaa.gov/science/atmosphere.htm.
214 Stratospheric ozone depletion
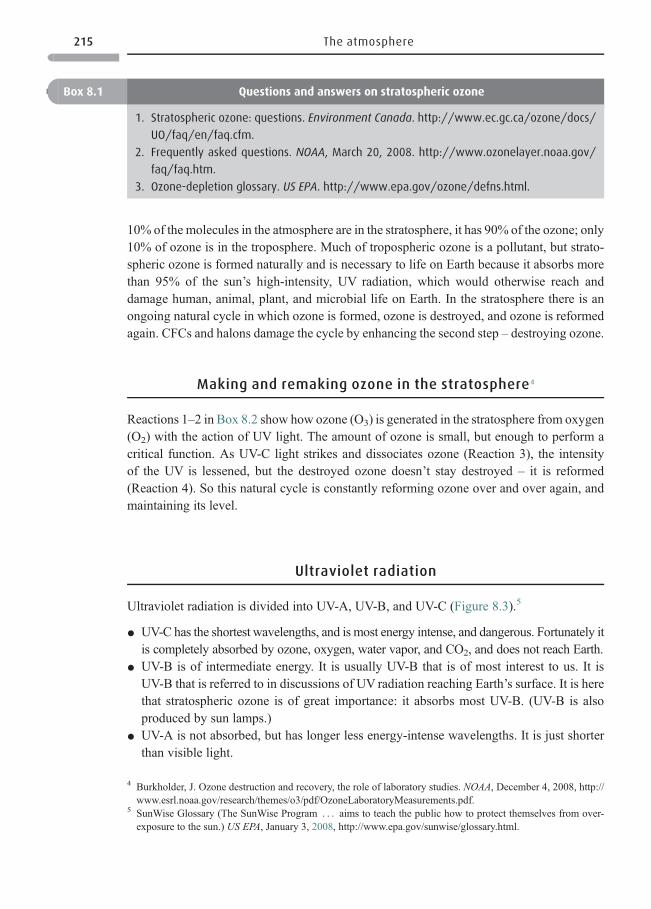
10% of the molecules in the atmosphere are in the stratosphere, it has 90% of the ozone; only10% of ozone is in the troposphere. Much of tropospheric ozone is a pollutant, but strato-spheric ozone is formed naturally and is necessary to life on Earth because it absorbs morethan 95% of the sun’s high-intensity, UV radiation, which would otherwise reach anddamage human, animal, plant, and microbial life on Earth. In the stratosphere there is anongoing natural cycle in which ozone is formed, ozone is destroyed, and ozone is reformedagain. CFCs and halons damage the cycle by enhancing the second step – destroying ozone.
Making and remaking ozone in the stratosphere4
Reactions 1–2 in Box 8.2 show how ozone (O3) is generated in the stratosphere from oxygen(O2) with the action of UV light. The amount of ozone is small, but enough to perform acritical function. As UV-C light strikes and dissociates ozone (Reaction 3), the intensityof the UV is lessened, but the destroyed ozone doesn’t stay destroyed – it is reformed(Reaction 4). So this natural cycle is constantly reforming ozone over and over again, andmaintaining its level.
Ultraviolet radiation
Ultraviolet radiation is divided into UV-A, UV-B, and UV-C (Figure 8.3).5
* UV-C has the shortest wavelengths, and is most energy intense, and dangerous. Fortunately itis completely absorbed by ozone, oxygen, water vapor, and CO2, and does not reach Earth.
* UV-B is of intermediate energy. It is usually UV-B that is of most interest to us. It isUV-B that is referred to in discussions of UV radiation reaching Earth’s surface. It is herethat stratospheric ozone is of great importance: it absorbs most UV-B. (UV-B is alsoproduced by sun lamps.)
* UV-A is not absorbed, but has longer less energy-intense wavelengths. It is just shorterthan visible light.
Box 8.1 Questions and answers on stratospheric ozone
1. Stratospheric ozone: questions. Environment Canada. http://www.ec.gc.ca/ozone/docs/
UO/faq/en/faq.cfm.
2. Frequently asked questions. NOAA, March 20, 2008. http://www.ozonelayer.noaa.gov/
faq/faq.htm.
3. Ozone-depletion glossary. US EPA. http://www.epa.gov/ozone/defns.html.
4 Burkholder, J. Ozone destruction and recovery, the role of laboratory studies. NOAA, December 4, 2008, http://www.esrl.noaa.gov/research/themes/o3/pdf/OzoneLaboratoryMeasurements.pdf.
5 SunWise Glossary (The SunWise Program . . . aims to teach the public how to protect themselves from over-exposure to the sun.) US EPA, January 3, 2008, http://www.epa.gov/sunwise/glossary.html.
215 The atmosphere
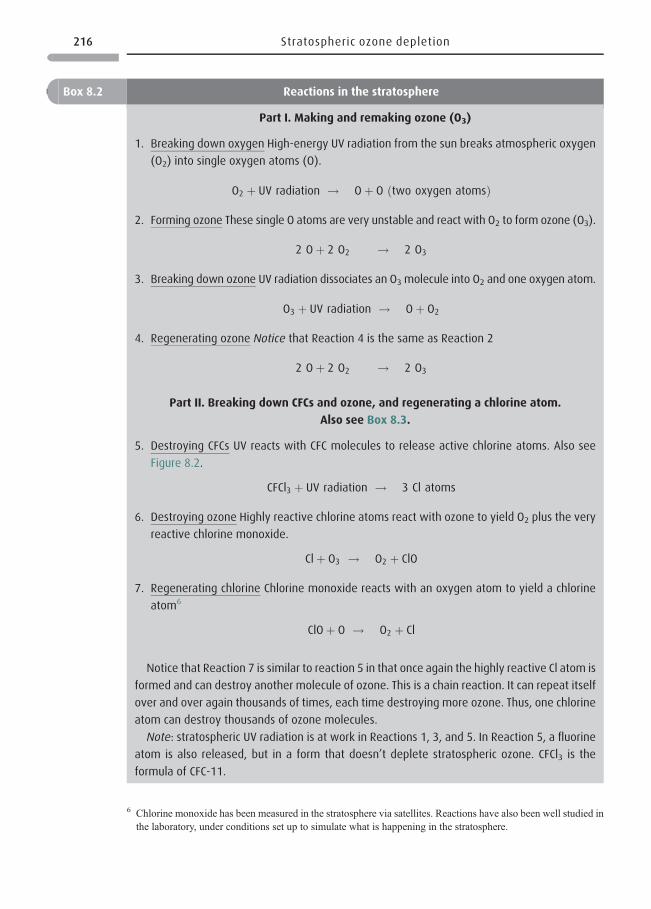
Box 8.2 Reactions in the stratosphere
Part I. Making and remaking ozone (O3)
1. Breaking down oxygen High-energy UV radiation from the sun breaks atmospheric oxygen
(O2) into single oxygen atoms (O).
O2 þ UV radiation ! Oþ O ðtwo oxygen atomsÞ
2. Forming ozone These single O atoms are very unstable and react with O2 to form ozone (O3).
2 Oþ 2 O2 ! 2 O3
3. Breaking down ozone UV radiation dissociates an O3 molecule into O2 and one oxygen atom.
O3 þ UV radiation ! Oþ O2
4. Regenerating ozone Notice that Reaction 4 is the same as Reaction 2
2 Oþ 2 O2 ! 2 O3
Part II. Breaking down CFCs and ozone, and regenerating a chlorine atom.
Also see Box 8.3.
5. Destroying CFCs UV reacts with CFC molecules to release active chlorine atoms. Also see
Figure 8.2.
CFCl3 þ UV radiation ! 3 Cl atoms
6. Destroying ozone Highly reactive chlorine atoms react with ozone to yield O2 plus the very
reactive chlorine monoxide.
Clþ O3 ! O2 þ ClO
7. Regenerating chlorine Chlorine monoxide reacts with an oxygen atom to yield a chlorine
atom6
ClOþ O ! O2 þ Cl
Notice that Reaction 7 is similar to reaction 5 in that once again the highly reactive Cl atom is
formed and can destroy another molecule of ozone. This is a chain reaction. It can repeat itself
over and over again thousands of times, each time destroying more ozone. Thus, one chlorine
atom can destroy thousands of ozone molecules.
Note: stratospheric UV radiation is at work in Reactions 1, 3, and 5. In Reaction 5, a fluorine
atom is also released, but in a form that doesn’t deplete stratospheric ozone. CFCl3 is the
formula of CFC-11.
6 Chlorine monoxide has been measured in the stratosphere via satellites. Reactions have also been well studied inthe laboratory, under conditions set up to simulate what is happening in the stratosphere.
216 Stratospheric ozone depletion
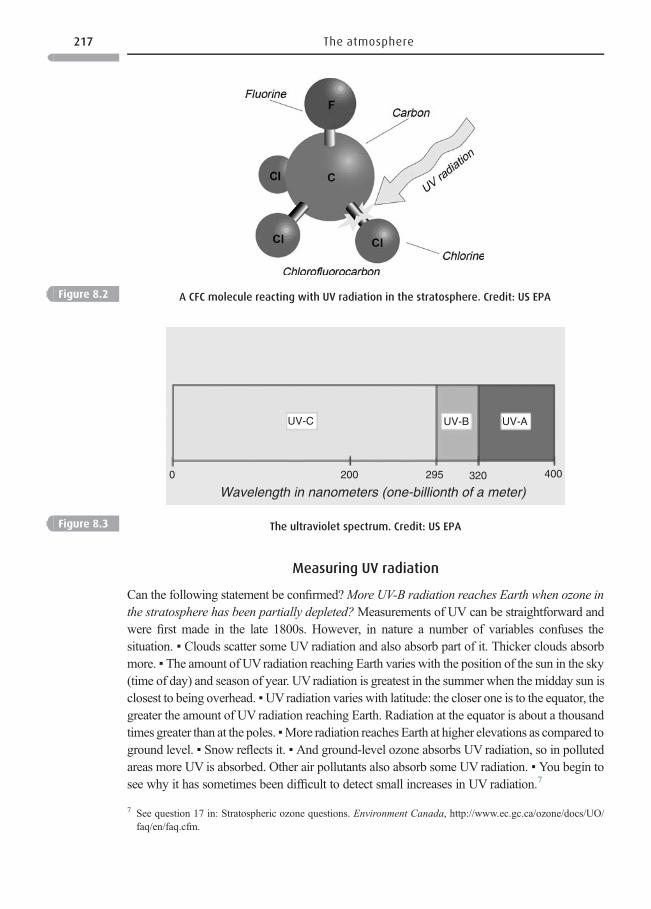
Measuring UV radiation
Can the following statement be confirmed?More UV-B radiation reaches Earth when ozone inthe stratosphere has been partially depleted?Measurements of UV can be straightforward andwere first made in the late 1800s. However, in nature a number of variables confuses thesituation. ▪ Clouds scatter some UV radiation and also absorb part of it. Thicker clouds absorbmore. ▪ The amount of UVradiation reaching Earth varies with the position of the sun in the sky(time of day) and season of year. UV radiation is greatest in the summer when the midday sun isclosest to being overhead. ▪UVradiation varies with latitude: the closer one is to the equator, thegreater the amount of UV radiation reaching Earth. Radiation at the equator is about a thousandtimes greater than at the poles. ▪More radiation reaches Earth at higher elevations as compared toground level. ▪ Snow reflects it. ▪ And ground-level ozone absorbs UV radiation, so in pollutedareas more UV is absorbed. Other air pollutants also absorb some UV radiation. ▪ You begin tosee why it has sometimes been difficult to detect small increases in UV radiation.7
UV-C UV-B UV-A
Wavelength in nanometers (one-billionth of a meter)0 200 295 320 400
Figure 8.3 The ultraviolet spectrum. Credit: US EPA
Figure 8.2 A CFC molecule reacting with UV radiation in the stratosphere. Credit: US EPA
7 See question 17 in: Stratospheric ozone questions. Environment Canada, http://www.ec.gc.ca/ozone/docs/UO/faq/en/faq.cfm.
217 The atmosphere
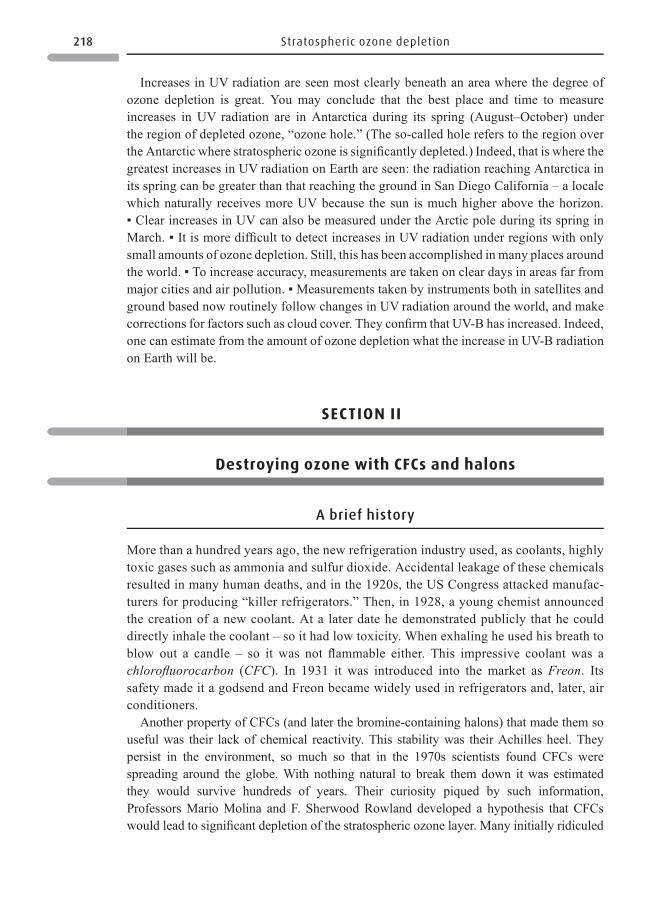
Increases in UV radiation are seen most clearly beneath an area where the degree ofozone depletion is great. You may conclude that the best place and time to measureincreases in UV radiation are in Antarctica during its spring (August–October) underthe region of depleted ozone, “ozone hole.” (The so-called hole refers to the region overthe Antarctic where stratospheric ozone is significantly depleted.) Indeed, that is where thegreatest increases in UV radiation on Earth are seen: the radiation reaching Antarctica inits spring can be greater than that reaching the ground in San Diego California – a localewhich naturally receives more UV because the sun is much higher above the horizon.▪ Clear increases in UV can also be measured under the Arctic pole during its spring inMarch. ▪ It is more difficult to detect increases in UV radiation under regions with onlysmall amounts of ozone depletion. Still, this has been accomplished in many places aroundthe world. ▪ To increase accuracy, measurements are taken on clear days in areas far frommajor cities and air pollution. ▪ Measurements taken by instruments both in satellites andground based now routinely follow changes in UV radiation around the world, and makecorrections for factors such as cloud cover. They confirm that UV-B has increased. Indeed,one can estimate from the amount of ozone depletion what the increase in UV-B radiationon Earth will be.
SECTION II
Destroying ozone with CFCs and halons
A brief history
More than a hundred years ago, the new refrigeration industry used, as coolants, highlytoxic gases such as ammonia and sulfur dioxide. Accidental leakage of these chemicalsresulted in many human deaths, and in the 1920s, the US Congress attacked manufac-turers for producing “killer refrigerators.” Then, in 1928, a young chemist announcedthe creation of a new coolant. At a later date he demonstrated publicly that he coulddirectly inhale the coolant – so it had low toxicity. When exhaling he used his breath toblow out a candle – so it was not flammable either. This impressive coolant was achlorofluorocarbon (CFC). In 1931 it was introduced into the market as Freon. Itssafety made it a godsend and Freon became widely used in refrigerators and, later, airconditioners.
Another property of CFCs (and later the bromine-containing halons) that made them souseful was their lack of chemical reactivity. This stability was their Achilles heel. Theypersist in the environment, so much so that in the 1970s scientists found CFCs werespreading around the globe. With nothing natural to break them down it was estimatedthey would survive hundreds of years. Their curiosity piqued by such information,Professors Mario Molina and F. Sherwood Rowland developed a hypothesis that CFCswould lead to significant depletion of the stratospheric ozone layer. Many initially ridiculed
218 Stratospheric ozone depletion
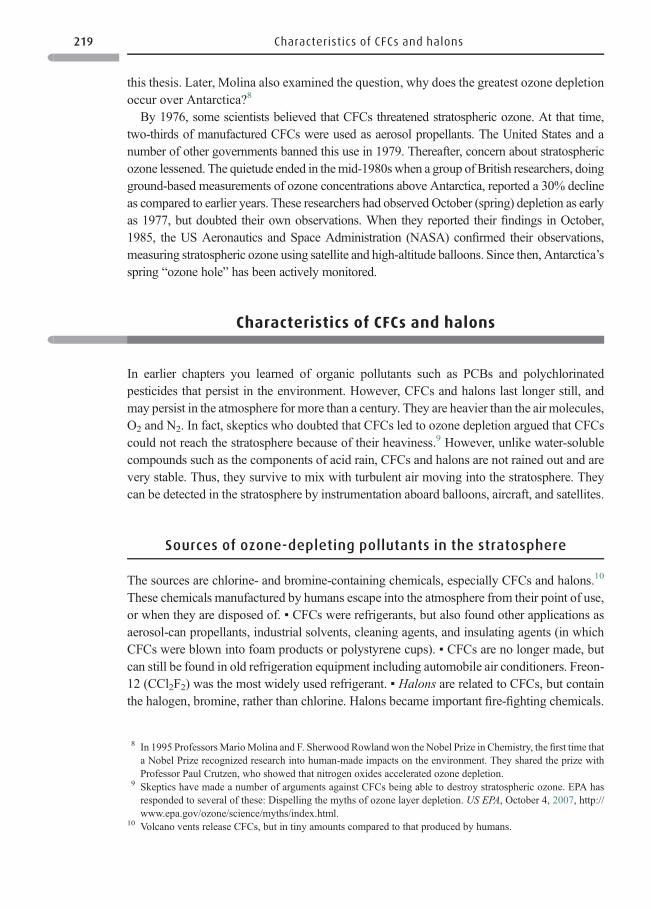
this thesis. Later, Molina also examined the question, why does the greatest ozone depletionoccur over Antarctica?8
By 1976, some scientists believed that CFCs threatened stratospheric ozone. At that time,two-thirds of manufactured CFCs were used as aerosol propellants. The United States and anumber of other governments banned this use in 1979. Thereafter, concern about stratosphericozone lessened. The quietude ended in themid-1980swhen a group of British researchers, doingground-based measurements of ozone concentrations above Antarctica, reported a 30% declineas compared to earlier years. These researchers had observed October (spring) depletion as earlyas 1977, but doubted their own observations. When they reported their findings in October,1985, the US Aeronautics and Space Administration (NASA) confirmed their observations,measuring stratospheric ozone using satellite and high-altitude balloons. Since then, Antarctica’sspring “ozone hole” has been actively monitored.
Characteristics of CFCs and halons
In earlier chapters you learned of organic pollutants such as PCBs and polychlorinatedpesticides that persist in the environment. However, CFCs and halons last longer still, andmay persist in the atmosphere for more than a century. They are heavier than the air molecules,O2 and N2. In fact, skeptics who doubted that CFCs led to ozone depletion argued that CFCscould not reach the stratosphere because of their heaviness.9 However, unlike water-solublecompounds such as the components of acid rain, CFCs and halons are not rained out and arevery stable. Thus, they survive to mix with turbulent air moving into the stratosphere. Theycan be detected in the stratosphere by instrumentation aboard balloons, aircraft, and satellites.
Sources of ozone-depleting pollutants in the stratosphere
The sources are chlorine- and bromine-containing chemicals, especially CFCs and halons.10
These chemicals manufactured by humans escape into the atmosphere from their point of use,or when they are disposed of. ▪ CFCs were refrigerants, but also found other applications asaerosol-can propellants, industrial solvents, cleaning agents, and insulating agents (in whichCFCs were blown into foam products or polystyrene cups). ▪ CFCs are no longer made, butcan still be found in old refrigeration equipment including automobile air conditioners. Freon-12 (CCl2F2) was the most widely used refrigerant. ▪ Halons are related to CFCs, but containthe halogen, bromine, rather than chlorine. Halons became important fire-fighting chemicals.
8 In 1995 ProfessorsMarioMolina and F. Sherwood Rowlandwon the Nobel Prize in Chemistry, the first time thata Nobel Prize recognized research into human-made impacts on the environment. They shared the prize withProfessor Paul Crutzen, who showed that nitrogen oxides accelerated ozone depletion.
9 Skeptics have made a number of arguments against CFCs being able to destroy stratospheric ozone. EPA hasresponded to several of these: Dispelling the myths of ozone layer depletion. US EPA, October 4, 2007, http://www.epa.gov/ozone/science/myths/index.html.
10 Volcano vents release CFCs, but in tiny amounts compared to that produced by humans.
219 Characteristics of CFCs and halons
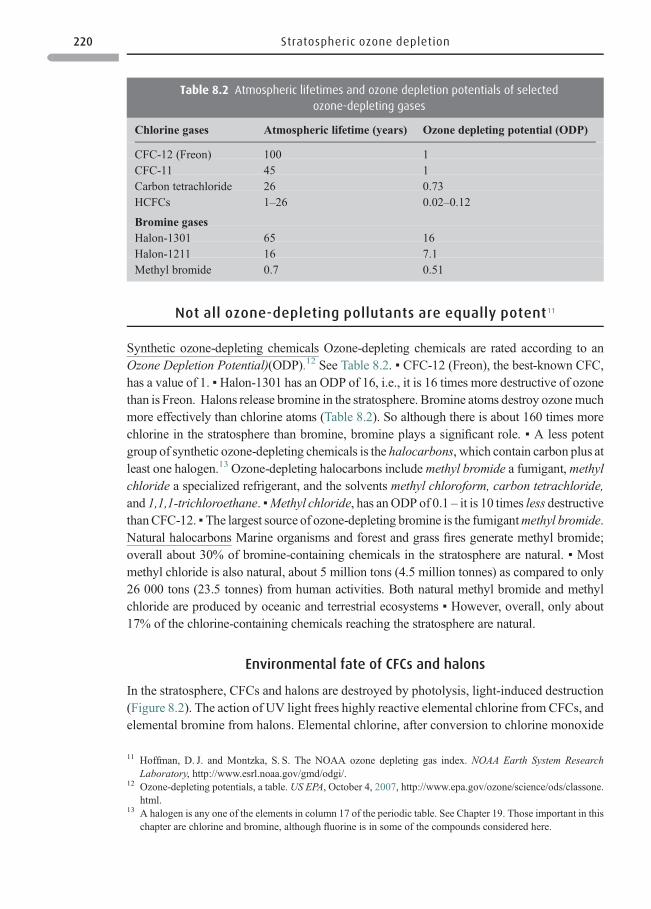
Not all ozone-depleting pollutants are equally potent11
Synthetic ozone-depleting chemicals Ozone-depleting chemicals are rated according to anOzone Depletion Potential)(ODP).12 See Table 8.2. ▪ CFC-12 (Freon), the best-known CFC,has a value of 1. ▪Halon-1301 has an ODP of 16, i.e., it is 16 times more destructive of ozonethan is Freon. Halons release bromine in the stratosphere. Bromine atoms destroy ozonemuchmore effectively than chlorine atoms (Table 8.2). So although there is about 160 times morechlorine in the stratosphere than bromine, bromine plays a significant role. ▪ A less potentgroup of synthetic ozone-depleting chemicals is the halocarbons, which contain carbon plus atleast one halogen.13 Ozone-depleting halocarbons includemethyl bromide a fumigant,methylchloride a specialized refrigerant, and the solvents methyl chloroform, carbon tetrachloride,and 1,1,1-trichloroethane. ▪Methyl chloride, has anODP of 0.1 – it is 10 times less destructivethanCFC-12. ▪The largest source of ozone-depleting bromine is the fumigantmethyl bromide.Natural halocarbons Marine organisms and forest and grass fires generate methyl bromide;overall about 30% of bromine-containing chemicals in the stratosphere are natural. ▪ Mostmethyl chloride is also natural, about 5 million tons (4.5 million tonnes) as compared to only26 000 tons (23.5 tonnes) from human activities. Both natural methyl bromide and methylchloride are produced by oceanic and terrestrial ecosystems ▪ However, overall, only about17% of the chlorine-containing chemicals reaching the stratosphere are natural.
Environmental fate of CFCs and halons
In the stratosphere, CFCs and halons are destroyed by photolysis, light-induced destruction(Figure 8.2). The action of UV light frees highly reactive elemental chlorine from CFCs, andelemental bromine from halons. Elemental chlorine, after conversion to chlorine monoxide
Table 8.2 Atmospheric lifetimes and ozone depletion potentials of selected
ozone-depleting gases
Chlorine gases Atmospheric lifetime (years) Ozone depleting potential (ODP)
CFC-12 (Freon) 100 1CFC-11 45 1Carbon tetrachloride 26 0.73HCFCs 1–26 0.02–0.12
Bromine gasesHalon-1301 65 16Halon-1211 16 7.1Methyl bromide 0.7 0.51
11 Hoffman, D. J. and Montzka, S. S. The NOAA ozone depleting gas index. NOAA Earth System ResearchLaboratory, http://www.esrl.noaa.gov/gmd/odgi/.
12 Ozone-depleting potentials, a table. US EPA, October 4, 2007, http://www.epa.gov/ozone/science/ods/classone.html.
13 A halogen is any one of the elements in column 17 of the periodic table. See Chapter 19. Those important in thischapter are chlorine and bromine, although fluorine is in some of the compounds considered here.
220 Stratospheric ozone depletion
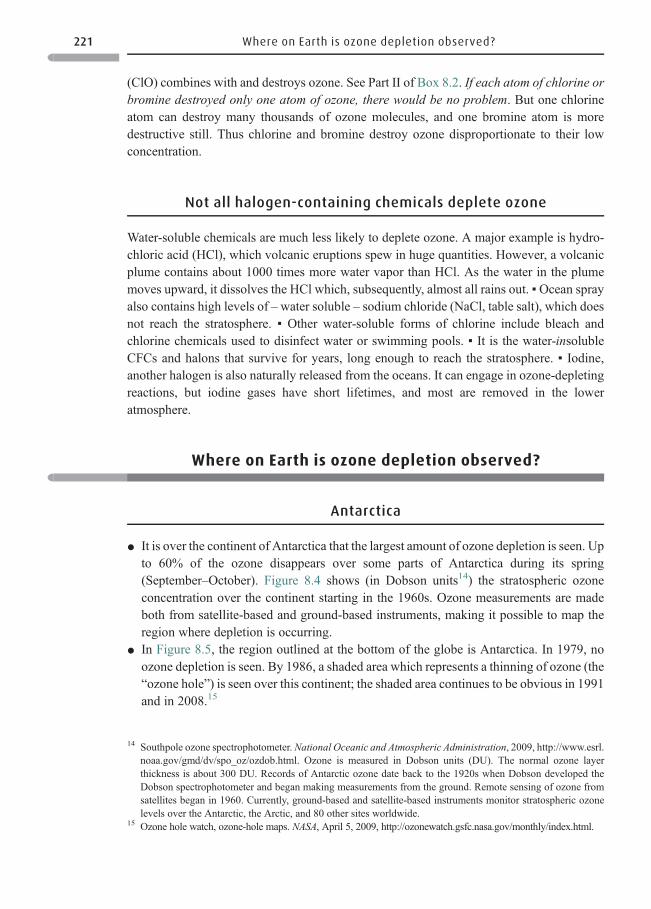
(ClO) combines with and destroys ozone. See Part II of Box 8.2. If each atom of chlorine orbromine destroyed only one atom of ozone, there would be no problem. But one chlorineatom can destroy many thousands of ozone molecules, and one bromine atom is moredestructive still. Thus chlorine and bromine destroy ozone disproportionate to their lowconcentration.
Not all halogen-containing chemicals deplete ozone
Water-soluble chemicals are much less likely to deplete ozone. A major example is hydro-chloric acid (HCl), which volcanic eruptions spew in huge quantities. However, a volcanicplume contains about 1000 times more water vapor than HCl. As the water in the plumemoves upward, it dissolves the HCl which, subsequently, almost all rains out. ▪Ocean sprayalso contains high levels of –water soluble – sodium chloride (NaCl, table salt), which doesnot reach the stratosphere. ▪ Other water-soluble forms of chlorine include bleach andchlorine chemicals used to disinfect water or swimming pools. ▪ It is the water-insolubleCFCs and halons that survive for years, long enough to reach the stratosphere. ▪ Iodine,another halogen is also naturally released from the oceans. It can engage in ozone-depletingreactions, but iodine gases have short lifetimes, and most are removed in the loweratmosphere.
Where on Earth is ozone depletion observed?
Antarctica
* It is over the continent of Antarctica that the largest amount of ozone depletion is seen. Upto 60% of the ozone disappears over some parts of Antarctica during its spring(September–October). Figure 8.4 shows (in Dobson units14) the stratospheric ozoneconcentration over the continent starting in the 1960s. Ozone measurements are madeboth from satellite-based and ground-based instruments, making it possible to map theregion where depletion is occurring.
* In Figure 8.5, the region outlined at the bottom of the globe is Antarctica. In 1979, noozone depletion is seen. By 1986, a shaded area which represents a thinning of ozone (the“ozone hole”) is seen over this continent; the shaded area continues to be obvious in 1991and in 2008.15
14 Southpole ozone spectrophotometer.National Oceanic and Atmospheric Administration, 2009, http://www.esrl.noaa.gov/gmd/dv/spo_oz/ozdob.html. Ozone is measured in Dobson units (DU). The normal ozone layerthickness is about 300 DU. Records of Antarctic ozone date back to the 1920s when Dobson developed theDobson spectrophotometer and began making measurements from the ground. Remote sensing of ozone fromsatellites began in 1960. Currently, ground-based and satellite-based instruments monitor stratospheric ozonelevels over the Antarctic, the Arctic, and 80 other sites worldwide.
15 Ozone hole watch, ozone-hole maps. NASA, April 5, 2009, http://ozonewatch.gsfc.nasa.gov/monthly/index.html.
221 Where on Earth is ozone depletion observed?
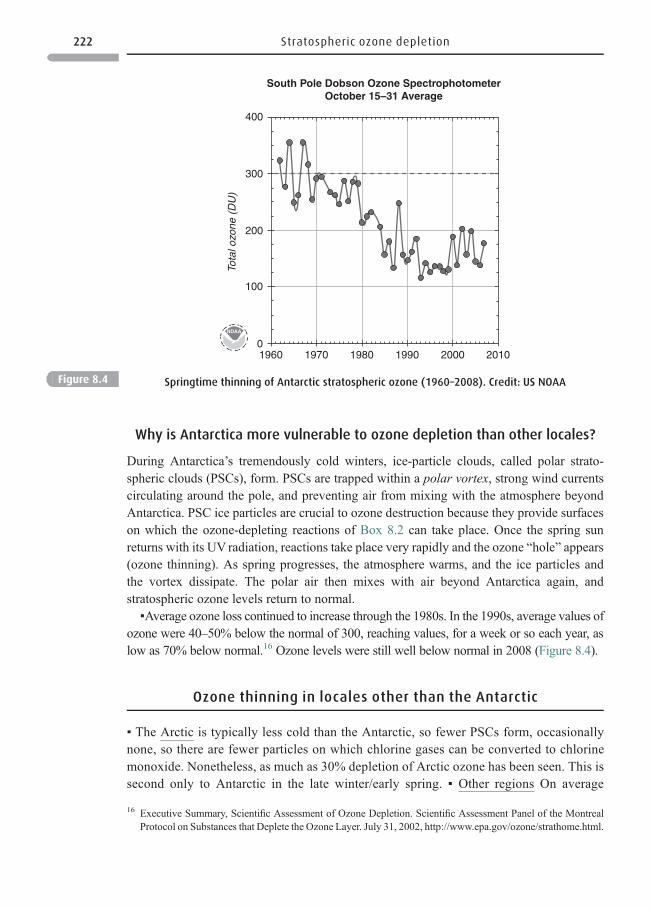
Why is Antarctica more vulnerable to ozone depletion than other locales?
During Antarctica’s tremendously cold winters, ice-particle clouds, called polar strato-spheric clouds (PSCs), form. PSCs are trapped within a polar vortex, strong wind currentscirculating around the pole, and preventing air from mixing with the atmosphere beyondAntarctica. PSC ice particles are crucial to ozone destruction because they provide surfaceson which the ozone-depleting reactions of Box 8.2 can take place. Once the spring sunreturns with its UV radiation, reactions take place very rapidly and the ozone “hole” appears(ozone thinning). As spring progresses, the atmosphere warms, and the ice particles andthe vortex dissipate. The polar air then mixes with air beyond Antarctica again, andstratospheric ozone levels return to normal.
▪Average ozone loss continued to increase through the 1980s. In the 1990s, average values ofozone were 40–50% below the normal of 300, reaching values, for a week or so each year, aslow as 70% below normal.16 Ozone levels were still well below normal in 2008 (Figure 8.4).
Ozone thinning in locales other than the Antarctic
▪ The Arctic is typically less cold than the Antarctic, so fewer PSCs form, occasionallynone, so there are fewer particles on which chlorine gases can be converted to chlorinemonoxide. Nonetheless, as much as 30% depletion of Arctic ozone has been seen. This issecond only to Antarctic in the late winter/early spring. ▪ Other regions On average
19600
100
Tota
l ozo
ne (
DU
)200
300
400
South Pole Dobson Ozone SpectrophotometerOctober 15–31 Average
1970 1980 1990 2000 2010
NDAA
Figure 8.4 Springtime thinning of Antarctic stratospheric ozone (1960–2008). Credit: US NOAA
16 Executive Summary, Scientific Assessment of Ozone Depletion. Scientific Assessment Panel of the MontrealProtocol on Substances that Deplete the Ozone Layer. July 31, 2002, http://www.epa.gov/ozone/strathome.html.
222 Stratospheric ozone depletion
around the globe, as measured by ground-based and satellite instruments, the amount ofstratospheric ozone is about 4% lower than in 1980. This is greater than natural varia-bility. Ozone losses are also seen over middle-latitude countries, the United States,Canada, and Europe as well as in middle-latitude countries of the southern hemisphere.▪ Specifically for Canada, average stratospheric ozone is about 6% below pre-1980values; scientists estimate that this has resulted in about a 7% increase in the amount ofUV-B radiation reaching Earth. ▪ In general: approaching the equator, ozone loss isprogressively lower. Approaching the poles, it is progressively higher.
(a) (b)
(d)(c)
Total ozone (dobson units)
110 220 330 440 550
Figure 8.5 Visualizing Antarctic ozone-thinning. (a) 1979; (b) 1986; (c) 1996; (d) 2008. Credit: US NOAA
223 Where on Earth is ozone depletion observed?
What other factors affect ozone depletion?
Volcanic eruptions
Usually, little hydrogen chloride (HCl) or other materials from volcanic eruptions reach thestratosphere. However, some eruptions such as Mt. Pinatubo in 1991, are violent enough toinject huge quantities of particles and gases including sulfur dioxide (SO2) into the strato-sphere.17 The SO2 was subsequently converted into sulfuric acid particles. These apparentlyserve the same function as ice particles at the poles providing surfaces on which reactivechlorine compounds can destroy ozone. (This has also been shown in laboratory studiessimulating stratospheric conditions.) In 1993 a NASA satellite recorded a stratospheric ozonevalue over Antarctica of 88 DU, the greatest Antarctic “ozone hole” ever observed. This wasascribed to particles injected into the stratosphere during the Mt. Pinatubo eruption.▪ Because particles settle out of the stratosphere, investigators hypothesized they shouldbe gone by 1994. Indeed, Antarctic ozone levels did partially recover in 1994, reverting tothe slower – but still ongoing – depletion rate seen before the volcano erupted.
Other sources of sulfur gases and thus of particles
Two other sources of sulfur dioxide to the stratosphere exist. ▪ One is carbonyl sulfide,naturally produced in and released from the ocean. Inert in the troposphere, it reaches thestratosphere where photolysis releases the sulfur, which is converted into sulfuric acidparticles. ▪ The other source is tropospheric SO2 (from human pollution), some of whichreaches the stratosphere. ▪ But alone, particles don’t deplete ozone. It is the interaction ofozone-depleting chemicals with the ice particles or sulfuric acid aerosols that cause theproblem.
SECTION III
Why there are concerns about more UV-B radiationreaching Earth18
Human health impacts
Forget about stratospheric ozone depletion for a moment and ask: can overexposure tonormal sunlight be detrimental? Yes, seriously detrimental as sunlight contains some UV-Beven with an intact ozone layer. Midday summer sun is the worst especially as one
17 Aerosols in the stratosphere. US EPA, October, 2007, http://www.epa.gov/ozone/science/myths/aerosol.html.Also see Volcanoes and global cooling [in the case of Mt. Pinatubo, working against global warming]. USGeological Survey, http://vulcan.wr.usgs.gov/Glossary/VolcWeather/description_volcanoes_and_weather.html.
18 The effects of ozone layer depletion. US EPA, October 4, 2007, http://www.epa.gov/ozone/strathome.html.
224 Stratospheric ozone depletion
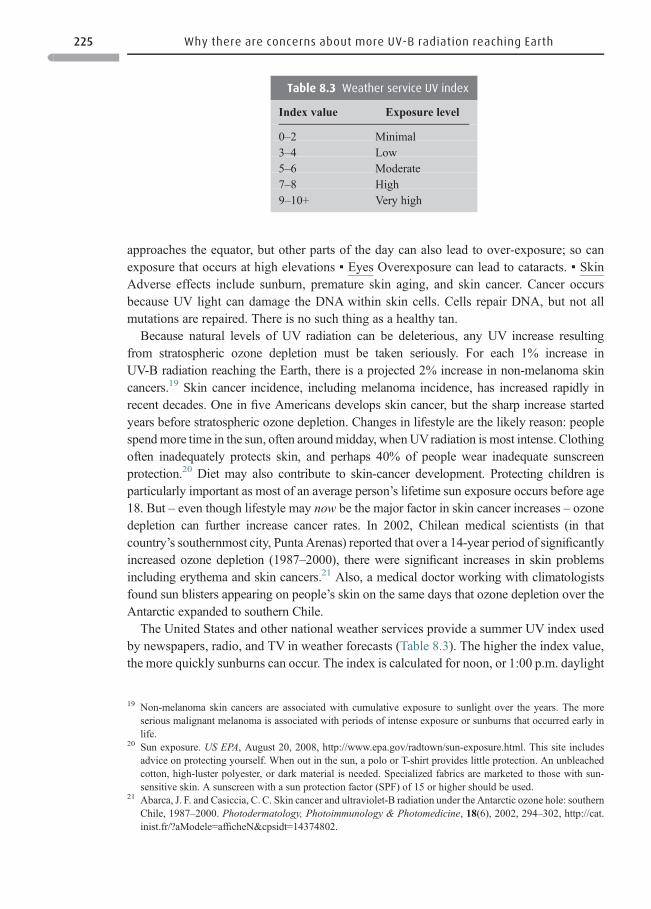
approaches the equator, but other parts of the day can also lead to over-exposure; so canexposure that occurs at high elevations ▪ Eyes Overexposure can lead to cataracts. ▪ SkinAdverse effects include sunburn, premature skin aging, and skin cancer. Cancer occursbecause UV light can damage the DNA within skin cells. Cells repair DNA, but not allmutations are repaired. There is no such thing as a healthy tan.
Because natural levels of UV radiation can be deleterious, any UV increase resultingfrom stratospheric ozone depletion must be taken seriously. For each 1% increase inUV-B radiation reaching the Earth, there is a projected 2% increase in non-melanoma skincancers.19 Skin cancer incidence, including melanoma incidence, has increased rapidly inrecent decades. One in five Americans develops skin cancer, but the sharp increase startedyears before stratospheric ozone depletion. Changes in lifestyle are the likely reason: peoplespendmore time in the sun, often aroundmidday, whenUVradiation is most intense. Clothingoften inadequately protects skin, and perhaps 40% of people wear inadequate sunscreenprotection.20 Diet may also contribute to skin-cancer development. Protecting children isparticularly important as most of an average person’s lifetime sun exposure occurs before age18. But – even though lifestyle may now be the major factor in skin cancer increases – ozonedepletion can further increase cancer rates. In 2002, Chilean medical scientists (in thatcountry’s southernmost city, Punta Arenas) reported that over a 14-year period of significantlyincreased ozone depletion (1987–2000), there were significant increases in skin problemsincluding erythema and skin cancers.21 Also, a medical doctor working with climatologistsfound sun blisters appearing on people’s skin on the same days that ozone depletion over theAntarctic expanded to southern Chile.
The United States and other national weather services provide a summer UV index usedby newspapers, radio, and TV in weather forecasts (Table 8.3). The higher the index value,the more quickly sunburns can occur. The index is calculated for noon, or 1:00 p.m. daylight
Table 8.3 Weather service UV index
Index value Exposure level
0–2 Minimal3–4 Low5–6 Moderate7–8 High9–10+ Very high
19 Non-melanoma skin cancers are associated with cumulative exposure to sunlight over the years. The moreserious malignant melanoma is associated with periods of intense exposure or sunburns that occurred early inlife.
20 Sun exposure. US EPA, August 20, 2008, http://www.epa.gov/radtown/sun-exposure.html. This site includesadvice on protecting yourself. When out in the sun, a polo or T-shirt provides little protection. An unbleachedcotton, high-luster polyester, or dark material is needed. Specialized fabrics are marketed to those with sun-sensitive skin. A sunscreen with a sun protection factor (SPF) of 15 or higher should be used.
21 Abarca, J. F. and Casiccia, C. C. Skin cancer and ultraviolet-B radiation under the Antarctic ozone hole: southernChile, 1987–2000. Photodermatology, Photoimmunology & Photomedicine, 18(6), 2002, 294–302, http://cat.inist.fr/?aModele=afficheN&cpsidt=14374802.
225 Why there are concerns about more UV-B radiation reaching Earth
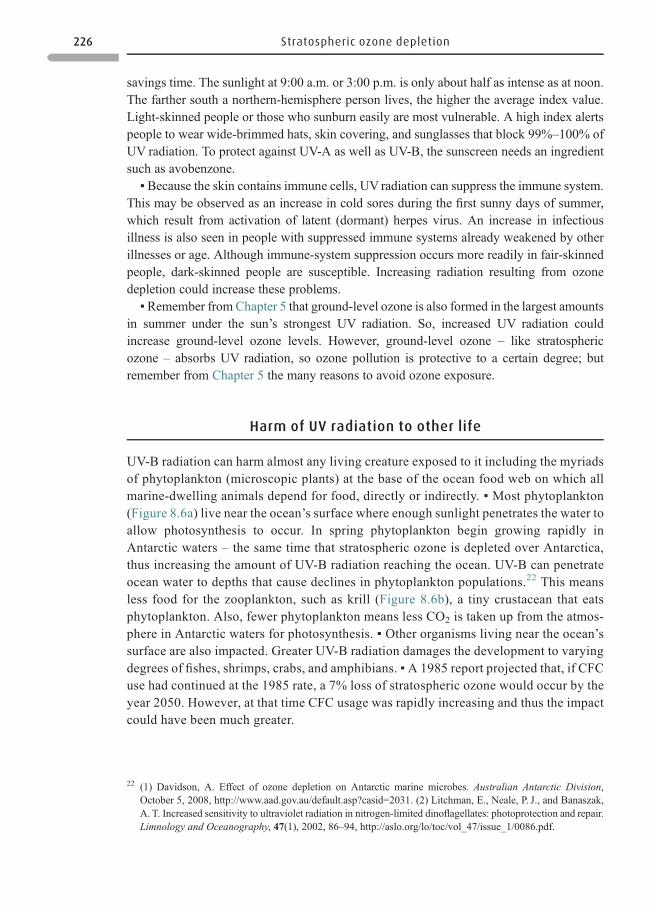
savings time. The sunlight at 9:00 a.m. or 3:00 p.m. is only about half as intense as at noon.The farther south a northern-hemisphere person lives, the higher the average index value.Light-skinned people or those who sunburn easily are most vulnerable. A high index alertspeople to wear wide-brimmed hats, skin covering, and sunglasses that block 99%–100% ofUV radiation. To protect against UV-A as well as UV-B, the sunscreen needs an ingredientsuch as avobenzone.
▪ Because the skin contains immune cells, UV radiation can suppress the immune system.This may be observed as an increase in cold sores during the first sunny days of summer,which result from activation of latent (dormant) herpes virus. An increase in infectiousillness is also seen in people with suppressed immune systems already weakened by otherillnesses or age. Although immune-system suppression occurs more readily in fair-skinnedpeople, dark-skinned people are susceptible. Increasing radiation resulting from ozonedepletion could increase these problems.
▪Remember from Chapter 5 that ground-level ozone is also formed in the largest amountsin summer under the sun’s strongest UV radiation. So, increased UV radiation couldincrease ground-level ozone levels. However, ground-level ozone – like stratosphericozone – absorbs UV radiation, so ozone pollution is protective to a certain degree; butremember from Chapter 5 the many reasons to avoid ozone exposure.
Harm of UV radiation to other life
UV-B radiation can harm almost any living creature exposed to it including the myriadsof phytoplankton (microscopic plants) at the base of the ocean food web on which allmarine-dwelling animals depend for food, directly or indirectly. ▪ Most phytoplankton(Figure 8.6a) live near the ocean’s surface where enough sunlight penetrates the water toallow photosynthesis to occur. In spring phytoplankton begin growing rapidly inAntarctic waters – the same time that stratospheric ozone is depleted over Antarctica,thus increasing the amount of UV-B radiation reaching the ocean. UV-B can penetrateocean water to depths that cause declines in phytoplankton populations.22 This meansless food for the zooplankton, such as krill (Figure 8.6b), a tiny crustacean that eatsphytoplankton. Also, fewer phytoplankton means less CO2 is taken up from the atmos-phere in Antarctic waters for photosynthesis. ▪ Other organisms living near the ocean’ssurface are also impacted. Greater UV-B radiation damages the development to varyingdegrees of fishes, shrimps, crabs, and amphibians. ▪ A 1985 report projected that, if CFCuse had continued at the 1985 rate, a 7% loss of stratospheric ozone would occur by theyear 2050. However, at that time CFC usage was rapidly increasing and thus the impactcould have been much greater.
22 (1) Davidson, A. Effect of ozone depletion on Antarctic marine microbes. Australian Antarctic Division,October 5, 2008, http://www.aad.gov.au/default.asp?casid=2031. (2) Litchman, E., Neale, P. J., and Banaszak,A. T. Increased sensitivity to ultraviolet radiation in nitrogen-limited dinoflagellates: photoprotection and repair.Limnology and Oceanography, 47(1), 2002, 86–94, http://aslo.org/lo/toc/vol_47/issue_1/0086.pdf.
226 Stratospheric ozone depletion
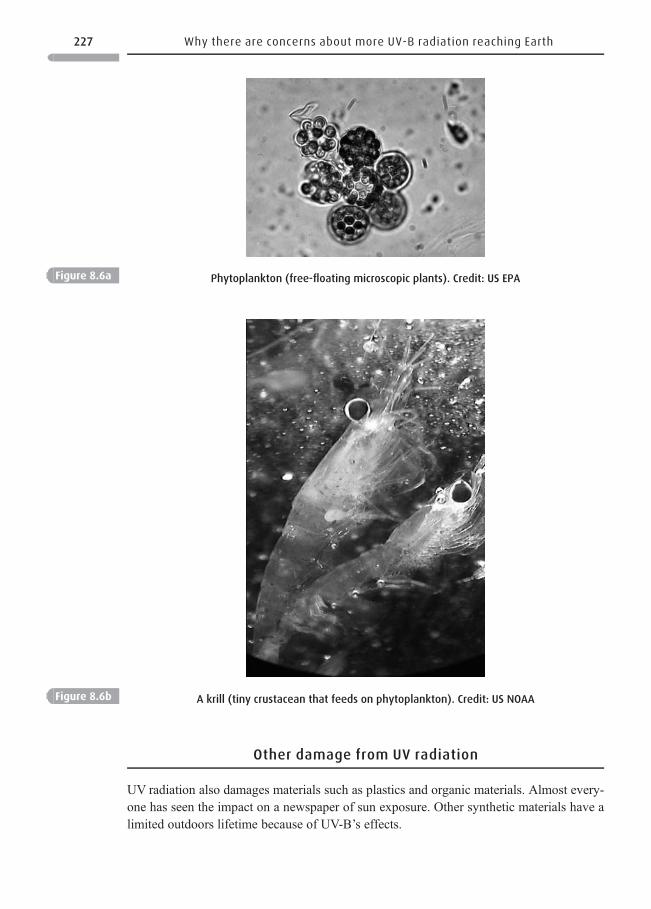
Other damage from UV radiation
UV radiation also damages materials such as plastics and organic materials. Almost every-one has seen the impact on a newspaper of sun exposure. Other synthetic materials have alimited outdoors lifetime because of UV-B’s effects.
Figure 8.6a Phytoplankton (free-floating microscopic plants). Credit: US EPA
Figure 8.6b A krill (tiny crustacean that feeds on phytoplankton). Credit: US NOAA
227 Why there are concerns about more UV-B radiation reaching Earth
CFCs and climate
CFCs absorb wavelengths of infrared radiation emanating from Earth not absorbed by othergreenhouse gases. CFCs are potent greenhouse gases – indeed, thousands of times morepotent than CO2. ▪ On the basis of several factors (not covered here), the overall impact ofCFCs is to cool the stratosphere.23 The cooling stratosphere, in fact, may balance out thewarming caused by CFC action as greenhouse gases in the troposphere. A colder strato-sphere can also contribute to the formation of more polar stratospheric clouds, which may, inturn, contribute to greater stratospheric ozone depletion.
SECTION IV
Eliminating ozone-depleting chemicals
The Montreal Protocol
Once stratospheric ozone depletion was confirmed in the mid-1980s, many believed that aquick and complete ban was necessary to avert serious consequences, especially becauseCFCs and halons have atmospheric lifetimes of decades to centuries. In 1987, mostindustrialized nations signed the Montreal Protocol on Substances That Deplete theOzone Layer, an agreement to ban CFC and halons manufacture. This treaty was furtherstrengthened in 1992. The Protocol, now ratified by 190 nations, established legally
Questions 8.1
1. Some people have asked if we can pump ground-level ozone into the stratosphere to
replace lost stratospheric ozone. Assume this is practical. Why would that not solve the
stratospheric ozone loss problem?
2. Why are most air molecules in the troposphere?
3. Ozone is heavier than oxygen and nitrogen, but most is in the stratosphere – why?
4. (a) Why does more UV radiation reach higher elevations than lower elevations? (b) Why
does more UV radiation reach locales closer to the equator than those further away?
5. In response to stronger UV radiation, plankton can move deeper into the water. This being
the case, why are we concerned about the effect of UV on plankton?
6. The Montreal Protocol with its ban on ozone-depleting substances is largely a success. Why
can’t we replicate the success of this treaty with carbon dioxide and other GHG emissions?
23 Fergusson, A. Ozone depletion and climate change: understanding the linkages.Meteorological Service of Canada,2001, http://exp-studies.tor.ec.gc.ca/e/ozone/OzoneDepletionClimateChange.pdf.
228 Stratospheric ozone depletion
binding controls on the production and consumption of ozone-depleting gases.24
▪ Although halons are no longer manufactured, they are still plentiful; they are foundin fire extinguishers and are stored in substantial quantities. Halons probably willcontinue to reach the stratosphere and their levels are likely to remain high for manyyears to come. ▪ However, the Montreal Protocol is considered a success. It wassignificant both because it banned ozone-depleting chemicals, and because it repre-sented the first global environmental-protection treaty. In the United States, by 1995,almost all CFC and halons manufacture had ceased.
Less potent ozone-depleting gases
Methyl chloride (CH3Cl) and methyl bromide (CH3Br) are among the least potent ozone-depleting gases. These are also different from CFCs and halons because a large proportion oftheir emissions are from natural sources. At the end of the twenty-first century methylchloride may represent the predominant amount of stratospheric chlorine because the moreworrisome CFCs and halons should be largely gone.
Less-developed countries
Production in the United States and other Western countries ceased in 1996, but theMontreal Protocol allowed eight developing countries that produce CFCs a grace periodof 10 years. They began phasing out production in 1999. China, in accordance with theMontreal Protocol banned the production and import of CFCs and halons as of June, 2007.The grace period was necessary because new equipment is necessary for the substituterefrigerants, and its cost posed a problem to poor countries. ▪ However, ensuring compli-ance by less-developed countries is essential if the Montreal Protocol is to succeed. Moneyis a form of assistance that developed nations provide. The World Bank agreed to payRussian companies to compensate them for ending production of CFCs and halons. Morerecently the Protocol’s Multilateral Fund has helped China and Venezuela to end theirproduction.25 These halts are verified by outside experts who will continue to monitor thesituation for some years. ▪ Sometimes, information has been useful in helping the ban tosucceed. In the case of halons, poor nations especially had the problem of ensuring fireprotection while banning the very-effective safe and affordable halons. The UNEnvironmental Program assisted by providing published case studies showing how thiscould be accomplished.
24 Some methyl bromide uses have received a “critical use exemption” under the Montreal Protocol. One suchexemption was obtained by the United States in 2005 for almost 23 million pounds (10 million kg) of methylbromide, much more than the rest of the world combined. It is used as a soil fumigant and to fumigate shippingcrates. However, even in the United States increasing restrictions are slowing the use of methyl bromide asfarmers slowly transition to alternatives.
25 China closes ozone-depleting chemical plants. United Nations Environment Programme, July 1, 2007, http://www.unep.org/documents.multilingual/default.asp?documentid=514&articleid=5624&l=en.
229 Eliminating ozone-depleting chemicals
Smuggling CFCs and halons27
One problem is that some facilities in less-developed countries continue to illegally produceCFCs and halons, and their smuggling has been a serious problem. Contraband CFCs areused to recharge auto air conditioners. Halons are still valued fire suppressors. The substitutechemicals don’t cost more than the CFCs they replace. However, expensive equipment mustbe replaced too. The illegal trade may decrease as more less-developed countries receiveassistance from theMultilateral Fund to install new equipment. Also demand for contrabandwill abate as older cars are removed from the road. Nonetheless, illegal trade is seen as anongoing threat, which could slow recovery of the ozone layer. This is especially truebecause, as seen below, the first group of chemicals developed as CFCs replacements arestrong greenhouse gases. So, these initial alternatives must in their turn be replaced bychemicals that are not greenhouse gases, but remain safe to ozone.
SECTION V
Developing alternatives for ozone-depleting chemicals
The initial substitutes developed to replace CFCs were the hydrofluorocarbons(HFCs) andhydrochlorofluorocarbons (HCFCs). These gases have some chemical reactivity and thus
Box 8.3 NASA and the twentieth anniversary of the Montreal Protocol26
The twentieth anniversary of signing the Montreal Protocol was celebrated at a September
2007 conference in Greece. Richard Stolarski of NASA spoke of their Aura satellite, which
monitors the chemical make-up of the atmosphere. He also noted the data gathered by NASA’s
Airborne Antarctic Ozone Experiment, which in 1987 “provided the smoking gun measure-
ments that nailed down the cause of the ozone hole being the increase of CFCs combined with
the unique meteorology of the Antarctic.” After praising the Montreal Protocol as a “resound-
ing success,” Stolarski said, “The effect can be seen in the leveling off of chlorine compounds in
the atmosphere and the beginning of their decline.” ▪ However, springtime ozone depletion in
polar regions continues to be prominent and, another NASA speaker noted: “it’s a long
process” and CFCs aren’t expected to fall below the levels that produced the ozone hole
until about 2070. Meanwhile it has become clear that ozone depletion and climate change are
linked “in subtle but profoundly important ways.” NASA scientists now study climate change as
well as the ozone layer.
26 Thompson, T. NASA keeps eye on ozone layer amid Montreal Protocol’s success. NASA/Goddard Space FlightCenter, September 14, 2007, http://www.nasa.gov/home/hqnews/2007/sep/HQ_07192_montreal_protocol.html.
27 (1) Illegal trade in ozone depleting substances. UN Environmental Program, 2008, http://www.grida.no/pub-lications/vg/vog/page/1395.aspx. (2) Environmental investigation agency . . . tackles a threat to global ecolog-ical security – depletion of the ozone layer. http://www.eia-international.org/campaigns/global_environment/.
230 Stratospheric ozone depletion
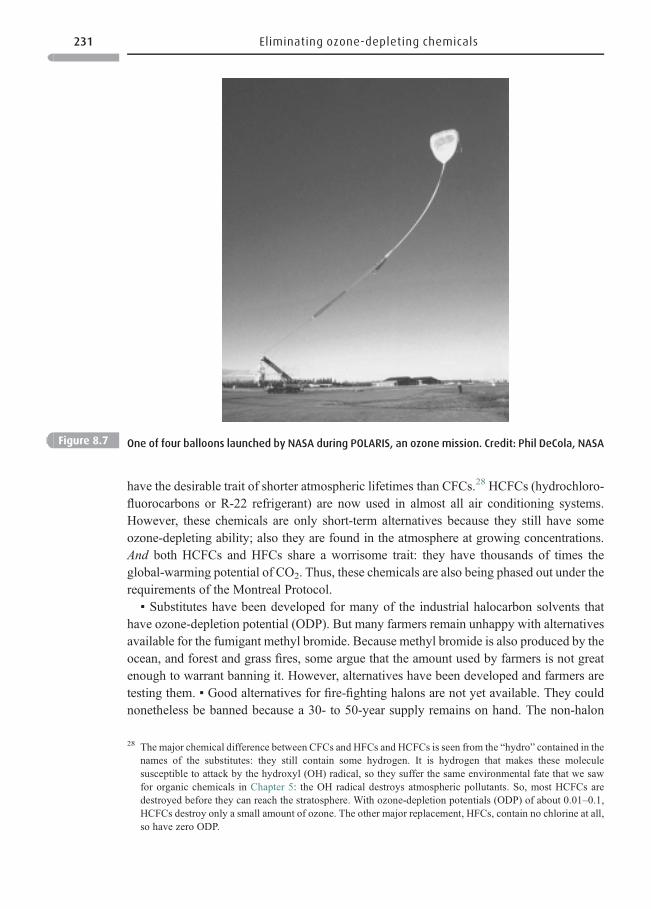
have the desirable trait of shorter atmospheric lifetimes than CFCs.28 HCFCs (hydrochloro-fluorocarbons or R-22 refrigerant) are now used in almost all air conditioning systems.However, these chemicals are only short-term alternatives because they still have someozone-depleting ability; also they are found in the atmosphere at growing concentrations.And both HCFCs and HFCs share a worrisome trait: they have thousands of times theglobal-warming potential of CO2. Thus, these chemicals are also being phased out under therequirements of the Montreal Protocol.
▪ Substitutes have been developed for many of the industrial halocarbon solvents thathave ozone-depletion potential (ODP). But many farmers remain unhappy with alternativesavailable for the fumigant methyl bromide. Because methyl bromide is also produced by theocean, and forest and grass fires, some argue that the amount used by farmers is not greatenough to warrant banning it. However, alternatives have been developed and farmers aretesting them. ▪ Good alternatives for fire-fighting halons are not yet available. They couldnonetheless be banned because a 30- to 50-year supply remains on hand. The non-halon
Figure 8.7 One of four balloons launched by NASA during POLARIS, an ozone mission. Credit: Phil DeCola, NASA
28 The major chemical difference between CFCs and HFCs and HCFCs is seen from the “hydro” contained in thenames of the substitutes: they still contain some hydrogen. It is hydrogen that makes these moleculesusceptible to attack by the hydroxyl (OH) radical, so they suffer the same environmental fate that we sawfor organic chemicals in Chapter 5: the OH radical destroys atmospheric pollutants. So, most HCFCs aredestroyed before they can reach the stratosphere. With ozone-depletion potentials (ODP) of about 0.01–0.1,HCFCs destroy only a small amount of ozone. The other major replacement, HFCs, contain no chlorine at all,so have zero ODP.
231 Eliminating ozone-depleting chemicals
fire-fighting substitutes evaluated either have undesirable properties or are very costly. Forexample, one iodine- and fluorine-containing chemical showed good fire-fighting propertiesand had a short atmospheric life, but was too toxic for routine use. So, the search goes on.
Developing alternatives for the alternatives
Especially because of their strong capacity to act as greenhouse gases, efforts are beingmadeto phase out HCFCs and HFCs more speedily than initially intended. Thus, US productionof HCFC-22 (R-22) will stop in 2010; however, small amounts will be manufactured until2020 to allow service of equipment using R-22. ▪ Supermarkets The US EPA has beenworking with manufacturers and supermarket chains on evaluating new refrigerants.Supermarkets are important businesses with which to begin the transition to safer substitutesbecause a typical store has been using about 4000 lb (1800 kg) R-22 in its cooling systems.Each can lose 1000 lb (450 kg) per year through leaks so, along with new alternatives, leakprevention is of importance too. ▪ As of 2007, the US EPA approved three products, blendsof refrigerants, to replace R-22. These do not deplete ozone and, although they have somewarming potential, this will be largely circumvented by prohibiting any intentional leakageof the gases to the atmosphere. ▪ Autos EU countries, especially Germany, are taking thelead in changing over to new refrigerants for auto air conditioners. As of 2011, Germancarmakers will substitute carbon dioxide for fluorochemicals. However, CO2 requires newequipment andmost automakers prefer a chemical that can directly substitute for HFC-134a,the auto refrigerant now being used around the world. EU countries will be unable to use anyfluorinated gas with a global warming potential (GWP) more than 150 times greater thanthat of CO2. The chemical manufacturers, DuPont and Honeywell, have developed ahydrofluoroolefin with a GWP of only 4. ▪ Remember the CFCs introduced so manyyears ago in 1928 were so desirable because they were not flammable, toxic, or corrosive.Now chemists and manufacturers continue searching for substitutes that not only have thoseattributes, but that also avoid ozone-depletion or global warming problems.
The future
A decline in CFCs and a return to normalcy29,30
Together, CFC-11 and CFC-12 represent 50% of all CFCs that were used. Stratosphericlevels of CFCs increased until 2002. Data supporting this conclusion were gathered frommonitoring stations around the globe, including the South Pole and Point Barrow,Alaska. Stratospheric levels are now declining, but only slowly because the lifetime ofCFC-11 is 45 years and that of CFC-12 is 100 years. However, concentrations in thetroposphere peaked in 1992–94 and have declined since then. ▪ The Antarctic ozone hole
29 Current state of the ozone layer. US EPA, 2007, http://www.epa.gov/ozone/science/currentstate.html.30 vonHobe,M.Atmospheric science: revisiting ozone depletion. Science, 318(5858), December 21, 2007, 1878–1879.
232 Stratospheric ozone depletion
still appears each polar spring with peak depletion in September right after the spring sunreturns.31 There was concern in 2006 when a record-breaking ozone hole opened overAntarctica in September of about 11.4 million mi2 (28 million km2).32 However, in 2007the peak value fell to 9.7 million mi2 (23.8 km2); this value was similar to the average ofthe previous 15 years. It was similar to 2002 and 2004, which had maximum areas ofabout 8.3 million and 8.7 million mi2, respectively (20.4 and 21.4 million km2). Ofcourse, any one of these values is large compared to the 1970s before ozone depletionexisted. The UNEP and the WMO had believed that, given full compliance with theMontreal Protocol, stratospheric ozone level would return to normal about the year2050. However, NASA more recently stated that stratospheric ozone will not return tonormal before about 2070.
Further reading
von Hobe, M. Atmospheric science: revisiting ozone depletion. Science, 318(5858),December 21, 2007, 1878–1879.
Wuebbles, D. J. Atmosphere: nitrous oxide: no laughing matter (impact in global warmingand in stratospheric ozone depletion). Science, 326, October 2, 2009, 56–57.
Internet resources
Fergusson, A. Ozone depletion and climate change: understanding the linkages. Meteoro-logical Service of Canada. http://exp-studies.tor.ec.gc.ca/e/ozone/OzoneDepletionClimateChange.pdf.
Gleason, K. L. 2008. Ozone depletion. NOAA. http://www.ozonelayer.noaa.gov/science/o3depletion.htm (March 20, 2008).
Global Environment Campaign (1997–2009) (environmental investigation agency exam-ines threats to ozone layer). http://www.eia-international.org/campaigns/global_ envi-ronment/.
Hoffman, D. J. and Montzka, S. S. The NOAA Ozone Depleting Gas Index. NOAA EarthSystem Research Laboratory. http://www.esrl.noaa.gov/gmd/odgi/.
NOAA Chemical Sciences Division. NOAA Earth System Research Laboratory. http://www.esrl.noaa.gov/csd/.
2008. Stratospheric ozone, monitoring and research. http://www.ozonelayer.noaa.gov/index.htm (March 20, 2008).
31 (1) Hansen, K. NASA data reveal “average” ozone hole in 2007.NASA, October 18, 2007, http://www.nasa.gov/vision/earth/environment/ozone_2007.html. (2) Leahy, S. Sixty years to restore the ozone layer over Antarctica.IPS, September 21, 2006, http://ipsnews.net/news.asp?idnews=34810.
32 The year 2000 saw the largest ozone hole ever seen over Antarctica 30.3 million km2 (12.3 million mi2);scientists believed that this record depletion was due to the unusual intensity of the Antarctic vortex.
233 Internet resources
Parson, R. 1997. Ozone Depletion FAQ PART I: Introduction to the ozone layer. http://www.faqs.org/faqs/ozone-depletion/intro/ (December 24, 1997). Part I deals with basic ques-tions about the ozone layer; Part II with sources of stratospheric chlorine and bromine;Part III with the Antarctic ozone hole; and Part IV with the properties and effects ofultraviolet radiation.
Slanina, S. 2007. Antarctic ozone hole. The Encyclopedia of Earth. http://www.eoearth.org/article/Antarctic_ozone_hole (December 18, 2007).
UNEP. 2002. Environmental effects of ozone depletion and its interaction withclimate change. The Environmental Effects Assessment Panel Report. http://www.gcrio.org/OnLnDoc/pdf/unep_ozone2002.pdf.
2008. Illegal trade in ozone depleting substances. http://www.grida.no/publications/vg/vog/page/1395.aspx.
2009. Vital ozone graphics. http://www.grida.no/publications/vg/vog/.US EPA. 1995. Stratospheric ozone depletion (early useful document on EPA’s research)
(March 1995) http://www.epa.gov/ord/WebPubs/stratoz.pdf.2006. Why is the ozone hole over Antarctica? http://www.epa.gov/ozone/science/hole/whyant.html (March, 2006).
2007. Dispelling the myths of ozone layer depletion. http://www.epa.gov/ozone/science/myths/index.html (October 4, 2006).
2007. Ozone-depleting potentials of substances (a table). http://www.epa.gov/ozone/science/ods/classone.html (October 4, 2007).
2007. The effects of ozone layer depletion. http://www.epa.gov/ozone/science/effects/effects.html (October 4, 2007).
2008. Current state of the ozone layer. http://www.epa.gov/ozone/science/currentstate.html (September 11, 2008).
2008. Ozone (ground-level and stratospheric). http://www.epa.gov/docs/ozone/ (June 12,2008).
2008. Ozone depletion glossary. http://www.epa.gov/ozone/defns.html (May 9,2008).
2008. Ozone Layer: ozone layer depletion: quick finder. http://www.epa.gov/ozone/strathome.html (June 12, 2008).
2008. SunWise Glossary (Protect yourself from overexposure to the sun). http://www.epa.gov/sunwise/glossary.html January 3, 2008).
2009. Report on the environment: ozone depletion. http://oaspub.epa.gov/hd/home#9(March 14, 2009).
US NASA 2002. Stratospheric ozone depletion, educational resources. http://www.nas.nasa.gov/About/Education/Ozone/ozone.html (August 4, 2002).
2007. Thompson, T. NASA keeps eye on ozone layer amid Montreal Protocol’s success.http://www.nasa.gov/home/hqnews/2007/sep/HQ_07192_montreal_protocol.html(September 14, 2007).
2009. Ozone-hole watch, ozone-hole maps. http://ozonewatch.gsfc.nasa.gov/monthly/index.html (April 5, 2009).
234 Stratospheric ozone depletion

US National Oceanic & Atmospheric Administration (NOAA) 2008. Stratospheric ozone:monitoring and research in NOAA. http://www.ozonelayer.noaa.gov/index.htm(March 20, 2008).
2009. Hoffman, D. J. and Montzka, S. S. NOAA ozone depleting gas index: guidingrecovery of the ozone layer. http://www.esrl.noaa.gov/gmd/odgi/.
2009. Regions of the atmosphere. http://www.ozonelayer.noaa.gov/science/atmosphere.htm (March 20, 2009).
235 Internet resources
9 Water pollution
“The key to reducing dead zones will be to keep fertilizers on the land and out ofthe sea. For agricultural systems in general, methods need to be developed thatclose the nutrient cycle from soil to crop and back to agricultural soil.”
Robert J. Diaz and Rutger Rosenberg
Whether animal, plant, or microbe, water is essential to life. Fish and other water-dwellingcreatures are vulnerable to polluted water and there are waters in the world so polluted thatlife has disappeared. In other locales fish and shellfish survive, but are not safe to eat becausetheir flesh is contaminated. Humans enjoy being around water, but contamination withinfectious organisms often makes swimming unsafe, and being near water with noxiousodors or scum is not pleasant. Clean water – and enough of it – is vital. ▪ Laws governingwater quality existed in the United States before 1972, but no uniform national law existed.Water pollution was not well controlled and some states, eager to keep or attract industry,were negligent. The Clean Water Act1 (CWA) of 1972 and the Safe Drinking Water Act(SDWA) of 1974 were laws mandating that water pollution be treated uniformly nationwide;they have been updated over the years. ▪ In developed countries, water bodies are generallycleaner. In the United States, some are much cleaner than in 1972, the year that Congresspassed the CWA: in 1972, only 30% of US waters were judged fishable and swimmable. By1994, it was greater than 60%. Fishablemeans that fish living in the water are safe to eat andthat the water is safe enough for the fish to live in. Swimmable means that the water is safeenough to swim in without fear of infectious organisms or other unhealthy contaminants.However, in 2009, many places are still not fishable or swimmable. Moreover, not all waterbodies are regularly monitored – perhaps cannot be regularly monitored – leading to largeinformation gaps. Methods used to monitor water also vary widely, and many consider thestatistics unreliable.2
This chapter surveys water pollutants, the problems they cause, their sources, and actionstaken to reduce their emissions. Section I introduces point and nonpoint source waterpollution. After first emphasizing the importance of the six conventional water pollutants,this section moves on to priority (toxic) pollutants, and non-conventional pollutants.Section II examines some of the water bodies impacted by pollution, groundwater, wetlands,estuaries, and coastlines, including an overview of Chesapeake Bay. Section III discusses
1 Summary of the Clean Water Act. US EPA, February 19, 2009, http://www.epa.gov/lawsregs/laws/cwa.html.2 Surface waters (with relevant links, including one to fishable/swimmable). Net Industries, 2009, http://www.libraryindex.com/pages/328/Surface-Water-Rivers-Lakes.html.
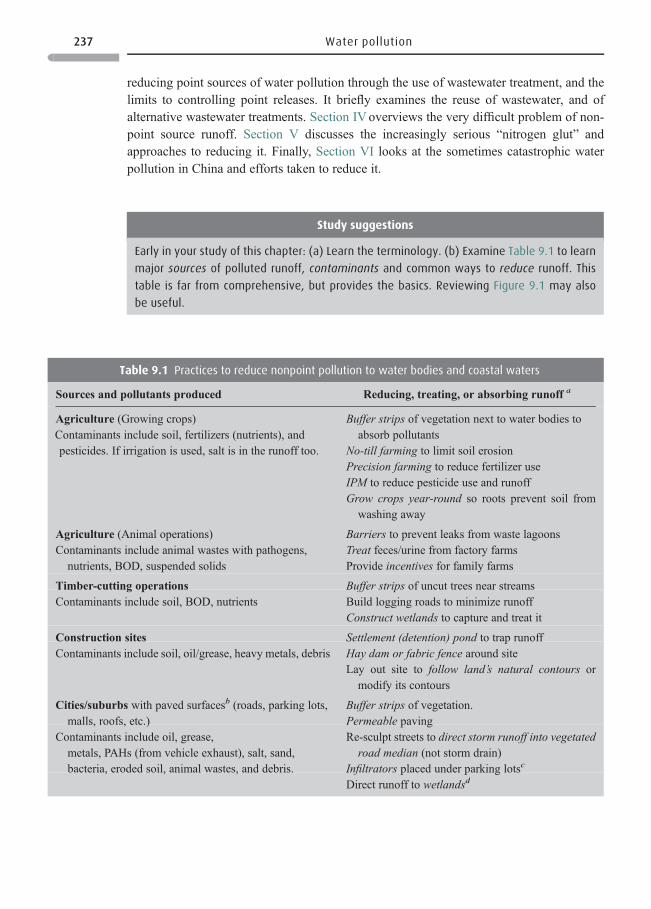
reducing point sources of water pollution through the use of wastewater treatment, and thelimits to controlling point releases. It briefly examines the reuse of wastewater, and ofalternative wastewater treatments. Section IVoverviews the very difficult problem of non-point source runoff. Section V discusses the increasingly serious “nitrogen glut” andapproaches to reducing it. Finally, Section VI looks at the sometimes catastrophic waterpollution in China and efforts taken to reduce it.
Study suggestions
Early in your study of this chapter: (a) Learn the terminology. (b) Examine Table 9.1 to learn
major sources of polluted runoff, contaminants and common ways to reduce runoff. This
table is far from comprehensive, but provides the basics. Reviewing Figure 9.1 may also
be useful.
Table 9.1 Practices to reduce nonpoint pollution to water bodies and coastal waters
Sources and pollutants produced Reducing, treating, or absorbing runoff a
Agriculture (Growing crops)Contaminants include soil, fertilizers (nutrients), andpesticides. If irrigation is used, salt is in the runoff too.
Buffer strips of vegetation next to water bodies toabsorb pollutants
No-till farming to limit soil erosionPrecision farming to reduce fertilizer useIPM to reduce pesticide use and runoffGrow crops year-round so roots prevent soil fromwashing away
Agriculture (Animal operations) Barriers to prevent leaks from waste lagoonsContaminants include animal wastes with pathogens,
nutrients, BOD, suspended solidsTreat feces/urine from factory farmsProvide incentives for family farms
Timber-cutting operations Buffer strips of uncut trees near streamsContaminants include soil, BOD, nutrients Build logging roads to minimize runoff
Construct wetlands to capture and treat it
Construction sites Settlement (detention) pond to trap runoffContaminants include soil, oil/grease, heavy metals, debris Hay dam or fabric fence around site
Lay out site to follow land’s natural contours ormodify its contours
Cities/suburbs with paved surfacesb (roads, parking lots,malls, roofs, etc.)
Buffer strips of vegetation.Permeable paving
Contaminants include oil, grease,metals, PAHs (from vehicle exhaust), salt, sand,bacteria, eroded soil, animal wastes, and debris.
Re-sculpt streets to direct storm runoff into vegetatedroad median (not storm drain)
Infiltrators placed under parking lots c
Direct runoff to wetlands d
237 Water pollution
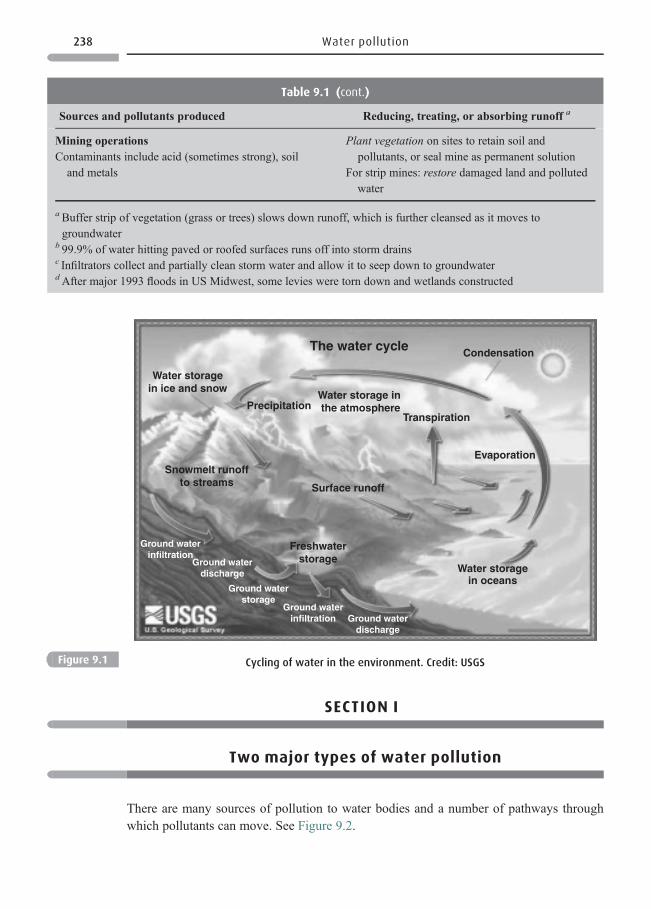
SECTION I
Two major types of water pollution
There are many sources of pollution to water bodies and a number of pathways throughwhich pollutants can move. See Figure 9.2.
Table 9.1 (cont.)
Sources and pollutants produced Reducing, treating, or absorbing runoff a
Mining operationsContaminants include acid (sometimes strong), soiland metals
Plant vegetation on sites to retain soil andpollutants, or seal mine as permanent solution
For strip mines: restore damaged land and pollutedwater
aBuffer strip of vegetation (grass or trees) slows down runoff, which is further cleansed as it moves togroundwater
b 99.9% of water hitting paved or roofed surfaces runs off into storm drainsc Infiltrators collect and partially clean storm water and allow it to seep down to groundwaterdAfter major 1993 floods in US Midwest, some levies were torn down and wetlands constructed
The water cycle Condensation
Water storagein ice and snow
PrecipitationWater storage in the atmosphere
Transpiration
Evaporation
Surface runoff
Snowmelt runoffto streams
Ground waterinfiltration
Ground waterdischarge
Ground waterstorage
Freshwaterstorage
Ground waterinfiltration Ground water
discharge
Water storagein oceans
Figure 9.1 Cycling of water in the environment. Credit: USGS
238 Water pollution
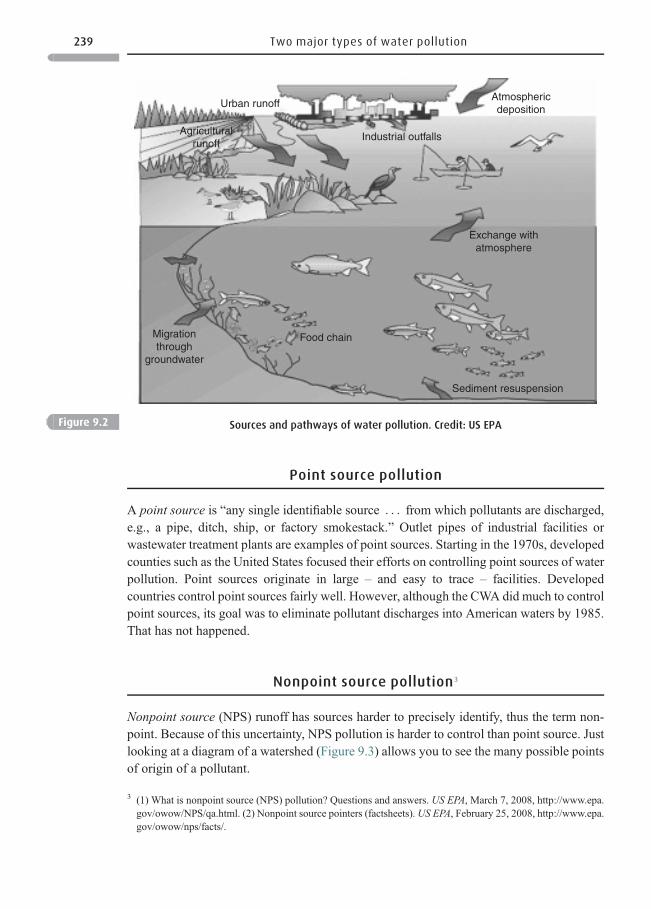
Point source pollution
A point source is “any single identifiable source . . . from which pollutants are discharged,e.g., a pipe, ditch, ship, or factory smokestack.” Outlet pipes of industrial facilities orwastewater treatment plants are examples of point sources. Starting in the 1970s, developedcounties such as the United States focused their efforts on controlling point sources of waterpollution. Point sources originate in large – and easy to trace – facilities. Developedcountries control point sources fairly well. However, although the CWA did much to controlpoint sources, its goal was to eliminate pollutant discharges into American waters by 1985.That has not happened.
Nonpoint source pollution3
Nonpoint source (NPS) runoff has sources harder to precisely identify, thus the term non-point. Because of this uncertainty, NPS pollution is harder to control than point source. Justlooking at a diagram of a watershed (Figure 9.3) allows you to see the many possible pointsof origin of a pollutant.
AtmosphericdepositionUrban runoff
Agriculturalrunoff
Industrial outfalls
Exchange withatmosphere
Food chainMigrationthrough
groundwater
Sediment resuspension
Figure 9.2 Sources and pathways of water pollution. Credit: US EPA
3 (1) What is nonpoint source (NPS) pollution? Questions and answers. US EPA, March 7, 2008, http://www.epa.gov/owow/NPS/qa.html. (2) Nonpoint source pointers (factsheets). US EPA, February 25, 2008, http://www.epa.gov/owow/nps/facts/.
239 Two major types of water pollution
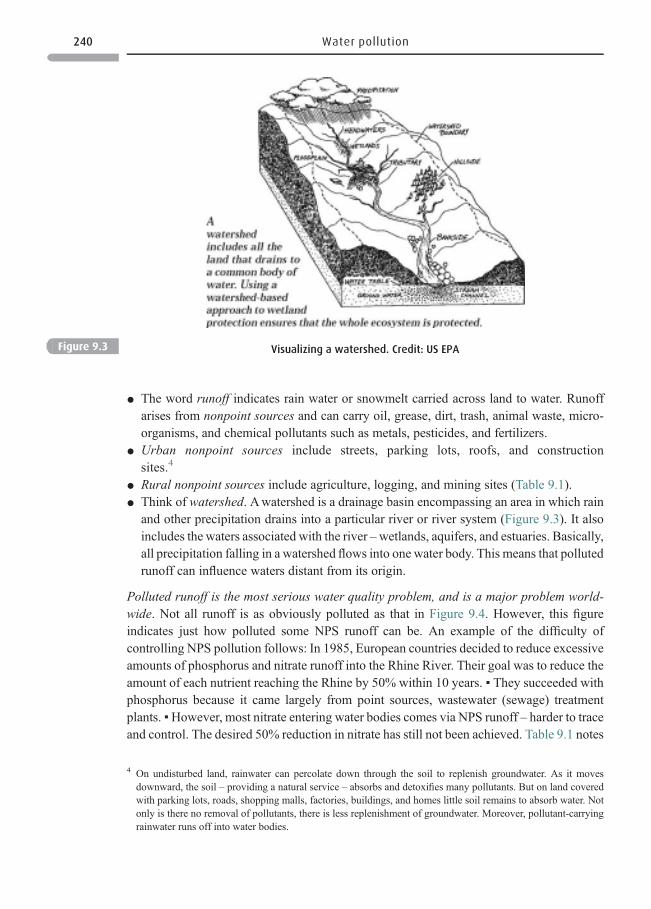
* The word runoff indicates rain water or snowmelt carried across land to water. Runoffarises from nonpoint sources and can carry oil, grease, dirt, trash, animal waste, micro-organisms, and chemical pollutants such as metals, pesticides, and fertilizers.
* Urban nonpoint sources include streets, parking lots, roofs, and constructionsites.4
* Rural nonpoint sources include agriculture, logging, and mining sites (Table 9.1).* Think of watershed. Awatershed is a drainage basin encompassing an area in which rain
and other precipitation drains into a particular river or river system (Figure 9.3). It alsoincludes the waters associated with the river –wetlands, aquifers, and estuaries. Basically,all precipitation falling in a watershed flows into one water body. This means that pollutedrunoff can influence waters distant from its origin.
Polluted runoff is the most serious water quality problem, and is a major problem world-wide. Not all runoff is as obviously polluted as that in Figure 9.4. However, this figureindicates just how polluted some NPS runoff can be. An example of the difficulty ofcontrolling NPS pollution follows: In 1985, European countries decided to reduce excessiveamounts of phosphorus and nitrate runoff into the Rhine River. Their goal was to reduce theamount of each nutrient reaching the Rhine by 50% within 10 years. ▪ They succeeded withphosphorus because it came largely from point sources, wastewater (sewage) treatmentplants. ▪However, most nitrate entering water bodies comes via NPS runoff – harder to traceand control. The desired 50% reduction in nitrate has still not been achieved. Table 9.1 notes
Figure 9.3 Visualizing a watershed. Credit: US EPA
4 On undisturbed land, rainwater can percolate down through the soil to replenish groundwater. As it movesdownward, the soil – providing a natural service – absorbs and detoxifies many pollutants. But on land coveredwith parking lots, roads, shopping malls, factories, buildings, and homes little soil remains to absorb water. Notonly is there no removal of pollutants, there is less replenishment of groundwater. Moreover, pollutant-carryingrainwater runs off into water bodies.
240 Water pollution
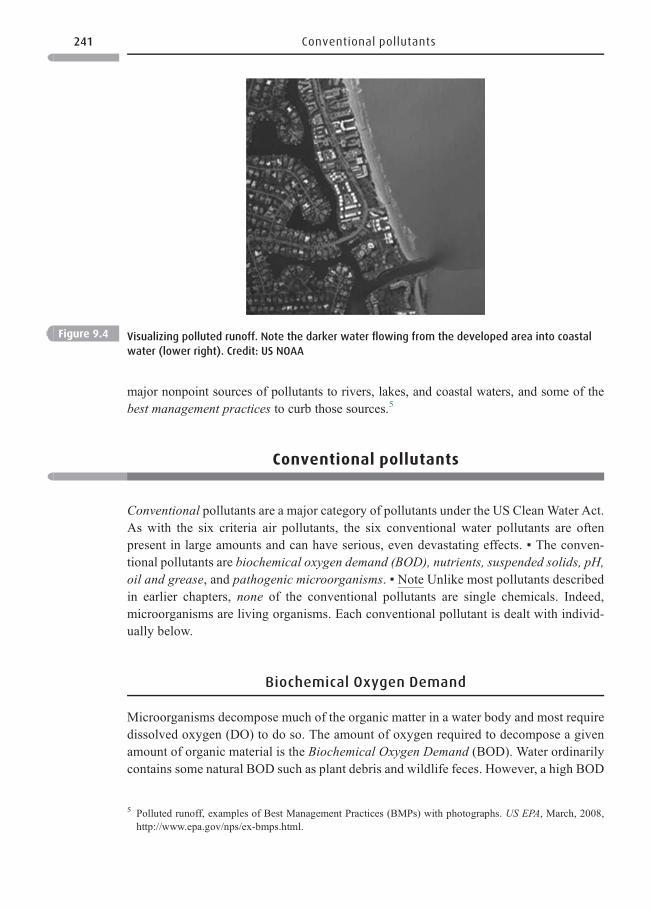
major nonpoint sources of pollutants to rivers, lakes, and coastal waters, and some of thebest management practices to curb those sources.5
Conventional pollutants
Conventional pollutants are a major category of pollutants under the US Clean Water Act.As with the six criteria air pollutants, the six conventional water pollutants are oftenpresent in large amounts and can have serious, even devastating effects. ▪ The conven-tional pollutants are biochemical oxygen demand (BOD), nutrients, suspended solids, pH,oil and grease, and pathogenic microorganisms. ▪ Note Unlike most pollutants describedin earlier chapters, none of the conventional pollutants are single chemicals. Indeed,microorganisms are living organisms. Each conventional pollutant is dealt with individ-ually below.
Biochemical Oxygen Demand
Microorganisms decompose much of the organic matter in a water body and most requiredissolved oxygen (DO) to do so. The amount of oxygen required to decompose a givenamount of organic material is the Biochemical Oxygen Demand (BOD). Water ordinarilycontains some natural BOD such as plant debris and wildlife feces. However, a high BOD
Figure 9.4 Visualizing polluted runoff. Note the darker water flowing from the developed area into coastal
water (lower right). Credit: US NOAA
5 Polluted runoff, examples of Best Management Practices (BMPs) with photographs. US EPA, March, 2008,http://www.epa.gov/nps/ex-bmps.html.
241 Conventional pollutants
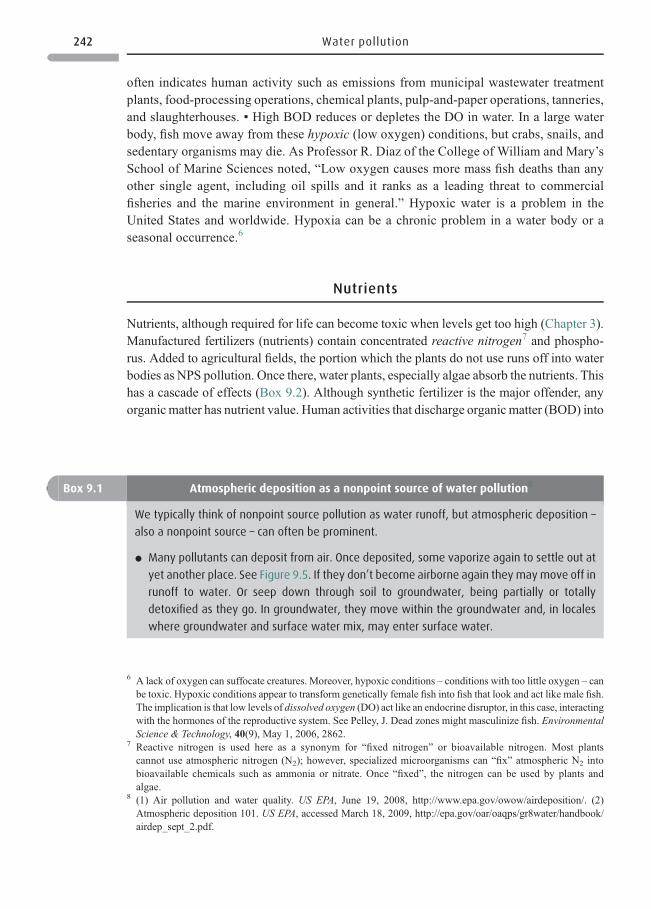
often indicates human activity such as emissions from municipal wastewater treatmentplants, food-processing operations, chemical plants, pulp-and-paper operations, tanneries,and slaughterhouses. ▪ High BOD reduces or depletes the DO in water. In a large waterbody, fish move away from these hypoxic (low oxygen) conditions, but crabs, snails, andsedentary organisms may die. As Professor R. Diaz of the College of William and Mary’sSchool of Marine Sciences noted, “Low oxygen causes more mass fish deaths than anyother single agent, including oil spills and it ranks as a leading threat to commercialfisheries and the marine environment in general.” Hypoxic water is a problem in theUnited States and worldwide. Hypoxia can be a chronic problem in a water body or aseasonal occurrence.6
Nutrients
Nutrients, although required for life can become toxic when levels get too high (Chapter 3).Manufactured fertilizers (nutrients) contain concentrated reactive nitrogen7 and phospho-rus. Added to agricultural fields, the portion which the plants do not use runs off into waterbodies as NPS pollution. Once there, water plants, especially algae absorb the nutrients. Thishas a cascade of effects (Box 9.2). Although synthetic fertilizer is the major offender, anyorganic matter has nutrient value. Human activities that discharge organic matter (BOD) into
Box 9.1 Atmospheric deposition as a nonpoint source of water pollution8
We typically think of nonpoint source pollution as water runoff, but atmospheric deposition –
also a nonpoint source – can often be prominent.
* Many pollutants can deposit from air. Once deposited, some vaporize again to settle out at
yet another place. See Figure 9.5. If they don’t become airborne again they maymove off in
runoff to water. Or seep down through soil to groundwater, being partially or totally
detoxified as they go. In groundwater, they move within the groundwater and, in locales
where groundwater and surface water mix, may enter surface water.
6 A lack of oxygen can suffocate creatures. Moreover, hypoxic conditions – conditions with too little oxygen – canbe toxic. Hypoxic conditions appear to transform genetically female fish into fish that look and act like male fish.The implication is that low levels of dissolved oxygen (DO) act like an endocrine disruptor, in this case, interactingwith the hormones of the reproductive system. See Pelley, J. Dead zones might masculinize fish. EnvironmentalScience & Technology, 40(9), May 1, 2006, 2862.
7 Reactive nitrogen is used here as a synonym for “fixed nitrogen” or bioavailable nitrogen. Most plantscannot use atmospheric nitrogen (N2); however, specialized microorganisms can “fix” atmospheric N2 intobioavailable chemicals such as ammonia or nitrate. Once “fixed”, the nitrogen can be used by plants andalgae.
8 (1) Air pollution and water quality. US EPA, June 19, 2008, http://www.epa.gov/owow/airdeposition/. (2)Atmospheric deposition 101. US EPA, accessed March 18, 2009, http://epa.gov/oar/oaqps/gr8water/handbook/airdep_sept_2.pdf.
242 Water pollution
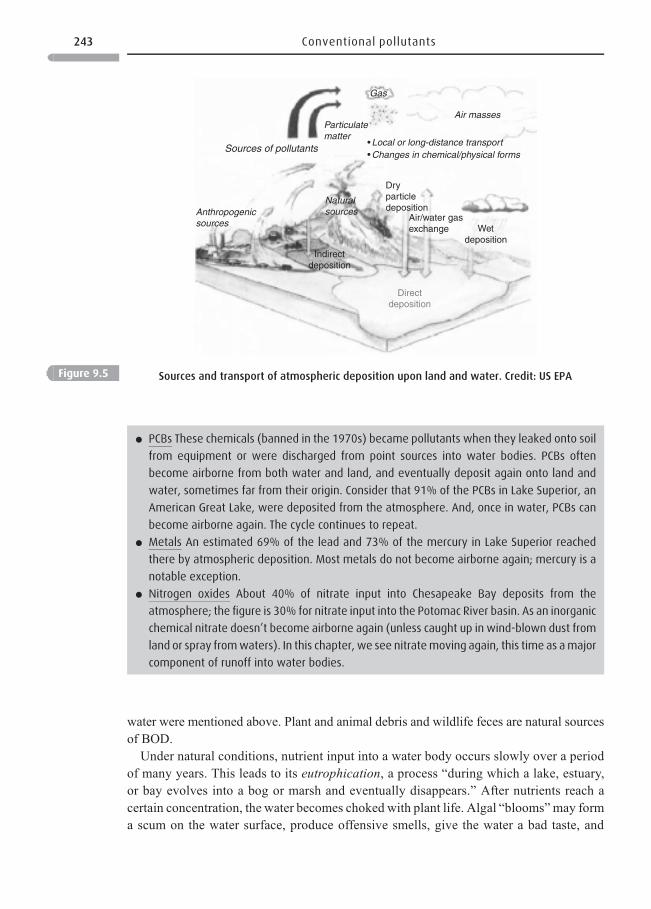
water were mentioned above. Plant and animal debris and wildlife feces are natural sourcesof BOD.
Under natural conditions, nutrient input into a water body occurs slowly over a periodof many years. This leads to its eutrophication, a process “during which a lake, estuary,or bay evolves into a bog or marsh and eventually disappears.” After nutrients reach acertain concentration, the water becomes choked with plant life. Algal “blooms”may forma scum on the water surface, produce offensive smells, give the water a bad taste, and
Air masses
Gas
Local or long-distance transport
Wetdeposition
Air/water gasexchange
Indirectdeposition
Directdeposition
Dryparticledeposition
Naturalsources
Particulatematter
Anthropogenicsources
Sources of pollutantsChanges in chemical/physical forms
Figure 9.5 Sources and transport of atmospheric deposition upon land and water. Credit: US EPA
* PCBs These chemicals (banned in the 1970s) became pollutants when they leaked onto soil
from equipment or were discharged from point sources into water bodies. PCBs often
become airborne from both water and land, and eventually deposit again onto land and
water, sometimes far from their origin. Consider that 91% of the PCBs in Lake Superior, an
American Great Lake, were deposited from the atmosphere. And, once in water, PCBs can
become airborne again. The cycle continues to repeat.
* Metals An estimated 69% of the lead and 73% of the mercury in Lake Superior reached
there by atmospheric deposition. Most metals do not become airborne again; mercury is a
notable exception.
* Nitrogen oxides About 40% of nitrate input into Chesapeake Bay deposits from the
atmosphere; the figure is 30% for nitrate input into the Potomac River basin. As an inorganic
chemical nitrate doesn’t become airborne again (unless caught up in wind-blown dust from
land or spray fromwaters). In this chapter, we see nitratemoving again, this time as amajor
component of runoff into water bodies.
243 Conventional pollutants
make it unfit for swimming. ▪ Human activities can put eutrophication on fast forward byrapidly discharging large amounts of nutrients (especially nitrate and phosphorus) intowater.9 A final step results when the water’s DO becomes greatly depleted or eliminated.At that point, it becomes a dead zone. Too many nutrients lead to eutrophication and then,increasingly dead zones. Dead zones have been increasing rapidly around the world,especially in the northern hemisphere, but are now reported in the southern hemispheretoo in less-developed countries. See Section V below for more detail on the nitrogen glut. ▪Surplus nutrients can impact animals too. For a number of years, frogs have been foundwith a number of different deformities related to excess nitrogen/phosphorus levels, asdescribed in more detail in the discussion of adverse effects of excess nutrients later in thechapter.10
pH11
Acid deposition Recall (Chapter 6) that the global problem of acid deposition can lead towater bodies with a pH too low to optimally support life or, sometimes to support life at all.
Box 9.2 BOD and fertilizer nutrients
Nitrate and phosphorus (as phosphorus pentoxide) are two nutrients found in commercial
fertilizer, which often also contains potash (a potassium source). Just as on land, these
nutrients stimulate plant growth in surface waters. Then, as the vegetation dies, it becomes
BOD.
* Nutrients stimulate phytoplankton (algae) growth in water, sometimes enough to cause an
algal bloom.
* Zooplankton, tiny animals, eat the proliferating algae.
* As plankton and vegetation, after dying fall toward bottomwaters bacteria digest them and
also digest the fecal pellets of zooplankton. They use the DO in the water to do so. Thus, if
there is much material to digest, oxygen levels fall and aquatic organisms suffer. If most
oxygen is depleted, a dead zone can result. Sometimes all DO is depleted.
In estuaries and coastal areas, nitrate is often themajor culprit, that is to say that the growth of
vegetation is limited by the amount of nitrogen present: add more reactive nitrogen and the
vegetation flourishes, especially algae. In freshwater lakes, it is more often phosphorus that
limits plant growth.
9 The nitrogen in nitrate is reactive nitrogen; plants can use it. When there is more reactive nitrogen than needed,excessive growth of algae occurs. The relatively more rapid growth of algae crowds out the growth of other plantlife.
10 Dunham, W. Frog deformities blamed on farm and ranch runoff. Reuters, September 24, 2007, http://www.reuters.com/article/environmentNews/idUSN2432027920070924.
11 Extremes of pH can be either acid or basic (alkaline). See Figure 6.2. Too low a pH (excessive acid) is typicallythe major problem. However, too high a pH (excessively alkaline) can also harm or kill aquatic life as can happenwhen there is a spill of alkaline “liquor” from a kraft pulp and paper mill.
244 Water pollution
▪ Mining operations are another source of acid: metal ore and coal deposits often containmetal sulfides, brought to Earth’s surface by mining. There, exposed to atmospheric oxygen,sulfide is oxidized to sulfate. If moisture is present, the sulfate is converted to sulfuric acid,which runs off into nearby water. Worsening the situation, sulfuric acid can dissolve thehazardous metals contained in mining wastes, and these too are found in NPS runoff. If thereceiving water is a river or stream, the acid may be carried far downstream. If iron is one ofthe metals present, contaminated streams can turn orange.
Suspended solids
As with other conventional pollutants, suspended solids (SS) are naturally found in water.As always, it is a surplus that is deleterious. Recall that in air, it is the very fine particleswhich cause the greatest health problems. Similarly, it is the very fine particles in SS,which can cause the most serious problems. ▪ Increased SS content makes water moreturbid or cloudy. This limits the sunlight reaching aquatic plants, stunting their growth.▪ Fine SS can also clog fish gills and harm their respiration and the respiration of otheraquatic animals. A major source of SS is soil runoff from agricultural fields; row cropssuch as corn are particular offenders. Forestry and construction activities contribute too.Point sources of SS include facilities that discharge various solids including BOD. ▪ SSentering drinking-water treatment plants can interfere with efficient water disinfection byshielding microorganisms from disinfectant. Surviving microbes enter drinking water.12
Oil and grease
Oil spills pose a major problem in near-coastal waters, killing or adversely affecting fish,other aquatic organisms, birds, and mammals. Oil can also kill or injure organisms living incoastal sands and rocks, and the worms and insects that are food to birds and wildlife. If itintrudes into coastal marshes, the oil can damage or kill fish, shrimp, birds, and otheranimals (Box 9.3). Oil spills can foul beaches used for swimming and recreation.▪ Despite the sometimes horrendous damage of oil spills, they are seen as a relativelyminor problem for fish and the marine environment in comparison to chronic nutrientpollution. Depending upon the amount and type of oil spilled, where it is spilled, andweather conditions, ecosystem recovery can be quick or painfully slow.
12 Soil particles that are not suspended can cause problems too. Heavier particles fall to the bottom of a water bodywhere excessive input can suffocate or damage bottom-dwelling organisms, and change the characteristics of thewater body. In the worst cases, it fills in stream beds. Eroded soil carried in runoff from agricultural lands andconstruction sites has badly impaired water quality in a number of rivers and lakes in the United States andelsewhere.
245 Conventional pollutants
The Exxon Valdez is a notorious example of an oil spill causing major damage14 (Box 9.3).Other large spills may result from15 oil line leaks, as has occurred in the Arctic (Alaska andSiberia). Warfare has caused horrendous spills, most recently (2006) when Israel bombed anoil-burning power plant in Lebanon. The largest occurred during the 1991 Gulf war, whenIraq deliberately released 882 000 tons (800 000 tonnes) of crude oil into the Persian Gulf –23 times the amount spilled by the Exxon Valdez. ▪ How difficult spills are to clean uppartially depends on weather; it may be helpful if wind and water currents move the oil out tosea. Viscous and sticky oil is harder to clean up, whereas products such as diesel evaporateand dissipate fairly quickly. Equipment used to contain oil spills includes “booms andskimmers.” Chemicals such as dispersants and gelling agents may be used. Shorelines maybe partially cleaned by raking and bulldozing. No method is wholly satisfactory; often thedamage cannot be reversed.
Small spills on land result from leaks from vehicles, and oil released during accidents.Rain washes these off roads and into water bodies. Improperly disposed of used oil alsowashes into water bodies; a portion may seep into groundwater. Direct releases of oil intowater bodies also occur: motor and other recreational boats release up to 30% of their fuel,
Box 9.3 The Exxon Valdez
The Exxon Valdez oil tanker spilled 39 000 tons (35 200 tonnes) when it went aground in Prince
William Sound, Alaska, in March, 1989. It was the largest spill in US history, killing hundreds of
thousands of birds andmarine animals and soiling 1200miles (1931 km) of coastline. Clean up
and reparations cost billions of dollars. By 2006, water, beaches, and animals appeared to
have recovered, but oil persists below the surface along about 6.2 miles (10 km) of shore-
line.13 There is controversy as to whether this still harms animals that live or feed in this beach
(in the part exposed during low tide) as when otters dig into the shore. However, one
researcher commented, “The oil really is petering out, and it doesn’t look bioavailable.”
Regardless of lingering effects, consider the 1993 comments of biologist Rick Steiner describ-
ing the spill’s effects. “The essence of the disaster lies in images of once-playful river otters
oiled and crawling off to die in rock crevasses along their home streams; bald eagles losing
their grip in the treetops, falling dead deep in the forest; orphaned sea otter pups searching for
dead parents, shivering through oiled fur in cold water that once seemed warm; seals, sea
lions, and whales staring up at a black surface through which they must swim in order to take
their next breath, eyes and nostrils inflamed, often then inhaling oil instead of air; diving birds,
soaked in oil and unable to fly, with simply nowhere to go but back into the thick of the oil. If
nothing else, the Exxon Valdez should serve to remind all of us that any true prosperity we
seek in this world must also include consideration for the many innocent beings along the
way.” Mr. Steiner would probably use similar words to describe the more recent “spills.”
13 Renner, R. Exxon Valdez oil no longer a threat? Environmental Science & Technology, 40(20), 15 October 2006,6188–6189.
14 Exxon Valdez oil spill. Wikipedia, March 15, 2009, http://en.wikipedia.org/wiki/Exxon_Valdez_oil_spill.15 Key facts about oil spills. Reuters, August 17, 2006, http://www.planetark.com/dailynewsstory.cfm/newsid/
37692/story.htm.
246 Water pollution
unburned, into water. ▪ Such individually small, but ongoing events add up to much more oilthan is spilled in a dramatic event such as the Exxon Valdez. However, the environmentalimpact of ongoing small events is hard to assess.
Pathogenic microorganisms16
Most microorganisms do not cause disease.17 ▪ The problem arises with very specificmicrobes: pathogens. Pathogens can cause infectious disease. A microbial pathogen canbe a bacterium, virus, fungus, protozoan, or toxic algal species. In Chapter 10 we willexplore pathogens in drinking water. These pose a tremendous health threat. ▪ Infectiousmicrobes found in shellfish (or the toxins that some produce) can halt their harvest as food.▪ Pathogenic viruses and bacteria in coastal water can infect swimmers. Viruses are abundantin coastal waters, often surviving in salt water longer than bacteria. Infection results throughingesting contaminated water or through broken skin. In the United States, as many as 19 outof 1000 swimmers each year are reported to suffer gastroenteritis caused by swimming inwater containing infectious microbes.
Sources of pathogens
* Nonpoint Pathogenic microbes in a water body often result from human activities onland; they arrive via runoff of storm water, from improperly operating septic systems, andrunoff from livestock operations. ▪Eighty-five percent of beach closures in the UnitedStates are traced to the presence of fecal bacteria, which arrived in storm water runoff,often from impervious paving in the area. Certain fecal microbes from septic systems nearthe beach can pass through soil to groundwater and to beach areas – sometimes withinhours. ▪ But a bigger problem in coastal areas is the increasing amounts of imperviouspaving; these have a direct relationship to fecal microbes reaching the beaches. Considerone rapidly growing coastal area in North Carolina: in one subdivision where asphalt andconcrete covered 22% of the surrounding watershed, the fecal coliform count was seventimes higher than in a nearby subdivision where the figure was only 7%. Impervioussurfaces increase in tandem with increasing population and more developed land: “themost polluted beaches and bays in the United States are generally located in denselypopulated coastal counties.”18
16 Water Quality Criteria, Microbial (pathogen). US EPA, May, 2008, http://www.epa.gov/waterscience/criteria/humanhealth/microbial/microbial.html.
17 Microorganisms perform useful, often vital functions for humans including assisting the digestion in our guts.We also depend on microbes to degrade organic wastes in the environment, and to biodegrade the organicmaterial in trash and landfills. We use microbes in fermentations to make food products, pharmaceuticals, andother chemicals. They are ubiquitous in our environment, found almost anywhere that one looks. ProfessorsBruce Levin and Rustom Antia state, “Almost every time we eat, brush our teeth, scrape our skin, have sex, getbitten by insects, and inhale, we are confronted with populations of microbes that are capable of colonizing themucosa lining of our orifices and alimentary tract and proliferating in fluids and cells within us. Nevertheless, werarely get sick much less succumb to these infections.”
18 Mallin, M. A. Wading in waste. Scientific American, 294(6), June, 2006, 53–59.
247 Conventional pollutants
* Point Some pathogens arrive from point sources, especially poorly performing municipalsewage treatment plants. ▪ The situation is worse in many less-developed nations wheremost sewage may be dumped untreated into rivers and oceans.
Priority (toxic) pollutants
Conventional pollutants often pose the largest and the worst pollution problems with whichwe must deal, but other pollutants can be significant. Priority water pollutants, also calledtoxic pollutants form another category regulated under the CWA. Recall that many pollu-tants such as lead or chloroform are found in more than one environmental medium, and youwon’t be surprised to learn that many of the hazardous air pollutants (Chapter 5) arecommonly found as water pollutants too. ▪ The US EPA, under the CWA, regulates 126pollutants, including the metals, arsenic, cadmium, lead, mercury, nickel, copper, and zinc.Thus, these metals are both priority water pollutants and hazardous air pollutants (HAPs),see Table 5.4. ▪ Likewise, many organic chemicals that are HAPs are also priority waterpollutants; these include widely used industrial chemicals as benzene, toluene, as well asmany pesticides.
▪ A high concentration of a priority water pollutant, commonly a pesticide, may causeacute illness in aquatic creatures or death. In the United States, fish kills continue to bereported as a result of runoff of spilled pesticides or other chemicals. In lower concen-trations, many priority pollutants present a chronic health risk as when certain pesticides actas environmental hormones (Chapter 3). Point sources of priority pollutants, such as waste-water treatment facilities can usually be well controlled. Nonpoint sources are moreproblematic as when pesticides run off from agricultural fields; when organic chemicalsrunoff from city streets; or when PAHs are deposited from air.
Pesticides
US Geological Survey (USGS) scientists over a 10-year study found pesticides and theirbreakdown products nationwide in United States streams, usually as mixtures of pesti-cides.19 More than 90% of USGS samples contained at least two pesticides (and theirmetabolic products); 20% contained ten. Organochlorine pesticides banned years ago –
DDT, dieldrin, and chlordane – did show declining concentrations as compared to earlieryears. These results were found in both rural and urban locales, in streams, groundwater,riverbed sediments, and fish tissues. Pesticide concentrations were fortunately low, butcould impact aquatic life or fish-eating animals.
19 Christen, K. Pesticide mixtures ubiquitous in US streams. Environmental Science & Technology, 40(11), June 1,2006, 3446–3447 [also see http://pubs.usgs.gov/fs/2006/3028/].
248 Water pollution
Nonconventional and nontoxic pollutants
A third group of water pollutants regulated under the CWA is the nonconventional andnontoxic pollutants. Here we find ammonia, chloride (as in sodium chloride), iron, alumi-num, total phenols, and color. ▪ Many facilities – textile factories, for instance – dischargecolored effluents. The intensity of the discharged color is regulated by law. ▪ Heat isregulated too. Electric power plants especially, but also many industrial facilities dischargeheated effluents. This thermal pollution can cause problems but not ordinarily so serious asmany other pollutants discussed in this chapter.Salt Remember that the “dose makes the poison.” Then consider that, as of 2005, the
United States had enough impervious paving (blacktopped surfaces) – roads, parking lots,and driveways – to cover the state of Ohio. More continue to be built. ▪Now think that EPA’slimit for salt in drinking water is 500 mg/l. ▪ Then consider that sodium chloride (NaCl) –plain table salt is used every winter to clear snow and ice from American roads in northernclimates.20 ▪Water moving over paved surfaces dissolves the salt – it is very water soluble –and carries it to nearby streams. ▪More salt is used every year because there are more pavedsurfaces every year. Thus, the amount of salt reaching northern US streams increases yearly.The result is that streams and groundwater are becoming salinized. ▪ In streams feeding intoBaltimore, Maryland, reservoirs, salinity increased from ~10 mg/l to ~50 mg/l between the1970s and 2004. In Dutchess County, NY, the increase was from 30 mg/l to ~60 mg/lbetween the 1980s and 2004. These values correspond to about 25% of the concentration ofchloride found in seawater. Even in summer, some streams remain up to 100 times moresaline than unaffected streams. ▪ University of Maryland researcher, Sujay Kaushal stated,“There is a direct connection between the number of driveways and parking lots and thequality of our water.” There are alternative means to de-ice roads, but they too have impacts.“The problem is the number of roads,” said Kaushal.
Banned discharges
The Clean Water Act totally forbids discharges of radioactive chemicals, chemical warfareagents, and biological warfare agents. ▪ Discharge of PCBs is prohibited under the ToxicSubstances Control Act (TSCA). In industrialized countries, the manufacture of PCBs wasbanned in the 1970s, but they still persist in runoff from old spills, waste sites, or leaks fromold electrical equipment. As a result of discharges into water that occurred when PCBmanufacture was still legal, these long-lived chemicals still survive in sediments where theyare more likely found due to their low solubility in water.
20 (1) Kaushal, S. S., et al. Increased salinization of fresh water in the northeastern US. National Academy ofSciences, 102, October 3, 2005, 14487–14488, http://www.pnas.org/content/102/38/13517. (2) Jackson, R. B.and Jobbágy, E. G. From icy roads to salty streams. Proceedings of the National Academy of Sciences, Publishedonline October 3, 2005. http://www.pnas.org/content/102/41/14487.full.
249 Banned discharges
SECTION II
Water bodies impacted by pollution
When thinking about a pollutant, consider the water body it impacts. Is it a river, lake,stream, wetland, estuary or coastal water, ocean or groundwater? This can be important:
* A specified amount of pollutant running off one time into a large fast-running river mayhave little impact, but the same amount may be noticeable in a slow-moving stream orsmall lake.
* If the pollutant continues to enter the large river in large quantities – as when reactivenitrogen from fertilizer enters the Mississippi River system – the river itself may stillremain undamaged. But the locale to which the pollutants are carried may be harmed –
consider the Gulf of Mexico dead zone at the mouth of the Mississippi, as you will see inSection V, below.
* Metals are natural components of sea water, and small additional inputs may go unno-ticed. But adding the same amount of metals to a freshwater lake, where concentrationsare normally low, may lead to problems. Lakes may also have little exchange of water todilute the metal.
* Or, what happens if an organic pollutant is added to surface water? Microbes, oxygen,sunlight, and wave movement may break it down, or it may evaporate. Conversely, ingroundwater there are few means to degrade the pollutant.
Groundwater21
More than a quarter of the world’s population depends on groundwater for drinking water. Inthe United States, metropolitan systems usually depend on surface water, but plants insmaller communities often use groundwater. When groundwater is very deep underground,contaminants running off in rainwater may not reach it. However, much of the groundwaterused for drinking water is in shallow aquifers and above-ground pollutants may beincompletely removed as they are carried down into groundwater. Once in groundwaterthen, because of often close connections between shallow groundwater and surface water,the pollution can reach surface water. ▪ The opposite is also true, i.e. surface water pollutionsometimes reaches groundwater. ▪ Once polluted, groundwater can remain that way for a
21 Groundwater is found beneath the Earth’s surface in aquifers (porous geologic formations). Sometimes ground-water flows in a channel, but not ordinarily like a surface stream. Rather the formation is composed of permeablerock, gravel, or sand that is saturated with water. Groundwater can flow, but ordinarily more slowly than surfacewater. On the other hand, groundwater sometimes supplies above-ground springs and wells. (1) Ground waterand drinking water. US EPA, http://www.epa.gov/safewater/. (2) Ground water primer. EPA and PurdueUniversity, http://www.purdue.edu/dp/envirosoft/groundwater/src/ground.htm.
250 Water pollution
long time. Especially in slow-moving groundwater, pollutants may persist indefinitely. ▪Oily chemicals with low water solubility pose special problems. Trapped in soil and rock,they may continue to slowly leach into the groundwater, maintaining contaminationindefinitely.
Sources of groundwater pollution
Water-soluble surface pollutants infiltrate soil, often reaching groundwater. Shallowgroundwater is most easily contaminated. ▪ How much pollutant reaches groundwaterdepends on soil type, pollutant characteristics, and the distance to the groundwater. ▪Contamination sources (Table 9.2) include agricultural and urban runoff, chemical spills,and landfill leachate – anything releasing pollutants that are able to descend through soil intogroundwater. Land use affects how much pollution reaches groundwater: intensively usedagricultural land can leach out nutrients (reactive nitrogen in fertilizers), pesticides, andmicrobes; a portion of each of these can reach groundwater. ▪Likewise, in urban areas highlycontaminated runoff, once it reaches surface soil, can percolate down to groundwatercarrying with it a portion of its pollutant load. ▪ Pathogens, especially viruses which aremuch smaller than most bacteria, reach groundwater too. Thus, sewage from improperlyinstalled or maintained septic systems can contaminate groundwater; as can nitrate in wastesfrom confined-animal operations. ▪ Improperly protected landfills can leach contaminants,some of which reach groundwater. This is also true for petrochemicals from leakingunderground-storage tanks. Groundwater often has detectable levels of pesticides too. ▪You begin to see that a great many pollutants can be found in groundwater. Detectabledoesn’t necessarily indicate a problem, but points out the need for pollution prevention (P2)because cleaning up groundwater is either very difficult or not possible at all.
Pollution prevention and reducing groundwater contamination
* Surface water and groundwater are often closely interconnected, and runoff can contam-inate both. Thus, a holistic approach is necessary. The US EPA works with states to
Table 9.2 Sources of contamination to groundwater a
Source Contaminant
Landfill (improperly built or maintained), old dump,unsecured hazardous waste site
Water-soluble chemicals in trash (metals, salts,some organic chemicals)
Septic systems (poorly built or maintained) Microorganisms including pathogensFarms, grassy areas (lawns, golf greens, etc.) Fertilizer (nutrients) and pesticidesAnimal farms (especially large-scale operations) Nutrients and microorganisms leached from wasteSurface spills Oil, hazardous chemicals, etc.
aGroundwater is frequently used for drinking water, so humans may be exposed to these contaminants. Also,groundwater can often contact surface water in streams, rivers, lakes, thus allowing any contaminants to reachsurface water. Information source: US EPA, http://www.epa.gov/ogwdw/protect/assessment.html.
251 Water bodies impacted by pollution
develop pollution prevention (P2) strategies to protect watersheds that feed aquifers andwellheads. (Awellhead is the immediate area around the intake of a public water supply.)▪ P2 can help maintain groundwater purity as when regulations specify that only thosepesticides with little tendency to migrate into groundwater can be used in a wellhead area,or regulations may specify how to apply pesticides in a way that limits the amount thatruns off with rain. ▪ Another P2 approach is regulating how land can be used: prohibitingsiting of landfills or gasoline stations over groundwater that feeds into a wellhead;prohibiting large confined-animal operations near vulnerable groundwater, or morestrictly, prohibiting farmers from grazing livestock there. ▪ A hazardous waste site is anexample where pollution already exists and only control, not P2 is possible. However, it isstill possible to control the levels of waste site pollutants reaching groundwater.
Groundwater can be hard or impossible to clean up
* Groundwater, once polluted can remain so for years, decades, or indefinitely. ▪ Cleaningup polluted groundwater is extremely costly, often not possible with today’s technology.Nonetheless, pump-and-treat is commonly used with the goal of restoring the water todrinking-water quality. The groundwater is pumped to the surface, treated to removepollutants, and then returned to its source. Especially in aquifers with large volumes ofwater, pump-and-treat may continue for many years without notably reducing pollution.▪ A US National Academy of Sciences panel, after extensively studying pump-and-treat,concluded that some sites would not reach drinking water quality even if treatmentcontinued for 1000 years. The panel advised against its routine use, instead recommendingcontaining the contaminated water in place until effective treatment technologies becomeavailable. ▪Containment involves building an underground barrier to prevent contaminantsfrommigrating off-site. However, this works only for shallowwater that is contaminated ina way that it can realistically be contained. ▪ Sometimes groundwater is treated in place, notremoved from the aquifer. One such technique involves digging trenches, and installingtons of iron filings mixed with sand in the path of the groundwater. As contaminatedgroundwater flows through this permeable barrier, some organic pollutants, such astrichloroethylene will react with the iron, and decompose into benign products. ▪ Anotherin place technique being explored is using anaerobic microorganisms that can degrade thecontaminants. (They need to be anaerobic because groundwater has little oxygen.)
Volatile organic chemicals in groundwater
The United States manufactures very large quantities of volatile organic chemicals (VOCs),and has done so for many years. Many are environmentally persistent and are known to beable to migrate in groundwater.22 ▪ Given these facts, it was logical to investigate whetherVOCs were contaminating groundwater and drinking water. The US Geological Surveyanalyzed thousands of samples from aquifers and drinking water wells from around the
22 The types of products produced in which VOCs are used include plastics, adhesives, paints, gasoline, fumigants,refrigerants, and dry-cleaning fluids.
252 Water pollution
United States, monitoring for 55 different VOCs.23 They detected 42 in the nation’s aquifers.Chemicals often detected included toluene, tetrachloroethylene, trichloroethylene, andMTBE (methyl tertiary butyl ether). ▪ Investigators found that most aquifers throughoutthe United States did contain detectable VOCs, not just those in certain locales. Fortunately,concentrations were all very low and the VOCs were not detected at all in about 80% of thehome drinking water wells sampled. ▪ It is not reassuring that these chemicals were found.However, the facts that levels were almost all very low, and that the VOCs were not typicallydetected in home wells is reassuring. Again think P2: prevent further pollution.
Wetlands24
The US EPA describes wetlands as the “link between land and water . . . transition zones,”which are not necessarily wet year around. Chapter 1 noted ecosystem services of wetlands,swamps, bogs, and marshes (coastal and inland). ▪ Relevant to this chapter is the sequester-ing of pollution in wetlands: they absorb surplus nutrients, sediment, and other pollutantsbefore they reach rivers, lakes, and other water bodies. They also absorb and slow flood-waters, thus alleviating flood damage; and provide habitat for thousands of species of plantsand animals. Thus, knowing that an estimated 50% of the world’s wetlands have alreadydisappeared means knowing that we have lost a major source of pollution and flood controland have lost wildlife habitat. ▪ Although wetlands can buffer against pollution, they can beoverwhelmed and become contaminated enough to harm the animals, plants, and microbesthat live within them. Constructed wetlands will be addressed in Chapter 10.
Questions 9.1
1. Remember concepts from Chapter 3. (a) Why should we concern ourselves about very low
levels of a pesticide? (b) When multiple pesticides are present, what is the difficulty in
determining the total toxicity of the mixture?
2. Consider that the health limit for salt in drinking water is 500 mg/l and the highest value in
polluted streams in the example given earlier is ~60 mg/l. So, why be concerned?
3. Levels of VOCs detected nationwide in groundwaterwere almost all very low.Moreover, they
were seldom detected in home wells. This is reassuring, but what else could concern us?
4. Ponder some facts. (a) The population of southeastern Michigan may grow by 6% in the
coming 20 years, but the amount of developed land could grow 40%. (b) Nationwide, the
average number of persons per household declined from 3.6 to 2.7 over the past 40 years,
thus increasing the number of households. (c) The number of vacation homes in the United
States is increasing. (d) The amount of shopping space per person has been increasing,
usually as more shopping malls. So: (i) How do these facts lead to greater water, air, and
land pollution? (ii) What can you as an individual do to begin turning this situation around?
23 Moran, M. J., Hamilton, P. A., and Zogorski, J. S. Volatile organic chemicals in the nation’s ground water anddrinking water supply wells: a summary. USGS, April, 2006, http://pubs.usgs.gov/fs/2006/3048/.
24 (1) Wetlands. US EPA, January 14, 2009, http://www.epa.gov/owow/wetlands/. (2) Wetlands Fact Sheets. USEPA, January 12, 2009, http://www.epa.gov/owow/wetlands/facts/contents.html (3) Wetlands Overview. USEPA, 2004, http://www.epa.gov/owow/wetlands/facts/overview.pdf. (4) Functions and Values of Wetlands. US EPA,September, 2001, http://www.epa.gov/owow/wetlands/facts/fun_val.pdf.
253 Water bodies impacted by pollution
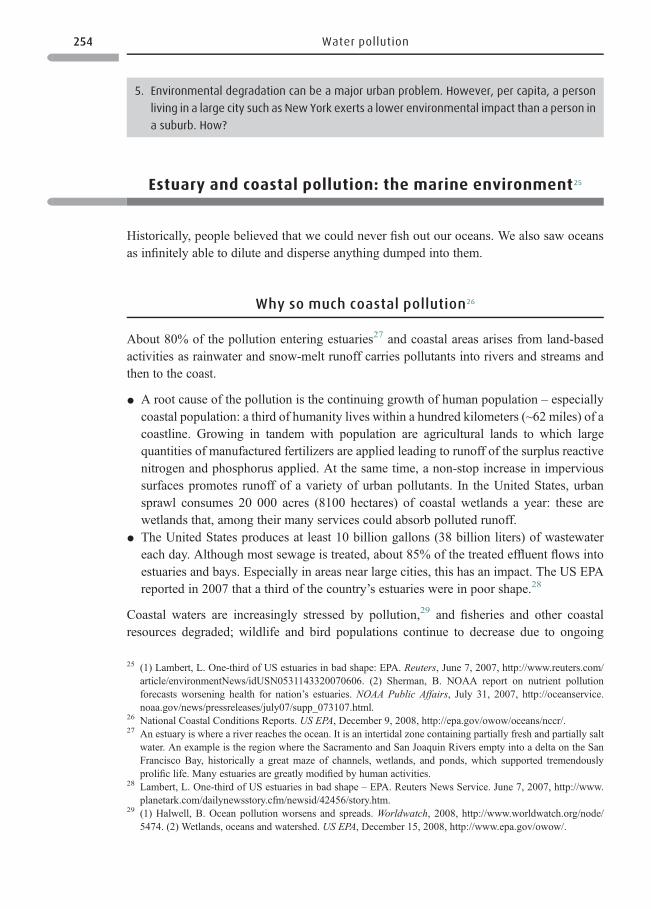
Estuary and coastal pollution: the marine environment25
Historically, people believed that we could never fish out our oceans. We also saw oceansas infinitely able to dilute and disperse anything dumped into them.
Why so much coastal pollution26
About 80% of the pollution entering estuaries27 and coastal areas arises from land-basedactivities as rainwater and snow-melt runoff carries pollutants into rivers and streams andthen to the coast.
* A root cause of the pollution is the continuing growth of human population – especiallycoastal population: a third of humanity lives within a hundred kilometers (~62 miles) of acoastline. Growing in tandem with population are agricultural lands to which largequantities of manufactured fertilizers are applied leading to runoff of the surplus reactivenitrogen and phosphorus applied. At the same time, a non-stop increase in impervioussurfaces promotes runoff of a variety of urban pollutants. In the United States, urbansprawl consumes 20 000 acres (8100 hectares) of coastal wetlands a year: these arewetlands that, among their many services could absorb polluted runoff.
* The United States produces at least 10 billion gallons (38 billion liters) of wastewatereach day. Although most sewage is treated, about 85% of the treated effluent flows intoestuaries and bays. Especially in areas near large cities, this has an impact. The US EPAreported in 2007 that a third of the country’s estuaries were in poor shape.28
Coastal waters are increasingly stressed by pollution,29 and fisheries and other coastalresources degraded; wildlife and bird populations continue to decrease due to ongoing
5. Environmental degradation can be a major urban problem. However, per capita, a person
living in a large city such as New York exerts a lower environmental impact than a person in
a suburb. How?
25 (1) Lambert, L. One-third of US estuaries in bad shape: EPA. Reuters, June 7, 2007, http://www.reuters.com/article/environmentNews/idUSN0531143320070606. (2) Sherman, B. NOAA report on nutrient pollutionforecasts worsening health for nation’s estuaries. NOAA Public Affairs, July 31, 2007, http://oceanservice.noaa.gov/news/pressreleases/july07/supp_073107.html.
26 National Coastal Conditions Reports. US EPA, December 9, 2008, http://epa.gov/owow/oceans/nccr/.27 An estuary is where a river reaches the ocean. It is an intertidal zone containing partially fresh and partially salt
water. An example is the region where the Sacramento and San Joaquin Rivers empty into a delta on the SanFrancisco Bay, historically a great maze of channels, wetlands, and ponds, which supported tremendouslyprolific life. Many estuaries are greatly modified by human activities.
28 Lambert, L. One-third of US estuaries in bad shape – EPA. Reuters News Service. June 7, 2007, http://www.planetark.com/dailynewsstory.cfm/newsid/42456/story.htm.
29 (1) Halwell, B. Ocean pollution worsens and spreads. Worldwatch, 2008, http://www.worldwatch.org/node/5474. (2) Wetlands, oceans and watershed. US EPA, December 15, 2008, http://www.epa.gov/owow/.
254 Water pollution
destruction of habitat by development, invasive species, and pollution. ▪ In 2004, twoseparate commissions reported that US coastal waters and oceans are in a state of crisis.And a 2007 National Coastal Condition Report30 rated 25% of US coastal waters asimpaired for swimming, 22% impaired for fishing, and 28% as unable to fully supportaquatic life. ▪ One major problem, according to a NOAA (National Oceanic andAtmospheric Administration) study is the continued eutrophication of coastal waters. Thestudy expressed pessimism for the future if communities don’t begin to control NPS nutrientpollution.31 See Section V, the “nitrogen glut.”
Sewage pollution
Shellfish harvesting
At any given time, about a third of US shellfish beds are closed to harvesting because ofcontamination with fecal microorganisms. ▪ To reduce coastal pollution, the United Statesbans ocean dumping of industrial waste and sewage sludge, treated or not. The US EPAworks with states and cities along marine and Great Lakes coasts to reduce pollution; thehope is to maintain shellfish harvesting, fishing, and swimming or to regain them once lost.Large coastal cities must have stormwater discharge permits which, among other require-ments, stem the flow of pollutants into the sea.32 US municipalities are slowly meetingstricter combined sewer overflow regulations that prevent untreated sewage from flowinginto water bodies; see Box 9.4. Chapter 10 will come back to sewage pollution in moredetail.
Box 9.4 Sewer terminology
* A sewer is an underground pipe system that carries wastewater to a treatment plant.
* A sanitary sewer carries wastewater from homes, commercial, industrial, and institutional
establishments to a treatment plant.
* A storm sewer carries the street runoff from rainstorms or melting snow.
* A combined sewer carries both sanitary wastewater and storm water runoff. Its contents
should go to awastewater treatment plant. However, if a heavy stormexceeds the capacity of
the system, it overflows. Then, the combined sewer overflow (CSO) containing both untreated
sewage and contaminated stormwater discharges into nearbywater bodies untreated.33 See
Figure 9.6. Combined sewers date from the late nineteenth and early twentieth century, and
remain in use in many hundreds of eastern and mid-western US cities.
30 US national coastal condition report. US EPA, December 9, 2008, www.epa.gov/owow/oceans/nccr.31 (1) Effect of nutrient enrichment in the nation’s estuaries. NOAA, 2004, http://ccma.nos.noaa.gov/publications/
eutroupdate/Exec_summary.pdf. (2) The future looks bleak for US coastal waters. Environmental Science &Technology, 41(19) October 1, 2007, 6637.
32 Stormwater management. US EPA, December 24, 2008, http://www.epa.gov/oaintrnt/stormwater/index.htm.33 Tibbetts, J. Combined sewer systems: down, dirty, and out of date [basic information on wastewater treatment].
Environmental Health Perspectives, 113(7), July 2005, A464–467.
255 Estuary and coastal pollution: the marine environment
Closing beaches34
* Storm-water runoff, CSO, and other poorly controlled sewage continue to reach coast-lines, and lead to the closure of US beaches for swimming. In 2006, there were closures orhealth advisories at 3500 beaches on the oceans and Great Lakes – up from 1500 in 1998.Closure is due to fecal bacteria such as Escherichia coli from animal and human wastes.▪ In southern California alone, 1.5 million (out of about 80 million) swimmers and surferssuffer gastrointestinal symptoms (stomach cramps, diarrhea, and vomiting) after contactwith coastal water. Savings in healthcare costs would likely more than offset the costs ofpreventing beach contamination.35 Not only water is contaminated, beach sand is alsoinfected with fecal bacteria. Indeed coastal waters flush themselves clean before thebacteria in the sand expire.36
Not just sewage pollution
In the 1990s, the US EPA began to regulate or provide guidelines for storm-related events,not just for CSO, but also for storm drains that discharge directly to water, carryingpollutants and trash with them.37 The Natural Resources Defense Council believes thatinstead of expensive engineering solutions, New York City (one city with major stormwater
Dry weather
Downspout
Stormdrain
Outfall pipeto river
Dam
Sewer to POTW
Sewage from domesticcommercial, and industrial sources
Wet weather
Downspout
Stormdrain
Outfall pipeto river
Combinedsewage and storm water
Sewer to POTW
Dam
Figure 9.6 How a combined sewer works and what happens in wet weather. Credit US EPA
34 (1) Beaches: basic information. US EPA, December 1, 2006, http://www.epa.gov/beaches/basicinfo.html. (2)Health concerns close record number of US beaches in 2006, ENS, August 7, 2007, http://www.ens-newswire.com/ens/aug2007/2007–08–07–02.asp.
35 Polakovic, G. Healthcare savings could offset beach cleanup costs. Los Angeles Times, July 18, 2006.36 Sand can be polluted even with clean water. The Associated Press, May 24, 2006, http://www.washingtonpost.
com/wp-dyn/content/article/2006/05/24/AR2006052402306_pf.html.37 Stormwater program. US EPA, April 30, 2009, http://cfpub.epa.gov/npdes/home.cfm?program_id=6.
256 Water pollution
problems) could use “green” solutions: more trees, roofs with gardens, and porous pave-ment. These could help to capture storm water where it falls rather than allowing it to runoffand overwhelm sewers.
Coastal pollution beyond the United States
International coastal pollution
In less-developed countries beach pollution can be much worse. Most sewage is dumpedinto rivers and oceans untreated. The UN Environmental Program (UNEP) stated in 2007that, “Rising tides of untreated sewage and plastic debris are seriously threatening marinelife and habitat around the globe.”38 Developed countries can sometimes be casual aboutdisposing of their sewage too including, surprisingly, Canada. ▪ Not only does about a thirdof humanity live within a hundred kilometers (62 miles) of a coastline, people increasinglylive in megacities – cities with a population of 10 million or greater. Thirteen of the world’scurrent 19 megacities are coastal cities. Worse, coastal populations are projected to double inthe coming 40 years. Sewage pollution will be discussed further in Chapter 10.
Plastics are a major pollutant
A person walking along a coastline even on isolated Arctic beaches can see the accumulatedtrash on the world’s beaches. One man, hiking on the most isolated of Iceland’s beaches,reported his dismay at finding trash on all of them. David Barnes of the British AntarcticSurvey notes that plastic debris is found even the remotest regions of Antarctica, saying“Truly pristine locales no longer exist.” In parts of the Southern (Antarctic) Ocean, thevolume of marine debris has tripled in just a decade.39 ▪ Plastic debris is estimated to kill amillion seabirds and 100 000 marine mammals and turtles each year as they ingest or becomeentangled in plastic bags, fishing line and nets, six-pack holders, string from balloons andkites, glass bottles, and cans.40 Plastic bags, bottle tops, and polystyrene foam coffee cupshave been found in the stomachs of dead sea lions, dolphins, sea turtles, and birds. North Seaseagulls had an average of 30 pieces of plastic in their stomachs, according to a 2004 study.Only about 20% of the plastic debris comes from offshore sources, the other 80% from land.Plastics do not biodegrade, but break up into smaller and smaller pieces, and finally micro-scopic bits. Even tiny one-celled phytoplankton can absorb these bits. Chapter 11 will discussfurther the massive amounts of plastics reaching our oceans.
38 Leahy, S. Marine scientists report massive “dead zones,”United Nations report on the marine environment. InterPress Service, October 6, 2006, http://www.commondreams.org/headlines06/1006–04.htm.
39 Leahy, S. Marine scientists report massive “dead zones,”United Nations report on the marine environment. InterPress Service, October 6, 2006, http://www.commondreams.org/headlines06/1006–04.htm.
40 The world’s only snapshot of trash in the ocean and its hazardous effects on ocean life. Ocean Conservancy,April 16, 2008, http://www.oceanconservancy.org/site/News2?abbr=press_&page=NewsArticle&id=10773.
257 Coastal pollution beyond the United States
Non-plastic debris, oil, and other pollutants
Many other types of debris also present problems. According to the UNEP, “The problem ofmarine litter has steadily grown worse, despite national and international efforts to controlit.” However, there are some success stories. ▪ An international treaty has banned a dozenPOPs (persistent organic pollutants) such as DDT and other polychlorinated chemicals. ▪Input into ocean waters of radioactive waste is also down sharply. This treaty, however, doesnot affect debris (as opposed to chemicals). ▪ Oil spills remain a problem, but there areimprovements: the US Oil Pollution Act of 1990 requires double hulls for new or upgradedoil-carrying vessels. Safe transport is a priority for some oil companies. Nonetheless, spillscontinue because of human error, bad weather, and crowded harbors. Oily waste dischargesfrom industry and cities have also been cut about 90% as compared to the mid-1980s.
Coastal protection
You saw earlier that two commissions reported in 2004 that US coastal waters and oceanswere in a state of crisis. Both made recommendations to remediate the problems, but the USBush Administration took no action. ▪ As seen in the Chesapeake Bay example (Box 9.5),states with coastlines do have protective programs, but they also need federal input, money,and coordination of state programs. ▪ Protecting the marine environment from land-basedactivities is enormously challenging. The UN initiated a program in 1995 involving several ofits agencies and involved the governments of 108 countries in this task.41
Box 9.5 Chesapeake Bay42
One-hundred fifty rivers and streams from six states feed into Chesapeake Bay creating the
largest estuary in North America. Bay ecosystems once flourished and were major sources of
fish and shellfish.
The problems
Human population, industrial and agricultural activities increased over the decades, and
impervious (paved) surfaces increased even more rapidly, up 41% just in the 1990s.
41 The UN agencies’ first task was to understand the contaminants and activities contributing to coastal pollutionand degradation. It established a clearinghouse to make scientific and technical information easily available tothose that need it, and to provide information on financial resources available to help nations attack coastalpollution. Just one international effort amongmany directed toward reducing coastal pollution was the ban on 12persistent organic pollutants (POPs) instituted through the Stockholm Convention of 2000.
42 (1) Barringer, F. A plan to curb farm-to-watershed pollution of Chesapeake Bay.New York Times, April 13, 2007.(2) Blankenship, K. Progress of Chesapeake cleanup. Bay Journal, January, 2008, http://www.bayjournal.com/article.cfm?article=3233. (3) Phillips, S. Many factors will challenge the recovery of the Chesapeake Bay. USGeological Survey, February 11, 2008, http://www.usgs.gov/newsroom/article.asp?ID=1871&from=rss. (4)Wyatt, K. Bay governors say progress with Chesapeake is too slow. Associated Press, December 6, 2007,http://www.wtop.com/?nid=25&sid=1305381.
258 Water pollution
▪ Nutrients (reactive nitrogen and phosphorus) were and are major pollutants. To understand
this, see the description of dead zones in Section V. In addition to NPS pollutants, poorly
functioning sewage-treatment plants are point sources of nutrients. ▪ Pathogens come from
improperly treated sewage and septic systems, and from runoff of animal waste. ▪ Suspendedsolids pour in with runoff. ▪Metal and organic pollutants flow in from industrial point sources
and, especially from urban runoff. ▪Water quality over the years deteriorated somuch that fish
and oyster populations dropped as much as 80%. Underwater grasses vital to coastal life
disappeared. The most severely polluted areas are around urban centers, but the whole bay is
impacted.
Starting restoration
The Chesapeake Bay Program,43 a federal–state partnership works with the states on pollution
control and P2 strategies to protect and restore the estuary and adjacent coastal waters. ▪Reducing NPS runoff to the Bay is a major goal of the effort and the major challenge. Among
actions taken, farmers began improving how they applied fertilizer, andmanagedmanure and
sludge. ▪ Other actions were to ask pesticide users to enroll in integrated pest management
(IPM) programs to help them reduce pesticide runoff. Another action was to begin planting
more forest buffers along river banks to absorb runoff.▪ To reduce Bay microbial contamina-
tion, wastewater treatment plants were to be upgraded, and millions of home septic systems
controlled. ▪ Plans were developed to reduce input into the bay of 14 high-priority toxic
chemicals. ▪ Few of these plans were actively pursued, but some were and early results
showed efforts were paying off. Underwater grass beds began to rebound, and more striped
bass were found in the bay. (Review Table 9.1 for Best Management Practices.)
A stalled restoration
Each year 13 indicators are assessed for the bay including wetlands, forest buffers, underwater
grasses, toxic pollutants, nutrients, water clarity, dissolved oxygen, and populations of crab,
rockfish, oyster, and shad. ▪ A score of 100 would represent the pristine Bay that existed before
European settlement. In 2001 the score was 27, not much better than the 23 seen in 1983, the
year the Bay “bottomed out.” Unfortunately, by 2000 population growth – averaging 150 000 a
year – and sprawling development with its loss of farmland and loss of 100 acres (40.5 hectares)
of forest a day stalled restoration. There was an ongoing decline in blue crab, and an increase in
algae and suspended solids, both blocking the sunlight needed by underwater grasses, and
smothering fish and shellfish. It was noted that “The bay remains a system dangerously out of
balance.” High nutrient levels in the bay remained the major challenge. In December 2007, the
Chesapeake Bay Foundation gave the estuary a grade of D for the ninth straight year, citing poor
water quality, habitat destruction, continuing fish kills, and low-oxygen zones. ▪ A more promis-
ing development, also in December 2007 was a meeting of three governors from States border-
ing the Bay. They conceded that the 2000 Bay restoration goals would not be met by 2010.
Nonetheless, they optimistically cited such actions as Maryland setting aside $50 million for the
43 Chesapeake Bay Program: protecting watersheds. September, 2008, http://www.chesapeakebay.net/news.aspx?menuitem=15845.
259 Coastal pollution beyond the United States
SECTION III
Reducing point sources of water pollution
Wastewater
Wastewater is tap water after it has been used in homes, businesses, and institutions fordrinking, bathing, flushing toilets, and other purposes. For a community to have a centraltreatment plant to treat wastewater coming in from many households requires an expensive
Chesapeake, mostly to reduce the number one problem of farm runoff. Virginia upgraded its
sewage treatment plants. Pennsylvania planted 600 miles (966 km) of forest buffers along
waterways. The governors noted that many steps had only recently been taken, and may still
significantly improve water quality and the local environment.
For Chesapeake Bay to thrive again, reactive nitrogen and phosphorus must be cut in half.
One official stated “Wewill never again see the Chesapeake restored to its pristine state of four
centuries ago, but we believe a Bay with an index of 70 is achievable by 2050.We must
remember how rich our Chesapeake Bay was, even 40 years ago, and not settle for a small
fraction of what we know it can be.”
Questions 9.2
1. How would recovering phosphorus from sewage or animal waste for use in fertilizers be
superior to removing it in a way that simply reduces the amount of phosphorus reaching
receiving waters?
2. (a) Diagram how releasing BOD (organic matter) to a water body has some of the same
effects as nutrients. (b) Why is the reactive nitrogen (nitrate) and phosphorus in synthetic
fertilizer more effective at stimulating an algal bloom than that in organic matter?
3. Dr. Stephen Eisenreich of Rutgers University notes that eutrophication is probably the major
water quality problem that the United States faces. He noted that although environmental
health is critical to ongoing economic development, we seem willing to accept eutrophi-
cation and other adverse impacts of urban sprawl rather than change land use practices.
(a) How does urban sprawl increase nutrient input to plant life in a water body? (b) Lay out
a strategy that you believe could succeed at reducing harmful inputs to an area affected by
eutrophication. How could you, personally fit into that strategy?
4. (a) How does surplus nutrient input to a water body change the composition of plant
species found there? (b) How does a change in plant species affect aquatic and bird life?
5. Given the extent that worsening pollution problems are directly correlated to increasing
population growth in the United States: (a) Why do we so seldom hear about the increasing
population of the United States? (b) Are there any policies that the United States could
realistically consider to limit population growth?
260 Water pollution
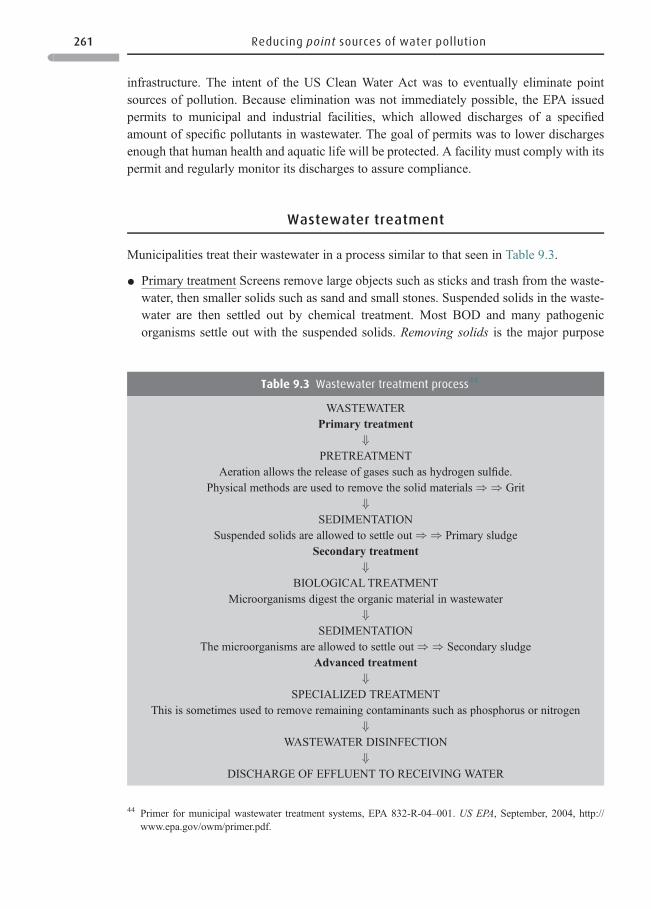
infrastructure. The intent of the US Clean Water Act was to eventually eliminate pointsources of pollution. Because elimination was not immediately possible, the EPA issuedpermits to municipal and industrial facilities, which allowed discharges of a specifiedamount of specific pollutants in wastewater. The goal of permits was to lower dischargesenough that human health and aquatic life will be protected. A facility must comply with itspermit and regularly monitor its discharges to assure compliance.
Wastewater treatment
Municipalities treat their wastewater in a process similar to that seen in Table 9.3.
* Primary treatment Screens remove large objects such as sticks and trash from the waste-water, then smaller solids such as sand and small stones. Suspended solids in the waste-water are then settled out by chemical treatment. Most BOD and many pathogenicorganisms settle out with the suspended solids. Removing solids is the major purpose
Table 9.3 Wastewater treatment process44
WASTEWATERPrimary treatment
⇓
PRETREATMENTAeration allows the release of gases such as hydrogen sulfide.
Physical methods are used to remove the solid materials ⇒ ⇒ Grit⇓
SEDIMENTATIONSuspended solids are allowed to settle out ⇒ ⇒ Primary sludge
Secondary treatment⇓
BIOLOGICAL TREATMENTMicroorganisms digest the organic material in wastewater
⇓
SEDIMENTATIONThe microorganisms are allowed to settle out ⇒ ⇒ Secondary sludge
Advanced treatment⇓
SPECIALIZED TREATMENTThis is sometimes used to remove remaining contaminants such as phosphorus or nitrogen
⇓
WASTEWATER DISINFECTION⇓
DISCHARGE OF EFFLUENT TO RECEIVING WATER
44 Primer for municipal wastewater treatment systems, EPA 832-R-04–001. US EPA, September, 2004, http://www.epa.gov/owm/primer.pdf.
261 Reducing point sources of water pollution
of primary wastewater treatment. Reactive nitrogen and phosphorus are only partiallyremoved in this process. The settled solids – primary sludge – are removed leaving thewastewater to move on to secondary treatment.
* Secondary treatment Here, soluble organic contaminants in the wastewater are digestedby bacteria. Because the bacteria multiply rapidly during this process, major quantities ofmicrobes are produced during treatment. These settle out from the secondary wastewater,and are recovered as secondary sludge, see Box 9.6. ▪ The final step before dischargingthe wastewater is to disinfect it, typically with a chlorine-containing chemical.
Box 9.6 Managing biosolids (treated sludge) from wastewater treatment
Large quantities of sludge result from primary and secondary wastewater treatment. In the
past sludge was dumped at sea, landfilled, or incinerated. Dumping at sea is prohibited in the
United States and a number of other countries. Landfilling is expensive. Europeans increasingly
incinerate it as do some American communities, but still must deal with the ash.
Land spreading sludge
In what most see as beneficial reuse, the United States applies about 60% of its treated
sludge – biosolids – to farms, forests, parks, and golf courses as fertilizer or soil amendment.45
Biosolids contain all the elements needed for plant growth, and its organic matter benefits soil,
helping to hold moisture and nutrients around plant roots, and allowing rainwater to infiltrate,
not run off. ▪ To meet standards for land spreading, sludge is sanitized to control pathogens. It
is also treated to meet legal standards for hazardous metals and other contaminants. Lime
may be added to raise the pH and reduce unpleasant odors. It is hard to argue that sludge,
properly treated, is a valuable biological resource that should be land spread. However, some
raise objections that it contains harmful levels of metals, and persistent organic chemicals such
as PCBs. Concern is expressed too for the health of the workers spreading it and for those living
nearby. Communities sometimes protest sludge spreading, fearing its contaminants, its odor,
and the flies it attracts. They assert that illnesses, even deaths, have resulted from the use of
biosolids.
Heavy metal standards
European countries have stricter standards for heavy metal levels in sludge meant for land
spreading than does the United States. They fear that soil to which sludge is applied may build
up harmful levels of cadmium, zinc, copper, and other metals. This sometimes happened in
earlier years, especially in Eastern Europe. Europeans now consider how difficult, even impos-
sible, it is to remediate metal-contaminated farmland. Thinking ahead 50 or even 500 years
45 (1) Land application of biosolids, Technology Fact Sheet EPA 832-F-00–064. US EPA, Office of Water,September, 2000, http://epa.gov/owm/mtb/land_application.pdf. (2) Wastewater management, biosolids publi-cations. US EPA, October 15, 2007, http://epa.gov/owm/sectbio.htm. (3) Biosolids Applied to Land: AdvancingStandards and Practices in Biosolids Management. Washington, DC: The National Academies Press, 2002,http://www.nap.edu/openbook.php?record_id=10426&page=31.
262 Water pollution
Standard wastewater treatment removes only a portion of the nutrients – reactive nitrogenand phosphorus – which can be so detrimental to receiving waters. Advanced treatment isnecessary to accomplish nutrient removal. Moreover, if standard treatment does notadequately remove priority water pollutants, yet additional treatment may be necessary.Non-conventional contaminants such as excessive color may also need to be removed fromsome wastewaters. ▪ Think about an illustration of the effectiveness of point-source control:after receiving poor reports on the quality of its beach water in the mid-1990s, Englandimproved its sewage treatment facilities and took measures to prevent sewer overflows. By2005 they found that 99% of the water at their beaches was clean. Even when tougher EUstandards were applied, almost 75% still met standards. They felt the results well justifiedthe money spent.46
Limits to controlling point sources
* Over the years wastewater treatment has become increasingly effective at removingcontaminants. Compared to 1972, when the Clean Water Act was passed, some point
they ask, what will the soil metal levels be? Some metals in soil are not very bioavailable to
plants, but plant roots do take up some metals such as the toxic cadmium. Europe has such
strict standards for metals in food that even the low cadmium content now permitted in sludge
would result in wheat levels that would exceed standards.
Industrial wastewater
The land spreading of sludge is a means of recycling biological material. This fits into the
industrial ecology paradigm where wastes are no longer wastes, but resources. However,
there is a need to ensure that wastewater from industrial facilities undergoes prior treatment
before sending it to municipal wastewater treatment plants. It was once common practice for
industry to pay municipal facilities to treat their wastewater along with their own. This was
financially attractive to municipal plants, however, some industrial effluents had components
the municipal plant could not remove, and these would pass into receiving waters.
Municipalities also often wanted to use wastewater sludge for beneficial purposes, and the
presence of industrial pollutants could make that impossible. So,the EPA began requiring
industrial plants to pre-treat their wastewater before sending it to a municipal plant.
Alternatively, some industrial facilities now treat their ownwastewater, then release it directly
to surface waters themselves. Most environmental organizations support land spreading of
sludge done to strict standards. On the other hand, some citizens’ groups still strenuously
oppose it, convinced that it is harmful. Clearly more work must be done if land spreading
controversies are to be resolved.
46 English beach water quality at record high. Reuters, November 10, 2005, http://www.planetark.com/dailynewsstory.cfm/newsid/33401/story.htm.
263 Reducing point sources of water pollution
emissions have been reduced by 95%, even 99%. By 1994, only about 15% of US waterpollution could be traced to point sources. But the original intent of the CWA was toeliminate point discharges – the name of the permit issued to municipalities and industrieswas the National Pollutant Discharge Elimination System (NPDES). But recall howdifficult it is to eliminate a pollutant end-of-pipe (Chapter 2), even with expensivetreatment. A spokesperson for the Water Environment Federation, an organization ofscientists, engineers, and wastewater managers, observed that many pollutants exist atlevels so low that they are hard to quantify and often very difficult to eliminate. He stated,“It would probably cost as much to eliminate the last 5% of a contaminant as to eliminatethe other 95% . . . Our philosophy is to move toward smaller amounts of pollutants andanalyze the cost of eliminating decreasing quantities versus the benefit of the environ-mental gain.” ▪ P2 involves actually reducing the amount of pollutant formed, nottrapping it afterwards. This has led some to suggest that society should give the mosttoxic pollutants a deadline by which time their discharge must be eliminated. This wouldlikely mean societal phase out of those chemicals, which has already happened for somechemicals. An example is the international treaty banning 12 of the worst persistentorganic pollutants (POPs). Another (Chapter 15) is the elimination of many uses of leadand mercury leading to greatly reduced emissions in developed countries.
* By the mid-1990s, US water quality was better than in 1970 despite a 25% increase inpopulation and a 50% increase in national economic activity. Yet point sources, municipalsewage treatment plants and industrial wastewater treatment plants, continue to haveproblems. Maintaining infrastructure is an ongoing challenge. Municipalities have diffi-culty finding money to modernize or even properly maintain wastewater treatmentsystems. Many struggle too with CSO: storm water is still sometimes released withuntreated sewage during storms. Nationwide, modernization of treatment systemscould cost hundreds of billions of dollars.
Reusing wastewater or reducing its volume
Reusing sewage indirectly for drinking water
In many parts of the world, water, especially clean water, is increasingly scarce. But – forcommunities that can afford it – it is possible to treat sewage to a purity that allows its use asdrinking water. ▪ This happens in the space station where urine (not urine mixed with feces)is purified so thoroughly that it can be used for drinking, food preparation, and washing.Recycled wastewater is also used in Israel, Singapore, and parts of Europe. ▪ SeveralAmerican communities approach this issue indirectly. AVirginia community takes purifiedwastewater and adds it to a stream that feeds into its drinking water reservoir. In water-poorSouthern California an off-and-on drought combined with ongoing population growth led tothe Advanced Water Purification Facility. This takes industrial and household sewage andproduces 70 million gallons (265 million liters) of drinkable water per day, about 10% of thewater needs of 2.3 million residents. The water goes through an elaborate purification
264 Water pollution
procedure that treats organic chemicals, pathogens, and other contaminants includingpharmaceuticals. But the product, at least as clean as drinking water, is not directly used.Rather, it goes into a percolation pond situated over permeable soil that allows the water toslowly percolate down to recharge the groundwater, being further purified as it moves.Taking at least six months, it finally reaches the intakes of drinking water wells. This water iscarefully tested for hundreds of contaminants and meets or exceeds all drinking waterstandards.47 Yet, at least one community in Australia has rejected such a possibility despiteongoing drought and a severe water shortage.
Reducing the volume of wastewater
Households, businesses, institutions
Gray water is all wastewater except that flushed down toilets. Gray water usually goes downdrains to the sewage line. But now, some water-scarce areas are beginning to use that graywater. It is recovered by separate pipes, and used to flush toilets, wash cars, or to water yards.
Cities
Wastewater reclamation is a major issue in arid urban areas with increasing populations andincreasing water demand. In reclamation, treated wastewater is not discharged, but used ascooling and process water for commercial washing, ornamental fountains, fire fighting, golf-course irrigation, creation of artificial wetlands, and groundwater recharge. The majorconcern, but not the only one, is surviving pathogens. But, because the reclaimed water isnot used for drinking, pathogens need only be reduced, not eliminated. Many embrace waterreuse, but caution that more monitoring is needed.
Reusing wastewater inappropriately?48
In many cities of less-developed countries, farmers use raw wastewater or wastewaterdiluted in streams to irrigate their crops, commonly vegetables and rice grown on urbanagricultural land. This often happens in cities in China, India, Vietnam, sub-Saharan Africaand some Latin American countries. One example is Accra in Ghana, where each day about10% of the people in this city of 2 million buy produce grown on ~250 acres (100 hectares).These practices may be unhealthy, but it produces much needed food and provides live-lihoods to farmers. A researcher for the International Water Management Institute said “Inthe face of water scarcity generally and a lack of access to clean water, urban farmers willhave no alternative except to use diluted or untreated wastewater or polluted river water.”
47 Kemsley, J. Treating sewage for drinking water, new California plant cleanses water to replenish supply.Chemical & Engineering News, 86(04), January 28, 2008, 71–73.
48 Cox, A. Scores of cities using untreated wastewater-study. Reuters. August 18, 2008, http://www.alertnet.org/thenews/newsdesk/LG151453.htm.
265 Reusing wastewater or reducing its volume
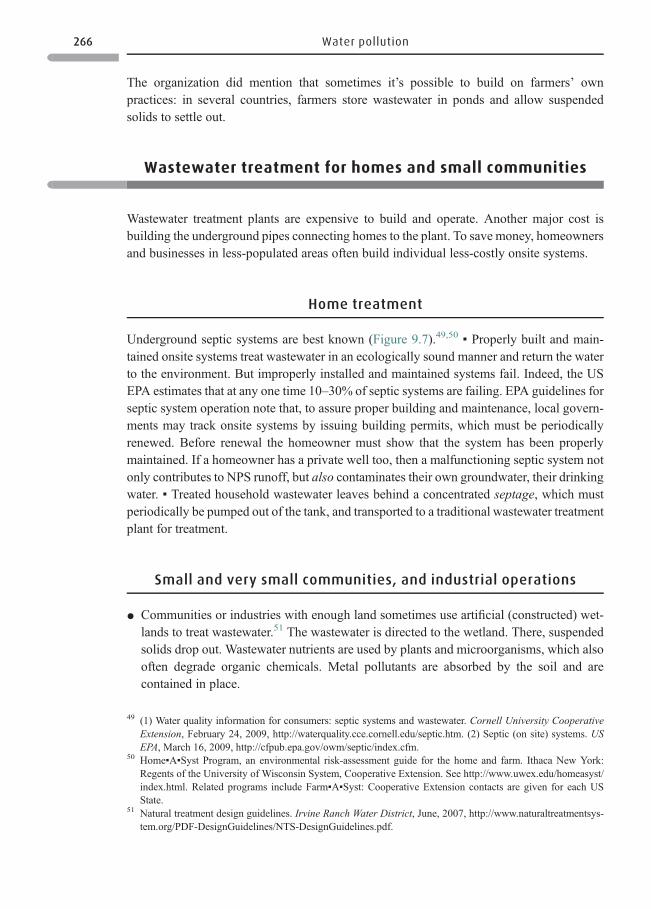
The organization did mention that sometimes it’s possible to build on farmers’ ownpractices: in several countries, farmers store wastewater in ponds and allow suspendedsolids to settle out.
Wastewater treatment for homes and small communities
Wastewater treatment plants are expensive to build and operate. Another major cost isbuilding the underground pipes connecting homes to the plant. To save money, homeownersand businesses in less-populated areas often build individual less-costly onsite systems.
Home treatment
Underground septic systems are best known (Figure 9.7).49,50 ▪ Properly built and main-tained onsite systems treat wastewater in an ecologically sound manner and return the waterto the environment. But improperly installed and maintained systems fail. Indeed, the USEPA estimates that at any one time 10–30% of septic systems are failing. EPA guidelines forseptic system operation note that, to assure proper building and maintenance, local govern-ments may track onsite systems by issuing building permits, which must be periodicallyrenewed. Before renewal the homeowner must show that the system has been properlymaintained. If a homeowner has a private well too, then a malfunctioning septic system notonly contributes to NPS runoff, but also contaminates their own groundwater, their drinkingwater. ▪ Treated household wastewater leaves behind a concentrated septage, which mustperiodically be pumped out of the tank, and transported to a traditional wastewater treatmentplant for treatment.
Small and very small communities, and industrial operations
* Communities or industries with enough land sometimes use artificial (constructed) wet-lands to treat wastewater.51 The wastewater is directed to the wetland. There, suspendedsolids drop out. Wastewater nutrients are used by plants and microorganisms, which alsooften degrade organic chemicals. Metal pollutants are absorbed by the soil and arecontained in place.
49 (1) Water quality information for consumers: septic systems and wastewater. Cornell University CooperativeExtension, February 24, 2009, http://waterquality.cce.cornell.edu/septic.htm. (2) Septic (on site) systems. USEPA, March 16, 2009, http://cfpub.epa.gov/owm/septic/index.cfm.
50 Home▪A▪Syst Program, an environmental risk-assessment guide for the home and farm. Ithaca New York:Regents of the University of Wisconsin System, Cooperative Extension. See http://www.uwex.edu/homeasyst/index.html. Related programs include Farm▪A▪Syst: Cooperative Extension contacts are given for each USState.
51 Natural treatment design guidelines. Irvine Ranch Water District, June, 2007, http://www.naturaltreatmentsys-tem.org/PDF-DesignGuidelines/NTS-DesignGuidelines.pdf.
266 Water pollution
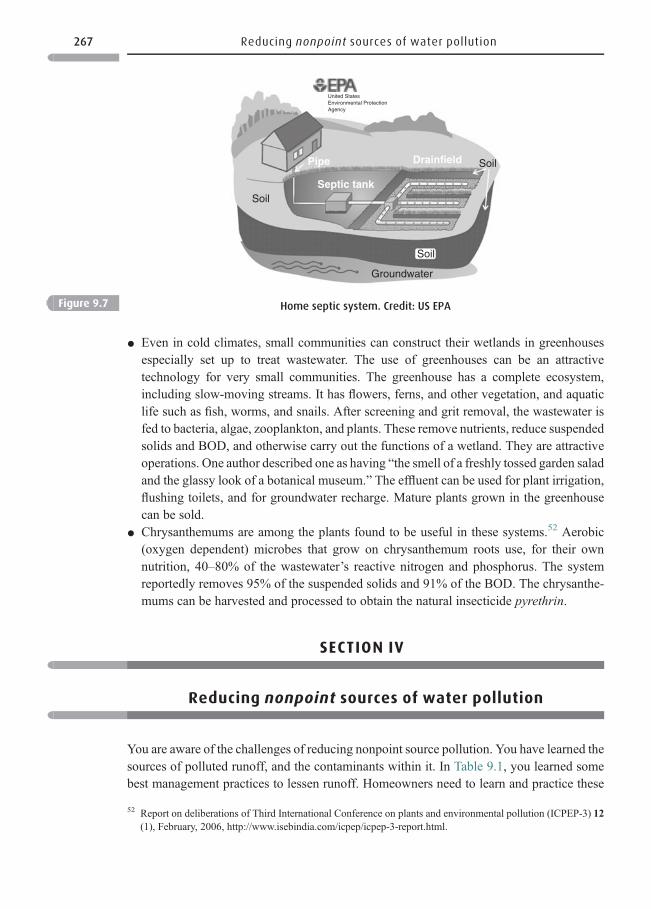
* Even in cold climates, small communities can construct their wetlands in greenhousesespecially set up to treat wastewater. The use of greenhouses can be an attractivetechnology for very small communities. The greenhouse has a complete ecosystem,including slow-moving streams. It has flowers, ferns, and other vegetation, and aquaticlife such as fish, worms, and snails. After screening and grit removal, the wastewater isfed to bacteria, algae, zooplankton, and plants. These remove nutrients, reduce suspendedsolids and BOD, and otherwise carry out the functions of a wetland. They are attractiveoperations. One author described one as having “the smell of a freshly tossed garden saladand the glassy look of a botanical museum.” The effluent can be used for plant irrigation,flushing toilets, and for groundwater recharge. Mature plants grown in the greenhousecan be sold.
* Chrysanthemums are among the plants found to be useful in these systems.52 Aerobic(oxygen dependent) microbes that grow on chrysanthemum roots use, for their ownnutrition, 40–80% of the wastewater’s reactive nitrogen and phosphorus. The systemreportedly removes 95% of the suspended solids and 91% of the BOD. The chrysanthe-mums can be harvested and processed to obtain the natural insecticide pyrethrin.
SECTION IV
Reducing nonpoint sources of water pollution
You are aware of the challenges of reducing nonpoint source pollution. You have learned thesources of polluted runoff, and the contaminants within it. In Table 9.1, you learned somebest management practices to lessen runoff. Homeowners need to learn and practice these
Pipe
Septic tank
Drainfield Soil
Soil
United StatesEnvironmental ProtectionAgency
Soil
Groundwater
Figure 9.7 Home septic system. Credit: US EPA
52 Report on deliberations of Third International Conference on plants and environmental pollution (ICPEP-3) 12(1), February, 2006, http://www.isebindia.com/icpep/icpep-3-report.html.
267 Reducing nonpoint sources of water pollution
approaches.53 ▪ In the United States, the first stage of cleaning up rivers, lakes, and streamswas straightforward: point sources were contained through laws and regulations.Commercial and municipal sources of pollution – as identified by effluent pipes – becamefairly well controlled. ▪ The remaining problem was and is much more difficult: how tocontain or, better, prevent runoff from roads, parking lots, paved and roofed urban surfaces,farms, and timber operations.
Reducing agricultural runoff
Agriculture is a major cause of NPS runoff of soil, pesticides, fertilizers, and animal wastesinto rivers, lakes, and other water bodies. See Table 9.1 as an introduction to reducing NPSpollution.
* Plant grass or trees as buffer strips next to water bodies to absorb the runoff.* When possible, use no-till farming in which crop residues are not tilled into the ground,
but left on soil. This greatly limits soil erosion and runoff. A disadvantage is that moreherbicide is needed to manage the weeds that are no longer plowed into the ground.
* Farmers ordinarily apply more fertilizer than needed. Crops cannot capture or use it alland, when it rains, the surplus run off into surface water or infiltrate down into ground-water. One way to lessen runoff is to apply smaller amounts more frequently to help keepfertilizer in the soil.54 In some instances, agricultural specialists work with farmers toanalyze land nutrient needs, section by section, and enter the results into a computerwithin a tractor. The computer lets the farmer know whether a particular section needsfertilizer, and howmuch, before any is applied. Less fertilizer applied means less fertilizerrunoff into water.
* Contour strip-cropping (planting rows of different crops) helps to lower both chemicalrunoff and soil erosion.
* Minimize pesticide runoff by using integrated pest management (IPM). In IPM, farmersevaluate their fields regularly, and use a pesticide only when a pest population reaches acertain level. This contrasts with applying pesticides according to a schedule regardless ofneed. Reduced applications mean less pesticide in runoff from treated fields.
* Get chemical companies to place priority on developing herbicides that can kill weeds inmuch smaller amounts. Newer herbicides are often less water soluble and bind moretightly to soil, both characteristics that can lower pesticide runoff.
* Confined animal feeding operations with large numbers of confined animals producerunoff, which contaminates both surface and ground water with potentially infectiousbacteria, viruses, or protozoa (especiallyGiardia andCryptosporidium). Methods exist to
53 Lake and watershed protection: dos and don’ts for individual homeowners and farmers to reduce nonpointrunoff. Woodstock Conservation Commission, January 13, 2009, http://www.woodstockconservation.org/watershed_dos_and_donts.htm.
54 Magdoff, F. and Van Es, H. Building Soils for Better Crops. Sustainable Agriculture Research and Education,Chapter 16 Nutrient Management, http://www.sare.org/publications/bsbc/bsbc.pdf.
268 Water pollution
minimize runoff, but some mammoth operations do little more than allow animal wastesolids to settle out in a detention pond. P2 could mean a return to smaller family farmswith fewer animals at one locale, and encouraging people to eat less meat.
Changing farming methods to reduce agricultural runoff can present major challenges tofarmers. They need to be willing to educate themselves on methods to reduce runoff. Takingaction can mean significant changes in farming methods, and require more time, and oftenadditional costs. Providing incentives or assistance can make a difference. A P2 storyA cooperative venture among Wisconsin dairy farmers, the University of Wisconsin, andthe US Department of Agriculture provides an example of reducing runoff of pesticides,fertilizers, and eroded soil to waterways. Cooperative Extension Service agents visitedparticipating farms each week of the growing season for three years. They worked withfarmers to monitor pest populations in the crops they grew to feed cows with the intent ofusing fewer pesticide applications. They encouraged farmers to plant nitrogen-fixinglegumes to enrich the soil, thus reducing the need for artificial fertilizer. Farmers did reducepesticides and fertilizer use and reduced volumes of contaminated runoff. Participatingfarmers also saved several dollars for each dollar invested. Eighty percent of farmerscontinued with these methods after the program ended. ▪ However, most farmers do notuse such methods, and groundwater and many surface water bodies continue to have high orsometimes increasing levels of reactive nitrogen. The situation is worse in Europe, which ismore populous than the United States. It is especially bad in Asia where attention is focusedon the immediate problem of producing enough food for growing populations.
* Growing crops for biofuels The US National Research Council warns of the consequen-ces of growing more corn and other crops for biofuels without environmental protec-tion.55 When corn is grown to produce ethanol, more pesticides and herbicides areapplied per acre than for soy or mixed-species perennial grasses. More water and fertilizeris also used. The overall result is more eroded soil and more pesticides carried away inrunoff. ▪ Farmers need to rotate between corn and soy crops (soy to replenish nutrientsnaturally), to apply fertilizer in smaller amounts (but more frequently so there will be lessrunoff), and to learn when in the growing cycle fertilizer can be applied with less runoff.▪ More generally, life-cycle assessments need to be carried out on the environmentalconsequences of the various crops grown to produce biofuels.
Reducing urban runoff
Because runoff from paved surfaces is a major problem, attempts are slowly being made toaddress the problem. Runoff can be reduced even from paved roads, using low impactdesign.56 The first step is to realize that the ways we traditionally handled water are
55 Water implications of biofuels production in the United States. National Research Council, October, 2007. http://dels.nas.edu/dels/rpt_briefs/biofuels_brief_final.pdf.
56 Lubick, N. Using nature’s design to stem urban storm-water problems. Environmental Science & Technology,40(19) October 1, 2006, 5832–5833.
269 Reducing nonpoint sources of water pollution
environmentally harmful – as seen in the runoff problems noted here. A number of differentapproaches have been started since the late 1990s.
* The city of Seattle is redesigning its streets to function more like a natural drainagesystem. They meander along like a stream, no longer straight; some spots are left unpavedto allow stormwater to infiltrate into the ground; other places are designed to simplykeep the water from running off, allowing it to evaporate later. Street retrofittingcosts ~$300 000 per block. ▪ Benefits: the need to treat or store storm water is eliminated;there is less flooding of local streams and less soil erosion. People living on these streetsenjoy them and contribute by planting and caring for vegetation along the new streets. Butretrofitting is more costly than designing in such solutions before streets are built.
* In Prince George’s County, Maryland, low impact design includes streets that usevegetation and holding ponds to enhance stormwater drainage into the soil.
* Alleys in the city of Chicago cover an area equivalent to “five midsize airports.” Chicagois now working to transform them into “green” alleys.57 Whenever an alley needsrepaving or sewer improvements, they take up the old paving and lay down a stonebed. This is covered with permeable paving (either concrete or asphalt). When it rains,stormwater filters through the paving and stone bed, and infiltrates the soil and rechargesgroundwater. The pavement also reflects sunlight and so is cooler on hot days and warmeron cold days. The alleys also are provided with more energy-efficient lighting. ProfessorMichael Martin of Iowa State University praises Chicago: “The alley is not only func-tional, but an educational green landscape that is helping a city experiment with designand different ways to handle water.”
* Regulations to prevent stormwater runoff are stricter in Europe and designers usemethods such as public plazas with waterworks that also function to store water. Allthese methods decrease stormwater runoff, but also recharge aquifers underneath thecities.
Reducing nonpoint source runoff from other activities
In Table 9.1 notice that many sources of runoff are controlled in similar ways. ▪ Providingbuffer zones of grass or trees near water bodies onto which runoff can flow is a controlcommon to many sources of runoff. ▪ Building detention ponds or constructed wetlands intowhich runoff can flow for natural treatment is another technique. ▪ Some methods are uniqueto specific sources such as sealing off an open mine that is the source of runoff. ▪ For largeconstruction sites or logging roads, reducing runoff may mean laying out the sites in a waythat makes use of or modifies the land’s natural contours, see Box 9.7.
57 Chicago has other ongoing programs including retrofitting old buildings to reduce energy usage, rooftop gardensto collect rainwater, 90 miles (145 km) of landscaped road medians, a half million new trees, and 200 acres(81 hectares ) of new parks and open spaces. Saulny, S. In miles of alleys, Chicago finds its next environmentalfrontier. New York Times, November 26, 2007, http://www.nytimes.com/2007/11/26/us/26chicago.html?n=Top/Reference/Times%20Topics/People/S/Saulny,%20Susan.
270 Water pollution
Box 9.7 Reducing phosphorus and reactive nitrogen pollution
Reducing point source phosphorus pollution: treatment, P2, and industrial ecology
Wastewater treatment plants do not routinely remove phosphorus and reactive nitrogen.
Examples of approaches to reduce phosphorus include:
* Control The US EPA in 2007 said that it was now possible for treatment plants, at a
reasonable cost, to remove phosphorus to levels below 10 μg/l.58
* P2 To prevent some phosphates from even reaching treatment plants, the State of
Washington outlawed automatic dishwasher detergents that contain phosphates. This
means less phosphorus in sewage to be removed. As of 2008 the initiative is going
nationwide.59
* Industrial ecology (IE) Most of the world’s arable land lacks enough phosphorus for optimal
plant growth. Thus, phosphorus is also a component of fertilizers. However, good ores, from
which phosphate is extracted, are expected to run out within 100 years. Attention is being
given to recovering phosphorus from excrement – make sewage treatment plants an
alternate source of phosphorus.60 Currently, study is ongoing to recover phosphorus from
wastewater in a form concentrated enough to use in fertilizer. Study is ongoing too on how
to recover phosphorus from the massive amounts of livestock waste produced by intensive
animal farms.
Reducing reactive nitrogen pollution through emissions trading
Recall from Chapter 6, the sulfur dioxide (SO2) trading scheme whereby one electric power
plant, which is exceeding its permit for SO2 emissions could buy credits from another power
plant, which is releasing less SO2 than its permit allows. Similar efforts are underway for
nutrients emitted by wastewater treatment plants: a plant that releases a greater weight of
nutrients to a waterway than its permit allows buys credits from a plant releasing less than
its permit allows. The plant buying credits is thus able to put off expensive upgrading of its
equipment. Both sides save money. ▪ However, it is much more difficult to trade between
point and NPS nutrients. Whereas it is straightforward to calculate the amount arriving in a
water body from a wastewater treatment plant, a point source, it is much harder to
calculate the amount arriving via runoff or from atmospheric deposition. However, there
has been some successful trading of point with nonpoint, and efforts to do so will
continue.61
58 Advanced wastewater treatment to achieve low concentration of phosphorus. US EPA, April, 2007, http://yosemite.epa.gov/r10/water.nsf/Water+Quality+Standards/AWT-Phosphorus/$FILE/AWT+Report.pdf.
59 An exception will be made for industrial and institutional settings where phosphates are critical to good cleaning.60 Christen, K. Closing the phosphorus loop. Environmental Science & Technology, 40(7), April 1, 2007, 2078.61 Lubick, N. Advancing water-quality credit trading. Environmental Science & Technology, 41(20), October 1,
2007, 6882.
271 Reducing nonpoint sources of water pollution
Reducing water use to reduce NPS pollution
The EPA has noted, “The high demand for and overuse of water can contribute markedly tononpoint source pollution.” This happens in many ways.
* When farmers use more water than necessary to irrigate their land, this increases runoff,which carries with it sediment, nutrients, and salts.
* Homeowners who overuse water to maintain yards and gardens increase runoff carryingsoil, nutrients, and pesticides.
* When households with septic systems overuse water, this contributes to system failurewith resultant nonpoint source runoff carrying microbes and nutrients.62
Reducing atmospheric deposition
Methods to reduce atmospheric deposition are specific to given pollutants and are notedthroughout this book. Reducing acidic deposition, for example, was discussed in Chapter 6.
SECTION V
The “nitrogen glut” and dead zones
The major increase of reactive nitrogen in the environment is often called the “nitrogenglut.” In this book’s second edition, the “nitrogen glut”was described as “one of the world’sbiggest environmental headaches.” The headache has become life-threatening. Humanshave at least doubled the rate at which reactive nitrogen is delivered to plant life. ▪ An 8-year study finished in the late 1990s indicated that human activity had increased inputs ofreactive nitrogen into coastal regions three-fold in North America, six-fold in Europe, and11-fold in Europe’s North Sea.63 You might hypothesize just from a re-examination ofFigure 3.2 that such sharp increases could have adverse effects, and that is proving to be thecase.
The nitrogen (N2) in the air we breathe is a very stable chemical and is biologically inert tomost living organisms. Until the twentieth century, people fertilized their crops by applyingnutrient-containing manure or compost (decaying leaves, grass, and other organic materi-als). They also periodically planted fields with legumes: legumes have root nodules, whichcontain bacteria that convert nitrogen into bioavailable reactive nitrogen, thus boosting
62 How does excessive water use affect water quality? US EPA, July 31, 2009, http://www.epa.gov/watersense/water/save/water_quality.htm.
63 Howarth, R. W. An assessment of human influences on fluxes of nitrogen from the terrestrial landscape to theestuaries and continental shelves of the North Atlantic Ocean. Nutrient Cycling in Agroecosystems, 52(2–3),1998, 213–223, http://www.springerlink.com/content/v2381059700171t1/.
272 Water pollution
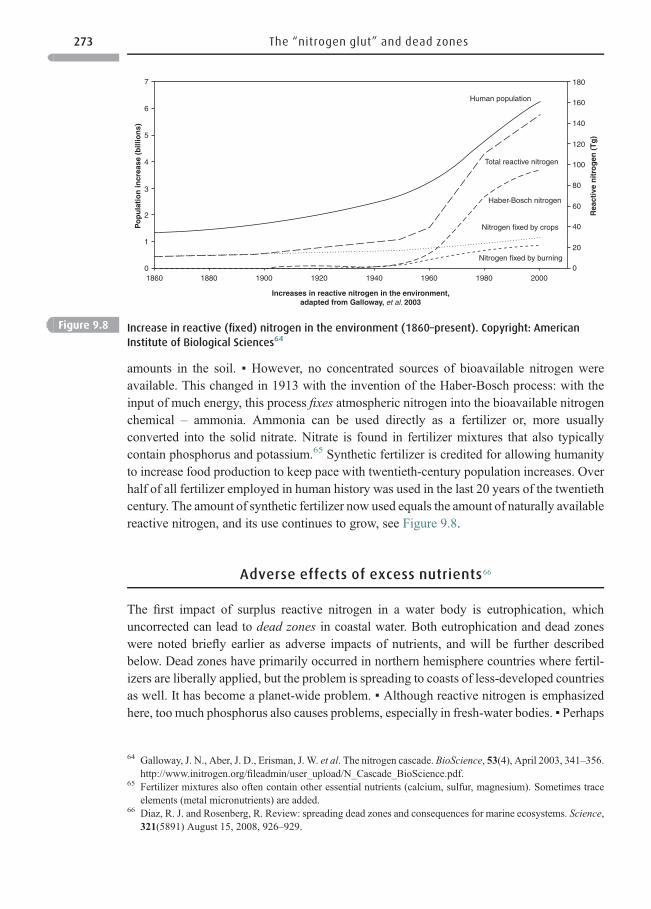
amounts in the soil. ▪ However, no concentrated sources of bioavailable nitrogen wereavailable. This changed in 1913 with the invention of the Haber-Bosch process: with theinput of much energy, this process fixes atmospheric nitrogen into the bioavailable nitrogenchemical – ammonia. Ammonia can be used directly as a fertilizer or, more usuallyconverted into the solid nitrate. Nitrate is found in fertilizer mixtures that also typicallycontain phosphorus and potassium.65 Synthetic fertilizer is credited for allowing humanityto increase food production to keep pace with twentieth-century population increases. Overhalf of all fertilizer employed in human history was used in the last 20 years of the twentiethcentury. The amount of synthetic fertilizer now used equals the amount of naturally availablereactive nitrogen, and its use continues to grow, see Figure 9.8.
Adverse effects of excess nutrients66
The first impact of surplus reactive nitrogen in a water body is eutrophication, whichuncorrected can lead to dead zones in coastal water. Both eutrophication and dead zoneswere noted briefly earlier as adverse impacts of nutrients, and will be further describedbelow. Dead zones have primarily occurred in northern hemisphere countries where fertil-izers are liberally applied, but the problem is spreading to coasts of less-developed countriesas well. It has become a planet-wide problem. ▪ Although reactive nitrogen is emphasizedhere, too much phosphorus also causes problems, especially in fresh-water bodies. ▪ Perhaps
7
6
5
4
3
2
1
01860 1880
Po
pu
lati
on
incr
ease
(b
illio
ns)
Rea
ctiv
e n
itro
gen
(T
g)
1900 1920
Increases in reactive nitrogen in the environment,adapted from Galloway, et al. 2003
Human population
Total reactive nitrogen
Haber Bosch nitrogen
Nitrogen fixed by burning
Nitrogen fixed by crops
1940 1960 1980 20000
20
40
60
80
100
120
140
160
180
-
Figure 9.8 Increase in reactive (fixed) nitrogen in the environment (1860–present). Copyright: American
Institute of Biological Sciences64
64 Galloway, J. N., Aber, J. D., Erisman, J. W. et al. The nitrogen cascade. BioScience, 53(4), April 2003, 341–356.http://www.initrogen.org/fileadmin/user_upload/N_Cascade_BioScience.pdf.
65 Fertilizer mixtures also often contain other essential nutrients (calcium, sulfur, magnesium). Sometimes traceelements (metal micronutrients) are added.
66 Diaz, R. J. and Rosenberg, R. Review: spreading dead zones and consequences for marine ecosystems. Science,321(5891) August 15, 2008, 926–929.
273 The “nitrogen glut” and dead zones
surprisingly, nutrients can be indirectly toxic to developing frogs. For a number of years,deformed frogs – too many or too few limbs or displaced limbs – have been found in manylocales with no explanation as to how their deformities occurred. These deformities weretraced to excess nitrogen and phosphorus in lakes and ponds. The nutrients stimulate thegrowth of a parasitic flatworm, which burrows in large numbers into tadpoles at the pointswhere limbs are developing. This causes cysts that lead to developmental deformities.67
Below algal blooms are first considered and then dead zones.
Algal blooms
Surplus nitrate and phosphorus from fertilizers, atmospheric deposition of nitrate, andnutrients in sewage and manure are associated with eutrophication. In coastal areas nitrateis the major culprit, whereas in freshwater lakes, it is more often phosphorus. ▪ Of majorimportance, high nutrient levels trigger heavy growth of phytoplankton (algal blooms). Inturn, these trigger rapid growth of the zooplankton that eat the phytoplankton. As all theseorganisms die and sink toward the bottom they contribute to BOD: oxygen-requiringbacteria degrade them and the move toward hypoxia, conditions with too little oxygenbegins.
* If the bloom is severe or if conditions persist, hypoxia and eutrophication results. Algalblooms have other ill effects – crowding out other plants and covering the water surfaceso thickly that sunlight is prevented from reaching the underwater grasses that providefood, shelter and a spawning ground for crabs, fish, and other aquatic creatures, habitat fortheir offspring, and food for water fowl. If the hypoxic area is in an estuary, fish can swimaway. However, sedentary creatures die if they don’t have enough oxygen. ▪ As you maysurmise from this description, too many nutrients in a water body change the compositionof species. This change moves through the food web to affect plant, bird, and animaldiversity. ▪ A bloom can create esthetic problems too – scum and unpleasant smells.
* Harmful algal blooms (HABs) produce the problems just noted and also produce toxins.The bloom of one dinoflagellate, Gonyaulax appears as red tide in marine coastal water.Red-tide organisms produce a toxin that accumulates in the fish and shellfish that eatthem. Fish may become ill and suffer impaired reproduction and damaged immunesystems. Some humans eating the contaminated shellfish suffer from paralytic shellfishpoisoning. ▪ Thus, a red tide leads to banning the eating of shellfish from the affectedareas. Water birds and other sea life may also suffer ill effects.68 Other algae toxins havebeen associated with a variety of other ill effects including tumors in sea animals such asturtles.
67 Dunham, W. Frog deformities blamed on farm and ranch runoff. Reuters, September 24, 2007, http://www.reuters.com/article/environmentNews/idUSN2432027920070924.
68 The diatom Pseudo-nitzchia australis also generates a noxious HAB producing the neurotoxin, domoic acid. In a1987 case, 140 people on Canada’s Prince Edward Island were poisoned after eating mussels that had ingestedthis diatom. Three died, and others suffered memory loss that was still apparent in 2000. In California the 1998deaths of 400 sea lions was convincingly tied to their eating of anchovies that had eaten the domoic acid-producing algae.
274 Water pollution
Sources of reactive nitrogen
* Natural reactive nitrogen Bacteria in the root nodules of legumes (peas, beans, and relatedplants) can fix atmospheric nitrogen into bioavailable nitrogen, which is released to plantroots. ▪Cyanobacteria in water bodies also fix atmospheric nitrogen. ▪A small amount ofatmospheric nitrogen is also fixed by lightning.
* Reactive nitrogen from human sources The major chemical form of reactive nitrogenrunning off to rivers, streams, lakes, and coastal areas is nitrate. The largest source ofnitrate is fertilizers applied to agricultural fields; smaller amounts come from yards andgreens. Fertilizer use is projected to continue to increase, especially in Asian, African, andSouth American countries, which now use relatively little. With increased fertilizer use,more nitrate is expected in the runoff that reaches coastal areas. Very often, excessfertilizer nitrogen is applied to crops, i.e., more than the crops can use, and often morethan the soil can hold. To capture nitrate from runoff, a grass or tree buffer zone or awetland can be placed between farm fields and water bodies, see Table 9.1. ▪ Fossil fuelburning is a lesser, but important source of reactive nitrogen. Nitrogen oxide (NOx)emissions worldwide have quintupled in the twentieth century. The result is that nitrate(oxidized from NOx) now represents a quarter of the reactive nitrogen from humansources. Just as fertilizer nitrate arriving on a coast may come from far up-river,atmospheric nitrate can come from afar. Unlike nitrate from fertilizer, atmospheric NOx
cannot be trapped in buffer zones: after its conversion to nitrate or nitric acid, it directlydeposits from the atmosphere. Sewage, poorly treated or untreated, is a source of nutrientstoo as is runoff of animal manure. More generally, biological matter has nutrient value.The reactive nitrogen in these sources is not concentrated.
Study Figure 9.8: notice that the amount of reactive (fixed) nitrogen has grown over theyears.
* Top line: as human population grows, reactive nitrogen likewise increases.* Second line: total reactive nitrogen in the environment – natural and synthetic – began
growing in the early twentieth century, then much more rapidly toward the end of thecentury.
* Third line: increase in Haber-Bosch nitrogen explains much of this increase in reactivenitrogen as more and more is applied to crops.
* Fourth line: nitrogen fixed by legumes is also increasing because more legumes aregrown.
* Bottom line: nitrogen fixed by burning is increasing as we increase our burning of fossilfuels.
Livestock operations
Reactive nitrogen in manure is much less concentrated than in synthetic fertilizer but oftenthousands of animals are kept in confined-animal feeding operations (CAFOs) producinglarge amounts of waste. Waste runoff is a nutrient source. At any one time, the United States
275 The “nitrogen glut” and dead zones
has 60 million hogs, 47 million beef and dairy cows, and 7.5 billion chickens. In confine-ment, they produce about a billion tons (0.9 billion tonnes) of manure and urine a year. Thisis often stored in waste lagoons. In a 1995 incident in North Carolina, a lagoon leaked25 million gallons (95 million liters) of hog waste into the New River, leading to an algalbloom, which depleted the water of oxygen, and killed off fish and other aquatic organisms. ▪Other ways that CAFOs release nitrogen pollution include chronic seepage fromanimal-waste lagoons, and runoff from fields onto which lagoon liquids have been sprayed.Both surface water and groundwater contamination occurs. ▪ In Colorado, groundwaternitrate concentrations of towns near large beef cattle feedlots are double the EPA human-health standard. Livestock operations also emit the pungent gas, ammonia into the atmos-phere. Rained out, ammonia is converted to nitrate in the soil contributing to acidification. InNorth Carolina, ammonia in rain increased 25% between 1990 and 1995, coincident withincreased hog operations. ▪ The Netherlands has intensive pig farms too. This very smallcountry produces almost a quarter as much pork as does the much larger United States and ithas similar problems. However, its government places the most stringent controls in theworld on CAFOs; it also mandates a limit to the pig population, and has a system to accountfor all nutrients entering or leaving its borders. These actions reduce, but do not eliminate,escaping nutrients. Probably because of this careful regulation, some owners of intensive pigfarms have chosen to set up operations in the United States where regulations are morelenient. Worse, corporations also set up industrial-size livestock operations in less-developed countries, which can least handle the resulting pollution.
Dead zones resulting from surplus nutrients
Once dissolved oxygen levels in a water body or portion of a water body are depleted, lifedisappears. Creatures living there have either died or swum away. At this point it is a deadzone. There are many areas in the world that have undergone eutrophication (that stillsupport some life) and have not yet progressed to dead zones. The dead zone is the finalstage of damage. However, note how rapidly the situation is worsening: the number andextent of areas with hypoxia, worldwide, increased from 46 in 1995 to at least 400 in 2008.69
This may happen even more frequently as massive inflows of nutrients into coastal areacontinue. Two dead zones are described below.
The US Gulf of Mexico70
In the bottom waters of the US Gulf of Mexico (beyond the mouth of the Mississippi Riversystem) a dead zone occurs each summer. At its largest, its size is equivalent to the state ofNew Jersey. River waters draining into the Gulf contain massive amounts of nutrients from31 states, representing about two-thirds of the area of the continental United States (starting
69 Diaz1, R. J. and Rosenberg, R. Worldwide spreading dead zones and consequences for marine ecosystems.Science, 321, August 15, 2008, 926–929
70 Rabalais, N. Hypoxia in the Gulf of Mexico. Louisiana Universities Marine Consortium, http://www.csc.noaa.gov/products/gulfmex/html/rabalais.htm.
276 Water pollution
inMinnesota and including every state between the Rocky and the AppalachianMountains).The nutrients stimulate algal blooms in the gulf leading to hypoxic water. As oxygenbecomes scarce, fish move elsewhere. Creatures unable to leave, including crabs and brittlestars, suffocate. As expressed by Elizabeth Carlisle,71 “Hypoxic waters appear normal onthe surface, but on the bottom, they are covered with dead and distressed animals, and inextreme cases, layers of stinking, sulfur-oxidizing bacteria.” This dead zone occurs in aregion that provides 40% of US seafood. Fishing boats must move across it before findingfish.72 ▪ Nonpoint sources of pollutants Corn and soybean crops are the largest contributorsof reactive nitrogen to the Gulf. An estimated 16% of nitrate fertilizer applied to crops in theMississippi River watershed runs off and is delivered to the gulf. The largest source ofphosphorus is animal waste carried in runoff from animal pastures and from confined animalfeeding operations. There is also point-source pollution from municipal wastewater treat-ment plants.
Reducing nutrients runoff to the Gulf Studies of Gulf sediment show that nitrate levelsincreased three-fold since 1960 and phosphorus two-fold.
* Prior to 2007, reactive nitrogen was estimated to account for two-thirds of the nutrientproblem and phosphorus for the rest. However, further EPA analysis pointed to phos-phorus as making a greater than one-third contribution. A new EPA assessment recom-mends lowering both reactive nitrogen and phosphorus in the Mississippi River by atleast 45%.
* An earlier 31-state plan proposed paying farmers to reduce fertilizer use, restore wetlands,plant trees or grass buffers between crops and streams, and take measure to reducemanure runoff. It also recommended assisting municipal sewage treatment plants toinstall equipment capable of removing nutrients.
* Other research indicated that 9 of the 31 states involved contribute 75% of the twonutrients. This is leading to greater focus on those nine states.73
* Other work found that the adverse effects of algal blooms on the marine ecosystem carryover from year to year making the results of the hypoxia (low oxygen) or anoxia (nooxygen) increasingly hard to correct.
* Moreover, the United States is growing ever more corn for biofuel production, a croprequiring large amounts of fertilizer.74 This leads to increasing amounts of reactivenitrogen runoff. As has been pointed out: providing subsidies and other economicincentives to farmers that favor corn-based ethanol “are at odds with the goals of hypoxiareduction.”But farmers point to the investigations indicating that phosphorus is more of aproblem than previously realized. They take this information to mean that nitrogen runoff
71 Carlisle, E. The Louisiana environment, the Gulf of Mexico dead zone. Louisiana Universities MarineConsortium, 2000, http://www.tulane.edu/~bfleury/envirobio/enviroweb/DeadZone.htm. (Although written in2000, this article provides a good description of the problem.)
72 Achenbach, J. A “dead zone” in the Gulf of Mexico, scientists say area that cannot support some marine life isnear record size.Washington Post, July 31, 2008, A02, http://www.washingtonpost.com/wp-dyn/content/story/2008/07/31/ST2008073100349.html?hpid=topnews.
73 Targeted cuts can ease Gulf dead zone. Chemical & Engineering News, 86(05), February 4, 2008, 20.74 Hogue, C. Gulf of Mexico: Shrinking the dead zone, draft report faults corn-based ethanol. Chemical &
Engineering News, 85(41), October 8, 2007, 11.
277 The “nitrogen glut” and dead zones
from corn and soybeans is less important, and point to phosphorus-releasing wastewatertreatment plants.75
From this Gulf of Mexico dead zone example, you see how difficult it is to revive a deadzone or even, sometimes to know how to revive it.76 First scientists and agencies mustcarefully define the problem and decide what needs to be done. The next step is harder still,getting responsible parties, governments, farmers, livestock operations, municipalities, andothers to take the necessary steps. As Professor Laurence Mee notes: “reducing nutrientrunoff . . . requires major changes in agricultural practices and wastewater treatment efforts.Most programs have achieved only partial cuts . . . To shrink nutrient loads, comprehensiveplans (at the scale of an entire river catchment system) must be put in place.”77
Reviving the Black Sea dead zone
The Black Sea dead zone had an area equivalent to that of Switzerland. This sea is an almostlandlocked body of water in Eastern Europe bordered by Bulgaria, the Republic of Georgia,Romania, Russia, Turkey, and Ukraine. In these and other upstream countries intensive useof fertilizers on agricultural lands and CAFOs began in the 1960s leading to much increasedrunoff of reactive nitrogen and phosphorus to the Danube River. In addition, there werepoint sources of industrial and urban sewage emptying into the Danube. As all these reachedthe Black Sea, levels of reactive nitrogen and phosphorus doubled between the 1960s andthe 1980s. This led to what has been called a Black Sea catastrophe. Year-round severeeutrophication and hypoxia developed, and the incidence of red tide blooms greatlyincreased. Sixty million tons (54 million tonnes) of creatures living on the bottom of thesea (benthic life) perished from hypoxia. A final blow came in the early 1980s when anexotic (foreign) species, the Atlantic jelly comb was accidentally released. This jellybloomed so ferociously that it became the dominant Black Sea species. It destroyed nativefish species, and 20 of 26 commercial fish species became extinct. Finally, the jellies almostwiped out the zooplankton on which they themselves fed, which led to the collapse of theirown population. ▪ A major change occurred after 1990 when the Soviet Union regime,which had provided fertilizer subsidies to support intensive agriculture collapsed.Thereafter, fertilizer use fell by more than half and many huge animal farms closed. ▪Nutrient runoff to the Black Sea fell between two- and four-fold. It was obviously recover-ing by 1994 and, by 2005 it appeared normal, although species had not completelyrecovered. ▪ Potential problem As economic conditions improve, fertilizer use could againincrease. However, the governments involved, with aid from the UN Global EnvironmentFacility, started an initiative to maintain nutrient runoff at levels no higher than those ofthe mid-1990s. Farmers began adding buffer zones around agricultural fields to absorbrunoff, and wastewater treatment practices improved. ▪ Obviously, these changes must be
75 (1) Dead zone plan adrift. Environmental Science & Technology, 42(10), April 2, 2008, 3485–3486. (2) Ferber,D. Ocean ecology: dead zone fix not a dead issue. Science, 305(5690), September 10, 2004, 1557.
76 Engelhaupt, E. Trouble killing the dead zone? Environmental Science & Technology, 41(23), December 1, 2007,7956–7957.
77 Mee, L. Reviving dead zones. Scientific American, 294(11), November, 2006, 79–85.
278 Water pollution
maintained. Again quoting Professor Mee: “Coastal dead zones remind us that humanitycannot simply expect natural ecosystems to absorb our wastes without severe, oftenunexpected consequences. We now know how to revive dead zones, but ultimately thesteps required to do so depend on our recognition of the ramifications to the environment ofwaste disposal and the degree to which we value the world’s marine ecosystems.”
Reducing the “nitrogen glut”
Professors Diaz and Rosenberg have noted that “there is no other variable of such ecologicalimportance to coastal marine ecosystems that has changed so drastically over such a shorttime as dissolved oxygen” (see Further reading).
* Agriculture Implementing practices to reduce nutrient and manure runoff is difficult.Farmers believe they will get a lower yield if they use less fertilizer, and it takes resourcesto set up buffer zones. Owners of CAFOs often fight attempts to require them to changetheir handling of animal waste. ▪ People eating less meat would reduce the problem notonly because this could lead to fewer CAFOs, but because animals eat several pounds ofgrain per pound of meat produced. Eating meat means that more grain is grown – and morefertilizer used – than if humans eat the grain themselves. In poor sections of the world,when people’s incomes increase, they eat more meat. About 40% of the world’s grain nowgoes to food animals. ▪ Another approach to reducing nitrogen in manure is to feed foodanimals a diet that results in less reactive nitrogen excretion; that too is expensive.
* Power plants Methods exist to reduce emissions of NOx by power plants beyond whatthey are presently doing. Moreover, NOx emissions could be trapped and converted intofertilizer, but this is costly compared to using synthetic fertilizer. And, although produc-ing synthetic fertilizer is energy intensive, its use continues to increase. ▪ On a morepositive note, Europe expects to reduce NOx emissions more than 40% by 2010 as a resultof the Gothenburg Protocol, a 1999 treaty.
* Motor vehicles In the United States, NOx emissions from vehicles and fertilizer runoff arestill poorly controlled. As one observer commented: “We are not making the lifestylechanges needed to cap nitrogen inputs.” Moreover, the sources of reactive nitrogen areoften far from the coastal areas impacted (the Gulf of Mexico), and people balk at takingresponsibility for distant impacts. However, results from the Black Sea have beenpositive. Professors Diaz and Rosenberg, writing a review on dead zones64 note, thereare other success stories of eliminating, or almost eliminating dead zones including thosein the Mersey and Thames estuaries in England. Mostly, these reversals in hypoxia havebeen small scale. These authors espouse a goal of reducing nutrient inputs to levels seenin the middle of the twentieth century. Some believe that the major problem is that“people haven’t recognized the global nature of nitrogen and that human activity isaltering the nitrogen cycle.” That recognition may be slowly occurring. UN studieshave projected that reactive nitrogen will soon be a global problem. The US NationalResearch Council has urged the government to develop a strategy to combat both reactivenitrogen and phosphorus pollution.
279 Reducing the “nitrogen glut”
SECTION VI
China’s water pollution
China has the largest population in the world. Its rapid economic growth and development isoccurring at the expense of its environment. Reports from the UN Food and AgricultureOrganization, the World Bank, the World Resources Institute, and China’s StateEnvironmental Protection Administration (SEPA) all stress the gravity of China’s environ-mental degradation including severe water pollution. Water pollutants include agriculturalrunoff, massive quantities of domestic sewage and wastes from oil refineries, chemical plants,and paper mills. Agricultural runoff, untreated human sewage, and animal waste have led toexcessive BOD, suspended solids, and microbial contamination in rivers. China has a waterscarcity problem too, made worse by the fact that so much of the water is polluted.
Pollution’s impact on China’s water bodies
Rivers,78 lakes, and coastlines
* Rivers Significant portions along the length of China’s seven major rivers including theYellow and Yangtze no longer support fish life. Some fish species have become extinct,taking with them a valuable food source. Pollution is especially bad in the industrial north.In places, the water is unsuitable even for industrial use let alone irrigation or drinkingwater. A drought worsened the pollution in recent years because during a drought, the sameamount of pollution may enter the rivers, but with less water to dilute it. ▪ China’s statemedia describes the Yangtze, China’s longest river as “cancerous with pollution.” In 2000,SEPA reported that 23 billion tons (21 billion tonnes) of sewage and industrial waste weredischarged into the Yangtze and its branches. Wildlife is severely impacted and the numberof animal species living in the river fell from 126 in the mid-1980s to 52 in 2002. TheYangtze may be completely dead within a few years.79 ▪ Likewise, billions of tons ofwastewater flow into China’s second longest river, the Yellow River so that sewage may beas much as a tenth of its volume.80 The Yellow River has lost a third of its fish species.About 70% of its length is considered unfit for drinking or swimming; yet it provides waterto 150 million people and irrigates 15% of China’s farmland.
* Lakes About 75% of China’s lakes are highly polluted. More than 60% of its large lakesare eutrophic, and suffer algal blooms that kill fish, make water undrinkable and some-times have sickening odors.
78 (1) Polluted China rivers threaten “sixth” of population. Reuters, August 27, 2008, http://www.abc.net.au/news/stories/2007/08/27/2016373.htm. (2) Tremblay, J.-F. Efforts to clean the Huai fail again. Chemical &Engineering News, 85(36), September 3, 2007, 28.
79 Pollution risks Yangtze’s “death”. BBCNews, May 30, 2006, http://news.bbc.co.uk/2/hi/asia-pacific/5029136.stm.80 China’s Yellow River ten percent sewage. Reuters, May 14, 2007, http://www.reuters.com/article/
environmentNews/idUSPEK26151720070511.
280 Water pollution
* Coastlines81 A group of Chinese authors describe the coastal waters of seaside towns inthe east China provinces of Jiangsu and Shandong as “massive dumping grounds” withfilthy water and vanishing fish. Fishermen are giving up and going elsewhere to look forwork. Coastal pollutants include reactive nitrogen, phosphorus, and oil products. Largequantities of waste come from fish and shrimp farms along the coast while, at the sametime villagers in Shuigou find dead and dying fish in their nets. Sometimes nets, ladenwith rubbish and black oil are almost too heavy to pull up. Clam beds are dead or dying.This village and many other coastal communities are disintegrating.
Drinking water
In 2007, the Organization for Economic Cooperation & Development (OECD) reportedthat water in half of China’s major cities does not meet drinking-water quality standards:~300 million people drink contaminated water and 70 million drink water containingenough arsenic and fluoride to put their health at risk. An estimated 190 million peoplecontract water-related illnesses every year, especially diarrhea. People who can afford itdrink bottled water.
Severe water pollution and working to reduce it
Why water pollution is so severe
China’s population of ~1.3 billion continues to grow as does industrialization and urban-ization. Although the majority of industrial wastewater is treated, only half is treated togovernment standards. Unregulated pollution pours from about 7 million small villagebusinesses, this although China shut down many thousands of the worst. Farmers useinappropriately large amounts of pesticides and fertilizers, much of which run off intosurface water or infiltrates groundwater. The central government struggles to at leaststabilize the pollution. Its highest decision-making body, the State Council says a majorreason is that lower-level government bodies do not enforce national standards.
Reducing China’s water pollution
In late 2007, China, with a new urgency passed the Water Pollution Prevention and ControlLaw82,83 which allows for stiff fines against companies that foul water. China also has
81 Chen,Y., Bin, L., Chuanmin,Y. et al. Darkwater: coastal China on the brink. SouthernMetropolisDaily, April 8, 2008.82 China launches vast water clean-up. ENN, March 19, 2009, http://www.enn.com/top_stories/article/39464.83 China cracks down on water polluters with new law. Reuters, February 28, 2008, http://www.enn.com/
ecosystems/article/31965.
281 Severe water pollution and working to reduce it
developed a detailed plan to restore its lakes to their original state by 2030:84 the StateCouncil ordered strict regulation of wastewater releases to lakes and improved sewage-treatment plants. Because of the major quantities of waste coming from fish farms, thegovernment ordered their removal from the country’s three largest lakes by the end of 2008;it also issued regulations as to where fish farms could be placed. It will close heavilypolluting factories near lakes. It furthermore banned the use of certain pesticides near itslarge lakes, and detergents containing phosphates. ▪ China has also released a three-yearmaster plan to manage environmental degradation more generally, and plans to spend ~$300billion on air, water and solid waste control.85 Of this, $85 billion will go to reducing waterpollution. Because the State Council believes that a major problem is the lack of enforce-ment by lower-level government bodies, it decided to start auditing how well local govern-ments enforced standards.
Delving deeper
1. See Nonpoint Source Success Stories, US EPA, February 23, 2009. http://www.epa.gov/
nps/success/pdf/319_cat1.pdf. Choose one story of interest to you, e.g., one in which
individuals are actively involved, one in which a business chose to do the right thing, or one
involving an agency working with a community. After you understand the story, write a
brief paper or make a brief report to the class regarding what made it a success and what
larger lessons can be drawn. How could individuals or companies, sometimes just by
maintaining awareness prevent such an occurrence?
2. Examine the many possibilities listed on The Chesapeake Bay Program, Help the Bay in
Your Backyard. http://www.chesapeakebay.net/inyourbackyard.aspx?menuitem=16888.
Then, consider what possibilities you see for an individual such as yourself to use this
information to develop a project on NPS pollution. Or how you realistically could change
your own lifestyle.
3. We are most aware of acid deposition, but many pollutants are deposited from the sky.
Read the references in footnote86 or other relevant references. Summarize this issue
including addressing its importance.
4. Examine the two US EPA (1990 and 2008) “Citizens’ Guides” references in Internet
Resources. Prepare a report on their relevance to you, and how to make these issues
more relevant to your fellow citizens.
5. Investigate permeable concrete and porous asphalt. What are its advantages? Is it available
locally? How much does it cost relative to ordinary concrete and asphalt? What goes under
the concrete or asphalt and why?
84 Bradsher, K. China offers plan to clean up its polluted lakes. New York Times, January 23, 2008, http://www.nytimes.com/2008/01/23/world/asia/23china.html?ex=1358744400&en=2aef30682eb8b69b&ei=5088&partner=rssnyt&emc=rss.
85 Tremblay, J. –F. China releases new cleanup plan.Chemical & Engineering News, 85(49) December 3, 2007, 12.86 (1) Air pollution and water quality. US EPA, June 19, 2008, http://www.epa.gov/owow/airdeposition/.
(2) Atmospheric deposition 101. US EPA, March 18, 2009, http://epa.gov/oar/oaqps/gr8water/handbook/airdep_sept_2.pdf.
282 Water pollution
Further reading
Christen, K. Pesticide mixtures ubiquitous in US streams. Environmental Science &Technology, 40(11), June 1, 2006, 3446–3447.
Christen, K. Closing the phosphorus loop. Environmental Science & Technology, 40(7),April 1, 2007, 2078.
Diaz, R. J. and Rosenberg, R. Spreading dead zones and consequences for marine ecosys-tems. Science, 321(5891), August 15, 2008, 926–929.
Kemsley, J. Treating sewage for drinking water. Chemical & Engineering News, 86(04),January 28, 2008, 71–73.
Lubick, N. Using nature’s design to stem urban storm-water problems. EnvironmentalScience & Technology, 40(19) October 1, 2006, 5832–5833.
Mallin, M.A. Wading in waste. Scientific American, 294(6), June, 2006, 53–59.Mee, L. Reviving dead zones. Scientific American, 294(11), November, 2006, 79–85.Renner, R. Exxon Valdez oil no longer a threat? Environmental Science & Technology,
40(20), 15 October 2006, 6188–6189.
Internet resources
Dunham, W. 2007. Frog deformities blamed on farm and ranch runoff. http://www.reuters.com/article/environmentNews/idUSN2432027920070924?pageNumber=2&virtualBrandChannel=0 (September 26, 2007).
ENN. 2009. China launches vast water clean-up. http://www.enn.com/top_stories/article/39464 (March 19, 2009).
Exxon Valdez oil spill. 2009. Wikipedia. http://en.wikipedia.org/wiki/Exxon_Valdez_oil_spill (March 15, 2009).
Halwell, B. 2008. Ocean pollution worsens and spreads. Worldwatch. http://www.worldwatch.org/node/5474.
Jackson, R. B. and Jobbágy, E. G. 2005. From icy roads to salty streams. Proceedings of theNational Academy of Sciences. http://www.pnas.org/content/102/41/14487.full(October 3, 2005).
Lambert, L. 2007. One-third of US estuaries in bad shape – EPA. Reuters. http://www.reuters.com/article/environmentNews/idUSN0531143320070606 (June 7, 2007).
Leahy, S. 2006. Marine scientists report massive “dead zones,” UN report. InterPress Service. http://www.commondreams.org/headlines06/1006–04.htm (October 6,2006).
Reuters. 2007. China’s Yellow River ten percent sewage. http://www.reuters.com/article/environmentNews/idUSPEK26151720070511 (May 14, 2007).
2008. Polluted China rivers threaten sixth of population. http://www.abc.net.au/news/stories/2007/08/27/2016373.htm (August 27, 2008).
283 Internet resources
Sherman, B. 2007. Report on nutrient pollution forecasts worsening health for nation’sestuaries. NOAA Public Affairs. http://oceanservice.noaa.gov/news/pressreleases/july07/supp_073107.html (July 31, 2007).
UNEP. 2009. Global Program of Action for the Protection of the Marine Environment fromLand-Based Activities. http://www.gpa.unep.org/about/#tag10 (March 17, 2009).
US EPA. 1990. Citizens’ guide to groundwater protection. http://www.epa.gov/safewater/sourcewater/pubs/citguid.pdf (April, 1990).
2001. Functions and values of wetlands. http://www.epa.gov/owow/wetlands/facts/fun_val.pdf (September, 2001).
2004. Wetlands overview. http://www.epa.gov/owow/wetlands/facts/overview.pdf(December, 2004).
2006. Beaches: basic information. http://www.epa.gov/beaches/basicinfo.html(December 1, 2006).
2008. Citizens’Guide: Polluted Runoff, what you can do to prevent NPS pollution. http://www.epa.gov/owow/nps/whatudo.html (March 7, 2008).
2008. Clean Water Act, an introduction. http://www.epa.gov/watertrain/cwa/cwa8.htm(September 12, 2008).
2008. Example photographs of BestManagement Practices (BMPs). http://www.epa.gov/nps/ex-bmps.html (March 7, 2008).
Great Lakes Today: Concerns. http://www.epa.gov/glnpo/atlas/glat-ch4.html (July 28,2008).
2008. How does excessive water use affect water quality? http://www.epa.gov/WaterSense/water/save/water_Quality.htm (August 28, 2008).
2008. National Coastal Conditions Reports. http://epa.gov/owow/oceans/nccr/(December 9, 2008).
2008. Stormwater management. http://www.epa.gov/oaintrnt/stormwater/index.htm(December 24, 2008).
2008. US national coastal condition report. http://www.epa.gov/owow/oceans/nccr(December 9, 2008).
2008. Wetlands, oceans and watershed. http://www.epa.gov/owow/ (December 15,2008).
2008. What is nonpoint source (NPS) pollution? Questions and answers. http://www.epa.gov/owow/NPS/qa.html (March 7, 2008).
2009. Air pollution and water quality. http://www.epa.gov/owow/airdeposition/(March 18, 2009).
2009. Assessing and reporting water quality: questions and answers. http://www.epa.gov/waters/ir/attains_Q_and_a.html (January 21, 2009).
2009. Atmospheric deposition 101. http://epa.gov/oar/oaqps/gr8water/handbook/airdep_sept_2.pdf (March 18, 2009).
Clean Water Act. http://www.epa.gov/oecaagct/lcwa.html (January 20, 2009).2009. Summary of the Clean Water Act. http://www.epa.gov/lawsregs/laws/cwa.html(February 19, 2009).
2009. Surface and ground water. http://www.epa.gov/oecaagct/tsur.html (March 10,2009).
284 Water pollution

2009. Water science. http://www.epa.gov/waterscience/ (April 21, 2009).2009. Wetlands. http://www.epa.gov/owow/wetlands/ (January 14, 2009).
UN Environment Program. 2009. The Global Program of Action for the Protection of theMarine Environment from Land-Based Activities. http://www.gpa.unep.org/about/#tag10 (March 17, 2009).
US National Research Council. 2007. Water implications of biofuels production in theUnited States. http://dels.nas.edu/dels/rpt_briefs/biofuels_brief_final.pdf (October,2007).
285 Internet resources
10 Drinking-water pollution
“The wall between us and microbes, is beginning to crumble.”American Academy of Microbiology
Most of us in developed countries take clean and plentiful water as a given, not just drinkingwater, but water for household, yard, and other uses. Yet, says the American Academy ofMicrobiology, “Microbiologically safe drinking water can no longer be assumed, even in theUnited States and other developed countries, and the situation will worsen unless measuresare taken in the immediate future – the crisis is global.” Treating drinking water to killpathogens is given much credit for increasing the life span of US people from 47 years at theturn of the twentieth century to 77 years. But the twenty-first century begins with a fifth ofhumanity still without clean drinking water. Even poor-quality water is becoming scarcerand even scarcer for sanitary needs. ▪ The UN estimates that in the near future, at least 40%of the world’s people will live in countries where they cannot get enough water to satisfybasic needs. Wildlife is increasingly deprived of water. Domestic animals may go wanting.Demand for fresh water increased six-fold in the twentieth century, more than twice the rateof population growth.1 Reasons for water scarcity include an increasing human populationthat wants and needs more water. Industrial use of water has increased. However, most of theincreased water use has arisen from irrigating farm land.
Less than 3% of the water on Earth is fresh and only about a third of this is available forhuman – and wildlife – use because the other 2% is frozen into polar ice sheets and glaciers.▪ Ninety-seven percent of Earth’s water, including ocean water is too salty to drink.▪ Brackish water is less salty than ocean water, but usually not potable. Some groundwateris also too brackish to drink as is some non-marine surface water such as Utah’s Great SaltLake. However, an increasing amount of freshwater is too polluted to drink. Humanactivities that pollute water were described in Chapter 9. Surface water is more likely tobe significantly contaminated with pathogens, but contaminated groundwater is an increas-ing concern.
The emphasis in Chapter 10 is on pathogens, monumental drinking-water pollutants inless-developed countries. Section I addresses drinking-water protection in developed coun-tries. Primary and secondary water standards are examined. Two primary pollutants areemphasized, microbes and nitrate, which can have immediate impacts on health. Drinking-water treatment, disinfection, and disinfection by-products are examined, as is fluoride in
1 Increasingly there are predictions of competition over water resources leading to violent international conflict.“A looming crisis that overshadows nearly two-thirds of the Earth’s population is drawing closer because ofcontinued human mismanagement of water, population growth and changing weather patterns” (former UNSecretary Kofi Annan speaking on World Water Day, March 22, 2002).
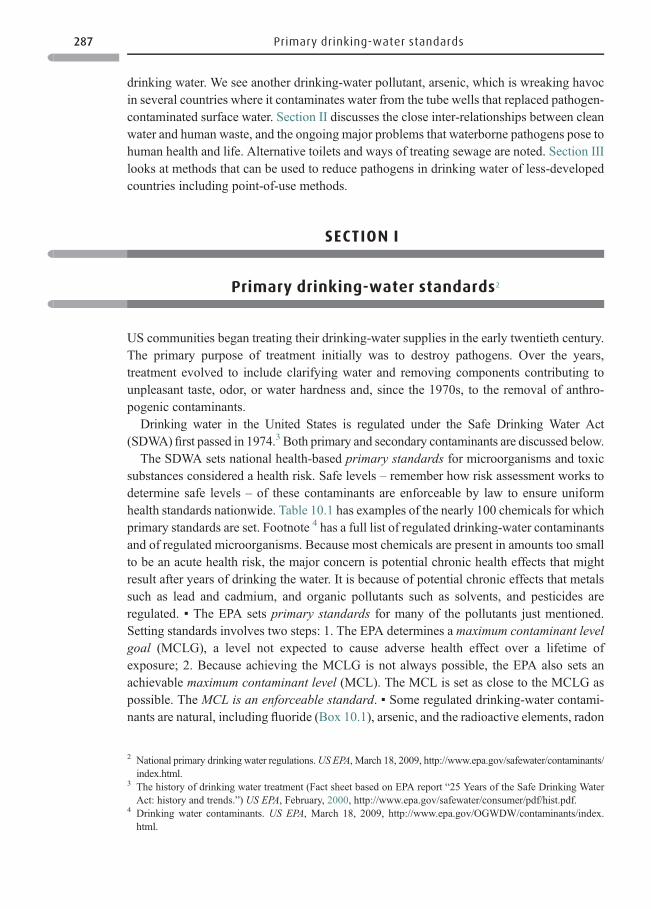
drink ing water. We see anothe r drink ing-wate r po llutant, arseni c, which is wre aking ha vocin severa l countr ies wher e it contamina tes water from the tube wel ls that repla ced pathog en-contam inated surfa ce water. Secti on II discusses the close inter-relationships betw een cleanwat er and human waste, and the ongoin g major problems that waterbor ne pathog ens pose tohuman health and life. Al ternative toile ts and ways o f treating sewage are noted. Section IIIlooks a t methods that can be used to reduce pathog ens in drink ing wat er of less -develo pedcountr ies incl uding point-of- use met hods.
SECTION I
Primary drinking -water standards2
US comm unities began treat ing their drink ing-wat er suppl ies in the early twen tieth centur y.The prima ry purpos e of treat ment initially was to destr oy pathog ens. Over the yea rs,treat ment evolve d to incl ude clarifyi ng water and removing compo nents contribut ing tounplea sant tast e, odor, or water hardness and, since the 1970s, to the removal of anthr o-pogeni c contam inants.
Drinking water in the United States is regulated under the Safe Drinking Water Act(SDWA) first passed in 1974.3 Both primary and secondary contaminants are discussed below.
The SDWA sets nati onal healt h-based primary stand ards for microorganisms and toxi csubst ances conside red a health risk. Safe levels – reme mber how risk a ssessment wor ks todeter mine safe level s – of these contam inants are enforc eable by law to ensure unifo rmhealt h stand ards nationw ide. Table 10.1 has examp les of the nearl y 100 chemi cals for whi chprim ary stand ards are set. Fo otnote 4 has a full list of regul ated drinking-wat er contamina ntsand of regula ted microorganisms. Bec ause most chemicals are presen t in amoun ts too smallto be an acute health risk , the major concern is po tential chroni c healt h effects that mig htresul t after years of drinking the water. It is because of potential chroni c effec ts that metalssuch as lead and cadmi um, and organic poll utants such as solvents, a nd pesticide s areregul ated. ▪ The EPA sets primary stand ards for many of the pollutant s just ment ioned.Se tting stand ards involves two steps: 1. The EPA deter mines a maxi mum contami nant levelgoal (MC LG), a level not expect ed to cause advers e healt h effect over a lifetime ofexposur e; 2. Bec ause achiev ing the MCLG is not always possible, the EPA also sets anachiev able maxim um contami nant level (MCL ). The MCL is set as close to the MC LG aspossible. The MCL is an enforceable standard. ▪ Some regulated drinking-water contami-nants are natural, including fluoride (Box 10.1), arsenic, and the radioactive elements, radon
2 National primary drinking water regulations.US EPA, March 18, 2009, http://www.epa.gov/safewater/contaminants/index.html.
3 The history of drinking water treatment (Fact sheet based on EPA report “25 Years of the Safe Drinking WaterAct: history and trends.”) US EPA, February, 2000, http://www.epa.gov/safewater/consumer/pdf/hist.pdf.
4 Drinking water contaminants. US EPA, March 18, 2009, http://www.epa.gov/OGWDW/contaminants/index.html.
287 Primary drinking-water standards
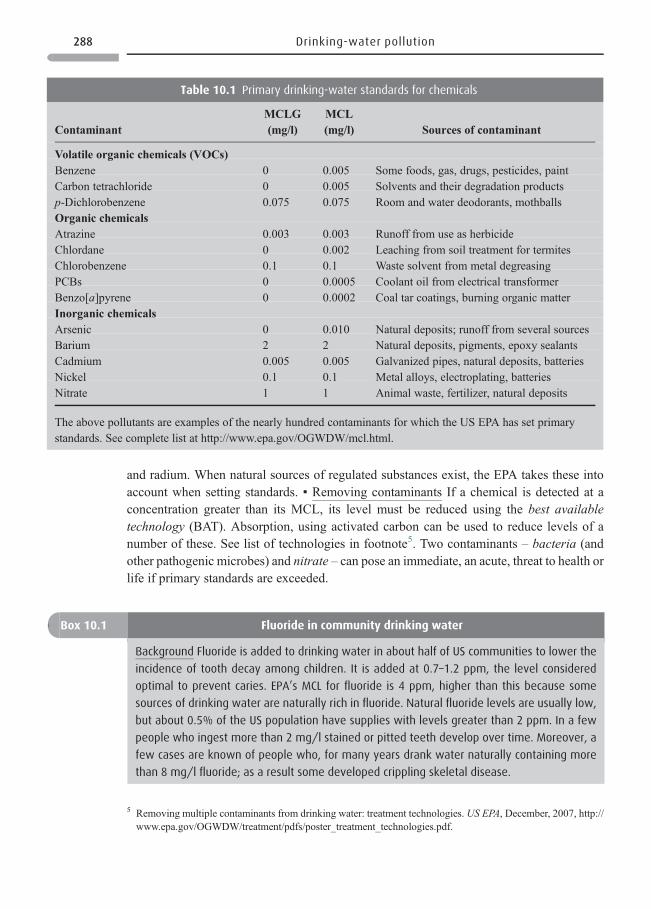
and radium. When natural sources of regulated substances exist, the EPA takes these intoaccount when setting standards. ▪ Removing contaminants If a chemical is detected at aconcentration greater than its MCL, its level must be reduced using the best availabletechnology (BAT). Absorption, using activated carbon can be used to reduce levels of anumber of these. See list of technologies in footnote5. Two contaminants – bacteria (andother pathogenic microbes) and nitrate – can pose an immediate, an acute, threat to health orlife if primary standards are exceeded.
Table 10.1 Primary drinking-water standards for chemicals
ContaminantMCLG(mg/l)
MCL(mg/l) Sources of contaminant
Volatile organic chemicals (VOCs)Benzene 0 0.005 Some foods, gas, drugs, pesticides, paintCarbon tetrachloride 0 0.005 Solvents and their degradation productsp-Dichlorobenzene 0.075 0.075 Room and water deodorants, mothballsOrganic chemicalsAtrazine 0.003 0.003 Runoff from use as herbicideChlordane 0 0.002 Leaching from soil treatment for termitesChlorobenzene 0.1 0.1 Waste solvent from metal degreasingPCBs 0 0.0005 Coolant oil from electrical transformerBenzo[a]pyrene 0 0.0002 Coal tar coatings, burning organic matterInorganic chemicalsArsenic 0 0.010 Natural deposits; runoff from several sourcesBarium 2 2 Natural deposits, pigments, epoxy sealantsCadmium 0.005 0.005 Galvanized pipes, natural deposits, batteriesNickel 0.1 0.1 Metal alloys, electroplating, batteriesNitrate 1 1 Animal waste, fertilizer, natural deposits
The above pollutants are examples of the nearly hundred contaminants for which the US EPA has set primarystandards. See complete list at http://www.epa.gov/OGWDW/mcl.html.
Box 10.1 Fluoride in community drinking water
Background Fluoride is added to drinking water in about half of US communities to lower the
incidence of tooth decay among children. It is added at 0.7–1.2 ppm, the level considered
optimal to prevent caries. EPA’s MCL for fluoride is 4 ppm, higher than this because some
sources of drinking water are naturally rich in fluoride. Natural fluoride levels are usually low,
but about 0.5% of the US population have supplies with levels greater than 2 ppm. In a few
people who ingest more than 2 mg/l stained or pitted teeth develop over time. Moreover, a
few cases are known of people who, for many years drank water naturally containing more
than 8 mg/l fluoride; as a result some developed crippling skeletal disease.
5 Removing multiple contaminants from drinking water: treatment technologies. US EPA, December, 2007, http://www.epa.gov/OGWDW/treatment/pdfs/poster_treatment_technologies.pdf.
288 Drinking-water pollution
Pathogens
Destroying pathogenic agents – bacteria, viruses, protozoa – remains the primaryreason to treat drinking water. Microorganisms are naturally present in water.▪ However, fecal coliform bacteria in the water may indicate human or animal wastesbecause these bacteria inhabit the intestines of humans and other vertebrates. Coliformbacteria do not necessarily cause disease themselves, but are an indicator of fecalmaterial, which may contain pathogens. They are used as an indicator because simpleinexpensive methods are available to detect them. If coliform bacteria are detected, thewater is further tested for the presence of organisms known to be pathogens. Examplesare: Legionella bacteria are responsible for the respiratory disease, Legionnaire’sdisease. ▪ Enteric viruses are pathogens which can cause gastrointestinal distress. ▪Two protozoa causing serious intestinal illness are Giardia lamblia andCryptosporidium parvum (Figure 10.1).8
Controversy
After more than 50 years of use, fluoridation remains controversial because some believe it is
harmful. Critics assert that lax monitoring leads to fluoride ingestion at levels high enough to
harm human health. In one (now old) example, a grape juice for babies was found to contain
6.8 ppm fluoride. People ingest fluoride from food and beverages that were processed with
fluoridated water. Fluoride is also sometimes found in tooth paste, which children may
swallow.
Government position
In 2006, on the basis of a report from the National Research Council (NRC), the CDC affirmed
the use of fluoride in drinking water to prevent dental caries.6 The report’s emphasis was on
addressing the safety of high natural levels of fluoride in water (2 ppm or more). It did not
question using lower levels to prevent tooth decay. However, the CDC advisedthe EPA to lower
the MCL for fluoride because natural levels of up to 4 ppm (and sometimes greater) were
associated, after lifetime exposure, with an increased risk of bone fractures and, rarely, severe
skeletal fluorosis. Babies and children Severe tooth enamel fluorosis has occurred in some
babies and children up to 8 years of age from exposure to high natural levels. However, at less
than 2 ppm, the NRC committee noted that severe fluorosis was near zero. The CDC recom-
mends that, if water systems have fluoride levels greater than 2 ppm, parents of young
children give them an alternative source of drinking water.7
6 CDC statement on the 2006 NRC report on fluoride in drinking water. CDC, Division of Oral Health, September24, 2008, http://www.cdc.gov/fluoridation/safety/nrc_report.htm.
7 Community water fluoridation overview. CDC, May 15, 2008, http://www.cdc.gov/fluoridation/.8 Cryptosporidium and Giardia. US EPA, October 30, 2007, http://www.epa.gov/nerlcwww/cpt_gda.htm.
289 Primary drinking-water standards
Sources of pathogens
Pathogen sources include poorly treated sewage, malfunctioning septic systems, runoff ofanimal manure, and other storm water runoff. Pathogenic agents can also come from fish,water birds, and wild animals. Before the twentieth century, pathogens frequently contami-nated drinking water causing epidemics of cholera, typhoid fever, amoebic dysentery, andother diseases. Small children in particular, often died from waterborne diseases and a greatmany still do in less-developed countries. As communities began disinfecting drinkingwater in the early twentieth century, these diseases fell dramatically. Nonetheless, pathogencontamination did not disappear. A 1985 CDC report estimated that 940 000 Americansbecome ill each year from infectious organisms in drinking water, and about 900 die. Thoseat greatest risk are infants, elderly people, and individuals with immune systems compro-mised by other illnesses. ▪ An especially serious incident occurred in 1993 when about400 000 people in Milwaukee, Wisconsin, became ill after drinking water contaminatedwith Cryptosporidium. More than 100 already ill people died. The US EPA already requiredwater utilities to remove at least 99% of Cryptosporidium from their drinking water; thisregulation became stricter as of 2006 for certain utilities.9
Killing microbes in drinking water
Disinfection is often vital to obtain safe drinking water.10 The most common and techno-logically simple means of disinfection is with chlorine-containing chemicals, chlorination.Unfortunately, chlorination produces its own contaminants, disinfection by-products(DBPs). These result from the reaction of chlorine with organic material present in water.
Figure 10.1 Two parasitic protozoa. Credit H. D. A. Lindquist, US EPA (Bar = 10 microns) EPA
9 Bad Bug Book: Foodborne Pathogenic Microorganisms and Natural Toxins Handbook. US FDA, June 18, 2009,http://www.fda.gov/Food/FoodSafety/FoodborneIllness/FoodborneIllnessFoodbornePathogensNaturalToxins/BadBugBook/default.htm.
10 Water and disinfection. Centers for Disease Control and Prevention, 2008, http://www.cdc.gov/Features/DrinkingWater/index.html.
290 Drinking-water pollution
Higher chlorine concentrations produce higher levels of DBPs, especially if significantquantities of organic material are present. High levels of chlorination can also produce anodor and affect taste.
Disinfection by-products
Chloroform is the DBP produced in the largest amount. At high doses, chloroform is ananimal carcinogen. ▪ The EPA has established an MCL for total trihalomethanes (THMs), afamily of DBPs found in chlorinated water, so THMs are a primary water pollutant.Epidemiologic studies suggest that drinking chlorinated water for many years increasesthe risk of bladder and rectal cancer.11 This raises a dilemma because disinfection is criticalto killing harmful microorganisms; moreover, disinfectant levels must be high enough toaccomplish this. Some argue that chloroform levels and, more generally, total DBPs are notof concern, especially balanced against the risk of infectious diseases. ▪ Removing DBPsRemoving DBPs from drinking water is an end-of-pipe process, and sometimes costly. A P2
approach is to remove as much organic material as possible from water before chlorination,which results in lower levels of DBPs. Better, ensure that water comes from a clean sourcesuch as the Catskill Mountain watershed for New York City.
Alternative disinfectants
These produce smaller amounts of DBPs than does chlorine. However, all disinfectants formsome DBPs, which may pose problems too. What are these disinfectants?
* Chlorine dioxide is more effective at destroying pathogenic microbes than chlorine; italso produces much smaller quantities of DBPs. However, it does produce chlorite, anEPA-regulated DBP; and without careful handling ClO2 is dangerous. An increasingnumber of United States communities use chlorine dioxide.
* Chloramine is effective too and produces fewer DPBs. ▪ However, chloramine hasproduced a major problem in some situations – it leaches out the dangerous pollutantlead from old plumbing.12 ▪ Moreover, chloramine can lead to the formation of nitros-amines, which are much stronger carcinogens than are THMs.13 This is ironic becauseone reason for switching to chloramines was that THMs from chlorine are associated withan increased bladder-cancer risk.
* Ozone (O3) disinfection works even better than chlorine, and also helps to removepoor tastes, color, and odors from water. Ozone decomposes into oxygen (O2) and afree oxygen atom O. With its unpaired electron, this oxygen atom is a free radical and
11 Another epidemiologic study had raised concern that DBPs in chlorinated tap water might also increase the riskof miscarriage in pregnant women. However, a well-regarded 3-year, $3.5 million study of pregnant womenexposed to THMs found no greater risk of miscarriage than in less-exposed women. Renner, R. DBPs notassociated with miscarriage. Environmental Science & Technology, 39(20), October 15, 2005, 416A.
12 Renner, R. Chloramine’s effect on lead in drinking water. Environmental Science & Technology, 40(10), May 17,2006, 3129–3130.
13 Lubick, N. More nitrosamines in drinking water. Environmental Science & Technology, 40(24), December 15,2006, 7454.
291 Primary drinking-water standards
extremely reactive. It reacts with and degrades many water contaminants. However,O3 cannot maintain disinfection just because it does so readily break down; thus, tomaintain disinfection a small amount of chlorine must be added before piping thewater to users; so small amounts of THMs form. Many consider ozone the idealdisinfectant. However, if the water contains bromide, ozone oxidizes it to the DBP,bromate; bromate is a strong animal carcinogen and a regulated pollutant. Ozonedisinfection is about 10% more expensive, and needs better trained operators.Nonetheless, cities planning new drinking-water treatment plants are moving towardozone if they have the financial resources. Another major positive for ozone is that itdestroys the serious protozoan contaminant Cryptosporidium, whereas chlorine isconsiderably less effective.
* Ultraviolet light (UV) kills pathogens. However, because it is expensive, it has been usedprimarily to treat small volumes of water. Like ozone, UV light also can destroyCryptosporidium. As with ozone, small amounts of a chemical disinfectant must beadded before piping water to users. However, cities able to afford the added cost seriouslyconsider UV light. Plants using UV light cost more, but less expensive UVoperations arebeing developed. Small-scale inexpensive versions are also being explored for less-developed countries.
* Distillation of water can purify it and the distillate has no DBPs. However distillation iscostly and the distilled water lacks minerals and taste.
Reducing the need for disinfection
Disinfection is critical for impure water. But if a community conscientiously works to reduceinfectious microorganisms in its water supply, it needs less or no disinfection. The US EPAand a number of states have watershed protection programs to maintain the purity of watersources. Recall the New York City P2 example: spend money to buy and protect landbordering on the water bodies that supply drinking water. ▪ At the individual level, thosewith private wells can make sure there is no source of pathogens that can reach thegroundwater serving the well. See Table 9.1 for approaches used to reduce polluted runoff.As population continues to increase and development pressures grow, maintaining waterpurity becomes both more important and more difficult.
Nitrate: a second threat to health
The second contaminant able to pose an acute threat to health – if above its MCL of 1 mg/l –is nitrate. Recall that nitrate is found in runoff from fertilizer-treated fields and from areaswith large amounts of manure (animal operations). This happens because rainwater candissolve the nitrate, which then runs off into surface water. It can also infiltrate into soil andgroundwater and sometimes contaminates rural wells. Infants are most vulnerable becausenitrate is converted to nitrite in infant stomachs more readily than in adults or older children.After absorption into the bloodstream, nitrite reacts with the iron in the infant’s hemoglobin
292 Drinking-water pollution
to produce methemoglobin, which cannot carry oxygen. The result may be “blue baby”syndrome.14 Excessive nitrate ingestion has resulted in infant deaths in the MidwesternUnited States.
Arsenic:15 “the largest mass poisoning in history”
Arsenic is a primary drinking-water pollutant16 that is becoming “the key environmentalhealth problem of the twenty-first century.” Public health personnel make this statementbecause of what is happening in portions of Bangladesh, West Bengal, India, Vietnam,and a number of other countries. In Bangladesh, more than a hundred million peopledrink water contaminated with more than 50 μg/l of arsenic – this although the WorldHealth Organization (WHO) advises a maximum permissible level for arsenic in drink-ing water of 50 μg/l, and recommends 10 μg/l. In some Asian wells levels exceed 3000μg/l. Why is this happening? Surface water in Bangladesh and in many other impov-erished countries is so polluted with pathogens (and sometimes with industrial chem-icals) that it cannot serve as drinking water. So, more than 30 years ago the UNInternational Children’s Emergency Fund (UNICEF) began funding the drilling ofwells to provide clean drinking water. Once well water became available, infant deathsfrom diarrhea dropped dramatically. The wells seemed a major success. However,organic matter is buried in the sediments into which the wells were drilled; its decayleads to chemical events that result in arsenic release into groundwater, and thusinto wells.
Arsenic toxicity17
Although arsenic levels in Bangladeshi wells are high, they are not acutely toxic. Chronictoxicity is the problem. This meant that awareness of the poisoning was slow in coming.People began showing symptoms after drinking the water for 5 to 10 years or more. In oneregion of Bangladesh where 59% of nearly 11 000 well-water samples contained morethan 50 μg/l arsenic, nearly a quarter of the villagers examined had skin lesions. ▪ Earlysymptoms are changes in skin coloration or many hard corns on the palms, soles, andtorso. Drinking water with arsenic levels greater than about 300 μg/l resulted in skinlesions (Figure 10.2). Later, skin cancers also began appearing. ▪ Over decades, as people
14 Nitrate and nitrite, human health fact sheet. Argonne National Laboratory, August, 2005, http://www.ead.anl.gov/pub/doc/nitrate-ite.pdf.
15 ToxFAQs™ for arsenic. ATSDR, August, 2007, http://www.atsdr.cdc.gov/tfacts2.html.16 (1) Arsenic in drinking water. US EPA, September 14, 2006, http://www.epa.gov/safewater/arsenic/index.html.
(2) Arsenic in drinking water, basic information. US EPA, March 26, 2007, http://www.epa.gov/safewater/arsenic/basicinformation.html.
17 Mead, M. N. Arsenic: in search of an antidote to a global poison. Environmental Health Perspectives, 113(6),June 2005, A378–A386.
293 Arsenic: “the largest mass poisoning in history”
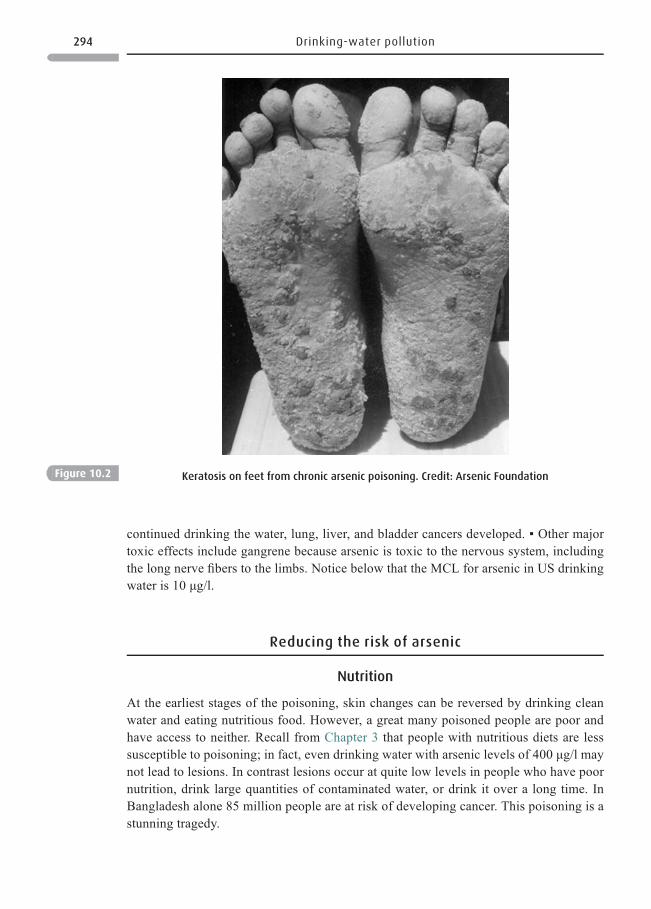
continued drinking the water, lung, liver, and bladder cancers developed. ▪ Other majortoxic effects include gangrene because arsenic is toxic to the nervous system, includingthe long nerve fibers to the limbs. Notice below that the MCL for arsenic in US drinkingwater is 10 μg/l.
Reducing the risk of arsenic
Nutrition
At the earliest stages of the poisoning, skin changes can be reversed by drinking cleanwater and eating nutritious food. However, a great many poisoned people are poor andhave access to neither. Recall from Chapter 3 that people with nutritious diets are lesssusceptible to poisoning; in fact, even drinking water with arsenic levels of 400 μg/l maynot lead to lesions. In contrast lesions occur at quite low levels in people who have poornutrition, drink large quantities of contaminated water, or drink it over a long time. InBangladesh alone 85 million people are at risk of developing cancer. This poisoning is astunning tragedy.
Figure 10.2 Keratosis on feet from chronic arsenic poisoning. Credit: Arsenic Foundation
294 Drinking-water pollution
Pregnant women and their babies
Studies showed adverse impacts showing up after many years in people whose mothersdrank water with high levels of arsenic when pregnant. One researcher noted that, if no otheraction is taken, pregnant women should receive low-arsenic water.
Other personal actions to reduce risk
Contaminated wells have had their handles painted red to warn people. Nonetheless, ifuncontaminated water is located far from their homes, some people continue to drink fromarsenic-contaminated wells. ▪Recall (Chapter 3) synergism: studies find that the lung cancerrisk of smokers who also drink water high in arsenic was 32 times that of non-smokers withlow levels of drinking-water arsenic. Compare this to a six-fold greater risk for lung cancerresulting from smoking alone.
Removing arsenic from water18
An intense effort has been underway to find ways to cheaply remove arsenic from water.Technologies already existed, but were too costly for impoverished countries. When amillion dollar prize was offered for methods to inexpensively reduce arsenic levels below50 μg/l, a number of good technologies were developed: the winner produced a simple,inexpensive system for filtering arsenic from well drinking water. It uses buckets of riversand, pieces of cast iron, and charcoal. At the time the prize was received in 2006, some ofthese devices were still being successfully used after five years in Bangladeshi villages. Insome cases, drilling deeper wells is appropriate. However, close oversight over theirinstallation must be provided because of potential corruption.
Arsenic in wealthier countries
In the United States, the MCL is 10 μg/l (as of 2006); previously it had been 50 μg/l. The10 μg/l resulted from epidemiologic studies finding association between low-dose expo-sures to arsenic and increased risks of vascular disease, diabetes, and some cancers.Laboratory studies on animal cells indicated that at low doses, arsenic is an environmentalhormone (endocrine disrupter): it disrupts the action of cortisol, a steroid hormone involvedin regulating blood glucose levels and blood pressure.19 ▪ However, the United States toohas many water wells containing greater than 50 μg/l arsenic. A great many more contain atleast 10 μg/l. But the MCL regulation does not apply to private wells, many of which havenot been tested.
18 Ritter, S. K. Sustainable technology: chemist wins gold in million-dollar arsenic challenge. Chemical &Engineering News, 85(7), February 12, 2007, 19.
19 Arnette, R. Low dose arsenic is an endocrine disruptor. NIEHS, January, 2008, http://www.niehs.nih.gov/news/newsletter/2008/january/arsenic.cfm.
295 Arsenic: “the largest mass poisoning in history”
Secondary drinking-water standards
Secondary standards are designed to protect public welfare. The contaminants involved arethose that can influence taste, odor, or color. See Table 10.2. These are primarily aestheticconcerns. The EPA has guidelines for these substances but they are not enforceable unlessindividual states treat them as enforceable. A full list of secondary contaminants is found onthe US EPA website noted in footnote20 (following the list of primary drinking-watercontaminants).
Emerging drinking-water contaminants
Recall (Section Vof Chapter 1) “The tyranny of small decisions.” Think of all the shampoos,cosmetics, personal care products, and other household chemicals that go down the drain.Plus the metabolic breakdown products of pharmaceuticals that go down the toilet.Sometimes people deliberately dump the whole of unused prescriptions down the toilet.They end up at small levels in surface waters, sometimes re-emerging, albeit at tiny levels, inour drinking-water taps. Among the chemicals being disposed of this way, the ones of mostconcern are environmental hormones and antibiotics. ▪ Hormones The metabolites ofhormones that we ingest, e.g., birth control pills become, once they are released into theenvironment, environmental hormones. Recall that although most environmental hormoneshave weak activity, the downside is that hormones are active at tiny concentrations. This isreason enough to be concerned that these substances are reaching water bodies. ▪Antibiotics
Table 10.2 Secondary drinking-water standards
Contaminant Suggested levels Contaminant effects
Aluminum 0.05–0.2 mg/l Water discolorationChloride 250 mg/l Salty taste and corrosion of pipesColor 15 color units Visible tintManganese 0.05 mg/l Taste or staining of laundrySulfate 250 mg/l Salty taste, laxative effectsTotal dissolved solids 500 mg/l Bad taste or may damage plumbing or limit
effectiveness of detergentsOdor threshold odor Rotten egg, musty, or chemical smellpH 6.5–8.5 Low pH: bitter metallic taste, corrosion
High pH: slippery feel, soda taste, deposits
See complete list at http://www.epa.gov/OGWDW/mcl.html.
20 Drinking water contaminants. US EPA. See table following list of primary drinking-water contaminants in thisfile, http://www.epa.gov/OGWDW/contaminants/index.html (August, 2008).
296 Drinking-water pollution
Perhaps of the greatest concern are the antibiotics released into the water. These cancontribute to the development of resistance to antibiotics.21 ▪ These contaminants are notregulated. The American Water Works Association has assessed 18 possible treatments thatUS water purification facilities could use, and suggested several treatments that can removethese micro-contaminants including ozonation (see description above), activated carbon,and reverse osmosis.22 The good news is that ozonation is already being adopted by anincreasing number of facilities for other reasons, and activated carbon is also often used toabsorb other contaminants.
Maintaining drinking-water safety
See Table 10.3 for typical steps taken to treat water to bring it to drinking-water standards.In the United States, the EPA requires states to evaluate the performance of their water
supply systems, but many fail to do so due to limited resources. Many water-treatmentsystems are aging, or lack the modern technology needed for optimal performance.▪ Most US public water systems are small, serving 25 to 3300 customers. At one time,small systems had only to meet standards for water clarity, bacteria, and nitrate levels.After 1986 they were required to meet the same demanding regulations that largersystems meet. ▪ Nonetheless, the cost of drinking water to US citizens is low; it was anaverage of $0.51 per m3 in 2000 as compared to $1.15 in the United Kingdom and $1.82in Germany. Still, Americans pay as much for water as Europeans because they use muchmore water. ▪ Europe has many of the same concerns as the United States, includingpollution resulting from pesticide and nitrate runoff from agricultural lands and livestock
Questions 10.1
1. (a) How do microorganisms get into groundwater? (b) Viruses move in groundwater more
quickly than do other microbes – why?
2. How can diarrhea cause death?
3. Considering the problems associated with DBPs, why is chlorination still often used, indeed
promoted in less-developed countries?
4. Many individuals obtain drinkingwater from homewells. (a) Where should wells be sited in
order to avoid pathogen contamination? (b) To avoid contaminating thewells with fertilizer
or pesticides, where should they be located? (c) Howmight the ages of wells affect the risk
of groundwater contamination? Explain.
5. Think about a community that obtains its drinking water from a well. What are practical
steps that it can take to educate its citizens to protect the source of their water?
21 One product that we can completely control is triclosan. Triclosan is not an antibiotic (which is ingested), but anantibacterial product found in nearly all liquid hand cleansers and many other products. Triclosan is used outsidethe body. However, many believe that triclosan could also be stimulating resistance to antibiotics.
22 Snyder, E.M., Pleus, R. C., and Snyder, S. A. Current issues. Pharmaceuticals and EDCs in the US waterindustry: an update. AWWA, 97(11) November, 2005, pp. 32–34, 35, http://www.awwa.org/Resources/content.cfm?ItemNumber=1140&showLogin=N.
297 Maintaining drinking-water safety
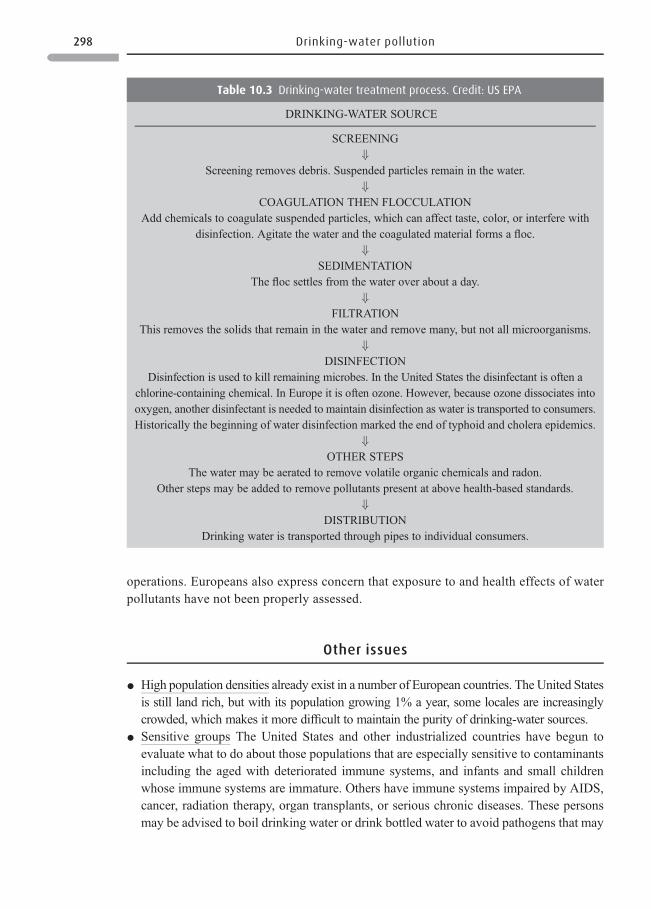
operations. Europeans also express concern that exposure to and health effects of waterpollutants have not been properly assessed.
Other issues
* High population densities already exist in a number of European countries. The United Statesis still land rich, but with its population growing 1% a year, some locales are increasinglycrowded, which makes it more difficult to maintain the purity of drinking-water sources.
* Sensitive groups The United States and other industrialized countries have begun toevaluate what to do about those populations that are especially sensitive to contaminantsincluding the aged with deteriorated immune systems, and infants and small childrenwhose immune systems are immature. Others have immune systems impaired by AIDS,cancer, radiation therapy, organ transplants, or serious chronic diseases. These personsmay be advised to boil drinking water or drink bottled water to avoid pathogens that may
Table 10.3 Drinking-water treatment process. Credit: US EPA
DRINKING-WATER SOURCE
SCREENING⇓
Screening removes debris. Suspended particles remain in the water.⇓
COAGULATION THEN FLOCCULATIONAdd chemicals to coagulate suspended particles, which can affect taste, color, or interfere with
disinfection. Agitate the water and the coagulated material forms a floc.⇓
SEDIMENTATIONThe floc settles from the water over about a day.
⇓
FILTRATIONThis removes the solids that remain in the water and remove many, but not all microorganisms.
⇓
DISINFECTIONDisinfection is used to kill remaining microbes. In the United States the disinfectant is often a
chlorine-containing chemical. In Europe it is often ozone. However, because ozone dissociates intooxygen, another disinfectant is needed to maintain disinfection as water is transported to consumers.Historically the beginning of water disinfection marked the end of typhoid and cholera epidemics.
⇓
OTHER STEPSThe water may be aerated to remove volatile organic chemicals and radon.
Other steps may be added to remove pollutants present at above health-based standards.⇓
DISTRIBUTIONDrinking water is transported through pipes to individual consumers.
298 Drinking-water pollution
have survived to reach tap water. Another group of people routinely advised to drinkbottled water is those who travel to poor countries where microbes may be in tap water(Box 10.2).
Box 10.2 Bottled drinking water23
Over a billion people lack any access to clean drinking water, but others buy bottled water in
placeswell served by treatment plants that produce high-quality drinkingwater. USmunicipal-
ities spend $43 billion a year to provide clean drinking water. Moreover, the water quality
standards that the US EPA sets for tap water are more stringent than those set by the US Food
and Drug Administration (FDA) for bottled water. In Europe as well as the US, more regulations
govern the quality of tap water than of bottled water.
People believe bottled water is purer than tap water, or prefer its taste. The Natural
Resources Defense Council, a US environmental organization, had 103 brands tested. Results
revealed that about a quarter of the brands were simply tap water; some had been further
treated. Some brands had contaminant levels exceeding those allowed by state or bottled-
water industry standards, but most appeared safe and clean. ▪ Similar situations are reported
in other countries. A University of Geneva (Switzerland) study found that a bottled-water
category called “purified” was drawn from rivers, lakes, or underground springs and treated.
Its quality was usually good, but some samples differed little from tap water and had the same
contaminants. ▪ Similarly, a University of Winnipeg (Canada) study examined 40 domestic and
imported bottled water brands. It found some brands in which total dissolved solids, chloride,
and lead exceeded the Canadian Water Quality Guidelines for drinking water. ▪ In these three
countries, bottled water is muchmore expensive – costing from 240 to 10 000 timesmore than
tap water. For instance, in San Francisco, residents can purchase 1000 gallons (38 000 liters) of
tap water for the same amount spent on 1 gallon (3.8 liters) of bottled water. Worldwide, the
industry is worth about $100 billion a year.
The environmental impact24 of producing bottled water includes drawing down some local
streams and aquifers to obtain the water. There are the energy costs and environmental
pollution of producing, bottling, packaging, storing, and shipping bottled water. To manufac-
ture the 29 billion plastic bottles that the US uses each year for bottled water takes the
equivalent of ~17 million barrels of crude oil. Bottled water is often shipped long distances
which, of course, requires fossil fuel. And US drinkers recycle less than a quarter of the bottles;
they become garbage or litter. Municipalities, often the same ones that produce valuable tap
water, end upwith the cost of landfilling the bottles. ▪ US cities have been responding. Chicago,tired of paying landfilling costs, placed a 5 cent tax on each bottle of water sold in the city; the
intent is to cut consumption. San Francisco has barred its city departments, agencies, and
23 Aslam, A. Bottled water: nectar of the frauds? February 5, 2006, OneWorld.net, http://www.commondreams.org/headlines06/0205-01.htm.
24 Zabarenko, D. Report finds bottled water has high environmental costs. Reuters, May 11, 2007, http://www.alertnet.org/thenews/newsdesk/N10484560.htm.
299 Maintaining drinking-water safety
* Emerging problems In the 1990s several infectious-disease outbreaks were traced todrinking water in North America. The worst by far was the outbreak described above ofcryptosporidiosis in Milwaukee, Wisconsin. Another cryptosporidiosis outbreak inWalkerton, Ontario (Canada), sickened 13 000. In response, the US EPA began to morestrongly focus on ambient water quality criteria, and will establish pathogen-monitoringprotocols, guidelines for septic system operations, and requirements for water reuseapplications. The EPA is also developing a risk assessment protocol for waterborneinfectious diseases, as well as examining pathogens in sediments.
SECTION II
Clean water and human waste are closely intertwined26
In Chapter 9 you learned that pathogens are a conventional water pollutant. In this chapteryou have learned that pathogenic microbes in drinking water can pose an immediate threat tohealth or life if primary standards are exceeded. In both these cases – wastewater anddrinking water – the source of the pathogens are human and animal excreta. ▪ “The WHOestimates that 80% of all sickness in the less-developed countries of the world is attributableto unsafe water and sanitation.”27 Thus the most important point to remember in this sectionis the great unmet need for clean water and sanitation around the world. In 2007, the BritishMedical Journal surveyed its readers as to what they considered the “greatest medical
contractors from using city funds to serve water in plastic bottles when tap is available. New
York City reminds its citizens that its tap water is naturally filtered in the well-protected Catskill
Mountains (see Chapter 1). In Louisville, Kentucky, the water utility provides free “sports”
bottles to citizens, urging them to fill themwith “Pure Tap.” Many other local governments are
also taking action. ▪ The industry defends itself saying that water is healthier than sugary
beverages served in the same type of bottles (and with the same environmental impact).
Moreover, they defend the rights of citizens to buy whatever they want. ▪ However, the
promotion of bottled water consumption is seen by many as a back-door approach to the
privatization of water. In less-developed countries, people who can afford it drink bottled
water to avoid water contaminated with pathogens and other pollutants. But increasingly,
governments around the world are saying that governments should have a primary role in
improving access to safe drinking water.25
25 Mulvey, K. Water ought to be a public good, not a commodity. Star Tribune, March 20, 2006, http://www.commondreams.org/views06/0321-25.htm.
26 Montgomery, M. A. and Elimelech, M. Water and sanitation in developing countries: millions suffer frompreventable illnesses and die every year. Environmental Science & Technology, 41(1) January 1, 2007, 17–24.
27 Even malaria is transmitted by mosquitoes, which lay their eggs in stagnant water.
300 Drinking-water pollution
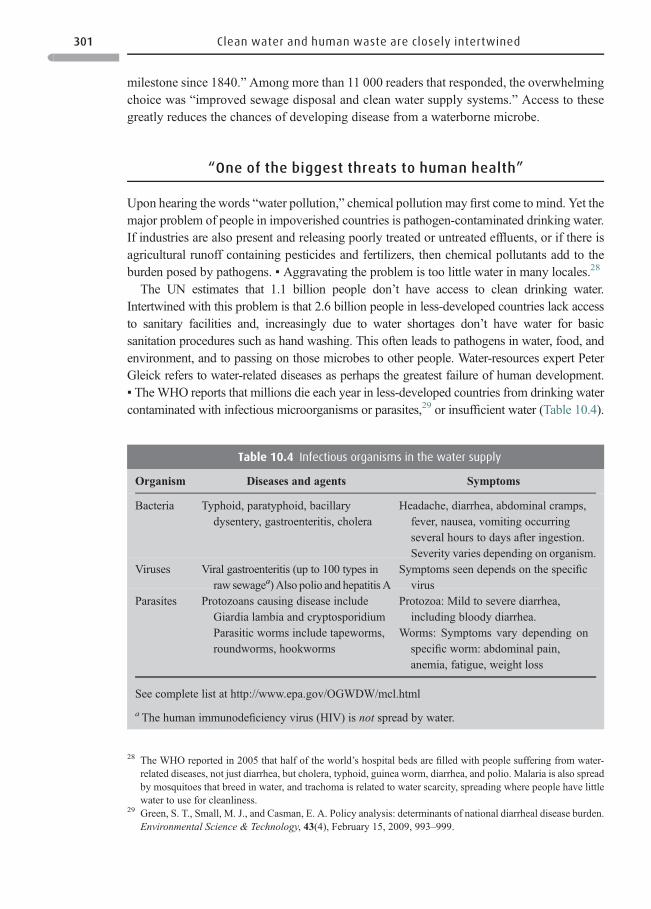
milestone since 1840.” Among more than 11 000 readers that responded, the overwhelmingchoice was “improved sewage disposal and clean water supply systems.” Access to thesegreatly reduces the chances of developing disease from a waterborne microbe.
“One of the biggest threats to human health”
Upon hearing the words “water pollution,” chemical pollution may first come to mind. Yet themajor problem of people in impoverished countries is pathogen-contaminated drinking water.If industries are also present and releasing poorly treated or untreated effluents, or if there isagricultural runoff containing pesticides and fertilizers, then chemical pollutants add to theburden posed by pathogens. ▪ Aggravating the problem is too little water in many locales.28
The UN estimates that 1.1 billion people don’t have access to clean drinking water.Intertwined with this problem is that 2.6 billion people in less-developed countries lack accessto sanitary facilities and, increasingly due to water shortages don’t have water for basicsanitation procedures such as hand washing. This often leads to pathogens in water, food, andenvironment, and to passing on those microbes to other people. Water-resources expert PeterGleick refers to water-related diseases as perhaps the greatest failure of human development.▪ TheWHO reports that millions die each year in less-developed countries from drinking watercontaminated with infectious microorganisms or parasites,29 or insufficient water (Table 10.4).
Table 10.4 Infectious organisms in the water supply
Organism Diseases and agents Symptoms
Bacteria Typhoid, paratyphoid, bacillarydysentery, gastroenteritis, cholera
Headache, diarrhea, abdominal cramps,fever, nausea, vomiting occurringseveral hours to days after ingestion.Severity varies depending on organism.
Viruses Viral gastroenteritis (up to 100 types inraw sewagea) Also polio and hepatitis A
Symptoms seen depends on the specificvirus
Parasites Protozoans causing disease includeGiardia lambia and cryptosporidiumParasitic worms include tapeworms,roundworms, hookworms
Protozoa: Mild to severe diarrhea,including bloody diarrhea.
Worms: Symptoms vary depending onspecific worm: abdominal pain,anemia, fatigue, weight loss
See complete list at http://www.epa.gov/OGWDW/mcl.html
aThe human immunodeficiency virus (HIV) is not spread by water.
28 The WHO reported in 2005 that half of the world’s hospital beds are filled with people suffering from water-related diseases, not just diarrhea, but cholera, typhoid, guinea worm, diarrhea, and polio. Malaria is also spreadby mosquitoes that breed in water, and trachoma is related to water scarcity, spreading where people have littlewater to use for cleanliness.
29 Green, S. T., Small, M. J., and Casman, E. A. Policy analysis: determinants of national diarrheal disease burden.Environmental Science & Technology, 43(4), February 15, 2009, 993–999.
301 Clean water and human waste are closely intertwined
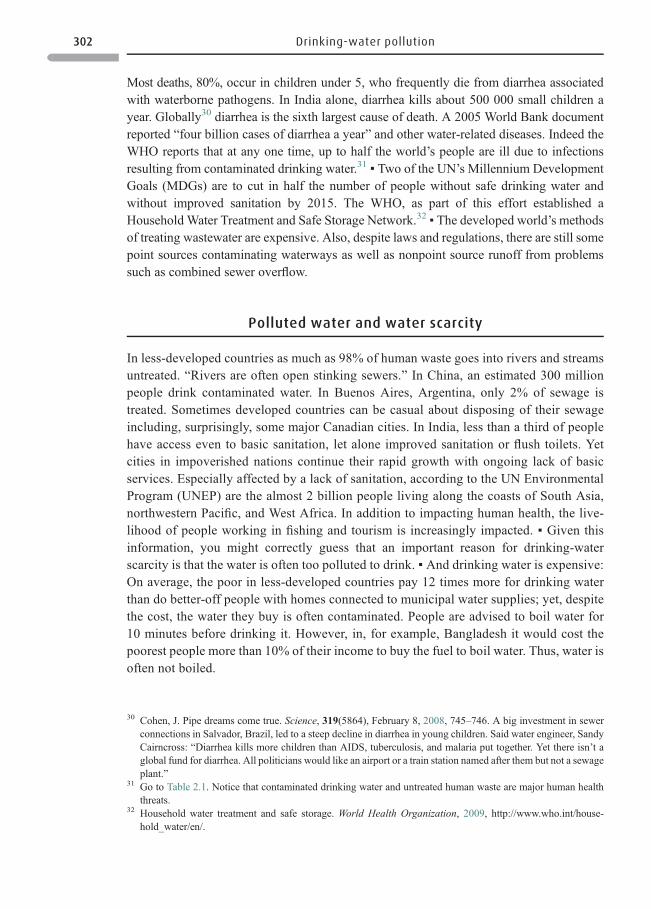
Most deaths, 80%, occur in children under 5, who frequently die from diarrhea associatedwith waterborne pathogens. In India alone, diarrhea kills about 500 000 small children ayear. Globally30 diarrhea is the sixth largest cause of death. A 2005 World Bank documentreported “four billion cases of diarrhea a year” and other water-related diseases. Indeed theWHO reports that at any one time, up to half the world’s people are ill due to infectionsresulting from contaminated drinking water.31 ▪ Two of the UN’s Millennium DevelopmentGoals (MDGs) are to cut in half the number of people without safe drinking water andwithout improved sanitation by 2015. The WHO, as part of this effort established aHousehold Water Treatment and Safe Storage Network.32 ▪ The developed world’s methodsof treating wastewater are expensive. Also, despite laws and regulations, there are still somepoint sources contaminating waterways as well as nonpoint source runoff from problemssuch as combined sewer overflow.
Polluted water and water scarcity
In less-developed countries as much as 98% of human waste goes into rivers and streamsuntreated. “Rivers are often open stinking sewers.” In China, an estimated 300 millionpeople drink contaminated water. In Buenos Aires, Argentina, only 2% of sewage istreated. Sometimes developed countries can be casual about disposing of their sewageincluding, surprisingly, some major Canadian cities. In India, less than a third of peoplehave access even to basic sanitation, let alone improved sanitation or flush toilets. Yetcities in impoverished nations continue their rapid growth with ongoing lack of basicservices. Especially affected by a lack of sanitation, according to the UN EnvironmentalProgram (UNEP) are the almost 2 billion people living along the coasts of South Asia,northwestern Pacific, and West Africa. In addition to impacting human health, the live-lihood of people working in fishing and tourism is increasingly impacted. ▪ Given thisinformation, you might correctly guess that an important reason for drinking-waterscarcity is that the water is often too polluted to drink. ▪ And drinking water is expensive:On average, the poor in less-developed countries pay 12 times more for drinking waterthan do better-off people with homes connected to municipal water supplies; yet, despitethe cost, the water they buy is often contaminated. People are advised to boil water for10 minutes before drinking it. However, in, for example, Bangladesh it would cost thepoorest people more than 10% of their income to buy the fuel to boil water. Thus, water isoften not boiled.
30 Cohen, J. Pipe dreams come true. Science, 319(5864), February 8, 2008, 745–746. A big investment in sewerconnections in Salvador, Brazil, led to a steep decline in diarrhea in young children. Said water engineer, SandyCairncross: “Diarrhea kills more children than AIDS, tuberculosis, and malaria put together. Yet there isn’t aglobal fund for diarrhea. All politicians would like an airport or a train station named after them but not a sewageplant.”
31 Go to Table 2.1. Notice that contaminated drinking water and untreated human waste are major human healththreats.
32 Household water treatment and safe storage. World Health Organization, 2009, http://www.who.int/house-hold_water/en/.
302 Drinking-water pollution
Deliberately polluting surface waters
Why deliberately pollute water with human waste?
Those in developed countries take for granted toilets connected to an underground pipesystem with sewage transported to a facility for treatment, disinfection, and finally releasedto receiving waters. However, some find it strange to deliberately pollute receiving waterswith human waste, albeit treated. Indeed, US President Teddy Roosevelt said 100 years agothat “civilized people ought to know how to dispose of the sewage in some other way thanputting it into the drinking water.” Such disposal raises a number of problems:
* The sludge produced by wastewater treatment needs to be dealt with.* Flush toilets consume significant quantities of water, although more efficient toilets are
increasingly used.* Pharmaceutical chemicals and their metabolites enter wastewater in feces and urine. Many
are not removed by treatment systems. Hormones and antibiotics pose particular concerns.* Wastewater treatment plants discharge reactive nitrogen and phosphorus.* As human populations grow, so do the problems associated with treating increasing
quantities of human waste.
Alternative toilets
There are alternative means to handle human waste, but none are widely used. ▪ Electric orgas-fired incinerating toilets33 incinerate waste products deposited in a holding tank; the ashcan be disposed of in the trash. However, it adds to energy usage and destroys usefulnutrients and organic matter. ▪ Composting toilets34 can be used inside or outside, butrequire some maintenance and a system to disperse odors. In some composting toilets, theunderlying compost chamber is solar or electrically heated to assure that microbial actioncontinues regardless of season. These toilets are used most often in isolated locations.
Treating sewage as a valuable resource
* Consider: phosphorus is now produced from mining phosphate rock, an increasinglylimited resource,35 and mining phosphorus is often environmentally destructive.Phosphate rock is high in cadmium, a heavy metal taken up by plants. ▪ Manufacturing
33 Incinerating toilets. Water efficiency technology fact sheet. US EPA, Office of Water, September, 1999, http://www.epa.gov/owm/mtb/incinera.pdf.
34 Composting toilets. Water efficiency technology fact sheet. US EPA, Office of Water, September, 1999, http://www.epa.gov/owm/mtb/comp.pdf.
35 Phosphate recovery. Natural History Museum, September–October, 1998, http://www.nhm.ac.uk/research-curation/research/projects/phosphate-recovery/p&k217/steen.htm.
303 Alternative toilets
nitrogen fertilizer is an energy-intensive process, which converts (fixes) atmosphericnitrogen into reactive nitrogen.
* Also consider: urine is an especially rich source of nitrogen, phosphorus, and potassium –
the three main ingredients of fertilizer. The urine cannot be used separately with currentsewage systems because urine and feces are mixed. ▪To address these issues, the Swissdeveloped a technology to separate urine from feces; only feces being carried to a centralplant. This uses 80% less water than that needed to flush even a water-saving toilet. If thistechnology was used, wastewater treatment plants would be small and less sludgeproduced, and reactive nitrogen and phosphorus would not be released to waterways.
* Urine could be temporarily stored and separately collected. After collecting and steriliz-ing the urine and removing pollutants and odor, a rich fertilizer would be left. And urine isa renewable resource. Homeowners would use less water.
However, setting up a new system would be very expensive, which would deter mostcommunities from considering this scheme at least for the present.
Ecological sanitation36,37
The Chinese have used human excreta as fertilizer for thousands of years. Many Chinesestill do. However, some Chinese (and others) use ecological sanitation, collecting urine andfeces separately for use as fertilizers. This can be done safely. The latrine includes a structuresitting over a raised sealed vault, which diverts urine and feces into two separate chamberswithin a vault below. Urine is sterile as it comes from the body and only becomescontaminated outside the urethra. The urine, after dilution with water, can be used imme-diately to fertilize crops. The feces remain in their separate chamber for a number of monthsto allow pathogens to die; thereafter it can be handled safely and applied to crops. It is not sorich a source of nutrients as urine, but is rich in organic matter and serves as a soilamendment. Having a sealed vault prevents groundwater pollution. ▪ A similar system isused by over 100 000 people in Sweden, a developed country; they call it urine diversion38
or NoMix. The urine is given to farmers for use, after dilution, on fields. Decent sanitationfor the billions without it has now become a subject of intensive study and work. At the FirstInternational Conference on Ecological Sanitation in 2001,39 the system that developedcountries primarily use is seen as “in the long term an unsustainable sanitation model”even for rich countries: there is a great need for “safe and efficient no-flush sanitationsystems” in well-to-do countries too. ▪ Meanwhile, in less-developed countries even a
36 George, R. Wasted waste ecological sanitation. International Herald Tribune, February 27, 2009, http://www.istockanalyst.com/article/viewiStockNews/articleid/3075874.
37 Ecological sanitation. Wikipedia, January 23, 2009, http://en.wikipedia.org/wiki/Ecological_sanitation. Thisarticle introduces not just the two chamber toilet described here, but other ecologically viable alternatives aswell.
38 George, R. Wasted waste ecological sanitation. International Herald Tribune, February 27, 2009, http://www.istockanalyst.com/article/viewiStockNews/articleid/3075874.
39 Report on First International Conference on Ecological Sanitation, Nanning, China, November 5–8, 2001, http://www.ecosanres.org/pdf_files/Nanning_Conf_report_final.pdf.
304 Drinking-water pollution
simple pit latrine is better than streets, gutters, or bushes. Latrines often have strong odorsand flies, but a ventilated and sheltered one allows odors to escape, prevents flies fromentering, and provides privacy. Getting such latrines to the many millions without themcould fulfill a major need while reducing pollution. At the same time, there is the relatedneed for enough water so people can wash their hands.
SECTION III
Reducing pathogens in drinking water of less-developedcountries
It would cost an estimated $68 billion worldwide and a 10-year effort to provide cleandrinking water to all in the world who need it. This is about 1% of the amount that the worldspends on military expenditures. In 1992, Agenda 21 that emerged from the Earth Summit inRio de Janeiro in 1992 spelled out universal access to safe drinking water as a goal.Subsequent efforts had partial success in increasing access to clean drinking water.However, population growth and lack of adequate funding has left at least 1.1 billion peoplewithout clean drinking water at the beginning of the twenty-first century, and 2.4 billionwithout adequate sanitary facilities. ▪ At the 2002 World Summit in Johannesburg, 10 yearsafter Rio, the world’s nations again made commitments. They pledged that by 2015, theywill half the proportion of people without access to safe drinking water, and half theproportion of people who do not have access to basic sanitation. Unfortunately, especiallyin sub-Saharan Africa, it appears increasingly doubtful that they will succeed by 2015.
Point-of-use methods to purify drinking water
Especially in cities there is a great need for clean inexpensive water that is directly piped intohomes after being treated at a central facility. At the same time, there is ongoing research andimplementation of POU (point of use) purification of drinking water. In 2007, the Bill andMelinda Gates Foundation granted $17 million to further the development of simple POUwater treatments. In return, they want a determination as to which devices were worth beingmass produced and knowledge of how to market them. Several devices and chemicalapproaches are described below. In all the methods, the water may become contaminatedagain so it is necessary to maintain disinfection.
* Ceramic filter40 (fired clay filter): the water to be purified is allowed to percolate throughthe filter, which can be made from local materials, and sold for $5–15. It is already in use
40 Lubick, N. Ceramic filter makes water treatment easy. Environmental Science & Technology, 42(3), February 1,2008, 650–651.
305 Point-of-use methods to purify drinking water
in a number of locales. It can remove 98% or more of Escherichia coli from the water; ifcoated with a fine layer of silver it can remove 100%.
* PUR41 (Purifier of Water) is a well regarded POU treatment developed by Procter &Gamble working with the US CDC. It is a powder containing calcium hypochlorite asdisinfectant. Iron sulfate is the flocculating agent, which aggregates the solids in the water(dirt, organic matter, etc.) into a floc. The floc is filtered out of the water through a cottoncloth leaving purified water behind. PUR is sold in individual packets, each treating 2.6gallons (10 l) of water. It cannot be produced locally. Initially Procter & Gamble intendedto break even in terms of cost. When that proved impossible, it started giving the packetsaway or selling them at about a third of cost.
* Solar treatment42 can be simple and cheap. The easiest method is to fill transparent plasticbottles (PET, polyethylene terephthalate bottles) with water, and place them on a black-painted roof or a roof with a piece of dark roofing underneath the bottles. The water mustnot be turbid. To assure disinfection – by solar rays and by heat – the bottles are left all day(or two days under a cloudy sky). A chlorine-containing tablet can be added to maintaindisinfection. One Tanzanian village woman commented, “We no longer suffer fromstomach illness.” She is also grateful there is no longer a need to collect firewood, starta fire, and boil the water.
* Safe Water System (SWS)43 was developed by the US CDC. It is a bottle of a chlorine-containing solution, which can be produced locally. It provides clean water for a familyof six for about a penny a day. First the water is treated with the SWS (dilute sodiumhypochlorite). Subsequently, as with other POU methods, the disinfected water mustbe stored in a way that makes it unlikely to become re-contaminated. Like solartreatment, it cannot treat turbid water well. Also, certain protozoan cysts resist thechlorine.
* Water treatment tablets Use of these tablets is a variation on SWS. The tablets are veryinexpensive calcium hypochlorite tablets that cost about a half cent and treat 5.3 gallons(20 L) of water.44 Tablets are more easily transported, stored, and have a longer shelf lifethan SWS.
41 (1) Amato, I. Making troubled waters potable. Chemical & Engineering News, 84(16), April 17, 2006, 3940.(2) Short, P. L. Keeping it clean. Chemical & Engineering News, 85(17), April 23, 2007, 13–20, http://pubs.acs.org/cen/coverstory/85/8517cover.html. This article describes a number of ways of purifying water, including theremoval of arsenic.
42 (1) Hasslberger, S. Low-tech solar water purification: it works. Solar Water Disinfection, March 24, 2006, http://www.newmediaexplorer.org/sepp/2006/03/24/lowtech_solar_water_purification_it_works.htm. This is a POUmethod for water treatment at the household level. (2) Migration of organic components from polyethyleneterephthalate bottles to water. SANDEC, Report 429670, June 20, 2003, http://www.sodis.ch/files/Report_EMPA.pdf. The study found that levels of plasticizers were no higher than in water not exposed to plastic.
43 Best practices in social marketing, a safe water solution for household water treatment: lessons learned.Population Services International Field Programs, March, 2007, http://www.ehproject.org/PDF/ehkm/LessonsLearnedFinal.pdf. This project was supported by the US Agency for International Development andothers involved in developing safe water programs in developing countries. This Safe Water System (SWS) forhousehold water treatment (and subsequent safe storage) was originally designed in response to choleraoutbreaks in Latin America. The use of a chlorine solution ensures that water will remain disinfected.
44 The web site http://www.ehproject.org/PDF/ehkm/LessonsLearnedFinal.pdf focuses on treating water with achlorine solution. However, Population Services International also works with a manufacturer of chlorinetablets.
306 Drinking-water pollution
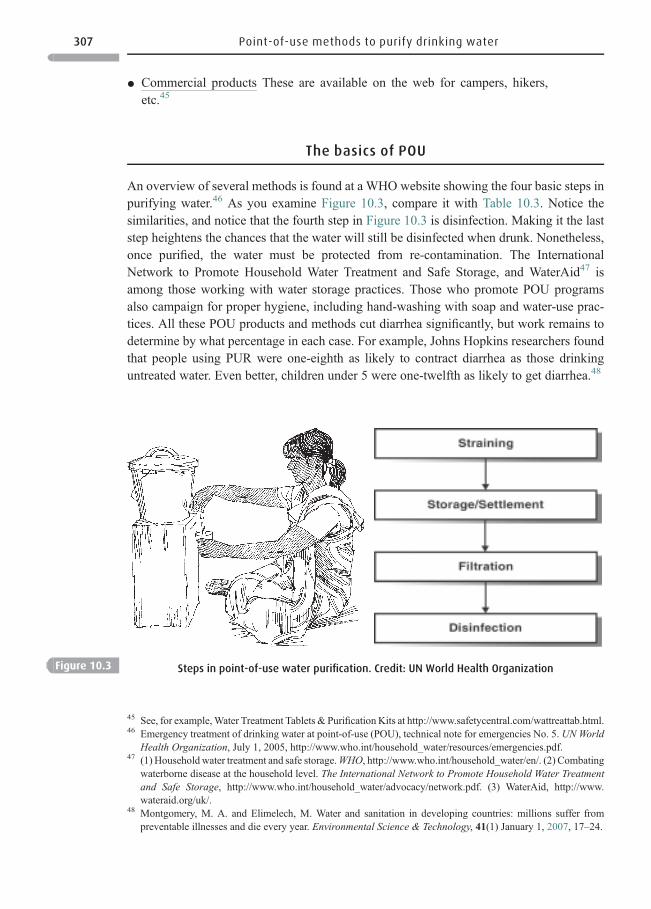
* Commercial products These are available on the web for campers, hikers,etc.45
The basics of POU
An overview of several methods is found at a WHO website showing the four basic steps inpurifying water.46 As you examine Figure 10.3, compare it with Table 10.3. Notice thesimilarities, and notice that the fourth step in Figure 10.3 is disinfection. Making it the laststep heightens the chances that the water will still be disinfected when drunk. Nonetheless,once purified, the water must be protected from re-contamination. The InternationalNetwork to Promote Household Water Treatment and Safe Storage, and WaterAid47 isamong those working with water storage practices. Those who promote POU programsalso campaign for proper hygiene, including hand-washing with soap and water-use prac-tices. All these POU products and methods cut diarrhea significantly, but work remains todetermine by what percentage in each case. For example, Johns Hopkins researchers foundthat people using PUR were one-eighth as likely to contract diarrhea as those drinkinguntreated water. Even better, children under 5 were one-twelfth as likely to get diarrhea.48
Figure 10.3 Steps in point-of-use water purification. Credit: UN World Health Organization
45 See, for example,Water Treatment Tablets & Purification Kits at http://www.safetycentral.com/wattreattab.html.46 Emergency treatment of drinking water at point-of-use (POU), technical note for emergencies No. 5. UN World
Health Organization, July 1, 2005, http://www.who.int/household_water/resources/emergencies.pdf.47 (1) Householdwater treatment and safe storage.WHO, http://www.who.int/household_water/en/. (2) Combating
waterborne disease at the household level. The International Network to Promote Household Water Treatmentand Safe Storage, http://www.who.int/household_water/advocacy/network.pdf. (3) WaterAid, http://www.wateraid.org/uk/.
48 Montgomery, M. A. and Elimelech, M. Water and sanitation in developing countries: millions suffer frompreventable illnesses and die every year. Environmental Science & Technology, 41(1) January 1, 2007, 17–24.
307 Point-of-use methods to purify drinking water
Further reading
Cohen, J. Pipe dreams come true (increased investment in sewer connections lead to steepdecline in diarrhea). Science, 319(5864), February 8, 2008, 745–746.
Questions 10.2
1. Latin America had been free of cholera (caused by the bacterium Vibrio cholera) for a hundred
years. Then, in about 1991, Peru’s capital city, Lima ceased chlorinating the city’s water after
reading an US EPA report indicating that the DBPs left by chlorination could cause cancer.
Lima’s water supply was later contaminated by Vibrio cholera. Over the years hundreds of
thousands became ill with cholera in Latin America and about 10 000 died. Cholera is now
endemic to that region. Think back to risk assessment described in Chapter 4 before answering
the question: how does the risk of DBPs differ from the risk of impure drinking water?
2 What is the difference between a bore well and a dug well? Which is most likely to have
clean water? You may need to go to the web to answer this question.
3. The “arsenic eaters” were Austrian smugglers who found that arsenic increased their
physical endurance during difficult journeys across high mountains.49 They began by
ingesting about 10 mg twice a week, eating it with bacon to increase absorption into
their bodies. As their bodies acclimated, they ended up eating doses perhaps 40-fold
greater than those which could kill sensitive people. With this information inmind, consider
Bangladesh. People here are ingesting low doses of arsenic compared to the arsenic eaters.
What are possible reasons for the fact that they don’t adapt in the sameway as the Austrian
smugglers?
Delving deeper
1. Think about how water is treated to make it safe for drinking. Visit or speak with your local
drinking-water treatment plant. Are there specific contaminants that are of concern locally?
How are they removed? What concerns do you have at present regarding the status of
drinking water in your community? What future concerns do you or your local treatment
plant have about safe drinking water and enough of it? Do a presentation to your class or to
a local school.
2. Go to “Safe Drinking Water Is Essential,” www.drinking-water.org. View documentaries on
how households in poor countries without tap water can purify their own water. Assume
you are working on a project to provide safe drinking water. How would you go about
coming to a decision on an effective solution?
49 Christen, K. The arsenic threat worsens. Environmental Science & Technology, 35(13), July 1, 2001, 286 A–291A, http://pubs.acs.org/subscribe/journals/esthag-a/35/free/13christen.html.
308 Drinking-water pollution
Mead, M.N. Arsenic: in search of an antidote to a global poison. Environmental HealthPerspectives, 113(6), June, 2005.
Montgomery, M.A. and Elimelech, M. Water and sanitation in developing countries.Environmental Science & Technology, 41(1) January 1, 2007, 17–24.
Renner, R. Disinfection by-products not associated with miscarriage. EnvironmentalScience & Technology, 39(20), October 15, 2005, 416A.
Ritter, S. K. Sustainable technology: chemist wins million-dollar arsenic challenge.Chemical & Engineering News, 85(7), February 12, 2007, 19.
Short, P. L. Keeping it clean (purifying water; includes a chronicle of drinking water treat-ment). Chemical & Engineering News, 85(17), April 23, 2007, 13–20, http://pubs.acs.org/cen/coverstory/85/8517cover.html.
Internet resources
Aslam, A. 2006. Bottled water: nectar of the frauds? OneWorld.net. http://www.common-dreams.org/headlines06/0205-01.htm (February 5, 2006).
First International Conference on Ecological Sanitation, Nanning, China, November 5–8,2001. http://www.ecosanres.org/pdf_files/Nanning_Conf_report_final.pdf.
Hasslberger, S. 2006. Low-tech solar water purification works. http://www.newme-diaexplorer.org/sepp/2006/03/24/lowtech_solar_water_purification_it_works.htm(March 24 2006).
National Academies of Sciences and Global Health and Education Foundation,2008. Safe drinking water is essential. http://www.drinking-water.org/flash/splash.html.
US CDC. 2008. Water and disinfection. http://www.cdc.gov/Features/DrinkingWater/index.html.
2008. CDC statement on fluoride in drinking water. http://www.cdc.gov/fluoridation/safety/nrc_report.htm (September 24, 2008).
UNEP. Fresh water. Fresh water links. http://www.unep.org/themes/freshwater/.US EPA. Ground water and drinking water. http://www.epa.gov/safewater/.
2000. History of drinking water treatment. http://www.epa.gov/ogwdw000/consumer/pdf/hist.pdf (February, 2000).
2006. Arsenic in drinking water. http://www.epa.gov/safewater/arsenic/index.html(September 14, 2006).
2009 Drinking water health advisories. http://www.epa.gov/waterscience/criteria/drinking/ (April 27, 2009).
2009. Drinking water contaminants. (Description of pollutant categories) http://www.epa.gov/safewater/hfacts.html#Inorganic (May 12, 2009).
2009. EPA’s report on the environment: drinking water. http://oaspub.epa.gov/hd/home#slider-wrap (January 21, 2009).
2009. Ground water and drinking water, frequently asked questions. http://www.epa.gov/safewater/faq/faq.html (June 24, 2009).
309 Internet resources

2009. Removing multiple contaminants from drinking water: treatment technologies.http://www.epa.gov/OGWDW/treatment/pdfs/poster_treatment_technologies.pdf.
World Health Organization. 2009. Household water treatment and safe storage. http://www.who.int/household_water/en/.
Zabarenko, D. 2007. Report finds bottled water has high environmental costs. Reuters.http://www.alertnet.org/thenews/newsdesk/N10484560.htm (May 10, 2007).
310 Drinking-water pollution
11 Solid waste
“Pollution is a symbol of bad design. ”William McDonough
Municipal solid waste (MSW) is the waste we know best. However, MSW is only one amongmany wastes: construction and demolition debris, municipal sludge, combustion ash, miningand drilling debris, agricultural wastes, industrial process wastes including sludge, hazardouswaste, and others. The United States alone produces more than 12 billion tons (10.9 billiontonnes) a year of waste.1 MSW, which includes home, business, and institutional waste, is lessthan 3% of that great stream, but it is directly important to us – its composition and amount isthe result of our behavior. Moreover, move back one step – look at the whole life cycle of eachproduct – and we observe much more than 3%. We see the extractors of raw materials, themanufacturers and businesses producing, selling, and transporting the products that eventuallyend up as MSW. We begin to see many more of those billions of pounds of waste.2
Secti on I of Cha pter 11 asks why we generat e so much waste. It exami nes the compo sitionof MSW and why it is o f concern . Secti on II looks at the waste manag ement hiera rchy(WMH ). Source reduction (poll ution prevention) sit s atop the WMH . Secti on III exami nesvario us means of reducin g was te incl uding envir onmen tally preferable buying , extend edproduce r respon sibi lity, and desig n for the envir onment. It also looks at what is happeni ng inour oceans as we conti nue to irresponsibly dispose of was te, especi ally plastics . The secti onalso examine s reuse – and its similarity to source reduct ion – and the recycl ing of bothcomm on and less commo n mat erials. Incine ration and landfi lling are also overvi ewed.Se ction IV moves onto the major probl ems that MSW poses in less-devel oped and imp ov-erished societies. It ends with the story of a city, Curitiba, Brazil.
SECTION I
Why do we generate so much waste?
As one illustration of why we and our society produce so much waste, consider a metal. Toobtain it, an ore is mined. However, the metal is but a small portion of an ore, so most of the
1 Wastes, A– Z subject index. US EPA, February 26, 2009, http://www.epa.gov/epawaste/topics.htm.2 Wastes: information resources (with links to other information resources). US EPA, February 18, 2009, http://www.epa.gov/epawaste/inforesources/index.htm.
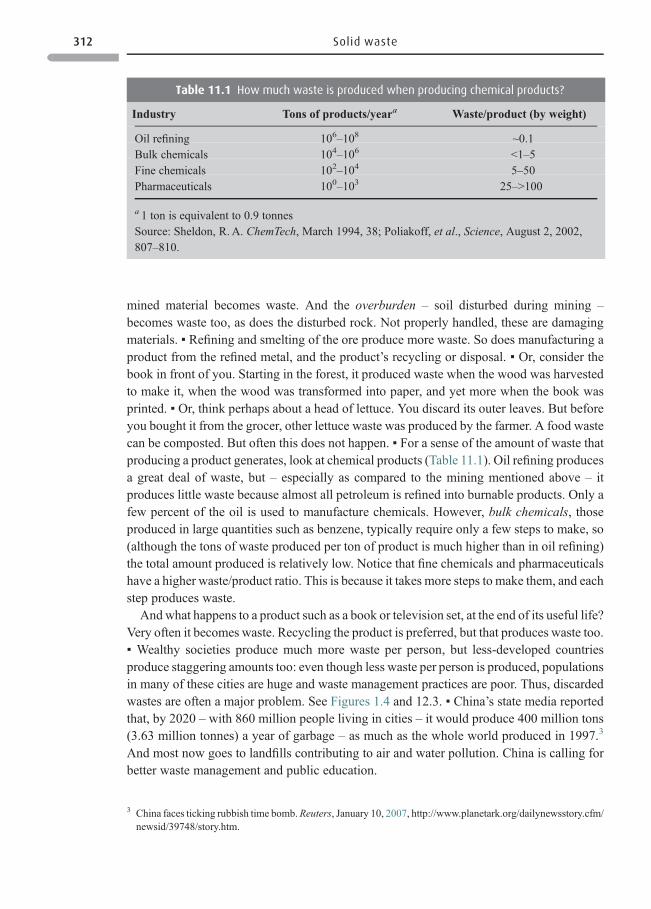
mined material becomes waste. And the overburden – soil disturbed during mining –
becomes waste too, as does the disturbed rock. Not properly handled, these are damagingmaterials. ▪ Refining and smelting of the ore produce more waste. So does manufacturing aproduct from the refined metal, and the product’s recycling or disposal. ▪ Or, consider thebook in front of you. Starting in the forest, it produced waste when the wood was harvestedto make it, when the wood was transformed into paper, and yet more when the book wasprinted. ▪ Or, think perhaps about a head of lettuce. You discard its outer leaves. But beforeyou bought it from the grocer, other lettuce waste was produced by the farmer. A food wastecan be composted. But often this does not happen. ▪ For a sense of the amount of waste thatproducing a product generates, look at chemical products (Table 11.1). Oil refining producesa great deal of waste, but – especially as compared to the mining mentioned above – itproduces little waste because almost all petroleum is refined into burnable products. Only afew percent of the oil is used to manufacture chemicals. However, bulk chemicals, thoseproduced in large quantities such as benzene, typically require only a few steps to make, so(although the tons of waste produced per ton of product is much higher than in oil refining)the total amount produced is relatively low. Notice that fine chemicals and pharmaceuticalshave a higher waste/product ratio. This is because it takes more steps to make them, and eachstep produces waste.
Andwhat happens to a product such as a book or television set, at the end of its useful life?Very often it becomes waste. Recycling the product is preferred, but that produces waste too.▪ Wealthy societies produce much more waste per person, but less-developed countriesproduce staggering amounts too: even though less waste per person is produced, populationsin many of these cities are huge and waste management practices are poor. Thus, discardedwastes are often a major problem. See Figures 1.4 and 12.3. ▪ China’s state media reportedthat, by 2020 – with 860 million people living in cities – it would produce 400 million tons(3.63 million tonnes) a year of garbage – as much as the whole world produced in 1997.3
And most now goes to landfills contributing to air and water pollution. China is calling forbetter waste management and public education.
Table 11.1 How much waste is produced when producing chemical products?
Industry Tons of products/year a Waste/product (by weight)
Oil refining 106–108 ~0.1Bulk chemicals 104–106 <1–5Fine chemicals 102–104 5–50Pharmaceuticals 100–103 25–>100
a 1 ton is equivalent to 0.9 tonnesSource: Sheldon, R.A. ChemTech, March 1994, 38; Poliakoff, et al., Science, August 2, 2002,807–810.
3 China faces ticking rubbish time bomb.Reuters, January 10, 2007, http://www.planetark.org/dailynewsstory.cfm/newsid/39748/story.htm.
312 Solid waste
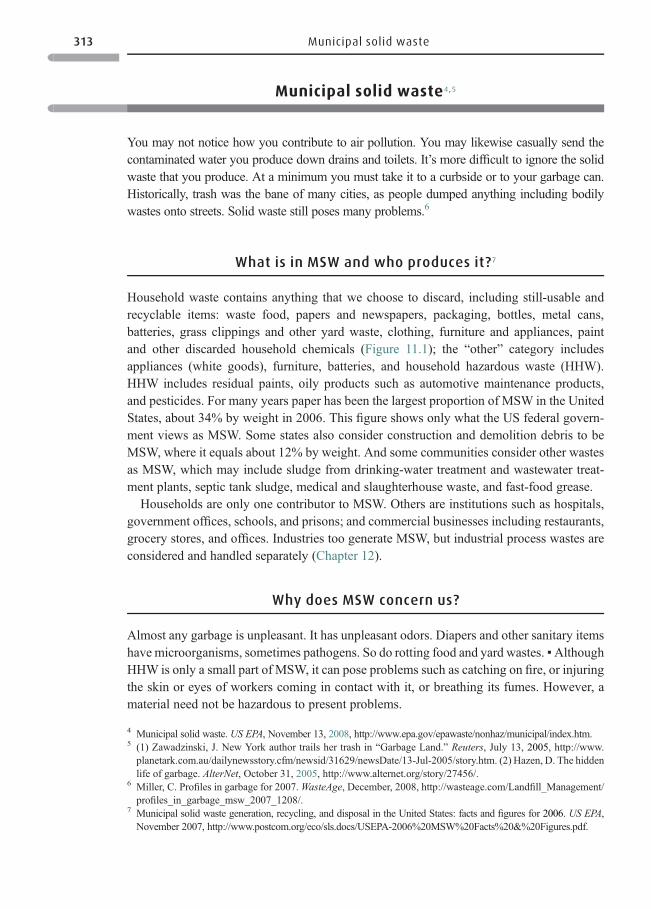
Municipal solid waste4 , 5
You m a y no t n oti ce ho w y ou c on trib ut e t o a ir po llution. Yo u may li kewise casual ly send thecontaminated water you produce down drains a nd toilets. It’s more difficult to ignore t he s oli dwaste t ha t y ou produce. At a minimum you m us t take it t o a cu rbside or to your ga rbag e can.Historically, t rash was the bane of many ci ties, as people du mped an ything including bodilywastes onto str eets. Solid wast e st ill poses many pr oblem s.6
What is in MSW and who produces i t?7
Hous ehold waste contains anything that we choose to discard, incl uding sti ll-usabl e an drecycl able items: waste food, papers and news papers , packagi ng, bottles, metal cans,batt eries, grass clipp ings and other yard was te, clothing, furniture and appli ances, paintand other discarded househo ld chemi cals ( Figure 11.1 ); the “ other ” catego ry includesappli ances (wh ite goods) , furni ture, batt eries, and h ousehold hazardo us was te (HHW) .HHW incl udes residual paint s, oily product s such as autom otive mai ntenan ce product s,and pesticide s. For many years pa per has been the largest propor tion o f MSW in the UnitedState s, about 34% by weight in 2006. This fi gure shows only what the US federal govern-ment views as MSW. Some states also consider const ruction and demolit ion d ebris to beMSW, wher e it e quals abo ut 1 2% by weight. And some comm unities consi der other wastesas MSW, which may incl ude sludg e from drinking-wat er treatmen t and wastewater treat -ment plants, septic tank sludge, medi cal and slaug hterh ouse was te, a nd fast -food grease.
Hous eholds are only one contr ibutor to MSW. Others are instit utions such as hospital s,governm ent of fices, school s, and pris ons; an d commerci al businesses incl uding restaurant s,grocer y stores, and of fices. Indust ries too generat e MSW, but indus trial process wastes areconsi dered and handle d separately ( Chapter 12 ).
Why does MSW concern us?
Al most any garbage is unpleasant. It has unp leasant odors. Diapers and other sanit ary itemshave microorganisms, sometimes pathogens. So do rotting food and yard wastes. ▪AlthoughHHW is only a small part of MSW, it can pose problems such as catching on fire, or injuringthe skin or eyes of workers coming in contact with it, or breathing its fumes. However, amaterial need not be hazardous to present problems.
4 Municipal solid waste. US EPA, November 13, 2008, http://www.epa.gov/epawaste/nonhaz/municipal/index.htm.5 (1) Zawadzinski, J. New York author trails her trash in “ Garbage Land.” Reuters, July 13, 2005, http://www.planetark.com.au/dailynewsstory.cfm/newsid/31629/newsDate/13-Jul-2005/story.htm. (2) Hazen, D. The hiddenlife of garbage. AlterNet, October 31, 2005, http://www.alternet.org/story/27456/.
6 Miller, C. Profiles in garbage for 2007.WasteAge, December, 2008, http://wasteage.com/Landfill_Management/profiles_in_garbage_msw_2007_1208/.
7 Mu nicipa l solid waste gener at ion, recycl ing, and disposal i n t he United States: facts and figur es fo r 2006 . US EPA,November 2007, http://www.postcom.org/eco/sls.docs/USEPA-2006%20MSW%20Facts%20&%20Figures.pdf.
313 Municipal solid waste
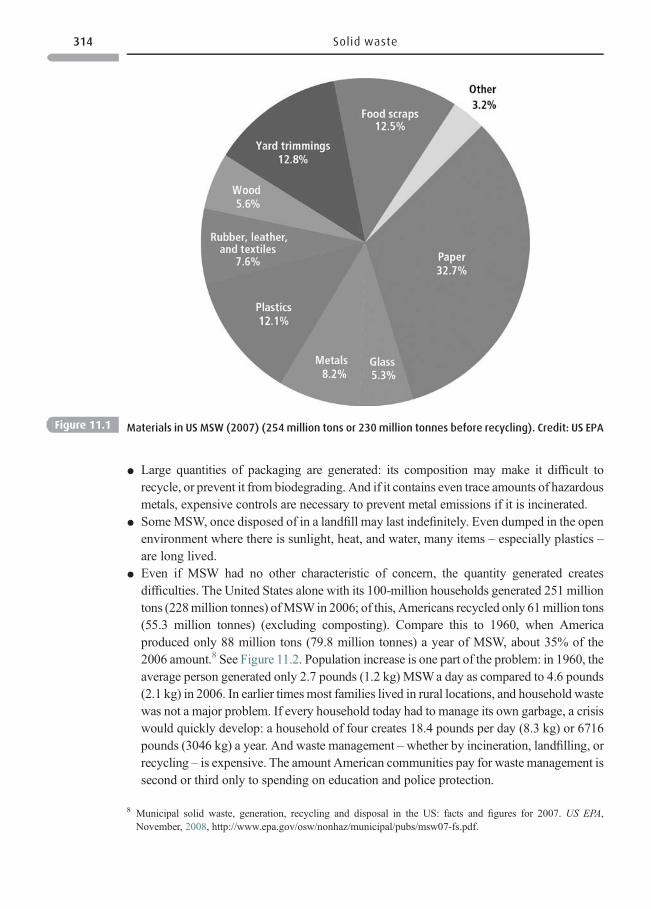
* Large quantities of packaging are generated: its composition may make it difficult torecycle, or prevent it from biodegrading. And if it contains even trace amounts of hazardousmetals, expensive controls are necessary to prevent metal emissions if it is incinerated.
* SomeMSW, once disposed of in a landfill may last indefinitely. Even dumped in the openenvironment where there is sunlight, heat, and water, many items – especially plastics –are long lived.
* Even if MSW had no other characteristic of concern, the quantity generated createsdifficulties. The United States alone with its 100-million households generated 251 milliontons (228million tonnes) ofMSWin 2006; of this, Americans recycled only 61million tons(55.3 million tonnes) (excluding composting). Compare this to 1960, when Americaproduced only 88 million tons (79.8 million tonnes) a year of MSW, about 35% of the2006 amount.8 See Figure 11.2. Population increase is one part of the problem: in 1960, theaverage person generated only 2.7 pounds (1.2 kg) MSWa day as compared to 4.6 pounds(2.1 kg) in 2006. In earlier timesmost families lived in rural locations, and household wastewas not a major problem. If every household today had to manage its own garbage, a crisiswould quickly develop: a household of four creates 18.4 pounds per day (8.3 kg) or 6716pounds (3046 kg) a year. And waste management –whether by incineration, landfilling, orrecycling – is expensive. The amount American communities pay for waste management issecond or third only to spending on education and police protection.
Figure 11.1 Materials in US MSW (2007) (254 million tons or 230 million tonnes before recycling). Credit: US EPA
8 Municipal solid waste, generation, recycling and disposal in the US: facts and figures for 2007. US EPA,November, 2008, http://www.epa.gov/osw/nonhaz/municipal/pubs/msw07-fs.pdf.
314 Solid waste
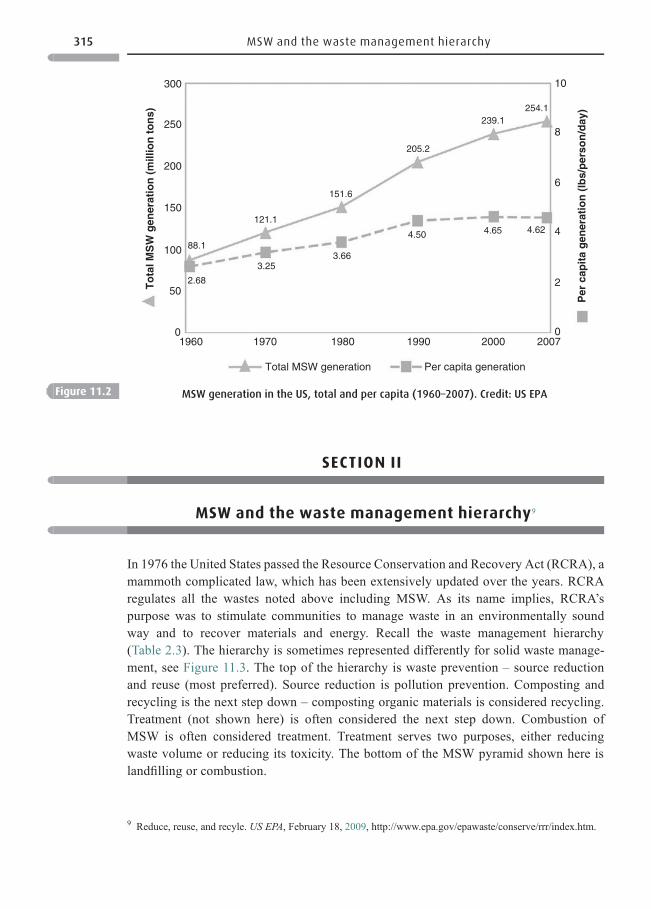
SECTION II
MSW and the waste management hierarchy9
In 1976 the United States passed the Resource Conservation and Recovery Act (RCRA), amammoth complicated law, which has been extensively updated over the years. RCRAregulates all the wastes noted above including MSW. As its name implies, RCRA’spurpose was to stimulate communities to manage waste in an environmentally soundway and to recover materials and energy. Recall the waste management hierarchy(Table 2.3). The hierarchy is sometimes represented differently for solid waste manage-ment, see Figure 11.3. The top of the hierarchy is waste prevention – source reductionand reuse (most preferred). Source reduction is pollution prevention. Composting andrecycling is the next step down – composting organic materials is considered recycling.Treatment (not shown here) is often considered the next step down. Combustion ofMSW is often considered treatment. Treatment serves two purposes, either reducingwaste volume or reducing its toxicity. The bottom of the MSW pyramid shown here islandfilling or combustion.
Total MSW generation
1960
88.1
121.1
3.253.66
151.6
4.50
205.2
4.65 4.62
239.1254.1
2.68
0
50
100
150
200
250
300
0
2
4
6
8
10
1970 1980 1990 2000 2007
Per capita generation
Per
cap
ita
gen
erat
ion
(lb
s/p
erso
n/d
ay)
To
tal M
SW
gen
erat
ion
(m
illio
n t
on
s)
Figure 11.2 MSW generation in the US, total and per capita (1960–2007). Credit: US EPA
9 Reduce, reuse, and recyle. US EPA, February 18, 2009, http://www.epa.gov/epawaste/conserve/rrr/index.htm.
315 MSW and the waste management hierarchy
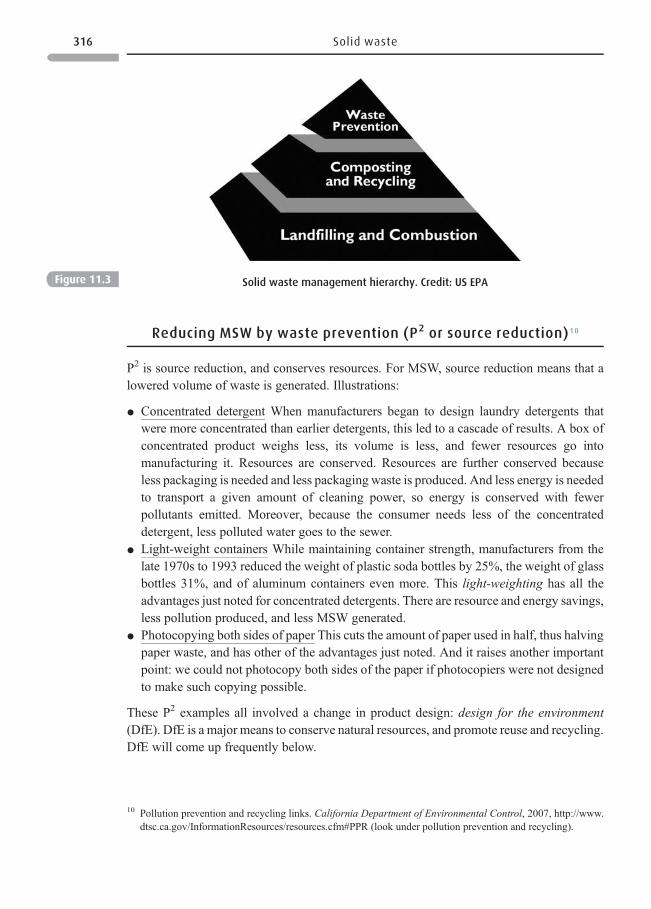
Reducing MSW by waste prevention (P2 or source reduction)10
P2 is source reduction, and conserves resources. For MSW, source reduction means that alowered volume of waste is generated. Illustrations:
* Concentrated detergent When manufacturers began to design laundry detergents thatwere more concentrated than earlier detergents, this led to a cascade of results. A box ofconcentrated product weighs less, its volume is less, and fewer resources go intomanufacturing it. Resources are conserved. Resources are further conserved becauseless packaging is needed and less packaging waste is produced. And less energy is neededto transport a given amount of cleaning power, so energy is conserved with fewerpollutants emitted. Moreover, because the consumer needs less of the concentrateddetergent, less polluted water goes to the sewer.
* Light-weight containers While maintaining container strength, manufacturers from thelate 1970s to 1993 reduced the weight of plastic soda bottles by 25%, the weight of glassbottles 31%, and of aluminum containers even more. This light-weighting has all theadvantages just noted for concentrated detergents. There are resource and energy savings,less pollution produced, and less MSW generated.
* Photocopying both sides of paper This cuts the amount of paper used in half, thus halvingpaper waste, and has other of the advantages just noted. And it raises another importantpoint: we could not photocopy both sides of the paper if photocopiers were not designedto make such copying possible.
These P2 examples all involved a change in product design: design for the environment(DfE). DfE is a major means to conserve natural resources, and promote reuse and recycling.DfE will come up frequently below.
Figure 11.3 Solid waste management hierarchy. Credit: US EPA
10 Pollution prevention and recycling links. California Department of Environmental Control, 2007, http://www.dtsc.ca.gov/InformationResources/resources.cfm#PPR (look under pollution prevention and recycling).
316 Solid waste
Reducing hazardous metal levels in products
Waste prevention and DfE examples were given above that can reduce the volume of MSW.How can we reduce its toxicity? Here we will consider hazardous metals. Many hazardousmetals such as lead or chromium are found, albeit in low amounts, in a number of products.Because metals don’t degrade, even small amounts can build up over time.
* Printing Newspaper and magazine printers traditionally used lead ink, and for coloredsections hazardous metal pigments. As soy bean and organic inks were developed, the useof metals has diminished.
* Packaging and plastics Metals served useful functions in packaging and plastics, andcould not arbitrarily be eliminated. But, when a search for alternatives was undertaken, itwas possible to find relatively benign organic molecules to serve equivalent functions,and reduce hazardous metal content in these products.
* Lead and mercury in products Major reductions have been made in the content of thehazardous metals, lead and mercury, in many products (Chapter 15).
Reducing food waste
Remember that food waste is also part of MSW. Figure 11.1 shows food scraps as 12.5% ofMSW. Food is thrown away in homes, grocery stores, and restaurants, often edible food, notfood waste.11 In New York City and other municipalities, organizations have begun to pickup leftover food from restaurants including whole untouched pans of food. These are takendirectly to places serving the needy or are frozen. For food that cannot be consumed byhumans, some is offered to farmers for livestock consumption. Another means to reducefood wastage is to eliminate trays in school and college cafeterias: this leads to studentstaking less food. At the very least, waste food can be composted; see Composting andbiotreatment below.
Box 11.1 Reducing waste through environmentally preferable purchasing12
Environmentally preferable products13 are those that have been analyzed and selected on the
basis of having lesser impacts on human health and the environment as compared to others
that serve the same purpose. Buying them represents P2. The title of one article expresses the
enthusiasm of those espousing this approach: “Buying Green, Harnessing the Incredible
11 Martin, S. One country’s scraps, another country’s meal. New York Times, May 18, 2008, http://www.nytimes.com/2008/05/18/weekinreview/18martin.html.
12 Good stuff: a behind-the-scenes guide to the things we buy.Worldwatch Institute, 2008, http://www.worldwatch.org/taxonomy/term/44.
13 (1) Environmentally preferable purchasing. US EPA, November 7, 2007, http://www.epa.gov/opptintr/epp/.(2) The environmentally preferable purchasing guide. Rethink Recycling.com, April 25, 2008, http://www.greenguardian.com/government/eppg (guidelines for goods and services, paper products, printing services,office machines, motor-vehicle products, cleaning products, carpets, grounds and building maintenance, includ-ing integrated pest management, and many others).
317 MSW and the waste management hierarchy
Procurement Power of Governments, Hospitals, Colleges and America’s Biggest Corporations
to Protect the Environment.” In the United States, EPA has developed guidelines to identify
environmentally preferable products, and federal agencies are asked to give buying prefer-
ence to these. The expectation is that government buying power will drive change: businesses
wanting to sell to government agencies will modify their products to fulfill the guidelines. State
and municipal agencies, universities and colleges can also use the guidelines. The EPA
developed the following criteria to assist product identification.
Less hazardous Buy a product with the lowest level of hazard able to do the job. This is
indicated on the label. Caution refers to mild to moderate hazard.Warning refers to moderate
hazard. Danger is the highest hazard (corrosive, extremely flammable, or highly toxic). Poison
is also at the highest level, but refers specifically to a toxicity hazard. If low-hazard products are
not available, or one must buy the more hazardous product, follow all precautions on the label
and use the least amount possible for the job. Use the product up entirely to avoid creating
HHW.
Conserves energy14 Buy energy-efficient products. In the United States the Energy Star label
identifies these products, which also save money on energy bills.
Recycled content If the label says pre-consumer content, this indicates that manufacturer
scrap was recycled. Post-consumer is materials actually used by consumers, such as paper,
cans, glass, or plastic, and then collected after use and recycled.
Prevents waste(P2) Buy the least amount of material possible to accomplish a task. When
possible buy a product that is repairable, durable, refillable, or able to be reused.
Low-volatile organic compounds Examine labels to find low-VOC products. VOCs evaporate
from many consumer products including office equipment, adhesives, carpeting, upholstery,
manufactured wood products, paints, solvents, pesticides, and cleaning products. Because
they can concentrate in indoor air, they are of special concern in offices and homes.
Conserve Water Choose water-conserving products and services such as automatic flushers
and low-flow faucets and toilets. These also save money on water and sewer bills.
End of life management
What happens to a product after we use it? Somematerials cannot go in the trash because they
are hazardous in some way and therefore need separate – and sometimes expensive – special
management. Some products aremore easily recycled than others that do the same job. Making
wiser buying choices can prevent a disposal concern at the end of a product’s useful life, keep
hazardous materials out of the environment, and expand options for recycling and reuse.
End of life
What happens to this product at the end of its useful life? Is it recyclable? If so, is it likely to be
recycled? Does the manufacturer have a take back policy, i.e., will it take it back after its useful
life is over? Might it be a hazardous waste that needs special handling?
14 States and cities follow federal lead in energy-efficient purchasing. EETD Newsletter, Winter 2004, 7, http://eetdnews.lbl.gov/nl16/eetd-nl16-4-estar.html.
318 Solid waste
Some states and cities are more ambitious than the federal government. Massachusetts and
the city of Santa Monica, California have vigorously pursued environmentally preferable
products; so have Minnesota’s Twin Cities. Such products can save money if they conserve
energy or water. In the workplace, using less-hazardous products can reduce liability, improve
worker safety, and lower disposal costs. Products that are reusable, refillable, more durable, or
can be repaired are more cost-effective in the long run.
Other “green procurement” efforts15
Some European countries and Canada place green labels on products to denote those judged
environmentally preferable. China’s government started a “green procurement” program in
2007 applicable to both central and provincial governments. It specifies the recommended
products, which carry the China Environmental Label (Figure 11.4). Government purchasers
must buy products from the list when available; otherwise they may not get reimbursement.
China’s environmental agency, SEPA, hopes that the government “could become the real
driving force for industry to develop green technology.”
Individual action
Buying environmentally preferable products: as an individual you can choose to buy durable
goods, or to buy a television set or appliance that can be repaired. Consider EPA guidelines
when purchasing a car. Choose one with good gas mileage and maintain it well to reduce
gasoline consumption, and reduce pollutant emissions from the vehicle. A clothing drier is a
major energy user in the home, so purchase an energy-efficient model. Small steps are
important. If you can use it up, buy a product in bulk because that has less packaging per
unit of product. Take fabric bags to go shopping rather than accepting new bags. Paper bags
too can often be reused many times. This saves resources and prevents the pollution used
to manufacture new products. There are hundreds of ways to reduce energy and water use,
and to produce less household waste. Multiplied by hundreds of millions, the net impact is
indeed significant. But be aware that guidelines are not absolute. There are always
instances where a product preferable in one or more respects is less desirable in others.
The individual buyer must still make judgments. Recycled-content products save energy and
resources, while also keeping waste out of landfills and incinerators. Recycled-content
products can be made with post-consumer content, pre-consumer content, or a mix of
both. Products made with post-consumer recycled content support recycling programs at
home and at work. If people do not buy products with post-consumer recycled content,
manufacturers will no longer want the paper, cans, glass, or plastic we separate from trash.
Pre-consumer content comes primarily from manufacturer scrap, and as such does not
directly support such recycling efforts.
15 Li, L. Chinese government to start “Buying Green.” Worldwatch Institute, November 30, 2006, http://www.worldwatch.org/node/4760.
319 MSW and the waste management hierarchy
Reuse of component parts of products – r emanu f actu ring
Design for disassem bly (DfD) is similar to DfE excep t desig ners focus on desig ning effi cientdisassem bly of a product so that its reusab le compo nents can be quickly obtai ned. At the endof one of its lives, a machi ne, such a s a photoc opier, can be disassem bled into reusab le andrecycl able parts. The se are examin ed, refur bishe d, and becom e parts of newly assembledproduct s that meet the same stand ards as a new product – it has been reman ufactured .
* Caterpill ar, Inc. refers to its rema nufact ured product s as Cat Reman. Whe reas previ ously70% of Caterpill ar ’s costs when maki ng new machi nes were for raw material s, thosecosts are largely elimin ated by refur bishing and reusing old machine parts .16 The savingsfor companies that use remanufact uring is as much as 70%. This makes rema nufactu ringbene ficial envir onmen tally and econom ically.
* Some 70 –90% of auto parts are rema nufact ured. When you repla ce an alte rnator, clutch,or brake- caliper in your car, the n ew part was probably remanufact ured from a previo uslydiscarded one. The part is inspected, cleane d, and rebuilt to speci fication s. Whil ereducing pollution, this also reduces the need for energy and labor to ha lf that requi redfor a new part.
* Cell phones are very conducive to remanufacture: a Nokia cell phone can be disassembledin two minutes, and Nokia has a prototype, which can “pop” apart in seconds. Most of itsparts, including a titanium-coated capacitor, can be used multiple times. Nokia phones alsohave enough gold that it would take the gold from only 200 phones to make a gold ring.
As these examp les show, remanufact uring is especiall y feasible for met al products. This isfortunate because a nu mber of metals are becom ing harder to recover. The US Geol ogicalSurvey (USGS ) reports that , at the rates of curren t use, there is only enough econom icallyrecover able lead left for 18 more years. This fi gure is 20 years for tin, 25 years for copper, 69for bauxite (from which aluminum is extracted), and 64 years for iron (from which tomanufacture steel). About 71% of steel is now recycled from scrap, and is found in almost allcars, 90% of household appliances, and 60% of cans.17 ▪ Unfortunately, the US industries
Figure 11.4 China’s environmentally preferable label. Source: Worldwatch
16 Remanufacturing. Caterpillar, 2009, http://www.cat.com/parts/remanufactured-products.17 Rhodes, C. Metals shortages, September 16, 2008, http://www.scitizen.com/stories/Future-Energies/2008/09/
METALS-SHORTAGES-/.
320 Solid waste
that make computers and other electronics have been much slower to act without a lawrequiring them to do so.18
Recycling19
Recycling may be lower on the WMH than P2 or reuse (and remanufacturing), but it is vital.Its environmental benefits include saving resources, using less energy, and producing lesspollution than making a product from virgin resources.20 Recycling also provides jobs.About 8500 US curbside recycling programs existed in 2005. These serve over half thepopulation, and 84% of US cities. Recyclables could be dropped off at 12 000 other sites.Materials collected include paper, steel (tin) and aluminum cans, glass containers, plasticcontainers (especially #1 and #2) and waste oil (Figure 11.5). Although the US recycling rateincreased sharply in the years before 2000, it has since almost leveled off and in 2007 wasonly 32.5%. However, some cities, San Francisco is one, has a 69% recycling rate; this citydoes not ask citizens to separate recyclables, but collects them in a single stream which arelater sorted in a facility that combines machine and human separators. One way the city
Questions 11.1
Because of lack of education or of environmental awareness, we may overlook many oppor-
tunities to buy environmentally preferable products.
(1) The United States with 4.5% of the world’s population uses about half the world’s
detergent. Most people buy top-loading washers although front-loadingmachines require
less detergent and less water; they then run the machines with less than full loads of
clothes. (a) In addition to these examples, how else can clothing be kept clean with less
detergent? (b) In addition to saving detergent, what are the other environmental advan-
tages of front-loading machines?
(2) How canwemotivate individuals who can afford to buy larger models to buy smaller more
energy-efficient refrigerators and cars?
(3) The United States uses 30%of theworld’s paper production. Each year, a person consumes
the equivalent of 670 copies of the daily New York Times. How can we use less paper
without detracting from quality of life?
(4) Box 11.1 provides instances of how individuals can lessen their environmental impacts by
the purchasing decisions that theymake. (a) Provide examples of purchases that you think
you yourself may begin to adopt. (b) Which purchasing decisions seem too confusing or
too much trouble to you?
18 Slade, G. E-waste watch: why not a national law? E The Environmental Magazine, September, 2008, http://www.emagazine.com/view/?3568.
19 Granger, T. Eight ways to green your recycling. Earth911.com, February 18, 2008. This story is one of a seriesshowcasing ways to increase ways of living with greater environmental awareness, http://earth911.com/blog/2008/02/18/eight-ways-to-green-your-recycling/#panel-recycling-search.
20 The truth about recycling. The Economist, June 7, 2007.
321 MSW and the waste management hierarchy
keeps the amount of trash down is through a pay-as-you throw system where the feesresidents pay depend on the number of trash bins that they use.21 However, a Germancommenting on San Francisco’s system pointed out that Germans are much more thor-ough.22 A number of other West Coast cities also have high recycling rates. ▪ Incinerating orlandfilling is costly to a community. However, recycling – excepting high-value materialslike aluminum – is sometimes accused of being more costly still. New York City cancelledplastic and glass recycling programs because of cost, but as landfill costs went up, recyclingof these was reinstituted and the city worked vigorously to cut costs. Many cities have savedon costs after buying, as did New York City, automatic sorting and processing machinery.Some coastal cities, New York is one, found that it pays to export recyclables to less-developed countries where their value is greater. Some cities pick up recyclables less often,but have found that residents, angered by the accumulating recyclables, recycled less. SeeBox 11.2 for the recycling of specific materials.
Box 11.2 Recycling of common materials
Also see Figure 11.5 and see Wastes quick finder, A–Z topics. US EPA. http://www.epa.gov/
epawaste/index.htm
* Aluminum23 In 2008, barely half of the aluminum cans used in the United States were
recycled, this despite the fact that aluminum is a valuable metal, and recycling aluminum
pays for itself. Moreover, the United States has only about 1% of the bauxite ore fromwhich
aluminum is recovered, so thrown-away cans could become an ongoing aluminum mine.
Aluminum cans are also relatively easy to collect. Collecting aluminum foil, pie pans, lawn
furniture, or aluminum used in siding, gutters, and window and door frames is more
difficult, but can be done. Aluminum recycling has major environmental advantages – it
uses up to 95% less energy thanmining it from bauxite, and reduces air and water pollution
about the same amount. Meanwhile, 3% of the world’s electricity goes into making new
aluminum cans and about a third of that electricity is generated from coal-burning power
plants
* Steel cans Recycling steel cans reduces energy consumption about 60% compared to
starting with raw materials. Both bauxite mining for aluminum and iron mining for steel
can be highly polluting and also result in major land degradation in the area where mining
occurs. These are also called tin cans because some are still tin coated.
* Paper Recycling paper can reduce energy use 40% as compared to making paper from new
trees. In 1999, the paper industry recovered 45% of the paper and paperboard used in the
United States. By 2001 paper recycling increased to 48%, close to the 50% goal the industry
21 Barringer, F. A city committed to recycling is ready for more. The New York Times, May 7, 2008, http://www.nytimes.com/2008/05/07/us/07garbage.html.
22 Amann, S. How one German views recycling in San Francisco: you have only just begun. San FranciscoChronicle, August 12, 2008, http://www.sfgate.com/cgi-bin/article.cgi?f=/c/a/2008/08/12/ED9Q1283C5.DTL.
23 The Good Earth Correlation Guide, 2001. Physical geology, Updated Internet Edition, 2001, http://www.mhhe.com/earthsci/geology/plummer/information/olc/plummercorrelation.mhtml.
322 Solid waste
had set for itself. Most recovered paper is post-consumer waste, not mill scraps. About half
is old corrugated cardboard containers. By 2007 it recycled 56% and now has a goal of 60%
by 2012. The 54.3 million tons (49.3 million tonnes) of paper recovered in 2007 amounts to
more than 360 pounds (163 kg) for every American. Each percentage point gained repre-
sents enough paper to fill more than 14 000 railroad cars.24 However, the higher the
recycling rate, the greater the difficulty there is as most good-quality paper is already
recovered. However, poorer-quality paper can be composted or incinerated for its energy.
* Plastics25 The world produces 250 billion pounds (~113 billion kg) of plastic pellets a year. It
is from these that all plastic products or plastic composite products aremade from soft-drink
bottles to medical equipment or cars. Plastic discards in US MSW were less than 1% by
weight in 1960, but by 2006 they were 11.7%. See Box 11.3. Types of plastics included
14 million tons (12.7 million tonnes) as containers and packaging, over 6 million tons
(5.4 million tonnes) as nondurable goods, and about 9 million tons (8.2 million tonnes) as
durable goods. In the 11 US states in 2008 that charged deposits on beverage containers –
plastic bottles and aluminum cans – recycling rates are higher than in states without
deposits. Deposits are returned when the bottles are returned.26 In states with deposits,
more people save containers to get their money back; others add to their incomes by
collecting plastic bottles and aluminum cans discarded by others. Some of the 11 states are
working to increase the deposit charged; yet other states are introducing bills to start
charging deposits. The average rate of recycling plastic bottles remains low (Figure 11.5).
Only about 4% of plastics in the MSW stream are recycled; however, the figure for two
specific plastics is higher. The rate for polyethylene terephthalate (PET) soft-drink bottles
was 31% in 2007, and recovery of HDPE milk and water bottles about 31%. Recycling the
PET used to make soft-drink bottles uses 47% less energy than making it from raw
materials. ▪ Recycling plastics poses challenges. One is collecting and separating multiple
types of plastics. Another is recovering plastics from products more complicated than plastic
bottles or other simple plastic products. An instance is the tens of millions of plastic casings
on computers that are discarded in increasing quantities. It’s even more difficult to recover
plastic from composite products where plastic is only part of the composition. ▪ However,
once discarded plastic has been collected and sorted, it is valuable and goes into products
such as TyvekTM (disposable medical suits and insulation), fleece garments, plastic lumber,
and water-repellent coatings for shipping boxes, and asphalt too. Compared to other
products, plastics are often more durable, perform better, or weigh less than counterparts
made from other materials. For example, plastic lumber can last much longer than real
wood. Although valuable, businesses often cannot be assured of a dependable supply of
used plastics. Moreover, the price that plastic recyclers pay varies with the price of oil. Most
common plastics are thermoplastics; that is, they can be melted down and reshaped into
new plastic products.
24 US paper recycling hits record high. International Council of Forest and Paper Associations, April, 2008, http://www.icfpa.org/media_center/press_releases/uSPaperRecyclingRecord.php.
25 Wastes. Resource conservation: plastics. US EPA, http://www.epa.gov/epawaste/conserve/materials/plastics.htm.
26 Miller, C. The bottle battle.Waste Age, June 1, 2007, http://wasteage.com/mag/waste_bottle_battle/index.html.
323 MSW and the waste management hierarchy
* Used oil 27 Of the 1.3 billion gallons (4.9 billion liters) of used oil generated each year in the
United States, only 3.4% is refined into new automotive oil, whereas about 15% is illegally
dumped into backyards, drains, or streams. In addition to the environmental impacts of this
oil is the lost possibility of re-refining it into motor oil: 1 gallon (3.8 liters) of used motor oil
provides 2.5 quarts (2.4 liters) of lubricating oil, the same amount as obtained from 42
gallons (159 liters) of crude oil. Most of the rest of used oil generated is collected with most
used for industrial fuel or space heating. 28
* Glass Recycling glass saves energy, about 30%. About a quarter of glass containers are
recycled.
* Electronics Although electronics are an increasing part of our waste stream, only a small
portion is responsibly recycled. Beginning in 2007, European Union (EU) citizens began
taking their used computers, iPods, radios, and other electronic waste to collection points.
This was in response to the EU Waste Electrical and Electronic Equipment (WEEE) Directive,
which requires producers in member states to finance electronic waste take-back programs;
they must also treat the waste. Electronic waste has been increasing three times faster than
MSW as a whole. It is expected that WEEE will encourage producers to practice DfE: design
changes in their electronic products that make for easier disassembly, recycling, or reuse.
▪ Another EU directive is also pushing DfE, the restriction of hazardous substances (RoHS) inelectrical and electronic equipment. RoHS largely bans products containing lead, mercury,
cadmium, hexavalent chromium, polybrominated biphenyls, and polybrominated diphenyl
ethers. 29 Because these are found in electronic equipment, this directive will be another
stimulus to DfE. In the United States, the EPA has formed partnerships with industry to
promote safer electronics; this includes using safer chemicals. 30 Also in the United States, an
increasing number of communities and states ban computers and TV monitors from landfills,
which also exerts pressure on manufacturers. Electronics are not intrinsically hazardous. Yet
the quantity of electronic waste and the way it is often dealt with can make it hazardous
(see Chapter 12).
* Appliances Many millions of used appliances are discarded each year – air conditioners,
dishwashers, dryers, washing machines, refrigerators, freezers, stoves, microwave ovens,
water heaters, etc. Some states ban appliances from landfills. Although they contain
recyclable metals, these can be difficult to recover.
* Packaging This is the largest component of US MSW, almost 32% by weight; about half is
paper. Over the years, the use of glass and steel in packaging has decreased; aluminum is
staying about the same. Meanwhile, plastics use, has increased dramatically. See
Figure 11.6▪ If you examine products in US stores, you see many with unnecessary pack-
aging. However, proper packaging performs valuable functions: on food, it reduces spoilage
and the amount thrown away. In the United States, 15% to 20% of food is disposed of as
27 Wastes: Resource conservation, used oil management program. US EPA, August 29, 2008, http://www.epa.gov/epawaste/conserve/materials/usedoil/index.htm.
28 Used oil collection. RS Used Oil, Inc., 2009, http://www.rsusedoil.com/usedoil.cfm.29 Burke, M. E-waste campaign begins in the U.K. Environmental Science & Technology, 41(13), July 1, 2007,
4492.30 Design for the environment. US EPA, February 19, 2009, http://www.epa.gov/dfe/pubs/about/index.htm.
324 Solid waste
waste between leaving the farm until it reaches the consumer’s table. In contrast, in very
poor countries, foods lack protective packaging, and 40% to 70% is thrown away because it
spoils during shipping and storage.31 For non-food items, appropriate packaging also serves
protective functions. Recycling ▪ About 40% of packaging materials in the United States was
recovered for recycling in 2006.32 ▪ The EU started an EPR program for packaging in 1994
called “The Producer Pays.” Producers must accept back their packaging, which can be left at
the place of purchase, or sent to producers at their expense; or a fee is paid to the Green Dot
organization to handle it. The Green Dot take-back program is used in dozens of EU
countries, but not in the United States. Nonetheless, many United States businesses are
undertakingmajor efforts to reduce packaging.33 Wal-Mart is pushing its 660 000 vendors to
get rid of excess packaging. It also pledges to recover as much packaging material as
possible through recycling, reuse and, possibly composting.34 A group of other companies
have formed a Sustainable Packaging Coalition, which has produced a guide for designers to
move toward sustainable packaging.
Recycling can go far beyond the examples shown here. With a little readjustment in our
perspective, recycling could become one of life’s routines. Recycling is not without problems.
Consider paper. It contains coaters, fillers, and pigments, which must be removed before the
paper fiber can be recycled. These extraneous components, not currently reusable, are land-
filled. And working in recycling facilities is not easy. Workers are injured, occasionally killed in
accidents involving equipment used to recycle cans, bottles, and paper. Injuries occur even in
industrialized countries. Imagine then recycling done from dumps such as the one described
below in the Philippines. And recycling facilities suffer the same resistance to having them in
the neighborhood as do landfills and incinerators, the not-in-my-backyard, or NIMBY,
phenomenon.
Box 11.3 The Great Pacific Garbage Patch and beyond
“In a high-tech era of radiation, carcinogenic chemicals, and human-induced
climate change, the problem of the trash produced by ocean-going vessels or
litter swept out to sea must seem old-fashioned by comparison. Regrettably, that
perception is wrong.”
(US Senator, Daniel Inouye, Hawaii)
31 In addition to a lack of packaging, there is also a lack of infrastructure to transport food quickly (especially insub-Saharan African countries). Insect and microbe damage, and high humidity also play a role in lost foodaccording to the UN Commission on Sustainable Development.
32 Hartwell, S. Recyclability of packaging in the United States. US EPA, April 30, 2008, http://www.ftc.gov/bcp/workshops/packaging/presentations/hartwell.pdf.
33 Deutsch, C. H. Incredible shrinking packages (companies reducing packaging, and barriers to doing so).New York Times, May 12, 2007, http://www.nytimes.com/2007/05/12/business/12package.html?ei=5088&en=007ee5ef59b64410&ex=1336622400&partner=rssnyt&emc=rss&pagewanted=print.
34 Maestri, N. Wal-Mart’s new packaging credo: let ’s get small. Reuters, April 19, 2007, http://www.boston.com/business/articles/2007/04/19/wal_marts_new_packaging_credo_lets_get_small/.
325 MSW and the waste management hierarchy
To get a sense of our problem with irresponsible disposal of plastics,35 examineFigure 11.7. This shows only one creek flowing into the ocean in the city of Baltimore,one creek in one city among a multitude of coastal cities. The debris shown is not allplastic, but much is, especially plastic bottles. Under this bridge a trash interceptorcatches the debris, preventing it from entering Baltimore Harbor. This one interceptorcollects about 5 tons (4.5 tonnes) of trash a month,36 a “drop in the bucket” compared tothe massive quantities of trash washing into our oceans. The interceptor is used for publiceducation, letting people know what happens when we litter. Consider the countlessstreams and rivers flowing into our Earth’s oceans where human detritus is not inter-cepted, and you may begin to understand why any coastal place you visit in the worldincluding isolated places have junk, especially plastics on the beaches.
The Great Pacific Garbage Patch37,38
More striking than trash on beaches is a phenomenon that most people will never see
(Figure 11.8). A great swirling field of trash – held in place by underwater currents – is found
in the Pacific Ocean stretching “from about 500 nautical miles off the California coast, across
the northern Pacific, past Hawaii and almost as far as Japan.” Swirling within this vortex
(actually two vortices, “the Western and Eastern Pacific Garbage Patches”) are an estimated
100 million tons (91 million tonnes) of refuse. Trash escapes when a vortex comes close to
land, throwing large quantities of debris onto beaches. Tony Andrady of the US Research
Triangle Institute, says: “Every little piece of plastic manufactured in the past 50 years that
made it into the ocean is still out there somewhere.” These materials cannot be seen from
space as they swirl below the water’s surface, but they are observed from ships, and inves-
tigators at the sea’s surface level can pull up samples – see Figure 11.9 for some smaller pieces
found. About 80% of ocean debris originates on land, the other 20% from ships or oil
platforms. Flotsam has always been pulled into these vortices but, before plastics existed,
most flotsam biodegraded. However, now the UNEP estimates that plastics are about 90% of
the mass. Through the action of salt water, sun, and wind, plastic pieces very slowly erode
35 Six resins are used to make most plastic containers and packaging. Each has a code number often found on thecontainer. Code #1: Polyethylene terephthalate (PET), a strong, clear polymer used to make soft-drink bottlesand medicine containers. Code #2: High-density polyethylene (HPDE), often found in milk, juice, and waterbottles and in containers for household cleaners such as detergent. Code #3: Polyvinyl chloride (PVC) or vinyl(V) is found in clear films used, e.g., to protect meats. It allows air to pass through it, clings, and is punctureresistant. Vinyl is also found in pipes and sporting goods. Code #4: Low-density polyethylene (LPDE) is flexibleand strong. It is commonly used in grocery and garbage bags, and in shrink and stretch film. Code #5:Polypropylene (PP) has a high melting point, so it can be filled with hot products, which can then cool withinthe bottles. It is also used for caps and yogurt containers. #6: Polystyrene (PS) is a hard, often colorless plastic. Inits expanded form, foam, PS provides shipping protection for products such as electronics.
36 It’s a trash interceptor. The Container Recycling Institute, http://www.container-recycling.org/general/interceptor.htm.
37 Marks, K. and Howden, D. The world’s rubbish dump: a garbage tip that stretches from Hawaii to Japan. TheIndependent, February 5, 2008, http://www.independent.co.uk/environment/the-worlds-rubbish-dump-a-gar-bage-tip-that-stretches-from-hawaii-to-japan-778016.html.
38 Allsopp, M., Walters, A., Santillo, D., and Johnston, P. Plastic debris in the world’s oceans. Greenpeace, 2006,http://oceans.greenpeace.org/raw/content/en/documents-reports/plastic_ocean_report.pdf.
326 Solid waste
away – they do not biodegrade – into smaller pieces and finally into microscopic granular or
fiberlike fragments, which continue to steadily accumulate in our oceans as well as in the sand
of beaches.
Animal deaths
The UNEP estimates that plastic debris causes the deaths of a million seabirds a year and at
least 100 000 marine mammals.39 As one instance, the most endangered mammal species in
the United States, the monk seal, gets entangled in cheap plastic nets lost or discarded.
Another is the Hawaiian green sea turtle, which eats the debris, mistaking it for food as
when a plastic bagmay bemistaken for a jellyfish. Large plastic items including plastic six-pack
rings and discarded fishing lines and nets can entangle, suffocate, or disrupt digestion in birds,
fish, andmammals. “Syringes, cigarette lighters, and toothbrushes have been found inside the
stomachs of dead seabirds.” The seabirds skim the ocean’s surface and scoop up debris as they
would small fish, crustaceans, and other food; the debris with its jagged edges becomes
trapped in their GI tracts, leading to their deaths. Such items, fed by a parent to its chick can kill
it too: one dead Layson albatross chick had “cigarette lighters, bottle caps, and hundreds of
other pieces of plastic” in its gut. Ellen Anderson, walking along a beach in Washington State
had something bright and red catch her eye. Investigating, she found a dead bird with “its
exposed belly filled with shiny bits of plastic. Chunks yellowed like old teeth, a perforated pink
rectangle, hairy tan slivers,” and the red shard that had first caught her attention. This bird, a
Northern fulmer was subsequently found to contain 59 pieces of plastic within its gut.
Anderson discovered this was not a rare find.40
Microscopic impacts
Other researchers are examining what happens to the microscopic fragments and fibers into
which larger pieces of plastics eventually break down.41 These fragments have been found to
be widespread in the open sea, in sediments of estuaries and in the sand of beaches. They are
ingested by marine organisms: one group of investigators kept amphipods, lugworms, and
barnacles in aquaria containing small quantities of microscopic plastics. All three species
ingested the plastics within days. The researchers note that the environmental consequences
are not known. The Algalita Marine Research Foundation expresses greater concern. Its
researchers have extensively sampled surface waters in one of the vortices noted above,
and collected a “rich broth of minute sea creatures mixed with hundreds of colored plastic
fragments – a plastic-plankton soup” with six times more plastic particles by weight than
zooplankton. Moreover, these particles absorb oily and persistent pollutants that may
39 Effects of marine litter. UNEP, http://www.unep.org/regionalseas/marinelitter/about/effects/default.asp.40 Block, P. Oceans of waste, waves of junk are flowing into the food chain. Seattle Times, April 23, 2006, http://
www.k-state.edu/environment/ArticlesoftheWeek/Article04-30-06_05-06-06.htm. The article notes: “Dutchresearchers [use] fulmars to monitor litter in the North Sea, and have analyzed stomach contents of hundredsof birds over two decades.” In the early 1980s, 92% of the fulmars had ingested an average of 12 pieces of plastic.By the late 1990s, 98% of bird stomachs contained an average 31 pieces of plastic.
41 Thompson, R. C. et al. Lost at sea: where is all the plastic? Science, 304 (5672), May 7, 2004, 838, http://www.sciencemag.org/cgi/content/full/304/5672/838.
327 MSW and the waste management hierarchy
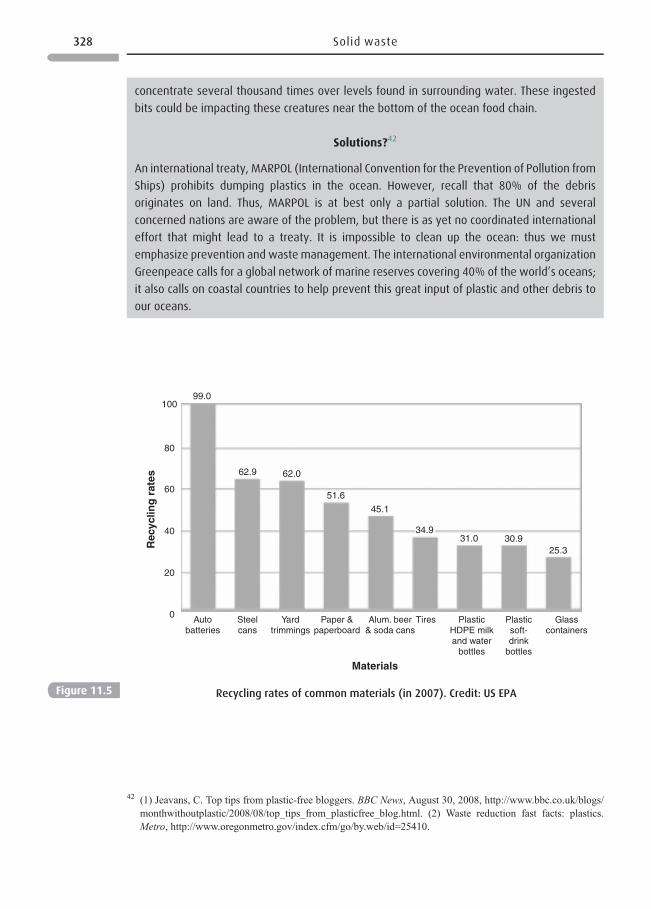
concentrate several thousand times over levels found in surrounding water. These ingested
bits could be impacting these creatures near the bottom of the ocean food chain.
Solutions?42
An international treaty, MARPOL (International Convention for the Prevention of Pollution from
Ships) prohibits dumping plastics in the ocean. However, recall that 80% of the debris
originates on land. Thus, MARPOL is at best only a partial solution. The UN and several
concerned nations are aware of the problem, but there is as yet no coordinated international
effort that might lead to a treaty. It is impossible to clean up the ocean: thus we must
emphasize prevention and waste management. The international environmental organization
Greenpeace calls for a global network of marine reserves covering 40% of the world’s oceans;
it also calls on coastal countries to help prevent this great input of plastic and other debris to
our oceans.
42 (1) Jeavans, C. Top tips from plastic-free bloggers. BBC News, August 30, 2008, http://www.bbc.co.uk/blogs/monthwithoutplastic/2008/08/top_tips_from_plasticfree_blog.html. (2) Waste reduction fast facts: plastics.Metro, http://www.oregonmetro.gov/index.cfm/go/by.web/id=25410.
Materials
Autobatteries
99.0
62.9 62.0
51.6
45.1
34.931.0 30.9
25.3
100
80
60
40
20
0 Steelcans
Yardtrimmings
Paper &paperboard
Alum. beer& soda cans
Tires PlasticHDPE milkand water
bottles
Plasticsoft-drink
bottles
Glasscontainers
Rec
yclin
g r
ates
Figure 11.5 Recycling rates of common materials (in 2007). Credit: US EPA
328 Solid waste
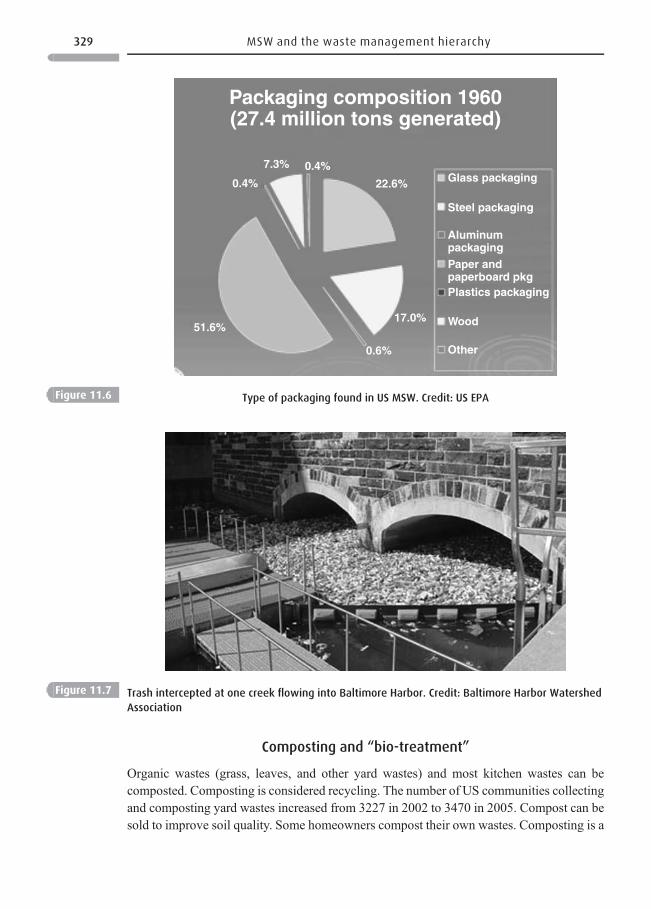
Composting and “bio-treatment”
Organic wastes (grass, leaves, and other yard wastes) and most kitchen wastes can becomposted. Composting is considered recycling. The number of US communities collectingand composting yard wastes increased from 3227 in 2002 to 3470 in 2005. Compost can besold to improve soil quality. Some homeowners compost their own wastes. Composting is a
Glass packaging
Steel packaging
AluminumpackagingPaper andpaperboard pkgPlastics packaging
Wood
Other0.6%
17.0%
22.6%
0.4%
Packaging composition 1960(27.4 million tons generated)
7.3%
0.4%
51.6%
Figure 11.6 Type of packaging found in US MSW. Credit: US EPA
Figure 11.7 Trash intercepted at one creek flowing into Baltimore Harbor. Credit: Baltimore Harbor Watershed
Association
329 MSW and the waste management hierarchy
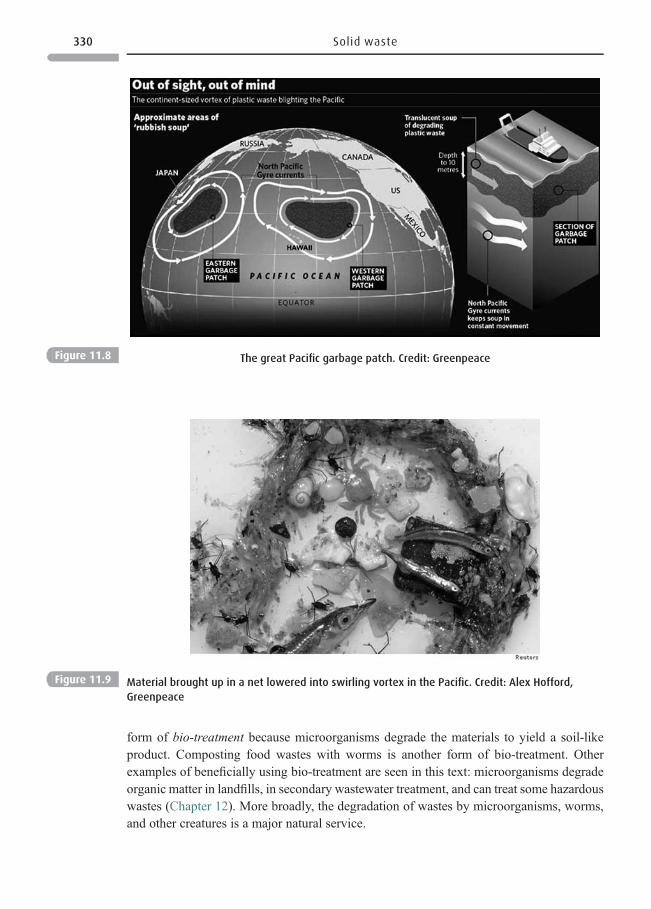
form of bio-treatment because microorganisms degrade the materials to yield a soil-likeproduct. Composting food wastes with worms is another form of bio-treatment. Otherexamples of beneficially using bio-treatment are seen in this text: microorganisms degradeorganic matter in landfills, in secondary wastewater treatment, and can treat some hazardouswastes (Chapter 12). More broadly, the degradation of wastes by microorganisms, worms,and other creatures is a major natural service.
Figure 11.8 The great Pacific garbage patch. Credit: Greenpeace
Figure 11.9 Material brought up in a net lowered into swirling vortex in the Pacific. Credit: Alex Hofford,
Greenpeace
330 Solid waste
Promoting recycling
First, recognize used materials as products or commodities, not waste. Society can promoterecycling in many ways. Following are some – by no means all – approaches that commun-ities, states, and countries are using to promote recycling.
Box 11.4 Junked cars
The United States has 210 million vehicles on the road with more added all the time. Fifteen
million are junked each year. Fortunately, 95% are mostly recycled. About 75%, by weight,
mostly metal, of discarded automobiles are reused or recycled. Much of the iron is recycled.
Lead-acid batteries, starters, tires, generators, and other engine parts are also typically reused
or recycled. The rest of the car, “fluff” (plastics, liquids, and glass) has, in the past, gone to a
landfill. ▪ Legislation in the EU dictates Extended Producer Responsibility (EPR) for automobiles:
auto manufacturers must take responsibility for their vehicles over their whole life cycle,
including the end of their useful lives; the legislationmandates that 95% of a discarded vehicle
must be recycled by 2015 (at no cost to the auto owner).43 To comply, European companies,
BMW (Germany), Fiat (Italy), and Renault (France) have developed facilities to dismantle,
shred, and recycle components of their discarded cars. They share information and technology,
and each accepts used vehicles from the others.
No EPR laws exist in the United States. However, US manufacturers selling cars in EU
countries must comply with their law. Thus, a US Vehicle Recycling Partnership has emerged,
working with the US Department of Energy and the American Plastics Council to develop
means to recycle a higher percentage of an auto. Although plastics are barely 5% of an auto’s
weight they are 50% by volume. Plastic use has led to an auto being 400 pounds (181 kg)
lighter than the average vehicle of the mid-1980s. However, plastic is a big reason that only
75% of a junked car has been recyclable: much of the remaining 25% is plastic. In Japan, to
facilitate recycling as much as 95% of a vehicle, they use only one type of plastic.
Design for disassembly
DfD is one form of DfE and its use led the Japanese to mark each material for easy identification.
Nissan already has several car models that allow a recovery rate of 95% of junked autos.
Life-cycle assessment
To effectively utilize DfE for a product, one needs to know its current environmental impact. The
Swedish car manufacturer, Volvo did a life-cycle assessment (LCA) on a Volvo to evaluate its
impact from the extraction of raw materials used to manufacture it, the manufacturing process,
and its use, maintenance, and disposal. LCA results are very helpful in designing more environ-
mentally sound vehicles. DfE includes DfD, and reuse, and recycling of component parts.
43 Motavilli, J. Here today, gone tomorrow: the auto industry ratchets up recycling Emagazine.com, November,2005, http://www.emagazine.com/view/?2959COMMENTARY.
331 MSW and the waste management hierarchy
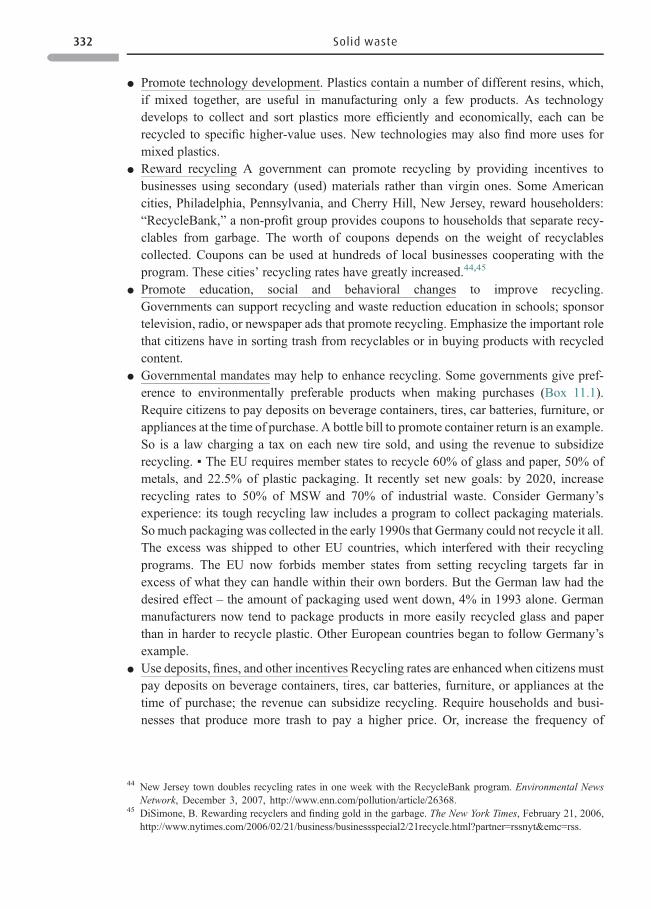
* Promote technology development. Plastics contain a number of different resins, which,if mixed together, are useful in manufacturing only a few products. As technologydevelops to collect and sort plastics more efficiently and economically, each can berecycled to specific higher-value uses. New technologies may also find more uses formixed plastics.
* Reward recycling A government can promote recycling by providing incentives tobusinesses using secondary (used) materials rather than virgin ones. Some Americancities, Philadelphia, Pennsylvania, and Cherry Hill, New Jersey, reward householders:“RecycleBank,” a non-profit group provides coupons to households that separate recy-clables from garbage. The worth of coupons depends on the weight of recyclablescollected. Coupons can be used at hundreds of local businesses cooperating with theprogram. These cities’ recycling rates have greatly increased.44,45
* Promote education, social and behavioral changes to improve recycling.Governments can support recycling and waste reduction education in schools; sponsortelevision, radio, or newspaper ads that promote recycling. Emphasize the important rolethat citizens have in sorting trash from recyclables or in buying products with recycledcontent.
* Governmental mandates may help to enhance recycling. Some governments give pref-erence to environmentally preferable products when making purchases (Box 11.1).Require citizens to pay deposits on beverage containers, tires, car batteries, furniture, orappliances at the time of purchase. A bottle bill to promote container return is an example.So is a law charging a tax on each new tire sold, and using the revenue to subsidizerecycling. ▪ The EU requires member states to recycle 60% of glass and paper, 50% ofmetals, and 22.5% of plastic packaging. It recently set new goals: by 2020, increaserecycling rates to 50% of MSW and 70% of industrial waste. Consider Germany’sexperience: its tough recycling law includes a program to collect packaging materials.So much packaging was collected in the early 1990s that Germany could not recycle it all.The excess was shipped to other EU countries, which interfered with their recyclingprograms. The EU now forbids member states from setting recycling targets far inexcess of what they can handle within their own borders. But the German law had thedesired effect – the amount of packaging used went down, 4% in 1993 alone. Germanmanufacturers now tend to package products in more easily recycled glass and paperthan in harder to recycle plastic. Other European countries began to follow Germany’sexample.
* Use deposits, fines, and other incentives Recycling rates are enhanced when citizens mustpay deposits on beverage containers, tires, car batteries, furniture, or appliances at thetime of purchase; the revenue can subsidize recycling. Require households and busi-nesses that produce more trash to pay a higher price. Or, increase the frequency of
44 New Jersey town doubles recycling rates in one week with the RecycleBank program. Environmental NewsNetwork, December 3, 2007, http://www.enn.com/pollution/article/26368.
45 DiSimone, B. Rewarding recyclers and finding gold in the garbage. The New York Times, February 21, 2006,http://www.nytimes.com/2006/02/21/business/businessspecial2/21recycle.html?partner=rssnyt&emc=rss.
332 Solid waste
recyclables pick ups while decreasing trash collections. Require government offices,when purchasing products to give preference to environmentally preferable products.
* Tax throw-aways Taxing throw-away and hard-to-recycle products such as throwawaycameras and disposable razors46 can stimulate business to look at the life cycle of theirproducts and either redesign them for recycling or stop making them. One case is TetraPak drink cartons; their layers of different materials make recycling difficult. In the UK,less than 10% are recycled; however, Germany places a charge on the cartons to pay fortheir collection – this has led to 65% of drink cartons being recycled. At the same time,consumers think about switching to durable alternatives that are not thrown away.
* Make recycling mandatory. Some communities such as Pittsburgh, Pennsylvania, and thestate of Connecticut require households and businesses to recycle all paper, cardboard,aluminum, glass, and plastic. Trash haulers may not collect trash until the recyclables areremoved to the recycling bin. Other cities fine those found to have greater than theallowed amounts of recyclables in their trash; a second fine is much bigger than the first.
* Encourage businesses to make voluntary changes In cooperation with the US EPA’sWasteWi$e program, L. L. Bean of Maine formed teams to reduce waste. Bean set waste-reduction goals and an action schedule to meet them. As the name WasteWi$e implies,waste reduction can provide financial rewards. ▪ The EPA urges businesses to preferen-tially buy recycled products when making purchasing decisions, and manufacturers toinclude recycled content in their products. ▪ To make greater use of DfE, encouragedesigners to develop products that are easily disassembled into reusable or recyclableparts. The result can be fewer types of plastics in products, plastics labeled for easyidentification, and use of plastic in ways that allows easy separation from other compo-nents at the end of product life. A few companies have zero-waste targets. Even whenunrealistic, it stimulates thinking on materials management and promotes thinking aboutthe entire life cycle of a product. This brings us back again to DfE, designing excessmaterial out of the product, designing it for easier recycling.
Box 11.5 Reducing waste by Extended Producer Responsibility: take-back programs
Take-back – also referred to as Extended Producer Responsibility (EPR) – programs promise to
enhance the use of DfE. When producers must, by law take back discarded products, such as
TVs or computers, they have an incentive to design easy-to-disassemble products so compo-
nents can be reused or recycled. Several US corporations have pilot take-back programs for
consumer electronics including TVs and computer monitors. ▪ Japan has very active take-back
laws and programs for many products including electronics, home appliances, and cars.47 The
intent is to shift responsibility for discarded products away from municipalities to producers.
But responsibility in Japan goes beyond producers to include consumers and retailers.
46 Tax throw-away culture. Reuters. November 20, 2006, http://www.theage.com.au/news/world/british-call-for-tax-on-throwaway-goods/2006/11/19/1163871272286.html.
47 Ogushi, Y. Assessing extended producer responsibility laws in Japan. Environmental Science & Technology,41(13), July 1, 2007, 4502–4508.
333 MSW and the waste management hierarchy
Consumers, when purchasing a car or computer must pay a fee to cover its end-of-life
expenses. Retailers must collect discarded products. Only then do producers see to the reuse
or recycling of the collected products. Home appliances for instance are disassembled, and the
separated parts treated as raw materials. Japan’s laws also cover rechargeable batteries and
construction waste. The laws don’t always work. The fee for home appliances is paid not at the
time of purchase, but at disposal, and only an estimated 50% of old appliances come back to
producers. This happens because some retailers find it profitable to charge consumers less than
the full fee when collecting appliances; they then sell the appliances for export and reprocess-
ing abroad. Other consumers avoid the fee entirely by placing appliances at the curbside for
pickup by municipalities that don’t strictly enforce the take-back law. In the case of cars, a
manifest system tracks cars end-of-life. The Japanese continue working on making their EPR
laws more effective. Meanwhile, Japanese manufacturers are developing new technologies,
some very sophisticated, to separate product components; they are obtaining many patents
for their efforts. ▪ EU countries have mandatory take-back programs also and they too
encounter problems. So the EU has created incentives including a product certification label
to stimulate manufacturers to take DfE more seriously. Electronics take-back will be discussed
in Chapter 12. Examine Figure 11.10, and you’ll see one reason for Japan’s special interest in
EPR. They have a scarcity of usable land and landfills take space. The country makes a major
effort to reuse or recycle as much as they can.48 For the wastes that are generated, they prefer
incineration. Up to 80% of MSW is incinerated; in the United States about 80% is landfilled.
Questions 11.2
1. Instead of a flat fee to haul a household’s waste away, regardless of the quantity, some
communities charge per bag. (a) What are possible disadvantages to this? (b) If your
community charged you per bag, what steps if any would you take to reduce waste?
2. Ponder this quotation from Agenda 21, a document resulting from the 1992 World Summit:
“the major cause of the continued deterioration of the global environment is the unsus-
tainable pattern of consumption and production, particularly in industrialized countries.”
Do you agree with this assessment? Explain.
3. The Union of Concerned Scientists carried out risk assessments of common activities.
(a) They found that an individual’s major environmental impact comes from the use of
transportation. How do our transportation decisions affect the environment? (b) Eating
meat is another activity with a major environmental impact. Why does eating meat have
more adverse environmental impact than eating grains, fruits, and vegetables?
4. (a) How could coastal countries keep plastic debris out of the oceans? (b) What control can
be used to lower the amount of debris entering the oceans? (c) What pollution prevention
methods might be used?
48 Onishi, N. How do Japanese dump trash? Let us count the myriad ways. New York Times, May 12, 2005, http://www.nytimes.com/2005/05/12/international/asia/12garbage.html.
334 Solid waste
Disposal
The fate of disposed MSW
At the bottom of the WMH is disposal. In practice that typically means landfilling orincineration (combustion) (Figure 11.11). In developed countries, both these options arecarefully regulated.
Incineration50
The purpose of treating waste is to reduce its quantity or its toxicity, or both. CombustingMSW reduces volume by up to 90% and 75% by weight. Ash uses only about a third asmuch landfill space as does MSW.
5. Banning plastic bags: (a) What is the environmental advantage of banning plastic? (b) What
is the environmental disadvantage of using more paper rather than plastic? (c) What might
happen if, after banning plastic bags, nothing more is done? (d) Should plastics’ producers
share the responsibility for what is done with waste plastics? If so what should they do?
Population density matters
Picture a landfill here
United States61 per km2*
* inhabitable area
The Netherlands459 per km2*
Japan1616 per km2*
Figure 11.10 Siting a landfill in a densely populated locale is difficult. Credit: Dr. Cynthia F. Murphy, University of
Texas, Austin49
49 Gutowski, T., Murphy, C., Allen, D. et al. Environmentally benign manufacturing. WTEC Panel Report, April,2001, http://www.wtec.org/loyola/pdf/ebm.pdf.
50 Wastes. Non-hazardous waste: municipal solid waste: combustion. US EPA, http://www.epa.gov/epawaste/nonhaz/municipal/combustion.htm.
335 The fate of disposed MSW
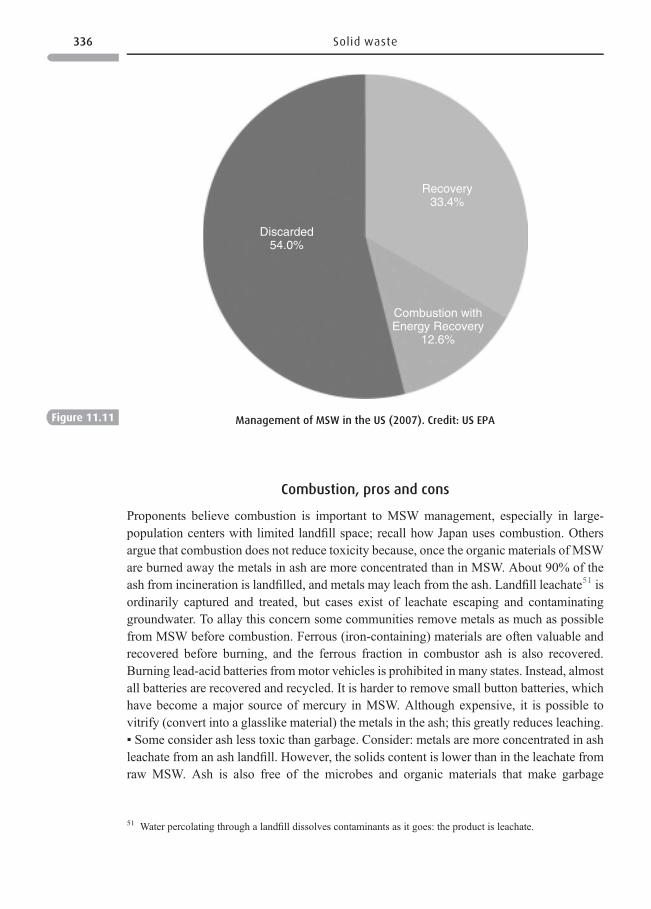
Combustion, pros and cons
Proponents believe combustion is important to MSW management, especially in large-population centers with limited landfill space; recall how Japan uses combustion. Othersargue that combustion does not reduce toxicity because, once the organic materials of MSWare burned away the metals in ash are more concentrated than in MSW. About 90% of theash from incineration is landfilled, and metals may leach from the ash. Landfill leachate51 isordinarily captured and treated, but cases exist of leachate escaping and contaminatinggroundwater. To allay this concern some communities remove metals as much as possiblefrom MSW before combustion. Ferrous (iron-containing) materials are often valuable andrecovered before burning, and the ferrous fraction in combustor ash is also recovered.Burning lead-acid batteries frommotor vehicles is prohibited in many states. Instead, almostall batteries are recovered and recycled. It is harder to remove small button batteries, whichhave become a major source of mercury in MSW. Although expensive, it is possible tovitrify (convert into a glasslike material) the metals in the ash; this greatly reduces leaching.▪ Some consider ash less toxic than garbage. Consider: metals are more concentrated in ashleachate from an ash landfill. However, the solids content is lower than in the leachate fromraw MSW. Ash is also free of the microbes and organic materials that make garbage
Discarded54.0%
Recovery33.4%
Combustion withEnergy Recovery
12.6%
Figure 11.11 Management of MSW in the US (2007). Credit: US EPA
51 Water percolating through a landfill dissolves contaminants as it goes: the product is leachate.
336 Solid waste
Table 11.2 Recycling is not just about paper and cansa
Using incinerator ash tomake an island and tomake roads
An island: land-poor Singapore has constructed a 865-acre (350 hectare) island a20 minute ferry ride from the mainland made entirely of the ash produced by itsfour incinerators. b Incoming ash, after being carefully protected, is covered withsand and planted with mangrove trees. The island itself , and its adjoining marinewaters, have rich ecosystems. It has enough space to continue serving Singaporeuntil 2045.
Roads: some European countries, after stabilizing incinerator ash to prevent leaching,incorporate it into aggregate for use in road paving.
Building: incorporating ash into cement and other building materials.A park made from asphalt
and a garden made froma garbage dump
San Francisco converted a former Air Force base, the Presidio, into a park; 70 acres(28.3 hectare) of asphalt and concrete from its air field were crushed and reusedbeneath pathways and parking lots.c
Curitiba Brazil converted an 11-acre (4.5-hectare) garbage dump into a botanicalgarden.
Curitiba converted a derelict quarry into a Free University of the Environment, whichholds free courses on land-use and environmental issues.
Old clothing and textiles Paper, in the nineteenth century, was made from cotton rags, and clothing made fromdiscarded woolens. Today, clothes are recycled by selling at yard sales or donatingthem. Old clothing is often exported to poor countries. Clothing that cannot bereused is processed into rags or mixed into asphalt to make roof shingles.
Disposable diapers By age 30 months, a child may have used 5000 diapers. A number of citiesworldwide, including Toronto recycle them. Wood pulp is extracted from the useddiapers as are the super-absorbent polymer and plastic.
Grease Fast-food restaurants discard billions of pounds per year of used cooking grease. Thiscan be processed into ingredients of poultry and cattle feed, or used as lubricatingoil. Another growing use is as a bio-diesel fuel for motor vehicles.
TV sets and telephones European TVand glass manufacturers formed a consortium to recycle picture tubesfrom discarded TV sets. Germany’s largest telephone company has formed aconsortium to recycle telephones.
Building materials Wood and other materials from old buildings can be recovered, often reused. Builderscan incorporate materials into new construction – discarded tires, plastic bottles, ormetal cans, but it may be difficult to obtain building permits. Incinerator ash can gointo concrete, and old newspapers into insulation.
Discarded sinks, tubs, andtoilets
EnviroGLAS uses these to make colorful durable countertops and fl ooring tiles d
California crushed discarded toilets into aggregate to add to concrete for road-building projects.
Telephone poles Old telephone poles contain creosote and pentachlorophenol, wood preservativesthat are now banned. However, using a bioremediation process, poles arechipped into small pieces and composted with microorganisms that candegrade creosote and pentachlorophenol. Clean wood fiber is then sold topaper mills.
Fluorescent lamps The United States uses more than a half billion fluorescent lamps yearly. They contain aglass tube, aluminum end caps, inert gases, phosphor powders. Because they alsocontain 20-50mg of mercury, many states ban them from MSW landfills.Techniques are available to recover and recycle the mercury, aluminum, and othercomponents. Newer lamps such as CFLs contain much less mercury.
337 The fate of disposed MSW
objectionable.52 And, without organic material, ash does not generate methane gas as garbagedoes. MSW incinerators are highly regulated in developed countries including strict regula-tions on emissions of dioxin and hazardous metals, including mercury. The United Statesburns about 17% of its MSW. ▪ B ut c on ce nt ra te d m et al s a re n ot a sh ’s only problem. It is rich inmineral salts. In small amounts, salts may pose no problem. However, in the quantitiesgenerated by burning large amounts of MSW, they pose the same problem posed by piles ofsalt used to control road ice in winter. Salts dissolve in water and run off into surface water orpercolate into groundwater. Thus, even ash without hazardous metals contains salts such asthose of calcium, magnesium, and potassium. So proper landfilling is very important for ash aswell as trash to prevent leaching into the environment. ▪ In the United States, most ash islandfilled. However, as traditional resources become more expensive or technologies developmore may be put to use. Innovative uses of incinerator ash are seen in Table 11.2.
Energy value of MSW53
Combus tion c an recover some of the fuel value of plast ics, paper, and other carbon-containing was tes in MSW, producing steam and elect ricity. Certain mat erials have espe-cially good fuel value. Polystyrene a plastic used in foam has an energy value of 17 800 Btu/lb (4487 kcal/ kg), and was te tires have 15 000 Btu/l b (3781 kcal/ kg). Both values are much
Table 11.2 ( cont. )
Radioactive materials Without a long-term storage site – the nuclear power industry recycles metal fromused radioactive pumps into new pumps used within the industry.
Old subway cars Remanufacture them into new cars.Submerge unusable cars along coastal areas for use as arti ficial reefs.
a For more illustrations, see: Deneen, S. Emptying the land fills, one product at a time. E//Magazine, June 23, 2006.http://www.alternet.org/envirohealth/37959/.bLin, K. Singapore ’s Eco-land fill. The Globe and Mail , August 31, 2005, http://www.theglobeandmail.com/servlet/story/LAC.20050831.SINGAPORE31/TPStory/Travel.cThe rest of the project involved planting 100 000 plants on recovered land. These represented 73 native species.Twenty acres (8 hectares) of tidal marsh were constructed, attracting birds and animals not seen in the area formany years. Twenty-eight acres (11 hectares) of grassy fields and sandy beaches are also a part of the park. TheUS Park Service sponsored the work, with thousands of volunteer assistants, and more than 2400 donations ($34million).dBates-Ballard, P. Recycled Toilets Find a Home . EnviroGLAS Products Inc., October 19, 2006.
52 Tiny amounts of organic chemicals are formed during incineration and are found in fly ash. Fly ash is fine ash,which could “fly” into the atmosphere if not captured. The organic chemicals formed include dioxins and furans,which make it especially important to capture fly ash. Dioxins formed can be much minimized in a well-operating incinerator.
53 (1) Municipal solid waste, electricity from MSW. US EPA, February 5, 2009, http://www.epa.gov/cleanrgy/energy-and-you/affect/municipal-sw.html. (2) Clean energy, air emissions (from various energy sources: naturalgas, coal, oil, MSW, etc.). US EPA, December 28, 2007, http://www.epa.gov/cleanrgy/energy-and-you/affect/air-emissions.html.
338 Solid waste
higher than wood; its Btu/lb value is 6700 Btu/lb (1689 kcal/kg). However, the fuel value oftrash with its many components is much less. Wet garbage must be heated before it evenburns. To generate electric power from MSW, a combustor must be well supplied with fuel-rich materials such as paper and plastics. This may hinder recycling by taking awayrecyclable materials. The value of recyclables must be high to promote recycling overincineration. ▪ Only a few percent of plastics are recycled (with the exception of PET andHDPE). But, plastics are made from petroleum – and most petroleum is burned as fuelanyway (only about 4% goes to chemical manufacture). Some argue that, we already burnmore than 90% so why object to burning somewhat more?
Mass burn and RDF incinerators Mass-burn incinerators burn everything in MSW,although some recyclables may be removed first. In RDF (refuse-derived fuel) incinerators,non-combustible wastes such as ferrous materials, glass, and grit are first removed and theresidual trash is shredded into fluff before burning. ▪ Recent technologies54 One recenttechnology pyrolyzes MSW (decomposes it at high temperatures in the absence of oxygen);this converts MSW into gases (methane, hydrocarbons, hydrogen, and carbon monoxide),which can be burned for fuel. A variation on pyrolysis is thermal gasification in which alimited amount of oxygen is present. This also produces combustible gases. ▪ Even morerecent is a technology introducingMSW into a very high temperature, up to 5000°C (9032°F)plasma arc furnace. This creates combustible gases, which can fuel the plant, but other gasesproduced are potential pollutants, which must be captured. In the plasma arc process, moltenmetals are tapped off and cast into ingots for recycling. Almost everything else in the plasmafurnace process is converted into glasslike substances, which can be processed into bricks,tiles and other useful materials.
Sanitary landfills55
In the United States, 54% of MSW was discarded to landfills in 2007 (Figure 11.11). ▪ Inaddition to MSW, landfills often hold construction and demolition debris, municipal sludge,agricultural wastes, combustion ash (unless it has been determined to be hazardous), non-hazardous mining and drilling debris, and non-hazardous industrial process wastes.▪ Hazardous wastes, excepting those from households cannot be landfilled. Leachate Asanitary landfill is engineered to minimize water infiltration. Nonetheless leachate is pro-duced, and must be collected and treated. Large facilities (such as New York City’s FreshKills Landfill closed in 2001) produce enormous amounts of leachate. In the early years aftera waste has been landfilled, its leachate contains foul-smelling organic compounds. This iscollected and treated to meet EPA standards before discharge. Methane gas Because mostlandfills have little oxygen, anaerobic microorganisms degrade the organic materials andproduce methane gas. This must be managed to prevent explosions. However, methane is avaluable fuel and many landfills collect and use it as a fuel.
54 Geary, P. Company touts plasma technology to reduce waste, create alternative fuel. ENN, March 22, 2005,http://www.enn.com/top_stories/article/12909.
55 Landfills. US EPA, September 11, 2008, http://www.epa.gov/epawaste/nonhaz/municipal/landfill.htm.
339 The fate of disposed MSW
Bioreactor landfills56
Organicmaterials can biodegrade.However, this happens very slowly inmost landfills becauselandfill microorganisms, which degrade organic materials, lack the water and nutrients neededto do so. Indeed, landfills are often criticized as places to store mummified trash, “dry tombs,”mummified foods and newspapers can be found intact many years after being disposed. TheUS EPA in cooperation with a number of landfill operators has been studying bioreactors.Instead of treating and releasing landfill leachate, which is rich in organic chemicals, leachate iscirculated in the landfill. Kept within the landfill, the leachate provides energy and nutrients tothe microorganisms that degrade organic wastes. Re-circulating leachate greatly hastenslandfill stabilization too. A landfill is considered stabilized after most organic material hasbiodegraded. At that point, it releases much lower amounts of organic contaminants into theleachate and generates much less methane gas. In an ordinary landfill, stabilization can takemanyyears.However, if leachate is re-circulated, this can happen in 5 to 10years. Furthermore,in the years before stabilization, bioreactors produce much more methane gas than typicallandfills making them a richer source of this valuable fuel. A traditional landfill, once full, iscapped with an impermeable layer and its discharges are monitored for 30 years. However, ifwaste is quickly stabilized in a bioreactor landfill, it may be possible to reducemonitoring to aslittle as 10 years. Moreover, once organic materials degrade, landfills could be more easilymined for recyclables. One obstacle to bioreactor landfills is that they are initially moreexpensive because they need machinery and pipes to re-circulate leachate.
Landfill siting
Dumps Historically, trash was dumped in the open, often close to rivers or over groundwater.In fact, dumpswere sometimes deliberately placed on river banks so spring floodswould washthe trash away. Open burning of trash in dumps continued into the 1970s. Landfills Starting inthe 1980s, strict regulations came into force in the United States as to where landfills could besited, and how they needed to be built, maintained, andmonitored.When possible, landfills aresited over near-impermeable clay to provide natural containment for the waste. To further trapwater percolating through them, landfills have synthetic liners, and a collection system torecover and treat the leachate. Monitoring wells are built around the landfill and regularlysampled to detect leaks. Such landfills, built according to strict regulations and carefullyengineered standards, are clearly safer than “dumps.” Even so, there is concern that leachatemay escape into the environment before wastes have degraded to the point where leakage is ofmuch less concern. However, a carefully constructed facility may remain leak-free past thepoint where leakage poses a problem. Such sophisticated landfills are very expensive to build.From that perspective, they provide a waste-reduction incentive – the more expensive it is tolandfill materials, the more attractive are recycling options.
NIMBYNot in my backyard (NIMBY) is a potent force making it extremely difficult to sitelandfills or incinerators. This is true although the United States has a much lower population
56 Wastes, Bioreactors. US EPA, http://www.epa.gov/epawaste/nonhaz/municipal/landfill/bioreactors.htm.
340 Solid waste
density than many other countries (Figure 11.10). There are several reasons for NIMBY. Amodern landfill must be large to be cost-effective. But a small community doesn’t need a largelandfill, nor can it afford to build one. Instead, a regional landfill serving many communities isbuilt. People have no sense of ownership in a landfill many miles distant; and communitieshosting landfills feel resentful at taking others’ trash. Moreover, truck traffic with its pollution,noise, and road degradation comes with the landfill. Property values often go down. Landfillsand other waste facilities are disproportionately built in poor and minority communities, andas these became more socially aware, they increasingly object.
Landfill mining
Sometimes landfill mining57 is useful. Materials such as metals are excavated from a landfillbecause they have value or because space is required for more waste. Mining is done after theorganic materials have mostly decomposed to avoid unacceptable health and safety concerns.
So, inst ead of closing land fills, it is some times possible to extend thei r lives. Many olderland fills contain up to 7 0% dirt and only 30% trash. Eve n if recover ed materials have littl evalue, remo ving the dirt creat es space for more tras h. And, the dirt recovered can serve as aland fill cover. Recovered materials go to a sort ing plant, where wood , rubbl e, and met als areremo ved. Mate rials not worth recover ing are incinerat ed or return ed to the land fill. In thefutur e as some raw mat erials be come more expensi ve or scarce, landfi ll mining may becom emore comm on. When landfi lls are full , they are eith er covered with grass or develope d into apark or golf course.
Box 11.6 We can reduce but not ordinarily eliminate waste
Ideally we reuse or recycle materials but, except for metals and glass, which can be recycled
indefinitely, recycled materials become trash too. Some materials, we cannot recycle at all.
Combustion lowers waste volume, but leaves ash. Waste will thus remain with us into the
foreseeable future – “I am, therefore I pollute.” But we can redefine wastes as by-products,
and find uses for these by-products.
Box 11.7 Batteries and the WMH58
Manufacturing a disposable battery takes about 50 timesmore energy than the battery provides
when used. US residents purchase and throw away about 3 billion dry cell59 batteries a year. This
57 Landfill mining, preserving resources through integrated sustainable management of waste, technical brief.World Resource Foundation, http://www.enviroalternatives.com/landfill.html.
58 (1) Batteries. European Commission, March 11, 2009, http://ec.europa.eu/environment/waste/batteries/index.htm. (2) Batteries. US EPA, August 28, 2008, http://www.epa.gov/epawaste/conserve/materials/battery.htm. (3)Wastes. Partnerships–product stewardship: batteries. USEPA, September 25, 2008, http://www.epa.gov/epa-waste/partnerships/stewardship/products/batteries.htm.
59 Wet cell batteries are most commonly the lead-acid batteries used in motor vehicles. Included among dry-cellbatteries are common household batteries that we use for so many purposes such as powering toys, the buttonbatteries that run our watches and hearing aids, and rechargeable batteries.
341 The fate of disposed MSW
uses resources inefficiently and contributes hazardous metals to MSW. This complicates both
combustion and landfilling. How can we better manage batteries more efficiently?
* P2: avoid unnecessary batteries. Buy toys and appliances that don’t need batteries.
* P2: in another form of P2, manufacturers eliminated mercury and cadmium from some
batteries although button batteries still contain mercury or silver. These were a source of
mercury emissions if MSW is incinerated. Buy mercury-free zinc–air button batteries.
* Reuse: purchase rechargeable batteries. They require energy to recharge, but much less
than manufacturing them from virgin materials. Solar rechargeable batteries are available
in regions with plentiful sunlight.
* Recycling: when household batteries (A,C,D, and 9V) are collected for “recycling,” it is the
metals within them that are reclaimed. Batteries are collected, sorted, and smelted as part
of the reclamation process. Unfortunately, this does not pay for itself. Button batteries (used
in watches, hearing aids, calculators, etc.) with their high percentage of mercury, silver, or
other high-value metals are valuable. The rechargeable batteries found in many appliances
and lap-top computers, nickel–cadmium (Ni–cad) batteries can be removed and reproc-
essed for metal reclamation.
* Disposal: most disposable household batteries are indeed disposed of, but some commun-
ities collect them to divert the metals away from MSW incinerators and landfills.
Rechargeable batteries too, eventually wear out, and in the United States Ni–cad batteries
have been a major source of nickel and cadmium in MSW.
European Union countries have a directive covering all batteries regardless of shape,
volume, weight, material composition or use.60 It also strictly regulates the mercury and
cadmium content of batteries. And battery manufacturers must provide clear labeling
with information to enable consumers to choose among batteries. The producer pays for
collecting, treating, and recycling all waste batteries as well as the cost of public information
campaigns.
Questions 11.3
1 The above description of batteries and the WMH does not mention treatment. Would you
consider incineration of batteries a treatment? Why or why not?
2 Evaluate your battery use. (a) How many do you use? What kind? (b) What do you do with
dead batteries? (c) Under what circumstances would you routinely have your batteries
collected for metal reclamation? (c) Under what circumstances would you voluntarily use
fewer batteries?
60 Greek, D. Retailers will have to take back old batteries as EU directive comes into force. Computer Active, July28, 2008, http://www.computeractive.co.uk/computeractive/news/2222670/retailers-back-old-batteries.
342 Solid waste
SECTION III
MSW Internationally
OECD countries
The average person in the 29 prosperous member nations of the OECD61 produces anaverage 3 pounds (1.4 kg) of MSWa day. Without preventive action this may increase to 3.8pounds (1.7 kg) a day by 2020. Thus, the OECD believes that trash generation requiresattention now. The situation is more serious than weight per person would indicate becausethe population is growing; although population in some western European countries isstagnant, the population of the United States is growing about 1% a year. About two-thirdsof OECD garbage is landfilled, less than a fifth is incinerated, and only 18% is recycled. TheOECD targets for 2020 are 33% recycling, 50% landfilling, and 17% incineration.
Waste in less-developed countries
Residents of poor countries produce less trash per person than those in wealthy countries.Still, waste is a major problem and it may double within 20 years. This is happening incountries with few resources to deal with the waste that contributes to clogged and filthystreets and canals, and to disease. In Kabul, Afghanistan, the planning director said the cityis becoming “one big reservoir of solid waste.” In Asia, except for Japan and Singapore,litter is everywhere, especially plastic litter. And Hong Kong, despite its riches, is as authorJ. Tremblay notes “plagued by litterbugs,” where individuals don’t take responsibility fortheir own waste. In Africa, the UN estimates that only 10% of trash is collected and taken todumps. Many governments believe they have more serious problems to deal with.
Garbage and slums The UN estimates that more than a billion people worldwide live inslums in cities such as Bombay, Bogata, Cairo, orManila. Their numbers mount daily. In Asiamore than half the urban population lives in slums, often in extreme poverty. City govern-ments typically don’t pick up garbage so it piles up, litters neighborhoods, and fouls localwaters, see Figure 1.4. Residents sometimes burn garbage to reduce its volume, which createsnoxious fumes. Lack of passable roads can be a problem, making it impossible for pickuptrucks to enter neighborhoods to collect garbage. The garbage plus, often, excrement aresources of pathogens and disease. Residents want better conditions, and often attempt tocreate them. However, they typically lack title to the plots holding their make-shift dwellings;in some places the government periodically bulldozes these homes or otherwise evicts theirinhabitants. Some governments are working to give slum inhabitants legal title to theirhabitations. ▪ Self-help organizations for slum dwellers have formed in many cities. In
61 The OECD (Organization for Economic Cooperation and Development) has 29 member states, mostly devel-oped nations. These include the United States, UK, other western European countries, Australia, New Zealand,and Japan.
343 MSW Internationally
Bangladesh, Waste Concern, a nonprofit organization promotes waste composting. Withassistance from outside organizations, it pays individuals in Dhaka to collect and sort trash,and compost its organic waste. This practice also produces useful compost, creates jobs, andcurbs disease. The organization is working to spread the project throughout Bangladesh.▪ The UN is testing a garbage-burning oven in a Nairobi (Kenya) slum.62 After being heatedto a high temperature with waste “sump oil,” the temperature is maintained by garbageshoveled into it, about a half ton a day. It badly pollutes local air, but has benefits. While itburns garbage, people for a small fee can use an interior chamber to bake, or can heat water onits top. The oven has led to cleaner drainage ditches in its vicinity as rubbish is collected tofeed the cooker. If the concept is workable, and the pollution can be partially corrected, it mayreceive wide usage. This would cut the enormous trash problem of huge slums, ameliorate thedeforestation resulting from widespread use of wood and wood charcoal for fuel, and also theorganic portion can be composted. A Kenyan supermarket chain has pledged funding for 20more ovens, which can be operated by local people. Many such projects are needed.Philippines In the city of Manila, people living in regular housing typically have their
garbage picked up. However, the dumps to which garbage is taken – as is also the case inmany other impoverished cities – are not the sanitary landfills of industrialized countries.Many thousands of Manila’s 10-million residents work – and live and eat – amidst thisgarbage. They scavenge recyclable paper, plastics, bottles, and metals, and often eat wastefood.Many children and whole families are among the workers. An estimated 60 000 peopleare at one dump called Payatas, and another 100 000, whose livelihoods are based on “therecycling-waste chain” live around it. Scavengers are exposed to broken glass and cans, andto the microorganisms multiplying in the garbage. They work without masks, gloves,sometimes without shoes, and without first-aid stations. They continued working evenafter a flashflood and fire destroyed many tents and shacks in 2000 killing about 100 peopleand “disappearing” another 150. Better-off Manilans, says environmentalist Alvin Sotero,regard them “as little better than the trash they handle.” He asks what Manila would dowithout the scavengers. He hails them as “the city’s environmental heroes.” Not all is bleak.“Shanties are hung with flowerpots and posters of athletes and movie idols. There are tinybarbershops and ice cream stands . . . births and weddings and school graduations.” Theseconditions are not unique to the Philippines. They are found in many impoverished places.
China Imagine a nation with 1.3 billion people, but poor waste practices. Waste isdescribed as an “ever-growing ocean,” increasing about 10% a year. Lacking enoughtreatment and disposal facilities, waste is often dumped in the open causing soil, air, andwater pollution, and posing risks to humans and wildlife.63 Where there are dumps, it can beconsidered a waste of land in a country without land to spare. In 1995 China enacted thePrevention and Control of Solid Waste Pollution to the Environment Act mandating sourcereduction, recycling, treatment, and sound disposal. The law was poorly enforced: there waslittle money to build processing facilities and train workers, the public was not educated, and
62 Crilly, R. Kenyan slum cleans streets with trash oven: UN-sponsored program places garbage-burning ovens inan African shantytown. Christian Science Monitor, November 1, 2007, http://www.csmonitor.com/2007/1101/p01s05-woaf.html.
63 China faces ticking rubbish time bomb. Reuters, January 10, 2007, http://www.alertnet.org/thenews/newsdesk/PEK208804.htm.
344 Solid waste
recyclables continued being mixed with garbage. Hongtao Wang and Yongfeng Nie, ofBeijing’s Tsinghua University urged that regulations be improved and enforced. Theyadvocate a “polluter pays system” as an incentive for businesses and individuals to reducewaste generation, and separate out reusable and recyclable items. China now has new goalswith a schedule to implement them, and is developing regulations and standards, trainingwaste-management personnel, establishing college-level research and training in materialrecovery and reuse, composting, incineration, and landfilling. It has purchased some neededtechnologies, started demonstration projects, and established an information network. Noone foresees quick changes especially with limited funding. Chinese waste experts believethat an urgent need exists for cooperative projects with developed countries to developtechnologies and equipment suited to China’s specific needs.
Plastic bags pose special problems
Around the world, perhaps 500 billion one-time-use plastic bags are used each year. 64 Thinones, especially, are littered almost ubiquitously. Dudley Greeley of the University ofSouthern Maine speaks of a trip to Delaware Beach where he saw that “the snow geese andseagulls in the corn field stubble were outnumbered by white, windblown plastic bags. From adistance, they could be mistaken for hundreds of thousands of birds gleaning the stubble forfood. Some of these “bird bags” flapped across the fields until snared by a bit of corn stalk.”Greeley continued, “Plastic bags could be used as a symbol of waste and misuse.” In poorcountries they block water movement in narrow sewage channels, sometimes causing flood-ing. On land, after water collects in them they breed mosquitoes. They take a great many yearsto break down into ever tinier particles – they don’t biodegrade. Banning bagsMore and moreAfrican and Asian countries are banning plastic bags. The industry making them in Taiwanwarned, after Taiwan banned them, that it would move its plant and jobs to mainland China;however, China now bans them too. So do some European countries. Ireland, after taxing theplastic bags used at retail stores saw their use fall by more than 90%.65 In the United States,San Francisco was the first major city to ban them although the states of New York and NewJersey require that retailers recycle them. In poor countries where the ban is strictly enforced,litter is much reduced. Often paper bags are used instead. However, sometimes creativechanges are made as when Uganda started using – biodegradable – banana leaves instead.
A brighter picture: Curitiba Brazil66
Curitiba provides a model of how successful recycling and waste management can exist even ina poor city, where the population tripled in less than 30 years as people came flooding in. It has a
64 (1) Lohan, T. The great plastic plague. AlterNet, September 5, 2007, http://www.alternet.org/environment/61607/.(2) Eco-friendly reusable bags plus facts and news on plastic bag issue. http://www.reusablebags.com/.
65 Horovitz, B.Whole foods sacks plastic bags.USATODAY, January 22, 2008, http://www.usatoday.com/money/industries/food/2008-01-21-whole-foods-bags_N.htm.
66 Orienting urban planning to sustainability in Curitiba, Brazil. ICLEI, 1995–2005, http://www3.iclei.org/localstrategies/summary/curitiba2.html.
345 A brighter picture: Curitiba Brazil
“Garbage That Isn’t Garbage Initiative,” which led 70% of its households to sort recyclables,paper, metal, and glass in one bag, collected three times a week; organic waste goes into aseparate bag. Two-thirds of thematerials in recyclables bags are indeed recycled, furnishing halfthe cost of the collection system. In neighborhoods without paving where collection truckscannot enter, a “Green Exchange” occurs: citizens bring their bags to trucks and, in exchangereceive tickets to exchange for food or items such as school books.Much of the food used for theexchange is the excess produced by local farmers. Another project, “All Clean” clears litter fromhard-to-reach areas especially those near the rivers, which the city works to avoid polluting.Children receive environmental education starting from an early age, and it is incorporated intothe whole curriculum. People coming into the city, far from being evicted may receive smallplots of land, and buildingmaterials withwhich to build dwellings.When possible, the city hiresthem for clean-up and recycling jobs. “In Curitiba, everything is recycled” including old busesand buildings. This approach to “waste” is part of a wider attitude to good governance that hasalso set up a model transportation system and non-polluting industries, and that uses land inways that avoids polluting the land or the rivers and air around it. Curitiba decided to treat itscitizens, “most of all its children – not as its burden but as its most precious resource.”
Further reading
Chemical & Engineering News. Polymers may chemically degrade in the ocean.Chemical & Engineering News, 87, August 24, 2009, 32–33.
Ogushi, Y. Assessing extended producer responsibility laws in Japan. EnvironmentalScience & Technology, 41(13), July 1, 2007, 4502–4508.
Thompson, R. C. et al. Lost at sea: Where is all the plastic? Science, 304(5672), 838, May 7,2004.
Internet resources
Environment, Health and Safety Online. Wastes, frequently asked questions on ResourceRecovery and Conservation Act (RCRA). http://www.ehso.com/ehshome/wastefaqs.htm
European Environment Agency. 2009. Wastes and material resources. http://www.eea.europa.eu/themes/waste.
Hazen, D. 2005. The hidden life of garbage. Alternet. http://www.alternet.org/story/27456/(October 31, 2005).
ICLEI. 1995–2005.Orienting urban planning to sustainability (Curitiba, Brazil).http://www3.iclei.org/localstrategies/summary/curitiba2.html.
Delving deeper
Encouraging manufacturers to design for durability and to produce easy-to-repair products is
difficult because they believe theywould have fewer sales. Is there away out of this conundrum?
346 Solid waste
Lohan, T. 2007. The great plastic plague. http://www.alternet.org/environment/61607/(September 5, 2007).
Martin, S. 2008. One country’s scraps, another country’s meal. New York Times.http://www.nytimes.com/2008/05/18/weekinreview/18martin.html (May 18, 2008).
Remanufacturing. 2009. Caterpillar. http://www.cat.com/cda/layout?m=94424&x=7.Rethink Recycling.com. 2008. Environmentally preferable purchasing guide (for purchasing
goods and services). http://www.greenguardian.com/government/eppg (April 25, 2008).Reuters. 2007. China faces ticking rubbish time bomb. http://www.alertnet.org/thenews/
newsdesk/PEK208804.htm (January 10, 2007).Rhodes, C. 2008. Metals shortages (and the need for systematic recycling). http://www.
scitizen.com/stories/Future-Energies/2008/09/METALS-SHORTAGES-/ (September16, 2008).
US EPA. 2006. Life-cycle assessment: principles and practice. Scientific ApplicationsInternational Corporation. http://www.epa.gov/NRMRL/lcaccess/pdfs/600r06060.pdf(May, 2006).
2008. Landfills. http://www.epa.gov/epawaste/nonhaz/municipal/landfill.htm (September11, 2008).
2008. Wastes, laws and regulations. http://www.epa.gov/epawaste/laws-regs/index.htm(September 9, 2008).
2008.Wastes, MSWgeneration, recycling and disposal in theUS: facts andfigures for 2007.http://www.epa.gov/osw/nonhaz/municipal/pubs/msw07-fs.pdf (November, 2008).
2008. Wastes, municipal solid waste (MSW). http://www.epa.gov/epawaste/nonhaz/municipal/index.htm (November 13, 2008).
2008. Wastes: partnerships for product stewardship. http://www.epa.gov/epawaste/partnerships/stewardship/index.htm (September 25, 2008).
2008. Wastes: resource conservation. Plastics. http://www.epa.gov/epawaste/conserve/materials/plastics.htm (November 6, 2008).
2009. Consumer’s handbook for reducing solid waste around the home. http://www.epa.gov/epawaste/wycd/catbook/index.htm (February 25, 2009).
2009. Design for the environment (partnerships with industry). http://www.epa.gov/dfe/pubs/about/index.htm (June 26, 2009).
2009. Public access, frequent questions. http://publicaccess.custhelp.com/cgi-bin/publicaccess.cfg/php/enduser/std_adp.php?p_faqid=1178&p_created=1098895388&p_topview=1 (June 27, 2009).
2009. Reduce, reuse, and recycle (links to relevant sites). http://www.epa.gov/epawaste/conserve/rrr/index.htm (February 18, 2009).
2009. Wastes: information resources (links). http://www.epa.gov/epawaste/inforesources/index.htm (February 18, 2009).
2009. Wastes, quick-finder by waste type. http://www.epa.gov/epawaste/index.htm (June16, 2009).
World Resource Foundation. 2009. Landfill mining, a technical brief. http://www.enviroalternatives.com/landfill.html.
Worldwatch Institute. 2008. Good stuff: a behind-the-scenes guide to the things we buy.http://www.worldwatch.org/taxonomy/term/44.
347 Internet resources
12 Hazardous waste
“I’ve worked with indigenous people on all continents but Antarctica, and onething they all agree on is the Earth is sacred.We’re the only ones who look at it as acommodity.”
Dr. Paul Cox, ethnobiologist
A hazardous waste is one that is either ignitable, corrosive, reactive, toxic, or more than one ofthese. As with municipal solid waste, hazardous waste is a small percentage of the more than12 billion tons (10.9 billion tonnes) of total waste that the United States generates each year.But hazardous waste has been abandoned at many thousands of sites in the United States, andaround the world. At these sites, hazardous substances may contaminate soil, seep intogroundwater, or run off into nearby water, and evaporate into the air. Section I of this chapterexamines hazardous waste (HW) characteristics, locales of HW sites, and who generates HW.Section II returns to theWaste Management Hierarchy (WMH) as applied to hazardous waste.Section III deals with how human exposure occurs and how the risks of HW sites areevaluated. Section IV examines how to reduce the risk of HW sites, and examines cleanupmethods including bioremediation. Section V moves on to HW dumping in impoverishednations and the international accord negotiated to combat this practice. One waste still movinginto these countries is a stream of electronic discards. We look at how we can reduce that flow.
SECTION I
Introduction to hazardous waste1,2
Characteristics
Hazardous waste is regulated by the US Resource Recovery and Conservation Act (RCRA).It has one or more of the following characteristics.3
* A toxic substance can adversely affect the health of living organisms exposed to it.Examples are arsenic, cyanide, pesticides, and many metals.
1 Wastes, hazardous waste. US EPA, March 19, 2009, http://www.epa.gov/osw/hazard/index.htm.2 Hazardous waste data. US EPA, September 29, 2009, http://www.epa.gov/osw/inforesources/data/index.htm#rcra-info.
3 These same characteristics apply to the definition of a hazardous chemical. Indeed, hazardous chemicals oftenbecome hazardous wastes.
* A corrosive substance can cause grievous injury at the point of contact, skin, eyes, lungs,or mouth. Strong acids and alkalis are corrosive, as are chlorine and hydrogen peroxide.Although the concentrations of chlorine (as hypochlorite) and hydrogen peroxide foundin household products is not corrosive, much higher concentrations are often used inindustrial and laboratory settings.
* An ignitable or flammable substance can catch on fire, is a fire hazard. Petroleumdistillates and many organic solvents are ignitable. Ethyl ether, once used as an anes-thetic, is highly flammable, and its volatility adds to its danger.
* A reactive substance reacts violently with water, air, or other substances. Ethers (used inindustry and laboratories) can form explosive peroxides if left sitting in their containers foryears. More familiar reactive substances are dynamite, gun ammunition, and firecrackers. Inthe household, chlorine bleach and ammonia, if mixed together react to form toxic fumes.
Hazardous waste is considered solid waste under RCRA, but includes containerized liquidor gaseous wastes. Some wastes that might be hazardous are exempted by law such ascertain mining wastes and coal combustion ash. Household hazardous waste (about 1% ofHW) is exempt even if it contains the same chemicals that are regulated when industryproduces them. Types of HW that are generated are noted in Table 12.1. Separate lawsaddress two other hazards, infectious agents and radioactive materials.
Table 12.1 Typical hazardous wastes generated by selected manufacturing industries
Industry Hazardous wastes generated
Food and beverages Animal waste, cleaning wastes, refrigerantsChemical Strong acids and bases, reactive wastes, ignitable wastes, discarded
commercial chemical productsMetals Paint wastes containing heavy metals, strong acids and bases, cyanide
wastes, sludges containing heavy metalsPaper and printing Ink wastes including solvents and metals, photography wastes with
heavy metals, ignitable and corrosive wastes, heavy metal solutionsConstruction Ignitable wastes, paint wastes, spent solvents, strong acids and basesFurniture and wood Ignitable wastes, spent solvents, paint wastesVehicle maintenance Paint wastes, ignitable wastes, spent solvents, acids and basesCleaning and cosmetics Heavy metal dusts and sludges, ignitable wastes, solvents, strong acids
and basesAdapted from: UNEP http://www.grid.unep.ch/waste/images/22–23_table_hazarous.gif
Box 12.1 Remember that a hazard differs from a risk
For a HW to be a risk, a person, animal, or plant must be exposed to it, exposed in a way that
can cause harm. Unless the waste has escaped into the environment, the greatest hazard is
usually to the workers handling it. Corrosive, ignitable, or reactive wastes can also harm
materials, as when a corrosive “eats” through a metal drum.
349 Introduction to hazardous waste
Locations of hazardous waste sites
In earlier years, generators of HW placed it in lagoons or trenches such as at the infamousLove Canal (Box 12.2). Other means of disposal included injecting it into undergroundwells, or disposing of it along with municipal solid waste (MSW). ▪ Dumping metal drumscontaining HW onto land also occurred, usually at rural sites. It still occurs in somecountries. There, corrosive wastes sometimes ate through the containers and escaped into
Box 12.2 Two complex and troubling Superfund sites
Love Canal4
The Love Canal, built in the 1890s, was never used as a canal. Then, starting in 1942, Hooker
Chemical Co. disposed of 22 000 tons (20 000 tonnes) of HW there with more than 200
chemicals including halogenated organic chemicals and pesticides, some contaminated with
dioxins. Hooker’s disposal methods were standard practice for that time. The US Army was
responsible for about 25% of the waste. In 1953, Hooker filled in the site, and capped it with a
layer of protective clay. At the request of the city of Niagara Falls, Hooker sold the property to
the Board of Education for one dollar. The deed warned that hazardous chemicals were buried
at the site, but the city later said Hooker had not informed it of the hazards of the wastes.
Occidental Chemical purchased Hooker in 1968 before Love Canal’s problems became known,
and Occidental was held responsible for paying a significant portion of the cleanup costs.
In 1954, the School Board built one school next to the landfill and a second directly over it. It
sold a portion of the land to a developer, who put up hundreds of houses, some directly around
the landfill. See Figure 12.1. The on-site school is seen in the photo as well as the houses
around the site. In the 1960s, a highway bordering the development was built. During
construction, roads and sewers were constructed over and also directly through the Hooker
site, and its protective clay cap was partially excavated, allowing rainwater access to the
waste. This highway created the greatest problem because it blocked the normal path of
groundwater migration through the area. The result was that waste and an increasing amount
of groundwater and rainwater became trapped in a clay “bathtub” (the canal). In the 1960s,
this, along with its contaminants began overflowing into the basements and back yards of
homeowners living nearby. People complained of odors. Complaints increased in the 1970s as
the water table continued to rise. In 1980, the federal government in an emergency action,
bought several hundred homes, and evacuated their occupants. Homes closest to the canal
were destroyed, and the rest sealed off. By 1993, much contaminated soil had been removed
from Love Canal. The 40-acre cap had been repaired and sealed with a thick layer of clay plus a
high-density plastic membrane. Around the site, 8-foot-high (2.4-m) fencing had been built.
Low-permeability clay was at the site’s bottom; this greatly retards downward movement of
leachate while a drainage system directs leachate to a treatment system. Occidental Chemical
4 (1) Engelhaupt, E. Happy birthday, Love Canal. Environmental Science & Technology, 42(22), November 15,2008, 8179–8186. (2) Love Canal, public health time bomb. NewYork Office of Public Health, September, 1978,http://www.health.state.ny.us/environmental/investigations/love_canal/lctimbmb.pdf.
350 Hazardous waste
soil, air, or water. ▪Military bases are major locales of hazardous wastes sites. ▪ Other earlygenerators of HW legally released hazardous substance into waterways with little or notreatment leading to, in some places, water-based HW sites. In Chapter 14, you will read of a40-mile section of the Hudson River, which is a HW site due to PCB contamination.▪ Sometimes a whole industrial production site becomes a HW site. ▪ Many HW sites datefrom the nineteenth and early twentieth century, including locations where municipalities
assumed responsibility for maintaining the leachate system. These efforts cost about $325
million dollars. However, this only stabilized, not remediated the site, which must be main-
tained for many years. After officials believed that it no longer threatened human health or the
environment, they decided to redevelop the area and sell, at reduced prices, the homes that
were still intact. New inhabitants, as well as those who never moved, are of two minds: some
who had refused to leave, believe the risks were greatly overstated and blame the city and
state for disrupting the canal. Others believe the site still poses unacceptable risks.
An ongoing study examines the health of local people. Children born at Love Canal were twice
as likely as children in other parts of the county to be born with a birth defect. Those conceived
there were more than twice as likely to be female compared with children conceived after the
mother left the neighborhood. This is consistent with exposure to dioxins and with findings in
Seveso, Italy, where more girls were born to fathers (in that case) who were exposed to dioxin
released during a 1976 plant accident. However, there is no way to measure the psychological
effects on those involved. One resident stated that “Niagara Falls is no longer the honeymoon
capital but the toxic waste capital.” It was Love Canal that, in 1980, led the US Congress to pass a
law governing abandoned HW sites. This is called CERCLA (Comprehensive Environmental
Response, Compensation, and Liability Act) or just “Superfund.”5
Coeur d’Alene River Basin
This superfund site,6 located in the northern section of the state of Idaho is a megasite, one
among many former mining sites in the western United States. Lead and silver were once
mined in Coeur d’Alene. The site covers hundreds of miles and encompasses human commun-
ities. The site includes streams, rivers, wetlands, lakes and their sediments, and banks. About
62 million tons (56 million tonnes) of mine tailings ended up in local waters here. Lead
concentrations are high enough in about 18 000 acres (7200 hectares) of wetland sediments
to be acutely toxic to waterfowl. Children living near a former lead smelting complex at Coeur
d’Alene – unlike the children in the Smuggler Mine community (Chapter 3) – once had greatly
elevated blood levels of lead. Since the smelters were closed and the surroundings cleaned up,
children living in the area have almost normal blood levels. Coeur d’Alene not only contains
huge quantities of waste, but many different contaminants with many sources. Experts
studying the site found that even removing limited amounts of wastes, as has been proposed
would be costly, difficult, perhaps not even feasible. It would also take many .years.
5 S up e rf un d, C l ea n in g u p th e n at io n ’s h a za r do us wa s te s it e s . US E PA , March 9, 20 09 , ht tp : // ww w. ep a .g ov /superfund/index.htm.
6 Gustavson, K. E. et al. Superfund and mining megasites. Environmental Science & Technology, 41(8), April 15,2007, 2667–2672.
351 Introduction to hazardous waste
produced town gas from coal or oil to use for lighting; many later became HW sites. Otherold sites include early mines, contaminated with hazardous metals and acids.
Over time, the location and even the existence of many old sites were forgotten. ▪ Casualdisposal was thoughtless rather than malicious; all kinds of waste were once disposed ofcasually. So long as the population was small and industrial and military operationsrelatively small, such disposal was largely disregarded. But operations producing HWgrew in size and number. At the same time, human populations grew and urban areas spreadinto the countryside. It was inevitable that people and HW would make contact. Now it ispossible to research what Superfunds are in your area and see who produces hazardouswaste.7
Hazardous waste sources
Large petroleum refineries and chemical manufacturers generate up to 90% of the about 270million tons (245 million tonnes) of HW that the United States produced in 1998. Thesefacilities treat and dispose of about 90% of their waste on site. ▪ Manufacturers of metalproducts are another large generator producing wastewater with concentrations of metalshigh enough to be hazardous; most of this is treated. Also – as reported in the Toxics ReleaseInventory – more than a third of generators send their metal waste offsite for recycling,copper, zinc, lead, and others. ▪ Military operations often generate HW in large amounts asdo government agencies especially the Department of Energy. ▪ Hospitals, universities, andcommercial laboratories, generate small quantities. Other small-quantity generators includesmall businesses such as gas stations, photographic developers, dry cleaners, even beautyparlors. Although the definition of HW varies, the UN Environmental Program (UNEP)estimates that more than 300 million tons (272 million tonnes) are produced worldwide eachyear. See Table 12.1.
Household hazardous waste (HHW)
The HW produced in homes in the largest amounts is paint residue. Others are paint thinnersand strippers; pesticides; cleaners and polishes that contain petroleum distillates; andalkaline drain and oven cleaners. Even some discarded cosmetics, such as acetone nail-polish remover are considered HW. Municipal solid waste incinerator ash, although derivedfrom household trash, may be deemed HW if it does not pass an EPA-specified leaching test.▪ A familiar HHW, which is both ignitable and toxic, is used oil. Many do-it-yourselferschange their own car’s oil. Of this, the EPA estimates that much, at least 150 million gallons(568 million liters) a year ends up in landfills or sewer systems or poured on the ground. TheEPA could regulate used oil as HW, but with millions of do-it-yourselfers this is impractical.Instead, the EPA developed standards for commercial handlers: If the oil is to be disposed, itmay be treated as HW. It is treated less strictly if it is for recycling.
7 Envirofacts Data Warehouse, Waste. US EPA, March 21, 2009, http://oaspub.epa.gov/enviro/ef_home2.waste.
352 Hazardous waste
SECTION II
Dealing with hazardous waste
Pollution prevention
Once waste is generated, it is too late for P2. An exception is when the system is designedto treat the HW as a useful by-product to be fed into another process, i.e., industrialsymbiosis (Chapter 2). However, HW can stimulate P2 because companies want to avoidthe costs of regulations, treatments, expensive disposal, and legal liabilities. Some partnerwith the US EPA in their efforts to reduce HW.8 There are many approaches to P2 effortsincluding working to minimize the use of those chemicals that produce HW. EPAsponsors a National Waste Minimization Program to reduce 31 priority chemicals foundin HW.9 See Chapter 18 (green chemistry and green engineering, using Design for theEnvironment to design more environmentally benign chemicals, etc.). Chapter 2 hasexamples of P2, recycling, and reuse.
Recycling and reuse
Some industrial HW can be reused or recycled.10,11 Hazardous organic solvents used byindustry can, after use, be purified and reused. The reuse–purification process may berepeated many times. However, some waste is necessarily produced including the con-taminants removed during purification. A company sometimes produces a by-productuseful to another company, and sells or gives it away, i.e., a limited form of industrialsymbiosis (Chapter 2). ▪ The EPA encourages metal recycling12 and has different stand-ards for metals. Industry already carefully manages many metals such as scrap metal fromautomobiles, and much more so for precious metals, e.g., silver. ▪ Combusting organicHW can be used both to destroy the waste while also recovering its energy value. This issometimes controversial because of concerns relating to air emissions duringincineration.13
8 Partnerships. US EPA, February 18, 2009, http://www.epa.gov/wastes/partnerships/index.htm.9 Priority chemicals. US EPA, January 12, 2009, http://www.epa.gov/epawaste/hazard/wastemin/priority.htm..10 Hazardous waste recycling. US EPA, March 16, 2009, http://www.epa.gov/osw/hazard/recycling/index.htm.11 Safe hazardous waste recycling. US EPA, October, 2000, http://www.epa.gov/osw/wycd/manag-hw/e00–001d.
pdf.12 Hogue, C. Recycling waste, EPAwill allow companies to sell or reuse somemanufacturing leftovers classified as
hazardous. Chemical & Engineering News, 86(41) October 13, 2008, 11.13 Hogue, C. EPA rebuked: Congress asks for more analysis of proposal for burning hazardous waste as fuel.
Chemical & Engineering News, 85(49), December 3, 2007, 13.
353 Dealing with hazardous waste
Treatment
Recall that the two major purposes of treating waste are to reduce its volume or to reduce itstoxicity. Four types of treatment are shown in Table 12.2: physical, chemical, thermal, andbiological. Some reduce volume, some reduce toxicity, and some accomplish both.Treatment can lead to safer transport, storage, or disposal of HW.14 ▪ Reducing volumeAs with MSW, incineration is often used to reduce the volume of HW. However, inTable 12.2 notice that other methods can also decrease volume. ▪ Reducing toxicity Thereare many variations of these methods that can lead to reduced waste toxicity.
Bioremediation
Bioremediation uses living creatures to treat waste, to reduce toxicity, and sometimes toreduce volume too.15 Bioremediation is of great interest because it works with naturalsystems and sometimes has lower costs than other treatment methods. A precondition isthat the HW does not poison the creatures used.
* Reducing volume Bioremediation can reduce volume as when certain plants and trees – ina process called phytoremediation – take up and concentrate within themselves a hazard-ous metal from soil or water. University of Washington scientists developed geneticallyengineered (GE) poplar trees that can break down many toxic industrial contaminantsincluding benzene and the common groundwater contaminant trichloroethylene (TCE)into carbon dioxide, water, and salts.16 The poplars destroy TCE much more efficientlythan do unmodified poplars. Moreover, their leaves also absorb pollutants from the airand degrade them. GE poplars have been extensively field tested, but remain controver-sial. Researchers must assure that GE trees don’t spread into the environment; some saythis can be prevented by harvesting the trees before they reach the age of flowering.
* Reducing toxicity Microbes reduce the toxicity of some organic chemicals by taking upand degrading them into less toxic chemicals. In one application, microbes are grown onfilters and hazardous organic gases then passed through them. This destroys, in somecases, 95–99% of the gases. Research to develop microorganisms bioengineered tospecific uses is of great interest. More is seen below on using bioremediation to cleanup HW sites.
Disposal
Unlike municipal solid waste, HW cannot legally be landfilled in the United States until ithas been treated to destroy its toxicity, or stabilized to prevent its hazardous components
14 Hazardous waste treatment and disposal. US EPA, September 5, 2008, http://epa.gov/epawaste/hazard/tsd/td/index.htm.
15 Reynolds, K. A. Bioremediation: using microbes to clean up hazardous waste. Water Conditioning &Purification, 44(9), September, 2002, http://www.wcponline.com/column.cfm?T=T&ID=1725&AT=T.
16 Genetically engineered poplar plants disarm toxic pollutants 100 times better than controls. ScienceDaily,October 16, 2007, http://www.sciencedaily.com/releases/2007/10/071015193434.htm.
354 Hazardous waste
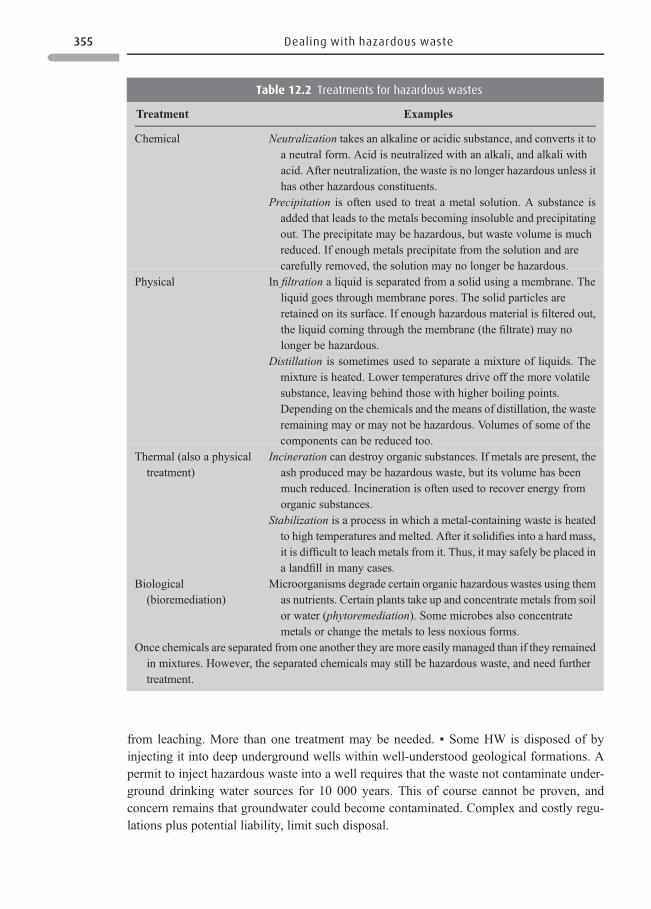
from leaching. More than one treatment may be needed. ▪ Some HW is disposed of byinjecting it into deep underground wells within well-understood geological formations. Apermit to inject hazardous waste into a well requires that the waste not contaminate under-ground drinking water sources for 10 000 years. This of course cannot be proven, andconcern remains that groundwater could become contaminated. Complex and costly regu-lations plus potential liability, limit such disposal.
Table 12.2 Treatments for hazardous wastes
Treatment Examples
Chemical Neutralization takes an alkaline or acidic substance, and converts it toa neutral form. Acid is neutralized with an alkali, and alkali withacid. After neutralization, the waste is no longer hazardous unless ithas other hazardous constituents.
Precipitation is often used to treat a metal solution. A substance isadded that leads to the metals becoming insoluble and precipitatingout. The precipitate may be hazardous, but waste volume is muchreduced. If enough metals precipitate from the solution and arecarefully removed, the solution may no longer be hazardous.
Physical In filtration a liquid is separated from a solid using a membrane. Theliquid goes through membrane pores. The solid particles areretained on its surface. If enough hazardous material is filtered out,the liquid coming through the membrane (the filtrate) may nolonger be hazardous.
Distillation is sometimes used to separate a mixture of liquids. Themixture is heated. Lower temperatures drive off the more volatilesubstance, leaving behind those with higher boiling points.Depending on the chemicals and the means of distillation, the wasteremaining may or may not be hazardous. Volumes of some of thecomponents can be reduced too.
Thermal (also a physicaltreatment)
Incineration can destroy organic substances. If metals are present, theash produced may be hazardous waste, but its volume has beenmuch reduced. Incineration is often used to recover energy fromorganic substances.
Stabilization is a process in which a metal-containing waste is heatedto high temperatures and melted. After it solidifies into a hard mass,it is difficult to leach metals from it. Thus, it may safely be placed ina landfill in many cases.
Biological(bioremediation)
Microorganisms degrade certain organic hazardous wastes using themas nutrients. Certain plants take up and concentrate metals from soilor water (phytoremediation). Some microbes also concentratemetals or change the metals to less noxious forms.
Once chemicals are separated from one another they are more easily managed than if they remainedin mixtures. However, the separated chemicals may still be hazardous waste, and need furthertreatment.
355 Dealing with hazardous waste
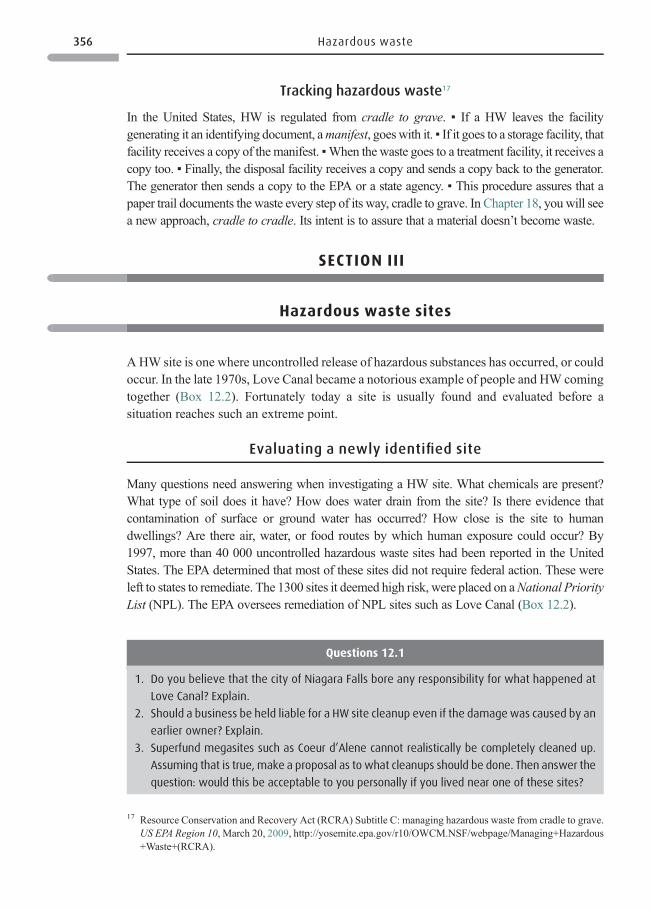
Tracking hazardous waste17
In the United States, HW is regulated from cradle to grave. ▪ If a HW leaves the facilitygenerating it an identifying document, amanifest, goeswith it. ▪ If it goes to a storage facility, thatfacility receives a copy of themanifest. ▪When the waste goes to a treatment facility, it receives acopy too. ▪ Finally, the disposal facility receives a copy and sends a copy back to the generator.The generator then sends a copy to the EPA or a state agency. ▪ This procedure assures that apaper trail documents the waste every step of its way, cradle to grave. In Chapter 18, you will seea new approach, cradle to cradle. Its intent is to assure that a material doesn’t become waste.
SECTION III
Hazardous waste sites
AHW site is one where uncontrolled release of hazardous substances has occurred, or couldoccur. In the late 1970s, Love Canal became a notorious example of people and HW comingtogether (Box 12.2). Fortunately today a site is usually found and evaluated before asituation reaches such an extreme point.
Evaluating a newly identified site
Many questions need answering when investigating a HW site. What chemicals are present?What type of soil does it have? How does water drain from the site? Is there evidence thatcontamination of surface or ground water has occurred? How close is the site to humandwellings? Are there air, water, or food routes by which human exposure could occur? By1997, more than 40 000 uncontrolled hazardous waste sites had been reported in the UnitedStates. The EPA determined that most of these sites did not require federal action. These wereleft to states to remediate. The 1300 sites it deemed high risk, were placed on aNational PriorityList (NPL). The EPA oversees remediation of NPL sites such as Love Canal (Box 12.2).
Questions 12.1
1. Do you believe that the city of Niagara Falls bore any responsibility for what happened at
Love Canal? Explain.
2. Should a business be held liable for a HW site cleanup even if the damagewas caused by an
earlier owner? Explain.
3. Superfund megasites such as Coeur d’Alene cannot realistically be completely cleaned up.
Assuming that is true, make a proposal as to what cleanups should be done. Then answer the
question: would this be acceptable to you personally if you lived near one of these sites?
17 Resource Conservation and Recovery Act (RCRA) Subtitle C: managing hazardous waste from cradle to grave.US EPA Region 10, March 20, 2009, http://yosemite.epa.gov/r10/OWCM.NSF/webpage/Managing+Hazardous+Waste+(RCRA).
356 Hazardous waste
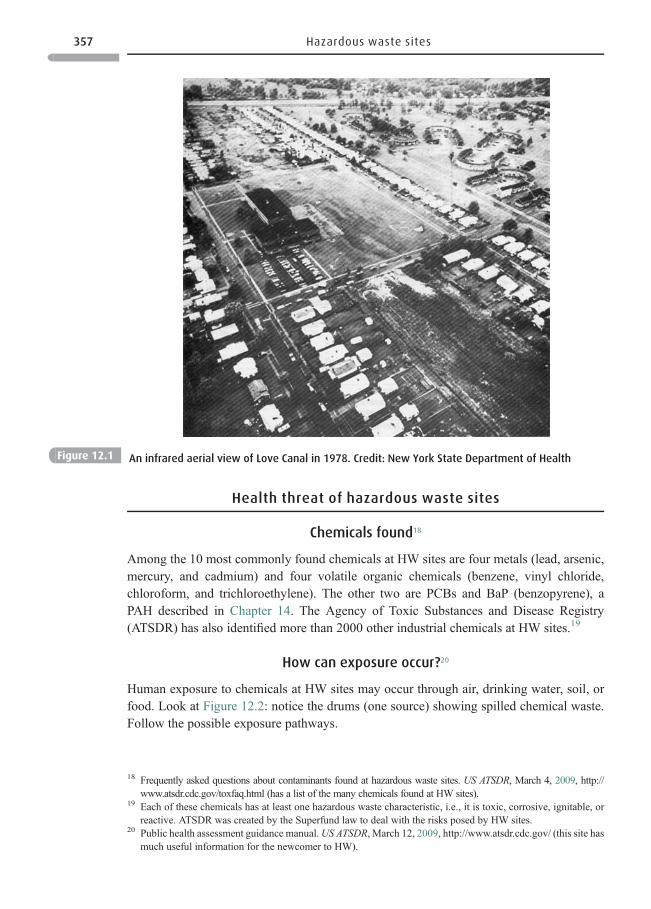
Health threat of hazardous waste sites
Chemicals found18
Among the 10 most commonly found chemicals at HW sites are four metals (lead, arsenic,mercury, and cadmium) and four volatile organic chemicals (benzene, vinyl chloride,chloroform, and trichloroethylene). The other two are PCBs and BaP (benzopyrene), aPAH described in Chapter 14. The Agency of Toxic Substances and Disease Registry(ATSDR) has also identified more than 2000 other industrial chemicals at HW sites.19
How can exposure occur?20
Human exposure to chemicals at HW sites may occur through air, drinking water, soil, orfood. Look at Figure 12.2: notice the drums (one source) showing spilled chemical waste.Follow the possible exposure pathways.
Figure 12.1 An infrared aerial view of Love Canal in 1978. Credit: New York State Department of Health
18 Frequently asked quest ions about contami nants found at hazardous waste sites. US ATSDR, March 4, 2009, http://www.atsdr.cdc.gov/toxfaq.html (has a list of the many chemicals found at HW sites).
19 Each of these chemicals has at least one hazardous waste characteristic, i.e., it is toxic, corrosive, ignitable, orreactive. ATSDR was created by the Superfund law to deal with the risks posed by HW sites.
20 Public health assessment guidance manual. US ATSDR, March 12, 2009, http://www.atsdr.cdc.gov/ (this site hasmuch useful information for the newcomer to HW).
357 Hazardous waste sites
* Air If volatile organic chemicals (VOCs) were in the spilled waste, these can evaporate.Direct inhalation by humans would ordinarily be very small unless they live very near thesite or they are unprotected on-site workers.
* Food Evaporated VOCs could condense onto vegetation such as the trees and corn plantsshown in Figure 12.2. Animals may eat the contaminated vegetation or grain. Later,humans may eat contaminated meat, vegetation, or grain.
* Soil Although soil is not ordinarily a direct exposure source for humans, contaminatedsoil could affect plants and animals on site.
* Water A portion of the spilled waste could percolate into groundwater or runoff intosurface water. Groundwater used for drinking is the most likely exposure route for thoseliving near sites.
Health-risk assessments
Before taking action to clean up aHWsite, possible risks to people living nearby are assessed. Toassess possible exposure, questions that need answers include:what is the route of exposure to thechemicals – ingestion (from food or water), inhalation (from air), or skin absorption?What is the
Source of pollutant
HOW EXPOSURE CAN OCCUR – INGESTION
HOW EXPOSURE CAN OCCUR – INHALATION
Hazardous waste spills from drums or fromoil tankers, or it is dumped. It evaporates intoair, runs off into surface water, or percolates
down into groundwater, or absorbs into the soil
Ingestion viaWATER
Ingestion viaFOOD CHAIN
Drinking watercontaminated by pollutant(from surface water, wellwater, or bottled water)
Eating grain or producecontaminated by pollutant
deposited from air, or takenup from soil or water
Eating meat, milk, and eggs pollutedby deposition from air, or taken
up from the soil or in the animal’s food
People or animals breathe in aircontaminated by the evaporation
of the waste
Figure 12.2 How exposure to hazardous waste can occur. Credit: US ATSDR
358 Hazardous waste
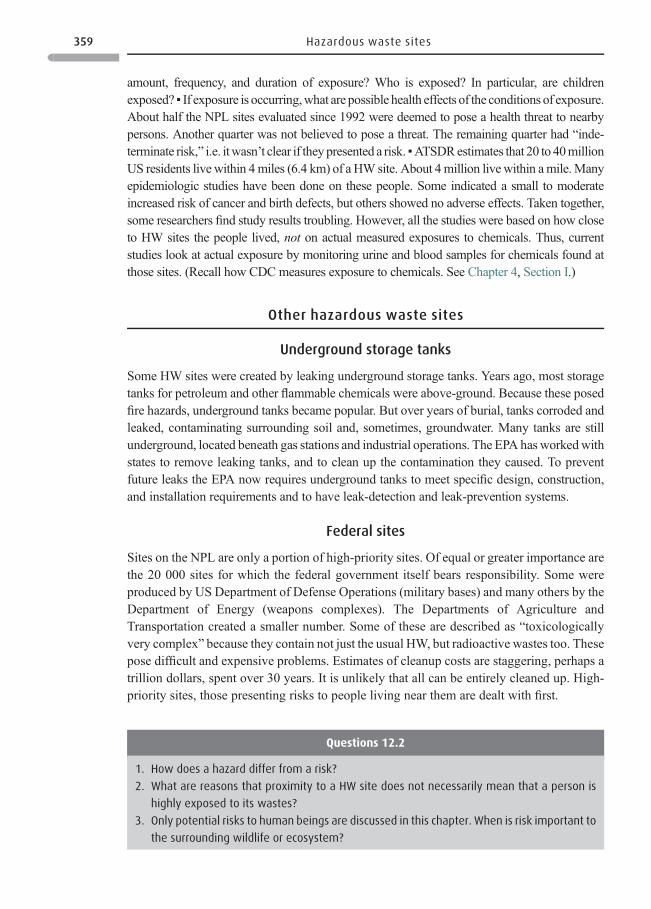
amount, frequency, and duration of exposure? Who is exposed? In particular, are childrenexposed? ▪ If exposure is occurring,what are possible health effects of the conditions of exposure.About half the NPL sites evaluated since 1992 were deemed to pose a health threat to nearbypersons. Another quarter was not believed to pose a threat. The remaining quarter had “inde-terminate risk,” i.e. itwasn’t clear if theypresented a risk. ▪ATSDRestimates that 20 to 40millionUS residents live within 4miles (6.4 km) of a HW site. About 4million live within amile.Manyepidemiologic studies have been done on these people. Some indicated a small to moderateincreased risk of cancer and birth defects, but others showed no adverse effects. Taken together,some researchers find study results troubling. However, all the studies were based on how closeto HW sites the people lived, not on actual measured exposures to chemicals. Thus, currentstudies look at actual exposure by monitoring urine and blood samples for chemicals found atthose sites. (Recall how CDC measures exposure to chemicals. See Chapter 4, Section I.)
Other hazardous waste sites
Underground storage tanks
Some HW sites were created by leaking underground storage tanks. Years ago, most storagetanks for petroleum and other flammable chemicals were above-ground. Because these posedfire hazards, underground tanks became popular. But over years of burial, tanks corroded andleaked, contaminating surrounding soil and, sometimes, groundwater. Many tanks are stillunderground, located beneath gas stations and industrial operations. The EPA hasworkedwithstates to remove leaking tanks, and to clean up the contamination they caused. To preventfuture leaks the EPA now requires underground tanks to meet specific design, construction,and installation requirements and to have leak-detection and leak-prevention systems.
Federal sites
Sites on the NPL are only a portion of high-priority sites. Of equal or greater importance arethe 20 000 sites for which the federal government itself bears responsibility. Some wereproduced by US Department of Defense Operations (military bases) and many others by theDepartment of Energy (weapons complexes). The Departments of Agriculture andTransportation created a smaller number. Some of these are described as “toxicologicallyvery complex” because they contain not just the usual HW, but radioactive wastes too. Thesepose difficult and expensive problems. Estimates of cleanup costs are staggering, perhaps atrillion dollars, spent over 30 years. It is unlikely that all can be entirely cleaned up. High-priority sites, those presenting risks to people living near them are dealt with first.
Questions 12.2
1. How does a hazard differ from a risk?
2. What are reasons that proximity to a HW site does not necessarily mean that a person is
highly exposed to its wastes?
3. Only potential risks to human beings are discussed in this chapter. When is risk important to
the surrounding wildlife or ecosystem?
359 Hazardous waste sites
SECTION IV
Reducing the risk of hazardous waste sites
You know that pollution prevention is the preferred step in the WMH. But once a spill hasoccurred it is too late for P2. Nonetheless, spills can push companies to pursue P2. Thishappens because of the cost, bother, and bad publicity that result from spills and HW sites. Italso happens because companies, along with society at large, have become more aware ofthe results of indiscriminate disposal that characterized earlier years.
Immediate protections afforded to those living near a site
Of 1300 NPL sites, the US EPA concluded that 2% posed an imminent (urgent) hazard. Animminent hazard is dealt with quickly to avoid continuing exposure to nearby communitiesand to protect workers. Examples are explosives, or conditions that could lead to contam-ination of groundwater used for drinking. ▪ Even if a site poses no imminent hazards, actionsmay be taken immediately to limit possible exposure to waste-site chemicals. Amongpossible actions: restrict access to the site, provide a different source of drinking water, orissue fish-consumption advisories.
Cleanup
Once site characteristics are well understood, cleanup possibilities are evaluated. For a NPLsite, EPA consults with other concerned parties to select a cleanup remedy from identifiedalternatives. ▪ The selected remedy must comply with federal, state, and local laws. It mustalso protect human health and the environment – a controversial requirement: must the sitebe returned to “pristine” conditions? If it’s to become an industrial site again or a parking lot,can the cleanup stop after 90 or 95% of the contaminants are removed (Box 12.3)? ▪ Afterselecting a remedy, an engineering design is prepared followed by the construction neces-sary to accomplish the cleanup. Finally, the remedy is carried out. These actions may require10 years or more. After cleanup, monitoring must continue for years. If groundwater is beingtreated, the process could take many more years. Although EPA takes responsibility for theNPL sites, others may perform the actual cleanups. The public has a right to comment at allstages, although some believe their input is not always taken seriously. ▪ Funding cleanupCleanup is funded in two ways: ▪ If parties responsible for creating the site are identified,they pay. ▪ If parties cannot be identified or if the sites are old ones such as abandonedmining areas or sites that once manufactured town-gas (some from the nineteenth century),Superfund pays for the cleanup. Superfund was created by a tax levied on oil, chemical, andmanufacturing industries. If the company that was responsible for creating the site now hasdifferent ownership, its new owners must take responsibility. This has led companies tobecome very careful about properties they purchase. For example, Hooker Chemical
360 Hazardous waste
Company disposed of hazardous waste at Love Canal, but Occidental Chemical, thesubsequent owner had to assume the responsibility of remediation. Cleanup of NPL siteshas been slow mostly because there are many legal challenges. In 1995, the US Congressallowed the Superfund tax to expire and has not renewed it. Now, Superfund depends on anannual appropriation leading to concern that some sites may not be cleaned up properly ormay have to be cleaned up at public expense. Nonetheless, cleanups still seem to beprogressing.23 The cleanup of many sites such as those contaminated by the military andthe Department of Energy are already government funded.
Cleanup methods
You were introduced above to methods used to treat HW (Table 12.2). Methods used toclean up HWat abandoned sites are similar, but more complex. Consider the complexity of aLove Canal remediation or a cleanup made necessary by finding dozens or hundreds ofdrums of leaking chemicals.
Box 12.3 Brownfields21
A number of reasons exist to explain why a business might not buy a brownfield (an
abandoned industrial site) to locate a facility. One reason for avoiding brownfields is that
the buyer may be required to clean up the land. To avoid potential problems, a company
usually prefers greenfield, land that is undeveloped. Inner-city Detroit, Michigan, has been
devastated by large tracts of abandoned land, that some said resemble a war zone.
Nationwide there are about 45 000 brownfields. Strict cleanup standards can inhibit land
reuse and mean that undeveloped land is developed. To counter this trend, EPA funds brown-
field redevelopment projects. Site-specific standards allow a brownfield to be cleaned up to
standards consistent with its future use. For some brownfield sites, vegetation including native
flora have been reintroduced providing greenery and parks to some urban areas. The city of
Pittsburgh, Pennsylvania, sees itself as a national model for brownfield development.22 It
transformed what, for more than a century, were major industrial sites (including mammoth
deserted steel mills) and the pollution associated with them into useful and attractive places
that also generate tax revenue. Cleanup is very thorough when reclaimed land is to be used for
new housing, retail, entertainment, and research and development.
21 Annual Superfund data shows continuing cleanup progress. US EPA, November 22, 2005, http://yosemite.epa.gov/opa/admpress.nsf/0/177D956E79308A46852570C1006CD11C.
22 Brownfi elds and land revitalization, basic information. US EPA, April 23, 2008, http://www.epa.gov/brown-fields/basic_info.htm.
23 Dettore, J. N. Brownfield development in Pittsburgh, recycling and reuse of the steel industry’s abandonedmills:the environmental transformation of an American industrial city. Pittsburgh Green Story, http://www.pittsburgh-greenstory.org/html/brownfields.html.
361 Cleanup methods
Cleaning up metal contamination
Soil contaminated with lead or other heavy metals is often found at HWand old mining sites.▪ One way to deal with this is to excavate the soil, treat it, and place it in a landfill dedicatedto HW. This option is expensive, and simply moves the problem “away.” ▪ Anotherexpensive option is to stabilize the metals on site by heating the soil to a temperature highenough to melt the soil into a hard mass (vitrification). Stabilized metals are much less likelyto leach. ▪ A less-expensive on-site stabilization technique is mixing the soil with cementand letting it solidify. ▪Or, metals can sometimes be removed from the soil. Themethod useddepends on the metals involved. The TerraMet process is specific to lead:24 (1) Separate thecontaminated soil into its components (gravel, sand, silt, and clay). (2) Wash the gravel toremove most lead; then return it to the site. (3) Shake the sand in water. Because lead isdenser than sand, it settles to the bottom and is removed. Treat the sand itself with aproprietary chemical that dissolves the remaining lead. Return the cleaned sand to the site.Treat the proprietary chemical solution to precipitate the lead from it; recover the lead forrecycling. (4) Treat the silt and clay using methods similar to those for sand, and return theseto the site.
Bioremediation
Recall the poplar trees capable of accumulating organic solvents. Other living organisms cansometimes be used to bioremediateHW sites contaminated with oil or munitions, or to cleanup contaminated water or sediments. The microorganisms and plants used must concentratethe contaminant of concern, but not be poisoned by it.
Bioremediation using microorganisms
First, investigate the site as to pollutants present, characteristics of its soil and water, andmicroorganisms naturally present. Often site microbes have already slowly begun todegrade organic waste. Humans may work to speed up microbial action by providingfertilizer for the microbes. Oxygen may be added in some cases. ▪ A well-known use ofbioremediation followed the Exxon Valdez Alaskan oil spill. First a physical cleanupmethod such as using high-pressure water to wash oil from rocks was used; this was noteffective and may have caused harm. But bioremediation helped. Microbes naturally presentalong the shore had already begun degrading the oil’s hydrocarbons; tidal flux providedoxygen. A nitrogen fertilizer was added to speed the microbial action. Microorganisms thatreceived fertilizer degraded surface and subsurface oil three to five times faster thanmicrobes in unfertilized areas. Oil that could have taken 10 years or longer to degradenaturally broke down in 2–3 years. Microbes could not degrade those hydrocarbons that hadbecome immobilized into an insoluble asphalt-like material. However, the immobilizedhydrocarbons were not expected to affect biological systems.
24 Terramet soil remediation system, COGNIS®, February 20, 1997, http://www.epa.gov/ORD/SITE/reports/540_MR-95_535.pdf.
362 Hazardous waste
Bioremediation at metal-contaminated sites
Microbes cannot destroymetals, but do sometimes convert them to less hazardous forms. ▪Theymay cause reactions that lead to metal stabilization: at one site, microbes converted sulfate tosulfide. Sulfide reacted with metal contaminants to produce metal sulfides, very insolublechemicals. Basically, the metals were immobilized in place. This is analogous to stabilizingmetals in soil by heat or cement, but the microbial treatment is cheaper and more environ-mentally benign. ▪ In another case, microbes concentrated plutonium, a dangerous radioactiveelement present at a site. This ability has promise to help clean hazardous-weapons-productionsites. ▪ Natural microbes are typically used in remediation projects, but effort is ongoing tobioengineer organisms capable of degrading specific chemicals. A bioengineered organism isone intowhich one ormore genes have been introduced tomake it capable of carrying out a taskit previously was unable to accomplish. Natural microbes can degrade the persistent PCBs anddioxins, but do so very slowly. The challenge is developing organisms that rapidly destructhazardous chemicals, while not themselves becoming a new environmental risk.
Phytoremediation
Hundreds of plants and trees have been identified that can accumulate metals from soil orwater, sometimes to high concentrations – they are hyperaccumulators – and do so withoutill effects to themselves. Plants hyperaccumulate metals such as nickel, zinc, copper,cadmium, selenium, and manganese. Some hyperaccumulate metals up to 40% of theirweight.Why they hyperaccumulate is unknown except that it may give them ametallic taste,which insects that otherwise would feed on them do not like. Plants can subsequently beharvested and burned to recover the metals. One aquatic plant took water contaminated withthe explosive TNT from a concentration of 128 ppm down to 10 ppm. Envision a HW sitecovered with attractive plants or trees that are cleaning it up and you see the appeal ofphytoremediation. However, it is not yet widely practiced commercially.
Bioremediation’s potential
The potential, whether with microbes or plants, is tremendous. It costs less than most othermethods and it works with natural systems. Yet bioremediation raises a familiar problem – itcannot degrade or take up all the contaminant. ▪ Consider a microorganism that degrades anorganic chemical. It does so because it uses it as a nutrient or as a source of energy to promote itsown growth. When the concentration becomes low, the chemical no longer supports microbialgrowth. When growth stops or slows, so does the accelerated degradation of the chemical.▪ Likewise, for a plant that hyperaccumulates, it does not use all the metal in soil or water.
Questions 12.3
1. Organic HW can sometimes be treated by spreading it on land and allowing natural
processes to degrade it. (a) What natural factors contribute to such degradation? (b)
What are the potential environmental health and safety shortcomings of land spreading?
2. Consider hazardous chemicals buried in sediment. What natural factors, available in the
water itself, are not available in the sediment to assist in the degradation?
363 Cleanup methods
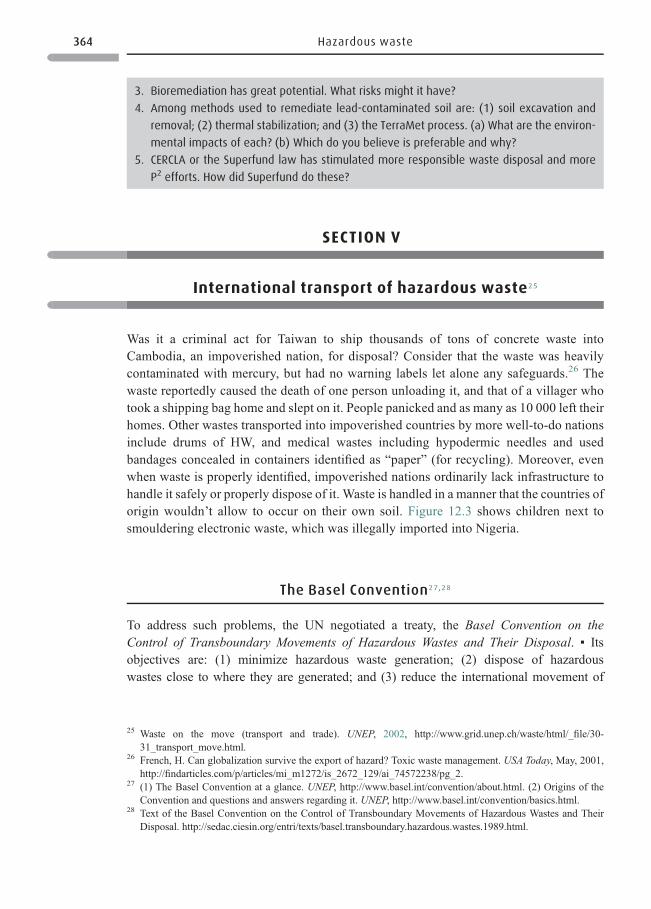
SECTION V
International transport of hazardous waste25
Was it a criminal act for Taiwan to ship thousands of tons of concrete waste intoCambodia, an impoverished nation, for disposal? Consider that the waste was heavilycontaminated with mercury, but had no warning labels let alone any safeguards.26 Thewaste reportedly caused the death of one person unloading it, and that of a villager whotook a shipping bag home and slept on it. People panicked and as many as 10 000 left theirhomes. Other wastes transported into impoverished countries by more well-to-do nationsinclude drums of HW, and medical wastes including hypodermic needles and usedbandages concealed in containers identified as “paper” (for recycling). Moreover, evenwhen waste is properly identified, impoverished nations ordinarily lack infrastructure tohandle it safely or properly dispose of it. Waste is handled in a manner that the countries oforigin wouldn’t allow to occur on their own soil. Figure 12.3 shows children next tosmouldering electronic waste, which was illegally imported into Nigeria.
The Basel Convention27,28
To address such problems, the UN negotiated a treaty, the Basel Convention on theControl of Transboundary Movements of Hazardous Wastes and Their Disposal. ▪ Itsobjectives are: (1) minimize hazardous waste generation; (2) dispose of hazardouswastes close to where they are generated; and (3) reduce the international movement of
3. Bioremediation has great potential. What risks might it have?
4. Among methods used to remediate lead-contaminated soil are: (1) soil excavation and
removal; (2) thermal stabilization; and (3) the TerraMet process. (a) What are the environ-
mental impacts of each? (b) Which do you believe is preferable and why?
5. CERCLA or the Superfund law has stimulated more responsible waste disposal and more
P2 efforts. How did Superfund do these?
25 Waste on the move (transport and trade). UNEP, 2002, http://www.grid.unep.ch/waste/html/_file/30-31_transport_move.html.
26 French, H. Can globalization survive the export of hazard? Toxic waste management. USA Today, May, 2001,http://findarticles.com/p/articles/mi_m1272/is_2672_129/ai_74572238/pg_2.
27 (1) The Basel Convention at a glance. UNEP, http://www.basel.int/convention/about.html. (2) Origins of theConvention and questions and answers regarding it. UNEP, http://www.basel.int/convention/basics.html.
28 Text of the Basel Convention on the Control of Transboundary Movements of Hazardous Wastes and TheirDisposal. http://sedac.ciesin.org/entri/texts/basel.transboundary.hazardous.wastes.1989.html.
364 Hazardous waste
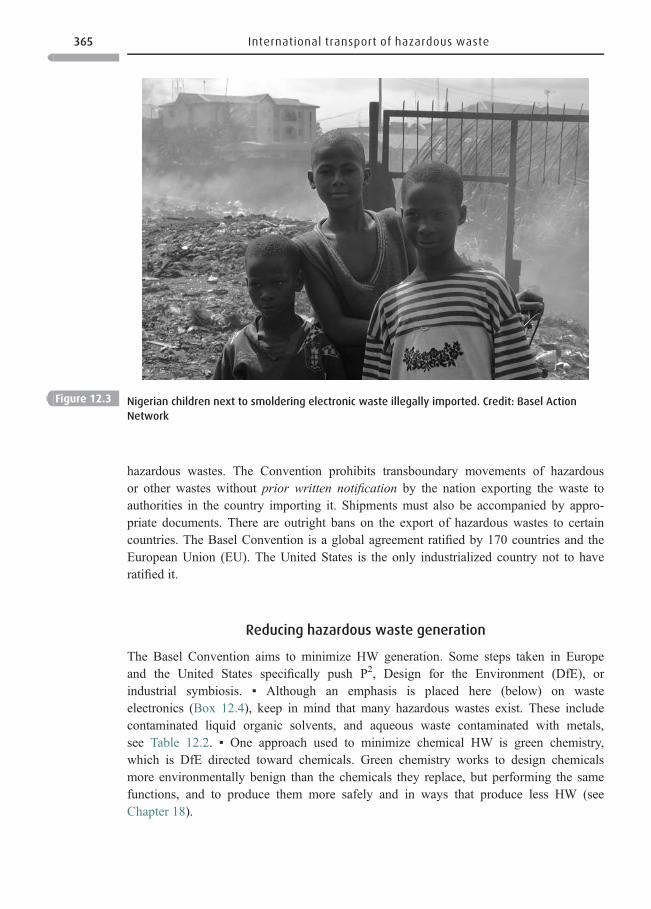
hazardous wastes. The Convention prohibits transboundary movements of hazardousor other wastes without prior written notification by the nation exporting the waste toauthorities in the country importing it. Shipments must also be accompanied by appro-priate documents. There are outright bans on the export of hazardous wastes to certaincountries. The Basel Convention is a global agreement ratified by 170 countries and theEuropean Union (EU). The United States is the only industrialized country not to haveratified it.
Reducing hazardous waste generation
The Basel Convention aims to minimize HW generation. Some steps taken in Europeand the United States specifically push P2, Design for the Environment (DfE), orindustrial symbiosis. ▪ Although an emphasis is placed here (below) on wasteelectronics (Box 12.4), keep in mind that many hazardous wastes exist. These includecontaminated liquid organic solvents, and aqueous waste contaminated with metals,see Table 12.2. ▪ One approach used to minimize chemical HW is green chemistry,which is DfE directed toward chemicals. Green chemistry works to design chemicalsmore environmentally benign than the chemicals they replace, but performing the samefunctions, and to produce them more safely and in ways that produce less HW (seeChapter 18).
Figure 12.3 Nigerian children next to smoldering electronic waste illegally imported. Credit: Basel Action
Network
365 International transport of hazardous waste
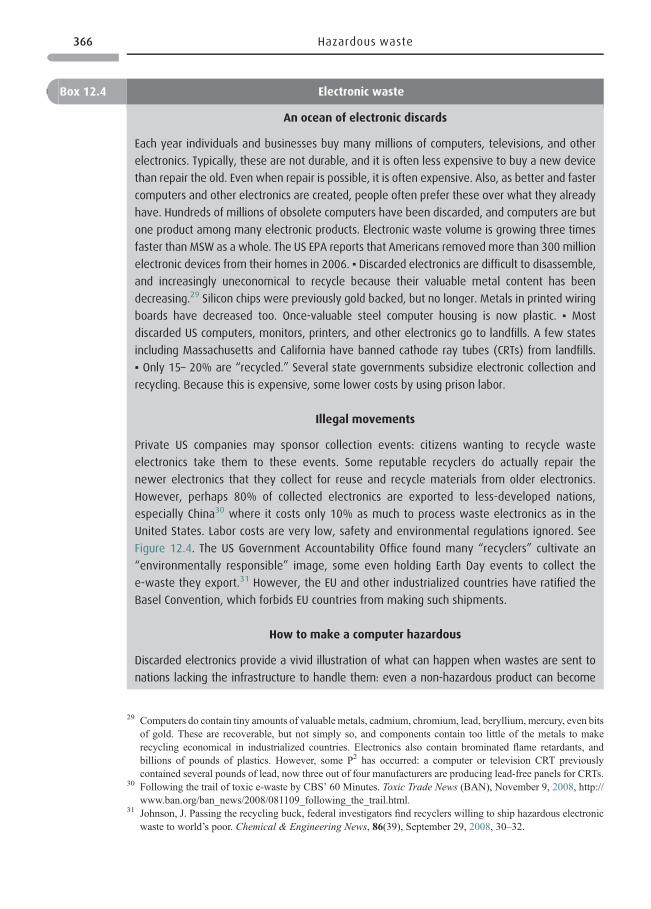
Box 12.4 Electronic waste
An ocean of electronic discards
Each year individuals and businesses buy many millions of computers, televisions, and other
electronics. Typically, these are not durable, and it is often less expensive to buy a new device
than repair the old. Even when repair is possible, it is often expensive. Also, as better and faster
computers and other electronics are created, people often prefer these over what they already
have. Hundreds of millions of obsolete computers have been discarded, and computers are but
one product among many electronic products. Electronic waste volume is growing three times
faster than MSW as a whole. The US EPA reports that Americans removed more than 300 million
electronic devices from their homes in 2006. ▪ Discarded electronics are difficult to disassemble,
and increasingly uneconomical to recycle because their valuable metal content has been
decreasing.29 Silicon chips were previously gold backed, but no longer. Metals in printed wiring
boards have decreased too. Once-valuable steel computer housing is now plastic. ▪ Most
discarded US computers, monitors, printers, and other electronics go to landfills. A few states
including Massachusetts and California have banned cathode ray tubes (CRTs) from landfills.
▪ Only 15– 20% are “recycled.” Several state governments subsidize electronic collection and
recycling. Because this is expensive, some lower costs by using prison labor.
Illegal movements
Private US companies may sponsor collection events: citizens wanting to recycle waste
electronics take them to these events. Some reputable recyclers do actually repair the
newer electronics that they collect for reuse and recycle materials from older electronics.
However, perhaps 80% of collected electronics are exported to less-developed nations,
especially China30 where it costs only 10% as much to process waste electronics as in the
United States. Labor costs are very low, safety and environmental regulations ignored. See
Figure 12.4. The US Government Accountability Office found many “recyclers” cultivate an
“environmentally responsible” image, some even holding Earth Day events to collect the
e-waste they export.31 However, the EU and other industrialized countries have ratified the
Basel Convention, which forbids EU countries from making such shipments.
How to make a computer hazardous
Discarded electronics provide a vivid illustration of what can happen when wastes are sent to
nations lacking the infrastructure to handle them: even a non-hazardous product can become
29 Computers do contain tiny amounts of valuable metals, cadmium, chromium, lead, beryllium, mercury, even bitsof gold. These are recoverable, but not simply so, and components contain too little of the metals to makerecycling economical in industrialized countries. Electronics also contain brominated flame retardants, andbillions of pounds of plastics. However, some P2 has occurred: a computer or television CRT previouslycontained several pounds of lead, now three out of four manufacturers are producing lead-free panels for CRTs.
30 Following the trail of toxic e-waste by CBS’ 60 Minutes. Toxic Trade News (BAN), November 9, 2008, http://www.ban.org/ban_news/2008/081109_following_the_trail.html.
31 Johnson, J. Passing the recycling buck, federal investigators find recyclers willing to ship hazardous electronicwaste to world’s poor. Chemical & Engineering News, 86(39), September 29, 2008, 30–32.
366 Hazardous waste
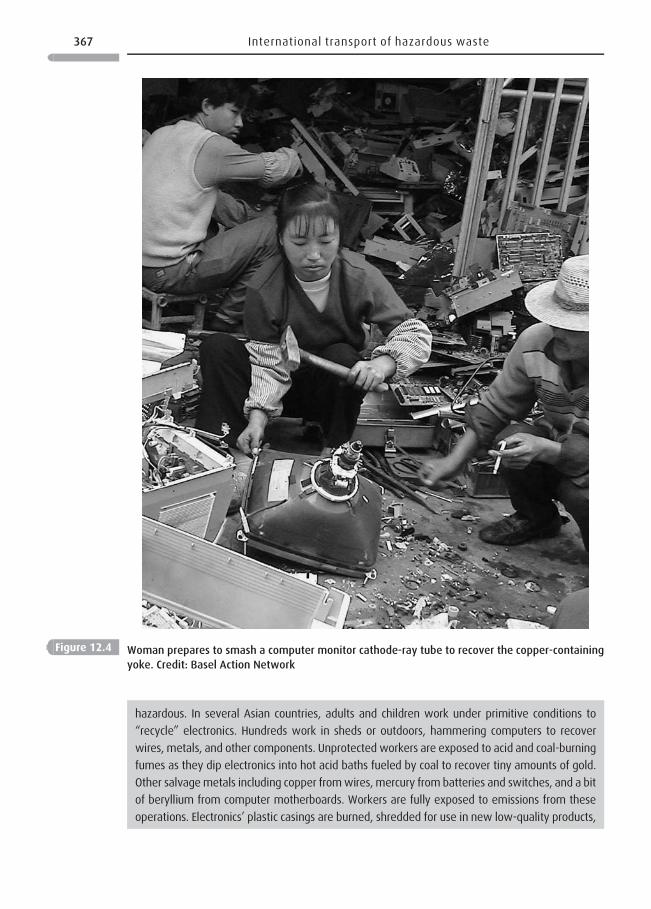
hazardous. In several Asian countries, adults and children work under primitive conditions to
“recycle” electronics. Hundreds work in sheds or outdoors, hammering computers to recover
wires, metals, and other components. Unprotected workers are exposed to acid and coal-burning
fumes as they dip electronics into hot acid baths fueled by coal to recover tiny amounts of gold.
Other salvagemetals including copper fromwires, mercury from batteries and switches, and a bit
of beryllium from computer motherboards. Workers are fully exposed to emissions from these
operations. Electronics’ plastic casings are burned, shredded for use in new low-quality products,
Figure 12.4 Woman prepares to smash a computer monitor cathode-ray tube to recover the copper-containing
yoke. Credit: Basel Action Network
367 International transport of hazardous waste
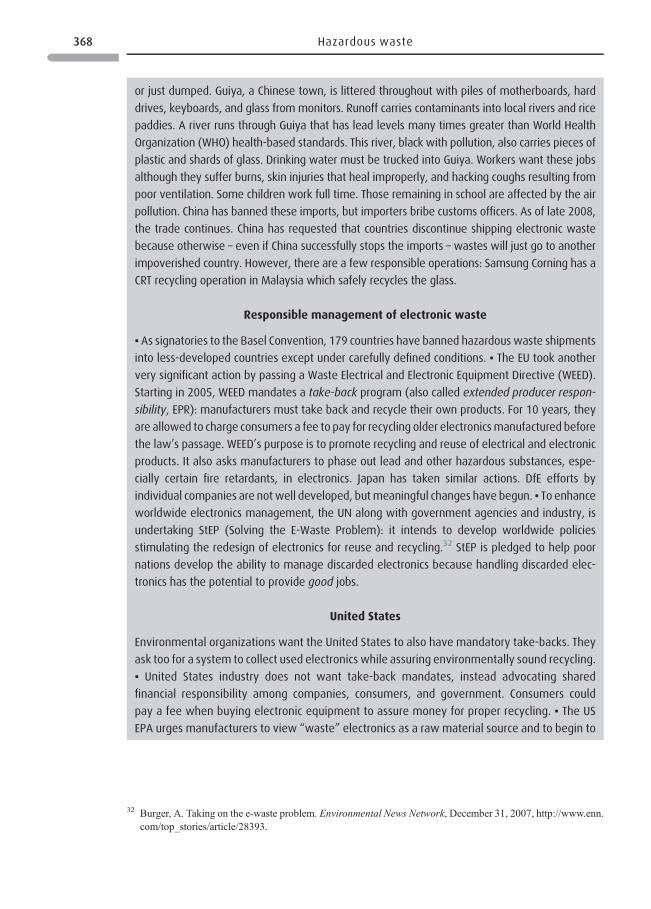
or just dumped. Guiya, a Chinese town, is littered throughout with piles of motherboards, hard
drives, keyboards, and glass from monitors. Runoff carries contaminants into local rivers and rice
paddies. A river runs through Guiya that has lead levels many times greater than World Health
Organization (WHO) health-based standards. This river, black with pollution, also carries pieces of
plastic and shards of glass. Drinking water must be trucked into Guiya. Workers want these jobs
although they suffer burns, skin injuries that heal improperly, and hacking coughs resulting from
poor ventilation. Some children work full time. Those remaining in school are affected by the air
pollution. China has banned these imports, but importers bribe customs officers. As of late 2008,
the trade continues. China has requested that countries discontinue shipping electronic waste
because otherwise – even if China successfully stops the imports – wastes will just go to another
impoverished country. However, there are a few responsible operations: Samsung Corning has a
CRT recycling operation in Malaysia which safely recycles the glass.
Responsible management of electronic waste
▪ As signatories to the Basel Convention, 179 countries have banned hazardouswaste shipments
into less-developed countries except under carefully defined conditions. ▪ The EU took another
very significant action by passing a Waste Electrical and Electronic Equipment Directive (WEED).
Starting in 2005, WEED mandates a take-back program (also called extended producer respon-
sibility, EPR): manufacturers must take back and recycle their own products. For 10 years, they
are allowed to charge consumers a fee to pay for recycling older electronicsmanufactured before
the law’s passage. WEED’s purpose is to promote recycling and reuse of electrical and electronic
products. It also asks manufacturers to phase out lead and other hazardous substances, espe-
cially certain fire retardants, in electronics. Japan has taken similar actions. DfE efforts by
individual companies are notwell developed, butmeaningful changes have begun. ▪ To enhanceworldwide electronics management, the UN along with government agencies and industry, is
undertaking StEP (Solving the E-Waste Problem): it intends to develop worldwide policies
stimulating the redesign of electronics for reuse and recycling.32 StEP is pledged to help poor
nations develop the ability to manage discarded electronics because handling discarded elec-
tronics has the potential to provide good jobs.
United States
Environmental organizations want the United States to also have mandatory take-backs. They
ask too for a system to collect used electronics while assuring environmentally sound recycling.
▪ United States industry does not want take-back mandates, instead advocating shared
financial responsibility among companies, consumers, and government. Consumers could
pay a fee when buying electronic equipment to assure money for proper recycling. ▪ The US
EPA urges manufacturers to view “waste” electronics as a raw material source and to begin to
32 Burger, A. Taking on the e-waste problem. Environmental News Network, December 31, 2007, http://www.enn.com/top_stories/article/28393.
368 Hazardous waste
consciously use DfE to move toward less or even zero waste.33 Maine, Washington, California,
and Maryland have laws requiring manufacturers to pay for recycling old computers, monitors,
and TVs. As more states develop requirements, manufacturers may come to prefer a uniform
national law.
Corporate actions34
▪ Panasonic has taken steps to design-for-disassembly, and design-for-recycling. It has cut the
number of plastic types in its television sets from 13 to 2, and labels each to allow easier
separation during disassembly and subsequent recycling. It cut the time to disassemble its TVs
from 142 to 78 s. It uses 10% recycled glass in its CRT (the funnel-shaped glass inmonitors) and
plans to make TVs with lead-free solder.35 ▪ Sony has a national system to collect and recycle
old electronics responsibly: “We don’t allow recyclers to export to developing countries. We do
our own audits, but need the help of the federal government so as to have a uniform
nationwide system.” Hewlett-Packard has a Product Take Back operation, recycling more
electronics than any other company in the United States.
Technology
Processes to manage discarded electronics are not simple. Electronics must be collected,
sorted, and disassembled. Recovering metals from complex electronics requires large-scale,
high-technology processing. Printed circuit boards (PCBs) are the most valuable component;
they are mainly composed of copper, lead, and tin. Although there is technology to do so, it is
still a challenge to recover PCBs as they must be separated from many other electronic
components. Work is ongoing to improve the efficiencies of such separations.36 However,
the ultimate goal is not managing waste electronics, but DfE – producing electronics that are
straightforward to disassemble and reuse. Such electronics would not become waste, but
become an important contribution to closed-cycle operations.
33 (1) Promoting and practicing environmental stewardship for electronic products wastes. US EPA, December 4,2008, http://www.epa.gov/epawaste/partnerships/stewardship/products/electronics.htm. (2) Green electronics.US EPA, December 24, 2008, http://www.epa.gov/oaintrnt/practices/electronics.htm. (3) Wastes. Partnerships,product stewardship: electronics. US EPA, December 4, 2008, http://www.epa.gov/epawaste/partnerships/stew-ardship/products/electronics.htm.
34 One company, Redemtech’s Sustainable Computing Initiative helps businesses extend the life of purchasedequipment, and not just buy newer technology. They work to redeploy technology within a firm or as donationsor remarketing. They advocate a zero-landfill disposal policy and have a tracking system to fully account forevery item received. It supports high standards for e-waste recycling through the Basel Action network.Moreover, it claims significant savings for the businesses with which it works. http://www.greenercomputing.com/news/2008/10/08/redemtech-launches-sustainable-consulting-initiative.
35 Greenpeace developed a Guide to Greener Electronics, how the companies line up. Greenpeace, August, 2006,http://www.greenpeace.org/international/campaigns/toxics/electronics/how-the-companies-line-up. Greenpeaceranks 18 manufacturers of personal computers, mobile phones, TVs, and games consoles according to policieson toxic chemicals, recycling, and climate change.
36 A good description of ongoing work to improve technologies is: Betts, K. Producing usable materials from e-waste, new technologies being developed in China and Eastern Europe may create usable materials from e-waste. Environmental Science & Technology, 42(18), September 15, 2008, 6782–6783.
369 International transport of hazardous waste
Other life-cycle issues
Manufacturing an average 53-lb (24-kg) desktop computer plus its monitor requires at least 10
times its weight in fossil fuels and chemicals. Pound for pound this is much more than required
for an automobile or refrigerator, which require one–two times their weight in fossil fuels.37
These factors must be considered too when doing DfE.
Questions 12.4
1. The EU expects that the Waste Electrical and Electronic Equipment Directive to stimulate DfE
among those who manufacture electronics – explain why this is likely to happen.
2. Explain how DfE leads to closed-cycle operations or to industrial symbiosis.
3. (a) The United States has no take-back directive. Do manufacturers of electronics nonethe-
less have ethical responsibilities for their products? Explain what that responsibility might
look like.
4. Itaru Yasui of the UN University has stated: “Collectively, the role of consumers is enor-
mously important to the world environment, whether purchasing, using or disposing of
electronic equipment.” Explain what this couldmean in actions that you yourself could take.
Box 12.5 “Throwing away” a ship38
Shipbreaking is the dismantling of old ships for scrap metal and other valuables.39 It was once
carried out in the United States and Europe. In the 1970s as labor costs and environmental
regulations increased, the industry moved to Korea and Taiwan. Lastly, it moved to the poorest
countries including India, Bangladesh, and Pakistan. About 90% of the 700 end-of-life ships a
year end up in impoverished countries. Hazardous substances in the ships include asbestos,
PCBs, and heavy metals such as lead, mercury, and cadmium. Workers, often barefoot,
dismantle ships by hand using tools such as hammers and blowtorches. They are exposed to
toxic fumes, excessive noise, and heat and have no occupational safety and health regula-
tions.40 Accident rates are high and there is much pollution around the operations. Bangladesh
wants the steel that the ships contain, steel that is several times cheaper to produce by re-
rolling from dismantled ships than milling it from fresh ore. Ore must be imported because the
country “is a river delta with no mineral deposits, just sand and earth.”
Figure 12.5 shows a step far along in ship dismantlement, recovering copper from wiring by
burning off its rubber casings. Photographer Claudio Cambon comments that this sight is
37 Kuehr, R. andWilliams, E. (eds.) Computers and the environment, understanding andmanaging their impacts. InEco-Efficiency in Industry and Science Series (ECOE 14). Dodrecht/NL: Kluwer Academic Publishers &UnitedNations University, October, 2003.
38 Breaking more than ships. UNEP, 2002, http://www.grid.unep.ch/waste/html/file/40–41/shipbreaking.html.39 Ship dismantling. European Commission, Environment, January 1, 2009, http://ec.europa.eu/environment/
waste/ships/index.htm.40 Langewiesche, W. The shipbreakers. Atlantic Monthly, 286(2), August, 2000, 31–49.
370 Hazardous waste
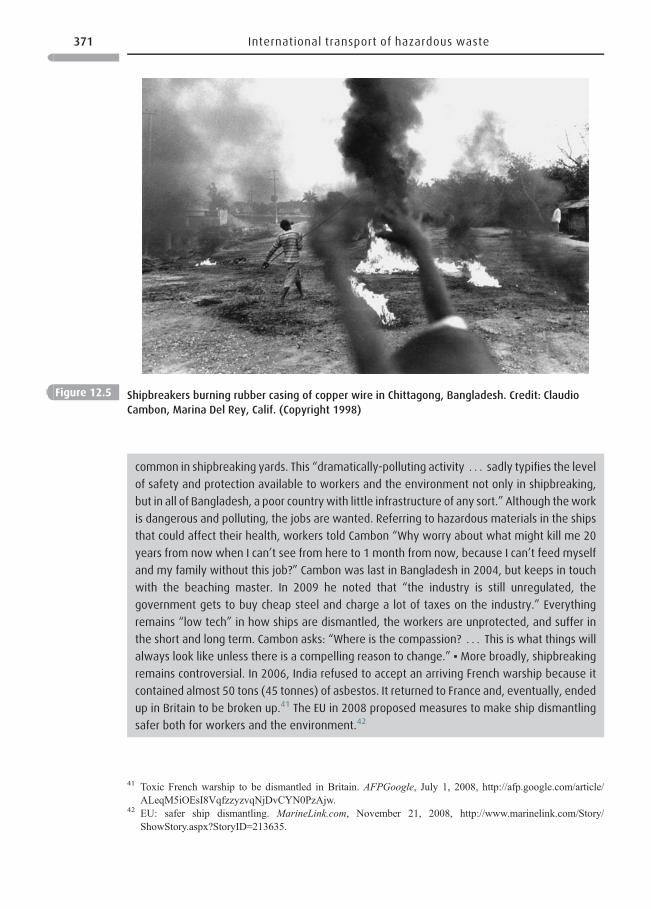
Figure 12.5 Shipbreakers burning rubber casing of copper wire in Chittagong, Bangladesh. Credit: Claudio
Cambon, Marina Del Rey, Calif. (Copyright 1998)
common in shipbreaking yards. This “dramatically-polluting activity . . . sadly typifies the level
of safety and protection available to workers and the environment not only in shipbreaking,
but in all of Bangladesh, a poor country with little infrastructure of any sort.” Although thework
is dangerous and polluting, the jobs are wanted. Referring to hazardous materials in the ships
that could affect their health, workers told Cambon “Why worry about what might kill me 20
years from now when I can’t see from here to 1 month from now, because I can’t feed myself
and my family without this job?” Cambon was last in Bangladesh in 2004, but keeps in touch
with the beaching master. In 2009 he noted that “the industry is still unregulated, the
government gets to buy cheap steel and charge a lot of taxes on the industry.” Everything
remains “low tech” in how ships are dismantled, the workers are unprotected, and suffer in
the short and long term. Cambon asks: “Where is the compassion? . . . This is what things will
always look like unless there is a compelling reason to change.” ▪ More broadly, shipbreaking
remains controversial. In 2006, India refused to accept an arriving French warship because it
contained almost 50 tons (45 tonnes) of asbestos. It returned to France and, eventually, ended
up in Britain to be broken up.41 The EU in 2008 proposed measures to make ship dismantling
safer both for workers and the environment.42
41 Toxic French warship to be dismantled in Britain. AFPGoogle, July 1, 2008, http://afp.google.com/article/ALeqM5iOEsI8VqfzzyzvqNjDvCYN0PzAjw.
42 EU: safer ship dismantling. MarineLink.com, November 21, 2008, http://www.marinelink.com/Story/ShowStory.aspx?StoryID=213635.
371 International transport of hazardous waste
Further reading
Betts, K. Producing usable materials from e-waste. Environmental Science & Technology,42(18), September 15, 2008, 6782–6783.
Engelhaupt, E. Happy birthday, Love Canal. Environmental Science & Technology, 42(22),November 15, 2008, 8179–8186.
Gustavson, K. E. et al. Superfund and mining megasites. Environmental Science &Technology, 41(8), April 15, 2007, 2667–2672.
Johnson, J. Passing the recycling buck (recyclers shipping hazardous electronic waste toworld’s poor). Chemical & Engineering News, 86(39), September 29, 2008, 30–32.
Reynolds, K. A. Using microbes to clean up hazardous waste. Water Conditioning &Purification, 44(9), September, 2002, http://www.wcponline.com/column.cfm?T=T&ID=1725&AT=T.
Internet resources
ASTDR. 2009. Frequently asked questions about contaminants found at hazardous wastesites. http://www.atsdr.cdc.gov/toxfaq.html#a (March 4, 2009).
2009. ToxFaqsTM Frequently asked questions about contaminants found at hazardouswaste sites (search by name of chemical). http://www.atsdr.cdc.gov/toxfaq.html#a(March 4, 2009).
Dettore, J. N. 2009. Brownfield development, recycling and reuse of the steel industry’sabandoned mills. Pittsburgh Green Story. http://www.pittsburghgreenstory.org/html/brownfields.html.
European Commission, Environment. 2009. Ship dismantling. http://ec.europa.eu/environment/waste/ships/index.htm (January 1, 2009).
Greener Computing. 2008. Redemtech launches sustainable consulting initiative. http://www.greenercomputing.com/news/2008/10/09/redemtech-launches-sustainable-consulting-initiative (October 9, 2008).
MSWManagement. 2008. E-waste regulations. http://www.mswmanagement.com/the-latest/epa-e-waste-regulations.aspx (November 26, 2008).
Reuters. 2009. Italy finds wreck of toxic waste ship sunk by mafia (one of more than 30 just inthe Mediterranean). September 15, 2009. http://www.reuters.com/article/environmentNews/idUSTRE58E38K20090915
Toxic TradeNews (BAN). 2008. Following the trail of toxic e-waste byCBS’ 60Minutes. http://www.ban.org/ban_news/2008/081109_following_the_trail.html (November 9, 2008).
UNEP. 2002.Vital Waste graphics. http://www.grid.unep.ch/waste/index.html.2009. Origins of the Basel Convention and questions and answers regarding it. http://www.basel.int/convention/basics.html.
2009. Public health assessment guidance manual. (Useful information for the hazardouswaste novice.) http://www.atsdr.cdc.gov/ (March 12, 2009).
372 Hazardous waste
US EPA. 2000. Safe Hazardous Waste Recycling (used oil, precious and scrap metals).http://www.epa.gov/osw/wycd/manag-hw/e00–001d.pdf (October, 2000).
2008. Green electronics (links). http://www.epa.gov/oaintrnt/practices/electronics.htm(December 24, 2008).
2008. Hazardous waste treatment and disposal. http://epa.gov/epawaste/hazard/tsd/td/index.htm (September 5, 2008).
2008. International Agreements and Treaties. http://www.epa.gov/oppfead1/international/agreements/index.html (October 16, 2008).
2008.Wastes – Partnerships, product stewardship. http://www.epa.gov/epawaste/partner-ships/stewardship/index.htm (September 25, 2008).
2009. Brownfields and land revitalization, basic information. http://www.epa.gov/brown-fields/basic_info.htm (June 4, 2009).
2009. Hazardous waste, quick finder. http://www.epa.gov/osw/hazard/index.htm (June24, 2009).
2009. Hazardous waste recycling. http://www.epa.gov/osw/hazard/recycling/index.htm(June 23, 2009).
2009. Managing hazardous waste from cradle to grave. http://yosemite.epa.gov/r10/owcm.nsf/webpage/Resource+Conservation+and+Recovery+Act+(RCRA)+Subtitle+C:+Managing+Hazardous+Waste+from+Cradle+to+Grave (May 27, 2009).
2009. Priority chemicals (in products and wastes). http://www.epa.gov/epawaste/hazard/wastemin/priority.htm (May 12, 2009).
2009. Superfund, cleaning up the nation’s hazardous waste sites. http://www.epa.gov/superfund/index.htm (June 18, 2009).
373 Internet resources
13 Energy
“Society can move to the next phase of the industrial revolution that runs withoutfossil fuels, or it can ignore the problem, sentencing humanity and other creaturesto struggle on an increasingly desolate planet.”
Dr. James E. Hansen, director of the NationalAeronautics & Space Administration’s Goddard
Institute of Space Studies
Chapter 13 provides an overview of energy production and use as a major source ofpollution, and how that pollution may be alleviated. Section I surveys world demand forenergy. Section II concentrates on motor vehicle pollution and how we can reduce thatpollution. Section III delves into pollution from electricity generation and use and means toreduce that pollution. Section IV briefly examines nuclear power. Section V summarizesrenewable sources of energy. Finally Section VI looks at plans directed toward sustainableenergy generation.
SECTION I
Energy demand, usage
Overviewing world energy use
The continuing increase in world energy demand is being viewed with alarm. Between1970 and 1997 world energy consumption nearly doubled, and is projected to grow 57%between 2004 to 2030 (Figure 13.1).1 Worldwide, total energy use is projected to growfrom 447 quadrillion British thermal units (Btu) in 2004 to 702 quadrillion Btu in 2030.2 Inless-developed countries energy consumption is projected to rise three times as fast as inOECD countries. And as energy use increases, so does pollution. ▪ Consumption would behigher still except that energy intensity, the amount of energy used to per dollar of grossdomestic product (GDP) produced is declining, especially in less-developed countries. TheUnited States uses about a quarter of the world’s energy, almost twice more than Japan on a
1 International Energy Outlook, DOE/EIA-0484, Chapter 1: World energy demand and economic outlook. EIA,2008, http://www.eia.doe.gov/oiaf/ieo/world.html.
2 International Energy Outlook.Washington, D.C.: USDepartment of Energy,May, 2009, http://www.eia.doe.gov/oiaf/ieo/world.html.
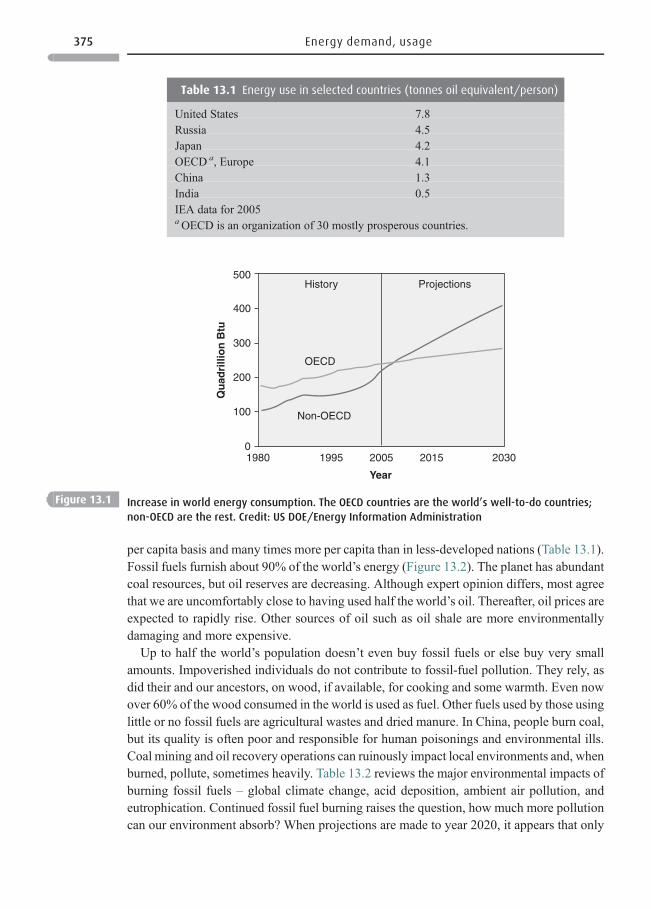
per capita basis and many times more per capita than in less-developed nations (Table 13.1).Fossil fuels furnish about 90% of the world’s energy (Figure 13.2). The planet has abundantcoal resources, but oil reserves are decreasing. Although expert opinion differs, most agreethat we are uncomfortably close to having used half the world’s oil. Thereafter, oil prices areexpected to rapidly rise. Other sources of oil such as oil shale are more environmentallydamaging and more expensive.
Up to half the world’s population doesn’t even buy fossil fuels or else buy very smallamounts. Impoverished individuals do not contribute to fossil-fuel pollution. They rely, asdid their and our ancestors, on wood, if available, for cooking and some warmth. Even nowover 60% of the wood consumed in the world is used as fuel. Other fuels used by those usinglittle or no fossil fuels are agricultural wastes and dried manure. In China, people burn coal,but its quality is often poor and responsible for human poisonings and environmental ills.Coal mining and oil recovery operations can ruinously impact local environments and, whenburned, pollute, sometimes heavily. Table 13.2 reviews the major environmental impacts ofburning fossil fuels – global climate change, acid deposition, ambient air pollution, andeutrophication. Continued fossil fuel burning raises the question, how much more pollutioncan our environment absorb? When projections are made to year 2020, it appears that only
Qu
adri
llio
n B
tu
500
400
300
200
100
1980 1995 2005
Year
2015 20300
History Projections
OECD
Non-OECD
Figure 13.1 Increase in world energy consumption. The OECD countries are the world’s well-to-do countries;
non-OECD are the rest. Credit: US DOE/Energy Information Administration
Table 13.1 Energy use in selected countries (tonnes oil equivalent/person)
United States 7.8Russia 4.5Japan 4.2OECD a, Europe 4.1China 1.3India 0.5IEA data for 2005aOECD is an organization of 30 mostly prosperous countries.
375 Energy demand, usage
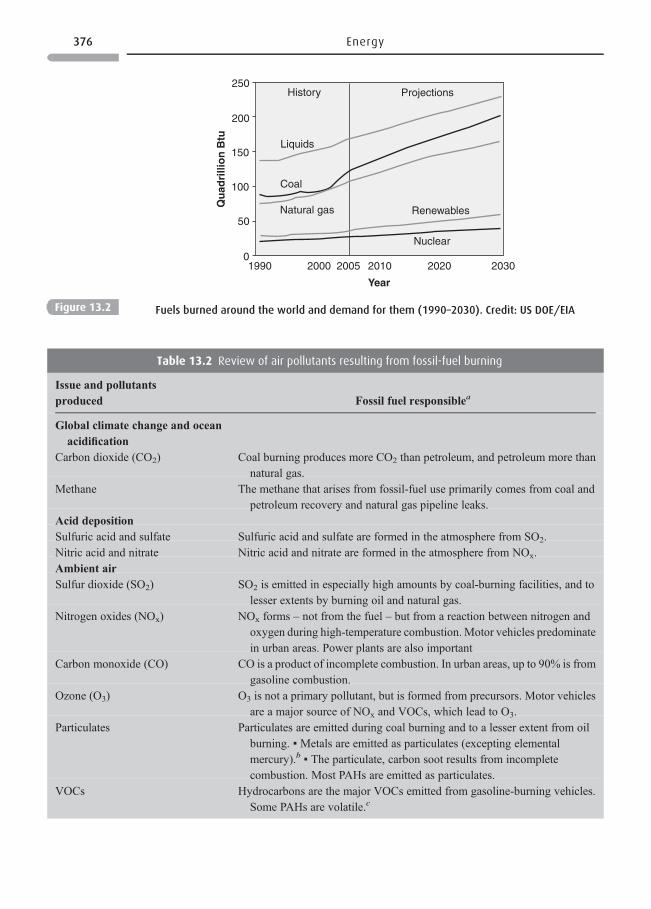
Qu
adri
llio
n B
tu
200
250
100
150
50
1990 2000 2005 2010
Year
2020 20300
History
Liquids
Coal
Natural gas Renewables
Nuclear
Projections
Figure 13.2 Fuels burned around the world and demand for them (1990–2030). Credit: US DOE/EIA
Table 13.2 Review of air pollutants resulting from fossil-fuel burning
Issue and pollutantsproduced Fossil fuel responsible a
Global climate change and oceanacidification
Carbon dioxide (CO2) Coal burning produces more CO2 than petroleum, and petroleum more thannatural gas.
Methane The methane that arises from fossil-fuel use primarily comes from coal andpetroleum recovery and natural gas pipeline leaks.
Acid depositionSulfuric acid and sulfate Sulfuric acid and sulfate are formed in the atmosphere from SO2.Nitric acid and nitrate Nitric acid and nitrate are formed in the atmosphere from NOx.Ambient airSulfur dioxide (SO2) SO2 is emitted in especially high amounts by coal-burning facilities, and to
lesser extents by burning oil and natural gas.Nitrogen oxides (NOx) NOx forms – not from the fuel – but from a reaction between nitrogen and
oxygen during high-temperature combustion. Motor vehicles predominatein urban areas. Power plants are also important
Carbon monoxide (CO) CO is a product of incomplete combustion. In urban areas, up to 90% is fromgasoline combustion.
Ozone (O3) O3 is not a primary pollutant, but is formed from precursors. Motor vehiclesare a major source of NOx and VOCs, which lead to O3.
Particulates Particulates are emitted during coal burning and to a lesser extent from oilburning. ▪ Metals are emitted as particulates (excepting elementalmercury). b ▪ The particulate, carbon soot results from incompletecombustion. Most PAHs are emitted as particulates.
VOCs Hydrocarbons are the major VOCs emitted from gasoline-burning vehicles.Some PAHs are volatile. c
376 Energy
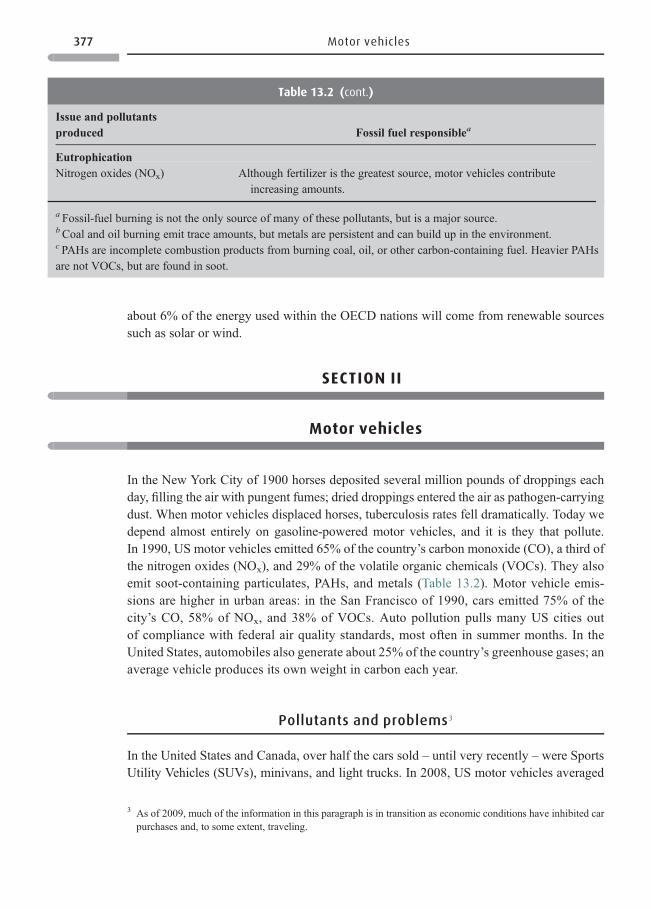
about 6% of the energy used within the OECD nations will come from renewable sourcessuch as solar or wind.
SECTION II
Motor vehicles
In the New York City of 1900 horses deposited several million pounds of droppings eachday, filling the air with pungent fumes; dried droppings entered the air as pathogen-carryingdust. When motor vehicles displaced horses, tuberculosis rates fell dramatically. Today wedepend almost entirely on gasoline-powered motor vehicles, and it is they that pollute.In 1990, US motor vehicles emitted 65% of the country’s carbon monoxide (CO), a third ofthe nitrogen oxides (NOx), and 29% of the volatile organic chemicals (VOCs). They alsoemit soot-containing particulates, PAHs, and metals (Table 13.2). Motor vehicle emis-sions are higher in urban areas: in the San Francisco of 1990, cars emitted 75% of thecity’s CO, 58% of NOx, and 38% of VOCs. Auto pollution pulls many US cities outof compliance with federal air quality standards, most often in summer months. In theUnited States, automobiles also generate about 25% of the country’s greenhouse gases; anaverage vehicle produces its own weight in carbon each year.
Pollutants and problems3
In the United States and Canada, over half the cars sold – until very recently – were SportsUtility Vehicles (SUVs), minivans, and light trucks. In 2008, US motor vehicles averaged
Table 13.2 (cont.)
Issue and pollutantsproduced Fossil fuel responsible a
EutrophicationNitrogen oxides (NOx) Although fertilizer is the greatest source, motor vehicles contribute
increasing amounts.
a Fossil-fuel burning is not the only source of many of these pollutants, but is a major source.bCoal and oil burning emit trace amounts, but metals are persistent and can build up in the environment.c PAHs are incomplete combustion products from burning coal, oil, or other carbon-containing fuel. Heavier PAHsare not VOCs, but are found in soot.
3 As of 2009, much of the information in this paragraph is in transition as economic conditions have inhibited carpurchases and, to some extent, traveling.
377 Motor vehicles
21mpg (8.9 km/l),4 about 6% lower than the high point attained in 1987 – and that was only22 mpg (9.3 km/l). Until late 2008, many more cars were being sold than at any previoustime; for many years auto ownership grew six times faster than the population. And each cartraveled more miles than did those of earlier years.5 Considering these facts, it was notsurprising that a UN study showed that US andCanadian citizens use nine times more gasolinethan the global average. All forms of transport put together consume about a third of the energyused in the United States. More roads continue to be built to “solve” the congestion created bythe increasing millions of vehicles. Roads add to the burden of impervious surfaces and thus topolluted runoff to water, and to disruption of wildlife habitat. And adding roads doesn’t solvecongestion. As University of California Professor M. Wachs notes, “You can never buildenough roads to keep up with congestion. Traffic always rises to exceed capacity.” ▪ ManyEuropean cities have population densities four times greater than American cities. Shoppingand other facilities are close enough to homes that individuals canmake up to 50% of their tripson foot or bike. About 10% use energy-efficient public transit. Trains are, per passenger, sixtimes more energy efficient than automobiles. In contrast US individuals make 87% of theirtrips by car and only 3% via public transit although, as fuel prices have risen, that percentageis growing. Author Molly Sheehan states, “US drivers consume roughly 43% of the world’sgasoline to propel less than 5% of the world’s population.”6 Burning gasoline exerts a heavyenvironmental price, and dependence on foreign oil threatens national energy security.Nonetheless, gasoline use has continued to grow. Manufacturing and fueling cars is theworld’s biggest industry, and a vehicle can produce as much pollution during its manufactureas over its driving lifetime. ▪ And remember the whole life cycle: In 1995, a car used nearly1800 pounds (820 kg) of steel, 398 pounds (180 kg) of iron, 188 pounds(85kg) of aluminum,and 246 pounds (112 kg) of plastics. Thereafter, as Americans bought larger vehicles, resourceuse has become higher still. ▪ And beyond cars are trucks, farm machinery, snowmobiles, all-terrain vehicles, and gasoline-driven appliances of all types, including lawn mowers and leafblowers. As with multiplying brooms in the story of the Sorcerer’s Apprentice, petroleum-powered vehicles and appliances have multiplied out of control.
Reducing air pollution from motor vehicles
Recommendations include: mandating that cars have greater fuel efficiency and use lesspolluting fuels; raising fees charged on cars; and aggressively promoting carpooling.
4 Cars and light trucks, fuel economy trends, 1975–2008. US EPA, January 14, 2009, http://www.epa.gov/otaq/fetrends.htm.
5 In what author Hertsgaard says “must rank among the great corporate crimes of the century, General Motorssecretly joined with Standard Oil of California, Firestone Tire and Rubber, Phillips Petroleum, and Mack (Truck)Manufacturing in 1932 to form National City Lines . . . ” This syndicate bought about 100 railways and trolleylines in 45 US cities, shut them down and tore out their tracks. Their “punishment” was a $5000 fine in 1949.Meanwhile, highways were being built, and it was to private cars – exactly as the conspirators desired – thatAmericans turned.
6 O’Meara Sheehan, M. City Limits: Putting the Brakes on Sprawl. Worldwatch Paper 156. Washington DC:Worldwatch Institute, 2001, http://www.worldwatch.org/node/834.
378 Energy
Reducing or eliminating auto emissions is discussed below. Remember that cars also poseother major problems. Roads destroy communities when high-speed, high-traffic roadsbisect them, and disrupt wildlife habitat and destroy farmland as people leave cities.7
Beyond more air pollution from increased driving, is increased runoff of polluted watercontaining oil, chemicals, tire shreds, and the like.
Reducing air pollution from cars
By mandate The 1990 US Clean Air Act Amendments (CAAA) mandated steps to reducemotor vehicle pollution from cars, buses and trucks, non-road vehicles, boats, farm equip-ment, bulldozers, lawn and garden devices, and construction machinery. Tailpipe emissionswere tightened. Cities not in compliance with EPA standards were expected to reducehydrocarbon emissions 25–29%, toxic emissions 20–22%, and NOx emissions 9–10%.Many approaches were used to accomplish this. ▪ By conservation The CAAA asked thesmoggiest cities to encourage alternatives to people driving alone. In especially pollutedareas, businesses employing more than 100 people were asked to find ways to increase thenumber of passengers per vehicle commuting to work and in work-related trips, and, tofurther reduce car use, encourage carpooling and provide incentives to carpool. To encour-age biking, provide bike paths and a place to shower after bikers get to work. Most importantin the long run is redesigning cities to make walking, bicycling, and use of public transportmore convenient.
Methods used to reduce air pollution
* Carbon monoxide (CO) Motor vehicles are the major source of CO emissions. Two CAAprograms addressed this problem. (1) Greater CO emissions occur in cold weather whenfuel burns less efficiently and pollution control equipment works less well. Cold-engineemissions may represent 75% of emissions on short trips Manufacturers had to modifyvehicles to lower cold-engine emissions. (2) Because CO is a product of incompletecombustion, the EPA asked cities out of compliance with CO standards to use gasoline towhich an oxygen-containing chemical was added; more oxygen assists in convertingcarbon monoxide to carbon dioxide and thus reduces CO in the exhaust.8
* Ozone (O3) The EPA characterizes ozone as the United States’s most serious and persistentair quality problem. Thus, restrictions were placed on the pollutants, hydrocarbon, and
7 A US Union of Concerned Scientists evaluation concluded that, among our personal habits, it is transportation –and driving cars in particular – that is most environmentally destructive. Moreover, 40 000 Americans die inaccidents each year. Worldwide, about 900 000 a year die. Many recommend the re-urbanization of America, i.e.,moving back into more compact communities. This would benefit public transport, and increase walking andbiking to get groceries and other necessities. Professor Tim Gutowski of Massachusetts Institute of Technologynotes that the automobile even threatens itself. This is true because infrastructure and roadway constructioncannot keep pace with ever-increasing auto use especially in locales with already high population densities.
8 Previously, the United States used methyl tertiary butyl ether (MTBE) to provide oxygen, but MTBE provedmorewater soluble than expected and became a widespread water contaminant. The oxygen-containing chemical,ethanol (common alcohol) is now used to furnish oxygen.
379 Reducing air pollution from motor vehicles
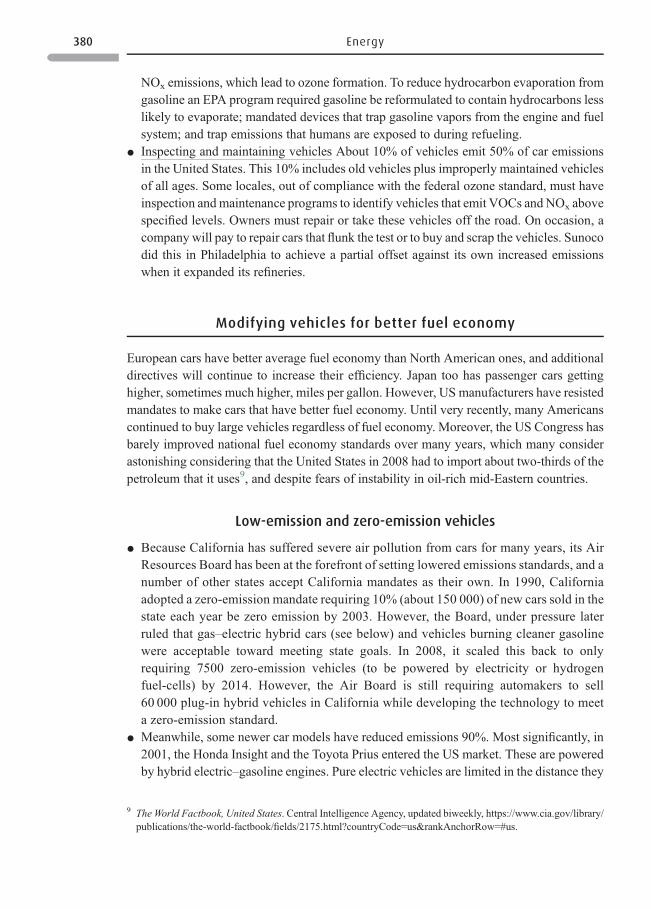
NOx emissions, which lead to ozone formation. To reduce hydrocarbon evaporation fromgasoline an EPA program required gasoline be reformulated to contain hydrocarbons lesslikely to evaporate; mandated devices that trap gasoline vapors from the engine and fuelsystem; and trap emissions that humans are exposed to during refueling.
* Inspecting and maintaining vehicles About 10% of vehicles emit 50% of car emissionsin the United States. This 10% includes old vehicles plus improperly maintained vehiclesof all ages. Some locales, out of compliance with the federal ozone standard, must haveinspection andmaintenance programs to identify vehicles that emit VOCs and NOx abovespecified levels. Owners must repair or take these vehicles off the road. On occasion, acompany will pay to repair cars that flunk the test or to buy and scrap the vehicles. Sunocodid this in Philadelphia to achieve a partial offset against its own increased emissionswhen it expanded its refineries.
Modifying vehicles for better fuel economy
European cars have better average fuel economy than North American ones, and additionaldirectives will continue to increase their efficiency. Japan too has passenger cars gettinghigher, sometimes much higher, miles per gallon. However, US manufacturers have resistedmandates to make cars that have better fuel economy. Until very recently, many Americanscontinued to buy large vehicles regardless of fuel economy. Moreover, the US Congress hasbarely improved national fuel economy standards over many years, which many considerastonishing considering that the United States in 2008 had to import about two-thirds of thepetroleum that it uses9, and despite fears of instability in oil-rich mid-Eastern countries.
Low-emission and zero-emission vehicles
* Because California has suffered severe air pollution from cars for many years, its AirResources Board has been at the forefront of setting lowered emissions standards, and anumber of other states accept California mandates as their own. In 1990, Californiaadopted a zero-emission mandate requiring 10% (about 150 000) of new cars sold in thestate each year be zero emission by 2003. However, the Board, under pressure laterruled that gas–electric hybrid cars (see below) and vehicles burning cleaner gasolinewere acceptable toward meeting state goals. In 2008, it scaled this back to onlyrequiring 7500 zero-emission vehicles (to be powered by electricity or hydrogenfuel-cells) by 2014. However, the Air Board is still requiring automakers to sell60 000 plug-in hybrid vehicles in California while developing the technology to meeta zero-emission standard.
* Meanwhile, some newer car models have reduced emissions 90%. Most significantly, in2001, the Honda Insight and the Toyota Prius entered the US market. These are poweredby hybrid electric–gasoline engines. Pure electric vehicles are limited in the distance they
9 The World Factbook, United States. Central Intelligence Agency, updated biweekly, https://www.cia.gov/library/publications/the-world-factbook/fields/2175.html?countryCode=us&rankAnchorRow=#us.
380 Energy
can drive between recharging. However, hybrids are partially fueled by gasoline and their(lightweight nickel–metal hydride pack) batteries are charged in a totally differentmanner; batteries charge via regenerative braking, i.e., the electric motor harnesseskinetic energy from the forward momentum of the vehicle whenever the car decelerates.Moreover, hybrid bodies and frames are made of lightweight materials designed to keepdrag low. Depending on several factors, they obtain 50 to more than 60 mpg, and areserved by the gasoline infrastructure already in place. ▪ Purely electric vehicles don’tpollute at all, although the electric power plants recharging them do. However, societycontrols emissions from a limited number of electric power plants more efficiently thanemissions from millions of individual vehicles; also, electric power plants are usuallyfound outside the most polluted urban areas, thus relieving urban pollution. ▪ Solar-powered vehicles are zero-emission vehicles too, but are a long way from reachingcommercial status.
Alternative motor fuels to lower emissions
The CAA did not address flexibly fueled vehicles (FFVs); these don’t use gasoline, butdifferent less-polluting fuels such as natural gas, propane, electricity, biodiesel,10 andpotentially hydrogen. ▪ Propane fuels hundreds of thousands of US vehicles, still only atiny percentage of the total cars. Vehicle maintenance costs and engine wear are loweredbecause the clean-burning propane leaves no lead, varnish, or carbon deposits, and haslower emissions of ambient air pollutants. And because propane and natural gas contain lesscarbon than gasoline, emissions of the greenhouse gas, CO2, are reduced. ▪A majoradvantage to those driving gasoline-powered cars is an established service infrastructure,fueling stations, mechanics, etc. So, if FFVs are to succeed, an infrastructure must beavailable to fuel and service them. To prod infrastructure development, the US EnergyPolicy Act of 1992 required that 75% of the light duty fleet owned by federal agencies beFFVs. However, compliance has been spotty. Some local and state governments and privatecompanies have bought a limited number of propane-fueled buses. ▪A tiny but important setof FFVs are those powered by hydrogen fuel cells.
Hydrogen fueled cars for zero emissions?
A zero-emission vehicle of great interest is the hydrogen fuel-cell powered auto, whichemits little more than hot water, and no CO2. A fuel cell converts chemical energy directly toelectric current (Figure 13.3). Its engine makes little noise, and has low maintenance costs.
10 One definition of biodiesel comes from the web: biodiesel is a type of biofuel made by combining animal fat orvegetable oil (such as soybean oil or recycled restaurant grease) with alcohol. It can be directly substituted fordiesel as a stand-alone fuel (called B100, for 100% biodiesel) or be used as an additive. http://www.mtpc.org/cleanenergy/energy/glossarytechfuels.htm.
381 Alternative motor fuels to lower emissions
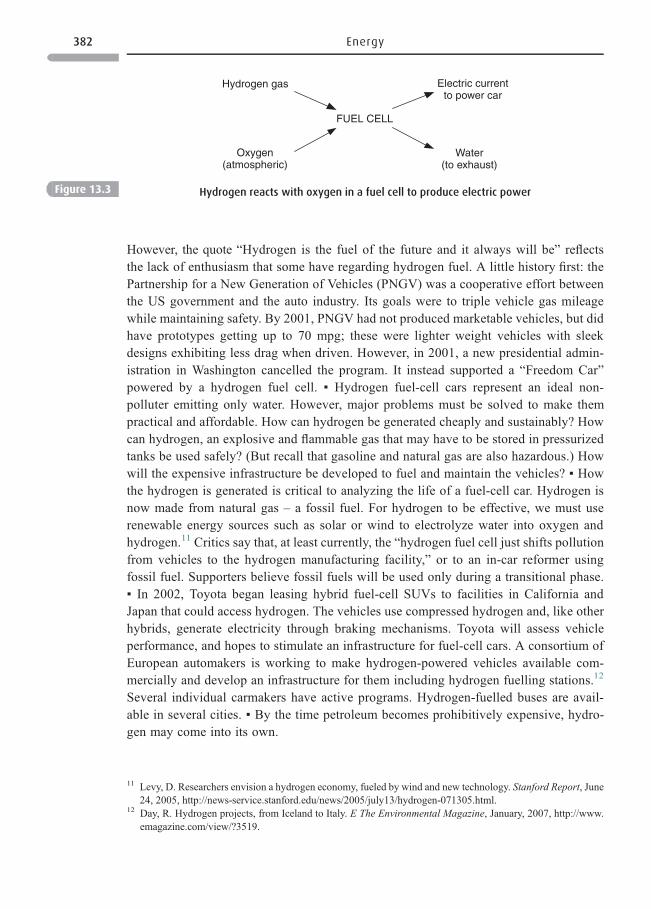
However, the quote “Hydrogen is the fuel of the future and it always will be” reflectsthe lack of enthusiasm that some have regarding hydrogen fuel. A little history first: thePartnership for a New Generation of Vehicles (PNGV) was a cooperative effort betweenthe US government and the auto industry. Its goals were to triple vehicle gas mileagewhile maintaining safety. By 2001, PNGV had not produced marketable vehicles, but didhave prototypes getting up to 70 mpg; these were lighter weight vehicles with sleekdesigns exhibiting less drag when driven. However, in 2001, a new presidential admin-istration in Washington cancelled the program. It instead supported a “Freedom Car”powered by a hydrogen fuel cell. ▪ Hydrogen fuel-cell cars represent an ideal non-polluter emitting only water. However, major problems must be solved to make thempractical and affordable. How can hydrogen be generated cheaply and sustainably? Howcan hydrogen, an explosive and flammable gas that may have to be stored in pressurizedtanks be used safely? (But recall that gasoline and natural gas are also hazardous.) Howwill the expensive infrastructure be developed to fuel and maintain the vehicles? ▪ Howthe hydrogen is generated is critical to analyzing the life of a fuel-cell car. Hydrogen isnow made from natural gas – a fossil fuel. For hydrogen to be effective, we must userenewable energy sources such as solar or wind to electrolyze water into oxygen andhydrogen.11 Critics say that, at least currently, the “hydrogen fuel cell just shifts pollutionfrom vehicles to the hydrogen manufacturing facility,” or to an in-car reformer usingfossil fuel. Supporters believe fossil fuels will be used only during a transitional phase.▪ In 2002, Toyota began leasing hybrid fuel-cell SUVs to facilities in California andJapan that could access hydrogen. The vehicles use compressed hydrogen and, like otherhybrids, generate electricity through braking mechanisms. Toyota will assess vehicleperformance, and hopes to stimulate an infrastructure for fuel-cell cars. A consortium ofEuropean automakers is working to make hydrogen-powered vehicles available com-mercially and develop an infrastructure for them including hydrogen fuelling stations.12
Several individual carmakers have active programs. Hydrogen-fuelled buses are avail-able in several cities. ▪ By the time petroleum becomes prohibitively expensive, hydro-gen may come into its own.
Hydrogen gas
Oxygen(atmospheric)
FUEL CELL
Electric currentto power car
Water(to exhaust)
Figure 13.3 Hydrogen reacts with oxygen in a fuel cell to produce electric power
11 Levy, D. Researchers envision a hydrogen economy, fueled by wind and new technology. Stanford Report, June24, 2005, http://news-service.stanford.edu/news/2005/july13/hydrogen-071305.html.
12 Day, R. Hydrogen projects, from Iceland to Italy. E The Environmental Magazine, January, 2007, http://www.emagazine.com/view/?3519.
382 Energy
Lowering emissions using biomass fuels?
* Interest in using biomass such as ethanol from corn or biodiesel from soybeans as motor-vehicle fuel is partially driven by an interest in lowering greenhouse gas emissions,especially CO2.
13 A biomass fuel, when burned produces CO2, but if grown sustainably,the next generation of plants takes up as much CO2 as was released when the biofuel wasburned. Thus, ideally, cycling through the generations, no more CO2 is released than istaken up. Unfortunately, there are many problems with producing and using biofuels.14
▪ In the United States there is a push to grow more corn to produce ethanol. However,many analysts – examining the whole life cycle – have concluded that growing, harvest-ing, and then fermenting cornstarch to produce ethanol may require almost as much fossilfuel energy as the fuel value of the ethanol being produced. And, growing more corn, anopen-row crop leads to more soil erosion and more runoff of fertilizer and pesticides.15,16
Corn is also water intensive to grow, especially irrigated corn; in addition it takes severalgallons of water to produce one gallon of ethanol. A major ethical concern is: in a worldwhere producing enough food is an ongoing problem, to use corn, soybeans, and otherfood crops as fuel is considered questionable.17
* Professor L. Lave of Carnegie-Mellon University and others propose that we produceethanol from switchgrass or various agricultural wastes. This poses other problems. Itmeans that instead of using, as an ethanol source, corn starch, which is quite easilydegraded into glucose, we use cellulose. Cellulose is much more difficult to degrade intoglucose; it is also a more expensive process. However, agriculturally undesirable land canbe used to produce grasses and trees, and agricultural waste could be used, thus avoidingthe major impacts of growing corn (or even of growing sugarcane in Brazil). Nonetheless,as stated by Jeffrey Fox, vice president of a biorefinery, “It will be a huge issue just gettingcellulosic material to the biorefinery.” And using crop residues, which would otherwiseremain on and nourish the soil, may be shortsighted. ▪ Although still believing thatproducing biofuels is important, Europeans and, more slowly, Americans are developingstandards as to what constitutes sustainably grown biomass, and to also think of how foodprices might be impacted.18
* One non-controversial biomass source is – very specifically – biodiesel made fromthe billions of gallons of waste oil produced in countless restaurants that deep fry food.
* A much bigger source potentially that some believe may approach fruition within adecade is growing large quantities of algae and extracting oil from them to produce
13 Equally, if not stronger, reasons for the interest in biofuels include lowering the amounts of imported petroleumand providing another means to farmers to make a more profitable livelihood.
14 Schultz, W. The costs of biofuels. Chemical & Engineering News, 85(51) December 17, 2007, 12–16. (Thisarticle presents two points of view on using corn ethanol and, eventually, ethanol made from cellulosic biomass.)
15 Biofueling water problems. Environmental Science & Technology, 41(22), November 15, 2007, 7593.16 Engelhaupt, E. High corn demand could harmUSwaters.Environmental Science& Technology, 41(19), October
1, 2007, 6635–6635.17 Exploding US grain demand for automotive fuel threatens world food security and political stability. Earth
Policy Institute, November 6, 2006.18 Widenoja, R. and Halweil, B. Banning “bad” biofuels, becoming better consumers. Worldwatch Institute,
January 23, 2008, http://www.worldwatch.org/node/5587.
383 Alternative motor fuels to lower emissions
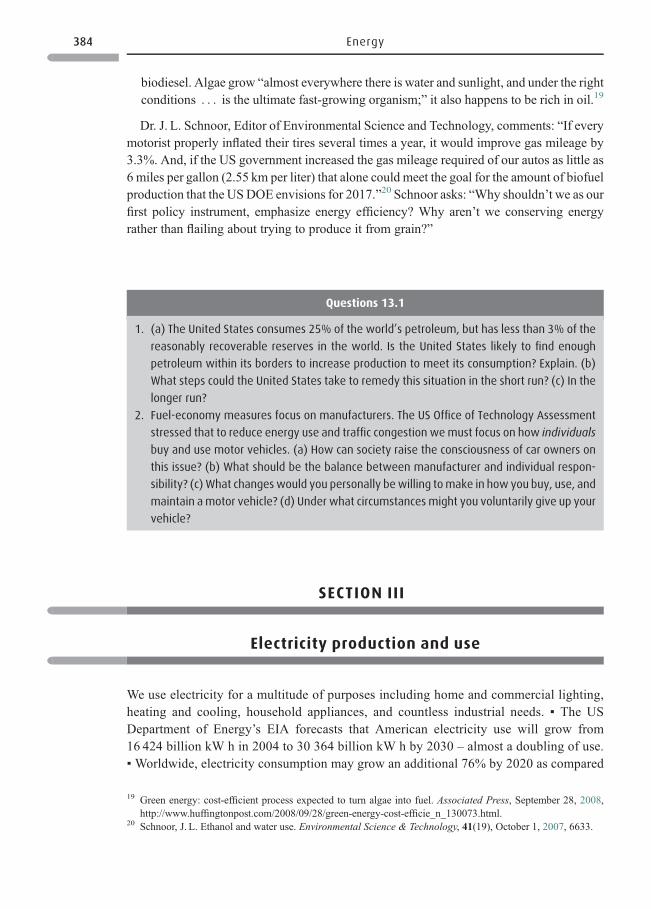
biodiesel. Algae grow “almost everywhere there is water and sunlight, and under the rightconditions . . . is the ultimate fast-growing organism;” it also happens to be rich in oil.19
Dr. J. L. Schnoor, Editor of Environmental Science and Technology, comments: “If everymotorist properly inflated their tires several times a year, it would improve gas mileage by3.3%. And, if the US government increased the gas mileage required of our autos as little as6 miles per gallon (2.55 km per liter) that alone could meet the goal for the amount of biofuelproduction that the USDOE envisions for 2017.”20 Schnoor asks: “Why shouldn’t we as ourfirst policy instrument, emphasize energy efficiency? Why aren’t we conserving energyrather than flailing about trying to produce it from grain?”
SECTION III
Electricity production and use
We use electricity for a multitude of purposes including home and commercial lighting,heating and cooling, household appliances, and countless industrial needs. ▪ The USDepartment of Energy’s EIA forecasts that American electricity use will grow from16 424 billion kW h in 2004 to 30 364 billion kW h by 2030 – almost a doubling of use.▪ Worldwide, electricity consumption may grow an additional 76% by 2020 as compared
Questions 13.1
1. (a) The United States consumes 25% of the world’s petroleum, but has less than 3% of the
reasonably recoverable reserves in the world. Is the United States likely to find enough
petroleum within its borders to increase production to meet its consumption? Explain. (b)
What steps could the United States take to remedy this situation in the short run? (c) In the
longer run?
2. Fuel-economy measures focus on manufacturers. The US Office of Technology Assessment
stressed that to reduce energy use and traffic congestion wemust focus on how individuals
buy and use motor vehicles. (a) How can society raise the consciousness of car owners on
this issue? (b) What should be the balance between manufacturer and individual respon-
sibility? (c) What changeswould you personally bewilling tomake in how you buy, use, and
maintain amotor vehicle? (d) Under what circumstances might you voluntarily give up your
vehicle?
19 Green energy: cost-efficient process expected to turn algae into fuel. Associated Press, September 28, 2008,http://www.huffingtonpost.com/2008/09/28/green-energy-cost-efficie_n_130073.html.
20 Schnoor, J. L. Ethanol and water use. Environmental Science & Technology, 41(19), October 1, 2007, 6633.
384 Energy
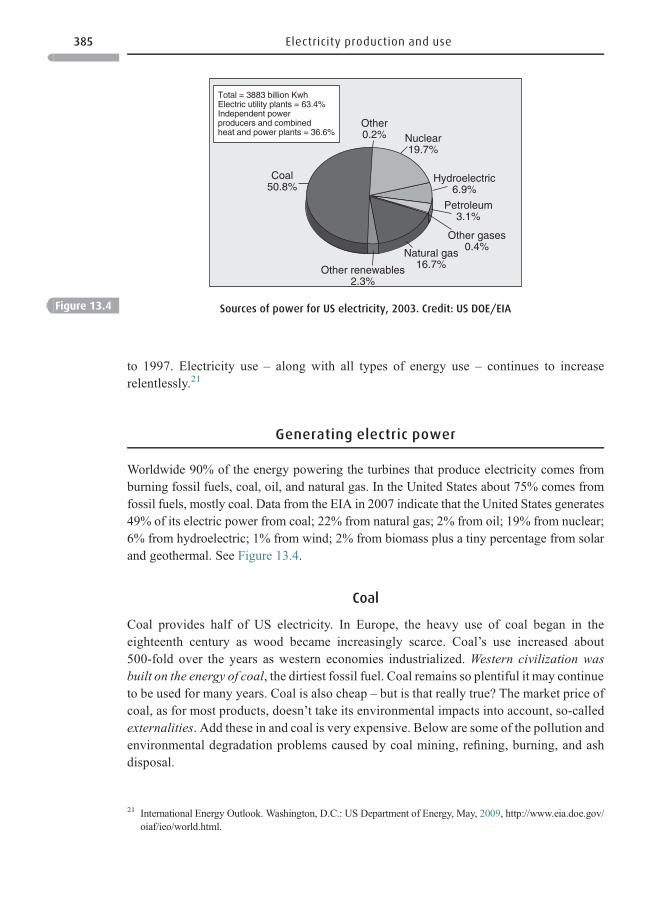
to 1997. Electricity use – along with all types of energy use – continues to increaserelentlessly.21
Generating electric power
Worldwide 90% of the energy powering the turbines that produce electricity comes fromburning fossil fuels, coal, oil, and natural gas. In the United States about 75% comes fromfossil fuels, mostly coal. Data from the EIA in 2007 indicate that the United States generates49% of its electric power from coal; 22% from natural gas; 2% from oil; 19% from nuclear;6% from hydroelectric; 1% from wind; 2% from biomass plus a tiny percentage from solarand geothermal. See Figure 13.4.
Coal
Coal provides half of US electricity. In Europe, the heavy use of coal began in theeighteenth century as wood became increasingly scarce. Coal’s use increased about500-fold over the years as western economies industrialized. Western civilization wasbuilt on the energy of coal, the dirtiest fossil fuel. Coal remains so plentiful it may continueto be used for many years. Coal is also cheap – but is that really true? The market price ofcoal, as for most products, doesn’t take its environmental impacts into account, so-calledexternalities. Add these in and coal is very expensive. Below are some of the pollution andenvironmental degradation problems caused by coal mining, refining, burning, and ashdisposal.
Other0.2% Nuclear
19.7%
Hydroelectric6.9%
Petroleum3.1%
Other gases0.4%
Natural gas16.7%Other renewables
2.3%
Coal50.8%
Total = 3883 billion KwhElectric utility plants = 63.4%Independent powerproducers and combinedheat and power plants = 36.6%
Figure 13.4 Sources of power for US electricity, 2003. Credit: US DOE/EIA
21 International Energy Outlook. Washington, D.C.: US Department of Energy, May, 2009, http://www.eia.doe.gov/oiaf/ieo/world.html.
385 Electricity production and use
* Air pollution: ▪ Sulfur The sulfur content of coal ranges from 1% to 5%. Industrializedcountries often remove the water-soluble portion of sulfur in high-sulfur coal beforeburning it. The sulfur that is part of coal’s matrix is insoluble and cannot be washed out.During burning, sulfur is converted to the major pollutant, sulfur dioxide (SO2). Modernequipment can capture most SO2, but many facilities lack good controls. ▪ Nitrogenoxides Another major pollutant formed during burning coal and other fossil fuels is NOx.Low-NOx burners, when used, can remove most. ▪Metals Coal has only trace amounts ofmetals, but a billion tons (0.91 billion tonnes) a year is burned in the United Statesalone.22 Without good controls to remove these persistent pollutants, environmentallevels build over time. Coal also contains radioactive elements, uranium (~1.3 ppm)and thorium (~3.2 ppm). People living near coal-burning power plants have higherpotential exposure to ionizing radiation than those living near nuclear power plantsbecause emissions from the latter are better controlled. Water pollution Many air pollu-tants result from burning coal, which are either particulates to begin with such as metals orare converted to particulates such as acids. These settle onto water bodies as well as land.
* Coal’s life cycle: Mining Surface mines can ruin local environments. One particularlydestructive form is the mountain-top removal of coal (Chapter 1). Underground miningposes dangers to workers, and until modern workplace protections, coal dust oftencaused deadly black-lung disease. Both surface and underground mining expose sulfur-containing rocks to water and air, which oxidize the sulfur to sulfuric acid. Moreover,the acid dissolves metals in rocks, which with the acid run off to local water bodies.Processing As coal is crushed, sized, and (sometimes) washed, scarce water may bepolluted. Coal mining and processing produce large quantities of waste and air pollutants.Water use Coal cleaning and burning require large amounts of water.23 Burning Althoughcoal burning releases significantly fewer pollutants than a generation ago, power plants inthe aggregate still produce significant pollution, even in developed nations. Ash About100 million tons (91 million tonnes) of ash results from burning a billion tons (0.91billion tonnes) of coal a year in the United States. About 40% of this is used in road bedsand to make cement, wallboard, and other products. Once organic matter is burnt away,ash has a high metal content. Stored above ground, ash can result in acid and metal runoffinto area waters. Some ash is disposed of in old mines. Much, sometimes decades ofaccumulation, is stored in “ponds”where the ash is kept wet. A billion-gallon (3.8 billionliters) spill of coal ash sludge and water occurred in 2008. This happened when the damon a coal-ash pond failed, greatly damaging a river and a Tennessee community.
* Coal reserves Tremendous reserves of coal exist around the world, especially in theUnited States, China, and India. Challenging questions include: can coal be mined in lessdestructive ways? Can it be burned cleanly? Can the ash be either beneficially used orsafely disposed of? How possible is the addition of the very expensive technology neededfor carbon capture and sequestration (CCS)?
22 US to burn 1.2 pct less coal for power in 2009, EIA. Reuters, February 10, 2009, http://uk.reuters.com/article/oilRpt/idUKN1029694020090210.
23 Frazer, L. Low water consumption: a new goal for coal. Environmental Health Perspectives, April, 2004,A296–299.
386 Energy
Natural gas24
▪ Compared to coal and oil, natural gas has fewer contaminants, burns more cleanly, andgenerates only about half as much CO2 per unit of energy as coal. However, as with coaland oil, burning natural gas produces NOx. Low-NOx burners are necessary to control it. Theprimary component of natural gas is a different greenhouse gas, >the potent methane, which
Box 13.1 Energy and pollution in China
Figure 13.1 indicates that energy use in less-developed (non-OECD) countrieswill likely grow even
faster than inOECD countries. The two countrieswith the largest populations, China and India, have
between them about 2.3 billion people. Both have abundant coal, and use it heavily; however,
China currently uses about five times more coal than India.25 Coal supplies about 70% of China’s
energy needs as compared to a world average of less than 30%.26 And 80% of China’s electricity
is fueled by coal. Thus, not surprisingly China’s CO2 emissions have outstripped US emissions, and
will continue to grow as it builds about one new coal-burning power plant a week.27 ▪ China’seconomy is projected to grow 6% per year in the coming years, twice the rate as the world as a
whole.28 Air andwater pollution is already at painful levels, and onewonders how China will cope
if pollution increases in step with energy use,29 especially as officials in Beijing are not successful
in controlling provincial officials who won’t curb local industry. China has a huge heavy industry
sector making products such as steel and cement. But even its newest factories and plants are
energy inefficient. Moreover 95% of its new buildings require twice the energy to heat and cool
as do United States and European buildings. ▪ More positively, China is investing heavily in
renewable energy. By 2020, it intends that 15% of its energy be from solar, wind, and hydro-
electric dams. Although still building huge hydroelectric dams, many small dams are also being
built. And the government in 2007 started a public education drive.30 It gives citizens information
on ways they can significantly reduce energy use by using CFL light bulbs, choosing energy-
efficient appliances, using public transport instead of cars, etc. The advice is, not surprisingly,
similar to that given in Western countries. ▪ The challenge says an IEA report “is for all countries to
put in motion a transition to a more secure, lower-carbon energy system, without undermining
economic and social development. Nowhere will this challenge be tougher, or of greater impor-
tance to the rest of the world, than in China and India. Vigorous, immediate, and collective policy
action by all governments is essential to move the world onto a more sustainable energy path.”
24 Note that oil is not covered here because only 2% of US electricity is generated by burning oil.25 Coal and climate change facts. Pew Center on Global Climate Change, 2007, http://www.pewclimate.org/
global-warming-basics/coalfacts.cfm.26 World Energy Outlook, 2007, China and India insights. IEA, 2007, http://www.iea.org/Textbase/npsum/
WEO2007SUM.pdf.27 China’s future in an energy-constrained world. World Resources Institute, December 12, 2008, http://earthtrends.
wri.org/updates/node/274.28 As with any current projection (2009), it is not clear how the worldwide economic downturn will impact growth.29 Kahn, J. and Yardley, J. As China roars, pollution reaches deadly extremes. New York Times, August 26, 2007,
http://www.climateark.org/shared/reader/welcome.aspx?linkid=82634.30 Li, L. China launches energy conservation guide for citizens: WorldWatch Institute and Global Environmental
Institute (Beijing), September 13, 2007, http://www.worldwatch.org/node/5346.
387 Electricity production and use
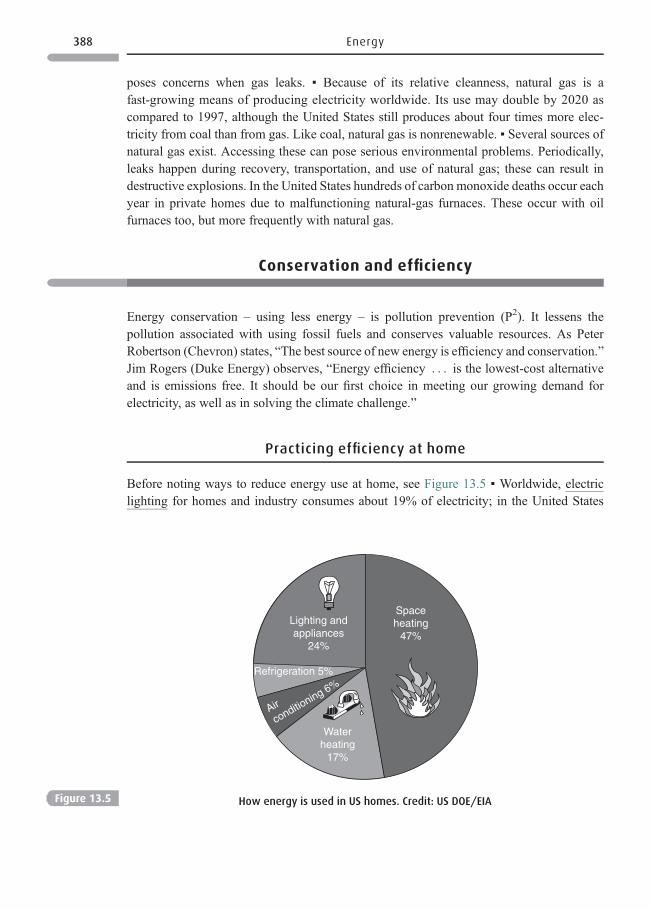
poses concerns when gas leaks. ▪ Because of its relative cleanness, natural gas is afast-growing means of producing electricity worldwide. Its use may double by 2020 ascompared to 1997, although the United States still produces about four times more elec-tricity from coal than from gas. Like coal, natural gas is nonrenewable. ▪ Several sources ofnatural gas exist. Accessing these can pose serious environmental problems. Periodically,leaks happen during recovery, transportation, and use of natural gas; these can result indestructive explosions. In the United States hundreds of carbon monoxide deaths occur eachyear in private homes due to malfunctioning natural-gas furnaces. These occur with oilfurnaces too, but more frequently with natural gas.
Conservation and efficiency
Energy conservation – using less energy – is pollution prevention (P2). It lessens thepollution associated with using fossil fuels and conserves valuable resources. As PeterRobertson (Chevron) states, “The best source of new energy is efficiency and conservation.”Jim Rogers (Duke Energy) observes, “Energy efficiency . . . is the lowest-cost alternativeand is emissions free. It should be our first choice in meeting our growing demand forelectricity, as well as in solving the climate challenge.”
Practicing efficiency at home
Before noting ways to reduce energy use at home, see Figure 13.5 ▪ Worldwide, electriclighting for homes and industry consumes about 19% of electricity; in the United States
Spaceheating
47%
Waterheating
17%
Lighting andappliances
24%
Refrigeration 5%
Air
conditioning 6%
Figure 13.5 How energy is used in US homes. Credit: US DOE/EIA
388 Energy
the figure for lighting and appliances is 24%31 (plus another 5% for refrigeration and 6%for air conditioning). An average home uses 1500 kilowatt hours/year (kW h/year) forlighting, 40% more than in 1970. ▪ An incandescent light bulb uses only 10% of the energythat it consumes to produce light; the rest is given off as heat. Replace a quarter of yourincandescent bulbs with compact fluorescents lights (CFLs), and cut your lighting bill asmuch as half. CFLs cost more, but use two-thirds less electricity and last up to ten timeslonger. ▪ About half of an American home’s energy use is for space heating. One-third of atypical home’s heat loss is through doors and windows. If you can’t put in double-panewindows, buy plastic kits to install plastic over the glass. The air trapped between the plasticand glass can reduce heat loss 25–50%. And check that doors are sealed tightly to preventair leaks. ▪ A home’s water heater uses about 17% of its energy, so use less hot water. Installlow-flow showerheads. Their cost will be repaid in energy savings in three to four months.▪ Buy energy star appliances (Figure 13.6), those identified by the US EPA and DOE as themost energy-efficient products in their classes. Other good suggestions are found at anumber of web sites.32
Becoming more energy conscious
All these suggestions require a small up-front investment, which is paid back with interest.There are other simple conservation measures with no upfront cost. ▪ Turn off unneededlights. ▪ Turn down the thermostat at night. ▪ Turn down the temperature of your waterheater. ▪ Use cold water to wash clothes. ▪ Don’t wash clothing more often than necessary.Clothing driers, in particular, are large energy users.
Figure 13.6 The EnergyStar® logo
31 Johnson, J. The end of the light bulb. Chemical & Engineering News, 85(49), December 3, 2007, 46–51.32 (1) Vogel, J. Ten simple ways to save energy.E The EnvironmentalMagazine, XVI(2),March/April, 2005, http://
www.emagazine.com/view/?2313. (2) A consumer’s guide to energy efficiency and renewable energy. USDepartment of Energy, March 12, 2009, http://apps1.eere.energy.gov/consumer/. (3) Creating an energy-efficient world. Alliance to Save Energy, 2009, http://www.ase.org/.
389 Conservation and efficiency
Conservation in industry
Manufacturing consumes about half of the world’s energy, and US facilities use a third of thenation’s total energy. Joseph Romm’s book, Cool Companies notes that companies – evenafter having already gone through a careful examination of energy-saving opportunities –can repeat the process and find additional ways to conserve energy. John Browne, CEOof BP-Amoco, stated that BP had by 2002 voluntarily cut its greenhouse gas emissions 10%below 1990 levels at no net cost to the company. Browne said this was “the product . . . ofhundreds of different initiatives carried through by tens of thousands of people across BP.”Notice Browne’s point: conservation and efficiency measures were accomplished not by onebig step, but by multiple small ones. ▪ However, companies often hesitate to make upfrontinvestments in energy saving features, especially if the payback time on the investmentis years.
* In the United States industrial motors consume two-thirds of the electricity used byindustry, about 50% of the electric power produced in the United States. Motors are ofteninefficient and bigger than necessary for their particular job. The DOE is working withcompanies to stimulate their use of efficient motors. In one audit of a dozen industrialsites, they found that – by installing motors more appropriate to the job – energy use couldbe cut by a third with a payback time of 18 months.
* Generating steam is another energy hog, and the steam’s energy is often not fully used.This contrasts with Kalundborg (Figure 2.2) where the power plant passes unused steamon to other facilities or to to warm households. This “district heating,” where an electricpower plant forwards steam to central city buildings is often used in Europe; a limitednumber of US industrial generators do likewise. In Jay, Maine, Androscoggin Energyoperates a natural gas power plant, which is co-located with a pulp and paper mill ownedby International Paper. The power plant generates electricity for sale elsewhere, and sellspart of its steam to the mill. Thus, the mill and power plant both use energy more
Questions 13.2
1. Why is coal ash stored in wet “ponds”?
2. Some believe that coal can be burned cleanly. Others say clean-coal is a myth. With which
of these two statements do you most tend to agree and why?
3. One American uses twice as much energy as a European or Japanese person, 15 times as
much as an Indian, etc. Above and beyond environmental impacts, what other impacts of
this high energy use should Americans consider?
4. Cutting greenhouse gas emissions also reduces emissions of SO2, NOx, and particulates.
How?
5. What are three energy-conservation steps a business or institution can carry out without
cost?
6. What are three ways of conserving energy that have upfront costs, but will pay for
themselves?
390 Energy
efficiently and save money. This is called cogeneration or, recently, recycled energy.33,34
Unfortunately, the EPA found that only a small percentage of the waste energy producedby 16 American industries was being used, although the EPA had calculated that energycould have provided power for 48 million homes.35 However, more industries are nowlooking into the potential that energy offers them.
* The US DOE in 2005, developed computer software to help plants assess where energysavings in their facilities can be made.36 An 800 acre (324 hectare) chemical plant ownedby Rohm and Hass is one among hundreds of beneficiaries of DOE’s effort. The plantalready had a team that had worked for ten years on energy use and pollution abatementand believed it had found all the “low hanging fruit” energy savings. But the DOE auditcoupled with the energy team resulted in seeing the plant with fresh eyes and yielded“astounding” results. “Ten years of looking at this plant –we’d never seen this situation,”said Frederick Fendt, a systems engineer. One audit finding was that they could have beenusing previously wasted heat for many applications that only needed low-pressure steam.DOE’s Scheihing noted the program was “a crash course in educating manufacturingmanagers . . . in what this fruit looks like.”
Burning cleaner fuel
▪Natural gas is the cleanest burning (generates less pollution) of the fossil fuels. Petroleumis intermediate. Coal is the least clean-burning, although the most-advanced coal-burningplants reportedly burn much more cleanly. ▪ CO2 emissions from gas burning are lowerbecause natural gas contains less carbon. ▪ Low-sulfur coal produces less SO2 whenburned than higher sulfur coals. Some coals from western US states have as little as0.3% sulfur.
Adopting clean-coal technology
* Scrubbers are commonly used to capture SO2 and particulates (including metals andsoot). Although 100% of pollutants cannot be captured, advanced technologies capturealmost all. Low-NOx burners cut NOx emissions as much as two-thirds, and newertechnology much more.
* One P2 method involves washing crushed coal with water to remove the soluble sulfur sothat the coal has lower SO2 emissions when burned. Another P2 approach is burning coalon a fluidized bed: coal is pulverized and burned together with ground limestone on a
33 Another natural gas power plant, a two hour drive from the one in Jay vents its lower-energy steam (which cannotdrive a turbine) into the atmosphere. Especially on cold days, big clouds of steam (wasted energy) hang over thearea.
34 Combined heat and power partnership. US EPA, March 18, 2009, http://www.epa.gov/CHP/index.html.35 Johnston, M.W. Considering cogeneration: clean power whose time has come back. E The Environmental
Magazine, January–February, 2008, http://www.recycled-energy.com/newsroom/news/emagazine-jan-feb2008.html.
36 Johnson, J. Ending plants’ wasting ways. Chemical & Engineering News, 86(02), January 14, 2008, 37–38. (2)Energy trends in selected manufacturing sectors: opportunities and challenges for environmentally preferableenergy outcomes. US EPA, February 17, 2009, http://www.epa.gov/sectors/energy/index.html.
391 Conservation and efficiency
screen. Air currents keep the coal particles in constant motion, giving the appearance of aboiling (fluidized) bed. The limestone captures SO2 as it is formed. A fluidized bed alsoallows more efficient burning with fewer by-products of incomplete combustion.
* Carbon is an integral part of coal’s chemical matrix and cannot be washed out likeinorganic sulfur. Also, CO2 is not ordinarily captured from flue gas.37 As discussed inChapter 7 major problems remain with finding efficient affordable techniques to captureand sequester CO2 emissions. Meanwhile, we depend on conservation and efficiency toreduce CO2 emissions, and on greater use of renewable energy sources.
* Modern clean-coal technology can burn coal efficiently, capture SO2, metals, and otherparticulates, and has greatly lowered NOx emissions.38 Compare three pictures: (1) If nocoal-burning plants in the United States had controls, they would emit 20 million tons(18 million tonnes) of SO2. (2) With the controls that plants actually use now, they emitabout 12million tons (11 million tonnes). (3) If all plants used state-of-the-art technology,they would emit only 2 million tons (1.8 million tonnes). But many companies resistspending large sums for major retrofits to reduce pollution, and resist building expensivenew plants. Thus, many dirty facilities remain in operation. These were “grandfathered”in under the first CAA of 1970, and so chose not to install modern controls. Many stillexist, producing a disproportionate amount of pollution. At the other end of the spectrum,the Bruce Mansfield Power Plant in Pennsylvania spent almost a third of its constructionbudget on environmental technologies, and built a state-of-the-art plant that burnscoal much more cleanly. ▪ In poor countries the situation is typically worse. In Chinaand especially India, air-emission controls are poor and sulfur often not removed. Andbecause pollutants travel, SO2 emitted in China can impact Japan, a country that usesmodern controls.
SECTION IV
Electricity from nuclear power
In 2007, nuclear power generated 16% of the world’s electricity and 19% in the UnitedStates. In the EU as a whole, nuclear power provides 34% of the electric power, but someEU countries don’t use nuclear at all, whereas France generates a remarkable 78% of itselectricity from nuclear. Nuclear power plants produce no air pollution. Some nuclear waste
37 Small amounts are captured for such uses as carbonating beverages or making the calcium carbonate used inpaper making.
38 A technology being tested in demonstration projects is coal gasification, which converts coal to syngas, thenburned to produce electricity. Gasification is not incineration, the whole process is changed. Almost all the sulfurin Syngas can be recovered as elemental sulfur, a salable commodity. Mercury can be contained within thesystem. Carbon monoxide (CO) can be converted to carbon dioxide (CO2) before it reaches the flue gas. Sopollutant emissions are low. Gasification technology is also more energy efficient than a traditional coal-burningplant. It may be commercialized in a decade. However, it is more expensive than building a traditional electricpower plant.
392 Energy
components are very long-lived or highly radioactive, but waste volume is small and solid.Consider arguments39 against and for nuclear power. ▪ An argument in favor of nuclearpower is that modern nuclear reactors are much safer than those involved in the 1986Chernobyl accident; one is the pebble bed modular reactor. 40 ▪Opponents argue that even ifplants are operated safely, radioactive wastes cannot be safely disposed. Disposal is socontroversial that, many years after selecting a burial site in the United States, it may bemany more years before it is used, if ever. Meanwhile, waste is stored at the sites where it isgenerated. Proponents point to France a country that recycles its spent fuel. Eighty percentof the fuel actually remains after being “burned.” France recovers this to reuse in the powerplant.41 It vitrifies the other 20%, which greatly reduces the risk of radionuclides leachingout. The process is expensive, but no more than the long-drawn-out approaches that theUnited States has used to find and prepare acceptable storage. Proponents point to the Oklo“natural reactor” in the Republic of Gabon. Starting about two billion years ago andcontinuing over a 500 000-year period, natural uranium fission reactions occurred thatcreated hundreds of tons of nuclear fission products. In 2 billion years no radioactivematerials have migrated from the rocks. Opponents say there is no assurance that otherstorage sites would be equally safe. ▪Many believe that our energy needs and the pollutionfrom burning fossil fuels are so great that we cannot discard nuclear power. Kurt Yeager ofthe US Electric Power Research Institute observed, “I believe it would be a tragedy forfuture generations if we outlaw nuclear power because the current generation of engineeringdoesn’t meet our standards.”
Coal versus nuclear
Nuclear proponents compare a 1000-megawatt nuclear power plant to a 1000-megawattcoal-burning power plant.
* Coal A coal-burning plant emits up to 35 000 tons (32 tonnes) a year of SO2 (althoughgood controls can much reduce this). Metals, although emitted in small quantities buildup in the environment. Uranium and thorium are radioisotopes emitted at levels greaterthan those permitted for a nuclear reactor. Current environmental controls cannot reducethe 4.5 million tons (4 million tonnes) of CO2 that a coal-burning plant may emit. It alsoproduces 3.5 million cubic feet (99 000 cubic meters) of ash a year. Mining coal oftenentails great environmental damage.
39 Sovacool, B. K. Think again: nuclear energy. Foreign Policy, September 22, 2005, http://news-nuclear.blogspot.com/2005/09/foreign-policy-think-again-nuclear_22.html.
40 Schmidt, C. The next generation of nuclear power? Environmental Science & Technology, 40(5), March 1,2006, 1382–1383. In addition to being safer, this reactor operates at a high temperature of 1652ºF (900ºC),which could be used to electrolyze water to obtain hydrogen gas. This could assist society in its transition to ahydrogen economy.
41 During recycling, some plutonium is produced. If this fell into the wrong hands it could be used in the building ofnuclear weapons. Another concern relates directly to nuclear installations. There has been fear since the 9/11attacks on the United States, that attacks from the air could result in widely broadcast radioactive chemicals. Notall consider this a concern.
393 Electricity from nuclear power
* Nuclear The nuclear plant produces only 70 cubic feet (2 cubic meters) of high-levelradioactive waste.42 There is no CO2 or other emissions during operations, except forhot water. However, a life-cycle analysis indicates carbon emissions are involved becausemuch energy is required to mine and mill uranium. Moreover, a large amount ofelectricity is necessary to enrich uranium. And, pollution is a concern when the plant isdismantled.
Nuclear Fusion
Nuclear fusion does not use radioactive chemicals and produces no air pollution.43 Theprocess produces neutrons, and it is the capture of these neutrons that produces heat. Thereaction vessel becomes radioactive during this process, but remains so for a much shortertime than do isotopes produced by nuclear fission. Research and development on nuclearfusion has been ongoing for decades and has been extremely expensive. Congress hassupported nuclear fusion research done in cooperation with the EU, Japan, and Russiaintended to demonstrate self-sustaining fusion, and to eventually operate a reactor. Somescientists consider the likelihood of successful nuclear fusion dim. Others say progress hasbeen steady, and that “despite enormous hurdles, the most promising long-term nuclearpower source is still fusion.” They believe that we may see a commercial fusion reactor in adecade.44
Questions 13.3
1. Put yourself into the world of 1945. World War II has just ended after nuclear bombs were
dropped on Japan. Your country strongly desires to use nuclear energy for peaceful
purposes, and especially to produce nuclear electric power. Consider that you know prob-
lems that can arise with using nuclear power to produce electricity: ionizing radiation can
harm life, and nuclear reactors may not always be safe. Even if reactors are fail-safe, human
operators are not. Some nuclear waste components remain radioactive for many thousands
of years, and disposing of them raises perplexing and expensive problems. Nuclear power
technology can sometimes be used to develop nuclear weapons. Your nation nonetheless
believes that nuclear power is desirable. If your country knew in 1945 what we know now,
how would it have developed nuclear power in a more environmentally and socially
responsible way?
42 The great majority of radioactive waste needing to be dealt with in the United States is not from commercialreactors, but from old military and US DOE operations. Thus, even if no new nuclear plants are built, this wasteneeds action. Unlike civilian power-plant waste, which is solid, much military and DOE waste is liquid, iscomplex, and often mixed with other hazardous waste. The military and DOE sites containing this waste presenttremendously expensive and technologically challenging cleanup problems.
43 How is nuclear fission different from nuclear fusion? WikiAnswers, 2008, http://wiki.answers.com/Q/How_is_nuclear_fission_different_from_nuclear_fusion.
44 Kanellos, M. Nuclear fusion is coming. Green Tech, February 7, 2008, http://news.cnet.com/8301-11128_3-9866626-54.html.
394 Energy
SECTION V
Electricity from renewable sources45,46
With the exception of nuclear and geothermal power, renewable energies all depend directlyor indirectly on the sun. The Earth’s surface yearly receives sunlight with energy equivalentto 10 times more than that stored in all known reserves of coal, oil, natural gas, and uraniumcombined. And were we capable of harnessing 40 minutes of sunlight, it could satisfy globalenergy needs for a year.
* We use solar energy indirectly when we burn wood and other biomass fuels or when weburn fossil fuels, which are organic material stored beneath Earth’s surface eons ago. ▪Energy represented by the flow of water over dams originates from the sun’s energy(which evaporates the water that subsequently falls onto the Earth). ▪ The energy of thewind that drives wind turbines comes from the sun. So does sea wave power.
* We directly use solar power when we use photovoltaic cells, solar concentrators, orpassive solar. The solar power industry currently supplies less than 0.1% of US electricity,but that figure may grow to 15% by 2020.
Solar, photovoltaic (PV)47
The term solar energy as applied to electric power generation refers to either photovoltaiccells or thermal-solar systems. Photovoltaic (PV) cells directly generate electricity fromlight. ▪ Solar power does not directly pollute, but remember life-cycle issues (see Box 13.2).▪ Location Solar power plants are located in areas when sunlight is plentiful but, to be usefulon a large scale must be transported to less-sun rich locales. ▪ Storage Because solar energyis generated only when the sun shines, storage is necessary to have it available for othertimes.
PV operations
* Small48 You are probably familiar with very small-scale applications such as powering acalculator or, recharging batteries with a solar-powered charger.49 Solar panels on a roof
45 Alternative energy: biofuels, fuel cells, geothermal energy, hydropower, solar energy, wind power. NationalGeographic, http://environment.nationalgeographic.com/environment/global-warming/alternative-energy/.
46 Renewable energy sources: a consumer’s guide. EIA, 2004, http://www.eia.doe.gov/neic/brochure/renew05/renewable.html.
47 Exploring ways to use solar energy. US DOE, September 12, 2005, http://apps1.eere.energy.gov/consumer/renewable_energy/solar/index.cfm/mytopic=50011.
48 HomePower Magazine (wind, solar and other micropower sources), http://www.homepower.com/home/.49 More recently small lamps, powered by small solar panels are beginning to be used in less-developed counties as
affordable electricity; they can be charged by several hours of sunlight. They are also useful for camping trips.
395 Electricity from renewable sources
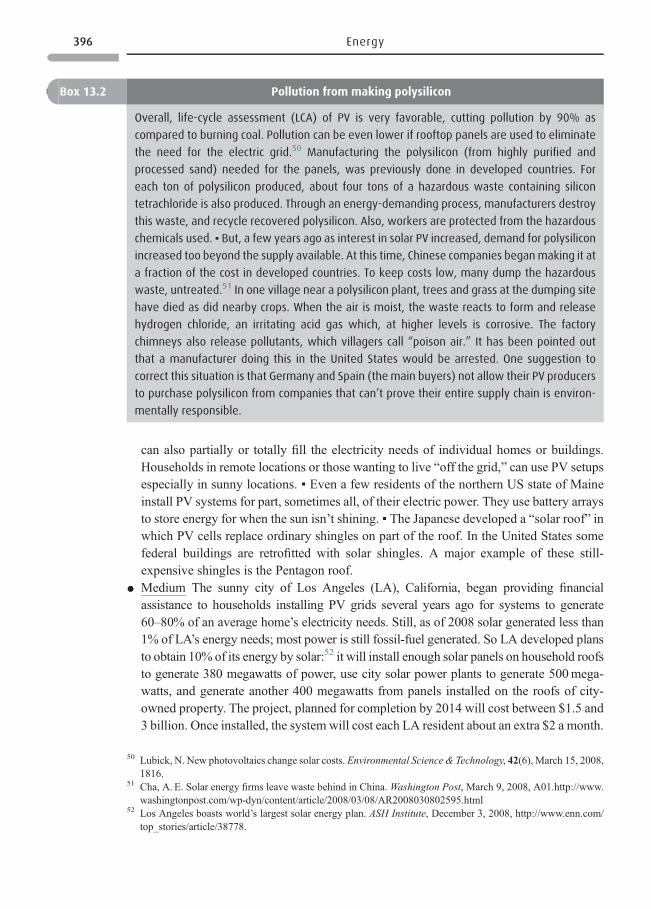
can also partially or totally fill the electricity needs of individual homes or buildings.Households in remote locations or those wanting to live “off the grid,” can use PV setupsespecially in sunny locations. ▪ Even a few residents of the northern US state of Maineinstall PV systems for part, sometimes all, of their electric power. They use battery arraysto store energy for when the sun isn’t shining. ▪ The Japanese developed a “solar roof” inwhich PV cells replace ordinary shingles on part of the roof. In the United States somefederal buildings are retrofitted with solar shingles. A major example of these still-expensive shingles is the Pentagon roof.
* Medium The sunny city of Los Angeles (LA), California, began providing financialassistance to households installing PV grids several years ago for systems to generate60–80% of an average home’s electricity needs. Still, as of 2008 solar generated less than1% of LA’s energy needs; most power is still fossil-fuel generated. So LA developed plansto obtain 10% of its energy by solar:52 it will install enough solar panels on household roofsto generate 380 megawatts of power, use city solar power plants to generate 500mega-watts, and generate another 400 megawatts from panels installed on the roofs of city-owned property. The project, planned for completion by 2014 will cost between $1.5 and3 billion. Once installed, the system will cost each LA resident about an extra $2 a month.
Box 13.2 Pollution from making polysilicon
Overall, life-cycle assessment (LCA) of PV is very favorable, cutting pollution by 90% as
compared to burning coal. Pollution can be even lower if rooftop panels are used to eliminate
the need for the electric grid.50 Manufacturing the polysilicon (from highly purified and
processed sand) needed for the panels, was previously done in developed countries. For
each ton of polysilicon produced, about four tons of a hazardous waste containing silicon
tetrachloride is also produced. Through an energy-demanding process, manufacturers destroy
this waste, and recycle recovered polysilicon. Also, workers are protected from the hazardous
chemicals used. ▪ But, a few years ago as interest in solar PV increased, demand for polysilicon
increased too beyond the supply available. At this time, Chinese companies beganmaking it at
a fraction of the cost in developed countries. To keep costs low, many dump the hazardous
waste, untreated.51 In one village near a polysilicon plant, trees and grass at the dumping site
have died as did nearby crops. When the air is moist, the waste reacts to form and release
hydrogen chloride, an irritating acid gas which, at higher levels is corrosive. The factory
chimneys also release pollutants, which villagers call “poison air.” It has been pointed out
that a manufacturer doing this in the United States would be arrested. One suggestion to
correct this situation is that Germany and Spain (the main buyers) not allow their PV producers
to purchase polysilicon from companies that can’t prove their entire supply chain is environ-
mentally responsible.
50 Lubick, N. New photovoltaics change solar costs. Environmental Science & Technology, 42(6), March 15, 2008,1816.
51 Cha, A. E. Solar energy firms leave waste behind in China. Washington Post, March 9, 2008, A01.http://www.washingtonpost.com/wp-dyn/content/article/2008/03/08/AR2008030802595.html
52 Los Angeles boasts world’s largest solar energy plan. ASH Institute, December 3, 2008, http://www.enn.com/top_stories/article/38778.
396 Energy
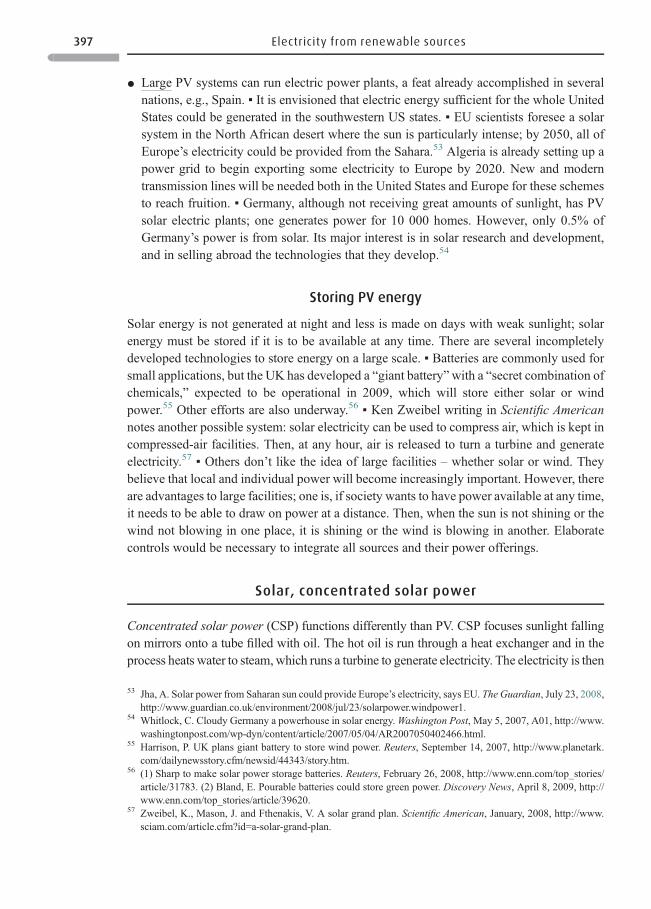
* Large PV systems can run electric power plants, a feat already accomplished in severalnations, e.g., Spain. ▪ It is envisioned that electric energy sufficient for the whole UnitedStates could be generated in the southwestern US states. ▪ EU scientists foresee a solarsystem in the North African desert where the sun is particularly intense; by 2050, all ofEurope’s electricity could be provided from the Sahara.53 Algeria is already setting up apower grid to begin exporting some electricity to Europe by 2020. New and moderntransmission lines will be needed both in the United States and Europe for these schemesto reach fruition. ▪ Germany, although not receiving great amounts of sunlight, has PVsolar electric plants; one generates power for 10 000 homes. However, only 0.5% ofGermany’s power is from solar. Its major interest is in solar research and development,and in selling abroad the technologies that they develop.54
Storing PV energy
Solar energy is not generated at night and less is made on days with weak sunlight; solarenergy must be stored if it is to be available at any time. There are several incompletelydeveloped technologies to store energy on a large scale. ▪ Batteries are commonly used forsmall applications, but the UK has developed a “giant battery”with a “secret combination ofchemicals,” expected to be operational in 2009, which will store either solar or windpower.55 Other efforts are also underway.56 ▪ Ken Zweibel writing in Scientific Americannotes another possible system: solar electricity can be used to compress air, which is kept incompressed-air facilities. Then, at any hour, air is released to turn a turbine and generateelectricity.57 ▪ Others don’t like the idea of large facilities – whether solar or wind. Theybelieve that local and individual power will become increasingly important. However, thereare advantages to large facilities; one is, if society wants to have power available at any time,it needs to be able to draw on power at a distance. Then, when the sun is not shining or thewind not blowing in one place, it is shining or the wind is blowing in another. Elaboratecontrols would be necessary to integrate all sources and their power offerings.
Solar, concentrated solar power
Concentrated solar power (CSP) functions differently than PV. CSP focuses sunlight fallingon mirrors onto a tube filled with oil. The hot oil is run through a heat exchanger and in theprocess heats water to steam,which runs a turbine to generate electricity. The electricity is then
53 Jha, A. Solar power from Saharan sun could provide Europe’s electricity, says EU. The Guardian, July 23, 2008,http://www.guardian.co.uk/environment/2008/jul/23/solarpower.windpower1.
54 Whitlock, C. Cloudy Germany a powerhouse in solar energy.Washington Post, May 5, 2007, A01, http://www.washingtonpost.com/wp-dyn/content/article/2007/05/04/AR2007050402466.html.
55 Harrison, P. UK plans giant battery to store wind power. Reuters, September 14, 2007, http://www.planetark.com/dailynewsstory.cfm/newsid/44343/story.htm.
56 (1) Sharp to make solar power storage batteries. Reuters, February 26, 2008, http://www.enn.com/top_stories/article/31783. (2) Bland, E. Pourable batteries could store green power. Discovery News, April 8, 2009, http://www.enn.com/top_stories/article/39620.
57 Zweibel, K., Mason, J. and Fthenakis, V. A solar grand plan. Scientific American, January, 2008, http://www.sciam.com/article.cfm?id=a-solar-grand-plan.
397 Electricity from renewable sources
fed to the power grid.58 Energy expert JosephRomm recognizes that there is nomagic bullet toreplace fossil fuels and that we must use many technologies, but nonetheless refers to CSP as“the technology that will save humanity.”59 ▪ Storing CSPAn important attribute is – becauseCSP generates energy as heat – the heat can be storedmany timesmore cheaply and efficientlythan electricity generated by PV. To store it: allow CSP to heat oil or molten salt, which thenretain enough heat so that energy can be released for a number of hours to generate electricity.
Solar, passive60
Passive solar usually requires some upfront costs in a home or building. Costs can be smallunless solar is expected to supply a large percentage of heating. Even in cloudy or northernlocations homes can be built to capture solar energy to help meet daytime heating needs.Or the sun can warm building material, dark flooring, or walls within the structure, or to heatlarge containers of water; these release their warmth at night. There are many examples ofpassive solar. Most are much more economical than using PV.61 ▪ Another practical use ofpassive solar is to provide hot water; water is pumped through black roof pipes exposed to thesun. The amount of hot water produced depends on the amount and intensity of sunshine. InBogata Columbia the hot water in many apartment buildings is generated this way. Even incloudy or northern locales, there is often enough sunlight to heat part of a household’s water.
Wind power63,64
Wind machines (turbines) are located in areas with dependably strong winds. Becausepeople often don’t want to live near turbines, European nations have begun building them
Questions 13.4
Author Andrew Leonard asks, “Who is responsible for the poisonous silicon tetrachloride liquid
waste being dumped, untreated in open fields near the town of Gaolong, in Henan province,
China?”62 Is it the polysilicon foundry creating the waste? The government, which does not
enforce its own regulations? The European buyers of polysilicon? The foreign governments that
subsidize the purchase of PV panels after they are produced? Respond to these questions
individually or as a class exercise.
58 Schmidt, C. Sunlight on mirrors. Environmental Science & Technology, 42(19), October 1, 2008, 7031.59 Romm, J. The technology that will save humanity. April 14, 2008, http://www.salon.com/news/feature/2008/04/
14/solar_electric_thermal/print.html.60 Siliski, A. Everyday environmental stewardship: passive heating. http://www.mipandl.org/ees/EES_
PassiveSolarHeat.pdf.61 Solar do it yourself space heating projects. http://www.builditsolar.com/Projects/SpaceHeating/Space_Heating.htm.62 Leonard, A. Paying the polysilicon piper. How the World Works, March 10, 2008, http://www.salon.com/tech/
htww/2008/03/10/polysilicon_pollution/.63 Exploring ways to use wind energy. US DOE, September 12, 2005, http://apps1.eere.energy.gov/consumer/
renewable_energy/wind/index.cfm/mytopic=50014.64 Motavalli, J. Unplugging: living off the grid. E The Environmental Magazine, July, 2005, http://www.emaga-
zine.com/view/?2650.
398 Energy
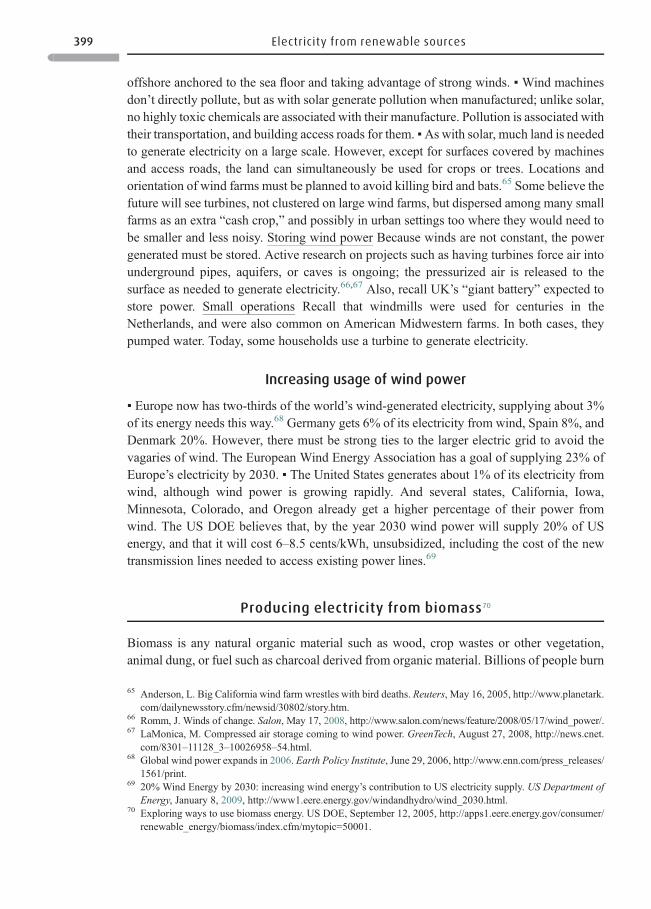
offshore anchored to the sea floor and taking advantage of strong winds. ▪ Wind machinesdon’t directly pollute, but as with solar generate pollution when manufactured; unlike solar,no highly toxic chemicals are associated with their manufacture. Pollution is associated withtheir transportation, and building access roads for them. ▪As with solar, much land is neededto generate electricity on a large scale. However, except for surfaces covered by machinesand access roads, the land can simultaneously be used for crops or trees. Locations andorientation of wind farms must be planned to avoid killing bird and bats.65 Some believe thefuture will see turbines, not clustered on large wind farms, but dispersed among many smallfarms as an extra “cash crop,” and possibly in urban settings too where they would need tobe smaller and less noisy. Storing wind power Because winds are not constant, the powergenerated must be stored. Active research on projects such as having turbines force air intounderground pipes, aquifers, or caves is ongoing; the pressurized air is released to thesurface as needed to generate electricity.66,67 Also, recall UK’s “giant battery” expected tostore power. Small operations Recall that windmills were used for centuries in theNetherlands, and were also common on American Midwestern farms. In both cases, theypumped water. Today, some households use a turbine to generate electricity.
Increasing usage of wind power
▪ Europe now has two-thirds of the world’s wind-generated electricity, supplying about 3%of its energy needs this way.68 Germany gets 6% of its electricity from wind, Spain 8%, andDenmark 20%. However, there must be strong ties to the larger electric grid to avoid thevagaries of wind. The European Wind Energy Association has a goal of supplying 23% ofEurope’s electricity by 2030. ▪ The United States generates about 1% of its electricity fromwind, although wind power is growing rapidly. And several states, California, Iowa,Minnesota, Colorado, and Oregon already get a higher percentage of their power fromwind. The US DOE believes that, by the year 2030 wind power will supply 20% of USenergy, and that it will cost 6–8.5 cents/kWh, unsubsidized, including the cost of the newtransmission lines needed to access existing power lines.69
Producing electricity from biomass70
Biomass is any natural organic material such as wood, crop wastes or other vegetation,animal dung, or fuel such as charcoal derived from organic material. Billions of people burn
65 Anderson, L. Big California wind farm wrestles with bird deaths. Reuters, May 16, 2005, http://www.planetark.com/dailynewsstory.cfm/newsid/30802/story.htm.
66 Romm, J. Winds of change. Salon, May 17, 2008, http://www.salon.com/news/feature/2008/05/17/wind_power/.67 LaMonica, M. Compressed air storage coming to wind power. GreenTech, August 27, 2008, http://news.cnet.
com/8301–11128_3–10026958–54.html.68 Global wind power expands in 2006. Earth Policy Institute, June 29, 2006, http://www.enn.com/press_releases/
1561/print.69 20% Wind Energy by 2030: increasing wind energy’s contribution to US electricity supply. US Department of
Energy, January 8, 2009, http://www1.eere.energy.gov/windandhydro/wind_2030.html.70 Exploring ways to use biomass energy. US DOE, September 12, 2005, http://apps1.eere.energy.gov/consumer/
renewable_energy/biomass/index.cfm/mytopic=50001.
399 Electricity from renewable sources
biomass in developing nations, as has happened for eons to generate heat and light. Biomasscan be used directly to produce electricity when it is burned, or used indirectly to producefuels including biodiesel, ethanol or methane (Box 13.3). ▪ One example that many peopleknow is generating electricity from burning the biomass in our municipal solid waste.If grown in a sustainable manner, biomass has no net CO2 emissions. Many of the problemsassociated with using biomass as a fuel were noted above when considering its use to makebiofuels for motor vehicles. ▪ If grown sustainably, biomass can provide new markets tofarmers for their crops. If row crops (corn) are avoided, it can sometimes lead to moreenvironmentally sound land management. Biomass can create new technologies and con-tribute jobs to local economies. In some cases, it could provide fuel to generate electricity inlocal economies. And if used in a sustainable manner to produce ethanol, biomass maylessen dependence on foreign petroleum imports. Some optimistically assert that biomasscould provide 8–16% of US electricity without displacing critical food crops. ▪ Over manyyears economies that are now industrial evolved from using biomass to using fossil fuels.Now, some visualize a return to biomass, but a return based upon sound environmentalprinciples.
Box 13.3 Using biomass energy
* Use biomass directly as a fuel ▪ When large amounts of biomass are available, it can be
burned to power electricity-producing turbines. Crops that can be used include switchgrass,
or agricultural waste such as stover (dried stalks and leaves of a crop). ▪ One type of biomass
is available as a liquid: used vegetable cooking oil from restaurants. This, after simple
processing, can be used to power motor vehicles.
* Ferment biomass to obtain fuel Biomass contains polymers. ▪ The major polymer in corn is
cornstarch, which can be treated to release glucose. The glucose is fermented to ethanol,
which is burned as fuel. ▪ Cellulose is the major polymer in switchgrass or other grasses and
in agricultural waste. Cellulose gives up its glucose with more difficulty than is the case for
starch, but intensive ongoing research strives to find means to do so economically. Once
obtained, it is fermented to ethanol. ▪ Any of these approaches can be viable, but would
need careful monitoring to prevent adverse impacts. One potential problem relates to
taking biomass from the land, and depleting the soil’s organic material and minerals. A
possible solution is, after fermenting the glucose, to compost the resulting waste. Likewise,
when biomass is burned, a mineral-rich ash is produced; this too can be returned to the soil.
* Fermentation of manure Manure is animal, not plant matter, but can be used in similar
ways. In countries as different as the United States and Nepal, manure is sometimes
fermented to generate methane, which can be burned as a cooking fuel. When larger
quantities are generated, it can be burned to generate electric power. In the United States,
New York State is subsidizing farmers to purchase digesters to ferment manure, and use the
methane generated to produce electricity for their farms. ▪ In the poor country of Nepal,
harvesting wood as cooking fuel aggravates deforestation. Fermenting manure and human
waste partially solves this problem: it provides clean-burning methane as a cooking fuel.
Residues remaining from fermentation can be composted.
400 Energy
Geothermal energy71
Geothermal refers to the heat below the Earth’s surface. The deeper into the Earth’s interiorone goes, the higher is the temperature.
* In volcano-rich Iceland and some parts of California, hot water and steam are found close tothe Earth’s surface. If the temperature is at least 302ºF (150ºC), these can be used togenerate electric power. Unlike wind or solar it’s always available. It’s as much as 80% lessexpensive than fossil fuels, and involves only about a sixth as much CO2 as compared to anatural-gas-fueled power plant. But some foul-smelling highly-toxic hydrogen sulfide gasis released. There are also geothermal fluids with toxic substances which must be disposedof. And, overdrawing local geothermal supplies is sometimes a problem.
* A different technique called heat mining is useful in many places where steam is not nearthe surface. Wells are drilled to reach hot rocks in the Earth’s crust, which are thenconnected to an area of fractured rock through which water is pumped. This waterbecomes heated and, carried to the surface provides the hot water or steam able to runan electric generator. Energy is needed to do the drilling but once the hot rocks areaccessed, no further fuel is needed. Environmental impacts are low as operations areunderground except for the power plant at the surface. However, the power plant needswater, sometimes a problem. An MIT panel studying heat mining concluded that, whendeveloped, it could supply 6% of US electric energy.72
* There is no need to drill into hot rocks when the intention is simply to obtain warmth forspace heating in a home or other structure. The Earth starting within a few feet (about ameter) below the surface has a temperature of 45–70ºF (7–21ºC), considerably higherthan above-ground winter temperatures. To warm a home, fluid is circulated (using ageothermal heat pump) into a well dug several feet down; the fluid becomes warmed andits warmth is transferred into the home. The home temperature obtained may be lowerthan desired, and an electrically operated surface heat pump is used to raise the temper-ature further. However, the amount of electricity used is much less than would be the casewithout geothermal heat. In the summer, the geothermal pump can be operated in reverseto cool the home. The system is significantly more expensive to install than a conven-tional heating/cooling system, but can pay back the investment within a few years.73
Hydrogen74
Hydrogen fuel cells were discussed above as a means to power cars. However, they canbe scaled to many sizes to provide electricity for a house or building, or to power an electric
71 Geothermal heat pumps. US DOE, May 1, 2008, http://apps1.eere.energy.gov/consumer/your_home/space_heating_cooling/index.cfm/mytopic=12640.
72 MIT-lead panel. The future of geothermal energy: impacts of enhanced geothermal systems (EGS) on the UnitedStates in the 21st century. US Department of Energy, January 22, 2007, http://web.mit.edu/newsoffice/2007/geothermal.html.
73 Geothermal heat pump. Wikipedia, November 30, 2008, http://en.wikipedia.org/wiki/Geothermal_heat_pump.74 Exploring ways to use hydrogen. US DOE, September 2, 2008, http://apps1.eere.energy.gov/consumer/
renewable_energy/hydrogen/index.cfm/mytopic=50005.
401 Electricity from renewable sources
power plant. In fact, using hydrogen to provide electricity for stationary uses is easier thanusing it in a vehicle. Some buildings that need totally dependable electric power already usehydrogen – however, hydrogen is produced by using fossil fuels. ▪ In a demonstrationproject,75 Maine’s Chewonki Foundation placed solar panels on its Education Center roof toprovide the power to electrolyze water and obtain hydrogen (H2O→ H2 + O2). In this case,the energy used to produce the hydrogen comes from a renewable source. The hydrogengenerated is piped into the building, where fuel cells convert it into electricity, which is thenavailable to supply power to the building for 4 days in the event of a power outage. Acompany involved in the project, Maine Oxy, uses solar energy on a larger scale to producehydrogen and oxygen, which it sells. ▪ Iceland heats 90% of its buildings using hydroelectricand geothermal energy. It also uses geothermal energy to electrolyze water into hydrogen: itis making hydrogen from a renewable source. Iceland plans to fuel all its vehicles withhydrogen, and end fossil fuel use by 2030. The city of Reykjavík already has hydrogen-powered buses. Other countries lack Iceland’s geothermal supplies. However, other meansof generating geothermal as described above may be able to do so in the future.
Harnessing the ocean’s energy76,77
The oceans provide several opportunities to generate electrical energy.
* Wave energy technologies make use of devices placed on the water’s surface that convertwave movements into mechanical energy, which is used to drive a turbine. Wave energyis already used in Portugal on a small scale.78 As of 2008, this country obtains 42% of itselectricity from renewable resources, mostly solar and wind. Now “sea snakes” offshore,using wave energy are connected to the commercial grid and supply electricity to 1500homes. Many more snakes are planned. Other nations are also actively exploring waveenergy’s potential. Because it is variable, it would need to be part of a mix of energysources.
* Tidal energy harnesses energy from the difference between high and low tides; thatdifference must be at least 16 ft (4.9m), which limits its use in the United States to Maineand Alaska.79 One means to trap tidal energy is by building a dam across an estuary. Asthe tide changes, it forces water through turbines in the dam to turn a generator. In 2008,the UK built a commercial marine turbine in Northern Ireland powering about a thousandhomes. It has plans to build many more. For example, Scotland is moving toward
75 Harkavy, J. Chewonki’s renewable hydrogen center. Chewonki, August 28, 2006, http://www.chewonki.org/news_detail.asp?news=11.
76 Exploring ways to use the ocean’s energy, US DOE, September 12, 2005, http://apps1.eere.energy.gov/consumer/renewable_energy/ocean/index.cfm/mytopic=50007.
77 Harnessing the ocean’s energy. Environmental Health Perspectives, 112(5) April 2004, 1, http://www.thefreelibrary.com/The+state+of+the+oceans,+part+2:+delving+deeper+into+the+sea%27s+bounty-a0137505234.
78 Durham, N. The little nation that could go green. CBC News, October 20, 2008, http://www.nowpublic.com/environment/little-nation-could-go-green-and.
79 Johnson, I. “Saudi Arabia of renewable energy” off Scotland’s coast, June 22, 2007, http://news.scotsman.com/index.cfm?id=982522007.
402 Energy
commercial development. Some fear that deriving power from tides could disrupt wholeecosystems.
* Ocean thermal energy conversion, which works in warm climates, takes advantage of thedifferences between the solar-warmed surface waters and the colder deep waters.
Hydroelectric dams80
Hydroelectricity is often referred to as a renewable source of electricity. A dam does havemany advantages: it produces little air pollution, uses few nonrenewable resources, gen-erates needed electricity, prevents floods, and provides irrigation water. However, largedams81 flood agricultural land, displace people from their homes and communities, disruptecosystems and wildlife habitats up and downstream, interfere with fish migration, anddeprive downstream recreational users of water. Moreover, on occasion changes in waterflow can lead to catastrophic floods. The irrigation water a dam provides can waterlog theland where it is used and saturate it with salt. Dams have safety concerns. Their lifetimes arelimited by a buildup of silt. And dams are not pollution free: decomposing organic matter inreservoirs generates methane, and reservoir bacteria are unusually active in convertingelemental mercury to methylmercury. Dams, even within one country, and much moreoften when on international rivers, can cause severe tensions.82 ▪ Small dams, depending onthe characteristics of each, avoid the worst of these problems.
Obstacles to renewable energy sources
Fossil fuels receive government subsidies in many parts of the world. Eliminating thesesubsidies is widely seen as a step that would promote wider use of renewable energy sourcesand a number of countries have begun to do so. Another barrier to renewable energy is thatthe environmental damage caused by fossil fuels is not accounted for in their price. Coal,especially, remains cheap.
Promoting conservation
Governments could provide incentives to conserve energy, regardless of where the energycomes from. EU countries already consume less energy than North Americans, but believe
80 Exploring ways to use hydropower, US DOE, September 12, 2005, http://apps1.eere.energy.gov/consumer/renewable_energy/hydropower/index.cfm/mytopic=50006.
81 A large dam is one almost 50-ft ( more than 15-meters) high or one with a reservoir holding more than 106million ft3 (3 million m3) of water. There are over 45 000 large dams in the world. China, which already has agreat many of these, has built the biggest dam of all, the Three Gorges Dam on the Yangtze River, displacing twomillion people in the process.
82 The World Commission on Dams in 2000 presented a decision-making framework to guide dam construction.This analyzes whether another option could meet the same goal as a dam, evaluates the impacts the dam willhave, and makes recommendations to assure that benefits would not be appropriated by only a few individuals. Italso recommends providing for people whose livelihoods and homes are destroyed.
403 Obstacles to renewable energy sources
they can make further reductions. Toward this end, they may reduce taxes on energy-efficient products and buildings; implement stricter building codes that promote energy-efficient buildings; promote co-generation; and promote renewable energy sources.▪ California is among the US states passing legislation to promote renewable energy use.Already 12% of California’s electric power comes from wind, solar, geothermal steam,small hydroelectric plants, and biomass plants burning waste wood or other biomass. In2002, California passed legislation requiring utilities to increase their purchase of renewablepower by 1% a year until they reach 20%. ▪ Considering the 29 OECD countries as a whole,it appears that no more than 6% of the energy used by the year 2020 will come fromrenewable sources such as solar or wind. However, the pace of new development isincreasing to an extent that this situation could change.
The promise of micropower
Micropower refers to buildings or individual households off the central grid, providing theirown electric power. Some banks, high-technology firms, or sensitive government operationsthat cannot tolerate even momentary disruption in electric supply sometimes use micro-power. Some of these use fuel cells, although the hydrogen is not from renewable energysources. Micropower can be provided by a microturbine fueled by natural gas, which is lessexpensive than hydrogen, and some of the steam generated can heat water or be used forspace heating. ▪Micropower is not limited to special circumstances. Individual householdscan use many of the renewable energy sources just discussed. For those wanting to pursueone of these options many sources of information are available.83
Questions 13.5
1. Having examined the variety of renewable energy sources available, pick two that sound
most promising to you. Explain why.
2. If youwanted tomicropower your own new home, which energy sources would you choose
to research? Explain. How would your thinking differ if you were going to retrofit a pre-
existing home?
3. Which form of solar energy do you believe is most feasible for large-scale applications?
Explain.
4. For hydrogen to become ameans of lowering the pollution now generated by fossil fuels, it
must be produced by renewable energy sources and affordably so: explain what source
you see as most likely to serve this purpose, and how soon it might happen.
5. Fossil fuels can power a plant generating electricity around the clock. Excepting geother-
mal, renewable sources don’t provide round-the-clock power. (a) Do you believe storage
83 A consumer’s guide to energy efficiency and renewable energy. US DOE, November, 2008, http://apps1.eere.energy.gov/consumer/.
404 Energy
SECTION VI
The future
For most of the first decade of the twenty-first century the US government did little tomanage an evolving energy crisis. The result is that, in 2009 the United States has a senseof urgency in moving toward renewable sources of energy. ▪ Cutting greenhouse gasemissions is cited as a major reason for renewable energies. ▪ However, also consider therampant air pollution and other environmental degradation that are a part of burning fossilfuels. The United States, humanity more generally must find means to eliminate mostpollution resulting from energy use. ▪ Energy security is also widely cited as a major reason
Delving deeper
1. An estimated 2 billion of the world’s people don’t have electricity. Using web-based and
other information, find the obstacles to serving the rural poor with electric power from a
central grid. Secondly, find out how else this population can obtain electric power. What is
being done to solve this problem, e.g., the World Bank has a large project toward this end –
what do you think are its attractive features? Its shortcomings? By yourself or in cooperation
with a partner or the class, propose a feasible means to provide electricity inexpensively to
a large number of people.
2. Go to the web to learn more about one of the items in Section VI: Re-power America, the
Apollo Project, or Stabilization Wedges. After being clear in your own mind that you
understand your selection, critique it in a written or verbally presented report. Make your
own recommendations as they relate to the item you chose.
3. Investigate how heat can be recovered from each of the following sources in useful
amounts and the uses to which it can be put: sewage effluent; a power plant’s air stacks;
methane in a landfill; and regenerative braking. Why aren’t these being used more widely?
technologies have evolved far enough to solve this problem? Explain. (b) Does the energy
necessarily have to be stored – how else can these energies be used without disrupting
consumer supply?
6. Consider PV solar and solar thermal. (a) Which of these is less likely to be useful in powering
a private home or building and why? (b) For providing power to a national network of
customers, which of the two sources do you consider superior and why?
7. Compare the environmental impacts of a coal-burning power plant and a large hydro-
electric dam. (a) Give at least two reasons why it is it difficult to directly compare the two.
(b) The difficulty you had in answering this question also comes into play when comparing
other sources of energy. How then can society make decisions on how best to produce
energy?
405 The future
for finding realistic renewable energy sources within one’s own border especially if thosesources also provide good jobs and enhance a nation’s infrastructure. ▪ There must be a mixof renewable energy sources so that when, e.g., wind is not working, solar and otherrenewable energy sources are on line. And we need to develop means to efficiently storerenewable energies using a “smart grid”84 to assure that the national electric grid is flexible.
A number of plans have been proposed to move the United States toward renewableenergies while also stabilizing and reducing greenhouse gas emissions. Following are threeplans that, with variations, are applicable to many countries.
* Former US Vice President Al Gore supports Re-power America, a plan to reach 100%carbon-free sources of energy within 10 years.85 This plan assumes that the governmentwould be actively involved in providing incentives for concentrated solar-thermal plantsand wind farms; planning and constructing a new “smart grid” to transport renewableelectricity from its rural sites of production to cities where it is needed; converting ourcar fleet to plug-in hybrids; retrofitting buildings to make them more energy efficient86;and taking a leading role in developing a post-Kyoto treaty to cap global CO2 emissionswhile encouraging nations to come together in investing in means to reduce greenhousegas emissions and deforestation.
* The Apollo Project87 aims to integrate social goals (increasing jobs, technologicalinnovation, and economic opportunity) with energy efficiency and conservation, andgreater use of renewable energies. The program includes accomplishing all of thefollowing by 2025: reducing by 30% the energy used in new and existing buildings;producing 25% of US electric power from renewable and recycled (now wasted) energyresources; modernizing the power grid; improving by 20%, the efficiency in existingpower plants and industries; and connecting neighborhoods and cities with world-classpublic transit systems.
* In 2004, two Princeton University scientists presented a case for Stabilization Wedges.They state that “Humanity already possesses the fundamental scientific, technical, andindustrial know-how to solve the carbon and climate problem for the next half-century.”88
These scientists propose taking the next 50 years to stabilize CO2 in the atmosphere atno higher than 500 ppm89 using already established technologies, which they describe.Concurrently, we must immediately pursue research and development to develop the“revolutionary technologies” required to actually make steep cuts in the amount of
84 Charles, D. Energy: Renewables test IQ of the grid. Science, 324(5924), April 10, 2009, 172–175.85 Repower America, 100% clean energy within 10 years. http://www.repoweramerica.org/.86 Keep in mind that buildings use over 70% of US electricity and account for 40% of CO2 emissions.87 The new Apollo program. Apollo Alliance, 2008, http://apolloalliance.org/apollo-14/executive-summary/.88 Pacala, S. and Socolow, R. Stabilization wedges: solving the climate problem for the next 50 years with current
technologies. Science, 305(5686), August 13, 2004, 968–972. One stabilization wedge equals what it would taketo keep a billion tons of carbon from being emitted every year by 2054.
89 500 ppm is less than double the pre-industrial level of 280 ppm CO2. 500 ppm is considered a “tipping point”beyond which humanity must not allow itself to go before irrevocable changes could take place in our climate.Stabilizing CO2 at 500 ppmwould be accomplished by energy efficiency and conservation; replacing many coalwith gas power plants; using CO2 capture and sequestration; adding more nuclear power plants; using morewind, solar, and biomass to replace coal; and reducing deforestation while working toward reforestation andusing conservation tillage for agriculture.
406 Energy
atmospheric CO2. The methods that they propose, not surprisingly, include energyconservation and efficiency, and making use of a number of renewable energy technol-ogies already available or rapidly developing.
Japan has already taken major energy-saving steps.90 After the energy crises of the 1970s,the government mandated conservation and energy efficiency, placed high taxes on petro-leum, and maintained a steady government investment in energy research and development.Japan’s energy intensity (the amount of GDP produced per unit of energy) was, in 2005,more than twice that of the United States and the EU, and eight times that of China and India.Consider steel-making, a heavy user of energy. Japan invested large amounts in energy-savings technologies for this industry. An example of rewards for this effort is the Keihinsteel mill on Tokyo Bay: it captures waste heat and gases so efficiently that the mill cangenerate 90% of its own electricity. However, Japan still uses a great deal of coal and hassignificant CO2 emissions; it is now targeting reductions in CO2 emissions from industry.Japan now sells its energy-saving technologies around the world.
Further reading
Boswell, R. Is gas hydrate energy within reach? Science, 325, August 21, 2009, 957–958.Charles, D. Energy: Renewables test IQ of the grid. Science, 324(5924) April 10, 2009,
172–175.Earth Policy Institute.Exploding US grain demand for automotive fuel threatens world food
security and political stability. November 6, 2006.Engelhaupt, E. High corn demand could harm US waters. Environmental Science &
Technology, 41(19), October 1, 2007, 6635–6635.Johnson, J. Ending (industrial) plants’ wasting ways. Chemical & Engineering News,
86(02), January 14, 2008, 37–38.Kulish, N. and Glanz, J. German geothermal project leads to second thoughts after the earth
rumbles. New York Times, September 10, 2009, http://www.nytimes.com/2009/09/11/science/earth/11quake.html.
Schmidt, C. The next generation of nuclear power? Environmental Science & Technology,40(5), March 1, 2006, 1382–1383.
Schmidt, C. Sunlight on mirrors. Environmental Science & Technology, 42(19), October 1,2008, 7031.
Schnoor, J. L. Ethanol and water use.Environmental Science & Technology, 41(19), October1, 2007, 6633.
Schultz, W. The costs of biofuels (two perspectives on corn ethanol and cellulosic ethanol).Chemical & Engineering News, 85(51), December 17, 2007, 12–16.
Zweibel, K., Mason, J., and Fthenakis, V. A solar grand plan. Scientific American,December, 2007, http://www.sciam.com/article.cfm?id=a-solar-grand-plan.
90 Fackler, M. Japan sees a chance to promote its energy-frugal ways. New York Times, July 4, 2008, http://www.nytimes.com/2008/07/04/world/asia/04japan.html.
407 Further reading
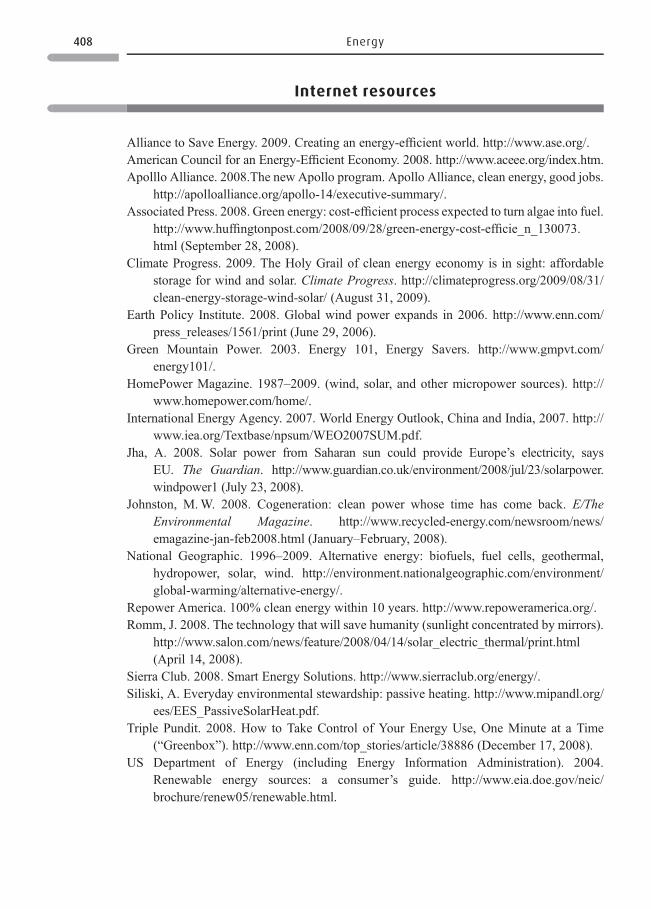
Internet resources
Alliance to Save Energy. 2009. Creating an energy-efficient world. http://www.ase.org/.American Council for an Energy-Efficient Economy. 2008. http://www.aceee.org/index.htm.Apolllo Alliance. 2008.The new Apollo program. Apollo Alliance, clean energy, good jobs.
http://apolloalliance.org/apollo-14/executive-summary/.Associated Press. 2008. Green energy: cost-efficient process expected to turn algae into fuel.
http://www.huffingtonpost.com/2008/09/28/green-energy-cost-efficie_n_130073.html (September 28, 2008).
Climate Progress. 2009. The Holy Grail of clean energy economy is in sight: affordablestorage for wind and solar. Climate Progress. http://climateprogress.org/2009/08/31/clean-energy-storage-wind-solar/ (August 31, 2009).
Earth Policy Institute. 2008. Global wind power expands in 2006. http://www.enn.com/press_releases/1561/print (June 29, 2006).
Green Mountain Power. 2003. Energy 101, Energy Savers. http://www.gmpvt.com/energy101/.
HomePower Magazine. 1987–2009. (wind, solar, and other micropower sources). http://www.homepower.com/home/.
International Energy Agency. 2007. World Energy Outlook, China and India, 2007. http://www.iea.org/Textbase/npsum/WEO2007SUM.pdf.
Jha, A. 2008. Solar power from Saharan sun could provide Europe’s electricity, saysEU. The Guardian. http://www.guardian.co.uk/environment/2008/jul/23/solarpower.windpower1 (July 23, 2008).
Johnston, M.W. 2008. Cogeneration: clean power whose time has come back. E/TheEnvironmental Magazine. http://www.recycled-energy.com/newsroom/news/emagazine-jan-feb2008.html (January–February, 2008).
National Geographic. 1996–2009. Alternative energy: biofuels, fuel cells, geothermal,hydropower, solar, wind. http://environment.nationalgeographic.com/environment/global-warming/alternative-energy/.
Repower America. 100% clean energy within 10 years. http://www.repoweramerica.org/.Romm, J. 2008. The technology that will save humanity (sunlight concentrated by mirrors).
http://www.salon.com/news/feature/2008/04/14/solar_electric_thermal/print.html(April 14, 2008).
Sierra Club. 2008. Smart Energy Solutions. http://www.sierraclub.org/energy/.Siliski, A. Everyday environmental stewardship: passive heating. http://www.mipandl.org/
ees/EES_PassiveSolarHeat.pdf.Triple Pundit. 2008. How to Take Control of Your Energy Use, One Minute at a Time
(“Greenbox”). http://www.enn.com/top_stories/article/38886 (December 17, 2008).US Department of Energy (including Energy Information Administration). 2004.
Renewable energy sources: a consumer’s guide. http://www.eia.doe.gov/neic/brochure/renew05/renewable.html.
408 Energy
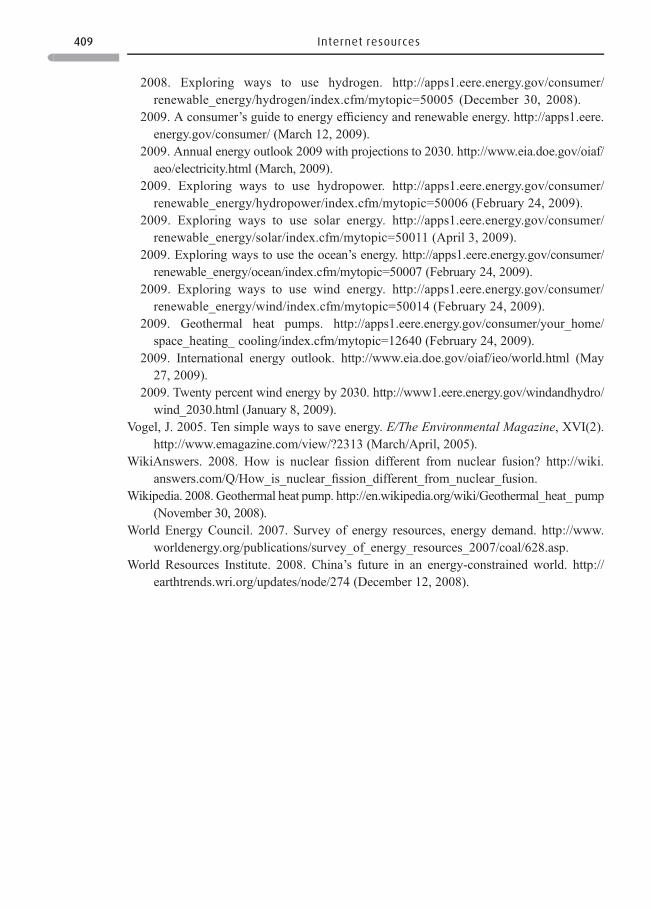
2008. Exploring ways to use hydrogen. http://apps1.eere.energy.gov/consumer/renewable_energy/hydrogen/index.cfm/mytopic=50005 (December 30, 2008).
2009. A consumer’s guide to energy efficiency and renewable energy. http://apps1.eere.energy.gov/consumer/ (March 12, 2009).
2009. Annual energy outlook 2009 with projections to 2030. http://www.eia.doe.gov/oiaf/aeo/electricity.html (March, 2009).
2009. Exploring ways to use hydropower. http://apps1.eere.energy.gov/consumer/renewable_energy/hydropower/index.cfm/mytopic=50006 (February 24, 2009).
2009. Exploring ways to use solar energy. http://apps1.eere.energy.gov/consumer/renewable_energy/solar/index.cfm/mytopic=50011 (April 3, 2009).
2009. Exploring ways to use the ocean’s energy. http://apps1.eere.energy.gov/consumer/renewable_energy/ocean/index.cfm/mytopic=50007 (February 24, 2009).
2009. Exploring ways to use wind energy. http://apps1.eere.energy.gov/consumer/renewable_energy/wind/index.cfm/mytopic=50014 (February 24, 2009).
2009. Geothermal heat pumps. http://apps1.eere.energy.gov/consumer/your_home/space_heating_ cooling/index.cfm/mytopic=12640 (February 24, 2009).
2009. International energy outlook. http://www.eia.doe.gov/oiaf/ieo/world.html (May27, 2009).
2009. Twenty percent wind energy by 2030. http://www1.eere.energy.gov/windandhydro/wind_2030.html (January 8, 2009).
Vogel, J. 2005. Ten simple ways to save energy. E/The Environmental Magazine, XVI(2).http://www.emagazine.com/view/?2313 (March/April, 2005).
WikiAnswers. 2008. How is nuclear fission different from nuclear fusion? http://wiki.answers.com/Q/How_is_nuclear_fission_different_from_nuclear_fusion.
Wikipedia. 2008. Geothermal heat pump. http://en.wikipedia.org/wiki/Geothermal_heat_ pump(November 30, 2008).
World Energy Council. 2007. Survey of energy resources, energy demand. http://www.worldenergy.org/publications/survey_of_energy_resources_2007/coal/628.asp.
World Resources Institute. 2008. China’s future in an energy-constrained world. http://earthtrends.wri.org/updates/node/274 (December 12, 2008).
409 Internet resources
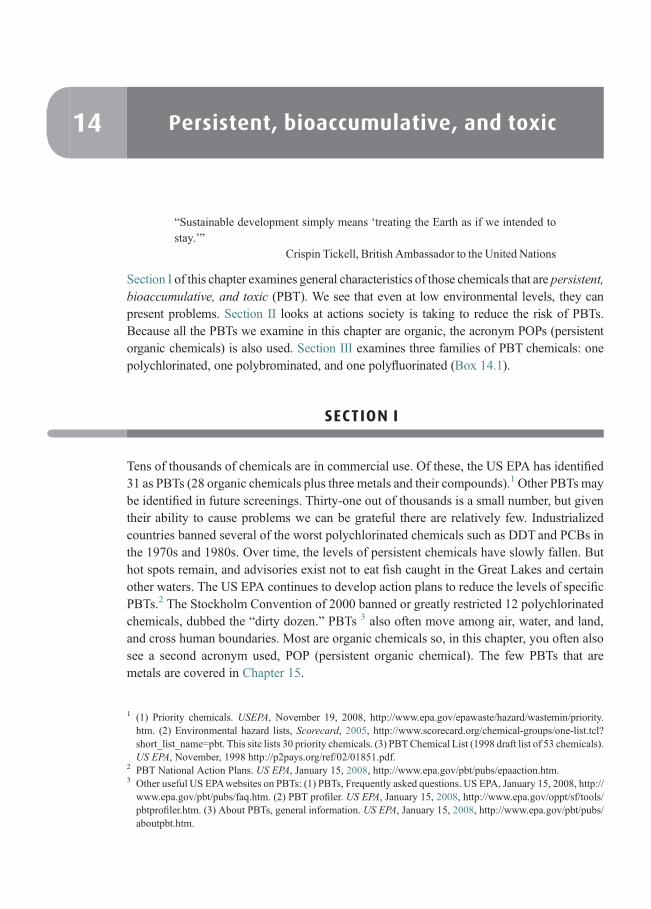
14 Persistent, bioaccumulative, a nd toxic
“ Sustainable development simply means ‘treating the Earth as if we intended tostay.’”
Crispin Tickell, British Ambassador to the United Nations
Se ct io n I of this chapter examines general characteristics of those chemicals that are persistent,bioaccumulative, and toxic (PBT). We see that even at low environmental levels, they canpresent problems. Section II looks at actions society is taking to reduce the risk of PBTs.Because all the PBTs we examine in this chapter are organic, the acronym POPs (persistentorganic chemicals) is also used. Section III examines three families of PBT chemicals: onepolychlorinated, one polybrominated, and one polyfluorinated (Box 14.1).
SECT ION I
Tens of thous ands of chemi cals are in comm ercial use. Of these, the US EPA has identi fied31 as PBTs (28 organic chemi cals plus three met als and thei r compo unds). 1 Other PBTs maybe ident ifi ed in future screen ings. Thi rty-one out of thousands is a small numbe r, but giventheir abil ity to cause probl ems we can be grateful there are relativel y few. Industria lizedcountr ies banned severa l of the worst polychlori nated chemic als such as DD T an d PCBs inthe 1970s and 1980s. Over time, the level s of p ersistent chemicals have slowly fallen. Buthot spots rema in, and advis ories exist not to eat fish caugh t in the Great Lak es and certainother wat ers. The US EPA continues to d evelop acti on plans to reduce the level s o f speci ficPBTs. 2 The Stockho lm Conventi on of 2000 banned or greatly restrict ed 12 polych lorinatedchemicals , dubbed the “ dirty dozen. ” PBTs 3 also often move among air, water, and land,and cross human b oundaries. Most are organic ch emicals so, in this chapter, you often alsosee a second acronym used, POP (pers istent organic chemical) . The few PBTs that aremetals are c overed in Chapter 15.
1 (1) Priority chemicals. USEPA, November 19, 2008, http://www.epa.gov/epawaste/hazard/wastemin/priority.htm. (2) Environmental hazard lists, Scorecard, 2005, http://www.scorecard.org/chemical-groups/one-list.tcl?short_list_name=pbt. This site lists 30 priority chemicals. (3) PBT Chemical List (1998 draft list of 53 chemicals).US EPA, November, 1998 http://p2pays.org/ref/02/01851.pdf.
2 PBT National Action Plans. US EPA, January 15, 2008, http://www.epa.gov/pbt/pubs/epaaction.htm.3 Other useful US EPAwebsites on PBTs: (1) PBTs, Frequently asked questions. US EPA, January 15, 2008, http://www.epa.gov/pbt/pubs/faq.htm. (2) PBT profiler. US EPA, January 15, 2008, http://www.epa.gov/oppt/sf/tools/pbtprofi ler.htm. (3) About PBTs, general information. US EPA, January 15, 2008, http://www.epa.gov/pbt/pubs/aboutpbt.htm.
Red-�ag characteristics
Persistence
A persistent chemical4 – one that does not readily degrade – raises a red flag. In thelaboratory, a POP (persistent organic pollutant) is more soluble in octanol (an oily substancethat stands-in for fat) than in water, i.e., a POP favors a fatty environment and bioaccumu-lates in fatty tissues. A POP has an environmental half-life greater than a month, sometimesmuch greater. Thus, even low emissions of a POP, if they continue, allow it to build up in theenvironment. As its level increases, the possibility of harm to wildlife or humans exposed toit increases too. Most POPs are polyhalogenated; that is, they contain a number of halogenatoms (Box 14.1).
Nature produces thousands of chemicals that contain halogens but these ordinarily haveonly one or two halogen atoms5 – they are not polyhalogenated. Humans have synthesizedmany polyhalogenated chemicals. These can degrade, but only slowly over, sometimes,many years. If emissions continue environmental levels build up and the POP may bio-accumulate in animals. Depending on the specific pollutant and the conditions involved,POPs can take months, years, or decades to degrade. At the poles, buried in ice they maynever degrade. See Box 14.2.
Bioaccumulation and biomagnification
* Another red flag is raised if a chemical bioaccumulates, i.e., builds up to levels in livingorganisms higher than those in the environment. This happens when a microbe, plant,animal, or human only very slowly breaks down a chemical, or if the chemical finds sites
Box 14.1 A bit of chemistry
* Look at Figure 19.2, the periodic table of the elements. Go to column 17 and you will see the
halogens, a family of five elements with related chemical properties. Note that the column
begins with F (fluorine). The element below it is Cl (chlorine), and below Cl is Br (bromine).
* A polyhalogenated chemical is one that contains several halogen elements in its structure,
e.g., CFCs contain the halogens, fluorine, and chlorine.
* An organochlorine is an organic chemical that contains chlorine. All 12 of the chemicals
banned by the Stockholm Convention (described later) are polychlorinated.
* An organobromine is an organic chemical that contains bromine.
* An organofluorine is an organic chemical that contains fluorine.
4 Chemical reactivity as a tool for estimating persistence. Environmental Science & Technology, 39(230),D ec e m be r 1 , 2 00 5 , 48 0A – 486A.
5 One exception is thyroxine, a hormone produced by the thyroid gland, which contains four iodine atoms.
411 Red-flag characteristics
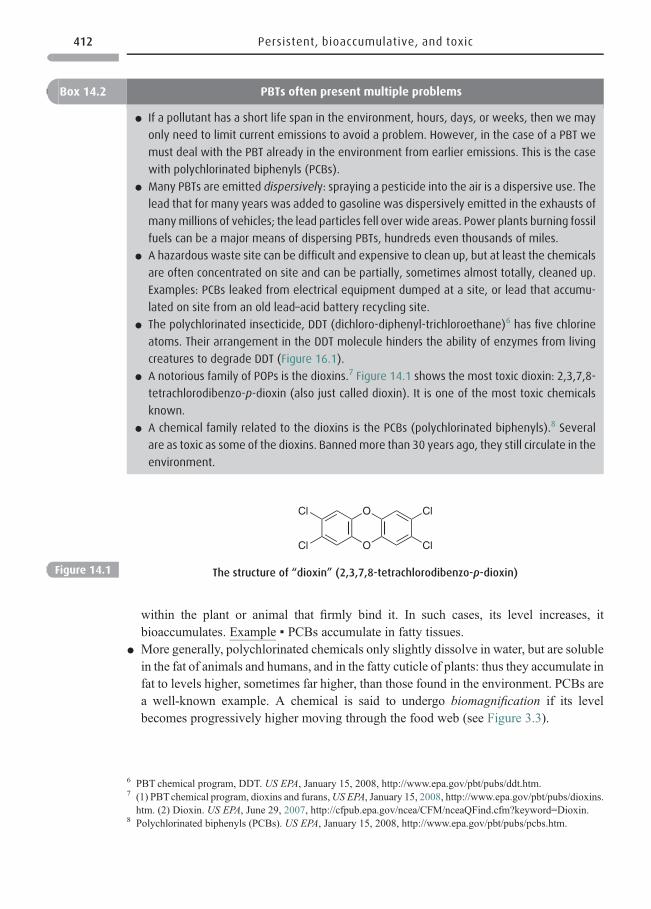
within the plant or animal that firmly bind it. In such cases, its level increases, itbioaccumulates. Example ▪ PCBs accumulate in fatty tissues.
* More generally, polychlorinated chemicals only slightly dissolve in water, but are solublein the fat of animals and humans, and in the fatty cuticle of plants: thus they accumulate infat to levels higher, sometimes far higher, than those found in the environment. PCBs area well-known example. A chemical is said to undergo biomagnification if its levelbecomes progressively higher moving through the food web (see Figure 3.3).
Box 14.2 PBTs often present multiple problems
* If a pollutant has a short life span in the environment, hours, days, or weeks, then we may
only need to limit current emissions to avoid a problem. However, in the case of a PBT we
must deal with the PBT already in the environment from earlier emissions. This is the case
with polychlorinated biphenyls (PCBs).
* Many PBTs are emitted dispersively: spraying a pesticide into the air is a dispersive use. The
lead that for many years was added to gasoline was dispersively emitted in the exhausts of
manymillions of vehicles; the lead particles fell over wide areas. Power plants burning fossil
fuels can be a major means of dispersing PBTs, hundreds even thousands of miles.
* A hazardous waste site can be difficult and expensive to clean up, but at least the chemicals
are often concentrated on site and can be partially, sometimes almost totally, cleaned up.
Examples: PCBs leaked from electrical equipment dumped at a site, or lead that accumu-
lated on site from an old lead–acid battery recycling site.
* The polychlorinated insecticide, DDT (dichloro-diphenyl-trichloroethane)6 has five chlorine
atoms. Their arrangement in the DDT molecule hinders the ability of enzymes from living
creatures to degrade DDT (Figure 16.1).
* A notorious family of POPs is the dioxins.7 Figure 14.1 shows the most toxic dioxin: 2,3,7,8-
tetrachlorodibenzo-p-dioxin (also just called dioxin). It is one of the most toxic chemicals
known.
* A chemical family related to the dioxins is the PCBs (polychlorinated biphenyls).8 Several
are as toxic as some of the dioxins. Bannedmore than 30 years ago, they still circulate in the
environment.
O
ClCl O
ClCl
Figure 14.1 The structure of “dioxin” (2,3,7,8-tetrachlorodibenzo-p-dioxin)
6 PBT chemical program, DDT. US EPA, January 15, 2008, http://www.epa.gov/pbt/pubs/ddt.htm.7 (1) PBT chemical program, dioxins and furans, US EPA, January 15, 2008, http://www.epa.gov/pbt/pubs/dioxins.htm. (2) Dioxin. US EPA, June 29, 2007, http://cfpub.epa.gov/ncea/CFM/nceaQFind.cfm?keyword=Dioxin.
8 Polychlorinated biphenyls (PCBs). US EPA, January 15, 2008, http://www.epa.gov/pbt/pubs/pcbs.htm.
412 Persistent, bioaccumulative, and toxic
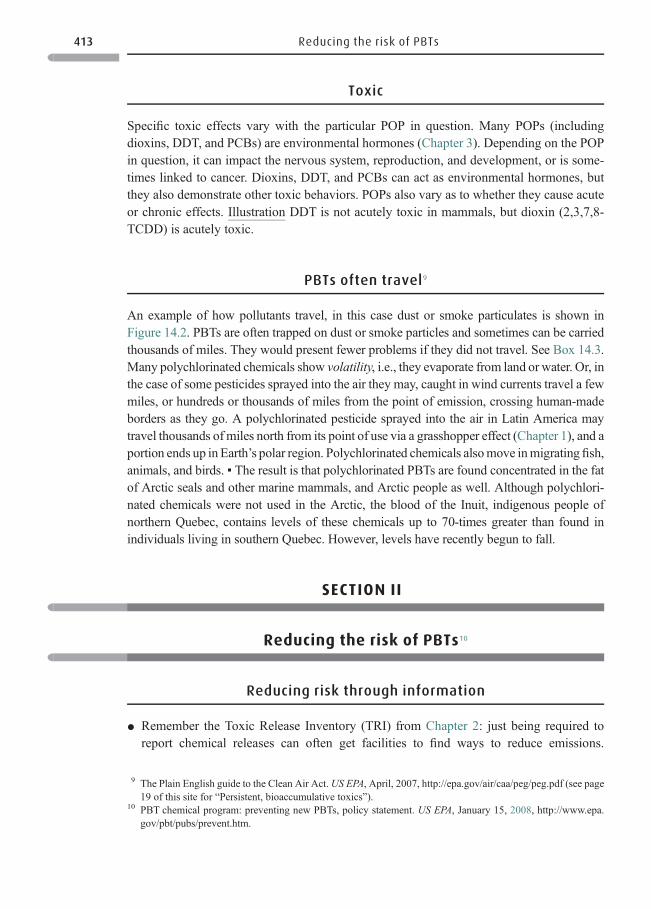
Toxic
Specific toxic effects vary with the particular POP in question. Many POPs (includingdioxins, DDT, and PCBs) are environmental hormones (Chapter 3). Depending on the POPin question, it can impact the nervous system, reproduction, and development, or is some-times linked to cancer. Dioxins, DDT, and PCBs can act as environmental hormones, butthey also demonstrate other toxic behaviors. POPs also vary as to whether they cause acuteor chronic effects. Illustration DDT is not acutely toxic in mammals, but dioxin (2,3,7,8-TCDD) is acutely toxic.
PBTs often travel9
An example of how pollutants travel, in this case dust or smoke particulates is shown inFigure 14.2. PBTs are often trapped on dust or smoke particles and sometimes can be carriedthousands of miles. They would present fewer problems if they did not travel. See Box 14.3.Many polychlorinated chemicals show volatility, i.e., they evaporate from land or water. Or, inthe case of some pesticides sprayed into the air they may, caught in wind currents travel a fewmiles, or hundreds or thousands of miles from the point of emission, crossing human-madeborders as they go. A polychlorinated pesticide sprayed into the air in Latin America maytravel thousands of miles north from its point of use via a grasshopper effect (Chapter 1), and aportion ends up in Earth’s polar region. Polychlorinated chemicals alsomove inmigrating fish,animals, and birds. ▪ The result is that polychlorinated PBTs are found concentrated in the fatof Arctic seals and other marine mammals, and Arctic people as well. Although polychlori-nated chemicals were not used in the Arctic, the blood of the Inuit, indigenous people ofnorthern Quebec, contains levels of these chemicals up to 70-times greater than found inindividuals living in southern Quebec. However, levels have recently begun to fall.
SECTION II
Reducing the risk of PBTs10
Reducing risk through information
* Remember the Toxic Release Inventory (TRI) from Chapter 2: just being required toreport chemical releases can often get facilities to find ways to reduce emissions.
9 The Plain English guide to the Clean Air Act. US EPA, April, 2007, http://epa.gov/air/caa/peg/peg.pdf (see page19 of this site for “Persistent, bioaccumulative toxics”).
10 PBT chemical program: preventing new PBTs, policy statement. US EPA, January 15, 2008, http://www.epa.gov/pbt/pubs/prevent.htm.
413 Reducing the risk of PBTs
Previously, US facilities did not need to report POP emissions as none were released inthe large quantities characteristic of other TRI chemicals. However, in the year 2000 theUS EPA began requiring businesses to report if they make, use or release 10 pounds(22 kg) or more of any of 27 specified PBTs.
Screening chemicals before they are produced11
* The US EPA developed a PBT Profiler12 to screen chemicals and identify those with PBTproperties.13 The EPA also has National Action Plans to minimize the use of several PBTs
Figure 14.2 Airborne aerosol particles (microscopic dust/smoke) blowing out to sea from North Africa. Credit:
Earth Probe TOMS Aerosol Index. Credit: US NASA
Box 14.3 A bit of chemistry
Phthalates are small chemicals, often incorporated into plastics as plasticizers. Their function is
to soften plastics, make them pliable. Another group of small chemicals (often PBDEs) are
incorporated into products as fire retardants. Because plasticizers and fire retardants are not
chemically bonded within these products, they are not held in place – they can volatilize or
leach out. This can lead to both human and wildlife exposure. Sometimes it is possible to
chemically bond flame retardants or plasticizers to the products. Bound chemicals won’t leach
out unless the chemical bond is broken.
11 (1) Chemical reactivity as a tool for estimating persistence. Environmental Science & Technology, 39(230),December 1, 2005, 480A– 486A. ( 2) Renner, R. Bioaccumulation assess ments point to pressing data gaps.Environmental Science & Technology, 39(13), July 1, 2005, 278A.
12 PBT Profi ler. US EPA, January 14, 2008, http://www.epa.gov/oppt/sf/tools/pbtprofiler.htm.13 Ritter, S.K. Crystal ball on the environment: detective work and expertise are used to evaluate environmental
contaminants of emerging concern. Chemical & Engineering News, 84(5), January 30, 2006, 37– 40.
414 Persistent, bioaccumulative, and toxic
including dioxins/furans, hexachlorobenzene, mercury, and benzo[a]pyrene. ▪Large chem-ical companies includingDuPont, Proctor&Gamble, andDow had already begun to screenchemicals for PBT properties whenever they began developing new chemical products.They work to design chemicals without such properties. This represents “green chemistry,”deliberately designing chemicals or processes to make themmore environmentally benign.
Reducing the risk worldwide14
InDecember 2000, after years of negotiation representatives of 122 countries finalized a treaty,the Stockholm Convention on Persistent Organic Pollutants (POPS).15,16 This banned orgreatly limited 12 chemicals, called the “dirty dozen.” It was agreed that these 12 posedgreater risks than other POPS. This treatywas the first-ever global agreement to abolish a classof chemicals. ▪ All 12 chemicals are polychlorinated.17 Nine are pesticides: aldrin, chlordane,DDT (notorious for greatly damaging populations of bald eagles, ospreys, and other predatorybirds), dieldrin, endrin, heptachlor, hexachlorobenzene, mirex, and toxaphene. Two areindustrial chemicals, PCBs and hexachlorobenzene. Two are by-products of combustionand industrial processes, dioxins and furans. ▪Most had already been banned in industrializedcountries, but were still used elsewhere as in India and Latin America. For the treaty to work,industrialized nations had to assist less-developed nations. They provide $150 million a yearplus technical assistance to help phase out production and use of the dirty dozen, destroyexisting stockpiles and, sometimes to help set up the production of alternatives. Delegatescontinue working on additional chemicals that may be banned in the future.18
Exceptions to the treaty
* DDTwas banned many years ago inWestern countries. However, at the urging of malariaexperts, the treaty allows poorer countries to continue using DDT to control malaria-bearing mosquitoes. They spray DDT on the walls of homes,19 a procedure which repelsor kills mosquitoes entering a home.
14 (1) Persistent organic pollutants (POPS): a global issue, a global response. US EPA, October 2, 2008, http://www.epa.gov/oia/toxics/pop.pdf. (2) International agreements and treaties. US EPA, October 16, 2008, http://www.epa.gov/oppfead1/international/agreements/index.html.
15 Ridding the world of POPS: a guide to the Stockholm Convention on persistent organic pollutants.UNEP, April,2005, http://www.pops.int/documents/guidance/beg_guide.pdf.
16 Hogue, C. No vote for US in chemicals treaty.Chemical & Engineering News, 83(18),May 2, 2005, 26–27. (TheUS signed the treaty, but has not passed enabling legislation so is not yet a party to the treaty.)
17 (1) UN to review “dirty dozen” chemicals. Reuters, May 2, 2005, http://www.planetark.com/dailynewsstory.cfm/newsid/30639/story.htm. (2) A longer description is: The Foundation for Global Action on POPS: a USperspective. US EPA, March, 2002, http://www.epa.gov/ncea/pdfs/pops/POPsa.pdf.
18 (1) Governments take decisive action to rid world of POPS: four new chemicals proposed for phase-out. UNEP,May 6, 2005, www.pops.int/documents/meetings/cop_1/ . . . /pr5–05POPsCOP1.pdf. (2) Arnaud, C. PersistentOrganic Pollutants, more chemicals may be flagged as risky. Chemical & Engineering News, 85(26), July 16,2007, 6.
19 Handwerk, B. DDT to return as weapon against malaria. National Geographic, August 1, 2006, http://news.nationalgeographic.com/news/2006/08/060801-ddt-malaria.html.
415 Reducing the risk of PBTs
* PCBs are still found in old electrical equipment. The treaty allows the equipment’scontinued use through 2025 if maintained to prevent leaks.
* For dioxins, the treaty has “the goal of their continuing minimization and, whenfeasible, ultimate elimination.” Dioxins and furans cannot be banned because,except for laboratories making tiny amounts for research work, no one deliberatelymakes them. We can modify the processes that produce them to often virtuallyeliminate emissions: pesticide production processes that once produced dioxinby-products have been modified or eliminated. Current means of bleaching woodpulp has eliminated or greatly lowered the formation of dioxin by-products. Someof these reductions were started decades ago and, over the years, environmentallevels and body burdens of dioxins have decreased. Combustion remains their majorsource.
The Stockholm Convention may be working
The Stockholm Convention may be showing results. PCBs, DDT, chlordane, andtoxaphene levels in Canadian Arctic animals have leveled off or fallen.20 ▪ PCBs inbeluga, narwhal, walrus, and ringed seal decreased by an of average 43% since 1997.The exposure of the Inuit, the Arctic’s indigenous people dropped about 20% thispast decade. In pregnant women PCB blood levels fell 24% between 2000 and2007. Because the Inuit body burdens of PCBs had been among the highest in theworld, this finding is welcome, but results need to be confirmed. ▪ Mercury, a metal tobe discussed in Chapter 15, has not decreased. Moreover, not all POPs were examined inthis study and, as seen below, levels of polybrominated fire retardants may still beincreasing.
SECTION III
Three families of POPs
Three families of POPs are discussed below. The first, PCBs, have been frequentlymentioned in this text. The second, polybrominated fire retardants, are still in use.Production of the third family, perfluorooctane sulfonates, is being phased out and may beeliminated.
20 Toxic chemical levels finally dropping in Arctic animals. The Canadian Press, July 14, 2008, http://www.panna.org/files/CanadianPressActicToxicsDrop20080714.pdf.
416 Persistent, bioaccumulative, and toxic
Family one: the ubiquitous and long-lasting polychlorinatedbiphenyls (PCBs)
The PCBs are a family of 209 chemicals.21 Each PCB varies in the number and location ofits chlorine atoms. These chemicals banned 30-years ago in the United States still poseproblems because of their longevity. Those with the most chlorine atoms are the mostpersistent, and they are the ones that concentrate most heavily in fat. A major use of PCBs(sold as the mixture, Aroclor) was insulation of electrical equipment. This use resulted fromthe fact that PCBs are nonflammable even at high temperatures. Safety codes once mandatedtheir use. PCBs were also used in paints, inks, adhesives, newsprint, carbonless duplicatingpaper, even deep-fat fryers. But after it became clear that PCBs were persistent, bioaccu-mulative, and harmed wildlife, the United States banned them. ▪By that time, the late 1970s,the United States had manufactured about 1.4 billion pounds (over 600 million kg). Severalhundred million pounds (about 200 million kg) had become environmental pollutants invarious ways as when they leaked from electrical equipment. In earlier years, manufacturerslegally released PCB-containing wastes, and New York’s Hudson River suffered heavypollution. Contamination was even worse on a land site near Anniston, Alabama, wherePCBs were manufactured for 40 years.22 Many locales around the Great Lakes and marinecoasts were also heavily polluted. PCBs are major pollutants in 20% of US Superfund sites.PCB manufacture continued until 2001 in less-developed countries until the StockholmConvention was passed.
* PCBs cycle in the environment PCBs concentrate in sediments from which they slowlymove into the water above. From water some escape to air, become windborne, depositinto water again, and concentrate in sediments again. PCBs can also leave their sedimentsink when bottom-feeding organisms take them up, and once again they begin movingthrough the food web. They also escape during dredging operations.
* PCBs toxicity23 The toxicity of a few PCBs is comparable to the more toxic dioxins.Depending on dose and the particular PCB, they can damage the nervous and immunesystems, the liver, and thyroid gland. They can profoundly affect fetal brain development.Many workers, heavily exposed to PCBs over years, developed liver damage. Many alsodeveloped chloracne, a form of acne resulting from prolonged contact with organo-chlorine chemicals, especially PCBs and dioxins. Chloracne can be severe and last foryears. Moreover, the US EPA and the World Health Organization (WHO) classify PCBsas probable human carcinogens.
* Today’s exposure Although environmental levels are much lower than in the 1970s,PCBs remain ubiquitous contaminants in the United States and worldwide. PCB
21 (1) Polychlorinated biphenyls (PCBs). US EPA, August 8, 2008, http://www.epa.gov/opptintr/pcb/. (2) PCBstoxicity exposure pathways. ATSDR, September 30, 2000, http://www.atsdr.cdc.gov/csem/pcb/exposure_pathways.html.
22 (1) Anniston, Alabama.Wikipedia, March 18, 2009, http://en.wikipedia.org/wiki/Anniston,_Alabama. (2) Grunwald,M. Montsanto hid years of pollution. Washington Post, January 1, 2002. http://www.commondreams.org/headlines02/0101–02.htm.
23 The health effects of PCBs. US EPA, August 8, 2008, http://www.epa.gov/epawaste/hazard/tsd/pcbs/pubs/effects.htm.
417 Three families of POPs
exposure occurs today mainly via eating fatty meat, milk, milk products, and fish. SincePCB production was banned in the United States, PCB levels in Great Lakes fish fell up to90%. However, many fish still exceed 2 ppm, the US Food and Drug Administration(FDA) standard for PCBs in commercial fish; above 2 ppm they are considered unsafe toeat. Nonetheless, people still catch and consume fish from the Great Lakes; for thesepeople, fish are the major source of PCB exposure. PCBs still rank as high-risk chemicalsin the Great Lakes, the Arctic, and several other locales.
A half-billion dollar risk-reduction project
From 1947 to 1977 two General Electric (GE) plants on New York’s Hudson Rivermanufactured PCB-containing electrical equipment, meanwhile releasing over 1 millionpounds (454 000 kg) into the Hudson. Fish in the Hudson’s most contaminated section had2–41 ppm PCBs in their flesh. Some fish showed obvious harm: 90% of one codfish varietydeveloped liver tumors by adulthood. Other fish suffered DNA damage similar to that seenin some human tumors. In 1984 the US EPA declared a 200 miles (322 km) section of theHudson River a Superfund site. GE officials insisted that the river had been cleaning itselfand was continuing to do so. In 2000, the EPA did find it cleaner than in earlier years. ButPCBs in fish were still above levels considered safe for women of childbearing age and smallchildren. Consideration was given to capping heavily contaminated sections with cleansediments culled from elsewhere, but the EPA believed these sections were too turbulent forcapping. In 2001, after ten years of research costing $25 million and exhaustive scientificreview, the EPA ordered GE to dredge sediments from a 40-mile (64-km) long section of theHudson at an estimated half-billion dollars cost. GE called the plan “absurd,” and claimedthat dredging would only stir up contaminated sediment. In response, the EPA noted itwould regularly evaluate PCB levels in water and sediment to decide whether to continuedredging. In 2005, GE committed to dredging 43 miles (72 km) of the river,24 but as of late2008, little progress had been made.25
Questions 14.1 Obvious versus subtle toxicity26
Japan and Taiwan In the 1960s and 1970s, respectively, many individuals were poisoned after
ingesting cooking oil accidentally contaminated with PCBs and furans.27 Researchers followed
the development of children born within 7 years to women who had been poisoned. The
children showed abnormal skin pigmentation, impaired mental development, impaired
musclemovements, and slower growth. The severity depended on howmuch oil their mothers
were estimated to have eaten. Some children were clearly poisoned.
24 DePalma, A. GE commits to dredging 43 miles of Hudson River. New York Times, October 7, 2005, http://www.nytimes.com/2005/10/07/nyregion/07pcb.html.
25 Hudson River PCBs. US EPA, December 1, 2008, http://www.epa.gov/hudson/.26 Barry L. Johnson, B. L., Hicks, H. E. et al. Public health implications of exposure to PCBs. ATSDR, http://www.
atsdr.cdc.gov/DT/pcb007.html.27 Furans are close chemical relatives of dioxins.
418 Persistent, bioaccumulative, and toxic
Family two: polybrominated fire retardants
With PCBs, the concern is for chemicals that have persisted for many years after they werebanned. We now consider PBDEs (polybrominated diphenyl ethers), another family of over200 analogs; with PBDEs, the concern is right now. PBDEs are incorporated, often in largeamounts into electrical equipment, electronics, plastics within television sets, automobiles,furniture foam, textiles, upholstery, and carpets. PBDEs serve the important function ofpreventing or retarding fires.
* How PBDEs become pollutants They represent 5–30% by weight of the products intowhich they are incorporated. Although not very volatile, they do slowly outgas.Discarded into landfills, PBDEs in products may leach out. Moreover, high levels ofPBDEs are being found in discarded electronics and in shredded auto waste,29 fromwhich they could enter the environment. ▪ Not surprisingly considering the many homeproducts containing PBDEs, they are found in house dust in US homes, sometimes at
United States Now consider children born to mothers eating large amounts of PCB-
contaminated fish from the Great Lakes. Epidemiological studies examined these infants and
small children for possible developmental defects correlated to their mothers’ exposure.
Trained observers detected small differences in the learning ability and memory of the infants
as compared to control children, and also reported that the infants were more easily distrac-
ted, and their muscle tone poorer.
Commenting on these studies, one researcher stated, “The literature on prenatal exposure to
PCBs and developmental neurotoxicity is one of the strongest bodies of evidence of human health
effects in low-level environmental exposure.” Yet others, analyzing the same studies remained
unconvinced that the reported effects were even real. Because the United States has not used
PCBs since the late 1970s, and they are now bannedworldwide, some believe PCBs are no longer
important. For adults, exposure to PCBs at current environmental levels is not considered a threat.
1. On the basis of this limited information, explain whether you believe that women of
childbearing age should be warned not to eat sports fish from the Great Lakes. Read
“Contaminants in Great Lakes sports fish,” which points out the benefits of eating fish as
well as the contaminants in Great Lakes fish including PCBs.28
2. What if family income is low and the fish are an important dietary source of protein and
other nutrients – would this affect your response?
3. PCBs, dioxins, and furans concentrate in fat. How could fish be prepared or cooked to
remove or reduce a portion of the fat-soluble chemicals?
4. Was the US EPA justified in demanding that more than 40 miles (64 km) of the Hudson be
cleansed of PCBs? Explain.
28 Contaminants in Great Lakes sports fish. US EPA, March 9, 2006, http://www.epa.gov/glindicators/fishtoxics/sportfishb.html.
29 Betts, K. S. A new record for PBDEs in people. Environmental Science & Technology, 39(14), July 15, 2005,296A–298.
419 Three families of POPs
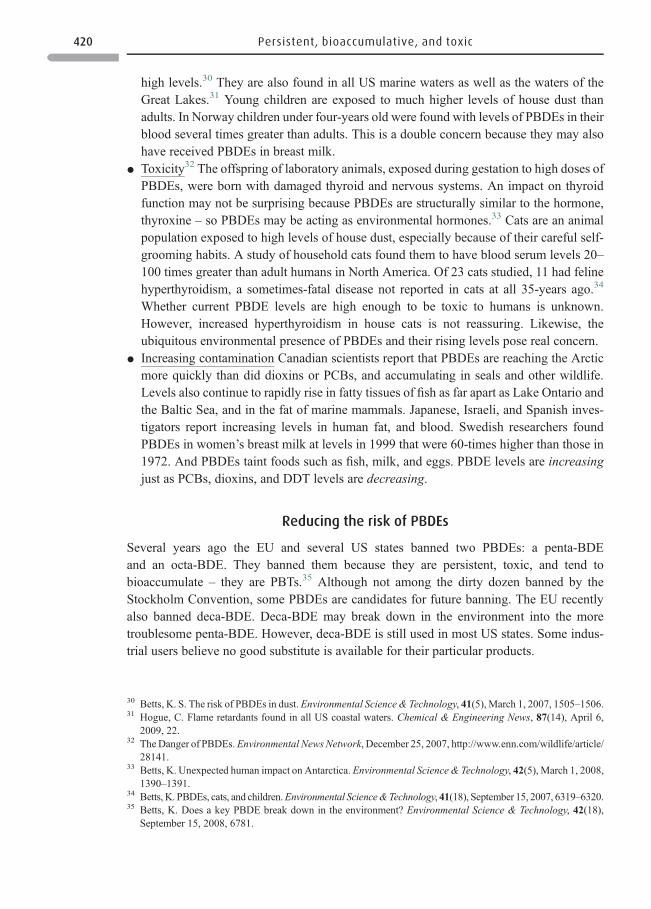
high levels.30 They are also found in all US marine waters as well as the waters of theGreat Lakes.31 Young children are exposed to much higher levels of house dust thanadults. In Norway children under four-years old were found with levels of PBDEs in theirblood several times greater than adults. This is a double concern because they may alsohave received PBDEs in breast milk.
* Toxicity32 The offspring of laboratory animals, exposed during gestation to high doses ofPBDEs, were born with damaged thyroid and nervous systems. An impact on thyroidfunction may not be surprising because PBDEs are structurally similar to the hormone,thyroxine – so PBDEs may be acting as environmental hormones.33 Cats are an animalpopulation exposed to high levels of house dust, especially because of their careful self-grooming habits. A study of household cats found them to have blood serum levels 20–100 times greater than adult humans in North America. Of 23 cats studied, 11 had felinehyperthyroidism, a sometimes-fatal disease not reported in cats at all 35-years ago.34
Whether current PBDE levels are high enough to be toxic to humans is unknown.However, increased hyperthyroidism in house cats is not reassuring. Likewise, theubiquitous environmental presence of PBDEs and their rising levels pose real concern.
* Increasing contamination Canadian scientists report that PBDEs are reaching the Arcticmore quickly than did dioxins or PCBs, and accumulating in seals and other wildlife.Levels also continue to rapidly rise in fatty tissues of fish as far apart as Lake Ontario andthe Baltic Sea, and in the fat of marine mammals. Japanese, Israeli, and Spanish inves-tigators report increasing levels in human fat, and blood. Swedish researchers foundPBDEs in women’s breast milk at levels in 1999 that were 60-times higher than those in1972. And PBDEs taint foods such as fish, milk, and eggs. PBDE levels are increasingjust as PCBs, dioxins, and DDT levels are decreasing.
Reducing the risk of PBDEs
Several years ago the EU and several US states banned two PBDEs: a penta-BDEand an octa-BDE. They banned them because they are persistent, toxic, and tend tobioaccumulate – they are PBTs.35 Although not among the dirty dozen banned by theStockholm Convention, some PBDEs are candidates for future banning. The EU recentlyalso banned deca-BDE. Deca-BDE may break down in the environment into the moretroublesome penta-BDE. However, deca-BDE is still used in most US states. Some indus-trial users believe no good substitute is available for their particular products.
30 Betts, K. S. The risk of PBDEs in dust. Environmental Science & Technology, 41(5), March 1, 2007, 1505–1506.31 Hogue, C. Flame retardants found in all US coastal waters. Chemical & Engineering News, 87(14), April 6,
2009, 22.32 The Danger of PBDEs.Environmental News Network, December 25, 2007, http://www.enn.com/wildlife/article/
28141.33 Betts, K. Unexpected human impact on Antarctica. Environmental Science & Technology, 42(5), March 1, 2008,
1390–1391.34 Betts, K. PBDEs, cats, and children.Environmental Science&Technology, 41(18), September 15, 2007, 6319–6320.35 Betts, K. Does a key PBDE break down in the environment? Environmental Science & Technology, 42(18),
September 15, 2008, 6781.
420 Persistent, bioaccumulative, and toxic
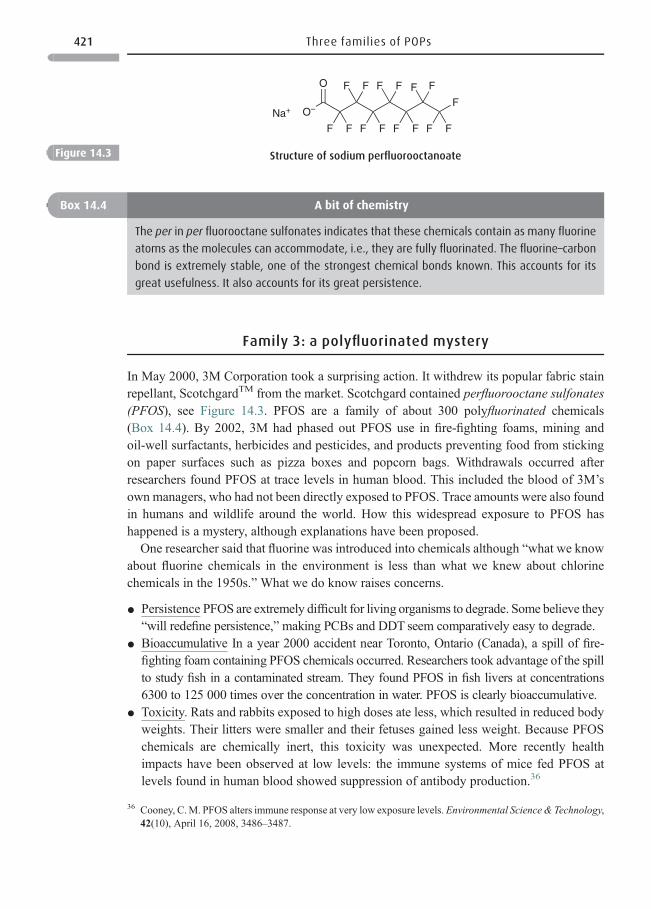
Family 3: a polyfluorinated mystery
In May 2000, 3M Corporation took a surprising action. It withdrew its popular fabric stainrepellant, ScotchgardTM from the market. Scotchgard contained perfluorooctane sulfonates(PFOS), see Figure 14.3. PFOS are a family of about 300 polyfluorinated chemicals(Box 14.4). By 2002, 3M had phased out PFOS use in fire-fighting foams, mining andoil-well surfactants, herbicides and pesticides, and products preventing food from stickingon paper surfaces such as pizza boxes and popcorn bags. Withdrawals occurred afterresearchers found PFOS at trace levels in human blood. This included the blood of 3M’sown managers, who had not been directly exposed to PFOS. Trace amounts were also foundin humans and wildlife around the world. How this widespread exposure to PFOS hashappened is a mystery, although explanations have been proposed.
One researcher said that fluorine was introduced into chemicals although “what we knowabout fluorine chemicals in the environment is less than what we knew about chlorinechemicals in the 1950s.” What we do know raises concerns.
* Persistence PFOS are extremely difficult for living organisms to degrade. Some believe they“will redefine persistence,” making PCBs and DDT seem comparatively easy to degrade.
* Bioaccumulative In a year 2000 accident near Toronto, Ontario (Canada), a spill of fire-fighting foam containing PFOS chemicals occurred. Researchers took advantage of the spillto study fish in a contaminated stream. They found PFOS in fish livers at concentrations6300 to 125 000 times over the concentration in water. PFOS is clearly bioaccumulative.
* Toxicity. Rats and rabbits exposed to high doses ate less, which resulted in reduced bodyweights. Their litters were smaller and their fetuses gained less weight. Because PFOSchemicals are chemically inert, this toxicity was unexpected. More recently healthimpacts have been observed at low levels: the immune systems of mice fed PFOS atlevels found in human blood showed suppression of antibody production.36
O–
O
F F F F
FF FF
F F FF
F
FF
Na+
Figure 14.3 Structure of sodium perfluorooctanoate
Box 14.4 A bit of chemistry
The per in per fluorooctane sulfonates indicates that these chemicals contain as many fluorine
atoms as the molecules can accommodate, i.e., they are fully fluorinated. The fluorine–carbon
bond is extremely stable, one of the strongest chemical bonds known. This accounts for its
great usefulness. It also accounts for its great persistence.
36 Cooney, C.M. PFOS alters immune response at very low exposure levels. Environmental Science & Technology,42(10), April 16, 2008, 3486–3487.
421 Three families of POPs
* Traveling PFOS. How the non-volatile PFOS ended up in birds in the Pacific Ocean, andin animals in other isolated locations is a mystery.
Reducing the risk of PFOS chemicals
3M Corporation phased out production of PFOS chemicals while, meanwhile developing anon-fluorinated Scotchgard. It also reformulated many other products. The new products haveundergone extensive environmental, health, and safety testing, and reportedly have little to noenvironmental impact. They are manufactured and sold under consent orders with the USEPA.37 The EPA believes that the quick phase out of PFOS chemicals will result in a quickdecrease in exposure. ▪ Government of Canada scientists concluded that current levels ofexposure to PFOS would not adversely affect human health, but were concerned that somewildlife, such as polar bears or fish-eating bird species, might be near potentially harmful levels.▪ Canada will eliminate PFOS use by 2009,38 and the EU by mid-2008. ▪ In both places, thereare limited exemptions for products without substitutes such as PFOS in aviation hydraulicfluids. ▪ InMay, 2009, there will be a vote under the StockholmConvention to classify PFOS asa POP. If that happens, there could be a global ban on PFOS and PFOS-related compounds
Further reading
Arnaud, C. Persistent Organic Pollutants, more chemicals may be flagged as risky.Chemical & Engineering News, 85(26), July 16, 2007, 6.
Betts, K. Unexpected human impact on Antarctica. Environmental Science & Technology,42(5), March 1, 2008, 1390–1391.
Questions 14.2
1. Why are small children exposed to greater levels of house dust than adults?
2. (a) Why do POPs (including PCBs and PBDEs) concentrate in breast milk? (b) Does this mean
mothers should avoid breast feeding? You may want to examine a respected site on the
web such as that of the Centers for Disease Control and Prevention39 before answering this.
3. (a) Manufacturers state that PBDEs should not be banned because fire prevention is so
important. Is this reasoning legitimate? Explain. (b)What if no suitable substitutes are available
for certain products and we continue to sell PBDEs – are there ways to lessen the risk?
4. Consider the PFOS story. What went wrong here? How can we prevent such happenings in
the future?
37 PFOS/PFOA information: what is 3M doing? http://solutions.3m.com/wps/portal/3M/en_US/PFOS/PFOA/Information/Action/#top.
38 Perfluorooctane Sulfonate (PFOS). Government of Canada, December 30, 2008, http://www.chemicalsubstanceschimiques.gc.ca/interest-interet/pfos_e.html.
39 Breastfeeding, exposure to environmental toxins. US Centers for Disease Control, http://www.cdc.gov/breastfeeding/disease/environmental_toxins.htm.
422 Persistent, bioaccumulative, and toxic
Chemical reactivity as a tool for estimating persistence. Environmental Science &Technology, 39(230), December 1, 2005, 480A–486A.
Ritter, S. K. Detective work and expertise are used to evaluate environmental contami-nants of emerging concern. Chemical & Engineering News, 84(5), January 30, 2006,37–40.
Internet resources
Canadian Press. 2008. Toxic chemical levels finally dropping in Arctic animals. http://www.panna.org/files/CanadianPressActicToxicsDrop20080714.pdf (July 14, 2008).
Environmental hazard lists (of 30 priority chemicals), Scorecard. Green Media Toolshed,2005. http://www.scorecard.org/chemical-groups/one-list.tcl?short_list_name=pbt.
Lignell, S., Aune,M., Darnerud, P.O., Cnattingius, S. and Glynn, A. Declines seen in levels ofpersistent organic pollutants in mothers’milk. Environmental Health News. http://www.environmentalhealthnews.org/ehs/newscience/pops-levels-decline-in-mothers-milk(July 24, 2009).
Reuters. 2005. UN to review “dirty dozen” chemicals. http://www.planetark.com/dailynewsstory.cfm/newsid/30639/story.htm (May 2, 2005).
UNEP. 2002. Foundation for Global Action on POPS: a US perspective. http://www.epa.gov/ncea/pdfs/pops/POPsa.pdf (March, 2002).
US EPA. 2006. Contaminants in Great Lakes sports fish. http://www.epa.gov/glindicators/fishtoxics/sportfishb.html (March 9, 2006).
2008. About PBTs, general information. http://www.epa.gov/pbt/pubs/aboutpbt.htm(January 15, 2008).
2008. DDT: what is DDT? http://www.epa.gov/pbt/pubs/ddt.htm (January 15, 2008).2007. Dioxin. (June 29). http://cfpub.epa.gov/ncea/CFM/nceaQFind.cfm?keyword=Dioxin2008. Dioxins and furans: what is dioxin? http://www.epa.gov/pbt/pubs/dioxins.htm
(January 15, 2008).2008. International agreements and treaties. http://www.epa.gov/oppfead1/international/
agreements/index.html (October 16, 2008).2008. PBT national action plans. http://www.epa.gov/pbt/pubs/epaaction.htm (January
15, 2008).2008. PBT profiler. http://www.epa.gov/oppt/sf/tools/pbtprofiler.htm (January 14, 2008).2008. PBTs, Frequently asked questions. http://www.epa.gov/pbt/pubs/faq.htm (January
15, 2008).2008. Persistent organic pollutants (POPS): a global issue, a global response. http://www.
epa.gov/oia/toxics/pop.pdf (October 2, 2008).2008. Polychlorinated biphenyls (PCBs). http://www.epa.gov/pbt/pubs/pcbs.htm
(January 15, 2008).2008. Preventing new PBTs: policy statement. http://www.epa.gov/pbt/pubs/prevent.htm
(January 15, 2008).
423 Internet resources

2008. The health effects of PCBs. http://www.epa.gov/epawaste/hazard/tsd/pcbs/pubs/effects.htm (August 8, 2008).
2009. Polychlorinated biphenyls (PCBs). http://www.epa.gov/epawaste/hazard/tsd/pcbs/index.htm (June 25, 2009).
US Fish & Wildlife Service. 2009. Environmental contaminants: endocrine disruptors.http://www.fws.gov/contaminants/Issues/EndocrineDisruptors.cfm (June 9, 2009).
424 Persistent, bioaccumulative, and toxic
15 Metals
“Society is a partnership not only between those who are living, but between thosewho are living, those who are dead, and those who are to be born.”
Edward Burke, 1790
All metals are persistent, but not all fit the other two PBTcriteria. ▪Ability to bioaccumulatelimits the list of PBT metals to three: lead, methylmercury, and cadmium. Notice that theelement, mercury is not a PBT, but rathermethylmercury, which can bioaccumulate in livingcreatures and biomagnify in the food web a million-fold or more. ▪ Also remember thatmany metals are nutrients, and that exposure to metal nutrients at normal levels is not toxic.It is the metals that are not nutrients, especially the so-called “heavy” or hazardous metalsthat can be toxic even at relatively low concentrations. ▪ Another factor in toxicity is thechemistry of the metal’s compounds.1 ▪ The US EPA now has only three metals on its PBTlist: mercury, lead, and cadmium.2 Section I of this chapter is a metal primer, providinginformation on metals and metal pollution regardless of whether they are PBTs. Section IIdetails the three especially troublesome metal PBTs, lead, mercury, and cadmium plus onemetalloid that is not a PBT, arsenic.
A metal primer
Metals are elemental and cannot be chemically destroyed (Chapter 19). But a metal doesbond to other elements to become part of a compound. The compounds of a metal showproperties different from the parent metal. Consider three examples.
1 This is illustrated by the metal chromium. For compounds in which chromium has a valence of three, it is anutrient. However, industrially important compounds with hexavalent chromium are toxic, carcinogenic, andmutagenic. Thus, chromium can be a necessary nutrient or a hazard, depending on its chemical state. Valence hasto do with the number of electrons in the outer shell of an element, which is very important in determining how anelement will react with other atoms, see Chapter 19. (1) Chromium. Micronutrient information center, LinusPauling Institute, September, 2007, http://lpi.oregonstate.edu/infocenter/minerals/chromium/index.html. (2)Biedermann, K.A. and Landolph, J. R. Role of valence state and solubility of chromium compounds on inductionof cytotoxicity, mutagenesis, and anchorage independence in diploid human fibroblasts. Cancer Research, 50,December 15, 1990, 7835–7842, http://cancerres.aacrjournals.org/cgi/reprint/50/24/7835.
2 In an earlier draft list of PBTs, http://p2pays.org/ref/02/01851.pdf, the US EPA evaluated 53 chemicals aspossible PBTs including 11 metals (some of which were nutrients). However, there are only 30 chemicals inEPA’s final PBTs list, and only three metals. See: http://www.scorecard.org/chemical-groups/one-list.tcl?short_list_name=pbt.
* Elemental lead is a solid, but the lead compound, tetraethyl lead an antiknock agent is anoily liquid. The lead is still there, but bonded to carbon in a molecule. The molecule hasvery different properties than does lead itself.
* When elemental iron reacts with other elements to become a compound, its propertieschange too. A common iron compound is iron oxide (rust, a reddish substance) formedwhen iron reacts with atmospheric oxygen and forms a compound. You have probablyobserved rust on a bridge.
* Consider metal pollutants in soil at levels too high for safe agriculture. They may bepresent in compounds that plant roots can take up. Sometimes, it is possible to add lime(calcium oxide) to the soil. The polluting metals react to become metal oxides, which areinsoluble and not easily taken up by plant roots. However, if the treated soil later becomesacidic – perhaps after a prolonged period of acid deposition – the metal may againbecome soluble.
Movement of metal pollution
Excepting mercury, metals are usually emitted to air as particulates. In Table 15.1, noticethat the particles don’t stay airborne, but fall out to water and land. Much of this atmosphericdeposition occurs near emission sources, but metal particulates can travel with the wind,some for long distances before fallout. In the 1950s, pilots flying in the Arctic in winter saw ahaze so heavy it obscured visibility. Later, the haze was found to be composed of particlestransported by winter winds from industrialized regions in Europe and Asia. The hazecontained soot, soil particles, POPS, and metals.
Metals in soil and sediment
Because metals are natural substances, they are found in soil, usually at low levels.However, metals emitted during fossil fuel combustion, mining, or other industrialprocesses and falling on soil and water can increase metal concentrations. Becausemetals don’t degrade, they can remain in the soil. However, concentration can belowered: contaminating metals in surface soil are buried by the slow buildup ofoverlying soil. Rain may partially leach out soluble metals from surface soil andcarry them away in runoff. Or water may erode and carry away the soil itself includingits bound metals. ▪ In a water body, metals bind to sediment and may become moredeeply buried as overlying sediment builds up. They may be buried deeply enough tono longer pose a problem – unless the sediment is stirred up as when a harbor or riveris dredged.
▪ Especially near the sediment’s surface though, problems can arise. Bottom-dwellingcreatures can take up some metals as well as other chemicals from the sediment. Mostproblematic, however, is what happens to mercury: some sediment bacteria can convert it tothe more toxic methylmercury, which can be absorbed into organisms and then through thefood web.
426 Metals
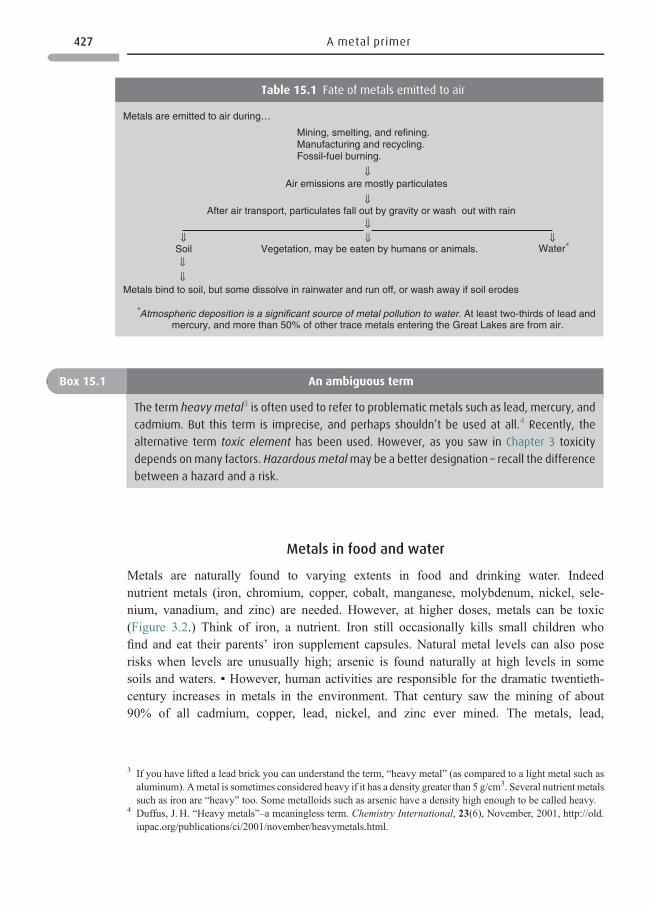
Metals in food and water
Metals are naturally found to varying extents in food and drinking water. Indeednutrient metals (iron, chromium, copper, cobalt, manganese, molybdenum, nickel, sele-nium, vanadium, and zinc) are needed. However, at higher doses, metals can be toxic(Figure 3.2.) Think of iron, a nutrient. Iron still occasionally kills small children whofind and eat their parents’ iron supplement capsules. Natural metal levels can also poserisks when levels are unusually high; arsenic is found naturally at high levels in somesoils and waters. ▪ However, human activities are responsible for the dramatic twentieth-century increases in metals in the environment. That century saw the mining of about90% of all cadmium, copper, lead, nickel, and zinc ever mined. The metals, lead,
Table 15.1 Fate of metals emitted to air
Metals are emitted to air during…
Mining, smelting, and refining.Manufacturing and recycling.Fossil-fuel burning.
⇓Air emissions are mostly particulates
⇓
⇓
After air transport, particulates fall out by gravity or wash out with rain⇓
⇓ ⇓Soil Vegetation, may be eaten by humans or animals. Water⇓⇓
Metals bind to soil, but some dissolve in rainwater and run off, or wash away if soil erodes
Atmospheric deposition is a significant source of metal pollution to water. At least two-thirds of lead andmercury, and more than 50% of other trace metals entering the Great Lakes are from air.
Box 15.1 An ambiguous term
The term heavy metal3 is often used to refer to problematic metals such as lead, mercury, and
cadmium. But this term is imprecise, and perhaps shouldn’t be used at all.4 Recently, the
alternative term toxic element has been used. However, as you saw in Chapter 3 toxicity
depends onmany factors. Hazardous metalmay be a better designation – recall the difference
between a hazard and a risk.
3 If you have lifted a lead brick you can understand the term, “heavy metal” (as compared to a light metal such asaluminum). Ametal is sometimes considered heavy if it has a density greater than 5 g/cm3. Several nutrient metalssuch as iron are “heavy” too. Some metalloids such as arsenic have a density high enough to be called heavy.
4 Duffus, J. H. “Heavy metals”–a meaningless term. Chemistry International, 23(6), November, 2001, http://old.iupac.org/publications/ci/2001/november/heavymetals.html.
427 A metal primer
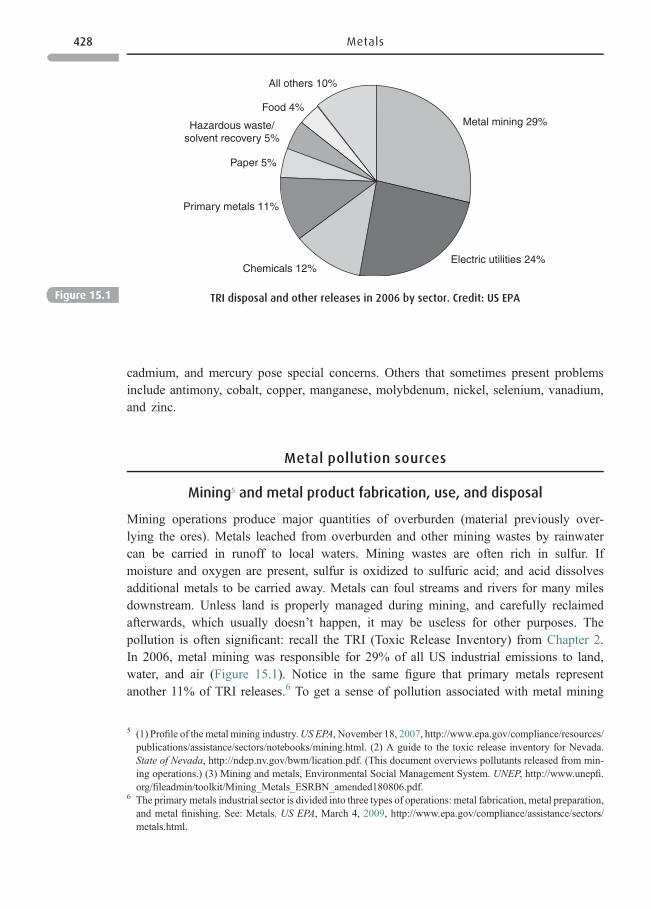
cadmium, and mercury pose special concerns. Others that sometimes present problemsinclude antimony, cobalt, copper, manganese, molybdenum, nickel, selenium, vanadium,and zinc.
Metal pollution sources
Mining5 and metal product fabrication, use, and disposal
Mining operations produce major quantities of overburden (material previously over-lying the ores). Metals leached from overburden and other mining wastes by rainwatercan be carried in runoff to local waters. Mining wastes are often rich in sulfur. Ifmoisture and oxygen are present, sulfur is oxidized to sulfuric acid; and acid dissolvesadditional metals to be carried away. Metals can foul streams and rivers for many milesdownstream. Unless land is properly managed during mining, and carefully reclaimedafterwards, which usually doesn’t happen, it may be useless for other purposes. Thepollution is often significant: recall the TRI (Toxic Release Inventory) from Chapter 2.In 2006, metal mining was responsible for 29% of all US industrial emissions to land,water, and air (Figure 15.1). Notice in the same figure that primary metals representanother 11% of TRI releases.6 To get a sense of pollution associated with metal mining
All others 10%
Food 4%
Paper 5%
Primary metals 11%
Chemicals 12%Electric utilities 24%
Metal mining 29%Hazardous waste/solvent recovery 5%
Figure 15.1 TRI disposal and other releases in 2006 by sector. Credit: US EPA
5 (1) Profile of the metal mining industry.US EPA, November 18, 2007, http://www.epa.gov/compliance/resources/publications/assistance/sectors/notebooks/mining.html. (2) A guide to the toxic release inventory for Nevada.State of Nevada, http://ndep.nv.gov/bwm/lication.pdf. (This document overviews pollutants released from min-ing operations.) (3) Mining and metals, Environmental Social Management System. UNEP, http://www.unepfi.org/fileadmin/toolkit/Mining_Metals_ESRBN_amended180806.pdf.
6 The primary metals industrial sector is divided into three types of operations: metal fabrication, metal preparation,and metal finishing. See: Metals. US EPA, March 4, 2009, http://www.epa.gov/compliance/assistance/sectors/metals.html.
428 Metals
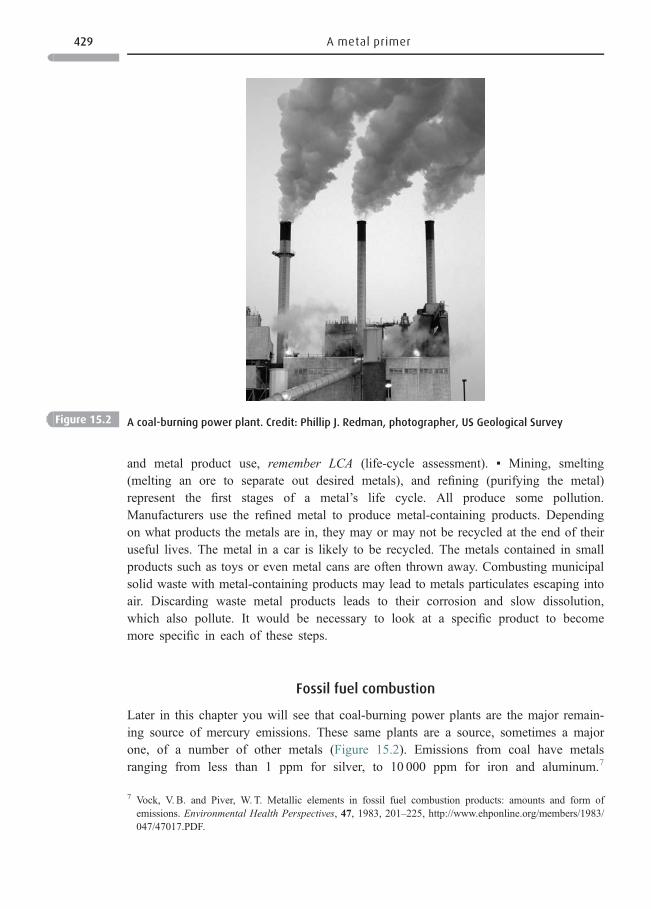
and metal product use, remember LCA (life-cycle assessment). ▪ Mining, smelting(melting an ore to separate out desired metals), and refining (purifying the metal)represent the first stages of a metal’s life cycle. All produce some pollution.Manufacturers use the refined metal to produce metal-containing products. Dependingon what products the metals are in, they may or may not be recycled at the end of theiruseful lives. The metal in a car is likely to be recycled. The metals contained in smallproducts such as toys or even metal cans are often thrown away. Combusting municipalsolid waste with metal-containing products may lead to metals particulates escaping intoair. Discarding waste metal products leads to their corrosion and slow dissolution,which also pollute. It would be necessary to look at a specific product to becomemore specific in each of these steps.
Fossil fuel combustion
Later in this chapter you will see that coal-burning power plants are the major remain-ing source of mercury emissions. These same plants are a source, sometimes a majorone, of a number of other metals (Figure 15.2). Emissions from coal have metalsranging from less than 1 ppm for silver, to 10 000 ppm for iron and aluminum.7
Figure 15.2 A coal-burning power plant. Credit: Phillip J. Redman, photographer, US Geological Survey
7 Vock, V. B. and Piver, W. T. Metallic elements in fossil fuel combustion products: amounts and form ofemissions. Environmental Health Perspectives, 47, 1983, 201–225, http://www.ehponline.org/members/1983/047/47017.PDF.
429 A metal primer
Emissions at any moment are small. However, the United States burns a billion tons ofcoal each year; China burns more than that. Thus, even small emissions of metalpollutants build up over time, especially near combustion sources. Petroleum combus-tion to a lesser extent emits metal pollutants. ▪ Air Except for mercury, metal emissionsare particulates or attached to particles. ▪ Water and land Within days or weeks theparticulates settle onto land or water (Table 15.1). ▪ Combustion ash Coal-burningplants produce immense quantities of ash. Because the organic portion of coal hasburned away, metals in ash are concentrated. A portion of both fly ash and bottom ashfind use in making Portland cement and asphalt concrete aggregate.8 Disposing of therest of the ash is a problem. Much is stored in lagoons, but remains potentially usable.It is important to keep it wet as dry ash can blow away. If unprotected, rainwater canleach metals from the ash. ▪ Catastrophic failure of an ash pond9 An earthen dam pondat a TVA coal-fired power plant held decades’ accumulation of coal ash on the banks ofthe Emory River in Harriman Tennessee; the Emory flows into two other rivers, whichare a drinking water source for many municipalities. On December 22, 2008, afterheavy rains, the dam “failed catastrophically” and a billion gallons (3.8 million liters) ofcoal ash sludge and water flooded out, covering 300 acres (121 hectares). Homes werealso destroyed or partially so by the sludge. Elevated levels of lead and thallium, andvery high levels of arsenic were found in water samples taken near the site of the spill.An environmental advocacy group had further professional tests performed; theseshowed concentrations of eight metals above drinking-water standards. There wasconcern for fish and other aquatic life directly exposed to elevated metal concentrations.Environmentalists and, to some extent, the EPA already believed that coal ash should beregulated as hazardous waste; this tremendous spill has brought that issue to the foreagain.
Other sources
▪ Municipal and industrial wastewater treatment plants are point sources of metal pollu-tants to water. ▪ Paved roads and construction sites are among the sources from whichmetal particulates can be blown with the wind or runoff with rainwater. ▪ Metal-containingwastes disposed on land are a source of pollution. ▪ Some fertilizers, pesticides, sewagesludge, and animal wastes applied to soil have higher metal concentrations than thosefound naturally.
Natural sources
These include volcanoes, forest fires, and sea salt sprays. Although significant, it is humanactivities that are increasing the environmental load of metals.
8 (1) Coal fly ash. Turner-Fairbank Highway Research Center, http://www.tfhrc.gov/hnr20/recycle/waste/cfa51.htm. (2) Coal bottom ash/boiler slag. Turner-Fairbank Highway Research Center, http://www.tfhrc.gov/hnr20/recycle/waste/cbabs1.htm.
9 Dewan, S. At plant in coal ash spill, toxic deposits. New York Times, December 29, 2008, http://www.nytimes.com/2008/12/30/us/30sludge.html.
430 Metals
Where metal pollution can present problems
* Fresh water bodies Because fresh-water organisms evolved with low metal levels, higherconcentrations can be problematic. Moreover, many lakes have small volumes or fewoutlets to dilute or displace polluting metals.
* Marine waters Metal levels in marine waters are naturally higher than in fresh.Nonetheless, ever-growing coastal populations have led to increasing marine pollution;runoff and rivers carry pollutants to the sea from ever-more developed land.
* Acid rain In acidified lakes, bacteria convert elemental mercury to the highly toxicmethylmercury more efficiently. ▪ Metals are more soluble in acid soils. Aluminum isa prominent example; it can be washed out by rain, and run off into nearby waterbodies.
* Cities Older cities had more metal-processing facilities than rural areas leaving some citysoils highly polluted.
* Agricultural soils Some European agricultural soils, even in Western Europe, wherepollution is better controlled are above or close to the maximum loading rate for somemetals. Above that rate, the soil is not fit to grow crops. Some agricultural villages inEastern Europe are deserted due to metal contamination. In Japan, metal contaminationhas made nearly 10% of rice paddy land unusable. The cost to remediate metal-contaminated soil is high. Much cannot be cleaned up at all.
* Hazardous waste sites Lead, cadmium, mercury, and arsenic are four of the ten mostcommon pollutants found at US hazardous waste sites.
Human exposure
Human exposure to metal pollutants occurs in various ways. ▪ Fish consumption is the majorroute of exposure to mercury. ▪ Shellfish, if eaten frequently, can be a major route ofexposure to cadmium, but for smokers, tobacco is the major route of exposure. ▪ For most
Box 15.2 Ancient mining
Most metal mining occurred in the twentieth century. However, humanity is fortunate that the
ancient Greeks and Romans didn’t mine and smelt as much ore as their twentieth century
counterparts. The ancient Romans smelted metal ores over open fires with emissions so
noxious that authors of the day complained of them. Lead and copper pollution from thou-
sands of years ago is still detectable around the world today, recorded in buried layers of ice,
and in bogs and sediment. In the sixteenth century, large furnaces with tall stacks were
developed to process ores. These still badly polluted their surroundings, but were an improve-
ment over ancient methods. Without careful controls, modern mining, smelting. and refining
can still pollute badly.
431 A metal primer
of us, food is the highest source of arsenic exposure, although much of that arsenic can benatural. But recall the many millions of individuals in Asian countries exposed to higharsenic levels in contaminated well water. For them, drinking water is the most significantsource of arsenic. Adverse health and environmental effects are specific to the metalinvolved.
Treating diseases with metals
As with other chemicals, metal toxicity depends upon the dose absorbed into the body,nutritional status, and many other factors. Long before antibiotics existed, arsenic was usedto treat syphilis, and patients were sometimes poisoned. ▪ Metals still have medicinal uses.Bismuth, as in Pepto Bismol, treats some stomach problems. Gold is sometimes used totreat rheumatoid arthritis, lithium for manic-depressive illness, and zinc is found in somedrugs. ▪ More dangerous situations arise when the hazardous metals, lead, mercury,cadmium, and arsenic are used in “folk remedies.” Some Caribbean religions such asSanteria see mercury as a substance attracting good and repelling evil, and use it inmedicine. Poisoning cases have been reported among US immigrants who brought metalremedies with them. A well-balanced diet can help protect against ingested pollutantsincluding metals (Box 15.3).
Reducing metal risk
Many countries have laws to control metal emissions, but not all enforce them well. US lawcontrols point source metal discharges to water. Air emissions are controlled under the 1990
Box 15.3 A healthy diet can reduce risk
A diet emphasizing fruits, vegetables, and grains provides many benefits including a lowered
susceptibility to toxic substances such as metals as well as lessened susceptibility to infections.
A varied diet contains a variety of metals including, but not limited to, nutrient metals. Some
metals oppose the biological effects of others. ▪ Dietary calcium and iron provide some
protection against ingested lead by inhibiting lead absorption from the gut. ▪ Zinc antagonizessome toxic effects of cadmium. ▪ Selenium provides some protection against toxic effects of
mercury, cadmium, and silver. A diet high in calcium, iron, and fiber is associated with lower
blood levels of cadmium. ▪ In the arsenic poisonings described in Chapter 10, people with good
nutrition were less likely to develop skin lesions from drinking water with high arsenic levels. ▪Such examples demonstrate the need for a varied diet. However, a healthy diet is often not
available to the poor. Remember also, that too high a dose of any metal can be toxic. In fact,
selenium – a nutrient when taken in proper amounts – has been poisoning wildlife for years in
the western United States.
432 Metals
Clean Air Act Amendments. EPA regulations greatly reduce lead, cadmium, and mercuryemissions from municipal solid waste and medical waste incinerators. A joint Canadian–USeffort is working to prevent further metal buildup in the Great Lakes. Modern technologysuch as used in a new smelter-refinery complex in Utah, among the cleanest of the world’ssmelters, can help lower metal pollution.10 Pollution prevention efforts have resulted inlowered metal pollution in many cases as when the printing industry replaced hazardousmetal pigments with soy-based ones, or when hazardous metals in paper and plastic pack-aging were restricted.
Box 15.4 Fouling ocean-going vessels
Tin is not very toxic. Indeed, elemental tin has often been the inner layer in metal food cans,
coming in direct contact with food. But organotin chemicals are toxic. Algae, barnacles, slime,
fungi, diatoms, and crustaceans attach themselves to the hulls of ocean-going vessels, slowing
speed, decreasing maneuverability, and increasing fuel use. In the 1970s antifouling paints
with organotin additives (especially tributyltin, TBT) were introduced. Hulls became much
cleaner. Unfortunately, water leaches TBT from the paint into surroundingwaters. ▪ PersistenceReleased near the water’s surface TBT persists only a few days. Microbes can degrade TBT to
the less toxic dibutyltin and monobutyltin. However, degradation is slower for TBT in sedi-
ments. In cold-water sediments, its half-life is over 2 years. Harbors and marinas are often the
spots most polluted with TBT. Bioaccumulation TBT bioaccumulates in fat. Toxicity TBT is
exceptionally toxic. Depending on dose and conditions TBT causes high rates of death
among mussel larvae, can thicken oyster shells, and causes snail imposex (female snails
have a penis). TBT can be toxic to crustaceans at concentrations of less than 1 μg/l.
▪ Reducing risk Some countries had already banned or restricted TBTs. Then, in 2001 the 159
member states of the International Maritime Organization voted to restrict persistent organo-
tin additives in paint, and to ban them in 2008. The delay was to allow time to find less
environmentally harmful substitute biocides.
Questions 15.1
1. Why would TBT near the water’s surface break downmore quickly than that which is buried
in sediments?
2. Why was it possible to ban tributyl tin but not to ban methylmercury – what is the
difference?
10 Rio Tinto: reclaiming the environment from a century of mining. Kennecott Utah Copper, 2008, http://www.kennecott.com/library/media/papers/pdf/Final_August_Remediation_Report.pdf.
433 A metal primer
SECTION II
Th ree PBT metals 11
The US EPA ranks metals as among the agents posin g the greatest hazard to human s. Fourmetals, lead, mercury, cad mium, and arsenic, a re among the 10 most common poll utantsfound at US hazardo us was te sites. All four met als with the ex ception of arsenic arecharact erized as PBTs. Lead, mercury, and cad mium are also included among 31 chemi calsthat EPA co nsiders of high prior ity.12
Lead13 and lead products
Lead has wond erful p roperties . Ductil e and easy to work with, human s have used lead forthousa nds of years. The great est quantity was used in the twentieth centur y. ▪ It is widelyused in plum bing14 and solde ring. Added to paint, lead protects both indoor and outsidesurfac es. In gas, tetraethy l lead is an excellent anti knock agent. Lea d print was used inprinting newspap ers, magaz ines, and books. ▪ Con sidering its emi ssion source s (belo w) it isnot surpr ising that lead becam e u biquitous in the envir onmen t. The lead concent ration inrecent ly forme d Ant arctic ice is four times great er than in ice formed prior to the industrialage. Its concent ration in recent coral shells is 15 time s greater than in shells deposi ted acentur y ago. In househo ld dusts lead ’s concent ration can be 500 times greater than thebackgro und level in the Ear th’s crust.
Sources of lead
Lead emissi ons Assumi ng that you live in a coun try that n o longer adds lead to its gasoline,the largest lead –emi tting source s to air 15 are coal-burni ng powe r plant s and incinerat ors, andalso mining and smelti ng. The most concent rated emissi ons are near lead smelter s. Facilitiesmanufacturing lead–acid batteries may also be high emitters. Natural emissions These arevolcanoes, airborne soil particles, sea spray, and forest fires. Lead already in the environ-ment The lead already in the environment due to human actions often represents the mostserious exposure.
11 Action on heavy metals among key GC decisions. UNEP, February 25, 2005, http://www.unep.org/Documents.Multilingual/Default.asp?DocumentID=424&ArticleID=4740&l=en.
12 Priority chemicals chemical name and summary fact sheet. US EPA, January 12, 2009, http://www.epa.gov/epawaste/hazard/wastemin/priority.htm.
13 Lead and cadmium working group, Geneva. UNEP, September 18–22, 2006, 6–12, http://www.chem.unep.ch/pb_and_cd/WG/Docs/K0653416%20-%20Lead%20Cadmium%20Report.pdf.
14 The word plumbing comes from the Latin word for lead, plumbum. The Romans used lead to make water pipesand to create urban water systems: it doesn’t rust, is easy-to-work-with, and readily available; it seemed ideal forplumbing.
15 Lead in air. US EPA, October 16, 2008, http://epa.gov/air/lead/.
434 Metals
Movement
Lead is released into air as particles and after days or weeks settles or is rained out;progressively less is found with increasing distance from the source. Remember the heavywinter haze that pilots flying in the Arctic saw in the 1950s? Among the haze’s componentswas lead, all carried by wind currents that were traced back to Europe and the Asian part ofRussia. Another example of lead transport was the finding of lead in the soil of Kauai,Hawaii; this lead was transported from both Asia and North America.
Sources of lead exposure
Children Most at risk of lead poisoning are small children, who live in improperly main-tained older houses containing leaded paint.16 They inhale the dust that forms as peelingleaded paint crumbles and becomes airborne. Exposure may come too from lead-contaminated soil around older homes where exterior leaded paint flakes off into the soil.Tracked indoors, the soil may enter household dust. Lead is also ingested: toddlers may suckon sweet-tasting leaded paint on windowsills. Moreover, poor children often have less thanoptimal calcium and iron in their diet; this leads to more absorption of the ingested lead.▪ Old housing is more likely to have lead solder in the water pipes, so drinking water cancontribute to exposure. For people living in lead-free or lead-safe homes food is the highestsource of exposure. Workplace exposure Wealthy countries control lead exposure in theworkplace. Jobs that involve working with lead have moved to countries with poorprotection. Moreover, less-developed countries often have small “cottage industries.”Without controls on fume emissions, these recycle lead-acid batteries, or add lead glazingto pottery. Toxic effects suffered by workers include high blood pressure and kidney failure.Children are employed in some of these cottage industries.
Toxic effects17
The ancients knew that lead was toxic, and forced slaves to do the leadmining. Thousands ofyears later lead still presents major hazards. Children Childhood lead poisoning wasdescribed as the most consequential environmental health problem in the United States.Lead’s effect on the nervous system of the developing fetus and small child is of mostconcern. The potential for damage starts long before pregnancy. The mother may have beenexposed to lead as a child and, because the body treats lead much as it does calcium, lead thatshe ingested would have bioaccumulated in her bones and teeth. About 90% of a person’slead intake is eventually stored in the skeleton. Lead levels in modern human skeletons andteeth are hundreds of times greater than those found in pre-industrial age skeletons. Duringpregnancy, when the mother’s bones release calcium to the blood to meet the needs of herfetus, lead is released too. And along with calcium, lead too passes through the placentaexposing the fetus. ▪Very low doses of lead may not obviously harm the fetus or small child.
16 Lead in paint, dust and soil. US EPA, November 6, 2008, http://www.epa.gov/lead/.17 ToxFAQsTM for Lead. ATSDR, October 5, 2007, http://www.atsdr.cdc.gov/tfacts13.html.
435 Three PBT metals
However, it can have subtle effects on the nervous system, detected as lowered intelligencequotients (IQ). The average deficit may be only a few points, but one author noted, “On asocietal basis, the aggregate loss of cognitive acuity due to lead exposure can be enormous.”And for children who would have had a low IQ anyway, a further lowering could shift theminto a severe deficit range. For children with higher exposure to lead and higher than averagebody burdens, lead is associated with increased distractibility, aggressiveness, and delin-quency.18 In addition to lead’s toxicity to the developing nervous system, lead may causekidney cancer. Mice exposed to lead in utero developed kidney cancer later in their lives.▪ Adults Adults are not as sensitive as children, but do suffer toxic effects from leadexposure. Chronic workplace exposure increases the likelihood of high blood pressure;can damage the nervous system and kidneys; and sometimes lead to anemia and infertility.In one disturbing study, Johns Hopkins University researchers followed 535 individualswho had worked with lead an average of 8 years. They went unexposed in the subsequent 16years. Thereafter they were compared to a control group of 118 unexposed individuals livingin the same neighborhood. Lead-exposed workers still showed clear deficits in memory andlearning abilities, as compared to controls. Researchers said it was as if lead exposure hadaged the workers’ brains by 5 years.19
Reducing lead’s risk
Because lead was used in dozens of useful products, it was difficult to back off, but step-by-step industrialized countries banned lead from plumbing, paint, gasoline, print, and manysmaller uses. These removal efforts represent pollution prevention (P2). ▪ Removing leadfrom gasoline Until the mid-1970s, motor vehicle exhaust was a major source of lead to theUS environment. Such dispersively emitted lead was the major source of exposure. Afterbanning lead from gasoline (a phase out that began in 1976), air emissions fell more than90%, and blood levels in US children fell concurrently. A level of 10 μg/100 ml of blood isthe threshold of concern. By the mid-1990s, lead levels in the blood of most children in thecritical age range of 1–5 years, was down to 4–6 μg/100 ml. Only 4.3% tested above 10 μg/100 ml. The P2 measure of banning lead from gasoline is given most credit for loweringbody burdens of lead, although in some locales reducing lead emissions from incinerators isalso considered to have been a factor. Many developing countries have also prohibitedadding lead to gasoline (although some still use leaded gasoline in 2008). China, where 65%of children had blood lead levels greater than 10 μg/100 ml, has banned lead additions togasoline. Other P2 measures Over the years, improved control of incinerator emissionslimited emissions of lead and other metals into air; recent US EPA regulations are reducingemissions even more significantly. In the late 1970s adding lead to paint used for homepurposes was banned, as was the use of lead solder for drinking water pipes and lead indrinking water fountains. Lead solder to seal food and soft drink cans was banned. In the
18 (1) Bellinger, D. C. Lead. Pediatrics, 113(4), April, 2004, 1016–1022, http://pediatrics.aappublications.org/cgi/content/full/113/4/S1/1016. (2) What makes a failing school? Arizona School Board Association, 2009, http://www.azsba.org/static/index.cfm?contentID=152.
19 Lead exposure at work can be lifelong problem. UPI, October 27, 2000, http://www.applesforhealth.com/HealthyBusiness/leadjob2.html.
436 Metals
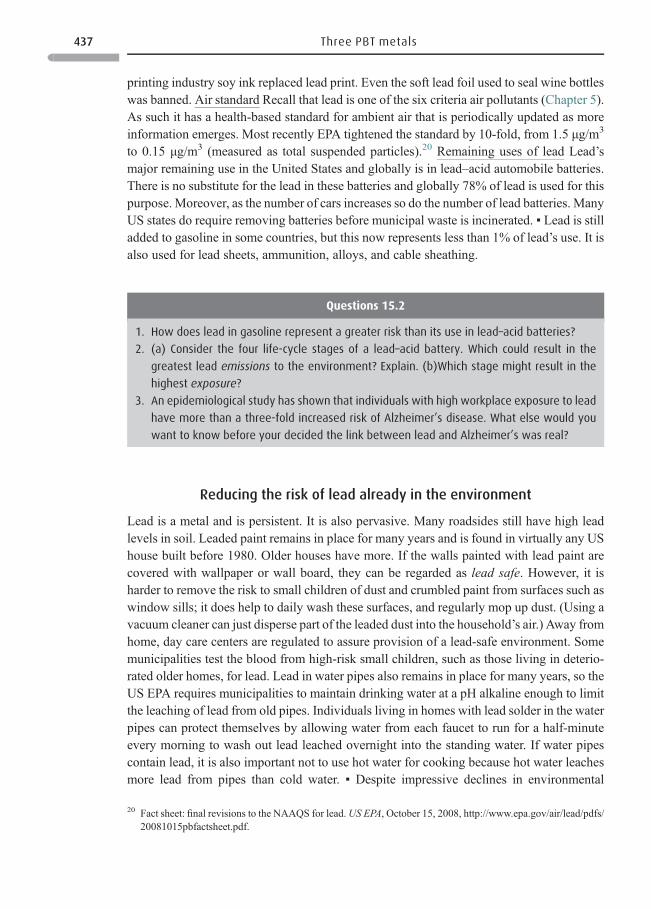
printing industry soy ink replaced lead print. Even the soft lead foil used to seal wine bottleswas banned. Air standard Recall that lead is one of the six criteria air pollutants (Chapter 5).As such it has a health-based standard for ambient air that is periodically updated as moreinformation emerges. Most recently EPA tightened the standard by 10-fold, from 1.5 μg/m3
to 0.15 μg/m3 (measured as total suspended particles).20 Remaining uses of lead Lead’smajor remaining use in the United States and globally is in lead–acid automobile batteries.There is no substitute for the lead in these batteries and globally 78% of lead is used for thispurpose. Moreover, as the number of cars increases so do the number of lead batteries. ManyUS states do require removing batteries before municipal waste is incinerated. ▪ Lead is stilladded to gasoline in some countries, but this now represents less than 1% of lead’s use. It isalso used for lead sheets, ammunition, alloys, and cable sheathing.
Reducing the risk of lead already in the environment
Lead is a metal and is persistent. It is also pervasive. Many roadsides still have high leadlevels in soil. Leaded paint remains in place for many years and is found in virtually any UShouse built before 1980. Older houses have more. If the walls painted with lead paint arecovered with wallpaper or wall board, they can be regarded as lead safe. However, it isharder to remove the risk to small children of dust and crumbled paint from surfaces such aswindow sills; it does help to daily wash these surfaces, and regularly mop up dust. (Using avacuum cleaner can just disperse part of the leaded dust into the household’s air.) Away fromhome, day care centers are regulated to assure provision of a lead-safe environment. Somemunicipalities test the blood from high-risk small children, such as those living in deterio-rated older homes, for lead. Lead in water pipes also remains in place for many years, so theUS EPA requires municipalities to maintain drinking water at a pH alkaline enough to limitthe leaching of lead from old pipes. Individuals living in homes with lead solder in the waterpipes can protect themselves by allowing water from each faucet to run for a half-minuteevery morning to wash out lead leached overnight into the standing water. If water pipescontain lead, it is also important not to use hot water for cooking because hot water leachesmore lead from pipes than cold water. ▪ Despite impressive declines in environmental
Questions 15.2
1. How does lead in gasoline represent a greater risk than its use in lead–acid batteries?
2. (a) Consider the four life-cycle stages of a lead–acid battery. Which could result in the
greatest lead emissions to the environment? Explain. (b)Which stage might result in the
highest exposure?
3. An epidemiological study has shown that individuals with high workplace exposure to lead
have more than a three-fold increased risk of Alzheimer’s disease. What else would you
want to know before your decided the link between lead and Alzheimer’s was real?
20 Fact sheet: final revisions to the NAAQS for lead.US EPA, October 15, 2008, http://www.epa.gov/air/lead/pdfs/20081015pbfactsheet.pdf.
437 Three PBT metals
contamination with lead, issues remain. Even the 4–6 μg/100 ml now found in most USchildren is hundreds of times greater than the estimated 0.016 μg/100 ml of prehistoricpeople. And blood levels are still high in many African–American children because they aremore likely to live in old substandard inner-city housing. This puts them at risk of adverseeffects on behavior and mental abilities. In the United States, if a child’s blood level is onlyslightly above 10, the recommended follow-up is to find and reduce sources of leadexposure. Levels greater than 10 elicit more aggressive attempts to find the source of leadexposure, and eliminate it. Medical intervention has been used to remove lead from child-ren’s bodies although it is considered of questionable value.
Reducing lead’s risk in Mexico
InMexico a phase out of lead in gasoline began in 1992. But lead-glazed pottery is still madeand used. Investigators found that children in Tijuana, a city on the Mexico–US border, hadblood-lead levels twice the average of US children. Moreover, unlike US children, the levelsdid not decrease with age, and sometimes increased. This was partially attributed to the useof lead-glazed pottery. Investigators doing the study provided information to parents ofthose children whose lead levels they had measured; they showed them how to identifysources of lead andminimize its risk. Children of parents so educated were later tested again.Their blood lead levels had dropped. Investigators concluded that parental education couldpartially protect children. However, limited resources prevented more aggressive forms ofintervention that could have lowered blood levels further. In countries still using leadedgasoline, motor vehicle exhaust remains a major source of exposure, but an increasingnumber of countries have banned leaded gasoline.
Some lead is natural
It is vital to reduce human exposure to lead as much as possible. But remember that lead, likeother metals, is a natural element. We cannot totally eliminate it. And alternatives can poseproblems too. In gasoline, lead was added as an antiknock agent. After lead was banned, itwas replaced by benzene – a human carcinogen. The amount of benzene in gasoline has alsobeen substantially reduced. Worldwide, most of the lead in use is in lead–acid batteries.21
Lead use in consumer electronics is also slowly growing.
Mercury22
You have probably heard of “quicksilver,” seen mercury in thermometers, and know it is aliquid metal. Or, you may have read of the “Mad Hatter” in Lewis Carroll’s Alice in
21 Lead and cadmium working group, Geneva. UNEP, September 2006, 18–22, http://www.chem.unep.ch/pb_and_cd/WG/Docs/K0653416%20-%20Lead%20Cadmium%20Report.pdf.
22 (1) Mercury programme.UNEP, September, 2002, http://www.chem.unep.ch/mercury/default.htm. (2) Mercuryinformation. US EPA, October 24, 2008, www.epa.gov/mercury/about.htm. (3) Mercury quick finder. US EPA,December 11, 2008, http://www.epa.gov/mercury/.
438 Metals
Wonderland. In Carroll’s time, hatters were exposed to mercury vapor as part of the feltingprocess, and often suffered damaged nervous systems as a result. Mercury is mined from amercury-containing ore called cinnabar.
Products,23 processes, and end of life
* Common products containing mercury are seen in Table 15.2. By 2005, the only batteriescontaining mercury were rechargeable- and button batteries. ▪ Mercury use in dentalamalgam was second only to batteries in 2005. ▪ About 3% of mercury is used influorescent lights, which receive negative attention because of this. Although the mercurydoes not escape unless the bulb is broken, careful recycling is required. Smaller amountsof mercury are used in mercury thermometers and other mercury measuring devices suchas thermostats and blood pressure cuffs; and electrical devices such as switches, andelectronic products.
* Three processes commonly use mercury: small-scale (artisanal) gold mining; productionof vinyl chloride monomer; and chlor-alkali production – electrolyzing sodium chlorideto make chlorine and sodium hydroxide. Again see Table 15.2.
* End-of-life In developed countries, mercury-containing products such as batteries may beincinerated at the end of their lives; if so, emission standards for mercury must be met. Forlandfilled products containing mercury, investigation revealed that the air above landfillscontains mercury including significant amounts of methylmercury, so landfills havebacteria that convert mercury to methylmercury.
Table 15.2 Global mercury demand (tonnes) a
Processes using mercury Year 2000 Year 2005Small-scale gold mining 650 1000Making vinyl chloride monomer – 700Chlor-alkali plants 797 618Products containing mercuryBatteries 1081 400Dental amalgam 272 270Measuring & control devices 166 150Electrical & electronic 154 140Lighting 91 120Other uses 175 120
Information from European Commissionhttp://ec.europa.eu/environment/chemicals/mercury/pdf/conf/doa.pdfa 1 metric tonne is equivalent to 1.1 tons
23 Agarwal, R. Mercury working group, heavy metals meeting, Budapest, September 23, 2006, http://www.who.int/ifcs/documents/forums/forum5/hm_agarwal.pdf. See: Global mercury demand by use, 2005.
439 Three PBT metals
Mercury sources
* A recent UNEP report24 estimates global air emissions of mercury of about 5700 tons/year (5200 tonnes),25 of which human activity accounts for about 2130 tons (1930tonnes). Natural sources (out gassing from the ocean and other surface waters, rocksand soil, and volcanic eruptions) are about 1765 tons (1600 tonnes). Re-emissions areabout 1875 tons (1700 tonnes). Re-emissions (or “recycling” of mercury) arise asfollows. Over the years as happened during mining operations in the western UnitedStates, thousands of tons of mercury were emitted to the atmosphere. This mercury oncemobilized, continues to move: it is taken up by soil, plants, and sediments. From there itcan once again escape to the atmosphere – it is re-emitted – and continues cycling throughthe environment. It is estimated that the total amount of mercury in the environment istwo to four times greater than in pre-industrial times.
* The largest American source of mercury emissions is coal-burning power plants. In theUnited States the 600 largest coal-burning power plants emit about 48 tons (44 tonnes)mercury a year, which is close to 40% of the United States total. Altogether US anthro-pogenic mercury emissions are about 3% of the global total.26,27 ▪Globally, power plantsare also the largest source of mercury emissions, about 1500 tons (1360 tonnes) a year.About two-thirds are from Asia, especially China and India. Another important globalsource is mining, both artisanal and industrial. Artisanal gold mining is small-scalemining by artisans and generates about 18% of global emissions; UNEP estimates that10–15 million people work, largely unprotected in artisanal gold mining and produce20–30% of the world’s gold (Figure 15.3). Mercury mining itself contributes much less toworld emissions, about 1%. Cement production contributes about 10% of global mercuryemissions.
Mercury can move far from its emission point
Much of themercury emitted by fossil-fuel burning facilities is elemental mercury vapor, whichcan remain airborne for 6–18 months, and travel long distances including globally. Eventuallyatmospheric reactions result in its transformation into mercury compounds such as mercuricoxide, which can then rain out or slowly fall out. ▪ An illustration of transport from distant
24 (1) The global atmospheric mercury assessment: sources, emissions and transport. UNEP ChemicalsBranch, December, 2008, http://www.chem.unep.ch/mercury/Atmospheric_Emissions/UNEP%20SUMMARY%20REPORT%20-%20CORRECTED%20May09%20%20final%20for%20WEB%202008.pdf. (2) Clean airmercury rule, basic information. US EPA, February 26, 2008, http://www.epa.gov/camr/basic.htm and anothermercury report (3) Pavlish, J. H. Global mercury emissions. EERC Technology, August 11, 2006, http://www.undeerc.org/catm/pdf/PavlishMercury2006SpecialSessionSlides.pdf.
25 Each of these numerical figures is the mid-point of a high and low estimate of the range given for emissions ineach case
26 Mercury emissions, the global context. US EPA, October 24, 2008, http://www.epa.gov/mercury/control_emis-sions/global.htm.
27 Other mercury emission sources are industrial boilers (considered separately from power plant boilers), whichcontribute about 10% of the US total. Hazardous-waste incinerators emit about 5%, and chlorine production isabout 5%. Tightly regulated municipal solid waste and medical waste incinerators currently release very little.Combustion in US residences emits a few tons.
440 Metals
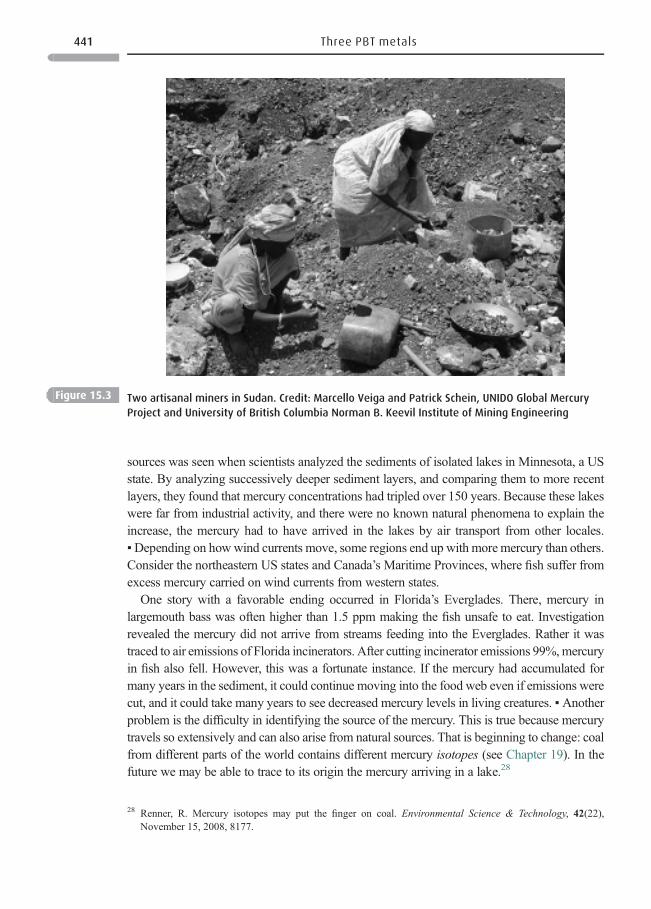
sources was seen when scientists analyzed the sediments of isolated lakes in Minnesota, a USstate. By analyzing successively deeper sediment layers, and comparing them to more recentlayers, they found that mercury concentrations had tripled over 150 years. Because these lakeswere far from industrial activity, and there were no known natural phenomena to explain theincrease, the mercury had to have arrived in the lakes by air transport from other locales.▪Depending on howwind currents move, some regions end up with moremercury than others.Consider the northeastern US states and Canada’s Maritime Provinces, where fish suffer fromexcess mercury carried on wind currents from western states.
One story with a favorable ending occurred in Florida’s Everglades. There, mercury inlargemouth bass was often higher than 1.5 ppm making the fish unsafe to eat. Investigationrevealed the mercury did not arrive from streams feeding into the Everglades. Rather it wastraced to air emissions of Florida incinerators. After cutting incinerator emissions 99%,mercuryin fish also fell. However, this was a fortunate instance. If the mercury had accumulated formany years in the sediment, it could continue moving into the food web even if emissions werecut, and it could take many years to see decreased mercury levels in living creatures. ▪Anotherproblem is the difficulty in identifying the source of the mercury. This is true because mercurytravels so extensively and can also arise from natural sources. That is beginning to change: coalfrom different parts of the world contains different mercury isotopes (see Chapter 19). In thefuture we may be able to trace to its origin the mercury arriving in a lake.28
Figure 15.3 Two artisanal miners in Sudan. Credit: Marcello Veiga and Patrick Schein, UNIDO Global Mercury
Project and University of British Columbia Norman B. Keevil Institute of Mining Engineering
28 Renner, R. Mercury isotopes may put the finger on coal. Environmental Science & Technology, 42(22),November 15, 2008, 8177.
441 Three PBT metals
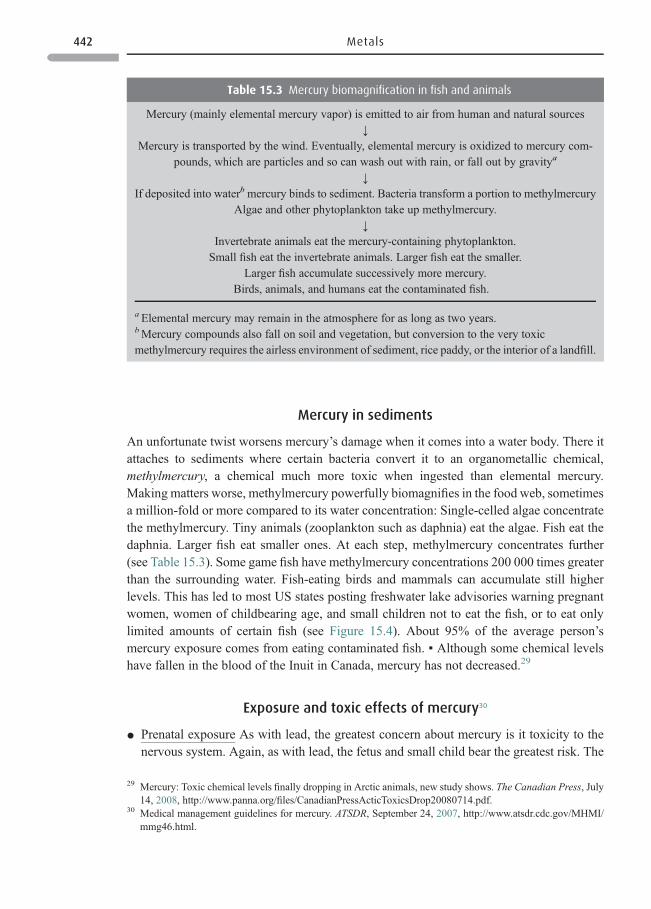
Mercury in sediments
An unfortunate twist worsens mercury’s damage when it comes into a water body. There itattaches to sediments where certain bacteria convert it to an organometallic chemical,methylmercury, a chemical much more toxic when ingested than elemental mercury.Making matters worse, methylmercury powerfully biomagnifies in the food web, sometimesa million-fold or more compared to its water concentration: Single-celled algae concentratethe methylmercury. Tiny animals (zooplankton such as daphnia) eat the algae. Fish eat thedaphnia. Larger fish eat smaller ones. At each step, methylmercury concentrates further(see Table 15.3). Some game fish have methylmercury concentrations 200 000 times greaterthan the surrounding water. Fish-eating birds and mammals can accumulate still higherlevels. This has led to most US states posting freshwater lake advisories warning pregnantwomen, women of childbearing age, and small children not to eat the fish, or to eat onlylimited amounts of certain fish (see Figure 15.4). About 95% of the average person’smercury exposure comes from eating contaminated fish. ▪ Although some chemical levelshave fallen in the blood of the Inuit in Canada, mercury has not decreased.29
Exposure and toxic effects of mercury30
* Prenatal exposure As with lead, the greatest concern about mercury is it toxicity to thenervous system. Again, as with lead, the fetus and small child bear the greatest risk. The
Table 15.3 Mercury biomagnification in fish and animals
Mercury (mainly elemental mercury vapor) is emitted to air from human and natural sources↓
Mercury is transported by the wind. Eventually, elemental mercury is oxidized to mercury com-pounds, which are particles and so can wash out with rain, or fall out by gravity a
↓
If deposited into water b mercury binds to sediment. Bacteria transform a portion to methylmercuryAlgae and other phytoplankton take up methylmercury.
↓
Invertebrate animals eat the mercury-containing phytoplankton.Small fish eat the invertebrate animals. Larger fish eat the smaller.
Larger fish accumulate successively more mercury.Birds, animals, and humans eat the contaminated fish.
aElemental mercury may remain in the atmosphere for as long as two years.bMercury compounds also fall on soil and vegetation, but conversion to the very toxicmethylmercury requires the airless environment of sediment, rice paddy, or the interior of a landfill.
29 Mercury: Toxic chemical levels finally dropping in Arctic animals, new study shows. The Canadian Press, July14, 2008, http://www.panna.org/files/CanadianPressActicToxicsDrop20080714.pdf.
30 Medical management guidelines for mercury. ATSDR, September 24, 2007, http://www.atsdr.cdc.gov/MHMI/mmg46.html.
442 Metals
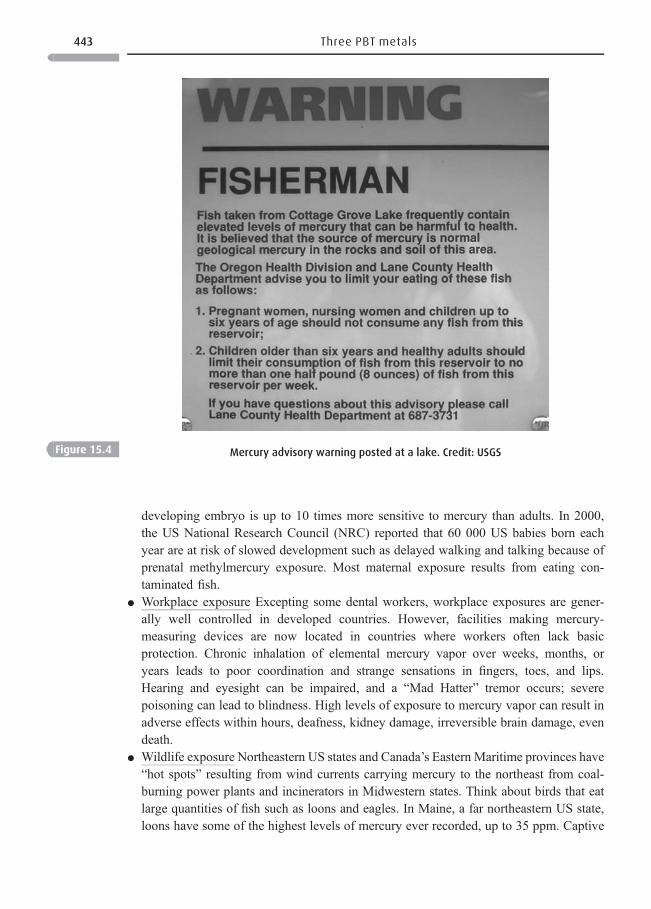
developing embryo is up to 10 times more sensitive to mercury than adults. In 2000,the US National Research Council (NRC) reported that 60 000 US babies born eachyear are at risk of slowed development such as delayed walking and talking because ofprenatal methylmercury exposure. Most maternal exposure results from eating con-taminated fish.
* Workplace exposure Excepting some dental workers, workplace exposures are gener-ally well controlled in developed countries. However, facilities making mercury-measuring devices are now located in countries where workers often lack basicprotection. Chronic inhalation of elemental mercury vapor over weeks, months, oryears leads to poor coordination and strange sensations in fingers, toes, and lips.Hearing and eyesight can be impaired, and a “Mad Hatter” tremor occurs; severepoisoning can lead to blindness. High levels of exposure to mercury vapor can result inadverse effects within hours, deafness, kidney damage, irreversible brain damage, evendeath.
* Wildlife exposure Northeastern US states and Canada’s Eastern Maritime provinces have“hot spots” resulting from wind currents carrying mercury to the northeast from coal-burning power plants and incinerators in Midwestern states. Think about birds that eatlarge quantities of fish such as loons and eagles. In Maine, a far northeastern US state,loons have some of the highest levels of mercury ever recorded, up to 35 ppm. Captive
Figure 15.4 Mercury advisory warning posted at a lake. Credit: USGS
443 Three PBT metals
birds with levels of mercury as high as those found in wild loons reproduce poorly, as doeagles that have high levels of mercury in their feathers. It is feared that such birds havepoorer physical dexterity and may have more difficulty catching fish or avoiding pred-ators. Wild animals that eat contaminated fish are also at risk.
Box 15.5 A mercury poisoning disaster
Beginning in the 1930s and continuing until the late 1960s, Tokyo’s Chisso Corporation
routinely discharged elemental mercury into Japan’s Minamata Bay. There, bacteria converted
some to methylmercury, which built up in the food web (Figure 16.3). Methylmercury levels in
Bay fish ranged from 9–24 ppm, although some were as high as 40 ppm. Unknowing people
ate the fish, and as many as 200 000 were poisoned. Hundreds died. Thousands suffered
chronic disease. Chronic, sometimes severe and debilitating nervous system damage was
seen. So were miscarriages, and deformed fetuses. Victims charged authorities with knowing
about the pollution and its risks, but failing to stop them or inform the public. The poisonings
resulted in a bitter lawsuit against Chisso that continued for nearly 30 years. In 1996, 3171
victims finally settled. However, one elderly and still ill embittered group, refused to settle
until the government officially apologized to them. ▪ The tragedy at Minamata was later
eclipsed by other industrial tragedies such as the Bhopal explosion (Chapter 1) and the
Exxon Valdez oil spill (Chapter 9). But a World Bank report emphasized Minamata as a water-
shed event that brought increased international attention to industrial pollution. After
Minamata was publicized, many developing countries set up environmental agencies to
control pollution, and many of these countries have made progress. Mercury guidelines Fish
in Minamata Bay had mercury levels as high as 40 ppm. Compare these to US Food and Drug
Administration (FDA) guidelines for eating fish.
Fish with less than 0.5 ppm mercury are considered safe for consumption in any amount.
At 1 ppm, people are advised to limit fish consumption. A level of 1 ppm is 10 times lower
than the amount shown to produce toxic effects in adults in the Minamata Bay poisoning.
Above 1.5 ppm, people are advised not to eat the fish at all.
In 1991, the FDA reported that mercury in most American fish ranged from 0.01 to 0.5 ppm.
Exceptions were larger or older ocean fish, shark, and swordfish, which naturally bioaccumu-
late mercury to 3 ppm or more. In 2002, both the US FDA and the UK Food Standards Agency
issued alerts advising pregnant women, women who may become pregnant, infants, and
children under 16 not to eat shark, swordfish, andmarlin because of highmercury levels. These
are marine species. ▪ Since 1991, 37 US states have issued health advisories onmercury in fish.
Usually state standards are stricter than those of the US FDA. Recommendations from the US
EPA and State and Canadian Province agencies for freshwater fish advise those who eat large
quantities of fish, such as some Native Americans to pay special attention to advisories. In
1995, mercury contamination accounted for about two-thirds of all fish advisories issued in the
United States. Other contaminants on which advisories are still sometimes posted include
dioxins and PCBs.
444 Metals
Reducing mercury’s risk
* EPA regulations Mercury emissions31 from municipal waste combustors were reducedabout 90% between 1990 and 2005. Emissions from medical waste incinerators fell 95%between 1990 and 1998. Hazardous waste incinerators, industrial boilers, and facilitiesusing the mercury-cell process to make chlorine also reduced emissions.32 ▪ Overall,mercury deposits on land and water have fallen considerably: analysis of peat cores in thestate of Minnesota indicate that mercury deposition reached a peak in 1960 and sub-sequently began falling. By the 1980s deposition was less than half of the 1950s.
* Regulations of power plants Despite such progress, the EPA did not control the biggestsource of mercury emissions to the US atmosphere, coal-burning power plants. EPA’s ruleFinally, in 2005, the agency issued a rule to cap and reduce mercury emissions from thenation’s 1100 power plants.33 The EPA stated that, even without using technologiesspecific to reducing mercury emissions that the technologies applied to reduce sulfurdioxide and nitrogen oxides emissions were simultaneously recovering about a third ofthe mercury released during coal combustion. So the EPA proposed to regulate mercuryemissions as part of a multi-pollutant strategy in which sulfur dioxide and nitrogen oxidesemissions were also further controlled. The rule was to create a cap-and-trade program toallow utilities to swap rights to emit mercury (as is done with sulfur dioxide emissions).The result would be that plants emitting 48 tons (43.5 tonnes) of mercury a year wouldemit 38 tons (34.5 tonnes) in 2010 and 15 tons (13.6 tonnes) in 2018, a 70% drop. Suingthe EPA Seventeen states plus environmental organizations sued the EPA saying that itwas required to set strict limits on mercury emissions under requirements of the Clean AirAct (CAA) as an hazardous air pollutant. They stated that “maximum achievable controltechnology” could cut mercury emissions by 90% in 3 years. A US Court of Appealsagreed, and ruled that EPA had violated the CAA. It further noted that the EPA itself, in2000, had concluded that coal-fired power plants are sources of hazardous air pollutantsand their mercury emissions should be regulated under the CAA.34 EPA appeals The EPAappealed to the US Supreme Court in 2008 for permission to implement its mercury-control program.35 While this case moves forward, individual states can choose whetherto set stricter controls on mercury emissions.
* Reducing workplace exposure Workers in less-developed countries often remain unpro-tected from mercury exposure. Visitors to China describe toxic reactions among unpro-tected workers as routine. Workers are simply allowed some time off work to partiallyrecover.
31 What else is EPA doing to reduce mercury emissions? US EPA, January 3, 2008, http://publicaccess.custhelp.com/cgi-bin/publicaccess.cfg/php/enduser/std_adp.php?p_faqid=1834&p_created=1106164694.
32 Mercury emission control R&D. US DOE, January 18, 2006, http://www.fossil.energy.gov/programs/power-systems/pollutioncontrols/overview_mercurycontrols.html.
33 Controlling power plant emissions of mercury. US EPA, October 24, 2008, http://www.epa.gov/mercury/control_emissions/index.htm.
34 Baltimore, C. EPA must rewrite utility mercury rule: U.S. federal court. Reuters, February 8, 2008, http://www.reuters.com/article/environmentNews/idUSN0847678520080208?sp=true.
35 Cicero, R. EPA asks SupremeCourt to reviewmercury emissions case. Andrews Publications, October 24, 2008,http://news.findlaw.com/andrews/en/haz/20081024/20081024_epa.html.
445 Three PBT metals
* Reducing or elimin ating mercury-co ntaining product s 36 Mercu ry use in the United Statesfell sharply b etween 1980 and 2001, from 2453 tons (2225 tonnes ) to 30 0 tons (271tonnes). A maj or reason for this decline is that merc ury use in dispo sable batteries fellalmost 85% over this time; only rechargeable batt eries and button batteries still containmercury. Se e Table 15.2 . The EPA c ancelled fungi cide regis trations for the use ofmercury in paint after a child ’s death resul ting from merc ury emissions into indoorair.37 Many chlor-alkali manuf actur ing plant s have closed or are closing in the UnitedStates and Europ e. ▪ Althoug h merc ury is used in fluoresc ent lights in smal ler amoun tsthan previ ous years, the use of mercury in lightin g noneth eless ( Table 15.2 ) went upbecause more lights are being produce d. A goal of the EPA’s volunt ary Green Lig htsprogra m is to elimin ate merc ury use in lightin g and, in the interim , recycl e all spentfluoresc ent tubes . Some stat es regulate merc ury-co ntaining fluoresc ent lights as hazard-ous waste. ▪ Se e Table 15.2 for reduct ions in merc ury use just between 2000 and 2005.▪ So me US states are also diligent in elim inating merc ury-co ntaining product s, even feverthermom eters and other meas uring and contr ol device s. The group, “ Health Car e wi thoutHarm ” is successful ly wor king with hospital s to phase out the use of merc ury-co ntainingproducts incl uding blood press ure cuffs, thermom eters, and lab che micals. Anotherprogra m, “ Mad as a Hatter ” aims to elimin ate merc ury from research facilit ies underthe contr ol of the Nationa l Institutes of Health.
* Internati onal The UN is urging countr ies to speed up thei r phase outs of merc ury for allproces ses that now use it. 38 A numbe r of less-devel oped countries rely on merc ury forartisanal gold mining. Exp erts believe that there are reasonab le alternati ves for virt uallyall industria l processes and merc ury-co ntaining product s. The re is broad internationalagreemen t to phase out merc ury use including the EU. Howe ver, some governme ntsoppose a legally b inding treaty to impose fi rm target dates. The United State s opposed ituntil the Obam a Administr ation took of fice; it now prom otes a treaty.39
Box 15.6 A dental quandary
Some human exposure results from minute amounts of mercury vapor emitted within the
mouth by amalgams used to fill dental cavities. 40 Some contain 50% mercury. Critics of
mercury amalgams – used for more than 150 years to fill cavities – claim they are linked to
multiple sclerosis, arthritis, mental disorders, and other diseases. People with amalgam fillings
do have higher mercury concentrations in their blood than people who don’t. However, a 1994
36 Doa, M. J. Addressing reduction of demand and supply of mercury. International Mercury Conference, Brussels,2006, http://ec.europa.eu/environment/chemicals/mercury/pdf/conf/doa.pdf.
37 Until the early 1990s, mercury was also used as a fungicide for seeds, and golf course greens.38 (1) Global agreement on mercury pollution focus of international meeting. UNEP, November 12, 2007, http://
www.unep.org/Documents.Multilingual/Default.asp?DocumentID=521&ArticleID=5702&l=en. (2) Wallis,D. UN wants global action on mercury threat. Reuters, November 12, 2007, http://uk.reuters.com/article/environmentNews/idUKL1265692120071112?sp=true.
39 Maliti, T. US calls for treaty on mercury reduction. San Francisco Chronicle, February 16, 2009, http://www.sfgate.com/cgi-bin/article.cgi?f=/n/a/2009/02/16/international/i074829S39.DTL.
40 Questions and answers on dental amalgam. Food and Drug Administraton, June 3, 2008, http://www.fda.gov/cdrh/consumer/amalgams.html.
446 Metals
Questions 15.3
1. In the United States, several federal agencies evaluated psychological andmotor tests done
on the babies and small children of island-dwelling peoples who eat large amounts of fish
contaminated with methylmercury. Using this evaluation the US EPA set guidelines about
four times more stringent than the US FDA standard. The guidelines are used by regulators
who make decisions ranging from fish consumption advisories to air emissions standards.
The EPA was criticized for being so strict relative to the FDA, but the EPA reminded critics
that its charge is to protect the most sensitive population, in this case women of child-
bearing age and small children. A US NRC report supported EPA’s conclusion. It concluded
that 60 000 US babies a year are at risk of slowed development because of prenatal
methylmercury exposure. The FDA made the counterpoint that, if the EPA’s guideline
stood, it would prevent sales of swordfish, shark, and most tuna. The FDA asks: How can
we protect people without scaring them away from a food providing a good source of
protein, polyunsaturated fatty acids, and antioxidants, and without needlessly hurting the
fishing industry? (a) With which agency do you tend to agree and why? (b) What do you see
as a possible way to resolve the issue?
2. The NRC report estimated that 60 000 US babies a year are at risk of slowed development
such as delayed walking and talking after prenatal exposure to methylmercury. Does this
mean that 60 000 babies will be born each year with these adverse effects? Explain.
3. The lowest methylmercury concentration in human blood associated with any observed
toxic effect in adults is 200 ppb. The average mercury concentration in American blood is
about 8 ppb. (a) Do you believe that 8 ppb is a comfortable margin of safety for adults?
Explain using, if you can the factor-10 concept from Chapter 4. (b) Would your answer be
the same if women of childbearing age had an average of 25 ppb methylmercury in their
blood? Explain.
4. Assume you ingested elemental mercury in an amount equivalent to that in a thermom-
eter. (a) What would happen to the ingested mercury? (b) Does your answer explain why
article in a dentistry journal reported that, although dentists have a much higher body burden
of mercury than the average American, they have no higher incidence of any disease. Also, a
study of elderly nuns in Java showed no association between long-term amalgams in teeth,
and lowered reasoning ability. Three-quarters of US dentists continue to use silver-mercury
amalgams, but the fillings remain controversial. Because other, albeit somewhat more costly
options exist – gold and compositematerials – some dentists no longer usemercury amalgams.
The position of the US Public Health Service is that amalgam use should not be regulated unless
it is linked to illness. Rarely, individuals have an amalgam allergy with symptoms similar to a
skin allergy. However, Norway, Sweden, and Denmark have banned dental mercury use as of
2008 because of the precautionary principle and the belief that composites are now strong
enough to be good replacements for the amalgam.41
41 Dental mercury use banned in Norway, Sweden, and Denmark because composites are adequate replacements.Reuters, January 3, 2008, http://www.orthomolecular.org/resources/omns/v04n24.shtml.
447 Three PBT metals
Cadmium42,43
Cadmium is not mined as such. Rather cadmium is found in zinc ores and recovered duringthe smelting and refining of zinc. Whereas lead has been mined for at least 4000 years,cadmium was not even discovered until 1817, and has been heavily mined only since themid-1940s. Environmental cadmium levels are lower than those of lead and people ordina-rily have lower exposure. But cadmium levels in the environment have been increasing, andexposure is hundreds of times greater than in pre-industrial times.
Cadmium uses, sources, and movement
* Because cadmium has good corrosion resistance it has value for a number of uses. It isused in electroplating on iron and steel; in alloys with lead, copper, and tin; as a stabilizerfor PVC plastic; and in ceramics, enamels, and pigments. Some of these uses havedecreased in recent years. The largest use by far in the United States and globally, is inNiCad (nickel–cadmium) rechargeable batteries. In 2004, this represented 82% of allcadmium used. In the United States, NiCad batteries are a major source of cadmium inmunicipal solid waste.
* Sources Cadmium is released into the air during the smelting and refining of the metalszinc, lead, and copper. However, the largest source of cadmium is fossil fuel burning,especially of coal. Municipal solid-waste and other incinerators can emit cadmium too.
ingested elemental mercury is much less toxic thanmethylmercury. (c) What if themercury
in a thermometer was broken in a small bathroom and not cleaned up – would the mercury
then pose somewhat greater risk? Explain.
5. Older larger fish such as sharks and swordfish have higher mercury concentrations than
younger or smaller fish. Why?
6. Unlike organic PBTs (which concentrate in fat) mercury concentrates in fish muscle.
Remember the techniques you could use to remove PCBs or dioxins from fish that you
have purchased – could you use the same techniques to remove mercury? Why?
7. In 1996, the US Department of Defense (DOD) proposed selling its mercury stockpile, then
60% of the world’s supply, on the open market. After much protest, the DOD dropped its
proposal. (a) What would be your reaction to such a sale and why? (b) In Brazil, mercury
used in gold mining resulted in the release of about 170 tons (154 tonnes) of mercury into
the environment between 1989 and 2004. Brazil imports mercury from other countries.
Had the DOD sale gone through, part could have been sold to Brazil. Does knowing this
affect your viewpoint on selling mercury abroad? (c) Most nations that sell mercury to Brazil
restrict the use of mercury within their own borders. Does this raise ethical concerns?
Explain.
42 Lead and cadmium working group, Geneva. UNEP,18–22 September 2006, 13–18, http://www.chem.unep.ch/pb_and_cd/WG/Docs/K0653416%20-%20Lead%20Cadmium%20Report.pdf.
43 Cadmium. US EPA, http://www.epa.gov/epawaste/hazard/wastemin/minimize/factshts/cadmium.pdf.
448 Metals
▪ Because cadmium is found naturally in soils, rocks (coal too), and mineral fertilizers, itends up as an impurity in such products as phosphate fertilizers, detergents, and refinedpetroleum products. Polyphosphate fertilizers and sewage sludge contribute to cadmiumbuildup in soils.
* Movement Like lead, cadmium is released as a particulate and thus has a limitedatmospheric life, days to weeks before settling out. However, within that time a portionreaches remote locales including the Arctic. The Arctic presence has been demonstratedby Arctic ice cores: cadmium deposition in Greenland in the 1960s and 1970s was eight-fold greater than in pre-industrial times. Fortunately, recent information indicates thatcadmium levels have steadily declined since the then.
Routes of exposure
* Food More than 90% of the average non-smoker’s exposure to cadmium is fromfood. Shellfish concentrate cadmium, and can be a major exposure for those who eatscallops and oysters. Fish concentrate less. Because liver and kidney concentratethis metal, hunters in some locales are advised not to eat moose or bear liver or kidney.▪ Cadmium also is taken up in some crops, especially irrigated rice. Vegetarians andothers consuming high levels of cereals and vegetables may have higher exposure. Highsoil levels are a special concern because plants take up cadmium more readily than othermetals.
* Tobacco products Because tobacco plants accumulate cadmium so well, smoking onepack of cigarettes each day can double exposure. Smokers absorb more than 90% ofinhaled cadmium. Conversely only about 5% of the cadmium ingested in food isabsorbed. Inhalation is also the greatest route of exposure among those with occupationalexposure and those living near industrial sources. Recall once again the value of goodnutrition: a balanced diet can reduce the amount of cadmium absorbed into the body fromfood and drink.
Toxic effects44
* The kidney is a critical target organ for cadmium, and it bioaccumulates in that organ;storage increases with age. Kidney damage is the most common chronic effect amongthose who suffered high occupational exposure; it may also contribute to kidney stones.Cadmium is stored in the liver too. It takes 10–30 years to eliminate half of the cadmiumfrom kidney and liver. ▪ In individuals occupationally exposed to airborne cadmium,lungs are the primary target organ, and severe lung damage can result. More generally, asone ages, cadmium levels in kidney, liver, and other tissues increase. Amongmiddle-agedor older individuals not occupationally exposed, cases have been observed in whichcadmium became concentrated to levels almost as high as those known to affect kidneyfunction.
44 ToxFAQsTM for cadmium. ATSDR, September, 2008, http://www.atsdr.cdc.gov/tfacts5.html.
449 Three PBT metals
* Cadmium affects calcium metabolism too. Chronic exposure accentuates bone damageincluding osteoporosis. Recall from Questions 3.1 a cadmium poisoning event, whichoccurred among poor elderly Japanese women, whose diet was largely limited to ricegrown in cadmium-contaminated rice paddies.45 They experienced itai itai (pain, pain)disease, characterized by kidney damage and brittle painful bones (Questions 3.1).
* Cadmium is a known human carcinogen (via inhalation, but not ingestion). In 2006, thejournal Lancet Oncology reported results of a study of individuals living near zinc smelters.Professor Jan Staessen of the University of Leuven and colleagues studied 521 people livingclose to zinc smelters in northeastern Belgium and compared them to 473 people livingfurther away. Cadmium exposures were directly evaluated by measuring levels of cadmiumin urine over a four-year period (1985–1989). For 17 years thereafter, until 2004, they lookedfor cancer diagnoses, both lung cancer and other cancers in these populations, correlatingcancer cases to urine levels of cadmium. Results indicated that a doubling of urinarycadmium was associated with a 30% increased risk of all cancers and a 70% increased riskof lung cancers. The increased risk of lung cancer was comparable to that from smoking.46
Reducing risk
* Environmental cadmium Society controls cadmium in several ways. In the United States,an enforceable standard limits exposure to cadmium through drinking water. Becausecadmium is a hazardous air pollutant, its air emissions are controlled by Best AvailableTechnology. As with lead and mercury, recent EPA regulations are greatly reducingcadmium emissions from municipal solid waste and medical waste incinerators. But forcadmium, as for lead, power plant emissions have not been controlled. Overall, althoughmore data are needed, it appears that anthropogenic cadmium emissions have decreasedabout half between 1990 and 2003 in developed countries.
* Products containing cadmium Cadmium is no longer used in disposable batteries.However, large amounts are used in NiCad rechargeable batteries and, as with one-timeuse batteries, rechargeable batteries end up discarded and become a major source ofcadmium in solid waste. The amount continues to grow.
Reducing risk in Australia
Although cadmium concentrations in Australian soils were still low, they had been increas-ing over the years, perhaps as a result of phosphate fertilizer. This raised concern. In 2002,the Australian government decided to reverse this trend, and maintain the “clean and green”image of their exported agricultural products.47 ▪ It tightened permissible levels of cadmium
45 Kjellstrom T. 1986. Itai-itai disease. In: Cadmium and Health: A Toxicological and Epidemiological Appraisal.Vol II. Effects and Response, Friberg, L., Elinder, C. G., Kjellstrom, T. and Nordberg G. (eds.). Boca Raton, FL:CRC Press, 257–290.
46 Osterweil, N. Cadmium exposure increases cancer risk. MedPage Today, January 16, 2006, http://www.medpagetoday.com/PublicHealthPolicy/EnvironmentalHealth/2491.
47 Australia cadmium minimisation strategy. CSIRO Land and Water, February 7, 2008, http://www.cadmium-management.org.au/about.html.
450 Metals
in foods such as chocolate, peanuts, mollusks, and organ meats. To meet these new foodstandards, the government had to minimize cadmium additions to soils. This was done bylowering permissible amounts entering the soil from manures, sewage sludge, and fertil-izers. The fertilizer industry significantly decreased the cadmium in its products by usingrock phosphate, which has less cadmium than polyphosphate. The government also devel-oped guidelines for livestock, vegetables, other crops, water, and soil.48
Arsenic49
A metal – or a metalloid in the case of arsenic – need not be a PBT for it to cause severeharm. In Chapter 10 you learned of the toxicity of arsenic and that its contamination ofdrinking water50 is becoming “the key environmental health problem of the twenty-firstcentury.” It is sickening millions in Asia, “the largest mass poisoning of a population inhistory.”
Uses and sources
Uses
* Until recently, most industrially used arsenic went to making chromated copper arsenate(CCA), a wood preservative used in “pressure-treated” lumber since the 1940s. ▪ CCA inplayground and homes In earlier years, playground equipment was metal, but wasreplaced by wood. To lengthen its life, about 98% of wood destined for outdoor use inthe United States was impregnated with CCA. CCA is regulated as a pesticide as itprevents mold, insects, and other creatures from feeding on the wood.51 However, therewere concerns with CCA-treated wood when used around homes or in playgrounds:52
unless properly sealed and maintained to remain sealed, arsenic comes in contact withchildren’s hands and, through hand-to-mouth activity they may ingest it. Arsenic canleach from CCAwood and contaminate playground soil, sometimes with risky levels ofarsenic. ▪ Disposal CCA-treated wood structures may endure for decades, but at the endof their usefulness, disposal is a problem. If mulched, metals can leach out. If burned,emissions must be carefully controlled. If landfilled, arsenic leaching from the wood mustbe captured. So, the EPA worked with pesticide manufacturers to voluntarily phase out
48 Final report on cadmium minimisation. National Cadmium Management Committee, 2000–2006, April 2007,http://www.cadmium-management.org.au/publications.html.
49 Public access, frequent questions: Where can I find information on arsenic? December 1, 2008, http://publicaccess.custhelp.com/cgi-bin/publicaccess.cfg/php/enduser/std_adp.php?p_faqid=2123&p_created=1126044551&p_topview=1.
50 Arsenic as a primary drinking water contaminant: see table, http://www.epa.gov/OGWDW/contaminants/index.html.
51 Pesticides, chromated copper arsenate.US EPA, November, 2008, http://www.epa.gov/oppad001/reregistration/cca/.
52 Beder, S. Arsenic and old wood. Sydney Morning Herald, July 15, 2003, http://www.ewg.org/node/15559.
451 Arsenic
CCA-treated wood products used around homes and children’s play areas.53
▪ Alternatives On December 31, 2003, CCA wood was banned for residential use, withcertain exceptions. One of the arsenic-free alternatives54 developed is borate-treatedwood.55 Other countries including Sweden, Germany, Vietnam, and Indonesia havealso restricted or banned CCA-treated wood. ▪ Industry CCA wood continues to beused in industrial settings – utility poles, dock pilings, etc.
* The arsenic used in CCA is inorganic, more risky than organic arsenic. Organoarseniccompounds are primarily used as pesticides, but not as broadly as was the case histor-ically.56 ▪ Arsenic compounds are added to chicken feed to promote growth, and killparasites.57 It provides pigmentation in chicken meat. In 2007, it was used in 70% ofbroiler chickens in the United States. In the chicken’s body organic arsenic is convertedinto the more hazardous inorganic arsenic, almost all of which is excreted into chickenlitter; the litter is often used to fertilize farm fields.58 The EU banned arsenic from chickenfeed in 1999; its use has been voluntarily discontinued by some American companies.
* Arsenic also has many uses in paints, dyes, metals, drugs, soaps, and semi-conductors. Adarker use, as most people know, was arsenic use for many hundreds of years as aninstrument of murder. That seldom happens now because arsenic is easily detected byforensic scientists.
Delving deeper
1. Steel use dwarfs that of all other metals combined. It is used in producing motor vehicles,
construction and appliances. The steel in cars is already highly recycled in the United States;
in fact, 71% of all steel produced in 2003 in the United States was from scrap with only 29%
produced from virgin ore. What are the barriers to recycling other steel-containing items,
appliances, and constructions? How could barriers be overcome?
2. Feeding arsenic to chickens Those supporting the addition of arsenic to chicken feed say the
level subsequently found in the meat is too low to harm humans. Explain why this state-
ment is or is not consistent with the fact that it can change the pigmentation of chicken
meat. What is the most likely reason that chicken producers still use arsenic? Based on your
examination of this question, do you believe that the practice should be allowed? Explain.
You will need to do some research to answer these questions.
53 Public access, frequent questions: What is being done about wood treated with CCA? December 1, 2008, http://publicaccess.custhelp.com/cgi-bin/publicaccess.cfg/php/enduser/std_adp.php?p_faqid=325&p_created=1090509617.
54 Alternatives to CCA.US EPA, May 5, 2008, http://www.epa.gov/oppad001/reregistration/cca/alternativestocca.htm.
55 Borates, an alternative to CCA. US EPA, April 7, 2008, http://www.epa.gov/oppad001/reregistration/cca/borates.htm.
56 Before modern pesticides emerged, arsenic was a common weedkiller and rat poison. It was stored in homes andoutbuildingswhere old containers can still be found. In a recent incident in the US state ofMaine, arsenic from anold container was somehow added to coffee drunk by a group of people. One died and others were seriouslypoisoned.
57 Hileman, B. Arsenic in chicken production. Chemical & Engineering News, 85(15), April 9, 2007, 34–35.58 Hopey, D. Chicken feed may present arsenic danger. Pittsburgh Post-Gazette, March 08, 2007, http://www.post-
gazette.com/pg/07067/767756–34.stm.
452 Metals
Sources
* Anthropogenic sources of arsenic include mining and dust emissions from metal smelt-ing, especially of copper and lead ores, which often contain arsenic. It is this dust, whencaptured that is the source of arsenic used in CCA-treated wood. ▪ Coal burning is asource of arsenic. Some coals such as those in some parts of China have high arseniclevels.
* Natural sources are volcanic eruptions and forest fires. Arsenic occurs naturally in rocksand soil. Some soils, such as those in the western United States have relatively highlevels. A few natural mineral springs and other waters contain very high arsenic levels.
Sources of exposure and toxicity
* Sources of exposure Unless you live in an area with arsenic-contaminated drinking wateras is common in Bangladesh and some other Asian countries, food is your biggestexposure. This is true because arsenic is naturally present in soil and taken up into plants.Arsenic in rice is likely to be a problem in some parts of the world: Bangladesh oftenirrigates rice with water from arsenic-contaminated wells.59 Arsenic is present in seafoodat levels higher than in land-grown foods; however, arsenic toxicity varies dependingupon its chemical form, and much of the arsenic in seafood does not seem to bebioavailable.
* Toxicity60 Arsenic toxicity is described in Section I of Chapter 10.
Questions 15.4
1. Recall that mercury in fish continue to accumulate as the fish age. How does that fact relate
to what happens to humans with long-term exposure to cadmium?
2. (a) What is the relationship between the emissions of metals to the environment and coal
burning? (b) Several radioactive elements (metals) are also released during coal burning,
more than from nuclear power plants. What is your reaction to this?
3. Individuals in industrialized countries have a cadmium intake between 10–50 μg/day. EPA
recommends as an upper limit 70 μg/day. (a) Think back to risk assessment in Chapter 4.
Do you believe that 10–50 μg provides a comfortable margin of safety? Explain. (b) What
else could society do to limit cadmium emissions or exposure? (c) Are there ways that you
can lower your cadmium exposure?
4. Seafood contains higher levels of metals such as mercury, cadmium, and arsenic than do
freshwater fish. Does the composition of seawater versus freshwater explain this? Explain.
59 Lubick, N. Rice paddies map arsenic problem. Environmental Science & Technology, 41(17), September 1,2007, 5928. The soil absorbs arsenic from the contaminated water, and the rice takes it up from the soil. This addsanother source of arsenic exposure to an already very serious problemwith arsenic-contaminated drinking water.
60 What are arsenic’s health effects? ToxFAQsTM for arsenic. ATSDR, August, 2007, http://www.atsdr.cdc.gov/tfacts2.html.
453 Arsenic
Internet resources
ATSDR. 1999. ToxFAQsTM for mercury. http://www.atsdr.cdc.gov/tfacts46.html (April,1999).
2006. Medical management guidelines for mercury. http://www.atsdr.cdc.gov/MHMI/mmg46.html (September 24).
2007. ToxFAQsTM for arsenic. http://www.atsdr.cdc.gov/tfacts2.html (August, 2007).2007. ToxFAQsTM for lead. http://www.atsdr.cdc.gov/tfacts13.html (October 5, 2007).2008. ToxFAQsTM for cadmium. http://www.atsdr.cdc.gov/tfacts5.html (September,2008).
Canadian Press. 2008. Mercury: levels finally dropping in Arctic animals. http://www.panna.org/files/CanadianPressActicToxicsDrop20080714.pdf (July 14, 2008).
Fraser, B. 2009. Peruvian gold rush threatens health and the environment. EnvironmentalScience & Technology, 43, 7162–7164, http://pubs.acs.org/doi/full/10.1021/es902347z (September 29, 2009).
Green Media Toolshed, 2005.Environmental hazard lists (of 30 priority chemicals),Scorecard. http://www.scorecard.org/chemical-groups/one-list.tcl?short_list_name=pbt.
Kennecott Utah Copper. 2008. Rio Tinto: reclaiming the environment from a centuryof mining. http://www.kennecott.com/library/media/papers/pdf/Final_August_Remediation_Report.pdf.
EIA. No date. Mining and metals, Environmental Social Management System. http://www.eia.doe.gov/bookshelf/brochures/greenhouse/greenhouse.pdf.
UNEP. 2005. Action on heavy metals among key GC decisions. http://www.unep.org/Documents.Multilingua/Default.asp?DocumentID=424&ArticleID=4740&l=en(25 February, 2005).
US Department of Energy. 2006. Mercury emission control R&D. http://www.fossil.energy.gov/programs/powersystems/pollutioncontrols/overview_mercurycontrols.html(January 18, 2006).
US EPA. 1999. Cadmium. http://www.epa.gov/epawaste/hazard/wastemin/minimize/factshts/cadmium.pdf.
2007. Profile of the metal mining industry. http://www.epa.gov/compliance/resources/publications/assistance/sectors/notebooks/mining.html (November 18, 2007).
2008. Alternatives to chromated copper arsenate (CCA). http://www.epa.gov/oppad001/reregistration/cca/alternativestocca.htm (May 5, 2008).
2008. Controlling power plant emissions of mercury. http://www.epa.gov/mercury/control_emissions/index.htm (October 24, 2008).
2008. Lead in air. http://epa.gov/air/lead/ (October 16, 2008).2008. Lead in paint, dust and soil. http://www.epa.gov/lead/ (November 6, 2008).2008. Mercury information. http://www.epa.gov/mercury/about.htm (October 24, 2008).2008. Mercury quick finder. http://www.epa.gov/mercury/ (December 11, 2008).
454 Metals
2008. Mercury emissions, the global context. http://www.epa.gov/mercury/control_emis-sions/global.htm (October 24, 2008).
2008. Pesticides, chromated copper arsenate. http://www.epa.gov/oppad001/reregistra-tion/cca/ (November, 2008).
2008. What is EPA doing to reduce mercury emissions? http://publicaccess.custhelp.com/cgi-bin/publicaccess.cfg/php/enduser/std_adp.php?p_faqid=1834&p_created=1106164694 (January 3, 2008).
2009. Frequent questions: finding information on arsenic. http://publicaccess.custhelp.com/cgi-bin/publicaccess.cfg/php/enduser/std_adp.php?p_faqid=2123&p_created=1126044551&p_topview=1 (June 28, 2009).
2009. Frequent questions: finding information about lead, lead-based paint inspectors, orEPA lead publications. http://publicaccess.custhelp.com/cgi-bin/publicaccess.cfg/php/enduser/std_adp.php?p_faqid=1635&p_created=1099663321 (June 28, 2009).
2009. Frequent questions: what is being done with CCA- treated wood? http://publicac-cess.custhelp.com/cgi-bin/publicaccess.cfg/php/enduser/std_adp.php?p_faqid=325&p_created=1090509617 (May 4, 2009).
2009. Metals. http://www.epa.gov/compliance/assistance/sectors/metals.html (March 4,2009).
US Food and Drug Adminstration. 2008. Questions and answers on dental amalgam. http://www.fda.gov/MedicalDevices/ProductsandMedicalProcedures/DentalProducts/DentalAmalgam/default.htm (June 3, 2008).
455 Internet resources
16 Pesticides
“ Good soil is not just dirt. It is a hive of life, much of it either microscopic or evendisgusting to urban eyes because urbanites don’t understand the need for thegrowth and decay of slimy things to sustain life. Good farmers are not just peoplewho dig in the dirt. They are the stewards of healthy soil.”
George B. Pyle, Land Institute, Salina, Kansas
Pest icide use is both controversial a nd preval e nt . Ma ny in di vid ua l s b elie ve pe stic id es a rene ce ss ary t o de str oy the ene mies of hu ma n a gr i culture and h ealth. O th er s b elie ve we ca n u seorganic farming to accomplish these ends with out syntheti c pesticides. Another group bel ievespe sti cid es are n ee de d, but re co gn i ze s t h ei r lim itat i on s, an d u se i nte gr ate d p e st ma na ge men t tomin imiz e pe sti cid e us e. T h er e is no si mpl e an swe r, b ut we d o ne ed a ns w er s. Con sid er t hischal lenge from the aut hors o f a n a rticle called , Ca n g re en ch emi str y p rom ote su sta ina bl eag ric ul t ur e? “Human population is increasing. Demand for food is rising . . . Environmentalimpacts a re worsening. Taken t og ether, few issues reflec t t he d i f ficult ies o f sustainable develop-me nt mo re th an the p ro bl em of c o ntrolli ng p es t s an d in cr ea sin g fo od pro du ct i on while pro t e cti ngthe environment and conserving natural resources.” Section I of this chapter overviews whatpesticides are, why we use them, and who uses them. Section II looks at pesticides as pollutants,where exposure occurs, their impacts on non-target species, and pesticide resistance. Secti on IIIex am ine s h o w we ca n re du ce t h e r i sk o f p es tic ide s by re gu lati on , by c ha ng ing t h e na tu re ofpe sti cid es , an d by c ha ng i n g fa rmin g m e t ho ds . It compares integrated pest management andorganic farming to conventional agriculture. Section IV looks at some of the problems posed bypesticide use in less-developed countries and at their attempts to reduce pesticide use.
SECTION I
Background on pollutants of concern: pesticides
What are pesticides?1
Pesticides are agents used to destroy pests. Under certain circumstances almost any livingcreature can be a pest. The goals of pesticide use are to increase the production of food and
1 (1) What is a pesticide? US EPA, February 3, 2009, http://www.epa.gov/pesticides/about/. (2) Pesticides, A–Zin de x. US EPA, December 17, 2008, http://www.epa.gov/pesticides/a-z/index.htm. (3) Pesticides, frequent ques-tions. US EPA, August 26, 2008, http://pesticides.custhelp.com/cgi-bin/pesticides.cfg/php/enduser/std_alp.php.
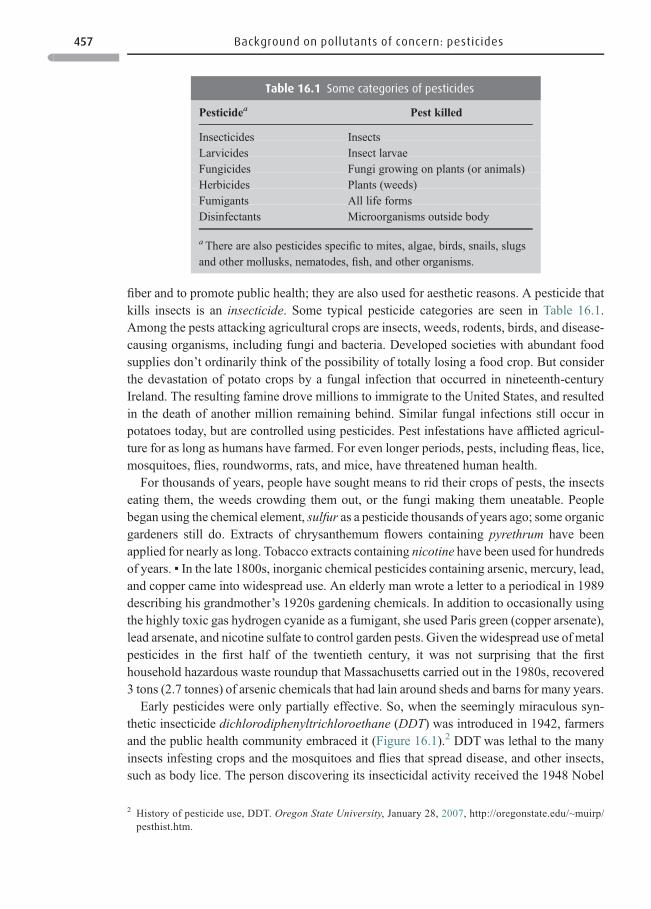
fiber and to promote public health; they are also used for aesthetic reasons. A pesticide thatkills insects is an insecticide. Some typical pesticide categories are seen in Table 16.1.Among the pests attacking agricultural crops are insects, weeds, rodents, birds, and disease-causing organisms, including fungi and bacteria. Developed societies with abundant foodsupplies don’t ordinarily think of the possibility of totally losing a food crop. But considerthe devastation of potato crops by a fungal infection that occurred in nineteenth-centuryIreland. The resulting famine drove millions to immigrate to the United States, and resultedin the death of another million remaining behind. Similar fungal infections still occur inpotatoes today, but are controlled using pesticides. Pest infestations have afflicted agricul-ture for as long as humans have farmed. For even longer periods, pests, including fleas, lice,mosquitoes, flies, roundworms, rats, and mice, have threatened human health.
For thousands of years, people have sought means to rid their crops of pests, the insectseating them, the weeds crowding them out, or the fungi making them uneatable. Peoplebegan using the chemical element, sulfur as a pesticide thousands of years ago; some organicgardeners still do. Extracts of chrysanthemum flowers containing pyrethrum have beenapplied for nearly as long. Tobacco extracts containing nicotine have been used for hundredsof years. ▪ In the late 1800s, inorganic chemical pesticides containing arsenic, mercury, lead,and copper came into widespread use. An elderly man wrote a letter to a periodical in 1989describing his grandmother’s 1920s gardening chemicals. In addition to occasionally usingthe highly toxic gas hydrogen cyanide as a fumigant, she used Paris green (copper arsenate),lead arsenate, and nicotine sulfate to control garden pests. Given the widespread use of metalpesticides in the first half of the twentieth century, it was not surprising that the firsthousehold hazardous waste roundup that Massachusetts carried out in the 1980s, recovered3 tons (2.7 tonnes) of arsenic chemicals that had lain around sheds and barns for many years.
Early pesticides were only partially effective. So, when the seemingly miraculous syn-thetic insecticide dichlorodiphenyltrichloroethane (DDT) was introduced in 1942, farmersand the public health community embraced it (Figure 16.1).2 DDT was lethal to the manyinsects infesting crops and the mosquitoes and flies that spread disease, and other insects,such as body lice. The person discovering its insecticidal activity received the 1948 Nobel
Table 16.1 Some categories of pesticides
Pesticide a Pest killed
Insecticides InsectsLarvicides Insect larvaeFungicides Fungi growing on plants (or animals)Herbicides Plants (weeds)Fumigants All life formsDisinfectants Microorganisms outside body
aThere are also pesticides specific to mites, algae, birds, snails, slugsand other mollusks, nematodes, fish, and other organisms.
2 History of pesticide use, DDT. Oregon State University, January 28, 2007, http://oregonstate.edu/~muirp/pesthist.htm.
457 Background on pollutants of concern: pesticides
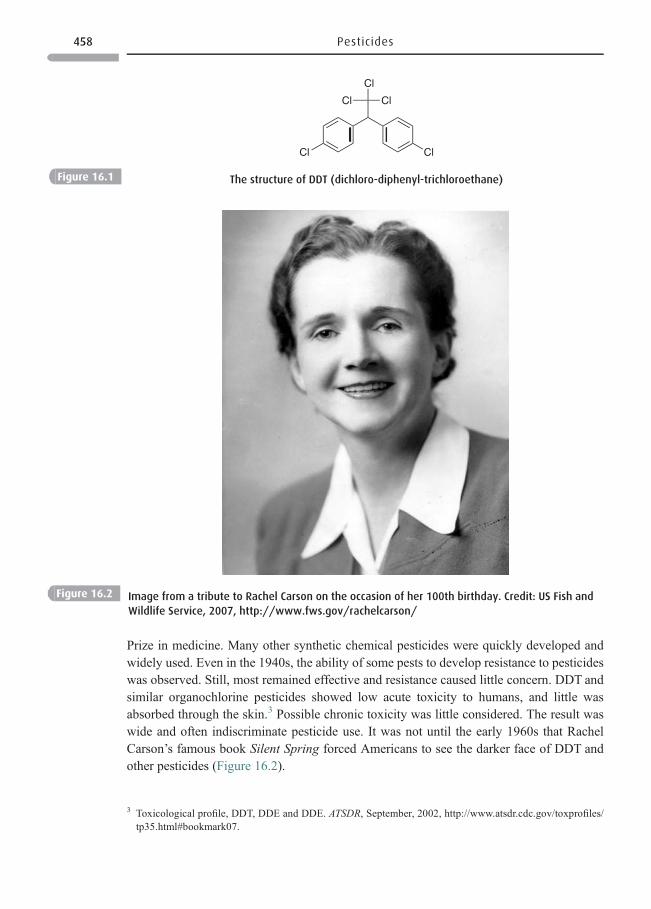
Prize in medicine. Many other synthetic chemical pesticides were quickly developed andwidely used. Even in the 1940s, the ability of some pests to develop resistance to pesticideswas observed. Still, most remained effective and resistance caused little concern. DDT andsimilar organochlorine pesticides showed low acute toxicity to humans, and little wasabsorbed through the skin.3 Possible chronic toxicity was little considered. The result waswide and often indiscriminate pesticide use. It was not until the early 1960s that RachelCarson’s famous book Silent Spring forced Americans to see the darker face of DDT andother pesticides (Figure 16.2).
Cl
ClCl
ClCl
Figure 16.1 The structure of DDT (dichloro-diphenyl-trichloroethane)
Figure 16.2 Image from a tribute to Rachel Carson on the occasion of her 100th birthday. Credit: US Fish and
Wildlife Service, 2007, http://www.fws.gov/rachelcarson/
3 Toxicological profile, DDT, DDE and DDE. ATSDR, September, 2002, http://www.atsdr.cdc.gov/toxprofiles/tp35.html#bookmark07.
458 Pesticides
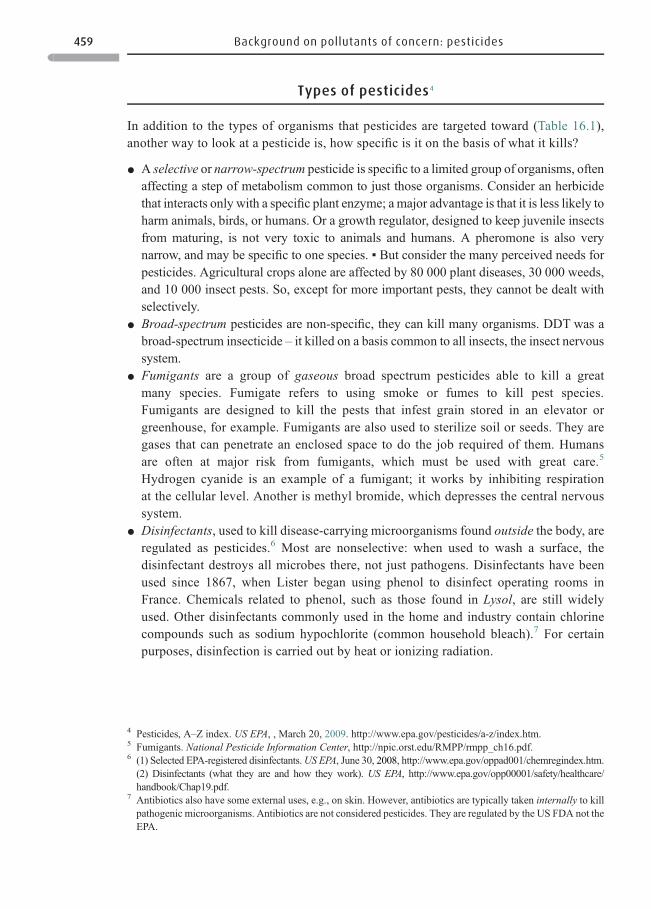
Types of pesticides4
In addi tion t o the types of organisms that pesticides are targeted toward (Ta ble 16.1),a n ot he r w ay to lo ok at a p es ti ci de is , h ow sp ec i fi c is it on the basis of what it kills?
* A selec tive or narrow-spect rum pesticide is speci fic to a limited group of organisms, oftenaffecting a step of metabolism comm on to just those organisms. Conside r an herbi cidethat inte racts only with a speci fic plant enzyme; a major advant age is that it is less like ly toharm anim als, birds, or human s. Or a grow th regula tor, desig ned to keep juvenile insec tsfrom mat uring , is not very toxic to animals and h umans. A pherom one is also verynarrow, and may be speci fic to on e speci es. ▪ But con sider the many perceived needs forpesti cides. Agr icultural crops alone are affected by 80 000 plant diseases, 30 000 weed s,and 10 000 insec t pests. So, except for more imp ortan t p ests, they canno t b e dealt withselec tively.
* Broad-sp ectrum pesticide s are non-sp eci fic, they can kill many organisms. DD T was abroad- spect rum insectici de – it kille d on a basis commo n to all insec ts, the insec t nervoussyst em.
* Fumiga nts are a group of gaseous broad spec tru m pestic ide s able t o k ill a greatmany sp ecies. Fumigate r efers t o using smoke or f umes to kill pest spec ie s.Fumiga nts a re d esigned t o kill t he pests t hat i nfest g ra in stored in an e lev ator orgree nhouse, for example. F umig ants are also u se d t o sterilize soil or seeds. They a rega se s t hat can p enetrate an en closed space to do the job required o f th em. Hu ma nsare ofte n at major risk from fumig ants, wh ic h must be used with great care. 5
Hydrogen cyanide is an example of a fumigant; i t w orks by inhibiting respirationat th e cellular l ev el. A nother i s m eth yl bromide, which depre sse s t he central nervo ussystem.
* Disinfectants , used to kill disease-carrying microorganisms f ound outside the body, areregulated as pesti ci des.6 Most ar e nonsel ective: when used t o w ash a surface, thedisinf ectant des troys all m icrobes there, not just pathogens . Disinfect ants have beenused since 1867, when Lister began using phenol to di sinfect operating r ooms inFrance. Chemicals r elated to phenol, such as those found in Lys o l , are st il l widel yused. Other disinfectants commonly used in the home and industry contain chlorinecompounds such as sodium hypochlorite (common household bleach).7 For certainpurposes, disinfection is carried out by heat or ionizing radiation.
4 Pesticides, A–Z index. US EPA, , March 20, 2009. http://www.epa.gov/pesticides/a-z/index.htm.5 Fumigants. National Pesticide Information Center, http://npic.orst.edu/RMPP/rmpp_ch16.pdf.6 (1) Sel ected EPA-regi stered disinfectant s. US EPA, J un e 3 0, 20 08 , h tt p: //w ww. e pa . go v/ op pa d 00 1/ c he m re g i n de x .h tm .(2) Disinfectants (what they are and how they work). US EPA, http://www.epa.gov/opp00001/safety/healthcare/handbook/Chap19.pdf.
7 Antibiotics also have some external uses, e.g., on skin. However, antibiotics are typically taken internally to killpathogenic microorganisms. Antibiotics are not considered pesticides. They are regulated by the US FDA not theEPA.
459 Background on pollutants of concern: pesticides
Box 16.1 Biopesticides
The US EPA distinguishes three classes of biopesticides, pesticides derived from natural sources.
(1) Some biopesticides are biochemicals, i.e., chemicals produced within living organisms,8
and then extracted from those organisms (plants, animals, or bacteria).9 Sometimes the
extract itself may be used or a specific biochemical may be isolated from the extract. A
botanical pesticide10 is a biochemical purified from a plant extract. See Table 16.2. ▪ Fourinsecticides available in the United States are biochemicals derived from the neem tree,
grown in India.11 These have limited uses because, when exposed to sunlight, they quickly
degrade. Still they have meaningful uses. ▪ Pyrethrum, purified from chrysanthemums, is a
botanical pesticide. Because natural pyrethrums have limited uses, more effective syn-
thetic pyrethrins have been developed and synthesized by humans: from this example,
Table 16.2 Alternatives to synthetic pesticides
Alternative Definition Examples
Natural An extract prepared from a livingorganism
An extract of chrysanthemum,tobacco, or the neem tree
Botanical An ingredient purified from a naturalextract
Pyrethrum purified fromchrysanthemum extract or nicotinefrom tobacco extract
Biological a A living agent that acts as a pesticide(e.g., a microorganism, insect, orfish)
An explosion in the rabbit populationin Australia was controlled byreleasing a microbe, which infectedand killed them
Microbial b A biological agent, that is amicroorganism (bacterium, virus,fungus, or protozoan)
The Bt virus or baculovirus, either ofwhich can act as a pesticide
Bioengineeredorganismc
A living organism with genes – takenfrom another organism – inserted intoits DNA. The genes allow it tomake asubstance (in this case, a pesticide)that it previously could not
A plant with the Bt gene inserted intoits DNA allowing it to produce apesticide that repels insects Aplant given genes to produce aproduct that makes it resistant toherbicides
aThese are not extracts or chemicals, but living organisms.b In a biological the living organism itself is the pesticide.c In a bioengineered organism, a living organism has had its DNA modified so that it produces apesticide or other protective chemical.
8 What are biopesticides? US EPA, October 15, 2008, http://www.epa.gov/pesticides/biopesticides/whatarebio-pesticides.htm.
9 Biologicals and insecticides of biological origin. US EPA, http://www.epa.gov/pesticides/safety/healthcare/handbook/Chap07.pdf.
10 Natural insecticides. Yardener, 2003–2008, http://yardener.com/?search=natural+insecticides11 Neem oil insecticides. LivingWithBugs.com, http://www.livingwithbugs.com/neem_oil.html.
460 Pesticides
Why are pesticides used?
As you read the reasons for pesticide use, distinguish between what pesticides allow us todo, versus whether what they allow is always necessary.
* Pesticides make it possible to grow crops at times of year where they could not otherwisegrow because pests would make it impossible. Fruits and vegetables are found at themarket year round not only because they can be transported long distances from warmer
you can see that a botanical pesticidemay be closely related to a synthetic pesticide. ▪ Evenmore closely related is a chemical, e.g., a pheromone produced by an insect to influence
the behavior of another insect. Pheromones are produced naturally in such tiny quantities
that it may not be possible to extract enough from insects to be practical. However, once
the structure of the pheromone is known, the exact same chemical can be synthesized. So
the question can be asked: is it natural or is it synthetic? In fact the US EPA has a committee
that ponders such questions when registering a biochemical pesticide.
(2) Another category of biopesticide is a microbial pesticide,12 i.e., it is a living microorganism,
but is applied just as a chemical pesticide. The best-knownmicrobial is the bacterium Bacillus
thuringiensis (Bt) used to control caterpillars, beetles, and flies. Microbial insecticides such as
Bt and baculoviruses are narrow spectrum pesticides, thus lessening the threat to non-target
species. Bt pesticides are favored by organic farmers. But, like other pesticides, a microbial
must be shown not to threaten humans, animals, or the environment. Also, although
pesticides specific to one pest are environmentally desirable, they may be less profitable
to the company that manufactures them because each is applicable to few species.
(3) Bioengineered microorganisms are still microbes (often the Bt microbes just referred to),
but with modified DNA. It has become a genetically engineered organism (GEO) with
foreign DNA inserted into its genetic material. This gives the GEO organism the ability to
make a new chemical, such as a pesticide that it could not previously produce.13 The
reasons for developing GEOs include increasing crop yield, crop nutritional value, reducing
the need for pesticides, or providing disease resistance. A long-term goal is to develop
GEOs with abilities such as being able to grow in salty soil or dry soils. A number of GEO
crops are already widely planted in the United States and around much of the world.
▪ Some GEOs have Plant-Incorporated-Protectants (PIPs) within their DNA, i.e., they have
been given a fragment of DNA that, when translated within the organism, produces a
pesticide. For example, a gene can be taken from a pesticidal Bt microbe and that gene
introduced into a plant’s genetic material. Thereafter the plant and its progeny can
produce the same pesticide as did the Bt microbe. PIPs are becoming widely used but,
at the same time, are rejected by those verymuch concerned about GEOs. Amajor concern
is the possibility that the plant’s modified DNA may escape into the broader environment
and have unexpected, possibly adverse, impacts.
12 Weinzierl, R., Henn, T., Koehler, P. G., and Tucker, C. L. Microbial insecticides. University of Florida CooperativeExtension, 2008, http://edis.ifas.ufl.edu/IN081.
13 GEOs are also called transgenic organisms or genetically modified (GM) organisms.
461 Background on pollutants of concern: pesticides
climates, but also because pesticides make longer growing seasons possible. Withoutfungicides, for example, certain crops could not grow under climatic conditions whenfungi proliferate. Many believe that the health advantages of fresh fruit and vegetablesavailable year round and their lowered cost make up for any health risk that pesticides pose.
* Pesticides make it possible to grow crops in ecologically inappropriate regions wherethey could not otherwise be reliably grown, at least on a commercial scale. In suchlocales, greater quantities of pesticides are often required for successful crops. Cottongrows well in some sections of Texas with little or no pesticide. However, in the humidsoutheastern US states, cotton requires many pesticide applications. Strawberries wouldnot grow there without pesticides. Growing such crops in more appropriate regions maynot be easy or even possible for established farmers as, for instance, when a farmer hasalready established a fruit orchard in a region requiring high pesticide use. If we grewcrops only in ecologically appropriate locales, it would mean lower yields of some crops.It also means that some foods would be available only seasonally.
* Public health uses of pesticides allow the killing of disease-carrying organisms, mosqui-toes, flies, ticks, and rats. Another health-related reason is reducing growth of fungi oncrops, fungi which produce toxic chemicals. Recall the highly toxic aflatoxins (Box 3.2)
* Pesticides make it possible to store food products for long periods. After harvest, grain isfumigated to kill insects and other infesting organisms, which could otherwise multiplyduring storage, destroying grain or making it inedible. For similar reasons, crops arefumigated before being transported long distances to market.
* Pesticides are often used for aesthetic reasons. People growing up in an age of pesticidesexpect perfect fruits and vegetables. Many blemishes on fruit and vegetables caused byinsects do not harm the produce, but people won’t buy blemished fruit – even fruits suchas oranges, which are peeled anyway. Or, although caterpillars on broccoli can be washedaway, people wouldn’t buy broccoli with caterpillars. Half a century ago, a worm in anapple was something to pare from it, not a reason to throw it away. Golfing greens are keptlooking perfect using pesticides, although historically golf was played on imperfectgreens.
* Pesticides make monocultures possible allowing large tracts of land to be devoted seasonafter season to only one crop such as wheat, cotton, soybeans, or corn. Without pesticides,the pests that prey on a crop would build up to a point the crop could no longer be grownat that location. In fact, monocultures were not possible until the 1940s when effectiveand inexpensive pesticides became available. Moreover, monoculture crops are farmedusing heavy machinery leading to soil compaction. Soil quality is further degradedbecause unlike manure or compost neither pesticides nor synthetic fertilizers provideorganic material to the soil. Lack of organic matter makes the soil inhospitable to theworms and microorganisms needed for good soil fertility. Fields planted in row-cropmonocultures are also prone to soil erosion and runoff of fertilizer and pesticides.Monocultures – by definition – do not support biodiversity. University of Maine ento-mologist Dr. Randall Alford spoke of entering cotton fields as a student in the SouthernUnited States and being struck by the stillness, the awareness that he and the cotton plantswere probably the only living creatures there because intensive pesticide application had,for a time, destroyed all other life. At one point, when he entered a field not posted as
462 Pesticides
having been recently treated with organophosphate pesticide, he became very ill withsweating, trembling, and tunnel vision.
Who uses pesticides?
Perhaps a more pertinent question would be who does not use pesticides? Few people don’t.▪ Farmers are the largest users, employing them to control pests on their crops. The herbicidesthat they use account for half of the volume of pesticide used in the United States. Loweramounts of insecticides and fungicides are used, and on significantly fewer acres. ▪ Public-health officials control rats, insects, or other pests in the community that carry disease orpresent other dangers. ▪ Foresters kill invasions of insects or other pests. ▪Utility owners keeprights-of-way clear using pesticides. ▪ Golf course owners maintain weed-free greens usingpesticides. ▪ Businesses maintain their premises free of insects, mold, and other pests.▪ Industrial enterprises control mold and algae that would otherwise grow in their processtanks. ▪Homeowners kill hornets in a nest too close to the home, unwanted dandelions, gardenslugs, insects, house flies, cockroaches, ants, moths, rodents, fleas on a pet, or mildew.
SECTION II
Sources of pesticide pollution
Pesticide movement
Herbicides and insecticides are applied over large areas of agricultural fields and forests.Farmers may apply them a dozen or more times during a growing season. Less than half of
Questions 16.1
1 (a) For what purposes do you believe that it is acceptable to use a pesticide in your home, yard,
or garden? (b) Are there uses of pesticides that you would consider trivial? What are these?
2 Recall and describe, if you can, a TV advertisement for pesticides.
3 To willingly buy discolored or less-attractive fruits and vegetables, you may have to overcome
certain preconceived notions. What types of blemished produce would you avoid buying?
4 By the year 2000, humans used 5 billion pounds (~2.3 billion kg) yearly of pesticides
worldwide. In the United States that figure was 1.2 billion pounds (0.5 billion kg).14
Despite this, an estimated third of crops are lost to pests (insects, weeds, and plant
diseases), a figure similar to the losses in 1945. Does this mean that pesticides are
ineffective? Or does it mean that humans harvest no more crops now than in 1940? Explain.
14 Fishel, F.M. Pesticide use trends in the US: global consumption.University of Florida, EDIS, 2008, http://edis.ifas.ufl.edu/PI180.
463 Sources of pesticide pollution
the applied pesti cide a ctually reaches the insect, weed , or other pest. The rest sett les ontosoil, vegeta tion, land, and wat er close to the point of appli cation. Smal ler amoun ts, swept upinto the atmospher e can trave l many miles, and be found far from the areas in which they areapplied. The persistan t organic pollutant s (POPs) detect ed in wilderne ss lakes in the north-ern United States or Can ada are not used there , but are b lown north from Mexi co or o therLatin Am erican countr ies. Bec ause a POP is persi stent, its level can build up even in areasfar from wher e it was appli ed ( Box 1.3 ). In cold areas, once contamina tion occurs , it maypersist inde finitely, wher e low tem perature an d lack of intense sunlight prevent it fromdegradi ng. ▪ Pestic ides also move throu gh surfa ce water, groundwat er, and soil. The y runofffrom lands to whi ch they have been applied as well as percol ating throu gh soil to contam-inate groundw ater.
Where pesticides are detected
Conside ring their movement s in the environmen t, it is not surpr ising that pesticide s aredetected in many places . Surface and ground waters Pe sticides app lied to farm s and otherareas are often found in water bodies into whic h they have run off (see Chapter 9). Pesti cidesalso run off from municipal stre ets and grounds , areas spraye d by utilities, golf coursegreens , and homeowne rs ’ ya rds and gardens . They are detect ed in streams and other surfa cewaters and groundwat er in the United State s and other industri alized cou ntries. 15 Pesti cidesare especi ally preval ent in waters of areas where they are used he avily, e.g., the US Midw est.A 10-year study in the Missis sippi River basin detected more than 40 pesti cides in surfa ceand ground water. Pesticides wer e also detect ed in 80% of the fi sh of the river s and stre amsstudied. The most heavily used he rbicide in the United States, atraz ine (used especi ally oncorn), was found in 95% of the samp les. ▪ In some places , atrazine has been found at levelsabove 1 ppb in rainwat er. In localized areas, atraz ine in surfa ce water exceeds the EPA’sMaximum Contam inant Lev el for d rinking water. Several European cou ntries have bannedatrazine. The US EPA is still revie wing its risk .16
Human and animal exposure
* Air Pesti cides pose the great est risk to those who actual ly work with and ap ply them.Pesticides also concern indi viduals living near areas being treated.
* Groundwater The organochlorine pesticides with their low water solubility cling to soilparticles, and are less likely to contaminate groundwater. However, water-soluble organo-phosphate pesticides can seep down to groundwater. An EPA study found that 10% ofAmerican community drinkingwater wells and 4%of rural wells contained detectable – not
15 (1) Pesticides in the nation’s streams and ground water, 1992–2001.USGS, February 15, 2007, http://pubs.usgs.gov/circ/2005/1291/. (2) Pesticides in ground water. USGS, November 17, 2008, http://ga.water.usgs.gov/edu/pesticidesgw.html.
16 Atrazine updates. US EPA, November 24, 2008, http://www.epa.gov/pesticides/reregistration/atrazine/atrazine_up-date.htm.
464 Pesticides
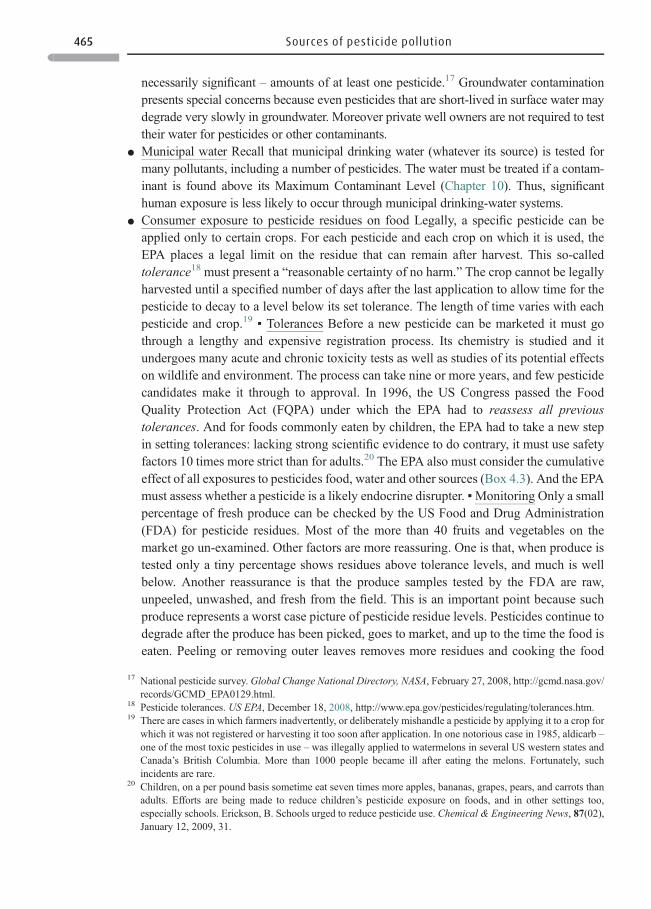
necessarily significant – amounts of at least one pesticide.17 Groundwater contaminationpresents special concerns because even pesticides that are short-lived in surface water maydegrade very slowly in groundwater. Moreover private well owners are not required to testtheir water for pesticides or other contaminants.
* Municipal water Recall that municipal drinking water (whatever its source) is tested formany pollutants, including a number of pesticides. The water must be treated if a contam-inant is found above its Maximum Contaminant Level (Chapter 10). Thus, significanthuman exposure is less likely to occur through municipal drinking-water systems.
* Consumer exposure to pesticide residues on food Legally, a specific pesticide can beapplied only to certain crops. For each pesticide and each crop on which it is used, theEPA places a legal limit on the residue that can remain after harvest. This so-calledtolerance18 must present a “reasonable certainty of no harm.” The crop cannot be legallyharvested until a specified number of days after the last application to allow time for thepesticide to decay to a level below its set tolerance. The length of time varies with eachpesticide and crop.19 ▪ Tolerances Before a new pesticide can be marketed it must gothrough a lengthy and expensive registration process. Its chemistry is studied and itundergoes many acute and chronic toxicity tests as well as studies of its potential effectson wildlife and environment. The process can take nine or more years, and few pesticidecandidates make it through to approval. In 1996, the US Congress passed the FoodQuality Protection Act (FQPA) under which the EPA had to reassess all previoustolerances. And for foods commonly eaten by children, the EPA had to take a new stepin setting tolerances: lacking strong scientific evidence to do contrary, it must use safetyfactors 10 times more strict than for adults.20 The EPA also must consider the cumulativeeffect of all exposures to pesticides food, water and other sources (Box 4.3). And the EPAmust assess whether a pesticide is a likely endocrine disrupter. ▪Monitoring Only a smallpercentage of fresh produce can be checked by the US Food and Drug Administration(FDA) for pesticide residues. Most of the more than 40 fruits and vegetables on themarket go un-examined. Other factors are more reassuring. One is that, when produce istested only a tiny percentage shows residues above tolerance levels, and much is wellbelow. Another reassurance is that the produce samples tested by the FDA are raw,unpeeled, unwashed, and fresh from the field. This is an important point because suchproduce represents a worst case picture of pesticide residue levels. Pesticides continue todegrade after the produce has been picked, goes to market, and up to the time the food iseaten. Peeling or removing outer leaves removes more residues and cooking the food
17 National pesticide survey. Global Change National Directory, NASA, February 27, 2008, http://gcmd.nasa.gov/records/GCMD_EPA0129.html.
18 Pesticide tolerances. US EPA, December 18, 2008, http://www.epa.gov/pesticides/regulating/tolerances.htm.19 There are cases in which farmers inadvertently, or deliberately mishandle a pesticide by applying it to a crop for
which it was not registered or harvesting it too soon after application. In one notorious case in 1985, aldicarb –one of the most toxic pesticides in use – was illegally applied to watermelons in several US western states andCanada’s British Columbia. More than 1000 people became ill after eating the melons. Fortunately, suchincidents are rare.
20 Children, on a per pound basis sometime eat seven times more apples, bananas, grapes, pears, and carrots thanadults. Efforts are being made to reduce children’s pesticide exposure on foods, and in other settings too,especially schools. Erickson, B. Schools urged to reduce pesticide use. Chemical & Engineering News, 87(02),January 12, 2009, 31.
465 Sources of pesticide pollution
degrades yet more. ▪ Imports It is less reassuring that most food imports remainunchecked. It may be impossible to do pesticide analyses on more than a tiny proportionof imported foods.
Many people remain concerned about pesticide residues on food. Partially in response tothat, the sale of organic produce is growing. In North American and European countries andJapan, the sale of produce grown without synthetic pesticides continues to grow by 20% ormore a year. This happens, although organic produce is more expensive.
Toxic effects
There are many ways that a given insecticide, herbicide, or other pesticide can exert itskilling effects. Box 16.2 describes some of these with the emphasis on insecticides.
Box 16.2 How insecticides are toxic
There are many pesticides andmany ways that they exert toxic effects. The emphasis below is
comparing families of insecticides that are especially toxic to the nervous system.
Polychlorinated insecticides
DDT is the best-known organochlorine pesticide (Figure 16.1). DDT acts on nerve membranes
to prevent normal conduction of nervous impulses. Lindane, aldrin, and heptachlor are other
polychlorinated insecticides that are also POPs and widely used. Most of these have been
banned, or their use greatly restricted because of environmental persistence, ability to bio-
accumulate in fat, and damage to animal populations. Direct sunlight can destroy them and
oxygen can help, but they are often trapped in sediments. Until it was banned in 1972, after
over 30 years of use, DDT accumulated in many locations, including the Great Lakes region of
the United States Given time polychlorinated chemicals do break down, and, 20 years after
banning DDT, its environmental levels had dramatically declined in the Great Lakes area, as
had its level in fish, blood, breast milk, and tissues of humans eating the fish. Nonetheless, DDT
remains detectable and will be for years to come. See Figure 16.3 for an illustration of DDT’s
biomagnification in the food web. ▪ Another defining characteristic of organochlorine pesti-
cides is their high solubility in lipid materials, including animal fat. The opposite side of this is
that they have low water solubility, and cling to soil particles; thus, little is lost to rainwater
runoff. However, recall (Chapter 1) the ability of polychlorinated chemicals to reach the Arctic.
Once there, extreme cold prevents their degradation.
Organophosphate insecticides
These came into wide use during the period that POP insecticides were being banned.
Organophosphates are also toxic to the nervous system. In their case, they inhibit the action
of the enzyme that breaks down acetylcholine. As this neurotransmitter builds up, nerves fire
466 Pesticides
Figure 16.3 Biomagnification of DDT in the food web. Credit: US Fish & Wildlife Service
uncontrollably. Organophosphates are more, sometimes much more, acutely toxic than orga-
nochlorine pesticides. Whereas DDT, for example, has an LD50 of 113mg/kg in rats, the LD50 of
the organophosphate insecticide parathion is 30 times lower – 3.6mg/kg in male rats. Some
organophosphate pesticides – again consider parathion – are absorbed across the skin, which
greatly increases the danger to pesticide applicators. Most acute poisonings in humans are
caused by organophosphate pesticides. In fact, organophosphates are chemical relatives of the
exceedingly toxic organophosphate nerve gases. More positively, organophosphates have
short lives in the environment and, not being fat soluble, don’t bioaccumulate to high levels in
fat. However, this implies increased water solubility; thus, after application to a field, they can
runoff in rainwater readily or percolate into groundwater.
Carbamate insecticides
Most carbamates are less acutely toxic than organophosphate pesticides, although a few are
exceptionally toxic. They exert toxicity in a manner similar to organophosphates, but their
effects don’t last as long. Like the organophosphates, they are short-lived in the environment.
Because of their lower toxicity, they are often found in products used by homeowners but are
less useful to farmers.
How to expose insects to insecticides
Nomatter how an insecticide ultimately kills, the insect must first be exposed to it. Recall, from
Chapter 3, ingestion, inhalation, and dermal contact. Rotenone, a botanical insecticide
(Table 16.2), is a stomach and contact poison: a stomach poison is one ingested as the insect
eats treated leaves; a contact poison exerts its effect after an insect comes into contact with it
externally. Fumigants are gases, or can become gases, so the insect breathes it in. There are
467 Toxic effects
Impacts on non-target species
In locales where pesticides are being applied, birds, animals, and insects are often exposed.The adverse impacts seen depend upon the specific pesticide used. With high pesticideexposure as when a large amount of pesticide runs off into a water body, toxic effects can beacute (as in fish kills). However, chronic impacts, e.g., damage to the immune system ofwildlife or to wildlife reproduction, take longer to observe. As you read the informationbelow, remember that a given pesticide can often be toxic to a number of species, not just theones mentioned, and exhibit toxicity in a number of ways.
* Pollinating insects are of great importance to successful crops. Yet, in California, anestimated 11% of honey-bee colonies are lost each year to pesticide exposure.Responsible applicators are careful to minimize the exposure of desirable insects bycarefully choosing the pesticides used, not applying them during blossoming, and spray-ing when pollinating insects are absent (early morning or evening). Another precaution isto use ground, not aerial spraying to lessen the pesticide drift that could harm nearbycolonies.22 ▪ However, in 2006, a mass die off of honey bees began in the United States,colony collapse disorder.23 Up to 90% of hives were lost in places. The cause is not clear,pathogens, artificial diets, stress, or pesticides. Some cite pesticides as the cause, but noconsensus has emerged.
* Some years ago the Cornell Laboratory of Ornithology estimated that 67 million birdsdied each year just on US farmland from pesticide poisoning.24 A great many bird deathsalso reportedly result from homeowners’ pesticide misuse; homeowners use on averagethree times more pesticide per amount of land than farmers. ▪ Birds can die from direct
many other ways that an insecticide can be described on the basis of how they impact
insects.21
Herbicides
Because the metabolism of plants is, in many ways, different than that of insects, other means
have been developed to kill weeds. Herbicides fall into groups based on their chemistry and
how they kill. As illustrations, they may interfere with plant metabolism to inhibit the action of
particular enzymes, cause abnormal growth, or impact the function of plant cell membranes.
21 Koehler, P. G. and Belmont, R.A. What are pesticides? Introduction. US EPA, http://schoolipm.ifas.ufl.edu/newtechp1.htm (briefly describes how various categories of pesticides exert their toxic effects).
22 Riedl, H., Johansen, E., Brewer, L., and Barbour, J. How to reduce bee poisoning from pesticides. PacificNorthwest Extension, November, 2006, http://extension.oregonstate.edu/catalog/pdf/pnw/pnw591.pdf.
23 Pesticide issues in the works: honey bee colony collapse disorder. US EPA, October, 2008, http://www.epa.gov/pesticides/about/intheworks/honeybee.htm.
24 (1) Frequently asked questions on pesticides and birds. American Bird Conservancy, 2007, http://www.abcbirds.org/abcprograms/policy/pesticides/faq.html. (2) Phillips, T. Pesticides and birds. Birdscope, 2001. CornellLaboratory of Ornithology, http://www.birds.cornell.edu/Publications/Birdscope/Summer2001/pesticides.html.
468 Pesticides
pesticide exposure or from eating pesticide-treated seeds, foliage, insects, or poisonedprey. Pesticides can also make birds more susceptible to predators, or have chroniceffects. ▪ On the US East Coast, as many as 2 million bird deaths in one incident wereassociated with carbofuran, an insecticide also extremely toxic to humans. When appliedin granular form, birds mistake it for dietary grit, eat it, and die. In a tragic incident on theArgentine Pampas, nearly 6000 migrating Swainson’s hawks died from exposure to thepesticidemonocrotophoswhich the Argentine government later banned. The US EPA hasnow banned, restricted use, or begun the phase out of several particularly toxic pesticides,diazinon, chlorpyrifos, monocrotophos, and carbofuran.25 But, bird poisonings continueto occur.
* Fish die by hundreds, thousands, or in some cases millions along with other aquaticspecies. Deaths are attributed to pesticide runoff or pesticide drift settling onto water.Pesticides may also cause acute illness or death in fish and other aquatic creatures. Inlower concentrations, many present chronic health risks, including cancer. Fish killscontinue to be reported.
* Amphibians An alarming trend is the disappearance or much reduced populations world-wide of frogs and other amphibians. Amphibians have thin skins making them especiallyvulnerable to outside agents. Some see the loss of amphibians as the “canary in the mine”reminding humans that we too are at peril. Many factors appear to be implicated inamphibian decline – loss of habitat is a major factor – but organophosphate-pesticideexposure may also be important. ▪ A significant study: University of Pittsburghresearcher, Rick Relyea, in a 9-year study examined impacts of individual pesticides ascompared to mixtures of ten pesticides (herbicides and insecticides) on the tadpoles ofleopard frogs and gray tree frogs.26 He tested pesticides at concentrations far below thosethat EPA calculates as harmful to humans, but toxicity in frogs may be very different(Chapter 3), and the impact of mixtures different than toxicants tested one by one. Relyeafound that insecticide mixtures were especially lethal to tadpoles. And such low concen-tration mixtures can be found in natural settings not just in the laboratory. One insecticidehe examined, endosulfan, was about 1000-times more lethal than the other pesticidesstudied.
Humans – chronic effects
In developed countries with the exceptions of persons directly working with pesticides orliving close to sites that are sprayed, most concerns relate to possible chronic effects ofexposure to pesticides at low doses. Major concerns are possible cancer or damage to thedeveloping fetus or small child. In less-developed countries cases of acute toxic effects frompesticides are very common.
25 Erickson, B. E. Manufacturer drops carbofuran uses.Chemical & Engineering News, 87(1), January 5, 2009, 18.26 Low concentrations of pesticides can become toxic mixture for amphibians. Science Daily, November 18, 2008,
http://www.sciencedaily.com/releases/2008/11/081111183041.htm.
469 Toxic effects
Effects of pesticides on the pests themselves
Secondary pests and pest resurgence
The pest that a farmer wants to kill, called the primary pestmay sometimes be holding downthe population of a potential pest, the secondary pest. Killing the primary pest may free thesecondary pest of its enemy, allowing it to undergo population growth, until it becomes apest itself. ▪ Or, pesticides may kill the natural predators of the primary pest. Then, whenprimary pest survivors reproduce their population rebounds because their predator is gone orreduced. This is pest resurgence.
Pest resistance
Resistance is a major pesticide-use problem. When a pesticide is used on a population ofinsects, plants, or other pests, one or more individuals may have a genetic mutation permittingthem to tolerate the pesticide. When these resistant individuals reproduce, they pass resistancegenes to their offspring. Over time, the resistant population increases until most individuals areresistant to the pesticide. Often, when resistance is observed, the response is to apply largerquantities of pesticide. This allows the pest to express resistance to the higher doses too. Or, ifthe applicator switches to a different pesticide, resistance develops to it as well. Because somepest species reproduce very quickly and in huge numbers, resistance sometimes developsrapidly. There are cases of insect resistance appearing in as little as 5-years.27
Questions 16.2
1 Velpar (hexazinone) is an herbicide used on Maine’s blueberry barrens. In 1995, after
10 years of use, Velpar was detected in groundwater at an average concentration of
5 ppb in locales where it was used. The drinking water of one school had less than 2 ppb,
but school board members decided to install a filter to remove it. Some individuals want to
forbid blueberry growers to continue using Velpar. (a) The EPA’s health-based limit for this
herbicide is 210 ppb. Knowing this, would you be concerned about 2 ppb in water that you
yourself drink? (b) Would you be concerned if the 2 ppb were in water drunk by your child?
Why? (c) Do you believe that pesticides that migrate into groundwater should be banned, or
restrictions placed on their use? Explain. (d) Assume that current levels of Velpar do not
concern you. Would you nonetheless support continued groundwater monitoring? Why?
2 Long-term use of Velpar or other herbicides leads to loss of organic material from soil.
(a) Why does the soil lose organic material? (b) Why is loss of organic matter a concern?
27 Part of the problemmay be that crop breeders over the years based their work on selecting crop offspring that hadenhanced yields. They ignored or were unaware of resistance genes that help plants naturally fight off pests, andmany resistance genes were lost during the process of selecting for traits giving enhanced yields. Curiously,genetic engineering is used now to introduce genes, albeit from a different species, to help resist pests.
470 Pesticides
Hundreds of insects, mites, weeds, and plant diseases have become resistant to one ormore pesticides. The numbers of resistant pests continue growing and some weeds alreadyresist all known herbicides. One entomologist said, “We’re about a half step ahead of theinsects, and only a little more than that for weeds and plant diseases.” Insects have inhabitedEarth for several hundred million years, plants and microbes for much longer still. Theyhave adapted to ever-changing sometimes dramatically different circumstances. Human-made chemicals are but one more challenge. Consider the Anopheles mosquito that carriesthe malaria parasite. Worldwide 2.4 billion people live in locales where they could contractmalaria, which now causes about 3 million deaths a year. DDT and other pesticides oncekilled Anopheles mosquitoes easily, and the possibility seemed real that malaria could bewiped out. Now, mosquitoes are increasingly resistant. And in some places the incidence ofmalaria is higher than before pesticides were introduced. However, spraying a home’s wallswith a DDT solution can still keep mosquitoes from entering. ▪ The process of pestsdeveloping resistance to pesticides is entirely analogous to microorganisms developingresistance to antibiotic drugs. In the case of antibiotics, this situation has become so seriousthat physicians now refer to a post-antibiotic age. For pesticides too, as increasing numbersof pest species become resistant, many agricultural scientists worry whether effective andrelatively safe new pesticides can be developed fast enough to cope with them.
SECTION III
Reducing the risk of pesticides
There are many approaches to reducing pesticide use. One piece of advice from RachelCarson was: “Spray as little as you possibly can, rather than, ‘Spray to the limit of yourcapacity.’”
Reducing risk through regulation28
The US law regulating pesticides is the Federal Insecticide, Fungicide and Rodenticide Act(FIFRA) administered by the EPA.29 The EPA must ensure that a pesticide will not poseunreasonable adverse effects on human health and the environment. The Fish & WildlifeService works with the EPA to prevent and minimize the pesticide impacts on fish, wildlife,and plants. In 2008, the EPA started a Pesticide Registration Review Program with which itplans to re-evaluate effects of all pesticides on threatened or endangered species. But,although FIFRAmandates no “unreasonable adverse effects,” it also mandates that pesticiderisks be balanced with their benefits. ▪ FIFRA covers the active ingredients in pesticide
28 Pesticide topics. US EPA, November 15, 2007, http://www.epa.gov/oecaagct/pesticide.html.29 About EPA’s pesticide program. US EPA, April, 2007, http://www.epa.gov/pesticides/about/aboutus.htm.
471 Reducing the risk of pesticides
prepar ations, i.e., the ingredient s actually kill ing the pest. The EPA does not regulate theinert ingre dients, although these are often the bulk of the product . However, if the inertingred ient is a highl y toxic substance, it must be identi fied. 30 The purpos e of inert ingre-dients is to make the active ingredient solub le, to stabilize it, or allo w it to be applied in aspeci fi c way.
Controlling a pest with the pest’s own chemicals
One major example of a pheromone is a chemical produced by female insects to attract males.In the world of pesticides, a pheromone is used to attract males into a trap. Another example ofusing an insect’s own chemicals is growth regulators, chemicals that control stages of insects’life cycle. The regulator is sprayed on a crop infested with that insect’s larvae, where itinterferes with larval development into adults. ▪ Notice that the chemist’s handiwork isnecessary to obtain pheromones or growth regulators. A pheromone or growth regulatormust firs t b e i de nt ified for what it is, purified from insects, and its structure elucidated.Then, because such tiny amounts of these chemicals are produced naturally by the insects,the chemicals are synthesized to provide quantities large enough to be useful – they aresynthetic chemicals, but the information used to make them comes from living organisms.
Green chemistry
Two major goals of “ green chemi stry ” are to develo p chemicals that are less toxic or tomake chemicals in less toxi c ways, prefer ably bo th. The ph eromones and growth regul atorsjust mentioned are examples of green chemi stry; they are toxic o nly to the insec ts whoselives they disrupt. In recent years, chemical compa nies hav e empha sized the develo pment ofpesticide s less toxic to non-target speci es a nd to the environmen t, and pesticide s wor king atmuch lower concent rations. ▪ Se e Table 16.3 for desirable traits in a pesticide . Someexamp les follow. ▪ An herbi cide appli ed at only teasp oons per acre (about 8 g) affects oneplant enzym e, and has very low toxicit y to human s and animals. Compar e this to about 2pounds per acre (2.2 kg per hectar e) for older herbi cides. ▪ An insec ticide (als o applied intiny quanti ties) a ffects one insect enzym e, and show s low toxicity to non-ta rget speci es. ▪ Anherbic ide used on corn and soybean s has an LD50 in rats of 500 mg /kg body wei ght, i.e.,only slig htly toxic (Table 3.4 ). The herbi cide is also not a terat ogen or carcino gen, breaksdown quickl y in the envir onmen t, and does not threaten groundwat er. ▪ US Departm ent ofAgriculture scientists developed a crop protectant. This simple product called Surround 31 ismade of processed kaolin (clay). Sprayed onto plants it forms a film barrier that inhibitsmany insect species and mites from feeding on the plants while also reducing sun damageand heat stress. It also has low toxicity. Surround is not considered a pesticide and didn’tneed to go through the usual EPA registration process.
30 Inert or other ingredients. US EPA, December, 2000, http://npic.orst.edu/factsheets/inerts.pdf.31 Surround at home crop protectant. Gardens Alive, 2009, http://www.gardensalive.com/product.asp_Q_pn_E_8072.
472 Pesticides
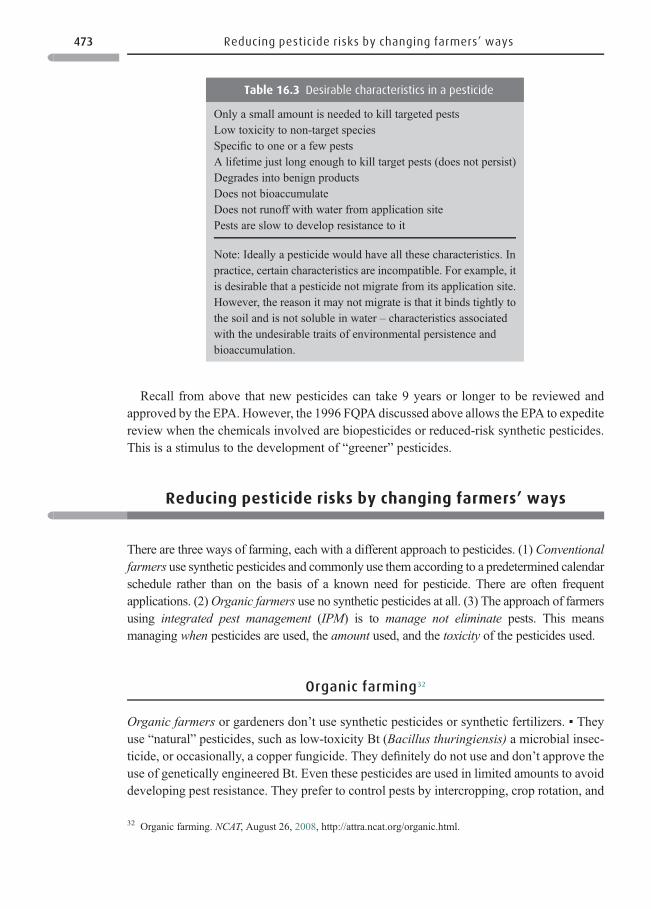
Recall from above that new pesticides can take 9 years or longer to be reviewed andapproved by the EPA. However, the 1996 FQPA discussed above allows the EPA to expeditereview when the chemicals involved are biopesticides or reduced-risk synthetic pesticides.This is a stimulus to the development of “greener” pesticides.
Reducing pesticide risks by changing farmers’ ways
There are three ways of farming, each with a different approach to pesticides. (1) Conventionalfarmers use synthetic pesticides and commonly use them according to a predetermined calendarschedule rather than on the basis of a known need for pesticide. There are often frequentapplications. (2)Organic farmers use no synthetic pesticides at all. (3) The approach of farmersusing integrated pest management (IPM) is to manage not eliminate pests. This meansmanaging when pesticides are used, the amount used, and the toxicity of the pesticides used.
Organic farming32
Organic farmers or gardeners don’t use synthetic pesticides or synthetic fertilizers. ▪ Theyuse “natural” pesticides, such as low-toxicity Bt (Bacillus thuringiensis) a microbial insec-ticide, or occasionally, a copper fungicide. They definitely do not use and don’t approve theuse of genetically engineered Bt. Even these pesticides are used in limited amounts to avoiddeveloping pest resistance. They prefer to control pests by intercropping, crop rotation, and
Table 16.3 Desirable characteristics in a pesticide
Only a small amount is needed to kill targeted pestsLow toxicity to non-target speciesSpecific to one or a few pestsA lifetime just long enough to kill target pests (does not persist)Degrades into benign productsDoes not bioaccumulateDoes not runoff with water from application sitePests are slow to develop resistance to it
Note: Ideally a pesticide would have all these characteristics. Inpractice, certain characteristics are incompatible. For example, itis desirable that a pesticide not migrate from its application site.However, the reason it may not migrate is that it binds tightly tothe soil and is not soluble in water – characteristics associatedwith the undesirable traits of environmental persistence andbioaccumulation.
32 Organic farming. NCAT, August 26, 2008, http://attra.ncat.org/organic.html.
473 Reducing pesticide risks by changing farmers’ ways
other methods described below. ▪ They don’t use synthetic fertilizers either. Nor do they usesewage sludge because it often has extraneous components. They do use manure andcompost as fertilizers or grow legumes in rotation with regular crops; the legumes providenitrogen nutrients to the soil and also condition the soil by providing organic matter.
Integrated pest management (IPM)33
IPM farmers do use synthetic pesticides, but the major tenet is to manage pests, noteradicate them. IPM farmers assess their fields and identify what pests are present. Theycheck for signs that a pest is reaching a stage where it could cause significant damage. Onlythen is pesticide applied – there is no predetermined spraying schedule. Depending on theparticular crop and the circumstances under which it is grown IPM can reduce pesticide use50–70%. Critics say that, sometimes pest populations inflict damage too rapidly for aninspection regime to work. Other tactics that IPM farmers may use follow. ▪ Choose,whenever possible, pesticides with low toxicity to humans and other organisms. ▪ Applythe pesticide in the lowest quantity that can do the job.
Techniques used by organic farmers and many IPM farmers
Change how farming and gardening is done to reduce pesticide use.
* Grow crops in ecologically appropriate regions, locales that require no or little pesticidefor a successful crop. This can much reduce pesticide use.
* Control weeds mechanically, not with herbicides when possible, i.e., use hand tools orfarmmachinery to destroy them. This reduces herbicide use but requires more energy use,human or machinery.
* Use crop rotation, i.e., vary the crops grown on a piece of land, season to season or year toyear. This controls pests that cannot long survive without a specific crop present. Cornillustrates the value of rotation. Corn root-worm survives over the winter, living to damageor destroy corn if it is replanted in the same place again. In crop rotation, corn is planted oneyear and soybeans the next, greatly reducing the amount of pesticide needed. Rotation hasanother advantage if legumes are included; they replenish soil organic nitrogen and organicmatter so, when the alternate crop is grown, less pesticide and less fertilizer are needed.(Conventional farmers typically grow large tracts of monoculture corn, cotton, wheat, orother crops, and would find rotation impracticable or expensive.)
* Intercropping, growingmore than one crop on the land at the same time also lowers pesticidedependence. (Conventional farmers would find intercropping too labor intensive.)
* Eliminate pest-breeding places by destroying crop residues after harvest. This does notleave pests a place to overwinter.
33 (1) Integrated pest management (IPM), How to manage pests. University of California IPM online, 2008, http://www.ipm.ucdavis.edu/. (2) Matthews, G. Integrated pest management. Scitopics, November 7, 2008, http://www.scitopics.com/Integrated_Pest_Management.html. (3) IPM. US Fish & Wildlife Service, September 24,2008, http://www.fws.gov/contaminants/Issues/IPM.cfm
474 Pesticides
* When possible, plant a crop in a season that minimizes its exposure to destructive pests.* Use biological control (biocontrol), i.e., use a natural enemy of the pest (a pest of the
pest). This can be a parasitic insect that preys on the pest, or a microorganism that causes adisease in the pest. Well-known examples of insect predators are praying mantises andladybugs. Ladybugs are reared in large numbers and released to infested areas, wherethey temporarily reduce insect populations. Biocontrol does not fully replace pesticides.For example, introduced parasites partially control the alfalfa weevil, but some pesticideis still needed. In another instance of biocontrol, large numbers of a pest’s eggs arehatched, raised to adulthood, sterilized, and released. The sterilized pests mate withnormal insects, but with no offspring produced, there are fewer pests. ▪ A part ofbiocontrol involves ensuring that enough habitat exists to allow a pest’s natural enemiesto grow. ▪ Sometimes an exotic enemy is, after careful consideration imported from adistant location (Box 16.3).
Box 16.3 Importing biocontrol agents
▪ In nineteenth century California, the cottony-cushion scale threatened the California citrus
industry. This pest was an insect that had been introduced from Australia. Australian entomol-
ogists identified two enemies of the scale and, in the 1880s, took them to California. Within a
fewmonths the scale was brought under control and, over the years has remained so. ▪ Nearlya hundred years later, cassava plant roots (a basic food for millions in Africa) became infested
by the cassava mealybug, an insect that grows entirely on cassava. In heavily infested fields,
farmers could lose 80% of their crop. Detective work revealed that the mealybug was not
African, but South American, the same continent from which cassava came. Subsequently, a
wasp, Epidinocarsis lopezi, a natural enemy of the mealybug, was identified in South America.
After careful study, the wasp was introduced into African cassava fields. Once it was clear that
the wasp effectively killed mealybugs, researchers bred it in large numbers and distributed it
over the large region of Africa affected by the mealybug.
There is a major concern with importing exotics. Introducing an exotic insect – from another
region or country – may allow the exotic to become a pest itself as it may have no enemies in
its new setting. This is why the South American wasp was carefully studied before it was
introduced into Africa to control the mealybug. However, an insect that preys on other insects
has a fortunate characteristic. It usually preys only on those species with which it evolved.
Because it attacks only the pest it was introduced to control, the concern associated with
introducing an exotic species is reduced.
The Californian and African examples given here are not isolated instances. In more than 160
countries, about 560 biological control agents have been introduced to combat nearly 300 target
insect pests with substantial or complete success. Professor L. E. Ehler of the University of
California at Davis points out that this remedy does not have the toxic side effects of chemical
pesticides and is often permanent and economical. Not just insects, but weeds and other pests
can be biologically controlled. As with insects, many weeds infesting US crops are exotics. To
control an exotic weed, researchers go to its place of origin to find an insect or pathogenic
microorganism that can control it. A critical caveat in all these efforts is that the biocontrol agent
be very carefully studied to minimize the chance that it will itself become a pest.
475 Reducing pesticide risks by changing farmers’ ways
For eith er IPM or organic farm ing to wor k well farm ers and gardene rs must be educat edto understand the crops they grow, the p ests that infes t them , and how clim atic condition saffect crops and pests. They must also take the time and effort to use thei r know ledge to findless-toxi c pe sticides (or non-pes ticide alternativ es).
Which mode of agriculture is sustainable?
Critics of organic agriculture hold that on a given la nd area, food yields cannot matchthose o f pesticide- and fertilizer-aided agriculture. In recent years there may be a shifttoward the belief that o rganic agriculture can work,34 espe cially in less-deve lo pednations. I n i ndu stria lize d societies wh ere a great dea l of fe rtilizer and o th er in putsare add ed to ensure max imum pos sib le y ie ld s, an equiva lent yield with org anic agricul-ture may be l ess feasible. ▪ On the other h and, many do not b elie ve t hat h igh-inputagriculture – in put of energy, pesticides , f ertilize r s, wa te r, an d expen s iv e m achinery, andthe i mpac t of t hese on soil – is s ustainable. ▪ Some see IPM as an intermediate path thatmay b e sustainable. ▪ So me are strong propone nts of tra nsgenic plants (GEOs) believingthey a re nece ssary to pro duce enoug h food for t he gro wing human p opulation, and t hatthey may have m uch to o ffer the less-developed world . O ne of several criticisms ofGEOs is that they will en courag e m onoc ultu re crop s and th e prob le ms associated withmonocu l tu re. ▪ Whic hever approach demonstrates the greatest compatibility with theenviron m ent m ust, in the lo ng run, win out beca use sustaina ble agricu lture i s, bydefi nitio n, nece ssary.
Questions 16.3
1 As a consumer of food, would you rather buy food from conventional farmers or organic and
IPM farmers? Why?
2 ( a) If you could eliminate one use of pe sticides, what would i t be , an d w hat w ould be t he
consequences of eliminating th is use? (b) Could th i s use reas o na b ly be eliminat ed?
Explain.
3 Do you believe the increased high-input food production seen over the past 50 years is
sustainable over the long term? Explain.
34 (1) Meeting the food security challenge through organic agriculture. FAO Newsroom May 3, 2007, http://www.fao.org/newsroom/en/news/2007/1000550/index.html (2) Halweil, B. Can organic farming feed us all? WorldWatch, 19(3), May/June, 2006, 18–24 (Also, http://www.worldwatch.org/node/3918 interview with Halweil)(3) Cummings, C. H. Ripe for change: agriculture’s tipping point. World Watch, 19(4), July/August 2006, 38(4) Cooney, C. M. Sustainable agriculture delivers the crops. World Prout Assembly, February 17, 2006,http://www.worldproutassembly.org/archives/2006/02/sustainable_agr_1.html.
476 Pesticides
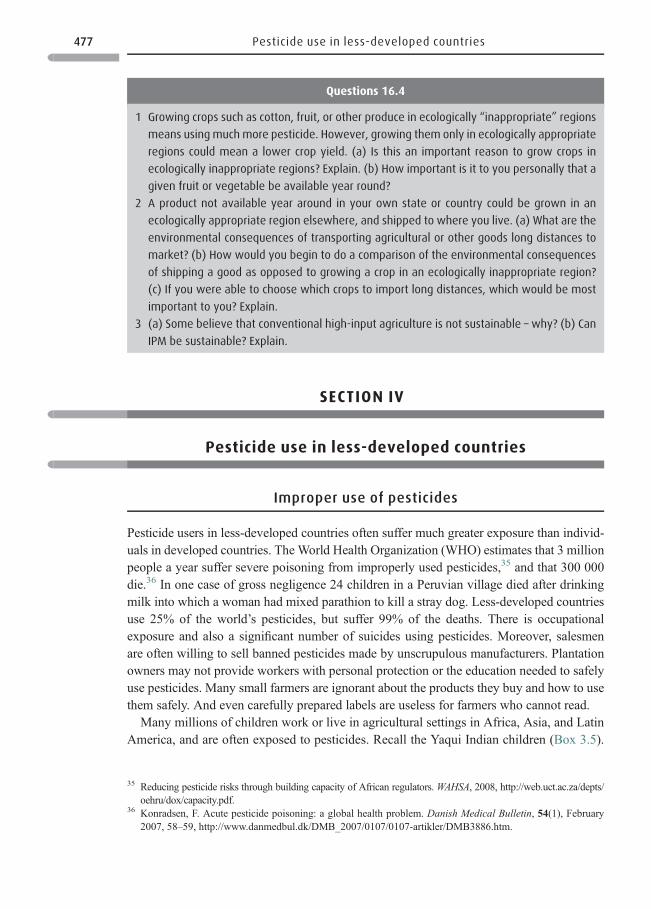
SECTION IV
Pesticide use in less-developed countries
Improper use of pesticides
Pesticide users in less-developed countries often suffer much greater exposure than individ-uals in developed countries. The World Health Organization (WHO) estimates that 3 millionpeople a year suffer severe poisoning from improperly used pesticides,35 and that 300 000die.36 In one case of gross negligence 24 children in a Peruvian village died after drinkingmilk into which a woman had mixed parathion to kill a stray dog. Less-developed countriesuse 25% of the world’s pesticides, but suffer 99% of the deaths. There is occupationalexposure and also a significant number of suicides using pesticides. Moreover, salesmenare often willing to sell banned pesticides made by unscrupulous manufacturers. Plantationowners may not provide workers with personal protection or the education needed to safelyuse pesticides. Many small farmers are ignorant about the products they buy and how to usethem safely. And even carefully prepared labels are useless for farmers who cannot read.
Many millions of children work or live in agricultural settings in Africa, Asia, and LatinAmerica, and are often exposed to pesticides. Recall the Yaqui Indian children (Box 3.5).
Questions 16.4
1 Growing crops such as cotton, fruit, or other produce in ecologically “inappropriate” regions
means using much more pesticide. However, growing them only in ecologically appropriate
regions could mean a lower crop yield. (a) Is this an important reason to grow crops in
ecologically inappropriate regions? Explain. (b) How important is it to you personally that a
given fruit or vegetable be available year round?
2 A product not available year around in your own state or country could be grown in an
ecologically appropriate region elsewhere, and shipped to where you live. (a) What are the
environmental consequences of transporting agricultural or other goods long distances to
market? (b) How would you begin to do a comparison of the environmental consequences
of shipping a good as opposed to growing a crop in an ecologically inappropriate region?
(c) If you were able to choose which crops to import long distances, which would be most
important to you? Explain.
3 (a) Some believe that conventional high-input agriculture is not sustainable – why? (b) Can
IPM be sustainable? Explain.
35 Reducing pesticide risks through building capacity of African regulators.WAHSA, 2008, http://web.uct.ac.za/depts/oehru/dox/capacity.pdf.
36 Konradsen, F. Acute pesticide poisoning: a global health problem. Danish Medical Bulletin, 54(1), February2007, 58–59, http://www.danmedbul.dk/DMB_2007/0107/0107-artikler/DMB3886.htm.
477 Pesticide use in less-developed countries
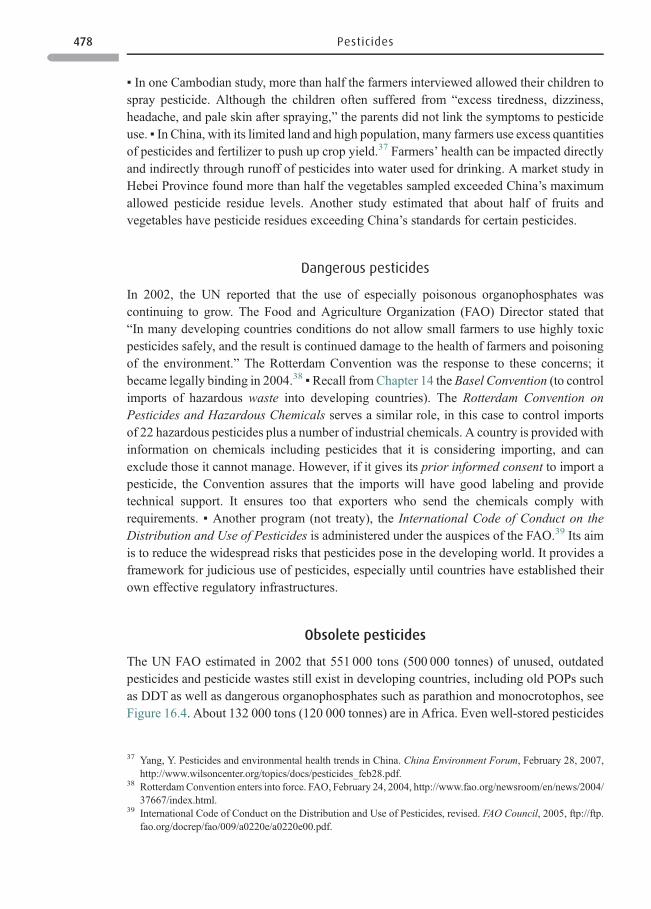
▪ In one Cambodian study, more than half the farmers interviewed allowed their children tospray pesticide. Although the children often suffered from “excess tiredness, dizziness,headache, and pale skin after spraying,” the parents did not link the symptoms to pesticideuse. ▪ In China, with its limited land and high population, many farmers use excess quantitiesof pesticides and fertilizer to push up crop yield.37 Farmers’ health can be impacted directlyand indirectly through runoff of pesticides into water used for drinking. A market study inHebei Province found more than half the vegetables sampled exceeded China’s maximumallowed pesticide residue levels. Another study estimated that about half of fruits andvegetables have pesticide residues exceeding China’s standards for certain pesticides.
Dangerous pesticides
In 2002, the UN reported that the use of especially poisonous organophosphates wascontinuing to grow. The Food and Agriculture Organization (FAO) Director stated that“In many developing countries conditions do not allow small farmers to use highly toxicpesticides safely, and the result is continued damage to the health of farmers and poisoningof the environment.” The Rotterdam Convention was the response to these concerns; itbecame legally binding in 2004.38 ▪Recall from Chapter 14 the Basel Convention (to controlimports of hazardous waste into developing countries). The Rotterdam Convention onPesticides and Hazardous Chemicals serves a similar role, in this case to control importsof 22 hazardous pesticides plus a number of industrial chemicals. A country is provided withinformation on chemicals including pesticides that it is considering importing, and canexclude those it cannot manage. However, if it gives its prior informed consent to import apesticide, the Convention assures that the imports will have good labeling and providetechnical support. It ensures too that exporters who send the chemicals comply withrequirements. ▪ Another program (not treaty), the International Code of Conduct on theDistribution and Use of Pesticides is administered under the auspices of the FAO.39 Its aimis to reduce the widespread risks that pesticides pose in the developing world. It provides aframework for judicious use of pesticides, especially until countries have established theirown effective regulatory infrastructures.
Obsolete pesticides
The UN FAO estimated in 2002 that 551 000 tons (500 000 tonnes) of unused, outdatedpesticides and pesticide wastes still exist in developing countries, including old POPs suchas DDT as well as dangerous organophosphates such as parathion and monocrotophos, seeFigure 16.4. About 132 000 tons (120 000 tonnes) are in Africa. Even well-stored pesticides
37 Yang, Y. Pesticides and environmental health trends in China. China Environment Forum, February 28, 2007,http://www.wilsoncenter.org/topics/docs/pesticides_feb28.pdf.
38 RotterdamConvention enters into force. FAO, February 24, 2004, http://www.fao.org/newsroom/en/news/2004/37667/index.html.
39 International Code of Conduct on the Distribution and Use of Pesticides, revised. FAO Council, 2005, ftp://ftp.fao.org/docrep/fao/009/a0220e/a0220e00.pdf.
478 Pesticides
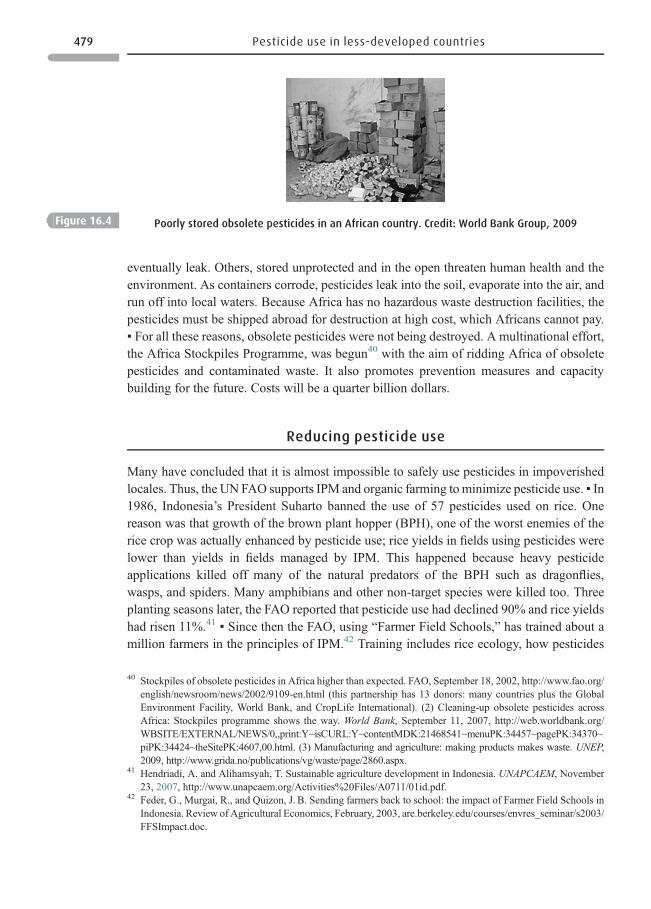
eventually leak. Others, stored unprotected and in the open threaten human health and theenvironment. As containers corrode, pesticides leak into the soil, evaporate into the air, andrun off into local waters. Because Africa has no hazardous waste destruction facilities, thepesticides must be shipped abroad for destruction at high cost, which Africans cannot pay.▪ For all these reasons, obsolete pesticides were not being destroyed. A multinational effort,the Africa Stockpiles Programme, was begun40 with the aim of ridding Africa of obsoletepesticides and contaminated waste. It also promotes prevention measures and capacitybuilding for the future. Costs will be a quarter billion dollars.
Reducing pesticide use
Many have concluded that it is almost impossible to safely use pesticides in impoverishedlocales. Thus, the UN FAO supports IPM and organic farming tominimize pesticide use. ▪ In1986, Indonesia’s President Suharto banned the use of 57 pesticides used on rice. Onereason was that growth of the brown plant hopper (BPH), one of the worst enemies of therice crop was actually enhanced by pesticide use; rice yields in fields using pesticides werelower than yields in fields managed by IPM. This happened because heavy pesticideapplications killed off many of the natural predators of the BPH such as dragonflies,wasps, and spiders. Many amphibians and other non-target species were killed too. Threeplanting seasons later, the FAO reported that pesticide use had declined 90% and rice yieldshad risen 11%.41 ▪ Since then the FAO, using “Farmer Field Schools,” has trained about amillion farmers in the principles of IPM.42 Training includes rice ecology, how pesticides
Figure 16.4 Poorly stored obsolete pesticides in an African country. Credit: World Bank Group, 2009
40 Stockpiles of obsolete pesticides in Africa higher than expected. FAO, September 18, 2002, http://www.fao.org/english/newsroom/news/2002/9109-en.html (this partnership has 13 donors: many countries plus the GlobalEnvironment Facility, World Bank, and CropLife International). (2) Cleaning-up obsolete pesticides acrossAfrica: Stockpiles programme shows the way. World Bank, September 11, 2007, http://web.worldbank.org/WBSITE/EXTERNAL/NEWS/0,,print:Y~isCURL:Y~contentMDK:21468541~menuPK:34457~pagePK:34370~piPK:34424~theSitePK:4607,00.html. (3) Manufacturing and agriculture: making products makes waste. UNEP,2009, http://www.grida.no/publications/vg/waste/page/2860.aspx.
41 Hendriadi, A. and Alihamsyah, T. Sustainable agriculture development in Indonesia. UNAPCAEM, November23, 2007, http://www.unapcaem.org/Activities%20Files/A0711/01id.pdf.
42 Feder, G., Murgai, R., and Quizon, J. B. Sending farmers back to school: the impact of Farmer Field Schools inIndonesia. Review of Agricultural Economics, February, 2003, are.berkeley.edu/courses/envres_seminar/s2003/FFSImpact.doc.
479 Pesticide use in less-developed countries
affect ecosystems, and how to recognize pests and when they reach significant levels. FAOnow has training projects in more than 40 countries for a variety of crops. Pesticide use isabsolutely minimized. An FAO Coordinator noted that “countries across the Asia region arenow at a crossroads where they must choose between a future of farmer-based, sustainableagriculture, or a return to the input-led systems fostered by the Green Revolution in decadespast.” ▪ In Latin America, the Inter-American Development Bank loaned the Nicaraguangovernment money to train 14 000 farmers in IPM and soil conservation techniques includ-ing contour plowing, ditching, and terracing.
Many farmers are losing knowledge of farming techniques indigenous to their cultures.Former UN Environment Program Director Klaus Töpfer stated, “Enshrined in theircultures and customs are secrets of how to manage habitats and the land in environ-mentally friendly, sustainable ways.” For an illustration of how this works, see Andeanpotato peasants are “seed bankers.”43 ▪ In another case, the African country of Ethiopia,after years of drought and soil degradation was suffering famine and malnutrition.Government agents encouraged farmers to use synthetic pesticides and fertilizers toimprove crop yields. But farmers had difficulty with pesticides, which led to human andanimal poisonings. The organization Save the Children began training Ethiopian farmerson how to use traditional methods and IPM. Farmers learned to recognize pests andbeneficial insects, and how to enhance populations of beneficial creatures. They did notautomatically use synthetic pesticides. Instead, when possible, they used local alternativesto pesticides, various plant extracts and even fermented cow’s urine. Participating farmerssignificantly reduced pesticide use.44 ▪ One of the objections to organic farming and IPMis that they require more human labor. However, labor is plentiful in many less-developedcountries as is the desire to own and care for their own land. An important benefit forfarmers is that they learn to trust their own judgment, rather than automatically dependingon pesticides.
Delving deeper
Read the article “Greening the Farm.”45 Then do the following. (1) Using the raising of
Christmas trees as an example show how pesticide use has been decreasing in the United
States and the positive impacts being seen as a result. (2) Again using Christmas trees, show
how IPM has been helpful in reducing pesticide use. (3) Now do the same for organic farming
techniques.
43 Benzing, A. Andean potato peasants are “seed bankers.” ILEIA Newsletter, December, 1989, http://www.leisa.info/index.php?url=getblob.php&o_id=69084&a_id=211&a_seq=1.
44 Ademe, M. S. Progress in farmer field school, IPM in Ethiopia’s lowlands. PAN, March, 2003, http://www.pan-uk.org/pestnews/Issue/pn59/pn59p15.htm.
45 Ritter, S. K. Greening the farm. Chemical & Engineering News, 87(07), February 16, 2009, 13–20, http://pubs.acs.org/cen/coverstory/87/8707cover.html.
480 Pesticides
Further reading
Halweil, B. Can organic farming feed us all? World Watch, 19(3), May/June, 2006, 18–24.Ritter, S. K. Greening the farm. Chemical & Engineering News, 87(07), February 16, 2009,
13–20. http://pubs.acs.org/cen/coverstory/87/8707cover.html.
Internet resources
Ademe, M. S. 2003. Ademe, M. S. Progress in farmer field school, IPM in Ethiopia. http://www.pan-uk.org/pestnews/Issue/pn59/pn59p15.htm (March, 2003).
American Bird Conservancy. 2007. Frequently asked questions on pesticides and birds.http://www.abcbirds.org/abcprograms/policy/pesticides/faq.html.
FAO Newsroom. 2007. Meeting the food security challenge through organic agriculture.http://www.fao.org/newsroom/en/news/2007/1000550/index.html (May 3, 2007).
Hendriadi, A. and Alihamsyah, T. 2007. Sustainable agriculture development in Indonesia.http://www.unapcaem.org/Activities%20Files/A0711/01id.pdf (November 23, 2007).
Koehler, P. G. and Belmont, R. A. 1998. What are pesticides? (how they exert toxiceffects). University of Florida. http://schoolipm.ifas.ufl.edu/newtechp1.htm(March, 1998).
Maryland Department of Agriculture. 1999. Integrated pest management (IPM) and sustain-able agriculture: What you need to know about IPM. MD_ipmsupmanual.pdf(September, 1999).
Matthews, G. 2008. IPM. Scitopics, http://www.scitopics.com/Integrated_Pest_Management.html (November 7, 2008).
NASA. 2009. National pesticide survey. Global Change National Directory, http://gcmd.nasa.gov/records/GCMD_EPA0129.html (February 27, 2009).
NCAT. 2008. Organic farming. http://attra.ncat.org/organic.html (August 26, 2008).National Pesticide Information Center, NPIC. 2009. NPIC makes available chemical,
health, and environmental information on more than 600 active pesticide ingredientsfound in over 50 000 pesticide products. This includes toxicological and product-labelinformation, cleanup and disposal procedures, and information on US pesticide regu-lations. The NPIC also accepts complaints about pesticides. Its toll-free line is 1–800–858–7378, 6:30 A.M.–4:30 P.M. (PST), 7 days a week (or e-mail at [email protected]). NPIC is an EPA-sponsored hotline. http://npic.orst.edu/.
Pesticide fact sheets http://npic.orst.edu/npicfact.htmNational Pesticide Telecommunications Network. 2000. Inert or other ingredients. http://
npic.orst.edu/factsheets/inerts.pdf (December, 2000).Oregon State University. 2007. History of pesticide use, DDT. http://oregonstate.edu/
~muirp/pesthist.htm (January 28, 2007).
481 Internet resources
Science Daily. 2008. Low concentrations of pesticides can become toxic mixture for amphib-ians. http://www.sciencedaily.com/releases/2008/11/081111183041.htm (November 18,2008).
US EPA. 2008. Pesticides, frequent questions. http://pesticides.custhelp.com/cgi-bin/pesticides.cfg/php/enduser/std_alp.php (August 26, 2008).
2008. What are biopesticides? http://www.epa.gov/pesticides/biopesticides/whatarebio-pesticides. htm (October 15, 2008).
2008. Pesticide tolerances. http://www.epa.gov/pesticides/regulating/tolerances.htm(December 18, 2008).
2008. Pesticide issue: honey bee colony collapse disorder. http://www.epa.gov/pesti-cides/about/intheworks/honeybee.htm (October, 2008).
2009. About EPA’s pesticide program. http://www.epa.gov/pesticides/about/aboutus.htm(January 29, 2009).
2009. Pesticides, A-Z index. http://www.epa.gov/pesticides/a-z/index.htm (March 20,2009).
2009. What is a pesticide? http://www.epa.gov/pesticides/about/ (February 3, 2009).US Fish &Wildlife Service. 2008. Environmental contaminants: IPM program. http://www.
fws.gov/contaminants/Issues/IPM.cfm (September 24, 2008).USGS. 2007. Pesticides in ground water. http://ga.water.usgs.gov/edu/pesticidesgw.html
(November 17, 2007).2007. Pesticides in the nation’s streams and ground water, 1992–2001. http://pubs.usgs.gov/circ/2005/1291/ (February 15, 2007).
University of California. 2008. IPM: how to manage pests. http://www.ipm.ucdavis.edu/.
482 Pesticides
17 Pollution at home
“Seeing things differently is the first step toward doing things differently.”Anon.
Thirty years ago, the US EPA, working with Harvard University was studying the sources ofvarious environmental pollutants. They made what was then a startling observation: regardlessof the community studied – its location, whether rural or urban, lightly or highly industrialized,and regardless of sex, age, smoking habits, and occupation – indoor air pollution was the majorsource of exposure to many air pollutants. This is perhaps not surprising: Most people spend90% or more of their time indoors, indoor sources emit many of the same pollutants as outdoorssources, and dilutionwith outdoor air may be slow to occur. In the following years, theAdvisoryBoard of the US EPA ranked indoor air pollution as a priority environmental health risk.▪ Section I of this chapter reviews specific contaminants that impact indoor air quality:combustion pollutants (including tobacco smoke), volatile organic chemicals (VOCs), radonand biological pollutants. It also examines health impacts of combustion particulates on peoplein less-developed countries. Section II delves into hazardous household products and householdhazardous waste, and describes two old hazards that remain with us, asbestos and lead paint.
SECTION I
Indoor air pollution1
Contaminants affecting indoor air quality spring from many sources (Table 17.12). To fullyunderstand Figure 17.1, go to URL in footnote3 and, one-by-one click each room shown.
* Combustion appliances4 including wood stoves and fireplaces, gas stoves, and keroseneheaters emit particulates and several criteria air pollutants (Chapter 5).
1 (1) The inside story, a guide to indoor air quality (CPSC Document #450). US CPSC and US EPA, no date, http://www.cpsc.gov/cpscpub/pubs/450.html#Look6. (2) Indoor air quality.USEPA, January 5, 2009, http://www.epa.gov/iaq/. (3) EPA’s report on the environment: indoor air. US EPA, March 26, 2009, http://oaspub.epa.gov/hd/home#11.
2 (1) Indoor air quality, subject index. US EPA, November 25, 2008, http://www.epa.gov/iaq/atozindex.html. (2)Air pollution and your home. American Lung Association, 1995–2009, http://www.alaw.org/air_Quality/indoor_air_Quality/air_pollution_in_your_home.html.
3 Remodeling your home? Have you considered indoor air quality.US EPA, August 26, 2008, http://www.epa.gov/iaq/homes/hip-front.html.
4 What you should know about combustion appliances and indoor air pollution (Doc. #452). Consumer ProductSafety Commission, no date, http://www.cpsc.gov/CPSCPUB/PUBS/452.html.
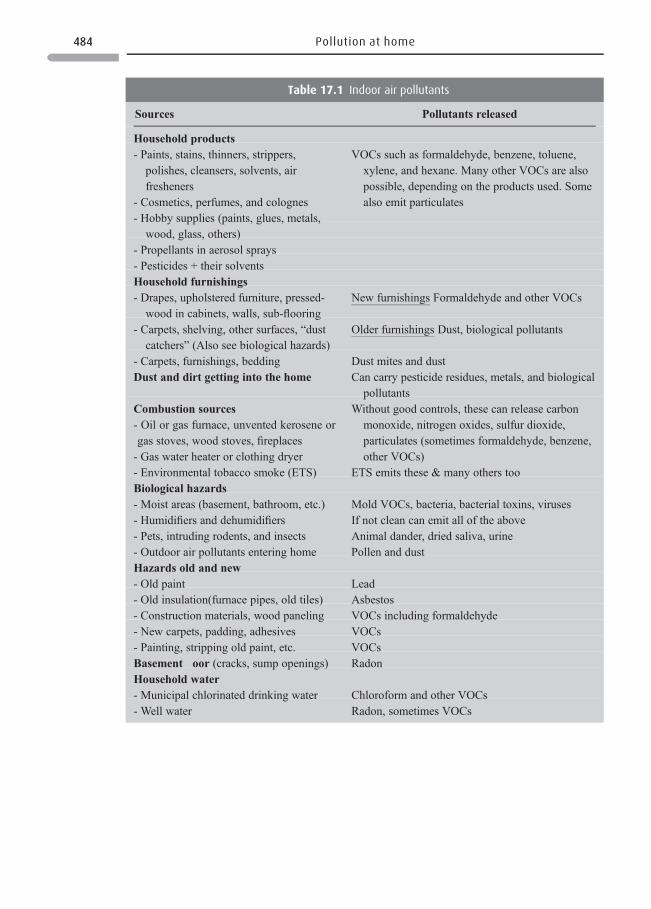
Table 17.1 Indoor air pollutants
Sources Pollutants released
Household products- Paints, stains, thinners, strippers,
polishes, cleansers, solvents, airfresheners
VOCs such as formaldehyde, benzene, toluene,xylene, and hexane. Many other VOCs are alsopossible, depending on the products used. Somealso emit particulates- Cosmetics, perfumes, and colognes
- Hobby supplies (paints, glues, metals,wood, glass, others)
- Propellants in aerosol sprays- Pesticides + their solventsHousehold furnishings- Drapes, upholstered furniture, pressed-
wood in cabinets, walls, sub-flooringNew furnishings Formaldehyde and other VOCs
- Carpets, shelving, other surfaces, “dustcatchers” (Also see biological hazards)
Older furnishings Dust, biological pollutants
- Carpets, furnishings, bedding Dust mites and dustDust and dirt getting into the home Can carry pesticide residues, metals, and biological
pollutantsCombustion sources- Oil or gas furnace, unvented kerosene orgas stoves, wood stoves, fireplaces- Gas water heater or clothing dryer- Environmental tobacco smoke (ETS)
Without good controls, these can release carbonmonoxide, nitrogen oxides, sulfur dioxide,particulates (sometimes formaldehyde, benzene,other VOCs)
ETS emits these & many others tooBiological hazards- Moist areas (basement, bathroom, etc.)- Humidifiers and dehumidifiers- Pets, intruding rodents, and insects- Outdoor air pollutants entering home
Mold VOCs, bacteria, bacterial toxins, virusesIf not clean can emit all of the aboveAnimal dander, dried saliva, urinePollen and dust
Hazards old and new- Old paint Lead- Old insulation(furnace pipes, old tiles) Asbestos- Construction materials, wood paneling VOCs including formaldehyde- New carpets, padding, adhesives VOCs- Painting, stripping old paint, etc. VOCsBasement floor (cracks, sump openings) RadonHousehold water- Municipal chlorinated drinking water Chloroform and other VOCs- Well water Radon, sometimes VOCs
484 Pollution at home
* VOCs arise from construction materials (particle board is one) and consumer productsincluding cleansers, polishes, paints, moth balls, glue, new rugs, furniture, drapes, rugs,clothing, and hobby materials. Chlorinated water emits VOCs too.
* Biological contaminants grow in moist areas in homes and become airborne.* Radon, a natural radioactive gas seeps up from rocks and soil under homes into indoor air.
It also enters air from well water pumped into the home (Table 17.1).* Older homes may have flaking lead paint or asbestos. Some may have more biological
contaminants resulting from persistent wet places or old rugs.
Health effects of indoor air pollutants5
Health effects may be negligible or major depending on the pollutant, its concentration, howexposure occurs, and length of exposure. Acute effects can result from high levels of apollutant. Chronic effects may result from lower ongoing exposure. Examples:
BATH
KITCHEN
AC
HVAC
BASEMENT CRAWL SPACE
DEN
HOMEOFFICE
Figure 17.1 Sources of indoor air pollution. Credit: US EPA [Click on individual rooms at http://www.epa.gov/
iaq/homes/hip-front.html]
5 Indoor air quality resources (questions and answers).US EPA, November 25, 2008, http://www.epa.gov/iaq/iaqinfo.html.
485 Indoor air pollution
* Irritation of eyes, nose, and throat can result from formaldehyde or nitrogen oxides.* Allergies or infections can result from exposure to airborne microorganisms.* Flu-like symptoms or headaches can result from low-level exposure to carbon monoxide
(CO); high CO levels can be deadly.What are some adverse effects that can result from household exposures?
* Temporary reactions can arise many ways: ▪A college student fainted while using a spraycleaner in a small unventilated bathroom. ▪A student reported coughing and choking afterusing an aerosol spray near his face. ▪ An individual sneezes and tears up when walkingthrough a store aisle lined with VOC-emitting products. ▪ Another temporary, but severereaction occurred in a woman temporarily paralyzed after vigorously applying flea sprayinside her home without adequate ventilation.
* Chronic, sometimes life-threatening, effects also occur. ▪ A woman, whose hobby wasrefinishing furniture, developed liver cirrhosis after using paint stripper in a closed roomover several winter months. ▪ Over a four-month period, a man stripped lead paint fromthe interior of his old house without any protection. He developed an ongoing fever andother symptoms. Investigation revealed a blood lead level of 116 μg/100 ml, the highestever seen in the US state of Maine.
Many reactions are not serious and quickly over. Or, as in the case of the personsoverexposed to flea killer, paint stripper, and leaded paint, reactions were severe. Somepeople live miserable lives due to a syndrome called Multiple Chemical Sensitivity. Theseindividuals are hyper-sensitive to VOC odors. Others are equally miserable from theemissions of molds growing in the home.
Reducing indoor air pollution6
Precautionary steps to protect one’s home against harmful emissions follow.
* Products Become aware of products emitting VOCs or other pollutants. Unless their useis necessary, consider eliminating them, i.e., practice source reduction (P2).
* Mold7 One major P2 step is to assure that your home does not develop long-lasting wetspots. These promote mold growth, which release VOCs and spores that promote andaggravate allergies. Occasionally, reactions to mold toxins are deadly. Mold grows inmoist basements, but no place is immune. In bathrooms and other often-moist places,install fans and vent them to the outside.
* Ventilation8 Because you cannot eliminate every source likely to affect indoor air quality,your home needs good ventilation. Make sure your stove has an exhaust fan vented to theoutside. In a modern tight home, install an air-to-air heat exchanger to provide ventilation
6 Links to a number of useful sites: A list of indoor air quality (IAQ) and IAQ-related resources. Hygenair, 2001,http://www.hygenaire.com/Indoor%20Air%20Quality%20Publications.htm.
7 (1) Mold resources. US EPA, September 18, 2008, http://www.epa.gov/mold/moldresources.html. (2) Mold.CDC, http://www.cdc.gov/mold/faqs.htm. (3) Mold, questions and answers. US CDC, November, 2004, http://www.cdc.gov/mold/pdfs/stachy.pdf.
8 Ventilation and indoor air quality. Alliance for healthy homes, http://www.afhh.org/dah/dah_ventilation.htm.
486 Pollution at home
with minimum heat loss. Someone coined a phrase to emphasize the need for both energyconservation and good ventilation: “Seal tight, ventilate right.” Electronic air cleaners andhigh efficiency particulate air (HEPA) filters work by trapping dust, fibers, pollens, skinflakes, and pet dander. But filters do not trap VOCs. Filters also need to be regularly changed.
* Other steps are noted below for specific groups of indoor air pollutants.
Combustion pollutants
Almost all homes use combustion appliances such as furnaces, stoves, fireplaces, gas-burning appliances, or kerosene heaters, and many homes have smokers. In less-developedcountries, cooking and heating fires may be built inside the home with little ventilation.
Combustion pollutants and sources
* Carbon monoxide9 In enclosed spaces CO causes hundreds of deaths in the United Stateseach year. Lower levels of this colorless odorless gas can lead to headaches, dizziness,nausea, and flu-like symptoms. The US Consumer Product Safety Commission (CPSC)recommends that households install CO detectors that will sound an alarm if CO reachesunsafe levels. To largely eliminate CO emissions, combustion appliances need goodmaintenance. This is true of all types of stoves and furnaces and of fireplaces, andchimneys, and their connections. Kerosene heaters should be vented outdoors. Alsovent stove hoods to the outside and install appliances according to the manufacturer’sinstructions. Don’t leave a fire smoldering in a fireplace; if a fire is still burning, close itoff from the room (Figure 17.2).
* Nitrogen oxides10 Efficient burning is typically desirable except that a very hot flamepromotes reactions between atmospheric nitrogen and oxygen to produce NOx. These canirritate eyes, nose, and throat, increase asthma attacks and susceptibility to infection. NOx
sometimes reach significant levels in homes with a gas stove or dryer or a kerosene heater.* Particulates Wood-burning stoves and fireplaces are a major source of particulates to
indoor air. This is true anywhere, but much more so in the homes of hundreds of millionsof the world’s impoverished people who burn biomass such as wood indoors. Thereconcentrations are often so high that millions of deaths a year are attributed to them.
Other sources of combustion pollutants11
* Environmental Tobacco Smoke (ETS) When present ETS poses serious environmentalhealth risks. Burning tobacco emits particulates and hundreds of chemicals, including
9 Carbon monoxide, questions and answers (#466CPSD). Consumer Product Safety Commission, September,2008, http://www.cpsc.gov/CPSCPUB/PUBS/466.html.
10 ToxFAQ™ for nitrogen oxides. ATSDR, April, 2002, http://www.atsdr.cdc.gov/tfacts175.html.11 Diseases A–Z. American Lung Association, 2008, http://www.lungusa.org/diseases/.
487 Combustion pollutants
CO, benzene, formaldehyde, cadmium, lead, arsenic, even tiny amounts of dioxins.Especially in enclosed spaces, levels of combustion products build up. Children livingin homes with smokers often develop respiratory problems or such problems mayworsen. Smokers also run the risk of lung cancer, and severe pulmonary and heartdisease. The association of ETS with heart diseases results from the CO in smoke.Inhaled CO deprives the body, including the heart of oxygen. A cigarette left smolderingproduces more CO than one being smoked.
* Wood-burning stoves and fireplaces Fires are lovely, but they emit VOCs, CO, and NOx,and can be large sources of particulates including PAHs. Many are very-fine particulates,which can be breathed deeply into the lungs. Particulates contribute to or cause respira-tory diseases, and sometimes, infections. They can irritate the eyes, nose, and throat. Veryefficient, but costly stoves and fireplaces exist, which greatly reduce emissions.
* Garages Homes with garages attached to or under them, expose occupants to combustionproducts from the exhausts of automobiles, lawnmowers, and other internal combustionengines. In addition to CO, much of the benzene in indoor air is traced to attachedgarages. Car exhaust, stoves, and furnaces also emit formaldehyde.
Volatile organic chemicals (VOCs)
VOC sources are almost ubiquitous
* Many building materials, furnishings, and often new clothing emit VOCs.* Paints, stains, paint thinners and strippers, varnishes, and turpentine emit VOCs.When paint
is in use, it is the major emitter of VOCs in indoor air. This was a greater problem when oil-based paints were often used indoors, but water-based paints are now more common.
Properly maintain allcombustion appliances
Car inclosedgarage
Furnace
Fireplace
Charcoalgrill
Cookingrange
Waterheater
Roomheaters
Don't leave smolderingfire in fireplace or use grill
indoors
Figure 17.2 Sources of and potential sources of carbon monoxide
488 Pollution at home
* Pesticides, if not volatile themselves, can volatilize when discharged in aerosol sprays.Certain solid pesticides such as naphthalene in moth balls also slowly volatilize.
* Floor and furniture polishes and some waxes emit VOCs, as do many home cleaningproducts, and many personal care products such as nail polish, nail polish removers, andhair sprays. Home products containing chemicals from petroleum emit VOCs.
* Art and craft materials, glues, paints, etc., emit VOCs. Hobbies that generate pollutants,sometimes in significant amounts include model building, photography, ceramics, paint-ing, jewelry making, metal- and stained-glass working, and pottery making. Some ofthese activities generate metal fumes too. Woodworking generates enough VOCs andparticulates that some individuals are forced to give up this activity. See Box 17.1.
* Aerosol sprays emit VOCs and tiny particulates. Hand-pump sprays are a lesser problem.
Box 17.1 Some pollutants are difficult to avoid
We can avoid many VOCs and hazardous chemicals by shunning products that contain them,
but some are too prevalent to totally avoid. As you read about the chemicals below, recall that
“the dose makes the poison,” and that exposures are often low. However, if a product is
thoughtlessly used, air concentrations can rapidly increase as happened with the girl who
vigorously sprayed a cleanser into the air of a tiny closed bathroom. And, some people are
exceptionally sensitive. A third consideration is that we are typically exposed to mixtures of
chemicals, not just one; this makes it hard to assess the impact.
* Polycyclic aromatic hydrocarbons (PAHs)12 are a family of more than a hundred chemicals.
See Box 5.7. They occur naturally in petroleum, but our major exposure to PAHs is from
combustion: they are products of incomplete combustion. Soot from wood stoves and
fireplaces contain PAHs. Kerosene stoves can be sources too. Smokers can produce large
amounts. One PAH, benzo[a]pyrene (BaP) is a potent carcinogen; other PAHs aremutagens.
With combustion so prevalent, we cannot totally avoid these contaminants in our air, food,
and water. Even browned foods and toast contain tiny quantities, and charbroiled foods
have larger amounts. PAHs are common contaminants in carpets. Two US EPA researchers
pointed out that some urban infants are exposed to BaP the equivalent of smoking three
cigarettes a day.
* Formaldehyde13 This small and volatile molecule, HCHO, can react with other chemicals,
linking them into useful polymers. It is an exceptionally useful chemical used in and emitted
by dozens of products including construction materials, resins and glues in pressed wood
products (particleboard, fiberboard, and hardwood plywood), and sealants in floors and
cabinets and other furniture. Drapes, wall coverings, and permanent-press clothing often
also emit formaldehyde. Many cosmetics emit tiny amounts. Because of its high reactivity,
HCHO also functions as a fungicide in latex paints and wallpaper. Unfortunately, the same
property thatmakes formaldehyde so useful allows it to irritate themoist membranes in our
12 ToxFAQsTM for polycyclic aromatic hydrocarbons (PAHs). ATSDR, October 11, 2007, http://www.atsdr.cdc.gov/tfacts69.html.
13 ToxFAQs for formaldehyde. ATSDR, June, 1999, http://www.atsdr.cdc.gov/tfacts111.html.
489 Volatile organic chemicals (VOCs)
respiratory tract and eyes. Some individuals react severely. Fatigue and nausea are among
possible symptoms. Others develop an allergy and become sensitive to even tiny amounts
of formaldehyde.14 For especially sensitive individuals, formaldehyde home monitors are
available. ▪When formaldehyde reacts to form polymers it becomes an integral part of the
product. The problem arises because a portion of the formaldehyde did not react and
become part of the polymer. This escapes into air. Some products, plywood, particleboard
(found in cabinets and other furniture), and sub-flooring can continue emitting HCHO for
months after installation, or for weeks for plastic-laminate counters. New carpets are no
longer a HCHO source. When possible, do remodeling and install new furnishings in the
summer when windows can be open. Wash wrinkle-resistant clothing before wearing
them. Clean permanent-press drapes before installation or at least install them with plenty
of ventilation. (A new method to make wrinkle-free fabrics without formaldehyde was
recently reported. This is an example of “green chemistry,” of design for the environment.)
Formaldehyde emissions from many building products have been reduced in recent years.
Ask for low-formaldehyde emitters when you buy building products.
* Benzene15 occurs naturally in petroleum. As with formaldehyde, benzene is almost ubiq-
uitous. Vapor traps protect us from benzene and other VOCs as we pump gasoline, but
benzene is in motor-vehicle exhausts too. Benzene was added to gasoline as an anti-knock
agent years ago to replace lead. However, because of benzene’s toxicity, the amount in
gasoline was lowered. At levels once found in certain occupational settings benzene was
associated with leukemia and aplastic anemia. Smokers are exposed to benzene too, but at
considerably lower levels than industrial workers once were. Non-smokers are exposed to
lower levels still. Still, benzene in indoor air may be three times higher than outdoors. It is
found in small amounts in fumes evaporating from glues, paints, furniture wax, detergents,
nail polish, and remover. Wood-burning stoves and fireplaces are sources. Garages attached
to homes allow gasoline fumes to seep inside. Stored paints, incompletely sealed, and
stored products containing gasoline are sources too. Although benzene levels in homes are
typically small, regulatory agencies treat exposure to a cancer-causing substance at any
level greater than zero as posing some risk. But tiny amounts of benzene are naturally
present in water and in foods such as nuts, fruit, vegetables, and dairy products.
* Tetrachloroethylene16 (perchloroethylene) or PERC is another ongoing, albeit small expo-
sure for individuals wearing dry-cleaned clothing. At high doses it is a carcinogen in
experimental animals. Among humans, drycleaners have the highest exposures. People
living in buildings with dry-cleaning facilities can have quite high exposures too. Wearing
dry-cleaned clothing or entering closets containing them involves some exposure.
Compared to earlier years, less PERC remains in dry-cleaned clothing. Reduce it further by
airing dry-cleaned clothing before wearing. Some dry-cleaners are using alternative
cleaners, and PERC use is expected to decrease.
14 We don’t develop allergies to molecules as tiny as formaldehyde, but formaldehyde reacts with proteins in thebody. The formaldehyde-linked proteins can lead to allergic reactions. At high levels (not found in homes),formaldehyde causes nasal cancer in rodents. Even formaldehyde levels in our homes present a hypothetical riskof cancer.
15 ToxFAQsTM for benzene. ATSDR, August, 2007, http://www.atsdr.cdc.gov/tfacts3.html.16 ToxFAQsTM for tetrachloroethylene. ATSDR, September, 1997, http://www.atsdr.cdc.gov/tfacts18.html.
490 Pollution at home
Advice
Don’t try to remember each product that emits VOCs. Instead, remember that almost anyconsumer product can do so, and can pose a risk. Routinely read labels and followinstructions. If danger or poison is on the label, consider an alternative.
* Paradichlorobenzene17 is added to stored clothing and other fabrics to repel moths. It is also
found in some toilet disinfectants, deodorizers, and air “fresheners.” Like the chemicals
mentioned above it too is an animal carcinogen at high doses. Almost all exposure to
paradichlorobenzene occurs indoors. Of 1000 Americans selected at random, more than
95% had detectable levels in their urine or blood. ▪ Depending on the brand of air freshener,other ingredients are present too such as camphor, alcohol, or the lemony-smelling limo-
nene. As the University of California Wellness Letter points out, “a product label may say
“natural, but natural doesn’t necessarily mean you want it in your home.” Disperse
unwanted odors by increasing home ventilation, or sprinkling baking soda in areas needing
odor control.
* Other indoor pollutants The chemicals discussed here are among well-studied indoor
contaminants. Currently, phthalates, commonly used as plasticizers in consumer products
are among the chemicals being more carefully examined as indoor air pollutants. Because
phthalates are not chemically bound to the matrix of a product, they volatilize into air and
house dust. They have been found in home air at levels as much as 10-fold higher than
PAHs. House dust could be a large source of phthalate exposure to children. Finding
detectable amounts of phthalates in indoor air does not necessarily indicate a problem.
The concern is that so many substances are found, which raises the topic of chemical
mixtures.
Does the impact of a mixture differ from that of a lone chemical?
In one study scientists studied people’s reactions to VOCs in the air they were breathing. They
started testing one chemical at a time. They looked for the concentration of each chemical that
caused objectively measurable amounts of eye or nasal irritation. Subsequently, they tested
the chemicals again, but in mixtures. With mixtures, irritations were more likely to occur. More
investigations are needed because it is to mixtures that we are most often exposed. ▪ Butnotice that the concentrations studied were high enough to actually cause irritation. In homes,
contaminant concentrations are likely lower or much lower. Still, the conclusion holds that it is
prudent to be aware of VOCs: don’t use more than necessary, and use them with care. See
Chapter 3.
17 (1) IRIS toxicological review and summary documents for 1,4-dichlorobenzene. US EPA, January 17, 2009,http://cfpub.epa.gov/ncea/cfm/recordisplay.cfm?deid=155906. (2) Moth balls (naphthalene and paradichloro-benzene). NPIC, no date, http://npic.orst.edu/hottopic/mothball/health.html. (3) Health effects document fornaphthalene. US EPA, February, 2003, http://www.epa.gov/safewater/ccl/pdfs/reg_determine1/support_cc1_naphthalene_healtheffects.pdf.
491 Volatile organic chemicals (VOCs)
Health effects of VOCs18
Some among many potential effects of VOCs were noted above.
Recommendations for reducing VOC emissions
* Avoid unneeded products.* Maintain good ventilation.* Read labels, not just for products known to be hazardous such as pesticides, but also of
cleaning products, polishes and cosmetics.* Use the minimum amount of a VOC-emitting product that will do the job.* Ask for products with low VOC emissions such as low-formaldehyde emitting wood
products.
EPA cannot regulate VOC-emitting products, but actively studies them, and works withmanufacturers to make changes that would produce products with lower VOC emissions.Increasingly, paints have lower VOCs. As a means to pressure manufacturers to developmore such products, it is helpful for consumers to ask for them even if they are not nowavailable. However, recall that consumers want products that do just as good a job as a high-emitting product.
Moisture
Chronic moisture is an enemy of human health, and also of the structural integrity of a house.Wetness supports mold and bacteria growth. Molds emit the bioaerosols and spores (whichare particulates), and also emit VOCs detected as a moldy smell. Some mold aerosolscontain highly toxicmycotoxins. Mold emissions are at best only a nuisance, but at worst cancause or aggravate respiratory diseases and allergies, or result in infections. Mold infesta-tions are often detected as a well-known “moldy” smell. If enough mold grows, it can beseen as well.19
Moisture sources and remediation
* Damp attics and basements When a cold wall exposed to moisture hits the dew point,moisture settles onto it, and it becomes a place for mold growth. A place that is warm aswell as moist is especially attractive to microorganism growth. A device sold at hardwarestores can measure indoor humidity.
18 Diseases A–Z. American Lung Association, 2008, http://www.lungusa.org/diseases/.19 An estimated 25% of the world’s biomass is in the fungal kingdom. This includes molds and other members of
their family such as mildew. Outdoors, molds play the vital role of degrading organic matter. It is indoor growththat presents problems. Avoiding mold growth inside homes is worth the effort.
492 Pollution at home
* Water-damaged areas of a house and water-damaged household items (carpets, furniture,papers, books) are all attractive to mold growth.
* Other sources include humidifiers, air conditioners, ventilation systems, and refrigeratordrip pans. These all need to be maintained properly.
* Plants in the home can be healthful, but, kept too moist, they breed microbial growth.Changing plant soils frequently can minimize mold growth.
Recommended humidity levels are 30–50%, although some argue that anything over 30%encourages growth of undesired organisms. However, especially in summer, humidity maynaturally be higher. ▪ Recommended actions: when indoor air is too dry in the winter or indesert homes, health specialists may recommend drinking more water rather than installing ahumidifier. If you use a humidifier, choose one generating steam, not cold mist. If using acold-mist humidifier, use deionized water to avoid the mineral particulates that tap water cangenerate. Regularly clean humidifiers and dehumidifiers. Make sure that wet places do notpersist in the home. ▪ Diluted bleach can be used to clean bathrooms contaminated withmold, but damaged furnishings often cannot easily be cleaned, and may need to bediscarded. ▪As with indoor VOCs, always maintain good ventilation. A particulate-trappingair purifier can remove mold spores.
Biological pollutants
The molds just described are biological contaminants and produce air-borne contaminantssuch as spores. However, the word biological goes beyond microbes. Biological pollutantsinclude pollens, animal dander, dust mites and their feces, cockroaches and their feces, catsaliva, rodent urine, i.e., a great many biological substances can become contaminants ofindoor air. Almost any of these can cause or enhance allergies. Airborne microbes need notbe dead to cause reactions. Bits of dead cockroaches or plants can also be allergenic. About15% of people are allergic to dust mite feces. Dust mite and cockroach exposure isassociated with an increased likelihood of asthma. Somemicrobes cause infectious diseases.
Sources and remediation
* Sources of molds were discussed above. Other sources of biological contaminants arecarpets, mattresses, and other bedding, which often harbor dust mites. Pollens arecontaminants originating outdoors that enter the home with outside air or carried in onpets. Animal dander and cat saliva obviously come from pets; after they dry, the particlescan also become airborne. Cockroaches find their way inside especially in warm regions.Their body parts and feces can enter a home’s dust.
* Prevention and remediation strategies include maintaining a home without food particlesthat attract cockroaches. Seal cracks that allow entry to cockroaches, ants, and otherinsects. Maintain clean carpets or even eliminate carpets; use wood flooring or washable
493 Biological pollutants
throw rugs instead. Allergic people must sometimes avoid pets. There are ways forsensitive individuals to allergy-proof a home; the internet, libraries and bookstores, andphysicians are sources of information.
Dust and dirt
AUS EPA study provided the interesting information that – like the Peanuts cartoon characterPig-Pen – each of usmoves about in a cloud of tiny particles. These are released from clothing,carpets, furniture, and other items, stirred up as wemove around or when cooking. Almost anycontaminant capable of becoming airborne – molds, bacteria, pesticide residues, leaded dust,or anything tracked in with dirt on shoes – can become associated with dust particles. Thesealso deposit onto carpets and furniture. Carpets can be almost impossible to keep completelyclean. Vacuuming carpets or sweeping wood floors gives rise to airborne dust. To lessen dust,damp mop the floor before sweeping. Plants, artificial flowers, and dried arrangements aretruly dust catchers. Get in the habit of leaving shoes in the entry way.
Radon20
Radon (radon-222 or 222Rn), is a natural radioactive gas found outdoors and indoors. Itsultimate source is uranium (uranium-238 or 238U),21 which is naturally found in soil androcks throughout the world. 238U goes through a series of decay reactions to form 222Rn(Figure 17.3). As a gas, radon makes its way to the surface as it is formed or into under-ground water where part dissolves. If radon surfaces outside, it dissipates into the atmos-phere. However, if it surfaces beneath a house or other building, it seeps through openingsinto indoor air. There, unless ventilation is very good, its concentration builds up especiallywhen it surfaces in basements. Radon in schools can be a concern. Trailers do not contact theearth and don’t have radon. Radon levels in outdoor air range from 0.1–0.4 pCi/l(pCi picocurie, a unit of radioactivity). An average home has over 1 pCi/l in its air, andeven 1 pCi/l is equivalent to about 50 chest X-rays a year. In the United States, the actionlevel is 4 pCi/l: if a home’s radon level is 4 pCi/l or higher, EPA recommends taking action tolower it.22 An estimated 6–8 million American homes have more than 4 pCi/l. Canada’saction level is 20 pCi/l. Action levels for the UK and Germany are between 3 and 10 pCi/l.See Boxes 17.2 and 17.3.
20 A citizen’s guide to radon. US EPA, September 9, 2008, http://www.epa.gov/radon/pubs/citguide.html.21 Radon also results from the radioactive decay of thorium, found naturally in rock, soil, and water. Thorium
decays by a path that is different than that of uranium.22 This does not mean that radon levels below 4 pCi/l are safe. As is the case for carcinogenic chemicals, any
exposure to ionizing radiation greater than zero may pose some risk. Thus, even small amounts of radon maypose a small risk.
494 Pollution at home
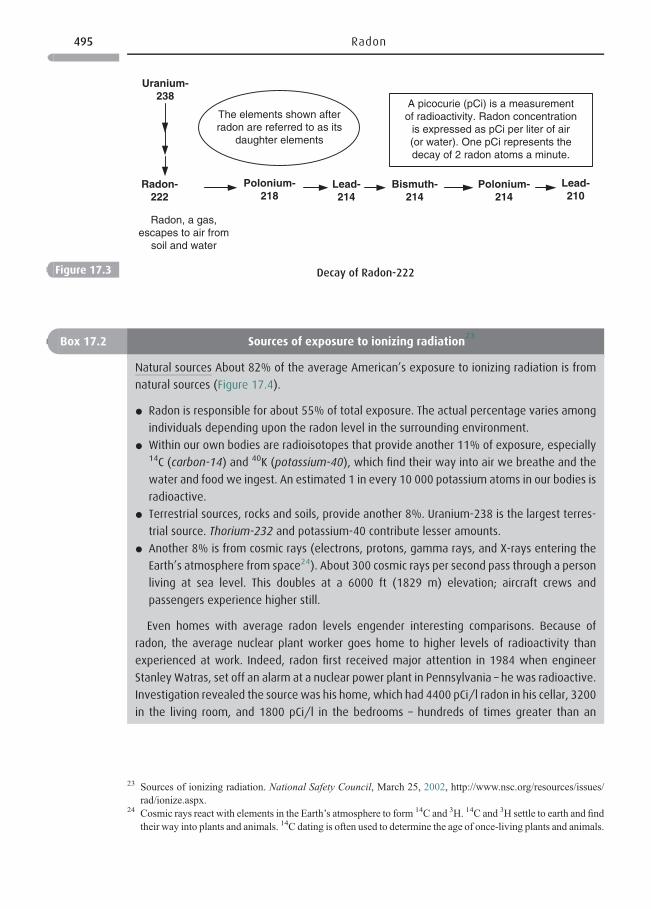
Uranium-238
Radon-222
Polonium-218
Lead-214
Bismuth-214
Polonium-214
Lead-210
Radon, a gas,escapes to air from
soil and water
The elements shown afterradon are referred to as its
daughter elements
A picocurie (pCi) is a measurementof radioactivity. Radon concentration
is expressed as pCi per liter of air(or water). One pCi represents thedecay of 2 radon atoms a minute.
Figure 17.3 Decay of Radon-222
Box 17.2 Sources of exposure to ionizing radiation23
Natural sources About 82% of the average American’s exposure to ionizing radiation is from
natural sources (Figure 17.4).
* Radon is responsible for about 55% of total exposure. The actual percentage varies among
individuals depending upon the radon level in the surrounding environment.
* Within our own bodies are radioisotopes that provide another 11% of exposure, especially14C (carbon-14) and 40K (potassium-40), which find their way into air we breathe and the
water and food we ingest. An estimated 1 in every 10 000 potassium atoms in our bodies is
radioactive.
* Terrestrial sources, rocks and soils, provide another 8%. Uranium-238 is the largest terres-
trial source. Thorium-232 and potassium-40 contribute lesser amounts.
* Another 8% is from cosmic rays (electrons, protons, gamma rays, and X-rays entering the
Earth’s atmosphere from space24). About 300 cosmic rays per second pass through a person
living at sea level. This doubles at a 6000 ft (1829 m) elevation; aircraft crews and
passengers experience higher still.
Even homes with average radon levels engender interesting comparisons. Because of
radon, the average nuclear plant worker goes home to higher levels of radioactivity than
experienced at work. Indeed, radon first received major attention in 1984 when engineer
Stanley Watras, set off an alarm at a nuclear power plant in Pennsylvania – he was radioactive.
Investigation revealed the source was his home, which had 4400 pCi/l radon in his cellar, 3200
in the living room, and 1800 pCi/l in the bedrooms – hundreds of times greater than an
23 Sources of ionizing radiation. National Safety Council, March 25, 2002, http://www.nsc.org/resources/issues/rad/ionize.aspx.
24 Cosmic rays react with elements in the Earth’s atmosphere to form 14C and 3H. 14C and 3H settle to earth and findtheir way into plants and animals. 14C dating is often used to determine the age of once-living plants and animals.
495 Radon
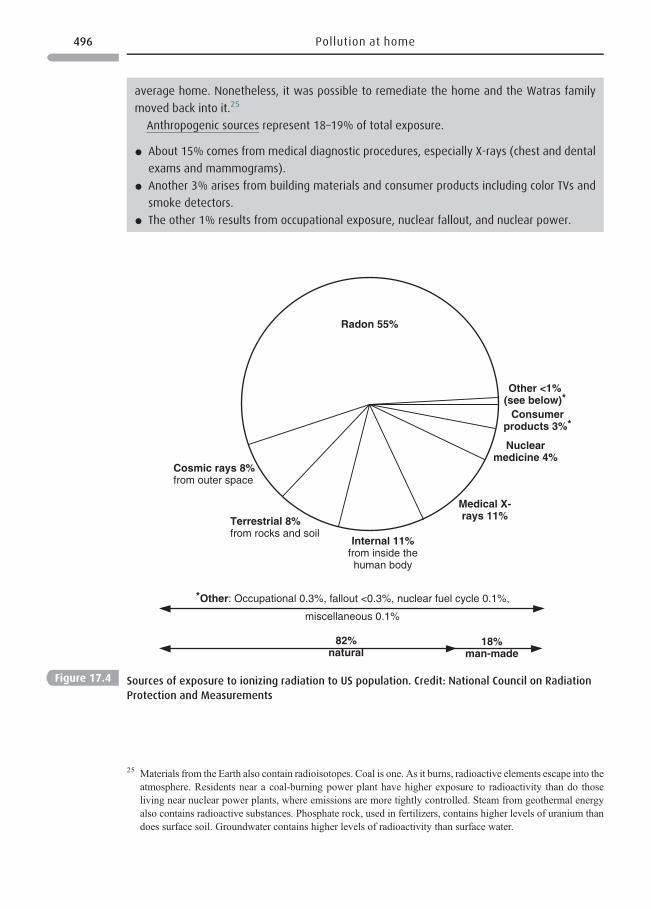
average home. Nonetheless, it was possible to remediate the home and the Watras family
moved back into it.25
Anthropogenic sources represent 18–19% of total exposure.
* About 15% comes from medical diagnostic procedures, especially X-rays (chest and dental
exams and mammograms).
* Another 3% arises from building materials and consumer products including color TVs and
smoke detectors.
* The other 1% results from occupational exposure, nuclear fallout, and nuclear power.
Radon 55%
Cosmic rays 8%from outer space
Terrestrial 8%from rocks and soil
Internal 11%from inside thehuman body
Medical X-rays 11%
Nuclearmedicine 4%
Consumerproducts 3%*
82%natural
18%man-made
*Other: Occupational 0.3%, fallout <0.3%, nuclear fuel cycle 0.1%,
miscellaneous 0.1%
Other <1%(see below)*
Figure 17.4 Sources of exposure to ionizing radiation to US population. Credit: National Council on Radiation
Protection and Measurements
25 Materials from the Earth also contain radioisotopes. Coal is one. As it burns, radioactive elements escape into theatmosphere. Residents near a coal-burning power plant have higher exposure to radioactivity than do thoseliving near nuclear power plants, where emissions are more tightly controlled. Steam from geothermal energyalso contains radioactive substances. Phosphate rock, used in fertilizers, contains higher levels of uranium thandoes surface soil. Groundwater contains higher levels of radioactivity than surface water.
496 Pollution at home
Why radon concerns us26
As a radioisotope decays, it emits ionizing radiation27 – an alpha particle, a beta particle, orgamma rays.Any of these can ionize the atoms that they hit by stripping electrons from them. Inliving tissue, this may damage the genetic material, DNA. The half-life of a radioisotopeindicates how long it takes for one-half of its atoms to undergo decay. Radon-222 has a half-lifeof 3.8 days, so the average radon atom breathed into the lungs is breathed out again before itdecays. Themajor problem is not radon-222 itself, but its solid radioactive daughter elements ofwhich polonium-218 is one; it results from the decay of radon-222 (222Rn → 218Po + alphaparticle). Because polonium-218 and polonium-214 are solids they can attach to dust particlesin the air. Unlike inhaling a gas, if the dust is inhaled, it can deposit onto airway walls andsometimes reside long enough to decay. The solid daughters, polonium-218 and polonium-214,have half-lives of 3 minutes and less than 1 second, respectively. They can decay in the lung,emitting alpha particles, which can damage the DNA in dividing lung cells. Cells repair suchdamage, but not always. When not repaired, cancer can result. Approximately 150 000 lungcancer deaths occur each year in the United States. Radon exposure accounts for an estimated18 000 of these. But it is smokers and people in homes with smokers who bear the brunt of therisk. This is because the radon daughters (218Po and 214Po) attach to tobacco particles, whichcan be inhaled into the lungs and trapped. See A citizen’s guide to radon.28
Detecting and reducing radon
In air
* Testing A test kit, typically a canister of activated charcoal, is left open to the air for 2–7days, usually in the basement. It is then sealed, and mailed to a laboratory. After analysis,results are sent to the homeowner. If the reading is high, result needs to be confirmedthrough a longer-term test. Some states require radon testing before a home is sold. ▪ Anumber of factors affect radon concentration in indoor air. Levels are lower in summer,when a house is more open, so testing is done in winter to find the highest levels.
* Reducing radon Levels can sometimes be much reduced simply by sealing openings inbasement floors. Or radon can be diverted through a pipe installed below the basement,which extends up the house walls and vents to the outside with the help of a suction fan.For new homes, the EPA encourages preventive action upfront by installing a diversionsystem, especially in locales with high potential for radon.
In water
A second source of radon in the home is well water, especially water from a deep well.Municipal tap water typically has lower levels even if its source is groundwater. This is true
26 ToxFAQsTM for radon. ATSDR, September, 2008, http://www.atsdr.cdc.gov/tfacts145.html.27 ToxFAQSTM for ionizing radiation. ATSDR, June, 1999, http://www.atsdr.cdc.gov/tfacts149.html.28 A citizen’s guide to radon. US EPA, March 26, 2009, http://www.epa.gov/radon/pubs/citguide.html.
497 Radon
because radon escapes into the air during processing. Showering and other uses of water in ahome allow radon to escape into indoor air. However, only about 1 in 10 000 molecules inwater escapes. This amounts to only 1–2% of the total radon in a home’s air.29 There is acircumstance in which radon fromwater can bemeaningful: radon can build to high levels in aclosed bathroom during showering, but the exposure time is short. Despite the small amount,risk assessment estimates that radon escaping from water may cause 160 lung-cancer deaths ayear, about 1%of the lung cancers attributed to radon in air. Also, people who drink water withhigh radon levels run a slightly greater risk of stomach cancer. An estimated 20 out of 13 000stomach-cancer deaths in the United States each year may be due to radon in drinking water.▪However, the greatest risk by far is from radon seeping from the ground into indoor air. Andsmokers and their families bear a disproportionate amount of that risk.
Box 17.3 Radon and scientific uncertainty
What could be less controversial than urging people to measure radon levels in their home and to
remediate high levels? Scientific groups including a National Academy of Sciences panel agreed
that radon causes lung cancer in humans. Moreover, unlikemost other carcinogens, for which only
animal data are available, we have human information for radon. The association between radon
and lung cancer is clear in miners exposed to high radon levels. However, it is difficult to make
extrapolations from underground mines to home environments: the association was made by
studying miners who worked before the introduction of modern ventilation in mines, most of
whom also smoked. Themines also contained radon levels hundreds or thousands of times higher
than those inmost homes. Theywere also extremely dusty. Some scientists doubt that lung-cancer
deaths among suchworkers can be extrapolated to the conditions of average homes. However,
most of these scientists do believe that levels two to four times higher than the EPA’s action
level of 4 pCi/L can cause cancer. Their caution relates to saying the same about low exposures.
Many studies have examined possible relationships between radon levels in homes and
lung cancer incidence. Three studies reported in late 2008 found little evidence of a correla-
tion.30 One conclusion where there is widespread agreement is that smokers and those that
live with them bear most of the radon risk. Assuming this is true, some argue that the EPA
should concern itself only with finding homes with much higher radon levels than 4 pCi/l
where even non-smokers could be at risk, at least 20 pCi/l of radon. This is an estimated
29 EPA once proposed a maximum contaminant level (MCL) for radon in water of 300 pCi/l. This would haverequired municipalities having radon levels higher than 300 in their water supplies to reduce them. EPA droppedthe proposed MCL, but this represents an interesting case: EPA estimated that an additional 160 lung-cancerdeaths per year in the US result from radon that has escaped into air from water. This risk is greater than that forany other contaminant in the water supply that is regulated by EPA. Some expressed concern that if we do notregulate radon then industry could claim that, because the pollutants it releases into water present a smaller riskthan radon, they should not be regulated either. Others countered that society has the right to expect industrialemissions to be more strictly controlled than natural ones.
30 Leary, W. E. Studies raise doubts about need to lower home radon levels. New York Times, January 17, 2009,http://query.nytimes.com/gst/fullpage.html?res=9C00E4DF1038F935A3575AC0A962958260&sec=health&spon=&pagewanted=2.
498 Pollution at home
Indoor air of less-developed countries
The problems
For hundreds of millions of people in less-developed countries as far apart as Bolivia,Kenya, and China, indoor air is a major health risk. The worst offender is smoke. Fuel isoften burned inside homes without ventilation especially in cold weather without ventingsmoke to the outside. Those suffering the greatest exposures to particulates and othercombustion pollutants are women as they cook, and their children. Not surprisingly,respiratory diseases are commonplace, often severe. Worldwide, acute respiratory diseasecauses millions of deaths in children under five each year. ▪ People burn wood, straw, ordried manure, although rural Chinese most often burn coal.32 These fuels are often used forheating too, so adult males are also affected. Chronic bronchitis is common among all adults.In the winter months, when indoor stoves are used for heating as well as cooking, carbonmonoxide poisoning is common. ▪ In China where about 800 million people burn coal,problems of contaminants from coal can be serious:33 some coals burned are as high as
50 000 homes in the United States. However, the EPA reminds skeptics that no amount of
ionizing radiation is free of risk, and that about 700 deaths a year in the United States are
attributed to even the low levels of radon in outside air.31 Moreover, some researchers state
that “there is no evidence of a threshold below which any exposure would not increase risk.”
Questions 17.1
1. Explain why you are or are not personally concerned about radon.
2. Before buying a home, will you ask that it be tested for radon? Explain.
3. What level would radon have to be in your home before you would voluntarily remediate
your home? Explain.
4. (a) If small children lived in the home, would you be comfortable if they regularly played in
a basement not tested for radon? (b) If the children only occasionally played there, would
that affect your concern?
31 Recall that for chemicals, an increasing dose has an increasing effect. This holds for radioactivity too. In the mid-1990s investigators reanalyzed lung cancer deaths among uranium miners exposed to radon, pooling data from11 studies covering 2700 lung-cancer deaths among 65 000 miners. They found that as the miners’ exposure toradon increased, so did lung cancer. Their results suggested that even average home radon levels pose some risk.The study also found that long-term exposures to low doses of radiation – a condition similar to those found inhomes – was more risky than short-term exposure to high doses. The authors understood the difficulty ofextrapolating from conditions found in mines to those in homes, but still recommended remediation of homeswith radon levels greater than EPA’s action level of 4 pCi/l.
32 Hildebrandt, T. and Turner, J. L. Air pollution challenges rural China. Wilson Center, April 23, 2003, http://www.wilsoncenter.org/index.cfm?fuseaction=events.event_summary&event_id=28825.
33 Hricko, A. Environmental problems behind the great wall. Environmental Health Perspectives, August 21,1998, http://ehp.niehs.nih.gov/docs/1994/102–2/focus.html.
499 Indoor air of less-developed countries
35 000 ppm arsenic and many are high in fluorine. Thousands have developed severe arsenicpoisoning and millions fluorine poisoning. Other coals have toxic levels of elements such asmercury. Lung cancer rates are also very high.
Some solutions
Simple technologies can make a major difference.
* A cooperative project between Beijing’s Chinese Academy of PreventiveMedicine and theUS EPA found that replacing poorly ventilated stoves with well-ventilated ones resulted inless soot and smoke in the air, and a dramatic reduction in lung cancer rates. ▪ In Kenya, aproject gave women stoves. Although simple in design, they burned more efficiently thantraditional stoves, burning 40% less fuel and emitting much less smoke. Thus, respiratoryhealth was improved and the women saved hours a day previously spent in collectingbiomass fuel. At the same time scarce biomass such as wood was conserved.
* In China’s Yunan Province the Nature Conservancy works with the Chinese governmentand villages to produce biogas (methane) from manure.34 In the mountain village, Haixi,they set up a demonstration project: animal manure and human waste is loaded into alined pit, and a greenhouse built over it. Heat generated from the digesting manure warmsthe greenhouse, which grows vegetables for villagers, and the fermenting manure emitsmethane, which is piped into an adjacent schoolhouse. Teachers previously cookedchildren’s lunch over wood fires with not even windows open in this cold climate. Nowthey use a biogas stove with clean-burning methane. When the waste is no longerfermenting and producing methane, it is used as fertilizer. After this successful demon-stration, individual villagers dug their own household fermentation pits, and were givenhelp toward the $170 cost. Over one year, one cow’s manure provides the energyequivalent to 135 gallons (511 l) of gasoline. Some villagers still burn wood. Thesehave been assisted with more energy-efficient stoves, which are vented to the outside. Theproject is spreading to other villages. With less need for wood, deforestation in the area isreduced as well as indoor air pollution.
SECTION II
Hazardous household products
About 1.5 million Americans visit hospital emergency rooms each year because of poisoningsor possible poisonings. About 10% are admitted into the hospital. More than 80% of the casesare among children under 6 years old. These figures do not include the many people who react
34 Gaetz, R. High energy on the edge of the Himalayas. Nature Conservancy Magazine, 52(2), Summer, 2002; orsee Smokeless in China. Earth Report, http://www.tve.org/earthreport/archive/doc.cfm?aid=1544
500 Pollution at home
to hazardous products such as pesticides, solvents, ammonia, or chlorine, but do not reportthem. In addition to poisonings, some exposures result in injuries to the skin and eyes.
How household products concern us
The words, toxic, corrosive, flammable, and reactive were introduced in Chapter 12 todescribe characteristics of industrial hazardous waste. Some products used in the home havethe same characteristics. A useful web site is Hazardous Substance Information andEducation Office, State of Washington.35
Corrosive products
These can directly damage (corrode) skin, eyes, or mouth. Examples are products containingalkali (lye) such as drain openers or oven cleaners. Corrosive products often have the wordpoison on the label and the word, danger. Emergency room visits for treatment of skin or eyeinjuries resulting from improper use of corrosives are common. ▪ Diluted with water, acorrosive substance may only be an irritant. A much-diluted corrosive may not present ahazard. Although an irritant is less dangerous for most people, it may cause skin redness,itching, or rashes. Cleaners, cosmetics, metals, and polishes are sometimes irritants. ▪ Anirritant is a greater problem for a person who becomes sensitized to it, where repeated useleads to more severe reactions. Since latex gloves have come into common use, many peoplehave become sensitized to latex.
Toxic products
Household products can be toxic. Because all substances are toxic in high doses, treat allproducts thoughtfully including vitamins, minerals, aspirin, and laxatives. This is especiallyimportant if children are in the home. However, only a few household products are legallypoisons, and they are clearly labeled. They include oxalic acid, found in a few cleaningproducts, and methanol, found in windshield washing fluids. Most pesticides36 available tohouseholders are less toxic than those used by professional applicators and are not consideredpoisons. Nonetheless, home pesticide poisonings occur,37 and children are particularly vul-nerable. ▪ Toxicity information on the label38 refers to acute toxicity, an adverse health effectoccurring soon after exposure. The label does not – often cannot – provide information onchronic toxicity. Significantly, although home-use pesticides may be relatively safe forhumans, creatures including some birds, earthworms, or bees can be poisoned.
35 Shoppers’ guide: toxic free tips. Hazardous Substance Information and Education Office, State of Washington,no date, http://www.ecy.wa.gov/toxicfreetips/shoppersguide.html.
36 An introduction to indoor air quality, pesticides.US EPA, November 25, 2008, http://www.epa.gov/iaq/pesticid.html.
37 (1) Pesticides: read the label first. US EPA, November 7, 2008, http://www.epa.gov/pesticides/label/.(2) Pesticide poisoning first aid. About.com, 2009, http://firstaid.about.com/od/poisons/qt/07_pesticides.htm.
38 Signal word, toxic fact sheet (answering questions about pesticides). NPIC, July, 2008, http://npic.orst.edu/factsheets/signalwords.pdf.
501 Hazardous household products
Flammable products
A flammable product can catch on fire easily. Household products that contain petroleumdistillates are flammable. Examples are oil-based paints, paint thinners, paint strippers,certain furniture and floor polishes, and some rug cleaners. Products that contain organicsolvents are often flammable, and many aerosol sprays use flammable hydrocarbons aspropellants. A combustible substance is similar to a flammable one except that it does not asreadily catch on fire.
Reactive products
Well-known reactive substances are dynamite, gun powder, and firecrackers. Certain house-hold products are reactive too: dry or liquid bleaches that contain chlorine will, mixed withhousehold ammonia give off highly irritating and toxic fumes. Even some dish-washingdetergents contain ammonia and should not be mixed with chlorine-containing products.▪Chlorine also reacts with acid-containing products such as some toilet and tile cleaners. ▪Ageneral rule is, don’t mix any chemical products. Overheated or accidentally puncturedaerosol cans may be reactive in a different way, they may explode.
No radioactive products
TV sets emit small amounts of ionizing radiation. Other materials that emit higher thanbackground levels of ionizing radiation are building materials coming from the earth:granite and other rocks, and soil. We do not ordinarily find radioactive substances in theitems around us except for tiny amounts in some smoke detectors, exit signs, and Colemanlampmantles. Our exposure to radioactive substances or ionizing radiation is almost all fromnatural sources, or from medical procedures (Figure 17.4).
Some products have more than one hazard
A product may have more than one hazard. A prominent example is gasoline. It is flammableand explosive, its fumes are toxic, and it is a skin irritant. Young people who inhale gasolinefumes for a “high” can be poisoned or killed by this practice. Another hazard is accidentallyaspirating gasoline into the lungs when (unwisely) sucking it from a motor vehicle’s fueltank. Even small amounts in the lungs can be disabling. These same hazards are present inother products that contain petroleum distillates or organic solvents.
Labeling laws
At the beginning of the twentieth century, perhaps 500 American children a year, mostlyunder age five reportedly died in accidental home poisonings. Thousands more were burnedby the lye (caustic) used to make household soap. This situation changed in 1927 afterCongress passed the Caustic Poison Act requiring that containers of caustic be labeled. In
502 Pollution at home
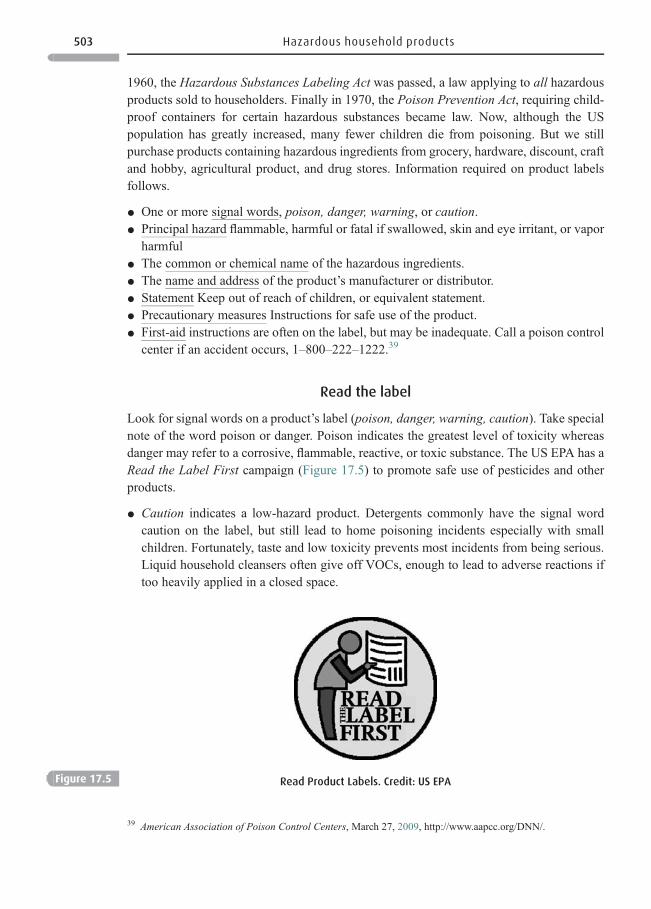
1960, the Hazardous Substances Labeling Act was passed, a law applying to all hazardousproducts sold to householders. Finally in 1970, the Poison Prevention Act, requiring child-proof containers for certain hazardous substances became law. Now, although the USpopulation has greatly increased, many fewer children die from poisoning. But we stillpurchase products containing hazardous ingredients from grocery, hardware, discount, craftand hobby, agricultural product, and drug stores. Information required on product labelsfollows.
* One or more signal words, poison, danger, warning, or caution.* Principal hazard flammable, harmful or fatal if swallowed, skin and eye irritant, or vapor
harmful* The common or chemical name of the hazardous ingredients.* The name and address of the product’s manufacturer or distributor.* Statement Keep out of reach of children, or equivalent statement.* Precautionary measures Instructions for safe use of the product.* First-aid instructions are often on the label, but may be inadequate. Call a poison control
center if an accident occurs, 1–800–222–1222.39
Read the label
Look for signal words on a product’s label (poison, danger, warning, caution). Take specialnote of the word poison or danger. Poison indicates the greatest level of toxicity whereasdanger may refer to a corrosive, flammable, reactive, or toxic substance. The US EPA has aRead the Label First campaign (Figure 17.5) to promote safe use of pesticides and otherproducts.
* Caution indicates a low-hazard product. Detergents commonly have the signal wordcaution on the label, but still lead to home poisoning incidents especially with smallchildren. Fortunately, taste and low toxicity prevents most incidents from being serious.Liquid household cleansers often give off VOCs, enough to lead to adverse reactions iftoo heavily applied in a closed space.
Figure 17.5 Read Product Labels. Credit: US EPA
39 American Association of Poison Control Centers, March 27, 2009, http://www.aapcc.org/DNN/.
503 Hazardous household products
* Labels on pesticides are covered by the Federal Insecticide Fungicide and RodenticideAct, FIFRA, not the Hazardous Substances Labeling Act. For pesticides, poison indicatesthe most toxic product, warning refers to medium toxicity, and caution to the least.
* Active ingredients are those that carry out the function that the product is designed to do.Its inert ingredients carry the active ingredient, or make it easy to apply. However, someinert chemicals are hazardous too.
* Sometimes the word nontoxic is found on a label, which has no legal meaning. Anysubstance can be toxic in high enough doses. Nonetheless, a product labeled nontoxic isprobably less toxic. Otherwise, a signal word would be on the label.
* A petroleum distillate contains chemicals produced during petroleum cracking. The termpetroleum distillates is generic as is organic solvent. It may refer to acetone, isopropylalcohol, methylene chloride, or another solvent.
Reducing exposure to hazardous products
Toxics use reduction (TUR)
* TUR is P2 that refers to reducing exposure to hazardous substances by eliminating orreducing their use. To protect yourself: read and follow directions on the label. Minimizeuse of especially hazardous products. If you need to use a hazardous product, then handle it ina way to minimize exposure. ▪ Use minimum amount necessary to do the job. ▪ Always keepproducts in original containers, even if only adults are around. ▪ Use plentiful ventilation.▪Do not use aerosol products in closed rooms. That includes latex paint. ▪Use exhaust fan toremove fumes from petroleum-based products (paints, shellacs, etc.). ▪ Wait for summer tostrip paint from furniture, and do it outside. ▪ Get in the habit of using gloves and safetyglasses. ▪Don’t mix chemical products; in particular, never mix bleach and ammonia. ▪Keepproducts away from children, including detergents, and vitamin and mineral supplements.
Alternatives
Alternatives are usually available for products with the signal word danger or poison. Forchildren, buy glue with the word nontoxic on the label. For paint, use water-based (latex)rather than oil-based paint when possible. A number of web sites give simple recipes foralternative cleaners and insecticides, etc.40 The National Geographic’s Green Guide has aparticularly useful site for do-it-yourself cleaning recipes.41
40 See: ToxicFreeTips for household cleaners. Washington State, 2, http://www.ecy.wa.gov/toxicfreetips/0804011TFTHouseholdCleaners.pdf.
41 McRandle, P. DIY Household Cleaners. Green Guide. National Geographic, May 3, 2007, http://www.thegreenguide.com/home-garden/cleaning/diy-cleaners?source=email_gg_20090121&email=gg. The author notesuseful items to keep handy and explains how each works. The items are baking soda, borax, distilled whitevinegar, hydrogen peroxide, lemon, olive oil, vegetable-based liquid soap, and washing soda. One suggestion:spray hydrogen peroxide and vinegar one after the other (to replace chlorine bleach). Examples of two recipesare: (1) All-purpose cleaner: dissolve 1/2 cup borax in a gallon hot water. Mix in pail (or use in spray bottle).After using, wipe clean with rag. (2) For wood floors: mix 1/4 cup white vinegar in gallon warm water.
504 Pollution at home
Hazards in older homes and buildings
Asbestos42
* The problem Asbestos is a naturally occurring fibrous mineral. Because of its heatresistance, asbestos was widely used to insulate furnaces and furnace pipes. It is stilloften found in old homes and buildings. Flaking asbestos poses the greatest danger as itsparticles can become airborne, and may be inhaled. Flaking is much less of a problem forasbestos in floor and ceiling tiles, fireplace gloves, and ironing board covers. Chrysotileasbestos, which is considered less dangerous than amphibole asbestos, was used in mostbuildings and homes.
* Lowering the risk Removing asbestos from heating systems is not recommended unless itis deteriorating because the removal process releases asbestos fibers into the air. Rather,ask a professional how best to maintain it in place. Professional advice is also needed toassess whether asbestos is present in old tiles. Leave asbestos-containing tiles in placeunless they are deteriorating. Repair or removal of asbestos-containing materials shouldbe done by an EPA-approved professional. Exposure to asbestos, especially at levelsfound in industrial settings, is associated with asbestosis, lung cancer, and mesothe-lioma.43 Some risk is associated with ingesting asbestos in drinking water, but theprimary risk is inhaling airborne fibers into the lungs, where they may become perma-nently trapped.
Lead
* The problem Leaded paint was once the paint of choice. Lead was added to paints in theUnited States for many years, although in progressively lower amounts until its banningfrom indoor house paint in 1978. Highest levels are most often found in homes builtbefore 1940. Tiny children may eat flaking lead paint from window sills or woodworkand, of even greater concern they may inhale dust in homes with flaking leaded paint.
* Lessening the risk44 Local and state health departments can provide information onidentifying lead paint. Using an ordinary vacuum may result in exhausting lead-containing particles back into household air so, unless an especially equipped vacuumcleaner is available, use wet cloths and mops. As with asbestos, if the lead paint is in goodcondition, leave it undisturbed. Cover it with wall paper or another covering. If paintedwoodwork is in good condition, wipe it frequently with a wet cloth to lessen the chance oflead dust entering the air. If small children live in the home, consider asking a professionalto remove the paint from woodwork or replace the woodwork. Homeowners should notremove leaded paint themselves. Soil around old houses often contains high lead levels,which can be tracked into the home on footwear.
42 ToxFAQsTM for asbestos. ATSDR, September, 2001, http://www.rst2.edu/ties/asbestos/university/asbestospdf/1g7.pdf.
43 The author’s brother, a long-time sheet metal worker, developed asbestosis and died of lung cancer in December,2008.
44 Indoor air quality: lead. US EPA, November 25, 2008, http://www.epa.gov/iaq/lead.html.
505 Hazardous household products
Household hazardous waste45
* The problem Residues of hazardous products become household hazardous waste(HHW).46 Waste paint is the most common HHW. Other left-over products in HHW arepaint thinners and strippers, pesticides, cleaners and polishes that contain petroleumdistillates, and alkaline drain and oven cleaners. Even some discarded cosmetics, such asacetone nail-polish remover contribute small amounts of HHW. Several web sites provide agood description of household hazardous waste, how to handle it and further references.47
* Lessening HHW Creation of HHW can be prevented by buying the smallest amount of aproduct that can do the job desired. This is one time to avoid economy sizes. Oncepurchased, use it up or give it to someone who will. Some residues can be disposed of, forexample if paint is first allowed to dry out (in a place safely away from children), theresidue may go in the trash. Sometimes product labels have disposal instructions or atelephone number to call for more information on the product. Although it takes a changein habits, consider making your own products; many of them are simple. See Table 17.2.
Table 17.2 Alternative household products
All-purpose cleaner: 1 gallon hot water, 2/3 cup baking soda, 1/4 cup ammonia, 1/4 cup vinegar (OK to double theingredients added to the water for a stronger cleaner.)
Window/glass cleaner: 1/4 cup ammonia with 1 quart water (or ½ cup vinegar with 1 quart water)Scouring powder cleaner: use baking soda (For laundry, add ½ cup to wash water.)Furniture polish: mix 1 teaspoon lemon oil and 1 pint mineral oilOven cleaner: wash oven with warm water/baking soda mixture. Soften burned-on spills by placing a small pan ofammonia in the oven overnight. Sprinkle salt onto fresh grease spills and then wipe clean
Toilet cleaner. use baking soda, a mild detergent, and a toilet brushFloor cleaner: ½ cup vinegar in a gallon of waterFloor polish: club sodaSilver cleaner: to small pan of water add 1 teaspoon baking soda, 1 teaspoon salt plus 2” × 2” piece of aluminumfoil. Soak silverware overnight.
Rug cleaner: sprinkle cornstarch on carpets, then vacuumDrain opener: first spoon baking soda into drain, and then slowly add 1/3 cup white vinegar. Use a plunger to get ridof loosened clog. Prevent clogs by pouring boiling water down drains once a week. Also use drain strainers, anddon’t pour grease down drains
Moth balls: put cedar chips or blocks in closets and drawers with clothes. Store clothing cleanInsecticides: mix 2 tablespoons dish-washing liquid with 2 cups water: spray on leavesAnt poison: clean counter tops with mixture of half vinegar and half waterFly repellants: use fly swatter or place mint plants on window sills
45 (1) Household hazardous waste. US EPA, September 30, 2008, http://www.epa.gov/epawaste/conserve/materials/hhw.htm. (2) Household hazardous waste. Land-of-Sky Regional Council’s Environmental PlanningDivision, 2004, http://www.landofsky.org/planning/p_hhw.html.
46 Wastes, ask a question. US EPA, January 19, 2009, http://waste.custhelp.com/cgi-bin/waste.cfg/php/enduser/std_alp.php.
47 Household hazardous waste. Ewgateway.org, August 19, 2008, http://www.ewgateway.org/progproj/hhw/hhw.htm.
506 Pollution at home
* HHW Collection Programs In the hands of a householder, HHW is not regulated ashazardous waste, but once it passes into the hands of a collection program, it is strictlyregulated. However, community collection programs, although still expensive, are notsubject to regulations regarding collection, storage, and transportation of some HHW.However, the waste must be either recycled or properly treated before disposal.
Paint
About half of all HHW is paint. Water-based (latex) paint is less hazardous than oil-based.Alternative “natural” paints containing beeswax, plant waxes, and linseed oil are available,but check the expiration date as some can, literally, rot. Buy only the amount needed. If theleftovers are usable, give it away. Encourage your community and state to adopt a paintrecycling program or a paint “drop and swap.”
Used oil and antifreeze
* Another HHW produced in large volumes is familiar to those who change their own caroil. Used oil is both ignitable and toxic. Never pour used oil on the ground or down adrain, whether it’s a home or storm drain. Check with your city for locations that take usedoil. Because millions of do-it-yourselfers make it impractical for the EPA to regulatewaste oil, it chose to develop standards for commercial handlers of used oil: if destined fordisposal, the oil may fall under hazardous waste regulations. But oil that is to be recycledis treated less strictly.
* Antifreeze too should never be poured on the ground or driveway. Its sweet taste canattract and poison animals and children. Some brands have a bitter-tasting additive todiscourage ingestion. Contact the local wastewater treatment plant to inquire if it canhandle antifreeze. If it can, then, little by little flush the antifreeze down the toilet. Don’tpour antifreeze down the drain if the home has a septic system, as it may kill the system’smicroorganisms.
Pesticides48
* The problems Most American households use pesticides, commonly lawn and gardenpesticides, moth repellents, pet-flea collars, no-pest strips, and disinfectants. Pesticidesavailable to householders are less hazardous than commercial products. However, pesti-cides may be blown by wind or run off with rainwater into other people’s yards or a localstream or lake. They lead to many bird deaths, and can kill beneficial insects such ashoney bees. Pesticides, picked up on footwear and tracked into homes are detected oncarpets even in homes not using pesticides. ▪ The person most highly exposed to pesticideis usually the one applying it, but others within the home and yard are also exposed.
48 (1) What is integrated pest management or IPM? University of Wisconsin System, 2005, http://www.uwex.edu/homeasyst/. (2) Healthy neighborhoods, going the extra yard (yard environmental health). Audubon Magazine,March, 2002, http://audubonmagazine.org/features0203/healthy_habitats.html.
507 Hazardous household products
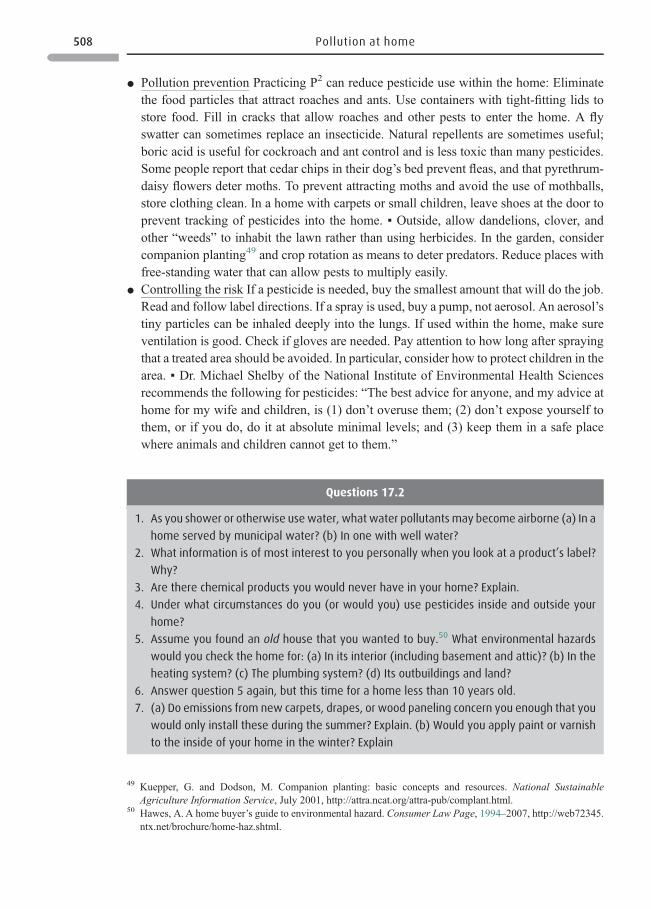
* Pollution prevention Practicing P2 can reduce pesticide use within the home: Eliminatethe food particles that attract roaches and ants. Use containers with tight-fitting lids tostore food. Fill in cracks that allow roaches and other pests to enter the home. A flyswatter can sometimes replace an insecticide. Natural repellents are sometimes useful;boric acid is useful for cockroach and ant control and is less toxic than many pesticides.Some people report that cedar chips in their dog’s bed prevent fleas, and that pyrethrum-daisy flowers deter moths. To prevent attracting moths and avoid the use of mothballs,store clothing clean. In a home with carpets or small children, leave shoes at the door toprevent tracking of pesticides into the home. ▪ Outside, allow dandelions, clover, andother “weeds” to inhabit the lawn rather than using herbicides. In the garden, considercompanion planting49 and crop rotation as means to deter predators. Reduce places withfree-standing water that can allow pests to multiply easily.
* Controlling the risk If a pesticide is needed, buy the smallest amount that will do the job.Read and follow label directions. If a spray is used, buy a pump, not aerosol. An aerosol’stiny particles can be inhaled deeply into the lungs. If used within the home, make sureventilation is good. Check if gloves are needed. Pay attention to how long after sprayingthat a treated area should be avoided. In particular, consider how to protect children in thearea. ▪ Dr. Michael Shelby of the National Institute of Environmental Health Sciencesrecommends the following for pesticides: “The best advice for anyone, and my advice athome for my wife and children, is (1) don’t overuse them; (2) don’t expose yourself tothem, or if you do, do it at absolute minimal levels; and (3) keep them in a safe placewhere animals and children cannot get to them.”
Questions 17.2
1. As you shower or otherwise usewater, what water pollutants may become airborne (a) In a
home served by municipal water? (b) In one with well water?
2. What information is of most interest to you personally when you look at a product’s label?
Why?
3. Are there chemical products you would never have in your home? Explain.
4. Under what circumstances do you (or would you) use pesticides inside and outside your
home?
5. Assume you found an old house that you wanted to buy.50 What environmental hazards
would you check the home for: (a) In its interior (including basement and attic)? (b) In the
heating system? (c) The plumbing system? (d) Its outbuildings and land?
6. Answer question 5 again, but this time for a home less than 10 years old.
7. (a) Do emissions from new carpets, drapes, or wood paneling concern you enough that you
would only install these during the summer? Explain. (b) Would you apply paint or varnish
to the inside of your home in the winter? Explain
49 Kuepper, G. and Dodson, M. Companion planting: basic concepts and resources. National SustainableAgriculture Information Service, July 2001, http://attra.ncat.org/attra-pub/complant.html.
50 Hawes, A.A home buyer’s guide to environmental hazard. Consumer Law Page, 1994–2007, http://web72345.ntx.net/brochure/home-haz.shtml.
508 Pollution at home
Internet resources
Alliance for healthy housing. 2009. Ventilation and indoor air quality. http://www.afhh.org/dah/dah_ventilation.htm.
American Association of Poison Control Centers. 2009. http://www.aapcc.org/DNN/(March 27, 2009).
American Lung Association. 1995–2009. Air pollution and your home. http://www.alaw.org/air_Quality/indoor_air_Quality/air_pollution_in_your_home.html.
American Lung Association. 2008. Diseases A-Z. http://www.lungusa.org/diseases/.Ewgateway. 2007. Household hazardous waste. http://www.ewgateway.org/progproj/hhw/
hhw.htm (May 21, 2007).Hawes, A.A. home buyer’s guide to environmental hazard.Consumer LawPage, 1994–2007.
http://www.consumerlawpage.com/brochure/home-haz.shtml.Hildebrandt, T. and Turner, J. L. 2003. Air pollution challenges rural China. Wilson Center,
http://www.wilsoncenter.org/index.cfm?fuseaction=events.event_summary&event_id=28825(April 23, 2003).
McRandle, P. 2007. Do it yourself household cleaners. Green Guide, National Geographic,http://www.thegreenguide.com/home-garden/cleaning/diy-cleaners?source=email_gg_20090121&email=gg (May 3, 2007).
National Safety Council. 2002. Ionizing radiation sources. http://www.nsc.org/resources/issues/rad/ionize.aspx (March 25, 2002).
NPIC. 2008. Signal word, toxic fact sheet (answering questions about pesticides). http://npic.orst.edu/factsheets/signalwords.pdf (July, 2008).
State of Washington. 2009. Shoppers’ guide: toxic free tips. http://www.ecy.wa.gov/toxicfreetips/shoppersguide.html.
University of Wisconsin. 2005. What is (home) integrated pest management? http://www.uwex.edu/homeasyst/.
US Consumer Product Safety Commission (CPSC) No date. A guide to indoor air quality(whole booklet here online). http://www.cpsc.gov/cpscpub/pubs/450.html#Look6.
No date. What you should know about combustion appliances and indoor air pollution.http://www.cpsc.gov/CPSCPUB/PUBS/452.html.
2008. Carbon monoxide, questions and answers. http://www.cpsc.gov/CPSCPUB/PUBS/466.html (September, 2008).
Delving deeper
Go to the Farm*A*Syst/Home*A*Syst links (http://www.uwex.edu/homeasyst/). Choose a
topic of interest to you from among the home environmental safety topics given. Follow the
links to get enough information to feel comfortable that you know what is necessary or useful
to your home. Prepare a brief report. Along with other students who each examine a different
topic, make brief oral reports to your class.
509 Internet resources
US EPA 2008. An introduction to indoor air quality: pesticides. http://www.epa.gov/iaq/pesticid.html (November 25, 2008).
2008. Household hazardous waste. http://www.epa.gov/epawaste/conserve/materials/hhw.htm (September 30, 2008).
2008. Indoor air quality: lead. http://www.epa.gov/iaq/lead.html (November 25, 2008).2008. Indoor air quality resources (questions and answers). http://www.epa.gov/iaq/iaqinfo.html (November 25, 2008).
2008. Mold resources. http://www.epa.gov/mold/moldresources.html (September 18,2008).
2008. Pesticides: read the label first. http://www.epa.gov/pesticides/label/ (November 7,2008).
2008. Remodeling your home? Consider indoor air quality. http://www.epa.gov/iaq/homes/hip-front.html (August 26, 2008).
2009. A citizen’s guide to radon. http://www.epa.gov/radon/pubs/citguide.html (March26, 2009).
2009. EPA’s report on the environment: indoor air. http://oaspub.epa.gov/hd/home#11(March 26, 2009).
2009. Indoor air quality. http://www.epa.gov/iaq/ (January 5, 2009).2009. Indoor air quality index. http://www.epa.gov/iaq/atozindex.html (April 8, 2009).2009. Wastes: ask a question. http://waste.custhelp.com/cgi-bin/waste.cfg/php/enduser/std_alp.php (January 19, 2009).
510 Pollution at home
18 Zero waste, zero emissions
“The time has come for humankind not to expect the Earth to produce more, butrather to do more with what the Earth already produces.”
Gunter Pauli, Belgian industrialist
Remember the concept of nature’s services from Chapter 1: conserving nature is abso-lutely necessary to the sustaining of meaningful life on Earth, its habitats and biodiversity,and its ability to continue to perform the services on which humanity and all life depends.Sustaining nature’s services necessitates producing a minimal amount (“zero”) of damag-ing wastes and emissions. The Product Life Institute provides a worthwhile introductionto sustainability; see footnote1. But how can we speak of zero waste or zero emissions if,as you learned earlier, no process is 100% efficient? The answer is that zero waste is aphilosophy, one that says there is no waste: What we call “waste” or “pollutant” is really auseful resource. However, this philosophy recognizes that waste is now a major problemand, if we aspire to reduce waste 100%, we accomplish more than if our goal was 40% or80%. Thinking of wastes and pollution in this manner is not contradictory to otherconcepts covered in this book such as pollution control and pollution prevention becausehumanity is working at a number of levels, both doing what we must at the present whilealso working toward the future vision of finding means to a sustainable environmentand world.
Dematerialization is emphasized in the first three sections of this chapter, i.e., reducingthe quantities of materials we use. Section I asks how well we are doing now in reducingwaste and pollution. Section II discusses industrial ecology, which has the goal ofenmeshing industrial society into the environment. It introduces closed-loop systemsand examines the possibility of increasing our efficiency in resource use at least four-fold. Section III examines tools to work toward zero-waste: life-cycle assessment (LCA)and design for the environment (DfE) as well as servicizing and product stewardship.Section IV emphasizes detoxification (green chemistry): changing the chemicals we useand how we produce them, to reduce chemical risk to humans and the environment.Section V asks what progress is there toward zero waste – by corporations, cities, andcountries?
1 The Product Life Institute, 1982–2008, http://www.product-life.org/en/node. A sustainable economy and societyrests on five pillars: nature conservation; limiting toxicity; maximizing resource productivity; and on socialecology (peace and justice) and cultural ecology (defined at this web site).
SECTION I
Waste and emissions
In the United States, pollution has been reduced – up to a point.
* Air Collectively, US emissions of the six criteria air pollutants2 fell more than 50%between 1980 and 2007. This improvement occurred despite a 195% increase in GrossDomestic Product (GDP), 178% increase in vehicle miles traveled, and a populationincrease of 42%. ▪ These are impressive gains. Nonetheless, 159 million Americans livein areas where standards set to protect human health are exceeded for at least one criteriapollutant. Ground-level ozone remains high enough to affect health in many cities.Moreover, greenhouse gas emissions continue to increase in the United States.
* Water is more complicated to assess. The acidity of surface water has decreased in surfacewater ecosystems sensitive to acid impact. But many waters have too much bioavailablenitrogen; nitrate levels especially have increased in the Mississippi River (Chapter 9).Non-point runoff remains a major problem.Many shallowwells in agricultural areas havedetectable pesticides.
* Considering the environment more generally, see Electronic report on the environment.US EPA, 2008. http://www.epa.gov/roe/index.htm. This site connects you to air, water,land, and other environmental trends.
Worldwide, the picture is sobering3 (Table 2.1). Consider Asia where rapid economicgrowth severely strains the environment.4 The Asian Development Bank states that, unlesschanges are made in economic-development patterns to address pollution and natural-resource degradation Asian cities will increasingly become unlivable, and available resour-ces further degraded.5,6 Equally serious problems exist in many places in addition to Asia.▪ Meanwhile, the complexity of environmental problems increases and problems willworsen without decisive action. Major action is needed to greatly increase citizens’ environ-mental awareness and the will of governments, businesses, and organizations to act.
2 (1) Earthday 2008 fact sheet. The National Center for Public Policy Research, 2008, http://www.nationalcenter.org/EarthDay08Progress.html. (2) Air trends, basic information. US EPA, November 21, 2008, http://www.epa.gov/airtrends/sixpoll.html. (The criteria air pollutants are carbon monoxide, lead, sulfur dioxide, nitrogen oxides,ground-level ozone, and particulate matter.)
3 Vitousek, P. M., Mooney, H. A., Lubchenco, J., and Melillo, J. M. Human domination of Earth’ s ecosystems.Science, 277, July 25, 1997, 494–499.
4 The long-term strategic framework of the Asian Development Bank (2008–2020). Asian Development Bank,December, 2007, 8–9, http://www.adb.org/Documents/Policies/LTSF-W-Paper/LTSF-W-paper.pdf.
5 The Asian Development Bank stated (2002) that “environmental degradation – air pollution, biodiversity loss,land degradation, exhaustion of aquifers, water pollution and exposure to hazardous waste – is now ‘pervasive,accelerating and unabated.’” Its five-fold policy to turn this around is: reduce poverty, take the environment intoaccount in bank operations, and when addressing economic growth, promote regional and global cooperation,work with partners to reverse environmental degradation.
6 Starting in 2008, a severe economic downturn may indeed be altering economic development worldwide, butsuch a precipitous drop in economic activity is definitely not a path we would deliberately choose to take.
512 Zero waste, zero emissions
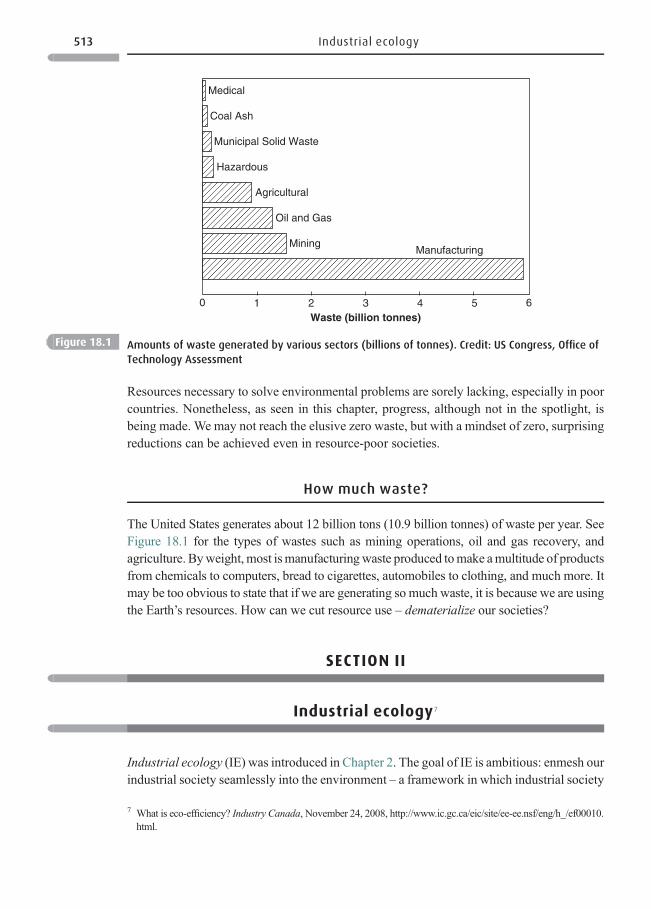
Resources necessary to solve environmental problems are sorely lacking, especially in poorcountries. Nonetheless, as seen in this chapter, progress, although not in the spotlight, isbeing made. We may not reach the elusive zero waste, but with a mindset of zero, surprisingreductions can be achieved even in resource-poor societies.
How much waste?
The United States generates about 12 billion tons (10.9 billion tonnes) of waste per year. SeeFigure 18.1 for the types of wastes such as mining operations, oil and gas recovery, andagriculture. Byweight, most ismanufacturingwaste produced tomake amultitude of productsfrom chemicals to computers, bread to cigarettes, automobiles to clothing, and much more. Itmay be too obvious to state that if we are generating so much waste, it is because we are usingthe Earth’s resources. How can we cut resource use – dematerialize our societies?
SECTION II
Industrial ecology7
Industrial ecology (IE) was introduced in Chapter 2. The goal of IE is ambitious: enmesh ourindustrial society seamlessly into the environment – a framework in which industrial society
Waste (billion tonnes)0
Medical
Coal Ash
Municipal Solid Waste
Hazardous
Agricultural
Oil and Gas
MiningManufacturing
1 2 3 4 5 6
Figure 18.1 Amounts of waste generated by various sectors (billions of tonnes). Credit: US Congress, Office of
Technology Assessment
7 What is eco-efficiency? Industry Canada, November 24, 2008, http://www.ic.gc.ca/eic/site/ee-ee.nsf/eng/h_/ef00010.html.
513 Industrial ecology
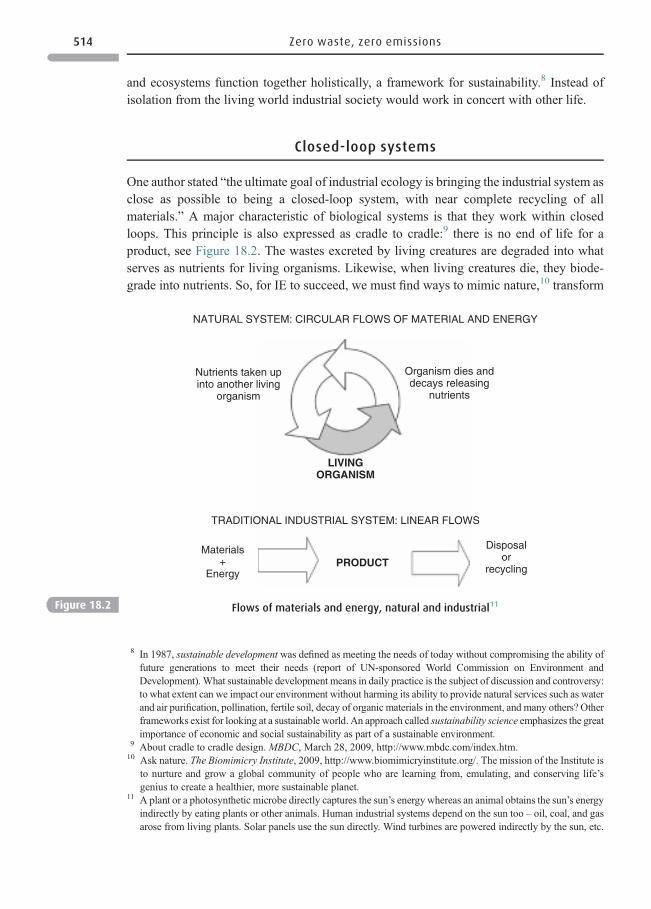
and ecosystems function together holistically, a framework for sustainability.8 Instead ofisolation from the living world industrial society would work in concert with other life.
Closed-loop systems
One author stated “the ultimate goal of industrial ecology is bringing the industrial system asclose as possible to being a closed-loop system, with near complete recycling of allmaterials.” A major characteristic of biological systems is that they work within closedloops. This principle is also expressed as cradle to cradle:9 there is no end of life for aproduct, see Figure 18.2. The wastes excreted by living creatures are degraded into whatserves as nutrients for living organisms. Likewise, when living creatures die, they biode-grade into nutrients. So, for IE to succeed, we must find ways to mimic nature,10 transform
NATURAL SYSTEM: CIRCULAR FLOWS OF MATERIAL AND ENERGY
Nutrients taken upinto another living
organism
Organism dies anddecays releasing
nutrients
LIVINGORGANISM
PRODUCT
TRADITIONAL INDUSTRIAL SYSTEM: LINEAR FLOWS
Materials+
Energy
Disposalor
recycling
Figure 18.2 Flows of materials and energy, natural and industrial11
8 In 1987, sustainable development was defined as meeting the needs of today without compromising the ability offuture generations to meet their needs (report of UN-sponsored World Commission on Environment andDevelopment). What sustainable development means in daily practice is the subject of discussion and controversy:to what extent can we impact our environment without harming its ability to provide natural services such as waterand air purification, pollination, fertile soil, decay of organic materials in the environment, and many others? Otherframeworks exist for looking at a sustainable world. An approach called sustainability science emphasizes the greatimportance of economic and social sustainability as part of a sustainable environment.
9 About cradle to cradle design. MBDC, March 28, 2009, http://www.mbdc.com/index.htm.10 Ask nature. The Biomimicry Institute, 2009, http://www.biomimicryinstitute.org/. The mission of the Institute is
to nurture and grow a global community of people who are learning from, emulating, and conserving life’sgenius to create a healthier, more sustainable planet.
11 A plant or a photosynthetic microbe directly captures the sun’s energy whereas an animal obtains the sun’s energyindirectly by eating plants or other animals. Human industrial systems depend on the sun too – oil, coal, and gasarose from living plants. Solar panels use the sun directly. Wind turbines are powered indirectly by the sun, etc.
514 Zero waste, zero emissions
society’s activities into closed loops. This future world would create useable by-products –nutrients – not wastes. You have already seen the example of Kalundborg (Figure 2.2) with itsextensive use of industrial symbiosis. Kalundborg has not reached the IE goal, but is pointingthe way. In closed-loop systems, by-products continuously recycle within closed loops.Biodegradable materials could be discarded in amounts and under circumstances where weknow they will degrade without harming the environment. There have been attempts to set upclosed-loop systems experimentally. See Box 18.1 and remember Biosphere 2 (Box 1.1).
Recycling is not enough
Recycling only slows the linear – as opposed to closed loop – flow of materials. Industrialsymbiosis (Chapter 2) is a great improvement, but needs to be applied widely and to all typesof industrial systems. As architect William McDonough stated, “We should recycle, but it isnot the first thing we should do, it is the last. Redesign first, then reduce, and finally recycle,if there is no other alternative.”
Is it possible to use resources ten times more efficiently?
To achieve closed-loop systems we must use resources with much greater efficiency: we mustuse less material and less energy. ▪ Some believe that to maintain today’s living standards weneed a factor ten13 improvement in efficiency, i.e., produce the same amount of goods andservices with 90% fewer resources. Others go further and think factor twenty. ▪Why would weneed such dramatic increases in efficiency? One major reason is that our already large humanpopulation continues to grow. At the same time, billions of the world’s people live in poverty,
Box 18.1 Space ecology
Manned space flights store their wastes and bring them back to Earth. This would be impractical for
long-term missions. In 1978, NASA began studying a self-sustained system for living in space, an
Advanced Life Support System.12 Long-term flights would need systems to produce food, purify
water, regenerate oxygen, and prevent air pollutants and wastes from building up – they need
closed-loop systems. Green plants would be grown as food. Plants would also absorb the carbon
dioxide that humans respire, while emitting the oxygen that humans need. Plant transpiration
would provide pure water. Plant and human wastes would be resources. “All systems would have
to operate under the restrictions of minimizing volume, mass, energy, and labor.” A computer
would integrate this complex system, which would need intensive testing on Earth. Knowledge
gained in developing this system would also have applications on an Earth that contains more
human beings,morewastes, and fewer virgin resources. ▪Both Biosphere 2 and theNASA programteach us more about how natural systems work. They help clarify howwemay adapt ourselves to
nature rather than continuing in a na�ve expectation that nature can boundlessly adapt to humans.
12 Braukus, M. and Matthews-Schmidt. L. Team begins test of Advanced Life Support System. NASA, January 31,2009, http://findarticles.com/p/articles/mi_pasa/is_/ai_3053565124.
13 The Product Life Institute, 1982–2008, http://www.product-life.org/en/about.
515 Industrial ecology
many in absolute poverty not knowing where their next meal is coming from: they need morefood andmaterial goods, thuswe need to increase economic activity to satisfy basic needs. But ifsociety increases economic activity using “business as usual” therewill not be enough resources.Nor, most likely, will the environment continue to efficiently provide natural services. Becausefactor ten seems a daunting goal factor four is seen as a more reachable challenge.
Designing to use less material
Computers became remarkably more useful when size was reduced. Even if, 50 years ago ithad been possible to use a computer as a word processor, that computer would have filled aroom. Remarkable advances in technologymade possible themicrocomputers of today, whichuse conspicuously less material. Changing computer technology was not motivated by theenvironment, but it shows us what can be accomplished. Today, we need to deliberately useDfE to find ways to use fewer material resources and less energy and water to make products.The emerging field of nanotechnology has a vision of making machines the size of molecules.But nanotechnology aside, there are already tools we can use to lessen material and energyuse.14 Is the computer a special case or could factor of four, or more be applied to many moreproducts? There are products, which cannot fulfill their purpose if built with much lessmaterial. What if, instead of discarding such products, we reuse them or their parts in acontinuous loop? In the process, we dematerialize, i.e., use fewer materials. ▪ Think about asofa.We could and should findways to lessen the amount of energy and water needed tomakethe sofa. But assuming we want a full-sized sofa, what do we do? We must design durabilityinto the sofa. Keep the sofa indefinitely, re-upholstering as necessary. All its components,upholstery, foam, wood, and metal would be reusable and recyclable. Design it for disassem-bly so that when parts need replacing or the sofa is finally “discarded,” its parts are not. Thesofa would “live” indefinitely. The social question remains: how do we change ourselves todesire durable products? For any product, design it so that minimal waste and pollution areproduced during all steps of its life cycle including disassembly and reuse.
SECTION III
Tools for dematerialization, moving towarda zero-waste society
Pollution prevention (P2)15 reduces waste and pollution, while conserving energy, water, andmaterials. But P2 seldom eliminates all waste. Before using P2 or design for the environment
14 Although computers and other electronics are very small compared to their antecedents, many people inindustrialized societies use many more electronics, and discard them frequently as they are replaced withnewer products with ever-increasing efficiency and attractive features. To deal with this, the EU and Japan arerequiring manufacturers to be responsible for their electronic products throughout their entire lives. Thisstimulates DfE. However, it does not address the perceived need of our industrial society to grow forever.
15 Pollution prevention. US EPA, January 14, 2009, http://www.epa.gov/p2/. This site has a number of useful linksto other sites relevant to P2.
516 Zero waste, zero emissions

(DfE) effectively, we need to know as much about the product as it now exists as possible.For that, a major tool is life-cycle assessment (LCA).16
Life-cycle assessment
LCA allows us to study the flows of materials, energy and water throughout the life of aproduct (or a process such as fossil fuel combustion) as it now exists. It examines theenvironmental impacts at each point in its life, see Table 18.1 Once flows and impacts areunderstood, then both P2 and DfE can more effectively come into play. LCA can be usefulfor examining a piece of paper, plastic bag, car, or a food item such as an apple. ▪ Look at thefour life-cycle stages (Figure 18.3). (1) The impacts of acquiring the raw materials for theproduct. (2) The impacts of manufacturing it. (3) The impacts of using (reusing) andmaintaining it. (4) The impacts of recycling or otherwise managing the product at the endof its useful life. For each of the four stages we analyze:
* Inputs (left of diagram) for raw material acquisition: How much material, energy, andwater are used?
* Outputs (right): What – for each of these inputs – are the outputs in terms of pollutants,wastes, and by-products?
LCA can be very complex17
Most products contain more than one component – each step of the LCA must be done oneach component. Often LCA is an ambitious, time-consuming, and expensive undertaking.
Table 18.1 Environmental impacts that may be evaluated during an LCA a
Type of impactb Example of pollutant, which can cause the effectGlobal warming Greenhouse gas such as carbon dioxideAcidification Acid substance such sulfuric acidEutrophication Nutrient such as nitratePhotochemical smog HydrocarbonsTerrestrial toxicity c PesticideHuman health Chemical such as arsenicOther types of effect ExplanationResource depletion Quantity of resource used compared to how much remainsLand use Quantity of waste disposed into a landfillDamage to biodiversity, etc.
aThe impacts noted are illustrative, not complete.bConsideration is also given to whether the impact is local, regional, or global (See Table 2.2).cToxicity to plants, animals of all types, and microbes.
16 Life cycle assessment.US EPA, October 17, 2008, http://www.epa.gov/nrmrl/lcaccess/. This site will link you tosites such as LCA 101.
17 Life Cycle Inventory. Environment Canada, February 2, 2001, http://www.mindfully.org/Plastic/Life-Cycle.htm.
517 Tools for dematerialization, moving toward a zero-waste society
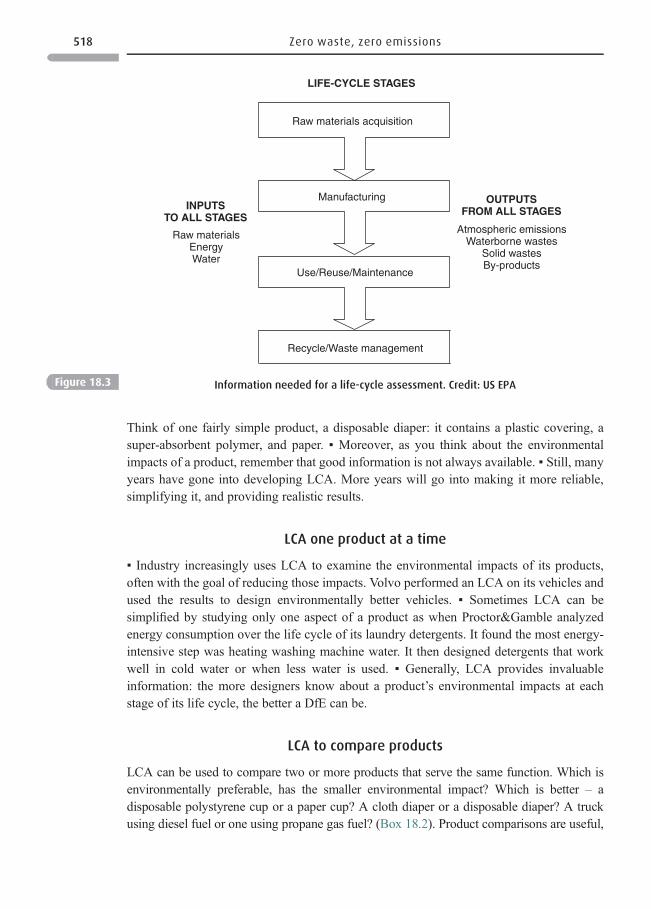
Think of one fairly simple product, a disposable diaper: it contains a plastic covering, asuper-absorbent polymer, and paper. ▪ Moreover, as you think about the environmentalimpacts of a product, remember that good information is not always available. ▪ Still, manyyears have gone into developing LCA. More years will go into making it more reliable,simplifying it, and providing realistic results.
LCA one product at a time
▪ Industry increasingly uses LCA to examine the environmental impacts of its products,often with the goal of reducing those impacts. Volvo performed an LCA on its vehicles andused the results to design environmentally better vehicles. ▪ Sometimes LCA can besimplified by studying only one aspect of a product as when Proctor&Gamble analyzedenergy consumption over the life cycle of its laundry detergents. It found the most energy-intensive step was heating washing machine water. It then designed detergents that workwell in cold water or when less water is used. ▪ Generally, LCA provides invaluableinformation: the more designers know about a product’s environmental impacts at eachstage of its life cycle, the better a DfE can be.
LCA to compare products
LCA can be used to compare two or more products that serve the same function. Which isenvironmentally preferable, has the smaller environmental impact? Which is better – adisposable polystyrene cup or a paper cup? A cloth diaper or a disposable diaper? A truckusing diesel fuel or one using propane gas fuel? (Box 18.2). Product comparisons are useful,
Raw materials acquisition
Manufacturing
Use/Reuse/Maintenance
Recycle/Waste management
INPUTSTO ALL STAGES
Raw materialsEnergyWater
OUTPUTSFROM ALL STAGES
Atmospheric emissionsWaterborne wastes
Solid wastesBy-products
LIFE-CYCLE STAGES
Figure 18.3 Information needed for a life-cycle assessment. Credit: US EPA
518 Zero waste, zero emissions
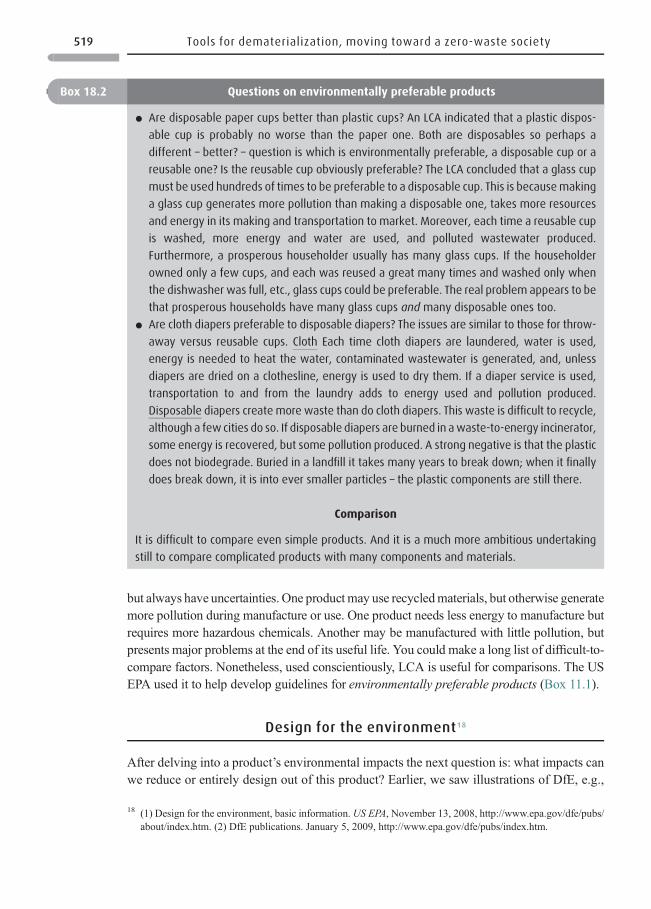
but always have uncertainties. One product may use recycledmaterials, but otherwise generatemore pollution during manufacture or use. One product needs less energy to manufacture butrequires more hazardous chemicals. Another may be manufactured with little pollution, butpresents major problems at the end of its useful life. You could make a long list of difficult-to-compare factors. Nonetheless, used conscientiously, LCA is useful for comparisons. The USEPA used it to help develop guidelines for environmentally preferable products (Box 11.1).
Design for the environment18
After delving into a product’s environmental impacts the next question is: what impacts canwe reduce or entirely design out of this product? Earlier, we saw illustrations of DfE, e.g.,
Box 18.2 Questions on environmentally preferable products
* Are disposable paper cups better than plastic cups? An LCA indicated that a plastic dispos-
able cup is probably no worse than the paper one. Both are disposables so perhaps a
different – better? – question is which is environmentally preferable, a disposable cup or a
reusable one? Is the reusable cup obviously preferable? The LCA concluded that a glass cup
must be used hundreds of times to be preferable to a disposable cup. This is becausemaking
a glass cup generates more pollution than making a disposable one, takes more resources
and energy in its making and transportation to market. Moreover, each time a reusable cup
is washed, more energy and water are used, and polluted wastewater produced.
Furthermore, a prosperous householder usually has many glass cups. If the householder
owned only a few cups, and each was reused a great many times and washed only when
the dishwasher was full, etc., glass cups could be preferable. The real problem appears to be
that prosperous households have many glass cups and many disposable ones too.
* Are cloth diapers preferable to disposable diapers? The issues are similar to those for throw-
away versus reusable cups. Cloth Each time cloth diapers are laundered, water is used,
energy is needed to heat the water, contaminated wastewater is generated, and, unless
diapers are dried on a clothesline, energy is used to dry them. If a diaper service is used,
transportation to and from the laundry adds to energy used and pollution produced.
Disposable diapers create more waste than do cloth diapers. This waste is difficult to recycle,
although a few cities do so. If disposable diapers are burned in awaste-to-energy incinerator,
some energy is recovered, but some pollution produced. A strong negative is that the plastic
does not biodegrade. Buried in a landfill it takes many years to break down; when it finally
does break down, it is into ever smaller particles – the plastic components are still there.
Comparison
It is difficult to compare even simple products. And it is a much more ambitious undertaking
still to compare complicated products with many components and materials.
18 (1) Design for the environment, basic information. US EPA, November 13, 2008, http://www.epa.gov/dfe/pubs/about/index.htm. (2) DfE publications. January 5, 2009, http://www.epa.gov/dfe/pubs/index.htm.
519 Tools for dematerialization, moving toward a zero-waste society
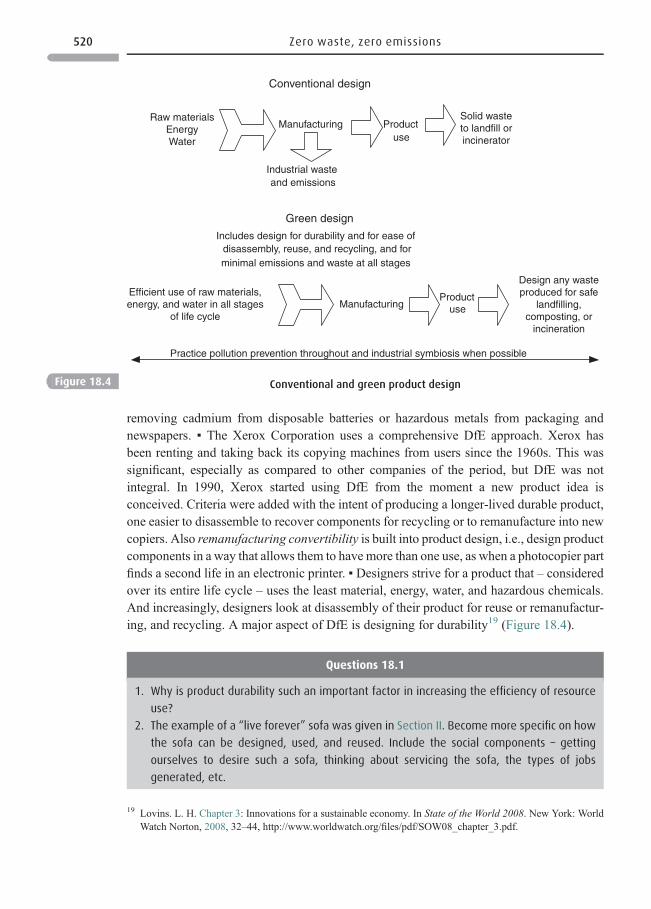
removing cadmium from disposable batteries or hazardous metals from packaging andnewspapers. ▪ The Xerox Corporation uses a comprehensive DfE approach. Xerox hasbeen renting and taking back its copying machines from users since the 1960s. This wassignificant, especially as compared to other companies of the period, but DfE was notintegral. In 1990, Xerox started using DfE from the moment a new product idea isconceived. Criteria were added with the intent of producing a longer-lived durable product,one easier to disassemble to recover components for recycling or to remanufacture into newcopiers. Also remanufacturing convertibility is built into product design, i.e., design productcomponents in a way that allows them to have more than one use, as when a photocopier partfinds a second life in an electronic printer. ▪ Designers strive for a product that – consideredover its entire life cycle – uses the least material, energy, water, and hazardous chemicals.And increasingly, designers look at disassembly of their product for reuse or remanufactur-ing, and recycling. A major aspect of DfE is designing for durability19 (Figure 18.4).
Conventional design
Raw materialsEnergyWater
Manufacturing
Industrial wasteand emissions
Productuse
Solid wasteto landfill orincinerator
Green design
ManufacturingEfficient use of raw materials,energy, and water in all stages
of life cycle
Productuse
Includes design for durability and for ease ofdisassembly, reuse, and recycling, and forminimal emissions and waste at all stages
Design any wasteproduced for safe
landfilling,composting, or
incineration
Practice pollution prevention throughout and industrial symbiosis when possible
Figure 18.4 Conventional and green product design
Questions 18.1
1. Why is product durability such an important factor in increasing the efficiency of resource
use?
2. The example of a “live forever” sofa was given in Section II. Become more specific on how
the sofa can be designed, used, and reused. Include the social components – getting
ourselves to desire such a sofa, thinking about servicing the sofa, the types of jobs
generated, etc.
19 Lovins. L. H. Chapter 3: Innovations for a sustainable economy. In State of the World 2008. New York: WorldWatch Norton, 2008, 32–44, http://www.worldwatch.org/files/pdf/SOW08_chapter_3.pdf.
520 Zero waste, zero emissions
Product stewardship20
Product stewardship means a producer takes responsibility for a product throughout itsentire life cycle. Stewardship can be freely chosen by a forward-looking company. Or, as inthe EU and Japan take-back laws (or extended producer responsibility, EPR) imposestewardship. EPR provides a major incentive for manufacturers to redesign their products.21
This is because it is expensive to handle a take-back product as waste. It can be profitable ormuch less expensive to take back a product that retains value – as when Xerox takes back itscopiers. ▪ Producers begin to ask: is the product durable enough to retain value after theconsumer gives it up? Can this car, this computer, or other product be disassembledefficiently? Can its component parts be recycled or remanufactured? Are component partsnon-toxic, and so easily dealt with at end of life?
European and Japanese take-back laws
In Chapter 11 you saw that for fairly simple products such as packaging EU producers beganto use less packaging when required to take back packaging.
* Japanese and EU manufacturers also take back electronics products – not just computersand TVs, but any product containing electronics including refrigerators, stereo equip-ment, even some toys. When a program begins, unless manufacturers are well fore-warned, take back is difficult because products already sold or on the market were notdesigned for disassembly, reuse, remanufacturing, or recycling. In fact, there may beaspects of the product that the producer is unaware of such as purity of potentiallyrecyclable materials, possible unknown hazardous constituents, or even the product’smaterial composition.
* Take-back laws for motor vehicles require EU manufacturers to reuse or recycle at least80% of the vehicle by weight; this increases to 85% by 2015.
3. Choose a simple product. Using a diagram as you proceed, design the product to have a
minimal environmental impact. Be prepared to discuss and justify your approach before
fellow students.
4. Renting rather than selling products impacts how Xerox manages its products. Why is its
approach likely to be more environmentally benign than if it sold its products?
5. Develop an example of servicizing (not one given in this text), either real or one you think
could work, see pp. 522–3. Explain how it works and how it would save resources (energy,
materials, water).
6. Do servicizing and EPR have the same purpose? Do a comparison.
20 Product stewardship. US EPA, September 25, 2008, http://www.epa.gov/epaoswer/non-hw/reduce/epr/.21 Thorpe, B. How producer responsibility for product take back can promote eco-design. Clean Production Action,
2008, www.amrc.guelph.org/proceedings/fall2008/Bev%20Thorpe.ppt.
521 Tools for dematerialization, moving toward a zero-waste society
European and Japanese electronics and automobile take-back laws have already stimulatedDfE even in the United States where Ford designed a car to meet requirements of Europe’sprogram. Take back in the United States, when present at all is voluntary, but some proactiveUS companies are working on pilot programs, e.g., IBM has an electronics recycling effort.
Product stewardship: barriers and drivers
* Barriers Producers often resist product stewardship. EPR means producers must developdetailed knowledge of their products and of their products’ life cycles, which can becostly and time consuming. Some virgin industries have been receiving governmentsubsidies, which they resist giving up. Remaking a take-back product to the samespecifications as the virgin-material product may be difficult or more costly.
* Drivers Purchasers who buy large volumes of products – federal, state, and localagencies, universities/colleges and other institutions – can drive product stewardship ifthey choose products designated environmentally preferable (Chapter 11). This providesan incentive for producers to make environmentally preferable products.
Servicizing22
Transforming a product into a service is servicizing. The consumer pays for the function of aproduct, its service, not a physical product. How does this promote dematerialization?
* Recall that Xerox Corporation has leased products for many years, thus stimulating itself todesign products that retain usefulness when reclaimed. Xerox has a Xero-Waste Initiative,and in 1998 had an 88% recycling rateworldwide. ▪ Interface Corp. leases some of its carpetsto business: it lays down the carpet as tiles. In heavily-used places, tiles wear out fairlyquickly. A representative comes, removes and replaces only those tiles, not thewhole carpet.
* Servicizing stimulates producers to make durable products because durability is related toprofitability. It’s an advantage to Interface Corp. that its products be durable. Also, such abusiness has an incentive to do more with less – less material, less energy, and less water.Servicizing stimulates LCA too because to redesign products producers need to know asmuch about their life cycles as possible. As one author noted, “information is the lubricantof the transition to a service economy.” Servicizing is a deliberately chosen form of EPR.
Servicizing chemicals23,24
As with other products, the value of chemicals lies in the functions they perform such ascleaning, coating, or lubricating.
22 Nassos, G. Servicizing: a business model for a sustainable environment. Sustainable Enterprise, May 12, 2008,http://www.sustainabiliity.com/blog/2008/05/servicizing-a-b.html.
23 Reiskin, E. D., Whie, A. L., Kauffman Johnson, J., and Votta, T. J. Servicizing the chemical supply chain.Journal of Industrial Ecology, 3, 2000, 18–31.
24 Stoughton, M. Servicizing: the quiet transition to extended product responsibility. The Tellus Institute, 2000,http://www.epa.gov/nrmrl/std/mtb/pdf/stoughton.pdf.
522 Zero waste, zero emissions
* If you sell paint by the gallon, you want to sell as many gallons as possible. But what if acar manufacturer hires you to paint its cars? What the manufacturer wants is not quantityof paint, but a quality paint job. This frees the paint seller to ask, how can I increase theefficiency of paint application and use as few gallons as possible? In one case, a Raytheonfacility analyzed its operations and found ways to increase its paint application efficiencyand, at the same time reduce paint waste by 71%.
* Navistar produces truck engines. Another company, Castrol Chemical sells coolants,cleaners, and additives to Navistar. Since 1987 the two companies working togetherreduced coolant use 50% and coolant waste 90%.
* Motorola has begun to have outside managers handle their chemical use with an emphasison efficiency of chemical use, i.e., using the least amount of chemicals while also using theleast hazardous chemicals that will do the job and handling them with maximum safety.
Value of these tools
Regulations are useful for mandating limits on pollutant emissions during production, reuse,recycling, and disposal. However, take back and servicizing go further. They lead to greaterefficiency in the use of materials and energy. When producers retain custody, they have anincentive to look at their products in a totally new way, from “cradle to cradle.”
SECTION IV
Detoxification
When thinking of chemicals, societymust consider thatmany are hazardous or have propertiesthat accentuate toxicity such as persistence or being bioaccumulative (PBT chemicals,Chapters 14 and 15). Detoxification involves reducing the use of toxic substances.
Green chemistry: designing chemicals for the environment25,26,27
Green chemistry is DfE applied to chemicals: it “aims to design hazards out of chemicalproducts and processes.” It is sometimes defined as “doing chemistry the way nature does
25 Wiion, S. L. Green chemistry is practical, profitable. Chemical & Engineering News, 75(31), August 4, 1997,35–43.
26 Hjeresen, D. L. Green chemistry: progress and challenges worldwide. Environmental Science & Technology, 35(5), March 1, 2001,114A-119A.
27 Green engineering. US EPA, September 13, 2007, http://www.epa.gov/oppt/greenengineering/. This websiteincludes excerpts from the textbook, Green Engineering: Environmentally Conscious Design of ChemicalProcesses. It also has the complete Green Engineering Educator’s modules in PowerPoint format. Other topics,such as available software tools and additional resources, are also highlighted.
523 Detoxification
chemistry.”28 The US EPA has a DfE program that emphasizes chemicals29 (Figure 18.5).30
Green chemistry has one or more of the following goals.
* Change the product: find or design a safer one that performs the same function as the morehazardous substance.
* Change the process: make a chemical using a more environmentally benign process. Aprocess is the series of steps or operations used in manufacturing a substance or product. ▪Careful changes in a process can also result in dematerialization, i.e., more efficientoperations that produce less waste.
* Other possible changes include those resulting in less hazardous waste, reduced energyuse, or improved competitiveness of chemical manufacturers.
Japan, Italy, the United Kingdom, China, Australia, and the United States are among thecountries pursuing both research and applications of green chemistry, working towardalternative chemicals and alternative ways to synthesize them. To promote innovativegreen chemical technologies, the US EPA makes yearly awards for outstanding achieve-ments, the Presidential Green Chemistry Challenge Awards for projects developed byindustry or by the academic world.31 The US state of California has started an activegreen chemistry program.32
Change the chemical product
The global market for the polymer, polyacrylate is about 2 billion pounds(0.9 billion kg) ayear. Polyacrylates are used in industry, agriculture, and consumer products. Polyacrylate isthe super-absorbent component of disposable diapers. Polyacrylates are inexpensive and
Figure 18.5 The US EPA’s design for the environment logo
28 Partnerships for safer chemistry. US EPA, January 12, 2009, http://www.epa.gov/dfe/.29 (1) DfE screens for safer chemical ingredients.US EPA, February 19, 2009, http://www.epa.gov/dfe/pubs/projects/
gfcp/index.htm. (2) Design for the environment, basic information.US EPA, November 13, 2008, http://www.epa.gov/dfe/pubs/about/index.htm.
30 What does the DfE label on a product mean? US EPA, November 13, 2008, http://www.epa.gov/dfe/pubs/projects/formulat/label.htm.
31 Green chemistry award winners. US EPA, August 26, 2008, http://www.epa.gov/gcc/pubs/pgcc/past.html.32 California officials launch green initiative; the plan would help gauge the safety of chemical products. ASH
Institute, December 22, 2008, http://www.enn.com/top_stories/article/38911.
524 Zero waste, zero emissions
easy to manufacture. Unfortunately, they “last virtually forever.” ▪ Some years ago, chemistsat Donlar and Bayer Corporations noticed that a natural biopolymer, polyaspartic acid ischemically similar to polyacrylate. Shellfish produce polyaspartic acid to mold their calciumcarbonate shells. It is biodegradable, and moreover, can be synthesized from a non-hazardous chemical, aspartic acid (an amino acid). Markets are potentially huge, butpolyaspartic acid is still more expensive than polyacrylate. However, polyaspartic acidhas found other uses in agriculture and in water treatment. ▪ Producers continue to seeksafer pesticides. One 2008 Green Chemistry award went to Dow for developing thepesticide, Spinetoram, which has low toxicity to non-target species and is effective at10–34 times lower levels than traditional insecticides, is less persistent, and has low toxicityto non-target species. Spinetoram is now in commercial use.33
Change the process used to produce or use the chemical
* US households spend about $1.5 billion a year on termite control. This typically involvessurrounding their homeswith a chemical barrier. The SENTRICON systemworks differently.Monitoring stations containing wood are set up around the home. When, during periodicinspection, termites are detected, bait containing hexaflumuron is loaded into the stations.This chemical prevents termites from making chitin, an essential part of their exoskeleton –
they cannot molt and they die. Hexaflumuron is not used until termite activity is detected, andthen only inside the stations. It is in commercial use, although some question its effectiveness.However, in 2008, China selected it as an alternative to traditional hazardous termite killers.34
* The risks of even an extremely hazardous chemical can be reduced: manufacture it only atthe rate it is used so it doesn’t accumulate. The very useful, but extremely hazardouschemical, chlorine dioxide provides an example. Processes were developed to make it onsite only as needed. And remember (Chapter 1) the extremely hazardous chemical, methylisocyanate (MIC) used to produce insecticides. It is a chemical that was involved in killingthousands in Bhopal, India. MIC is still used, but can now be made from much lesshazardous chemicals. Moreover, once produced it is immediately consumed in a closed-loop process, so that – unlike the situation at Bhopal – large volumes do not accumulate.
* Looking into the future, miniature chemical plants are envisioned as a means to reducerisk. Designers anticipate making chemicals at the sites they are needed using tinymicrochip-based chemical reactors – there would be no need for shipping or storinghazardous chemicals. Reactors could be installed wherever needed. If an accident orworker exposure did occur, it would be very small.
Reduce the waste associated with making chemicals
Synthesizing complex chemicals such as some pharmaceuticals can involve multiple stepprocesses. Each step generates some, sometimes much, waste. Thus, “The greenest course of
33 Designing greener chemicals, Dow Agrosciences, Spinetoram. US EPA, August 26, 2008, http://www.epa.gov/greenchemistry/pubs/pgcc/winners/dgca08.html.
34 China selects the SENTRICON system as environmentally responsible termite control alternative.Dow, July 25,2008, http://www.dow.com/greaterchina/en/news/20080807a.htm.
525 Detoxification
action is to minimize the number of reactions.” ▪ Zoloft is a well-known prescription drug.To synthesize sertaline, Zoloft’s active ingredient, previously took three steps. A newprocedure uses only one step. And, whereas it previously took 60 000 gallons (227 000liters) of solvent per ton to synthesize sertraline, it now takes 6000. The new processeliminated 485 tons (440 tonnes) of waste titanium dioxide-methylamine hydrochloridesalt, 165 tons (150 tonnes) of 35% hydrochloric acid, and 110 tons(100 tonnes) of 50%sodium hydroxide.
Major changes in how chemicals are made
Using green chemistry signals a major change in perspective of how chemicals are made.However, changes are made only on one or at most a few chemicals at a time. Now, greenchemists want to “introduce radical new technologies that will transform the nature ofchemical use and manufacture.” A futuristic approach to do this was mentioned above,developing miniature chemical plants. Other approaches are to use natural systems, theliving organisms, themselves, or the enzymes that they produce. Some chemical synthesesare already done using organisms or enzymes, but these are limited whereas chemistsenvision synthesizing many different chemicals and materials in these manners and to doso using waste biomass.
Using natural systems – microorganisms
You have seen how useful microorganisms can be in degrading the organic materials inwastewater, in landfills, and some hazardous wastes (Chapters 10, 11, and 12). However, thetalents of microbes can also be used to make specific chemicals. Microbial fermentation isalready used to make some pharmaceuticals and a few other chemicals. Fermentations withwhich you are probably familiar include those for making alcohol and vinegar. Comparemanufacturing chemicals from petroleum as compared to microbial fermentations(Table 18.2). ▪ Petroleum Producing chemicals from petroleum typically requires hightemperature and pressure, and also often requires hazardous metal catalysts and hazardouschemicals; hazardous waste is often produced. ▪ Microorganisms Microbial fermentationswork at low temperature, sometimes room temperature and low pressure. The catalysts usedby microbes are enzymes; the enzymes are, of course, synthesized by the microbes them-selves. Microbes do not need (cannot usually tolerate) hazardous metals or hazardouschemicals, and microbial waste is biodegradable.
A major obstacle to using microbes to make chemicals is that microbes ordinarily makethe chemicals they need for themselves, not what humans desire. Sometimes, incidentally aswhen a mold synthesizes certain antibiotics, they make enough to satisfy the humans thatculture it. However, in other cases we can manipulate microbes using special growingconditions or feedstocks to induce them to make larger amounts of chemicals we desire. ▪ Away we can program microbes to synthesize specific chemicals is bioengineering (geneticmodification). As noted in Chapter 16, this technique introduces new genes into a microbeso that it synthesizes the desired chemical. Example Billions of pounds of adipic acid are
526 Zero waste, zero emissions
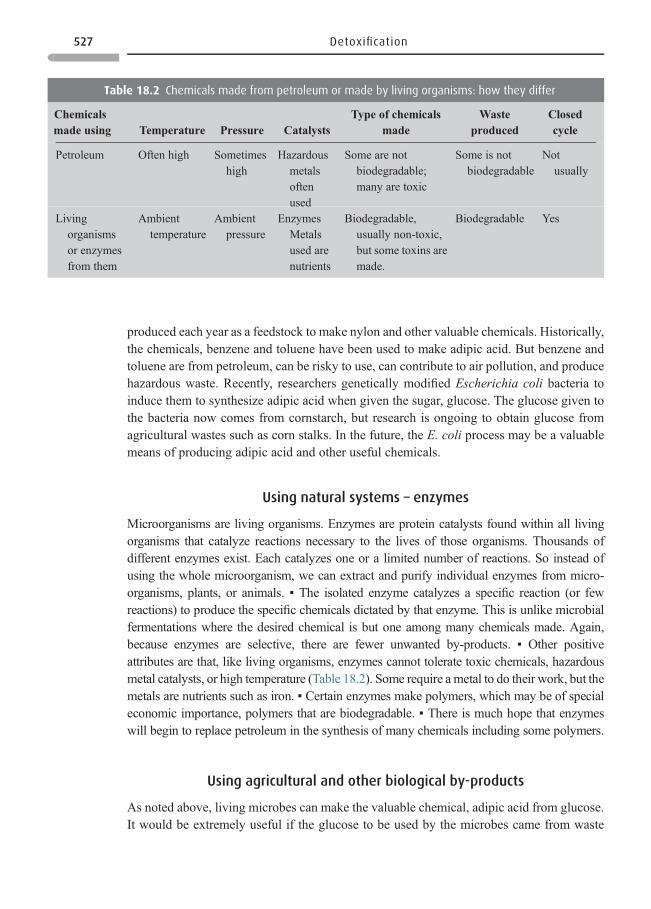
produced each year as a feedstock to make nylon and other valuable chemicals. Historically,the chemicals, benzene and toluene have been used to make adipic acid. But benzene andtoluene are from petroleum, can be risky to use, can contribute to air pollution, and producehazardous waste. Recently, researchers genetically modified Escherichia coli bacteria toinduce them to synthesize adipic acid when given the sugar, glucose. The glucose given tothe bacteria now comes from cornstarch, but research is ongoing to obtain glucose fromagricultural wastes such as corn stalks. In the future, the E. coli process may be a valuablemeans of producing adipic acid and other useful chemicals.
Using natural systems – enzymes
Microorganisms are living organisms. Enzymes are protein catalysts found within all livingorganisms that catalyze reactions necessary to the lives of those organisms. Thousands ofdifferent enzymes exist. Each catalyzes one or a limited number of reactions. So instead ofusing the whole microorganism, we can extract and purify individual enzymes from micro-organisms, plants, or animals. ▪ The isolated enzyme catalyzes a specific reaction (or fewreactions) to produce the specific chemicals dictated by that enzyme. This is unlike microbialfermentations where the desired chemical is but one among many chemicals made. Again,because enzymes are selective, there are fewer unwanted by-products. ▪ Other positiveattributes are that, like living organisms, enzymes cannot tolerate toxic chemicals, hazardousmetal catalysts, or high temperature (Table 18.2). Some require a metal to do their work, but themetals are nutrients such as iron. ▪ Certain enzymes make polymers, which may be of specialeconomic importance, polymers that are biodegradable. ▪ There is much hope that enzymeswill begin to replace petroleum in the synthesis of many chemicals including some polymers.
Using agricultural and other biological by-products
As noted above, living microbes can make the valuable chemical, adipic acid from glucose.It would be extremely useful if the glucose to be used by the microbes came from waste
Table 18.2 Chemicals made from petroleum or made by living organisms: how they differ
Chemicalsmade using Temperature Pressure Catalysts
Type of chemicalsmade
Wasteproduced
Closedcycle
Petroleum Often high Sometimeshigh
Hazardousmetalsoftenused
Some are notbiodegradable;many are toxic
Some is notbiodegradable
Notusually
Livingorganismsor enzymesfrom them
Ambienttemperature
Ambientpressure
EnzymesMetalsused arenutrients
Biodegradable,usually non-toxic,but some toxins aremade.
Biodegradable Yes
527 Detoxification
organic material (biomass), not from starch. There are many organic wastes: agriculturalwastes (corn stalks, rice straw, etc.) as well as waste paper, cheese whey, and industrialsludge from biological processes.35 One company, BioEnergy International has built a pilot-scale plant to produce ethanol and eventually specialty chemicals from organic wastes suchas wood and agricultural residues.36 ▪ Another attractive feature of waste materials is their“negative cost.” Instead of needing to pay to dispose of waste, it may be possible to obtainthe waste for the cost of transport.
Using biochemicals and biopolymers doesnot eliminate all problems
Both microbial fermentations and enzymes produce waste, often much waste such asgreat masses of microbes (as happens in wastewater treatment plants). As bio-wastes,these can be composted or used as fertilizer. However, whenever large quantities ofwastes are produced, transporting and otherwise dealing with them can be difficult. ▪ Animportant reason biomass is considered an attractive source of chemicals and polymers isbecause it is renewable. This concept is appealing. Corn is promoted as a source of ethanolto add to gasoline (as an oxygenated chemical to promote cleaner burning or just as afuel). Corn is also used as a source of glucose used to make biodegradable biopolymers.But the net environmental effect may not be positive: much energy is needed to grow corn,so are large amounts of fertilizer and pesticides, which run off into water along witheroded soil. Indeed, there are great concerns that when growing high-volume crops, ofwhich corn is a major example, soil is being mined rather than farmed sustainably. ▪ Otherquestions: should land be used for growing food not for growing biomass to makechemicals? Should it be left as much-needed wildlife habitat? ▪ Dow Chemical andCargill Inc. have built a facility that uses corn as a source of glucose to make thebiodegradable polymer, polylactide. The biodegradable polylactide can be used inclothing, carpet, diapers, packaging, and other products. In the future, producers hope touse agricultural waste from crops such as wheat, rice, and other crops as a glucose source.This is a more difficult proposition than using corn. Using waste may make the process moreattractive environmentally. However, impacts on soil from which the waste has beenremoved are not yet clear.
35 There is even hope that manure and sewage sludge could become chemical feedstock. Manure is already used togenerate methane (used as a fuel). A prison in Washington State (a US state) generates its own electricity usingmethane as a fuel. The methane is produced by allowing anaerobic microbes to ferment manure in a closeddigester. The manure comes from farm animals maintained on site. ▪ Some dairies in Oregon State (USA) alsoproduce methane from dairy manure. ▪ And some households in very poor countries generate enough methanefrom fermenting manure (produced by their cows) to use as fuel in their homes. But the use of manure or sewageenvisioned in this chapter is to use these materials as feedstocks useful in the synthesis of a variety of chemicals.
36 Pennsylvania announces major corn-ethanol plant, cellulosic-ethanol pilot plant. Green Car Congress, August17, 2006, http://www.greencarcongress.com/2006/08/pennsylvania_an.html.
528 Zero waste, zero emissions
Recycling carpet “forever”
Nylon is a plastic and very difficult to recycle. So when the DuPont Corporation developedan almost closed-loop recycling for nylon carpet, it marked a special success.37 The UnitedStates alone uses about 1.4 billion pounds (0.6 billion kg) of new nylon carpet each year.Discarded carpets go to landfills where they don’t biodegrade, enduring indefinitely. Unlikeplastic containers such as soda or milk bottles, nylon is not a thermoplastic, i.e., it cannot bemelted down and then remolded. ▪ To recycle nylon, it must first be depolymerized, brokendown into the subunit chemicals from which it was made, processes that do produce somewaste. Then the subunits must be purified to meet the same standards as chemicals madefrom virgin resources. Only then can carpet of quality equivalent to virgin ones be made. ▪Glues, backing, and other matter associated with old carpets are wastes to be dealt with too.And collecting carpets isn’t easy. Some recyclers obtain used carpets directly from localcommercial establishments that rip them out. Dupont and other companies have begunasking municipalities to do curbside carpet collections. They recycle 55 million pounds (25million kg) of carpet each year. This may seem like a great deal except that the United Statesalone landfills more than a billion pounds of nylon carpet each year, plus large quantities ofother carpets. ▪ Dupont and Evergreen recycle nylon carpets only, but there are many typesof carpets, wool and cotton plus other synthetic carpets. An association of European carpetmakers collects all kinds of carpets for recycling. In the past these were sorted by hand, butnow there is an automated sorting system.
SECTION V
Progress toward zero waste38
Hans van Ginkel, Vice-Secretary General of the UN and Rector of the United NationsUniversity states that “The ultimate goal of Zero Emissions is to create a new type of societythat seeks to achieve a social and industrial transformation whereby humankind mimics thesustainable cycles found in the world of nature.”39 Another quote, one from the GrassrootsRecycling Network is “Zero waste maximizes recycling, minimizes waste, reduces con-sumption and ensures that products are made to be reused, repaired or recycled back intonature or the marketplace.” 40 See Figure 18.6.
37 (1) Tullo, A. H. DuPont, Evergreen to recycle carpet forever. Chemical & Engineering News, 78(4), January 24,2000, 23–24, http://gertrude-old.case.edu/276/materials/C&ENews/CENnylonfiberrecycle_files/7804bus2.htm(2) Life cycle studies, nylon. World Watch Magazine, November/December, 21(6), 2008, inside cover, http://www.worldwatch.org/node/5906. Also see Block, B. 70 years of “miracle fiber.”WorldWatch, October 3, 2008.http://www.worldwatch.org/node/5899.
38 Case studies on the way to zero-waste worldwide, http://www.grrn.org/zerowaste/kit/briefing/case1.pdf.39 The idea of zero emissions. United Nations University, 2002, http://www.unu.edu/zef/about.html.40 Working toward a world without waste. Zero Waste International Alliance, http://www.zwia.org/index.html.
529 Progress toward zero waste
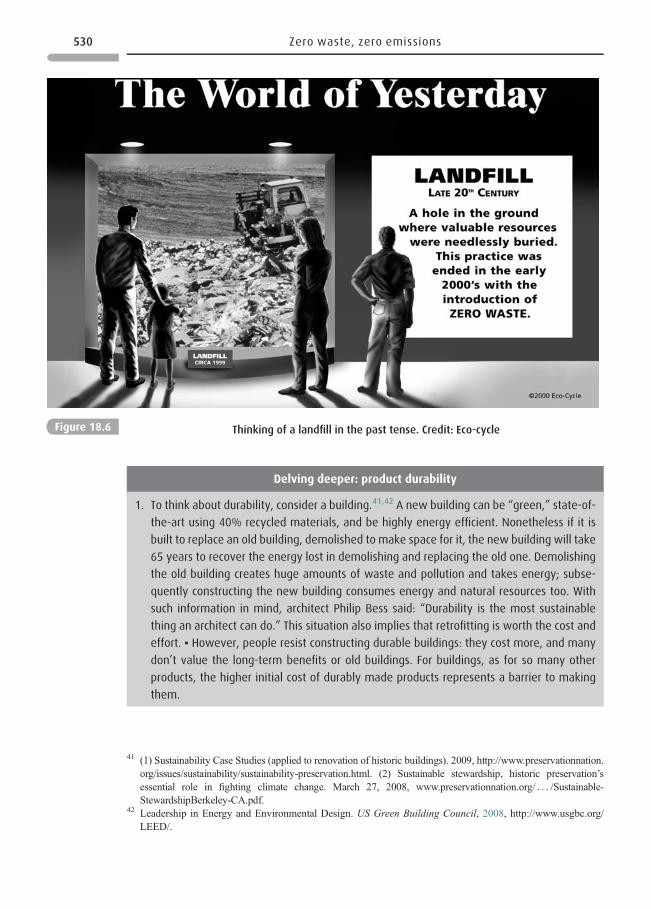
Figure 18.6 Thinking of a landfill in the past tense. Credit: Eco-cycle
Delving deeper: product durability
1. To think about durability, consider a building.41,42 A new building can be “green,” state-of-
the-art using 40% recycled materials, and be highly energy efficient. Nonetheless if it is
built to replace an old building, demolished to make space for it, the new building will take
65 years to recover the energy lost in demolishing and replacing the old one. Demolishing
the old building creates huge amounts of waste and pollution and takes energy; subse-
quently constructing the new building consumes energy and natural resources too. With
such information in mind, architect Philip Bess said: “Durability is the most sustainable
thing an architect can do.” This situation also implies that retrofitting is worth the cost and
effort. ▪ However, people resist constructing durable buildings: they cost more, and many
don’t value the long-term benefits or old buildings. For buildings, as for so many other
products, the higher initial cost of durably made products represents a barrier to making
them.
41 (1) Sustainability Case Studies (applied to renovation of historic buildings). 2009, http://www.preservationnation.org/issues/sustainability/sustainability-preservation.html. (2) Sustainable stewardship, historic preservation’sessential role in fighting climate change. March 27, 2008, www.preservationnation.org/ . . . /Sustainable-StewardshipBerkeley-CA.pdf.
42 Leadership in Energy and Environmental Design. US Green Building Council, 2008, http://www.usgbc.org/LEED/.
530 Zero waste, zero emissions
Corporations committing to zero waste and sustainability43
Some corporate facilities have greatly reduced their solid waste generation.44 See the Subaruexample in Box 18.4. Xerox’s xero-waste program has been noted too. Other examples areEpson, an Oregon computer-printer maker that recycles 90% of its materials and incineratesthe rest for energy. Other companies include Pillsbury (Minnesota), which diverts 96% of itswaste and is working toward 100%.
* Fetzer Vineyards in California cut its garbage generation 93% and is aiming for zero. Itdid so by composting large quantities of grape seeds and corks, committing to buyingrecycled products, and using recyclable packaging for all its products. Fetzer is also usinglighter glass bottles.45 It also developed enough solar capacity to power its buildings andfill and cap 1.2 million bottles of wine each year. Fetzer also converted its vineyards toorganic agriculture, which eliminated pesticide emissions.
* Being sustainable means more than zero-waste. A company must also rethink all stagesof the life cycle for each of its products. Interface, Inc. is a carpet company, vigorouslypursuing the goal of sustainability. To Interface this means “to take nothing from the Earththat is not renewable and do no harm to the biosphere.” One of Interface’s programs,Evergreen Lease was noted above.46 ▪ Other companies are also striving to varyingextents to pursue principles of sustainable development.
2. Now choose a product of interest to you, one that you think should be durable. Decide how
long a time period would represent durability for your product. Then plan whatever
combination of actions would be necessary to maintain your product for that period of
time, whether it be recycling, disassembling to recover reusable components, remanufac-
turing, or? Realistically, how long is “forever”? For example, what losses would occur when
your product was subjected to an action such as recycling? Under what circumstances could
such losses be close to zero or very low? Note social barriers to making the product durable.
Summarize your conclusions.
43 Dow Jones Sustainability Indexes. 2008, http://www.sustainability-index.com/07_htmle/sustainability/corpsustainability.html.
44 Orzech, D. At clean plants, it’s waste not.WIRED, August 10, 2005, http://www.wired.com/science/planetearth/news/2005/08/68448.
45 Fetzer vineyards convert to lighter glass bottles. GreenBiz, October 19, 2008, http://www.greenbiz.com/news/2008/10/19/fetzer-vineyards-converts-lightweight-glass-bottles.
46 Interface, Inc. 2008, http://www.interfaceglobal.com/Company/Mission-Vision.aspx. “We believe that there’ s acure for resourcewaste that is profitable, creative and practical.Wemust create a company that addresses the needs ofsociety and the environment by developing a system of industrial production that decreases our costs anddramatically reduces the burdens placed upon living systems. This also makes precious resources available forthe billions of people who needmore.Whatwe call the next industrial revolution is amomentous shift in howwe seethe world, how we operate within it, what systems will prevail and which will not . . . Our vision is to lead theway to the next industrial revolution by becoming the first sustainable corporation, and eventually a restorativeenterprise.”
531 Progress toward zero waste
Box 18.3 A government intervention to promote reuse of PVC
Dealing with the plastic, polyvinyl chloride (PVC), at the end of its useful life is a problem.47 If
landfilled, it does not degrade. If incinerated, hydrochloric acid and other pollutants are
produced. In Japan a PVC recycling systemwas set up. Construction waste is carefully collected
and sorted. PVC waste is recycled into new PVC pipes and window frames. Recycled PVC costs
more than virgin PVC. To overcome this cost difference, the Japanese government subsidizes
PVC recycling, obtaining the funding to do so by imposing a tax on construction sites. The result
is a market price for recycled PVC window frames similar to virgin PVC. To further boost sales,
the government encourages the construction industry to choose recycled window frames. This
action has led to a transition from using virgin PVC to recycled PVC.
Box 18.4 Environmentally benign manufacturing (EBM)48
EBM addresses the question of “how to achieve economic growth while protecting the
environment.” A panel examining EBM asked the question, “Is ‘environmentally benign
manufacturing’ an oxymoron?” The EBM panel (sponsored by the US National Science
Foundation and the US Department of Energy in the late 1990s) examined manufacturing
sectors making plastics, electronics, automobiles, and metal products in the United States, EU,
and Japan. EBM, sometimes called smart or lean production focuses on technologies that can
ameliorate manufacturing’s environmental impact. (Also see green engineering.49) The panel,
chaired by Dr. Timothy Gutowski of the Massachusetts Institute of Technology visited EU,
United States, and Japanese sites producing metal products, polymers, automobiles, and
electronics. Their report discussed environmental problems of each sector starting with raw
materials extraction to manufacturing, product use, and recycling. It identified technologies
that would be needed if EBM were to become a reality. EBM also leads to advantages such as
efficient production, flexibility from regulatory agencies, and a more positive corporate image.
Progressive companies see striving for absolutely minimal waste as the thing to do. The EBM
panel found one Toyota assembly plant in Japan producing only 40 lb (18 kg) of landfill waste
per vehicle produced. Today (2009) a zero-waste philosophy has spread beyond Japan. A
Subaru factory in Indiana diverts 99.8% of its waste from the landfill, doing so by separating,
reusing, or recycling various materials. Also, it strives to use fewer resources to begin with
47 Environmental issues of PVC. Commission of the European Communities, July 26, 2000, http://www.pvcinformation.org/assets/pdf/EU_PVC_wasteReport.pdf.
48 Gutowski, T., Murphy, C., Allen, D. et al. Environmentally benign manufacturing: observations from Japan,Europe and the US. Journal of Cleaner Production, 13, 2005, 1–17, http://web.mit.edu/ebm/www/Publications/EBM in Japan, Europe and US.pdf.
49 (1) What is green engineering? US EPA, September 13, 2007, http://www.epa.gov/oppt/greenengineering/pubs/whats_ge.html (This site has an excellent figure, “Proliferation of environmental laws and regulations.”) (2)Anastas, P. T. and Zimmerman, J. B. Design through the 12 principles of green engineering. EnvironmentalScience & Technology, 37(5), March 1, 2003, 94A-191A. (3) Green engineering for a sustainable environment.US EPA, September 13, 2007, http://www.epa.gov/oppt/greenengineering/.
532 Zero waste, zero emissions
Cities and countries committing to zero waste
Cities52
* Canberra, Australia (population 340 000) has adopted zero waste as a goal. To demon-strate its commitment, Canberra is working to eliminate its landfills and replace themwithResource Recovery Estates, each with a processing plant to separate and reprocess usefulmaterials. Some products are recycled; other companies on the site use “wastes” asresources to make other products (see Figure 2.2).53
* Seattle, Washington (population 600 000) had been discouraged because, despite persis-tent effort, its recycling rate remained under 40%. In 1998, Seattle decided to change itsphilosophy and go zero waste,54 “managing resources instead of waste, conservingnatural resources through waste prevention and recycling, turning ‘trash’ into jobs and
leaving less waste.50 Illustrations: the Subaru factory stamps out its car roofs and bodies from a
sheet of metal of a size calculated with such precision that very little metal remains behind to
be recycled. When defects occur in plastic bumpers, these are ground into pellets used tomake
new bumpers. Personnel found that some protective shrink wraps used for shipping could be
eliminated. Styrofoam inserts that protect engine parts during shipping are reused until they
no longer can be and, thereafter, the styrofoam is recycled. Many other often small changes
have been made to reduce waste. Indeed, factory personnel find themselves thinking about
and discussing other means to reduce waste; they have had a change in mindset.
The EBM panel compared Japan, Europe, and the United States in terms of how geographic
constraints, cultures, and governments affected EBM strategies. Japan has a strong culture of
avoiding waste and saving resources; it practices kaizen, continuous improvement which has
as one tenet – muda – reducing waste. The EU, like Japan also pays close attention to how it
uses increasingly scarce green space, and there is a strong relationship between industry and
government. In the EU, issues such as recycling are ingrained in its citizens, and take-back
product stewardship has become important. ▪ An encouraging finding was that manufacturers,
especially international firms showed “a clear trend towards ‘internalization’ of environmental
concerns.”51 Moreover, the companies that successfully pursued EBM were also able to
integrate “technology, economic motivation, regulatory actions and business practices.” The
EBM panel came away convinced that many companies really do understand that their long-
term success is based on a sustainable business policy and environmental sustainability.
50 Woodyard, C. It’s waste not, want not at super green Subaru plant.USATODAY, February 19, 2008, http://www.usatoday.com/money/industries/environment/2008-02-18-green-factories_N.htm.
51 World Business Council for Sustainable Development, 1997–2009, http://www.wbcsd.org/templates/TemplateWBCSD5/layout.asp?MenuID=1
52 (1) Local governments for sustainability. ICLEI, 1995–2008, http://www.iclei.org/index.php?id=643. (2)Around the world, http://www.grrn.org/zerowaste/zw_world.html.
53 Canberra Australia zero-waste initiative. Canberra, 2005, http://www.green-alliance.org.uk/uploadedFiles/Our_Work/Canberra.pdf.
54 Zero-waste goal in city’s solid waste plan. Zero Waste, http://www.grrn.org/zerowaste/articles/seattle_1998.html.
533 Progress toward zero waste
products, promoting durable products and materials, and discouraging products that canonly become trash after use.”
* Several other US cities have created resource recovery parks wherein a city creates acentral location for recycling, composting, and reuse facilities. New manufacturing andretailing facilities co-locate to use incoming materials. ▪ Many communities compostleaves and yard waste, but still leave much compostable materials in their municipal solidwaste (MSW) stream. About 15% of US MSW is food. Perhaps twice that much isun-recyclable paper such as contaminated fast food wrappers. Such organic material canbe composted. ▪ There are many other ways to reduce MSW; see Section II of Chapter 11.
Countries embracing or actively moving toward zero waste
* New Zealand55 is committed to zero waste. Its government issued a challenge to itscitizens in 1999: move from waste management to waste elimination by 2020. Its visionapplies three core principles: (1) End cheap waste disposal, which it believes has helpedcreate a “hugely inefficient industrial system that externalizes costs to the environmentand future generations.” (2) Design waste out of the system by incorporating waste-reduction technologies at all points along the supply chain, DfE. Anyone designing aproduct will first think about the need for it, and then ensure that no waste is created in itsproduction, use, and final return to the human economy or nature. (3) “Engage . . . everyperson at a national and community level in our quest for Zero Waste. . . . unleash thecreativity and energy of communities, businesses and institutions in its pursuit.”
* Japan is making great strides in reducing waste and energy use. In Box 18.4, note Japan’sstrong work with EBM. And, recall that Japan is, along with the EU, at the forefront oftake-back programs. ▪ More generally, Japan is committed to “the 3Rs – reuse, recycle,and reduce.” With little space for land fills (Figure 11.10) Japan incinerates 80% of itswaste. One city, Yokohama,56 gives residents a 27-page booklet with detailed instructionson how to sort 518 items of garbage into 10 categories. This exacting effort is seen as nomore expensive than incineration. Japan also does “urban mining,” extracting preciousmetals from waste electronics and other metal-containing products.57 But recall(Chapter 12) that great quantities of waste electronics are dumped in less-developedcountries for “recycling.” Japan works to prevent such illegal trade. Moreover, it assistsless-developed countries to develop the capacity to properly treat waste electronics andother recyclables. It also requires the recycling of all cell phones. ▪ Energy: a New YorkTimes article noted that “Japan’s single-minded dedication to reducing energy use is acommitment that dates back to the oil shocks of the 1970s that shook this resource-poor
55 Zero waste. New Zealand Trust, 2008, http://www.yha.co.nz/Sustainability/WhatWeDo/ZeroWaste/. See alsoTarget zero, Canada, http://www.grrn.org/zerowaste/articles/tzc.html.
56 Onishi, N. How do Japanese dump trash? Let us count the myriad ways. New York Times, May 12, 2005, http://www.nytimes.com/2005/05/12/international/asia/12garbage.html
57 Newcomb, A. Japan as ground zero for no-waste lifestyle. Christian Science Monitor, December 16, 2008,http://www.csmonitor.com/2008/1216/p01s04-woap.html. A Dowa Eco-System Recycling Co. official statedthat a ton (0.9 tonnes) of earth may yield 5 g of gold when mined, while causing significant environmentaldamage. However, a ton of cell phones contains 1.1 pounds (400 g) gold as well as 0.9 pounds (500 g) silver and0.1 ounce (4 g) palladium.
534 Zero waste, zero emissions
nation.”58 Japan is “bymanymeasures the world’s most energy-frugal developed nation.”In 2005, Japan consumed half as much energy per dollar’s worth of economic activity asthe EU or the United States, and one-eighth as much as China and India. Even whenenergy was cheap it continued to invest in energy research and development. Lowerenergy use means, of course lower carbon dioxide emissions and lower emissions of othersignificant air pollutants (Chapter 5). ▪ However, Japan does not have a sustainableenvironment. The fact that this nation, which is making a major effort, still has far togo indicates how greatly other nations need to be following Japan’s path
The Environmental Performance Index60
Early in this chapter you noted the reductions in air and water emissions made in the UnitedStates. More generally, how well are humans caring for their environments? There is a lack
Delving deeper
1. Go to the web and further investigate Kalundborg, how the industrial symbiosis system got
started, why it is useful to them, what is working well, what problems have arisen, and
what else needs to be done. Prepare an oral or written report. Also address why the United
States finds setting up such systems to be more difficult than do European countries.
2. Durability is a key need for the products that we produce, but howdowe let go of the “need,”
the desire for something new, with new being perceived as better? Develop your own ideas
individually while several others do the same. Then, discuss the issue as a group. Come up
with a report that next year’s class can use as a starting point for their own deliberations.
3. Reduced consumption could damage the economy. How could this be mitigated or even
avoided? Start with examining material from the International Society for Ecological
Economics: http://www.ecoeco.org/. Write a report or make a presentation.
4. An individual commitment to zero waste: to further develop your environmental conscious-
ness and what meaningful actions you could take, carry out the following exercise: choose
an internet site (one given here59 or one of special interest to you). Spend time pondering
the information provided. Then – as if you really intended to follow your own plan – design a
project to reduce waste and pollution, one that you could start by yourself, with friends or
your community. What will you accomplish and how will you accomplish it?
58 Fackler, M. Japan sees a chance to promote its energy-frugal ways. New York Times, July 4, 2008, http://www.nytimes.com/2008/07/04/world/asia/04japan.html.
59 Possible Internet sites include the following. (1) Wastes, what you can do (in your home, community, office andat the store). US EPA, October 8, 2008, http://www.epa.gov/epawaste/wycd/index.htm. (2) Fisk, U. A con-sumption manifesto: the top ten principles of good consumption. WorldWatch, http://www.worldwatch.org/node/1470. (3) The Consumer’ s Handbook for Reducing Solid Waste. US EPA, September 12, 2008, http://www.epa.gov/epawaste/wycd/catbook/index.htm. (4) In the quest for sustainable stuff, http://susdev.agecon.vt.edu/worksheets/Green%20Technologies%20Worksheets.pdf.
60 (1) Environmental Performance Index. Yale and Columbia Universities, 2008, http://epi.yale.edu/Home. (2)Guterl, F. and Sheridan, B. Green Countries, a global report card on nations doing the most, and least, to clean upthe environment. Newsweek, July 7–14, 2008, http://www.newsweek.com/id/143678/output/print. (3) Also see:Raven, P. H. Sustainability, and the Human Prospect. Science, 297(5583), August 9, 2002, 954–958, http://www.sciencemag.org/cgi/content/full/297/5583/954.
535 The Environmental Performance Index
of good data to answer this question, and some nations do not speak truthfully about theirenvironment. So it’s often difficult to precisely rate the performance of various govern-ments, let alone to discuss sustainability and zero waste/zero emissions. ▪ Despite theseconstraints, Yale and Columbia University researchers using the best information they couldfind, analyzed and ranked the world’s countries using an Environmental Performance Index(EPI). The highest score is 100.
▪ Not surprisingly, Japan has a high EPI. So do many EU countries, especially Germanyand France. Among factors contributing to Germany’s rating is good regulation of pesti-cides, of water use and quality, good management of natural resources, good recycling, andinvestment in alternative energy. The United States does not rank as highly among nations inits income class (including the EU and Japan) primarily due to high greenhouse gasemissions, much of which result from coal burning. Other rich countries that didn’t dowell on the EPI were Belgium and, surprisingly, the Netherlands.
The EPI study had some revealing results. ▪ Recall from earlier chapters the description ofChina’s pollution and environmental degradation. China claims that it cannot afford superiorenvironmental performance.However, China’s EPI rankingwas the lowest among the 15 nationsin its income group even behind Vietnam. ▪ It is true that poor countries generally have poorratings. Take India where hundreds of millions of people lack proper sanitation, clean drinkingwater, or reliable energy, and where often severe air pollution affects both human health and theenvironment. ▪ However, good governance, even in poor countries can enhance environmentalperformance. In sub-Saharan Africa many countries have poor EPI scores. But one sub-Saharancountry, Tanzania, ranks ahead of even the wealthy United Arab Emirates. It also ranks highestamong those nations (the poorest 10% of nations) in its income group. One reason for this is thatTanzania has a stable government, one which works to care for its environment.
Further reading
Anastas, P. T. and Zimmerman, J. B. Design through the 12 Principles of Green Engineering.Environmental Science & Technology, 37(5), March 1, 2003, 94A–191A.
Gutowski, T., Murphy, C., Allen, D., Bauer, D., Bras, B., Piwonka, T., Sheng, P.,Sutherland, J., Thurston, D., and Wolff, E. Environmentally benign manufacturing:observations from Japan, Europe and the US. Journal of Cleaner Production, 13, 2005,1–17, http://web.mit.edu/ebm/www/Publications/EBM in Japan, Europe and US.pdf.
Hjeresen, D. L. Green chemistry: progress and challenges worldwide. EnvironmentalScience & Technology, 35(5), March 1, 2001, 114A–119A.
Raven, P. H. Sustainability, and the Human Prospect. Science, 297(5583), August 9, 2002,954–958, http://www.sciencemag.org/cgi/content/full/297/5583/954.
Reiskin, E. D., Whie, A. L., Kauffman Johnson, J., and Votta, T. J. Servicizing the chemicalsupply chain. Journal of Industrial Ecology, 3, 2000, 19–31.
536 Zero waste, zero emissions
Internet resources
Biomimicry Institute. 2009. Ask nature. (emulating life’s genius to create a more sustainableplanet). http://www.biomimicryinstitute.org/.
Braukus,M. andMatthews-Schmidt.L. 2009.Teambegins test ofAdvancedLifeSupport System.NASA. http://findarticles.com/p/articles/mi_pasa/is_/ai_3053565124 (January 31, 2009).
Dow Jones. 2006. Sustainability Indexes. http://www.sustainability-index.com/07_htmle/sustainability/corpsustainability.html.
Grass Roots Recycling Network. 2009. Case studies on the way to zero-waste worldwide.New Zealand. http://www.grrn.org/zerowaste/kit/briefing/case1.pdf.
2009. Target zero, Canada. http://www.grrn.org/zerowaste/articles/tzc.html.2009. Zero-waste goal in Seattle’s solid waste plan, adopted 1998. http://www.grrn.org/
zerowaste/articles/seattle_1998.html.Guterl, F. and Sheridan, B. 2008. Green Countries, A global report card on nations doing the
most, and least, to clean up the environment. Newsweek. http://www.newsweek.com/id/143678/output/print (July 7–14, 2008).
ICLEI. 1995–2008. Local governments for sustainability. http://www.iclei.org/index.php?id=643.
Interface, Inc. 2008. “Our vision is to lead the way to the next industrial revolution bybecoming the first sustainable corporation, and eventually a restorative enterprise.”http://www.interfaceglobal.com/Company/Mission-Vision.aspc.
Lovins. L. H. 2008. Innovations for a sustainable economy, Chapter 3, 32–44 in State of theWorld. New York: W. W. Norton. MBDC. 2009. About cradle to cradle design. http://www.mbdc.com/index.htm (June 30, 2009).
McKeown, R. 2002. Education for Sustainable Development Toolkit (version 2).Universityof Tennessee. www.esdtoolkit.org (July, 2002).
Nassos, G. 2008. Servicizing: a business model for a sustainable environment. Sustainable Enter-prise. http://www.sustainabiliity.com/blog/2008/05/servicizing-a-b.html (May 12, 2008).
Newcomb, A. 2008. Japan as ground zero for no-waste lifestyle. Christian ScienceMonitor. http://www.csmonitor.com/2008/1216/p01s04-woap.html (December 16, 2008).
New Zealand Trust. 2008. What is zero waste? Product Life Institute. 1982–2008. http://www.product-life.org/en/about.
1982–2008. Five pillars: nature conservation; limiting toxicity; maximizing resourceproductivity; and social ecology. http://www.product-life.org/en/node.
Stoughton, M. 2000. Servicizing: the quiet transition to extended product responsibility. TheTellus Institute. http://www.epa.gov/nrmrl/std/mtb/pdf/stoughton.pdf.
Thorpe, B. No date. How producer responsibility for product take back can promote eco-design. Clean Production Action. www.amrc.guelph.org/proceedings/fall2008/Bev%20Thorpe.ppt.
UNEP. 2003. Sustainable Development Online: access to significant sustainable develop-ment web sites. http://sd-online.ewindows.eu.org/.http://www.worldwatch.org/files/pdf/SOW08_chapter_3.pdf.
537 Internet resources
US EPA. 2007. Green engineering for a sustainable environment (with excerpts from“Green Engineering: Environmentally Conscious Design of Chemical Processes”and Green Engineering Educator’s modules in PowerPoint format). http://www.epa.gov/oppt/greenengineering/ (September 13, 2007).
2007. What is green engineering (excellent figure, “Proliferation of environmental lawsand regulations.” http://www.epa.gov/oppt/greenengineering/pubs/whats_ge.html(September 13, 2007).
2008. Design for the environment, basic information. http://www.epa.gov/dfe/pubs/about/index.htm (November 13, 2008).
2008. Green chemistry award winners. http://www.epa.gov/gcc/pubs/pgcc/past.html(August 26, 2008).
2008. Industrial ecology/eco-efficiency and cleaner production. http://www.epa.gov/ncei/international/ecology.htm (March 4, 2008).
2008. Life-cycle assessment with link to sites LCA 101. http://www.epa.gov/nrmrl/lcaccess/ (October 17, 2008).
2008. Product stewardship. http://www.epa.gov/epaoswer/non-hw/reduce/epr/ (September25, 2008).
2009. DfE publications. http://www.epa.gov/dfe/pubs/index.htm (June 26, 2009).2009. Partnerships for safer chemistry. http://www.epa.gov/dfe/ (January 12, 2009).2009. Pollution prevention (useful links). http://www.epa.gov/p2/ (January 14, 2009).2009. The Consumer’s Handbook for Reducing Solid Waste. http://www.epa.gov/epawaste/wycd/catbook/index.htm (February 25, 2009).
2009. Wastes, what you can do (home, community, office and stores). http://www.epa.gov/epawaste/wycd/index.htm (February 25, 2009).
2009. What does the DfE label on a product mean? http://www.epa.gov/dfe/pubs/projects/formulat/label.htm (June 26, 2009).
US Green Building Council. 2008. Leadership in Energy and Environmental Design. http://www.usgbc.org/LEED/.
United Nations University. 2002. The idea of zero emissions. http://www.unu.edu/zef/about.html.
Virginia Tech. 2009. In the quest for sustainable stuff: redesign it. http://susdev.agecon.vt.edu/worksheets/Green%20Technologies%20Worksheets.pdf.
World Business Council for Sustainable Development. 1997–2009. http://www.wbcsd.org/templates/TemplateWBCSD5/layout.asp?MenuID=1. http://www.yha.co.nz/Sustainability/WhatWeDo/ZeroWaste/.
Woodyard, C. 2008. It’s waste not, want not at super green Subaru plant. USA Today. http://www.usatoday.com/money/industries/environment/2008 – 02 – 18-green-factories_N.htm (February 19, 2008).
Worldwatch Institute. 2008. Good stuff: a behind-the-scenes guide to the things we buy.http://www.worldwatch.org/taxonomy/term/44.
Yale and Columbia Universities. 2008. Environmental Performance (environmental healthand ecosystem vitality) Index. http://epi.yale.edu/Home.
Zero Waste International Alliance. 2009. Working toward a world without waste. http://www.zwia.org/index.html.
538 Zero waste, zero emissions
19 Chemistry: some basic concepts
This chapter assumes that the student has had little or no chemistry. First, recognize thatchemicals are not something “out there.” The whole Earth is composed of chemicals. So isyour body. You breathe in chemicals with each breath, you eat chemicals – all food iscomposed of chemicals – and you excrete chemicals. So chemicals are not just syntheticchemicals, i.e., not just chemical pollutants. Rather, everything you touch, taste, or smell ischemical in nature.
After introducing necessary concepts, the chapter selects several pollution issues fromearlier chapters in this text and explains them from a simple chemical perspective. Section Iintroduces the atom and its subatomic particles, as well as isotopes; and then goes on tochemical bonds and valence. Section II overviews organic and inorganic chemicals, andthen moves on to free radicals and their capability to sometimes help solve pollutionproblems but, in other cases worsening them. Section III looks at oxidation reactions fromthe perspective of burning fossil fuels. Avogadro’s constant and the mole are also intro-duced. Finally, Section IV uses simple chemistry to overview two major acid pollutionproblems: acid deposition and ocean acidification.
SECTION I
Atoms1,2
An element is the fundamental form of matter. Each element is composed of atoms, whichcannot be further subdivided. There are 92 natural elements. Among them are familiarnames such as iron, gold, sodium, calcium, and carbon. ▪ The atom of every elementcontains a nucleus and a shell of electrons. Within the nucleus are found protons andneutrons. ▪ A proton3 is a subatomic particle found in the nucleus of the atom; it has anelectric charge of +1 and an atomic mass (weight) of 1. The number of protons in the nucleusis specific to a particular element and the number of electrons is equal to the number ofprotons. Because the number of protons and electrons is equal, the atom has no net charge.
1 Farabee, M. J. Atoms a nd molecules, 20 07, ht tp: //www.e mc .m ar ic op a. ed u/ faculty/farabee/ BIOBK/Bio BookCHEM1.html.
2 Barbalace, R. B. Anatomy of the atom. Environmentalchemistry.com, 1995–2009, http://environmentalchemistry.com/yogi/periodic/atom_anatomy.html#AtomicMass.
3 Proton. Wikipedia, February 22, 2009, http://en.wikipedia.org/wiki/Proton.
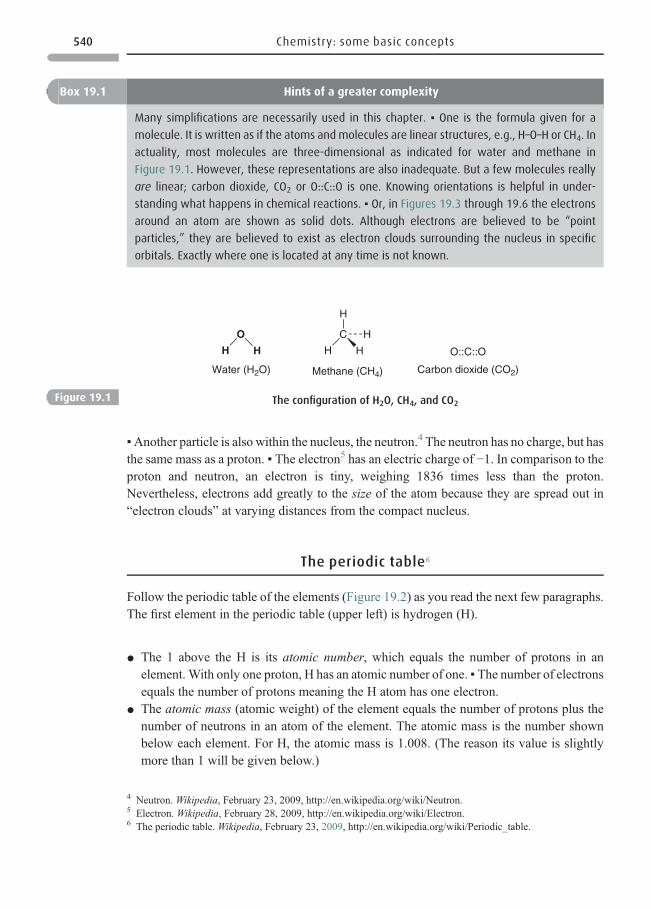
▪Another particle is also within the nucleus, the neutron.4 The neutron has no charge, but hasthe same mass as a proton. ▪ The electron5 has an electric charge of −1. In comparison to theproton and neutron, an electron is tiny, weighing 1836 times less than the proton.Nevertheless, electrons add greatly to the size of the atom because they are spread out in“electron clouds” at varying distances from the compact nucleus.
The periodic table6
Follow the periodic table of the elements (Figure 19.2) as you read the next few paragraphs.The first element in the periodic table (upper left) is hydrogen (H).
* The 1 above the H is its atomic number, which equals the number of protons in anelement. With only one proton, H has an atomic number of one. ▪ The number of electronsequals the number of protons meaning the H atom has one electron.
* The atomic mass (atomic weight) of the element equals the number of protons plus thenumber of neutrons in an atom of the element. The atomic mass is the number shownbelow each element. For H, the atomic mass is 1.008. (The reason its value is slightlymore than 1 will be given below.)
Box 19.1 Hints of a greater complexity
Many simplifications are necessarily used in this chapter. ▪ One is the formula given for a
molecule. It is written as if the atoms andmolecules are linear structures, e.g., H–O–H or CH4. In
actuality, most molecules are three-dimensional as indicated for water and methane in
Figure 19.1. However, these representations are also inadequate. But a few molecules really
are linear; carbon dioxide, CO2 or O::C::O is one. Knowing orientations is helpful in under-
standing what happens in chemical reactions. ▪ Or, in Figures 19.3 through 19.6 the electrons
around an atom are shown as solid dots. Although electrons are believed to be “point
particles,” they are believed to exist as electron clouds surrounding the nucleus in specific
orbitals. Exactly where one is located at any time is not known.
C
HH
H
H
O
HH
Water (H2O) Methane (CH4) Carbon dioxide (CO2)
O::C::O
Figure 19.1 The configuration of H2O, CH4, and CO2
4 Neutron. Wikipedia, February 23, 2009, http://en.wikipedia.org/wiki/Neutron.5 Electron. Wikipedia, February 28, 2009, http://en.wikipedia.org/wiki/Electron.6 The periodic table. Wikipedia, February 23, 2009, http://en.wikipedia.org/wiki/Periodic_table.
540 Chemistry: some basic concepts

118
12
HH
e1.
007
942
1314
1516
174.
002
602
34
56
78
910
LiB
eB
CN
OF
Ne
6.94
19.
012
182
10.8
1112
.010
714
.006
715
.999
418
.998
403
220
.179
7
1112
1314
1516
1718
Na
Mg
Al
Si
PS
Cl
Ar
22.9
89 7
7024
.305
34
56
78
910
1112
26.9
81 5
3828
.085
530
.973
761
32.0
6535
.453
39.9
48
1920
2122
2324
2526
2728
2930
3132
3334
3536
KC
aS
cT
iV
Cr
Mn
Fe
Co
Ni
Cu
Zn
Ga
Ge
As
Se
Br
Kr
39.0
983
40.0
7844
.955
910
47.8
6750
.941
551
.996
154
.938
049
55.8
4558
.933
200
58.6
934
63.5
4665
.409
69.7
2372
.64
74.9
2178
.96
79.9
0483
.798
3738
3940
4142
4344
4546
4748
4950
5152
5354
Rb
Sr
YZ
rN
bM
oT
cR
uR
hP
dA
gC
dIn
Sn
Sb
TeI
Xe
85.4
678
87.6
288
.905
85
91.2
2492
.906
38
95.9
497
.907
210
1.07
102.
905
5010
6.42
107.
8682
112.
411
114.
818
118.
710
121.
760
127.
6012
6.90
4 47
131.
293
5556
57–7
172
7374
7576
7778
7980
8182
8384
8586
Cs
Ba
lant
hano
ids
Hf
TaW
Re
Os
IrP
tA
uH
gT
lP
bB
iP
oA
tR
n13
2.90
5 45
137.
327
178.
4918
0.94
7918
3.84
186.
207
190.
2319
2.21
719
5.07
819
6.96
6 55
200.
5920
4.38
3320
7.2
208.
890
38(2
08.9
824)
(209
.987
1)(2
22.0
176)
8788
89–1
0310
410
510
610
710
810
911
011
1Fr
Ra
actin
oids
Rf
Db
Sg
Bh
Hs
Mt
Ds
Rg
(223
.019
7)(2
26.0
254)
(261
.108
8)(2
62.1
141)
(266
.121
9)(2
64.1
2)(2
77)
(268
.138
8)(2
71)
(272
)
5758
5960
6162
6364
6566
6768
6970
71La
Ce
Pr
Nd
Pm
Sm
Eu
Gd
Tb
Dy
Ho
Er
Tm
Yb
Lu13
8.90
5514
0.11
614
0.90
7 65
144.
24(1
44.9
127)
150.
3615
1.96
415
7.25
158.
925
3416
2.50
016
4.93
0 32
167.
259
168.
934
2117
3.04
174.
967
8990
9192
9394
9596
9798
9910
010
110
210
3A
c T
h P
a U
N
p P
u A
m
Cm
B
k C
f E
s F
m
Md
No
Lr(2
27.0
277)
232
.038
1 23
1.03
5 88
238.
028
91(2
37.0
482)
(24
4.06
42)
(243
.061
4) (
247.
0704
) (2
47.0
703)
(2
51.0
796)
(25
2.08
30)
(257
.095
1) (
258.
0984
) (2
59.1
010)
(26
2.10
97)
Figure 19.2
The periodic table 50
of the elements. Credit: International Union of Pure and Applied Chemistry, Nove
mber 1, 2004
Notice that H, atomic mass of 1.008, is the lightest of any element in the periodic table. Forany given row, the atomic mass of elements increases as you move from column 1 to column18 of the table. Likewise, within any given column the atomic mass increases as youmove down the column. As an illustration, find the row beginning with Cs (cesium), atomicmass 133. Move along this row until you reach Hg (mercury) with its atomic mass of 200and then Pb (lead) with a mass of 207. An atom of mercury weighs nearly 200 times morethan hydrogen, and lead nearly 207 times more. And notice the atomic numbers for mercuryand lead. Mercury has 80 electrons and lead has 82. Within each column of the table, theelements have characteristics that they share in common. For example, the elements incolumn 1 (except for hydrogen) are the alkali metal elements, those in column 17 are thehalogens, and those in column 18 the inert (or noble) gases.
Neutrons
Look at Li (lithium), the element below H in the periodic table. Its atomic number is3 meaning it has three protons, so its unit weight is 3. However, its atomic mass is 6.941.The reason is that each nucleus contains neutrons as well as protons,7 with each neutronweighing as much as a proton. So, the atomic mass equals the number of protons plus thenumber of neutrons. At this point, you might guess that, with a mass of 6.94, there are fourneutrons in Li. But if this is the case, why isn’t the atomic mass 7?
Isotopes
▪ The reason that the atomic masses shown below each element are not whole numbers isbecause the number of neutrons can vary within any given element – an element hasisotopes. An isotope has the same atomic number but a different mass. ▪ Go back to Hwith its atomic mass of 1.079. From this number you may guess that even this smallest ofelements has isotopes. Hydrogen-1 (1H) – atomic mass 1– is by far the most abundantisotope and has no neutron. ▪But there is also a hydrogen-2 (2H) called deuterium; much lessabundant than 1H it does have a neutron (so one neutron plus one proton yields an atomicmass of two). Hydrogen-3 (3H) called tritium is the third isotope of H; with two neutrons, itsatomic mass is three. Tritium is very rare in nature. The atomic mass of hydrogen is 1.079because it averages the mass of all three isotopes and the relative abundance of each. ▪Goingback to Li: its atomic mass, 6.941, averages the mass of five isotopes, and the relativeabundance of each. Except for properties related to mass, the properties of isotopes are thesame.
The existence of isotopes is often very useful to environmental chemists. ▪ One of anumber of instances is in the analysis of ice-core bubbles. Remember (Chapter 7) the abilityto calculate the temperature of years long past by examining the relative abundance ofoxygen-16 to that of the isotope, oxygen-18, in air bubbles trapped in ice cores. Oxygen-18 is
7 1H is an exception among the elements in that it has no neutrons. However 2H has one neutron and 3H has two.
542 Chemistry: some basic concepts
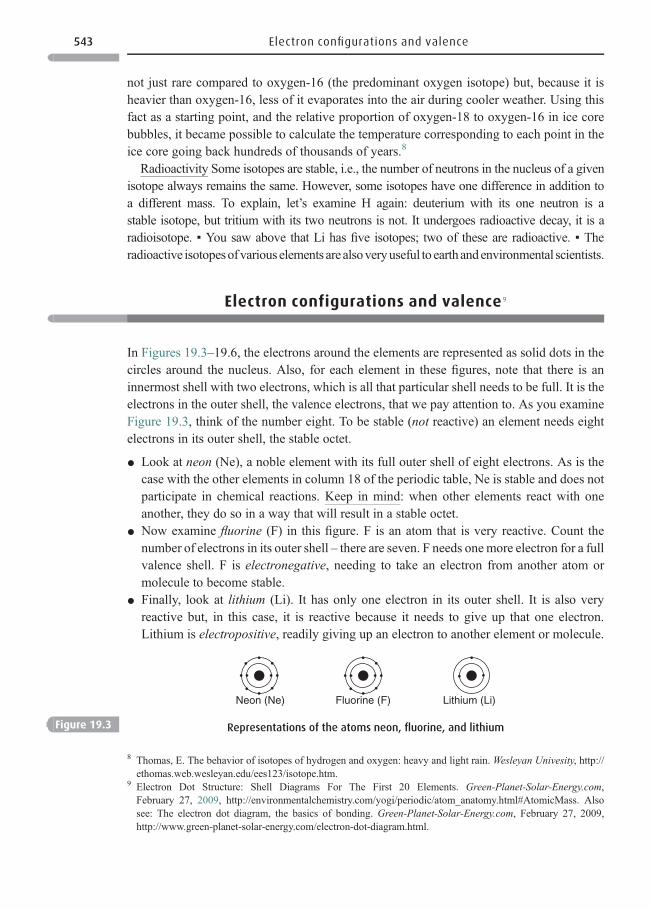
not just rare compared to oxygen-16 (the predominant oxygen isotope) but, because it isheavier than oxygen-16, less of it evaporates into the air during cooler weather. Using thisfact as a starting point, and the relative proportion of oxygen-18 to oxygen-16 in ice corebubbles, it became possible to calculate the temperature corresponding to each point in theice core going back hundreds of thousands of years.8
Radioactivity Some isotopes are stable, i.e., the number of neutrons in the nucleus of a givenisotope always remains the same. However, some isotopes have one difference in addition toa different mass. To explain, let’s examine H again: deuterium with its one neutron is astable isotope, but tritium with its two neutrons is not. It undergoes radioactive decay, it is aradioisotope. ▪ You saw above that Li has five isotopes; two of these are radioactive. ▪ Theradioactive isotopesofvariouselements are alsoveryuseful toearthandenvironmental scientists.
Electron configurations and valence9
In Figures 19.3–19.6, the electrons around the elements are represented as solid dots in thecircles around the nucleus. Also, for each element in these figures, note that there is aninnermost shell with two electrons, which is all that particular shell needs to be full. It is theelectrons in the outer shell, the valence electrons, that we pay attention to. As you examineFigure 19.3, think of the number eight. To be stable (not reactive) an element needs eightelectrons in its outer shell, the stable octet.
* Look at neon (Ne), a noble element with its full outer shell of eight electrons. As is thecase with the other elements in column 18 of the periodic table, Ne is stable and does notparticipate in chemical reactions. Keep in mind: when other elements react with oneanother, they do so in a way that will result in a stable octet.
* Now examine fluorine (F) in this figure. F is an atom that is very reactive. Count thenumber of electrons in its outer shell – there are seven. F needs one more electron for a fullvalence shell. F is electronegative, needing to take an electron from another atom ormolecule to become stable.
* Finally, look at lithium (Li). It has only one electron in its outer shell. It is also veryreactive but, in this case, it is reactive because it needs to give up that one electron.Lithium is electropositive, readily giving up an electron to another element or molecule.
Neon (Ne) Fluorine (F) Lithium (Li)
Figure 19.3 Representations of the atoms neon, fluorine, and lithium
8 Thomas, E. The behavior of isotopes of hydrogen and oxygen: heavy and light rain. Wesleyan Univesity, http://ethomas.web.wesleyan.edu/ees123/isotope.htm.
9 Electron Dot Structure: Shell Diagrams For The First 20 Elements. Green-Planet-Solar-Energy.com,February 27, 2009, http://environmentalchemistry.com/yogi/periodic/atom_anatomy.html#AtomicMass. Alsosee: The electron dot diagram, the basics of bonding. Green-Planet-Solar-Energy.com, February 27, 2009,http://www.green-planet-solar-energy.com/electron-dot-diagram.html.
543 Electron configurations and valence
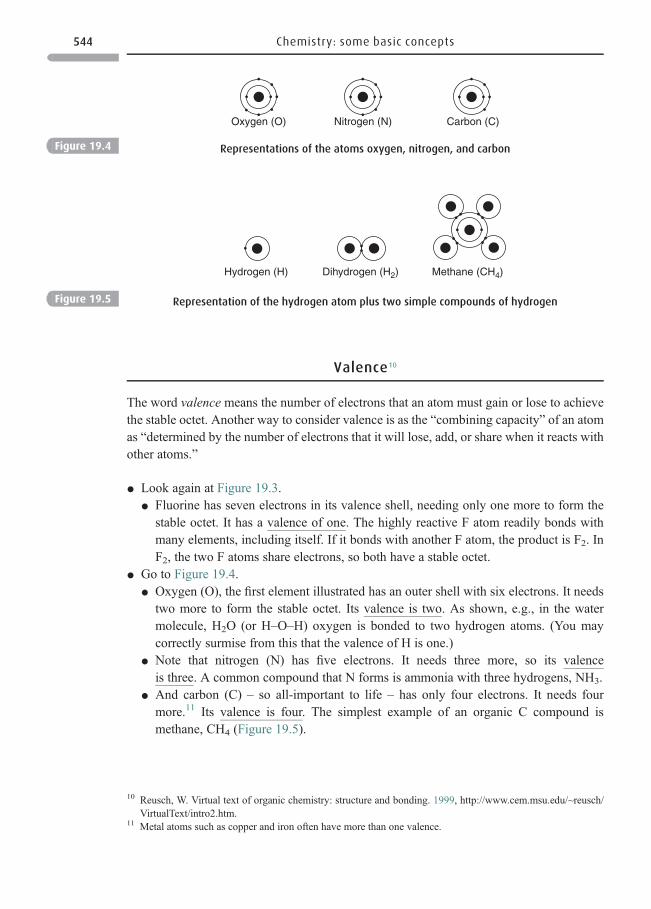
Valence10
The word valence means the number of electrons that an atom must gain or lose to achievethe stable octet. Another way to consider valence is as the “combining capacity” of an atomas “determined by the number of electrons that it will lose, add, or share when it reacts withother atoms.”
* Look again at Figure 19.3.* Fluorine has seven electrons in its valence shell, needing only one more to form the
stable octet. It has a valence of one. The highly reactive F atom readily bonds withmany elements, including itself. If it bonds with another F atom, the product is F2. InF2, the two F atoms share electrons, so both have a stable octet.
* Go to Figure 19.4.* Oxygen (O), the first element illustrated has an outer shell with six electrons. It needs
two more to form the stable octet. Its valence is two. As shown, e.g., in the watermolecule, H2O (or H–O–H) oxygen is bonded to two hydrogen atoms. (You maycorrectly surmise from this that the valence of H is one.)
* Note that nitrogen (N) has five electrons. It needs three more, so its valenceis three. A common compound that N forms is ammonia with three hydrogens, NH3.
* And carbon (C) – so all-important to life – has only four electrons. It needs fourmore.11 Its valence is four. The simplest example of an organic C compound ismethane, CH4 (Figure 19.5).
Oxygen (O) Nitrogen (N) Carbon (C)
Figure 19.4 Representations of the atoms oxygen, nitrogen, and carbon
Hydrogen (H) Dihydrogen (H2) Methane (CH4)
Figure 19.5 Representation of the hydrogen atom plus two simple compounds of hydrogen
10 Reusch, W. Virtual text of organic chemistry: structure and bonding. 1999, http://www.cem.msu.edu/~reusch/VirtualText/intro2.htm.
11 Metal atoms such as copper and iron often have more than one valence.
544 Chemistry: some basic concepts
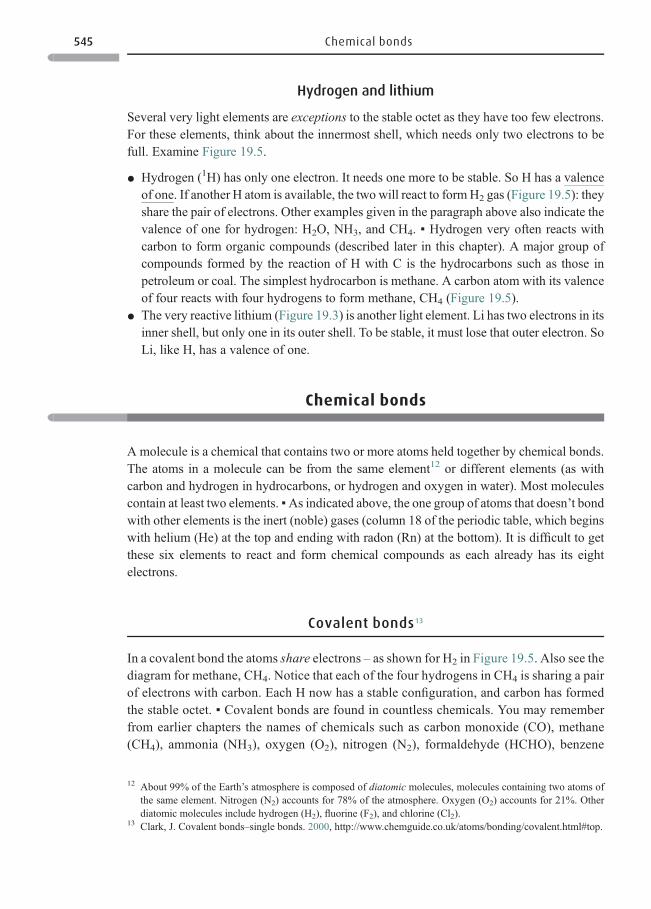
Hydrogen and lithium
Several very light elements are exceptions to the stable octet as they have too few electrons.For these elements, think about the innermost shell, which needs only two electrons to befull. Examine Figure 19.5.
* Hydrogen (1H) has only one electron. It needs one more to be stable. So H has a valenceof one. If another H atom is available, the two will react to formH2 gas (Figure 19.5): theyshare the pair of electrons. Other examples given in the paragraph above also indicate thevalence of one for hydrogen: H2O, NH3, and CH4. ▪ Hydrogen very often reacts withcarbon to form organic compounds (described later in this chapter). A major group ofcompounds formed by the reaction of H with C is the hydrocarbons such as those inpetroleum or coal. The simplest hydrocarbon is methane. A carbon atom with its valenceof four reacts with four hydrogens to form methane, CH4 (Figure 19.5).
* The very reactive lithium (Figure 19.3) is another light element. Li has two electrons in itsinner shell, but only one in its outer shell. To be stable, it must lose that outer electron. SoLi, like H, has a valence of one.
Chemical bonds
A molecule is a chemical that contains two or more atoms held together by chemical bonds.The atoms in a molecule can be from the same element12 or different elements (as withcarbon and hydrogen in hydrocarbons, or hydrogen and oxygen in water). Most moleculescontain at least two elements. ▪As indicated above, the one group of atoms that doesn’t bondwith other elements is the inert (noble) gases (column 18 of the periodic table, which beginswith helium (He) at the top and ending with radon (Rn) at the bottom). It is difficult to getthese six elements to react and form chemical compounds as each already has its eightelectrons.
Covalent bonds13
In a covalent bond the atoms share electrons – as shown for H2 in Figure 19.5. Also see thediagram for methane, CH4. Notice that each of the four hydrogens in CH4 is sharing a pairof electrons with carbon. Each H now has a stable configuration, and carbon has formedthe stable octet. ▪ Covalent bonds are found in countless chemicals. You may rememberfrom earlier chapters the names of chemicals such as carbon monoxide (CO), methane(CH4), ammonia (NH3), oxygen (O2), nitrogen (N2), formaldehyde (HCHO), benzene
12 About 99% of the Earth’s atmosphere is composed of diatomic molecules, molecules containing two atoms ofthe same element. Nitrogen (N2) accounts for 78% of the atmosphere. Oxygen (O2) accounts for 21%. Otherdiatomic molecules include hydrogen (H2), fluorine (F2), and chlorine (Cl2).
13 Clark, J. Covalent bonds–single bonds. 2000, http://www.chemguide.co.uk/atoms/bonding/covalent.html#top.
545 Chemical bonds
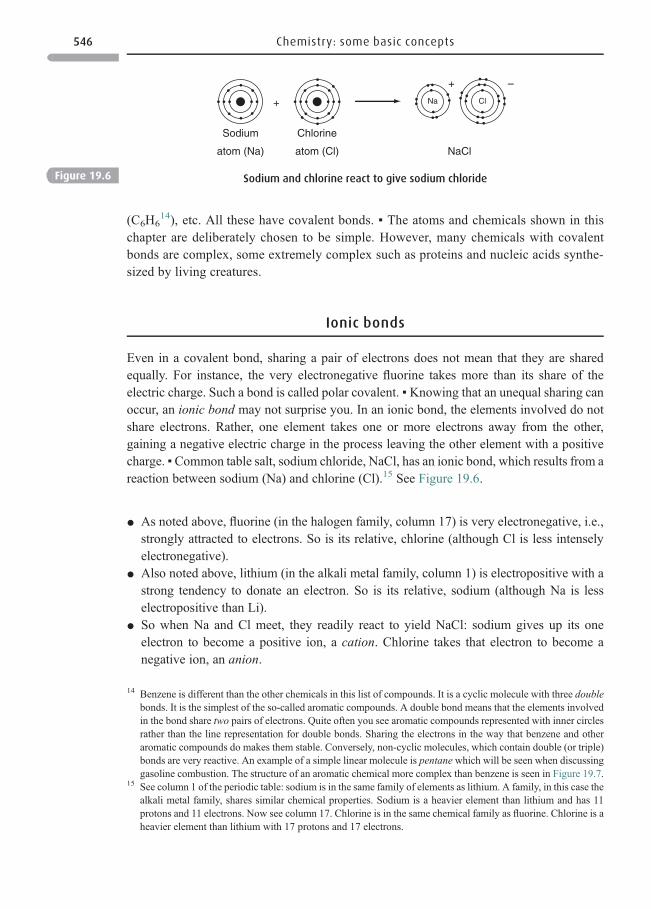
(C6H614), etc. All these have covalent bonds. ▪ The atoms and chemicals shown in this
chapter are deliberately chosen to be simple. However, many chemicals with covalentbonds are complex, some extremely complex such as proteins and nucleic acids synthe-sized by living creatures.
Ionic bonds
Even in a covalent bond, sharing a pair of electrons does not mean that they are sharedequally. For instance, the very electronegative fluorine takes more than its share of theelectric charge. Such a bond is called polar covalent. ▪Knowing that an unequal sharing canoccur, an ionic bond may not surprise you. In an ionic bond, the elements involved do notshare electrons. Rather, one element takes one or more electrons away from the other,gaining a negative electric charge in the process leaving the other element with a positivecharge. ▪Common table salt, sodium chloride, NaCl, has an ionic bond, which results from areaction between sodium (Na) and chlorine (Cl).15 See Figure 19.6.
* As noted above, fluorine (in the halogen family, column 17) is very electronegative, i.e.,strongly attracted to electrons. So is its relative, chlorine (although Cl is less intenselyelectronegative).
* Also noted above, lithium (in the alkali metal family, column 1) is electropositive with astrong tendency to donate an electron. So is its relative, sodium (although Na is lesselectropositive than Li).
* So when Na and Cl meet, they readily react to yield NaCl: sodium gives up its oneelectron to become a positive ion, a cation. Chlorine takes that electron to become anegative ion, an anion.
Sodium
atom (Na) atom (Cl) NaCl
Chlorine
+
+
Na Cl
–
Figure 19.6 Sodium and chlorine react to give sodium chloride
14 Benzene is different than the other chemicals in this list of compounds. It is a cyclic molecule with three doublebonds. It is the simplest of the so-called aromatic compounds. A double bond means that the elements involvedin the bond share two pairs of electrons. Quite often you see aromatic compounds represented with inner circlesrather than the line representation for double bonds. Sharing the electrons in the way that benzene and otheraromatic compounds do makes them stable. Conversely, non-cyclic molecules, which contain double (or triple)bonds are very reactive. An example of a simple linear molecule is pentane which will be seen when discussinggasoline combustion. The structure of an aromatic chemical more complex than benzene is seen in Figure 19.7.
15 See column 1 of the periodic table: sodium is in the same family of elements as lithium. A family, in this case thealkali metal family, shares similar chemical properties. Sodium is a heavier element than lithium and has 11protons and 11 electrons. Now see column 17. Chlorine is in the same chemical family as fluorine. Chlorine is aheavier element than lithium with 17 protons and 17 electrons.
546 Chemistry: some basic concepts
* The fact that one element takes and another gives up electrons doesn’t mean that ionicspecies are not bonded. There are strong electrostatic forces. ▪ Note something else aboutionic bonds: Na+ is smaller thanNa, the parent atombecause it has given up an electron. Thechlorine atom is about the same size as it has only added one more electron to its outer shell.
Ionic compounds share several characteristics. ▪An ionic compound is formed by a reactionbetween a metal and a nonmetal; here the reaction was between an alkali metal Na or Li anda halogen, Cl or F. ▪ Ionic compounds are solids. ▪ However, like NaCl, ionic compoundsgenerally dissolve freely in water. ▪ Once dissolved ionic compounds easily conduct anelectric current. With that information, you may guess that certain ionic compounds areuseful in making batteries. Although they were not identified as ionic, ionic compoundshave been mentioned earlier, e.g., the metal salts that predominate in incinerator ash(Chapter 11). An important point to remember about ionic compounds is that they are notmolecules in the same sense that covalently bonded compounds are.
Molecules with both covalent and ionic bonds
From the above discussion of covalent and ionic bonds, you may conclude that the atoms in amolecule can form only covalent bonds or only ionic bonds. However, many chemicals haveboth covalent and ionic bonds. As just one of a great many examples, look at Figure 14.3,which shows the structure of sodiumperfluorooctanoate. Note that sodium’s bond to oxygen isionic with sodium having a positive charge and oxygen a negative. However, also note that allthe other bonds in the molecule are covalent. It is worthwhile to note that carbon forms onlycovalent bonds. However, when carbon is bonded to, for example, oxygen as in Figure 14.3,the oxygen can participate in an ionic bond. ▪Commonmolecules with which you are familiarthat have both covalent and ionic bonds are detergents. A detergent has a water-loving (ionic)bond at one end whereas the body of the molecule is hydrophobic and has only covalentbonds. The ionic interaction of Na+ and -O− keeps the detergent soluble in water whereas thehydrophobic body of the molecule is attracted to organic molecules. Thus the hydrophobicportion of the molecule interacts with organic materials such as the grease in dirty clothes.When the clothes are subsequently rinsed the grease rinses out with the detergent. ▪ Anothermolecule with which you are familiar is acetic acid, CH3COOH, in vinegar. CH3COOH itselfhas only covalent bonds. However, in water it is a weak acid with a small portion of the aceticacid dissociating to give the acetate ion CH3COO
−and a proton, H+.
CH3COOHÐCH3COO� þHþ
Molecular mass (molecular weight)16
How heavy is a molecule? You learned above that the atomic mass of an element equals thenumber of protons plus the number of neutrons in its nucleus. The atomic mass of each
16 Molecular mass (molecular weight) AUS-e-TUTE, http://www.ausetute.com.au/mmcalcul.html.
547 Molecular mass (molecular weight)
element is below its symbol in the periodic table, see Figure 19.2. Li is 6.94, Ca is 40.07, etc.Let’s look at several examples of calculating molecular weight (MW). (To simplify calcu-lations, round off the mass of each element to the nearest whole number.)
Look at the two molecules in Figure 19.5, H2 and CH4.
* Each H atom has an atomic mass of one so the MW is 1 + 1 = 2.* Methane has four hydrogens (4) plus the mass of one carbon (12) as seen in column 12 of
the periodic table. The MWof a methane molecule is 4 +12 =16.
See NaCl in Figure 19.6
* Add the mass of the Na atom (23) as seen in column 1 to that of chlorine (35) as seen incolumn 17. The MW is 23 + 35 =58.
Other molecules mentioned here include CO, NH3, and HCHO.
* CO: add the atomic mass of oxygen (16) as seen in column 16 to the atomic mass ofcarbon (12). The MW is 16 + 12= 28.
* NH3: add the mass of three hydrogens (3) to that of nitrogen (14) seen in column 15. TheMW is 3 + 14 = 17.
* HCHO: add the mass of two hydrogens (2) to that of carbon (12) and that of O (16). TheMW is 2 + 12 + 16 =30.
Basically, as you can see, to get the MWof a molecule: take the atomic mass of each elementand multiply it by the number of atoms of that element in the molecule. Do that for eachelement in the molecule. Finally, add together the masses.
SECTION II
Two categories of chemicals: organic and inorganic
Many people think of the word “organic” in the context of organic farming, farming thatdoes not use synthetic pesticides or fertilizers. That use of the word “organic” is historic as itwas once believed that only living organisms could synthesize organic compounds: a “lifeforce” was needed. Then in 1828, Friedrich Wohler synthesized the organic chemical, urea
2HN–CO–NH2.
Organic chemicals
* Organic chemicals contain the element carbon and there are millions of carbon com-pounds. Except for very simple compounds such as methane (CH4), organic chemicalscontain more than one carbon atom, tens, sometimes hundreds or more, linked incarbon–carbon bonds. ▪ Those that contain only carbon and hydrogen are called
548 Chemistry: some basic concepts
hydrocarbons; a simple example is H3C–(CH2)3–CH3 (pentane). Organic chemicalscommonly contain other elements too, such as oxygen, nitrogen, or sulfur. An organo-metallic chemical has a carbon atom bonded to a metal as in tetraethyl lead. Someorganometallic chemicals are found naturally, e.g., hemoglobin (iron) and vitamin B12
(cobalt), and many other proteins and enzymes,* Many organic chemicals are synthetic, i.e., produced not by living creatures, but manu-
factured by human beings. However, the feedstocks from which the chemicals are madecome from nature. Commonly synthetic organic chemicals are made from petroleum ornatural gas feedstock; these are often called petrochemicals. ▪ Coal or wood also some-times serve as feedstocks for organic chemicals. Plastics are synthetic organic chemicals.Even so-called bioplastics, that humans produce from plant materials, involve somesynthetic chemistry. Some commercial organic chemicals are produced too by culturesof molds or bacteria; such chemicals must then be purified from these cultures by humanactions.
* Most chemicals found in petroleum are hydrocarbons. Methane (CH4) found in naturalgas is the simplest hydrocarbon. Often, to make the desired chemicals other elementssuch as oxygen or chlorine must be added to hydrocarbons. Synthetic chemicals may besimple as is formaldehyde (HCHO), used for purposes ranging from making plastics toembalming corpses. Other synthetic chemicals such as some pharmaceuticals, certainvitamins, or peptides can be much more complicated.
* A biochemical is an organic chemical synthesized by a living creature. Proteins, fats, andcarbohydrates are biochemicals. Sucrose (table sugar) and the sour acetic acid (invinegar) are examples of simple biochemicals. Many more complicated chemicals aresynthesized by living organisms too: these include proteins such as enzymes, deoxyri-bonucleic acid (DNA), and ribonucleic acid (RNA). ▪ Many biochemicals can also bemade synthetically, not only simple chemicals such as vinegar or the sugars, sucrose, andxylose, but also complex ones. If the structure of a chemical made by synthetic means isexactly the same as that found in nature, it is indeed the same chemical – the body treatsboth in exactly the same way so there is no biological difference between them.Chemicals synthesized by living creatures can also be extensively manipulated duringextraction and purification and still legally be called natural. The word “natural” is oftenmisused or used without explanation.
Inorganic chemicals
* An inorganic chemical is one not containing carbon, although there are a few exceptions,i.e., chemicals that contain carbon and yet are considered inorganic. These includesodium bicarbonate (baking soda) and sodium carbonate (washing soda).
* Inorganic chemicals may contain almost any element in the periodic table – nitrogen,sulfur, lead, arsenic, etc.
* Many inorganic chemicals are found naturally – salts in the ocean, minerals in the soil,the silicate skeleton made by a diatom, or the calcium carbonate skeleton made bya coral.
549 Two categories of chemicals: organic and inorganic
* Inorganic chemicals are also often manufactured by humans. Ammonia used as a nitrogenfertilizer is a major example. Simple inorganic chemicals can be manipulated to makemore complicated ones. However, the total number of inorganic chemicals is muchsmaller than the number of organic chemicals.
Free radicals
Let’s start looking at some of the chemistry associated with pollution issues, starting withfree radicals.
Electrons normally come in pairs. You have seen that the inner shell of atoms have twoelectrons (one pair). The outer shell contains up to eight electrons (four pairs). A free radicalis an atom (or a fragment of a molecule) that has at least one unpaired electron. That electronis very reactive. Some elements are free radicals. Consider the lithium atom: with only oneelectron in its outer shell, it is extremely reactive. Exposed to air or water, lithium reactsviolently. To a lesser extent sodium (Na) and potassium (K) – in the same family as lithiumand also with only one electron in the outer shell – are also very reactive. Free radicals areextremely important in a number of circumstances including pollution events. Some will benoted below.
The hydroxyl radical as a solution
▪ The environmental fate of a number of pollutants is noted in this text. In soil and water,microorganisms can break down many organic pollutants and materials into carbon dioxideand water. A major means of degrading pollutants in the atmosphere is via the hydroxylradical, •OH. Although present in the atmosphere in only tiny concentrations, •OH destroysmany pollutants.17 In fact, it is sometimes called “the detergent of the atmosphere.” Itsimportance was noted in Chapter 5 (Air pollution) because it participates in the destructionof many VOC pollutants and a number of inorganic pollutants as well including sulfurdioxide and ozone.18
▪ The hydroxyl radical, composed of one oxygen and one hydrogen, is represented as•OH where the dot represents the unpaired electron. Between them the oxygen and thehydrogen have only seven electrons. So •OH is highly reactive, needing an eighth electronin order to regain stability. ▪ How is destruction initiated by •OH carried out? Considerbelow what happens to methane, the simplest hydrocarbon when it is attacked by •OH.Follow the movement of the radical•. The names of the chemical entities are not important toremember – the important thing is to note that the chemical entity to which the radical isattached changes at every step of the reaction. That happens because, when •OH attacks anatom, that atom gives up an electron and now it holds the unpaired electron. In its turn the
17 Hydroxyl radical. Wikipedia, January 13, 2009, http://en.wikipedia.org/wiki/Hydroxyl_radical.18 Borrell, P. Tropospheric chemistry. In The Encyclopedia of Ecology and Environmental Management. Peter
Calow (ed.). Oxford: Blackwell Science, 1998, http://www.luna.co.uk/~pborrell/p&pmb/tropchem.htm.
550 Chemistry: some basic concepts
new radical attacks another atom, which in turn becomes a free radical, etc. This is oftenreferred to as a chain reaction. The reaction will continue until interrupted in some way.
(1) The •OH comes in contact with a CH4 and removes a H from it. The H becomespart of a stable water molecule. The electron is now associated with a methylfragment •CH3.
CH4 þ •OH ! •CH3 þH2O
(2) The •CH3 radical reacts with atmospheric O2 to form the methylperoxy radical •CH3O2.
•CH3 þO2 ! •CH3O2
(3) If the reaction is happening in a locale where nitric oxide, NO is in the atmosphere, themethylperoxy radical converts the NO to NO2, and in the process becomes a methoxyradical, •CH3O.
•CH3O2 þNO ! •CH3OþNO2
(4) The methoxy radical reacts with O2 and forms formaldehyde, HCHO.
•CH3OþO2 ! HCHO þ •HO2
At this point, notice that there is no trace of the original CH4. It has been converted toformaldehyde, HCHO and yet another radical. Formaldehyde is also a pollutant, but can, inits turn, be destroyed. Eventually, the products are CO2 and H2O. ▪ More complicatedhydrocarbon pollutants go through a longer series of reactions. Not all organic moleculesdegraded by a free radical are converted to CO2 and H2O, but are often broken down tochemicals that can deposit onto the Earth, or into chemicals such as acids which are solublein water and can be rained out.
Inorganic molecules are also attacked by the •OH.
The hydroxyl radical as a problem
The above example showed a free radical destroying pollutants in the atmosphere. InChapter 8 we saw free radicals in a different light. CFCs swept into the stratosphere aredestroyed by the sun’s ultraviolet radiation. In the process, CFCs release chlorine as thechlorine-free radical Cl•. (A bromine radical, Br• is released from halons.) Such freeradicals can destroy the stratospheric ozone that serves the protective function ofabsorbing high-energy radiation from the sun that could otherwise reach and damagelife on Earth. ▪ A major substitute for CFCs are the HCFCs (hydrochlorofluorocar-bons). Because HCFCs contain some hydrogen–carbon bonds, they are often destroyedin the lower atmosphere by •OH before they can reach the stratosphere. Thus, HCFCsare fortunately less persistent in the environment and less likely to reach the strato-sphere. Another CFCs replacement, HFCs (hydrofluorocarbons) contain no chlorineand are even more subject to destruction by free radical reactions in the loweratmosphere.
551 Free radicals
SECTION III
Oxidation reactions19
Many chemical reactions noted in this text involve adding oxygen to hydrocarbons. Thebest-known examples are of oxygen atoms added to hydrocarbons during the combustion offossil fuel (Box 1.2 and Table 13.2). In such oxidation reaction, the proportion of oxygen inthe molecule is increased. Because adding oxygen to an element or molecule generallymeans that it is losing electrons the word oxidation has a much broader meaning: it is a
Box 19.2 Avogadro’s constant and the mole
Avogadro’s constant equals 6.022 × 10²³. It is a fundamental constant in chemistry.
Look at the periodic table. Notice carbon, the first element in column 14. Its atomic mass is
12. Now note: in 12 g of carbon there are 6.022 × 10²³ atoms. Also, 12 g of carbon equals a
mole.
So a mole of carbon, indeed a mole of any element contains exactly the same number of
atoms, 6.022 × 10²³. A mole of 1H (1.008 g) contains 6.022×10²³ atoms. So does a mole of
aluminum, 13Al (26.98 g) or a mole of silver, 47Ag (107.87 g) or a mole of any other element.
One can also speak of a mole ofmolecules (such as a mole of H2or a mole of H2SO4). A mole
of any one of these contains 6.022×10²³ molecules. The term can also be used for ions. A mole
of Na+ ions has 6.022 × 10²³ions. The mole along with Avogadro’s constant gives a sense of
great order to the discipline of chemistry.
Stoichiometry
Before examining the oxidation reactions that follow, it is important to introduce the concept
of stoichiometry. The two sides of a chemical reaction must always be balanced.
* First consider any molecule, let’s say water. On the basis of what you already know about
valence you can say that the molecule H2O always has two atoms of hydrogen and one
atom of oxygen; themolar proportion of hydrogen to oxygen is two to one. You can also say
the stoichiometry of hydrogen and oxygen in H2O is 2:1.
* All chemical reactions take place in definite ratios. For instance: 2 H2+ O2→ 2 H2O
* This simple equation tells you the quantities of reactants (left side) must balance with the
quantities of products (right side) in a chemical reaction. Seeing this equation you can say
that two moles of H2 plus one mole of O2 yields two moles of water. There are four
hydrogens and two oxygens on both sides of the equation. The water example is a simple
one, but the stoichiometry holds for any chemical equation: one must balance out the
quantities of reactants and products.
19 Oxidation and reduction. Columbia Encyclopedia, 2003, http://www.answers.com/topic/redox.
552 Chemistry: some basic concepts
reaction in which an element or molecule loses electrons. The converse of oxidation isreduction: adding electrons to an element or molecule. Consider the reaction of lithium withchlorine: Li + Cl → LiCl. In this reaction lithium loses an electron: it was oxidized.Conversely chlorine gains an electron: it was reduced. Overall, it is called a redox reaction.
Below, see illustrations of adding oxygen to elements or molecules in gasoline duringcombustion. In developed countries, significant amounts of these pollutants are removed bycatalytic converters and other changes in the operation of the vehicle,20 but significantquantities are still emitted.
Oxidation reactions of metals
Many metals are present in trace amounts in gasoline.21 Metal oxidation will be examinedfirst. Metals, when combusted, react with atmospheric O2 to yield metal oxides, tiny partic-ulate pollutants released in car exhaust. Many particulates are captured by modern vehicleemissions controls. Four metals have been chosen to illustrate metal oxidation. Assume thatthe valence of oxygen is two in each of the following cases, then determine for yourself thevalence of each metal. Many metals (for reasons not covered here) can have more than onevalence state. Notice that each equation is – must be – balanced, i.e., the number of atoms ofeach element on the left side of the equation must equal those on the right.
Silver
Iron
Iron
Aluminum
Lead
Lead
4 AgþO2 ! 2 Ag2O
4 Feþ 3 O2 ! 2 Fe2O3
3 Feþ 2 O2 ! Fe3O4
4 Alþ 3 O2 ! 2 Al2O3
2 PbþO2 ! 2 PbO
PbþO2 ! PbO2
Oxidation reactions of nitrogen and sulfurwhen burning gasoline
The sulfur and nitrogen compounds in gasoline are also oxidized when it is burned(Box 1.2). At the high temperature of gasoline combustion, atmospheric O2 also reactswith atmospheric nitrogen (N2) resulting in nitrogen oxides (NOx), released in the exhaust.
20 (1 ) Catalytic converter. Wi k i pe di a, March 3, 2009, h ttp://en.wikipedia. org/wi ki/ Catalytic_conve rt er. ( 2) Automobileemissions control.Wikipedia, March 5, 2009, http://en.wikipedia.org/wiki/Automobile_emissions_control.
21 Metals found in gasoline in trace amounts include cadmium (Cd), arsenic (As), vanadium (V), manganese (Mn),nickel (Ni), antimony (Sb), chromium (Cr), zinc (Zn), copper (Cu), boron (B), calcium (Ca), magnesium (Mg),silver (Ag), aluminum (Al), iron (Fe), and lead (Pb) – all released as metal oxides in car exhaust. Fortunately, inmost countries Pb is no longer added to gasoline, so this once large contaminant is now present in very smallamounts. Nonetheless, remember that metals cannot degrade; they can build up in soils along roads. Also recallthat these metals are found in trace amounts in coal too; with more than a billion tons of coal burned each year inthe United States, even trace amounts can slowly but surely add up as these pollutants first released into the airdeposit onto soil.
553 Oxidation reactions
N2 þ O 2 ! 2NO
N2 þ 2O 2 ! 2NO 2
Again noti ce that the two sides of the equation are b alanced. Because NO, NO2, and N 2O aremajor pollutant s (refer red to a s NOx), we are fort unate that more than 85% of the N 2 is notoxidized, but is relea sed unchange d in the car ’s exhaust . However, enough is released to leadto signi ficant envir onmental probl ems; see NOx poll utants in Chapter 5, 6, 7, 9, and 13. TheNOx contribut e g reatly to tropo spheric ozone formati on. One NO x gases, N 2O is a powe rfulgreenho use gas. NOx also contr ibutes to acid deposi tion. ▪ Similar react ions oxidize thesulfur compo unds in the gasol ine to sulfur oxides .
Oxidation of hydrocarbons i n gasoline22
There are hundred s of different h ydrocarbon compo unds in gasol ine.23 Hydr ocarbon s withone to four carbons a re not found in gasol ine because they are gases. So, for purposes ofillustrati on, the smalles t liquid hydroca rbon, pentane (with five carbons ) is used here toexamine the oxidation of a hydrocarbon. The formula for pentane is CH3–CH 2–CH 2–CH2–
CH3, abbreviated as CH 3–(CH 2) 3–CH 3. ▪ Remem ber that the valenc e of hydroge n is one andthat of carbon is four, so hydroge n is bonded to only one other a tom, but carbon is bonded tofour. At both ends of the hydroca rbon molecule carbon is bonded to only one other carbonand to three hydroge ns whereas in the molecule ’s center carbon is bonded to two othercarbons and tw o hydroge ns. Ass ume that the gasol ine is b urning at 495° F (232° C) and thatthe pe ntane is being oxidi zed to CO2 and H 2O.
* First conside r the reaction of h ydrogen wi th atmo spheric O2. The re are 12 hydroge ns inthe pentan e mol ecule and two hydroge ns in each H2O, so . . .
CH3 - ð CH 2 Þ 3 - CH 3 þ 3O 2 ðatmo spheric gas Þ ! 6H 2 O
Note that the two sides of the eq uation are balanc ed for oxygen an d hydroge n: 12 hydroge natoms require 6 O atoms (left side of equation) to produce the six water molecules.* Then consider the formation of carbon dioxide.
CH3-ðCH2Þ3-CH3 þ 5O2 ! 5CO2
Here the two sides of the equation must balance: five carbon atoms require ten oxygenmolecules to yield five molecules of CO2.* The overall reaction is the sum of those first two equations.
CH3-ðCH2Þ3-CH3 þ 8O2 ! 5CO2 þ 6H2O
22 Hy dr o ca r bo n c h em is tr y. Encyclopedia of Eart h, F eb r ua ry 4 , 2 00 7, ht tp : // ww w. eo e ar th .o rg /a rt ic le /Hydrocarbon_chemistry.
23 Hamilton, B. FAQ: Automotive gasoline. January 8, 1995, http://www.turborick.com/gsxr1127/gasoline.html.
554 Chemistry: some basic concepts
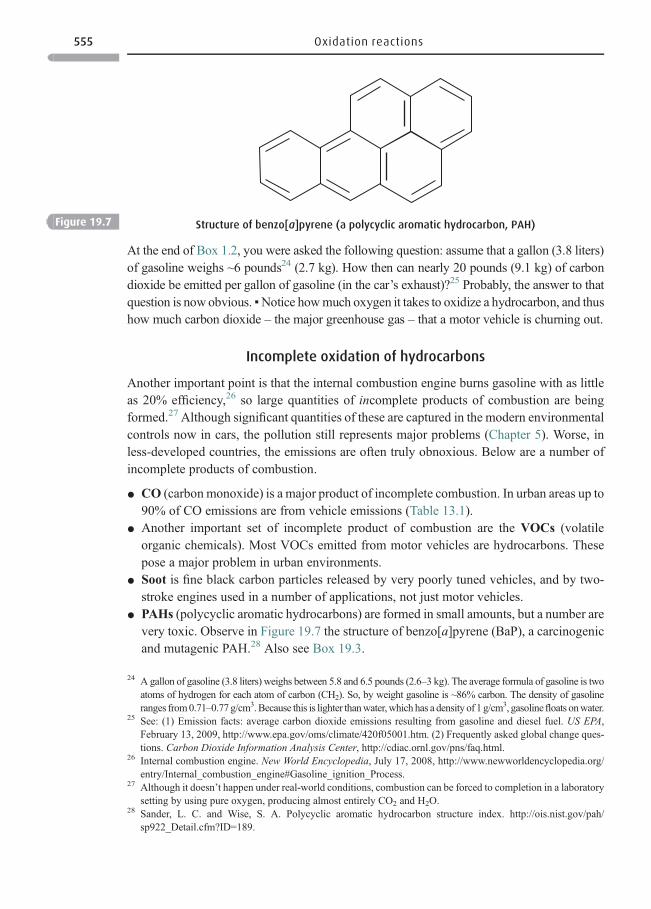
At the end of Box 1.2, you were asked the following question: assume that a gallon (3.8 liters)of gasoline weighs ~6 pounds24 (2.7 kg). How then can nearly 20 pounds (9.1 kg) of carbondioxide be emitted per gallon of gasoline (in the car’s exhaust)?25 Probably, the answer to thatquestion is now obvious. ▪Notice howmuch oxygen it takes to oxidize a hydrocarbon, and thushow much carbon dioxide – the major greenhouse gas – that a motor vehicle is churning out.
Incomplete oxidation of hydrocarbons
Another important point is that the internal combustion engine burns gasoline with as littleas 20% efficiency,26 so large quantities of incomplete products of combustion are beingformed.27 Although significant quantities of these are captured in the modern environmentalcontrols now in cars, the pollution still represents major problems (Chapter 5). Worse, inless-developed countries, the emissions are often truly obnoxious. Below are a number ofincomplete products of combustion.
* CO (carbon monoxide) is a major product of incomplete combustion. In urban areas up to90% of CO emissions are from vehicle emissions (Table 13.1).
* Another important set of incomplete product of combustion are the VOCs (volatileorganic chemicals). Most VOCs emitted from motor vehicles are hydrocarbons. Thesepose a major problem in urban environments.
* Soot is fine black carbon particles released by very poorly tuned vehicles, and by two-stroke engines used in a number of applications, not just motor vehicles.
* PAHs (polycyclic aromatic hydrocarbons) are formed in small amounts, but a number arevery toxic. Observe in Figure 19.7 the structure of benzo[a]pyrene (BaP), a carcinogenicand mutagenic PAH.28 Also see Box 19.3.
Figure 19.7 Structure of benzo[a]pyrene (a polycyclic aromatic hydrocarbon, PAH)
24 A gallon of gasoline (3.8 liters) weighs between 5.8 and 6.5 pounds (2.6–3 kg). The average formula of gasoline is twoatoms of hydrogen for each atom of carbon (CH2). So, by weight gasoline is ~86% carbon. The density of gasolineranges from0.71–0.77 g/cm3.Because this is lighter thanwater,which has a density of 1g/cm3, gasolinefloats onwater.
25 See: (1) Emission facts: average carbon dioxide emissions resulting from gasoline and diesel fuel. US EPA,February 13, 2009, http://www.epa.gov/oms/climate/420f05001.htm. (2) Frequently asked global change ques-tions. Carbon Dioxide Information Analysis Center, http://cdiac.ornl.gov/pns/faq.html.
26 Internal combustion engine. New World Encyclopedia, July 17, 2008, http://www.newworldencyclopedia.org/entry/Internal_combustion_engine#Gasoline_ignition_Process.
27 Although it doesn’t happen under real-world conditions, combustion can be forced to completion in a laboratorysetting by using pure oxygen, producing almost entirely CO2 and H2O.
28 Sander, L. C. and Wise, S. A. Polycyclic aromatic hydrocarbon structure index. http://ois.nist.gov/pah/sp922_Detail.cfm?ID=189.
555 Oxidation reactions
SECTION IV
Acid pollution29
▪ First, consider water30 (H2O or H–O–H). The oxygen atom in the H2O molecule stronglyattracts the two hydrogen atoms to which it is bonded. However, the O also attracts the Hatoms in other water molecules, resulting in a phenomenon called hydrogen bonding.Hydrogen bonding leads to water molecules clustering closer together than would otherwisehappen. ▪ Pure water is mostly composed of intact H–O–H molecules, but it does slightlydissociate into H+ions (cations) and OH− ions (anions).The H+is characteristic of an acid andOH− is characteristic of a base (also called alkali). ▪ Acids are compounds of hydrogen.Remember that the hydrogen atom has one proton and one electron. When acting as an acid,H loses its electron, leaving only the proton, H+. But the proton is not bare. In water, H+isassociated with a H2Omolecule, and is represented as H3O
+; it is a hydrated H+.31 However,the proton is typically represented as H+, not H3O
+.
Acids
* pH32,33 is a measure of how acid or alkaline a water solution is. It has a scale of 0 to 14. ThepH of pure water is 7, which is neutral. If an acid such as hydrochloric acid (HCl) is added, itdissociates into Cl − anions andH+cations. Because ofH+, thewater becomes acidic. AsmoreH+ is added, the solution becomes progressively more acidic, and its pH becomes progres-sively lower.34 Examine Figure 6.1 for examples of the acidity of common substances.
Box 19.3 More on BaP
The double lines shown in the BaP structure (Figure 19.7) represent double bonds, i.e., the
atoms involved share two pairs of electrons. However, saying that two carbon atoms share
two pairs of electrons in such rings is a simplification; rather the electrons are “spread” among
the carbons. The atoms that make up BaP are not shown because it is assumed that the
carbons and the hydrogens are present; each apex represents a carbon atom. Benzene, the
simplest aromatic ring compound has a formula of C6H6. Examine the BaP molecule and
determine why each ring is able to have less than six carbons.
29 Acid. Wikipedia, February 18, 2009, http://en.wikipedia.org/wiki/Acid.30 Water (molecule). Wikipedia, February 24, 2009, http://en.wikipedia.org/wiki/Water_(molecule).31 H3 O
+ is a cation called hydronium. See Hydronium. Wikipedia, February 19, 2009, http://en.wikipedia.org/wiki/Hydronium.
32 What is pH? US EPA, June 8, 2007, http://www.epa.gov/acidrain/measure/ph.html33 pH. Wikipedia, February 24, 2009. http://en.wikipedia.org/wiki/PH.34 Conversely, if a base such as sodium hydroxide (NaOH) is added, the solution becomes alkaline, and the pH
becomes progressively higher as more base is added.
556 Chemistry: some basic concepts
* An acid35 is a chemical compound that, when dissolved in water, releases H+and givesrise to a solution with a pH below 7. A pH of 7 means the solution is neutral. Some acids(hydrochloric acid and nitric acid, HNO3) are strong, meaning all their hydrogens arereleased as H+ions, they ionize completely.36 However, a weak acid such as acetic acid(CH3COOH) found in vinegar only partially ionizes into CH3COO
− and H+.* The converse of an acid is a base. A base releases OH− when dissolved in water. When the
base, sodium hydroxide (NaOH) is added to water, it dissociates into Na+ cations and OH−
anions and the pH rises. The solution becomes progressively more alkaline as more OH− isadded. (Note: don’t confuse the OH− ion with the •OH radical. The OH− ion has an octet ofelectrons whereas the •OH radical is so unstable because it has only seven electrons.)
* When OH− ions, are added to H+ ions, the solution begins to move toward 7. If just enoughOH− ions are added to reach a pH of 7, the solution is neutralized. One mole of OH− ionsadded to one mole of H+ ions means the solution is no longer acidic or basic; it is neutral.
Acid deposition37
In Chapter 6 you saw the problems of water and soil acidification resulting from aciddeposition. Pollutants emitted to the atmosphere were transformed into acids, then depositedonto earth and water.
Carbonic acid
Even without acids generated by human actions, rain has a slightly acid pH. That is becausecarbon dioxide (CO2) is always present in the atmosphere. So, to varying extents is watervapor. Thus the following reaction occurs.
CO2 ðgasÞ þH2O ðvaporÞ Ð H2CO3 ðcarbonic acidÞThe reversible arrows indicate that the reaction between CO2 and H2O to formH2CO3 doesn’tgo to completion. Carbonic acid also dissociates back into CO2 and H2O. Carbonic acid is aweak and natural acid. It does affect the pH of rain, but the problematic acids in acid depositionare sulfuric acid (H2SO4) and nitric acid (HNO3). The atmospheric transformations of SO2 andNOx to these acids are complex, and simplified versions are presented here.
Sulfuric acid
Coal-burning power plants and other sources release SO2. There are three means to convertSO2 to H2SO4. One involves the hydroxyl radical (•OH).
35 Acid. Wikipedia, February 18, 2009, http://en.wikipedia.org/wiki/Acid.36 Sulfuric acid (H2SO4), which is heavily involved in acid deposition, is also a strong acid. However, only the first
H+ is completely released.37 Atmospheric reactions of sulfur and nitrogen. Northern Arizona University, April 14, 2008, http://jan.ucc.nau.
edu/~doetqp-p/courses/env440/env440_2/lectures/lec37/lec37.htm.
557 Acid deposition
SO2 ð gas Þ þ • OH ! HOSO 2 •
HOSO2 • þ O 2 ð gas Þ ! HO 2 •SO 3 ð sulfur trioxide ; gas ÞSO3 ð gas Þ þ H 2 O ð water vapor Þ ! H 2 SO 4 ð sulfuric acid ; aqueous Þ
The sulfuric acid is was hed out of the atm osphere by rain into the soils and wat ers below. Or,in dry cond itions, the sulf ate (SO4
–2) is form ed and settles from the atmospher e. There arealso bases in the atm ospher e of which the volat ile ammonia (NH3) is the most comm on. Itcan react wi th H2SO4.
NH3 þ H 2 SO 4 ! NH 4 HSO 4 ð ammonium bisulfat e ÞAmmon ium bisul fate is a salt. It is strong ly attrac ted to water, in whi ch it dissolves . It iswashed out with rain or other preci pitatio n, or if it rema ins dry, can settle out as parti cles.
Nitric acid
Most nitr ogen oxides (NOx) results from the high- temperat ure reaction of atmospher icnitrogen with atmospher ic oxygen durin g fossil-fuel combu stion. Conside r how this ox ida-tion happens in the atm ospher e.
N2 ð gas Þ þO 2 ð gas Þ ! 2 NO ð nitric oxide ; gas Þ2NO ð gas Þ þO2 ð gas Þ ! 2 NO 2 ð nitrogen dio xide ; gas Þ
2 NO2 ð gas Þ þ H2 O ð wate r vap orÞ ! HNO 2 ð nitrou s acid ; aqueou sÞþ HNO3 ðnitric acid ; aqueous Þ
Ocean acidification38,39, 40,41
▪ In the past 200 years, the oce ans have absorb ed ab out 550 billion tons (499 bill ion tonnes)of CO2 from the atmospher e, about a third of the CO 2 emissions for whi ch humans havebeen respon sible. 42 That oceani c absorption of CO2 still continues.
43
38 The acid ocean: the other problem with CO2 emission. Real Climate, July 2, 2009, http://www.realclimate.org/index.php?p=169.
39 Petkewich, R. Off-balance ocean: acidification from absorbing atmospheric CO2 is changing the ocean’schemistry. Chemical & Engineering News, 87(8), February 23, 2009, http://pubs.acs.org/cen/science/87/8708sci2.html.
40 Ocean acidifi cation. Wikipedia, February 22, 2009, http://en.wikipedia.org/wiki/Ocean_acidification.41 Young, R. O. What is causing ocean acidification? Articles of Health, November 27, 2008, http://articlesof-
health.blogspot.com/2008/11/what-is-causing-ocean-acidification.html.42 Carbon dioxide. Wikipedia, February 27, 2009, http://en.wikipedia.org/wiki/Carbon_dioxide.43 That so much CO2 has been absorbed into the oceans from the air has had a major positive aspect: there is less CO2
in the atmosphere to absorb the infrared radiation coming from the Earth. This mitigates the warming compared towhat could otherwise occur. Unfortunately, that CO2 is affecting the pH of the oceans, as discussed here.
558 Chemistry: some basic concepts
Carbonic acid and the fall in ocean pH
The following three reactions have always occurred in the oceans, making use of some of theCO2 absorbed into the ocean’s waters.
ðReaction 1Þ CO2 ðgasÞ þH2O Ð H2CO3 ðcarbonic acidÞThe problem with the increased and increasing CO2 concentration is that more and moreis being converted into carbonic acid.44 ▪ Carbonic acid, a weak acid, as Reaction 2 shows,partially dissociates into the acidic H+cation and the bicarbonate anion (HCO3
–1). Andas seen in Reaction 3, the HCO3
–1 partially dissociates into the second H+ and carbonate(CO3
2−).45,46
ðReaction 2Þ H2CO3 Ð HCO3� ðbicarbonate anionÞ þHþ
ðReaction 3Þ HCO3� Ð CO3
2� ðcarbonate anionÞ þHþ
The consequence of increased hydrogen ions in the ocean
Although carbonic acid is weak and, in turn, only a small proportion of the protons aredissociated from the HCO3
−, such great quantities of carbonic acid have formed over theyears that the pH of the oceans’ surface waters has decreased about 0.1 pH unit (from aboutpH 8.2 to pH 8.1). This does not sound like much, but because pH is a logarithmic function,this small drop represents about a 30% rise in acidity.47 ▪What does this matter? Geologiststell us that the pH of the oceans has been stable for many millions of years. A great manytiny creatures at the base of the ocean food chain depend on calcium carbonate to build theirshells (coral, and the many plankton, protozoa and algae that form calcium carbonateshells).
Caþþ ðcalcium ionÞ þHCO3� Ð CaCO3 ðcalcium carbonateÞ þHþ
For millions of years, calcium carbonate shells have been stable because there hasalways been more than enough carbonate to maintain them: the waters have been “shellfriendly.” However, with more CO3
2− moving back toward HCO3− (Reaction 3), there
is less calcium carbonate with which to form shells. To date, the change has not beengreat enough to cause obvious harm. However, in controlled studies, it is clearly seen
44 As noted above, the reversible arrows indicate that the reaction goes in both directions, andH2CO3 can dissociateto release CO2. If you drink carbonated beverages, you have seen what happens to the carbonic acid added tothese beverages. When you remove the cap, the release in pressure allows the CO2 to begin gassing out, thuspulling the reaction to the left.
45 Bicarbonate is used as an antacid NaHCO3 (bicarbonate of soda), as baking soda, and for cleaning purposes.Na2CO3 may be familiar to you as washing soda; it is also used, with sand to make glass.
46 Most of the inorganic carbon in the ocean, about 88%, is bicarbonate. The concentrations of carbonate ion andCO2 are about 11% and 1%, respectively. NASA educational workshop, the basics of ocean chemistry. NASASeaWiFS Project,http://oceancolor.gsfc.nasa.gov/SeaWiFS/TEACHERS/CHEMISTRY/.
47 The pH of the ocean is actually slightly alkaline, about pH 8.2. What is happening is that the ocean is becomingless alkaline. It is easier to refer to this as ocean acidification as the pH is indeed moving ever lower.
559 Ocean acidification
that as H+ continues to increase shell formation is harmed. ▪ Moreover, not onlycreatures that form their shells from calcium carbonate are in danger. A change inocean pH can affect other fundamental biological and geochemical processes in theoceans.48
You now see that every pollution issue in this text could be examined from the perspectiveof the chemistry involved. For those interested in going further, consider:
* Manahan. S. E. Environmental Chemistry, ninth edition. Boca Raton: CRC Press, 2009.* Schwedt, G. The Essential Guide to Environmental Chemistry. Chichester: JohnWiley &
Sons, LTD, 2001 (reprinted in 2007).* An on-line environmental chemistry course fromNorthern Arizona University is found at
http://jan.ucc.nau.edu/~doetqp-p/courses/env440/env440_2/index.htm.
Further reading
Manahan, S. E. Environmental Chemistry, ninth edition. Boca Raton: CRC Press, 2009.Petkewich, R. Off-Balance Ocean, acidification from absorbing atmospheric CO2 is chang-
ing the ocean’s chemistry. Chemical & Engineering News, 87(8), February 23, 2009,56–58. http://pubs.acs.org/cen/science/87/8708sci2.html.
Internet resources
AUS-e-TUTE. Molecular mass (molecular weight). http://www.ausetute.com.au/mmcalcul.html.
Barbalace, R. B. 2009. Anatomy of the atom. http://environmentalchemistry.com/yogi/periodic/atom_anatomy.html#AtomicMass (April 14, 2008).
Borrell, P. 1998. Tropospheric chemistry. In Encyclopedia of Ecology and EnvironmentalManagement, Calow, P., ed, Oxford: Blackwell Science. http://www.luna.co.uk/~pbor-rell/p&pmb/tropchem.htm.
Columbia Encyclopedia. 2003. Oxidation and reduction. http://www.answers.com/topic/redox.
Clark, J. 2000. Covalent bonds – single bonds. http://www.chemguide.co.uk/atoms/bonding/covalent.html#top.
Encyclopedia of Earth. 2007. Hydrocarbon chemistry. http://www.eoearth.org/article/Hydrocarbon_chemistry (February 4, 2007).
48 (1) Zeebel, R. E., Zachos, J. C., Caldeira, K., and Tyrrell, T. Carbon emissions and acidification. Science,321(5885), July 4, 2008, 5152. (2) Kerr, R. A. The many dangers of greenhouse acid. Science, 323(5913),January 23, 2009, 459.
560 Chemistry: some basic concepts
Farabee, M. J. 2007. Atoms and molecules. http://www.emc.maricopa.edu/faculty/farabee/BIOBK/BioBookCHEM1.html.
Green-Planet-Solar-Energy.com. 2009. The electron dot diagram: the basics of bonding.http://www.green-planet-solar-energy.com/electron-dot-diagram.html (February 27,2009).
Hamilton, B. 1995. FAQ: Automotive gasoline. http://www.turborick.com/gsxr1127/gasoline.html (January 8, 1995).
Northern Arizona University. 2008. Atmospheric reactions of sulfur and nitrogen. http://jan.ucc.nau.edu/~doetqp-p/courses/env440/env440_2/lectures/lec37/lec37.htm.
Northern Arizona University. 2009. Environmental chemistry, an online course. http://jan.ucc.nau.edu/~doetqp-p/courses/env440/env440_2/index.htm.
Real Climate. 2005. The acid ocean – the other problem with CO2 emission. http://www.realclimate.org/index.php?p=169 (July 2, 2005).
Reusch, W. 1999. Virtual text of organic chemistry: structure and bonding. http://www.cem.msu.edu/~reusch/VirtualText/intro2.htm.
Thomas, E. 1998. The behavior of isotopes of hydrogen and oxygen: heavy and light rain.Wesleyan University. http://ethomas.web.wesleyan.edu/ees123/isotope.htm.
US EPA. 2007. Acid and pH What is pH? http://www.epa.gov/acidrain/measure/ph.html(June 8, 2007).
Wikipedia. 2009. Acid. http://en.wikipedia.org/wiki/Acid (February 18, 2009).2009. Hydronium. http://en.wikipedia.org/wiki/Hydronium (February 19, 2009).2009. Hydroxyl radical. http://en.wikipedia.org/wiki/Hydroxyl_radical (January 13,
2009).2009. Ocean acidification. http://en.wikipedia.org/wiki/Ocean_acidification (February
22, 2009).2009. The periodic table. http://en.wikipedia.org/wiki/Periodic_table February 23, 2009.2009. Water (molecule). http://en.wikipedia.org/wiki/Water_(molecule) (February 24,
2009).Yung,R.O. 2008.What is causing ocean acidification?Articles ofHealth. http://articlesofhealth.
blogspot.com/2008/11/what-is-causing-ocean-acidification.html (November 27, 2008).
561 Internet resources
Index
accidents and major exposuresarsenic, “largest mass poisoning”, 451Bhopal explosion, 18Chernobyl explosion, 393Danube cyanide spill , 14Exxon Valdez oil spill, 246Minamata, mercury poisoning, 444Rhine chemical spill, 14TVA ash pond, failure, 430
acetic acid, 557acetone, 504acetylcholine, 466acid depositionacid-forming pollutants, 155aerosols, 155buffers, 157carbonic acid, 156dry and wet, 156formed of, 155high stack emissions, 156history, 156ill effects, 159–162
aluminum, 431erosion, haze, 162forests, 160mercury, 431metals, 431water and aquatic life, 159
internationalAsia, 167China, 167–168Europe, 166
NAPAP, 158, 159, 160, 164pH, 158recovery from, 164reducing
nitrogen oxides, 163sulfur dioxide, 162
soilbase cations, 157ill effects, 431
sources, 162transboundary, 165
acid from mining, 428adipic acid, 526Afghanistan, 343
Africa, 28, 74, 83, 88, 143, 144, 147, 181, 302, 343,414, 475, 477, 478, 479
agenciesUS Centers for Disease Control, 25, 70, 85, 91, 289,
290, 422US Consumer Product Safety Commission
(CPSC), 487US Department of Agriculture, 472US Department of Energy, 47, 331, 352, 359, 361,
384, 532US DOE, see US Department of EnergyUS EPA, 12, 24, 39, 42, 47, 71, 98, 102, 104, 110,
111, 112, 113, 118, 121, 125, 126, 131,134, 135, 138, 144, 198, 199, 232, 248,249, 251, 253, 254, 255, 256, 261, 263,266, 271, 272, 276, 277, 282, 287, 288,289, 290, 291, 292, 296, 297, 299, 300,308, 318, 319, 324, 333, 339, 352, 353,356, 359, 360, 366, 368, 379, 389, 391,410, 414, 417, 418, 422, 425, 430, 433,434, 436, 437, 444, 445, 447, 450, 451,460, 464, 465, 469, 470, 471, 472, 483,489, 492, 494, 497, 498, 500, 503, 505,507, 519, 524
US EPA’s Science Advisory Panel, 165US Fish & Wildlife Service, 471US Food and Drug Administration, 84, 102, 299,
418, 444, 447, 465US Geological Survey, 320US National Academy of
Sciences, 498US National Aeronautics and Space Administration,
8, 219closed-loop system, 515
US National Oceanic and AtmosphericAdministration, 178, 213,221, 255
US National Research Council, 102, 114, 269, 279,289, 443, 447
Agenda 21, 21, 305, 334AIDS, 27, 28, 72, 298, 302air pollutants
HAPsexamples, 139
summary, 119sulfur and nitrogen oxides, 129
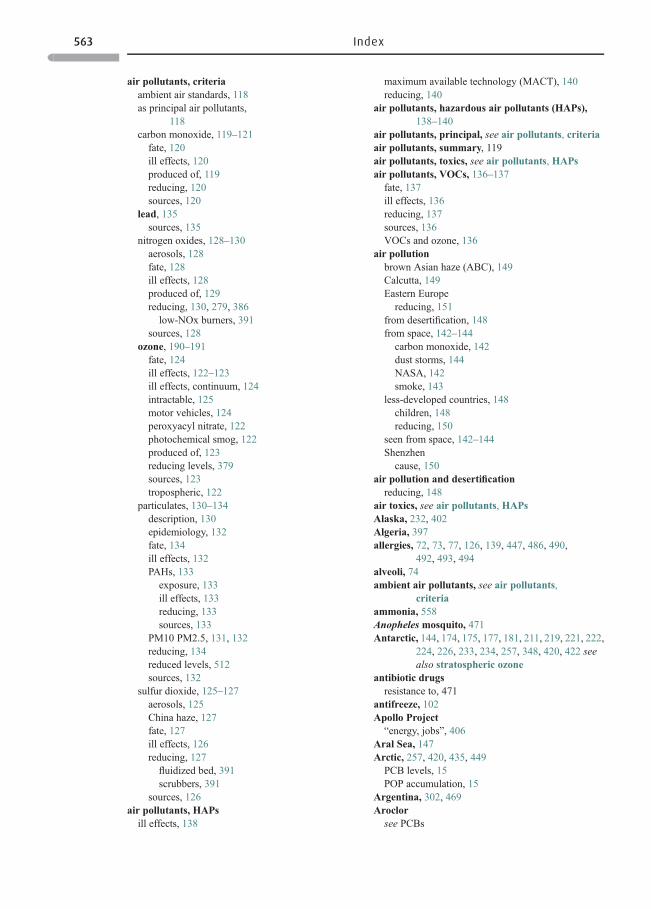
air pollutants, criteriaambient air standards, 118as principal air pollutants,
118carbon monoxide, 119–121fate, 120ill effects, 120produced of, 119reducing, 120sources, 120
lead, 135sources, 135
nitrogen oxides, 128–130aerosols, 128fate, 128ill effects, 128produced of, 129reducing, 130, 279, 386
low-NOx burners, 391sources, 128
ozone, 190–191fate, 124ill effects, 122–123ill effects, continuum, 124intractable, 125motor vehicles, 124peroxyacyl nitrate, 122photochemical smog, 122produced of, 123reducing levels, 379sources, 123tropospheric, 122
particulates, 130–134description, 130epidemiology, 132fate, 134ill effects, 132PAHs, 133
exposure, 133ill effects, 133reducing, 133sources, 133
PM10 PM2.5, 131, 132reducing, 134reduced levels, 512sources, 132
sulfur dioxide, 125–127aerosols, 125China haze, 127fate, 127ill effects, 126reducing, 127
fluidized bed, 391scrubbers, 391
sources, 126air pollutants, HAPs
ill effects, 138
maximum available technology (MACT), 140reducing, 140
air pollutants, hazardous air pollutants (HAPs),138–140
air pollutants, principal, see air pollutants, criteriaair pollutants, summary, 119air pollutants, toxics, see air pollutants, HAPsair pollutants, VOCs, 136–137fate, 137ill effects, 136reducing, 137sources, 136VOCs and ozone, 136
air pollutionbrown Asian haze (ABC), 149Calcutta, 149Eastern Europe
reducing, 151from desertification, 148from space, 142–144
carbon monoxide, 142dust storms, 144NASA, 142smoke, 143
less-developed countries, 148children, 148reducing, 150
seen from space, 142–144Shenzhen
cause, 150air pollution and desertificationreducing, 148
air toxics, see air pollutants, HAPsAlaska, 232, 402Algeria, 397allergies, 72, 73, 77, 126, 139, 447, 486, 490,
492, 493, 494alveoli, 74ambient air pollutants, see air pollutants,
criteriaammonia, 558Anopheles mosquito, 471Antarctic, 144, 174, 175, 177, 181, 211, 219, 221, 222,
224, 226, 233, 234, 257, 348, 420, 422 seealso stratospheric ozone
antibiotic drugsresistance to, 471
antifreeze, 102Apollo Project“energy, jobs”, 406
Aral Sea, 147Arctic, 257, 420, 435, 449PCB levels, 15POP accumulation, 15
Argentina, 302, 469Aroclor
see PCBs
563 Index
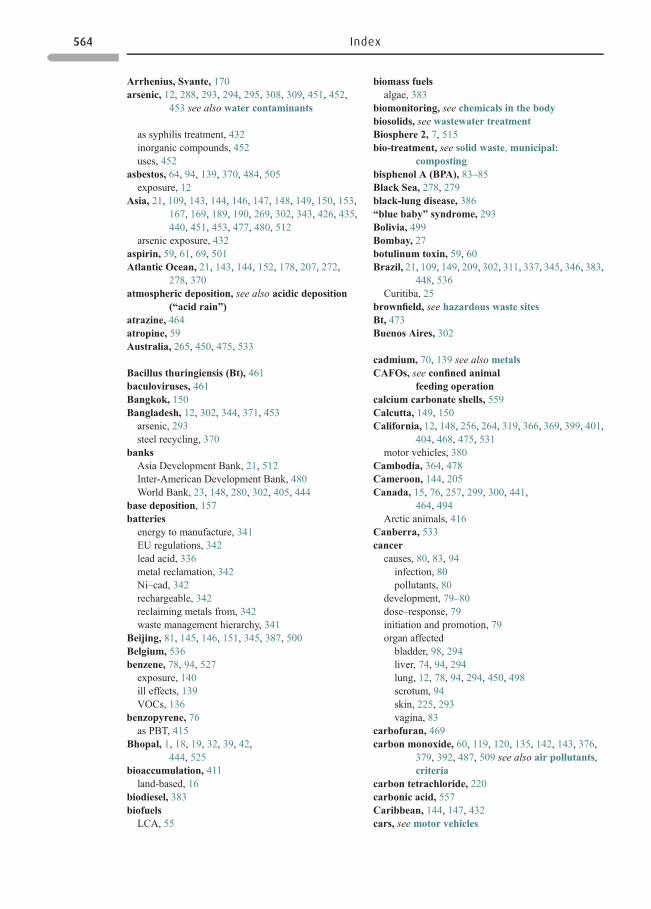
Arrhenius, Svante, 170arsenic, 12, 288, 293, 294, 295, 308, 309, 451, 452,
453 see also water contaminants
as syphilis treatment, 432inorganic compounds, 452uses, 452
asbestos, 64, 94, 139, 370, 484, 505exposure, 12
Asia, 21, 109, 143, 144, 146, 147, 148, 149, 150, 153,167, 169, 189, 190, 269, 302, 343, 426, 435,440, 451, 453, 477, 480, 512
arsenic exposure, 432aspirin, 59, 61, 69, 501Atlantic Ocean, 21, 143, 144, 152, 178, 207, 272,
278, 370atmospheric deposition, see also acidic deposition
(“acid rain”)atrazine, 464atropine, 59Australia, 265, 450, 475, 533
Bacillus thuringiensis (Bt), 461baculoviruses, 461Bangkok, 150Bangladesh, 12, 302, 344, 371, 453arsenic, 293steel recycling, 370
banksAsia Development Bank, 21, 512Inter-American Development Bank, 480World Bank, 23, 148, 280, 302, 405, 444
base deposition, 157batteriesenergy to manufacture, 341EU regulations, 342lead acid, 336metal reclamation, 342Ni–cad, 342rechargeable, 342reclaiming metals from, 342waste management hierarchy, 341
Beijing, 81, 145, 146, 151, 345, 387, 500Belgium, 536benzene, 78, 94, 527exposure, 140ill effects, 139VOCs, 136
benzopyrene, 76as PBT, 415
Bhopal, 1, 18, 19, 32, 39, 42,444, 525
bioaccumulation, 411land-based, 16
biodiesel, 383biofuelsLCA, 55
biomass fuelsalgae, 383
biomonitoring, see chemicals in the bodybiosolids, see wastewater treatmentBiosphere 2, 7, 515bio-treatment, see solid waste, municipal:
compostingbisphenol A (BPA), 83–85Black Sea, 278, 279black-lung disease, 386“blue baby” syndrome, 293Bolivia, 499Bombay, 27botulinum toxin, 59, 60Brazil, 21, 109, 149, 209, 302, 311, 337, 345, 346, 383,
448, 536Curitiba, 25
brownfield, see hazardous waste sitesBt, 473Buenos Aires, 302
cadmium, 70, 139 see also metalsCAFOs, see confined animal
feeding operationcalcium carbonate shells, 559Calcutta, 149, 150California, 12, 148, 256, 264, 319, 366, 369, 399, 401,
404, 468, 475, 531motor vehicles, 380
Cambodia, 364, 478Cameroon, 144, 205Canada, 15, 76, 257, 299, 300, 441,
464, 494Arctic animals, 416
Canberra, 533cancer
causes, 80, 83, 94infection, 80pollutants, 80
development, 79–80dose–response, 79initiation and promotion, 79organ affected
bladder, 98, 294liver, 74, 94, 294lung, 12, 78, 94, 294, 450, 498scrotum, 94skin, 225, 293vagina, 83
carbofuran, 469carbon monoxide, 60, 119, 120, 135, 142, 143, 376,
379, 392, 487, 509 see also air pollutants,criteria
carbon tetrachloride, 220carbonic acid, 557Caribbean, 144, 147, 432cars, see motor vehicles
564 Index
cataracts, 225caustic, 502CCA alternatives, 452CFL light bulbs, 387chemical
bioavailability, 66persistence, 35PCBs, dioxins, 65
reference, 44chemical effects
body organs, 71–74irritant, 63local, 73multiple chemicals, 62additive, 19, 63antagonists, antidotes, 19, 63synergism, 19, 63, 74
synergism, 74target organs, 65
chemical exposure, 89children, 76multiple chemicals, 62one chemical, 63
chemical riskimpoverished countries, 109occupational, 109
chemical risk assessment, 34–35, 98–108animal tests, 105cancer, 104–108dose–response, 105excess tumors, 105exposure assessment, 105hazard identification, 104maximum tolerated dose, 105no safe dose, 105potency factor, 106risk
assumptions, 107risk characterization, 106upper-bound risk, 108
cancer dose–response assessment, 105definition, 34dose responsereference dose, 101safety factor, 101
dose–responseNOAEL, 101
dose–response assessment, 100,101, 105
ecosystem assessment, 108exposure assessment, 100most highly exposed, 103route of, 103source, 103worse-case, 103
future of, 113hazard, 98
hazard assessment, 100hazard identification, 100hazardous waste sites
indicator chemicals, 99human subjects, 102non-cancer, 100–104pesticides
cumulative risk, 104risk characterization, 100
hazard quotient, 104safety factor
children, 465factors of 10, 102–103
what it compensates for, 99when warranted, 99why do, 99
chemical risk management,110–113
factors considered, 110laws and regulations, 110legislative tools, 110negligible risk, 110
chemical toxicity, 62aflatoxins, action level, 74ammonia, 218arsenic, 64, 453
drinking water, 293epidemiologic studies, 295exposure
chronic, 293drinking water, 451sources of, 453
exposure levels, 295gangrene, 294in utero, 295key environmental health
problem, 451local and systemic effects, 73mass poisoning, 293murders, 452reducing risk, 294–295
asbestos, 12, 73atrazine, 114benzene, 65cadmium, 70caffeine, 62carbofuran, 469carbon monoxide, 72, 388carbon tetrachloride, 62DDT, 413, 415DES, 83dibromochloropropane, 76diethylene glycol, 102dioxins, 413endosulfan, 469ethyl alcohol, 62, 72formaldehyde, 63, 64, 73
565 Index
chemical toxicity, (cont.)insecticides, 466–468
carbamates, 467DDT, 466organochlorines, 466organophosphates, 466
iron, 427lead
IQ and memory, 435mercury
inhalation, 66metals, 72, 427, 432methylmercury, 66, 447
wildlife, 444neomycin, 73nitrite
methemoglobin, 293nutrition and toxicity, 432oxalic acid, 62parathion, 65particles, 73PCBs, 413, 417
fetal brain, 417pesticides, 73, 466–469pesticides and children, 77radon, 12reactive gases, 73solanine, 62teratogens, 75thalidomide, 76tin, organo-, 433tobacco products, 76toxic element, 427trichloroethylene, 107vitamin A, 76
chemicals in the bodyabsorption, 64–65
ingestion, 64portal blood, 64
inhalation, 64lung alveoli, 64skin, 65
ADME, 64–68bioaccumulation, 35, 67biomagnification, 67
methylmercury, 67biomonitoring, 91body burden, 91–93
chemicals found, 91CDC studies, 91
usefulness, 93distribution and target organs, 65excretion
how occurs, 67metabolism, 65
biotransformation, 65storage, 66
chemistryacids, 556analytical, 19
vanishing zero, 42atomic mass, 540atomic nucleus
neutrons, 539protons, 539
atomic number, 540atoms, 539Avogadro’s constant, 552balancing reactions, 552, 554chemical bonds, 547
covalent, 545ionic, 546
electron, 540configuration, 543
electrostatic forces, 547elements, 539
electronegative, 543, 546electropositive, 543hydrogen, 540, 545deuterium, 542tritium, 542
lithium, 545noble, 543
free radicals, 550hydroxyl radical
atmospheric roles, 550incomplete products of combustion, 555isotopes
environmental chemistry, 542lithium, 542mercury, 441oxygen, 175radioisotopes, 175, 393, 543stable, 543what they are, 542
metal primer, 426molecular mass
calculating, 547neutralization, 557oxidation
hydrocarbons, 554oxidation reactions, 552–555periodic table, 540pH, 556reduction reactions, 553stable octet, 544stoichiometry, 552subatomic particles, 539valence, 544
chemistry, chemicalsacids, 556–558
ocean, 556–558acids, strong, 557acids, weak, 557
566 Index
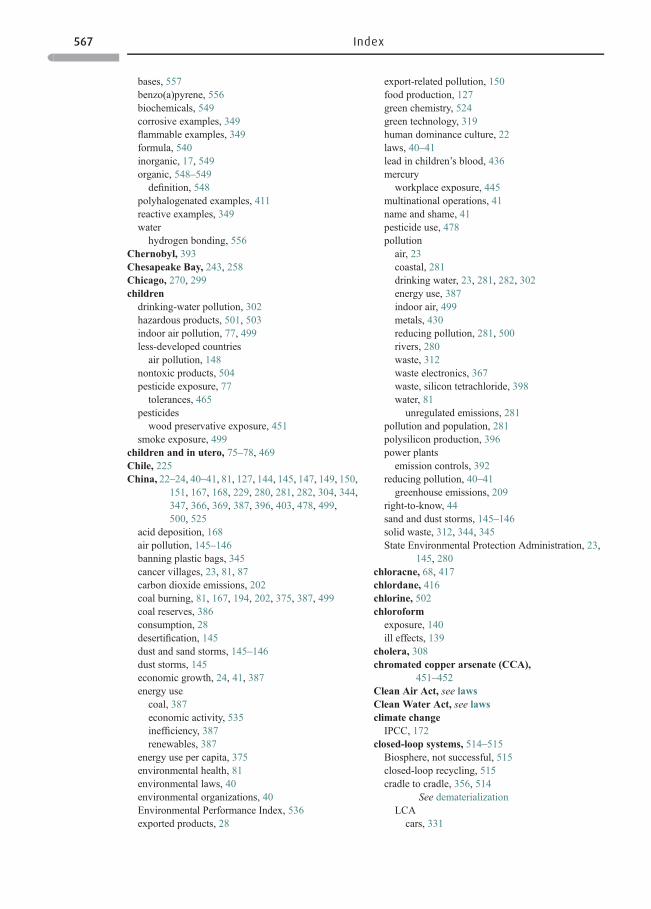
bases, 557benzo(a)pyrene, 556biochemicals, 549corrosive examples, 349flammable examples, 349formula, 540inorganic, 17, 549organic, 548–549definition, 548
polyhalogenated examples, 411reactive examples, 349waterhydrogen bonding, 556
Chernobyl, 393Chesapeake Bay, 243, 258Chicago, 270, 299children
drinking-water pollution, 302hazardous products, 501, 503indoor air pollution, 77, 499less-developed countriesair pollution, 148
nontoxic products, 504pesticide exposure, 77tolerances, 465
pesticideswood preservative exposure, 451
smoke exposure, 499children and in utero, 75–78, 469Chile, 225China, 22–24, 40–41, 81, 127, 144, 145, 147, 149, 150,
151, 167, 168, 229, 280, 281, 282, 304, 344,347, 366, 369, 387, 396, 403, 478, 499,500, 525
acid deposition, 168air pollution, 145–146banning plastic bags, 345cancer villages, 23, 81, 87carbon dioxide emissions, 202coal burning, 81, 167, 194, 202, 375, 387, 499coal reserves, 386consumption, 28desertification, 145dust and sand storms, 145–146dust storms, 145economic growth, 24, 41, 387energy usecoal, 387economic activity, 535inefficiency, 387renewables, 387
energy use per capita, 375environmental health, 81environmental laws, 40environmental organizations, 40Environmental Performance Index, 536exported products, 28
export-related pollution, 150food production, 127green chemistry, 524green technology, 319human dominance culture, 22laws, 40–41lead in children’s blood, 436mercury
workplace exposure, 445multinational operations, 41name and shame, 41pesticide use, 478pollution
air, 23coastal, 281drinking water, 23, 281, 282, 302energy use, 387indoor air, 499metals, 430reducing pollution, 281, 500rivers, 280waste, 312waste electronics, 367waste, silicon tetrachloride, 398water, 81
unregulated emissions, 281pollution and population, 281polysilicon production, 396power plants
emission controls, 392reducing pollution, 40–41
greenhouse emissions, 209right-to-know, 44sand and dust storms, 145–146solid waste, 312, 344, 345State Environmental Protection Administration, 23,
145, 280chloracne, 68, 417chlordane, 416chlorine, 502chloroformexposure, 140ill effects, 139
cholera, 308chromated copper arsenate (CCA),
451–452Clean Air Act, see lawsClean Water Act, see lawsclimate changeIPCC, 172
closed-loop systems, 514–515Biosphere, not successful, 515closed-loop recycling, 515cradle to cradle, 356, 514
See dematerializationLCA
cars, 331
567 Index
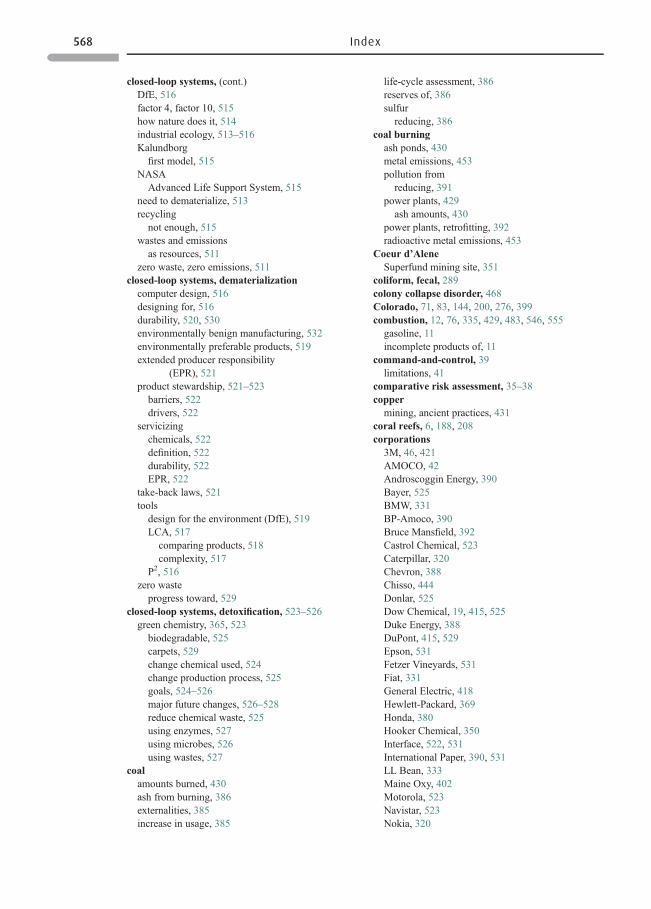
closed-loop systems, (cont.)DfE, 516factor 4, factor 10, 515how nature does it, 514industrial ecology, 513–516Kalundborg
first model, 515NASA
Advanced Life Support System, 515need to dematerialize, 513recycling
not enough, 515wastes and emissions
as resources, 511zero waste, zero emissions, 511
closed-loop systems, dematerializationcomputer design, 516designing for, 516durability, 520, 530environmentally benign manufacturing, 532environmentally preferable products, 519extended producer responsibility
(EPR), 521product stewardship, 521–523
barriers, 522drivers, 522
servicizingchemicals, 522definition, 522durability, 522EPR, 522
take-back laws, 521tools
design for the environment (DfE), 519LCA, 517
comparing products, 518complexity, 517
P2, 516zero waste
progress toward, 529closed-loop systems, detoxification, 523–526green chemistry, 365, 523
biodegradable, 525carpets, 529change chemical used, 524change production process, 525goals, 524–526major future changes, 526–528reduce chemical waste, 525using enzymes, 527using microbes, 526using wastes, 527
coalamounts burned, 430ash from burning, 386externalities, 385increase in usage, 385
life-cycle assessment, 386reserves of, 386sulfur
reducing, 386coal burning
ash ponds, 430metal emissions, 453pollution from
reducing, 391power plants, 429
ash amounts, 430power plants, retrofitting, 392radioactive metal emissions, 453
Coeur d’AleneSuperfund mining site, 351
coliform, fecal, 289colony collapse disorder, 468Colorado, 71, 83, 144, 200, 276, 399combustion, 12, 76, 335, 429, 483, 546, 555
gasoline, 11incomplete products of, 11
command-and-control, 39limitations, 41
comparative risk assessment, 35–38copper
mining, ancient practices, 431coral reefs, 6, 188, 208corporations
3M, 46, 421AMOCO, 42Androscoggin Energy, 390Bayer, 525BMW, 331BP-Amoco, 390Bruce Mansfield, 392Castrol Chemical, 523Caterpillar, 320Chevron, 388Chisso, 444Donlar, 525Dow Chemical, 19, 415, 525Duke Energy, 388DuPont, 415, 529Epson, 531Fetzer Vineyards, 531Fiat, 331General Electric, 418Hewlett-Packard, 369Honda, 380Hooker Chemical, 350Interface, 522, 531International Paper, 390, 531LL Bean, 333Maine Oxy, 402Motorola, 523Navistar, 523Nokia, 320
568 Index
Occidental Chemical, 350Panasonic, 369Pillsbury, 531Proctor & Gamble, 415, 518Raytheon, 523Renault, 331Rohm and Hass, 391Sony, 369Sunoco, 380Toyota, 380, 532Unilever, 50Union Carbide, 18, 42Volvo, 331, 518Wal-Mart, 325Xerox, 520, 522, 531
cotinine, 91crabs, 242, 274, 277cradle to cradle, 356criteria air pollutants, see air pollutants,
criteriaCryptosporidium parvum, 289, 300curare, 59Curitiba, 25, 311, 337, 345, 346, 536Czech Republic, 151
right-to-know, 44
Davis, 475DDT, 15, 17, 35, 66, 67, 75, 77, 82, 83, 86, 92, 106, 107,
108, 156, 248, 258, 410, 412, 415, 416, 420,421, 423, 457, 458, 459, 466, 467, 471, 478,481 see also persistent organic pollutants(POPs); see also pesticidal chemicals
biomagnification, 466malaria, 415metabolite, 92one of “dirty dozen”, 415
dead zones, 273, 276–279Black Sea, 278recovery, 278
description, 277Gulf of Mexico, 276–278nitrate fertilizer, 277reducingCAFOs, 279fertilizer, 279
water pollution, nitrogen glut, 273dematerialization, 516Denmark, 51, 107, 399, 447
industrial symbiosis, 51DES, 83, 84, 93, 94desert
Gobi, 144, 146Sahara and Sahel, 144
desertification, 6, 145, 146, 147, 148,153, 202
and pollution, 145design for disassembly (DfD), 320
design for the environment, see alsoDfE, closed-loopsystems
design for disassembly, 320, 369cars, 331
remanufacturing examples, 320design for the environment (DfE)Detroit, 361DfE, 48, 316, 365, 370, 516, 517, see also green
chemistryand design for disassembly, 320, 331design changes, 324design for durability, 520design for waste minimization, 334, 369, 534electronic equipment, 324examples of, 519green chemistry, 523redesigning electronics, 369reducing excess material, 333reducing hazardous waste, 365take-back programs, 333
Dhaka, 344dibromochloropropane, 76dichlorodiphenyltrichloroethane, see DDTdiethylene glycol, 102diethylstilbestrol, see DESdimethyl sulfoxide (DMSO), 65dioxins, 14, 17, 35, 37, 44, 65, 67, 68, 90, 92, 93, 114,
134, 338, 350, 351, 363, 412, 415, 416, 417,418, 420, 444, 448, 488
air emissions, 14as PBTs, 414bioaccumulation, 67bioavailability, 66biomagnification, 90cannot totally ban, 416chloracne, 417chlorine-using processes, 90combustion, 90processes that produce, 416
dissolved oxygen, 241, 242, 259, 276, 279Dobson units
see stratospheric ozone depletion, 221Dominican Republic, 146drinking waterbackground, 286bottled
compared to tap, 299environmental impact, 299standards, 299
contaminated, 300human waste, 300–303ill effects, 300
issuesmost sensitive groups, 298population, 298
less-developed countries, 300–302cholera, 308
569 Index
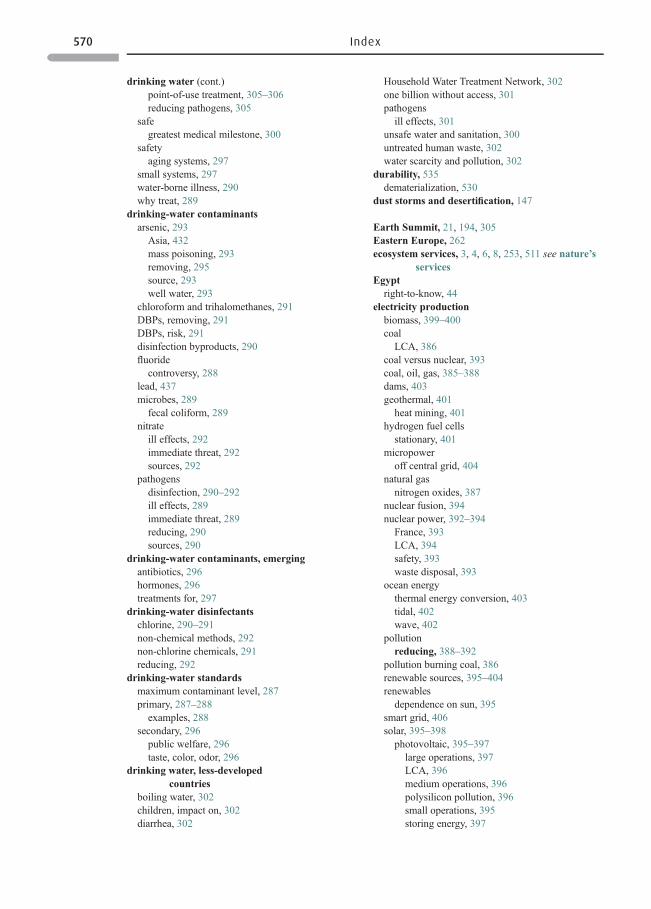
drinking water (cont.)point-of-use treatment, 305–306reducing pathogens, 305
safegreatest medical milestone, 300
safetyaging systems, 297
small systems, 297water-borne illness, 290why treat, 289
drinking-water contaminantsarsenic, 293
Asia, 432mass poisoning, 293removing, 295source, 293well water, 293
chloroform and trihalomethanes, 291DBPs, removing, 291DBPs, risk, 291disinfection byproducts, 290fluoride
controversy, 288lead, 437microbes, 289
fecal coliform, 289nitrate
ill effects, 292immediate threat, 292sources, 292
pathogensdisinfection, 290–292ill effects, 289immediate threat, 289reducing, 290sources, 290
drinking-water contaminants, emergingantibiotics, 296hormones, 296treatments for, 297
drinking-water disinfectantschlorine, 290–291non-chemical methods, 292non-chlorine chemicals, 291reducing, 292
drinking-water standardsmaximum contaminant level, 287primary, 287–288
examples, 288secondary, 296
public welfare, 296taste, color, odor, 296
drinking water, less-developedcountries
boiling water, 302children, impact on, 302diarrhea, 302
Household Water Treatment Network, 302one billion without access, 301pathogens
ill effects, 301unsafe water and sanitation, 300untreated human waste, 302water scarcity and pollution, 302
durability, 535dematerialization, 530
dust storms and desertification, 147
Earth Summit, 21, 194, 305Eastern Europe, 262ecosystem services, 3, 4, 6, 8, 253, 511 see nature’s
servicesEgypt
right-to-know, 44electricity production
biomass, 399–400coal
LCA, 386coal versus nuclear, 393coal, oil, gas, 385–388dams, 403geothermal, 401
heat mining, 401hydrogen fuel cells
stationary, 401micropower
off central grid, 404natural gas
nitrogen oxides, 387nuclear fusion, 394nuclear power, 392–394
France, 393LCA, 394safety, 393waste disposal, 393
ocean energythermal energy conversion, 403tidal, 402wave, 402
pollutionreducing, 388–392
pollution burning coal, 386renewable sources, 395–404renewables
dependence on sun, 395smart grid, 406solar, 395–398
photovoltaic, 395–397large operations, 397LCA, 396medium operations, 396polysilicon pollution, 396small operations, 395storing energy, 397
570 Index
solar, concentrated, 397wind machinesstoring energy, 398
Emergency Planning and Community Right-to-Know Act (EPCRA), see laws, US
emissions trading, 110endocrine disrupter, see hormones,
environmentalend-of-pipe, 39, 45
definition, 39endosulfan, 469energy use, world, 374–377
coal, 375conservationin industry, 390–392in the home, 388–389
conservation and efficiency, 388–392conservation, promoting, 403energy intensity, 407fossil fuels, 375future possibilities, 407increased demand, 374associated pollution, 374
industrycogeneration, recycled energy, 391district heating, 390electric motors, 390energy audit, 391manufacturing, 390reducing
clean coal technology, 391cleaner fuels, 391
reducing use, 392steam generation, 390waste energy, 391
Japan as a model, 407rural poor, 405wood and other biofuels, 375
England, 107environmental health, poverty, 21environmental hormones
potential human impact, 86environmental issues
high-risk global issues, 36US trendsUS EPA, 512
environmental justice, 110Environmental Performance Index, 535
good governance, 536environmentally benign manufacturing, 532environmentally preferable products, 318epidemics
cancer, 83water-borne, 290
epidemiology, 93–97benzene, 94biological plausibility, 96
birth defects, 96chimney sweeps, 94cluster, 95community studies, 95confounding factors, 94definition, 93electromagnetic fields, 96exposure evaluation, 94judging studies, 95–96limits of, 96occupational exposures, 94PCBs, 418radon, 94risk factor, 96scrotal cancer, 94
EPR, 325, 331, 333, 368, 521, 522ethanol, 400from cellulosic material, 383from corn, 383
ethanol and aflatoxins, 78Ethiopia, 480EU, 44, 403, 407, 420, 422 see also European UnionEurope, 23, 24, 27, 28, 76, 78, 101, 112, 121, 134, 141,
143, 147, 150, 151, 152, 156, 165, 166, 168,174, 190, 202, 223, 263, 264, 269, 270, 272,278, 279, 297, 298, 299, 365, 369, 370, 385,390, 397, 399, 408, 426, 431, 435, 446, 522,532, 533, 536
air pollutants, 141energy production
coal, 385European Pollutant Emission Register, see laws, EUEuropean Union, 44, 85, 111, 134, 151, 152, 165, 194,
195, 324, 342, 365Producer Pays Program, 325
exotic, 1, 278, 475control agents, danger, 475
exposure to chemicals, see chemical exposureextended producer responsibility (EPR), 325Exxon Valdez oil spill, 246, 444
FDA, see agencies: US Food and DrugAdministration
Federal Insecticide, Fungicide, and Rodenticide Act,see laws
fire retardantsPBDEs, 414
fishable and swimmable, 39, 236, 255Florida, 7, 79, 82, 83, 86, 144, 441, 461, 463fluorine, 543, 544formaldehydeill effects, 139
France, 14, 74, 331, 371, 392, 459, 536Freedom Car, 382frogs, 82, 114, 158, 244, 274, 469fuel cells, 381furans, see dioxins
571 Index
gasolinecombustion, 11
general circulation models,see global warming
genetically engineered organism (GEO)why develop, 461
Geneva, 299GEOs, 461, 476geothermalelectricity production, 401space heating, 401
Germany, 14, 24, 151, 158, 166, 201, 232,297, 331, 332, 333, 337, 396, 397, 399,452, 494, 536
recycling, 322Ghana, 265Giardia lamblia, 289, 290global dimming, 23, 143global distillation, see grasshopper effectglobal warminga warming earth, 176–178assessing, 182–185
GCMs, 182–184IPCC report, 184, 206
background, 170feedback loop, 186heat island, 176how seen, 64–68
future, 206–208melting ice, 178permafrost, 180sea levels, 182warming earth, 176warming oceans, 178
ice-core studies, 173–175ice-core bubbles, 542mitigation, 203–205natural?, 183
external forcings, 183human signature, 183sun’s radiation, 183
reducingcarbon dioxide, 196CFCs, 198economics of, 206fluorochemicals, 198how, 196–198International Energy
Agency, 208Kyoto, 194–196Kyoto, beyond, 208less-developed countries, 209methane, 198Montreal Protocol, 198nitrous oxide, 199political entities, 199–203soot, 199
global warming, greenhouse gasescarbon dioxide, 187–188
sinks, 187sources, 187
carbon dioxide equivalent, 185CFCs and others, 192levels of, 173livestock emissions, 192methane, 189–190
fate, 190sources, 189
nitrous oxide, 191ocean acidification, 188ozone
fate, 191soot, 192water vapor, 186
Gobi desert, 144grasshopper effect, 15–16, 413Great Lakes, 67, 255, 256, 284, 410, 417, 418, 419,
420, 423, 433, 466green chemistry
designing chemicals, 415what it is, 523
Green Revolution, 480Greenland, 449growth regulators, 472Gulf of Mexico, 250, 276, 277,
278, 279
Haber-Bosch, 273, 275fertilizer, 273population growth, 273
Hawaii, 435hazard
definition, 35variety of meanings, 99
Hazard and risk, 34hazardous air pollutants, see air pollutants, HAPs,
air pollutants, hazardoushazardous products, 500–502
alternatives, 504characteristics
corrosiveexamples, 501
flammableexamples, 502labels, 501
more than one hazard, 502reactive, 502examples, 502
toxic, 501HHW
antifreeze, 507collection programs, 507paint, oil-based, 507pesticides, 507
572 Index
reducing amounts, 508used oil, 507
household hazardous waste(HHW), 506
labels, 491, 502–504caution, 503nontoxic, 504
reducing exposure, 504reducing HHW, 506required information, 503safe use, 504toxiclabels, 501
TUR, 504ventilation, 504
hazardous wastecharacteristics, 348corrosive, 349flammable, 349reactive, 349toxic, 348
generators, 352hazard or risk, 349reducing generation, 365tracking cradle to grave, 356why important, 348WMH, 353–355disposal, 354pollution prevention, 353recycling and reuse, 353sources, 352treatment, 355, 363
bioremediation, 354purposes of, 354
hazardous waste generatorsindustry categories, 349
hazardous waste sites, 350, 351brownfields, 361cleanupbioremediation, 363genetically modified organisms, 363metal contamination, 362phytoremediation, 363site specific standards, 361
cleanup methods, 361–363definition, 356evaluating, 356old, 350reducing risk, 360–361cleanup, 360–361imminent hazard, 360
Superfund, 356hazardous waste sites, Superfund, 71
Coeur d’Alene megasite, 351Love Canal, 350cleanup, 350dioxins, 351
mining megasites, 351National Priority List, 356Smuggler Mountain, 71
hazardous waste, household, 349composition, 352
hazardous waste, international transport, 364–365Basel Convention
Control of Transboundary Movements ofHazardous Wastes, 364–365
electronic waste, 370electronics
illegal movement, 366ships, old, 370–371
hazardsold buildings
asbestos, 505heat island, see global warmingheavy metal, 304, 362, 370definition, 427
helium, 545hemoglobin, 60, 120, 293, 549hexachlorobenzene, 415as PBT, 415
hexazinone, 470Hong Kong, 343hormones, 80cortisol, 295estrogen, 62hormone receptor, 62pharmaceutical
androgens, 86pharmaceutical estrogens, 83
hormones, environmental, 80–86alligators, 82BPA, 83dioxins, DDT and PCBs, 413estrogen mimic
DDT, 82Lake Apopka, 82mimics, 62phthalates, 85
infant males, 101phytoestrogens, 81, 86pollutant, 62
Houston, 25, 123air pollution, 118
Hudson River, 417Human Domination, 1, 33, 512Hungary, 14hydrocarbons, 133, 489hydrochloric acid, 556hydrogenfuel cell, 381
Iceland, 401, 402incomplete products of combustionexamples, 555
573 Index
India, 12, 22, 149, 265, 302, 371,407, 536
coal reserves, 386energy use, 387
economic activity, 535energy use per capita, 375Kerala, 25power plants emission controls, 392steel, 370
individualsconsequences of actions, 334personal actions, 319pollution prevention examples, 48recycling and reuse
examples, 49Indonesia, 452, 479indoor air pollutants, 483–500auto exhaust, 488benzene
description, 490ill effects, 490sources, 490
biologicaldescription, 493
carbon monoxide sources, 487–488formaldehyde
description, 489ill effects, 490
from carpets, 494from combustion appliances, 487from consumer products
advice, 491reducing exposure, 486
from stoves, fireplaces, 488moisture
mold, 492reducing, 492
mold, 486nitrogen oxides
combustion appliances, 487other chemicals, 491PAHs
benzo(a)pyrene, 489description, 489sources, 489
paradichlorobenzenesources, 491
particulatescombustion appliances, 487description, 494sources, 494
PERCsources, 490
radonaction level, 494, 498how generated, 494ill effects, uncertainty, 498
lung cancer, 498polonium-218 and -214, 497reducing levels, 497smoking, 497, 498sources, 494testing for, 497well water, 497
tobacco smoke, 487ubiquitous chemicals, 488VOCs
sources, 488indoor air pollution, 77
background, 483ill effects, 485–486
chronic, 486examples, 485temporary, 486
reducing, 493ventilation, 486
sources, 483indoor air pollution, less-developed countries,
499–500carbon monoxide, 499China, 500
indoor air pollutionill effects, 499reducing
alternative fuels, 500efficient stoves, 500
reducing exposure, 500smoke, 499
exposure, 499fuels used, 499
industrial ecology, 51–54, 513–515,513–516
phosphorus, 271ultimate goal, 514wastewater, 263
industrial symbiosis, 51–54integrated pest management, 268, 474
See IPMInuit, 15, 413, 416, 442ionizing radiation, see also indoor air pollutants:
radonalpha, beta, gamma particles, 497carbon-14, 495cosmic rays, 495exposure sources, 496isotopes
nuclear fission, 394radioisotopes, 495
potassium-40, 495radioisotopes, 175
half-life, 497radon, 497tritium, 542uranium, thorium, 393
574 Index
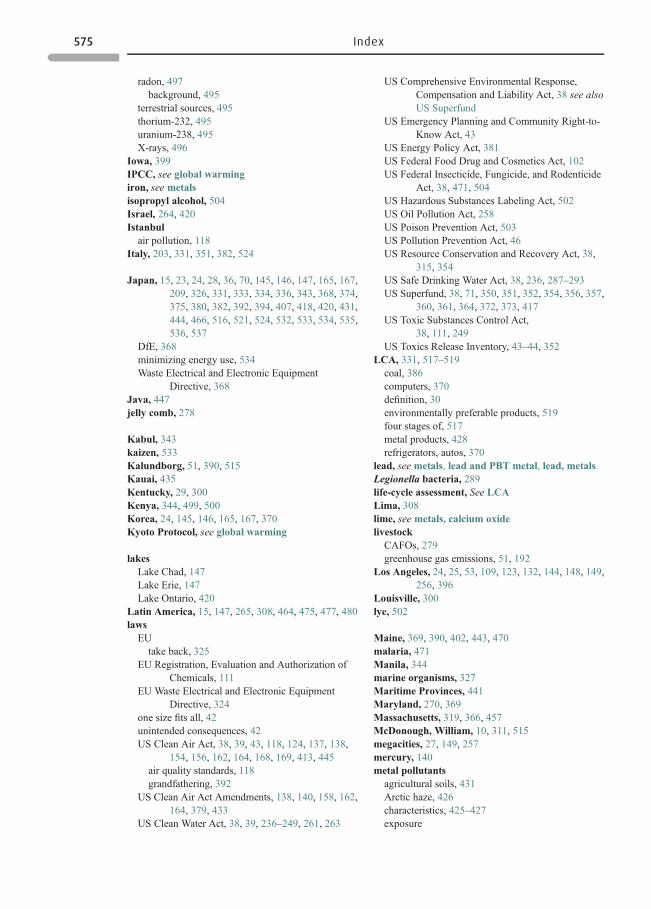
radon, 497background, 495
terrestrial sources, 495thorium-232, 495uranium-238, 495X-rays, 496
Iowa, 399IPCC, see global warmingiron, see metalsisopropyl alcohol, 504Israel, 264, 420Istanbul
air pollution, 118Italy, 203, 331, 351, 382, 524
Japan, 15, 23, 24, 28, 36, 70, 145, 146, 147, 165, 167,209, 326, 331, 333, 334, 336, 343, 368, 374,375, 380, 382, 392, 394, 407, 418, 420, 431,444, 466, 516, 521, 524, 532, 533, 534, 535,536, 537
DfE, 368minimizing energy use, 534Waste Electrical and Electronic Equipment
Directive, 368Java, 447jelly comb, 278
Kabul, 343kaizen, 533Kalundborg, 51, 390, 515Kauai, 435Kentucky, 29, 300Kenya, 344, 499, 500Korea, 24, 145, 146, 165, 167, 370Kyoto Protocol, see global warming
lakesLake Chad, 147Lake Erie, 147Lake Ontario, 420
Latin America, 15, 147, 265, 308, 464, 475, 477, 480laws
EUtake back, 325
EU Registration, Evaluation and Authorization ofChemicals, 111
EU Waste Electrical and Electronic EquipmentDirective, 324
one size fits all, 42unintended consequences, 42US Clean Air Act, 38, 39, 43, 118, 124, 137, 138,
154, 156, 162, 164, 168, 169, 413, 445air quality standards, 118grandfathering, 392
US Clean Air Act Amendments, 138, 140, 158, 162,164, 379, 433
US Clean Water Act, 38, 39, 236–249, 261, 263
US Comprehensive Environmental Response,Compensation and Liability Act, 38 see alsoUS Superfund
US Emergency Planning and Community Right-to-Know Act, 43
US Energy Policy Act, 381US Federal Food Drug and Cosmetics Act, 102US Federal Insecticide, Fungicide, and Rodenticide
Act, 38, 471, 504US Hazardous Substances Labeling Act, 502US Oil Pollution Act, 258US Poison Prevention Act, 503US Pollution Prevention Act, 46US Resource Conservation and Recovery Act, 38,
315, 354US Safe Drinking Water Act, 38, 236, 287–293US Superfund, 38, 71, 350, 351, 352, 354, 356, 357,
360, 361, 364, 372, 373, 417US Toxic Substances Control Act,
38, 111, 249US Toxics Release Inventory, 43–44, 352
LCA, 331, 517–519coal, 386computers, 370definition, 30environmentally preferable products, 519four stages of, 517metal products, 428refrigerators, autos, 370
lead, see metals, lead and PBT metal, lead, metalsLegionella bacteria, 289life-cycle assessment, See LCALima, 308lime, see metals, calcium oxidelivestockCAFOs, 279greenhouse gas emissions, 51, 192
Los Angeles, 24, 25, 53, 109, 123, 132, 144, 148, 149,256, 396
Louisville, 300lye, 502
Maine, 369, 390, 402, 443, 470malaria, 471Manila, 344marine organisms, 327Maritime Provinces, 441Maryland, 270, 369Massachusetts, 319, 366, 457McDonough, William, 10, 311, 515megacities, 27, 149, 257mercury, 140metal pollutantsagricultural soils, 431Arctic haze, 426characteristics, 425–427exposure
575 Index
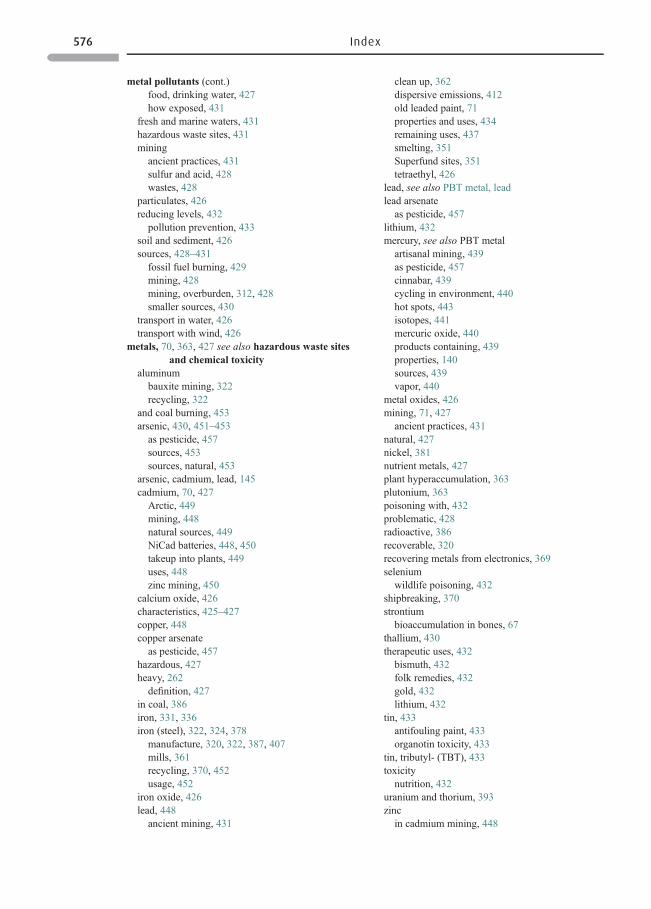
metal pollutants (cont.)food, drinking water, 427how exposed, 431
fresh and marine waters, 431hazardous waste sites, 431mining
ancient practices, 431sulfur and acid, 428wastes, 428
particulates, 426reducing levels, 432
pollution prevention, 433soil and sediment, 426sources, 428–431
fossil fuel burning, 429mining, 428mining, overburden, 312, 428smaller sources, 430
transport in water, 426transport with wind, 426
metals, 70, 363, 427 see also hazardous waste sitesand chemical toxicity
aluminumbauxite mining, 322recycling, 322
and coal burning, 453arsenic, 430, 451–453
as pesticide, 457sources, 453sources, natural, 453
arsenic, cadmium, lead, 145cadmium, 70, 427
Arctic, 449mining, 448natural sources, 449NiCad batteries, 448, 450takeup into plants, 449uses, 448zinc mining, 450
calcium oxide, 426characteristics, 425–427copper, 448copper arsenate
as pesticide, 457hazardous, 427heavy, 262
definition, 427in coal, 386iron, 331, 336iron (steel), 322, 324, 378
manufacture, 320, 322, 387, 407mills, 361recycling, 370, 452usage, 452
iron oxide, 426lead, 448
ancient mining, 431
clean up, 362dispersive emissions, 412old leaded paint, 71properties and uses, 434remaining uses, 437smelting, 351Superfund sites, 351tetraethyl, 426
lead, see also PBT metal, leadlead arsenate
as pesticide, 457lithium, 432mercury, see also PBT metal
artisanal mining, 439as pesticide, 457cinnabar, 439cycling in environment, 440hot spots, 443isotopes, 441mercuric oxide, 440products containing, 439properties, 140sources, 439vapor, 440
metal oxides, 426mining, 71, 427
ancient practices, 431natural, 427nickel, 381nutrient metals, 427plant hyperaccumulation, 363plutonium, 363poisoning with, 432problematic, 428radioactive, 386recoverable, 320recovering metals from electronics, 369selenium
wildlife poisoning, 432shipbreaking, 370strontium
bioaccumulation in bones, 67thallium, 430therapeutic uses, 432
bismuth, 432folk remedies, 432gold, 432lithium, 432
tin, 433antifouling paint, 433organotin toxicity, 433
tin, tributyl- (TBT), 433toxicity
nutrition, 432uranium and thorium, 393zinc
in cadmium mining, 448
576 Index
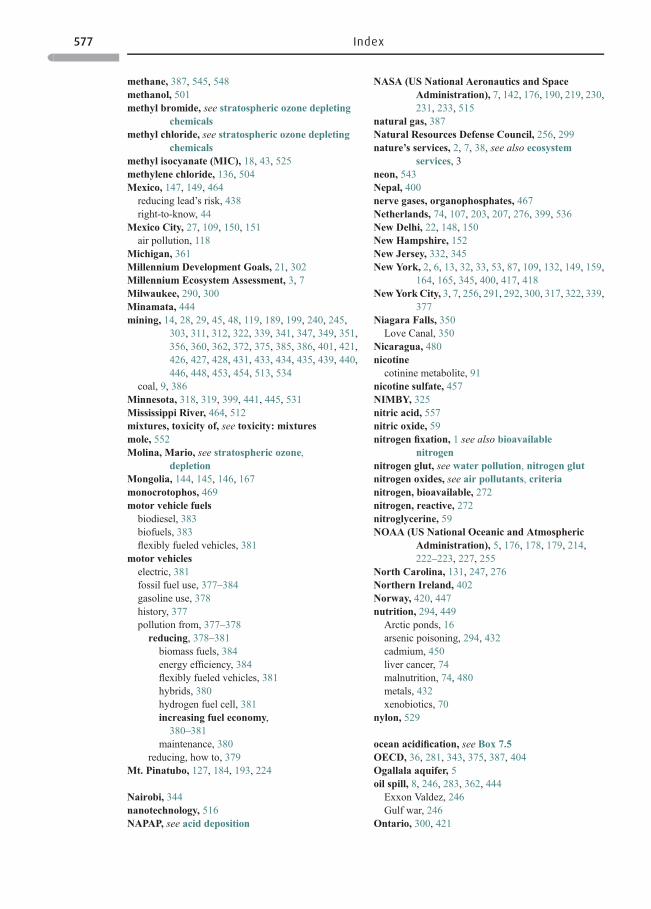
methane, 387, 545, 548methanol, 501methyl bromide, see stratospheric ozone depleting
chemicalsmethyl chloride, see stratospheric ozone depleting
chemicalsmethyl isocyanate (MIC), 18, 43, 525methylene chloride, 136, 504Mexico, 147, 149, 464
reducing lead’s risk, 438right-to-know, 44
Mexico City, 27, 109, 150, 151air pollution, 118
Michigan, 361Millennium Development Goals, 21, 302Millennium Ecosystem Assessment, 3, 7Milwaukee, 290, 300Minamata, 444mining, 14, 28, 29, 45, 48, 119, 189, 199, 240, 245,
303, 311, 312, 322, 339, 341, 347, 349, 351,356, 360, 362, 372, 375, 385, 386, 401, 421,426, 427, 428, 431, 433, 434, 435, 439, 440,446, 448, 453, 454, 513, 534
coal, 9, 386Minnesota, 318, 319, 399, 441, 445, 531Mississippi River, 464, 512mixtures, toxicity of, see toxicity: mixturesmole, 552Molina, Mario, see stratospheric ozone,
depletionMongolia, 144, 145, 146, 167monocrotophos, 469motor vehicle fuels
biodiesel, 383biofuels, 383flexibly fueled vehicles, 381
motor vehicleselectric, 381fossil fuel use, 377–384gasoline use, 378history, 377pollution from, 377–378reducing, 378–381
biomass fuels, 384energy efficiency, 384flexibly fueled vehicles, 381hybrids, 380hydrogen fuel cell, 381increasing fuel economy,
380–381maintenance, 380
reducing, how to, 379Mt. Pinatubo, 127, 184, 193, 224
Nairobi, 344nanotechnology, 516NAPAP, see acid deposition
NASA (US National Aeronautics and SpaceAdministration), 7, 142, 176, 190, 219, 230,231, 233, 515
natural gas, 387Natural Resources Defense Council, 256, 299nature’s services, 2, 7, 38, see also ecosystem
services, 3neon, 543Nepal, 400nerve gases, organophosphates, 467Netherlands, 74, 107, 203, 207, 276, 399, 536New Delhi, 22, 148, 150New Hampshire, 152New Jersey, 332, 345New York, 2, 6, 13, 32, 33, 53, 87, 109, 132, 149, 159,
164, 165, 345, 400, 417, 418NewYork City, 3, 7, 256, 291, 292, 300, 317, 322, 339,
377Niagara Falls, 350Love Canal, 350
Nicaragua, 480nicotinecotinine metabolite, 91
nicotine sulfate, 457NIMBY, 325nitric acid, 557nitric oxide, 59nitrogen fixation, 1 see also bioavailable
nitrogennitrogen glut, see water pollution, nitrogen glutnitrogen oxides, see air pollutants, criterianitrogen, bioavailable, 272nitrogen, reactive, 272nitroglycerine, 59NOAA (US National Oceanic and Atmospheric
Administration), 5, 176, 178, 179, 214,222–223, 227, 255
North Carolina, 131, 247, 276Northern Ireland, 402Norway, 420, 447nutrition, 294, 449Arctic ponds, 16arsenic poisoning, 294, 432cadmium, 450liver cancer, 74malnutrition, 74, 480metals, 432xenobiotics, 70
nylon, 529
ocean acidification, see Box 7.5OECD, 36, 281, 343, 375, 387, 404Ogallala aquifer, 5oil spill, 8, 246, 283, 362, 444Exxon Valdez, 246Gulf war, 246
Ontario, 300, 421
577 Index
orebauxite, 322cinnabar, 439copper, 431gold, 29iron, 370lead, 29, 431metal, 245, 311, 429
Oregon, 399oxalic acid, 501ozone hole, see stratospheric ozone depletionozone, ground level, see air pollutants, criteriaozone, stratospheric, see stratospheric ozone
Pacific Garbage Patch, 325–328Pacific Ocean, 24, 144, 178, 326, 422packagingfunctions of, 324
PAHs (polycyclic aromatic hydrocarbons), seecriteria air pollutants (criteria) and indoorair pollutants
bioavailability, 66Pakistan, 370Paracelsus, 57parathion, 467Paris, 109pathogens, 300–302wells, where site, 297
PBDEs, 419–420blood of house cats, 420Canadian Arctic, 420fire retardants, 414, 419in breast milk, 420in foods, 420outgassing, 419reducing, 420toxicity, 420
PBT metal, cadmium, 448–451bioaccumulation, 67, 449, 453exposure
limits, 453study of, 450vegetarians, smokers, 449why in food, 448–451
exposure sourcesfood, 449
ill effects, 70, 449–450calcium metabolism, 450carcinogen, 450epidemiologic study, 450itai itai, 70occupational exposure, 449target organs, 449
levels in environment, 448reducing levels
Australia, 450batteries, 450regulations, 451
sources, 448transport, 449
PBT metal, lead, 434–438bioaccumulation, 67blood levels, 436
prehistoric, 438exposure sources
children, 435home and workplace, 435
ill effects, 435IQ and memory, 436Zambian children, 87
lead from earlier emissions, 434reducing risk
from gasoline, 436from paint, 436lead safe, 437old lead, 437
from soil, 362sources, 434
natural, 438storage in bones, teeth, 435transport, 435
PBT metal, mercury, 415, 438–448Arctic animals, 416biomagnification, 67, 442, 444, 448
fish, 441blood levels, 447exposure
dental amalgams, 446fish, 103, 442fish-eating animals, 442Inuit, 442prenatal, 442wildlife, 443workplace, 443
fish advisories, 444commercial fish, 444
ill effects, 444humans, 444mad hatter, 438poisoning, Minamata, 444
mercury to methylmercury, 403, 431,439, 442
reducing deposition, 445reducing risk, 446
changing industrial processes, 446combustion, 445dental amalgams, 447eliminating products, 446international reductions, 446regulations, 445workplace, 445
riskguidelines, 447prenatal, 447selling mercury, 448
sediment, 426
578 Index
sources, 440mining, 440power plants, 440
transport, 441atmospheric lifetime, 440identifying sources, 441
transport and accumulation, 440PBTs, metals, 434
multiple problems, 412PBTs, organic
Arctic animals, 413bodies of Inuit, 413characteristics, 411–413characteristicsbioaccumulation, 411biomagnification, 412persistence, 411toxic, 413transport, 413volatility, 413
DDT, 466decreases in Arctic animals, 416“dirty dozen” polychlorinated , 415emissionsdispersive, 412
fire retardants, 414multiple problems, 412names of “dirty dozen”, 415number of, 410PBT examples, 414PCBs, 548–549PFOSs, 421–422polybrominated fire retardants (PBDEs), 414,
419–420polyhalogenated, 411POPs, 411reducing, 413–416screening for, 414
PCBs, 11, 15, 17, 38, 67, 68, 72, 73, 75, 90, 92, 103,107, 156, 219, 243, 249, 262, 288, 357, 363,369, 370, 410, 412, 415, 416, 417, 418, 420,421, 422, 423, 424, 444, 448
bioaccumulation, 67, 412bioavailability, 66chloracne, 417cooking oil contamination, 418cycling in environment, 417epidemiological studies, 418exposure today, 417family, 417–419fish exposure, 418Great Lakes fish, 419Hudson Rivercontamination and cleanup, 417–418Superfund site
dredge sediment, 418obvious toxicity, 418
sediment concentration, 417subtle toxicity, 419toxicity, 417, 418, 419ubiquitous contaminant, 417uses, 417where still found, 416
Pennsylvania, 332, 495persistent organic pollutants (POPs) see also PBTspersistent, bioaccumulative, and toxic, see PBTsPeru, 308, 477pest populationspest resurgence, 470resistance
development of, 470increasing problem, 471
secondary pest, 470pesticidal chemicals, 65atrazine, 464DDT
broad spectrum insecticide, 459history of, 457
fumigant examples, 459hydrogen cyanide, 457, 459methyl bromide, 459neem tree extract, 460nicotine sulfate, 457pheromone, 461pyrethrum, 457rotenone, 467
pesticide pollutioncrops and food, 465exposure, 464–466farming
conventional, 473IPM, 474organic, 473
ill effects, 466–469amphibians, 469birds, 468fish, 469humans, 469insecticides
carbamates, 467organophosphates, 466–467polychlorinated, 466
nontarget species, 468–469on pollinating insects, 468soil organic material, 470
organophosphatesfate, 467
pest resistance, 470–471POPs fate, 466POPs, persistence and climate, 464reducing risk, 471–476
biocontrol, 475changing farming methods,
473–475
579 Index
pesticide pollution (cont.)crop protectant, 472ecologically appropriate regions, 477educating farmers, 476green chemistry, 472organic farming, 473phermones and growth regulators, 472reducing pesticide use, 474regulations, 471sustainable farming, 476techniques, 474–475
residuesmonitoring imported food, 466monitoring produce, 465
sources of, 463–466transport, 463
POPs, 464where detected, 464
pesticides“dirty dozen”, 415alternatives to, 460arsenic
chickens, 452biopesticides, 461
botanicals, 460classes of, 460genetically engineered, 461microbials, 461
broad spectrum, 459categories, 457definition of, 456desirable characteristics, 473disinfectants, 459exposing insects, 467exposure
farmers’ children, 77flower growing, 78fumigants, 459herbicides, 468household hazardous waste, 457ingredients
active and inert, 471insecticides
organochlorine, 466persistence, 466polychlorinated examples, 466
introduction to, 456–458organophosphate metabolites, 91organophosphate, parathion, 467organophosphates, 60pest resistance, 458polychlorinated
POPs, 466solubility, 466
POPsquantities used, 463registration process, 465
school use, 78selective (narrow spectrum), 459testing in humans, 115tolerances, 465
what they are, 113types of, 459–461water solubility, 464who uses
almost everyone, 463why banned, 466why use, 456, 463
aesthetic reasons, 462, 463grow in more places, 462long storage time, 462longer season, 461monocultures, 462public health reasons, 462
wood preservative, 451pesticides, less-developed countries, 477–480
Cambodia, 478China, 478dangerous pesticides, 478Ethiopia, 480ill effects
poisoning, 477Indonesia, 479Nicaragua, 480obsolete pesticides, 478prior informed consent, 478reducing pesticide use, 479reducing risk
Farmer Field Schools, 479petroleum distillates, 504PFOSs
Arctic wildlife, 422bioaccumulative, 421fluorine chemicals, 421persistence, 421reducing levels, 422toxicity, 421
pH, see water pollutants, conventionalpH, ocean, 558phenol, 459pheromone, 472Philadelphia, 332, 380Philippines, 27, 184, 344phthalates, 85
metabolites, 92plasticizers, 414
Plant-Incorporated-Protectants, 461plasticizers, 414Poland, 151pollutant
concentrationsdescribed, 9
definition, 8oxidation, 17
580 Index
sources, 12transportair, 14chemical signature, 23grasshopper, 15transboundary, 23water, 14
pollutantsanthropogenic, 10barely detectable, 19buried, 16fate, 16fate and transport, 13inorganic, 17mineralization, 17natural, 10organicdegradation, 16fate, 16
pollutionactions at a distance, 29driversaffluence, 28individuals, 29, 30, 31population growth, 26technology, 28
electronic waste, 370less-developed countries, 21obvious, 8why it happens, 10
pollution indoor air, 77pollution prevention (P2), 46–48
definition, 45examples, 46industry, 47
housekeeping practices, 46polyacrylates, 524polyethylene terephthalate, 306, 323polysilicon, 396polyvinyl chloride, 532POPs, see also PBTs, organic
three families, 416population growth, 8, 12, 26, 27, 36, 171, 197, 260,
264, 286, 305, 470poverty and efficient resource use, 515
Portugal, 402Potomac River, 243precautionary principle, 85, 89, 112, 114, 447product stewardship, 521propane, 381pyrethrins, 460pyrethrum, 457
Quebec, 413
radon, 11, 107, 484, 485, 494–499, 545in mines, 498
radon-222, 497recyclingproblems, 49
recycling and reuse, 48–49examples, 49
red tide, 274Re-power Americacarbon-free energy, 406
reuse, 48Reykjavík, 402right-to-knowEurope, see laws, EU
Rio de Janeiro, 305riskdefinition, 35, 98
risk assessmentchemical, see also chemical risk assessmentcomparative, see also comparative risk
assessmentcomparative, 37individual activities, 334
risk management, see also chemical riskmanagement
children, 113greater protection, 113pesticides, 113
Europe, North America, 112non-regulatory tools, 111pesticide tolerance, 113precautionary principle, 111, 112
riverBig Sandy, 29Coeur Alene, 351Cuyahoga, 8Danube, 14, 278Emory, 430Hai, 23Hudson, 351, 417, 418Mississippi, 158, 250, 276, 277, 464, 512New River, 276Potomac, 83, 243Rhine, 14, 240, 280, 403, 418Songhua, 24Tisza, 14Yangtze, 3, 146, 280Yellow, 146, 280
Romania, 14Rowland, F. Sherwood see stratospheric ozone,
depletionRussia, 375, 394, 435rust, 426
Safe Drinking Water Act, see lawsSan Diego, 218San Francisco, 144, 254, 299, 321, 322, 337, 345,
377, 446sand storms, see air pollution
581 Index
sanitationgreatest medical milestone, 301
ScotchgardTM, 421Scotland, 402Seattle, 270, 533selenium, 432Seoul, 145septic systems, see wastewater treatmentservicizing, 522–523chemicals
how it works, 522sewage, 300–308shellfish, 139, 236, 247, 255, 258, 259, 274shipbreaking, 370–371silicon tetrachloride, 396silicosis, 69silver, see metals, silverSingapore, 264, 337, 343sludge, see wastewater treatmentsmog, history of word, 122smokers, 63, 133, 295, 431, 487, 488, 490, 497, 498sodium hydroxide, 557sodium hypochlorite, 459solanine, 62solar energy, 395–398passive, 398
solid wasteChina, 344combustion of, 336slums, 343sources, 311types, 311
solid waste, developed countriesmanagement, 343
solid waste, less-developed countriesin slums, 343problems, 343–345recovering value
Bangladesh, 344Curitiba, 345scavengers, 344
solid waste, municipal, 317components, 313composting, 329design for the environment (DfE) see design for the
environmentdisposal, irresponsible, 326environmentally preferable products, questions, 519ill effects, 313impact on oceans, 325–328junked cars, 331landfills, 341
bioreactor, 340leachate, 339methane, 339mining resources, 341sanitary, 339
Pacific Garbage Patch, land origin of, 326plastic bags, 345
banning, 345pollution prevention, 316
design for recycling, 369examples, 316reducing food waste, 317reducing toxicity, 317reducing volume, 316
quantities generated, US, 314recycling, 321–325
appliances, 324common materials, 322electronics, 324, 366, 368packaging, 324paper, 322plastics, 323challenges, 323
problems, 325promoting, 322, 331, 333used oil, 324why do, 321
recycling examples, 337reducing
environmentally preferable products, 317–318preferable products, 317guidelines, 318
take back, 334source reduction
reuse, 48treatment
incineration, 335–339Japan, 334pros and cons, 336regulation of, 338
two purposes, 335waste management hierarchy,
315, 335solid waste, social issues
EuropeGreen Dot, 325
landfillsNIMBY, 340siting, 340
take back, 325Europe, Japan, 333
source reduction, see pollution preventionreuse, 48
Soviet Union, 208, 278Spain, 396, 397, 420Stabilization Wedges
stabilizing atmospheric carbon dioxide, 406steel, 452Stockholm Convention, 420, 422 see Stockholm
Convention on Persistent OrganicPollutants
banning the “dirty dozen”, 415
582 Index
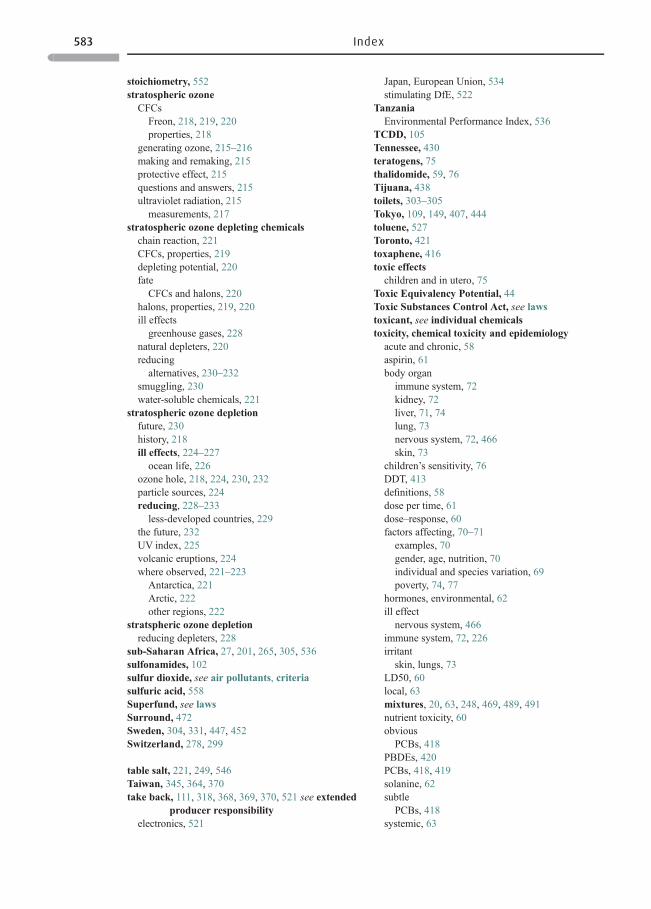
stoichiometry, 552stratospheric ozone
CFCsFreon, 218, 219, 220properties, 218
generating ozone, 215–216making and remaking, 215protective effect, 215questions and answers, 215ultraviolet radiation, 215measurements, 217
stratospheric ozone depleting chemicalschain reaction, 221CFCs, properties, 219depleting potential, 220fateCFCs and halons, 220
halons, properties, 219, 220ill effectsgreenhouse gases, 228
natural depleters, 220reducingalternatives, 230–232
smuggling, 230water-soluble chemicals, 221
stratospheric ozone depletionfuture, 230history, 218ill effects, 224–227ocean life, 226
ozone hole, 218, 224, 230, 232particle sources, 224reducing, 228–233less-developed countries, 229
the future, 232UV index, 225volcanic eruptions, 224where observed, 221–223Antarctica, 221Arctic, 222other regions, 222
stratspheric ozone depletionreducing depleters, 228
sub-Saharan Africa, 27, 201, 265, 305, 536sulfonamides, 102sulfur dioxide, see air pollutants, criteriasulfuric acid, 558Superfund, see lawsSurround, 472Sweden, 304, 331, 447, 452Switzerland, 278, 299
table salt, 221, 249, 546Taiwan, 345, 364, 370take back, 111, 318, 368, 369, 370, 521 see extended
producer responsibilityelectronics, 521
Japan, European Union, 534stimulating DfE, 522
TanzaniaEnvironmental Performance Index, 536
TCDD, 105Tennessee, 430teratogens, 75thalidomide, 59, 76Tijuana, 438toilets, 303–305Tokyo, 109, 149, 407, 444toluene, 527Toronto, 421toxaphene, 416toxic effectschildren and in utero, 75
Toxic Equivalency Potential, 44Toxic Substances Control Act, see lawstoxicant, see individual chemicalstoxicity, chemical toxicity and epidemiologyacute and chronic, 58aspirin, 61body organ
immune system, 72kidney, 72liver, 71, 74lung, 73nervous system, 72, 466skin, 73
children’s sensitivity, 76DDT, 413definitions, 58dose per time, 61dose–response, 60factors affecting, 70–71
examples, 70gender, age, nutrition, 70individual and species variation, 69poverty, 74, 77
hormones, environmental, 62ill effect
nervous system, 466immune system, 72, 226irritant
skin, lungs, 73LD50, 60local, 63mixtures, 20, 63, 248, 469, 489, 491nutrient toxicity, 60obvious
PCBs, 418PBDEs, 420PCBs, 418, 419solanine, 62subtle
PCBs, 418systemic, 63
583 Index
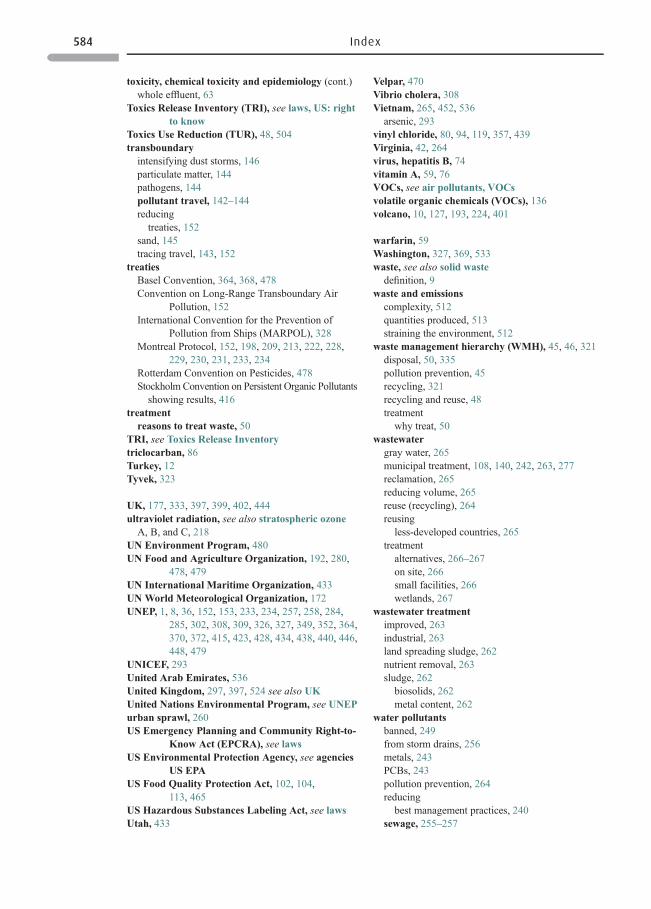
toxicity, chemical toxicity and epidemiology (cont.)whole effluent, 63
Toxics Release Inventory (TRI), see laws, US: rightto know
Toxics Use Reduction (TUR), 48, 504transboundaryintensifying dust storms, 146particulate matter, 144pathogens, 144pollutant travel, 142–144reducing
treaties, 152sand, 145tracing travel, 143, 152
treatiesBasel Convention, 364, 368, 478Convention on Long-Range Transboundary Air
Pollution, 152International Convention for the Prevention of
Pollution from Ships (MARPOL), 328Montreal Protocol, 152, 198, 209, 213, 222, 228,
229, 230, 231, 233, 234Rotterdam Convention on Pesticides, 478Stockholm Convention on Persistent Organic Pollutants
showing results, 416treatmentreasons to treat waste, 50
TRI, see Toxics Release Inventorytriclocarban, 86Turkey, 12Tyvek, 323
UK, 177, 333, 397, 399, 402, 444ultraviolet radiation, see also stratospheric ozoneA, B, and C, 218
UN Environment Program, 480UN Food and Agriculture Organization, 192, 280,
478, 479UN International Maritime Organization, 433UN World Meteorological Organization, 172UNEP, 1, 8, 36, 152, 153, 233, 234, 257, 258, 284,
285, 302, 308, 309, 326, 327, 349, 352, 364,370, 372, 415, 423, 428, 434, 438, 440, 446,448, 479
UNICEF, 293United Arab Emirates, 536United Kingdom, 297, 397, 524 see also UKUnited Nations Environmental Program, see UNEPurban sprawl, 260US Emergency Planning and Community Right-to-
Know Act (EPCRA), see lawsUS Environmental Protection Agency, see agencies
US EPAUS Food Quality Protection Act, 102, 104,
113, 465US Hazardous Substances Labeling Act, see lawsUtah, 433
Velpar, 470Vibrio cholera, 308Vietnam, 265, 452, 536
arsenic, 293vinyl chloride, 80, 94, 119, 357, 439Virginia, 42, 264virus, hepatitis B, 74vitamin A, 59, 76VOCs, see air pollutants, VOCsvolatile organic chemicals (VOCs), 136volcano, 10, 127, 193, 224, 401
warfarin, 59Washington, 327, 369, 533waste, see also solid waste
definition, 9waste and emissions
complexity, 512quantities produced, 513straining the environment, 512
waste management hierarchy (WMH), 45, 46, 321disposal, 50, 335pollution prevention, 45recycling, 321recycling and reuse, 48treatment
why treat, 50wastewater
gray water, 265municipal treatment, 108, 140, 242, 263, 277reclamation, 265reducing volume, 265reuse (recycling), 264reusing
less-developed countries, 265treatment
alternatives, 266–267on site, 266small facilities, 266wetlands, 267
wastewater treatmentimproved, 263industrial, 263land spreading sludge, 262nutrient removal, 263sludge, 262
biosolids, 262metal content, 262
water pollutantsbanned, 249from storm drains, 256metals, 243PCBs, 243pollution prevention, 264reducing
best management practices, 240sewage, 255–257
584 Index
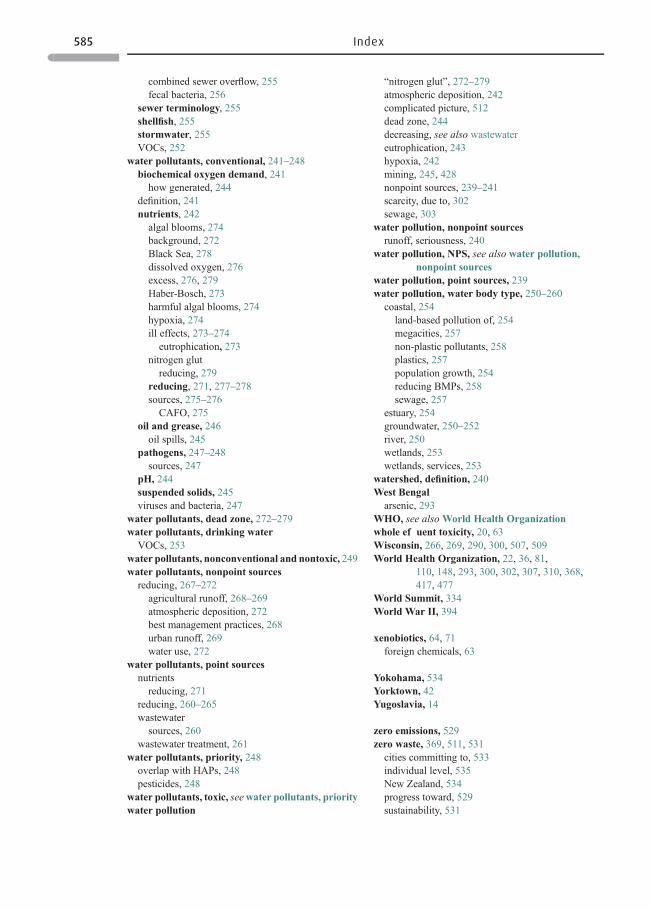
combined sewer overflow, 255fecal bacteria, 256
sewer terminology, 255shellfish, 255stormwater, 255VOCs, 252
water pollutants, conventional, 241–248biochemical oxygen demand, 241how generated, 244
definition, 241nutrients, 242algal blooms, 274background, 272Black Sea, 278dissolved oxygen, 276excess, 276, 279Haber-Bosch, 273harmful algal blooms, 274hypoxia, 274ill effects, 273–274
eutrophication, 273nitrogen glut
reducing, 279reducing, 271, 277–278sources, 275–276
CAFO, 275oil and grease, 246oil spills, 245
pathogens, 247–248sources, 247
pH, 244suspended solids, 245viruses and bacteria, 247
water pollutants, dead zone, 272–279water pollutants, drinking water
VOCs, 253water pollutants, nonconventional and nontoxic, 249water pollutants, nonpoint sources
reducing, 267–272agricultural runoff, 268–269atmospheric deposition, 272best management practices, 268urban runoff, 269water use, 272
water pollutants, point sourcesnutrientsreducing, 271
reducing, 260–265wastewatersources, 260
wastewater treatment, 261water pollutants, priority, 248
overlap with HAPs, 248pesticides, 248
water pollutants, toxic, seewater pollutants, prioritywater pollution
“nitrogen glut”, 272–279atmospheric deposition, 242complicated picture, 512dead zone, 244decreasing, see also wastewatereutrophication, 243hypoxia, 242mining, 245, 428nonpoint sources, 239–241scarcity, due to, 302sewage, 303
water pollution, nonpoint sourcesrunoff, seriousness, 240
water pollution, NPS, see also water pollution,nonpoint sources
water pollution, point sources, 239water pollution, water body type, 250–260coastal, 254
land-based pollution of, 254megacities, 257non-plastic pollutants, 258plastics, 257population growth, 254reducing BMPs, 258sewage, 257
estuary, 254groundwater, 250–252river, 250wetlands, 253wetlands, services, 253
watershed, definition, 240West Bengalarsenic, 293
WHO, see also World Health Organizationwhole effluent toxicity, 20, 63Wisconsin, 266, 269, 290, 300, 507, 509World Health Organization, 22, 36, 81,
110, 148, 293, 300, 302, 307, 310, 368,417, 477
World Summit, 334World War II, 394
xenobiotics, 64, 71foreign chemicals, 63
Yokohama, 534Yorktown, 42Yugoslavia, 14
zero emissions, 529zero waste, 369, 511, 531cities committing to, 533individual level, 535New Zealand, 534progress toward, 529sustainability, 531
585 Index


