Embed Size (px)
Citation preview

Sustainability 2015, 7, 13726-13760; doi:10.3390/su71013726
sustainability ISSN 2071-1050
www.mdpi.com/journal/sustainability
Article
Understanding Innovation for Sustainable Business Management Capabilities and Competencies under Uncertainty
Kuo-Jui Wu 1, Ching-Jong Liao 1, Ming-Lang Tseng 2,* and Pei-Jay Chou 2
1 Department of Industrial Management, National Taiwan University of Science and Technology,
Taipei 10607, Taiwan; E-Mails: [email protected] (K.-J.W.);
[email protected] (C.-J.L.) 2 Department of Business Administration, Lunghwa University of Science and Technology,
No. 300, Sec. 1, Wanshou Road, Taoyuan County 33306, Taiwan;
E-Mail: [email protected]
* Author to whom correspondence should be addressed; E-Mail: [email protected];
Tel.: +886-910-309-400.
Academic Editor: Kannan Govindan
Received: 7 July 2015 / Accepted: 8 October 2015 / Published: 12 October 2015
Abstract: In recent years, many firms have come to understand that innovation is an
important issue in sustainable business management, as it helps improve firm capabilities
and competencies. Because of the fiercely competitive environment in the hotel industry,
innovation has become a critical factor in the process of hotel differentiation, leading to
sustainable business success. However, the literature has not thoroughly examined the role
of innovation or the hierarchical structure of the capabilities and competencies in sustainable
business management. This study adopts interval-valued triangular fuzzy numbers and grey
relational analysis to provide a competitive priority ranking for the aspects and criteria that
assist firms in decision-making. The study results indicate that innovation in technology
capabilities and networking and social capabilities—in addition to competencies in systemic
thinking—are the most important aspects of sustainable business management. In particular,
this study indicates that to succeed in building a sustainable business in the hotel industry,
firms should upgrade and integrate their business technologies, collaborate with actors inside
and outside the firm, build trust as well as a shared vision that includes common agreement,
and develop competencies in inventive thinking to support innovation and foster changes in
strategy, structure, administrative procedures, and systems when necessary.
OPEN ACCESS

Sustainability 2015, 7 13727
Keywords: sustainable business management; innovation; capabilities and competences;
interval-valued triangular fuzzy numbers; grey relational analysis
1. Introduction
In the era of globalization, the hotel industry has become more cut-throat as a result of increased
competition from more firms [1–3]. To compete, hotels must enhance their capabilities and
competencies to improve operational performance in myriad ways as judged under various criteria.
Thus, hotels must apply new technologies to track and respond to customer demands and achieve
sustainability [3,4]. Sustainability will be achieved based on innovation in response to customer needs
for new services and products, which will lead to increased market share and profits and will also
contribute to business sustainability [5–7]. However, innovation involves increased risk, and success is
not guaranteed; to enjoy a higher likelihood of success in innovation, thorough assessments must be
undertaken and value-creating investments must be chosen [8–11].
In the literature, innovation is considered an important element of firm success [12]. Harper and
Becker [13] indicated that innovation resulted in significant change—preferably an improvement in the
real product, process, or service—that exceeds the impact of previous achievements; these authors
further indicated that innovation supported sustainable business management. Firms encourage
innovation to achieve production and marketing goals, to improve product or service quality, to lower
their operational costs, to increase their market share, to attain production flexibility, and to improve the
management process [14]. Previous studies have generally indicated that innovation was positively
associated with business sustainability [15,16]. However, Zahra [17] and Colquitt et al. [18] also noted
that innovation may be a risky investment; developing and launching new products and/or services is
necessary for firm survival and sustainability, but these are costly business processes. Delgado [19]
argued that the positive effects of innovation, particularly technology innovation, may be exaggerated,
whereas the potential negative effects are typically ignored or underemphasized. Hence, it is critical to
understand and properly manage firm capabilities and competencies to minimize and avoid risky
investments in innovation.
Innovation supports management by introducing new services, products, and improvements in
quality [5]; thus, innovation has significantly influenced business outcomes by enhancing the
competitiveness and sustainability of businesses [20]. Nonetheless, Hjalager [9] noticed a gap between
innovation and sustainable business; thus, the manner in which innovation assists sustainable business
management must be investigated to gain greater and deeper insights for hotel managers. In addition,
sustainable business management capabilities and competencies (SBMCC) must be identified and
utilized to promote innovation efficiency and effectiveness and to enable firms to enjoy and foster
a sustainable business [21,22]. This study suggests that technology capabilities play an important role in
innovation, and the readiness to upgrade and integrate new technology can enable innovation for product
and service development, marketing, and even for management processes. Moreover, networking and
social capabilities were determined to be important in gathering and sharing knowledge, which assists a
firm’s innovation output by enabling innovative collaboration [23–25].

Sustainability 2015, 7 13728
Certain measures play a significant role in defining and illuminating SBMCC because the complex,
limited, and diverse information available regarding SBMCC has led to incomplete and vague
descriptions of the notion. Moreover, these measures have provided qualitative information and linguistic
descriptions, as well as incomplete information, from firms. In particular, imprecise information
has resulted because of situations in which there are insufficient data and the data pattern remains
unknown [26,27]. Therefore, this evaluation system would be well-served by applying a classic grey
system. In addition, this study must utilize experts’ subjective opinions, assigning them relative weights,
and combining them with grey relation analysis (GRA) to evaluate and understand the important aspects
and criteria of particular firms. To identify the relative weights of the proposed aspects and criteria is an
important part of this approach, and this study applies interval-valued triangular fuzzy numbers (IVTFN)
for the subjective approaches. To overcome the shortcomings discussed above, this study proposes
IVTFN and GRA together to shed additional light on SBMCC in firms. Finally, achieving a sustainable
business requires capabilities and competencies to understand the innovation activities. Hence, the
objective of this study is to investigate the contributions of innovation criteria to SBMCC under uncertainty
and to demonstrate the effects on SBMCC when there is incomplete information. Accordingly, this study
is organized as follows. First, innovation and its relationship with SBMCC are presented. In Section 2,
the theory adopted is discussed. Section 3 presents the methods. The results are discussed in Section 4.
Section 5 presents the theoretical and managerial implications. The last section concludes and discusses
the limitations of this study.
2. Literature Review
This section reviews the definitions and the role of innovation in SBMCC. The subsection review
emphasizes the following specific areas: innovation, SBMCC, the proposed method, and the development
of the proposed measures.
2.1. Innovation
Van Kleef and Roome [21] defined “innovation as the process of discovery and development that
generates new products, production processes, organizations, technology, and institutional and systemic
arrangements”. This definition includes employing ideas, knowledge, and technology in a manner that
enables firms to significantly improve performance. Onsel et al. [28] indicated that innovation is not
necessarily related to problem-solving but is instead typically related to improving competitiveness and
economic success—and it is frequently spurred by technology. The previous literature distinguished the
different types of innovation as technology, process, product and service, management, operations, and
organization [29,30].
Innovation was viewed as supporting businesses in a variety of ways, such as in product and service
innovation; technological innovation can increase the efficiency and effectiveness of a firm’s operations,
whereas organizational innovation can promote growth in productivity and competitiveness by encouraging
the application of new technologies [31]. Several studies have indicated that innovation is directly or
indirectly linked to the sustainable business management of a firm [32,33]. Hence, the contributions of
innovation to sustainable business management might be implemented by utilizing and developing firm
capabilities and competencies [21]. However, capability and competency problems also have affected
Sustainability 2015, 7 13729
innovation activities. Van de Ven and Engleman [34] noted the problem of managing networking and
social capabilities; innovative ideas arise from different areas inside or outside a firm, and multiple
functions and resources within a corporation are necessary to transform an innovative idea into reality.
2.2. Innovation for Sustainable Business Management Capabilities and Competencies
Van Kleef and Roome [21] defined sustainable business management as “the management of sustainable
business that recognizes its embeddedness in social, environmental and economic systems and focuses
on management and relationships to meet the environmental, social, and economic requirements of the
many different stakeholders in its networks”. Recently, innovation for sustainable business management
has received an increasing amount of attention from management [35], as innovation is increasingly
recognized as an important means to contribute to sustainability [36,37]. However, people and firms
tend to focus on and take advantage of existing practices rather than exploring new ideas, needs, and
opportunities for innovation; thus, it is difficult to encourage innovation in these cases [34]. Hence, there
is an essential need for firms to explore the insights of capabilities and competencies to drive innovation.
Dutta et al. [38] considered capability as the ability to transform resources into objectives, which
relates to performing a set of synchronizing tasks and utilizing resources to attain a particular result.
These results offer an individual or an entire organization the ability to construct the building blocks of
business competencies [21]. Thus, competencies are combinations of knowledge, experience, and productive
attributes, in addition to being accurate combinations of functional and technical skills to perform the
tasks, solve problems, and operate effectively under uncertainty [39–42]. Competencies are also
represented in the entirety of the firm, which contains the contribution of employees, alignments within
the firm, and the value added to customers and stakeholders. These attributes allow firms to create new
products and services while adapting to changing circumstances faster than competitors and thus
enhancing their competiveness [5].
This study extends the definition of SBMCC from van Kleef and Roome [21]: “Sustainable business
management builds embeddedness capabilities and competencies by addressing the social, environmental
and economic systems and focuses on innovation and relationships to meet the different stakeholder
requirements in its networks”. Ensuring that innovation competencies are present in the key roles within
a firm and that these competencies are used to build internal capabilities at all levels is also essential to
the pursuit of business sustainability [42–44]. In particular, innovation yields benefits to SBMCC by
leveraging those capabilities and competencies that enable firms to build cost efficiencies and operational
effectiveness to compete in a sustainable business environment. To enhance the understanding in this
field, this study proposes five aspects by which to identify SBMCC: (1) technological capabilities;
(2) networking and social capabilities; (3) learning and developing capabilities; (4) competencies for
systemic thinking; and (5) capabilities for integrating business, environmental/social problems, perspectives
and information.
2.3. Proposed Method
Previous studies have focused on applying classical statistical methods in addressing sustainable
business management [45,46]. Few studies have considered SBMCC as a multiple criteria problem to
identify its importance by adopting linguistic variables and providing sufficient results. Within the

Sustainability 2015, 7 13730
identification, linguistic variables rely on expert opinions and contain vagueness, imprecision, and
uncertainties [47]. Hence, IVTFN is proposed in this study to overcome these situations and to convert
the linguistic variables into quantitative evaluations. Therefore, the computation of the geometric mean
is taken as the membership degree to derive the statistical unbiased effect and avoid the impact of
extreme values. The advantage of this method is the simplicity that results from all the expert opinions
being contained in one investigation and that aggregates the evaluations from diverse perspectives. Once
the fuzzy decision matrix is obtained, the GRA must arrange to address the incomplete system information.
GRA was developed by Deng [48] to identify the relation between two sequences. This method is
suggested as an instrument for solving the multiple criteria problem, which enables us to find solutions
from a finite set of aspects and criteria under incomplete information [26,27,49]. The basic principle is
that if a comparability sequence translated from a criterion has the highest grey relational grade among
the reference sequence, it represents the best choice. All the criteria can be ranked upon the grey relational
grade, which will help the decision-maker in handling a multi-criteria decision-making problem. This study
integrated IVTFN and GRA to illuminate the relationship between innovations and SBMCC. The criteria
are formed as linguistic variables and expressed in IVTFN, then GRA is used to determine the ranking
of aspects and criteria under incomplete information [50].
2.4. Proposed SBMCC Measures
The previous literature has been used to identify the capabilities and competencies required to
innovate for competitive purposes in sustainable business management [21,42–44]. However, previous
studies in the field of innovation have discussed these capabilities and competencies separately, which
include systems thinking; learning and developing; networking and social capabilities; integrating
business, environmental, information and social problems; and technology (as shown in Table 1).
A comprehensive study is required to aggregate all as a whole to understand how these capabilities and
competencies can lead to innovation for sustainable business management. Hence, the multi-criteria
approach is adopted in this study to derive the significant implications resulting from our approach.
Systems thinking is a new concept in addressing competencies; accordingly, product invention,
creativity, processes and/or business models require firm personnel to learn from experience in terms
of both practice and theory to contribute to job performance and new firm projects [21,51,52].
Moreover, systems thinking can utilize multi-theories and techniques to build holistic, contingent
perspectives and practices [53–55]. Independent thinking creates diversity and the potential to contribute
to organizational learning and to address complexity [52,56]—the individual is the building block in the
development of diverse skills and competencies [21,57]. However, teammates who have developed their
own specific abilities and inventive strategies may increase the possibility of bringing ideas together to
solve problems [58].

Sustainability 2015, 7 13731
Table 1. Proposed innovation measures for sustainable business management capabilities
and competencies.
Aspects Criteria
Competencies
for systems
thinking (AS1)
C1 The competency to think independently
C2 Expertise in organization design will be a critical skill—how to analyze,
modify and simulate the behavior of complex human systems
C3 A powerful tool to facilitate both individual and organizational learning
C4 Product life-cycle management systems offer core innovation competencies
C5 The competency to think inventively
C6 Grasping manufacturing cycle time will improve on-time delivery, product quality and cost
Networking and
social capabilities
(AS2)
C7 To gather and review the alternative strategies of each stakeholder
C8 To build trust, a shared vision and agreement on basic values
C9 To develop social relations with unfamiliar actors inside or outside the organization
for information gathering, experimentation and negotiation purposes
C10 To involve many stakeholders from the start (e.g., local communities,
regional, state or national stakeholders, supply chain partners, and buyers)
C11 To co-operate with universities/research institutes, to develop brand new ideas
C12 To participate in industrial networks such as industrial
associations, standard organizations and industrial forums
Technology
capabilities (AS3)
C13
New approaches to developing knowledge for performing management
functions and new processes that produce changes in
the organization’s strategy, structure, administrative procedures, and systems
C14 To upgrade and integrate technology capabilities, new product development and marketing
C15 Using existing technology
C16
Adoption of electronic data processing for a variety of internal information storage,
retrieval and analytical purposes, indirectly related to the basic work activity of
the firm and more immediately related to its management
C17 Quantum leaps in performance
C18 To define technology that could help
Capabilities for
learning and
developing (AS4)
C19 To learn and translate learning into action
C20 Typically adopt new ideas and develop them as reliable products
C21 To effectively address the requirements, values, assumptions
and cultures of various interacting network actors
C22 To develop insights and observe what local community does, how they think,
what they need and want
C23 To encourage cross-functional learning and fertilization
C24 To successfully understand and execute innovation activities with the network
Capabilities for
integrating business,
environmental,
information and
social problems.
(AS5)
C25 To integrate the perspectives and knowledge of different actors in the network
C26 To integrate traditional criteria of efficiency with eco- and social-efficiency and effectiveness
C27 To integrate one or two socio-environmental indicators into a single perspective
C28 To apply the knowledge gained in previous projects to new projects
C29 To integrate differences in information processing and decision styles,
to address differences in the width of focus and the desired degree of maximization of the result
C30 To identify the business problem and constraints (time, resources, market)
Source from: [21,51,59,60–62].

Sustainability 2015, 7 13732
In the case of learning and developing, different actors in the networks provide greater potential
for learning and are necessary to evoke the potential solutions to solve complex issues [63,64].
These actors are internal and external to the firm and develop insights and observe what the local
community does, how individual members think, and what they need and want; these actors understand
and execute innovation activities within the network by developing knowledge and forming new
innovation networks [61,63]. Although all the firms aim to reach this level, most encounter difficulties
in the basic practice that requires collaboration in various business and management functions, such as
marketing affiliations and certification schemes aligning to promote environmental awareness and
education as well as new product development and innovation [65].
For a firm, competitive advantage not only is dependent on research and development but also is
enhanced by potential technology [60,66]. In reality, most of the firm is unable to have up-to-date
technology developed in-house because of the increasingly complex nature of technology and short
product life cycles. If a firm wants to remain competitive in the market, it must quickly integrate, adopt,
and upgrade the diversity of its external and internal information storage, retrieval, and analytical tools
that relate to basic work activities—in addition to business and management functions—with external
technologies and on-time product launches [21,60]. Therefore, searching for the internal factors that
encourage technological innovation capabilities might augment the understanding of innovative
processes in the firm [67,68].
Some sustainable actions involve collective problem solving, system development, technological
progress, and other innovations that are identified with achieving business goals. These stages can be
presented in the open processes of innovation and can input the implementation into a broad range of
stakeholders. Hence, the social networks offer a platform for individuals and stakeholders in a community
to reference, gather, and exchange ideas, information, experimentation, and negotiation [69]. Although
these platforms can be designed for searching opportunities, it remains insufficient to discuss the
sustainability issues currently [21,65]. Thus, firms require a strategy that is compatible with integrating
into these platforms and with these stakeholders, that creates competitive advantages such as cost
reductions and favorable future market positions, and that benefits the firm by enabling it to acquire
increased legitimacy through collaborations with external stakeholders in a community [70].
Dyllick and Hockerts [71] have suggested that sustainable business management requires the concept
of efficiency (the economic value added in relation to the aggregate resources used) to be extended to
eco-efficiency and socio-efficiency (the economic value added in relation to the aggregated ecological
and social impacts, respectively). In addition, concepts such as eco-effectiveness and socio-effectiveness
have been suggested as ways to address the absolute thresholds in social and ecological sustainability [72].
The European Commission [73] has suggested that efficiency might be complemented or replaced by
the notion of sufficiency. Deciding upon the size and character of social and environmental thresholds
and determining sufficiency criteria are understood to require inputs from actors outside of firms as units
of production [65,74].
3. Method
GRA was initially proposed by Deng [75] to overcome the insufficient information among systems.
In addition, IVTFN was used to assist decision-makers in the precise evaluation of subjects. This study

Sustainability 2015, 7 13733
integrates GRA and IVTFN to explore the important aspects and criteria for building sustainability under
uncertainty. The method and proposed analytical steps are described below.
3.1. Interval-Valued Triangular Fuzzy Numbers with Grey Relational Analysis
Consider a decision-making problem with aspects and criteria; then, let α = α , α ,⋯ , α and β = β , β ,⋯ , β be a finite set of feasible aspects and criteria, respectively. Although the weightage
of criteria = , ,⋯ is unknown, it must satisfy ≥ 0, = 1,2,⋯n, ∑ = 1. Assume that
the performance β related to aspect α is defined as s ; then, the decision matrix can be presented by = × . According to the illustration of Figure 1, can be rewritten as IVTFN s = (s , s , s )(s , s , s ) and is also expressed as s = (s , s ); s ; (s , s ) .
Figure 1. An interval-valued triangular fuzzy number.
The proposed IVTFN-GRA method is associated with an unknown weightage vector and
calculated by the following procedures. First, normalize the decision matrix , which consists of = , ; ; ̃ , , as indicated in Table 2. If there are experts in the expert group,
the responses must be calculated in = + + + ⋯ = ∑ . In addition,
the responses must normalize into performance rating matrix ∗ = ∗ × as below:
× = , ; ; ̃ , × , = 1,2,⋯ , ; = 1,2,⋯ , , ∈ (1)
× = , ̃ ; ; , × , = 1,2,⋯ , ; = 1,2,⋯ , , ∈ (2)
where = , = 1⋯ , = , = 1⋯ , and and are the sets of benefit and
cost criteria.

Sustainability 2015, 7 13734
Table 2. Definitions of linguistic variables for the importance ratings.
Linguistic Variables Interval-Valued TFNs
Very unimportant (VU) (0,0); 0; (0.1, 0.15) Unimportant (U) (0,0.05); 0.1; (0.25,0.35)
Medium unimportant (MU) (0,0.15); 0.3; (0.45,0.55) Medium (M) (0.25,0.35); 0.5; (0.65,0.75)
Medium important (MI) (0.45,0.55); 0.7; (0.8,0.95) Important (I) (0.55,0.75); 0.9; (0.95,1)
Very important (VI) (0.85,0.95); 1; (1,1)
Second, determine the reference series = ( , , ⋯ , ), which is supposed to be 1 as in the
case of the reference value in the decision-making problem. Hence, the reference series can be rewritten
as = ( (1,1); 1; (1,1) , (1,1); 1; (1,1) ,⋯ , (1,1); 1; (1,1) ). Once the reference series is obtained,
the following computation must identify the gap between the reference value and each comparison value.
The computation can use the following equations:
( ) = 13 − 1 + + − 1 ,( ) = 13 − 1 + + ̃ − 1 ,( ) = 13 ̃ − 1 + + − 1 ,( ̅) = 13 − 1 + + − 1
(3)
The gap can be simplified as an interval value ϑ∗ = , , where = ( ) − ( ) and = ( ) − ( ̅). Because some information is lost during the computation process, the interval value
must convert into a crisp value immediately. Simultaneously, the maximum ρ , γ and minimum ρ , γ can be gathered from the crisp value, as below: ρ , γ = ,ρ , γ = , , = 1,2,⋯ , ; = 1,2,⋯ , (4)
Third, assuming τ is 0.5 and using the following equations to generate the grey relational coefficient: ε = ρ + τρ + τρ⁄ε∗ = γ + τγ + τγ⁄ , = 1,2,⋯ , ; = 1,2,⋯ , (5)
To obtain the grey relational grade, Zhang et al. [76] suggested normalizing the data by adopting weightage vector : = ε + ε∗ ε + ε∗ , = 1,2,⋯ , (6)

Sustainability 2015, 7 13735
When the weightage vector = ( , ,⋯ ) is attained, the grey relational grade can be expressed as an interval value = ̅ , : ̅ = ε , = ε∗ , = 1,2⋯ , (7)
Therefore, the grey relational grade must comply with the likelihood properties to transfer the interval
value to a likelihood matrix. Li et al. [77] presented the following helpful likelihood properties: 0 ≤ μ( ≥ ) ≤ 1;μ( ≥ ) + μ( ≥ ) = 1;μ( ≥ ) + μ( ≥ ) = 0.5 μ( ≥ ) = μ( ≥ );μ( ≥ ) = 0 ≤ ; , , μ( ≥ ) = μ( ≥ ) ≥ (8)
Finally, transform the grey relational grade into likelihood relations. The likelihood relation can be denoted as ≽ , which means “criteria being not inferior to ”. Li et al. [77] indicated that the
likelihood relation of ≽ is evaluated by ≽ , where and are corresponding grey
relational grade interval numbers of criteria α and α in α . The transforming process applies
the equation as below: ρ ≽ = ρ ≽ = max 1 − max − ̅ φ( ) + φ , 0 , 0 (9)
where = ̅ , , = ̅ , , φ( ) = − ̅ , φ = − ̅ .
The likelihood relations can be arranged into the likelihood matrix as :
= × = α α ⋯ αα ρ ρ ⋯ ρα ρ ρ ⋯ ρ⋮ ⋮ ⋮ ⋮α ρ ρ ⋯ ρ (10)
where ρ = ρ α ≽ α ( , = 1,2,⋯ , ) for criteria α and α . Consequently, the is
a complementary judgment matrix, and the ranking weightage can be sorted from the eigenvector ( =1,2,⋯ ) . The larger value of represents the greater importance of criteria α ( = 1,2,⋯ ) [76].
3.2. Proposed Analytical Step
This study adopts IVTFN and GRA to evaluate five aspects and 30 criteria. The objective is to
determine the priority ranking in innovation for SBMCC. The expert group followed the proposed
solution with a four-step procedure. The analysis procedures are explained as follows:
(1) Identification of the evaluating aspects and criteria. This step collects group knowledge
and experiences from the expert committee to evaluate the importance of SBMCC.
The committee develops the aspects and criteria—and the survey instruments—to establish a set
of aspects and criteria for evaluation. The cluster of aspects and criteria has the nature of
complicated relationships.

Sustainability 2015, 7 13736
(2) Computation of the range between the experts’ decisions related to each criterion. In the
beginning of this step, this study used interval-valued triangular fuzzy numbers (as indicated in
Table 2) to normalize the decision matrix into an important rating. If the expert committee has
different opinions about the decision, the average scores can eliminate the situation. Benefit and
cost can be found by following Equations (1) and (2). Next, calculating the distance is required
to contract with the reference value and transfer to the interval value by Equation (3). However,
some information has been lost during the computation, so the interval values must be expressed
as crisp values immediately, as in Equation (4).
(3) Once the crisp value is obtained, the grey relational coefficient must be generated by Equation (5).
Before converting the grey relational coefficient to the grey relational grade, the weightage vector
must be obtained through Equation (6) first and then Equation (7) is used to finish the
transformation. Consequently, the grey relational grade must associate with likelihood properties
as in Equation (8) to calculate the likelihood relations.
(4) Then, adopt Equation (9) to gather all likelihood relations and arrange them into a matrix by
adopting Equation (10). The matrix is decomposed using MATLAB 10 to acquire the eigenvectors
for each of the criteria. The largest eigenvector has the greatest effect on SBMCC.
4. Results
This section presents an overview of Taiwanese hotels and data collection methods and is divided
into two subsections: industrial background and analytical results.
4.1. Industrial Background
The tourism industry continues to expand and diversify and has become one of the largest and fastest
growing economic sectors in the world [78]. In Taiwan, the demand for recreational travel has increased
rapidly as the number of foreign visitors has increased. The tourism industry not only brings in
substantial foreign exchange income but also provides job opportunities. The Tourism Bureau of
the Ministry of Transportation and Communications of Taiwan 2014 has announced new directions for
the Taiwan tourism industry. Hopefully, the number of foreign tourists visiting Taiwan will continue to
increase, thus benefiting the hotel industry. Additionally, several international hotel chains are racing to
boost their presence in response to the booming tourism industry due to globalization. This intensifies
the competition in the hospitality industries, particularly in hotel firms.
To assist firms in the hotel industry in this competitive environment and to guarantee sustainable
growth, this study has been conducted to obtain a better understanding of the contribution of innovation
to sustainable business, thus providing several managerial insights related to SBMCC. This study
adopted GRA and IVTFN to evaluate the importance of certain aspects and criteria. Questionnaires were
created based on interviews with executive management and industrial experts to collect the aspects and
criteria. The analysis outlined in the following section describes the process followed by the hotels in
Taiwan and the recommendations given to them.
Sustainability 2015, 7 13737
4.2. The Empirical Results
Gathering the respondent opinions ensures that clear relationships are determined in the evaluation
of aspects and criteria; it also confirms the information that is relevant to representing the SBMCC by
consulting the expert committee. Each proposed aspect and criterion in Table 1 prompted several
arguments and discussions among the members of the expert committee related to enhancing the study’s
validity and reliability. Once the experts raised an argument or debate, interviewing was adopted for
further clarification. To overcome problematic linguistic preferences and complicated interactions in the
respondent feedback, a hybrid method was designed integrating IVTFN and GRA.
(1) Table 3 presents the preference information of the experts’ responses. The preference information
must convert into IVTFNs based on Table 1; the average IVTFNs are displayed in Table 4.
Tables 5 and 6 display the benefit and cost criteria matrices generated by Equations (1) and (2).

Sustainability 2015, 7 13738
Table 3. Experts’ responses.
Expert 1 Expert 2 Expert 3 Expert 4 Expert 5 Expert 6 Expert 7
AS1 AS2 AS3 AS4 AS5 AS1 AS2 AS3 AS4 AS5 AS1 AS2 AS3 AS4 AS5 AS1 AS2 AS3 AS4 AS5 AS1 AS2 AS3 AS4 AS5 AS1 AS2 AS3 AS4 AS5 AS1 AS2 AS3 AS4 AS5
C1 M I MI M MU M VI MI U M VU I MI U U M VI MI M M M VI I M M U I I U U I VI VI MU M
C2 MU I MI MU U M VI MI VU U M VI MI M M VU VI I I M M I I U VU M I I M U M M VI U U
C3 U VI I MU MU U I VI U U M VI I M M M VI VI M M U I VI U M U I MI M M U VI VI MU M
C4 U I I VU MU U I I MU U M I M M U M I M M VU M I M M M M MI M VU VU I M M VU VU
C5 U I VI MU M M I I M MU U MI MI MU M M VI VI M I U VI VI U U U I VI U U U VI VI I MU
C6 U VI VI MU MU VU VI I I U VU VI VI U MU M I I I M U VI VI M U U I MI M M MU VI VI MU M
C7 M I I MU U U I I VI MU VU MI I MU MU M VI I M M U I I M M U I I U U I M VI MU M
C8 U VI I M MU VU VI VI I M M MI MI MU M M I VI I M U I VI M U U I I M U U VI I I I
C9 I VI VI I I I VI VI I I I VI VI I I I VI VI MI I I VI VI I I I VI VI I I I VI VI I I
C10 MU VI I U VU M I M VU M VU I MI MU U M I I I M M I I M U U I I U U I VI I M MU
C11 U VI I U U VU VI VI U U VU MI MI MU M M I VI M M U VI VI M M U I I M U U VI MI MU I
C12 M I I U M VU VI VI MU MU M VI VI MU M M I I M I U I I U U U MI MI M M U VI VI I M
C13 MU VI VI M U VU VI VI M U VU MI I M MU M I I I I M VI VI U U U VI I U U U VI VI MU M
C14 MI VI I I I M VI I I MI U VI MI MI MI MI VI I I MI I VI I MI MI I VI I MI MI I VI I MI MI
C15 U I I U M U VI MI MU M VU I VI U MU M I VI M M M VI I U M U I MI M M U I M I MU

Sustainability 2015, 7 13739
Table 3. Cont.
Expert 1 Expert 2 Expert 3 Expert 4 Expert 5 Expert 6 Expert 7
AS1 AS2 AS3 AS4 AS5 AS1 AS2 AS3 AS4 AS5 AS1 AS2 AS3 AS4 AS5 AS1 AS2 AS3 AS4 AS5 AS1 AS2 AS3 AS4 AS5 AS1 AS2 AS3 AS4 AS5 AS1 AS2 AS3 AS4 AS5
C16 U I VI M MU U I I MU M VU I M MU MU U I VI M I M VI I M U U I MI M U U I I I MU
C17 M VI I M M M I I M MU M M M MU U M I I M M M I I U M U I I U U I I M M M
C18 MU I VI M MU M I I MU MU VU M M M MU U I I M VI U VI I M U U I I M U I VI I I MU
C19 M I VI MU U VU VI VI U MU VU I VI MU M M I I I M U I I M M U MI I U U I I M MU MU
C20 M VI VI M M VU VI I MU MU VU I VI MU MU U VI I I M U I VI U U U I I U M I I M MU M
C21 MU I VI U MU VU VI MI MU U U VI VI MU MU M VI VI M M U VI I U M U VI MI U U MU I VI I I
C22 I M MI MU MU I I M MU MU I I M MU MU I I MI MU MU MI I MI MU MU I I M MU MU M I M M I
C23 M VI I M MU VU VI I MU M U VI I U M M I I M M M VI I M U U I I U U I M I I MU
C24 MU I MU MU MU M VI M MU U U VI M M MU U I M M I U I M U M U I I M M I I I I MU
C25 MU I I U M M I VI U M VU I M M M M I I M I U I I M U U I I U U I I M I I
C26 U I M M MU M VI I MU M M I MI M MU M I M I M M VI MI VU U U I MI VU U I I M M M
C27 MU I I MU MU M I MI MU MU M M VI MU U M I I M I M VI VI U U U VI I MU M U I I M MU
C28 U I VI M U U VI I U MU M M M M M M VI VI I I M VI VI M U U MI MI U MU U I I MU I
C29 U VI I U MU U VI I U M VU I M U MU M I I M M M VI VI M M U MI MI M U I I I MU MU
C30 M I VI M U VU VI MI U MU U M M M U M VI I M M M I VI U M U I I M MU MU M I M I

Sustainability 2015, 7 13740
Table 4. Converting interval-valued triangular fuzzy numbers from expert responses.
AS1 AS2 AS3
C1 0.2214 0.3143 0.4286 0.5571 0.6429 0.7214 0.8643 0.9571 0.9786 1.0000 0.5357 0.6643 0.8000 0.8714 0.9714
C2 0.1786 0.2714 0.4000 0.5429 0.6357 0.6357 0.7786 0.8857 0.9286 0.9643 0.5500 0.6929 0.8286 0.8929 0.9786
C3 0.0714 0.1357 0.2143 0.3643 0.4643 0.7214 0.8643 0.9571 0.9786 1.0000 0.7071 0.8357 0.9286 0.9571 0.9929
C4 0.2214 0.3214 0.4429 0.5786 0.6714 0.4929 0.6643 0.8143 0.8857 0.9571 0.3357 0.4643 0.6143 0.7357 0.8214
C5 0.0714 0.1357 0.2143 0.3643 0.4643 0.6643 0.8071 0.9143 0.9500 0.9929 0.7500 0.8643 0.9429 0.9643 0.9929
C6 0.0357 0.0929 0.1571 0.2929 0.3786 0.7643 0.8929 0.9714 0.9857 1.0000 0.7071 0.8357 0.9286 0.9571 0.9929
C7 0.1500 0.2286 0.3143 0.4429 0.5286 0.5357 0.6929 0.8286 0.8929 0.9571 0.5929 0.7786 0.9143 0.9571 1.0000
C8 0.0714 0.1286 0.2000 0.3429 0.4357 0.6643 0.8071 0.9143 0.9500 0.9929 0.6643 0.8071 0.9143 0.9500 0.9929
C9 0.5500 0.7500 0.9000 0.9500 1.0000 0.8500 0.9500 1.0000 1.0000 1.0000 0.8500 0.9500 1.0000 1.0000 1.0000
C10 0.1857 0.2857 0.4000 0.5286 0.6143 0.6357 0.8071 0.9286 0.9643 1.0000 0.4929 0.6643 0.8143 0.8857 0.9571
C11 0.0357 0.0786 0.1286 0.2643 0.3500 0.7071 0.8357 0.9286 0.9571 0.9929 0.6500 0.7786 0.8857 0.9286 0.9857
C12 0.1071 0.1714 0.2571 0.4000 0.4929 0.6643 0.8071 0.9143 0.9500 0.9929 0.6643 0.8071 0.9143 0.9500 0.9929
C13 0.0714 0.1357 0.2143 0.3500 0.4357 0.7500 0.8643 0.9429 0.9643 0.9929 0.7214 0.8643 0.9571 0.9786 1.0000
C14 0.4000 0.5357 0.6714 0.7643 0.8571 0.8500 0.9500 1.0000 1.0000 1.0000 0.5357 0.7214 0.8714 0.9286 0.9929
C15 0.0714 0.1286 0.2000 0.3429 0.4357 0.6357 0.8071 0.9286 0.9643 1.0000 0.5643 0.6929 0.8143 0.8786 0.9500
C16 0.0357 0.0857 0.1429 0.2857 0.3786 0.5929 0.7786 0.9143 0.9571 1.0000 0.5786 0.7214 0.8429 0.9000 0.9571
C17 0.2571 0.3643 0.5000 0.6357 0.7286 0.5500 0.7214 0.8571 0.9143 0.9643 0.4643 0.6357 0.7857 0.8643 0.9286
C18 0.1143 0.2000 0.2857 0.4143 0.5000 0.5929 0.7500 0.8714 0.9214 0.9643 0.5500 0.7214 0.8571 0.9143 0.9643
C19 0.1500 0.2214 0.3000 0.4214 0.5000 0.5786 0.7500 0.8857 0.9357 0.9929 0.6357 0.7786 0.8857 0.9286 0.9643
C20 0.1143 0.1786 0.2429 0.3643 0.4429 0.6786 0.8357 0.9429 0.9714 1.0000 0.6357 0.7786 0.8857 0.9286 0.9643
C21 0.0357 0.1143 0.2000 0.3429 0.4357 0.7643 0.8929 0.9714 0.9857 1.0000 0.6929 0.8071 0.9000 0.9357 0.9857
C22 0.4929 0.6643 0.8143 0.8857 0.9571 0.5071 0.6929 0.8429 0.9071 0.9643 0.3357 0.4357 0.5857 0.7143 0.8357
C23 0.1857 0.2714 0.3714 0.5000 0.5857 0.6786 0.8071 0.9000 0.9357 0.9643 0.5500 0.7500 0.9000 0.9500 1.0000
C24 0.1143 0.2071 0.3000 0.4357 0.5286 0.6357 0.8071 0.9286 0.9643 1.0000 0.3000 0.4357 0.5857 0.7071 0.7929
C25 0.1500 0.2429 0.3429 0.4714 0.5571 0.5500 0.7500 0.9000 0.9500 1.0000 0.5071 0.6643 0.8000 0.8714 0.9286
C26 0.2214 0.3214 0.4429 0.5786 0.6714 0.6357 0.8071 0.9286 0.9643 1.0000 0.3786 0.4929 0.6429 0.7571 0.8714
C27 0.1429 0.2357 0.3571 0.5071 0.6071 0.5929 0.7500 0.8714 0.9214 0.9643 0.6214 0.7786 0.9000 0.9429 0.9929
C28 0.1071 0.1786 0.2714 0.4214 0.5214 0.6214 0.7500 0.8571 0.9071 0.9571 0.6214 0.7500 0.8571 0.9071 0.9571
C29 0.1500 0.2286 0.3143 0.4429 0.5286 0.6643 0.8071 0.9143 0.9500 0.9929 0.5357 0.6929 0.8286 0.8929 0.9571
C30 0.1071 0.1857 0.2857 0.4286 0.5214 0.5500 0.6929 0.8143 0.8786 0.9286 0.5786 0.7214 0.8429 0.9000 0.9571

Sustainability 2015, 7 13741
Table 4. Cont.
AS4 AS5
C1 0.1071 0.1929 0.3000 0.4500 0.5500 0.1429 0.2357 0.3571 0.5071 0.6071
C2 0.1500 0.2429 0.3429 0.4714 0.5571 0.0714 0.1286 0.2000 0.3429 0.4357
C3 0.1071 0.2071 0.3286 0.4786 0.5786 0.1786 0.2786 0.4143 0.5643 0.6643
C4 0.1071 0.1714 0.2571 0.3857 0.4643 0.0357 0.0857 0.1429 0.2714 0.3500
C5 0.1500 0.2643 0.3857 0.5214 0.6143 0.1500 0.2643 0.3857 0.5214 0.6143
C6 0.2286 0.3643 0.5000 0.6214 0.7071 0.1071 0.2071 0.3286 0.4786 0.5786
C7 0.1929 0.3071 0.4286 0.5571 0.6429 0.1071 0.2071 0.3286 0.4786 0.5786
C8 0.3429 0.4929 0.6429 0.7500 0.8286 0.1857 0.2929 0.4143 0.5500 0.6429
C9 0.5357 0.7214 0.8714 0.9286 0.9929 0.5500 0.7500 0.9000 0.9500 1.0000
C10 0.1500 0.2429 0.3429 0.4714 0.5571 0.0714 0.1429 0.2286 0.3714 0.4643
C11 0.1071 0.2071 0.3286 0.4786 0.5786 0.1857 0.2786 0.3857 0.5214 0.6143
C12 0.1500 0.2643 0.3857 0.5214 0.6143 0.2214 0.3357 0.4714 0.6071 0.7000
C13 0.1857 0.2929 0.4143 0.5500 0.6429 0.1143 0.2071 0.3000 0.4357 0.5286
C14 0.4929 0.6357 0.7857 0.8643 0.9714 0.4643 0.5786 0.7286 0.8214 0.9571
C15 0.1500 0.2500 0.3571 0.4929 0.5857 0.1786 0.2929 0.4429 0.5929 0.6929
C16 0.2214 0.3500 0.5000 0.6357 0.7286 0.1143 0.2357 0.3571 0.4929 0.5857
C17 0.1429 0.2357 0.3571 0.5071 0.6071 0.1429 0.2357 0.3571 0.5071 0.6071
C18 0.2571 0.3786 0.5286 0.6643 0.7571 0.1214 0.2357 0.3429 0.4714 0.5571
C19 0.1143 0.2357 0.3571 0.4929 0.5857 0.1071 0.2071 0.3286 0.4786 0.5786
C20 0.1143 0.2357 0.3571 0.4929 0.5857 0.1429 0.2500 0.3857 0.5357 0.6357
C21 0.1143 0.2214 0.3286 0.4643 0.5571 0.1500 0.2643 0.3857 0.5214 0.6143
C22 0.0357 0.1786 0.3286 0.4786 0.5786 0.0786 0.2357 0.3857 0.5214 0.6143
C23 0.1857 0.2929 0.4143 0.5500 0.6429 0.1071 0.2071 0.3286 0.4786 0.5786
C24 0.1857 0.3071 0.4429 0.5786 0.6714 0.1500 0.2786 0.4143 0.5500 0.6429
C25 0.1857 0.2786 0.3857 0.5214 0.6143 0.2643 0.3786 0.5000 0.6214 0.7071
C26 0.1857 0.2786 0.3857 0.5071 0.5857 0.1071 0.2071 0.3286 0.4786 0.5786
C27 0.0714 0.1929 0.3286 0.4786 0.5786 0.1143 0.2357 0.3571 0.4929 0.5857
C28 0.1857 0.2929 0.4143 0.5500 0.6429 0.1929 0.3214 0.4429 0.5643 0.6500
C29 0.1071 0.1929 0.3000 0.4500 0.5500 0.1071 0.2214 0.3571 0.5071 0.6071
C30 0.1786 0.2643 0.3857 0.5357 0.6357 0.1500 0.2643 0.3857 0.5214 0.6143

Sustainability 2015, 7 13742
Table 5. Benefit matrix.
AS1 AS2 AS3
C1 0.2214 0.3143 0.4286 0.5571 0.6429 0.7214 0.8643 0.9571 0.9786 1.0000 0.5357 0.6643 0.8000 0.8714 0.9714
C2 0.1786 0.2714 0.4000 0.5429 0.6357 0.6357 0.7786 0.8857 0.9286 0.9643 0.5500 0.6929 0.8286 0.8929 0.9786
C3 0.0714 0.1357 0.2143 0.3643 0.4643 0.7214 0.8643 0.9571 0.9786 1.0000 0.7071 0.8357 0.9286 0.9571 0.9929
C4 0.2214 0.3214 0.4429 0.5786 0.6714 0.4929 0.6643 0.8143 0.8857 0.9571 0.3357 0.4643 0.6143 0.7357 0.8214
C5 0.0714 0.1357 0.2143 0.3643 0.4643 0.6643 0.8071 0.9143 0.9500 0.9929 0.7500 0.8643 0.9429 0.9643 0.9929
C6 0.0357 0.0929 0.1571 0.2929 0.3786 0.7643 0.8929 0.9714 0.9857 1.0000 0.7071 0.8357 0.9286 0.9571 0.9929
C7 0.1500 0.2286 0.3143 0.4429 0.5286 0.5357 0.6929 0.8286 0.8929 0.9571 0.5929 0.7786 0.9143 0.9571 1.0000
C8 0.0714 0.1286 0.2000 0.3429 0.4357 0.6643 0.8071 0.9143 0.9500 0.9929 0.6643 0.8071 0.9143 0.9500 0.9929
C9 0.5500 0.7500 0.9000 0.9500 1.0000 0.8500 0.9500 1.0000 1.0000 1.0000 0.8500 0.9500 1.0000 1.0000 1.0000
C10 0.1857 0.2857 0.4000 0.5286 0.6143 0.6357 0.8071 0.9286 0.9643 1.0000 0.4929 0.6643 0.8143 0.8857 0.9571
C11 0.0357 0.0786 0.1286 0.2643 0.3500 0.7071 0.8357 0.9286 0.9571 0.9929 0.6500 0.7786 0.8857 0.9286 0.9857
C12 0.1071 0.1714 0.2571 0.4000 0.4929 0.6643 0.8071 0.9143 0.9500 0.9929 0.6643 0.8071 0.9143 0.9500 0.9929
C13 0.0714 0.1357 0.2143 0.3500 0.4357 0.7500 0.8643 0.9429 0.9643 0.9929 0.7214 0.8643 0.9571 0.9786 1.0000
C14 0.4000 0.5357 0.6714 0.7643 0.8571 0.8500 0.9500 1.0000 1.0000 1.0000 0.5357 0.7214 0.8714 0.9286 0.9929
C15 0.0714 0.1286 0.2000 0.3429 0.4357 0.6357 0.8071 0.9286 0.9643 1.0000 0.5643 0.6929 0.8143 0.8786 0.9500
C16 0.0357 0.0857 0.1429 0.2857 0.3786 0.5929 0.7786 0.9143 0.9571 1.0000 0.5786 0.7214 0.8429 0.9000 0.9571
C17 0.2571 0.3643 0.5000 0.6357 0.7286 0.5500 0.7214 0.8571 0.9143 0.9643 0.4643 0.6357 0.7857 0.8643 0.9286
C18 0.1143 0.2000 0.2857 0.4143 0.5000 0.5929 0.7500 0.8714 0.9214 0.9643 0.5500 0.7214 0.8571 0.9143 0.9643
C19 0.1500 0.2214 0.3000 0.4214 0.5000 0.5786 0.7500 0.8857 0.9357 0.9929 0.6357 0.7786 0.8857 0.9286 0.9643
C20 0.1143 0.1786 0.2429 0.3643 0.4429 0.6786 0.8357 0.9429 0.9714 1.0000 0.6357 0.7786 0.8857 0.9286 0.9643
C21 0.0357 0.1143 0.2000 0.3429 0.4357 0.7643 0.8929 0.9714 0.9857 1.0000 0.6929 0.8071 0.9000 0.9357 0.9857
C22 0.4929 0.6643 0.8143 0.8857 0.9571 0.5071 0.6929 0.8429 0.9071 0.9643 0.3357 0.4357 0.5857 0.7143 0.8357
C23 0.1857 0.2714 0.3714 0.5000 0.5857 0.6786 0.8071 0.9000 0.9357 0.9643 0.5500 0.7500 0.9000 0.9500 1.0000
C24 0.1143 0.2071 0.3000 0.4357 0.5286 0.6357 0.8071 0.9286 0.9643 1.0000 0.3000 0.4357 0.5857 0.7071 0.7929
C25 0.1500 0.2429 0.3429 0.4714 0.5571 0.5500 0.7500 0.9000 0.9500 1.0000 0.5071 0.6643 0.8000 0.8714 0.9286
C26 0.2214 0.3214 0.4429 0.5786 0.6714 0.6357 0.8071 0.9286 0.9643 1.0000 0.3786 0.4929 0.6429 0.7571 0.8714
C27 0.1429 0.2357 0.3571 0.5071 0.6071 0.5929 0.7500 0.8714 0.9214 0.9643 0.6214 0.7786 0.9000 0.9429 0.9929
C28 0.1071 0.1786 0.2714 0.4214 0.5214 0.6214 0.7500 0.8571 0.9071 0.9571 0.6214 0.7500 0.8571 0.9071 0.9571
C29 0.1500 0.2286 0.3143 0.4429 0.5286 0.6643 0.8071 0.9143 0.9500 0.9929 0.5357 0.6929 0.8286 0.8929 0.9571
C30 0.1071 0.1857 0.2857 0.4286 0.5214 0.5500 0.6929 0.8143 0.8786 0.9286 0.5786 0.7214 0.8429 0.9000 0.9571

Sustainability 2015, 7 13743
Table 5. Cont.
AS4 AS5
C1 0.1071 0.1929 0.3000 0.4500 0.5500 0.1429 0.2357 0.3571 0.5071 0.6071
C2 0.1500 0.2429 0.3429 0.4714 0.5571 0.0714 0.1286 0.2000 0.3429 0.4357
C3 0.1071 0.2071 0.3286 0.4786 0.5786 0.1786 0.2786 0.4143 0.5643 0.6643
C4 0.1071 0.1714 0.2571 0.3857 0.4643 0.0357 0.0857 0.1429 0.2714 0.3500
C5 0.1500 0.2643 0.3857 0.5214 0.6143 0.1500 0.2643 0.3857 0.5214 0.6143
C6 0.2286 0.3643 0.5000 0.6214 0.7071 0.1071 0.2071 0.3286 0.4786 0.5786
C7 0.1929 0.3071 0.4286 0.5571 0.6429 0.1071 0.2071 0.3286 0.4786 0.5786
C8 0.3429 0.4929 0.6429 0.7500 0.8286 0.1857 0.2929 0.4143 0.5500 0.6429
C9 0.5357 0.7214 0.8714 0.9286 0.9929 0.5500 0.7500 0.9000 0.9500 1.0000
C10 0.1500 0.2429 0.3429 0.4714 0.5571 0.0714 0.1429 0.2286 0.3714 0.4643
C11 0.1071 0.2071 0.3286 0.4786 0.5786 0.1857 0.2786 0.3857 0.5214 0.6143
C12 0.1500 0.2643 0.3857 0.5214 0.6143 0.2214 0.3357 0.4714 0.6071 0.7000
C13 0.1857 0.2929 0.4143 0.5500 0.6429 0.1143 0.2071 0.3000 0.4357 0.5286
C14 0.4929 0.6357 0.7857 0.8643 0.9714 0.4643 0.5786 0.7286 0.8214 0.9571
C15 0.1500 0.2500 0.3571 0.4929 0.5857 0.1786 0.2929 0.4429 0.5929 0.6929
C16 0.2214 0.3500 0.5000 0.6357 0.7286 0.1143 0.2357 0.3571 0.4929 0.5857
C17 0.1429 0.2357 0.3571 0.5071 0.6071 0.1429 0.2357 0.3571 0.5071 0.6071
C18 0.2571 0.3786 0.5286 0.6643 0.7571 0.1214 0.2357 0.3429 0.4714 0.5571
C19 0.1143 0.2357 0.3571 0.4929 0.5857 0.1071 0.2071 0.3286 0.4786 0.5786
C20 0.1143 0.2357 0.3571 0.4929 0.5857 0.1429 0.2500 0.3857 0.5357 0.6357
C21 0.1143 0.2214 0.3286 0.4643 0.5571 0.1500 0.2643 0.3857 0.5214 0.6143
C22 0.0357 0.1786 0.3286 0.4786 0.5786 0.0786 0.2357 0.3857 0.5214 0.6143
C23 0.1857 0.2929 0.4143 0.5500 0.6429 0.1071 0.2071 0.3286 0.4786 0.5786
C24 0.1857 0.3071 0.4429 0.5786 0.6714 0.1500 0.2786 0.4143 0.5500 0.6429
C25 0.1857 0.2786 0.3857 0.5214 0.6143 0.2643 0.3786 0.5000 0.6214 0.7071
C26 0.1857 0.2786 0.3857 0.5071 0.5857 0.1071 0.2071 0.3286 0.4786 0.5786
C27 0.0714 0.1929 0.3286 0.4786 0.5786 0.1143 0.2357 0.3571 0.4929 0.5857
C28 0.1857 0.2929 0.4143 0.5500 0.6429 0.1929 0.3214 0.4429 0.5643 0.6500
C29 0.1071 0.1929 0.3000 0.4500 0.5500 0.1071 0.2214 0.3571 0.5071 0.6071
C30 0.1786 0.2643 0.3857 0.5357 0.6357 0.1500 0.2643 0.3857 0.5214 0.6143

Sustainability 2015, 7 13744
Table 6. Cost matrix.
AS1 AS2 AS3
C1 0.1613 0.1136 0.0833 0.0641 0.0556 0.0495 0.0413 0.0373 0.0365 0.0357 0.0667 0.0538 0.0446 0.0410 0.0368
C2 0.2000 0.1316 0.0893 0.0658 0.0562 0.0562 0.0459 0.0403 0.0385 0.0370 0.0649 0.0515 0.0431 0.0400 0.0365
C3 0.5000 0.2632 0.1667 0.0980 0.0769 0.0495 0.0413 0.0373 0.0365 0.0357 0.0505 0.0427 0.0385 0.0373 0.0360
C4 0.1613 0.1111 0.0806 0.0617 0.0532 0.0725 0.0538 0.0439 0.0403 0.0373 0.1064 0.0769 0.0581 0.0485 0.0435
C5 0.5000 0.2632 0.1667 0.0980 0.0769 0.0538 0.0442 0.0391 0.0376 0.0360 0.0476 0.0413 0.0379 0.0370 0.0360
C6 1.0000 0.3846 0.2273 0.1220 0.0943 0.0467 0.0400 0.0368 0.0362 0.0357 0.0505 0.0427 0.0385 0.0373 0.0360
C7 0.2381 0.1563 0.1136 0.0806 0.0676 0.0667 0.0515 0.0431 0.0400 0.0373 0.0602 0.0459 0.0391 0.0373 0.0357
C8 0.5000 0.2778 0.1786 0.1042 0.0820 0.0538 0.0442 0.0391 0.0376 0.0360 0.0538 0.0442 0.0391 0.0376 0.0360
C9 0.0649 0.0476 0.0397 0.0376 0.0357 0.0420 0.0376 0.0357 0.0357 0.0357 0.0420 0.0376 0.0357 0.0357 0.0357
C10 0.1923 0.1250 0.0893 0.0676 0.0581 0.0562 0.0442 0.0385 0.0370 0.0357 0.0725 0.0538 0.0439 0.0403 0.0373
C11 1.0000 0.4545 0.2778 0.1351 0.1020 0.0505 0.0427 0.0385 0.0373 0.0360 0.0549 0.0459 0.0403 0.0385 0.0362
C12 0.3333 0.2083 0.1389 0.0893 0.0725 0.0538 0.0442 0.0391 0.0376 0.0360 0.0538 0.0442 0.0391 0.0376 0.0360
C13 0.5000 0.2632 0.1667 0.1020 0.0820 0.0476 0.0413 0.0379 0.0370 0.0360 0.0495 0.0413 0.0373 0.0365 0.0357
C14 0.0893 0.0667 0.0532 0.0467 0.0417 0.0420 0.0376 0.0357 0.0357 0.0357 0.0667 0.0495 0.0410 0.0385 0.0360
C15 0.5000 0.2778 0.1786 0.1042 0.0820 0.0562 0.0442 0.0385 0.0370 0.0357 0.0633 0.0515 0.0439 0.0407 0.0376
C16 1.0000 0.4167 0.2500 0.1250 0.0943 0.0602 0.0459 0.0391 0.0373 0.0357 0.0617 0.0495 0.0424 0.0397 0.0373
C17 0.1389 0.0980 0.0714 0.0562 0.0490 0.0649 0.0495 0.0417 0.0391 0.0370 0.0769 0.0562 0.0455 0.0413 0.0385
C18 0.3125 0.1786 0.1250 0.0862 0.0714 0.0602 0.0476 0.0410 0.0388 0.0370 0.0649 0.0495 0.0417 0.0391 0.0370
C19 0.2381 0.1613 0.1190 0.0847 0.0714 0.0617 0.0476 0.0403 0.0382 0.0360 0.0562 0.0459 0.0403 0.0385 0.0370
C20 0.3125 0.2000 0.1471 0.0980 0.0806 0.0526 0.0427 0.0379 0.0368 0.0357 0.0562 0.0459 0.0403 0.0385 0.0370
C21 1.0000 0.3125 0.1786 0.1042 0.0820 0.0467 0.0400 0.0368 0.0362 0.0357 0.0515 0.0442 0.0397 0.0382 0.0362
C22 0.0725 0.0538 0.0439 0.0403 0.0373 0.0704 0.0515 0.0424 0.0394 0.0370 0.1064 0.0820 0.0610 0.0500 0.0427
C23 0.1923 0.1316 0.0962 0.0714 0.0610 0.0526 0.0442 0.0397 0.0382 0.0370 0.0649 0.0476 0.0397 0.0376 0.0357
C24 0.3125 0.1724 0.1190 0.0820 0.0676 0.0562 0.0442 0.0385 0.0370 0.0357 0.1190 0.0820 0.0610 0.0505 0.0450
C25 0.2381 0.1471 0.1042 0.0758 0.0641 0.0649 0.0476 0.0397 0.0376 0.0357 0.0704 0.0538 0.0446 0.0410 0.0385
C26 0.1613 0.1111 0.0806 0.0617 0.0532 0.0562 0.0442 0.0385 0.0370 0.0357 0.0943 0.0725 0.0556 0.0472 0.0410
C27 0.2500 0.1515 0.1000 0.0704 0.0588 0.0602 0.0476 0.0410 0.0388 0.0370 0.0575 0.0459 0.0397 0.0379 0.0360
C28 0.3333 0.2000 0.1316 0.0847 0.0685 0.0575 0.0476 0.0417 0.0394 0.0373 0.0575 0.0476 0.0417 0.0394 0.0373
C29 0.2381 0.1563 0.1136 0.0806 0.0676 0.0538 0.0442 0.0391 0.0376 0.0360 0.0667 0.0515 0.0431 0.0400 0.0373
C30 0.3333 0.1923 0.1250 0.0833 0.0685 0.0649 0.0515 0.0439 0.0407 0.0385 0.0617 0.0495 0.0424 0.0397 0.0373

Sustainability 2015, 7 13745
Table 6. Cont.
AS4 AS5
C1 0.3333 0.1852 0.1190 0.0794 0.0649 0.2500 0.1515 0.1000 0.0704 0.0588
C2 0.2381 0.1471 0.1042 0.0758 0.0641 0.5000 0.2778 0.1786 0.1042 0.0820
C3 0.3333 0.1724 0.1087 0.0746 0.0617 0.2000 0.1282 0.0862 0.0633 0.0538
C4 0.3333 0.2083 0.1389 0.0926 0.0769 1.0000 0.4167 0.2500 0.1316 0.1020
C5 0.2381 0.1351 0.0926 0.0685 0.0581 0.2381 0.1351 0.0926 0.0685 0.0581
C6 0.1563 0.0980 0.0714 0.0575 0.0505 0.3333 0.1724 0.1087 0.0746 0.0617
C7 0.1852 0.1163 0.0833 0.0641 0.0556 0.3333 0.1724 0.1087 0.0746 0.0617
C8 0.1042 0.0725 0.0556 0.0476 0.0431 0.1923 0.1220 0.0862 0.0649 0.0556
C9 0.0667 0.0495 0.0410 0.0385 0.0360 0.0649 0.0476 0.0397 0.0376 0.0357
C10 0.2381 0.1471 0.1042 0.0758 0.0641 0.5000 0.2500 0.1563 0.0962 0.0769
C11 0.3333 0.1724 0.1087 0.0746 0.0617 0.1923 0.1282 0.0926 0.0685 0.0581
C12 0.2381 0.1351 0.0926 0.0685 0.0581 0.1613 0.1064 0.0758 0.0588 0.0510
C13 0.1923 0.1220 0.0862 0.0649 0.0556 0.3125 0.1724 0.1190 0.0820 0.0676
C14 0.0725 0.0562 0.0455 0.0413 0.0368 0.0769 0.0617 0.0490 0.0435 0.0373
C15 0.2381 0.1429 0.1000 0.0725 0.0610 0.2000 0.1220 0.0806 0.0602 0.0515
C16 0.1613 0.1020 0.0714 0.0562 0.0490 0.3125 0.1515 0.1000 0.0725 0.0610
C17 0.2500 0.1515 0.1000 0.0704 0.0588 0.2500 0.1515 0.1000 0.0704 0.0588
C18 0.1389 0.0943 0.0676 0.0538 0.0472 0.2941 0.1515 0.1042 0.0758 0.0641
C19 0.3125 0.1515 0.1000 0.0725 0.0610 0.3333 0.1724 0.1087 0.0746 0.0617
C20 0.3125 0.1515 0.1000 0.0725 0.0610 0.2500 0.1429 0.0926 0.0667 0.0562
C21 0.3125 0.1613 0.1087 0.0769 0.0641 0.2381 0.1351 0.0926 0.0685 0.0581
C22 1.0000 0.2000 0.1087 0.0746 0.0617 0.4545 0.1515 0.0926 0.0685 0.0581
C23 0.1923 0.1220 0.0862 0.0649 0.0556 0.3333 0.1724 0.1087 0.0746 0.0617
C24 0.1923 0.1163 0.0806 0.0617 0.0532 0.2381 0.1282 0.0862 0.0649 0.0556
C25 0.1923 0.1282 0.0926 0.0685 0.0581 0.1351 0.0943 0.0714 0.0575 0.0505
C26 0.1923 0.1282 0.0926 0.0704 0.0610 0.3333 0.1724 0.1087 0.0746 0.0617
C27 0.5000 0.1852 0.1087 0.0746 0.0617 0.3125 0.1515 0.1000 0.0725 0.0610
C28 0.1923 0.1220 0.0862 0.0649 0.0556 0.1852 0.1111 0.0806 0.0633 0.0549
C29 0.3333 0.1852 0.1190 0.0794 0.0649 0.3333 0.1613 0.1000 0.0704 0.0588
C30 0.2000 0.1351 0.0926 0.0667 0.0562 0.2381 0.1351 0.0926 0.0685 0.0581

Sustainability 2015, 7 13746
(2) Table 7 presents the interval value by adopting Equation (3). However, it generated the
information lost during the computation; thus, the interval value should be addressed as a crisp
value using Equation (4). Therefore, Table 8 expresses the grey relational coefficient generated
from Equation (5).
Table 7. Interval value ϑ∗ .
, , , , ,
C1 0.0629 0.0545 0.0562 0.0036 0.0380 0.0069 0.0688 0.0595 0.0697 0.0419
C2 0.0659 0.0663 0.0476 0.0048 0.0375 0.0068 0.0671 0.0394 0.0564 0.0810
C3 0.0614 0.1786 0.0199 0.0036 0.0182 0.0037 0.0744 0.0636 0.0698 0.0316
C4 0.0667 0.0429 0.1012 0.0088 0.0625 0.0138 0.0544 0.0516 0.0497 0.1131
C5 0.0614 0.1764 0.0085 0.0045 0.0136 0.0030 0.0768 0.0434 0.0768 0.0434
C6 0.0550 0.2593 0.0216 0.0029 0.0182 0.0037 0.0774 0.0257 0.0744 0.0636
C7 0.0616 0.0809 0.0258 0.0072 0.0352 0.0065 0.0727 0.0303 0.0744 0.0636
C8 0.0564 0.1783 0.0236 0.0045 0.0236 0.0045 0.0670 0.0145 0.0718 0.0311
C9 0.0424 0.0100 0.0057 0.0018 0.0057 0.0018 0.0433 0.0080 0.0424 0.0078
C10 0.0678 0.0647 0.0637 0.0054 0.0487 0.0088 0.0671 0.0394 0.0624 0.0894
C11 0.0489 0.2565 0.0290 0.0037 0.0242 0.0046 0.0744 0.0636 0.0669 0.0291
C12 0.0584 0.1230 0.0236 0.0045 0.0236 0.0045 0.0768 0.0434 0.0712 0.0247
C13 0.0574 0.1811 0.0180 0.0030 0.0175 0.0036 0.0718 0.0311 0.0706 0.0573
C14 0.0589 0.0233 0.0585 0.0018 0.0433 0.0080 0.0453 0.0084 0.0456 0.0087
C15 0.0564 0.1776 0.0450 0.0054 0.0345 0.0060 0.0716 0.0409 0.0745 0.0336
C16 0.0542 0.2517 0.0386 0.0065 0.0340 0.0059 0.0754 0.0261 0.0817 0.0639
C17 0.0656 0.0357 0.0649 0.0071 0.0529 0.0095 0.0697 0.0419 0.0697 0.0419
C18 0.0658 0.1123 0.0442 0.0058 0.0404 0.0071 0.0695 0.0203 0.0771 0.0577
C19 0.0568 0.0851 0.0228 0.0066 0.0270 0.0048 0.0817 0.0639 0.0744 0.0636
C20 0.0549 0.1201 0.0312 0.0044 0.0270 0.0048 0.0817 0.0639 0.0749 0.0447
C21 0.0663 0.2555 0.0240 0.0029 0.0188 0.0038 0.0762 0.0608 0.0768 0.0434
C22 0.0487 0.0012 0.1036 0.0086 0.0582 0.0127 0.0950 0.1767 0.0974 0.1083
C23 0.0626 0.0671 0.0503 0.0039 0.0424 0.0078 0.0718 0.0311 0.0744 0.0636
C24 0.0706 0.1131 0.1241 0.0054 0.0689 0.0170 0.0766 0.0329 0.0819 0.0456
C25 0.0671 0.0809 0.0538 0.0078 0.0450 0.0078 0.0669 0.0291 0.0676 0.0190
C26 0.0667 0.0507 0.0979 0.0054 0.0564 0.0113 0.0635 0.0287 0.0744 0.0636
C27 0.0697 0.0845 0.0266 0.0058 0.0296 0.0055 0.0846 0.1097 0.0817 0.0639
C28 0.0631 0.1192 0.0276 0.0048 0.0276 0.0048 0.0718 0.0311 0.0785 0.0322
C29 0.0616 0.0871 0.0532 0.0045 0.0411 0.0072 0.0688 0.0595 0.0798 0.0672
C30 0.0642 0.1155 0.0298 0.0063 0.0340 0.0059 0.0648 0.0293 0.0768 0.0434 ̅ , 0.1651 0.4306 ̅ , 0.0160 0.0094
Sustainability 2015, 7 13747
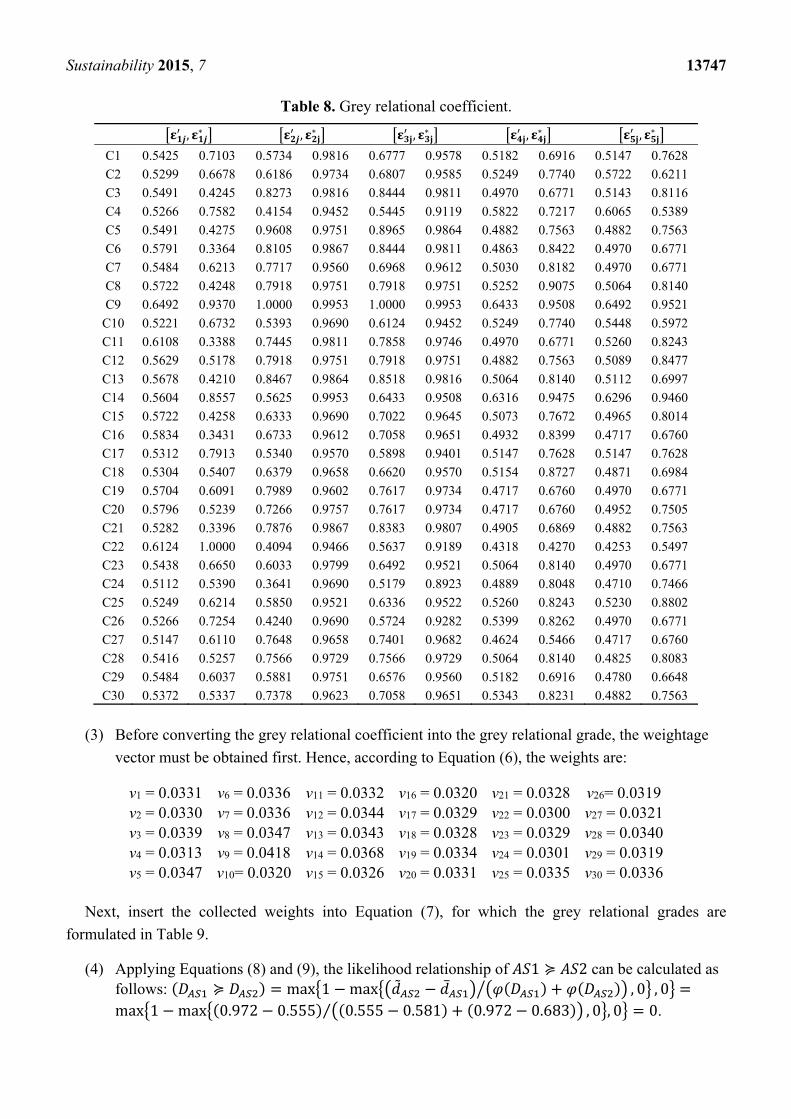
Table 8. Grey relational coefficient.
, ∗ , ∗ , ∗ , ∗ , ∗
C1 0.5425 0.7103 0.5734 0.9816 0.6777 0.9578 0.5182 0.6916 0.5147 0.7628
C2 0.5299 0.6678 0.6186 0.9734 0.6807 0.9585 0.5249 0.7740 0.5722 0.6211
C3 0.5491 0.4245 0.8273 0.9816 0.8444 0.9811 0.4970 0.6771 0.5143 0.8116
C4 0.5266 0.7582 0.4154 0.9452 0.5445 0.9119 0.5822 0.7217 0.6065 0.5389
C5 0.5491 0.4275 0.9608 0.9751 0.8965 0.9864 0.4882 0.7563 0.4882 0.7563
C6 0.5791 0.3364 0.8105 0.9867 0.8444 0.9811 0.4863 0.8422 0.4970 0.6771
C7 0.5484 0.6213 0.7717 0.9560 0.6968 0.9612 0.5030 0.8182 0.4970 0.6771
C8 0.5722 0.4248 0.7918 0.9751 0.7918 0.9751 0.5252 0.9075 0.5064 0.8140
C9 0.6492 0.9370 1.0000 0.9953 1.0000 0.9953 0.6433 0.9508 0.6492 0.9521
C10 0.5221 0.6732 0.5393 0.9690 0.6124 0.9452 0.5249 0.7740 0.5448 0.5972
C11 0.6108 0.3388 0.7445 0.9811 0.7858 0.9746 0.4970 0.6771 0.5260 0.8243
C12 0.5629 0.5178 0.7918 0.9751 0.7918 0.9751 0.4882 0.7563 0.5089 0.8477
C13 0.5678 0.4210 0.8467 0.9864 0.8518 0.9816 0.5064 0.8140 0.5112 0.6997
C14 0.5604 0.8557 0.5625 0.9953 0.6433 0.9508 0.6316 0.9475 0.6296 0.9460
C15 0.5722 0.4258 0.6333 0.9690 0.7022 0.9645 0.5073 0.7672 0.4965 0.8014
C16 0.5834 0.3431 0.6733 0.9612 0.7058 0.9651 0.4932 0.8399 0.4717 0.6760
C17 0.5312 0.7913 0.5340 0.9570 0.5898 0.9401 0.5147 0.7628 0.5147 0.7628
C18 0.5304 0.5407 0.6379 0.9658 0.6620 0.9570 0.5154 0.8727 0.4871 0.6984
C19 0.5704 0.6091 0.7989 0.9602 0.7617 0.9734 0.4717 0.6760 0.4970 0.6771
C20 0.5796 0.5239 0.7266 0.9757 0.7617 0.9734 0.4717 0.6760 0.4952 0.7505
C21 0.5282 0.3396 0.7876 0.9867 0.8383 0.9807 0.4905 0.6869 0.4882 0.7563
C22 0.6124 1.0000 0.4094 0.9466 0.5637 0.9189 0.4318 0.4270 0.4253 0.5497
C23 0.5438 0.6650 0.6033 0.9799 0.6492 0.9521 0.5064 0.8140 0.4970 0.6771
C24 0.5112 0.5390 0.3641 0.9690 0.5179 0.8923 0.4889 0.8048 0.4710 0.7466
C25 0.5249 0.6214 0.5850 0.9521 0.6336 0.9522 0.5260 0.8243 0.5230 0.8802
C26 0.5266 0.7254 0.4240 0.9690 0.5724 0.9282 0.5399 0.8262 0.4970 0.6771
C27 0.5147 0.6110 0.7648 0.9658 0.7401 0.9682 0.4624 0.5466 0.4717 0.6760
C28 0.5416 0.5257 0.7566 0.9729 0.7566 0.9729 0.5064 0.8140 0.4825 0.8083
C29 0.5484 0.6037 0.5881 0.9751 0.6576 0.9560 0.5182 0.6916 0.4780 0.6648
C30 0.5372 0.5337 0.7378 0.9623 0.7058 0.9651 0.5343 0.8231 0.4882 0.7563
(3) Before converting the grey relational coefficient into the grey relational grade, the weightage
vector must be obtained first. Hence, according to Equation (6), the weights are:
v1 = 0.0331 v6 = 0.0336 v11 = 0.0332 v16 = 0.0320 v21 = 0.0328 v26= 0.0319 v2 = 0.0330 v7 = 0.0336 v12 = 0.0344 v17 = 0.0329 v22 = 0.0300 v27 = 0.0321v3 = 0.0339 v8 = 0.0347 v13 = 0.0343 v18 = 0.0328 v23 = 0.0329 v28 = 0.0340v4 = 0.0313 v9 = 0.0418 v14 = 0.0368 v19 = 0.0334 v24 = 0.0301 v29 = 0.0319v5 = 0.0347 v10= 0.0320 v15 = 0.0326 v20 = 0.0331 v25 = 0.0335 v30 = 0.0336
Next, insert the collected weights into Equation (7), for which the grey relational grades are
formulated in Table 9.
(4) Applying Equations (8) and (9), the likelihood relationship of 1 ≽ 2 can be calculated as follows: ( ≽ ) = max 1 − max − ̅ ( ) + ( ) , 0 , 0 =max 1 − max (0.972 − 0.555) (0.555 − 0.581) + (0.972 − 0.683)⁄ , 0 , 0 = 0.
Sustainability 2015, 7 13748
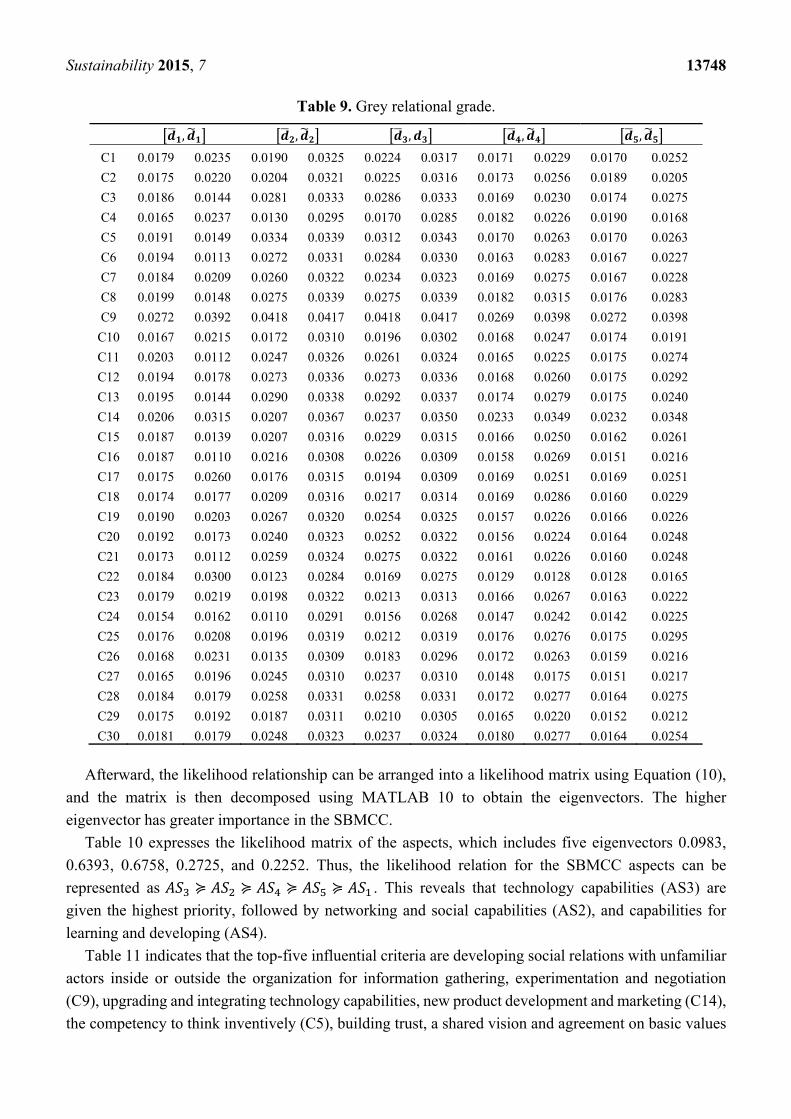
Table 9. Grey relational grade.
, , , , ,
C1 0.0179 0.0235 0.0190 0.0325 0.0224 0.0317 0.0171 0.0229 0.0170 0.0252
C2 0.0175 0.0220 0.0204 0.0321 0.0225 0.0316 0.0173 0.0256 0.0189 0.0205
C3 0.0186 0.0144 0.0281 0.0333 0.0286 0.0333 0.0169 0.0230 0.0174 0.0275
C4 0.0165 0.0237 0.0130 0.0295 0.0170 0.0285 0.0182 0.0226 0.0190 0.0168
C5 0.0191 0.0149 0.0334 0.0339 0.0312 0.0343 0.0170 0.0263 0.0170 0.0263
C6 0.0194 0.0113 0.0272 0.0331 0.0284 0.0330 0.0163 0.0283 0.0167 0.0227
C7 0.0184 0.0209 0.0260 0.0322 0.0234 0.0323 0.0169 0.0275 0.0167 0.0228
C8 0.0199 0.0148 0.0275 0.0339 0.0275 0.0339 0.0182 0.0315 0.0176 0.0283
C9 0.0272 0.0392 0.0418 0.0417 0.0418 0.0417 0.0269 0.0398 0.0272 0.0398
C10 0.0167 0.0215 0.0172 0.0310 0.0196 0.0302 0.0168 0.0247 0.0174 0.0191
C11 0.0203 0.0112 0.0247 0.0326 0.0261 0.0324 0.0165 0.0225 0.0175 0.0274
C12 0.0194 0.0178 0.0273 0.0336 0.0273 0.0336 0.0168 0.0260 0.0175 0.0292
C13 0.0195 0.0144 0.0290 0.0338 0.0292 0.0337 0.0174 0.0279 0.0175 0.0240
C14 0.0206 0.0315 0.0207 0.0367 0.0237 0.0350 0.0233 0.0349 0.0232 0.0348
C15 0.0187 0.0139 0.0207 0.0316 0.0229 0.0315 0.0166 0.0250 0.0162 0.0261
C16 0.0187 0.0110 0.0216 0.0308 0.0226 0.0309 0.0158 0.0269 0.0151 0.0216
C17 0.0175 0.0260 0.0176 0.0315 0.0194 0.0309 0.0169 0.0251 0.0169 0.0251
C18 0.0174 0.0177 0.0209 0.0316 0.0217 0.0314 0.0169 0.0286 0.0160 0.0229
C19 0.0190 0.0203 0.0267 0.0320 0.0254 0.0325 0.0157 0.0226 0.0166 0.0226
C20 0.0192 0.0173 0.0240 0.0323 0.0252 0.0322 0.0156 0.0224 0.0164 0.0248
C21 0.0173 0.0112 0.0259 0.0324 0.0275 0.0322 0.0161 0.0226 0.0160 0.0248
C22 0.0184 0.0300 0.0123 0.0284 0.0169 0.0275 0.0129 0.0128 0.0128 0.0165
C23 0.0179 0.0219 0.0198 0.0322 0.0213 0.0313 0.0166 0.0267 0.0163 0.0222
C24 0.0154 0.0162 0.0110 0.0291 0.0156 0.0268 0.0147 0.0242 0.0142 0.0225
C25 0.0176 0.0208 0.0196 0.0319 0.0212 0.0319 0.0176 0.0276 0.0175 0.0295
C26 0.0168 0.0231 0.0135 0.0309 0.0183 0.0296 0.0172 0.0263 0.0159 0.0216
C27 0.0165 0.0196 0.0245 0.0310 0.0237 0.0310 0.0148 0.0175 0.0151 0.0217
C28 0.0184 0.0179 0.0258 0.0331 0.0258 0.0331 0.0172 0.0277 0.0164 0.0275
C29 0.0175 0.0192 0.0187 0.0311 0.0210 0.0305 0.0165 0.0220 0.0152 0.0212
C30 0.0181 0.0179 0.0248 0.0323 0.0237 0.0324 0.0180 0.0277 0.0164 0.0254
Afterward, the likelihood relationship can be arranged into a likelihood matrix using Equation (10),
and the matrix is then decomposed using MATLAB 10 to obtain the eigenvectors. The higher
eigenvector has greater importance in the SBMCC.
Table 10 expresses the likelihood matrix of the aspects, which includes five eigenvectors 0.0983,
0.6393, 0.6758, 0.2725, and 0.2252. Thus, the likelihood relation for the SBMCC aspects can be
represented as ≽ ≽ ≽ ≽ . This reveals that technology capabilities (AS3) are
given the highest priority, followed by networking and social capabilities (AS2), and capabilities for
learning and developing (AS4).
Table 11 indicates that the top-five influential criteria are developing social relations with unfamiliar
actors inside or outside the organization for information gathering, experimentation and negotiation
(C9), upgrading and integrating technology capabilities, new product development and marketing (C14),
the competency to think inventively (C5), building trust, a shared vision and agreement on basic values

Sustainability 2015, 7 13749
(C8), and new approaches in the knowledge for performing management functions and new processes
that produce changes in the organization's strategy, structure, administrative procedures, and systems
(C13). The ranking of criteria can be stated as: C ≽ C ≽ C ≽ C ≽ C ≽ C ≽ C ≽ C ≽ C ≽C ≽ C ≽ C ≽ C ≽ C ≽ C ≽ C ≽ C ≽ C ≽ C ≽ C ≽ C ≽ C ≽ C ≽ C ≽C ≽ C ≽ C ≽ C ≽ C ≽ C .These results provide significant evidence and a quantitative basis
for the case firm to understand innovation in current SBMCC practice.
Table 10. Likelihood matrix for aspects.
AS1 AS2 AS3 AS4 AS5 Eigenvectors Ranking
AS1 0.500 0.000 0.000 0.248 0.279 0.0983 5
AS2 1.000 0.500 0.474 0.841 0.888 0.6393 2
AS3 1.000 0.526 0.500 0.902 0.958 0.6758 1
AS4 0.752 0.159 0.098 0.500 0.531 0.2725 3
AS5 0.721 0.112 0.042 0.469 0.500 0.2252 4
Table 11. Likelihood matrix for criteria.
C1 C2 C3 C4 C5 C6 C7 C8 C9 C10 C11 C12 C13 C14 C15 C16
C1 0.5000 0.50413 0.4073 0.6530 0.3011 0.4414 0.4477 0.3378 0.0000 0.5917 0.4846 0.3704 0.3642 0.2330 0.5398 0.6017
C2 0.4959 0.5000 0.3904 0.6633 0.2691 0.4283 0.4378 0.3161 0.0000 0.5960 0.4770 0.3523 0.3418 0.2105 0.5392 0.6079
C3 0.5927 0.6096 0.5000 0.8058 0.3482 0.5538 0.5346 0.3869 0.0000 0.7204 0.6160 0.4317 0.4377 0.2388 0.6626 0.7643
C4 0.3470 0.3367 0.1942 0.5000 0.0644 0.2257 0.2740 0.1501 0.0000 0.4375 0.2747 0.1859 0.1454 0.0969 0.3698 0.4213
C5 0.6989 0.7309 0.6518 0.9356 0.5000 0.7167 0.6530 0.5002 0.0000 0.8415 0.7825 0.5475 0.5859 0.3025 0.7928 0.9194
C6 0.5586 0.5717 0.4462 0.7743 0.2833 0.5000 0.4939 0.3401 0.0000 0.6875 0.5652 0.3864 0.3810 0.2064 0.6246 0.7250
C7 0.5523 0.5622 0.4654 0.7260 0.3470 0.5061 0.5000 0.3787 0.0000 0.6565 0.5549 0.4151 0.4166 0.2524 0.6039 0.6799
C8 0.6622 0.6839 0.6131 0.8499 0.4998 0.6599 0.6213 0.5000 0.0000 0.7756 0.7093 0.5372 0.5636 0.3312 0.7313 0.8229
C9 1.0000 1.0000 1.0000 1.0000 1.0000 1.0000 1.0000 1.0000 0.5000 1.0000 1.0000 1.0000 1.0000 0.9186 1.0000 1.0000
C10 0.4083 0.4040 0.2796 0.5625 0.1585 0.3125 0.3435 0.2244 0.0000 0.5000 0.3595 0.2592 0.2327 0.1498 0.4384 0.4949
C11 0.5154 0.5230 0.3840 0.7253 0.2175 0.4348 0.4451 0.2907 0.0000 0.6405 0.5000 0.3368 0.3188 0.1759 0.5734 0.6665
C12 0.6296 0.6477 0.5683 0.8141 0.4525 0.6136 0.5849 0.4628 0.0000 0.7408 0.6632 0.5000 0.5187 0.3065 0.6937 0.7811
C13 0.6358 0.6582 0.5623 0.8546 0.4141 0.6190 0.5834 0.4364 0.0000 0.7673 0.6812 0.4813 0.5000 0.2693 0.7137 0.8227
C14 0.7670 0.7895 0.7612 0.9031 0.6975 0.7936 0.7476 0.6688 0.0814 0.8502 0.8241 0.6935 0.7307 0.5000 0.8244 0.8911
C15 0.4602 0.4608 0.3374 0.6302 0.2072 0.3754 0.3961 0.2687 0.0000 0.5616 0.4266 0.3063 0.2863 0.1756 0.5000 0.5675
C16 0.3983 0.3921 0.2357 0.5787 0.0806 0.2750 0.3201 0.1771 0.0000 0.5051 0.3335 0.2189 0.1773 0.1089 0.4325 0.5000
C17 0.4885 0.4913 0.4029 0.6268 0.3090 0.4330 0.4401 0.3408 0.0000 0.5714 0.4714 0.3702 0.3646 0.2428 0.5232 0.5775
C18 0.4745 0.4764 0.3689 0.6317 0.2548 0.4037 0.4173 0.3018 0.0000 0.5684 0.4494 0.3360 0.3233 0.2047 0.5127 0.5749
C19 0.5313 0.5400 0.4218 0.7241 0.2795 0.4677 0.4696 0.3311 0.0000 0.6466 0.5249 0.3725 0.3647 0.2099 0.5863 0.6711
C20 0.5017 0.5069 0.3846 0.6864 0.2455 0.4275 0.4382 0.3030 0.0000 0.6120 0.4828 0.3432 0.3294 0.1939 0.5505 0.6286
C21 0.4749 0.4775 0.3217 0.6841 0.1460 0.3711 0.3978 0.2388 0.0000 0.5992 0.4384 0.2859 0.2545 0.1420 0.5268 0.6157
C22 0.2582 0.2406 0.0878 0.3975 0.0000 0.1145 0.1802 0.0604 0.0000 0.3401 0.1611 0.0946 0.0414 0.0354 0.2690 0.3090
C23 0.4834 0.4860 0.3855 0.6352 0.2781 0.4190 0.4294 0.3189 0.0000 0.5742 0.4624 0.3517 0.3422 0.2197 0.5211 0.5814
C24 0.2813 0.2669 0.1325 0.4119 0.0199 0.1578 0.2113 0.1018 0.0000 0.3583 0.1999 0.1331 0.0906 0.0669 0.2938 0.3324
C25 0.5338 0.5405 0.4588 0.6781 0.3651 0.4911 0.4885 0.3881 0.0000 0.6206 0.5301 0.4182 0.4198 0.2753 0.5745 0.6342
C26 0.4137 0.4104 0.3064 0.5486 0.2065 0.3346 0.3579 0.2555 0.0000 0.4941 0.3741 0.2855 0.2671 0.1800 0.4404 0.4889
C27 0.4003 0.3942 0.2339 0.5848 0.0738 0.2743 0.3206 0.1742 0.0000 0.5095 0.3346 0.2170 0.1738 0.1059 0.4356 0.5052
C28 0.5890 0.6022 0.5174 0.7613 0.4061 0.5583 0.5420 0.4252 0.0000 0.6927 0.6052 0.4605 0.4705 0.2866 0.6442 0.7219
C29 0.3953 0.3895 0.2535 0.5567 0.1219 0.2879 0.3255 0.1990 0.0000 0.4911 0.3383 0.2359 0.2032 0.1294 0.4254 0.4840
C30 0.5489 0.5583 0.4618 0.7208 0.3446 0.5019 0.4967 0.3765 0.0000 0.6521 0.5501 0.4126 0.4136 0.2517 0.5996 0.6743

Sustainability 2015, 7 13750
Table 11. Cont.
C17 C18 C19 C20 C21 C22 C23 C24 C25 C26 C27 C28 C29 C30 Eigenvectors Ranking
C1 0.5115 0.5255 0.4687 0.4983 0.5251 0.7418 0.5166 0.7187 0.4662 0.5863 0.5997 0.4110 0.6047 0.4511 0.1664 15
C2 0.5087 0.5236 0.4600 0.4931 0.5225 0.7594 0.5140 0.7331 0.4595 0.5896 0.6058 0.3978 0.6105 0.4417 0.1633 17
C3 0.5971 0.6311 0.5782 0.6154 0.6783 0.9122 0.6145 0.8675 0.5412 0.6936 0.7661 0.4826 0.7465 0.5382 0.2006 8
C4 0.3732 0.3683 0.2759 0.3136 0.3159 0.6025 0.3648 0.5881 0.3219 0.4514 0.4152 0.2387 0.4433 0.2792 0.1031 28
C5 0.6910 0.7452 0.7205 0.7545 0.8540 1.0000 0.7219 0.9801 0.6349 0.7935 0.9262 0.5939 0.8781 0.6554 0.2454 3
C6 0.5670 0.5963 0.5323 0.5725 0.6289 0.8855 0.5810 0.8422 0.5089 0.6654 0.7257 0.4417 0.7121 0.4981 0.1857 10
C7 0.5599 0.5827 0.5304 0.5618 0.6022 0.8198 0.5706 0.7887 0.5115 0.6421 0.6794 0.4580 0.6745 0.5033 0.1862 9
C8 0.6592 0.6982 0.6689 0.6970 0.7612 0.9396 0.6811 0.8982 0.6119 0.7445 0.8258 0.5748 0.8010 0.6235 0.2312 4
C9 1.0000 1.0000 1.0000 1.0000 1.0000 1.0000 1.0000 1.0000 1.0000 1.0000 1.0000 1.0000 1.0000 1.0000 0.3700 1
C10 0.4286 0.4316 0.3534 0.3880 0.4008 0.6599 0.4258 0.6417 0.3794 0.5059 0.4905 0.3073 0.5089 0.3479 0.1284 24
C11 0.5286 0.5506 0.4751 0.5172 0.5616 0.8389 0.5376 0.8001 0.4699 0.6259 0.6654 0.3948 0.6617 0.4499 0.1675 14
C12 0.6298 0.6640 0.6275 0.6568 0.7141 0.9054 0.6483 0.8669 0.5818 0.7145 0.7830 0.5395 0.7641 0.5874 0.2177 6
C13 0.6354 0.6767 0.6353 0.6706 0.7455 0.9586 0.6578 0.9094 0.5802 0.7329 0.8262 0.5295 0.7968 0.5864 0.2188 5
C14 0.7572 0.7953 0.7901 0.8061 0.8580 0.9646 0.7803 0.9331 0.7247 0.8200 0.8941 0.7134 0.8706 0.7483 0.2762 2
C15 0.4768 0.4873 0.4137 0.4495 0.4732 0.7310 0.4789 0.7062 0.4255 0.5596 0.5644 0.3558 0.5746 0.4004 0.1481 22
C16 0.4225 0.4251 0.3289 0.3714 0.3843 0.6910 0.4186 0.6676 0.3658 0.5111 0.4948 0.2781 0.5160 0.3257 0.1205 27
C17 0.5000 0.5113 0.4581 0.4850 0.5071 0.7090 0.5037 0.6899 0.4582 0.5687 0.5752 0.4070 0.5823 0.4432 0.1630 18
C18 0.4887 0.5000 0.4357 0.4676 0.4914 0.7247 0.4917 0.7021 0.4413 0.5658 0.5723 0.3799 0.5807 0.4211 0.1555 20
C19 0.5419 0.5643 0.5000 0.5369 0.5795 0.8285 0.5517 0.7935 0.4879 0.6321 0.6703 0.4232 0.6662 0.4737 0.1759 13
C20 0.5150 0.5324 0.4631 0.5000 0.5345 0.7902 0.5215 0.7591 0.4618 0.6028 0.6268 0.3940 0.6289 0.4424 0.1641 16
C21 0.4929 0.5086 0.4205 0.4655 0.5000 0.8018 0.4974 0.7660 0.4324 0.5910 0.6131 0.3482 0.6178 0.4031 0.1498 21
C22 0.2910 0.2753 0.1715 0.2098 0.1982 0.5000 0.2752 0.4933 0.2402 0.3651 0.3010 0.1488 0.3409 0.1859 0.0693 30
C23 0.4963 0.5083 0.4483 0.4785 0.5026 0.7248 0.5000 0.7029 0.4507 0.5710 0.5790 0.3931 0.5864 0.4329 0.1596 19
C24 0.3101 0.2979 0.2065 0.2409 0.2340 0.5067 0.2971 0.5000 0.2630 0.3796 0.3256 0.1816 0.3598 0.2163 0.0799 29
C25 0.5418 0.5587 0.5121 0.5382 0.5676 0.7598 0.5493 0.7370 0.5000 0.6122 0.6329 0.4537 0.6339 0.4914 0.1808 12
C26 0.4313 0.4342 0.3679 0.3972 0.4090 0.6349 0.4290 0.6204 0.3878 0.5000 0.4850 0.3262 0.5016 0.3617 0.1332 23
C27 0.4248 0.4277 0.3297 0.3732 0.3869 0.6990 0.4210 0.6744 0.3671 0.5150 0.5000 0.2776 0.5209 0.3263 0.1208 26
C28 0.5930 0.6201 0.5768 0.6060 0.6518 0.8512 0.6069 0.8184 0.5463 0.6738 0.7224 0.5000 0.7122 0.5449 0.2015 7
C29 0.4177 0.4193 0.3338 0.3711 0.3822 0.6591 0.4136 0.6402 0.3661 0.4984 0.4791 0.2878 0.5000 0.3304 0.1220 25
C30 0.5568 0.5789 0.5263 0.5576 0.5969 0.8141 0.5671 0.7837 0.5086 0.6383 0.6737 0.4551 0.6696 0.5000 0.1850 11
5. Theoretical and Managerial Implications
This section presents the theoretical contributions that relate to innovation and SBMCC and provides
managerial implications for practice.
5.1. Theoretical Implications
Innovation was found to contribute to SBMCC, as in previous studies [15,20,79]. This study
contributes to the literature by prioritizing the capabilities and competencies, thereby revealing a better
understanding of innovation in these areas and of SBMCC. This study provides evidence that suggests
that innovation in technology capabilities, networking and social capabilities, and the capabilities for
learning and developing should be the priorities for a sustainable business.

Sustainability 2015, 7 13751
Firms that have the potential to make products using technologies that challenge the current
technology have technology capabilities [80]. Technology capabilities contribute to firm innovation in
a highly competitive environment by helping to satisfy customer demand for product and service
innovation [81]. Moreover, it affects the business model: Business sustainability drives the firm to adopt
management innovation [21,82]. Management innovation refers to the generation or adoption of
management processes, practices, structures or techniques that are new to the firm and that affect its
performance in terms of innovation, productivity and competitiveness [83,84]. Hence, it changes the
way management, techniques and procedures are used to accomplish a specific task or goal and improves
on traditional processes and practices. These changes can create sustainable competitive advantages that
lead to economic success [85–87].
Previous studies have widely noted that to proceed to a stage of sustainable business, it is necessary
to involve a range of actors, including government, societal, nongovernmental organizations, and the
community [23,88–91]. Different actors in society and in networks provide learning opportunities,
innovation, positive influences, business opportunities and even solutions for complex problems [63].
Thus, innovation of SBMCC requires networking capabilities for collaboration, which facilitates
changes at all levels—both inside and outside of the firm [92]. In terms of technology activities, strong
networking and social capabilities benefit technology innovation because of the collaboration among
actors in a network, as innovation can be achieved by implementing additional capabilities from outside
sources [93]. In particular, collaborating with universities and research institutions positively affects
product innovation [94]. Specifically, such collaboration allows firms to acquire new scientific knowledge
from universities and research institutions, which might benefit product or process innovation. By
contrast, failing to understand the benefits of this collaboration may lead to a firm lagging behind in
terms of competitive advantage [95].
Learning is the basis of the enhancement of sustainable competitive advantage [96]. Firms that have
learning and development capabilities stand a better chance of sensing and efficiently adapting to trends
in the marketplace [97]. Capabilities for learning and developing facilitate innovation, which in turn
significantly influences the achievement of sustainable business [22]. It ensures business sustainability,
i.e., that successes and best practices are transferred and translated into action. In addition, creativity,
innovation and adaptability can be leveraged. Learning can be approached from different levels, such as
the individual, group, organization and network levels [98,99]. Networks such as industrial associations
and industrial forums as discussed above or even competitors can promote innovation for sustainable
business. The advantages of collaborating and learning from competitors are sharing knowledge and
skills, solving common problems, and gaining more knowledge about competitor strategies [100,101].
5.2. Managerial Implications
This section presents several practical implications. The ranking of the most important criteria are
provided in the results section, which offers several managerial insights for the hotel industry. Given
the highly competitive nature of the hotel industry, a basic understanding of innovation is necessary for
SBMCC. Next, we discuss the implications derived from this study.
The top-ranking criterion is to develop social relations with (culturally) unfamiliar actors inside or
outside the organization for information gathering, experimentation and negotiation (C9). Sustainable
business may require a re-thinking of the terms of competition and collaboration among the actors

Sustainability 2015, 7 13752
engaged in entire networks. The hotel must facilitate cooperation among the actors in a network, creating
a basis for new product and service development and innovation as well as developing advantages
associated with lower costs, the preemption of competitors, and a favorable future market position,
which can help the hotel achieve increased legitimacy through transparency and collaboration with
stakeholders [21,64]. Therefore, management should encourage and facilitate social relations for the
sake of improving their products and services; for example, building relationships with research
institutions for learning and innovation; building relationships with governments and industrial associations
that assist firms in predicting and adapting to new policies and trends in business; collaborating with
travel agencies for stable customer sources; and even collaborating with technology-based app developers
to receive support from customer app searches.
Upgrading and integrating technology capabilities may benefit new product development and
marketing (C14) in several ways; for example, it may decrease the cost of products and services while
improving the efficient use of resources [102,103]. Some noteworthy advanced technologies include
social media, mobile-friendly content, new technology for traditional points of sale, etc., and these new
technologies can help a hotel advertise its products and services to potential customers regardless of
distance with low-cost systems for searching and purchasing products. Moreover, technology may assist
in changing a firm’s business model [104]. Technology is the basis of e-commerce, which is now
considered the future of the hotel industry. Cloud computing reduces costs, strengthens security, and
allows easy access to information. Currently, mobile phones and tablets can be used to book rooms, plan
trips, and search for hotels. Thus, both the accessibility and security of information are critical in
business. Hotels that aim to achieve sustainability should consider continuous upgrades in, integration
with, and exploitation of new technology.
The ability to think inventively (C5) is an individual skill that is crucial for innovation and that is
directed toward finding new solutions to problems. This capability should be strongly developed, as the
ability to think innovatively assumes the role of idea generator to achieve change and innovation in
hotels. Management and employees with a competency for inventive thinking form the basis of innovation.
Therefore, hotels seek and hire inventive employees to improve innovation. Moreover, support and
encouragement from management can assist individual employees with thinking inventively, thus
creating benefits for firms in terms of innovation and problem-solving. In practice, training courses in
problem-solving techniques, such as brainstorming, have proven effective in leveraging inventive
thinking and creativity on the part of employees. As employees are the main actors in processing and
delivering hotel service to customers, an inventive employee can derive solutions to complex problems
and use work experience as a basis for innovation.
Building trust and a shared vision and agreement on basic values (C8) is necessary for collaboration;
however, it involves a highly diverse group of stakeholders, which is problematic because of opposing
interests and perspectives [21]. Collaboration within a network requires a shared vision and values to
achieve uniformity in action. In terms of supporting employees, management is encouraged to be open
and responsive to different perspectives—as opposed to closed management attitudes—because it might
lead to new knowledge bases for sustainable business management and thus benefit the common
agreement on basic values. To achieve openness, managers must be willing to relinquish some control,
to find a balance between managing and being managed, and to empower employees. Employees with

Sustainability 2015, 7 13753
more freedom are also free to create innovative solutions that can make the firm more competitive.
Hence, the advantages of empowerment in the firm should be emphasized.
Finally, new approaches to knowledge regarding management functions and new processes that
produce changes in organizational strategies, structures, administrative procedures, and systems (C13)
foster firm process innovation and management innovation. In the hotel industry, process innovation
focuses on eliminating waste in delivering services to customers. In this case, implementing technology
advancements can improve service quality by providing greater convenience and better experiences to
customers while minimizing managerial costs. Currently, the most remarkable technologies that have
improved hotel service in terms of process and management are virtual booking and cloud computing.
These technologies might help hotels cut costs by reducing the upfront costs associated with setting up
the hotel agent, hardware, and operations. More specifically, systems that can be migrated to the cloud
and accessed on electronic equipment are desirable to increase customer convenience while improving
managerial efficiency and effectiveness. Moreover, the minor details that should be considered include
Internet access, sufficient electronics support (adequate and easy-to-reach electrical outlets), etc.
6. Conclusions
This study employs IVTFNs and the GRA method to understand innovations in SBMCC by
identifying and ranking capabilities and competencies. The capabilities and competencies regarding
sustainable business management are presented as several aspects, including competencies for systemic
thinking; networking and social capabilities; technology capabilities; capabilities for learning and
developing; and capabilities for integrating business, environmental problems, social problems, perspectives
and information. These five aspects were considered and evaluated in enhancing the capabilities and
competencies for firms to achieve sustainability. The degrees of importance of the aforementioned
aspects and criteria are determined by linguistic preference number and the ranking of eigenvectors.
The findings confirm that innovation was found to support SBMCC; this finding implies that
innovation in the aspects of technology capabilities, networking and social capabilities, and capabilities
for learning and development should be more highly prioritized than other aspects in management
decision-making. Specifically, technology capabilities are particularly important in the innovation of
management, process, and procedure, all of which can lead to economic success and sustainable
business. In the hotel industry, as a result of globalization, the future of doing business is providing
service to customers regardless of geographic barriers. Technology enables this possibility for hotels
because of e-commerce, which provides virtual reservations, check-in, and ordering. This affirms the
sustainability of the business even within the highly competitive environment of the hotel industry.
Furthermore, to achieve a sustainable business, a variety of actors must be involved, including government,
civic society, nongovernmental organizations, and the community; hence, strong networking and social
capabilities require more attention from management. This benefits sustainable business management
by fostering long-term collaboration and agreement among the actors and stakeholders in a firm network,
which can lead to synergies for development. To exploit a firm’s network and social capabilities, the
capabilities for learning and development must be translated into action; in addition, innovation is
necessary for competitiveness and business success.
This study has contributed to understanding innovation in SBMCC. In practice, establishing a variety
of social relations is necessary for a hotel to better adapt to the changes in the business environment.
Sustainability 2015, 7 13754
In addition, applying technology upgrades and integration improves customers’ convenience and also
plays an important role in business. Technology not only changes management functions and processes,
but also reduces the costs, improves service speed, and enhances customer satisfaction. However, the
idea of improvements may originate from an individual employee or at the management level; thus, the
competency to think inventively is required to encourage and spread the changes to all levels of process
and management. Moreover, building trust, a shared vision, and agreement on basic values drives the
actors in a network that is dedicated to the common development of sustainable business. In particular,
managers are advised to stimulate the entrepreneurial spirit and thinking among employees [105].
This study has certain limitations. First, it was conducted using the extant innovation and SBMCC
literature to identify the relevant aspects and criteria; thus, the set of aspects and criteria may not be
comprehensive. Second, the sample collection focused only on Taiwanese hotels; hence, external
generalizability is limited. Future research would benefit from multi-industry data, which might address
potential problems with generalizability. Similarly, the expert sample might be categorized into different
industries that may benefit from the comparison and examination of the effective aspects and criteria.
Furthermore, to promote and deepen the understanding of SBMCC, additional studies must be investigated
to uncover additional valuable aspects and criteria to refine the accuracy of the analysis.
Acknowledgments
The authors of this study would like to thank Hong Thuy Tien Nguyen, Kim Truong Pham,
Phuong Quy Huynh and Quoc Cuong Dang for their efforts. Their contributions provided a significant
basis for the formulation of this study.
Author Contributions
Kuo-Jui Wu and Ching-Jong Liao found the phenomenon in the industry and conducted this study.
Ming-Lang Tseng and Pei-Jay Chou proposed the research method and finalized the analysis to
overcome the uncertainty and incomplete information. Then Kuo-Jui Wu combined the research design
and analysis to write the paper for enhancing the understanding of SBMCC. Consequently, all authors
read and approved the final manuscript.
Conflicts of Interest
The authors declare no conflict of interest.
References
1. Tseng, C.; Kuo, H.; Chou, S. Configuration of innovation and performance in the service industry:
Evidence from the Taiwanese hotel industry. Serv. Ind. J. 2008, 28, 1015–1028.
2. Gu, H.; Ryan, C.; Yu, L. The changing structure of the Chinese hotel industry: 1980–2012.
Tour. Manag. Perspect. 2012, 4, 56–63.
3. Grissemann, U.S.; Pikkemaat, B.; Weger, C. Antecedents of innovation activities in tourism:
An empirical investigation of the Alpine hospitality industry. Tourism 2013, 61, 7–27.

Sustainability 2015, 7 13755
4. Zhou, K.Z.; Brown, J.R.; Dev, C.S.; Agarwal, S. The effects of customer and competitor
orientations on performance in global markets: A contingency analysis. J. Int. Bus. Stud. 2007, 38,
303–319.
5. Chen, J.S.; Tsou, H.T.; Huang, Y.H. Service delivery innovation: Antecedents and impact on firm
performance. J. Serv. Res. 2009, 12, 36–55.
6. Den Hertog, P. Knowledge-intensive business services as co-producers of innovation. Int. J.
Innov. Manag. 2000, 4, 491–528.
7. Gebauer, H.; Gustafsson, A.; Witell, L. Competitive advantage though service differentiation by
manufacturing companies. J. Bus. Res. 2011, 64, 1270–1280.
8. Damanpour, F. An integration of research findings of effects of firm size and market competition
on product and process innovations. Br. J. Manag. 2010, 21, 996–1010.
9. Hjalager, A.M. A review of innovation research in tourism. Tour. Manag. 2010, 31, 1–12.
10. Nybakk, E. Learning orientation, innovativeness and financial performance in traditional
manufacturing firms: A higher-order structural equation model. Int. J. Innov. Manag. 2012, 16, 1–33.
11. Rhee, J.; Park, T.; Lee, D.H. Drivers of innovativeness and performance for innovative SMEs in
South Korea: Mediation of learning orientation. Technovation 2010, 30, 65–75.
12. Delgado-Verde, M.; Martín-de Castro, G.; Navas-López, J.E. Organizational Knowledge Assets
and Innovation Capability: Evidence from Spanish Manufacturing Firms. J. Intell. Cap. 2011, 12,
5–19.
13. Harper, S.M.; Becker, S.W. On the leading edge of innovation: A comparative study of innovation
practices. South. Bus. Rev. 2004, 29, 1–15.
14. Walker, R.M.; Damanpour, F.; Devece, C.A. Management innovation and organizational
performance: The mediating effect of performance management. J. Public Adm. Res. Theory 2011,
21, 367–386.
15. McEvily, B.; Zaheer, A. Bridging ties: A source of firm heterogeneity in competitive capabilities.
Strateg. Manag. J. 2003, 20, 1133–1156.
16. Teece, D.; Pisano, G.; Shuen, A. Dynamic capabilities and strategic management. Strateg. Manag. J.
1997, 18, 509–533.
17. Zahra, S.A. Entrepreneurial risk taking in family firms. Fam. Bus. Rev. 2005, 18, 23–40.
18. Colquitt, J.A.; Scott, B.A.; LePine, J.A. Trust, trustworthiness, and trust propensity: A meta-analytic
test of their unique relationships with risk-taking and job performance. J. Appl. Psychol. 2007, 92,
909–927.
19. Delgado, M.; Porter, M.E.; Stern, S. Clusters and entrepreneurship. J. Econ. Geogr. 2010, 10,
495–518.
20. Orfila-Sintes, F.; Mattsson, J. Innovation behavior in the hotel industry. Omega 2009, 37, 380–394.
21. Van Kleef, J.A.G.; Room, N.J. Developing capabilities and competencies for sustainable business
management as innovation: A research agenda. J. Clean. Prod. 2007, 15, 38–41.
22. Weerawardena, J.; Mavondo, F.T. Capabilities, innovation and competitive advantage.
Ind. Mark. Manag. 2011, 40, 1220–1223.
23. Bodin, Ö.; Crona, B.I. The role of social networks in natural resource governance:
What relationship patterns make a difference? Glob. Environ. Chang. 2009, 19, 366–374.

Sustainability 2015, 7 13756
24. Tseng, M.L.; Wang, R.; Chiu, A.S.F.; Geng, Y.; Lin, Y.H. Improving performance of green
innovation practices in uncertainty. J. Clean. Prod. 2013, 40, 71–82.
25. Wong, Y.P.; Tseng, M.L.; Tan, K. A business process management capabilities perspective on
organization performance. Total Qual. Manag. Bus. Excell. 2014, 25, 602–617.
26. Kuo, Y.; Yang, T.; Huang, G.W. The use of grey relational analysis in solving multiple attribute
decision-making problems. Comput. Ind. Eng. 2008, 55, 80–93.
27. Tseng, M.L. Using linguistic preferences and grey relational analysis to evaluate the environmental
knowledge management capacity. Expert Syst. Appl. 2010, 37, 70–81.
28. Onsel, S.; Ulengin, F.; Kaba, O. A cluster-based approach for the innovation assessment of
countries. In Proceedings of the Engineering Management Conference, Estoril, Portugal,
28–30 June 2008; pp. 1–5.
29. McFadzean, E.; O’Loughlin, A.; Shaw, E. Corporate entrepreneurship and innovation part 1:
The missing link. Eur. J. Innov. 2005, 8, 350–372.
30. Oke, A. Innovation types and innovation management practices in service companies. Int. J. Oper.
Prod. Manag. 2007, 7, 564–587.
31. Edquist, C. Systems of innovation approaches—Their emergence and characteristics. In Systems
of Innovation—Technologies, Institutions and Organizations; Pinter Publishers/Cassell Academic:
London, UK, 1997; pp. 1–35.
32. Johannesen, J.; Olsen, B. Systemic knowledge processes, innovation and sustainable competitive
advantages. Kybernetes 2009, 38, 559–580.
33. Liao, T.; Price, J. Innovation investments, market engagement and financial performance: A study
among Australian manufacturing SMEs. Res. Policy 2010, 39, 117–125.
34. Van de Ven, A.; Engleman, R. Central problems in managing corporate innovation and
entrepreneurship. In Advances in Entrepreneurship, Firm Emergence and Growth 7; Emerald
Group Publishing: West Yorkshire, UK, 2007; pp. 47–72.
35. Hallstedt, S.I.; Thompson, A.W.; Lindahl, P. Key elements for implementing a strategic
sustainability perspective in the product innovation process. J. Clean. Prod. 2013, 51, 277–288.
36. Hansen, E.G.; Grosse-Dunker, F.; Reichwald, R. Sustainability innovation cube—A framework to
evaluate sustainability-oriented innovations. Int. J. Innov. Manag. 2009, 13, 683–713.
37. Schaltegger, S.; Wagner, M. Sustainable entrepreneurship and sustainability innovation:
Categories and interactions. Bus. Strategy Environ. 2011, 20, 222–237.
38. Dutta, S.; Narasimhan, O.; Rajiv, S. Conceptualizing and measuring capabilities: Methodology and
empirical application. Strateg. Manag. J. 2005, 26, 277–285.
39. Campion, M.A.; Fink, A.A.; Ruggeberg, B.J.; Carr, L.; Phillips, G.M.; Odman, R.B. Doing
Competencies Well: Best Practices in Competency Modelling. Pers. Psychol. 2011, 64, 225–262.
40. Leblanc, R.; James, G. Inside the Boardroom: How Boards Really Work and the Coming
Revolution in Corporate Governance; John Wiley & Sons: Hoboken, NJ, USA, 2010.
41. Markus, L.H.; Cooper-Thomas, H.D.; Allpress, K.N. Confounded by Competencies? An Evaluation
of the Evolution and Use of Competency Models. N. Z. J. Psychol. 2005, 34, 117–126.
42. Yusoff, W.F.W.; Armstrong, A. What Competencies Should Directors Possess? Malaysia
Perspective. Int. J. Bus. Manag. 2012, 7, 142–149.

Sustainability 2015, 7 13757
43. Lim, J.H.; Stratopoulos, T.C.; Wirjanto, T.S. Role of IT executives in the firm’s ability to achieve
competitive advantage through IT capability. Int. J. Account. Inf. Syst. 2012, 13, 21–40.
44. Nobre, F.S.; Walker, D.; Harris, R.J. Technological, Managerial and Organizational Core
Competencies: Dynamic Innovation and Sustainable Development. IGI Global: Hershey, PA,
USA, 2012.
45. Matos, S.; Silvestre, B. Managing stakeholder relations when developing sustainable business
models: The case of the Brazilian energy sector. J. Clean. Prod. 2013, 45, 61–73.
46. Schoenherr, T. The role of environmental management in sustainable business development:
A multi-country investigation. Int. J. Prod. Econ. 2012, 140, 116–128.
47. Wu, K.J.; Liao, C.J.; Tseng, M.L.; Chiu, A.S.F. Exploring decisive factors in green supply practices
under uncertainty. Int. J. Prod. Econ. 2015, 159, 147–157.
48. Deng, J.L. Introduction to grey system theory. J. Grey Syst. 1989, 1, 1–24.
49. Lin, Y.H.; Lee, P.C.; Chang, T.P. Practical expert diagnosis model based on the grey relational
analysis technique. Expert Syst. Appl. 2009, 36, 1523–1528.
50. Wei, G.U. GRA method for multiple attribute decision making with incomplete weight information
in intuitionistic fuzzy setting. Knowl. Based Syst. 2010, 23, 243–247.
51. Kapsali, M. Systems thinking in innovation project management: A match that works. Int. J. Proj.
Manag. 2011, 29, 396–407.
52. Lansdown, T.C.; Stephens, A.N.; Walker, G.H. Multiple driver distractions: A systemic transport
problem. Accid. Anal. Prev. 2015, 74, 360–367.
53. Joham, C.; Metcalfe, M.; Sastrowardoyo, S. Project conceptualization using pragmatic methods.
Int. J. Proj. Manag. 2009, 27, 787–794.
54. Pourdehnad, G. Synthetic (integrative) project management, an idea whose time has come.
Bus. Strategy Ser. 2007, 8, 426–434.
55. Salmon, P.M.; McClure, R.; Stanton, N.A. Road transport in drift? Applying contemporary
systems thinking to road safety. Saf. Sci. 2012, 50, 1829–1838.
56. Kline, N. More Time to Think: The Power of Independent Thinking; Octopus: London, UK, 2015.
57. Brodin, E.M. The Critical and Creative Thinking Nexus: Learning Experiences of Doctoral
Students. In Studies in Higher Education; Routledge: London, UK, 2014.
58. Levine, M. A Mind at a Time: How Every Child Can Succeed? Simon & Schuster: New York, NY,
USA, 2012.
59. Colvin, W.; Lyden, S.; Barra, B.A.L. Attracting Girls to Civil Engineering through Hands-on
Activities that Reveal the Communal Goals and Values of the Profession. J. Leadersh. Manag. Eng.
2013, 13, 35–41.
60. Chang, Y.C.; Chang, H.T.; Chi, H.R.; Chen, M.H.; Deng, L.L. How do established firms improve
radical innovation performance? The organizational capabilities view. Technovation 2012, 32,
441–451.
61. Erzurumlu, S.S.; Erzurumlu, Y.O. Sustainable mining development with community using
design thinking and multi-criteria decision analysis. Resour. Policy 2014,
doi:10.1016/j.resourpol.2014.10.001.

Sustainability 2015, 7 13758
62. Petrini, M.; Pozzebon, M. Managing sustainability with the support of business intelligence:
Integrating socio-environmental indicators and organisational context. J. Strateg. Inf. Syst. 2009,
18, 178–191.
63. Christiansen, A.; Prescott, T.; Ball, J. Learning in action: Developing safety improvement
capabilities through action learning. Nurse Educ. Today 2014, 34, 243–247.
64. Yang, Y.; Narayanan, V.K.; Zahra, S. Developing the selection and valuation capabilities through
learning: The case of corporate venture capital. J. Bus. Ventur. 2009, 24, 261–273.
65. O’Connor, K.M.; Gladstone, E. How social exclusion distorts social network perceptions?
Soc. Netw. 2015, 40, 123–128.
66. Hsieh, M.H.; Tsai, K.H. Technological capability, social capital and the launch strategy for
innovative products. Ind. Mark. Manag. 2007, 36, 493–502.
67. Galende, J.; de la Fuente, J.M. Internal factors determining a firm’s innovative behavior.
Res. Policy 2003, 32, 715–736.
68. Kafetzopoulos, D.; Psomas, E. The impact of innovation capability on the performance of
manufacturing companies: The Greek case. J. Manuf. Technol. Manag. 2015, 26, 104–130.
69. Finin, T.; Ding, L.; Zou, L. Social networking on the semantic web. Learn. Organ. 2005, 12, 418–435.
70. McGrath, H.; O’Toole, T. A cross-cultural comparison of the network capability development of
entrepreneurial firms. Ind. Mark. Manag. 2014, 43, 897–910.
71. Dyllick, T.; Hockerts, K. Beyond the business case for corporate sustainability. Bus. Strategy Environ.
2002, 11, 130–141.
72. Young, W.; Tilley, F. Can businesses move beyond efficiency? The shift toward effectiveness and
equity in the corporate sustainability debate. Bus. Strategy Environ. 2006, 15, 402–415.
73. European Commission. Sustainable production, challenges and objectives for EU research policy.
In Report of the Expert Group on Competitive and Sustainable Production & Related Service
Industries in Europe in the Period to 2020; EUR19880; European Commission: Brussel,
The Netherland, 2001.
74. Letki, N.; Mieriņa, I. Getting support in polarized societies: Income, social networks, and
socioeconomic context. Soc. Sci. Res. 2015, 49, 217–233.
75. Deng, J.L. Control problems of grey systems. Syst. Control Lett. 1982, 1, 288–294.
76. Zhang, S.F.; Liu, S.Y.; Zhai, R.H. An extended GRA method for MCDM with interval-valued
triangular fuzzy assessments and unknown weights. Comput. Ind. Eng. 2011, 61, 1336–1341.
77. Li, D.-F.; Wang, Y.-C.; Liu, S.; Shan, F. Fractional programming methodology for multi-attribute
group decision-making using IFS. Appl. Soft Comput. 2009, 9, 219–225.
78. World Tourism Organization. UNWTO Tourism Highlights, 2014. Available online:
http://mkt.unwto.org/publication/unwto-tourism-highlights-2014-edition (accessed on 15
February 2015).
79. Grissemann, U.S.; Plank, A.; Brunner-Sperdin, A. Enhancing business performance of hotels:
The role of innovation and customer orientation. Int. J. Hosp. Manag. 2013, 33, 347–356.
80. Veryzer, R.W. Discontinuous innovation and the new product development process. J. Prod.
Innov. Manag. 1998, 15, 304–321.
81. Pantano, E.; Viassone, M. Consumers’ expectation of innovation: Shift retail strategies for more
attractive points of sale. Int. J. Digit. Content Technol. Appl. 2012, 16, 455–461.
Sustainability 2015, 7 13759
82. Hecker, A.; Ganter, A. The influence of product market competition on technological and
management innovation: Firm-level evidence from a large scale survey. Eur. Manag. Rev. 2013,
10, 17–33.
83. Birkinshaw, J.; Hamel, G.; Mol, M.J. Management innovation. Acad. Manag. Rev. 2008, 33, 825–845.
84. Volberda, H.W.; van den Bosch, F.A.J.; Heij, C.V. Management innovation: Management as fertile
ground for innovation. Eur. Manag. Rev. 2013, 10, 1–15.
85. D’Amato, A.; Roome, N. Leadership of organizational change toward an integrated model of
leadership for corporate responsibility and sustainable development: A process model of corporate
responsibility beyond management innovation. Corp. Govern. 2009, 9, 421–434.
86. Hamel, G. The why, what and how of management innovation. Harv. Bus. Rev. 2006, 84, 72–84.
87. Wu, L.Y. Which companies should implement management innovation? A commentary essay.
J. Bus. Res. 2010, 63, 321–323.
88. Meadows, J.; Herbohn, J.; Emtage, N. Engaging Australian small-scale lifestyle landowners in
natural resource management programmes—Perceptions, past experiences and policy implications.
Land Use Policy 2014, 36, 618–627.
89. Phillips, P.S.; Tudor, T.L.; Bird, H.; Bates, M.B. A critical review of a key Waste Strategy initiative
in England: Zero Waste Places Projects 2008–2009. Resour. Conserv. Recycl. 2011, 55, 335–343.
90. Starkl, M.; Brunner, N.; López, E.; Martínez-Ruiz, J.L. A planning-oriented sustainability
assessment framework for peri-urban water management in developing countries. Water Resour.
2013, 47, 7175–7183.
91. Weber, T.C.; Allen, W.L. Beyond on-site mitigation: An integrated multiscaleapproach to
environmental mitigation and stewardship for transportation projects. Lands. Urban Plan. 2010,
96, 240–256.
92. Clarke, S.; Roome, N.J. Sustainable business: Learning-action networks as organizational assets.
Bus. Strategy Environ. 1999, 8, 296–310.
93. Becker, W.; Dietz, J. R&D cooperation and innovation activities of firms—Evidence for the
German manufacturing industry. Res. Policy 2004, 33, 209–223.
94. Nieto, M.J.; Santamaría, I. The importance of diverse collaboration networks for the novelty of
product innovation. Technovation 2007, 27, 367–377.
95. Spencer, J. Firms’ knowledge-sharing strategies in the global innovation system: Empirical
evidence from the flat panel display industry. Strateg. Manag. J. 2003, 24, 217–233.
96. Brockmand, B.; Morgan, F. The role of existing knowledge in new product innovativeness and
performance. Decis. Sci. 2003, 32, 385–419.
97. Tippins, M.J.; Sohi, R.S. IT competency and firm performance: Is organizational learning a
missing link? Strateg. Manag. J. 2003, 24, 745–761.
98. Bontis, N.; Crossan, M.; Hulland, J. Managing organizational learning systems by aligning stocks
and flows. J. Manag. Stud. 2002, 39, 437–469.
99. Knight, L. Network learning: Exploring learning by interorganizational networks. Hum. Relat.
2002, 55, 427–454.
100. Linn, T.A. Learning from the competition. J. Account. 1994, 177, 43–46.
101. Tether, B. Who co-operate for innovation, and why: An empirical analysis. Res. Policy 2002, 31,
947–967.

Sustainability 2015, 7 13760
102. Bodhani, A. Shops offer the e-tail experience. Eng. Technol. 2012, 7, 46–49.
103. Tajeddini, K.; Trueman, M. Perceptions of innovativeness among Iranian hotel managers. J. Hosp.
Tour. Technol. 2014, 5, 62–77.
104. Boons, F.A.A.; Lüdeke-Freund, F. Business models for sustainable innovation: State-of-the-art and
steps towards a research agenda. J. Clean. Prod. 2013, 45, 9–19.
105. Tajeddini, K. Exploring the antecedents of effectiveness and efficiency. Int. J. Hosp. Manag. 2015,
49, 125–135.
© 2015 by the authors; licensee MDPI, Basel, Switzerland. This article is an open access article
distributed under the terms and conditions of the Creative Commons Attribution license
(http://creativecommons.org/licenses/by/4.0/).


