Embed Size (px)
Citation preview
1
UNIWHEELS Group
INVESTOR
PRESENTATION
January 2016
2 2
Safe-Harbor-Statement
UNIWHEELS GROUP INVESTOR PRESENTATION
This presentation includes forward-looking statements based on the beliefs of UNIWHEELS
AG management. Such statements reflect current views of UNIWHEELS AG with respect to
future events and results and are subject to risks and uncertainties. Actual results may vary
materially from those projected here, due to factors including changes in general economic
and business conditions, changes in currency exchange, the introduction of competing
products, lack of market acceptance of new products, services or technologies and changes
in business strategy. UHIWHEELS AG does not intend or assume any obligation to update
these forward-looking statements.
This presentation constitutes neither an offer nor recommendation to subscribe or buy in any
other way securities of UNIWHEELS AG or any of the companies that are members of the
Group at present or in the future, nor does it form part of such an offer and it should not be
understood as such. This presentation does not constitute an offer of sale of securities in the
United States of America. Securities may not be offered or sold in the United States of
America without registration or exemption from registration in accordance with the U.S.
Securities‘ Act of 1933 in its currently valid form.
3
01 UNIWHEELS AT A GLANCE
02 THE BUSINESS
03 9M 2015 UPDATE
04 FINANCIALS 12-14
05 APPENDIX
UNIWHEELS Group Investor Presentation
AGENDA
4
UNIWHEELS AT A GLANCE
UNIWHEELS Group Investor Presentation
01
5 5
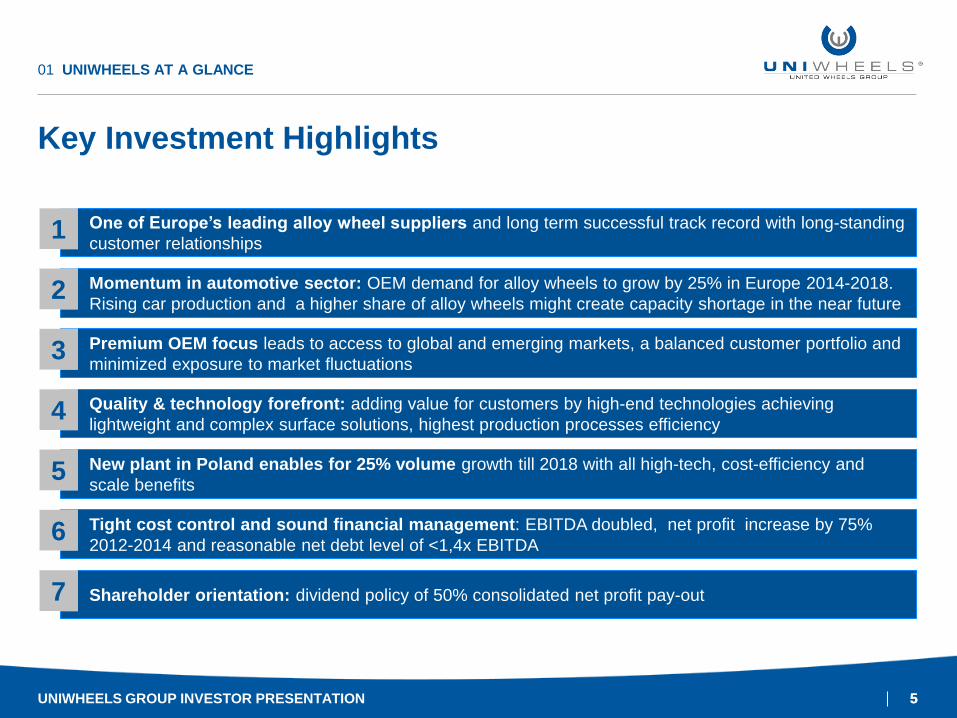
Key Investment Highlights
01 UNIWHEELS AT A GLANCE
Premium OEM focus leads to access to global and emerging markets, a balanced customer portfolio and
minimized exposure to market fluctuations 3
Quality & technology forefront: adding value for customers by high-end technologies achieving
lightweight and complex surface solutions, highest production processes efficiency 4
New plant in Poland enables for 25% volume growth till 2018 with all high-tech, cost-efficiency and
scale benefits 5
Tight cost control and sound financial management: EBITDA doubled, net profit increase by 75%
2012-2014 and reasonable net debt level of <1,4x EBITDA 6
One of Europe’s leading alloy wheel suppliers and long term successful track record with long-standing
customer relationships 1
Momentum in automotive sector: OEM demand for alloy wheels to grow by 25% in Europe 2014-2018.
Rising car production and a higher share of alloy wheels might create capacity shortage in the near future 2
Shareholder orientation: dividend policy of 50% consolidated net profit pay-out 7
UNIWHEELS GROUP INVESTOR PRESENTATION
6 6
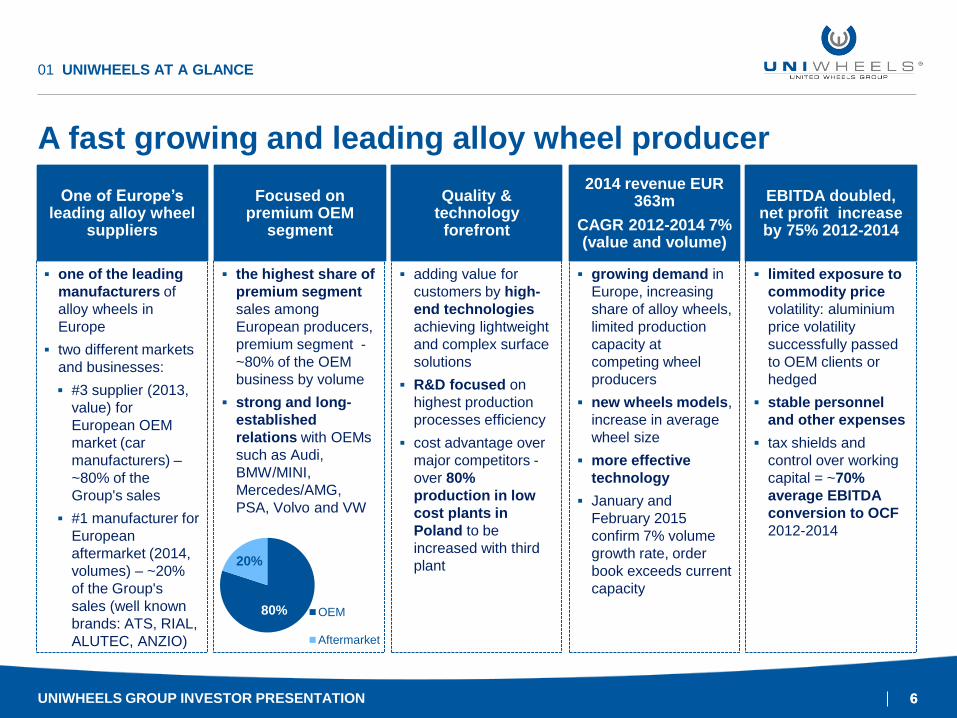
A fast growing and leading alloy wheel producer
UNIWHEELS GROUP INVESTOR PRESENTATION
01 UNIWHEELS AT A GLANCE
One of Europe’s leading alloy wheel
suppliers
one of the leading
manufacturers of
alloy wheels in
Europe
two different markets
and businesses:
#3 supplier (2013,
value) for
European OEM
market (car
manufacturers) –
~80% of the
Group's sales
#1 manufacturer for
European
aftermarket (2014,
volumes) – ~20%
of the Group's
sales (well known
brands: ATS, RIAL,
ALUTEC, ANZIO)
Focused on premium OEM
segment
the highest share of
premium segment
sales among
European producers,
premium segment -
~80% of the OEM
business by volume
strong and long-
established
relations with OEMs
such as Audi,
BMW/MINI,
Mercedes/AMG,
PSA, Volvo and VW
Quality & technology
forefront
adding value for
customers by high-
end technologies
achieving lightweight
and complex surface
solutions
R&D focused on
highest production
processes efficiency
cost advantage over
major competitors -
over 80%
production in low
cost plants in
Poland to be
increased with third
plant
2014 revenue EUR 363m
CAGR 2012-2014 7% (value and volume)
growing demand in
Europe, increasing
share of alloy wheels,
limited production
capacity at
competing wheel
producers
new wheels models,
increase in average
wheel size
more effective
technology
January and
February 2015
confirm 7% volume
growth rate, order
book exceeds current
capacity
EBITDA doubled, net profit increase by 75% 2012-2014
limited exposure to
commodity price
volatility: aluminium
price volatility
successfully passed
to OEM clients or
hedged
stable personnel
and other expenses
tax shields and
control over working
capital = ~70%
average EBITDA
conversion to OCF
2012-2014
80%
20%
OEM
Aftermarket
7 7
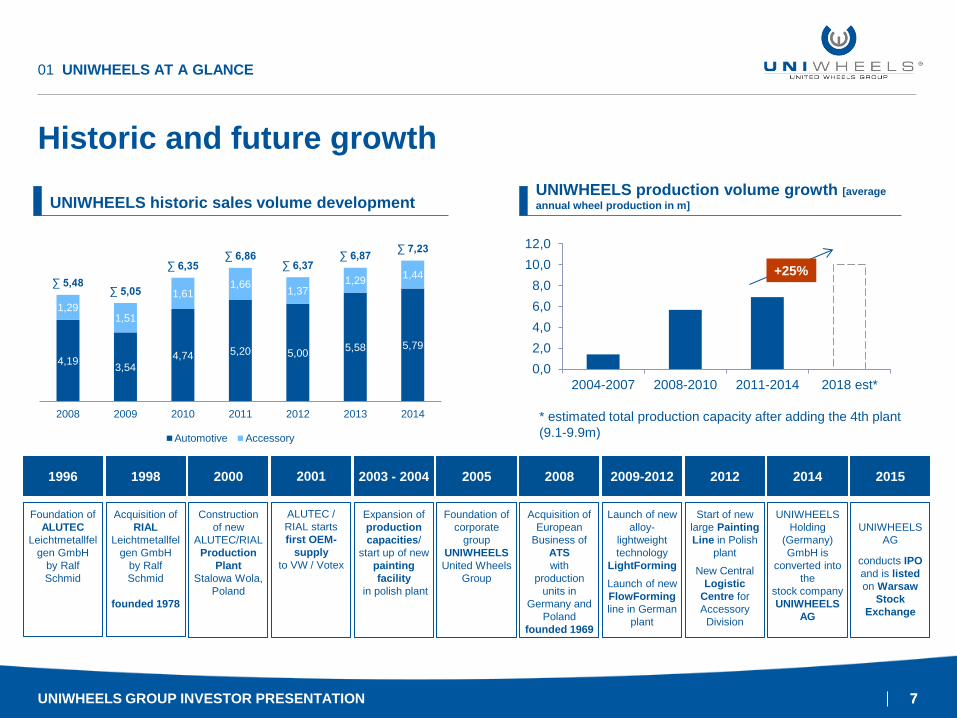
Historic and future growth
01 UNIWHEELS AT A GLANCE
Acquisition of
RIAL
Leichtmetallfel
gen GmbH
by Ralf
Schmid
founded 1978
ALUTEC /
RIAL starts
first OEM-
supply
to VW / Votex
Foundation of
corporate
group
UNIWHEELS
United Wheels
Group
Foundation of
ALUTEC
Leichtmetallfel
gen GmbH
by Ralf
Schmid
Construction
of new
ALUTEC/RIAL
Production
Plant
Stalowa Wola,
Poland
Expansion of
production
capacities/
start up of new
painting
facility
in polish plant
Start of new
large Painting
Line in Polish
plant
New Central
Logistic
Centre for
Accessory
Division
Launch of new
alloy-
lightweight
technology
LightForming
Launch of new
FlowForming
line in German
plant
Acquisition of
European
Business of
ATS
with
production
units in
Germany and
Poland
founded 1969
1996 2000 2003 - 2004 2008 1998 2001 2005 2012
UNIWHEELS
Holding
(Germany)
GmbH is
converted into
the
stock company
UNIWHEELS
AG
2014 2009-2012
UNIWHEELS
AG
conducts IPO
and is listed
on Warsaw
Stock
Exchange
2015
0,0
2,0
4,0
6,0
8,0
10,0
12,0
2004-2007 2008-2010 2011-2014 2018 est*
* estimated total production capacity after adding the 4th plant
(9.1-9.9m)
+25%
UNIWHEELS production volume growth [average
annual wheel production in m] UNIWHEELS historic sales volume development
4,19 3,54
4,74 5,20 5,00 5,58 5,79
1,29 1,51
1,61 1,66
1,37 1,29
1,44 ∑ 5,48
∑ 5,05
∑ 6,35 ∑ 6,86
∑ 6,37 ∑ 6,87
∑ 7,23
2008 2009 2010 2011 2012 2013 2014
Automotive Accessory
UNIWHEELS GROUP INVESTOR PRESENTATION
8 8
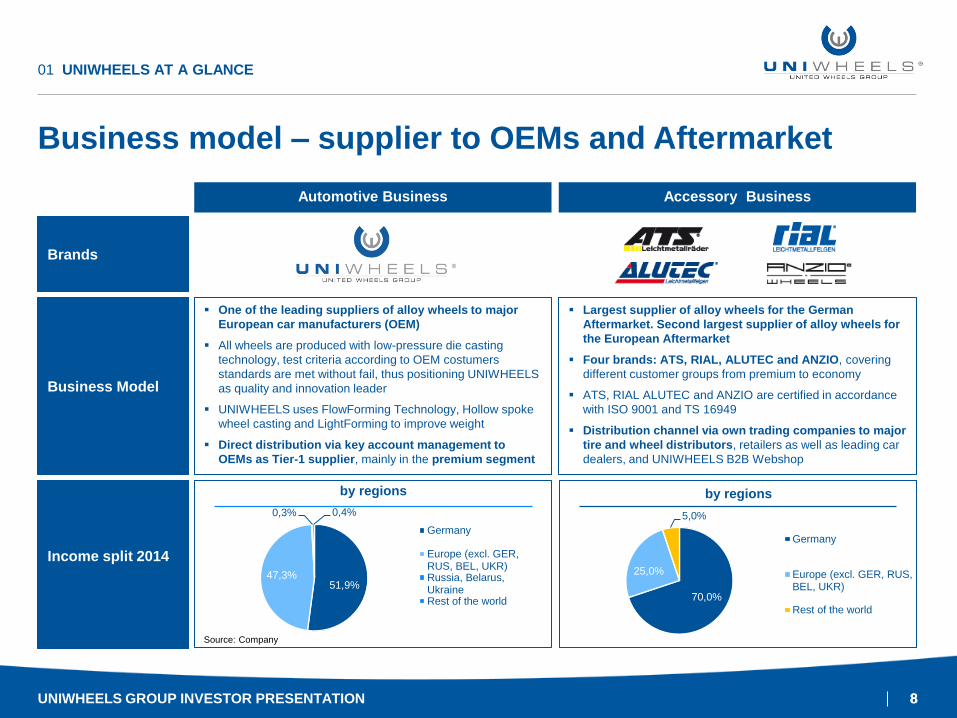
Business model – supplier to OEMs and Aftermarket
01 UNIWHEELS AT A GLANCE
Automotive Business Accessory Business
Brands
Business Model
Income split 2014
One of the leading suppliers of alloy wheels to major
European car manufacturers (OEM)
All wheels are produced with low-pressure die casting
technology, test criteria according to OEM costumers
standards are met without fail, thus positioning UNIWHEELS
as quality and innovation leader
UNIWHEELS uses FlowForming Technology, Hollow spoke
wheel casting and LightForming to improve weight
Direct distribution via key account management to
OEMs as Tier-1 supplier, mainly in the premium segment
Largest supplier of alloy wheels for the German
Aftermarket. Second largest supplier of alloy wheels for
the European Aftermarket
Four brands: ATS, RIAL, ALUTEC and ANZIO, covering
different customer groups from premium to economy
ATS, RIAL ALUTEC and ANZIO are certified in accordance
with ISO 9001 and TS 16949
Distribution channel via own trading companies to major
tire and wheel distributors, retailers as well as leading car
dealers, and UNIWHEELS B2B Webshop
70,0%
25,0%
5,0%
by regions
Germany
Europe (excl. GER, RUS,BEL, UKR)
Rest of the world
Source: Company
51,9% 47,3%
0,3% 0,4%
by regions
Germany
Europe (excl. GER,RUS, BEL, UKR)Russia, Belarus,UkraineRest of the world
UNIWHEELS GROUP INVESTOR PRESENTATION
9 9
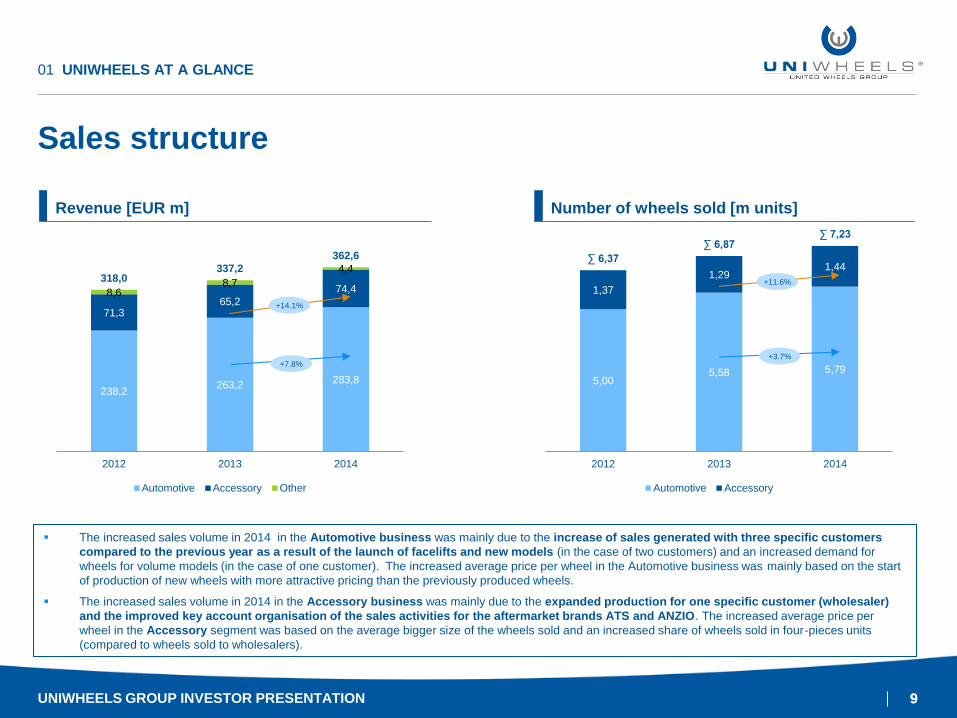
Sales structure
UNIWHEELS GROUP INVESTOR PRESENTATION
01 UNIWHEELS AT A GLANCE
Revenue [EUR m] Number of wheels sold [m units]
5,00 5,58 5,79
1,37
1,29 1,44
∑ 6,37
∑ 6,87 ∑ 7,23
2012 2013 2014
Automotive Accessory
+11.6%
+3.7%
The increased sales volume in 2014 in the Automotive business was mainly due to the increase of sales generated with three specific customers
compared to the previous year as a result of the launch of facelifts and new models (in the case of two customers) and an increased demand for
wheels for volume models (in the case of one customer). The increased average price per wheel in the Automotive business was mainly based on the start
of production of new wheels with more attractive pricing than the previously produced wheels.
The increased sales volume in 2014 in the Accessory business was mainly due to the expanded production for one specific customer (wholesaler)
and the improved key account organisation of the sales activities for the aftermarket brands ATS and ANZIO. The increased average price per
wheel in the Accessory segment was based on the average bigger size of the wheels sold and an increased share of wheels sold in four-pieces units
(compared to wheels sold to wholesalers).
238,2 263,2
283,8
71,3 65,2
74,4 8,6 8,7
4,4 318,0
337,2
362,6
2012 2013 2014
Automotive Accessory Other
+7.8%
+14.1%
10 10
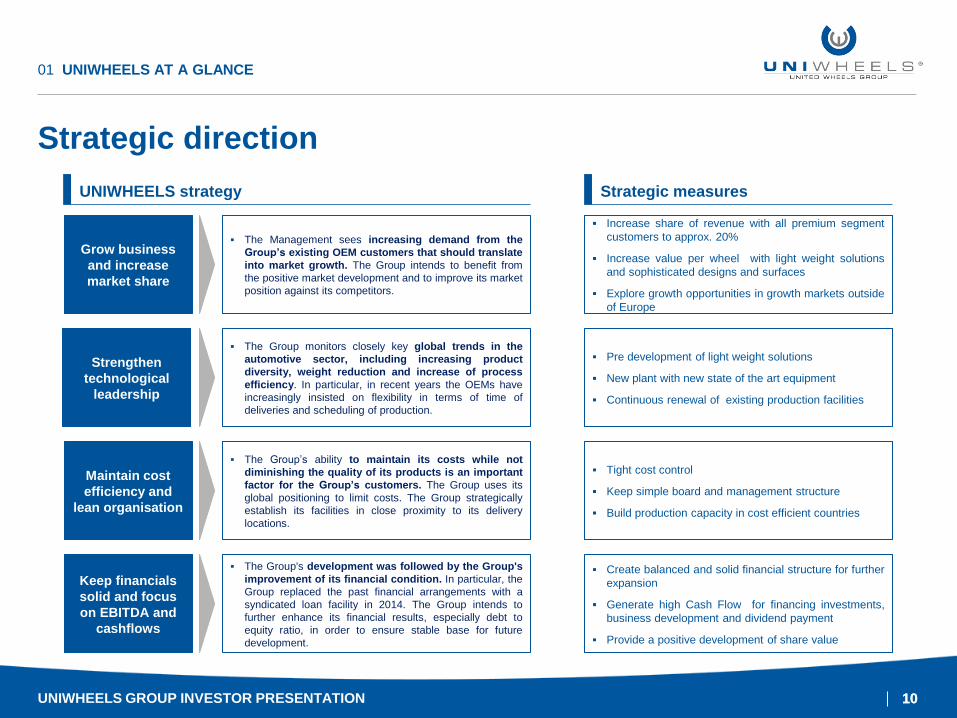
Strategic direction
UNIWHEELS GROUP INVESTOR PRESENTATION
01 UNIWHEELS AT A GLANCE
UNIWHEELS strategy Strategic measures
Grow business
and increase
market share
The Management sees increasing demand from the
Group’s existing OEM customers that should translate
into market growth. The Group intends to benefit from
the positive market development and to improve its market
position against its competitors.
Strengthen
technological
leadership
Maintain cost
efficiency and
lean organisation
Keep financials
solid and focus
on EBITDA and
cashflows
The Group monitors closely key global trends in the
automotive sector, including increasing product
diversity, weight reduction and increase of process
efficiency. In particular, in recent years the OEMs have
increasingly insisted on flexibility in terms of time of
deliveries and scheduling of production.
The Group’s ability to maintain its costs while not
diminishing the quality of its products is an important
factor for the Group’s customers. The Group uses its
global positioning to limit costs. The Group strategically
establish its facilities in close proximity to its delivery
locations.
The Group's development was followed by the Group's
improvement of its financial condition. In particular, the
Group replaced the past financial arrangements with a
syndicated loan facility in 2014. The Group intends to
further enhance its financial results, especially debt to
equity ratio, in order to ensure stable base for future
development.
Increase share of revenue with all premium segment
customers to approx. 20%
Increase value per wheel with light weight solutions
and sophisticated designs and surfaces
Explore growth opportunities in growth markets outside
of Europe
Pre development of light weight solutions
New plant with new state of the art equipment
Continuous renewal of existing production facilities
Tight cost control
Keep simple board and management structure
Build production capacity in cost efficient countries
Create balanced and solid financial structure for further
expansion
Generate high Cash Flow for financing investments,
business development and dividend payment
Provide a positive development of share value
11
THE BUSINESS
UNIWHEELS Group Investor Presentation
02
12 12
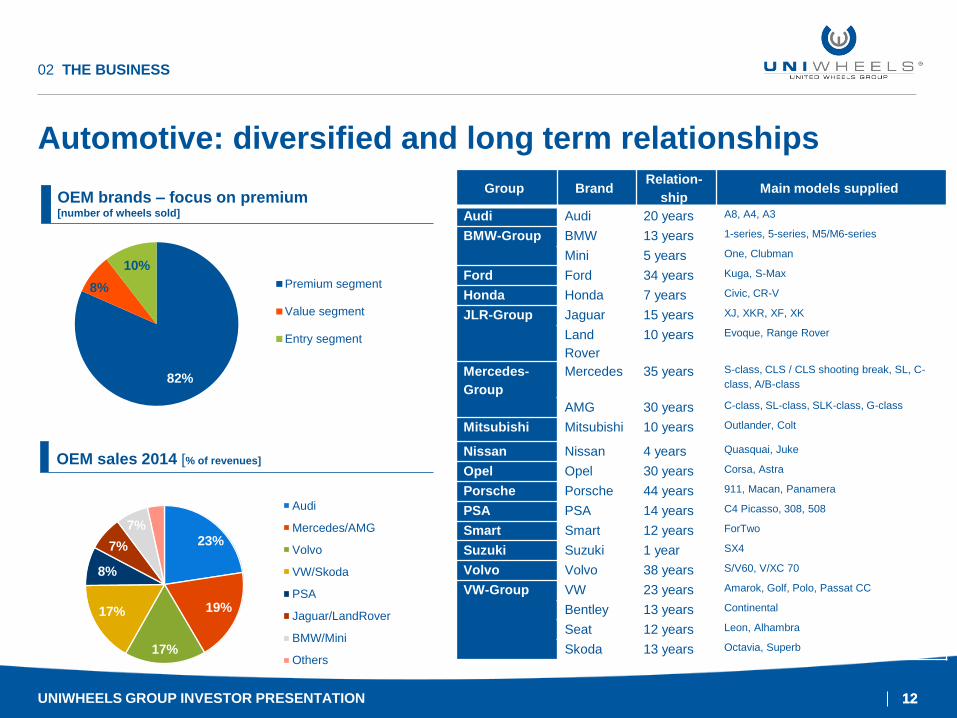
Automotive: diversified and long term relationships
UNIWHEELS GROUP INVESTOR PRESENTATION
02 THE BUSINESS
Group Brand Relation-
ship Main models supplied
Audi Audi 20 years A8, A4, A3
BMW-Group BMW 13 years 1-series, 5-series, M5/M6-series
Mini 5 years One, Clubman
Ford Ford 34 years Kuga, S-Max
Honda Honda 7 years Civic, CR-V
JLR-Group Jaguar 15 years XJ, XKR, XF, XK
Land
Rover
10 years Evoque, Range Rover
Mercedes-
Group
Mercedes 35 years S-class, CLS / CLS shooting break, SL, C-
class, A/B-class
AMG 30 years C-class, SL-class, SLK-class, G-class
Mitsubishi Mitsubishi 10 years Outlander, Colt
Nissan Nissan 4 years Quasquai, Juke
Opel Opel 30 years Corsa, Astra
Porsche Porsche 44 years 911, Macan, Panamera
PSA PSA 14 years C4 Picasso, 308, 508
Smart Smart 12 years ForTwo
Suzuki Suzuki 1 year SX4
Volvo Volvo 38 years S/V60, V/XC 70
VW-Group VW 23 years Amarok, Golf, Polo, Passat CC
Bentley 13 years Continental
Seat 12 years Leon, Alhambra
Skoda 13 years Octavia, Superb
82%
8%
10%
Premium segment
Value segment
Entry segment
23%
19%
17%
17%
8%
7%
7%
4% Audi
Mercedes/AMG
Volvo
VW/Skoda
PSA
Jaguar/LandRover
BMW/Mini
Others
OEM sales 2014 [% of revenues]
OEM brands – focus on premium [number of wheels sold]
13 13
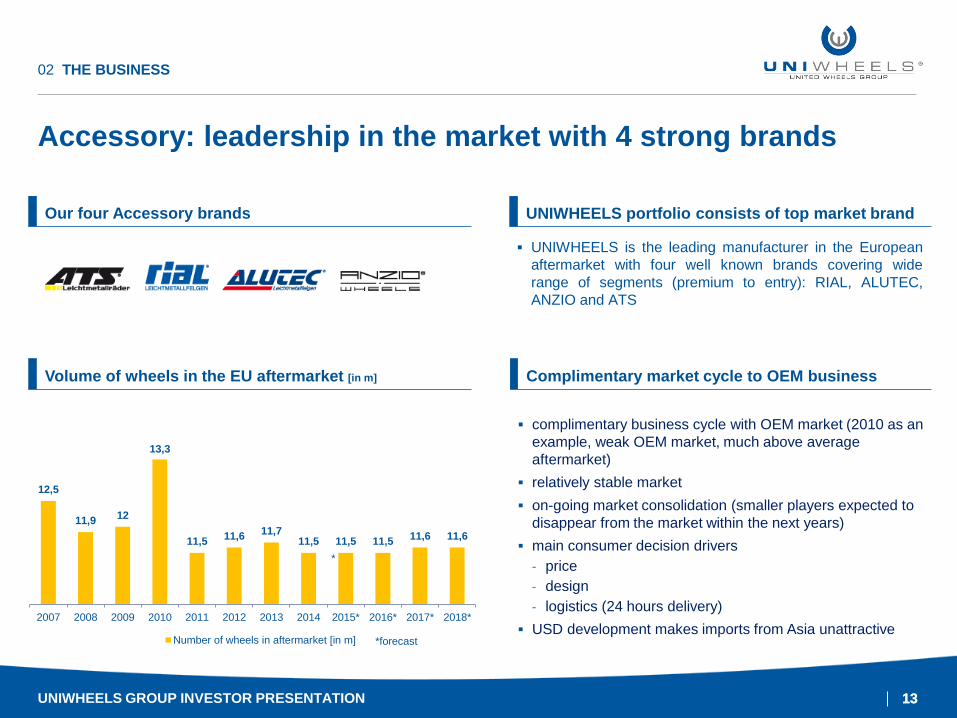
Accessory: leadership in the market with 4 strong brands
UNIWHEELS GROUP INVESTOR PRESENTATION
02 THE BUSINESS
complimentary business cycle with OEM market (2010 as an
example, weak OEM market, much above average
aftermarket)
relatively stable market
on-going market consolidation (smaller players expected to
disappear from the market within the next years)
main consumer decision drivers
- price
- design
- logistics (24 hours delivery)
USD development makes imports from Asia unattractive
12,5
11,9 12
13,3
11,5 11,6
11,7 11,5 11,5 11,5
11,6 11,6
2007 2008 2009 2010 2011 2012 2013 2014 2015* 2016* 2017* 2018*
Number of wheels in aftermarket [in m]
Our four Accessory brands
Volume of wheels in the EU aftermarket [in m]
*
Complimentary market cycle to OEM business
UNIWHEELS is the leading manufacturer in the European
aftermarket with four well known brands covering wide
range of segments (premium to entry): RIAL, ALUTEC,
ANZIO and ATS
UNIWHEELS portfolio consists of top market brand
*forecast
14 14
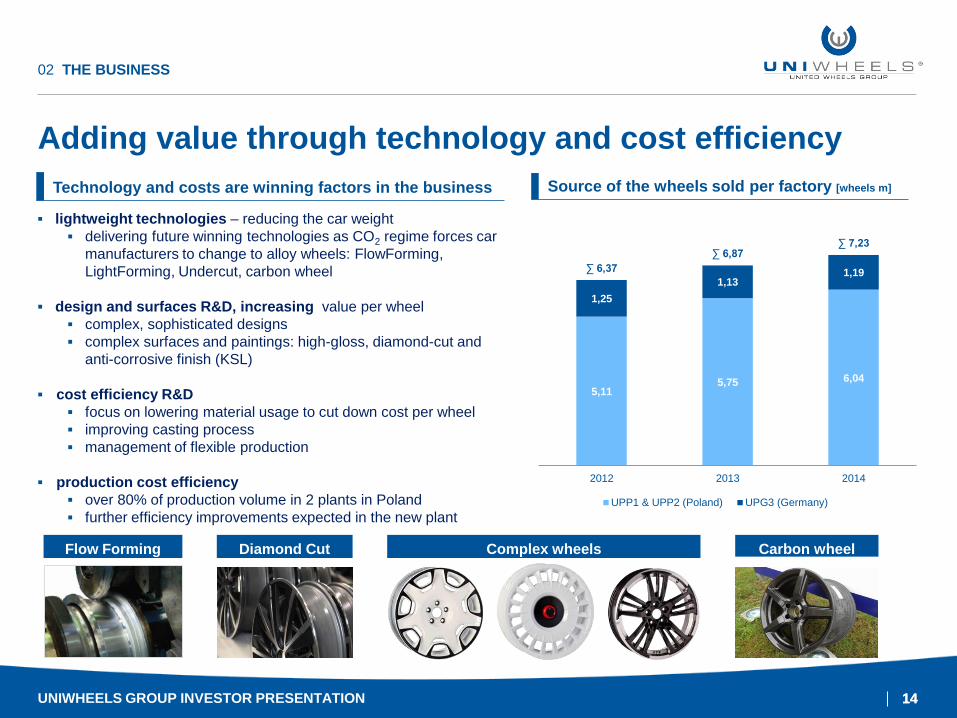
Adding value through technology and cost efficiency
UNIWHEELS GROUP INVESTOR PRESENTATION
02 THE BUSINESS
5,11 5,75 6,04
1,25
1,13 1,19 ∑ 6,37
∑ 6,87 ∑ 7,23
2012 2013 2014
UPP1 & UPP2 (Poland) UPG3 (Germany)
lightweight technologies – reducing the car weight
delivering future winning technologies as CO2 regime forces car
manufacturers to change to alloy wheels: FlowForming,
LightForming, Undercut, carbon wheel
design and surfaces R&D, increasing value per wheel
complex, sophisticated designs
complex surfaces and paintings: high-gloss, diamond-cut and
anti-corrosive finish (KSL)
cost efficiency R&D
focus on lowering material usage to cut down cost per wheel
improving casting process
management of flexible production
production cost efficiency
over 80% of production volume in 2 plants in Poland
further efficiency improvements expected in the new plant
Technology and costs are winning factors in the business
Flow Forming Diamond Cut Carbon wheel Complex wheels
Source of the wheels sold per factory [wheels m]
15 15
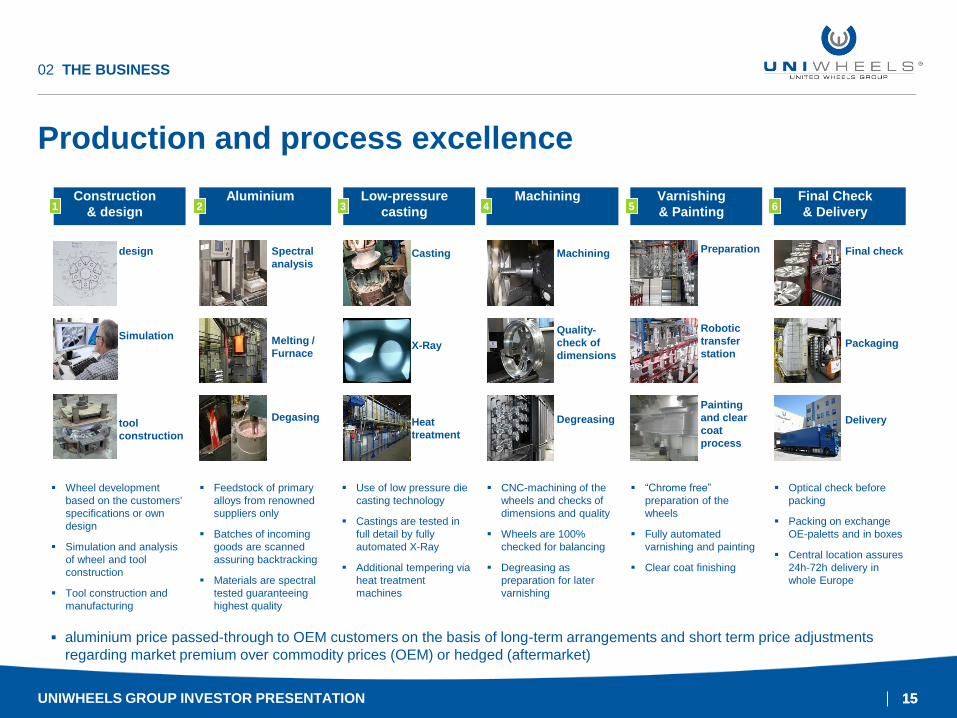
Production and process excellence
UNIWHEELS GROUP INVESTOR PRESENTATION
02 THE BUSINESS
Low-pressure
casting
Machining Varnishing
& Painting
Aluminium Final Check
& Delivery
Spectral
analysis
Melting /
Furnace
Degasing
Feedstock of primary
alloys from renowned
suppliers only
Batches of incoming
goods are scanned
assuring backtracking
Materials are spectral
tested guaranteeing
highest quality
Casting
X-Ray
Heat
treatment
Use of low pressure die
casting technology
Castings are tested in
full detail by fully
automated X-Ray
Additional tempering via
heat treatment
machines
Machining
Quality-
check of
dimensions
Degreasing
CNC-machining of the
wheels and checks of
dimensions and quality
Wheels are 100%
checked for balancing
Degreasing as
preparation for later
varnishing
Preparation
Robotic
transfer
station
Painting
and clear
coat
process
“Chrome free”
preparation of the
wheels
Fully automated
varnishing and painting
Clear coat finishing
Final check
Packaging
Delivery
Optical check before
packing
Packing on exchange
OE-paletts and in boxes
Central location assures
24h-72h delivery in
whole Europe
2 3 4 5
aluminium price passed-through to OEM customers on the basis of long-term arrangements and short term price adjustments
regarding market premium over commodity prices (OEM) or hedged (aftermarket)
Construction
& design
design
Simulation
tool
construction
Wheel development
based on the customers'
specifications or own
design
Simulation and analysis
of wheel and tool
construction
Tool construction and
manufacturing
6 1
16 16
Production companies, plants and capacities
UNIWHEELS GROUP INVESTOR PRESENTATION
02 THE BUSINESS
UPP (Poland) UPG (Germany)
Plant 1 Plant 2 Plant 4 (under
construction)
Plant 3
Capacity 1.7-1.9m
wheels
4.4-4.7m
wheels
Approx. 2.0 m 1.1-1.4m wheels
Wheel
dimensions
14‘‘-20” 14“-21“ 14”-23” 18“-23“
Employees 1,834 + 250 (for planned plant 4) 368
Strengths Labor cost efficiency combined with automated
and flexible robot cells for machining
Tax shield due to location in special economic
zone
New planned plant: most advanced
manufacturing facility with latest technology
The already world's largest contiguous
production site for light-alloy wheels will be
extended by another approx. 2 million wheels.
Highly skilled for
large wheels and
complex surfaces
Innovation:
closeness to
R&D used to
introduce and
optimize new
production
technologies
UPG UPP
HQ,
logistic
center
5,08 5,73 6,02
1,25 1,13 1,19
∑ 6,33 ∑ 6,86 ∑ 7,21
2012 2013 2014
UPP1 & UPP2 (Poland) UPG3 (Germany)
Werdohl
Bad Durkheim
Stalowa Wola
Plants and distribution companies
Source of the wheels sold (mn pieces)
Plant 4 Capex and Capacity Schedule 2015 2016 2017 2018 Total
New plant investment plan [EUR m] 33.3 34.2 18.2 0.4 86.8
New capacity [wheels m /year] 0.5 0.7 0.7 1.9
Total capex [EUR m] 57.5 46.9 33.7 15.8 153.9
Estimated total capacity* [wheels m
/year] 7.2-8.0 7.7-8.5 8.4-9.2 9.1-9.9
Capacity vs. 2014 production of 7.2m
wheels [%] +6% +13% +22% +32%
17 17
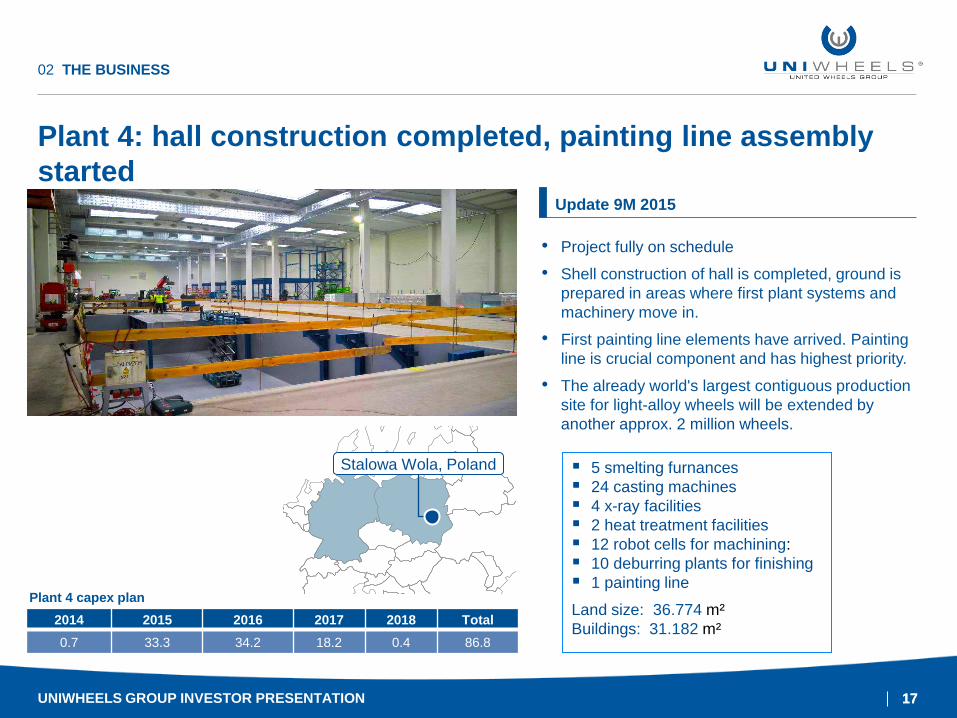
Plant 4: hall construction completed, painting line assembly
started
UNIWHEELS GROUP INVESTOR PRESENTATION
02 THE BUSINESS
2014 2015 2016 2017 2018 Total
0.7 33.3 34.2 18.2 0.4 86.8
Plant 4 capex plan
• Project fully on schedule
• Shell construction of hall is completed, ground is
prepared in areas where first plant systems and
machinery move in.
• First painting line elements have arrived. Painting
line is crucial component and has highest priority.
• The already world's largest contiguous production
site for light-alloy wheels will be extended by
another approx. 2 million wheels.
Update 9M 2015
Stalowa Wola, Poland 5 smelting furnances
24 casting machines
4 x-ray facilities
2 heat treatment facilities
12 robot cells for machining:
10 deburring plants for finishing
1 painting line
Land size: 36.774 m²
Buildings: 31.182 m²
18 18
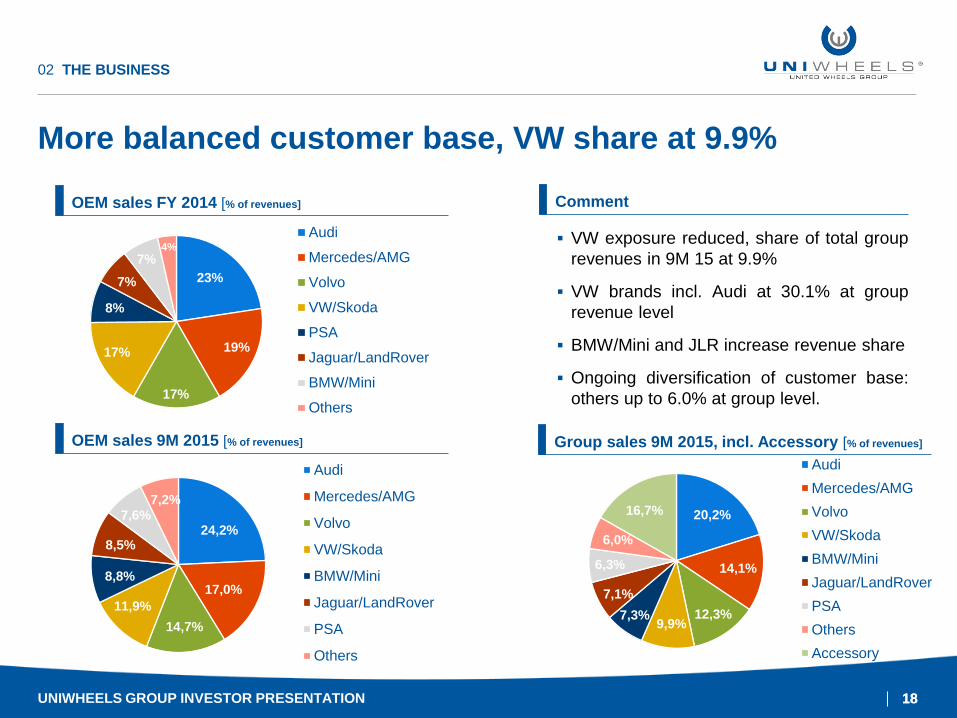
More balanced customer base, VW share at 9.9%
02 THE BUSINESS
24,2%
17,0%
14,7%
11,9%
8,8%
8,5%
7,6% 7,2%
Audi
Mercedes/AMG
Volvo
VW/Skoda
BMW/Mini
Jaguar/LandRover
PSA
Others
OEM sales 9M 2015 [% of revenues]
20,2%
14,1%
12,3% 9,9%
7,3%
7,1%
6,3%
6,0%
16,7%
Audi
Mercedes/AMG
Volvo
VW/Skoda
BMW/Mini
Jaguar/LandRover
PSA
Others
Accessory
Group sales 9M 2015, incl. Accessory [% of revenues]
Comment
VW exposure reduced, share of total group
revenues in 9M 15 at 9.9%
VW brands incl. Audi at 30.1% at group
revenue level
BMW/Mini and JLR increase revenue share
Ongoing diversification of customer base:
others up to 6.0% at group level.
23%
19%
17%
17%
8%
7%
7%
4% Audi
Mercedes/AMG
Volvo
VW/Skoda
PSA
Jaguar/LandRover
BMW/Mini
Others
OEM sales FY 2014 [% of revenues]
4%
UNIWHEELS GROUP INVESTOR PRESENTATION
19 19
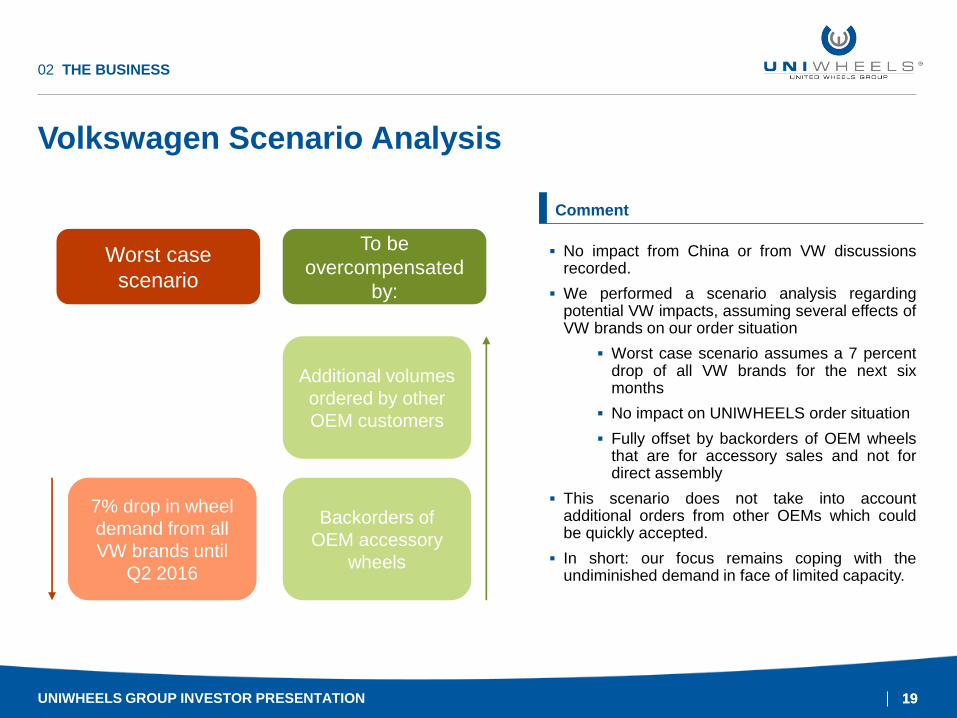
Volkswagen Scenario Analysis
02 THE BUSINESS
No impact from China or from VW discussions recorded.
We performed a scenario analysis regarding potential VW impacts, assuming several effects of VW brands on our order situation
Worst case scenario assumes a 7 percent drop of all VW brands for the next six months
No impact on UNIWHEELS order situation
Fully offset by backorders of OEM wheels that are for accessory sales and not for direct assembly
This scenario does not take into account additional orders from other OEMs which could be quickly accepted.
In short: our focus remains coping with the undiminished demand in face of limited capacity.
Comment
7% drop in wheel
demand from all
VW brands until
Q2 2016
Backorders of
OEM accessory
wheels
Worst case
scenario
To be
overcompensated
by:
Additional volumes
ordered by other
OEM customers
UNIWHEELS GROUP INVESTOR PRESENTATION
20 20
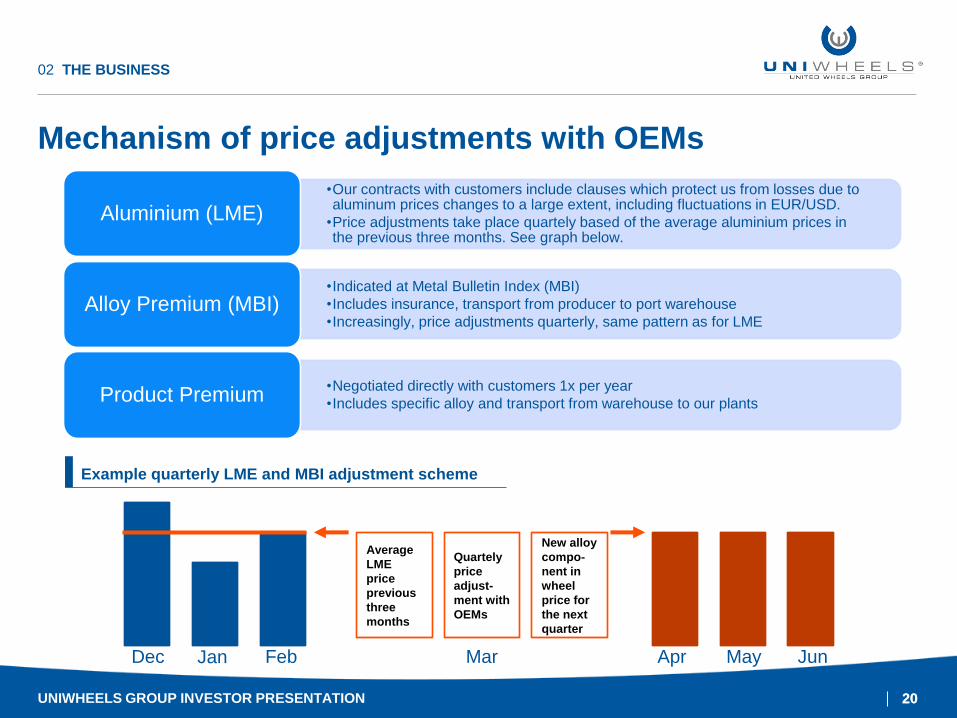
Mechanism of price adjustments with OEMs
02 THE BUSINESS
•Our contracts with customers include clauses which protect us from losses due to aluminum prices changes to a large extent, including fluctuations in EUR/USD.
•Price adjustments take place quartely based of the average aluminium prices in the previous three months. See graph below.
Aluminium (LME)
•Indicated at Metal Bulletin Index (MBI)
•Includes insurance, transport from producer to port warehouse
•Increasingly, price adjustments quarterly, same pattern as for LME Alloy Premium (MBI)
•Negotiated directly with customers 1x per year
•Includes specific alloy and transport from warehouse to our plants Product Premium
Dec Jan Feb Mar Apr May Jun
Example quarterly LME and MBI adjustment scheme
New alloy
compo-
nent in
wheel
price for
the next
quarter
Average
LME
price
previous
three
months
Quartely
price
adjust-
ment with
OEMs
UNIWHEELS GROUP INVESTOR PRESENTATION
21 21
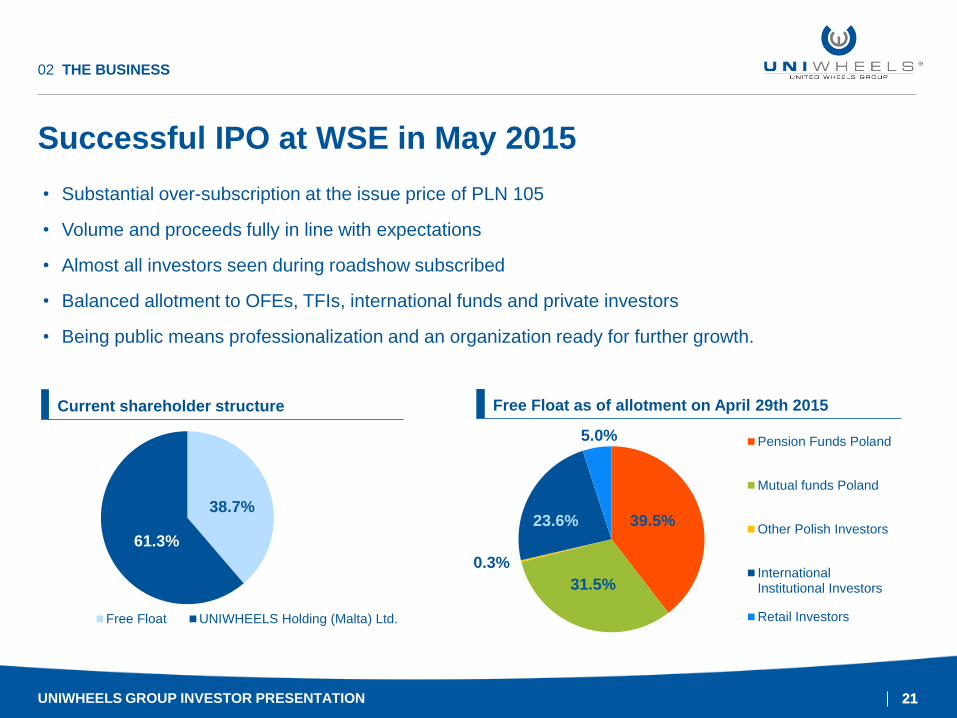
Successful IPO at WSE in May 2015
02 THE BUSINESS
• Substantial over-subscription at the issue price of PLN 105
• Volume and proceeds fully in line with expectations
• Almost all investors seen during roadshow subscribed
• Balanced allotment to OFEs, TFIs, international funds and private investors
• Being public means professionalization and an organization ready for further growth.
Free Float UNIWHEELS Holding (Malta) Ltd.
61.3%
38.7%
Pension Funds Poland
Mutual funds Poland
Other Polish Investors
InternationalInstitutional Investors
Retail Investors
31.5%
39.5% 23.6%
5.0%
0.3%
UNIWHEELS GROUP INVESTOR PRESENTATION
Current shareholder structure Free Float as of allotment on April 29th 2015
22
9M 2015 UPDATE
UNIWHEELS Group Investor Presentation
03
23 23
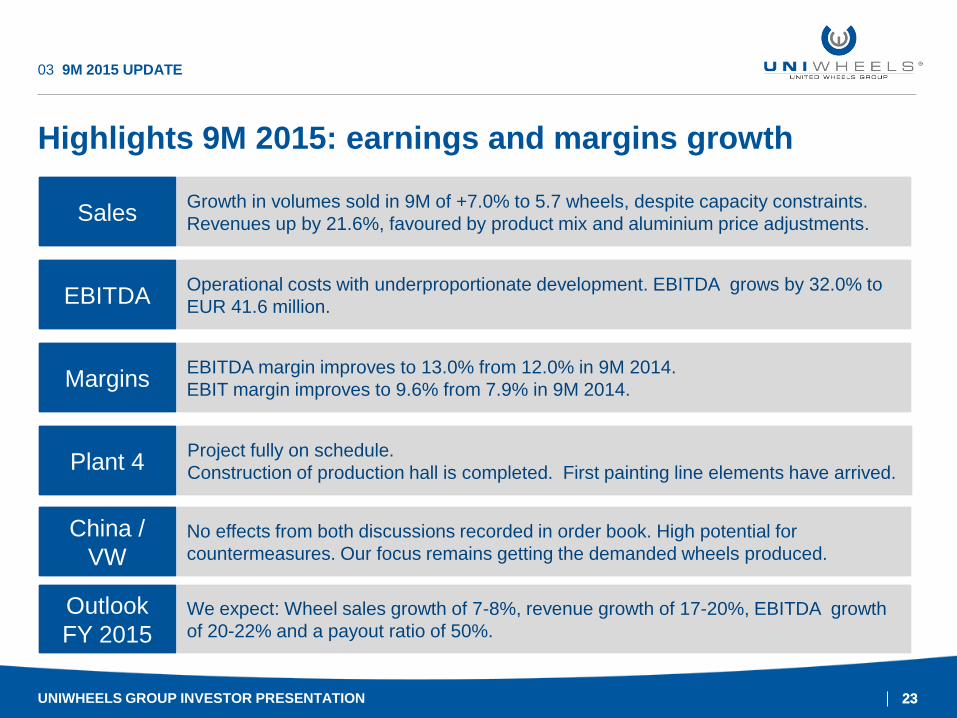
Highlights 9M 2015: earnings and margins growth
03 9M 2015 UPDATE
Sales
EBITDA
Margins
Plant 4
China /
VW
Outlook
FY 2015
Growth in volumes sold in 9M of +7.0% to 5.7 wheels, despite capacity constraints.
Revenues up by 21.6%, favoured by product mix and aluminium price adjustments.
EBITDA margin improves to 13.0% from 12.0% in 9M 2014.
EBIT margin improves to 9.6% from 7.9% in 9M 2014.
No effects from both discussions recorded in order book. High potential for
countermeasures. Our focus remains getting the demanded wheels produced.
Operational costs with underproportionate development. EBITDA grows by 32.0% to
EUR 41.6 million.
Project fully on schedule.
Construction of production hall is completed. First painting line elements have arrived.
We expect: Wheel sales growth of 7-8%, revenue growth of 17-20%, EBITDA growth
of 20-22% and a payout ratio of 50%.
UNIWHEELS GROUP INVESTOR PRESENTATION
24 24
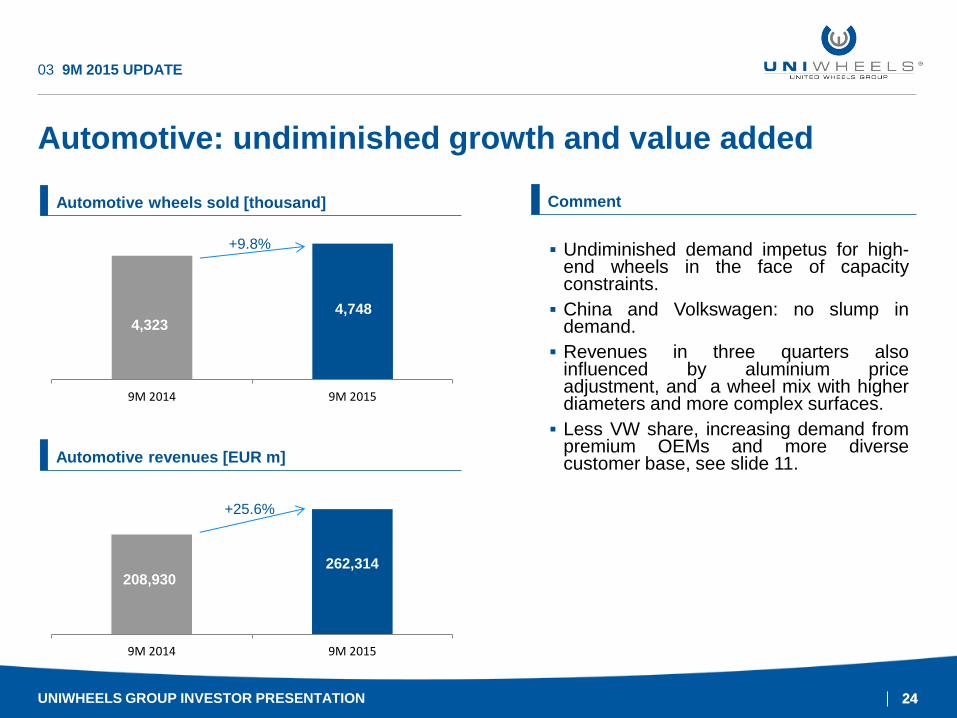
Automotive: undiminished growth and value added
03 9M 2015 UPDATE
Automotive wheels sold [thousand]
9M 2014 9M 2015
+9.8%
4,748 4,323
Automotive revenues [EUR m]
9M 2014 9M 2015
+25.6%
262,314 208,930
Comment
Undiminished demand impetus for high-end wheels in the face of capacity constraints.
China and Volkswagen: no slump in demand.
Revenues in three quarters also influenced by aluminium price adjustment, and a wheel mix with higher diameters and more complex surfaces.
Less VW share, increasing demand from premium OEMs and more diverse customer base, see slide 11.
UNIWHEELS GROUP INVESTOR PRESENTATION
25 25
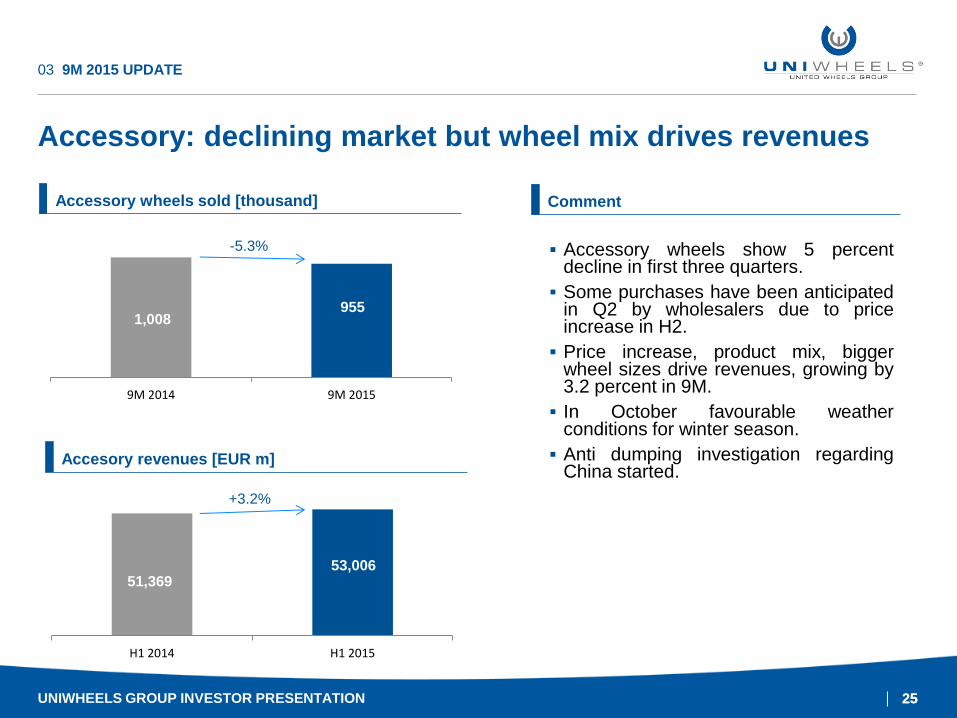
Accessory: declining market but wheel mix drives revenues
03 9M 2015 UPDATE
Accesory revenues [EUR m]
H1 2014 H1 2015
+3.2%
53,006 51,369
Accessory wheels sold [thousand]
9M 2014 9M 2015
-5.3%
955 1,008
Comment
Accessory wheels show 5 percent decline in first three quarters.
Some purchases have been anticipated in Q2 by wholesalers due to price increase in H2.
Price increase, product mix, bigger wheel sizes drive revenues, growing by 3.2 percent in 9M.
In October favourable weather conditions for winter season.
Anti dumping investigation regarding China started.
UNIWHEELS GROUP INVESTOR PRESENTATION
26 26
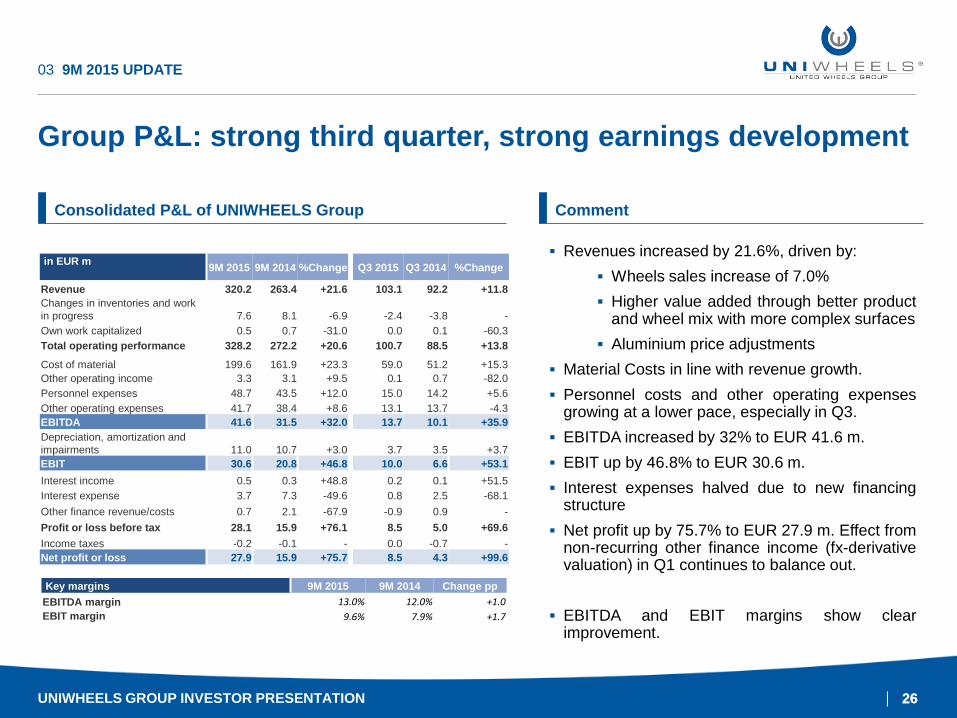
Group P&L: strong third quarter, strong earnings development
6. Januar 2016
03 9M 2015 UPDATE
in EUR m
9M 2015 9M 2014 %Change Q3 2015 Q3 2014 %Change
Revenue 320.2 263.4 +21.6 103.1 92.2 +11.8
Changes in inventories and work
in progress 7.6 8.1 -6.9 -2.4 -3.8 -
Own work capitalized 0.5 0.7 -31.0 0.0 0.1 -60.3
Total operating performance 328.2 272.2 +20.6 100.7 88.5 +13.8
Cost of material 199.6 161.9 +23.3 59.0 51.2 +15.3
Other operating income 3.3 3.1 +9.5 0.1 0.7 -82.0
Personnel expenses 48.7 43.5 +12.0 15.0 14.2 +5.6
Other operating expenses 41.7 38.4 +8.6 13.1 13.7 -4.3
EBITDA 41.6 31.5 +32.0 13.7 10.1 +35.9
Depreciation, amortization and
impairments 11.0 10.7 +3.0 3.7 3.5 +3.7
EBIT 30.6 20.8 +46.8 10.0 6.6 +53.1
Interest income 0.5 0.3 +48.8 0.2 0.1 +51.5
Interest expense 3.7 7.3 -49.6 0.8 2.5 -68.1
Other finance revenue/costs 0.7 2.1 -67.9 -0.9 0.9 -
Profit or loss before tax 28.1 15.9 +76.1 8.5 5.0 +69.6
Income taxes -0.2 -0.1 - 0.0 -0.7 -
Net profit or loss 27.9 15.9 +75.7 8.5 4.3 +99.6
Key margins 9M 2015 9M 2014 Change pp
EBITDA margin 13.0% 12.0% +1.0
EBIT margin 9.6% 7.9% +1.7
Consolidated P&L of UNIWHEELS Group
Revenues increased by 21.6%, driven by:
Wheels sales increase of 7.0%
Higher value added through better product and wheel mix with more complex surfaces
Aluminium price adjustments
Material Costs in line with revenue growth.
Personnel costs and other operating expenses growing at a lower pace, especially in Q3.
EBITDA increased by 32% to EUR 41.6 m.
EBIT up by 46.8% to EUR 30.6 m.
Interest expenses halved due to new financing structure
Net profit up by 75.7% to EUR 27.9 m. Effect from non-recurring other finance income (fx-derivative valuation) in Q1 continues to balance out.
EBITDA and EBIT margins show clear improvement.
Comment
UNIWHEELS GROUP INVESTOR PRESENTATION
27 27
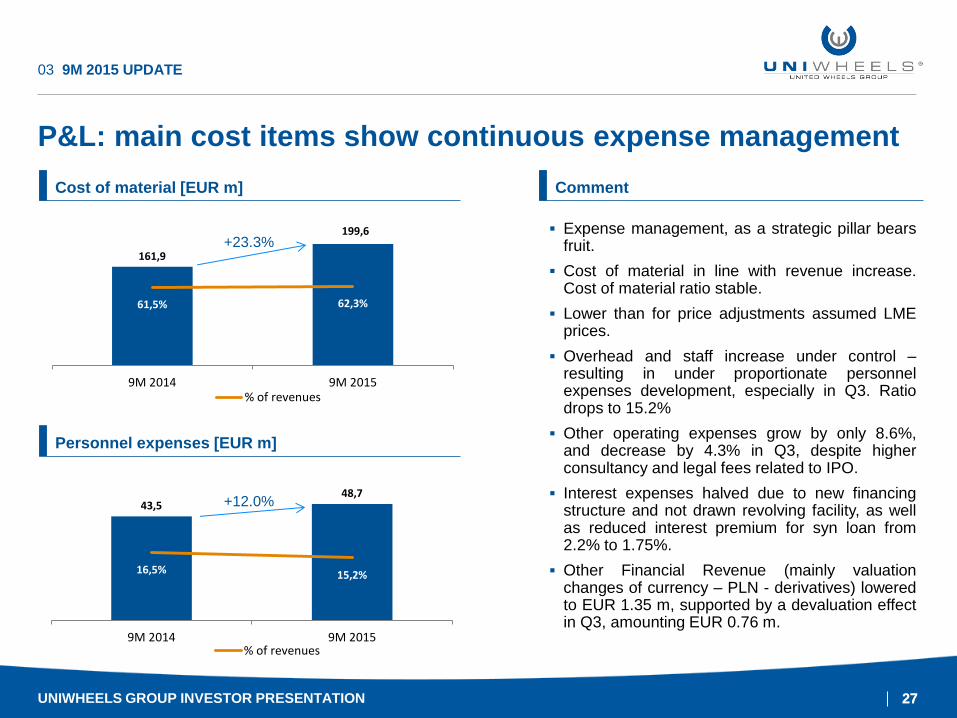
P&L: main cost items show continuous expense management
03 9M 2015 UPDATE
Personnel expenses [EUR m]
43,5 48,7
16,5% 15,2%
9M 2014 9M 2015% of revenues
Cost of material [EUR m]
Expense management, as a strategic pillar bears fruit.
Cost of material in line with revenue increase. Cost of material ratio stable.
Lower than for price adjustments assumed LME prices.
Overhead and staff increase under control – resulting in under proportionate personnel expenses development, especially in Q3. Ratio drops to 15.2%
Other operating expenses grow by only 8.6%, and decrease by 4.3% in Q3, despite higher consultancy and legal fees related to IPO.
Interest expenses halved due to new financing structure and not drawn revolving facility, as well as reduced interest premium for syn loan from 2.2% to 1.75%.
Other Financial Revenue (mainly valuation changes of currency – PLN - derivatives) lowered to EUR 1.35 m, supported by a devaluation effect in Q3, amounting EUR 0.76 m.
Comment
+12.0%
161,9
199,6
61,5% 62,3%
9M 2014 9M 2015% of revenues
+23.3%
UNIWHEELS GROUP INVESTOR PRESENTATION
28 28
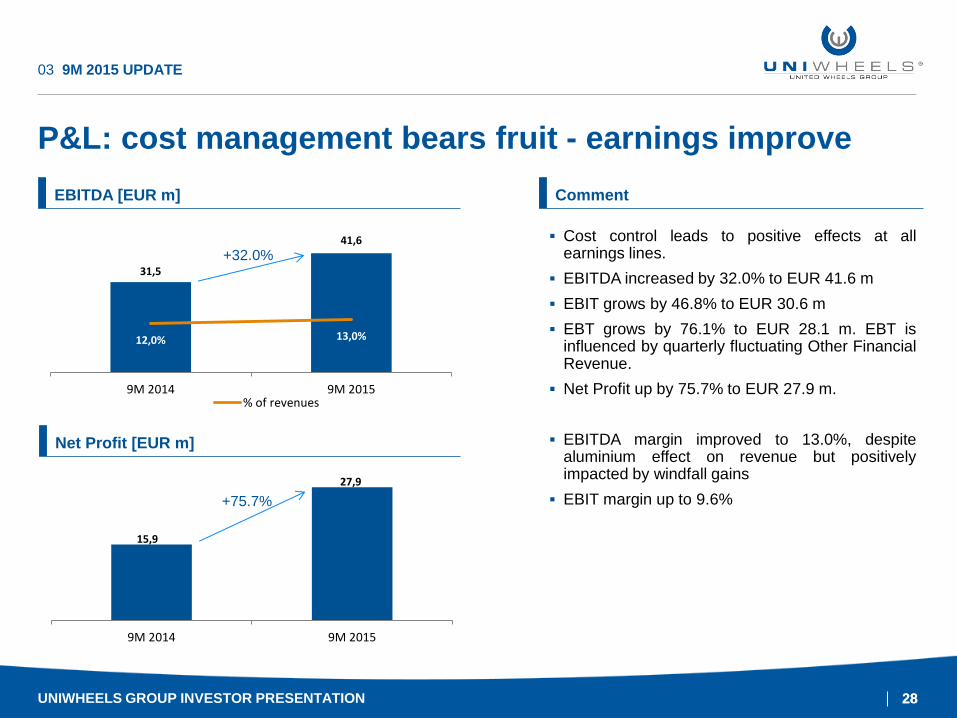
P&L: cost management bears fruit - earnings improve
03 9M 2015 UPDATE
Net Profit [EUR m]
15,9
27,9
9M 2014 9M 2015
Cost control leads to positive effects at all earnings lines.
EBITDA increased by 32.0% to EUR 41.6 m
EBIT grows by 46.8% to EUR 30.6 m
EBT grows by 76.1% to EUR 28.1 m. EBT is influenced by quarterly fluctuating Other Financial Revenue.
Net Profit up by 75.7% to EUR 27.9 m.
EBITDA margin improved to 13.0%, despite aluminium effect on revenue but positively impacted by windfall gains
EBIT margin up to 9.6%
Comment
+75.7%
EBITDA [EUR m]
31,5
41,6
12,0% 13,0%
9M 2014 9M 2015% of revenues
+32.0%
UNIWHEELS GROUP INVESTOR PRESENTATION
29 29
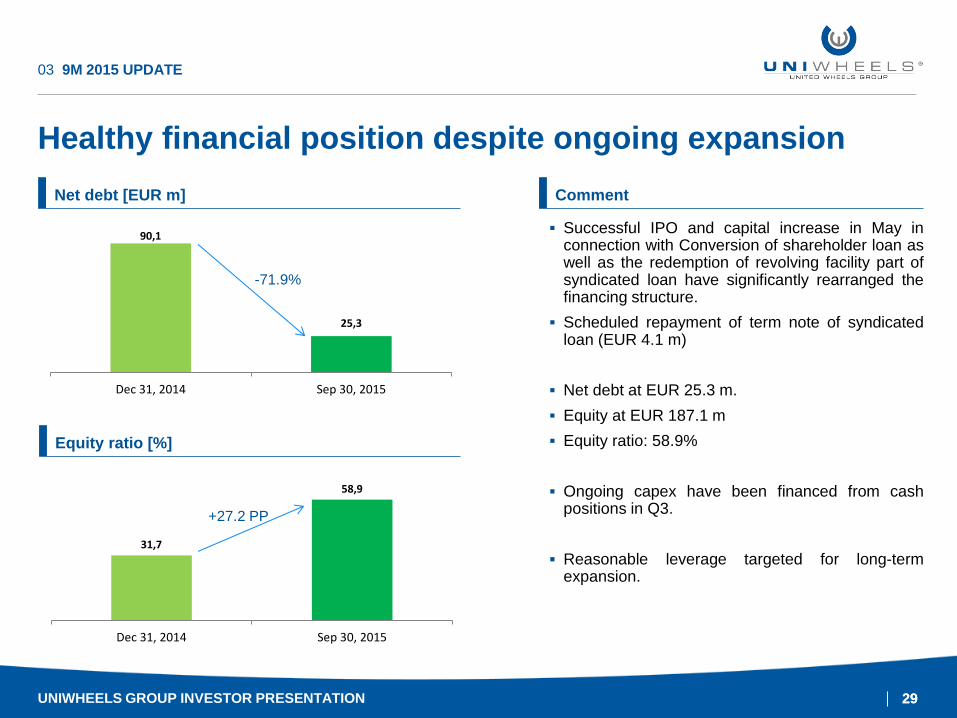
Healthy financial position despite ongoing expansion
03 9M 2015 UPDATE
Equity ratio [%]
31,7
58,9
Dec 31, 2014 Sep 30, 2015
Successful IPO and capital increase in May in connection with Conversion of shareholder loan as well as the redemption of revolving facility part of syndicated loan have significantly rearranged the financing structure.
Scheduled repayment of term note of syndicated loan (EUR 4.1 m)
Net debt at EUR 25.3 m.
Equity at EUR 187.1 m
Equity ratio: 58.9%
Ongoing capex have been financed from cash positions in Q3.
Reasonable leverage targeted for long-term expansion.
Comment
+27.2 PP
Net debt [EUR m]
90,1
25,3
Dec 31, 2014 Sep 30, 2015
-71.9%
UNIWHEELS GROUP INVESTOR PRESENTATION
30 30
Outlook FY 2015
UNIWHEELS GROUP INVESTOR PRESENTATION
03 9M 2015 UPDATE
For the Fiscal Year 2015, we expect a wheel sales increase of 7-8%.
Revenue will be influenced by a higher-value product mix and aluminium
price adjustments leading to an expected growth of 17% to 20%
compared to FY 2014.
Stringent cost management will show its effects. In total, we expect an
EBITDA growth of 20% to 22% in 2015, compared to 2014.
2015 will be influenced by increasing wheel demand from European car
manufacturers, the fact that we are operating at maximum capacity and
driven by an increased aluminium price influencing revenues and material
costs.
Wheel sales growth of
7-8%,
Revenue growth of
17-20%
EBITDA growth of
20-22%
We expect:
Dividend policy of 50% consolidated net profit payout, given an
appropriate liquidity situation. Payout ratio 50%
31
FINANCIALS 12-14
UNIWHEELS Group Investor Presentation
04
32 32
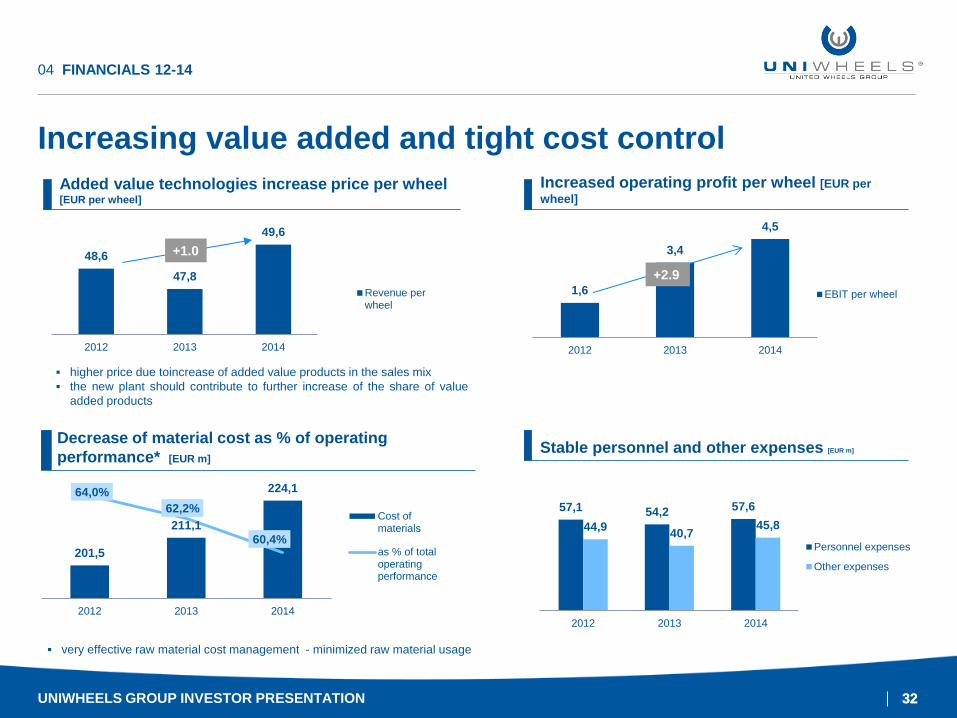
Increasing value added and tight cost control
04 FINANCIALS 12-14
higher price due toincrease of added value products in the sales mix
the new plant should contribute to further increase of the share of value
added products
48,6
47,8
49,6
2012 2013 2014
Revenue perwheel
Added value technologies increase price per wheel [EUR per wheel]
+1.0
Increased operating profit per wheel [EUR per
wheel]
1,6
3,4
4,5
2012 2013 2014
EBIT per wheel
+2.9
Decrease of material cost as % of operating
performance* [EUR m]
very effective raw material cost management - minimized raw material usage
201,5
211,1
224,1 64,0%
62,2%
60,4%
2012 2013 2014
Cost ofmaterials
as % of totaloperatingperformance
57,1 54,2 57,6
44,9 40,7
45,8
2012 2013 2014
Personnel expenses
Other expenses
Stable personnel and other expenses [EUR m]
UNIWHEELS GROUP INVESTOR PRESENTATION
33 33
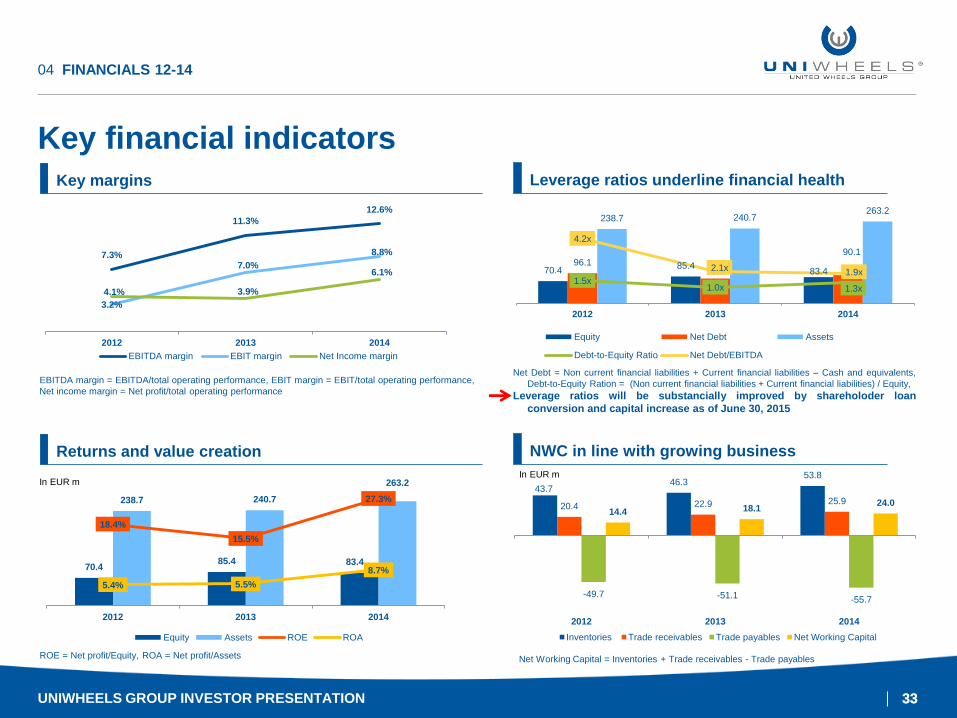
Key financial indicators
04 FINANCIALS 12-14
Key margins Leverage ratios underline financial health
Returns and value creation NWC in line with growing business
7.3%
11.3%
12.6%
3.2%
7.0%
8.8%
4.1% 3.9%
6.1%
2012 2013 2014
EBITDA margin EBIT margin Net Income margin
70.4 85.4 83.4
238.7 240.7
263.2
18.4%
15.5%
27.3%
5.4% 5.5%
8.7%
2012 2013 2014
Equity Assets ROE ROA
In EUR m 43.7
46.3 53.8
20.4 22.9 25.9
-49.7 -51.1 -55.7
14.4 18.1 24.0
2012 2013 2014
Inventories Trade receivables Trade payables Net Working Capital
In EUR m
EBITDA margin = EBITDA/total operating performance, EBIT margin = EBIT/total operating performance,
Net income margin = Net profit/total operating performance
Net Debt = Non current financial liabilities + Current financial liabilities – Cash and equivalents,
Debt-to-Equity Ration = (Non current financial liabilities + Current financial liabilities) / Equity,
Leverage ratios will be substancially improved by shareholoder loan
conversion and capital increase as of June 30, 2015
ROE = Net profit/Equity, ROA = Net profit/Assets Net Working Capital = Inventories + Trade receivables - Trade payables
70.4 85.4
83.4 96.1
79.0
90.1
238.7 240.7 263.2
1.5x 1.0x 1.3x
4.2x
2.1x 1.9x
2012 2013 2014
Equity Net Debt Assets
Debt-to-Equity Ratio Net Debt/EBITDA
UNIWHEELS GROUP INVESTOR PRESENTATION
34 34
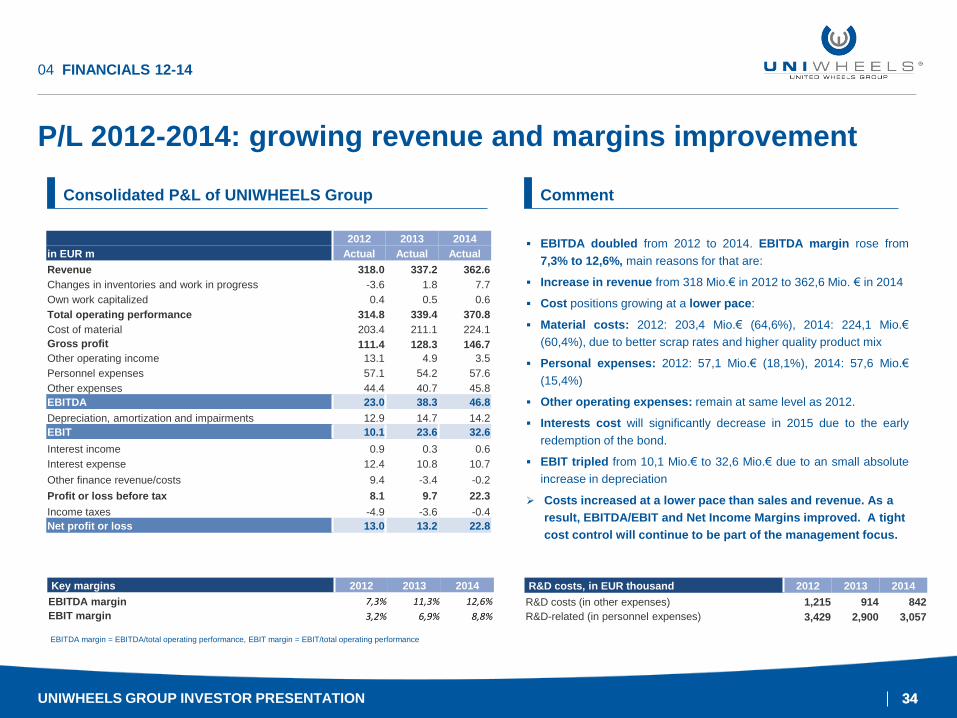
P/L 2012-2014: growing revenue and margins improvement
UNIWHEELS GROUP Q1 2015 RESULTS
04 FINANCIALS 12-14
Consolidated P&L of UNIWHEELS Group Comment
EBITDA doubled from 2012 to 2014. EBITDA margin rose from
7,3% to 12,6%, main reasons for that are:
Increase in revenue from 318 Mio.€ in 2012 to 362,6 Mio. € in 2014
Cost positions growing at a lower pace:
Material costs: 2012: 203,4 Mio.€ (64,6%), 2014: 224,1 Mio.€
(60,4%), due to better scrap rates and higher quality product mix
Personal expenses: 2012: 57,1 Mio.€ (18,1%), 2014: 57,6 Mio.€
(15,4%)
Other operating expenses: remain at same level as 2012.
Interests cost will significantly decrease in 2015 due to the early
redemption of the bond.
EBIT tripled from 10,1 Mio.€ to 32,6 Mio.€ due to an small absolute
increase in depreciation
Costs increased at a lower pace than sales and revenue. As a
result, EBITDA/EBIT and Net Income Margins improved. A tight
cost control will continue to be part of the management focus.
2012 2013 2014
in EUR m Actual Actual Actual
Revenue 318.0 337.2 362.6
Changes in inventories and work in progress -3.6 1.8 7.7
Own work capitalized 0.4 0.5 0.6
Total operating performance 314.8 339.4 370.8
Cost of material 203.4 211.1 224.1
Gross profit 111.4 128.3 146.7
Other operating income 13.1 4.9 3.5
Personnel expenses 57.1 54.2 57.6
Other expenses 44.4 40.7 45.8
EBITDA 23.0 38.3 46.8
Depreciation, amortization and impairments 12.9 14.7 14.2
EBIT 10.1 23.6 32.6
Interest income 0.9 0.3 0.6
Interest expense 12.4 10.8 10.7
Other finance revenue/costs 9.4 -3.4 -0.2
Profit or loss before tax 8.1 9.7 22.3
Income taxes -4.9 -3.6 -0.4
Net profit or loss 13.0 13.2 22.8
EBITDA margin = EBITDA/total operating performance, EBIT margin = EBIT/total operating performance
R&D costs, in EUR thousand 2012 2013 2014
R&D costs (in other expenses) 1,215 914 842
R&D-related (in personnel expenses) 3,429 2,900 3,057
Key margins 2012 2013 2014
EBITDA margin 7,3% 11,3% 12,6%
EBIT margin 3,2% 6,9% 8,8%
UNIWHEELS GROUP INVESTOR PRESENTATION
35 35
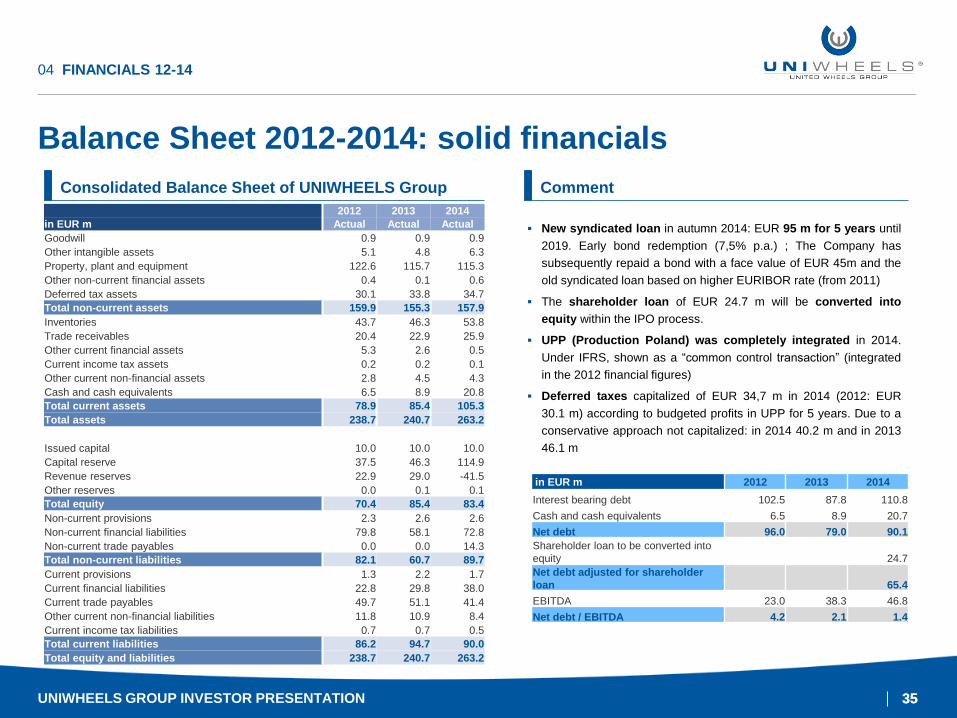
Balance Sheet 2012-2014: solid financials
04 FINANCIALS 12-14
Consolidated Balance Sheet of UNIWHEELS Group Comment
2012 2013 2014
in EUR m Actual Actual Actual
Goodwill 0.9 0.9 0.9
Other intangible assets 5.1 4.8 6.3
Property, plant and equipment 122.6 115.7 115.3
Other non-current financial assets 0.4 0.1 0.6
Deferred tax assets 30.1 33.8 34.7
Total non-current assets 159.9 155.3 157.9
Inventories 43.7 46.3 53.8
Trade receivables 20.4 22.9 25.9
Other current financial assets 5.3 2.6 0.5
Current income tax assets 0.2 0.2 0.1
Other current non-financial assets 2.8 4.5 4.3
Cash and cash equivalents 6.5 8.9 20.8
Total current assets 78.9 85.4 105.3
Total assets 238.7 240.7 263.2
Issued capital 10.0 10.0 10.0
Capital reserve 37.5 46.3 114.9
Revenue reserves 22.9 29.0 -41.5
Other reserves 0.0 0.1 0.1
Total equity 70.4 85.4 83.4
Non-current provisions 2.3 2.6 2.6
Non-current financial liabilities 79.8 58.1 72.8
Non-current trade payables 0.0 0.0 14.3
Total non-current liabilities 82.1 60.7 89.7
Current provisions 1.3 2.2 1.7
Current financial liabilities 22.8 29.8 38.0
Current trade payables 49.7 51.1 41.4
Other current non-financial liabilities 11.8 10.9 8.4
Current income tax liabilities 0.7 0.7 0.5
Total current liabilities 86.2 94.7 90.0
Total equity and liabilities 238.7 240.7 263.2
New syndicated loan in autumn 2014: EUR 95 m for 5 years until
2019. Early bond redemption (7,5% p.a.) ; The Company has
subsequently repaid a bond with a face value of EUR 45m and the
old syndicated loan based on higher EURIBOR rate (from 2011)
The shareholder loan of EUR 24.7 m will be converted into
equity within the IPO process.
UPP (Production Poland) was completely integrated in 2014.
Under IFRS, shown as a “common control transaction” (integrated
in the 2012 financial figures)
Deferred taxes capitalized of EUR 34,7 m in 2014 (2012: EUR
30.1 m) according to budgeted profits in UPP for 5 years. Due to a
conservative approach not capitalized: in 2014 40.2 m and in 2013
46.1 m
in EUR m 2012 2013 2014
Interest bearing debt 102.5 87.8 110.8
Cash and cash equivalents 6.5 8.9 20.7
Net debt 96.0 79.0 90.1
Shareholder loan to be converted into
equity 24.7
Net debt adjusted for shareholder
loan 65.4
EBITDA 23.0 38.3 46.8
Net debt / EBITDA 4.2 2.1 1.4
UNIWHEELS GROUP INVESTOR PRESENTATION
36 36
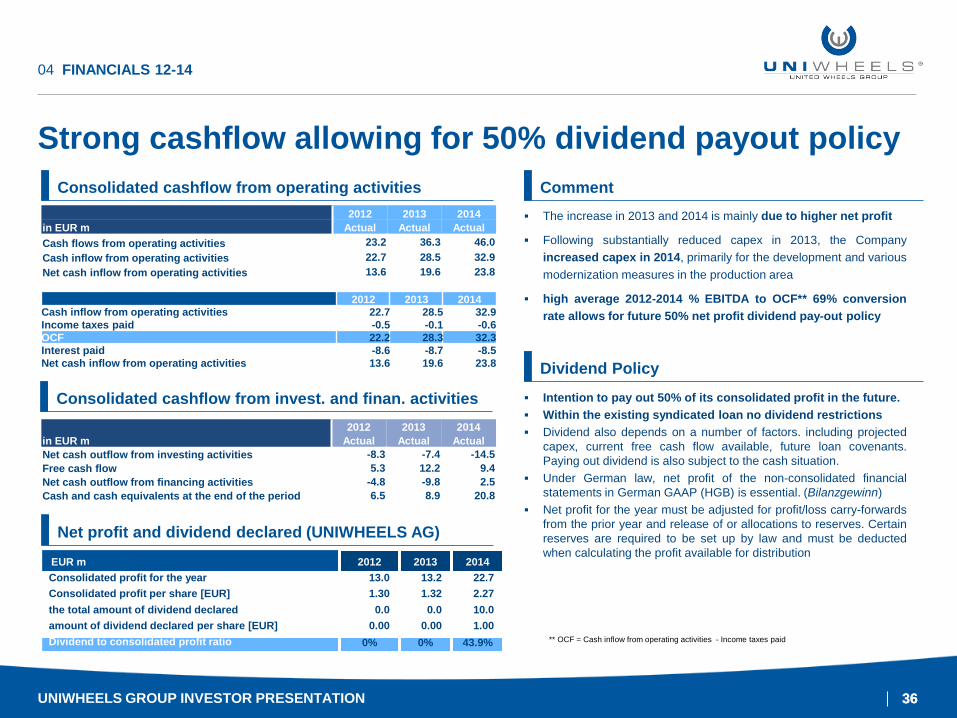
Strong cashflow allowing for 50% dividend payout policy
04 FINANCIALS 12-14
2012 2013 2014
in EUR m Actual Actual Actual
Cash flows from operating activities 23.2 36.3 46.0
Cash inflow from operating activities 22.7 28.5 32.9
Net cash inflow from operating activities 13.6 19.6 23.8
2012 2013 2014
in EUR m Actual Actual Actual
Net cash outflow from investing activities -8.3 -7.4 -14.5
Free cash flow 5.3 12.2 9.4
Net cash outflow from financing activities -4.8 -9.8 2.5
Cash and cash equivalents at the end of the period 6.5 8.9 20.8
The increase in 2013 and 2014 is mainly due to higher net profit
Following substantially reduced capex in 2013, the Company
increased capex in 2014, primarily for the development and various
modernization measures in the production area
high average 2012-2014 % EBITDA to OCF** 69% conversion
rate allows for future 50% net profit dividend pay-out policy
Intention to pay out 50% of its consolidated profit in the future.
Within the existing syndicated loan no dividend restrictions
Dividend also depends on a number of factors. including projected
capex, current free cash flow available, future loan covenants.
Paying out dividend is also subject to the cash situation.
Under German law, net profit of the non-consolidated financial
statements in German GAAP (HGB) is essential. (Bilanzgewinn)
Net profit for the year must be adjusted for profit/loss carry-forwards
from the prior year and release of or allocations to reserves. Certain
reserves are required to be set up by law and must be deducted
when calculating the profit available for distribution
2012 2013 2014
Cash inflow from operating activities 22.7 28.5 32.9 Income taxes paid -0.5 -0.1 -0.6 OCF 22.2 28.3 32.3 Interest paid -8.6 -8.7 -8.5 Net cash inflow from operating activities 13.6 19.6 23.8
EUR m 2012 2013 2014
Consolidated profit for the year 13.0 13.2 22.7
Consolidated profit per share [EUR] 1.30 1.32 2.27
the total amount of dividend declared 0.0 0.0 10.0
amount of dividend declared per share [EUR] 0.00 0.00 1.00
Dividend to consolidated profit ratio 0% 0% 43.9% ** OCF = Cash inflow from operating activities - Income taxes paid
Consolidated cashflow from operating activities
Consolidated cashflow from invest. and finan. activities
Net profit and dividend declared (UNIWHEELS AG)
Comment
Dividend Policy
UNIWHEELS GROUP INVESTOR PRESENTATION
37
THANK YOU FOR YOUR ATTENTION!
We are happy to answer your questions.
IR Contact:
Oliver Madsen
Head of Investor Relations
+49 (0) 63 22 / 9899 – 6209
UNIWHEELS GROUP INVESTOR PRESENTATION
38
APPENDIX
UNIWHEELS Group Investor Presentation
05
39 39
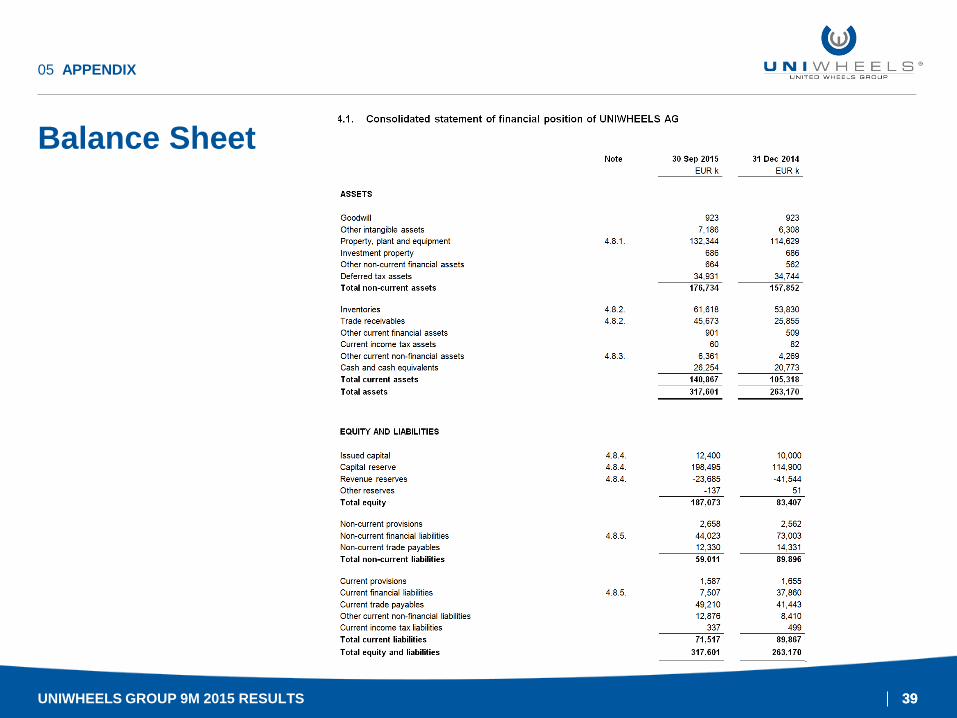
Balance Sheet
UNIWHEELS GROUP 9M 2015 RESULTS
05 APPENDIX
40 40
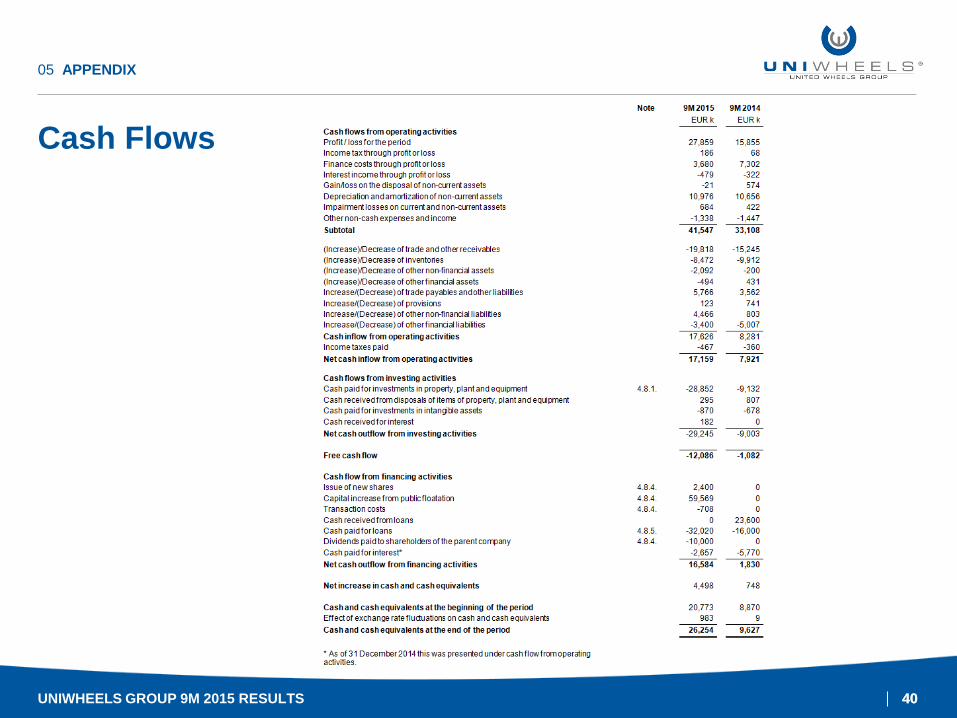
Cash Flows
UNIWHEELS GROUP 9M 2015 RESULTS
05 APPENDIX
41 41
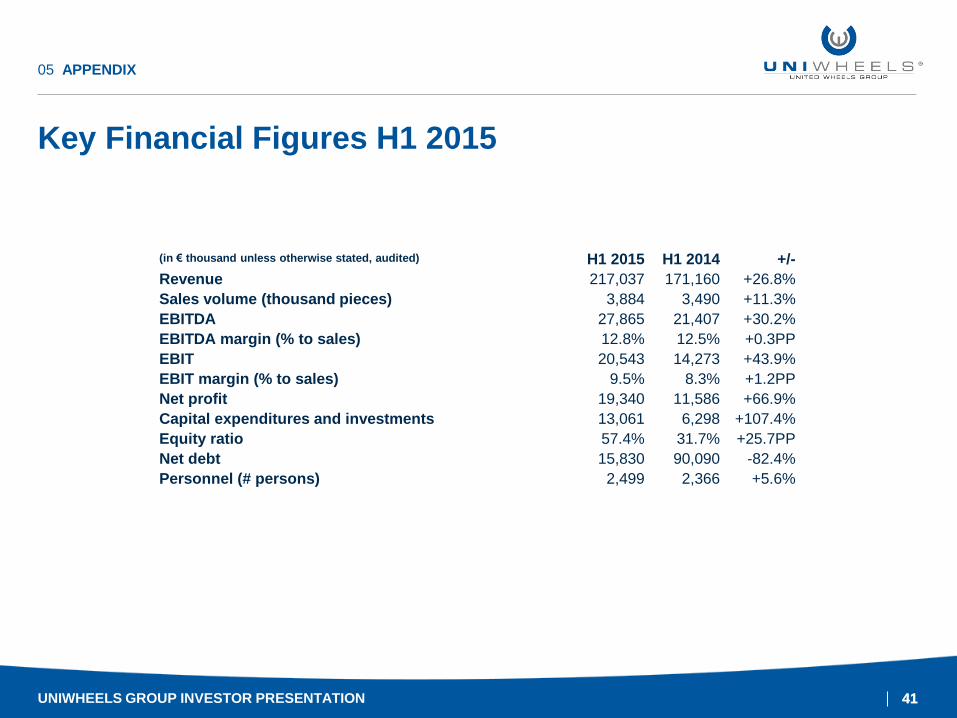
Key Financial Figures H1 2015
05 APPENDIX
(in € thousand unless otherwise stated, audited) H1 2015 H1 2014 +/-
Revenue 217,037 171,160 +26.8%
Sales volume (thousand pieces) 3,884 3,490 +11.3%
EBITDA 27,865 21,407 +30.2%
EBITDA margin (% to sales) 12.8% 12.5% +0.3PP
EBIT 20,543 14,273 +43.9%
EBIT margin (% to sales) 9.5% 8.3% +1.2PP
Net profit 19,340 11,586 +66.9%
Capital expenditures and investments 13,061 6,298 +107.4%
Equity ratio 57.4% 31.7% +25.7PP
Net debt 15,830 90,090 -82.4%
Personnel (# persons) 2,499 2,366 +5.6%
UNIWHEELS GROUP INVESTOR PRESENTATION
42 42
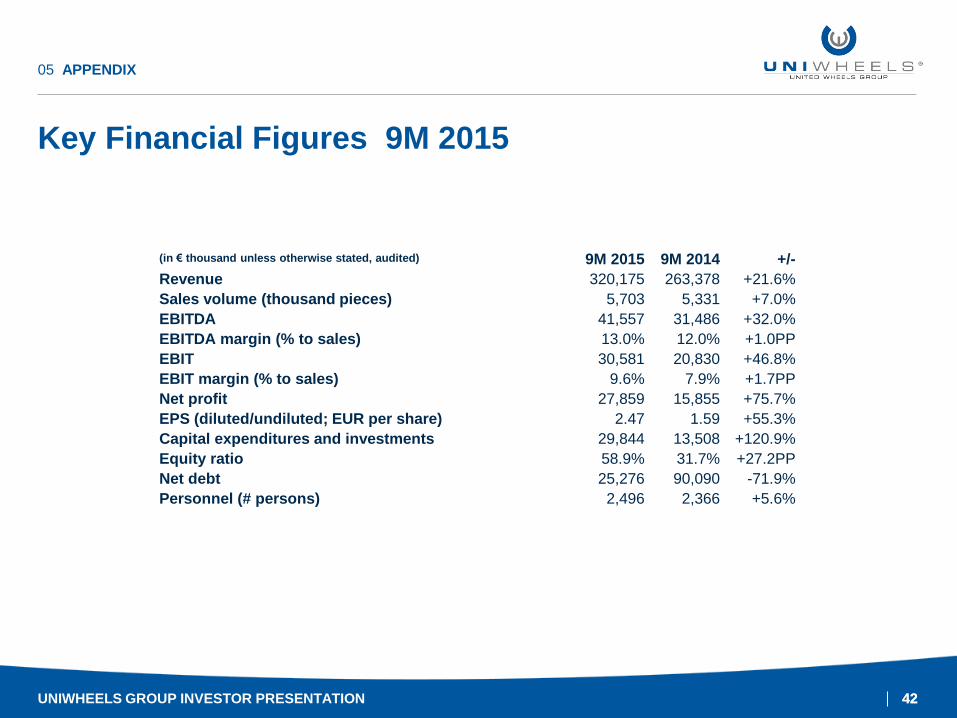
Key Financial Figures 9M 2015
UNIWHEELS GROUP INVESTOR PRESENTATION
05 APPENDIX
(in € thousand unless otherwise stated, audited) 9M 2015 9M 2014 +/-
Revenue 320,175 263,378 +21.6%
Sales volume (thousand pieces) 5,703 5,331 +7.0%
EBITDA 41,557 31,486 +32.0%
EBITDA margin (% to sales) 13.0% 12.0% +1.0PP
EBIT 30,581 20,830 +46.8%
EBIT margin (% to sales) 9.6% 7.9% +1.7PP
Net profit 27,859 15,855 +75.7%
EPS (diluted/undiluted; EUR per share) 2.47 1.59 +55.3%
Capital expenditures and investments 29,844 13,508 +120.9%
Equity ratio 58.9% 31.7% +27.2PP
Net debt 25,276 90,090 -71.9%
Personnel (# persons) 2,496 2,366 +5.6%
43 43
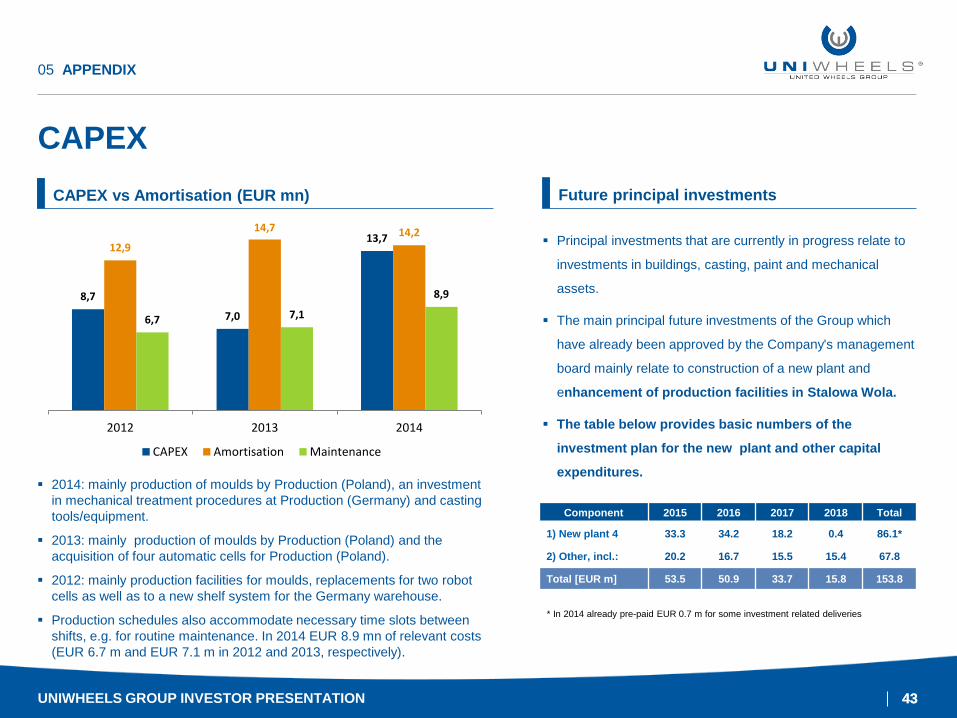
CAPEX
05 APPENDIX
CAPEX vs Amortisation (EUR mn)
2014: mainly production of moulds by Production (Poland), an investment
in mechanical treatment procedures at Production (Germany) and casting
tools/equipment.
2013: mainly production of moulds by Production (Poland) and the
acquisition of four automatic cells for Production (Poland).
2012: mainly production facilities for moulds, replacements for two robot
cells as well as to a new shelf system for the Germany warehouse.
Production schedules also accommodate necessary time slots between
shifts, e.g. for routine maintenance. In 2014 EUR 8.9 mn of relevant costs
(EUR 6.7 m and EUR 7.1 m in 2012 and 2013, respectively).
Future principal investments
Principal investments that are currently in progress relate to
investments in buildings, casting, paint and mechanical
assets.
The main principal future investments of the Group which
have already been approved by the Company's management
board mainly relate to construction of a new plant and
enhancement of production facilities in Stalowa Wola.
The table below provides basic numbers of the
investment plan for the new plant and other capital
expenditures.
* In 2014 already pre-paid EUR 0.7 m for some investment related deliveries
8,7
7,0
13,7 12,9
14,7 14,2
6,7 7,1
8,9
2012 2013 2014
CAPEX Amortisation Maintenance
Component 2015 2016 2017 2018 Total
1) New plant 4 33.3 34.2 18.2 0.4 86.1*
2) Other, incl.: 20.2 16.7 15.5 15.4 67.8
Total [EUR m] 53.5 50.9 33.7 15.8 153.8
UNIWHEELS GROUP INVESTOR PRESENTATION
44 44
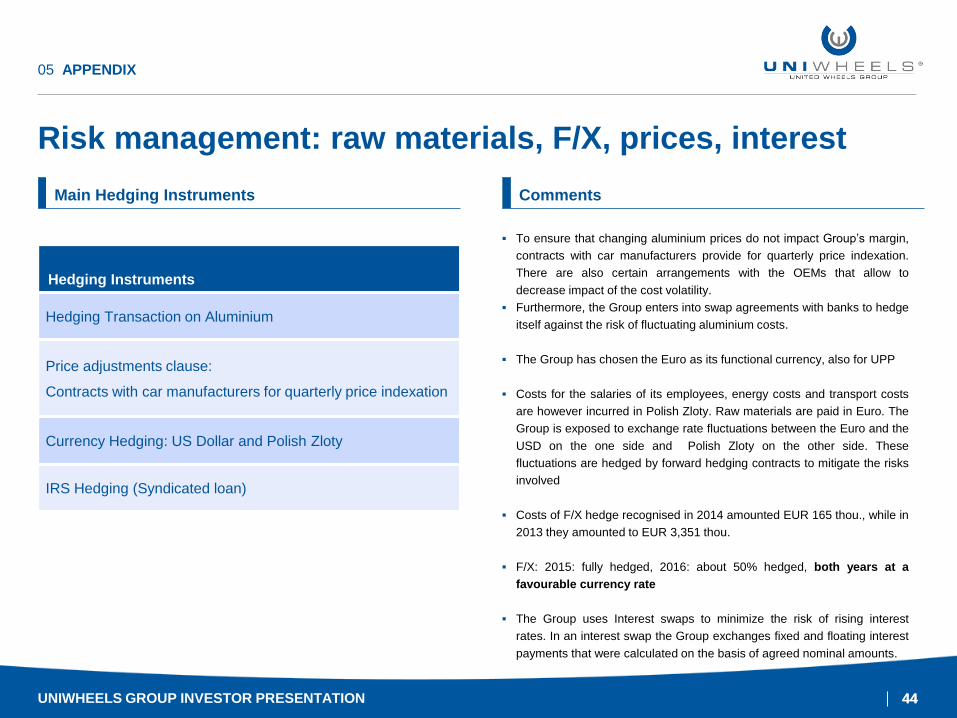
Risk management: raw materials, F/X, prices, interest
05 APPENDIX
Hedging Instruments
Hedging Transaction on Aluminium
Price adjustments clause:
Contracts with car manufacturers for quarterly price indexation
Currency Hedging: US Dollar and Polish Zloty
IRS Hedging (Syndicated loan)
To ensure that changing aluminium prices do not impact Group’s margin,
contracts with car manufacturers provide for quarterly price indexation.
There are also certain arrangements with the OEMs that allow to
decrease impact of the cost volatility.
Furthermore, the Group enters into swap agreements with banks to hedge
itself against the risk of fluctuating aluminium costs.
The Group has chosen the Euro as its functional currency, also for UPP
Costs for the salaries of its employees, energy costs and transport costs
are however incurred in Polish Zloty. Raw materials are paid in Euro. The
Group is exposed to exchange rate fluctuations between the Euro and the
USD on the one side and Polish Zloty on the other side. These
fluctuations are hedged by forward hedging contracts to mitigate the risks
involved
Costs of F/X hedge recognised in 2014 amounted EUR 165 thou., while in
2013 they amounted to EUR 3,351 thou.
F/X: 2015: fully hedged, 2016: about 50% hedged, both years at a
favourable currency rate
The Group uses Interest swaps to minimize the risk of rising interest
rates. In an interest swap the Group exchanges fixed and floating interest
payments that were calculated on the basis of agreed nominal amounts.
Main Hedging Instruments Comments
UNIWHEELS GROUP INVESTOR PRESENTATION
45 45
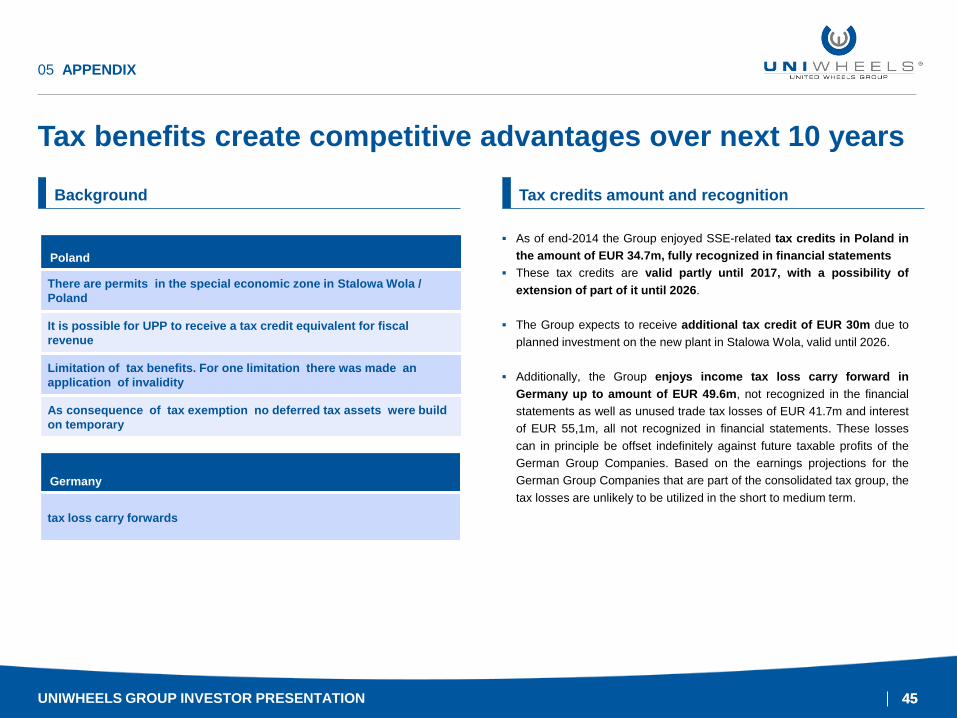
Tax benefits create competitive advantages over next 10 years
05 APPENDIX
As of end-2014 the Group enjoyed SSE-related tax credits in Poland in
the amount of EUR 34.7m, fully recognized in financial statements
These tax credits are valid partly until 2017, with a possibility of
extension of part of it until 2026.
The Group expects to receive additional tax credit of EUR 30m due to
planned investment on the new plant in Stalowa Wola, valid until 2026.
Additionally, the Group enjoys income tax loss carry forward in
Germany up to amount of EUR 49.6m, not recognized in the financial
statements as well as unused trade tax losses of EUR 41.7m and interest
of EUR 55,1m, all not recognized in financial statements. These losses
can in principle be offset indefinitely against future taxable profits of the
German Group Companies. Based on the earnings projections for the
German Group Companies that are part of the consolidated tax group, the
tax losses are unlikely to be utilized in the short to medium term.
Background Tax credits amount and recognition
Poland
There are permits in the special economic zone in Stalowa Wola /
Poland
It is possible for UPP to receive a tax credit equivalent for fiscal
revenue
Limitation of tax benefits. For one limitation there was made an
application of invalidity
As consequence of tax exemption no deferred tax assets were build
on temporary
Germany
tax loss carry forwards
UNIWHEELS GROUP INVESTOR PRESENTATION
46 46
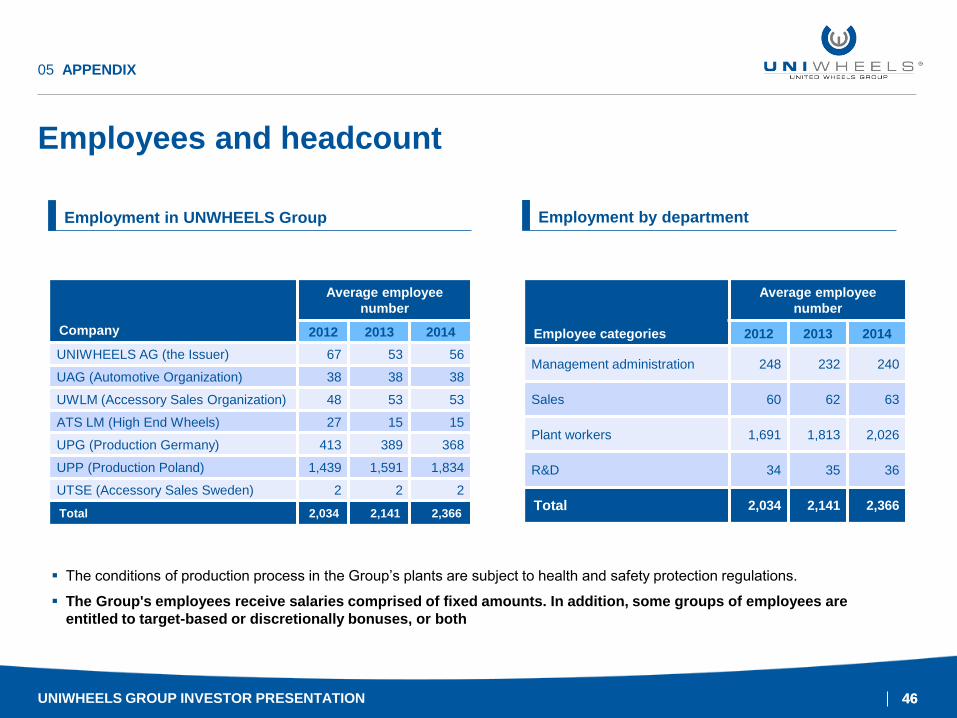
Employees and headcount
05 APPENDIX
Company
Average employee
number
2012 2013 2014
UNIWHEELS AG (the Issuer) 67 53 56
UAG (Automotive Organization) 38 38 38
UWLM (Accessory Sales Organization) 48 53 53
ATS LM (High End Wheels) 27 15 15
UPG (Production Germany) 413 389 368
UPP (Production Poland) 1,439 1,591 1,834
UTSE (Accessory Sales Sweden) 2 2 2
Total 2,034 2,141 2,366
Employee categories
Average employee
number
2012 2013 2014
Management administration 248 232 240
Sales 60 62 63
Plant workers 1,691 1,813 2,026
R&D 34 35 36
Total 2,034 2,141 2,366
The conditions of production process in the Group’s plants are subject to health and safety protection regulations.
The Group's employees receive salaries comprised of fixed amounts. In addition, some groups of employees are
entitled to target-based or discretionally bonuses, or both
Employment in UNWHEELS Group Employment by department
UNIWHEELS GROUP INVESTOR PRESENTATION
47 47
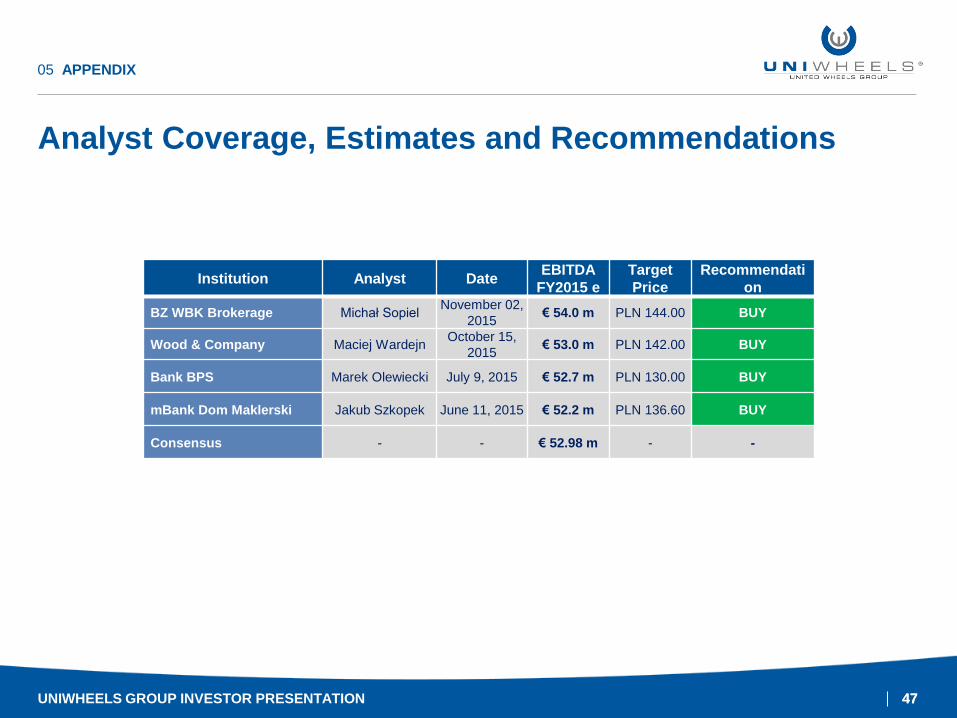
Analyst Coverage, Estimates and Recommendations
UNIWHEELS GROUP INVESTOR PRESENTATION
Institution Analyst Date EBITDA
FY2015 e
Target
Price
Recommendati
on
BZ WBK Brokerage Michał Sopiel November 02,
2015 € 54.0 m PLN 144.00 BUY
Wood & Company Maciej Wardejn October 15,
2015 € 53.0 m PLN 142.00 BUY
Bank BPS Marek Olewiecki July 9, 2015 € 52.7 m PLN 130.00 BUY
mBank Dom Maklerski Jakub Szkopek June 11, 2015 € 52.2 m PLN 136.60 BUY
Consensus - - € 52.98 m - -
05 APPENDIX
48 48
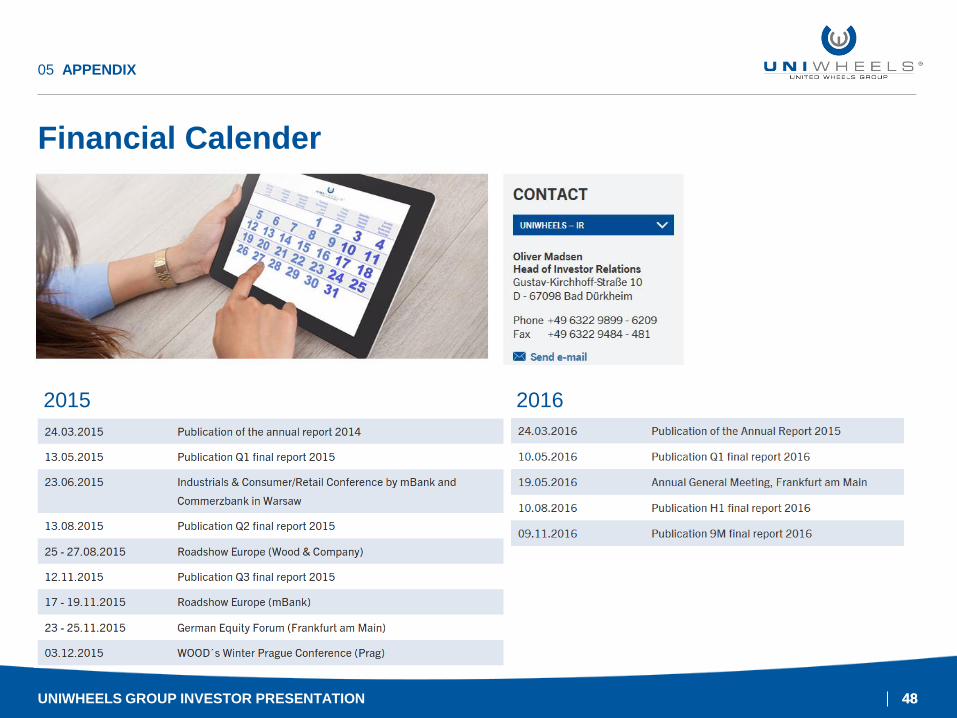
Financial Calender
UNIWHEELS GROUP INVESTOR PRESENTATION
05 APPENDIX
2015 2016


