Embed Size (px)
Citation preview

The Cryosphere, 9, 1075–1087, 2015
www.the-cryosphere.net/9/1075/2015/
doi:10.5194/tc-9-1075-2015
© Author(s) 2015. CC Attribution 3.0 License.
Unlocking annual firn layer water equivalents from
ground-penetrating radar data on an Alpine glacier
L. Sold1, M. Huss1,2, A. Eichler3, M. Schwikowski3, and M. Hoelzle1
1Department of Geosciences, University of Fribourg, Fribourg, Switzerland2Laboratory of Hydraulics, Hydrology and Glaciology, ETH Zurich, Switzerland3Laboratory of Radiochemistry and Environmental Chemistry, Paul Scherrer Institut, Villigen, Switzerland
Correspondence to: L. Sold ([email protected])
Received: 10 July 2014 – Published in The Cryosphere Discuss.: 11 August 2014
Revised: 1 April 2015 – Accepted: 27 April 2015 – Published: 21 May 2015
Abstract. The spatial representation of accumulation mea-
surements is a major limitation for current glacier mass bal-
ance monitoring approaches. Here, we present a method for
estimating annual accumulation rates on a temperate Alpine
glacier based on the interpretation of internal reflection hori-
zons (IRHs) in helicopter-borne ground-penetrating radar
(GPR) data. For each individual GPR measurement, the sig-
nal travel time is combined with a simple model for firn
densification and refreezing of meltwater. The model is cal-
ibrated at locations where GPR repeat measurements are
available in two subsequent years and the densification can
be tracked over time. Two 10.5 m long firn cores provide
a reference for the density and chronology of firn layers.
Thereby, IRHs correspond to density maxima, but not exclu-
sively to former summer glacier surfaces. Along GPR pro-
file sections from across the accumulation area we obtain the
water equivalent (w.e.) of several annual firn layers. Because
deeper IRHs could be tracked over shorter distances, the to-
tal length of analysed profile sections varies from 7.3 km for
the uppermost accumulation layer (2011) to 0.1 km for the
deepest (i.e. oldest) layer (2006). According to model re-
sults, refreezing accounts for 10 % of the density increase
over time and depth, and for 2 % of the water equivalent. The
strongest limitation to our method is the dependence on layer
chronology assumptions. We show that GPR can be used not
only to complement existing mass balance monitoring pro-
grammes on temperate glaciers but also to retrospectively ex-
tend newly initiated time series.
1 Introduction
Mountain glaciers are not only known to be excellent indica-
tors of climatic change (Haeberli and Beniston, 1998; Kaser
et al., 2006; IPCC, 2013) but also important to the hydrol-
ogy and ecology of Alpine regions (Beniston, 2003). In or-
der to better understand their response and adaption, glacier
changes are monitored around the globe (Barry, 2006; Zemp
et al., 2009). Conventional mass balance measurements are
prone to large uncertainties when compared to geodetically
derived volume change. The reconciliation of the two ap-
proaches is the subject of ongoing research (Huss et al., 2009;
Fischer, 2011; Zemp et al., 2013). Ablation can be measured
accurately at many locations across a glacier. For many study
sites, the main drawback is a lack of accumulation measure-
ments that typically involve the time-consuming excavation
of snow pits (Østrem and Brugman, 1991). If measurements
of accumulation are under-represented, the spatial variabil-
ity is often not resolved correctly in modern monitoring ap-
proaches (e.g., Huss et al., 2014). To compensate for this
drawback, an adequate complement to conventional accumu-
lation measurements is necessary, which should preferably
be non-destructive and efficient.
In glaciology, ground-penetrating radar (GPR) is used for
a variety of purposes (Plewes and Hubbard, 2001). The low
electrical conductivity of snow and ice facilitates the deep
penetration of the signal, and the use of narrow-bandwidth,
high-resolution systems (Ulriksen, 1982). Because the sig-
nal is reflected from boundaries with a contrast in dielectric
permittivity, not only a change in the related material prop-
erties can be detected, such as from ice to bedrock, water
Published by Copernicus Publications on behalf of the European Geosciences Union.

1076 L. Sold et al.: Recent accumulation rates derived from repeated helicopter-borne ground-penetrating radar
content, or impurities, but also changes in density are re-
solved (Plewes and Hubbard, 2001; Woodward and Burke,
2007). Thus, GPR applications range from ice thickness mea-
surements (e.g. Robin et al., 1969; Bauder et al., 2003), to
the mapping of snow accumulation distribution (Machguth
et al., 2006; Sold et al., 2013; Helfricht et al., 2014), to the
observation of internal layers within the snow cover (e.g.,
Heilig et al., 2010). Thereby, airborne GPR surveys can cover
large areas in short periods. On ice sheets with rather homo-
geneous accumulation patterns, internal reflection horizons
(IRHs) within firn and ice can be tracked over long-ranging
GPR profiles (Arcone et al., 2004; Huybrechts et al., 2009;
Miège et al., 2013; Hawley et al., 2014). Past accumula-
tion rates are typically estimated from a set of pronounced
IRHs that do not correspond to annual layers. Based on a
given depth–age relation and the density, an average mass
balance is obtained for the period that is covered by each
pair of IRHs. Only a few studies have observed and analysed
the water equivalent (w.e.) of annually spaced IRHs in radar
data (e.g., Kohler et al., 1997; Hawley et al., 2006; Kruetz-
mann et al., 2011; Van Pelt et al., 2014), but not on temperate
mountain glaciers in mid-latitudes to low latitudes.
On temperate glaciers, or glaciers that are constrained by
topography and have complex flow fields, the continuous
tracking of IRHs is often difficult (Karlsson et al., 2009).
Therefore, studies have focused on the mapping of facies
zones and other general glaciological characteristics (Pälli
et al., 2003; Langley et al., 2008; Eisen et al., 2009; Dunse
et al., 2009). On the other hand, GPR not only could accom-
pany ongoing monitoring programmes to complement the
sparse accumulation measurements with high spatial resolu-
tion but also could be used to retrospectively extend newly
initiated time series into the past.
To extract past annual accumulation rates from the GPR
signal, the IRHs must correspond to previous summer sur-
faces. In polar and sub-polar regions this is confirmed by sev-
eral studies (e.g., Wadham et al., 2006; Van Pelt et al., 2014).
For mid-latitude glaciers with a complex firn stratigraphy it
can be difficult to establish this link (Kohler et al., 1997), al-
though the large number of melt–refreeze cycles suggests the
generation of a high-density or ice layer at the snow surface
during summer. Thus, this precondition must be verified by
independent layer dating information.
Furthermore, an estimate of the propagation velocity is
required to convert the GPR travel time to depth. Because
the velocity depends on the density of the material, the lat-
ter needs to be measured or estimated (Plewes and Hubbard,
2001). Thus, density introduces an uncertainty, as it also does
for conventional accumulation measurements that are based
on the determination of layer thickness. In order to obtain
the density and water equivalent of firn layers, meltwater
that percolates from the surface into the firn must be taken
into account. Aside from its effect on the propagation veloc-
ity (Schmid et al., 2014), it changes the density and water
equivalent of firn layers when it refreezes.
Studies that analyse IRHs in firn along GPR profiles are
typically complemented by cores to provide density, layer
dating, and potentially, dielectric characteristics (Pälli et al.,
2002; Arcone et al., 2004; Eisen et al., 2006). However, firn
cores are expensive in terms of cost and effort and provide
point measurements only. Physical models can be used to
estimate firn density profiles along GPR profiles. They re-
quire various input data such as temperature, precipitation,
wind, and terrain to calculate the accumulation rate (Ligten-
berg et al., 2011).
In this study we obtain IRH travel times from GPR data
measured in May 2012 by 400 MHz helicopter-borne GPR
on Findelengletscher, a temperate Alpine valley glacier in
Switzerland. The analysis is limited, however, to the upper
part of the glacier where sufficient accumulation allows for
distinguishing multiple IRHs. Due to IRH discontinuities and
variations in the GPR signal penetration depth, the analysed
subset consists of disjoint profile sections. The chronology
of the IRHs is directly retrieved from two shallow firn cores.
Comparison with density and impurity profiles shows that
not all IRHs represent former summer surfaces. The mea-
sured travel times of annual IRHs serve as input to a simple
transient model for the density of firn layers and the refreez-
ing of meltwater. The model is calibrated with an observed
change in the IRH travel times at multiple locations. They
are obtained from a repeat survey conducted in April 2013.
The model is run for all analysed GPR measurement loca-
tions separately and provides estimates for the density, wa-
ter equivalent, and meltwater refreezing in annual firn layers.
Thus, on the basis of the layer chronology from firn cores,
we estimate annual accumulation rates for Findelengletscher
over a multiyear period from airborne GPR measurements.
2 Study site and field data
Findelengletscher is a 13 km2 temperate Alpine valley
glacier in the vicinity of Zermatt, Switzerland, ranging from
2600 to 3900 ma.s.l. It is situated directly below the main
Alpine ridge with a north-westerly exposure (Fig. 1). A mon-
itoring programme for annual mass balance was started in
2004 (Machguth, 2008) with a network of 13 ablation stakes
and two snow pits for density measurements in the accumu-
lation area (Fig. 1). Since 2009, the data record is comple-
mented by measurements of winter mass balance using con-
ventional snow probings and snow pits. The seasonal mass
balance measurements are extrapolated to the entire glacier
by constraining a distributed accumulation and temperature-
index melt model operating on a daily resolution (Huss
et al., 2009). The model is calibrated for each year indi-
vidually using the point measurements of ablation and accu-
mulation and takes into account spatial variations of poten-
tial solar radiation and snow accumulation. Meteorological
data are available from automatic weather stations at Zer-
matt (1638 ma.s.l.; 6 km west of the glacier terminus) and
The Cryosphere, 9, 1075–1087, 2015 www.the-cryosphere.net/9/1075/2015/
L. Sold et al.: Recent accumulation rates derived from repeated helicopter-borne ground-penetrating radar 1077
2600
2800
3000
3200
3400
3400
3600
3800
1
2
7.88°E45.99°N
Milan
Bern
Geneva
IT
FR
CH
50km
Analysed GPR profiles (2012)Mean ELA 2008 − 2011Firn cores 1 and 2Ablation stakesAccumulation measurements (snow pits)Locations used for model calibration
1km
N
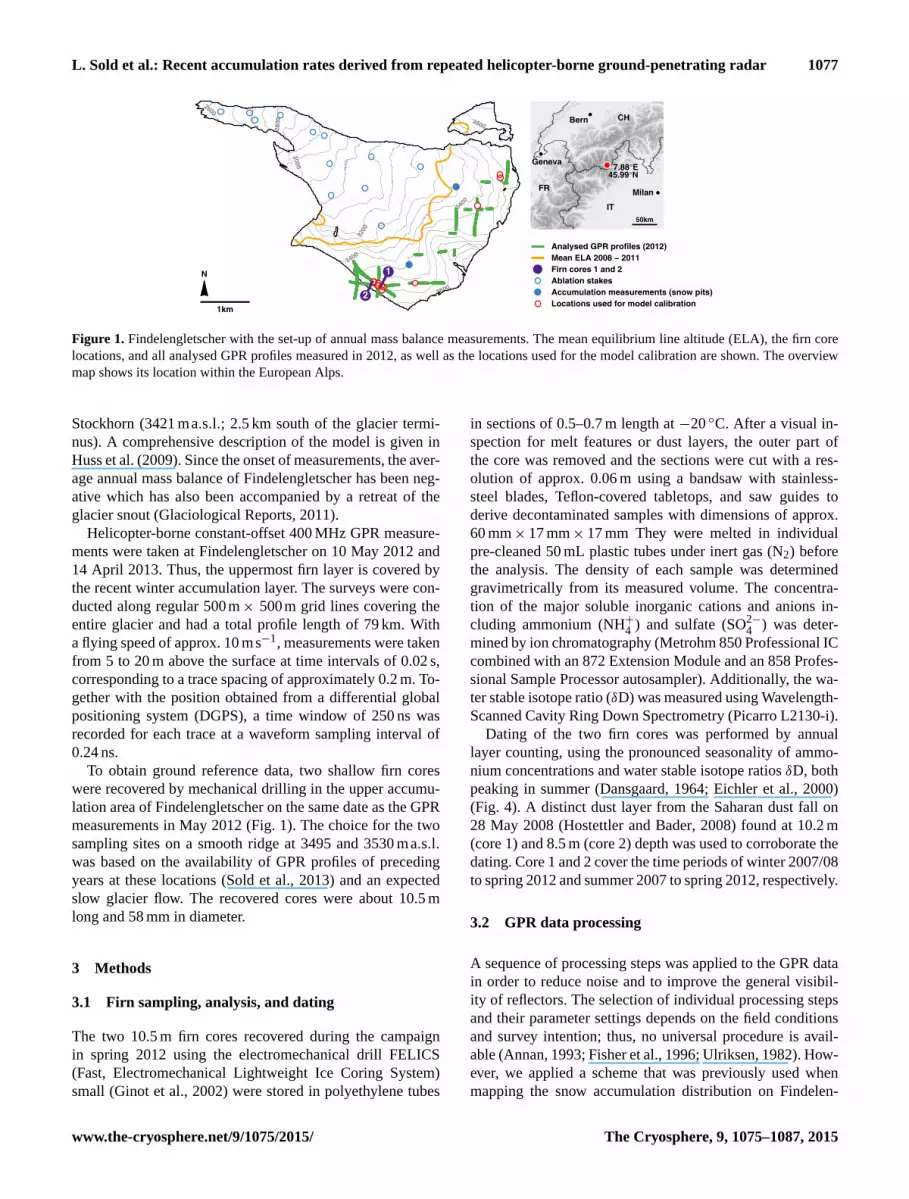
Figure 1. Findelengletscher with the set-up of annual mass balance measurements. The mean equilibrium line altitude (ELA), the firn core
locations, and all analysed GPR profiles measured in 2012, as well as the locations used for the model calibration are shown. The overview
map shows its location within the European Alps.
Stockhorn (3421 m a.s.l.; 2.5 km south of the glacier termi-
nus). A comprehensive description of the model is given in
Huss et al. (2009). Since the onset of measurements, the aver-
age annual mass balance of Findelengletscher has been neg-
ative which has also been accompanied by a retreat of the
glacier snout (Glaciological Reports, 2011).
Helicopter-borne constant-offset 400 MHz GPR measure-
ments were taken at Findelengletscher on 10 May 2012 and
14 April 2013. Thus, the uppermost firn layer is covered by
the recent winter accumulation layer. The surveys were con-
ducted along regular 500m× 500m grid lines covering the
entire glacier and had a total profile length of 79 km. With
a flying speed of approx. 10 ms−1, measurements were taken
from 5 to 20 m above the surface at time intervals of 0.02 s,
corresponding to a trace spacing of approximately 0.2 m. To-
gether with the position obtained from a differential global
positioning system (DGPS), a time window of 250 ns was
recorded for each trace at a waveform sampling interval of
0.24 ns.
To obtain ground reference data, two shallow firn cores
were recovered by mechanical drilling in the upper accumu-
lation area of Findelengletscher on the same date as the GPR
measurements in May 2012 (Fig. 1). The choice for the two
sampling sites on a smooth ridge at 3495 and 3530 ma.s.l.
was based on the availability of GPR profiles of preceding
years at these locations (Sold et al., 2013) and an expected
slow glacier flow. The recovered cores were about 10.5 m
long and 58 mm in diameter.
3 Methods
3.1 Firn sampling, analysis, and dating
The two 10.5 m firn cores recovered during the campaign
in spring 2012 using the electromechanical drill FELICS
(Fast, Electromechanical Lightweight Ice Coring System)
small (Ginot et al., 2002) were stored in polyethylene tubes
in sections of 0.5–0.7 m length at −20 ◦C. After a visual in-
spection for melt features or dust layers, the outer part of
the core was removed and the sections were cut with a res-
olution of approx. 0.06 m using a bandsaw with stainless-
steel blades, Teflon-covered tabletops, and saw guides to
derive decontaminated samples with dimensions of approx.
60 mm× 17 mm× 17 mm They were melted in individual
pre-cleaned 50 mL plastic tubes under inert gas (N2) before
the analysis. The density of each sample was determined
gravimetrically from its measured volume. The concentra-
tion of the major soluble inorganic cations and anions in-
cluding ammonium (NH+4 ) and sulfate (SO2−4 ) was deter-
mined by ion chromatography (Metrohm 850 Professional IC
combined with an 872 Extension Module and an 858 Profes-
sional Sample Processor autosampler). Additionally, the wa-
ter stable isotope ratio (δD) was measured using Wavelength-
Scanned Cavity Ring Down Spectrometry (Picarro L2130-i).
Dating of the two firn cores was performed by annual
layer counting, using the pronounced seasonality of ammo-
nium concentrations and water stable isotope ratios δD, both
peaking in summer (Dansgaard, 1964; Eichler et al., 2000)
(Fig. 4). A distinct dust layer from the Saharan dust fall on
28 May 2008 (Hostettler and Bader, 2008) found at 10.2 m
(core 1) and 8.5 m (core 2) depth was used to corroborate the
dating. Core 1 and 2 cover the time periods of winter 2007/08
to spring 2012 and summer 2007 to spring 2012, respectively.
3.2 GPR data processing
A sequence of processing steps was applied to the GPR data
in order to reduce noise and to improve the general visibil-
ity of reflectors. The selection of individual processing steps
and their parameter settings depends on the field conditions
and survey intention; thus, no universal procedure is avail-
able (Annan, 1993; Fisher et al., 1996; Ulriksen, 1982). How-
ever, we applied a scheme that was previously used when
mapping the snow accumulation distribution on Findelen-
www.the-cryosphere.net/9/1075/2015/ The Cryosphere, 9, 1075–1087, 2015

1078 L. Sold et al.: Recent accumulation rates derived from repeated helicopter-borne ground-penetrating radar
0 50 100 1500
20
100
80
60
40
Distance (m)
Two-
way
trav
el ti
me
(ns)
Figure 2. Processed GPR profile exemplarily showing IRHs within
the firn in the accumulation area of Findelengletscher. Red lines
highlight potential previous summer surfaces.
gletscher (Sold et al., 2013) but with some adjustments to
the parameter sets. The scheme consists of a spatial interpo-
lation of traces to a 0.3 m spacing to correct for variations
in the helicopter’s velocity, a frequency bandpass filter and
background removal to reduce noise, and a gain function to
account for signal attenuation with depth. Additionally, the
profiles were flattened to a horizontal snow surface that is
represented by the first and most pronounced reflector. Mi-
gration was found to not improve the data quality for the
given survey design, due to the moderate surface slopes at
the analysed GPR measurement locations (95 % less than
15◦). The processing was performed with the software Re-
flexw (Sandmeier Scientific Software) and sufficiently im-
proved data quality without the risk of over-processing and
generation of artificial reflectors (Fig. 2).
The analysis of firn layers is limited to locations where ac-
cumulation occurs. To extract an annual firn layer, at least
two IRHs must be present, i.e. representing two subsequent
summer surfaces. Furthermore, it must be ensured that be-
tween the upper- and lowermost detected IRHs all other IRHs
of summer surfaces are present and can be distinguished.
Thus, areas with little or no accumulation, as well as profile
sections where the interpretation was ambiguous, were ex-
cluded from the data set. The reduced set of processed GPR
data consists of disjunct profile sections in the accumulation
area of Findelengletscher (7.3 km total length for the upper-
most firn layer in May 2012) (Fig. 1). The penetration depth
of the GPR signal depends on the height of the helicopter
above ground and the physical properties of the subsurface.
Therefore, the IRHs of deeper, i.e. older, layers appear in
shorter sections, leading to differences in the spatial extent
of extracted layers. We found reflections down to about 20 m
below the snow surface and a maximum of eight IRHs. They
were digitised manually in the processing software due to
noise and lateral variability in layer thickness which impede
a reliable automatic tracking of IRHs.
350 400 450 500 550 600Initial density (kg⋅m−3)
1000
2000
3000
4000
5000
Com
pact
ion
rate
sca
ling
f (m
−0.
5 ⋅yr−
0.5 )
492
1.4 1.6 1.8 2.0 2.2RMSD modelled − measured dTWT (ns)
Figure 3. Optimal scaling f of the compaction rate (Eqs. 2 and 3)
as a function of the initial model density ρf(0, td)= 492 kgm−3,
found by comparing 35 modelled and measured changes in IRH
travel times at locations where GPR repeat measurements are avail-
able in 2012 and 2013. The shading shows the root mean square
deviation (RMSD) while the line provides the optimal relation. The
horizontal error bar shows the uncertainty in the initial model den-
sity. The related uncertainty in f is indicated with black markers.
For the evaluation of the GPR repeat measurements in
May 2012 and April 2013, we aimed at locating the corre-
spondent of each reflector at its new depth in the second year.
A matching procedure was applied on the travel-time domain
at 12 locations where a sequence of IRHs was found in both
GPR data sets. (Fig. 1). Thereby, the uppermost IRH in the
second year was omitted, representing the added first year’s
accumulation. A free scaling of ±20 % of the depth of the
uppermost reflector in the first year was applied, which ex-
periences the strongest compaction over the year. Then, the
one-to-one mapping of reflectors was found with the mini-
mum distance in the time domain.
3.3 Modelling firn density
An estimate for the dielectric permittivity of the firn is re-
quired to obtain the radar-wave velocity, converting the two-
way travel time of the GPR signal from time to depth do-
main. Density strongly affects the dielectric properties of
snow and firn and several empirical formulas exist to esti-
mate the permittivity (e.g. Kovacs et al., 1993; Frolov and
Macheret, 1999). In addition, the density is required to ulti-
mately determine the water equivalent of firn layers.
We used the approach by Reeh (2008) to model firn
layer compaction. It is based on the empirical steady-state
model of Herron and Langway (1980), which assumes den-
sity changes over time t to be linearly related to the pressure
of overlying snow or firn:
dρf
dt= c · (ρice− ρf), (1)
The Cryosphere, 9, 1075–1087, 2015 www.the-cryosphere.net/9/1075/2015/

L. Sold et al.: Recent accumulation rates derived from repeated helicopter-borne ground-penetrating radar 1079
where ρf is the density of the firn fraction of an annual
layer, ρice is the density of ice, and c is a dimensionless
parameter depending on the mean annual firn temperature
T (K) and the average mass balance b (mw.e.yr−1) that con-
trols the overlying weight. It is separated by ρf = 550kgm−3
to respect different stages during the densification process
(Herron and Langway, 1980). Here, we neglect the lower
stage (ρf < 550kgm−3) because the model will be calibrated
and measured autumn snow densities were not considerably
lower (492 kgm−3, see below). For ρf ≥ 550kgm−3 c is ob-
tained as
c = k · b0.5
with (2)
k = f · exp
(−
E
R · T
), (3)
where R = 8.314J K−1 mol−1 is the gas constant, E =
21 400Jmol−1 is the activation energy, and f (m−0.5 yr−0.5)
is an empirically derived constant controlling the densifi-
cation rates. This steady-state approach was used by Reeh
(2008) but with variable accumulation rates, initial densities,
and air temperatures. The density ρf(t, td) of an annual firn
layer t years after its deposition at td is then given by solv-
ing Eq. (1) as an initial value problem with ρf(0, td) being
the layer’s individual initial density. Thereby, instead of as-
suming steady-state conditions, an individual c is obtained
for each layer from the mean annual mass balances bprev and
mean annual temperatures of the t − 1 preceding years since
deposition.
In the context of our study, the local annual mass balances
are initially unknown and the model cannot be applied as it
is. However, along the GPR profiles, the IRH travel times of
firn layers and the snow cover are given. We used this in-
formation to progressively derive the unknown densities ρf,i
and water equivalents ωi of all i = 1, . . .,n layers at the time
of the GPR measurements, i.e. ti years after each layer was
deposited at td. We follow Reeh (2008) by substituting the
long-term mean mass balance in Eq. (2) with the mean wa-
ter equivalent of the i− 1 overlying firn layers to obtain an
individual proportionality factor ci for each firn layer as
ci = k ·
(i−1∑j=0
ωj · t−1i
)0.5
. (4)
This allows for estimating the density ρf,i of a firn layer
by solving Eq. (1) over ti , the time since layer deposition, if
the initial density ρf(0, td) and the water equivalents of over-
lying firn layers are given. Then, the difference in IRH two-
way travel time τi can be converted to the firn layer water
equivalent ωi by
ωi = 0.5 · τi · v(ρf,i) · ρf,i, (5)
with the radio wave velocity v(ρf,i) estimated from the den-
sity using the empirical relation by Frolov and Macheret
(1999).
When the density of the uppermost layer is known, Eq. (5)
provides its water equivalent and Eqs. (4) and (1) can be used
to estimate the density of the second layer. The densities and
water equivalents of all other layers can then be calculated
similarly in a stepwise manner by using the previously ob-
tained water equivalents of all overlying layers. In our case,
the uppermost layer (i = 0) is the winter snow cover. We set
its density to ρf,0 = 400kgm−3, which is in line with obser-
vations in spring 2010–2013 (395±32kgm−3 from 14 mea-
surements ≥ 3200ma.s.l.). According to Reeh (2008), the
deposition of a layer at time td is attributed to the end of the
respective melting season. Because the GPR measurements
were taken in spring, we set the age of the first annual firn
layer (i = 1) as t1 = 0.3yr. This also accounts for the asso-
ciated compaction processes being stronger during the sum-
mer months due to higher temperatures and the refreezing of
meltwater. For all subsequent layers we set ti+1 = ti + 1yr.
To account for the temperate nature of Findelengletscher,
temperature was set to T = 0 ◦C= 273.15K (constant). For
the initial firn density we used ρf(0, td)= 492 kgm−3 as the
mean density measured within the conventional glaciologi-
cal accumulation measurements at the end of the summer in
2010–2013. We derived a conservative uncertainty estimate
of±61 kgm−3 from the mean standard deviations of (1) mul-
tiple density measurements within the same snow pits, i.e.
the measurement error (±21 kgm−3); (2) within single years,
i.e. the spatial variability (±31 kgm−3); and (3) at locations
with annual repeat measurements, i.e. the temporal variabil-
ity (±49 kgm−3). The initial density is assumed to be spa-
tially and temporarily constant. However, as the uppermost
firn layer is of age t1 = 0.3 yr, it experienced compaction.
Thus, this assumption does not imply a spatially homoge-
neous layer density, but rather defines the initial (i.e. the pre-
ceding autumn) model condition.
3.4 Refreezing of meltwater
Due to cooling from the surface during winter, firn can pe-
riodically have temperatures below 0 ◦C even on temperate
glaciers. The relocation and refreezing of surface meltwa-
ter alters the water equivalent of firn layers and affects their
density. Because of the temperate conditions, we assume that
during each summer all subfreezing temperatures are com-
pensated by the refreezing of meltwater. This is supported
by the direct observations of summer mass balance that gen-
erally indicate > 1 mw.e. of snow melt during the summer
months. Thus, the amount of refreezing is given by the firn
temperature profile that is generated by the surface cooling
during winter. We calculate a one-dimensional end-of-winter
firn temperature profile at each GPR measurement location
using heat conduction from the surface in the period from
1 October to 1 May. A vertical density profile with a reso-
lution of 0.1 m was set up, describing the winter snow cover
and the underlying firn layers. The winter snow cover is built
up linearly between 1 October and 1 May to reach the thick-
www.the-cryosphere.net/9/1075/2015/ The Cryosphere, 9, 1075–1087, 2015

1080 L. Sold et al.: Recent accumulation rates derived from repeated helicopter-borne ground-penetrating radar
ness estimated from the IRH travel time. The density was as-
sumed to increase linearly over time from 100 to 400 kgm−3.
For the firn section the respective modelled end-of-winter
density profile was used. The thermal diffusivity of snow and
firn was estimated from an empirical relationship with den-
sity (Calonne et al., 2011). The heat equation could then be
solved numerically on a 1 h resolution with a forward in time,
central in space scheme.
We applied the model to every annual layer and all win-
ter periods since its deposition using the daily mean air
temperature at the automatic weather station at Stockhorn,
corrected for elevation with a moist adiabatic lapse rate of
−0.006 Km−1. In order to account for differences between
the air and snow surface temperatures we applied a mean
temperature offset for each month. The offset was based on
the observed monthly mean difference in 2002–2010 at the
Stockhorn weather station that was estimated from the out-
going long-wave radiation. The offset is the largest in De-
cember (−6.7K) and decreases to −3.5K in April. For each
year and each layer, the amount of refrozen meltwater was
calculated from the specific heat capacity of snow and the
latent heat of fusion and was added to the layer water equiv-
alent. The given layer thickness then allowed for updating of
its modelled density.
However, the two models for temperature and density were
not fully coupled because they run on different domains. The
densification model primarily steps through the layers from
top to bottom, whereas the heat conduction is solved over
time. Thus, each year’s density profile remains static in the
temperature model, whereas the layer water equivalents stay
constant within the densification model but are adjusted sep-
arately. This is in line with the model itself neglecting varia-
tions in the loading history of each firn layer.
3.5 Model calibration
Aside from the refreezing, the change in density over time is
controlled by the density contrast to the density of ice and the
weight of overlying layers (Eq. 4). The model sensitivity to
those variables is controlled by the factor f (Eq. 3). Changes
in f propagate through the entire model as they affect not
only the densities of individual layers but also their water
equivalent, their weight, and, hence, the modelled densities
of the following layers. Because the initial density ρf(0, td)
can be constrained with conventional measurements in au-
tumn, we used the parameter f to calibrate the model to our
site characteristics.
At locations where repeat GPR measurements are avail-
able in 2012 and 2013, the density change of each layer
was modelled over the time of 1 year. To reduce the ef-
fects of ice flow, a potential imprecision of the positioning
and differences in the GPR footprint size, the model was
applied using the mean IRH travel times within a distance
of 25 m from the common location. In order to obtain the
new overlying weight on each layer, the IRH travel times
of the snow cover and the new annual accumulation layer
were considered. The resulting layer densities for the second
year were used to estimate the respective hypothetical GPR
signal travel times. The model was calibrated with a scaling
factor of f = 2614 m−0.5 yr−0.5 (Eq. 2) that was found by
minimising the root mean square deviation of the modelled
and measured IRH travel times of 35 layers at 12 locations
(Fig. 1). However, the temporal density change also depends
on the density contrast that is linked to the initial density.
Therefore, the optimal value of f is related to the choice of
ρf(0, td) (Fig. 3).
4 Results and discussion
4.1 Local results at firn core locations
We observed a variable density profile for both firn cores
that increased with depth (Fig. 4). Maximum densities cor-
responded to melt features of bubble-free or bubble-poor ice.
They are more transparent and form when surface snow melts
and the meltwater percolates into deeper layers where it fills
the pores and refreezes. In many cases melt features involve
enhanced concentrations of NH+4 and δD. Due to the tem-
perate conditions at the drilling site, refreezing of meltwa-
ter not only contributes to the densification of firn and al-
ters the water equivalents of firn layers but also strongly in-
fluences the chemical and stable isotope composition (Ginot
et al., 2010). The drilling took place in spring 2012 and thus,
the snow accumulation of winter 2011/12 did not experi-
ence major melting. In contrast, the firn layers below experi-
enced one or more cycles of melting and refreezing, leading
to an enhanced smoothing of seasonal variations and poten-
tially, a partial relocation of chemical species. Nevertheless,
in agreement with studies on the nearby polythermal Grenz-
gletscher (Eichler et al., 2001), NH+4 and δD seasonal cycles
were still detectable, even under temperate conditions.
The measured density profile allowed for a direct estima-
tion of the GPR signal velocity using the empirical relation
by Frolov and Macheret (1999). On the travel-time domain,
we observed agreement between the GPR signal and pro-
nounced changes in the density profile (Fig. 4), suggesting
that the reflectors were composed of dense layers. This un-
derlines the high potential of GPR for the detection of sum-
mer layers. However, not all density maxima and melt layers
correspond to a former glacier summer surface, but can also
originate from exceptional melting and refreezing in other
seasons, or from percolation of meltwater into deeper parts of
the firn. In core 1 at a depth of 9.2 m (7.2 m in core 2), the ac-
cumulation layer of 2009 contained a pronounced ice layer of
0.12 m (0.15 m) thickness, corresponding to maximum mea-
sured densities of 856 kgm−3 (853 kgm−3) (Fig. 4). The low
δD ratio implies low temperatures during the formation of
the precipitation that was incorporated into the ice layer by
in situ densification or refreezing. We suppose that this layer
The Cryosphere, 9, 1075–1087, 2015 www.the-cryosphere.net/9/1075/2015/

L. Sold et al.: Recent accumulation rates derived from repeated helicopter-borne ground-penetrating radar 1081
2011
2010
2009
2008
Density (kg⋅m−3)
0 500 1000
0 150 300NH4
+ (ppb) SO42− (ppb)
0 150 300
−200 −100 0δD (0/00)
2
4
6
8
10
Dep
th (
m)
0 25 50GPR (m)
100
80
60
40
20
0
Tra
vel t
ime
(ns)
Density (kg⋅m−3)
100
80
60
40
20
00 500 1000
0 150 300NH4
+ (ppb) δD (0/00)
−200 −100 0
Core 1 Core 2
Figure 4. Ground penetrating radar profile at firn core 1 (Fig. 1), the measured vertical profiles of density, transformed to the travel-time
domain, with marked melt layers (orange) and dust layers (yellow), ammonium (NH+4
) and sulfate (SO2−4
) concentrations, and the water
stable isotope ratio (δD). Grey bars represent summer surfaces. For comparison, density, NH+4
and δD are shown for firn core 2.
was formed by surface meltwater that was hindered from fur-
ther percolation by a blocking layer, such as a boundary with
a change in the grain structure or a thin ice layer (Pfeffer and
Humphrey, 1996). This is supported by a high concentration
of most of the measured ions right below the ice layer (e.g.
SO2−4 ) that typically just extends over one or two samples.
By preventing meltwater from percolating and refreezing un-
derneath the ice layer, the chemical composition is preserved
and does not experience enhanced smoothing. After a period
of major snow falls, high wind speeds and mild temperatures
were registered on 20 December 2008. It was followed by
clear weather until mid-January (Etter et al., 2011). We sug-
gest that this allowed for the formation of a dense layer at
the surface of a fresh snow pack, creating a hydraulic barrier
for meltwater formed later in the season. Because no defined
clear ice layer was built up in the following summer of 2009
(Fig. 4), meltwater of several seasons could have penetrated
down to and have been retained above the blocking layer, re-
sulting in the thick ice layer with a considerable water equiv-
alent within the firn layer of 2009 and a strong IRH in the
GPR signal.
4.2 Spatial extraction of recent accumulation rates
The firn core profiles of density, NH+4 concentrations, and
δD ratios suggested that, aside from the ice lens inherent
to the 2009 accumulation layer, the IRHs can be attributed
to dense summer layers. In fact, the related reflection in the
GPR signal was observed in all analysed profile sections and
was more pronounced at higher altitudes. The spatial con-
tinuity of the ice layer is further supported by its evidence
in both firn cores. By disregarding the respective IRH, the
water equivalents of annual accumulation layers were ex-
tracted. As described above, the firn densification model was
applied to all GPR traces individually where multiple IRHs
were found that correspond to subsequent previous sum-
mer surfaces. Thus, the analysis is limited to areas where
sufficient annual accumulation allows for distinguishing the
corresponding IRHs. Furthermore, a continuous tracking of
IRHs is impeded due to crevasses, ice dynamics, irregular
accumulation such as avalanche deposits, changes in the dis-
tance of the helicopter to the snow surface, or lateral varia-
tions in layer properties that determine the strength of IRHs.
The total length of analysed IRHs was 7.3, 6.8, 5.9, 2.8, 1.3,
and 0.1 km for the accumulation layers of 2011 to 2006.
Conventional glaciological measurements refer to the an-
nual surface mass balance, as they are taken from the recent
accumulation layer in the end of the hydrological year. This
layer experienced melting and the meltwater, which may par-
tially refreeze deeper in the firn column, is not covered by the
measurement. In contrast, water equivalents obtained from
IRH travel times contain internal accumulation originating
from surface melt in multiple seasons. As our goal is to re-
construct surface mass balance, consistent with conventional
measurements, the computed quantity of refrozen meltwater
was subtracted from each layer and was not re-attributed to
its source layer.
The water equivalents derived from GPR exceeded those
obtained by spatial extrapolation of conventional mass bal-
ance measurements, albeit reproducing their temporal pat-
www.the-cryosphere.net/9/1075/2015/ The Cryosphere, 9, 1075–1087, 2015

1082 L. Sold et al.: Recent accumulation rates derived from repeated helicopter-borne ground-penetrating radar
0.0
0.5
1.0
1.5
2.0
2.5
0.0
0.5
1.0
1.5
2.0
2.5
Laye
r w
.e. (
m)
2011 2010 2009 2008
GPR−derivedExtrapolated glaciol.
2011 2010 2009 2008300
400
500
600
700
800
900
Modelled densityWithout refreezing
Data range
Den
sity
(kg
⋅m−
3 )
a) b)
Figure 5. (a) Average water equivalents of annual layers derived
by GPR and by extrapolated glaciological field measurements at
locations where all four summer layers could be extracted from the
GPR signal. Error bars show the uncertainty from the initial density
ρf(0, td). (b) Mean layer densities, the related uncertainty and data
range for the same locations.
2011 2010
2009 2008
0.0 0.5 1.0 1.5 2.0 2.5 m w.e.
Figure 6. Annual accumulation layer water equivalent (m) derived
along the GPR profiles (highlighted in black) for 2008–2011. For
visualisation, the water equivalent was interpolated by inverse linear
distance weighting, restricted to the 400 m surrounding of all GPR
data points.
tern (Fig. 5a). This can be attributed to the limited number
of direct observations in the mass balance monitoring pro-
gramme and the extrapolation scheme applied. Layer water
equivalents derived from the firn cores revealed similar dis-
crepancies with extrapolated mass balance. These findings
highlight the need for a further investigation and better rep-
resentation of accumulation processes in current glacier mass
balance monitoring programmes.
The spatial distribution of each annual layer’s water equiv-
alent showed considerable small- and medium-scale vari-
ability, following the general topography to some degree
(Fig. 6). The large-scale pattern of areas with increased an-
nual accumulation rates recurs in all analysed layers. How-
ever, with increasing depth, older IRHs were more diffi-
cult to locate in the radargrams and appear in shorter pro-
files sections, thus hampering a direct temporal compari-
son of the accumulation patterns. Modelled layer densities
increased with age as expected (Fig. 5b), reaching a mean
value of 728 kgm−3 4 years after deposition. The cumu-
lative effect of spatial variations in layer water equivalent,
together with the fixed initial density in the densification
model, results in a higher variability of the density of deeper,
i.e. older, firn layers. Refreezing is a considerable contribu-
tor to firn densification on Alpine glaciers. It accounted for
approx. 10 % of the density increase over time and depth
(Fig. 5b). At the analysed GPR measurement locations, the
annual internal accumulation in the entire firn column is
about 0.028 mw.e.yr−1, affecting several previous accumu-
lation layers. In summer 2011 the accumulation layers of
2010, 2009, and 2008 gained 0.019 mw.e., 0.007 mw.e., and
0.001 mw.e., respectively. On average, 2 % of the firn stratig-
raphy is made up by refrozen meltwater. In contrast, a higher
value of 10 % was measured by Miller and Pelto (1999) on a
temperate glacier in Alaska. This may be due to the different
climatic condition but can also be related to processes not in-
corporated in the model, such as the formation of blocking
layers and the storage or lateral flow above such barriers.
The conservative uncertainty estimate for the initial model
density that covers measurement uncertainty, spatial and
temporal variability, and the related uncertainty introduced
within the model calibration affects the modelled layer den-
sities and thus, the layer water equivalents by±8 % (Fig. 5a).
For conventional glaciological accumulation measurements
the density measurement error is approx. 4 % (±21 kgm−3
from repeat measurements). In contrast, the combination of
GPR with a firn density model provides a considerable spa-
tial coverage for several annual accumulation layers with
a small trade-off in terms of uncertainty.
4.3 Data interpretation and error analysis
Generally, the formation of ice layers is not limited to surface
processes. At boundaries with changes in the grain structure
or on top of a blocking layer, e.g. a thin ice layer, meltwater
can be retained (e.g., Pfeffer and Humphrey, 1996). Thus, an
outstanding weather event during winter is not a necessary
criterion to generate an ice lens that can potentially be mis-
interpreted as a former summer surface in the GPR signal. In
the case of Findelengletscher, such a layer could be identi-
fied within the 2009 accumulation layer with the help of ref-
erence data from firn cores. Ultimately, the presented method
of deriving past accumulation rates from GPR is based on the
interpretation of GPR profiles by an observer, with the IRHs
relating to high-density layers (Fig. 4). Therefore, the inter-
pretation of GPR data can be ranked similar to a visual and
The Cryosphere, 9, 1075–1087, 2015 www.the-cryosphere.net/9/1075/2015/
L. Sold et al.: Recent accumulation rates derived from repeated helicopter-borne ground-penetrating radar 1083
0.4 0.6 0.8 1.00.0
0.5
1.0
1.5
0.4 0.6 0.8 1.0Mass balance (m w.e.)
0.0
0.5
1.0
1.5
GP
R−
deriv
ed la
yer
w.e
. (m
)
2011
2010
2009
2008
2007
0.1 0.2 0.3 0.4 0.5Winter precipitation sum (m)
0.0
0.5
1.0
1.5
2011
2010
2009
2008
2007
a) b)
Correct IRH datingIRH dating disturbed in 2009 accumulation layer
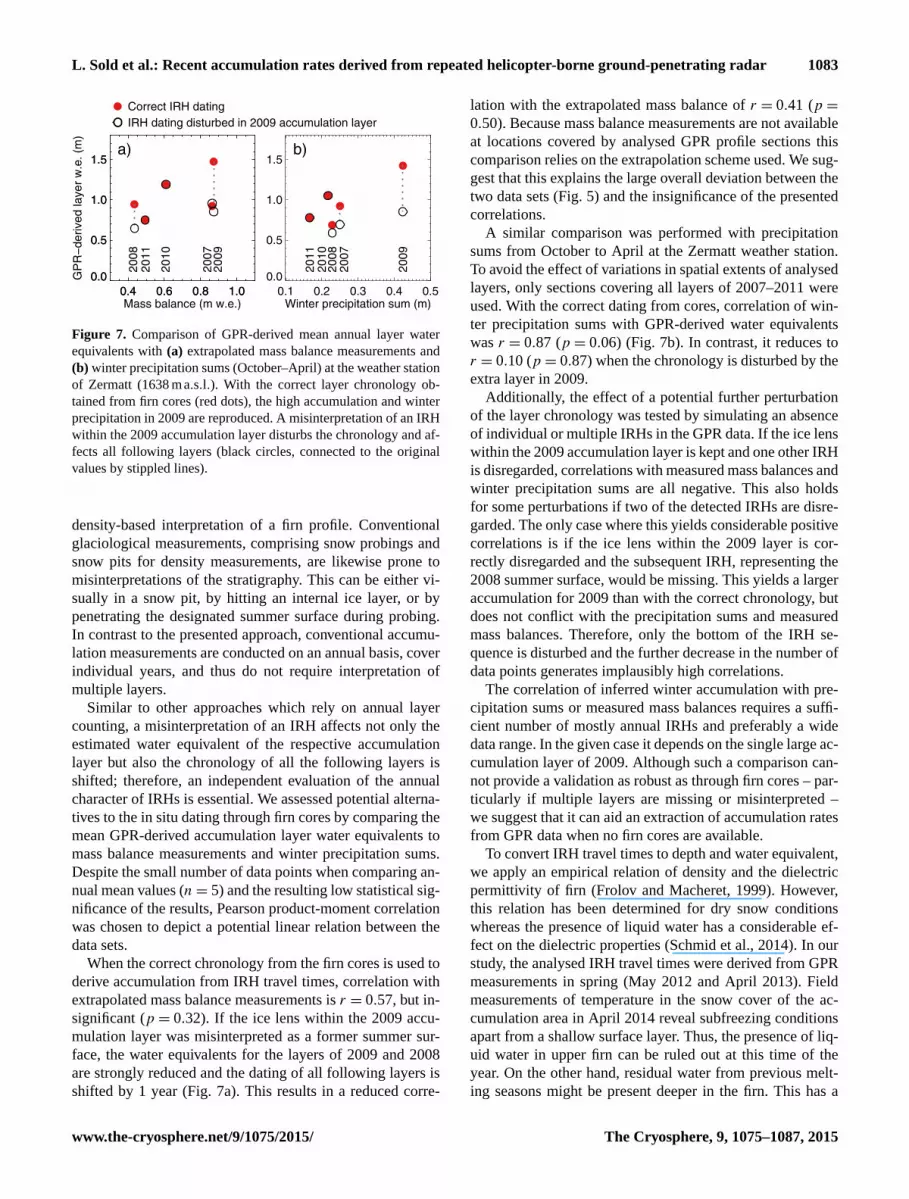
Figure 7. Comparison of GPR-derived mean annual layer water
equivalents with (a) extrapolated mass balance measurements and
(b) winter precipitation sums (October–April) at the weather station
of Zermatt (1638 ma.s.l.). With the correct layer chronology ob-
tained from firn cores (red dots), the high accumulation and winter
precipitation in 2009 are reproduced. A misinterpretation of an IRH
within the 2009 accumulation layer disturbs the chronology and af-
fects all following layers (black circles, connected to the original
values by stippled lines).
density-based interpretation of a firn profile. Conventional
glaciological measurements, comprising snow probings and
snow pits for density measurements, are likewise prone to
misinterpretations of the stratigraphy. This can be either vi-
sually in a snow pit, by hitting an internal ice layer, or by
penetrating the designated summer surface during probing.
In contrast to the presented approach, conventional accumu-
lation measurements are conducted on an annual basis, cover
individual years, and thus do not require interpretation of
multiple layers.
Similar to other approaches which rely on annual layer
counting, a misinterpretation of an IRH affects not only the
estimated water equivalent of the respective accumulation
layer but also the chronology of all the following layers is
shifted; therefore, an independent evaluation of the annual
character of IRHs is essential. We assessed potential alterna-
tives to the in situ dating through firn cores by comparing the
mean GPR-derived accumulation layer water equivalents to
mass balance measurements and winter precipitation sums.
Despite the small number of data points when comparing an-
nual mean values (n= 5) and the resulting low statistical sig-
nificance of the results, Pearson product-moment correlation
was chosen to depict a potential linear relation between the
data sets.
When the correct chronology from the firn cores is used to
derive accumulation from IRH travel times, correlation with
extrapolated mass balance measurements is r = 0.57, but in-
significant (p = 0.32). If the ice lens within the 2009 accu-
mulation layer was misinterpreted as a former summer sur-
face, the water equivalents for the layers of 2009 and 2008
are strongly reduced and the dating of all following layers is
shifted by 1 year (Fig. 7a). This results in a reduced corre-
lation with the extrapolated mass balance of r = 0.41 (p =
0.50). Because mass balance measurements are not available
at locations covered by analysed GPR profile sections this
comparison relies on the extrapolation scheme used. We sug-
gest that this explains the large overall deviation between the
two data sets (Fig. 5) and the insignificance of the presented
correlations.
A similar comparison was performed with precipitation
sums from October to April at the Zermatt weather station.
To avoid the effect of variations in spatial extents of analysed
layers, only sections covering all layers of 2007–2011 were
used. With the correct dating from cores, correlation of win-
ter precipitation sums with GPR-derived water equivalents
was r = 0.87 (p = 0.06) (Fig. 7b). In contrast, it reduces to
r = 0.10 (p = 0.87) when the chronology is disturbed by the
extra layer in 2009.
Additionally, the effect of a potential further perturbation
of the layer chronology was tested by simulating an absence
of individual or multiple IRHs in the GPR data. If the ice lens
within the 2009 accumulation layer is kept and one other IRH
is disregarded, correlations with measured mass balances and
winter precipitation sums are all negative. This also holds
for some perturbations if two of the detected IRHs are disre-
garded. The only case where this yields considerable positive
correlations is if the ice lens within the 2009 layer is cor-
rectly disregarded and the subsequent IRH, representing the
2008 summer surface, would be missing. This yields a larger
accumulation for 2009 than with the correct chronology, but
does not conflict with the precipitation sums and measured
mass balances. Therefore, only the bottom of the IRH se-
quence is disturbed and the further decrease in the number of
data points generates implausibly high correlations.
The correlation of inferred winter accumulation with pre-
cipitation sums or measured mass balances requires a suffi-
cient number of mostly annual IRHs and preferably a wide
data range. In the given case it depends on the single large ac-
cumulation layer of 2009. Although such a comparison can-
not provide a validation as robust as through firn cores – par-
ticularly if multiple layers are missing or misinterpreted –
we suggest that it can aid an extraction of accumulation rates
from GPR data when no firn cores are available.
To convert IRH travel times to depth and water equivalent,
we apply an empirical relation of density and the dielectric
permittivity of firn (Frolov and Macheret, 1999). However,
this relation has been determined for dry snow conditions
whereas the presence of liquid water has a considerable ef-
fect on the dielectric properties (Schmid et al., 2014). In our
study, the analysed IRH travel times were derived from GPR
measurements in spring (May 2012 and April 2013). Field
measurements of temperature in the snow cover of the ac-
cumulation area in April 2014 reveal subfreezing conditions
apart from a shallow surface layer. Thus, the presence of liq-
uid water in upper firn can be ruled out at this time of the
year. On the other hand, residual water from previous melt-
ing seasons might be present deeper in the firn. This has a
www.the-cryosphere.net/9/1075/2015/ The Cryosphere, 9, 1075–1087, 2015

1084 L. Sold et al.: Recent accumulation rates derived from repeated helicopter-borne ground-penetrating radar
0.0
0.5
1.0
1.5
2.0
0.0
0.5
1.0
1.5
2.0
Laye
r w
.e. (
m)
2011 2010 2009 2011 2010 2009400
500
600
700
800
900
Laye
r de
nsity
(kg
⋅m−
3 )
a) b) GPR−derivedCore (direct)
Core (modelled)
Figure 8. Layer water equivalents (a) and densities (b) at firn core 1,
derived from GPR, directly from the firn core, and modelled using
the hypothetical travel time obtained from the firn core layer water
equivalent and density. Error bars show the uncertainty derived from
variations in the initial density ρf(0, td).
potential impact on the evolution of the temperature profile
over the winter season because latent heat is released when
it refreezes. More importantly, it affects the GPR propaga-
tion velocity and, thus, the resulting layer water equivalents.
The potential impact was assessed using a rather conservative
hypothetical liquid water content of 5 %vol. and the mixing
formula for dielectric permittivity by Looyenga (1965). The
related change in the resulting layer water equivalent is about
−16 %, comprising the direct effect on the estimated layer
thickness (Eq. 5), as well as the effect on the modelled den-
sities. However, comparison with the firn cores showed good
agreement in the depths of IRHs (Fig. 4) and, thus, no ev-
idence for the presence of liquid water. On the other hand,
this finding cannot be transferred to the lower parts of the
accumulation area, and does not necessarily hold for all in-
vestigated years.
The firn densification model is calibrated with the ob-
served changes in IRH travel time from spring 2012 to 2013
at 12 locations and for 35 firn layers. Therefore, a different
amount of liquid water at the date of the measurements could
lead to an over- or underestimation of the compaction rate.
This could, to some degree, account for the compaction rate
scaling f = 2614 m−0.5 yr−0.5 being higher than previously
published values. When the model was originally set up, Her-
ron and Langway (1980) obtained f = 575 m−0.5 yr−0.5 for
densities above 550 kgm−3, using ice cores in cold firn on
Greenland and Antarctica. Huss (2013) calibrated the same
model with a set of 19 firn cores from temperate and poly-
thermal mountain glaciers and ice caps in the European Alps,
western and Arctic Canada, Central Asia, Patagonia, and
Svalbard. The larger value of f = 1380 m−0.5 yr−0.5 is in line
with the different climatic conditions and different firn com-
paction regimes compared to the original formulation.
Aside from the potential liquid water content, the scheme
used to calibrate the model is affected by horizontal ice mo-
tion. At the two accumulation measurement sites (Fig. 1),
flow velocities are about 35 myr−1 (north-eastern site) and
15 myr−1 (south-western site). For the upper accumulation
area, no direct observations of flow speed are available. How-
ever, due to a smaller ice thickness, velocities are expected to
be considerably lower and to remain within the 25 m radius
that was used to evaluate the mean IRH travel times.
In order to obtain a reliable change rate in the model we
did not run the calibration for individual locations to account
for spatial variations in the densification regime. Rather, the
derived parameter set was assumed to represent the mean
temporal and spatial condition for the investigated site. Com-
parison with the densities and layer water equivalents de-
rived from the firn cores revealed a moderate overestimation
of the local densities for the 2010 and 2009 accumulation
layers resulting in a difference of 9 % for the water equiva-
lents (Fig. 8). This also holds when hypothetical GPR travel
times are calculated from the measured densities to run the
model. Because the density estimate for the uppermost firn
layer (2011) and, thus, the initial model density is adequate,
this indicates an overestimation of the compaction rate. We
suggest that this discrepancy is due to spatial variations in
the density regime, related to processes not incorporated in
the model, such as the snow grain structure, the temperature
dependence of densification processes or particular weather
conditions.
The water equivalent stored as firn between IRHs also dif-
fers from the accumulation component within the mass bal-
ance term regarding the definition of a “year”. Mass balance
monitoring approaches typically use the hydrologic year,
with 30 September marking the end of the ablation period
in the Northern Hemisphere. In contrast, the analysis of the
GPR data is based on the firn stratigraphy, where the build-
up of a high-density layer due to particular weather condi-
tions provides the chronology of firn layers. Thus, a com-
parison or combination of such data sets requires converting
between the stratigraphic and the fixed-date mass balance
(Mayo et al., 1972; Huss et al., 2009), but does not gener-
ally conflict with the mass balance concept. With a coupled
energy-balance–snow model the temporal evolution of accu-
mulation layers can be tracked. Van Pelt et al. (2014) cali-
brated the accumulation input to such a model by matching
modelled and observed IRH travel times. With this inverse
approach they obtain the adjusted accumulation distribution
along a GPR transect on a polythermal Svalbard glacier.
Their model solves the surface energy balance and computes
percolation, capillary storage, refreezing, and runoff of liquid
water to provide subsurface density, temperature, and water
content. Storage and lateral flow of water on top of ice layers
are not resolved. Post-depositional processes related to re-
freezing are taken into account. Thereby, uncertainties in the
model initialisation and physics directly affect the obtained
accumulation patterns (Van Pelt et al., 2014). In this study,
we used IRH travel times as input to a simple model for firn
densification and meltwater refreezing. Thus, firn layer wa-
The Cryosphere, 9, 1075–1087, 2015 www.the-cryosphere.net/9/1075/2015/

L. Sold et al.: Recent accumulation rates derived from repeated helicopter-borne ground-penetrating radar 1085
ter equivalents could be derived in a forward approach. Our
model involves strong assumptions on liquid water content
and percolation, temperature evolution and densification of
firn. By assuming that all subfreezing temperatures are com-
pensated by meltwater refreezing we avoid modelling melt
rates. This is reasonable under temperate conditions, but pre-
cludes an application to cold firn. On the other hand, a sound
representation of physical processes depends on extensive in-
put data such as air temperature, pressure, humidity, precipi-
tation, and radiation (Mitterer et al., 2011). Finally, both ap-
proaches share the largest source of uncertainty which is the
misinterpretation of IRHs as annual layers and a careful val-
idation with reference data remains essential.
5 Conclusions
We established a new approach to derive past accumula-
tion rates on temperate Alpine valley glaciers from repeated
GPR surveys. Our method is based on the interpretation of
IRHs as previous summer surfaces. By linking the measured
GPR travel time of each layer to a simple model for firn
densification, a density estimate was derived for each layer.
Thereby, we take into account the refreezing of meltwater
by modelling the end-of-winter temperature profile that, for
temperate firn, is entirely compensated by refreezing. The
model was calibrated by comparing the modelled and mea-
sured change in IRH travel times of 35 layers at locations
where GPR measurements exist in 2 subsequent years. It was
applied to each GPR measurement location where multiple
IRHs were found to obtain the distribution of the mass of
annual firn layers along the GPR profiles.
The strongest limitation to the methodology is the non-
annual character of IRHs for our study site as it was found
from the analysis of two shallow firn cores. A potential mis-
interpretation of IRHs affects the results for all subsequent
layers by changing their ages. We suggest that, if no firn cores
are available, measured mass balance data or winter precipi-
tation sums could serve as a plausibility check. However, the
formation of high-density and ice layers is linked to small-
scale physical characteristics of snow and firn and is driven
by particular weather conditions. Thus, a general conclusion
about the validity of a dating-by-counting scheme for differ-
ent study sites cannot be drawn.
We showed that GPR measurements can be used to es-
timate multiyear accumulation rates on a temperate valley
glacier. Thereby, measurements can be conducted from a he-
licopter, facilitating efficient data acquisition even in inac-
cessible areas. Because the GPR penetrates several layers of
accumulation, it could be used not only as a complement to
existing monitoring programmes, but also for a retrospective
extension of newly initiated time series.
Acknowledgements. We gratefully acknowledge the valuable
comments and suggestions by the two anonymous reviewers.
We also thank everybody who contributed to the mass balance
measurements on Findelengletscher as well as Pierre-Alain Herren
and Johannes Schindler for supporting the firn core drilling. The
GPR measurements were conducted by Geosat SA, Sion. This
study is supported by the Swiss National Science Foundation
(SNSF), grant 200021_134768.
Edited by: R. Bingham
References
Annan, A. P.: Practical Processing of GPR Data, in: Proceedings of
the Second Government Workshop on Ground Penetrating Radar,
October, 1993, Columbus, Ohio, 1993.
Arcone, S. A., Spikes, V. B., Hamilton, G. S., and Mayewski, P. A.:
Stratigraphic continuity in 400 MHz short-pulse radar pro-
files of firn in West Antarctica, Ann. Glaciol., 39, 195–200,
doi:10.3189/172756404781813925, 2004.
Barry, R. G.: The status of research on glaciers and global
glacier recession: a review, Prog. Phys. Geog., 30, 285–306,
doi:10.1191/0309133306pp478ra, 2006.
Bauder, A., Funk, M., and Gudmundsson, G. H.: The ice-thickness
distribution of Unteraargletscher, Switzerland, Ann. Glaciol., 37,
331–336, doi:10.3189/172756403781815852, 2003.
Beniston, M.: Climatic change in mountain regions: a re-
view of possible impacts, Climatic Change, 59, 5–31,
doi:10.1023/A:1024458411589, 2003.
Calonne, N., Flin, F., Morin, S., Lesaffre, B., du Roscoat, S. Rol-
land, and Geindreau, C.: Numerical and experimental investi-
gations of the effective thermal conductivity of snow, Geophys.
Res. Lett., 38, L23501, doi:10.1029/2011GL049234, 2011.
Dansgaard, W.: Stable isotopes in precipitation, Tellus, 16, 436–
468, doi:10.1111/j.2153-3490.1964.tb00181.x, 1964.
Dunse, T., Schuler, T. V., Hagen, J. O., Eiken, T., Brandt, O., and
Høgda, K. A.: Recent fluctuations in the extent of the firn area
of Austfonna, Svalbard, inferred from GPR, Ann. Glaciol., 50,
155–162, doi:10.3189/172756409787769780, 2009.
Eichler, A., Schwikowski, M., Gäggeler, H. W., Furrer, V.,
Synal, H.-A., Beer, J., Saurer, M., and Funk, M.: Glaciochemical
dating of an ice core from upper Grenzgletscher (4200 m a.s.l.),
J. Glaciol., 46, 507–515, doi:10.3189/172756500781833098,
2000.
Eichler, A., Schwikowski, M., and Gageler, H. W.: Meltwater-
induced relocation of chemical species in Alpine firn, Tellus B,
53, 192–203, doi:10.1034/j.1600-0889.2001.d01-15.x, 2001.
Eisen, O., Wilhelms, F., Steinhage, D., and Schwander, J.: Improved
method to determine radio-echo sounding reflector depths from
ice-core profiles of permittivity and conductivity, J. Glaciol., 52,
299–310, doi:10.3189/172756506781828674, 2006.
Eisen, O., Bauder, A., Lüthi, M., Riesen, P., and Funk, M.: De-
ducing the thermal structure in the tongue of Gornergletscher,
Switzerland, from radar surveys and borehole measurements,
Ann. Glaciol., 50, 63–70, doi:10.3189/172756409789097612,
2009.
Etter, H. J., Zweifel, B., and Dürr, L.: Schnee und Lawinen in den
Schweizer Alpen: Hydrologisches Jahr 2008/09, WSL-Institut
für Schnee- und Lawinenforschung SLF, Davos, 2011.
www.the-cryosphere.net/9/1075/2015/ The Cryosphere, 9, 1075–1087, 2015

1086 L. Sold et al.: Recent accumulation rates derived from repeated helicopter-borne ground-penetrating radar
Fischer, A.: Comparison of direct and geodetic mass balances
on a multi-annual time scale, The Cryosphere, 5, 107–124,
doi:10.5194/tc-5-107-2011, 2011.
Fisher, S. C., Stewart, R. R., and Jol, H. M.: Ground Penetrating
Radar (GPR) data enhancement using seismic techniques, J. En-
viron. Eng. Geoph., 1, 89–96, doi:10.4133/JEEG1.2.89, 1996.
Frolov, A. D. and Macheret, Y. Y.: On dielectric properties of dry
and wet snow, Hydrol. Process., 13, 1755–1760, 1999.
Ginot, P., Stampfli, F., Stampfli, D., Schwikowski, M., and
Gaggeler, H. W.: FELICS, a new ice core drilling system for
high-altitude glaciers, Memoirs of National Institute of Polar Re-
search, Special Issue No. 56, 38–48, 2002.
Ginot, P., Schotterer, U., Stichler, W., Godoi, M. A., Francou, B.,
and Schwikowski, M.: Influence of the Tungurahua eruption on
the ice core records of Chimborazo, Ecuador, The Cryosphere, 4,
561–568, doi:10.5194/tc-4-561-2010, 2010.
Glaciological Reports: The Swiss Glaciers 2005/06 and 2006/07:
Yearbooks of the Cryospheric Commission of the Swiss
Academy of Sciences (SCNAT), Laboratory of Hydraulics, Hy-
drology and Glaciology (VAW) of ETH Zürich, Zürich, 2011.
Haeberli, W. and Beniston, M.: Climate change and its impacts on
glaciers and permafrost in the Alps, Ambio, 27, 258–265, 1998.
Hawley, R. L., Morris, E. M., Cullen, R., Nixdorf, U., Shep-
herd, A. P., and Wingham, D. J.: ASIRAS airborne radar resolves
internal annual layers in the dry-snow zone of Greenland, Geo-
phys. Res. Lett., 33, L04502, doi:10.1029/2005GL025147, 2006.
Hawley, R. L., Courville, Z. R., Kehrl, L. M., Lutz, E. R., Oster-
berg, E. C., Overly, T. B., and Wong, G. J.: Recent accumula-
tion variability in northwest Greenland from ground-penetrating
radar and shallow cores along the Greenland Inland Traverse, J.
Glaciol., 60, 375–382, doi:10.3189/2014JoG13J141, 2014.
Heilig, A., Eisen, O., and Schneebeli, M.: Temporal observations of
a seasonal snowpack using upward-looking GPR, Hydrol. Pro-
cess., 24, 3133–3145, doi:10.1002/hyp.7749, 2010.
Helfricht, K., Kuhn, M., Keuschnig, M., and Heilig, A.: Lidar snow
cover studies on glaciers in the Ötztal Alps (Austria): compari-
son with snow depths calculated from GPR measurements, The
Cryosphere, 8, 41–57, doi:10.5194/tc-8-41-2014, 2014.
Herron, M. M. and Langway, C. C.: Firn densification: an empirical
model, J. Glaciol., 25, 373–385, 1980.
Hostettler, A. and Bader, S.: MeteoSchweiz – Föhn-
sturm und Saharasand 27./28. Mai 2008, available
at: http://www.meteoschweiz.admin.ch/web/de/wetter/
wetterereignisse/foehnsturm_27__28.html (last access: 10
July 2014), 2008.
Huss, M.: Density assumptions for converting geodetic glacier
volume change to mass change, The Cryosphere, 7, 877–887,
doi:10.5194/tc-7-877-2013, 2013.
Huss, M., Bauder, A., and Funk, M.: Homogenization of long-
term mass-balance time series, Ann. Glaciol., 50, 198–206,
doi:10.3189/172756409787769627, 2009.
Huss, M., Zemp, M., Joerg, P. C., and Salzmann, N.: High uncer-
tainty in 21st century runoff projections from glacierized basins,
J. Hydrol., 510, 35–48, doi:10.1016/j.jhydrol.2013.12.017, 2014.
Huybrechts, P., Rybak, O., Steinhage, D., and Pattyn, F.:
Past and present accumulation rate reconstruction along the
Dome Fuji–Kohnen radio-echo sounding profile, Dronning
Maud Land, East Antarctica, Ann. Glaciol., 50, 112–120,
doi:10.3189/172756409789097513, 2009.
IPCC: Climate Change 2013: The Physical Science Basis, Con-
tribution of Working Group I to the Fifth Assessment Report
of the Intergovernmental Panel on Climate Change, edited by:
Stocker, T. F., Qin, D., Plattner, G.-K., Tignor, M., Allen, S. K.,
Boschung, J., Nauels, A., Xia, Y., Bex, V., and Midgley, P. M.,
Cambridge University Press, Cambridge, UK and New York, NY,
USA, 2013.
Karlsson, N. B., Rippin, D. M., Vaughan, D. G., and Corr, H. F. J.:
The internal layering of Pine Island Glacier, West Antarctica,
from airborne radar-sounding data, Ann. Glaciol., 50, 141–146,
2009.
Kaser, G., Cogley, J. G., Dyurgerov, M. B., Meier, M. F., and
Ohmura, A.: Mass balance of glaciers and ice caps: consen-
sus estimates for 1961–2004, Geophys. Res. Lett., 33, L19501,
doi:10.1029/2006GL027511, 2006.
Kohler, J., Moore, J., Kennett, M., Engeset, R., and Elvehøy, H.:
Using ground-penetrating radar to image previous years sum-
mer surfaces for mass-balance measurements, Ann. Glaciol., 24,
355–360, 1997.
Kovacs, A., Gow, A. J., and Morey, R. M.: A reassessment of the
in-situ dielectric constant of polar firn, vol. 93-26 of CRREL re-
port, US Army Corps of Engineers, Cold Regions Research &
Engineering Laboratory, Hanover, 1993.
Kruetzmann, N. C., Rack, W., McDonald, A. J., and George, S. E.:
Snow accumulation and compaction derived from GPR data
near Ross Island, Antarctica, The Cryosphere, 5, 391–404,
doi:10.5194/tc-5-391-2011, 2011.
Langley, K., Hamran, S.-E., Hogda, K. A., Storvold, R., Brandt, O.,
Kohler, J., and Hagen, J. O.: From Glacier Facies to SAR
backscatter zones via GPR, IEEE T. Geosci. Remote, 46, 2506–
2516, doi:10.1109/TGRS.2008.918648, 2008.
Ligtenberg, S. R. M., Helsen, M. M., and van den Broeke, M. R.: An
improved semi-empirical model for the densification of Antarc-
tic firn, The Cryosphere, 5, 809–819, doi:10.5194/tc-5-809-2011,
2011.
Looyenga, H.: Dielectric constants of heterogeneous mix-
tures, Physica, 31, 401–406, doi:10.1016/0031-8914(65)90045-
5, 1965.
Machguth, H.: On the use of RCM data and gridded climatologies
for regional scale glacier mass balance modeling in high moun-
tain topography: the example of the Swiss Alps, Ph. D. thesis,
University of Zurich, Switzerland, 2008.
Machguth, H., Eisen, O., Paul, F., and Hoelzle, M.: Strong spatial
variability of snow accumulation observed with helicopter-borne
GPR on two adjacent Alpine glaciers, Geophys. Res. Lett., 33,
L13503, doi:10.1029/2006GL026576, 2006.
Mayo, L. R., Meier, M. F., and Tangborn, W. V.: A system to com-
bine stratigraphic and annual mass-balance systems: a contribu-
tion to the International Hydrological Decade, J. Glaciol., 11, 3–
14, 1972.
Miège, C., Forster, R. R., Box, J. E., Burgess, E. W., Mc-
CONNELL, J. R., Pasteris, D. R., and Spikes, V. B.: South-
east Greenland high accumulation rates derived from firn cores
and ground-penetrating radar, Ann. Glaciol., 54, 322–332,
doi:10.3189/2013AoG63A358, 2013.
Miller, M. M. and Pelto, M. S.: Mass balance measurements on the
Lemon Creek Glacier, Juneau Icefield, Alaska 1953–1998, Ge-
ografiska Annaler, 81A, 671–681, 1999.
The Cryosphere, 9, 1075–1087, 2015 www.the-cryosphere.net/9/1075/2015/

L. Sold et al.: Recent accumulation rates derived from repeated helicopter-borne ground-penetrating radar 1087
Mitterer, C., Hirashima, H., and Schweizer, J.: Wet-snow insta-
bilities: comparison of measured and modelled liquid water
content and snow stratigraphy, Ann. Glaciol., 52, 201–208,
doi:10.3189/172756411797252077, 2011.
Østrem, G. and Brugman, M.: Glacier mass-balance measurements:
a manual for field and office work, vol. 4 of NHRl Science Re-
port, National Hydrological Research Institute, Saskatoon, 1991.
Pälli, A., Kohler, J. C., Isaksson, E., Moore, J. C., Pinglot, J. F.,
Pohjola, V. A., and Samuelsson, H.: Spatial and temporal vari-
ability of snow accumulation using ground-penetrating radar
and ice cores on a Svalbard glacier, J. Glaciol., 48, 417–424,
doi:10.3189/172756502781831205, 2002.
Pälli, A., Moore, J. C., and Rolstad, C.: Firn-ice transition-
zone features of four polythermal glaciers in Svalbard seen
by ground-penetrating radar, Ann. Glaciol., 37, 298–304,
doi:10.3189/172756403781816059, 2003.
Pfeffer, W. T. and Humphrey, N. F.: Determination of timing and
location of water movement and ice-layer formation by temper-
ature measurements in sub-freezing snow, J. Glaciol., 42, 292–
304, 1996.
Plewes, L. A. and Hubbard, B.: A review of the use of radio-
echo sounding in glaciology, Prog. Phys. Geog., 25, 203–236,
doi:10.1177/030913330102500203, 2001.
Reeh, N.: A nonsteady-state firn-densification model for the per-
colation zone of a glacier, J. Geophys. Res., 113, F03023,
doi:10.1029/2007JF000746, 2008.
Robin, G. D. Q., Evans, S., and Bailey, J. T.: Interpretation of radio
echo sounding in polar ice sheets, Philos. T. R. Soc. A, 265, 437–
505, doi:10.1098/rsta.1969.0063, 1969.
Schmid, L., Heilig, A., Mitterer, C., Schweizer, J., Maurer, H.,
Okorn, R., and Eisen, O.: Continuous snowpack monitoring
using upward-looking ground-penetrating radar technology, J.
Glaciol., 60, 509–525, doi:10.3189/2014JoG13J084, 2014.
Sold, L., Huss, M., Hoelzle, M., Andereggen, H., Joerg, P. C., and
Zemp, M.: Methodological approaches to infer end-of-winter
snow distribution on alpine glaciers, J. Glaciol., 59, 1047–1059,
doi:10.3189/2013JoG13J015, 2013.
Ulriksen, C. P. F.: Application of impulse radar to civil engineer-
ing, Ph. D. thesis, Lund University of Technology, Department
of Engineering Geology, Lund, 1982.
Van Pelt, W. J. J., Pettersson, R., Pohjola, V. A., Marchenko, S.,
Claremar, B., and Oerlemans, J.: Inverse estimation of
snow accumulation along a radar transect on Nordenskiöld-
breen, Svalbard, J. Geophys. Res.-Earth, 119, 816–835,
doi:10.1002/2013JF003040, 2014.
Wadham, J., Kohler, J., Hubbard, A., Nuttall, A., and Rippin, D.:
Superimposed ice regime of a high Arctic glacier inferred using
ground-penetrating radar, flow modeling, and ice cores, J. Geo-
phys. Res., 111, F01007, doi:10.1029/2004JF000144, 2006.
Woodward, J. and Burke, M. J.: Applications of ground-penetrating
radar to glacial and frozen materials, J. Environ. Eng. Geoph.,
12, 69–85, doi:10.2113/JEEG12.1.69, 2007.
Zemp, M., Hoelzle, M., and Haeberli, W.: Six decades of
glacier mass-balance observations: a review of the world-
wide monitoring network, Ann. Glaciol., 50, 101–111,
doi:10.3189/172756409787769591, 2009.
Zemp, M., Thibert, E., Huss, M., Stumm, D., Rolstad Denby, C.,
Nuth, C., Nussbaumer, S. U., Moholdt, G., Mercer, A.,
Mayer, C., Joerg, P. C., Jansson, P., Hynek, B., Fischer, A.,
Escher-Vetter, H., Elvehøy, H., and Andreassen, L. M.: Re-
analysing glacier mass balance measurement series, The
Cryosphere, 7, 1227–1245, doi:10.5194/tc-7-1227-2013, 2013.
www.the-cryosphere.net/9/1075/2015/ The Cryosphere, 9, 1075–1087, 2015


