Embed Size (px)
Citation preview
Unpacking the Math HiSET Test Part 1: Topic Lessons & Activities
Kim Hanson
Summer 2014
For this part of the Mini-Grant, I have taken the top 10 Math topics from two HiSET
Practice Tests and found contextual activities, lessons, and Foldable Lessons to support
them.
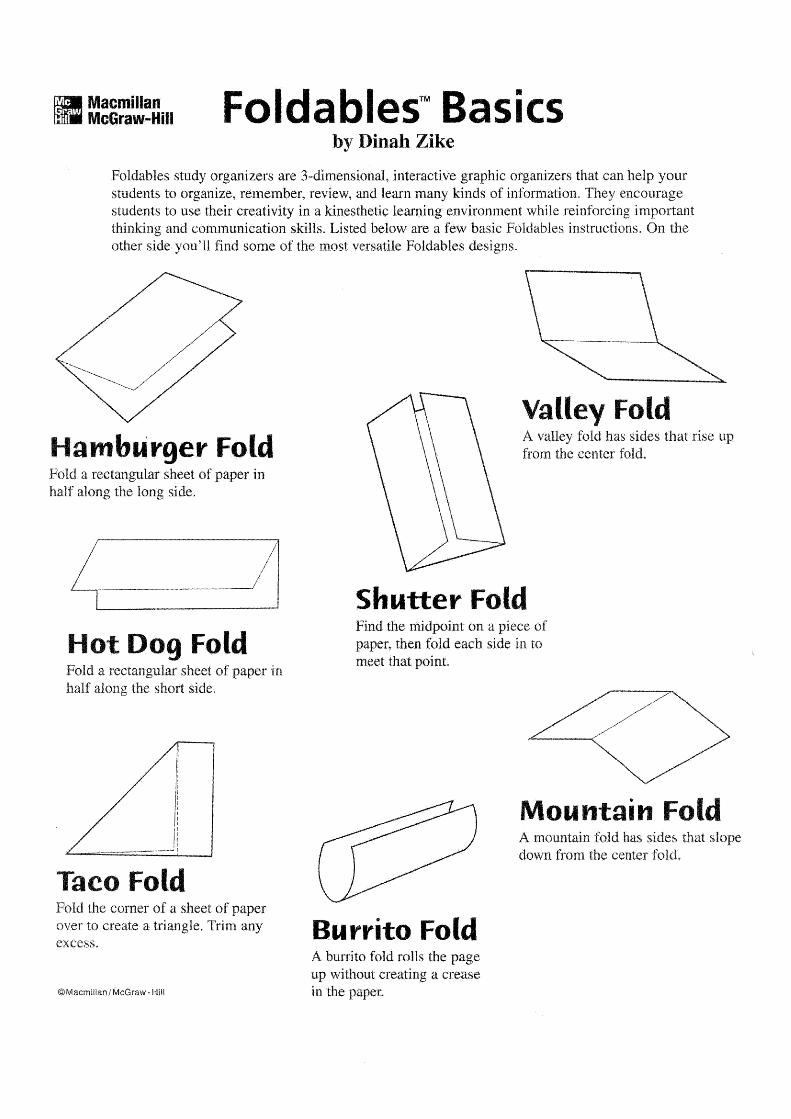
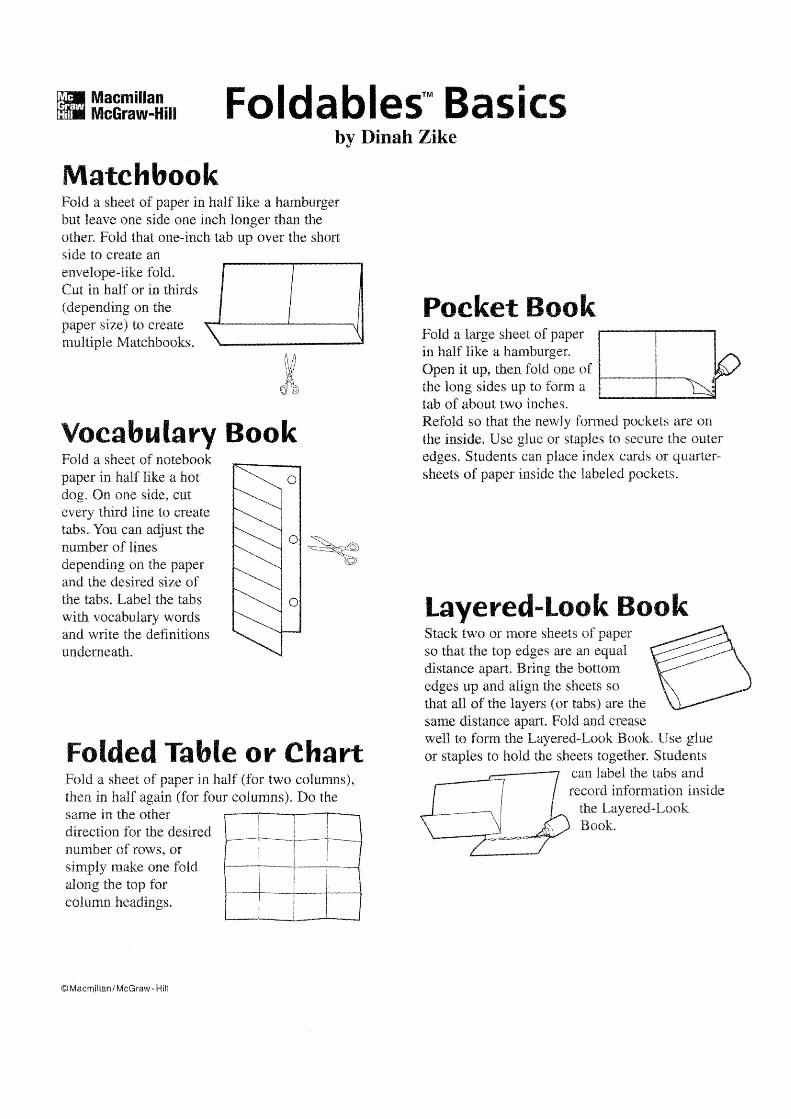
Foldable Lesson Ideas: Foldables are 3-dimesional graphic organizers that students create
to enhance the learning of a skill or concept. They help the student stay organized and
retain information. Foldables break up information into smaller pieces making it easier for
students too process and remember information.
a. Material needs for these hands-on activities include: different sized and colored
papers, scissors, glue sticks, and colored writing utensils.
b. See Foldables Basics in Appendix
Table of Contents
Numbers & Operations ................................................................................................................................................. 1
Operations ..................................................................................................................................................................... 1
Real Numbers ............................................................................................................................................................... 3
Order of Operations .................................................................................................................................................... 11
Proportions.................................................................................................................................................................. 11
Percent ......................................................................................................................................................................... 16
Measurement & Geometry ......................................................................................................................................... 17
Standard (Customary) System .................................................................................................................................... 17
Metric System ............................................................................................................................................................. 17
Shapes & Formulas .................................................................................................................................................. 19
Quadrilaterals: ............................................................................................................................................................ 19
3-D Geometry ............................................................................................................................................................. 22
Data Analysis/ Probability/ Statistics ................................................................................................................... 22
Probability ................................................................................................................................................................... 22
Measures of Central Tendency (Mean*Median*Mode*Range) ...................................................................... 26
Algebra ............................................................................................................................................................................. 34
Single Variable Equations ...................................................................................................................................... 34
One-Step Equation ...................................................................................................................................................... 34
Multi-Step Equation .................................................................................................................................................... 35
Word Problems ........................................................................................................................................................... 37
Coordinate Plane ....................................................................................................................................................... 37
Linear Functions ....................................................................................................................................................... 38
Horizontal and Vertical Lines ...................................................................................................................................... 40
Slope ........................................................................................................................................................................... 40
Graphing Lines ................................................................................................................ Error! Bookmark not defined.
Scientific Notation..................................................................................................................................................... 43
Conversion .................................................................................................................................................................. 43
Operations .................................................................................................................................................................. 44
Appendix ......................................................................................................................................................................... 45
1
Numbers & Operations
Operations
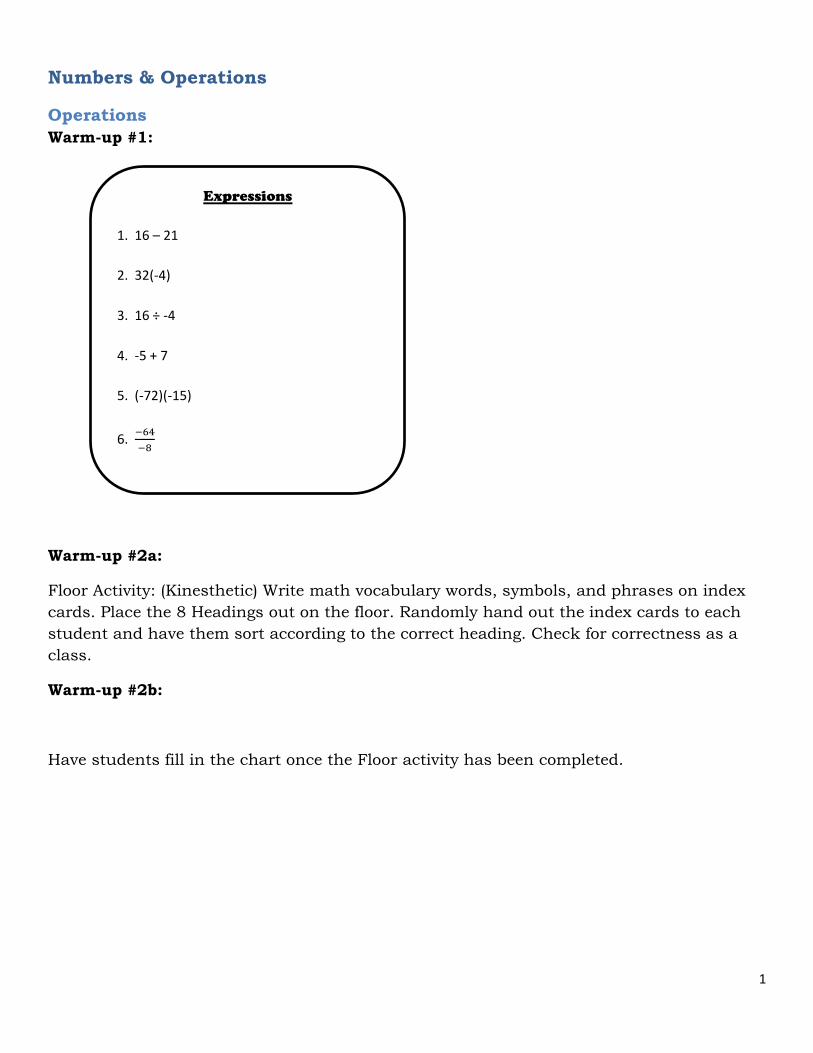
Warm-up #1:
Warm-up #2a:
Floor Activity: (Kinesthetic) Write math vocabulary words, symbols, and phrases on index
cards. Place the 8 Headings out on the floor. Randomly hand out the index cards to each
student and have them sort according to the correct heading. Check for correctness as a
class.
Warm-up #2b:
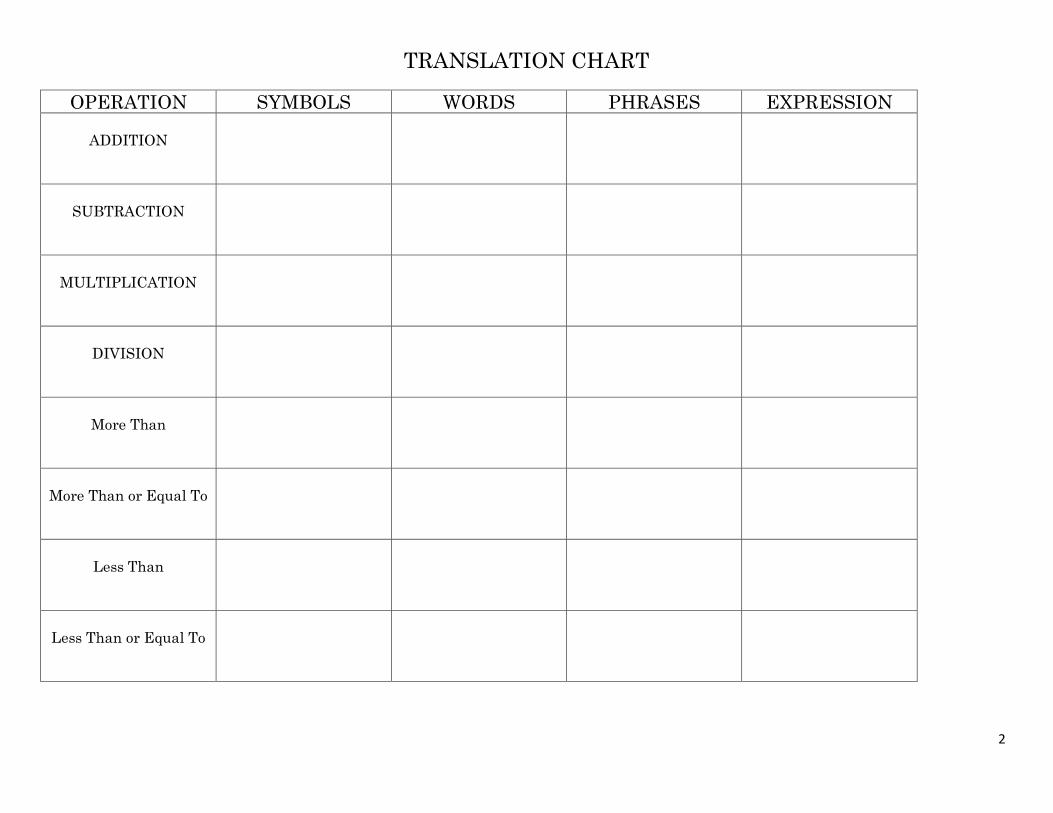
Have students fill in the chart once the Floor activity has been completed.
Expressions
1. 16 – 21
2. 32(-4)
3. 16 ÷ -4
4. -5 + 7
5. (-72)(-15)
6.
2
TRANSLATION CHART
OPERATION SYMBOLS WORDS PHRASES EXPRESSION
ADDITION
SUBTRACTION
MULTIPLICATION
DIVISION
More Than
More Than or Equal To
Less Than
Less Than or Equal To
3
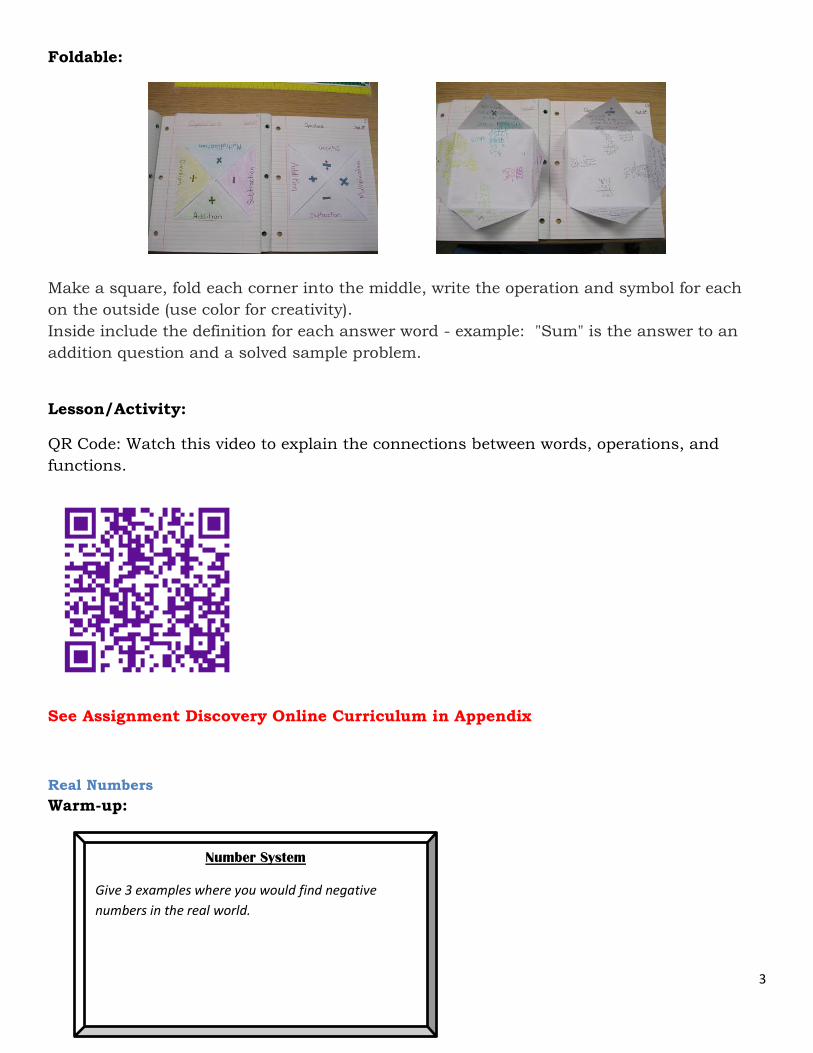
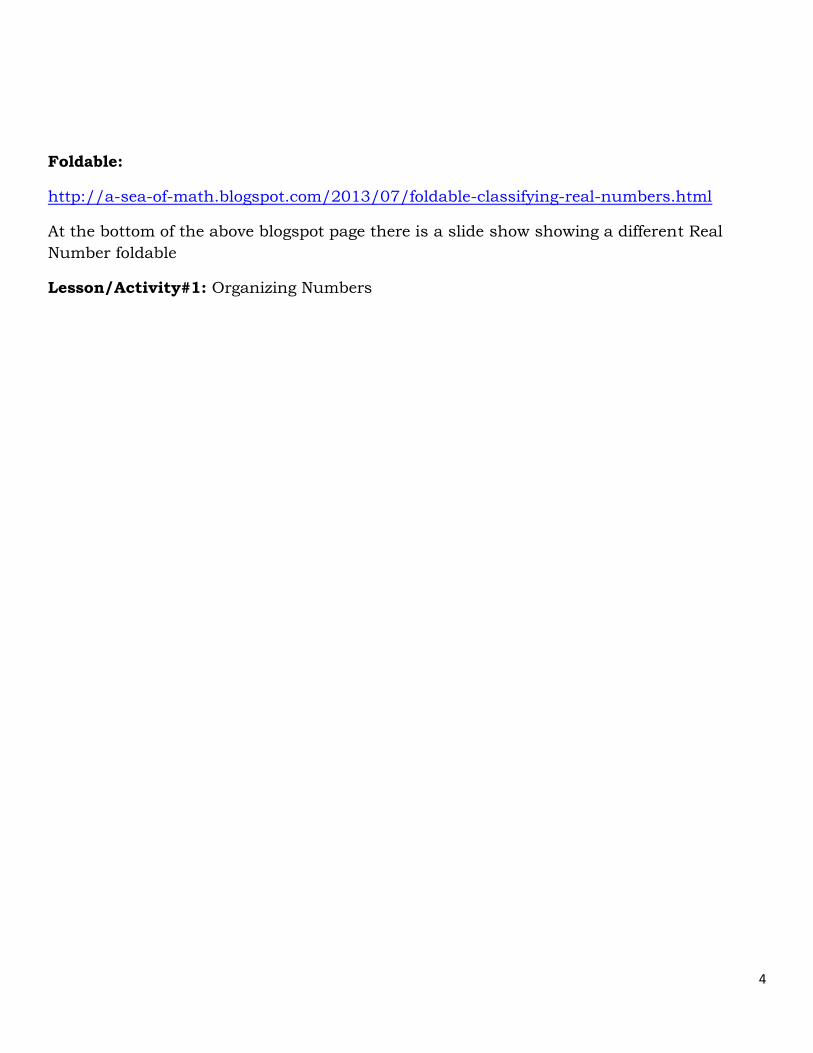
Foldable:
Make a square, fold each corner into the middle, write the operation and symbol for each
on the outside (use color for creativity).
Inside include the definition for each answer word - example: "Sum" is the answer to an
addition question and a solved sample problem.
Lesson/Activity:
QR Code: Watch this video to explain the connections between words, operations, and
functions.
See Assignment Discovery Online Curriculum in Appendix
Real Numbers
Warm-up:
Number System
Give 3 examples where you would find negative
numbers in the real world.
4
Foldable:
http://a-sea-of-math.blogspot.com/2013/07/foldable-classifying-real-numbers.html
At the bottom of the above blogspot page there is a slide show showing a different Real
Number foldable
Lesson/Activity#1: Organizing Numbers
5
Organizing Numbers
Reporting Category Number and Number Sense
Topic Investigating the real number system
Primary SOL 8.2 The student will describe orally and in writing the relationships between the subsets of the real number system.
Materials
Real Numbers Cards (attached) Scissors Real Number System Subset Labels (attached) Real Number System Venn Diagram (attached) Student whiteboards and markers
Vocabulary
natural numbers, whole numbers, integers (earlier grades)
rational numbers, irrational numbers, real numbers (8.2)
Student/Teacher Actions (what students and teachers should be doing to facilitate learning)
1. Distribute scissors and copies of the Real Numbers Cards. Discuss various characteristics of the numbers. Then, direct students to cut the cards apart and sort them any way they like. When they are finished sorting, have them discuss with partners how they did their sorts. Lead a class discussion about the different ways they sorted the numbers, asking them to explain the processes they used.
2. Distribute copies of the Real Number System Subset Labels. Have students cut them apart and arrange them in any order. Have students assign each number card to a subset. Point out how some numbers belong in more than one subset, and discuss the characteristics of each subset.
3. Have students work with partners to sort the number cards into rational and irrational numbers. Then, have them sort the rational numbers into integers, whole numbers, and/or natural numbers. When they have finished sorting, discuss the fact that some numbers can appear in more than one subset, e.g., 4 is a rational number, an integer, a whole number, and a natural or counting number. Explain that the attributes of one subset can be contained in whole or in part in another subset. Explain the process of sorting numbers into the most specific subset.
4. Distribute copies of the Real Number System Venn Diagram. Have students write the names of the subsets in the appropriate areas on the diagram and then write the numbers from the number cards in the most specific subsets. Finally, have students add two more numbers to each subset, explaining why the only number that can be uniquely in the “Whole Numbers” subset area is zero.
6
Assessment
Questions o To which subset(s) of the real number system does the number −0.75 belong? Why? o Is the square root of 15 rational or irrational? How do you know?
Journal/Writing Prompts o Identify whether a number can be both whole and irrational, and explain why or why not. o Identify which subset of the real number system contains the most rational numbers, and explain why. o Explain why rational numbers are “friendly.” o Identify whether pi (π) is rational or irrational, and explain why.
Extensions and Connections (for all students)
Display examples of Venn diagrams used in other areas of study to model the purpose of a Venn diagram. Have students utilize graphic organizer software to create their own organizers to represent the real number system. Prepare a large shopping bag labeled “Real Numbers.” Inside the bag, place two smaller equal-size bags, one labeled “Irrational Numbers”
and the other labeled “Rational Numbers.” Inside the “Rational Numbers” bag, place a smaller bag labeled “Integers.” In the “Integers” bag, place a yet smaller bag labeled “Whole Numbers,” and in the “Whole Numbers” bag, place the smallest bag labeled “Natural Numbers.” Display the “Real Numbers” bag, and pull the smaller bags out one at a time to show the differences in sizes and how they relate to each other. Discuss the types of numbers that would be in each bag. Hand student number cards to put into the most specific bags, and then demonstrate putting the set of bags together again.
Strategies for Differentiation
Use different colors of paper to help students distinguish the different subsets of numbers. Use the Venn diagram with only the vocabulary terms, and as a class, create examples to include. Then, have students create their own
Venn diagrams and use the real number cards provided to glue into place. Place location signs around the room labeled “Natural Numbers, Whole Numbers, Integers, Rational Numbers, Irrational Numbers, and Real
Numbers.” Give each student a number card, and have him/her match the number to as many locations as possible by going to the location(s) and writing the number on the sign(s). Confirm in class discussion the place or places each number is placed. Repeat this activity throughout the year.
7
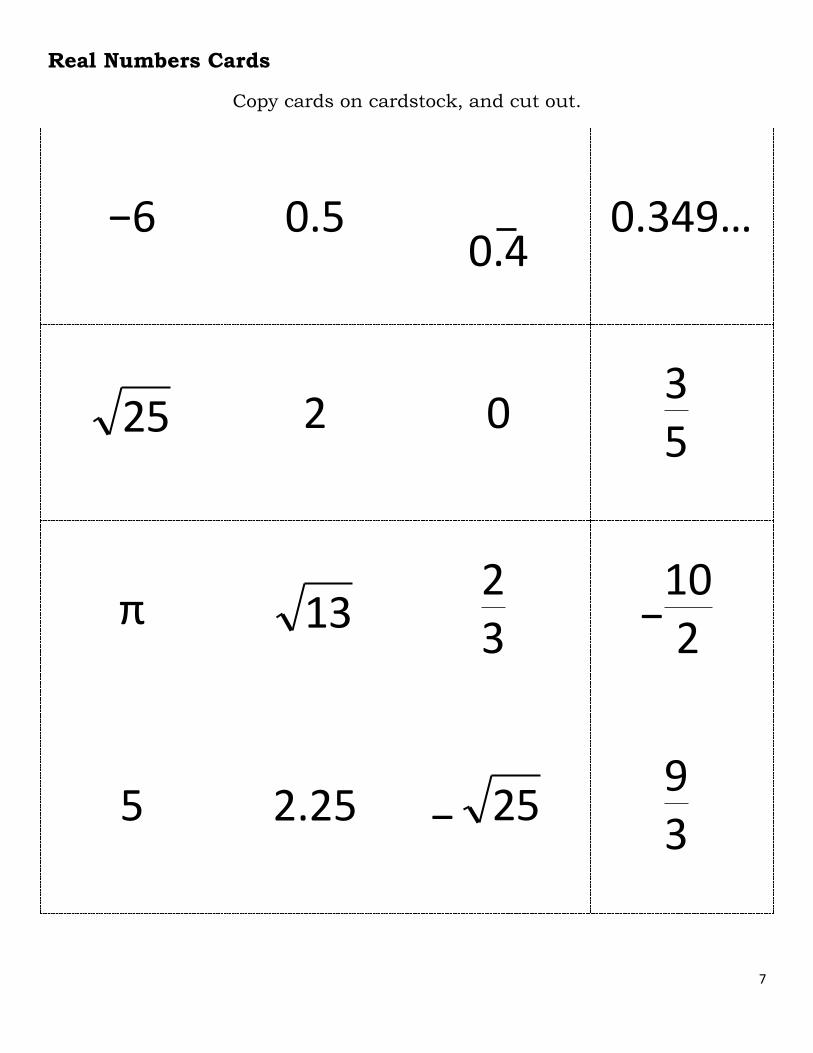
Real Numbers Cards
Copy cards on cardstock, and cut out.
−6 0.5
0.4 0.349…
25 2 0 35
π 13 23 −
102
5 2.25 − 25 93
8
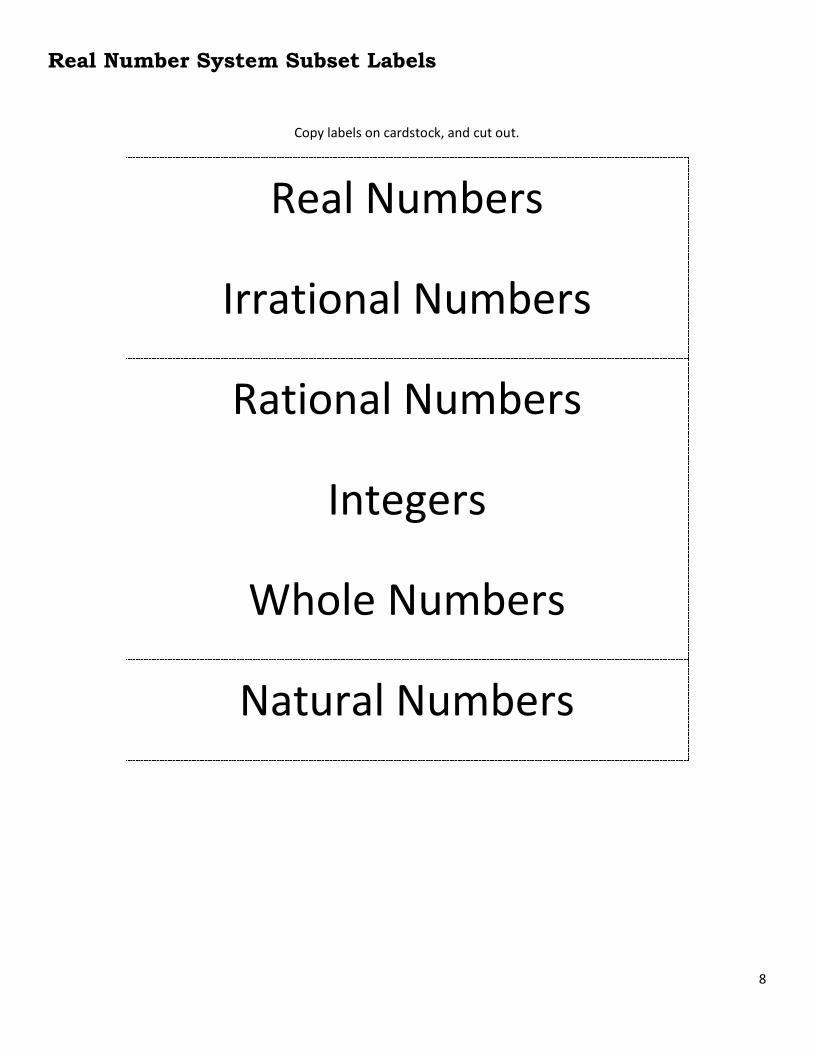
Real Number System Subset Labels
Copy labels on cardstock, and cut out.
Real Numbers
Irrational Numbers
Rational Numbers
Integers
Whole Numbers
Natural Numbers
9
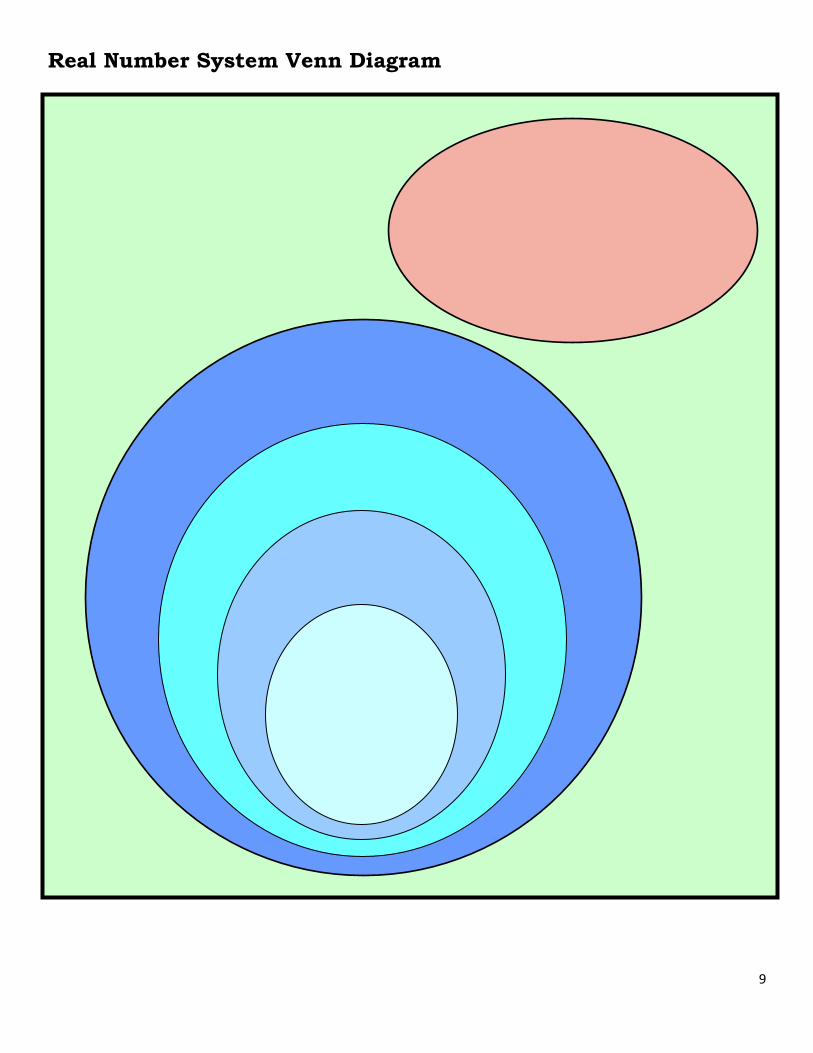
Real Number System Venn Diagram
http://alex.state.al.us/lesson_view.php?id=11762
This is a good kinesthetic lab. It has a power point presentation to teach the
definitions/organization of the Real Number System and then a group activity that gets
students involved.
Practice Worksheet:
Answers:
10
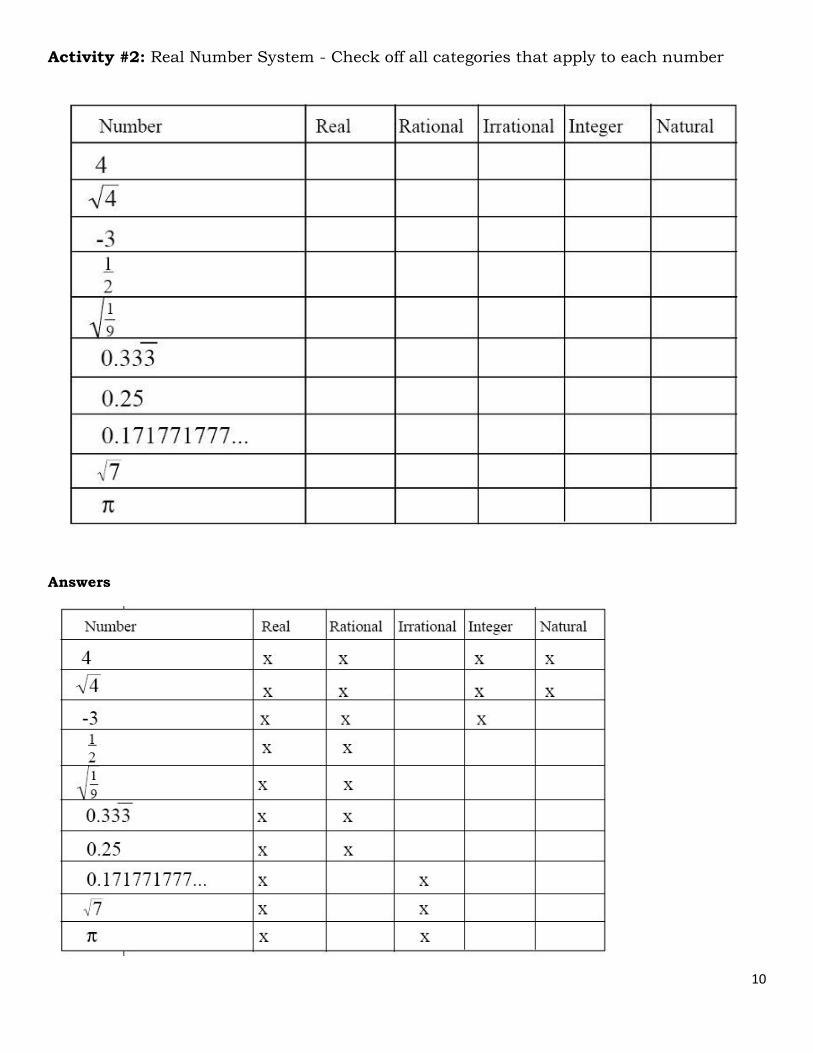
Activity #2: Real Number System - Check off all categories that apply to each number
Answers
11
Order of Operations
Warm-up:
http://www.scribd.com/doc/109117656/Order-of-Operation-Puzzles
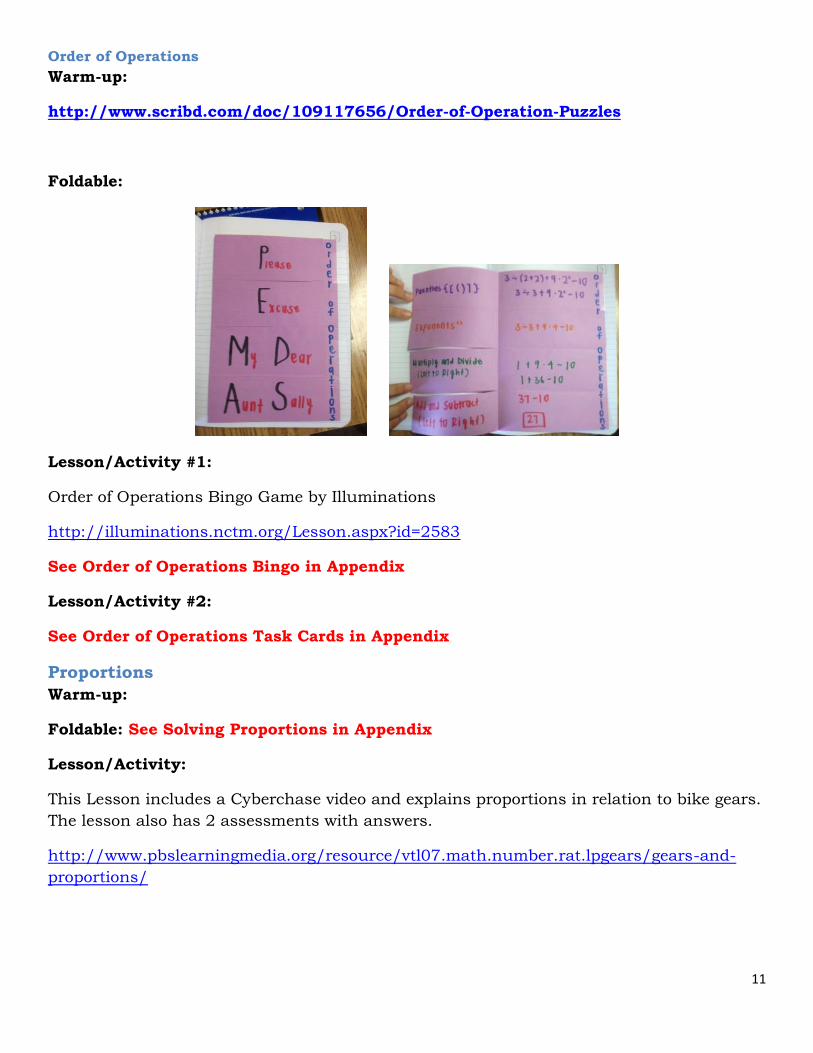
Foldable:
Lesson/Activity #1:
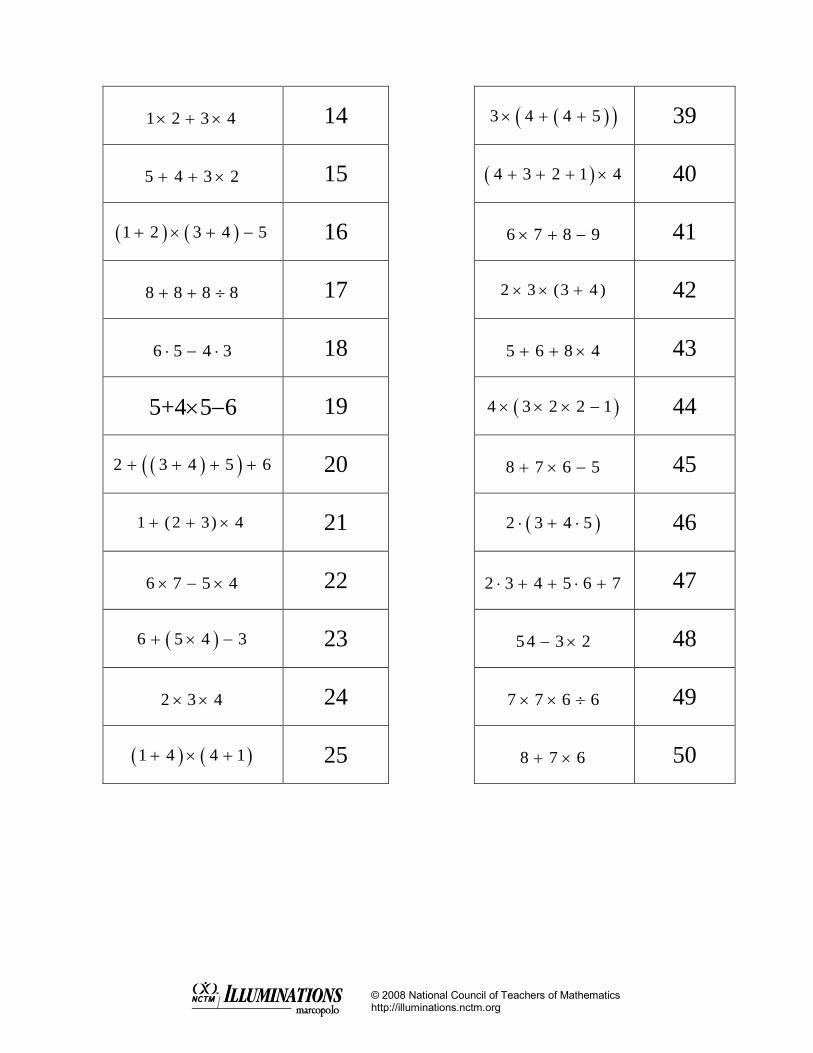
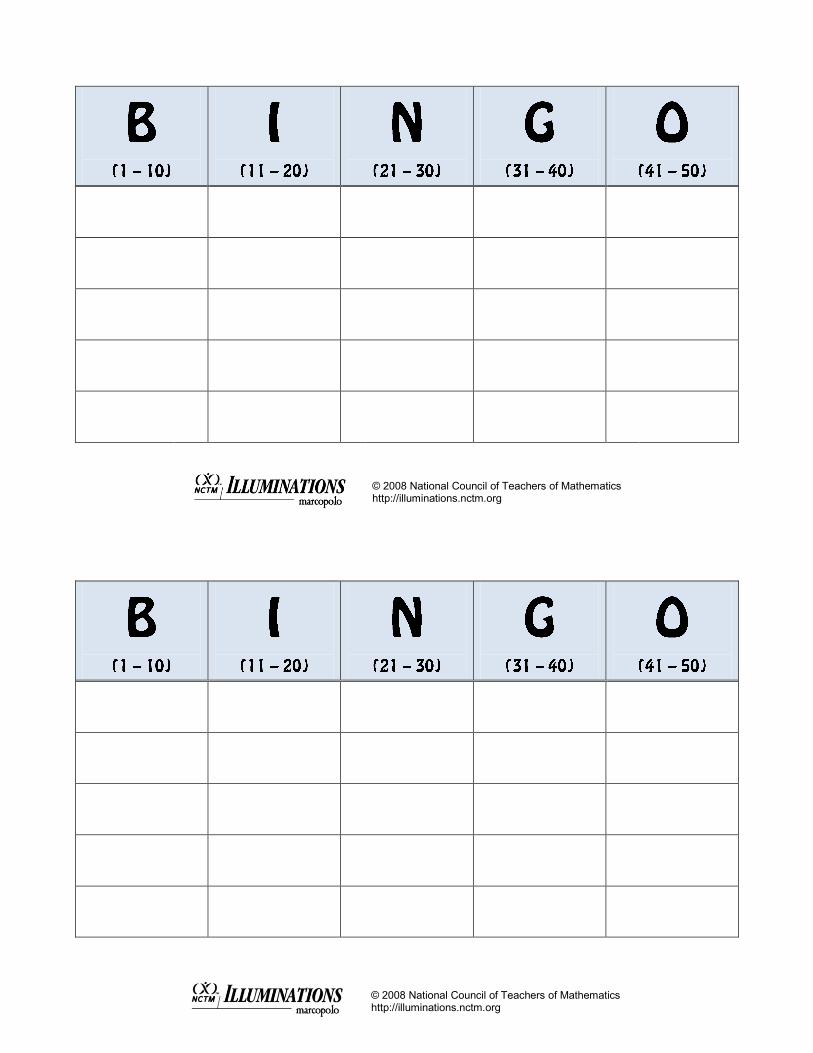
Order of Operations Bingo Game by Illuminations
http://illuminations.nctm.org/Lesson.aspx?id=2583
See Order of Operations Bingo in Appendix
Lesson/Activity #2:
See Order of Operations Task Cards in Appendix
Proportions
Warm-up:
Foldable: See Solving Proportions in Appendix
Lesson/Activity:
This Lesson includes a Cyberchase video and explains proportions in relation to bike gears.
The lesson also has 2 assessments with answers.
http://www.pbslearningmedia.org/resource/vtl07.math.number.rat.lpgears/gears-and-
proportions/
12
“Gearing Up” Handout
Bicycles have a bewildering assortment of gears on them. But what are all those gears for? Let’s
explore how the gears on a bike work.
Part 1
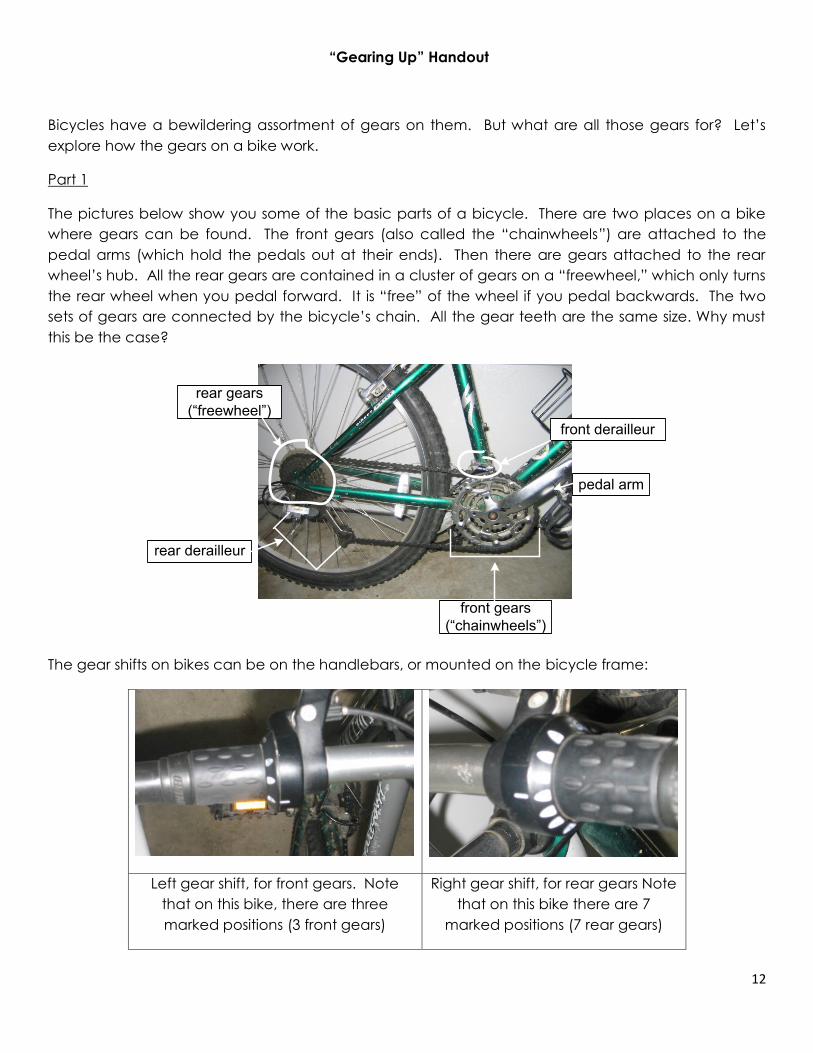
The pictures below show you some of the basic parts of a bicycle. There are two places on a bike
where gears can be found. The front gears (also called the “chainwheels”) are attached to the
pedal arms (which hold the pedals out at their ends). Then there are gears attached to the rear
wheel’s hub. All the rear gears are contained in a cluster of gears on a “freewheel,” which only turns
the rear wheel when you pedal forward. It is “free” of the wheel if you pedal backwards. The two
sets of gears are connected by the bicycle’s chain. All the gear teeth are the same size. Why must
this be the case?
The gear shifts on bikes can be on the handlebars, or mounted on the bicycle frame:
Left gear shift, for front gears. Note
that on this bike, there are three
marked positions (3 front gears)
Right gear shift, for rear gears Note
that on this bike there are 7
marked positions (7 rear gears)
front gears
(“chainwheels”)
rear gears
(“freewheel”)
pedal arm
rear derailleur
front derailleur
13
“Gearing Up” Handout
The left shifter controls the front derailleur, for the front gears, or chainwheels. The right shifter controls
the rear derailleur, for the rear gears, or freewheel.
The derailleurs, as their name suggest, “de-rail” the chain from one gear to the next, by pushing the
chain to the left or the right.
From your own experience, and the pictures, answer the following questions.
1. Each time a pedal goes all the way around, which gearset--the front or the rear--goes around
once?
2. When the rear wheel goes around once, which gear set--the front or the rear--goes around
once?
3. If a bicycle has 2 gears in the front, and 5 in the rear, how many different combinations of
gears are possible? Justify your answer.
14
“Gearing Up” Handout
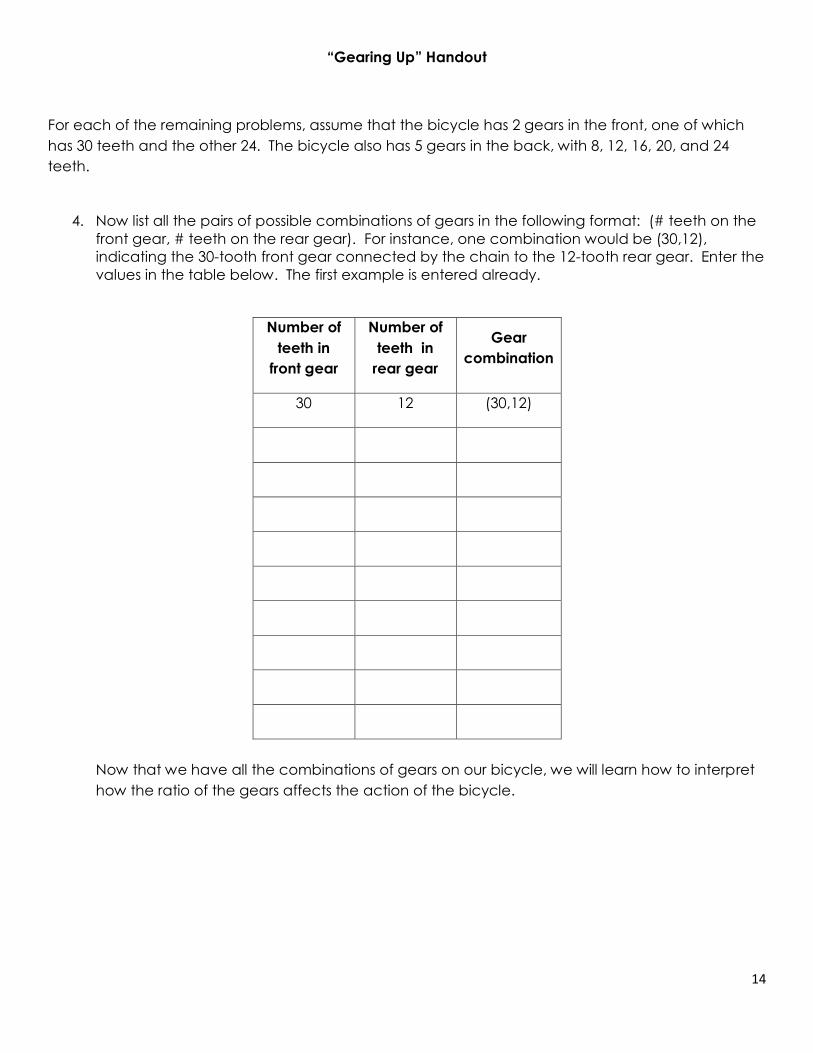
For each of the remaining problems, assume that the bicycle has 2 gears in the front, one of which
has 30 teeth and the other 24. The bicycle also has 5 gears in the back, with 8, 12, 16, 20, and 24
teeth.
4. Now list all the pairs of possible combinations of gears in the following format: (# teeth on the
front gear, # teeth on the rear gear). For instance, one combination would be (30,12),
indicating the 30-tooth front gear connected by the chain to the 12-tooth rear gear. Enter the
values in the table below. The first example is entered already.
Number of
teeth in
front gear
Number of
teeth in
rear gear
Gear
combination
30 12 (30,12)
Now that we have all the combinations of gears on our bicycle, we will learn how to interpret
how the ratio of the gears affects the action of the bicycle.
15
“Gearing Up” Handout
5. If a front gear had 24 teeth, and a rear gear has 12 teeth:
a. Each time the pedal goes around once, how many times does the rear gear (and
wheel) go around?
b. If the pedal goes around twice, how many times will the rear wheel go around?
c. If the pedal goes around 4 times, how many times will the rear wheel go around?
We say that the ratio of the number of teeth in the front gear, to the number of teeth in the rear gear,
is equal to 24:12. When we put this ratio in simplest terms, we call it the “gear ratio.” Therefore, this
24:12 ratio represents a gear ratio of 2:1.
When the bike shop owner told Bianca about a speed gear, he was referring to gear ratios that
cause the wheel to go around more times per pedal revolution. High performance bikes can have
chainwheel-freewheel combinations that include gear ratios of up to 5 or more.
6. If the chain is on the 24 tooth front gear, and on the 8-tooth rear gear:
a. What is the gear ratio?
b. How many times does the rear wheel go around when the pedal goes around once?
c. Will this combination result in a higher speed than the 2:1 gear ratio? Justify your
answer.
16
“Gearing Up” Handout
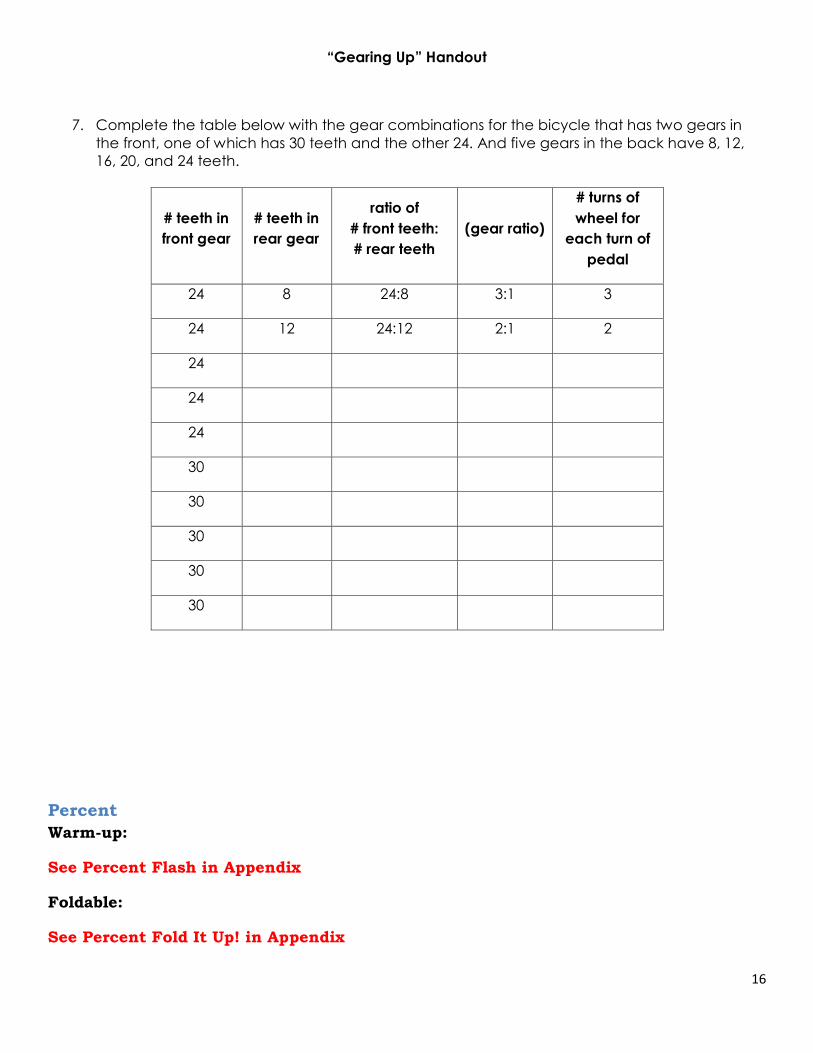
7. Complete the table below with the gear combinations for the bicycle that has two gears in
the front, one of which has 30 teeth and the other 24. And five gears in the back have 8, 12,
16, 20, and 24 teeth.
# teeth in
front gear
# teeth in
rear gear
ratio of
# front teeth:
# rear teeth
(gear ratio)
# turns of
wheel for
each turn of
pedal
24 8 24:8 3:1 3
24 12 24:12 2:1 2
24
24
24
30
30
30
30
30
Percent
Warm-up:
See Percent Flash in Appendix
Foldable:
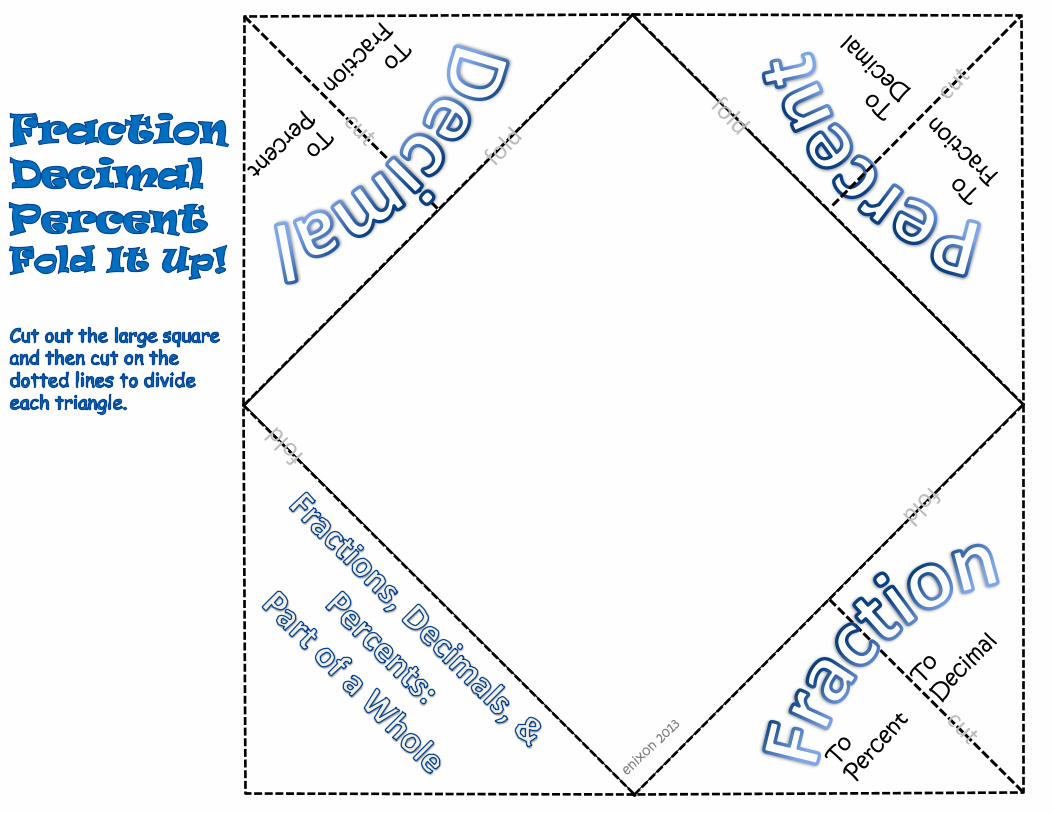
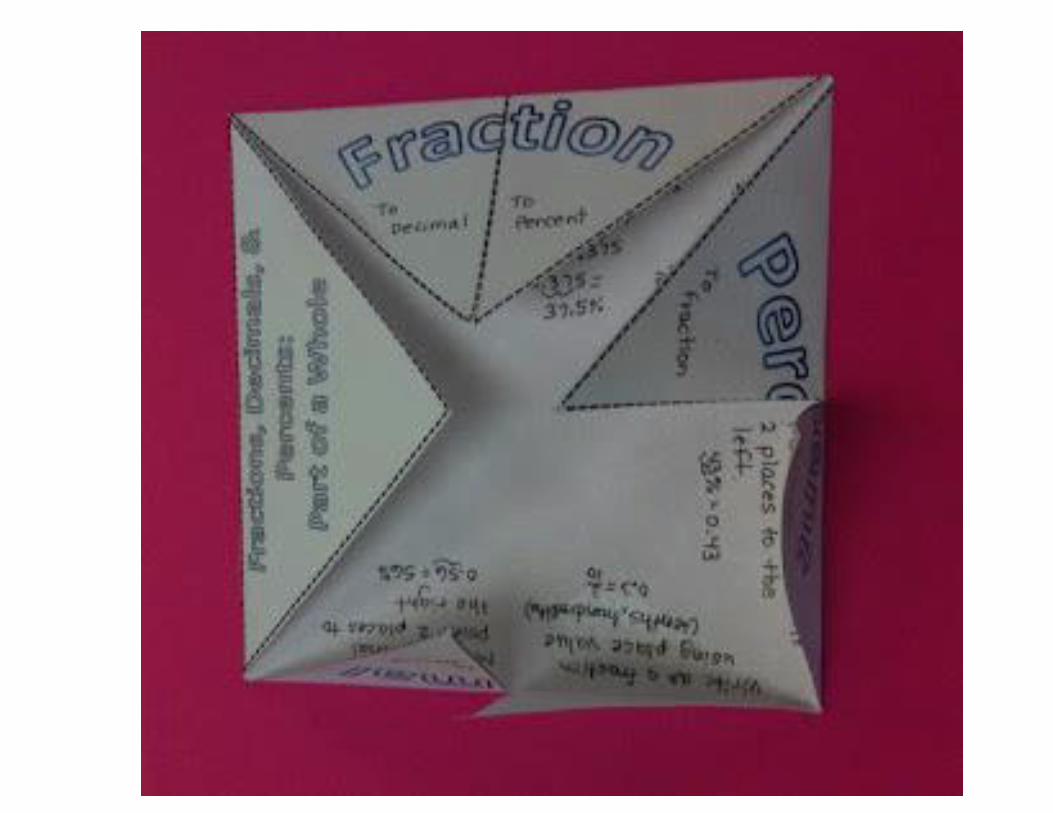
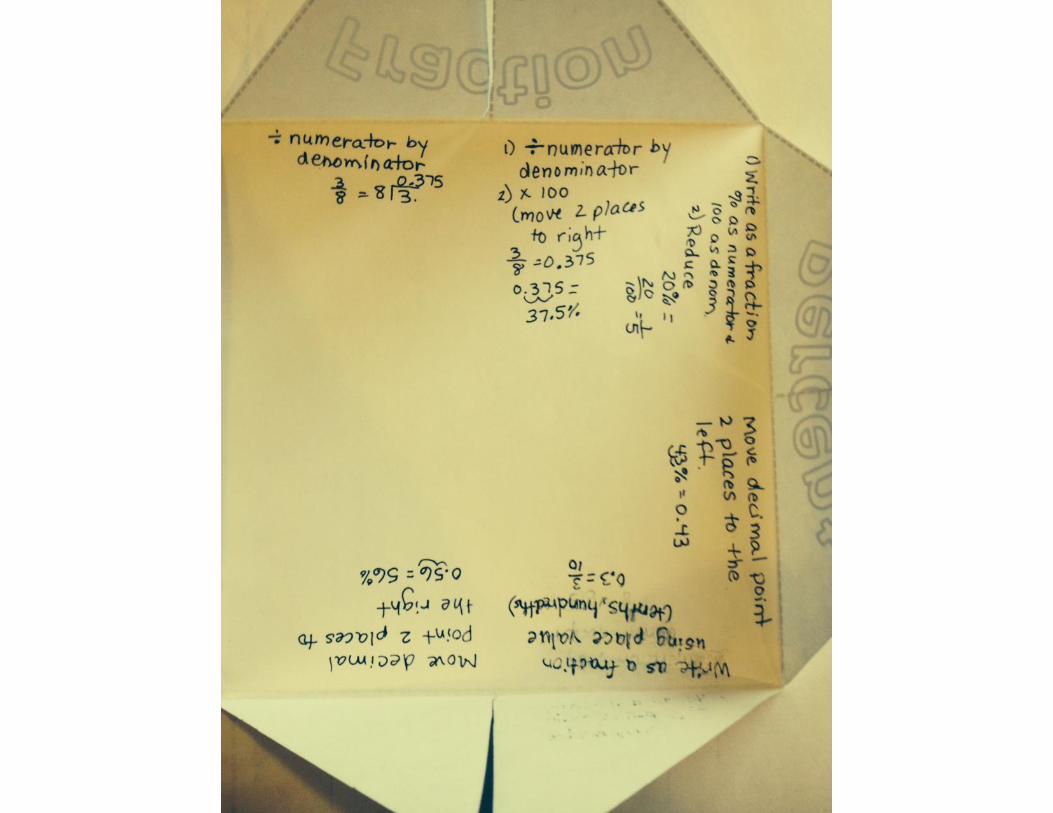
See Percent Fold It Up! in Appendix
17
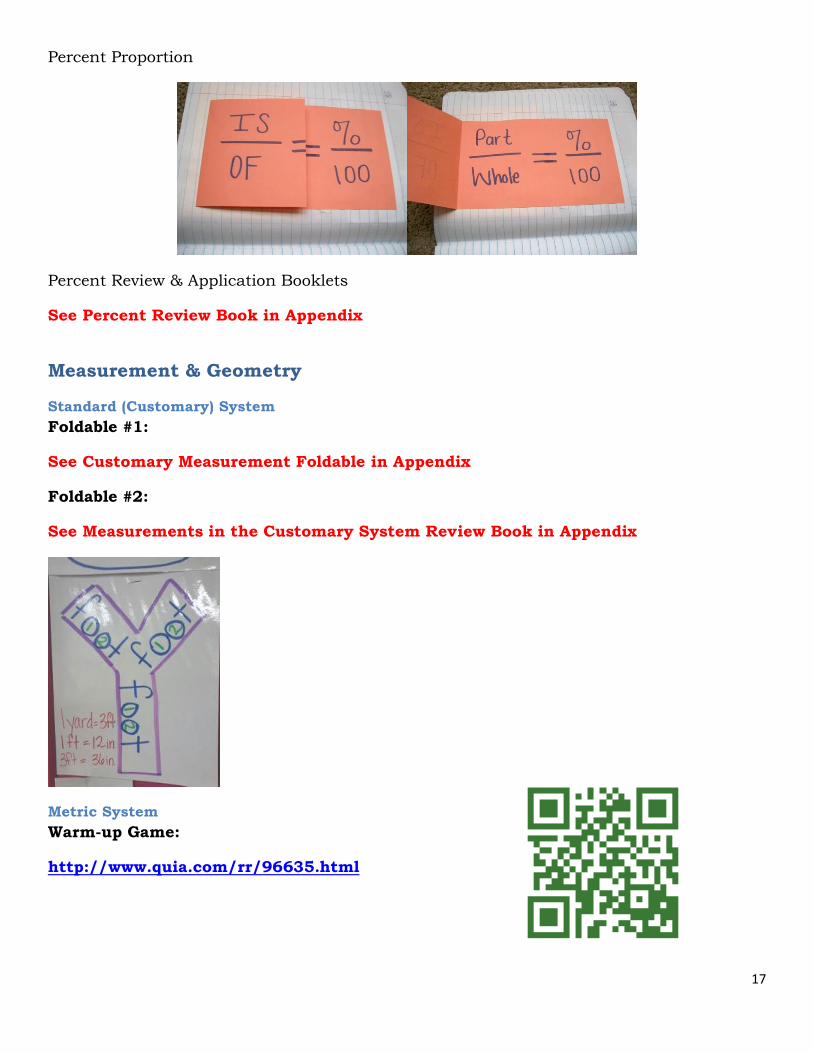
Percent Proportion
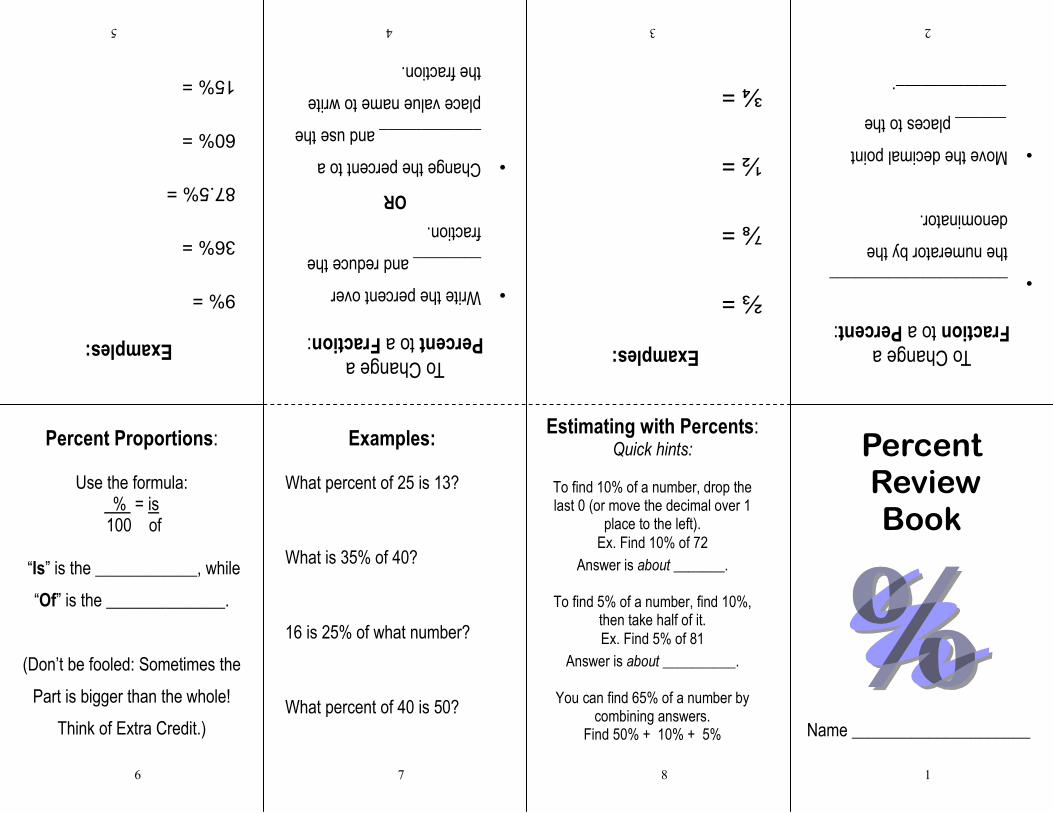
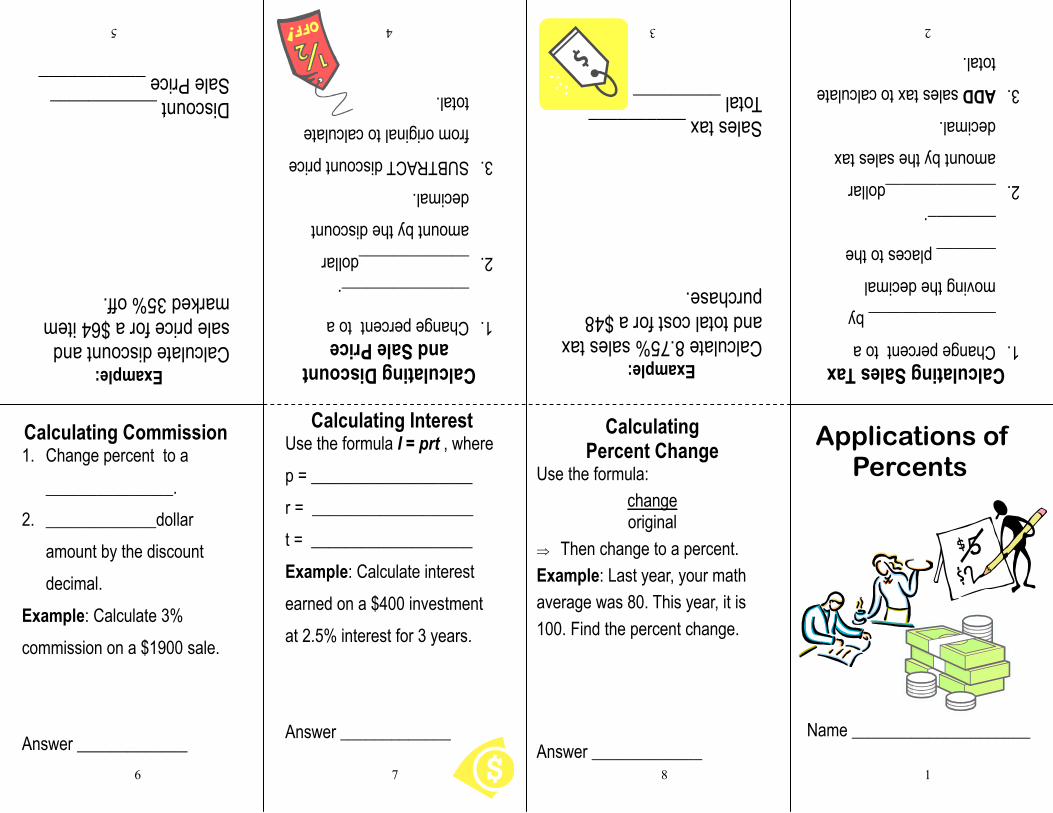
Percent Review & Application Booklets
See Percent Review Book in Appendix
Measurement & Geometry
Standard (Customary) System
Foldable #1:
See Customary Measurement Foldable in Appendix
Foldable #2:
See Measurements in the Customary System Review Book in Appendix
Metric System
Warm-up Game:
http://www.quia.com/rr/96635.html
18
Foldable:
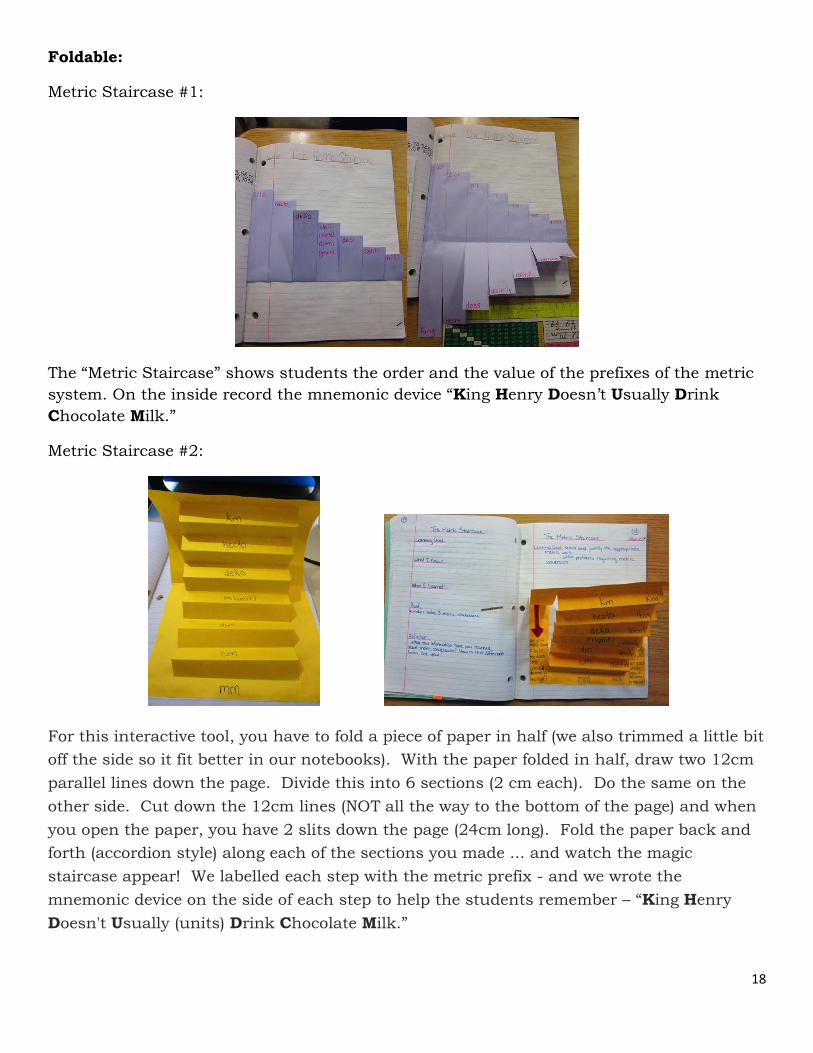
Metric Staircase #1:
The “Metric Staircase” shows students the order and the value of the prefixes of the metric
system. On the inside record the mnemonic device “King Henry Doesn’t Usually Drink
Chocolate Milk.”
Metric Staircase #2:
For this interactive tool, you have to fold a piece of paper in half (we also trimmed a little bit
off the side so it fit better in our notebooks). With the paper folded in half, draw two 12cm
parallel lines down the page. Divide this into 6 sections (2 cm each). Do the same on the
other side. Cut down the 12cm lines (NOT all the way to the bottom of the page) and when
you open the paper, you have 2 slits down the page (24cm long). Fold the paper back and
forth (accordion style) along each of the sections you made ... and watch the magic
staircase appear! We labelled each step with the metric prefix - and we wrote the
mnemonic device on the side of each step to help the students remember – “King Henry
Doesn't Usually (units) Drink Chocolate Milk.”
19
Conversion:
On the left side of the staircase make a BIG red arrow pointing down and write under it--
Move down-multiply by 10 for each step (shortcut: move decimal to the right).
On the right side of the staircase make a BIG red arrow pointing up and write under it—
Move up divide by 10 for each step (shortcut: move decimal to the left)
Lesson/Activity:
http://www.teacherspayteachers.com/Product/The-Metric-System-and-Handout-Math-PowerPoint-355181
This Power Point Presentation is located at Teachers Pay Teachers. Must become a member
and then able to download this for free.
Shapes & Formulas
Quadrilaterals:
20
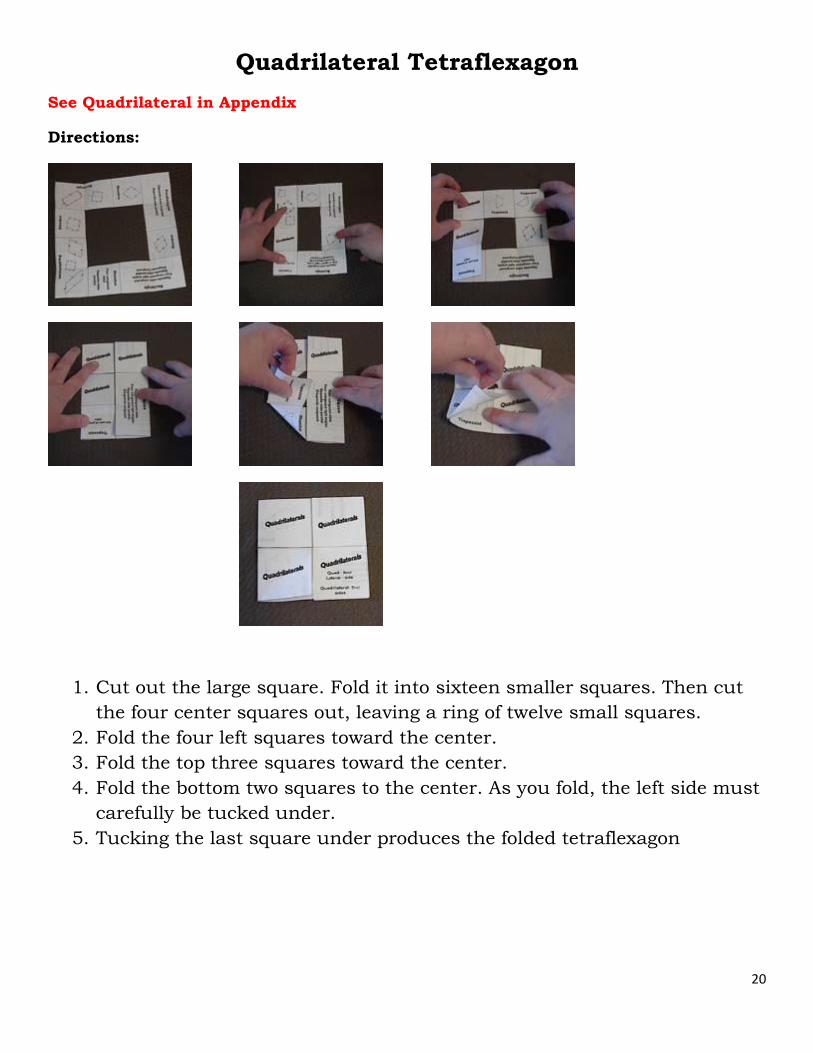
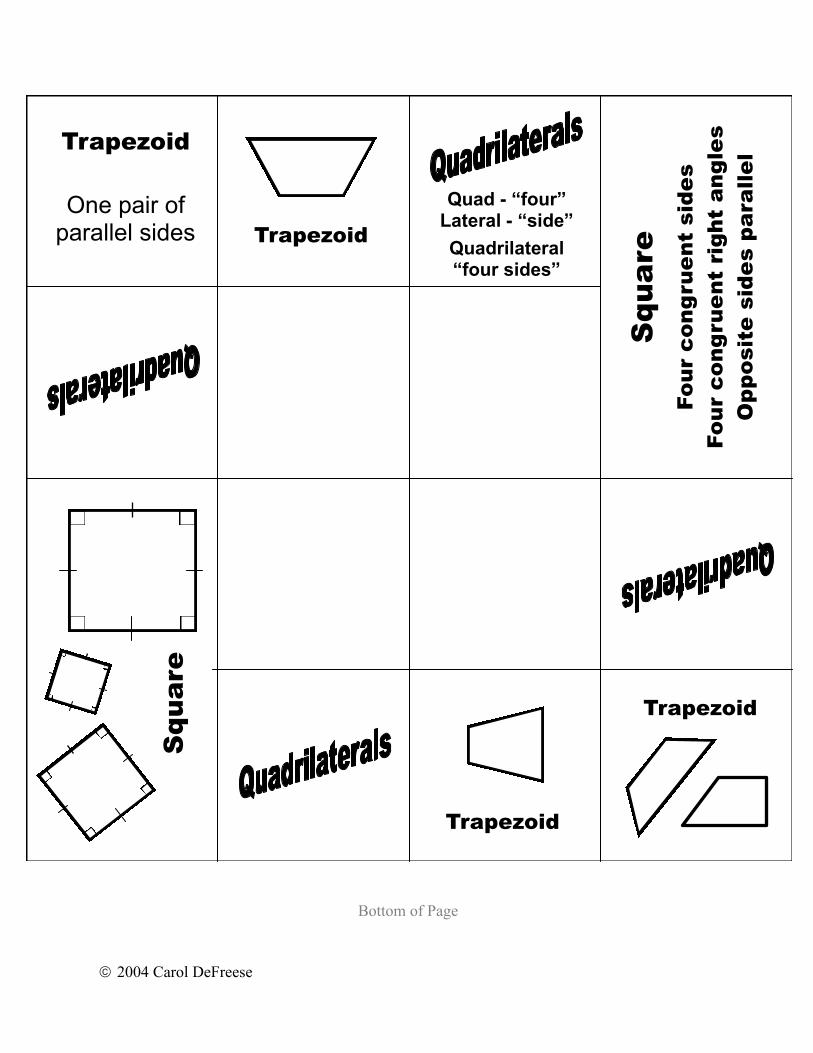
Quadrilateral Tetraflexagon
See Quadrilateral in Appendix
Directions:
1. Cut out the large square. Fold it into sixteen smaller squares. Then cut
the four center squares out, leaving a ring of twelve small squares.
2. Fold the four left squares toward the center.
3. Fold the top three squares toward the center.
4. Fold the bottom two squares to the center. As you fold, the left side must
carefully be tucked under.
5. Tucking the last square under produces the folded tetraflexagon
21
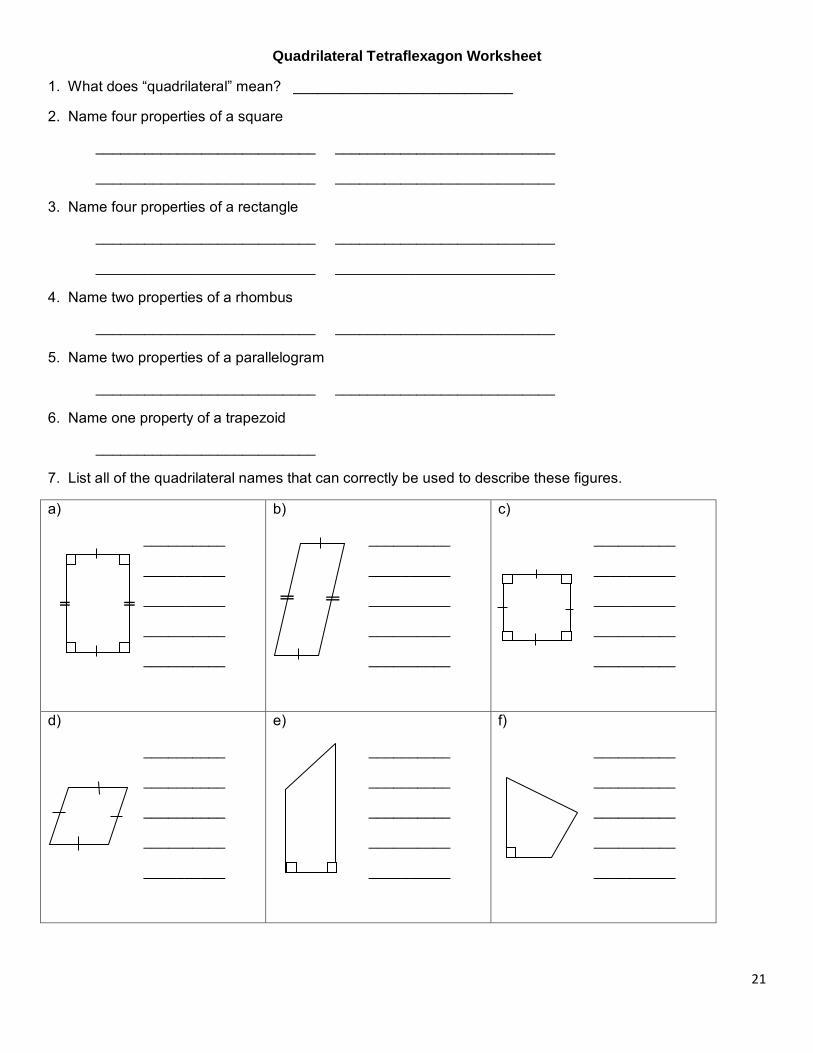
Quadrilateral Tetraflexagon Worksheet
1. What does “quadrilateral” mean? ___________________________
2. Name four properties of a square
___________________________ ___________________________
___________________________ ___________________________
3. Name four properties of a rectangle
___________________________ ___________________________
___________________________ ___________________________
4. Name two properties of a rhombus
___________________________ ___________________________
5. Name two properties of a parallelogram
___________________________ ___________________________
6. Name one property of a trapezoid
___________________________
7. List all of the quadrilateral names that can correctly be used to describe these figures.
a)
__________
__________
__________
__________
__________
b)
__________
__________
__________
__________
__________
c)
__________
__________
__________
__________
__________
d)
__________
__________
__________
__________
__________
e)
__________
__________
__________
__________
__________
f)
__________
__________
__________
__________
__________
22
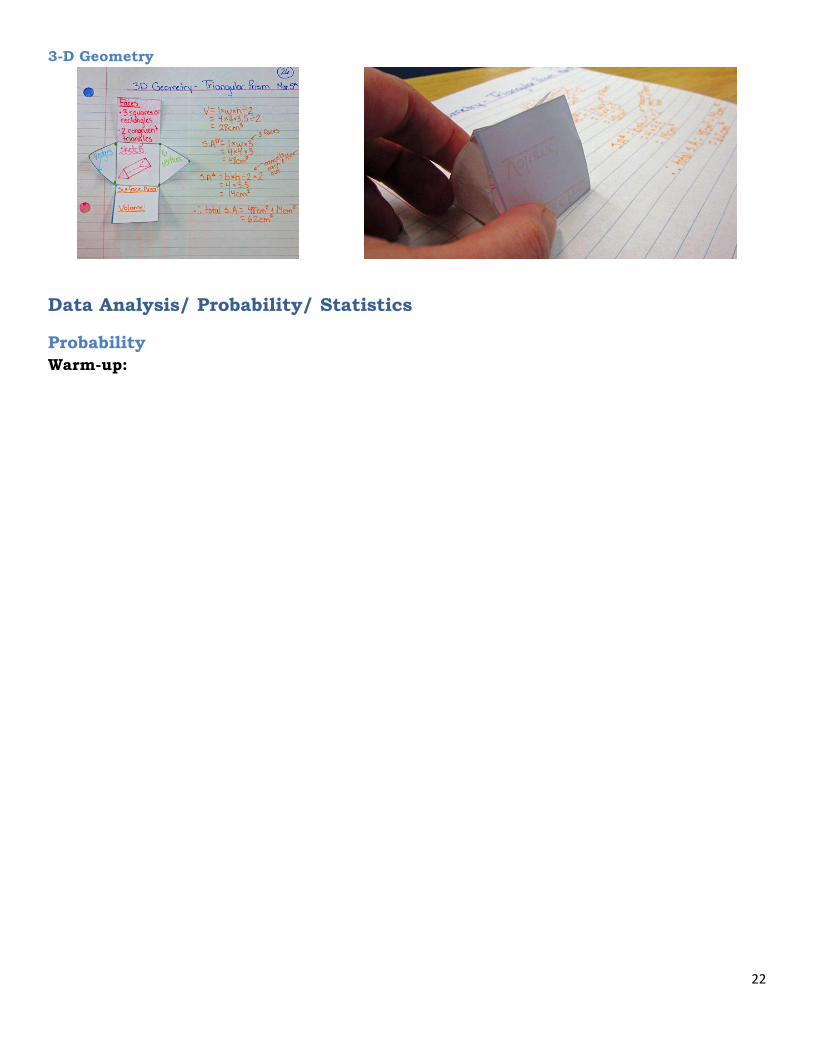
3-D Geometry
Data Analysis/ Probability/ Statistics
Probability
Warm-up:
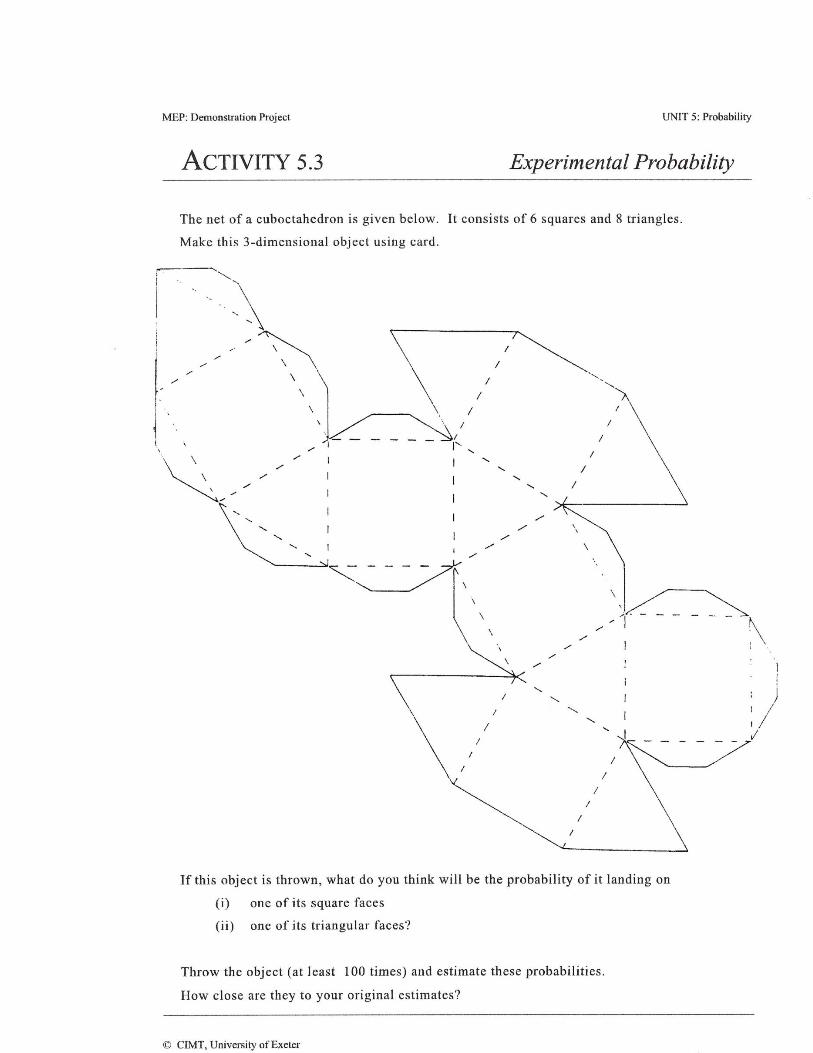
23
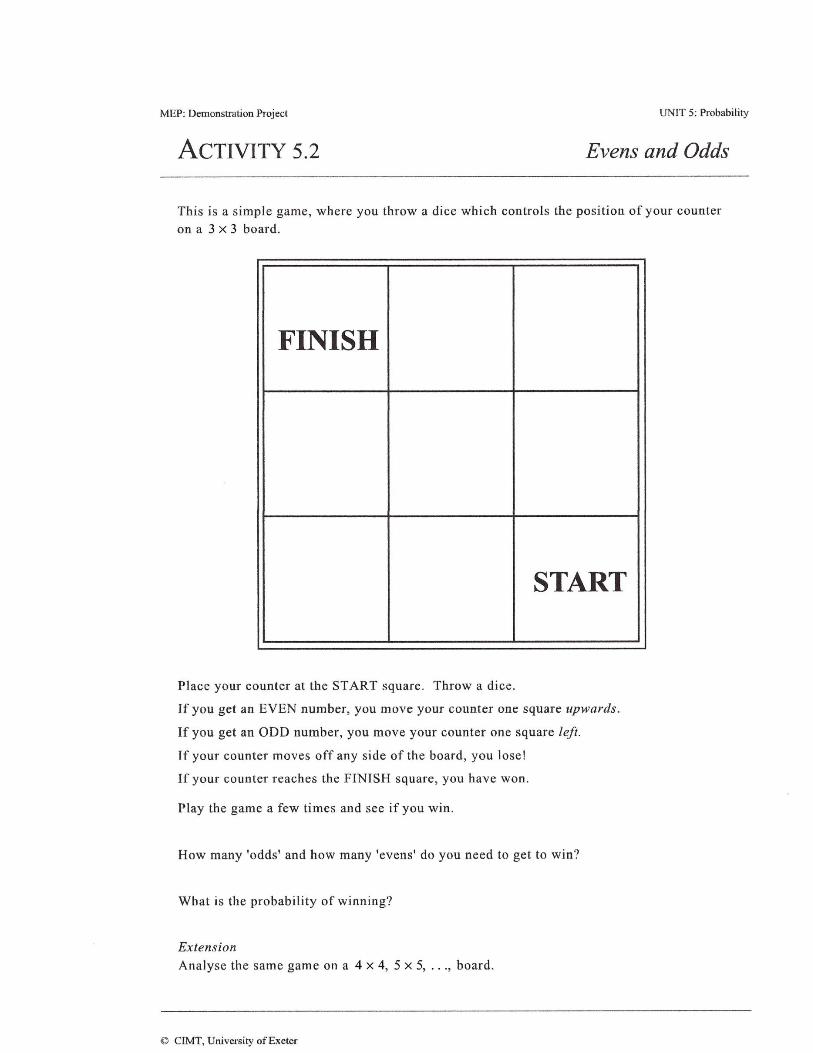
24
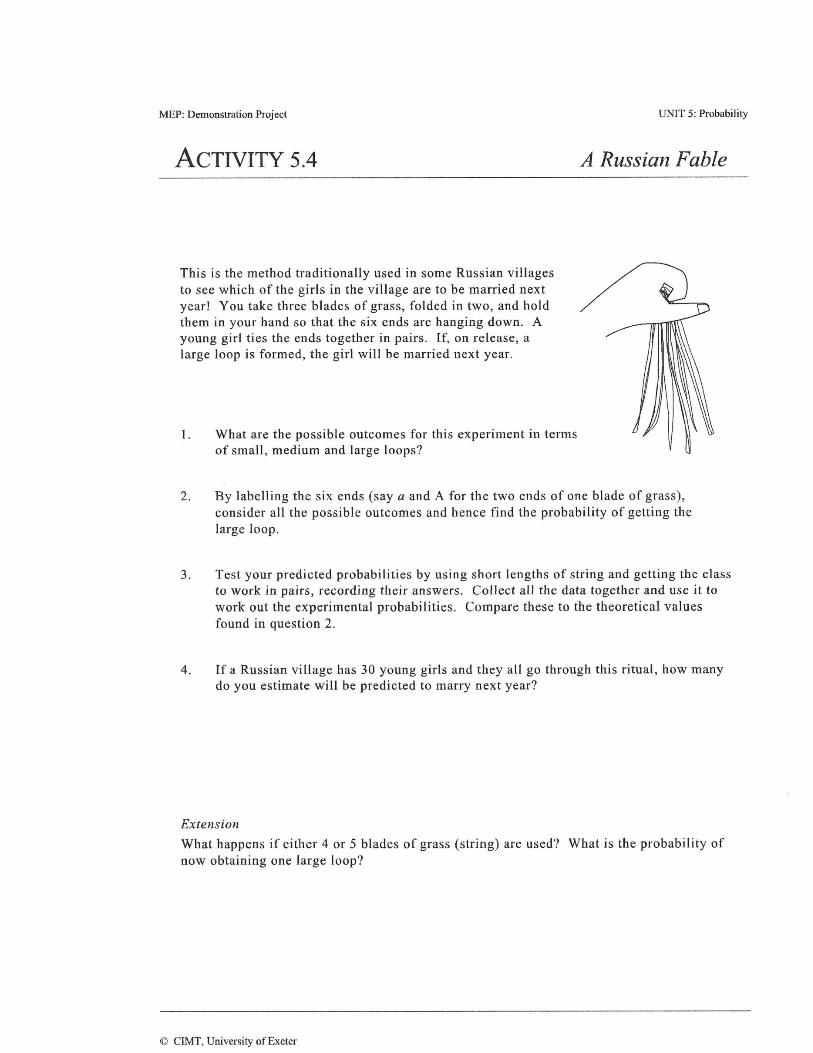
25
26
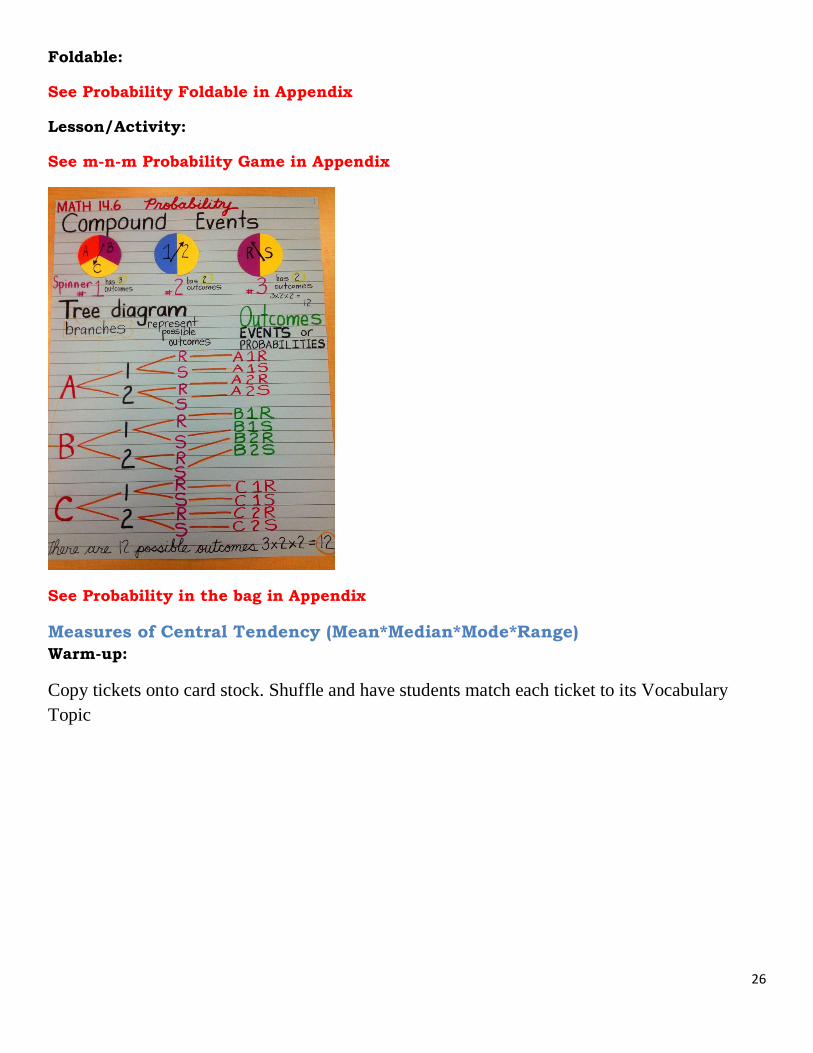
Foldable:
See Probability Foldable in Appendix
Lesson/Activity:
See m-n-m Probability Game in Appendix
See Probability in the bag in Appendix
Measures of Central Tendency (Mean*Median*Mode*Range)
Warm-up:
Copy tickets onto card stock. Shuffle and have students match each ticket to its Vocabulary
Topic
27
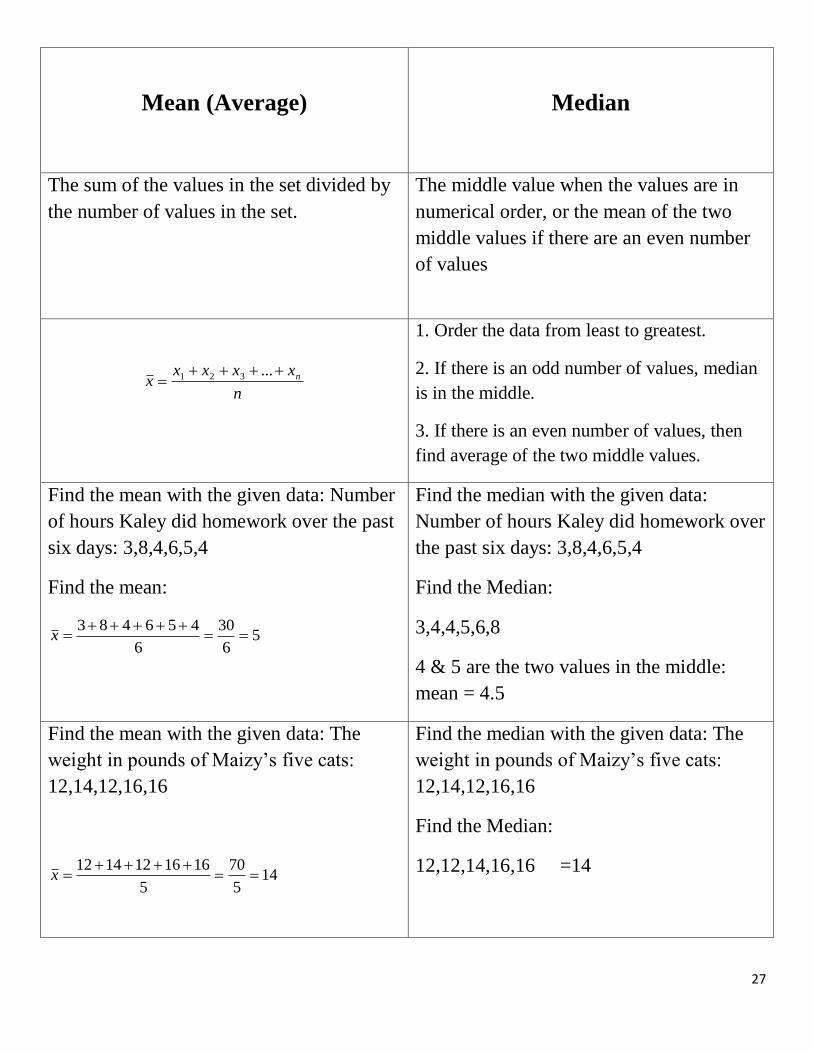
Mean (Average)
Median
The sum of the values in the set divided by
the number of values in the set.
The middle value when the values are in
numerical order, or the mean of the two
middle values if there are an even number
of values
n
xxxxx n
...321
1. Order the data from least to greatest.
2. If there is an odd number of values, median
is in the middle.
3. If there is an even number of values, then
find average of the two middle values.
Find the mean with the given data: Number
of hours Kaley did homework over the past
six days: 3,8,4,6,5,4
Find the mean:
56
30
6
456483
x
Find the median with the given data:
Number of hours Kaley did homework over
the past six days: 3,8,4,6,5,4
Find the Median:
3,4,4,5,6,8
4 & 5 are the two values in the middle:
mean = 4.5
Find the mean with the given data: The
weight in pounds of Maizy’s five cats:
12,14,12,16,16
145
70
5
1616121412
x
Find the median with the given data: The
weight in pounds of Maizy’s five cats:
12,14,12,16,16
Find the Median:
12,12,14,16,16 =14
28
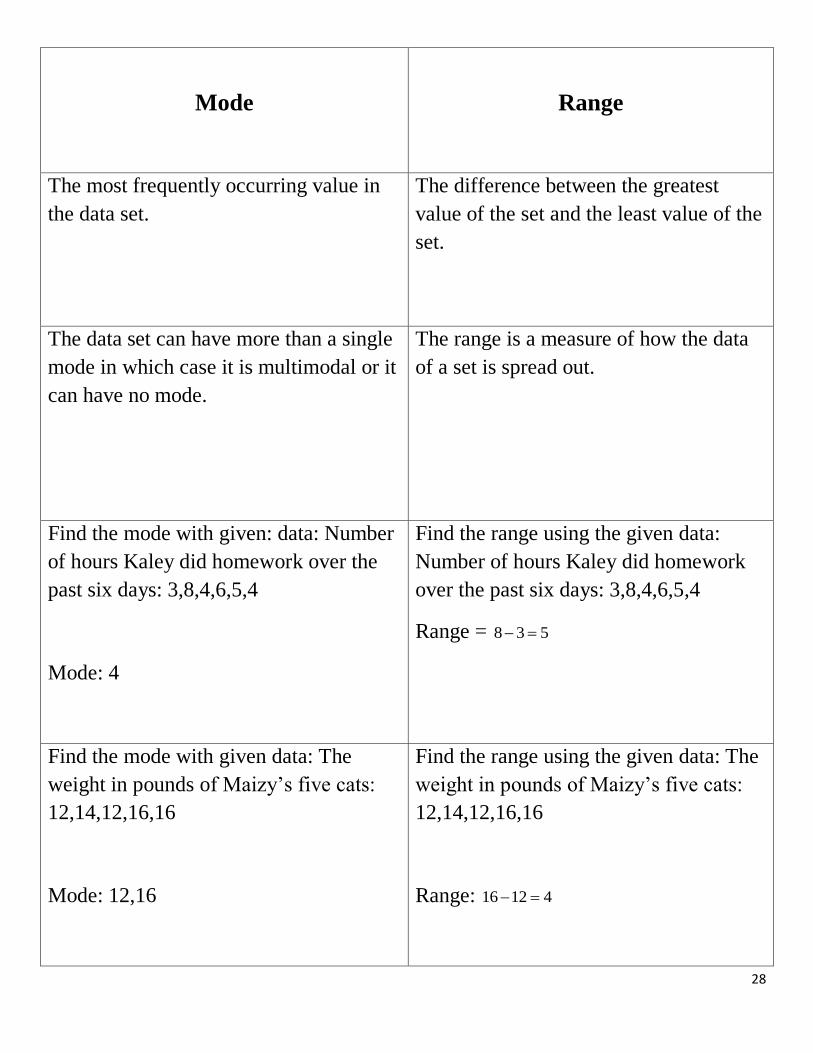
Mode
Range
The most frequently occurring value in
the data set.
The difference between the greatest
value of the set and the least value of the
set.
The data set can have more than a single
mode in which case it is multimodal or it
can have no mode.
The range is a measure of how the data
of a set is spread out.
Find the mode with given: data: Number
of hours Kaley did homework over the
past six days: 3,8,4,6,5,4
Mode: 4
Find the range using the given data:
Number of hours Kaley did homework
over the past six days: 3,8,4,6,5,4
Range = 538
Find the mode with given data: The
weight in pounds of Maizy’s five cats:
12,14,12,16,16
Mode: 12,16
Find the range using the given data: The
weight in pounds of Maizy’s five cats:
12,14,12,16,16
Range: 41216
29
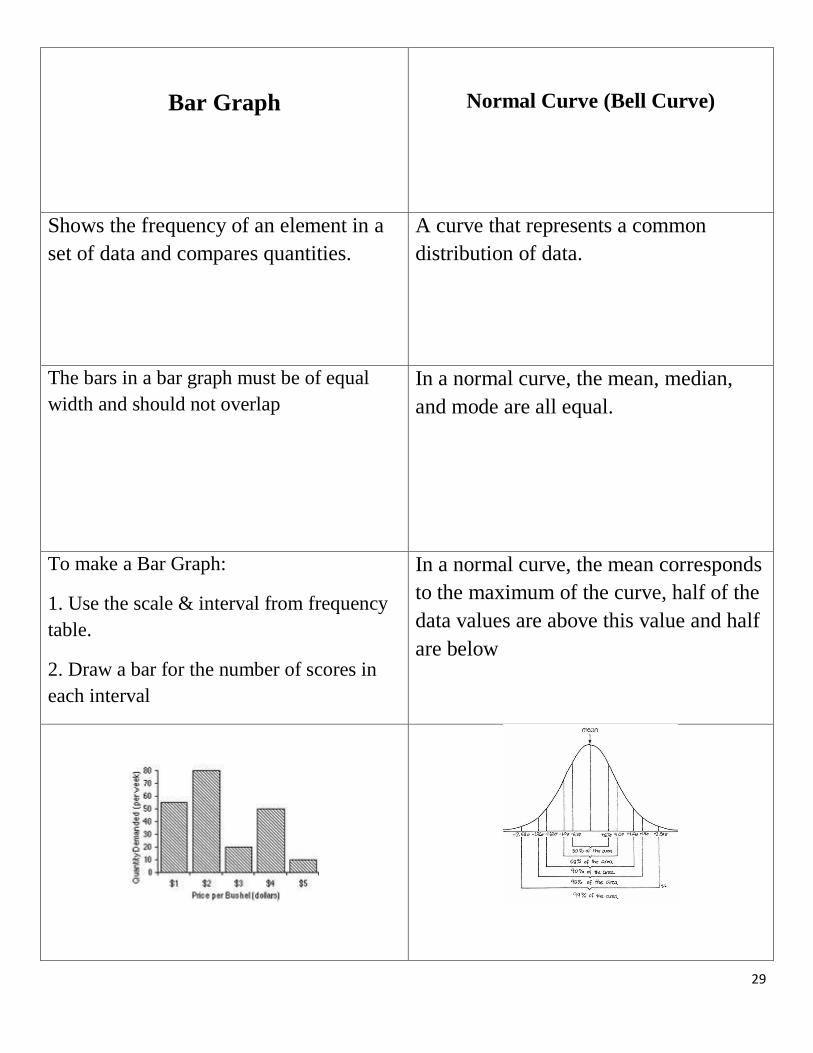
Bar Graph
Normal Curve (Bell Curve)
Shows the frequency of an element in a
set of data and compares quantities.
A curve that represents a common
distribution of data.
The bars in a bar graph must be of equal
width and should not overlap
In a normal curve, the mean, median,
and mode are all equal.
To make a Bar Graph:
1. Use the scale & interval from frequency
table.
2. Draw a bar for the number of scores in
each interval
In a normal curve, the mean corresponds
to the maximum of the curve, half of the
data values are above this value and half
are below
30
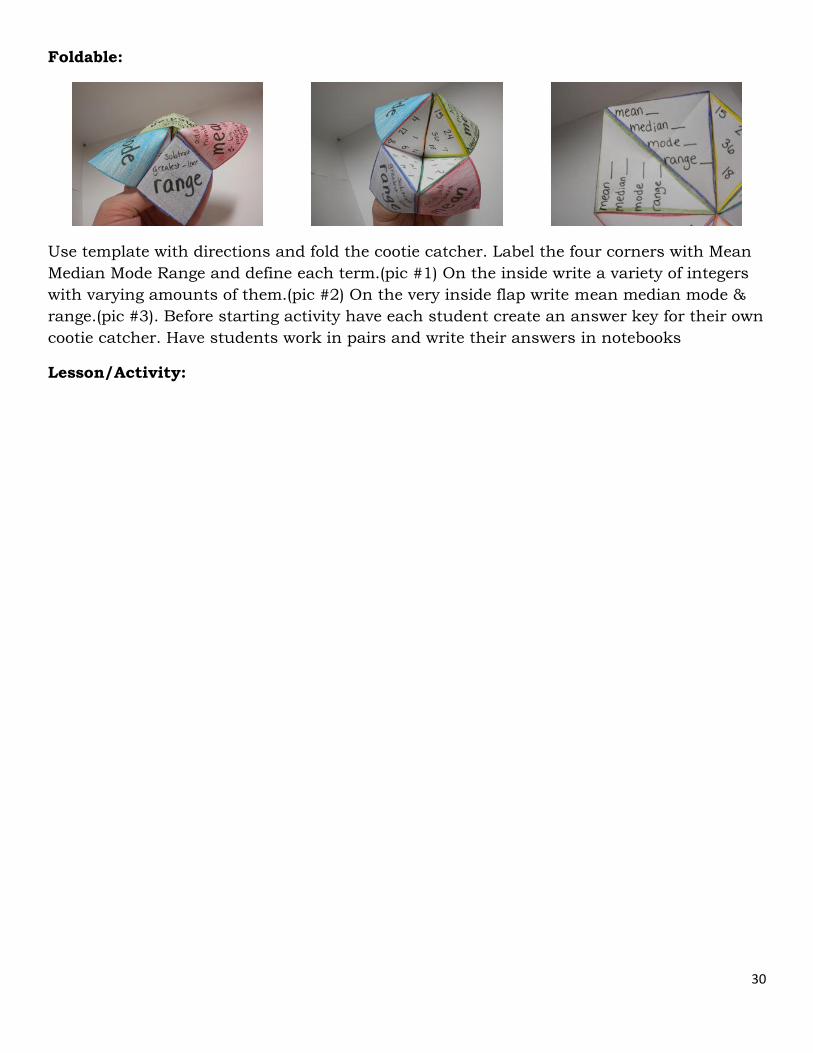
Foldable:
Use template with directions and fold the cootie catcher. Label the four corners with Mean
Median Mode Range and define each term.(pic #1) On the inside write a variety of integers
with varying amounts of them.(pic #2) On the very inside flap write mean median mode &
range.(pic #3). Before starting activity have each student create an answer key for their own
cootie catcher. Have students work in pairs and write their answers in notebooks
Lesson/Activity:
31
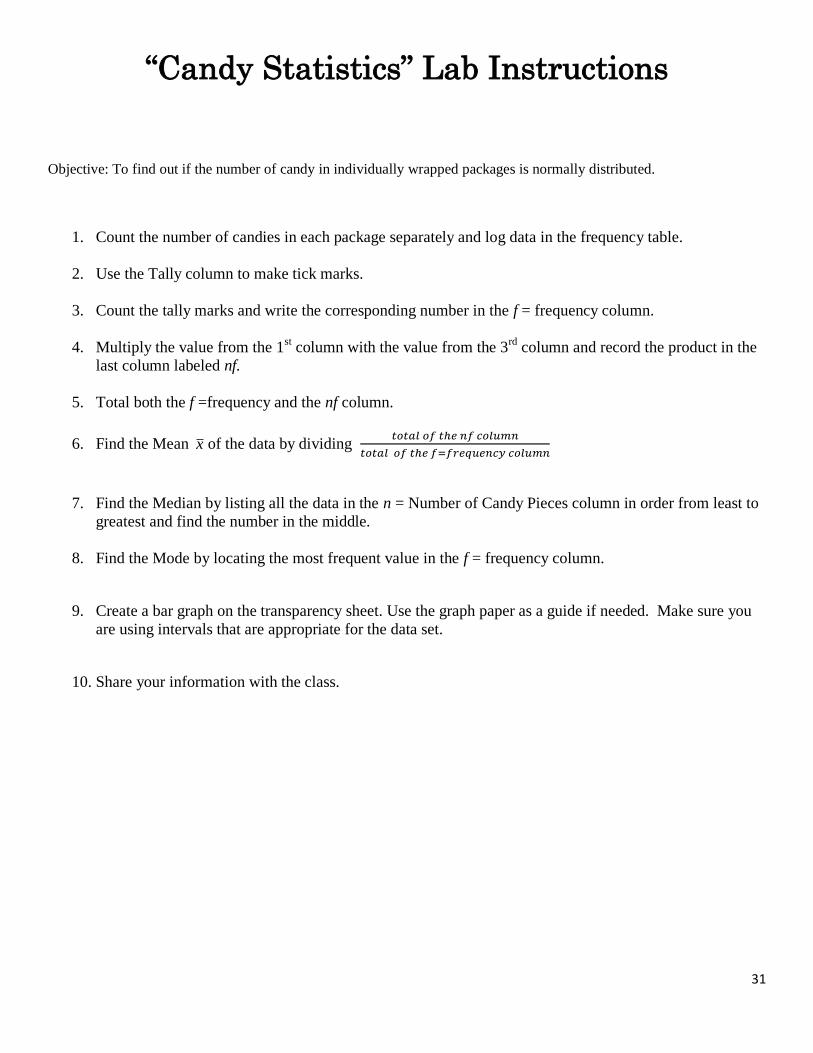
“Candy Statistics” Lab Instructions
Objective: To find out if the number of candy in individually wrapped packages is normally distributed.
1. Count the number of candies in each package separately and log data in the frequency table.
2. Use the Tally column to make tick marks.
3. Count the tally marks and write the corresponding number in the f = frequency column.
4. Multiply the value from the 1st column with the value from the 3
rd column and record the product in the
last column labeled nf.
5. Total both the f =frequency and the nf column.
6. Find the Mean x of the data by dividing
7. Find the Median by listing all the data in the n = Number of Candy Pieces column in order from least to
greatest and find the number in the middle.
8. Find the Mode by locating the most frequent value in the f = frequency column.
9. Create a bar graph on the transparency sheet. Use the graph paper as a guide if needed. Make sure you
are using intervals that are appropriate for the data set.
10. Share your information with the class.
32
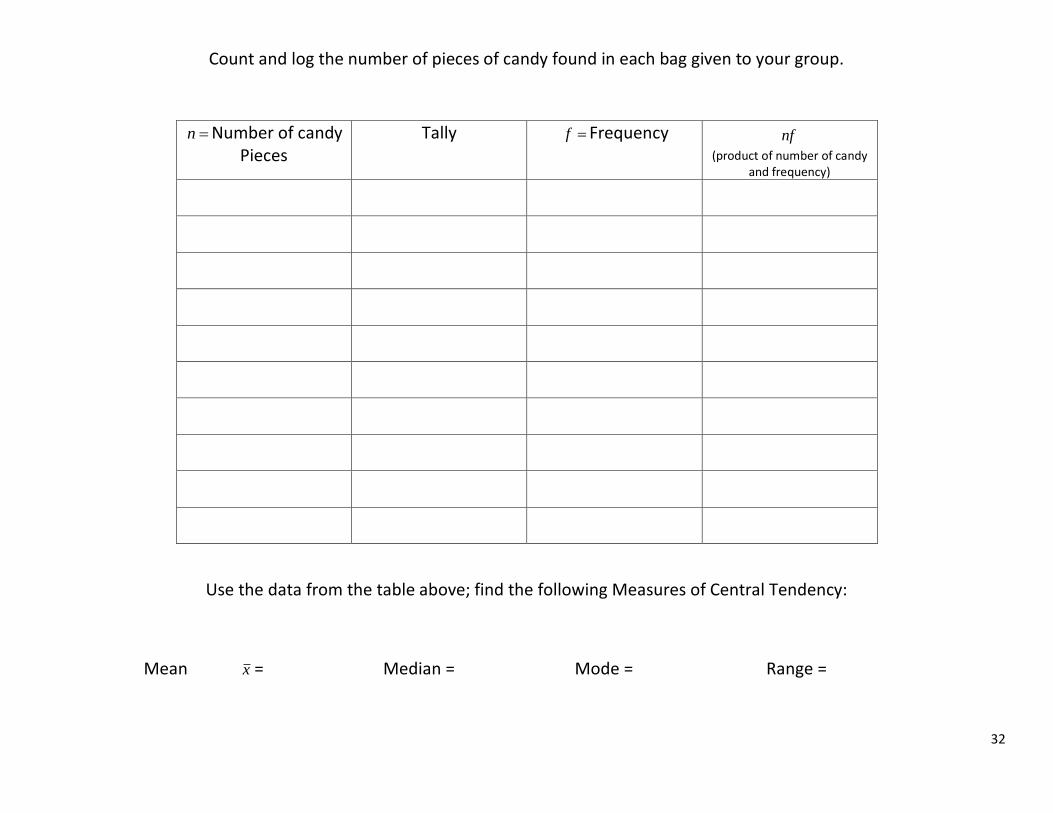
Count and log the number of pieces of candy found in each bag given to your group.
n Number of candy Pieces
Tally f Frequency nf (product of number of candy
and frequency)
Use the data from the table above; find the following Measures of Central Tendency:
Mean x = Median = Mode = Range =
33
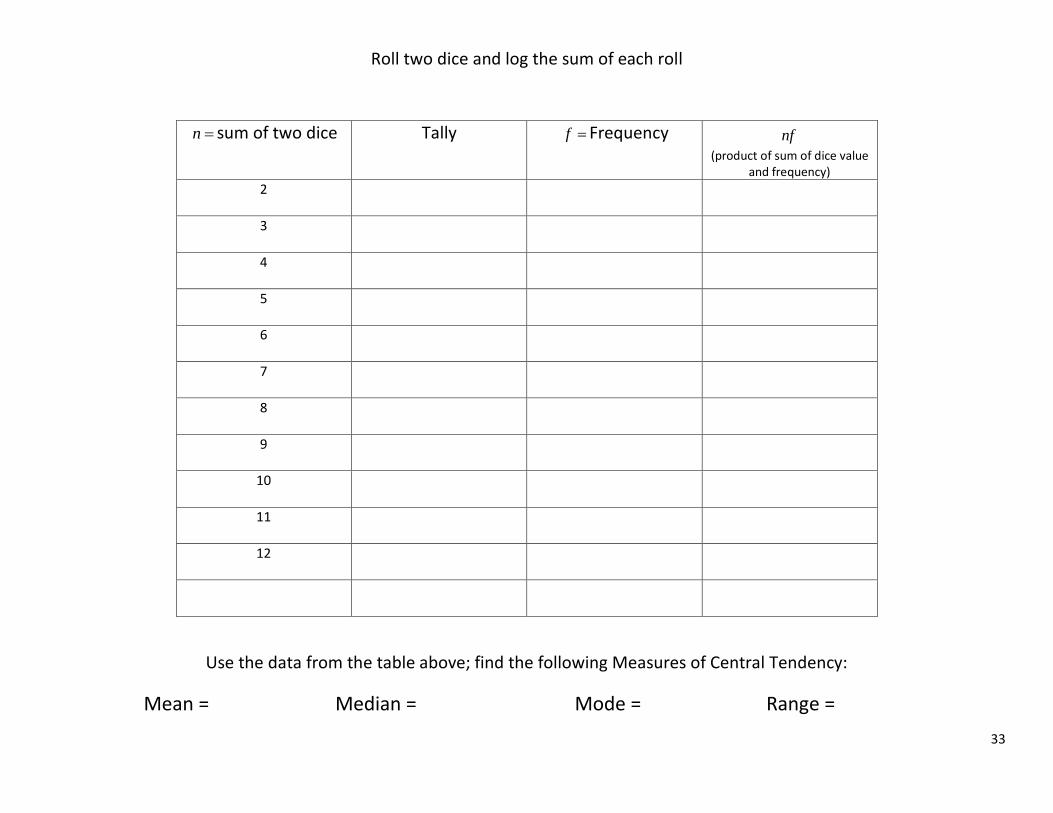
Roll two dice and log the sum of each roll
n sum of two dice Tally f Frequency nf (product of sum of dice value
and frequency)
2
3
4
5
6
7
8
9
10
11
12
Use the data from the table above; find the following Measures of Central Tendency:
Mean = Median = Mode = Range =
34
Algebra
Foldable:
See Algebra Properties in Appendix
Single Variable Equations
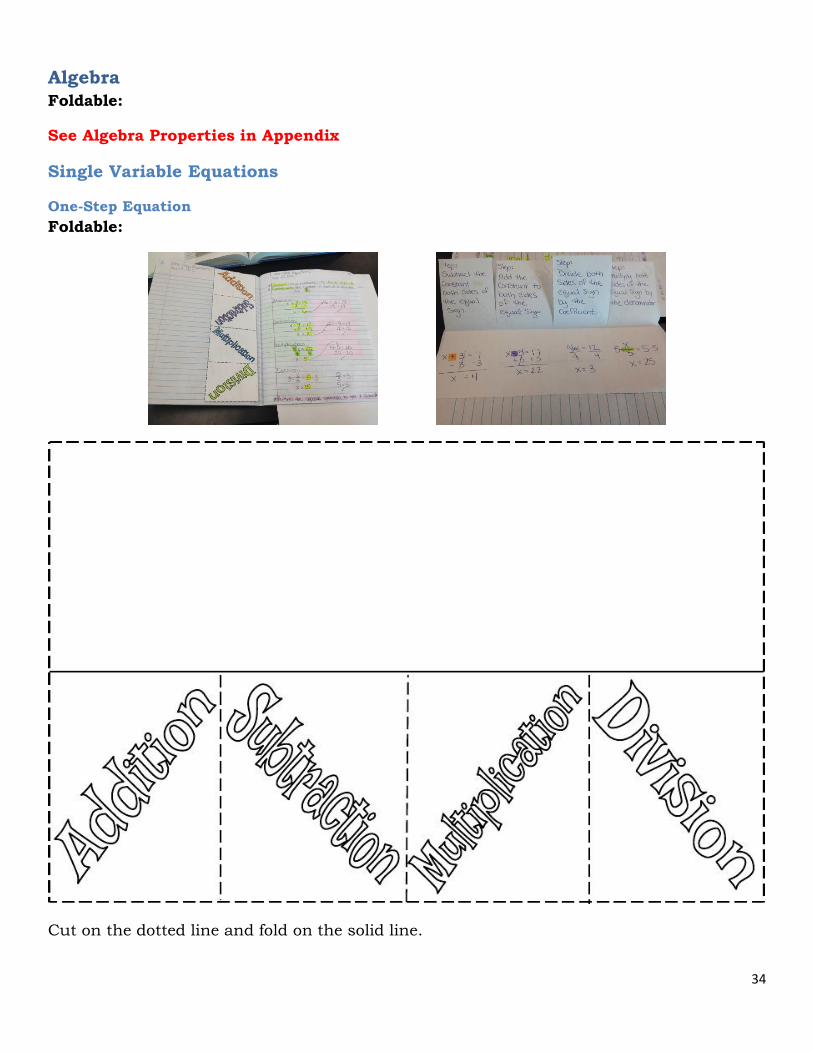
One-Step Equation
Foldable:
Cut on the dotted line and fold on the solid line.
35
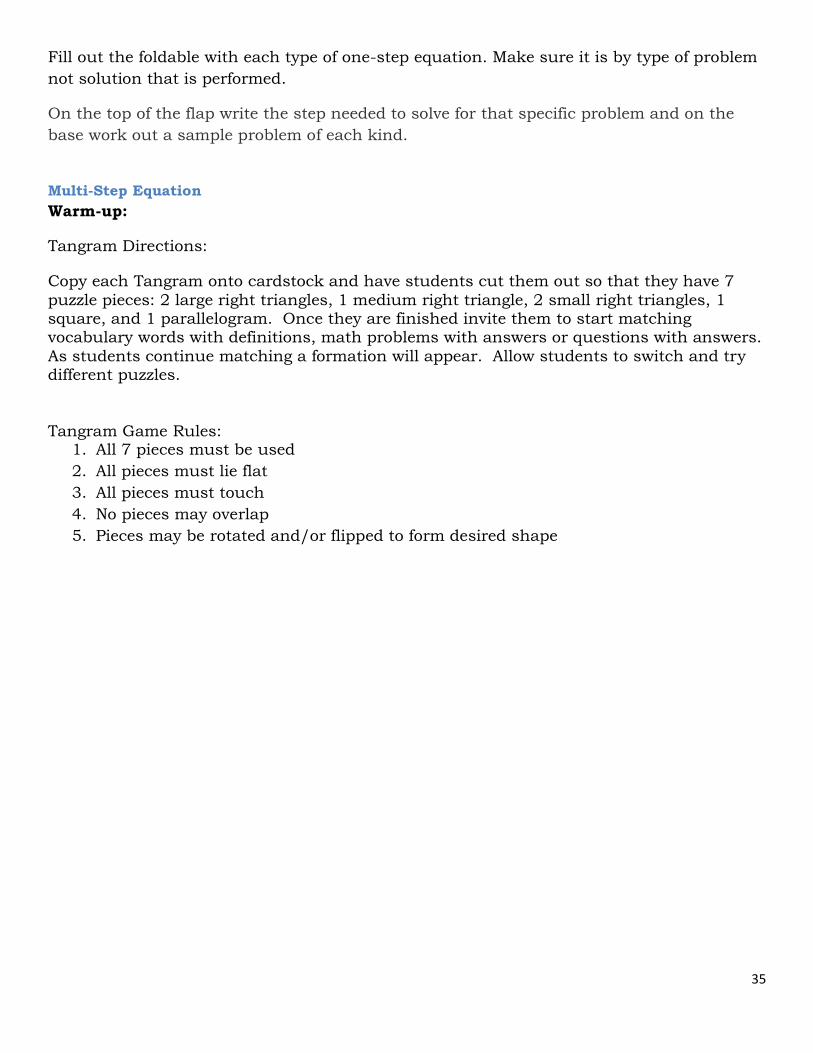
Fill out the foldable with each type of one-step equation. Make sure it is by type of problem
not solution that is performed.
On the top of the flap write the step needed to solve for that specific problem and on the
base work out a sample problem of each kind.
Multi-Step Equation
Warm-up:
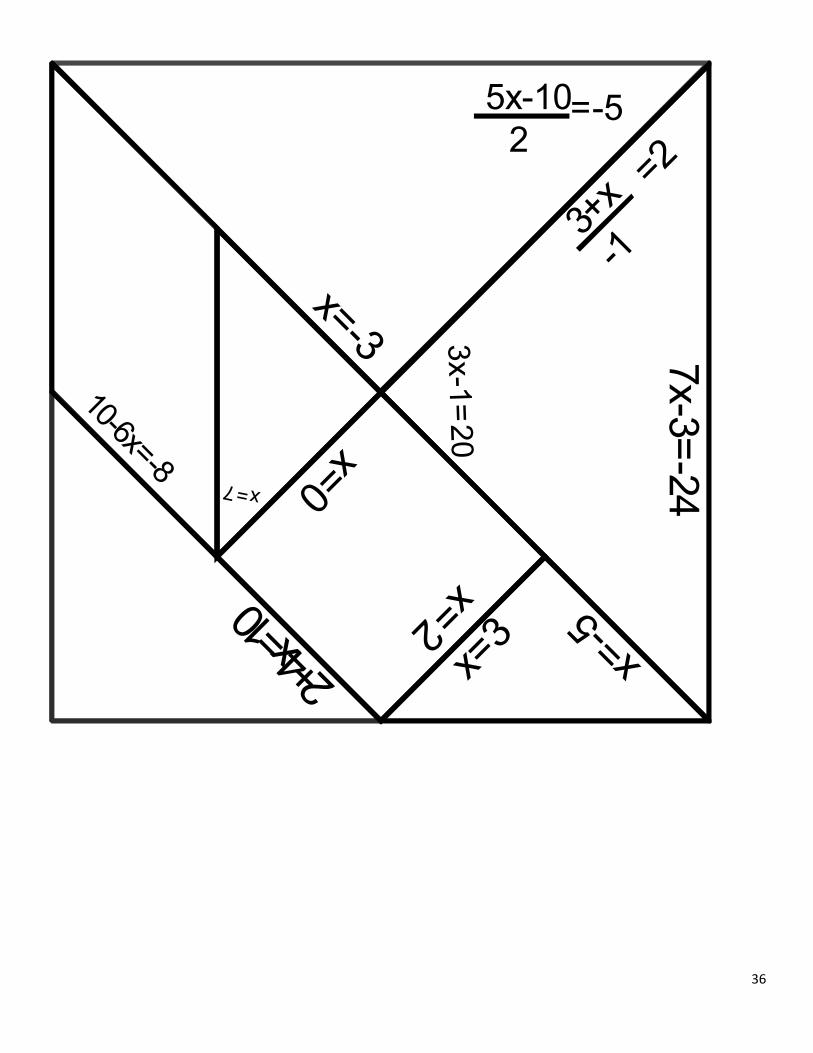
Tangram Directions:
Copy each Tangram onto cardstock and have students cut them out so that they have 7
puzzle pieces: 2 large right triangles, 1 medium right triangle, 2 small right triangles, 1 square, and 1 parallelogram. Once they are finished invite them to start matching vocabulary words with definitions, math problems with answers or questions with answers.
As students continue matching a formation will appear. Allow students to switch and try different puzzles.
Tangram Game Rules: 1. All 7 pieces must be used
2. All pieces must lie flat
3. All pieces must touch
4. No pieces may overlap
5. Pieces may be rotated and/or flipped to form desired shape
36
2+4x=
10x=2
3x-1
=20
x=7
10-6x=-8
x=3
7x-3
=-2
4
x=-3
x=-5
x=0
3+x
-1
=2
5x-10
2=-5
37
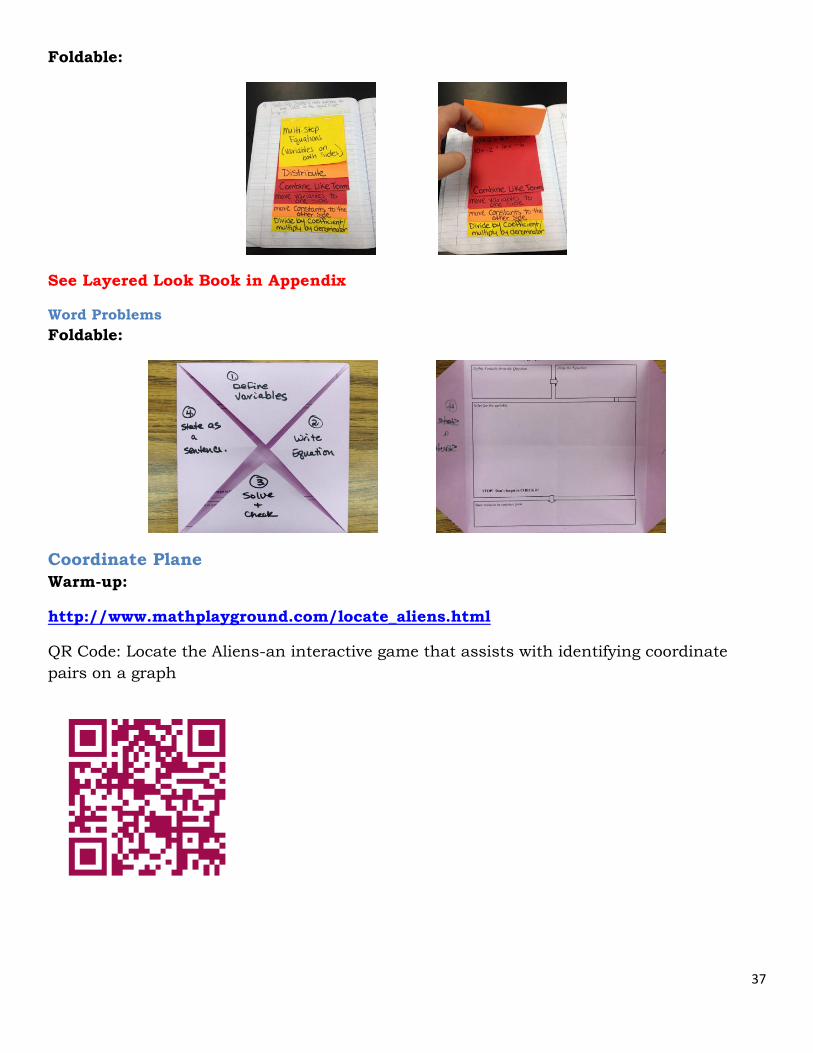
Foldable:
See Layered Look Book in Appendix
Word Problems
Foldable:
Coordinate Plane
Warm-up:
http://www.mathplayground.com/locate_aliens.html
QR Code: Locate the Aliens-an interactive game that assists with identifying coordinate
pairs on a graph
38
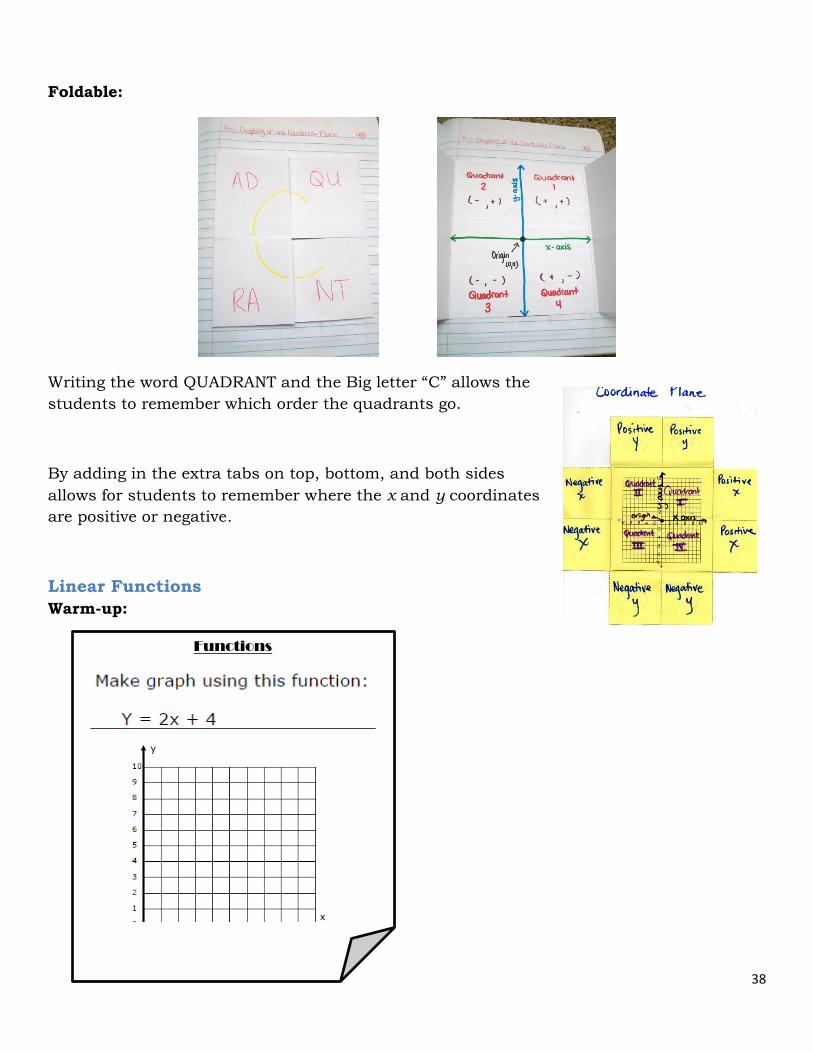
Foldable:
Writing the word QUADRANT and the Big letter “C” allows the
students to remember which order the quadrants go.
By adding in the extra tabs on top, bottom, and both sides
allows for students to remember where the x and y coordinates
are positive or negative.
Linear Functions
Warm-up:
Functions
39
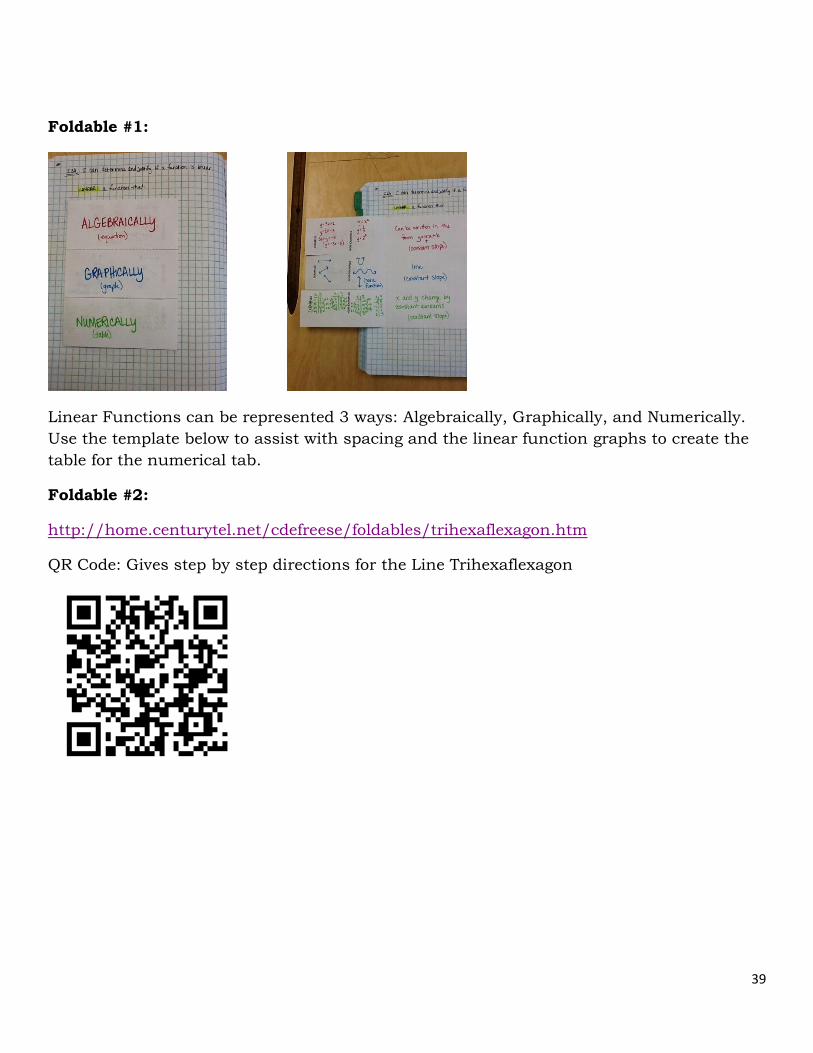
Foldable #1:
Linear Functions can be represented 3 ways: Algebraically, Graphically, and Numerically.
Use the template below to assist with spacing and the linear function graphs to create the
table for the numerical tab.
Foldable #2:
http://home.centurytel.net/cdefreese/foldables/trihexaflexagon.htm
QR Code: Gives step by step directions for the Line Trihexaflexagon
40
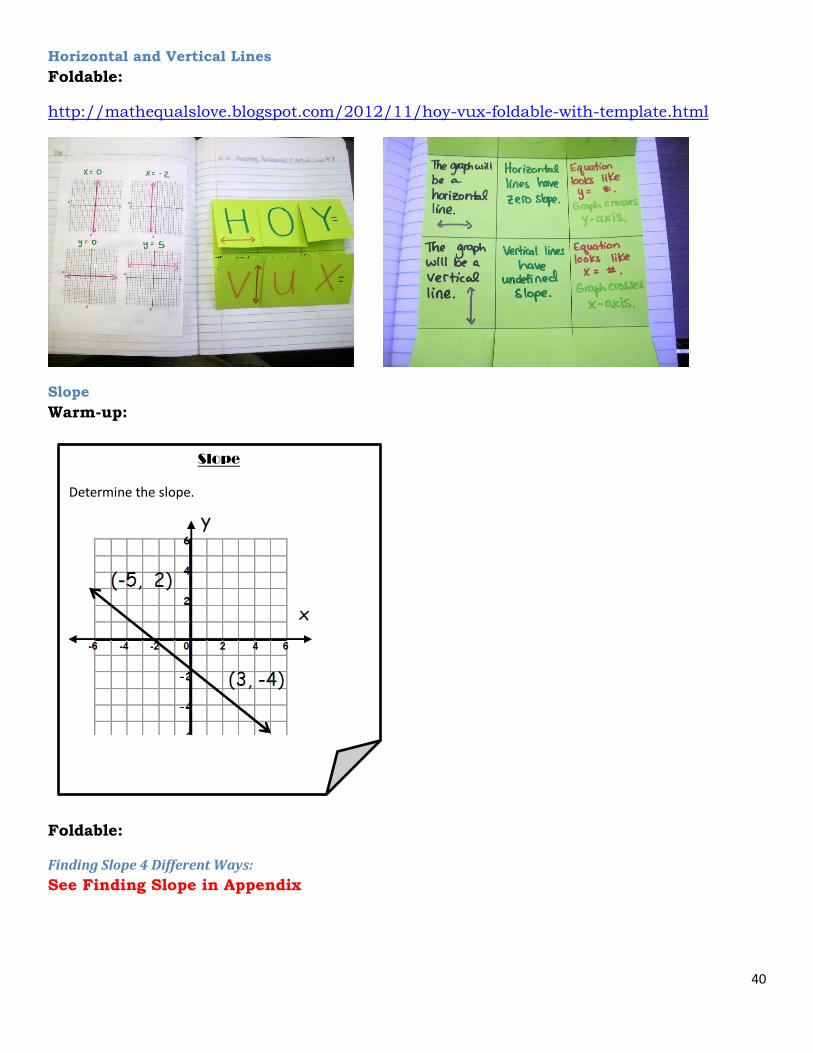
Horizontal and Vertical Lines
Foldable:
http://mathequalslove.blogspot.com/2012/11/hoy-vux-foldable-with-template.html
Slope
Warm-up:
Foldable:
Finding Slope 4 Different Ways:
See Finding Slope in Appendix
Slope
Determine the slope.
41
To fold: Place paper blank side up, fold along solid lines so each side (left &right) meets in
the middle, cut along dotted lines( creating 4-flaps), solve each of the four ways to find
slope on the inside under corresponding flap.
Lesson/Activity #1:
QR Code below: This Comparing Slopes Interactive can be used on its own or with a
worksheet to verify different slopes.
Lesson/Activity #2:
42
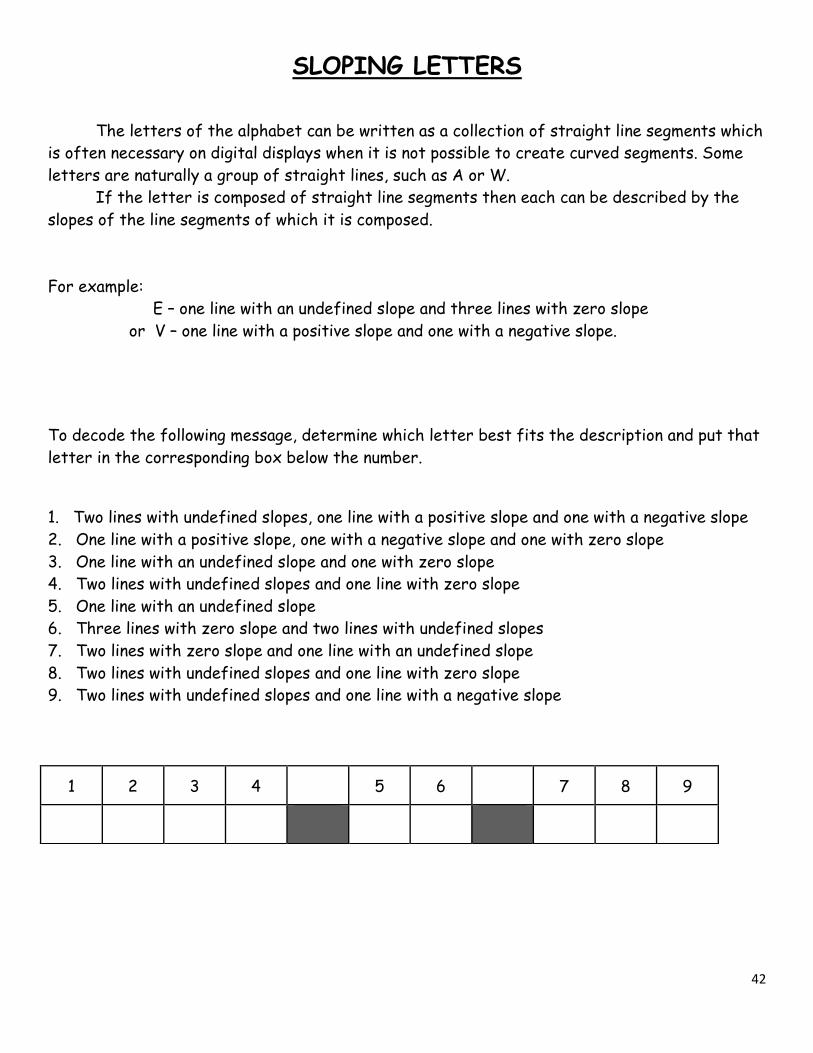
SLOPING LETTERS
The letters of the alphabet can be written as a collection of straight line segments which
is often necessary on digital displays when it is not possible to create curved segments. Some
letters are naturally a group of straight lines, such as A or W.
If the letter is composed of straight line segments then each can be described by the
slopes of the line segments of which it is composed.
For example:
E – one line with an undefined slope and three lines with zero slope
or V – one line with a positive slope and one with a negative slope.
To decode the following message, determine which letter best fits the description and put that
letter in the corresponding box below the number.
1. Two lines with undefined slopes, one line with a positive slope and one with a negative slope
2. One line with a positive slope, one with a negative slope and one with zero slope
3. One line with an undefined slope and one with zero slope
4. Two lines with undefined slopes and one line with zero slope
5. One line with an undefined slope
6. Three lines with zero slope and two lines with undefined slopes
7. Two lines with zero slope and one line with an undefined slope
8. Two lines with undefined slopes and one line with zero slope
9. Two lines with undefined slopes and one line with a negative slope
1 2 3 4 5 6 7 8 9
43
Scientific Notation
Conversion
Warm-up #1:
QR Code: Power of 10 Game – Connecting the size of things in the universe to powers of ten
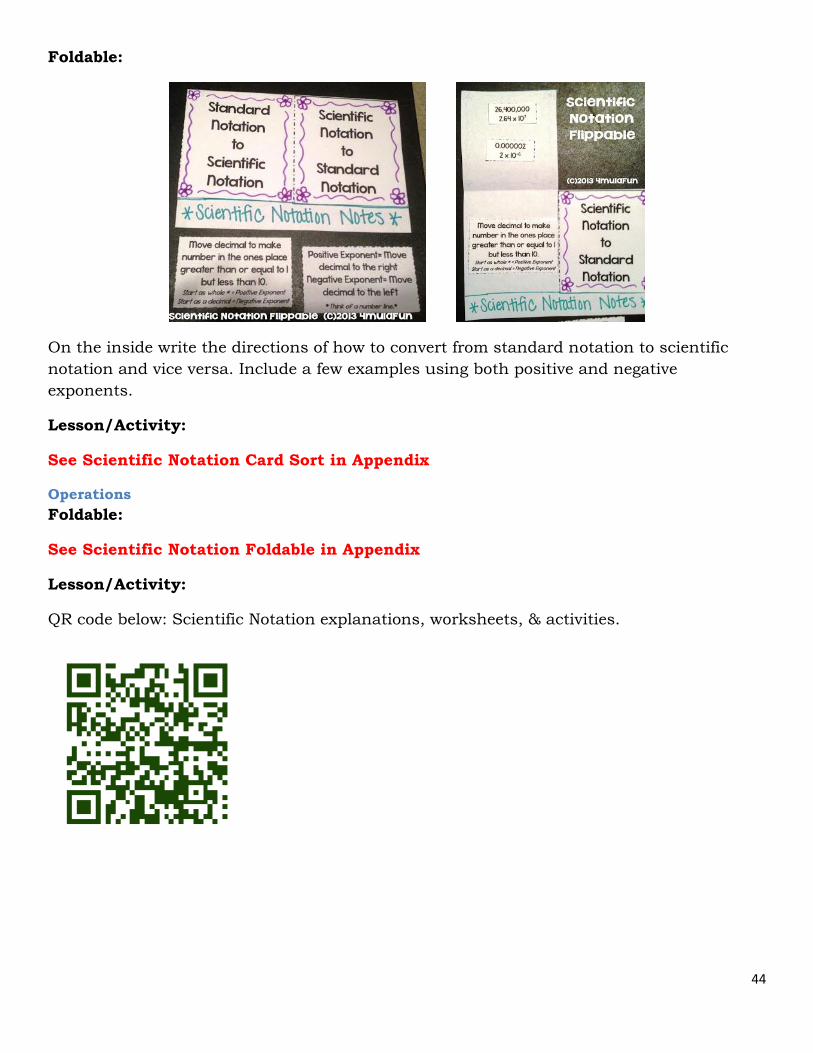
Warm-up #2:
Scientific Notation
Write in scientific notation.
1. 34,000,000
2. 0.0000543
Write in standard form.
3. 1.527 x 10⁷
4. 8.3 x 10⁻⁹
44
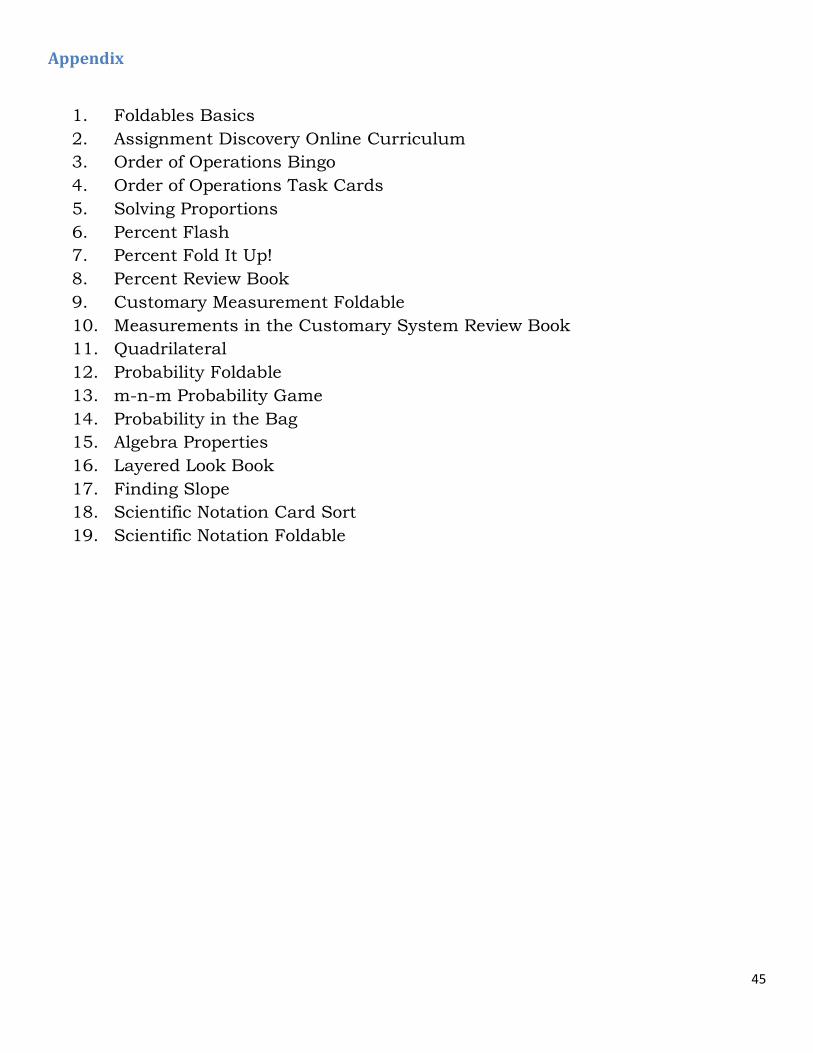
Foldable:
On the inside write the directions of how to convert from standard notation to scientific
notation and vice versa. Include a few examples using both positive and negative
exponents.
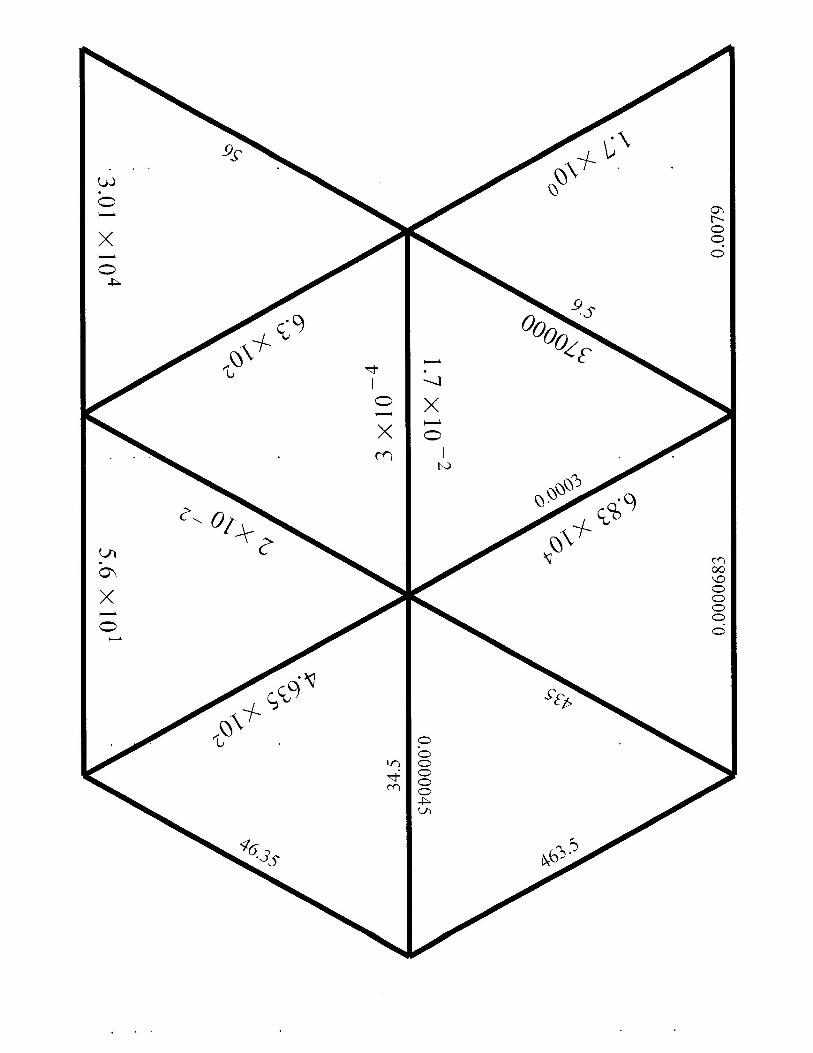
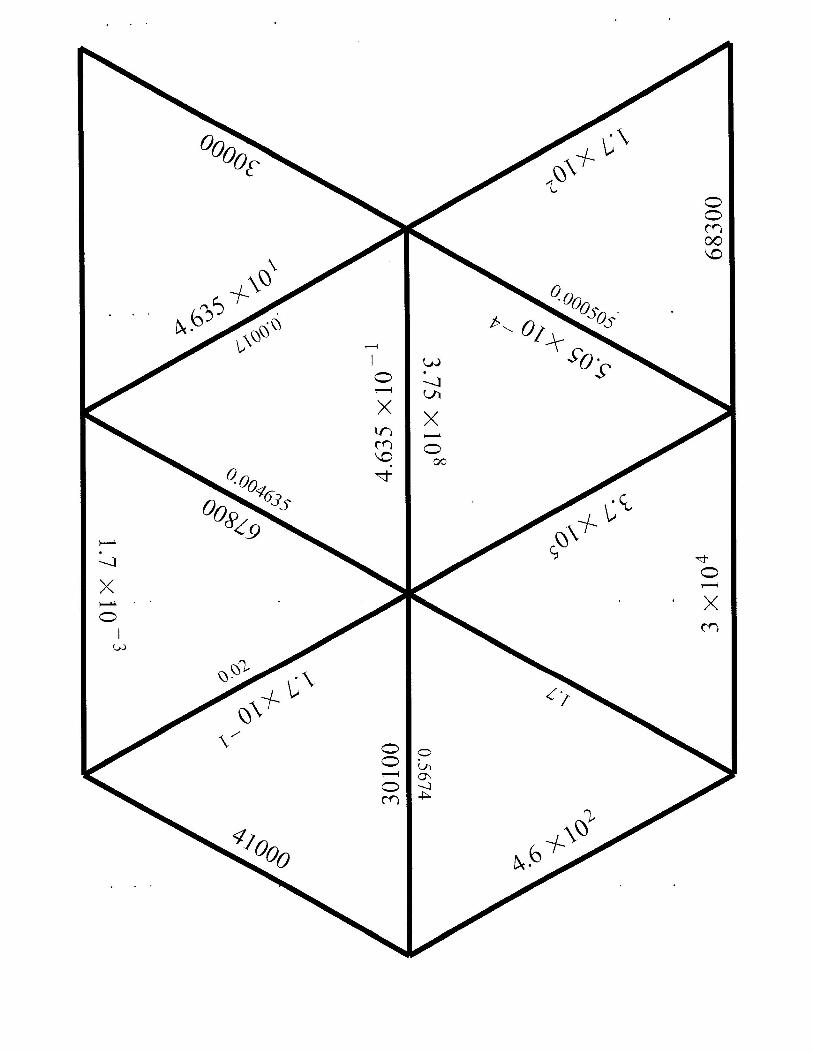
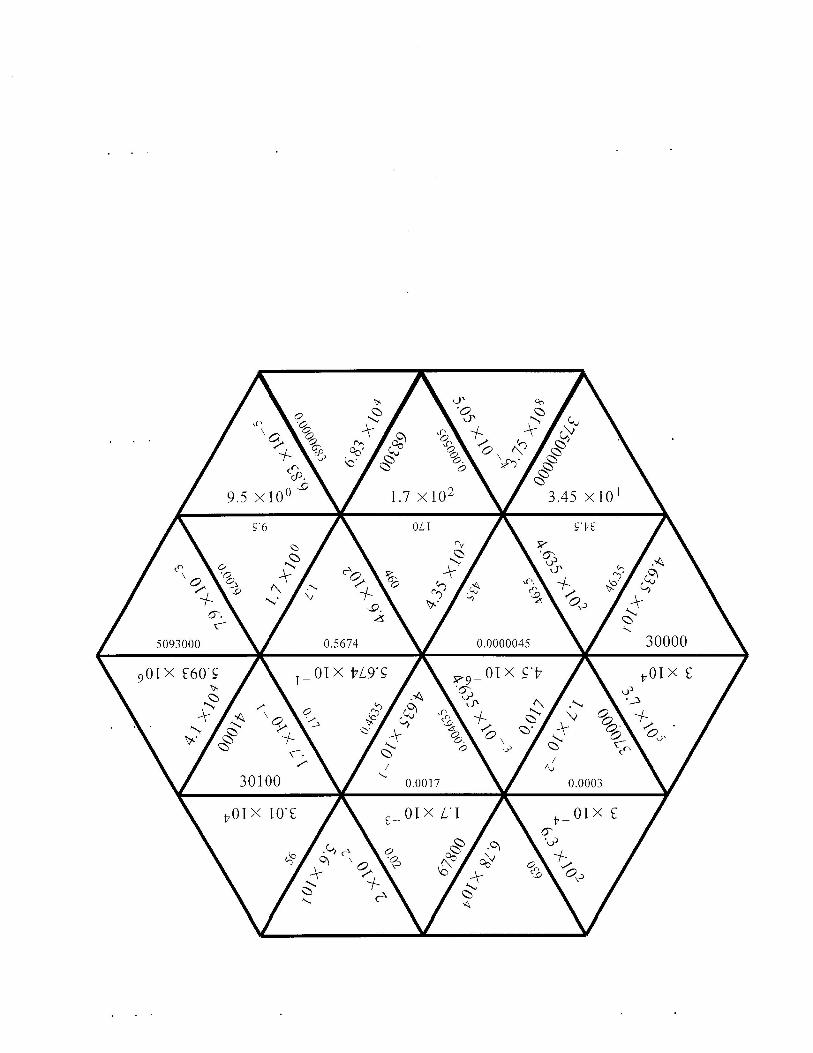
Lesson/Activity:
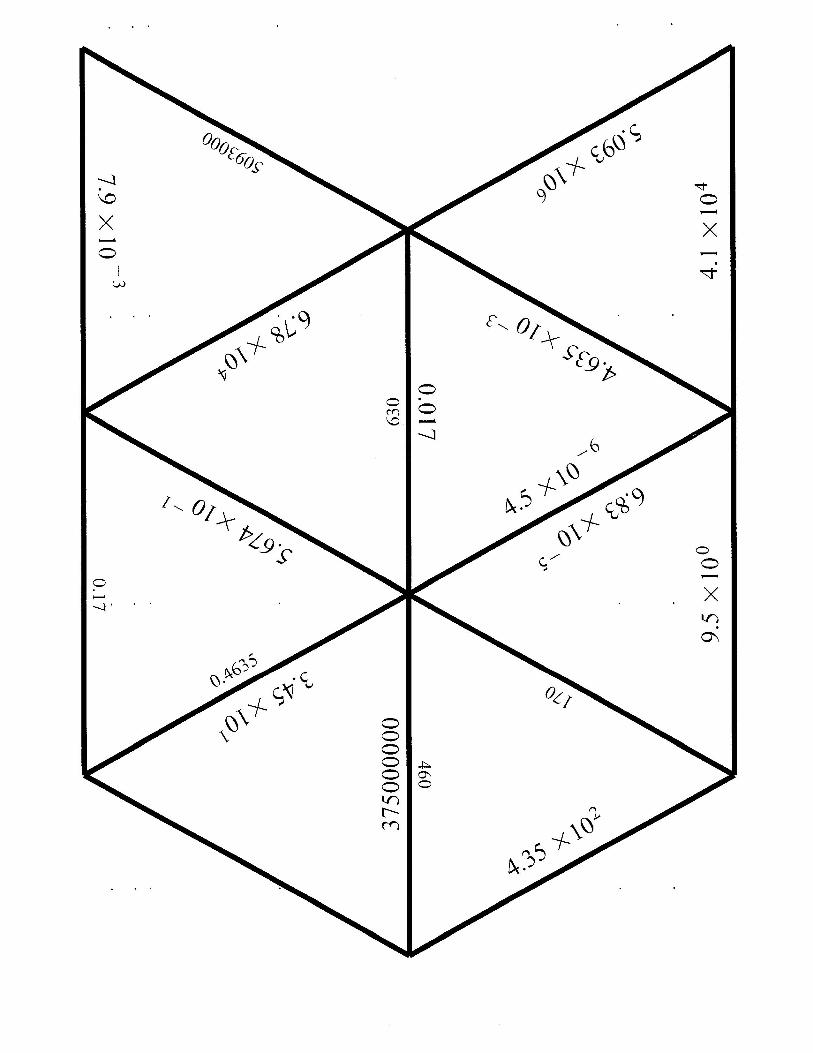
See Scientific Notation Card Sort in Appendix
Operations
Foldable:
See Scientific Notation Foldable in Appendix
Lesson/Activity:
QR code below: Scientific Notation explanations, worksheets, & activities.
45
Appendix
1. Foldables Basics
2. Assignment Discovery Online Curriculum
3. Order of Operations Bingo
4. Order of Operations Task Cards
5. Solving Proportions
6. Percent Flash
7. Percent Fold It Up!
8. Percent Review Book
9. Customary Measurement Foldable
10. Measurements in the Customary System Review Book
11. Quadrilateral
12. Probability Foldable
13. m-n-m Probability Game
14. Probability in the Bag
15. Algebra Properties
16. Layered Look Book
17. Finding Slope
18. Scientific Notation Card Sort
19. Scientific Notation Foldable
1
Assignment Discovery Online Curriculum
Lesson title:Math in Everyday Life
Grade level:2-3
Subject area:Math
Duration:Two class periods
Objectives:Students will do the following:
• Discuss how to solve word problems involving time and money• Work as a class to solve word problems focusing on addition, subtraction,
multiplication, and simple fractions• Work with a partner to make up their own word problems
Materials:• Overhead projector with transparencies and pens
Procedures:1. Begin the lesson by asking students to think about how time and money are used intheir daily lives. Students may suggest the following:
• Amount of time it takes to get to soccer practice• Amount of time they are supposed to practice their musical instrument• The times school starts and ends• How much money they earn for allowance or receive as gifts• How much money they need to save to buy a new toy
2. Explain to students that they use math every time they figure out how much time ormoney they have, spend, or need. During this lesson, students will be working together toapply the math skills they already know (addition, subtraction, multiplication, andfractions) to solve real-life problems about money and time. They will begin by workingas a class to solve word problems about money and time. After practicing, students willwork with partners to apply the same writing and math skills as they prepare their ownword problems involving either time or money.
3. Write the following problem on the board or on an overhead transparency:
2
Your teacher told you to buy a notebook, a ruler, a pencil, and an eraser for mathclass. The notebook costs $3.00, the ruler $1.50, the pencil $.20, and the eraser$.40. What is the total amount of money you need to buy these items?
Ask students how they would solve this problem. First, discuss which operation theyshould use. Point out that the words “the total amount” usually indicate that addition iscalled for.
Go through the following steps with your students to solve this problem:
- To find out how much money you need, add up the following:$3.00$1.50$0.20$0.40+____$5.10
- You would need to take $5.10 to the store to have enough money to buy the supplies.- Ask students how they would solve the problem if the teacher asked them to get three
pencils and three erasers. Explain that when they hear the word each, they know thatthey will likely have to multiply.
- To find out how much money you would need now, begin by multiplying:$.20 X 3 = $.60$.40 X 3 = $1.20
- Then add those totals to the other expenses for single items:$3.00$1.50$0.60$1.20+____$6.30
4. Now work on this problem with the class:
Sophie has soccer practice at 3:45 p.m. If it takes one hour to drive there, plus anadditional 15 minutes during rush hour, what time do she and her mother leave toget there on time?
Discuss the way to solve the problem with the class. What operation must they use? Havethem identify the need to use subtraction to determine that one hour earlier than 3:45would be 2:45. Subtracting another 15 minutes would bring the time to 2:30. To get topractice on time, Sophie and her mom must leave at 2:30.
3
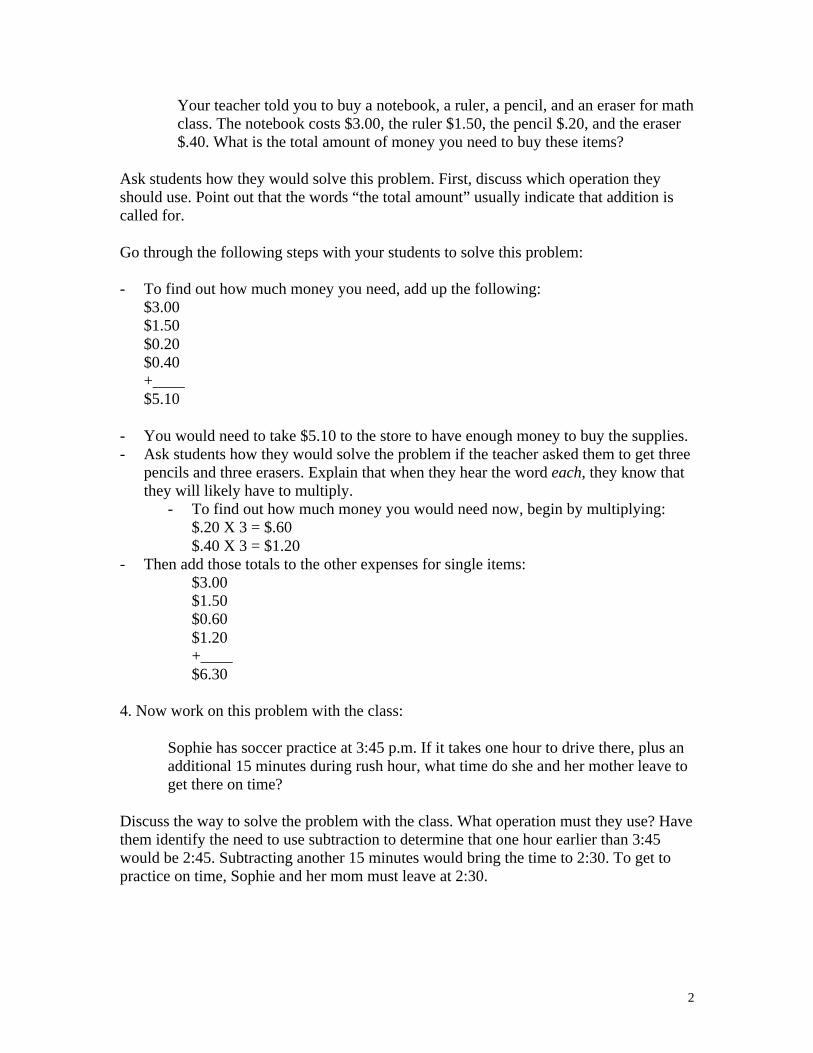
Ask students how they would figure out how much total time Sophie would be gone fromhome, including travel time to and from practice and actual practice time (which is 1 hourand 30 minutes). Tell them to try to use fractions in solving this problem.
In this case, they would need to determine that 1 hour and 15 minutes is the same as 1 1/4hours and that 1 hour and 30 minutes is the same as 1 1/2 hours. Then they would add thetravel time to the practice time and the travel time home:
1 1/4 hours1 1/4 hours
+1 1/2 hours4 hours
You may want to use a circle graph like this one to illustrate this information. Thequarter of the pie missing represents 15 minutes, or one-quarter of an hour.
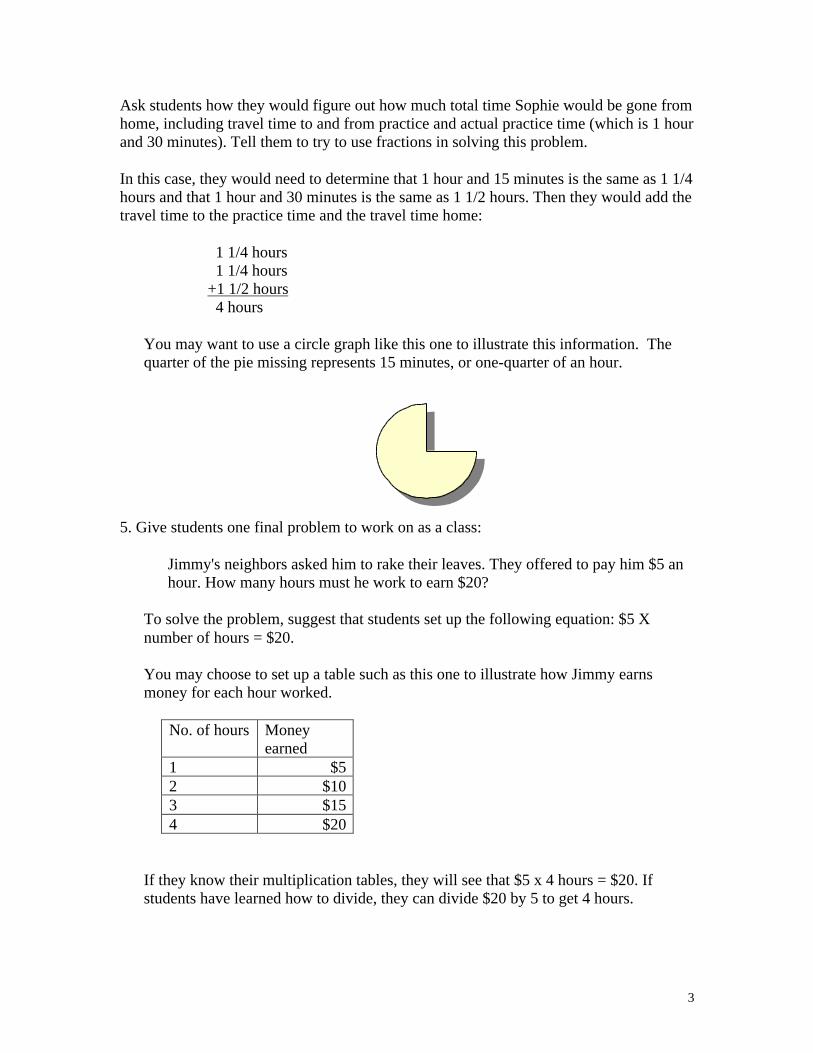
5. Give students one final problem to work on as a class:
Jimmy's neighbors asked him to rake their leaves. They offered to pay him $5 anhour. How many hours must he work to earn $20?
To solve the problem, suggest that students set up the following equation: $5 Xnumber of hours = $20.
You may choose to set up a table such as this one to illustrate how Jimmy earnsmoney for each hour worked.
No. of hours Moneyearned
1 $52 $103 $154 $20
If they know their multiplication tables, they will see that $5 x 4 hours = $20. Ifstudents have learned how to divide, they can divide $20 by 5 to get 4 hours.
4
6. Ask students if they understand how they use math all the time. Have them pickpartners. Then have each pair make up one word problem focusing on time or money.The problems should give students practice working on addition, subtraction,multiplication, or fractions. Have students write their problems on a piece of paper or ona transparency so they can present to the class. After they have written the problems,have them prepare their own solution in the form of an equation or equations, as well as awritten explanation of the steps they used to solve the problem.
Have each pair present its problem to the class. Have the presenting pair lead a discussionabout the steps needed to solve the problem. Then they can reveal their own solutions.
Discussion Questions:
1. Which words in a word problem usually mean that addition is the correct operation touse? Which words usually indicate that subtraction should be used?
2. Give two examples of problems about money or time that came up in your everydaylife. Were you able to solve them?
3. Take one of the problems presented by your classmates and add a sentence to it thatrequires using another mathematical operation to find the solution. (They might askthem to figure out how much time is needed each week, if the activity was only forone day. Or, they might ask how much change they would get back for their purchase,if they gave the cashier a $20 bill for a smaller amount.)
Evaluation:Use the following three-point rubric to evaluate how well students listened in class,participated in class discussions, and were able to apply what they learned to write theirown word problems.
Three points: very attentive during class; actively participated in class discussions; andapplied what they learned to write accurate, interesting word problems.
Two points: somewhat attentive during class; showed some involvement during classdiscussions; and applied what they learned to write satisfactory word problems.
One point: not attentive during class; showed little involvement during class discussions;and had difficulty applying what they learned to write their own word problems.
Extension:
Tips for Solving Problems
5
Divide students into groups of three or four. Based on what they learned during class,have each group write a chart of at least three tips for other students on how to solveword problems. The chart should encourage students to do the following when solvingword problems:
• Read the problem very carefully.• Point out key words that signify which operation to use.• Discuss the importance of showing the steps involved in solving a problem.
Students can be as creative as they want in developing their posters and can use symbols,drawings, or problems to express their ideas. If time permits, have students share theirposters. Then display them in the classroom
Suggested Reading:
Numbers (Math Matters series, vol. 1)Grolier Educational, 1999.This is a clear introduction to the world of math and numbers. Lots of cartoon drawingsexplain the history of numbers, number places, minus numbers, fractional numbers, andnumbers on graphs, and a lot more. Good examples accompany all the information. Thisis the first title in an excellent series to introduce young people to math concepts.
Telling Time: How to Tell Time on Digital and Analog Clocks!Jules Older. Charlesbridge Publishing, 2000.This is a colorful and cheerful introduction to telling time for young children. In additionto describing in detail how to tell time on both analog and digital clocks, the concept oftime is covered. Lots of examples are found on every page and a poem at the end willhelp children remember how long things take!
Vocabulary:
decimalDefinition: A fraction (as .25 = 25/100 or .025 = 25/1000) or mixed number (as 3.025 =3-25/1000) in which the denominator is a power of 10 usually expressed by use of thedecimal point .Context: We use decimals when we count money.
elapsed timeDefinition: The actual time taken to complete a task.Context: The amount of time it takes to complete a project is known as elapsed time.
equationDefinition: A mathematical statement of equality.Context: Addition, subtraction, multiplication and division can be used in solvingequations.
fraction
6
Definition: A numerical representation of a portion of a whole.Context: One-fourth (1/4) and one-half (1/2) are fractions.
operationDefinition: The practical application of principles or processes; in mathematics, thisrefers to addition, subtraction, multiplication, or division.Context: When solving word problems, the first step in finding the answer is determiningwhich operation to use.
Academic Standards:This lesson adheres to standards from the National Council on the Teaching ofMathematics:
• Numbers and Operations• Problem Solving
Credit:Marilyn Fenichel, freelance writer and curriculum developer.
This lesson was developed in consultation with Dianne Hoffman, consulting teacher inMontgomery County, Maryland.
DiscoverySchool.comhttp://www.discoveryschool.comCopyright 2002 Discovery.com.
Teachers may reproduce copies of these materials for classroom use only.
© 2008 National Council of Teachers of Mathematics http://illuminations.nctm.org
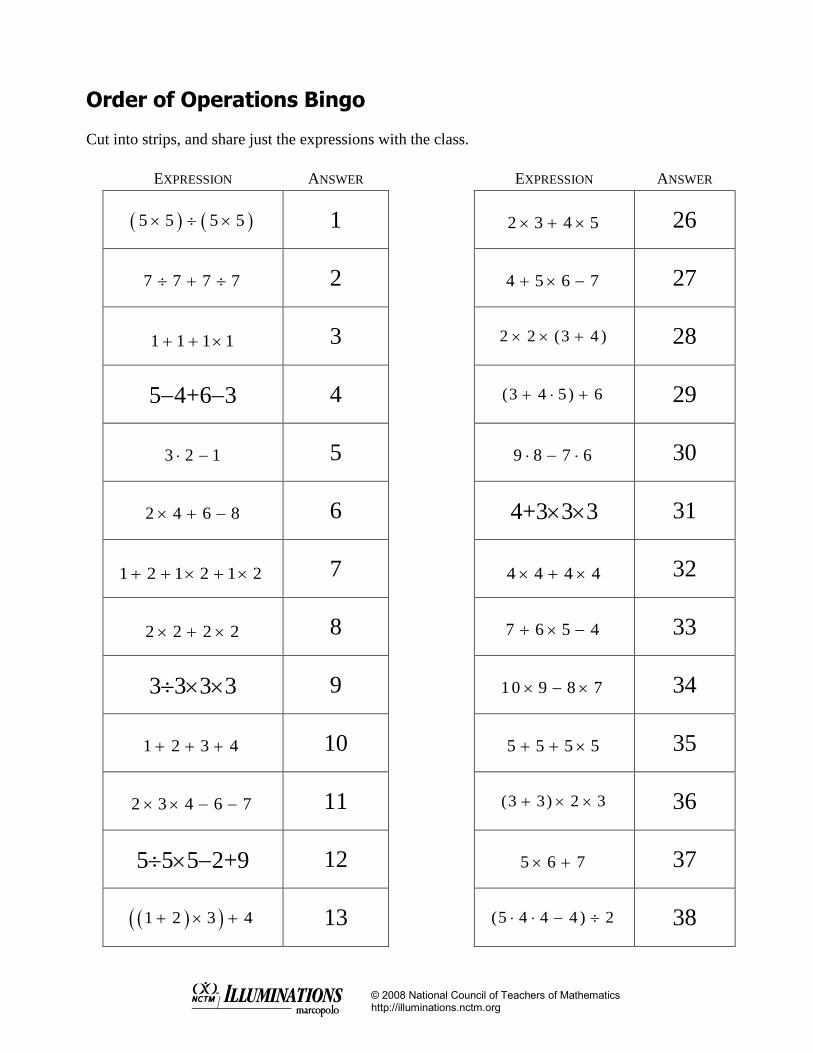
Order of Operations Bingo
Cut into strips, and share just the expressions with the class.
EXPRESSION ANSWER EXPRESSION ANSWER
5 5 5 5 1 2 3 4 5 26
7 7 7 7 2 4 5 6 7 27
1 1 1 1 3 2 2 (3 4 ) 28
54+63 4 (3 4 5) 6 29
3 2 1 5 9 8 7 6 30
2 4 6 8 6 4+333 31
1 2 1 2 1 2 7 4 4 4 4 32
2 2 2 2 8 7 6 5 4 33
3333 9 10 9 8 7 34
1 2 3 4 10 5 5 5 5 35
2 3 4 6 7 11 (3 3) 2 3 36
5552+9 12 5 6 7 37
1 2 3 4 13 (5 4 4 4 ) 2 38
© 2008 National Council of Teachers of Mathematics http://illuminations.nctm.org
1 2 3 4 14 3 4 4 5 39
5 4 3 2 15 4 3 2 1 4 40
1 2 3 4 5 16 6 7 8 9 41
8 8 8 8 17 2 3 (3 4 ) 42
6 5 4 3 18 5 6 8 4 43
5+456 19 4 3 2 2 1 44
2 3 4 5 6 20 8 7 6 5 45
1 (2 3) 4 21 2 3 4 5 46
6 7 5 4 22 2 3 4 5 6 7 47
6 5 4 3 23 54 3 2 48
2 3 4 24 7 7 6 6 49
1 4 4 1 25 8 7 6 50
© 2008 National Council of Teachers of Mathematics http://illuminations.nctm.org
© 2008 National Council of Teachers of Mathematics http://illuminations.nctm.org
Order of
Operations Matching
Task Cards
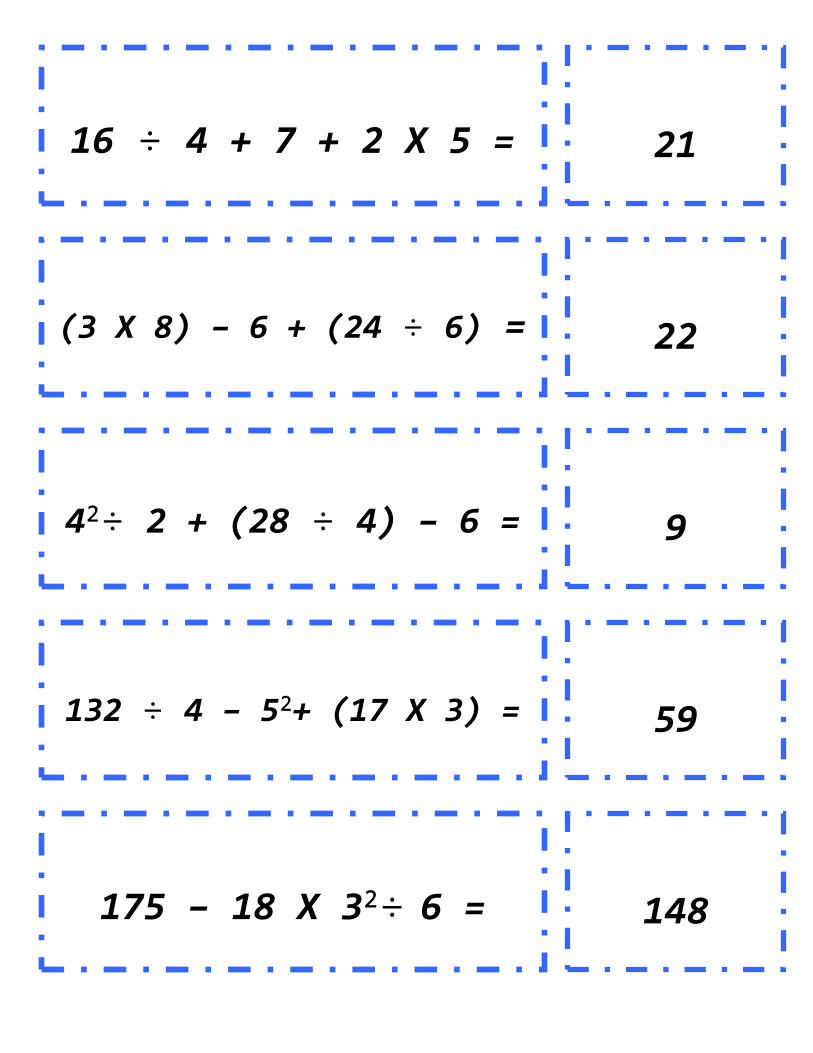
16 ÷ 4 + 7 + 2 X 5 =
21
(3 X 8) – 6 + (24 ÷ 6) =
4²÷ 2 + (28 ÷ 4) – 6 =
132 ÷ 4 – 5²+ (17 X 3) =
22
9
59
175 – 18 X 3²÷ 6 =
148
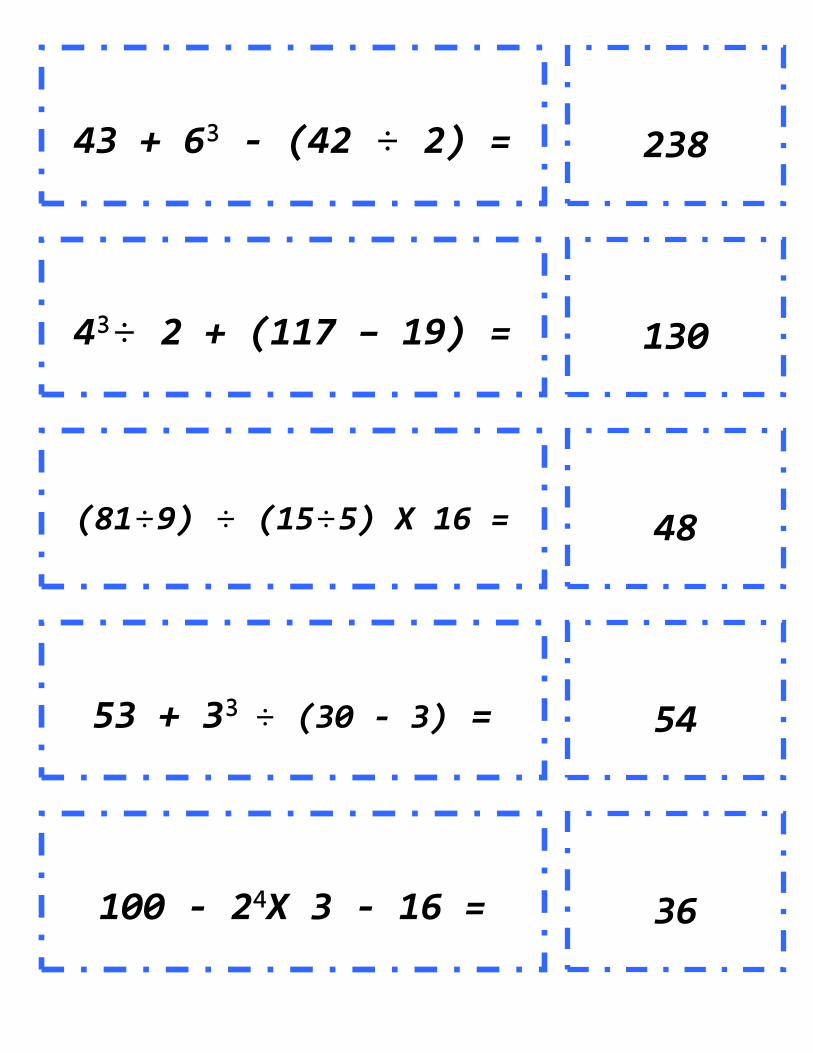
43 + 6³ - (42 ÷ 2) =
238
4³÷ 2 + (117 – 19) =
130
(81÷9) ÷ (15÷5) X 16 =
53 + 3³ ÷ (30 - 3) =
100 - 2⁴X 3 - 16 =
48
54
36
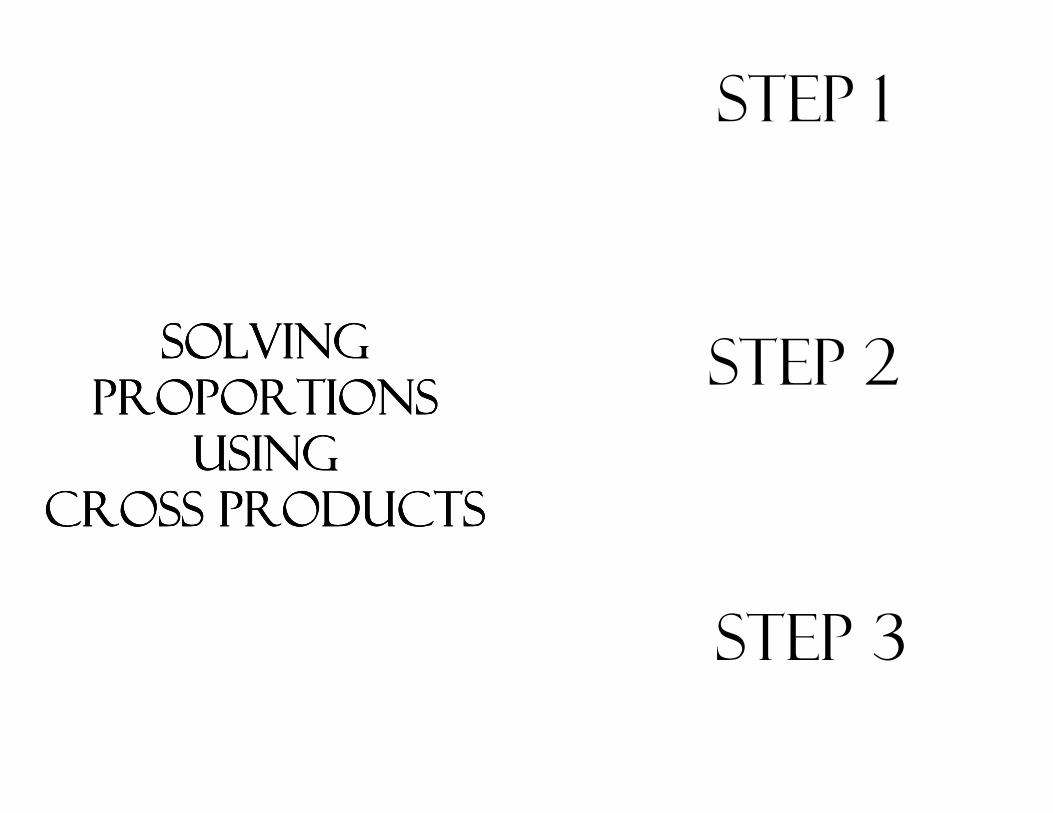
Solving Solving Solving Solving
proportions proportions proportions proportions
using using using using
cross productscross productscross productscross products
Step 1
Step 2
Step 3
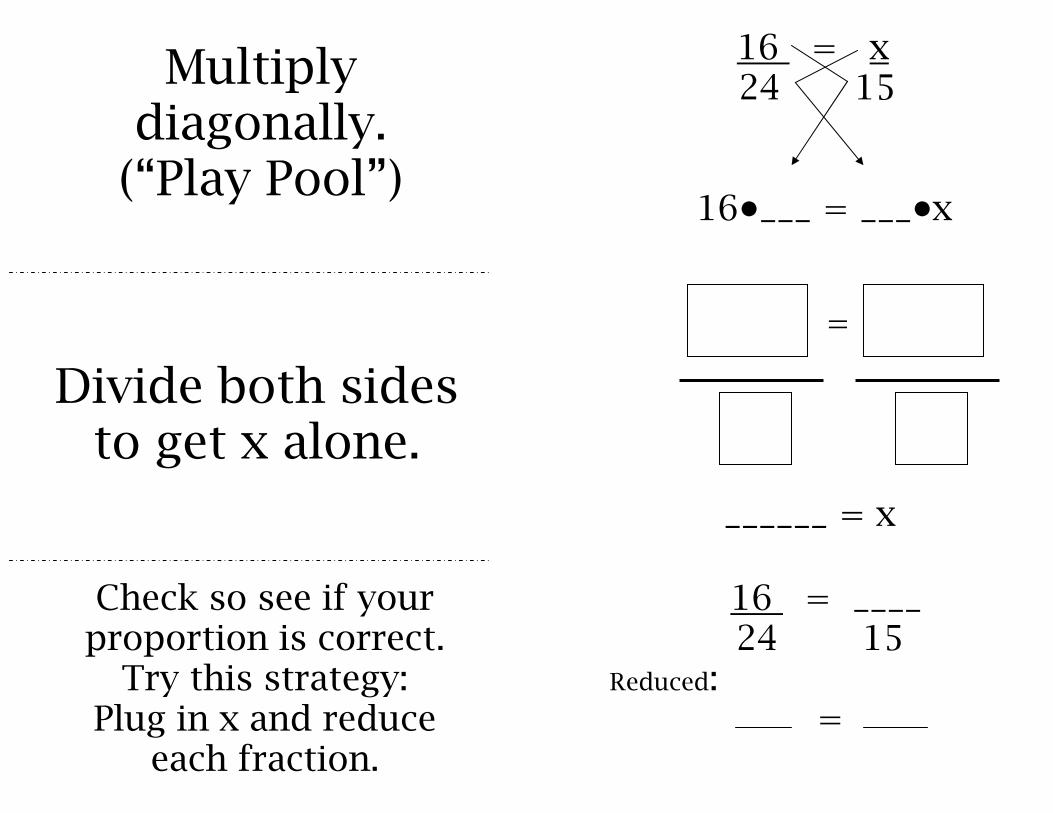
Multiply
diagonally. (“Play Pool”)
16 = x 24 15 16•___ = ___•x
Divide both sides to get x alone.
Check so see if your proportion is correct. Try this strategy:
Plug in x and reduce each fraction.
=
______ = x
16 = ____ 24 15 Reduced: =
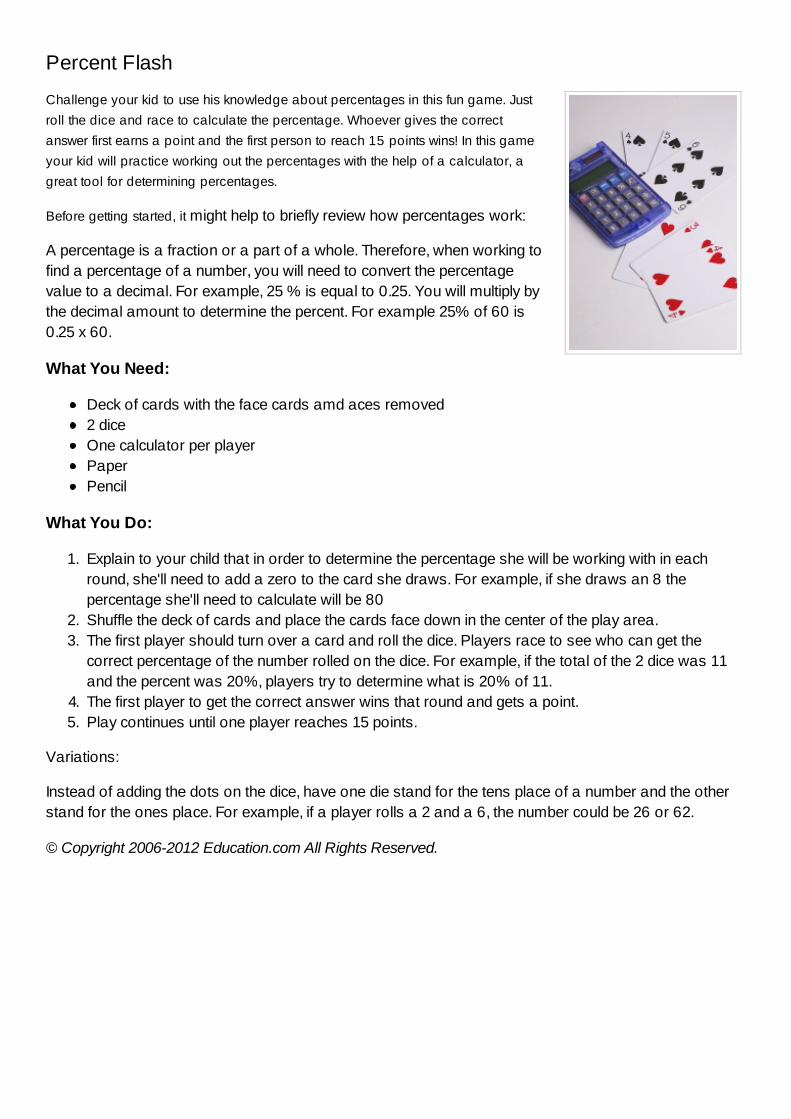
Percent Flash
Challenge your kid to use his knowledge about percentages in this fun game. Just
roll the dice and race to calculate the percentage. Whoever gives the correct
answer first earns a point and the first person to reach 15 points wins! In this game
your kid will practice working out the percentages with the help of a calculator, a
great tool for determining percentages.
Before getting started, it might help to briefly review how percentages work:
A percentage is a fraction or a part of a whole. Therefore, when working tofind a percentage of a number, you will need to convert the percentagevalue to a decimal. For example, 25 % is equal to 0.25. You will multiply bythe decimal amount to determine the percent. For example 25% of 60 is0.25 x 60.
What You Need:
Deck of cards with the face cards amd aces removed2 diceOne calculator per playerPaperPencil
What You Do:
1. Explain to your child that in order to determine the percentage she will be working with in eachround, she'll need to add a zero to the card she draws. For example, if she draws an 8 thepercentage she'll need to calculate will be 80
2. Shuffle the deck of cards and place the cards face down in the center of the play area.3. The first player should turn over a card and roll the dice. Players race to see who can get the
correct percentage of the number rolled on the dice. For example, if the total of the 2 dice was 11and the percent was 20%, players try to determine what is 20% of 11.
4. The first player to get the correct answer wins that round and gets a point.5. Play continues until one player reaches 15 points.
Variations:
Instead of adding the dots on the dice, have one die stand for the tens place of a number and the otherstand for the ones place. For example, if a player rolls a 2 and a 6, the number could be 26 or 62.
© Copyright 2006-2012 Education.com All Rights Reserved.
Thank you for purchasing this product!
Please stop back at my store http://www.teacherspayteachers.com/Store/Middle-School-Math-Moments
(When you leave feedback, you earn TpT Credits towards future purchases!)
Please visit me:
Blog: http://ellienix.blogspot.com/
Pinterest: https://pinterest.com/midschoolmath/
Facebook: https://www.facebook.com/middleschoolmathmoments
Feel free to contact me at: [email protected]
Credits
Logo credits to http://www.teacherspayteachers.com/Store/Lindy-Du-Plessis (frame) and
http://www.teacherspayteachers.com/Store/Cupcakes-N-Curriculum (font)
4 http://www.teacherspayteachers.com/Store/Middle-School-Math-Moments
©ENIXON2013
1 8 7 6 2 3 4 5
Name _____________________
Percent Review Book
To Change a Fraction to a Percent:
• _____________________
the numerator by the
denominator.
• Move the decimal point
______ places to the
_____________.
To Change a Percent to a Fraction:
• Write the percent over
________ and reduce the
fraction.
OR
• Change the percent to a
____________ and use the
place value name to write
the fraction.
Examples:
⅔ =
⅞ =
½ =
¾ =
Examples:
9% =
36% =
87.5% =
60% =
15% =
Percent Proportions:
Use the formula: % = is 100 of
“Is” is the ____________, while
“Of” is the ______________.
(Don’t be fooled: Sometimes the
Part is bigger than the whole!
Think of Extra Credit.)
Examples: What percent of 25 is 13?
What is 35% of 40?
16 is 25% of what number?
What percent of 40 is 50?
Estimating with Percents: Quick hints:
To find 10% of a number, drop the last 0 (or move the decimal over 1
place to the left). Ex. Find 10% of 72
Answer is about _______.
To find 5% of a number, find 10%, then take half of it. Ex. Find 5% of 81
Answer is about __________.
You can find 65% of a number by combining answers. Find 50% + 10% + 5%
1 8 7 6 2 3 4 5
Name _____________________
Applications of Percents
Calculating Sales Tax 1. Change percent to a
_______________ by
moving the decimal
_______ places to the
________.
2. _____________dollar
amount by the sales tax
decimal.
3. ADD sales tax to calculate
total.
Example:
Calculate 8.75% sales tax and total cost for a $48 purchase. Sales tax __________ Total _________
Calculating Discount and Sale Price
1. Change percent to a
_______________.
2. _____________dollar
amount by the discount
decimal.
3. SUBTRACT discount price
from original to calculate
total.
Example:
Calculate discount and sale price for a $64 item marked 35% off. Discount ___________ Sale Price ___________
Calculating Commission 1. Change percent to a
_______________.
2. _____________dollar
amount by the discount
decimal.
Example: Calculate 3%
commission on a $1900 sale.
Answer _____________
Calculating Interest Use the formula I = prt , where
p = ___________________
r = ___________________
t = ___________________
Example: Calculate interest
earned on a $400 investment
at 2.5% interest for 3 years.
Answer _____________
Calculating Percent Change
Use the formula:
change original
⇒ Then change to a percent.
Example: Last year, your math
average was 80. This year, it is
100. Find the percent change.
Answer _____________
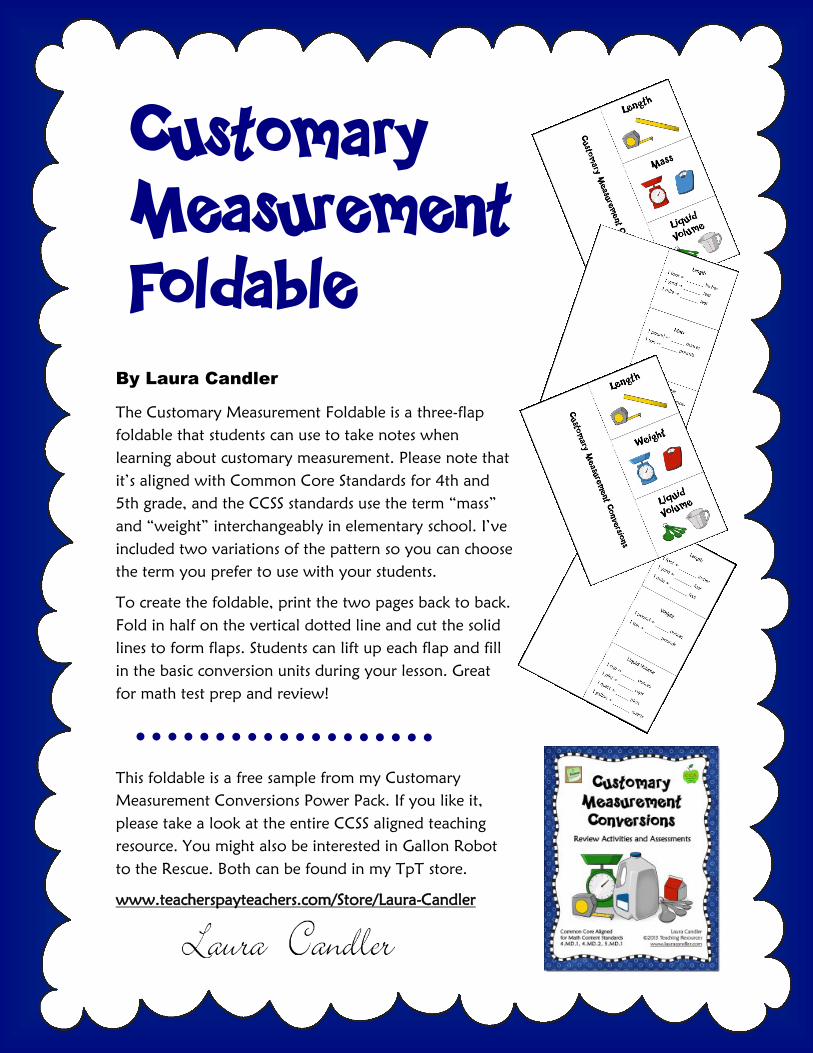
Customary Measurement Foldable
By Laura Candler
The Customary Measurement Foldable is a three-flap
foldable that students can use to take notes when
learning about customary measurement. Please note that
it’s aligned with Common Core Standards for 4th and
5th grade, and the CCSS standards use the term “mass”
and “weight” interchangeably in elementary school. I’ve
included two variations of the pattern so you can choose
the term you prefer to use with your students.
To create the foldable, print the two pages back to back.
Fold in half on the vertical dotted line and cut the solid
lines to form flaps. Students can lift up each flap and fill
in the basic conversion units during your lesson. Great
for math test prep and review!
This foldable is a free sample from my Customary
Measurement Conversions Power Pack. If you like it,
please take a look at the entire CCSS aligned teaching
resource. You might also be interested in Gallon Robot
to the Rescue. Both can be found in my TpT store.
www.teacherspayteachers.com/Store/Laura-Candler
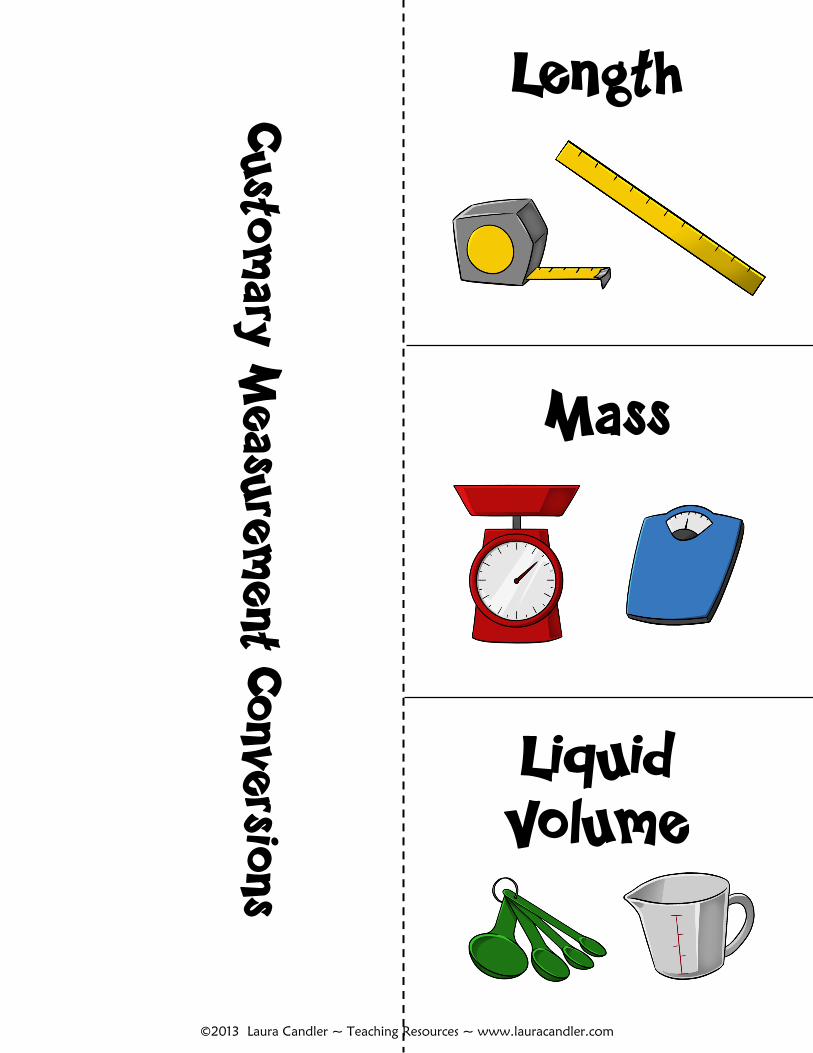
Length
Custo
mary M
easu
rem
ent C
onve
rsions
Mass
Liquid Volume
©2013 Laura Candler ~ Teaching Resources ~ www.lauracandler.com
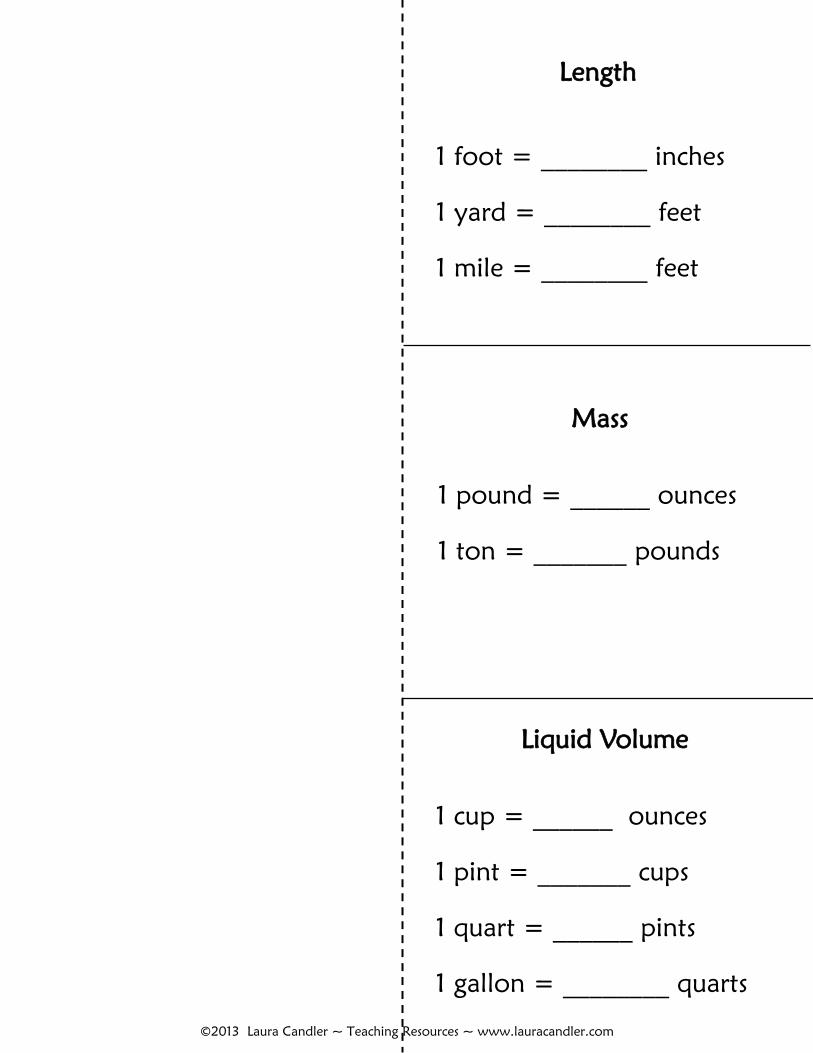
Length
1 foot = ________ inches
1 yard = ________ feet
1 mile = ________ feet
Mass
1 pound = ______ ounces
1 ton = _______ pounds
Liquid Volume
1 cup = ______ ounces
1 pint = _______ cups
1 quart = ______ pints
1 gallon = ________ quarts
©2013 Laura Candler ~ Teaching Resources ~ www.lauracandler.com
Length
Custo
mary M
easu
rem
ent C
onve
rsions
Weight
Liquid Volume
©2013 Laura Candler ~ Teaching Resources ~ www.lauracandler.com
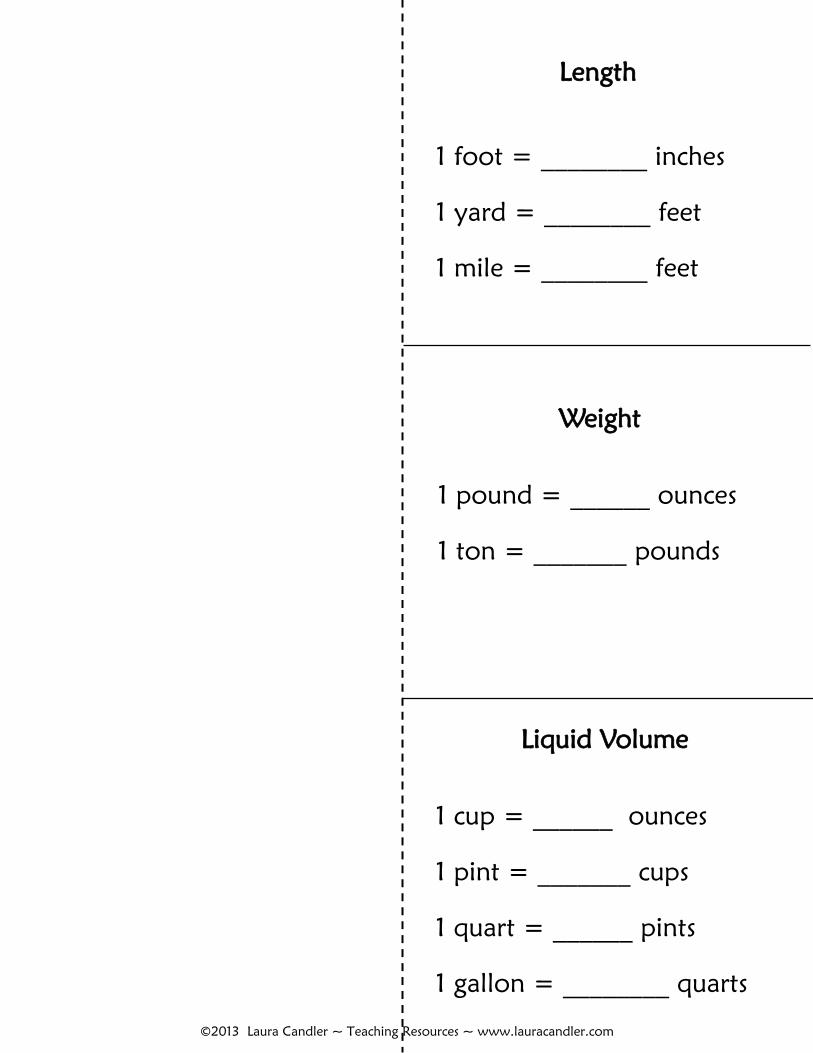
Length
1 foot = ________ inches
1 yard = ________ feet
1 mile = ________ feet
Weight
1 pound = ______ ounces
1 ton = _______ pounds
Liquid Volume
1 cup = ______ ounces
1 pint = _______ cups
1 quart = ______ pints
1 gallon = ________ quarts
©2013 Laura Candler ~ Teaching Resources ~ www.lauracandler.com
Artwork Credits
The clipart, borders, and frames in my ebooks come from a
variety of sources. If you like the artwork and design elements
you see in my materials, visit the stores of these clipart sellers.
Digital Classroom Clipart
www.digitalclassroomclipart.com
Digital Swirls Creations
http://www.teacherspayteachers.com/Store/Digital-Swirls-Creations
Fancy Dog Studio
http://www.teacherspayteachers.com/Store/Fancy-Dog-Studio
Common Core Alignment
The Customary Measurement Foldable is aligned with the parts of the
4th and 5th Grade Common Core Operations Measurement and Data
Standards below:
4.MD.1 Know relative sizes of measurement units within one system of
units including km, m, cm; kg, g; lb, oz.; l, ml; hr, min, sec.
5.MD.1 Convert among different-sized standard measurement units
within a given measurement system .
Even though the foldable is not specifically aligned with standards for
middle school students, it will come in handy if they are having trouble
remembering their basic units of measurement.
©2013 Laura Candler ~ Teaching Resources ~ www.lauracandler.com
Teaching Multiple Intelligence Theory
Bingo Showdown:
Confusing Words Review
Character Bio Reports
Analyzing Character Traits
Powerful Poetry Combo
Plural Noun Showdown
Sentence Go Round
Writing Powerful Poetry
Geometry: Exploring the Basics
Math Stations for Middle Grades (3-8)
Mastering Math Facts
Polygon Explorations
Talking Sticks Discussions (CCSS Aligned)
Place Value Spinner Games
Fraction Spinner Games
Simplify and Snap Fraction Game
Order of Operations Bingo
Seasonal
Teaching Packs
October
November
December
January
February (Free!)
March
April
If you enjoyed the materials in this teaching resources pack, you might also enjoy these ebooks
and lessons. You can purchase them from my store on TeachersPayTeachers.com by clicking the
links below or by visiting my Teaching Resources website: www.lauracandler.com.
1 7 6 3 4 5
This book belongs to:
__________________
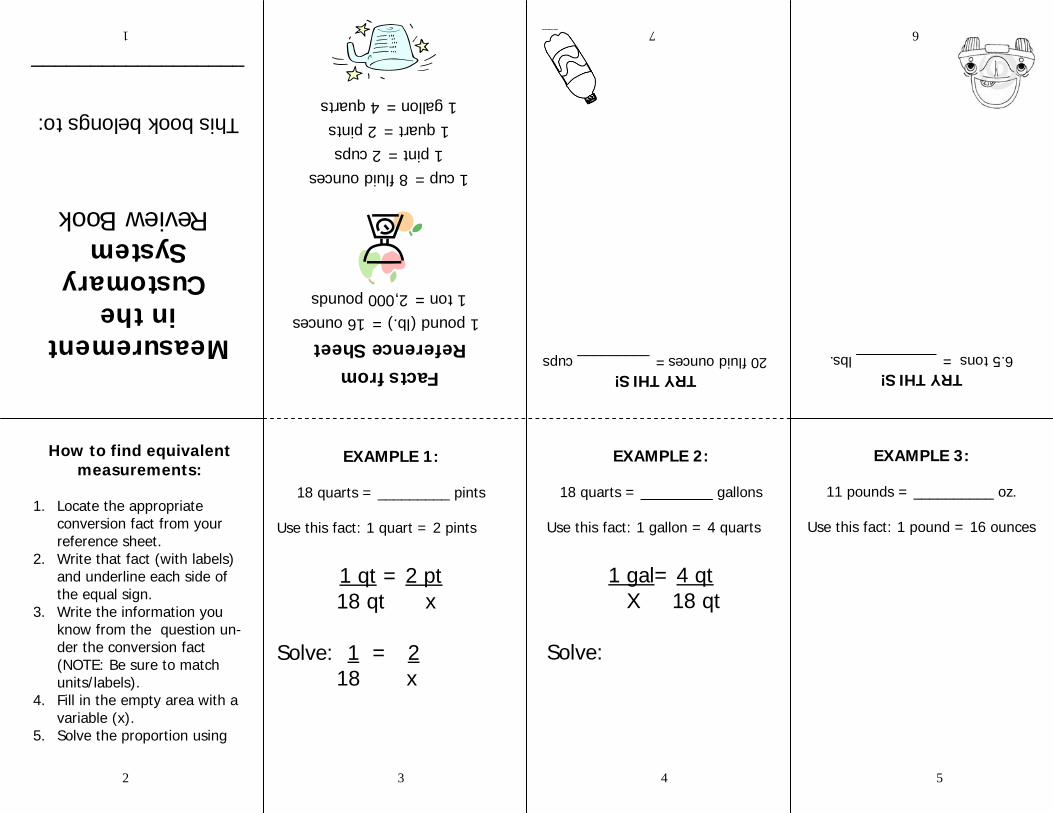
Measurement in the
Customary System
Review Book
2
Facts from Reference Sheet
1 pound (lb.) = 16 ounces 1 ton = 2,000 pounds
1 cup = 8 fluid ounces 1 pint = 2 cups
1 quart = 2 pints 1 gallon = 4 quarts
How to find equivalent measurements:
1. Locate the appropriate
conversion fact from your reference sheet.
2. Write that fact (with labels) and underline each side of the equal sign.
3. Write the information you know from the question un-der the conversion fact (NOTE: Be sure to match units/labels).
4. Fill in the empty area with a variable (x).
5. Solve the proportion using
EXAMPLE 1:
18 quarts = _________ pints Use this fact: 1 quart = 2 pints
1 qt = 2 pt
18 qt x Solve: 1 = 2 18 x
EXAMPLE 2:
18 quarts = _________ gallons Use this fact: 1 gallon = 4 quarts
1 gal= 4 qt
X 18 qt Solve:
EXAMPLE 3:
11 pounds = __________ oz. Use this fact: 1 pound = 16 ounces
TRY THIS! 6.5 tons = __________ lbs.
TRY THIS! 20 fluid ounces = _________ cups
1 7 6 3 4 5
This book belongs to:
__________________
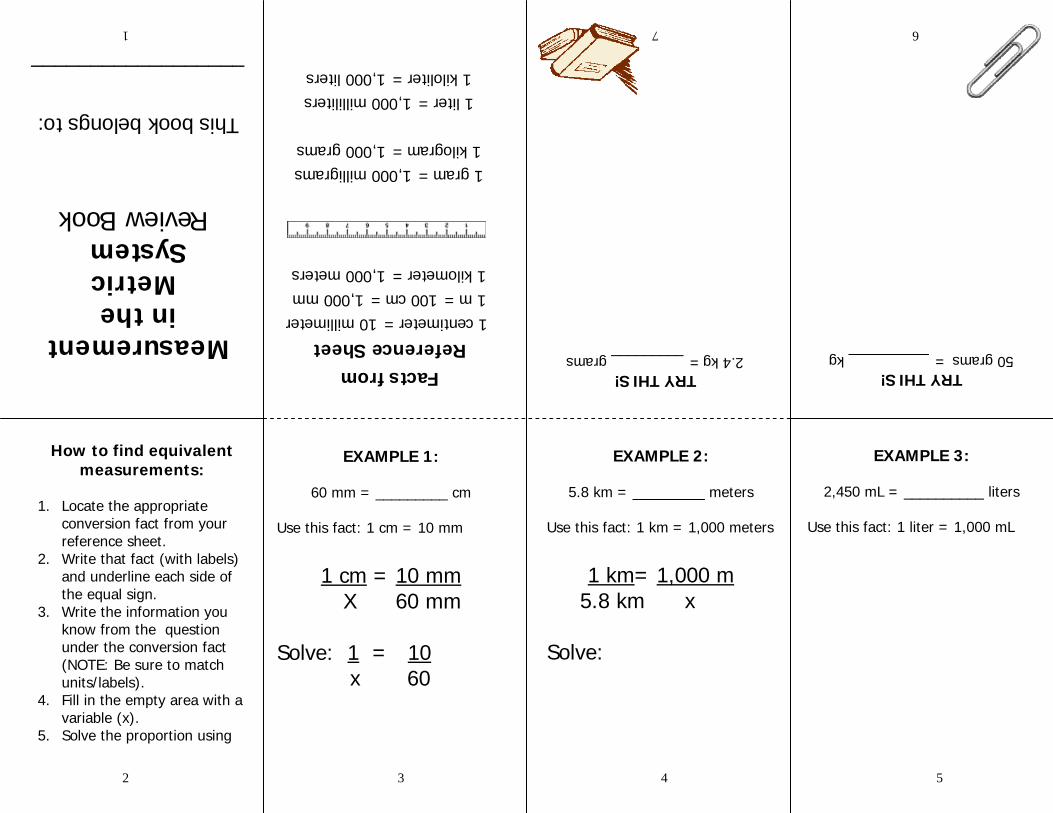
Measurement in the Metric System
Review Book
2
Facts from Reference Sheet
1 centimeter = 10 millimeter 1 m = 100 cm = 1,000 mm 1 kilometer = 1,000 meters
1 gram = 1,000 milligrams 1 kilogram = 1,000 grams
1 liter = 1,000 milliliters 1 kiloliter = 1,000 liters
How to find equivalent measurements:
1. Locate the appropriate
conversion fact from your reference sheet.
2. Write that fact (with labels) and underline each side of the equal sign.
3. Write the information you know from the question under the conversion fact (NOTE: Be sure to match units/labels).
4. Fill in the empty area with a variable (x).
5. Solve the proportion using
EXAMPLE 1:
60 mm = _________ cm Use this fact: 1 cm = 10 mm
1 cm = 10 mm
X 60 mm Solve: 1 = 10 x 60
EXAMPLE 2:
5.8 km = _________ meters Use this fact: 1 km = 1,000 meters
1 km= 1,000 m
5.8 km x Solve:
EXAMPLE 3:
2,450 mL = __________ liters Use this fact: 1 liter = 1,000 mL
TRY THIS! 50 grams = __________ kg
TRY THIS! 2.4 kg = _________ grams
2004 Carol DeFreese
Bottom of Page
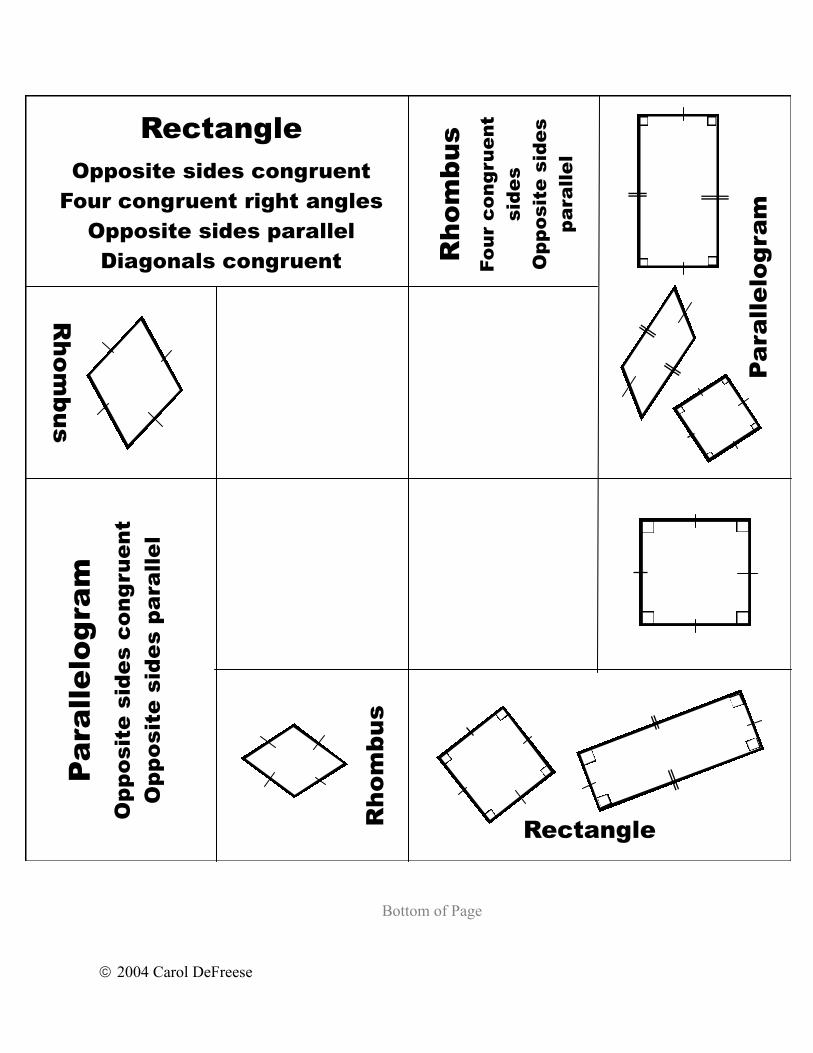
Rectangle
Opposite sides congruent
Four congruent right angles
Opposite sides parallel
Diagonals congruent
Rhom
bus
Fo
ur c
on
gru
ent
sid
es
Op
po
site
sid
es
pa
ra
lle
l
Rh
om
bu
s
Pa
ra
lle
lo
gra
m
Op
po
site
sid
es c
on
gru
en
t
Op
po
site
sid
es p
ara
lle
l
Rh
om
bu
s
Rectangle
Pa
ra
lle
lo
gram
2004 Carol DeFreese
Bottom of Page
Trapezoid
One pair of parallel sides Trapezoid
Quad - “four” Lateral - “side”
Quadrilateral “four sides”
Trapezoid
Trapezoid
Sq
uare
Sq
ua
re
Fo
ur c
on
gru
en
t sid
es
Fo
ur c
on
gru
en
t rig
ht a
ng
le
s
Op
po
site
sid
es p
ara
lle
l
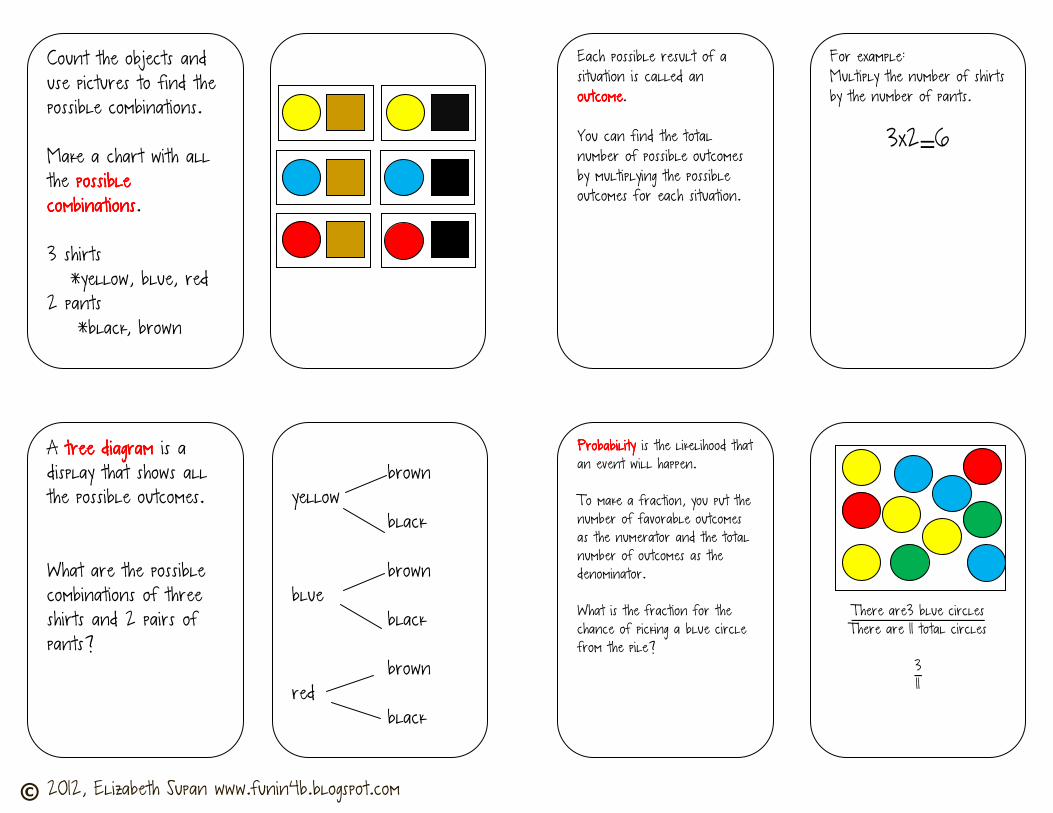
© 2012, Elizabeth Supan www.funin4b.blogspot.com
Count the objects and use pictures to find the possible combinations. Make a chart with all
the possible possible possible possible
combinationscombinationscombinationscombinations. 3 shirts *yellow, blue, red 2 pants *black, brown
A tree diagramtree diagramtree diagramtree diagram is a display that shows all the possible outcomes. What are the possible
combinations of three
shirts and 2 pairs of
pants?
brown yellow black brown blue black brown red black
For example: Multiply the number of shirts by the number of pants.
3x2=6
There are3 blue circles There are 11 total circles
3 11
Each possible result of a
situation is called an
outcomeoutcomeoutcomeoutcome. You can find the total
number of possible outcomes by multiplying the possible outcomes for each situation.
Probability Probability Probability Probability is the likelihood that an event will happen. To make a fraction, you put the number of favorable outcomes
as the numerator and the total
number of outcomes as the
denominator. What is the fraction for the
chance of picking a blue circle from the pile?
© 2012, Elizabeth Supan www.funin4b.blogspot.com
Outcomes
Probability as a
Fraction
Finding Combinations
Tree
Diagrams
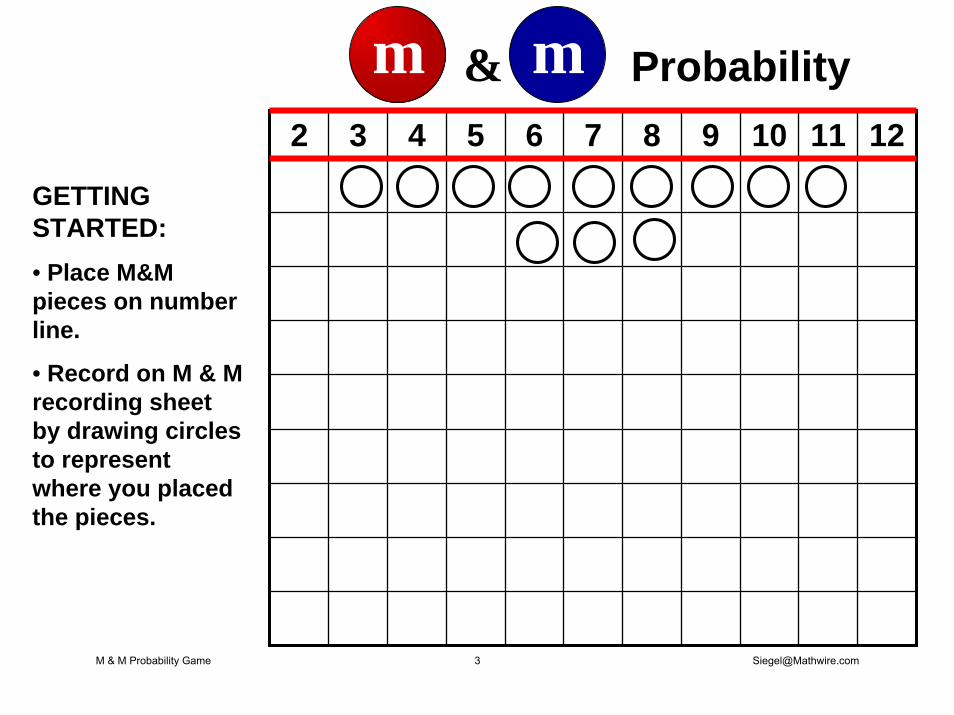
2 3 4 5 6 7 8 9 10 11 12
& Probabilitym m
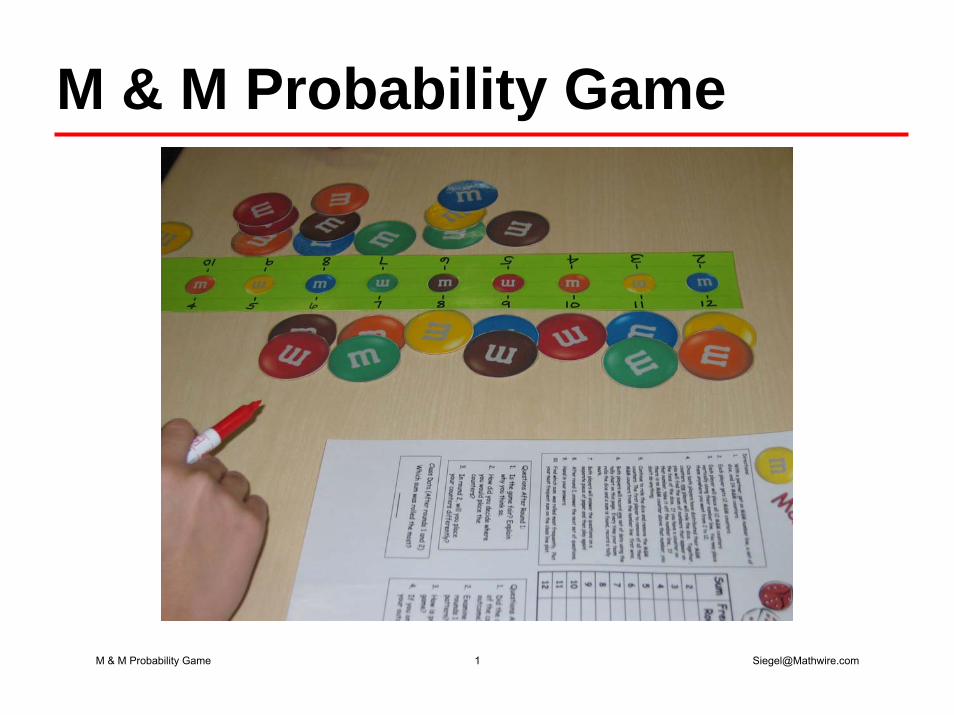
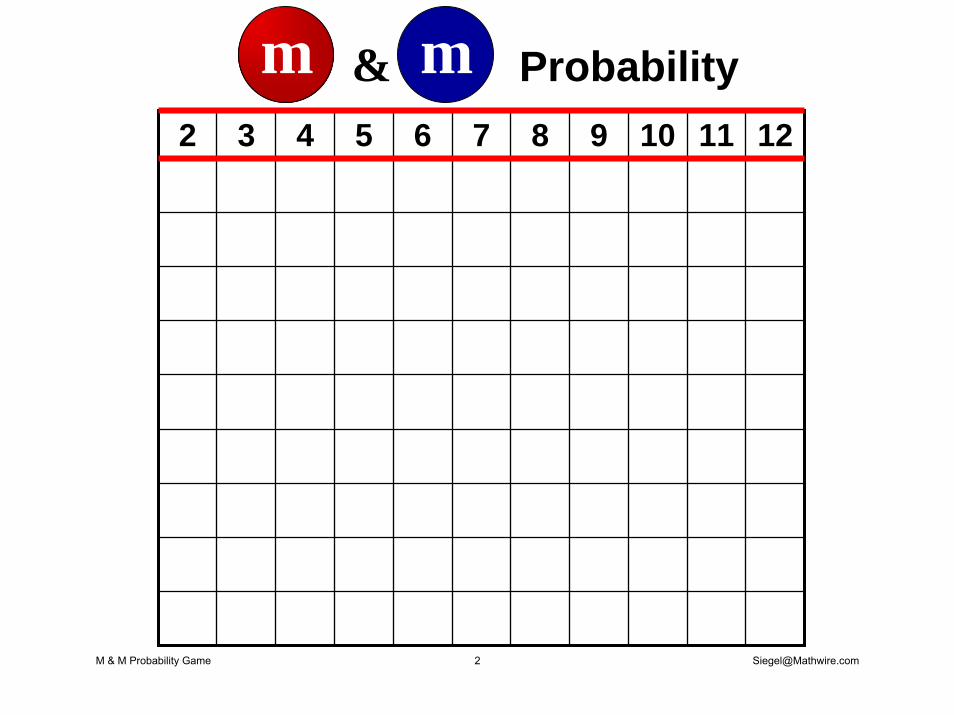
GETTING STARTED:• Place M&M pieces on number line.
• Record on M & M recording sheet by drawing circles to represent where you placed the pieces.
M & M Probability Game 3 [email protected]
2 3 4 5 6 7 8 9 10 11 12
& Probabilitym m
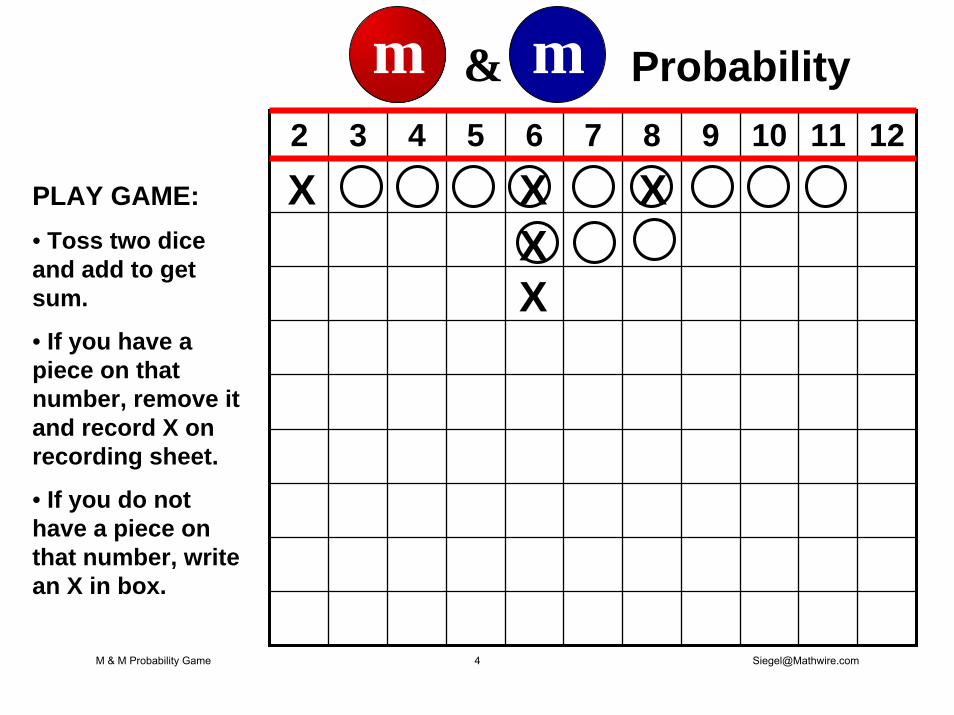
PLAY GAME:• Toss two dice and add to get sum.
• If you have a piece on that number, remove it and record X on recording sheet.
• If you do not have a piece on that number, write an X in box.
XXX
X X
M & M Probability Game 4 [email protected]
2 3 4 5 6 7 8 9 10 11 12
& Probabilitym m
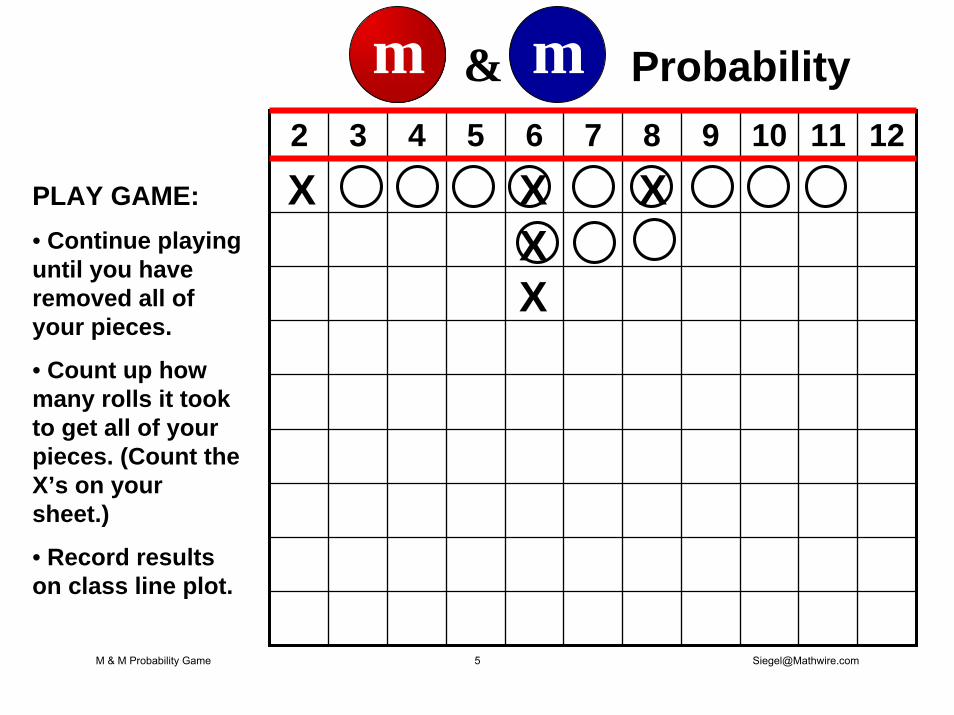
PLAY GAME:• Continue playing until you have removed all of your pieces.
• Count up how many rolls it took to get all of your pieces. (Count the X’s on your sheet.)
• Record results on class line plot.
XXX
X X
M & M Probability Game 5 [email protected]
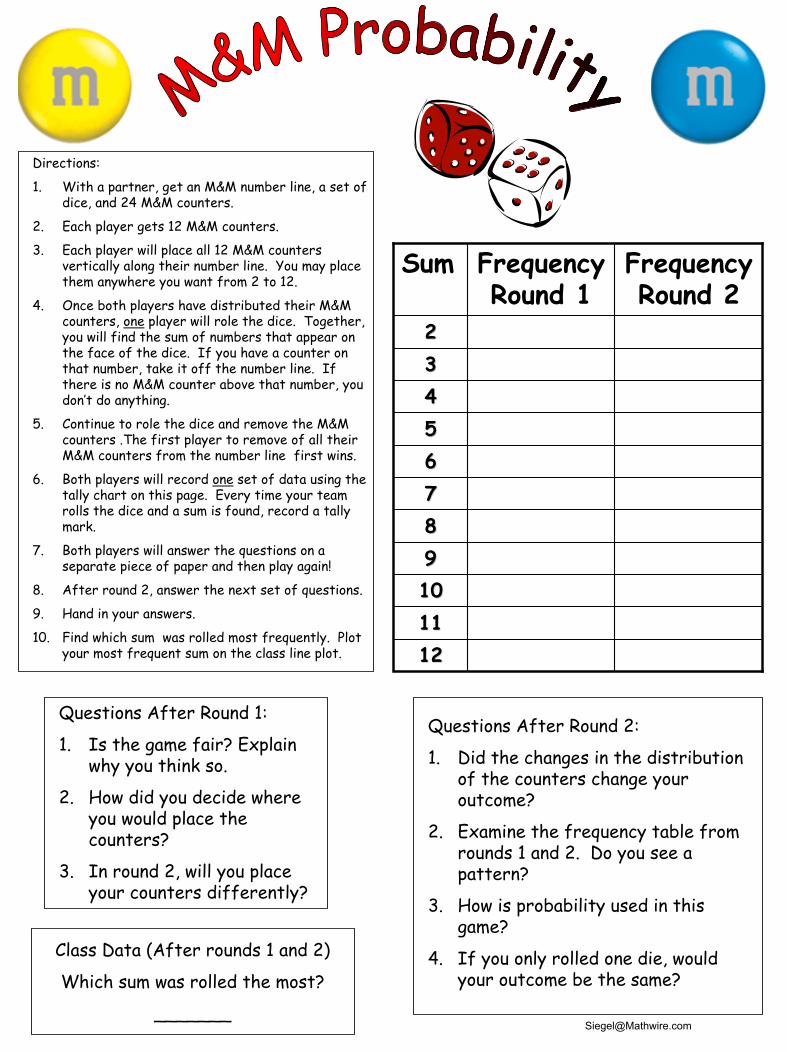
Directions:
1. With a partner, get an M&M number line, a set of dice, and 24 M&M counters.
2. Each player gets 12 M&M counters.
3. Each player will place all 12 M&M counters vertically along their number line. You may place them anywhere you want from 2 to 12.
4. Once both players have distributed their M&M counters, one player will role the dice. Together, you will find the sum of numbers that appear on the face of the dice. If you have a counter on that number, take it off the number line. If there is no M&M counter above that number, you don’t do anything.
5. Continue to role the dice and remove the M&M counters .The first player to remove of all their M&M counters from the number line first wins.
6. Both players will record one set of data using the tally chart on this page. Every time your team rolls the dice and a sum is found, record a tally mark.
7. Both players will answer the questions on a separate piece of paper and then play again!
8. After round 2, answer the next set of questions.
9. Hand in your answers.
10. Find which sum was rolled most frequently. Plot your most frequent sum on the class line plot.
Sum Frequency Round 1
Frequency Round 2
2233445566778899101011111212
Questions After Round 1:
1. Is the game fair? Explain why you think so.
2. How did you decide where you would place the counters?
3. In round 2, will you place your counters differently?
Questions After Round 2:
1. Did the changes in the distribution of the counters change your outcome?
2. Examine the frequency table from rounds 1 and 2. Do you see a pattern?
3. How is probability used in this game?
4. If you only rolled one die, would your outcome be the same?
Class Data (After rounds 1 and 2)
Which sum was rolled the most?
©
D10. Represent the likelihood of possible outcomes for chance situations
D9. Conduct simple probability experiments and draw conclusions from the results; e.g., rolling number cubes or drawing marbles from a bag.
What’s in the Bag?
D10. Represent the likelihood of possible outcomes for chance situations
D9. Conduct simple probability experiments and draw conclusions from the results; e.g., rolling number cubes or drawing marbles from a bag.
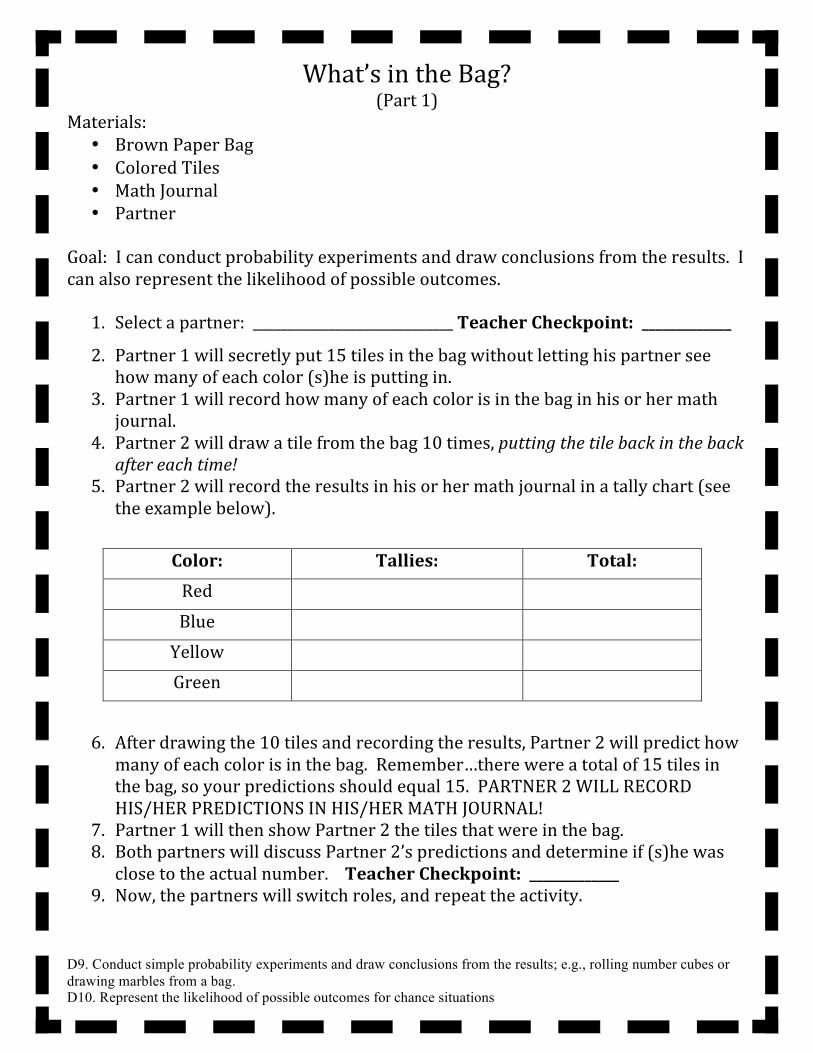
What’s in the Bag? (Part 1)
Materials: • Brown Paper Bag • Colored Tiles • Math Journal • Partner
Goal: I can conduct probability experiments and draw conclusions from the results. I can also represent the likelihood of possible outcomes. 1. Select a partner: _____________________________ Teacher Checkpoint: _____________
2. Partner 1 will secretly put 15 tiles in the bag without letting his partner see how many of each color (s)he is putting in.
3. Partner 1 will record how many of each color is in the bag in his or her math journal.
4. Partner 2 will draw a tile from the bag 10 times, putting the tile back in the back after each time!
5. Partner 2 will record the results in his or her math journal in a tally chart (see the example below).
Color: Tallies: Total: Red Blue Yellow Green
6. After drawing the 10 tiles and recording the results, Partner 2 will predict how many of each color is in the bag. Remember…there were a total of 15 tiles in the bag, so your predictions should equal 15. PARTNER 2 WILL RECORD HIS/HER PREDICTIONS IN HIS/HER MATH JOURNAL!
7. Partner 1 will then show Partner 2 the tiles that were in the bag. 8. Both partners will discuss Partner 2’s predictions and determine if (s)he was close to the actual number. Teacher Checkpoint: _____________
9. Now, the partners will switch roles, and repeat the activity.
D10. Represent the likelihood of possible outcomes for chance situations
D9. Conduct simple probability experiments and draw conclusions from the results; e.g., rolling number cubes or drawing marbles from a bag.
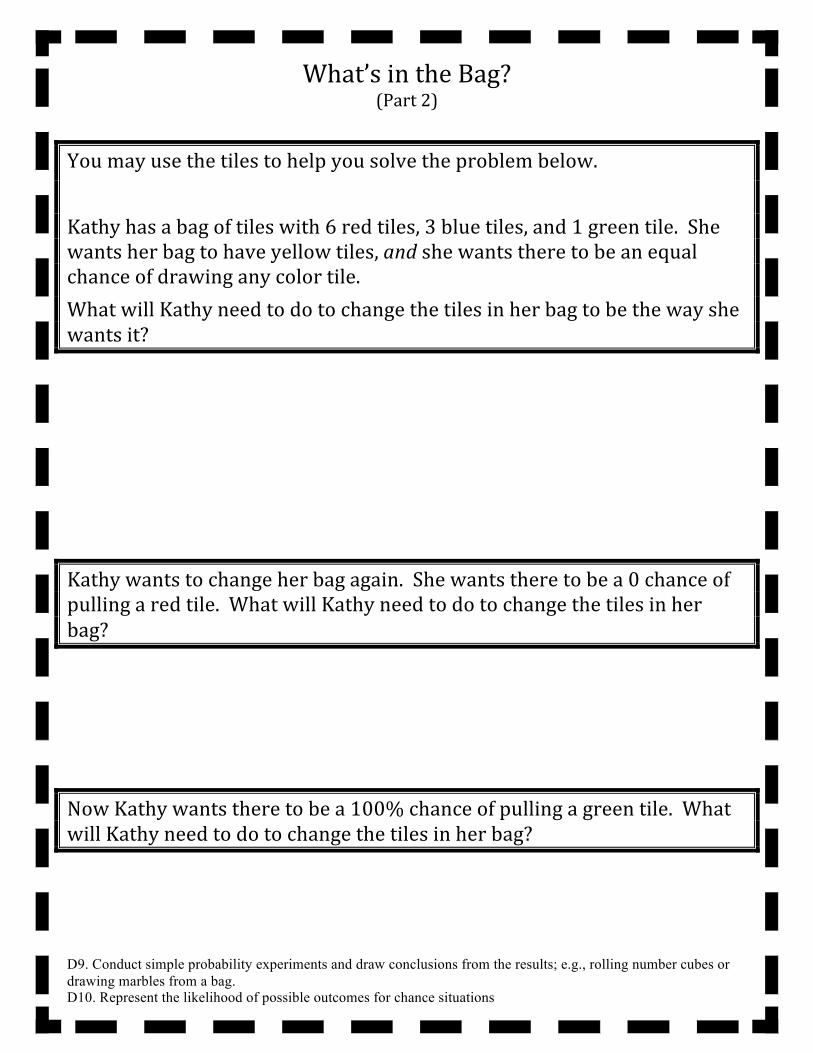
What’s in the Bag? (Part 2)
You may use the tiles to help you solve the problem below. Kathy has a bag of tiles with 6 red tiles, 3 blue tiles, and 1 green tile. She wants her bag to have yellow tiles, and she wants there to be an equal chance of drawing any color tile. What will Kathy need to do to change the tiles in her bag to be the way she wants it?
Kathy wants to change her bag again. She wants there to be a 0 chance of pulling a red tile. What will Kathy need to do to change the tiles in her bag?
Now Kathy wants there to be a 100% chance of pulling a green tile. What will Kathy need to do to change the tiles in her bag?
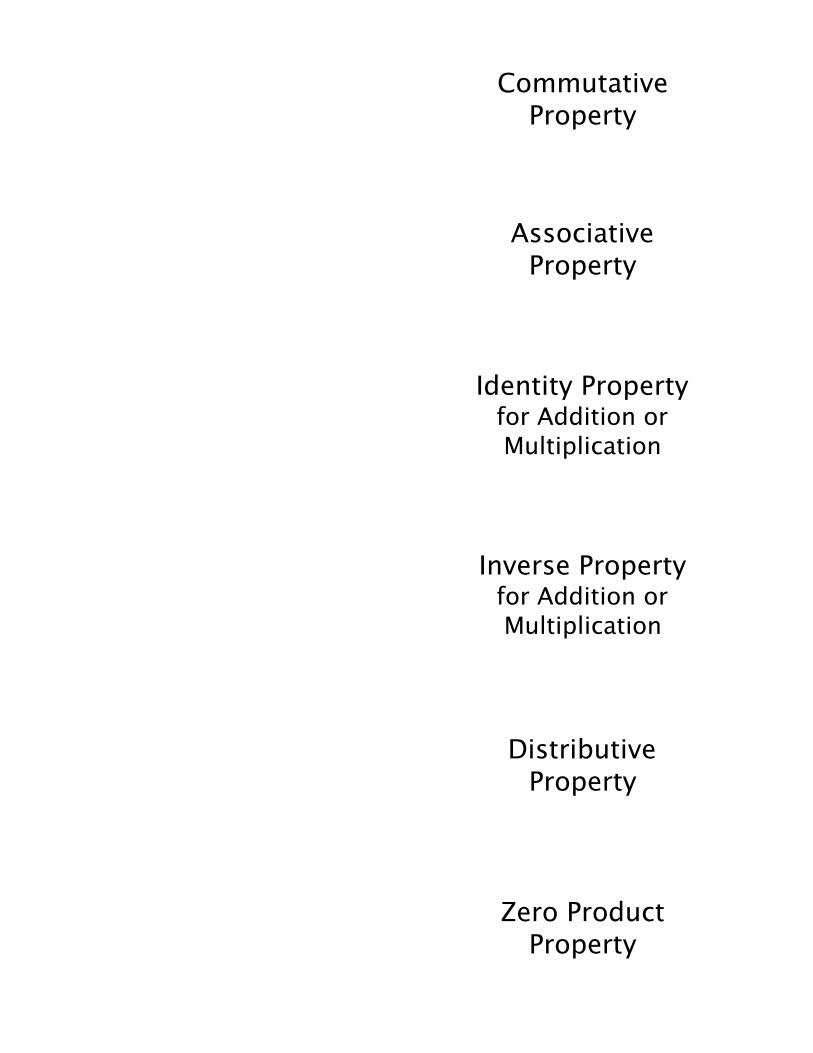
Commutative Property
Associative Property
Identity Property for Addition or Multiplication
Inverse Property for Addition or Multiplication
Distributive Property
Zero Product Property
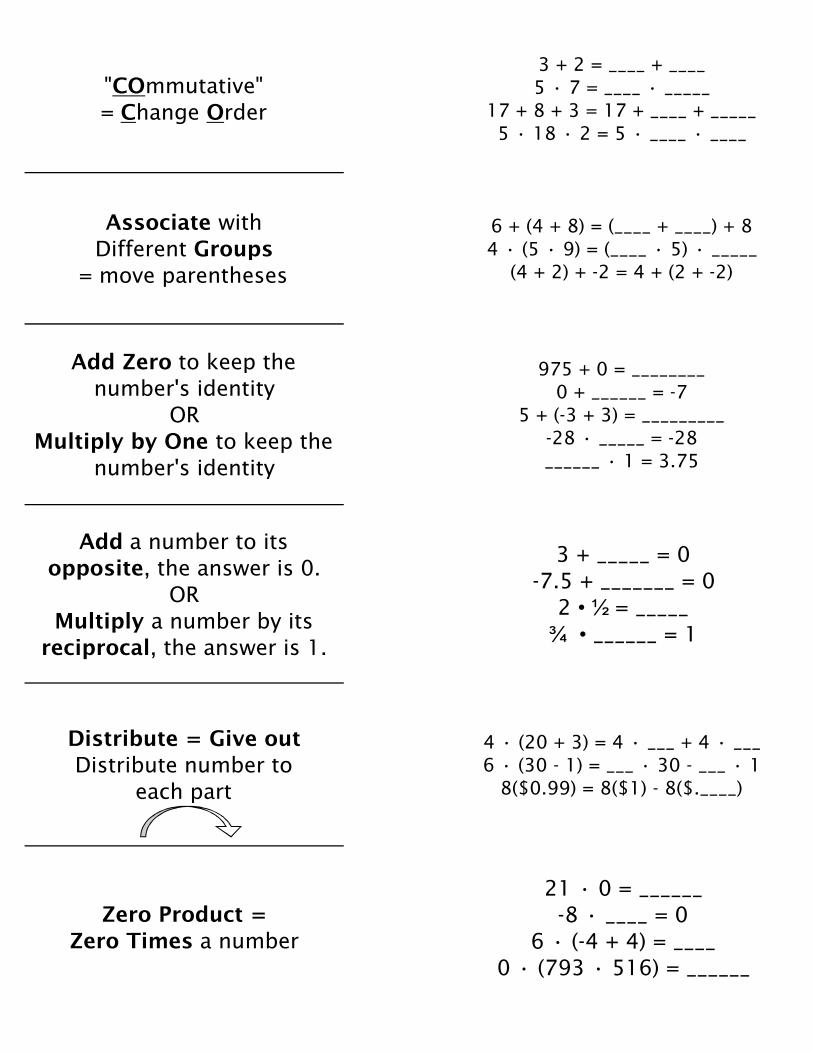
"COmmutative"
= Change Order
3 + 2 = ____ + ____
5 • 7 = ____ • _____
17 + 8 + 3 = 17 + ____ + _____
5 • 18 • 2 = 5 • ____ • ____
Associate with
Different Groups
= move parentheses
6 + (4 + 8) = (____ + ____) + 8
4 • (5 • 9) = (____ • 5) • _____
(4 + 2) + -2 = 4 + (2 + -2)
Add Zero to keep the
number's identity
OR
Multiply by One to keep the
number's identity
975 + 0 = ________
0 + ______ = -7
5 + (-3 + 3) = _________
-28 • _____ = -28
______ • 1 = 3.75
Add a number to its
opposite, the answer is 0.
OR
Multiply a number by its
reciprocal, the answer is 1.
3 + _____ = 0
-7.5 + _______ = 0
2 • ½ = _____
¾ • ______ = 1
Distribute = Give out
Distribute number to
each part
4 • (20 + 3) = 4 • ___ + 4 • ___
6 • (30 - 1) = ___ • 30 - ___ • 1
8($0.99) = 8($1) - 8($.____)
Zero Product =
Zero Times a number
21 • 0 = ______
-8 • ____ = 0
6 • (-4 + 4) = ____
0 • (793 • 516) = ______
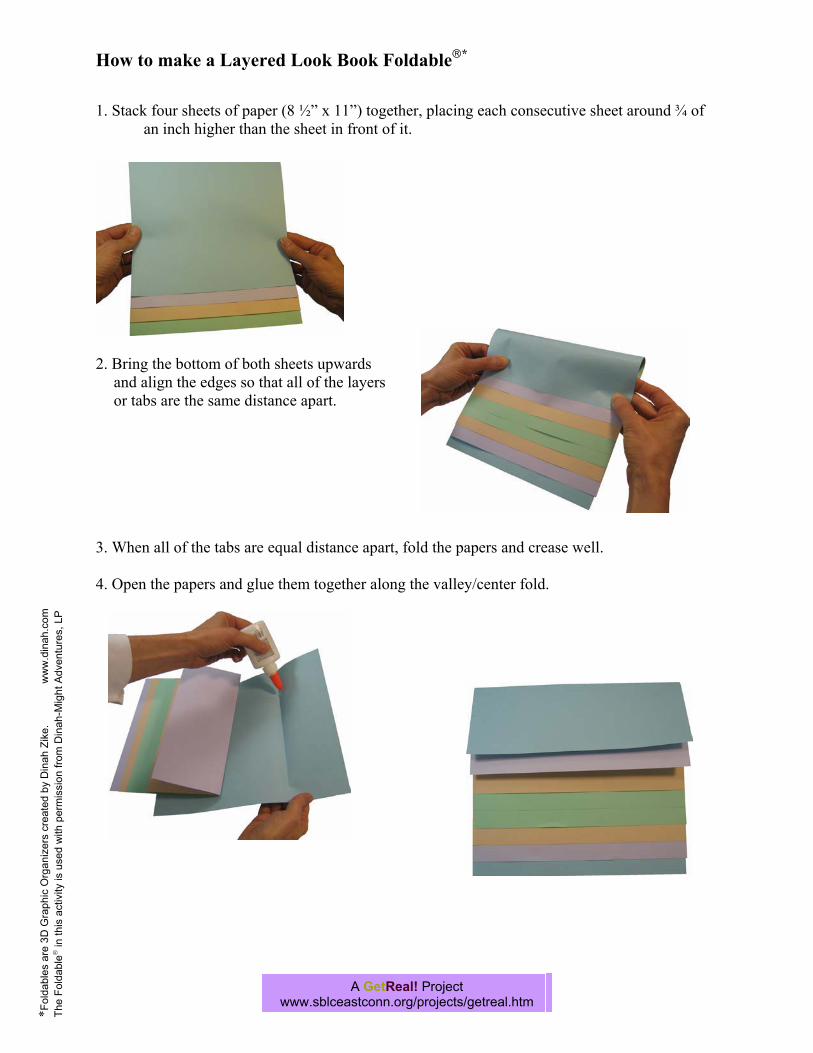
How to make a Layered Look Book Foldable *
1. Stack four sheets of paper (8 ½” x 11”) together, placing each consecutive sheet around ¾ of an inch higher than the sheet in front of it.
2. Bring the bottom of both sheets upwards and align the edges so that all of the layersor tabs are the same distance apart.
3. When all of the tabs are equal distance apart, fold the papers and crease well.
4. Open the papers and glue them together along the valley/center fold.
A GetReal! Project www.sblceastconn.org/projects/getreal.htm
*Fol
dabl
es a
re 3
D G
raph
ic O
rgan
izer
s cr
eate
d by
Din
ah Z
ike.
ww
w.d
inah
.com
Th
e Fo
ldab
le in
this
act
ivity
is u
sed
with
per
mis
sion
from
Din
ah-M
ight
Adv
entu
res,
LP
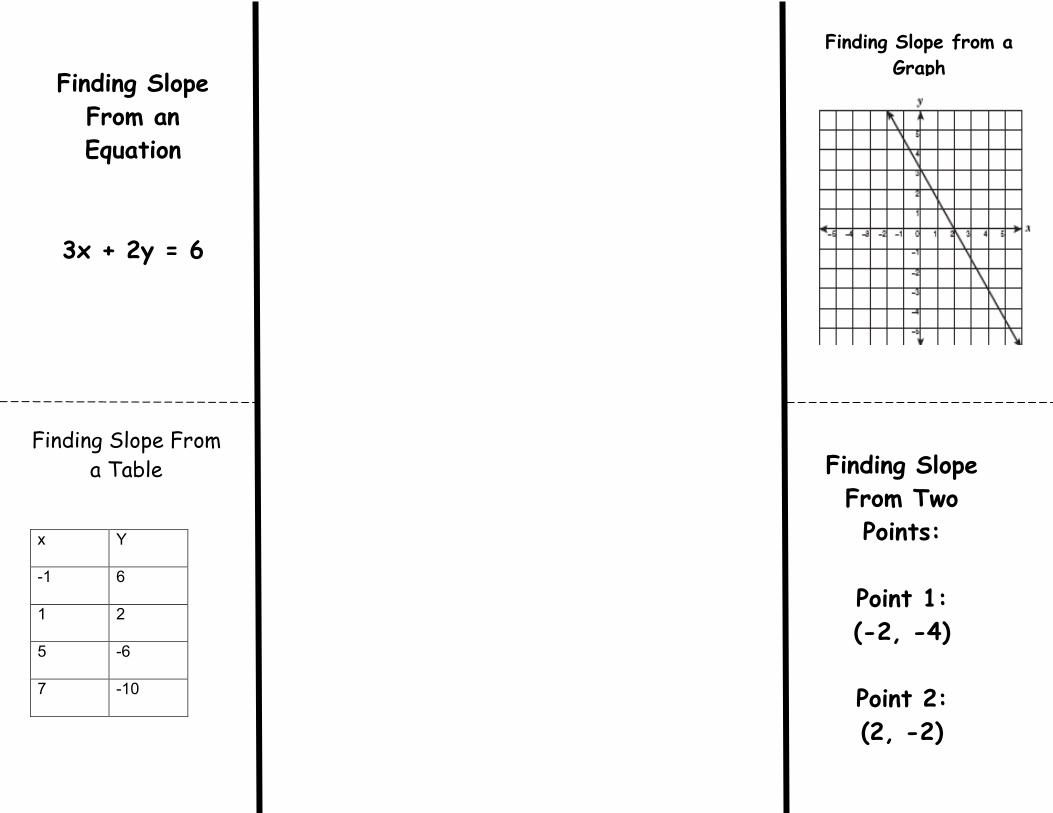
Finding Slope
From Two
Points:
Point 1:
(-2, -4)
Point 2:
(2, -2)
Finding Slope
From an
Equation
3x + 2y = 6
Finding Slope From
a Table
x Y
-1 6
1 2
5 -6
7 -10
Finding Slope from a
Graph
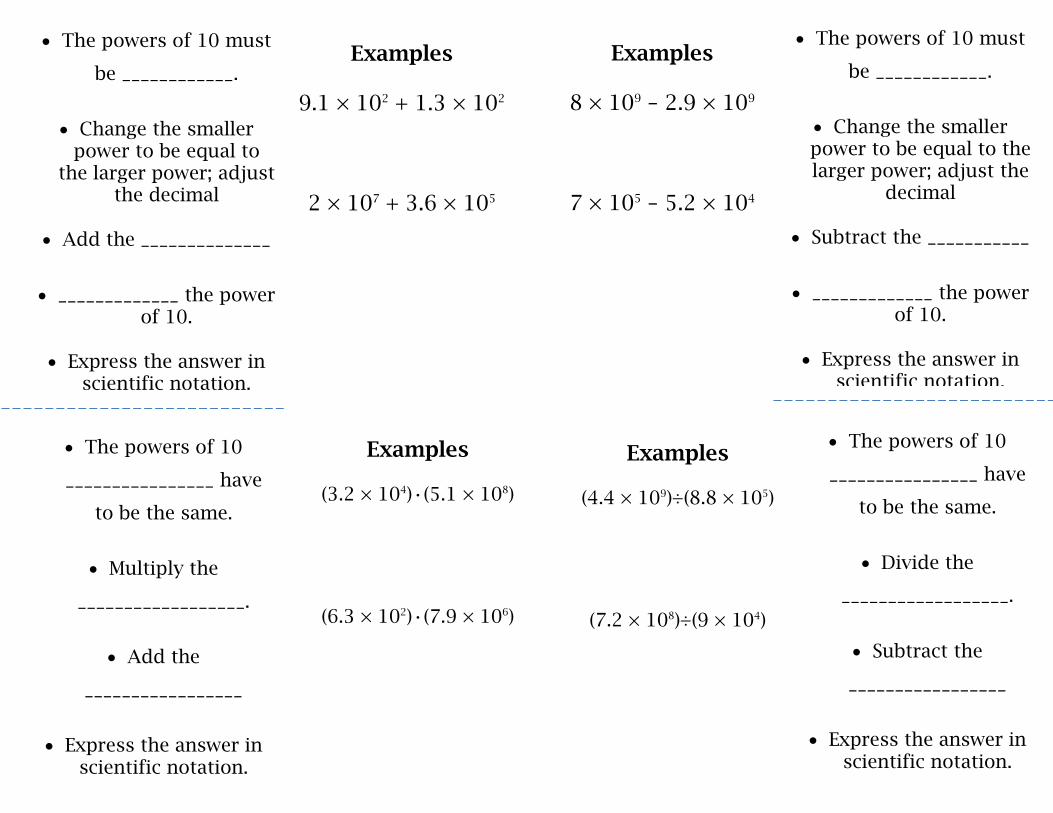
Examples 9.1 × 10² + 1.3 × 10²
2 × 10⁷ + 3.6 × 10⁵
• The powers of 10 must
be ____________.
• Change the smaller
power to be equal to the larger power; adjust
the decimal • Add the ______________
• _____________ the power
of 10.
• Express the answer in scientific notation.
Examples 8 × 10⁹ – 2.9 × 10⁹
7 × 10⁵ – 5.2 × 10⁴
• The powers of 10
________________ have
to be the same.
• Multiply the
__________________.
• Add the
_________________
• Express the answer in
scientific notation.
• The powers of 10 must
be ____________.
• Change the smaller power to be equal to the larger power; adjust the
decimal • Subtract the ___________
• _____________ the power
of 10.
• Express the answer in scientific notation.
• The powers of 10
________________ have
to be the same.
• Divide the
__________________.
• Subtract the
_________________
• Express the answer in
scientific notation.
Examples (3.2 × 10⁴)•(5.1 × 10⁸)
(6.3 × 10²)•(7.9 × 10⁶)
Examples (4.4 × 10⁹)÷(8.8 × 10⁵)
(7.2 × 10⁸)÷(9 × 10⁴)
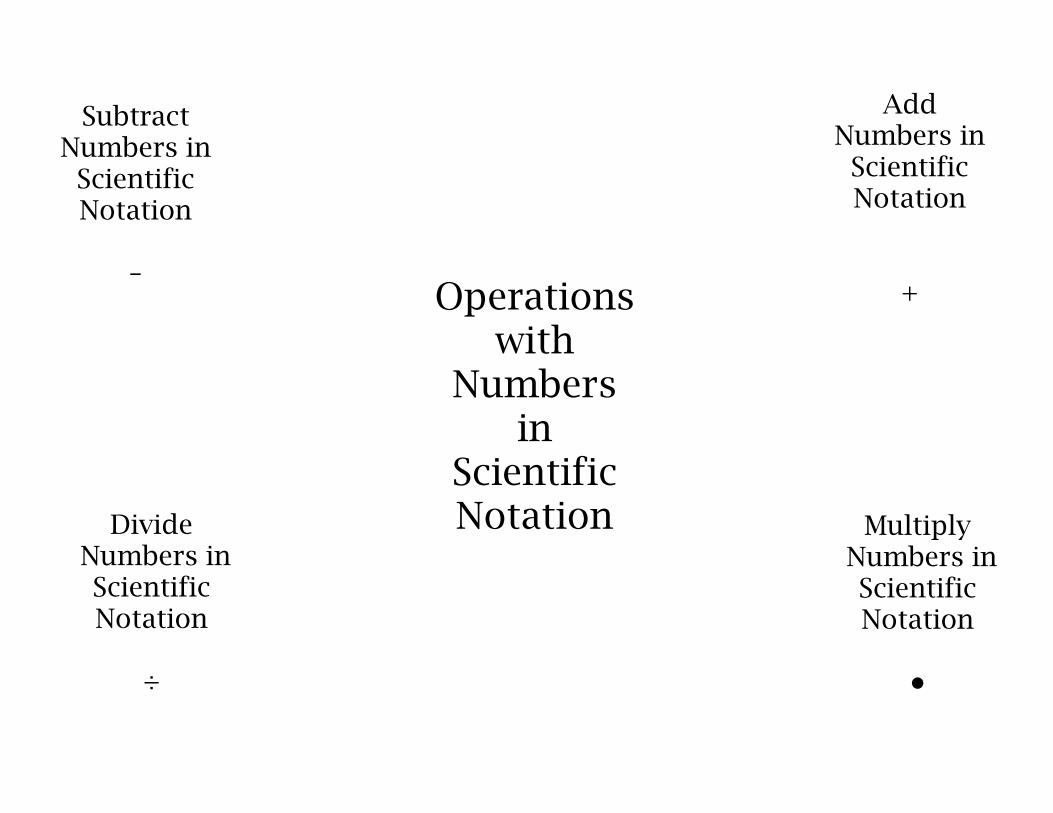
Subtract Numbers in Scientific Notation
–
Divide Numbers in
Scientific Notation
÷
Add Numbers in Scientific Notation
+
Multiply Numbers in
Scientific Notation
●
Operations with
Numbers in
Scientific Notation
Works Cited
"I Is a Number." I Is a Number. Web. 29 Sept. 2014.
"IHD." IHD. Web. 29 Sept. 2014.
"Illuminations." Illuminations. Web. 29 Sept. 2014.
"Math = Love." Math = Love. Web. 29 Sept. 2014.
"Math Can Take You Places." Math Can Take You Places RSS. Web. 29
Sept. 2014.
"Math Is Fun - Homework Help." Math Is Fun - Homework Help. Web. 28
Sept. 2014.
"Mathwire.com | Games." Mathwire.com | Games. Web. 29 Sept. 2014.
"Middle School." Middle School. Web. 29 Sept. 2014.
"PBS KIDS:." Games. Web. 28 Sept. 2014.
"Restructuring Algebra." Restructuring Algebra. Web. 29 Sept. 2014.
"Runde's Room." Runde's Room. Web. 29 Sept. 2014.
"Table of Contents - Math Open Reference." Table of Contents - Math
Open Reference. Web. 29 Sept. 2014.
"Teaching in Special Education." Teaching in Special Education. Web. 29
Sept. 2014.
"Tothesquareinch." Tothesquareinch. Web. 29 Sept. 2014.
"The University of North Carolina at Greensboro." The University of
North Carolina at Greensboro. Web. 29 Sept. 2014.
"Youth Education Services." Youth Education Services. Web. 29 Sept.
2014.