Embed Size (px)
Citation preview
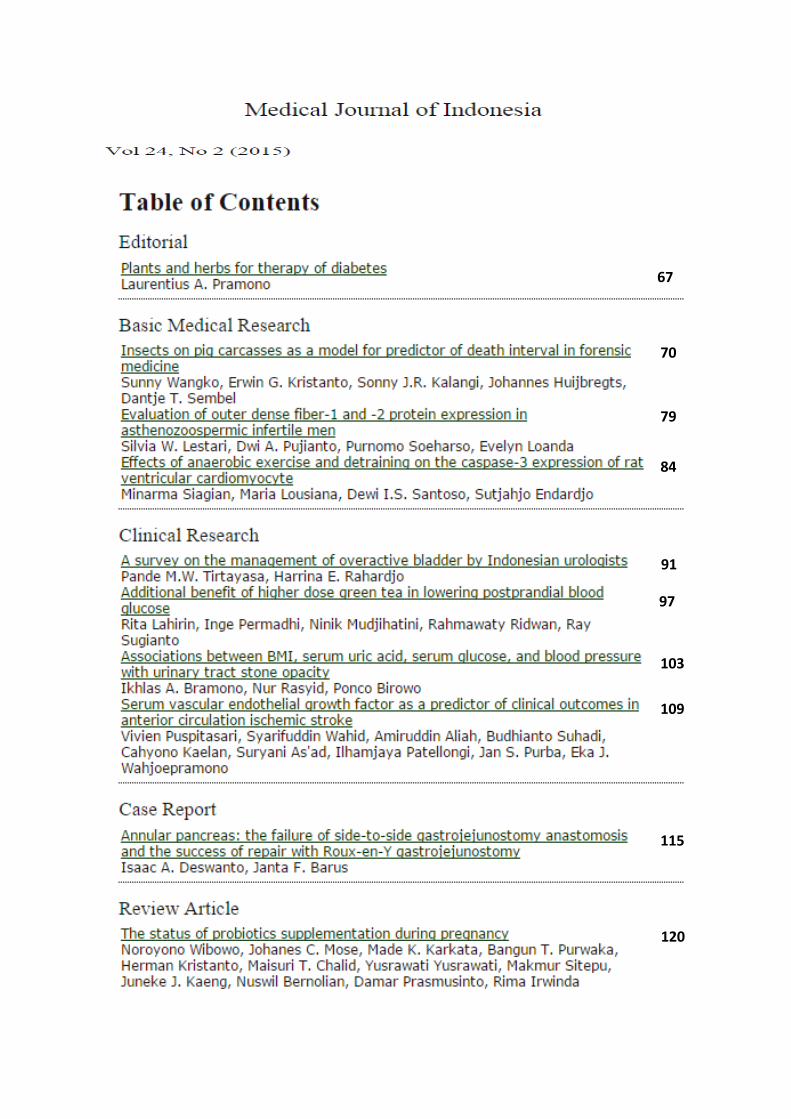
67
70
79
84
91
97
103
109
115
120

Pramono.Editorial
67
Plants and herbs for therapy of diabetes
Laurentius A. PramonoDepartment of Internal Medicine, Faculty of Medicine, Universitas Indonesia, Jakarta, Indonesia
Editorial
Medical Journal of Indonesia
Nowdays, many plants and herbs are believed and proved to have blood glucose lowering effect. The phenomenon called “traditional medicine” or “back to nature” is growing and becoming popular in the society with low level of education and the need of other treatment besides ‘chemistry agents’. As clinicians and researchers, we must put evidences and pathophysiology (biologic plausibility) in the first place before giving patients suggestion for consuming plants or herbs for treatment of diabetes.
Diabetes in low resource countriesDiabetes is a major public health problem nowdays.1,2 According to the latest International Diabetes Federation (IDF) Atlas (2014), prevalence of diabetes all over the world reaches 8.3%, with 46.3% undiagnosed cases. Globally, in 2014, 387 millions people living with diabetes and it has been estimated in 2015, this number will increase up to 592 millions people. Diabetes prevalence in Indonesia reaches 5.81% with 9,116,030 people living with diabetes.2 The popularity of diabetes is very high, set this disease to become a global concern for many healthcare professionals, educators, pharmacists, scientists, and traditional healers all over the world.3,4 It is established that treatment for diabetes need multidisciplinary approach.4
Diabetes is treated from the level of primary care physician, family physician, internist, and endocrinologist.5 In many remote rural areas with low human resources, sometimes paramedics (nurses, midwifes, even traditional healers) give treatment for diabetes patients.6,7 This phenomena also occur in remote rural areas in Indonesia.6 Since in several remote villages there are only glibenclamide which is available in the primary health cares, health practitioners always suggest glibenclamide for the treatment of diabetes as if the drug is the only drug used for diabetes. This pitifull condition continue from time to time without any evaluation of
blood glucose (no monitoring), complication examination, and titration of doses and intensification of treatment, while blood glucose control has not achieve the target. The situation undoubtedly will bring to poor glycemic control and increase of complications in patients living in remote and rural areas all over the world.8
Diabetes is a syndrome with many complicated aspects, from new pathophysiology, diagnosis, complication prevention, and novel treatments.9,10 The advancement of technology in diabetes treatment worldwide sometimes not followed by accessibility of diabetes patient to get standard diagnostic and treatment, such as portable glucometer for self monitoring blood glucose (SMBG), good quality laboratory for HbA1c examination, and also complete medications for diabetes.8 In Indonesia primary healthcare facilities, as been said previously, only glibenclamide and sometimes metformin is available. In some districts, insulin is not available at all, even in the government hospitals. At the end, this condition and myths about diabetes in society leads to the growth and popularity of traditional ingredients from plants and herbs, nutriceuticals, complimentary, and alternative therapy for lowering blood glucose in diabetes patients.11,12
Green tea as complimentary alternative therapy for diabetesIn this issue, there is one clinical research written by Lahirin, et al13 from Department of Nutrition Faculty of Medicine Universitas Indonesia, Jakarta, Indonesia, about green tea (Camellia sinensis), one of the most popular herbs studied worldwide, which give blood glucose lowering effect in healthy subjects. Green tea is a well-known beverages in Asian countries such as Japan, Korea, and China which has been spread to become famous beverages all over the world.14 For Indonesian society, green tea usually consumed at breakfast or coffee/tea break in the afternoon.
68 Med J Indones, Vol. 24, No. 2June 2015
Now, green tea is not only famous because of its delicious taste, which is suitable for most tea lovers, but also for its beneficial for maintaining several metabolism process in our body.14
From clinical trials, green tea consumption is associated with reduction of cardiovascular risks, such as diabetes, hypertension, dyslipidemia, and obesity. Green tea consumption is also in line with reduction of markers of inflammation, oxidative stress, and free radicals. These trials were done in several eastern countries like Taiwan, Japan, and Korea. Overall, almost all trials support the consumption of green tea.14 It is also known that its effect correlate positively with doses of green tea in one day (calculate with cups). In meta-analysis done by Peng, et al15 it is suggested that green tea consumption had a favorable effect on decrease of blood pressure. Although this meta-analysis only prove a little reduction on blood pressure (± 2 mmHg), but samples from 13 clinical trials included in this meta-analysis and significancy of the statistical calculation speak ‘the big beneficial effect’ for green tea lovers. Unfortunately, meta-analysis about green tea consumption and the effect of weight reduction not achieve statistically and clinically. Although Baladia, et al16 found decrease in the percentage of fat mass, it is not clinically relevant.
There is a meta-analysis which correlates green tea consumption and blood glucose management published in 2014. Unfortunately, this analysis did not show any statistical and clinical relevancy from green tea consumption on fasting plasma glucose, fasting serum insulin, OGTT-2 h glucose, HbA1c, and HOMA-IR in populations at risk of type 2 diabetes.17 As the effect of green tea in vitro molecularly has been known, Wang, et al17 suggested other high quality clinical trials for definitely determine the effect of green tea on glycemic control in population at risk of type 2 diabetes. It is also needed clinical trials that perform in patient with type 2 diabetes.
Lahirin, et al13 finding in this research revealed a beneficial effect of postprandial glucose in high dose consumption of green tea. Although it is not a new strike, Lahirin strengthen the dose-effect relationship of green tea consumption and blood glucose management. Despite it is not applicative to consume many cups of green tea in one day, Lahirin finding can reinforce other pharmacy
research: which dose is most suitable for blood glucose lowering. In the future, it is not impossible that green tea extract can be a phytopharmacy or supplement, along with convensional oral hypoglycemic agents, to manage blood glucose in patient at risk of diabetes, prediabetes (impaired glucose tolerance), and diabetes.
Suggestions for clinicians and researchersWe are now in the era of commercialization. Everything can be look beneficial and important to be consumed as long as packaged and marketed flawlessly. Abundant of researches in the field of complimentary alternative medicine from small group of patients to meta-analysis using plants and herbs for many purposes must drive our critical thinking of many aspects. First, is it applicative in daily practice to consume a lot of plants or herbs which have beneficial effect for our body? What doses is the most ideal for us to get the beneficial effect? Second, is the evidence clinically significant or just statistical game that bring the positive effect of the herbs? Third, what parameters used in monitoring of the beneficial effect? Is it applicable and clinically relevant to examine it in daily practice? These principals of appraisal must be deeply held by all clinicians before suggesting any plants or herbs for the treatment of specific disease.
But, as a part of academics society, we must also support and reinforce research which is using plants and herbs in manage specific disease, commonly metabolic or degenerative diseases such as hypertension, diabetes, dyslipidemia, obesity, and metabolic syndrome. Give the best evidence with the best ethical manner. The result can help building evidences related to the topics. Last but not least, always honestly report the result although it is a negative result.
REFERENCES
1. Soewondo P, Ferrario A, Tahapary DL. Challenges in diabetes management in Indonesia: a literature review. Global Health. 2013;9:63.
2. Guariguata L, Nolan T, Beagley J, Linnenkamp U, Jacqmain O. IDF Diabetes Atlas. 6th ed. International Diabetes Federation; 2013.
3. Misita CP. Clinical pharmacist in outpatient diabetes care: essential members of the multidisciplinary team. Clin Diabetes. 2013;31(4):162-5.
4. Bayless M, Martin C. The team approach to
http://mji.ui.ac.id
Pramono.Editorial
69
intensive diabetes management. Diabetes Spectr. 1998;11(1):33-7.
5. Zhang J, Burridge L, Baxter KA, Donald M, Foster MM, Hollingworth SA, et al. A new model of integrated primary-secondary care for complex diabetes in the community: study protocol for a randomised controlled trial. Trials. 2013;14:382.
6. Pramono LA, Fanumbi C. Permasalahan lanjut usia di daerah perdesaan terpencil. Jurnal Kesmas. 2012;6(5):201-11. Indonesian.
7. Aikins AG. Healer shopping in Africa: new evidence from rural-urban qualitative study of Ghanaian diabetes experiences. BMJ. 2005;331:737.
8. Gill G, Gebrekidan A, English P, Wile D, Tesfaye S. Diabetic complications and glycaemic control in remote North Africa. QJM. 2008;101(10):793-8.
9. Kalra S. Recent advances in pathophysiology of diabetes: beyond the dirty dozen. J Pak Med Assoc. 2013;63(2):277-80.
10. DeFronzo RA. Current issues in the treatment of type 2 diabetes. Overview of newer agents: where treatment is going. Am J Med. 2010;123(3 Suppl):S38-48.
11. Cefalu WT, Stephens JM, Ribnicky DM. Diabetes and herbal (botanical) medicine. In: Benzie IFF, Wachtel-Galor S, editors. Herbal Medicine: Biomolecular and Clinical
Aspects. 2nd ed. Boca Raton (FL): CRC Press; 2011.12. Grise DE, McAllister HM, Langland J. Improved clinical
outcomes of patients with type 2 diabetes mellitus utilizing integrative medicine: a case report. Glob Adv Health Med. 2015;4(3):57-61.
13. Lahirin R, Permadhi I, Mudjihartini N, Rahmawati R, Sugianto R. Additional benefit of higher dose green tea in lowering postprandial blood glucose. Med J Indones. 2015;24(2):97-102.
14. Kim HM, Kim J. The effect of green tea on obesity and type 2 diabetes. Diabetes Metab J. 2013;37(3):173-5.
15. Peng X, Zhou R, Wang B, Yu X, Yang X, Liu K, et al. Effect of green tea consumption on blood pressure: A meta-analysis of 13 randomized controlled trials. Sci Rep. 2014;4(6251):1-7.
16. Baladia E, Basulto J, Manera M, Martinez R, Calbet D. [Effect of green tea or green tea extract consumption on body weight and body composition; systematic review and meta-analysis]. Nutr Hosp. 2014;29(3):479-90. Spanish.
17. Wang X, Tian J, Jiang J, Li L, Ying X, Tian H, et al. Effects of green tea or green tea extract on insulin sensitivity and glycaemic control in populations at risk of type 2 diabetes mellitus: a systematic review and meta-analysis of randomised controlled trials. J Hum Nutr Diet. 2014;27(5):501-12.
pISSN: 0853-1773 • eISSN: 2252-8083 • http://dx.doi.org/10.13181/mji.v24i2.1260 • Med J Indones. 2015;24:67-69
Correspondence author: Laurentius A. Pramono, [email protected]
Copyright @ 2015 Authors. This is an open access article distributed under the terms of the Creative Commons Attribution-NonCommercial-ShareAlike 4.0 International License (http://creativecommons.org/licenses/by-nc-sa/4.0/), which permits unrestricted non-commercial use, distribution, and reproduction in any medium, provided the original author and source are properly cited.
Medical Journal of Indonesia
70 Med J Indones, Vol. 24, No. 2June 2015
Insects on pig carcasses as a model for predictor of death interval in forensic medicine
Keywords: Chrysomya, forensic entomology, Hermetia
pISSN: 0853-1773 • eISSN: 2252-8083 • http://dx.doi.org/10.13181/mji.v24i2.1224 • Med J Indones. 2015;24:70-8• Received 25 Mar 2015 • Accepted 25 May 2015
Correspondence author: Sunny Wangko, [email protected]
Copyright @ 2015 Authors. This is an open access article distributed under the terms of the Creative Commons Attribution-NonCommercial-ShareAlike 4.0 International License (http://creativecommons.org/licenses/by-nc-sa/4.0/), which permits unrestricted non-commercial use, distribution, and reproduction in any medium, provided the original author and source are properly cited.
Sunny Wangko,1 Erwin G. Kristanto,2 Sonny J.R. Kalangi,1 Johannes Huijbregts,3 Dantje T. Sembel41 Department of Anatomy-Histology, Faculty of Medicine, University of Sam Ratulangi, Manado, Indonesia2 Department of Forensic and Medicolegal Science, Faculty of Medicine, University of Sam Ratulangi, Manado, Indonesia3 Naturalis Biodiversity Center, Leiden, Netherlands4 Department of Pests and Plant Diseases, Faculty of Agriculture, University of Sam Ratulangi, Manado, Indonesia
Basic Medical Research
Medical Journal of Indonesia
ABSTRAK
Latar belakang: Entomologi forensik belum dimanfaatkan sebagaimana mestinya di Indonesia. Keberadaan serangga forensik di Indonesia juga belum banyak dilaporkan. Penelitian ini bertujuan untuk mendapatkan jenis-jenis serangga pada bangkai hewan coba yang dapat dipergunakan untuk perkiraan saat kematian.
Metode: Empat babi domestik yang dimatikan dengan cara berbeda digunakan sebagai model. Bangkai diamati dua kali sehari (sekitar pukul 09.00 dan 16.00) selama 15 hari untuk mendapatkan tahap-tahap dekomposisi dan koleksi serangga baik imatur maupun dewasa. Serangga imatur dipelihara dan serangga dewasa diidentifikasi di Laboratorium hama dan penyakit tanaman, Universitas Sam Ratulangi, Manado. Chrysomya megacephala dan C. rufifacies diidentifikasi baik secara morfologik maupun tehnik deoxyribose-nucleic acid (DNA).
Hasil: Lima tahap dekomposisi didapatkan dalam penelitian (segar, pembusukan awal, pembusukan aktif, pembusukan lanjut, dan skeletonisasi ). Serangga yang ditemukan ialah 11 spesies Diptera and delapan Coleoptera selama 15 hari suksesi. Chrysomya megacephala, C. rufifacies dan Hermetia illucens berkolonisasi pada semua bangkai.
Kesimpulan: Pada keempat ekor babi serangga yang ditemukan terutama terdiri dari Diptera dan Coleoptera. Chrysomya megacephala, C. rufifacies dan Hermetia illucens tampaknya merupakan kandidat utama untuk perkiraan saat kematian.
ABSTRACT
Background: Forensic entomology has not been acknowledged in Indonesia so far. Indonesian carrion insects are very rarely reported. The aim of this study was to obtain the types of insects on pig carcasses that could be used for the estimation of post-mortem interval.
Methods: Four domestic pigs sacrificed with different methods were used as a model. The carcasses were observed twice daily (around 9 a.m and 4 p.m) during 15 days to assess the stages of decomposition and to collect insects, both in mature and immature stages. The immature insects were reared and the mature insects were indentified in the Laboratory of Pests and Plant Diseases, University of Sam Ratulangi, Manado. Chrysomya megacephala and C. rufifacies were identified both morphologically and with deoxyribose-nucleic acid (DNA) techniques.
Results: Five stages of decomposition (fresh, bloated, active decay, post-decay, and skeletonization) were observed. A total of 11 Diptera and 8 Coleoptera species were found during a 15-days succession study. Chrysomya megacephala, C. rufifacies and Hermetia illucens colonized in all carcasses.
Conclusion: Insects found on four different pig carcasses consisted mainly of widespread Diptera and Coleoptera. Chrysomya megacephala, C. rufifacies and Hermetia illucens seemed to be primary candidates for the estimation of the post-mortem interval.
Wangko, et al.Insects as predictor of death interval
71
Insects have been used in forensic investigation as early as the thirteenth century in China.1 The first serious description of insect succession on corpses was given by Mégnin.2 Early forensic work on insects was done by Nuorteva3 in Finland and Leclercq4 in Belgium. After the publication of the first handbook by Smith1 in 1986, forensic entomology became gradually more fashionable in normal police work. In the last three decades forensic entomology developed rapidly, especially in the areas with a temperate climate. More recently studies on this topic have been carried out in several tropical countries. As the carrion insects in most tropical countries are not very well documented, thus the findings of those insects will be a great challenge. So far, no specific forensic entomology studies have been conducted in Indonesia. Research was done on the island of Sulawesi, which is on the transition of the Oriental and Australian biogeographical regions. Sulawesi has a very peculiar fauna, rich in endemic species. During the Wallace project in 19855 carrion flies were collected by Kurahashi, et al6-9 and carrion beetles by Hanski and Krikken10, and Hanski and Niemela.11 These insects were studied mainly in undisturbed rainforest habitats. Most human corpses are however found in an urban or suburban environment and the carrion fauna of this habitat type was not examined in Sulawesi on a systematic way.
According to the information from the Department of Forensic and Medicolegal Prof. Dr. R. D. Kandou General Hospital Manado, the most common cases of violent deaths in Manado are blunt stroke on the occipital area and cardiac puncture. In order to test whether the cause of death influenced the insect succession, four pigs were sacrificed in different ways. The aim of the present study was to identify the insect succession on pig carcasses as a model in forensic entomology for predictor of death interval.
METHODS
Field studies were carried out at Winangun and Batu Kota, Manado, North Sulawesi, Indonesia, between January 27th and February 15th, 2012. Winangun and Batu Kota are located at a latitude 1°26’41”N and longitude 124°50’11”E, respectively, at an altitude of 66 metres above sea level. Four domestic pigs weighing approximately
20 kg each (aged two month old) were used as a model. The 1st pig was sacrificed by using 200 g potassium cyanide per oral designated as carcass I; the 2nd pig was sacrificed by a blunt stroke on its occipital area, carcass II; the 3rd and 4th pig were sacrificed by cardiac punctures, carcass III and IV. After death, three pigs were placed in protective cages at a distance of 20 m from each other at Winangun, and the other one (carcass IV) at Batu Kota. The cages consisted of a wooden frame (1.6x1x1 m3) were covered with wire meshing (diameter ± 1.7 cm).
The carcasses were observed twice daily (around 9 a.m and 4 p.m) during 15 days to assess the stages of decomposition (fresh, bloated, active decay, post-decay or skeletonization) and to collect insects.
Both mature and immature insects were collected. Insects flying around the carcasses or pearched on the carcasses were collected with an insect net and recorded. Immature insects including eggs, larvae in natural cavities and wounds, and larvae from other parts of the carcasses were collected for rearing and identification in the Laboratory of Pests and Plant Diseases, Sam Ratulangi University, Manado. Soil around and underneath the carcasses were examined to observe the presence of insects including pupae. Immature insects were reared on slices of fresh pig liver. Adult insects were sacrificed with ethyl acetate and mounted on entomological pins, while immature specimens were stored in 95% alcohol.
Specific literature for the identification of adult Sulawesi carrion insects is mainly limited to blowflies. Most other species were identified by direct comparison with identified museum material. The identification of immature insects is based on rearing to adults. Voucher specimens were deposited at the Sam Ratulangi University, Manado; and Naturalis Biodiversity Center, Leiden.
Chrysomya megacephala and C. rufifacies were identified both morphologically and with deoxyribose-nucleic acid (DNA) techniques. Samples for DNA identification were extracted with AxyPrep Multisource Genomic DNA Miniprep Kit. This kit uses column purification technique that extracts both core and mitochondrial DNA.
Medical Journal of Indonesia
72 Med J Indones, Vol. 24, No. 2June 2015
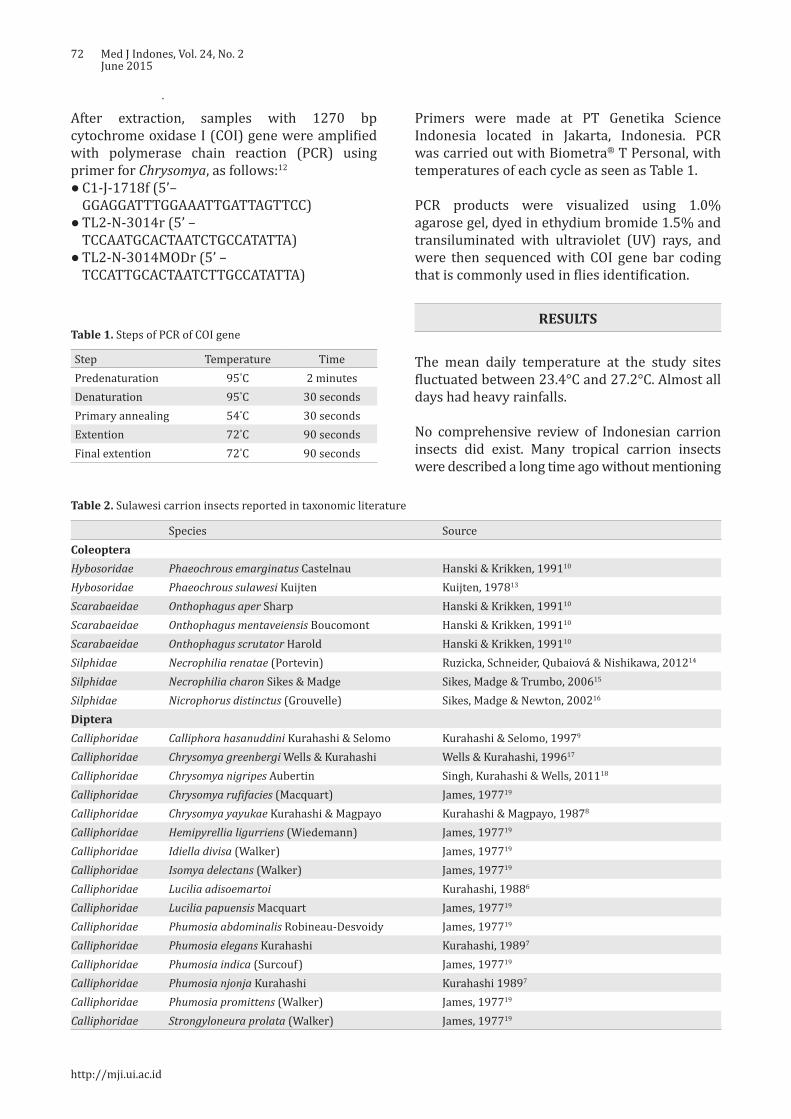
After extraction, samples with 1270 bp cytochrome oxidase I (COI) gene were amplified with polymerase chain reaction (PCR) using primer for Chrysomya, as follows:12
● C1-J-1718f (5’–GGAGGATTTGGAAATTGATTAGTTCC)
● TL2-N-3014r (5’ – TCCAATGCACTAATCTGCCATATTA)
● TL2-N-3014MODr (5’ – TCCATTGCACTAATCTTGCCATATTA)
Step Temperature TimePredenaturation 95°C 2 minutesDenaturation 95°C 30 secondsPrimary annealing 54°C 30 secondsExtention 72°C 90 secondsFinal extention 72°C 90 seconds
Table 1. Steps of PCR of COI gene
Species SourceColeopteraHybosoridae Phaeochrous emarginatus Castelnau Hanski & Krikken, 199110
Hybosoridae Phaeochrous sulawesi Kuijten Kuijten, 197813
Scarabaeidae Onthophagus aper Sharp Hanski & Krikken, 199110
Scarabaeidae Onthophagus mentaveiensis Boucomont Hanski & Krikken, 199110
Scarabaeidae Onthophagus scrutator Harold Hanski & Krikken, 199110
Silphidae Necrophilia renatae (Portevin) Ruzicka, Schneider, Qubaiová & Nishikawa, 201214
Silphidae Necrophilia charon Sikes & Madge Sikes, Madge & Trumbo, 200615
Silphidae Nicrophorus distinctus (Grouvelle) Sikes, Madge & Newton, 200216
DipteraCalliphoridae Calliphora hasanuddini Kurahashi & Selomo Kurahashi & Selomo, 19979
Calliphoridae Chrysomya greenbergi Wells & Kurahashi Wells & Kurahashi, 199617
Calliphoridae Chrysomya nigripes Aubertin Singh, Kurahashi & Wells, 201118
Calliphoridae Chrysomya rufifacies (Macquart) James, 197719
Calliphoridae Chrysomya yayukae Kurahashi & Magpayo Kurahashi & Magpayo, 19878
Calliphoridae Hemipyrellia ligurriens (Wiedemann) James, 197719
Calliphoridae Idiella divisa (Walker) James, 197719
Calliphoridae Isomya delectans (Walker) James, 197719
Calliphoridae Lucilia adisoemartoi Kurahashi, 19886
Calliphoridae Lucilia papuensis Macquart James, 197719
Calliphoridae Phumosia abdominalis Robineau-Desvoidy James, 197719
Calliphoridae Phumosia elegans Kurahashi Kurahashi, 19897
Calliphoridae Phumosia indica (Surcouf) James, 197719
Calliphoridae Phumosia njonja Kurahashi Kurahashi 19897
Calliphoridae Phumosia promittens (Walker) James, 197719
Calliphoridae Strongyloneura prolata (Walker) James, 197719
Table 2. Sulawesi carrion insects reported in taxonomic literature
Primers were made at PT Genetika Science Indonesia located in Jakarta, Indonesia. PCR was carried out with Biometra® T Personal, with temperatures of each cycle as seen as Table 1.
PCR products were visualized using 1.0% agarose gel, dyed in ethydium bromide 1.5% and transiluminated with ultraviolet (UV) rays, and were then sequenced with COI gene bar coding that is commonly used in flies identification.
RESULTS
The mean daily temperature at the study sites fluctuated between 23.4°C and 27.2°C. Almost all days had heavy rainfalls.
No comprehensive review of Indonesian carrion insects did exist. Many tropical carrion insects were described a long time ago without mentioning
http://mji.ui.ac.id
Wangko, et al.Insects as predictor of death interval
73
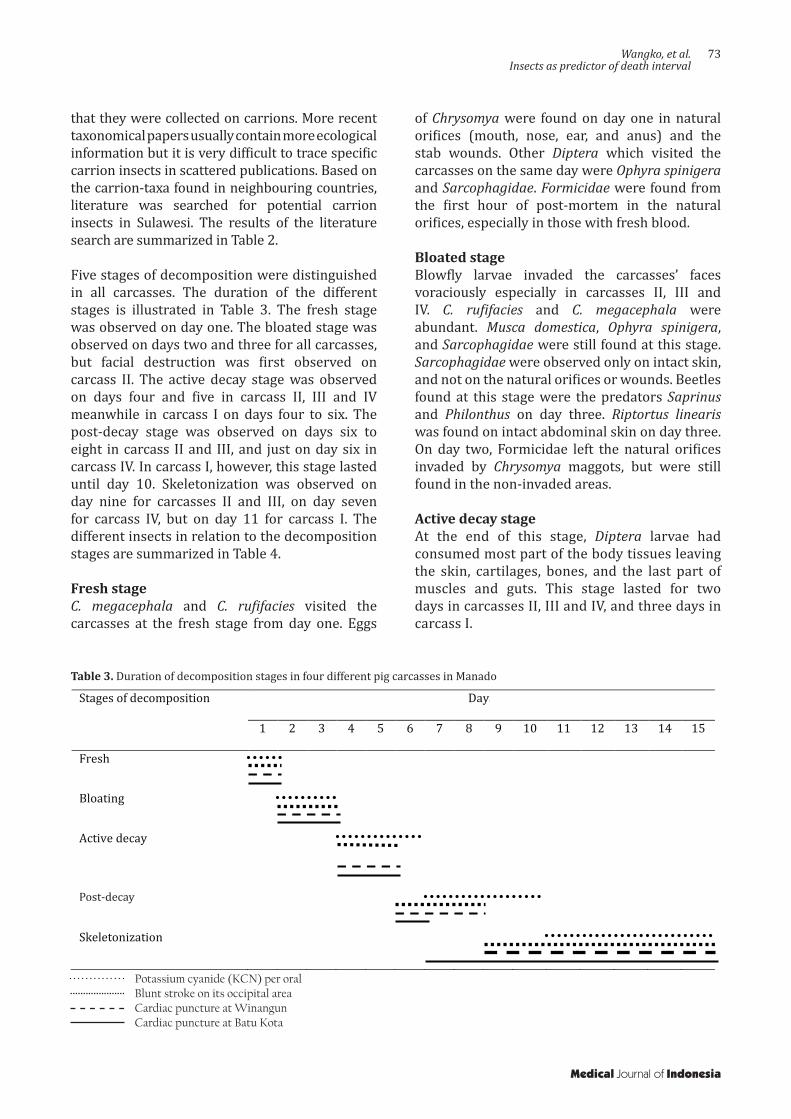
that they were collected on carrions. More recent taxonomical papers usually contain more ecological information but it is very difficult to trace specific carrion insects in scattered publications. Based on the carrion-taxa found in neighbouring countries, literature was searched for potential carrion insects in Sulawesi. The results of the literature search are summarized in Table 2.
Five stages of decomposition were distinguished in all carcasses. The duration of the different stages is illustrated in Table 3. The fresh stage was observed on day one. The bloated stage was observed on days two and three for all carcasses, but facial destruction was first observed on carcass II. The active decay stage was observed on days four and five in carcass II, III and IV meanwhile in carcass I on days four to six. The post-decay stage was observed on days six to eight in carcass II and III, and just on day six in carcass IV. In carcass I, however, this stage lasted until day 10. Skeletonization was observed on day nine for carcasses II and III, on day seven for carcass IV, but on day 11 for carcass I. The different insects in relation to the decomposition stages are summarized in Table 4.
Fresh stageC. megacephala and C. rufifacies visited the carcasses at the fresh stage from day one. Eggs
Stages of decomposition Days
1 2 3 4 5 6 7 8 9 10 11 12 13 14 15
Fresh
Bloating
Active decay
Post decay
Skeletonization
Table 3. Duration of decomposition stages in four different pig carcasses in Manado
Potassium cyanide (KCN) per oralBlunt stroke on its occipital areaCardiac puncture at WinangunCardiac puncture at Batu Kota
of Chrysomya were found on day one in natural orifices (mouth, nose, ear, and anus) and the stab wounds. Other Diptera which visited the carcasses on the same day were Ophyra spinigera and Sarcophagidae. Formicidae were found from the first hour of post-mortem in the natural orifices, especially in those with fresh blood.
Bloated stageBlowfly larvae invaded the carcasses’ faces voraciously especially in carcasses II, III and IV. C. rufifacies and C. megacephala were abundant. Musca domestica, Ophyra spinigera, and Sarcophagidae were still found at this stage. Sarcophagidae were observed only on intact skin, and not on the natural orifices or wounds. Beetles found at this stage were the predators Saprinus and Philonthus on day three. Riptortus linearis was found on intact abdominal skin on day three. On day two, Formicidae left the natural orifices invaded by Chrysomya maggots, but were still found in the non-invaded areas.
Active decay stage At the end of this stage, Diptera larvae had consumed most part of the body tissues leaving the skin, cartilages, bones, and the last part of muscles and guts. This stage lasted for two days in carcasses II, III and IV, and three days in carcass I.
Post-decay
Medical Journal of Indonesia
74 Med J Indones, Vol. 24, No. 2June 2015
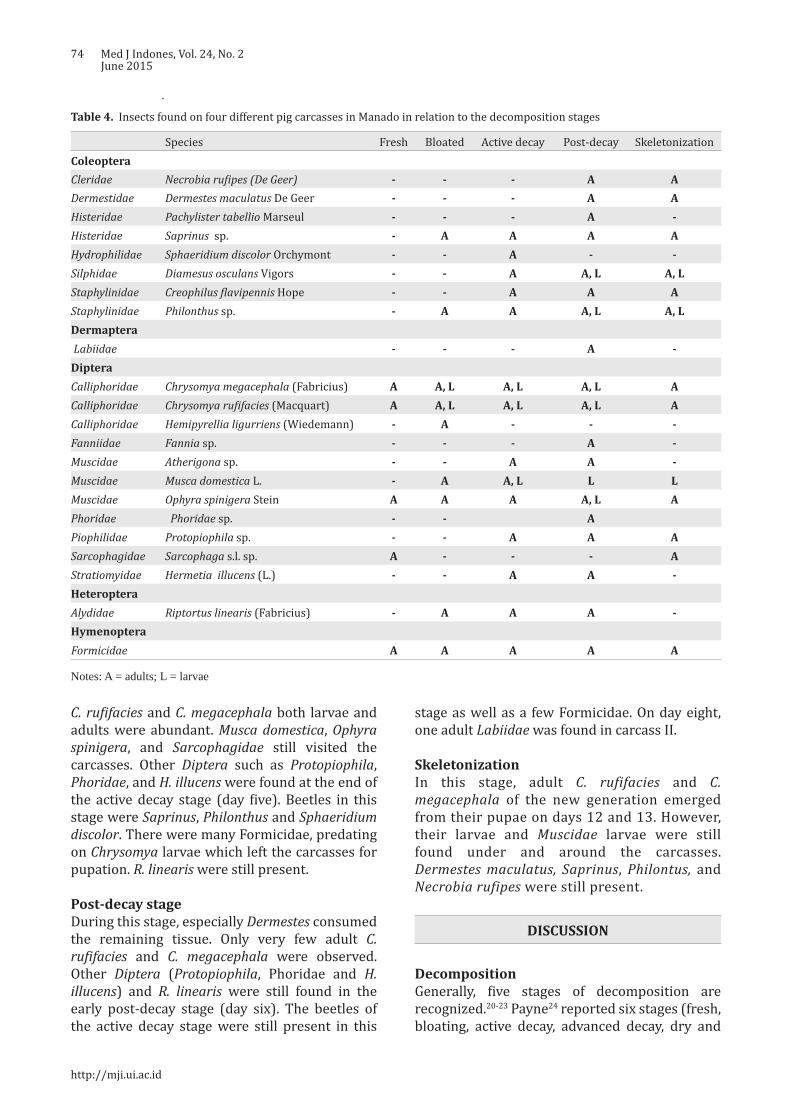
Species Fresh Bloated Active decay Post-decay SkeletonizationColeoptera Cleridae Necrobia rufipes (De Geer) - - - A ADermestidae Dermestes maculatus De Geer - - - A AHisteridae Pachylister tabellio Marseul - - - A -Histeridae Saprinus sp. - A A A AHydrophilidae Sphaeridium discolor Orchymont - - A - -Silphidae Diamesus osculans Vigors - - A A, L A, LStaphylinidae Creophilus flavipennis Hope - - A A AStaphylinidae Philonthus sp. - A A A, L A, LDermaptera Labiidae - - - A -Diptera Calliphoridae Chrysomya megacephala (Fabricius) A A, L A, L A, L ACalliphoridae Chrysomya rufifacies (Macquart) A A, L A, L A, L ACalliphoridae Hemipyrellia ligurriens (Wiedemann) - A - - -Fanniidae Fannia sp. - - - A -Muscidae Atherigona sp. - - A A -Muscidae Musca domestica L. - A A, L L LMuscidae Ophyra spinigera Stein A A A A, L APhoridae Phoridae sp. - - APiophilidae Protopiophila sp. - - A A ASarcophagidae Sarcophaga s.l. sp. A - - - AStratiomyidae Hermetia illucens (L.) - - A A -Heteroptera Alydidae Riptortus linearis (Fabricius) - A A A -Hymenoptera Formicidae A A A A A
Table 4. Insects found on four different pig carcasses in Manado in relation to the decomposition stages
Notes: A = adults; L = larvae
C. rufifacies and C. megacephala both larvae and adults were abundant. Musca domestica, Ophyra spinigera, and Sarcophagidae still visited the carcasses. Other Diptera such as Protopiophila, Phoridae, and H. illucens were found at the end of the active decay stage (day five). Beetles in this stage were Saprinus, Philonthus and Sphaeridium discolor. There were many Formicidae, predating on Chrysomya larvae which left the carcasses for pupation. R. linearis were still present.
Post-decay stageDuring this stage, especially Dermestes consumed the remaining tissue. Only very few adult C. rufifacies and C. megacephala were observed. Other Diptera (Protopiophila, Phoridae and H. illucens) and R. linearis were still found in the early post-decay stage (day six). The beetles of the active decay stage were still present in this
stage as well as a few Formicidae. On day eight, one adult Labiidae was found in carcass II.
Skeletonization In this stage, adult C. rufifacies and C. megacephala of the new generation emerged from their pupae on days 12 and 13. However, their larvae and Muscidae larvae were still found under and around the carcasses. Dermestes maculatus, Saprinus, Philontus, and Necrobia rufipes were still present.
DISCUSSION
DecompositionGenerally, five stages of decomposition are recognized.20-23 Payne24 reported six stages (fresh, bloating, active decay, advanced decay, dry and
http://mji.ui.ac.id
Wangko, et al.Insects as predictor of death interval
75
remains) in Clemson, South Carolina. Archer and Elgar25 reported only two stages (initial decomposition and advanced decomposition) from Victoria, Australia while Wang, et al26 in South China distinguished four stages.
In our study we observed five stages of decomposition in all carcasses; the duration of the decomposition stages in the different carcasses was however not the same. Carcass I took 10 days for skeletonization, carcasses II and III only took eight days, and carcass IV six days. Carcass I had no wounds or external blood in contrast to carcass II (fresh blood that came out of the mouth), III and IV (stab wound); oviposition by blowflies on carcass I was therefore much later. The duration of decomposition (7-10 days) resembled to those reported by Wang, et al26 in South China and Heo, et al27 at Tanjung Sepat, peninsular Malaysia meanwhile Apichat, et al28 in Phitsanulok, Thailand reported one day each for fresh, bloated, and active decay stages, but three days for post-decay stage and a much longer skeletonization period (days 8-31).
Generally, Calliphoridae are the first insects to lay eggs on a corpse or carcass which makes them the most important tool of the forensic entomologist.1,29 In our study, Chrysomya megacephala and C. rufifacies were abundantly found in both adult and immature forms. C. rufifacies maggots are predators on C. megacephala maggots and their eggs are therefore deposited later than those of C. megacephala. These dominant Chrysomya species are the same as those from similar experiments in other parts of tropical Asia as reported by Heo, et al27 in Malaysia, Apichat, et al28 in Thailand and Wang, et al26 in South China.
Rearing of larvae and pupae in the laboratory resulted in adult C. rufifacies and C. megacephala. From both larva and pupa samples of carcasses II and III, the adults emerged one day earlier than those of carcass I. Adult Chrysomya at the study site emerged one day later than those in the laboratory. This faster development was caused by the higher temperature in the laboratory (28°-30°C).
Heo, et al27 reported that the second generation blowflies appeared on day-12 and -13 around the vegetation on the study sites, which are similar to our results. Larvae of C. megacephala and C. rufifacies were still present underneath and around
the carcasses until skeletonization. According to Gunn30 adult flies also feed on the carcass during the post-decay stage or skeletonization, but they did not initiate oviposition.
Hermetia illucens was originally restricted to the New World but it has spread to other regions, both tropical and temperate.29,31 This species is not often found in corpses, and is reported to colonize carrion in an advanced stage: 20-30 days post-mortem21,30,32 In our study, adult Hermetia illucens were already found on day five. Diclaro and Kauffman33 reported that H. illucens larvae have six instars which needed 14 days, and a pupation period of two weeks. The rearing of soil around the carcasses collected on day 11, resulted in a second generation of Hermetia illucens on days 35-39. The growth of the larvae was in accordance with the findings of Tomberlin, et al.34
Sarcophagidae larvae are reported from large carrion including forensic cases.29,35 In our study, adult Sarcophagidae were found in small numbers from day 1 until the end of the study, but no maggots or pupae were observed. As these species apparently did not develop in the carcasses they cannot be used as forensic indicators. The adult Sarcophagidae were not identified to species level.
Larvae of Ophyra (instar two and three) are predators of larvae Musca domestica and other Muscidae larvae.1,29,36 In our study, adult Ophyra spinigera was found from day 1-8, and their larvae on day 6-14 together with other Muscidae larvae.
Adults of Musca domestica usually visit a corpse after the arrival of blowflies and flesh flies in both the active and post-decay stages. House flies are rarely attracted to fresh corpses, unless there is excreta or exposed gut present.1,29,30 In our study, Musca domestica was found from day 2-5, earlier than that observed by Byrd and Castner29, Gunn30, and Smith1. The first adult fly emerged during rearing in the laboratory on day seven which is similar to that of Gunn30 who stated that the life cycle of Musca domestica takes six to eight days at a relatively high temperature.
In our study, adults of Phoridae were found on day-5. Rearing in the laboratory of soil collected at day eight resulted in pupae and adult Phoridae
Medical Journal of Indonesia
76 Med J Indones, Vol. 24, No. 2June 2015
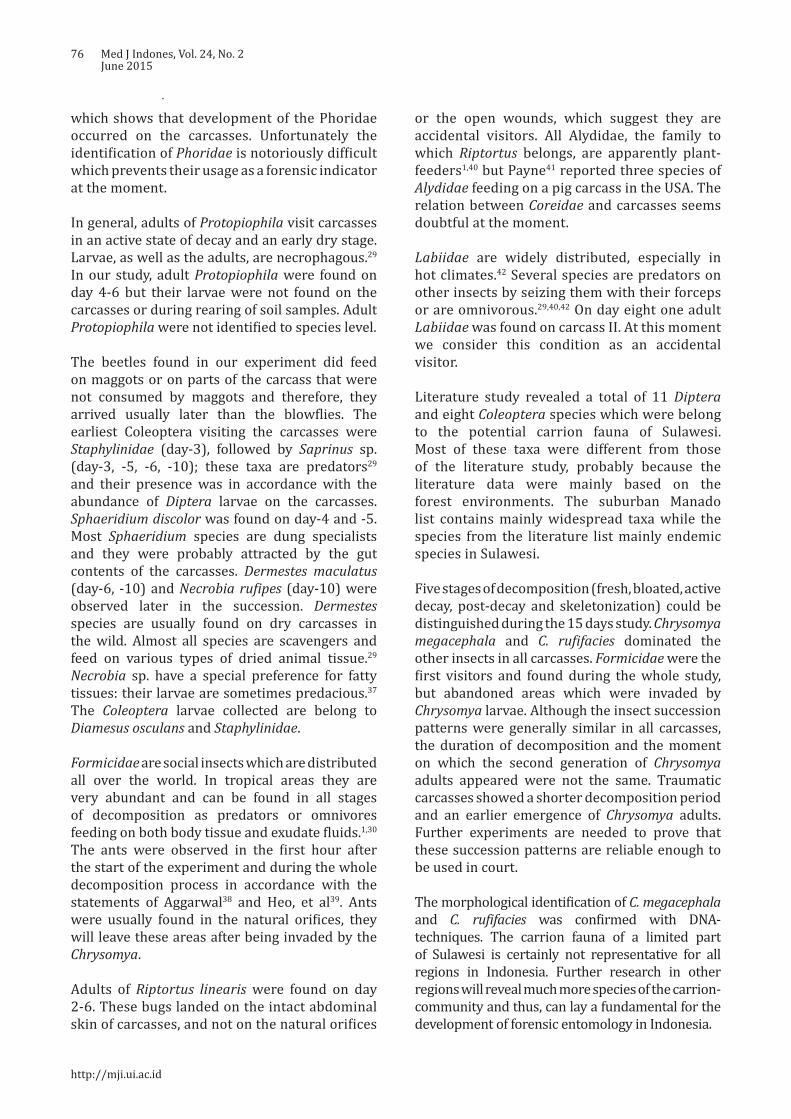
which shows that development of the Phoridae occurred on the carcasses. Unfortunately the identification of Phoridae is notoriously difficult which prevents their usage as a forensic indicator at the moment.
In general, adults of Protopiophila visit carcasses in an active state of decay and an early dry stage. Larvae, as well as the adults, are necrophagous.29 In our study, adult Protopiophila were found on day 4-6 but their larvae were not found on the carcasses or during rearing of soil samples. Adult Protopiophila were not identified to species level.
The beetles found in our experiment did feed on maggots or on parts of the carcass that were not consumed by maggots and therefore, they arrived usually later than the blowflies. The earliest Coleoptera visiting the carcasses were Staphylinidae (day-3), followed by Saprinus sp. (day-3, -5, -6, -10); these taxa are predators29 and their presence was in accordance with the abundance of Diptera larvae on the carcasses. Sphaeridium discolor was found on day-4 and -5. Most Sphaeridium species are dung specialists and they were probably attracted by the gut contents of the carcasses. Dermestes maculatus (day-6, -10) and Necrobia rufipes (day-10) were observed later in the succession. Dermestes species are usually found on dry carcasses in the wild. Almost all species are scavengers and feed on various types of dried animal tissue.29 Necrobia sp. have a special preference for fatty tissues: their larvae are sometimes predacious.37 The Coleoptera larvae collected are belong to Diamesus osculans and Staphylinidae.
Formicidae are social insects which are distributed all over the world. In tropical areas they are very abundant and can be found in all stages of decomposition as predators or omnivores feeding on both body tissue and exudate fluids.1,30 The ants were observed in the first hour after the start of the experiment and during the whole decomposition process in accordance with the statements of Aggarwal38 and Heo, et al39. Ants were usually found in the natural orifices, they will leave these areas after being invaded by the Chrysomya.
Adults of Riptortus linearis were found on day 2-6. These bugs landed on the intact abdominal skin of carcasses, and not on the natural orifices
or the open wounds, which suggest they are accidental visitors. All Alydidae, the family to which Riptortus belongs, are apparently plant-feeders1,40 but Payne41 reported three species of Alydidae feeding on a pig carcass in the USA. The relation between Coreidae and carcasses seems doubtful at the moment.
Labiidae are widely distributed, especially in hot climates.42 Several species are predators on other insects by seizing them with their forceps or are omnivorous.29,40,42 On day eight one adult Labiidae was found on carcass II. At this moment we consider this condition as an accidental visitor.
Literature study revealed a total of 11 Diptera and eight Coleoptera species which were belong to the potential carrion fauna of Sulawesi. Most of these taxa were different from those of the literature study, probably because the literature data were mainly based on the forest environments. The suburban Manado list contains mainly widespread taxa while the species from the literature list mainly endemic species in Sulawesi.
Five stages of decomposition (fresh, bloated, active decay, post-decay and skeletonization) could be distinguished during the 15 days study. Chrysomya megacephala and C. rufifacies dominated the other insects in all carcasses. Formicidae were the first visitors and found during the whole study, but abandoned areas which were invaded by Chrysomya larvae. Although the insect succession patterns were generally similar in all carcasses, the duration of decomposition and the moment on which the second generation of Chrysomya adults appeared were not the same. Traumatic carcasses showed a shorter decomposition period and an earlier emergence of Chrysomya adults. Further experiments are needed to prove that these succession patterns are reliable enough to be used in court.
The morphological identification of C. megacephala and C. rufifacies was confirmed with DNA-techniques. The carrion fauna of a limited part of Sulawesi is certainly not representative for all regions in Indonesia. Further research in other regions will reveal much more species of the carrion-community and thus, can lay a fundamental for the development of forensic entomology in Indonesia.
http://mji.ui.ac.id
Wangko, et al.Insects as predictor of death interval
77
In conclusion, during our succession study on pig carcasses in suburban Manado, 11 Diptera and 8 Coleoptera taxa were collected. Six of the collected taxa were collected as larvae on the field location and two additional taxa were reared to adults from soil samples collected at the field location. The fact that these species developed on the carcasses classify them as potential forensic indicators. From Chrysomya megacephala, C. rufifacies and Hermetia illucens, the development from larvae to adults in relation to the ambient temperature is already known and they seem therefore to be primary candidates for the estimation of the post-mortem interval in suburban Sulawesi.
AcknowledgmentWe would like to thank the International Affair Office of University of Sam Ratulangi Manado that facilitated Drs. Johannes Huijbregts from Naturalis Biodiversity Center, Leiden, Netherlands, to come to Manado, Indonesia.
Conflict of interestThe authors affirm no conflict of interest in this study.
REFERENCES
1. Smith KGV. A manual of forensic entomology. London: The Trustees of the British Museum (Natural History); 1986.
2. Mégnin JP. La faune des cadavres: application de l’entomologie à la médecine légale, Encyclopédie Scientifique des Aide-Mémoire 101. Paris: Masson et Gauthiers-Villars; 1894. France.
3. Nuorteva P. Sarcosaprophagous insects as forensic indicators. In: Tedeschi CG, Eckert WG, Tedeshi LG, editors. Forensic medicine, a study in trauma and environmental hazards. Philadelphia: Saunders; 1977. p. 1072-95.
4. Leclercq M. Entomologie et médecine légale, datation de la mort. Collection de Médecine Légale et de Toxicologie Médicale 108. Paris: Masson; 1978. France.
5. Knight WJ, Holloway JD. Insects and the rain forests of South East Asia (Wallacea). London: Royal Entomological Society of London; 1990.
6. Kurahashi H. A new species of Lucilia (Diptera, Calliphoridae) from Sulawesi. Kontyu. 1988;56:144-7.
7. Kurahashi H. The genus Phumosia of Sulawesi, Indonesia, with descriptions of two new species (Diptera: Calliphoridae). Jpn J Sanit Zool. 1989;40(3):203-10.
8. Kurahashi H, Magpayo FR. Two new species of the genus Chrysomya from Wallacea (Diptera, Calliphoridae). Kontyu. 1987;55:71-9.
9. Kurahashi H, Selomo M. A new species of Calliphora from Sulawesi, Indonesia (Diptera, Calliphoridae), Jpn J Syst Ent. 1997;3:123-7.
10. Hanski I, Krikken J. Dung beetles in tropical forests in South-East Asia. In: Hanski I, Cambefort Y, editors. Dung beetle ecology. Princeton: Princeton University Press; 1991. p. 179-97.
11. Hanski I, Niemela J. Elevational distributions of dung and carrion beetles in northern Sulawesi. In: Knight WJ, Holloway JD, editors. Insects and the rain forests of South East Asia (Wallacea). London: Royal Entomological Society of London; 1990. p. 145-52.
12. Harvey ML, Gaudieri S, Villet MH, Dadour IR. A global study of forensically significant calliphorids: implications for identification. Forensic Sci Int. 2008;177(1):66-76.
13. Kuijten PJ. Revision of the Indo-Australian species of the genus Phaeochrous Castelnau, 1840 (Coleoptera: Scarabaeidae, Hybosorinae), with notes on the African species. Zool Verh.1978;165:3-42.
14. Růžička J, Schneider J, Qubaiova J, Nishikawa M. Revision of palaearctic and oriental necrophila Kirby & Spence, part 2: subgenus Chrysosilpha Portevin (Coleoptera: Silphidae). Zootaxa. 2012;3261:33-58.
15. Sikes DS, Madge RB, Trumbo ST. Revision of Nicrophorus in part: new species and inferred phylogeny of the nepalensis-group based on evidence from morphology and mitochondrial DNA (Coleoptera: Silphidae: Nicrophorinae). Invertebr Syst. 2006;20(3):305-65.
16. Sikes DS, Madge RB, Newton AF. A catalog of the Nicrophorinae (Coleoptera: Silphidae) of the world. Zootaxa. 2002;65:1-304.
17. Wells JD, Kurahashi H. A new species of Chrysomya (Diptera: Calliphoridae) from Sulawesi, Indonesia, with a key to the Oriental, Australasian and Oceanian species. Med Entomol Zool. 1996;47(2):131-8.
18. Singh B, Kurahashi H, Wells JD. Molecular phylogeny of the blowfly genus Chrysomya, Med Vet Entomol. 2011;25(2):126-34.
19. James MT. Family Calliphoridae. In: Delfinado MD, Hardy DE, editors. A catalog of the Diptera of the oriental region. Honolulu: University Press; 1977. p. 526-56.
20. Goff ML. Early postmortem changes and stages of decomposition. In: Amendt J, Campobasso CP, Goff ML, Grassberger M, editors. Current concepts in forensic entomology. Dordrecht: Springer; 2010. p. 1-24.
21. Goff ML. Forensic entomology. In: Mozayani A, Noziglia C, editors. The forensic laboratory handbook procedures and practice. New York: Humana Press; 2011. p. 448-54.
22. Kreitlow KLT. Insect succession in a natural environment. In: Byrd JH, Castner JL, editors. Forensic entomology: The utility of arthropods in legal investigations. Boca Raton: CRC Press; 2010. p. 251-6.
23. Sharanowski BJ, Walker EG, Anderson GS. Insect succession and decomposition patterns on shaded and sunlit carrion in Saskatchewan in three different seasons. Forensic Sci Int. 2008;179(2-3):219-40.
24. Payne JA. A summer carrion study of the baby pig Sus scrofa Linnaeus. Ecology. 1965;46(5):592-602.
25. Archer MS, Elgar MA. Effects of decomposition on carcass attendance in a guild of carrion-breeding flies. Med Vet Entomol. 2003;17(3):263-71.
26. Wang J, Li Z, Chen Y, Chen Q, Yin X. The succession and development of insects on pig carcasses and their significances in estimating PMI in south China. Forensic Sci Int. 2008;179(1):11-8.
Medical Journal of Indonesia
78 Med J Indones, Vol. 24, No. 2June 2015
27. Heo CC, Mohamad AM, Ahmad FM, Jeffrey J, Kurahashi H, Omar B. Study of insect succession and rate of decomposition on a partially burned pig carcass in an oil palm plantation in Malaysia. Trop Biomed. 2008;25(3):202-8.
28. Apichat V, Wilawan P, Udomsak T, Chanasorn P, Saengchai N. A preliminary study on insects associated with pig (Sus scrofa) carcasses in Phitsanulok, northern Thailand. Trop Biomed. 2007;24(2):1-5.
29. Byrd JH, Castner JL, editors. Forensic Entomology: The utility of arthropods in legal investigations. 2nd ed. Boca Raton: CRC Press; 2010.
30. Gunn A. Essential forensic biology. 2nd ed. Chichester (UK): Wiley-Blackwell; 2009.
31. Tomberlin JK, Shepard DC. Lekking behavior of the black soldier fly (Diptera: Stratiomyidae). Fla Entomol. 2001;84(4):729-30.
32. Lord WD, Goff ML, Adkins TR, Haskell NH. The black soldier fly Hermetia illucens (Diptera: Stratiomyidae) as a potential measure of human postmortem interval: observations and case histories. J Forensic Sci. 1994;39(1):215-22.
33. Diclaro JW, Kaufman PE. Black soldier fly Hermetia illucens Linnaeus (Insecta: Diptera: Stratiomyidae). EENY. 2009;461:1-3.
34. Tomberlin JK, Sheppard DG, Joyce JA. Selected life-history
traits of black soldier flies (Diptera: Stratiomyidae) reared on three artificial diets Ann Entomol Soc Am. 2002;95(3):379-86.
35. Villet MH. African carrion ecosystems and their insect communities in relation to forensic entomology. Pest Technol. 2011;5(1):1-15.
36. Vibe-Petersen S. Development, survival and fecundity of the urine fly Scatella (Teichomyza) fusca and predation by the black dumpfly, Hydrotaea aenescens. Entomol Exp Appl. 1998;87(2):157-69.
37. Busvine JR. Insects and Hygiene. The biology and control of insect pests of medical and domestic importance. 2nd ed. London: Methuen; 1966.
38. Aggarwal AD. Estimating the post-mortem interval with the help of entomological evidence [Thesis]. Medical College, Patiala. Baba Farid University of Health Sciences Faridkot, India; 2005.
39. Heo CC, Mohamad AR, Rosli H, Nurul Ashikin A, Chen CD, John J, et al. Ants (Hymenoptera: Formicidae) associated with pig carcasses in Malaysia. Trop Biomed. 2009;26(1):106-9.
40. Kalshoven LGE. Pests of crops in Indonesia. Jakarta: Ichtiar Baru; 1981.
41. Payne JA, Mead FW, King EW. Hemiptera associated with pig carrion. Ann Entomol Soc Am. 1968;61:565-7.
42. Gillott C. Entomology. 3rd ed. Dordrecht: Springer; 2005.
http://mji.ui.ac.id
Lestari, et al.ODF expression in asthenozoospermic men
79
Evaluation of outer dense fiber-1 and -2 protein expression in asthenozoospermic infertile men
Keywords: asthenozoospermia, male infertility, ODF1, ODF2
pISSN: 0853-1773 • eISSN: 2252-8083 • http://dx.doi.org/10.13181/mji.v24i2.998 • Med J Indones. 2015;24:79-83• Received 07 Jul 2014 • Accepted 18 Jun 2015
Correspondence author: Silvia W. Lestari, [email protected]
Copyright @ 2015 Authors. This is an open access article distributed under the terms of the Creative Commons Attribution-NonCommercial-ShareAlike 4.0 International License (http://creativecommons.org/licenses/by-nc-sa/4.0/), which permits unrestricted non-commercial use, distribution, and reproduction in any medium, provided the original author and source are properly cited.
Silvia W. Lestari,1,3 Dwi A. Pujianto,1,3 Purnomo Soeharso,1,3 Evelyn Loanda2
1 Department of Medical Biology, Faculty of Medicine, Universitas Indonesia, Jakarta, Indonesia2 Department of Biochemistry, Faculty of Medicine, University of Atmajaya, Jakarta, Indonesia3 Indonesian Reproductive Medicine Research and Training Centre (Ina-Repromed), Yasmin Infertility Clinic, Kencana Cipto
Mangunkumuso Hospital, Jakarta, Indonesia
Basic Medical Research
Medical Journal of Indonesia
ABSTRAK
Latar belakang: Sebagian besar penyebab ketidaksuburan laki-laki adalah rendahnya motilitas spermatozoa (astenozoospermia). Hingga saat ini, etiologi astenozoospermia pada tingkat molekuler belum banyak diketahui. Motilitas spermatozoa sangat ditentukan oleh struktur aksonem yang disusun mikrotubul dan didukung oleh protein outer dense fiber (ODF) dan fibrous sheath (FS). Penelitian ini bertujuan untuk menganalisis ekspresi protein ODF1 dan ODF2 pada spermatozoa pria yang tidak subur astenozoospermia dan kontrol pada pria yang subur normozoospermia.
Metode: Sampel semen astenozoospermia (n=18) diperoleh dari Laboratorium Andrologi Rumah Sakit Cipto Mangunkusumo Jakarta dan kontrol diperoleh dari donor laki-laki subur normozoospermia (n=18). Motilitas semen dianalisis dengan computer-assisted sperm analysis (CASA). Semen selanjutnya dianalisis dengan Western blot dan imunositokimia menggunakan antibodi yang mengenali protein ODF1 dan ODF2.
Hasil: Analisis ekspresi protein ODF1 menunjukkan adanya pita dengan berat molekul (BM) ~30 kDa dan ODF2 dengan pita BM ~85 kDa. Rerata intensitas pita ODF1 dan ODF2 lebih rendah pada kelompok astenozoospermia (AG) dibanding kelompok normozoospermia (NG). Selain itu, kedua protein ODF terlokalisasi tidak padat dan tidak merata pada AG, dibandingkan dengan NG. Motilitas spermatozoa kelompok AG lebih rendah dibandingkan dengan kelompok NG berdasarkan average path velocity (VAP) = 32,07 ± 7,03 vs 37,58 ± 8,73 µm/dtk, p = 0,455; straight line velocity (VSL) = 24,17 ± 6,90 vs 27,61 ± 4,50 µm/dtk, p = 0,317 dan curvilinear velocity (VCL) = 45,68 ± 7,91 vs 55,55 ± 16,40 µm/dtk, p = 0,099.
Kesimpulan: Terdapat penurunan ekspresi dan penyebaran lokalisasi difus protein ODF1 dan ODF2 pada AG dibandingkan dengan NG. Perbedaan ini mungkin menyebabkan gangguan motilitas spermatozoa.
ABSTRACT
Background: Most of male infertility are caused by defect in sperm motility (asthenozoospermia). The molecular mechanism of low sperm motility in asthenozoospermic patients has not been fully understood. Sperm motility is strongly related to the axoneme structure which is composed of microtubules and supported by outer dense fiber (ODF) and fibrous sheath (FS) protein. The objective of this study was to characterize the ODF (ODF1 and ODF2) expression in asthenozoospermic infertile male and control normozoospermic fertile male.
Methods: Asthenozoospermic samples (n=18) were collected from infertile patients at Andrology Lab, Cipto Mangunkusumo Hospital Jakarta and control were taken from normozoospermic fertile donor (n=18). After motility analyses by computer-assisted sperm analysis (CASA), semen were divided into two parts, for Western blot and for immunocytochemistry analysis. Antibody against ODF1 and ODF2 protein were used in both analyses.
Results: Analysis of ODF1 protein expression showed bands with molecular weight of ~30 kDa and ODF2 ~85 kDa. The mean band intensity of ODF1 and ODF2 protein were lower in the asthenozoospermic group (AG) compared to normozoospermic group (NG). Moreover, both ODF proteins were less intense and less localized in the AG than NG. Sperm motility was lower in AG, compared to control NG, i.e. average path velocity (VAP) = 32.07 ± 7.03 vs 37.58 ± 8.73 µm/s, p = 0.455; straight line velocity (VSL) = 24.17 ± 6.90 vs 27.61 ± 4.50 µm/s, p = 0.317 and curvilinear velocity (VCL) = 45.68 ± 7.91 vs 55.55 ± 16.40 µm/s, p = 0.099.
Conclusion: There is down-regulation of ODF1 and ODF2 protein expression and less-compact localization in AG sperm compared to the NG. These changes might have caused disturbances in the sperm motility as observed in this study.
80 Med J Indones, Vol. 24, No. 2June 2015
Indonesia has 40% fertile couples of 200 million total population. Ten percents of those couples are infertile. Infertility is defined as inability to conceive after at least one year of unprotected intercourse. Male infertility reaches 40-50% of general infertility cases,1,2 with asthenozoospermia being one of the causes.3
Asthenozoospermia is a condition in which the number of motile spermatozoa moving straight is below the WHO normal reference values of 32%.4 The decrease of sperm motility may be caused by sperm dysfunction, abstinence, partial obstruction of seminal tract, varicocele and genetic factor.5,6 The mechanism of sperm motility involves sliding action of microtubules in the axoneme of sperm tail. In the morphogenesis process that occurs during spermatogenesis in the testes, sperm tail formation involves proteins such as outer dense fiber (ODF) and fibrous sheath (FS). In addition, sperm motility cannot be separated from the process of sperm maturation in the epididymis. Sperm maturation is a process in which sperm achieves its ability to fertilize the egg, occurring in the proximal of epididymis.7 In relation to the role of epididymis in sperm maturation, Aitken, et al8 showed that there are differences of protein profile in the caput of epididymis compared to the cauda.
In addition, several studies have identified proteins that are expressed in the epithelium of the epididymal duct, including the ODF. The importance of ODF and FS in the formation of fully competent sperm cells is indicated by the presence of ODF and FS protein in the epididymis,9 in which sperm cells undergo maturation by interaction with proteins secreted in the epididymal lumen.7,9 Chen, et al10 showed that the expression of ODF1 was decreased significantly in asthenozoospermic men. The role of ODF protein in sperm motility has also been showen by ODF2 knock out mouse study.11
Until now, the expression of ODF protein in infertile men with asthenozoospermia is still largely unknown. Thus, in the present study we wanted to characterize the ODF expression in asthenozoospermic sperm and to give information about sperm motility disruption at molecular level. It is expected that this might help the clinician to diagnose and give an appropriate treatment to asthenozoospermic patients.
METHODS
Sperm were collected from male infertile patients with asthenozoospermia who came to Andrology Lab at Cipto Mangunkusumo General Hospital, namely asthenozoospermic group (AG) and from control male fertile donor with normozoospermia, namely normozoospermic group (NG). After motility analysis by computer-assisted sperm analysis (CASA), semen were divided into two parts, one part for Western immunoblotting and another part for immunocytochemistry analysis. The study was conducted from May 2013 to September 2014. The protocol of this study has been approved by the Ethics Committee of the Faculty of Medicine, Universitas Indonesia (No. 317/HS F1/ETIK/2013).
Computer-assisted sperm analysis (CASA) Motility parameters were examined using CASA (Hamilton - Thorne v.12.4 Build 006A). Parameter settings have been optimized to assess human spermatozoa. The motility parameters were analyzed of average path velocity (VAP), straight line velocity (VSL) and curvilinear velocity (VCL). Distance visual field calibrated with a calibration slide (Leja) and the final setting was stored. Filming was set up as many as 30 shots per second, where each movement of the head of spermatozoa taken at least 25 points per second to form a circuit trace. VSL (the distance between the start point to the end point divided by the length of time the formation of traces of the circuit traces) and VCL (the amount of displacement at each distance divided by the length of time shooting the formation of a series of traces) were analyzed. The analyses were performed 10 times on each sample, then the average was taken as the VAP, VSL and VCL. Analysis was performed on 100 spermatozoa per analysis time.
Western blottingSperms were washed in phosphate buffered saline (PBS) and protein were extracted with sodium dodecyl sulphate (SDS) extraction buffer containing 10% SDS, 0.375 M Tris HCl, sucrose and protease inhibitor. Sperm protein were separated by SDS-polyacrylamide gel12 and transferred to polyvinylidene difluoride (PVDF) membrane (Amersham, CA, USA).13 The membrane was blocked in 5% dry milk in tris-buffered saline and tween 20 (TBST) (10 mM Tris/HCl 7.6, 150 mM NaCl, 0.05% Tween 20), and incubated with anti-human ODF antibody (Santa Cruz Biotechnology,
http://mji.ui.ac.id
Lestari, et al.ODF expression in asthenozoospermic men
81
USA) diluted 1:200 in blocking solution for overnight in 4°C. Membrane was washed in TBST three times of five minutes each and then incubated with a secondary antibody (anti-rabbit-Ig-G conjugated horse radish peroxidase –Horseradish peroxidase/HRP) diluted in 1:1000 in 3% skim milk or 1% for one hour in room temperature. Complex antigen-antibody were detected by enhanced chemiluminescence (ECL) plus Western blot detection system (Amersham, CA, USA)
ImmunocytochemistrySperm were washed in Percoll gradient, air dried onto poly-L-lysine slides and fixed with 4% formaldehyde then permeabelized with 0.2% triton X-100. Antibody incubation was performed with anti-ODF protein antiserum SA 963, diluted 1:200 in blocking solution in 4°C for overnight. For detection, a secondary antibody (anti-rabbit-Ig-G antibody) linked to fluorecein isothicyanate (FITC) was used. The distribution and localization of ODF signal were detected by convocal microscope (Zeiss, Vanadia).
RESULTS
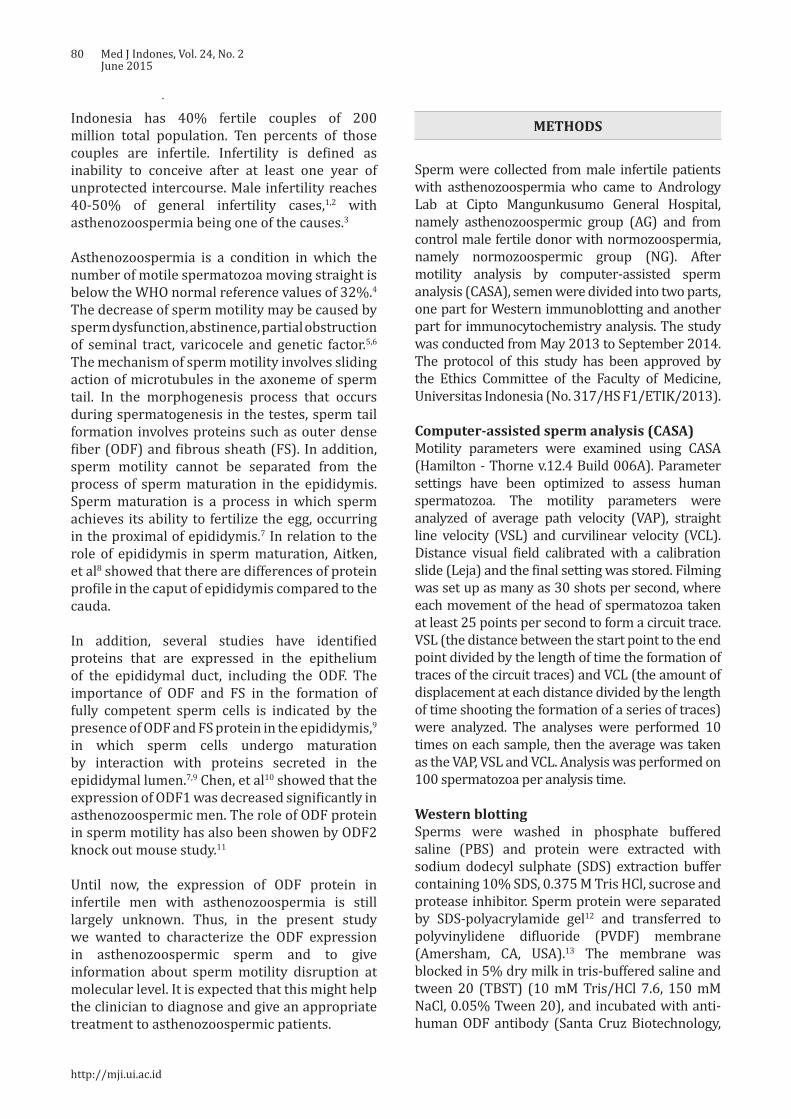
The results showed that there were differences between the AG and NG. CASA analysis showed that VAP was 32.07 ± 7.03 µm/s in AG and 37.58 ± 8.73 µm/s in NG (p = 0.455); VSL were 24.17 ± 6.90 and 27.61 ± 4.50 µm/s respectively (p=0.317); whereas VCL were 45.68 ± 7.91 and 55.55 ± 16.40 µm/s (p=0.099) (Figure 1). Based on CASA analysis, we could state that motility parameters i.e. VAP, VSL and VCL in AG were lower than NG.
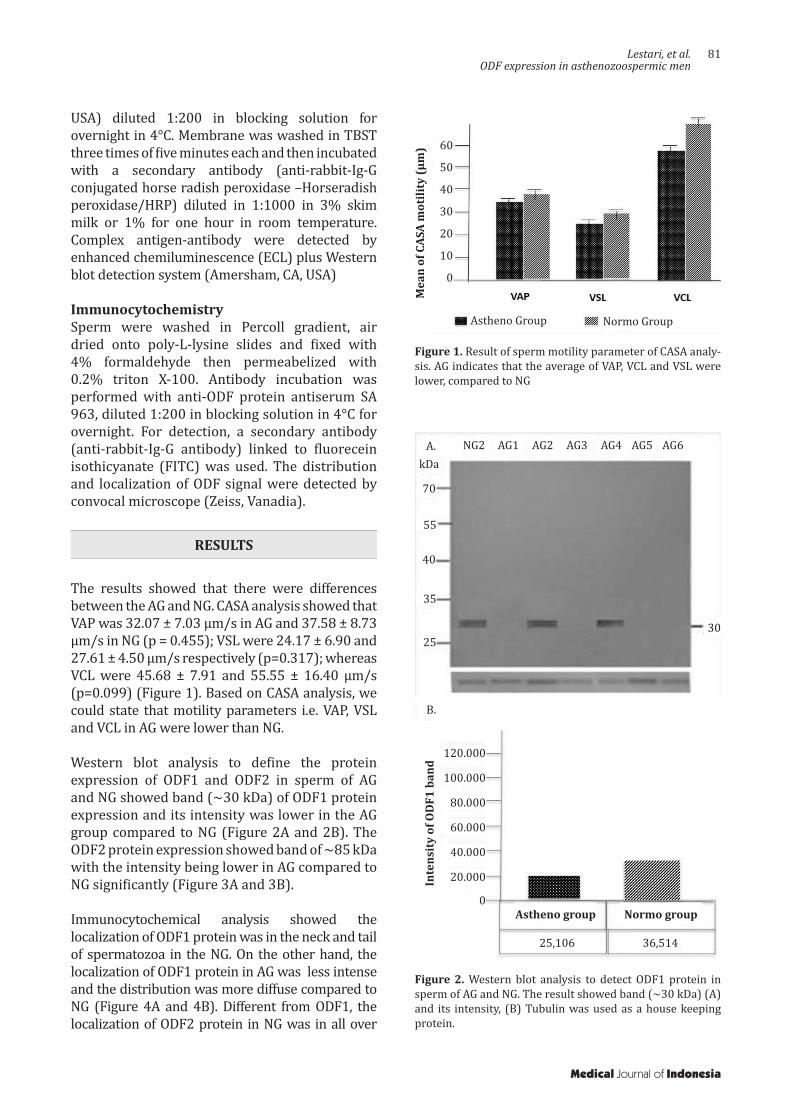
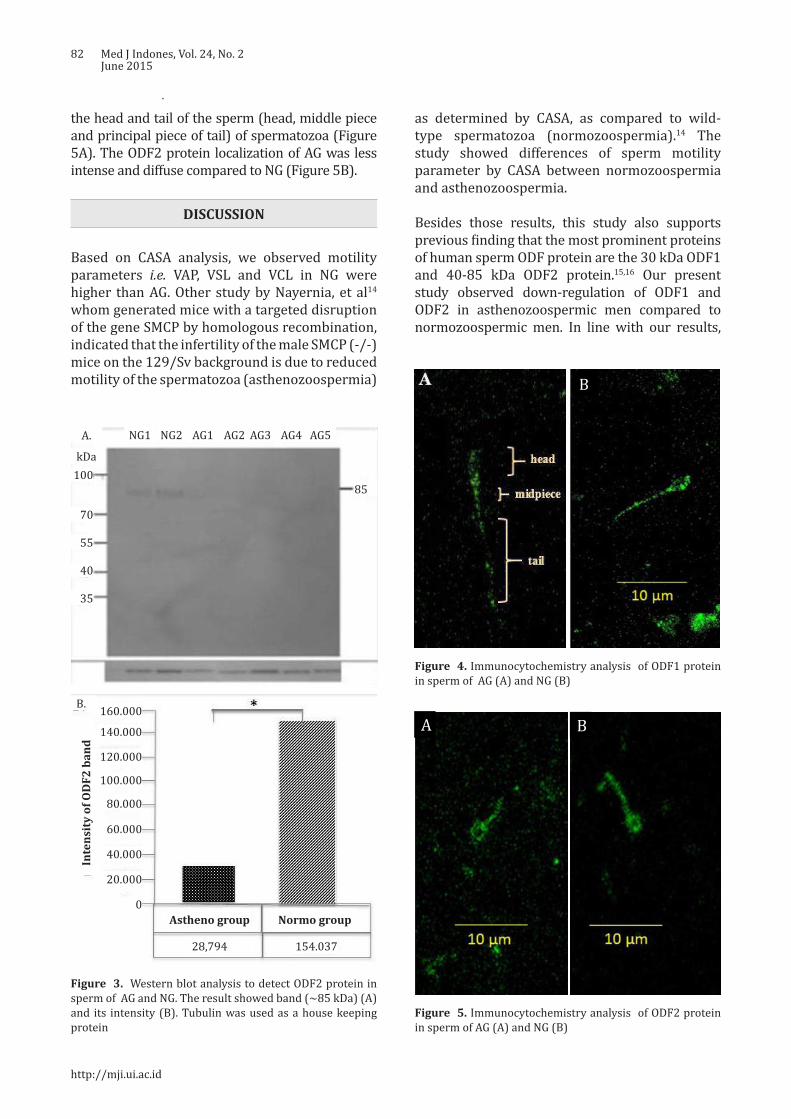
Western blot analysis to define the protein expression of ODF1 and ODF2 in sperm of AG and NG showed band (~30 kDa) of ODF1 protein expression and its intensity was lower in the AG group compared to NG (Figure 2A and 2B). The ODF2 protein expression showed band of ~85 kDa with the intensity being lower in AG compared to NG significantly (Figure 3A and 3B).
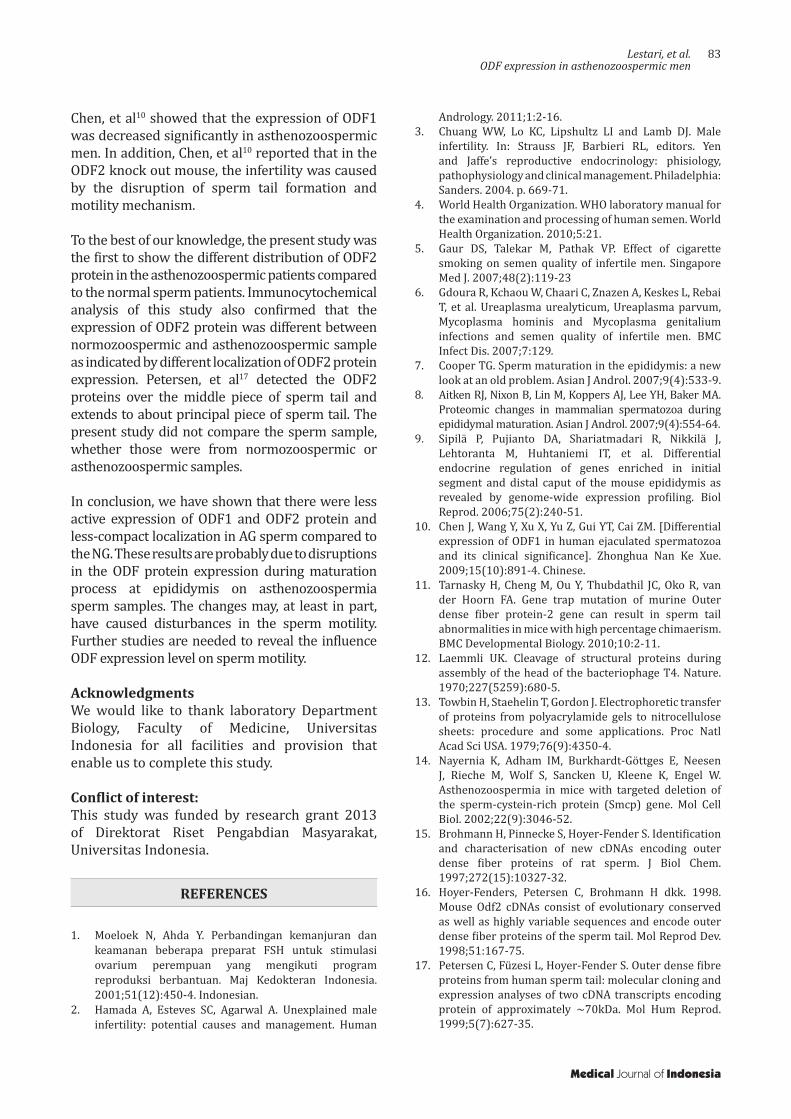
Immunocytochemical analysis showed the localization of ODF1 protein was in the neck and tail of spermatozoa in the NG. On the other hand, the localization of ODF1 protein in AG was less intense and the distribution was more diffuse compared to NG (Figure 4A and 4B). Different from ODF1, the localization of ODF2 protein in NG was in all over
Mea
n of
CAS
A m
otili
ty (μ
m)
Figure 1. Result of sperm motility parameter of CASA analy-sis. AG indicates that the average of VAP, VCL and VSL were lower, compared to NG
Figure 2. Western blot analysis to detect ODF1 protein in sperm of AG and NG. The result showed band (~30 kDa) (A) and its intensity, (B) Tubulin was used as a house keeping protein.
Medical Journal of Indonesia
NG2 AG1 AG2 AG3 AG4 AG5 AG6A.kDa
70
55
40
35
2530
B.
25,106 36,514
120.000
100.000
80.000
60.000
40.000
20.000
0
Inte
nsit
y of
OD
F1 b
and
Astheno group Normo group
Normo GroupAstheno Group
60
50
40
30
20
10
0
82 Med J Indones, Vol. 24, No. 2June 2015
the head and tail of the sperm (head, middle piece and principal piece of tail) of spermatozoa (Figure 5A). The ODF2 protein localization of AG was less intense and diffuse compared to NG (Figure 5B).
DISCUSSION
Based on CASA analysis, we observed motility parameters i.e. VAP, VSL and VCL in NG were higher than AG. Other study by Nayernia, et al14 whom generated mice with a targeted disruption of the gene SMCP by homologous recombination, indicated that the infertility of the male SMCP (-/-) mice on the 129/Sv background is due to reduced motility of the spermatozoa (asthenozoospermia)
Figure 3. Western blot analysis to detect ODF2 protein in sperm of AG and NG. The result showed band (~85 kDa) (A) and its intensity (B). Tubulin was used as a house keeping protein
A B
Figure 4. Immunocytochemistry analysis of ODF1 protein in sperm of AG (A) and NG (B)
A B
A B
Figure 5. Immunocytochemistry analysis of ODF2 protein in sperm of AG (A) and NG (B)
as determined by CASA, as compared to wild-type spermatozoa (normozoospermia).14 The study showed differences of sperm motility parameter by CASA between normozoospermia and asthenozoospermia.
Besides those results, this study also supports previous finding that the most prominent proteins of human sperm ODF protein are the 30 kDa ODF1 and 40-85 kDa ODF2 protein.15,16 Our present study observed down-regulation of ODF1 and ODF2 in asthenozoospermic men compared to normozoospermic men. In line with our results,
http://mji.ui.ac.id
A. NG1 NG2 AG1 AG2 AG3 AG4 AG5
kDa100
70
55
40
35
85
B. 160.000
Inte
nsit
y of
OD
F2 b
and
140.000
120.000
100.000
80.000
60.000
40.000
20.000
0Astheno group Normo group
28,794 154.037
Lestari, et al.ODF expression in asthenozoospermic men
83
Chen, et al10 showed that the expression of ODF1 was decreased significantly in asthenozoospermic men. In addition, Chen, et al10 reported that in the ODF2 knock out mouse, the infertility was caused by the disruption of sperm tail formation and motility mechanism. To the best of our knowledge, the present study was the first to show the different distribution of ODF2 protein in the asthenozoospermic patients compared to the normal sperm patients. Immunocytochemical analysis of this study also confirmed that the expression of ODF2 protein was different between normozoospermic and asthenozoospermic sample as indicated by different localization of ODF2 protein expression. Petersen, et al17 detected the ODF2 proteins over the middle piece of sperm tail and extends to about principal piece of sperm tail. The present study did not compare the sperm sample, whether those were from normozoospermic or asthenozoospermic samples.
In conclusion, we have shown that there were less active expression of ODF1 and ODF2 protein and less-compact localization in AG sperm compared to the NG. These results are probably due to disruptions in the ODF protein expression during maturation process at epididymis on asthenozoospermia sperm samples. The changes may, at least in part, have caused disturbances in the sperm motility. Further studies are needed to reveal the influence ODF expression level on sperm motility.
Acknowledgments We would like to thank laboratory Department Biology, Faculty of Medicine, Universitas Indonesia for all facilities and provision that enable us to complete this study.
Conflict of interest: This study was funded by research grant 2013 of Direktorat Riset Pengabdian Masyarakat, Universitas Indonesia.
REFERENCES
1. Moeloek N, Ahda Y. Perbandingan kemanjuran dan keamanan beberapa preparat FSH untuk stimulasi ovarium perempuan yang mengikuti program reproduksi berbantuan. Maj Kedokteran Indonesia. 2001;51(12):450-4. Indonesian.
2. Hamada A, Esteves SC, Agarwal A. Unexplained male infertility: potential causes and management. Human
Andrology. 2011;1:2-16.3. Chuang WW, Lo KC, Lipshultz LI and Lamb DJ. Male
infertility. In: Strauss JF, Barbieri RL, editors. Yen and Jaffe’s reproductive endocrinology: phisiology, pathophysiology and clinical management. Philadelphia: Sanders. 2004. p. 669-71.
4. World Health Organization. WHO laboratory manual for the examination and processing of human semen. World Health Organization. 2010;5:21.
5. Gaur DS, Talekar M, Pathak VP. Effect of cigarette smoking on semen quality of infertile men. Singapore Med J. 2007;48(2):119-23
6. Gdoura R, Kchaou W, Chaari C, Znazen A, Keskes L, Rebai T, et al. Ureaplasma urealyticum, Ureaplasma parvum, Mycoplasma hominis and Mycoplasma genitalium infections and semen quality of infertile men. BMC Infect Dis. 2007;7:129.
7. Cooper TG. Sperm maturation in the epididymis: a new look at an old problem. Asian J Androl. 2007;9(4):533-9.
8. Aitken RJ, Nixon B, Lin M, Koppers AJ, Lee YH, Baker MA. Proteomic changes in mammalian spermatozoa during epididymal maturation. Asian J Androl. 2007;9(4):554-64.
9. Sipilä P, Pujianto DA, Shariatmadari R, Nikkilä J, Lehtoranta M, Huhtaniemi IT, et al. Differential endocrine regulation of genes enriched in initial segment and distal caput of the mouse epididymis as revealed by genome-wide expression profiling. Biol Reprod. 2006;75(2):240-51.
10. Chen J, Wang Y, Xu X, Yu Z, Gui YT, Cai ZM. [Differential expression of ODF1 in human ejaculated spermatozoa and its clinical significance]. Zhonghua Nan Ke Xue. 2009;15(10):891-4. Chinese.
11. Tarnasky H, Cheng M, Ou Y, Thubdathil JC, Oko R, van der Hoorn FA. Gene trap mutation of murine Outer dense fiber protein-2 gene can result in sperm tail abnormalities in mice with high percentage chimaerism. BMC Developmental Biology. 2010;10:2-11.
12. Laemmli UK. Cleavage of structural proteins during assembly of the head of the bacteriophage T4. Nature. 1970;227(5259):680-5.
13. Towbin H, Staehelin T, Gordon J. Electrophoretic transfer of proteins from polyacrylamide gels to nitrocellulose sheets: procedure and some applications. Proc Natl Acad Sci USA. 1979;76(9):4350-4.
14. Nayernia K, Adham IM, Burkhardt-Göttges E, Neesen J, Rieche M, Wolf S, Sancken U, Kleene K, Engel W. Asthenozoospermia in mice with targeted deletion of the sperm-cystein-rich protein (Smcp) gene. Mol Cell Biol. 2002;22(9):3046-52.
15. Brohmann H, Pinnecke S, Hoyer-Fender S. Identification and characterisation of new cDNAs encoding outer dense fiber proteins of rat sperm. J Biol Chem. 1997;272(15):10327-32.
16. Hoyer-Fenders, Petersen C, Brohmann H dkk. 1998. Mouse Odf2 cDNAs consist of evolutionary conserved as well as highly variable sequences and encode outer dense fiber proteins of the sperm tail. Mol Reprod Dev. 1998;51:167-75.
17. Petersen C, Füzesi L, Hoyer-Fender S. Outer dense fibre proteins from human sperm tail: molecular cloning and expression analyses of two cDNA transcripts encoding protein of approximately ~70kDa. Mol Hum Reprod. 1999;5(7):627-35.
Medical Journal of Indonesia
84 Med J Indones, Vol. 24, No. 2June 2015
Effects of anaerobic exercise and detraining on the caspase-3 expression of rat ventricular cardiomyocyte
Keywords: anaerobic exercise, cardiomyocytes left ventricle, caspase-3, detraining
pISSN: 0853-1773 • eISSN: 2252-8083 • http://dx.doi.org/10.13181/mji.v24i2.1220 • Med J Indones. 2015;24:84-90• Received 17 Mar 2015 • Accepted 3 Jul 2015
Correspondence author: Minarma Siagian, [email protected]
Copyright @ 2015 Authors. This is an open access article distributed under the terms of the Creative Commons Attribution-NonCommercial-ShareAlike 4.0 International License (http://creativecommons.org/licenses/by-nc-sa/4.0/), which permits unrestricted non-commercial use, distribution, and reproduction in any medium, provided the original author and source are properly cited.
Minarma Siagian,1 Maria Lousiana,1 Dewi I.S. Santoso,1 Sutjahjo Endardjo2
1 Department of Physiology, Faculty of Medicine, Universitas Indonesia, Jakarta, Indonesia 2 Department of Pathology, Faculty of Medicine, Universitas Indonesia, Jakarta, Indonesia
Basic Medical Research
Medical Journal of Indonesia
ABSTRAK
Latar belakang: Latihan fisik anaerobik adalah latihan fisik yang dilakukan dalam waktu singkat dengan intensitas tinggi. Hal ini dapat merangsang apoptosis pada kardiomiosit ventrikel kiri. Penelitian ini bertujuan untuk menganalisis apoptosis kardiomiosit pasca latihan serta pasca henti latih latihan fisik anaerobik.
Metode: Penelitian ini menggunakan 32 ekor tikus Wistar Ratus Novergicus dengan berat badan antara 250-350 gram (usia 8-10 minggu), dibagi dalam 8 kelompok dengan n=4 pada tiap kelompok dan diberi latihan fisik anaerobik selama 4 dan 12 minggu (kelompok Exc-4, Exc-12) dan latihan anaerobik diikuti empat minggu henti latih (Exc-4-D, Exc-12-D). Kelompok pembanding hanya diobservasi dalam periode yang sama (kelompok Ctl-4, Ctl-12, Ctl-4-D, Ctl-12-D). Pada akhir pengamatan tikus dieutanasia dan jantung diambil untuk pemeriksaan ekspresi caspase-3 sebagai indikator proses apoptosis menggunakan pulasan imunohistokimia. Data dianalisis dengan uji ANOVA.
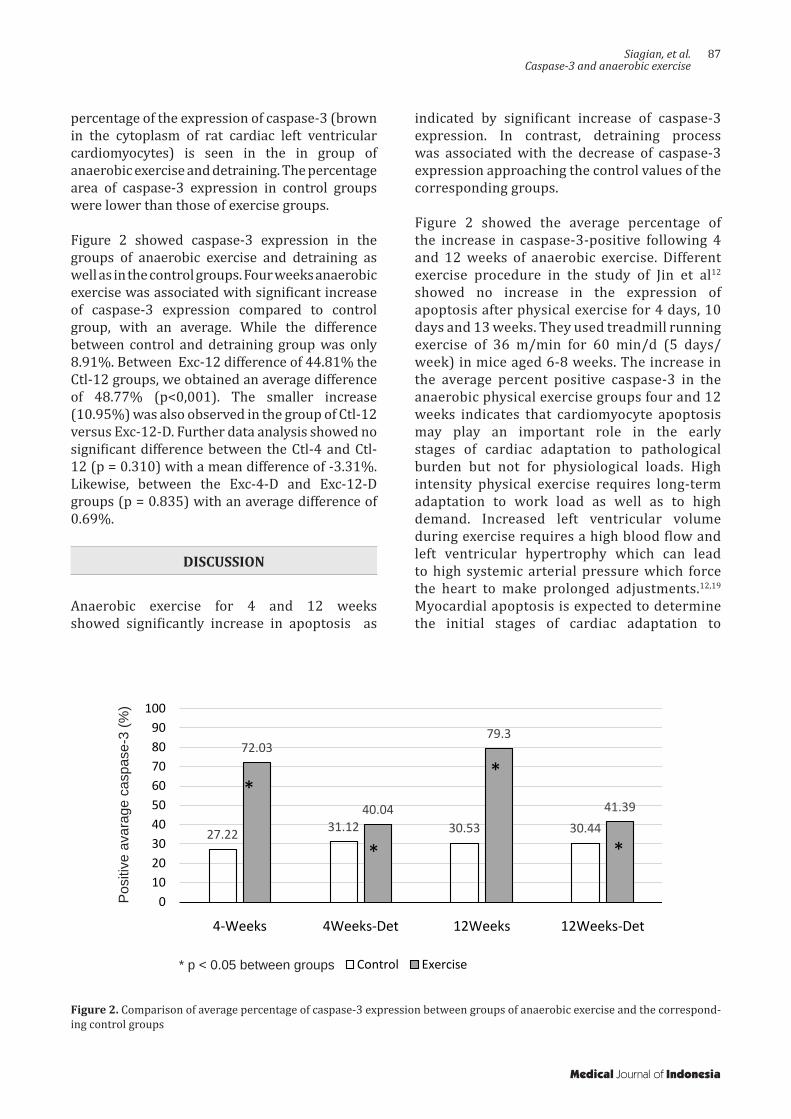
Hasil: Terjadi peningkatan ekspresi caspase-3 pada kelompok Exc-4 (72,03%) dibanding Ctl-4 (27,22%), (p < 0,001); dan Exc-12 (79,30%) dibanding Ctl-12 (30,53%) (p = 0,027). Proses henti latih menurunkan ekspresi caspase-3 secara signifikan (31,12% pada Exc-4-D dan 30,44% pada Exc-12-D).
Kesimpulan: Latihan fisik anerobik dapat meningkatkan apoptosis pada kardiomiosit jantung tikus ditandai dengan peningkatan ekspresi caspase-3. Henti latih dapat memperbaiki kondisi jantung yang ditandai dengan penurunan ekspresi caspase-3.
ABSTRACT
Background: Anaerobic physical exercise is a high intensity physical exercise performed in a short time. This exercise can stimulate apoptosis in left ventricular cardiomyocytes. The aim of this study is to analyze the apoptosis of cardiomyocytes after anaerobic exercise and detraining.
Methods: Thirty two wistar rats Ratus Novergicus 250-350 grams (8-10 weeks old) were divided into the following groups (n = 4) and given naerobic physical exercise four and 12 weeks (group Exc-4, Exc-12) and anaerobic exercise followed by four weeks of detraining (Exc-4-D, Exc-12-D). The control groups were only observed in the same period (group CTL-4, CTL-12, CTL-4-D, CTL-12-D). At the end of observation, the rats were sacrificed and examination of the expression of caspase-3 as an indicator of apoptosis was done using immunohistochemical staining. Data were analyzed with ANOVA test.
Results: An increase in expression of caspase-3 in the group Exc-4 (72.03%) compared to the CTL-4 (27.22%), (p < 0,001); and Exc-12 (79.30%) compared to the CTL-12 (30.53%) (p = 0.027). Detraining process showed a significant decline Capase-3 expression (31.12% in exc-4-D and 30.44% in the exc-12-D).
Conclusion: Anaerobic physical exercise can increase apoptosis in rat left ventricle cardiomyocyte characterized by increased expression of caspase-3. Detraining can improve heart condition characterized by decreased expression of caspase-3.
Siagian, et al.Caspase-3 and anaerobic exercise
85
Physical exercise is a series of regular exercise and movement consciously planned by people to improve the functional capacities and then improving health status.1 In addition to improving health, physical exercise is also beneficial for treatment or prevention of disease.2 Physical exercise becomes important in everyday life because accordingly about 12% of cardiovascular diseases are due to lack of physical activity.2
According to its type and intensity, physical exercise will give positive influence on the physiology of the heart, such as increased myocardial oxygen supply and myocardial contractility. In addition, some morphological changes can also be observed, such as an increase in left and right ventricle the diameter, left atrial dimension, cardiac mass and thickening of the left ventricular wall.3,4 These changes are followed by the change in ejection fraction which is characteristic of cardiac physiology in athletes (athlete’s heart).3-5
Some studies showed the risk of cardiac arrhythmias in athlete’s heart, especially cardiac arrest caused by pathological changes as a result of an increase in wall stress, decreased elasticity, impaired left ventricular diastolic relaxation, increased left ventricular end-diastolic volume and decreased contractility. Whereas the function of the heart and blood vessels constantly is challenged to meet the metabolic needs of skeletal muscle in high intensity physical exercise.6-8 Anaerobic exercise might also a trigger of myocardial infarction as approximately 4%-20% of myocardial infarction (MCI) is reported to occur immediately after exertion.2 Evidence of increased sudden cardiac death and myocardial infarction have been reported, with the incidence in adults being higher than young people. The incidence is 2.62/100,000 cases in men and 1.07/100,000 in women athletes per year. Risk of sudden cardiac death was also 2.5 times higher in athletes than those who do not exercise.9,10
High intensity physical exercise causes an increase in myocardial oxygen demand and requires more oxygen supply, which can induce cardiac hypertrophy both physiological and pathological.11
Animal study in rat showed that physical exercise for four days, 10 days, and 13 weeks are associated with chronic excessive pressure load on the heart that stimulates apoptosis.12
The occurence of cardiomyocyte apoptosis is associated with the stretching of cardiomyocytes and increased concentrations of neurohormonal factors, such as angiotensin II and natriuretic factor. Stretching is the mechanical factor that plays a role in apoptosis of cardiomyocytes and causes morphological changes in the later phases of the stages of apoptosis. 13
Barauna et al14 reported that resistant exercise for four weeks induced cardiac hypertrophy without changes in heart function. The opposite is reported by Daustar et al15 that training for four weeks did not induce excessive damage to the heart, because the level of apoptosis and infarct size did not change. Siu et al16 stated that exercise above 12 weeks did not show increased expression of Bax and Bcl-2 (apoptosis induction attenuated). In contrast, Kwak et al17 reported that 12-weeks exercise significantly increased apoptosis in the left ventricle.
Apoptotic stimulus is expected to decrease with the cessation of exercise or detraining after high intensity exercise. Detraining train for four weeks can reduce the wall stress of the left ventricle which causes a decrease in adaptation and function of left ventricular myoctes contractility back just like before getting physical exercise.18 High intensity exercise has the potential to cause death in athletes, due to the occurrence of pathological cardiac hypertrophy. Whether the cessation of exercise will reduce the risk of death is still questionable.12
In this study, we wanted to verify the hypothesis that physical anaerobic exercise will increase apoptosis and detraining will decrease the level of expression of apoptotic proteins in cardiac muscle cells.
METHODS
This was an experimental study conducted in the Department of Physiology and Department of Pathology, Faculty of Medicine, Universitas Indonesia, Jakarta, Indonesia from May to July 2014. Wistar rats (Rattus norvegicus) aged between 8-10 weeks with body weights ranging between 250-350 grams were used. Animal were alocated to four groups of anaerobic exercise: four and 12 weeks anaerobic exercise (group Exc-4, Exc-12) and four and 12 weeks exercise followed
Medical Journal of Indonesia
86 Med J Indones, Vol. 24, No. 2June 2015
by four weeks of detraining (group Exc-4-D and Exc-12-D). In addition, we also allocated four control groups for each exercise groups, namely Ctl-4, Ctl-12, Ctl-4-D, and Ctl-12-D, respectively. The control groups were not subjected to exercise, but only observed for the same length of period.
Anaerobic physical exercise was done with animal treadmill at 35 meter/min speed, for 15 minutes (with 90 seconds break every five minutes of exercise).
At the end of exercise or detraining period, the animals were sacrificed by decapitation, and the heart was collected and paraffin blocks of left ventricle were prepared with immunohistochemical staining of caspase-3 as indicator of apoptosis.
Expressions of caspase-3 were detected according to standard protocol from the Department of Pathological Anatomy, Faculty of Medicine Universitas Indonesia (Starr Trek HRP-DAB or Horseradish Peroxidase Diaminobenzidine method). The primary antibody used was anti-caspase-3 antibody (Abcam Ab4051) with of the optimization 1:100. Primary antibody incubation
with PBS 0,1% + tween 20 + 5% donor horse serum and carried out overnight.
Photos of immunohistochemistry (IHC) with 2048x1536 pixels were taken from light microscope Leica DM500 with Leica ICC50 HD camera (magnification 40x). Five different visual fields were taken at random. The data measured were the percentage of caspase-3 expression area counted using Image J program.
Data analysis was done by using SPSS 17. Normality of caspase-3 expression was tested by Saphiro-Wilk method. Comparison among groups was done by one-way ANOVA test, followed by the least significant different (LSD) as post hoc analysis. The protocol of this study has been approved by the Research Ethics Committee of the Faculty of Medicine, Universitas Indonesia (No. 153/PT02.FK/ETIK/2011).
RESULTS
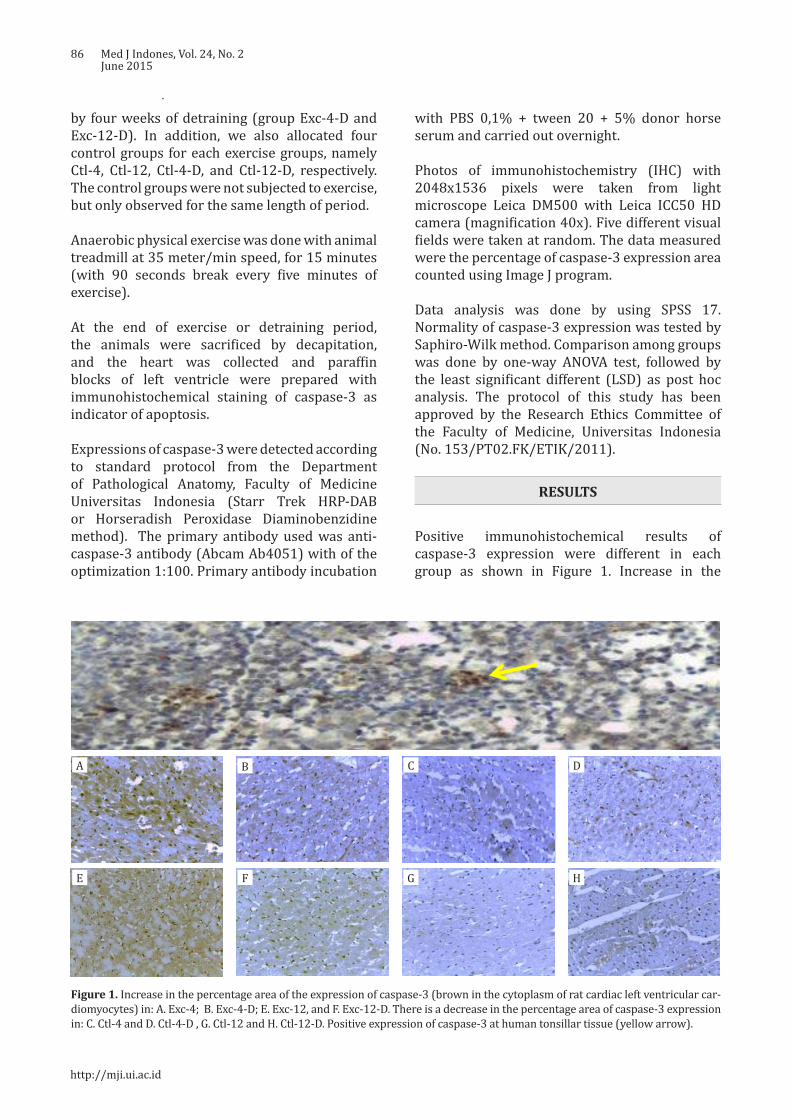
Positive immunohistochemical results of caspase-3 expression were different in each group as shown in Figure 1. Increase in the
A B C D
E F G H
Figure 1. Increase in the percentage area of the expression of caspase-3 (brown in the cytoplasm of rat cardiac left ventricular car-diomyocytes) in: A. Exc-4; B. Exc-4-D; E. Exc-12, and F. Exc-12-D. There is a decrease in the percentage area of caspase-3 expression in: C. Ctl-4 and D. Ctl-4-D , G. Ctl-12 and H. Ctl-12-D. Positive expression of caspase-3 at human tonsillar tissue (yellow arrow).
http://mji.ui.ac.id
Siagian, et al.Caspase-3 and anaerobic exercise
87
percentage of the expression of caspase-3 (brown in the cytoplasm of rat cardiac left ventricular cardiomyocytes) is seen in the in group of anaerobic exercise and detraining. The percentage area of caspase-3 expression in control groups were lower than those of exercise groups.
Figure 2 showed caspase-3 expression in the groups of anaerobic exercise and detraining as well as in the control groups. Four weeks anaerobic exercise was associated with significant increase of caspase-3 expression compared to control group, with an average. While the difference between control and detraining group was only 8.91%. Between Exc-12 difference of 44.81% the Ctl-12 groups, we obtained an average difference of 48.77% (p<0,001). The smaller increase (10.95%) was also observed in the group of Ctl-12 versus Exc-12-D. Further data analysis showed no significant difference between the Ctl-4 and Ctl-12 (p = 0.310) with a mean difference of -3.31%. Likewise, between the Exc-4-D and Exc-12-D groups (p = 0.835) with an average difference of 0.69%.
DISCUSSION
Anaerobic exercise for 4 and 12 weeks showed significantly increase in apoptosis as
27.22 31.12 30.53 30.44
72.03
40.04
79.3
41.39
0102030405060708090
100
4-Weeks 4Weeks-Det 12Weeks 12Weeks-Det
Positive avarage caspase-3 (%)
Control Exercise
*
*
*
*
Figure 2. Comparison of average percentage of caspase-3 expression between groups of anaerobic exercise and the correspond-ing control groups
* p < 0.05 between groups
indicated by significant increase of caspase-3 expression. In contrast, detraining process was associated with the decrease of caspase-3 expression approaching the control values of the corresponding groups.
Figure 2 showed the average percentage of the increase in caspase-3-positive following 4 and 12 weeks of anaerobic exercise. Different exercise procedure in the study of Jin et al12
showed no increase in the expression of apoptosis after physical exercise for 4 days, 10 days and 13 weeks. They used treadmill running exercise of 36 m/min for 60 min/d (5 days/week) in mice aged 6-8 weeks. The increase in the average percent positive caspase-3 in the anaerobic physical exercise groups four and 12 weeks indicates that cardiomyocyte apoptosis may play an important role in the early stages of cardiac adaptation to pathological burden but not for physiological loads. High intensity physical exercise requires long-term adaptation to work load as well as to high demand. Increased left ventricular volume during exercise requires a high blood flow and left ventricular hypertrophy which can lead to high systemic arterial pressure which force the heart to make prolonged adjustments.12,19 Myocardial apoptosis is expected to determine the initial stages of cardiac adaptation to
Pos
itive
ava
rage
cas
pase
-3 (
%)
Medical Journal of Indonesia
88 Med J Indones, Vol. 24, No. 2June 2015
physiological and pathological burden. Influence of physical exercise on the heart vary according to differences in the species, age, sex, and duration and intensity of exercise.12 Duration and intensity of training are the important factors that promote adaptation of cardiomyosite.20
Teiger et al21 founds that apoptosis occurs in the first seven days after excessive pressure, with a peak at four days, whereas cardiac growth continues for more than 30 days. The increase of caspase-3 expression indicated that cardiac adaptation to pressure overload is mediated by cardiomyocyte apoptosis.12 Caspase-3 is an executor of apoptosis pathway as a mediator between mitochondrial and death receptor apoptotic pathway. Stretching cardiomyocyte and increased left ventricular wall stress can trigger death receptor as characterized by the increased expression of Fas protein.22
High-intensity anaerobic physical exercise causes an increase of end-diastolic pressure due to excessive load and can lead to wall stress, which further stimulate sarcomer replication, fiber elongation, and enlargement of cardiac chamber or eccentric hypertrophy.13 Acute
increase of wall stress may lead to replication of sarcomeres, concentric wall thickening and hypertrophy associated with significant increase of left ventricular mass.14 According to some literatures, the excessive pressure burden can also stimulate apoptosis and cause excessive expression of growth factors, increased collagen deposits and deletion of mitochondrial deoxyribose nucleic acid (mtDNA).2,11,21,23 Cell growth signal produces conflicting genetic request and trigger the apoptotic response. Continuous growth stimulation can induce cardiomyocyte hypertrophy as a result of loss of intracellular survival signals that normally suppress the apoptosis.24
Regarding the influence of detraining, Pelliccia et al25 reported that ventricular adaptation and myocardial contractility returned to normal conditions Teiger et al21 after detraining.25 Detraining can reduce changes in cardiac function, fibrosis and susceptibility to arrhythmia.13,18 However, the size of cardiac chamber and left ventricular mass may remain elevated despite reduction of dilation by detraining.13 Decrease
cardiac chamber is hindered due to the expansion of interstitial collagen matrix that occur during cardiac remodelling in response to chronic stretching of the pericardium. Normalization of cardiac morphology in athletes occurred long after detraining as indicated by the reversibility of arrhythmia after cessation of exercise.13,26 In mice, regression occurs even after only two weeks of detraining train which indicates that cardiac mass in mice returned to basal state after about 21 days of detraining.27
According to Liu et al28 age may contribute to the loss of more than 30% of cardiac myocytes without heart disease, and can lead to myocardial dysfunction or heart failure.29 In addition, These authors also reported that the expression of protein Bcl-2 and Bax increased in the heart of old Fischer-344 rats under physiological conditions.28 While other author reported age-related increase in cardiomyocyte apoptosis without significant changes in proteins Bax and Bcl-2.30 Progressive apoptosis of left and right ventricles of male rats occurred at 6,16, and 24 months of age, while cytochrome C was significantly increased at 16 and 24 months compared to six months of age. So, the study on mice aged 4, 8, 12 and 16 weeks has not demonstrated quite high activity of caspase-3 protein.
Stages of myocyte loss may be associated with cell death that continuously and constantly occur throughout life.26 In humans and animals, cardiac aging is characterized by a decrease in the number of myocytes with reactive hypertrophy and fibrosis of the remaining cells.30 Increased apoptosis may be a consequence of a decrease in mitochondrial membrane stability and transition pore formation due to increasing age, which leads to the release of cytochrome into the cytosol, and ultimately to activation of caspase-3 and caspase-9.30 The loss of cardiac myocytes do not always lead to a reduction in cardiac mass. Aging process may cause an increase in cardiac connective tissue, stiffness/thickness of the wall, and loss of elasticity of the heart due to the loss or decrease in the number of myocytes. This will ultimately affect the contractility of the heart muscle.30
In conclusion, an increase in expression of caspase-3 after physical anaerobic exercise of
http://mji.ui.ac.id
Siagian, et al.Caspase-3 and anaerobic exercise
89
4 and 12 weeks showed that anaerobic physical exercise causes an increase in the cardiomyocyte apoptosis. Increased intensity and duration of anaerobic exercise may have harmful effect on the heart. Decreased expression of caspase-3 after detraining indicates that detraining is important for the recovery of cardiac dysfunction.
AcknowledgmentsThe authors are grateful to beasiswa pendidikan pasca-sarjana Direktorat Jenderal Pendidikan Tinggi (BPPS DIKTI) and Sekolah Tinggi Ilmu Kesehatan Sint Carolus (STIK Sint Carolus), which have funded this study.
Conflict of interestThe authors affirm no conflict of interest in this study.
REFERENCES
1. Giriwijoyo S, Sidik DZ. Ilmu faal olahraga (fisiologi olahraga): fungsi tubuh manusia pada olahraga kesehatan dan prestasi. Bandung: Remaja Rosdakarya; 2012. Indonesian.
2. Bowles DK, Laughlin MH. Mechanism of beneficial effects of physical activity on atherosclerosis and coronary heart disease. J Appl Physiol (1985). 2011;111(1):308-10.
3. Boreham C, Budgett R, Carbon R, Nicholas D, Franco A, Godfrey R, et al. The physiology of training. Philadelphia: Elselvier; 2006.
4. McArdle WD, Katch FL, Katch KL. Exercise physiology: nutrition, energy and human performance. 4th ed. Philadelphia: Lippincott William & Wilkins; 2011.
5. Haykowsky MJ. Left ventricular remodelling and the athlete’s heart: time to revisit the Morganroth hypothesis. J Physiol. 2011;589(Pt 24):5915.
6. Elmore S. Apoptosis: a review of programmed cell death. Toxicol Pathol. 2007;35(4):495-516.
7. Gielen S, Schuler G, Adams V. Cardiovascular effect of exercise training molecular mechanism. Circulation. 2010;122(12):1221-38.
8. Thompson PD, Franklin BA, Balady GJ, Blair SN, Corrado D, Estes NA, et al. Exercise and acute cardiovascular events placing the risk into perspective: a scientific statement from the American Heart Association Council on Nutrition, Physical Activity, and Metabolism and the Council on Clinical Cardiology. Circulation. 2007;115(17):2358-68.
9. Dickson EW, Hogrefe CP, Ludwig PS, Ackermann LW, Stoll LL, Denning GM. Exercise enhances myocardial ischemic tolerance via an opioid receptor-dependent mechanism. Am J Physiol Heart Circ Physiol. 2008;294(1):402-8.
10. Kavazis AN, Mc Clung JM, Hood DA, Powers SK. Exercise induces a cardiac mitochondrial phenotype that resists apoptotic stimuli. Am J Pysiol Heart Circ. 2008;294(2);H928-35.
11. Ellison GM, Waring CD, Vicinanza C, Torella D. Physiological cardiac remodelling in response to endurance exercise training: cellular and molecular mechanisms. Heart. 2012:98(1):5-10.
12. Jin H, Yang R, Li W, Lu H, Ryan AM, Ogasawara AK, et al. Effect of exercise training on cardiac function, gene expression, and apoptosis in rats. Am J Physiol Heart Circ Physiol. 2000;279(6):H2994-H3002.
13. Dispersyn GD, Borgers M. Apoptosis in the heart: about programmed cell death and survival. News Physiol Sci. 2001;16:Barauna VG, Rosa KT, Irigoyen MC, de Oliveira EM. Effects of resistance training on ventricular function and hypertrophy in a rat model. Clin Med Res. 2007;5(2):114–20.
14. Daustar Y, Soufi FG, Jafary A, Saber MM, Ghiassie R. Role of four-week resistance exercise in preserving the heart against ischaemia-reperfusion-induced injury. Cardiovasc J Afr. 2012;23(8):451-5.
15. Siu PM, Bryner RW, Martyn JK, Always SE. Apoptotic adaptations from exercise training in skeletal and cardiac muscles. FASEB J. 2004;18(10):1150-2.
16. Kwak HB, Song W, Lawler JM. Exercise training attenuates age-induced elevation in Bax/Bcl-2 ratio, apoptosis, and remodeling in the rat heart. FASEB J.2006;20:791e3.
17. Carneiro-Júnior MA, Pelúzio MC, Silva CH, Amorim PR, Silva KA, Souza MO, et al. Exercise training and detraining modify the morphological and mechanical properties of single cardiac myocytes obtained from spontaneosly hypertensive rats. Braz J Med Biol Res. 2010;43(11):1042-6.
18. Rhoades R, Tanner G. Medical physiology. 2nd ed. Philadelphia: Lippincott Williams & Wilkins; 2003.
19. Ahmadiasl N, Soufi FG, Alipour M, Bonyadi M, Sheikhzadeh F, Vatankhah A, et al. Effects of age increment and 36-week exercise training on antioxidant enzymes and apoptosis in rat heart tissue. J Sport Sci Med. 2007;6(2):243-9.
20. Teiger E, Than VD, Richard L, Wisnewsky C, Tea BS, Gaboury L, et al. Apoptosis in pressure overload-induced heart hypertrophy in the rat. J Clin Invest. 1996;97(12):2891-7.
21. Moorjani N, Ahmad M, Catarino P, Brittin R, Trabzuni D, Al-Mohanna F, et al. Activation of apoptotic caspase cascade during the transition to pressure overload-induced heart failure. J Am Coll Cardiol. 2006;48(7):1451-8.
22. Huang CC, Lin TJ, Chen CC, Lin WT. Endurance training accelerates exhaustive exercise-induced mitochondrial DNA deletion and apoptosis of left ventricle myocardium in rats. Eur J Appl Physiol. 2009;107(6):697-706.
23. Fortuño MA, Ravassa S, Fortuño A, Zalba G, Diez J. Cardiomyocyte apoptotic cell death in arterial hypertension: mechanisms and potential management. Hypertension. 2001;38(6):1406-12.
24. Pelliccia A, Maron BJ, De Luca R, Di Paolo FM, Spataro A, Culasso F. Remodeling of left ventricular hypertrophy in elite athletes after long-term deconditioning. Circulation. 2002;105(8):944-9.
25. Mallat Z, Fornes P, Costagliola R, Esposito B, Belmin J, Lecomete D, et al. Age and gender effects on cardiomyocyte apoptosis in the normal human heart. J Gerontol A Biol Sci Med Sci. 2001;56(11):M719-23.
Medical Journal of Indonesia

90 Med J Indones, Vol. 24, No. 2June 2015
26. Bocalini D, Carvalho E, Mello de Sousa A, Levy R, Tucci P. Exercise training-induced enhancement in myocardial mechanics is lost after 2 weeks of henti latihin rats. Eur J App Physiol. 2010;109:909-14.
27. Liu M, Zhang P, Chen M, Zhang W, Yu L, Yang XC, et al. Aging might increase myocardial ischemia / reperfusion-induced apoptosis in humans and rats. Age
(Dordr). 2012;34(3):621-32.28. Kajstura J, Cheng W, Sarangarajan R, Li P, Li B, Nitahara
JA, et al. Necrotic and apoptotic myocyte cell death in the aging heart of Fischer 344 rats. Am J Physiol. 1996;271(3 Pt 2):H1215-28.
29. Kwak HB. Effects of aging and exercise training on apoptosis in the heart. J Exerc Rehabil. 2013;9(2):212-9.
http://mji.ui.ac.id
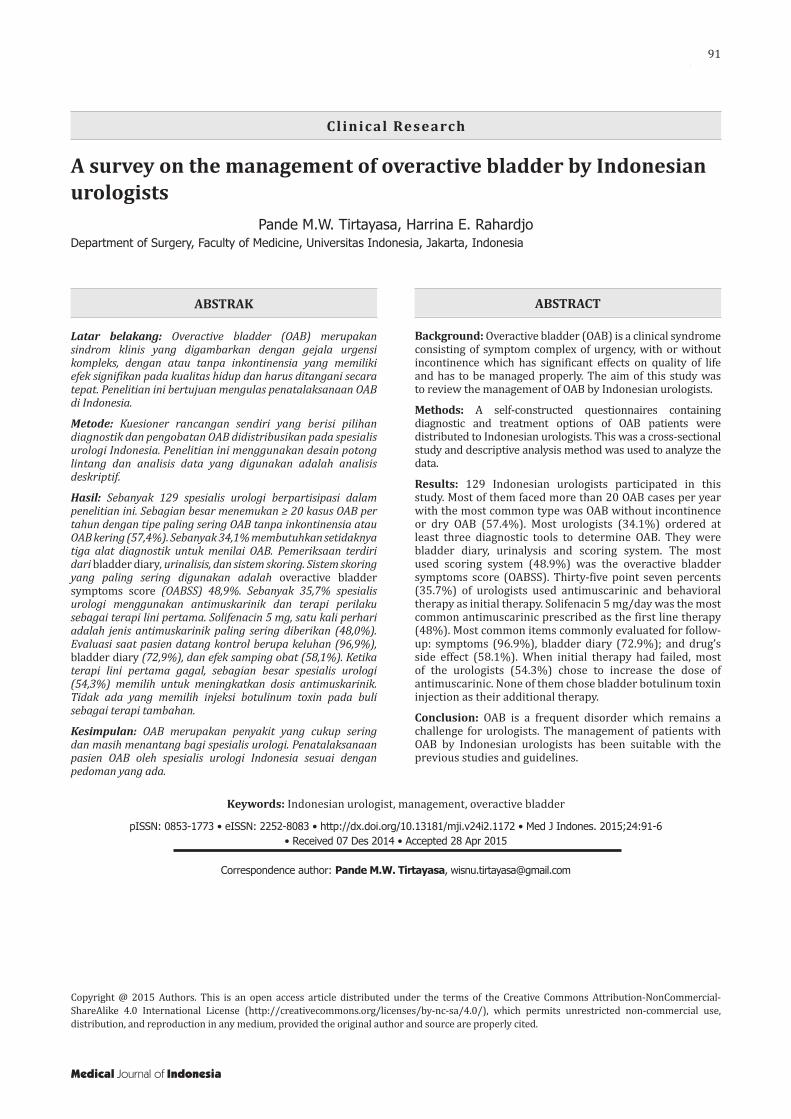
Tirtayasa and Rahardjo.Overactive bladder by Indonesian urologists
91
A survey on the management of overactive bladder by Indonesian urologists
Keywords: Indonesian urologist, management, overactive bladder
pISSN: 0853-1773 • eISSN: 2252-8083 • http://dx.doi.org/10.13181/mji.v24i2.1172 • Med J Indones. 2015;24:91-6• Received 07 Des 2014 • Accepted 28 Apr 2015
Correspondence author: Pande M.W. Tirtayasa, [email protected]
Copyright @ 2015 Authors. This is an open access article distributed under the terms of the Creative Commons Attribution-NonCommercial-ShareAlike 4.0 International License (http://creativecommons.org/licenses/by-nc-sa/4.0/), which permits unrestricted non-commercial use, distribution, and reproduction in any medium, provided the original author and source are properly cited.
Pande M.W. Tirtayasa, Harrina E. RahardjoDepartment of Surgery, Faculty of Medicine, Universitas Indonesia, Jakarta, Indonesia
Clinical Research
Medical Journal of Indonesia
ABSTRAK
Latar belakang: Overactive bladder (OAB) merupakan sindrom klinis yang digambarkan dengan gejala urgensi kompleks, dengan atau tanpa inkontinensia yang memiliki efek signifikan pada kualitas hidup dan harus ditangani secara tepat. Penelitian ini bertujuan mengulas penatalaksanaan OAB di Indonesia.
Metode: Kuesioner rancangan sendiri yang berisi pilihan diagnostik dan pengobatan OAB didistribusikan pada spesialis urologi Indonesia. Penelitian ini menggunakan desain potong lintang dan analisis data yang digunakan adalah analisis deskriptif.
Hasil: Sebanyak 129 spesialis urologi berpartisipasi dalam penelitian ini. Sebagian besar menemukan ≥ 20 kasus OAB per tahun dengan tipe paling sering OAB tanpa inkontinensia atau OAB kering (57,4%). Sebanyak 34,1% membutuhkan setidaknya tiga alat diagnostik untuk menilai OAB. Pemeriksaan terdiri dari bladder diary, urinalisis, dan sistem skoring. Sistem skoring yang paling sering digunakan adalah overactive bladder symptoms score (OABSS) 48,9%. Sebanyak 35,7% spesialis urologi menggunakan antimuskarinik dan terapi perilaku sebagai terapi lini pertama. Solifenacin 5 mg, satu kali perhari adalah jenis antimuskarinik paling sering diberikan (48,0%). Evaluasi saat pasien datang kontrol berupa keluhan (96,9%), bladder diary (72,9%), dan efek samping obat (58,1%). Ketika terapi lini pertama gagal, sebagian besar spesialis urologi (54,3%) memilih untuk meningkatkan dosis antimuskarinik. Tidak ada yang memilih injeksi botulinum toxin pada buli sebagai terapi tambahan.
Kesimpulan: OAB merupakan penyakit yang cukup sering dan masih menantang bagi spesialis urologi. Penatalaksanaan pasien OAB oleh spesialis urologi Indonesia sesuai dengan pedoman yang ada.
ABSTRACT
Background: Overactive bladder (OAB) is a clinical syndrome consisting of symptom complex of urgency, with or without incontinence which has significant effects on quality of life and has to be managed properly. The aim of this study was to review the management of OAB by Indonesian urologists.
Methods: A self-constructed questionnaires containing diagnostic and treatment options of OAB patients were distributed to Indonesian urologists. This was a cross-sectional study and descriptive analysis method was used to analyze the data.
Results: 129 Indonesian urologists participated in this study. Most of them faced more than 20 OAB cases per year with the most common type was OAB without incontinence or dry OAB (57.4%). Most urologists (34.1%) ordered at least three diagnostic tools to determine OAB. They were bladder diary, urinalysis and scoring system. The most used scoring system (48.9%) was the overactive bladder symptoms score (OABSS). Thirty-five point seven percents (35.7%) of urologists used antimuscarinic and behavioral therapy as initial therapy. Solifenacin 5 mg/day was the most common antimuscarinic prescribed as the first line therapy (48%). Most common items commonly evaluated for follow-up: symptoms (96.9%), bladder diary (72.9%); and drug’s side effect (58.1%). When initial therapy had failed, most of the urologists (54.3%) chose to increase the dose of antimuscarinic. None of them chose bladder botulinum toxin injection as their additional therapy.
Conclusion: OAB is a frequent disorder which remains a challenge for urologists. The management of patients with OAB by Indonesian urologists has been suitable with the previous studies and guidelines.
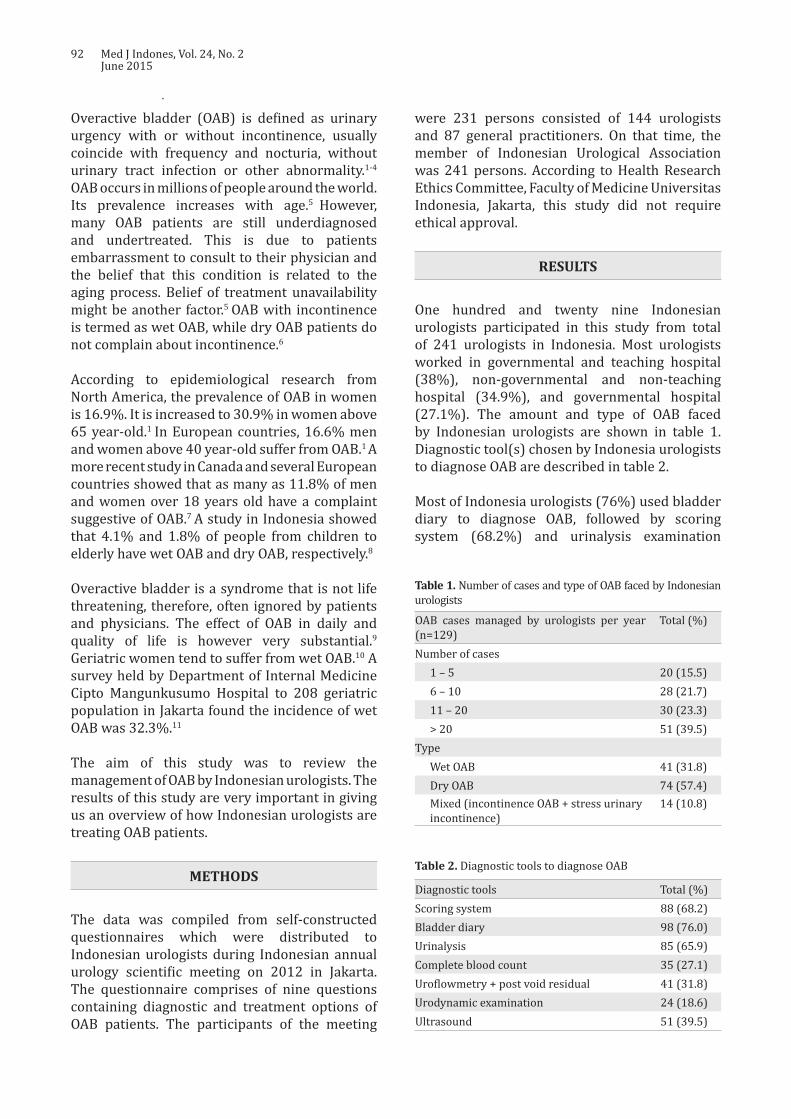
92 Med J Indones, Vol. 24, No. 2June 2015
OAB cases managed by urologists per year (n=129)
Total (%)
Number of cases1 – 5 20 (15.5)6 – 10 28 (21.7)11 – 20 30 (23.3)> 20 51 (39.5)
TypeWet OAB 41 (31.8)Dry OAB 74 (57.4)Mixed (incontinence OAB + stress urinary incontinence)
14 (10.8)
Table 1. Number of cases and type of OAB faced by Indonesian urologists
Diagnostic tools Total (%)Scoring system 88 (68.2)Bladder diary 98 (76.0)Urinalysis 85 (65.9)Complete blood count 35 (27.1)Uroflowmetry + post void residual 41 (31.8)Urodynamic examination 24 (18.6)Ultrasound 51 (39.5)
Table 2. Diagnostic tools to diagnose OAB
Overactive bladder (OAB) is defined as urinary urgency with or without incontinence, usually coincide with frequency and nocturia, without urinary tract infection or other abnormality.1-4 OAB occurs in millions of people around the world. Its prevalence increases with age.5 However, many OAB patients are still underdiagnosed and undertreated. This is due to patients embarrassment to consult to their physician and the belief that this condition is related to the aging process. Belief of treatment unavailability might be another factor.5 OAB with incontinence is termed as wet OAB, while dry OAB patients do not complain about incontinence.6
According to epidemiological research from North America, the prevalence of OAB in women is 16.9%. It is increased to 30.9% in women above 65 year-old.1 In European countries, 16.6% men and women above 40 year-old suffer from OAB.1 A more recent study in Canada and several European countries showed that as many as 11.8% of men and women over 18 years old have a complaint suggestive of OAB.7 A study in Indonesia showed that 4.1% and 1.8% of people from children to elderly have wet OAB and dry OAB, respectively.8
Overactive bladder is a syndrome that is not life threatening, therefore, often ignored by patients and physicians. The effect of OAB in daily and quality of life is however very substantial.9 Geriatric women tend to suffer from wet OAB.10 A survey held by Department of Internal Medicine Cipto Mangunkusumo Hospital to 208 geriatric population in Jakarta found the incidence of wet OAB was 32.3%.11
The aim of this study was to review the management of OAB by Indonesian urologists. The results of this study are very important in giving us an overview of how Indonesian urologists are treating OAB patients.
METHODS
The data was compiled from self-constructed questionnaires which were distributed to Indonesian urologists during Indonesian annual urology scientific meeting on 2012 in Jakarta. The questionnaire comprises of nine questions containing diagnostic and treatment options of OAB patients. The participants of the meeting
were 231 persons consisted of 144 urologists and 87 general practitioners. On that time, the member of Indonesian Urological Association was 241 persons. According to Health Research Ethics Committee, Faculty of Medicine Universitas Indonesia, Jakarta, this study did not require ethical approval.
RESULTS
One hundred and twenty nine Indonesian urologists participated in this study from total of 241 urologists in Indonesia. Most urologists worked in governmental and teaching hospital (38%), non-governmental and non-teaching hospital (34.9%), and governmental hospital (27.1%). The amount and type of OAB faced by Indonesian urologists are shown in table 1. Diagnostic tool(s) chosen by Indonesia urologists to diagnose OAB are described in table 2.
Most of Indonesia urologists (76%) used bladder diary to diagnose OAB, followed by scoring system (68.2%) and urinalysis examination
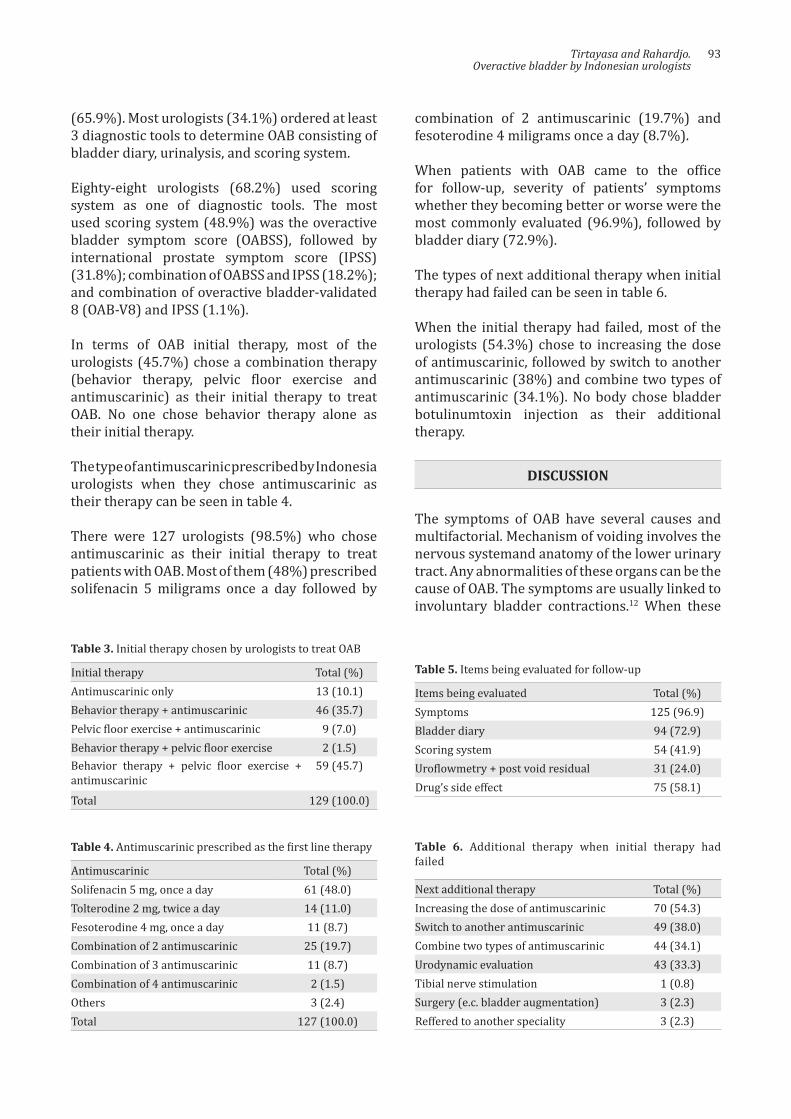
Tirtayasa and Rahardjo.Overactive bladder by Indonesian urologists
93
Initial therapy Total (%)Antimuscarinic only 13 (10.1)Behavior therapy + antimuscarinic 46 (35.7)Pelvic floor exercise + antimuscarinic 9 (7.0)Behavior therapy + pelvic floor exercise 2 (1.5)Behavior therapy + pelvic floor exercise + antimuscarinic
59 (45.7)
Total 129 (100.0)
Table 3. Initial therapy chosen by urologists to treat OAB
Antimuscarinic Total (%)Solifenacin 5 mg, once a day 61 (48.0)Tolterodine 2 mg, twice a day 14 (11.0)Fesoterodine 4 mg, once a day 11 (8.7)Combination of 2 antimuscarinic 25 (19.7)Combination of 3 antimuscarinic 11 (8.7)Combination of 4 antimuscarinic 2 (1.5)Others 3 (2.4)Total 127 (100.0)
Table 4. Antimuscarinic prescribed as the first line therapy
Items being evaluated Total (%)Symptoms 125 (96.9)Bladder diary 94 (72.9)Scoring system 54 (41.9)Uroflowmetry + post void residual 31 (24.0)Drug’s side effect 75 (58.1)
Table 5. Items being evaluated for follow-up
Next additional therapy Total (%)Increasing the dose of antimuscarinic 70 (54.3)Switch to another antimuscarinic 49 (38.0)Combine two types of antimuscarinic 44 (34.1)Urodynamic evaluation 43 (33.3)Tibial nerve stimulation 1 (0.8)Surgery (e.c. bladder augmentation) 3 (2.3)Reffered to another speciality 3 (2.3)
Table 6. Additional therapy when initial therapy had failed
(65.9%). Most urologists (34.1%) ordered at least 3 diagnostic tools to determine OAB consisting of bladder diary, urinalysis, and scoring system.
Eighty-eight urologists (68.2%) used scoring system as one of diagnostic tools. The most used scoring system (48.9%) was the overactive bladder symptom score (OABSS), followed by international prostate symptom score (IPSS) (31.8%); combination of OABSS and IPSS (18.2%); and combination of overactive bladder-validated 8 (OAB-V8) and IPSS (1.1%).
In terms of OAB initial therapy, most of the urologists (45.7%) chose a combination therapy (behavior therapy, pelvic floor exercise and antimuscarinic) as their initial therapy to treat OAB. No one chose behavior therapy alone as their initial therapy.
The type of antimuscarinic prescribed by Indonesia urologists when they chose antimuscarinic as their therapy can be seen in table 4.
There were 127 urologists (98.5%) who chose antimuscarinic as their initial therapy to treat patients with OAB. Most of them (48%) prescribed solifenacin 5 miligrams once a day followed by
combination of 2 antimuscarinic (19.7%) and fesoterodine 4 miligrams once a day (8.7%).
When patients with OAB came to the office for follow-up, severity of patients’ symptoms whether they becoming better or worse were the most commonly evaluated (96.9%), followed by bladder diary (72.9%).
The types of next additional therapy when initial therapy had failed can be seen in table 6.
When the initial therapy had failed, most of the urologists (54.3%) chose to increasing the dose of antimuscarinic, followed by switch to another antimuscarinic (38%) and combine two types of antimuscarinic (34.1%). No body chose bladder botulinumtoxin injection as their additional therapy.
DISCUSSION
The symptoms of OAB have several causes and multifactorial. Mechanism of voiding involves the nervous systemand anatomy of the lower urinary tract. Any abnormalities of these organs can be the cause of OAB. The symptoms are usually linked to involuntary bladder contractions.12 When these
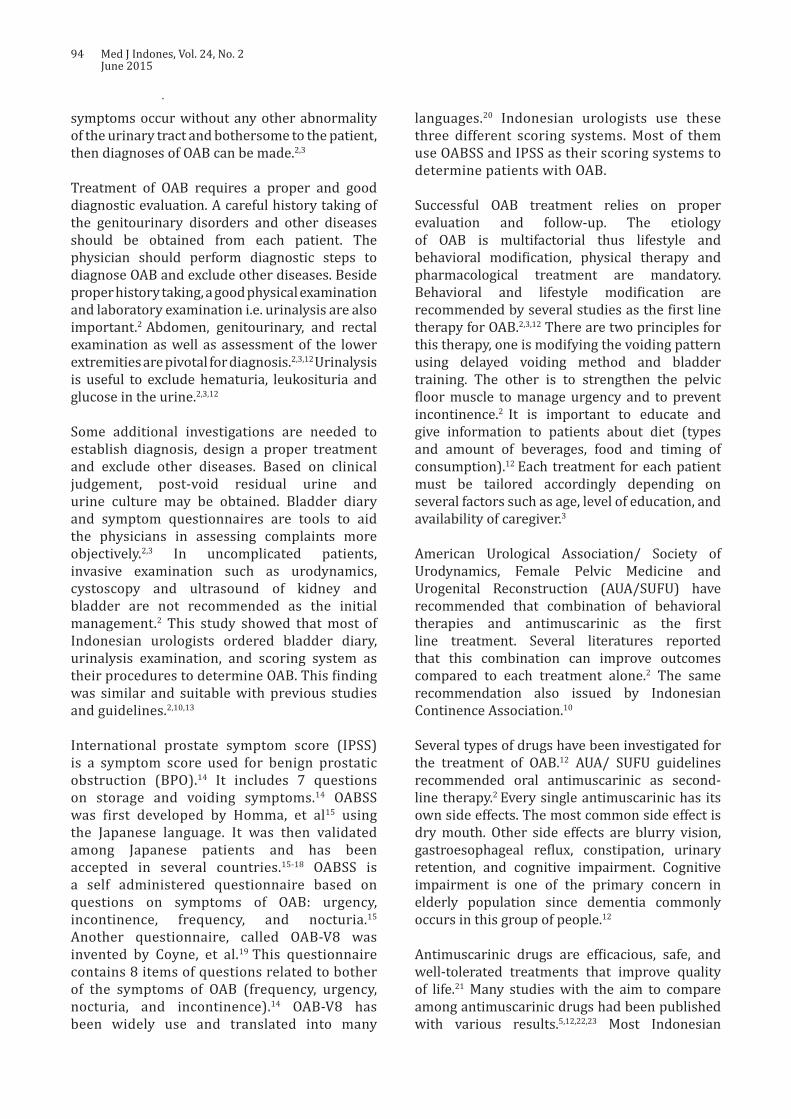
94 Med J Indones, Vol. 24, No. 2June 2015
symptoms occur without any other abnormality of the urinary tract and bothersome to the patient, then diagnoses of OAB can be made.2,3
Treatment of OAB requires a proper and good diagnostic evaluation. A careful history taking of the genitourinary disorders and other diseases should be obtained from each patient. The physician should perform diagnostic steps to diagnose OAB and exclude other diseases. Beside proper history taking, a good physical examination and laboratory examination i.e. urinalysis are also important.2 Abdomen, genitourinary, and rectal examination as well as assessment of the lower extremities are pivotal for diagnosis.2,3,12 Urinalysis is useful to exclude hematuria, leukosituria and glucose in the urine.2,3,12
Some additional investigations are needed to establish diagnosis, design a proper treatment and exclude other diseases. Based on clinical judgement, post-void residual urine and urine culture may be obtained. Bladder diary and symptom questionnaires are tools to aid the physicians in assessing complaints more objectively.2,3 In uncomplicated patients, invasive examination such as urodynamics, cystoscopy and ultrasound of kidney and bladder are not recommended as the initial management.2 This study showed that most of Indonesian urologists ordered bladder diary, urinalysis examination, and scoring system as their procedures to determine OAB. This finding was similar and suitable with previous studies and guidelines.2,10,13
International prostate symptom score (IPSS) is a symptom score used for benign prostatic obstruction (BPO).14 It includes 7 questions on storage and voiding symptoms.14 OABSS was first developed by Homma, et al15 using the Japanese language. It was then validated among Japanese patients and has been accepted in several countries.15-18 OABSS is a self administered questionnaire based on questions on symptoms of OAB: urgency, incontinence, frequency, and nocturia.15
Another questionnaire, called OAB-V8 was invented by Coyne, et al.19 This questionnaire contains 8 items of questions related to bother of the symptoms of OAB (frequency, urgency, nocturia, and incontinence).14 OAB-V8 has been widely use and translated into many
languages.20 Indonesian urologists use these three different scoring systems. Most of them use OABSS and IPSS as their scoring systems to determine patients with OAB.
Successful OAB treatment relies on proper evaluation and follow-up. The etiology of OAB is multifactorial thus lifestyle and behavioral modification, physical therapy and pharmacological treatment are mandatory. Behavioral and lifestyle modification are recommended by several studies as the first line therapy for OAB.2,3,12 There are two principles for this therapy, one is modifying the voiding pattern using delayed voiding method and bladder training. The other is to strengthen the pelvic floor muscle to manage urgency and to prevent incontinence.2 It is important to educate and give information to patients about diet (types and amount of beverages, food and timing of consumption).12 Each treatment for each patient must be tailored accordingly depending on several factors such as age, level of education, and availability of caregiver.3
American Urological Association/ Society of Urodynamics, Female Pelvic Medicine and Urogenital Reconstruction (AUA/SUFU) have recommended that combination of behavioral therapies and antimuscarinic as the first line treatment. Several literatures reported that this combination can improve outcomes compared to each treatment alone.2 The same recommendation also issued by Indonesian Continence Association.10
Several types of drugs have been investigated for the treatment of OAB.12 AUA/ SUFU guidelines recommended oral antimuscarinic as second-line therapy.2 Every single antimuscarinic has its own side effects. The most common side effect is dry mouth. Other side effects are blurry vision, gastroesophageal reflux, constipation, urinary retention, and cognitive impairment. Cognitive impairment is one of the primary concern in elderly population since dementia commonly occurs in this group of people.12
Antimuscarinic drugs are efficacious, safe, and well-tolerated treatments that improve quality of life.21 Many studies with the aim to compare among antimuscarinic drugs had been published with various results.5,12,22,23 Most Indonesian
Tirtayasa and Rahardjo.Overactive bladder by Indonesian urologists
95
urologists (98.5%) used antimuscarinic as their initial therapy to treat OAB. This result was suitable with the guideline that has been published.2,10,13
Follow-up is useful in assessing treatment compliance, symptom improvement and side effects of the drugs. Based on those information, alternative treatments can be prescribed for patients with minimal symptom improvement and disturbing side effects of the drugs.2 Offering follow-up and alternative treatments to the patients have been recommended by the guidelines.2,10 All of the Indonesian urologists perform follow-up for the patients and almost all of them assess the symptom improvement. This finding was in line with the guidelines.2,10
AUA/SUFU guideline recommends antimuscarinic dose modification or switching to a different antimuscarinic in patients with minimal symptom improvement and intolerable side effects of the drugs.2 One antimuscarinic drug has not been proven superior to other drugs for improvement in symptoms and quality of life.13 Recent study showed that most of Indonesian urologists choose to modify the antimuscarinic dose or to switch the type of antimuscarinic once a patient had failed the initial therapy. This finding was suitable with the guideline.2
OnabotulinumtoxinA and/or neuromodulation may be an other treatment option for the carefully selected patients who has failed behavioral and antimuscarinic therapies.2,10 Previous studies reported the efficacy of peripheral tibial nerve stimulation (PTNS) in the treatment of incontinence, frequency, nocturia, and the improvement of quality of life.2,24-27 Studies on sacral neuromodulation demonstrated that all improvement of quality of life and subjective symptoms.2,28-31 The FDA has already approved injection of intradetrusor onabotulinumtoxinA (100U) as a third-line treatment in non-neurogenic OAB patients.2
Indwelling catheters remain the last treatment option and are not recommended for OAB. Patients with refractory and complicated OAB can be offered augmentation of the bladder or urinary diversion although these treatments are very rare.2,10,12,13 A few of Indonesian urologists offered neuromodulation and augmentation of
the bladder once they failed the therapy. None of them offer the use of onabotulinumtoxinA to a patient probably due to the regiment has not been circulating in Indonesia.
In conclusion, OAB is a frequent disorder which remains a challenge for urologists. The management of patients with OAB by Indonesian urologists has been suitable with the previous studies and guidelines.
Conflict of interestAll authors affirm no conflict of interest in this study.
REFERENCES
1. Robinson D, Cardozo L. Overactive bladder: diagnosis and management. Maturitas. 2012;71(2):188-93.
2. Gormley EA, Lightner DJ, Burgio KL, Chai TC, Clemens JQ, Culkin DJ, et al. Diagnosis and treatment of overactive bladder (non-neurogenic) in adults: AUA/SUFU guideline. J Urol. 2012.188(6Suppl):2455-63.
3. Foon R, Drake MJ. The overactive bladder. TherAdv Urol. 2010;2(4):147-55.
4. Mostwin JL. Pathophysiology: the varieties of bladder overactivity. Urology. 2002;60(5Suppl1):22-6.
5. Chapple CR, Martinez-Garcia R, Selvaggi L, Toozs-Hobson P, Warnack W, Drogendijk T, et al. A comparison of the efficacy and tolerability of solifenacin succinate and extended release tolterodine at treating overactive bladder syndrome: results of the STAR trial. Eur Urol. 2005;48(3):464-70.
6. Tubaro A. Defining overactive bladder: epidemiology and burden of disease. Urology. 2004;64(6 Suppl 1):2-6.
7. Irwin DE, Milsom I, Hunskaar S, Reilly K, Kopp Z, Herschorn S, et al. Population-based survey of urinary incontinence, overactive bladder, and other lower urinary tract symptoms in five countries: results of the EPIC study. Eur Urol. 2006;50(6):1306-15.
8. Sumardi R, Mochtar CA, Junizaf, Santoso BI, Setiati S, Nuhonni SA, et al. Prevalence of urinary incontinence, risk factors and its impact: multivariate analysis from Indonesian nationwide survey. Acta Med Indones. 2014;46(3):175-82.
9. Freeman RM, Adekanmi OA. Overactive bladder. Best Pract Res Clin Obstet Gynaecol. 2005;19(6):829-41.
10. Rahardjo HE, Santoso BI, Hakim S, Hasan B, Tjahjodjati, Moegni F. Inkontinensia urin pada perempuan. In: Rahardjo HE. Panduan tatalaksana inkontinensia urin pada dewasa. Jakarta: Perkumpulan Kontinensia Indonesia (PERKINA). 2012;6-12. Indonesian.
11. Setiati S, Istanti R. Survei inkontinensia urin (mengompol) pada usia lanjut di lingkungan pusat santunan keluarga (pusaka). Maj Kedokt Indon. 2003;53:136-9. Indonesian
12. Ouslander JG. Management of overactive bladder. N Eng J Med. 2004;350(8):786-99.
96 Med J Indones, Vol. 24, No. 2June 2015
13. Lucas MG, Bedretdinova D, Bosch JLHR, Burkhard F, Cruz F, Nambiar AK, et al. Guidelines on urinary incontinence. European Association of Urology. 2014.
14. Barry MJ, Fowler FJ Jr, O’Leary MP, Bruskewitz RC, Holtgrewe HL, Mebust WK, et al. The American Urological Association symptom index for benign prostatic hyperplasia. The Measurement Committee of the American Urological Association. J Urol. 1992;148(5):1549-57.
15. Homma Y, Yoshida M, Seki N, Yokoyama O, Kakizaki H, Gotoh M, et al. Symptom assessment tool for overactive bladder syndrome-overactive bladder symptom score. Urology. 2006;68(2):318-23.
16. Homma Y, Kakizaki H, Yamaguchi O, Yamanishi T, Nishizawa O, Yokoyama O, et al. Assessment of overactive bladder symptoms: comparison of 3-day bladder diary and the overactive bladder symptoms score. Urology. 2011;77(1):60-4.
17. Hung MJ, Chou CL, Yen TW, Chuang YC, Meng E, Huang ST, et al. Development and validation of the Chinese Overactive Bladder Symptom Score for assessing overactive bladder syndrome in a RESORT study. J Formos Med Assoc. 2013;112(5):276-82.
18. Blaivas JG, Panagopoulos G, Weiss JP, Somaroo C. Validation of the overactive bladder symptom score. J Urol. 2007;178(2):543-7.
19. Coyne KS, Zyczynski T, Margolis MK, Elinoff V, Roberts RG. Validation of an overactive bladder awareness tool for use in primary care settings. AdvTher. 2005;22(4):381-94.
20. Acquadro C, Kopp Z, Coyne KS, Corcos J, Tubaro A, Choo MS, et al. Translating overactive bladder questionnaires in 14 languages. Urology. 2006;67(3):536-40.
21. Chapple CR, Khullar V, Gabriel Z, Muston D, Bitoun CE, Weinstein D. The effects of antimuscarinic treatments in overactive bladder: an update of a systematic review and meta-analysis. Eur Urol. 2008;54(3):543-62.
22. Chapple CR, Rechberger T, Al-Shukri S, Meffan P, Everaert K, Huang M, et al. Randomized, double-blind placebo- and tolterodine-controlled trial of the once-daily antimuscarinic agent solifenacin in patients with symptomatic overactive bladder. BJU Int. 2004;93(3):303-10.
23. Chapple C, Van Kerrebroeck P, Tubaro A, Haag-Molkenteller C, Forst HT, Massow U, et al. Clinical efficacy, safety, and tolerability of once-daily fesoterodine in subjects with overactive bladder. Eur Urol. 2007;52(4):1204-12.
24. Amarenco G, Ismael SS, Even-Schneider A, Raibaut P, Demaille-Wlodyka S, Parratte B, et al. Urodynamic effect of acute transcutaneous posterior tibial nerve stimulation in overactive bladder. J Urol. 2003;169(6):2210-5.
25. MacDiarmid SA, Peters KM, Shobeiri SA, Wooldridge LS, Rovner ES, Leong FC, et al. Long-term durability of percutaneous tibial nerve stimulation for the treatment of overactive bladder. J Urol. 2010;183(1):234-40.
26. Peters KM, Carrico DJ, Perez-Marrero RA, Khan AU, Wooldridge LS, Davis GL, et al. Randomized trial of percutaneous tibial nerve stimulation versus Sham efficacy in the treatment of overactive bladder syndrome: results from the SUmiT trial. J Urol. 2010;183(4):1438-43.
27. Yoong W, Ridout AE, Damodaram M, Dadswell R, et al. Neuromodulative treatment with percutaneous tibial nerve stimulation for intractable detrusor instability: outcomes following a shortened 6-week protocol. BJU Intl. 2010;106(11):1673-6.
28. Groen J, Blok BF, Bosch JL. Sacral neuromodulation as treatment for refractory idiopathic urge urinary incontinence: 5-year results of a longitudinal study in 60 women. J Urol. 2011;186(3):954-9.
29. Leong RK, Marcelissen TA, Nieman FH, De Bie RA, Van Kerrebroeck PE, De Wachter SG. Satisfaction and patient experience with sacral neuromodulation: results of a single center sample survey. J Urol. 2011;185(2):588-92.
30. Oerlemans DJ, Van Voskuilen AC, Marcelissen T, Weil EH, de Bie RA, Van Kerrebroeck PE. Is on-demand sacral neuromodulation in patients with OAB syndrome a feasible therapy regime?. Neurourol Urodyn. 2011;30(8):1493-6.
31. Vaarala MH, Tammela TL, Perttilä I, Luukkonen P, Hellström P. Sacral neuromodulation in urological indications: the Finnish experience. Scand J UrolNephrol. 2011;45(1):46-51.
Lahirin, et al.Green tea for lowering blood glucose
97
Additional benefit of higher dose green tea in lowering postprandial blood glucose
Keywords: cathecin, green tea, postprandial blood glucose
pISSN: 0853-1773 • eISSN: 2252-8083 • http://dx.doi.org/10.13181/mji.v24i2.1167 • Med J Indones. 2015;24:97-102• Received 02 Des 2014 • Accepted 13 May 2015
Correspondence author: Rita Lahirin, [email protected]
Copyright @ 2015 Authors. This is an open access article distributed under the terms of the Creative Commons Attribution-NonCommercial-ShareAlike 4.0 International License (http://creativecommons.org/licenses/by-nc-sa/4.0/), which permits unrestricted non-commercial use, distribution, and reproduction in any medium, provided the original author and source are properly cited.
Rita Lahirin,1 Inge Permadhi,1 Ninik Mudjihartini,2 Ridwan Rahmawati,2 Ray Sugianto1
1 Department of Nutrition, Faculty of Medicine Universitas Indonesia, Jakarta, Indonesia 2 Department of Biochemistry, Faculty of Medicine Universitas Indonesia, Jakarta, Indonesia
Clinical Research
Medical Journal of Indonesia
ABSTRAK
Latar belakang: Teh hijau mengandung katekin yang memiliki efek menghambat amilase, sukrosa, dan sodium dependent glucose transporter (SGLT) yang mengakibatkan penurunan kadar gula darah postprandial (GDP). Efek menguntungkan ini telah didemonstrasikan secara luas menggunakan teh hijau dosis biasa (DB). Penelitian ini bertujuan mempelajari efek penurunan yang lebih besar dari GDP dengan menggunakan teh hijau dosis tinggi (DT) pada remaja sehat.
Metode: 24 subjek menerima larutan 100 mL dari seduhan 0,67 atau 3,33 gram teh hijau bersama dengan makanan uji. Gula darah puasa postprandial (GDPP) menit ke-30, ke-60, dan ke-120 diukur. Dilakukan cross-over setelah wash out. GDP dan incremental area under the curve (IAUC) dianalisis dengan uji T berpasangan. Kandungan katekin dalam teh diukur menggunakan high-performance liquid chromatography (HPLC).
Hasil: GDP kelompok DT lebih rendah dibanding DB (menit ke-60 = 113,70 ± 13,20 vs 124,16 ± 8,17 mg/dL, p = 0,005; menit ke-120 = 88,95 ± 6,13 vs 105,25 ± 13,85). IAUC kelompok DT juga ditemukan lebih rendah dibanding DB (2055,0 vs 3411,9 min.mg/dL, p < 0,001).
Kesimpulan: Efek tambahan yang menguntungkan dari penurunan GDPP dapat dicapai dengan menggunakan dosis teh hijau yang lebih tinggi. Oleh karena itu, penelitian ini merekomendasikan penggunaan dosis teh hijau yang lebih tinggi untuk kontrol gula darah postprandial yang lebih baik.
ABSTRACT
Background: Green tea contains catechins that have inhibitory effects on amylase, sucrase, and sodium-dependent glucose transporter (SGLT) which result in lowering of postprandial blood glucose (PBG). This beneficial effect has been widely demonstrated using the usual dose (UD) of green tea preparation. Our study was aimed to explore futher lowering of PBG using high dose (HD) of green tea in healthy adolescents.
Methods: 24 subjects received 100 mL infusion of either 0.67 or 3.33 grams of green tea with test meal. Fasting, PBG at 30, 60, 120 minutes were measured. Subjects were cross-overed after wash out. PBG and its incremental area under the curve (IAUC) difference between groups were analyzed with paired T-test. Cathecin contents of tea were measured using high-performance liquid chromatography (HPLC).
Results: The PBG of HD group was lower compared to UD (at 60 minutes =113.70 ± 13.20 vs 124.16 ± 8.17 mg/dL, p = 0.005; at 120 minutes = 88.95 ± 6.13 vs 105.25 ± 13.85 mg/dL, p < 0.001). The IAUC of HD was also found to be lower compared to UD (2055.0 vs 3411.9 min.mg/dL, p < 0.001).
Conclusion: Additional benefit of lowering PBG can be achieved by using higher dose of green tea. This study recommends preparing higher dose of green tea drinks for better control of PBG.
98 Med J Indones, Vol. 24, No. 2June 2015
One of degenerative diseases with high prevalence according to International Diabetes Federation (IDF) is diabetes mellitus type two. Approximately five million people in Indonesia suffered from diabetes in year 2000, and 12 millions are predicted to have this condition by year 2025. World Health Organization (WHO) estimated that Indonesia will be one of ten countries with highest prevalence of diabetes in the world in 2025.1
The pathophysiology of diabetes type two is related to prolonged state of hyperglycemia, insulin resistance and deficiency of insulin production. Diabetes mellitus is defined if random blood glucose level is more than 200 mg/dL, or fasting glucose level more than 126 mg/dL, or both.1,2 However, hyperglycemia alone may be found in diabetic or non-diabetic patients.3,4 Prolonged state of hyperglycemia which carries a risk in developing diabetes in the future usually caused by unhealthy lifestyle due to high carbohydrate diet and sedentary lifestyle.2
Green tea contains high level of polyphenol substances (catechins) because green tea leaves undergo minimal fermentation process compared to black tea.5 One of its active substances, epigallocatechin gallate (EGCG), was known with its beneficial effects as hypocholesterolemic,6 antibacteria,7 and antioxidant,8,9 with minimal side effects.10
The role of green tea catechins in maintaining normal blood glucose level (euglycemia) is achieved via inhibitory activity of amylase, sucrase, and sodium-dependent glucose transporter (SGLT),11 as well as enhancing activity of tyrosine phophorilase enzyme,12 which enhances insulin secretion. The secretion of insulin, with its roles in glycogen synthesis and decreasing gluconeogenic enzyme such as phosphoenol pyruvate carboxy kinase (PEPCK) and glucose-6-phosphatase (G-6-P),13,14 also maintained by catechins through its antioxidant effect of preventing liver and pancreatic beta cells damage caused by free radicals.10 Nagao, et al15 reported that EGCG could cause a decrease in HbA1c and improve sensitivity of insulin. A study by Tsuneki, et al16 in healthy subjects showed that green tea could lower blood glucose level compared with water. Meanwhile, Josic, et al17 and Ryu, et al18 did not find any positive effect of green tea in lowering blood glucose levels.
Until now, the optimal dose of green tea catechins suggested in lowering postprandial blood glucose (PBG) elevation has been varied; however, some studies showed that the dose of green tea catechin which yields beneficial effect starting from 84 mg of EGCG. This is equivalent to 176 mg of total green tea catechin as reported by Babu, et al19 which showed that 48–55 % of green tea catechins occurred as EGCG. This can be obtained by infusing green tea in boiling water for three minutes.15,16,20 The beneficial effect has been widely demonstrated using the usual dose of green tea consumption by drinking two small cups of regular strength tea (0.67 gram of green tea infused in 100 mL of boiling water). This study was aimed to explore potential further lowering of PBG by using higher dose of green tea (3.33 grams of green tea infused in 100 mL of boiling water) in healthy adolescents. As the catechin content of Indonesian green tea might be different from tea from other countries,10 we hope that our study can be extrapolated to other population using different tea. In addition, we also analyzed the catechin content of tea used in this study.
METHODS
This study was a randomized, double-blind, cross over design clinical trial. It was held from May until June 2014 and the protocol of this study has been approved by Medical Ethics Committee of University of Indonesia (No. 320/H2.F1/ETIK/2014). The subjects were healthy female nursing students at Muhammadiyah Tangerang University aged 19-24 years with normal body mass index (BMI) of 18.5-22.9 kg/m2, 21 systolic blood pressure < 120 mmHg and diastolic blood pressure < 80 mm Hg,22 random blood glucose 200 mg/dL,1,23 and provided written informed consent. Exclusion criteria were history of degenerative diseases such as diabetes mellitus, cardiovascular, renal or liver diseases, smokers, use of antioxidant supplements in the last two weeks, symptom of gastritis after consumption of tea, and pregnancy or lactation. Subjects who were sick during the study, refused to finish the study, consumed EGCG supplements or food contain catechins during wash-out period, and could not complete the tasks, were dropped out from this study.
The study was carried out in two separate days with three days wash out period. Subjects were
http://mji.ui.ac.id
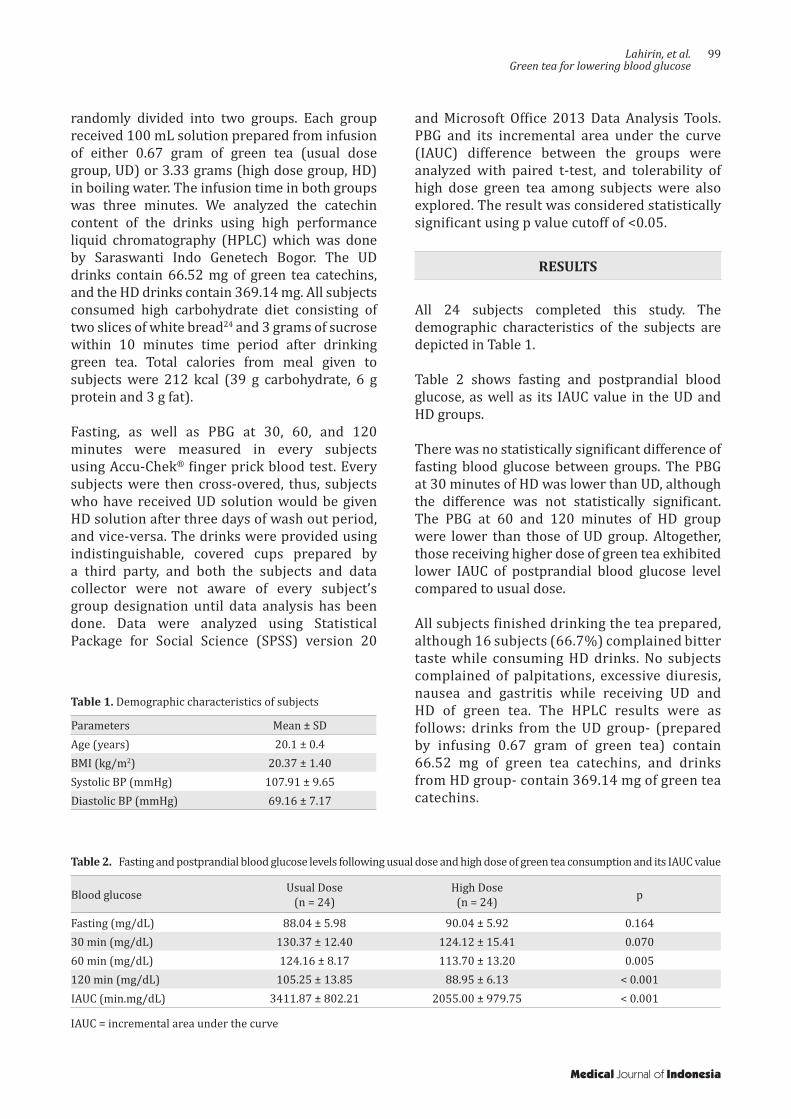
Lahirin, et al.Green tea for lowering blood glucose
99
randomly divided into two groups. Each group received 100 mL solution prepared from infusion of either 0.67 gram of green tea (usual dose group, UD) or 3.33 grams (high dose group, HD) in boiling water. The infusion time in both groups was three minutes. We analyzed the catechin content of the drinks using high performance liquid chromatography (HPLC) which was done by Saraswanti Indo Genetech Bogor. The UD drinks contain 66.52 mg of green tea catechins, and the HD drinks contain 369.14 mg. All subjects consumed high carbohydrate diet consisting of two slices of white bread24 and 3 grams of sucrose within 10 minutes time period after drinking green tea. Total calories from meal given to subjects were 212 kcal (39 g carbohydrate, 6 g protein and 3 g fat).
Fasting, as well as PBG at 30, 60, and 120 minutes were measured in every subjects using Accu-Chek® finger prick blood test. Every subjects were then cross-overed, thus, subjects who have received UD solution would be given HD solution after three days of wash out period, and vice-versa. The drinks were provided using indistinguishable, covered cups prepared by a third party, and both the subjects and data collector were not aware of every subject’s group designation until data analysis has been done. Data were analyzed using Statistical Package for Social Science (SPSS) version 20
Parameters Mean ± SDAge (years) 20.1 ± 0.4BMI (kg/m2) 20.37 ± 1.40Systolic BP (mmHg) 107.91 ± 9.65Diastolic BP (mmHg) 69.16 ± 7.17
Table 1. Demographic characteristics of subjects
and Microsoft Office 2013 Data Analysis Tools. PBG and its incremental area under the curve (IAUC) difference between the groups were analyzed with paired t-test, and tolerability of high dose green tea among subjects were also explored. The result was considered statistically significant using p value cutoff of <0.05.
RESULTS
All 24 subjects completed this study. The demographic characteristics of the subjects are depicted in Table 1.
Table 2 shows fasting and postprandial blood glucose, as well as its IAUC value in the UD and HD groups.
There was no statistically significant difference of fasting blood glucose between groups. The PBG at 30 minutes of HD was lower than UD, although the difference was not statistically significant. The PBG at 60 and 120 minutes of HD group were lower than those of UD group. Altogether, those receiving higher dose of green tea exhibited lower IAUC of postprandial blood glucose level compared to usual dose.
All subjects finished drinking the tea prepared, although 16 subjects (66.7%) complained bitter taste while consuming HD drinks. No subjects complained of palpitations, excessive diuresis, nausea and gastritis while receiving UD and HD of green tea. The HPLC results were as follows: drinks from the UD group- (prepared by infusing 0.67 gram of green tea) contain 66.52 mg of green tea catechins, and drinks from HD group- contain 369.14 mg of green tea catechins.
Blood glucose Usual Dose(n = 24)
High Dose(n = 24) p
Fasting (mg/dL) 88.04 ± 5.98 90.04 ± 5.92 0.16430 min (mg/dL) 130.37 ± 12.40 124.12 ± 15.41 0.07060 min (mg/dL) 124.16 ± 8.17 113.70 ± 13.20 0.005120 min (mg/dL) 105.25 ± 13.85 88.95 ± 6.13 < 0.001IAUC (min.mg/dL) 3411.87 ± 802.21 2055.00 ± 979.75 < 0.001
Table 2. Fasting and postprandial blood glucose levels following usual dose and high dose of green tea consumption and its IAUC value
IAUC = incremental area under the curve
Medical Journal of Indonesia
100 Med J Indones, Vol. 24, No. 2June 2015
DISCUSSION
Green tea’s beneficial anti-hyperglycemic effects occurred both in the short- and long-term timeframe. When taken with meal, green tea exhibits protective effect by shortening the duration of hyperglycemia and reducing overall elevation of postprandial blood glucose above the baseline or fasting level.11-14 Secondly, the antioxidant effects of habitual green tea drinking yields protective effect from free radical damage of pancreatic beta cell.9,10 Several studies showed that green tea effect in lowering blood glucose levels depends on its catechins content per drinks consumed and drinking frequency.16,17,25,26 This study focused on the short-term protective effect of green tea drinking, examined the additional postprandial blood glucose (PBG) lowering effect by increasing the dose taken at mealtime.
The subjects in this study were healthy adolescents aged 19-24 years and all of them were female. It was considered that carbohydrate metabolism was not impaired in young population, except in diabetes mellitus type 1 patients.27 Basu, et al28 also indicated that women have higher sensitivity of insulin compared with men, possibly due to hormonal factor, as estrogen and progesterone affects tissue responses to glucose and gut motility.29 Although the result of this study might not be able to be extrapolated to male and older population, the homogeneity of subjects does minimize the bias of this study.
The fasting blood glucose levels of all subjects were considered within normal limits, and the blood glucose levels at 30 minutes reached almost two times the fasting level which indicates first and second stage of insulin secretion.29,30 Higher insulin secretion at second stage leads to a decrease in blood glucose levels at 60 minutes and further lowering at 120 minutes. Thus, the data of PBG in both HD and UD groups were considered within normal bounds of physiological insulin secretion in controlling blood glucose following a meal.30,31
As expected of the good cross over study, the fasting blood glucose level did not differ significantly between the groups (UD = 88.04 ± 5.98, HD = 90.04 ± 5.92; p = 0.164) because the subjects themselves exposed to the two different
treatment, thus eliminating individual variation between groups in non-cross over studies. Furthermore, the subjects were not permitted to consume green tea and other food sources of catechins during wash out period. The PBG at minutes 30 also did not differ between the HD and UD groups, implying the role of green tea catechins in the later period of PBG elevation rather than in the early period, by inducing salivary a amylase bond to hydrogen complex interaction13 and inhibiting the activity of pancreatic a amylase.32,33 Other study conducted by Kobayashi, et al11 showed that EGC and EGCG can inhibit the activity of SGLT-1 which lead to decreased absorption of carbohydrate. The same results were also reported by Snoussi, et al34.
The PBG at 60 and 120 minutes were found to be lower in the HD group compared to UD group and the differences were statistically significant. The PBG were 8.42% lower at minutes 60 and 15.49% lower at minutes 120 in the HD group compared to UD group. The mechanism involved at these point of time related to an increase in glucose uptake into cells by increasing insulin secretion.35 Babu, et al36 in animal study found that green tea catechins could stimulate glucose uptake by increasing insulin secretion, inhibiting glucose transporter type four system, and decreasing gene expression that control gluconeogenesis mechanism. Other study conducted by Sheperd, et al37 also agrees with this finding. The total/cumulative effect of the benefit of HD of green tea over UD in this study can be evaluated by comparing overall elevation of postprandial blood glucose following the same test meal using incremental area under the curve (IAUC) of PBG. The IAUC in the HD group was 2055.00 ± 979.75 min.mg/dL, or 39.8%, which was significantly lower than the UD group (3411.87 ± 802.21 min.mg/dL, p < 0.001) suggesting the HD yields overall additional benefit in postprandial blood glucose control over UD.
Regarding the return of postprandial blood glucose level to its baseline or fasting value, we found that the return at minutes 120 was observed in 14 subjects (58.3%) from the HD group but only observed in two subjects (8.3%) from the UD group. During the two hour period, no subjects in either groups have exhibited symptoms of hypoglycemia or have PBG value lower than 70 mg/dL.
http://mji.ui.ac.id
Lahirin, et al.Green tea for lowering blood glucose
101
Of interesting note was our finding related to the time of return of postprandial glucose elevation to baseline or fasting level. Only 8.3% subjects receiving UD of green tea have their PBG returned to baseline level at minutes 120, while greater proportions of subjects (58.3%) receiving HD of green tea have achieved baseline levels at minutes 120. These findings suggest that drinking higher dose of green tea together with meals could somehow offset the risk of developing diabetes mellitus type two if done consistently, because prolonged state of hyperglycemia is an independent risk factor of type two diabetes mellitus.2 Although the meal used in this study contains fewer calories than meals typically consumed during lunch or dinner, the use of higher calorie meals could be evaluated in future studies. These findings could also be explored in future studies using higher dose of green tea to determine the ceiling dose of green tea that further increase of dose could not yield additional benefits.
The side effects reported in this study were only related to the taste of drinks prepared from HD of green tea, certainly, this could not be avoided because the bitterness of the drinks would increase when infusing greater amount of tea. Longer term studies by evaluating whether this taste preference would change should be studied to make our recommendations of using HD more acceptable to the public. As we found no negative short term effects of drinking HD of green tea reported and that the safety of higher quantity of green tea drinking in the long term has already been established38 the HD of green tea preparation could be recommended.
In conclusion, the additional benefit of lowering postprandial blood glucose can be achieved by using higher dose of green tea. Thus, we recommend preparing green tea drinks by infusing at least 3.33 grams of green tea in boiling water for 3 minutes as a better alternative to usual preparation of 0.67 gram for better control of PBG elevations following high carbohydrate meals. Acknowledgment
The author would like to thank the staff of Muhammadiyah Tangerang University and the nursing students for their willingness to participate in this study.
Conflict of interestThe authors affirm no conflict of interest in this study.
REFERENCES
1. Perkumpulan Endokrinologi Indonesia. Konsensus Pengendalian dan Pencegahan Diabetes Mellitus Tipe2 di Indonesia Jakarta: PB PERKENI; 2011. Indonesian.
2. Alan JG. American College of Endocrinology and American Diabetes Association Consensus statement on inpatient diabetes and glycemic control. Diabetes Care. 2006;29(8):1955–62.
3. Grooper SS, Smith JL, Groff JL. Advance nutrition and human metabolism. 5th ed. USA: Wadsworth Cengage Learning. 2009. p. 63-123.
4. Direktorat Pengendalian Penyakit Tidak Menular dan Penyehatan Lingkungan, Departemen Kesehatan RI. Pedoman teknis penemuan dan tatalaksana penyakit diabetes melitus. Jakarta; 2008.
5. Del Rio D, Borges G, Crozier A. Berry flavonoids and phenolics: bioavailability and evidence of protective effects. Br J Nutr. 2010;104(Suppl3):S67–90.
6. Namita P, Mukesh R, Vijay KJ. Camellia sinensis (green tea): a review. Global J Pharmacol. 2012;6(2):52–9.
7. Bhatt PR, Pandya KB, Sheth NR. Camellia sinensis (L): the medical beverage. Int J Pharmaceut Sci. 2010;3(2):6–9.
8. Babu PV, Liu D. Green tea catechins and cardiovascular health: an update. Curr Med Chem. 2008;15(18):1840–50.
9. Bahoran T, Soobrattee MA, Ramma-Luximon V, OI Aruoma. Free radicals and antioxidants in cardiovascular health and disease. Internet J of Med Update. 2006;1(2):25–41.
10. Cabrera C, Artacho R, Giménez R. Beneficial effects of green tea - a review. J Am Coll Nutr. 2006;25(2):79–99.
11. Kobayashi Y, Suzuki M, Satsu H, Arai S, Hara Y, Suzuki K, et al. Green tea polyphenols inhibit the sodium-dependent glucose transporter of intestinal epithelial cells by a competitive mechanism. J Agric Food Chem. 2000;48(11):5618–23.
12. Stote KS, Bae DJ. Tea consumption may improve biomarkers of insulin sensitivity and risk factors for diabetes. J Nutr. 2008;138(1):1584S–8S.
13. Lee YJ, Jeong KW, Kim Y. Epigallocatechin 3-gallate binds to human salivary α-amylase with complex hydrogen bonding interactions. Bull Korean Chem Soc. 2011;32(7):2222–6.
14. Durak ZE, Ozturk B. Effects of black and green tea extracts on glucose utilisation rate in bovine skeletal muscle in vitro. Int Inv J Biochem Bioinform. 2013;1(1):5–8.
15. Nagao T, Meguro S, Hase T, Otsuka K, Komikado M, Tokimutsu I, et al. A catechin-rich beverage improves obesity and blood glucose control in patients with type 2 diabetes. Obesity (Silver Spring). 2008;17(2):310–7.
16. Tsuneki H, Ishizuka M, Terasawa M, Wu JB, Sasaoka T, Kimura I. Effect of green tea on blood glucose levels and serum proteomic patterns in diabetic (db/db) mice and on glucose metabolism in healthy humans. BMC Pharmacol. 2004;4(18):1–10.
Medical Journal of Indonesia
102 Med J Indones, Vol. 24, No. 2June 2015
17. Josic J, Olsson AT, Wickeberg J, Lindstedt S, Hlebowicz J. Does green tea affect postprandial glucose, insulin and satiety in healthy subjects: a randomized controlled trial. J Nutr. 2010;9(63):1–8.
18. Ryu OH, Lee J, Lee KW, Kim HY, Seo JA, Kim SG, et al. Effects of green tea consumption on inflammation, insulin resistance and pulse wave velocity in type 2 diabetes patients. Diabetes Res Clin Pract. 2006;71(3):356–8.
19. Babu VP, Liu D. Green tea catechins and cardiovascular health: an update. Curr Med Chem. 2008;15(18):1840–50.
20. Thielecke F, Boschmann M. The potential role of green tea catechins in the prevention of the metabolic syndrome - a review. Phytochemistry. 2009;70(1):11–24.
21. World Health Organization. The Asia-Pacific perspective: Redefining obesity and its treatment. Australia: Health Communication; 2000. p.18.
22. Hendarwanto, Waspadji S, Markum HMS. Pemeriksaan fisis umum. In: Markum HMS. Penuntun anamnesis dan pemeriksaan fisis. Jakarta: Pusat Penerbitan Departemen Ilmu Penyakit Dalam Fakultas Kedokteran Universitas Indonesia; 2005. p. 54–5. Indonesian.
23. Garber AJ, Abrahamson MJ, Barzilay JI, Blonde L, Bloomgarden ZT, et al. American Association of Clinical Endocrinogists’ comprehensive diabetes management algorithm 2013 consensus statement. Endocr Pract. 2013;19(Suppl2):1–48.
24. Wolever TM, Ming Y, Zeng XY, Atkinson F, Brand-Miller JC. Food glycemic index, as given in glycemic index tables, is a significant determinant of glycemic responses elicited by composite breakfast meals. Am J Clin Nutr. 2006;83(6):1306 –12.
25. Iso H, Date C, Wakai K, Fukui M, Tamakoshi A, JAC Study Group. The relationship between green tea and total caffeine intake and risk for self-reported type 2 diabetes among Japanese adults. Ann Intern Med. 2006;144(8):554–62.
26. Jing Y, Han G, Hu Y, Bi Y, Li L, Zhu D. Tea consumption and risk of type 2 diabetes: a meta-analysis of cohort studies. J Gen Intern Med. 2009;24(5):557–62.
27. Rodwin AJ. Mechanism of age related-glucose tolerance. Diabetes Care. 1990;13(Suppl2):9–19.
28. Basu R, Dalla Man C, Campioni M, Basu A, Klee G, Toffolo G, et al. Effects of age and sex on postprandial glucose metabolism: differences in glucose turnover, insulin secretion, insulin action, and hepatic insulin extraction. Diabetes. 2006;55(7):2001–14.
29. Mark DB, Mark AD, Smith CM. Carbohydrate Metabolism. Basic medical biochemistry: A clinical approach USA: Lippincott Williams & Wilkins; 2011. p. 493–580.
30. Guyton AC, Hall JE. Textbook of medical physiology. Insulin, glucagon, and diabetes melitus. 11th ed. Philadelphia: Elsevier; 2006. p. 961–77.
31. Sherwood L. Human physiology from cells to systems. The digestive system. 7th ed. USA: Brooks/Cole Cengage Learning; 2010. p. 589–639.
32. Hara Y, Honda M. The inhibition of a-amylase by tea polyphenols. Agricul Biol Chem 1990;54(8):1939–45.
33. Forester SC, Gu Y, Lambert JD. Inhibition of starch digestion by the green tea polyphenol, (-)-epigallocatechin-3- gallate. Mol Nutr Food Res. 2012;56(11):1647-54.
34. Snoussi C, Ducroc R, Hamdaoui MH, Dhaouadi K, Abaidi H, Cluzeaud F, et al. Green tea decoction improves glucose tolerance and reduces weight gain of rats fed normal and high-fat diet. J Nutr Biochem. 2014;25(5):557–64.
35. Yashin A, Nemzer B, Yashin Y. Bioavailability of tea components. J Food Res. 2012;1(1):281–90.
36. Babu PV, Sabitha KE, Shyamaladevi CS. Therapeutic effect of green tea extract on oxidative stress in aorta and heart of streptozotocin diabetic rats. Chem Biol Interact. 2006;162(2):114–20.
37. Sheperd PR, Kahn BB. Glucose transporters and insulin action--implications for insulin resistance and diabetes mellitus. N Engl J Med. 1999;341(4):248–57.
38. Hara Y. Green tea: health benefits and application. New York: Basel; 2011. p.11−47.
http://mji.ui.ac.id
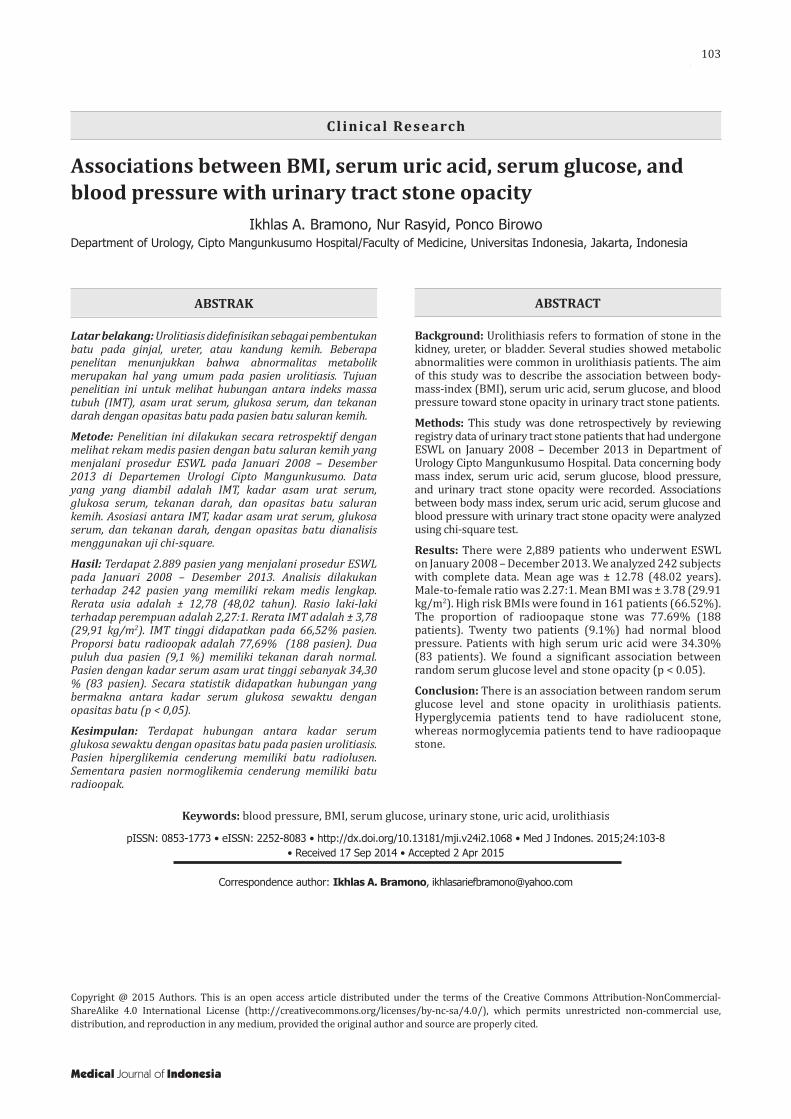
Bramono, et al.Hyperglycemia induce radiolucent stone genesis
103
Associations between BMI, serum uric acid, serum glucose, and blood pressure with urinary tract stone opacity
Keywords: blood pressure, BMI, serum glucose, urinary stone, uric acid, urolithiasis
pISSN: 0853-1773 • eISSN: 2252-8083 • http://dx.doi.org/10.13181/mji.v24i2.1068 • Med J Indones. 2015;24:103-8• Received 17 Sep 2014 • Accepted 2 Apr 2015
Correspondence author: Ikhlas A. Bramono, [email protected]
Copyright @ 2015 Authors. This is an open access article distributed under the terms of the Creative Commons Attribution-NonCommercial-ShareAlike 4.0 International License (http://creativecommons.org/licenses/by-nc-sa/4.0/), which permits unrestricted non-commercial use, distribution, and reproduction in any medium, provided the original author and source are properly cited.
Ikhlas A. Bramono, Nur Rasyid, Ponco BirowoDepartment of Urology, Cipto Mangunkusumo Hospital/Faculty of Medicine, Universitas Indonesia, Jakarta, Indonesia
Clinical Research
Medical Journal of Indonesia
ABSTRAK
Latar belakang: Urolitiasis didefinisikan sebagai pembentukan batu pada ginjal, ureter, atau kandung kemih. Beberapa penelitan menunjukkan bahwa abnormalitas metabolik merupakan hal yang umum pada pasien urolitiasis. Tujuan penelitian ini untuk melihat hubungan antara indeks massa tubuh (IMT), asam urat serum, glukosa serum, dan tekanan darah dengan opasitas batu pada pasien batu saluran kemih.
Metode: Penelitian ini dilakukan secara retrospektif dengan melihat rekam medis pasien dengan batu saluran kemih yang menjalani prosedur ESWL pada Januari 2008 – Desember 2013 di Departemen Urologi Cipto Mangunkusumo. Data yang yang diambil adalah IMT, kadar asam urat serum, glukosa serum, tekanan darah, dan opasitas batu saluran kemih. Asosiasi antara IMT, kadar asam urat serum, glukosa serum, dan tekanan darah, dengan opasitas batu dianalisis menggunakan uji chi-square.
Hasil: Terdapat 2.889 pasien yang menjalani prosedur ESWL pada Januari 2008 – Desember 2013. Analisis dilakukan terhadap 242 pasien yang memiliki rekam medis lengkap. Rerata usia adalah ± 12,78 (48,02 tahun). Rasio laki-laki terhadap perempuan adalah 2,27:1. Rerata IMT adalah ± 3,78 (29,91 kg/m2). IMT tinggi didapatkan pada 66,52% pasien. Proporsi batu radioopak adalah 77,69% (188 pasien). Dua puluh dua pasien (9,1 %) memiliki tekanan darah normal. Pasien dengan kadar serum asam urat tinggi sebanyak 34,30 % (83 pasien). Secara statistik didapatkan hubungan yang bermakna antara kadar serum glukosa sewaktu dengan opasitas batu (p < 0,05).
Kesimpulan: Terdapat hubungan antara kadar serum glukosa sewaktu dengan opasitas batu pada pasien urolitiasis. Pasien hiperglikemia cenderung memiliki batu radiolusen. Sementara pasien normoglikemia cenderung memiliki batu radioopak.
ABSTRACT
Background: Urolithiasis refers to formation of stone in the kidney, ureter, or bladder. Several studies showed metabolic abnormalities were common in urolithiasis patients. The aim of this study was to describe the association between body-mass-index (BMI), serum uric acid, serum glucose, and blood pressure toward stone opacity in urinary tract stone patients.
Methods: This study was done retrospectively by reviewing registry data of urinary tract stone patients that had undergone ESWL on January 2008 – December 2013 in Department of Urology Cipto Mangunkusumo Hospital. Data concerning body mass index, serum uric acid, serum glucose, blood pressure, and urinary tract stone opacity were recorded. Associations between body mass index, serum uric acid, serum glucose and blood pressure with urinary tract stone opacity were analyzed using chi-square test.
Results: There were 2,889 patients who underwent ESWL on January 2008 – December 2013. We analyzed 242 subjects with complete data. Mean age was ± 12.78 (48.02 years). Male-to-female ratio was 2.27:1. Mean BMI was ± 3.78 (29.91 kg/m2). High risk BMIs were found in 161 patients (66.52%). The proportion of radioopaque stone was 77.69% (188 patients). Twenty two patients (9.1%) had normal blood pressure. Patients with high serum uric acid were 34.30% (83 patients). We found a significant association between random serum glucose level and stone opacity (p < 0.05).
Conclusion: There is an association between random serum glucose level and stone opacity in urolithiasis patients. Hyperglycemia patients tend to have radiolucent stone, whereas normoglycemia patients tend to have radioopaque stone.
104 Med J Indones, Vol. 24, No. 2June 2015
Urolithiasis refers to formation of stone in the kidney, ureter, or bladder. It is the third most common cause of urinary tract disease. The prevalence of urolithiasis is reported between 2 and 20% globally, with peak incidence in the second and third decade of life.1,2 The incidence of urolithiasis increased along with the increasing life expectancy.3
There are several factors that may be related to the development of urinary stones, such as age, gender, race, genetic, climate, dietary intake, and metabolic changes.1,2 Metabolic abnormalities were found in more than 90% of stone patients.1 Hypercalciuria and hypocitraturia are the most prevalent condition that cause stone disease, although there are also other causes such as hyperuricosuria, hypokalemia, hyperuricemia, hypophosphatemia, and low urine volume.1,2,4,5
In large epidemiological studies, obesity and type 2 diabetes have been associated with increased risk of nephrolithiasis.6 Insulin resistance reduces the production and transport of ammonia, resulting in alterations of urine acidification and low urine pH.7 The changes in urinary constituents, including lower urinary pH, decreased citrate excretion, and uric acid and calcium excretion also has been associated with glucose intolerance, elevated blood pressure, and dyslipidemia. These conditions lead to increased risks of uric acid and calcium stone formation.6,8,9
Urolithiasis as renal manifestations in gout patients usually is due to low urine pH.10 Several studies have shown association between recurrent uric acid kidney stones and metabolic syndrome. Kidney stones patients with type 2 diabetes have higher prevalence of uric acid kidney stones than other patients with kidney stones. Increased soluble undissociated uric acid will lead to uric acid stone genesis.11
Increased body mass index (BMI) not only associated with kidney stone formation but also associated with stone size. Mechanisms of obesity to affect urolithiasis genesis are still being investigated. A study by Amaro, et al.1 has shown that metabolic syndrome (including obesity and high blood pressure) patients were at risk of certain stone formation (uric acid and calcium oxalate stones). Significant contribution of high BMI to kidney stone formation were through its
influence in lowering urine pH. Obesity not only induces acidic urine, but also increases excretion of uric acid, calcium, and oxalate.12 Maalouf, et al.12 have suggested visceral obesity as a factor to disrupt insulin resistance. Insulin resistance will lead to low urine pH. Inadequate ammonium excretion and/or production occurred, if there was reduced insulin bioactivity in the kidney proximal tubule.11
Knowing about the association between metabolic abnormalities and type of stone formation is really important, because metabolic factors can be modified to prevent the risk of certain urinary stones. It also can be used to select proper medical and dietary therapies to prevent recurrent stone formation.2 The aim of the study was to describe theassociations between BMI, uric acid serum, glucose serum, and blood pressure with stone opacity in urinary tract stone patients.
METHODS
We collect data from patients who underwent extra-corporeal shock-wave lithotripsy (ESWL) procedure from January 2008 to December 2013. Inclusion criteria were urinary tract stone disease patients who came to Department of Urology, Cipto Mangunkusumo Hospital to undergo ESWL procedure. Exclusion criteria were patients whose medical record data were not complete. Medical records that contained complete data, i.e. baseline demographic data (age, sex) and physical characteristics (bodyweight, height, and calculated BMI), systolic and diastolic blood pressure, stone size (length and width), uric acid serum level, and random glucose serum level were used. Confidentiality of subject identity was guaranteed.
Blood pressure (BP) (mmHg), which was measured according to the Eighth Joint National Committee (JNC 8) guidelines13 was noted. BMI that was calculated as weight in kilograms divided by square of height in meters, and radiographic data that showed opacity and size of urinary tract stone were taken from medical record.
WHO expert consultation stated BMI cut off points for determining overweight and obesity in Asian populations: <23 kg/m2 as normal and >23 kg/m2 as increased risk.14 According to JNC 8 guideline, systolic blood pressure <120
http://mji.ui.ac.id
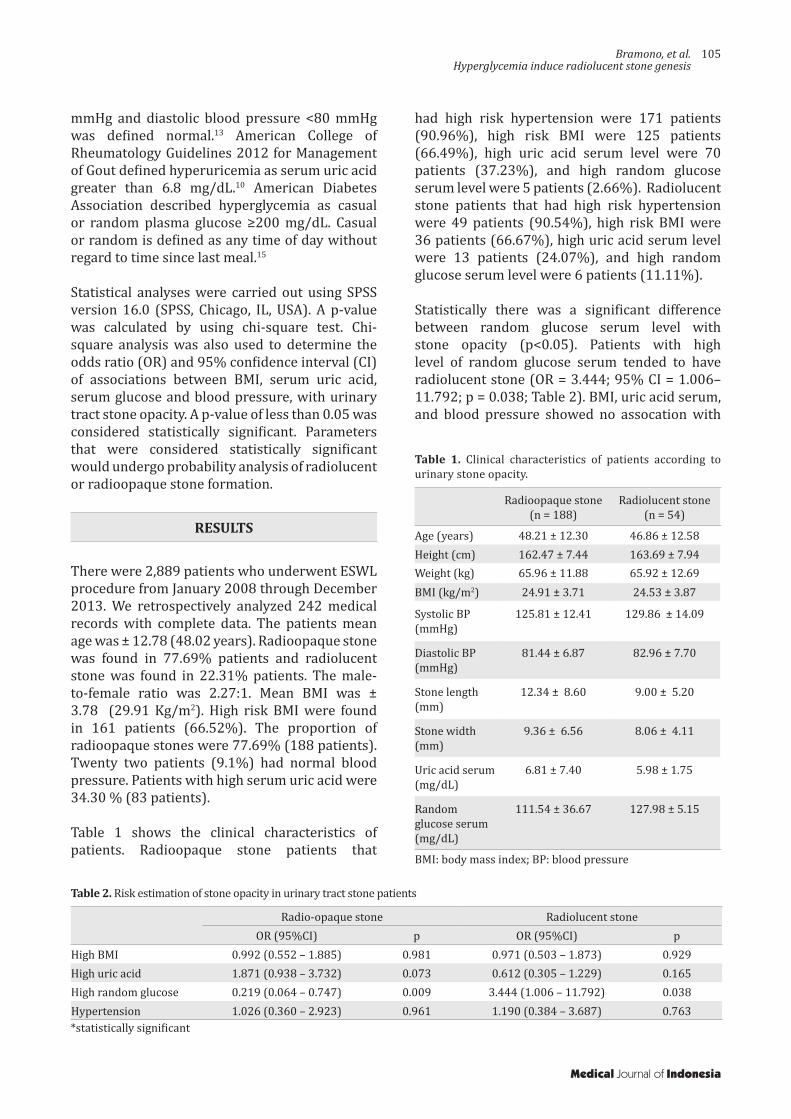
Bramono, et al.Hyperglycemia induce radiolucent stone genesis
105
Radioopaque stone(n = 188)
Radiolucent stone(n = 54)
Age (years) 48.21 ± 12.30 46.86 ± 12.58Height (cm) 162.47 ± 7.44 163.69 ± 7.94Weight (kg) 65.96 ± 11.88 65.92 ± 12.69BMI (kg/m2) 24.91 ± 3.71 24.53 ± 3.87
Systolic BP (mmHg)
125.81 ± 12.41 129.86 ± 14.09
Diastolic BP (mmHg)
81.44 ± 6.87 82.96 ± 7.70
Stone length (mm)
12.34 ± 8.60 9.00 ± 5.20
Stone width (mm)
9.36 ± 6.56 8.06 ± 4.11
Uric acid serum (mg/dL)
6.81 ± 7.40 5.98 ± 1.75
Random glucose serum (mg/dL)
111.54 ± 36.67 127.98 ± 5.15
Table 1. Clinical characteristics of patients according to urinary stone opacity.
Radio-opaque stone Radiolucent stoneOR (95%CI) p OR (95%CI) p
High BMI 0.992 (0.552 – 1.885) 0.981 0.971 (0.503 – 1.873) 0.929High uric acid 1.871 (0.938 – 3.732) 0.073 0.612 (0.305 – 1.229) 0.165High random glucose 0.219 (0.064 – 0.747) 0.009 3.444 (1.006 – 11.792) 0.038Hypertension 1.026 (0.360 – 2.923) 0.961 1.190 (0.384 – 3.687) 0.763
Table 2. Risk estimation of stone opacity in urinary tract stone patients
mmHg and diastolic blood pressure <80 mmHg was defined normal.13 American College of Rheumatology Guidelines 2012 for Management of Gout defined hyperuricemia as serum uric acid greater than 6.8 mg/dL.10 American Diabetes Association described hyperglycemia as casual or random plasma glucose ≥200 mg/dL. Casual or random is defined as any time of day without regard to time since last meal.15
Statistical analyses were carried out using SPSS version 16.0 (SPSS, Chicago, IL, USA). A p-value was calculated by using chi-square test. Chi-square analysis was also used to determine the odds ratio (OR) and 95% confidence interval (CI) of associations between BMI, serum uric acid, serum glucose and blood pressure, with urinary tract stone opacity. A p-value of less than 0.05 was considered statistically significant. Parameters that were considered statistically significant would undergo probability analysis of radiolucent or radioopaque stone formation.
RESULTS
There were 2,889 patients who underwent ESWL procedure from January 2008 through December 2013. We retrospectively analyzed 242 medical records with complete data. The patients mean age was ± 12.78 (48.02 years). Radioopaque stone was found in 77.69% patients and radiolucent stone was found in 22.31% patients. The male-to-female ratio was 2.27:1. Mean BMI was ± 3.78 (29.91 Kg/m2). High risk BMI were found in 161 patients (66.52%). The proportion of radioopaque stones were 77.69% (188 patients). Twenty two patients (9.1%) had normal blood pressure. Patients with high serum uric acid were 34.30 % (83 patients).
Table 1 shows the clinical characteristics of patients. Radioopaque stone patients that
had high risk hypertension were 171 patients (90.96%), high risk BMI were 125 patients (66.49%), high uric acid serum level were 70 patients (37.23%), and high random glucose serum level were 5 patients (2.66%). Radiolucent stone patients that had high risk hypertension were 49 patients (90.54%), high risk BMI were 36 patients (66.67%), high uric acid serum level were 13 patients (24.07%), and high random glucose serum level were 6 patients (11.11%).
Statistically there was a significant difference between random glucose serum level with stone opacity (p<0.05). Patients with high level of random glucose serum tended to have radiolucent stone (OR = 3.444; 95% CI = 1.006–11.792; p = 0.038; Table 2). BMI, uric acid serum, and blood pressure showed no assocation with
*statistically significant
Medical Journal of Indonesia
BMI: body mass index; BP: blood pressure
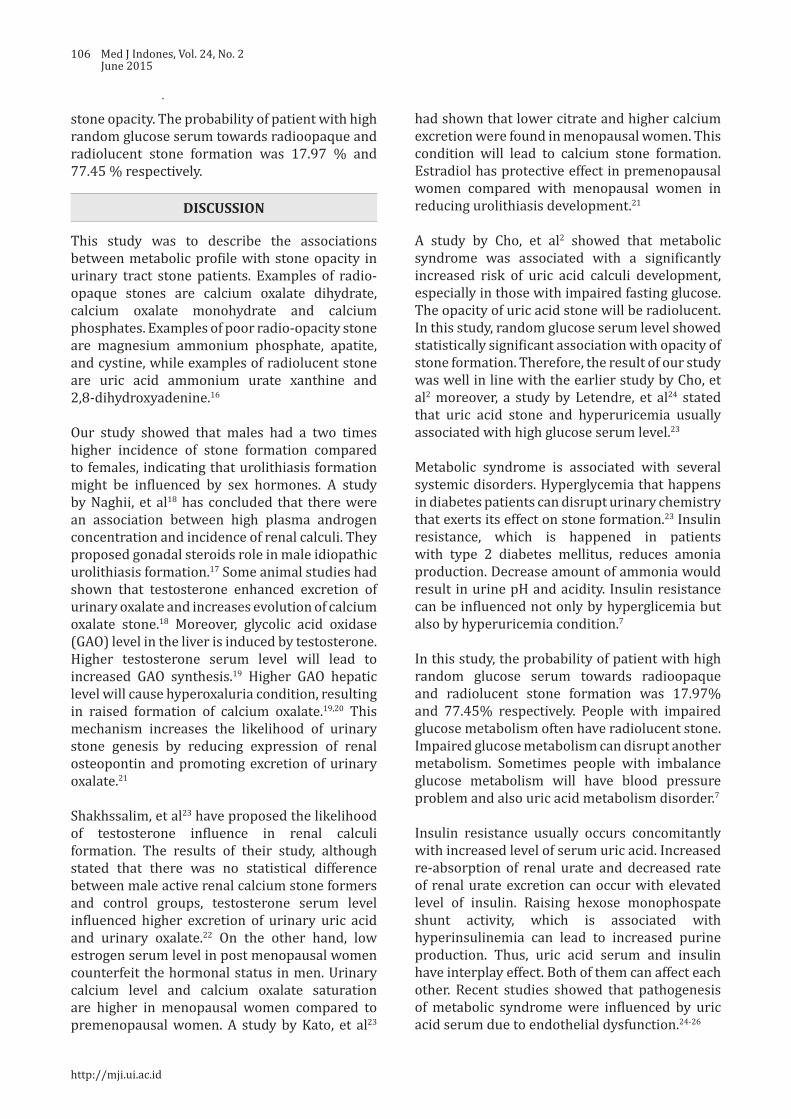
106 Med J Indones, Vol. 24, No. 2June 2015
stone opacity. The probability of patient with high random glucose serum towards radioopaque and radiolucent stone formation was 17.97 % and 77.45 % respectively.
DISCUSSION
This study was to describe the associations between metabolic profile with stone opacity in urinary tract stone patients. Examples of radio-opaque stones are calcium oxalate dihydrate, calcium oxalate monohydrate and calcium phosphates. Examples of poor radio-opacity stone are magnesium ammonium phosphate, apatite, and cystine, while examples of radiolucent stone are uric acid ammonium urate xanthine and 2,8-dihydroxyadenine.16
Our study showed that males had a two times higher incidence of stone formation compared to females, indicating that urolithiasis formation might be influenced by sex hormones. A study by Naghii, et al18 has concluded that there were an association between high plasma androgen concentration and incidence of renal calculi. They proposed gonadal steroids role in male idiopathic urolithiasis formation.17 Some animal studies had shown that testosterone enhanced excretion of urinary oxalate and increases evolution of calcium oxalate stone.18 Moreover, glycolic acid oxidase (GAO) level in the liver is induced by testosterone. Higher testosterone serum level will lead to increased GAO synthesis.19 Higher GAO hepatic level will cause hyperoxaluria condition, resulting in raised formation of calcium oxalate.19,20 This mechanism increases the likelihood of urinary stone genesis by reducing expression of renal osteopontin and promoting excretion of urinary oxalate.21
Shakhssalim, et al23 have proposed the likelihood of testosterone influence in renal calculi formation. The results of their study, although stated that there was no statistical difference between male active renal calcium stone formers and control groups, testosterone serum level influenced higher excretion of urinary uric acid and urinary oxalate.22 On the other hand, low estrogen serum level in post menopausal women counterfeit the hormonal status in men. Urinary calcium level and calcium oxalate saturation are higher in menopausal women compared to premenopausal women. A study by Kato, et al23
had shown that lower citrate and higher calcium excretion were found in menopausal women. This condition will lead to calcium stone formation. Estradiol has protective effect in premenopausal women compared with menopausal women in reducing urolithiasis development.21
A study by Cho, et al2 showed that metabolic syndrome was associated with a significantly increased risk of uric acid calculi development, especially in those with impaired fasting glucose. The opacity of uric acid stone will be radiolucent. In this study, random glucose serum level showed statistically significant association with opacity of stone formation. Therefore, the result of our study was well in line with the earlier study by Cho, et al2 moreover, a study by Letendre, et al24 stated that uric acid stone and hyperuricemia usually associated with high glucose serum level.23
Metabolic syndrome is associated with several systemic disorders. Hyperglycemia that happens in diabetes patients can disrupt urinary chemistry that exerts its effect on stone formation.23 Insulin resistance, which is happened in patients with type 2 diabetes mellitus, reduces amonia production. Decrease amount of ammonia would result in urine pH and acidity. Insulin resistance can be influenced not only by hyperglicemia but also by hyperuricemia condition.7
In this study, the probability of patient with high random glucose serum towards radioopaque and radiolucent stone formation was 17.97% and 77.45% respectively. People with impaired glucose metabolism often have radiolucent stone. Impaired glucose metabolism can disrupt another metabolism. Sometimes people with imbalance glucose metabolism will have blood pressure problem and also uric acid metabolism disorder.7
Insulin resistance usually occurs concomitantly with increased level of serum uric acid. Increased re-absorption of renal urate and decreased rate of renal urate excretion can occur with elevated level of insulin. Raising hexose monophospate shunt activity, which is associated with hyperinsulinemia can lead to increased purine production. Thus, uric acid serum and insulin have interplay effect. Both of them can affect each other. Recent studies showed that pathogenesis of metabolic syndrome were influenced by uric acid serum due to endothelial dysfunction.24-26
http://mji.ui.ac.id
Bramono, et al.Hyperglycemia induce radiolucent stone genesis
107
Although several studies showed that BMI, hypertension, and uric acid serum were associated with composition of stone formation2,24,26 our study showed no statistically significant associations.
Hypertension can be induced by uric acid by decreased nitric oxide. While urate reaches the vascular smooth muscle, it will promote cellular proliferation, followed by renal microvascular disease progression. Further, reduced number of nitric oxide will lead to renin-angiotensin system (RAS) activation that will lead to proliferation of smooth muscle cells and formation of various inflammatory mediators. Decrease amount of nitric oxide and RAS activation will procede to endothelial dysfunction. This condition will cause vasoconstriction in kidneys.27 Several studies proposed theory that in the beginning uric acid will initiate hypertension. As time goes by, uric acid serum will have a role in salt-sensitive hypertensive condition rather than direct effect in vascular dysfunction.28
Strohmaier, et al7 have concluded that uric acid serum level significantly correlate with uric acid stone formation. Moreover, Skolarikos, et al29 have proposed that patients with radiolucent stones (uric acid and ammonium urate) may have high level of uric acid serum. However, there is weak evidence in association between radiolucent stones and hyperuricemia.31 A study by Jeong, et al33 concluded that increased uric acid excretions were not only associated with uric acid stone formation but also calcium oxalate stone formation. Calcium oxalate stone is formed by salting-out mechanism in a hyperuricosuria condition. Lower urine pH will cause reduced formation of calcium phospate crystals, which happen in the rising formation of calcium oxalate stones.30
Several metabolic parameters were not analyzed in our study due to lack of data. Clinicians often provide care to urolithiasis patients with numerous co-morbidities, but not all of metabolic parameters were checked. European Association of Urology (EAU) Guidelines 2014 on Urolithiasis did not include metabolic syndrome parameters work-up (HDL cholesterol & triglycerides).16 EAU Guidelines 2014 on Urolithiasis suggest several ways to evaluate and treat urolithiasis patient. Each stone type has its specific work-up to prevent stone recurrence.29
Our study showed that there was no significant association between hyperuricemia with radiolucent stone formation. We assumed that a bigger sample size should be obtained to get a more significant result. A further study with longer time needs to be done to confirm the results of our study.
In conclusion, there is an association between random glucose serum level with stone opacity in urinary tract stone patients. Patients with high level of random glucose serum tend to have radiolucent stone. Whereas, patients with normal level of random glucose serum tend to have radioopaque stone.
AcknowledgmentWe would like to thank University of Indonesia Research Grant 2013-2014 who have given financial support for this study.
Conflict of Interest:The authors affirm no conflict of interest of this study.
REFERENCES
1. Amaro CR, Goldberg J, Damasio PC, Leitao VA, Turney B, Padovani CR, et al. An update on metabolic assessment in patients with urinary lithiasis. World J Urol. 2015. 33(1):125-9.
2. Cho ST, Jung SI, Myung SC, Kim TH. Correlation of metabolic syndrome with urinary stone composition. Int J Urol. 2013;20(2):208-13.
3. Ahmad I, Pansota MS, Tariq M, Tabassum SA. Frequency of metabolic abnormalities in urinary stones patients. Park J Med Sci. 2013;29(6):1363-6.
4. Freitas Junior CH, Mazzucchi E, Danilovic A, Brito AH, Srougi M. Metabolic assessment of elderly men with urolithiasis. Clinics (Sao Paulo). 2012;67(5):457-61.
5. Pascual E, Perdiguero M. Gout, diuretics and the kidney. Ann Rheum Dis. 2006;65(8):981-2.
6. Naseri M, Varasteh AR, Alamdaran SA. Metabolic factors associated with urinary calculi in children. Iran J Kidney Dis. 2010;4(1):32-8.
7. Strohmaier WL, Wrobel BM, Schubert G. Overweight, insulin resistance and blood pressure (parameters of the metabolic syndrome) in uric acid urolithiasis. Urol Res. 2012;40(2):171-5.
8. Fernandez A, Fuller A, Al-Bareeq R, Nott L, Razvi H. A comparison of the metabolic profiles of diabetic and non-diabetic uric acid stone formers. Can Urol Assoc J. 2013;7(3-4):E190-2.
9. Maalouf N. Approach to the Adult Kidney Stone Former. Clin Rev Bone Miner Metab. 2012;10(1):38-49.
10. Khanna D, Fitzgerald JD, Khanna PP, Bae S, Singh MK, Neogi T, et al. 2012 American College of Rheumatology
Medical Journal of Indonesia
108 Med J Indones, Vol. 24, No. 2June 2015
guidelines for management of gout. Part 1: systematic nonpharmacologic and pharmacologic therapeutic approaches to hyperuricemia. Arthritis care & research. 2012;64(10):1431-46.
11. Maalouf NM, Sakhaee K, Parks JH, Coe FL, Adams-Huet B, Pak CY. Association of urinary pH with body weight in nephrolithiasis. Kidnet Int. 2004;65(4):1422-5.
12. Mosli HA, Mosli HH, Kamal WK. Kidney stone composition in overweight and obese patients: a preliminary report. Res Rep Urol. 2013;5:11-5.
13. James PA, Oparil S, Carter BL, Cushman WC, Dennison-Himmelfarb C, Handler J, et al. 2014 evidence-based guideline for the management of high blood pressure in adults: report from the panel members appointed to the Eighth Joint National Committee (JNC 8). JAMA. 2014;311(5):507-20.
14. WHO Consultation Expert. Appropriate body-mass index for Asian populations and its implications for policy and intervention strategies. Lancet. 2004;363(9403):157-63.
15. American Diabetes Association. Diagnosis and classification of diabetes mellitus. Diabetes Care. 2008;33(Suppl1):S55-60.
16. Uroweb.org [Internet]. Europe: European Association of Urology [update 2014; cited 2014 Dec 19. Available from: http://uroweb.org/wp-content/uploads/22-Urolithiasis_LR.pdf.
17. Naghii MR, Babaei M, Hedayati M. Androgens involvement in the pathogenesis of renal stones formation. PloS One. 2014;9(4):e93790.
18. Yagisawa T, Ito F, Osaka Y, Amano H, Kobayashi C, Toma H. The influence of sex hormones on renal osteopontin expression and urinary constituents in experimental urolithiasis. J Urol. 2001;166(3):1078-82.
19. Soundararajan P, Mahesh R, Ramesh T, Begum VH. Effect of Aerva lanata on calcium oxalate urolithiasis in rats. Indian J Exp Biol. 2006;44(12):981-6.
20. Fan J, Chandhoke PS, Grampsas SA. Role of sex hormones in experimental calcium oxalate nephrolithiasis. J Am Soc Nephrol. 1999;10 Suppl 14:S376-80.
21. Kato Y, Yamaguchi S, Kakizaki H, Yachiku S. Influence of estrus status on urinary chemical parameters related to urolithiasis. Urol Res. 2005;33(6):476-80.
22. Shakhssalim N, Gilani KR, Parvin M, Torbati PM, Kashi AH, Azadvari M, et al. An assessment of parathyroid hormone, calcitonin, 1,25 (OH)2 vitamin D3, estradiol and testosterone in men with active calcium stone disease and evaluation of its biochemical risk factors. Urol Res. 2011;39(1):1-7.
23. Kang HW, Seo SP, Kim WT, Kim YJ, Yun SJ, Lee SC, et al. Hypertriglyceridemia is associated with increased risk for stone recurrence in patients with urolithiasis. Urology. 2014;84(4):766-71.
24. Tang W, Fu Q, Zhang Q, Sun M, Gao Y, Liu X, et al. The association between serum uric acid and residual beta -cell function in type 2 diabetes. J Diabetes Res. 2014;2014:709691.
25. Miyake T, Kumagi T, Furukawa S, Hirooka M, Kawasaki K, Koizumi M, et al. Hyperuricemia is a risk factor for the onset of impaired fasting glucose in men with a high plasma glucose level: a community-based study. PloS One. 2014;9(9):e107882.
26. Bhole V, Choi JW, Kim SW, de Vera M, Choi H. Serum uric acid levels and the risk of type 2 diabetes: a prospective study. Am J Med. 2010;123(10):957-61.
27. Wang J, Qin T, Chen J, Li Y, Wang L, Huang H, et al. Hyperuricemia and risk of incident hypertension: a systematic review and meta-analysis of observational studies. PloS One. 2014;9(12):e114259.
28. Samimi A, Ramesh S, Turin TC, MacRae JM, Sarna MA, Reimer RA, et al. Serum uric acid level, blood pressure, and vascular angiotensin II responsiveness in healthy men and women. Physiol Rep. 2014;2(12) pii: e12235.
29. Skolarikos A, Straub M, Knoll T, Sarica K, Seitz C, Petrik A, et al. Metabolic Evaluation and Recurrence Prevention for Urinary Stone Patients: EAU Guidelines. Eur Urol. 2015;67(4):750-63.
30. Jeong JY, Doo SW, Yang WJ, Lee KW, Kim JM. Differences in Urinary Stone Composition according to Body Habitus. Korean J Urol. 2011;52(9):622-5.
http://mji.ui.ac.id
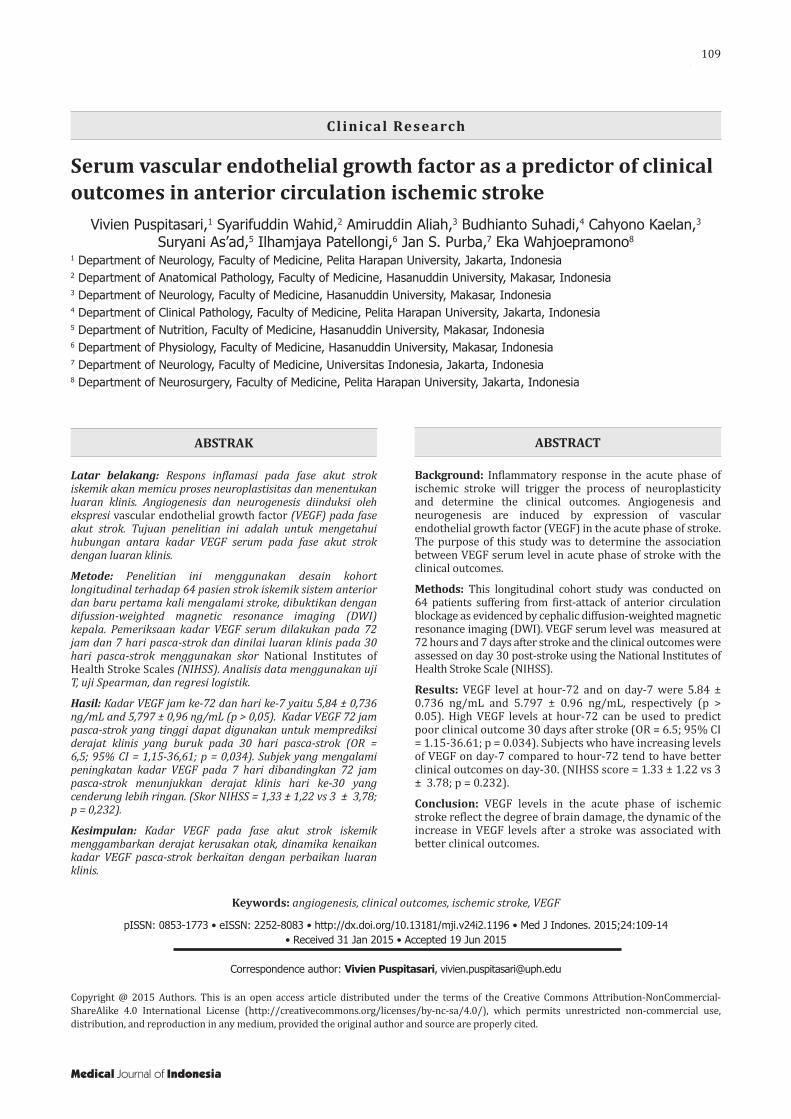
Puspitasari, et al.Vascular endothelial growth factor as predictor of stroke outcome
109
Serum vascular endothelial growth factor as a predictor of clinical outcomes in anterior circulation ischemic stroke
Keywords: angiogenesis, clinical outcomes, ischemic stroke, VEGF
pISSN: 0853-1773 • eISSN: 2252-8083 • http://dx.doi.org/10.13181/mji.v24i2.1196 • Med J Indones. 2015;24:109-14• Received 31 Jan 2015 • Accepted 19 Jun 2015
Correspondence author: Vivien Puspitasari, [email protected]
Copyright @ 2015 Authors. This is an open access article distributed under the terms of the Creative Commons Attribution-NonCommercial-ShareAlike 4.0 International License (http://creativecommons.org/licenses/by-nc-sa/4.0/), which permits unrestricted non-commercial use, distribution, and reproduction in any medium, provided the original author and source are properly cited.
Vivien Puspitasari,1 Syarifuddin Wahid,2 Amiruddin Aliah,3 Budhianto Suhadi,4 Cahyono Kaelan,3 Suryani As’ad,5 Ilhamjaya Patellongi,6 Jan S. Purba,7 Eka Wahjoepramono8
1 Department of Neurology, Faculty of Medicine, Pelita Harapan University, Jakarta, Indonesia2 Department of Anatomical Pathology, Faculty of Medicine, Hasanuddin University, Makasar, Indonesia3 Department of Neurology, Faculty of Medicine, Hasanuddin University, Makasar, Indonesia4 Department of Clinical Pathology, Faculty of Medicine, Pelita Harapan University, Jakarta, Indonesia5 Department of Nutrition, Faculty of Medicine, Hasanuddin University, Makasar, Indonesia6 Department of Physiology, Faculty of Medicine, Hasanuddin University, Makasar, Indonesia7 Department of Neurology, Faculty of Medicine, Universitas Indonesia, Jakarta, Indonesia8 Department of Neurosurgery, Faculty of Medicine, Pelita Harapan University, Jakarta, Indonesia
Clinical Research
Medical Journal of Indonesia
ABSTRAK
Latar belakang: Respons inflamasi pada fase akut strok iskemik akan memicu proses neuroplastisitas dan menentukan luaran klinis. Angiogenesis dan neurogenesis diinduksi oleh ekspresi vascular endothelial growth factor (VEGF) pada fase akut strok. Tujuan penelitian ini adalah untuk mengetahui hubungan antara kadar VEGF serum pada fase akut strok dengan luaran klinis.
Metode: Penelitian ini menggunakan desain kohort longitudinal terhadap 64 pasien strok iskemik sistem anterior dan baru pertama kali mengalami stroke, dibuktikan dengan difussion-weighted magnetic resonance imaging (DWI) kepala. Pemeriksaan kadar VEGF serum dilakukan pada 72 jam dan 7 hari pasca-strok dan dinilai luaran klinis pada 30 hari pasca-strok menggunakan skor National Institutes of Health Stroke Scales (NIHSS). Analisis data menggunakan uji T, uji Spearman, dan regresi logistik.
Hasil: Kadar VEGF jam ke-72 dan hari ke-7 yaitu 5,84 ± 0,736 ng/mL and 5,797 ± 0,96 ng/mL (p > 0,05). Kadar VEGF 72 jam pasca-strok yang tinggi dapat digunakan untuk memprediksi derajat klinis yang buruk pada 30 hari pasca-strok (OR = 6,5; 95% CI = 1,15-36,61; p = 0,034). Subjek yang mengalami peningkatan kadar VEGF pada 7 hari dibandingkan 72 jam pasca-strok menunjukkan derajat klinis hari ke-30 yang cenderung lebih ringan. (Skor NIHSS = 1,33 ± 1,22 vs 3 ± 3,78; p = 0,232).
Kesimpulan: Kadar VEGF pada fase akut strok iskemik menggambarkan derajat kerusakan otak, dinamika kenaikan kadar VEGF pasca-strok berkaitan dengan perbaikan luaran klinis.
ABSTRACT
Background: Inflammatory response in the acute phase of ischemic stroke will trigger the process of neuroplasticity and determine the clinical outcomes. Angiogenesis and neurogenesis are induced by expression of vascular endothelial growth factor (VEGF) in the acute phase of stroke. The purpose of this study was to determine the association between VEGF serum level in acute phase of stroke with the clinical outcomes.
Methods: This longitudinal cohort study was conducted on 64 patients suffering from first-attack of anterior circulation blockage as evidenced by cephalic diffusion-weighted magnetic resonance imaging (DWI). VEGF serum level was measured at 72 hours and 7 days after stroke and the clinical outcomes were assessed on day 30 post-stroke using the National Institutes of Health Stroke Scale (NIHSS).
Results: VEGF level at hour-72 and on day-7 were 5.84 ± 0.736 ng/mL and 5.797 ± 0.96 ng/mL, respectively (p > 0.05). High VEGF levels at hour-72 can be used to predict poor clinical outcome 30 days after stroke (OR = 6.5; 95% CI = 1.15-36.61; p = 0.034). Subjects who have increasing levels of VEGF on day-7 compared to hour-72 tend to have better clinical outcomes on day-30. (NIHSS score = 1.33 ± 1.22 vs 3 ± 3.78; p = 0.232).
Conclusion: VEGF levels in the acute phase of ischemic stroke reflect the degree of brain damage, the dynamic of the increase in VEGF levels after a stroke was associated with better clinical outcomes.
110 Med J Indones, Vol. 24, No. 2June 2015
Stroke is the third leading cause of death in developing countries among population above 60 years old, after heart disease and cancer. Approximately, more than 80% cases of stroke is ischemic and the rest is hemorrhagic.1,2 In Indonesia, stroke is the first leading cause of death.3 It is not just an elderly disease, but also affects young people. Stroke causes both physical and psychological burden for patients, families, and communities. The impact of this medical issue economically results in the decline of productivity and economic capacity of communities and nations.1-4
Mechanism of brain injury after ischemic stroke is a complex process and is concomitant with inflammatory process that involves neuronal cells, glial cells, endothelial cells, extracellular matrix, and peripheral leukocytes.5-7 Post-stroke outcome is not solely determined by pro- and anti-inflammatory cytokines, but also by neurotrophic factors released in acute stroke as a result of neuronal injury. After cerebral ischemia, neuron plasticity is once again triggered on surviving cells to compensate the dead neurons and support the function of the damaged ones. The mechanisms underlying neuronal plasticity are dendrite reorganization, axonal sprouting and activation of endogenous pluripotent cells which are able to differentiate into neurons. Angiogenesis and arteriogenesis are the major processes of vascular plasticity. After an ischemic attack, angiogenesis is necessary to provide new capillary and increase blood flow to regenerate the suffering cells.8
Vascular endothelial growth factor (VEGF) is a vascular permeability factor, a major protein that induces angiogenesis in both normal and pathological conditions. VEGF binds to tyrosine kinase receptors, vascular endothelial growth factor receptor-1 (VEGFR-1) and VEGFR-2 / kinase insert domain receptor (KDR) / fetal liver kinase-1 (Flk-1), and mediates intracellular signals for cell growth and cell survival.8 In the brain, VEGF is produced primarily by neurons, vascular cells, and astrocytes. Following ischemic stroke, hypoxic condition induces VEGF expression followed by fibroblast growth factor (FGF), angiopoietins, transforming growth factor beta (TGFβ), platelet-derived growth factor (PDGF) and tissue-plasminogen activator (tPA).9,10
Previous studies reported that the VEGF serum
level in acute phase of stroke (within 24 hours onset of symptoms) is associated with infarct volume and a better prognosis in three months. Plasma VEGF levels increase immediately after the onset of ischemic stroke in all types of strokes up to 90 days.11
Although it seems to be constructive in long term, this response may contribute to deleterious edema formation during the acute phase of ischemic stroke. Several studies showed that VEGF contain an unfavorable effect towards outcome. High VEGF in acute ischemic stroke correlates with cerebral micro-bleeding.12 Early post ischemic administration of recombinant VEGF to ischemic rats significantly increased blood brain barrier leakage, hemorrhagic transformation and ischemic lesions.13
This study aimed to explore the role of VEGF in the pathomechanism of acute ischemic stroke and its role in predicting clinical outcomes.
METHODS
This longitudinal cohort study was conducted from August to December 2014, in Siloam Hospital, Karawaci, West Java. Patients with acute onset (<72 hours) of anterior circulation ischemic stroke, were closely observed for one month after the initial stroke. Patients with history of previous stroke and thrombolytic therapy, decreased liver and kidney functions, congestive heart failure, acute myocardial infarction, and pneumonia were excluded from the study. Magnetic resonance imaging (MRI) was performed at admission to confirm the ischemic stroke and to assess cerebral infarction volume. Formula ABC/2 (mm3) was used to measure infarct volume (A:length; B:width: C:number of slice).14
VEGF serum levels were measured with human VEGF immunoassay Quantikine® (R&D Systems, Inc, USA) within 72 hours and on day 7 after stroke. This assay employed the quantitative sandwich enzyme immunoassay technique. A monoclonal antibody specific for VEGF has been pre-coated onto a microplate. Following a wash to remove any unbound antibody-enzyme reagent, a substrate solution was added to the wells and color develops in proportion to the amount of VEGF bound in the initial step. The color development was stopped and the
http://mji.ui.ac.id
Puspitasari, et al.Vascular endothelial growth factor as predictor of stroke outcome
111
intensity of the color was measured at 450 nm wavelength.
Clinical outcomes were assessed at hour-72, day-7 and up to day-30 after stroke using National Institutes of Health Stroke Scales (NIHSS). The severity of stroke was evaluated with NIHSS and they were categorized as mild (0-3), moderate (4-15) and severe (16-42). Ethical clearance was obtained from Mochtar Riady Institute for Nanotechnology Ethics Committee Number 072/MRIN-EC/08/2014.
Data were analyzed with SPSS 20.0. T-test was used to compare NIHSS scores on day 30 in group with increased or decreased VEGF levels. Spearman correlation test was used to evaluate the correlation between VEGF levels with NIHSS score. Logistic regression analysis was used to predict 30 days outcome after stroke.
RESULTS
In total, 64 patients aged 37 - 89 year old (mean of 58.8 ± 11.3 years) met the inclusion criteria of this study, consisted of 46 (62.0%) males and 18 (29.0%) females. The largest group of age was 46.8% in the range of 50 - 59 years old. About 93.8% of participants had history of hypertension, while 76.7% of them also had lacunar anterior circulation infarct (LACI). About 59.4 % of subjects had a moderate NIHSS score (4-15) on admission with an average score of 5.2 ± 3.7. On day 30, we found 89.5% of subjects had a mild NIHSS score (0-3). There were only 16 patients evaluated for VEGF serum level on day-7 after stroke(Table 1).
Mean VEGF serum level at hour-72 was 5.84 ± 0.736 ng/mL, and on day-7 was 5.797 ± 0.96 ng/mL (p > 0.05). VEGF serum level at hour-72 had a significant correlation with NIHSS score on admission (r = 0.264; p = 0.035) (Table 2).
There was no significant correlation between VEGF level at hour-72 with NIHSS score on day-30 (r = 0.156; p = 0.217). VEGF levels on day-7 (5.797 ± 0.96 ng/mL, n = 16) was significantly associated with 30 days clinical severity with a value of r = 0.518 and p = 0.040 (Table 2).
The changes in VEGF levels at hour-72 and on
Characteristics n ValueGender
Male 46 71.88 %Female 18 28.13%
Bamford classificationLACI* 49 76.56%Non-LACI 15 23.43%
Age (mean ± SD ; years ) 64 58.78 ± 11.31BMI$ (mean ± SD) 64 25.11 ± 3.88MAP# (mean ± SD ; mmHg) 64 111.26 ± 14.28Infarct volume+ (logmean ± SD; mm3)
64 1.05 ± 1.77
VEGF level hour-72 (logmean ± SD; ng/mL)
64 5.84 ± 0.73
VEGF level day-7 (logmean ± SD ng/mL)
16 5.79 ± 0.96
NIHSS‡ hour-72 (mean ± SD) 64 5.2 ± 3.74NIHSS day-7 (mean ± SD) 64 3.55 ± 3.22NIHSS day-30 (mean ± SD) 64 1.76 ± 2.28
Table 1. Characteristic of patients, VEGF serum levels, and NIHSS score
* LACI: Lacunar anterior circulation infarct # MAP : Mean arterial pressure$ BMI: Body mass index+ Infarct volume measured using formula ABC/2 mm3
(A=length; B=width; C=number of slice) 14,20‡ NIHSS : National Institute of Health Stroke Scale
n R phour-72 VEGF level vs NIHSS hour-72
64 0.264 0.035
hour-72 VEGF level vs NIHSS day-30
64 0.156 0.217
Day-7 VEGF level vs NIHSS day-30
16 0.518 0.040
Table 2. Correlation between VEGF level and NIHSS score
day-7 can be categorized as “increased” and “decreased” (Figure 1). T-test was then used to see the difference in NIHSS score on day-7 and -30. In this category, the group with increasing VEGF serum level (n = 9) tended to have milder clinical severity than the group with decreased VEGF level (n = 7). NIHSS score in both groups were 1.33 ± 1.22 and 3.001 ± 3.78, respectively; p = 0.232) (Figure 2).
This study also explored correlation between infarct volume, Bamford classification, and clinical outcomes 30 days after stroke. There was positive correlation between infarct volume
Medical Journal of Indonesia
112 Med J Indones, Vol. 24, No. 2June 2015
Figure 1. VEGF level at 72 hours compared to NIHSS score 30 days after stroke
Figure 2. NIHSS scores at day 30 after onset in group with increasing (n = 9) and decreasing (n = 7) VEGF level
Variables OR SE z p (95% CI)Infarct volume 5.97 1.08 1.65 0.099 0.02 - 1.39Bamford classification 1.16 0.99 0.16 0.874 0.12 - 5.97VEGF 6.5 0.88 2.12 0.034 1.15 - 36.61
Table 3. Logistic regression to predict 30 days outcome after stroke
and NIHSS score 30 days (r = 0.362; p = 0.005). There was also correlation between Bamford classification and NIHSS score 30 days after stroke. Multivariate analysis logistic regression showed that VEGF was the strongest clinical predictor on day 30 after stroke, compared to the infarct volume and Bamford classification with an OR = 6.5 and p = 0.034 (CI = 1.15-36.61) (Table 3).
DISCUSSION
VEGF showed a dramatic increase in serum of stroke patients with highest expression occurred on day 7, and it remained significantly elevated at 14 days after stroke, even after 3 months post- stroke.11,15
Lee, et al16 reported a relationship between elevated serum level of VEGF and infarct volume, and the highest level of VEGF was found in large vessel disease (LVD) stroke. Moreover, he also found that the high VEGF serum level in 24 hours post-stroke was related with more favorable prognosis in three months follow-up. This study seems to show different result, as the high VEGF serum taken in
acute phase of stroke was related with more severe prognosis (r = 0.264; p = 0.035). This could be explained by result of Matsuo’s study.11 They found that the VEGF serum level in acute ischemic stroke was higher than control, this elevation continued up to three months after onset. It is interesting that VEGF level varied in subtype stroke according to TOAST (Trial of Org 10172 in acute Stroke Treatment) classification of ischemic stroke type. There was a positive correlation between VEGF level and clinical presentation within three months after onset on cardioembolic infarct subtype and lacunar infarct. On the other hand, a negative correlation was found in atherothrombotic infarct subtype. In this study, VEGF serum levels taken within 72 hours post-stroke were positively correlated with early clinical presentation within 72 hours after onset (r = 0.264 and p = 0.035), and also have positive correlation with 30 days outcome (r = 0.15 and p = 0.217). Whereas VEGF serum level on day-7 after ischemic stroke had a positive correlation with 30 days outcome (r = 0.518 and p = 0.04). Referring to Matsuo study,11 the positive correlation between VEGF and 30 days clinical outcome, might be caused by lacunar infarct (LACI) happened in majority of the study subjects. (Bamford classification).
http://mji.ui.ac.id
Puspitasari, et al.Vascular endothelial growth factor as predictor of stroke outcome
113
After acute stroke, VEGF expression appears within six hours in response to hypoxia along the ischemic area.17 In vivo study shows that introducing intravenous Vascular Endothelial Growth Factor-A (VEGF-A) two days post-stroke would induce angiogenesis in penumbra and help neuron recovery due to ischemic process.18 Intraventricular VEGF antibody had shown negative impact in increasing infarct volume in post focal cerebral ischemia mice.19 Topical and intramuscular VEGF had also shown that infarct volume and edema was significantly decreased in medial cerebral artery occluded mice. This revealed that VEGF has a neuroprotective effect.
This study revealed that subjects whose levels of VEGF on day-7 increased compared to levels at hour-72 led to the better NIHSS score at 30 days after stroke, and subjects with VEGF level on day-7 decreased compared to the level at hour-72 led to worse clinical outcomes (see Figure 2). Although this is not statistically significant, this phenomenon supports earlier statement that VEGF was believed to play a key role in angiogenesis and neurogenesis after stroke.
It could also be explained that VEGF serum level in acute phase reflected the brain response to hypoxia degree and neuronal damage, whereas VEGF dynamic change showed VEGF role as neuroprotector through angiogenesis and neurogenesis processes. We deduced that the clinical outcomes did not only rely on high VEGF serum level in early phase of stroke, but also on its dynamic in acute and after acute-phase of stroke.
We evaluated correlation between infarct volume and Bamford classification with clinical outcomes. Infarct volume measured at hour-72 post-stroke had significant correlation with clinical outcomes at day-30 (r = 0.382; p = 0.005). This is similar to other previous studies.20 Bamford classification also had correlation with clinical outcomes at day 30 after stroke (r = 0.243; p = 0.053). In this study we found that VEGF was the strongest clinical predictor on day-30, compared to the infarct volume and Bamford classification with an OR = 6.5 and p = 0.034 (95% CI = 1.15-36.61). (Table 3)
Limitations of this study was the small sample size, and there were 48 patients not measured VEGF level on day-7 and no measurement of. VEGF level on day-30.
In conclusion, VEGF levels in the acute phase of ischemic stroke can predict the degree of brain damage. The dynamics of the increase in VEGF levels after stroke correlated with improved clinical outcomes. Further research on neuroprotective role of VEGF in post-stroke recovery may open up opportunities in the management of post-ischemic stroke patients.
Acknowledgment We would like to thank Anyeliria Sutanto and Nora Tu for collecting data over the study period, also to Veli Sungono and Pricilla Gunawan for statistic analysis. We thank Prodia Laboratory for the support in this study. This study received financial support from Pelita Harapan University.
Conflict of interestThe authors affirm no conflict of interest in this study.
REFERENCES
1. World Health Organization [Internet]. Global burden of stroke. [Cited 2014 Aug 10]. Available from: http://www.who.int/cardiovascular_diseases/en/cvd_atlas_15_burden _stroke.pdf.
2. Go AS, Mozaffarian D, Roger VL, Benjamin EJ, Berry JD, Borden WB, et al. Heart disease and stroke statistics--2013 update: a report from the American Heart Association. Circulation. 2013;127(1):e6-245.
3. Kusuma Y, Venketasubramanian N, Kiemas LS, Misbach J. Burden of stroke in Indonesia. Int J Stroke. 2009;4(5):379-80.
4. Strong K, Mathers C, Bonita R. Preventing stroke: saving lives around the world. Lancet Neurol. 2007;6(2):182-7.
5. Brea D, Sobrino T, Ramos-Cabrer P, Castillo J. Inflammatory and neuroimmunomodulatory changes in acute cerebral ischemia. Cerebrovasc Dis. 2009;27(Suppl1):48-64.
6. Jin R, Yang G, Li G. Inflammatory mechanisms in ischemic stroke: role of inflammatory cells. J Leukoc Biol. 2010;87(5):779-89.
7. Iadecola C, Anrather J. The immunology of stroke: from mechanisms to translation. Nat Med. 2011;17(7):796-808.
8. Talwar T, Srivastava MVP. Role of vascular endothelial growth factor and other growth factors in post-stroke recovery. Ann Indian Acad Neurol. 2014:17(1):1-6.
9. Greenberg DA, Jin K. Vascular endothelial growth factors (VEGFs) and stroke. Cell Mol Life Sci. 2013;70(10):1753-61.
10. Yang JP, Liu HJ, Liu XF. VEGF promotes angiogenesis and functional recovery in stroke rats. J Invest Surg. 2010;23(3):149-55.
Medical Journal of Indonesia
114 Med J Indones, Vol. 24, No. 2June 2015
11. Matsuo R, Ago T, Kamouchi M, Kuroda J, Kuwashiro T, Hata J, et al. Clinical significance of plasma VEGF value in ischemic stroke - research for biomarkers in ischemic stroke (REBIOS) study. BMC Neurology. 2013;13(32):1-8.
12. Dassan P, Keir G, Jäger HR, Brown MM. Value of measuring serum vascular endothelial growth factor levels in diagnosing acute ischemic stroke. Int J Stroke. 2012;7(6):454-9.
13. Zhang ZG, Zhang L, Jiang Q, Zhang R, Davies K, Powers C, et al. VEGF enhances angiogenesis and promotes blood-brain barrier leakage in the ischemic brain. J Clin Invest. 2000;106(7):829-38.
14. Sims JR, Gharai LR, Schaefer PW, Vangel M, et al. ABC/2 for rapid clinical estimate of infarct, perfusion, and mismatch volumes. Neurology. 2009;72(24):2104-10.
15. Slevin M, Krupinski J, Slowik A, Kumar P, Szczudlik A, Gaffney J. Serial measurement of vascular endothelial growth factor and transforming growth factor-β1 in serum of patients with acute ischemic stroke. Stroke. 2000;31:1863-70.
16. Lee SC, Lee KY, Kim YJ, Kim SH, Koh SH, Lee YJ. Serum VEGF levels in acute ischemic strokes are correlated with longterm prognosis. Eur J Neurol. 2010;17(1):45-51.
17. Marti HJ, Bernaudin M, Bellail A, Schoch H, Euler M, Petit E, et al. Hypoxia-induced vascular endothelial growth factor expression precedes neovascularization after cerebral ischemia. Am J Pathol. 2000;156(3):965-76.
18. Xie L, Mao X, Jin K, Greenberg DA. Vascular endothelial growth factor-B expression in post ischemic rat brain. Vasc Cell. 2013;5(8):1-5.
19. Herz J, Reitmeir R, Hagen SI, Reinboth BS, Guo Z, Zechariah A, et al. Intracerebroventricularly delivered VEGF promotes contralesional corticorubral plasticity after focal cerebral ischemia via mechanisms involving anti-inflammatory actions. Neurobiology of Disease. 2012;45(3):1077-85.
20. Kasim KA, Brizzi M, Petersson J, Buchwald F, Sundgren PC. Combined Clinical and radiological prognostic model in acute ischemic stroke. Acta Neurol Belg. 2010;110(3):239-45.
http://mji.ui.ac.id
Deswanto and Barus.Gastrojejunostomy in annular pancreas
115
Annular pancreas: the failure of side-to-side gastrojejunostomy anastomosis and the success of repair with Roux-en-Y gastrojejunostomy
Keywords: annular pancreas, infant, Roux-en-Y gastrojejunostomy, side-to-side gastrojejunostomy
pISSN: 0853-1773 • eISSN: 2252-8083 • http://dx.doi.org/10.13181/mji.v24i2.1207 • Med J Indones. 2015;24:115-9• Received 17 Feb 2015 • Accepted 17 Jun 2015
Correspondence author: Isaac A. Deswanto, [email protected]
Copyright @ 2015 Authors. This is an open access article distributed under the terms of the Creative Commons Attribution-NonCommercial-ShareAlike 4.0 International License (http://creativecommons.org/licenses/by-nc-sa/4.0/), which permits unrestricted non-commercial use, distribution, and reproduction in any medium, provided the original author and source are properly cited.
Isaac A. Deswanto, Janta F. BarusDepartment of Surgery, Tarakan General Hospital, Tarakan, North Kalimantan, Indonesia
Case Report
Medical Journal of Indonesia
ABSTRAK
Pankreas annular adalah kelainan kongenital yang khas dengan terbentuknya cincin pankreas yang mengelilingi duodenum secara utuh atau sebagian. Kami melaporkan sebuah kasus pankreas annular pada pasien anak berusia 15 hari yang datang ke rumah sakit dengan keluhan muntah berulang dengan penurunan berat badan yang bermakna. Foto rontgen abdomen menunjukkan pembesaran lambung dengan pasase gas yang terkumpul pada duodenum proksimal. Laparotomi terbuka dilakukan dan ditemukan adanya pankreas annular yang mengelilingi duodenum proksimal yang menyebabkan hambatan pasase melewati duodenum. Pasien ini dilakukan side-to-side gastrojejunostomy dan stoma dibuat melewati obstruksi, dan didapatkan pasasenya memuaskan. Empat hari setelah operasi, pasien kembali muntah-muntah dengan abdomen yang membesar. Foto abdomen menggunakan kontras menunjukkan tidak adanya pasase kontras melalui stoma yang dibuat. Terjadi striktur atau re-stenosis pada stoma yang pertama dibuat. Hasil yang memuaskan tampak dengan teknik Roux-en-Y gastrojejunostomy bypass anastomosis. Pasien diperbolehkan pulang setelah 24 hari perawatan di rumah sakit tanpa sekuele yang tidak diinginkan.
ABSTRACT
Annular pancreas is a rare congenital anomaly characterized by a partial or complete encirclement of ectopic pancreas tissue around the duodenum. We report a case of annular pancreas in a 15 day-old infant admitted to the hospital with complaints of profuse and recurrent vomiting and loss of body weight. Non-contrast abdominal X-ray showed a dilated stomach with bubbles formation around the upper abdomen. An obstruction was noted and open laparotomy was performed. Upon laparotomy, pancreatic ring encircled the proximal duodenum causing an obstruction. Side-to-side gastrojejunostomy was performed and passage through the bypass was satisfactory. Four days after the operation, vomiting and bulging abdomen ensued. Contrast abdominal X-ray demonstrated filling defects at the level of obstruction and the anastomosis made. Anastomotic stricture was suspected and thus was corrected using Roux-en-Ygastrojejunostomy procedure. Postoperative course in this patient was satisfactory and patient was discharged after 24 days of hospitalization.
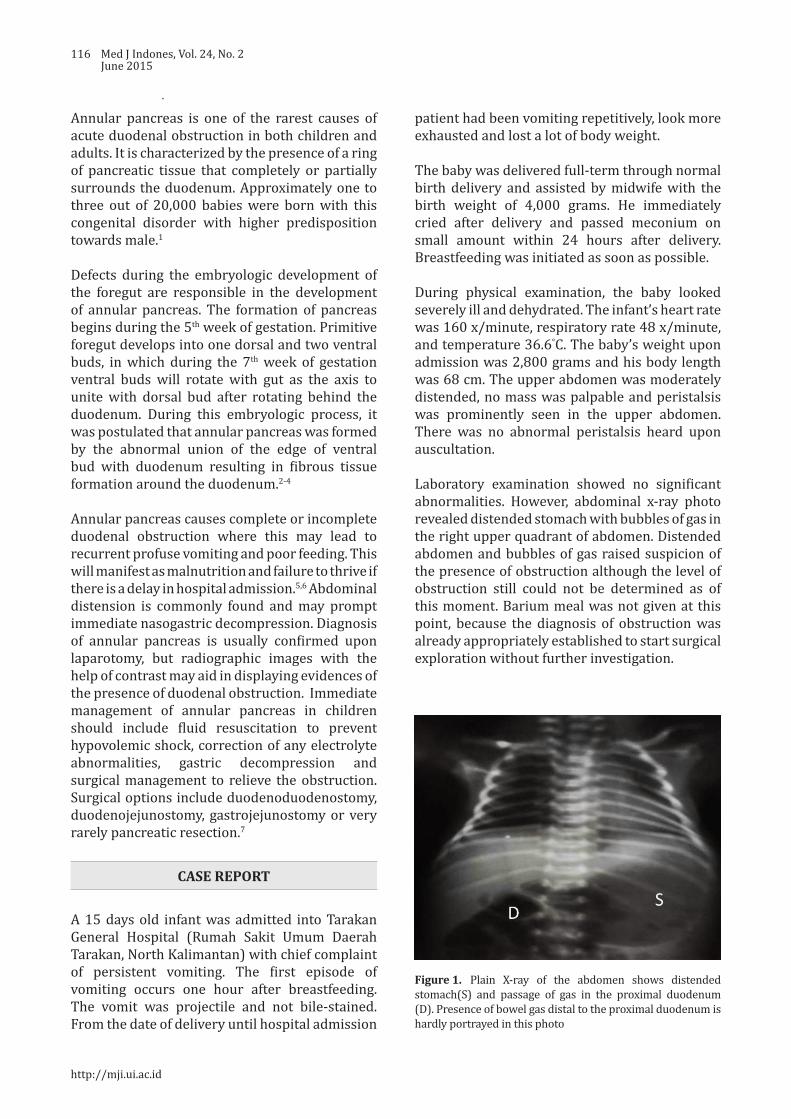
116 Med J Indones, Vol. 24, No. 2June 2015
Annular pancreas is one of the rarest causes of acute duodenal obstruction in both children and adults. It is characterized by the presence of a ring of pancreatic tissue that completely or partially surrounds the duodenum. Approximately one to three out of 20,000 babies were born with this congenital disorder with higher predisposition towards male.1
Defects during the embryologic development of the foregut are responsible in the development of annular pancreas. The formation of pancreas begins during the 5th week of gestation. Primitive foregut develops into one dorsal and two ventral buds, in which during the 7th week of gestation ventral buds will rotate with gut as the axis to unite with dorsal bud after rotating behind the duodenum. During this embryologic process, it was postulated that annular pancreas was formed by the abnormal union of the edge of ventral bud with duodenum resulting in fibrous tissue formation around the duodenum.2-4
Annular pancreas causes complete or incomplete duodenal obstruction where this may lead to recurrent profuse vomiting and poor feeding. This will manifest as malnutrition and failure to thrive if there is a delay in hospital admission.5,6 Abdominal distension is commonly found and may prompt immediate nasogastric decompression. Diagnosis of annular pancreas is usually confirmed upon laparotomy, but radiographic images with the help of contrast may aid in displaying evidences of the presence of duodenal obstruction. Immediate management of annular pancreas in children should include fluid resuscitation to prevent hypovolemic shock, correction of any electrolyte abnormalities, gastric decompression and surgical management to relieve the obstruction. Surgical options include duodenoduodenostomy, duodenojejunostomy, gastrojejunostomy or very rarely pancreatic resection.7
CASE REPORT
A 15 days old infant was admitted into Tarakan General Hospital (Rumah Sakit Umum Daerah Tarakan, North Kalimantan) with chief complaint of persistent vomiting. The first episode of vomiting occurs one hour after breastfeeding. The vomit was projectile and not bile-stained. From the date of delivery until hospital admission
patient had been vomiting repetitively, look more exhausted and lost a lot of body weight.
The baby was delivered full-term through normal birth delivery and assisted by midwife with the birth weight of 4,000 grams. He immediately cried after delivery and passed meconium on small amount within 24 hours after delivery. Breastfeeding was initiated as soon as possible. During physical examination, the baby looked severely ill and dehydrated. The infant’s heart rate was 160 x/minute, respiratory rate 48 x/minute, and temperature 36.6°C. The baby’s weight upon admission was 2,800 grams and his body length was 68 cm. The upper abdomen was moderately distended, no mass was palpable and peristalsis was prominently seen in the upper abdomen. There was no abnormal peristalsis heard upon auscultation.
Laboratory examination showed no significant abnormalities. However, abdominal x-ray photo revealed distended stomach with bubbles of gas in the right upper quadrant of abdomen. Distended abdomen and bubbles of gas raised suspicion of the presence of obstruction although the level of obstruction still could not be determined as of this moment. Barium meal was not given at this point, because the diagnosis of obstruction was already appropriately established to start surgical exploration without further investigation.
Figure 1. Plain X-ray of the abdomen shows distended stomach(S) and passage of gas in the proximal duodenum (D). Presence of bowel gas distal to the proximal duodenum is hardly portrayed in this photo
http://mji.ui.ac.id
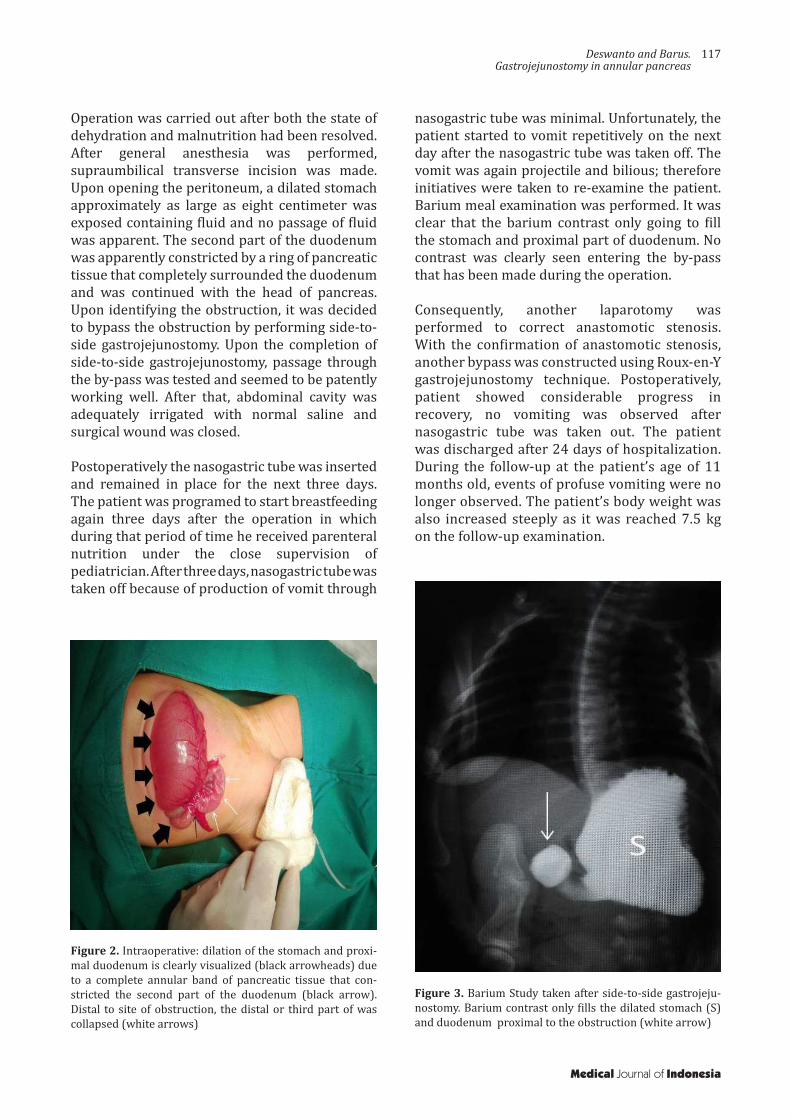
Deswanto and Barus.Gastrojejunostomy in annular pancreas
117
Operation was carried out after both the state of dehydration and malnutrition had been resolved. After general anesthesia was performed, supraumbilical transverse incision was made. Upon opening the peritoneum, a dilated stomach approximately as large as eight centimeter was exposed containing fluid and no passage of fluid was apparent. The second part of the duodenum was apparently constricted by a ring of pancreatic tissue that completely surrounded the duodenum and was continued with the head of pancreas. Upon identifying the obstruction, it was decided to bypass the obstruction by performing side-to-side gastrojejunostomy. Upon the completion of side-to-side gastrojejunostomy, passage through the by-pass was tested and seemed to be patently working well. After that, abdominal cavity was adequately irrigated with normal saline and surgical wound was closed.
Postoperatively the nasogastric tube was inserted and remained in place for the next three days. The patient was programed to start breastfeeding again three days after the operation in which during that period of time he received parenteral nutrition under the close supervision of pediatrician. After three days, nasogastric tube was taken off because of production of vomit through
Figure 2. Intraoperative: dilation of the stomach and proxi-mal duodenum is clearly visualized (black arrowheads) due to a complete annular band of pancreatic tissue that con-stricted the second part of the duodenum (black arrow). Distal to site of obstruction, the distal or third part of was collapsed (white arrows)
Figure 3. Barium Study taken after side-to-side gastrojeju-nostomy. Barium contrast only fills the dilated stomach (S) and duodenum proximal to the obstruction (white arrow)
nasogastric tube was minimal. Unfortunately, the patient started to vomit repetitively on the next day after the nasogastric tube was taken off. The vomit was again projectile and bilious; therefore initiatives were taken to re-examine the patient. Barium meal examination was performed. It was clear that the barium contrast only going to fill the stomach and proximal part of duodenum. No contrast was clearly seen entering the by-pass that has been made during the operation.
Consequently, another laparotomy was performed to correct anastomotic stenosis. With the confirmation of anastomotic stenosis, another bypass was constructed using Roux-en-Y gastrojejunostomy technique. Postoperatively, patient showed considerable progress in recovery, no vomiting was observed after nasogastric tube was taken out. The patient was discharged after 24 days of hospitalization. During the follow-up at the patient’s age of 11 months old, events of profuse vomiting were no longer observed. The patient’s body weight was also increased steeply as it was reached 7.5 kg on the follow-up examination.
Medical Journal of Indonesia
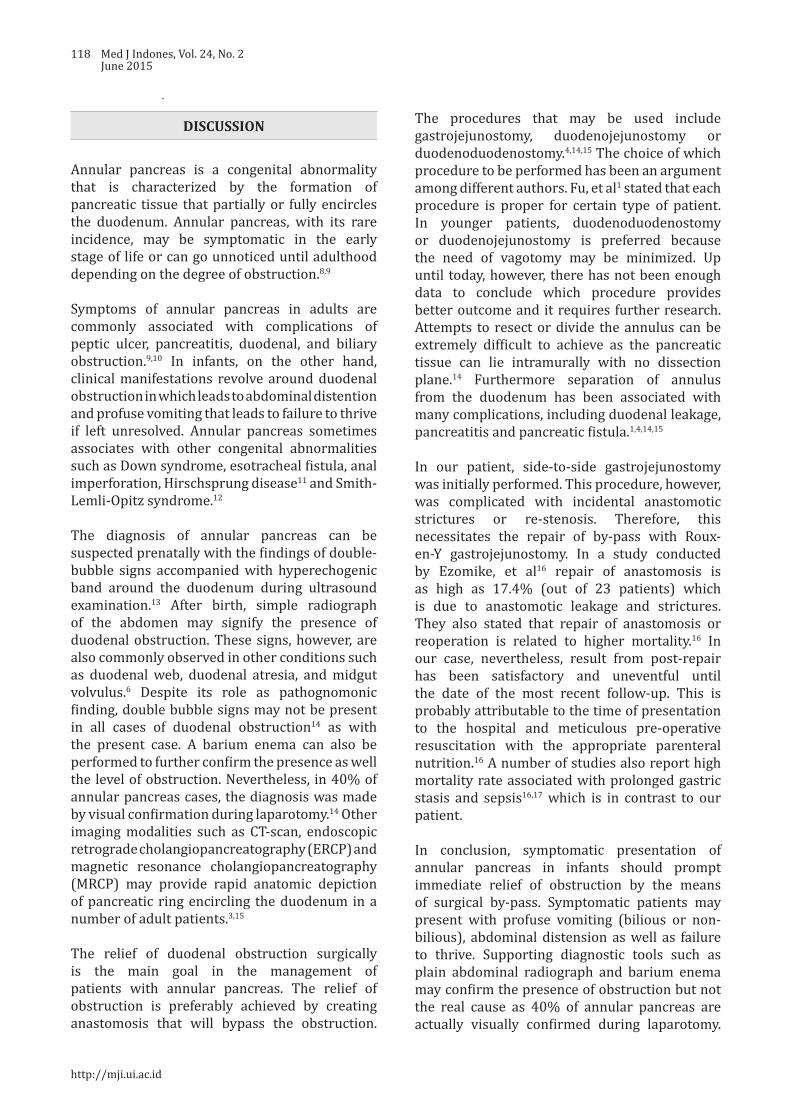
118 Med J Indones, Vol. 24, No. 2June 2015
DISCUSSION
Annular pancreas is a congenital abnormality that is characterized by the formation of pancreatic tissue that partially or fully encircles the duodenum. Annular pancreas, with its rare incidence, may be symptomatic in the early stage of life or can go unnoticed until adulthood depending on the degree of obstruction.8,9
Symptoms of annular pancreas in adults are commonly associated with complications of peptic ulcer, pancreatitis, duodenal, and biliary obstruction.9,10 In infants, on the other hand, clinical manifestations revolve around duodenal obstruction in which leads to abdominal distention and profuse vomiting that leads to failure to thrive if left unresolved. Annular pancreas sometimes associates with other congenital abnormalities such as Down syndrome, esotracheal fistula, anal imperforation, Hirschsprung disease11 and Smith-Lemli-Opitz syndrome.12
The diagnosis of annular pancreas can be suspected prenatally with the findings of double-bubble signs accompanied with hyperechogenic band around the duodenum during ultrasound examination.13 After birth, simple radiograph of the abdomen may signify the presence of duodenal obstruction. These signs, however, are also commonly observed in other conditions such as duodenal web, duodenal atresia, and midgut volvulus.6 Despite its role as pathognomonic finding, double bubble signs may not be present in all cases of duodenal obstruction14 as with the present case. A barium enema can also be performed to further confirm the presence as well the level of obstruction. Nevertheless, in 40% of annular pancreas cases, the diagnosis was made by visual confirmation during laparotomy.14 Other imaging modalities such as CT-scan, endoscopic retrograde cholangiopancreatography (ERCP) and magnetic resonance cholangiopancreatography (MRCP) may provide rapid anatomic depiction of pancreatic ring encircling the duodenum in a number of adult patients.3,15
The relief of duodenal obstruction surgically is the main goal in the management of patients with annular pancreas. The relief of obstruction is preferably achieved by creating anastomosis that will bypass the obstruction.
The procedures that may be used include gastrojejunostomy, duodenojejunostomy or duodenoduodenostomy.4,14,15 The choice of which procedure to be performed has been an argument among different authors. Fu, et al1 stated that each procedure is proper for certain type of patient. In younger patients, duodenoduodenostomy or duodenojejunostomy is preferred because the need of vagotomy may be minimized. Up until today, however, there has not been enough data to conclude which procedure provides better outcome and it requires further research. Attempts to resect or divide the annulus can be extremely difficult to achieve as the pancreatic tissue can lie intramurally with no dissection plane.14 Furthermore separation of annulus from the duodenum has been associated with many complications, including duodenal leakage, pancreatitis and pancreatic fistula.1,4,14,15
In our patient, side-to-side gastrojejunostomy was initially performed. This procedure, however, was complicated with incidental anastomotic strictures or re-stenosis. Therefore, this necessitates the repair of by-pass with Roux-en-Y gastrojejunostomy. In a study conducted by Ezomike, et al16 repair of anastomosis is as high as 17.4% (out of 23 patients) which is due to anastomotic leakage and strictures. They also stated that repair of anastomosis or reoperation is related to higher mortality.16 In our case, nevertheless, result from post-repair has been satisfactory and uneventful until the date of the most recent follow-up. This is probably attributable to the time of presentation to the hospital and meticulous pre-operative resuscitation with the appropriate parenteral nutrition.16 A number of studies also report high mortality rate associated with prolonged gastric stasis and sepsis16,17 which is in contrast to our patient.
In conclusion, symptomatic presentation of annular pancreas in infants should prompt immediate relief of obstruction by the means of surgical by-pass. Symptomatic patients may present with profuse vomiting (bilious or non-bilious), abdominal distension as well as failure to thrive. Supporting diagnostic tools such as plain abdominal radiograph and barium enema may confirm the presence of obstruction but not the real cause as 40% of annular pancreas are actually visually confirmed during laparotomy.
http://mji.ui.ac.id
Deswanto and Barus.Gastrojejunostomy in annular pancreas
119
Adequate pre-operative resuscitation without delaying definitive surgical by-pass is important to achieve better prognosis for the patient with lower mortality. The patency of the anastomosis must be also monitored carefully before patient is discharged. The presence of anastomotic stricture prompts immediate repair of anastomosis.
Conflicts of interest The authors affirm no conflict of interest in this study.
AcknowledgmentMany thanks is given to Tarakan General Hospital in Tarakan, North Kalimantan and the close relatives of the patient in giving their consent in regard to the publication of this article.
REFERENCES
1. Fu PF, Yu JR, Liu XS, Shen QY, Zheng SS. Symptomatic adult annular pancreas: report of two cases and a review of the literature. Hepatobiliary Pancreat Dis Int. 2005;4(3):468 - 71.
2. White J, Wilson J. USMLE Step 1 Anatomy Lecture Notes. Kaplan Medical. 2011: 247-8 p.
3. Türkvatan A, Erden A, Türkoğlu MA, Yener O. Congenital variants and anomalies of the pancreas and pancreatic duct: imaging by magnetic resonance cholangiopancreaticography and multidetector computed tomography. Korean J Radiol. 2013;14(6):905-13.
4. Mahdi B, Selim S, Hassen T, Mongi MM, Fadhel CM, Fathi C, et al. A rare cause of proximal intestinal obstruction in adults - annular pancreas: a case report. Pan Afr Med J. 2011;10:56.
5. Mulugeta PG, Hilmes MA. Annular pancreas in a toddler. Pediatr Radiol. 2010;40(Suppl1):S106.
6. Pansini M, Magerkurth O, Haecker FM, Sesia SB. Annular pancreas associated with duodenal obstruction. BMJ Case Reports. 2012;10:1-2.
7. Bouassria A EH, Elbouhaddouti H, Mouaqit O, Benjelloun E B, Ousadden A, Mazaz K, et al. Annular pancreas producing duodenal obstruction: A case report. Open J Gastroenterol. 2013;3(3):202-4.
8. Zeineb M, Sadri BA, Nizar M, Hassen H, Nafaa A, Taher K. Annular pancreas intra operatively discovered: a case report. Clin Pract. 2011;1(4):e82.
9. Patra DP, Basu A, Chanduka A, Roy A. Annular pancreas: a rare cause of duodenal obstruction in adults. Indian J Surg. 2011;73(2):163-5.
10. Tas A, Köklü S, Kocak E, Akbal E, Ergul B. An unusual cause of acute pancreatitis: annular pancreas and papillary opening of the cystic duct. Gut Liver. 2012;6(3):403-4.
11. Kandpal H, Bhatia V, Garg P, Sharma R. Annular pancreas in an adult patient: diagnosis with endoscopic ultrasonography and magnetic resonance cholangiopancreatography. Singapore Med J. 2009;50(1):e29-31.
12. Demirdöven M, Yazgan H, Korkmaz M, Gebeşçe A, Tonbul A. Smith-lemli-opitz syndrome: a case with annular pancreas. Case Rep Pediatr. 2014;2014:623926.
13. Dankovcik R, Jirasek JE, Kucera E, Feyereisl J, Radonak J, Dudas M. Prenatal diagnosis of annular pancreas: reliability of the double bubble sign with periduodenal hyperechogenic band. Fetal Diagn Ther. 2008;24(4):483-90.
14. Whittingham-Jones PM, Riaz AA, Clayton G, Thompson HH. Annular pancreas - a rare cause of gastric obstruction in an 82-year-old patient. Ann R Coll Surg Engl. 2005;87(1):W13-5.
15. Alahmadi R, Almuhammadi S. Annular pancreas: a cause of gastric outlet obstruction in a 20-year-old patient. Am J Case Rep. 2014;15:437-40.
16. Ezomike UO, Ekenze SO, Amah CC. Outcomes of surgical management of intestinal atresias. Niger J Clin Prac. 2014;17(4):479-83.
17. Kaddah SN, Bahaa-Aldin KHK, Aly HF, Hassan HS. Congenital duodenal obstruction. Ann Pediatr Surg. 2006;2(2):130-5.
Medical Journal of Indonesia
120 Med J Indones, Vol. 24, No. 2June 2015
The status of probiotics supplementation during pregnancy
Keywords: preeclampsia, pregnancy, probiotics, prenatal supplementation, preterm labor
pISSN: 0853-1773 • eISSN: 2252-8083 • http://dx.doi.org/10.13181/mji.v24i2.1223 • Med J Indones. 2015;24:120-30• Received 21 Mar 2015 • Accepted 18 Jun 2015
Correspondence author: Noroyono Wibowo, [email protected]
Copyright @ 2015 Authors. This is an open access article distributed under the terms of the Creative Commons Attribution-NonCommercial-ShareAlike 4.0 International License (http://creativecommons.org/licenses/by-nc-sa/4.0/), which permits unrestricted non-commercial use, distribution, and reproduction in any medium, provided the original author and source are properly cited.
Noroyono Wibowo,1 Johanes C. Mose,2 Made K. Karkata,3 Bangun T. Purwaka,4 Herman Kristanto,5 Maisuri T. Chalid,6 Yusrawati,7 Makmur Sitepu,8 Juneke J. Kaeng,9 Nuswil Bernolian,10 Damar
Pramusinto,1 Rima Irwinda1
1 Department of Obstetric and Gynecology, Faculty of Medicine, Universitas Indonesia, Ciptomangunkusumo Hospital, Jakarta, Indonesia
2 Department of Obstetric and Gynecology, Faculty of Medicine, Padjajaran University, Bandung, Indonesia3 Department of Obstetric and Gynecology, Faculty of Medicine, Udayana University, Bali, Indonesia4 Department of Obstetric and Gynecology, Faculty of Medicine, Airlangga University, Surabaya, Indonesia5 Department of Obstetric and Gynecology, Faculty of Medicine, Diponegoro University, Semarang, Indonesia6 Department of Obstetric and Gynecology, Faculty of Medicine, Hasanuddin University, Makassar, Indonesia7 Department of Obstetric and Gynecology, Faculty of Medicine, Andalas University, Padang, Indonesia8 Department of Obstetric and Gynecology, Faculty of Medicine, University of Sumatera Utara, Medan, Indonesia9 Department of Obstetric and Gynecology, Faculty of Medicine, Sam Ratulangi University, Medan, Indonesia10 Department of Obstetric and Gynecology, Faculty of Medicine, Sriwijaya University, Palembang, Indonesia
Review Article
Medical Journal of Indonesia
ABSTRAK
Probiotik telah sejak lama diketahui fungsinya dalam dunia medis. Salah satu aplikasinya adalah penggunaan probiotik selama kehamilan. Studi terbaru menunjukkan bahwa suplementasi probiotik prenatal dinilai aman dan berguna. Pada review ini, kami menyorot fungsi probiotik pada ibu hamil. Beberapa strain probiotik terbukti mampu mencegah kelahiran prematur dan preeklampsia pada ibu yang mendapatkan suplementasi prenatal, mengurangi kemungkinan dermatitis atopi meski tidak mampu mencegah kejadian asma dan sesak. Mekanisme yang terkait dengan fungsi ini masih belum diketahui secara pasti, namun diperkirakan sangat berkaitan dengan regulasi sel T.
ABSTRACT
Probiotics have been known for their use in medical field for quite a long time. Strong evidences are now available for the use of probiotics in clinical setting. One of the current issues on this topic is the use of probiotics in pregnancy. Recent studies showed that probiotics may be safe and beneficial for prenatal supplementation. In this review, we highlighted several proven use of probiotics supplementation in pregnant women. A few selected strains of probiotics showed promising outcome to prevent preterm labor and preeclampsia, and to reduce atopic eczema but not asthma and wheezing, in offspring of women who had prenatal probiotics supplementation. The mechanism of action responsible for this effect is closely related to the regulation of T cells, although the exact pathways are not defined yet.
Wibowo, et al.Probiotics supplementations in pregnancy
121
The role of microorganisms in food has been known for a long time. The first person to suggest the role of microorganism in food spoiling was A. Kircher, in 1658, who examined decaying bodies, meat, milk, and other substances and said the process was caused by “worms” invisible to the naked eye.1 But it was not until 1837 that L. Pasteur showed that microorganisms caused the souring of milk and used heat for the first time to prevent food from spoiling.1
Today, the established roles of microorganisms in food can be divided into three groups2,3 (1) pathogenic microorganisms that cause infection or food poisoning, (2) saprophytic microorganisms that play role in biodegradation and food spoiling, and (3) beneficial microorganisms used in fermentation process and to maintain healthy digestive tract.4
Among the beneficial microorganisms is a group named probiotic. The original observation of the role of probiotics to promote human health was underwent by a Russian scientist Eli Metchnikoff, who suggested that “The dependence of the intestinal microbes on the food makes it possible to adopt measures to modify the flora in our bodies and to replace the harmful microbes by useful microbes” in 1907.5
The number of microbes along human digestive tract is tremendous, sizing up to 100 trillion microorganisms.6 These microbes are of distinct phenotypes and each specific site can carry different type, from 56 phenotypes in mouth to 195 in colon. They are responsible to break down ingested polysaccharides, including the indigestible plant-derived pectin.7
In 2001, World Health Organization/Food and Agriculture Organization of the United Nations (WHO/FAO) defined probiotics as “living microorganisms which when administered in adequate amounts confer a health benefit on the host”.8 Probiotics consist of yeast or bacteria, especially lactic acid bacteria.4,9 The most well-known members of this group are Lactobacillus, Bifidobacterium and Streptococcus. They exhibit strain-specific differences on resistance against acid and bile, ability to colonize the gastrointestinal tract and clinical efficacy.9 The possible mechanism of actions includes inhibition of pathogenic bacteria, production of
useful metabolites or enzymes, enhancement of mucosal function, and modulation of host immune responses.8,9
Some modern definitions on probiotics include a preventive or therapeutic action of probiotics. Charteris, et al10 defined probiotics as ‘microorganisms, which, when ingested, may have a positive effect in the prevention and treatment of a specific pathologic condition’. Since probiotics have also been found to be effective in treatment of several gastrointestinal disorder such as acute infectious diarrhea,11 antibiotic-associated diarrhea,12 and irritable bowel syndrome,13 they are also considered as therapeutic agents.14
Probiotics are also associated with risk reduction in developing atopic sensitization in children,15 lower incidence of gestational diabetes mellitus16 and preeclampsia,17 and fewer case of necrotizing enterocolitis in preterm infants18, if given during prenatal period.
Despite the common mechanism of actions proposed, the beneficial effects of probiotics vary and can be strain-specific.19 One strain of probiotic can have different clinical effect to a certain disease, compared to other strain of probiotics. For example, a study by Wagner, et al20 found that four different strains of probiotics showed different efficacy and great diversity of immune effect in preventing colonization and sepsis with Candida albicans in mice. Therefore, generalization of probiotics effects without solid evidence should be avoided.
This literature review is aimed to address the possible benefits of probiotics and to recommend their usage in the field of obstetric.
Definition The term probiotic was first introduced by Lilly and Stillwell21 in 1965 to describe ‘substances secreted by one microorganism which stimulates the growth of another’. In 1989, Fuller22 highlighted that probiotics were living matter by describing them as ‘a living microbial food supplement which beneficially affects the host animal by improving its microbial balance’. Newer definitions of probiotics include the possible preventive or therapeutic effect for the host because recent publications stated that probiotics are proven to be effective in treating gastrointestinal disorders.10
Medical Journal of Indonesia
122 Med J Indones, Vol. 24, No. 2June 2015
Other terms that are closely related to probiotics are prebiotics and synbiotics. Prebiotics are indigestible food ingredient that are advantageous to the host by selectively promote the growth or activity of beneficial enteric bacteria.23 Meanwhile, synbiotic is the combination of prebiotics and probiotics designed to improve the survival of ingested microorganisms and the colonization of the intestinal tract.24
To be considered as probiotics, microorganisms have to own several characteristics. They must be resistant to gastric acid and bile, safe and confer health benefit for the host5, and have the ability to colonize the intestinal tract and ward off the pathogenic bacteria.25 Furthermore, any probiotics must be able to endure the manufacturing process and the long shelf-life.26,27
In newer publications, The International Scientific Association for Probiotics and Prebiotics8 stated that there are several categories of living microorganisms for human. The first one is not probiotics. Products (foods, drinks, etc) claimed as “containing living and active culture” with following criteria: contains any food fermentation microbes in minimum 1x10⁹ colony-forming unit (CFU) of microorganisms per serving, are not probiotics. Although these products contain living microbes, that do not imply they possessed the probiotic activity.
Meanwhile, the second group are the probiotics group. There are three different subgroups: supplement without health claim, supplement with health claim, and probiotic drug. The general criteria for all subgroup are every product must contain safely proven species with sufficient corroborating evidence, appropriate for human use, have proof of delivery of viable probiotics at efficacious dose, and (for drugs) meet the criteria for drug regulation.
Mechanism of action There are several microorganisms that have been widely known as probiotics. Bifidobacterium, Lactobacillus, and Saccharomyces are the most well-known probiotics bacteria. Their mechanisms of actions are very strain-specific and case-specific.19 Probiotics major mechanism of actions consisting of these following actions: secretion of anti-microbial substances, competitive adherence to mucosa and epithelium,
strengthening the gut epithelial barrier, and modulation of the immune system.28
Lactobacillus can modulate the regulation of genes encoding adherence junction protein, such as: E-cadherin and β-catenin, while also influence the phosphorylation of adherence junction proteins.28 Lactobacillus casei exhibited an ability to restore mucosal integrity by enhancing expression and redistributing tight junction proteins of the zonula occludens and protein kinase C. Two isolated and purified peptide secreted by Lactobacillus rhamnosus GG demonstrated anti-apoptotic activity and therefore limit the epithelial damage.28 Another mechanism is the ability to promote mucous secretion to improve barrier by increasing mucin production mediated by the upregulation of MUC2, MUC3, and MUC5AC in HT29 cells.28
Lactobacillus and Bifidobacterium also promote mucous adhesion mediated by protein, saccharide moieties, and lipotechoic acid. Lactobacillus reuteri produces an adhesin called MUB (mucus-binding protein).28 Bifidobacterium animalis subsp. Lactis and Bifidobacterium bifidum facilitate the colonization of human gut by degradation of extracellular matrix of cells.28 Lactobacillus and Bifidobacterium also have been shown to inhibit a broad range of pathogens, such as E. coli, Salmonella, H. pylori, L. monocytogens, and rotavirus by competing for available nutrients and mucosal adhesion sites. These bacteria can also modify their environment to make it less suitable for other competitors.28
Antimicrobial substances produced by probiotics are called bacteriocins, which mostly are organic acid (acetic and lactic acid) that can inhibit Gram-negative bacteria.28 They mediate pathogens killing by destruction of target cells by pore formation and/or inhibition of cell wall synthesis. Other than that, probiotics can also interact with immune system and modulate their response via pattern recognition receptors such as toll-like receptors and nucleotide oligomerization domain (NOD)-like receptors.28
SafetyThe safety of probiotics has been questioned for quite a long time. The issues addressed in this topics29 are disease occurrence and the possibility of infection, toxic and metabolic effect, antibiotic-
http://mji.ui.ac.id

Wibowo, et al.Probiotics supplementations in pregnancy
123
resistance transfer between gut microflora, and immunological adverse events.19,30 Few cases have shown the possibility of adverse events although the correlation is still doubted.
Infection The concern regarding infection came from the probable transmigration of bacteria and several reported cases on bacteremia or sepsis attributable to probiotic strains. Theoretically, the risk is very low since probiotics are not selected among the pathogenic microorganisms. The estimated risk was less than one per one million users for Lactobacillus and one per 5.6 million users for Saccharomyces boulardii and even less in general healthy population.31
It has been linked to the probiotics’ ability to adhere to human gut and in turn induce transmigration. Syndman stated that probiotics had no better adhesive properties to human gut compared to clinical strain and animal models suggested that probiotics actually reduced the translocation of other bacteria.29
In their review article, Boyle, et al19 listed 12 cases of bacterial sepsis and 24 cases of fungal sepsis related to probiotics use in human. Most of the cases were identified using pulse-field gel electrophoresis (PFGE) of different substances, deoxyribonucleic acid (DNA) sequencing using polymerase chain reaction (PCR), or antibiotic resistance measurement. Lactobacillus rhamnosus GG, Bacillus subtilis, and Saccharomyces boulardii were the most frequently used probiotics in those studies. All of the cases had risk factors, such as immune compromise condition, critical illness, use of central venous catheter (CVC), use of broad spectrum antibiotics, or impaired intestinal barrier, unless it was not stated in the original paper.
Although there were some cases of infection with the use of Lactobacillus or Bifidobacterium, Sanders, et al32 argued that no gene has been associated with pathogenicity in these microbes. Owing to the fact that different strains of Lactobacillus can also be found on normal human’s gut, the clinical isolate from blood still does not conclude that the use of these specific strains of probiotics can cause infection in population at risk.
Metabolic effectOne of metabolic effects related to the use of
probiotics is the production of D(-)-lactic acid and the probability of developing lactate acidosis.33 D(-)-lactic acid is a compound derived from methyl-glyoxal metabolic pathway that is also a specific bacterial metabolite produced by gut microbes, especially Lactobacillus spp.34 When the number of this particular species rises, the intraluminal pH rises. The acid state of gut creates a favorable environment for Lactobacillus spp. and not for other species. If the consumption of simple chain carbohydrate increases, Lactobacillus spp. will produce more lactic acid which may result in lactic acidosis.35
The lactic acidosis had been reported in patients with short bowel syndrome, with or without the use of probiotics.35-37 Neurologic sequelae can follow this condition, such as ataxia, slurred speech, memory loss, even loss of consciousness. One of the cases of lactic acidosis36 triggered by probiotics use a combination of Lactobacillus acidophilus and Bifidobacterium infantis to reduce diarrhea on two year-old post gut resection infant. Lactic acidosis occurred after three years eight months after surgery and four months after probiotic use.
In other study38 on healthy term infants, use of Lactobacillus paracasei was not associated with increase of lactic acid in blood. There were 88 infants, aged up to 72 hours, involved in this study. Half of the subjects were feed with formula containing probiotics while the rest were feed with non-probiotic containing formula. The subjects were followed up until day 168. There was no increase in level of lactic acid and no adverse events were associated with the use of probiotics in these infants. There is no study reporting probiotic-induced lactic acidosis in otherwise healthy individual.
Antibiotic resistance Another concern regarding probiotic safety is the potential antibiotic-resistance transfer between probiotics and gut microbiome, particularly pathogenic bacteria.19,29 It has been established that human gut acts as reservoir for antibiotic resistant genes called resistome.39 The so-called genes are natural reactions from gut bacteria to protect antibiotic-producing bacteria from their own products and to increase their chance of survival.39 The problem rise when these genes are transferred horizontally and vertically to pathogenic bacteria.
Medical Journal of Indonesia
124 Med J Indones, Vol. 24, No. 2June 2015
In a study of microbes found in chicken feces,40 lactic acid bacteria were found to be most sensitive to penicillin, amoxicillin, chloramphenicol, and ampicillin, while it is more resistant to gentamycin, suplhametoxazole, kanamycin and streptomycin.
The resistance genes, originated from mobile elements such as plasmids, transposons, and integrons, are spread by horizontal gene transfer (HGT).41,42 In lactic acid bacteria, these genes encode the resistance to tetracycline, chloramphenicol, erythromycin, and macrolide.29,41 Tetracycline resistance genes are the most abundant in lactobacilli, at least 11 genes had been identified, including genes coding for ribosomal protection proteins and efflux pumps.41 One chloramphenicol resistance gene had been identified in L. acidophilus, while four different erythromycin and three macrolide resistance genes had been found in several Lactobacillus species.41 Conjugation appears to be the most prevalent mechanism42 and a transfer from gram-positive enterococci to lactobacilli and lactococci can take place in animal gut and in vitro, and vice-versa, including transfer to Staphylococcus.41
Vancomycin resistance in lactic acid bacteria is characterized as intrinsic phenomenon caused by chromosomal mutation. The D-alanine/D-alanine terminal for vancomycin binding was replaced by either D-lactate of D-serine, therefore prevent the vancomycin binding process.41 There had been evidence of possible in vivo vancomycin resistant gene, vanA, transfers from an Enterococcus strain to L. acidophilus32 although there was no evidence of plasmids and genes related to this resistance found in Lactobacillus rhamnosus GG from hybridization or PCR.29
Safety in pregnancy Probiotics use in pregnancy is deemed safe in general, as shown in a recent meta-analysis43 of eight high-quality studies in more than 1,500 pregnant women. Most of the subjects were in 32-36 weeks of pregnancy, although one study was done in first trimester. The analysis compared the use of Lactobacillus sp. alone or in combination with Bifidobacterium sp. with placebo. The result showed no significant difference in outcomes: caesarean section rate, birth weight, and gestational age between two groups. Malformation as an outcome was reported in one study and it stated that there was no malformation found in
probiotic group while three malformation cases were found in placebo group.
Another recent review31 of eight different studies following the meta-analysis showed that there was no adverse pregnancy outcome related to the use of probiotics. Most of the included randomized placebo-controlled trials compared Lactobacillus sp. alone, or in combination with Bifidobacterium sp. or Propionibacterium sp.. Most of the studies agreed with the proceeding meta-analysis and reported no difference in gestational age, birth weight, or rate of Caesarean section. Luoto, et al16 reported lower incidence of gestational diabetes mellitus in probiotic group and significantly lower birth weight and shorter birth length of newborns from the aforementioned group. Allen, et al44 reported that there was no significant adverse event related to probiotic supplement on pregnancy, childbirth, and newborn’s general health until six months of life.
Another concern regarding safety for use in pregnancy is the possibility of disruption of T helper one (which exhibit pro-inflammatory activity – Th1) and T helper two cells (which exhibits anti-inflammatory activity – Th2) ratio.19 Throughout pregnancy, there is a shift from Th1 response to Th2 response that induces maternal tolerance and suppression of immune system.45,46 This response is shown as reduction in the percentage of interferon-γ (IFN-γ) and Tumor Necrosis Factor-α (TNF-α)-secreting T helper cells, and also the increased production of interleukin-4 (IL-4) produced by Th2.45 IFN-γ indirectly promotes Th1 differentiation by upregulating IL-12 receptor while at the same time inhibiting Th2 growth. IL-4 is the main cytokine to promote growth and differentiation of naive T cells to Th2, thus inhibiting differentiation to Th1 cells.45,47 Increased Th2 response is linked with fetus viability in utero, while surge of Th1 response is associated with recurrent spontaneous abortion and preeclampsia.45,46 There is evidence that links the use of probiotics with the changes of Th1/Th2 equilibrium. In patients with severe traumatic brain injury (TBI), probiotics were able to reverse the Th2 polarization response to the Th1/Th2 equilibrium.48 Probiotics’ ability to cause Th1 polarization may theoretically put the fetus in danger, if this mechanism occur in pregnancy. Although for now, there is still no evidence to support this claim, thus it still remains a theory.
http://mji.ui.ac.id
Wibowo, et al.Probiotics supplementations in pregnancy
125
Clinical evidence in obstetric fieldPrevention of preterm deliveryPreterm delivery is a global problem. According to WHO, the estimated number of preterm delivery is 15 million per year and about one million of those babies die annually.49 It is the leading cause of newborn death in the world, ranging from 5% to 18% of babies born, across 184 countries.49
Several important risk factors for preterm delivery had been named, such as history of preterm birth, twins pregnancy, ethnicity, maternal age <18 years, and genitourinary or intrauterine infections.50 Numerous evidences have reported an association between infection/inflammation and preterm birth. One of the consistent observed causes is the evidence of chorioamnitis, which affects 20-70% placentas of preterm born babies. Positive membrane culture is detected in 30-60% of those patients.
Probiotics, particularly lactobacilli, are a potential breakthrough way to prevent preterm birth that act to restore vaginal lactobacilli count. A study by Vitali, et al51 showed that supplementation of Lactobacillus spp (L. paracasei, L. plantarum, L. acidophilus, L. delbrueckii subsp. Bulgaricus), Bifidobactetium spp (B. longum, B. breve, B. infantis), and S. thermophilus can alter the cytokine and chemokine response in vaginal mucous.
A 2007 meta-analysis study52 on three trial of medium quality showed that there was no benefit from supplementation of probiotics to prevent very preterm birth (<32 weeks) (RR = 0.65; 95% CI = 0.03-15.88) and preterm birth (<37 weeks) (RR = 3.95; 95% CI = 0.36-42.91). The confidence intervals of these two findings are very wide and therefore possess no statistical significance. Reports of the studies included in this analysis mostly focused on laboratory evidence of infection (lactobacillus count, type of abnormal vaginal flora, vaginal fluid pH, presence of clue cells, etc) rather clinical findings regarding infection or preterm labor. Therefore, the writers of this meta-analysis could neither support nor oppose the use of probiotics in pregnancy to prevent preterm delivery.52
The more recent publications on the same topic, on the other hand, suggested that probiotics may play a role in preventing preterm labor. A study by Myhre, et al53 involving 18,888 women all
across Norway in Norwegian Mother and Child Cohort from 2002 to 2007 showed that probiotics reduces incidence of preterm labor. The subjects were asked to complete two questionnaires in gestational week 15 and in gestational week 17-22. They were asked about their probiotic milk consumption. Answers were divided into yes or no; yes were stratified into low and high intake. Of all subjects, 950 experienced preterm delivery. The risk for developing preterm labor in subjects consuming probiotic milk was lower than those who didn’t (OR = 0.857; 95% CI = 0.741-0.992; p = 0.038). Furthermore, the risk was lower in groups who consume high intake of milk (OR = 0.820; 95% CI = 0.681-0.986; p = 0.035) compared to no intake.
In women taking probiotics supplementation, the level of chemokine Eotaxine, which exerts pro-inflammatory activity, decreased from week 33 to 37, compared to control.51 Meanwhile, the level of anti-inflammatory cytokine and chemokine, interleukin (IL)-4 and IL-10, in probiotic group stayed in the same concentration from week 33 to 37, while it declined in the control group.51 The researcher hypothesized that:51 (1) probiotics counteracted the decrease of anti-inflammatory cytokine levels in control group, and (2) probiotics induced the decrease of pro-inflammatory cytokine in probiotics group.
Another paper by Yang, et al54 stated that injection of supernatant of L. rhamnosus GR-1 (GR-1 SN) in pregnant mice can lower preterm birth by 43%. The study found that GR-1 SN decrease the production of several pro-inflammatory cytokine and chemokine, such as IL-1β, -6, TNF-α in maternal plasma, myometrium, and amniotic fluid. Furthermore, maternal plasma progesterone also reduced significantly in mice given the GR-1 SN supernatant injection. Past studies have shown that SR-1 GN stimulate release of IL-10, in human monocytes, mouse macrophages, and human trophoblast cells,55
through the janus kinase/ signal transducer and activators of transcription (JAK/STAT) and mitogen-activated protein kinases (MAPK) pathway.56 The upturn of this cytokine respectively suppress TNF-α.56 This also support the hypothesis that probiotics may contribute to a reduction in overall systemic inflammation and keeping it at a subtreshold level to avoid progesterone-induced labor.
Medical Journal of Indonesia
126 Med J Indones, Vol. 24, No. 2June 2015
Prevention of preeclampsia Probiotics have been long known to have antihypertensive effect. A recent meta-analysis of 14 studies showed that probiotics have a blood pressure-lowering effect in general population.57 The studies included in this analysis originated from Japan and Europe with respondents’ age ranging from 35 to 75 years old. After taking probiotic fermented milk intervention, reduction in systolic-blood pressure was reported. The net systolic changes ranging from -1.5 to -12.4 mmHg (mean: -3,10; 95% CI = -4,63-(-)1,56; p = 0,193), while the mean of net change for diastolic blood pressure were -1.09 (95% CI = -2.11-(-)0.06; p = 0,153).
Theoretically, probiotics can prevent eclampsia since it prevents inflammation both systemically and locally.51,56 A study by Brantsæter, et al17
showed that probiotics may actually link to reduction of preeclampsia incidence. This study was a part of Norwegian Mother and Child Cohort Study. A total of 33,399 nulliparous pregnant women were included in the study and were asked to complete two sets of questionnaire in 15 weeks and 17-22 weeks of pregnancy, including food frequency questionnaire asking about milk consumption. Among the subjects, 1,755 women (5.3%) developed preeclampsia. In crude model, consumption of probiotics was associated with the reduced risk of all sub-type of preeclampsia (early-late, mild-severe), but after adjustment, probiotic use was only associated with the severe type of preeclampsia (OR = 0.79; 95% CI = 0.66-0.96). The consumption of probiotic milk then was divided into four criteria: no, low, moderate, and high intake (median of intake: low 13.2 mL/day, moderate 28.5 mL/day, and high 200 mL/day). The incidence of preeclampsia was lower in group with higher consumption (5.6% in no intake group, 4.1% in high intake group). The calculated risk of preeclampsia was also reduced among high consumers (OR = 0.61; 95% CI = 0.43-0.89).
Prevention of eczema in offspringFor several years, probiotic supplementation to pregnant women has been linked to reduction in incidence of eczema in their offspring. The evidences were mixed, some stated that there was no link while the others said that there was reduction in number of new cases. In a 2011 meta-analysis, Doege, et al58 on systematic review
claimed that there was a significant risk reduction for atopic eczema in children aged 2-7 years old whose mother received supplementation during pregnancy. Seven studies were included, involving a total of 2,800 pregnant women in this analysis. The result showed that the risk reduction for atopic eczema was significant when the lactobacilli were used as the probiotics agent (RR = 0.82; 95% CI = 0.71-0.96) rather than probiotic mixture (RR = 0.92; 95% CI = 0.83-1.02). It concluded that the use of lactobacilli, if taken as monotherapy, in pregnancy may be beneficial in preventing incidence of infant eczema.
A more recent meta-analysis by Pelucchi, et al59 identified 18 publications based on 14 trials and decided on two outcomes: atopic dermatitis and immunoglobulin E (IgE)-associated atopic dermatitis. The study found that there was a 20% reduction in incidence of atopic dermatitis and IgE-associated atopic dermatitis in women who had probiotic supplementation during pregnancy. The analysis reported an risk ration (RR) of 0.79 (95% CI = 0.71-0.88) for atopic dermatitis in the treatment groups. As for the IgE-associated atopic dermatitis, the RR was 0.80 (95% CI = 0.66-0.96) and consistent throughout random-effect model. Another outcome in this analysis was the effect of probiotic treatment on disease severity. Out of 18, 11 studies reported the disease severity as an outcome and 9 of 11 stated that there was no difference found between treatment and placebo groups, and there was no. Relation to dose or type of supplementation. They were also unable to determine whether the effect in those studies was limited into one specific strain, because the data availability was limited. However, they agreed with previous study that the use of lactobacilli, specifically L. rhamnosus GG, was associated with a RR of 0.74 (95% CI = 0.61-0.90). It was also worth noting that several studies in this meta-analysis performed intervention to only pregnant mothers while other studies also gave supplementation to the babies. Therefore, it was inconclusive whether the results of these studies were solely resulted from supplementation for mothers.
A large-scale cohort study in Norway (a part of The Norwegian Mother and Child Cohort Study),60
reported slight reduction in relative risk for atopic eczema in offspring of women who consumed probiotic milk during pregnancy. The study
http://mji.ui.ac.id
Wibowo, et al.Probiotics supplementations in pregnancy
127
included 40,614 children born in 2003 to 2009. Among them, 12.2% had symptoms of atopic eczema by six months of age, 13.6% had current atopic eczema at 18 months of age. If only the mother received probiotic milk supplementation, when their child reach six month, there was a small reduction of atopic eczema (RR = 0.94; 95% CI = 0.89-0.99), but then it was no longer found in 18 months (RR = 1.00; 95% CI = 0.95-1.05). However, if both mother and child took the supplementation (for child even after six months old), there was a slight reduction in atopic eczema risk (RR = 0.93; 95% CI = 0.86-1.00) although it was bordering insignificance.
Another challenge on the topic is finding the possible mechanism of how supplementation in pregnant mothers can affect their offspring, in terms of atopic eczema incidence. Several mechanisms were proposed to explain this phenomenon. The conventional approach is that probiotics modulate intestinal microbiota composition or directly stimulate its immune system. In allergy pathogenesis, type one and two T helper cells play important roles. Allergic disorders are associated with a shift of the Th1/Th2 balance towards a Th2 response, and in turns promotes the secretion of IL-4, IL-5, IL-9, IL-13, and IL-31, also increase the IgE production.15 In newborns, their immune systems are not fully developed, and tend to be skewing toward Th2 trend to prevent in-utero rejection. However, Th2 is responsible to stimulate B cells to produce more IgE, which can activate mast cells and cause allergic symptoms. Exposure to microbes in early life can help reverse this trend and promote the development of Th1 via activity of Th3.61 Th3 will release transforming growth factor (TGF)-β that modulates the activity of B cells. As a result, B cells suppress their production of IgE and promote production of IgA. IgA will act as allergen exclusion system and will reduce the contact between immune system and antigen. Probiotics can also modulate the toll-like receptors and proteoglycan recognition proteins of enterocyte, leading to activation of enteric dendritic cells and a Th1 response, thus inhibiting Th2 activity.15
Regulatory T cells (Treg) role is also thought to play a role in preventing allergy sensitization.62 Antigen-specific Treg (CD4+CD25+foxp3+) that secrete anti-inflammatory cytokines IL-10
and/or TGF-β has the potential to suppress the production of IgE and Th1/Th2 proliferation.61-63 Furthermore, recent advances stated that homeostasis of mothers’ Treg, Th1 and Th2 may influence their children’s allergy condition.63 With the fact that mother’s immune cells can cross the placenta, this may be the possible mechanism of eczema prevention by probiotic supplementation. Other possible mechanism is that prenatal probiotic supplementation modulates the maternal vaginal and intestinal microbiota, and provides important colonizing inoculum for the newborns and thus affecting colonization of their intestinal system.64 Furthermore, there is also new evidence that gut microbiota acquired during early postnatal period is required for the development of Treg.62
Prevention of wheezing in offspringNumerous murine model experiments proved that probiotic use, both perinatal or not, can prevent airway inflammation and hyperactivity.65-68 The mechanism underlying this property is closely related to the Th1/Th1/Treg activity to prevent eczema, with TGF-β as the main actor.65,66
Despite these evidences, recent meta-analysis showed that probiotics property to prevent wheezing and asthma was still debatable.69 The analysis included 20 clinical trials published between 2003 and 2013, enrolled a total of 4,866 infants. Different species and strains of probiotics were tested, alone or in combination. The probiotics used were: four Bifidobacterium spp and six Lactobacillus spp. Outcomes observed in these studies included wheezing, asthma, and lower respiratory tract infection. The median range of follow-up among these trials was 24 months (ranging from four months to eight years). Nine trials involving 3,257 children reported asthma as an outcome, and from data analysis, it was found that there was no significant difference of asthma incidence between subjects who received probiotics and those who did not (RR = 0.99; 95% CI = 0.81-1.21). Nine other studies, including 1,949 children, with wheezing as their outcome also reported that the incidence between two groups were similar (probiotics vs placebo: 35.0% vs 31.1%, RR = 0.97; 95% CI = 0.87-1.09). This result was also supported by another meta-analysis by Elazab, et al15 who stated that early life (prenatal and postnatal) use of probiotics
Medical Journal of Indonesia
128 Med J Indones, Vol. 24, No. 2June 2015
does not protect against asthma or wheezing (RR = 0.99; 95% CI = 0.88-1.12). A cohort study60 in Norway was also in agreement with two other meta-analyses. Early life probiotic milk intake (perinatal or postnatal) does not affect the incidence of asthma in child. Both perinatal supplementation to mothers only and supplementation to mothers and children peri- and post-natally do not alter the incidence of asthma among the children (mother only supplementation: RR = 0.96 (95% CI = 0.85-1.08 vs mother and child supplementation: RR = 1.07; 95% CI = 0.95-1.19). Therefore, for now, the evidence to support perinatal probiotic use to prevent wheezing or asthma in offspring is still lacking.
In conclusion, the current evidences support the claim that probiotic is safe for general population and pregnant women, although some cautions should be used for immunocompromised population. There was no adverse effect of probiotics on pregnancy outcomes including gestational age, birth weight, malformation and complication of pregnancy. Probiotics, especially Lactobacillus spp. and Bifidobacterium spp., were proven to reduce the incidence of preterm labor and preeclampsia in pregnant women and eczema in their offspring. However, present evidences failed to prove that probiotics were beneficial to prevent wheezing and asthma in the offspring of mothers given supplementation of probiotics. The mechanism underlying all these effects was closely related to regulation of T helper and T regulatory cells. Further studies are needed to determine the effective dosage of probiotics supplementation in order to produce these protective effects.
AcknowledgmentsAuthors give an acknowledgement to Ireska Tsaniya Afifa for writing assistance and collecting materials needed for this article.
Conflicts of InterestThe authors affirm no conflict of interest in this study.
REFERENCES
1. Jay JM. Modern food microbiology. 6th ed. Maryland, USA: Aspen Publishers, Inc.; 2000. p. 3-5.
2. Johannsen E. Probiotic bacteria: their properties and mode of action. SA Fam Pract. 2003;45(3):36-8.
3. Kumar S. Textbook of Microbiology. 1st ed. Greater Noida, India: Jp Medical Pub; 2012. p. 784.
4. Caplice E, Fitzgerald GF. Food fermentations: role of microorganisms in food production and preservation. Int J Food Microbiol. 1999;50(1-2):131-49.
5. World Health Organization. Probiotics in food: Health and nutritional properties and guidelines for evaluation. Rome: World Health Organization/Food and Agriculture Organization of The United Nations; 2001.
6. Bäckhed F, Ley RE, Sonnenburg JL, Peterson DA, Gordon JI. Host-bacterial mutualism in the human intestine. Science. 2005;307(5717):1915-20.
7. Dethlefsen L, McFall-Ngai M, Relman DA. An ecological and evolutionary perspective on human-microbe mutualism and disease. Nature. 2007;449(7164):811-8.
8. Hill C, Guarner F, Reid G, Gibson GR, Merenstein DJ, Pot B, et al. Expert consensus document. The International Scientific Association for Probiotics and Prebiotics consensus statement on the scope and appropriate use of the term probiotic. Nat Rev Gastroenterol Hepatol. 2014;11(8):506-14.
9. Pham M, Lemberg DA, Day AS. Probiotics: sorting the evidence from the myths. Med J Aust. 2008;188(5):304-8.
10. Charteris WP, Kelly PM, Morelli L, Collins JK. Selective detection, enumeration and identification of potentially probiotic Lactobacillus and Bifidobacterium species in mixed bacterial populations. Int J Food Microbiol. 1997;35(1):1-27.
11. Sazawal S, Hiremath G, Dhingra U, Malik P, Deb S, Black RE. Efficacy of probiotics in prevention of acute diarrhoea: a meta-analysis of masked, randomised, placebo-controlled trials. Lancet Infect Dis. 2006;6(6):374-82.
12. Hempel S, Newberry SJ, Maher AR, Wang Z, Miles JN, Shanman R, et al. Probiotics for the prevention and treatment of antibiotic-associated diarrhea: a systematic review and meta-analysis. JAMA. 2012;307(18):1959-69.
13. Hoveyda N, Heneghan C, Mahtani KR, Perera R, Roberts N, Glasziou P. A systematic review and meta-analysis: probiotics in the treatment of irritable bowel syndrome. BMC Gastroenterol. 2009;9:15.
14. Fioramonti J, Theodorou V, Bueno L. Probiotics: what are they? What are their effects on gut physiology?. Best Pract Res Clin Gastroenterol. 2003;17(15):711-24.
15. Elazab N, Mendy A, Gasana J, Vieira ER, Quizon A, Forno E. Probiotic administration in early life, atopy, and asthma: a meta-analysis of clinical trials. Pediatrics. 2013;132(3):e666-76.
16. Luoto R, Laitinen K, Nermes M, Isolauri E. Impact of maternal probiotic-supplemented dietary counselling on pregnancy outcome and prenatal and postnatal growth: a double-blind, placebo-controlled study. Br J Nutr. 2010;103(12):1792-9.
17. Brantsæter AL, Myhre R, Haugen M, Myking S, Sengpiel V, Magnus P, et al. Intake of probiotic food and risk of preeclampsia in primiparous women: the Norwegian Mother and Child Cohort Study. Am J Epidemiol. 2011;174(7):807-15.
18. Yang Y, Guo Y, Kan Q, Zhou XG, Zhou XY, Li Y. A meta-analysis of probiotics for preventing necrotizing enterocolitis in preterm neonates. Braz J Med Biol Res. 2014;47(9):804-10.
http://mji.ui.ac.id
Wibowo, et al.Probiotics supplementations in pregnancy
129
19. Boyle RJ, Robins-Browne RM, Tang ML. Probiotic use in clinical practice: what are the risks?. Am J Clin Nutr. 2006;83(6):1256-64.
20. Wagner RD, Pierson C, Warner T, Dohnalek M, Farmer J, Roberts L, et al. Biotherapeutic effects of probiotic bacteria on candidiasis in immunodeficient mice. Infect Immun. 1997;65(10):4165-72.
21. Lilly DM, Stillwell RH. Probiotics: growth-promoting factors produced by microorganisms. Science. 1965;147(3659):747-8.
22. Fuller R. Probiotics in man and animals. J Appl Bacteriol. 1989;66(5):365-78.
23. Gibson GR, Roberfroid MB. Dietary modulation of the human colonic microbiota: introducing the concept of prebiotics. J Nutr. 1995;125(6):1401-12.
24. Ohland CL, Macnaughton WK. Probiotic bacteria and intestinal epithelial barrier function. Am J Physiol Gastrointest Liver Physiol. 2010;298(6):G807-19.
25. World Health Organization/Food and Agriculture Organization of the United Nations. Guidelines for the evaluation of probiotics in food. Canada: FAO/WHO Working Group Report; 2002.
26. Brown M. Modes of action of probiotics: recent developments. J Anim Vet Adv. 2011;10(14):1895-900.
27. Senok AC, Ismaeel AY, Botta GA. Probiotics: facts and myths. Clin Microbiol Infect. 2005;11(12):958-66.
28. Bermudez-Brito M, Plaza-Diaz J, Muñoz-Quezada S, Gómez-Llorente C, Gil A. Probiotic mechanisms of action. Ann Nutr Metab. 2012;61(2):160-74.
29. Syndman DR. The safety of probiotics. Clin Infect Dis. 2008;46 Suppl 2:S104-11.
30. Marteau P. Safety aspects of probiotic products. Scand J Nutr. 2001;45:22-4.
31. Elias J, Bozzo P, Einarson A. Are probiotics safe for use during pregnancy and lactation?. Can Fam Physician. 2011;57(3):299-301.
32. Sanders ME, Akkermans LM, Haller D, Hammerman C, Heimbach J, Hörmannsperger G, et al. Safety assessment of probiotics for human use. Gut microbes. 2010;1(3):164-85.
33. Mack DR. D(-)-lactic acid-producing probiotics, D(-)-lactic acidosis and infants. Can J Gastroenterol. 2004;18(11):671-5.
34. Connolly E, Lönnerdal B. D(-)-Lactic acid-producing bacteria: Safe to use in infant formulas. NUTAfoods. 2004;3(3):37-49.
35. Htyte N, White L, Sandhu G, Jones J, Meisels I. An extreme and life-threatening case of recurrent D-lactate encephalopathy. Nephrol Dial Transplant. 2011;26(4):1432-5.
36. Ku W, Lau DCY, Huen KF. Probiotics Provoked D-lactic acidosis in short bowel syndrome: case report and literature review. HK J Paediatr (new series). 2006;11:246-54.
37. Munakata S, Arakawa C, Kohira R, Fujita Y, Fuchigami T, Mugishima H. A case of D-lactic acid encephalopathy associated with use of probiotics. Brain Dev. 2010;32(8):691-4.
38. Papagaroufalis K, Fotiou A, Egli D, Tran LA, Steenhout P. A randomized double blind controlled safety trial evaluating D-lactic acid production in healthy infants fed a Lactobacillus reuteri-containing formula. Nutr Metab Insights. 2014;7:19-27.
39. Rolain JM. Food and human gut as reservoirs of transferable antibiotic resistance encoding genes. Front Microbiol. 2013;4:173.
40. Shazali N, Foo HL, Loh TC, Choe DW, Abdul Rahim R. Prevalence of antibiotic resistance in lactic acid bacteria isolated from the faeces of broiler chicken in Malaysia. Gut Pathog. 2014;6(1):1.
41. Gueimonde M, Sánchez B, G de Los Reyes-Gavilán C, Margolles A. Antibiotic resistance in probiotic bacteria. Front Microbiol. 2013;4:202.
42. Devirgiliis C, Zinno P, Perozzi G. Update on antibiotic resistance in foodborne Lactobacillus and Lactococcus species. Front Microbiol. 2013;4:301.
43. Dugoua JJ, Machado M, Zhu X, Chen X, Koren G, Einarson TR. Probiotic safety in pregnancy: a systematic review and meta-analysis of randomized controlled trials of Lactobacillus, Bifidobacterium, and Saccharomyces spp. J Obstet Gynaecol Can. 2009;31(6):542-52.
44. Allen SJ, Jordan S, Storey M, Thornton CA, Gravenor M, Garaiova I, et al. Dietary supplementation with Lactobacilli and Bifidobacteria is well tolerated and not associated with adverse events during late pregnancy and early infancy. J Nutr. 2010;140(3):483-8.
45. Sykes L, MacIntyre DA, Yap XJ, Ponnampalam S, Teoh TG, Bennett PR. Changes in the Th1:Th2 cytokine bias in pregnancy and the effects of the anti-inflammatory cyclopentenone prostaglandin 15-deoxy-Δ(12,14)-prostaglandin J2. Mediators Inflamm. 2012;2012:416739.
46. Saito S, Nakashima A, Shima T, Ito M. Th1/Th2/Th17 and regulatory T-cell paradigm in pregnancy. Am J Reprod Immunol. 2010;63(6):601-10.
47. Delcenserie V, Martel D, Lamoureux M, Amiot J, Boutin Y, Roy D. Immunomodulatory effects of probiotics in the intestinal tract. Curr Issues Mol Biol. 2008;10(1-2):37-54.
48. Tan M, Zhu JC, Du J, Zhang LM, Yin HH. Effects of probiotics on serum levels of Th1/Th2 cytokine and clinical outcomes in severe traumatic brain-injured patients: a prospective randomized pilot study. Crit Care. 2011;15(6):R290.
49. who.int [Internet]. Preterm Birth. [update 2014 Nov; cited 2015 Feb]. Available from: http://www.who.int/mediacentre/factsheets/fs363/en/.
50. Krauss-Silva L, Moreira MEL, Alves MB, Braga A, Camacho KG, Batista MRR, et al. A randomised controlled trial of probiotics for the prevention of spontaneous preterm delivery associated with bacterial vaginosis: preliminary results. Trials. 2011;12:239.
51. Vitali B, Cruciani F, Baldassarre ME, Capursi T, Spisni E, Valerii MC, et al. Dietary supplementation with probiotics during late pregnancy: outcome on vaginal microbiota and cytokine secretion. BMC Microbiol. 2012;12:236.
52. Othman M, Neilson JP, Alfirevic Z. Probiotics for preventing preterm labour. Cochrane Database Syst Rev. 2007(1):Cd005941.
53. Myhre R, Brantsæter AL, Myking S, Gjessing HK, Sengpiel V, Meltzer HM, et al. Intake of probiotic food and risk of spontaneous preterm delivery. Am J Clin Nutr. 2011;93(1):151-7.
Medical Journal of Indonesia
130 Med J Indones, Vol. 24, No. 2June 2015
54. Yang S, Li W, Challis JR, Reid G, Kim SO, Bocking AD. Probiotic Lactobacillus rhamnosus GR-1 supernatant prevents lipopolysaccharide-induced preterm birth and reduces inflammation in pregnant CD-1 mice. Am J Obstet Gynecol. 2014;211(1):44.e1-e12.
55. Yeganegi M, Watson CS, Martins A, Kim SO, Reid G, Challis JR, et al. Effect of Lactobacillus rhamnosus GR-1 supernatant and fetal sex on lipopolysaccharide-induced cytokine and prostaglandin-regulating enzymes in human placental trophoblast cells: implications for treatment of bacterial vaginosis and prevention of preterm labor. Am J Obstet Gynecol. 2009;200(5):532.e1-8.
56. Yeganegi M. The effect of Lactobacillus rhamnosus GR-1 supernatant on cytokine production and prostaglandins in gestational tissues [thesis]. Ann Arbor: University of Toronto (Canada); 2010.
57. Dong JY, Szeto IM, Makinen K, Gao Q, Wang J, Qin LQ, et al. Effect of probiotic fermented milk on blood pressure: a meta-analysis of randomised controlled trials. Br J Nutr. 2013;110(7):1188-94.
58. Doege K, Grajecki D, Zyriax BC, Detinkina E, Zu Eulenburg C, Buhling KJ. Impact of maternal supplementation with probiotics during pregnancy on atopic eczema in childhood--a meta-analysis. Br J Nutr. 2012;107(1):1-6.
59. Pelucchi C, Chatenoud L, Turati F, Galeone C, Moja L, Bach JF, et al. Probiotics supplementation during pregnancy or infancy for the prevention of atopic dermatitis: a meta-analysis. Epidemiology. 2012;23(3):402-14.
60. Bertelsen RJ, Brantsæter AL, Magnus MC, Haugen M, Myhre R, Jacobsson B, et al. Probiotic milk consumption in pregnancy and infancy and subsequent childhood allergic diseases. J Allergy Clin Immunol. 2014;133(1):165-71.
61. Ouwehand AC. Antiallergic effects of probiotics. J Nutr. 2007;137(3 Suppl 2):794S-7S.
62. Kalliomäki M, Antoine JM, Herz U, Rijkers GT, Wells JM, Mercenier A. Guidance for substantiating the evidence for beneficial effects of probiotics: prevention and management of allergic diseases by probiotics. J Nutr. 2010;140(3):713S-21S.
63. Pali-Schöll I, Renz H, Jensen-Jarolim E. Update on allergies in pregnancy, lactation, and early childhood. J Allergy Clin Immunol. 2009;123(5):1012-21.
64. Rautava S, Kainonen E, Salminen S, Isolauri E. Maternal probiotic supplementation during pregnancy and breast-feeding reduces the risk of eczema in the infant. J Allergy Clin Immunol. 2012;130(6):1355-60.
65. Blümer N, Sel S, Virna S, Patrascan CC, Zimmermann S, Herz U, et al. Perinatal maternal application of Lactobacillus rhamnosus GG suppresses allergic airway inflammation in mouse offspring. Clin Exp Allergy. 2007;37(3):348-57.
66. Feleszko W, Jaworska J, Rha RD, Steinhausen S, Avagyan A, Jaudszus A, et al. Probiotic-induced suppression of allergic sensitization and airway inflammation is associated with an increase of T regulatory-dependent mechanisms in a murine model of asthma. Clin Exp Allergy. 2007;37(4):498-505.
67. Kim HJ, Kim YJ, Lee SH, Kang MJ, Yu HS, Jung YH, et al. Effects of Lactobacillus rhamnosus on asthma with an adoptive transfer of dendritic cells in mice. J Appl Microbiol. 2013;115(3):872-9.
68. Yu J, Jang SO, Kim BJ, Song YH, Kwon JW, Kang MJ, et al. The effects of Lactobacillus rhamnosus on the prevention of asthma in a murine model. Allergy Asthma Immunol Res. 2010;2(3):199-205.
69. Azad MB, Coneys JG, Kozyrskyj AL, Field CJ, Ramsey CD, Becker AB, et al. Probiotic supplementation during pregnancy or infancy for the prevention of asthma and wheeze: systematic review and meta-analysis. BMJ. 2013;347:f6471.
http://mji.ui.ac.id


