Embed Size (px)
Citation preview
i
THESIS ADVISOR
RECOMMENDATION LETTER
This thesis entitled “Improving Flowchart Data Input Process Using System
Development Life Cycle Methodology” is prepared and submitted by Pingky
Kharamoy in partial fulfillment of the requirements for the degree of Bachelor
Degree in the Faculty of Engineering has been reviewed and found to have
satisfied the requirements for a report fit to be examined. I therefore recommend
this thesis for Oral Defense.
ii
DECLARATION OF ORIGINALITY
I declare that this thesis, entitled “Improving Flowchart Data Input Process
Using System Development Life Cycle Methodology” is, to the best of my
knowledge and belief, an original piece of work that has not been submitted,
either in whole or in part, to another university to obtain a degree.
Cikarang, Indonesia, 2020
Pingky Kharamoy
iii
IMPROVING FLOWCHART DATA INPUT PROCESS
USING SYSTEM DEVELOPMENT LIFE CYCLE
METHODOLOGY
By
Pingky Kharamoy
ID No. 004201600033
iv
ABSTRACT
PT. AB Indonesia is a multinational company that located in Cikarang area. One
of the products of this company is fashion dolls. In PT. AB Indonesia, soft goods
engineering is a division that responsible and produce the costume of the toy.
Before the production process begins, there are several documents that need to be
made by the soft goods engineer. One of them is flowchart data. Flowchart data is
a data that contains yield number of materials, process name and code, machine
hour, and etc. In PT. AB Indonesia flowchart data is saved in AS400, the
integrated system that PT. AB Indonesia used. Unfortunately, there are several
cases of incorrect data of flowchart data in AS400. The flowchart data in AS400 is
different compared to the working order sheet. Working order sheet is a base data
for engineer to input flowchart data to AS400. These incorrect data are caused by
typo during input process, since the input process still be done manually. There
are total 5 cases of incorrect data from May 2019 until August 2019. To solve the
problem, the new system is created by using System Development Life Cycle
(SDLC) methodology, which consists of 5 stages; system planning, system
analysis, system design, implementation, and system support. After determined
the user requirements and have done the analysis of the current and the proposed
system, the system is created by using VBA in Microsoft Excel. The proposed
system is implemented from September 2019 until December 2019 and the result
of the implementation is there are no more incorrect data in flowchart data and it
also reduces the time needed to input the data to AS400. The current system took
8.4 min and the proposed system only took 1.8 min. It means that the proposed
system is successfully reach the objective of this research.
Keyword: Flowchart Data, Soft Goods Engineering, System Development Life
Cycle, AS400, Flow Process Diagram, Data Flow Diagram.
v
ACKNOWLEDGMENT
This thesis will never be finished without supports and prayers. Therefore, I
would like to record my deep sense of gratitude to:
1. The One Almighty God, who makes everything possible. Thank you for
loving and blessing me abundantly.
2. My family. Thank you for trusting me without asking anything, for the
unconditional love that you’ve always been showering to me.
3. All of Industrial Engineering lecturers, especially Mrs. Andira Taslim as
my thesis advisor, who always support and give me the best advice in
finishing the thesis. Without her, I will be very lost. Thank you very much,
Mrs.
4. PT. AB Indonesia people especially in soft goods engineering division.
Thank you so much for your guidance during my research.
5. All of my beloved friends who always supporting me and cheering me up.
6. Industrial Engineering 2016, my classmates and Engineering 2016. Thank
you for the memories and good luck for out next step of life.
7. Others that I cannot mention one by one but always support and motivate
me. Thank you very much.
vi
TABLE OF CONTENTS
THESIS ADVISOR RECOMMENDATION LETTER ......................................... i
DECLARATION OF ORIGINALITY ................................................................... ii
ABSTRACT ........................................................................................................... iv
ACKNOWLEDGMENT ......................................................................................... v
TABLE OF CONTENTS ....................................................................................... vi
LIST OF TABLES ............................................................................................... viii
LIST OF FIGURES ............................................................................................... ix
LIST OF TERMINOLOGIES ................................................................................ xi
CHAPTER I INTRODUCTION ............................................................................. 1
1.1 Problem Background ..................................................................................... 1
1.3 Objectives ...................................................................................................... 2
1.4 Scopes ........................................................................................................... 3
1.5 Assumptions .................................................................................................. 3
1.6 Research Outline ........................................................................................... 3
CHAPTER II LITERATURE STUDY ................................................................... 5
2.1 Information System ....................................................................................... 5
2.2 System Development Life Cycle .................................................................. 6
2.2.1 Planning ..................................................................................................... 7
2.2.2 Analysis ...................................................................................................... 8
2.2.3 Design ........................................................................................................ 8
2.2.4 Implementation .......................................................................................... 8
2.2.5 Testing ...................................................................................................... 10
2.2.6 Support and Maintenance ......................................................................... 10
vii
2.3 Data Flow Diagram ..................................................................................... 10
2.4 Data Dictionary ........................................................................................... 14
CHAPTER III RESEARCH METHODOLOGY ................................................. 16
3.1 Research Methodology ........................................................................... 16
3.2 Research Framework .............................................................................. 19
CHAPTER IV DATA ANALYSIS ...................................................................... 20
4.1 Flowchart Data in Soft Goods Engineering ................................................ 20
4.2 System Planning .......................................................................................... 20
4.3 System Analysis .......................................................................................... 24
4.3.1 Current System ......................................................................................... 24
4.3.2 Proposed System ...................................................................................... 31
4.4 System Design ............................................................................................. 40
4.5. Implementation .......................................................................................... 44
4.5.1 Software Documentation .......................................................................... 44
4.5.2 User Manual ............................................................................................. 46
4.5.3 Implementation Result and Comparison .................................................. 50
CHAPTER V CONCLUSION & RECOMMENDATION .................................. 55
5.1Conclusion ................................................................................................... 55
5.2 Recommendation......................................................................................... 55
REFERENCES ...................................................................................................... 56
APPENDIX A INTERWIEW RESULT ............................................................... 57
APPENDIX B DATA DICTIONARY ................................................................. 58
APPENDIX C VBA CODING ............................................................................. 64
viii
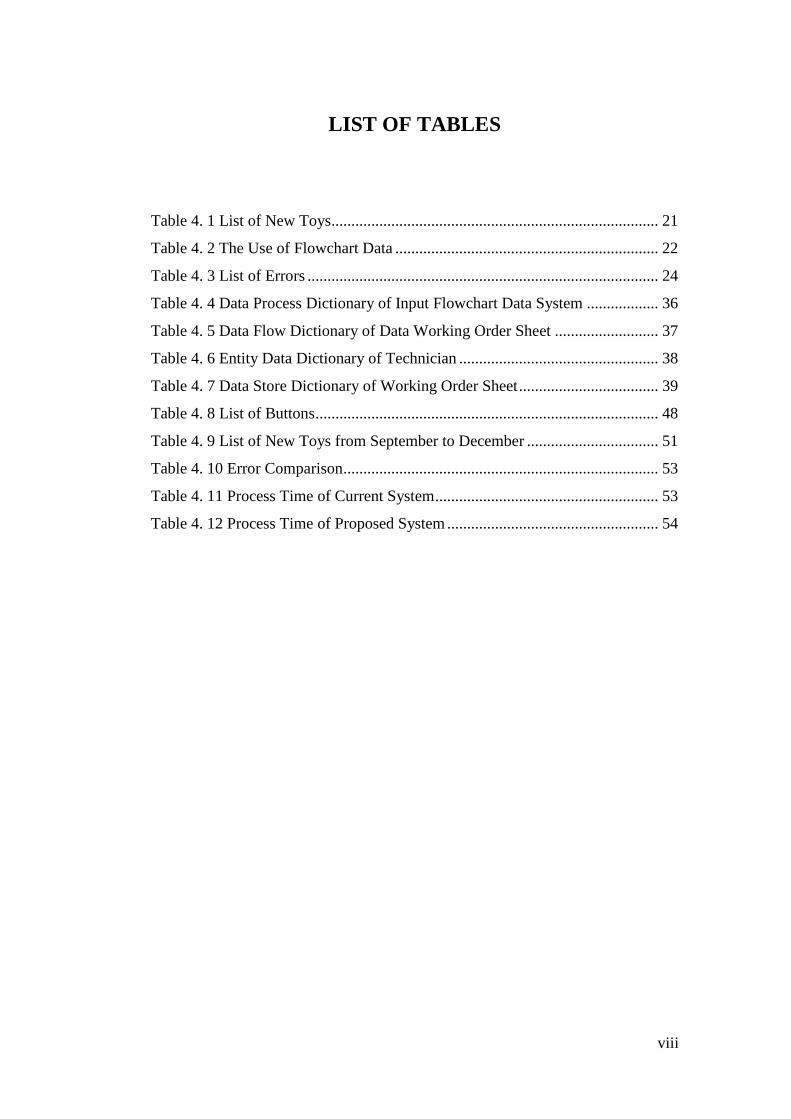
LIST OF TABLES
Table 4. 1 List of New Toys.................................................................................. 21
Table 4. 2 The Use of Flowchart Data .................................................................. 22
Table 4. 3 List of Errors ........................................................................................ 24
Table 4. 4 Data Process Dictionary of Input Flowchart Data System .................. 36
Table 4. 5 Data Flow Dictionary of Data Working Order Sheet .......................... 37
Table 4. 6 Entity Data Dictionary of Technician .................................................. 38
Table 4. 7 Data Store Dictionary of Working Order Sheet ................................... 39
Table 4. 8 List of Buttons ...................................................................................... 48
Table 4. 9 List of New Toys from September to December ................................. 51
Table 4. 10 Error Comparison ............................................................................... 53
Table 4. 11 Process Time of Current System ........................................................ 53
Table 4. 12 Process Time of Proposed System ..................................................... 54
ix
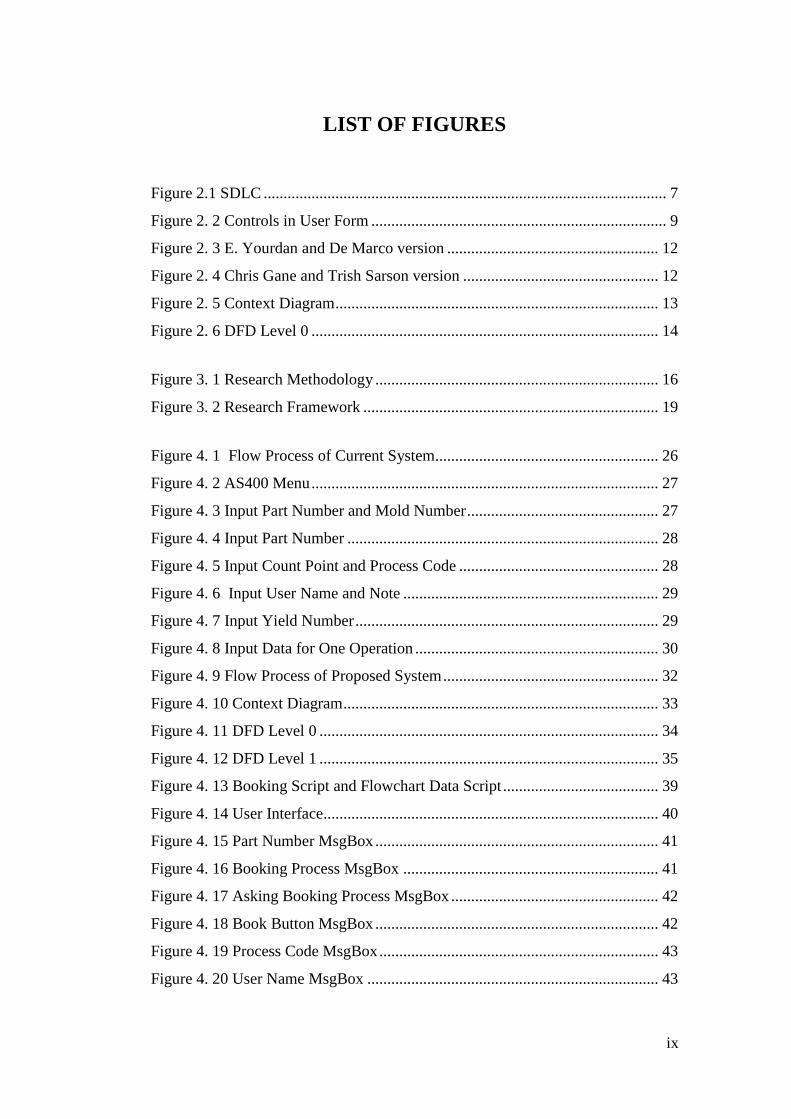
LIST OF FIGURES
Figure 2.1 SDLC ..................................................................................................... 7
Figure 2. 2 Controls in User Form .......................................................................... 9
Figure 2. 3 E. Yourdan and De Marco version ..................................................... 12
Figure 2. 4 Chris Gane and Trish Sarson version ................................................. 12
Figure 2. 5 Context Diagram ................................................................................. 13
Figure 2. 6 DFD Level 0 ....................................................................................... 14
Figure 3. 1 Research Methodology ....................................................................... 16
Figure 3. 2 Research Framework .......................................................................... 19
Figure 4. 1 Flow Process of Current System........................................................ 26
Figure 4. 2 AS400 Menu ....................................................................................... 27
Figure 4. 3 Input Part Number and Mold Number ................................................ 27
Figure 4. 4 Input Part Number .............................................................................. 28
Figure 4. 5 Input Count Point and Process Code .................................................. 28
Figure 4. 6 Input User Name and Note ................................................................ 29
Figure 4. 7 Input Yield Number ............................................................................ 29
Figure 4. 8 Input Data for One Operation ............................................................. 30
Figure 4. 9 Flow Process of Proposed System ...................................................... 32
Figure 4. 10 Context Diagram ............................................................................... 33
Figure 4. 11 DFD Level 0 ..................................................................................... 34
Figure 4. 12 DFD Level 1 ..................................................................................... 35
Figure 4. 13 Booking Script and Flowchart Data Script ....................................... 39
Figure 4. 14 User Interface.................................................................................... 40
Figure 4. 15 Part Number MsgBox ....................................................................... 41
Figure 4. 16 Booking Process MsgBox ................................................................ 41
Figure 4. 17 Asking Booking Process MsgBox .................................................... 42
Figure 4. 18 Book Button MsgBox ....................................................................... 42
Figure 4. 19 Process Code MsgBox ...................................................................... 43
Figure 4. 20 User Name MsgBox ......................................................................... 43
x
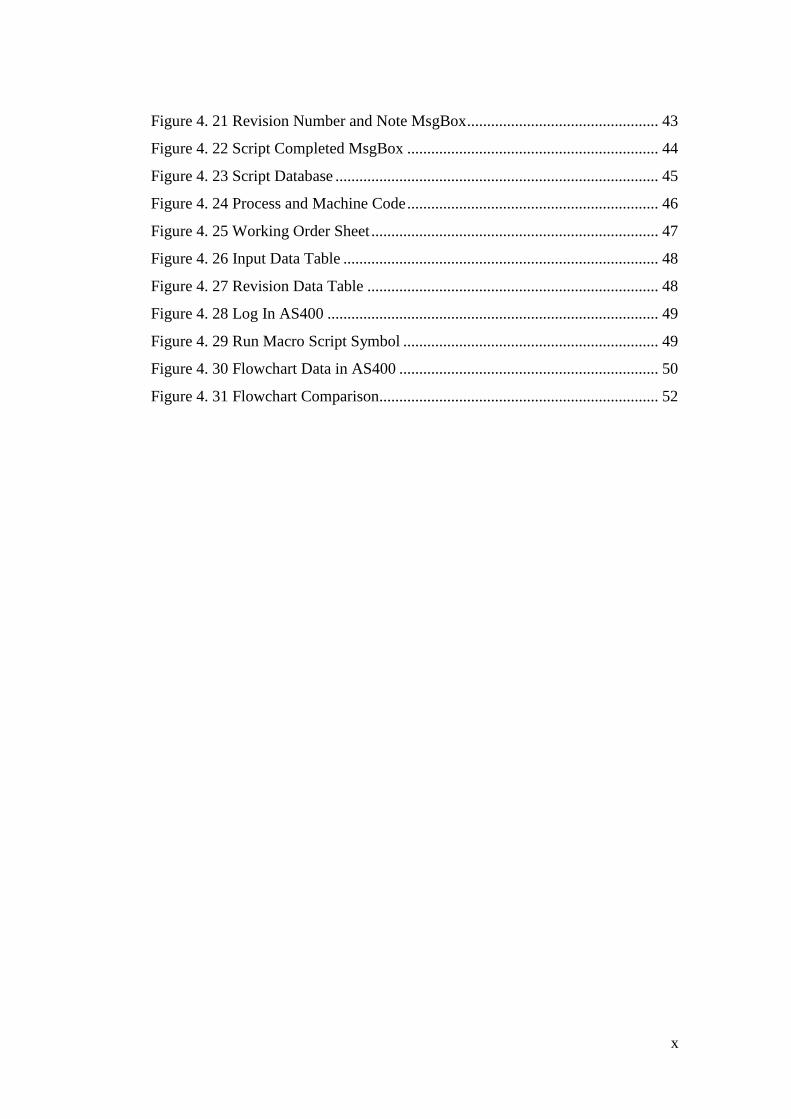
Figure 4. 21 Revision Number and Note MsgBox ................................................ 43
Figure 4. 22 Script Completed MsgBox ............................................................... 44
Figure 4. 23 Script Database ................................................................................. 45
Figure 4. 24 Process and Machine Code ............................................................... 46
Figure 4. 25 Working Order Sheet ........................................................................ 47
Figure 4. 26 Input Data Table ............................................................................... 48
Figure 4. 27 Revision Data Table ......................................................................... 48
Figure 4. 28 Log In AS400 ................................................................................... 49
Figure 4. 29 Run Macro Script Symbol ................................................................ 49
Figure 4. 30 Flowchart Data in AS400 ................................................................. 50
Figure 4. 31 Flowchart Comparison...................................................................... 52
xi
LIST OF TERMINOLOGIES
Soft Good Engineering Department : One of department at PT. AB that
in charge to produce costume of toy
or product.
AS400 :An enterprise system that developed
by software company which name
IBM company. It is used as the
information sharing software used by
PT. AB.
Die Cut :One of division in SGE department
that responsible to cut the fabric
before sewing process. There are
several methods to cut the fabric.
Flow Chart Die Cut :One of the documentation of data
toy that consists of yield number,
machine hour, and process name.
1
CHAPTER I
INTRODUCTION
1.1 Problem Background
AB Inc. is a multinational company from the United States that can be
categorized as the largest toy manufacturer in the world based on company
revenue. The company was founded in 1945 and has its headquarters in El
Segundo, California, United States. To support the production process, the
company has several factories in all around the world, one of them is in Indonesia.
The factory of AB Inc. in Indonesia is knows by PT. AB Indonesia, which located
in Jababeka industry area, Cikarang. PT. AB Indonesia itself was built in 1992.
PT. AB Indonesia has 2 plants in Cikarang, East Plant and West Plant. In East
Plant, the factory focus on producing fashion doll toys, and the West Plant focus
on producing car toys. PT. AB Indonesia has approximately 10.000 employees
every year. This company is led by one president director for both plants and with
the help of 8 directors. The 8 directors are engineering director, Finance and IT
director, Materials & Process Improvement Director, Quality Director, Human
Resources Director, EHS & Compliance Assurance Manager, Fashion Dolls
Manufacturing Senior Director, and Die Cast Manufacturing Director.
One of the products of PT. AB Indonesia is “B” fashion doll. Soft Goods
engineering is a division below Fashion Dolls Manufacturing Senior Director that
focuses on producing costumes for “B” fashion doll. In process making of “B”
costume, SGE divided the process into two; sewing and die cut. Die cut is a
process before sewing that cut the role of fabric into sewing pattern. In die cut
process there are a lot of data needed, for example working order sheet, capacity
sheet, flow chart data, and etc. Flow chart data is one of the important things in
die cut process. It used by several division, which are production, cost engineering
division, and material division. Production division use die cut flow chart data to
see what method of die cut that this toy use, how much the yield of fabric needed
for this toy, and how much time is given to do one step. The production use these
data to know how many operator needed, how to plan the schedule, and etc. Cost
2
engineering division also needs the same data to do a calculation of product cost.
The material division also needs the data of yield of fabric in die cut flow chart
data, to purchase the fabric.
To input data of flowchart to AS400, soft goods engineer needs data of
working order sheet as a source of flowchart data. The data needed from working
order sheet are name of processes, machine hour, and the yield of fabric needed,
and others. Working order sheet itself is created by technician. The process of
input flowchart data is manually done by soft goods engineer. There are several
flowchart data that engineer input by looking from database and the other data the
engineer copy it from working order sheet into AS400. The total data that need to
be input for one working order sheet is at least 50 data, whereas one toy can have
one until three working order sheets, it depends on how complex the costume and
how many kind of fabric used in one toy. A lot of input data process means a lot
of typing process which create a bigger possibility of error or typo. Once there is
an inaccurate data of flowchart data in AS400, it affects other divisions. The first
impact is the planner of production division set an inaccurate planning of people
and machine. The inaccurate planning of people caused operator excess or lack of
operator and inaccurate of machine planning of production caused machine idle or
can’t fulfill the demand because not enough machine capacity. The second impact
of an inaccurate data of flow chart is the material division orders the wrong
amount of material either it can be obsolescence or lack of material. Based on the
observation from May until August 2019, there are five inaccurate data.
1.2 Problem Statement
Based on problem background above, this research is done to answer the
following question:
How to reduce inaccurate data of flowchart data in AS400 system?
1.3 Objectives
The objective that need to be achieved is:
To increase flowchart data accuracy in AS400 system.
3
1.4 Scopes
There are some scopes in this observation, which are:
1. The data were taken from May – August 2019
2. The data is only applicable to be used in SGE department.
3. The improvement only can be used in SGE department.
1.5 Assumptions
The assumptions from this research are:
1. The engineer familiar with the integrated system that PT.AB used which is
AS400.
2. The engineer understands the flow process of input die cut flowchart
process.
3. The data of working order sheet from technician is correct.
1.6 Research Outline
Chapter I Introduction
This chapter consists of problem background,
problem statement, objective, scopes, assumptions
and research outline of the project.
Chapter II Literature Study
This chapter delivers the explanation of system
development life cycle (SDLC), data flow diagram,
and data dictionary.
Chapter III Research Methodology
This chapter consists of the research flow that is
carried out by the researcher.
Chapter IV Data Collection and Analysis
This chapter consists of the collected data and the
analysis of the data. For data analysis the method
that the researcher used is SDLC, there will be
several stages, which are system planning, system

4
analysis, system design, and system
implementation.
Chapter V Conclusion and Recommendation
This chapter consists of the conclusion of data
analysis that supports the research and
recommendation for future research.
5
CHAPTER II
LITERATURE STUDY
2.1 Information System
Information system is a software that analyze, process, and organize the
raw data into more useful data or database that will be used by the company or an
organization. Information system is a combination of computer hardware,
computer software, network, and people that processed the data and distributes it
to the company or organization. (Valacich & Schneider, 2010)
There are several components of information system, there are:
Computer Hardware
Computer hardware is a physical equipment or technology that use for
input, output, and process and works with information. Computer
hardware can be a smartphone or a computer. Example: monitor,
keyboard, printer, and etc.
Computer Software
Computer software is a system or application that used to analyze or
process the data. Example: Windows, IOS, Microsoft office, and etc.
Data
Data is facts or figures that will be processed by the information system. It
can be organized into list or table by the system. A collection of data is
called database.
Network
Network is a connection between computer hardware or computer
software. Network resources are intranet, internet, and extranet, these three
resources is called telecommunication networks. For physical devise, the
examples of network are cards, routers, and wire. For computer software,
the examples of network are data server, web server, and etc.
People
6
People are the user of the information system. They are the person who
run and manage the system. The objective of the system is to give
improvement or benefit to the user.
System development methodology is a method that plan, structures, and
control the information system development process. The objective of system
development is to improve the management of the system, simplify the system,
and standardize the process. One of them is system development life cycle.
2.2 System Development Life Cycle
System Development Life Cycle or also known as SDLC is a creating
process and changing process of systems or model and a methodology to develop
a system that fulfilled the user requirements, it can be in time aspect, cost aspect,
or efficiency and effectiveness aspect. (Sethi, 2013)
There are several model of System Development Life Cycle (SDLC):
Waterfall Model
Waterfall model is the oldest system development model and the most used
system. This model is use a systematic approach start from analysis stage, design,
coding, testing, and maintenance (Bassil, 2012). Here are the advantages using
this model; the development process is certain and structured, easy to apply,
suitable for a program/system that already have the requirements from the
beginning so it reduce the errors or mistakes. This model also has weakness, here
is the weakness: the development process became inflexible and it is hard to do
some changes in the middle of development process.
Prototype Model
Prototype model is an evolution of waterfall development method. This
method involves customer in it. The prototype of the system will be present in
front of the customer and the customer has a chance to give some input so the
result of the system will really fit the customer needs. Here are the advantages of
this model: customers actively participate in the development of the system, so the
results of product development will be more easily adjusted to the needs of
customers, easy to determine the customer needs, shorten the development time,
7
and easy to implement. This model also has several weaknesses; the analysis and
design process is to short, and pay less attention to quality and long term
maintenance.
Rapid Application Development model
Rapid Application Development (RAD) is a linear system development
process model that emphasizes a very short development cycle. This RAD model
is a rapid development by using a component based construction approach. Here
are the advantages of this model: This model is more effective than waterfall
model in creating a system that fulfills the requirement of customer and this model
suitable for project that require short time. Here are the weaknesses of this model:
this model is not suitable for high risk system, require a commitment between
customer and developer from the beginning, and it can’t have any changes in the
middle of development process.
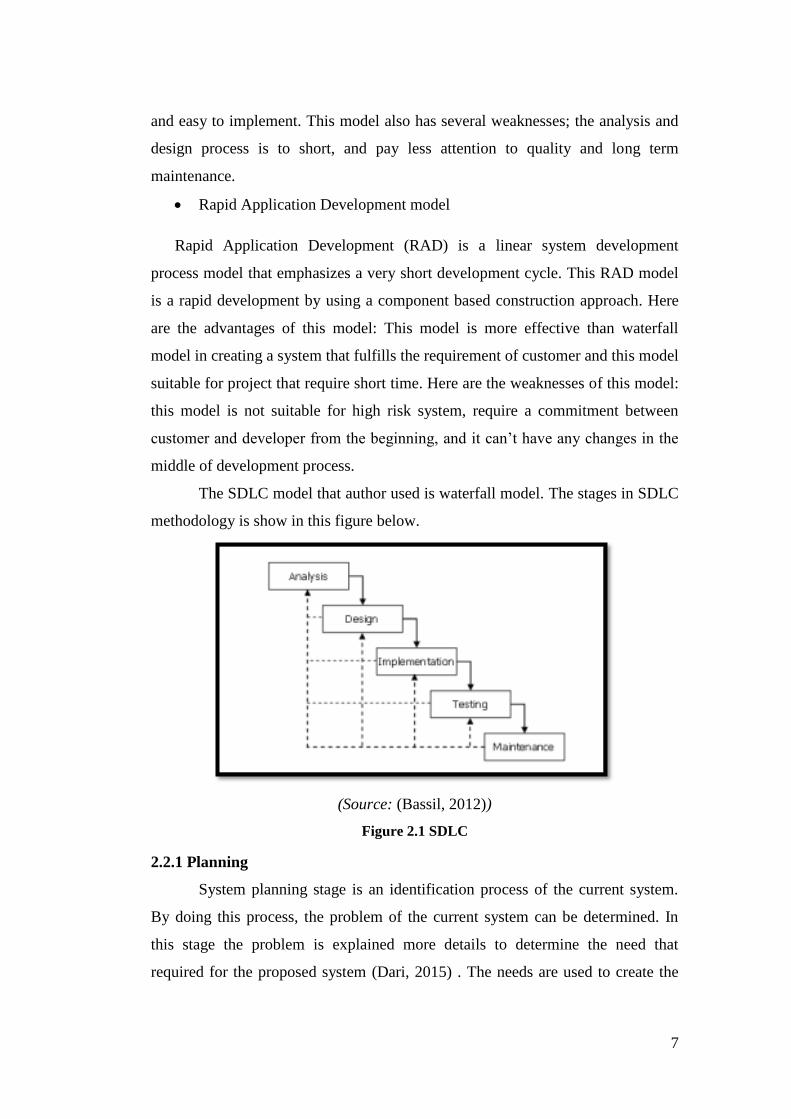
The SDLC model that author used is waterfall model. The stages in SDLC
methodology is show in this figure below.
(Source: (Bassil, 2012))
Figure 2.1 SDLC
2.2.1 Planning
System planning stage is an identification process of the current system.
By doing this process, the problem of the current system can be determined. In
this stage the problem is explained more details to determine the need that
required for the proposed system (Dari, 2015) . The needs are used to create the
8
strategy plan to develop the system. Not only determine the strategies, but also
determine the application that will be used to develop the proposed system.
2.2.2 Analysis
Analaysis stage or also known as software/system requirements
specification is focusing on the description and character of the program so that is
why the engineer need to know exactly what the functional and non functional
requirements of the program. The functional requirements is include the purpose
of the program, scope, the interface, user requirement, and others. Beside, the non
functional requirements include the limitation of the program, constraints, and
others. In this stage, the current system is observed and explored and identify the
improvement opportunities, and develop the proposed system (Alan Dennis,
2012). There are several ways to gather the information in order to develop a
system, there are use case analysis, data flow diagram, and data dictionary.
2.2.3 Design
In design stage there is a process to define the plan and problem solution.
This includes concept design, user interface design, system design, and others.
This process is used for to convert the requirements thathave been identified into a
system before the engineer start the coding process. For database design there are
two ways to do this process in order to know the relationship between entities,
there are conceptual, and physical design. (Abdullah, 2017)
2.2.4 Implementation
Implementation stage is a realization process of the requirements and the
design into a program, database, website, software, or system through
programming. In this stage, the engineer create a system based on the design that
have been made in previous stage. To be understood by machine or in this case is
a computer, then the design must be changed into a form that can be understood
by the computer which is into the programming language through the coding
process (Dari, 2015). Visual Basic in MS Exel is one of the tools that support
system implementation and do the programming. Visual Basic for Aplication is a
programming laguage of Excel and other office programs developed by Microsoft.
In general, people use VBA in MS Excel to develop programs or system in
9
microsoft excel. Visual Basic in MS Excel includes user form, module, and class
module.
USER FORM
Userform in Visual Basic is a custom form that needs to be created if the engineer
need to get information or data. Userform also helps user to do data entry easier
and more controable (Walkenbach, 2013). Here are the steps to create userform:
Open Visual Basic Editor by pressing Alt + F11, click insert and choose
Userform. There will be a blank box and a toolbox.
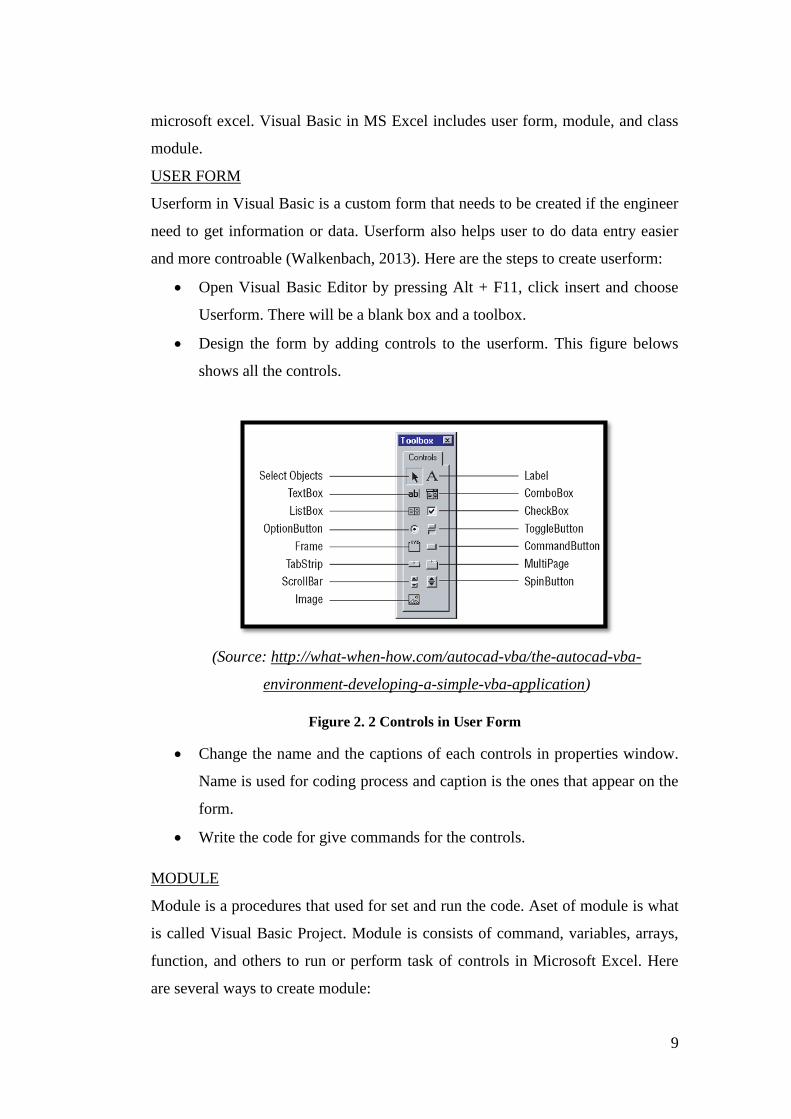
Design the form by adding controls to the userform. This figure belows
shows all the controls.
(Source: http://what-when-how.com/autocad-vba/the-autocad-vba-
environment-developing-a-simple-vba-application)
Figure 2. 2 Controls in User Form
Change the name and the captions of each controls in properties window.
Name is used for coding process and caption is the ones that appear on the
form.
Write the code for give commands for the controls.
MODULE
Module is a procedures that used for set and run the code. Aset of module is what
is called Visual Basic Project. Module is consists of command, variables, arrays,
function, and others to run or perform task of controls in Microsoft Excel. Here
are several ways to create module:
10
Open Visual Basic Editor by pressing Alt + F11, click insert and choose
module and directly do a coding process in there.
Create module by recording the actions by using excel macro recorder. All
od the action that have been recorded will directly turn into code in
module.
CLASS MODULE
Class module is helps the user to create objects or a templates for objects. In VBA
Microsoft Excel, they have collection, workbook, and worksheet as the objects
and class module is helps the user to custom their objects. It defones the method
of the objects and property.
2.2.5 Testing
After done creating the system through cprogramming process then the
next stage is testing. Testing stage or also knowsn as verification process is a
process checking the function of the system and the result needs to fulfill the user
rewuirements that have been indentified before. Other than that, this stage also an
evaluation process of the system whether it satisfy the condition at the beginning
of the stage. In this this process the customer will testing the proposed system.
2.2.6 Support and Maintenance
Maintenance stage is a process to maintain, protect, and modify the system
after implementing the system. The propose of this stage is to correct errors,
improve performace, and improve quality. Additional developoment is needed if
there is a changes in operation system, environment, new requirements, or
increasing software reliability.
2.3 Data Flow Diagram
Data Flow Diagrams or DFD is a modeling tool that allow engineer to
describe the system as a network of functional processes that are connected to
each other by data flow, both manually and computerized. Data flow diagram
helps the user to understand the details of the system (Ladjamudin, 2005). DFD
also known as bubble charts, bubble diagrams, process models, workflow
diagrams, or function models. As a system analyst, it needs to create data flow
11
diagram to describe the process and flow of the data in the system (Kendall &
Kendall, 2014). Here are the advantages of the data flow approach:
A. To understand the connection and relation of the system.
B. Explaining the detail process of the system to the user.
C. Analyze the proposed system.
D. Freedom from commitment to implement the system to early.
According to Kendall and Kendall, 2014, there four basic components in data
flow diagram, there are:
a. Entity
Entity is a person, group or system that gives an input or receives the data
from the system. Example of entity is a company/department or it could be
a person outside the system and it could be the final recipient of a report
produced by the system.
b. Data Flow
Data flow is usually shows as an arrow. It connects between process, data
store, and entities. Data flow shows the relationship between each
component, it could be an input for process or data store, or it could be an
output from process. Data flow has to be named close to the arrow.
c. Process
Process is an activity or an action by computer to store data, make a
decision, or information flows. A process can happened because of data
input and generates result or output. In each process symbol, it has to be a
process identification and process name.
d. Data Store
Data store is a place to store or save the data in a form of file or table in
database. In each symbols it has to be data store identification and name.
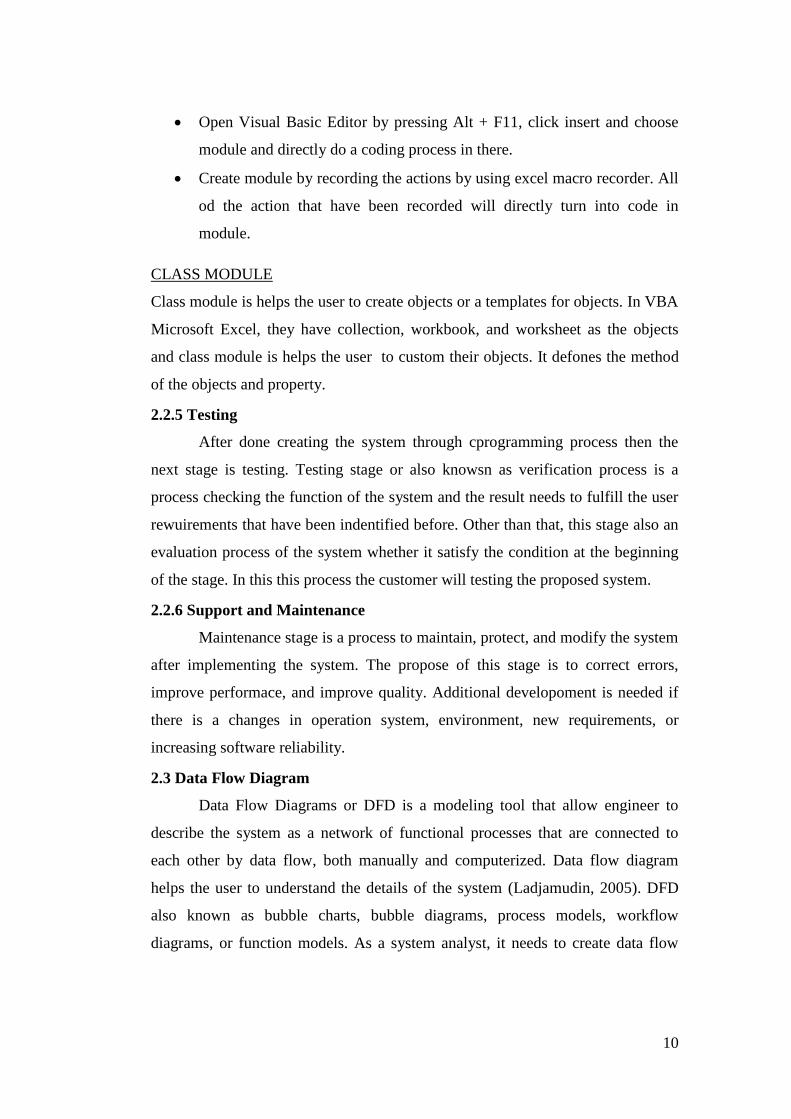
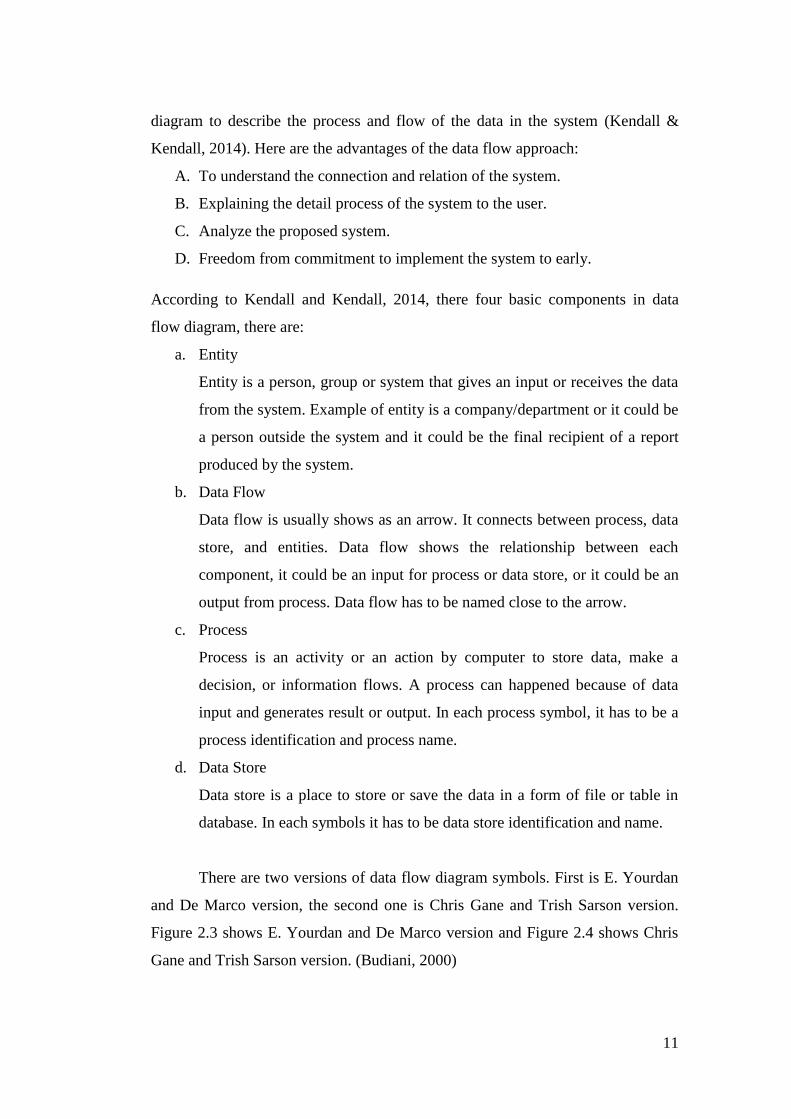
There are two versions of data flow diagram symbols. First is E. Yourdan
and De Marco version, the second one is Chris Gane and Trish Sarson version.
Figure 2.3 shows E. Yourdan and De Marco version and Figure 2.4 shows Chris
Gane and Trish Sarson version. (Budiani, 2000)
12
(Source: (Budiani, 2000))
Figure 2. 3 E. Yourdan and De Marco version
(Source: (Kendall & Kendall, 2014))
Figure 2. 4 Chris Gane and Trish Sarson version
There are two types of data flow diagram, which are physical data flow
diagram and logical data flow diagram.
a. Physical Data Flow Diagram
13
PDFD is a graphic representation of a system that shows entities in the
system, data flows for and from the entities. Physical data flow diagram
doesn’t shows what is being done but where, how and by who the process
have been done in the system. PDFD shows the infrastructure of the
system.
b. Logical Data Flow Diagram
LDFD is a graphic representation of a system that shows process in the
system, data flows for and from the process. Logical data flow diagram is
used for documentation of information system because LDFD can
represents the logic of the system LDFD shows the activities of the
system.
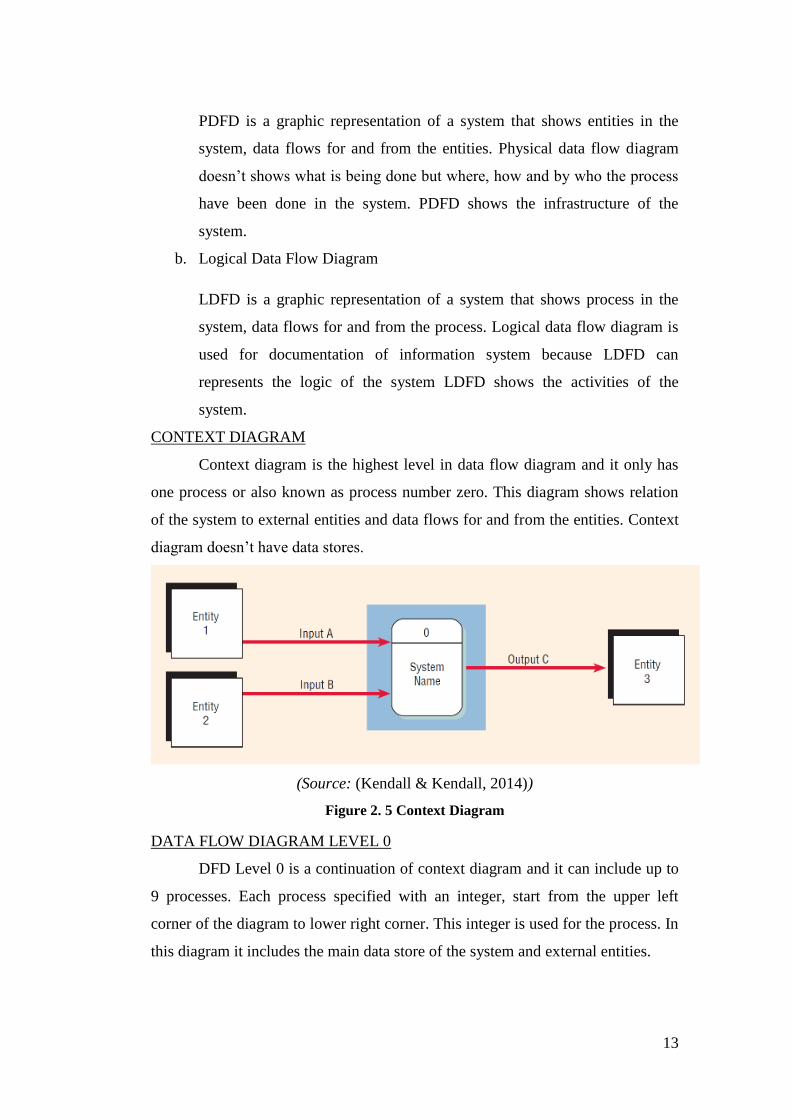
CONTEXT DIAGRAM
Context diagram is the highest level in data flow diagram and it only has
one process or also known as process number zero. This diagram shows relation
of the system to external entities and data flows for and from the entities. Context
diagram doesn’t have data stores.
(Source: (Kendall & Kendall, 2014))
Figure 2. 5 Context Diagram
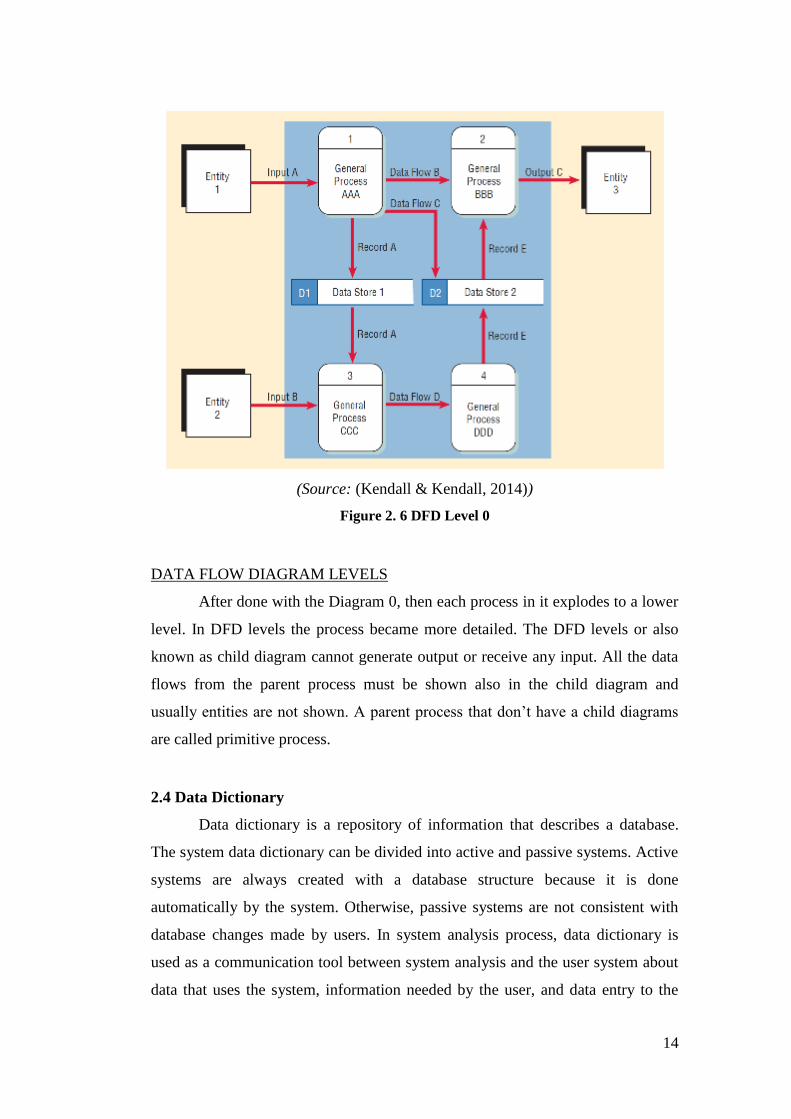
DATA FLOW DIAGRAM LEVEL 0
DFD Level 0 is a continuation of context diagram and it can include up to
9 processes. Each process specified with an integer, start from the upper left
corner of the diagram to lower right corner. This integer is used for the process. In
this diagram it includes the main data store of the system and external entities.
14
(Source: (Kendall & Kendall, 2014))
Figure 2. 6 DFD Level 0
DATA FLOW DIAGRAM LEVELS
After done with the Diagram 0, then each process in it explodes to a lower
level. In DFD levels the process became more detailed. The DFD levels or also
known as child diagram cannot generate output or receive any input. All the data
flows from the parent process must be shown also in the child diagram and
usually entities are not shown. A parent process that don’t have a child diagrams
are called primitive process.
2.4 Data Dictionary
Data dictionary is a repository of information that describes a database.
The system data dictionary can be divided into active and passive systems. Active
systems are always created with a database structure because it is done
automatically by the system. Otherwise, passive systems are not consistent with
database changes made by users. In system analysis process, data dictionary is
used as a communication tool between system analysis and the user system about
data that uses the system, information needed by the user, and data entry to the

15
system. For system design process, data dictionary is used to approve input,
database, and reports. Data Dictionary is based on data flow in data flow diagram.
Data dictionary explains details of data elements. Data elements or data item is the
smallest part of data in system. A combination of data elements that has data flow
is called record and it stored in data store. (Shelly & Rosenblatt, 2011)
16
CHAPTER III
RESEARCH METHODOLOGY
This chapter consists of procedure and the phases of the entire process in
completing this research. The flow process in this chapter will become a guidance.
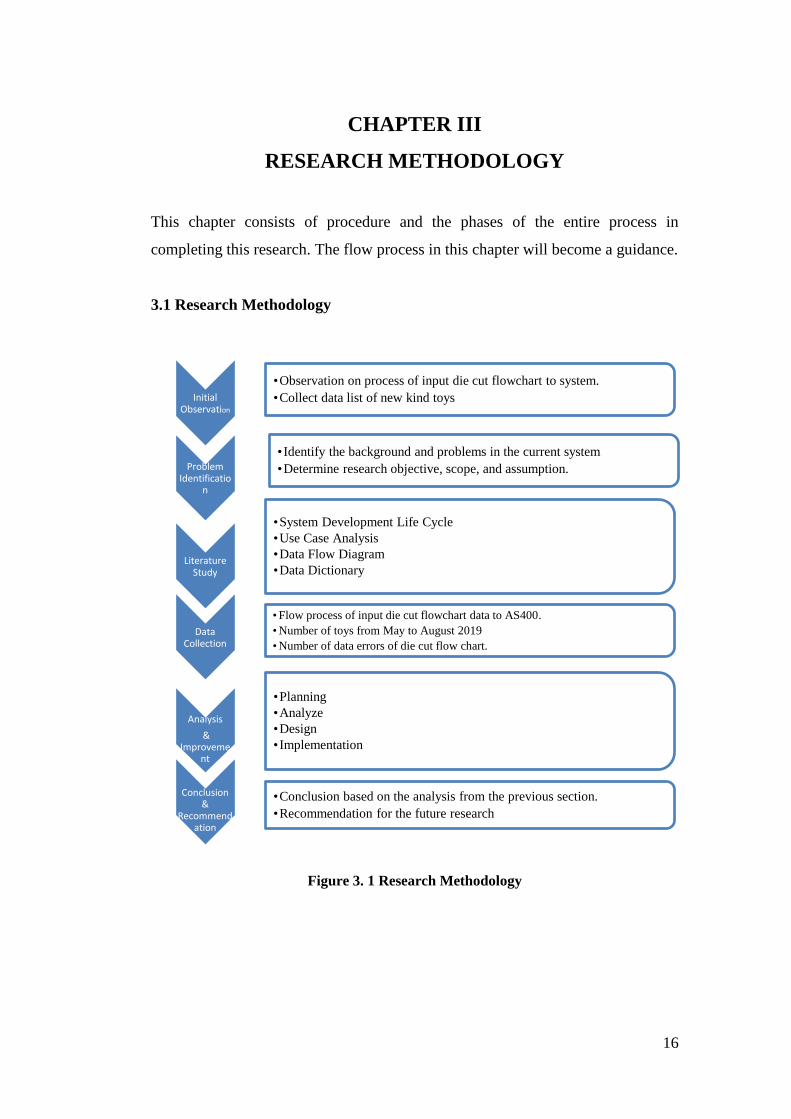
3.1 Research Methodology
Figure 3. 1 Research Methodology
Initial Observation
•Observation on process of input die cut flowchart to system.
•Collect data list of new kind toys
Problem Identificatio
n
• Identify the background and problems in the current system
•Determine research objective, scope, and assumption.
Literature Study
•System Development Life Cycle
•Use Case Analysis
•Data Flow Diagram
•Data Dictionary
Data Collection
• Flow process of input die cut flowchart data to AS400.
• Number of toys from May to August 2019
• Number of data errors of die cut flow chart.
Analysis
& Improveme
nt
•Planning
•Analyze
•Design
• Implementation
Conclusion &
Recommendation
•Conclusion based on the analysis from the previous section.
•Recommendation for the future research
17
3.1.1 Initial Observation
The thing observed is the current process of input process die cut
flowchart data to AS400. The first step is technician creates the working order
sheet that the sift engineer will received. The working order sheet itself is used by
operator as their guide and used by the engineer itself to input the data for flow
chart into the system (AS400). Then after already input the data into the system
and approved, the flow chart data will be used by several division, which are
production department, material department, and cost engineering department.
After done the observation, then the problem can be identified and know what
improvement should be done.
3.1.2 Problem Identification
The problem of the current system is there are an inaccurate data of
flowchart data in AS400 caused by error of typing or typo. To input flowchart
data to AS400, engineer input it one by one by type it into AS400. They open the
menu to input data in AS400 and start copy the data from working order sheet to
AS400. The objective this research is to reduce inaccurate data of flowchart data
in AS400 system. After identifying the problem and the objectives, then
determine the scope and the assumptions. In this research the scopes are the data
is only applicable to be used in SGE department and the improvement only can be
used in SGE department. For the assumptions are the engineer familiar with the
integrated system that PT. AB used (AS400), the engineer understand the flow
process of input die cut flowchart process, and the data from working order sheet
is correct.
3.1.3 Literature Study
The next step of this research is to do literature study. The literature study
of this research was taken from journals, books and other to review the material
that relevant with the problem and the problem solving method. The literature
study in this research is:
System Development Life Cycle Methodology
Use Case Analysis
18
Data Flow Diagram
Data Dictionary
3.1.4 Data Collection
The data is gathered from direct observation in SGE department, specifically
in the die cut area. The data was taken from May until August 2019. The data
collected for this research is list of toys, list of errors of data die cut flowchart in
AS400, and flow process of input die cut flowchart to system (AS400). Data is
collected to help the researcher analyze the problem in the company and fine the
improvement.
3.1.5 Data Analysis
After gathered all the data needed, the researcher will focus to processing
the data. This research use system development life cycle or SDLC as the method
of analysis. The first stage in this method is system planning, in this stage the
author explains more detail about the problem. Next is system analyze stage, this
stage contains of analysis of the current system of input flowchart data process to
AS400. Then create the flow process diagram of the current condition, explain the
weaknesses of the current system, and analyze the user requirements. It also
explain the proposed system of input flowchart data process by create flow
process diagram of the proposed system, data flow diagram, and data dictionary
for each process, entities, data store, and data flow in data flow diagram. The next
stage is system design, which is a process of creating the user interface of the
input flowchart data system. The user interface has to be fulfilled the user
requirements. Then after system design, next is the implementation stage.
Implementation stage is a realization stage of system design into a system. This
process is a changing process of system design into a programming language, so
the computer can be understood it by create a coding. For this research, the coding
was done by Visual Basic for Application in Microsoft Excel. The last stage is a
comparison between current and proposed system.
19
3.1.6 Conclusion and Recommendation
The final step of this research is to create the conclusion from the previous
chapter. The recommendation of this research will be provided after the
conclusion is presenting. The recommendation can be used for future research
with similar topic.
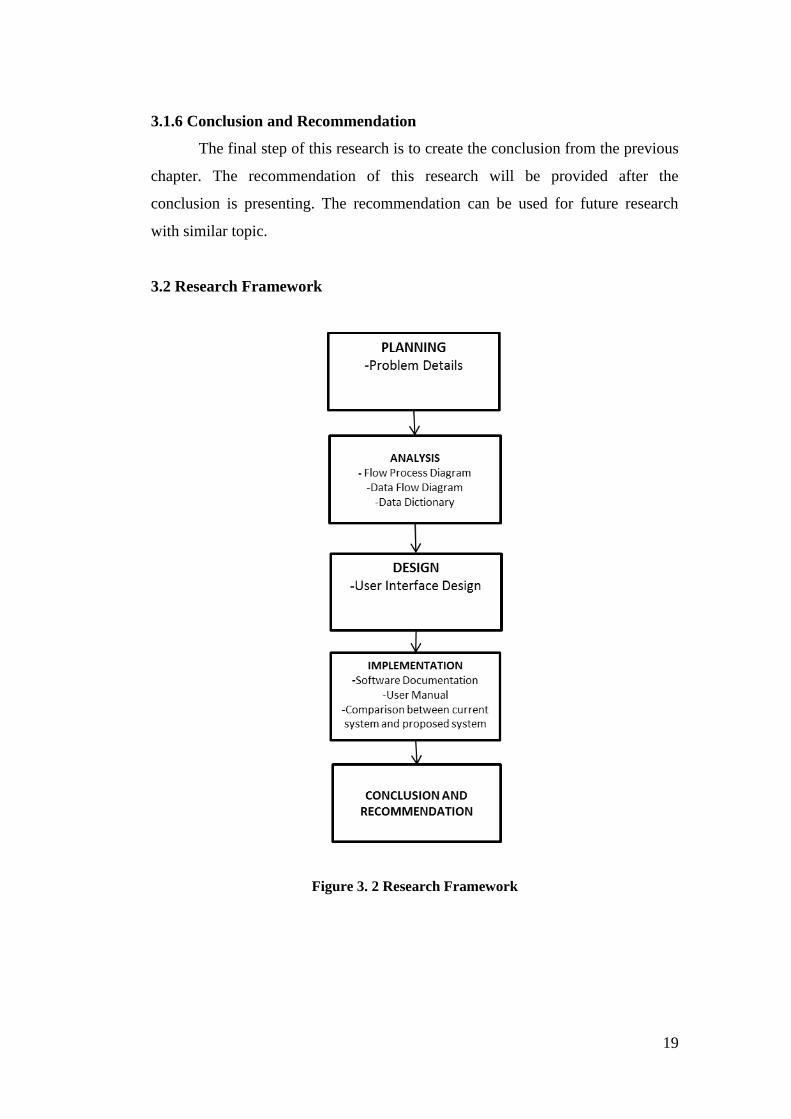
3.2 Research Framework
Figure 3. 2 Research Framework
20
CHAPTER IV
DATA ANALYSIS
4.1 Flowchart Data in Soft Goods Engineering
Soft goods engineering is one of the division in PT. AB Indonesia. Soft
goods engineer itself is divided into two sub division which are die cut engineer
and sewing engineer. There are several data that need to be input or created for
each toy by the engineer which are bill of material, flowchart data, part list, and
etc. These all data are created by the engineer and the data will be input to AS400,
the integrated system that the company used. This research focus on data input
process of flowchart data. Flowchart data is a data that contains yield of material,
process name, machine hour, part number, process and machine code. To input
flowchart data to AS400 there are 3 parties that involved. There are technician,
soft goods engineer, and soft goods manager. Technician in here has a task to
create a working order sheet as a base data of flowchart. Soft goods engineer as a
person who input the data into AS400. Soft goods manager as a person who has
authority to approved the flowchart data in AS400, because if the flowchart data
has not been approved then the data can’t be used by the other division.
After done the initial observation, there are several incorrect data of
flowchart in AS400. These incorrect data was caused by mistyping or typo during
the input process by the engineer, because the input process still done manually.
To improve this process, the researcher use system development life cycle as the
research methodology. System development life cycle has six stages which are
system planning, system analysis, system design, implementation, testing, and
maintain the system. But in this research the scope only until the implementation
stage.
4.2 System Planning
As stated earlier in Chapter I Problem Identification, in current condition
the engineer still manually copy the data of flowchart from working order sheet
into AS400. They open the menu in AS400 and input at least 50 data for only
from one working order sheet while one toy number can have one until three
21
working order sheets, it depends on how complex the costume and how many
kind of fabric used in one toy.
The manual process causes incorrect data input into AS400. This incorrect
data impacts to several divisions in PT. AB Indonesia. First to production
division, it causes the planner create an inaccurate planning of people and
machine hour. Second to cost engineering division, it causes the wrong calculation
if the data is not right. Last is material division, an inaccurate data of yield in
flowchart data it causes material division order the wrong amount of materials,
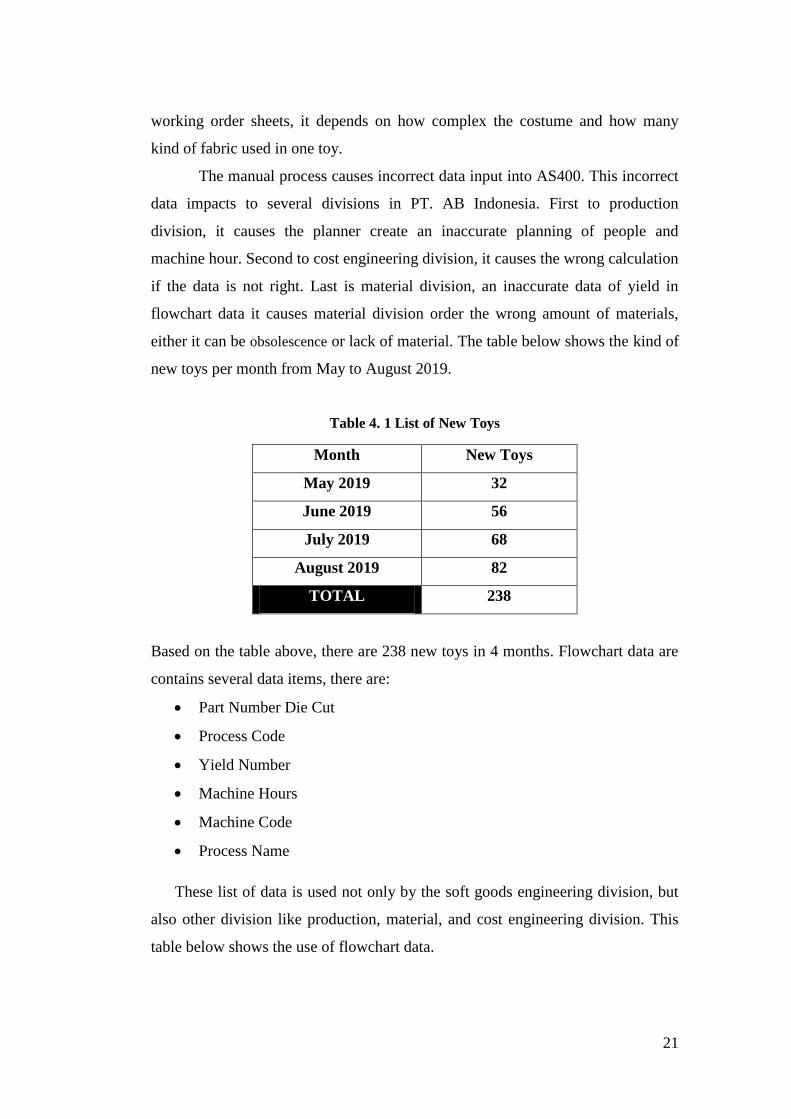
either it can be obsolescence or lack of material. The table below shows the kind of
new toys per month from May to August 2019.
Table 4. 1 List of New Toys
Month New Toys
May 2019 32
June 2019 56
July 2019 68
August 2019 82
TOTAL 238
Based on the table above, there are 238 new toys in 4 months. Flowchart data are
contains several data items, there are:
Part Number Die Cut
Process Code
Yield Number
Machine Hours
Machine Code
Process Name
These list of data is used not only by the soft goods engineering division, but
also other division like production, material, and cost engineering division. This
table below shows the use of flowchart data.
22
Table 4. 2 The Use of Flowchart Data
Division Flowchart Data Impacts
Production Division Process Code
Machine Code
Yield Number
Machine Hours
Process Name
Inaccurate planning for schedule
Not enough or overcapacity of
machine
Not enough or overcapacity of
people. It also affects the hiring
planning
Cost Engineering
Division
Process Code
Machine Code
Yield Number
Machine Hours
Process Name
Miscalculation of product cost
Material Division Yield Number Order the wrong amount of
materials. It can caused
obsolescence or lack of material
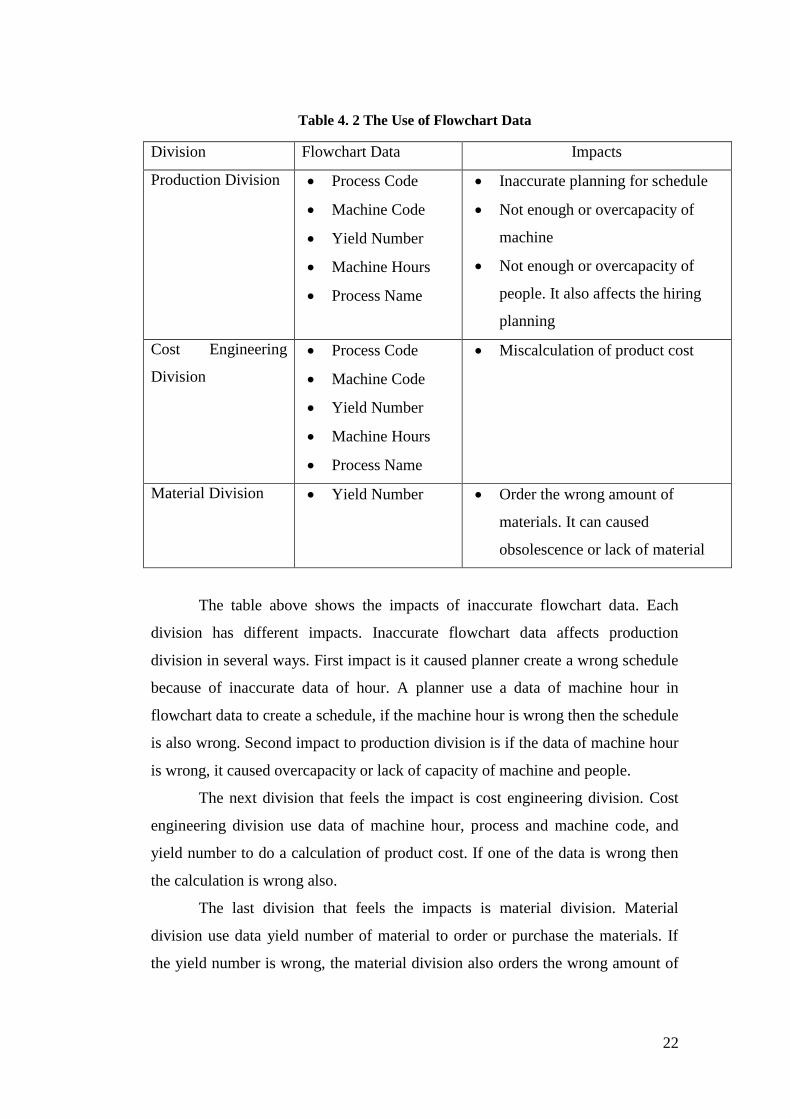
The table above shows the impacts of inaccurate flowchart data. Each
division has different impacts. Inaccurate flowchart data affects production
division in several ways. First impact is it caused planner create a wrong schedule
because of inaccurate data of hour. A planner use a data of machine hour in
flowchart data to create a schedule, if the machine hour is wrong then the schedule
is also wrong. Second impact to production division is if the data of machine hour
is wrong, it caused overcapacity or lack of capacity of machine and people.
The next division that feels the impact is cost engineering division. Cost
engineering division use data of machine hour, process and machine code, and
yield number to do a calculation of product cost. If one of the data is wrong then
the calculation is wrong also.
The last division that feels the impacts is material division. Material
division use data yield number of material to order or purchase the materials. If
the yield number is wrong, the material division also orders the wrong amount of
23
material. It caused an obsolescence or lack of material in inventory. All of those
impacts caused by inaccurate data of flowchart data are causing company losses.
After all if the data is incorrect it affects the production process, even
though the incorrect data was first identified by the mimics division, the division
that controls all of the data in AS400. The flowchart data will not be used by the
other division, it is still delayed the production time.
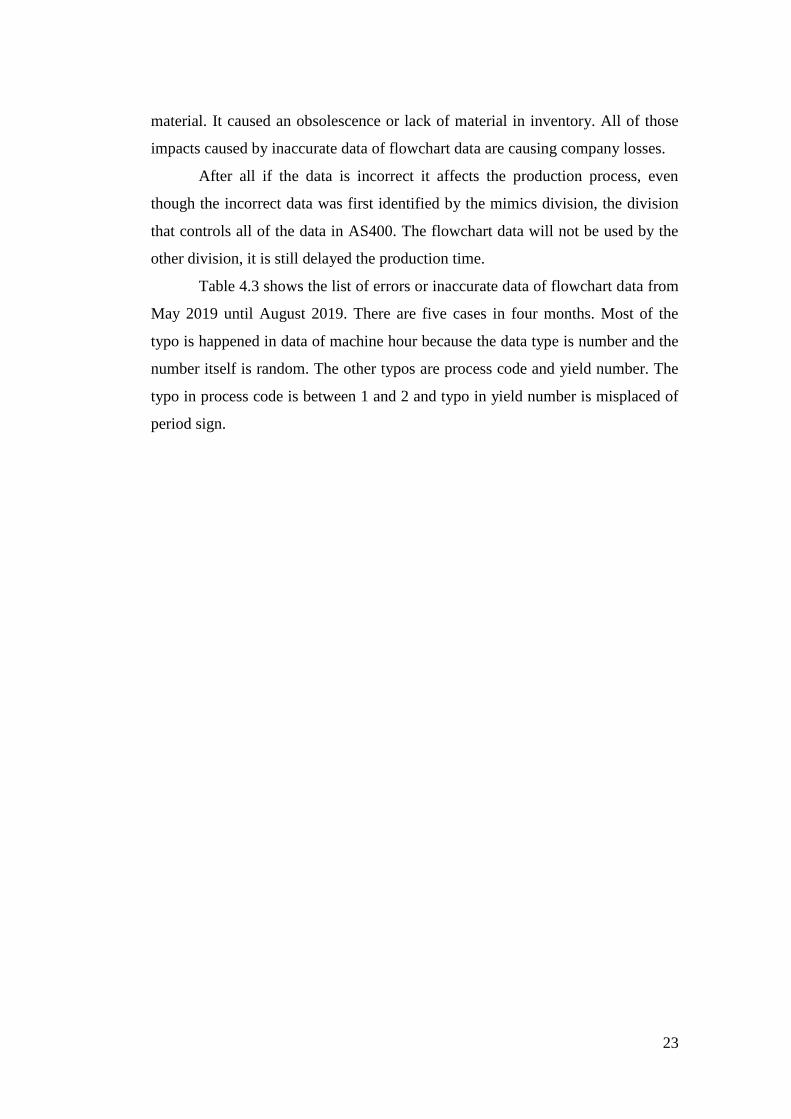
Table 4.3 shows the list of errors or inaccurate data of flowchart data from
May 2019 until August 2019. There are five cases in four months. Most of the
typo is happened in data of machine hour because the data type is number and the
number itself is random. The other typos are process code and yield number. The
typo in process code is between 1 and 2 and typo in yield number is misplaced of
period sign.
24
Table 4. 3 List of Errors
Toy
Number
Die Cut Part
Number Month
Type of
Data
Example of Error
Incorrect
Data
Correct
Data
ABC11 ABC11-4011 May 2019
Process
Code F01 F02
ABC22 ABC22-4361 Jul 2019
Yield
Number 462.3 46.23
ABC33 ABC33-4161 Jul 2019
Machine
Hour 3,204 3.204
ABC44 ABC44-4012 Aug 2019
Machine
Hour 1.021 1.201
ABC55 ABC55-4012 Aug 2019
Machine
Hour 0.327 0.427
4.3 System Analysis
System analaysis stage or also known as system requirements specification
is a stage to kwoning the description of the system so that is why the engineer
need to know exactly what the requirements of the system. There will be two
things explained in analysis stage, first about the current system and the proposed
system.
4.3.1 Current System
For the current system analysis there will be flow process diagram,
weaknesses of current system, and user requirements.
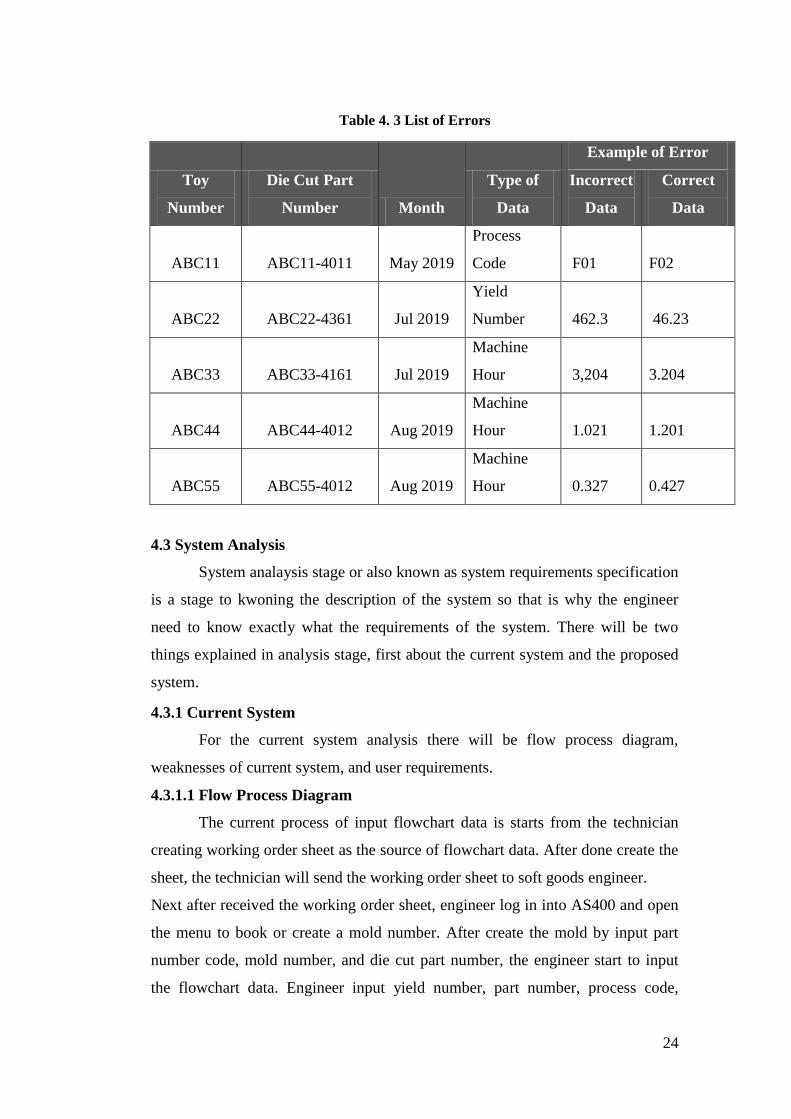
4.3.1.1 Flow Process Diagram
The current process of input flowchart data is starts from the technician
creating working order sheet as the source of flowchart data. After done create the
sheet, the technician will send the working order sheet to soft goods engineer.
Next after received the working order sheet, engineer log in into AS400 and open
the menu to book or create a mold number. After create the mold by input part
number code, mold number, and die cut part number, the engineer start to input
the flowchart data. Engineer input yield number, part number, process code,

25
machine code, machine hour, and process name for each part number. After done
input the data until the last part number, then it will be saved in AS400. Next, the
manager will check the data and approve it if there is no mistake or errors. The
flow process diagram is shown in Figure 4.1. In this figure below there are two
processes that are filled in red. These processes have a higher chance of typos than
others.
26
CURRENT SYSTEM
Thecnician Soft goods managerSoft goods engineer
START
Log in AS400 and Select
the working order sheet
Open menu in AS400 to
create new mold number
Input code for part number
and new mold number
Input part number
Open menu in AS400 to
create new flow chart
Input count point,
process center code,
engineer name and
date
Input yield number
Input part number die
cut, process code,
machine code, machine
hour, and process
name.
Already input the data
until the last part
number?
Save the data
Check all of the data.
Approve or
not?
Die Cut
Flow
Chart
Data
Finish
Create Working Order
Sheet
Working Order Sheet
NO
YES
NO
YES
Figure 4. 1 Flow Process of Current System
27
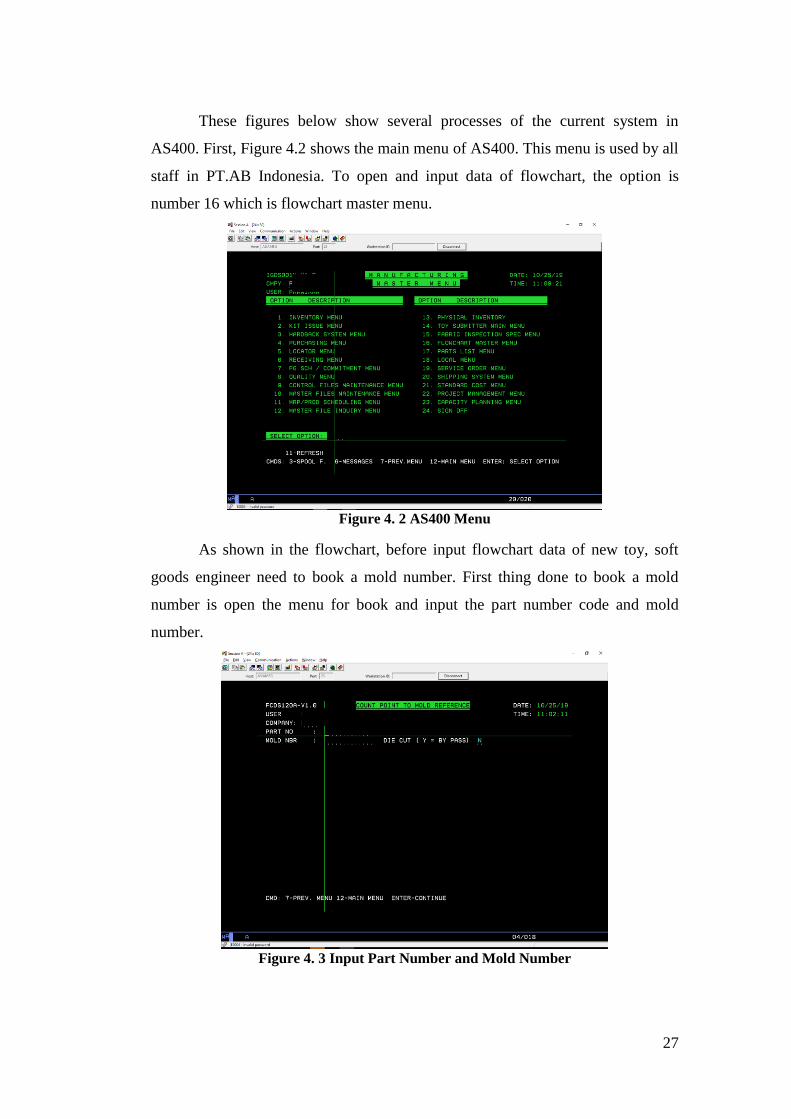
These figures below show several processes of the current system in
AS400. First, Figure 4.2 shows the main menu of AS400. This menu is used by all
staff in PT.AB Indonesia. To open and input data of flowchart, the option is
number 16 which is flowchart master menu.
Figure 4. 2 AS400 Menu
As shown in the flowchart, before input flowchart data of new toy, soft
goods engineer need to book a mold number. First thing done to book a mold
number is open the menu for book and input the part number code and mold
number.
Figure 4. 3 Input Part Number and Mold Number
28
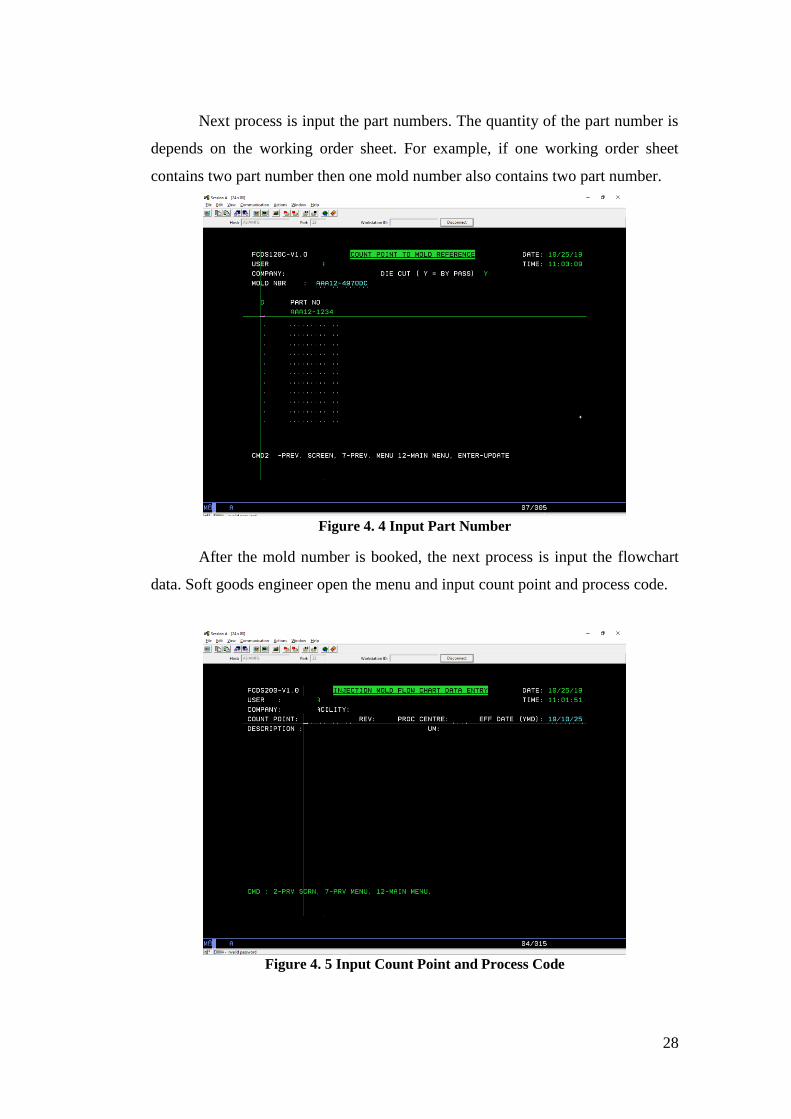
Next process is input the part numbers. The quantity of the part number is
depends on the working order sheet. For example, if one working order sheet
contains two part number then one mold number also contains two part number.
Figure 4. 4 Input Part Number
After the mold number is booked, the next process is input the flowchart
data. Soft goods engineer open the menu and input count point and process code.
Figure 4. 5 Input Count Point and Process Code
29
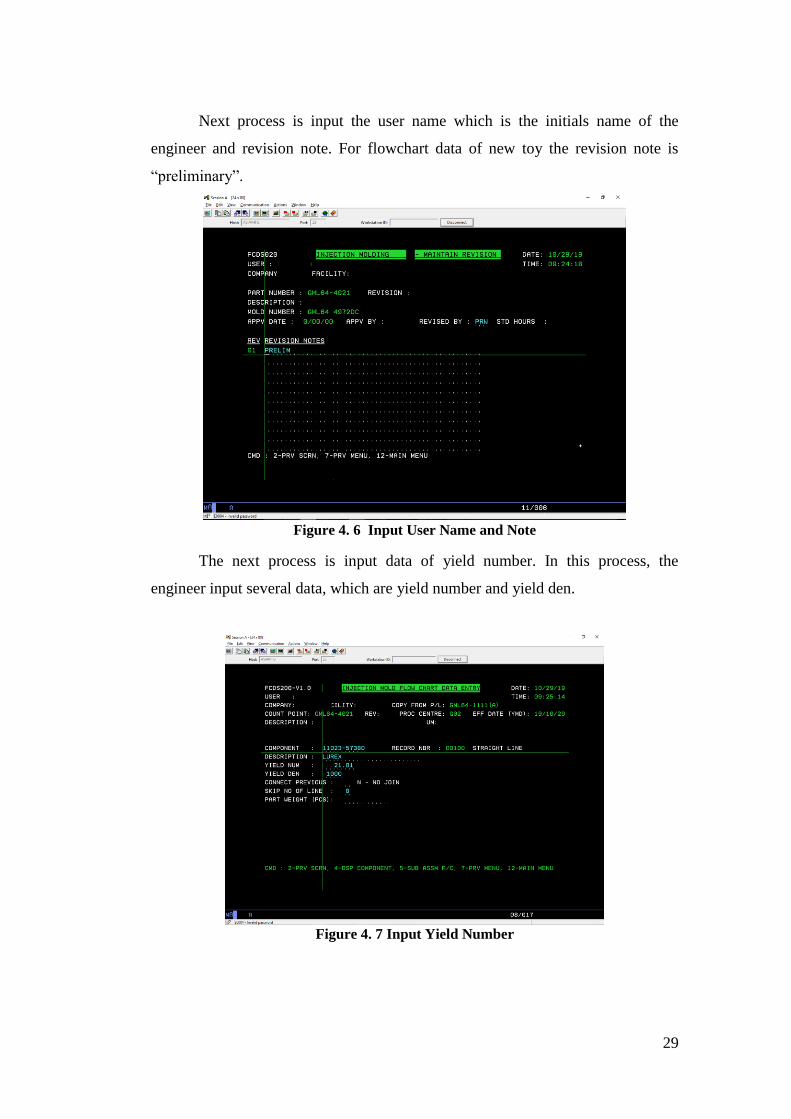
Next process is input the user name which is the initials name of the
engineer and revision note. For flowchart data of new toy the revision note is
“preliminary”.
Figure 4. 6 Input User Name and Note
The next process is input data of yield number. In this process, the
engineer input several data, which are yield number and yield den.
Figure 4. 7 Input Yield Number
30
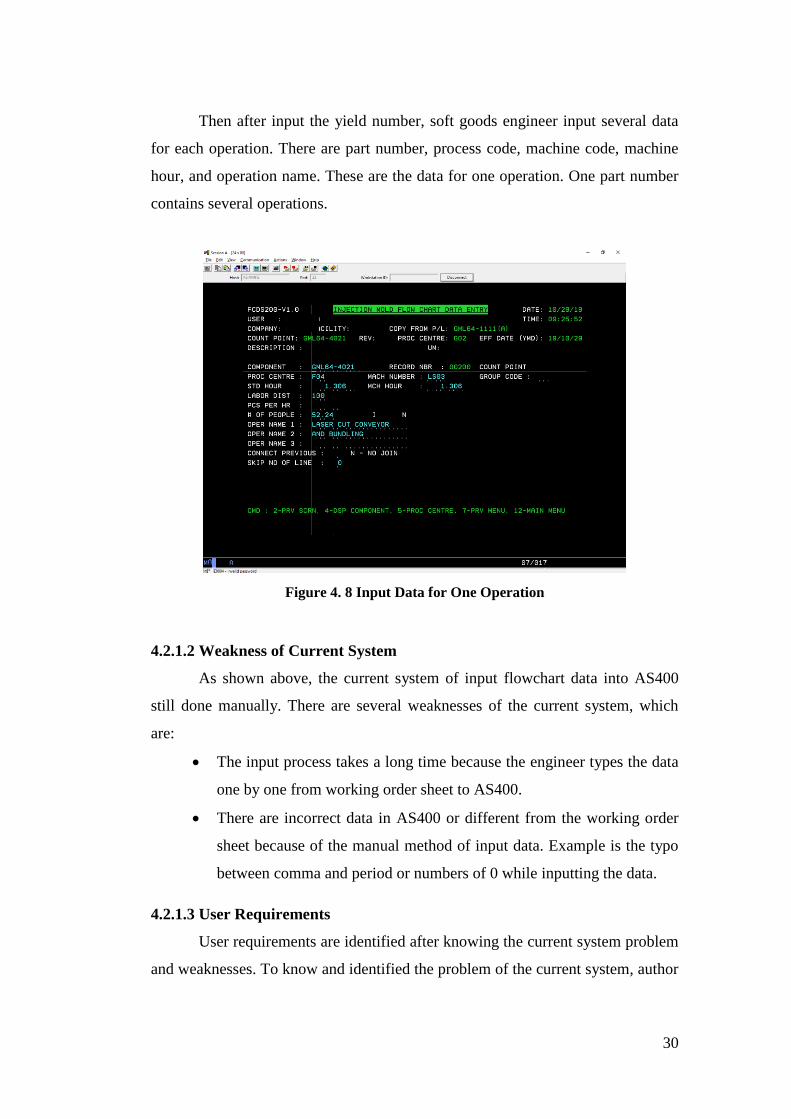
Then after input the yield number, soft goods engineer input several data
for each operation. There are part number, process code, machine code, machine
hour, and operation name. These are the data for one operation. One part number
contains several operations.
Figure 4. 8 Input Data for One Operation
4.2.1.2 Weakness of Current System
As shown above, the current system of input flowchart data into AS400
still done manually. There are several weaknesses of the current system, which
are:
The input process takes a long time because the engineer types the data
one by one from working order sheet to AS400.
There are incorrect data in AS400 or different from the working order
sheet because of the manual method of input data. Example is the typo
between comma and period or numbers of 0 while inputting the data.
4.2.1.3 User Requirements
User requirements are identified after knowing the current system problem
and weaknesses. To know and identified the problem of the current system, author
31
done an interview with the soft good engineers as the user of the system. The
question of interview will show in appendix. The interviewers asked the question
directly to interviewees, and interviewees will answer the question verbally and
interviewers wrote down the answer. These are the user requirement of input
flowchart data system:
User friendly system since the data mostly are code and numbers, the user
requires the interface to be as simple as possible.
The system can directly copy the machine hour data and yield data from
working order sheet, so there is no typing process for these crucial data.
The system can directly classify the process name to process code and
machine code, so the engineer no needs to see the database of code.
The system can work to input data flowchart of new toy and revise the
existing flowchart data.
4.3.2 Proposed System
For the proposed system analysis there will be a different flow diagram
process, data flow diagram, and data dictionary.
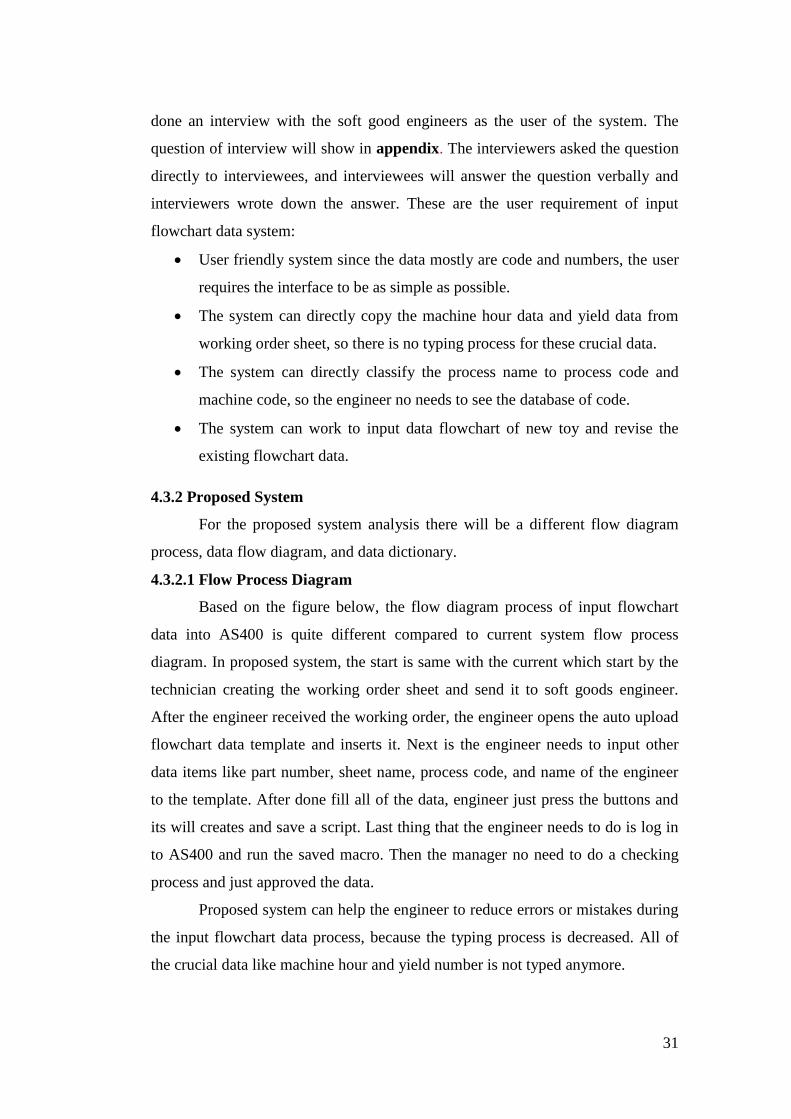
4.3.2.1 Flow Process Diagram
Based on the figure below, the flow diagram process of input flowchart
data into AS400 is quite different compared to current system flow process
diagram. In proposed system, the start is same with the current which start by the
technician creating the working order sheet and send it to soft goods engineer.
After the engineer received the working order, the engineer opens the auto upload
flowchart data template and inserts it. Next is the engineer needs to input other
data items like part number, sheet name, process code, and name of the engineer
to the template. After done fill all of the data, engineer just press the buttons and
its will creates and save a script. Last thing that the engineer needs to do is log in
to AS400 and run the saved macro. Then the manager no need to do a checking
process and just approved the data.
Proposed system can help the engineer to reduce errors or mistakes during
the input flowchart data process, because the typing process is decreased. All of
the crucial data like machine hour and yield number is not typed anymore.
32
PROPOSED SYSTEM
Softgoods Engineer Softgoods ManagerThecnician
Create Working Order
Sheet
START
Working Order Sheet
Open Template of Auto-
upload Flowchart Data
Insert WO to template
Input part number,
sheet name process
code, and engineer
name
New toy?
Press Button Book &
Create
Input revision number
and revision note
Press Button Revise
Log in AS400
Run the script
Finish
Die Cut
Flow
Chart
Data
NO
YES
Approved the data
Figure 4. 9 Flow Process of Proposed System
33
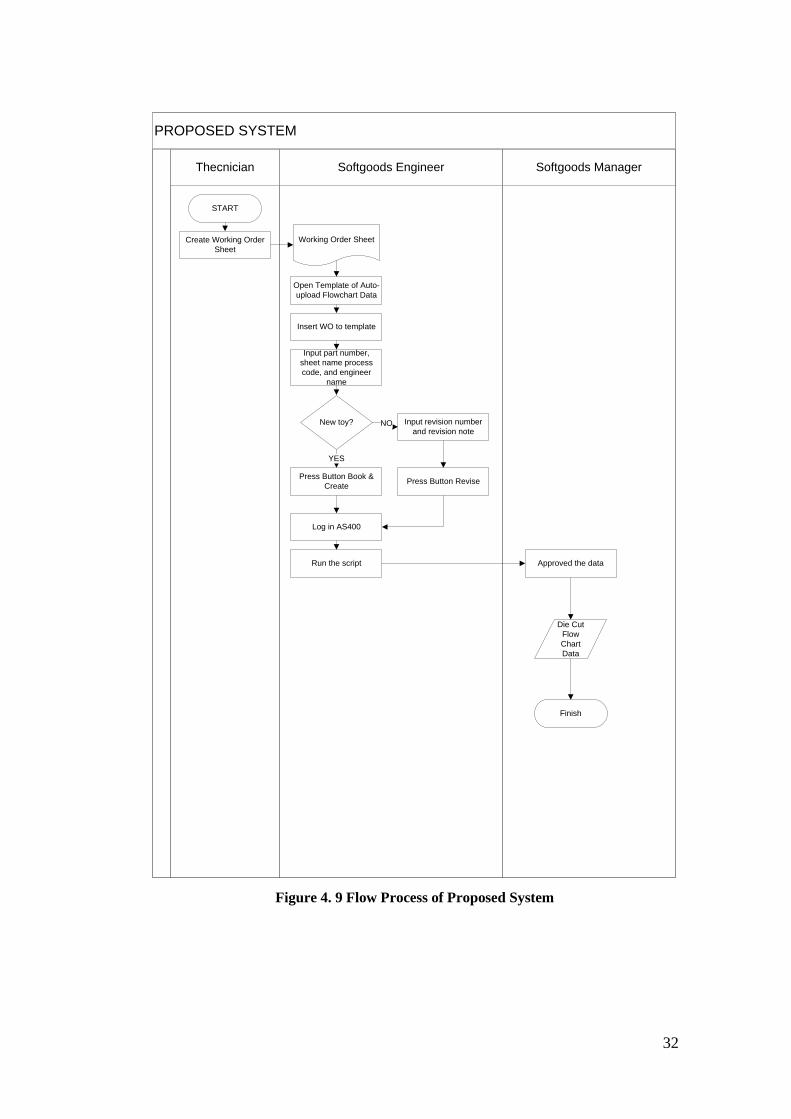
4.2.2.3 Proposed Data Flow Diagram
Data flow diagram or DFD is a tool that engineer use to describe data process and flows that connects each other both manually and
computerized in the system graphically. In this research there are context diagram and diagram 0.
Context Diagram
Context diagram is the highest level in data flow diagram. It only has one process or also known as process number zero and has no
data store.
Figure 4. 10 Context Diagram
Data Working
Order Sheet
Input DataRevision
Script 1
Input Flowchart Data System
AS400 Technician
Softgoods Engineer
0
34
In this research, the main process is input flowchart data system. This context diagram also contains three entities, which are
technician, soft goods engineer, and AS400 and contains 4 data flows which are data working order sheet, revision, input data, and script.
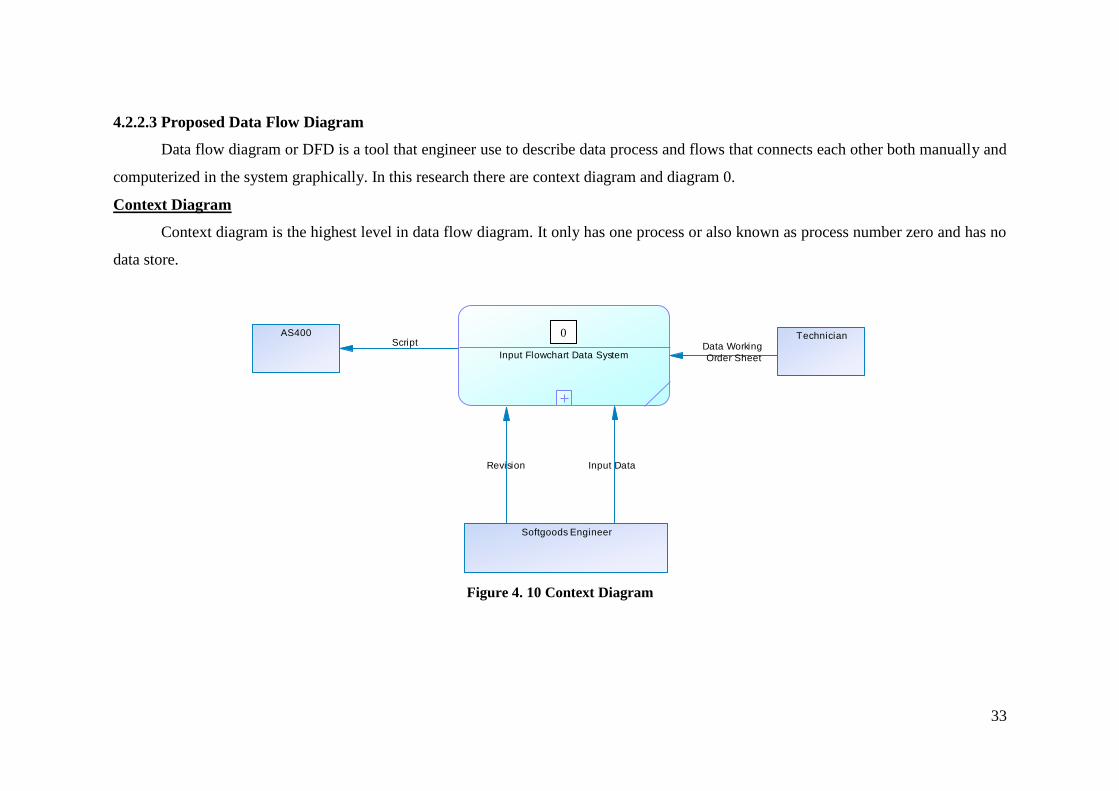
DFD Level 0
DFD level 0 or diagram 0 is the continuation dataflow diagram of context diagram. It explains more detail about the main process in
context diagram. DFD level 0 can include up to 9 processes.
Figure 4. 11 DFD Level 0
Data Working
Order Sheet
Script
RevisionInput Data
1.1
Create WO
1.2
Insert Data Items
1.3
Press Button
1.4
Run Macro Script
Technician
Softgoods Engineer
AS400
Working Order
Booking Script
Flowchart Data Script
Booking ScriptFlowchart Data Script
Working Order
Flowchart Data
1 Booking Script fi le
2Flowchart Data
Script File
3 Working Order Sheet
Flowchart Data
1 2 3 4
35
The figure above shows the DFD level 0. In this research the diagram 0 has 4 processes which are create WO, insert data items, press
button, and run macro script. It also has 3 data stores which are working order sheet, booking script file, and flowchart data script file.
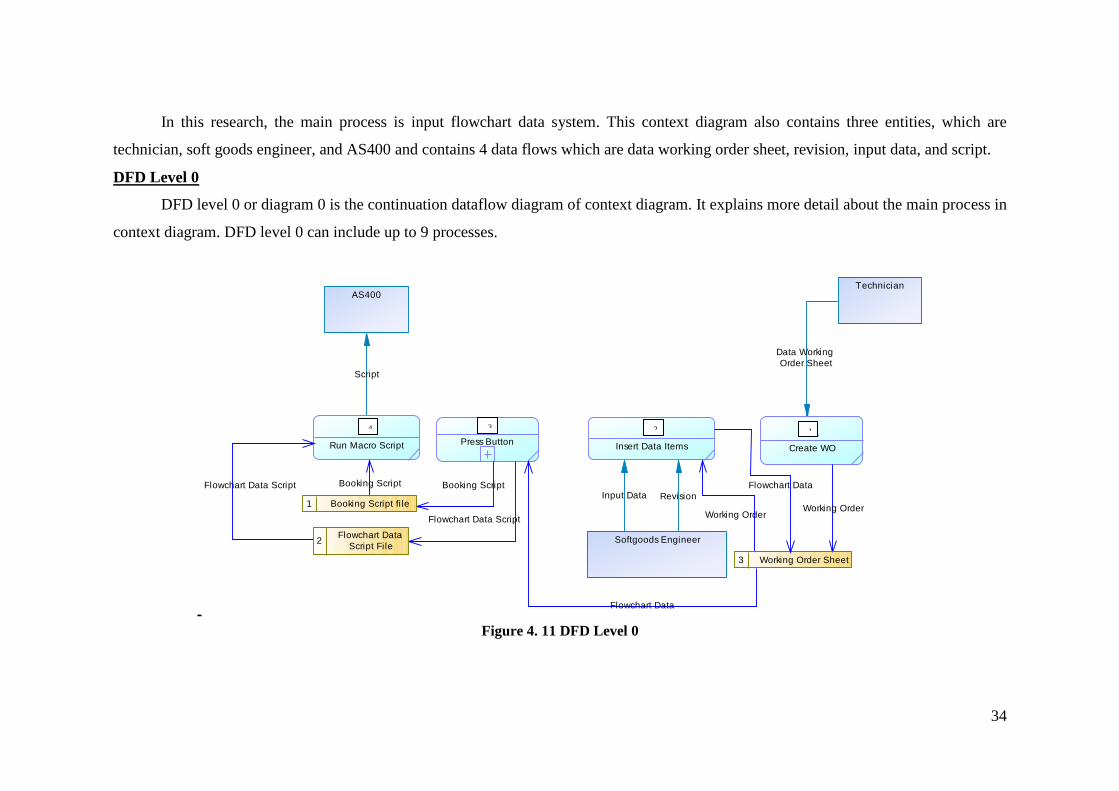
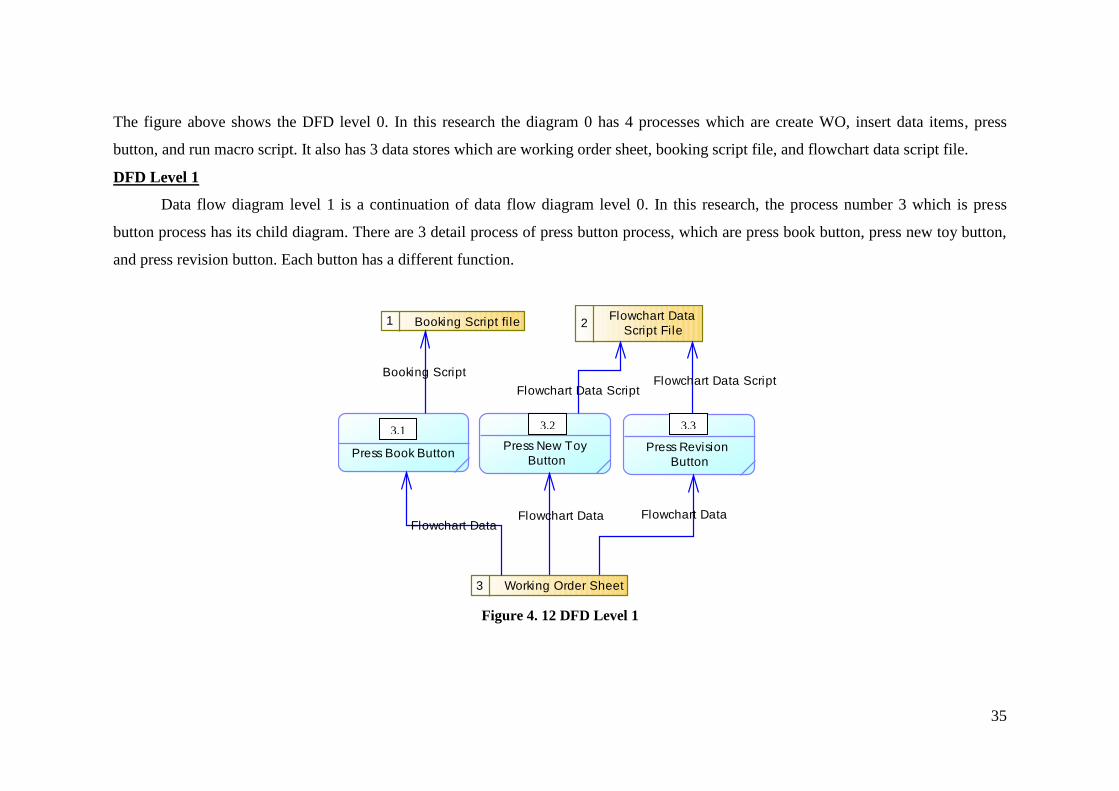
DFD Level 1
Data flow diagram level 1 is a continuation of data flow diagram level 0. In this research, the process number 3 which is press
button process has its child diagram. There are 3 detail process of press button process, which are press book button, press new toy button,
and press revision button. Each button has a different function.
Figure 4. 12 DFD Level 1
1.3.1
Press Book Button
1.3.2
Press New Toy
Button
1.3.3
Press Revision
Button
Flowchart Data Flowchart Data
1 Booking Script fi le 2Flowchart Data
Script File
3 Working Order Sheet
Flowchart Data
Booking Script
Flowchart Data ScriptFlowchart Data Script
3.1 3.2 3.3
36
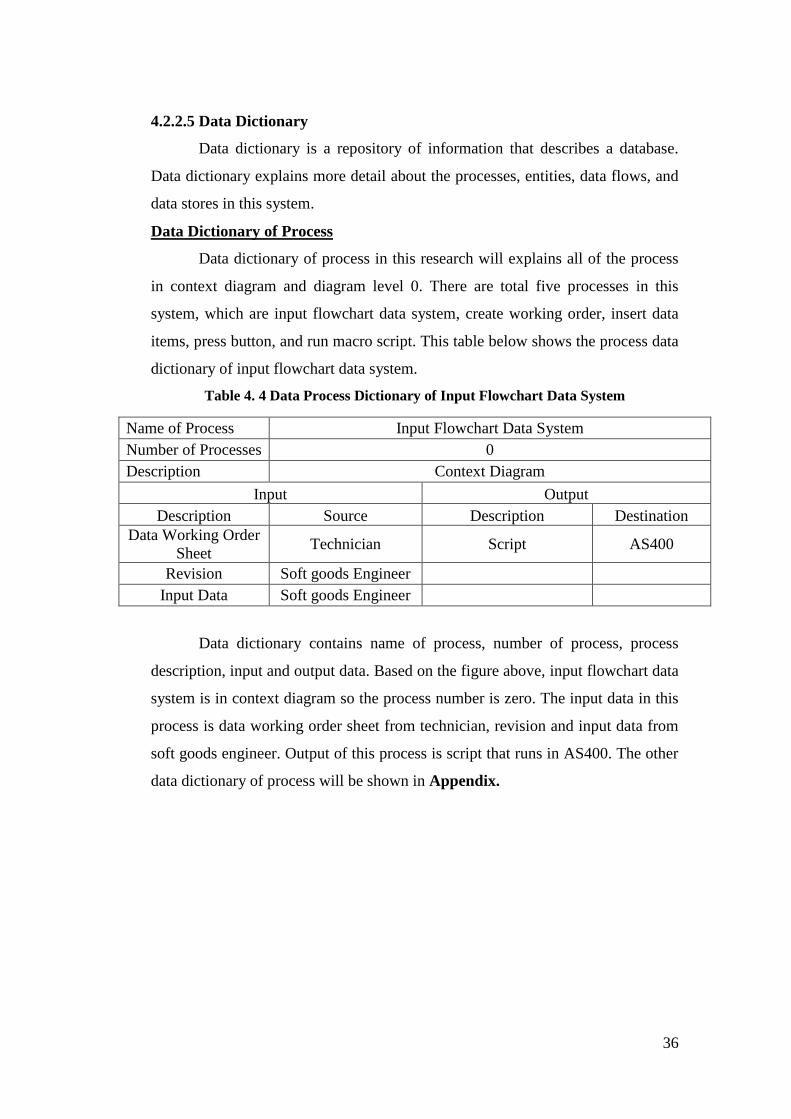
4.2.2.5 Data Dictionary
Data dictionary is a repository of information that describes a database.
Data dictionary explains more detail about the processes, entities, data flows, and
data stores in this system.
Data Dictionary of Process
Data dictionary of process in this research will explains all of the process
in context diagram and diagram level 0. There are total five processes in this
system, which are input flowchart data system, create working order, insert data
items, press button, and run macro script. This table below shows the process data
dictionary of input flowchart data system.
Table 4. 4 Data Process Dictionary of Input Flowchart Data System
Name of Process Input Flowchart Data System
Number of Processes 0
Description Context Diagram
Input Output
Description Source Description Destination
Data Working Order
Sheet Technician Script AS400
Revision Soft goods Engineer
Input Data Soft goods Engineer
Data dictionary contains name of process, number of process, process
description, input and output data. Based on the figure above, input flowchart data
system is in context diagram so the process number is zero. The input data in this
process is data working order sheet from technician, revision and input data from
soft goods engineer. Output of this process is script that runs in AS400. The other
data dictionary of process will be shown in Appendix.
37
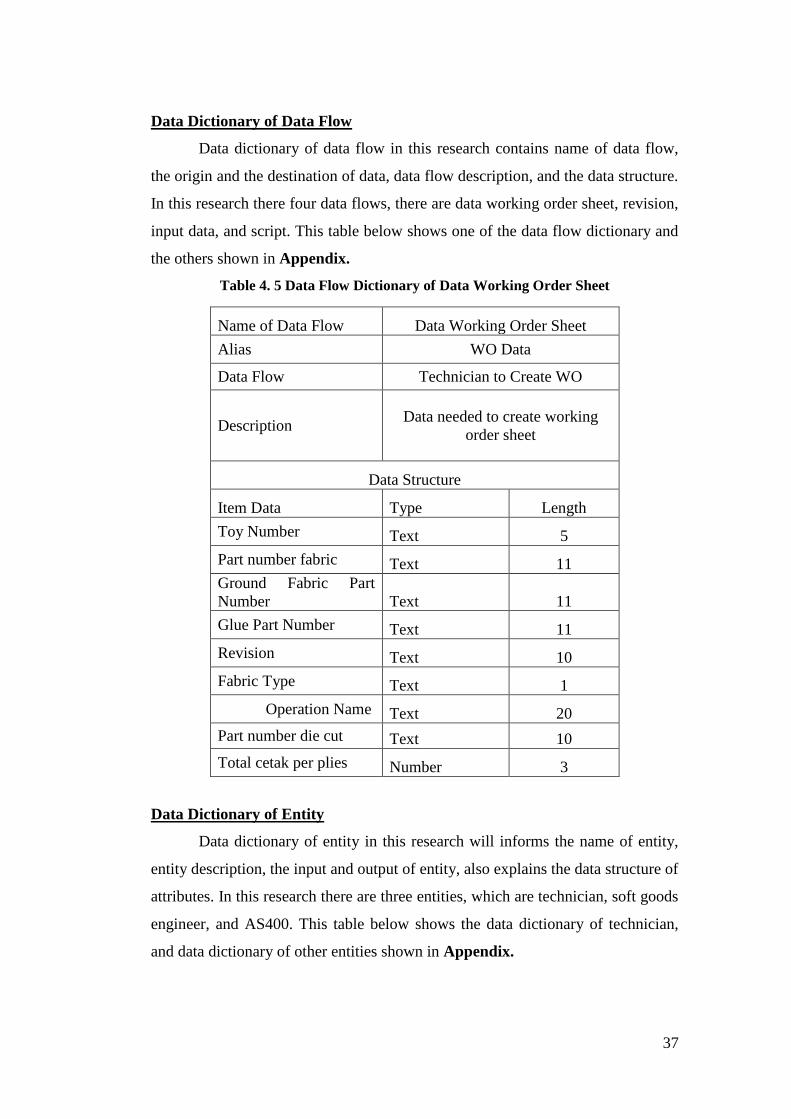
Data Dictionary of Data Flow
Data dictionary of data flow in this research contains name of data flow,
the origin and the destination of data, data flow description, and the data structure.
In this research there four data flows, there are data working order sheet, revision,
input data, and script. This table below shows one of the data flow dictionary and
the others shown in Appendix.
Table 4. 5 Data Flow Dictionary of Data Working Order Sheet
Name of Data Flow Data Working Order Sheet
Alias WO Data
Data Flow Technician to Create WO
Description Data needed to create working
order sheet
Data Structure
Item Data Type Length
Toy Number Text 5
Part number fabric Text 11
Ground Fabric Part
Number Text 11
Glue Part Number Text 11
Revision Text 10
Fabric Type Text 1
Operation Name Text 20
Part number die cut Text 10
Total cetak per plies Number 3
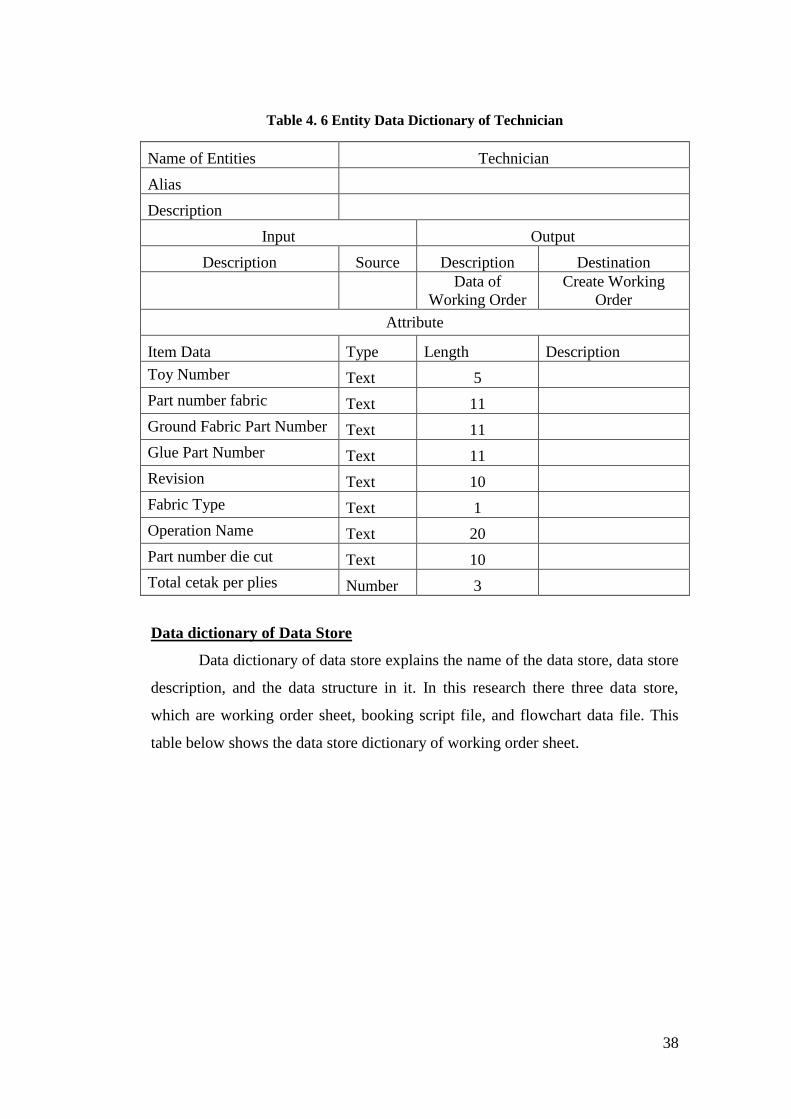
Data Dictionary of Entity
Data dictionary of entity in this research will informs the name of entity,
entity description, the input and output of entity, also explains the data structure of
attributes. In this research there are three entities, which are technician, soft goods
engineer, and AS400. This table below shows the data dictionary of technician,
and data dictionary of other entities shown in Appendix.
38
Table 4. 6 Entity Data Dictionary of Technician
Name of Entities Technician
Alias
Description
Input Output
Description Source Description Destination
Data of
Working Order
Create Working
Order
Attribute
Item Data Type Length Description
Toy Number Text 5
Part number fabric Text 11
Ground Fabric Part Number Text 11
Glue Part Number Text 11
Revision Text 10
Fabric Type Text 1
Operation Name Text 20
Part number die cut Text 10
Total cetak per plies Number 3
Data dictionary of Data Store
Data dictionary of data store explains the name of the data store, data store
description, and the data structure in it. In this research there three data store,
which are working order sheet, booking script file, and flowchart data file. This
table below shows the data store dictionary of working order sheet.
39
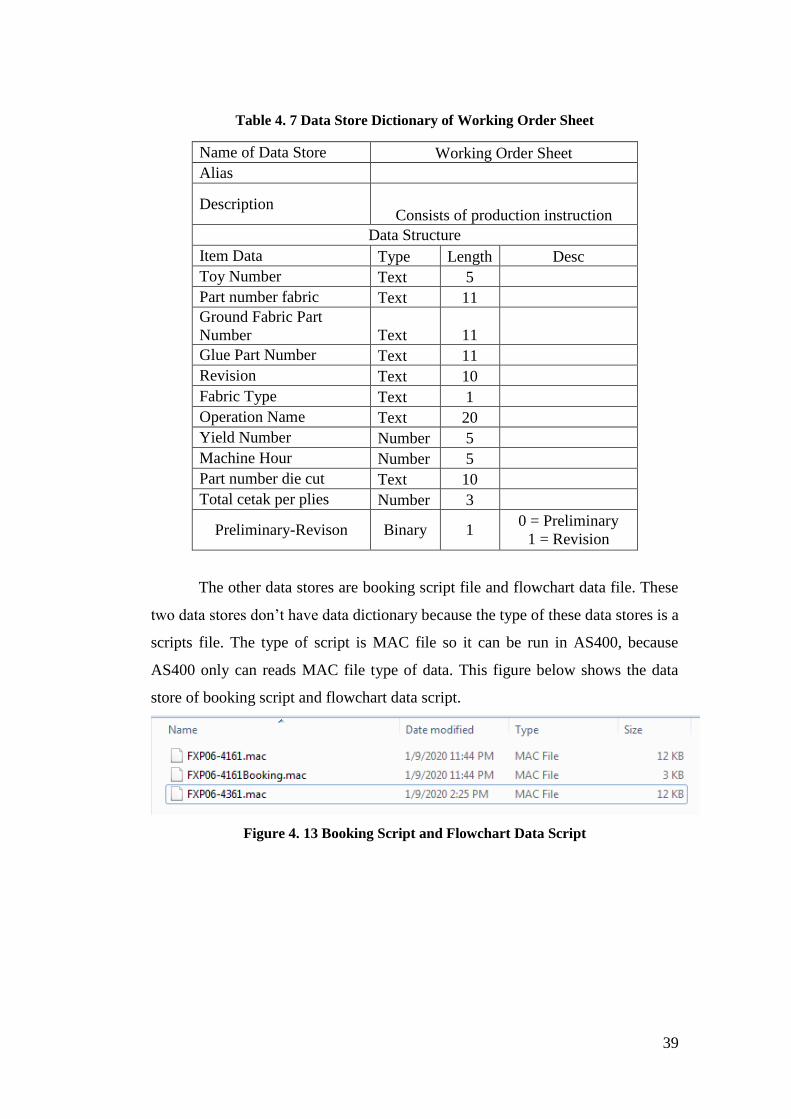
Table 4. 7 Data Store Dictionary of Working Order Sheet
Name of Data Store Working Order Sheet
Alias
Description Consists of production instruction
Data Structure
Item Data Type Length Desc
Toy Number Text 5
Part number fabric Text 11
Ground Fabric Part
Number Text 11
Glue Part Number Text 11
Revision Text 10
Fabric Type Text 1
Operation Name Text 20
Yield Number Number 5
Machine Hour Number 5
Part number die cut Text 10
Total cetak per plies Number 3
Preliminary-Revison Binary 1 0 = Preliminary
1 = Revision
The other data stores are booking script file and flowchart data file. These
two data stores don’t have data dictionary because the type of these data stores is a
scripts file. The type of script is MAC file so it can be run in AS400, because
AS400 only can reads MAC file type of data. This figure below shows the data
store of booking script and flowchart data script.
Figure 4. 13 Booking Script and Flowchart Data Script
40
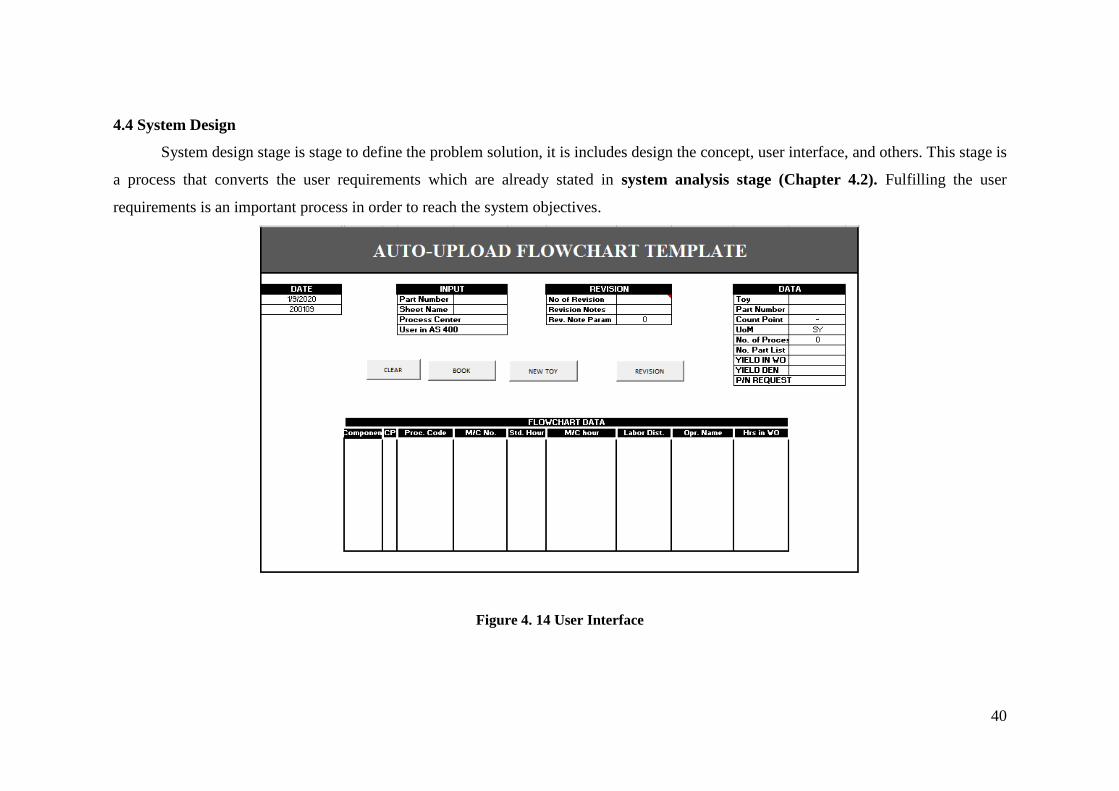
4.4 System Design
System design stage is stage to define the problem solution, it is includes design the concept, user interface, and others. This stage is
a process that converts the user requirements which are already stated in system analysis stage (Chapter 4.2). Fulfilling the user
requirements is an important process in order to reach the system objectives.
Figure 4. 14 User Interface
41
This figure above shows the user interface of input flowchart data system.
It can be seen that the interface contains five tables,which are date table, input
table, revision table, data table, and flowchart data table. Among five tables in
here, the user only needs to fill input and revision table, the other tables
automaticly filled by using excel formula and coding.
The user interface also contains four buttons, which are clear button, book
button, new toy button, and revision button. These four buttons has their own
functions. The function of these button are explained in user manual.
Other than table and buttons, there are several message box that will
appears in certain condition. These message boxes are contain of warning or
information. These message box will help the user to avoid errors when using the
system. The errors can be happened in this input flowchart data system or in
AS400.
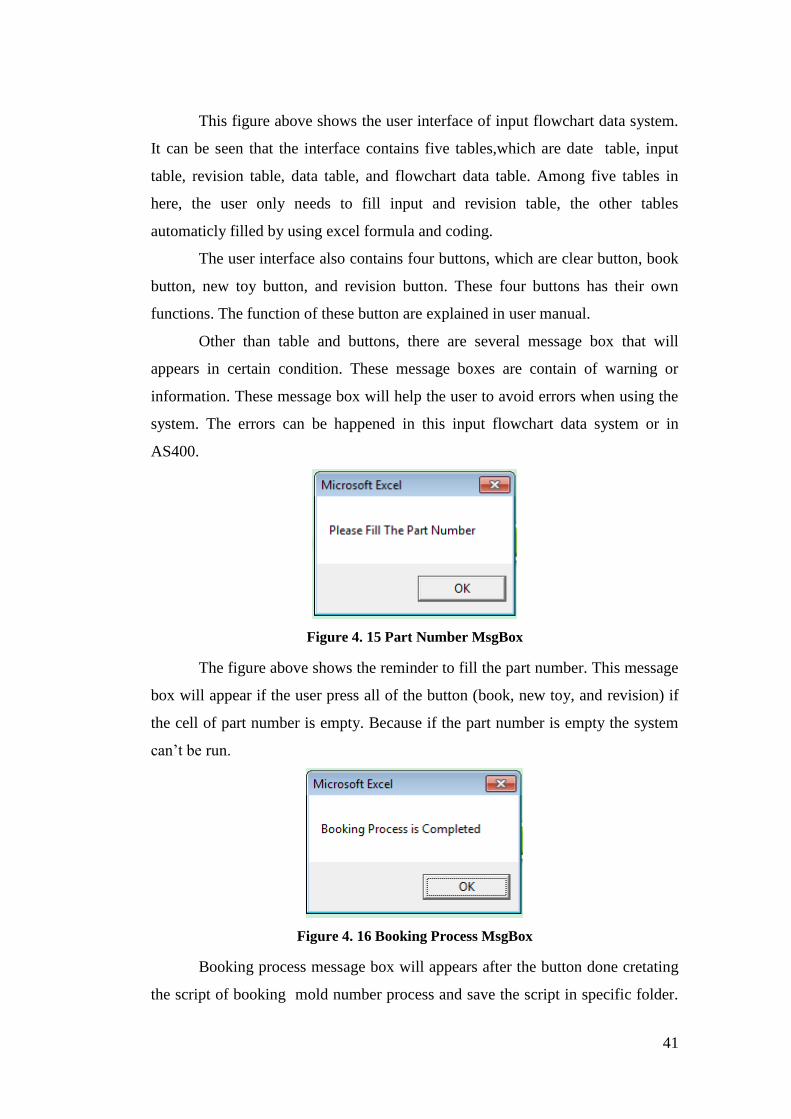
Figure 4. 15 Part Number MsgBox
The figure above shows the reminder to fill the part number. This message
box will appear if the user press all of the button (book, new toy, and revision) if
the cell of part number is empty. Because if the part number is empty the system
can’t be run.
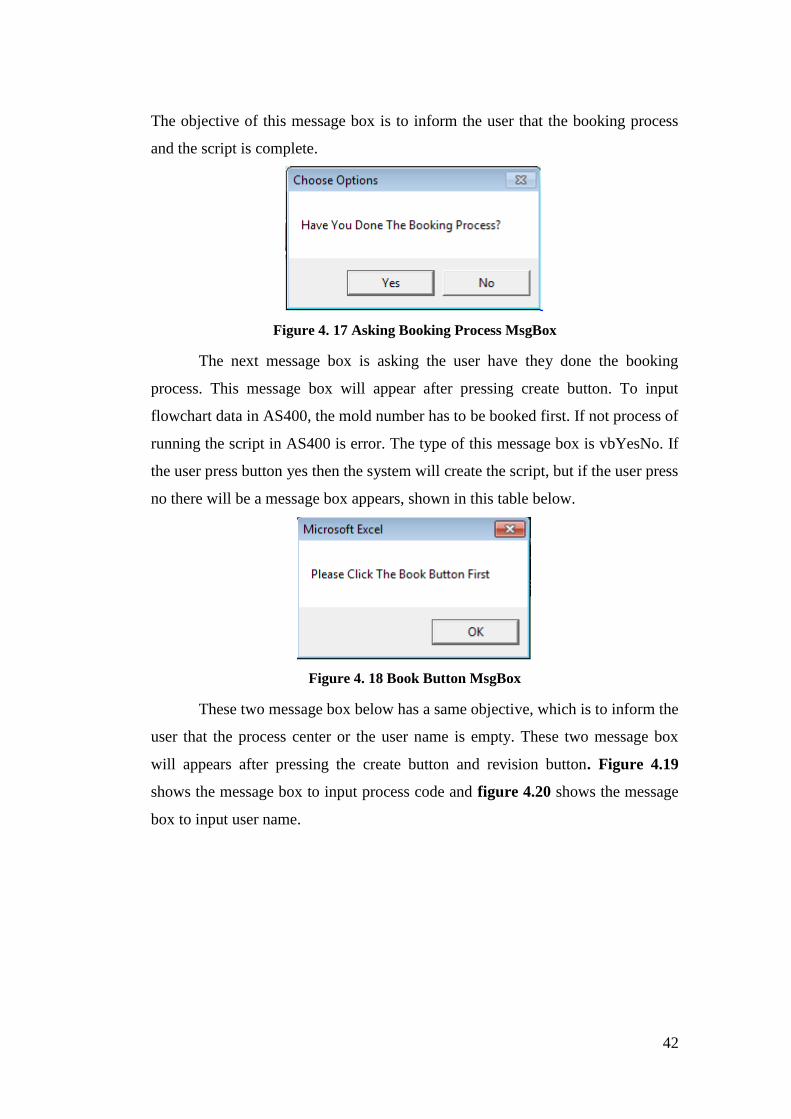
Figure 4. 16 Booking Process MsgBox
Booking process message box will appears after the button done cretating
the script of booking mold number process and save the script in specific folder.
42
The objective of this message box is to inform the user that the booking process
and the script is complete.
Figure 4. 17 Asking Booking Process MsgBox
The next message box is asking the user have they done the booking
process. This message box will appear after pressing create button. To input
flowchart data in AS400, the mold number has to be booked first. If not process of
running the script in AS400 is error. The type of this message box is vbYesNo. If
the user press button yes then the system will create the script, but if the user press
no there will be a message box appears, shown in this table below.
Figure 4. 18 Book Button MsgBox
These two message box below has a same objective, which is to inform the
user that the process center or the user name is empty. These two message box
will appears after pressing the create button and revision button. Figure 4.19
shows the message box to input process code and figure 4.20 shows the message
box to input user name.
43
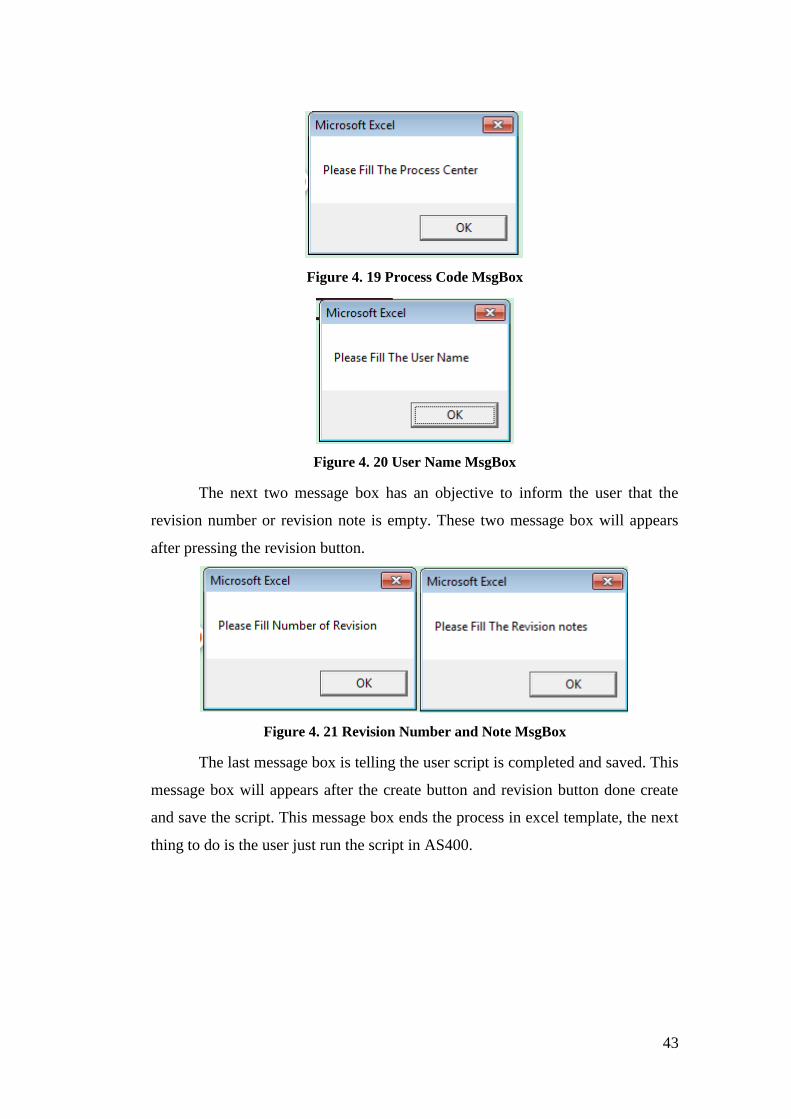
Figure 4. 19 Process Code MsgBox
Figure 4. 20 User Name MsgBox
The next two message box has an objective to inform the user that the
revision number or revision note is empty. These two message box will appears
after pressing the revision button.
Figure 4. 21 Revision Number and Note MsgBox
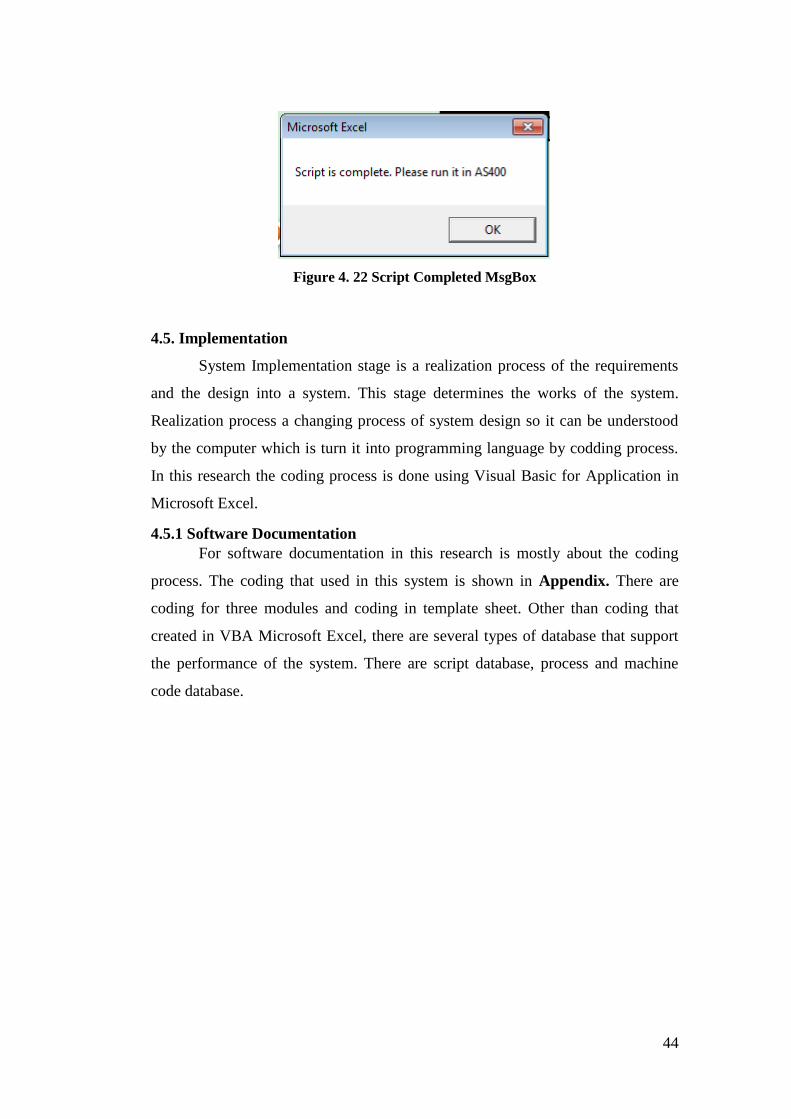
The last message box is telling the user script is completed and saved. This
message box will appears after the create button and revision button done create
and save the script. This message box ends the process in excel template, the next
thing to do is the user just run the script in AS400.
44
Figure 4. 22 Script Completed MsgBox
4.5. Implementation
System Implementation stage is a realization process of the requirements
and the design into a system. This stage determines the works of the system.
Realization process a changing process of system design so it can be understood
by the computer which is turn it into programming language by codding process.
In this research the coding process is done using Visual Basic for Application in
Microsoft Excel.
4.5.1 Software Documentation
For software documentation in this research is mostly about the coding
process. The coding that used in this system is shown in Appendix. There are
coding for three modules and coding in template sheet. Other than coding that
created in VBA Microsoft Excel, there are several types of database that support
the performance of the system. There are script database, process and machine
code database.
45
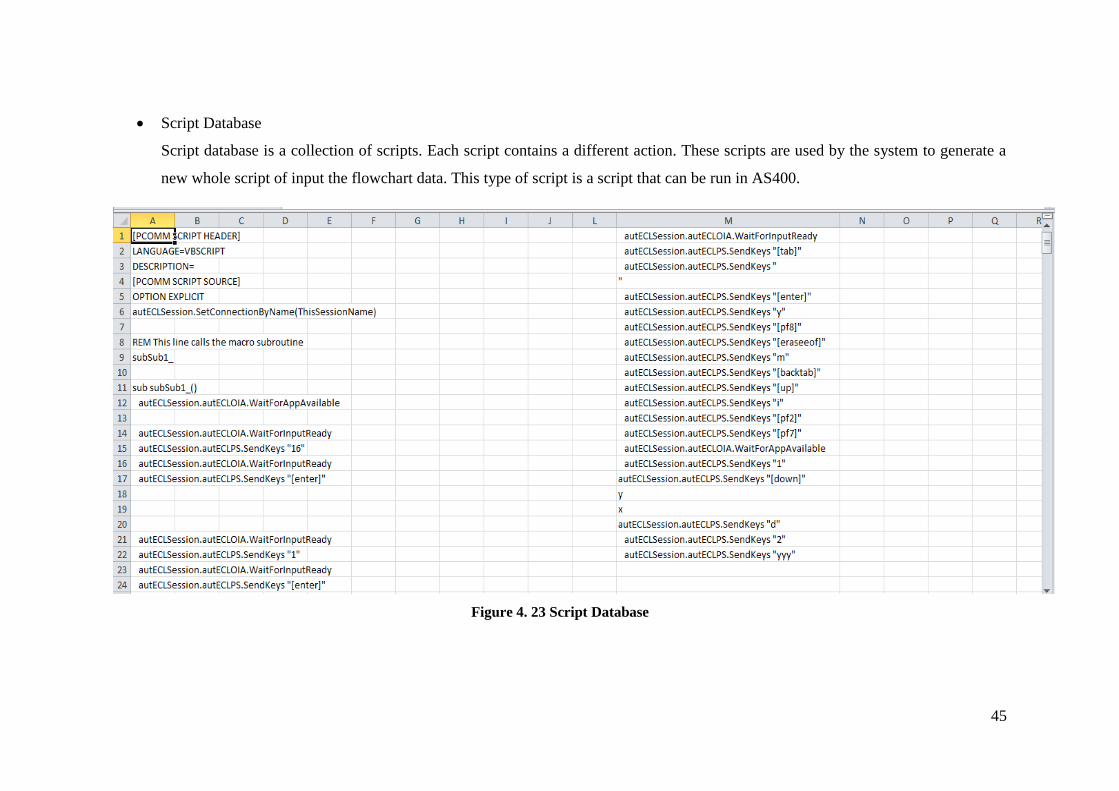
Script Database
Script database is a collection of scripts. Each script contains a different action. These scripts are used by the system to generate a
new whole script of input the flowchart data. This type of script is a script that can be run in AS400.
Figure 4. 23 Script Database
46
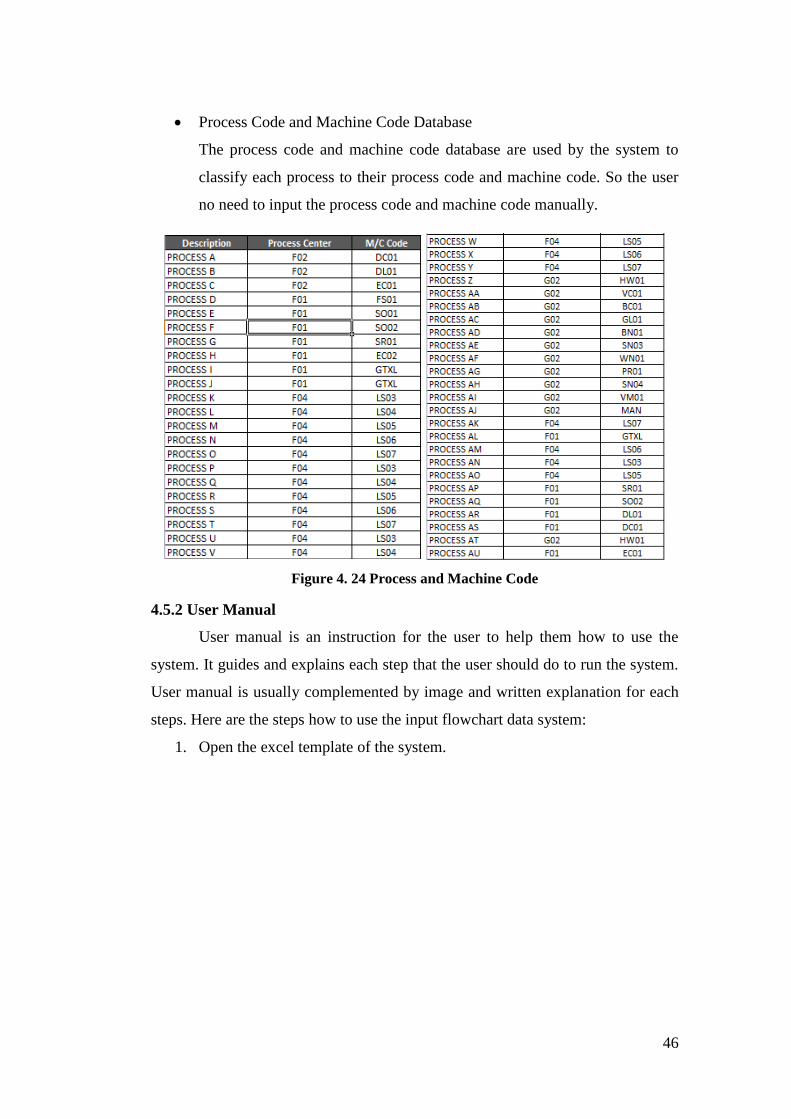
Process Code and Machine Code Database
The process code and machine code database are used by the system to
classify each process to their process code and machine code. So the user
no need to input the process code and machine code manually.
Figure 4. 24 Process and Machine Code
4.5.2 User Manual
User manual is an instruction for the user to help them how to use the
system. It guides and explains each step that the user should do to run the system.
User manual is usually complemented by image and written explanation for each
steps. Here are the steps how to use the input flowchart data system:
1. Open the excel template of the system.
47
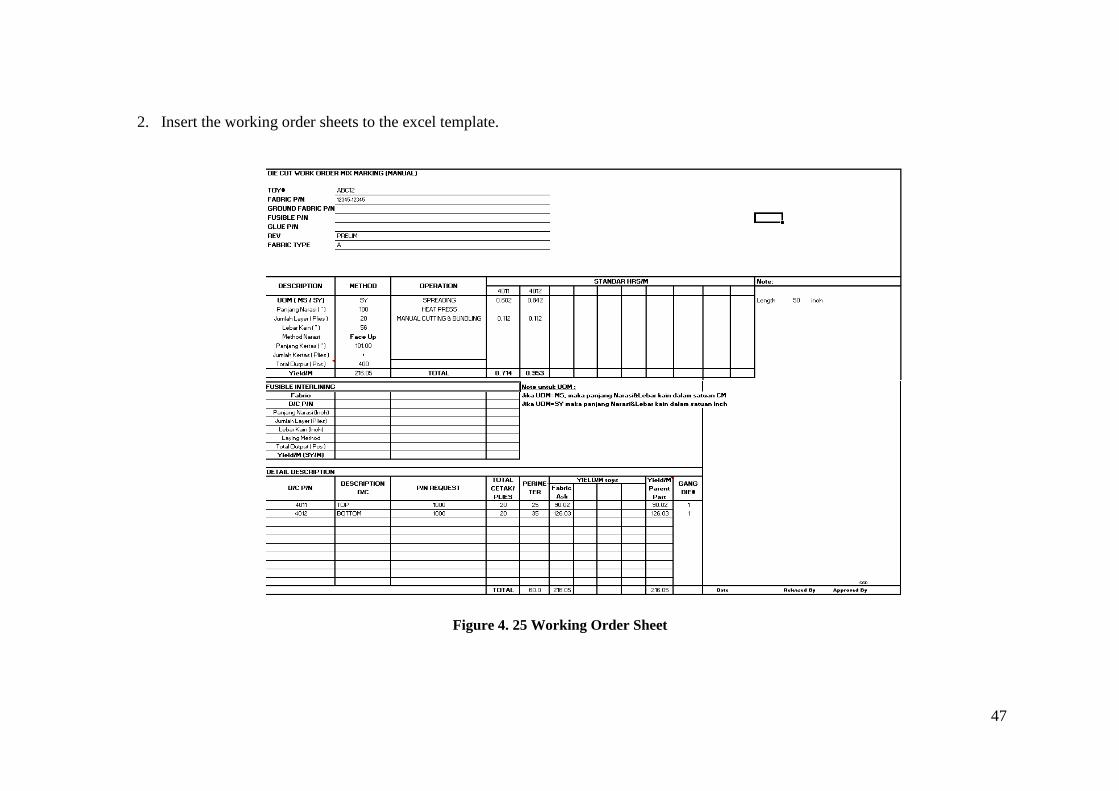
2. Insert the working order sheets to the excel template.
Figure 4. 25 Working Order Sheet
48
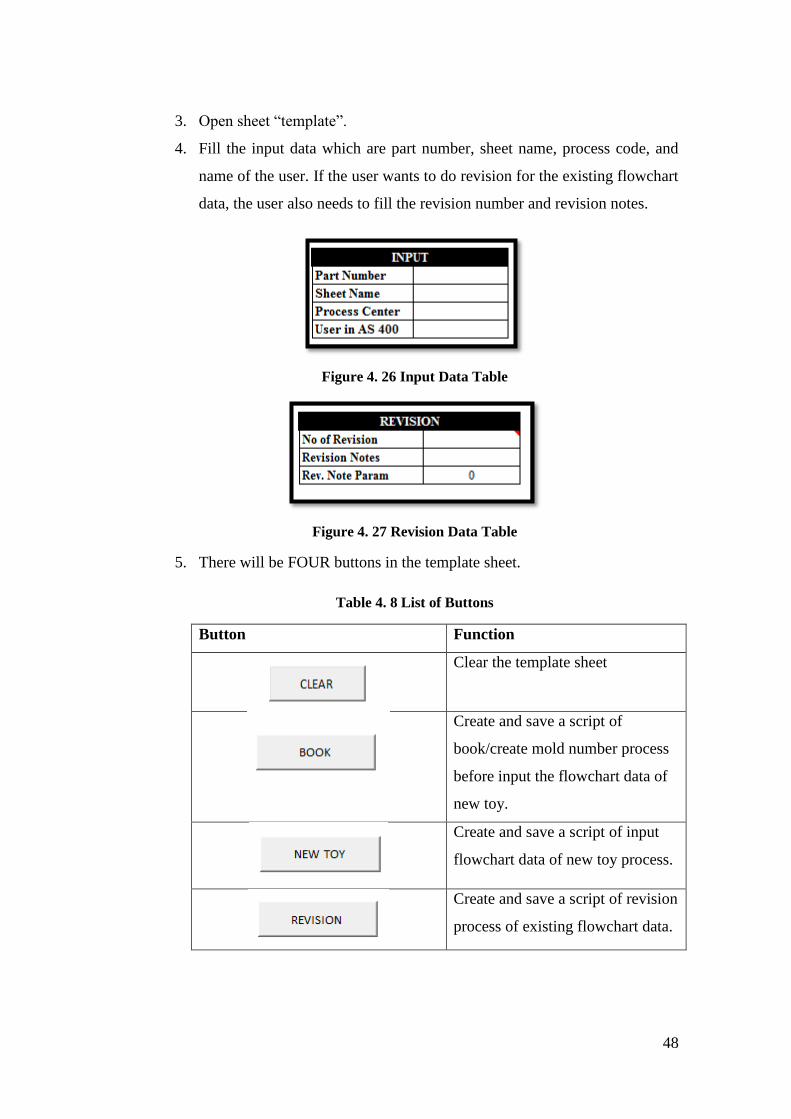
3. Open sheet “template”.
4. Fill the input data which are part number, sheet name, process code, and
name of the user. If the user wants to do revision for the existing flowchart
data, the user also needs to fill the revision number and revision notes.
Figure 4. 26 Input Data Table
Figure 4. 27 Revision Data Table
5. There will be FOUR buttons in the template sheet.
Table 4. 8 List of Buttons
Button Function
Clear the template sheet
Create and save a script of
book/create mold number process
before input the flowchart data of
new toy.
Create and save a script of input
flowchart data of new toy process.
Create and save a script of revision
process of existing flowchart data.
49
If the user wants to input new flowchart data, the user have to press
button then button and if the user wants to do
revision of the existing flowchart data, the user have to press button
.
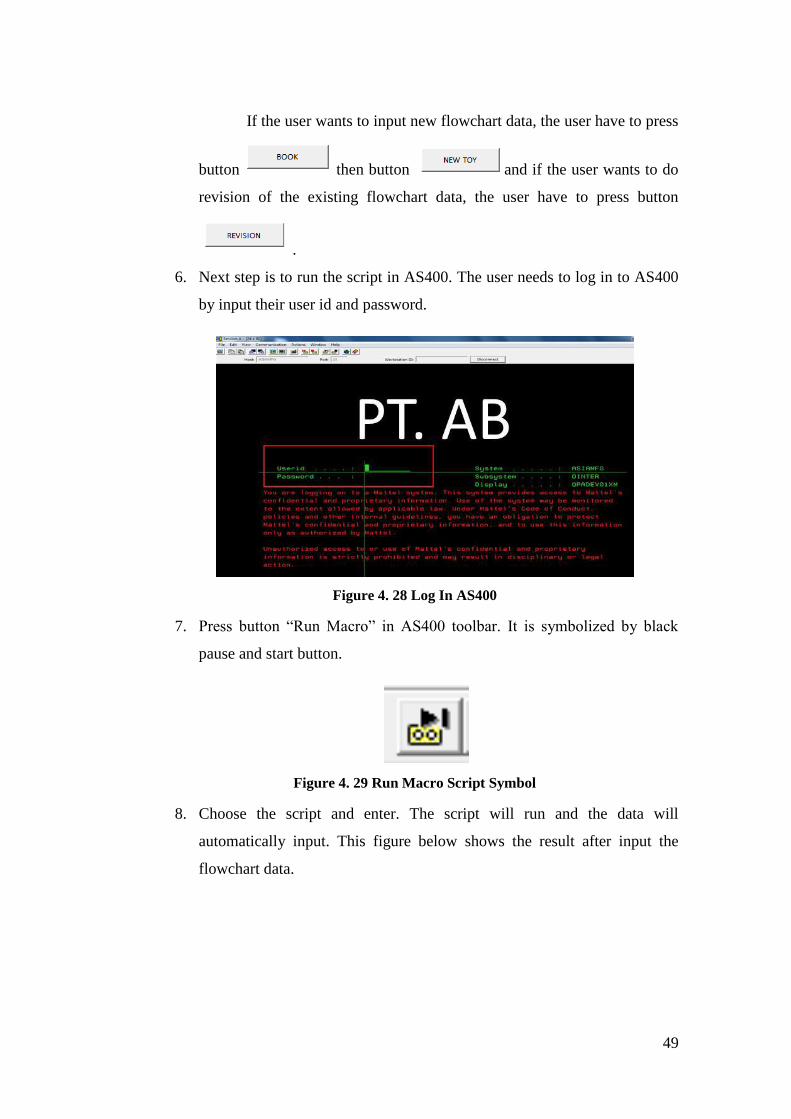
6. Next step is to run the script in AS400. The user needs to log in to AS400
by input their user id and password.
Figure 4. 28 Log In AS400
7. Press button “Run Macro” in AS400 toolbar. It is symbolized by black
pause and start button.
Figure 4. 29 Run Macro Script Symbol
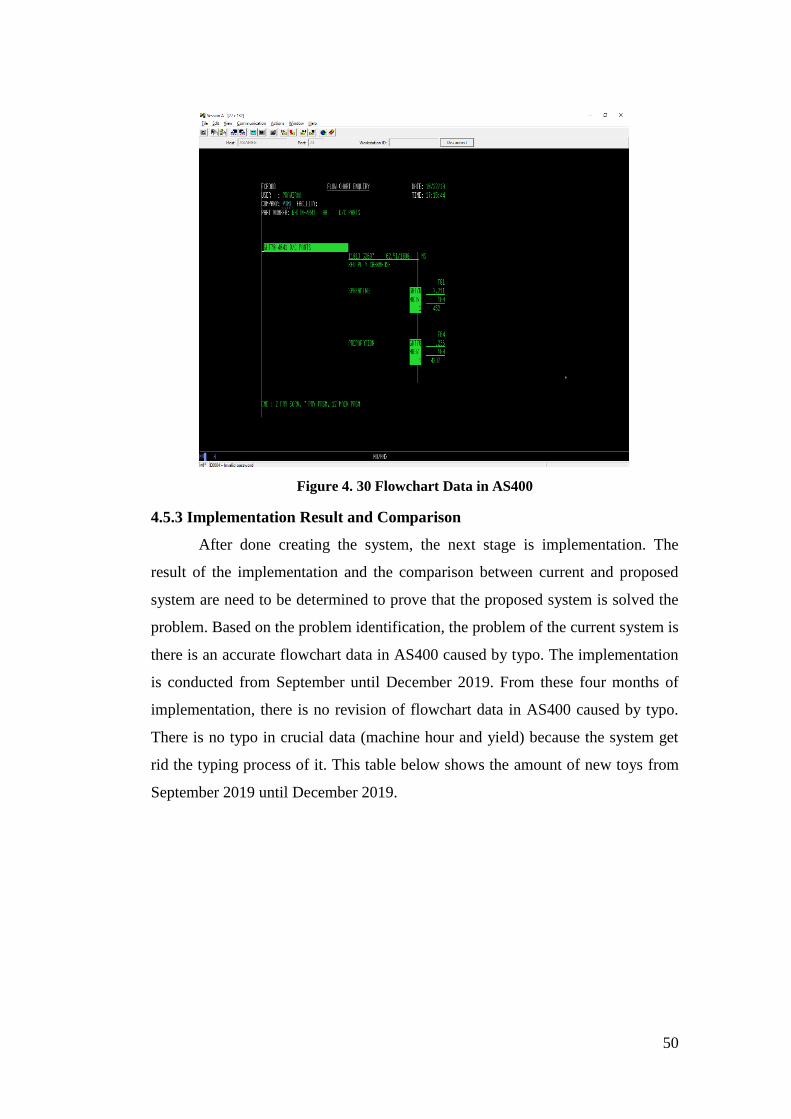
8. Choose the script and enter. The script will run and the data will
automatically input. This figure below shows the result after input the
flowchart data.
50
Figure 4. 30 Flowchart Data in AS400
4.5.3 Implementation Result and Comparison
After done creating the system, the next stage is implementation. The
result of the implementation and the comparison between current and proposed
system are need to be determined to prove that the proposed system is solved the
problem. Based on the problem identification, the problem of the current system is
there is an accurate flowchart data in AS400 caused by typo. The implementation
is conducted from September until December 2019. From these four months of
implementation, there is no revision of flowchart data in AS400 caused by typo.
There is no typo in crucial data (machine hour and yield) because the system get
rid the typing process of it. This table below shows the amount of new toys from
September 2019 until December 2019.
51
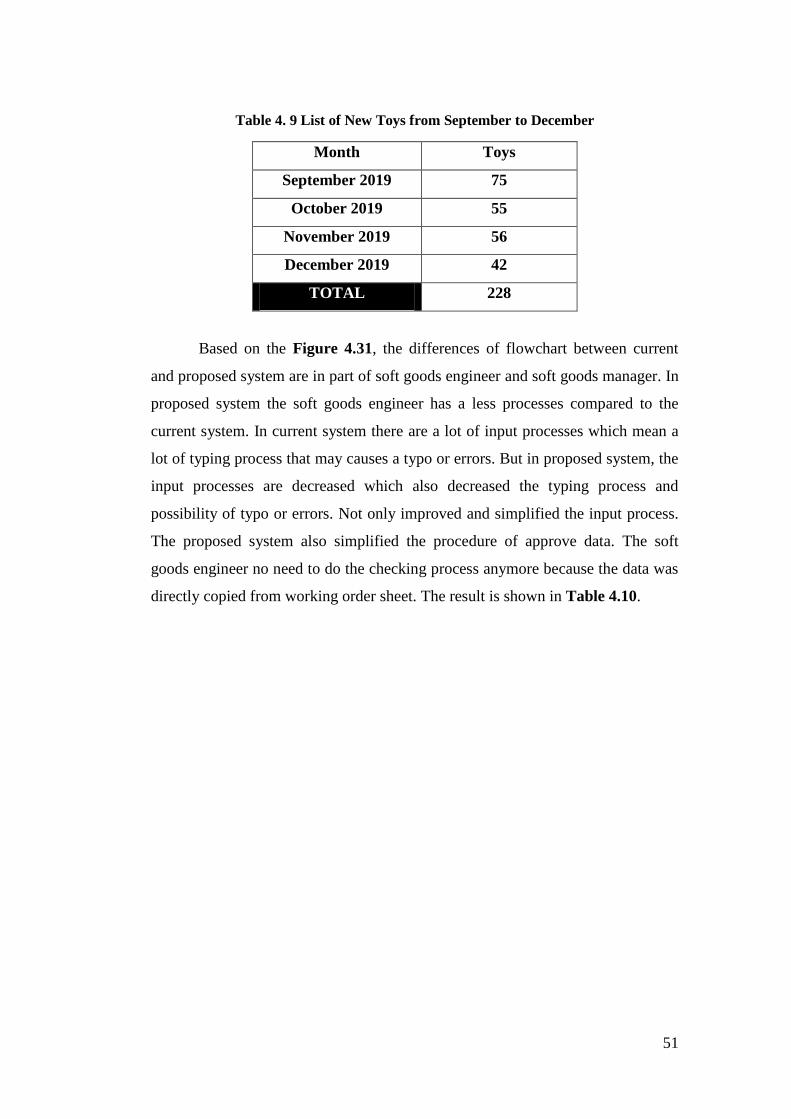
Table 4. 9 List of New Toys from September to December
Month Toys
September 2019 75
October 2019 55
November 2019 56
December 2019 42
TOTAL 228
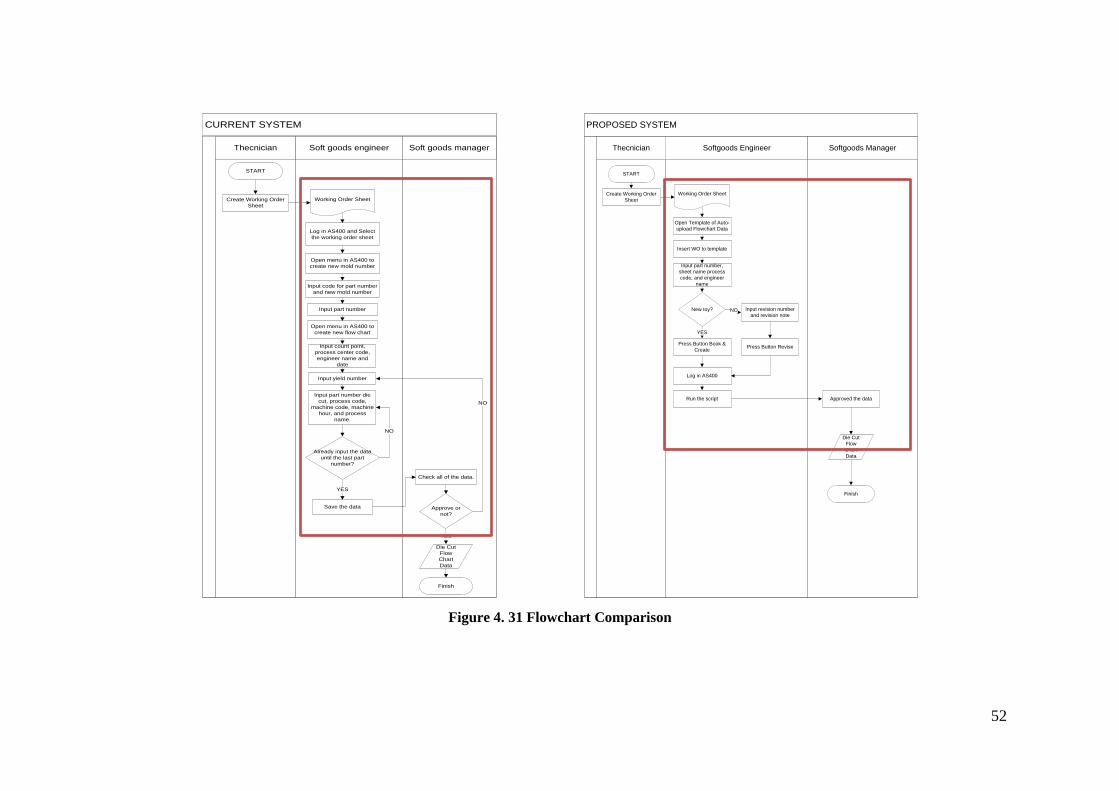
Based on the Figure 4.31, the differences of flowchart between current
and proposed system are in part of soft goods engineer and soft goods manager. In
proposed system the soft goods engineer has a less processes compared to the
current system. In current system there are a lot of input processes which mean a
lot of typing process that may causes a typo or errors. But in proposed system, the
input processes are decreased which also decreased the typing process and
possibility of typo or errors. Not only improved and simplified the input process.
The proposed system also simplified the procedure of approve data. The soft
goods engineer no need to do the checking process anymore because the data was
directly copied from working order sheet. The result is shown in Table 4.10.
52
CURRENT SYSTEM
Thecnician Soft goods managerSoft goods engineer
START
Log in AS400 and Select
the working order sheet
Open menu in AS400 to
create new mold number
Input code for part number
and new mold number
Input part number
Open menu in AS400 to
create new flow chart
Input count point,
process center code,
engineer name and
date
Input yield number
Input part number die
cut, process code,
machine code, machine
hour, and process
name.
Already input the data
until the last part
number?
Save the data
Check all of the data.
Approve or
not?
Die Cut
Flow
Chart
Data
Finish
Create Working Order
Sheet
Working Order Sheet
NO
YES
NO
YES
PROPOSED SYSTEM
Softgoods Engineer Softgoods ManagerThecnician
Create Working Order
Sheet
START
Working Order Sheet
Open Template of Auto-
upload Flowchart Data
Insert WO to template
Input part number,
sheet name process
code, and engineer
name
New toy?
Press Button Book &
Create
Input revision number
and revision note
Press Button Revise
Log in AS400
Run the script
Finish
Die Cut
Flow
Chart
Data
NO
YES
Approved the data
Figure 4. 31 Flowchart Comparison
53
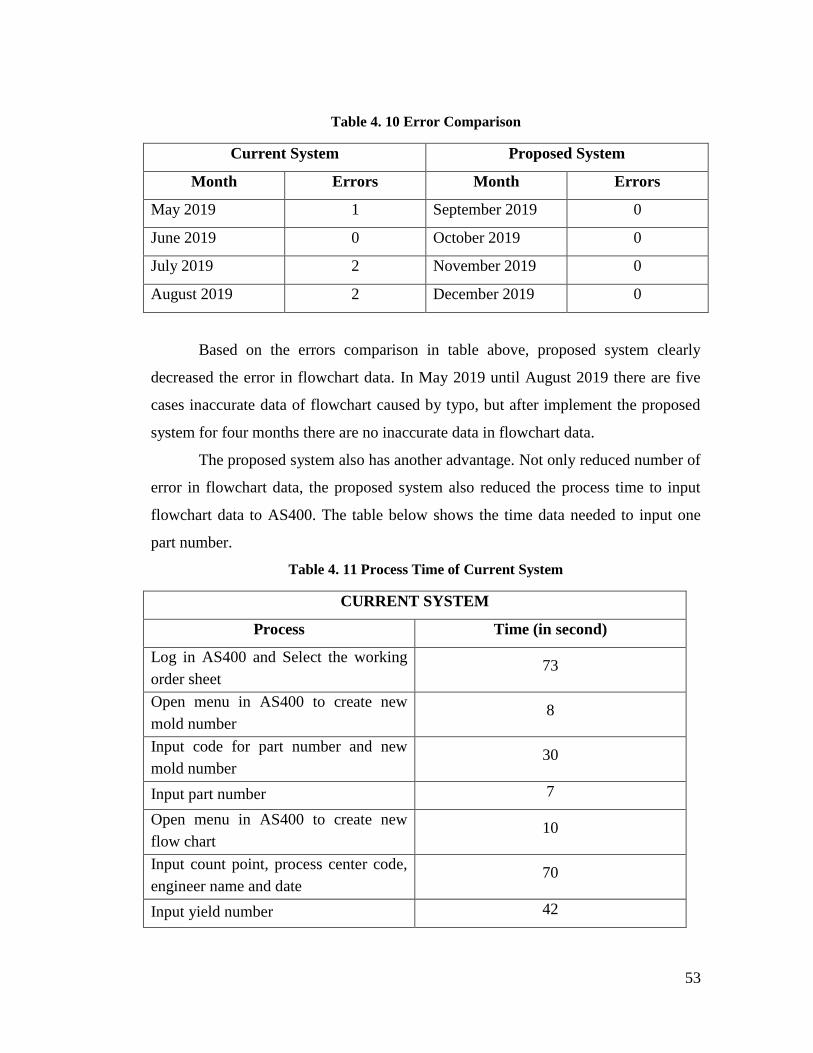
Table 4. 10 Error Comparison
Current System Proposed System
Month Errors Month Errors
May 2019 1 September 2019 0
June 2019 0 October 2019 0
July 2019 2 November 2019 0
August 2019 2 December 2019 0
Based on the errors comparison in table above, proposed system clearly
decreased the error in flowchart data. In May 2019 until August 2019 there are five
cases inaccurate data of flowchart caused by typo, but after implement the proposed
system for four months there are no inaccurate data in flowchart data.
The proposed system also has another advantage. Not only reduced number of
error in flowchart data, the proposed system also reduced the process time to input
flowchart data to AS400. The table below shows the time data needed to input one
part number.
Table 4. 11 Process Time of Current System
CURRENT SYSTEM
Process Time (in second)
Log in AS400 and Select the working
order sheet 73
Open menu in AS400 to create new
mold number 8
Input code for part number and new
mold number 30
Input part number 7
Open menu in AS400 to create new
flow chart 10
Input count point, process center code,
engineer name and date 70
Input yield number 42
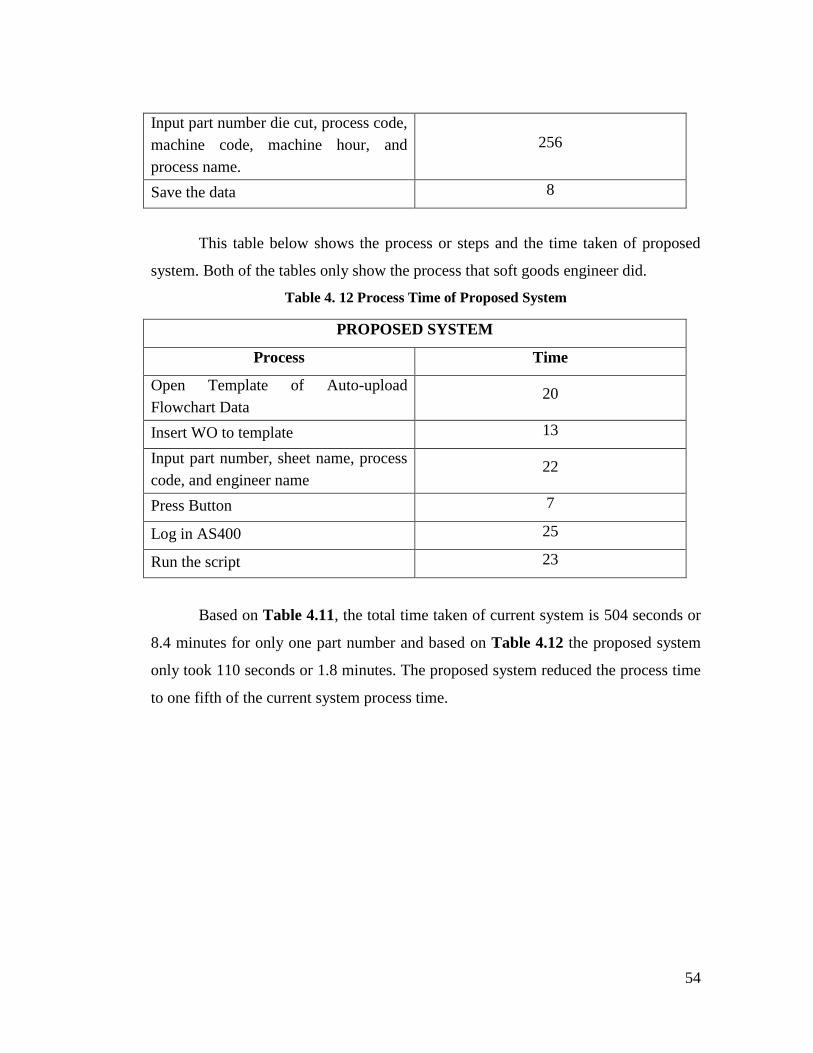
54
Input part number die cut, process code,
machine code, machine hour, and
process name.
256
Save the data 8
This table below shows the process or steps and the time taken of proposed
system. Both of the tables only show the process that soft goods engineer did.
Table 4. 12 Process Time of Proposed System
PROPOSED SYSTEM
Process Time
Open Template of Auto-upload
Flowchart Data 20
Insert WO to template 13
Input part number, sheet name, process
code, and engineer name 22
Press Button 7
Log in AS400 25
Run the script 23
Based on Table 4.11, the total time taken of current system is 504 seconds or
8.4 minutes for only one part number and based on Table 4.12 the proposed system
only took 110 seconds or 1.8 minutes. The proposed system reduced the process time
to one fifth of the current system process time.
55
CHAPTER V
CONCLUSION & RECOMMENDATION
5.1Conclusion
Based on the analysis of the research, the conclusion of this research is the
manual input of flowchart data to AS400 in soft goods engineering division of PT.
AB Indonesia caused inaccurate data. The incorrect flowchart data in AS400 affected
the other divisions in PT. AB Indonesia, which are production division, cost
engineering division, and material division. Based on the observation there are 5
cases of data error in flowchart data from May 2019 until August 2019. Flowchart
data in AS400 contain several types of data and that five data error occur in different
types of data. After identified the problem, then proposed the new system design
using system development life cycle or SDLC methodology. The implementation
process of the proposed system succeeded to reach the objective of this research
which is to reduce inaccurate data of flowchart data in AS400. The proposed system
was implemented from September 2019 until December 2019 and the result showed
no incorrect data of flowchart data in AS400. The proposed system is not only
reduced the errors but also it reduced the input process time. The current system took
504 seconds to input flowchart data of one toy and the proposed system only took
110 seconds.
5.2 Recommendation
There are several recommendations for the further research in order to
improve and maximize the system, which stated as follows:
1. Develop the system based on new requirements that may occur in the future.
2. Conduct a training about the steps to use this system and the details of it, so
the user can use the system smoothly and know what they have to do and
don’t. This training also can prevent errors in the system.
56
REFERENCES
Abdullah, D. (2017). Merancang Aplikasi Perpustakaan Menggunakan SDLC.
Lhokseumawe, Aceh: SEFA BUMI PERSADA .
Alan Dennis, B. H. (2012). System Analysis and Design.
Bassil, Y. (2012). A Simulation Model for the Waterfall. International Journal of
Engineering & Technology.
Budiani, N. (2000). Data Flow Diagram: Sebagai Alat Bantu Design System.
Dari, W. (2015). Penerapan Metode System Development Life Cycle pada
Pembuatan Sistem Informasi Penjualan Produk Batik Kurowo Jakarta.
JURNAL KHATULISTIWA INFORMATIKA, VOL. 3, NO. 2 .
Kendall, K., & Kendall, J. E. (2014). Systems Analysis and Design. Pearson
Education.
Ladjamudin, A.-B. b. (2005). Analisis dan Desain Sistem Informasi. Yogyakarta:
Graha Ilmu.
Sethi, M. (2013). Information System and System Development Life Cycle.
Shelly, G. B., & Rosenblatt, H. J. (2011). SYSTEMS ANALYSIS AND DESIGN.
Course Technology.
Valacich, J., & Schneider, C. (2010). Information Systems Today: Managing the
Digital World. Prentice Hall.
Walkenbach, J. (2013). Ms. Excel VBA Programming for Dummies.
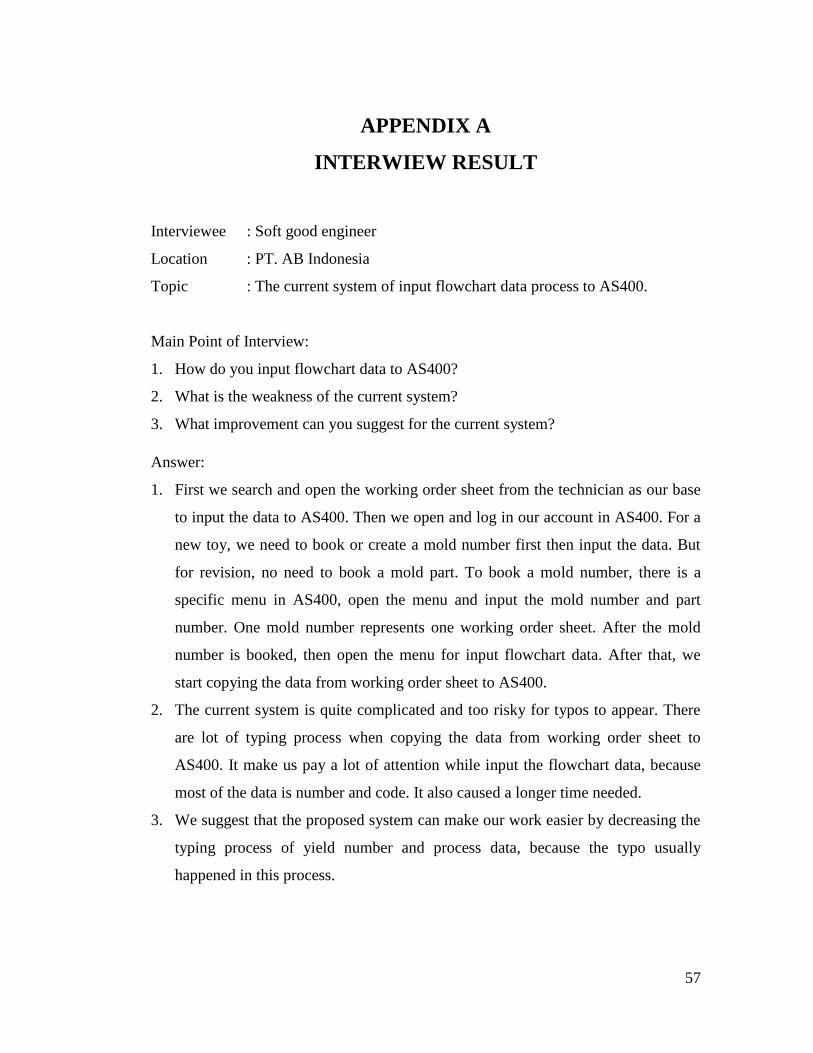
57
APPENDIX A
INTERWIEW RESULT
Interviewee : Soft good engineer
Location : PT. AB Indonesia
Topic : The current system of input flowchart data process to AS400.
Main Point of Interview:
1. How do you input flowchart data to AS400?
2. What is the weakness of the current system?
3. What improvement can you suggest for the current system?
Answer:
1. First we search and open the working order sheet from the technician as our base
to input the data to AS400. Then we open and log in our account in AS400. For a
new toy, we need to book or create a mold number first then input the data. But
for revision, no need to book a mold part. To book a mold number, there is a
specific menu in AS400, open the menu and input the mold number and part
number. One mold number represents one working order sheet. After the mold
number is booked, then open the menu for input flowchart data. After that, we
start copying the data from working order sheet to AS400.
2. The current system is quite complicated and too risky for typos to appear. There
are lot of typing process when copying the data from working order sheet to
AS400. It make us pay a lot of attention while input the flowchart data, because
most of the data is number and code. It also caused a longer time needed.
3. We suggest that the proposed system can make our work easier by decreasing the
typing process of yield number and process data, because the typo usually
happened in this process.
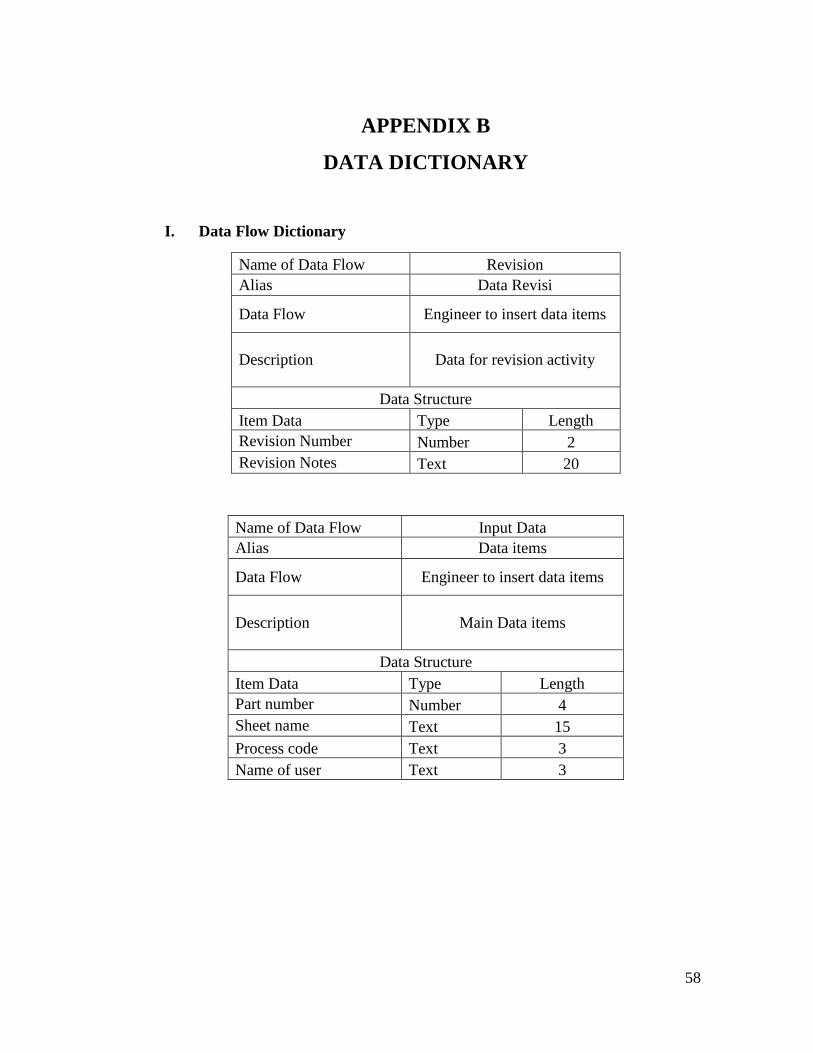
58
APPENDIX B
DATA DICTIONARY
I. Data Flow Dictionary
Name of Data Flow Revision
Alias Data Revisi
Data Flow Engineer to insert data items
Description Data for revision activity
Data Structure
Item Data Type Length
Revision Number Number 2
Revision Notes Text 20
Name of Data Flow Input Data
Alias Data items
Data Flow Engineer to insert data items
Description Main Data items
Data Structure
Item Data Type Length
Part number Number 4
Sheet name Text 15
Process code Text 3
Name of user Text 3
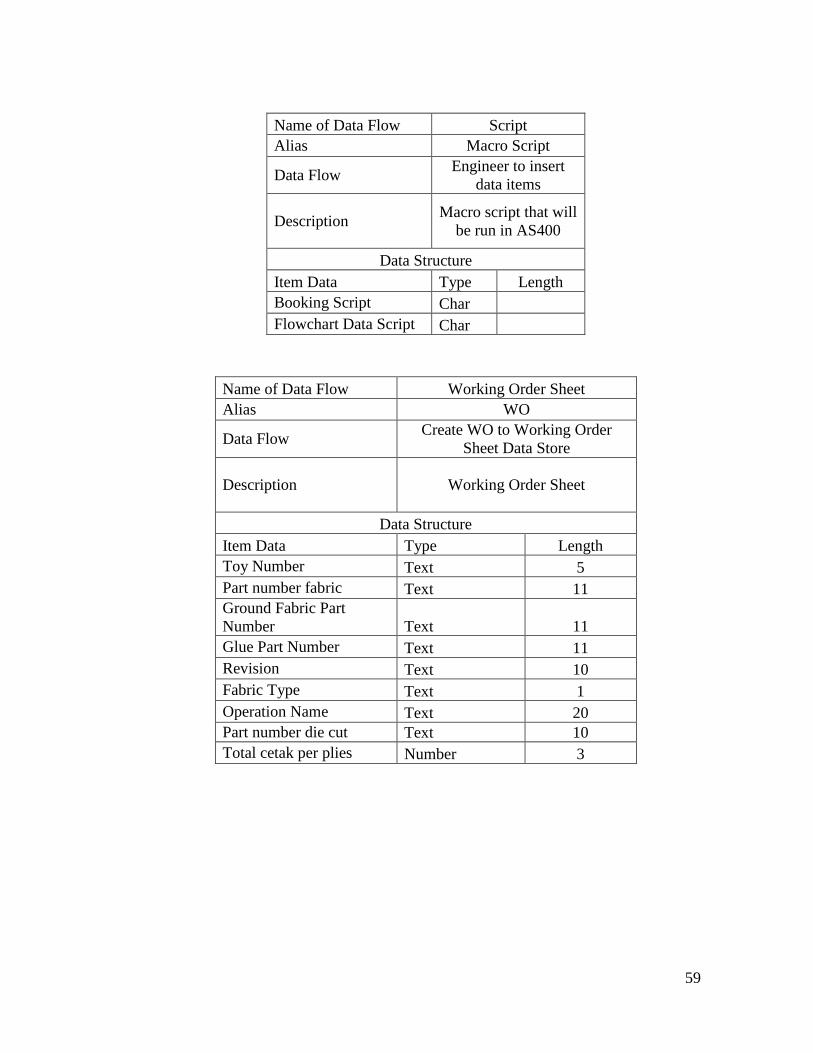
59
Name of Data Flow Script
Alias Macro Script
Data Flow Engineer to insert
data items
Description Macro script that will
be run in AS400
Data Structure
Item Data Type Length
Booking Script Char
Flowchart Data Script Char
Name of Data Flow Working Order Sheet
Alias WO
Data Flow Create WO to Working Order
Sheet Data Store
Description Working Order Sheet
Data Structure
Item Data Type Length
Toy Number Text 5
Part number fabric Text 11
Ground Fabric Part
Number Text 11
Glue Part Number Text 11
Revision Text 10
Fabric Type Text 1
Operation Name Text 20
Part number die cut Text 10
Total cetak per plies Number 3
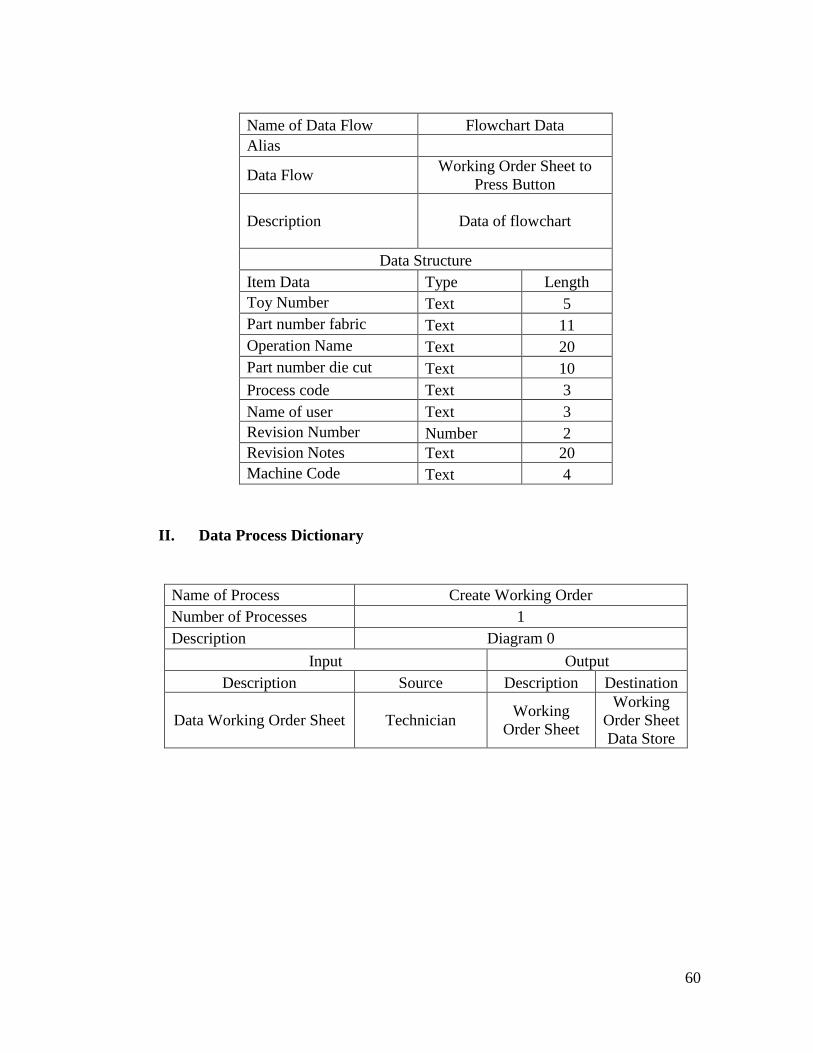
60
Name of Data Flow Flowchart Data
Alias
Data Flow Working Order Sheet to
Press Button
Description Data of flowchart
Data Structure
Item Data Type Length
Toy Number Text 5
Part number fabric Text 11
Operation Name Text 20
Part number die cut Text 10
Process code Text 3
Name of user Text 3
Revision Number Number 2
Revision Notes Text 20
Machine Code Text 4
II. Data Process Dictionary
Name of Process Create Working Order
Number of Processes 1
Description Diagram 0
Input Output
Description Source Description Destination
Data Working Order Sheet Technician Working
Order Sheet
Working
Order Sheet
Data Store
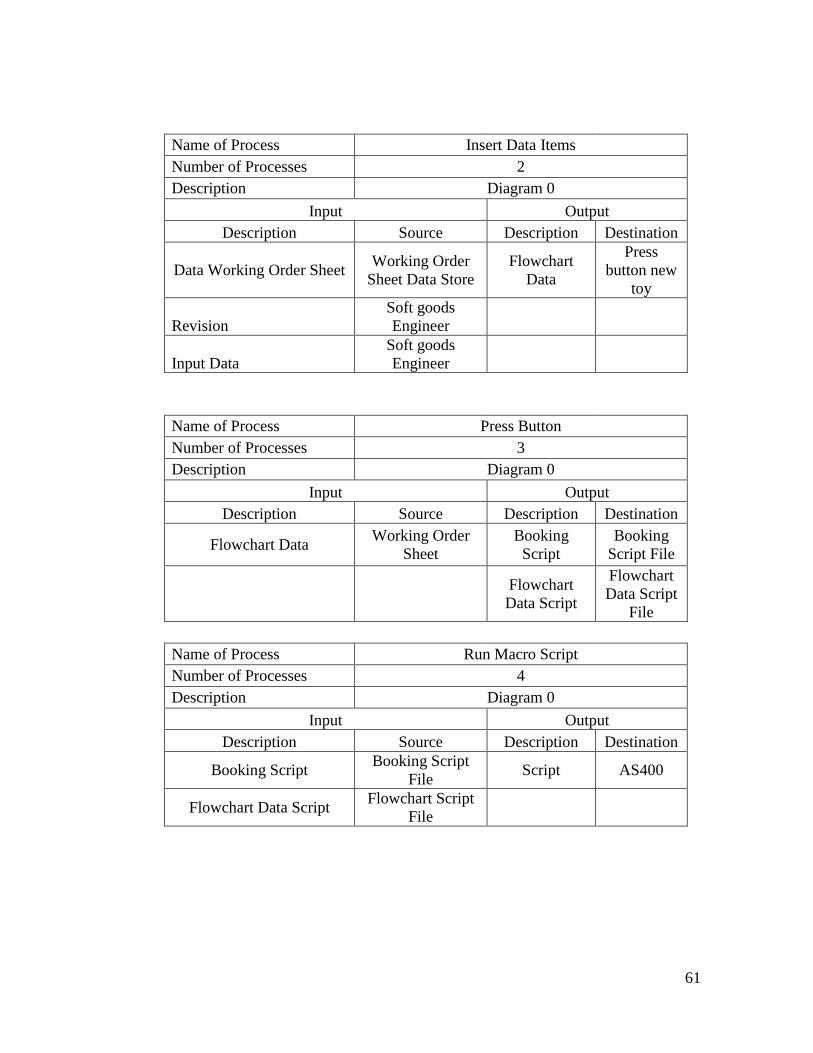
61
Name of Process Insert Data Items
Number of Processes 2
Description Diagram 0
Input Output
Description Source Description Destination
Data Working Order Sheet Working Order
Sheet Data Store
Flowchart
Data
Press
button new
toy
Revision
Soft goods
Engineer
Input Data
Soft goods
Engineer
Name of Process Press Button
Number of Processes 3
Description Diagram 0
Input Output
Description Source Description Destination
Flowchart Data Working Order
Sheet
Booking
Script
Booking
Script File
Flowchart
Data Script
Flowchart
Data Script
File
Name of Process Run Macro Script
Number of Processes 4
Description Diagram 0
Input Output
Description Source Description Destination
Booking Script Booking Script
File Script AS400
Flowchart Data Script Flowchart Script
File
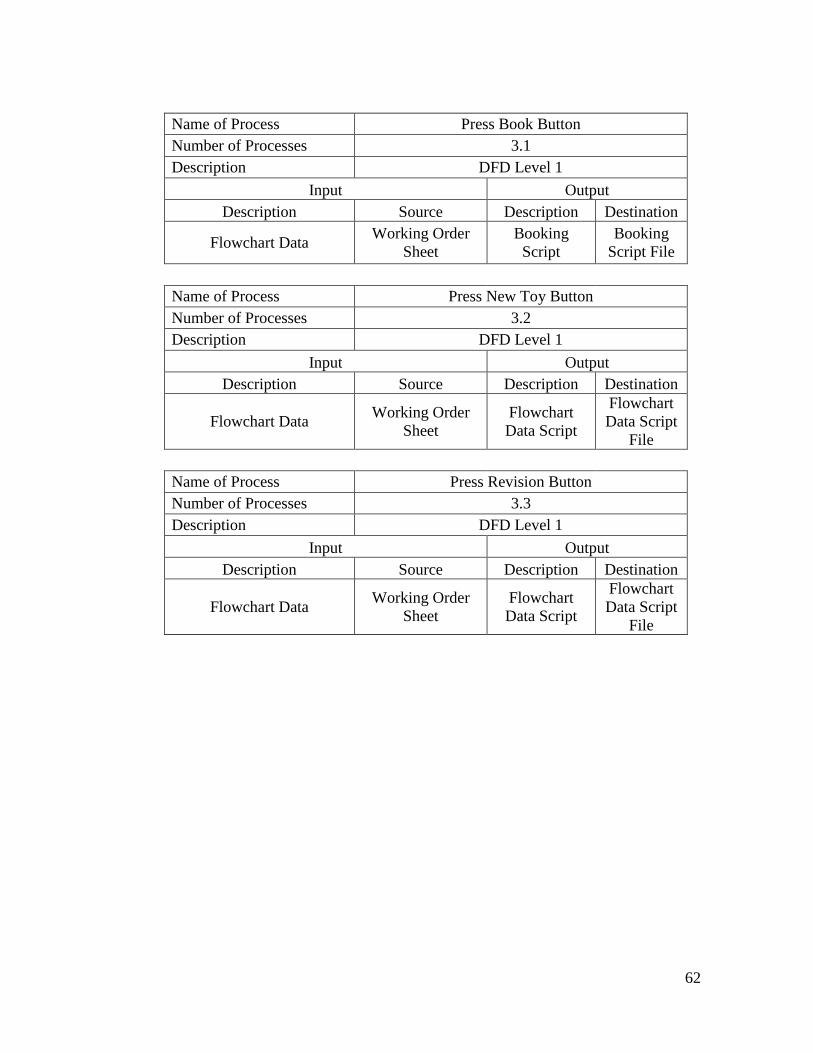
62
Name of Process Press Book Button
Number of Processes 3.1
Description DFD Level 1
Input Output
Description Source Description Destination
Flowchart Data Working Order
Sheet
Booking
Script
Booking
Script File
Name of Process Press New Toy Button
Number of Processes 3.2
Description DFD Level 1
Input Output
Description Source Description Destination
Flowchart Data Working Order
Sheet
Flowchart
Data Script
Flowchart
Data Script
File
Name of Process Press Revision Button
Number of Processes 3.3
Description DFD Level 1
Input Output
Description Source Description Destination
Flowchart Data Working Order
Sheet
Flowchart
Data Script
Flowchart
Data Script
File
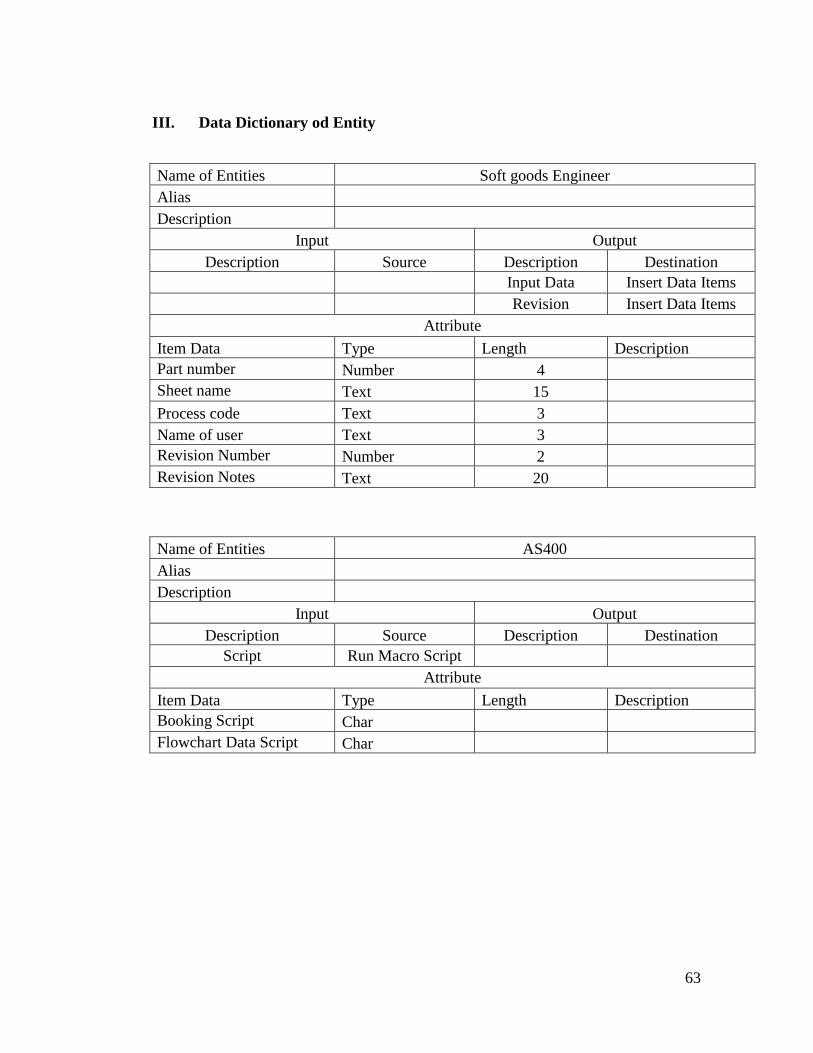
63
III. Data Dictionary od Entity
Name of Entities Soft goods Engineer
Alias
Description
Input Output
Description Source Description Destination
Input Data Insert Data Items
Revision Insert Data Items
Attribute
Item Data Type Length Description
Part number Number 4
Sheet name Text 15
Process code Text 3
Name of user Text 3
Revision Number Number 2
Revision Notes Text 20
Name of Entities AS400
Alias
Description
Input Output
Description Source Description Destination
Script Run Macro Script
Attribute
Item Data Type Length Description
Booking Script Char
Flowchart Data Script Char
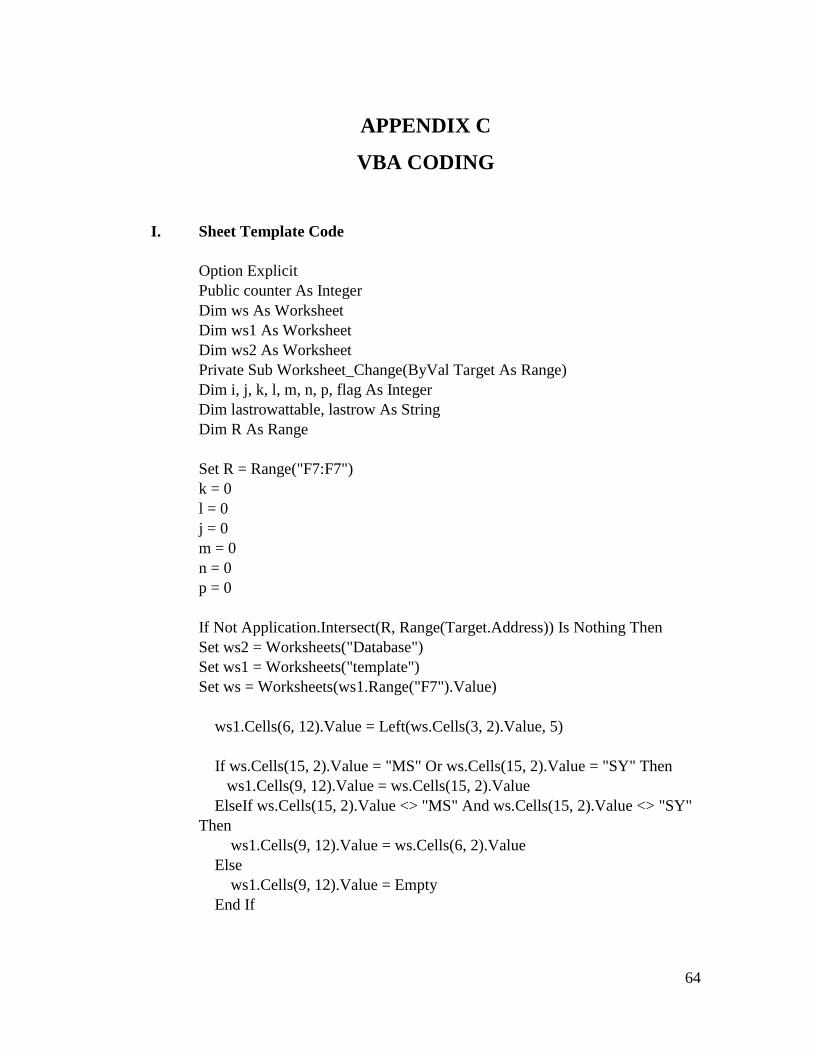
64
APPENDIX C
VBA CODING
I. Sheet Template Code
Option Explicit
Public counter As Integer
Dim ws As Worksheet
Dim ws1 As Worksheet
Dim ws2 As Worksheet
Private Sub Worksheet_Change(ByVal Target As Range)
Dim i, j, k, l, m, n, p, flag As Integer
Dim lastrowattable, lastrow As String
Dim R As Range
Set R = Range("F7:F7")
k = 0
l = 0
j = 0
m = 0
n = 0
p = 0
If Not Application.Intersect(R, Range(Target.Address)) Is Nothing Then
Set ws2 = Worksheets("Database")
Set ws1 = Worksheets("template")
Set ws = Worksheets(ws1.Range("F7").Value)
ws1.Cells(6, 12).Value = Left(ws.Cells(3, 2).Value, 5)
If ws.Cells(15, 2).Value = "MS" Or ws.Cells(15, 2).Value = "SY" Then
ws1.Cells(9, 12).Value = ws.Cells(15, 2).Value
ElseIf ws.Cells(15, 2).Value <> "MS" And ws.Cells(15, 2).Value <> "SY"
Then
ws1.Cells(9, 12).Value = ws.Cells(6, 2).Value
Else
ws1.Cells(9, 12).Value = Empty
End If
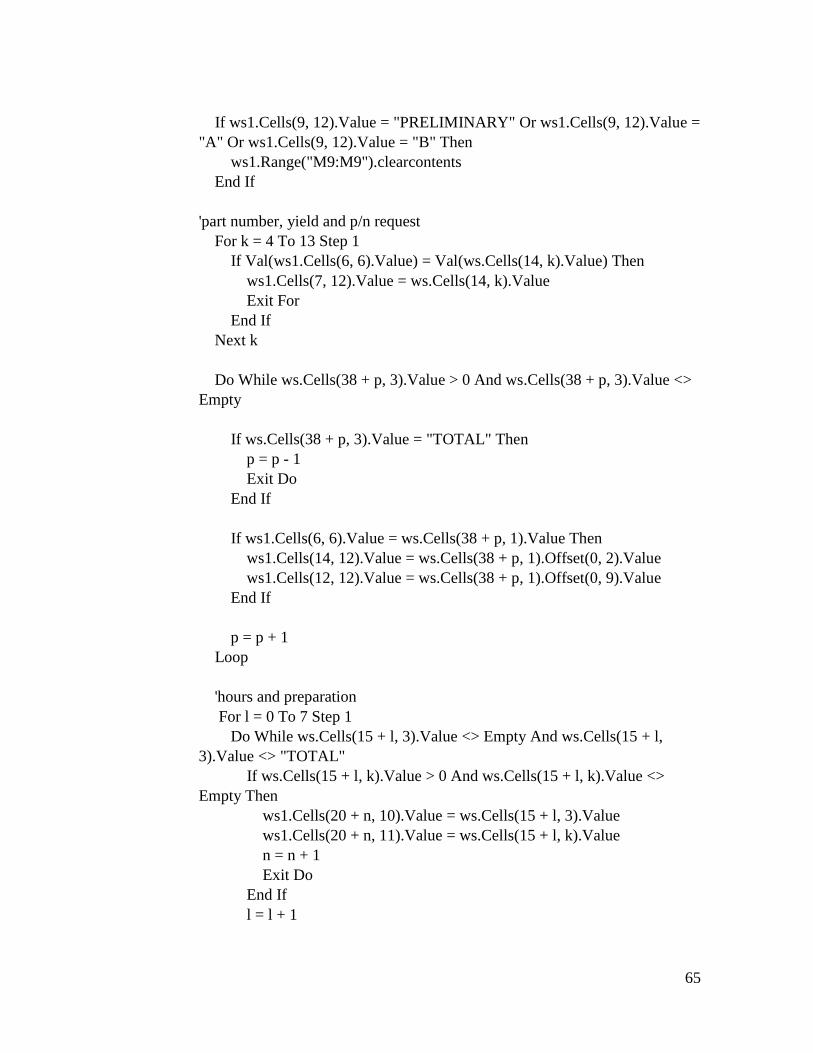
65
If ws1.Cells(9, 12).Value = "PRELIMINARY" Or ws1.Cells(9, 12).Value =
"A" Or ws1.Cells(9, 12).Value = "B" Then
ws1.Range("M9:M9").clearcontents
End If
'part number, yield and p/n request
For k = 4 To 13 Step 1
If Val(ws1.Cells(6, 6).Value) = Val(ws.Cells(14, k).Value) Then
ws1.Cells(7, 12).Value = ws.Cells(14, k).Value
Exit For
End If
Next k
Do While ws.Cells(38 + p, 3).Value > 0 And ws.Cells(38 + p, 3).Value <>
Empty
If ws.Cells(38 + p, 3).Value = "TOTAL" Then
p = p - 1
Exit Do
End If
If ws1.Cells(6, 6).Value = ws.Cells(38 + p, 1).Value Then
ws1.Cells(14, 12).Value = ws.Cells(38 + p, 1).Offset(0, 2).Value
ws1.Cells(12, 12).Value = ws.Cells(38 + p, 1).Offset(0, 9).Value
End If
p = p + 1
Loop
'hours and preparation
For l = 0 To 7 Step 1
Do While ws.Cells(15 + l, 3).Value <> Empty And ws.Cells(15 + l,
3).Value <> "TOTAL"
If ws.Cells(15 + l, k).Value > 0 And ws.Cells(15 + l, k).Value <>
Empty Then
ws1.Cells(20 + n, 10).Value = ws.Cells(15 + l, 3).Value
ws1.Cells(20 + n, 11).Value = ws.Cells(15 + l, k).Value
n = n + 1
Exit Do
End If
l = l + 1
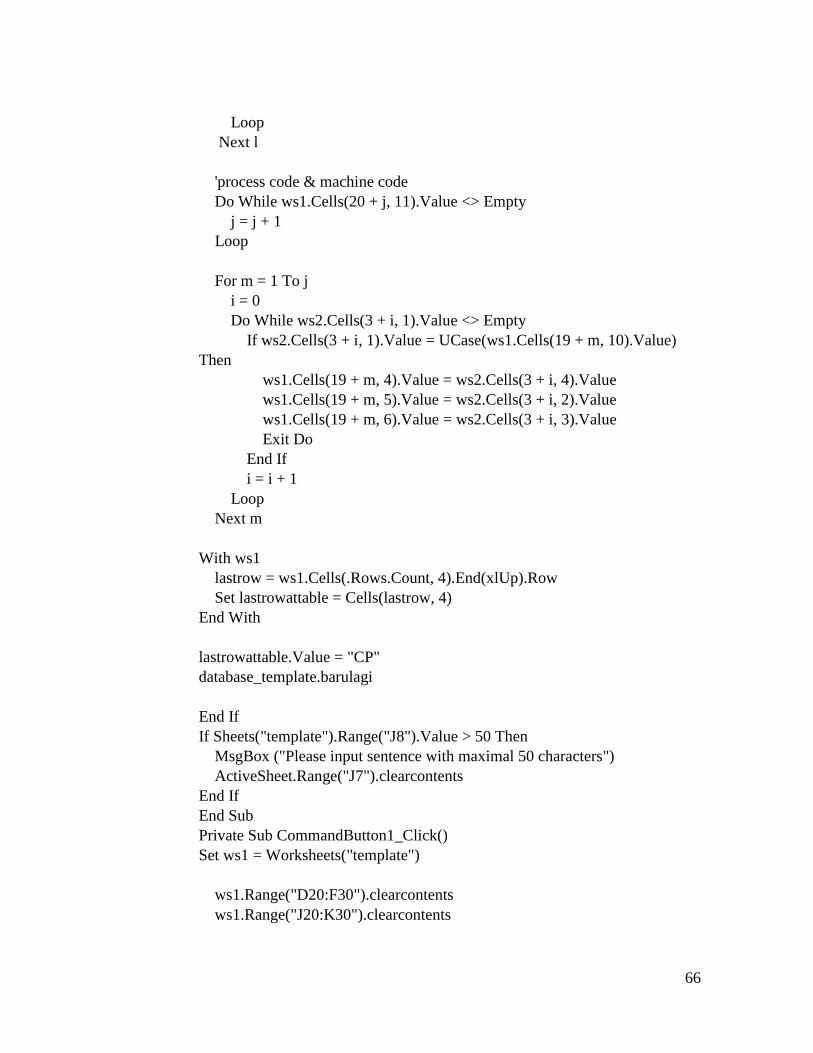
66
Loop
Next l
'process code & machine code
Do While ws1.Cells(20 + j, 11).Value <> Empty
j = j + 1
Loop
For m = 1 To j
i = 0
Do While ws2.Cells(3 + i, 1).Value <> Empty
If ws2.Cells(3 + i, 1).Value = UCase(ws1.Cells(19 + m, 10).Value)
Then
ws1.Cells(19 + m, 4).Value = ws2.Cells(3 + i, 4).Value
ws1.Cells(19 + m, 5).Value = ws2.Cells(3 + i, 2).Value
ws1.Cells(19 + m, 6).Value = ws2.Cells(3 + i, 3).Value
Exit Do
End If
i = i + 1
Loop
Next m
With ws1
lastrow = ws1.Cells(.Rows.Count, 4).End(xlUp).Row
Set lastrowattable = Cells(lastrow, 4)
End With
lastrowattable.Value = "CP"
database_template.barulagi
End If
If Sheets("template").Range("J8").Value > 50 Then
MsgBox ("Please input sentence with maximal 50 characters")
ActiveSheet.Range("J7").clearcontents
End If
End Sub
Private Sub CommandButton1_Click()
Set ws1 = Worksheets("template")
ws1.Range("D20:F30").clearcontents
ws1.Range("J20:K30").clearcontents
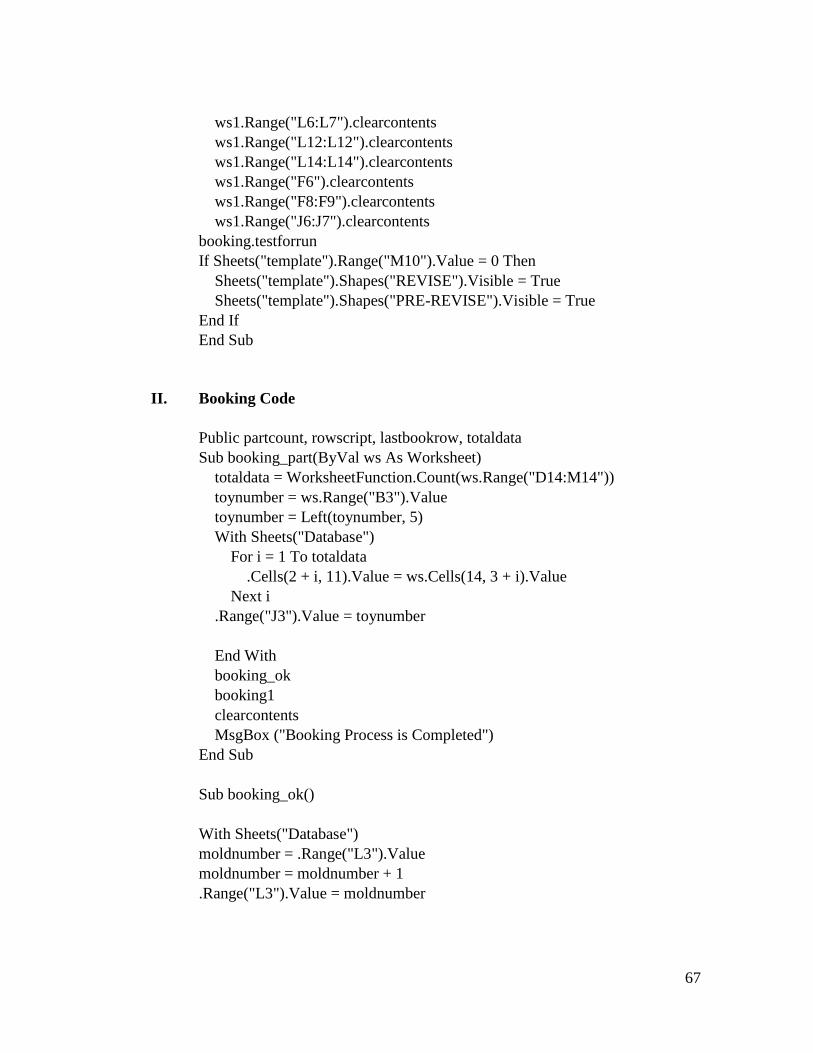
67
ws1.Range("L6:L7").clearcontents
ws1.Range("L12:L12").clearcontents
ws1.Range("L14:L14").clearcontents
ws1.Range("F6").clearcontents
ws1.Range("F8:F9").clearcontents
ws1.Range("J6:J7").clearcontents
booking.testforrun
If Sheets("template").Range("M10").Value = 0 Then
Sheets("template").Shapes("REVISE").Visible = True
Sheets("template").Shapes("PRE-REVISE").Visible = True
End If
End Sub
II. Booking Code
Public partcount, rowscript, lastbookrow, totaldata
Sub booking_part(ByVal ws As Worksheet)
totaldata = WorksheetFunction.Count(ws.Range("D14:M14"))
toynumber = ws.Range("B3").Value
toynumber = Left(toynumber, 5)
With Sheets("Database")
For i = 1 To totaldata
.Cells(2 + i, 11).Value = ws.Cells(14, 3 + i).Value
Next i
.Range("J3").Value = toynumber
End With
booking_ok
booking1
clearcontents
MsgBox ("Booking Process is Completed")
End Sub
Sub booking_ok()
With Sheets("Database")
moldnumber = .Range("L3").Value
moldnumber = moldnumber + 1
.Range("L3").Value = moldnumber
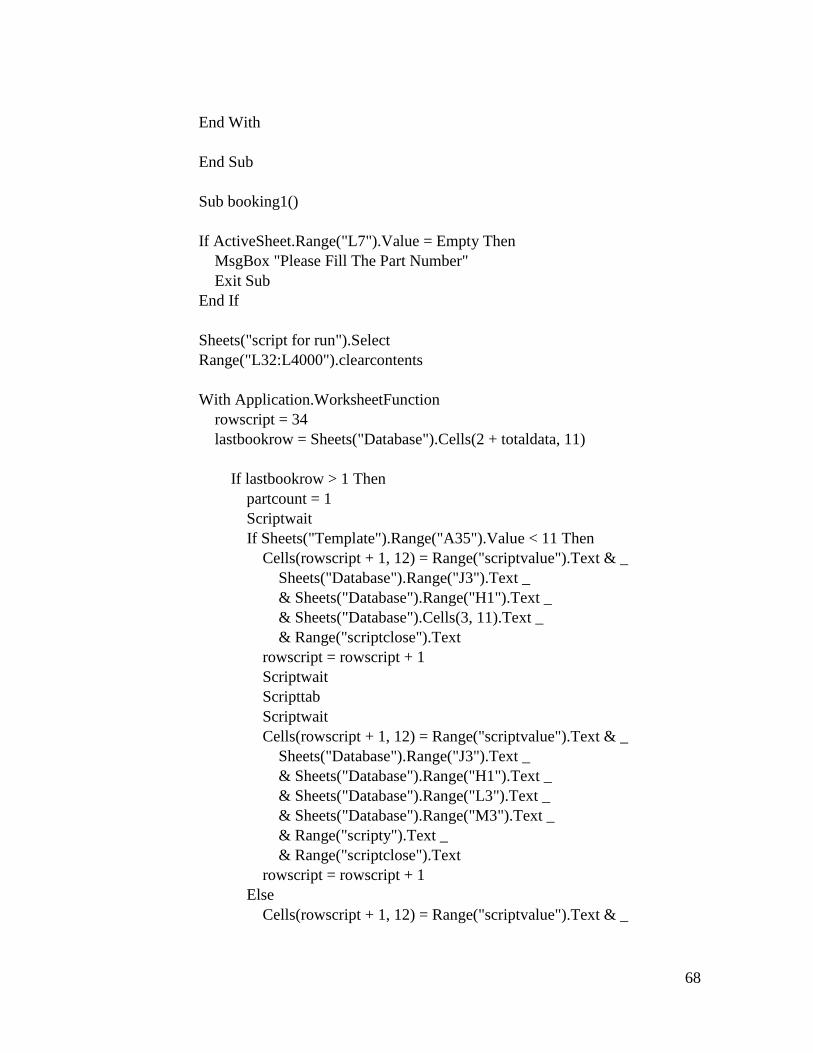
68
End With
End Sub
Sub booking1()
If ActiveSheet.Range("L7").Value = Empty Then
MsgBox "Please Fill The Part Number"
Exit Sub
End If
Sheets("script for run").Select
Range("L32:L4000").clearcontents
With Application.WorksheetFunction
rowscript = 34
lastbookrow = Sheets("Database").Cells(2 + totaldata, 11)
If lastbookrow > 1 Then
partcount = 1
Scriptwait
If Sheets("Template").Range("A35").Value < 11 Then
Cells(rowscript + 1, 12) = Range("scriptvalue").Text & _
Sheets("Database").Range("J3").Text _
& Sheets("Database").Range("H1").Text _
& Sheets("Database").Cells(3, 11).Text _
& Range("scriptclose").Text
rowscript = rowscript + 1
Scriptwait
Scripttab
Scriptwait
Cells(rowscript + 1, 12) = Range("scriptvalue").Text & _
Sheets("Database").Range("J3").Text _
& Sheets("Database").Range("H1").Text _
& Sheets("Database").Range("L3").Text _
& Sheets("Database").Range("M3").Text _
& Range("scripty").Text _
& Range("scriptclose").Text
rowscript = rowscript + 1
Else
Cells(rowscript + 1, 12) = Range("scriptvalue").Text & _
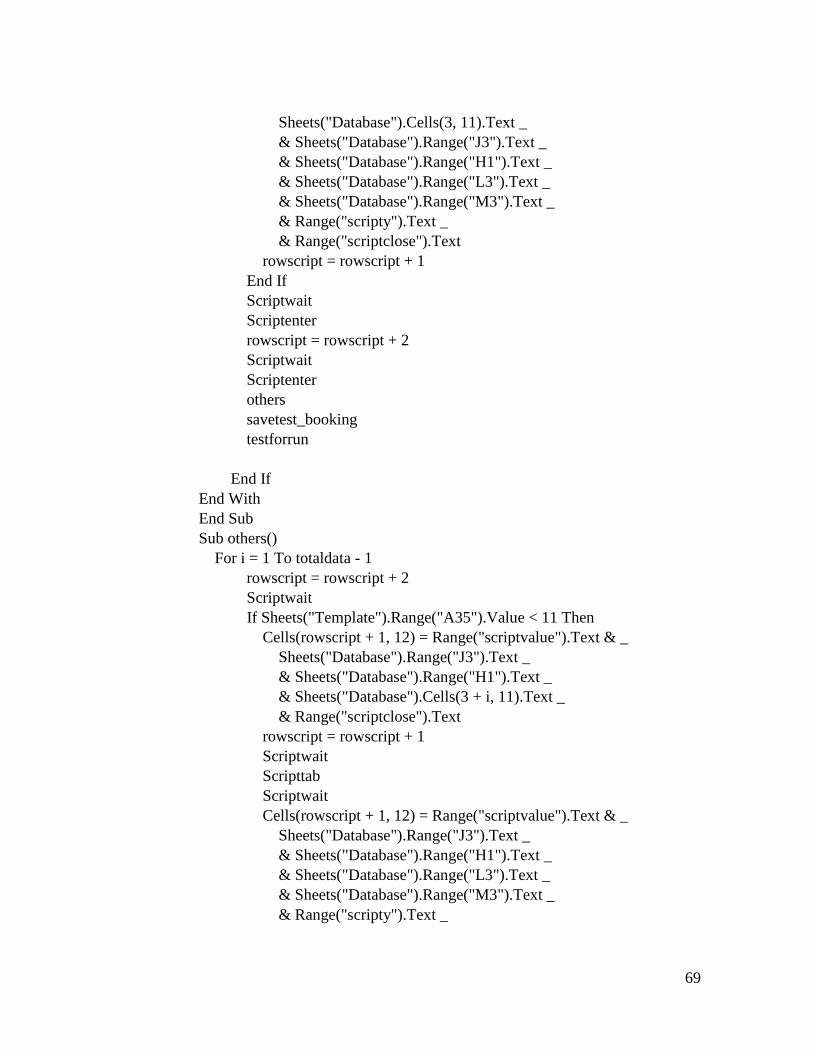
69
Sheets("Database").Cells(3, 11).Text _
& Sheets("Database").Range("J3").Text _
& Sheets("Database").Range("H1").Text _
& Sheets("Database").Range("L3").Text _
& Sheets("Database").Range("M3").Text _
& Range("scripty").Text _
& Range("scriptclose").Text
rowscript = rowscript + 1
End If
Scriptwait
Scriptenter
rowscript = rowscript + 2
Scriptwait
Scriptenter
others
savetest_booking
testforrun
End If
End With
End Sub
Sub others()
For i = 1 To totaldata - 1
rowscript = rowscript + 2
Scriptwait
If Sheets("Template").Range("A35").Value < 11 Then
Cells(rowscript + 1, 12) = Range("scriptvalue").Text & _
Sheets("Database").Range("J3").Text _
& Sheets("Database").Range("H1").Text _
& Sheets("Database").Cells(3 + i, 11).Text _
& Range("scriptclose").Text
rowscript = rowscript + 1
Scriptwait
Scripttab
Scriptwait
Cells(rowscript + 1, 12) = Range("scriptvalue").Text & _
Sheets("Database").Range("J3").Text _
& Sheets("Database").Range("H1").Text _
& Sheets("Database").Range("L3").Text _
& Sheets("Database").Range("M3").Text _
& Range("scripty").Text _
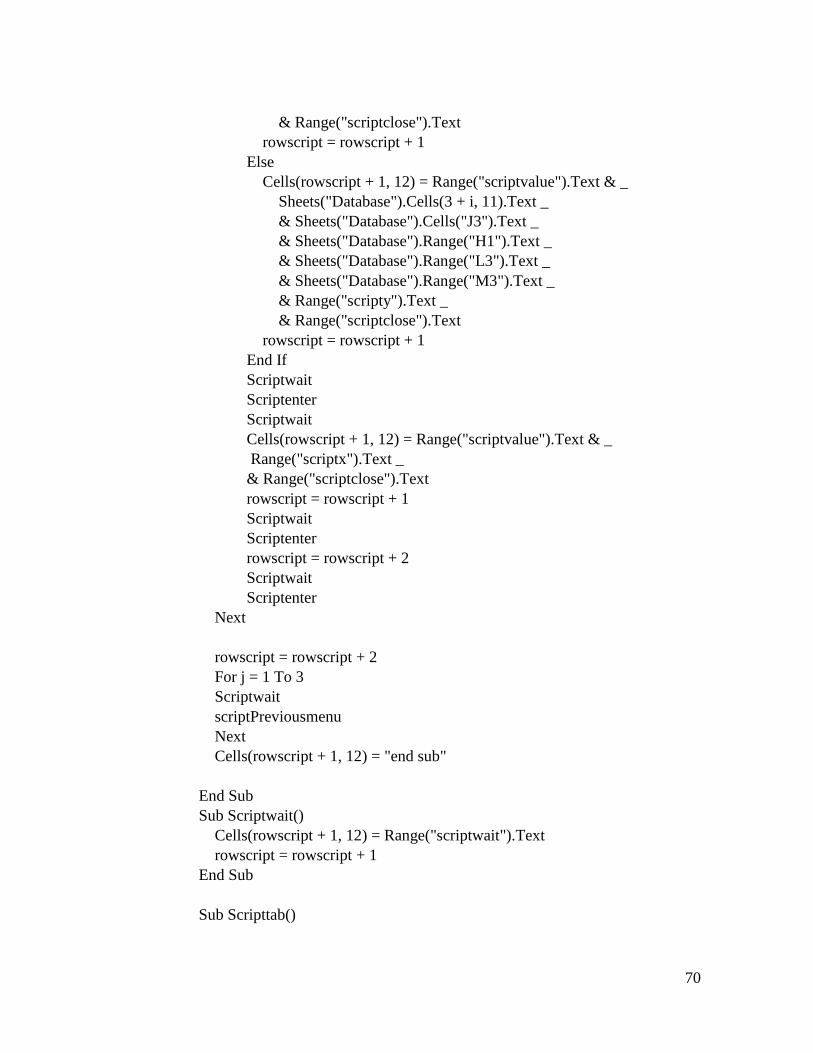
70
& Range("scriptclose").Text
rowscript = rowscript + 1
Else
Cells(rowscript + 1, 12) = Range("scriptvalue").Text & _
Sheets("Database").Cells(3 + i, 11).Text _
& Sheets("Database").Cells("J3").Text _
& Sheets("Database").Range("H1").Text _
& Sheets("Database").Range("L3").Text _
& Sheets("Database").Range("M3").Text _
& Range("scripty").Text _
& Range("scriptclose").Text
rowscript = rowscript + 1
End If
Scriptwait
Scriptenter
Scriptwait
Cells(rowscript + 1, 12) = Range("scriptvalue").Text & _
Range("scriptx").Text _
& Range("scriptclose").Text
rowscript = rowscript + 1
Scriptwait
Scriptenter
rowscript = rowscript + 2
Scriptwait
Scriptenter
Next
rowscript = rowscript + 2
For j = 1 To 3
Scriptwait
scriptPreviousmenu
Next
Cells(rowscript + 1, 12) = "end sub"
End Sub
Sub Scriptwait()
Cells(rowscript + 1, 12) = Range("scriptwait").Text
rowscript = rowscript + 1
End Sub
Sub Scripttab()
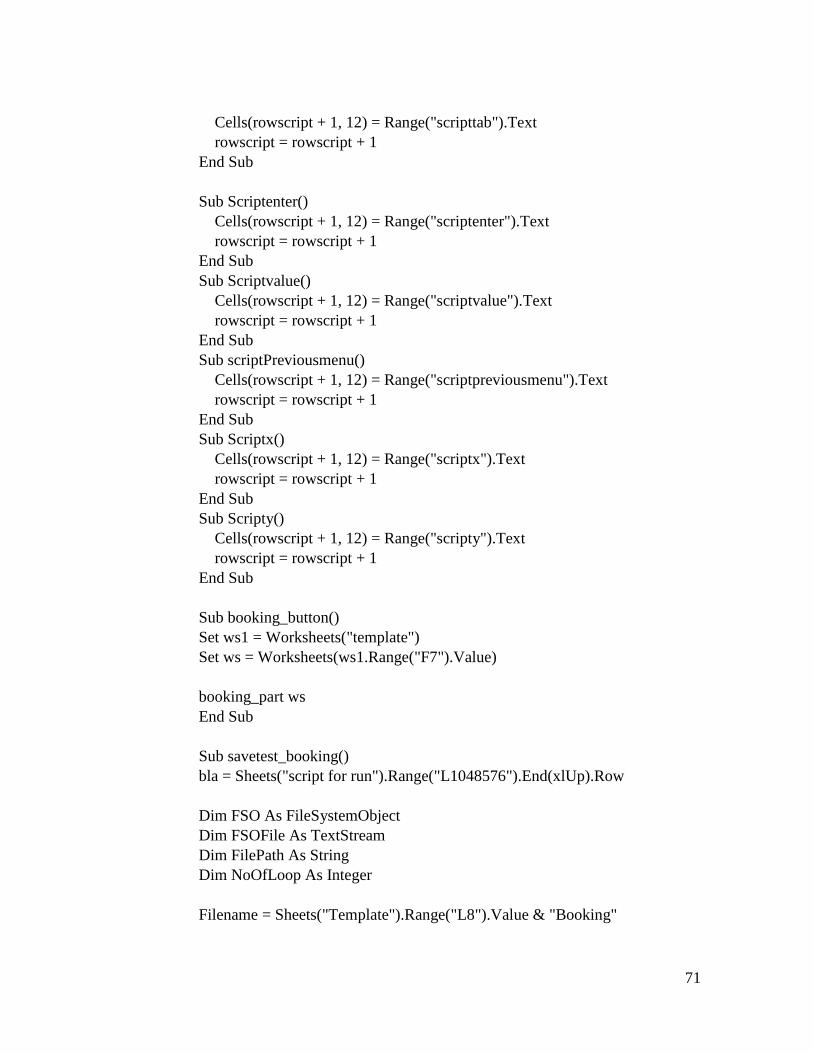
71
Cells(rowscript + 1, 12) = Range("scripttab").Text
rowscript = rowscript + 1
End Sub
Sub Scriptenter()
Cells(rowscript + 1, 12) = Range("scriptenter").Text
rowscript = rowscript + 1
End Sub
Sub Scriptvalue()
Cells(rowscript + 1, 12) = Range("scriptvalue").Text
rowscript = rowscript + 1
End Sub
Sub scriptPreviousmenu()
Cells(rowscript + 1, 12) = Range("scriptpreviousmenu").Text
rowscript = rowscript + 1
End Sub
Sub Scriptx()
Cells(rowscript + 1, 12) = Range("scriptx").Text
rowscript = rowscript + 1
End Sub
Sub Scripty()
Cells(rowscript + 1, 12) = Range("scripty").Text
rowscript = rowscript + 1
End Sub
Sub booking_button()
Set ws1 = Worksheets("template")
Set ws = Worksheets(ws1.Range("F7").Value)
booking_part ws
End Sub
Sub savetest_booking()
bla = Sheets("script for run").Range("L1048576").End(xlUp).Row
Dim FSO As FileSystemObject
Dim FSOFile As TextStream
Dim FilePath As String
Dim NoOfLoop As Integer
Filename = Sheets("Template").Range("L8").Value & "Booking"
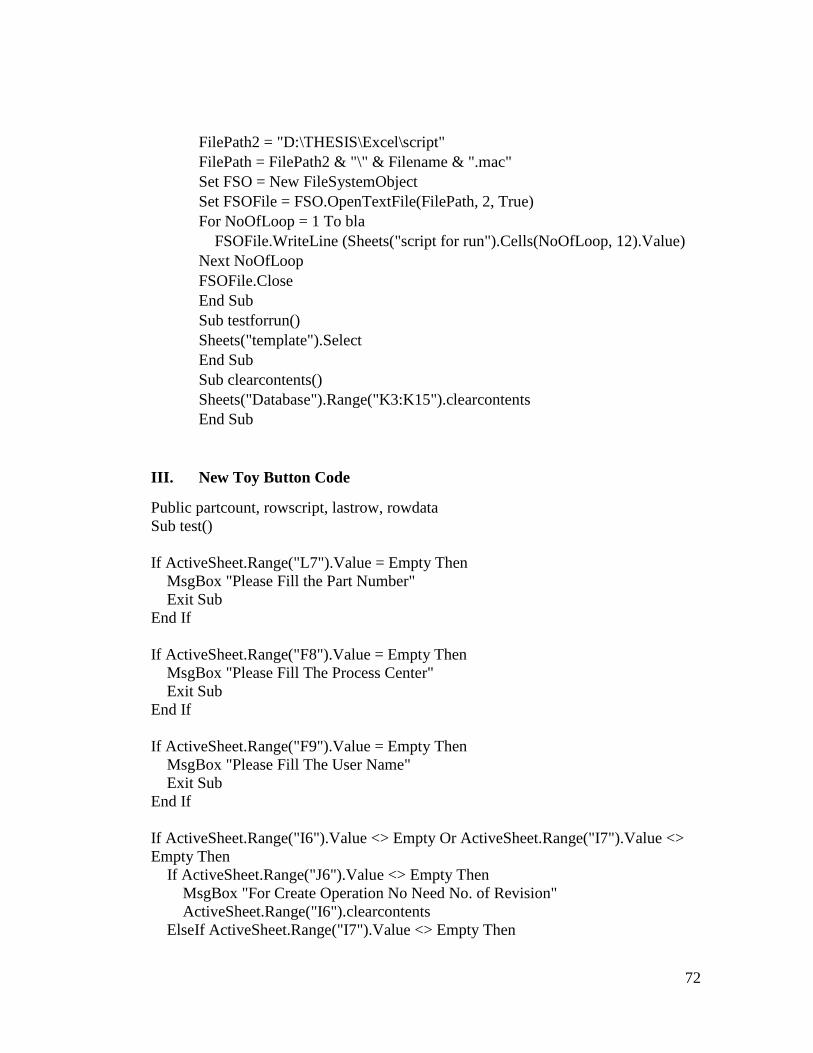
72
FilePath2 = "D:\THESIS\Excel\script"
FilePath = FilePath2 & "\" & Filename & ".mac"
Set FSO = New FileSystemObject
Set FSOFile = FSO.OpenTextFile(FilePath, 2, True)
For NoOfLoop = 1 To bla
FSOFile.WriteLine (Sheets("script for run").Cells(NoOfLoop, 12).Value)
Next NoOfLoop
FSOFile.Close
End Sub
Sub testforrun()
Sheets("template").Select
End Sub
Sub clearcontents()
Sheets("Database").Range("K3:K15").clearcontents
End Sub
III. New Toy Button Code
Public partcount, rowscript, lastrow, rowdata
Sub test()
If ActiveSheet.Range("L7").Value = Empty Then
MsgBox "Please Fill the Part Number"
Exit Sub
End If
If ActiveSheet.Range("F8").Value = Empty Then
MsgBox "Please Fill The Process Center"
Exit Sub
End If
If ActiveSheet.Range("F9").Value = Empty Then
MsgBox "Please Fill The User Name"
Exit Sub
End If
If ActiveSheet.Range("I6").Value <> Empty Or ActiveSheet.Range("I7").Value <>
Empty Then
If ActiveSheet.Range("J6").Value <> Empty Then
MsgBox "For Create Operation No Need No. of Revision"
ActiveSheet.Range("I6").clearcontents
ElseIf ActiveSheet.Range("I7").Value <> Empty Then
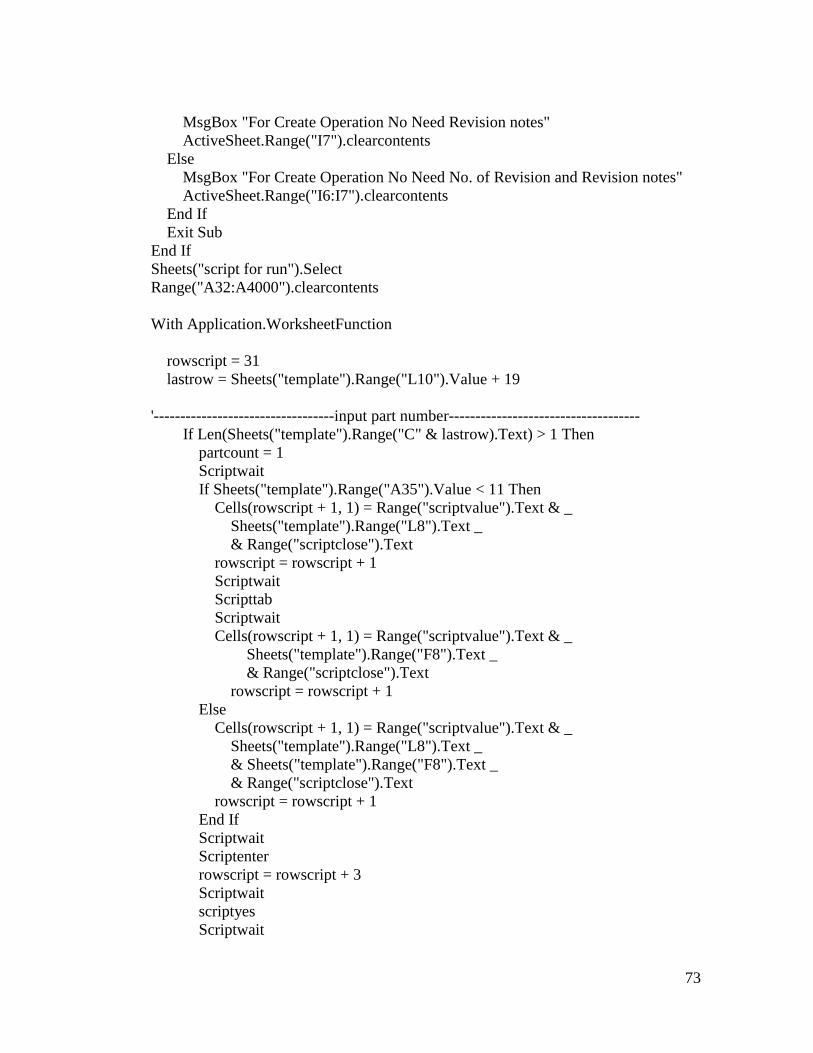
73
MsgBox "For Create Operation No Need Revision notes"
ActiveSheet.Range("I7").clearcontents
Else
MsgBox "For Create Operation No Need No. of Revision and Revision notes"
ActiveSheet.Range("I6:I7").clearcontents
End If
Exit Sub
End If
Sheets("script for run").Select
Range("A32:A4000").clearcontents
With Application.WorksheetFunction
rowscript = 31
lastrow = Sheets("template").Range("L10").Value + 19
'----------------------------------input part number------------------------------------
If Len(Sheets("template").Range("C" & lastrow).Text) > 1 Then
partcount = 1
Scriptwait
If Sheets("template").Range("A35").Value < 11 Then
Cells(rowscript + 1, 1) = Range("scriptvalue").Text & _
Sheets("template").Range("L8").Text _
& Range("scriptclose").Text
rowscript = rowscript + 1
Scriptwait
Scripttab
Scriptwait
Cells(rowscript + 1, 1) = Range("scriptvalue").Text & _
Sheets("template").Range("F8").Text _
& Range("scriptclose").Text
rowscript = rowscript + 1
Else
Cells(rowscript + 1, 1) = Range("scriptvalue").Text & _
Sheets("template").Range("L8").Text _
& Sheets("template").Range("F8").Text _
& Range("scriptclose").Text
rowscript = rowscript + 1
End If
Scriptwait
Scriptenter
rowscript = rowscript + 3
Scriptwait
scriptyes
Scriptwait
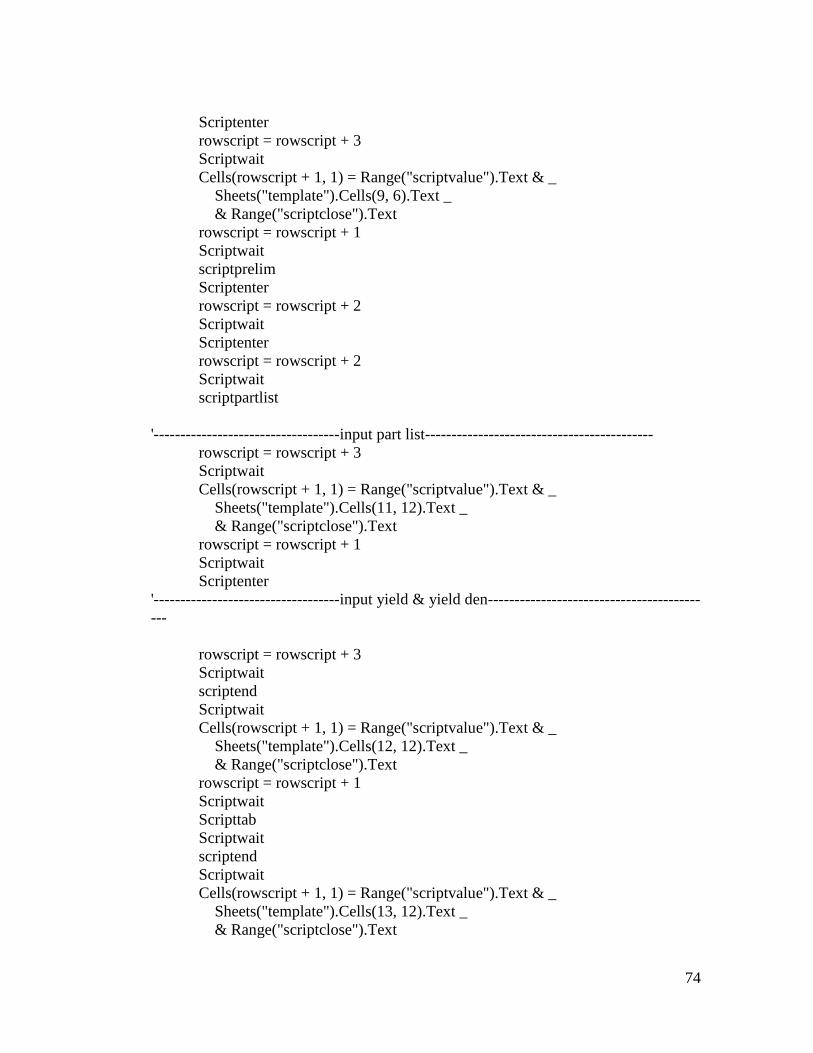
74
Scriptenter
rowscript = rowscript + 3
Scriptwait
Cells(rowscript + 1, 1) = Range("scriptvalue").Text & _
Sheets("template").Cells(9, 6).Text _
& Range("scriptclose").Text
rowscript = rowscript + 1
Scriptwait
scriptprelim
Scriptenter
rowscript = rowscript + 2
Scriptwait
Scriptenter
rowscript = rowscript + 2
Scriptwait
scriptpartlist
'-----------------------------------input part list-------------------------------------------
rowscript = rowscript + 3
Scriptwait
Cells(rowscript + 1, 1) = Range("scriptvalue").Text & _
Sheets("template").Cells(11, 12).Text _
& Range("scriptclose").Text
rowscript = rowscript + 1
Scriptwait
Scriptenter
'-----------------------------------input yield & yield den----------------------------------------
---
rowscript = rowscript + 3
Scriptwait
scriptend
Scriptwait
Cells(rowscript + 1, 1) = Range("scriptvalue").Text & _
Sheets("template").Cells(12, 12).Text _
& Range("scriptclose").Text
rowscript = rowscript + 1
Scriptwait
Scripttab
Scriptwait
scriptend
Scriptwait
Cells(rowscript + 1, 1) = Range("scriptvalue").Text & _
Sheets("template").Cells(13, 12).Text _
& Range("scriptclose").Text
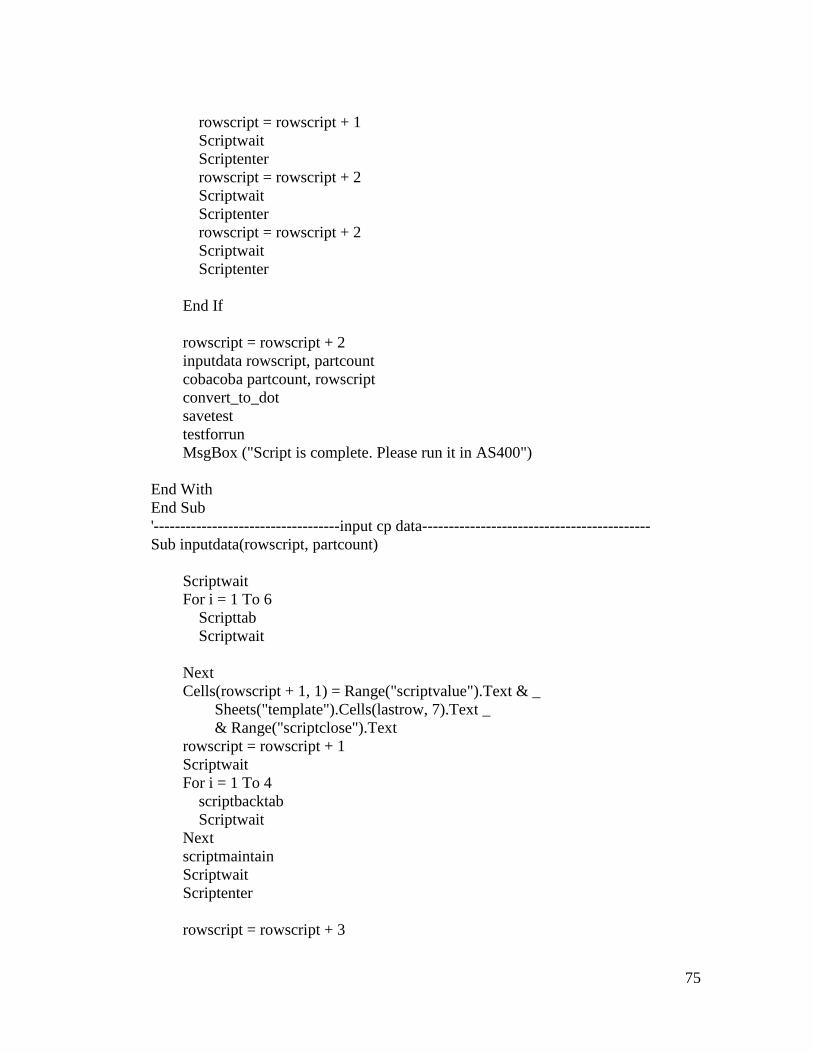
75
rowscript = rowscript + 1
Scriptwait
Scriptenter
rowscript = rowscript + 2
Scriptwait
Scriptenter
rowscript = rowscript + 2
Scriptwait
Scriptenter
End If
rowscript = rowscript + 2
inputdata rowscript, partcount
cobacoba partcount, rowscript
convert_to_dot
savetest
testforrun
MsgBox ("Script is complete. Please run it in AS400")
End With
End Sub
'-----------------------------------input cp data-------------------------------------------
Sub inputdata(rowscript, partcount)
Scriptwait
For i = 1 To 6
Scripttab
Scriptwait
Next
Cells(rowscript + 1, 1) = Range("scriptvalue").Text & _
Sheets("template").Cells(lastrow, 7).Text _
& Range("scriptclose").Text
rowscript = rowscript + 1
Scriptwait
For i = 1 To 4
scriptbacktab
Scriptwait
Next
scriptmaintain
Scriptwait
Scriptenter
rowscript = rowscript + 3
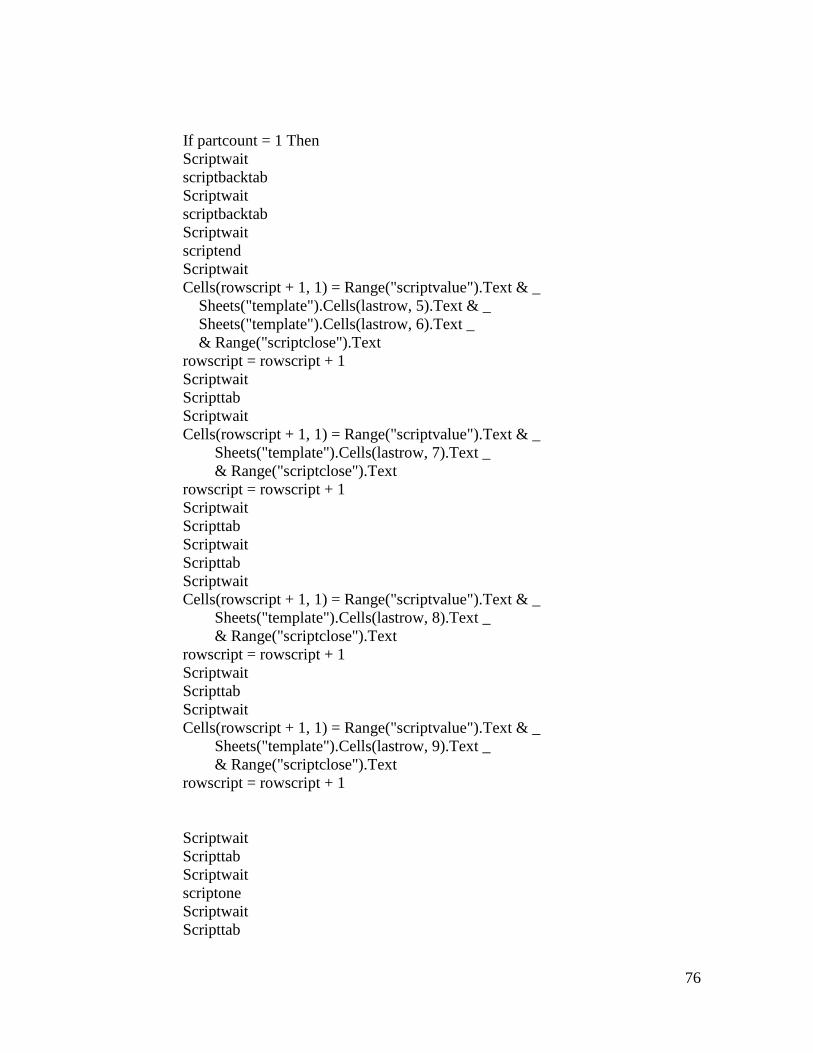
76
If partcount = 1 Then
Scriptwait
scriptbacktab
Scriptwait
scriptbacktab
Scriptwait
scriptend
Scriptwait
Cells(rowscript + 1, 1) = Range("scriptvalue").Text & _
Sheets("template").Cells(lastrow, 5).Text & _
Sheets("template").Cells(lastrow, 6).Text _
& Range("scriptclose").Text
rowscript = rowscript + 1
Scriptwait
Scripttab
Scriptwait
Cells(rowscript + 1, 1) = Range("scriptvalue").Text & _
Sheets("template").Cells(lastrow, 7).Text _
& Range("scriptclose").Text
rowscript = rowscript + 1
Scriptwait
Scripttab
Scriptwait
Scripttab
Scriptwait
Cells(rowscript + 1, 1) = Range("scriptvalue").Text & _
Sheets("template").Cells(lastrow, 8).Text _
& Range("scriptclose").Text
rowscript = rowscript + 1
Scriptwait
Scripttab
Scriptwait
Cells(rowscript + 1, 1) = Range("scriptvalue").Text & _
Sheets("template").Cells(lastrow, 9).Text _
& Range("scriptclose").Text
rowscript = rowscript + 1
Scriptwait
Scripttab
Scriptwait
scriptone
Scriptwait
Scripttab
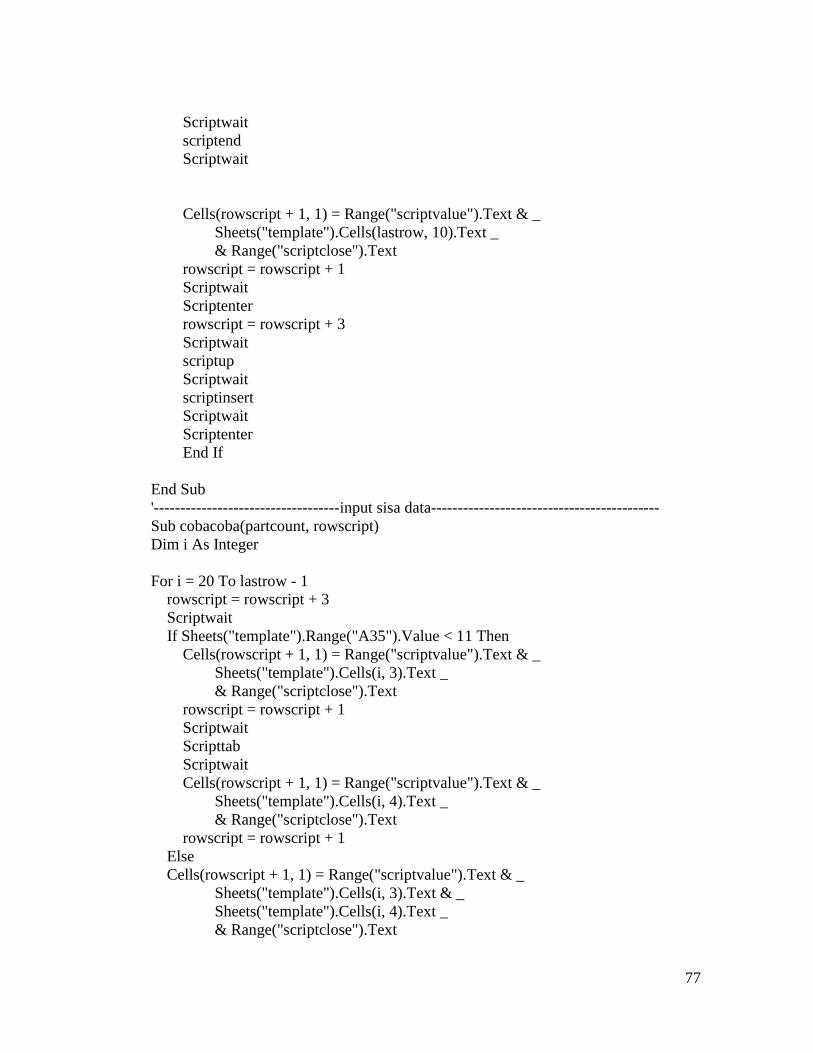
77
Scriptwait
scriptend
Scriptwait
Cells(rowscript + 1, 1) = Range("scriptvalue").Text & _
Sheets("template").Cells(lastrow, 10).Text _
& Range("scriptclose").Text
rowscript = rowscript + 1
Scriptwait
Scriptenter
rowscript = rowscript + 3
Scriptwait
scriptup
Scriptwait
scriptinsert
Scriptwait
Scriptenter
End If
End Sub
'-----------------------------------input sisa data-------------------------------------------
Sub cobacoba(partcount, rowscript)
Dim i As Integer
For i = 20 To lastrow - 1
rowscript = rowscript + 3
Scriptwait
If Sheets("template").Range("A35").Value < 11 Then
Cells(rowscript + 1, 1) = Range("scriptvalue").Text & _
Sheets("template").Cells(i, 3).Text _
& Range("scriptclose").Text
rowscript = rowscript + 1
Scriptwait
Scripttab
Scriptwait
Cells(rowscript + 1, 1) = Range("scriptvalue").Text & _
Sheets("template").Cells(i, 4).Text _
& Range("scriptclose").Text
rowscript = rowscript + 1
Else
Cells(rowscript + 1, 1) = Range("scriptvalue").Text & _
Sheets("template").Cells(i, 3).Text & _
Sheets("template").Cells(i, 4).Text _
& Range("scriptclose").Text
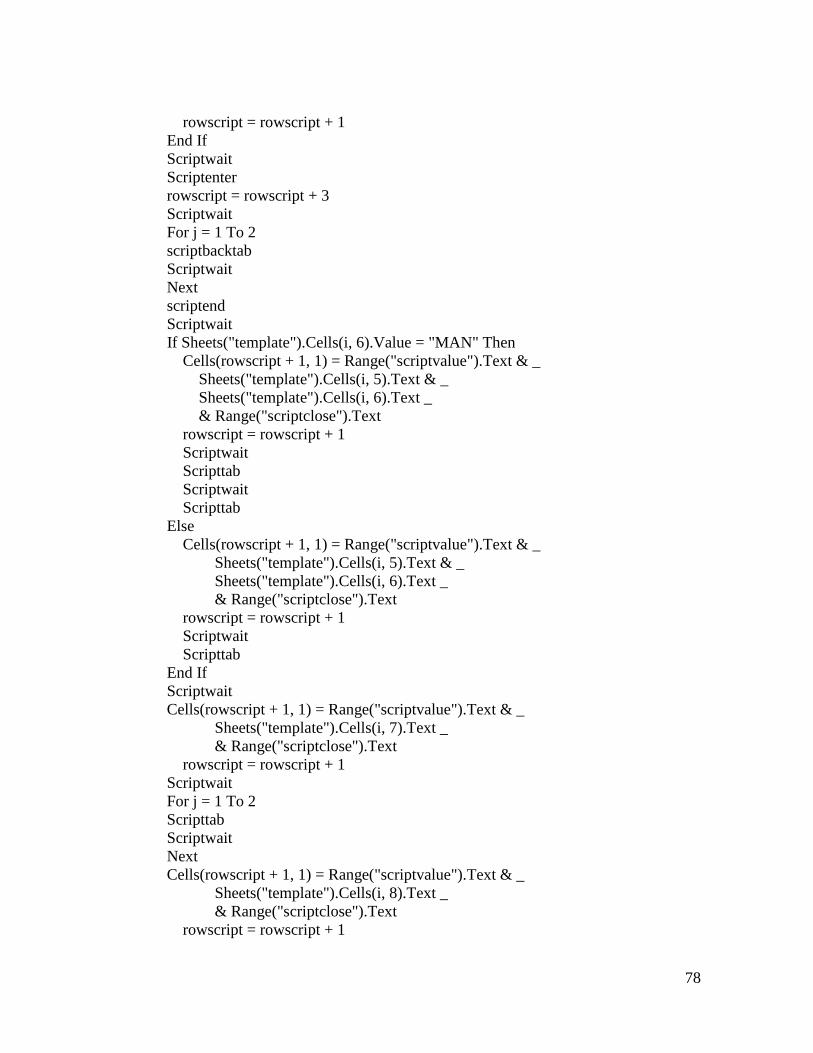
78
rowscript = rowscript + 1
End If
Scriptwait
Scriptenter
rowscript = rowscript + 3
Scriptwait
For j = 1 To 2
scriptbacktab
Scriptwait
Next
scriptend
Scriptwait
If Sheets("template").Cells(i, 6).Value = "MAN" Then
Cells(rowscript + 1, 1) = Range("scriptvalue").Text & _
Sheets("template").Cells(i, 5).Text & _
Sheets("template").Cells(i, 6).Text _
& Range("scriptclose").Text
rowscript = rowscript + 1
Scriptwait
Scripttab
Scriptwait
Scripttab
Else
Cells(rowscript + 1, 1) = Range("scriptvalue").Text & _
Sheets("template").Cells(i, 5).Text & _
Sheets("template").Cells(i, 6).Text _
& Range("scriptclose").Text
rowscript = rowscript + 1
Scriptwait
Scripttab
End If
Scriptwait
Cells(rowscript + 1, 1) = Range("scriptvalue").Text & _
Sheets("template").Cells(i, 7).Text _
& Range("scriptclose").Text
rowscript = rowscript + 1
Scriptwait
For j = 1 To 2
Scripttab
Scriptwait
Next
Cells(rowscript + 1, 1) = Range("scriptvalue").Text & _
Sheets("template").Cells(i, 8).Text _
& Range("scriptclose").Text
rowscript = rowscript + 1
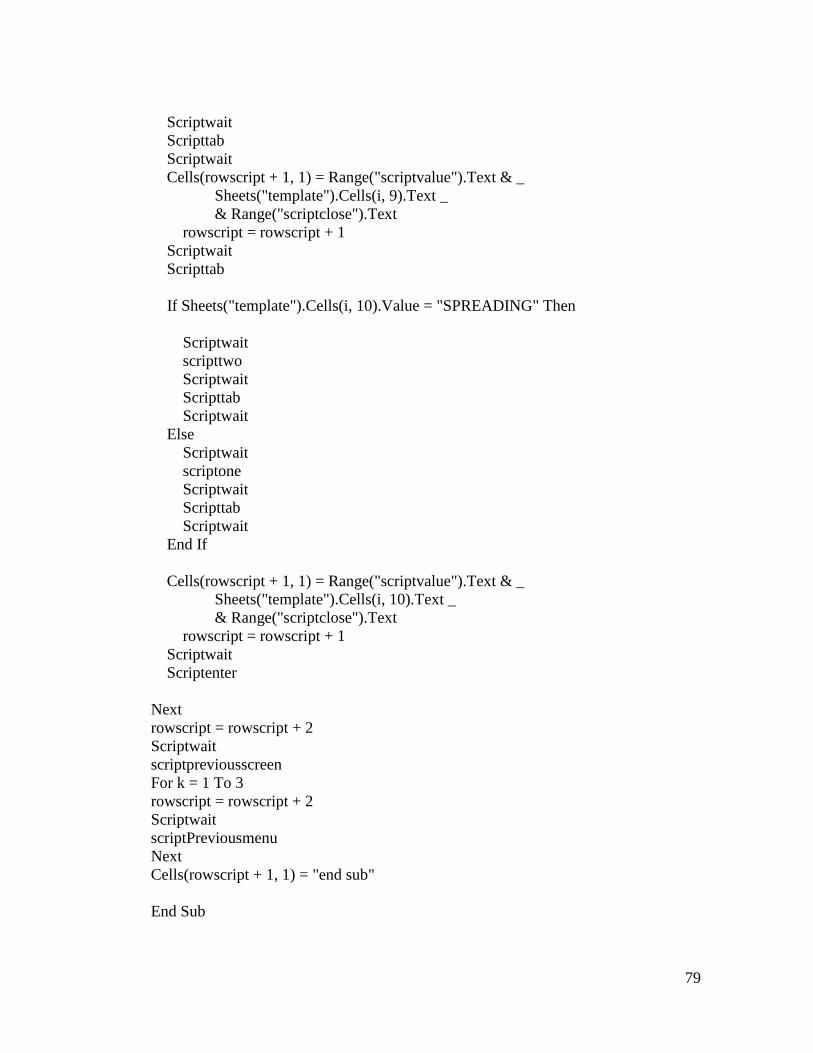
79
Scriptwait
Scripttab
Scriptwait
Cells(rowscript + 1, 1) = Range("scriptvalue").Text & _
Sheets("template").Cells(i, 9).Text _
& Range("scriptclose").Text
rowscript = rowscript + 1
Scriptwait
Scripttab
If Sheets("template").Cells(i, 10).Value = "SPREADING" Then
Scriptwait
scripttwo
Scriptwait
Scripttab
Scriptwait
Else
Scriptwait
scriptone
Scriptwait
Scripttab
Scriptwait
End If
Cells(rowscript + 1, 1) = Range("scriptvalue").Text & _
Sheets("template").Cells(i, 10).Text _
& Range("scriptclose").Text
rowscript = rowscript + 1
Scriptwait
Scriptenter
Next
rowscript = rowscript + 2
Scriptwait
scriptpreviousscreen
For k = 1 To 3
rowscript = rowscript + 2
Scriptwait
scriptPreviousmenu
Next
Cells(rowscript + 1, 1) = "end sub"
End Sub
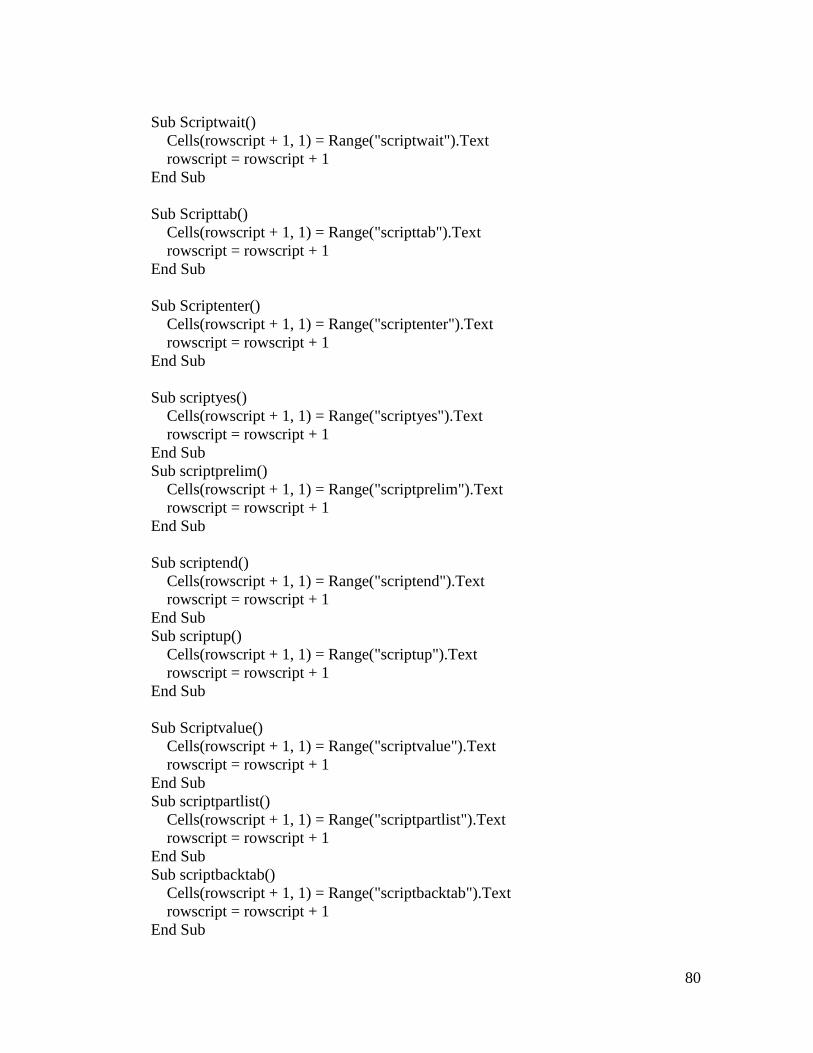
80
Sub Scriptwait()
Cells(rowscript + 1, 1) = Range("scriptwait").Text
rowscript = rowscript + 1
End Sub
Sub Scripttab()
Cells(rowscript + 1, 1) = Range("scripttab").Text
rowscript = rowscript + 1
End Sub
Sub Scriptenter()
Cells(rowscript + 1, 1) = Range("scriptenter").Text
rowscript = rowscript + 1
End Sub
Sub scriptyes()
Cells(rowscript + 1, 1) = Range("scriptyes").Text
rowscript = rowscript + 1
End Sub
Sub scriptprelim()
Cells(rowscript + 1, 1) = Range("scriptprelim").Text
rowscript = rowscript + 1
End Sub
Sub scriptend()
Cells(rowscript + 1, 1) = Range("scriptend").Text
rowscript = rowscript + 1
End Sub
Sub scriptup()
Cells(rowscript + 1, 1) = Range("scriptup").Text
rowscript = rowscript + 1
End Sub
Sub Scriptvalue()
Cells(rowscript + 1, 1) = Range("scriptvalue").Text
rowscript = rowscript + 1
End Sub
Sub scriptpartlist()
Cells(rowscript + 1, 1) = Range("scriptpartlist").Text
rowscript = rowscript + 1
End Sub
Sub scriptbacktab()
Cells(rowscript + 1, 1) = Range("scriptbacktab").Text
rowscript = rowscript + 1
End Sub
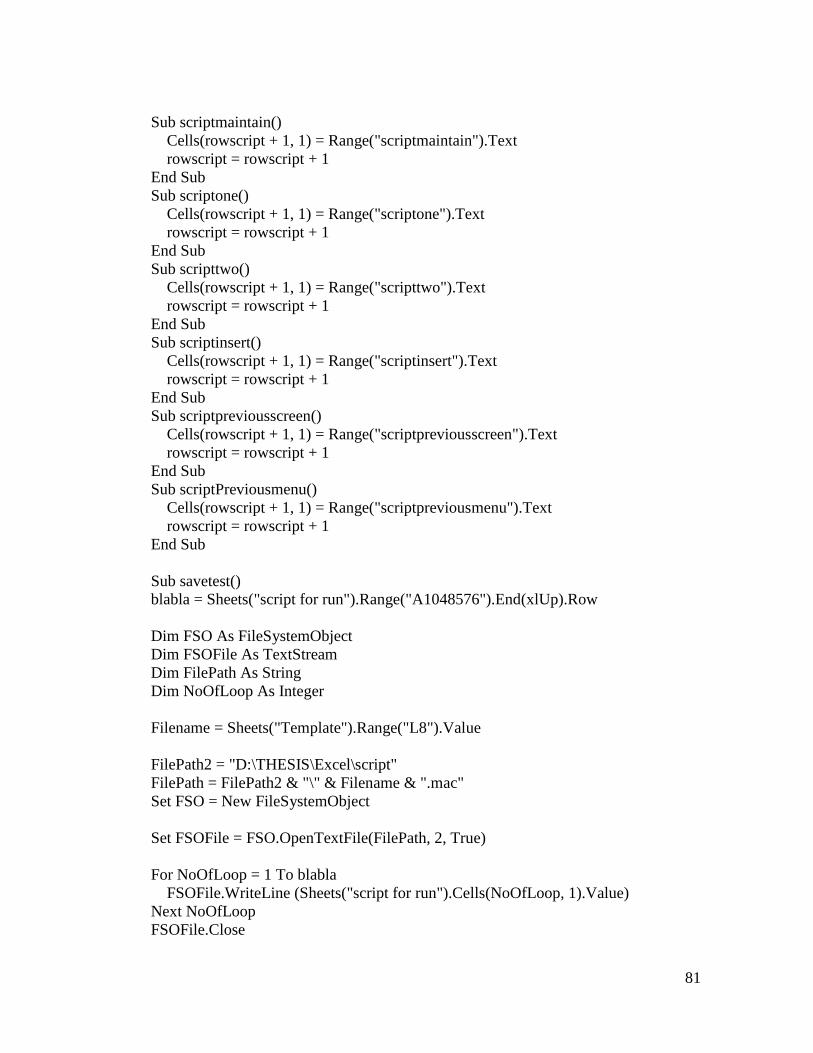
81
Sub scriptmaintain()
Cells(rowscript + 1, 1) = Range("scriptmaintain").Text
rowscript = rowscript + 1
End Sub
Sub scriptone()
Cells(rowscript + 1, 1) = Range("scriptone").Text
rowscript = rowscript + 1
End Sub
Sub scripttwo()
Cells(rowscript + 1, 1) = Range("scripttwo").Text
rowscript = rowscript + 1
End Sub
Sub scriptinsert()
Cells(rowscript + 1, 1) = Range("scriptinsert").Text
rowscript = rowscript + 1
End Sub
Sub scriptpreviousscreen()
Cells(rowscript + 1, 1) = Range("scriptpreviousscreen").Text
rowscript = rowscript + 1
End Sub
Sub scriptPreviousmenu()
Cells(rowscript + 1, 1) = Range("scriptpreviousmenu").Text
rowscript = rowscript + 1
End Sub
Sub savetest()
blabla = Sheets("script for run").Range("A1048576").End(xlUp).Row
Dim FSO As FileSystemObject
Dim FSOFile As TextStream
Dim FilePath As String
Dim NoOfLoop As Integer
Filename = Sheets("Template").Range("L8").Value
FilePath2 = "D:\THESIS\Excel\script"
FilePath = FilePath2 & "\" & Filename & ".mac"
Set FSO = New FileSystemObject
Set FSOFile = FSO.OpenTextFile(FilePath, 2, True)
For NoOfLoop = 1 To blabla
FSOFile.WriteLine (Sheets("script for run").Cells(NoOfLoop, 1).Value)
Next NoOfLoop
FSOFile.Close
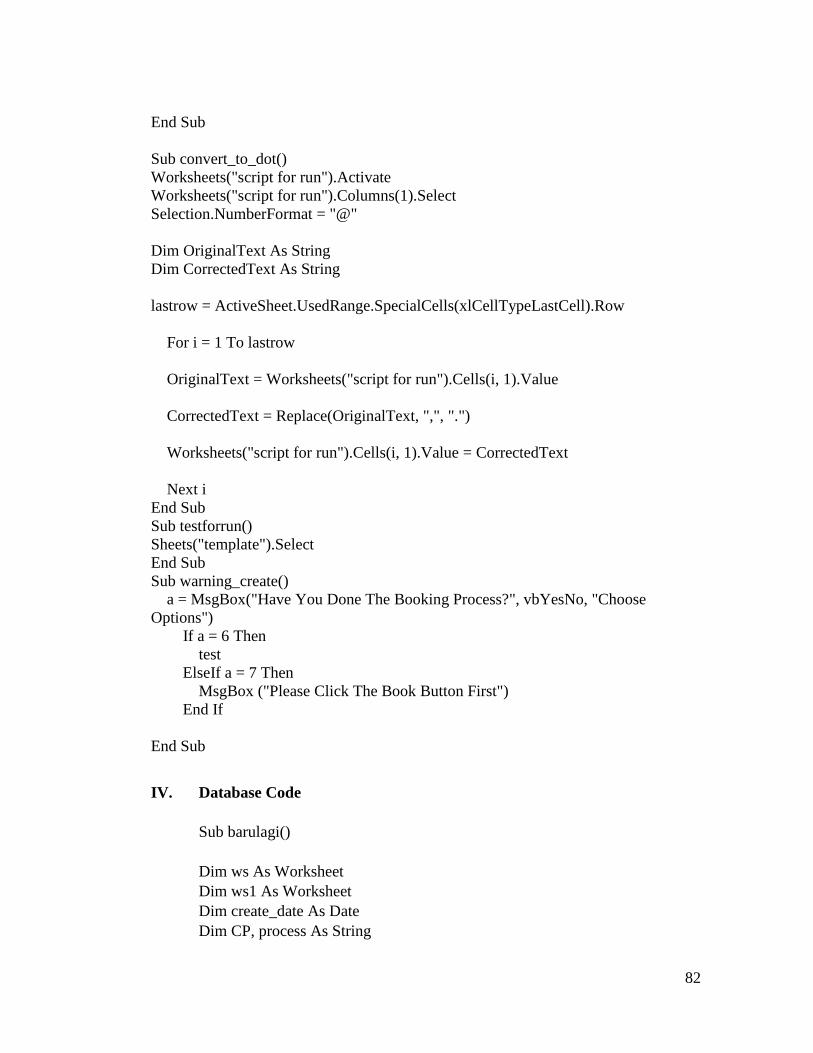
82
End Sub
Sub convert_to_dot()
Worksheets("script for run").Activate
Worksheets("script for run").Columns(1).Select
Selection.NumberFormat = "@"
Dim OriginalText As String
Dim CorrectedText As String
lastrow = ActiveSheet.UsedRange.SpecialCells(xlCellTypeLastCell).Row
For i = 1 To lastrow
OriginalText = Worksheets("script for run").Cells(i, 1).Value
CorrectedText = Replace(OriginalText, ",", ".")
Worksheets("script for run").Cells(i, 1).Value = CorrectedText
Next i
End Sub
Sub testforrun()
Sheets("template").Select
End Sub
Sub warning_create()
a = MsgBox("Have You Done The Booking Process?", vbYesNo, "Choose
Options")
If a = 6 Then
test
ElseIf a = 7 Then
MsgBox ("Please Click The Book Button First")
End If
End Sub
IV. Database Code
Sub barulagi()
Dim ws As Worksheet
Dim ws1 As Worksheet
Dim create_date As Date
Dim CP, process As String
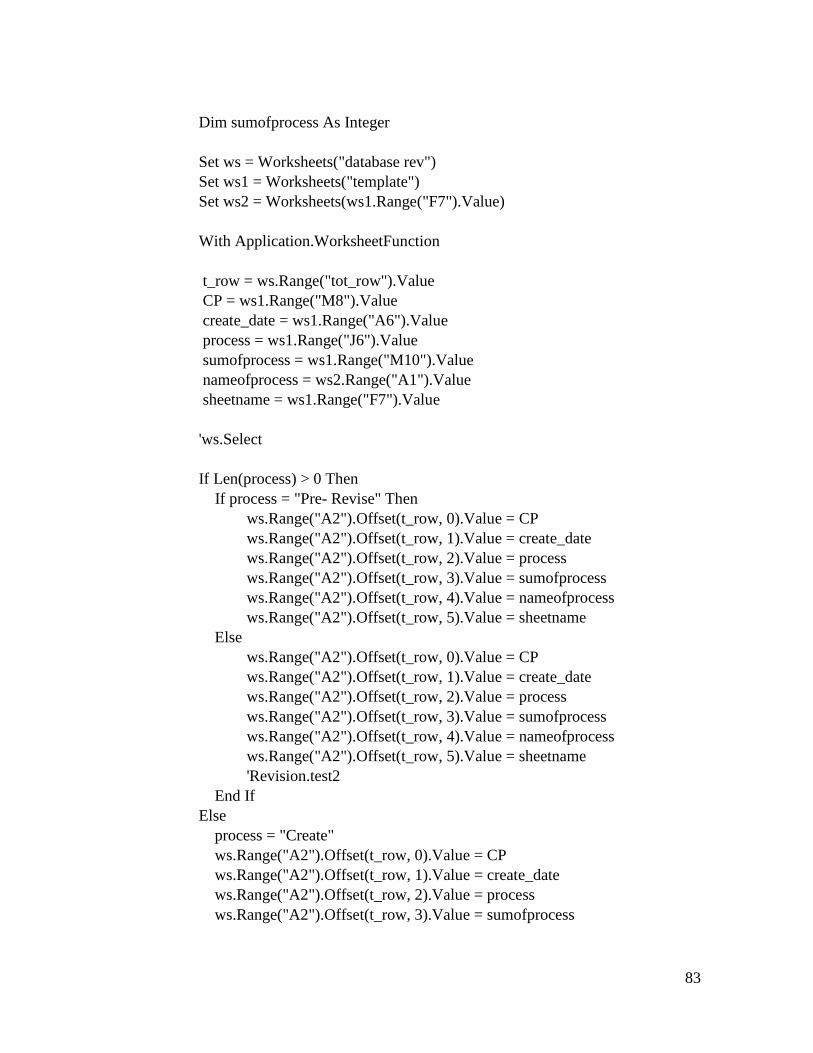
83
Dim sumofprocess As Integer
Set ws = Worksheets("database rev")
Set ws1 = Worksheets("template")
Set ws2 = Worksheets(ws1.Range("F7").Value)
With Application.WorksheetFunction
t_row = ws.Range("tot_row").Value
CP = ws1.Range("M8").Value
create_date = ws1.Range("A6").Value
process = ws1.Range("J6").Value
sumofprocess = ws1.Range("M10").Value
nameofprocess = ws2.Range("A1").Value
sheetname = ws1.Range("F7").Value
'ws.Select
If Len(process) > 0 Then
If process = "Pre- Revise" Then
ws.Range("A2").Offset(t_row, 0).Value = CP
ws.Range("A2").Offset(t_row, 1).Value = create_date
ws.Range("A2").Offset(t_row, 2).Value = process
ws.Range("A2").Offset(t_row, 3).Value = sumofprocess
ws.Range("A2").Offset(t_row, 4).Value = nameofprocess
ws.Range("A2").Offset(t_row, 5).Value = sheetname
Else
ws.Range("A2").Offset(t_row, 0).Value = CP
ws.Range("A2").Offset(t_row, 1).Value = create_date
ws.Range("A2").Offset(t_row, 2).Value = process
ws.Range("A2").Offset(t_row, 3).Value = sumofprocess
ws.Range("A2").Offset(t_row, 4).Value = nameofprocess
ws.Range("A2").Offset(t_row, 5).Value = sheetname
'Revision.test2
End If
Else
process = "Create"
ws.Range("A2").Offset(t_row, 0).Value = CP
ws.Range("A2").Offset(t_row, 1).Value = create_date
ws.Range("A2").Offset(t_row, 2).Value = process
ws.Range("A2").Offset(t_row, 3).Value = sumofprocess
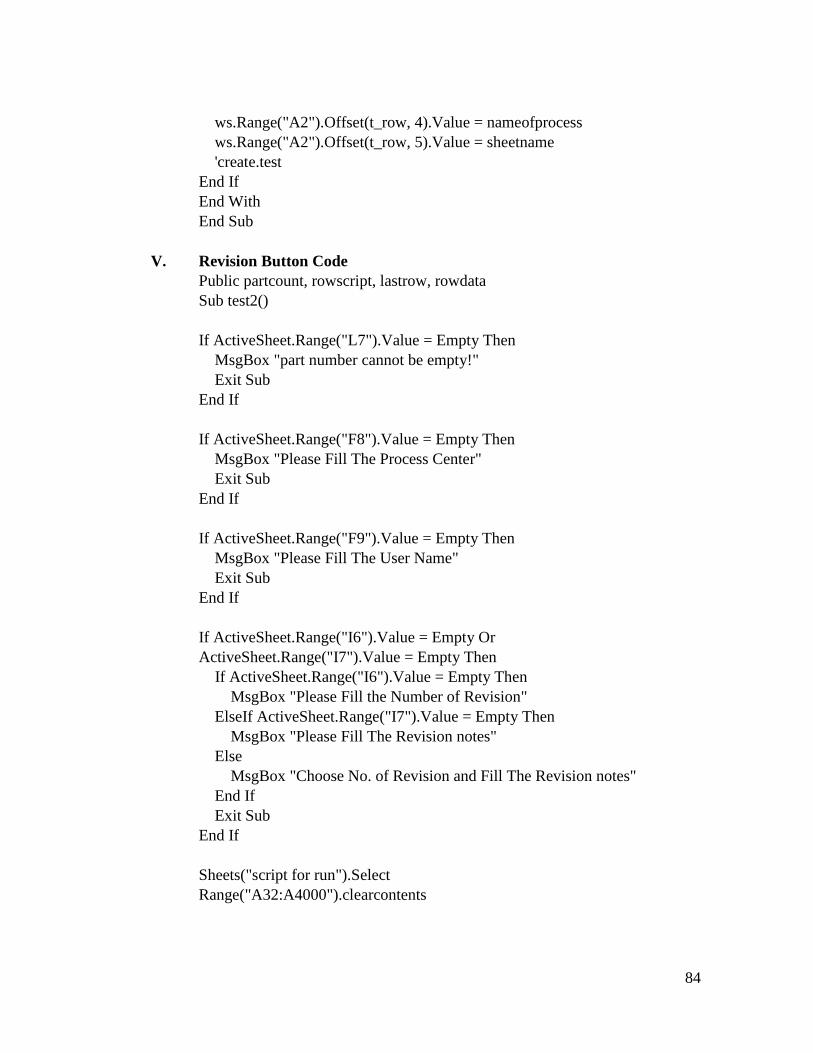
84
ws.Range("A2").Offset(t_row, 4).Value = nameofprocess
ws.Range("A2").Offset(t_row, 5).Value = sheetname
'create.test
End If
End With
End Sub
V. Revision Button Code
Public partcount, rowscript, lastrow, rowdata
Sub test2()
If ActiveSheet.Range("L7").Value = Empty Then
MsgBox "part number cannot be empty!"
Exit Sub
End If
If ActiveSheet.Range("F8").Value = Empty Then
MsgBox "Please Fill The Process Center"
Exit Sub
End If
If ActiveSheet.Range("F9").Value = Empty Then
MsgBox "Please Fill The User Name"
Exit Sub
End If
If ActiveSheet.Range("I6").Value = Empty Or
ActiveSheet.Range("I7").Value = Empty Then
If ActiveSheet.Range("I6").Value = Empty Then
MsgBox "Please Fill the Number of Revision"
ElseIf ActiveSheet.Range("I7").Value = Empty Then
MsgBox "Please Fill The Revision notes"
Else
MsgBox "Choose No. of Revision and Fill The Revision notes"
End If
Exit Sub
End If
Sheets("script for run").Select
Range("A32:A4000").clearcontents
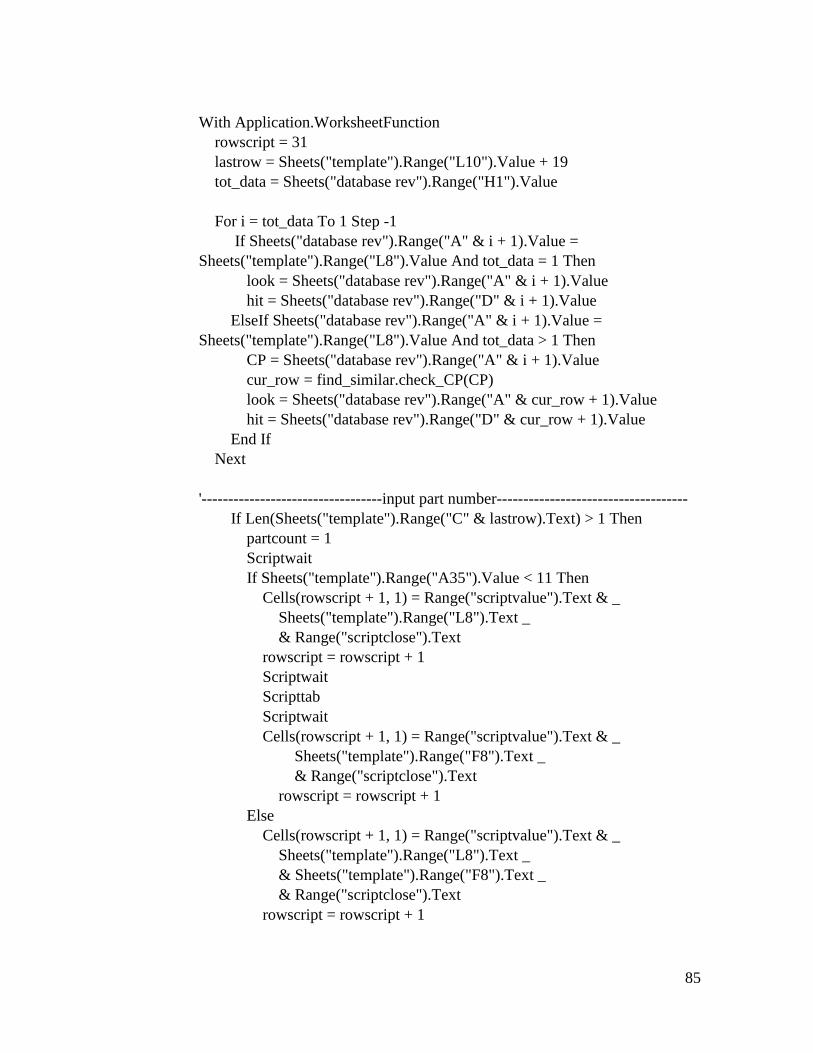
85
With Application.WorksheetFunction
rowscript = 31
lastrow = Sheets("template").Range("L10").Value + 19
tot_data = Sheets("database rev").Range("H1").Value
For i = tot_data To 1 Step -1
If Sheets("database rev").Range("A" & i + 1).Value =
Sheets("template").Range("L8").Value And tot_data = 1 Then
look = Sheets("database rev").Range("A" & i + 1).Value
hit = Sheets("database rev").Range("D" & i + 1).Value
ElseIf Sheets("database rev").Range("A" & i + 1).Value =
Sheets("template").Range("L8").Value And tot_data > 1 Then
CP = Sheets("database rev").Range("A" & i + 1).Value
cur_row = find_similar.check_CP(CP)
look = Sheets("database rev").Range("A" & cur_row + 1).Value
hit = Sheets("database rev").Range("D" & cur_row + 1).Value
End If
Next
'----------------------------------input part number------------------------------------
If Len(Sheets("template").Range("C" & lastrow).Text) > 1 Then
partcount = 1
Scriptwait
If Sheets("template").Range("A35").Value < 11 Then
Cells(rowscript + 1, 1) = Range("scriptvalue").Text & _
Sheets("template").Range("L8").Text _
& Range("scriptclose").Text
rowscript = rowscript + 1
Scriptwait
Scripttab
Scriptwait
Cells(rowscript + 1, 1) = Range("scriptvalue").Text & _
Sheets("template").Range("F8").Text _
& Range("scriptclose").Text
rowscript = rowscript + 1
Else
Cells(rowscript + 1, 1) = Range("scriptvalue").Text & _
Sheets("template").Range("L8").Text _
& Sheets("template").Range("F8").Text _
& Range("scriptclose").Text
rowscript = rowscript + 1
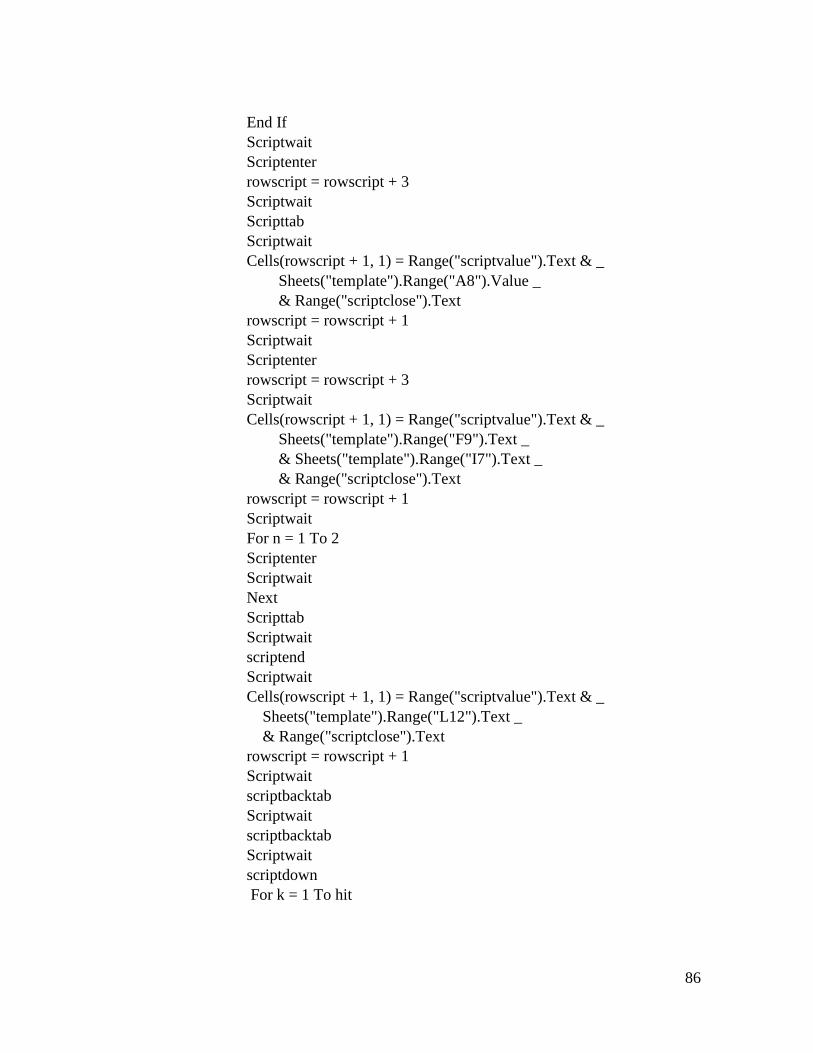
86
End If
Scriptwait
Scriptenter
rowscript = rowscript + 3
Scriptwait
Scripttab
Scriptwait
Cells(rowscript + 1, 1) = Range("scriptvalue").Text & _
Sheets("template").Range("A8").Value _
& Range("scriptclose").Text
rowscript = rowscript + 1
Scriptwait
Scriptenter
rowscript = rowscript + 3
Scriptwait
Cells(rowscript + 1, 1) = Range("scriptvalue").Text & _
Sheets("template").Range("F9").Text _
& Sheets("template").Range("I7").Text _
& Range("scriptclose").Text
rowscript = rowscript + 1
Scriptwait
For n = 1 To 2
Scriptenter
Scriptwait
Next
Scripttab
Scriptwait
scriptend
Scriptwait
Cells(rowscript + 1, 1) = Range("scriptvalue").Text & _
Sheets("template").Range("L12").Text _
& Range("scriptclose").Text
rowscript = rowscript + 1
Scriptwait
scriptbacktab
Scriptwait
scriptbacktab
Scriptwait
scriptdown
For k = 1 To hit
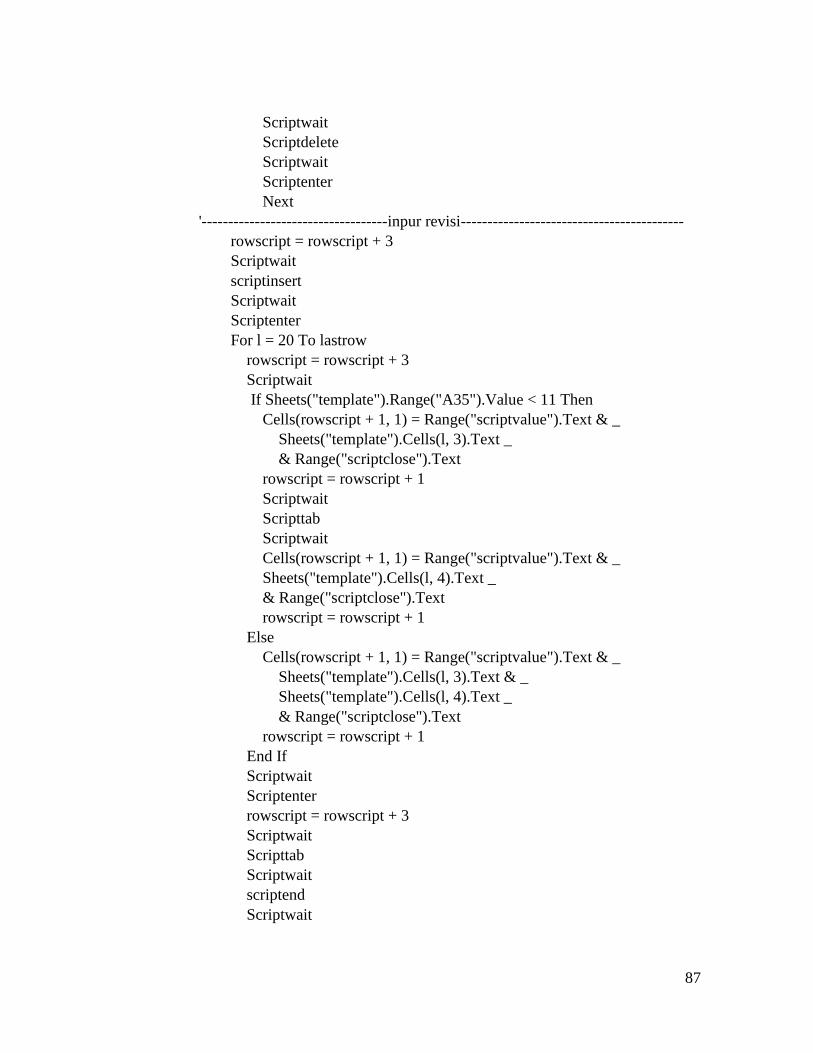
87
Scriptwait
Scriptdelete
Scriptwait
Scriptenter
Next
'-----------------------------------inpur revisi------------------------------------------
rowscript = rowscript + 3
Scriptwait
scriptinsert
Scriptwait
Scriptenter
For l = 20 To lastrow
rowscript = rowscript + 3
Scriptwait
If Sheets("template").Range("A35").Value < 11 Then
Cells(rowscript + 1, 1) = Range("scriptvalue").Text & _
Sheets("template").Cells(l, 3).Text _
& Range("scriptclose").Text
rowscript = rowscript + 1
Scriptwait
Scripttab
Scriptwait
Cells(rowscript + 1, 1) = Range("scriptvalue").Text & _
Sheets("template").Cells(l, 4).Text _
& Range("scriptclose").Text
rowscript = rowscript + 1
Else
Cells(rowscript + 1, 1) = Range("scriptvalue").Text & _
Sheets("template").Cells(l, 3).Text & _
Sheets("template").Cells(l, 4).Text _
& Range("scriptclose").Text
rowscript = rowscript + 1
End If
Scriptwait
Scriptenter
rowscript = rowscript + 3
Scriptwait
Scripttab
Scriptwait
scriptend
Scriptwait
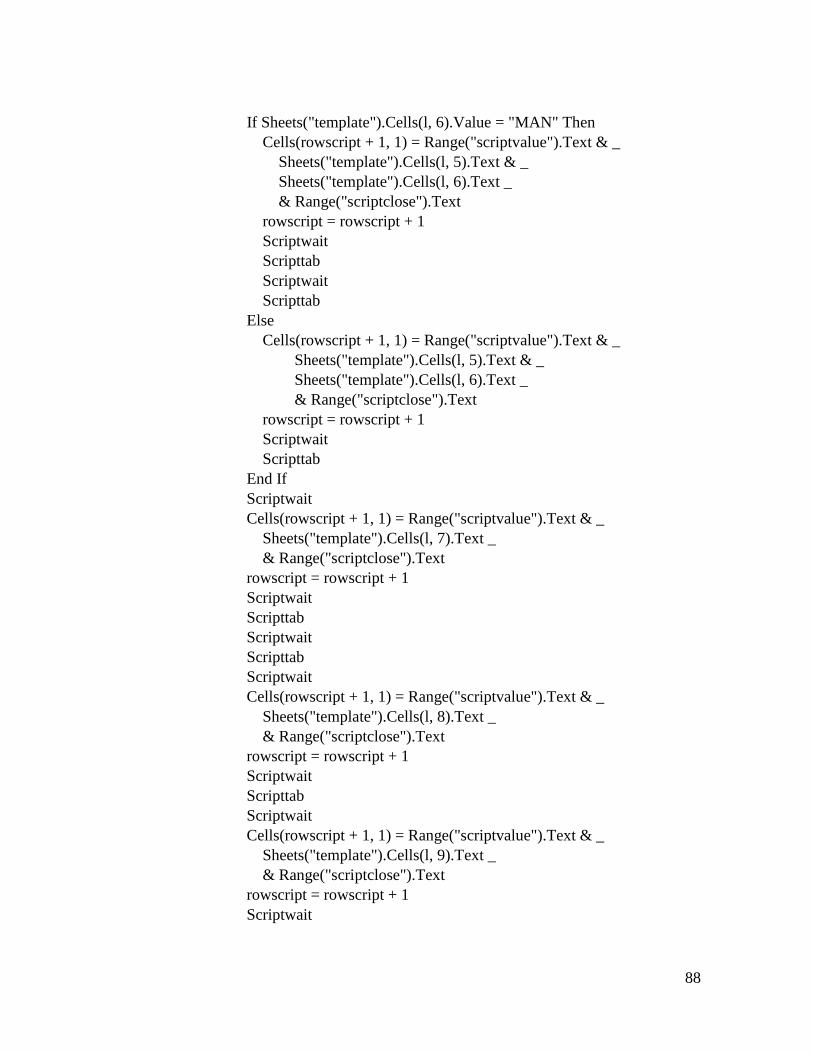
88
If Sheets("template").Cells(l, 6).Value = "MAN" Then
Cells(rowscript + 1, 1) = Range("scriptvalue").Text & _
Sheets("template").Cells(l, 5).Text & _
Sheets("template").Cells(l, 6).Text _
& Range("scriptclose").Text
rowscript = rowscript + 1
Scriptwait
Scripttab
Scriptwait
Scripttab
Else
Cells(rowscript + 1, 1) = Range("scriptvalue").Text & _
Sheets("template").Cells(l, 5).Text & _
Sheets("template").Cells(l, 6).Text _
& Range("scriptclose").Text
rowscript = rowscript + 1
Scriptwait
Scripttab
End If
Scriptwait
Cells(rowscript + 1, 1) = Range("scriptvalue").Text & _
Sheets("template").Cells(l, 7).Text _
& Range("scriptclose").Text
rowscript = rowscript + 1
Scriptwait
Scripttab
Scriptwait
Scripttab
Scriptwait
Cells(rowscript + 1, 1) = Range("scriptvalue").Text & _
Sheets("template").Cells(l, 8).Text _
& Range("scriptclose").Text
rowscript = rowscript + 1
Scriptwait
Scripttab
Scriptwait
Cells(rowscript + 1, 1) = Range("scriptvalue").Text & _
Sheets("template").Cells(l, 9).Text _
& Range("scriptclose").Text
rowscript = rowscript + 1
Scriptwait
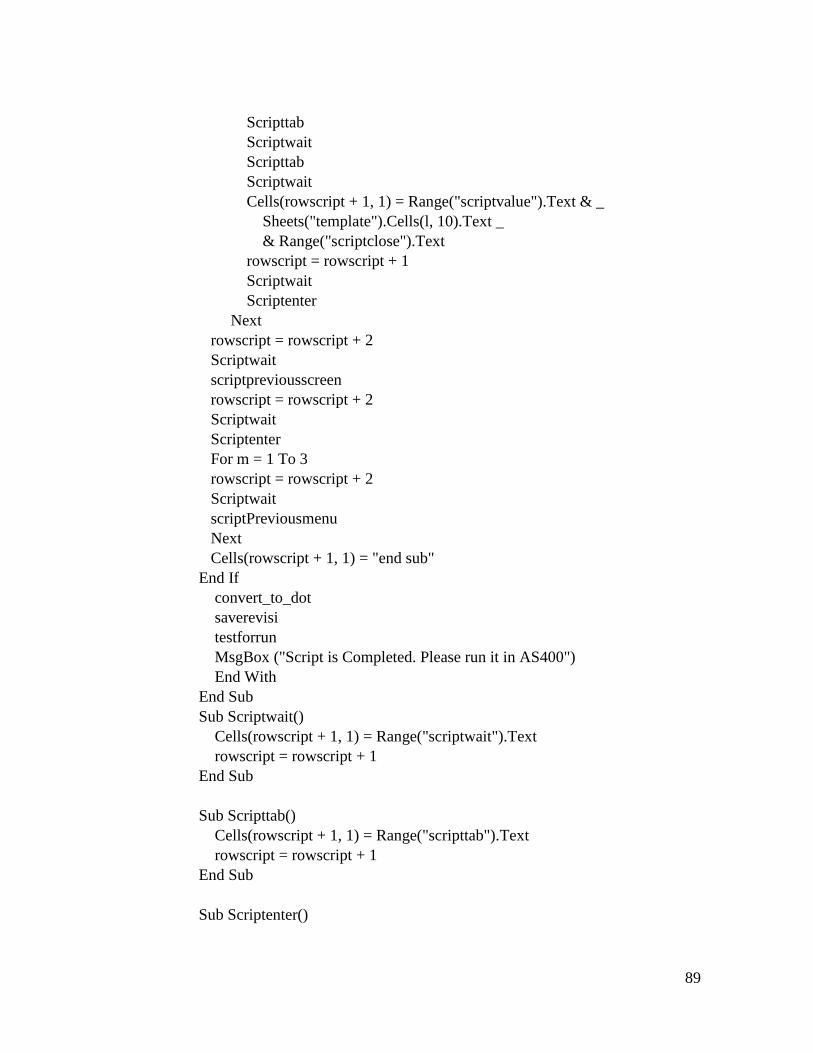
89
Scripttab
Scriptwait
Scripttab
Scriptwait
Cells(rowscript + 1, 1) = Range("scriptvalue").Text & _
Sheets("template").Cells(l, 10).Text _
& Range("scriptclose").Text
rowscript = rowscript + 1
Scriptwait
Scriptenter
Next
rowscript = rowscript + 2
Scriptwait
scriptpreviousscreen
rowscript = rowscript + 2
Scriptwait
Scriptenter
For m = 1 To 3
rowscript = rowscript + 2
Scriptwait
scriptPreviousmenu
Next
Cells(rowscript + 1, 1) = "end sub"
End If
convert_to_dot
saverevisi
testforrun
MsgBox ("Script is Completed. Please run it in AS400")
End With
End Sub
Sub Scriptwait()
Cells(rowscript + 1, 1) = Range("scriptwait").Text
rowscript = rowscript + 1
End Sub
Sub Scripttab()
Cells(rowscript + 1, 1) = Range("scripttab").Text
rowscript = rowscript + 1
End Sub
Sub Scriptenter()
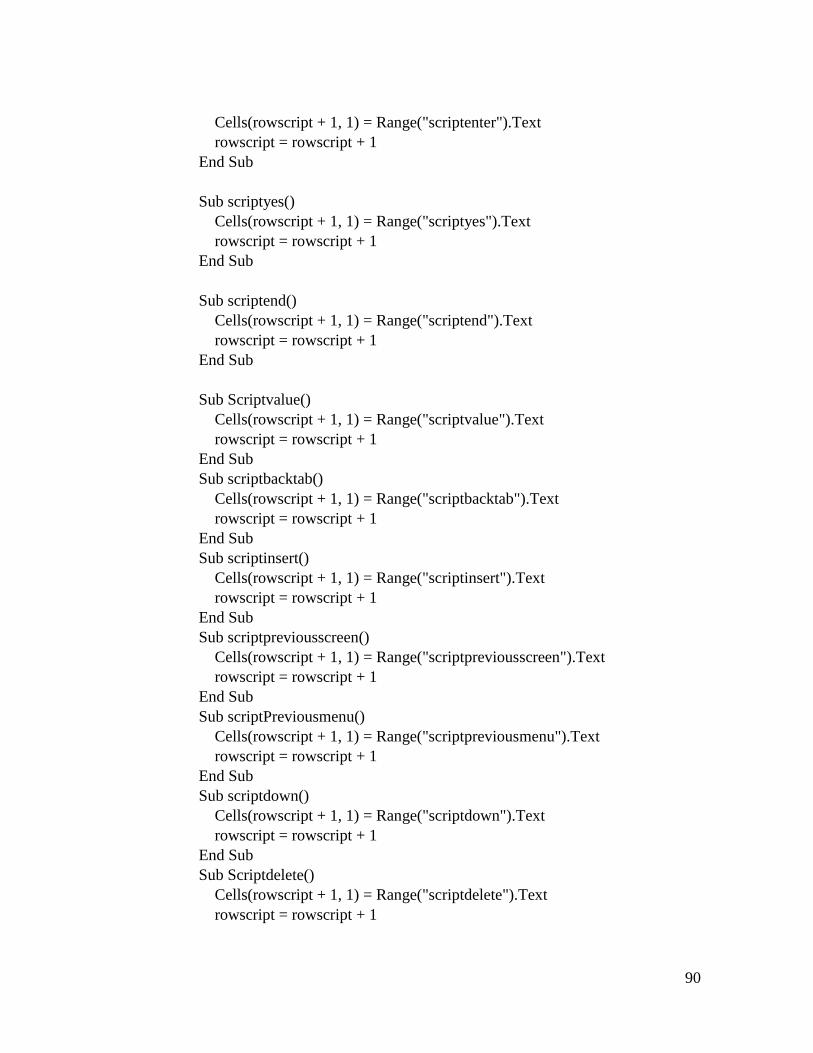
90
Cells(rowscript + 1, 1) = Range("scriptenter").Text
rowscript = rowscript + 1
End Sub
Sub scriptyes()
Cells(rowscript + 1, 1) = Range("scriptyes").Text
rowscript = rowscript + 1
End Sub
Sub scriptend()
Cells(rowscript + 1, 1) = Range("scriptend").Text
rowscript = rowscript + 1
End Sub
Sub Scriptvalue()
Cells(rowscript + 1, 1) = Range("scriptvalue").Text
rowscript = rowscript + 1
End Sub
Sub scriptbacktab()
Cells(rowscript + 1, 1) = Range("scriptbacktab").Text
rowscript = rowscript + 1
End Sub
Sub scriptinsert()
Cells(rowscript + 1, 1) = Range("scriptinsert").Text
rowscript = rowscript + 1
End Sub
Sub scriptpreviousscreen()
Cells(rowscript + 1, 1) = Range("scriptpreviousscreen").Text
rowscript = rowscript + 1
End Sub
Sub scriptPreviousmenu()
Cells(rowscript + 1, 1) = Range("scriptpreviousmenu").Text
rowscript = rowscript + 1
End Sub
Sub scriptdown()
Cells(rowscript + 1, 1) = Range("scriptdown").Text
rowscript = rowscript + 1
End Sub
Sub Scriptdelete()
Cells(rowscript + 1, 1) = Range("scriptdelete").Text
rowscript = rowscript + 1
91
End Sub
Sub saverevisi()
revisi = Sheets("script for run").Range("A1048576").End(xlUp).Row
Dim FSO As FileSystemObject
Dim FSOFile As TextStream
Dim FilePath As String
Dim NoOfLoop As Integer
Filename = Sheets("Template").Range("L8").Value &
Sheets("Template").Range("I6").Value
FilePath2 = "D:\THESIS\Excel\script"
FilePath = FilePath2 & "\" & Filename & ".mac"
Set FSO = New FileSystemObject
Set FSOFile = FSO.OpenTextFile(FilePath, 2, True)
For NoOfLoop = 1 To revisi
FSOFile.WriteLine (Sheets("script for run").Cells(NoOfLoop, 1).Value)
Next NoOfLoop
FSOFile.Close
End Sub
Sub convert_to_dot()
Worksheets("script for run").Activate
Worksheets("script for run").Columns(1).Select
Selection.NumberFormat = "@"
Dim OriginalText As String
Dim CorrectedText As String
lastrow = ActiveSheet.UsedRange.SpecialCells(xlCellTypeLastCell).Row
For i = 1 To lastrow
OriginalText = Worksheets("script for run").Cells(i, 1).Value
CorrectedText = Replace(OriginalText, ",", ".")
Worksheets("script for run").Cells(i, 1).Value = CorrectedText
Next i
End Sub
Sub testforrun()
Sheets("template").Select
End Sub