Embed Size (px)
Citation preview

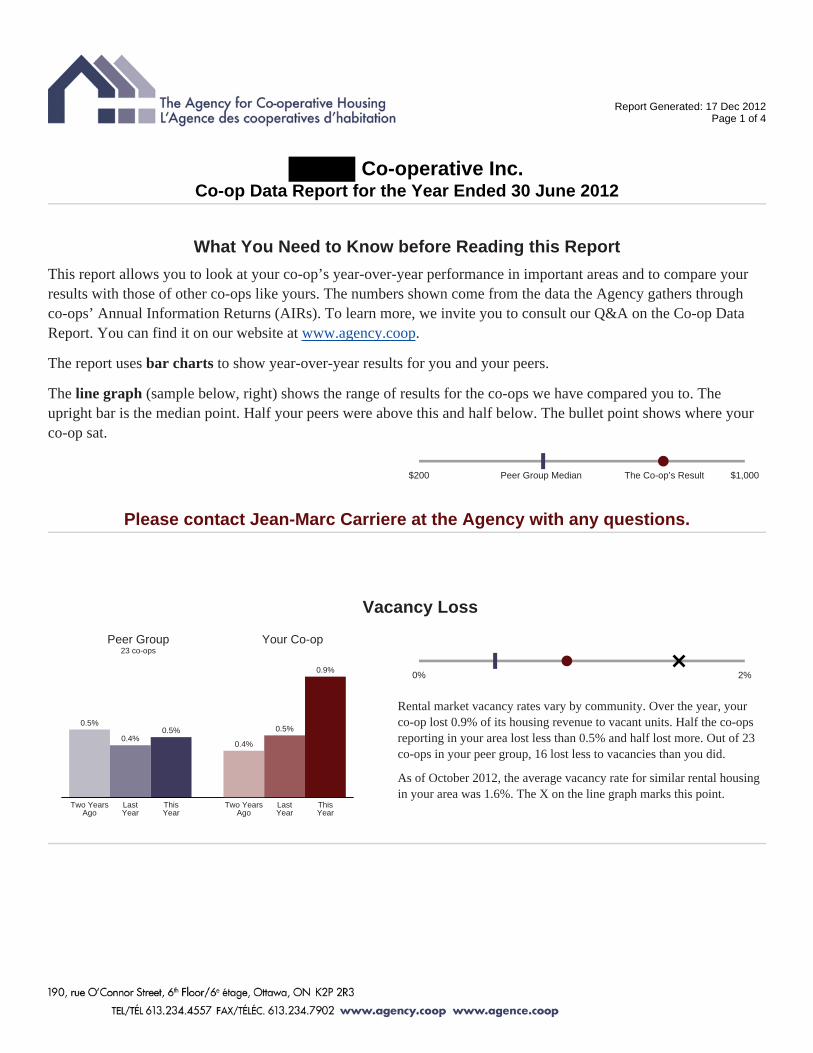
Report Generated: 17 Dec 2012Page 1 of 4
Co-operative Inc.Co-op Data Report for the Year Ended 30 June 2012
What You Need to Know before Reading this Report
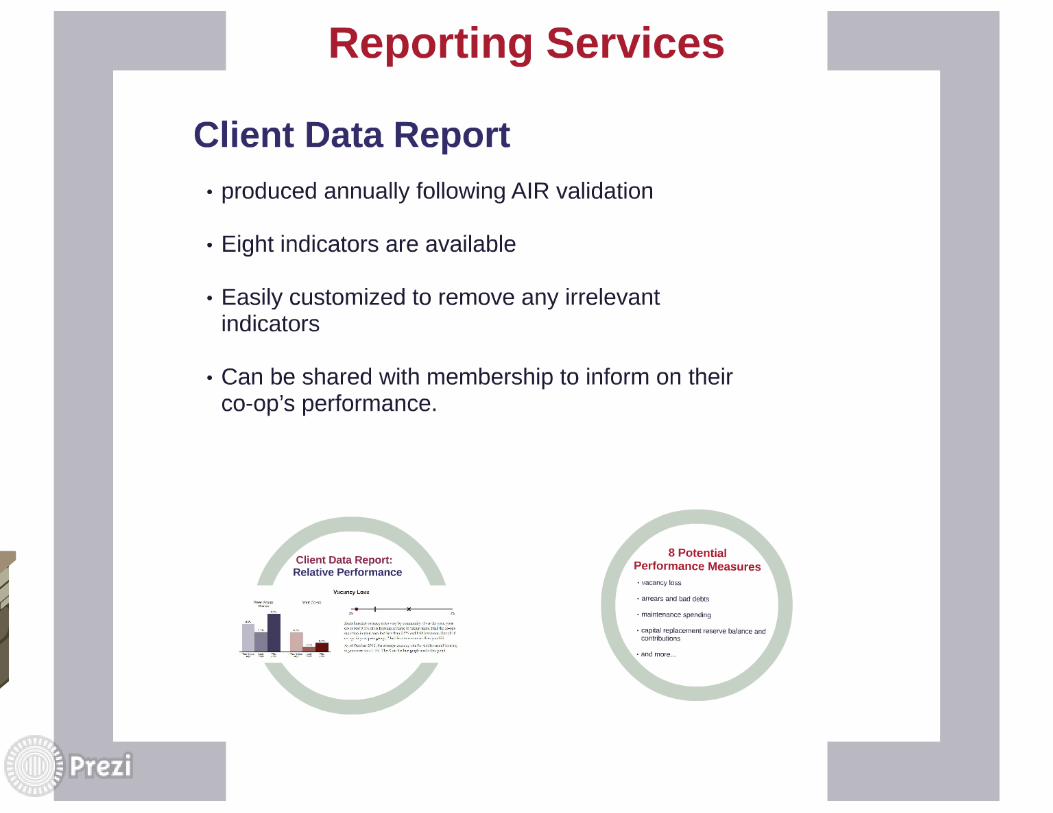
This report allows you to look at your co-op’s year-over-year performance in important areas and to compare yourresults with those of other co-ops like yours. The numbers shown come from the data the Agency gathers throughco-ops’ Annual Information Returns (AIRs). To learn more, we invite you to consult our Q&A on the Co-op DataReport. You can find it on our website at www.agency.coop.
The report uses bar charts to show year-over-year results for you and your peers.
The line graph (sample below, right) shows the range of results for the co-ops we have compared you to. Theupright bar is the median point. Half your peers were above this and half below. The bullet point shows where yourco-op sat.
$200 $1,000Peer Group Median The Co-op’s Result
Please contact Jean-Marc Carriere at the Agency with any questions.
Peer Group23 co-ops
0.5%
Two YearsAgo
0.4%
LastYear
0.5%
ThisYear
Your Co-op
0.4%
Two YearsAgo
0.5%
LastYear
0.9%
ThisYear
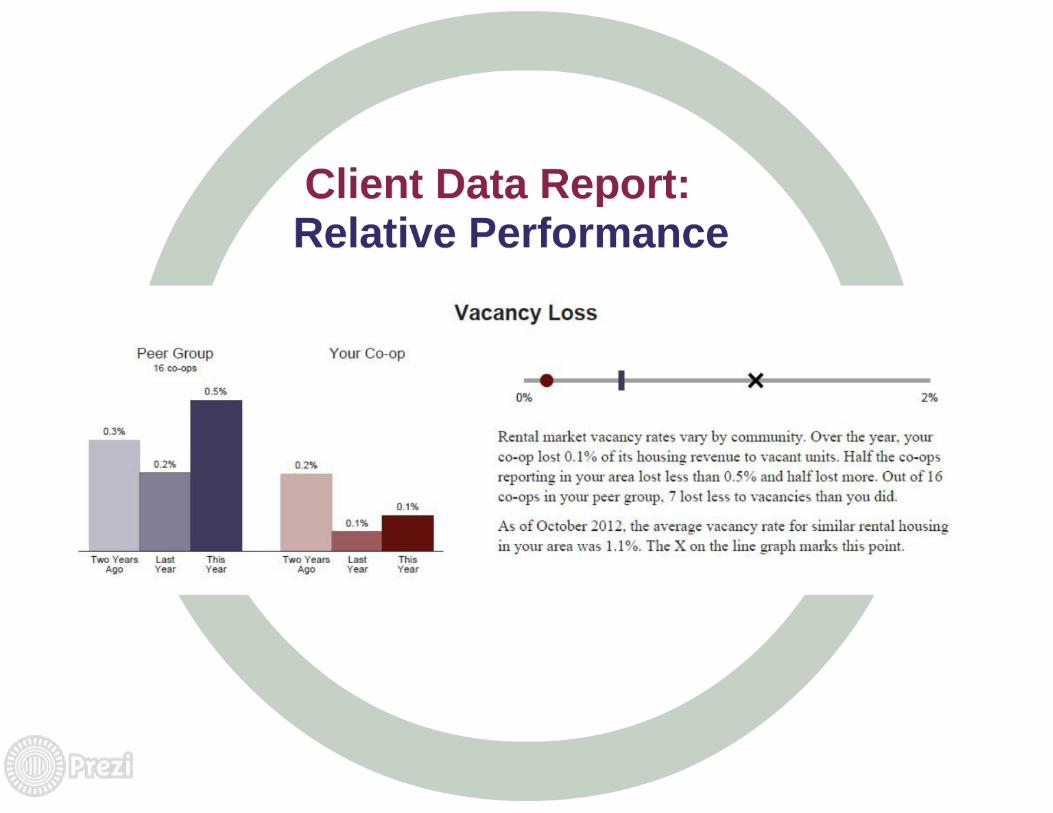
Vacancy Loss
0% 2%
Rental market vacancy rates vary by community. Over the year, yourco-op lost 0.9% of its housing revenue to vacant units. Half the co-opsreporting in your area lost less than 0.5% and half lost more. Out of 23co-ops in your peer group, 16 lost less to vacancies than you did.
As of October 2012, the average vacancy rate for similar rental housingin your area was 1.6%. The X on the line graph marks this point.
Report Generated: 17 Dec 2012Page 2 of 4
Co-operative Inc.Co-op Data Report for the year ended 30 June 2012
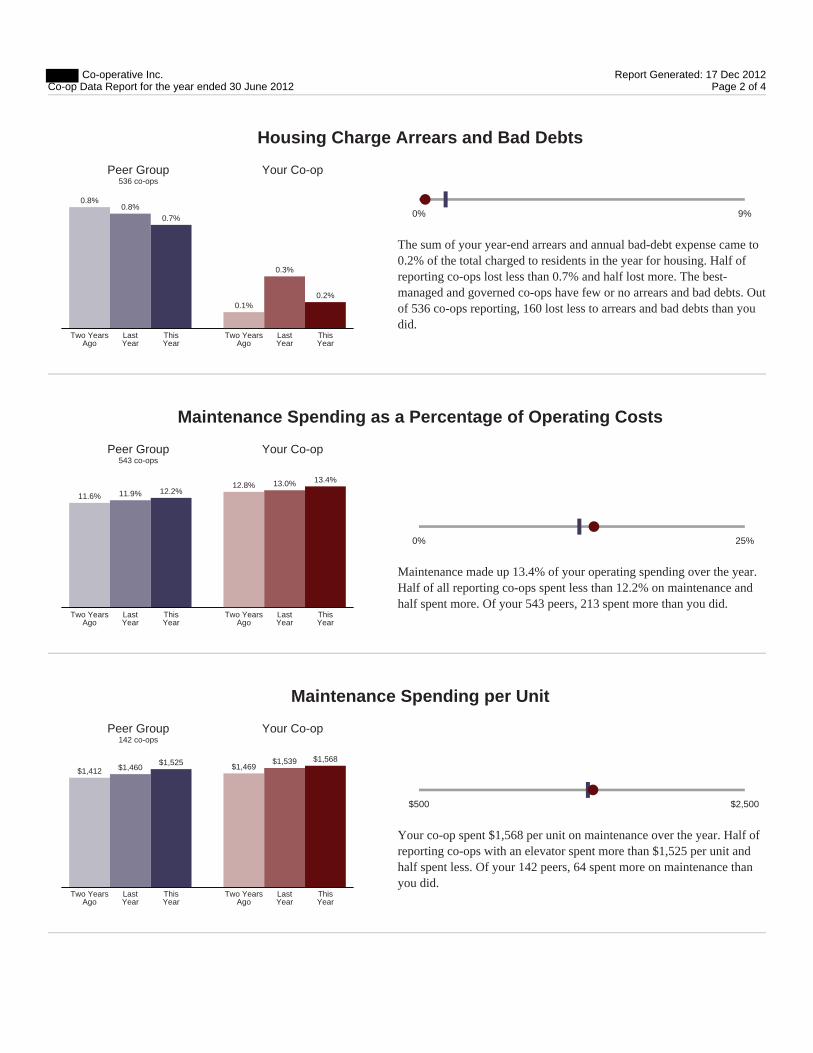
Peer Group536 co-ops
0.8%
Two YearsAgo
0.8%
LastYear
0.7%
ThisYear
Your Co-op
0.1%
Two YearsAgo
0.3%
LastYear
0.2%
ThisYear
Housing Charge Arrears and Bad Debts
0% 9%
The sum of your year-end arrears and annual bad-debt expense came to0.2% of the total charged to residents in the year for housing. Half ofreporting co-ops lost less than 0.7% and half lost more. The best-managed and governed co-ops have few or no arrears and bad debts. Outof 536 co-ops reporting, 160 lost less to arrears and bad debts than youdid.
Peer Group543 co-ops
11.6%
Two YearsAgo
11.9%
LastYear
12.2%
ThisYear
Your Co-op
12.8%
Two YearsAgo
13.0%
LastYear
13.4%
ThisYear
Maintenance Spending as a Percentage of Operating Costs
0% 25%
Maintenance made up 13.4% of your operating spending over the year.Half of all reporting co-ops spent less than 12.2% on maintenance andhalf spent more. Of your 543 peers, 213 spent more than you did.
Peer Group142 co-ops
$1,412
Two YearsAgo
$1,460
LastYear
$1,525
ThisYear
Your Co-op
$1,469
Two YearsAgo
$1,539
LastYear
$1,568
ThisYear
Maintenance Spending per Unit
$500 $2,500
Your co-op spent $1,568 per unit on maintenance over the year. Half ofreporting co-ops with an elevator spent more than $1,525 per unit andhalf spent less. Of your 142 peers, 64 spent more on maintenance thanyou did.
Report Generated: 17 Dec 2012Page 3 of 4
Co-operative Inc.Co-op Data Report for the year ended 30 June 2012
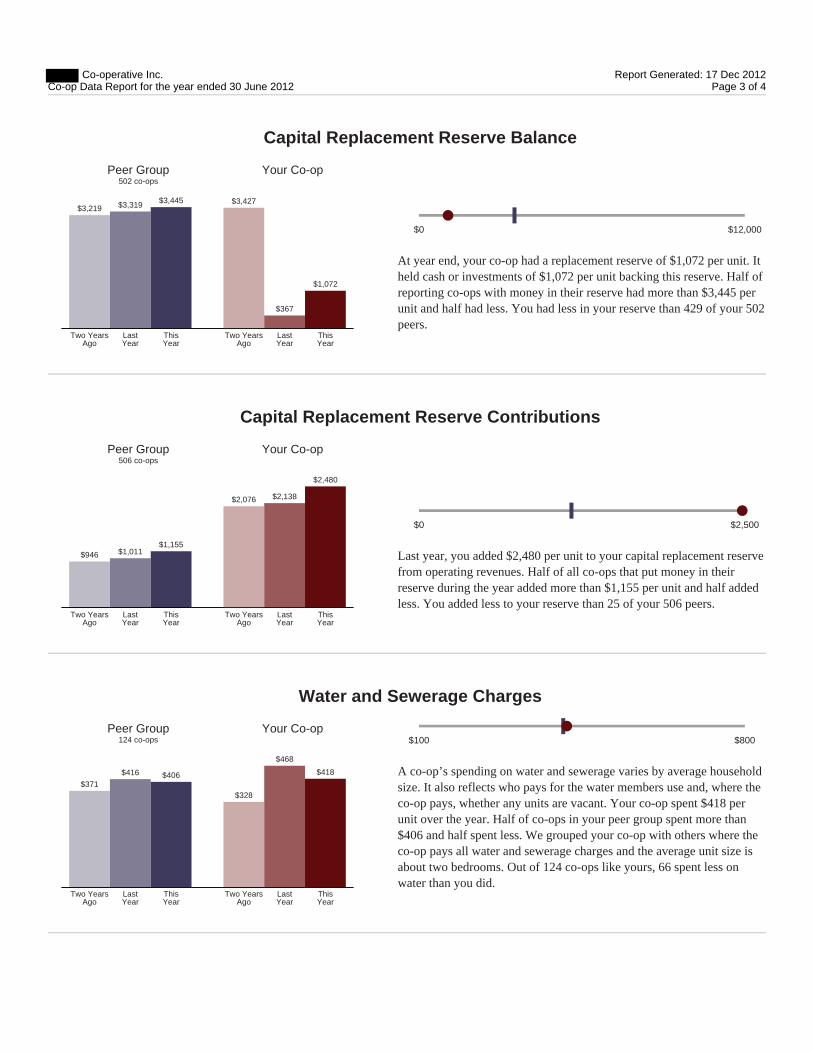
Peer Group502 co-ops
$3,219
Two YearsAgo
$3,319
LastYear
$3,445
ThisYear
Your Co-op
$3,427
Two YearsAgo
$367
LastYear
$1,072
ThisYear
Capital Replacement Reserve Balance
$0 $12,000
At year end, your co-op had a replacement reserve of $1,072 per unit. Itheld cash or investments of $1,072 per unit backing this reserve. Half ofreporting co-ops with money in their reserve had more than $3,445 perunit and half had less. You had less in your reserve than 429 of your 502peers.
Peer Group506 co-ops
$946
Two YearsAgo
$1,011
LastYear
$1,155
ThisYear
Your Co-op
$2,076
Two YearsAgo
$2,138
LastYear
$2,480
ThisYear
Capital Replacement Reserve Contributions
$0 $2,500
Last year, you added $2,480 per unit to your capital replacement reservefrom operating revenues. Half of all co-ops that put money in theirreserve during the year added more than $1,155 per unit and half addedless. You added less to your reserve than 25 of your 506 peers.
Peer Group124 co-ops
$371
Two YearsAgo
$416
LastYear
$406
ThisYear
Your Co-op
$328
Two YearsAgo
$468
LastYear
$418
ThisYear
Water and Sewerage Charges
$100 $800
A co-op’s spending on water and sewerage varies by average householdsize. It also reflects who pays for the water members use and, where theco-op pays, whether any units are vacant. Your co-op spent $418 perunit over the year. Half of co-ops in your peer group spent more than$406 and half spent less. We grouped your co-op with others where theco-op pays all water and sewerage charges and the average unit size isabout two bedrooms. Out of 124 co-ops like yours, 66 spent less onwater than you did.
Report Generated: 17 Dec 2012Page 4 of 4
Co-operative Inc.Co-op Data Report for the year ended 30 June 2012
Peer Group170 co-ops
8.2%
Two YearsAgo
8.5%
LastYear
8.5%
ThisYear
Your Co-op
7.2%
Two YearsAgo
7.1%
LastYear
7.0%
ThisYear
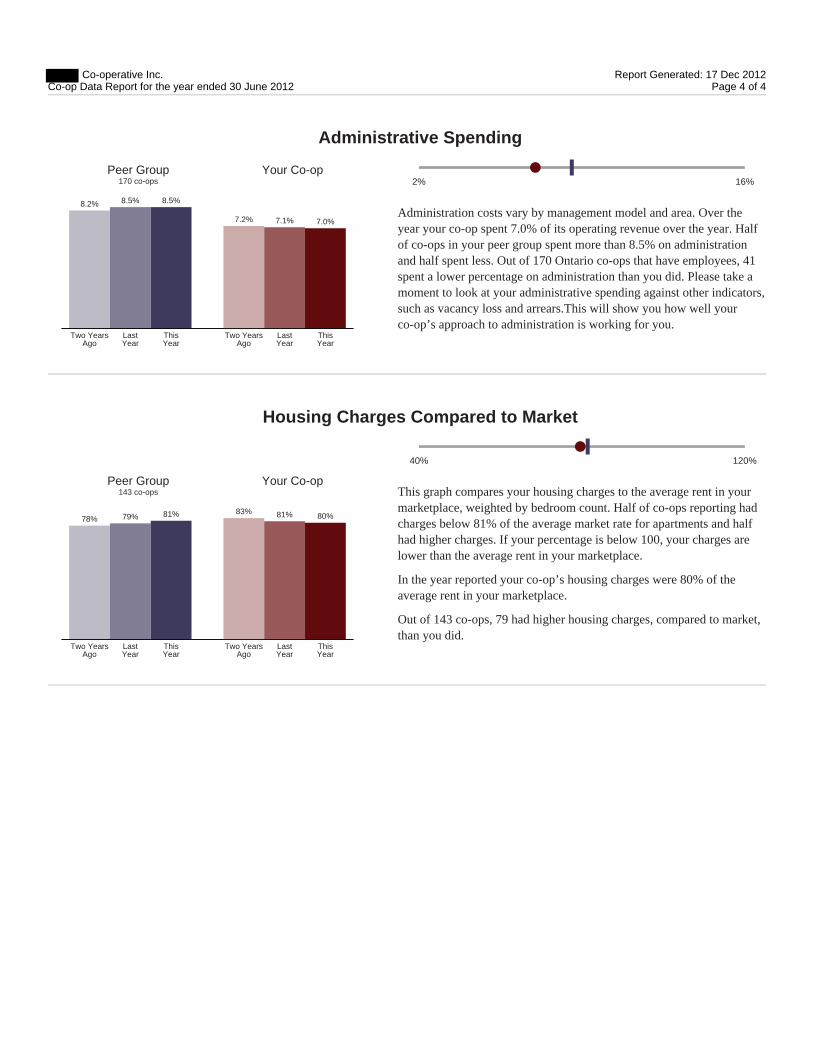
Administrative Spending
2% 16%
Administration costs vary by management model and area. Over theyear your co-op spent 7.0% of its operating revenue over the year. Halfof co-ops in your peer group spent more than 8.5% on administrationand half spent less. Out of 170 Ontario co-ops that have employees, 41spent a lower percentage on administration than you did. Please take amoment to look at your administrative spending against other indicators,such as vacancy loss and arrears.This will show you how well yourco-op’s approach to administration is working for you.
Peer Group143 co-ops
78%
Two YearsAgo
79%
LastYear
81%
ThisYear
Your Co-op
83%
Two YearsAgo
81%
LastYear
80%
ThisYear
Housing Charges Compared to Market
40% 120%
This graph compares your housing charges to the average rent in yourmarketplace, weighted by bedroom count. Half of co-ops reporting hadcharges below 81% of the average market rate for apartments and halfhad higher charges. If your percentage is below 100, your charges arelower than the average rent in your marketplace.
In the year reported your co-op’s housing charges were 80% of theaverage rent in your marketplace.
Out of 143 co-ops, 79 had higher housing charges, compared to market,than you did.
Your Score Excellent Good Fair
X
Your Score Excellent Good Fair
X
Your Score Excellent Good Fair
X
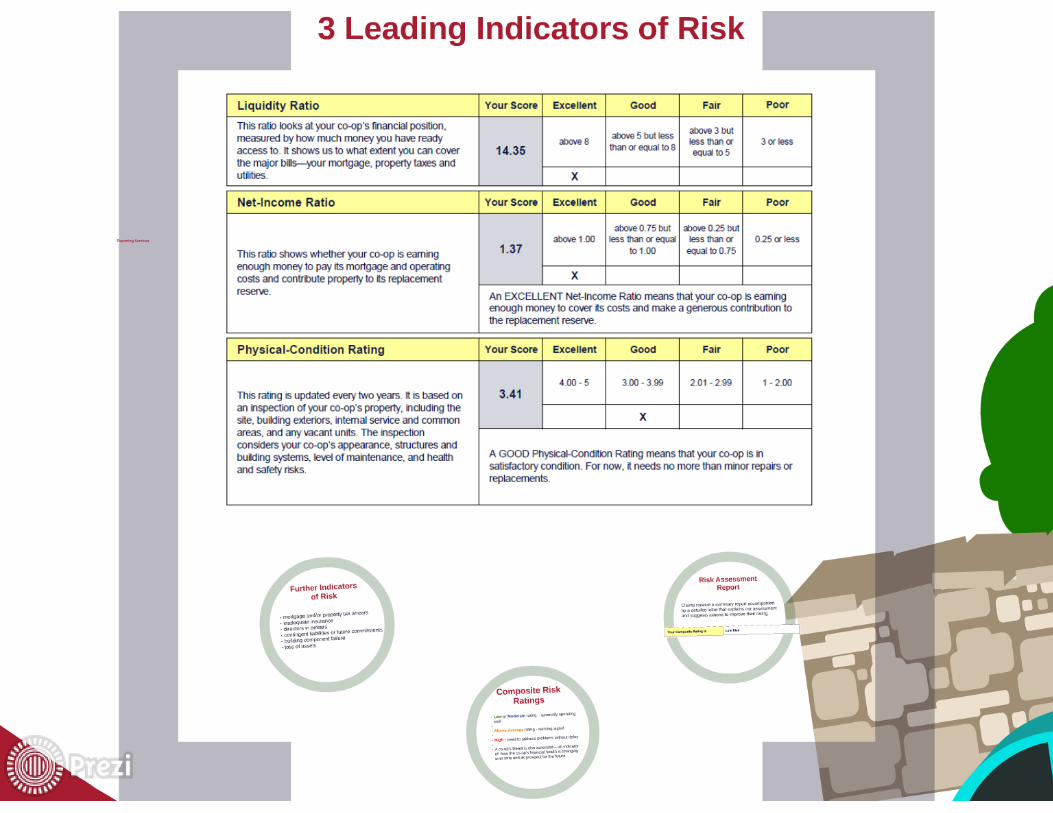
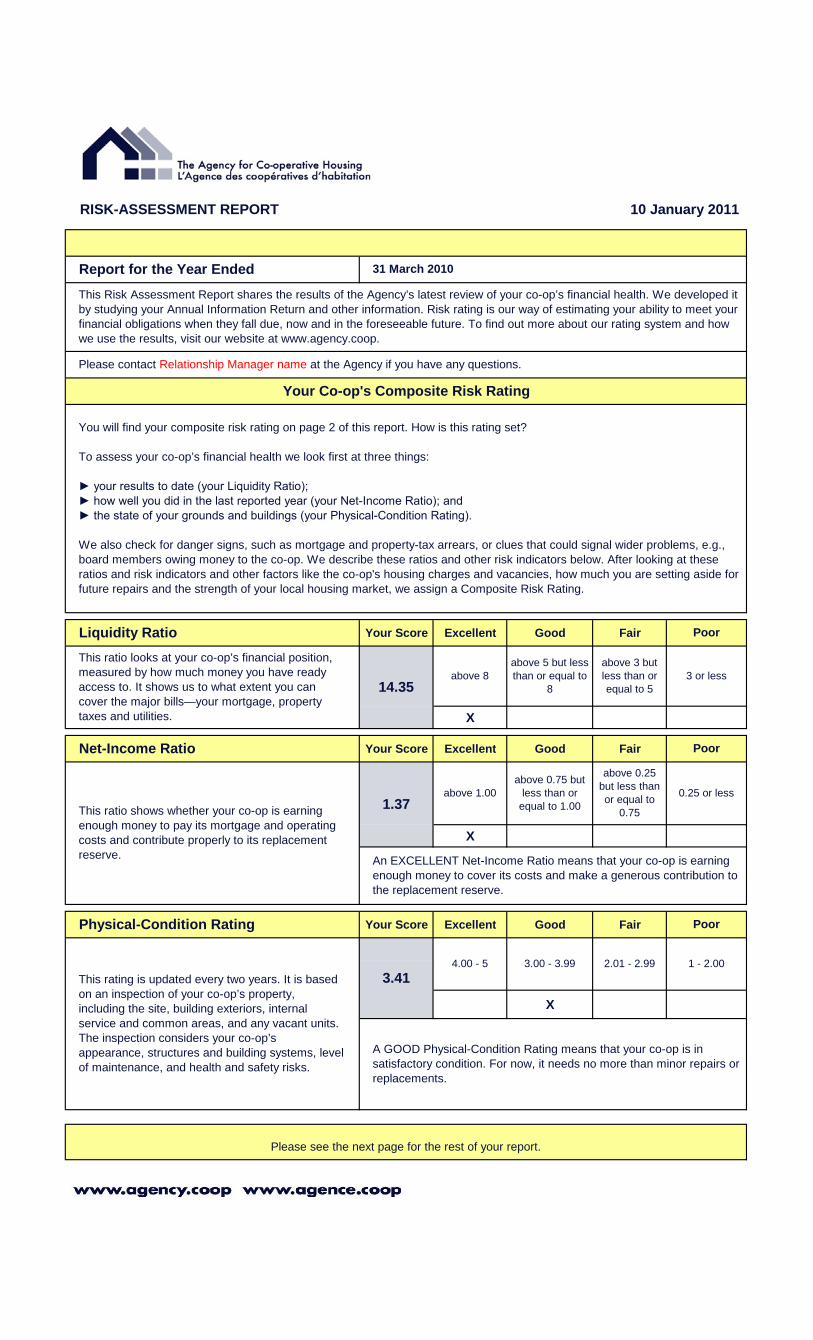
You will find your composite risk rating on page 2 of this report. How is this rating set?
To assess your co-op’s financial health we look first at three things:
► your results to date (your Liquidity Ratio); ► how well you did in the last reported year (your Net-Income Ratio); and ► the state of your grounds and buildings (your Physical-Condition Rating).
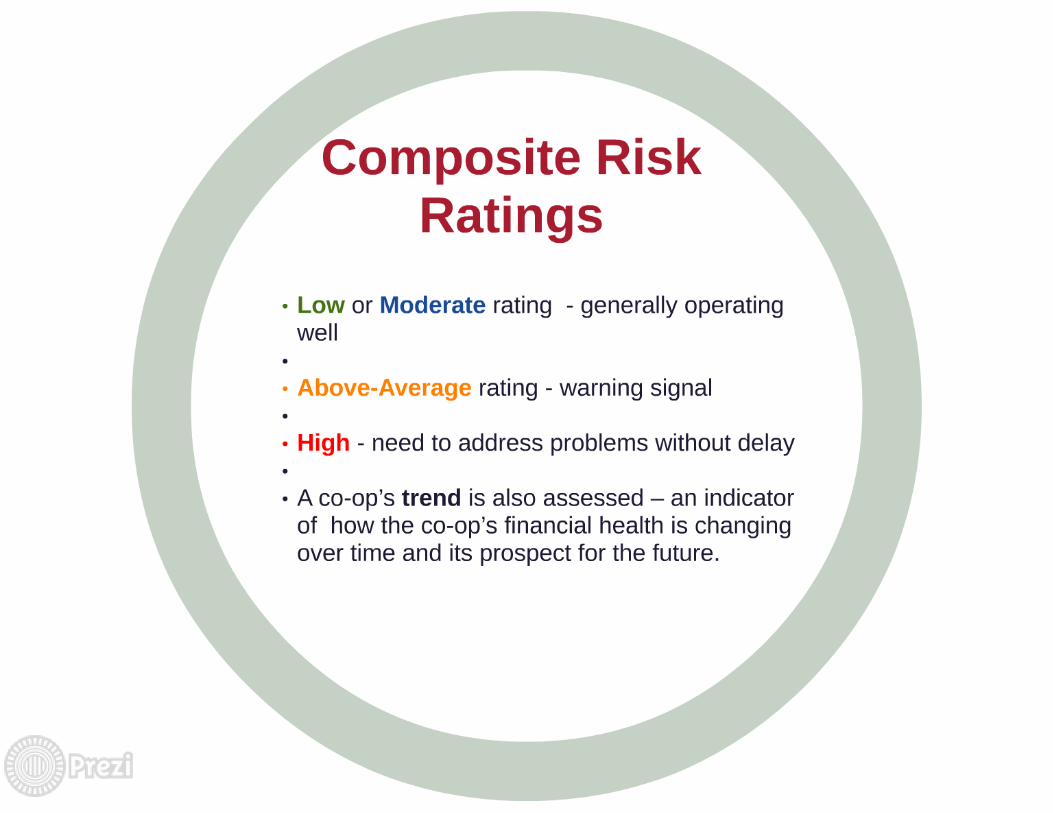
We also check for danger signs, such as mortgage and property-tax arrears, or clues that could signal wider problems, e.g., board members owing money to the co-op. We describe these ratios and other risk indicators below. After looking at these ratios and risk indicators and other factors like the co-op's housing charges and vacancies, how much you are setting aside for future repairs and the strength of your local housing market, we assign a Composite Risk Rating.
above 3 but less than or equal to 514.35
above 5 but less than or equal to
8above 8
3.00 - 3.99 2.01 - 2.99
Physical-Condition Rating
This ratio looks at your co-op’s financial position, measured by how much money you have ready access to. It shows us to what extent you can cover the major bills—your mortgage, property taxes and utilities.
Poor
0.25 or less1.37
above 0.25 but less than or equal to
0.75
Please see the next page for the rest of your report.
This rating is updated every two years. It is based on an inspection of your co-op’s property, including the site, building exteriors, internal service and common areas, and any vacant units. The inspection considers your co-op’s appearance, structures and building systems, level of maintenance, and health and safety risks.
3.411 - 2.004.00 - 5
above 0.75 but less than or
equal to 1.00
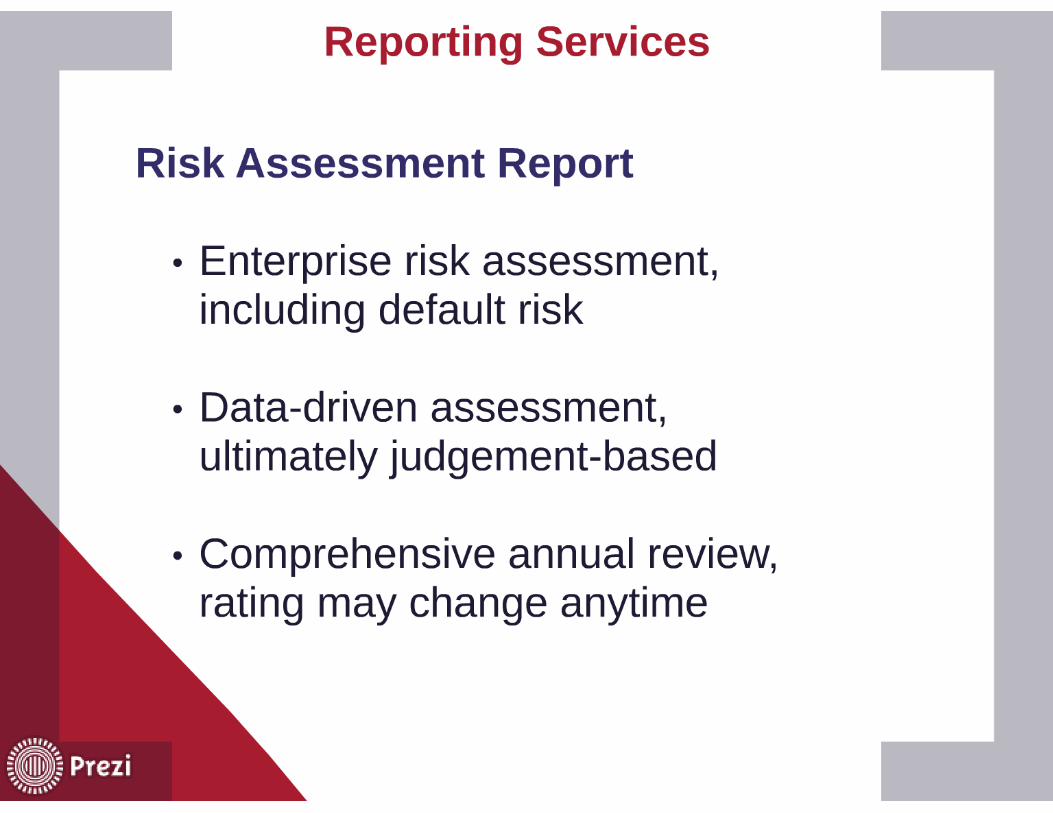
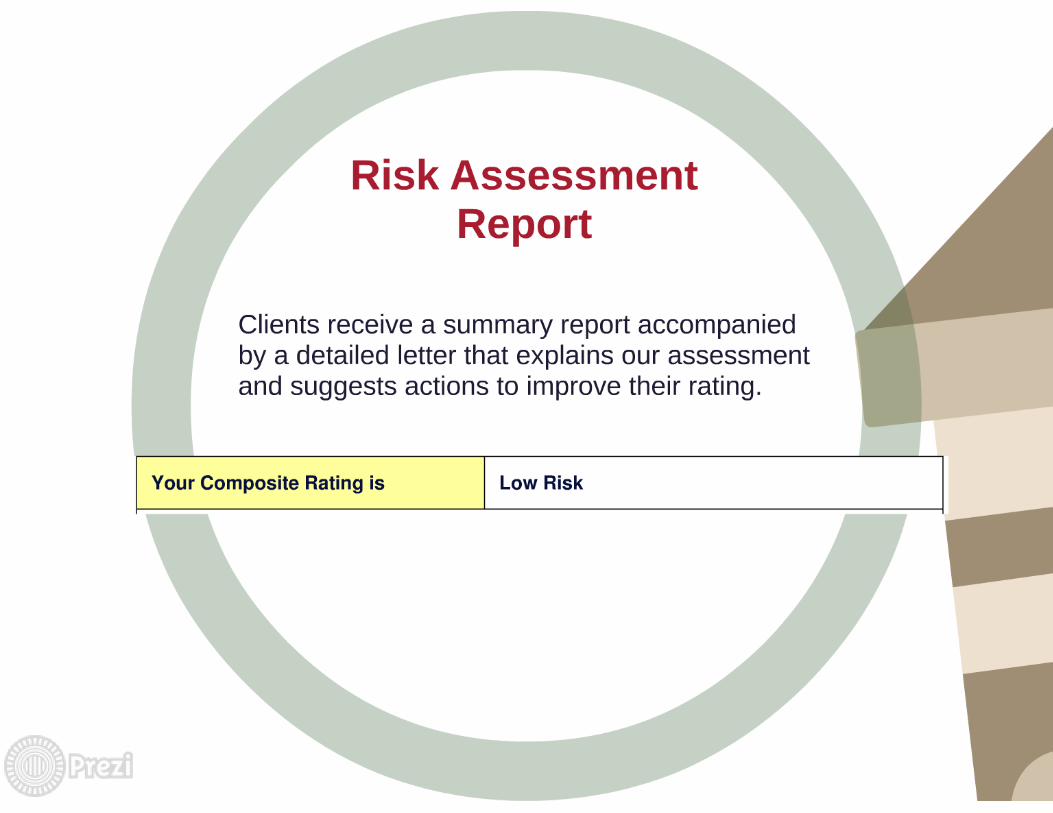
This Risk Assessment Report shares the results of the Agency’s latest review of your co-op’s financial health. We developed it by studying your Annual Information Return and other information. Risk rating is our way of estimating your ability to meet your financial obligations when they fall due, now and in the foreseeable future. To find out more about our rating system and how we use the results, visit our website at www.agency.coop.
3 or less
Net-Income Ratio
Poor
A GOOD Physical-Condition Rating means that your co-op is in satisfactory condition. For now, it needs no more than minor repairs or replacements.
This ratio shows whether your co-op is earning enough money to pay its mortgage and operating costs and contribute properly to its replacement reserve.
Liquidity Ratio
Your Co-op's Composite Risk Rating
above 1.00
An EXCELLENT Net-Income Ratio means that your co-op is earning enough money to cover its costs and make a generous contribution to the replacement reserve.
Poor
Please contact Relationship Manager name at the Agency if you have any questions.
RISK-ASSESSMENT REPORT
Report for the Year Ended 31 March 2010
10 January 2011
page 2
Weakening Stable
RISK-ASSESSMENT REPORT
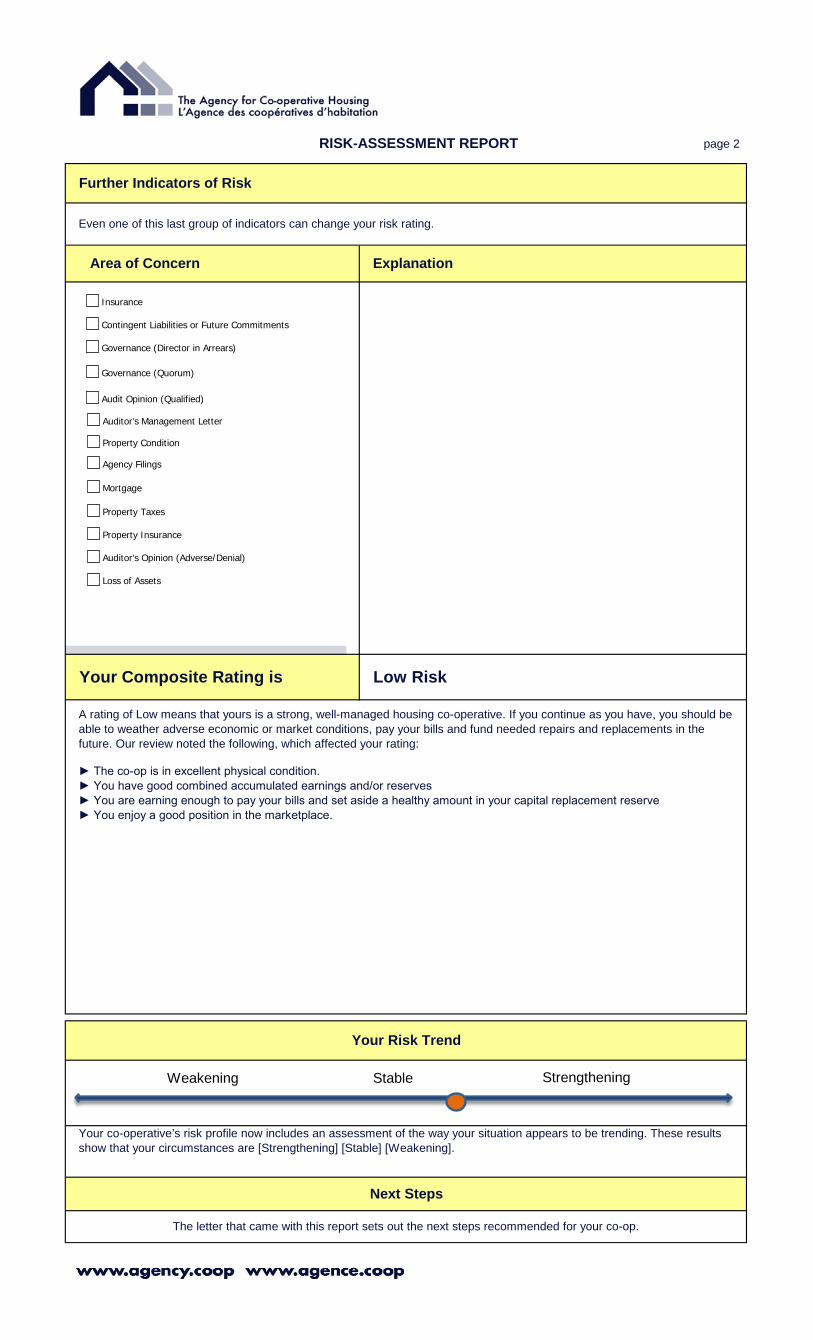
Your Risk Trend
Explanation
The letter that came with this report sets out the next steps recommended for your co-op.
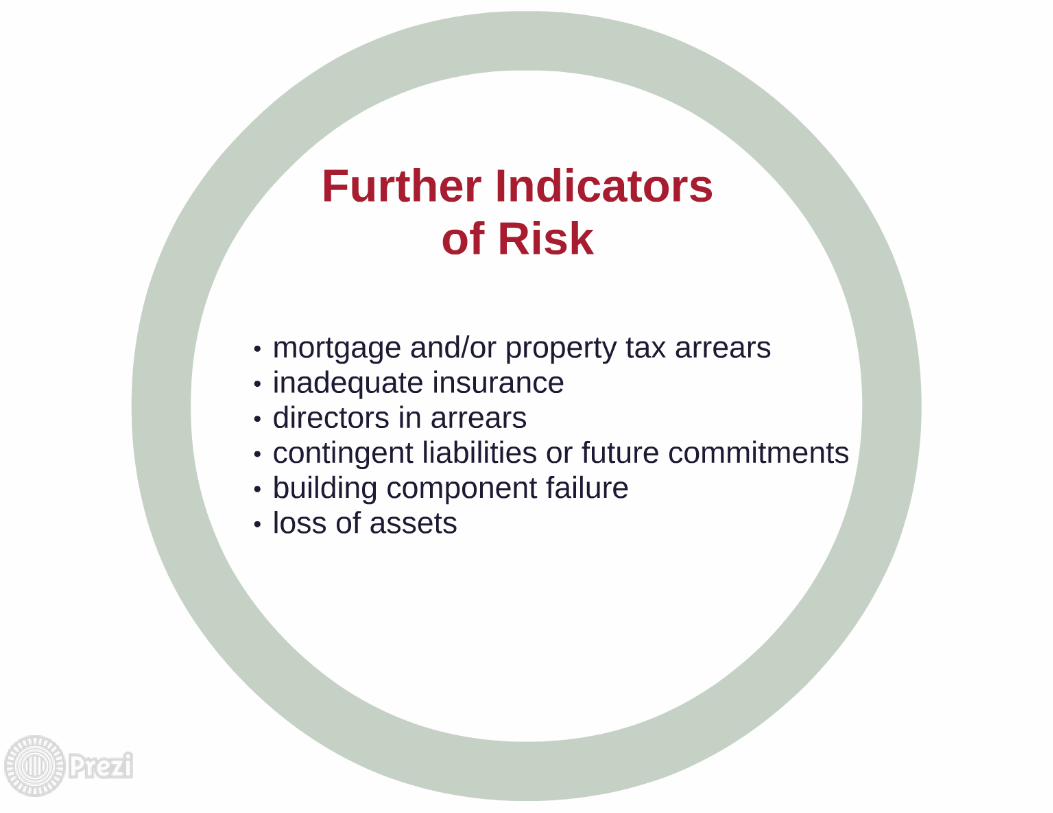
Further Indicators of Risk
Your co-operative’s risk profile now includes an assessment of the way your situation appears to be trending. These results show that your circumstances are [Strengthening] [Stable] [Weakening].
Strengthening
Next Steps
Area of Concern
Even one of this last group of indicators can change your risk rating.
► The co-op is in excellent physical condition.► You have good combined accumulated earnings and/or reserves ► You are earning enough to pay your bills and set aside a healthy amount in your capital replacement reserve► You enjoy a good position in the marketplace.
FALSE
Low RiskYour Composite Rating is
A rating of Low means that yours is a strong, well-managed housing co-operative. If you continue as you have, you should be able to weather adverse economic or market conditions, pay your bills and fund needed repairs and replacements in the future. Our review noted the following, which affected your rating:
Property Taxes
Audit Opinion (Qualified)
Auditor's Management Letter
Contingent Liabilities or Future Commitments
Governance (Director in Arrears)
Mortgage
Property Condition
Loss of Assets
Property Insurance
Auditor's Opinion (Adverse/Denial)
Agency Filings
Insurance
Governance (Quorum)
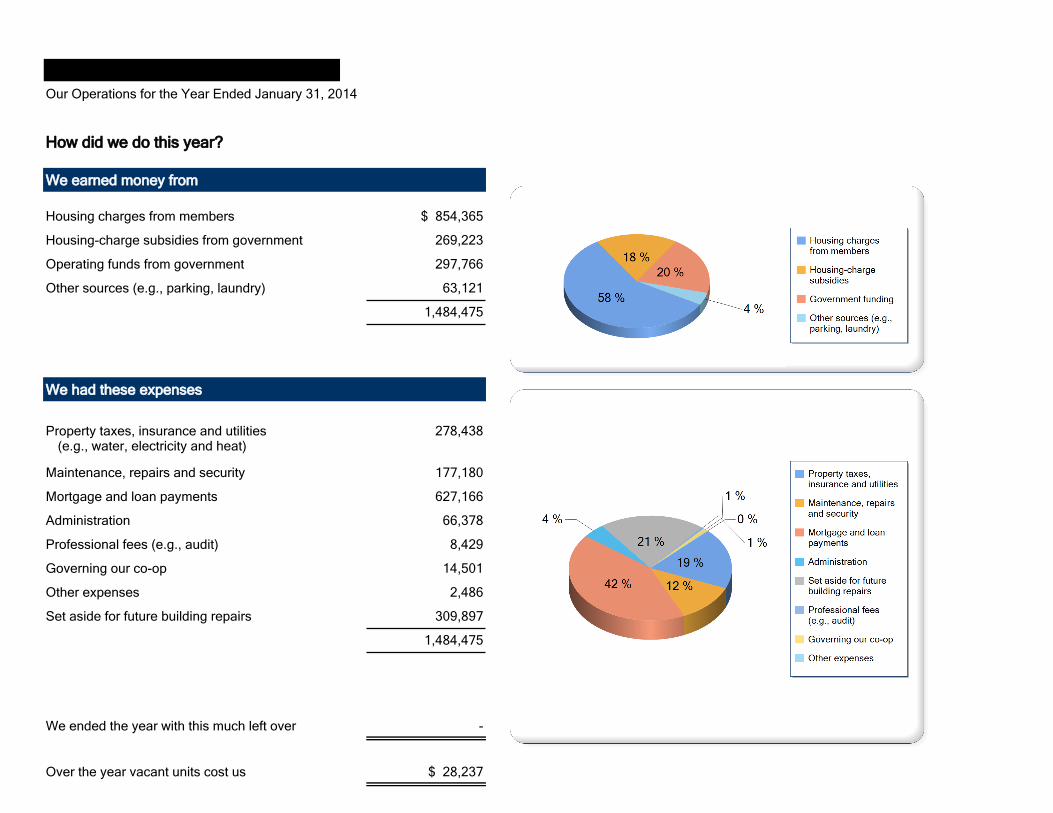
How did we do this year?
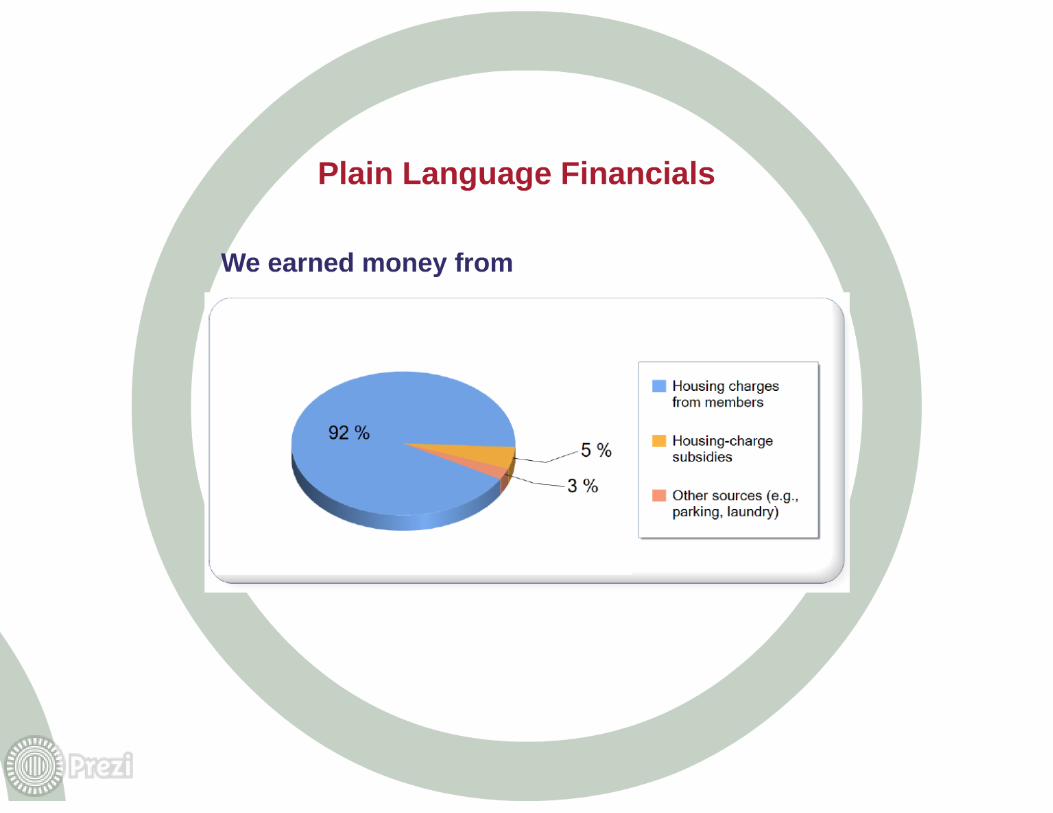
Housing charges from members
Housing-charge subsidies from government
Operating funds from government
Other sources (e.g., parking, laundry)
$ 854,365
269,223
297,766
63,121
1,484,475
We earned money from
Our Operations for the Year Ended January 31, 2014
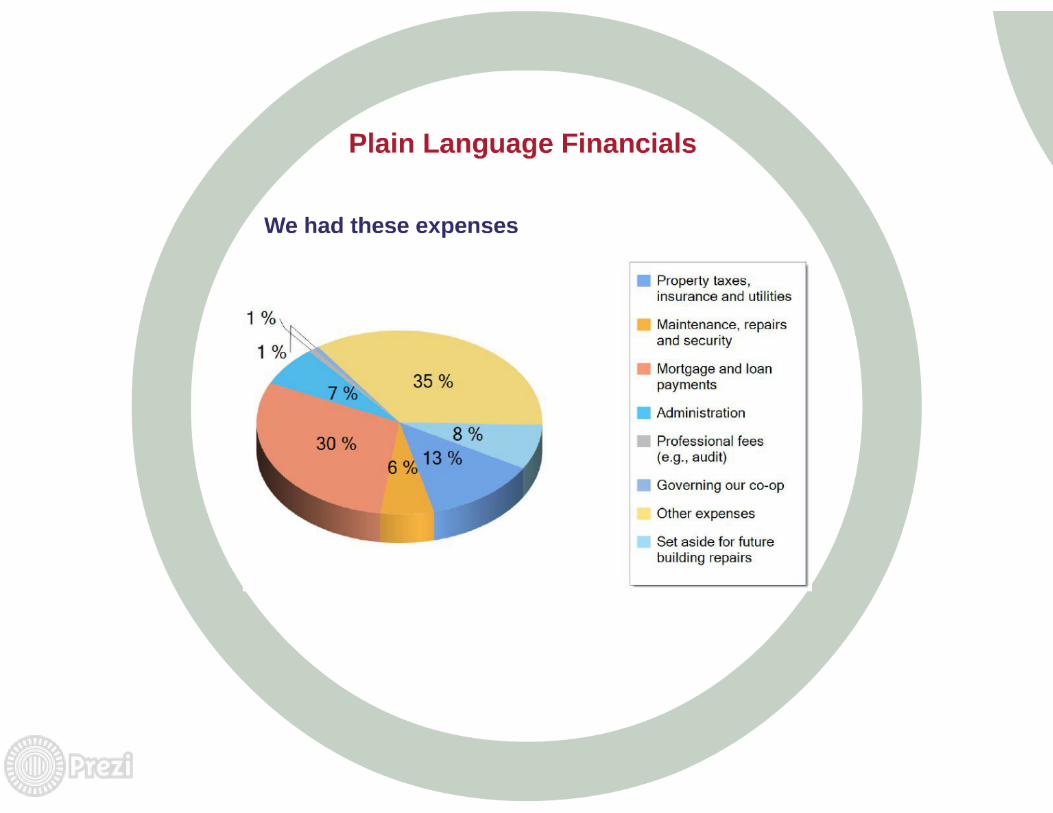
278,438Property taxes, insurance and utilities
Maintenance, repairs and security
Mortgage and loan payments
Administration
177,180
627,166
66,378
(e.g., water, electricity and heat)
Governing our co-op
Other expenses
Set aside for future building repairs
8,429
14,501
2,486
309,897
1,484,475
Professional fees (e.g., audit)
We ended the year with this much left over -
We had these expenses
$ 28,237Over the year vacant units cost us
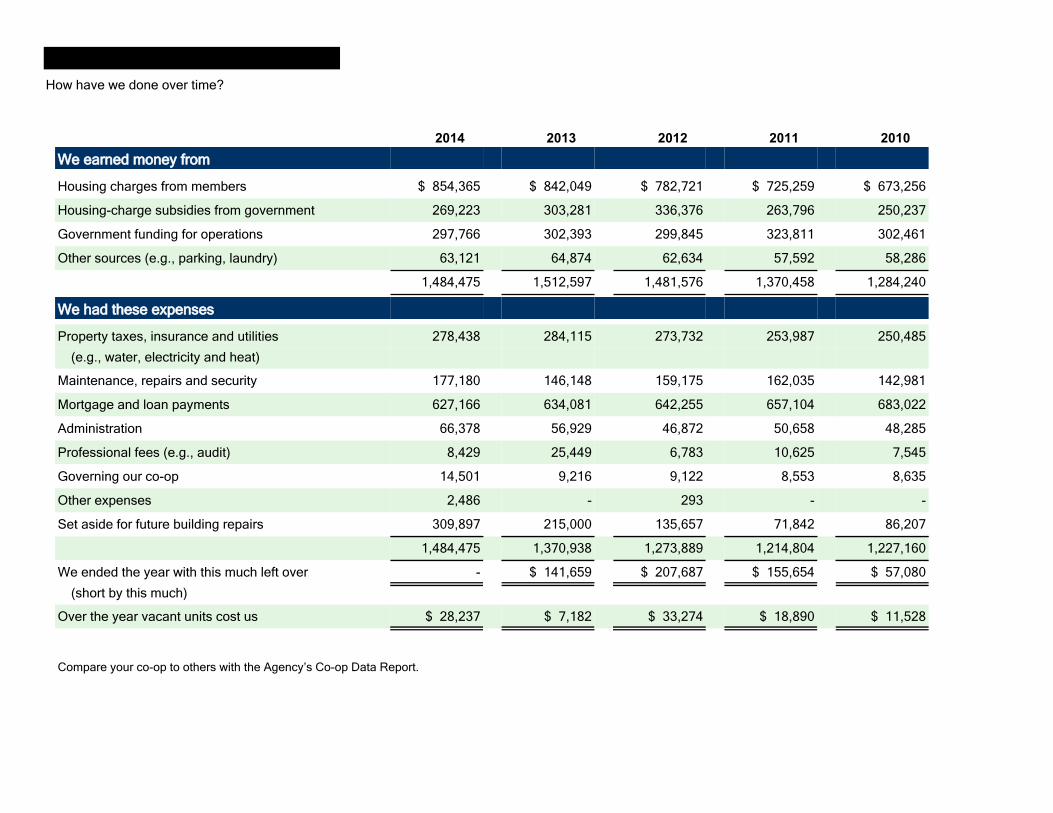
Compare your co-op to others with the Agency’s Co-op Data Report.
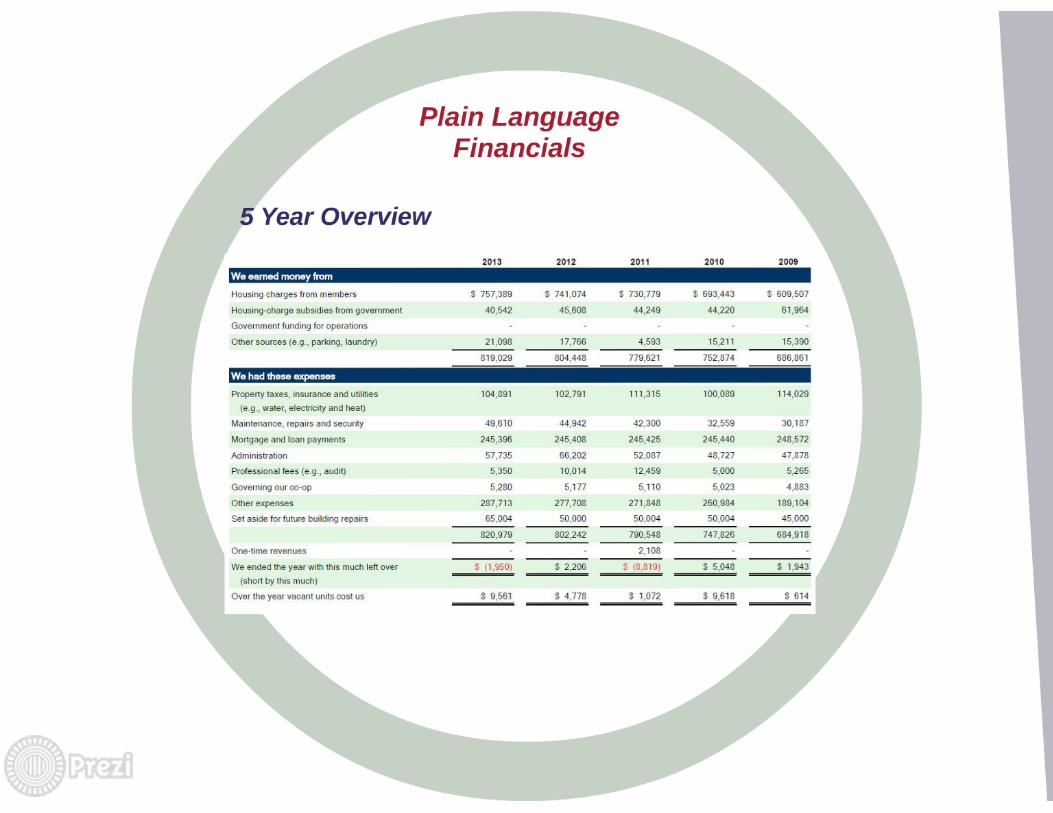
Mortgage and loan payments 627,166 634,081 642,255 657,104 683,022
Administration 66,378 56,929 46,872 50,658 48,285
Maintenance, repairs and security 177,180 146,148 159,175 162,035 142,981
Over the year vacant units cost us $ 28,237 $ 7,182 $ 33,274 $ 18,890 $ 11,528
(e.g., water, electricity and heat)
Professional fees (e.g., audit) 8,429 25,449 6,783 10,625 7,545
1,484,475 1,370,938 1,273,889 1,214,804 1,227,160
We ended the year with this much left over - $ 141,659 $ 207,687 $ 155,654 $ 57,080
Set aside for future building repairs 309,897 215,000 135,657 71,842 86,207
Governing our co-op 14,501 9,216 9,122 8,553 8,635
Other expenses 2,486 - 293 - -
(short by this much)
Property taxes, insurance and utilities 278,438 284,115 273,732 253,987 250,485
We had these expenses
Housing-charge subsidies from government 269,223 303,281 336,376 263,796 250,237
Housing charges from members $ 854,365 $ 842,049 $ 782,721 $ 725,259 $ 673,256
1,484,475 1,512,597 1,481,576 1,370,458 1,284,240
Other sources (e.g., parking, laundry) 63,121 64,874 62,634 57,592 58,286
Government funding for operations 297,766 302,393 299,845 323,811 302,461
We earned money from2014 2013 2012 2011 2010
How have we done over time?
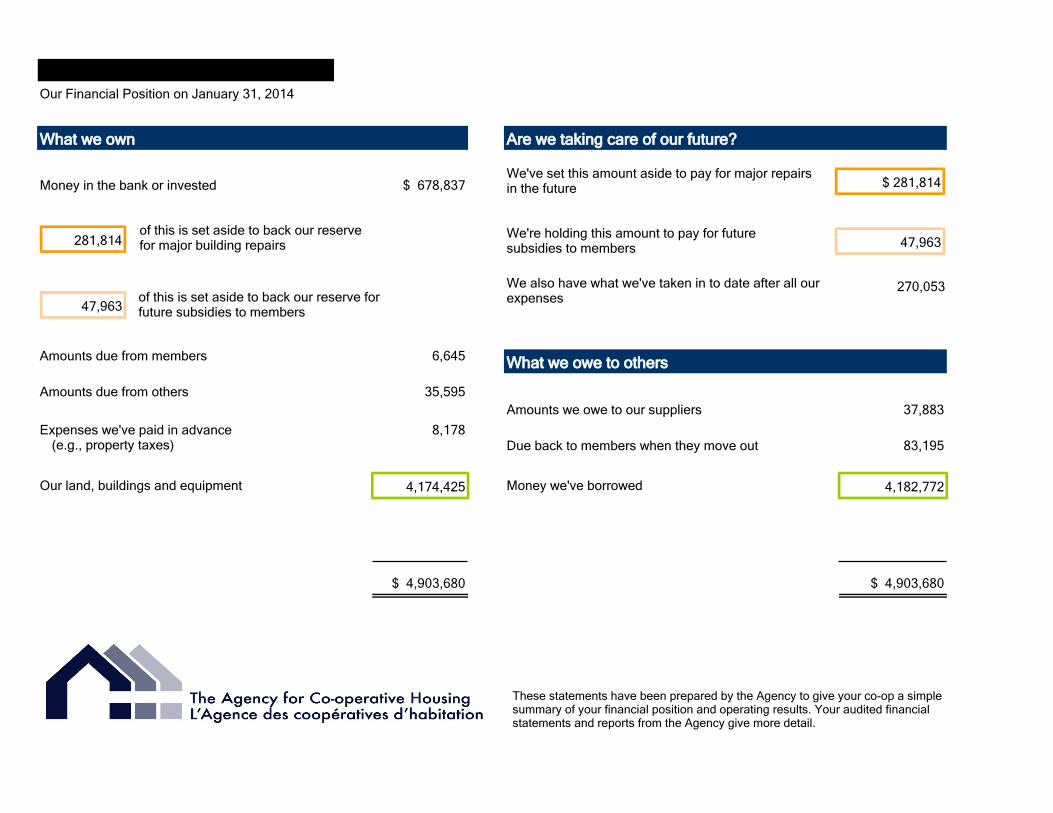
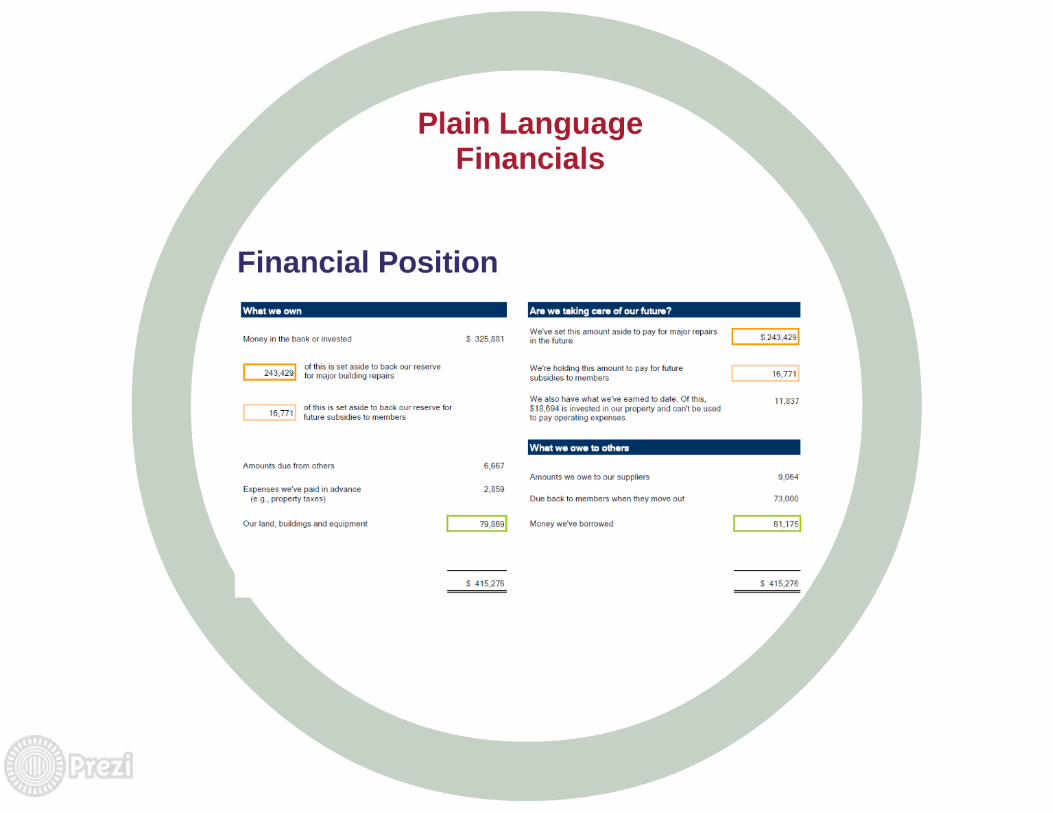
Our Financial Position on January 31, 2014
What we owe to others
Money in the bank or invested
Amounts due from members
Amounts due from others
Expenses we've paid in advance
Our land, buildings and equipment
Amounts we owe to our suppliers
Due back to members when they move out
Money we've borrowed
We've set this amount aside to pay for major repairs in the future
We're holding this amount to pay for future subsidies to members
270,053
$ 678,837
6,645
35,595
8,178
4,174,425
$ 4,903,680
4,182,772
83,195
37,883
We also have what we've taken in to date after all our expenses
$ 4,903,680
What we own Are we taking care of our future?
(e.g., property taxes)
of this is set aside to back our reserve for major building repairs
of this is set aside to back our reserve for future subsidies to members47,963
281,814
$ 281,814
47,963
These statements have been prepared by the Agency to give your co-op a simple summary of your financial position and operating results. Your audited financial statements and reports from the Agency give more detail.


