Embed Size (px)
Citation preview
Plant and Soil 175:1-11, 1995. (~) 1995 Kluwer Academic Publishers. Printed in the Netherlands.
Uptake of saline groundwater by plants: An analytical model for semi-arid and arid areas
Pe te r J. T h o r b u r n 1'2, G l e n R. W a l k e r 2 arid Ian D. Jol ly 2 1Resource Management Institute, Queensland Department of Primary Industries, Meiers Rd, bzdooroopilly QLD 4068, Australia and 2CSIRO Division of Water Resources and Centre for Groundwater Studies, PMB # 2, Glen Osmond SA 5064, Australia
Received 6 April 1994. Accepted in revised form 19 January 1995
Key words: Eucalyptus, floodplain, groundwater, salinity, transpiration, water table
Abstract
An analytical model, based on unsaturated zone water and solute balances, was developed to describe the uptake of saline groundwater by plants in dry regions. It was assumed that: i. initially, the profile had low water and salt contents to some depth; ii. both water and solutes move upwards from the water table by piston flow due only to plant water extraction; iii. the uptake of water concentrates solutes in the soil solution until some threshold salinity is reached, above which plants can no longer extract water due to osmotic effects; iv. uptake of the groundwater does not affect the water table level; and v. uptake of groundwater is only limited by transmission of groundwater through the soil. Model predictions were compared with measurements of groundwater uptake made over 15 months at five sites in a Eucalyptus forest in a semi-arid area, using independently measured model parameters. Depth and salinity of groundwater, and soil type varied greatly between sites. Predicted groundwater uptake rates were close to measured values, generally being within ~ 0.1 mm day- t . Sensitivity analysis showed that groundwater depth and salinity were the main controls on uptake of groundwater, while soil properties appeared to have a lesser effect. The model showed that uptake of groundwater would result in complete salinisation of the soil profile within 4 to 30 yr at the sites studied, unless salts were leached from the soil by rainfall or flood waters. However, a relatively small amount of annual leaching may be sufficient to allow groundwater uptake to continue. Thus groundwaters, even when saline, may be important sources of water to plants in arid and semi-arid areas.
Abbreviations:
Parameter Definition Dimensions
A aA~ L '~+l T -1
A~ [(Tr/n) csc(Tr/n)] n (Warrick, 1988)
a parameter in the K(S) function of Gardner (1958) L~,+IT -I
b parameter in the K(S) function of Gardner (1958) L '~
Co initial soil water solute concentration M L -~
Cg groundwater solute concentration M L -3
Cth threshold soil water solute concentration (above M L -3
which plants can no longer extract water)
Parameter Definition Dimensions
K hydraulic conductivity L T - 1
n exponent in the K(S) function of Gardner (1958)
q groundwater flux (positive upwards) L T-1
S soil matric suction (matric potential x - 1 ) L
t time T
t~ time at which Zf reaches the soil surface T
ts,,,,~x maximum time at which Zf reaches the soil surface T
(when '7 = 1)
groundwater uptake flux by plants L T - 1
depth of the salt front (or plane of evaporation) L
below the soil surface
depth of the groundwater below the soil surface L
Zg -Z f L z s zg -~
initial water content (above Zf) L3L -3
water content between Zf and Zg L3L -3
U ZI
2 9
AZg_f
"7
0o
01
I n t r o d u c t i o n
Groundwater is often an important source of water for native plants in semi-arid and arid environments (e.g. Dawson and Ehleringer, 1991; Ehleringer et al., 1991; Farrington et al., 1989; Thorburn et al., 1993). The importance of groundwater in meeting the water requirements of crops is also widely recognised (e.g. Mason et al., 1983 ; Wallender et al., 1979). How- ever, as all groundwaters contain solutes (of varying concentration), any uptake of groundwater by plants will induce a flux of solutes into the root zone. The resultant soil salinity levels can be considerable where the upward water flux and/or groundwater salinity is high (e.g. Jolly et al., 1993; Wallender et al., 1979). The low osmotic potential associated with high soil salinity will reduce the amount of water that can be extracted from soils by plants, so may limit the amount of groundwater taken up by plants. For example, van Hylckama (1974) found that as soil salinity increased in response to groundwater uptake by Tamarix pentan- dra (saltcedar), the groundwater uptake rates reduced to 50% of that in the non-saline control. Therefore, it is important that salt fluxes from the water table be considered when investigating the importance of saline groundwater to plant communities.
Modelling plant water uptake is generally based on numerical solutions of Richards' equation or, where solute movement in soils is also considered, the convective-dispersive equation, with a sink term rep- resenting the root water (and solute) uptake process- es (Gardner, 1991; Prathapar et al., 1992). In certain circumstances simplifying assumptions can be made allowing analytical solutions to be derived. For ~xam- pie, Passioura et al. (1992) develop an analytical mod- el of the flux of salts to roots of coastal mangroves by assuming that mangrove roots were uniformly dis- tributed throughout the soil and the soil surface was always maintained at the solute concentration of sea water. Climatic patterns in arid and semi-arid areas cause recharge of groundwaters to occur sporadically (Gee and Hillel, 1988). Thus, in these environments, periods of recharge and uptake of rain-derived soil water may be separated from periods of discharge and groundwater uptake. This assumption allows soil water movement to be described analytically during dis- charge periods, simplifying modelling of groundwater uptake by plants. Further, the high potential evapora- tion rates common in arid and semi-arid areas justifies an assumption that plant water uptake is limited by water movement to roots ("supply limited") rather than
4 - - - - 0 o x2
~ I zf - - I "~ I ~-01 Azg_r I ~
lzo
--~ C °
C th
i . . . . . i
i i i i
t C
soil surface
water table
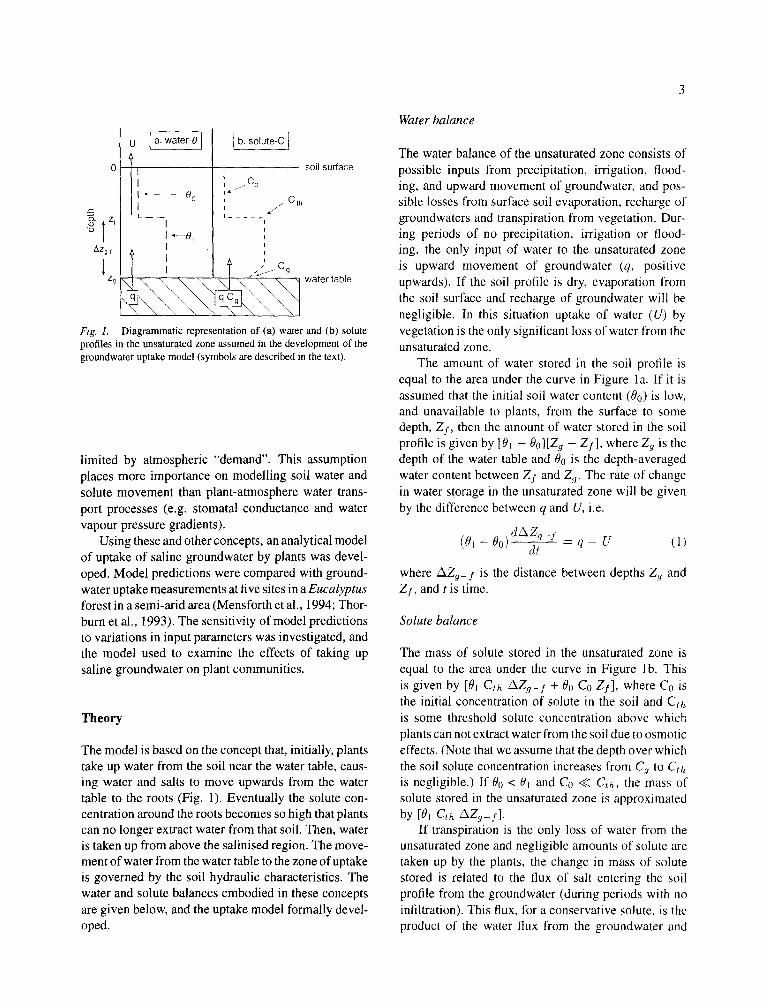
Fig. 1. Diagrammatic representation of (a) water and (b) solute profiles in the unsaturated zone assumed in the development of the groundwater uptake model (symbols are described in the text).
limited by atmospheric "demand". This assumption places more importance on modelling soil water and solute movement than plant-atmosphere water trans- port processes (e.g. stomatal conductance and water vapour pressure gradients).
Using these and other concepts, an analytical model of uptake of saline groundwater by plants was devel- oped. Model predictions were compared with ground- water uptake measurements at five sites in a Eucalyptus forest in a semi-arid area (Mensforth et al., 1994; Thor- burn et al., 1993). The sensitivity of model predictions to variations in input parameters was investigated, and the model used to examine the effects of taking up saline groundwater on plant communities.
T h e o r y
The model is based on the concept that, initially, plants take up water from the soil near the water table, caus- ing water and salts to move upwards from the water table to the roots (Fig. 1). Eventually the solute con- centration around the roots becomes so high that plants can no longer extract water from that soil. Then, water is taken up from above the salinised region. The move- ment of water from the water table to the zone of uptake is governed by the soil hydraulic characteristics. The water and solute balances embodied in these concepts are given below, and the uptake model formally devel- oped.
Water balance
The water balance of the unsaturated zone consists of possible inputs from precipitation, irrigation, flood- ing, and upward movement of groundwater, and pos- sible losses from surface soil evaporation, recharge of groundwaters and transpiration from vegetation. Dur- ing periods of no precipitation, irrigation or flood- ing, the only input of water to the unsaturated zone is upward movement of groundwater (q, positive upwards). If the soil profile is dry, evaporation from the soil surface and recharge of groundwater will be negligible. In this situation uptake of water (U) by vegetation is the only significant loss of water from the unsaturated zone.
The amount of water stored in the soil profile is equal to the area under the curve in Figure la. If it is assumed that the initial soil water content (Oo) is low, and unavailable to plants, from the surface to some depth, Zy, then the amount of water stored in the soil profile is given by [01 - 00][Z~ - Zf], where Zg is the depth of the water table and 00 is the depth-averaged water content between Zf and Zg. The rate of change in water storage in the unsaturated zone will be given by the difference between q and U, i.e.
d /.-~Zg - f (o,-Oo) -~ - q u (])
where AZg_f is the distance between depths Zq and Zy, and t is time.
Solute balance
The mass of solute stored in the unsaturated zone is equal to the area under the curve in Figure lb. This is given by [01 Cth AZg- f + ~o Co Zf], where Co is the initial concentration of solute in the soil and Ctn is some threshold solute concentration above which plants can not extract water from the soil due to osmotic effects. (Note that we assume that the depth over which the soil solute concentration increases from Cu to Cth is negligible.) If 0o < ~1 and Co << Cth, the mass of solute stored in the unsaturated zone is approximated by [01 Cth /kZq-f].
If transpiration is the only loss of water from the unsaturated zone and negligible amounts of solute are taken up by the plants, the change in mass of solute stored is related to the flux of salt entering the soil profile from the groundwater (during periods with no infiltration). This flux, for a conservative solute, is the product of the water flux from the groundwater and
the solute concentration of the groundwater (i.e. q Cg, Fig. lb). The rate of change in the mass of salt in the unsaturated zone is related to the salt flux from the water table by
01Cth - - - -~ -~ - qCg (2) dt
Groundwater uptake model
Expressions for groundwater uptake by plants can be derived from the foregoing water (Eq. 1) and solute (Eq. 2) balances in the unsaturated zone, provided q can be expressed as a function of AZg_ y.
Under the conditions depicted in Figure 1, plants would take up water in the region around depth Zf. At greater depths the solute concentration is too high for plant water uptake and at shallower depths there would be little available water. In this situation there can be considered to be a "plane of evaporation" at the depth Zf, and q will be limited by the soil's ability to transmit water from the water table to that plane (i.e. over the distance AZg_ y). For a soil of uniform texture this soil-limited value of q will be given by (Gardner, 1958; Jolly et al., 1993)
q = a An AZg_f -n (3)
where n and a are constants from the soil matric suction (S)-hydraulic conductivity (K) function K(S) = a (S '~ + b) -1, and An = [(Tr/n) csc(Tr/n)] '~ (Warrick, 1988). For Equation 3 to be applicable to our model of groundwa- ter uptake, U can not be limited by factors other than the soil's ability to transmit water (e.g. factors such as low evaporative demand, low rooting density, etc). Also, the water table depth must be constant. It should be noted that Jolly et al. (1993) referred to the depth Zy as the "salt front", due to the large increase in soil salinity occurring there (Fig. lb). That term shall also be used in this paper.
Now, substituting Equation 3 into Equation 1 and 2 then rearranging Equation 1 and equating it with Equation 2 gives groundwater uptake as a function of azg_/,
-n ( C9(Ol--O0)~ U = AAZg_f 1 01Cth ,] (4)
where A = a A,~. Since AZg_f is a function of time (Eqs. 1 and 2), an expression for the temporal varia- tions in groundwater uptake can be derived from Equa-
tion 4. Firstly, substituting Equations 3 into 2 and inte- grating with respect to AZg_f gives
A C~t AZg-fn+l -- k ÷ - - ( 5 )
n ÷ 1 OiCth
where k is the constant of integration. If at t = 0 the depth Zf is represented as a proportion (-y) of Zg, i.e. Zf = 7 Zg, then k = [Zq (1-3') ]n+l [n + l] -1. This allows Eq. 5 to be rearranged to give
__.L_I AZg_f=_((Zg[I_~/] '~+'+ ( n + l ) A C g t ) ~+~
O1 Cth (6 )
Substituting Equation 6 into Equation 4 then gives groundwater uptake as a function of time:
1 cg(o, - Oo) T, -c2 ) ( v )
The time (t~) at which Z/reaches the soil surface is also of interest, as this is when the solute concentra- tion of the whole profile equals Cth, so groundwater uptake ceases. Further, the model is not applicable at times greater than this. The value of t~ is given by setting AZg_f = Z q (i.e. Zf ---- 0 ) in Equation 6 and rearranging:
Z n + l ( 1 - - l1 - - " ) / ] n - - i ) 0 1 C t h L: s = g
(n + 1)ACq (8)
The maximum value of t~ occurs when ~/= i, and we will refer to this as t~,m=x.
Application of the theory
Groundwater uptake and soil measurements"
Model simulations were compared with measurements of groundwater uptake in Eucalyptus forests in the Chowilla anabranch region of the floodplain of the River Murray, South Australia (140 °, 52' E; 33 °, 59 t S). Groundwater uptake was determined at four sites, supporting either E. largiflorens (sites BM, BH and BT) or E. camaldulensis (site RM), by Thorburn et al. (1993). The flux of groundwater taken up by the trees was determined by firstly, measuring transpira- tion rates, then secondly, partitioning the transpira- tion flux into soil-water depletion and groundwater
2.0
1.6
1.2
0.8
0.4
0.0
2.0 &" 7:3
E 1.6 g
1.2
9 0.e
~ 0.4 c
BH
I
I 5 _ _ _
BM
2.0
1.6
1.2
0.8
0.4
0.0
BT
0 4 8 12 16
Time (months)
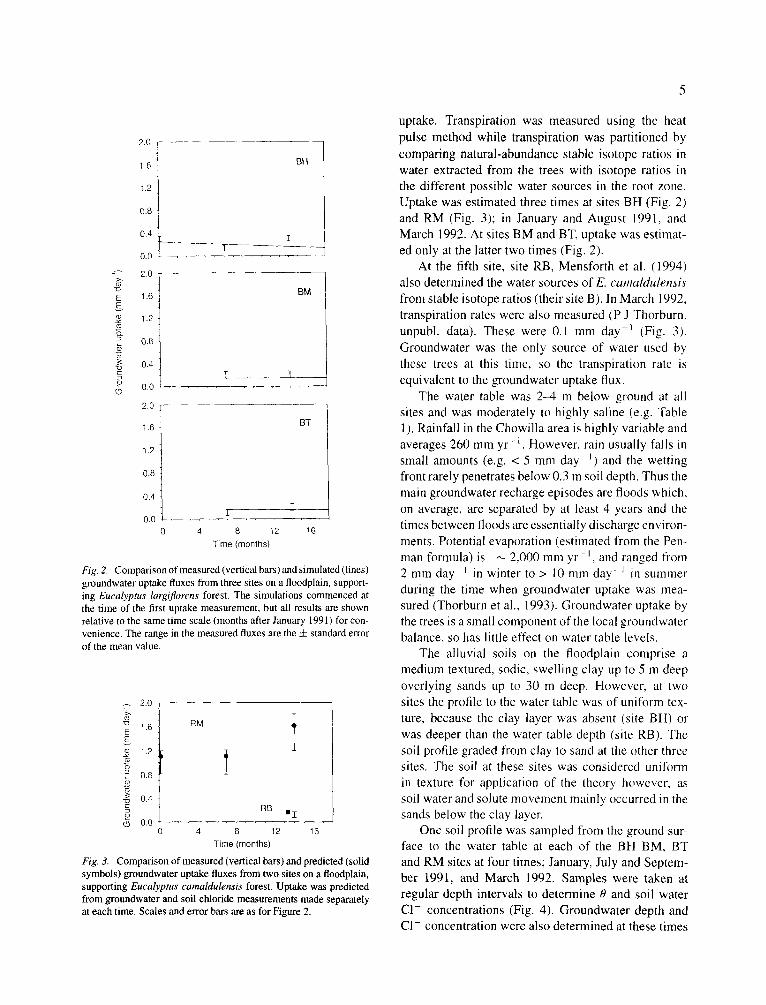
Fig. 2. Comparison of measured (vertical bars) and simulated (lines) groundwater uptake fluxes from three sites on a floodplain, support- ing Eucalyptus largiflorens forest. The simulations commenced at the time of the first uptake measurement, but all results are shown relative to the same time scale (months after January 1991) for con- venience. The range in the measured fluxes are the 4- standard error of the mean value.
2.0 g.
13 1.6
E E ~ 1.2
= 0.8
~ 0.4 c
£ (3 0.0
RM
RB m I
0 4 8 12 16
Time (months)
Fig. 3. Comparison of measured (vertical bars) and predicted (solid symbols) groundwater uptake fluxes from two sites on a floodplain, supporting Eucalyptus camaldulensis forest. Uptake was predicted from groundwater and soil chloride measurements made separately at each time. Scales and error bars are as for Figure 2.
uptake. Transpiration was measured using the heat pulse method while transpiration was partitioned by comparing natural-abundance stable isotope ratios in water extracted from the trees with isotope ratios in the different possible water sources in the root zone. Uptake was estimated three times at sites BH (Fig. 2) and RM (Fig. 3); in January and August 1991, and March 1992. At sites BM and BT, uptake was estimat- ed only at the latter two times (Fig. 2).
At the fifth site, site RB, Mensforth et al. (1994) also determined the water sources of E. camaldulensis from stable isotope ratios (their site B). In March 1992, transpiration rates were also measured (P J Thorburn, unpubl, data). These were 0.1 mm day i (Fig. 3). Groundwater was the only source of water used by these trees at this time, so the transpiration rate is equivalent to the groundwater uptake flux.
The water table was 2-4 m below ground at all sites and was moderately to highly saline (e.g. Table 1). Rainfall in the Chowilla area is highly variable and averages 260 mm yr - l . However, rain usually falls in small amounts (e.g. < 5 mm day J) and the wetting front rarely penetrates below 0.3 m soil depth. Thus the main groundwater recharge episodes are floods which, on average, are separated by at least 4 years and the times between floods are essentially discharge environ- ments. Potential evaporation (estimated from the Pen- man formula) is ~ 2,000 mm y r - t, and ranged from 2 m m d a y i in winter t o > 1 0 m m d a y -I in summer during the time when groundwater uptake was mea- sured (Thorburn et al., 1993). Groundwater uptake by the trees is a small component of the local groundwater balance, so has little effect on water table levels.
The alluvial soils on the floodplain comprise a medium textured, sodic, swelling clay up to 5 m deep overlying sands up to 30 m deep. However, at two sites the profile to the water table was of uniform tex- ture, because the clay layer was absent (site BH) or was deeper than the water table depth (site RB). The soil profile graded from clay to sand at the other three sites. The soil at these sites was considered uniform in texture for application of the theory however, as soil water and solute movement mainly occurred in the sands below the clay layer.
One soil profile was sampled from the ground sur- face to the water table at each of the BH BM, BT and RM sites at four times; January, July and Septem- ber 1991, and March 1992. Samples were taken at regular depth intervals to determine 0 and soil water C l - concentrations (Fig. 4). Groundwater depth and C1- concentration were also determined at these times
6
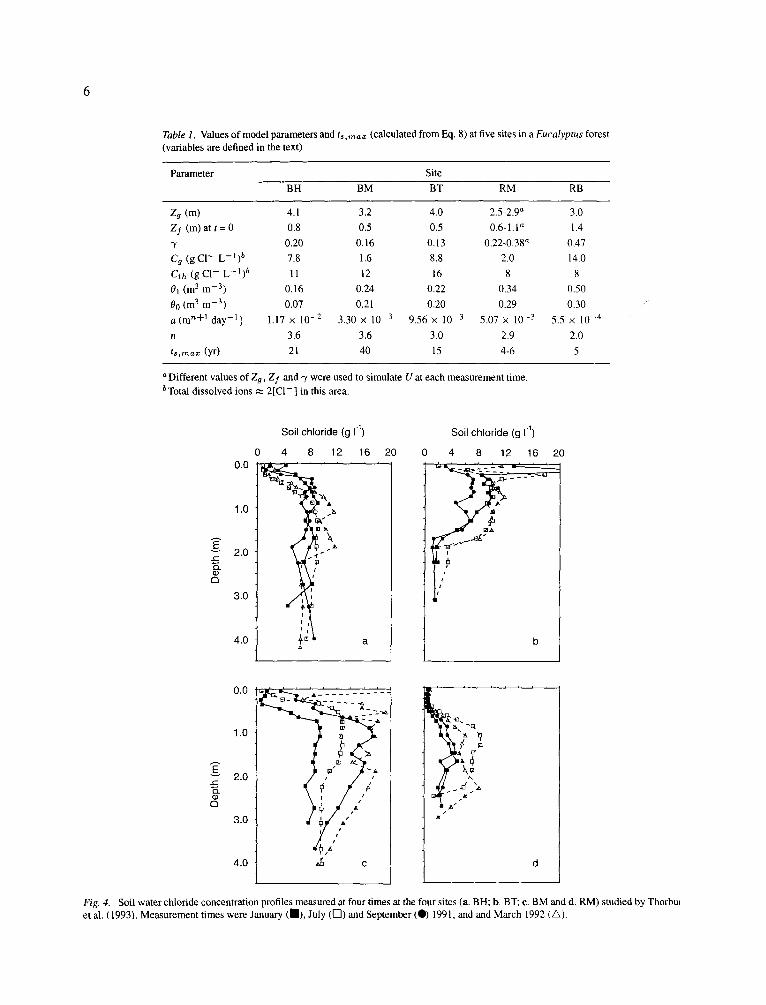
Table 1. Values of model parameters and ts,ma= (calculated from Eq. 8) at five sites in a Eucalyptus forest (variables are defined in the text)
Parameter Site
BH BM BT RM RB
Zg (m) 4.1 3.2 4.0 2.5-2.9 a 3.0
Zy (m) at t = 0 0.8 0.5 0.5 0.6-1.1 a 1.4
~/ 0.20 0.16 0.13 0.22-0.38 '~ 0.47
Cg (g CI- L - I ) b 7.8 1.6 8.8 2.0 14.0
Cth (g CI- L - l ) b 11 12 16 8 8
Ol (m 3 m -3) 0.16 0.24 0.22 0.34 0.50
Oo (m 3 m -3) 0.07 0.21 0.20 0.29 0.30
a (m n+~ day -1) 1.17 × 10 -2 3.30 x 10 -3 9.56 x 10 -3 5.07 × 10 -3 5.5 × 10 -4
n 3.6 3.6 3.0 2.9 2.0
ts,m~= (yr) 21 40 15 4-6 5
'~Different values ofZg, Z.f and "7 were used to simulate U at each measurement time.
bTotal dissolved ions ~ 2[C1-] in this area.
0.0
1.0
2.0
121
3.0
4.0
Soil chloride (g I 1)
0 4 8 12 16
i t
~m a
20 0
Soil chloride (g 1-1)
4 8 12 16 20
0.0
1.0
2.0 r - -
a
3.0
4.0
t
c
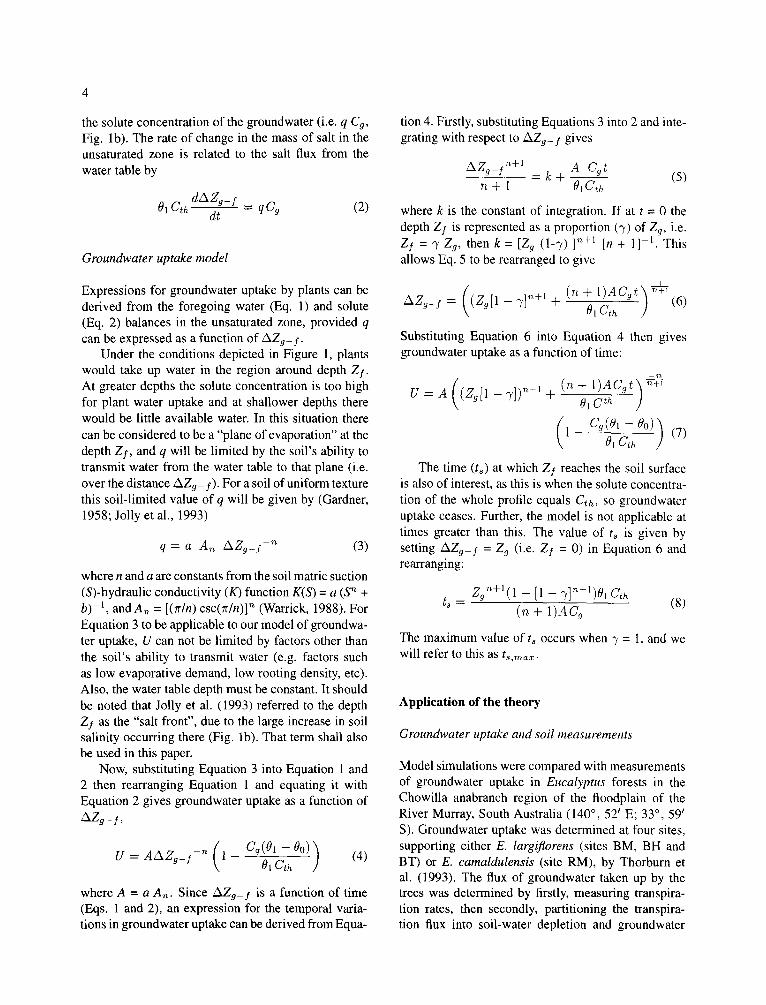
Fig. 4. Soil water chloride concentration profiles measured at four times at the four sites (a. BH; b. BT; c. BM and d. RM) studied by Thorbu~ et al. (1993). Measurement times were January (ll) , July ([--1) and September (0) 1991, and and March 1992 (/X).
from piezometers at each site. Similar soil C1- and groundwater measurements were made by Mensforth et al. (1994) at site RB in March 1992 and the data are given in their paper.
Parameter values
The parameters required for the model were derived from independent measurements, not from model cal- ibration exercises. The parameters Cg, Zg, Oo, 01 and Zf (Table l) were taken from the soil and groundwater measurements at the sampling time closest to the first uptake measurement at each site. Soil water content profiles provided values of 00 and 01. As stated above, 0~ was the average water content between depths Zg and Zf, while 00 was the average water content of the soil above the depth of Zf. Values of 00 were affected by soil texture changes in the profile at sites BM, BT and RM, because the depths over which 00 occurred were in the surface clay layer. Thus 00 values were greater than they would have been if the profiles had have been of more uniform texture. This variation in 00 did not have a large impact on predictions of U, as described in the section on parameter sensitivity below. The depth of the salt front, Zf, at the begin- ning of the simulations (required to determine 7) was assessed from soil C1- profiles (Fig. 4). ZI was tak- en as the shallowest depth at which the soil water C1- concentration approximately equalled the groundwater C1-
The values of n for the soils at sites BH, BM and BT were reported by Jolly et al. (1993) to be 3.6. They also gave values of q for Z 9 = 4 m at these three sites allowing the values of a (Table 1) to be derived from Equation 3.
There was no information on the hydraulic proper- ties of the soils at sites RM and RB. Therefore, values o fn and a (Table 1) had to be evaluated from soil tex- ture, previously published values of a and n (tabulated by Thorburn et al., 1992) and water content measure- ments. The soil at site RM below ,-~ 1 m depth had a texture and saturation moisture content (,-~ 0.45 m 3 m -3) similar to the "30% clay transition" soil described by Jolly et al. (1993). Therefore we adopted the val- ue of n of that soil. Yandera loam studied by Talsma (1963) had a similar n value and soil texture so we used its value ofa. The soil at the RB site was clayey in tex- ture to the water table (L J Mensforth, pers. commun.). In the absence of any information about the hydraulic properties of this soil, we used the properties of Cama- rooka clay (Talsma, 1963) in the simulations.
The value of the parameter Cth was determined by measuring the maximum soil water salinities in the root zone, assuming that soil salinities had reached C~h during the measurement period. This examination of previous soil C1- data from the site indicated that this assumption was reasonable. The maximum CI- con- centration measured under E. camaldulensis at sites R M a n d R B w a s ~ 8 g L I, and between l l a n d l 6 g L - 1 under E. largiflorens at the other sites (Fig. 4). It is not clear if the range in Cth across the three E. largi- florens sites was due to some difference in the physical conditions between sites (e.g. groundwater salinity) or a physiological difference between the trees.
Simulations
Temporal trends in groundwater uptake were calculat- ed from Equation 7 and the parameter values in Table 1 at sites BH, BM and BT (Fig. 2). The starting time (i.e. t = 0) was the time of the first groundwater uptake measurement at each site. This was January 1991 for site BH and August 1991 for sites BM and BT. How- ever, the time scales of all results are given relative to January 1991 for ease of comparison and values of U were calculated until July 1992 at all sites. Simulated groundwater uptake was within ,,~ 0.1 mm day-1 of the measured range at these sites. The range shown for the uptake measurements includes the standard error of the scaling of transpiration measurements and the stan- dard error of the repeated stable isotope measurements at each site. It should be noted that the error in the uptake measurements does not include the precision of the heat pulse technique itself, so the error shown for the uptake measurements in Figure 2 is underestimat- ed.
Water table depths varied through time at site RM (Table 1) due to hydrogeological factors, so temporal trends in groundwater uptake could not be predicted at this site. However, groundwater uptake at a particular time could be predicted from Equation 4 using mea- sured values of Zg and Zf. This was also done at the one measurement time at site RB. At site RM predict- ed uptake was within the range of uncertainty of the measured values at the three times (Fig. 3). For the E. camaldulensis underlain by more saline groundwater at site RB, simulated and measured uptake values also agreed and, importantly, were much lower than those of the trees underlain by groundwater of lower salinity at site RM.
The rapid rise in the salt front (i.e. change in Zf) above the water table at early times was illustrated
4.0 _2
BH J 3.0 ~
2.0 . . . . . . . . . / <3
. ' ' " RM s" 1.0
level of the soil surface
0 6 1'2 1'8 24 30 36 42 48 Time (months)
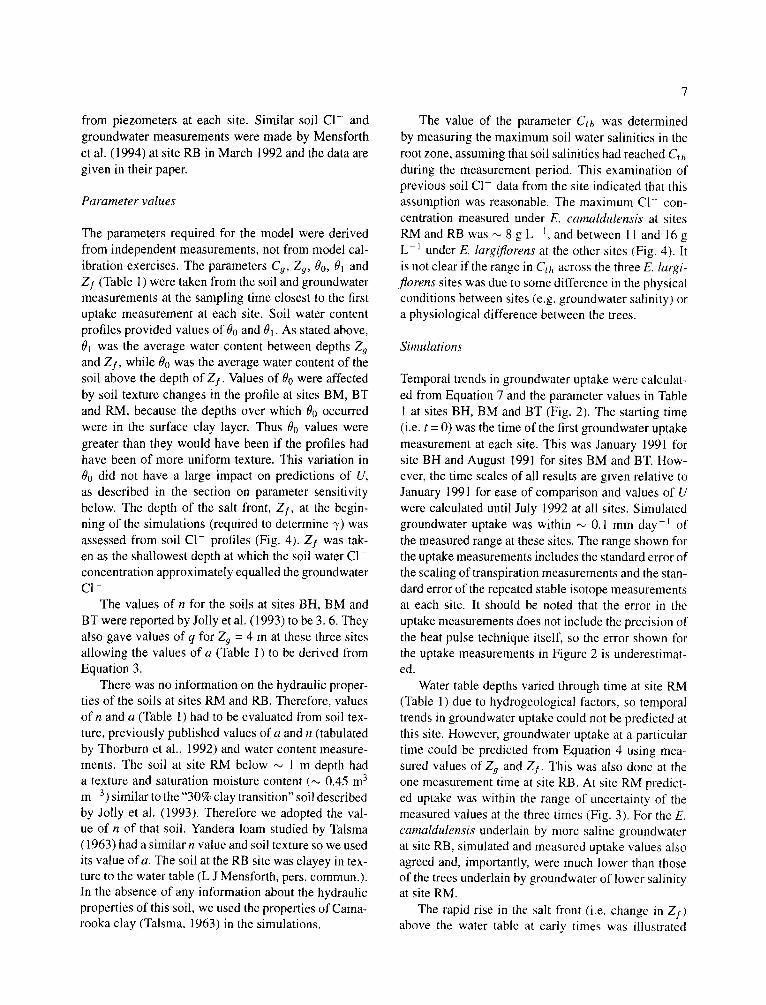
Fig. 5. The height of the salt front (Zf) above the water table (expressed as z.'XZg_ f ) simulated at two sites over a four year period. For both sites 3' = 1 and the level of the soil surface relative to the water table is shown.
by calculating AZg_ f from Equation 6 at sites BH and RM (Fig. 5). The parameter values given in Table 1 (Zg = 2.8 m for site RM) were used for these simulations, except that ZI was set equal to Zg at t = 0 (i.e. 3' = 1). The measured values of 3' at these sites at the time of the first uptake measurement, 3.3 and 2.0 m at sites BH and RM respectively, occurred between 16 and 24 months in the simulations. The change in ZI calculated from Equation 6 should, in principle, be comparable with the soil CI- profiles measured at these site (Fig. 4). While the measured profiles do indicate a general upward movement of Z I at all sites there are specific instances where this does not occur, e.g. between times 1 and 2 at site BH and between times 2 and 3 at site RM. However, it must be remembered that the soil CI- data are from single profiles, so take no account of spatial variability in C1- at the sites. This spatial variability can be considerable. A more rigorous sampling strategy would be required to properly test the predicted changes in ZI.
Values of ts,ma~, calculated for each site from Equation 8, vary between 4 and 40 yr across the sites (Table 1). Values of t , , calculated using the values of',/ shown in Table 1, are approximately 50% of t . . . . x at sites BH, BM and BT, and approximately 20% lower t han ts,maz at sites RM and RB.
Parameter sensitivity
There are two types of variation in the model parame- ters. The first is that due to errors in parameter measure- ment (e.g. determination of 0) and the second is that resulting from physical differences between sites (e.g. different soil type or groundwater salinity). To illus-
Table 2. Sensitivity of groundwater uptake calculated from Equation 7 to changes in parameter values for two sites. The values of Zf were taken as 0.5 Z 9. Values of other parameters are those listed in Table 1, with Zg = 2.8 m at site RM
Parameter Change (X %) Site BH Site RM +X% -X % +X% - X %
Cg/Cth 20 - 4 4 - 2 2
01 20 -11 16 - 3 4
0o 20 13 - 13 3 - 3
Zg 20 - 7 0 529 - 6 2 335
n 10 - 8 6 618 -77 347
trate the sensitivity of predicted groundwater uptake to parameter uncertainty, the proportional change in uptake resulting from variation in each model param- eter was determined. The value of 3' was set to 0.5 for this analysis to avoid biasing the results to the rapid changes in uptake that occur when 3' approaches 1. Only the results for sites BH and RM are shown (Table 2) as these generally encompassed the variability at all the sites.
For the salinity and water content parameters, a 20% parameter variation gave < 20% change in uptake at all sites. An exception was site RB, were at 20% change in Cg/Cth gave 40 to 60% change in U. This increased sensitivity was due to Cg being close to Ct h at this site. Variation in the values of 0 had a smaller effect (Table 2) for finer textured soils (e.g. at site RM) than for the coarser soils (e.g. BH). Groundwater uptake was highly sensitive to changes in Zg, as expected from the exponential nature of Equation 3. The model was also very sensitive changes in n; a 10% variation in n resulted in - 8 0 to +600% changes in uptake.
The effect of variations in Zf can be assessed from the slope of the curves in Figure 5a. The effect will vary with time as it is dependent on the difference between Zg and Zf, but is not great at large times (e.g. > 12 months). Variation in a (and A) will give the same relative variation in U (see Eq. 7).
Model sensitivity to physical differences between sites was assessed by calculating uptake (and AZg_ i) for different soil types and groundwater salinities. The effect of soil type differences was investigated by tak- ing values of n, A and 0 from two soils of different texture and calculating U and AZg_ i values. The soils were the loamy soil (,-~ 20% clay) from site BH and Camarooka clay ( ,,o 50% clay) described by Talsma (1963). The values of Zg, C 9 and Cth from site BH
4
0
4.0,
3 . 5
3 . 0
2.5
2.0
1.5
1.0
0.5
a}
Nxx day
I o a m ~
0
5
4
¥ 3
0 . . . . . 0 3 6 9 12 15
Time (months)
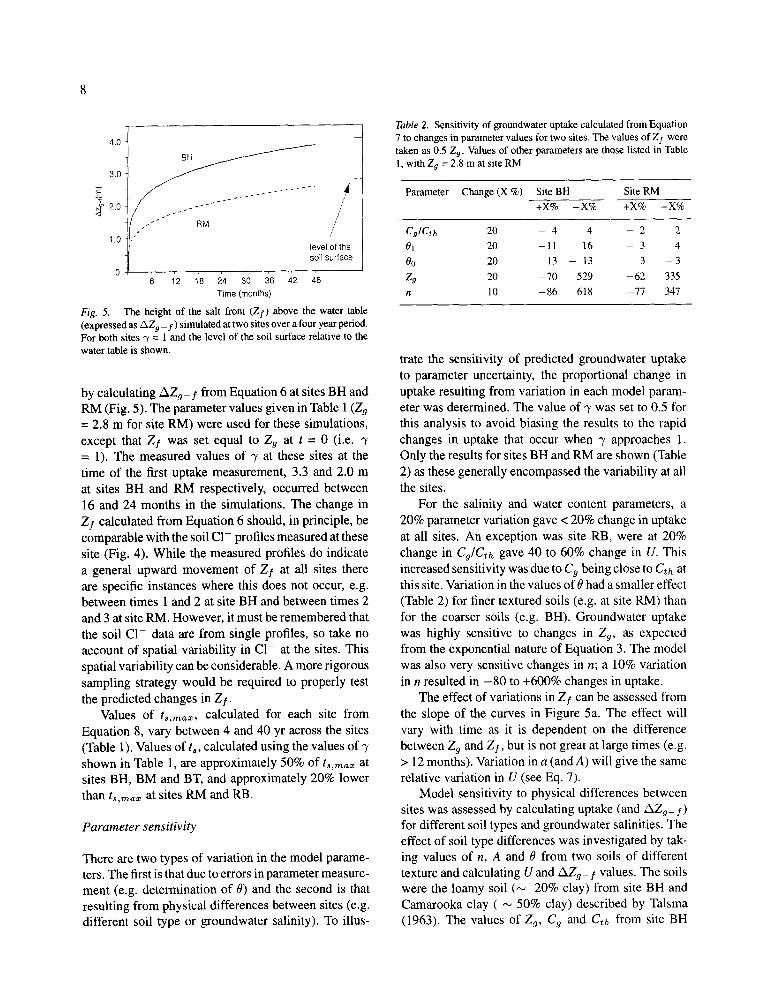
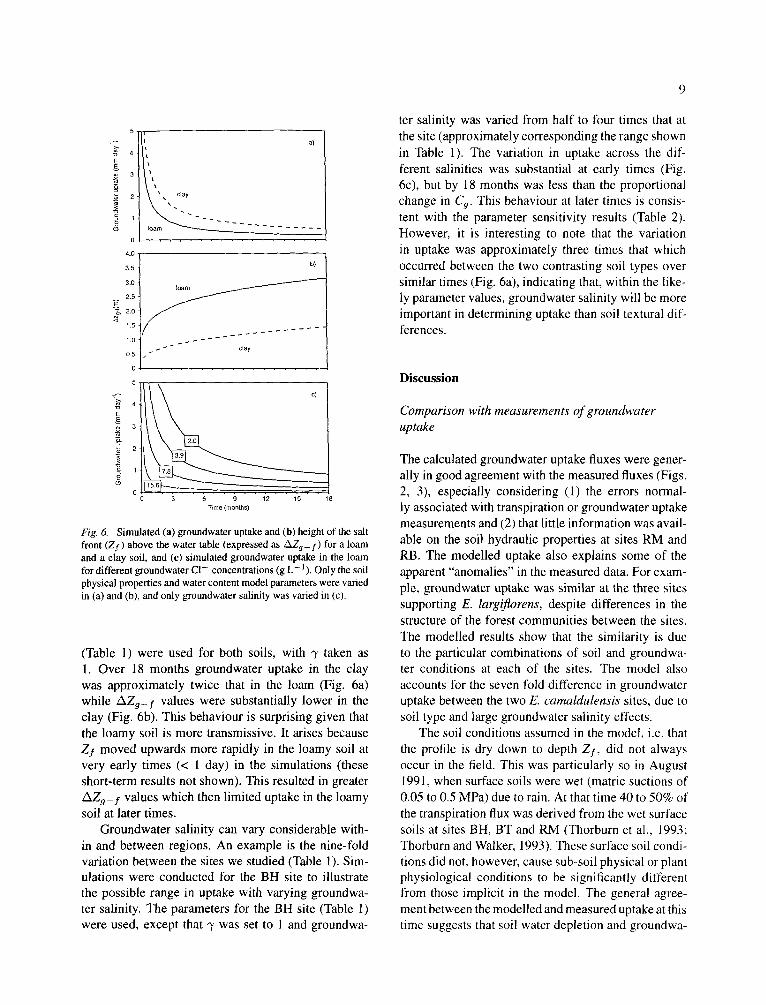
Fig. 6. Simulated (a) groundwater uptake and (b) height of the salt front (Zy) above the water table (expressed as /xZa_ f) for a loam and a clay soil, and (c) simulated groundwater uptake in the loam for different groundwater CI- concentrations (g L - ] ), Only the soil physical properties and water content model parameters were varied in (a) and (b), and only groundwater salinity was varied in (c).
(Table 1) were used for both soils, with ? taken as 1. Over 18 months groundwater uptake in the clay was approximately twice that in the loam (Fig. 6a) while AZa_f values were substantially lower in the clay (Fig. 6b). This behaviour is surprising given that the loamy soil is more transmissive. It arises because Zy moved upwards more rapidly in the loamy soil at very early times (< 1 day) in the simulations (these short-term results not shown). This resulted in greater AZg_f values which then limited uptake in the loamy soil at later times.
Groundwater salinity can vary considerable with- in and between regions. An example is the nine-fold variation between the sites we studied (Table 1). Sim- ulations were conducted for the BH site to illustrate the possible range in uptake with varying groundwa- ter salinity. The parameters for the BH site (Table 1) were used, except that "7 was set to 1 and groundwa-
9
ter salinity was varied from half to four times that at the site (approximately corresponding the range shown in Table 1). The variation in uptake across the dif- ferent salinities was substantial at early times (Fig. 6c), but by 18 months was less than the proportional change in C q. This behaviour at later times is consis- tent with the parameter sensitivity results (Table 2). However, it is interesting to note that the variation in uptake was approximately three times that which occurred between the two contrasting soil types over similar times (Fig. 6a), indicating that, within the like- ly parameter values, groundwater salinity will be more important in determining uptake than soil textural dif- ferences.
Discussion
Comparison with measurements of groundwater uptake
The calculated groundwater uptake fluxes were gener- ally in good agreement with the measured fluxes (Figs. 2, 3), especially considering (1) the errors normal- ly associated with transpiration or groundwater uptake measurements and (2) that little information was avail- able on the soil hydraulic properties at sites RM and RB. The modelled uptake also explains some of the apparent "anomalies" in the measured data. For exam- ple, groundwater uptake was similar at the three sites supporting E. largiflorens, despite differences in the structure of the forest communities between the sites. The modelled results show that the similarity is due to the particular combinations of soil and groundwa- ter conditions at each of the sites. The model also accounts for the seven fold difference in groundwater uptake between the two E. camaldulensis sites, due to soil type and large groundwater salinity effects.
The soil conditions assumed in the model, i.e. that the profile is dry down to depth Zf, did not always occur in the field. This was particularly so in August 1991, when surface soils were wet (matric suctions of 0.05 to 0.5 MPa) due to rain. At that time 40 to 50% of the transpiration flux was derived from the wet surface soils at sites BH, BT and RM (Thorburn et al., 1993; Thorburn and Walker, 1993). These surface soil condi- tions did not, however, cause sub-soil physical or plant physiological conditions to be significantly different from those implicit in the model. The general agree- ment between the modelled and measured uptake at this time suggests that soil water depletion and groundwa-
10
ter uptake may, in some circumstances, be "decoupled" from each other. This would be because the wet surface soil and the region in the profile wet by capillary rise from the groundwater were separated in the profile by a depth of dry soil. Thus the soil-physical conditions for capillary rise were maintained. Additionally, tran- spiration was still "supply limited" at this time, so both the rain-derived surface soil water and the groundwater sources could be exploited by the trees. However, if the profile was fully wet and/or potential evaporation rates were lower than possible groundwater uptake rates it is likely that two processes would be interrelated.
Assumptions in the model
It is assumed in the model that the water flux between Z 9 and Zf is governed by Equation 3. This may be a weak assumption because (1) Equation 3 was devel- oped under steady-state conditions (Gardner, 1958; Jolly et al., 1993), and (2) Equation 3 requires that water uptake occurs over a "plane" in the soil. Regard- ing this latter point, it would commonly be thought that plant water uptake occurs over a wide depth range rather than at a very narrow depth range associated with a plane of uptake. However, Gardner (1991) has recently suggested that this may not be the case because of non-linearities in the water flux-potential gradient relationship for roots. Considering the requirement for steady-state conditions, when Zf is close to Zg the system will be very dynamic (e.g. Fig. 5) and this assumption will be grossly incorrect and the model probably inaccurate. However, when Zf is at greater distances above Zg, q will be smaller and the system may approach a steady condition. For the initial condi- tion of the unsaturated zone dry to the water table (i.e. 7 = 1), Zf decreases (i.e. AZg_f increases) rapidly at early times (e.g. Fig. 5), so the time when the system is most dynamic is relatively short.
The distribution of roots has not been considered in the model and it is implicidy assumed that active roots can penetrate to the water table. This is a rea- sonable assumption for phreatophytic tree species. For example, roots ofBanksia (Farrington et al., 1989) and Eucalyptus (Greenwood et al., 1992) have been found throughout the unsaturated zone (to water table depths of up to 8 m). However, some plants, such as crop species, may have a limited rooting depth, even in the presence of a shallow water table (e.g. Mason et al., 1983). This situation may be approximated by setting 7 to some appropriate value < 1.
The diffusion of solutes has been ignored in this model, even though there will be solute concentration gradients between the soil to the groundwater where Cth and C 9 are different. The diffusion of salt out of the soil to the water table will "offset" a convective flux of salts from the groundwater into the soil where C~h is greater than Cg. Thus the process of diffusion may result in greater groundwater uptake rates than those calculated from the model, and it is of interest to consider the magnitude of the diffusive flux. The diffusive flux of solutes out of the root zone (Jd) under steady state conditions can be estimated from Fick's first law of diffusion, J~ = D dC/dz, where D is the diffusivity of the solute and dC/dz is the solute con- centration gradient, in this case between C,h at Zf and Cg at Zg. Allowing for the impedance of the movement of solutes through the soil and the water filled porosity of the soil, D is ,-~ 10 _6 m 2 day -~ . dC/dz ranges from 1 to 4 kg m -4 at sites BH, BM, BT and RM, so Jd is < 10 -5 kg m 2 day -1. The value of the steady-state con- vective groundwater flux equal to this diffusive flux given by Jd/Cg, and is < 0.007 mm day -~ . Thus the magnitude of the errors in the groundwater uptake esti- mates due to neglect of diffusion of salts is 5 to 1% of the calculated rates. It is interesting to note that at site RB, C 9 is greater than Cth, so solutes will diffuse into the root zone and reduce (negligibly) uptake.
Implications of the model
The model shows that utilisation of groundwater by plants may be severely limited by groundwater salin- ity. Further, the eventual "cost" of taking up ground- water may be complete salinisation of the soil profile, which would prevent transpiration and kill plants. This situation is most extreme where Cg is greater than Cth, or where water tables are shallow. However, salinity can restrict groundwater uptake even when groundwa- ter salinities are relatively low (e.g. site BM). Also, profile salinisation may occur comparatively rapidly, for example within ,,~ 5 yr at some sites (Table 1). These conclusions are at variance with the commonly found importance of groundwater to plants in arid and semi-arid areas (e.g. Dawson and Ehleringer, 1991; Ehleringer et al., 1991; Farrington et al., 1989), includ- ing our study sites (Mensforth et al., 1994; Thorburn et al., 1993; Thorburn and Walker, 1993). Consider- ation of the leaching process may help resolve this paradox.
To prevent complete salinisation, salts must be leached from the soil profile. In terms of the model
leaching is analogous to moving the salt front closer to the water table, i.e. increasing Zf. In arid and semi-arid areas rainfall alone may be insufficient to achieve this. This is the situation at our sites where floods would be the main mechanism of leaching salt from the profile. The average frequency at which our sites are flooded ranges from approximately each 4 yr for site RM to more than 13 yr for site BH. These flood intervals are shorter than the values of ts,max for these sites (Table 1) implying that, on average, the soil at these sites should not become fully salinised. In reality the situation is more complex, because the interval between floods may be much longer than the average flood recurrence interval and floods do not necessarily completely leach salts from the profile at these sites. However, because the salt front nears the soil surface comparatively slow- ly at times approaching t . . . . . (Fig. 5a) it only needs to be leached towards the water table a small distance to increase ts substantially. In the absence of floods annu- al infiltration of rainfall may leach the soil (especially where it is of coarse texture) sufficiently to enable the trees to continue to take up groundwater, although at small rates. Thus groundwater, even where saline, may be a reliable source of water at these sites. This explains the dependence of the trees on groundwater at our study sites, even when fresh water is available in the profile (Mensforth et al., 1994; Thorburn et al., 1993; Thorburn and Walker, 1993). In areas where leaching is limited, because of less frequent flooding or less permeable soils, and where Cg exceeds Cth trees will have a higher probability of dying due to salinity. Unfortunately, these conditions are common in the Chowilla anabranch region.
Acknowledgements
The first author acknowledges support from the Flinders University of South Australia and the Cen- tre for Groundwater Studies during this work, which was conducted while on leave from the Queensland Department of Primary Industries. This work was sup- ported by research grants from the Australian Land and Water Resources Research and Development Corpora- tion. Lisa Mensforth is thanked for providing informa- tion on her field sites.
11
References
Dawson T E and Ehleringer J R 1991 Streamside trees that do not use stream water. Nature 350, 335-337.
Ehleringer J R, Phillips S L, Schuster W S F and Sandquist D R 1991 Differential utilisation of summer rains by desert plants. Oecologia 88,430-434.
Farrington P, Greenwood E E A N , Bartle G A, Beresford J D and Watson G D 1989 Evaporation from Banksia woodland on a groundwater mound. J. Hydrol. 105, 173-186.
Gardner W R 1958 Some steady-state solutions of the unsaturated moisture flow equation with application to evaporation from a water table. Soil Sci. 85,228-232.
Gardner W R 1991 Modelling water uptake by roots. Irrig. Sci. 12, 109-114.
Gee G W and Hillel D 1988 Groundwater recharge in arid regions: Review and critique of estimation methods. Hydrologic Proc. 2, 255-266.
Greenwood E A N, Milligan A, Biddiscombe E E Rogers A L, Beresford J D, Watson G D and Wright K D 1992 Hydrologic and salinity changes associated with tree plantations in a saline agricultural catchment in southwestern Australia. Agric. Water Manage, 22, 307-323.
Jolly l D, Walker G R and Thorburn P J 1993 Salt accumulation in semi-arid floodplain soils with implications for forest health. J. Hydrol. 150, 589-614.
Mason W K, Meyer W S, Smith R C G and Barrs H D 1983 Water bal- ance of three irrigated crops on fine-textured soils of the Riverine Plain. Aust. J. Agric. Res. 34, 183-191.
Mensforth L J, Thorburn P J, Tyerman S D and Walker G R 1994 Sources of water used by Eucalyptus camaldulensis overlying saline groundwater on the River Murray floodplain, Australia. Oecologia 100, 21-28.
Passioura J B, Ball M C and Knight J H 1992 Mangroves may salinize the soil and in so doing limit their transpiration rate. Funct. Ecol. 6, 476-481.
Prathapar S A, Robbins C W, Meyer W S and Jayawardane N S 1992 Models for estimating capillary rise in a heavy clay soil with a saline shallow water table. Irrig. Sci. 13, 1-7.
Talsma T 1963 The control of saline groundwater. Meded. Land- bouwhogeschool Wageningen 63, 1-68.
Thorburn P J and Walker G R 1993 The source of water transpired by Eucalyptus camaldulensis: Soil, groundwater or streams? In Stable Isotopes and Plant Carbon-Water Relations. Eds. J R Ehleringer, A E Hall and G D Farquhar. pp 511-527. Academic Press Inc., San Diego.
Thorburn P J, Hatton T J and Walker G R 1993 Combining measure- ments of transpiration and stable isotopes of water to determine groundwater discharge from forests. J. Hydrol. 150, 563-587.
Thorburn P J, Walker G R and Woods P H 1992 Comparison of diffuse discharge from shallow water tables in soils and salt flats. J. Hydrol. 136, 253-274.
Van Hylckama T E A 1974 Water use by saltcedar as measured by the water budget method. USGS Professional Paper 491-E, US Govt. Printing Office, Washington, USA. 30 p.
Wallender W W, Grimes D W, Henderson D W and Stromberg L K 1979 Estimating the contribution of a perched water table to the seasonal evapotranspiration of cotton. Agron. J. 71, 1056--1060.
Warrick A W 1988 Additional solutions for steady-state evaporation from a shallow water table. Soil Sci. 146, 63-66.
Section editor: T J Flowers


