Embed Size (px)
Citation preview
Urban land-use effects on groundwater phosphate distributionin a shallow aquifer, Nanfei River basin, China
Jiazhong Qian & Lulu Wang & Hongbin Zhan &
Zhou Chen
Abstract Groundwater, surface water, soil and river sedi-ment samples, and information on land use in the NanfeiRiver basin (NRB) of China have been analyzed to studythe geochemistry, distribution, and mobilization of phos-phorus. The distribution of phosphate (PO4
3–) and therelationships between PO4
3– and several constituents ingroundwater were studied. Partial correlation analysisrelating PO4
3– to types of land use was conducted usingthe data analyzing tool SPSS 15.0. The processescontrolling the transport of PO4
3– are discussed. Theconclusions from this study are: (1) urban land use hasobvious impact on PO4
3– in groundwater, the averageconcentration of PO4
3– being 4.37mg/L, greater than thatresulting from farmland and mixed land use, which haveaverage PO4
3– concentrations of 0.10 and 0.18mg/L,respectively; (2) the partial correlation between PO4
3–
and types of land use is significant with a coefficient of0.760; (3) the PO4
3– concentrations in surface water aregenerally higher than those in groundwater, and the totalphosphorus (TP) concentrations in river sediments aregenerally higher than those in soil samples; (4) ground-water is a carrier of PO4
3– and is likely responsible for theredistribution of PO4
3– in different regions of NRB.
Keywords Urban groundwater . Groundwatermonitoring . Partial correlation analysis . Phosphate .China
Introduction
Groundwater flow has played an important role incarrying nutrients to surface water. Excess input ofnitrogen (N) and phosphorus (P) to surface water canlead to eutrophication which is a serious environmentalconcern (Belanger and Mikutel 1985; Kim et al. 2008; Leeet al. 2009). Some studies have shown that growth ofalgae in most of the eutrophic lakes is limited by theconcentration of P rather than N (Schindler 1977; Kamayaet al. 2004). It is important to understand the pathways inwhich P may be delivered to such ecosystems by hydro-logical processes. Point-source P inputs are relatively easyto quantify and can be managed via legislation on P use indomestic products and/or by enhanced waste-water-treat-ment technology. Understanding non-point source ordiffusive P inputs has proved to be more difficult. Verylittle attention has been paid to evaluating transport of Pvia groundwater due to the long-held belief that adsorp-tion and metal-complex formation retain the majority ofpotentially mobile P (Sims et al. 1998; Holman et al.2008).
To date, the studies related to P in groundwater mainlyfall into two categories. The first category is related tonon-point source P from agricultural activity, with a focuson transfer of P from agricultural land to surface water viasurface runoff and sub-surface discharge (Sawhney 1978;McDowell et al. 2001; Heathwaite et al. 2005; Oenema etal. 2005; Withers and Haygarth 2007). For instance, Jalali(2009) conducted a survey on P concentration, solubilityand species in groundwater in a semi-arid basin, southernMalayer, western Iran. Jalali (2009) showed that largeamounts of P fertilizer, inadequate management of Pfertilizer use, and low irrigation efficiency, coupled withsandy soils in some parts of the study area, could bemainly responsible for the elevated P concentration ingroundwater. The second category involves studying thetransport mechanism of non-point source P based onhydrochemical analysis. For example, Kulabako et al.(2008) studied P attenuation and adsorption capacities of
Received: 6 May 2010 /Accepted: 16 July 2011Published online: 6 August 2011
* Springer-Verlag 2011
J. Qian : L. Wang : Z. ChenSchool of Resources and Environmental Engineering,Hefei University of Technology,Hefei, Anhui Province 230009, People’s Republic of Chinae-mail: [email protected]
H. Zhan ())Department of Geology & Geophysics,Texas A&M University,College Station, TX 77843-3115, USAe-mail: [email protected].: +1-979-8627961Fax: +1-979-8456162
H. ZhanFaculty of Engineering and School of Environmental Studies,China University of Geosciences,Wuhan, Hubei Province 430074, China
Hydrogeology Journal (2011) 19: 1431–1442 DOI 10.1007/s10040-011-0770-x
soils in the laboratory and the field, and suggested that Pdynamics was related to calcium (Ca), Iron (Fe) andorganic carbon content of the soils. Carlyle and Hill(2001) studied groundwater P dynamics in a river riparianzone and showed that the sources of P associated withburied channel sediments could also influence subsurfacereactive transport and release of P to streams. Holman etal. (2010) proposed that groundwater P contributionsshould not automatically be viewed as a source ofdilution, but rather as having the potential to trigger and/or maintain eutrophication, based on field studies in theUK and Ireland.
To date, much less attention has been paid to inves-tigating the urban land-use effects on groundwater Pdistribution and transport, which has been the primaryfocus of this study. The selected field site, Nanfei Riverbasin (NRB), is located between Hefei City and ChaohuLake (see Fig. 1) in China. Chaohu Lake is the fourthlargest freshwater lake in China. Since the middle of1980s, algae blooms have occurred each year in this lake(Zhu et al. 2006). It has been reported that Chaohu Lakehas significant eutrophication as a result of the develop-ment of agriculture and industry near the lake (Jin et al.2005). To reduce the eutrophication in Chaohu Lake,national and local governments have paid great attentionto the control of point-source P inputs through regulatingP use in domestic products and by enhancing waste-water-treatment technology. However, such efforts have notalleviated the problem of eutrophication in Chaohu Lake(Jin et al. 2005; Zhu et al. 2006). This has lead to theauthors hypothesizing that non-point source P fromgroundwater discharged to Chaohu Lake, which has notbeen taken into account previously, could be considerablylarge and may be responsible for persistent eutrophicationin the lake. This issue has, so far, not been studied at thissite with the exception of a preliminary hydrochemicalsurvey on groundwater and surface water in NRB by Qianet al. (2007). The objective of this study is to study thespatial distribution of PO4
3– in groundwater affected byland use and urbanization in NRB and the geochemicalfactors affecting the P mobilization and transport.
Description of the study area
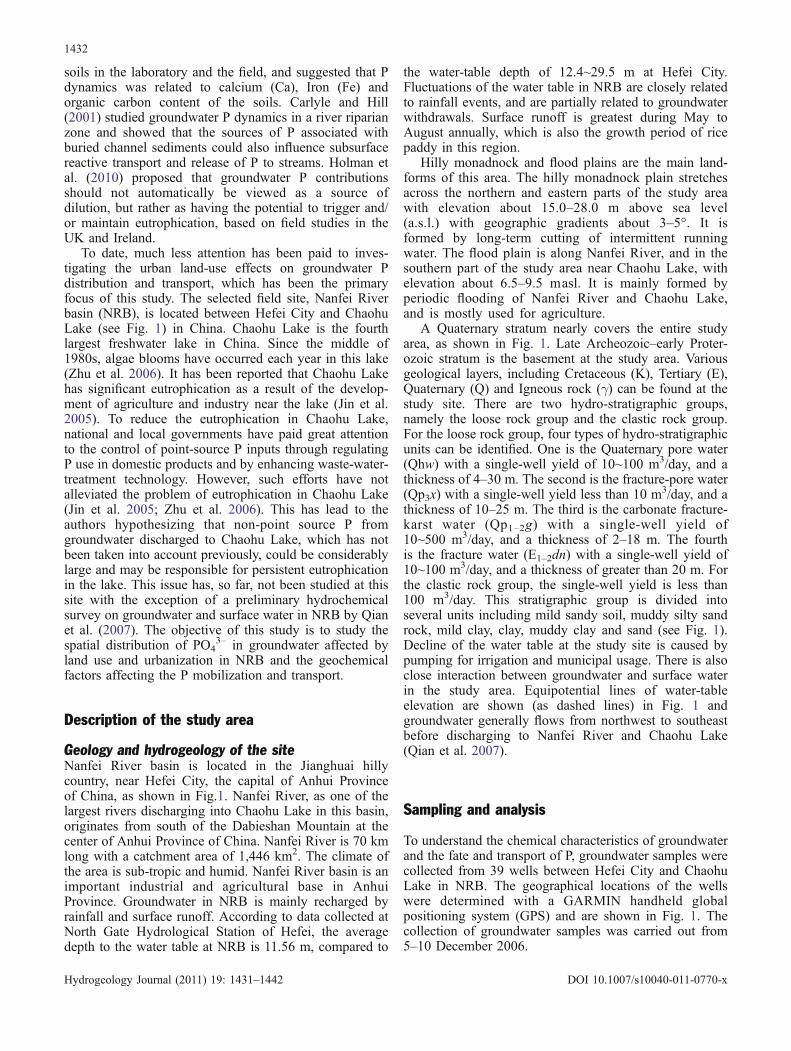
Geology and hydrogeology of the siteNanfei River basin is located in the Jianghuai hillycountry, near Hefei City, the capital of Anhui Provinceof China, as shown in Fig.1. Nanfei River, as one of thelargest rivers discharging into Chaohu Lake in this basin,originates from south of the Dabieshan Mountain at thecenter of Anhui Province of China. Nanfei River is 70 kmlong with a catchment area of 1,446 km2. The climate ofthe area is sub-tropic and humid. Nanfei River basin is animportant industrial and agricultural base in AnhuiProvince. Groundwater in NRB is mainly recharged byrainfall and surface runoff. According to data collected atNorth Gate Hydrological Station of Hefei, the averagedepth to the water table at NRB is 11.56 m, compared to
the water-table depth of 12.4~29.5 m at Hefei City.Fluctuations of the water table in NRB are closely relatedto rainfall events, and are partially related to groundwaterwithdrawals. Surface runoff is greatest during May toAugust annually, which is also the growth period of ricepaddy in this region.
Hilly monadnock and flood plains are the main land-forms of this area. The hilly monadnock plain stretchesacross the northern and eastern parts of the study areawith elevation about 15.0–28.0 m above sea level(a.s.l.) with geographic gradients about 3–5°. It isformed by long-term cutting of intermittent runningwater. The flood plain is along Nanfei River, and in thesouthern part of the study area near Chaohu Lake, withelevation about 6.5–9.5 masl. It is mainly formed byperiodic flooding of Nanfei River and Chaohu Lake,and is mostly used for agriculture.
A Quaternary stratum nearly covers the entire studyarea, as shown in Fig. 1. Late Archeozoic–early Proter-ozoic stratum is the basement at the study area. Variousgeological layers, including Cretaceous (K), Tertiary (E),Quaternary (Q) and Igneous rock (γ) can be found at thestudy site. There are two hydro-stratigraphic groups,namely the loose rock group and the clastic rock group.For the loose rock group, four types of hydro-stratigraphicunits can be identified. One is the Quaternary pore water(Qhw) with a single-well yield of 10~100 m3/day, and athickness of 4–30 m. The second is the fracture-pore water(Qp3x) with a single-well yield less than 10 m3/day, and athickness of 10–25 m. The third is the carbonate fracture-karst water (Qp1–2g) with a single-well yield of10~500 m3/day, and a thickness of 2–18 m. The fourthis the fracture water (E1–2dn) with a single-well yield of10~100 m3/day, and a thickness of greater than 20 m. Forthe clastic rock group, the single-well yield is less than100 m3/day. This stratigraphic group is divided intoseveral units including mild sandy soil, muddy silty sandrock, mild clay, clay, muddy clay and sand (see Fig. 1).Decline of the water table at the study site is caused bypumping for irrigation and municipal usage. There is alsoclose interaction between groundwater and surface waterin the study area. Equipotential lines of water-tableelevation are shown (as dashed lines) in Fig. 1 andgroundwater generally flows from northwest to southeastbefore discharging to Nanfei River and Chaohu Lake(Qian et al. 2007).
Sampling and analysis
To understand the chemical characteristics of groundwaterand the fate and transport of P, groundwater samples werecollected from 39 wells between Hefei City and ChaohuLake in NRB. The geographical locations of the wellswere determined with a GARMIN handheld globalpositioning system (GPS) and are shown in Fig. 1. Thecollection of groundwater samples was carried out from5–10 December 2006.
1432
Hydrogeology Journal (2011) 19: 1431–1442 DOI 10.1007/s10040-011-0770-x
Legend
Muddy clay
Clay
Mild clay
Mild sandy soil
Sand
Muddy silty sand rock
Water-table isobath (masl)
Groundwater sample
A
0 2.5 5 km
ANanfei
River
N
Soil sample
Surface water sample
Sediment sample
10-100Holocene series
100-500Early-mid Pleistocene series
10-100Early-mid Pleistocene series
<10Holocene series
Ele
vatio
n (m
asl)
129 A’
A’
40
0102030
-10-20-30-40-50
40
0102030
-10-20-30-40-50
Qp3x
Qp3x
Qp3x
Qp3x
Qp3x
Qp3x
E1-2dn
E1-2dn
E1-2dn
Qhw
Qhw
Qhw
Qhw
Qp1-2g
Qp1-2g
1. Single-well water yield (m 3/d)
2. Stratigraphic unit
Holocene alluvial Wuhu Group
Dingyuan Group
Early-mid Pleistocene Lacustrine Gunzihe Group
Late Pleistocene Aeolian Xiashu Group
1414
1111
17
88
S1
S2S3 S4
S5S6
S7
S8
(a)
(b)
Fig. 1 a Location and hydrogeologic map of the study area, showing locations where groundwater, surface water, soil- and river-sediments samples were collected. b Cross section A–A’
1433
Hydrogeology Journal (2011) 19: 1431–1442 DOI 10.1007/s10040-011-0770-x
It must be pointed out that due to the lack ofhydrogeological infrastructure at the site, including piez-ometers (with narrow screen intervals), no point measure-ments of groundwater quality could be taken. Nearly allthe groundwater sampling wells at the study site are openboreholes. The groundwater sampling depths range from4.5 to 60.0 m below ground surface (see Table 1). In eachgroundwater sampling well, the sample is taken from themiddle point between the water table and bottom of thewellbore. Be aware that although such a sample is takenfrom a point, it may better represent quality of mixedgroundwater over a vertical distance between the watertable and the bottom of the wellbore provided thatwater inside the open borehole is well mixed. Althoughthe open borehole may be regarded as a disadvantagefor groundwater sampling because it cannot yieldprecise point values of groundwater quality; it mayserve the purpose of this study which is of moreconcern regarding regional distribution of P. The wellsare located at various sites including urban residential
land, farmland and other mixed land use. The locationsof the 39 groundwater wells are classified according toland-use types. This includes eight samples in the urbanland, nine samples in the farmland and 22 samples inother mixed land use. In addition, 35 surface watersamples, 54 soil samples and 8 river sediments sampleswere collected in the study area during 5–10 December2006. Figures 1 and 2 show the locations of the samplecollection for this study.
The pH values of groundwater and surface-watersamples were measured using portable pH meters in situ(Orion 290 A). The groundwater and surface-watersamples were sealed in acid-washed polyethylene bottlesin situ, and sent to the geochemical laboratory at HefeiUniversity of Technology for analysis. All the watersamples were collected and preserved following thestandard procedure outlined in the groundwater collectionand analysis manual published by the Ministry of Landand Resources of China (DZT 1993). Water samples werefiltered using a 0.45-μm Millipore filter, then analyzed
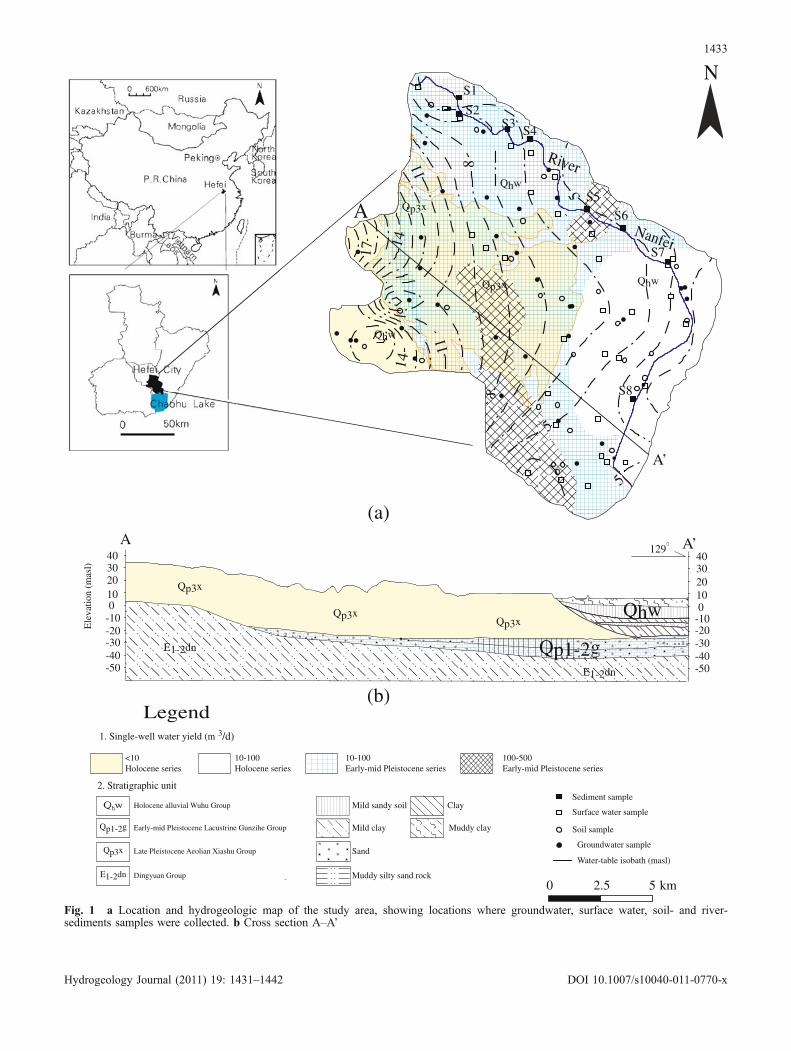
Table 1 Chemical compositions of groundwater from shallow aquifers in NRB of China
No. pH Na+
(mg/L)Ca2+
(mg/L)Mg2+
(mg/L)Cl–
(mg/L)PO4
3–
(mg/L)HCO3
–
(mg/L)Fe(mg/L)
NO3–
(mg/L)SO4
2–
(mg/L)TDS(mg/L)
Water type Samplingdepth(m)
Type ofland use
G1 7.40 73.0 66.9 30.1 60.7 3.50 352.1 0.33 3.68 58.4 647 Ca–Na–Mg–HCO3 24.7 3G2 7.49 160.9 120.9 52.7 123.8 0.29 594.8 0.07 10.20 165.4 1278 Na–Ca–HCO3 14.0 3G3 7.40 124.1 154.6 79.6 120.3 1.27 758.9 0.01 14.91 131.7 1443 Ca–Mg–Na–HCO3 11.0 3G4 7.16 202.6 115.4 53.4 210.9 11.63 437.6 0.04 161.85 297.9 1650 Na–HCO3–SO4–Cl 10.0 3G5 7.44 149.9 58.1 20.8 50.4 2.77 376.0 0.03 0.99 144.3 802 Na–Ca–HCO3–SO4 20.0 3G6 8.42 125.8 29.6 15.3 22.9 0.09 399.9 0.02 1.98 16.6 621 Na–HCO3 60.0 1G7 7.42 140.7 120.9 47.2 154.7 0.34 372.6 0.04 166.79 211.2 1269 Na–Ca–HCO3–SO4–Cl 16.0 1G8 7.53 42.5 90.5 24.8 26.4 0.04 311.1 0.07 46.42 70.1 618 Ca–HCO3 12.0 1G9 7.21 163.5 145.8 61.4 133.0 9.65 451.2 0.05 216.36 228.7 1449 Na–Ca–HCO3 8.0 3G10 7.53 95.3 110.5 50.8 135.2 0.14 338.4 0.01 8.42 183.0 973 Ca–Na–Mg–HCO3–Cl–SO4 20.0 1G11 7.93 85.7 42.1 22.7 13.8 0.13 413.6 0.02 1.86 14.2 603 Na–Ca–HCO3 40.0 1G12 7.13 54.7 92.6 39.4 47.0 0.00 376.0 0.01 11.07 96.9 721 Ca–Mg–HCO3 15.0 1G13 7.77 95.7 56.1 27.9 18.3 0.01 512.8 0.03 <0.2 5.6 729 Na–Ca–HCO3 40.0 2G14 7.90 96.0 92.7 34.1 149.0 0.22 153.8 0.03 4.86 206.7 740 Ca–Na–SO4–Cl 15.0 1G15 7.99 104.3 94.1 28.1 151.3 0.15 222.2 0.03 62.27 100.3 746 Ca–Na–Cl–HCO3 22.0 1G16 7.32 56.3 73.7 23.9 88.3 0.16 307.7 0.19 2.45 7.3 576 Ca–Na–HCO3–Cl 22.0 2G17 7.84 35.7 55.3 21.8 35.5 0.18 218.8 0.03 15.98 52.5 445 Ca–Mg–Na–HCO3 35.0 1G18 7.86 424.0 31.8 19.7 60.7 0.04 461.5 0.09 0.89 612.7 1652 Na–SO4–HCO3 55.0 1G19 8.38 83.3 53.2 18.6 55.0 0.16 256.4 0.02 17.14 63.6 592 Na–Ca–HCO3 25.0 1G20 7.68 31.9 64.8 16.6 33.2 0.17 262.5 0.65 17.79 28.2 508 Ca–HCO3 18.9 1G21 7.87 113.4 76.9 33.0 105.4 0.56 396.9 0.03 9.78 126.4 881 Na–Ca–HCO3 28.0 1G22 7.54 128.0 68.9 29.4 114.6 0.440 418.2 0.01 16.03 88.5 875 Na–Ca–HCO3–Cl 7.9 1G23 8.09 59.9 70.3 21.9 75.6 0.34 232.0 0.04 17.93 100.3 577 Ca–Na–HCO3–Cl–SO4 6.0 1G24 7.95 536.5 62.7 26.4 95.1 0.12 492.2 0.07 4.74 788.6 2115 Na–SO4–HCO3 30.0 1G25 7.72 101.4 51.5 23.9 22.9 0.09 451.2 0.05 3.17 21.1 717 Na–Ca–HCO3 50.0 2G26 8.00 80.3 50.8 23.6 16.1 0.11 423.9 0.05 2.71 15.3 666 Na–Ca–HCO3 50.0 2G27 7.45 41.3 54.1 18.9 6.9 0.25 348.7 0.179 <0.2 0.5 526 Ca–Na–Mg–HCO3 40.0 1G28 7.45 95.6 101.8 34.5 107.7 0.05 345.3 0.040 78.97 75.0 907 Ca–Na–HCO3–Cl 10.0 1G29 7.23 67.3 84.2 26.0 68.8 0.09 280.3 0.017 7.77 113.0 710 Ca–Na–HCO3–SO4 20.0 1G30 7.23 132.3 85.2 35.7 57.3 0.12 413.6 0.529 <0.2 210.4 965 Na–Ca–HCO3–SO4 36.0 2G31 7.28 125.1 106.7 54.6 73.4 0.36 583.1 0.037 3.10 131.6 1086 Na–Ca–Mg–HCO3 7.2 1G32 7.91 170.4 77.2 32.9 114.6 0.18 417.0 0.022 72.07 121.5 986 Na–Ca–HCO3–Cl 36.0 2G33 7.72 137.0 117.4 38.1 144.4 3.38 471.7 0.014 36.71 197.8 1200 Na–Ca–HCO3–SO4–Cl 30.0 3G34 7.43 122.6 134.5 50.1 241.8 2.43 358.9 0.012 92.43 105.1 1187 Na–Ca–Cl–HCO3 12.6 3G35 7.50 82.5 69.9 32.5 25.2 0.23 417.0 0.544 0.08 92.3 780 Na–Ca–Mg–HCO3 10.0 1G36 7.26 151.4 149.7 60.7 105.4 0.10 683.7 0.021 88.00 148.4 1432 Ca–Na–Mg–HCO3 38.0 2G37 7.07 90.8 54.3 26.2 21.8 0.04 444.4 0.259 0.53 25.0 688 Na–Ca–HCO3 24.0 2G38 7.76 65.8 58.5 20.5 11.5 0.03 403.4 0.060 0.58 7.8 586 Ca–Na–HCO3 4.5 1G39 7.55 166.7 77.8 28.6 56.2 0.04 454.6 1.518 0.24 142.5 899 Na–HCO3 38.0 1
Note: 3 urban residential land; 2 farmland; 1 mixed land use
1434
Hydrogeology Journal (2011) 19: 1431–1442 DOI 10.1007/s10040-011-0770-x
using ion chromatography (LC-10A, Shimadzu) to meas-ure nitrate (NO3
–), chloride (Cl–) and sulfate (SO42–)
concentrations. Concentrations of sodium (Na+), calcium(Ca2+) and magnesium (Mg2+) were measured by induc-tively coupled plasma atomic emission spectrometry(ICPS-1000 Ш C, Shimadzu). Fe2+ and Fe3+ wereanalyzed with a flame atomic absorption spectrophotom-eter (AAS) (220FS, Varian, Palo Alto, CA). Bicarbonate(HCO3
–) was determined by titration with hydrochloricacid (HCl) (Rowell 1994). Total dissolved solids (TDS)concentration was computed by multiplying the electricalconductivity (EC, dS/m) by a factor of 640 (Ayers andWestcot 1985). Concentrations of PO4
3– in groundwaterand surface-water samples were determined with a DionexDX-120 ion chromatograph. Ammonium concentrationswere measured by using the Nessler’s method (Wei 2003).
Soil samples were collected at two different depths ineach borehole. The shallower depth is from 0.6 to 0.9 mand the deeper depth is from 1.6 to 1.9 m. Thus, thechange of total phosphorus (TP) with sampling depthcould be found. Each soil sample was collected byinserting a 10-cm-long polyvinyl chloride (PVC) cylinderwith an inside diameter of 5 cm laterally into a designatedsoil horizon, and then placed in a sealed bag. Each soil
sample was subsequently fully mixed until it appeared tobe homogeneous. After that, 5 g (dry weight) of thesample was removed and analyzed using the molybdateblue method after dissolution in sulfuric acid andperchloric acid to measure the TP content (Liu 1996).Eight river sediments samples were collected from theupper 0~10 cm sediments at different locations: nearGujing Bridge (S1), Yangtze River Road Bridge (S2),Tunxi Road Bridge (S3), Shipyard (S4), Newport Dock(S5), Daxing Port (S6), the inlet of Twenty-li River (S7)and Sanli River (S8), which are shown in Fig 1. The riversediment samples were taken using a sediment coresampler, stored in sealed polyethylene bags, and trans-ported within 8 h to an ice locker in which the temperatureis kept at –10°C. The TP contents in the river sedimentsamples was measured in the same way as that for the soilsamples, right after they were air-dried. It is worthwhileto point out that the PO4
3– concentrations weremeasured for all the groundwater and surface-watersamples, but only TP contents were measured for all thesoil and river sediments samples. Partial correlationanalyses were performed using Statistical Package forthe Social Sciences (SPSS) version 15.0 (SPSS GmbHSoftware, Munich, Germany).
2.0
2.0
2.0
N
Dawei Town
Hefei
City
Legend
Groundwater samples
Isoline of groundwater phosphate
Nanfei RiverStudy area boundary
Guan Town
Land Use
Mixed land use
Urban residential land
Farmland
0 5 10 km
Main towm
Phosphate content in surface water(mg/L)
(0.31,1](1,2]
(2,3]
(3,4]
(4,5]
(5,6]
Surface water samples
G1G2
G3
G4
G5
G6G7
G8G9
G10
G11 G12 G13
G14
G15 G16
G17
G18
G19
G20G21
G22
G23 G24G25
G26
G27G28G29
G30
G31G32
G33
G34G35
G36
G37
G38 G39
0.0
0.0
0.0
0.0
0.01.0
1.0
1.0
3.0
3.0
3.0
4.0
4.0 5.0
5.06.0
6.0
7.08.09.0
0.0
Nanfei River
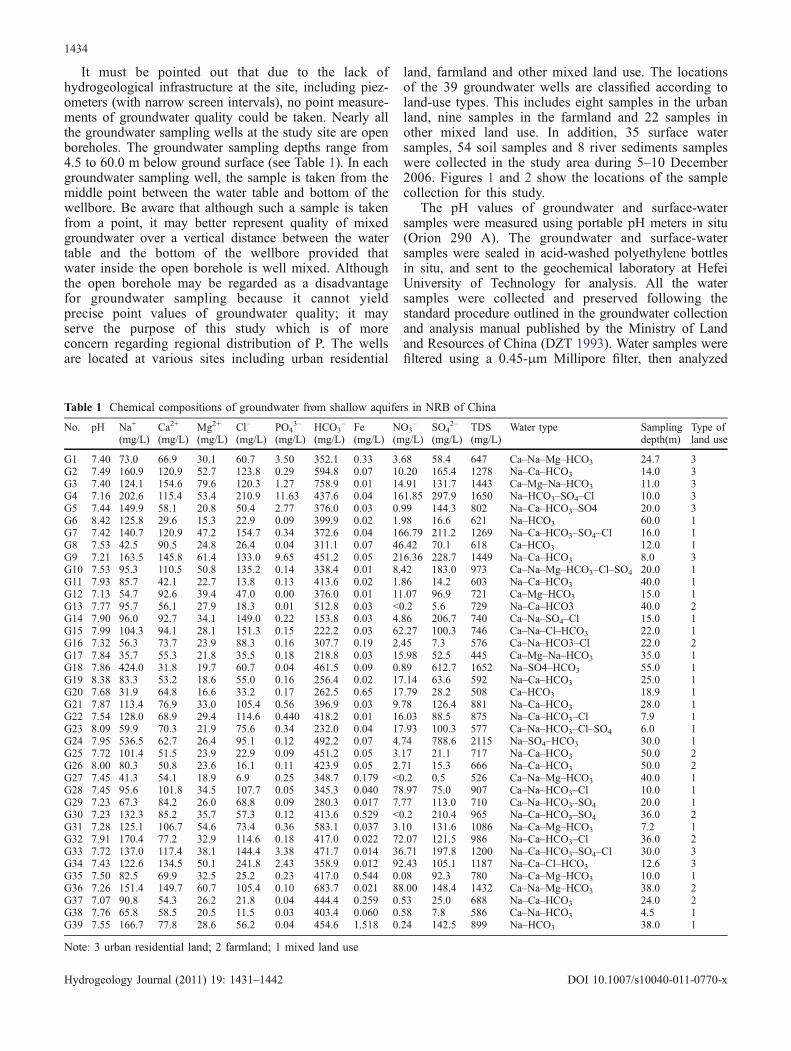
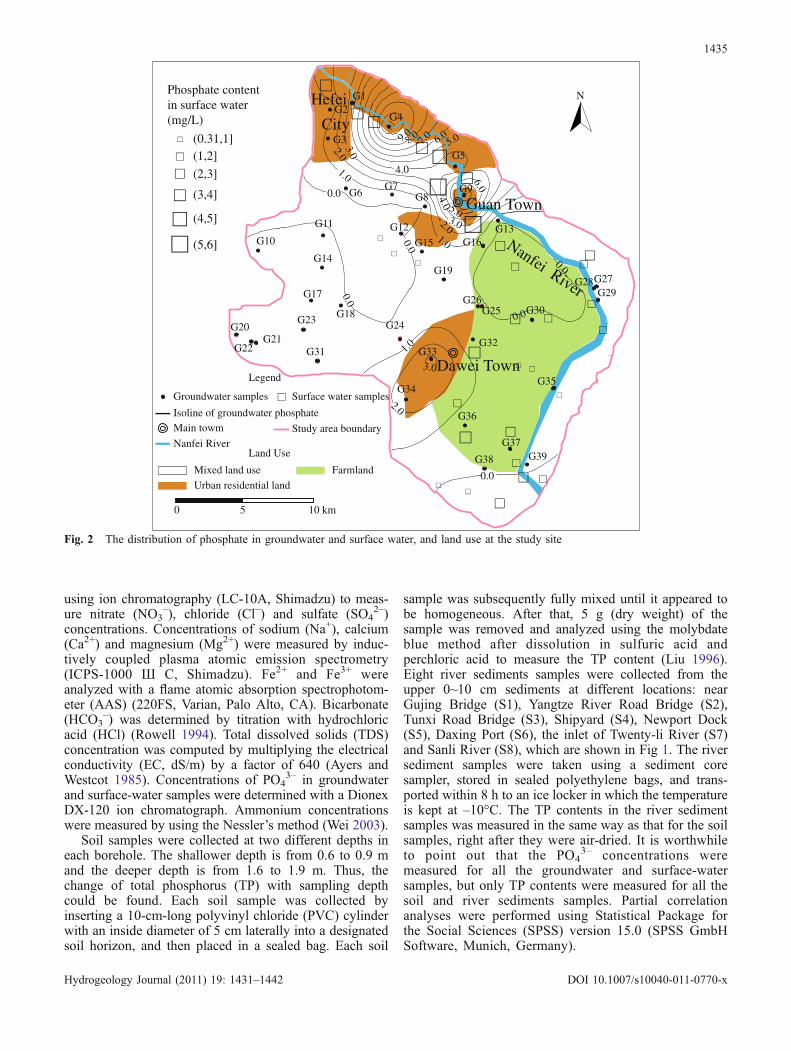
Fig. 2 The distribution of phosphate in groundwater and surface water, and land use at the study site
1435
Hydrogeology Journal (2011) 19: 1431–1442 DOI 10.1007/s10040-011-0770-x
Results and discussions
Groundwater chemistryGroundwater chemistry results are shown in Table 1,which includes the pH values, the concentrations of Na+,Ca2+, Mg2+, Cl–, PO4
3–, HCO3–, Fe (including Fe2+ and
Fe3+), NO3–, SO4
2– and TDS, water-chemistry type,groundwater sampling depth, and types of land use. ThepH values of these samples are slightly alkaline (7.07–8.42). TDS of groundwater ranges greatly from 508 to2,115 mg/L.
The Ca2+ and Mg2+ concentrations in groundwaterrange from 29.56 to 154.60 mg/L and 15.32 to 61.42 mg/L,respectively. Ca2+ andMg2+ probably come from dissolutionof magnesium carbonate or dolomite. The Na+ concentrationin groundwater is between 36.80 and 336.20 mg/L, withan average of 120.39 mg/L; while the Cl– concentrationin groundwater is from 6.88 to 241.83 mg/L. The Na/Clratios for more than half of the groundwater samples areapproximately equal to unity, an indication of halitedissolution. For groundwater samples whose Na/Clratios are greater than unity, the Na+ is typicallyinterpreted as released from silicate weathering reaction(Meybeck 1987). If silicate weathering is indeed asource of Na+, the concentration of HCO3
– should behigher than that of Na+. This is found to be true at thestudy site. Another source of Na+ is probably irrigationreturn flow. The Na+ concentration in groundwater mayalso increase due to evaporation.
The concentration of HCO3– varies between 153.83
and 683.67 mg/L. Natural processes such as dissolutionof carbonate minerals in the presence of atmospheric orsoil carbon dioxide (CO2) and the dissolution of CO2
(Eq. 1) are probably responsible for the occurrence ofHCO3
–.
CaCO3 þ CO2 þ H2O ¼ Ca2þ þ 2HCO�3 ; 2CO2 þ H2O ¼ 2HCO�
3 :
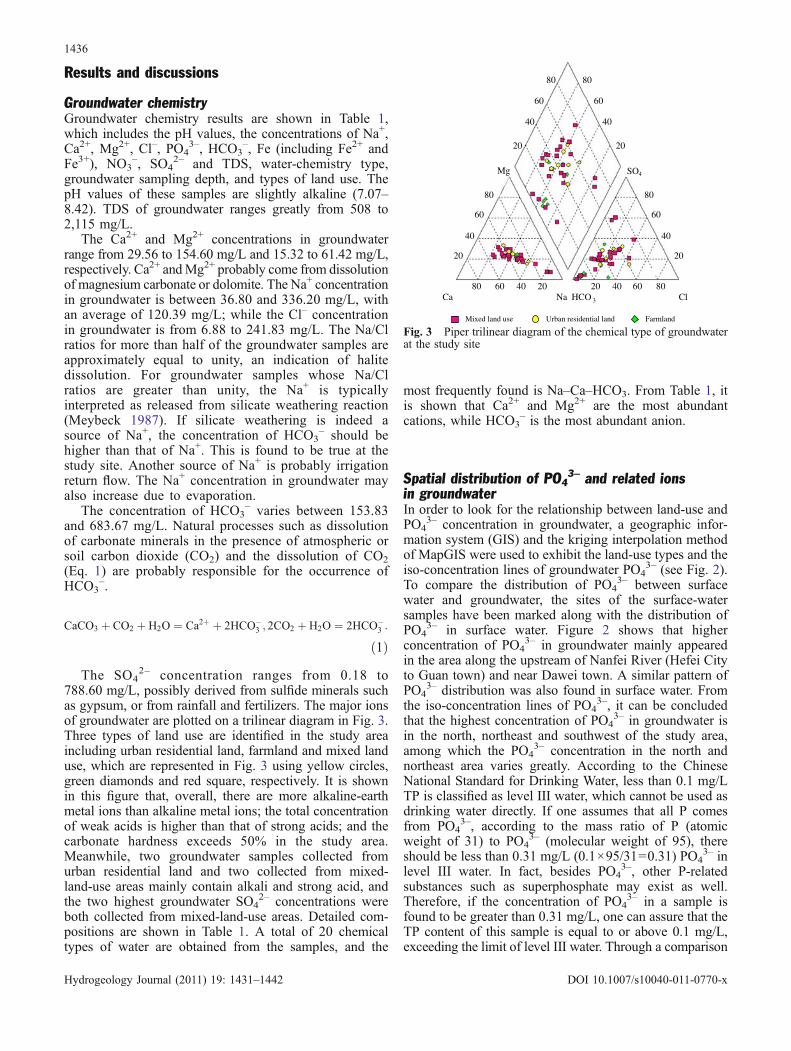
ð1ÞThe SO4
2– concentration ranges from 0.18 to788.60 mg/L, possibly derived from sulfide minerals suchas gypsum, or from rainfall and fertilizers. The major ionsof groundwater are plotted on a trilinear diagram in Fig. 3.Three types of land use are identified in the study areaincluding urban residential land, farmland and mixed landuse, which are represented in Fig. 3 using yellow circles,green diamonds and red square, respectively. It is shownin this figure that, overall, there are more alkaline-earthmetal ions than alkaline metal ions; the total concentrationof weak acids is higher than that of strong acids; and thecarbonate hardness exceeds 50% in the study area.Meanwhile, two groundwater samples collected fromurban residential land and two collected from mixed-land-use areas mainly contain alkali and strong acid, andthe two highest groundwater SO4
2– concentrations wereboth collected from mixed-land-use areas. Detailed com-positions are shown in Table 1. A total of 20 chemicaltypes of water are obtained from the samples, and the
most frequently found is Na–Ca–HCO3. From Table 1, itis shown that Ca2+ and Mg2+ are the most abundantcations, while HCO3
– is the most abundant anion.
Spatial distribution of PO43–
and related ionsin groundwaterIn order to look for the relationship between land-use andPO4
3– concentration in groundwater, a geographic infor-mation system (GIS) and the kriging interpolation methodof MapGIS were used to exhibit the land-use types and theiso-concentration lines of groundwater PO4
3– (see Fig. 2).To compare the distribution of PO4
3– between surfacewater and groundwater, the sites of the surface-watersamples have been marked along with the distribution ofPO4
3– in surface water. Figure 2 shows that higherconcentration of PO4
3– in groundwater mainly appearedin the area along the upstream of Nanfei River (Hefei Cityto Guan town) and near Dawei town. A similar pattern ofPO4
3– distribution was also found in surface water. Fromthe iso-concentration lines of PO4
3–, it can be concludedthat the highest concentration of PO4
3– in groundwater isin the north, northeast and southwest of the study area,among which the PO4
3– concentration in the north andnortheast area varies greatly. According to the ChineseNational Standard for Drinking Water, less than 0.1 mg/LTP is classified as level III water, which cannot be used asdrinking water directly. If one assumes that all P comesfrom PO4
3–, according to the mass ratio of P (atomicweight of 31) to PO4
3– (molecular weight of 95), thereshould be less than 0.31 mg/L (0.1×95/31=0.31) PO4
3– inlevel III water. In fact, besides PO4
3–, other P-relatedsubstances such as superphosphate may exist as well.Therefore, if the concentration of PO4
3– in a sample isfound to be greater than 0.31 mg/L, one can assure that theTP content of this sample is equal to or above 0.1 mg/L,exceeding the limit of level III water. Through a comparison
80 80
8080
80 80
60 60
6060
60 60
40 40
4040
40 40
20 20
2020
20 20
Ca Na
Mg
HCO 3 Cl
SO4
Urban residential land FarmlandMixed land use
Fig. 3 Piper trilinear diagram of the chemical type of groundwaterat the study site
1436
Hydrogeology Journal (2011) 19: 1431–1442 DOI 10.1007/s10040-011-0770-x
of PO43– concentrations and the land-use types shown in
Table 2, the highest concentration of PO43– is found to be in
the urban residential land (11.63 mg/L). Among the threetypes of land use, the average value of PO4
3– in the urbanresidential land is the highest (4.37 mg/L). The PO4
3–
concentrations in seven out of eight samples (87.5%) fromurban residential land exceed 0.31 mg/L. The samplescollected from farmland have an average PO4
3– concen-tration of 0.10 mg/L, and none of these samplesexceeds the PO4
3– concentration of 0.31 mg/L. Theaverage PO4
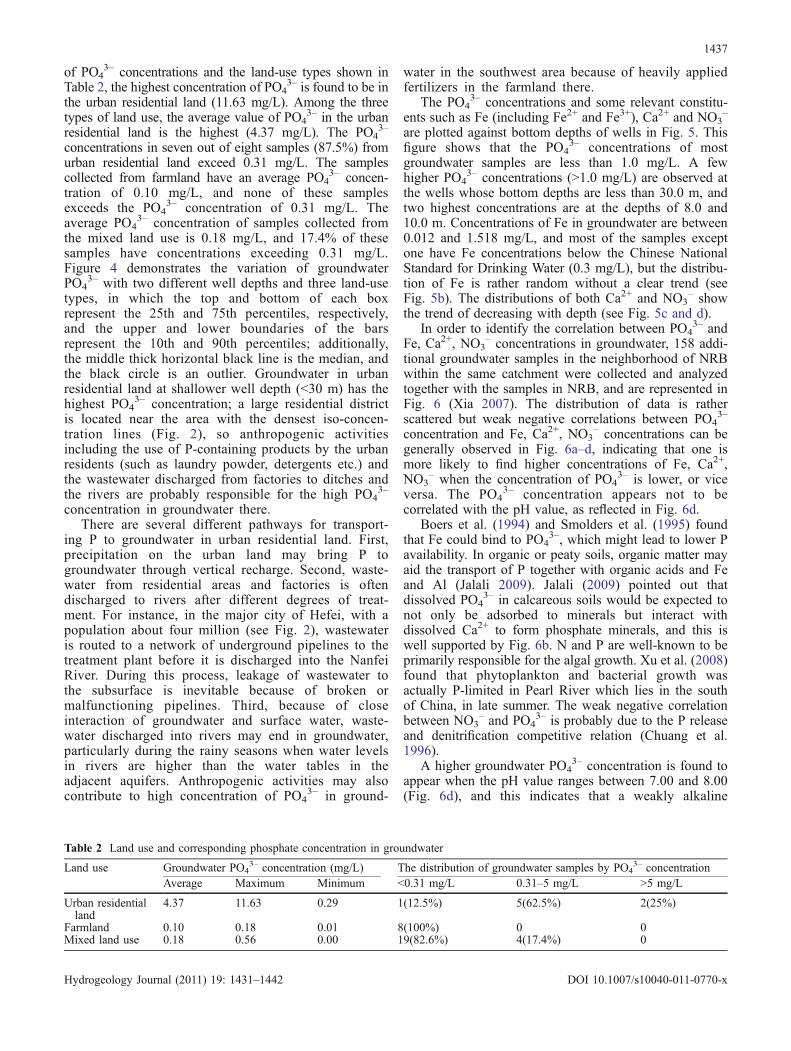
3– concentration of samples collected fromthe mixed land use is 0.18 mg/L, and 17.4% of thesesamples have concentrations exceeding 0.31 mg/L.Figure 4 demonstrates the variation of groundwaterPO4
3– with two different well depths and three land-usetypes, in which the top and bottom of each boxrepresent the 25th and 75th percentiles, respectively,and the upper and lower boundaries of the barsrepresent the 10th and 90th percentiles; additionally,the middle thick horizontal black line is the median, andthe black circle is an outlier. Groundwater in urbanresidential land at shallower well depth (<30 m) has thehighest PO4
3– concentration; a large residential districtis located near the area with the densest iso-concen-tration lines (Fig. 2), so anthropogenic activitiesincluding the use of P-containing products by the urbanresidents (such as laundry powder, detergents etc.) andthe wastewater discharged from factories to ditches andthe rivers are probably responsible for the high PO4
3–
concentration in groundwater there.There are several different pathways for transport-
ing P to groundwater in urban residential land. First,precipitation on the urban land may bring P togroundwater through vertical recharge. Second, waste-water from residential areas and factories is oftendischarged to rivers after different degrees of treat-ment. For instance, in the major city of Hefei, with apopulation about four million (see Fig. 2), wastewateris routed to a network of underground pipelines to thetreatment plant before it is discharged into the NanfeiRiver. During this process, leakage of wastewater tothe subsurface is inevitable because of broken ormalfunctioning pipelines. Third, because of closeinteraction of groundwater and surface water, waste-water discharged into rivers may end in groundwater,particularly during the rainy seasons when water levelsin rivers are higher than the water tables in theadjacent aquifers. Anthropogenic activities may alsocontribute to high concentration of PO4
3– in ground-
water in the southwest area because of heavily appliedfertilizers in the farmland there.
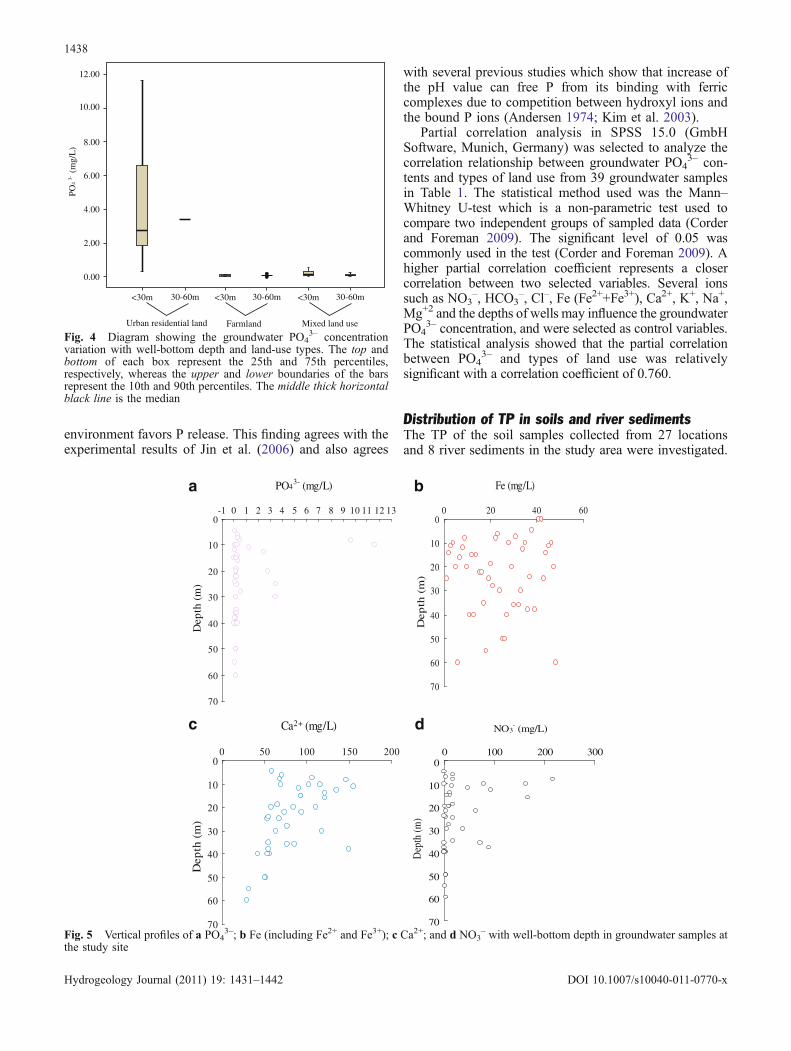
The PO43– concentrations and some relevant constitu-
ents such as Fe (including Fe2+ and Fe3+), Ca2+ and NO3–
are plotted against bottom depths of wells in Fig. 5. Thisfigure shows that the PO4
3– concentrations of mostgroundwater samples are less than 1.0 mg/L. A fewhigher PO4
3– concentrations (>1.0 mg/L) are observed atthe wells whose bottom depths are less than 30.0 m, andtwo highest concentrations are at the depths of 8.0 and10.0 m. Concentrations of Fe in groundwater are between0.012 and 1.518 mg/L, and most of the samples exceptone have Fe concentrations below the Chinese NationalStandard for Drinking Water (0.3 mg/L), but the distribu-tion of Fe is rather random without a clear trend (seeFig. 5b). The distributions of both Ca2+ and NO3
– showthe trend of decreasing with depth (see Fig. 5c and d).
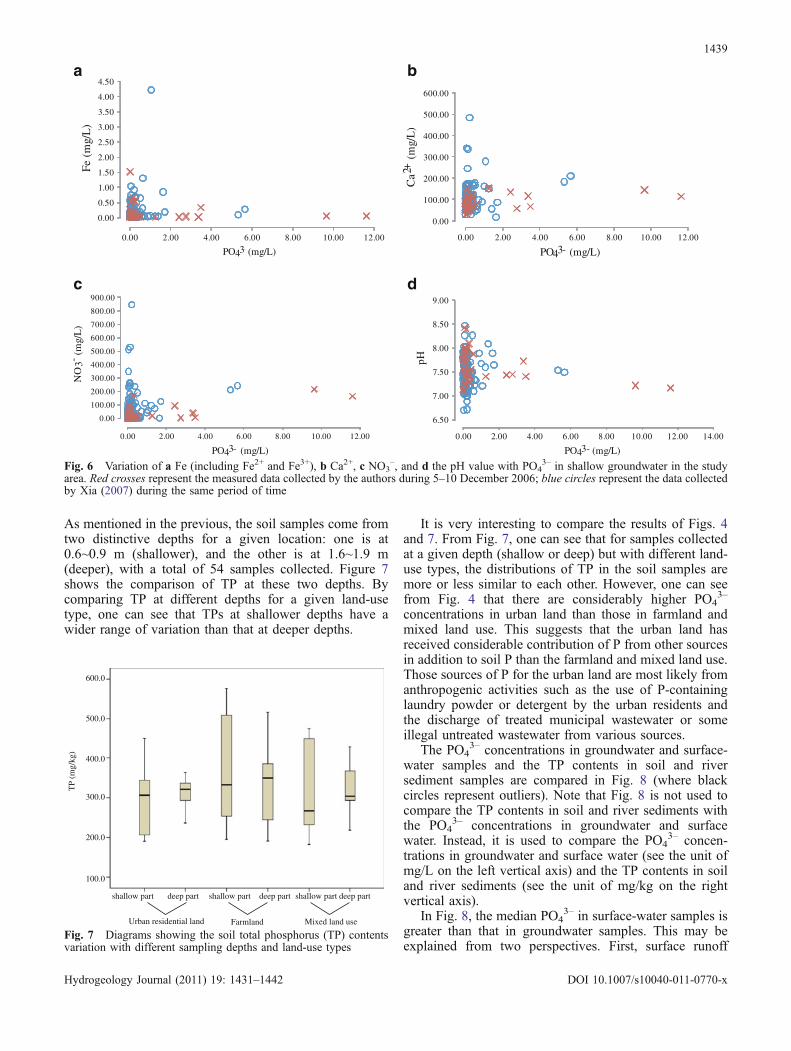
In order to identify the correlation between PO43– and
Fe, Ca2+, NO3– concentrations in groundwater, 158 addi-
tional groundwater samples in the neighborhood of NRBwithin the same catchment were collected and analyzedtogether with the samples in NRB, and are represented inFig. 6 (Xia 2007). The distribution of data is ratherscattered but weak negative correlations between PO4
3–
concentration and Fe, Ca2+, NO3– concentrations can be
generally observed in Fig. 6a–d, indicating that one ismore likely to find higher concentrations of Fe, Ca2+,NO3
– when the concentration of PO43– is lower, or vice
versa. The PO43– concentration appears not to be
correlated with the pH value, as reflected in Fig. 6d.Boers et al. (1994) and Smolders et al. (1995) found
that Fe could bind to PO43–, which might lead to lower P
availability. In organic or peaty soils, organic matter mayaid the transport of P together with organic acids and Feand Al (Jalali 2009). Jalali (2009) pointed out thatdissolved PO4
3– in calcareous soils would be expected tonot only be adsorbed to minerals but interact withdissolved Ca2+ to form phosphate minerals, and this iswell supported by Fig. 6b. N and P are well-known to beprimarily responsible for the algal growth. Xu et al. (2008)found that phytoplankton and bacterial growth wasactually P-limited in Pearl River which lies in the southof China, in late summer. The weak negative correlationbetween NO3
– and PO43– is probably due to the P release
and denitrification competitive relation (Chuang et al.1996).
A higher groundwater PO43– concentration is found to
appear when the pH value ranges between 7.00 and 8.00(Fig. 6d), and this indicates that a weakly alkaline
Table 2 Land use and corresponding phosphate concentration in groundwater
Land use Groundwater PO43– concentration (mg/L) The distribution of groundwater samples by PO4
3– concentrationAverage Maximum Minimum <0.31 mg/L 0.31–5 mg/L >5 mg/L
Urban residentialland
4.37 11.63 0.29 1(12.5%) 5(62.5%) 2(25%)
Farmland 0.10 0.18 0.01 8(100%) 0 0Mixed land use 0.18 0.56 0.00 19(82.6%) 4(17.4%) 0
1437
Hydrogeology Journal (2011) 19: 1431–1442 DOI 10.1007/s10040-011-0770-x
environment favors P release. This finding agrees with theexperimental results of Jin et al. (2006) and also agrees
with several previous studies which show that increase ofthe pH value can free P from its binding with ferriccomplexes due to competition between hydroxyl ions andthe bound P ions (Andersen 1974; Kim et al. 2003).
Partial correlation analysis in SPSS 15.0 (GmbHSoftware, Munich, Germany) was selected to analyze thecorrelation relationship between groundwater PO4
3– con-tents and types of land use from 39 groundwater samplesin Table 1. The statistical method used was the Mann–Whitney U-test which is a non-parametric test used tocompare two independent groups of sampled data (Corderand Foreman 2009). The significant level of 0.05 wascommonly used in the test (Corder and Foreman 2009). Ahigher partial correlation coefficient represents a closercorrelation between two selected variables. Several ionssuch as NO3
–, HCO3–, Cl–, Fe (Fe2++Fe3+), Ca2+, K+, Na+,
Mg+2 and the depths of wells may influence the groundwaterPO4
3– concentration, and were selected as control variables.The statistical analysis showed that the partial correlationbetween PO4
3– and types of land use was relativelysignificant with a correlation coefficient of 0.760.
Distribution of TP in soils and river sedimentsThe TP of the soil samples collected from 27 locationsand 8 river sediments in the study area were investigated.
0.00
2.00
4.00
6.00
8.00
10.00
12.00OP
4)
L/gm(
-3
<30m <30m<30m 30-60m 30-60m 30-60m
Urban residential land Farmland Mixed land use
Fig. 4 Diagram showing the groundwater PO43– concentration
variation with well-bottom depth and land-use types. The top andbottom of each box represent the 25th and 75th percentiles,respectively, whereas the upper and lower boundaries of the barsrepresent the 10th and 90th percentiles. The middle thick horizontalblack line is the median
0
10
20
30
40
50
60
70
-1 0 1 2 3 4 5 6 7 8 9 10 11 12 13
PO43- (mg/L)
Dep
th (m
)
a
c d
b
0
10
20
30
40
50
60
70
0 20 40 60
Fe (mg/L)
Dep
th (
m)
0
10
20
30
40
50
60
70
0 50 100 150 200
Ca2+ (mg/L)
Dep
th (
m)
0
10
20
30
40
50
60
70
0 100 200 300
NO3- (mg/L)
Dep
th (m
)
Fig. 5 Vertical profiles of a PO43–; b Fe (including Fe2+ and Fe3+); c Ca2+; and d NO3
– with well-bottom depth in groundwater samples atthe study site
1438
Hydrogeology Journal (2011) 19: 1431–1442 DOI 10.1007/s10040-011-0770-x
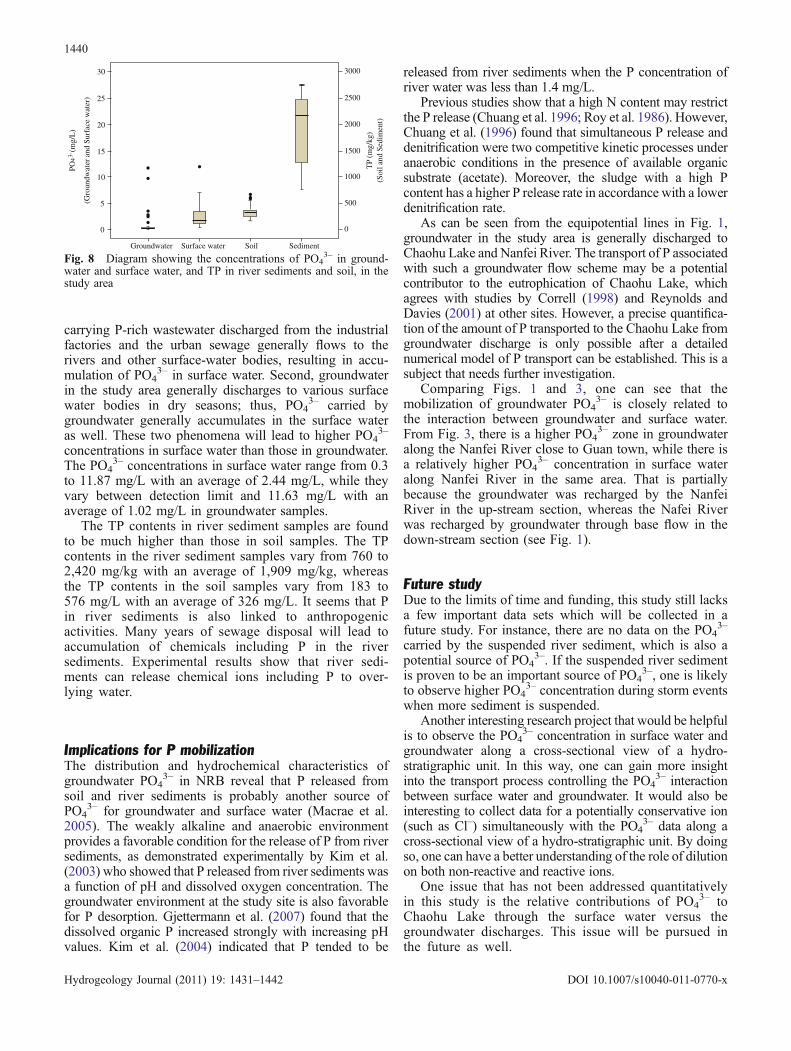
As mentioned in the previous, the soil samples come fromtwo distinctive depths for a given location: one is at0.6~0.9 m (shallower), and the other is at 1.6~1.9 m(deeper), with a total of 54 samples collected. Figure 7shows the comparison of TP at these two depths. Bycomparing TP at different depths for a given land-usetype, one can see that TPs at shallower depths have awider range of variation than that at deeper depths.
It is very interesting to compare the results of Figs. 4and 7. From Fig. 7, one can see that for samples collectedat a given depth (shallow or deep) but with different land-use types, the distributions of TP in the soil samples aremore or less similar to each other. However, one can seefrom Fig. 4 that there are considerably higher PO4
3–
concentrations in urban land than those in farmland andmixed land use. This suggests that the urban land hasreceived considerable contribution of P from other sourcesin addition to soil P than the farmland and mixed land use.Those sources of P for the urban land are most likely fromanthropogenic activities such as the use of P-containinglaundry powder or detergent by the urban residents andthe discharge of treated municipal wastewater or someillegal untreated wastewater from various sources.
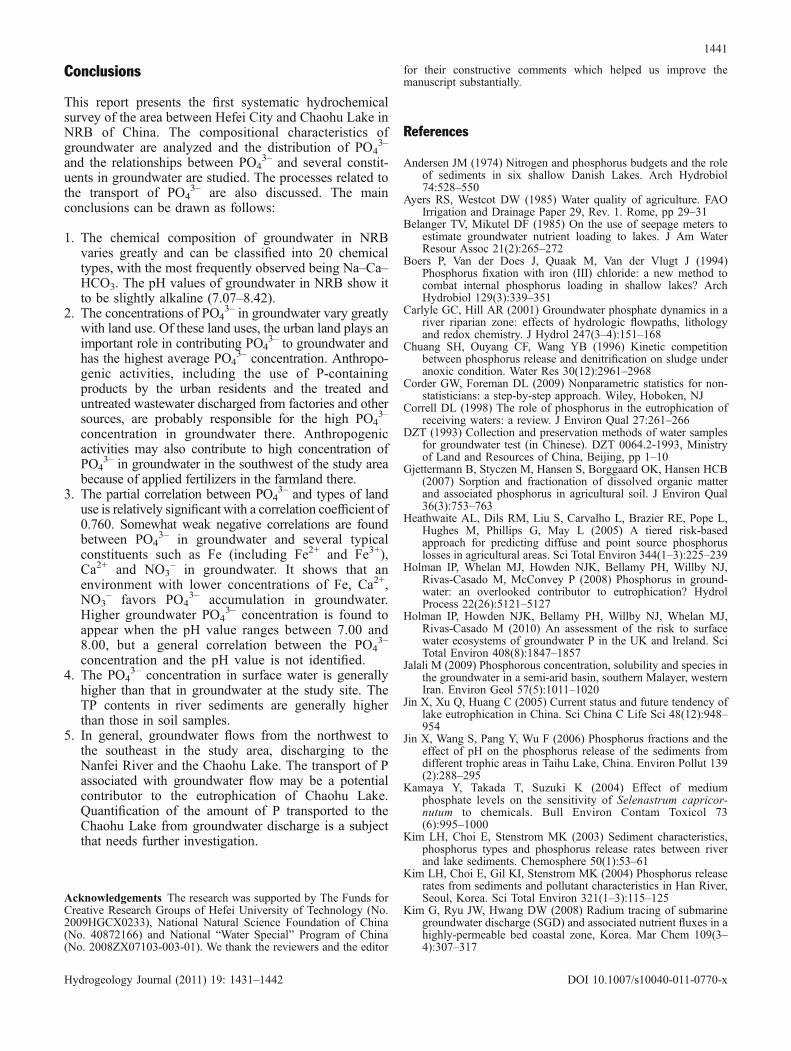
The PO43– concentrations in groundwater and surface-
water samples and the TP contents in soil and riversediment samples are compared in Fig. 8 (where blackcircles represent outliers). Note that Fig. 8 is not used tocompare the TP contents in soil and river sediments withthe PO4
3– concentrations in groundwater and surfacewater. Instead, it is used to compare the PO4
3– concen-trations in groundwater and surface water (see the unit ofmg/L on the left vertical axis) and the TP contents in soiland river sediments (see the unit of mg/kg on the rightvertical axis).
In Fig. 8, the median PO43– in surface-water samples is
greater than that in groundwater samples. This may beexplained from two perspectives. First, surface runoff
0.00
0.50
1.00
1.50
2.00
2.50
3.00
3.50
4.00
4.50
0.00 2.00 4.00 6.00 8.00 10.00 12.00
PO43- (mg/L)
Fe (
mg/
L)
a
c d
b
0.00
100.00
200.00
300.00
400.00
500.00
600.00
0.00 2.00 4.00 6.00 8.00 10.00 12.00
PO43- (mg/L)
Ca2
+ (
mg/
L)
0.00
100.00
200.00
300.00
400.00
500.00
600.00
700.00
800.00
900.00
0.00 2.00 4.00 6.00 8.00 10.00 12.00
PO43- (mg/L)
NO
3- (m
g/L
)
6.50
7.00
7.50
8.00
8.50
9.00
0.00 2.00 4.00 6.00 8.00 10.00 12.00 14.00
PO43- (mg/L)
pH
Fig. 6 Variation of a Fe (including Fe2+ and Fe3+), b Ca2+, c NO3–, and d the pH value with PO4
3– in shallow groundwater in the studyarea. Red crosses represent the measured data collected by the authors during 5–10 December 2006; blue circles represent the data collectedby Xia (2007) during the same period of time
shallow part shallow part shallow partdeep part deep part deep part
Urban residential land Farmland Mixed land use
100.0
200.0
300.0
400.0
500.0
600.0
TP
(mg/
kg)
Fig. 7 Diagrams showing the soil total phosphorus (TP) contentsvariation with different sampling depths and land-use types
1439
Hydrogeology Journal (2011) 19: 1431–1442 DOI 10.1007/s10040-011-0770-x
carrying P-rich wastewater discharged from the industrialfactories and the urban sewage generally flows to therivers and other surface-water bodies, resulting in accu-mulation of PO4
3– in surface water. Second, groundwaterin the study area generally discharges to various surfacewater bodies in dry seasons; thus, PO4
3– carried bygroundwater generally accumulates in the surface wateras well. These two phenomena will lead to higher PO4
3–
concentrations in surface water than those in groundwater.The PO4
3– concentrations in surface water range from 0.3to 11.87 mg/L with an average of 2.44 mg/L, while theyvary between detection limit and 11.63 mg/L with anaverage of 1.02 mg/L in groundwater samples.
The TP contents in river sediment samples are foundto be much higher than those in soil samples. The TPcontents in the river sediment samples vary from 760 to2,420 mg/kg with an average of 1,909 mg/kg, whereasthe TP contents in the soil samples vary from 183 to576 mg/L with an average of 326 mg/L. It seems that Pin river sediments is also linked to anthropogenicactivities. Many years of sewage disposal will lead toaccumulation of chemicals including P in the riversediments. Experimental results show that river sedi-ments can release chemical ions including P to over-lying water.
Implications for P mobilizationThe distribution and hydrochemical characteristics ofgroundwater PO4
3– in NRB reveal that P released fromsoil and river sediments is probably another source ofPO4
3– for groundwater and surface water (Macrae et al.2005). The weakly alkaline and anaerobic environmentprovides a favorable condition for the release of P from riversediments, as demonstrated experimentally by Kim et al.(2003) who showed that P released from river sediments wasa function of pH and dissolved oxygen concentration. Thegroundwater environment at the study site is also favorablefor P desorption. Gjettermann et al. (2007) found that thedissolved organic P increased strongly with increasing pHvalues. Kim et al. (2004) indicated that P tended to be
released from river sediments when the P concentration ofriver water was less than 1.4 mg/L.
Previous studies show that a high N content may restrictthe P release (Chuang et al. 1996; Roy et al. 1986). However,Chuang et al. (1996) found that simultaneous P release anddenitrification were two competitive kinetic processes underanaerobic conditions in the presence of available organicsubstrate (acetate). Moreover, the sludge with a high Pcontent has a higher P release rate in accordance with a lowerdenitrification rate.
As can be seen from the equipotential lines in Fig. 1,groundwater in the study area is generally discharged toChaohu Lake and Nanfei River. The transport of P associatedwith such a groundwater flow scheme may be a potentialcontributor to the eutrophication of Chaohu Lake, whichagrees with studies by Correll (1998) and Reynolds andDavies (2001) at other sites. However, a precise quantifica-tion of the amount of P transported to the Chaohu Lake fromgroundwater discharge is only possible after a detailednumerical model of P transport can be established. This is asubject that needs further investigation.
Comparing Figs. 1 and 3, one can see that themobilization of groundwater PO4
3– is closely related tothe interaction between groundwater and surface water.From Fig. 3, there is a higher PO4
3– zone in groundwateralong the Nanfei River close to Guan town, while there isa relatively higher PO4
3– concentration in surface wateralong Nanfei River in the same area. That is partiallybecause the groundwater was recharged by the NanfeiRiver in the up-stream section, whereas the Nafei Riverwas recharged by groundwater through base flow in thedown-stream section (see Fig. 1).
Future studyDue to the limits of time and funding, this study still lacksa few important data sets which will be collected in afuture study. For instance, there are no data on the PO4
3–
carried by the suspended river sediment, which is also apotential source of PO4
3–. If the suspended river sedimentis proven to be an important source of PO4
3–, one is likelyto observe higher PO4
3– concentration during storm eventswhen more sediment is suspended.
Another interesting research project that would be helpfulis to observe the PO4
3– concentration in surface water andgroundwater along a cross-sectional view of a hydro-stratigraphic unit. In this way, one can gain more insightinto the transport process controlling the PO4
3– interactionbetween surface water and groundwater. It would also beinteresting to collect data for a potentially conservative ion(such as Cl–) simultaneously with the PO4
3– data along across-sectional view of a hydro-stratigraphic unit. By doingso, one can have a better understanding of the role of dilutionon both non-reactive and reactive ions.
One issue that has not been addressed quantitativelyin this study is the relative contributions of PO4
3– toChaohu Lake through the surface water versus thegroundwater discharges. This issue will be pursued inthe future as well.
PO4
(m
g/L
)
0
5
10
15
20
25
303-
(Gro
undw
ater
and
Sur
face
wat
er)
0
500
1000
1500
2000
2500
3000
TP
(mg/
kg)
(Soi
l and
Sed
imen
t)
Groundwater Surface water Soil Sediment
Fig. 8 Diagram showing the concentrations of PO43– in ground-
water and surface water, and TP in river sediments and soil, in thestudy area
1440
Hydrogeology Journal (2011) 19: 1431–1442 DOI 10.1007/s10040-011-0770-x
Conclusions
This report presents the first systematic hydrochemicalsurvey of the area between Hefei City and Chaohu Lake inNRB of China. The compositional characteristics ofgroundwater are analyzed and the distribution of PO4
3–
and the relationships between PO43– and several constit-
uents in groundwater are studied. The processes related tothe transport of PO4
3– are also discussed. The mainconclusions can be drawn as follows:
1. The chemical composition of groundwater in NRBvaries greatly and can be classified into 20 chemicaltypes, with the most frequently observed being Na–Ca–HCO3. The pH values of groundwater in NRB show itto be slightly alkaline (7.07–8.42).
2. The concentrations of PO43– in groundwater vary greatly
with land use. Of these land uses, the urban land plays animportant role in contributing PO4
3– to groundwater andhas the highest average PO4
3– concentration. Anthropo-genic activities, including the use of P-containingproducts by the urban residents and the treated anduntreated wastewater discharged from factories and othersources, are probably responsible for the high PO4
3–
concentration in groundwater there. Anthropogenicactivities may also contribute to high concentration ofPO4
3– in groundwater in the southwest of the study areabecause of applied fertilizers in the farmland there.
3. The partial correlation between PO43– and types of land
use is relatively significant with a correlation coefficient of0.760. Somewhat weak negative correlations are foundbetween PO4
3– in groundwater and several typicalconstituents such as Fe (including Fe2+ and Fe3+),Ca2+ and NO3
– in groundwater. It shows that anenvironment with lower concentrations of Fe, Ca2+,NO3
– favors PO43– accumulation in groundwater.
Higher groundwater PO43– concentration is found to
appear when the pH value ranges between 7.00 and8.00, but a general correlation between the PO4
3–
concentration and the pH value is not identified.4. The PO4
3– concentration in surface water is generallyhigher than that in groundwater at the study site. TheTP contents in river sediments are generally higherthan those in soil samples.
5. In general, groundwater flows from the northwest tothe southeast in the study area, discharging to theNanfei River and the Chaohu Lake. The transport of Passociated with groundwater flow may be a potentialcontributor to the eutrophication of Chaohu Lake.Quantification of the amount of P transported to theChaohu Lake from groundwater discharge is a subjectthat needs further investigation.
Acknowledgements The research was supported by The Funds forCreative Research Groups of Hefei University of Technology (No.2009HGCX0233), National Natural Science Foundation of China(No. 40872166) and National “Water Special” Program of China(No. 2008ZX07103-003-01). We thank the reviewers and the editor
for their constructive comments which helped us improve themanuscript substantially.
References
Andersen JM (1974) Nitrogen and phosphorus budgets and the roleof sediments in six shallow Danish Lakes. Arch Hydrobiol74:528–550
Ayers RS, Westcot DW (1985) Water quality of agriculture. FAOIrrigation and Drainage Paper 29, Rev. 1. Rome, pp 29–31
Belanger TV, Mikutel DF (1985) On the use of seepage meters toestimate groundwater nutrient loading to lakes. J Am WaterResour Assoc 21(2):265–272
Boers P, Van der Does J, Quaak M, Van der Vlugt J (1994)Phosphorus fixation with iron (III) chloride: a new method tocombat internal phosphorus loading in shallow lakes? ArchHydrobiol 129(3):339–351
Carlyle GC, Hill AR (2001) Groundwater phosphate dynamics in ariver riparian zone: effects of hydrologic flowpaths, lithologyand redox chemistry. J Hydrol 247(3–4):151–168
Chuang SH, Ouyang CF, Wang YB (1996) Kinetic competitionbetween phosphorus release and denitrification on sludge underanoxic condition. Water Res 30(12):2961–2968
Corder GW, Foreman DL (2009) Nonparametric statistics for non-statisticians: a step-by-step approach. Wiley, Hoboken, NJ
Correll DL (1998) The role of phosphorus in the eutrophication ofreceiving waters: a review. J Environ Qual 27:261–266
DZT (1993) Collection and preservation methods of water samplesfor groundwater test (in Chinese). DZT 0064.2-1993, Ministryof Land and Resources of China, Beijing, pp 1–10
Gjettermann B, Styczen M, Hansen S, Borggaard OK, Hansen HCB(2007) Sorption and fractionation of dissolved organic matterand associated phosphorus in agricultural soil. J Environ Qual36(3):753–763
Heathwaite AL, Dils RM, Liu S, Carvalho L, Brazier RE, Pope L,Hughes M, Phillips G, May L (2005) A tiered risk-basedapproach for predicting diffuse and point source phosphoruslosses in agricultural areas. Sci Total Environ 344(1–3):225–239
Holman IP, Whelan MJ, Howden NJK, Bellamy PH, Willby NJ,Rivas-Casado M, McConvey P (2008) Phosphorus in ground-water: an overlooked contributor to eutrophication? HydrolProcess 22(26):5121–5127
Holman IP, Howden NJK, Bellamy PH, Willby NJ, Whelan MJ,Rivas-Casado M (2010) An assessment of the risk to surfacewater ecosystems of groundwater P in the UK and Ireland. SciTotal Environ 408(8):1847–1857
Jalali M (2009) Phosphorous concentration, solubility and species inthe groundwater in a semi-arid basin, southern Malayer, westernIran. Environ Geol 57(5):1011–1020
Jin X, Xu Q, Huang C (2005) Current status and future tendency oflake eutrophication in China. Sci China C Life Sci 48(12):948–954
Jin X, Wang S, Pang Y, Wu F (2006) Phosphorus fractions and theeffect of pH on the phosphorus release of the sediments fromdifferent trophic areas in Taihu Lake, China. Environ Pollut 139(2):288–295
Kamaya Y, Takada T, Suzuki K (2004) Effect of mediumphosphate levels on the sensitivity of Selenastrum capricor-nutum to chemicals. Bull Environ Contam Toxicol 73(6):995–1000
Kim LH, Choi E, Stenstrom MK (2003) Sediment characteristics,phosphorus types and phosphorus release rates between riverand lake sediments. Chemosphere 50(1):53–61
Kim LH, Choi E, Gil KI, Stenstrom MK (2004) Phosphorus releaserates from sediments and pollutant characteristics in Han River,Seoul, Korea. Sci Total Environ 321(1–3):115–125
Kim G, Ryu JW, Hwang DW (2008) Radium tracing of submarinegroundwater discharge (SGD) and associated nutrient fluxes in ahighly-permeable bed coastal zone, Korea. Mar Chem 109(3–4):307–317
1441
Hydrogeology Journal (2011) 19: 1431–1442 DOI 10.1007/s10040-011-0770-x
Kulabako NR, Nalubega M, Thunvik R (2008) Phosphorus trans-port in shallow groundwater in peri-urban Kampala, Uganda:results from field and laboratory measurements. Environ Geol53(7):1535–1551
Lee YW, Hwang DW, Kim G, Lee WC, Oh HT (2009) Nutrientinputs from submarine groundwater discharge (SGD) in MasanBay, an embayment surrounded by heavily industrialized cities,Korea. Sci Total Environ 407(9):3181–3188
Liu GS (1996) Soil physical, chemical analysis and description of soilprofiles (in Chinese). Standards Press of China, Beijing, pp 33–37
Macrae ML, Redding TE, Creed IF, Bell WR, Devito KJ (2005)Soil, surface water and ground water phosphorus relationshipsin a partially harvested Boreal Plain aspen catchment. For EcolManage 206(1–3):315–329
McDowell R, Sharpley A, Brookes P, Poulton P (2001) Relationshipbetween soil test phosphorus and phosphorus release tosolution. Soil Sci 166(2):137–149
Meybeck M (1987) Global chemical weathering of surficial rocksestimated from river dissolved loads. Am J Sci 287(5):401–428
Oenema O, van Liere L, Schoumans O (2005) Effects of loweringnitrogen and phosphorus surpluses in agriculture on the qualityof groundwater and surface water in the Netherlands. J Hydrol304(1–4):289–301
Qian JZ, Zhao WD, Hong TQ, Liu Y, Tang CY (2007) Spatialvariability in hydrochemistry of groundwater and surface water:a case study in Nanfei River catchment, China. In: Bullen DT,Wang Y (eds) Water–rock interaction, vols 1 and 2, proceedings.Taylor and Francis, London, pp887–890
Reynolds CS, Davies PS (2001) Sources and bioavailability ofphosphorus fractions in freshwaters: a British perspective. BiolRev 76(1):27–64
Rowell DL (1994) Soil science: methods and applications. Long-man, Harlow, UK; Wiley, New York
Roy WR, Hassett JJ, Griffin RA (1986) Competitive coefficients forthe adsorption of arsenate, molybdate, and phosphate mixturesby soils. Soil Sci Soc Am J 50(5):1176–1182
Sawhney BL (1978) Leaching of phosphorus from agricultural soilsto groundwater. Water Air Soil Pollut 9(4):499–505
Schindler DW (1977) Evolution of phosphorus limitation in lakes.Science 195:260–262
Sims JT, Simard RR, Joern BC (1998) Phosphorus loss inagricultural drainage: historical perspective and currentresearch. J Environ Qual 27:277–293
Smolders AJP, Nijboer RC, Roelofs JGM (1995) Prevention ofsulphide accumulation and phosphate mobilization by theaddition of iron (II) chloride to a reduced sediment: anenclosure experiment. Freshw Biol 34(3):559–568
Wei F (2003) Method of Analyzing and Monitoring the Water andWastewater, 4th edn., State Environmental ProtectionAdministrationof China. China Environmental Science Press. Beijing, pp 276–280
Withers PJA, Haygarth PM (2007) Agriculture, phosphorus andeutrophication: a European perspective. Soil Use Manage 23:1–4
Xia Q (2007) Hydrochemical Characteristics and Experimental Studyof Nitrate Removal in New Lakeshore District of Hefei City. MScThesis, Hefei University of Technology, China, pp 1–72
Xu J, Yin K, He L, Yuan X, Ho AYT, Harrison PJ (2008)Phosphorus limitation in the northern South China Sea duringlate summer: influence of the Pearl River. Deep-Sea Res 55(10):1330–1342
Zhu GW, Qin BQ, Zhang L, Luo LC (2006) Geochemical forms ofphosphorus in sediments of three large, shallow lakes of China.Pedosphere 16(6):726–734
1442
Hydrogeology Journal (2011) 19: 1431–1442 DOI 10.1007/s10040-011-0770-x


