Embed Size (px)
Citation preview
u.s. BIODIESEL OVERVIEW
Steven A. Howell, B.S., Research Director; J. Alan Weber, M.S., Program Director
National Biodiesel BoardP.O Box 104898
1907 Williams StreetJefferson City, MO 65110-4898
Abstract
Biodiesel is the mono alkyl esters of long chain fatty acids derived from renewable lipidsources. Through research and market development efforts led by the National BiodieselBoard, government agencies, academia, and private industry, biodiesel is moving towardcommercialization as regulations take effect in specific diesel markets and as biodieselbecomes recognized as a practical, low-cost alternative fuel option. Environmentally,biodiesel is biodegradable, non-toxic, and reduces most regulated engine exhaustemissions. Operationally, it performs very similar to petroleum based diesel (petrodiesel)in terms of power, torque, and fuel economy. Biodiesel also offers improved lubricitycharacteristics compared to petrodiesel. Economically, production and use of biodieselwill enhance both rural and urban economic development. Also, biodiesel blends can beutilized in vehicle fleets without modifying engines or infrastructure and competesfavorably with other alternative fuels on a life cycle cost basis. Market developmentactivities have been, and will continue to be, targeted toward specific market segmentswhere the attributes of biodiesel justify the price of a premium fuel. More biodieselproduction will come on-line as markets are established.
840
Biodiesel is not a new fuel to North America. In fact, activities with biodiesel as themono alkyl esters of long chain fatty acids date back to the late 70's and early 80's.As a result of the OPEC crisis, a significant amount of research was conducted byvarious universities and governm.ent agencies. In many cases, however, the researchwas completed with biodiesel purities which would not meet the existing qualityspecifications. Regardless, the general conclusion at that time was that biodiesel was atechnically acceptable substitute, replacement, or blending stock for conventionalpetroleum diesel, but that its costs were prohibitive compared to petroleum baseddiesel fuel. The recent passage of the Clean Air Act Amendments of 1990 and theEnergy Policy Act of 1992, reflecting the overall sentiment of the public to reduce airpollution and protect the environment as well as reduce our dependence on foreign oilsources has spurred the recent activities to commercialize biodiesel in North America.
In 1992, the National SoyDiesel Development Board (NSDB) was formed by soybeanfarmers, funded through the United Soybean Board with national soybean checkofffunds, as the lead organization in the United States conducting research and marketdevelopment activities with biodiesel. With guidance through a board of soybeanfarmer directors, the N ational SoyDiesel Development Board set off initially to provethe technical feasibility and quantify the attributes of biodiesel, as well as to gainoverall familiarity of biodiesel in the United States. The NSDB changed its name tothe National Biodiesel Board (NBB) in September, 1994. The rational for this changewas the realization that in order for the biodiesel industry to develop, additionalfeedstocks besides soybean oil would playa role and it was in the industry's bestinterest to consolidate and coordinate research and promotional efforts.
Definition of Biodiesel
Biodiesel is defined as the mono alkyl esters of long chain fatty acids derived fromrenewable lipid sources. Biodiesel, as defined, is widely recognized in the alternativefuels industry as well as by the Department of Energy (DOE), the EnvironmentalProtection Agency (EPA) and the American Society of Testing and Materials (ASTM).This definition has been the topic of some discussion, however, as other materials (treeoil derivatives, other woody products, or even biological slurries) have sometimes beenreferred to as "biodiesel." Although these other materials are biological in nature, andare a substitute for diesel fuel worthy of additional research and attention, they are notdeemed biodiesel as accepted by the NBB, DOE, ASTM, or diesel enginemanufacturers.
Biodiesel is typically produced through the reaction of a vegetable oil or animal fatwith methanol in the presence of a catalyst to yield glycerine and methyl esters. Thereaction is depicted in figure 1. Virtually all of the biodiesel used and produced in theU.S. to date has been made by this process, however, one additional process ofimportance is the direct reaction of a fatty acid with methanol, also in the presence ofa catalyst, to produce a methyl ester in water.
841
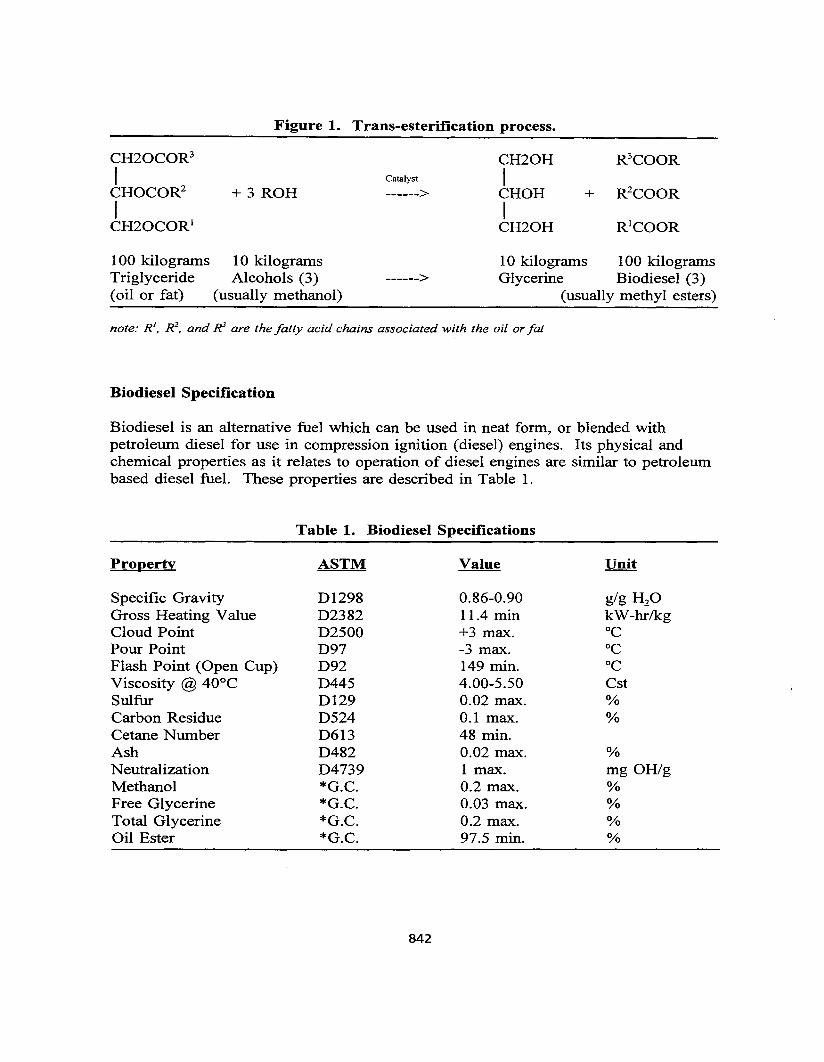
Figure 1. Trans-esterification process.
CH20COR3 CH20H R3COOR
I Catalyst ICHOCOR2 +3 ROH ------> CHOH + R2COOR
I ICH20COR1 CH20H R1COOR
100 kilograms 10 kilograms 10 kilograms 100 kilogramsTriglyceride Alcohols (3) ------> Glycerine Biodiesel (3)(oil or fat) (usually methanol) (usually methyl esters)
note: R 1, R 2
, and~ are the fatty acid chains associated with the oil or fat
Biodiesel Specification
Biodiesel is an alternative fuel which can be used in neat form, or blended withpetroleum diesel for use in compression ignition (diesel) engines. Its physical andchemical properties as it relates to operation of diesel engines are similar to petroleumbased diesel fuel. These properties are described in Table 1.
Table 1. Biodiesel Specifications
Property ASTM Value Unit
Specific Gravity 01298 0.86-0.90 gig H2O
Gross Heating Value 02382 11.4 min kW-hr/kgCloud Point 02500 +3 max. °CPour Point 097 -3 max. °CFlash Point (Open Cup) 092 149 min. °CViscosity @ 40°C 0445 4.00-5.50 CstSulfur 0129 0.02 max. %Carbon Residue 0524 0.1 max. %Cetane Number 0613 48 min.Ash 0482 0.02 max. %Neutralization 04739 1 max. mg OHigMethanol *G.C. 0.2 max. %Free Glycerine *G.C. 0.03 max. %Total Glycerine *G.C. 0.2 max. %Oil Ester *G.c. 97.5 min. %
842
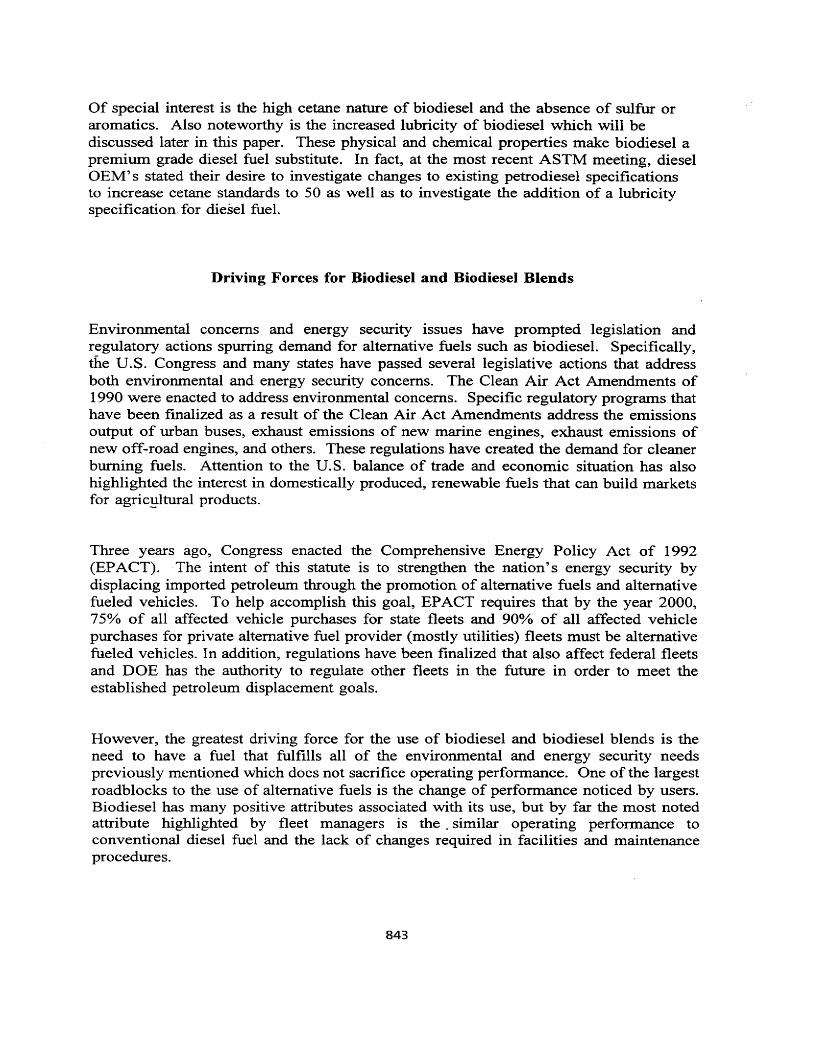
Of special interest is the high cetane nature of biodiesel and the absence of sulfur oraromatics. Also noteworthy is the increased lubricity of biodiesel which will bediscussed later in this paper. These physical and chemical properties make biodiesel apremium grade diesel fuel substitute. In fact, at the most recent ASTM meeting, dieselOEM's stated their desire to investigate changes to existing petrodiesel specificationsto increase cetane standards to 50 as well as to investigate the addition of a lubricityspecification, for diesel fuel.
Driving Forces for Biodiesel and Biodiesel Blends
Environmental concerns and energy security issues have prompted legislation andregulatory actions spurring demand for alternative fuels such as biodiesel. Specifically,the u.s. Congress and many states have passed several legislative actions that addressboth environmental and energy security concerns. The Clean Air Act Amendments of1990 were enacted to address environmental concerns. Specific regulatory programs thathave been finalized as a result of the Clean Air Act Amendments address the emissionsoutput of urban buses, exhaust emissions of new marine engines, exhaust emissions ofnew off-road engines, and others. These regulations have created the demand for cleanerburning fuels. Attention to the U.S. balance of trade and economic situation has alsohighlighted the interest in domestically produced, renewable fuels that can build marketsfor agricultural products.
Three years ago, Congress enacted the Comprehensive Energy Policy Act of 1992(EPACT). The intent of this statute is to strengthen the nation's energy security bydisplacing imported petroleum through the promotion of alternative fuels and alternativefueled vehicles. To help accomplish this goal, EPACT requires that by the year 2000,75% of all affected vehicle purchases for state fleets and 90% of all affected vehiclepurchases for private alternative fuel provider (mostly utilities) fleets must be alternativefueled vehicles. In addition, regulations have been finalized that also affect federal fleetsand DOE has the authority to regulate other fleets in the future in order to meet theestablished petroleum displacement goals.
However, the greatest driving force for the use of biodiesel and biodiesel blends is theneed to have a fuel that fulfills all of the environmental and energy security needspreviously mentioned which does not sacrifice operating performance. One of the largestroadblocks to the use of alternative fuels is the change of performance noticed by users.Biodiesel has many positive attributes associated with its use, but by far the most notedattribute highlighted by fleet managers is the. similar operating performance toconventional diesel fuel and the lack of changes required in facilities and maintenanceprocedures.
843
Research Highlights- and Biodiesel Attributes
Research efforts have been completed in coordination with government agencies,universities, as well as local and state agencies. To date, significant information has beenlearned of biodiesel and its attributes. Some of the highlights are as follows:
•
•
•
•
•
•
The Institute for Local Self-Reliance conducted an energy balance assessment whichquantified the positive energy balance of biodiesel as between three and four to one.
Booz-Allen & Hamilton conducted an economic analysis comparing biodiesel withother alternative fuels on a total cost basis and showed that biodiesel was the leastcost alternative fuel available presently on the market.
A significant amount of emissions testing has been conducted on 20% biodiesel blendsthat have shown a dramatic reduction of visible smoke and solid carbon particulates,as well as reductions in carbon monoxide and hydrocarbons. NOx emissions havebeen mixed, with some showing reductions, some showing increases and someremaining the same depending on the engine configuration, engine timing and the testcycle being used.
The cetane benefits from biodiesel have been quantified showing the cetane numberof neat (100%) biodiesel generally between 48 and 60. It has also been demonstratedthat the use of the cetane index is not appropriate for biodiesel.
The cold flow properties of biodiesel have been quantified. A 20% blend of biodieselincreases the temperature at which the blend will gell by 1 to 3 degrees Celsius overthe values of the neat petrodiesel.
The lubricity of neat biodiesel and biodiesel blends has been quantified. Neatbiodiesel has a BOCLE number of 6100 grams, and when blended with petrodieselat a 20% blend raised the BOCLE number from 4200 to 5200 grams.
Release Attributes
Biodiesel is biodegradable and non-toxic. These characteristics make it a valuable fuel,particularly in environmentally sensitive areas. It is believed that biodiesel blends willimprove the biodegradability and toxicity of petrodiesel. The effect on biodegradabilitywhen biodiesel is blended with petrodiesel in varying percentages is currently beingstudied.
Operating Performance
The operating performance and characteristics of biodiesel are similar to that ofconventional diesel fuel. Research results indicate that power, torque, and fuel economywith B20 are comparable to petrodiesel. In addition, tests have demonstrated that
844
the lubricity characteristics of biodiesel are superior to that of conventional diesel fuel.There are, however, two precautions to consider when utilizing biodiesel, or high percentbiodiesel blends. Biodiesel is a natural solvent and will soften and- degrade certain typesof elastomers and natural rubb-er compounds. Precautions are needed to ensure that theexisting fueling system, primarily fuel hoses and fuel pump seals, does not containelastomer compounds incompatible with biodiesel. If they do, replacement with biodieselcompatible elastomers is recommended. Fortunately, due to the introduction of low sulfurin 1993, virtually all the diesel OEM's have gone to a fluorocarbon (Viton) type seal thatis biodiesel resistant. Over the past three years, however, there have been no reportedelastomer problems with 20% blends of biodiesel with petrodiesel, even with olderengines.
The second area for caution is related to the cold flow properties of biodiesel. A 20%blend of biodiesel will increase the cold flow properties (cold filter plugging point, cloudpoint, pour point) of petrodiesel approximately 1 to 3 degrees Celsius. Thus far, noprecautions have been needed for fueling with 20% blends, however, operation of neat(100%) biodiesel in cold weather will experience gelling faster than petrodiesel. Thesolutions for this potential issue are much the same as that with low-sulfur diesel (i.e.,blending with No. 1 diesel, utilization of fuel heaters and storage of the vehicle in or neara building). Biodiesel appears to be unaffected by conventional pour point depressants.
Macroeconomics
An important factor that is not usually considered when calculating the costs and benefitsof industrial feedstock materials is the macroeconomics effects associated withdomestically produced, renewable energy sources. Benefits of a biodiesel industry in theU.S. would include value added to the feedstock (oilseeds, fats, or yellow grease), anincreased number of jobs, an increased tax base from plant operations and income taxes,and investments in plant and equipment.
Van Dyne (1995) estimates that 98 jobs (temporary and/or permanent) would be createdfor every million gallons ofbiodiesel used in the domestic U.S. In addition net increasedincome would increase $3.2 million and total net industry output would increase by $9.6million for every million gallons of biodiesel used.
A sustained biodiesel market would also provide direct benefits to the agricultural sector.According to economic modeling conducted by the Food and Agriculture Policy ResearchInstitute (FAPRI), 70 million gallons of annual demand could add up to $0.18 per bushelincrease to the price of soybeans alone. Achievement of 34 million gallons of annualdemand could increase revenues to soybean farmers between $125 to $225 million (basedon 1994 soybean production of 2.5 billion bushels and increased prices of $0.05 to $0.09per bushel).
845
Market Focus
The NBB has identified several market opportunities where the attributes of biodieselappear to justify the additional cost per gallon. During the next three years, biodieselindustry efforts will most likely be concentrated in four markets: urban transit,government/regulated fleets, marine, and underground mining. The NBB will alsocontinue to investigate other unanticipated marketing niches for biodiesellbiodiesel blends.As new high potential niches are identified, NBB will work to provide an indepthassessment of each market.
Urban Mass Transits
This market was established as a priority because it was the first major diesel marketsegment regulated as a result of the Clean Air Act Amendment of 1990. Approximately80 percent of the nation's 58,000 mass transit buses are subject to this rule which aimsto reduce particulate exhaust beginning in 1995. Information collected during assessmentof the urban bus market indicated that EPA regulations would create a marketingopportunity for biodiesel blends. Economic work completed by Booz-Allen & Hamilton,under contract with NBB, supported the conclusion that biodiesel blends (B20) werecompetitive with other alternative fuels that transits may consider. Research work wasconducted, and is being finalized, to verify that emissions reductions could be achievedand engine performance was similar to diesel.
Because biodiesel is the only alternative fuel that can be tested prior to conversion, theNBB completed a series of short-term demonstrations with transit operators throughoutthe nation. The NBB also completed surveys with transit property officials about theirintentions to use biodiesel. Approximately 20 percent said they consider biodiesel the topalternative fuel choice and approximately 50 percent were impressed with the prospectsfor biodiesel. The American Public Transit Association (APTA) estimated the urban busmarket annually consumes approximately 575 million gallons of petrodiesel.
Regulated Fleets
The U.S. Department of Energy was authorized to implement the provisions of EPACTand on February 28, 1995 proposed the Alternative Fuel Transportation Programregulations. As proposed, state fleets and private alternative fuel providers will berequired to begin purchasing specific percentages of alternative fuel vehicles in modelyear 1996 (beginning September, 1995). In addition to this federal regulation, manystates have implemented or will implement similar legislation.
Although biodiesel was not mentioned by name as an alternative fuel in the proposedregulations, DOE has confirmed that biodiesel is an alternative fuel. The biodieselindustry is working with the American Soybean Association (ASA), other nationalassociations, state soybean associations, oilseed crushers, cooperatives, electric utilities,and others to ensure that biodiesel blends are recognized by DOE as an alternative fuelunder these regulations.
846
Successful revisions in DOE's regulation could increase the use of biodiesel in affectedfleets. Previous economic work through NBB has demonstrated that biodiesel blends,specifically B20, are competitive with other alternative fuels on a full fuel life cycle basis.
Marine Market
The recreational segment of the marine market appears to offer the most potential for"neat" biodiesel sales. Two other segments which may be targeted include the U.S. CoastGuard and research vessels operating in domestic waters. An estimated 16,212,000recreational vessels operate in and around the U.S., with a significant portion operatingin California, Florida, Michigan, and Minnesota. Approximately one million dieselpowered boats consume on average 95 million gallons of diesel fuel annually. The othertwo segments highlighted have less than 3,000 vessels operating in U. S. waters, but doconsume large amounts of diesel fuel.
Various reasons exist for boaters to use an alternative fuel such as biodiesel. Regulatorydrivers for the marine market include the Clean Air Act Amendments and the CleanWater Act. Although the exhaust emission requirements outlined by the EPA for marineengines will most likely not result in large increased use of alternative fuels, riskassociated with fuel spills and the resulting liability may prove to be a driving force forthe use of biodiesel. Current research indicates that biodiesel is non-toxic andbiodegradable. In addition, many boaters have indicated that lack of smoke and thedramatic-change in exhaust odor are reasons why boaters will consider switching tobiodiesel or biodiesel blends.
Underground Mining
There are currently 252 metal and non-metal underground mines operating in the U.S.,in addition to 183 underground coal mines which use diesel engines. On an annual basis,these mines consume over 200 million gallons of diesel fuel. There is increasing interestin using diesel equipment in mines because of cost considerations. Diesel-poweredequipment is potentially less expensive to operate compared to other transportationsystems and can increase productivity. Safety is also an issue. Mine operators areinterested in replacing electric trolleys used to transport miners with diesel-poweredequipment because workers have expressed concern of electrocution by power lines andmine explosions caused by electrical sparks. For these reasons, the number of diesel unitsbeing used in mines is gradually increasing.
Because biodiesel has a higher flash point than diesel and since it lowers emissions ofparticulates, CO, oxides of sulfur, and potentially other air toxics, it could reduce the costof providing adequate ventilation in mines and improve the performance of dry emissionssystems by increasing the interval between cleaning particulate traps.
847
Future Biodiesel Research
Future research activities with biodiesel will include further quantification of the benefitsof biodiese1, including quantification of other air toxics (i.e., PAH's) as well as a fullcomplete life cycle analysis, confirmation and negotiation of an SAE or ASTMspecification with fuel suppliers, and users, distributors and OEM's; further quantificationof the emissions and durability of benefits of biodiesel both in bench scale and real lifeusage in additional markets; and further research on the cost effectiveness of biodiesel(lower blend levels, less expensive feedstocks, niche markets of high value).
Selected References
Arthur D. Little. 1995. Biodiesel Marine Market Pre-evaluation -- Draft Final Report.Prepared for the National Biodiesel Board. March 31, 1995.
FAPR!. 1994. Increased Soybean Oil Demand - Its Effects on the Soybean and ComIndustries. University of Missouri-Columbia. April, 1994.
Fleishman-Hillard Research. 1994. Biodiese1 Awareness and Attitudes by Transit SystemManagers. Prepared for the National Biodiesel Board. September, 1994.
Howell, .Steve. 1994. Lubricity of Biodiesel Fuel- Update #3. July 21, 1994.
Institute for Local Self-Reliance. 1994. How Much Energy Does It Take to Make aGallon of Soydiesel? Prepared for the National SoyDiesel Development Board. January,1994.
Midwest Biofuels. 1994. Biodiesel Cetane Number Engine Testing Comparison toCalculated Cetane Index Number. Prepared for the National SoyDiese1 DevelopmentBoard.
Van Dyne, Donald L. 1995. Estimated Impacts of Biodiese1 Production for Use in theKansas City Metropolitan Area. Presented at the Food for the 21st Seminar Series; Food,Feeds & Products Cluster on April 25, 1995.
848
THE BIODIESEL RESEARCH PROGRAMl\fEOF NEW ZEALAND
Professor Ralph E.H. SimsDepartment of Agricultural Engineering
Massey University, Palmerston North, New Zealand
Abstract
Research into using triglyceride fuels in compression ignition engines began in NewZealand in the 1970's. The objective was to identify, produce and evaluate a fuel fromvegetable oils or animal fats which could be used to power the existing engine fleetwithout modification. From a variety of fuels screened, methyl rapeseed oil esters andmethyl tallow esters appeared most promising due to their fuel characteristics and theirpotential availability of supply, tallow being a low value by-product from the exportmeat industry equivalent to 10% of the national diesel fuel demand.
Short term bench tests and long term road tests of engine performance were conductedfor a range of vehicles using neat esters and also blended with diesel. The high cetanevalue of tallow esters (> 70) was noteworthy. No technical problems were observedeven after extended oil change tests or on turbo-charged engines. Engine wear, afterover 200 -hours of normal road use> was less than in companion vehicles running ondiesel alone.
Economic analysis of a range of process plant sizes, from 4000 l/year on-farm, to 25,000rrr'zyear for a regional plant, showed economies of scale. By-product credits for glyceroland rapeseed meal were included in both commercial and national economic analyses.For tallow esters a single plant of 25,000 rrr'Zyear was preferred to match the nationalsupply of tallow. This would enable a blend of 10% esters/90% diesel to be producedto the current national fuel standard specifications.
The programme was concluded in 1989 after having shown triglyceride fuels weretechnically feasible but not economically competitive. High production costs forrapeseed resulted in esters being double the wholesale diesel price. For tallow esters tobe competitive crude oil would need to rise to US$27/barrel.
The New Zealand government is currently evaluating means of reducing the nationalCO2 levels including that produced by the transport sector. The biodiesel programmemay therefore be re-visited.
849
Introduction
New Zealand's primary industries, which account for over 60% of annual exportearnings, depend on diesel fuel for operating tractors, trucks and heavy machinery.Whereas a major proportion of gasoline has been substituted with synthetic petrol,compressed natural gas (eng) and liquid petroleum gas (lpg), all the diesel is still refinedfrom imported crude oil. A research programme was instigated in the mid 1970's toevaluate diesel fuel alternatives. At the time this was deemed to be strategic researchin order to maintain the balance of products from the oil refinery and to combat theanticipated continued rise in the price of crude oil.
Much of the work reported here was contracted by the Liquid Fuels Trust Board, whichwas funded by a $USO.002 levy on every litre of gasoline or diesel sold. It wasdisbanded in 1987 following the continued low price of crude oil.
A series of oil crop production trials were undertaken to assess the yields and costs forvarious regions of New Zealand (see for example Sims 1979(a) and 1979(b)) sincevegetable oil crops were not commonly grown. This work was followed by an overviewstudy to ascertain the availability, yields and costs of supply of natural oils and fats(Sims et al, 1982). It was apparent that oilseed rape was the preferred vegetable oil cropdue to its yield potential throughout the length of New Zealand; the ability to useconventional cultivation and harvesting equipment; its high protein meal by-products;and the suitability of the chemical and physical properties of the oil when used as a fuel.In addition, inedible tallow; a by-product from the meat industry, was selected forfurther evaluation, the export volumes being in excess of 10% of the national dieseldemand on an energy basis. Research on the use of eng, lpg and alcohol fuels as dieselsubstitutes was also conducted but the problems of low energy density, high productioncosts, and expensive engine modifications were limitations to their uptake.
The overall aim of the New Zealand research programme on triglyceride fuels was todevelop a fuel which would be technically feasible to produce, could be distributednationwide, would have a high strategic value, would produce no environmentalpollution, would be competitively priced, and would be suitable for use in the existingengine fleet without modifications being required. This paper outlines the programmeand highlights the major findings which could be of value to current programmes beingundertaken elsewhere. In addition the environmental benefits resulting from any biofuelwhen used as a substitute for fossil fuels is considered, the feedstock needing to beproduced on a sustainable basis.
Raw vegetable oils
The use of untreated home-grown rapeseed oil as a tractor fuel by a number of NewZealand farmers in 1982 created national interest but, as predicted, eventually led toengine operating problems. Some power loss became evident, fuel pumps seized, carbonbuild-up appeared on injectors resulting in poor atomisation, and dilution of thelubricating oils occurred leading to polymerisation and then, suddenly under specificconditions, the oil turned into a gel leading to disastrous results. Problems also appearedduring storage of the oil after only a few weeks following extraction. These factorsserved to confirm that although it was relatively easy to grow the rapeseed crop, extractthe oil and put it in the fuel tanks, continuation of a proper scientific evaluation wasjustified. Blending the oil with diesel could serve to reduce the problems listed,
850
particularly those resulting from high viscosity, but it would not eliminate them. It wastherefore strongly recommended to fanners not to use vegetable oil based fuels incompression ignition engines, particularly those with low compression ratios, rotary fuel pumps, worn injectors, direct injection, and those likely to operate under light dutycycles or cold conditions. Furthermore for any engine using such fuels daily checkingof lubricating oil for thickening and regular cleaning of injector nozzles was stronglyadvised. (Liquid Fuels Trust Board, 1982).
The solution to many of the problems experienced by these early rapeseed oil usersappeared to be solvable by converting the triglyceride oils to esters by transesterification, a well understood process with glycerol as the resultant by-product.
Triglyceride oil esters
Resource assessment
The resource assessment was an important early component of the programme. Theavailability of suitable land for growing oilseed rape crops was evaluated and the returnsto the farmer, based on assumed seed yields of up to 3 tlha (but typically 1.6-1.8 tJha)and 45% oil content, were compared with other farm enterprises. The volumes andquality of tallow produced at many meat works and transported to several ports forexport were also evaluated.
The oil/fat qualities in tenus of engine fuel specifications were measured. Theseincluded properties such as free fatty acid content, iodine value, viscosity, energy value,degree of chemical saturation as well as variations between batches and from differentextraction plants. For tallow esters, details were reported elsewhere (Sims et al, 1987).The existing infrastructure for processing and transporting the oils/fats was alsoexamined.
Existing markets
The values of the edible and inedible oil/fat supplies for export or for the domesticmarket were determined from market research. Future trends were considered but, aswith most commodities, it proved difficult to assess them with any reliable degree ofaccuracy. For example in the decade since this market assessment was undertaken, thesheep meat and wool price has fluctuated widely such that the New Zealand flocknumber reduced to close to 50 million and is only slowly increasing again back to itspeak of 65 million. The markets for the by-products, glycerol and protein meal werealso examined as it was realised their future value could offset production andprocessing costs in part and this could affect the economic viability of the enterprise.
Process and scale
Selection of the most appropriate process and design of plant was undertaken bychemical engineers. A base catalysis process using methanol and sodium methoxide ascatalyst was selected for New Zealand, the methanol currently being produced from thenatural gas resource for export. The choice was partly dependent on the availability ofchemicals and the scale of operation. Assessments were undertaken for rapeseed oilwhen extracted by a single grower on-farm, by small co-operatives of a few farmers, bylarger co-operatives, and at a regional plant (with annual production of 4,000, 36,000,190,000 and 2,750,000 litres respectively). Tallow ester plants of 4,200 rrr'Zyear and
851
25,000 m 3/year capacities were also evaluated. The smaller plants were more expensiveto operate (Sims et al, 1982) and the by-product values were more difficult to capture.Commercial costs of oil production, extraction and inter-esterification were allsignificantly less at the larger scale.
Product specifications
The goal was to produce a fuel blend which would be totally within current diesel fuelspecifications in all respects. Hence no engine modifications would be necessary andno changes in storage or handling regulations would be required. The intention was tolater relax these standards to make production more economic under less stringentprocessing conditions but only after considerable experience had been gained. Thiscautious approach was to provide early confidence in the fuel by consumers having achoice between diesel and biodiesel.
To meet these stringent conditions a test blend of tallow esters was restricted to 10%methyl tallow ester/90% diesel, although engine performance testing was also carriedout on 20% ester blends and 100% esters. If a 10% blend was introduced nationally toreplace diesel, the total volume of tallow available would be utilised. At higher blendscold temperature limitations of separation of the esters (at below 3° C) could becomeevident. Blends with greater volumes of rapeseed esters could remain within currentfuel specifications since rapeseed oil esters have higher degrees of saturation and highermelting points. There is also the potential to produce sufficient volumes assuming landis available.
A summary of the stringent fuel specifications set for the tallow esters is given in table1.
Table 1
Summary of Tallow Ester Fuel Specificationsused during Production of the Test Fuels
Fuel component
Free fatty acidsWaterMethanol residueCatalyst residuesMonoglyceridesIodine value
Insolubles
< 0.1%<0.5%< 0.05%< 0.5 ppm< 0.05%42-52
4 micron filter
Reason
Attacks metalStorage deteriorationFire/explosionWear in engineFilter blockageSolubility/oildegradation/melting pointFuel system blockage
Fuel blend property evaluation
A wide range of standard fuel tests (ASTM) were undertaken for a range of esters andblends. The major concern was the phase separation under cold conditions when higherblend levels of methyl tallow esters were produced. This was thought to result from
852
supercooling of the esters as ambient temperatures dropped. At wanner temperatureshomogeneous mixes occurred at all blend levels.
A high cetane value of over 70 was measured by Perkins Engines (UK) for methyltallow esters when evaluating these fuels under contract to the Liquid Fuels Trust Board.It is not clear what produced this extremely good combustion property and furtherevaluation is required. As a result of this characteristic, tallow esters could be used asan additive to upgrade poorer quality diesel produced cheaply from a wider-cut middledistillate. This would help improve the product balance at the oil refinery.
Storage evaluation
The stability of vegetable oils and tallow after prolonged storage is questionable mainlydue to biological degradation by bacteria, yeasts and other organisms particularly underwarm conditions. A field trial of tallow esters stored in 200 litre drums for fourteenmonths showed no thermal, oxidative or biological degradation. A more thoroughevaluation of storage potential conducted in Germany (Widman, 1989) confirmed thatoils/fats in the form of esters can be stored successfully for at least two years.
Engine performance tests
A series of screening trials were initially conducted on a wide range of oils, esters andblends (Sims, 1985). No major limitations became apparent in these short term testsother than when using raw tallow which as might be expected, solidified in the fuelsystem on cooling of the engine after shut down!
A series of engine bench tests using tallow ester fuels and blends were undertaken byPerkins Engines (UK). Compared with diesel it was noted that combustion improved,emissions were reduced, and that even under worst case operating conditions, lubricatingoil dilution was not a limiting factor.
Demonstration vehicle fleet trials
A fleet of 42 vehicles was selected to represent open road use (long and short hauldistances), urban transport, agricultural vehicles and marine engines (table 2).
853
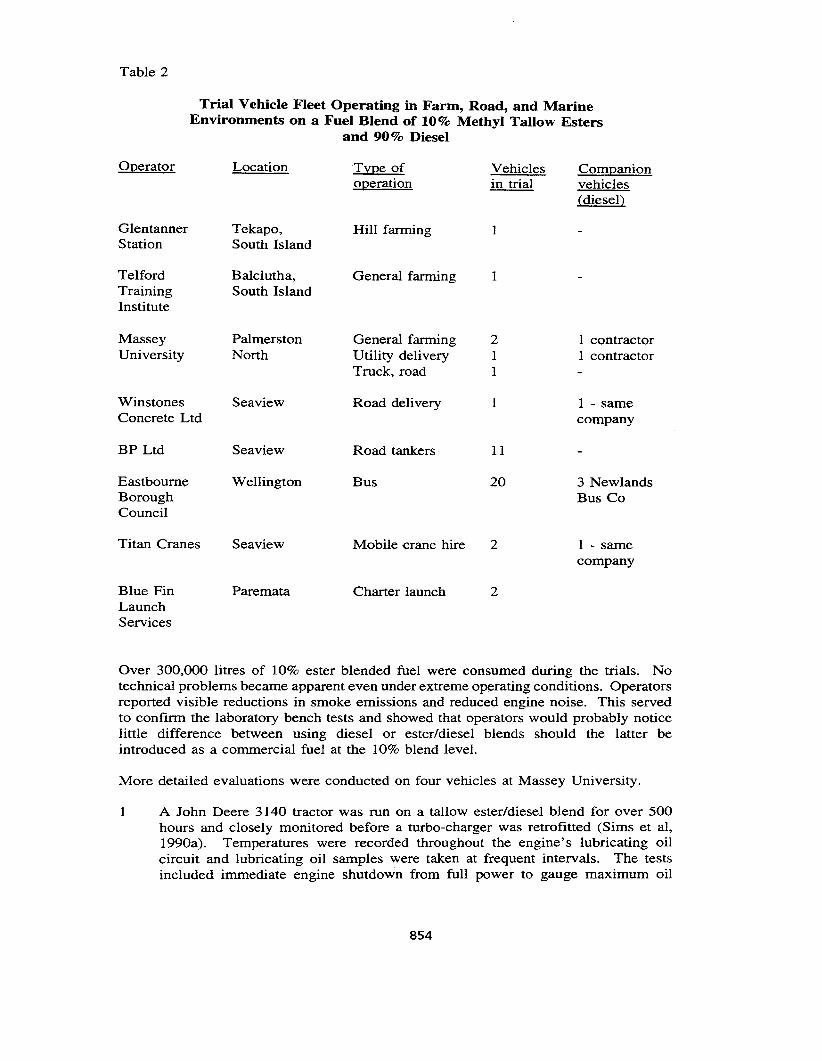
Over 300,000 litres of 10% ester blended fuel were consumed during the trials. Notechnical problems became apparent even under extreme operating conditions. Operatorsreported visible reductions in smoke emissions and reduced engine noise. This servedto confirm the laboratory bench tests and showed that operators would probably noticelittle difference between using diesel or ester/diesel blends should the latter beintroduced as a commercial fuel at the 10% blend level.
More detailed evaluations were conducted on four vehicles at Massey University.
1 A John Deere 3140 tractor was run on a tallow ester/diesel blend for over 500hours and closely monitored before a turbo-charger was retrofitted (Sims et al,1990a). Temperatures were recorded throughout the engine's lubricating oilcircuit and lubricating oil samples were taken at frequent intervals. The testsincluded immediate engine shutdown from full power to gauge maximum oil
854
gallery soak temperatures in the turbo-charger housing. The objective was toinvestigate the baking propensity of the lubricating oil if diluted with unbumtester contaminants. No problems became evident.
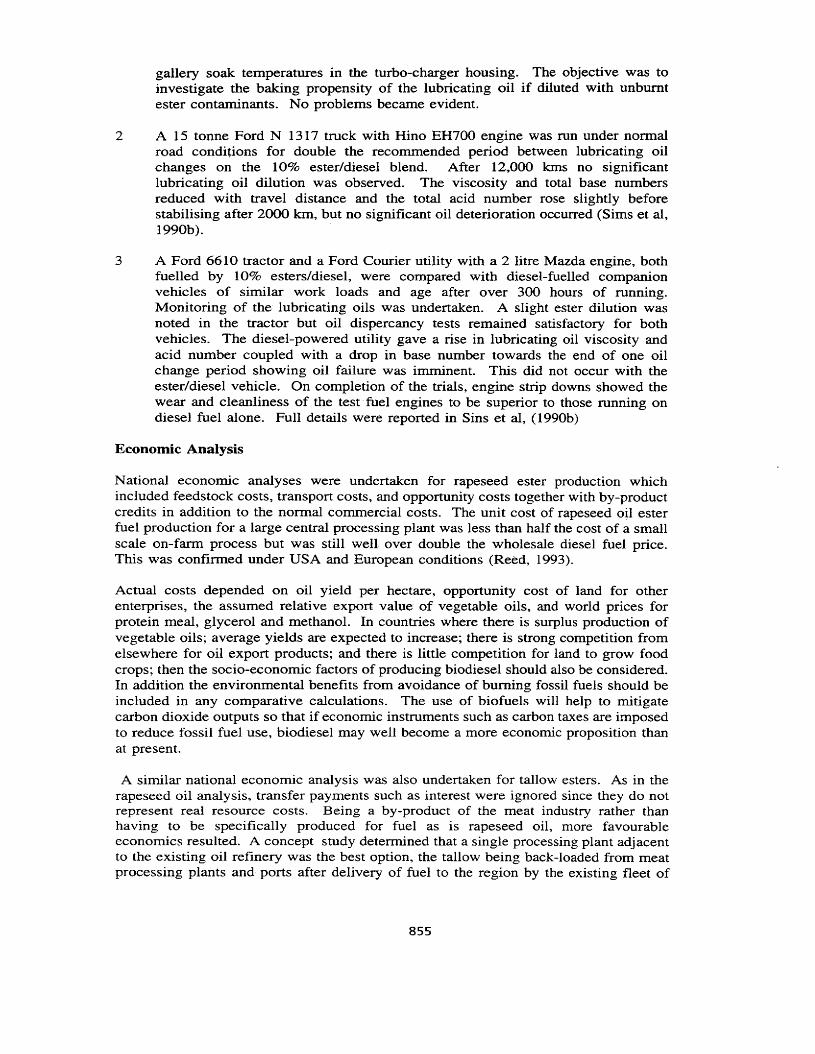
2 A 15 tonne Ford N 1317 truck with Hino EH700 engine was run under normalroad conditions for double the recommended period between lubricating oilchanges on the 10% ester/diesel blend. After 12~OOO kms no significantlubricating oil dilution was observed. The viscosity and total base numbersreduced with travel distance and the total acid number rose slightly beforestabilising after 2000 km, but no significant oil deterioration occurred (Sims et al,1990b).
3 A Ford 6610 tractor and a Ford Courier utility with a 2 litre Mazda engine, bothfuelled by 10% esters/diesel, were compared with diesel-fuelled companionvehicles of similar work loads and age after over 300 hours of running.Monitoring of the lubricating oils was undertaken. A slight ester dilution wasnoted in the tractor but oil dispercancy tests remained satisfactory for bothvehicles. The diesel-powered utility gave a rise in lubricating oil viscosity andacid number coupled with a drop in base number towards the end of one oilchange period showing oil failure was imminent. This did not occur with theester/diesel vehicle. On completion of the trials, engine strip downs showed thewear and cleanliness of the test fuel engines to be superior to those running ondiesel fuel alone. Full details were reported in Sins et al, (1990b)
Economic Analysis
National economic analyses were undertaken for rapeseed ester production whichincluded feedstock costs, transport costs, and opportunity costs together with by-productcredits in addition to the nonnal commercial costs. The unit cost of rapeseed oil esterfuel production for a large central processing plant was less than half the cost of a smallscale on-farm process but was still well over double the wholesale diesel fuel price.This was confirmed under USA and European conditions (Reed, 1993).
Actual costs depended on oil yield per hectare, opportunity cost of land for otherenterprises, the assumed relative export value of vegetable oils, and world prices forprotein meal, glycerol and methanol. In countries where there is surplus production ofvegetable oils; average yields are expected to increase; there is strong competition fromelsewhere for oil export products; and there is little competition for land to grow foodcrops; then the socio-economic factors of producing biodiesel should also be considered.In addition the environmental benefits from avoidance of burning fossil fuels should beincluded in any comparative calculations. The use of biofuels will help to mitigatecarbon dioxide outputs so that if economic instruments such as carbon taxes are imposedto reduce fossil fuel use, biodiesel may well become a more economic proposition thanat present.
A similar national economic analysis was also undertaken for tallow esters. As in therapeseed oil analysis, transfer payments such as interest were ignored since they do notrepresent real resource costs. Being a by-product of the meat industry rather thanhaving to be specifically produced for fuel as is rapeseed oil, more favourableeconomics resulted. A concept study determined that a single processing plant adjacentto the existing oil refinery was the best option, the tallow being back-loaded from meatprocessing plants and ports after delivery of fuel to the region by the existing fleet of
855
coastal .and road tankers. Such a concept study involving feedstock collection. oilprocessing, product distribution and quality control should be an essential part of anynational study of alternative fuels.
A further disadvantage of small scale installations would be the variation in fuel qualitywhich is bound to result from varying standards of feedstock and processing whichcould lead to a miscellany of engine operating problems.
The base cost assumptions of US$250/t to purchase tallow. US$O.lO/tIkm to transportit. US$85/t to process and blend the esters. and US$1200/t for the glycerol by-productcredits. the crude oil price would have to reach and maintain US$271bbl to provide a10% real rate of return after tax. The by-product value is critical such that a lowerglycerol price resulting from saturation of the market would increase the ester costs.
Market constraints
Several constraints were identified which will require careful assessment beforeimplementation of biodiesel fuels could successfully occur.
(a) Engine manufacturers will need to meet their usual warranties. In Austria whereesters have recently been manufactured and made commercially available several tractormanufacturers have agreed to maintain warranties within certain restrictions (Worgetter,1993).
(b) Distributors and consumers will need to be convinced that the ester fuel supplies willremain secure and readily available. This is another justification to use modest blendswith diesel initially then once proven. increase the ester proportion if appropriate.
(c) If the ester is to be blended with diesel. the refinery company must be agreeable orregulations put in place to enforce it. The petroleum suppliers will also need to be inagreement.
An extensive proving programme may also be needed over and above the demonstrationfleet trials. This would be unlikely to be supported until the use of biodiesel isimminent and is planned to continue for a long term.
Financial incentives by way of carbon emission levies, taxation benefits or capital grantsmay be required if a government wishes to seriously encourage the use of biofuels. Asthe environmental concerns from using fossil fuels increase; their price rises; long termsecurity of supply becomes questionable; and land use diversification from food andfibre crops to energy crops become feasible. then such incentives could well bewarranted.
Conclusions
Technically the use of triglyceride fuels in the form of neat esters or blended with dieselfor use in compression ignition engines is well understood.
Economically it is not a commercially viable proposition compared with current dieselprices in most OEeD countries. To become commercial some form of government
856
incentive is needed, or the environmental costs of using fossil fuels must be included,or the crude oil price must rise substantially, or the costs of producing and processingthe biodiesel need to decline by increasing crop yields or developing cheaper processsystems.
Research on biodiesel should be continued and international collaboration encouragedto develop it as a competitive fuel.
Acknowledgements
The New Zealand Liquid Fuels Trust Board funded the research programme. MasseyUniversity Council are thanked for approving my attendance at this conference.
References
Liquid Fuels Trost Board (1982). The use of rapeseed oil as a diesel fuel. Report LF5007 - advisory leaflet for users. Ministry of Commerce, Wellington, New Zealand.
Reed, T.B. (1993). An overview of the current status of biodiesel. Proc. 1st BiomassConference of the Americas. Vol. Il, 797-814. Burlington.
Sims, R.E.H. (1979a). Comparative methods of harvesting oilseed rape. N.Z. Journalof Experimental Agriculture 7, 79-83.
Sims, R.E.H. (1979b). Drying cycles and optimum harvest stage of oil seed rape. N.Z.Journal of Experimental Agriculture 7, 85-9.
Sims, R.E.H., Evers, M., Garland, B.R., Gendall, P.J., Johnson, C.B. Meister, A.D.,Newton S.D., Williamson, K.I. and Withers, N.J. (1982). Yields, costs and availabililtyof natural oils/fats as diesel fuel substitutes. Liquid Fuels Trust Board Project Report.LF 2021, 273 pp. (Available from Publications, Ministry of Commerce, Private Bag,Wellington, New Zealand).
Srms, R.E.H. (1985). Tallow esters as an alternative diesel fuel. Transactions,American Society of Agricultural Engineers. 28(3), 716-721.
Sims, R.E.H., Ritchie, W.R. and Thompson, M.C. (1987). Power from oil plants,systems and costs. Proc. of International Solar Energy Society conference IIAdvances inSolar-Energy Technology". Bloss, W.H. and Pfisterer, F. (eds). pp 2188-2195Hamburg. (Pergamon).
Sims, R.E.H. (1990). Tallow esters and vegetable oils as alternative diesel fuels - Solarand Wind Technology (Pergamon) 7(1), 31-36.
Sims, R.E.H., Ritchie, W.R., and Chadwick, A.I. (l990a). Turbocharging of anagricultural tractor engine. Journal of Agricultural Engineering Research. 47, 177-186.
857
Sims, R.E.H., Ritchie, W.R. and Thompson, M.e. (1990b). Tallow esters and vegetableoil esters. Proc. 1st World Renewable Energy Congress. Vol 3 pp 2128-2141. Reading(Pergamon).
Widman, B.A. (1989). Fundamental research to develop a standard for fuel quality ofrapeseed oils and esters. Proc. 5th European Biomass Conference pp 9-13. Lisbon(Elsevier).
Worgetter, M. (1993). Biodiesel in Austria. Proc. of seminar on "Vegetable Oils asTransport Fuels". International Energy Agency Bioenergy Agreement Tasks vm and X.pp 45-50. Pisa.
858
A SUMMARY OF THE -UNIVERSITY OF IDAHO CONFERENCECOMMERCIALIZATION OF BIODIESEL - ESTABLISHMENT OF
ENGINE WARRANTIES
c. Peterson, Ph.D.Professor
Department ofAgricultural EngineeringUniversity ofIdaho
Moscow, Idaho 83844-2040
Abstract
The University of Idaho, Department ofAgricultural Engineering with assistance from TheNational Center for Advanced Transportation, The PNW and Alaska Regional BioenergyProgram, The Idaho Department ofWater Resources Energy Division and the ASAE T-11,Energy Committee sponsored an invited, focused workshop on Commercialization ofBiodiesel, Establishment ofEngine Warranties. Participants were mvited from all segmentsof the Biodiesel industry but engine manufacturer's and users were particularly targeted.Representatives from Detroit Diesel, Navistar, Cummins, Mercedes Benz, the NationalBiodieselBoard, the Austrian Biodiesel Industry, Link Transportation, Spokane Transit plusother interested research workers and individuals participated in the conference. Theconference had two goals 1) development of a brief statement on the current status of theeffect of BiodieselonEngine Warranties 2) development of a strategic plan for makingBiodiesel a-recognized fuel acceptable by engine manufacturers for use in their engines. Thispaper will summarize the presentations ofthe conference, will discuss the draft statement onwhere we are today on warranty for use ofBiodiesel and the issues related to warranty whichthe engine manufacturer's and users developed as part ofthe conference.
A complete proceedings of'the warranty conference is available from the National Center forAdvanced Transportation Technology at the University ofIdaho.
859
Introduction
Biodiesel -- methyl or ethyl esters of animal or vegetable oils -- has received worldwideattention as a possible substitute for petroleum diesel fuels. As Biodiesel moves from researchand demonstration to serious utilization there are many issues to be resolved. One oftheseissues is acceptance by manufacturers of diesel engines and in particular how use of thesefuels would affect the manufacturer's engine warranty.
The workshop was organized to bring together Biodiesel users, research workers,representatives ofthe National Biodiesel Board and other interested parties to explore thecurrent status of Biodiesel, its effect on engine warranties and what issues remain to beresolved before Biodiesel can be thought of as a legitimate fuel for diesel engines. Theworkshop format included brief "state-of-the-art" presentations by researchers, NBB, DOEand Biodiesel users, followed by group sessions which developed a statement ofwhere weare now with engine warranties and a statement of issues that need to be resolved to bringBiodiesel under full warranty coverage equivalent to diesel.
The University of Idaho, Department of Agricultural Engineering; the National Center forAdvanced Transportation Technology (NCATT), the Pacific Northwest and Alaska RegionalBioenergy Program, The Idaho Department ofWater Resources, Energy Division and theASAE T-11 Energy Committee were the principal underwriters for this workshop. Theplanning committee included Craig Chase (a consultant to DOE), Jim Butler (consultant toNBB), Steve Howell (Director ofResearch at NBB), and Dave Woodall (Associate Dean,College ofEngineering, University ofIdaho).
NeATT
The National Center for Advanced Transportation Technology (NCATT) was founded in1991 through an act of Congress. It received funding to construct a new engineering andphysics building and a mandate to develop a transportation center with a focus on the needsand agenda of industry. During the past two years, it has organized its efforts around fivetechnology working groups, including hybrid electric vehicles, advanced materials andmanufacturing, power electronics, traffic control systems, and alternative fuels. While -thecenter is still relatively new, its work during the past two years has generated about $1.5million in external research funding involving nearly 100 University of Idaho faculty andstudents. The work at the center is guided by three primary customers: private industry andgovernmental agencies with a direct stake in our nation's transportation system, engineeringstudents, and faculty at the University ofIdaho.
Program
Welcome and Introductions
Charles L. Peterson, Agricultural Engineering Department, University ofIdahoDave Woodall, College ofEngineering, University of IdahoMike Kyte, National Center for Advanced Transportation Technology, University of Idaho
Biodiesel ResearchJim Butler, P.E. -- ModeratorEarle E. Gavett, National Biodiesel BoardMehboob Sumar, Ortech
860
Bill Marshall, National Institute for Petroleum and Energy ResearchMark Russell, University of MiSSOmlCharles L. Peterson, University of IdahoWerner Korbitz, Korbitz Consulting, Austria
Transit System and Other Use ofBiodieselCraig Chase -- ModeratorDick Yost, Spokane TransitTodd Daniel, Link TransitHoward Haines, Montana Department of'Natural Resources
Luncheon SpeakersJeffrey James, U.S. Department of EnergyJerry Allsup, U.S. Department ofEnergy
Engine Warranty PolicySteve Howell -- ModeratorRodica Baranescu, Navistar, Engine Manufacturers AssociationKarl Koontz, Cummins Engine Co., Inc.Ansgar Shafer, Mercedes BenzLester Walker, Detroit DieselMadan R. Goyal, Deere Power Systems Group (written only)
Industry and BiodieselGeorge Durany, J.R. Simplot Co.
Group Sessions: Questions and Answers.
Introductory Remarks
This was a focused workshop on commercialization of Biodiesel and the establishment ofengine warranties. There are many Biodiesel issues that are important, but this conference wasto focus on engine warranties.
During a trip some time ago in Europe several pieces of advertising literature were foundwhich recognized Biodiesel as an engine fuel. A Mercedes Benz "Unimog" advertisementsays, "Attention: New Information for Agriculture! I have RME in my tank.. It can be usedin diesel engines. It can be mixed with diesel. There's no effect on the engine. There's no effecton the engine warranty." In Europe there are other manufacturers who do warrant engines,and state so in their advertising literature. Deutz Fahr, for example, in an advertisement says"Environmentally Friendly, Energy Sparing with Deutz Fahr Tractors, II referring to use ofrape methyl ester. An advertisement from an Agricultural show in Frankfurt for Deutz Fahrtractors says "RME Usable" directly under the Deutz Fahr tractor model listing on the display.There are many other manufacturers that warrant their engines operating on Biodiesel inAustria.
This conference focused on the issue of establishment of engine warranties in the UnitedStates. The issues are where we are currently and what we have to do. There were two goalsfor the final product from this meeting. First, a brief statement on the status ofBiodieseltoday with respect to engine warranties. In many ofthe publications from the University ofIdaho notices are included stating that this is a research report and that we are not advocatinguse of Biodiesel in personal vehicles. We would like to rewrite that statement. WhenBiodiesel is used in a vehicle we want the owner to know what effect that will have on their
861
engine warranty. Second, to develop a strategic plan for what needs to be done to establishfull warranty ofengines fuelled with Biodiesel. The goal is for Biodiesel, as a recognized fuel,to be accepted by the engine manufacturers, removing the concern for engine warranty. Atthis meeting were engine manufacturers, Biodiesel producers, and research teams. They allneed to be part of the strategic plan. The goal was to develop the plan while they weretogether.
Biodiesel Research
For lack of space the Biodiesel Research results will not be included in any depth. Most ofthe research has been or will be presented elsewhere. Biodiesel is used to describe esters oflipids from a variety offeedstocks.
Specific Conclusions noted during the Conference from a variety offeedstocks:
Biodiesel has been found to be an acceptable substitute for diesel fuel, performingnormally in unmodified diesel engines.
Recipes for producing Biodiesel have been developed and used to producedemonstration quantities offuel.
Biodiesel is safer because the flashpoint is over 56 C (100 F) degreeshigher than that ofdiesel.
Engine durability tests of up to 1000 hours have generally shown Biodiesel to beequivalent to diesel fuel.
Biodegradability of Biodiesel was higher than the biodegradability of referencedextrose and much higher than diesel fuel.
Toxicity of Biodiesel was at least 15 times less than diesel and probably even muchlower.
Smoke, as measured by an opacity meter, has generally been found to be 33% to 65%lower than from diesel fuels.
Emissions test have shown a reduction in HC and CO2 and an increase in CO2 . Resultsfor PM and NOx are mixed. Much more work on emissions with Biodiesel is required.
Transit System and Other Use of Biodiesel
Spokane Transit, Dick Yost
Spokane Transit has a bus fleet of 144 heavy duty coaches that are operated in the city ofSpokane and surrounding area. The main base is in the downtown area where approximately124 busses are stored. A satellite facility is in the Spokane valley. The facility in the valleyis where the year-long test on biofuel was conducted. The test was divided into two sixmonth segments: the first six months the coaches used a 70% blend of#1 diesel with a 3()O.t/osoy-based oil. For the second six-month period the fuel was changed to an 80% #1 fuel witha 2()O.t/o soy-oil. The engines in the coaches designated for the test are all Detroit diesels with
862
several different engine types: six V-71's; six V-92's; sixL-71's. The coaches are from variousyears ranging from 1974 to 1992.
The test was conducted from October, 1993 to October, 1994. Particulate levels were testedwith a Bosch smoke analyzer, which is what the State of Washington uses for testingparticulate matter, Oil analysis tests were taken at different times during the test. Threemonths into the test the injectors were removed from two coaches, both an electronic injectorand a mechanical injector, which were sent to Salt Lake City, Utah by Spokane Detroit. Noproblems were found with any injectors at any point in the test. There also were nomechanical problems. The results from the test were really very positive. They reported aclean burning fuel. The particulate level decreased about 12% and they had an average ofabout 0.2 kilometerlliter (0.5 miles per gallon) better fuel mileage with the biofuel than withthe straight diesel.
During the first six months, the soybean association provided the fuel; during the second sixmonths they purchased the fuel. They were hoping from a maintenance standpoint tocontinue with the fuel, but the cost was too high. The cost was about $0.76 per liter ($2.89a gallon) for the soy fuel and $0.19 per liter ($.73 per gallon) for diesel. The increase in theannual fuel cost was 590A.. Even with the advantages ofBiodiesel they are not able to justifythe extra cost to the Board ofDirectors.
Link Transit Biodiesel Demonstration Project, Todd Daniel
•On December 16, 1994 Link will celebrate three years ofproviding public transit in Chelanand Douglas county. They are a fare free system; one of just three in the state ofWashington. Because ofthe high monthly fleet mileage they elected to try a fleet-wide, onemonth, 161,000 kilometer (100,000 mile), Biodiesel demonstration. The Biodiesel fuel wassupplied free ofcharge from farmer checkoff dollars and regulated by the National BiodieselBoard. A 200A. blend with number two low sulfur diesel powered their diesel fleet for twentyeight days, or the entire month ofFebruary, 1994.
A few points of interest that were recorded during the demonstration were total fleet milesrecorded at 167,000 kilometer (104,000 miles) on the 20% blend; oil sample results did notreflect anything unusual; there was no change in fuel economy; the average temperature was12 C (22 F) degrees with no fuel clouding; emission levels (smoke) were lowered 17%fleetwide; and finally, they received very positive public response. The Link Biodieseldemonstration was called a success. Public and staff involvement, along with loweremissions, were the ingredients. National news coverage was an added benefit. It is theirhope that better pricing and availability will develop and breed life into Biofuels!
"Truck in the Park" Demonstration, Howard Haines
The Montana Department ofNatural Resources and Conservation (DNRC) in cooperationwith the National Park Service (NPS) and the D, S. DOE Pacific Northwest and AlaskaRegional Bioenergy Program will conduct an operational demonstration of a diesel truckpowered by rape ethyl ester (REE). This fuel is produced by the University of Idaho (U ofI) for use in tourism-related service in Yellowstone National Park. DNRC will assist the ParkService and private industry in developing options for managing the impact of the growth intourism while preserving scenic resources.
863
Project Goals, Objectives, andApproachThe goals ofthis project are to:• Develop a biomass-derived transportation fuel that is attractive for use in tourism-related
industries and others that operate in environmentally sensitive areas.
• Provide a beachhead market for a developing industry, to encourage the development,production, and use ofthis biofuel within the region.
• Determine the feasibility ofusing Biodiesel at high elevation.
Industry
Navistar, Rodica Baranescu
Between 1991 and 1993 Navistar made 88,000 medium and heavy duty trucks. Last year theyproduced 178,300 engines. They are the largest producer ofdiesel engines in North America.Navistar has a statement for Biodiesel fuel use, it reads: "Use of 100% Biodiesel fuel is notrecommended due to performance and potential reliability issues. " By Biodiesel, they implymostly methyl esters ofvegetable oil. As to warranty position on this issue Navistar says,"Blends ofBiodiesel with conventional diesel fuel in amounts up to 20% may be suitable foruse. However, the user assumes warranty liability for any failure directly resulting from thesuitability of a 'BIO' fuel blend' and/or associated additives." They state that "This positionis consistent with the use ofany fuel additive." The Warranty Procedures and AdministrativePolicies procedure reads "...If the use of additives causes a failure, the cost to repair orreplace the failed part or component is not reimbursable. Users and fuel suppliers maintaina responsibility for the quality offuel regardless ofBiodiesel impacts. Further, durability andemissions impact testing will be required to better assess the vulnerabilities ofBiodiesel fuelusage in International engines." In one of the warranty statements it states "Warrantycoverage will not be voided by installation or use of special equipment additives or otherchemicals designed to improve vehicle performance, non-Navistar parts, or by modificationof any part of the vehicle. However, if the use of such devices, modifications or additivescauses a failure the cost to repair or replace the failed part or component is not reimbursable. "We believe we don't know enough today about the behavior, especially the long termbehavior, ofBiodiesel fuel.
The Engine Manufacturers Association brainstorming session identified the following criticalissues in the development and commercialization of Biodiesel: fuel characteristics, wateradsorption and additive compatibility, cold flow characteristics ofthe fuel, fuel specificationsfor Biodiesel, engine performance and emissions, engine certification for Biodiesel, engineoptimization for Biodiesel, emissions speciation for Biodiesel, compatibility with enginematerials, Effects of the fuel on lubricating oil, maintainance of Biodiesel engines incomparison to diesel engines, economics and infrastructure needs, availability ofthe fuel andpotential markets.
Cummins Engine Co., Karl Koontz
Cummins is celebrating the 75th year ofbuilding engines. Cummins produced 250,000 dieselengines last year. In the U.S., Cummins is number one in engines over 200 horsepower andnumber five over-all in diesel engine production.
864
The Cummins fuel specification bulletin lists recommended fuel specifications as well asalternative fuel specifications, and basically says that alternatives are not normally 'used inCummins engines and may be used only where a recommended fuel is not available. Biodieselis generally placed in the alternative fuel category at this time. Our standard fuelrecommendation is No.2 diesel fuel; No. 1 diesel blending for winter requirements.
The owner is responsible for the operation and maintenance ofthe engine as specified in theOperation and Maintenance manual, providing proofofthat maintenance. Under limitations,"Weare not responsible for failure or damage resulting from abuse, neglect," and "notresponsible for failures caused by incorrect fuels, by water or dirt, or other contaminants inthe fuel." Our warranty covers defects in Cummins workmanship and materials; we have builtthe engines with good parts that have been assembled properly and tested. It doesn't say youcan't wear it out; it doesn't say you can't damage it. We look at the fine line as thoseconsumables such as fuel and oil as user's choices, and at different times and emergencies, itmay be necessary to deviate from our recommendations; however, all our engines aredesigned, tested, proven, and fully warranted to run on our recommended consumables: fuel,oil, and coolant. So, in short, the choice ofthese things implies acceptance ofresponsibilityby the operator. These will not cancel our warranty. We follow ASTM recommended No.2-D diesel fuel and recommend blends ofNumbers 2-D and 1-D in the winter. This fuel needsto be kept above 1.3 degrees centigrade to provide adequate lubrication to the fuel system.
Cummins Concerns and Questions dealing with warranties:
1. Fuel properties2 Coldflow issue3. Seal and gasket compatibility4. Engine deposits5. Oil acidity6. Ignition delay7. Effect on combustion and engine
temperature8. Effect on fuel systems
Mercedes Benz, Ansgar Shafer
9. Effect on power and fuelconsumption
10. Effect on each ofthe seven Cumminsengine families
11. Reliability12. Emissions testing13. Durability, wear and deposits14. Experience in 240,000-320,000
kilometer (150,000- 200,000 miles)
Mercedes Benz employs 200,000 people world-wide. The U.S. affiliate is Freightliner.Mercedes Benz has world-wide, the largest market share ofheavy duty trucks.
Almost 14 to 15 years ago they found that vegetable oils themselves are not suitablealternative fuels. The transesterification ofvegetable oils into methyl esters is a well known,optimized.and commercially used large-scale standard process in the chemical industry. Theseesters are usable in all existing CI engines. If any, only minor engine modifications arerequired (e.g. elastomeric materials for fuel lines). This is the best researched and mostdeveloped vegetable oil based alternative fuel. The reality oftransesterification is that thereare all types ofimpurities. For example there are non-reacted triglycerides, partially reactedmonoglycerides and diglycerides, free fatty acids, and glycerol. There is also methanol, water,and the rest of the catalyst. All these things have to be removed because they all arethreatening the engine. For example the unreacted material, triglycerides, are building
865
materials for (injector) deposit formation. The free fatty acids are very dangerous for bearingmetals, by so-called dry corrosion. The same thing applies to the free glycerol and themonoglycerides because they are very eager to react with bearing metals. The catalysts formash. Methanol lowers the flash point.
A few important results from long term tests on different vegetable oil esters at MercedesBenz. (These are tests ofrapeseed oil methyl ester and palm oil methyl ester):
No sludging is apparent with a suitable lubricating oil;Oil dilution is within relatively tight limits; no serious effects on relevant lubricating oil
characteristics;Inlet valves show a slight tendency to coke when the content of glycerides in the ester is
too high;The cylinder gap has a slight tendency to burn, but these were within acceptable.limits;The fuel injection system can remain unchanged; no nozzle coking is found when fuel
quality is adequate: too high a glyceride content causes nozzle coking;Some elastomeric materials (e.g. some fuel lines) are not sufficiently resistant to vegetable oil
esters; the materials have to bechanged;The unusual exhaust gas smell is troublesome (some employees and customers could not
tolerate the odor); an oxidation catalyst significantly diminishes the respectiveinconvenience.
Based on these experiences with methyl esters, Mercedes Benz has produced a serviceinformation bulletin regarding the use ofrapeseed oil methyl ester produced according to thespecification shown earlier. It is not for Biodiesel, because Biodiesel is not clearly defined.This service information is being circulated world-wide to all our affiliates, service centers,and dealers.
Mercedes-Benz trucks (not passenger cars) produced since 1988 with series 300 and 400engines (DI CI) can be fuelled with RME.
The leak fuel lines ofthe injection nozzles on series 400 engines have to be replaced by anRME-resistant version and connected to the fuel feed line.
If RME is used in older vehicles, there is a risk that hoses and seals impaired by many yearscontact with diesel fuel will be attacked by RME and thus become leaky.
Commercial vehicles with MB series 600 engines (vans and pick-ups; IDI) cannot beoperated with RME.
Mercedes-Benz does not provide warranty coverage for damage caused by using RME ofinferior quality or by non-observance ofthe instructions for RME operation.
The same applies for industrial engines:
Industrial engines of series 300 and 400 are approved for RME operation
The fuel should correspond to the DIN standard DIN V 51606.
Operation with fuel of inferior quality may lead to malfunctions or engine damage.
866
Mixed-fuel operation using RME and diesel fuel is not approved.
Supplementary heaters: Some of them must not be operated on RME., others need to bemodified for R1\1E operation, others can be operated on~ without modificationprovided the control unit has been programmed appropriately. Generally, thesupplementary heater can be operated via a separate fuel oil or diesel fuel tank; retrofittingis possible and even advisable for winter operation.
Lester Walker, Detroit Diesel
Detroit Diesel is a well known manufacturer of diesel engines. Specification sheets andwarranty documents are very similar to what has already been discussed.
"Is the use ofBiodiesel covered under engine warranties?" The answer is right out ofourown individual statements: "Manufacturer warranties cover defects in materials andworkmanship," much as was covered by our Cummins representative, "Those warrantiesextend to engines burning Biodiesel. These warranties do not cover engine problems relatedto fuel ofany kind." Then there is a follow-up statement that says, "Tests and demonstrationshave shown Biodiesel to be no different than Petroleum diesel in terms of engine performanceand wear."
The engine warranty, in most cases, is not set up to deal specifically with the use ofa fuel.It is set up to cover defects in materials and defects in workmanship; engine problems thatare traceable directly to the manufacturer. It's not uncommon when there is an enginewarranty question that deals with a particularly severe warranty claim, for example, for therelevant parts ofthat engine to be returned to the factory or for a materials meeting to be setup to review and look at the condition of the parts to try to establish whether or not there isa root cause that relates to something that the manufacturer did.
Detroit diesel has the following concerns about using Biodiesel
Regulated emissions, especially NOxEffect on fuel seals;Durability testing of 1000 hours duration;Field demonstration ofover 160,000 kilometers (100,000 miles);Tear down of engine from 160,000 kilometer (100,000 mile) demonstration;Standardization of the fuel and fuel specification;EPA approval.
Diesel Power Systems Group, Madan R. Goyal
The Biodiesel fuels, methyl ester of rape seed oil (RME) or Methyl ester of soybean oil, arebelieved to be fairly good solvents. The switch over from the diesel fuel to the use ofBiodiesel is very likely to dissolve deposits from the fuel tank and fuel injection system andcould cause serious fuel filter plugging and / or injector plugging problems. The protectivecoating from the inside of the fuel tank could also be removed by the Biodiesel fuel.
867
The technical data in the literature discuss the following important engine durability issues:
1. Fuel Quality2. Material Compatibility3. Long Term Storage4. Low Temperature Operation
5. Phosphorus6. Oil Dilution7. ValveIPort deposits8. Durability Summary
Workshop Summary
DRAFT STATEMENT ON WHERE WE ARE TODAYON WARRANTY FOR USE OF BIODIESEL
Biodiesel (methyl or ethyl ester ofplant oils or animal fats) is a new fuel which is being testedunder a wide range ofconditions including both neat and blended with petrodiesel. Users ofthis fuel should be aware, however, that currently there is no fuel specification for Biodieseland, therefore, engine manufacturers cannot fully recognize it as equivalent to diesel. Usersof this or any fuel not meeting manufacturers' published fuel specification requirementsassume warranty liability for failure ofcomponents or emission certification traceable to thefuel. Non-fuel related warranty issues are not affected by the use ofBiodiesel.
CRITICAL ISSUES RELATED TO ACCEPTANCEOF BIODIESEL BY ENGINE MANUFACTURERS
A) Fuel Characteristics and Specifications-standard test methods-fuel standard such as ASTM
B) Engine Performance and Emissions-certified for use by EPA-many 1000 hour+ and/or 160,000 kilometer (100,000 mile)+ engine durability tests-test for air toxics
C) FuellEngine Interaction-materials compatibility tests-establishment ofoil change intervals-engine manufacturer tests
D) EconomicslInfrastructure-supply at competitive price-identify uses where price is justified
E) It is clear that development of the required data must be a joint effort of researchlabs, private and public; engine manufacturers; the biodiesel industry; andgovernmental agencies such as CARB, EPA, DOE, etc.
868
EMISSIONS AND ENGINE PERFORMANCEFROM BLENDS OF SOYA AND CANOLA METHYL ESTERS
WITH ARB #2 DIESEL IN A DDe 6V92TA MDI ENGINE
Alex Spataro, M.S., President; and Claude Romig, B.S., Project EngineerThe ADEPT Group, Inc. Los Angeles, CA 90024
Abstract
A Detroit Diesel 6V92TA MOl engine was operated on several blends of EPA #2 diesel,California ARB #2 diesel, soya methyl ester (SME) and canola methyl ester (CME).Various fuels and fuel blend characteristics were determined and engine emissions fromthese fuels and blends were compared. Increasing percentages of SJ\1E and CME blendedwith either ARB or EPA diesels led to increased emissions of NOx, C02 and solubleparticulate matter. Also noted were reductions in total hydrocarbons, CO and insolubleparticulate matter. Chassis dynamometer tests conducted on a 20/80 5MB/ARB blendshowed similar emissions trends. The data suggest that certain methyl ester/#2 dieselblends in conjunction with technologies that reduce the soluble fraction of particulateemissions merit further exploration as emissions reducing fuel options for North Americanmass transit sectors (excepting California, which mandates ARB diesel).
869
Introduction
The present study was originally concerned with the use of S:ME as a fuel blendcomponent with ARB diesel in heavy duty diesel engines for Southern California masstransit buses. During the final phase of the testing program we extended the enginedynamometer work to include tests on #2 diesel blends with canola methyl ester (C:ME).Both California ARB and u.S. EPA diesels (diesel fuel subject to October 1, 1993 U.S.EPA Standards) were blended with Cl\.1E. A 20/80 S:ME/ARB blend was retested tosubstantiate our earlier work. Because of the widespread use of EPA diesel in the U.S.and Canada (as opposed to the relatively small California ARB diesel market) it wasdecided to also conduct tests on Cl\.1E and S:ME in blends with EPA diesel.
Background - Research conducted using raw, degummed vegetable oils to fuel farmtractors during the early 1980s in Illinois, Idaho, Missouri and North Dakotademonstrated that diesel engines can operate with vegetable oils. Certain difficulties wereencountered, such as injector coking. Additional research, in the U.S. and abroad,demonstrated that methyl esters derived from vegetable oils create fewer difficulties thanthe use of vegetable oil in heavy duty diesel engines. It was therefore suggested that onon-road vehicles (e.g., mass transit buses) be tested using vegetable oil methyl esters. Asoybean oil derivative, soya methyl ester (S:ME) has recently received extensive attentionin the U.S. Canola methyl ester (Cl\.1E), derived from canola oil, has received similarattention in Canada. Produced through a catalyzed reaction between a vegetable oil andmethanol, it was demonstrated that Sl\.1E and C:ME can be used to fuel a diesel engine.Because both methyl esters contain less usable energy per unit volume, a diesel enginefueled on 100% S:ME or C:ME will develop approximately five percent less power than asimilar engine fueled on diesel fuel. Although a power loss was noted (Schumacher, et.al.), there was no significant reduction in the torque.
We proposed to investigate, from a commercial user's perspective, the benefits andcommon-use problems, if any, of a domestically produced "transition fuel" for dieselengines that would cost-effectively provide an overall emissions reduction. S:ME andC:ME presented the potential to be this transition fuel. The initial phase of the projectfocused on S:ME blends instead of neat S:ME due to fuel cost issues, suspected materialscompatibility problems and promising results from previous research on S:ME/diesel fuelblends. Work on C:ME was also conducted with blends but the blends were intentionallyleaner in C:ME content.
S:ME testing consisted of fuels characterization, engine and chassis dynamometer workand limited on-road vehicle durability/compatibility tests. Neat ARB and EPA diesel and20%, 30% and 40% S:ME/ARB blends were studied. Subsequent C:ME testing consistedof fuels characterization and engine dynamometer work. Neat ARB and EPA diesel aswell as 6%, 20% and 40% C:ME/ARB blends and 6%, 10% and 20% C:MEIEPA blendswere studied.
870
Results
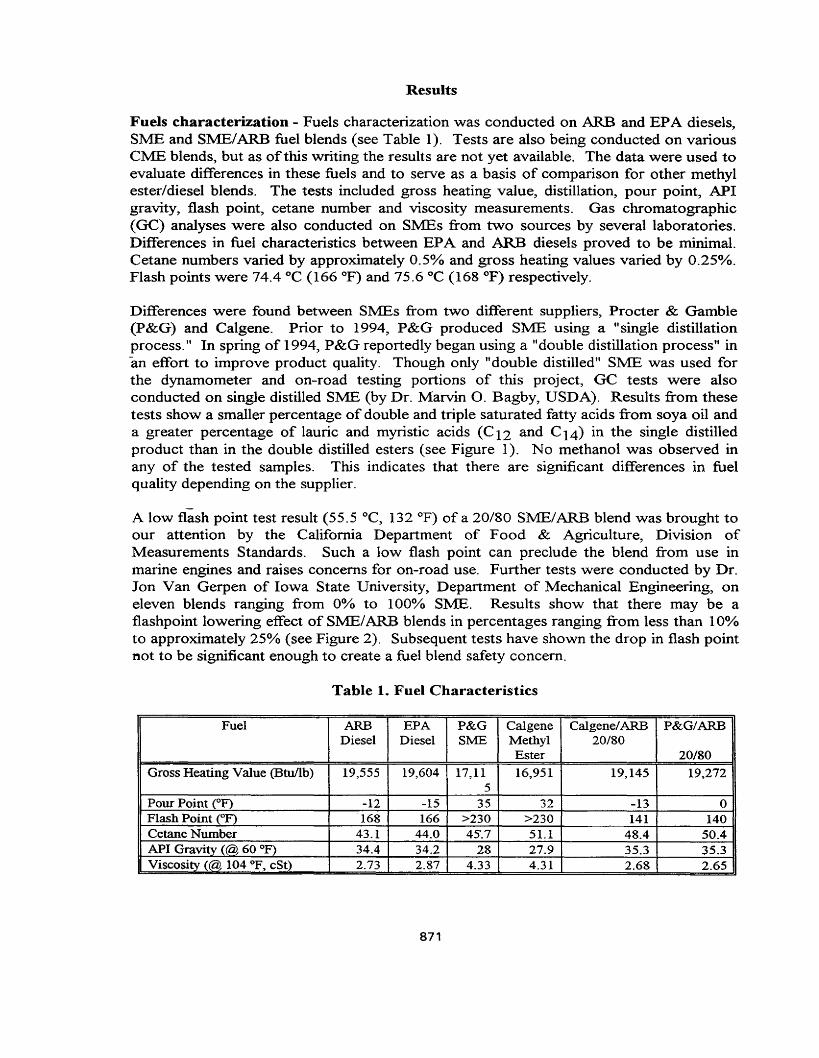
Fuels characterization - Fuels characterization was conducted on ARB and EPA diesels,5MB and S1\.1E/ARB fuel blends (see Table 1). Tests are also being conducted on variousC:ME blends, but as of this writing the results are not yet available. The data were used toevaluate differences in these fuels and to serve as a basis of comparison for other methylester/diesel blends. The tests included gross heating value, distillation, pour point, APIgravity, flash point, cetane number and viscosity measurements. Gas chromatographic(GC) analyses were also conducted on SrviEs from two sources by several laboratories.Differences in fuel characteristics between EPA and ARB diesels proved to be minimal.Cetane numbers varied by approximately 0.5% and gross heating values varied by 0.25%.Flash points were 74.4 °C (166 OF) and 75.6 °C (168 OF) respectively.
Differences were found between S:MEs from two different suppliers, Procter & Gamble(P&G) and Calgene. Prior to 1994, P&G produced 5MB using a "single distillationprocess." In spring of 1994, P&G reportedly began using a "double distillation process" in'an effort to improve product quality. Though only "double distilled" SME was used forthe dynamometer and on-road testing portions of this project, GC tests were alsoconducted on single distilled S:ME (by Dr. Marvin O. Bagby, USDA). Results from thesetests show a smaller percentage of double and triple saturated fatty acids from soya oil anda greater percentage of lauric and myristic acids (C12 and C14) in the single distilledproduct than in the double distilled esters (see Figure 1). No methanol was observed inany of the tested samples. This indicates that there are significant differences in fuelquality depending on the supplier.
A low flash point test result (55.5 °C, 132 OF) ofa 20/80 Sl\.1E/ARB blend was brought toour attention by the California Department of Food & Agriculture, Division ofMeasurements Standards. Such a low flash point can preclude the blend from use inmarine engines and raises concerns for on-road use. Further tests were conducted by Dr.Jon Van Gerpen of Iowa State University, Department of Mechanical Engineering, oneleven blends ranging from 0% to 100% SrvIE. Results show that there may be aflashpoint lowering effect of SJv1E/ARB blends in percentages ranging from less than 10%to approximately 25% (see Figure 2). Subsequent tests have shown the drop in flash pointnot to be significant enough to create a fuel blend safety concern.
Table 1. Fuel Characteristics
Fuel ARB EPA P&G Calgene Calgene/ARB P&G/ARBDiesel Diesel S:ME Methyl 20/80
Ester 20/80
Gross Heating Value (Btu/lb) 19,555 19,604 17,11 16,951 19,145 19,2725
Pour Point COY) -12 -15 35 32 -13 0Flash Point COY) 168 166 >230 >230 141 140Cetane Number 43.1 44.0 45.7 51.1 48.4 50.4API Gravity (~ 60 OF) 34.4 34.2 28 27.9 35.3 35.3Viscosity (~ 104 OF, cSt) 2.73 2.87 4.33 4.31 2.68 2.65
871
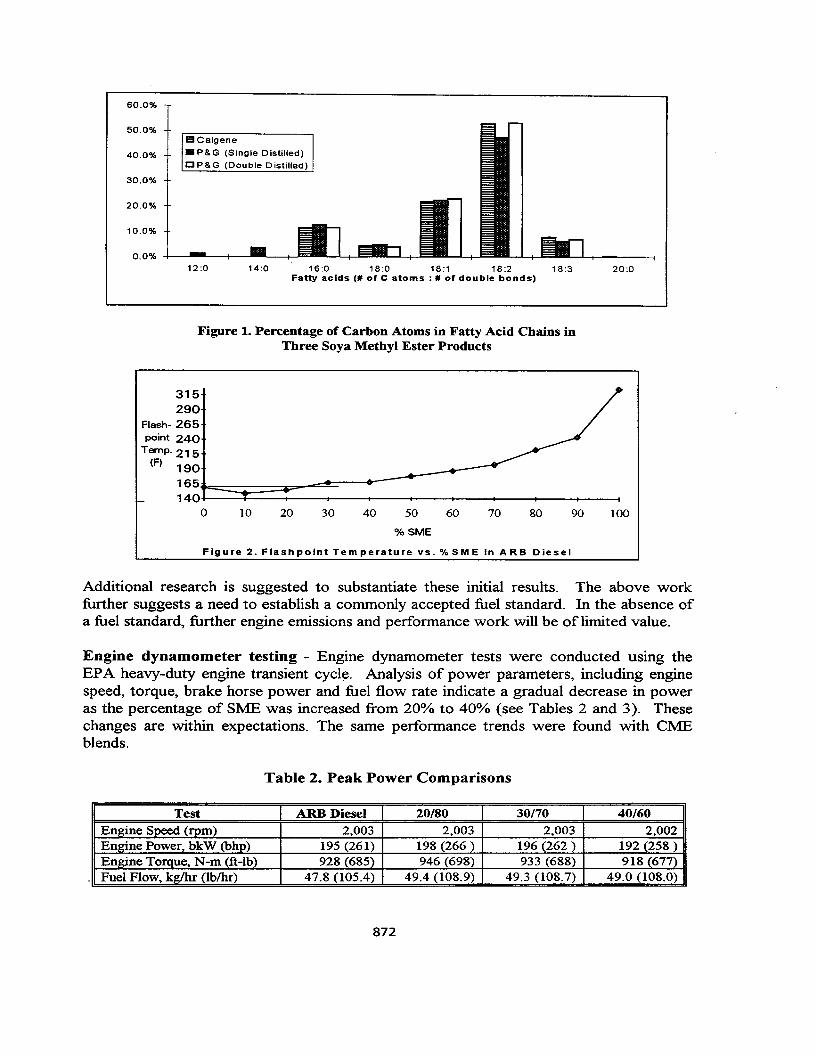
60.0%
0.0% +---------+--------+_
50.0%
40.0%
30.0%
20.0%
10.0%
E1Calgene
.P&G (Single Distilled)CP&G (Double Distilled)
12:0 14:0 16:0 18:0 18:1 18:2 18:3Fatty acids (# of C atoms: # of double bonds)
20:0
Figure 1. Percentage of Carbon Atoms in Fatty Acid Chains inThree Soya Methyl Ester Products
100908070605040302010
315290
Flash- 265point 240Temp. 215(F) 190
165~==~===:::=~~=:==:-_-....__-+-_----t~_-t-_---l140.1-o
%SME
Figure 2. Flashpoint Temperature vs. O/OSME in ARB Diesel
Additional research is suggested to substantiate these initial results. The above workfurther suggests a need to establish a commonly accepted fuel standard. In the absence ofa fuel standard, further engine emissions and performance work will be of limited value.
Engine dynamometer testing - Engine dynamometer tests were conducted using theEPA heavy-duty engine transient cycle. Analysis of power parameters, including enginespeed, torque, brake horse power and fuel flow rate indicate a gradual decrease in poweras the percentage of SME was increased from 20% to 40% (see Tables 2 and 3). Thesechanges are within expectations. The same performance trends were found with Cl\1Eblends.
Table 2. Peak Power Comparisons
Test ARB Diesel 20/80 30170 40/60Engine Speed (rom) 2,003 2,003 2,003 2,002Engine Power, bkW (bhp) 195 (261) 198 (266) 196 (262) 192 (258)Engine Torque, N-m (ft-lb) 928 (685) 946 (698) 933 (688) 918 (677)Fuel Flow, kg/hr (lblhr) 47.8 (105.4) 49.4 (108.9) 49.3 (l08.7) 49.0 (l08.0)
872
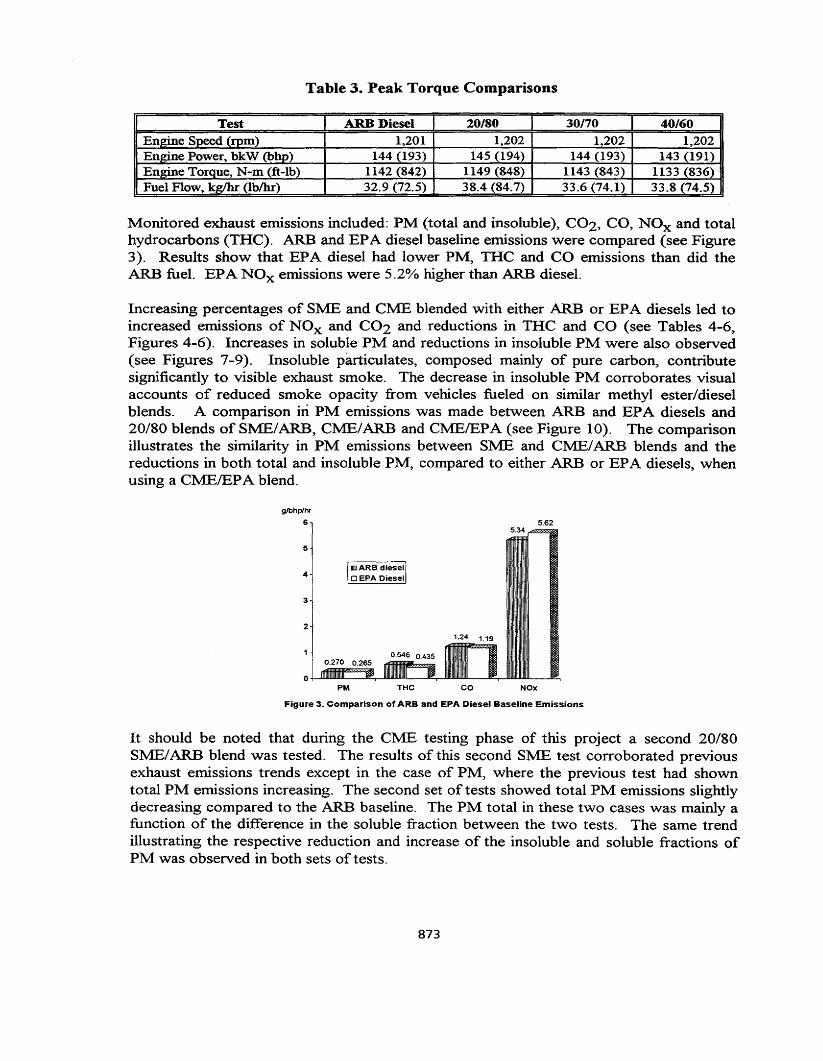
Table 3. Peak Torque Comparisons
Test ARB Diesel 20/80 30170 40/60Engine Sneed (rom) 1,201 1,202 1,202 1,202Engine Power, bkW (bhp) 144 (193) 145 (194) 144 (193) 143 (191)Engine Torque, N-m (ft-Ib) 1142 (842) 1149 (848) 1143 (843) 1133 (836)Fuel Flow, kWhr (lb/hr) 32.9 (72.5) 38.4 (84.7) 33.6 (74.1) 33.8 (74.5)
Monitored exhaust emissions included: PM (total and insoluble), C02, CO, NOx and totalhydrocarbons (THC). ARB and EPA diesel baseline emissions were compared (see Figure3). Results show that EPA diesel had lower PM, THC and CO emissions than did theARB fuel. EPA NOx emissions were 5.2% higher than ARB diesel. .
Increasing percentages of SlME and CME blended with either ARB or EPA diesels led toincreased emissions of NOx and C02 and reductions in THC and CO (see Tables 4-6,Figures 4-6). Increases in soluble PM and reductions in insoluble PM were also observed(see Figures 7-9). Insoluble particulates, composed mainly of pure carbon, contributesignificantly to visible exhaust smoke. The decrease in insoluble PM corroborates visualaccounts of reduced smoke opacity from vehicles fueled on similar methyl ester/dieselblends. A comparison iri PM emissions was made between ARB and EPA diesels and20/80 blends of Sl\.1E/ARB, CME/ARB and C:rvrEIEPA (see Figure 10). The comparisonillustrates the similarity in PM emissions between SlME and CME/ARB blends and thereductions in both total and insoluble PM, compared to either ARB or EPA diesels, whenusing a C:MEIEPA blend.
glbhplhr
6 5.62
NO)(coTHCPM
0.270 0.265
2
3
5
4
Figure 3. Comparison of ARB and EPA Diesel Baseline Emissions
It should be noted that during the CME testing phase of this project a second 20/80SME/ARB blend was tested. The results of this second SME test corroborated previousexhaust emissions trends except in the case of PM, where the previous test had showntotal PM emissions increasing. The second set of tests showed total PM emissions slightlydecreasing compared to the ARB baseline. The PM total in these two cases was mainly afunction of the difference in the soluble fraction between the two tests. The same trendillustrating the respective reduction and increase of the insoluble and soluble fractions ofPM was observed in both sets of tests.
873
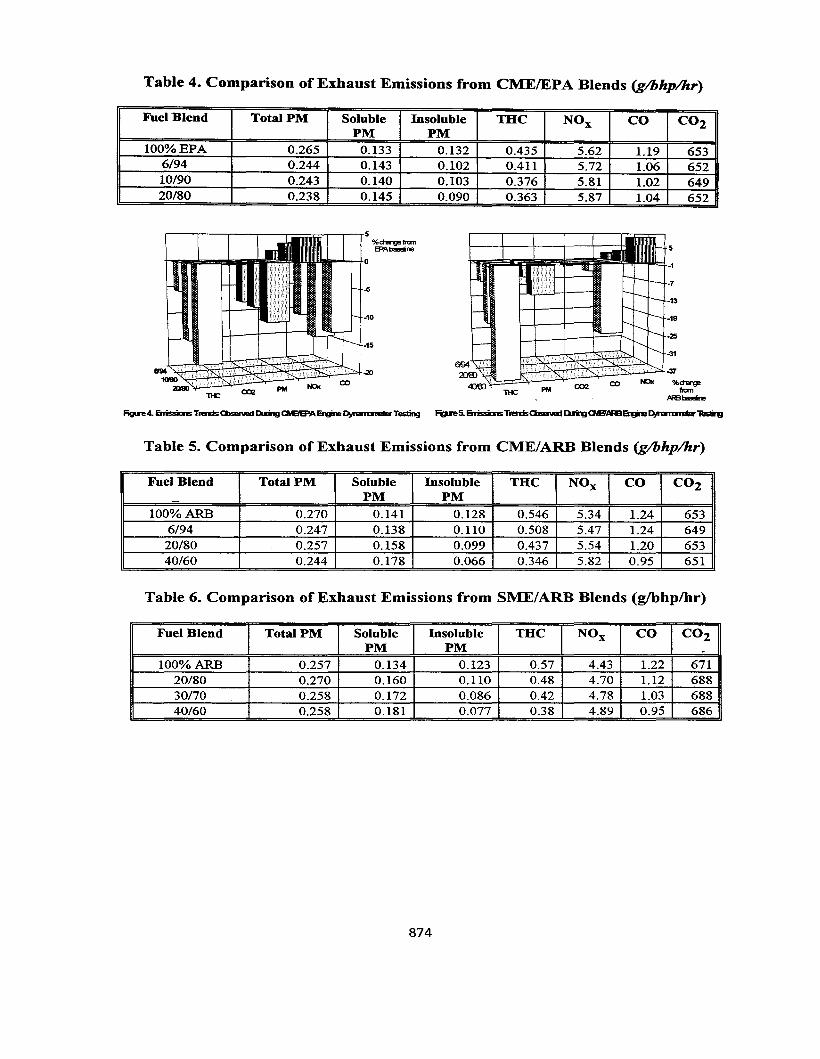
Table 4. Comparison of Exhaust Emissions from CMEIEPA Blends (g/bhp/hr)
Fuel Blend Total PM Soluble Insoluble THC NOx CO CO2PM PM
100% EPA 0.265 0.133 0.132 0.435 5.62 1.19 6536/94 0.244 0.143 0.102 0.411 5.72 1.06 65210/90 0.243 0.140 0.103 0.376 5.81 1.02 64920/80 0.238 0.145 0.090 0.363 5.87 1.04 652
5%c:toengefranEPA_re 5
0-1
-7-6
-13
-10 -19
-25-15
.ZJ -sr%c:toenge
<Xl2 1llC PM frannc MBIBsolire
Table 5. Comparison of Exhaust Emissions from CME/ARB Blends (g/bhp/hr)
Fuel Blend Total PM Soluble Insoluble THC NOx CO CO2PM PM
100% ARB 0.270 0.141 0.128 0.546 5.34 1.24 6536/94 0.247 0.138 0.110 0.508 5.47 1.24 64920/80 0.257 0.158 0.099 0.437 5.54 1.20 65340/60 0.244 0.178 0.066 0.346 5.82 0.95 651
Table 6. Comparison of Exhaust Emissions from SME/ARB Blends (g/bhp/hr)
Fuel Blend Total PM Soluble Insoluble THC NOx CO CO2PM PM .
100% ARB 0.257 0.134 0.123 0.57 4.43 1.22 67120/80 0.270 0.160 0.110 0.48 4.70 1.12 68830170 0.258 0.172 0.086 0.42 4.78 1.03 68840/60 0.258 0.181 0.077 0.38 4.89 0.95 686
874
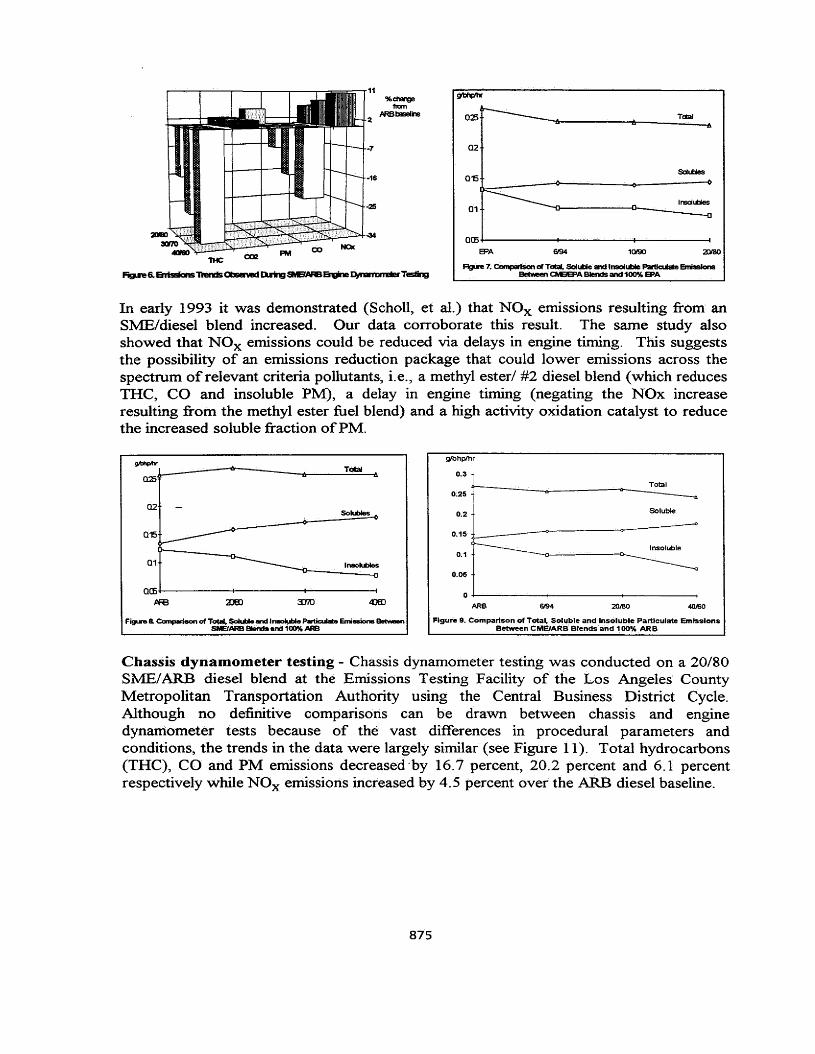
Talal
1()'90
figure 7. CcrnpiIrtson Dl Total. SoIu1l1e and Ir190IubIe P.;IItk:uIale EmIssIonsBetvo.een a.£IS>A BlenclSand100% EPA
g'bt¢I"
025
02
015
01
005EPA 6'94
11
2
·7
-25
In early 1993 it was demonstrated (Scholl, et al.) that NOx emissions resulting from anSJv1E/diesel blend increased. Our data corroborate this result. The same study alsoshowed that NOx emissions could be reduced via delays in engine timing. This suggeststhe possibility of an emissions reduction package that could lower emissions across thespectrum of relevant criteria pollutants, i.e., a methyl ester/ #2 diesel blend (which reducesTHe, co and insoluble PM), a delay in engine timing (negating the NOx increaseresulting from the methyl ester fuel blend) and a high activity oxidation catalyst to reducethe increased soluble fraction ofPM.
Total
glbhplhr
0.3
0;25 r_--'-'~_,>---_-~_--.:Total
Q2SoIubl8s 0.2 Soluble
01 In80IublIIs
0.15
0.1
0.05
Insoluble
40.160201806.'94
O+--'-'---'----''---'----<~'-------+--------1
ARB
Q05+-------t------+-'------i
~
Figure a~ ofT~ $<;Il!olbleandI~ Partic:uIate Emiaiorse.t-nSMEfARB BIerds and 100% ARB
Figure 9, Comparison of Total, Soluble and Insoluble Particulate emissionsBetween CMEIARB BlendS and 100% ARB
Chassis dynamometer testing - Chassis dynamometer testing was conducted on a 20/80SME/ARB diesel blend at the Emissions Testing Facility of the Los Angeles CountyMetropolitan Transportation Authority using the Central Business District Cycle.Although no definitive comparisons can be drawn between chassis and enginedynamometer tests because of the vast differences in procedural parameters andconditions, the trends in the data were largely similar (see Figure 11). Total hydrocarbons(THC), CO and PM emissions decreasedby 16.7 percent, 20.2 percent and 6.1 percentrespectively while NOx emissions increased by 4.5 percent over the ARB diesel baseline.
875
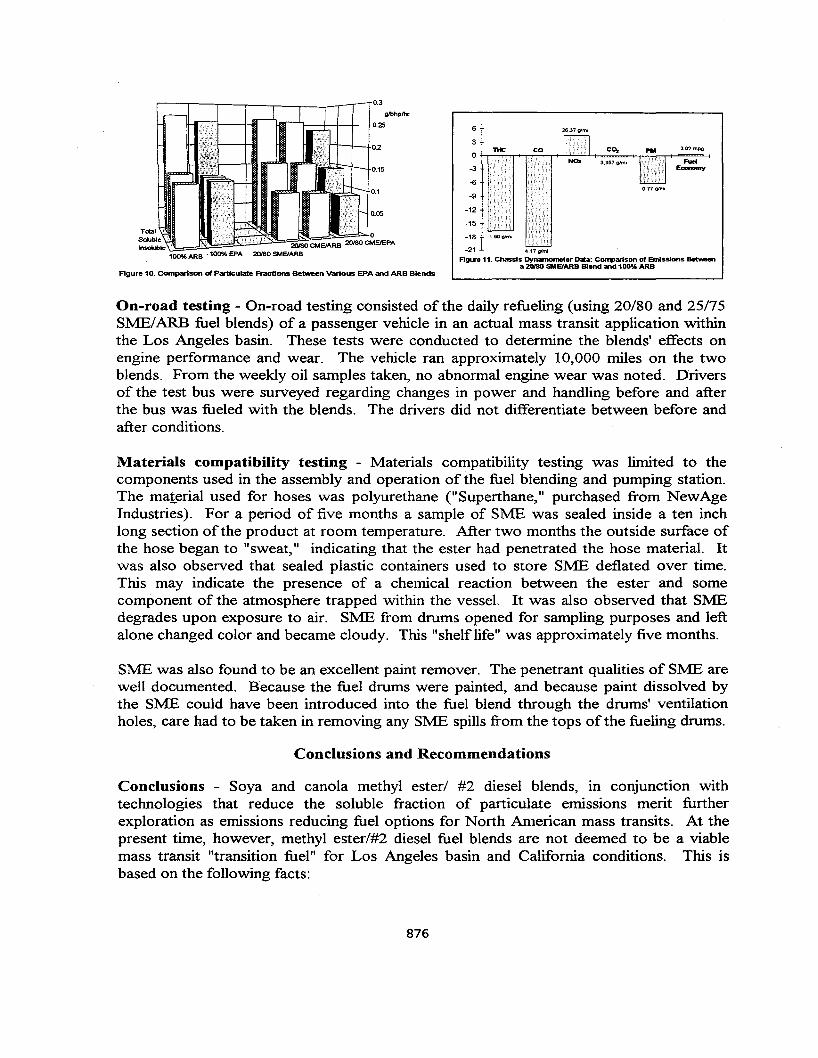
3.02mps!
F....Economy
6 26.370'ml
3
0
-3
-6
-9
-12
-15
-18
-21 4.17gImi
Rgu'811. Chassis Dynamometer Dara: CDll¥tar1son of EmIssions 8et¥ae..,a 20180 SME/ARB Blend and 100'" ARB
0.15
0.1
0.05
=2OI8~ObCM=Bd:"'!!:!RB=:2lII8O=='::a?E1EPA20180 SMEIARB
i-,---,r----r--,--..,.---,--r-"TiQ3
glbhplt-<
1-IIIr---"'-l-+-+-+0.25
TaaJSolu~e
Insoluble100% ARB ·100% EPA.
FIgure 10. Comparison of Particulate Fraetlons Between various EPA and ARB Blends
On-road testing - On-road testing consisted of the daily refueling (using 20/80 and 25/75S:ME/ARB fuel blends) of a passenger vehicle in an actual mass transit application withinthe Los Angeles basin. These tests were conducted to determine the blends' effects onengine performance and wear. The vehicle ran approximately 10,000 miles on the twoblends. From the weekly oil samples taken, no abnormal engine wear was noted. Driversof the test bus were surveyed regarding changes in power and handling before and afterthe bus was fueled with the blends. The drivers did not differentiate between before andafter conditions.
Materials compatibility testing - Materials compatibility testing was limited to thecomponents used in the assembly and operation of the fuel blending and pumping station.The material used for hoses was polyurethane ("Superthane," purchased from NewAgeIndustries). For a period of five months a sample of S:ME was sealed inside a ten inchlong section of the product at room temperature. After two months the outside surface ofthe hose began to "sweat," indicating that the ester had penetrated the hose material. Itwas also observed that sealed plastic containers used to store S:ME deflated over time.This may indicate the presence of a chemical reaction between the ester and somecomponent of the atmosphere trapped within the vessel. It was also observed that S:MEdegrades upon exposure to air. S:ME from drums opened for sampling purposes and leftalone changed color and became cloudy. This "shelflife" was approximately five months.
S:ME was also found to be an excellent paint remover. The penetrant qualities of S:ME arewell documented. Because the fuel drums were painted, and because paint dissolved bythe S:ME could have been introduced into the fuel blend through the drums' ventilationholes, care had to be taken in removing any S:ME spills from the tops of the fueling drums.
Conclusions and Recommendations
Conclusions - Soya and canola methyl ester/ #2 diesel blends, in conjunction withtechnologies that reduce the soluble fraction of particulate emissions merit furtherexploration as emissions reducing fuel options for North American mass transits. At thepresent time, however, methyl ester/#2 diesel fuel blends are not deemed to be a viablemass transit "transition fuel" for Los Angeles basin and California conditions. This isbased on the following facts:
876
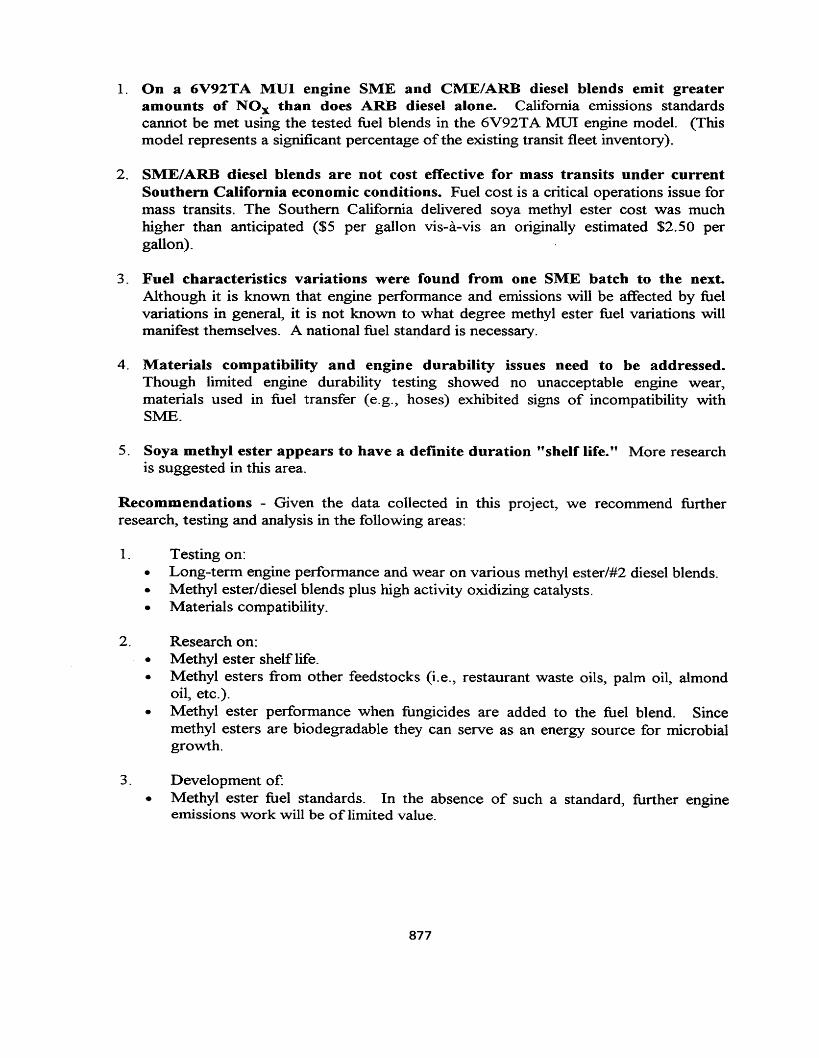
1. On a.6V92TA MUI engine SME and CME/ARB diesel blends emit greateramounts of NOx than does ARB diesel alone. California emissions standardscannot be met using the tested fuel blends in the 6V92TA Mill engine model. (Thismodel represents a significant percentage of the existing transit fleet inventory).
2. SME/ARB diesel blends are not cost effective for mass transits under currentSouthern California economic conditions. Fuel cost is a critical operations issue formass transits. The Southern California delivered soya methyl ester cost was muchhigher than anticipated ($5 per gallon vis-a-vis an originally estimated $2.50 pergallon).
3. Fuel characteristics variations were found from one SME batch to the next.Although it is known that engine performance and emissions will be affected by fuelvariations in general, it is not known to what degree methyl ester fuel variations willmanifest themselves. A national fuel standard is necessary.
4. Materials compatibility and engine durability issues need to be addressed.Though limited engine durability testing showed no unacceptable engine wear,materials used in fuel transfer (e.g., hoses) exhibited signs of incompatibility withS1\.ffi.
5. Soya methyl ester appears to have a definite duration "shelf life." More researchis suggested in this area.
Recommendations - Given the data collected in this project, we recommend furtherresearch, testing and analysis in the following areas:
1. Testing on:• Long-term engine performance and wear on various methyl ester/#2 diesel blends.• Methyl ester/diesel blends plus high activity oxidizing catalysts.• Materials compatibility.
2. Research on:• Methyl ester shelf life.• Methyl esters from other feedstocks (i.e., restaurant waste oils, palm oil, almond
oil, etc.).• Methyl ester performance when fungicides are added to the fuel blend. Since
methyl esters are biodegradable they can serve as an energy source for microbialgrowth.
3. Development of:• Methyl ester fuel standards. In the absence of such a standard, further engine
emissions work will be of limited value.
877
Methodology
This study concentrated on five key areas:• fuels characterization,• engine dynamometer tests,• chassis dynamometer tests,• on-road vehicle engine performance testing and field use Issues In a mass transit
application,• materials compatibility.
A list of the testing facilities used in this project appears in Table 7.
Diesel Engines - We selected an engine model for emissions and performance testing thatbest represented the California mass. transit fleet inventory for the next 5-10 years: a 1983Detroit Diesel 6V92TA Mechanical Unit Injection (MUI) engine. According to 1991ODC estimates, the 6V92TA was the engine most commonly used by California masstransit properties and represented approximately 85%-90% of the then existing fleetinventory. These engines had a remaining useful life of 5-10 years. Of these engines,approximately 80% were MUI models. An older MUI engine (as opposed to a moremodern Detroit Diesel Electronic Control design) was chosen because MUI technologyrepresented the present state of diesel engine technology in use by the majority of masstransit properties at that time. The underlying thought was that these older, less cleanburning engines would stand to benefit most from a cost-effective, relatively low emissionsinterim ~el. According to March 1995 estimates, the large majority of engines (70%75%) used by the California mass transit industry continue to be 6V92TA models. Ofthese, 70%-75% are thought to be MUIs. The particular engines used for this projectwere rebuilt to 1987 EPA D-bus standards (16-C upgrade, see Table 8). Additional 16-Cengine specifications included 9F80(T) injectors timed at 1.470, a throttle delay setting of0.636", a speed rating of2,000 rpm and a high idle speed of2,150 rpm.
Fuels Characterization - Fuels characterizations on both ARB diesel and SME wereconducted by several laboratories in accordance with ASTM testing standards. Thesetests included gross heating value, distillation curve, pour point, API gravity, flash point,Cetane number and viscosity tests (see Table 9). In addition, GC analyses were conductedon three batches of SME obtained from two suppliers as well as on the various blendswith diesel fuels in an effort to fully document fuel composition and quality. Additionalflash point tests on eleven SME/ARB diesel blends (0% to 100% SME) were conductedby Dr. Jon Van Gerpen, Iowa State University, Department of Mechanical Engineering.The flash points were determined using a Pensky-Martens closed tester using standardASTM test methods.
878
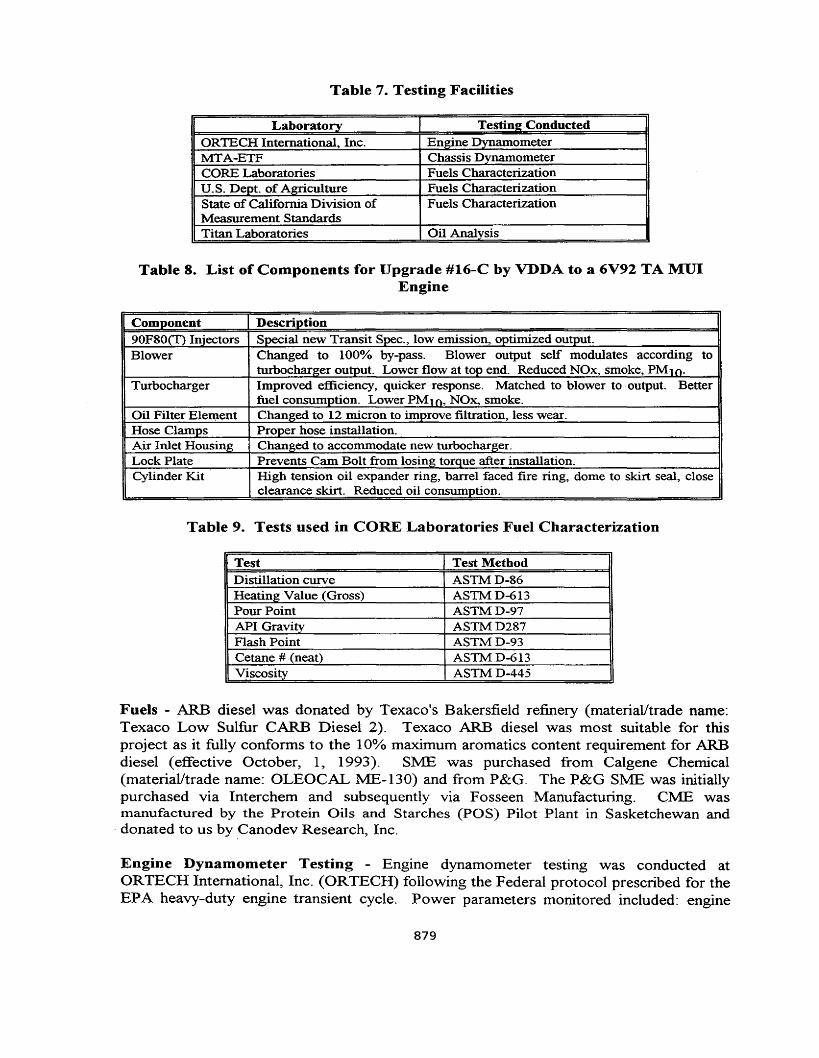
Table 7. Testing Facilities
Laboratory TestingConductedOR'IECH International, Inc. Engine DvnamometerMTA-ETF Chassis DynamometerCORE Laboratories Fuels CharacterizationU.S. Dept. of Agriculture Fuels CharacterizationState of California Division of Fuels CharacterizationMeasurement StandardsTitan Laboratories Oil Analysis
Table 8. List of Components for Upgrade #16-C by VDDA to a 6V92 TA MUIEngine
Component Description90F80(T) Injectors Special new Transit Spec., low emission, optimized output.Blower Changed to 100% by-pass. Blower output self modulates according to
turbocharger output. Lower flow at top end. Reduced NOx, smoke, PM1O.Turbocharger Improved efficiency, quicker response. Matched to blower to .output. Better
fuel consumption. Lower PM1o. NOx, smoke.Oil Filter Element Changed to 12 micron to improve filtration, less wear.Hose Clamps Proper hose installation.Air Inlet Housing Changed to acconunodate new turbocharger.Lock Plate Prevents Cam Bolt from losing torque after installation.Cylinder Kit High tension oil expander ring, barrel faced fire ring, dome to skirt seal, close
clearance skirt. Reduced oil consumption.
Table 9. Tests usedin CORE Laboratories Fuel Characterization
Test Test MethodDistillation curve ASTMD-86Heating Value (Gross) ASTMD-613Pour Point ASTMD-97API Gravity ASTMD287Flash Point ASTMD-93Cetane # (neat) ASTMD-613Viscosity ASTMD-445
Fuels - ARB diesel was donated by Texaco's Bakersfield refinery (material/trade name:Texaco Low Sulfur CARB Diesel 2). Texaco ARB diesel was most suitable for thisproject as it fully conforms to the 10% maximum aromatics content requirement for ARBdiesel (effective October, 1, 1993). S1vIE was purchased from CalgeneChemical(material/trade name: OLEOCAL ME-130) and from P&G. The P&G S:rv.tE was initiallypurchased via Interchem and subsequently via Fosseen Manufacturing. CME wasmanufactured by the Protein Oils and Starches (POS) Pilot Plant in Sasketchewan anddonated to us by Canodev Research, Inc.
Engine Dynamometer Testing - Engine dynamometer testing was conducted atORTECH International, Inc. (ORTECH) following the Federal protocol prescribed for theEPA heavy-duty engine transient cycle. Power parameters monitored included: engine
879
speed, torque, brake horse power, and fuel rate. Temperatures monitored included:combustion air, turbocharger out, coolant in, coolant out, oil sump and fuel temperatures.Pressures monitored included: exhaust back pressure, intake restriction, oil and fuelpressures. For each blend, the emissions monitored included: PM (total and soluble),C02, CO, NOx, total hydrocarbons (THC) and brake specific fuel consumption (BSFC).
All instrumentation was calibrated following standard operating procedures. Baselineemissions tests were performed and gaseous and particulate emissions were collected withboth EPA and ARB diesel fuels. Prior to running each set of tests, the engines wereconditioned on each new fuel by purging the fuel system and operating the engine underfull load for 1/2 hour. A 2-Point Power Check was performed followed by three hottransient cycles during which gaseous and particulate samples were obtained. Three hottransient cycles were run for each fuel blend. Emissions results from the three hot cycleswere then averaged.
Chassis Dynamometer Testing - Chassis dynamometer tests were performed at theMetropolitan Transportation Authority Emissions Testing Facility (MTA-ETF) in LosAngeles using an ARB baseline and a 20/80 SME/ARB blend. The same fuels were usedfor the chassis dynamometer tests as for the engine dynamometer tests. The selected testprotocol was the Central Business District (CBD) cycle. Actual vehicle on-road operatingconditions were simulated through use of a standard road load equation. Input parameterswere developed by the MTA-ETF based on coast downs conducted by the SouthwestResearch Institute and documented in SAE Paper No. 840349, Dynamometer Simulationof Truck and Bus Road Horsepower for Transient Emissions Evaluations. The selectedinertia weight for the test vehicle was the vehicle tare weight plus 23 passengers and drivertimes 150 lbs. It was assumed that there were no road gradients. The velocity andacceleration of the vehicle were established by the dynamometer protocol. Emissionswere monitored in units of grams per mile and included hydrocarbons, CO, NOx,particulate matter and C02.
On-Road Testing - On-road vehicle compatibility tests were performed at GardenaMunicipal Bus Lines (GMBL) in Gardena, California. These consisted of daily refuelingof a passenger vehicle with a 20/80, and later with a 25/75 SME/ARB blend. Engine oilwas sampled on a weekly basis to determine the presence of other than normal enginewear. Elements surveyed in the samples included twenty elements (metals and metalloids)that are commonly assumed to be indicative of engine wear. Material compatibility testswere conducted at ADEPT's facilities and at the GMBL bus refueling station.
There were challenges inherent in the fuel blending and bus refueling procedures. Localfire and air quality ordinance requirements dictated the following constraints: no use ofelectricity nor use of an above ground tank for fuel storage. An automatic dispensingnozzle was mandated. In addition, a flow of at least 14 gallons of fuel per minute wasneeded so as to not disrupt GMBL's fleet refueling schedules.
We finally designed and used a solar powered refueling station. The refueling systemconsisted ofthe following components:
• four interconnected 55-gallon drums,
880
• a 12-volt drum pump,• a flow totalizer,• a deep cycle marine battery connected to a solar panel, and• sixteen feet of polyurethane hose.
We were unable to use the automatic dispensing nozzle because the 12-volt drum pumpwas unable to deliver enough pressure to insure adequate flow through the nozzle. It wasnecessary to store the S:t\.ffi off-site and to transport it to G:MBL on a weekly basis. Thebus was refueled by first calculating (based on daily vehicle mileage and fuel consumption)the amount of 5MB needed to make up the appropriate blend. S:ME was then pumpedfrom the blending and dispensing system into the bus fuel tank, which was then topped offfrom ARB diesel from GMBL's underground tanks.
References
Interchem, "SoyDiesel Research Report," 1993.
Scholl, K. W. and S. C. Sorenson, "Combustion of Soybean Oil Methyl Ester in a DirectInjection Diesel Engine," SAB Technical Paper Series, 930934, 1993.
Schumacher, Leon G., et. aI., "Fueling A Diesel Engine With Methyl Ester Soybean Oil,"1993.
881
CUMMINS 5.9L BIODIESEL FUELED ENGINES
Leon. G. Schumacher, Ph. D., Assistant Professorand William G. Hires, Ph. D., Associate Professor
University ofMissouri-ColumbiaColumbia, MO 65211
andJuergen G. Krahl, PhD., wissenschaftlicher Mitarbeiter
Institut ofBiosystems Engineering, Federal Agricultural Research CentreBraunschweig, Germany D-38116
Abstract
The Agricultural Engineering Department at the University ofMissouri-Columbiahas fueled a 1991 and a 1992 Dodge pickup Cummins engine with 100 percent methylester soybean oil (biodiesel) for more than 172,545 kID (107,215 mile). The 1991 pickuphas been driven 89,888 km (55,854 mile) and the 1992 pickup has been drivenapproximately 82,658 km (51,361 mile). Fueling the 5.9 L (360 in") engines with 100%biodiesel initially increased engine power by 3% (1991 engine) and reduced power by 7%(1992 engine). However, both pickups produced less power while fueled on biodieselduring the latest series of chassis dynamometer testing. The pickups averaged 6.9 km/L(16.6 mile/gal). Analysis of engine lubrication oil showed that the engines were wearing ata normal rate. Black exhaust smoke normally observed when a diesel engine accelerateswas reduced when the diesel engine was fueled with 100% biodiesel. Increased EPAexhaust emissions requirements for diesel engines have created much interest in the use ofbiodiesel as a fuel for diesel engines.
882
Introduction
Much ofthe biodiesel research that has been conducted within the United States since1990 has involved the use of a blend ofbiodiesel and petroleum diesel fuel. The NationalBiodiesel Board has proactively researched the environmental and performance effects offueling compression ignition engines with a 20 percent blend (B20). A small number ofengines have been fueled with 100 percent biodiesel (BI00) (Peterson et al., 1994,National Biodiesel Board, 1995), a fuel that is biodegradable, lower in toxicity than fossilfuels, and a renewable agricultural commodity. Although the University ofIdaho isfueling two 5.9L engines with B 100, very little analysis ofengine wear and exhaustemissions have been conducted on over-the-road (OTR) vehicles fueled with BI00. Thisresearch provides much needed information for niche markets (such as the fueling ofmarine vessels on pristine waters) that will benefit by the fueling ofcompression ignitionengines with B 100
Related Literature
Ziejewski et al., (1984), Reece et al., (1993), Scholl et al., (1993), and Schumacher et al.,(1992, 1993) reported reductions in smoke density when fueling with biodiesel orbiodiesel as compared to #2 diesel. Reece et a1., (1993) also noted reductions in smokedensity when fueling with a 20% biodiese1l80% #2 diesel blend. Ziejewski fueled withsunflower derived biodiesel and Reece fueled with rapeseed derived biodiesel Scholl andSchumacher used soybean derived biodiesel. Srinivasa et al., (1991), however, notedincreases-in smoke density when fueling with karanja based biodiesel
Marshall (1993), Schumacher et at, (1992), Mittelbach et al., (1985), Mittelbach et al.,(1988), and Schon and Sorenson (1993) noted reductions in hydrocarbons and carbonmonoxide. Schumacher and Schon and Sorenson fueled with soybean derived biodiesel.Mittelbach fueled with rapeseed derived biodiesel in 1985, but used waste cooking oilduring the 1988 investigation. Marshall used animal derived fats as his source ofbiodiesel. Niehaus (1985), however, noted increases in. carbon monoxide and hydrocarbonexhaust emissions. Niehaus also noted decreases in oxides ofnitrogen exhaust emissions.
Ziejewski. et al., (1984), Niehaus et al., (1985), Schumacher et at, (1992), Reece andPeterson (1993), and Marshall (1993) observed reductions in power ranging from one toseven percent. Schumacher observed increased power (three percent) using a 1991Cummins 5.9L DJ turbocharged engine. Increased power was observed by Feldman andPeterson (1992) during a 200 hour EMA test using a 3 cylinder, DI, naturally aspirateddiesel engine with the injection timing advanced two degrees.
The review ofthese data and a study conducted by Krahl et al. (1994) suggest that trendsin engine exhaust emissions and performance exist when the engine is fueled on 100percent biodiesel Shifting the timing as performed by Feldman and Peterson appears tobe an appropriate and acceptable method that should be used to optimize the compressionignition engine for biodiesel fueling.
883
Purpose and Objectives
The purpose ofthis investigation was to determine the effects offueling a diesel enginewith 100% biodiesel as compared to fueling the engine with petroleum diesel fuel.Specific objectives that were investigated included: fuel efficiency, engine wear, power,and exhaust emission levels.
Materials and Methods
A 1991 and a 1992 Dodge pickup equipped with Cummins, six-cylinder, direct injectedturbocharged, 5.9 L (360 in") diesel engines were the OTR vehicles used in these tests.The engines were fueled with diesel fuel during the first months ofoperation. Fueling withbiodiesel began after 4,827 km(3,000 mile) ofoperation for the 1991 pickup and after2,413.5 km (1,500 mile) ofoperation for the 1992 pickup. An analysis ofthe fuel usedcan be found in Table 1.
Power determinations were made using a Super Flow Corporation model SF-601 chassisdynamometer. The engine was tested for power at 1700, 1900, 2100, 2300, 2500, and2700 rpm. The chassis dynamometer was used to load the engine to peak pound footratings as determined by Cummins Engine Company. The pickup was operated for sixminutes at each rpm. The load was then reduced by the dynamometer operator, allowingthe engine to accelerate to the next rpm interval as designated by the SAE power testprocedures.
Initially, the 1991 pickup engine lubricating oil (15w-40) and the engine lubricating oilfilter were changed at approximately 4,023 km (2,500 mile) intervals. Engine lubricatingoil was sampled at 805 km (500 mile) intervals and analyzed by MFA Oil Inc. laboratories.Analysis showed no indication oflube oil dilution, therefore, oil sampling interval and theoil change interval were subsequently lengthened to 1,609 km (1,000 mile) and 4,827 km(3,000 mile) respectively. The 1992 pickup engine lubricating oil sampling proceduresand change intervals have been maintained at 1,609 km (1,000 mile) and 4,827 km (3,000mile) intervals.
The biodiesel analysis was conducted by Cleveland Technical Center, Kansas City, MO forInterchem Environmental, Inc. The low sulfur diesel fuel was analyzed by PhillipsChemical Company.
Internal parts ofthe engine were visually examined using a boroscope on three separateoccasions by MU technicians. MFA technicians used an atomic absorptionspectrophotometer to analyze the lubricating oil samples for wear metal content.
The engines were not modified. Fuel storage and fuel delivery systems were modified. Anaftermarket fuel tank was installed for biodiesel fueling. An electric fuel valve (andswitch) was installed to permit the operator to switch between biodiesel and petroleumdiesel fuel. Stainless steel heat exchangers were installed to warm the fuel during coldweather operation. Rubber based components in the original fuel lines and in the 1991
884
Table I. Fuel properties ofBiodiesel and Reference Diesel fuelFuel
Low SulfurReferenceDiesel0.846642.4-14 (+6Op)-23 (-lOOP)67 (152Op)2.7Cst0.0330/086.8%46.7N/TN/Ap.N/Ap.N/Ap.
187 (369Op)213 (416Op)222 (431Op)233 (45 lOp)244 (47IOp)264 (507Op)285 (545Op)298 (568Op)314 (597Op)328 (622Op)338 (640Op)
Biodiesel
0.86-0.9037.23.3 (38 F) Max.-2.2 (28 F) Max.149 (300 F) Min.4.00-5.50Cst0.02% Max.0.1% Max.48 Min.0.02% Max.0.03% Max.0.2% Max.97.5% Min.
ASTMTestProcedureDI298D2382D2500D97D92D445D129D524D613D482G.C.G.C.G.C.
Fuel Property
Density gILGross Heat Value MJ/KgCloud PointPour PointFlash PointViscosity @ 40°CSulphurCarbon ResidueCetane NumberA~
Free GlycerineTotal Glycerine% EsterDistillation in °c
ffiP 264 (508<P)5 327 (622Op)10 331 (628Op)20 NIT30- 335 (636<P)50 337 (638Op)70 340 (644Op)80 NIT90 343 (650Op)95 350 (662Op)End 351 (664Op)
Nfr = Not tested~ N/Ap = Not a1lPlicable~G.e. = Gas Chromatograph
injection pump deteriorated when exposed to biodiesel. These components were replacedwith either viton (fluorinated rubber), steel, aluminum, or nylon reinforced tubing.
Results and Discussion
Fuel efficiency during biodiesel fueling fluctuated, depending on how the pickup wasoperated. The overall fuel economy for the 1991 pickup was 7.0 kmIL (16.9 mile/gal) andfor the 1992 pickup was 6.8 kmIL (16.3 mile/gal). The highway fuel economy while thevehicles were operating on 100% biodiesel as compared to diesel fuel was 9.5 kmIL (22.8mile/gal) vs 9.9 kmIL (23.9 mile/gal). Biodiesel fuel economy was nearly identical to thatobtained when the engine was fueled with diesel fuel under comparable conditions. Thesedata are summarized in Table 2.
885
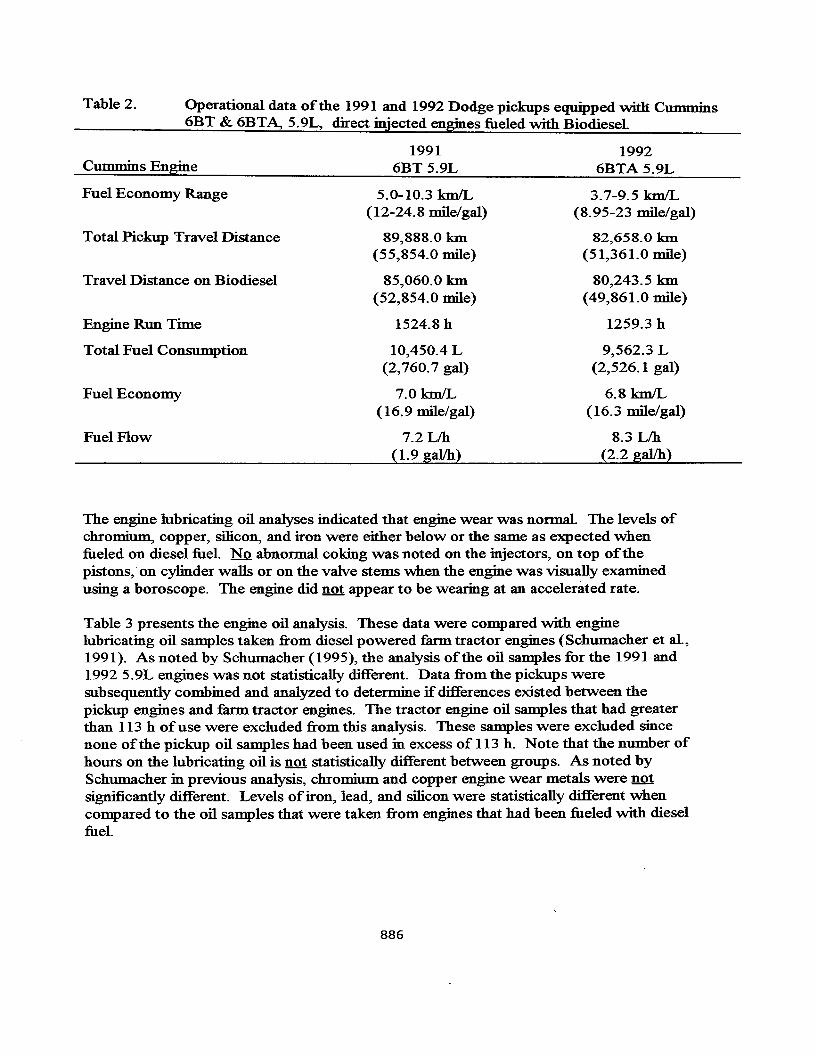
Table 2. Operational data ofthe 1991 and 1992 Dodge pickups equipped witli Cummins6BT & 6BTA, 5.9L, direct injected engines fueled with Biodiesel
1991 1992Cummins Engine 6BT 5.9L 6BTA5.9L
Fuel Economy Range 5.0-10.3 k.m/L 3.7-9.5 k.m/L(12-24.8 mile/gal) (8.95-23 mile/gal)
Total Pickup Travel Distance 89,888.0 km 82,658.0 km(55,854.0 mile) (51,361.0 mile)
Travel Distance on Biodiesel 85,060.0 km 80,243.5 km(52,854.0 mile) (49,861.0 mile)
Engine Run Time 1524.8 h 1259.3 h
Total Fuel Consumption 10,450.4 L 9,562.3 L(2,760.7 gal) (2,526.1 gal)
Fuel Economy 7.0 k.m/L 6.8 kmIL(16.9 mile/gal) (16.3 mile/gal)
Fuel Flow 7.2 L/h 8.3 L/h(1.9 ga1lh) (2.2 ga1lh)
The engine lubricating oil analyses indicated that engine wear was normal The levels ofchromium, copper, silicon, and iron were either below or the same as expected whenfueled on diesel fuel. No abnormal coking was noted on the injectors, on top ofthepistons, on cylinder walls or on the valve stems when the engine was visually examinedusing a boroscope. The engine did not appear to be wearing at an accelerated rate.
Table 3 presents the engine oil analysis. These data were compared with enginelubricating oil samples taken from diesel powered farm tractor engines (Schumacher et al.,1991). As noted by Schumacher (1995), the analysis ofthe oil samples for the 1991 and1992 5.9L engines was not statistically different. Data from the pickups weresubsequently combined and analyzed to determine ifdifferences existed between thepickup engines and farm tractor engines. The tractor engine oil samples that had greaterthan 113 h ofuse were excluded from this analysis. These samples were excluded sincenone ofthe pickup oil samples had been used in excess of 113 h. Note that the number ofhours on the lubricating oil is not statistically different between groups. As noted bySchumacher in previous analysis, chromium and copper engine wear metals were notsignificantly different. Levels ofiron, lead, and silicon were statistically different whencompared to the oil samples that were taken from engines that had been fueled with dieselfuel.
886
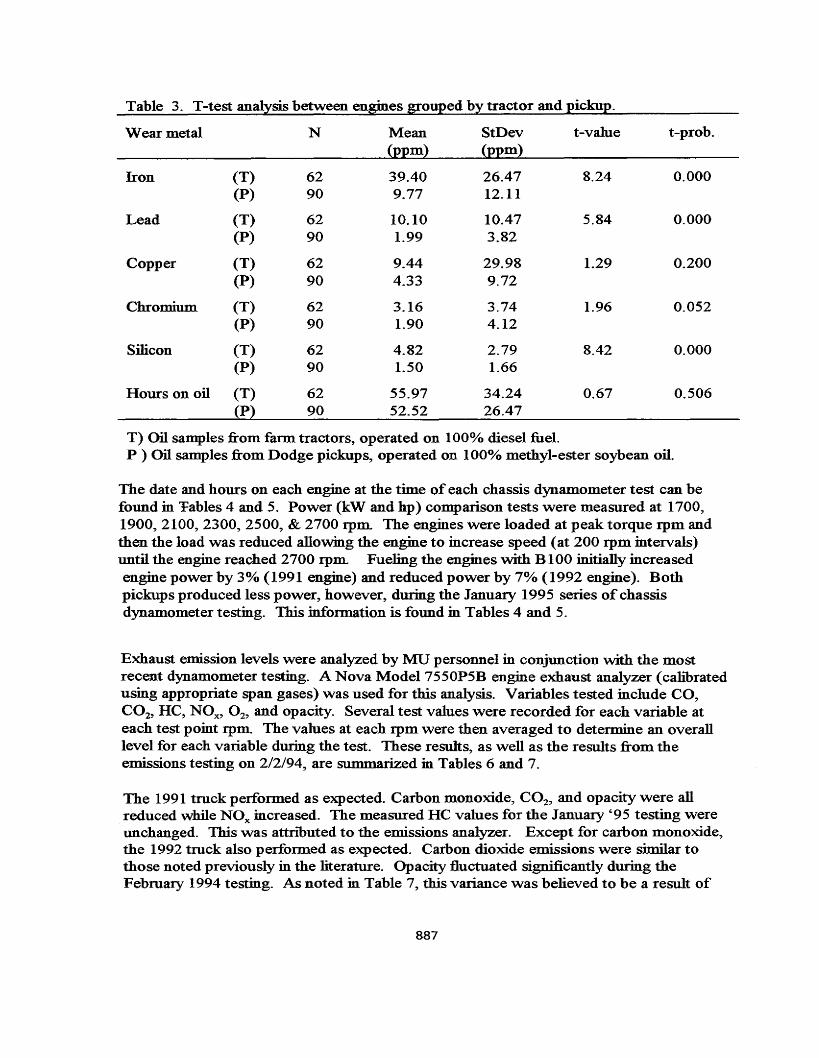
Table 3. T-test analysis between engines grouped by tractor and pickup.
Wear metal N Mean StDev t-value t-prob.(ppm) (ppm)
Iron (T) 62 39.40 26.47 8.24 0.000(P) 90 9.77 12.11
Lead (T) 62 10.10 10.47 5.84 0.000(P) 90 1.99 3.82
Copper (T) 62 9.44 29.98 1.29 0.200(P) 90 4.33 9.72
Chromium (T) 62 3.16 3.74 1.96 0.052(P) 90 1.90 4.12
Silicon (T) 62 4.82 2.79 8.42 0.000(P) 90 1.50 1.66
Hours on oil (T) 62 55.97 34.24 0.67 0.506(P) 90 52.52 26.47
T) Oil samples from farm tractors, operated on 100% diesel fuel.P ) Oil samples from Dodge pickups, operated on 100% methyl-ester soybean oil.
The date and hours on each engine at the time of each chassis dynamometer test can befound in 'Fables 4 and 5. Power (kW and hp) comparison tests were measured at 1700,1900,2100,2300,2500, & 2700 rpm. The engines were loaded at peak torque rpm andthen the load was reduced allowing the engine to increase speed (at 200 rpm intervals)until the engine reached 2700 rpm. Fueling the engines with BI00 initially increasedengine power by 3% (1991 engine) and reduced power by 7% (1992 engine). Bothpickups produced less power, however, during the January 1995 series ofchassisdynamometer testing. This information is found in Tables 4 and 5.
Exhaust emission levels were analyzed by MU personnel in conjunction with the mostrecent dynamometer testing. A Nova Model 7550P5B engine exhaust analyzer (calibratedusing appropriate span gases) was used for this analysis. Variables tested include CO,CO2, He, NOx, 02' and opacity. Several test values were recorded for each variable ateach test point rpm The values at each rpm were then averaged to determine an overalllevel for each variable during the test. These results, as well as the results from theemissions testing on 2/2/94, are summarized in Tables 6 and 7.
The 1991 truck performed as expected. Carbon monoxide, CO2, and opacity were allreduced while NOx increased. The measured He values for the January '95 testing wereunchanged. This was attributed to the emissions analyzer. Except for carbon monoxide,the 1992 truck also performed as expected. Carbon dioxide emissions were similar tothose noted previously in the literature. Opacity fluctuated significantly during theFebruary 1994 testing. As noted in Table 7, this variance was believed to be a result of
887
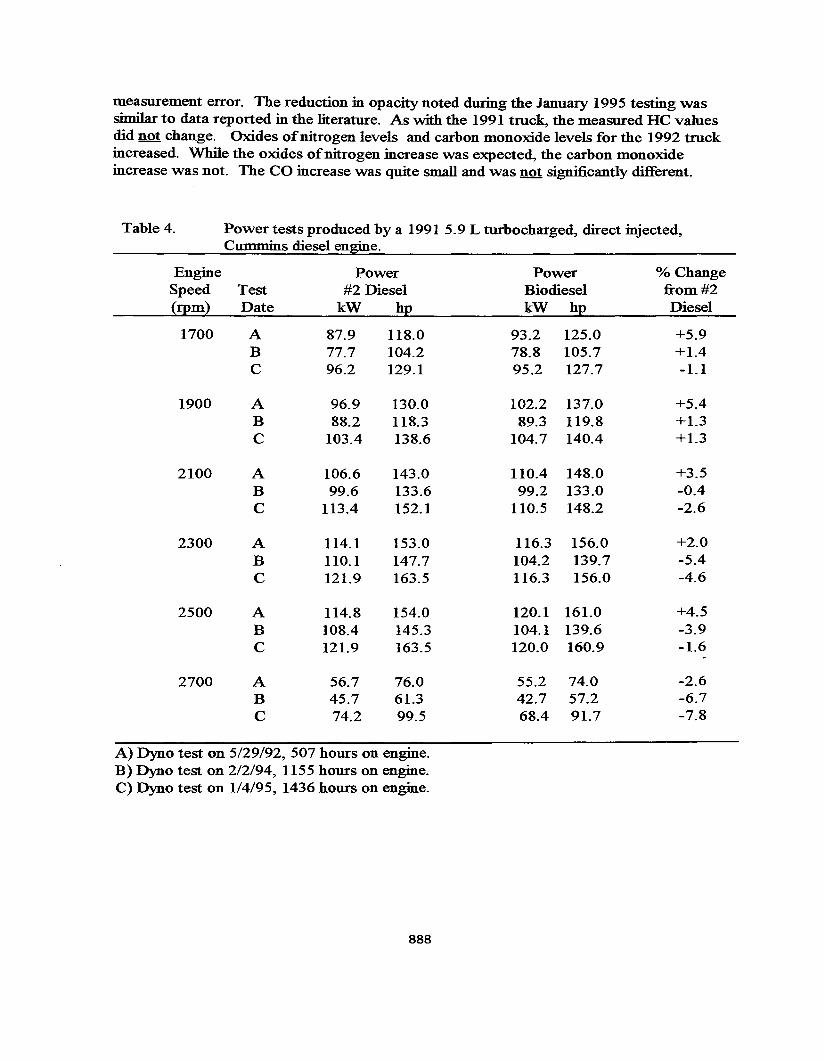
measurement error. The reduction in opacity noted during the January 1995 testing wassimilar to data reported in the literature. As with the 1991 truck, the measured He valuesdid not change. Oxides ofnitrogen levels and carbon monoxide levels for the 1992 truckincreased. While the oxides ofnitrogen increase was expected, the carbon monoxideincrease was not. The CO increase was quite small and was not significantly different.
Table 4. Power tests produced by a 1991 5.9 L turbocharged, direct injected,Cummins diesel engine.
Engine Power Power % ChangeSpeed Test #2 Diesel Biodiesel from #2(rpm) Date kW hp kW hp Diesel
1700 A 87.9 118.0 93.2 125.0 +5.9B 77.7 104.2 78.8 105.7 +1.4C 96.2 129.1 95.2 127.7 -1.1
1900 A 96.9 130.0 102.2 137.0 +5.4B 88.2 118.3 89.3 119.8 +1.3e 103.4 138.6 104.7 140.4 +1.3
2100 A 106.6 143.0 1l0.4 148.0 +3.5B 99.6 133.6 99.2 133.0 -0.4e 113.4 152.1 1l0.5 148.2 -2.6
2300 A 114.1 153.0 116.3 156.0 +2.0B 110.1 147.7 104.2 139.7 -5.4e 121.9 163.5 116.3 156.0 -4.6
2500 A 114.8 154.0 120.1 161.0 +4.5B 108.4 145.3 104.1 139.6 -3.9e 121.9 163.5 120.0 160.9 -1.6
2700 A 56.7 76.0 55.2 74.0 -2.6B 45.7 61.3 42.7 57.2 -6.7e 74.2 99.5 68.4 91.7 -7.8
A) Dyno test on 5/29/92, 507 hours on engine.B) Dyno test on 2/2/94, 1155 hours on engine.C) Dyno test on 1/4/95, 1436 hours on engine.
888
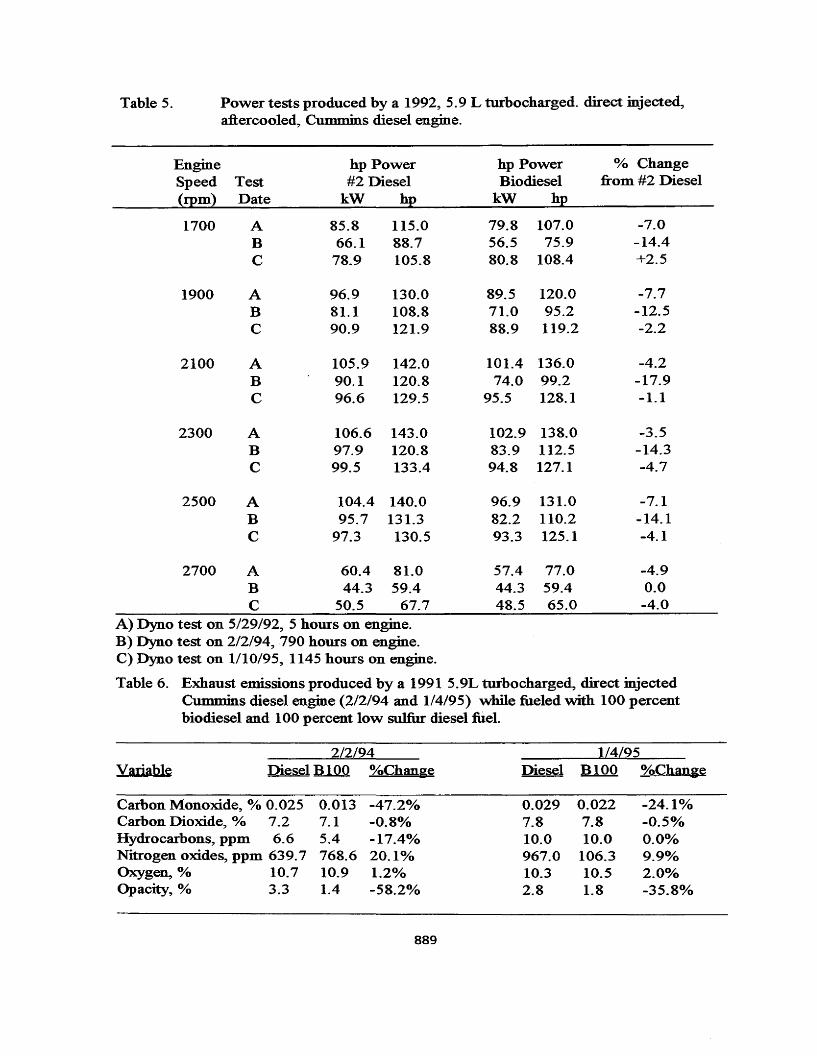
Table 5. Power tests produced by a 1992, 5.9 L turbocharged. direct injected,aftercooled, Curnmins diesel engine.
EngineSpeed Test(rpm) Date
1700 ABC
1900 ABC
2100 ABC
2300 ABC
2500 ABC
hp Power hp Power % Change#2 Diesel Biodiesel from #2 Diesel
kW hp kW hp
85.8 115.0 79.8 107.0 -7.066.1 88.7 56.5 75.9 -14.4
78.9 105.8 80.8 108.4 +2.5
96.9 130.0 89.5 120.0 -7.781.1 108.8 71.0 95.2 -12.590.9 121.9 88.9 119.2 -2.2
105.9 142.0 101.4 136.0 -4.290.1 120.8 74.0 99.2 -17.996.6 129.5 95.5 128.1 -1.1
106.6 143.0 102.9 138.0 -3.597.9 120.8 83.9 112.5 -14.399.5 133.4 94.8 127.1 -4.7
104.4 140.0 96.9 131.0 -7.195.7 131.3 82.2 110.2 -14.1
97.3 130.5 93.3 125.1 -4.1
2700 A 60.4 81.0B 44.3 59.4C 50.5 67.7
57.444.348.5
77.059.465.0
-4.90.0-4.0
A) Dyno test on 5/29/92, 5 hours on engine.B) Dyno test on 2/2/94,790 hours on engine.C) Dyno test on 1/10/95, 1145 hours on engine.
Table 6. Exhaust emissions produced by a 1991 5.9L turbocharged, direct injectedCummins diesel engine (2/2/94 and 1/4/95) while fueled with 100 percentbiodiesel and 100 percent low sulfur diesel fuel.
Variable2/2/94
Diesel B 100 %Change1/4/95
Diesel B 100 %Change
Carbon Monoxide, % 0.025Carbon Dioxide, % 7.2Hydrocarbons, ppm 6.6Nitrogen oxides, ppm 639.7Oxygen, % 10.7Opacity, % 3.3
0.0137.15.4768.610.91.4
-47.2%-0.8%-17.4%20.1%1.2%-58.2%
889
0.0297.810.0967.010.32.8
0.0227.810.0
106.310.51.8
-24.1%-0.5%0.0%9.9%2.0%-35.8%
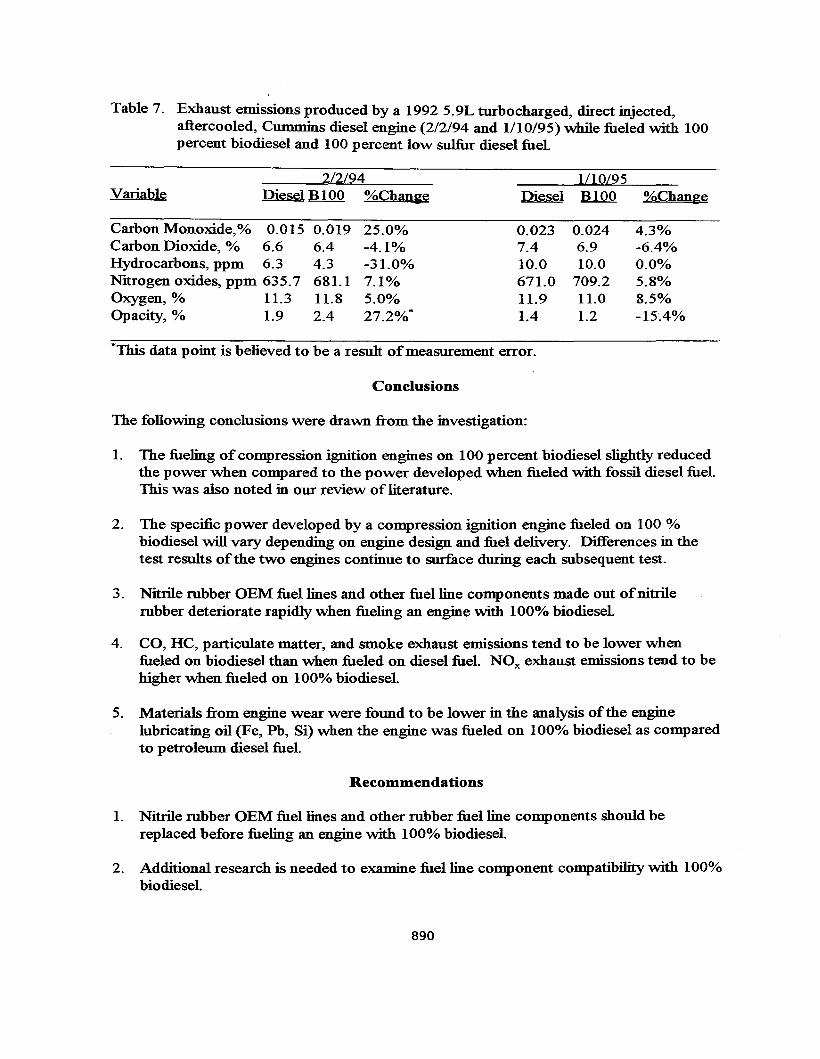
Table 7. Exhaust emissions produced by a 1992 5.9L turbocharged, direct injected,aftercooled, Cummins diesel engine (2/2/94 and 1/10/95) while fueled with 100percent biodiesel and 100 percent low sulfur diesel fuel.
2/2/94 1/10/95Variable DieselBI00 %Change Diesel BI00 %Change
Carbon Monoxide,% 0.015 0.019 25.0% 0.023 0.024 4.3%Carbon Dioxide, % 6.6 6.4 -4.1% 7.4 6.9 -6.4%Hydrocarbons, ppm 6.3 4.3 -31.0% 10.0 10.0 0.0%Nitrogen oxides, ppm 635.7 681.1 7.1% 671.0 709.2 5.8%Oxygen, % 11.3 1l.8 5.0% 11.9 11.0 8.5%Opacity, % 1.9 2.4 27.2%* 1.4 1.2 -15.4%
*This data point is believed to be a result ofmeasurement error.
Conclusions
The following conclusions were drawn from the investigation:
1. The fueling of compression ignition engines on 100 percent biodiesel slightly reducedthe power when compared to the power developed when fueled with fossil diesel fuel.This was also noted in our review ofliterature.
2. The specific power developed by a compression ignition engine fueled on 100 %biodiesel will vary depending on engine design and fuel delivery. Differences in thetest results ofthe two engines continue to surface during each subsequent test.
3. Nitrile rubber OEM fuel lines and other fuel line components made out ofnitrilerubber deteriorate rapidly when fueling an engine with 100% biodiesel.
4. CO, HC, particulate matter, and smoke exhaust emissions tend to be lower whenfueled on biodiesel than when fueled on diesel fuel NOx exhaust emissions tend to behigher when fueled on 100% biodiesel.
5. Materials from engine wear were found to be lower in the analysis ofthe enginelubricating oil (Fe, Pb, Si) when the engine was fueled on 100% biodiesel as comparedto petroleum diesel fuel.
Recommendations
1. Nitrile rubber OEM fuel lines and other rubber fuel line components should bereplaced before fueling an engine with 100% biodiesel.
2. Additional research is needed to examine fuel line component compatibility with 100%biodiesel.
890
3. Research should be conducted to determine the most efficient means ofreducing NOx
exhaust emissions when fueling with 100% biodiesel. As noted by Feldman andPeterson, an adjustment ofthe timing ofthe engine was beneficial when optimizing theengine for biodiesel fueling. Fuel injection timing should be evaluated closely as ameans ofreducing NOx emissions.
4. Research should be conducted to determine how HC, CO, and PM emissions changeafter the engine has been fueled in the real world for extended periods oftime.
5. Engine lubricating oil analysis data collection should be replicated. Findings over timeclearly suggest that lubricating oil samples taken at regular oil change intervals containlow levels ofengine wear materials (when compared to standards previouslyestablished for petroleum diesel fuel).
References
Feldman, M. E. and Peterson, C. L. (1992). Fuel injector timing and pressureoptimization on a DI diesel engine for operation on biodiesel. Liquid Fuels FromRenewable Resources - Proceedings ofan Alternative Energy Conference.N ashville, TN.
Krahl, J. G., Vellguth, G. And Munack, A. (1994). Ubersicht von Arbeiten zum Einsatzvon Rapsol und Rapsolmethylester als Kraftstoffe unter Bemcksichtinungumweltrelevanter Ausirkungen. Institute Fur Biosystemtechnik, FederalAgricultural Research Center, Braunschweig, Germany.
Marshall,W. F. (1993). Effects ofmethyl esters oftallow and grease on exhaustemissions and performance ofa Cummins LI0 engine. Itt Research Institute,National Institute for Petroleum and Energy Research, Bartlesville, OK (Reportprepared for Fats and Proteins Research Foundation, Inc, Ft. Myers, Beach, FL)
Mittelbach, M. P., Tritthart, P, and Junek, H. (1985). Diesel fuel derived from vegetableoils, II: emission tests using rape oil methyl ester. Energy Agriculture. 4: 208215.
Mittelbach, M. P., Tritthart, P. (1988). Diesel fuel derived from vegetable oils, ill.Emissions tests using methyl esters ofuse fiying oil. Journal ofthe American OilChemists' Society. 65(7): 1185-1187.
Niehaus, R. A., Goering, C. E. Savage, L. D., and Sorenson, S. C. (1985). Crackedsoybean oil as a fuel for a diesel engine. ASAE Paper No. 85-1560. ASAE, St.Joseph, MI.
Reece, D. L. and Peterson, C. L. (1993). A report on the Idaho on-road vehicle test withRME and neat rapeseed oil as an alternative to diesel fuel. ASE Paper No. 935018. ASAE, St. Joseph, MI.
891
Scholl, K w. and Sorenson, S. C. (1993). Combustion ofa soybean oil methyl ester in adirect injection diesel engine. SAE paper No. 930934. SAE, Warrendale, PA.
Schumacher, L.G., S.C. Borgelt, and W.G.Hires. 1995. Fueling a diesel engine withmethyl-ester soybean oil. AppliedEng. In Agr. 11(1):37-40.
Schumacher, L.G., J.C. Frisby and W.G. Hires. 1991. Tractor PTO horsepower, filtermaintenance and tractor engine oil analysis. AppliedEng. in Agr. 7(5):625-629.
Schumacher, L. G, Hires, W. G, and Borgelt, S. C. (1992). Fueling a diesel engine withmethyl-ester soybean oil LiquidFuels From Renewable Resources- Proceedingsofan Alternative Energy Conference. Nashville, TN.
Schumacher, L. G., Borgelt, S. C., Hires, W. G. and Humphrey, J. K (1993). Biodieselon the road- A report from Missouri. ASAE paper No. 93-5017. ASAE, St.Joseph, MI.
Schumacher, L. G., Borgelt, S. C., and Hires, W. G. (1993). SoydiesellBiodiesel BlendResearch. ASAE paper No. 93-6523. ASAE, St. Joseph, MI.
Srinivasa, R P. and Gopalakrishnan, K V. (1991). Vegetable oils and their methylestersas fuels for diesel engines. Indian Journal ofTechnology. 29: 292-297.
Ziejewski, M., Kaufinan, K R, Schwab, A W, and Pryde, E. H. (1984). Diesel engineevaluation ofan nonionic sunflower oil-aqueous ethanol microemulsion. Journalofthe American Oil Chemists Society. 61 (10): 1620-1626.
892
AN ALTERNATIVE FUEL FOR URBAN·BUSES - BIODIESELBLENDS
Leon G. Schumacher, Ph.D., Assistant Professor; J. Alan Weber, MS, Program DirectorNational Biodiesel Board; and Mark D. Russell, Ph.D., Research Associate; Juergen G.
Krahl, PhD., wissenschaftlicher MitarbeiterUniversity ofMissouri-Columbia
Columbia, MO 65211and
National Biodiesel BoardJefferson City, MO 65110
andInstitut ofBiosystems Engineering, Federal Agricultural Research Centre
Braunschweig, Germany D-38116
Abstract
Qualitative and quantitative biodiesel fueling performance and operational data havebeen collected from urban mass transit buses at Bi-State Development Agency in St.Louis Missouri. A total of 10 vehicles were selected for fueling; 5 - 6V92 TA DetroitDiesel engines have been fueled with a 20/80 biodiesel/diesel fuel blend and 5 - 6V92TA Detroit Diesel control vehicles have been fueled on petroleum based low sulfurdiesel fuel (LSD). The real-world impact ofa biodiesel blend on maintenance,reliability, cost, fuel economy and safety compared to LSD will be presented. Inaddition, engine exhaust emissions data collected by the University of West VirginiaDepartment of Energy (DOE) sponsored mobile emissions laboratory will be presented.Operational data from Bi-State Development Agency is collected by the University ofMissouri and quality control procedures are performed prior to placing the data in theAlternative Fuels Data Center (AFDC). The AFDC is maintained by the NationalRenewable Energy Laboratory in Golden, Colorado. This effort, which enables transitoperators to review a real-world comparison of biodiesel and LSD, has been funded bythe National Biodiesel Board with funds provided by the United Soybean Board withnational checkoff dollars and the National Renewable Energy Laboratory.
893
Introduction
The testing ofbiodiesel as a fuel for diesel powered transportation vehicles has beenconducted in several locations across the United States since July, 1991. Little effort hadbeen made to systematically, qualitatively, and quantitatively collect and record vehicleperformance and operational characteristics. The collection ofthis information is essentialto the commercialization ofbiodiesel in the United States.
Overview and Objectives
Vehicle performance, operation, and maintenance characteristics are used extensivelyduring the commercialization of a transportation fuel. Information concerning the use ofbiodiesel as a transportation fuel is needed to provide legislators and agencies theknowledge to make informed decisions that will effect market development and impact theacceptance ofbiodiesel as a transportation fuel for diesel engines.
Specific objectives ofthe project included:
1. Establish cooperative relationships and collect qualitative and quantitativevehicle performance and operational data from a mass transit district.
2. Summarize retrieved information and format appropriately for the NationalRenewable Energy Laboratory (NREL) Alternative Fuels Data Center(AFDC) database.
3. Transfer data (ASCn format) electronically to NREL and place in theAFDC database (monthly).
Methods and Procedures
This project involved highly controlled data collection from one mass transit agency. Datawere collected and compiled by researchers at the University ofMissouri (MU). Datacollected from the transit properties were compiled using Paradox, a relational database,and electronically transmitted using CCMAIL to the Alternative Fuels Data Center. TheAFDC is an electronic database that is operated by NREL. The AFDC contains datacollected from urban transit properties that are testing alternative fuels such as compressednatural gas (CNG), liquefied natural gas (LNG), methanol, ethanol, biodiesel, and in thevery near future, propane.
Site SelectionAs the managing agency ofthe AFDC, NREL has outlined several criteria that are to beused when selecting a mass transit agency to serve as a site for controlled data collection.The selected mass transit agency must be able to supply identical or comparable buses toensure that good control vehicles are available. Characteristics that must be similarinclude length, engine model, mileage, transmission, weight, year, and chassis model. Themass transit agency should have an accurate, acceptable means ofrecording data. Finally,
894
NREL site selection is based on the overall ability to collect reliable data on the part oftheoperators and the ability to implement in-house quality assurance programs.
Biodiesel Blend SelectionResearch conducted by Fosseen Manufacturing and Development (1993) suggested thatthe most appropriate blend when fueling the Detroit Diesel Corporation (DDC) 6V92 TAheavy duty engine was a 20/80 blend ofbiodiesel/diesel fuel. Based on their research, a20/80 (%) blend (B20) was selected as the fuel of choice for the urban buses involved inthis project. In their research, substituting 20 percent ofthe petroleum diesel withbiodiesel substantially reduced the emissions ofthe engine while minimizing theincremental increase in fuel costs associated with biodiesel fueling.
Information Collection ProceduresBi-State Development Agency, the regional transit agency of St. Louis, was selected asthe host site for this data collection project. A total of 10 vehicles were selected forfueling: 5 - 6V92 TA DDC engines were fueled with a B20 biodiesel/diesel fuel blend and5 - 6V92 TA DDC engines were fueled with petroleum based low sulfur diesel fuel(control group).
Visits were made to the cooperating mass transit agency to perform an initial vehicleinspection and explain both the importance of and how to accurately collect thisinformation. All test buses are being used in normal daily service. Data were collected todetermine the actual impact ofa biodiesel blend on maintenance, cost, fuel economy andsafety (In-service Data Collection, Table 1).
Several steps were taken to increase the quality and reliability ofthe information generatedfrom this project. Unit injectors for fuel in each ofthe ten test buses were replaced withnew unit injectors in April, 1994. At the close ofthe demonstration in September, 1995,selected unit injectors will be returned to DDC for examination by their analyticallaboratory. Injectors were replaced to ensure that any problems that occurred could beattributed to the test conditions. In addition, each ofthe ten test buses were placed in BiState's warranty program. This in-house program allowed MU researchers to track everyevent that happened to the test buses. In addition, Hi-State designated one employee tooversee the implementation ofthe data collection program.
Data are currently being collected using Bi-State's existing operating, dispatching,maintenance, and fueling systems. The data are collected, reported weekly and forwardedto the University ofMissouri Agricultural Engineering Department. Maintenance data arebeing coded by MU researchers according to type; scheduled, unscheduled, or road call.The work performed and parts replaced are coded using the American TruckingAssociation format to facilitate data entry and to allow the researchers to compare datafrom fleets that are testing other alternative fuels. Vehicle performance problems, routeinformation, and safety data are being monitored by Bi-State and forwarded to MU.
Fuel has been sampled and will be analyzed by Analysts, Inc. after each new shipment ofbiodiesel and low sulfur diesel fuel has been delivered. Engine oil samples were taken
895
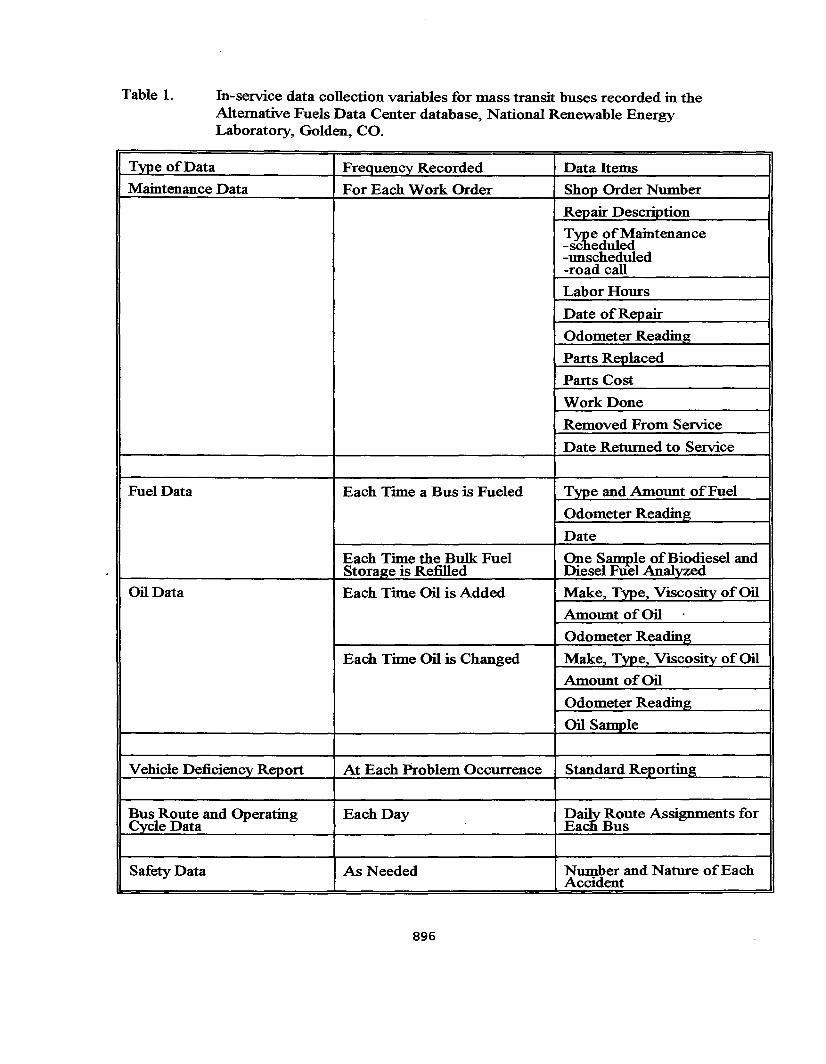
Table 1. In-service data collection variables for mass transit buses recorded in theAlternative Fuels Data Center database, National Renewable EnergyLaboratory, Golden, co.
Type ofData Frequency Recorded Data Items
Maintenance Data For Each Work Order Shop Order Number
Repair Description
T~e ofMaintenance-sc eduled-unscheduled-road call
Labor Hours
Date ofRepair
Odometer Reading
Parts Replaced
Parts Cost
Work Done
Removed From Service
Date Returned to Service
Fuel Data Each Time a Bus is Fueled Type and Amount ofFuel
Odometer Reading
Date
Each Time the Bulk Fuel One Sl!!DPle o~~~esel andStorage is Re:fi11ed Diesel Fuel An d
Oil Data Each Time Oil is Added Make, Type, Viscosity ofOil
Amount ofOil
Odometer Reading
Each Time Oil is Changed Make, Type, Viscosity ofOil
Amount ofOil
Odometer Reading
Oil Sample
Vehicle Deficiency Report At Each Problem Occurrence Standard Reporting
Bus Route and Operating Each Day D~Route Assignments forCycle Data Eac Bus
Safety Data As Needed Number and Nature ofEachAccident
896
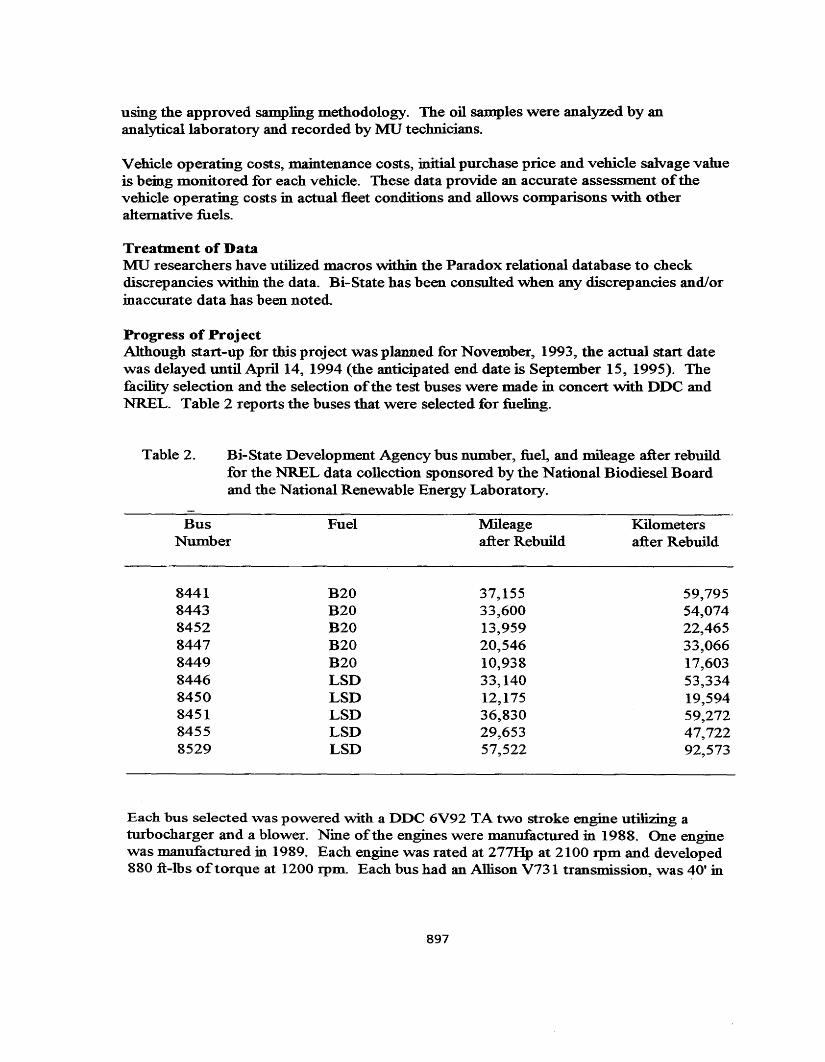
using the approved sampling methodology. The oil samples were analyzed by ananalytical laboratory and recorded by MU technicians.
Vehicle operating costs, maintenance costs, initial purchase price and vehicle salvage valueis being monitored for each vehicle. These data provide an accurate assessment ofthevehicle operating costs in actual fleet conditions and allows comparisons with otherahemative fuels.
Treatment of DataMU researchers have utilized macros within the Paradox relational database to checkdiscrepancies within the data. Bi-State has been consulted when any discrepancies and/orinaccurate data has been noted.
Progress of ProjectAlthough start-up for this project was planned for November, 1993, the actual start datewas delayed until April 14, 1994 (the anticipated end date is September 15, 1995). Thefacility selection and the selection ofthe test buses were made in concert with DDC andNREL. Table 2 reports the buses that were selected for fueling.
Table 2. Bi-State Development Agency bus number, fuel, and mileage after rebuildfor the NREL data collection sponsored by the National Biodiesel Boardand the National Renewable Energy Laboratory.
Bus Fuel Mileage KilometersNumber after Rebuild after Rebuild
8441 B20 37,155 59,7958443 B20 33,600 54,0748452 B20 13,959 22,4658447 B20 20,546 33,0668449 B20 10,938 17,6038446 LSD 33,140 53,3348450 LSD 12,175 19,5948451 LSD 36,830 59,2728455 LSD 29,653 47,7228529 LSD 57,522 92,573
Each bus selected was powered with a DDC 6V92 TA two stroke engine utilizing aturbocharger and a blower. Nine ofthe engines were manufactured in 1988. One enginewas manufactured in 1989. Each engine was rated at 277Hp at 2100 rpm and developed880 ft-Ibs oftorque at 1200 rpm. Each bus had an Allison V73l transmission, was ~O' in
897
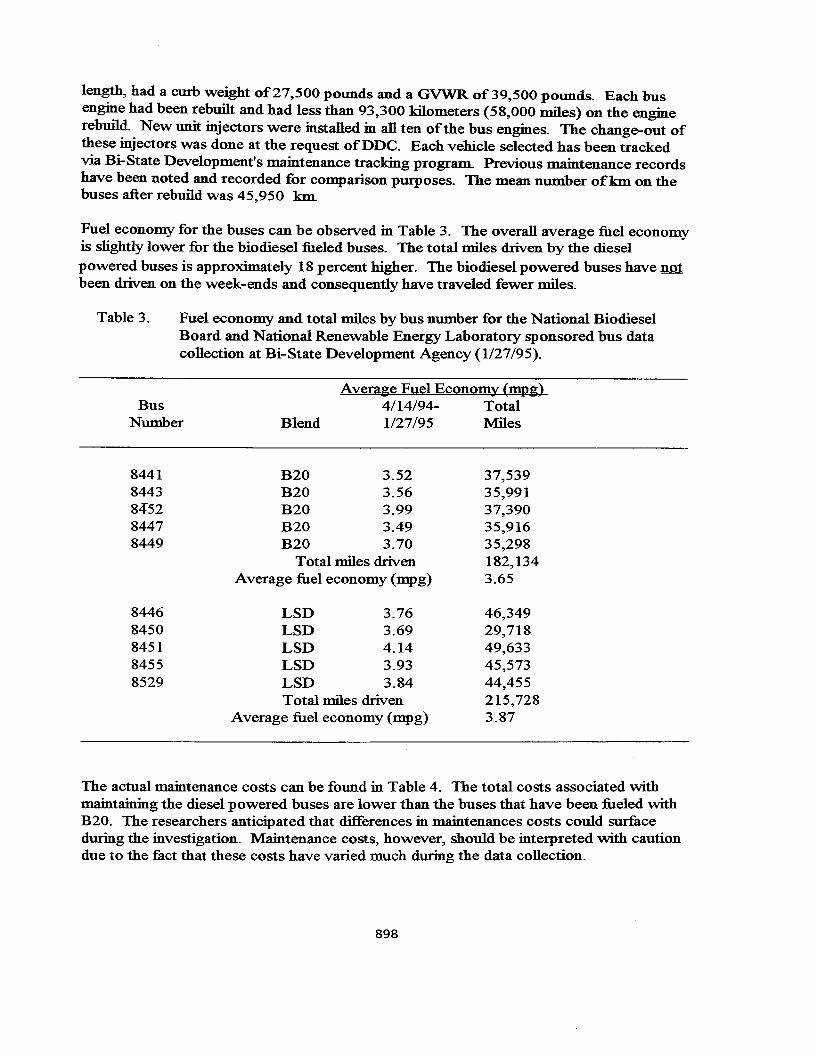
length, had a curb weight of27,500 pounds and a GVWR of39,500 pounds, Each busengine had been rebuilt and had less than 93,300 kilometers (58,000 miles) on the enginerebuild. New unit injectors were installed in all ten ofthe bus engines. The change-out ofthese injectors was done at the request ofDDC. Each vehicle selected has been trackedvia Bi-State Development's maintenance tracking program. Previous maintenance recordshave been noted and recorded for comparison purposes. The mean number ofkm on thebuses after rebuild was 45,950 km.
Fuel economy for the buses can be observed in Table 3. The overall average fuel economyis slightly lower for the biodiesel fueled buses. The total miles driven by the dieselpowered buses is approximately 18 percent higher. The biodiesel powered buses have notbeen driven on the week-ends and consequently have traveled fewer miles.
Table 3. Fuel economy and total miles by bus number for the National BiodieselBoard and National Renewable Energy Laboratory sponsored bus datacollection at Bi-State Development Agency (1/27/95).
BusNumber
Average Fuel Economy (mpg)4/14/94- Total
Blend 1/27/95 Miles
84418443845284478449
84468450845184558529
B20 3.52B20 3.56B20 3.99B20 3.49B20 3.70
Total miles drivenAverage fuel economy (mpg)
LSD 3.76LSD 3.69LSD 4.14LSD 3.93LSD 3.84Total miles driven
Average fuel economy (mpg)
37,53935,99137,39035,91635,298182,1343.65
46,34929,71849,63345,57344,455215,7283.87
The actual maintenance costs can be found in Table 4. The total costs associated withmaintaining the diesel powered buses are lower than the buses that have been fueled withB20. The researchers anticipated that differences in maintenances costs could surfaceduring the investigation. Maintenance costs, however, should be interpreted with cautiondue to the fact that these costs have varied much during the data collection.
898
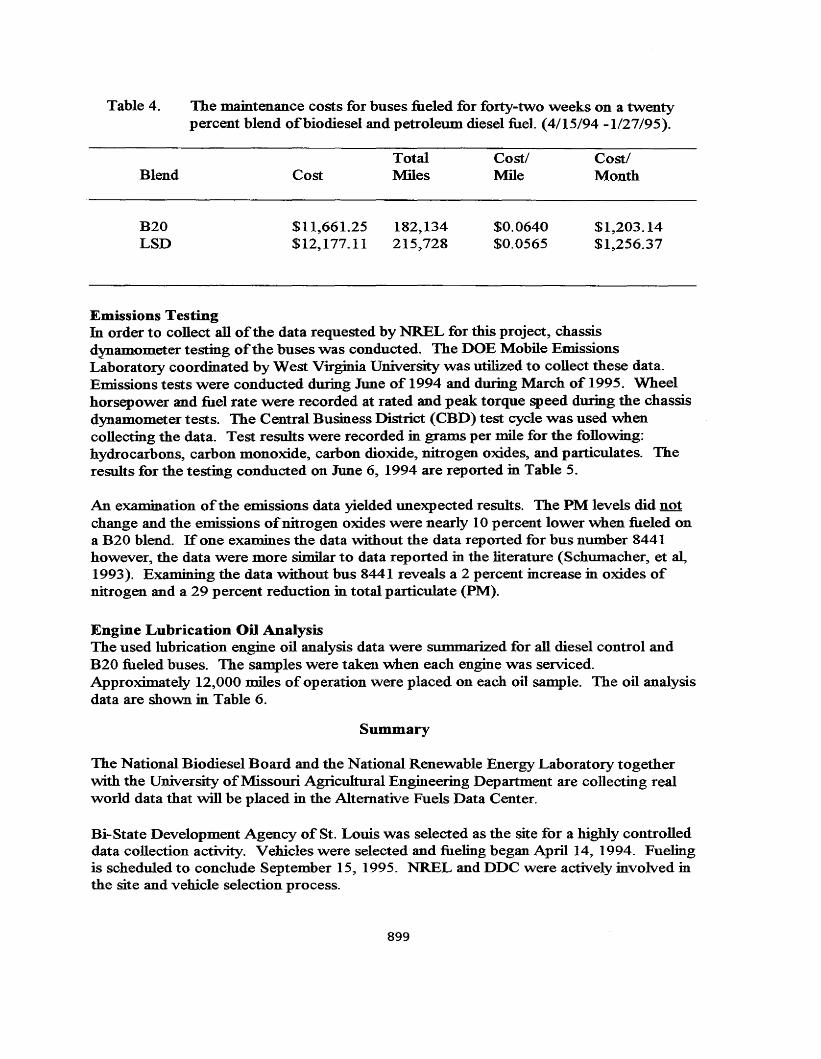
Table 4. The maintenance costs for buses fueled for forty-two weeks on a twentypercent blend ofbiodiesel and petroleum diesel fuel. (4/15/94 -1/27/95).
Blend
B20LSD
Cost
$11,661.25$12,177.11
TotalMiles
182,134215,728
Cost/Mile
$0.0640$0.0565
Cost/Month
$1,203.14$1,256.37
Emissions TestingIn order to collect all ofthe data requested by NREL for this project, chassisdynamometer testing ofthe buses was conducted. The DOE Mobile EmissionsLaboratory coordinated by West Virginia University was utilized to collect these data.Emissions tests were conducted during June of 1994 and during March of 1995. Wheelhorsepower and fuel rate were recorded at rated and peak torque speed during the chassisdynamometer tests. The Central Business District (CBD) test cycle was used whencollecting the data. Test results were recorded in grams per mile for the following:hydrocarbons, carbon monoxide, carbon dioxide, nitrogen oxides, and particulates. Theresults for the testing conducted on June 6, 1994 are reported in Table 5.
An examination ofthe emissions data yielded unexpected results. The PM levels did notchange and the emissions ofnitrogen oxides were nearly 10 percent lower when fueled ona B20 blend. Ifone examines the data without the data reported for bus number 8441however, the data were more similar to data reported in the literature (Schumacher, et al,1993). Examining the data without bus 8441 reveals a 2 percent increase in oxides ofnitrogen and a 29 percent reduction in total particulate (PM).
Engine Lubrication Oil AnalysisThe used lubrication engine oil analysis data were summarized for all diesel control andB20 fueled buses. The samples were taken when each engine was serviced.Approximately 12,000 miles ofoperation were placed on each oil sample. The oil analysisdata are shown in Table 6.
Summary
The National Biodiesel Board and the National Renewable Energy Laboratory togetherwith the University ofMissouri Agricultural Engineering Department are collecting realworld data that will be placed in the Alternative Fuels Data Center.
Bi-State Development Agency of St. Louis was selected as the site for a highly controlleddata collection activity. Vehicles were selected and fueling began April 14, 1994. Fuelingis scheduled to conclude September 15, 1995. NREL and nnc were actively involved inthe site and vehicle selection process.
899
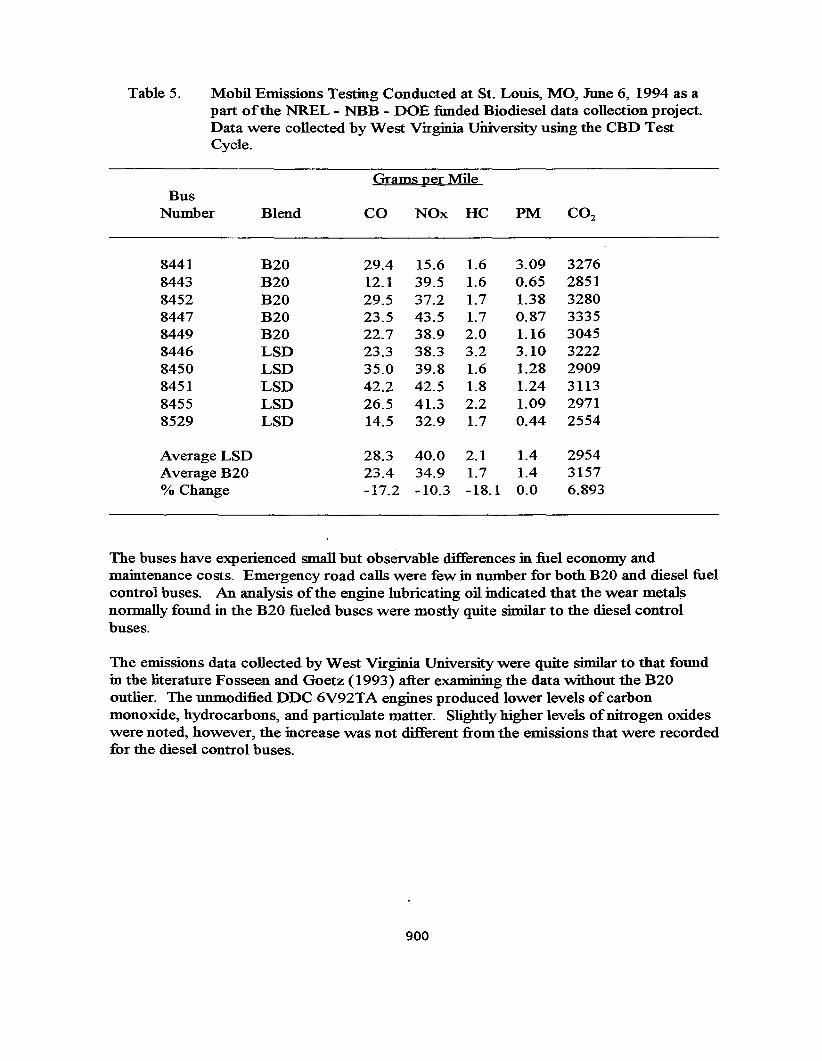
Table 5. Mobil Emissions Testing Conducted at St. Louis, MO, June 6, 1994 as apart ofthe NREL - NBB - DOE funded Biodiesel data collection project.Data were collected by West Virginia Uiiiversity using the CBD TestCycle.
Grams per MileBus
Number Blend CO NOx HC PM CO2
8441 B20 29.4 15.6 1.6 3.09 32768443 B20 12.1 39.5 1.6 0.65 28518452 B20 29.5 37.2 1.7 1.38 32808447 B20 23.5 43.5 1.7 0.87 33358449 B20 22.7 38.9 2.0 1.16 30458446 LSD 23.3 38.3 3.2 3.10 32228450 LSD 35.0 39.8 1.6 1.28 29098451 LSD 42.2 42.5 1.8 1.24 31138455 LSD 26.5 41.3 2.2 1.09 29718529 LSD 14.5 32.9 1.7 0.44 2554
Average LSD 28.3 40.0 2.1 1.4 2954AverageB20 23.4 34.9 1.7 1.4 3157% Change -17.2 -10.3 -18.1 0.0 6.893
The buses have experienced small but observable differences in fuel economy andmaintenance costs. Emergency road calls were few in number for both B20 and diesel fuelcontrol buses. An analysis ofthe engine lubricating oil indicated that the wear metalsnormally found in the B20 fueled buses were mostly quite similar to the diesel controlbuses.
The emissions data collected by West Virginia University were quite similar to that foundin the literature Fosseen and Goetz (1993) after examining the data without the B20outlier. The unmodified DDC 6V92TA engines produced lower levels of carbonmonoxide, hydrocarbons, and particulate matter. Slightly higher levels ofnitrogen oxideswere noted, however, the increase was not different from the emissions that were recordedfor the diesel control buses.
900
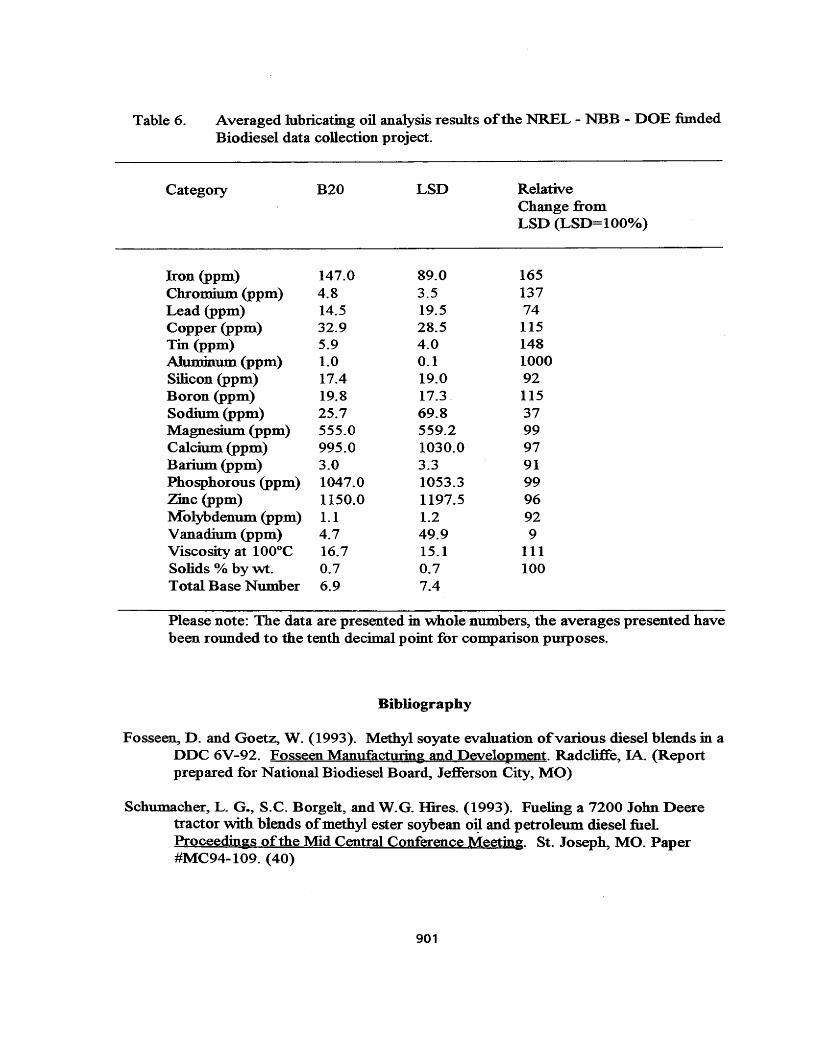
Table 6. Averaged lubricating oil analysis results ofthe NREL - NBB - DOE fundedBiodiesel data collection project.
Category
Iron (ppm)Chromium (ppm)Lead (ppm)Copper (ppm)Tin (ppm)Aluminum (ppm)Silicon (ppm)Boron (ppm)Sodium (ppm)Magnesium (ppm)Calcium (ppm)Barium (ppm)Phosphorous (ppm)Zinc (ppm)Molybdenum (ppm)Vanadium (ppm)Viscosity at 100°CSolids % by wt.Total Base Number
B20
147.04.814.532.95.91.017.419.825.7555.0995.03.01047.01150.01.14.716.70.76.9
LSD
89.03.519.528.54.00.119.017.369.8559.21030.03.31053.31197.51.249.915.10.77.4
RelativeChange fromLSD (LSD=100%)
16513774115148100092115379997919996929
111100
Please note: The data are presented in whole numbers, the averages presented havebeen rounded to the tenth decimal point for comparison purposes.
Bibliography
Fosseen, D. and Goetz, W. (1993). Methyl soyate evaluation ofvarious diesel blends in aDDC 6V-92. Fosseen Manufacturing and Development. Radcliffe, IA. (Reportprepared for National Biodiesel Board, Jefferson City, MO)
Schumacher, L. G.:> S.c. Borgelt, and W.G. Hires. (1993). Fueling a 7200 John Deeretractor with blends ofmethyl ester soybean oil and petroleum diesel fuelProceedings ofthe Mid Central Conference Meeting. St. Joseph, MO. Paper#MC94-109. (40)
901
CONVERSION OF VEGETABLE OILS AND ANIMAL FATSINTO PARAFFINIC CETANE ENHANCERS FOR DIESEL FUELS
A1 wong and yi FengArbokem Inc.
Vancouver, Canada
and
Ed HoganCANMET Natura1 Resources Canada
ottawa, Canada
Abstract
The two principa1 methods of producing biodiese1fue1s are a) transesterification of vegetab1e oi1s and anima1fats with a monohydric a1coho1,and b) direct hydrotreating oftree oi1s,vegetab1e oi1s and anima1 fats.
The patented hydrotreating techno1ogy is based on thecata1ytic processing of biomass oi1s and fats with hydrogen,under e1evated temperature and pressure conditions. Thetypica1 mix of hydrotreated products is as fo11ows: 5-15%1ight disti11ate (naphtha),40-60% midd1e disti11ate (cetane),5-15%J1eavy disti11ate and 5-10% burner gas. The naphthafraction may be used as a gaso1ine supp1ement. The midd1edisti11ate is designed for use as a cetane booster for diese1fue1s. Both heavy disti11ate and 1ight hydrocarbon gases areusab1e as power boi1er fue1s.
Typica11y, the cetane enhancer wou1d be admixed withdiese1 fue1 in the range of 5 to 30% by vo1ume. This newdiese1 b1end meets the essentia1 qua1ity characteristics ofthe basic diese1 fue1,for direct use in diese1 engines withoutany modifications.
The basic hydrotreatment techno1ogy has beeneva1uated further in the 1aboratory on degummed soya oi1,ye110w grease and anima1 ta11ow. The pre1iminary findingssuggest that the techno1ogy can provide efficient conversionof these materia1s into cetane enhancers for diese1 fue1s.
902
Introduction
Cetane number is a measure of the ignition quality ofdiesel fuel [1]. It is analogous to the Octane number for therating of gasoline. Normal hexadecane,n-c~6H34,hasaCetane Number rating of 100. The use of h1gh Cetane Numberfuel in diesel engines can be expected to provide loweremissions of pollutants. The present specification of CetaneNumber of canadian diesel fuel is only 40 minimum [2]. HigherCetane Number in diesel fuel is achieved typically through theuse of nitrate-based ignition additives and/or by moreintensive refining of petroleum in the manufacture of dieselfuel [3].
The two principal methods of producing biodieselfuels are a) transesterification of vegetable oils and animalfats with a monohydric alcohol, and b) direct hydrotreating oftree oils,vegetable oils and animal fats.
Most biomass oil can be esterified with methanol (orethanol) into a suitable diesel fuel additive. The exceptionis tall oil,a product of the wood pUlp industry; it can not beesterified efficiently because its specific chemicalcomposition. In the use of ester-based fuels, the diesel enginehas to be modified to accept the non-specification fuelproduct.
The proprietary Canadian technology is based thecatalyt1c hydrogen treatment of biomass oils under elevatedtemperature and pressure conditions [4,5]. The basictechnology is very similar to that practiced routinely in thepetroleum refining industry. Unlike the conventionalesterification approach, the hydrotreatment process does notproduce any non-fuel hydrocarbon by-products.
Figure 1 illustrates the basic processing scheme. Incommercial practice,it is contemplated that distillation wouldbe applied to produce a naphtha cut (b.p. <200 deg.C),a middledistillate (200 deg.C <b.p. <340 deg.C),and a heavy end (b.p.>340 deg.C). The desired chemical profile of the hydrocarbonproducts obtainable from a specific feedstock can bemanipUlated by the choices of hydrotreatment conditions and/orby distillation cuts.
The cetane (middle distillate) product is paraffinicin nature. Typically,it has a Cetane Number of 55 to 90,depending on product design. It is anticipated that theblending of this cetane enhancer into standard (petroleumbased) diesel fuel would be in the range of 5 to 30% byvolume.
903
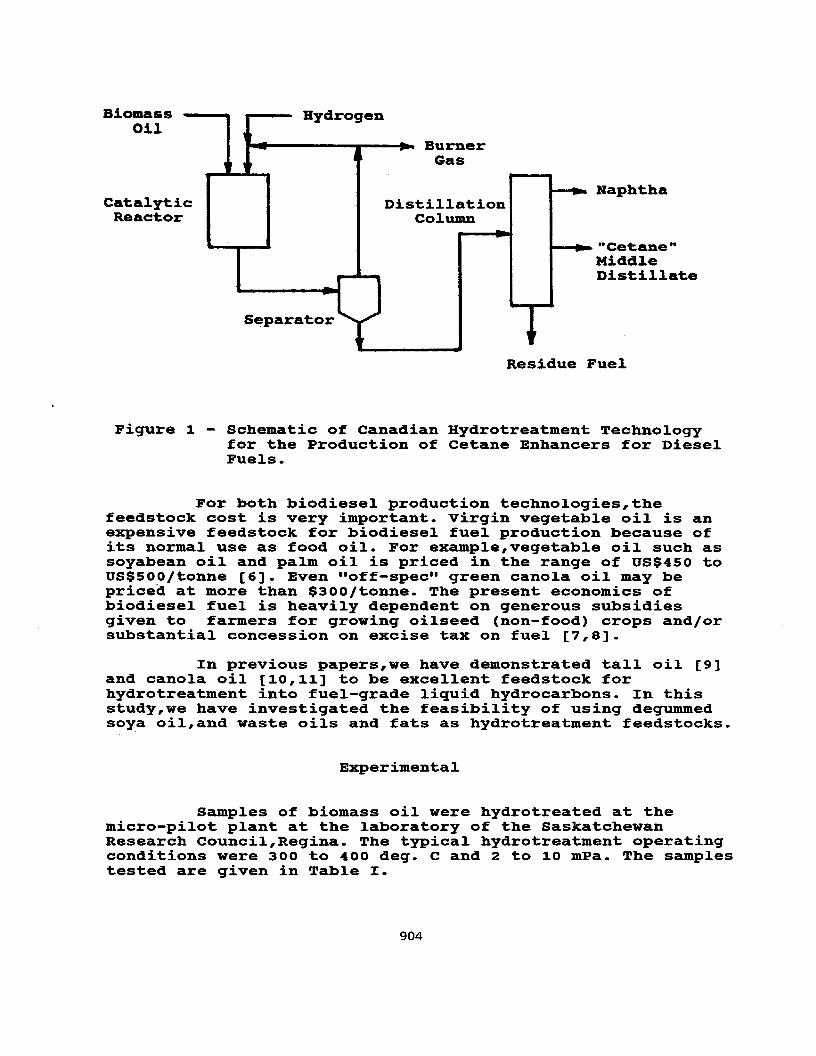
BiomassOil
-Hydrogen
BurnerGas
CatalyticReactor
,
Distil.l.ationCol.umn
I---- Naphtha
~_- "Cetane"Middl.eDistillate
Iseparatory
.....----...Residue Fuel
Figure 1 - Schematic of Canadian Hydrotreatment Technol.oqyfor the Production of Cetane Enhancers for Diesel.Fuel.s.
For both biodiesel. production technol.ogies,thefeedstock cost is very important. virgin vegetabl.e oil. is anexpensive feedstock for biodiesel. fuel. production because ofits normal. use as food oil.. For exampl.e,vegetabl.e oil. such assoyabean oil. and pal.m oil. is priced in the range of US$450 toUS$500/tonne [6]. Even "off-spec" green canol.a oil. may bepriced at more than $300/tonne. The present economics ofbiodiesel. fuel. is heavil.y dependent on generous subsidiesgiven to farmers for growing oil.seed (non-food) crops and/orsubstantial. concession on excise tax on fuel. [7,8].
In previous papers,we have demonstrated tal.l. oil. [9]and canol.a oil. [10,11] to be excel.l.ent feedstock forhydrotreatment into fuel.-grade l.iquid hydrocarbons. In thisstudy,we have investigated the feasibil.ity of using degummedsoya oil.,and waste oil.s and fats as hydrotreatment feedstocks.
Experimental.
Sampl.es of biomass oil. were hydrotreated at themicro-pil.ot pl.ant at the l.aboratory of the SaskatchewanResearch Council.,Regina. The typical. hydrotreatment operatingconditions were 300 to 400 deg. C and 2 to 10 mPa. The sampl.estested are given in Tabl.e I.
904
Table X - samples of Biomass oil Tested
Twe
Deqummed soya oil
Yellow Grease
Animal Tallow
commercial Source
xowa,united states
ontario, Canada
British Columbia, Canada
Typica11y,the neat hydrotreated sample was thenanalyzed using gas chromatography (GC) and gas chromatoqraphymass spectrometry (GC/MS) at the Arbokem Inc. laboratory inVancouver. The GC and GC/MS test conditions used have beendescribed elsewhere [12].
The feedstock oil was routinely saponified, and thereSUlting fatty acids were methylated with methanol in thepresence of BF 3 catalyst. Pentadecanoic acid (C15:0) orheptadecanoic acid (17:0) ester was used as the internalstandard. Hydrotreated samples did not require anyderivatization. Tetradecane or hexadecane was used as theinternal standard in the GC analysis of hydrotreated samples.
Results and Discussion
Deqummed Soya oil
This sample of deqummed soya oil (DBO) was providedby the National soydiesel Development Board (Jefferson City,MO). It is envisaged that deqummed soya oil would be pricedlower than degummed,refined soya oil,as a feedstock for cetaneproduction.
The predominant fatty acids in the DSO were C18:1(18.7%) and C18:2 (62.2%). As shown in Figure 2,C17 and C18parafffins are the principal components of hydrotreated DSO.The normal paraffins in the range of C6 to C24 account forabout 88% of the total hydrocarbons. Small amounts ofbranched/cyclic alkanes and alkenes were also detected in thehydrotreated liquid product. The middle distillate isestimated to have a Cetane Number >90.
905
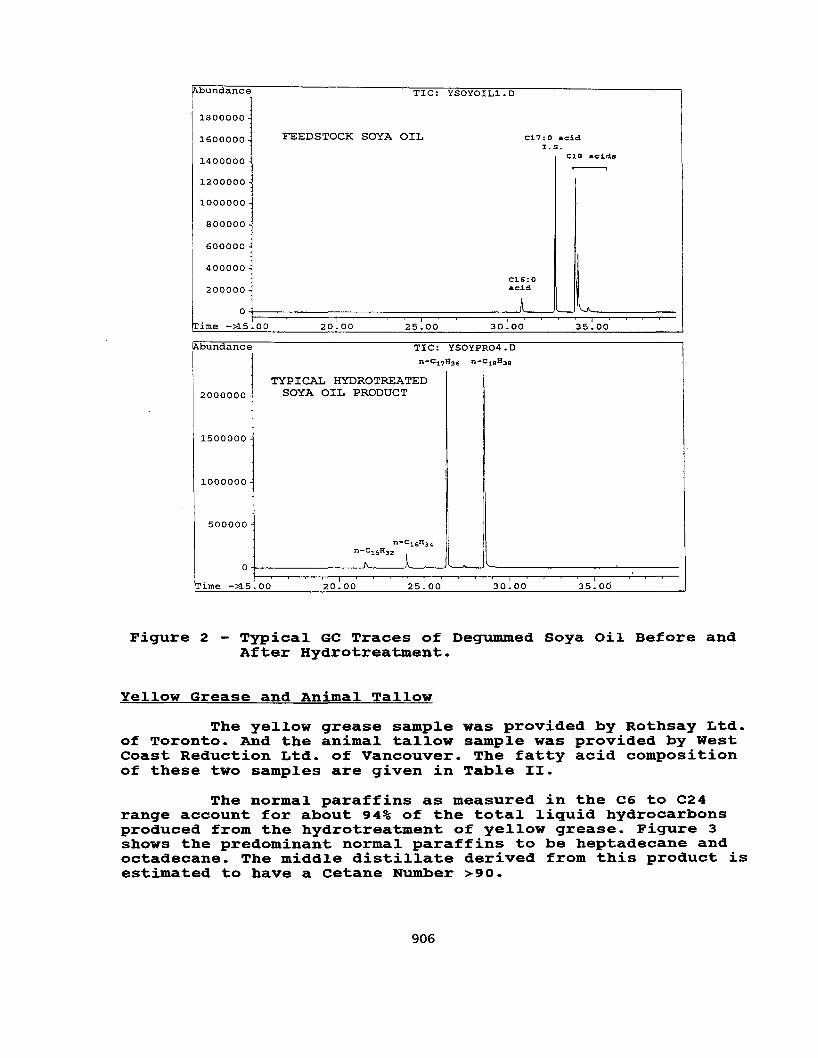
IAbundance
1800000
1600000
1400000
1200000
1000000
800000
600000
400000
TIC: YSOYOIL1.D
FEEDSTOCK SOYA OIL C17:0 acid.1:.S.
C1.8 aci.ds
200000C16:0acid.
bundance
2000000
1500000
1000000
500000
TIC: YSOYPR04.D
TYPICAL HYDROTREATEDSOYA OIL PRODUCT
ime ->15.00 20.00 25.00 30.00 35.00
Figure 2 - Typica1 GC Traces of Deqummed soya oi1 Before andAfter Hydrotreatment.
Ye110w Grease and Anima1 Ta110w
The ye110w grease samp1e was provided by Rothsay Ltd.of Toronto. And the anima1 ta110w samp1e was provided by WestCoast Reduction Ltd. of Vancouver. The fatty acid compositionof these two samp1es are given in Tab1e II.
The norma1 paraffins as measured in the C6 to C24range account for about 94% of the tota1 1iquid hydrocarbonsproduced from the hydrotreatment of ye110w grease. Figure 3shows the predominant norma1 paraffins to be heptadecane andoctadecane. The midd1e disti11ate derived from this product isestimated to have a Cetane Number >90.
906
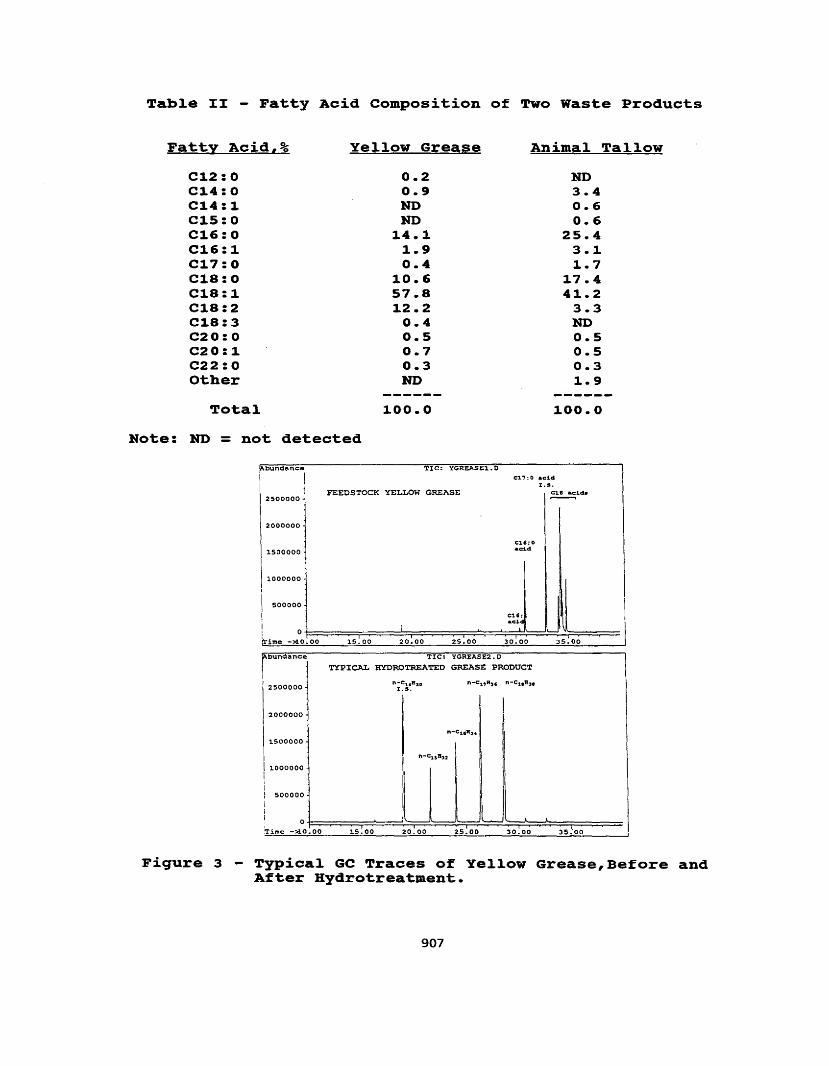
Table II - Fatty Acid Composition of Two Waste Products
Fatty Acid,% Yell.ow Grease Animal Tallow
C12:0C14:0C14:1C15:0C16:0C16:1C17:0C18:0C18:1C18:2C18:3C20:0C20:1C22:0Other
0.20.9NDND
14.11.90.4
10.657.812.20.40.50.70.3NO
ND3.40.60.6
25.43.11.7
17.441.2
3.3NO0.50.50.31.9
Total 100.0 100.0
Note: ND = not detected
!AbundanceiI
2500000
TIC: YGREASE:l..OC:17:0 ac1.d.
1.5.
FEEDSTOCK YELLOW GREASE CU ae1.d.a
2000000
:1.500000
:35.00
\ :1.000000II
I 500000
i
i 0 i~:;:::::;:::::;::=:;::::;=;:=:;=;:2:;:;:::::;:::::::;:::::;::=:::=T:::::::::=:~~::!;:::;:~~::;::::::;::::::;::::=(rime ->lD.OO
rbun ance
i, 2500000
TIC: YGREASE2.D
TYPIC1>.L HYDROTREATED GREASE PRODUCT
2000000
1500000
1000000
500000
Fiqure 3 Typical. GC Traces of Yel.low Grease,Before andAfter Hydrotreatment.
907
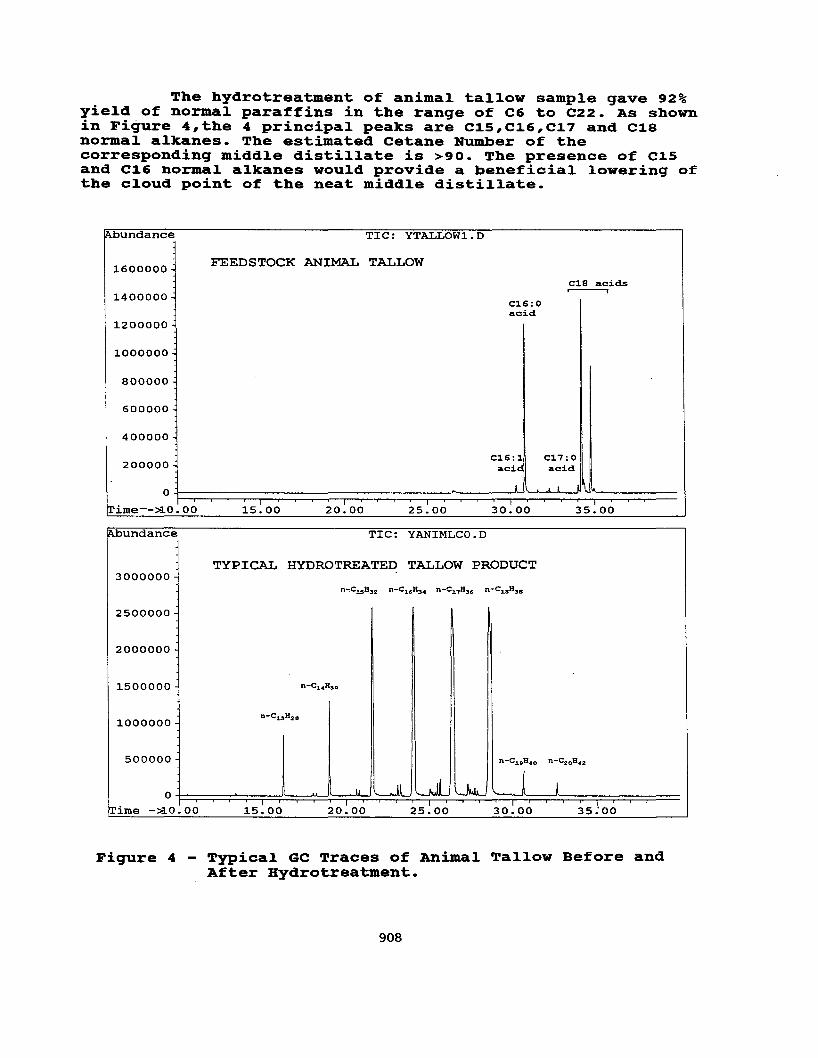
The hydrotreatment of anima1 ta110w samp1e gave 92%yie1d of norma1 paraffins in the range of C6 to C22. As shownin Figure 4,the 4 principa1 peaks are C1S,C16,C17 and C18norma1 a1kanes. The estimated Cetane Number of thecorresponding midd1e disti11ate is >90. The presence of C1Sand C16 norma1 a1kanes wou1d provide a beneficia1 10wering ofthe c10ud point of the neat midd1e disti11ate.
bundance
1600000
1400000
1200000
1000000
800000
600000
400000
200000
TIC: YTALLOW1.D
FEEDSTOCK ANIMAL TALLOW
C18 acids.....---,
C16:0acid
C16:1 C17:0acic acid
I 1 I
bundance
I15.00 20~00
I25.00
TIC: YANIMLCO.D
30~00 35~00
3000000
2500000
2000000
1500000
1000000
TYPICAL HYDROTREATED TALLOW PRODUCT
500000
15.00
II
20.00 25.00 30.00
I35:00
Figure 4 - Typica1 GC Traces of Anima1 Ta110w Before andAfter Hydrotreatment.
908
Concluding Remarks
The novel hydrotreatment technology provides anothermeans for the biomass oil industry to meet the increasingdemand for cleaner-burning diesel fuels.
The present study demonstrated that various types ofvirgin and waste biomass oils can be used as feedstock for theproduotion of cetane enhancers. In commercial practice, theneat hydrotreated product would be separated by distillationinto specific fuel products. The middle distillate fractionwith predominantly normal paraffins would have Cetane Numberin excess of 90.
Acknowledgment
The skillful technical work of the staff of theSaskatchewan Research Council (SRC Regina) is recognized. Theproject work at SRC was funded by CANMET-Natural ResourcesCanada.
The cooperation of the Aq processing Inc. (SergeantBluff,~A),National soydiesel Development Board (JeffersonCity,MO),Fats and Protein Research Foundation Inc.(Bloomington,IL),West Coast Reduction Ltd. (Vancouver,BC) andRothsay Ltd. (Toronto, ontario) in providing test samples aregratefully acknowledged.
AK13160
909
Literature cited
1. ASTM D613-86,"standard Test Method for Ignition Quality ofDiesel Fuels by the Cetane Method".
2. Almdal,w.W. et al.,"All-Synthetic Diesel Fuel fromAthabasca Bitumen: properties, Testing and operatingExperience",proc. ACS Division Fuel Chemistry Meeting,34,4:1149-1159 (1989).
3. Stumborg,M. et al.,"Catalytic Conversion of Vegetable oilsto Diesel Additives",Proc. XVI Energy from Biomass andWastes conference,IGT,Orlando,FL,March 2-6,1992.
4. craig,w. and Coxworth,E.,"Conversion of Vegetable oils toConventional Liquid Fuel Extenders",Proc. 6th CanadianBioenergy R&D Seminar,Ricbmond,B.C.,February 16-18,1987.
5. Craig,w.X. and soveran,D.W.,"Production of Hydrocarbonswith a Relatively High cetane Rating",u.S. Patent4,992,605 (February 12,1991).
6. Chemical Marketing Reporter,May 1,1995.
7. Howell,S.,"Biodiesel Boom or Bust?",Proc. Bio-OilsSymposium,SCDc,saskatoon,canada,March 2-3,1994.
8. Xarbitz,W.,"Status of BioDiesel Production in Europe",Proc. Bio-oils symposium,SCDc,saskatoon,canada,March 2-3,1994.
9. Wong.,A.,"Tall oil-based cetane enhancer for diesel fuel",Pulp Paper Can. (in press,1995).
10. Wong,A. et al.,"Technical and Economic Aspects ofManufacturing Cetane-Enhanced Diesel Fuel from CanolaOil",Proc. Bio-oils Symposium,SCDC,Saskatoon,canada,March 2-3,1994.
11. Stumborg,M. et al.,1994. "Hydroprocessed Vegetable oilsfor Diesel Fuel Improvement",paper presented at the 2ndAlternative Energy Conference: Liquid Fuels,Additives andLubricants from Biomass,xansas city,MO,June,1994.
12. Feng,Y. et al.,"Chemical composition of tall oil-basedcetane enhancer for diesel fuels",Proc. 1st BiomassConference of the Americas,Burlington,VT.,september,1993.
910
HYDROGENATED SOy ETHYL ESTER (HySEE)FROM ETHANOL AND WASTE VEGETABLE OIL
Charles Peterson, Ph.D, Professor; Daryl Reece, MS., Engineering Technician,Joseph Thompson, MS., Engineering Technician; Brian Hammond, B.S., Graduate Assistant
Sidney Beck, Ph.D., Professor Emeritus, BacteriologyDepartment ofAgricultural Engineering
University ofIdahoMoscow, ID 83844-2040, U.S.A
Abstract
Biodiesel is gaining recognition in the United States as a renewable fuel which may be used as analternative to diesel fuel without any modifications to the engine. Currently the cost ofthis fuel isthe factor that limits its use. One way to' reduce the cost ofbiodiesel is to use a less expensive formof vegetable oil such as waste oil from a processing plant. These operations use mainlyhydrogenated soybean oil, some tallow and some Canola as their frying oils. It is estimated thatthere are several million pounds ofwaste vegetable oil from these operations. Additional wasteflying oil-is available from smaller processors, off-grade oil seeds and restaurants.
This paper reports on developing a process to produce the :first 945 liters (250 gallons) ofHySEEusing recipes developed at the University of Idaho; fuel characterization tests on the HySEEaccording to the ASAE proposed Engineering Practice for Testing of Fuels from BiologicalMaterials, X552; short tenn injector coking tests and-performance tests in a turbocharged, DL CIengine; and a 300 hour screening test in a single cylinder, IDL CI engine.
911
Introduction
Due to increasing enviromnental awareness, Biodiesel is gaining recognition in the United Statesas a renewable fuel which may be used as an alternative to diesel fuel without any modificationsto the engine. Biodiesel fuels can be produced from ethanol and vegetable oil, both agriculturallyderived products. As such, they provide several advantages: they are renewable, they are safer,they are biodegradable, they contain little or no sulfur and they reduce engine exhaust smoke.Currently, the cost ofthis fuel is a primary factor that limits its use. One way to reduce the costof Biodiesel is to use a less expensive form of vegetable oil such as waste oil from a potatoprocessing plant.
Idaho produces approximately 120 million cwt ofpotatoes from over 152,000 ha annual. Nearly60 percent ofthese are processed, the vast majority being made into french fried potatoes. Theseoperations use mainly hydrogenated soybean oil, some beeftallow, and canola. It is estimated thatthere are several million pounds ofwaste vegetable oil from these operations each year. Additionalwaste frying oil is available from smaller processors, off-grade oil seeds and restaurants.
One ofthese processors, produces over 2 billion pounds offrozen potatoes per year at plants inOregon, Idaho and North Dakota. 'This company built two ethanol plants in the late 1980's, whichpotato waste is the feedstock. One plant provides an opportunity for a Biodiesel facility usingwaste vegetable oil and ethanol to produce hydrogenated soy ethyl esters (HySEE). The marketvalue ofwaste flying oils is about $0.11 per liter ($0.40 per gallon). Ethanol hasa plant value ofabout $0.28 per liter ($1.05 per gallon). It is projected that this facility could produce Biodieselat only slightly over $0.25 per liter ($1.00 per gallon) making it economically comparable to dieselfuel.
Biodiesel is being demonstrated as a motor fuel in an ongoing project entitled, "Demonstration ofthe On-the-Road Use ofBiodiesel." This project is a cooperative effort between the UniversityofIdaho and the Idaho Department ofWater Resources. Hydrogenated soy ethyl ester (HySEE)hasgood possibilities for use as a diesel fuel substitute because:
• Biodiesel made from waste french fly oil may be cost competitive with diesel fuel and otherdiesel substitutes.
• Ethyl Esters may reduce emissions which may help open markets in urban areas.• Ethyl Esters are made from ethanol and vegetable oil. They are therefore completely biomass
derived products.• Ethanol is nontoxic, making it safer to work with than methanol.
Objectives
1. Produce 1000 liters (250 gallons) ofHySEE using the University ofIdaho's AgriculturalEngineering transesteri:fication process.
2. Perform fuel characterization tests on the HySEE according to the ASAE proposedEngineering Practice for Testing ofFuels from Biological Materials, X552.
3. Conduct short term injector coking tests as reportedin Korus, Jo and Peterson (1985)using HySEE with three replicate runs on a John Deere 4239T test engine. This testincludes torque tests and mapping engine performance.
4. Conduct a 300 hour engine durability screening test using the Agricultural EngineeringDepartment's Yanmar TS70C single cylinder diesel engines.
912
5. Compare regulated emissions data including total hydrocarbons (HC), carbon monoxide(CO), carbon dioxide (COJ, nitrogen oxides (NOx), and particulate matter (PM) forHySEE and diesel control fuel.
Materials and Methods
Fuel ProductionThe potato processing company supplied a sufficient amount ofwaste hydrogenated soybean oilto produce 1000 liters (250 gallons) ofHySEE. This was produced at the University ofIdaho'sAgricultural Engineering Laboratory farm scale processing facility using a recipe developed by theAgricultural Engineering Department personnel. Phillips 66 Company low sulfur diesel referencefuel was used asthe baseline fuel for the 101m Deere engine testing and emissions testing, and D2from a local vendor was used for the 300 hour Yanmar engine testing.
Fuel CharacterizationThe fuels were characterized by evaluating the parameters required in ASAE EP X552. The testsfor specific gravity, viscosity, cloud point, pour point, flash point, heat ofcombustion, total acidvalue, catalyst, and fatty acid composition were performed at the Analytical Lab, Department ofAgricultural Engineering, University of Idaho. The boiling point, water and sediment, carbonresidue, ash, sulfur, cetane number,copper corrosion, Karl FJSChec water, particulate matter, iodinenumber, and the elemental analysis were performed at Phoenix Chemical Labs, Chicago IDinois.The high performance liquid chromatograph (HPLC) and titration analysis for total and freeglycerol, percent of oil esterified, free tatty acids, and mono-, di-, and trigylicerides wereperformed by Diversified Labs Inc., Chantilly~ Virginia.
Engine Performance TestsAll engine performance tests were conducted in the engine performance lab at the University ofIdaho. The equipment used and tests conducted are described below. The short term tests wereperformed with an in-line four cylinder John Deere 4239T turbocharged, direct injected dieselengine. It has a displacement of3.91iters (239 cubic inches), a high RPM of2650, 61 kW (82 hp)at 2500 RPM, and 290 Nm (214 ft lbt) torque at 1500 RPM. It is attached to a General Electric119 kW (159 hp) cradle dynamometer. The engine was not modified in any way for use withrenewable fuels.
A Hewlett Packard data acquisition unit (model 3497-A) and a personal computer were used tocollect data every thirty seconds for each ofthe test. Torque, power, opacity, fuel consumption,and temperatures ofvarious engine parameters were monitored throughout the testing and savedinto a data file.
Fuel Flow Equipment'The fuel deliveryand return lines were adapted with quick couplers for fast and clean changing ofthe fuels. Indiviclual19liter (5 gallon) metal fuel tanks were modified with a fuel filter and flexiblefuel lines which could be connected to the engine quick couplers. Fuel flow rate was determinedby direct weighing. 'Thefuel containers were placed on an electric 45.4 kg (100 lb) scale accurateto 23 grams (O.05Ib) withRS232 capability.
Opacity MeterA Telonic Berkley model 200 portable opacity meter was connected to the data acquisition unit.The opacity meter consists ofa light source positioned on one side ofthe exhaust stream and a
913
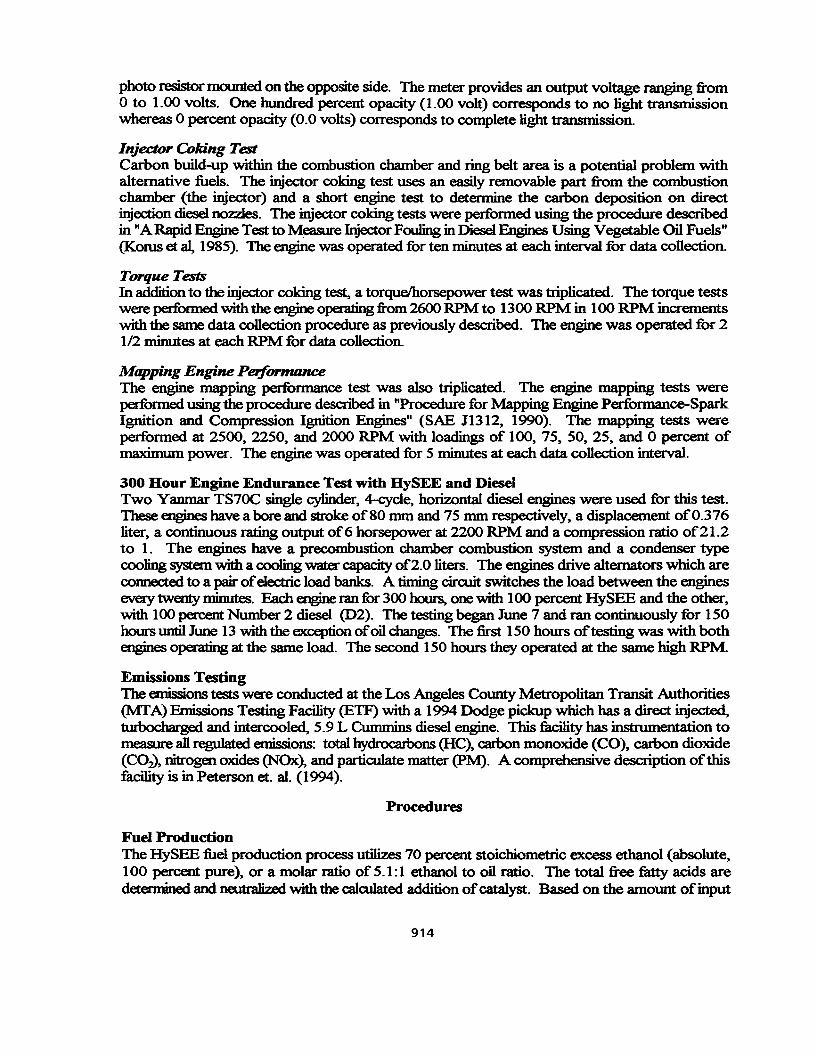
photo resistor motmted on the opposite side. The meter provides an output voltage ranging fromo to 1.00 volts. One hundred percent opacity (1.00 volt) corresponds to no light transmissionwhereas 0 percent opacity (0.0 volts) corresponds to complete light transmission.
Injector Coking TestCarbon build-up within the combustion chamber and ring belt area is a potential problem withalternative fuels. The injector coking test uses an easily removable part from the combustionchamber (the injector) and a short engine test to determine the carbon deposition on directinjection diesel nozzles. The injector coking tests were performed using the procedure describedin "ARapid Engine Test to Measure Injector Fouling in Diesel Engines Using Vegetable Oil Fuels"(Korns et a1, 1985). The engine was operated for ten minutes at each interval for data collection.
Torque TestsIn addition to the injector coking test, a torque/horsepower test was triplicated. The torque testswere perfonned with the engine operating from 2600 RPM to 1300 RPM in 100 RPM incrementswith the same data collection procedure as previously described. The engine was operated for 21/2 minutes at each RPM for data collection.
Mapping Engine PerformanceThe engine mapping performance test was also triplicated. The engine mapping tests wereperfonned using the procedure described in "Procedure for Mapping Engine Performance-SparkIgnition and Compression Ignition Engines" (SAE 11312, 1990). The mapping tests wereperformed at 2500, 2250, and 2000 RPM with loadings of 100, 75, 50, 25, and 0 percent ofmaximum power. The engine was operated for 5 minutes at each data collection interval.
300 Hour Engine Endurance Test with HySEE and DieselTwo Yanmar TS70C single cylinder, +cycle, horizontal diesel engines were used for this test.These engines have a bore and stroke of80 mm and 75 mm respectively, a displacement of0.376liter, a continuous rating output of6 horsepower at 2200 RPM and a compression ratio of21.2to 1. The engines have a precombustion chamber combustion system and a condenser typecooling system with a cooling water capacity of2.0 liters. The engines drive alternators which areconnected to a pair ofelectric load banks. A timing circuit switches the load between the enginesevery twenty mimrtes. Each engine ran for 300 hours, one with 100 percent HySEE and the other,with 100 percent Number 2 diesel (02). The testing beganJune 7 and ran continuously for 150hoursuntil June 13 with the exception ofoil changes. The first 150 hours oftesting was with bothengines operating at the same load. The second 150 hours they operated at the same high RPM
Emissions TestingThe emissions tests were conducted at the Los Angeles County Metropolitan Transit Authorities(MfA) Emissions Testing Facility (ETF) with a 1994 Dodge pickup which has a direct injected,turbocharged and intercooled, 5.9 L Cummins diesel engine. This facility has instrumentation tomeasure all regulated emissions: total hydrocarbons (HC), carbon monoxide (CO), carbon dioxide(CO~, nitrogen oxides (NOx), and particulate matter (PM). A comprehensive description ofthisfacility is in Peterson et. aI. (1994).
Procedures
Fuel ProductionThe HySEE fuel production process utilizes 70 percent stoichiometric excess ethanol (absolute,100 percent pure), or a molar ratio of 5.1: 1 ethanol to oil ratio. The total free tatty acids aredetennined and neutralized with the calculated addition ofcatalyst. Based on the amount ofinput
914
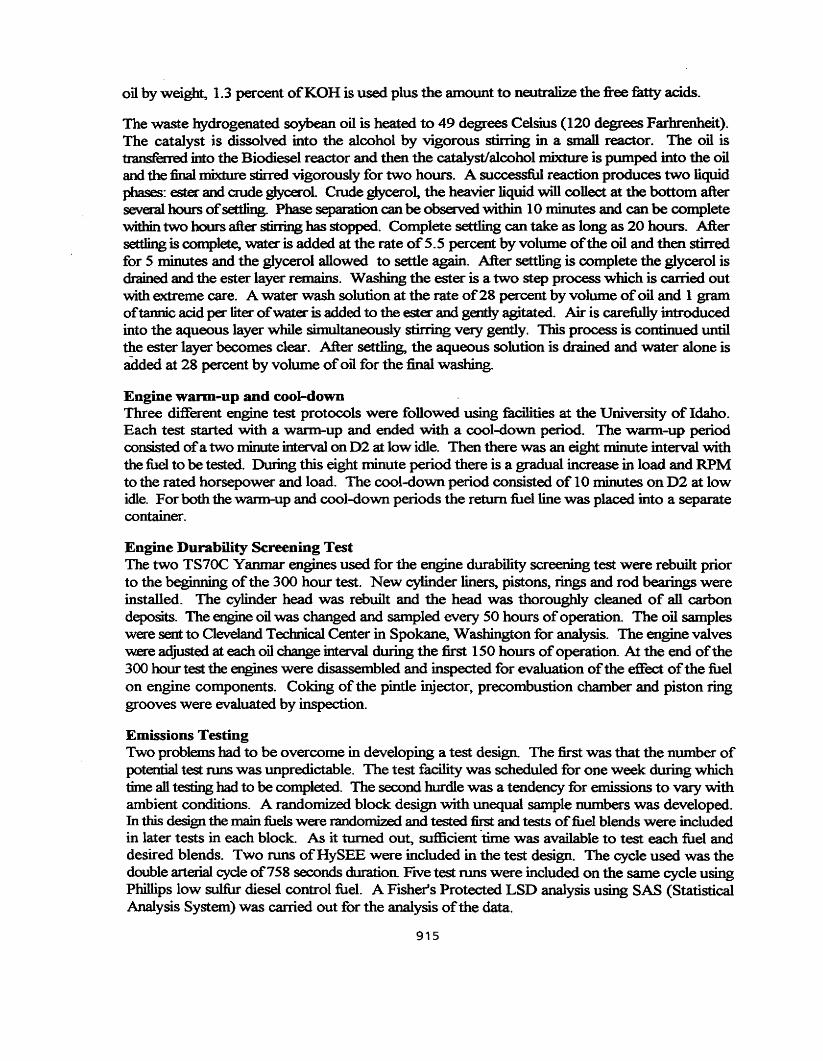
oil by weight, 1.3 percent ofKOH is used plus the amount to neutralize the free fatty acids.
The waste hydrogenated soybean oil is heated to 49 degrees Celsius (120 degrees Farhrenheit).The catalyst is dissolved into the alcohol by vigorous stining in a small reactor. The oil istransferred into the Biodiesel reactor and then the catalyst/alcohol mixture is pumped into the oiland the :final mixture stirred vigorously for two hours. A successful reaction produces two liquidphases: ester and crudeglycerol Crude glycerol, the heavier liquid will collect at the bottom afterseveral hours ofsettling. Phase separation can be observed within 10 minutes and can be completewithin two hours after stirring has stopped. Complete settling can take as long as 20 hours. AftersettIing is complete, water is added at the rate of5.5 percent by volume ofthe oil and then stirredfor 5 minutes and the glycerol allowed to settle again. After settling is complete the glycerol isdrained and the ester layer remains. Washing the ester is a two step process which is carried outwith extreme care. A water wash solution at the rate of28 percent by volume ofoil and 1 gramoftannic acid per liter ofwater is added to the ester and gently agitated. Air is carefully introducedinto the aqueous layer while simultaneously stirring very gently. This process is continued untilthe ester layer becomes clear. After settling, the aqueous solution is drained and water alone isadded at 28 percent by volume ofoil for the final washing.
Engine warm-up and cool-downThree different engine test protocols were followed using facilities at the University of Idaho.Each test started with a warm-up and ended with a cool-down period. The warm-up periodconsisted ofa two minute interval on D2 at low idle. Then there was an eight minute interval withthefuel to be tested. During this eight minute period there is a gradual increase in load and RPMto the rated horsepower and load. The cool-down period consisted of 10 minutes on D2 at lowidle. For both the warm-up and cool-down periods the return fuel line was placed into a separatecontainer.
Engine Durability Screening TestThe two TS70C Yanmar engines used for the engine durability screening test were rebuilt priorto the beginning ofthe 300 hour test. New cylinder liners, pistons, rings and rod bearingswereinstalled. The cylinder head was rebuilt and the head was thoroughly cleaned of all carbondeposits. The engine oil was changed and sampled every 50 hours ofoperation. The oil sampleswere sent to Cleveland Teclmical Center in Spokane, Washington for analysis. The engine valvesw.ereadjusted at each oil change interval during the first 150 hours ofoperation. At the end ofthe300 hour test the engines were disassembled and inspected for evaluation ofthe effect ofthe fuelon engine components. Coking of the pintle injector, precombustion chamber and piston ringgrooves were evaluated by inspection.
Emissions TestingTwo problems had to be overcome in developing a test design The first was that the number ofpotential test runs was unpredictable. The test facility was scheduled for one week during whichtimeall testing had to be completed. The second hurdle was a tendency for emissions to vary withambient conditions. A randomized block design with unequal sample numbers was developed.In this design the main fuels were randomized and tested first andtests offuel blends were includedin later tests in each block. As it turned out, sufficient "time was available to test each fuel anddesired blends. Two runs ofHySEE were included in the test design. The cycle used was thedouble arterial cycle of758 seconds duration FIVetest runs were included on the same cycle usingPhillips low sulfur diesel control fuel. A Fisher's Protected LSD analysis using SAS (StatisticalAnalysis System) was carried out for the analysis ofthe data.
915
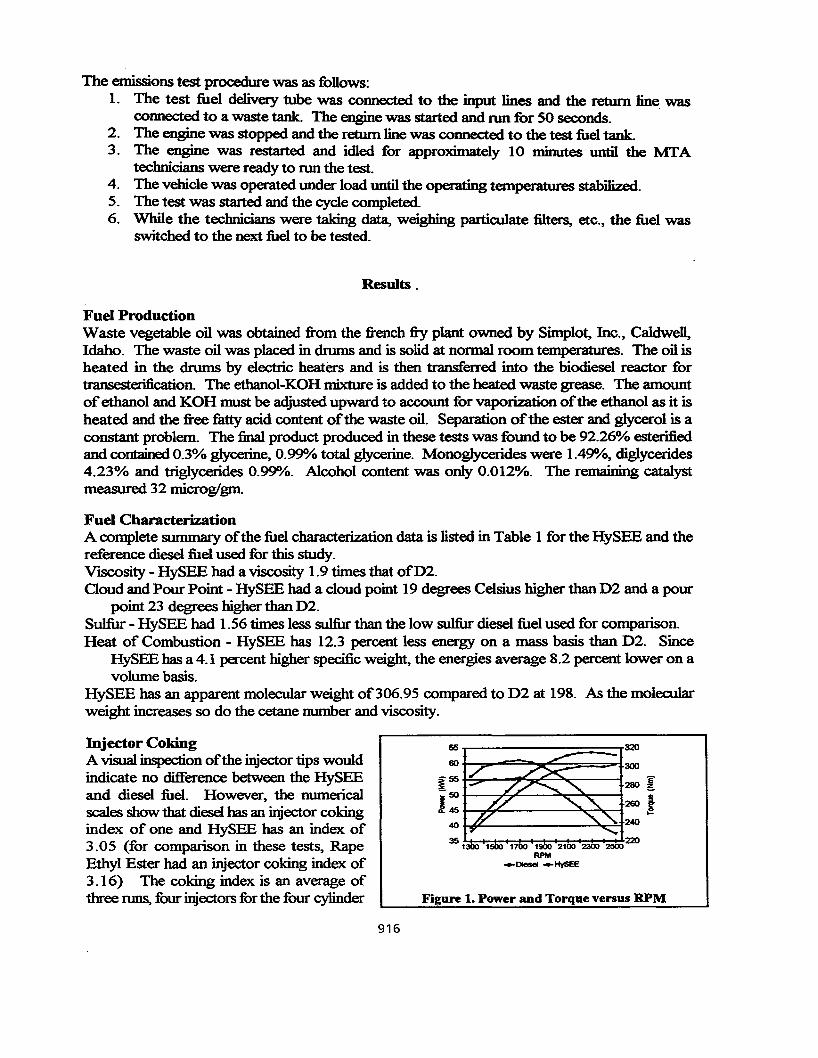
The emissions test procedure was as follows:1. The test fuel delivery tube was connected to the input lines and the return line was
Connected to a waste tank. The engine was started and run for 50 seconds. .2. The engine was stopped and the return line was connected to the test fuel tank.3. The engine was restarted and idled for approximately 10 minutes until the MfA
technicians were ready to run the test.4. The vehicle was operated under load until the operating temperatures stabilized.5. The test was started and the cycle completed.6. While the technicians were taking data, weighing particulate filters, etc., the fuel was
switched to the next fuel to be tested.
Results .
Fuel ProductionWaste vegetable oil was obtained from the french fly plant owned by Simplot, Inc., Caldwell,Idaho. The waste oil was placed in drums and is solid at normal room temperatures. The oil isheated in the drums by electric heaters and is then transferred into the biodiesel reactor fortransesterification. The ethanol-KOH mixture is added to the heated waste grease. The amountofethanol and KOH must be adjusted upward to account for vaporization ofthe ethanol as it isheated and the free fatty acid content ofthe waste oil. Separation ofthe ester and glycerol is aconstant problem. The final product produced in these tests was found to be 92.26% esterifiedand contained 0.3% glycerine, 0.990../0 total glycerine. Monoglycerides were 1.49%, diglycerides4.23% and triglycerides 0.990../0. Alcohol content was only 0.012%. The remaining catalystmeasured 32 microglgm.
Fuel CharacterizationA complete summary ofthe fuel characterization data is listed in Table 1 for the HySEE and thereference diesel fuel used for this study.Viscosity - HySEE had a viscosity 1.9 times that ofD2.Cloud and Pour Point - HySEE had a cloud point 19 degrees Celsius higher than D2 and a pour
point 23 degrees higher than D2.Sulfur - HySEE had 1.56 times less sulfur than the low sulfur diesel fuel used for comparison.Heat of Combustion - HySEE has 12.3 percent less energy on a mass basis than D2. Since
HySEE hasa 4.1 percent higher specific weight, the energies average 8.2 percent lower on avolume basis.
HySEE has an apparent molecular weight of306.95 compared to D2 at 198. As the molecularweight increases so do the cetane number and viscosity.
Injector CokingA visual inspection ofthe injector tips wouldindicate no difference between the HySEEand diesel fuel. However, the numericalscales show that diesel hasan injector cokingindex of one and HySEE has an index of3.05 (for comparison in these tests, RapeEthyl Ester had an injector coking index of3.16) The coking index is an average ofthree nms, four injectors for the four cylinder
916
65 .-----:::==:::132060 300
~ 55 r=:::.-~,.,~~~--J280 !j: 260 i....40f-6'~-----~::-=;
1700 1900 2100 2300 2500 220RPM
_DIesel _HYSEE
Figure 1. Power and Torque versus RPM
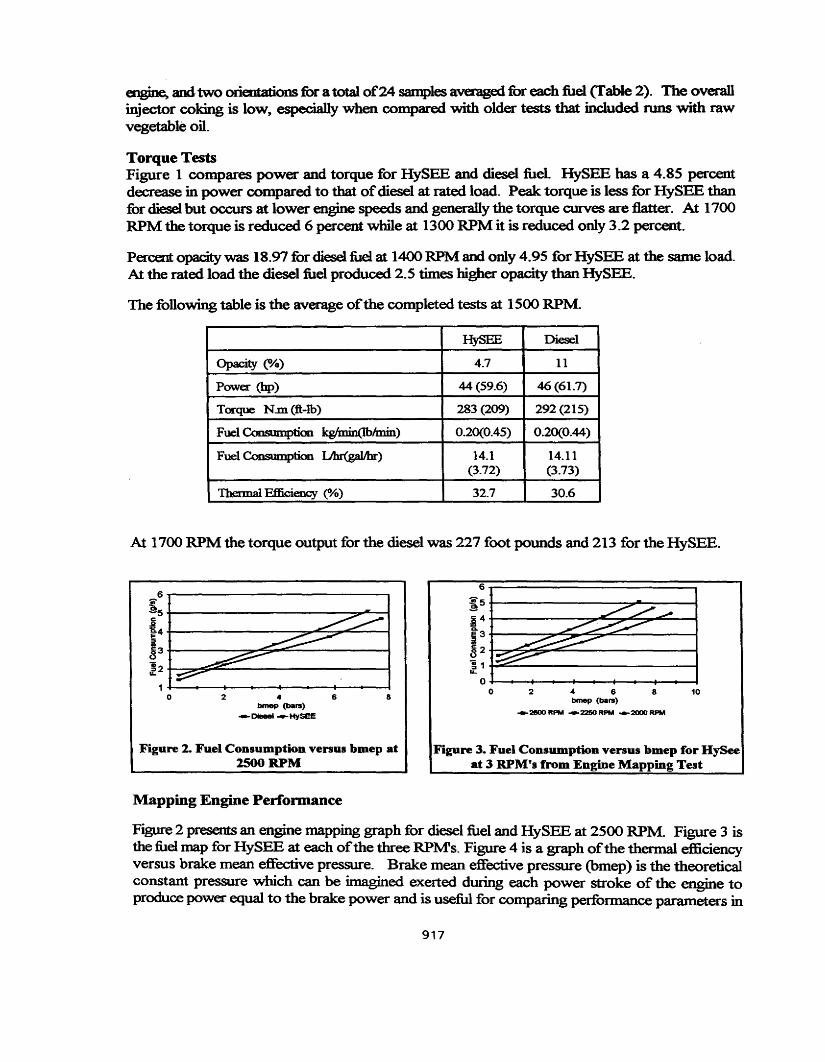
~ andtwo orientations for a total of24 samples averaged for each fuel (fable 2). The overallinjector coking is low, especia1ly when compared with older tests that included runs with rawvegetable oil.
Torque TestsFigure 1 compares power and torque for HySEE and diesel fuel. HySEE has a 4.85 percentdecrease in power compared to that ofdiesel at rated load. Peak torque is less for HySEE thanfor dieselbut occurs at lower engine speeds and generally the torque curves are flatter. At 1700RPM the torque is reduced 6 percent while at 1300 RPM it is reduced only 3.2 percent.
Percent opacity was 18.97 for dieselfuel at 1400RPM and only 4.95 for HySEE at the same load.At the rated load the diesel fuel produced 2.5 times higher opacity than HySEE.
The following table is the average ofthe completed tests at 1500 RPM
HySEE Diesel
Opacity (OA.) 4.7 11
Power (bp) 44(59.6) 46 (61.7)
Tocque N.m(ft-lb) 283 (209) 292(215)
Fuel Consumption kgfmin(1b1min) 0.20(0.45) 0.20(0.44)
Fuel Consumption 1.Jhr(gaIIhr) 14.1 14.11(3.72) (3.73)
Thermal Efficiency (0/0) 32.7 30.6
At 1700 RPM the torque output for the diesel was 227 foot pounds and 213 for the HySEE.
10.. 6 8bmep (bars)
_2500 RPM _2250 RPM _2000 RPM
6
~5
j4~3i82
!1....0
0 28246
bmep (bIIrs)_ 0lelIel _HY$EE
6~-----------.....,.-25 +----------~"..&-__1.§Q.4 +--------~"""'""'"~........-_f§S3 +----......,""""5:;o,....c:;~----__t
l2+--~SO--------------1
Figure 2. Fuel Consumption versus bmep at2500 RPM
Figure 3. Fuel Consumption versus bmep for HySeeat 3 RPM's from Engine Mapping Test
Mapping Engine Performance
Figure 2 presents an engine mapping graph for diesel fuel and HySEE at 2500 RPM Figure 3 isthe fuel map for HySEE at each ofthe three RPMs. Figure 4 is a graph ofthe thermal efficiencyversus brake mean effective pressure. Brake mean effective pressure (bmep) is the theoreticalconstant pressure which can be imagined exerted during each power stroke of the engine toproduce power equal to the brake power and is useful for comparing performance parameters in
917
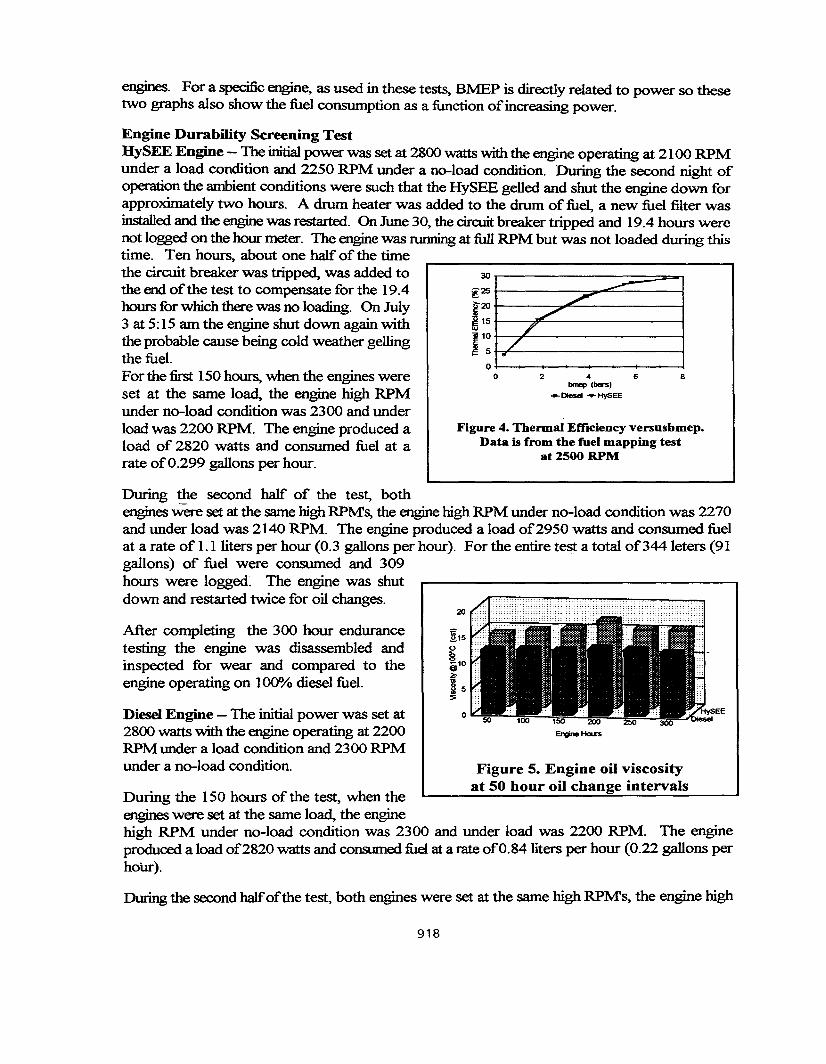
engines. For a specific engine, as used in these tests, BMEP is directly related to power so thesetwo graphs also show the fuel consumption as a function ofincreasing power.
Figure 4. Thermal Efficiency versusbmep.Data is from the fuel mapping test
at 2500 RPM
864bmep (bm's)__ DIesel _ HySEE
2
-----./'./
/'/.
30
~20
~ 15
r:o
o
Engine Durability Screening TestHySEE Engine - The initial power was set at 2800 watts with the engine operating at 2100 RPMunder a load condition and 2250 RPM under a no-load condition. During the second night ofoperation the ambient conditions were such that the HySEE gelled and shut the engine down forapproximately two hours. A drum heater was added to the drum offuel, a new fuel filter wasinstalled and the engine was restarted. On June 30, the circuit breaker tripped and 19.4 hours werenot logged on the hour meter. The engine was running at full RPM but was not loaded during thistime. Ten hours, about one half of the timethe circuit breaker was tripped, was added tothe endofthe test to compensate for the 19.4hours for which there was no loading. On July3 at 5:15 am the engine shut down againwiththe probable cause being cold weather gellingthe fuel.For the first 150 hours, when the engines wereset at the same load, the engine high RPMunder no-load condition was 2300 and underload was 2200 RPM. The engine produced aload of 2820 watts and consumed fuel at arate of0.299 gallons per hour.
EE
Figure 5. Engine oil viscosityat 50 hour oil change intervals
o
During the 150 hours of the test, when theengines were set at the same load, the enginehigh RPM under no-load condition was 2300 and under load was 2200 RPM. The engineproduced a load of2820 watts and consumed fuel at a rate of0.84 liters per hour (0.22 gallons perhow)
Diesel Engine - The initial power was set at2800 watts with the engine operating at 2200RPM under a load condition and 2300 RPMunder a no-load condition.
After completing the 300 hour endurancetesting the engine was disassembled andinspected for wear and compared to theengine operating on 1000.10 diesel fuel.
During the second half of the test, bothengines were set at the same high RPM's, the engine high RPM under no-load condition was 2270and under load was 2140 RPM. The engine produced a load of2950 watts and consumed fuelat a rate of 1.1 liters per hour (0.3 gallons per hour). For the entire test a total of3441eters (91gallons) of fuel were consumed and 309hours were logged. The engine was shutdown and restarted twice for oil changes.
During the second halfofthe test, both engines were set at the same high RPM's, the engine high
918
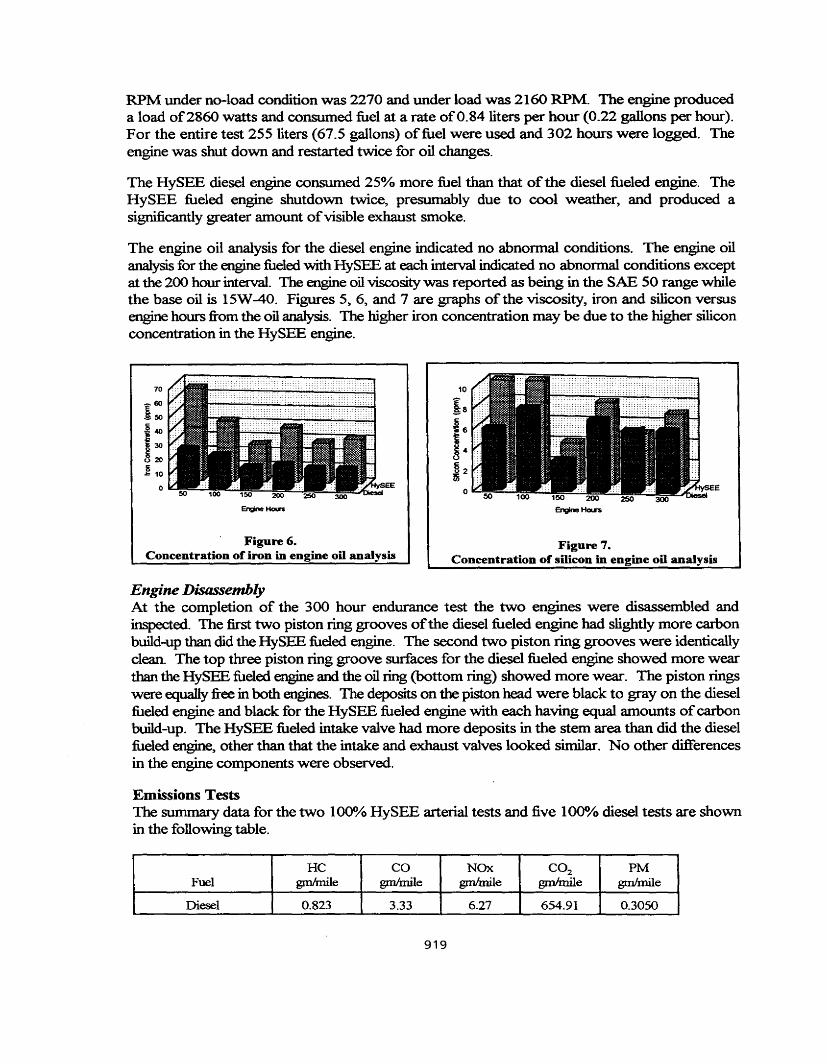
RPM under no-load condition was 2270 and under load was 2160 RPM. The engine produceda load of2860 watts and consumed fuel at a rate of0.84 liters per hour (0.22 gallons per hour).For the entire test 255 liters (67.5 gallons) offuel were used and 302 hours were logged. Theengine was shut down and restarted twice for oil changes.
The HySEE diesel engine consumed 25% more fuel than that ofthe diesel fueled engine. TheHySEE fueled engine shutdown twice, presumably due to cool weather, and produced asignificantly greater amount ofvisible exhaust smoke.
The engine oil analysis for the diesel engine indicated no abnormal conditions. The engine oilanalysis for the engine fueled with HySEE at each interval indicated no abnormal conditions exceptat the 200 hour interval. The engine oil viscosity was reported as being in the SAE 50 range whilethe base oil is 15W-40. Figures 5, 6, and 7 are graphs of the viscosity, iron and silicon versusengine hours from the oil analysis. The higher iron concentration may be due to the higher siliconconcentration in the HySEE engine.
70
~ 10
o
Figure 6.Concentration of iron in engine on analysis
Figure 7.Concentration of silicon in engine on analysis
Engine DisassemblyAt the completion of the 300 hour endurance test the two engines were disassembled andinspected. The first two piston ring grooves ofthe diesel fueled engine had slightly more carbonbuild-up than did the HySEE fueled engine. The second two piston ring grooves were identicallyclean. The top three piston ring groove surfaces for the diesel fueled engine showed more wearthan the HySEE fueled engine and the oil ring (bottom ring) showed more wear. The piston ringswere equallyfree in both engines. The deposits on the piston head were black to gray on the dieselfueled engine and black for the HySEE fueled engine with each having equal amounts ofcarbonbuild-up. The HySEE fueled intake valve had more deposits in the stem area than did the dieselfueled engine, other than that the intake and exhaust valves looked similar. No other differencesin the engine components were observed.
Emissions TestsThe summary data for the two 100% HySEE arterial tests and five 1()()O/O diesel tests are shownin the following table.
He co NOx CO2 PMFuel gmImile gmImile gmImile gm/mile gmhnile
Diesel 0.823 3.33 6.27 654.91 0.3050
919
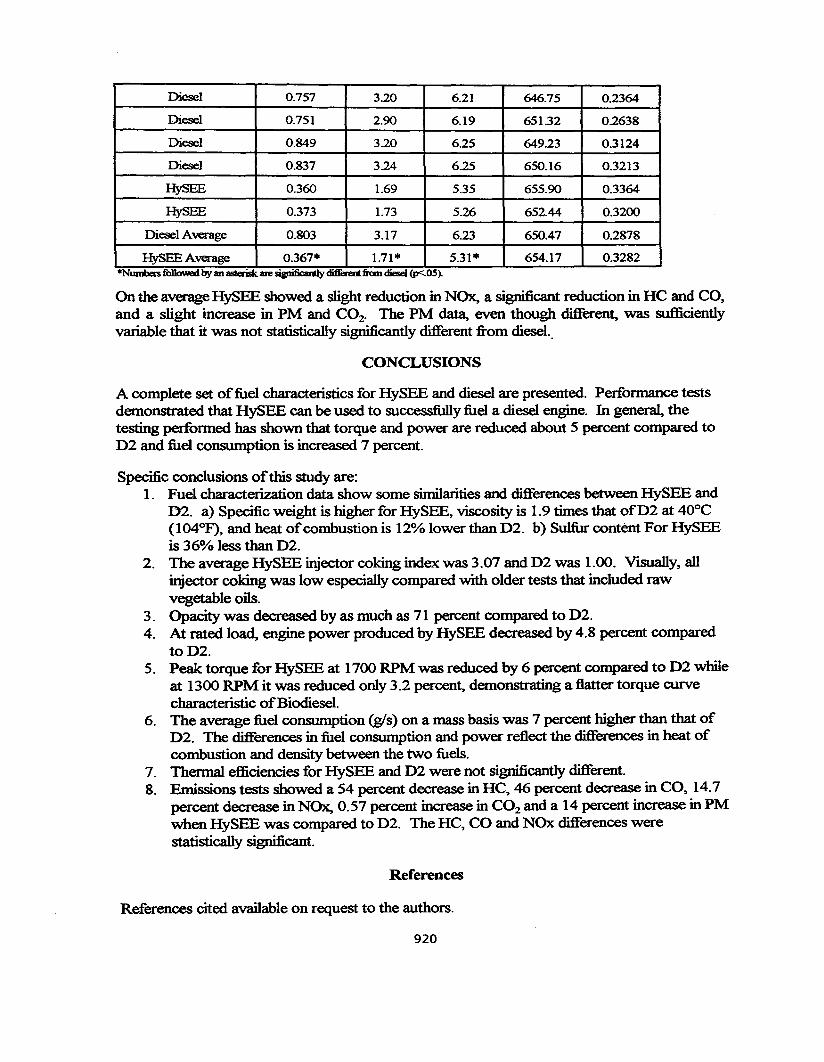
Diesel 0.757 3.20 6.21 646.75 0.2364
Diesel 0.751 2.90 6.19 651.32 0.2638
Diesel 0.849 3.20 6.25 649.23 0.3124
Diesel 0.837 3.24 6.25 650.16 0.3213
HySEE 0.360 1.69 5.35 655.90 0.3364
HySEE 0.373 1.73 5.26 652.44 0.3200
Diesel Average 0.803 3.17 6.23 650.47 0.2878
HySEE Average 0.367* 1.71* 5.31* 654.17 0.3282*Numbers fullowed by an asteriskare SIgnificantly diffi:reD &omdiesel(p<.os).
On the average HySEE showed a slight reduction in NOx, a significant reduction in HC and CO,and a slight increase in PM and CO2. The PM data, even though different, was sufficientlyvariable that it was not statistically significantly different from diesel.
CONCLUSIONS
A complete set offuel characteristics for HySEE and diesel are presented. Performance testsdemonstrated that HySEE can be used to successfully fuel a diesel engine. In general, thetesting performed has shown that torque and power are reduced about 5 percent compared toD2 and fuel consumption is increased 7 percent.
Specific conclusions ofthis study are:1. Fuel characterization data show some similarities and differences between HySEE and
02. a) Specific weight is higher for HySEE, viscosity is 1.9 times that ofD2 at 40°C(104°P), and heat ofcombustion is 12% lower than D2. b) Sulfur content For HySEEis 36% less than D2.
2. The average HySEE iniector coking index was 3.07 and D2 was 1.00. Visually, allinjector coking was low especially compared with older tests that included rawvegetable oils.
3. Opacity was decreased by as much as 71 percent compared to D2.4. At rated load, engine power produced by HySEE decreased by 4.8 percent compared
toD2.5. Peak torque for HySEE at 1700 RPM was reduced by 6 percent compared to D2 while
at 1300 RPM it was reduced only 3.2 percent, demonstrating a flatter torque curvecharacteristic ofBiodiesel.
6. The average fuel consumption (gIs) on a mass basis was 7 percent higher than that ofD2. The differences in fuel consumption and power reflect the differences in heat ofcombustion and density between the two fuels.
7. Thermal efficiencies for HySEE and D2 were not significantly different.8. Emissions tests showed a 54 percent decrease in HC, 46 percent decrease in CO, 14.7
percent decrease in NOx, 0.57 percent increase in CO2 and a 14 percent increase in PMwhen HySEE was compared to D2. The HC, CO and NOx differences werestatistically significant.
References
References cited available on request to the authors.
920
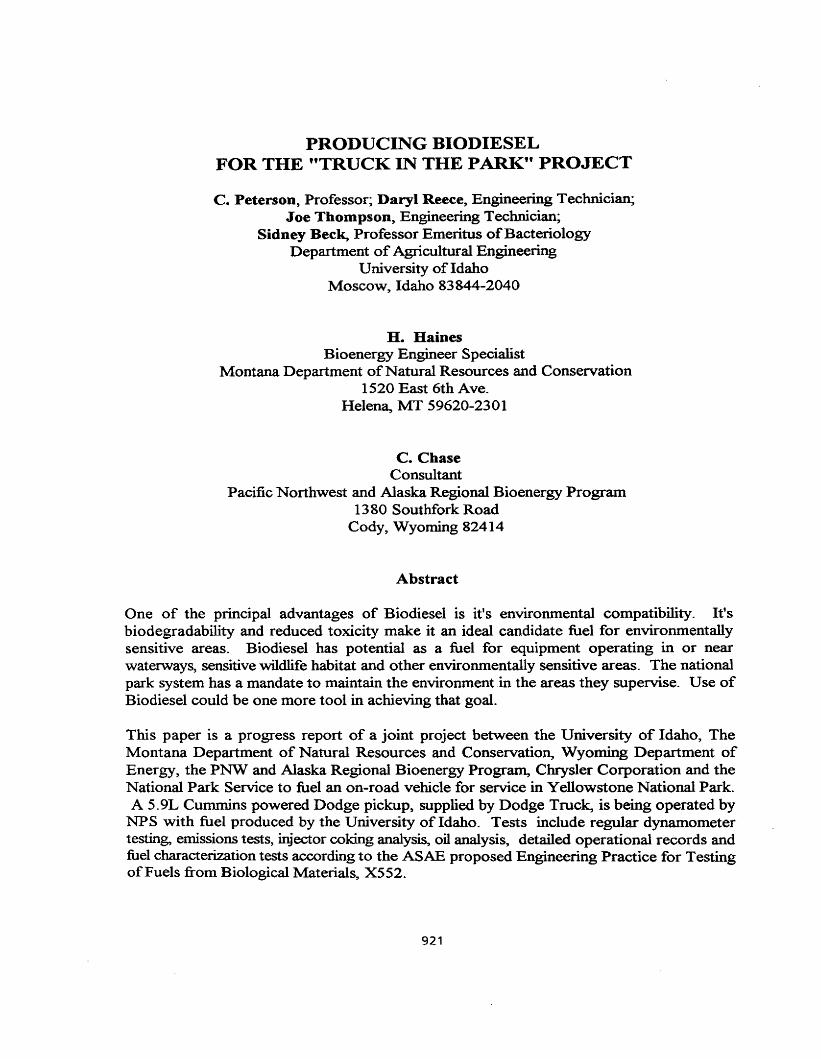
PRODUCING BIODIESELFOR THE "TRUCK IN THE PARK" PROJECT
c. Peterson, Professor; Daryl Reece, Engineering Technician;Joe Thompson, Engineering Technician;
Sidney Beck, Professor Emeritus ofBacteriologyDepartment of Agricultural Engineering
University of IdahoMoscow, Idaho 83844-2040
H. HainesBioenergy Engineer Specialist
Montana Department ofNatural Resources and Conservation1520 East 6th Ave.
Helena, MT 59620-2301
C. ChaseConsultant
Pacific Northwest and Alaska Regional Bioenergy Program1380 Southfork Road
Cody, Wyoming 82414
Abstract
One of the principal advantages of Biodiesel is it's environmental compatibility. It'sbiodegradability and reduced toxicity make it an ideal candidate fuel for environmentallysensitive areas. Biodiesel has potential as a fuel for equipment operating in or nearwaterways, sensitive wildlife habitat and other environmentally sensitive areas. The nationalpark system has a mandate to maintain the environment.in the areas they supervise. Use ofBiodiesel could be one more tool in achieving that goal.
This paper is a progress report of a joint project between the University of Idaho, TheMontana Department of Natural Resources and Conservation, Wyoming Department ofEnergy, the PNW and Alaska Regional Bioenergy Program, Chrysler Corporation and theNational Park Service to fuel an on-road vehicle for service in Yellowstone National Park.A 5.9L Cummins powered Dodge pickup, supplied by Dodge Truck, is being operated by
NPS with fuel produced by the University of Idaho. Tests include regular dynamometertesting, emissions tests, injector coking analysis, oil analysis, detailed operational records andfuel characterization tests according to the ASAE proposed Engineering Practice for TestingofFuels from Biological Materials, X552.
921
Introduction
In 1993, 7.5 million people visited Montana, a state with about 830,000 residents. Many ofthese visitors came to Montana for its recreational amenities, including access to two majornational parks, Yellowstone and Glacier. Their impact on its transportation energy useprofile, is significant. As ofyet, comparatively little research has been done either nationallyor regionally concerning alternative fuel use in the recreational or tourist sector. It is obviousthat areas of great natural beauty may in the long term be damaged by the effects oftransportation fuel use. This is especially true for the national parks and other high-use areasin the western region ofthe U. S.
This project will address the environmental impact ofBiodiesel use in tourism. The MontanaDepartment ofNatural Resources and Conservation (DNRC) in cooperation with the NationalPark Service (NPS) and the U.S. DOE Pacific Northwest and Alaska Regional BioenergyProgram will conduct an operational demonstration of a diesel truck powered by rape ethylester (REE). This fuel is produced by the University of Idaho (U ofl) for use in tourismrelated service in Yellowstone National Park. DNRC will assist the Park Service and privateindustry in developing options for managing the impact of the growth in tourism whilepreserving scenic resources. This demonstration is intended to:
- Help NPS and private industry develop options for reducing enviromental degradationwithout decreasing visitation to Yellowstone National Park.
- Support development of a process to convert vegetable oil into a transportation fuel.
- Encourage the development, production and use of this biofuel within the region byproviding a beachhead market for a developing industry.
- Determine the extent and probable impact, benefits and concerns of using biodiesel inenvironmentally sensitive areas, and its interaction with other diesel fuel additives used inYellowstone National Park.
-Determine the feasibility ofusing biodiesel at high elevations and cool temperatures at thebeginning and end ofthe tourist season in Yellowstone National Park.
- Initiate a cooperative working relationship regarding alternative fuels among NPS, DNRC,the University of Idaho, and the U.S. DOE Regional Bioenergy Program.
Because ofthe value ofconsumers and tourist service providers place on the environment andrecreational amenities, cleaner, less odoriferous fuels such as biodiesel, have the potential tocompete with conventional diesel fuel. The biofuel developed by U of I is at the stage ofdevelopment where a higher value market, such as this tourist-related application, is the nextlogical step on the way to commercialization.
Some previous market research supports investment in this and in future alternative fuelprojects. First, the project will reach large numbers of tourists whose home towns have airquality problems. A 1989 survey of600 guests at one of the lodges in Yellowstone NationalPark by Mings and McHugh (1989) of Arizona State University found that visitors to the
922
Park tended to come from large population states -- California, lllinois, and from nearbystates -- _Utah and Colorado. These states have large metropolitan areas that are nonattainment for air quality standards. Yellowstone Park is an ideal location to expose a largenumber ofvisitors to more environmentally benign fuels that could improve their experience,the air quality, and the amenity value oftransit in their own communities. Second, accordingto the same survey, visitors to the Park tended to consider it to be a "truly special" and uniquenatural place, and often are making the trip ofa lifetime. However, some have complainedabout the smoke and odor from the current fleet ofbuses, especially when these buses passby campgrounds in the Park. Reduction ofvisible particulate and diesel odor are two goalsof this project.
Finally, a 1991 survey ofU.S. travelers conducted by the U.S. Travel Data Center for theTravel Industry of America, found that more than 85 percent claimed they are very likely orsomewhat likely to patronize travel suppliers that help preserve the environment. The surveyalso found that travelers would spend an average of 8.8 percent more for environmentallyresponsible transportation services.
The current price offleet diesel delivered at Yellowstone National Park is $1.02 per gallon.Depending on the proportion offuel costs, capital and equipment, labor, and other costs ina tour or transit operation, a diesel fuel or blend could easily cost $1.10 or more and still beacceptable to many ofthe tourist transportation services and their customers, provided theywere aware of the environmental benefits. If the operation and test of a biodiesel vehicleattains the objectives of reducing air quality impacts (odor and visible exhaust smoke), andif production costs can be lowered, then biodiesel has the potential of being a viablealternative fuel in higher value applications such as tourism.
Objectives
The objectives of this project are to:
1. Develop a biomass-derived transportation fuel that is attractive for use in tourism-relatedindustries and others that operate in environmentally sensitive areas.
2. Provide a beachhead market for a developing industry, to encourage the development,production, and use ofthis biofuel within the region.
3. Determine the extent and probable impact, benefits, and concerns from using biodiesel inenvironmentally sensitive areas, including its interaction with other diesel fuel additivesused in Yellowstone National park and any tendency to attract bears.
4. Make the first step toward environmentally fiiendly fuels in tourism, leading to anticipateduse in tourist buses.
5. Operate the vehicle with the highest possible percentage ofbiodiesel in the spring to latefall (mid-April through mid-November) to acquire data on a cold weather operation.
6. Test the vehicle for regulated emissions both at the beginning and end of thedemonstration with and without the standard catalytic converter.
923
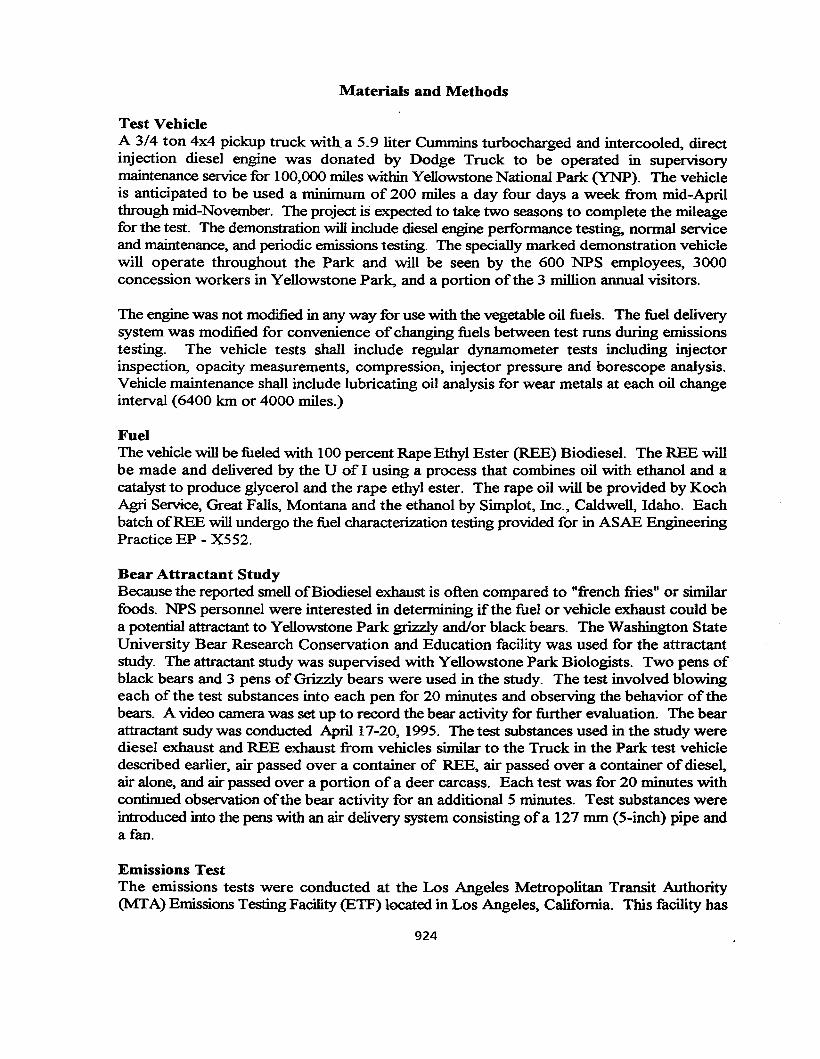
Materials and Methods
Test VehicleA 3/4 ton 4x4 pickup truck witha 5.9 liter Cummins turbocharged and intercooled, directinjection diesel engine was donated by Dodge Truck to be operated in supervisorymaintenance service for 100,000 miles within Yellowstone National Park (YNP). The vehicleis anticipated to be used a minimum of 200 miles a day four days a week from mid-Aprilthrough mid-November. The project is expected to take two seasons to complete the mileagefor the test. The demonstration will include diesel engine performance testing, normal serviceand maintenance, and periodic emissions testing. The specially marked demonstration vehiclewill operate throughout the Park and will be seen by the 600 NPS employees, 3000concession workers in Yellowstone Park, and a portion ofthe 3 million annual visitors.
The engine was not modified in any way for use with the vegetable oil fuels. The fuel deliverysystem was modified for convenience ofchanging fuels between test runs during emissionstesting. The vehicle tests shall include regular dynamometer tests including injectorinspection, opacity measurements, compression, injector pressure and borescope analysis.Vehicle maintenance shall include lubricating oil analysis for wear metals at each oil changeinterval (6400 km or 4000 miles.)
FuelThe vehicle will be fueled with 100 percent Rape Ethyl Ester (REE) Biodiesel. The REE willbe made and delivered by the U of I using a process that combines oil with ethanol and acatalyst to produce glycerol and the rape ethyl ester. The rape oil will be provided by KochAgri Service, Great Falls, Montana and the ethanol by Simplot, Inc., Caldwell, Idaho. Eachbatch ofREE will undergo the fuel characterization testing provided for in ASAE EngineeringPractice EP - X552.
Bear Attractant StudyBecause the reported smell ofBiodiesel exhaust is often compared to "french fries" or similarfoods. NPS personnel were interested in determining if the fuel or vehicle exhaust could bea potential attractant to Yellowstone Park grizzly and/or black bears. The Washington StateUniversity Bear Research Conservation and Education facility was used for the attractantstudy. The attractant study was supervised with Yellowstone Park Biologists. Two pens ofblack bears and 3 pens of Grizzly bears were used in the study. The test involved blowingeach of the test substances into each pen for 20 minutes and observing the behavior ofthebears. A video camera was set up to record the bear activity for further evaluation. The bearattractant sudy was conducted April 17-20, 1995. The test substances used in the study werediesel exhaust and REE exhaust from vehicles similar to the Truck in the Park test vehicledescribed earlier, air passed over a container of REE, air passed over a container ofdiesel,air alone, and air passed over a portion of a deer carcass. Each test was for 20 minutes withcontinued observation ofthe bear activity for an additional 5 minutes. Test substances wereintroduced into the pens with an air delivery system consisting ofa 127 mm (5-inch) pipe anda fan.
Emissions TestThe emissions tests were conducted at the Los Angeles Metropolitan Transit Authority(MfA) Emissions Testing Facility (ETF) located in Los Angeles, California. This facility has
924
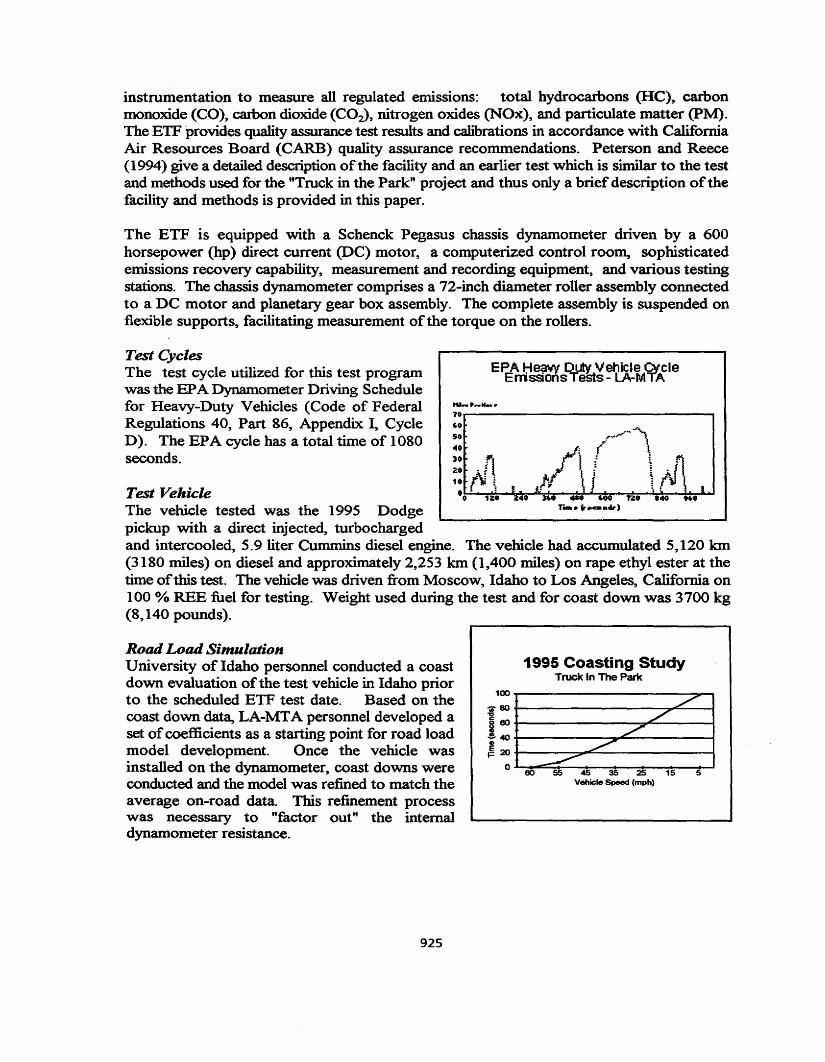
instrumentation to measure all regulated emissions: total hydrocarbons (He), carbonmonoxide (CO), carbon dioxide (CO:z), nitrogen oxides (NOx), and particulate matter (PM).The ETF provides quality assurance test results and cahbrations in accordance with CaliforniaAir Resources Board (CARB) quality assurance recommendations. Peterson and Reece(1994) give a detailed description of the facility and an earlier test which is similar to the testand methods used for the "Truck in the Park" project and thus only a briefdescription ofthefacility and methods is provided in this paper.
The ETF is equipped with a Schenck Pegasus chassis dynamometer driven by a 600horsepower (hp) direct current (DC) motor, a computerized control room, sophisticatedemissions recovery capability, measurement and recording equipment, and various testingstations. The chassis dynamometer comprises a 72-inch diameter roller assembly connectedto a DC motor and planetary gear box assembly. The complete assembly is suspended onflexible supports, facilitating measurement ofthe torque on the rollers.
EPA Heavy DlJlYVehicle ~CleErrissions Tests - LA-M A
tu....PWOw...
10
'0~......."50 ,... ,
"0 I: (. \:: .n II' : ~10 t-J ~,
I Ji I\} 'iJ'\ Io • !.~ l" " •
0 1Zt1 lt40 )4.41 4M ~OO no ...0 .~
T_.i-_ ..dr)
Test VehicleThe vehicle tested was the 1995 Dodgepickup with a direct injected, turbochargedand intercooled, 5.9 liter Cummins diesel engine. The vehicle had accumulated 5,120 km(3180 miles) on diesel and approximately 2,253 km (1,400 miles) on rape ethyl ester at thetime ofthis test. The vehicle was driven from Moscow, Idaho to Los Angeles, California on100 % REE fuel for testing. Weight used during the test and for coast down was 3700 kg(8,140 pounds).
Test CyclesThe test cycle utilized for this test programwas the EPA Dynamometer Driving Schedulefor Heavy-Duty Vehicles (Code of FederalRegulations 40, Part 86, Appendix I, CycleD). The EPA cycle has a total time of 1080seconds.
Road Load SimulationUniversity of Idaho personnel conducted a coastdown evaluation of the test vehicle in Idaho priorto the scheduled ETF test date. Based on thecoast down data, LA-MTA personnel developed aset ofcoefficients as a starting point for road loadmodel development. Once the vehicle wasinstalled on the dynamometer, coast downs wereconducted and the model was refined to match theaverage on-road data. This refinement processwas necessary to "factor out" the internaldynamometer resistance.
1995 Coasting StudyTruck In The Park
t~I,:;c?Cj;== Io 60 55 45 3S 25 15 5
Vehicle Speed (mph)
925
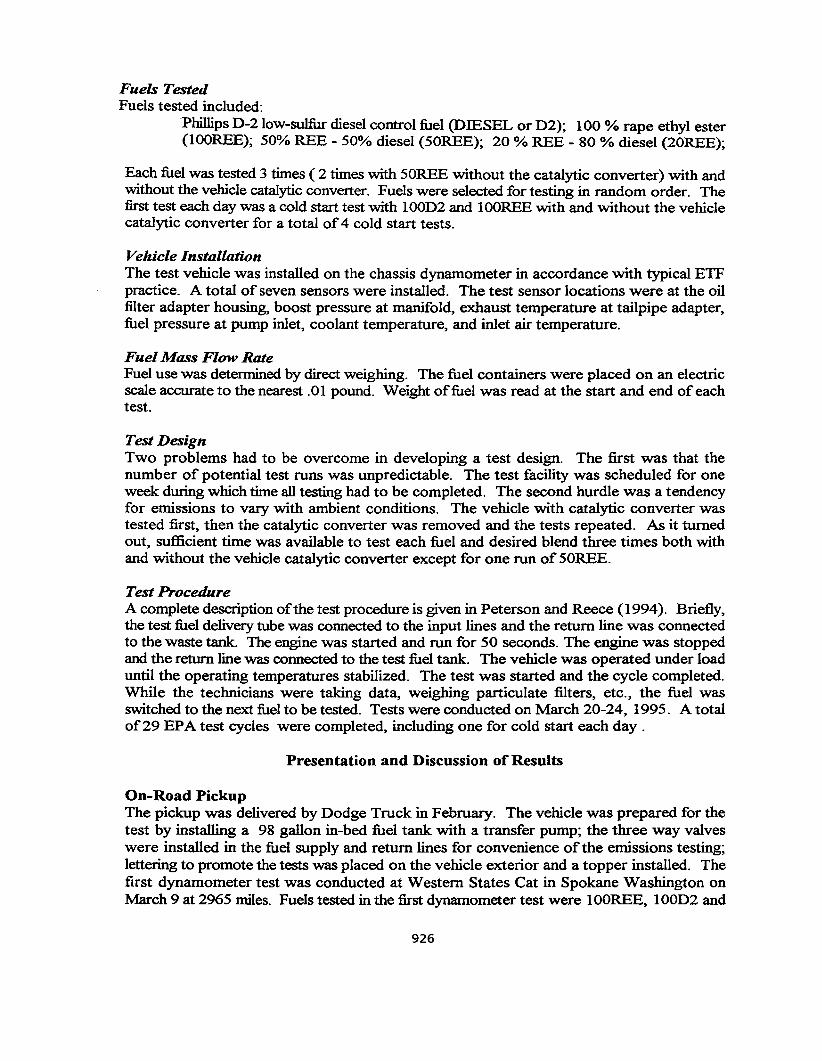
Fuels TestedFuels tested included:
Phillips D-210w-sulfur diesel control fuel (DIESEL or D2); 100 % rape ethyl ester(100REE); 50% REE - 50% diesel (50REE); 20 % REB - 80 % diesel (20REE);
Each fuel was tested 3 times ( 2 times with 50REE without the catalytic converter) with andwithout the vehicle catalytic converter. Fuels were selected for testing in random order. Thefirst test each day was a cold start test with lOOD2 and 100REE with and without the vehiclecatalytic converter for a total of4 cold start tests.
Vehicle InstallationThe test vehicle was installed on the chassis dynamometer in accordance with typical ETFpractice. A total of seven sensors were installed. The test sensor locations were at the oilfilter adapter housing, boost pressure at manifold, exhaust temperature at tailpipe adapter,fuel pressure at pump inlet, coolant temperature, and inlet air temperature.
Fuel Mass Flow RateFuel use was determined by direct weighing. The fuel containers were placed on an electricscale accurate to the nearest.01 pound. Weight offuel was read at the start and end ofeachtest.
Test DesignTwo problems had to be overcome in developing a test design. The first was that thenumber of potential test runs was unpredictable. The test facility was scheduled for oneweek during which time all testing had to be completed. The second hurdle was a tendencyfor emissions to vary with ambient conditions. The vehicle with catalytic converter wastested first, then the catalytic converter was removed and the tests repeated. As it turnedout, sufficient time was available to test each fuel and desired blend three times both withand without the vehicle catalytic converter except for one run of 50REE.
Test ProcedureA complete description ofthe test procedure is given in Peterson and Reece (1994). Briefly,the test fuel delivery tube was connected to the input lines and the return line was connectedto the waste tank. The engine was started and run for 50 seconds. The engine was stoppedand the return line was connected to the test fuel tank. The vehicle was operated under loaduntil the operating temperatures stabilized. The test was started and the cycle completed.While the technicians were taking data, weighing particulate filters, etc., the fuel wasswitched to the next fuel to be tested. Tests were conducted on March 20-24, 1995. A totalof29 EPA test cycles were completed, including one for cold start each day .
Presentation and Discussion of Results
On-Road PickupThe pickup was delivered by Dodge Truck in February. The vehicle was prepared for thetest by installing a 98 gallon in-bed fuel tank with a transfer pump; the three way valveswere installed in the fuel supply and return lines for convenience of the emissions testing;lettering to promote the tests was placed on the vehicle exterior and a topper installed. Thefirst dynamometer test was conducted at Western States Cat in Spokane Washington onMarch 9 at 2965 miles. Fuels tested in the first dynamometer test were 100REE, 100D2 and
926
20REE. Each of the fuels were testedthree times and a snap idle test wasperformed after each test. The firstdynamometer test resulted in a 5.6%drop in peak power and a 5.9% drop inaverage torque when 100REE (108 kwor 145 hp peak @ 2500 RPM) iscompared to 100D2 (115 kw or 154 hppeak @ 2500 RPM) and a 1.5% drop inpeak power and 2.1% drop in averagetorque when 20REE (112 kw or 150 hppeak @ 2500 RPM) is compared to100D2. Opacity was reduced by 50%for 100REE and 16.5% for 20REEcompared to 100D2.
Torque and Horsepower vs RPM1995 Dodge, 3000 miles
160 -r-------------...2500
140t~j~~~::~~~~~j 120 2000K. ~9,l 100 1500 E'"5 ~ ~:t: 60 +----------.....JM 1000
40 50014001600180020002200240026002800
RPM
1-Diesel - Blend - REE I
At 3183 miles the fuel injectors were removed, cleaned and photographed. The injectorvalve opening pressures were checked, the engine compression checked and the cylindersborescoped. At this time the diesel fuel was drained from the vehicle main tank and filledwith 100REE which then marked the beginning of the testing on Biodiesel.
Fuel ProductionThe REE fuel is being processed in a batch type reactor. The methyl ester process utilizes100 percent molar excess alcohol (preferably absolute or 100 percent pure), or a molar ratioof 6: 1 alcohol to oil ratio. Based on the amount of input oil by weight, 1.1 percent ofpotassium hydroxide (KOB) is used. Refer to Peterson et al. (1994) for a more completedescription ofthe process. The ethyl ester process utilizes 70 percent stoichiometric excessethanol (absolute, 100 percent pure), or a molar ratio of 5.1: 1 ethanol to oil ratio. Based onthe amount of input oil by weight, 1.3 percent ofKOH is used. The catalyst is dissolvedinto the alcohol by vigorous stirring in a small reactor. The oil is transferred into theBiodiesel reactor and then the catalyst/alcohol mixture is pumped into the oil and the finalmixture stirred vigorously for two hours. A successful reaction produces two liquid phases:ester and crude glycerol. Crude glycerol, the heavier liquid will collect at the bottom afterseveral hours of settling. Phase separation can be observed within 10 minutes and can becomplete within two hours after stirring has stopped. Complete settling can take as long as20 hours. After settling is complete, water is added at the rate of 5.5 percent by volume ofthe oil and then stirred for 5 minutes and the glycerol allowed to settle again. After settlingis complete the glycerol is drained and the ester layer remains. Washing the ester is a twostep process which is carried out with extreme care. A water wash solution at the rate of 28percent by volume ofoil and 1 gram oftannic acid per liter ofwater is added to the ester andgently agitated. Air is carefully introduced into the aqueous layer while simultaneouslystirring very gently. This process is continued until the ester layer becomes clear. Aftersettling, the aqueous solution is drained and water alone is added at 28 percent by volumeof oil for the final washing.
Fuel CharacterizationThe total REE produced to date for Yellowstone Park is 7,300 liters (1,935 gallons). Not
927
all ofthe Fuel Characterization parameters are available at this time. but the following is apartial analysis.
Fatty Acid Analysis:
16:018:018:1
2.67%1.9QO/o12.00%
18:218:320:1
11.02%8.11%6.76%
22:022:1
4.37%44.6%
Water and SedimentRamsbottom Carbon
(as received becausesample is non-distillab1e)
AshSulfurCetane Rating
(ASTMD613)Copper CorrosionKarl Fischer Water
0.01%
0.062%0.011%0.022%
59.5slight tarnish, 1A
757 ppm
Particulate MatterTotalnon-combustib1e
NitrogenCarbonHydrogenOxygenIodine NumberDistillation Initial
Boiling Point, C
2.44mgIL0.40mgIL14 ppm77.15 %9.52%13.3%97.5
227
Bear attractantThe bear attractant test will be reported by the Yellowstone Park biologists. Preliminaryresults indicated that the bears were very irritated by raw diesel fuel. diesel exhaust or REEexhaust being introduced into their pens. They ignored scent from the raw REE fuels andthe air and were quite interested in the deer rumen.
EmissionsThe summary data for each ofthe 29 EPA tests are not provided due to space. Since a largeamount of data was collected. only summary data is reported in this paper. The datapresented in the following table includes test fuel. HC. CO. CO2• NOx, PM for both withand without the catalytic converter. All of the emissions data is reported as grams/mile.
With Catalytic ConvertorPercent REE Fuel HC
o 100D220 2018050 50/50100 100REE
Without Catalytic Convertor
CO NOx CO2 PM0.76 3.60 6.70 663.50 0.1010.64 2.96 6.46 668.15 0.130.48 2.49 6.24 666.55 0.140.28 2.45 6.13 677.81 0.12
o2050100
D220/8050/50100REE
0.8540.7120.4820.324
3.683.032.402.40
6.756.246.555.91
669.54 0.18646.55 0.20687.05 0.25654.81 0.26
These data show a significant reduction in HC. CO. and NOx as percent ofvegetable oil isincreased and a non-significant increase in PM. The PM data had the most variability ofthedata and an examination of the raw data shows that there is scatter sufficient to neutralizedifferences.
928
The next table shows the percent change in emissions compared to the diesel control fuelwith and without the catalytic converter.
Fuel HC CO NOx CO2 PMWith Catalytic Convertor
ioooz 100% 1000.10 1000.10 1()()OJ'o 100%20/80 83% 82% 96% 101% 128%SO/50 63% 69OJ'o 93% 1()()OJ'o 140%l00REE 37% 68% 91% 102% 116%
Without Catalytic Convertorl00D2 100% 1ooss 1000/'0 100% l000J'o20180 83% 82% 92% 97% 106%SO/50 57% 65% 97% 103% 135%l00REE 38% 65% 88% 98% 144%
Other researchers have indicated that NOx and PM are inversely related, and that mayexplain the apparent difference in results from these tests. It has more generally been foundthat the esters increase NOx and decrease PM, however in these tests, generally speaking,the reverse was true. One might speculate that this trend is due to the fatty acid constituentsof rapeseed esters tested or that it is a characteristic of this particular engine. In either case,the result was consistent. In these tests a reduction in HC (63%), CO (33%), NOx (10%),CO2 unchanged and increases in PM (30%). The catalytic converter had an affect on onlythe HC and PM. It reduced HC for diesel 10.5% and for REE 13.6%. It also reduced PMfor diesel 45% and for REB 56%. Repeatability for HC, CO, C02, and NOx was very good.When one experiments with a number of fuels on a limited budget, setting up a testprocedure is extremely critical. It would have been more desirable to have replicated eachfuel two- or three times in succession and to have replicated each fuel in time in randomfashion as well. However, time did not allow tbis luxury.
Conclusions
The "Truck In The Park" project will provide a unique opportunity to observe use ofBiodiesel (REE) as a fuel in an environmental setting. As ofthis writing the truck has beendriven over 17,700 Ion (11 ,000 miles) under a wide variety ofconditions. The temperaturehas been near - 18 C (0 F) on several occasions. The bear attractant study indicated that noout-of-the-ordinary problem should be experienced with park wildlife because of the fuel.The first dynamometer test resulted in a 5.6% drop in peak power @ 2500 RPM and a 5.9%drop in average torque when IOOREE (108 kw or 145 hp) is compared to IOOD2 (115 lewor 154 hp) and a 1.5% drop in peak power @ 2500 RPM and 2.1% drop in average torquewhen 20 REB (112 kw or 150 hp) is compared to IOOD2. Opacity was reduced by 50% for100REE and 16.5% for 20REE compared to 100D2. The first emissions test has beencompleted and resulted in the following:
1) Reductions in HC (63%), CO'(33%), NOx (10%) when lOOREE is compared toIOOD2.
2) CO2 remained unchanged and PM increased (30%) when 100REE is compared toIOOD2.
3) The catalytic converter had an affect on only the HC and PM. It reduced HC for
929

diesel 10.5% and for REE 13.6%. The catalytic converter reduced PM for diesel 45%and for REE 56%.
References
References cited available on request to the authors.
930
ACUTE TOXICITY OF BIODIESEL TOFRESHWATER AND MARINE ORGANISMS
Daryl Reece, M.S., Engineer; Charles Peterson Ph.D., ProfessorDepartment of Agricultural Engineering
University of Idaho, Moscow, Idaho 83844-2040 U.S.A
Abstract
Biodiesel fuels are reported to be nontoxic resulting in less potential hazard to fish andother aquatic life in case ofaccidental spills. This paper reports on static tests withrapeseed methyl ester (RME) and rapeseed ethyl ester (REE) performed according toEPA/600/4-90/027. The acute aquatic toxicity tests were conducted with both rainbowtrout and daphnia magna by CH2M Hill in Corvallis, Oregon under contract to theUniversity ofIdaho.
The LC50 (the point at which SOOA, have died and 50% are still alive determined byinterpolation) values for each ofthe substances tested with daphnia magna in parts permillion were as follows: control (table salt (NaCl)) = 3.7, D2 = 1.43, RME = 23, REE =99, and Methyl Soyate = 332. Duplicate tests with rainbow trout were run with 10organisms per replicate. LC50 numbers were not reported because of the failure to kill asufficient number offish at the concentrations tested, even with the diesel control fuel.The 20 percent and 50 percent blends had scattered losses of fish but none of the tests hadless than 85 percent survival at any concentration after 96 hours.
931
Introduction
Current test guidelines for acute aquatic toxicity produced by the United StatesEnvironmental Protection Agency (EPA), American Standard Testing ofMaterials(ASTM), and other federal and state governing agencies are not generally applicable to oilproducts.
As part ofthe ongoing research ofBiodiesel at the University ofIdaho's Department ofAgricultural Engineering a test ofacute aquatic toxicity to freshwater organisms wasconducted by CH2M Hill in Corvallis, Oregon. Biodiesel fuels are reported to be nontoxicresulting in less potential hazard to fish and other aquatic life in case ofan accidental spill.Biodiesel has been shown to be readily biodegradable (peterson et al., 1994). To satisfy agrowing interest in renewable, biodegradable, and non-toxic fuel sources, ecotoxicitytesting was conducted on methyl and ethyl esters ofrapeseed oil and blends ofthese esterswith number two diesel fuel.
Literature Review
Cheng et al. (1991) compared hydraulic oils ofmineral oil, vegetable oil, polyglycol, and asynthetic ester for biodegradability, toxicity, and fluid performance parameters. They usedan oil-water dispersion procedure by the Ministry ofAgriculture, Fisheries and Food,England, and provided mechanical agitation to continually disperse the test materials assmall droplets in the water column. This procedure simulates physical dispersion by waveand current action. Rainbow trout were exposed to five concentrations ofeach testmaterial and a control. Toxicity was expressed as the concentration ofmaterial in ppm tokill 50% ofthe fish after 96 hours ofexposure (LC50). They reported that the base stocksfor the vegetable oil formulations were nontoxic (> 1000 ppm) but the formulatedproducts did not meet this criteria because ofone or more ofthe additives. The LC50with rainbow trout for mineral oil was 389 ppm; vegetable oil, 633 ppm; polyglycol, 80ppm; and synthetic ester, > 5000 ppm.
Lockhart et al. (1984) studied rainbow trout in forty-eight hour-LC50 (acute lethaltoxicity) tests exposed to water-soluble fractions (WSF) for a range of crude and refinedoils. The results were compared to the concentrations ofvolatile very low-boiling«115°C) and low-boiling (l15-270°C) hydrocarbons determined by a two-stage analyticalmethod. The results suggest that toxicity ofthe water-soluble fractions is associatedlargely with the substituted benzenes and naphthalenes, with boiling points between 115and 270°C.
Lockhart et al. (1984) found that the LC50 values were highly dependent on the particularexposure conditions. Thus, survival ofrainbow trout and their LC50 values wereconsistently higher in test containers that were open to the atmosphere than in sealedclosed containers. Aeration oftest containers, by bubbling air through the WSF, virtuallyeliminated toxicity to the trout in even the most toxic test preparations. The results werediscussed in terms ofthe design ofbioassays relevant to ice-covered environments and toother situations where volatilization may be low or reduced.
932
Weber, C.I. (1993) documents the EPA methods for acute toxicity ofeffiuents andreceiving waters to freshwater and marine organisms for the use in the National PollutantDischarge Elimination System Permits Program. Summaries ofthe test conditions for thedaphnids, daphnia magna, fathead minnows, rainbow trout, brook trout, the mysid,sheepshead minnows, and silversides are given. Three test types are-given: static nonrenewal, static renewal, and flow-through. Test duration may vary from 24 to 96 hoursdepending on the objective ofthe test. The tests are designed to provide dose-responseinformation, expressed as the percent effluent concentration that is lethal to 50 percent ofthe test organisms (LC50) within the prescribed period of time (24-96 hours), or thehighest effluent concentration in which survival is not statistically different from thecontrol.
Nearly identical procedures are outlined in 40 CFR. part 797.1300 (Daphnid acute toxicitytest) and part 797.1400 (fish acute toxicity test), and ASTM E 729-88. These proceduresinclude, with the LC50 (median lethal concentration), an EC50 (median effectiveconcentration), and an IC50 (inhibition concentration).
Materials and Methods
Toxicity TestsThe University ofIdaho Department ofAgricultural Engineering contracted with CH2MHill in Corvallis, Oregon to conduct two static definitive bioassays. The first bioassay wasa 48-hour bioassay using the water flea, daphnia magna. A 96-hour bioassay usingrainbow trout was conducted for the second study. Two rounds of tests were conductedfor this study. All tests were performed according to: Methods for Measuring the AcuteAquatic Toxicity ofEffiuents to Freshwater and Marine Organisms EPA600!4-90!027F.
FuelsFuel nomenclature is as follows: (1) Phillips D2low-sulfur diesel control fuel (02); (2)
100 percent rapeseed methyl ester (RME); (3) 100 percent rapeseed ethyl ester(REE); (4) 50 percent RME - SO percent D2 (50RME); (5) 50 percent REE - 50percent D2 (SOREE); (6) 20 percent RME - 80 percent D2 (20RME); 20 percentREE - 80 percent D2 (20REE); and 100 percent soybean methyl ester (S:ME).
Test quantities ofeach Biodiesel fuel tested were supplied by the University of Idaho. Therapeseed oil was expelled at the University ofIdaho's Agricultural Engineering farm scaleprocess facility. The RME, REE, and 5MB fuels were produced using the processdeveloped by University of Idaho researchers. Phillips 66 Company 0.05 low sulfur dieselfuel was used as the baseline for the Biodiesel fuels.
Test MethodsAll static tests were performed according to: Methods for Measuring the Acute ToxicityofEffiuents to Freshwater and Marine Organisms, Weber C., et al. (1991); EPAl600!490/027.
Test OrganismsDaphnia MagnaThe daphnia magna were obtained from CH2M Hill's in house cultures and were less than24 hours old prior to initiation of the test. All organisms tested were fed and maintained
933
during culturing. acclimation, and testing as prescribed by EPA (1989). The testorganisms appeared vigorous and in good condition prior to testing. The daphnia magnawere placed below the test surface at test initiation due to the non-soluble nature ofthesample.
Rainbow TroutThe rainbow trout used in the first round oftests were obtained from Thomas FishCompany, Anderson, California, and were 22 days old and 32±2 mm in length. Therainbow trout were acclimated to test conditions (dilution water and temperature) for 10days prior to test initiation. The rainbow trout used in the second round oftests wereobtained from Spring Creek Trout Hatchery, Lewiston, Montana, and were 24 days oldand 28±1 mm in length. The rainbow trout were acclimated to test conditions (dilutionwater and temperature) for 12 days prior to test initiation. All the test organisms appearedvigorous and in good condition prior to testing.
Dilution WaterDaphnia MagnaThe water used for acclimation and dilution during the static testing was reconstitutedmoderately hard water with a total hardness of98 as CaC03, alkalinity of64 mg/l asCaC03, and a pH of8.0 to 8.2.
Rainbow TroutThe water used for acclimation and dilution during the rainbow trout static testing wasreconstituted moderately hard water with a total hardness of92-98 as CaC03 , alkalinity of70-74 mWI as CaC03, and a pH of7.9 to 8.0.
Test ConcentrationsDaphnia MagnaThe concentrations tested in definitive test on REE were 33, 167, 833,4170, and 20800ppm of sample and dilution water for the control. The concentrations tested in thedefinitive test on RME were 67, 333, 1330, 6670, and 26700 ppm of sample and dilutionwater for the control. The concentrations tested in the definitive test on D2 were 6.67,13.3,33.3,66.7, and 1333 ppm of sample and dilution water for control. Theconcentrations tested in the definitive test on Methyl Soyate were 13.3, 33.3, 66.7, and6667 ppm of sample and dilution water for control. The fuel mixture concentrations wererun in quadruplicate with five organisms per replicate. Additional concentrations of 1.43and 3.33 ppm were set up for D2 with 10 organisms in on chamber. The fuel was stirredinto the water before the daphnia magna were introduced into the chamber. There was asheen offuel on the top of each chamber.
Rainbow TroutThe concentrations tested for round 1 in the definitive test on D2, 20RME, and REEwere 100, 300, 600, 1200, and 2400 ppm with dilution water for control. Theconcentrations tested for round 2 in the definitive test on RME and 50REE were 100,500, 750, 1000, and 7500 ppm and the 50RME sample was tested at 100, 500, 600, and7500 ppm due to a shortage ofthe sample.
934
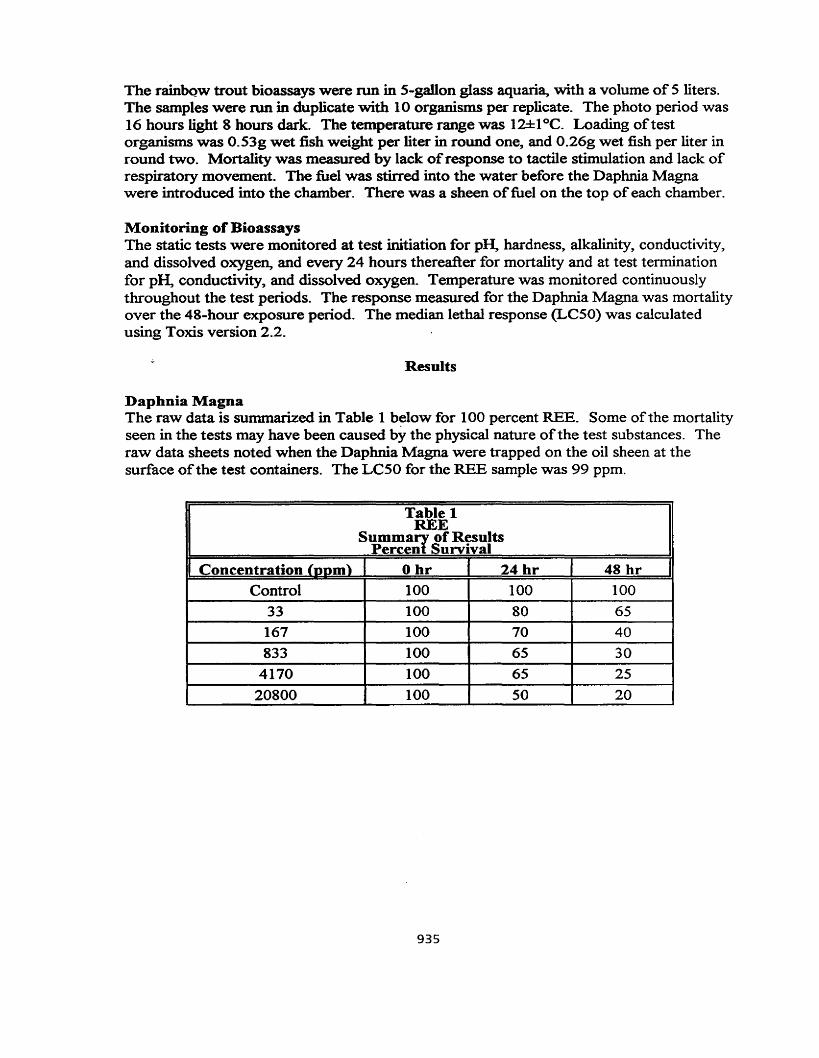
The rainbow trout bioassays were ron in 5-gaIlon glass aquaria, with a volume of 5 liters.The samples were run in duplicate with 10 organisms per replicate. The photo period was16 hours light 8 hours dark. The temperature range was 12±1°C. Loading oftestorganisms was 0.53g wet fish weight per liter in round one, and 0.26g wet fish per liter inround two. Mortality was measured by lack ofresponse to tactile stimulation and lack ofrespiratory movement. The fuel was stirred into the water before the Daphnia Magnawere introduced into the chamber. There was a sheen offuel on the top ofeach chamber.
Monitoring of BioassaysThe static tests were monitored at test initiation for pH, hardness, alkalinity, conductivity,and dissolved oxygen, and every 24 hours thereafter for mortality and at test terminationfor pH, conductivity, and dissolved oxygen. Temperature was monitored continuouslythroughout the test periods. The response measured for the Daphnia Magna was mortalityover the 48-hour exposure period. The median lethal response (LC50) was calculatedusing Toxis version 2.2.
Results
Daphnia MagnaThe raw data is summarized in Table 1 below for 100 percent REE. Some ofthe mortalityseen in the tests may have been caused by the physical nature ofthe test substances. Theraw data sheets noted when the Daphnia Magna were trapped on the oil sheen at thesurface ofthe test containers. The LC50 for the REE sample was 99 ppm.
Table 1REE
Summa~of ResultsPercen Survival
Concentration (oom'\ o hr 24 hr 48 hr
Control 100 100 100
33 100 80 65
167 100 70 40833 100 65 30
4170 100 65 25
20800 100 50 20
935
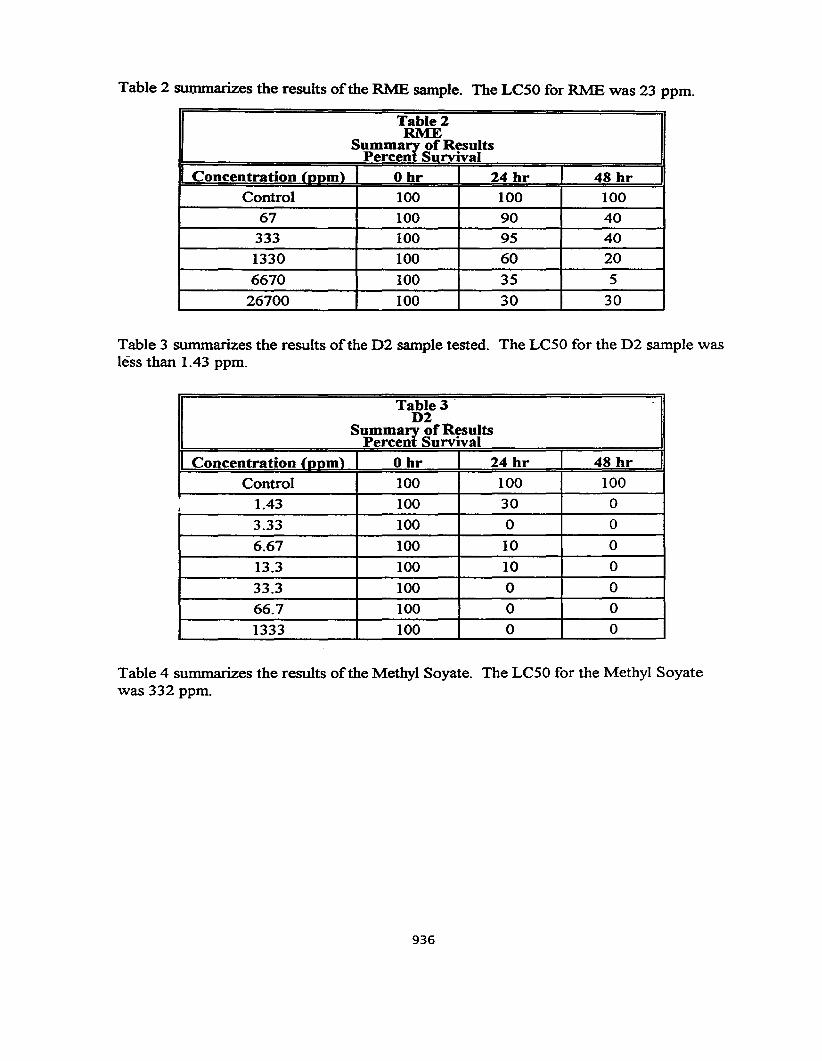
Table 2 summarizes the results ofthe RME sample. The LC50 for RME was 23 ppm.
Table 2RME
Summa~ofResultsPereen Survival
Concentration loom) o hr 24 hr 48 hrControl 100 100 100
67 100 90 40333 100 95 40
1330 100 60 20
6670 100 35 5
26700 100 30 30
Table 3 summarizes the results ofthe D2 sample tested. The LC50 for the D2 sample wasless than 1.43 ppm.
Table 3D2
Summa~of ResultsPereen Survival
Concentration loom) o hr 24 hr 48 hr
Control 100 100 100
1.43 100 30 0
3.33 100 0 0
6.67 100 10 0
13.3 100 10 0
33.3 100 0 0
66.7 100 0 0
1333 100 0 0
Table 4 summarizes the results ofthe Methyl Soyate. The LC50 for the Methyl Soyatewas 332 ppm.
936
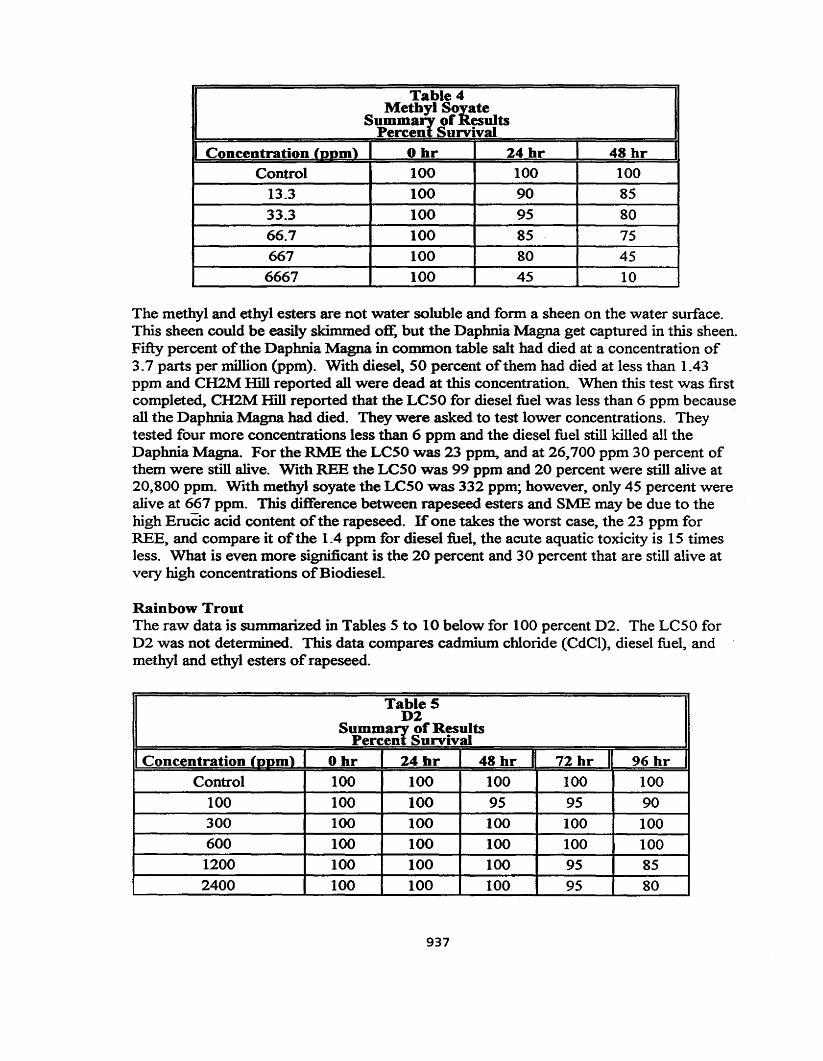
Table 4Methyl SOiate
Summa~of esultsPercen Survival
Concentration (oom) Ohr 24hr 48 hr
Control 100 100 10013.3 100 90 85
33.3 100 95 8066.7 100 85 75667 100 80 45
6667 100 45 10
The methyl and ethyl esters are not water soluble and form a sheen on the water surface.This sheen could be easily skimmed oft: but the Daphnia Magna get captured in this sheen.Fifty percent ofthe Daphnia Magna in common table salt had died at a concentration of3.7 parts per million (ppm). With diesel, 50 percent ofthem had died at less than 1.43ppm and CH2M Hill reported all were dead at this concentration. When this test was firstcompleted, CH2M Hill reported that the LC50 for diesel fuel was less than 6 ppm becauseall the Daphnia Magna had died. They were asked to test lower concentrations. Theytested four more concentrations less than 6 ppm and the diesel fuel still killed all theDaphnia Magna. For the RME the LCSO was 23 ppm, and at 26,700 ppm 30 percent ofthem were still alive. With REB the LC50 was 99 ppm and 20 percent were still alive at20,800 ppm. With methyl soyate the Le50 was 332 ppm; however, only 45 percent werealive at 667 ppm. This difference between rapeseed esters and SME may be due to thehigh Erucic acid content ofthe rapeseed. Ifone takes the worst case, the 23 ppm forREE, and compare it of the 1.4 ppm for diesel fuel, the acute aquatic toxicity is 15 timesless. What is even more significant is the 20 percent and 30 percent that are stilI alive atvery high concentrations ofBiodiesel.
Rainbow TroutThe raw data is summarized in Tables 5 to 10 below for 100 percent D2. The LC50 forD2 was not determined, This data compares cadmium chloride (CdCI), diesel fuel, andmethyl and ethyl esters of rapeseed.
Table 5D2
Summa~of ResultsPercen Survival
Concentration Inom) Ohr 24br 48 hr II 72 hr II 96 hrControl 100 100 100 100 100
100 100 100 95 95 90300 100 100 100 100 100600 100 100 100 100 1001200 100 100 100 95 852400 100 100 100 95 80
937
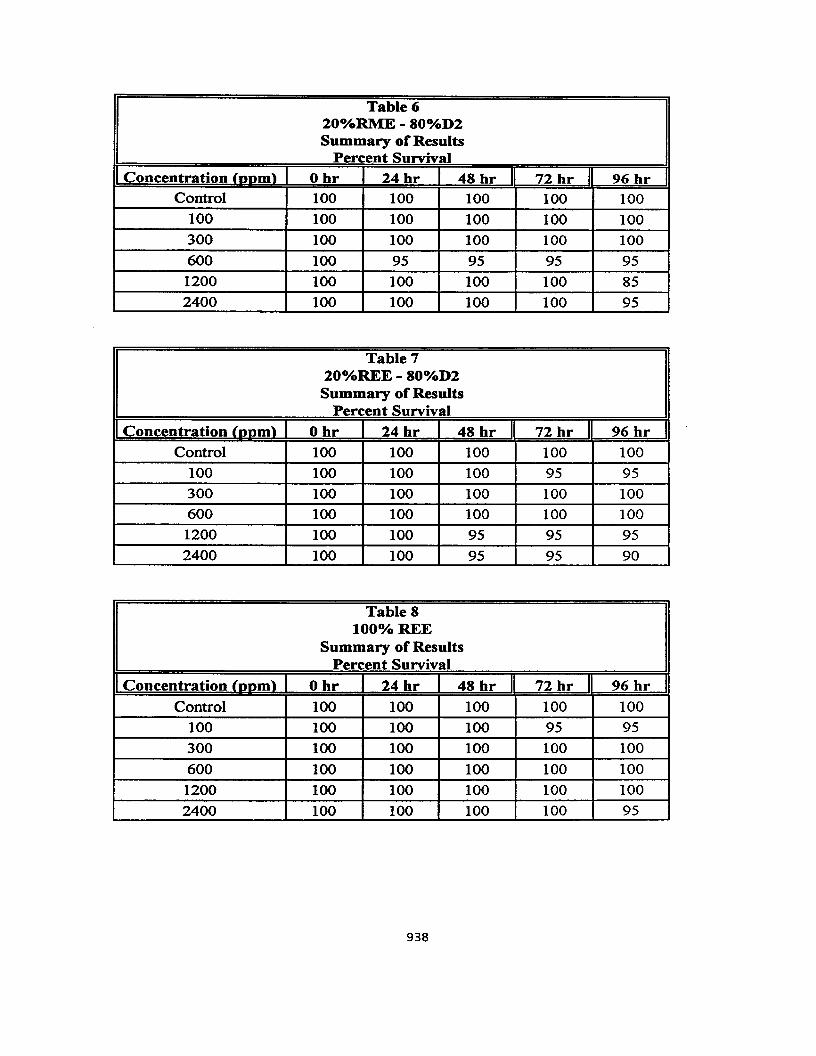
Table 620°;'oRME - 80%D2Summary ofResults
Percent SurvivalConcentration (enm) Ohr 24 hr 48 hr II 72 hr I 96 hr
Control 100 100 100 100 100100 100 100 100 100 100300 100 100 100 100 100
600 100 95 95 95 95
1200 100 100 100 100 85
2400 100 100 100 100 95
Table 720%REE - 80%D2Summary of Results
Percent SurvivalConcentration (nnm) Ohr 24 hr 48 hr I 72hr II 96 hr
Control 100 100 100 100 100
100 100 100 100 95 95
300 100 100 100 100 100
600 100 100 100 100 100
1200 100 100 95 95 95
2400 100 100 95 95 90
Table 8100% REE
Summary of ResultsPercent Survival
Concentration (nnm) Ohr 24 hr AID L II 72 hr II 96 hr
Control 100 100 100 100 100
100 100 100 100 95 95
300 100 100 100 100 100
600 100 100 100 100 100
1200 100 100 100 100 100
2400 100 100 100 100 95
938
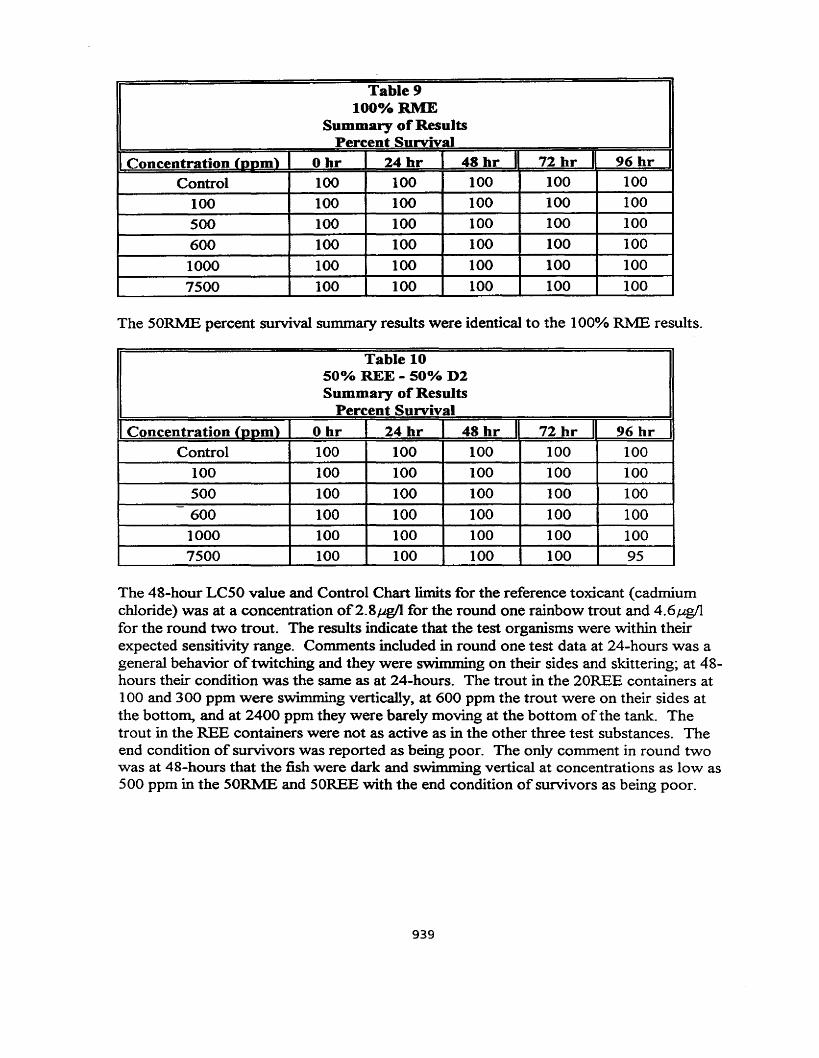
Table 9100%RME
Summary of ResultsPercent Survival
Concentration (nom) Ohr 24 hr 48 hr II 72 br II 96 hr
Control 100 100 100 100 100
100 100 100 100 100 100
500 100 100 100 100 100
600 100 100 100 100 100
1000 100 100 100 100 100
7500 100 100 100 100 100
The 50RME percent survival summary results were identical to the 100% R1vffi results.
Table 1050% REE - 50% D2Summary ofResults
Percent Surviva!
Concentration (nnm) ohr 24 hr 48 hr I 72 hr II 96 hr
Control 100 100 100 100 100100 100 100 100 100 100
500 100 100 100 100 100
600 100 100 100 100 1001000 100 100 100 100 1007500 100 100 100 100 95
The 48-hour LC50 value and Control Chart limits for the reference toxicant (cadmiumchloride) was at a concentration of2. 8JA¥!l for the round one rainbow trout and 4.6J.-LWlfor the round two trout. The results indicate that the test organisms were within theirexpected sensitivity range. Comments included in round one test data at 24-hours was ageneral behavior oftwitching and they were swimming on their sides and skittering; at 48hours their condition was the same as at 24-hours. The trout in the 20REE containers at100 and 300 ppm were swimming vertically, at 600 ppm the trout were on their sides atthe bottom, and at 2400 ppm they were barely moving at the bottom ofthe tank. Thetrout in the REE containers were not as active as in the other three test substances. Theend condition of survivors was reported as being poor. The only comment in round twowas at 48-hours that the fish were dark and swimming vertical at concentrations as low as500 ppm in the 50RME and 50REE with the end condition of survivors as being poor.
939
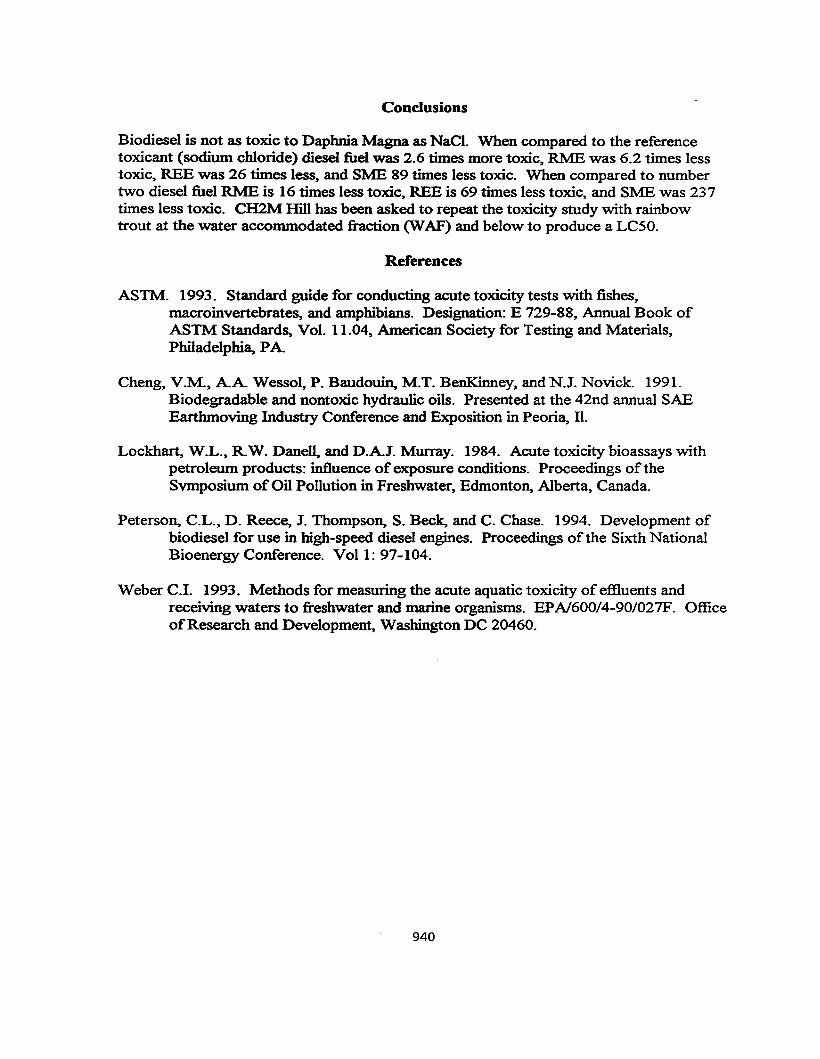
Conclusions
Biodiesel is not as toxic to Daphnia Magna as NaCI. When compared to the referencetoxicant (sodium chloride) diesel fuel was 2.6 times more toxic, RME was 6.2 times lesstoxic, REE was 26 times less, and 5MB 89 times less toxic. When compared to numbertwo diesel fuel RME is 16 times less toxic, REB is 69 times less toxic, and SME was 237times less toxic. CH2M Hill has been asked to repeat the toxicity study with rainbowtrout at the water accommodated fraction (WAF) and below to produce a LC50.
References
ASTM. 1993. Standard guide for conducting acute toxicity tests with fishes,macroinvertebrates, and amphibians. Designation: E 729-88, Annual Book ofASTM Standards, Vol. 11.04, American Society for Testing and Materials,Philadelphia, PA
Cheng, V.M., AA Wessol, P. Baudouin, M.T. BenKinney, and N.J. Novick. 1991.Biodegradable and nontoxic hydraulic oils. Presented at the 42nd annual SAEEarthmoving Industry Conference and Exposition in Peoria, Il,
Lockhart, W.L., RW. Danell, and D.AJ. Murray. 1984. Acute toxicity bioassays withpetroleum products: influence ofexposure conditions. Proceedings oftheSymposium ofOil Pollution in Freshwater, Edmonton, Alberta, Canada.
Peterson, C.L., D. Reece, J. Thompson, S. Beck, and C. Chase. 1994. Development ofbiodiesel for use in high-speed diesel engines. Proceedings ofthe Sixth NationalBioenergy Conference. Vol 1: 97-104.
Weber C.I. 1993. Methods for measuring the acute aquatic toxicity ofeffluents andreceiving waters to freshwater and marine organisms. EPA/600/4-90/027F. OfficeofResearch and Development, Washington DC 20460.
940
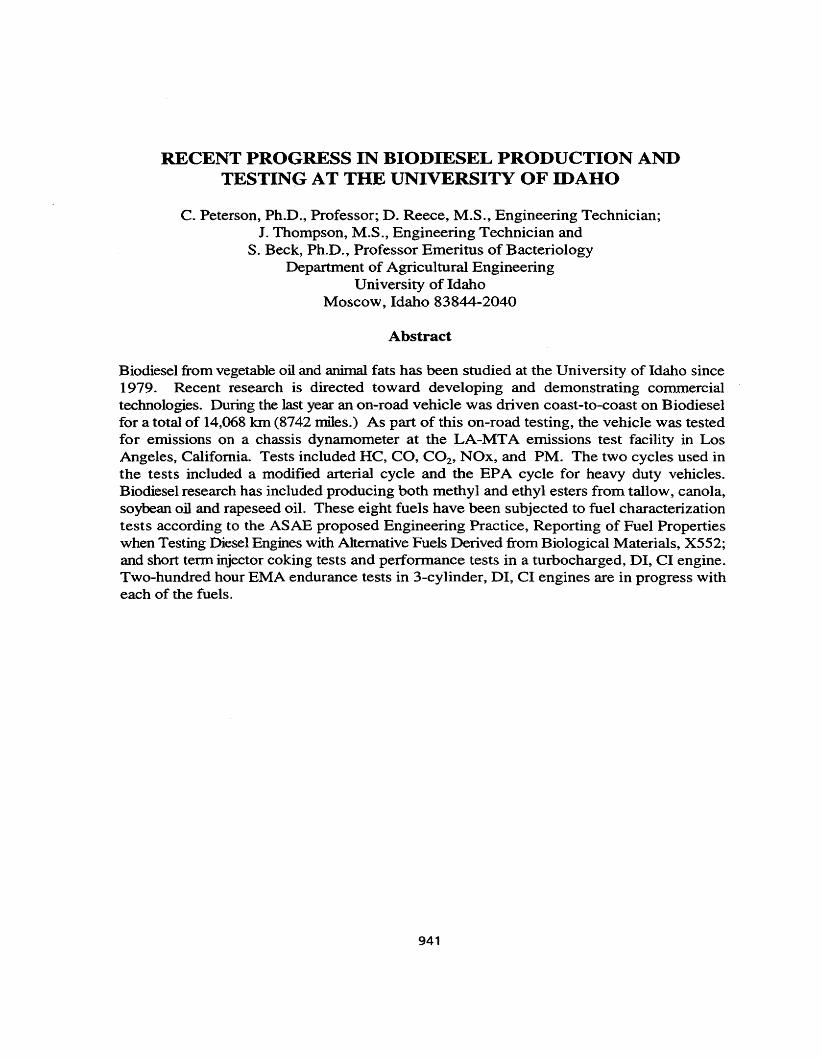
RECENT PROGRESS IN BIODIESEL PRODUCTION ANDTESTING AT THE UNIVERSITY OF IDAHO
C. Peterson, Ph.D., Professor; D. Reece, M.S., Engineering Technician;J. Thompson, M.S., Engineering Technician and
S. Beck, Ph.D., Professor Emeritus of BacteriologyDepartment of Agricultural Engineering
University of IdahoMoscow, Idaho 83844-2040
Abstract
Biodiesel from vegetable oil and animal fats has been studied at the University of Idaho since1979. Recent research is directed toward developing and demonstrating commercialtechnologies. During the last year an on-road vehicle was driven coast-to-coast on Biodieselfor a total of 14,068 Ian (8742 miles.) As part of this on-road testing, the vehicle was testedfor emissions on a chassis dynamometer at the LA-MTA emissions test facility in LosAngeles, California. Tests included HC, CO, CO2 , NOx, and PM. The two cycles used inthe tests included a modified arterial cycle and the EPA cycle for heavy duty vehicles.Biodiesel research has included producing both methyl and ethyl esters from tallow, canola,soybean oil and rapeseed oil. These eight fuels have been subjected to fuel characterizationtests according to the ASAE proposed Engineering Practice, Reporting of Fuel Propertieswhen Testing Diesel Engines with Alternative Fuels Derived from Biological Materials, X552;and short term injector coking tests and performance tests in a turbocharged, Df, CI engine.Two-hundred hour EMA endurance tests in 3-cylinder, Dl, CI engines are in progress witheach of the fuels.
941
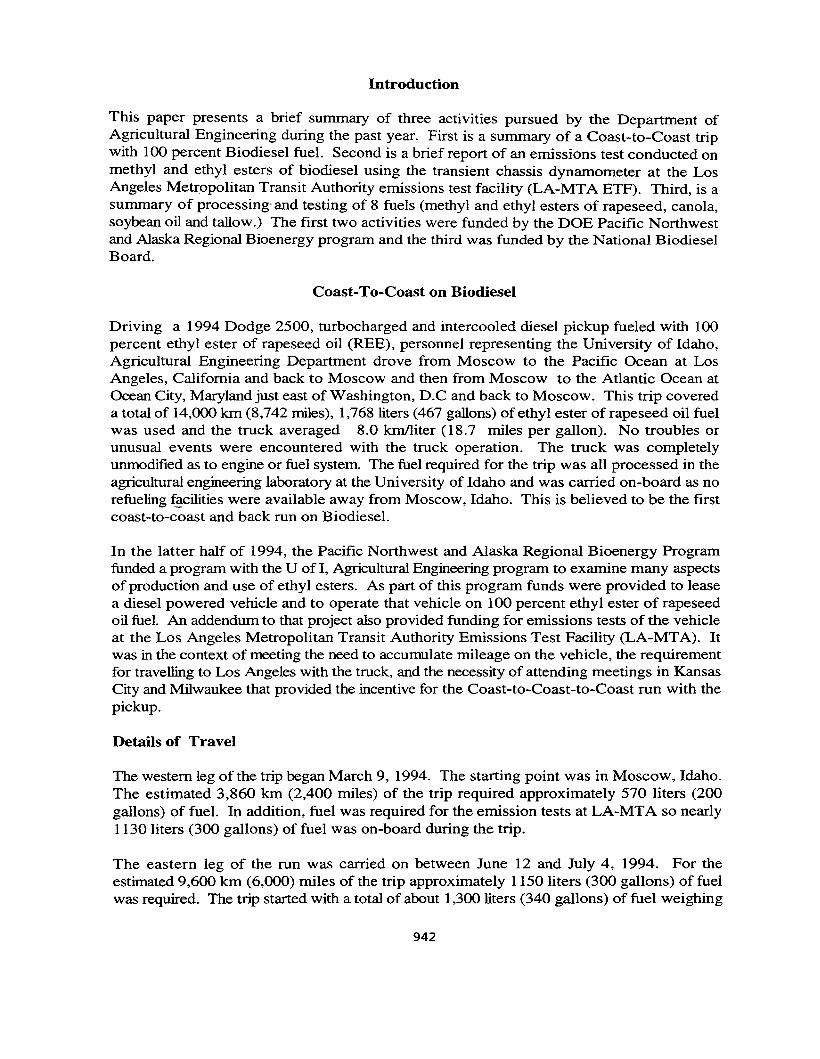
Introduction
This paper presents a brief summary of three activities pursued by the Department ofAgricultural Engineering during the past year. First is a summary of a Coast-to-Coast tripwith 100 percent Biodiesel fuel. Second is a brief report of an emissions test conducted onmethyl and ethyl esters of biodiesel using the transient chassis dynamometer at the LosAngeles Metropolitan Transit Authority emissions test facility (LA-MTA ETF). Third, is asummary of processing- and testing of 8 fuels (methyl and ethyl esters of rapeseed, canola,soybean oil and tallow.) The first two activities were funded by the DOE Pacific Northwestand Alaska Regional Bioenergy program and the third was funded by the National BiodieselBoard.
Coast-To-Coast on Biodiesel
Driving a 1994 Dodge 2500, turbocharged and intercooled diesel pickup fueled with 100percent ethyl ester of rapeseed oil (REE), personnel representing the University of Idaho,Agricultural Engineering Department drove from Moscow to the Pacific Ocean at LosAngeles, California and back to Moscow and then from Moscow to the Atlantic Ocean atOcean City, Maryland just east of Washington, D.C and back to Moscow. This trip covereda total of 14,000 km (8,742 miles), 1,768 liters (467 gallons) of ethyl ester of rapeseed oil fuelwas used and the truck averaged 8.0 krnIliter (18.7 miles per gallon). No troubles orunusual events were encountered with the truck operation. The truck was completelyunmodified as to engine or fuel system The fuel required for the trip was all processed in theagricultural engineering laboratory at the University of Idaho and was carried on-board as norefueling f~ilities were available away from Moscow, Idaho. This is believed to be the firstcoast-to-coast and back run on Biodiesel.
In the latter half of 1994, the Pacific Northwest and Alaska Regional Bioenergy Programfunded a program with the U of I, Agricultural Engineering program to examine many aspectsof production and use of ethyl esters. As part of this program funds were provided to leasea diesel powered vehicle and to operate that vehicle on 100 percent ethyl ester of rapeseedoil fuel. An addendum to that project also provided funding for emissions tests of the vehicleat the Los Angeles Metropolitan Transit Authority Emissions Test Facility (LA-MTA). Itwas in the context of meeting the need to accumulate mileage on the vehicle, the requirementfor travelling to Los Angeles with the truck, and the necessity of attending meetings in KansasCity and Milwaukee that provided the incentive for the Coast-to-Coast-to-Coast run with thepickup.
Details of Travel
The western leg of the trip began March 9, 1994. The starting point was in Moscow, Idaho.The estimated 3,860 km (2,400 miles) of the trip required approximately 570 liters (200gallons) of fuel. In addition, fuel was required for the emission tests at LA-MTA so nearly1130 liters (300 gallons) of fuel was on-board during the trip.
The eastern leg of the run was carried on between June 12 and July 4, 1994. For theestimated 9,600 km (6,000) miles of the trip approximately 1150 liters (300 gallons) of fuelwas required. The trip started with a total of about 1,300 liters (340 gallons) of fuel weighing
942
over 1,090 kg (2,400 pounds). Approximately 100 liters (30 gallons) remained at theconclusion of the trip.
Unique Characteristics of the Run
1. The total distance travelled was 14,068 km (8,742 miles) with one fueling location inMoscow, Idaho.
2. All of the fuel used in the test was 100 percent ethyl ester of rapeseed oil producedin the Agricultural Engineering Department Laboratory at the University of Idaho.
3. All of the fuel was on-board the vehicle when it left Moscow. No fuel was shippedand/or delivered at other locations.
4. The vehicle ran normally with no engine or fueling system modifications.5. No diesel fuel was used on the trip, none was carried or purchased and at no time was
it felt necessary to attempt to use diesel fuel.6. The vehicle was driven at normal highway speeds and no attempt was made to avoid
any particular situation. Traffic included heavy city traffic, freeways, tollways, etc.On two different days the vehicle travelled over 1450 km (900 miles).
LA-MTA Emissions Test
In March of 1994, University of Idaho personnel conducted a series of chassis dynamometeremissions tests in cooperation with the Los Angeles County Metropolitan Transit Authority(LA-MTA). Emissions data generated from this facility includes the regulated emissions:total hydrocarbons (HC), carbon monoxide (CO), carbon dioxide (C02) , oxides of nitrogenN Ox, and particulate matter (PM).
Two test cycles were used in the test program. First, an arterial cycle , which consisted ofeight replications of accelerating to 64 kmph (40 mph) and decelerating to 0 kmph (0 mph)and required 758 seconds was used for 26 tests. Second, the dynamometer driving schedulefor heavy duty vehicles (Code of Federal Regulations 40, Part 86, Appendix I, Cycle D), a1060 second test was used for 13 tests.
Fuels tested included ethyl ester of rapeseed oil (REE), methyl ester of rapeseed oil (RME),Phillips low sulfur diesel reference fuel (D2) and 20 percent and 50 percent blends of REEor RME with D2.
The vehicle tested was the 1994 Dodge pickup described above in the coast-to-coast run. Acomplete description of the test facility and the procedures used during the test is given inPeterson and Reece (1994).
The presentation of the data are tables 1 and 2, showing the percent change in the emissionscompared to the diesel control fuel for ethyl and methyl ester of rapeseed oil for the averageof the two cycles. Relative test results were the same for the two cycles even though theactual level of emissions was higher for the EPA cycle than for the arterial cycle. Table 3compares REE and RME. These tables show that HC and CO were reduced approximately50 percent by using rapeseed esters. CO2 increased by an amount indicative of the reductionin CO while no significant change in PM was detected although the trend was lowered PM
943
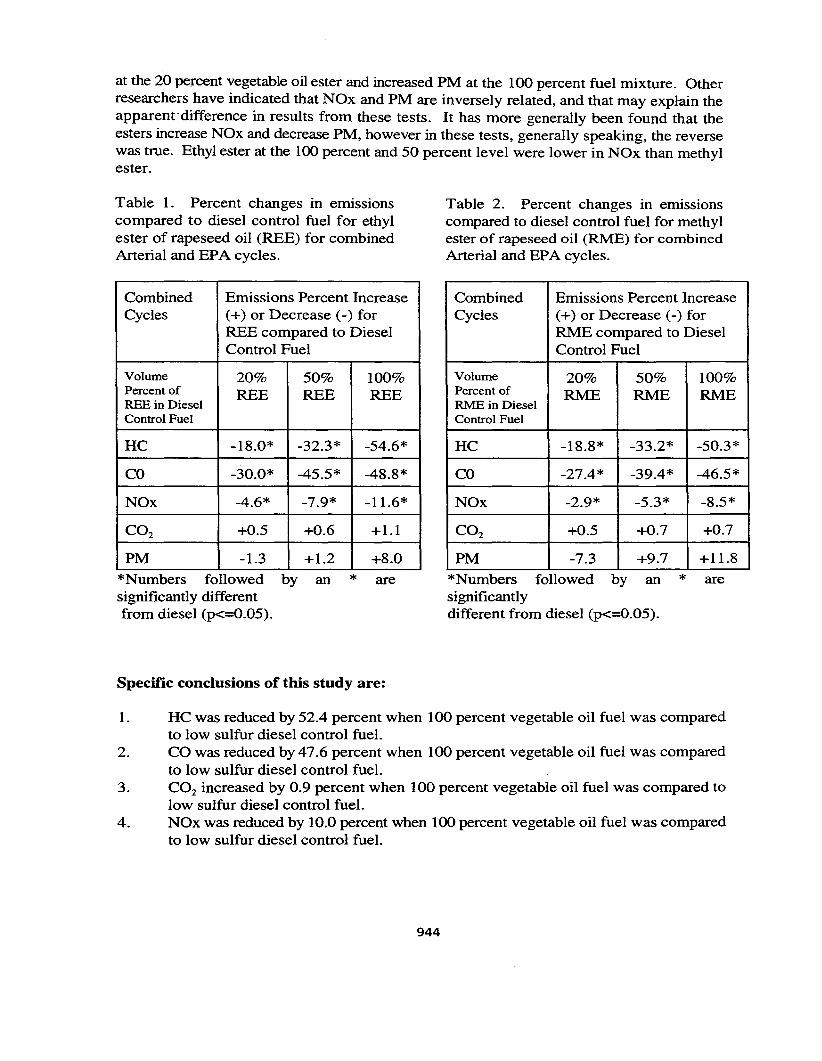
at the 20 percent vegetable oil ester and increased PM at the 100 percent fuel mixture. Otherresearchers have indicated that NOx and PM are inversely related, and that may explain theapparent difference in results from these tests. It has more generally been found that theesters increase NOx and decrease PM, however in these tests, generally speaking, the reversewas true. Ethyl ester at the 100 percent and 50 percent level were lower in NOx than methylester.
Table 1. Percent changes in emissionscompared to diesel control fuel for ethylester of rapeseed oil (REE) for combinedArterial and EPA cycles.
Table 2. Percent changes in emissionscompared to diesel control fuel for methylester of rapeseed oil (RME) for combinedArterial and EPA cycles.
Combined Emissions Percent IncreaseCycles (+) or Decrease (-) for
REE compared to DieselControl Fuel
Volume 20% 50% 100%Percent of REE REE REEREE in DieselControl Fuel
HC -18.0* -32.3* -54.6*
CO -30.0* -45.5* -48.8*
NOx -4.6* -7.9* -11.6*
CO2 +0.5 +0.6 +1.1
PM -1.3 +1.2 +8.0
Combined Emissions Percent IncreaseCycles (+) or Decrease (-) for
RME compared to DieselControl Fuel
Volume 20% 50% 100%Percent of RME RME RMERME in DieselControl Fuel
HC -18.8* -33.2* -50.3*
CO -27.4* -39.4* -46.5*
NOx -2.9* -5.3* -8.5*
CO2 +0.5 +0.7 +0.7
PM -7.3 +9.7 +11.8
*Numbers followed by ansignificantly differentfrom diesel (p<=O.05).
* are *Numbers followed by ansignificantlydifferent from diesel (p<=O.05).
* are
Specific conclusions of this study are:
1. HC was reduced by 52.4 percent when 100 percent vegetable oil fuel was comparedto low sulfur diesel control fuel.
2. CO was reduced by 47.6 percent when 100 percent vegetable oil fuel was comparedto low sulfur diesel control fuel.
3. CO2 increased by 0.9 percent when 100 percent vegetable oil fuel was compared tolow sulfur diesel control fuel.
4. NOx was reduced by 10.0 percent when 100 percent vegetable oil fuel was comparedto low sulfur diesel control fuel.
944
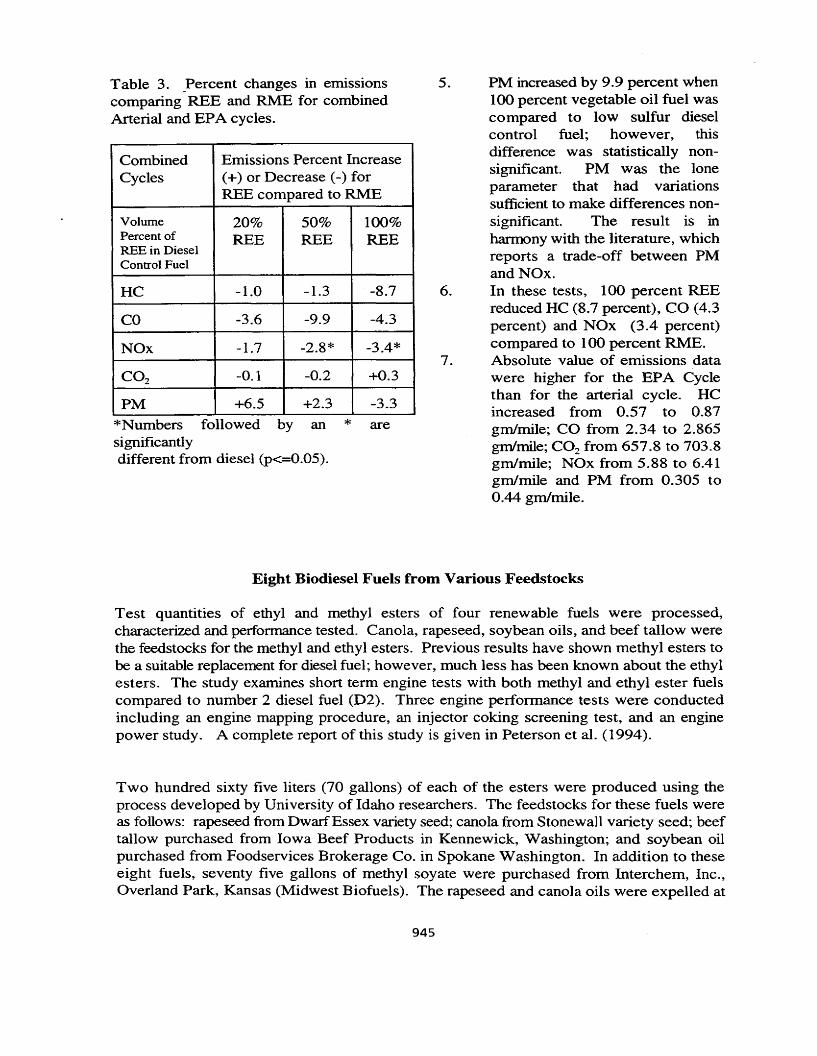
Table 3. _Percent changes in emissionscomparing REB and RME for combinedArterial and EPA cycles.
Combined Emissions Percent IncreaseCycles (+) or Decrease (-) for
REE compared to RME
Volume 20% 50% 100%Percent of REE REE REEREE in DieselControl Fuel
HC -1.0 -1.3 -8.7
CO -3.6 -9.9 -4.3
NOx -1.7 -2.8* -3.4*
CO2 -0.1 -0.2 +0.3
PM +6.5 +2.3 -3.3
*Numbers followed by ansignificantlydifferent from diesel (p<=0.05).
* are
5.
6.
7.
PM increased by 9.9 percent when100 percent vegetable oil fuel wascompared to low sulfur dieselcontrol fuel; however, thisdifference was statistically nonsignificant. PM was the loneparameter that had variationssufficient to make differences nonsignificant. The result is inharmony with the literature, whichreports a trade-off between PMandNOx.In these tests, 100 percent REEreduced HC (8.7 percent), CO (4.3percent) and NOx (3.4 percent)compared to 100 percent RME.Absolute value of emissions datawere higher for the EPA Cyclethan for the arterial cycle. HCincreased from 0.57 to 0.87gm/mile; CO from 2.34 to 2.865gmIrnile; CO2 from 657.8 to 703.8gm/mile; NOx from 5.88 to 6.41gm/mile and PM from 0.305 to0.44 gmImile.
Eight Biodiesel Fuels from Various Feedstocks
Test quantities of ethyl and methyl esters of four renewable fuels were processed,characterized and performance tested. Canola, rapeseed, soybean oils, and beef tallow werethe feedstocks for the methyl and ethyl esters. Previous results have shown methyl esters tobe a suitable replacement for diesel fuel; however, much less has been known about the ethylesters. The study examines short term engine tests with both methyl and ethyl ester fuelscompared to number 2 diesel fuel (D2). Three engine performance tests were conductedincluding an engine mapping procedure, an injector coking screening test, and an enginepower study. A complete report of this study is given in Petersonet aI. (1994).
Two hundred sixty five liters (70 gallons) of each of the esters were produced using theprocess developed by University of Idaho researchers. The feedstocks for these fuels wereas follows: rapeseed from DwarfEssex variety seed; canola from Stonewall variety seed; beeftallow purchased from Iowa Beef Products in Kennewick, Washington; and soybean oilpurchased from Foodservices Brokerage Co. in Spokane Washington. In addition to theseeight fuels, seventy five gallons of methyl soyate were purchased from Interchem, Inc.,Overland Park, Kansas (Midwest Biofuels). The rapeseed and canola oils were expelled at
945
the University of Idaho's Agricultural Engineering farm scale process facility. Each fuel,excluding the methyl soyate, was processed at this facility. Phillips 66 Company low sulfurdiesel reference fuel was used as the baseline fuel.
Fuel Preparation
The eight Biodiesel fuels were processed in a batch type reactor. The methyl ester processutilizes 100 percent molar excess alcohol (preferably absolute or 100 percent pure), or amolar ratio of 6: 1 alcohol to oil ratio. Based on the amount of input oil by weight, 1.1percent of potassium hydroxide (KOH) is used. The ethyl ester process utilizes 70 percentstoichiometric excess ethanol (absolute, 100 percent pure), or a molar ratio of 5.1: 1 ethanolto oil ratio. Based on the amount of input oil by weight, 1.3 percent of KOH is used. Thefollowing transesterification procedure is for the methyl and ethyl ester production. Thecatalyst is dissolved into the alcohol by vigorous stirring in a small reactor. The oil istransferred into the Biodiesel reactor and then the catalyst/alcohol mixture is pumped into theoil and the final mixture stirred vigorously for two hours. A successful reaction produces twoliquid phases: ester and crude glycerol. Crude glycerol, the heavier liquid will collect at thebottom after several hours of settling.. Phase separation can be observed within 10 minutesand can be complete within two hours after stirring has stopped. Complete settling can takeas long as 20 hours. After settling is complete, water is added at the rate of 5.5 percent byvolume of the oil and then stirred for 5 minutes and the glycerol allowed to settle again.After settling is complete the glycerol is drained and the ester layer remains. Washing theester is a two step process which is carried out with extreme care. A water wash solution atthe rate of 28 percent by volume of oil and 1 gram of tannic acid per liter of water is addedto the ester and gently agitated. Air is carefully introduced into the aqueous layer whilesimultaneously stirring very gently. This process is continued until the ester layer becomesclear. After settling, the aqueous solution is drained and water alone is added at 28 percentby volume of oil for the final washing.
Fuel Characterization
The fuels were characterized by evaluating the parameters required in ASAE EP X552. Thetests for specific gravity, viscosity, cloud point, pour point, flash point, heat of combustion,total acid value, catalyst, and fatty acid composition were performed at the Analytical Lab,Department of Agricultural Engineering, University of Idaho. The boiling point, water andsediment, carbon residue, ash, sulfur, cetane number, copper corrosion, Karl Fischer water,particulate matter, iodine number, and the elemental analysis were performed at PhoenixChemical Labs, Chicago Illinois. The HPLC and titration analysis for total and free glycerol,percent of oil esterified, free fatty acids, and mono-, di-, and trigylicerides were performedby Diversified Labs Inc., Chantilly, Virginia.
Engine Performance Tests
All engine performance tests were conducted in the engine performance lab at the Universityof Idaho. The equipment used and tests conducted are described below. The short termtests were performed with an in-line four cylinder John Deere 4239T turbocharged, directinjected diesel engine. It has a displacement of 3.9 liters 239 cubic inches), a high RPM of2650, 61 kw (82 hp) at 2500 RPM, and 290 Nm (214 ft lbf) torque at 1500 RPM. It is
946
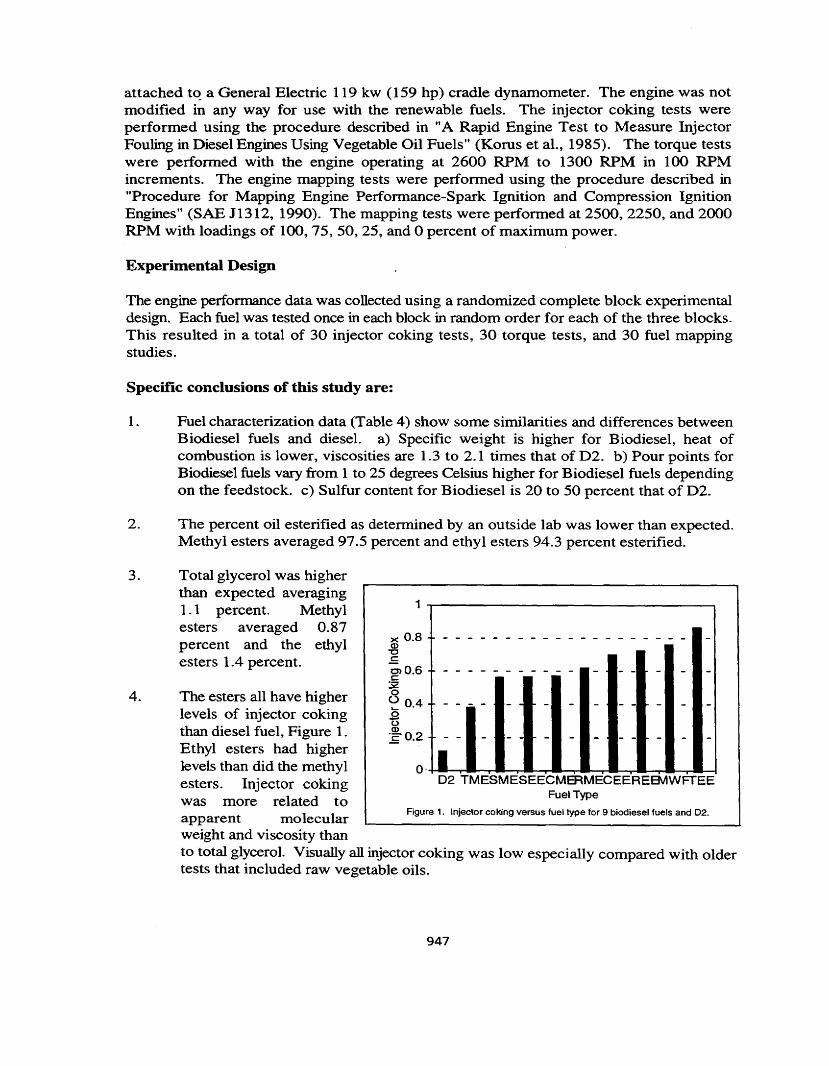
attached to a General Electric 119 kw (159 hp) cradle dynamometer. The engine was notmodified in any way for use with the renewable fuels. The injector coking tests wereperformed using the procedure described in "A Rapid Engine Test to Measure InjectorFouling in Diesel Engines Using Vegetable Oil Fuels" (Korns et al., 1985). The torque testswere performed with the engine operating at 2600 RPM to 1300 RPM in 100 RPMincrements. The engine mapping tests were performed using the procedure described in"Procedure for Mapping Engine Performance-Spark Ignition and Compression IgnitionEngines" (SAE 11312, 1990). The mapping tests were performed at 2500,2250, and 2000RPM with loadings of 100, 75, 50, 25, and 0 percent of maximum power.
Experimental Design
The engine performance data was collected using a randomized complete block experimentaldesign. Each fuel was tested once in each block in random order for each of the three blocks.This resulted in a total of 30 injector coking tests, 30 torque tests, and 30 fuel mappingstudies.
Specific conclusions of this study are:
1. Fuel characterization data (Table 4) show some similarities and differences betweenBiodiesel fuels and diesel. a) SPecific weight is higher for Biodiesel, heat ofcombustion is lower, viscosities are 1.3 to 2.1 times that of D2. b) Pour points forBiodiesel fuels vary from 1 to 25 degrees Celsius higher for Biodiesel fuels dependingon the feedstock. c) Sulfur content for Biodiesel is 20 to 50 percent that of D2.
2. The percent oil esterified as determined by an outside lab was lower than expected.Methyl esters averaged 97.5 percent and ethyl esters 94.3 percent esterified.
D2 TMESMESEECMERMECEEREa1WFTEEFuel Type
- - - - - - - - - - - - - - - - - - - - -
- - - - - - - - - - - - - - - - -
. - - - - - - - - - - - - - -
- - - - - - - - - - - -Io·
1
Figure 1. Injector coking versus fuel type for 9 biodiesel fuels and 02.
x 0.8~c0,0.6c32o'2 0.4.9u
~ 0.2
The esters all have higherlevels of injector cokingthan diesel fuel, Figure 1.Ethyl esters had higherlevels than did the methylesters. Injector cokingwas more related toapparent molecularweight and viscosity thanto total glycerol. Visually all injector coking was low especially compared with oldertests that included raw vegetable oils.
Total glycerol was higherthan expected averaging1.1 percent. Methylesters averaged 0.87percent and the ethylesters 1.4 percent.
4.
3.
947
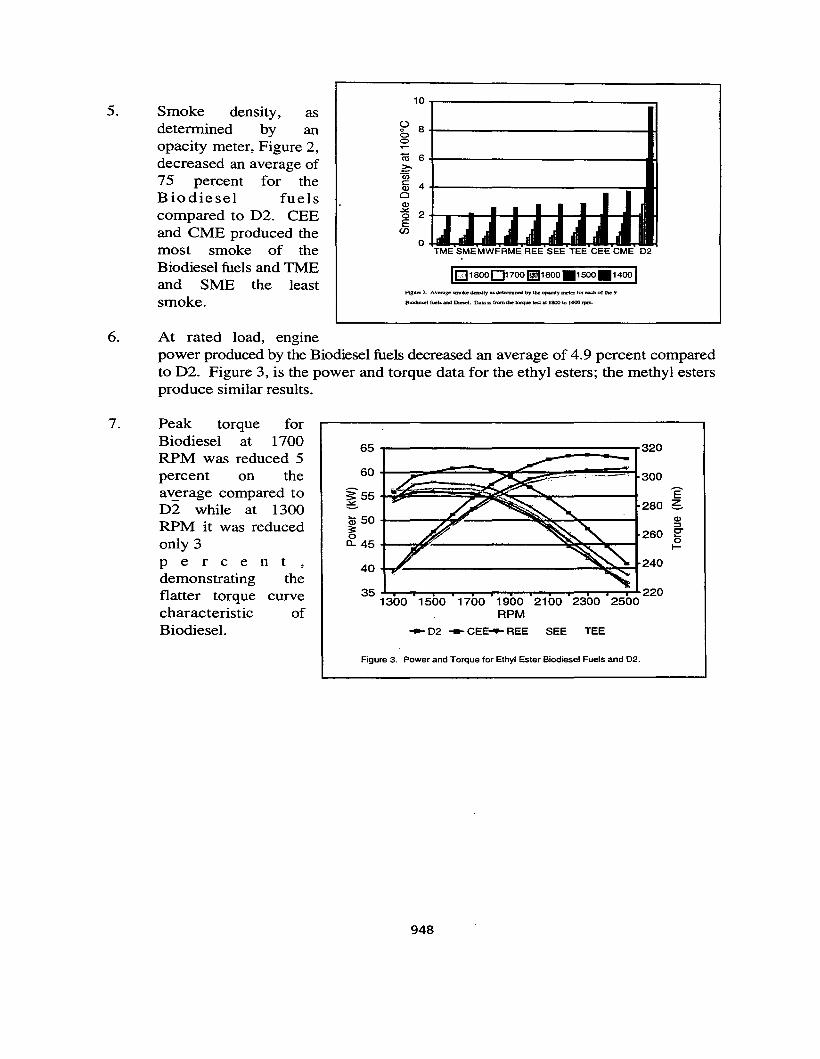
5. Smoke density, asdetermined by anopacity meter, Figure 2,decreased an average of75 percent for theBiodiesel fuelscompared to D2. CEEand CME produced themost smoke of theBiodiesel fuels and TMEand SME the leastsmoke.
10 T""""--------------...,oo 8 +---------------11-1o~rn6+---- _~.Ci5
a5 4+--------------=--ClQ)
i:52+-......-1r-.....--Ir-...--I1-...-tllt-...Een
Figure 2. Avenge smokedenllity udefamined by the opacity mda' (Of eacb of the 9
Biodiesel fucbaAcS Dics.cl. Data is from tbe rorque 1=>t II 1800 to 1400 rpm..
6. At rated load, enginepower produced by the Biodiesel fuels decreased an average of 4.9 percent comparedto D2. Figure 3, is the power and torque data for the ethyl esters; the methyl estersproduce similar results.
35 2201300 1500 1700 1900 2100 2300 2500
RPM-- D2 - CE~ REE SEE TEE
65 320
60 300
§:55 E~ 280 ~
:0 50 Q)~3: 260 e-o
n, 45 0I-
40 240
Peak torque forBiodiesel at 1700RPM was reduced 5percent on theav~rage compared toD2 while at 1300RPM it was reducedonly 3percentdemonstrating theflatter torque curvecharacteristic ofBiodiesel.
7.
Rgure 3. Power and Torque for Ethyl Ester Biodiesel Fuels and D2.
948
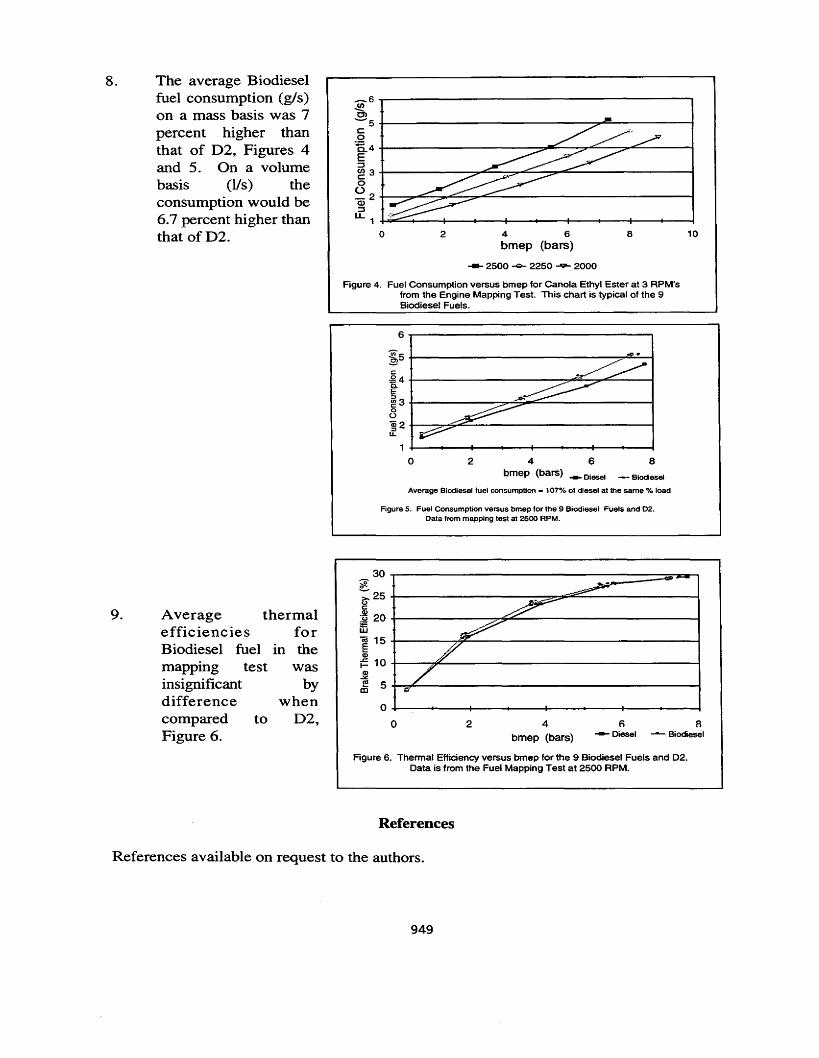
1084 6bmep (bars)
2
_6.,------------------------,JeC)
-5+----------------"'?""-=-------1coli4+------------..,.5--...,..""'--~...c:;....----tE:::J~3+-------,...c:;.....-=::o"""''''--~::>''''''''''''------------1
o~2+--,....~~...::::;;."""'::l,......:::~-------------~(l):::J
LL 1 -t-OO;:;"'-+-- --1- - _ - -+-- _ - - +-- -+-- --.,t--- _ - -to
The average Biodieselfuel consumption (gls)on a mass basis was 7percent higher thanthat of D2, Figures 4and 5. On a volumebasis (lis) theconsumption would be6.7 percent higher thanthat ofD2.
8.
- 2500 --- 2250~ 2000
Figure 4. Fuel Consumption versus bmep for Canola Ethyl Ester at 3 RPM'sfrom the Engine Mapping Test. This chart is typical of the 9Biodiesel Fuels.
6.,----------""""---------,
8
-- Biodiesel
4 6bmep (bars) _Diesel
2
~5 +---------------~"'O::;-=--_I~,g 4 +- ~""'"~,....c:;.....--_I
c.E~ 3 +------~~::;:'O'..,:::;--------_Ioo~ 2 +--'=""~"'---------------_Iu..
Average Biodiesel fuel consumption =107% of diesel at the same % load
Figure 5. Fuel Consumption versus bmep tor the 9 Biodiesel Fuels and 02.Data from mapping test at 2500 RPM.
30?;i:: 25
(,,)
9. Average thermalc:§ 20
efficiencies for::::w«i 15
Biodiesel fuel in the EQ)
mapping test was t= 10Q)
insignificant by~
e:! 5a:l
difference when 0compared to D2, 0 2 4 6 B
Figure 6. bmep (bars) -Diesel ~ Biodiesel
Figure 6. Thermal Efficiency versus bmep for the 9 Biodiesel Fuels and 02.Data is tram the Fuel Mapping Test at 2500 RPM.
References
References available on request to the authors.
949
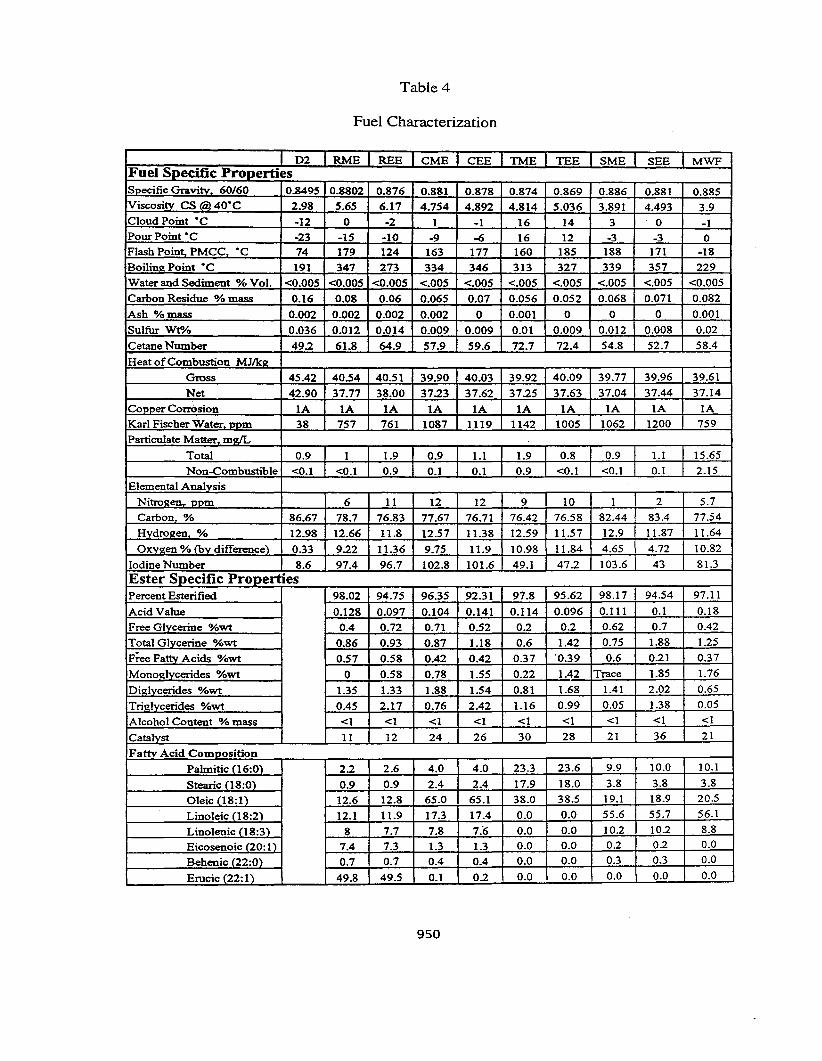
Table 4
Fuel Characterization
D2 RME REE I CME CEE TME TEE I SME SEE MWFFuel Soecific ProoertiesSpecific Gravitv. 60/60 0.8495 0.8802 0.876 0.881 0.878 0.874 0.869 0.886 0.881 0.885Viscosity CS (@40·C 2.98 5.65 6.17 4.754 4.892 4.814 5.036 3.891 4.493 3.9Cloud Point ·C -12 0 -2 1 -1 16 14 3 0 -1Pour Point ·C -23 -IS ·10 -9 -6 16 12 -3 .3 0Flash Point. PMCC ·C 74 179 124 163 177 160 185 188 171 -18
Boilinz Point ·C 191 347 273 334 346 313 327 339 357 229
Water and Sediment % Vol. <0.005 <0.005 <0.005 <.005 <.005 <.005 <.005 <.005 <.005 <0.005
Carbon Residue % mass 0.16 0.08 0.06 0.065 0.07 0.056 0.052 0.068 0.071 0.082
Ash %mass 0.002 0.002 0.002 0.002 0 0.001 0 0 0 0.001
Sulfur Wt"/o 0.036 0.012 0.014 0.009 0.009 0.01 0.009 0.012 0.008 0.02
Cetane Number 49.2 61.8 64.9 57.9 59.6 72.7 72.4 54.8 52.7 58.4
Heat ofCombustion MJlksz
Gross 45.42 40.54 40.51 39.90 40.03 39.92 40.09 39.77 39.96 39.61
Net 42.90 37.77 38.00 37.23 37.62 37.25 37.63 37.04 37.44 37.14
CODner Corrosion lA lA lA lA lA lA lA lA lA lA
Karl Fischer Water. DDm 38 757 761 1087 1119 1142 1005 1062 1200 759
Particulate Matter. mlllL
Total 0.9 1 1.9 0.9 1.1 1.9 0.8 0.9 1.1 15.65
Non-Combustible <0.1 <0.1 0.9 0.1 0.1 0.9 <0.1 <0.1 0.1 2.15
Elemental Analysis
Nitroaen, DDm 6 11 12 12 9 10 1 2 5.7
Carbon % 86.67 78.7 76.83 77.67 76.71 76.42 76.58 82.44 83.4 77.54
Hvdrozen % 12.98 12.66 11.8 12.57 11.38 12.59 11.57 12.9 11.87 11.64
OXYlZen % (by difference) 0.33 9.22 11.36 9.75 11.9 10.98 11.84 4.65 4.72 10.82
Iodine Number 8.6 97.4 96.7 102.8 101.6 49.1 47.2 103.6 43 81.3
Ester Specific ProoertiesPercent Esterified 98.02 94.75 96.35 92.31 97.8 95.62 98.17 94.54 97.11
Acid Value 0.128 0.097 0.104 0.141 0.114 0.096 0.111 0.1 0.18
Free Glycerine %wt 0.4 0.72 0.71 0.52 0.2 0.2 0.62 0.7 0.42
Total Glycerine %wt 0.86 0.93 0.87 1.18 0.6 1.42 0.75 1.88 1.25
Free Fattv Acids %wt 0.57 0.58 0.42 0.42 0.37 '0.39 0.6 0.21 0.37
Mouozlvcerides %wt 0 0.58 0.78 1.55 0.22 1.42 Trace 1.85 1.76
Dialvcerides %wt 1.35 1.33 1.88 1.54 0.81 1.68 1.41 2.02 0.65
Trialvcerides %wt 0.45 2.17 0.76 2.42 1.16 0.99 0.05 1.38 0.05
Alcohol Content % mass <1 <1 <1 <1 <1 <1 <1 <1 <1
Catalvst 11 12 24 26 30 28 21 36 21
Fattv Acid Comnositfon
Palmitic n 6:0) 2.2 2.6 4.0 4.0 23.3 23.6 9.9 10.0 10.1
Stearic fI8:0) 0.9 0.9 2.4 2.4 17.9 18.0 3.8 3.8 3.8
Oleic fI8:}) 12.6 12.8 65.0 65.1 38.0 38.5 19.1 18.9 20.5
Linoleic ri8:2) 12.1 11.9 17.3 17.4 0.0 0.0 55.6 55.7 56.1
Linolenic fI8:3) 8 7.7 7.8 7:6 0.0 0.0 10.2 10.2 8.8
Eicosenoic (20: I) 7.4 7.3 1.3 1.3 0.0 0.0 0.2 0.2 0.0
Behenic (22:0) 0.7 0.7 0.4 0.4 0.0 0.0 0.3 0.3 0.0
Erucic (22:}) 49.8 49.5 0.1 0.2 0.0 0.0 0.0 0.0 0.0
950
ON-ROAD TESTING OF RAPESEED BIODIESEL
Daryl Reece, M.S., Engineer; Charles Peterson, Ph.D., ProfessorDepartment of Agricultural Engineering
University of Idaho, Moscow, Idaho 83844-2040 U.S.A.
Abstract
Two on-road diesel pickups were operated on a mixture of 20 percent Biodiesel and 80percent diesel for 80,500 Ion (50,000 miles). One pickup, powered by a 5.9 liter directinjected, turbocharged, and intercooled engine was operated on 20 percent RME and 80percent diesel. The other pickup, powered by a 7.3 liter, naturally aspirated, precombustionchamber engine, was operated on 20 percent raw rapeseed oil and 80 percent diesel. Theengines were unmodified, but modifications were made to the vehicles for the convenienceof the test. In order to give maximum vehicle range, fuel mixing was done on-board toextend the driving range to over 4,800 kID (3,000 miles) between Biodiesel fill ups. Twotanks were added, one for a mixing chamber and one for the Biodiesel fuel tank in the bedof the pickup. Electric fuel pumps supply fuel to the combining chamber for correctproportioning. The Biodiesel fuel tanks were heated through a heat exchanger in the fueltank with the use of engine coolant.
Chassis dynamometer testing, injector coking, engine compression, injector valve openingpressures, and engine oil analyses were performed at regularly scheduled intervals tomonitor the engine performance parameters. RME produced 5 percent less power than D2,20RNtE produced 1 percent less than D2, and 20RAW produced 1 percent less power thanD2. Opacity was reduced 26 percent with RME, 20RME reduced opacity 10 percent, and20RAW decreased opacity by 11 percent with the snap idle test compared to D2.
Emissions tests with a chassis transient dynamometer at the Los Angeles MetropolitanAuthority Emissions Test Facility resulted in a decrease in HC (20 percent), CO (25percent), NOx (2.6 percent), PM (10.9 percent), and there was no difference in CO2 with20RME compared to D2.
951
Introduction
Much interest has been generated in the use of alternative fuels for transportation. TheClean Air Act Amendment of 1990 mandates phase-in adoption of clean fuels that are notharmful to the environment. The Energy Policy Act of 1992 also mandates fleet operatorsto begin purchasing alternative fueled vehicles as a percentage of all new vehicles purchasedstarting in model year 1996. Increased EPA exhaust emissions requirements for dieselengines have also created much interest in the use ofBiodiesel. Such legislation and federalpolicies will significantly increase the attractiveness of the use and expedite thecommercialization ofbiofuels, including ethanol and vegetable oils. Increased use of thesefuels can reduce U.S. dependence on imported oil and help improve air quality by reducingharmful gaseous and particulate emissions.
Emissions from compression ignition engines fueled with vegetable oil contain negligiblelevels of sulfur dioxide responsible for acid rain. Vegetable oils are also moreenvironmentally friendly in the case of a spill. The fuel is biodegradable and will quicklybreak down, thus preventing long-term damage to soil or water (Peterson et aI., 1994).
Vegetable oil as an alternative to diesel fuel has been under study at the University of Idahosince 1979. Researchers at the VI have pioneered the use of rapeseed oil as a diesel fuelsubstitute. Through this and other research, it has been demonstrated that raw rapeseed oilis best used for fuel in precombustion chamber type diesel engines as a blend with diesel.Most diesel engines in use in the United States are of the direct injection type. For theseengines, it has been found that the rapeseed oil should be transesterified before being usedas a diesel fuel substitute. Methyl ester ofrapeseed (RME) can be substituted for diesel fuelin unmodified diesel engines without significant reduction in engine performance.
Objectives
Past research has focused on the development and testing of Biodiesel in controlledenvironments. The objective of this project was to determine if Biodiesel is a viabletransportation fuel using two Biodiesel fueled on-the-road pickups. Specific objectives forachieving this goal are:• Operate two pickups for 80,467 km (50,000 miles) with a blend of 20 percent RME, 80
percent D2 (20RME) in one and a blend of 20 percent raw rapeseed oil 80 percent D2(20RAW) fuel in the other.
• Design an on-board fuel mixing system to maximize the travel range for each pickup andat the same time keeping the fuel from congealing.
• From chassis steady state dynamometer testing, determine the percent difference inpower, opacity, and fuel economy to that of D2.
• Conduct pending ASAE fuel standard tests for 20RME, 20RAW, number two diesel(D2), and 100% RME.
• Compare regulated emissions data including total hydrocarbons (HC), carbon monoxide(CO), carbon dioxide (COJ, nitrogen oxides (NOx), and particulate matter (PM) forRME, 20RME, and diesel control fuel.
952
Materials and Methods
Two blends of Biodiesel and number two diesel fuel (D2) were studied using two dieselpowered pickups at the University of Idaho. During the past decade researchers at theUniversity of Idaho have shown that methyl ester of rapeseed is comparable to D2. Thisstudy was to verify the use ofblends of Biodiesel in on-road vehicles.
FuelsThe feedstock for both fuels under study is winter rapeseed, Dwarf Essex variety, that wasexpelled at the University of Idaho's Department of Agricultural Engineering's Farm ScaleProcessing Facility. One blend of fuel was 20 percent raw rapeseed oil and 80 percent D2.The other was a 20 percent blend of rapeseed methyl ester (RME), produced at the farmscale processing facility, and 80 percent D2. The RME was processed using equipment andtechniques scaled up and modified from prior research at the University of Idaho (Mosgrove,1987). The abbreviations used to denote the different fuels are as follows:
RAW = 100 percent raw rapeseed oil from the oil expeller and filtered20RAW = 20 percent RAW and 80 percent D2RME = 100 percent methyl ester of rapeseed20IDdE = 20 percent RME and 80 percent D2D2 = 100 percent number two diesel fuel
The fuels were characterized by evaluating the parameters required in ASAE EP X552. Thetests for specific gravity, viscosity, cloud point, pour point, flash point, heat of combustion,total acid value, catalyst, and fatty acid composition were performed at the Analytical Lab,Department ofAgricultural Engineering, University of Idaho. The boiling point, water andsediment, carbon residue, ash, sulfur, cetane number, copper corrosion, Karl Fischer water,particulate matter, iodine number, and the elemental analysis were performed at PhoenixChemical Labs, Chicago, Illinois. The HPLC and titration analysis for total and freeglycerol, percent of oil esterified, free fatty acids, and mono-, di-, and trigylicerides wereperformed by Diversified Labs Inc., Chantilly, Virginia.
On-Road VehiclesDodgeThe first pickup was a Dodge] 3/4-ton powered by a Cummins 5.9 liter turbocharged,intercooled direct injected diesel engine. The engine is an in-line six cylinder and has a boreand stroke of 102.0 x 120.0 mm, respectively; a compression ratio of 17.5:1; produces 119kW at 2,500 RPM; and a peak torque of 542 N-m at 1750 RPM. It was equipped with aBosch VB distributor type fuel injection pump, This pickup has been operated on 20RME.
FordThe second pickup was a Ford, powered by a Navistar 7.3 liter, naturally aspirated,precombustion chambered V-8 diesel engine. The engine has a bore and stroke of 104.38x 104.44 mm, respectively; a compression ratio of21.5:1; produces 134 lew at 3,300 RPM;and a peak torque of467 N-m at 1400 RPM. It was equipped with a Stanadyne rotary typefuel injection pump. A blend of 20 percent raw rapeseed oil and 80 percent diesel wasselected for this pickup because of the precombustion chambered engine.
1The use ofmanufacturer's names or trade products does not represent an endorsement of theproduct nor discrimination toward similar products which are not named.
953
Check VehiclesT.hree. o.the~ pickups were used as check vehicles. Two were equipped with the 5.9 literdirect mjection engmes, and the other used a 7.3 liter engine with a precombustion chamber.These vehicles were privately owned and operated on 100 percent diesel fuel to serve as acomparison. Oil samples and analyses were performed at the owners discretion andanalyzed by the same laboratory as the Biodiesel pickups. When possible, these vehicleswere dynamometer tested at the same facility as the Biodiesel pickups. .
Fuel Mixing SystemThe fuel delivery systems in the Biodiesel pickups were modified to provide for on-boardmixing of the fuel. Providing for on-board mixing greatly extends the range of the vehiclescompared to the original equipment manufacturers tanks. A 210 L (55 gal) fuel tank wasadded to the bed of each vehicle and insulated to store the Biodiesel fuel. A one and onehalf gallon mixing chamber was mounted to the frame of each vehicle with the diesel andBiodiesel fuel lines routed to this chamber. Each fuel supply was transferred from the tanksto the combining chamber with 12 volt electric fuel pumps. The combining chamber wasconstructed from mild steel and designed to incorporate four floats. The bottom float wasa normally open, polypropylene float and stem mounted horizontally in the chamber 4.5 em(1.75 in) from the bottom. It operated a low fuel warning light in the operators cab whichmakes the operator aware that the fueling circuit is not functioning. The second float wasalso a normally open polypropylene float and stem mounted horizontally in the chamber.When the fuel drops below this float a relay turns on the diesel fuel pump. Diesel fuel isthen transferred into the chamber until the third float deactivates the relay and shuts off thediesel fuel pump. The third float simultaneously activates the Biodiesel fuel pump and fillsthe chamber until the 20/80 blend is obtained. A fourth float, made of Buna-N and a brassstem, was mounted vertically in the top of the tank and can be adjusted to give the correctblend. The adjustment was preset in the laboratory before being mounted in the frame ofthe vehicle. Based on a 20 percent blend of Biodiesel / 80 percent diesel and 7.5 kmIL (18mpg) fuel consumption the on-board mixing increased the travel mileage from 965 km (600miles) to 7,242 Ian (4,500 miles) before requiring a Biodiesel fill-up.
During the first 32,187 Ian (20,000 miles) of operation of the Dodge pickup, rust wasforming in the Biodiesel tank and transferring to the fuel filter. The fuel filter was beingreplaced every 4,830 Ian (3,000 miles) due to plugging and loss of engine power. The mildsteel 210 L (55 gal) tank and the combining chamber were replaced with stainless steel tanksof similar design on the Dodge pickup only. New 12-volt positive displacement fuel pumpswere installed for the Biodiesel fuel and a 12-volt shut-off solenoid valve was placed in linewith the pump on both vehicles.
Fuel Heating SystemDuring cold weather operation the Biodiesel fuels need to be kept above the pour point,which is higher than normal diesel fuel. Engine coolant was used to warm the fuel in theBiodiesel fuel tanks. A stainless steel in-line fuel warmer was installed horizontally into the210 L (55 gal) Biodiesel fuel tank. A thermostat with an adjustable set point was set at12.7°C (55°F) and closed on rise to operate the coolant pump. The coolant lines were 1.59em (5/8 in) silicon heater hose which were routed along side the fuel supply and return linesand laid beside the fuel combining chamber and Biodiesel fuel pump. They were insulatedto help keep the fuel lines and the fuel in the combining chamber above the pour point whenthe vehicle was not in operation.
954
When the pickup was sitting idle without the engine running, a 110-volt thermostaticallycontrolled engine pre-heater was used to keep the engine coolant at 38°C (100°F). Thethermostat was installed on the inlet side of the heater. It senses the temperature of thecoolant at the inlet to the heater, and keeps the coolant at the preset temperature range.
Since the coolant pump operates on 12 volts, a 10 amp DC power supply was used toconvert standard 120 volt AC power into regulated 12 volt DC power. A 12 volt, 25 ampDC power relay was used to switch the power source when 120 volts AC was required. Ashut off valve was added before the coolant pump for flow control purposes.
Other ModificationsWhile the engines of the test vehicles were unmodified, the vehicles themselves have beenmodified for convenience of running the test. For example, it is known that esters willdeteriorate rubber components over a period of time, so the rubber fuel lines were replacedwith viton hose. A low coolant indicator was installed and a red light in the cab was usedto warn the operator oflow coolant. An hour meter was also added and operated only whenthere was engine oil pressure. A Biodiesel fuel tank gauge gave an indication of the levelof fuel in the Biodiesel tank. Additional ammeters and indicator lights indicated that the fuelmixing system was working properly. Each pickup was equipped with a log book to keepdaily and long-term records. Also, a maintenance record book was kept for each vehicle,which included the oil samples, dynamometer test data sheets, and any other scheduled orunscheduled maintenance.
Dynamometer TestingBoth pickups had a break-in period and were dynamometer tested before the Biodiesel fuelmixing system was incorporated. Each pickup was dynamometer tested every 16,000 Ian(10,000 miles) at Western States Cat in Spokane, Washington. During each dynamometertest the vehicle was tested with the following: once with the 20/80 mix and again with 100percent diesel. In addition the Dodge pickup was also dynamometer tested with 100 percentRME. A predetermined set of engine RPM's was programmed into the computer to obtainrepetitive data. The Ford pickup was dynamometer tested from 1400 to 3400 RPM inincrements of 200 RPM. Engine RPM's for the Dodge were 1600 to 2650 RPM with 150RPM increments. A computer recorded vehicle power, vehicle speed, fuel economy, engineRPM, opacity, torque, engine oil pressure, fuel pressure and temperature, exhausttemperature, inlet air temperature, and coolant temperature. The Dodge pickup also had theintake manifold pressure and engine blowby measured.
Performance ParametersAfter each dynamometer test the injectors were removed from the engine to check for carbondeposits using the procedure described in "A Rapid Engine Test to Measure Injector Foulingin Diesel Engines Using Vegetable Oil Fuels" (Korus et al, 1985). The cylinder compressionwas tested and the injector valve opening pressure was also checked. The Dodge pickup,Cummins engine, has direct access to the combustion chamber and cylinder walls throughthe injector bore in the cylinder head. A fiberoptic borescope was used for this engine tovisually inspect the amount of carbon build up on the piston crown and valve heads and tocheck for any abnormal cylinder wear.
Oil samples were taken at each oil change, which was 4,800 Ian (3,000 miles) for theBiodiesel pickups, and at the convenience of the owners of the control vehicles. The oil
955
samples were analyzed at a commercial oil analysis laboratory for wear metals, and physicaltests were performed. including antifreeze, fuel dilution, water, and viscosity. An infraredanalysis for soot, sulfur, nitration, and oxidation of the engine oil were also conducted. Thereportable limits for each metal was supplied by the oil analysis lab.
The emissions tests were conducted at the Los Angeles Metropolitan Transit AuthorityEmissions Testing Facility (ETF) in Los Angeles, California. This facility hasinstrumentation to measure all regulated emissions: total hydrocarbons (HC), carbonmonoxide (CO), carbon dioxide (CO:z), nitrogen oxides (NOx), and particulate matter (PM).Peterson and Reece (1994) report on comprehensive emissions testing, materials andmethods, procedures, and results from the MTA ETF using methyl and ethyl esters ofrapeseed oil.
Two test cycles were utilized for this program. The first was a modified arterial cycle(arterial). The standard form oftbis test was doubled, creating a 758 second, 8 event cycle.The arterial cycle, as used. had eight repetitions of acceleration to 64 kmIh (40 mph) anddecelerating to 0 kmIh. The second cycle was the EPA Dynamometer Driving Schedule forHeavy-Duty Vehicles (CFR, 1993). The EPA cycle took a total of 1060 seconds.
Results and Discussion
FuelsA complete summary of the fuel characterization data is avialable in (Reece, 1995.)Important observations on a few of the parameters are listed below.Viscosity - The RAW fuel had a viscosity 15.7 times greater than D2 at 40·C while RME
was only 1.8 times greater than D2. The 20RME had a similar viscosity as did the D2.Cloud and Pour Point - All the pour points were within 10 C of D2 including the RAW oil.
RME had a cloud point of0°C and D2 was _12°C with the RAW and blends were within1°C ofD2.
Sulfur - D2 (not low sulfur diesel) had 18 times more sulfur than RME and 10.5 times morethan RAW.
Heat ofCombustion - The gross heat of combustion for D2 is 5.6 percent greater than RMEfuel and 11 percent greater than RAW oil on a mass basis.
Flash Point - A flash point of 74°C was measured for D2 while the RME was measured at179·C and RAW at 274°C. The higher flash points of Biodiesel indicate that it is saferto use, store, and handle based on fire safety concerns.
On-Road VehiclesDodgeThe Dodge pickup accumulated 89,146 km (55,393 miles) with 85,966 Ian (53,417 miles)on the 20/80 blend. The fuel economy for the first 3,180 km (1,976 miles) using 100percent D2 was 8.55 kmIL (20.6 mpg). The average fuel economy with the blend was 8.3km/L (20.0 mpg). It consumed 6,882 L (1818 gal) of diesel and 2,794 L (738 gal) ofRMEfor a blend of28.8 percent RME and 71.2 percent D2. This was 8.8 percent above the targetvalue of the 20 percent blend ofRME.
The rust in the steel tanks may have been due to the heating and cooling of the fuel in thetank during the winter, condensing the moisture in the atmospheric air and/or a very smallamount of catalyst is in the RME fuel which is basic and will speed-up the oxidation
956
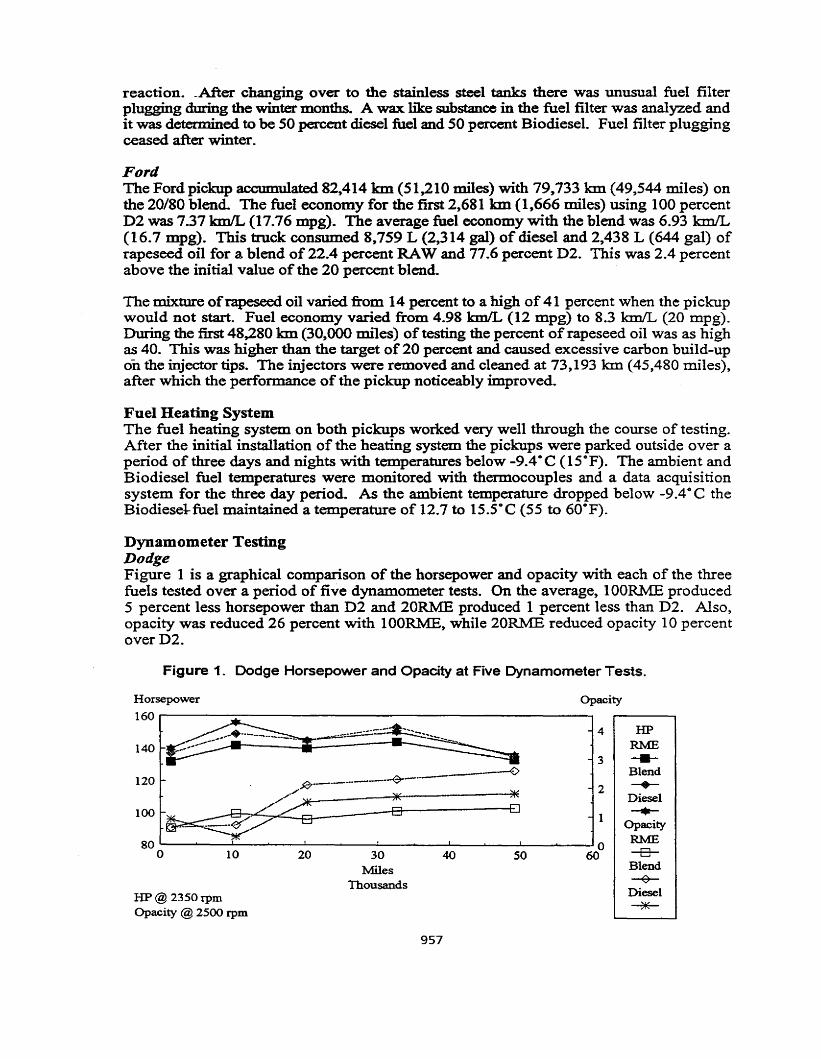
reaction. .After changing over to the stainless steel tanks there was unusual fuel filterplugging during the winter months. A wax like substance in the fuel filter was analyzed andit was determined to be SO percent diesel fuel and SO percent Biodiesel. Fuel filter pluggingceased after winter.
FordThe Ford pickup accumulated 82,414 km (51,210 miles) with 79,733 km. (49,544 miles) onthe 20/80 blend. The fuel economy for the first 2,681 km (1,666 miles) using 100 percentD2 was 7.37 km/L (17.16 mpg). The average fuel economy with the blend was 6.93 kmIL(16.7 mpg). This truck consumed 8,759 L (2,314 gal) of diesel and 2,438 L (644 gal) ofrapeseed oil for a blend of 22.4 percent RAW and 77.6 percent D2. This was 2.4 percentabove the initial value of the 20 percent blend.
The mixture ofrapeseed oil varied from 14 percent to a high of 41 percent when the pickupwould not start. Fuel economy varied from 4.98 kmIL (12 mpg) to 8.3 kmIL (20 mpg).During the first 48,280 Ian (30,000 miles) of testing the percent of rapeseed oil was as highas 40. This was higher than the target of 20 percent and caused excessive carbon build-upon the injector tips. The injectors were removed and cleaned at 73,193 km (45,480 miles),after which the performance of the pickup noticeably improved.
Fuel Heating SystemThe fuel heating system on both pickups worked very well through the course of testing.After the initial installation of the heating system the pickups were parked outside over aperiod of three days and nights with temperatures below -9.4°C (ISOF). The ambient andBiodiesel fuel temperatures were monitored with thermocouples and a data acquisitionsystem for the three day period. As the ambient temperature dropped below -9.4° C theBiodiesel-fuel maintained a temperature of 12.7 to I5.5°C (55 to 60 0P).
Dynamometer TestingDodgeFigure 1 is a graphical comparison of the horsepower and opacity with each of the threefuels tested over a period of five dynamometer tests. On the average, 100RME produced5 percent less horsepower than D2 and 20~ produced 1 percent less than D2. Also,opacity was reduced 26 percent with 100RME, while20~ reduced opacity 10 percentoverD2.
Figure 1. Dodge Horsepower and Opacity at Five Dynamometer Tests.
Opacity
4 HPRME
3 -----0 Blend
2 -+-
~ Diesel
---1 Opacity
0RME
50 60 -e-Blend~
Diesel~
4030Miles
Thousands
2010
HP@2350rpmOpacity @ 2500 rpm
140
120 .R/--.----~-.---
100 ""- --0/«: ~~~~
Horsepower160,-----::-----------------------.
957
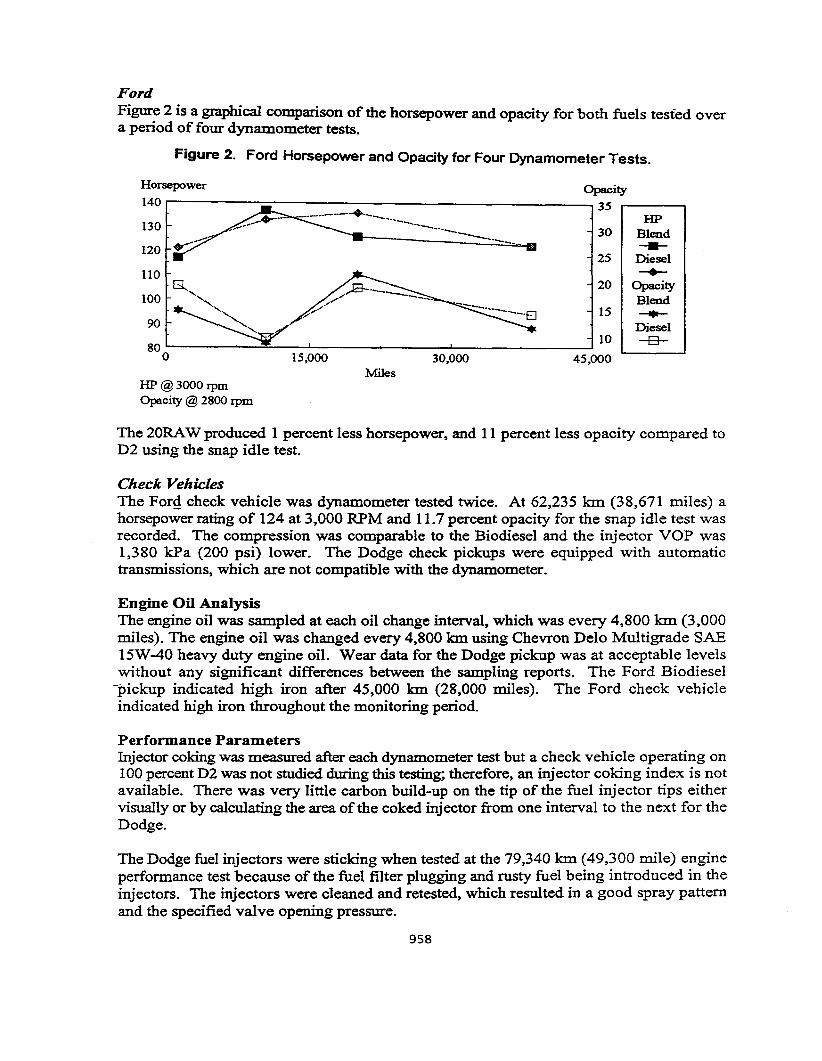
FordFigure 2 is a graphical comparison of the horsepower and opacity for both fuels tested overa period of four dynamometer tests.
Figure 2. Ford Horsepower and Opacity for Four Dynamometer Tests.
Opacity
35HP
30 Blend---25 Diesel~
20 OpacityBlend
15 ---Diesel10 ..;3-
45,00030,000
_._--_.__....._-------------------.. ....._-...
15,000
Horsepower
140 1 - - - - -;;;;:-- - - - - - - - - - - - - - - - _ --,
130
120
110
100
90
80o'--------:::!:~-....l..---------l----------l
MilesHP@3000rpmOpacity @ 2800 IpID.
The 20RAW produced 1 percent less horsepower, and 11 percent less opacity compared toD2 using the snap idle test.
Check VehiclesThe Ford check vehicle was dynamometer tested twice. At 62,235 km (38,671 miles) ahorsepower rating of 124 at 3,000 RPM and 11.7 percent opacity for the snap idle test wasrecorded. The compression was comparable to the Biodiesel and the injector VOP was1,380 kPa (200 psi) lower. The Dodge check pickups were equipped with automatictransmissions, which are not compatible with the dynamometer.
Engine Oil AnalysisThe engine oil was sampled at each oil change interval, which was every 4,800 km (3,000miles). The engine oil was changed every 4,800 km using Chevron Delo Multigrade SAE15W-40 heavy duty engine oil. Wear data for the Dodge pickup was at acceptable levelswithout any significant differences between the sampling reports. The Ford Biodiesel
"pickup indicated high iron after 45,000 km (28,000 miles). The Ford check vehicleindicated high iron throughout the monitoring period.
Performance ParametersInjector coking was measured after each dynamometer test but a check vehicle operating on100 percent D2 was not studied during this testing; therefore, an injector coking index is notavailable. There was very little carbon build-up on the tip of the fuel injector tips eithervisually or by calculating the area of the coked injector from one interval to the next for theDodge.
The Dodge fuel injectors were sticking when tested at the 79,340 km (49,300 mile) engineperformance test because of the fuel filter plugging and rusty fuel being introduced in theinjectors. The injectors were cleaned and retested, which resulted in a good spray patternand the specified valve opening pressure.
958
The Ford fuel injector tips had a significant amount of carbon build-up both visually and bycalculating the area of the coked injector from one interval to the next. The fuel injector tipswere cleaned at 73,193 km (45,480 miles) due to excess carbon build-up which wasdistorting the fuel spray pattern.
The engine cylinder compression, on both the Dodge and Ford engines, was checked at eachperformance interval. The cylinder compression in the Dodge either stayed the same ordecreased only as much as 103 kPa (15 psi) from the beginning of the test to the end. Thecylinder compression in the Ford increased in each cylinder as much as 276 kPa (40 psi)with the exception ofcylinder number 5 which decreased by 103 kPa (15 psi). The averagecylinder compression for both pickups was 3,447 kPa (500 psi).
The average beginning valve opening pressure (VOP) for the Dodge was 24.2 MPa (3,510psi) with a standard deviation of 144 kPa (21 psi) and the average ending VOP was 23.81v1Pa (3,450 psi) with a standard deviation of 65 psi. The average beginning VOP for theFord pickup was 13.81v.1Pa (2,005 psi) with a standard deviation of 117 kPa (17 psi) and theaverage ending VOP was 13.4 MPa (1950 psi) with a standard deviation of 220 kPa (32 psi).The Ford check vehicle had the VOP checked at 62,233 km (38,670 miles). The averageVOP was 12.7 MPa (1840 psi) and a standard deviation of317 kPa (46 psi).
The Dodge combustion areas were borescoped at each performance interval. There was nosignificant visual change from one time to the next. At the end of this study there were afew slight carbon scratches on the thrust side of the cylinder walls of each cylinder, whichis normal for the number of accumulated miles. There did not appear to be any excessamount of carbon build-up on the piston crowns or the cylinder head and valves.
Emissions TestsSince a large amount of data was collected, only summary data from emissions testing isreported. Modal data were archived every 1 second during the test. The data presented isfuel type, cycle, HC, CO, NOx, CO2 , and PM. All the regulated emissions were higher forthe EPA cycle than for the modified arterial cycle. This is probably due to the increasedidling time and non-repetitive nature of the EPA cycle. The 100RME showed a slightreduction in NOx, a significant reduction in He and CO, and a slight increase in PM andCO2 compared to 100D2.
DiscussionThe drivers of the vehicles have not noticed any change in vehicle operation or otherabnormalities during the course of the test. The Ford averaged 7 .35k:mIL (17.7 mpg) andthe Dodge 8.3 kmIL (20.0 mpg) for the 80,467 km (50,000 miles). The Ford check vehicleaveraged 5.4 km/L (13 mpg) and the Dodge 7.05 km/L (17 mpg). These two check vehicleswere used for utility type applications with heavy loads, while the test vehicles generallywere operated empty, which may explain the differences in economy.
On-road performance tests demonstrated that RME and 20RME can be used to successfullyfuel a diesel engine. The 20RAW fuel should be limited to pre-combustion chamber enginesand may require more frequent fuel injector tip cleaning. The 20RAW fuel has generallynot been recommended for general use because of potential engine polymerization andlubrication oil problems.
959
Conclusions
At the conclusion of 80,467 Ian (50,000 miles) with two pickups operating on 20 percentBiodiesel (RAW or RME) there is no indication of abnormal wear or performance. The onboard mixing system was essential only for purpose of this experiment. It should be clear,however, that for commercial use the blending would take place at the fuel plant eliminatingthe on-board mixing system.
Emission tests show that a 20 percent blend of RME and 80 percent diesel produced areduction in 4 ofthe 5 regulated emissions (C02 being the exception.) Specific conclusionsfrom the results of this testing are presented below.
• Fuel characterization data. show some similarities and differences between RME and D2. a)Specific weight is higher for RME, viscosity is 1.9 times that ofD2 at 40·C, and the heat ofcombustion is 5.6% lower than D2. b) Sulfur content for RME is 67% less than D2.
• Visually, all injector coking was low with 20RME especially compared with older teststhat included raw vegetable oils. The 20RAW injector tips had accumulated excessivedeposits and were cleaned at 73,193 Ian (45,480 miles) with a noticeable difference inperformance. The Dodge injectors were cleaned at 79,340 Ian (49,300 miles) due torust.
• The fuel heating systems worked well during the test period. The fuel combiningsystems were updated two times due to continual adjustments to achieve the targeted 20percent blend.
• On the average, RME produced 5 percent less power than D2 and 20RME produced 1percent less than D2. The 20RAW produced 1 percent less power than D2.
• On tile average, opacity was reduced 26 percent with RME, while 20RME reducedopacity 10 percent over D2. The 20RAW decreased opacity by 11 percent with the snapidle test.
• The average fuel economy (mpg) for RME was 4 percent higher than that ofD2 , 1.8percent higher for 20RME, and 2.6 percent higher for 20 RAW. The differences in fuelconsumption and power reflect the differences in heat of combustion and densitybetween the two fuels.
• Emissions tests with the arterial cycle showed decreases in HC (55 percent), CO (42percent), NOx (9.1 percent), PM (6.8 percent), and an increase in CO2 (0.7 percent)when 100 percent RME is compared to D2.
• The 20RME fuel, decreased HC( 20 percent), CO (25 percent), NOx (2.6 percent), PM(10.9 percent), and there was no difference in CO2 compared to D2.
• Statistical analysis showed significant differences with HC, CO, and NOx from diesel(p<=0.05), and no significant difference was determined for CO2 and PM.
References
References available upon request.
960
ONE-PHASE METHODS FOR ACCELERATING THEPRODUCTION OF BIODIESEL METHYL ESTERS
David G. B. Boocock, Ph. D.,Professor; S. K. Konar, Ph. D., Postdoctoral Fellow;V. Mao, B.A.Sc., Graduate Student; and H. Sidi, B. A.Sc., Graduate Student;
Department of Chemical Engineering and Applied Chemistry, University of Toronto,Toronto, Ontario, Canada, LIS 3G7
Abstract
The base-catalysed (methoxide or hydroxide) methanolysis of vegetable oils (6:1methanol/oil molar ratio), such as soybean, occurs 15-20 times slower than butanolysisbecause the former starts out as a two-phase system, in which the solubility of the oil inthe methanol phase, where the catalyst is located, is very low. The addition of acosolvent, such as 1.27 volumes of tetrahydrofuran (THF) per volume of methanol, formsan oil-rich, one phase system in which methanolysis is as fast as butanolysis. Othersuitable cosolvents include 1,4-dioxane, diethyl ether and t-butyl methyl ether. THF hasa boiling point very close to that of methanol and can be flashed and recycled along withunused alcohol. Glycerol separation usually occurs faster in the presence of cosolvent(4-5 times faster in the case of THF). The sudden and abnormal slowing of bothhydroxide and alkoxide transesterifications may be caused by a number of factorsincluding polarity of the mixture, the formation of undesired intermediates and structuraldifferences in the substrates. Simple appropriate measures can dramatically lower 98%conversion times to twenty minutes and less, in which case continuous processesemploying centrifuges for glycerol separation become very attractive.
961
Introduction
Biodiesel, in the form of vegetable oil methyl esters, is already being manufactured andsold in many European countries including Austria, Belgium, Sweden, Denmark,Germany, Italy, the Czech Republic and Hungary. There are 25-30 manufacturingfacilities, a few of which operate on a cooperative farm scale. In the U.S.A, 1500vehicles have been involved in 13 million kilometres of testing. Another 100,000 hoursof testing have been carried out in non-moving equipment to measure engine performancein terms other than mileage. 1 The incentives for Governments to encourage theproduction and use of Biodiesel are environmental concerns, management of theagricultural sector and some perception of self sufficiency. The incentives for farmersand producers are agricultural subsidies and fuel tax relief. The major benefits may wellbe environmental. The most obvious benefit is that the Biodiesel is made from arenewable crop which takes up carbon dioxide as it grows. Biodiesel is alsobiodegradeable. The less obvious advantage is the significant reduction in the engineemissions of hydrocarbons, carbon monoxide and particulate matter (nitric oxideemissions increase slightly). In engines in which the timing has been modified, emissionsfall even further. Biodiesel can either be run neat or in blends with petrodiesel. Theonly disadvantages are that engine oil should be changed more frequently and that paintwork may be less resistant to spilled fuel. While considerable attention has been placedon fuel performance, relatively little effon has been made on improving the process forBiodiesel production. It is generally assumed that the reaction is slow and must thereforebe carried out in a batch mode. Unfortunately, the kinetic data for the reaction has beenmisinterpreted particularly as mass transfer limitations were ignored.
Background
Methanolysis is used to transform vegetable oils to their methyl esters and thus effectivelysplit the vegetable oil molecules into three parts. The product is therefore less viscousthan the vegetable oils, and this dramatically improves engine performance. The bascatalysed reaction is preferred over the acid-catalysed method because it is considerablyfaster. However, this difference is only relative and it is generally assumed that themethanolysis reaction is inherently slow and also requires considerable time for theseparation of the byproduct, glycerol. Although methoxide ion is theoretically the bestcatalyst, particularly when water or carboxylic acids are absent, hydroxide ion, usuallyfrom sodium hydroxide, is the most convenient catalyst. The equilibrium betweenhydroxide ion and methanol is used to provide methoxide ion. The pKa's of water andmethanol are very similar, and if this dissociation comparison can be extended to themethanol rich- system then this is a good way to produce methoxide ions. The presenceof hydroxide ion is potentially detrimental because the attack of the hydroxide on theesters leads to the irreversible formation of carboxylic acids. It was determined in 19842
that a 6:1 methanol/oil molar ratio is sufficient to give methyl ester yields over 95%.This is a surprisingly low ratio for this type of reaction and strongly suggests that theglyceride anions are inferior nucleophiles compared to methoxide ions. The separation ofthe glycerol does not appear to be a factor in the phenomenon. It has been reponed thatglycerol separation does not playa role in the ethanolysis of peanut oil", In additionwhen glycerol trioctanoate is used as substrate in the presence of a cosolvent, the glyceroldoes not separate, but methyl ester yields are over 98%. It is also generally concluded"
962
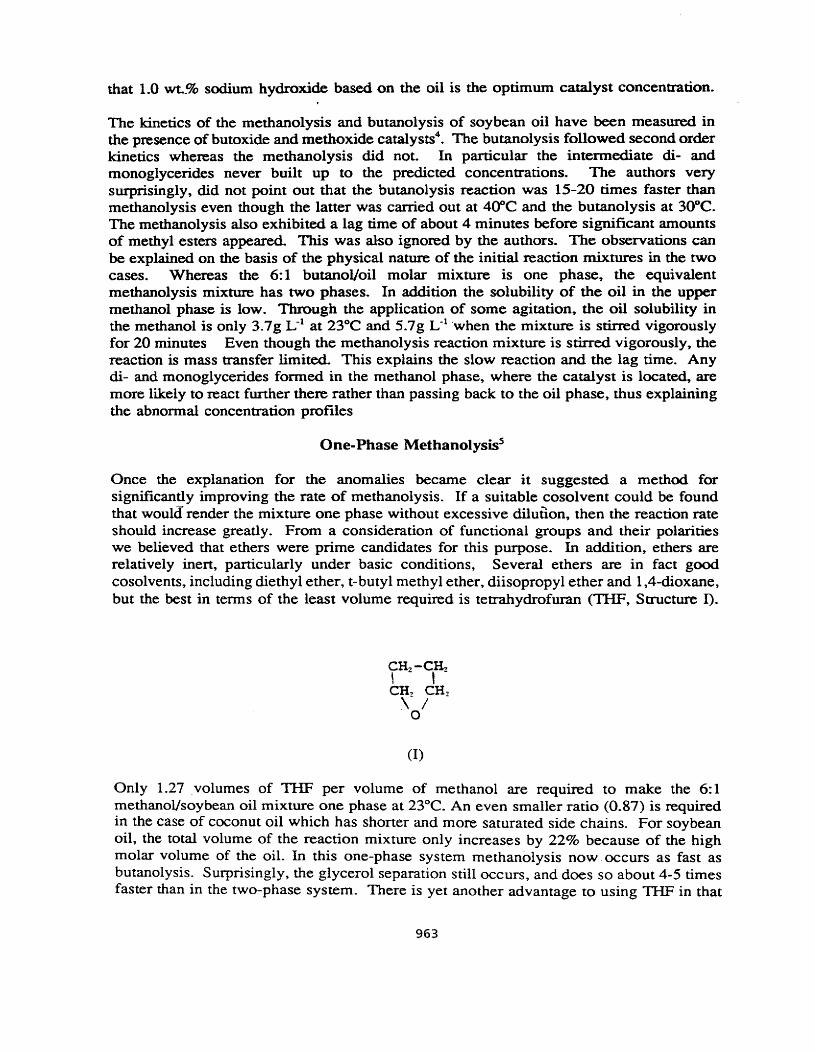
that 1.0 wt..% sodium hydroxide based on the oil is the optimum catalyst concentration.
The kinetics of the methanolysis and butanolysis of soybean oil have been measured inthe presence of butoxide and methoxide catalysts", The butanolysis followed second orderkinetics whereas the methanolysis did not. In particular the intermediate di- andmonoglycerides never built up to the predicted concentrations. The authors verysurprisingly, did not point out that the butanolysis reaction was 15-20 times faster thanmethanolysis even though the latter was carried out at 400C and the butanolysis at 30°C.The methanolysis also exhibited a lag time of about 4 minutes before significant amountsof methyl esters appeared. This was also ignored by the authors. The observations canbe explained on the basis of the physical nature of the initial reaction mixtures in the twocases. Whereas the 6:1 butanol/oil molar mixture is one phase, the equivalentmethanolysis mixture has two phases. In addition the solubility of the oil in the uppermethanol phase is low. Through the application of some agitation.. the oil solubility inthe methanol is only 3.7g L-1 at 23°C and 5.7g L-1 'when the mixture is stirred vigorouslyfor 20 minutes Even though the methanolysis reaction mixture is stirred vigorously, thereaction is mass transfer limited. This explains the slow reaction and the lag time. Anydi- and monoglycerides formed in the methanol phase, where the catalyst is located, aremore likely to react further there rather than passing back to the oil phase, thus explainingthe abnormal concentration profiles
One-Phase Methanolysis''
Once the explanation for the anomalies became clear it suggested a method forsignificantly improving the rate of methanolysis. If a suitable cosolvent could be foundthat would render the mixture one phase without excessive diluiion, then the reaction rateshould increase greatly. From a consideration of functional groups and their polaritieswe believed that ethers were prime candidates for this purpose. In addition, ethers arerelatively inert, particularly under basic conditions, Several ethers are in fact goodcosolvents, including diethyl ether, t-butyl methyl ether, diisopropyl ether and 1,4-dioxane,but the best in terms of the least volume required is tetrahydrofuran (TIfF, Structure I).
?Hz-C,~
CH .. CH ..\~/ -
(I)
Only 1.27 ,volumes of TIfF per volume of methanol are required to make the 6: 1methanol/soybean oil mixture one phase at 23°C. An even smaller ratio (0.87) is requiredin the case of coconut oil which has shorter and more saturated side chains. For soybeanoil, the total volume of the reaction mixture only increases by 22% because of the highmolar volume of the oil. In this one-phase system rnethanolysis now. occurs as fast asbutanolysis. Surprisingly, the glycerol separation still occurs, and does so about 4-5 timesfaster than in the two-phase system. There is yet another advantage to using TIIF in that
963
its boiling point is only 2°C different from that of methanol. Therefore, at the end of thereaction the methanol and THF may be flashed off and recycled together. Finally, in theone-phase system no stirring is required, in contrast to the two-phase reaction whichrequires vigorous stirring. Ternary phase diagrams have been constructed for mixturesof each of the above cosolvents with methanol and four vegetable oils. The results willbe published elsewhere.
The reaction in the one phase system is over 95% complete in 20 minutes. It is over 80%complete in one minute and therefore shows the same characteristics as the butanolysisreaction, in being a very fast in the first few seconds but significantly slower thereafter.It has been suggested from a study on the ethanolysis of peanut oil5 that the depletion ofhydroxide is rapid and could therefore cause the slowing of the reaction. However, webelieve we have observed this reaction in the study of octanoates (see below) and it isconsiderably slower than the transmethylation", The phenomenon can also be explainedby assuming much smaller rate constants for the conversion of the di- andmonoglycerides. We have even suggested cyclic intermediates that would interfere withthe transesterification of the mono- and diglycerides. Preliminary experiments with 1,2and 1,3-g1ycero1 dioctanoates and ethanediol dioctanoate appeared to confirm that the sixmembered ring intermediate which is only possible in the case of the 1,3-isomer, was thereal problem. However, glycerol trioctanoate (GTO), which should also be capable offorming the intermediate, failed to show the slow phase, the reaction being over 98%complete in three minutes. This is despite the fact that the glycerol does not separate inthis reaction. A comparison of the reaction conditions for the one phase methanolysis ofsoybean oil and GTO is instructive. Compared to the reaction with soybean oil thefollowing are true of the reaction conditions for the methanolysis of GTO: (6: 1 methanolfoil molar ratio, 1.0 wt.% sodium hydroxide based on the oil, THFfmethanol volumeratio, 1.6, i.e. 28.5% excess).
1. The oil molar concentration increases.2. The methanol concentration increases.3. The polarity of the mixture increases. because of item 2.4. The base molar concentration decreases .5. The glycerol does not separate and therefore decrease the polarity of the mixture.
The only other differences are the shorter and saturated side chains in GTO. There is notmuch flexibility in changing items 1-3 and 5 independently, particularly in the case ofvegtable oils.. However, we have now shown that by increasing the sodium hydroxideconcentration into the 1.0-2.0 wt. % range we can accomplish the transesterification ofsoybean oil in 1-3 minutes and further enhance the glycerol separation. This adjustmentis obviously not very effective in the two-phase reaction. The discovery of the one-phasereaction makes continuous processes for the production of vegetable oil methyl esters veryattractive. The process is conceptualised as -follows. The vegetable. oil andmethanol{fHF mixture (already containing the hydroxide) would be metered into theflow-through reactor. At the appropriate time the reaction would be quenched withcarbon dioxide or a small amount of acid. The mixture would pass through a continuouscentrifuge to remove most of the glycerol. The methanol and glycerol would be flashedoff and returned to a holding tank for readjustment of the methanoVIHF ratio andaddition of base. A second centrifugation of the crude product would remove more
964
separated glycerol. Continuous water washing and drying would yield the product.Depending on the purity of the product and the specifications of the required fuel,distillation mayor may not be required. The glycerol phase would require its ownpurification procedure.
Conclusions
Consideration of both chemical and mass transfer concepts has pinpointed that the majorreason for the slowness of the base-catalysed methanolysis of vegetable oils is the twophase nature of the initial reaction mixture. The solution to this problem is the use of aninert cosolvent which produces an oil-rich single phase. A dramatic slowing of thereaction rate towards the end of one -phase methanolyses of vegetable oils under thenormal reaction conditions (1.0 wt.% sodium hydroxide based on the oil and 6: 1methanol/oil ratio) does not occur in the case of glycerol trioctanoate. Although the exactreason for this is still being investigated, the transmethylation of vegetable oils can beaccomplished in 1-3 minutes by increasing the sodium hydroxide concentration into the1.0-2.0 wt. % range. This strategy would not work without the formation of the one-phasesystem. Continuous processes for the production of vegetable oil methyl esters are nowfeasible. There are obviously subtleties of the transmethylation process that are still notunderstood, even in a one-phase process, and further work is taking place to define theroles of substrate structure, polarity and base concentration.
References
1. BIODIESEL: A Technology, Performance and Regulatory Overview, National SoybeanDevelopment Board.
2. B. Freedman, E. H. Pryde and T. H. Mounts, "Variables Affecting the Yields of FattyAcid Esters from Transesterified Vegetable Oils", J. Amer.Oil Chern. Soc., 61 (10), 16381643, (1984).
3. A. J. Feuge and A. T. Gros, "Modification of Vegetable Oils VII: Base-CatalysedInteresterification of Peanut Oil". J. Amer. Oil Chern. Soc., 26 (3) 91-92 (1949).
4. B. Freedman, R. O. Butterfield and E. H. Pryde, "Transesterification Kinetics ofSoybean ou-, J. Amer. Oil Chern. Soc., 63 (10), 1375-1380, (1986).
5. D, G. B. Boocock, S. K. Konar, V. Mao and H. Sidi, "Fast One-Phase Oil-RichProcesses for the Preparation of Vegetable Oil Methyl Esters", Biomass and Bioenergy,(In Press).
6. This Laboratory.Unpublished results.
965
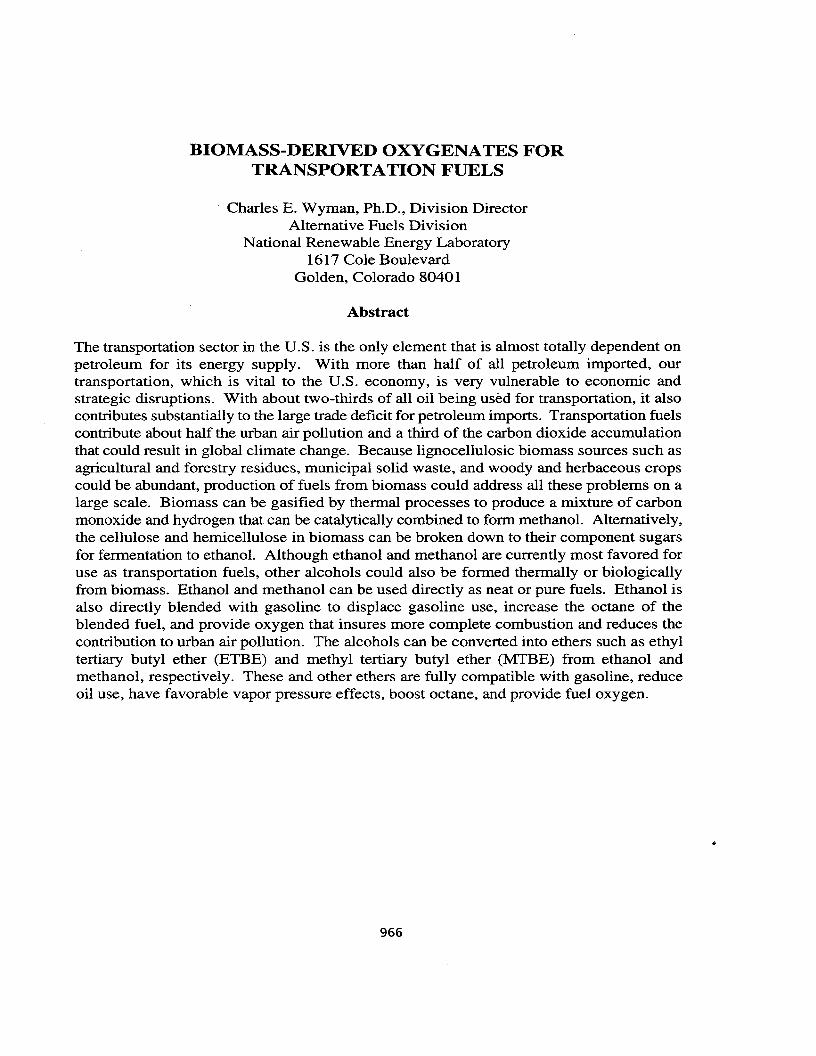
BIOMASS-DERIVED OXYGENATES FORTRANSPORTATION FUELS
Charles E. Wyman, Ph.D., Division DirectorAlternative Fuels Division
National Renewable Energy Laboratory1617 Cole Boulevard
Golden, Colorado 8040I
Abstract
The transportation sector in the U.S. is the only element that is almost totally dependent onpetroleum for its energy supply. With more than half of all petroleum imported, ourtransportation, which is vital to the U.S. economy, is very vulnerable to economic andstrategic disruptions. With about two-thirds of all oil being used for transportation, it alsocontributes substantially to the large trade deficit for petroleum imports. Transportation fuelscontribute about half the urban air pollution and a third of the carbon dioxide accumulationthat could result in global climate change. Because lignocellulosic biomass sources such asagricultural and forestry residues, municipal solid waste, and woody and herbaceous cropscould be abundant, production of fuels from biomass could address all these problems on alarge scale. Biomass can be gasified by thermal processes to produce a mixture of carbonmonoxide and hydrogen that can be catalytically combined to form methanol. Alternatively,the cellulose and hemicellulose in biomass can be broken down to their component sugarsfor fermentation to ethanol. Although ethanol and methanol are currently most favored foruse as transportation fuels, other alcohols could also be formed thermally or biologicallyfrom biomass. Ethanol and methanol can be used directly as neat or pure fuels. Ethanol isalso directly blended with gasoline to displace gasoline use, increase the octane of theblended fuel, and provide oxygen that insures more complete combustion and reduces thecontribution to urban air pollution. The alcohols can be converted into ethers such as ethyltertiary butyl ether (ETBE) and methyl tertiary butyl ether (MTBE) from ethanol andmethanol, respectively. These and other ethers are fully compatible with gasoline, reduceoil use, have favorable vapor pressure effects, boost octane, and provide fuel oxygen.
966
Introduction
The U.S. uses about 84 EJ (about 84xl015 BTUs or 84 quads) annually of energy, and thelargest fraction, about 34 EJ (34 quads) of that total is derived from petroleum. Furthermore,although all other energy sources such as natural gas and coal are produced domestically(often with some exported), more than half the petroleum that we use is imported. Importedoil accounts for the largest single contribution to the U.S. trade deficit and is equivalent toabout 40% of the net deficit.· With U.S. oil supplies continually declining, the fraction ofimported oil will increase significantly in the near future. This heavy reliance on importedpetroleum makes the U.S. extremely vulnerable to interruptions in its energy supply. It alsoresults in the loss of employment.
The transportation sector uses about two-thirds of the petroleum in the U.S. In addition,although all other end use sectors are well diversified in their energy sources, petroleumprovides about 97% of the 22 EJ (22 quads) of transportation energy. This severedependence on petroleum limits the ability of the transportation sector to switch fuel sourcesand makes it particularly vulnerable to disruptions in the petroleum supply from politicallyunstable oil exporting countries. It also results in severe economic problems when oil pricesrise as a result of such events or because of world political pressure.
The transportation sector is responsible for a large portion of a number of environmentalproblems. About two-thirds of the carbon monoxide pollution and about 40% of urban smogpollution in our cities is caused by the transportation sector. Through the Clean Air ActAmendments of 1990 (CAAA), 39 cities suffering from severe carbon monoxide pollutionare now .required to incorporate 2.7% oxygen in gasoline to insure more completecombustion during the winter months, when carbon monoxide formation is mostproblematic. In addition, 2.0% oxygen is required to be added to gasoline during the smogformation season to combat release of unburned hydrocarbons from vehicle exhaust. Fueloxygen is now usually provided by adding ethanol or methyl tertiary butyl ether (MTBE) togasoline.
With its almost total dependence on fossil fuel, the transportation sector is also a majorcontributor to the potential for global climate change. About one-third of the carbon dioxidereleased each year by the U.S. is from the transportation sector. Thus, for the u.S. to reducethe release of greenhouse gases, it must seek to reduce the use of fossil sources fortransportation. Three such options are available: (1) reduce the number of vehicle milestraveled, (2) improve the efficiency of vehicles to reduce the amount of fuel used, and (3) usealternative fuels that release far less carbon dioxide to the atmosphere. The first strategy isimportant, but there is concern that the strength of the economy and the number of vehiclemiles traveled are so closely intertwined that limited progress is possible in this area withouta significant negative impact on the economy. More efficient vehicles can certainly reducethe consumption of fossil fuels substantially if dramatic advances are made in vehicle/enginetechnology, but this approach will eventually reach a point of diminishing returns. Switchingto alternative fuels that release little, if any, net carbon dioxide to the atmosphere will insurevirtual elimination of the transportation sector's contribution to the potential for globalclimate change. These three strategies are mutually supportive to achieving significantreductions in the release of carbon dioxide.
967
The production of alcohols and ethers from lignocellulosic biomass sources such as wastepaper and other components of municipal solid waste (MSW), agricultural and forestryresidues, and woody and herbaceous (grassy) crops grown to support large-scale productionof transportation fuels, can provide a domestically abundant supply of fuels that will reduceor eliminate oil imports, improve air quality, and reduce the contribution to the potential forglobal climate change. In this paper, a brief overview of production of alcohols and ethersthat have the potential to be economically competitive when produced from cellulosicbiomass will be provided.
Lignocellulosic Biomass
Before discussing the production of alcohols and ethers from lignocellulosic biomass, it isinstructive to briefly review the availability of this plentiful resource to provide a context asto the importance of considering its conversion to transportation fuels and fuel additives. Ithas been estimated that from 1.5 to 3.2 Gtonnes (1.7 to 3.5 billion tons) of lignocellulosicbiomass could be made available annually in the U.S. from collectable municipal,agricultural, and forestry wastes, together with energy crops grown on available crop andforest lands. This amount of biomass could be converted into between 600 and 1300 GL(160 and 350 billion gal) of ethanol each year (Lynd et al. 1991); similar amounts of fuelcould result for methanol and other alcohols on an energy content basis. By comparison,about 510 GL (140 billion gal) of ethanol could displace all gasoline used in this country ifthe ethanol were employed as a pure fuel (Wyman and Goodman 1993). Although there issome debate about the exact price and quantity for lignocellulosic biomass that can beobtained, we can see that lignocellulosic biomass clearly provides an abundant resource fromwhich to make transportation fuels, and it would take some time before an infrastructurecould be developed that would challenge the production of these large quantities.
When transportation fuels such as ethanol are derived from lignocellulosic biomass, verylittle, if any, net release of carbon dioxide results (Lynd et al. 1991). This is because verylimited amounts of fossil fuel inputs are used to grow, harvest, and transport lignocellulosicbiomass. Furthermore, it is possible to substitute only renewable resources in these steps inthe long run, thereby eliminating all fossil inputs. In addition, the fuel production processis self-sustaining if a portion of the biomass is employed to produce the heat and electricityneeded for the process. Excess electricity would generally be left over to export, therebydisplacing fossil-based sources of heat and electricity that contribute to the buildup of carbondioxide in the atmosphere (Hinman et al. 1992, Wyman 1994). Thus, it is estimated thatproduction of alcohols such as ethanol from renewable lignocellulosic biomass resourcescould reduce net carbon dioxide release by 90% or more, relative to reformulated gasoline(Tyson et al. 1993).
Alcohols
Alcohols can be regarded as either hydroxyl derivatives of alkanes or as alkyl derivatives ofwater, because similarities exist with both parent groups. The boiling points of the loweralcohols (methanol, ethanol, and propanol) are comparable to that of water, and these loweralcohols are miscible in water in all proportions. The next three higher homologs (n-butylalcohol, n-amyl alcohol, and n-hexyl alcohol) are progressively less soluble in water. Thisis because the lower alcohols are like water in that the hydroxyl group composes a
968
considerable part of the molecule, whereas the higher alcohols are predominatelyhydrocarbon in character. These factors explain the unique fuel properties of alcohols.
Traditionally, most attention has been focused on methanol and ethanol as fuels. Like allalcohols, both are oxygenated, and they promote more complete combustion of gasolinewhen used as a fuel additive. However, when methanol is added to gasoline, the vaporpressure increases substantially, causing more evaporative emissions that lead to smog;therefore, methanol is not allowed as a direct gasoline additive in the U.S. (Wyman et al.1993). Methanol is considered for use as a pure or neat fuel because of its high octane andhistorically competitive price when made from low-cost, remote natural gas. Historically,the emphasis for ethanol has been for direct blending with gasoline to reduce the use of oil,boost octane, and provide oxygen that promotes more complete combustion, but there isconcern about the somewhat higher vapor pressure of ethanol blends contributing to smogformation during the summer months (Wyman and Goodman 1993). Because the fuelproperties of pure ethanol are very similar to those of methanol, ethanol is a very good neatfuel as well (Lynd 1989, Wyman and Hinman 1990), although the current cost of ethanolproduced from com is generally considered too high to be viable for large-scale use as a purefuel.
Methanol
Until 1923, methanol was prepared by the destructive distillation of wood. Wood, as forother forms of lignocellulosic biomass, is composed of about 40% to 50% cellulose, apolymer of glucose sugar; 20% to 35% hemicellulose, a heterogeneous polymer of severalsugars typically dominated by xylose; about 20% to 30% lignin, a polymeric substance
. containing aromatic rings containing methoxyl groups; and minor amounts of othercomponents such as oils and ash. Methanol derived from wood comes from the ligninfraction. When heated in the absence of air above about 250°C (480'F), the lignindecomposes into charcoal and a volatile fraction that partially condenses on cooling to yieldmethanol, acetic acid, and traces of acetone. However, the yields of methanol fromdestructive distillation are too low to be attractive as a route to large-scale fuel production.
Currently, methanol is synthesized by generating synthesis gas that contains carbonmonoxide and hydrogen from natural gas and then catalytically combining this mixture tomethanol. The latter reaction traditionally occurs in the gas phase, but liquid-phase processesare now employed as well. SYnthesis gas can also be generated by gasifying wood and otherforms of lignocellulosic biomass with a controlled supply of air to generate carbon monoxideand hydrogen. This gas can be catalytically combined (as for natural gas-based processes)to produce methanol. However, a hot gas cleanup step must be employed to removeparticulates and tars from the stream that would contaminate the catalysts. It is alsonecessary to add steam to the gaseous product to shift the gas composition to thehydrogen:carbon monoxide ratio to produce methanol in high yields. Methane and othernonreactive gases must be removed from the product stream prior to catalytic reaction tomethanol (Bain 1991; Overend 1991, Wyman et al. 1993).
At this time, it is estimated that methanol from biomass would cost about $0.22/L ($O.84/gal)from biomass feedstocks costing $46/tonne ($42/ton) to cover all costs of production andrealize a reasonable return on investment. Targets have been defined to reduce the cost to
969
be competitive with gasoline from $25/bbl (U.S. DOE 1993). Work is ongoing to operatea 90 tonne/d (100 ton/d) gasifier facility in Hawaii on sugar cane bagasse, to gatherinformation essential to improve the understanding of this technology and evaluateapproaches to clean up the gas stream for catalytic conversion into methanol.
Ethanol
Ethyl alcohol or ethanol has been made since antiquity by fermenting sugar with yeast, andbeverages such as beer and wine are still made by fermenting various crops such as barleyand grapes to ethanol. In Brazil, about 11 GUyr (3 billion gal/yr) of fuel ethanol is madefrom cane sugar. This fuel is used both as a 22% blend with gasoline and as a pure hydrous(95% ethanol with 5% water) for dedicated ethanol vehicles. Because the price of cane sugaris controlled at about $0.09/kg ($0.20Ilb) in the U.S., which is equivalent to about $0.66/L($2.50/gal) of ethanol produced just for the sugar, sugar is too expensive to be viable forproduction of fuels in the U.S. In the U.S., more than 4 GL/yr (l billion gallyr) of ethanolis made from corn. However, the cost of ethanol production from corn still exceeds its valuefor use as a fuel, and the excise tax on 10% blends of ethanol with gasoline is reduced by$0.014/L ($0.054/gal) to promote its use; this translates into an incentive of $0.14/L($0.54/gal) of ethanol used. Combined with various state incentives, ethanol from corn iseconomically attractive for blending with gasoline in certain regions (Wyman and Goodman1993).
Lignocellulosic biomass provides a much lower-cost substrate for producing ethanol. Acidsor enzymes can break down or hydrolyze the cellulose to form glucose sugar from which itis derived- so that yeast or other organisms can in turn ferment the glucose to ethanol.Similarly, acids or enzymes can hydrolyze the hemicellulosic fraction to form its componentsugars, in this case a heterogeneous mixture typically dominated by the five-carbon sugarxylose (glucose is a six-carbon sugar). Thus, typically between 65% and 75% of the biomassmaterial can be converted into ethanol, leaving the lignin and other nonfermentable fractionsbehind.
Over the years, a number of processes have been investigated for production of ethanol frombiomass based on acids and enzymes. Dilute acids rapidly break down the cellulose andhemicellulose in biomass to form sugars, but the harsh conditions required result insubstantial degradation of sugars to tars and various by-products. The maximum yields areabout 60% or less, and because high yields of ethanol are critical to economic viability, diluteacid technologies are not economically viable. Concentrated acids also produce sugarsrapidly but at mild enough conditions to achieve very high yields. However, because of thehigh price of the acids used, they must be recovered for reuse, and it is challenging to recoverthe acids at a lower cost than they can be purchased. Concentrated acid technology can beeconomically viable for near-term applications, particularly for some low-cost wastematerials (Wyman and Goodman 1993).
Enzymatic processes can also be employed to produce ethanol from biomass. The biomassis typically milled or processed by other means to reduce the size of the material and promoteheat and mass transfer in subsequent steps. Then, a pretreatment step opens up the structureof the biomass to promote more complete and rapid breakdown of the material to sugars;often dilute acids are used in the pretreatment step to hydrolyze the hemicellulose to form
970
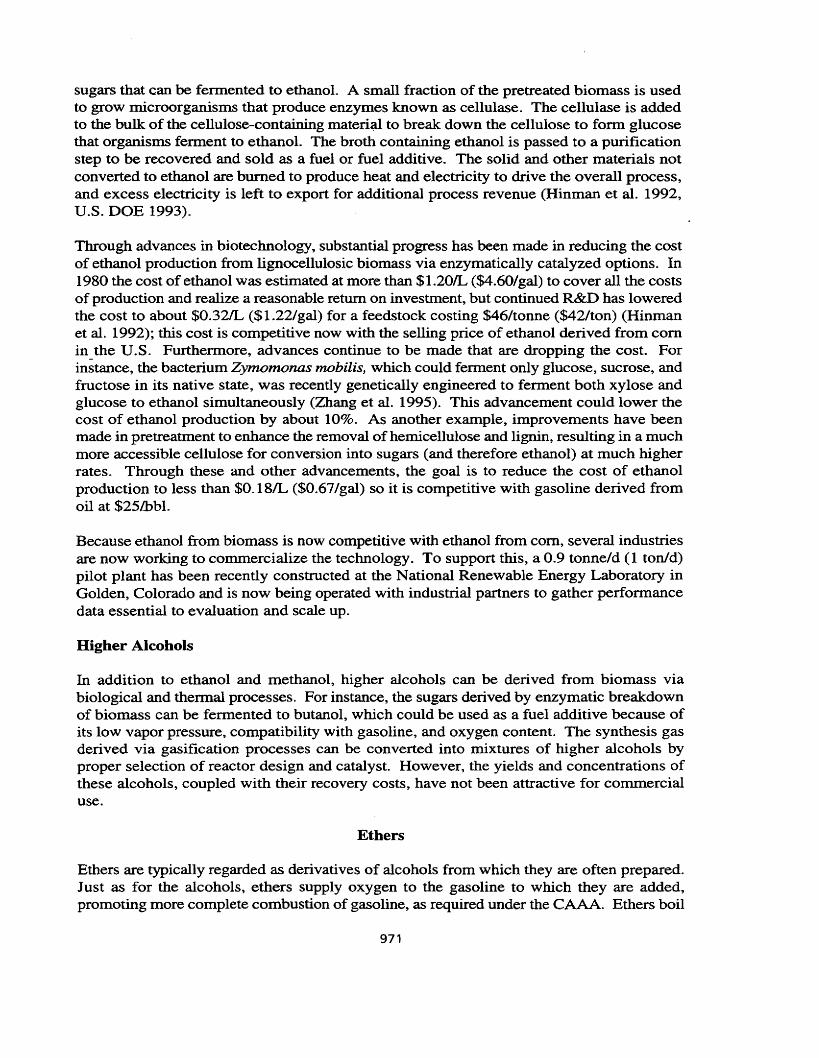
sugars that can be fermented to ethanol. A small fraction of the pretreated biomass is usedto grow microorganisms that produce enzymes known as cellulase. The cellulase is addedto the bulk of the cellulose-containing material to break down the cellulose to form glucosethat organisms ferment to ethanol. The broth containing ethanol is passed to a purificationstep to be recovered and sold as a fuel or fuel additive. The solid and other materials notconverted to ethanol are burned to produce heat and electricity to drive the overall process,and excess electricity is left to export for additional process revenue (Hinman et al. 1992,U.S. DOE 1993).
Through advances in biotechnology, substantial progress has been made in reducing the costof ethanol production from lignocellulosic biomass via enzymatically catalyzed options. In1980 the cost of ethanol was estimated at more than $1.201L ($4.60/gal) to cover all the costsof production and realize a reasonable return on investment, but continued R&D has loweredthe cost to about $O.32/L ($1.22/gal) for a feedstock costing $46/tonne ($42/ton) (Hinmanet al. 1992); this cost is competitive now with the selling price of ethanol derived from comin_the U.S. Furthermore, advances continue to be made that are dropping the cost. Forinstance, the bacterium Zymomonas mobilis, which could ferment only glucose, sucrose, andfructose in its native state, was recently genetically engineered to ferment both xylose andglucose to ethanol simultaneously (Zhang et al. 1995). This advancement could lower thecost of ethanol production by about 10%. As another example, improvements have beenmade in pretreatment to enhance the removal of hemicellulose and lignin, resulting in a muchmore accessible cellulose for conversion into sugars (and therefore ethanol) at much higherrates. Through these and other advancements. the goal is to reduce the cost of ethanolproduction to less than $O.18/L ($O.67/gal) so it is competitive with gasoline derived fromoil at $25Lbbl.
Because ethanol from biomass is now competitive with ethanol from com, several industriesare now working to commercialize the technology. To support this, a 0.9 tonneld (1 ton/d)pilot plant has been recently constructed at the National Renewable Energy Laboratory inGolden, Colorado and is now being operated with industrial partners to gather performancedata essential to evaluation and scale up.
Higher Alcohols
In addition to ethanol and methanol, higher alcohols can be derived from biomass viabiological and thermal processes. For instance, the sugars derived by enzymatic breakdownof biomass can be fermented to butanol, which could be used as a fuel additive because ofits low vapor pressure, compatibility with gasoline, and oxygen content. The synthesis gasderived via gasification processes can be converted into mixtures of higher alcohols byproper selection of reactor design and catalyst. However, the yields and concentrations ofthese alcohols, coupled with their recovery costs, have not been attractive for commercialuse.
Ethers
Ethers are typically regarded as derivatives of alcohols from which they are often prepared.Just as for the alcohols, ethers supply oxygen to the gasoline to which they are added,promoting more complete combustion of gasoline, as required under the CAAA. Ethers boil
971
at much lower temperatures than the alcohols from which they are derived or than alcoholsof similar molecular weight, but their boiling points correspond closely to these ofcomparable alkanes of similar molecular complexity. Ethers thus provide an effective meansto improve the mid range volatility of gasoline, compensating for the increased use ofaromatics to replace lead in gasoline. Just as for alcohols, ethers increase the octane of thegasoline to which they are added, reducing the need to add aromatics such as benzene thatare often toxic.
MTBE
MTBE is made by reacting isobutylene with methanol. MTBE is essentially vapor pressureneutral so the blended gasoline has nearly the same Reid Vapor Pressure (RVP) as the blendstock to which MTBE is added. MTBE is also fungible; that is, it is fully compatible withgasoline and can be blended, shipped, and stored in mixture with gasoline. Of course, if themethanol is derived from biomass, then the MTBE made from methanol has a renewablecomponent (Piel 1992, 1994).
With a blending octane of 110, MTBE is an effective octane booster. As is typical of ethers,its boiling point is low (55°C [131°F]), and the heat of vaporization of MTBE is quite lowat 240 MJIL (86,000 BTU/gal). Because MTBE has an oxygen content of 18.2 weight %compared to ethanol at 34.8%, almost twice as much MTBE is required as ethanol to achievethe same oxygen level in gasoline. The lower heating value of 26 MJIL (93,500 BTU/gal)is less than for gasoline (Piel 1992, 1994).
ETBE
Ethyl tertiary butyl ether (ETBE) is formed by reacting ethanol with isobutylene. Thereaction is very similar to that of methanol with isobutylene to form MTBE, and withrelatively low cost provisions, the etherification process can be made flexible enough toproduce either product. ETBE has a very low blending vapor pressure, and addition ofETBEto gasoline actually reduces the RVP considerably. This is a valuable attribute in helping tomeet the lower volatility requirements of the CAAA. Like MTBE, ETBE is fungible and canbe easily integrated into the existing fuel distribution infrastructure (Piel 1992, 1994).Ethanol derived from biomass provides a renewable feedstock for production of ETBE.
The blending octane of ETBE is 112, slightly higher than for MTBE but somewhat lowerthan for pure ethanol (115). Its boiling point of 72°C (161OP) is somewhat higher than forMTBE, but its heat of vaporization is somewhat lower at 230 MJIL (83,000 BTU/gal). Theoxygen content of ETBE is 15.7%, even less than for MTBE; thus, considerabledisplacement of gasoline results when ETBE is added to gasoline to provide a given level ofoxygen. The lower heating value of ETBE, like MTBE, is less than for gasoline at 27 MJIL(96,900 BTU/gal) (Piel 1992, 1994).
Other Ethers
A number of other ethers, including tertiary amyl methyl ether (TAME) from methanol andisoamylenes and tertiary amyl ethyl ether (TAEE) from ethanol and isoamylenes, can beproduced from renewable alcohols. These ethers reduce the RVP of gasoline to which they
972
are added even more than for ETBE. However, they have a somewhat lower blending octanethan ETBE or MTBE. Their other properties are quite similar to ETBE and MfBE (Piel1992, 1994).
A one-step process to produce dimethyl ether (DME) from syngas was recently announced,thereby simplifying the synthesis from the previous two-step approach (Hansen et al. 1995).The plans are to use DME directly as a diesel fuel substitute and not as an additive (Fleischet al. 1995). Although current practice is to use syngas from natural gas, biomass can alsobe gasified to syngas as discussed previously for manufacture of methanol. However, thecost of biomass-derived syngas must be compatible with that of syngas from natural gas.
DME has a volumetric energy density somewhat greater than half that of diesel fuel. Itscetane rating is 58 compared to 40 to 55 for diesel. Because DME is a vapor at ambienttemperature, pressurized fuel tanks similar to those used for propane are required to containDME. DME is noncarcinogenic, is virtually nontoxic, and degrades easily in thetroposphere. It is noncorrosive to metals, but compatibility with elastomers is a potentialproblem (Fleisch et al. 1995).
Conclusions
Lignocellulosic biomass provides an abundant resource that can be converted into methanoland ethanol and into higher alcohols. Production of alcohols from biomass contributes 10%or less of the carbon dioxide accumulation to the atmosphere of reformulated gasoline,substantially reducing the potential contribution to global climate change. Biomass can begasified to a synthesis gas that can in turn be catalytically reacted to form methanol.Alternatively, the cellulose and hemicellulose in biomass can be broken down to form sugarsthat can be fermented to ethanol. Substantial progress has been made in these technologies,and goals have been set to achieve cost competitiveness with gasoline as a neat fuel withoutthe need for tax incentives. However, ethanol from biomass is now competitive with ethanolfrom com for direct blending with gasoline, and a number of companies are now developingtechnologies for production of ethanol from various waste materials. Methanol and ethanolcan be reacted with isobutylene to form MTBE and ETBE, respectively. Both have desirableproperties for blending with gasoline to provide fuel oxygen that promotes more completecombustion and boosts octane. MTBE does not affect the vapor pressure of the gasolineblend, and ETBE actually reduces the vapor pressure, thereby lowering the impact ofgasoline on smog formation. A new synthesis process for DME could be used with biomassgasification to make a diesel fuel substitute with a number of promising attributes, althoughthe energy density is less than for diesel.
Acknowledgements
The support of the Transportation Sector projects of the BiofuelsEnergy Systems Programof the U.S. Department of Energy is gratefully acknowledged.
ReferencesBain, R. (1991). "Methanol from Biomass: Assessment of Production Costs." Presentedat the November 1989 Renewable Transportation Alternatives Workshop, Hawaii NaturalEnergy Institute, Honolulu, HI.
973
Fleisch, T ..; McCarthy, C.; Basu, A.; Udovich, C.; Charbonneau, P.; Slodowske, W.;Mikkelsen, S.-E.; MoCandless, J. (1995). "A New Clean Diesel Technology: DemonstrationofULEVEmissions in a Navistar Diesel Engine Fueled with Dimethyl Ether." Presented atthe International Congress and Exposition, Society of Automotive Engineers, Detroit, MI,February 27-Maich 2, 1995, paper 950061.
Hansen, J.B.; Voss, B.; Joensen, F.; Siguroardottir, 1.D. (1995). "Large Scale Manufactureof Dimethyl Ether - a New Alternative Diesel Fuel from Natural Gas." Presented at theInternational Congress and Exposition, Society of Automotive Engineers, Detroit, MIFebruary 27-March 2, 1995, paper 950063.
Hinman, N.D.; Schell, D.J.; Riley, C.J.; Bergeron, P.W.; Walter, P.J. (1992). "PreliminaryEstimate of the Cost of Ethanol Production for SSF Technology." Appl. Biochem. Biotech.;Vol. 34/35, p. 639.
Lynd, L. (1989). "Production of Ethanol from Lignocellulosic Materials Using ThermophilicBacteria: Critical Evaluation of Potential and Review." In Advances in BiochemicalEngineeringlBiotechnology. Edited by A. Fiechter, Vol. 38.
Lynd, L.R.; Cushman, J.H.; Nichols, R.J.; Wyman, C.E. (1991). "Fuel Ethanol fromCellulosic Biomass." Science; Vol. 251, p. 1318.
Overend, R. (1991). Proceedings of the Annual Automotive Technology DevelopmentContractor's Coordination Meeting 1991. Society of Automotive Engineers, Inc.Warrendale, PA, p. 779.
Piel, W.J. (1992). "Expanding Refinery Technology Leads to New Ether Potential." FuelReformulation; Vol. 34 (NovemberlDecember).
Piel, W.J. (1994). "Diversify Future Fuel Needs with Ethers." Fuel Reformulation; Vol. 28(MarchiApril).
Tyson, K.S.; Riley, C.J.; Humphreys, K.K. (1993). Fuel Cycle Evaluations of BiomassEthanol and Reformulated Gasoline. NRELITP-463-4950. Golden, co: NationalRenewable Energy Laboratory.
U.S. Department of Energy (1993). "Assessment of Costs and Benefits of Flexible andAlternative Fuel Use in the US Transportation Sector." Technical Report Eleven: Wood toEthanol Process; DOEIEP-0004. Prepared by Chern Systems for the US Department ofEnergy, Washington, DC.
Wyman, C.E. (1994). "Alternative Fuels from Biomass and Their Impact on Carbon DioxideAccumulation." Appl. Biochem. Biotech.; Vol. 45/46, p. 897.
Wyman, C.E.; Goodman, B.J. (1993). "Near Term Application of Biotechnology to FuelEthanol Production from Lignocellulosic Biomass." In Opportunities for Innovation inBiotechnology. Edited by R. Busche. National Institute of Standards and Technology,Gaithersburg, MD (accepted for publication).
974
Wyman, C.E.; Hinman, N.D.; Bain~ R.L.; Stevens, D.J. (1993). "Ethanol and Methanol fromCellulosic Biomass." Fuels and Electricity from Renewable Resources. Edited byR.H. Williams, T.B. Johansson, H. Kelly, & A.K.N. Reddy. United Nations Solar EnergyGroup for Environment and Development (SEGED), 1992, UN Conference on Environmentand Development in Brazil, pp. 865-924.
Wyman, C.E.; Hinman, N.D. (1990). "Ethanol: Fundamentals of Production fromRenewable Feedstocks and Use as a Transportation Fuel." Appl. Biochem. Biotech.; Vol.24/25, p. 735.
Zhang, M.; Eddy, C.; Deanda, K.; Finkelstein, M.; Picataggio, S. (1995). "MetabolicEngineering of a Pentose Metabolism Pathway in Ethanologenic Zymomonas mobilis."Science; Vol. 267~ p. 240.
975
ESTIMATING THE NET ENERGY VALUEOF CORN-ETHANOL
Hosein Shapouri, Ph.D; James Duffield, Ph.D, Agricultural EconomistsU.S. Department of Agriculture, Office of Energy and New Uses
1301 New York Avenue, N.W., Room 1208, Washington D.C. 20005Michael S. Graboski, Ph.D, Chemical EngineerColorado School of Mines, Golden Colorado.
Abstract
Potential air quality benefits and a desire to improve domestic energy security hasprompted researchers to investigate the net energy value (NEV) of corn-ethanol.Studies have been conducted in recent. years in an attempt to quantify the energyused in growing and .converting corn to ethanol. However, variations in data andassumptions among the studies have resulted in a wide range of NEV estimates. Thepurpose of this study is to identify the factors causing this wide variation and todevelop a more consistent NEV estimate. We conclude that the NEV of corn-ethanolis positive when fertilizers are produced by modern processing plants, corn isconverted in modern ethanol facilities, farmers achieve normal corn yields andenergy credits are allocated to basic coproducts. Our estimate of 16,193 BTU/gal canbe considered conservative, since it does not include energy credits for those plantsthat sell carbon dioxide. Corn ethanol is energy efficient as indicated by an energyratio of 1.24, i.e., for every BTU dedicated to producing ethanol there is a 24 percentenergy gain. Moreover, producing ethanol from domestic corn stocks achieves a netgain in a more desirable form of energy. Ethanol production utilizes abundantdomestic feedstocks of coal and natural gas to convert corn into a premium liquidfuel that can replace petroleum imports by a factor of 7 to 1.
976
Environmental concerns and fears about our Nation's energy security has prompted anumber of recent studies that examine the net energy balance of com-ethanol. However,there was a considerable amount of variation in the findings of these reports. This widevariation relates to various assumptions about farm production, ethanol conversion,fertilizer manufacturing efficiency and energy coproduct evaluation. Furthermore, authorsuse data from different time periods. Studies using older data may tend to overestimateenergy use because ethanol manufacturing and farm production technologies have becomeincreasingly energy efficient over time. The Purpose of this report is to identify themethodological differences creating the inconsistencies among study results and providea more consistent estimate- for the NEV of com-ethanol.
Table 1 shows the wide variation in the NEV estimates of several recent studies. Themidpoint is used when studies report a range of values. Pimentel reports the lowest NEVfor com-ethanol among the studies -- based on a low heating value scale, the total energyinput to produce one gallon of ethanol is 131,017 British Thermal Units (BTU).Compared to the LHV of ethanol, 76,000 BTU, this is a net energy loss of 55,017BTU/gal. Even when coproducts were considered, Pimentel still estimated a net energyloss of around 33,517 BTU/gallon. Keeney and DeLuca also reported a negative NEVfor an average farm, but the energy deficit was only 8,431 BTU/gal. Keeney and DeLucado not consider com processing byproducts, but they show that a positive energy balancecan be attained with low input com production. Marland and Turhollow reported that itrequires 73,934 BTU (HHV basis) to produce a gallon of ethanol assuming conversiontakes place in the best ethanol facilities available today. When energy credits fromcoproducts are included, such as gluten meal, gluten feed, and corn oil, they conclude thatthe NE"\L of com ethanol is 18,324 BTU/gal. The most favorable NEV estimate wasderived by Morris and Ahmed. They found a positive net energy balance of 703 BTU/galfor their average case, even without including energy from coproducts. When addingenergy coproduct credits, they estimated a net energy gain of 25,653 BTU/gal.
Data Trends
It is important that current data is used to estimate the NEV of ethanol because theefficiency of growing com and converting it to ethanol has improved significantly overthe past 1°years. Total energy used in agriculture including pesticides, fertilizers, otherchemicals, liquid fuels, natural gas, and electricity increased from 1,499 trillion BTU in1965 to 2,155 trillion BTU in 1978, and then declined to 1,550 trillion BTU by 1989.The decline in energy use in agriculture since 1978 is largely attributed to the replacementof gasoline powered farm vehicles with more fuel efficient diesel engines.
While energy use has been declining, there has been a rising trend in corn yields. Withthe exception of bad weather years, com yields have been increasing over time. Cornyields ranged between 70 and 110 bushels per acre in the 1970's; they ranged between80 and 117 bushels per acre in the 1980's; and so far in the 1990' s they've rangedbetween 100 and 140 bushels per acre.
Fertilizer use in grain production rose for many years but lately appears to be on a declineaccording to the latest data published by USDA (Taylor). Nitrogen use per planted acreof corn declined from 140 pounds per acre in 1985 to 123 pounds per acre in 1993.Phosphate use declined from 60 to 56 pounds per acre and potash use declined from 84
977
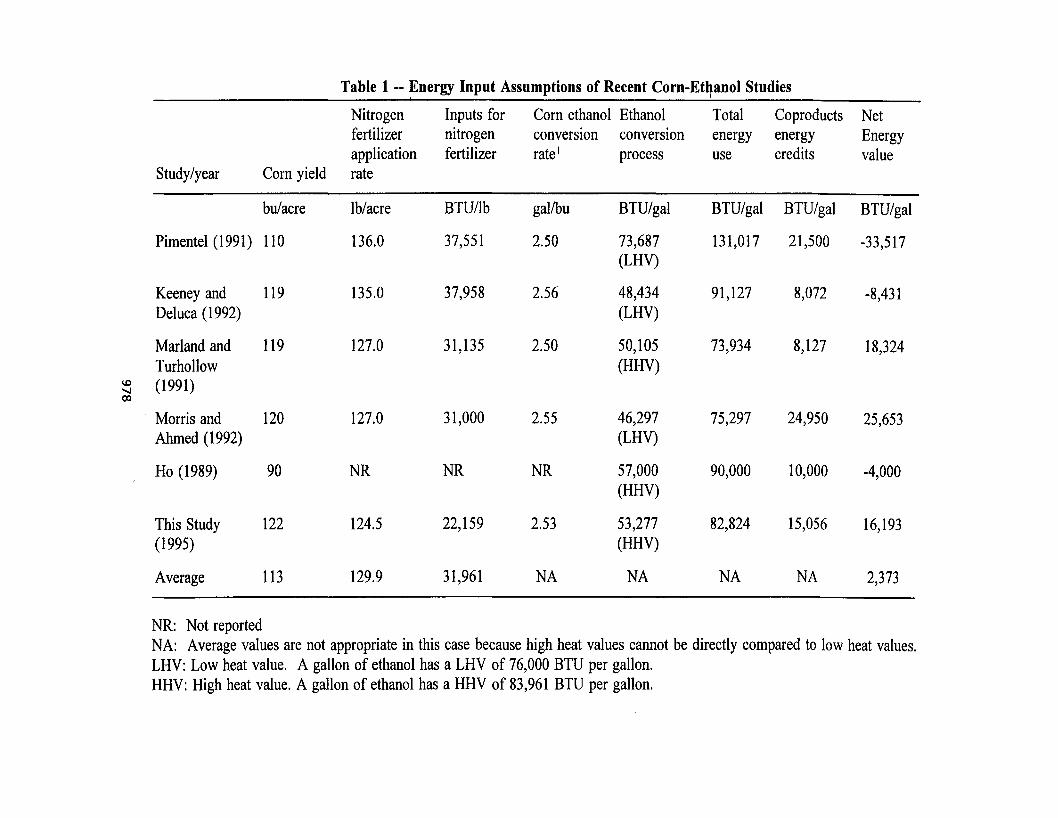
Table 1 -- Energy Input Assumptions of Recent Corn-Ethanol Studies, I
Nitrogen Inputs for Corn ethanol Ethanol Total Coproducts Netfertilizer nitrogen conversion conversion energy energy Energyapplication fertilizer rate I process use credits value
Study/year Corn yield rate
bu/acre lb/acre BTU/lb gal/bu BTU/gal BTU/gal BTU/gal BTU/gal
Pimentel (1991) 110 136.0 37,551 2.50 73,687 131,017 21,500 -33,517(LHV)
Keeney and 119 135.0 37,958 2.56 48,434 91,127 8,072 -8,431Deluca (1992) (LHV)
Marland and 119 127.0 31,135 2.50 50,105 73,934 8,127 18,324Turhollow (HHV)
10 (1991)-...I00
Morris and 120 127.0 31,000 2.55 46,297 75,297 24,950 25,653Ahmed (1992) (LHV)
Ho (1989) 90 NR NR NR 57,000 90,000 10,000 -4,000(HHV)
This Study 122 124.5 22,159 2.53 53,277 82,824 15,056 16,193(1995) (HHV)
Average 113 129.9 31,961 NA NA NA NA 2,373
NR: Not reportedNA: Average values are not appropriate in this case because high heat values cannot be directly compared to low heat values.LHV: Low heat value. A gallon of ethanol has a LHV of 76,000 BTU per gallon.HHV: High heat value. A gallon of ethanol has a HHV of 83,961 BTU per gallon.
pounds per.acre to 79 pounds per acre during the same period. In addition, manufacturingagricultural chemicals has become more energy efficient. For example, the fertilizerindustry has undergone a major technological advancement in the last decade and U.S.farmers have gained substantial real energy-saving benefits in terms of nitrogen andphosphorous. Bhat et. al reported that from 1979 to 1987 the energy consumed forproducing nitrogen fertilizers declined about 11 percent.
Making ethanol from com also has become more energy efficient. Hohmann andRendleman reported that a shift in production to larger plants and the adoption of energysaving innovations reduced the processing energy required to produce a gallon of ethanolfrom 120,000 BTU in 1981 to 43,000 BTU in 1991. Modem facilities are conservingenergy by utilizing cogeneration facilities that produce steam and electricity simultaneously.Advances in alcohol dehydration have also resulted in considerable energy savings(Hohmann and Rendleman).
Estimating Energy of Farm Inputs
Estimates of farm energy use are based on data from the 1991 Farm Costs and ReturnSurvey (FCRS). We focus on the major com producing states (table 2). These nine statesaccount for about 82 and 93 percent of U.S. com and ethanol production respectively.Farm input levels are weighted by com acreage planted in each state to estimate an averageenergy input level for com production. The 1990-92 state average com yield of 122 bulacwas used to convert farm inputs from a per acre basis to a per bushel basis.
Table 2 shows the energy used by farm inputs to produce a bushel of com for each stateand a 9-state weighted average. All thermal inputs in this study and outputs are made ona gross high heat value basis. The energy required for hauling these inputs to the farmfrom local retailers is included in the values in table 2. Electricity used on the farm isadjusted for transmission loss by a factor of 1.203 (EPA).
Estimates of the primary feedstocks used to manufacture farm chemicals are 60 percent foroil, 23 percent as natural gas and 17 percent for electricity. Electricity power was assumedto be produced from coal. It requires about 180,000 BTU to produce a pound of insecticideor herbicide including transportation energy. Energy used for manufacturing nitrogenfertilizer, potash, and phosphate are based on information provided by the FertilizerInstitute. It requires 22,159 BTU, 1,245 BTU, and 4,175 BTU to produce a pound ofnitrogen, potash, and phosphate respectively. More than 90 percent of the energy in theapplied fertilizer is in the form of nitrogen which is manufactured almost completely fromnatural gas. The energy embodied in phosphate includes 47.4 percent for electricity, 26.7percent for diesel and 25.9 percent for natural gas. The energy invested in potash is 42percent electricity, 31.3 percent diesel fuel, and 26.7 percent natural gas. Energy used forproducing lime is 620 BTU/lb.
The total energy required per bushel of com by state and the weighted average of the ninestates are shown on the bottom of table 2. Total BTU of energy per bushel of com variesfrom about 41,000 BTU in Minnesota to over 81,000 BTU of energy per bushel inNebraska. Com production in Minnesota, Iowa and Ohio require less energy than otherstates because they can achieve relatively high yields without irrigation. In contrast, directenergy use (gasoline, diesel. electricity, natural gas and LPG) for com production in
979
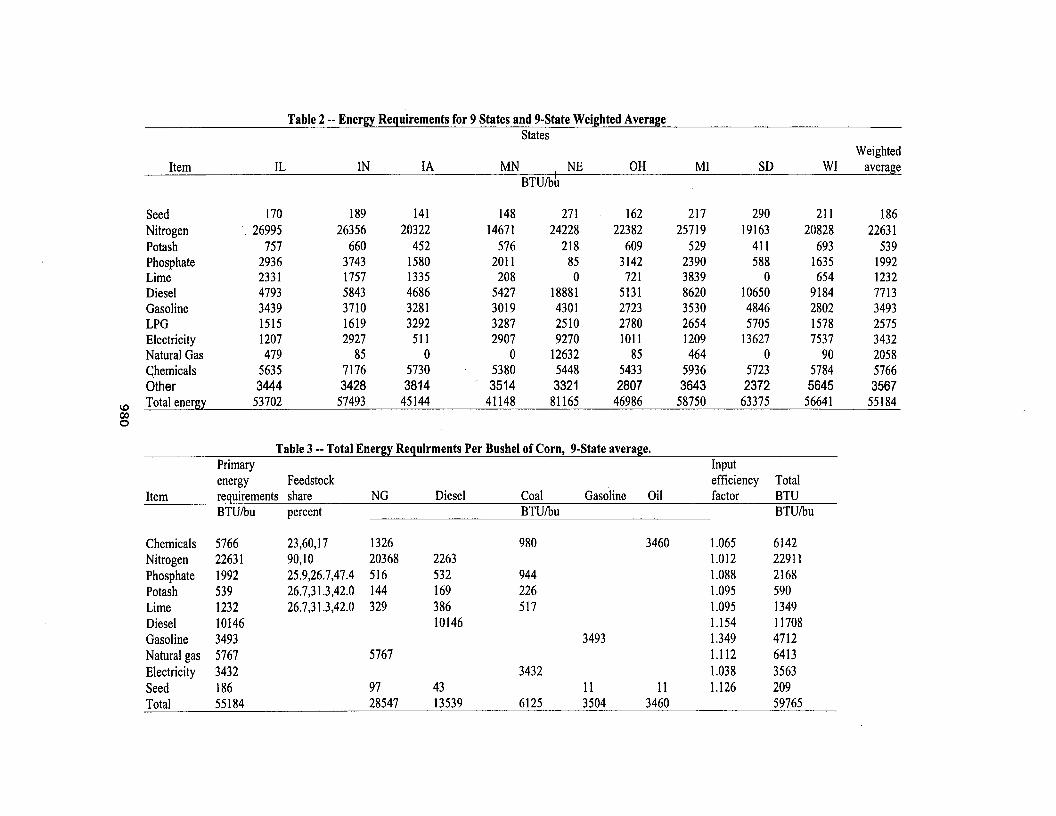
Table 2-- Energy Requirements for 9 Statesand 9-State Weighted AverageStates
WeightedItem IL IN IA MN NE OH MI SD WI average
BTUlbh
Seed 170 189 141 148 271 162 217 290 211 186Nitrogen . 26995 26356 20322 14671 24228 22382 25719 19163 20828 22631Potash 757 660 452 576 218 609 529 411 693 539Phosphate 2936 3743 1580 2011 85 3142 2390 588 1635 1992Lime 2331 1757 1335 208 0 721 3839 0 654 1232Diesel 4793 5843 4686 5427 18881 5131 8620 10650 9184 7713Gasoline 3439 3710 3281 3019 4301 2723 3530 4846 2802 3493LPG 1515 1619 3292 3287 2510 2780 2654 5705 1578 2575Electricity 1207 2927 511 2907 9270 1011 1209 13627 7537 3432Natural Gas 479 85 0 0 12632 85 464 0 90 2058Chemicals 5635 7176 5730 5380 5448 5433 5936 5723 5784 5766Other 3444 3428 3814 3514 3321 2807 3643 2372 5645 3567
\0 Total energy 53702 57493 45144 41148 81165 46986 58750 63375 56641 55184000
Table 3 --TotalEnergy Requirments Per Bushel ofCorn, 9-State average.Primary Inputenergy Feedstock efficiency Total
Item requirements share NG Diesel Coal Gasoline Oil factor BTUBTUlbu percent BTUlbu BTUlbu
Chemicals 5766 23,60,17 1326 980 3460 1.065 6142Nitrogen 22631 90,10 20368 2263 1.012 22911Phosphate 1992 25.9,26.7,47.4 516 532 944 1.088 2168Potash 539 26.7,31.3,42.0 144 169 226 1.095 590Lime 1232 26.7,31.3,42.0 329 386 517 1.095 1349Diesel 10146 10146 1.154 11708Gasoline 3493 3493 1.349 4712Natural gas 5767 5767 1.112 6413Electricity 3432 3432 1.038 3563Seed 186 97 43 11 11 1.126 209Total 55184 28547 13539 6125 3504 3460 59765
Nebraska accounts for about 48 thousand BTU per bushel. More than 75 percent of thearea planted to com in Nebraska requires irrigation.
The estimates up to this point do not consider the energy inputs required to mine, extract,and manufacture the raw materials into the final energy product. The sum of these energyvalues must be added to the values in table 2 to estimate the total energy associated witheach farm input required to produce a bushel of com. Input efficiencies for fossil energysources which have been developed by EPA were used to calculate these additional energyinput values. In addition, the energy content of fertilizer and other farm inputs are adjustedby the energy efficiencies for the fossil fuels used in their production. Since, a number offuels may be required to manufacture the various farm inputs, the input efficiencies areweighted by each energy source or feedstock. Adjusting all the inputs in table 2 results ina 9-state weighted average of 59,765 BTUlbu (table 3).
Estimating Energy for Transportation
Energy used in transporting production inputs to the farm is based on an average distanceof 500 miles by river and 150 miles by truck. This translates into 274 BTU per river-tonmile, and 2,000 BTU per-highway-ton-mile (DeLuchi). It is assumed that 25 percent ofthe com is directly delivered from the farm to ethanol plants. The remaining 75 percentis transported to ethanol plants from grain elevators. The estimated trucking distance fromelevator to plant is 100 miles round-trip. The diesel fuel requirement is about 2,000 BTUper ton-mile for a loaded truck and 1,000 BTU per ton-mile to return the empty truck. Itrequires 3,150 BTU per bushel to haul com to the plant. On a gallon per ethanol basis,each gallon of ethanol produced in a dry mill uses 1~212 BTU of diesel fuel for haulingcom to the plant. A wet mill uses 1,260 BTU of diesel fuel for each gallon of ethanol.
Estimating Ethanol Conversion
Since both wet and dry milling are used to convert com to ethanol, our energy conversionestimates are weighted accordingly. Wet milling accounts for about two thirds of U.S.ethanol production and dry milling accounts for about one third. Modem wet millingplants are able to produce one gallon of ethanol with 35,150 BTU of thermal energy and2.134 KWHs of electricity per gallon of ethanol production based upon azeotropicdistillation. If molecular sieves are used, the thermal input falls to 32,150 BTU per gallon.Of the total thermal energy, 7,000 BTU per/gal and 1.16 KWH were related to drying highgrade germ, fiber and gluten. On average, wet mills produce 2.5 gallons of ethanol perbushel. A new dry milling plant requires 37,000 BTU of thermal energy and 1.2 KWHsof electricity per gallon of ethanol. The typical dry mill facility produces 2.6 gallons ofethanol per bushel of corn. The total energy used for converting ethanol, weighted bymilling process and adjusted by EPA's input efficiency factor for the energy used to mineand transport coal is 51,343 BTU per/gal.
The conversion estimates developed for this analysis represent modem facilities that usecogeneration. The use of cogeneration is absent from most other studies, although it hasbecome common for both modem wet and dry mill ethanol plants. In our analysis, wecoupled a modem coal based cogeneration system to wet and dry mill facilities to supplypower and steam. The wet mill estimates are based on a plant with a 100 million gallonper year capacity and dry mills have a capacity of 30 million gallons per year.
981
Ethanol Distribution
Distribution and dispensing energy requirements for ethanol were developed by EPA(1993). Ethanol is shipped to the wholesaler by truck and/or barge. The average trip froma ethanol plant to a terminal requires 2,501 BTU of diesel fuel. Ethanol is blended withgasoline at the terminal and delivered to retailers by truck. It is generally blended with 90percent gasoline and 10 percent ethanol (ElO). The energy used for blending along withthe electricity used for dispensing the fuel from the pump is 672 BTU per gallon ofethanol.
Coproduct Credits
The coproducts used in this analysis include distillers' dried grains with solubles (DDGS)from dry milling, and corn oil, corn gluten meal (CGM) and corn gluten feed (CGF) fromwet milling. Energy credits are assumed to be equal to the energy value of a substituteproduct which the ethanol coproduct can replace. For example, in the case of corn glutenmeal and corn gluten feed, soybean meal can be used as a substitute, and soybean oil canreplace corn oil. Using this method, 19 percent of the energy used to produce ethanol isassigned to coproducts.
Results
Table 4 summarizes the energy requirements by phase of production on a BTU per gallonbasis. It includes energy losses from line loss, venting losses at the ethanol plant, andlosses associated with mining, refining and transporting raw materials. Also presented isthe NEV of corn-ethanol with and without coproduct credits for wet-milling, dry-millingand a weighted average of wet and dry milling. The weighted average is based onproduction capacity, i.e., two thirds of U.S. ethanol capacity is from wet-milling and onethird from dry-milling. The average conversion rate for the two processes is 2.525 gallonsper bushel. The NEV for dry-milling was the highest, 5,880 BTU per gallon. The NEVfor wet-milling was slightly negative, -1,199 BTU per/gal, but the weighted average of thetwo processes has a positive net energy balance, 1,137 BTU/gal. The energy ratio, whichis the ratio of energy-out to energy-in is close to 1 in all three cases. In other words, theBTU in a gallon of ethanol is about equal to the energy required to produce a gallon ofethanol even when energy coproducts are not considered.
When coproduct energy credits are added to the calculations, the NEV of corn-ethanol ispositive regardless of the type of milling used. Dry-milling results in the highest NEV,19,290 BTU but wet-milling NEV differs only by 4,989 BTU per/gal. The NEV forweighted average case is 16,193 BTU per gallon. Adjusting for coproduct credits alsoincreases the energy ratio significantly. The energy ratio is 1.21, and 1.30 for wet and drymilling respectively and the weighted average energy ratio is 1.24.
Table 5 shows the energy required for making corn-ethanol by energy feedstock for drymilling, wet-milling and a weighted average. On a weighted average basis, about 85percent of the total energy requirement comes from non liquid fuels -- coal accounts for137,750 BTU per bushel and natural gas and liquid petroleum (LP) account for 28,547BTU per bushel. The liquid fuels, which include gasoline, diesel and fuel oil account for29,998 BTU per bushel. Comparing the energy input value of these liquid fuels to the
982
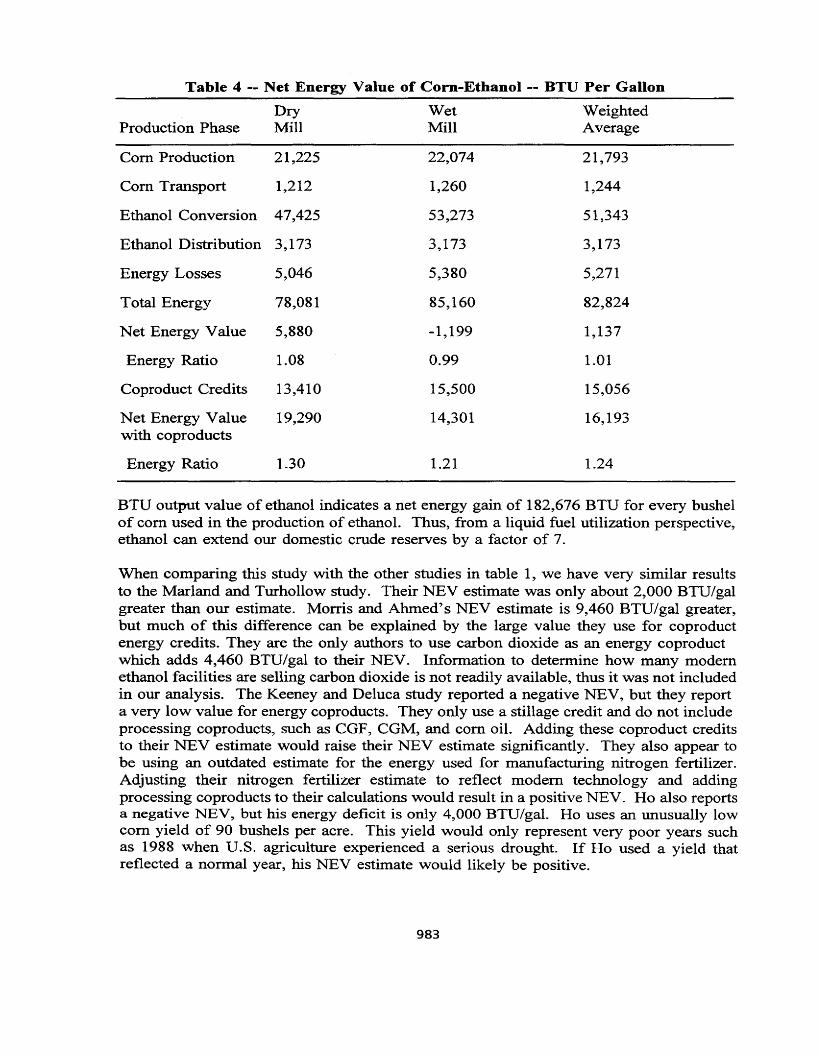
Table 4 -- Net Energy Value of Corn-Ethanol -- BTU Per Gallon
Dry Wet WeightedProduction Phase Mill Mill Average
Com Production 21,225 22,074 21,793
Com Transport 1,212 1,260 1,244
Ethanol Conversion 47,425 53,273 51,343
Ethanol Distribution 3,173 3,173 3,173
Energy Losses 5,046 5,380 5,271
Total Energy 78,081 85,160 82,824
Net Energy Value 5,880 -1,199 1,137
Energy Ratio 1.08 0.99 1.01
Coproduct Credits 13,410 15,500 15,056
Net Energy Value 19,290 14,301 16,193with coproducts
Energy Ratio 1.30 1.21 1.24
BTU output value of ethanol indicates a net energy gain of 182,676 BTU for every bushelof com used in the production of ethanol. Thus, from a liquid fuel utilization perspective,ethanol can extend our domestic crude reserves by a factor of 7.
When comparing this study with the other studies in table 1, we have very similar resultsto the Marland and Turhollow study. Their NEV estimate was only about 2,000 BTU/galgreater than our estimate. Morris and Ahmed's NEV estimate is 9,460 BTU/gal greater,but much of this difference can be explained by the large value they use for coproductenergy credits. They are the only authors to use carbon dioxide as an energy coproductwhich adds 4,460 BTU/gal to their NEV. Information to determine how many modemethanol facilities are selling carbon dioxide is not readily available, thus it was not includedin our analysis. The Keeney and Deluca study reported a negative NEV, but they reporta very low value for energy coproducts. They only use a stillage credit and do not includeprocessing coproducts, such as CGF, CGM, and com oil. Adding these coproduct creditsto their NEV estimate would raise their NEV estimate significantly. They also appear tobe using an outdated estimate for the energy used for manufacturing nitrogen fertilizer.Adjusting their nitrogen fertilizer estimate to reflect modem technology and addingprocessing coproducts to their calculations would result in a positive NEV. Ho also reportsa negative NEV, but his energy deficit is only 4,000 BTU/gal. Ho uses an unusually lowcom yield of 90 bushels per acre. This yield would only represent very poor years suchas 1988 when U.S. agriculture experienced a serious drought. If Ho used a yield thatreflected a normal year, his NEV estimate would likely be positive.
983
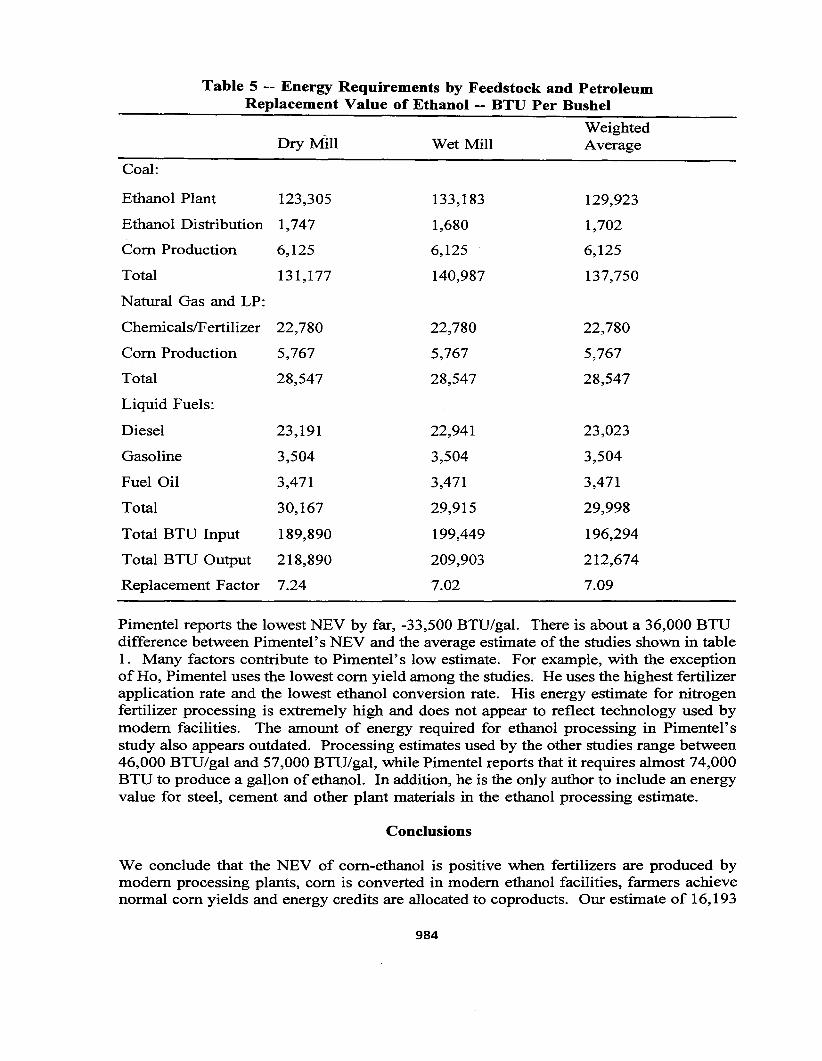
Table 5 -- Energy Requirements by Feedstock and PetroleumReplacement Value of Ethanol -- BTU Per Bushel
WeightedDry MIn Wet Mill Average
Coal:
Ethanol Plant 123,305 133,183 129,923
Ethanol Distribution 1,747 1,680 1,702
Corn Production 6,125 6,125 6,125
Total 131,177 140,987 137,750
Natural Gas and LP:
ChemicalslFertilizer 22,780 22,780 22,780
Corn Production 5,767 5,767 5,767
Total 28,547 28,547 28,547
Liquid Fuels:
Diesel 23,191 22,941 23,023
Gasoline 3,504 3,504 3,504
Fuel Oil 3,471 3,471 3,471
Total 30,167 29,915 29,998
Total BTU Input 189,890 199,449 196,294
Total BTU Output 218,890 209,903 212,674
Replacement Factor 7.24 7.02 7.09
Pimentel reports the lowest NEV by far, -33,500 BTU/gal. There is about a 36,000 BTUdifference between Pimentel's NEV and the average estimate of the studies shown in table1. Many factors contribute to Pimentel's low estimate. For example, with the exceptionof Ho, Pimentel uses the lowest corn yield among the studies. He uses the highest fertilizerapplication rate and the lowest ethanol conversion rate. His energy estimate for nitrogenfertilizer processing is extremely high and does not appear to reflect technology used bymodern facilities. The amount of energy required for ethanol processing in Pimentel'sstudy also appears outdated. Processing estimates used by the other studies range between46,000 BTU/gal and 57,000 BTU/gal, while Pimentel reports that it requires almost 74,000BTU to produce a gallon of ethanol. In addition, he is the only author to include an energyvalue for steel, cement and other plant materials in the ethanol processing estimate.
Conclusions
We conclude that the NEV of corn-ethanol is positive when fertilizers are produced bymodern processing plants, corn is converted in modern ethanol facilities, farmers achievenormal corn yields and energy credits are allocated to coproducts. Our estimate of 16,193
984
BTU/gal can be considered conservative, since it does not include energy credits for thoseplants that sell carbon dioxide. Com ethanol is energy efficient as indicated by an energyratio of 1.24, i.e., for every BTU dedicated to producing ethanol there is a 24 percentenergy gain. Moreover, producing ethanol from domestic com stocks achieves a net gainin a more desirable form of energy. Ethanol production utilizes abundant domesticfeedstocks of coal and natural gas to convert com into a premium liquid fuel that canreplace petroleum imports by a factor of 7 to 1.
References
Bhat, Mahadev, G., Burton C. English, Anthony F. Turhollow and Hezron O. Nyangito.Energy in Synthetic Fertilizers and Pesticides: Revisited. ORNL/Sub/90-99732/2. OakRidge National Laboratory, January, 1994.
DeLuchi, M.A., Emissions of Greenhouse Gases from the Use of Transportation Fuels andElectricity, Argonne National Laboratory, 1991.
Environmental Protection Agency (EPA), Regulatory Development and Support Division,Office of Mobile Sources, Office of Air and Radiation. Technical Support DocumentRenewable Oxygenate Mandate for Reformulated Gasoline, December, 1993.
Fertilizer Institute, Production Cost Survey, Compiled by TVA. 1992
Ho, S.P. Global Warming Impact of Ethanol Versus Gasoline. Presented at 1989 NationalConference, "Clean Air Issues and America's Motor Fuel Business." Washington D.C.,October, 1989.
Hohmann, Neil and C. Matthew Rendleman. Emerging Technologies In EthanolProduction. AIB-663. U.S. Dept. Agr., Econ. Res. Serv., January, 1993.
Keeney, D.R., and T.H. DeLuca. "Biomass as an Energy Source for the Midwestern U.S."American Journal of Alternative Agriculture, Vol. 7 (1992), pp. 137-143.
Marland, G., and A.F. Turhollow. "C02 Emissions From the Production and Combustionof Fuel Ethanol From Com." Oak Ridge National Laboratory. Atmospheric and ClimateResearch Division. Office of Health and Environmental Research. U.S. Department ofEnergy. February, 1991.
Morris, D, and Irshad Ahmed. How Much Energy Does it Take to Make a Gallon ofEthanol? Institute for Self Reliance, Washington D.C. December, 1992.
Pimentel, David. "Ethanol Fuels: Energy Security, Economics, and the Environment."Journal ofAgricultural and Environmental Ethics, VoL 4 (1991), pp 1-13.
Taylor, Harold, H. Fertilizer Use and Price Statistics, 1960-93. SBN 893. U.S. Dept.Agr., Econ. Res. Serv., September, 1994.
Turhollow, A.F. and R.D Perlack. Emissions of C02 from Energy Crop Production,Biomass and Energy, Vol 1(3), 1991.
985
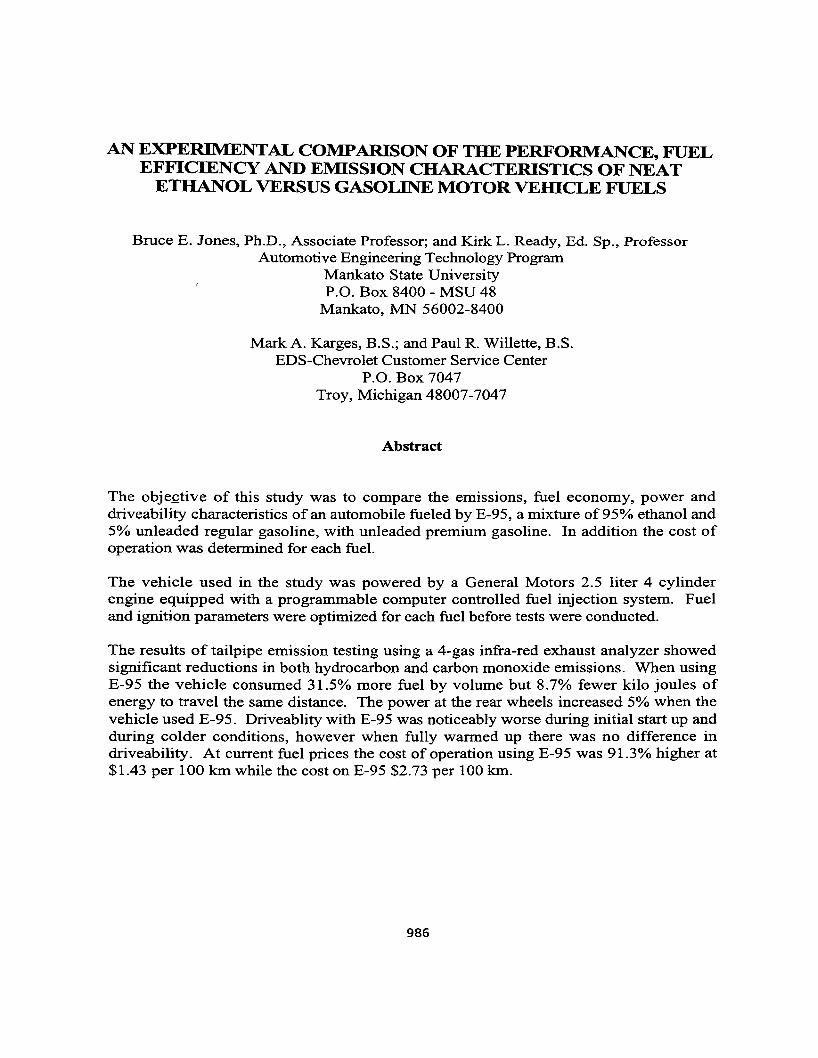
AN EXPERIMENTAL COMPARISON OF THE PERFORMANCE, FUELEFFICIENCY AND EMISSION CHARACTERISTICS OF NEAT
ETHANOL VERSUS GASOLINE MOTOR VEIDCLE FUELS
Bruce E. Jones, Ph.D., Associate Professor; and Kirk L. Ready, Ed. Sp., ProfessorAutomotive Engineering Technology Program
Mankato State UniversityP.O. Box 8400 - MSU 48
Mankato, MN 56002-8400
Mark A. Karges, B.S.; and Paul R. Willette, B.S.EDS-Chevrolet Customer Service Center
P.O. Box 7047Troy, Michigan 48007-7047
Abstract
The objective of this study was to compare the emissions, fuel economy, power anddriveability characteristics of an automobile fueled by E-95, a mixture of 95% ethanol and5% unleaded regular gasoline, with unleaded premium gasoline. In addition the cost ofoperation was determined for each fuel.
The vehicle used in the study was powered by a General Motors 2.5 liter 4 cylinderengine equipped with a programmable computer controlled fuel injection system. Fueland ignition parameters were optimized for each fuel before tests were conducted.
The results of tailpipe emission testing using a 4-gas infra-red exhaust analyzer showedsignificant reductions in both hydrocarbon and carbon monoxide emissions. When usingE-95 the vehicle consumed 31.5% more fuel by volume but 8.7% fewer kilo joules ofenergy to travel the same distance. The power at the rear wheels increased 5% when thevehicle used E-95. Driveablity with E-95 was noticeably worse during initial start up andduring colder conditions, however when fully warmed up there was no difference indriveability. At current fuel prices the cost of operation using E-95 was 91.3% higher at$1.43 per 100 km while the cost on E-95 $2.73 per 100 km.
986
Introduction
Ethanol has long been used as a fuel in internal combustion engines. Reasons for its usehave ranged from a fuel extender during the Arab Oil Embargo, to an octane enhancer andfinally most recently as an oxygenate to help reduce carbon monoxide emissions.
This study was funded by the Council of Great Lakes Governors, Inc. and the U.S.Department of Energy. The research was conducted, under the supervision of faculty inthe program, by two seniors in the Automotive Engineering Technology program atMankato State University in partial fulfillment of the requirements of graduation.
The test vehicle was the Mankato State University RAD-Sport project car. The vehiclewas designed and constructed by an earlier class of senior design students at MSU. Thevehicle has a one piece glass reinforced plastic body which covers a square tube chassis.The vehicle weight is 805 kg (1773 lbs.) without passengers. The RAD-Sport ispowered by a General Motors 2.5 liter 4 cylinder engine and a 4 speed manualtransmission.
The engine was modified by installing an after market camshaft and increasing thecompression ratio. For the purpose of this study the fuel and ignition system of thevehicle was modified to run on either E-95, a mixture of 95% ethanol and 5% unleadedregular gasoline or unleaded premium gasoline. An analysis of the tailpipe emissions,fuel economy, horsepower, driveability, and operational costs was conducted on thevehicle when operated on the two specific fuels.
Conversion Process
The vehicle was equipped with an Offenhauser aluminum intake manifold and acomputer controlled Holley Pro-Jection throttle body injection system with an oxygensensor for closed loop operation. The fuel injection system is fully adjustable allowingthe researchers to simply change the fuel enrichment parameters for each fuel used. Toaid in the throttle response of the engine on ethanol, a heated base plate (which usesengine coolant to supply the heat) was added between the throttle body and the intakemanifold. The system is a commercially available after market component.
Optimization Process
The vehicle was optimized using the same procedure for each fuel. This procedureincorporated the use of three primary pieces of equipment. A Clayton ChassisDynamometer was used to measure the power produced at the rear wheels. A Bear AceII engine analyzer was used to measure the engine rpm, oil temperature and ignitiontiming along with the levels of HC, CO, C02, and 02 present in the exhaust. The finalpiece used was a Sun distributor machine that allowed the researchers to adjust theignition timing curve for the most efficient operation.
The first step in the optimization process was to adjust the seven specific parameterscontrolled by the fuel injection system's electronic control unit (ECU). Light loadconditions, at idle and 2500 rpm, were adjusted while monitoring the HC and CO levels
987
as measured ahead of the catalytic converter. The mixture was adjusted to achieve thelowest CO reading, indicating a lean mixture, without causing a lean misfire indicated byan increased level ofHC. The power setting on the ECU provides for the right mixtureunder hard acceleration. This was optimized by running the vehicle on the chassisdynamometer. The primary adjustment that needed to be made was an increase in fuelpressure from 8 psi on gasoline to 30 psi on ethanol. The increased fuel pressureallowed the system to flow the greater volume of fuel needed because of the lowerenergy density ofE-95.
The second step in the process was the modification of the ignition timing curve. Toaccomplish this three points of the timing curve were chosen to step the timing; idle,88.5 kph (55 mph) under normal highway load, and 4700 rpm heavy load. The firstpoint on the timing curve, at idle, was set to provide easy starting.
To identify the second point on the timing curve, the load on the engine at 88.5 kph (55mph) had to be determined so it could be simulated on the chassis dynamometer. Todetermine the power needed to propel the RAD-Sport down the road at 88.5 kph (55MPH) two methods were used, the vacuum method and the throttle position method.
The vacuum method consisted of attaching a vacuum gauge to the intake manifold. Thevehicle was then driven on a stretch of road at 88.5 kph (55 mph). The car was drivenon a stretch of road at 88.5 kph (55 mph) and the vacuum reading was recorded alongwith the engine rpm. Another run was made in the opposite direction with the twomeasurements averaged to account for any wind or unlevel road. Two additional runswere made with the four data points averaged. The average rpm was 2031 and theaverage vacuum reading was 14.8" hg.
The throttle position method was conducted at the same time as the vacuum method. Adigital multimeter was connected to the throttle position sensor (TPS). The TPS voltageranges from .5 volts to 5 volts depending on how far the throttle plates are open. Thevoltage reading was taken at the same time as the vacuum readings with an averagereading of .94 volts.
The vehicle was then run on the chassis dynamometer to determine the power requiredat highway speeds. The vehicle was accelerated to 88.5 kph (55 mph) and thedynamometer load was increased until a vacuum reading of 14.8" HG was reached. Thepower was then recorded. The procedure was repeated using the TPS reading. Thedynamometer was loaded until the TPS value was .94 volts at 88.5 kph (55 mph) andthe power value recorded.
The researchers found that both methods used to determine the power required to movethe RAD-Sport down the road at 88.5 kph (55 mph) yielded the same results, 6.72 kW(9 hp). All subsequent testing that was to be done at highway speeds was simulated byrunning the vehicle on the chassis dynamometer loaded to 6.71 kW (9 hp) at 88.5 kph(55 mph).
988
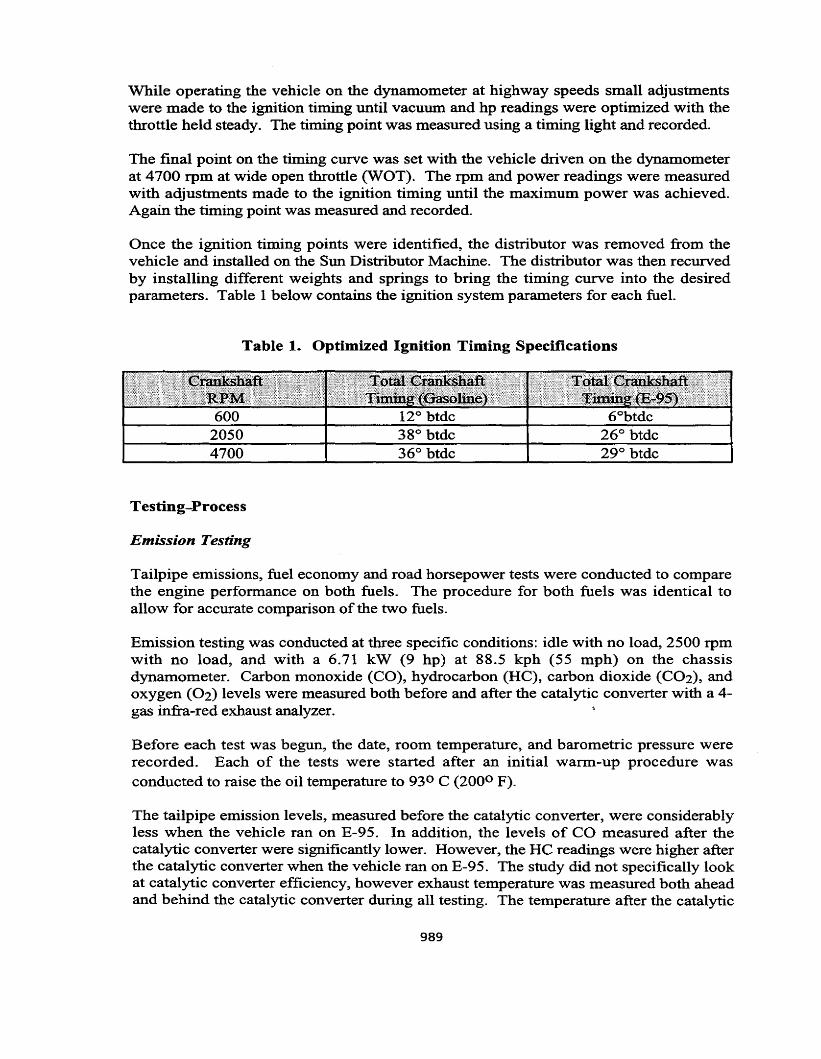
While operating the vehicle on the dynamometer at highway speeds small adjustmentswere made to the ignition timing until vacuum and hp readings were optimized with thethrottle held steady. The timing point was measured using a timing light and recorded.
The final point on the timing curve was set with the vehicle driven on the dynamometerat 4700 rpm at wide open throttle (WOT). The rpm and power readings were measuredwith adjustments made to the ignition timing until the maximum power was achieved.Again the timing point was measured and recorded.
Once the ignition timing points were identified, the distributor was removed from thevehicle and installed on the Sun Distributor Machine. The distributor was then recurvedby installing different weights and springs to bring the timing curve into the desiredparameters. Table 1 below contains the ignition system parameters for each fuel.
Table 1. Optimized Ignition Timing Specifications
60020504700
Testing-Process
Emission Testing
12° btdc38° btdc36° btdc
26° btdc29° btdc
Tailpipe emissions, fuel economy and road horsepower tests were conducted to comparethe engine performance on both fuels. The procedure for both fuels was identical toallow for accurate comparison of the two fuels.
Emission testing was conducted at three specific conditions: idle with no load, 2500 rpmwith no load, and with a 6.71 kW (9 hp) at 88.5 kph (55 mph) on the chassisdynamometer. Carbon monoxide (CO), hydrocarbon (HC), carbon dioxide (C02), andoxygen (02) levels were measured both before and after the catalytic converter with a 4gas infra-red exhaust analyzer.
Before each test was begun, the date, room temperature, and barometric pressure wererecorded. Each of the tests were started after an initial warm-up procedure wasconducted to raise the oil temperature to 93 0 C (2000 F).
The tailpipe emission levels, measured before the catalytic converter, were considerablyless when the vehicle ran on E-95. In addition, the levels of CO measured after thecatalytic converter were significantly lower. However, the HC readings were higher afterthe catalytic converter when the vehicle ran on E-95. The study did not specifically lookat catalytic converter efficiency, however exhaust temperature was measured both aheadand behind the catalytic converter during all testing. The temperature after the catalytic
989
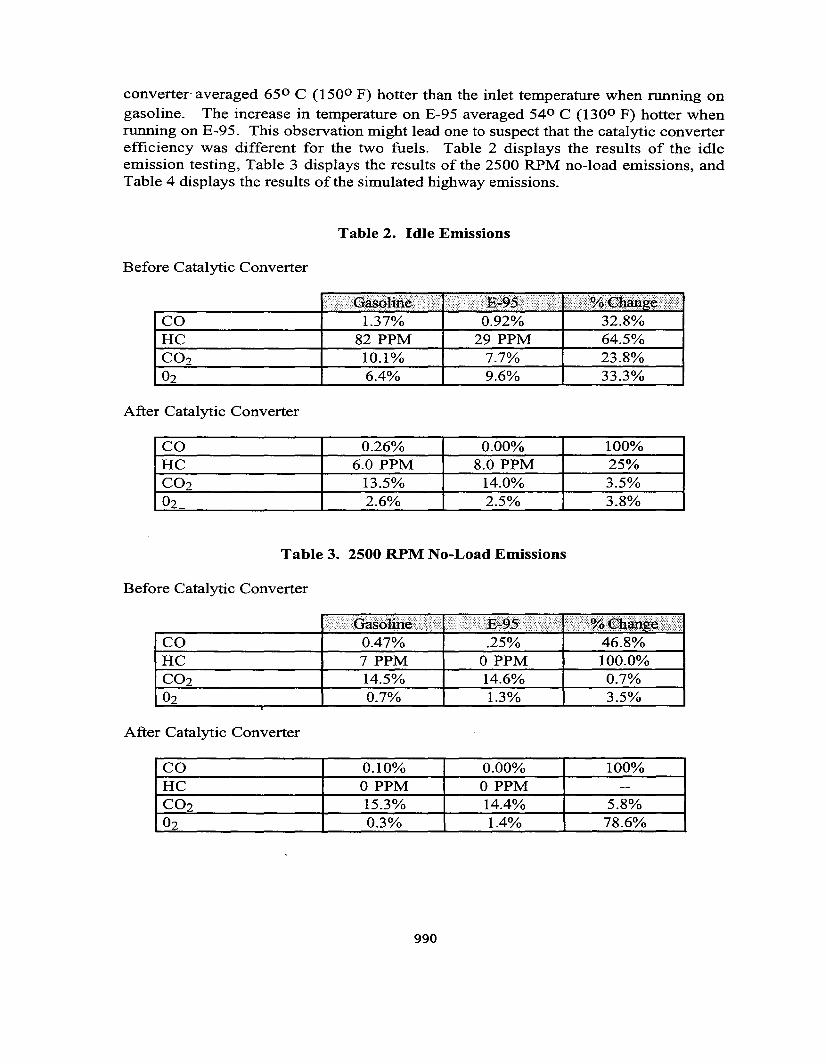
converter-averaged 650 C (1500 F) hotter than the inlet temperature when running ongasoline. The increase in temperature on E-95 averaged 540 C (1300 F) hotter whenrunning on E-95. This observation might lead one to suspect that the catalytic converterefficiency was different for the two fuels. Table 2 displays the results of the idleemission testing, Table 3 displays the results of the 2500 RPM no-load emissions, andTable 4 displays the results of the simulated highway emissions.
Table 2. Idle Emissions
Before Catalytic Converter
li;&';; .>;-
CO 1.37% 0.92% 32.8%HC 82 PPM 29 PPM 64.5%CO2 10.1% 7.7% 23.8%02 6.4% 9.6% 33.3%
After Catalytic Converter
CO 0.26% 0.00% 100%HC 6.0 PPM 8.0 PPM 25%CO2 13.5% 14.0% 3.5%02 2.6% 2.5% 3.8%
Table 3. 2500 RPM No-Load Emissions
Before Catalytic Converter
COHC
After Catalytic Converter
0.47%7 PPM14.5%0.7%
.25%o PPM14.6%1.3%
46.8%100.0%0.7%3.5%
CO 0.10% 0.00% 100%HC o PPM o PPM --CO2 15.3% 14.4% 5.8%02 0.3% 1.4% 78.6%
990
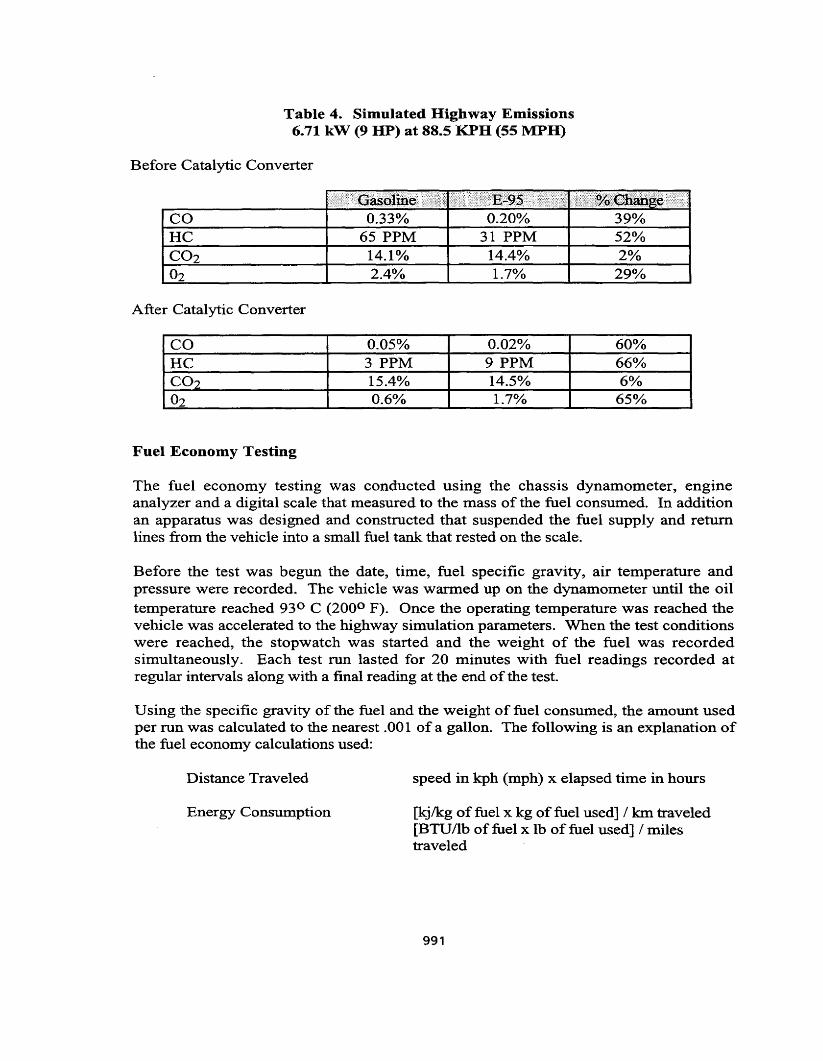
Table 4. Simulated Highway Emissions6.71 kW (9 HP) at 88.5 KPH (55 MPH)
Before Catalytic Converter .-I·'
CO 0.33% 0.20% 39%HC 65 PPM 31 PPM 52%CO2 14.10/0 14.4% 2%02 2.4% 1.7% 29%
After Catalytic Converter
CO 0.05% 0.02% 60%HC 3 PPM 9 PPM 66%CO2 15.4% 14.5% 6%02 0.6% 1.7% 65%
Fuel Economy Testing
The fuel economy testing was conducted using the chassis dynamometer, engineanalyzer and a digital scale that measured to the mass of the fuel consumed. In additionan apparatus was designed and constructed that suspended the fuel supply and returnlines from the vehicle into a small fuel tank that rested on the scale.
Before the test was begun the date, time, fuel specific gravity, air temperature andpressure were recorded. The vehicle was warmed up on the dynamometer until the oiltemperature reached 93 0 C (2000 F). Once the operating temperature was reached thevehicle was accelerated to the highway simulation parameters. When the test conditionswere reached, the stopwatch was started and the weight of the fuel was recordedsimultaneously. Each test run lasted for 20 minutes with fuel readings recorded atregular intervals along with a final reading at the end of the test.
Using the specific gravity of the fuel and the weight of fuel consumed, the amount usedper run was calculated to the nearest .001 of a gallon. The following is an explanation ofthe fuel economy calculations used:
Distance Traveled
Energy Consumption
speed in kph (mph) x elapsed time in hours
[kj/kg of fuel x kg of fuel used] / km traveled[BTU/lb of fuel x lb of fuel used] / milestraveled
991
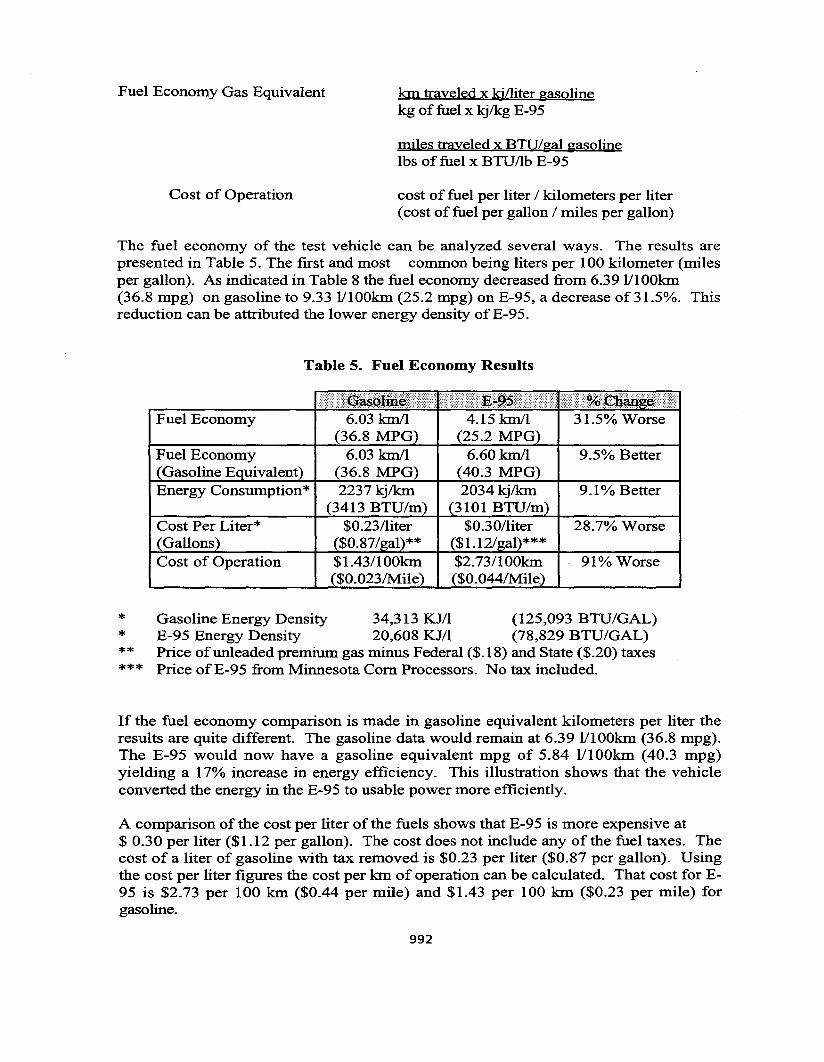
Fuel Economy Gas Equivalent
Cost of Operation
km traveled x kj/liter gasolinekg of fuel x kjlkg E-95
miles traveled x BTU/gal gasolinelbs of fuel x BTU/lb E-95
cost of fuel per liter / kilometers per liter(cost of fuel per gallon / miles per gallon)
The fuel economy of the test vehicle can be analyzed several ways. The results arepresented in Table 5. The first and most common being liters per 100 kilometer (milesper gallon). As indicated in Table 8 the fuel economy decreased from 6.3911100km(36.8 mpg) on gasoline to 9.33 1I100km (25.2 mpg) on E-95, a decrease of31.5%. Thisreduction can be attributed the lower energy density ofE-95.
Table 5. Fuel Economy Results
Fuel Economy
Fuel Economy(Gasoline E uivalent)Energy Consumption*
Cost Per Liter*(Gallons)Cost of Operation
6.03 kmIl(36.8 MPG)
6.03 kmIl(36.8 MPG2237kjlkm
(3413 BTU/m$0.23/liter
($0.87/gal)**$1.43/100km$0.023/Mile
31.5% Worse
9.5% Better
9.1% Better
28.7% Worse
91% Worse
*******
Gasoline Energy Density 34,313 KJ/I (125,093 BTU/GAL)E-95 Energy Density 20,608 KJ/I (78,829 BTU/GAL)Price ofunleaded premium gas minus Federal ($.18) and State ($.20) taxesPrice ofE-95 from Minnesota Com Processors. No tax included.
If the fuel economy comparison is made in gasoline equivalent kilometers per liter theresults are quite different. The gasoline data would remain at 6.39 1I100km (36.8 mpg).The E-95 would now have a gasoline equivalent mpg of 5.84 1I100km (40.3 mpg)yielding a 17% increase in energy efficiency. This illustration shows that the vehicleconverted the energy in the E-95 to usable power more efficiently,
A comparison of the cost per liter of the fuels shows that E-95 is more expensive at$ 0.30 per liter ($1.12 per gallon). The cost does not include any of the fuel taxes. Thecost of a liter of gasoline with tax removed is $0.23 per liter ($0.87 per gallon). Usingthe cost per liter figures the cost per km of operation can be calculated. That cost for E95 is $2.73 per 100 km ($0.44 per mile) and $1.43 per 100 km ($0.23 per mile) forgasoline.
992
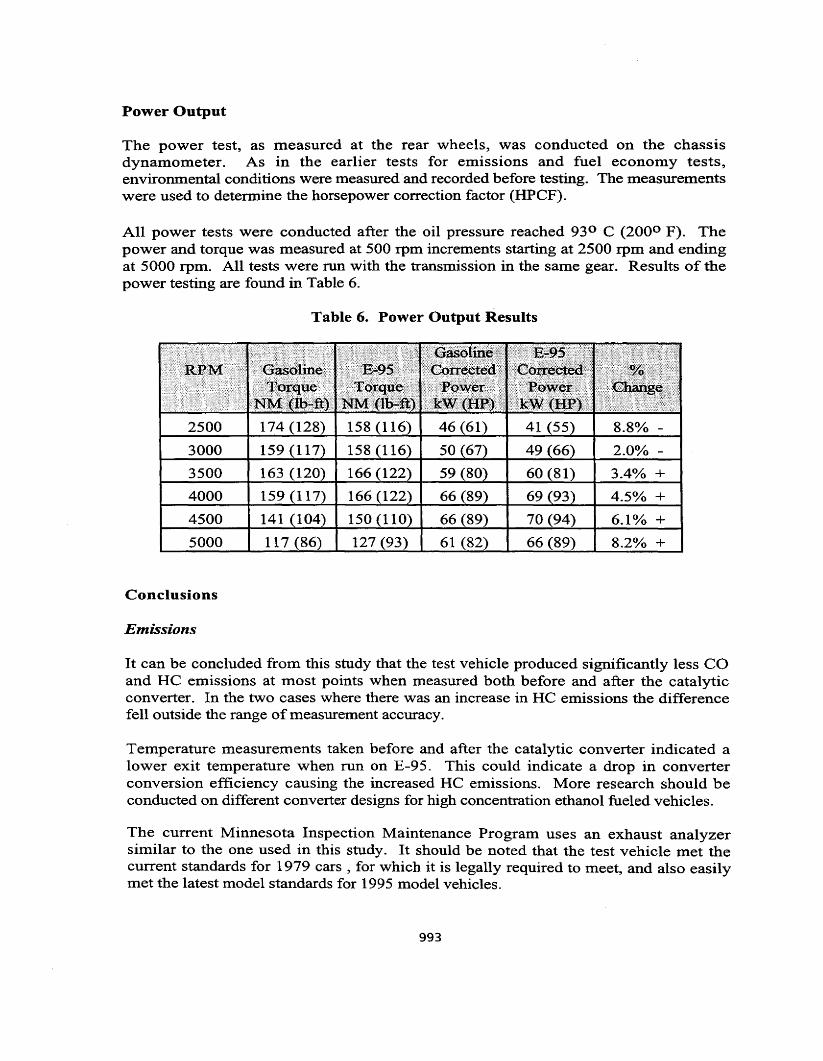
Power Output
The power test, as measured at the rear wheels, was conducted on the chassisdynamometer. As in the earlier tests for emissions and fuel economy tests,environmental conditions were measured and recorded before testing. The measurementswere used to determine the horsepower correction factor (HPCF).
All power tests were conducted after the oil pressure reached 93 0 C (2000 F). Thepower and torque was measured at 500 rpm increments starting at 2500 rpm and endingat 5000 rpm. All tests were run with the transmission in the same gear. Results of thepower testing are found in Table 6.
Table 6. Power Output Results
2500 174 128)
3000 159 (117 2.0% -
3500 163 (120) 3.4% +4000 159 (117) 4.5% +4500 141 104) 6.10/0 +5000 117 (86) 8.2% +
Conclusions
Emissions
It can be concluded from this study that the test vehicle produced significantly less COand HC emissions at most points when measured both before and after the catalyticconverter. In the two cases where there was an increase in HC emissions the differencefell outside the range of measurement accuracy.
Temperature measurements taken before and after the catalytic converter indicated alower exit temperature when run on £-95. This could indicate a drop in converterconversion efficiency causing the increased HC emissions. More research should beconducted on different converter designs for high concentration ethanol fueled vehicles.
The current Minnesota Inspection Maintenance Program uses an exhaust analyzersimilar to the one used in this study. It should be noted that the test vehicle met thecurrent standards for 1979 cars , for which it is legally required to meet, and also easilymet the latest model standards for 1995 model vehicles.
993
Fuel Economy
It can be concluded from this study that the test vehicle converted the energy in the E-95to usable power at the rear wheels more efficiently than when using gasoline. Thegasoline equivalent fuel economy and energy consumed per unit distance increased by8.1 % and 9.1 % respectively.
However, based on the lower energy density of the E-95 and its cost per unit volume,the vehicle range would be limited at the same time the cost of operation would beincreasing. This represents an increase in the cost of operation of 91 % if State andFederal taxes are not figured into the equation.
Power Output
In general, both the power and torque were slightly lower for the E-95 fuel at low rpm.At the middle and higher rpm the E-95 allowed the engine to produce more torque andpower. When the engine ran on E-95 the peak power output was 5% higher than thepeak power output on gasoline.
Driveability
Driveability using the E-95 fuel was significantly worse during cold operation and initialstartup. When fully warmed up, there was no difference in throttle response or anyother driveability characteristics. It is believed that variations in the volatility of the E95 alongwith heat storage devices could easily remedy any cold operation driveabilityproblems encountered.
994
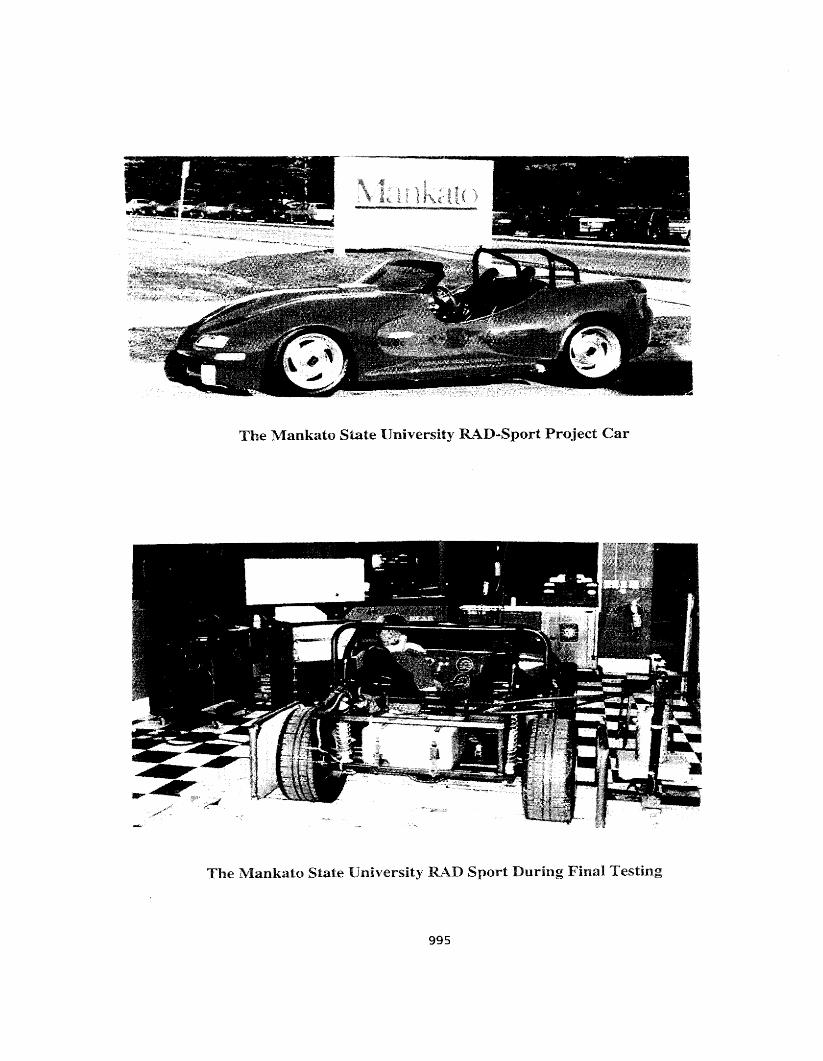
, =.. . ~.~,."~ . ~. ::~t:"_ ~ --..".. 0
. .' - . ~ ~~-.- ~ ,,\. "' - ~I'!i
.... ,. "'k~;M;~ f' ~$~ 't ..S ~ .. __ ~ ... i~
The Mankato State University RAD-Sport Project Car
The Mankato State University RAD Sport During Final Testing
995
A LABORATORY AND PILOT PLANT SCALED CONTINUOUSSTIRRED REACTOR SEPARATOR FOR THE PRODUCTION
OF ETHANOL FROM SUGARS, CORN GRITS/STARCHOR BIOMASS STREAMS
M. Clark Dale. Ph.D.• PresidentBio-Process Innovation. Inc.• 226 N. 500 West. W.Lafayette.1N 47906-8505
Shuiwang Lei. Ph.D., Visiting Faculty. and Chongde Zhou, MSE, Visiting FacultyBiochemical and Food Process Engineering Division
Agricultural Engineering. Purdue University. W. Lafayette. IN 47906-1146
Abstract
An improved bio-reactor has been developed to allow the high speed. continuos. lowenergy conversion of various substrates to ethanol. The Continuous Stirred ReactorSeparator (CSRS) incorporates gas stripping of the ethanol using a recalculating gasstream between cascading stirred reactors in series. We have operated a 4 liter lab scaleunit, ana built and operated a 24.000 liter pilot scale version of the bioreactor.. High ratesof fermentation are maintained in the reactor stages using a highly flocculant yeast strain.Ethanol is recovered from the stripping gas using a hydrophobic solvent absorber(isothermal), after which the gas is returned to the bioreactor. Ethanol can then beremoved from the solvent to recover a highly concentrated ethanol product. We haveapplied the lab scale CSRS to sugars (glucose/sucrose). molasses. and raw starch withsimultaneous saccharification and fermentation of the starch granules (SSF). The pilotscale CSRS has been operated as a cascade reactor using dextrins as a feed. Operatingdata from both the lab and pilot scale CSRS are presented. Details of how the systemmight be applied to cellulosics. with some preliminary data are also given.
996
Introduction
Ethanol production in the USA can offer a renewable source of liquid fuel producedwithin the borders of our own nation as well as providing a market for excess grain production capacity of the midwestern states. However, in order for the ethanol fuel industryto be able to expand without governmental subsidies, ethanol production costs must bereduced closer to the level of refined unleaded gasoline ($0.55-$0.75 per gallon). Ethanolproduction costs can be reduced via: 1) reducing costs of substrate, 2) increasing the efficiency of substrate conversion to ethanol, 3) reducing the energy costs for purifying anddehydrating the ethanol, 4) reducing the amount of effluent 'bottoms' waters which mustbe treated, 5) reducing the capital costs for the ethanol processing plant, 6) reducing thelabor for operating the ethanol plant.
A Continuous Stirred Reactor Separator (CSRS) consisting of stirred tank type reactorsoperated in series, with the liquid streams moving from tank to tank contacted with astripping gas to remove the ethanol product has been designed and tested. A patent(#5,141,861) has been issued which describes this reactor technology. Capital costs forthe CSRS system have been estimated to be about $1.40/annual gal. at the 500,000 gal/Yfscale, which compares to a cost of $2.70 for a batch plant at this scale. This CSRS is anew type reactor which allows simultaneous saccharification, fermentation, and ethanolseparation in a combined process. Combining these reactions allows significant improvements in each operation. Combining reaction with separation allows the fermentation ofhighly concentrated streams of up to 50% solids. Simultaneous saccharification and fermentation of polysaccharides such as starch and cellulose can be quickly completed in thisbio-reactor/separator. Saccharification (of both starch and cellulose)is sped by the reduction of sugar concentration as the sugar is fermented to ethanol. Fermentation is sped bythe removal of the toxic ethanol product, and ethanol purification and concentration costsare reduced by the enrichment of the ethanol in the vapor phase. The gas stream is cocurrent to the tank to tank liquid flow in the enriching section, and counter-current in thestripping section. The final effluent from the CSRS is characterized by complete saccharification of all polysaccharides, complete fermentation of sugars to ethanol and completeremoval or separation of the ethanol into the gas phase. A schematic of the CSRS processis shown in Figure 1 for a system incorporating complete recycle of the thin stillage.
The CSRS can be coupled with a solvent ethanol recovery system to give a low energycontinuous process for the production of ethanol from starch or biomass. Energy savingsare attained by combining the CSRS reactor concept with solvent absorption of theethanol from the gas stream exiting the CSRS as shown in Figure 1. The ideal solvent forabsorption of ethanol from a gas stream would have the following properties: 1) lowvapor pressure of the solvent, 2) solvent miscible with ethanol, 3)solvent vapor carry-overnon-toxic to fermenting microbes in CSRS, 4)low solubility of water in the solvent, and 5)low solubility of solvent in water. The ideal solvent would absorb only ethanol allowingan anhydrous ethanol product to be stripped off from the solvent/ethanol stream from theabsorber. However, all solvents having the ability to solvate ethanol also dissolve some
997
water. Tedder et al. (1986) state that the solvents they tested for direct solvent extractionof ethanol have a 3 to 5% water weight fraction in the solvent phase when contacted withan aqueous phase. Each solvent can be characterized by an equilibrium distributioncoefficient, Kdc' for ethanol between the water and solvent phase, as well as a distributioncoefficient for water, Kdw between the aqueous and solvent phases. Dividing the ethanoldistribution coefficient by the water distribution coefficient (Kdc! Kdw) gives a separationfactor, a, which describes the relative affinity of the solvent for ethanol compared towater. Dodecanol, found by Minier and Goma (1982) to be non-toxic in direct solventextraction in-situ separation, has an ethanol distribution coefficient of .21, and anethanol/water separation, a, factor of 21. Work by Kollerup and Daugulis, (1985) indicated that dodecanol was somewhat toxic to microbes. Research in our labs has shownthat dodecanol in direct contact with immobilized cells was toxic to yeast, but when usedas vapor ethanol absorber, the dodecanol vapors carried over to an immobilized cell typereactor were not toxic, with fermentation rates of immobilized cells stable over 4 to 6 days(Lee and Dale, 1991 unpublished data). By not actually contacting the cells with anorganic phase, toxicity problems and solvent loss into the water phase are both minimized.An anhydrous ethanol product may be recovered from the solvent using a simple extractive distillation procedure using the same solvent used for the ethanol absorption. Thisprocess has been designed, tested, and modeled by hand calculations and using the Aspenn library using solvents with a separation factors of 50-90, which would give the energyusages shown in Table 1 for steam energy requirements to recover an anhydrous ethanolproduct.
Sol. Abs. Extr. Distillation2213.38.46.75.9
Conv. Distillation/PS Dehydr.4421151311.5
Table 1. Distillation Steam Energy Requirements for Anhydrous Ethanol(MBTU/gal)
% Ethanol2.5
5.07.510.012.5
It can be seen that as the ethanol concentration in the stage from which the gas exits isallowed to increase, energy costs for ethanol recovery drop. The selection of solvents andtesting of the SAED system was described in a paper given by Dale (1993).
No-cook conversion ofstarch to sugars-If the cook process can be completely eliminated from the process of convertingstarch/grits to ethanol, energy, capital, and labor costs could be significantly reduced.This conversion, when coupled with ethanol separation may allow the simple starch toethanol process shown in Figure 1. Glucose inhibition of enzymatic action has been notedto increase at lower temperatures. These results are similar to the kinetics determined byMatsumura et al (1987,1989) for raw starch saccharification using a glucoamylase withsweet potato starch. The use of Aspergillus niger on wet com as a source of amylase
998
enzymes was reported by several researchers as giving good results with this type ofprocess (Han and Steinberg, 1986; Fujio et al, 1984; Ueda et al, 1981).
Bottoms water recycleIt is a common practice in the fermentation industry to recycle 20-50% of the stillage to
help reduce and control the pH of the initial fermentation broth. Nofsinger et al. (1982)showed good performance with 100% recycle of stillage. However, in a recycle scheme,there will be recycling of any non-volatile fermentation products or non-fermentables inthe feed. Thus for molasses (which is characterized by about 40-50% fermentable solids)a maximum. stillage recycle ratio of 30% has been determined, while for high-test molasseswith 85% fermentable solids, 1a 50% recycle can be used (Hodge and Hildebrandt, 1954).The major fermentation by-products that will tend to build up over time are glycerol(3.3% yield) and lactic/succinic acid (0.5-1.0% yield).
Conversion ofcellulose and hemicellulose to ethanol-Biomass in the form of corn stalks, wood chips, waste paper, and grass clippings offers anenOInlOUS and low cost source of sugars for ethanol production. Xylose fermentationtechniques, and the simultaneous saccharification and fermentation of cellulose are beingstudied as an application for the CSRS reactor system. The two stage fermentation of biomass, following a basic extrusion solubiliziaton of lignin and hemicellulose (the Xylan delignification process (Tyson et al, 1995» is being developed. We are hoping to demonstrate a 5 stage CSRS system with a two stage xylose fermentation followed by a 3 stageSSF of cellulose (Dale, 1994).
Methods and Materials
A four liter, four stage lab scale CSRS was constructed using rectangular stages as perFigure 2.The ethanol vapors were absorbed into an isothermal water stream flowing 4times faster than the feed to the reactor. Stage 1 has a liquid volume of 1,100 m1 andstages 2-4 have a hold up of 900 ml, A single trough type bubble cap contactor was usedas the gas-liquid contacting device after stages 2,3 and 4. This reactor was used forstarch, sucrose, and molasses fermentations. Batch fermentations were performed in 250to 500 ml Er. flasks using a magnetic stirrer placed in an environmental temperaturecontrolled cabinet. Organisms used included strains of S. pombe, S. cerevisae, K.marxianus, and A. niger obtained from the NCAUR and CBS culture collections.Standard nutrients used in these fermentations were a YEP supplementation, with yeastextract, malt extract, and peptone added at 3 gil each unless otherwise noted. A mix of8% malt and 200 to 300 DU/# starch L-200 glucoamylase from Solvay was used in ourno-cook fermentation studies. In the continuous reactor experiments, pH was maintainedat between 3.5 and 4.2 via addition of ammonium hydroxide. Degree of starch conversionwas determined by mass balance in the CSRS experments, and by glucose release fromthe fermentation broth in a post experiment cook with alpha-amylase followed by glucoamylase at 60 C (Solvay, 1991).
999
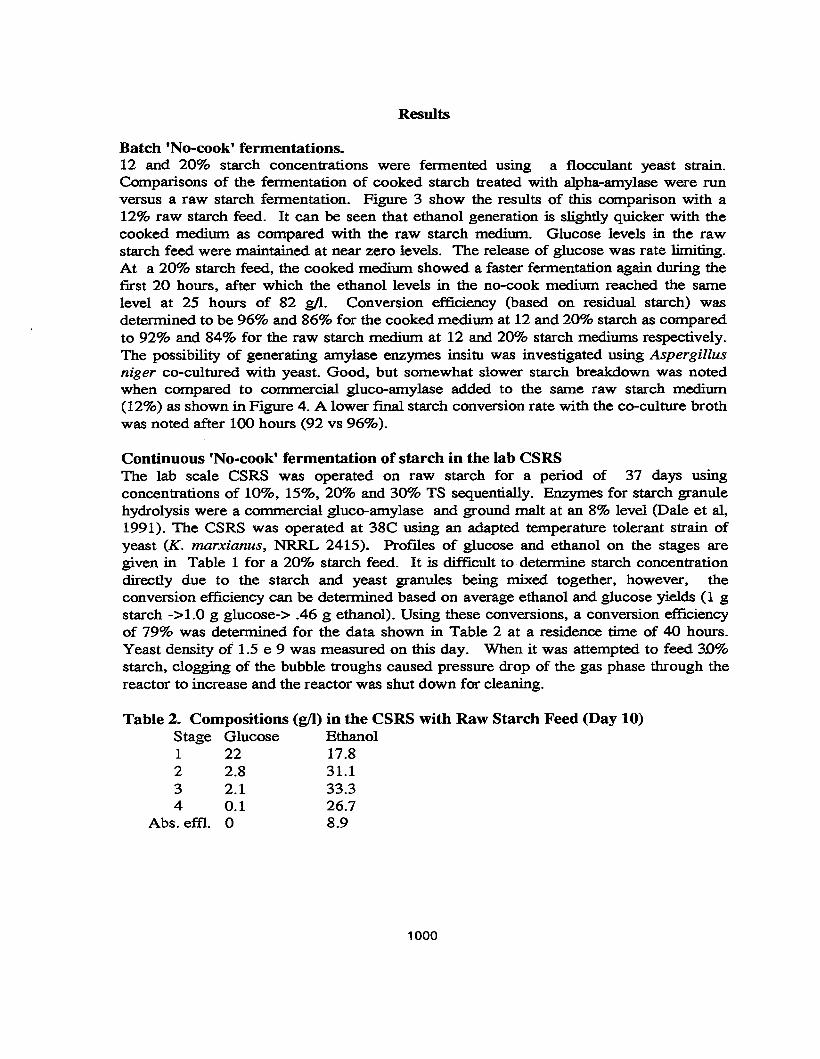
Results
Batch 'No-cook' fermentations.12 and 20% starch concentrations were fermented using a flocculant yeast strain.Comparisons of the fermentation of cooked starch treated with alpha-amylase were runversus a raw starch fermentation, Figure 3 show the results of this comparison with a12% raw starch feed. It can be seen that ethanol generation is slightly quicker with thecooked medium as compared with the raw starch medium. Glucose levels in the rawstarch feed were maintained at near zero levels. The release of glucose was rate limiting.At a 20% starch feed, the cooked medium showed a faster fermentation again during thefirst 20 hours, after which the ethanol levels in the no-cook medium reached the samelevel at 25 hours of 82 gil. Conversion efficiency (based on residual starch) wasdetermined to be 96% and 86% for the cooked medium at 12 and 20% starch as comparedto 92% and 84% for the raw starch medium at 12 and 20% starch mediums respectively.The possibility of generating amylase enzymes insitu was investigated using Aspergillusniger co-cultured with yeast. Good, but somewhat slower starch breakdown was notedwhen compared to commercial gluco-amylase added to the same raw starch medium(12%) as shown in Figure 4. A lower final starch conversion rate with the co-culture brothwas noted after 100 hours (92 vs 96%).
Continuous 'No-cook' fermentation of starch in the lab CSRSThe lab scale CSRS was operated on raw starch for a period of 37 days usingconcentrations of 10%, 15%, 20% and 30% TS sequentially. Enzymes for starch granulehydrolysis were a commercial gluco-amylase and ground malt at an 8% level (Dale et al,1991). The CSRS was operated at 38C using an adapted temperature tolerant strain ofyeast (K. marxianus, NRRL 2415). Profiles of glucose and ethanol on the stages aregiven in Table 1 for a 20% starch feed. It is difficult to· determine starch concentrationdirectly due to the starch and yeast granules being mixed together, however, theconversion efficiency can be determined based on average ethanol and glucose yields (1 gstarch ->1.0 g glucose-> .46 g ethanol). Using these conversions, a conversion efficiencyof 79% was determined for the data shown in Table 2 at a residence time of 40 hours.Yeast density of 1.5 e 9 was measured on this day. When it was attempted to feed 3D%starch, clogging of the bubble troughs caused pressure drop of the gas phase through thereactor to increase and the reactor was shut down for cleaning.
Table 2. Compositions (gil) in the CSRS with Raw Starch Feed (Day 10)Stage Glucose Ethanol1 22 17.82 2.8 31.13 2.1 33.34 0.1 26.7
Abs. effl. 0 8.9
1000
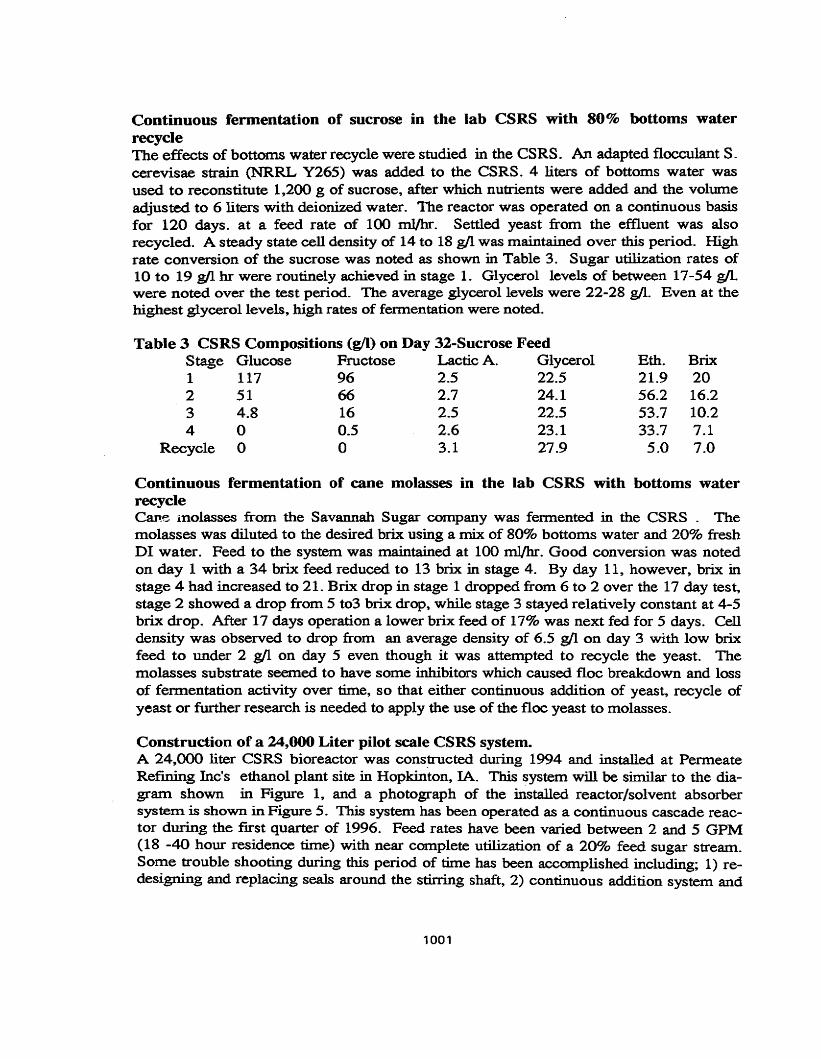
Continuous fermentation of sucrose in the lab CSRS with 80% bottoms waterrecycleThe effects of bottoms water recycle were studied in the CSRS. An adapted flocculant S.cerevisae strain (NRRL Y265) was added to the CSRS. 4 liters of bottoms water wasused to reconstitute 1,200 g of sucrose, after which nutrients were added and the volumeadjusted to 6 liters with deionized water. The reactor was operated on a continuous basisfor 120 days. at a feed rate of 100 ml/hr. Settled yeast from the effluent was alsorecycled. A steady state cell density of 14 to 18 gil was maintained over this period. Highrate conversion of the sucrose was noted as shown in Table 3. Sugar utilization rates of10 to 19 gil hr were routinely achieved in stage 1. Glycerol levels of between 17-54 gIl.were noted over the test period. The average glycerol levels were 22-28 gIl. Even at thehighest glycerol levels, high rates of fermentation were noted.
Table 3 CSRS Compositions (gil) on Day 32-Sucrose FeedStage Glucose Fructose Lactic A. Glycerol1 117 96 2.5 22.52 51 66 2.7 24.13 4.8 16 2.5 22.54 0 0.5 2.6 23.1
Recycle 0 0 3.1 27.9
Eth.21.956.253.733.7
5.0
Brix2016.210.27.17.0
Continuous fermentation of cane molasses in the lab CSRS with bottoms waterrecycleCane molasses from the Savannah Sugar company was fermented in the CSRS. Themolasses was diluted to the desired brix using a mix of 80% bottoms water and 200/0 freshDI water. Feed to the system was maintained at 100 ml/hr. Good conversion was notedon day 1 with a 34 brix feed reduced to 13 brix in stage 4. By day 11, however, brix instage 4 had increased to 21. Brix drop in stage 1 dropped from 6 to 2 over the 17 day test,stage 2 showed a drop from 5 103 brix. drop, while stage 3 stayed relatively constant at 4-5brix drop. After 17 days operation a lower brix feed of 17% was next fed for 5 days. Celldensity was observed to drop from an average density of 6.5 g/l on day 3 with low brixfeed to under 2 gil on day 5 even though it was attempted to recycle the yeast. Themolasses substrate seemed to have some inhibitors which caused floc breakdown and lossof fermentation activity over time, so that either continuous addition of yeast, recycle ofyeast or further research is needed to apply the use of the floc yeast to molasses.
Construction of a 24,000 Liter pilot scale CSRS system.A 24,000 liter CSRS bioreactor was constructed during 1994 and installed at PermeateRefining Inc's ethanol plant site in Hopkinton, IA. This system will be similar to the diagram shown in Figure 1, and a photograph of the installed reactor/solvent absorbersystem. is shown in Figure 5. This system has been operated as a continuous cascade reactor during the first quarter of 1996. Feed rates have been varied between 2 and 5 GPM(18 -40 hour residence time) with near complete utilization of a 20% feed sugar stream.Some trouble shooting during this period of time has been accomplished including; 1) redesigning and replacing seals around the stirring shaft, 2) continuous addition system and
1001
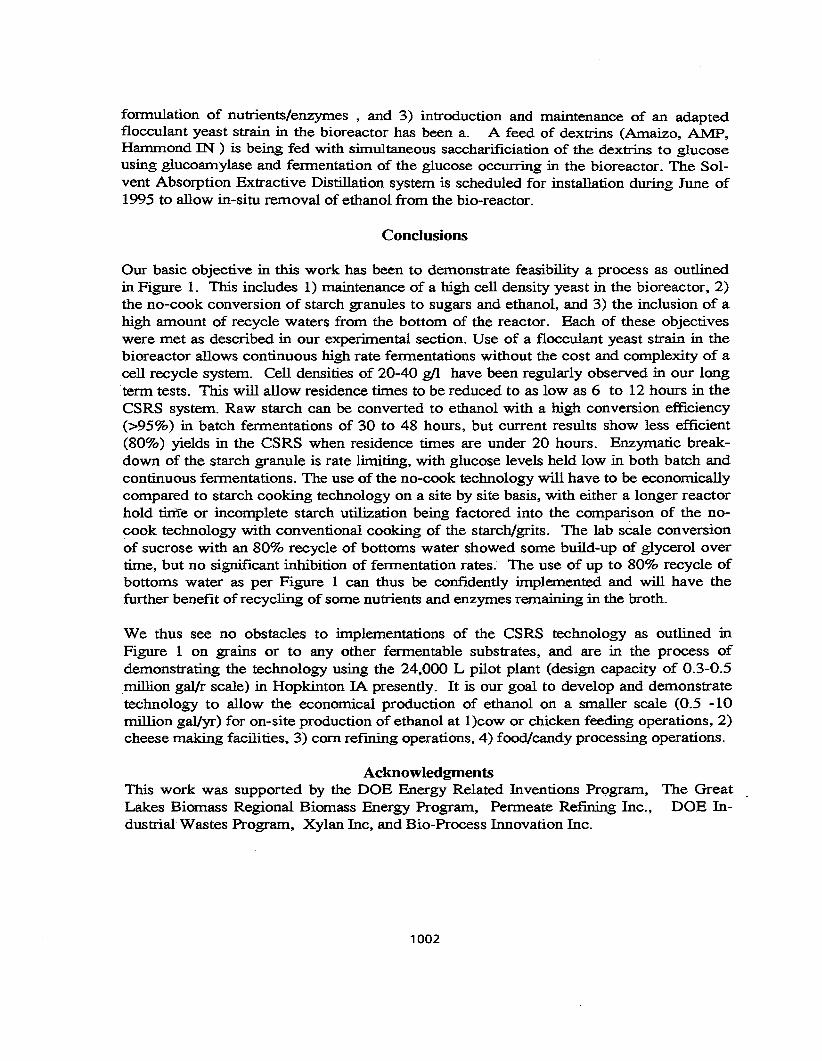
formulation of nutrients/enzymes , and 3) introduction and maintenance of an adaptedflocculant yeast strain in the bioreactor has been a. A feed of dextrins (Amaizo, AMP,Hammond IN ) is being fed with simultaneous saccharificiation of the dextrins to glucoseusing glucoamylase and fermentation of the glucose occurring in the bioreactor. The Solvent Absorption Extractive Distillation system is scheduled for installation during June of1995 to allow in-situ removal of ethanol from the bio-reactor.
Conclusions
Our basic objective in this work has been to demonstrate feasibility a process as outlinedin Figure 1. This includes 1) maintenance of a high cell density yeast in the bioreactor, 2)the no-cook conversion of starch granules to sugars and ethanol, and 3) the inclusion of ahigh amount of recycle waters from the bottom of the reactor. Each of these objectiveswere met as described in our experimental section. Use of a flocculant yeast strain in thebioreactor allows continuous high rate fermentations without the cost and complexity of acell recycle system. Cell densities of 20-40 gjl have been regularly observed in our longterm tests. This will allow residence times to be reduced to as low as 6 to 12 hours in theCSRS system. Raw starch can be converted to ethanol with a high conversion efficiency(>95%) in batch fermentations of 30 to 48 hours, but current results show less efficient(80%) yields in the CSRS when residence times are under 20 hours. Enzymatic breakdown of the starch granule is rate limiting, with glucose levels held low in both batch andcontinuous fermentations. The use of the no-cook technology will have to be economicallycompared to starch cooking technology on a site by site basis, with either a longer reactorhold time or incomplete starch utilization being factored into the comparison of the nocook technology with conventional cooking of the starch/grits. The lab scale conversionof sucrose with an 80% recycle of bottoms water showed some build-up of glycerol overtime, but no significant inhibition of fermentation rates. The use of up to 80% recycle ofbottoms water as per Figure 1 can thus be confidently implemented and will have thefurther benefit of recycling of some nutrients and enzymes remaining in the broth.
We thus see no obstacles to implementations of the CSRS technology as outlined inFigure 1 on grains or to any other fermentable substrates, and are in the process ofdemonstrating the technology using the 24,000 L pilot plant (design capacity of 0.3-0.5.million gal/r scale) in Hopkinton IA presently. It is our goal to develop and demonstratetechnology to allow the economical production of ethanol on a smaller scale (0.5 -10million gal/yr) for on-site production of ethanol at 1)cow or chicken feeding operations, 2)cheese making facilities, 3) com refining operations, 4) food/candy processing operations.
AcknowledgmentsThis work was supported by the DOE Energy Related Inventions Program,Lakes Biomass Regional Biomass Energy Program, Permeate Refining Inc.,dustrialWastes Program, Xylan Inc, and Bio-Process Innovation Inc.
1002
The GreatDOE In-
Bibliography
Arenson, D. S. Kertes, and J. King. 1990. Extraction of Ethanol from Aqueous Solutionwith Phenolic Extractants. IEC Res. 29:607.
Dale, M.C., A. Eagger and M. Okos. 1990. Osmolality Effects on Free and ImmobilizedK. fragilis. AICHE. Nov.
Dale.Mi, N. Perrin and M. Okos. 1994 Fermentation of Concentrated Sucrose andMolasses streams use Free and Immobilized S. pombe. AICHE Symp Series
Dale, M.e., 1992. A Continuous Multi-Stage Stirred Reactor-Separator for Production ofVolatile Fermentation Products. Patent # 5,141,861.
Dale, M.e., S. Michel, and M. Okos. 1993. Conversion of raw milled com to sugars as afunction of temperature and ensyme use. COFE Chicago, Feb.
Dale, M.C., 1993. "A Solvent Absorption-Extractive Distillation (SAED) Process for theRecovery of Ethanol from Vapor or Gas Streams." AICHE COFE. Chicago, Feb.
Dale, M.C., 1994 A Pilot Scale Reactor Separator for Biomass Conversion to Ethanol.Accepted Proposal to the GL Biomass Energy Program
Downs, H., B. Clary, and J. O'Neal. 1982. Ensyme Function and Control duringConversion of Grain Starches to Fermentable Sugars. ASAE Dec.
Fujio, Y., P Suyanadona, and S. Veda. 1984. Alcoholic Fermentation of Raw Cassava byRhiz. koji without Cooking. Biotech Bioeng 24:315
Han, I, and M. Steinberg. 1986. Solid State Fermentation of Raw Com with Koji Hydrolysis.Biotech Bioeng Symp. 17:449.
Kollerup, F. and A. Daugulis. 1985. Mathamatical Model for Extractive Fermentation.Biotech Bioeng. 27:1335
Matsumura, M. and J. Hirata. 1989. Cont. SSF of Raw Starch in a Membrane Reactor. J.Chern. Biotech. 46:313.
Matsumura, M., J. Hirata, and S. Ishii. 1987. Kinetics of Saccharification of Raw Starchby Glucoamylase. J.Chem Biotech. 42:51.
Minier, M. and G. Goma. 1982. Ethanol Production by Extractive Fermentation. Biotechand Bioeng. 25:1565
Munson, e. and C. King. 1984. Factors influencing Solvent Selection for Extraction ofEthanol from Aqeous Solutions. IEC Proc, Des. 23:115
Nofsinger, G.W., R. Bothast, and J. Wall. 1982. Fermentation Byproducts-RecyclingSoluble Solution, and Chemical Preservation, NRAES Cooperative Extension Publication.
Roddy, J., 1980. Distribution of Ethanol-Water Mixtrues to Organic Liquids. lEe Proc.Des. Dev. 20:104.
Tedder, D., W. Tawfic, and S. Poelheim. 1987. Ethanol Recovery by Solvent Extractionand Extractive Distillation- the SEED Process. Chern. Sep. Vol
Veda, S., C. Zenin, D. Monteiro, and Y. Park. 1981. Production of Ethanol from RawCassava Starch. Biotech Bioeng. 23:291
1003
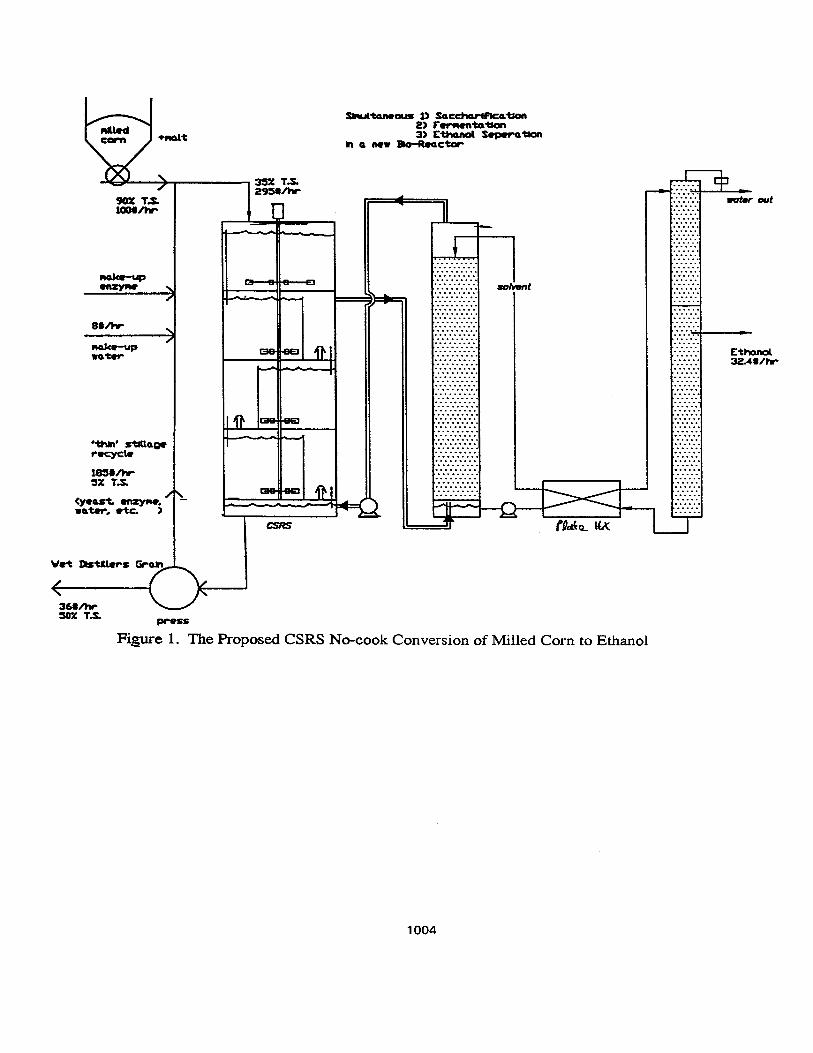
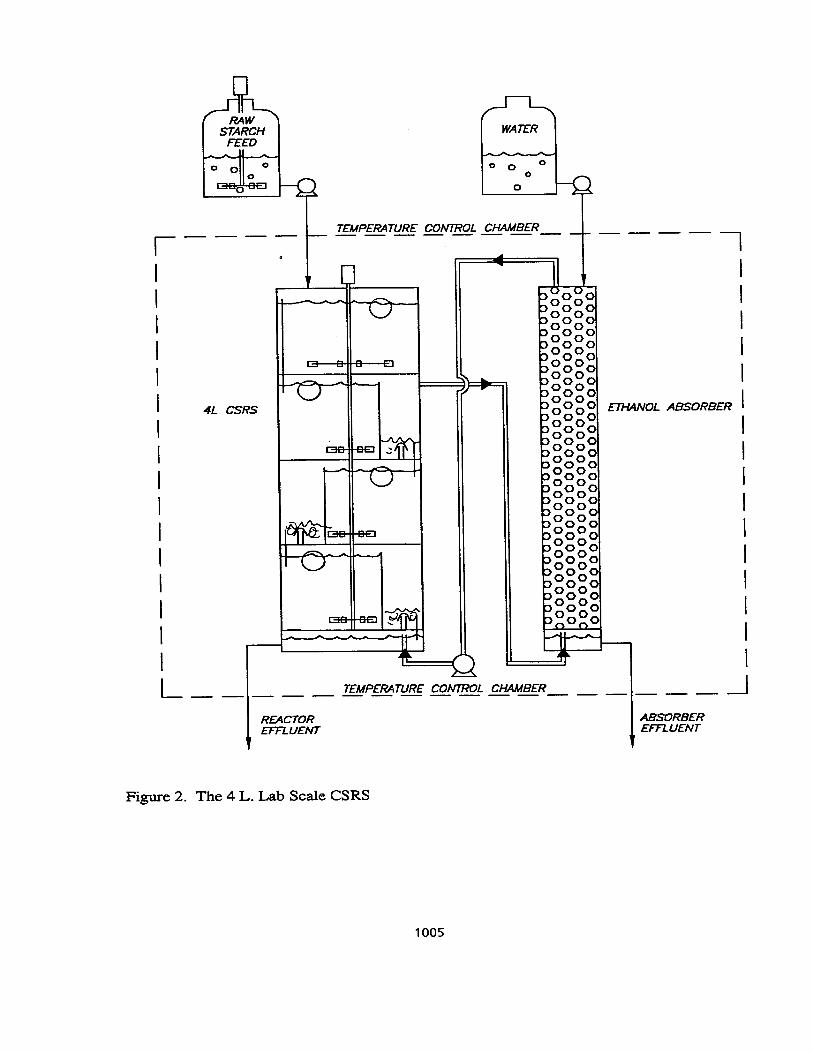
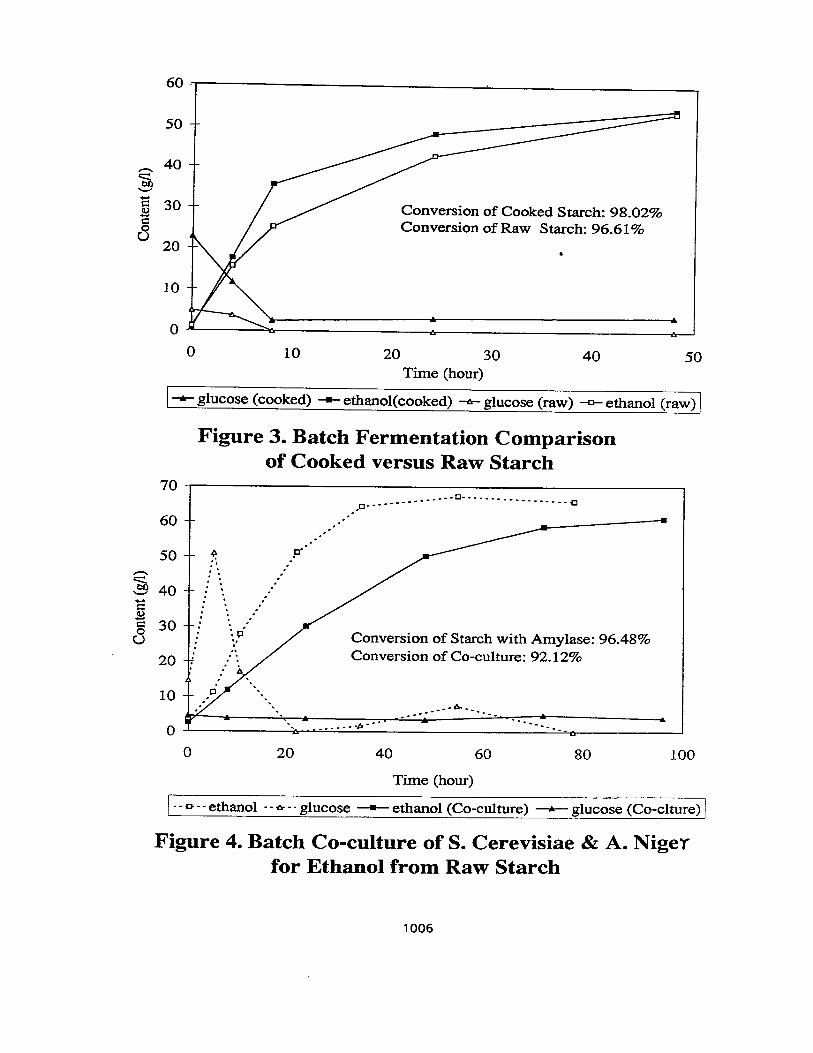
CELLS ON FOAM AND FIBER
Robert ClydeClyde Engineering
POB 740644New Orleans, La. 70174
Abstract
Cells grow on high area foam and when a screen is put around the foam, it is madeheavier so it can be fluidized. When foam is rotated iri a half full RBC, drops areformed and mass transfer of oxygen to drops is much faster. Most fungi and somemammalian cells need oxygen. Corrugated fibers with holes iri the valleys also producedrops. White rot fungus needs oxygen and it degrades many chlorine compounds, azodyes, and TNT. Old cardboard boxes are readily available and when buried in soil,oxygen is entrapped. In a lake, the boxes expose high area.
Fibers have high surface area for immobilizing cells and when the fibers are rotated,fast reactions occur,converting one chemical to another. Sugar has been fermented toalcohol in 10-15 minutes. Ethanol has high octane and does not need lead. Old cars andtrucks stifl use lead and high levels have been found in the drinking water of severallarge cities. Bacteria on fibers can remove lead in a few seconds. When an RBC ofplairi fiber discs is rotated and a light shone in the top the light hits a thin moving filmto degrade chlorine compounds. Microbes and light remove sulfur from oil. Calciummagnesium acetate is a non corrosive road deicer. Salt on roads causes millions ofdollars damage to bridges and cars. An inexpensive reactor has been made foroptimization studies of mammalian and plant cells. A magnet is near the bottom but nottouching and oxygen is put in the top where there is no seal that can leak.
1008
INTRODUCTION
In a recent article (1) Kargi removed COD and nitrogen from wastewater with wiremesh sponge, in a fluidized bed bioreactor.This design is covered in Clyde patent (2).Wire mesh sponge can also be used in a half full RBC where drops are formed. Masstransfer of oxygen to drops is much faster than to a flat surface. (3). Macaskie (44)removes uranium with sponge.
Two designs have been developed for rotating cells on fibers. These designs have manyapplications for environmental and energy purposes. They can assist in degrading toxicmetals, such as lead in drinking water, mercury, and cyanide. They can degrade jetfuel, chlorinated compounds, and TNT in soil. Cells on fibers can be used to degradetoxic azo dyes, and they can assist in removing sulfur from oil and burning coal. Inaddition to eliminating or reducing toxins, cells on fibers can also help create productsand procedures that are better for the environment and save energy. They can fermentsugar to alcohol for the production of gasohol, a lesser pollutant than currentautomobile fuel. Fibers have high surface area but to produce even mor~ Celite®canbe entrapped. Photos of Celite®in fiber and yeast growing on the Celit~e shown byClyde(4) Cells on rotating discs can help make lactic acid, which is used to makebiodegradable polymers for the manufacture of fast food cups. They can make calciummagnesium acetate (CMA), a non-corrosive road de-icer. For applications where a gasis evolved, as in sugar to alcohol, a horizontal unit is used for easy exit of the gas, butwhen the gas is evolved and then reacted, as in CMA, a vertical unit is better. Plainflat discs are used in the above applications.
In the second design, corrugated fibers with holes in the valleys are used so thatoxygen can be added quickly to fungi and some mammalian cells. Polyurethane foamcan also be cut to produce drops when rotated.
TOXIC METALS
Lead has been found in the drinking water of several large cities. Millions of people in100 large cities are drinking water that is over the limit of 10 ppb. It has been found inparking lot runoff so it probably comes from old cars and trucks that use leadedgasoline. In my design of cells on rotating fibers, lead can be removed in a fewseconds.
Tyvek ® fiber is not expensive and it has small pores and many fibers. When thebacterium Zymomonas mobilis was immobilized on a piece of white Tyvek ® fiberabout two inches long, and dipped into a colored solution of lead and six valentchromium, the metals got on the fiber immediately, not only on the part immersed, butthe color'climbed right up the fiber and got on the fingers of the holder. It was not justthe wicking effect, because a control showed nothing. In the control, the sameprocedure was used, including nutrients for Zymomonas, except no Zymomonas wasused. In another experiment 21 ppb of lead was stirred for 3 seconds with 100 Tyvek ®discs 45 rom in diameter and the 100 ml of lead was reduced to 3 ppb. This experimentwas repeated two more times on the same discs with the same result. The popular
1009
conception_of bacteria is that they are poisonous, but Morais found that Zymomonasis therapeutic (21) . Several doctors in the Recife (Brazil) area treated their patientswith intestinal disturbances and they showed great mending with disappearance oftheir symptoms.
Lead was analyzed with a Hitachi Z-8100 Polarized Zeeman automatic absorptionspectrometer with a graphite furnace. Presence of the metals was confirmed with aspectrometer at Tulane University, and photos made. The Zymomonas was NRRL14023 and the Tyvek R 1085B. It took about 30 hours for the Zymomonas to grow onthe fiber. Nutrients were 100 gil glucose, 10 gil yeast extract and 1 gil of three salts,(NH4)2S04, MgS04 and KH2P04. (4) . If the pH was below 6, half the amount ofK2HP04 was used .because it has a higher pH. Instead of yeast extract, inexpensive cornsteep liquor can be used.
A patent by Clyde-Whipple(7) covers removing metals with bacteria. Example 6 inthis patent also mentions Pseudomonas putida and cepacia. Chapatwala (9) degradescyanides with Ps.putida. Cadmium and trichloroethylene can be removed with these.Example 2 in the patent describes uranium and contamination from old fuel rods.
Steinberg (33) shows a photo of uranium and Zymomonas on fiber. Lovley (19)reduces uranium to an insoluble form with bacteria. Wang (37) reduces chromium in asimilar manner. If the bacteria were put on fibers, the process could be runcontinuously. Macaskie (44) removes uranium with a bacterium. Faison(ll) removesstrontium with a bacterium. Gas meters are leaking mercury. Pseudomonas putidaremoves -mercury (12) and degrades cyanides (39) also (9). These scientists did notimmobilize on fibers, but we have tried so many organisms successfully that we believethe chances are good that other bacteria could be immobilized and the reaction runfaster when the fibers are rotated.
ETHANOL
Ethanol is less pollluting than regular gasoline and the EPA has recently suggested weneed more ethanol. High rates of mass transfer result when yeast is put on a singlefiberglas disc at 90 rpm, say Bringi and Dale(45). We have found that 30 rpm workswell too. With the bacterium Zymomonas, sugar can be fermented to ethanol in 15minutes(38). Wayman rotated at 40 rpm. We have a 30 cm diameter reactor and werotate at 22 rpm because the tip speed is greater in the larger diameter. A turbineagitator rotating at 200 rpm uses much more energy.We have found, when you don'trotate, you get a bubble here and there, about 2 per second, but when you rotate, theCO2 which comes off sometimes blows the cotton right out of the vent.With polyesterdiscs 9.5 em in diameter, and rotated 40 rpm, Wayman got 96 % yield starting with 50gil glucose and termed the results "remarkable". Using almost identical equipmentexcept starting with 100 gil glucose, we got an 80% yield in 10-15 minutes in tworuns. Continuous runs have been made for up to two weeks, using the same residencetimes as in a batch run. . Nutrients were the same as those used to take lead out ofwastewater. Several runs were also made in "a smaller unit, 4.5 cm. in diameter.
1010
Alcohol was determined by HPLC. Higher concentrations of glucose can be fermentedand end product inhibition avoided by stripping off some alcohol and recycling thesugar as in Fig. 6 of a patent (8). Another method to eliminate end product inhibition isto extract the ethanol with a higher alcohol such as oleyl (15).Daugulis has a similarmethod (10).
E. coli also grows on fibers. The Zymomonas gene can be put into E. coli to fermentother sugars(14). The E. coli gene can also be put into Zymomonas (24).
SOIL AND SEDIMENT
Soil has been contaminated in many parts of the world by jet fuel. White rot fungusdegrades this( ), as well as chlorinated compounds and TNT, but the fungus needs airto grow. A fast way of getting oxygen into cells is described in a recent patent (5).Corrugated fibers are rotated in a half full rotary biological contactor. Liquid is carriedup into the vapor space and falls through holes in the valleys. Mass transfer of a gas todrops is much faster than to a flat surface (3). When a liquid is carried up into thevapor space with corrugated fiber or polyurethane foam, drops are formed. With avertical reactor, oxygen is depleted after passing through the column but in a longhorizontal reactor, oxygen can be added in the middle.When a small unit of corrugtedfibers was rotated, it took three days to grow white rot fungus, but when holes wereput in the valleys, it took a day and a half. The tube was 12 em long and 4.5 em indiameter. Holes in the valleys were about 3m.m in diameter and rotation was 6 rpm.The horizontal tube was half full of nutrient. Formula for nutrient is described in theAmerican-Type Culture Collection book.
Some people use pellets or microspheres but it's hard for oxygen to diffuse into theinterior of a pellet. At a distance of less than 0.4 m.m inside the pellet there was nooxygen says Reddy(25). When the corrugations are buried in contaminated soil, air isentrapped for further growth of the fungus. Sawdust was used in Brookhaven,Mississippi, but not very successfully, probably because there was not enough oxygeneven though soil was tilled once a week.
Spiker (32) says that white rot fungus is sensitive to large amounts of TNT and needsa matrix to protect it. The fungus on the inside of the corrugations will protect it fromthe TNT. Instead of filling up landfills with old cardboard boxes, fungus could becoated on the weighted boxes and then lowered slowly (so as to not spread thecontamination) into sediment in the bottom of a river. The Hudson River belowSchenectady is heavily contaminated.
A reactor for immobilizing the fungus is shown in patent 5,256,570 Fig. 7. If there areproblems with contamination from seals, it is rotated half way and then back in theopposite direction so as to not entangle flexible hoses for inlets and outlets. Alaboratory corrugator has been made from an old washing machine wringer, so otherfibers can be corrugated. Scale up will be easy because companies that make cardboardboxes have machines 87 inches wide and paper is fed in at 600 feet per minute.
1011
LACTIC ACID
Landfills are also full of fast food cups. Lactic acid polymers are biodegradable. Iyer(16) makes lactic acid with a fungus on plastic discs, but fibers have more area andcorrugated fibers supply oxygen faster. Tsai (36) makes lactic acid from potato waste.Fermentation is better than chemical synthesis because the biologically active L-formis produced.We feel confident that if these systems were used with rotating fibers, itwould be an improvement.
CITRIC ACID
When rotating discs are used with a fungus, there is. less energy and no foaming, saysImai(13), and the limiting step is oxygen transfer. In an air lift reactor, it takes energyto compress the air and bursting bubbles damage shear sensitive cells.A yeast can alsobe used says Sims (31) and productivity is increased sharply with an increase indissolved oxygen.
AZODYES
In a recent article, Suominen (34) degrades toxic azo dyes and nine other dyes withwhite rot fungus on nylon. These dyes are released into the water supply by the textileindustry and require energy to remove them by conventional means.Many people inthis area (including this author) drink only distilled water but this is a very energyintensive process.
CALCIUM MAGNESIUM ACETATE
Salt on roads causes millions of dollars damage to bridges and cars. People on low saltdiets are effected, because the salt gets into drinking water and damages crops.. In thefuture, when electronic devices are implanted in roads, salt will corrode them. CMAis a non-corrosive deicer which can be made with cells on rotating fibers saysLjungdahl(18). For this application Ljungdahl used a vertical unit because he wantedto save the carbon dioxide. They used Reemay polyester discs 48 rom in diameterseparated by teflon washers 0.8 rom thick and rotated at 80 rpm. A Figure is shownon page 412 of the book, and on page 365 he says "the basic idea is that of Clyde".Their conclusion was very positive. Raw material was hydrolyzed com starch, and theystated that the process could be more economical if corn steep liquor were usedinstead of yeast extract. In a recent talk by Shah(29) this is done and satisfactory resultsobtained. Cells on cotton also make CMA from cheese whey says Yang(40). If Tyvek
and Celite0were used, the reaction would probably be faster.
Cells on rotating fibers is covered in a patent by Clyde(8). Another one (2) describescells on polyurethane foam, cut so drops are formed. When a screen is put aroundfoam, it is made heavier so it can be fluidized.
1012
COAL AND OIL
Spraying CMA into burning coal removes most of the sulfur. Sulfur in oil is removed bymicrobes. These operations could be carried out using cells on rotating fibers. Polycyclicaromatic hydrocarbons (PARs) are degraded by fungi in a manufactured gas plant (46).There are over 1500 of these in the United States. We have developed a way to dramaticallyincrease the surface area of cardboard boxes so more cells can be immobilized.
PHOTO REACTOR
When an RBC is run half full and a light shone in the top, the light hits a thin movingfilm as in a patent (6). In other photo reactors, colored solution blocks the light.Titania can also be entrapped in the fibers to promote a faster reaction. Light has beenfound to degrade some chlorinated compounds, including dioxin, says Sawyer (28).The RBC can be run outside, saving energy by using the sun.
OTHER APPLICATIONS -l\tIAMMALIAN, PLANT CELLS, AND TAXOL
It takes a lot of energy to compress air and bubble it up from the bottom of a tallvertical reactor and bursting bubbles cause foam and damage to shear sensitive cells.To avoid damage to the cells, air can be put up the middle and the oxygenated wateroverflowed and put down the side to contact cells on fibers, but in this method, oxygenbecomes depleted as it reaches the bottom.In our design oxygen can be put in one end and also the middle of the horizontalreactor. Mitsuda (43) makes t-PA faster with cells on rotating fibers.
Scientists at Tufts University have found that polyester fibers are "much less costly andprovide a much higher surface/volume ratio than current matrices." (23),. They (andalso a well known company in New Jersey) put nutrient down through small discs in azig zag fashion, but we have found that when larger discs are rotated, nutrient makes alarge circle before dropping through holes to the next lower disc. Rubeai (27) hasfound that rotation removes cell debris. In our design, there is a magnet near (but nottouching) the bottom and oxygen is put in the top where there is no seal that can leak.The raw material for a small unit cost only $10. Larger units have been made also.
Kampala (17) puts bone marrow cells on fiberglass and gets a glucose consumption ratemore than 250-fold relative to monolayer. Yarmush (41) finds that a critical designfactor in liver cells is to deliver enough oxygen. The December '94 issue of In Vitro,Animal, has several articles on hepatocytes, also a recent meeting of In Vitro inDenver. Taxol for cancer can be made from a fungus; fungi need air which can besupplied from corrugations. Professor Demain at MIT states that a problem might beto supply enough oxygen for the fungus. Yoo (42)emphasizes the importance of lowstress and high oxygen for hairy roots. Langer (30) has developed a biodegradable fiberso organ cells can be grown on it and implanted in the body. Lin grows hepatocytes onsponge (34).
1013
DISCUSSION AND CONCLUSION
Bench scale tests look very promising and scale up tests would appear to be justified.In fermenting sugar to alcohol, Wayman used a condensor on top but we didn't so weprobably lost some alcohol. According to the literature, this is supposed to be anexothermic reaction, but we had to supply heat to the water bath with two fish tankheaters. This could be because the carbon dioxide carne off so fast it carried somewater with it. Evaporation is a cooling process. We also have a 20 em diameterreactor which we run at about 23 rpm because the tip speed is faster. We also plan totry Tyvek R fiber with Celite R entrapped and feel quite confident that the fermentationwill be faster. Inexpensive cheese whey has been fermented with Kluyveromycesfragilis . For toxic metals we plan to investigate the effect of other metals at differentpH values. In soil degradation, we have made a box about 2/3 of a meter on a sideand will check to see if soil venting is effective with the corrugated fibers, and to seehow far the fungus will travel in search of food, in different types of soil.
REFERENCES
1. Kargi, F. and Eyiisleyen.S. Batch biological treatment of synthetic wastewaterin a fluidized bed containing wire mesh sponge particles. Enz.Micro.Tech.17,119-123, "95.
2. US Patent, Clyde, 4,333,893.3. Perry's Chern. Eng. Handbook 6th ed. 18-41.4. Clyde, R., 1991, Methanol dissociation and cells on fibres for ethanol
production and pollution control. Fuel Magazine vol. 70 page 1225-6.5. Clyde, R., 1993, US Patent 5,256,570.6. Clyde, R.,1984, US Patent 4,446,236.7. Clyde and Whipple, 1985,US Patent 4,530,763.8. Clyde, R. 1983. US Patent 4,407,954.9. Chapatwala,K,et.al. Screening of encapsulated microbial cells for the
degradation of inorganic cyanides,J.Ind.Micro. 11,69-72,1993.10. Daugulis,A. et al. 1991,Extractive Fermentation by Zymomonas mobilis and the
Control of Oscillatory Behavior, Biot.Letters, 13,291-296.11. Faison, B. et. al.,1990, Binding of Dissolved Strontium by Micrococcus luteus.
App. Env. Micro. pg.3649-3656.12. Horn, J. 1992, Development of Bacterial Strains for the Detoxification of
Mercury-Containing Pollutants. Talk 131, GEOC section, ACS meeting, SanFrancisco.
13. Imai,H. 1992, Effect of Operational Conditions on the Rate of Citric AcidProduction by Rotating Disk Contactor Using Aspergillus niger, J. Perm.andBioeng. 73,251-254
14. Ingram, L. US Patent 5,000,000 ,1991,also Genetic Improvement of E. coli forEthanol Production; Chromosomal Integration of Zymomonas mobilis GenesEncoding Pyruvate Decarboxylase and Alcohol Dehyrogenase II. App. & Env.Micro 893-900
15. Ishii,S. et al.1985, Monitoring and Control for Extractive Fermentation ofClostridium acetobutylicum. , J. Ferm.Tech. 63,181-187.
1014
16. Iyer, C. 1992, Immobilized whole cell Reactor for Fermentation ofGlucose into Lactic Acid. Talk 100, Biot. Section, ACS meeting,SanFrancisco.
17. Kompala,D. et al. 1993, A Three Dimensional culture system for Murine BoneMarrow. Talk 134, BlOT section, ACS meeting, Denver.
18. Ljungdahl L. and Wiegel J.,1991, Ch. 16 in book, Calcium MagnesiumAcetate, Elsevier, ed. D. Wise
19. Lovley, D. et.al. 1993, Reduction of uranium by Cytochrome c3 ofDesulfovibrio vulgaris. App Env. Micro. 59,3572-3576c.
20. Macaskie,L. 1990, An Immobilized Cell Bioprocess for the Removal of HeavyMetals from Aqueous Flows. J. Chern. Tech.Biotech. 49,357-379. See alsoScience 257,782-784 (1992)
21. Morais, J.,et. al.1993, Zymomonas mobilis research in the Pernambuco FederalUniversity, J. of Biot.,31,75-91
22. Perry's Chemical Engineers Handbook, 1984, 6th ed., 18-3823. Petti.S, et al. 1992, Nonwoven polyester fabric as a matrix for three
dimensional mammalian cell growth. Talk 151c, AIChE meeting, Miami,alsoBiot.Progress,10,548-550.
24. Picataggio.S. et.al. Metabolic Engineering of a Pentose Metabolism Pathway inEthanologenic Zymomonas mobilis.Science 267,240.1995.
25. Reddy,C.et al. 1992, Determination of the Respiration Kinetics for MycelialPellets of Phanerochaete chrysosporium ,App.Env. Micro. 1740-1745
26. Reddy,C. and Yadav.J. 1993,Degradation of Benzene, Toluene, Ethylbenzene,and Xylenes (BTEX)by the Lignin-Degrading Basidiomycete Phanerochaetechrysosporium. App. Env. Micro. 756-762
27. Rubeai,M. 1993, Use of a spin filter can reduce disruption of hybridoma cellsin a bioreactor. Biot.Tech. 7,351-356.
28. Sawyer,C. 1983, Talk presented at ACS meeting, Washington D.C.Environmental Health, Safety, and Legal Considerations for the SuccessfulExcavation of a Dioxin-Contaminated Hazardous Waste Site.
29. Shah, M. et. al.,1993, Optimization & Scale-up of CMA Production byFermentation,AIChE meeting, St. Louis talk 116g
30. Langer, R. Chem. Eng. News, Nov.22, '93 pg. 4.31. Sims.K, 1994,Oxygen Uptake and Citric Acid Production by Candida lipolytica
Y 1095. Biot. and Bioeng. 43,131-13732. Spiker,J. et al. (1992) et al. Influence of 2,4,6-Trinitrotoluene (TNT)
Concentration on the Degradation of TNT in Explosive-Contaminated soils bythe White Rot Fungus Phanerochaete chrysosporium. App.Env. Micro 31993202
33. Steinberg, S. 1983, In a Ferment, Science News, 124,234-235.34. Lin,K. et.al. Long term maintenance of liver-specific functions in three
dimensional culture of adult rat hepatocytes with a porous gelatin spongesupport. Biotech.Appl. Biochem.21,19-27.1995.
35. Suominen,I. et al. 1993, Decolorization of Azo,Triphenylmethane,Heterocyclic, and polymeric dyes by Lignin Peroxidase Isoenzymesfrom Phanerochaete chrysosporium, App. Env. Micro. 59,4010-4016.
1015
36. Tsai.S. et.al. 1992, Strain Screening and Development for Industrial LacticAcid Fermentation. Paper 16, Gatlinburg com.
37. Wang,Y. and Shen,H. (1993) Characterization of Ernzymatic Reduction ofHexavalent chromium by Escherichia coli ATCC 33456. App. Env. Micro.59,3771-3777
38. Wayman, M. et. al.,1989, Ethanolic Fermentation of Wood-derived CelluloseHydrolysates by Zymomonas mobilis in a Continuous Dynamic ImmobilizedBiocatalyst Bioreactor, Process Bioch. June 88-91
39. Wolfram, 1993, Screening of encapsulated microbial cells for the degradation ofinorganic cyanides. J .Ind.Micro.ll ,69-72.
40. Yang, S.,1991, Biomass based Calcium Magnesium Acetate May ProveEconomical and Harmless Road Deicer. Biopr. Tech. Mar, pg. 6-7
41. Yarmush M. et al. 1993, Oxygen Uptake Rate of Hepatocytes;Importance inBioartificial Liver Design. AIChE meeting, St. Louis, talk 121b.
42. Yoo,Y. et al. 1993, Development of a Bioreactor for High Density Culture ofHairy Roots. Biotech. Techniques 7,859-862.
43. Mitsuda,S. et.al. Non Woven Fabrics as New Cell Matrices for IMR-90Human Embryonic Lung Diploid Fibroblast Cells. J.Ferm.and Bioeng. 70,289291.1990
44. Macaskie, L. et.al. Enzymatically-Mediated Uranium Accumulationand Uranium Recovery using a Citrobacter sp. Immobolized as a Biofilm Withina Plug-Flow Reactor. J.Chem.Tech.Biot.63,1-16.1995.
45. Bringi,V. and Dale,B. Experimental and Theoretical Evidence for ConvectiveNutrient Transport in an Immobilized Cell Support. Biot.Progress 6,205209,1990.
46. Cerniglia, C. et.al. Enantiomeric Composition of the transDihydrodiols Producedfrom Phenanthrene by Fungi. App. Env.Micro.59, 2145-2149, '93
1016
CONTINUOUS ETHANOL PRODUCTION IN BIOFILMREACTORS CONTAINING PLASTIC COMPOSITE
RINGS AND DISCS
Ali Demirci, Ph.D., Postdoc; Anthony L. Pometto III, Ph.D., Assoc. Prof;and Kai-Lai G. Ho, B.S., Graduate Student
Department of Food Science and Human NutritionCenter for Crops Utilization Research
2312 Food Sciences BuildingIowa State University
Ames, Iowa 50011 U.S.A.
Abstract
Biofilms are natural forms of cell immobilization in which microorganisms attach to solidsupports. At ISU we have developed plastic composite-supports (50% agriculturalmaterial, and 50% ploypropylene) which stimulate biofilm formation and which cansupply micronutrients to the attached microorganism. These plastic supports areproduced by twin-screw high temperature extrusion producing ring or discs. Forcontinuous ethanol fermentations with Saccharomyces cerevisiae (ATCC 24859), eachpacked-bed bioreactors (50 ml) contained plastic composite-rings and -discs, orpolypropylene rings (control) with support surface areas of 160 em", and operated at30°C. For polypropylene rings, cell-washout occurred at dilution rates of 1.9 h-1 in 0.6%yeast extract medium, and at 0.48 h' in >0.4 % ammonium sulfate medium. Withplastic composite-support bioreactors, however, S. cerevisiae at a dilution rate of 1.92h-1 produced 50 g/l/h with 100% expected theoretical conversions of glucose to ethanol.Also, repeated batch fermentations were performed for 11 different composite-supportsin medium with varying concentration of yeast extract to 0 % nitrogen. S. cerevisiaedemonstrated no significant reduction in ethanol production even in 0 % nitrogen mediumwith plastic composite-supports whereas with polypropylene supports, ethanol productionwas reduced significantly. The plastic composite-support blend selected for bestperformance contained 40 % ground soybean hulls, 5 % soybean flour, 5 % yeast extract,mineral salts, and 50% polypropylene. Therefore, increased productivity in low costmedium can be achieved beyond conventional fermentations by using this novelbioreactor design.
1017
Introduction
Ethanol, methanol, and ETBE (ethyl tertiary-butyl ether) are blended with gasoline asfuel extenders, and as octane enhancers. Ethanol is produced commercially by microbialbatch or continuous fermentation, and recovered by distillation. However, it isnecessary to increase productivity and ethanol concentration in the fermentation mediumin order to decrease ethanol production costs, which were $1.25 per gallon in 1992(Hohmann and Rendleman, 1993). Fermentation medium costs represent 70% of thefinal ethanol costs (Maiorella, 1984).
Some fermentation techniques have been developed to improve ethanol fermentation todecrease cost. End-product inhibition can be overcome by employing a vacuumfermentor which removes ethanol continuously from the fermentation medium.(Cysewski, and Wilke, 1977). Another method for continuous removal of ethanol fromfermentation medium is extractive fermentation which utilizes suitable solvent and/ormembrane (Christen et aI., 1990). Other commonly studied fermentor types focus toincrease biomass concentration in the fermentor which also increases productivity, andethanol concentration. Cell recycle (Tin et aI., 1993), hollow fiber membrane fermentors(Cheryan, and Mehaia, 1984), and cell immobilization (Nguyen, 1992) are continuouslybeing improved. However, these systems have found little application commercially,because of mass transfer limitation, and other limitations in long term fermentations.
Biofilms are a natural form of cell immobilization that results from microbial attachmentto solid supports (Characklis, and Marshall, 1990). Biofilms have been used in wastewater treatments (Kurt et ai. 1987), production of vinegar by the "quick vinegarprocess", mineral ore treatment (Crueger, and Crueger), and lactic acid production(Demirci et aI., 1993). In this paper, ethanol fermentation by S. cerevisiae in biofilmreactors containing plastic composite-supports is described in the medium with varyingnitrogen concentration. Continuous and repeated batch ethanol fermentation with plasticcomposite-supports stimulated biofilm formation, provided essential nutrients toSaccharomyces cerevisiae, and significantly reduced the medium composition and cost.
Materials and Methods
Microorganism and Media
Saccharomyces cerevisiae (ATCC 24859) was maintained in a medium containing 2 %(w/v) glucose, 0.6% yeast extract (Ardamine-Z, Champlain Industries, Inc., Clifton, NJ),0.023% CaCI2-2H20, 0.4% (NH4)2S04, 0.1 % MgS04-7H20, 0.15% KH2P04. Allfermentations inoculum were prepared from 24-h static culture at 30°C. For culture-tubefermentation medium, ingredients were kept the same except glucose was 5 %, and theconcentration of yeast extract and/or ammonium sulfate were varied. For continuousfermentation, glucose concentration was 7.5 % with varying concentration of nitrogen,
1018
and medium was sterilized in a B.B. Braun fermentor U-50 (Allentown, PA) withconstant agitation (220 rpm) at 121°C for 20 min. A KH2P04 solution was autoclavedseparately then added to the medium aseptically for all culture medium. Sixty-liter ofsterile medium was aseptically transferred into sterile carboy.
Support Materials
Various plastic composite-rings and -discs were produced from blends of 50% (w/w)agricultural materials and 50% polypropylene (Table 1). The plastic composite-supportswere prepared by high-temperature extrusion in a Brabender PL2000 co-rotating twinscrew extruder (Model CTSE-V, C. W. Brabender Instruments, Inc., South Hackensack,N.J) through a tubing assembly onto a metal rod, collected as 10-15 em length thenremoved from the rod and air cooled. The barrel temperatures were 200, 220 and200°C, the die temperature was set at 165°C, and the screw speed was 11 rpm. Theagricultural products used were 20-mesh soybean hulls (Cargill Soy processing Plant,Iowa Falls, IA), soybean flour (Archer Daniel Midland Co., Decatur, IL), yeast extract(Ardamine-Z, Champlain Industries, Inc., Clifton, NJ), and bovine globulin, bovinealbumin, and dried red blood cells (American Meat Protein Corporation, Inc., Ames,IA). Soybean hulls and soybean flour were vacuum dried for 48 h at 110°C.Polypropylene pellets (Quantum USI Division, Columbus, OH), specific agriculturalblends and salts (0.46 g of CaCI2-2H20, 8 g of (NH4)2S04, 2 g of MgS04-7H20 per kgof mixture) were mixed in a container by shaking and then added to the extruder hopper.The melted polypropylene was uniformly mixed with agricultural product by the corotating movement of the twin-screws and extruded through a large pipe die with 9.5 romID, 12.7 mm OD for rings or with 3.2 mm ID, 12.7 mm OD for discs, and then cut intoapproximately 3 mm slices. Polypropylene-alone rings were cut manually out of a sheetof polypropylene by using cork bores, 7 mm ID, 11 rom ODe
Repeated Batch Fermentation
The selected plastic composite-discs (bulk density: 0.19 g/ml), or polypropylene rings(bulk density: 0.2 g/crrr') with a total surface area of 60 cur were placed in 25x150 romscrew-cap culture tubes, and autoclaved dry for 30 min. After cooling, 10 ml of sterilemedium was added to each tube. The tubes were stored at 30°C for 24 hr, thenaseptically decanted to remove excessive particles. After adding 10 ml of fresh medium,the tubes were inoculated with 0.1 ml of a 24-hr suspension culture of S. cerevisiae.Every other day, the fermentation culture medium was aseptically decanted and 10 mlof fresh sterile medium was added for seven transfers. These repeated batchfermentations were performed in duplicate including suspension-culture fermentation withno support. At the end of seven transfer, medium nitrogen composition was decreasedto 0.3, 0.1, and 0.05% yeast extract, then all yeast extract was removed (0.4%ammonium sulfate medium) and finally all ammonium sulfate was removed (0 % Nmedium). The spent culture medium from each transfer was analyzed for change inabsorbance (620 nm), ethanol and glucose concentration. After the 7 transfers werecompleted for 0.4% ammonium sulfate medium, four discs were aseptically removedfrom each culture-tube for biofilm determination. The repeated batch fermentation
1019
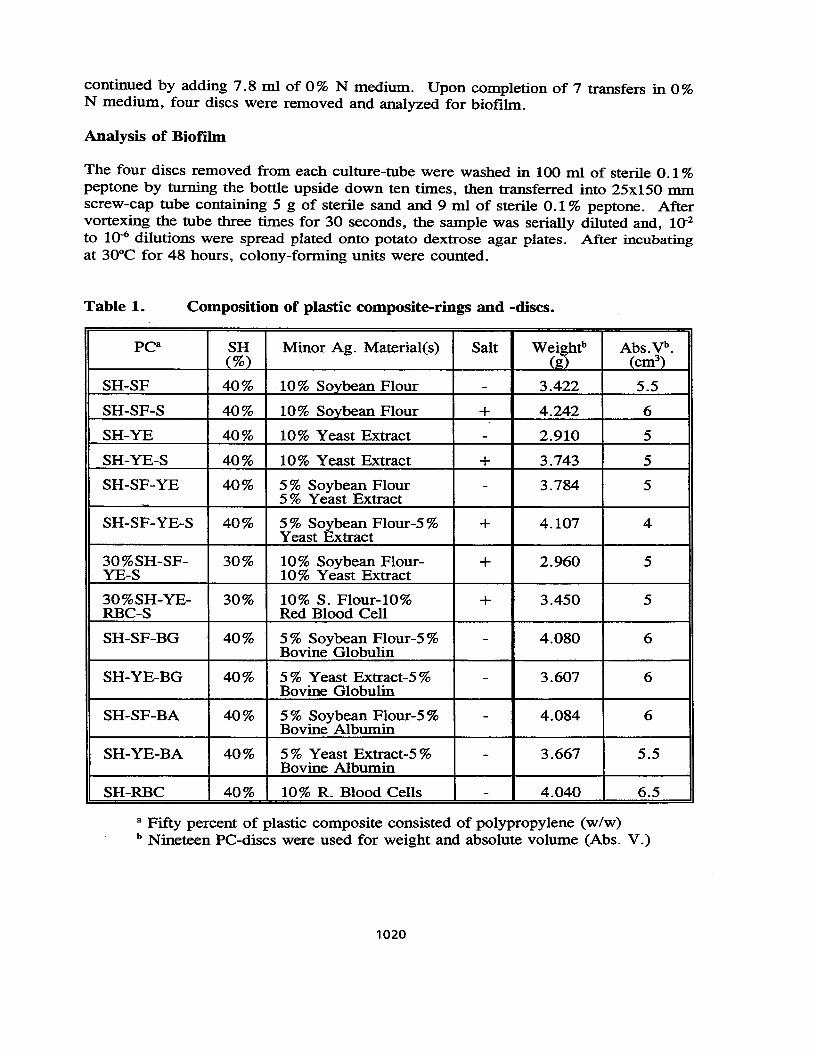
continued by adding 7.8 m1 of 0 % N medium. Upon completion of 7 transfers in 0 %N medium, four discs were removed and analyzed for biofilm.
Analysis of Biofilm
The four discs removed from each culture-tube were washed in 100 m1 of sterile 0.1 %peptone by turning the bottle upside down ten times, then transferred into 25x150 nunscrew-cap tube containing 5 g of sterile sand and 9 m1 of sterile 0.1 % peptone. Aftervortexing the tube three times for 30 seconds, the sample was serially diluted and, 10-2to 10-6 dilutions were spread plated onto potato dextrose agar plates. After incubatingat 30°C for 48 hours, colony-forming units were counted.
Table 1. Composition of plastic composite-rings and -discs.
r-c- SH Minor Ag. Material(s) Salt Weightb Abs.~b.(%) (li) (em"
SH-SF 40% 10% Sovbean Flour - 3.422 5.5
SH-SF-S 40% 10% Sovbean Flour + 4.242 6
SH-YE 40% 10 % Yeast Extract - 2.910 5
SH-YE-S 40% 10% Yeast Extract + 3.743 5
SH-SF-YE 40% 5 % Soybean Flour - 3.784 55 % Yeast Extract
SH-SF-YE-S 40% 5 % Soybean Flour-5 % + 4.107 4Yeast Extract
30%SH-SF- 30% 10% Soybean Flour- + 2.960 5YE-S 10% Yeast Extract
30%SH-YE- 30% 10% S. Flour-l0% + 3.450 5RBC-S Red Blood Cell
SH-SF-BG 40% 5 % Soybean Flour-5 % - 4.080 6Bovine Globulin
SH-YE-BG 40% 5 % Yeast Extract-S % - 3.607 6Bovine Globulin
SH-SF-BA 40% 5% Soybean Flour-5% - 4.084 6Bovine Albumin
SH-YE-BA 40% 5% Yeast Extract-5% - 3.667 5.5Bovine Albumin
SH-RBC 40% 10% R. Blood Cells - 4.040 6.5
a Fifty percent of plastic composite consisted of polypropylene (w/w)b Nineteen PC-discs were used for weight and absolute volume (Abs. V.)
1020
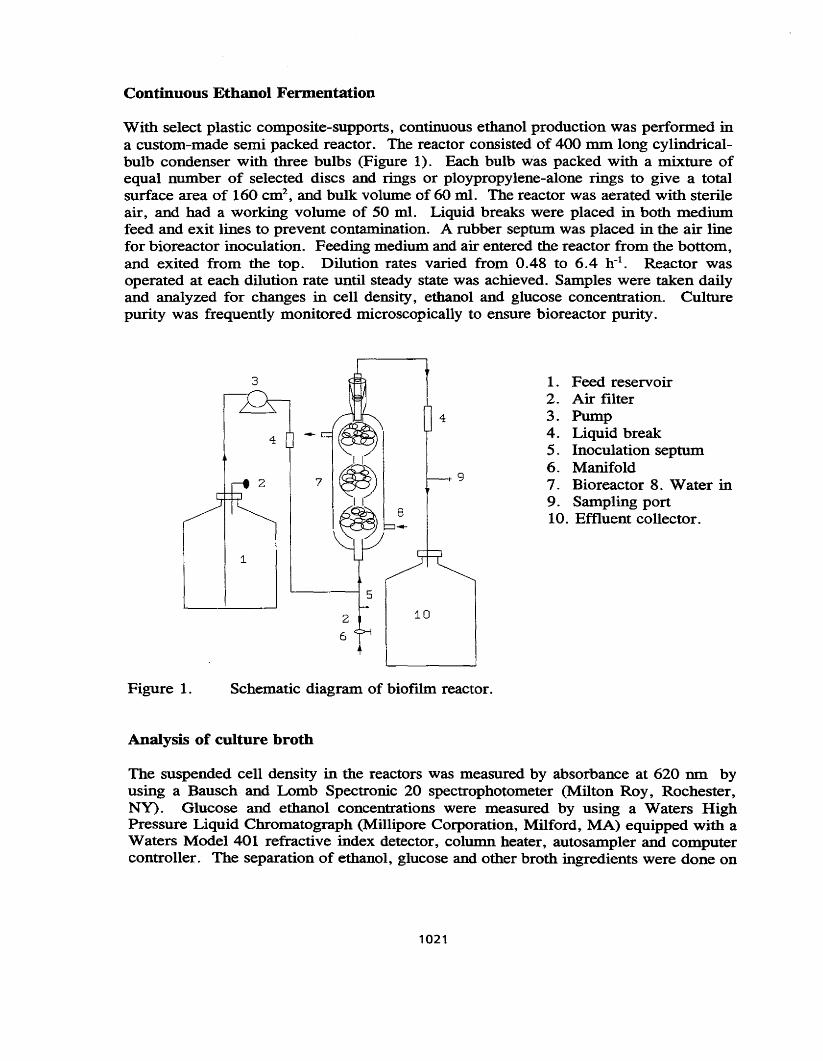
Continuous Ethanol Fermentation
With select plastic composite-supports, continuous ethanol production was performed ina custom-made semi packed reactor. The reactor consisted of 400 mm long cylindricalbulb condenser with three bulbs (Figure 1). Each bulb was packed with a mixture ofequal number of selected discs and rings or ploypropylene-alone rings to give a totalsurface area of 160 em", and bulk volume of 60 mI. The reactor was aerated with sterileair, and had a working volume of 50 mI. Liquid breaks were placed in both mediumfeed and exit lines to prevent contamination. A rubber septum was placed in the air linefor bioreactor inoculation. Feeding medium and air entered the reactor from the bottom,and exited from the top. Dilution rates varied from 0.48 to 6.4 tr'. Reactor wasoperated at each dilution rate until steady state was achieved. Samples were taken dailyand analyzed for changes in cell density, ethanol and glucose concentration. Culturepurity was frequently monitored microscopically to ensure bioreactor purity.
3
1
10
4
9
1. Feed reservoir2. Air filter3. Pump4. Liquid break5. Inoculation septum6. Manifold7. Bioreactor 8. Water in9. Sampling port10. Effluent collector.
Figure 1. Schematic diagram of biofilm reactor.
Analysis of culture broth
The suspended cell density in the reactors was measured by absorbance at 620 DID byusing a Bausch and Lomb Spectronic 20 spectrophotometer (Milton Roy, Rochester,NY). Glucose and ethanol concentrations were measured by using a Waters HighPressure Liquid Chromatograph (Millipore Corporation, Milford, MA) equipped with aWaters Model 401 refractive index detector, column heater, autosampler and computercontroller. The separation of ethanol, glucose and other broth ingredients were done on
1021
a Bio-Rad Aminex HPX-8711 column (300 x 7.8 nun) (Bio-Rad Chemical Division,Richmond, CA) using 0.012 N Sulfuric acid as a mobile phase at a flow rate of 0.8ml/min with a 20 1-'1 injection volume and a 65°C column temperature.
Results and Discussion
Continuous Ethanol Fermentation with Rich Medium
Plastic composite-supports (PC-supports) of soybean hull, and soybean flour (20%soybean hulls, 5% soybean flour, and 75% polypropylene) were used in continuousethanol fermentation as suggested by Kunduru, M.R. (1995). However, rings and discssupports were employed instead of chips, and higher total agricultural materialcomposition (40% soybean hulls, 10% soybean flour, and 50% polypropylene) was used.Increase in agricultural material could help biofilm formation on the PC-supports. InKunduru's initial study (1995) with chips, reactors slowly plugged with growing andflocculating S. cerevisiae cells. Therefore, to avoid reactor plugging the support shapewas changed to rings and discs, and dilution rates 0.48, 0.96, 1.92, 3.84, and 7.68 h-1
were employed. Reactors containing PC-supports of SH-SF constantly produced moreethanol especially at dilution rates of >0.96 h' than other PC-supports (Figure 2). Also,PC-supports of SH-SF reactors produced 26, 8.6, and 4.8 gil ethanol, whereas thepolypropylene-alone reactor produced no ethanol at dilution rates of > 1.92 h", with 3.2gil ethanol on day 26 at 3.84 h". This sudden spike in ethanol production in controlmight be the result of cell deposition in fermentor lines and junctions. Ethanol yields atthe dilution rates of 0.48, 0.96, and 1.92 h-1 were about 50%, with a decrease to about30% at higher dilution rates. The highest productivities for PC-supports of SH-SF andpolypropylene-alone were 50.2 and 20.8 gllih at the dilution rates 1.92 h', and 0.96 h",respectively. To reduce the level of S. cerevisiae flocculation each reactor started as abatch culture for 24 hr, than changed to continuous fermentation at a higher dilution rate(1.92 h-1) than previously used. The benefit of yeast extract addition to PC-supports SHYE, SH-YE-S, SH-SF-YE, and SH-SF-YE-S (Table 1) were evaluated. All four PCsupport bioreactors produced 4 to 6 gil ethanol at the dilution rate of 1.92 h' (Figure 3).At a slower dilution rate of 0.96 h-1 bioreactors with PC-supports of SH-SF-YE, SH-SFYE-S, and SH-YE-S produced 24 to 27 gil ethanol. At a dilution rate of 0.96 Ir",reactor with PC-supports of SH-YE-S, and SH-YE demonstrated a significant reductionin ethanol production to 12 to 22 gil, and 10 to 12 gil, respectively. These findingssuggested that PC-supports with both soybean flour, and yeast extract and mineral saltsaddition were beneficial to S. cerevisiae.
Repeated Batch Fermentation
In repeated batch fermentations, all the PC-supports, polypropylene-alone, andsuspension culture in 0.6, 0.3, 0.1, 0.05% yeast extract media demonstrated nodifferences, consuming all the glucose (50 gil), and producing 25 gil ethanol. However,in 0.4% (NH4)2S04 medium and in 0% N medium, ethanol production decreased to 5 too gil, respectively, in polypropylene-alone culture tubes. Whereas, all culture tubes
1022
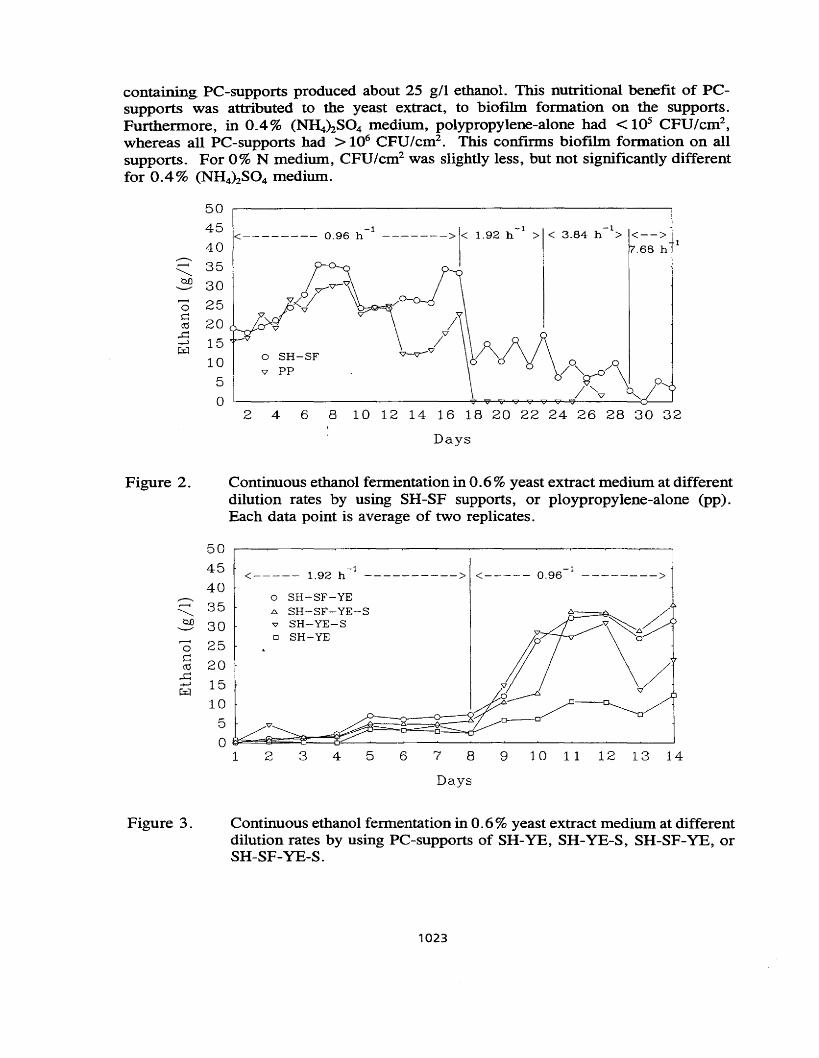
containing PC-supports produced about 25 gIl ethanol. This nutritional benefit of PCsupports was attributed to the yeast extract, to biofilm. formation on the supports.Furthermore, in 0.4% (NH4)2S04 medium, polypropylene-alone had < lOS CFU/cm2,
whereas all PC-supports had> 106 CFU/cm2. This confirms biofilm formation on allsupports. For 0% N medium, CFU/cm2 was slightly less, but not significantly differentfor 0.4% (NH4)2S04 medium.
o SH-SF'7 pp
2 4 6 8 10 12 14 16 18 20 22 24 26 28 30 32
1 I -1 -1<-------- 0.96 h - -------> < 1.92 h > < 3.84 h > <-->.68 h
5045
40---<, 35
~ 30
2520
1510
5
o
Days
Figure 2. Continuous ethanol fermentation in 0.6 % yeast extract medium at differentdilution rates by using SH-SF supports, or ploypropylene-alone (pp).Each data point is average of two replicates.
-1 -1<----- 1.92 h ----------> <----- 0.96 -------->
o SH-SF-YE~ SH-SF-YE~S
'<7 SH-YE-So SH-YE
2 3 4 5 6 7 8 9 10 11 12 13 14
Days
Figure 3. Continuous ethanol fermentation in 0.6 % yeast extract medium at differentdilution rates by using PC-supports of SH-YE, SH-YE-S, SH-SF-YE, orSH-SF-YE-S.
1023
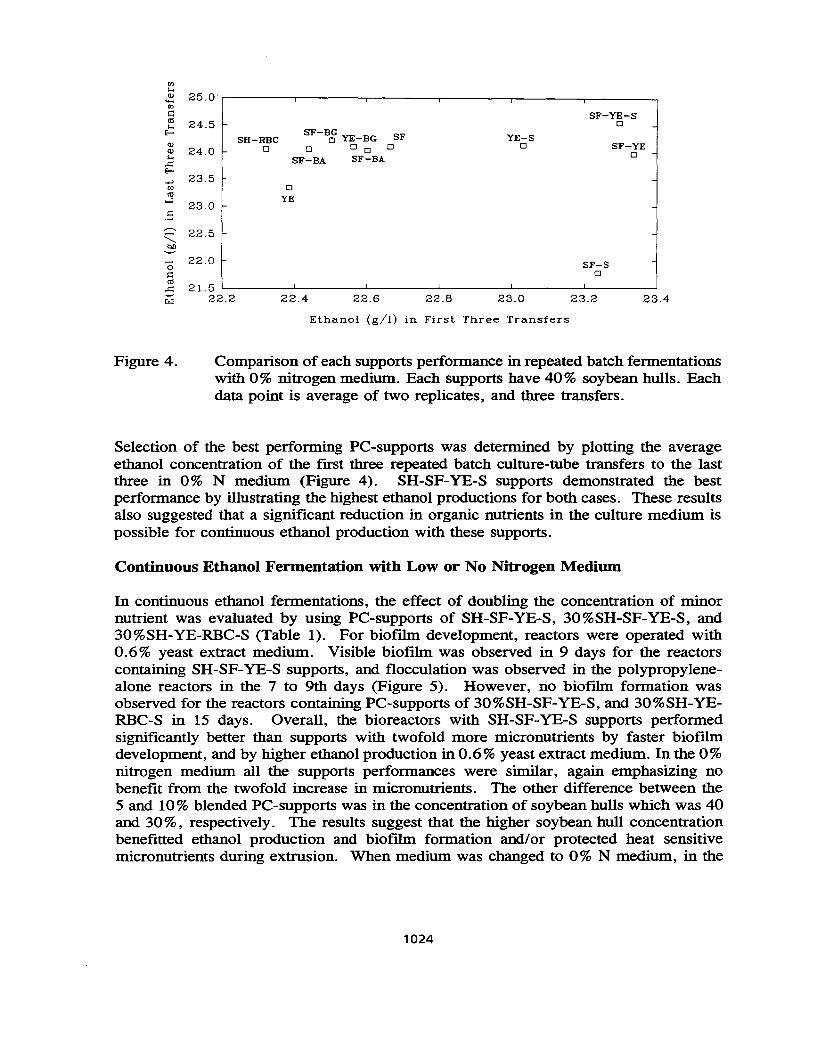
SF-YEo
lZl....~ 25.0lZllC:ttl 24.5....
Eo- SF-Bg YE-BG SFSH-RBC<l>
0 0 0 0<l> 24.0 0.... SF-BA SF-BA.c
Eo-
-' 23.5lZl 0ttl
YE'""" 23.0lC:
~
22.5.::::.QD-"0 22.0lC:ttl.c 21.5-' 22.2 22.4 22.6 22.8""
YE-So
23.0
SF-YE-So
SF-So
23.2 23.4
Figure 4.
Ethanol (gil) in First Three Transfers
Comparison of each supports performance in repeated batch fermentationswith 0% nitrogen medium. Each supports have 40% soybean hulls. Eachdata point is average of two replicates, and three transfers.
Selection of the best performing PC-supports was determined by plotting the averageethanol concentration of the first three repeated batch culture-tube transfers to the lastthree in 0% N medium (Figure 4). SH-SF-YE-S supports demonstrated the bestperformance by illustrating the highest ethanol productions for both cases. These resultsalso suggested that a significant reduction in organic nutrients in the culture medium ispossible for continuous ethanol production with these supports.
Continuous Ethanol Fermentation with Low or No Nitrogen Medium
In continuous ethanol fermentations, the effect of doubling the concentration of minornutrient was evaluated by using PC-supports of SH-SF-YE-S, 30%SH-SF-YE-S, and30%SH-YE-RBC-S (Table 1). For biofilm development, reactors were operated with0.6% yeast extract medium. Visible biofilm was observed in 9 days for the reactorscontaining SH-SF-YE-S supports, and flocculation was observed in the polypropylenealone reactors in the 7 to 9th days (Figure 5). However, no biofilm formation wasobserved for the reactors containing PC-supports of 30%SH-SF-YE-S, and 30%SH-YERBC-S in 15 days. Overall, the bioreactors with SH-SF-YE-S supports performedsignificantly better than supports with twofold more micronutrients by faster biofilmdevelopment, and by higher ethanol production in 0.6% yeast extract medium. In the 0%nitrogen medium all the supports performances were similar, again emphasizing nobenefit from the twofold increase in micronutrients. The other difference between the5 and 10% blended PC-supports was in the concentration of soybean hulls which was 40and 30%, respectively. The results suggest that the higher soybean hull concentrationbenefitted ethanol production and biofilm formation and/or protected heat sensitivemicronutrients during extrusion. When medium was changed to 0 % N medium, in the
1024
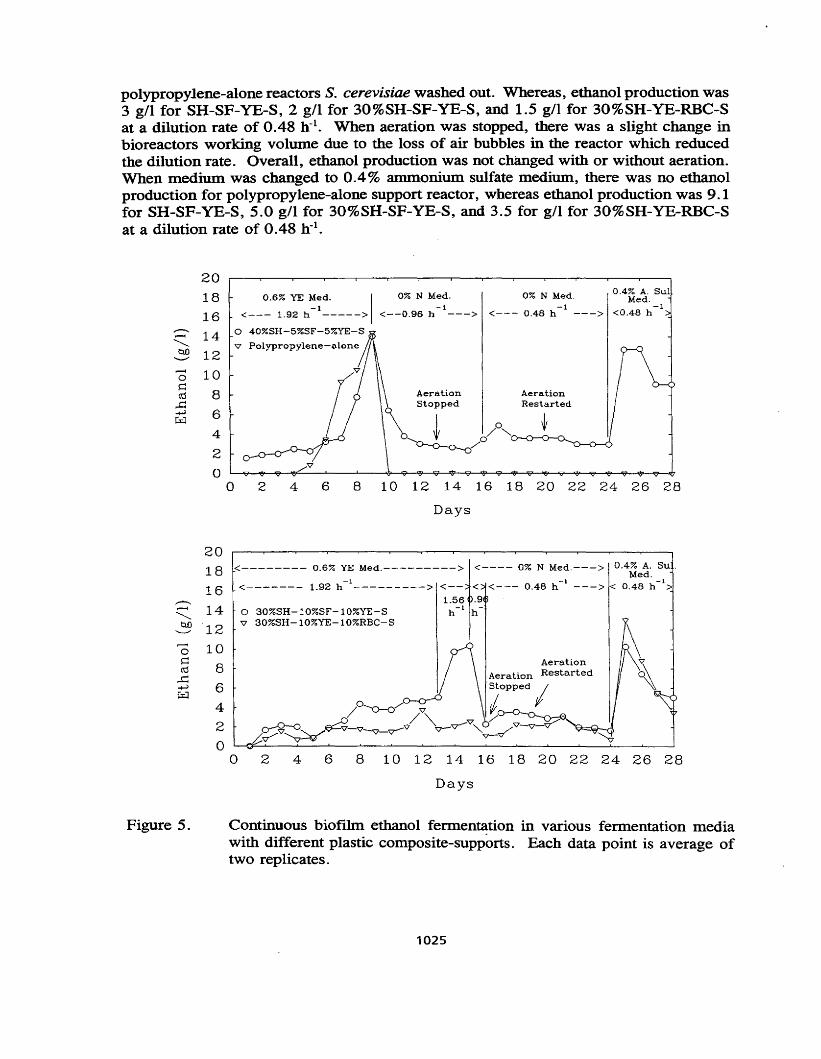
polypropylene-alone reactors S. cerevisiae washed out. Whereas, ethanol production was3 gIl for SH-SF-YE-S, 2 gil for 30%SH-SF-YE-S, and 1.5 gIl for 30%SH-YE-RBC-Sat a dilution rate of 0.48 h:'. When aeration was stopped, there was a slight change inbioreactors working volume due to the loss of air bubbles in the reactor which reducedthe dilution rate. Overall, ethanol production was not changed with or without aeration.When medium was changed to 0.4% ammonium sulfate medium, there was no ethanolproduction for polypropylene-alone support reactor, whereas ethanol production was 9.1for SH-SF-YE-S, 5.0 gIl for 30%SH-SF-YE-S, and 3.5 for gIl for 30%SH-YE-RBC-Sat a dilution rate of 0.48 tr'.
AerationRestarted
0% N Med. 0.4~ei. SuI-1 -1
<--- 0.48 h ---> <0.48 h
AerationStopped
8 10 12 14 16 18 20 22 24 26 28
Days
642
0.6% YE Med. I 0% N Med.-1 -1
<--- 1.92 h -----> <--0.96 h --->
o 40%SH-5%SF-5%YE-S
" Polypropylene-alone
20
18
16
14
12
10
8
6
4
2
oo
14 16 18 20 22 24 26 2810 128642
<-------- 0.6% YE Med.--------->j<---- 0% N Med.---> 0.4% A. Su .Med.
-1 -1-1<------- 1.92 h ---------> <-- < <--- 0.48 h ---> < 0.48 h >
1.56 .9o 3070SH-I0%SF-I0%YE-S h- 1 h-" 3070SH-IO%YE-IO%RBC-S
2018
16
14
12
10
8
64
2o
o
Days
Figure 5. Continuous biofilm ethanol fermentation in various fermentation mediawith different plastic composite-supports. Each data point is average oftwo replicates.
1025
Conclusion
Biofilm reactors containing plastic composite-rings and -discs potentially can benefitcontinuous ethanol production. Under conditions with limited organic nitrogen available,plastic composite-supports can act as a slow release material of an expensivemicronutrient like yeast extract. The result is high productivities, and decreasing themedium cost.
Acknowledgements
This research was supported by the Council of Great Lakes Governors, by the IllinoisCom Promotion Board, by the Iowa Com Promotion Board, and the ISU Center forCrops Utilization Research, and by the Iowa Agriculture and Home EconomicsExperiment Station. We also acknowledge Dr. John Strohl for technical assistance andthe use of the ISU Fermentation Facility.
References
Characklis, W.G., and K.C. Marshall. 1990. Biofilms. John Willey and Sons, Inc. NewYork, NY.
Christen, P., M. Minier, and H. Renon. 1990. Ethanol extraction by supported liquidmembrane fermentation. Biotech. Bioeng. 36: 116-123.
Crueger." W., and C. Crueger. 1989. A textbook of industrial microbiology. SinauerAssociates, Inc., Sunderland, Mass.
Cysewski, G.R., and C.R. Wilke. 1977. Rapid ethanol fermentation using vacuum andcell recycle. Biotech. Bioeng. 19: 1125-1143.
Demirci, A., A.L. Pometto III, K.E. Johnson. 1993. Lactic acid production in a mixedculture biofilm reactor. Appl. Environ. Microbiol. 59:203-207.
Hohmann, N., and C.M. Rendleman. 1993. Emerging technologies in ethanolproduction. Agric. Inform. Bull. 663.
Kunduru, M.R. 1995. Development of a biofilm bioreactor for enhanced ethanolproduction. Dissertation. Iowa State University. Ames, IA.
Kurt, M., I.J. Dunn, and J.R. Bourne. 1987. Biological denitrification of drinking waterusing autotrophic organisms weigh hydrogen in a fluidized bed biofilm reactor.Biotechnol. Bioeng. 26:493-501.
Maiorella, B.L., H.W. Blanch, C.R. Wilke. 1984. Feed compound inhibition inethanolic fermentation by Saccharomyces cerevisiae. Biotechnol. Bioeng.26: 1155-1166.
Nyguyen, V.T., and W.K. Shieh. 1992. Continuous ethanol fermentation usingimmobilized yeast in a fluidized bed reactor. Chern. Tech. Biotechnol. 55:339346.
Tin, C.S.F., and A.J. Mawson. 1993. Ethanol production from whey in a membranerecycle bioreactor. Process Biochem. 28:217-221.
1026
SUNSPUDSThi: A NEW SUGAR CROP FOR PRODUCING ETHANOL FUEL
Jose F. Barcia, CEO; and J. Murray McCombs, PresidentJMCA, Inc.,
8813 Woodland DriveSilver Spring, Maryland 20910
Abstract
A new proprietary sugar crop called Sunspuds't" has been developed by JMCA, Inc. and isbeing grown and tested to provide a new commercial energy crop for ethanol production.The question of potential crop superiority has never been answered. Previous technicalassessments have shown the crop is easy to grow using planting and harvesting practice withtypical potato machine farming. As an ethanol feedstock, the sugar tubers can be brokendown easily to solution for a value-added liquid product at the farm gate for export toexisting typical refineries. The crop has additional product potential markets for sugar andfood, and co-product as feed for cattle.
Sunspuds'" grow with little or no fertilization, irrigation, and pest damage. Study resultsindicate yields of ethanol twice that of corn at similar cost using simple preparation andfermentation processes adaptable to farm operations. Research continues on prototype scaleto expand seedstock and establish developing country markets. Objectives of the energy cropdevelopment include establishing costs involved in production of ethanol utilizing variousoptions of fermentation for expanded recovery.
JMCA, Inc. funding for the development research was provided through the SoutheasternRegional Biomass Energy Program (SERBEP) which is administered by the Tennessee ValleyAuthority (TVA) for the U.S. Department of Energy (DOE); and by the Western Area PowerAdministration (WAPA) which administers the Western Regional Biomass Energy Program(WRBEP) for U.S. DOE.
1027
Introduction
In recent years, efforts to produce ethanol from biomass have been initiated with scatteredeconomic success. There are many anticipated benefits for providing new resources to makeethanol. If a superior crop can be developed, and if the cost of energy supply required forpretreatment and conversion of wine into vehicle grade ethanol can be reduced to a nominalsum, then production economics will be radically improved.
JMCA, Inc. is involved in renewable energy, and especially in biomass research leading toalcohol fuel use for power, transport, heating, lighting and cooking. JMCA has developeda viable energy crop alternative to starch and cellulose that can result in the economicaloperation of the small farm units and the small refining and processing operations. This newcrop is a hybrid of the sunflower, researched and grown on a seed farm by JMCA, is calledSunspuds'": This sugar crop consists of tubers which are of a farinaceous nature, and canbe planted and harvested with standard potato machinery. The tubers can be grown andmarketed as ethanol feedstock with minor retrofit to farm and ethanol plant equipment. Asan ethanol feedstock, the sugar tubers easily reduce to solution for fermentation, thus creatinga potential value-added product at the farm gate for export to ethanol plants.The resulting new crop (Sunspuds™) and new products (i.e., fructose and ethanol) canprovide an adequate return on investment without subsidies or price supports.
The Sunspuds't" have characteristics more attractive for the production of ethanol.Agricultural planning/analysis and the planting and harvesting practices developed inColorado will be applied in other regions. Tuber growth, and sugar levels are currentlybeing monitored to determine maximum ethanol conversion potential.
The approach proposed by JMCA is a departure from cellulosic biomass projects whichrequire the development and construction of new processing facilities and the developmentof a new set of farming practices and farming equipment, all of these in a very large scale.The development of Sunspuds't" as a sugar energy crop can be achieved on a smaller scaleand provide economic ethanol fuel feedstock alternatives for standard farming and processingoperations. Activities required for achieving commercial business agreements are currentlybeing pursued. Licensing activities for contracting grower-farmers will focus on economicjustification for adopting the Sunspudsi" crop to produce ethanol. Minimum alteration ofagricultural potato practices and limited retrofit of existing ethanol plants will be emphasized.
The Sunspuds'" are being expanded to a scale required for pilot farms and commercial sales.JMCA plans for continuous availability of "seed" tubers beginning in the 1995-96 growingperiod. The objective is to continue propagation of the crop for supplying the potentialmarket. In Fall 1995, JMCA will begin a market program by developing SunspudsTM.licenseagreements for grower-farmers to start crops for harvest and sale in 1996 (see MarketApproach below). JMCA also plans to negotiate contract sales for sunspuds feedstock supplyto ethanol plants. Negotiations with investor groups for the construction of new ethanolplant facilities dedicated to Sunspuds'i" feedstock will be conducted.
Additional activities are focusing on the demonstration of optimum preparation andfermentation facilities to provide Sunspuds'" feedstock supply or fermented "broth" toethanol plants and coproducts for evaluation by industries and commercial users.Fermentation system design will be flexible and will allow for data to be obtained by ethanolrefiners so any alterations to existing product flow can be considered. Research has includedfarming practices which has lead to adaptation of the Sunspuds/" to typical planting,cultivating, and harvesting with conventional potato machinery. Replication plots wereestablished for testing cultivation, irrigation, soil conditioning (fertilizer), and possible stalkharvesting for animal silage.
1028
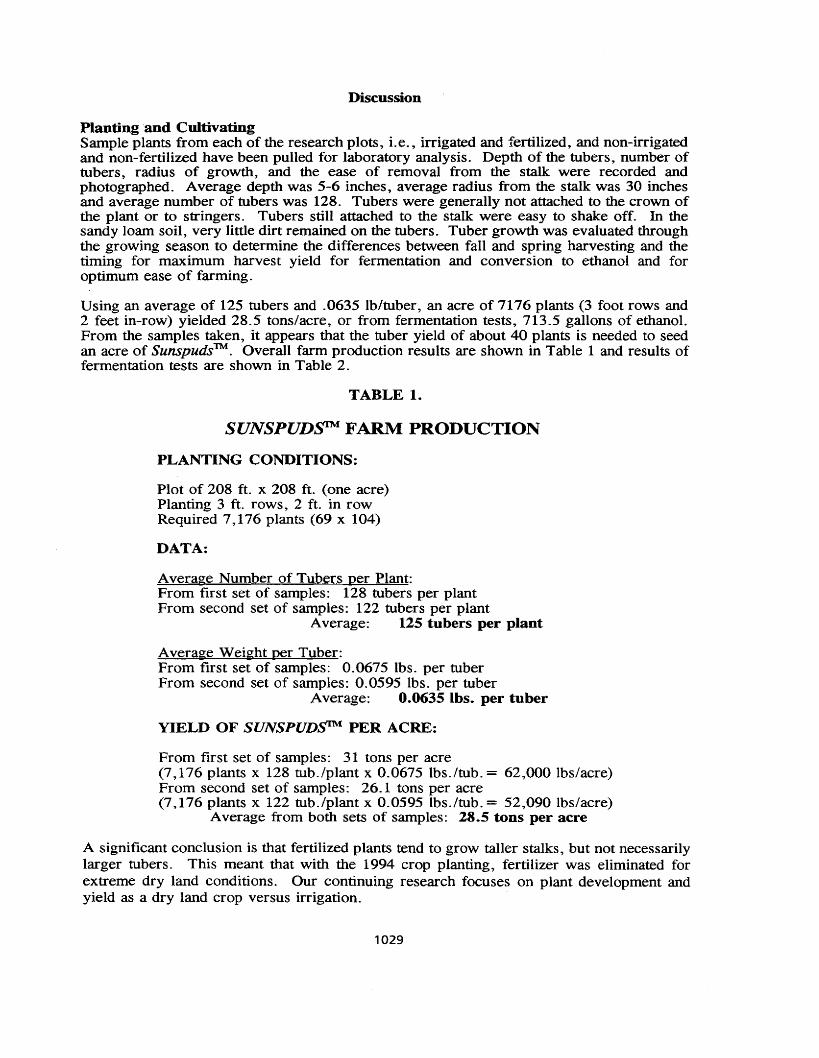
Discussion
Planting and CultivatingSample plants from each of the research plots, i.e., irrigated and fertilized, and non-irrigatedand non-fertilized have been pulled for laboratory analysis. Depth of the tubers, number oftubers, radius of growth, and the ease of removal from the stalk were recorded andphotographed . Average depth was 5-6 inches, average radius from the stalk was 30 inchesand average number of tubers was 128. Tubers were generally not attached to the crown ofthe plant or to stringers. Tubers still attached to the stalk were easy to shake off. In thesandy loam soil, very little dirt remained on the tubers. Tuber growth was evaluated throughthe growing season to determine the differences between fall and spring harvesting and thetiming for maximum harvest yield for fermentation and conversion to ethanol and foroptimum ease of farming.
Using an average of 125 tubers and .0635 lb/tuber, an acre of 7176 plants (3 foot rows and2 feet in-row) yielded 28.5 tons/acre, or from fermentation tests, 713.5 gallons of ethanol.From the samples taken, it appears that the tuber yield of about 40 plants is needed to seedan acre of Sunspuds't" . Overall farm production results are shown in Table 1 and results offermentation tests are shown in Table 2.
TABLE 1.
SUNSPUD~ FARM PRODUCTION
PLANTING CONDITIONS:
Plot of 208 ft. x 208 ft. (one acre)Planting 3 ft. rows, 2 ft. in rowRequired 7,176 plants (69 x 104)
DATA:
Average Number of Tubers per Plant:From first set of samples: 128 tubers per plantFrom second set of samples: 122 tubers per plant
Average: 125 tubers per plant
Average Weight per Tuber:From first set of samples: 0.0675 lbs. per tuberFrom second set of samples: 0.0595 lbs. per tuber
Average: 0.0635 Ibs. per tuber
YIELD OF SUNSPUDsmt PER ACRE:
From first set of samples: 31 tons per acre(7,176 plants x 128 tub.lplant x 0.0675 lbs.ltub. = 62,000 lbs/acre)From second set of samples: 26.1 tons per acre(7,176 plants x 122 tub.lplant x 0.0595 lbs.ltub. = 52,090 lbs/acre)
Average from both sets of samples: 28.5 tons per acre
A significant conclusion is that fertilized plants tend to grow taller stalks, but not necessarilylarger tubers. This meant that with the 1994 crop planting, fertilizer was eliminated forextreme dry land conditions. Our continuing research focuses on plant development andyield as a dry land crop versus irrigation. .
1029
Converting the Sunspuds't" to Ethanol
PreparationFor fuel alcohol production, direct fermentation is required. Sunspuds't" sugar is inulin, withabout 75 % water content. Testing of the fall sample Sunspuds'i" yielded a sugar content ofabout 21 %. (Future testing of Spring samples, after storage over winter, may yield highersugar concentrations.) The sugar concentration was measured as 21.0oB. The °B are Baumedegrees. This unit is used in the sugar industry to measure the concentration of sugarsolutions. This technique measures density of a solution as the equivalent density of asucrose solution and reports the concentration of the equivalent sucrose solution.
The tubers are approximately 21 % sugar and the solution was about 7% sugar. Fat, proteinand ash were not measured. It is assumed that only carbohydrates and water are present.Sunspuds'i" are a source of levulose for use in natural sweetening used by diabetics. Thecarbohydrates are mostly several polysaccharides, chiefly synanthrine, which whenhydrolyzed by acids or enzymes produce the very sweet sugar of levulose, fructose or fruitsugar.
Thus, Sunspuds't" will not require starch or cellulosic pretreatment, such as prehydrolysis,acid or enzymatic hydrolysis, xylose fermentation or lignin processing. Typically, the costof feedstock pretreatment is a factor which increases the overall production cost of ethanol.For example, most ethanol plants are designed to receive grain and especially corn with wetor dry milling plant equipment needed prior to fermentation.
Simplicity of preparation allows the Sunspud to be considered for on-farm processing to abeer, thus also reducing the cost of bulk transport and creating a general value-added productacceptable to most ethanol plants. As an alternative approach, a grower cooperative couldbe created for the preparation and fermentation stages of ethanol production. Such anapproach recognizes the need for reducing individual farm capital investment for equipmentand may optimize the scale of operations while controlling the quality and source of feedstockfor sales to ethanol plants. Ethanol plants would more likely accept purchase of prepared"broth" for distillation, reducing the cost of pretreatment.
FermentationFermentation of Sunspuds'" was conducted in several stages from November 1993 toFebruary 1994. The first fermentations were performed by chopping the samples in ablender with some water and adding the simplest "bakers" yeast to the slurry and fermentingin flasks with air-locks at room temperature as a baseline approach. The alcohol content wasdetermined by gas chromatography by comparison to known alcohol-water mixtures. Theyields varied from 8.2-18.8 gal/ton. Hence, the initial data showed an average yield of 13.5gal/ton with a standard deviation of 3.5 gal/ton.
A second set of fermentations was started. These samples were obtained by grating thetubers with Mouli, squeezing out the juice by twisting the gratings in a square of cloth,collecting the juice, using Saccharomyces cerevisiae, Red Star Distillers active dry yeast,rather than bakers yeast and fermenting at 90°F for five days. The results of the second setof fermentation were variable, indicating that not enough time might have been allowed forthe fermentation to finish or a problem with competing organisms. The highest percentagealcohol obtained from juices was 11.97%. This corresponds to about 21 gal/ton.
1030
For one sample, the pressed pulp was mixed with water and then re-pressed and this rinsewas then fermented. This rinsing process produces a lower alcohol content fermentate butthis process would increase the yield to about 25.2 gal/ton (25 gallons per ton will be usedfor yield calculation purposes--see Table 2).
A third set of fermentations was done to determine if the Distillers yeast could be used atroom temperature. These samples were fermented at 90 and 70°F from ten days. The 70°Fsamples gave slightly higher values. It is possible that some alcohol was lost by evaporationand this loss would be more for the hotter samples. At any rate, there does not seem to bea problem in doing the fermentation at a lower than optimum temperature, although it willtake longer. In production, it might be possible to heat the juice to close to 90°F and thendump it into underground tanks and add the yeast. In this manner fermentation would startfast, which would be an advantage if there are competing organisms (a quick increase inalcohol would discourage other organisms).
Fermentations were performed at both 70° to 90°F. The temperature difference does notseem to affect yield with the current yeast, but does affect the time for fermentation. With70% juice, 12 % alcohol fermentation yields 21.0 gallons per ton. A 20% boost is achievedby rinsing the pulp, yielding 25.2 gallons per ton. These numbers appear to be at leastconservative, since the yield per acre and the yield for fermentation can be improved withgreater sophistication of harvesting and preparation.
The best procedure seems to be to ferment the neat juice since this will give the highestalcohol concentration. The pulp can be rinsed and fermented to give a lower alcoholfermentate to increase the overall yield. JMCA is continuing research on optimum yeast orbacteria .strains to reduce fermentation time and reduce contamination risk. From thefermentation experiments, it was determined that the yield can be increased by at least 25 %if the pulp is rinsed and the rinse fermented. However, this rinse will produce a loweralcohol content fermentate so it will be somewhat more "expensive" to recover the alcohol.Also, alcohol can be obtained from the residue by acid or enzymatic hydrolysis or heatingbut this would be more energy expensive. The residue instead has value as a co-product forfeed or soil conditioner. The following are the estimates of ethanol per acre based onprevious fermentation tests performed under the JMCA/SERBEP contract:
TABLE 2.
SUNSPUDS£M ETHANOL PRODUCTION
Calculated average gallons of ethanol per ton yield: 25 gallton
YIELD OF ETHANOL PER ACRE:From first set of samples: 31 tons/acre x 25 gal/ton = 775 gal/ac.From second set of samples: 26.1 tonlac x 25 gal/ton = 652 gal/ac.
Average from both sets of samples: 713.5 gallons per acre
Based on the samples collected and the fermentation data produced under the JMCA/SERBEPwork, our estimates are that the yield of ethanol per acre of Sunspuds'" is about twice theaverage yield obtained from corn. It appears that with additional primary data from the1994-1995 season on the production cost of SunspudsTM, cost per gallon of ethanol will beequal or better than the cost of com. Also, since Sunspuds't" are a sugar crop, pretreatmentand distillation costs will be lower, with an overall reduction in ethanol price.
1031
Crop Yield- ComparisonsSunspuds't", which have a high content of easily fermented inulin sugar, may have a technicaland yield advantage over other sugar and starch feedstocks. For example, sugar cane offersan average production of 470 gal/acre of ethanol; sweet sorghum produces 280 gal/acre ofethanol; manioc has an output of 510 to 560 gal/acre of pure ethanol.
Using average data about corn from the USDA/CSRS "New Industrial Uses, New Marketfor US Crops", August, 1993, the yield of corn is estimated at 119 bushels/acre which canbe converted to 2.5 to 2.65 gal of ethanol/bushel, for a total of 315.35 gal/acre.
In comparison, from the analysis done in prior months on the fermentation and the cropyields per acre using typical potato farming practice, the Sunspuds'i" can yield an averageof 713 gal/acre, based on samples of 775 gal and 652 gal (see table 2). For cellulosefeedstocks, similar to the perennial switehgrass crop now being developed, -the Sunspudadvantage of reduced pretreatment processing is obvious.
Competing Technology
Sugar cane is the conventional sugar crop for fuel production purposes, but it is grown onlyin a few states in the U.S., whereas the Sunspuds's'ces: be grown in every state. Similarly,the sugar beet is grown only in the western and northern midwest U.S. and has little farmbase east of the Mississippi. A DOE report has stated that, for example, the primary reasonto reject the sugar beet from further consideration as an energy crop was the "necessity topractice crop rotation with sugar beets to control hematodes and other organisms, usually ona four-year cycle... ". No such restriction applies to the Sunspuds'":
Corn is currently a major starch crop used for conversion to ethanol. The National CornGrowers Association and the Governor's Ethanol Coalition have joined to promote andexpand the use of corn as a feedstock for ethanol. This is a logical rationale since corn iswidely grown and is used for production of high fructose sweetener. The refining processis well developed. However, corn, as a starch crop needs extensive pretreatment in orderto prepare and ferment sugars prior to distillation. Sunspuds'i" are already a sugar crop andtherefore the additional steps required for corn are not necessary with the Sunspudsi":
Many other feedstocks have been proposed for ethanol production, especially cellulosic types.However, the various pyrolytic conversion methods for cellulosic feedstock have highprocessing cost, and the ethanol output for per acre for cellulosic crops is generally less thanthe ethanol output obtained with the Sunspudsi":
Co-product UsesStillage from sugar fermentation and separation is the main co-product. Research on theprocessing of Sunspud stillage is beginning in the coming season with plans for installationand testing of a pilot fermentation plant. This stillage is both a problem and opportunity,depending on how it is managed and utilized. Use of stillage as high protein feed isconsidered as a co-product credit in most analyses of large industrial conversion plants.
By comparison, however, the small farm is penalized, since the required drying andprocessing equipment is costly, or animals to feed wet stillage may not be available.Therefore, stillage as fertilizer will be considered and evaluated as an alternate co-productuse, since both large and small farms may claim a valuable credit.
1032
The Sunspuds™ Ethanol Market Potential
Potential Domestic MarketTotal annual demand in 1995 (reported by the Renewable Fuels Association) could be asmuch as 430 million gallons. By 1996, the industry expansion is expected to reach a totalof over a billion gallons production annually.
Many ethanol plants are organized to receive feedstock and process grains throughpretreatment stages which preclude the use of alternative inputs. JMCA intends to pursuethe development of Sunspud preparation so that fermented beer can be delivered to ethanolplants for distillation. This procedure will reduce the volume of feedstock to be deliveredand therefore reduce transportation costs. This would enable farmers or farmer cooperativesthe option of delivering a value-added product for ethanol production.
SunspudsThf. and the International MarketJMCA is beginning seed farms for Sunspud development and ethanol production in PuertoRico, France, Ethiopia, India and Peru. It has been recognized that developing nations mustconsider and develop a wide variety of alternative fuel sources.
At the present state-of-the-art, ethanol burned straight(not as an additive) seems the mostsuitable choice for general uses. Ethanol is widely accepted as a logical substitute for oil andgas and has environmental benefits in addition to the potential for fuel supply differinggreatly from current availability and distribution of oil. Ethanol can be marketed as asubstitute for use in cooking, lighting and heating (kerosene), stationary power (diesel) orvehicles (gasoline). High protein feed is a co-product credit of the conversion process anda highly valued product. Because of high nitrogen and protein content, it is favored for soilconditioning or for animal feed.
While most production technologies envision the main end use for fuel ethanol in itsanhydrous state, there are fuel applications which do not require anhydrous (100%) ethanol.Using ethanol in the 150-190 proof range is well suited for many rural and urban usescurrently being supplied by wood or wood products. Ethanol is a potential substitute forcooking with kerosene, which is a preferred fuel. Therefore, ethanol acts as a "demandmanagement" tool to relieve pressure on fuelwood use, allowing long-term tree plantinggreater possibility for success.
Because of its flexibility and efficiency, kerosene is a highly desirable cooking and heatingfuel, but in many countries kerosene is also an oil-based import and very expensive. Ifethanol, processed to over 50% ethanol/water ratio (over 100 proof) can be produced on-farmat the lower-end equivalent cost for kerosene or coal used in a traditional stove, then ethanolbecomes a possible direct substitute for coal and kerosene. Where fuelwood is scarce andhigh labor or cash cost is incurred, locally produced ethanol may be price competitive ascooking fuel .. given at least farmer-contributed labor and self-produced ethanol fuel for plantoperations.
Ethanol can be utilized in a kerosene cooker with minor modification. The air-to-fuelmixture is different than kerosene, which is 18: 1. Ethanol (100 proof) has an air-to-fuel ratioof 5: 1. This means that for the same heat value, the rate of flow would be faster for ethanoland requires more fuel to combust. Therefore, the fuelport of a kerosene-cooker would needto be enlarged.
1033
The purchase cost of durable mass-produced, light weight and portable liquid fuel cookersand lighting lanterns, suitable for kerosene or ethanol, is affordable to many subsistence levelrural or urban people--if local ethanol fuel supply was being produced. Clearly, the optionof supplying a liquid biofuel must assume simultaneous capacity to produce the ethanol at lowcost locally. Such cookers and lanterns are already market available--designed, engineered,and fabricated for consumer sales at the equivalent cost of similar kerosene equipment.
For ethanol production, output of fuel at 150-190 proof would appear to broaden the potentialmarket opportunities and range of applications for rural use. A gross breakdown of variousquality outputs from ethanol conversion plants, shows the overall potential use for liquidbiofuels:
• 200-proof ethanol --substitute for gasoline (anhydrous) fueled vehicles.
• 190-proof ethanol --direct use in gas (hydrous) modified spark engine, or in ethanoldesigned engines.
• 150-190-proof ethanol --direct use for kerosene-modified cook-stoves, lighting andheating, or in similar ethanol designed products, such as fuel cells for electricity.
Potential to Economically Produce Energy from BiomassThe Sunspuds't" can be an effective new energy crop based on these market advantages:
1. The anticipated average yield of ethanol obtained from Sunspuds/" is about double theaverage yield of ethanol obtained with corn.
2. The yield of fodder may be as much as 3 to 4 tons an acre and the yield of tubers rangesfrom 20 to 35 tons.
3. The stems and leaves are very palatable, digestible and nourishing to cattle and horses,increase the yield of cow milk, and are equal to or better than sunflower for ensilage, andis preferred by animals.
4. The co-product residue is specially useful for fattening cattle, sheep and hogs and is aserviceable poultry feed.
For ethanol production that can be derived from perennial dedicated feedstock supplysystems, the Sunspuds't", have an advantage in terms of conversion economics and higherethanol yield over other feedstocks. In terms of conversion, the Sunspuds't", which havehigh content of easily hydrolyzed inulin, require lower energy input and simpler pretreatmentprocess as a sugar crop, as compared to cellulose or starch type of crops. This factor,combined with the high ethanol yield per acre obtained from the Sunspuds't" will improveconversion system production economics as compared to existing ethanol crops. Hence, itis our expectation that the Sunspudsi'" can be a competitive crop in the ethanol market.
Many ethanol plants are organized to receive feedstock and process grains throughpretreatment stages which preclude the use of alternative inputs. JMCA intends to pursuethe development of Sunspudsi" preparation so that fermented "broth" can be delivered toethanol plants for distillation. This procedure, demonstrated in this project at the Universityof Idaho, will reduce the volume of feedstock to be delivered and therefore reducetransportation costs. In commercial practice, this procedure would enable farmers or farmercooperatives the option of delivering a value-added product for ethanol production.
1034
Advantages Over Competing Technologies in the MarketThese growing characteristics of the Sunspuds'" also have advantages over other crops:
1. They will grow on most soils, poor as well as rich, if not too wet. It responds tomoderate amounts of irrigation. Hence, reclamation land can be used.
2. The growing season extends further into the winter than other root crops.3. They will grow in any climate where staple crops are grown, and will withstand frosts
that are ruinous to corn, beets, and potatoes.4. Periods of drought may lessen the yield of forage or tubers but do not injure the plant.5. The plant and tubers are impervious to injury by insects, except perhaps the grasshopper.
Herbicides and pesticides are not needed.6. Storage and keeping present little difficulty if the tubers are left in the ground or covered '
with a layer of earth immediately after being dug.7. The period of cultivation is shortened because abundant growth kills the weeds and
prevents the soil from baking.
In addition to the advantageous growing characteristics listed, the Sunspuds'i" can be acompetitive crop for ethanol because of the combination of these two previously mentionedfactors: the Sunspudsi'" are a high yield crop for ethanol feedstock, and the Sunspuds/"sugar tubers have the capability to be broken down easily to solution for fermentation,thereby reducing preparation costs creating a potential value-added product at the farm.
Conclusions
Based on information and data obtained, the following conclusions can be established:
From the Planting and Harvesting:Sunspudsi'" grow rapidly and can get between six and ten feet tall. They store well in theground during the winter months. However, the sugar content also changes during storage.Future analysis of spring harvest is required.
Periods of drought may lessen the yield of forage or tubers but do not appear to injure theplant. Hardiness of the plant is important for future growing seasons as a dryland crop, sinceirrigation and water consumption is a major issue. Next years crop will fully test the abilityof the plant to survive. Yield under these conditions will be monitored in detail.
Herbicides and pesticides were not used. It appears that such precautions are not needed,since there was no infestation. However, weed control is still an issue, requiring eithercarefully scheduled cultivation until the plants can gain control, or using weed preventiontechniques. Future seasons will test both approaches from cost, time and pollutionperspectives.
Typical potato farming machinery can be used for planting and harvesting. For futureharvesting, multi-row harvesters will be modified to use smaller gap chains to capture thesmaller tubers.
Fertilized and irrigated plants tended to grow taller stalks, but not necessarily greater volumeor larger tubers. With the 1994 crop planting, fertilizer was deleted to further test thispreliminary result. JMCA continuing research also focuses on plant development and yieldas a dryland crop versus irrigation.
1035
From the Fermentation Experiments:As a result of fermentation experiments, we were able to obtain an ethanol yield ofapproximately 25 gal/ton.
Temperature does not seem to affect alcohol yield, although the time of fermentation isprobably increased with lower temperatures.
The alcohol yield can be increased by at least 25 % if the pulp is rinsed and the rinsefermented. This rinse will produce a lower alcohol content fermentate so it will be somewhatmore "expensive" to recover the fuel alcohol.
Alcohol can be obtained from the residue by acid or enzymatic hydrolysis or heating but thiswould be more energy expensive. Instead, the residue may be used as a co-product for feedor as a substitute for chemical fertilizer.
General Conclusion:The Sunspuds't" produced between 26.1 to 31 tons per acre which, based on our fermentationtests (See Table 1 and Table 2), provide an equivalent estimated yield of between 652 to 775gallons of ethanol per acre. Therefore, the yield of ethanol obtained with Sunspuds™ isabout twice the average yield per acre obtained from com.
Selected References
The following is a selected list of references related to the research work:
The Clean Fuels Report. J. E. Sinor Consultants Inc., Vol. 5, No.4, September, 1993,pages 126-136.
New Industrial Uses. New Markets for U.S. Crops: Status of Technology andCommercial Adoption, USDA Cooperative Research Service, August, 1993.
Gerald J. Seiler, "Forage and Tuber Yields and Digestibility of Selected Wild andCultivated Genotypes of Jerusalem Artichoke", Agron. J., 85:29-33 (1993).
General Report: Biomass for Energy (Economic and Policy Issues), Working Party No.1of the Committee for Agriculture, Organization for Economic Operation and Development(OECD), A9RIWP1(83)5, June, 1983.
Vukov, K.; Erdelyi, M.; Pichler-Magyar, E. Preparation of pure inulin and variousinulin-containing products from Jerusalem Artichoke for human consumption and fordiagnostic use. Studies in Plant Science, 1993. (3) p. 341-345.
Barta, J. Jerusalem artichoke as a multipurpose raw material for food products of highfructose or inulin content. Studies in Plant Science, 1993. (3) p. 323-339.
Meijer, W.J.M.; Mathijssen, E.W.J.M.; Borm, G.E.L. Crop characteristics and inulinproduction of Jerusalem Artichoke and chicory. Studies in Plant Science. 1993. (3) p. 29-38.
Hans E. Grethlein and Thomas B. Nelson, "Projected Process Economics for EthanolProduction from Com" , Michigan Biotechnology Institute, Final Report toUSDA/Agricultural Research Service, July 12, 1992.
Inulin and inulin-containing crops. A. Fuchs. International Congress on Food and NonFood Applications of Inulin and Inulin Containing Crops. (1991: Wageningen, Netherlands).
Yokota, A. (Hokkaido Univ. Sapporo (Japan). Faculty of Agriculture); Enomoto, K.Tomita, F. Purification and properties of an inulin fructotransferase. Journal ofFermentation and Bioengineering, Oct. 1991, v. 72(4) p. 262-265.
1036
BIOMASS FAST PYROLYSIS
Tony Bridgwater, BSc (Tech), PhD., DSc. and Cordner Peacocke, BEng., PhD.Energy Research Group
Chemical Engineering and Applied Chemistry DepartmentAston University
Birmingham B4 7ETUK
Abstract
Fast pyrolysis of biomass for liquid fuels is of rapidly growing interest in Europe while inNorth America, interest seems to have peaked a few years ago. This paper summarises thecurrent status of fast pyrolysis activities in both regions and reviews the problems faced bythe developers of fast pyrolysis, upgrading and utilisation processes which requireresolution if the technologies are to be implemented. Aspects of design of a fast pyrolysissystem include feed drying; particle size; pretreatment; reactor configuration; heat supplyand transfer; heating rates; reaction temperature; vapour residence time; secondary cracking;char separation; ash separation; liquids collection. Each of these aspects is reviewed anddiscussed.
1037
Introduction
Interest. in fast pyrolysis of biomass is currently growing rapidly in Europe.Approximately US$ 12 million per year are being spent by the European Commission (EC)on .thermal biomass conversion research, development and demonstration which has beenestimated to increase to around US$ 25 million/y in the next few years. Most installationsthere are small laboratory units where number of units is the dominant effect rather thansc~e. ~ N<?rth America a number of units are operating commercially and RD&D is beingmaintained m a number of organisations but with few new activities.
Pyrolysis concepts
Biomass is a mixture of hemicellulose, cellulose, lignin and minor amounts of otherorganics which each pyrolyse or degrade at different rates and by different mechanisms andpathways depending on the process parameters such as reactor temperature, heating rateand pressure. The degree of secondary reaction (and hence the product yields) of thegas/vapour products depends on the time-temperature history to which they are subjectedbefore collection. Although some research has been carried out on the individualcomponents of biomass, most applied and larger scale work has focused on whole biomassas the cost of pre-separation is generally considered too high.
Research has shown that maximum liquid yields are obtained with high heating rates, atreaction temperatures around 500°C and with short vapour residence times to minimisesecondary reactions. Fast pyrolysis processes have been developed commercially forproduction of food flavours (to replace traditional slow pyrolysis processes) which utilisevery short vapour residence times of typically 100-500 ms. Speciality chemicals may bederived from pyrolysis liquids under carefully controlled and well specified conditions (1 ) .
Liquids for use as fuels can be produced from dry wood which gives maximum liquidyields of around 80 wt% dry feed basis (typically 64 wt% organics and 13 wt% water) attypically 500-520°C with vapour residence times not more than 1 second. Very shortresidence times result in incomplete depolymerisation of the lignin due to random bondcleavage and inter-reaction of the lignin macromolecule resulting in a less homogenousliquid product, while longer residence times cause secondary cracking of the primaryproducts, reducing yield and adversely affecting bio-oil properties.
Process characteristics and technology requirements
Although fast pyrolysis of biomass has achieved commercial status, there are still manyaspects of the process which are largely empirical and require further study to improvereliability, performance, product consistency, product characteristics and scale-up.
Reactor configuration
A variety of reactor configurations have been investigated as listed in Table 1. Pyrolysis,perhaps more than any other conversion technology, has received considerable creativityand innovation in devising reactor systems that provide the essential ingredients of highheating rates, moderate temperatures and short vapour product residence times for liquids.
1038
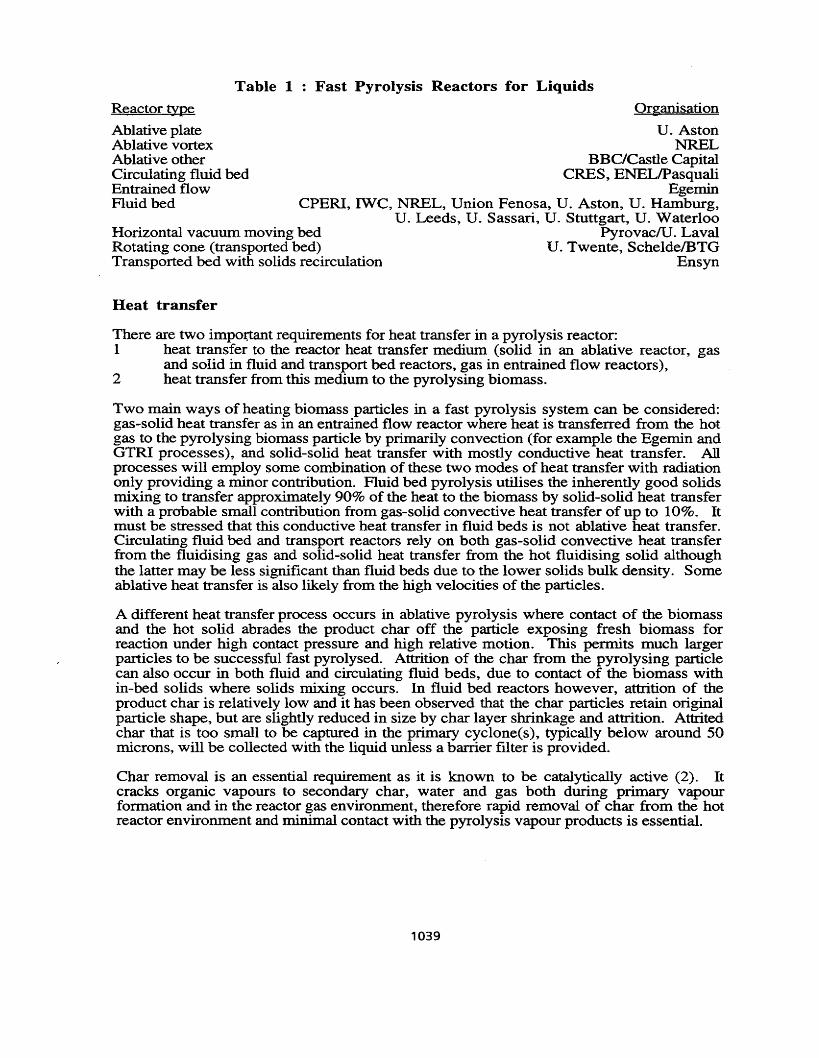
Table 1 Fast Pyrolysis Reactors for Liquids
Horizontal vacuum moving bedRotating cone (transported bed)Transported bed with solids recirculation
Reactor type
Ablative plateAblative vortexAblative otherCirculating fluid bedEntrained flowFluid bed
Organisation
U. AstonNREL
BBC/Castle CapitalCFUES,E~LlPasquali
EgeminCPERI, IWe, NREL, Union Fenosa, U. Aston, U. Hamburg,
u. Leeds, U. Sassari, U. Stuttgart, U. WaterlooPyrovaclU. Laval
U. Twente, ScheldelBTGEnsyn
Heat transfer
There are two important requirements for heat transfer in a pyrolysis reactor:1 heat transfer to the reactor heat transfer medium (solid in an ablative reactor, gas
and solid in fluid and transport bed reactors, gas in entrained flow reactors),2 heat transfer from this medium to the pyrolysing biomass.
Two main ways of heating biomass particles in a fast pyrolysis system can be considered:gas-solid heat transfer as in an entrained flow reactor where heat is transferred from the hotgas to the pyrolysing biomass particle by primarily convection (for example the Egemin andGTRI processes), and solid-solid heat transfer with mostly conductive heat transfer. Allprocesses will employ some combination of these two modes of heat transfer with radiationonly providing a minor contribution. Fluid bed pyrolysis utilises the inherently good solidsmixing to transfer approximately 900/0 of the heat to the biomass by solid-solid heat transferwith a probable small contribution from gas-solid convective heat transfer of up to 10%. Itmust be stressed that this conductive heat transfer in fluid beds is not ablative heat transfer.Circulating fluid bed and transport reactors rely on both gas-solid convective heat transferfrom the fluidising gas and solid-solid heat transfer from the hot fluidising solid althoughthe latter may be less significant than fluid beds due to the lower solids bulk density. Someablative heat transfer is also likely from the high velocities of the particles.
A different heat transfer process occurs in ablative pyrolysis where contact of the biomassand the hot solid abrades the product char off the particle exposing fresh biomass forreaction under high contact pressure and high relative motion. This permits much largerparticles to be successful fast pyrolysed. Attrition of the char from the pyrolysing particlecan also occur in both fluid and circulating fluid beds, due to contact of the biomass within-bed solids where solids mixing occurs. In fluid bed reactors however, attrition of theproduct char is relatively low and it has been observed that the char particles retain originalparticle shape, but are slightly reduced in size by char layer shrinkage and attrition. Attritedchar that is too small to be captured in the primary cyclonets), typically below around 50microns, will be collected with the liquid unless a barrier filter is provided.
Char removal is an essential requirement as it is known to be catalytically active (2). Itcracks organic vapours to secondary char, water and gas both during primary vapourformation and in the reactor gas environment, therefore rapid removal of char from the hotreactor environment and minimal contact with the pyrolysis vapour products is essential.
1039
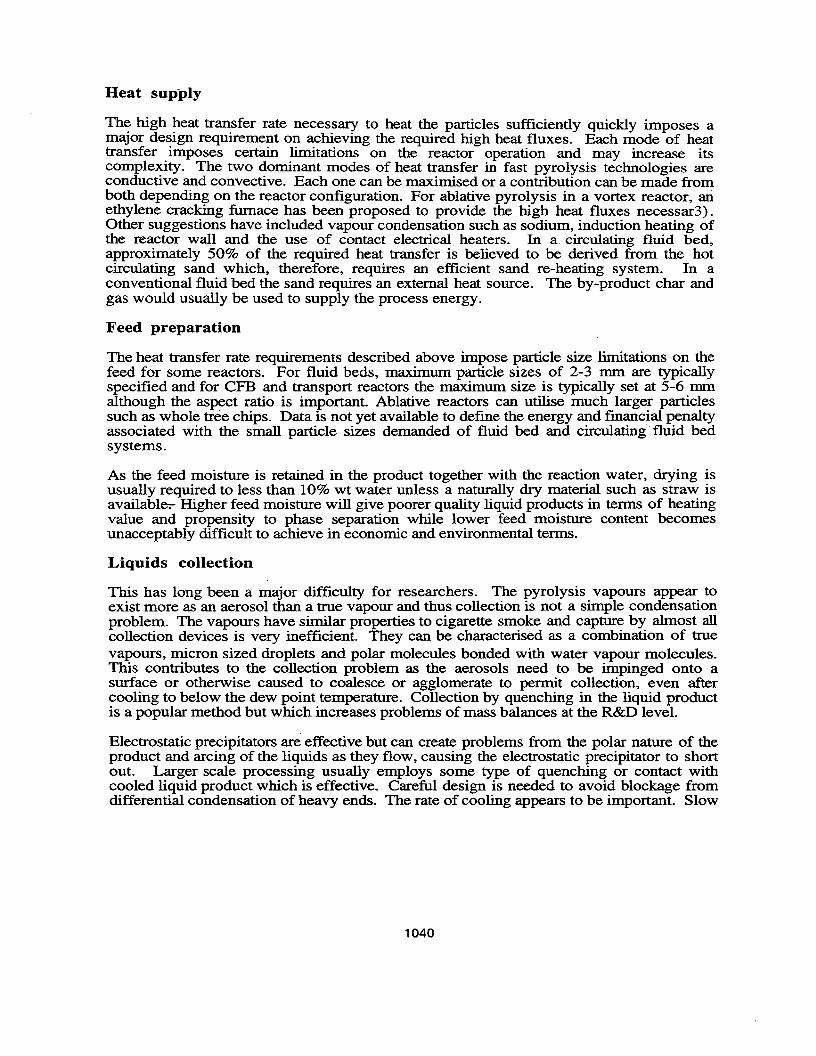
The high heat transfer rate necessary to heat the particles sufficiently quickly imposes amajor design requirement on achieving the required high heat fluxes. Each mode of heattransfer imposes certain limitations on the reactor operation and may increase itscomplexity. The two dominant modes of heat transfer in fast pyrolysis technologies areconductive and convective. Each one can be maximised or a contribution can be made fromboth depending on the reactor configuration. For ablative pyrolysis in a vortex reactor, anethylene cracking furnace has been proposed to provide the high heat fluxes necessar3).Other suggestions have included vapour condensation such as sodium, induction heating ofthe reactor wall and the use of contact electrical heaters. In a circulating fluid bed,approximately 50% of the required heat transfer is believed to be derived from the hotcirculating sand which, therefore, requires an efficient sand re-heating system. In aconventional fluid bed the sand requires an external heat source. The by-product char andgas would usually be used to supply the process energy.
Feed preparation
The heat transfer rate requirements described above impose particle size limitations on thefeed for some reactors. For fluid beds, maximum particle sizes of 2-3 mm are typicallyspecified and for CFB and transport reactors the maximum size is typically set at 5-6 mmalthough the aspect ratio is important. Ablative reactors can utilise much larger particlessuch as whole tree chips. Data is not yet available to define the energy and financial penaltyassociated with the small particle sizes demanded of fluid bed and circulating' fluid bedsystems.
As the feed moisture is retained in the product together with the reaction water, drying isusually required to less than 10% wt water unless a naturally dry material such as straw isavailable- Higher feed moisture will give poorer quality liquid products in terms of heatingvalue and propensity to phase separation while lower feed moisture content becomesunacceptably difficult to achieve in economic and environmental terms.
Liquids collection
This has long been a major difficulty for researchers. The pyrolysis vapours appear toexist more as an aerosol than a true vapour and thus collection is not a simple condensationproblem. The vapours have similar properties to cigarette smoke and capture by almost allcollection devices is very inefficient. They can be characterised as a combination of truevapours, micron sized droplets and polar molecules bonded with water vapour molecules.This contributes to the collection problem as the aerosols need to be impinged onto asurface or otherwise caused to coalesce or agglomerate to permit collection, even aftercooling to below the dew point temperature. Collection by quenching in the liquid productis a popular method but which increases problems of mass balances at the R&D level.
Electrostatic precipitators are effective but can create problems from the polar nature of theproduct and arcing of the liquids as they flow, causing the electrostatic precipitator to shortout. Larger scale processing usually employs some type of quenching or contact withcooled liquid product which is effective. Careful design is needed to avoid blockage fromdifferential condensation of heavy ends. The rate of cooling appears to be important. Slow
1040
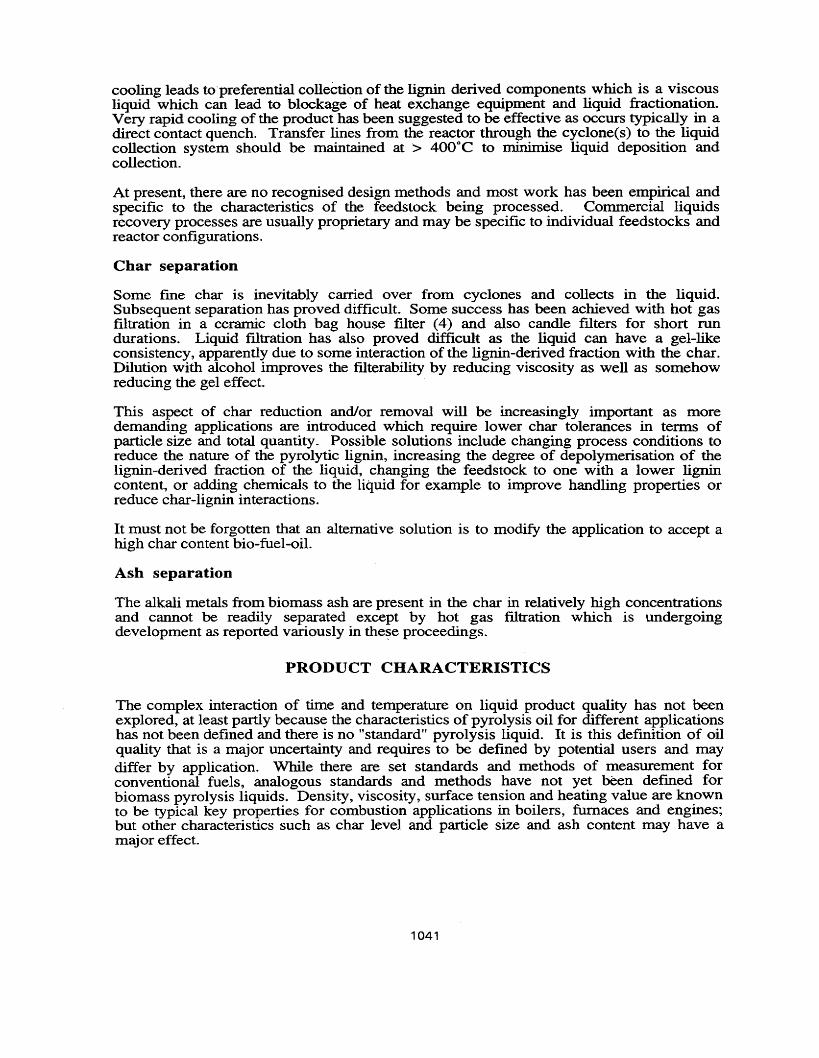
cooling leads topreferential collection of the lignin derived components which is a viscousliquid which can lead to blockage of heat exchange equipment and liquid fractionation.Very rapid cooling of the product has been suggested to be effective as occurs typically in adirect contact quench. Transfer lines from the reactor through the cyclone(s) to the liquidcollection system should be maintained at > 400°C to minimise liquid deposition andcollection.
At present, there are no recognised design methods and most work has been empirical andspecific to the characteristics of the feedstock being processed. Commercial liquidsrecovery processes are usually proprietary and may be specific to individual feedstocks andreactor configurations.
Char separation
Some fme char is inevitably carried over from cyclones and collects in the liquid.Subsequent separation has proved difficult. Some success has been achieved with hot gasfiltration in a ceramic cloth bag house filter (4) and also candle filters for short rundurations. Liquid filtration has also proved difficult as the liquid can have a gel-likeconsistency, apparently due to some interaction of the lignin-derived fraction with the char.Dilution with alcohol improves the filterability by reducing viscosity as well as somehowreducing the gel effect.
This aspect of char reduction and/or removal will be increasingly important as moredemanding applications are introduced which require lower char tolerances in terms ofparticle size and total quantity_Possible solutions include changing process conditions toreduce the nature of the pyrolytic lignin, increasing the degree of depolymerisation of thelignin-derived fraction of the liquid, changing the feedstock to one with a lower lignincontent, or adding chemicals to the liquid for example to improve handling properties orreduce char-lignin interactions.
It must not be forgotten that an alternative solution is to modify the application to accept ahigh char content bio-fuel-oil.
Ash separation
The alkali metals from biomass ash are present in the char in relatively high concentrationsand cannot be readily separated except by hot gas filtration which is undergoingdevelopment as reported variously in these proceedings.
PRODUCT CHARACTERISTICS
The complex interaction of time and temperature on liquid product quality has not beenexplored, at least partly because the characteristics of pyrolysis oil for different applicationshas not been defined and there is no "standard" pyrolysis liquid. It is this definition of oilquality that is a major uncertainty and requires to be defined by potential users and maydiffer by application. While there are set standards and methods of measurement forconventional fuels, analogous standards and methods have not yet been defmed forbiomass pyrolysis liquids. Density, viscosity, surface tension and heating value are knownto be typical key properties for combustion applications in boilers, furnaces and engines;but other characteristics such as char level and particle size and ash content may have amajor effect.
1041
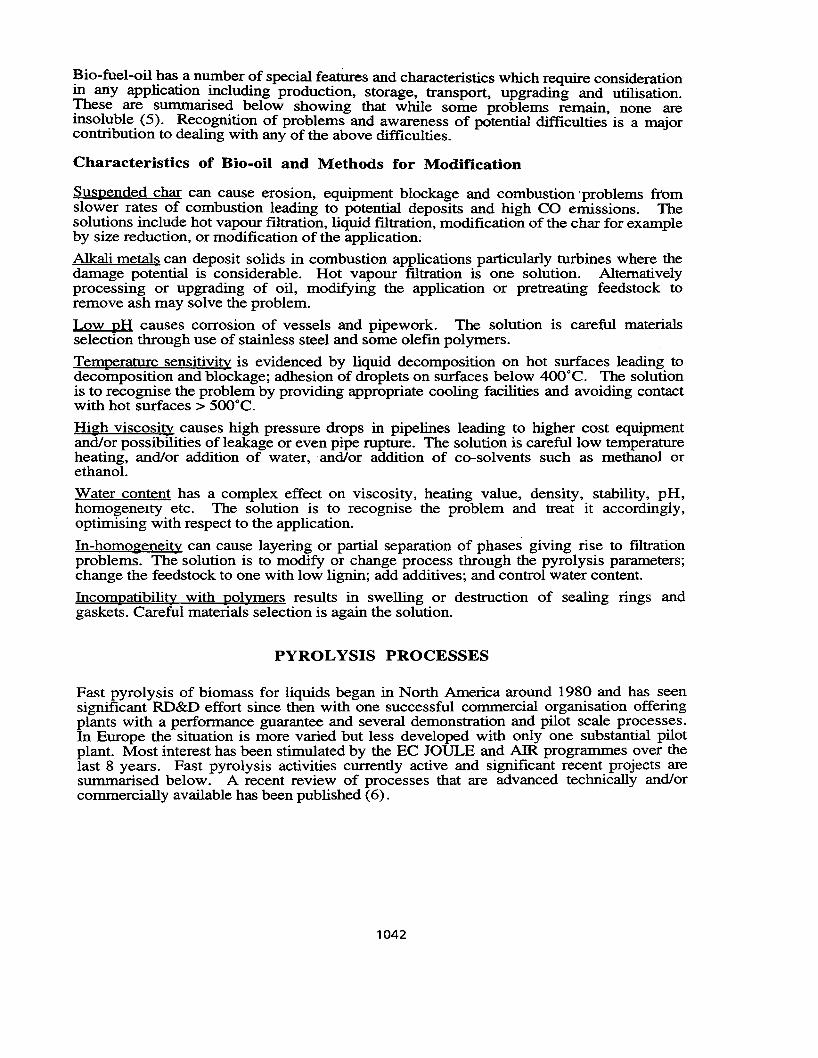
Bio-fuel-oil !-tas.anll:ffiber?f special fe~tures and characteristics which require considerationin any application mcluding production, storage, transport, upgrading and utilisation.!hese are summarise~.below showing that while some problems remain, none aremsol':lble. (5). Rec?gmti?n of problems and awareness of potential difficulties is a majorcontribution to dealmg WIth any of the above difficulties.
Characteristics of Bio-oil and Methods for Modification
Suspended char can cause erosion, equipment blockage and combustion 'problems fromslower rates of combustion leading to potential deposits and high CO emissions. Thesolutions include hot vapour filtration, liquid filtration, modification of the char for exampleby size reduction, or modification of the application;
Alkali metals can deposit solids in combustion applications particularly turbines where thedamage potential is considerable. Hot vapour filtration is one solution. Alternativelyprocessing or upgrading of oil, modifying the application or pretreating feedstock toremove ash may solve the problem.
Low pH causes corrosion of vessels and pipework. The solution is careful materialsselection through use of stainless steel and some olefin polymers.
Temperature sensitivity is evidenced by liquid decomposition on hot surfaces leading todecomposition and blockage; adhesion of droplets on surfaces below 400·C. The solutionis to recognise the problem by providing appropriate cooling facilities and avoiding contactwith hot surfaces> 500·C.
High viscosity causes high pressure drops in pipelines leading to higher cost equipmentand/or possibilities of leakage or even pipe rupture. The solution is careful low temperatureheating, and/or addition of water, and/or addition of co-solvents such as methanol orethanol.
Water content has a complex effect on viscosity, heating value, density, stability, p H,homogeneity etc. The solution is to recognise the problem and treat it accordingly,optimising with respect to the application.
In-homogeneity can cause layering or partial separation of phases giving rise to filtrationproblems. The solution is to modify or change process through the pyrolysis parameters;change the feedstock to one with low lignin; add additives; and control water content.
Incompatibility with polymers results in swelling or destruction of sealing rings andgaskets. Careful materials selection is again the solution.
PYROLYSIS PROCESSES
Fast pyrolysis of biomass for liquids began in North America around 1980 and has seensignificant RD&D effort since then with one successful commercial organisation offeringplants with a performance guarantee and several demonstration and pilot scale processes.In Europe the situation is more varied but less developed with only one substantial pilotplant. Most interest has been stimulated by the EC JOULE and AIR programmes over thelast 8 years. Fast pyrolysis activities currently active and significant recent projects aresummarised below. A recent review of processes that are advanced technically and/orcommercially available has been published (6).
1042
Organisations Currently and Recently Involved in Fast Pyrolysis forLiquids
Castle Capital (Canada) A 35-50 tid continuous ablation reactor designed by BBC has beenbuilt in Nova Scotia where it is operating successfully since 1994 with combustion of theraw product gas and no liquids collection (7, 8). A two stage direct liquids quench hasbeen successfully tested.CPERI (Greece) A small fluid bed pyrolyser provides liquids for conversion or upgradingto chemicals including methyl aryl ethers (9)CRES and Agricultural University of Athens (Greece) A circulating fluid bed fast pyrolysiswith integral char combustion at 10 kglh has been commissioned but is not yet producingliquids (10).Egemin (Belgium) A 200 kg/h capacity entrained downflow system was commissioned in1991 and operated at up to around 50 kglh giving liquid yields around 45% wt. (11). Itwas closed down permanently in 1992.ENEL (Italy) A 650 kg/h demonstration plant has been ordered from Ensyn for plannedstart up in Italy at the end of 1995 (12)Ensyn (Canada) There are three operational plants: a 25 dry teld unit at Red Arrow inWisconsin and an 80 kg/h unit and 10 kg/h R&D unit at Ensyn in Ottawa. Others are underconstruction and design. Current work includes hot vapour and liquid filtration to reducechar. Oil is being supplied for engine, turbine and combustion testing and characterisationin North America and Europe.!NETI (Portugal) A 0.6 kglh fluid bed has given 55% yield of total liquid withcharacteristics similar to those from other fast pyrolysis systems. Tests have also beencarried out on a 300 mm square fluid bed (13).Institute of Wood Chemistry (Germany) A 100 gIh fluid bed for processing wood wasteshas been operating since 1994.NREL (USA) NREL have been developing their 30 kg/h vortex ablative pyrolyser since1980 and a second unit of 70 kglh capacity was commissioned in 1994. A small fluid bedfast pyrolysis unit has also been commissioned. Zeolite cracking has been carried out onthe pyrolysis vapours and a circulating fluid bed zeolite cracker with regenerator hasrecently been commissioned (14)Pasquali-ENEL (Italy) A CFB unit has been designed for integration with an engine formass supply of small scale units of up to 500 kWe.Pyrovac (Canada) A horizontal moving bed vacuum process for biomass and wastes hasbeen developed from the University of Laval research (15). A 15000 tly plant has beensold in Belgium.Resource Transforms International (Canada) Speciality chemicals are produced from biooil. Small scale fast pyrolysis equipment is designed and supplied.ScheldelBTG (Netherlands) A rotating cone pyrolysis unit rated at 50 kg/h has been scaledup from early work at the University of Twente for supply to China.Union Fenosa (Spain) A fluid bed fast pyrolysis pilot plant of 160 kglh based on theUniversity of Waterloo process has been operating since mid. 1993. Feeds tested includeoak, pine, eucalyptus,. Liquid yields of better than 55% are currently achieved (2, 16).University of Aston (UK) An ablative plate reactor with a capacity of 5 kg/h has beenoperating for two years. Liquid yields of 75-80% have been achieved (17). A small fluidbed of 2 kg/h has recently been commissioned.University of Laval (Canada) Biomass and solid wastes are vacuum pyrolysed in ahorizontal moving bed vacuum reactor which has replaced the multiple hearth vacuum unit.The process is being commercialised by Pyrovac (q.v.). An extensive bibliography isavailable.
1043
University of Leeds (UK) A fluid bed reactor of about 500 gIh with close coupled andintegral zeolite cracking reactor has been studied (18) .
University of Naples (Italy) Models of fast pyrolysis have been derived and applied to fluidbed and ablative reactors.University of Sassari (Italy) A fluid bed with a capacity of 10 gIh has been tested (19) .University of Stuttgart (Germany) A fluid bed with a capacity of around 3 kg/h wasinstalled in 1994.University of Twente (Netherlands) A rotating cone reactor has been developed in severalversions of up to 50 kg/h (20), the latest including char combustion and recycle.University of Waterloo (Canada) Two fluid bed reactors of 100 gIh and 3 kg/h have beenused to extensively test a range of feedstocks and study the basic science of fast pyrolysis.There is an extensive bibliography which is readily available.VTT (Finland) A laboratory unit of 10 kg/h has been ordered from Ensyn and other unitsare being constructed.
Applications
A summary of the opportunities for utilising pyrolysis liquid is shown in Figure 1. WithinEurope the most promising application is seen as electricity production due to theanticipated ability to use raw bio-oil as produced in an engine or turbine without the needfor extensive upgrading as well as the ability to de-couple fuel production from electricitygeneration with storage and/or transport of the liquid fuel which is not possible forgasification of combustion systems.
Combustion
Liquid products are easier to handle and transport in combustion applications and this isimportant in retrofitting existing equipment. Fast pyrolysis liquids are likely to require onlyrelatively minor modifications of the equipment or even none in some cases. The problemsthat have been reported with high viscosity and suspended char causing atomisationdifficulties and incomplete combustion with some fuels are being successfully addressed inthe ongoing R&D described above (21, 22, 23) and pyrolysis liquids are now beingroutinely burned in commercial boilers (24) .
Power generation with liquids
A key advantage of production of liquids is that fuel production can be de-coupled frompower generation. Peak power provision is thus possible with a much smaller pyrolysisplant, or liquids can be readily transported to a central power plant using engines orturbine. There are additional benefits from potentially higher plant availability from theintermediate fuel storage. The economics of power generation suggest that a niche of up to10 MWe is available for exploitation.
Bio-oil has been successfully fired in a diesel test engine, where it behaves very similar todiesel in terms of engine parameters and emissions (25). A diesel pilot fuel is needed,typically 5% in larger engines, and no significant problems are foreseen in powergeneration up to 15 MWe per engine. Gas turbine applications are also considered to befeasible although no work has been carried out in the last 10 years nor on fast pyrolysisliquids. However, a new project has recently been implemented to investigate this which ismore likely to be viable for larger scale applications (26).
1044
Chemicals
Several hundred chemical constituents have been identified to date, and increasing attentionis being paid to recovery of individual compounds or families of chemicals. The potentiallymuch higher value of speciality chemicals compared to fuels could make recovery of evensmall concentrations viable. An integrated approach to chemicals and fuels productionoffers interesting possibilities for shorter term economic implementation. Chemicals thathave been reported as recovered include polyphenols for resins with formaldehyde, calciumand/or magnesium acetate for biodegradable de-icers, levoglucosan, hydroxyacetaldehyde,and a range of flavourings and essences for the food industry (1). There are substantialproblems to be overcome is establishing markets for the less common chemicals anddevising low cost and efficient separation and refining techniques. The only currentlyviable market opportunity is for speciality food flavourings with a current market size ofaround US$ 10 million in North America and which could expand to US $ 40-50 million in10 years.
Economics
A key factor in the continuing development of fast pyrolysis processes to eventualcommercial implementation is their economic viability. The current main interest in Europeis for electricity generation from biomass with the driving forces of environmental benefits,C02 mitigation, socio-economic benefits from using surplus agricultural land, and energyindependence. These have led to significant fiscal incentives being offered for renewableelectricity in many European countries such as prices of up to 20¢/kWh in Italy and up to14¢/kWh in the UK according to the system, the feedstock and the operating time.
A biomass fast pyrolysis system consists of a series of operations that start at the receptionof raw biomass, provide for necessary handling and storage, pretreat the material to therequired size and moisture content, pyrolyse the prepared material, collect the liquidproduct, and finally store the product. This is shown in Figure 2. All the costs andperformance data of such a system have been estimated from a wide range of publisheddata and incorporated into a sophisticated decision support system that estimates processperformance and product cost for a range of bio-electricity production systems which isreported elsewhere in these proceedings (27). It is clear that fast pyrolysis and an engineoffers the most economically attractive route of the thermal conversion technologies at sizesup to around 15 MWe, and that no processes are economically viable without somefinancial support or a low cost feed.
Conclusions
Fast pyrolysis is becoming more accepted as an emerging technology with commercialpotential for producing high yields of liquid fuels that can be used in many applications asdirect substitutes for conventional fuels or as a source of chemicals. There are stillproblems to be resolved but it is clear that considerable progress is being made in firstlyidentifying these problems and then finding and defining solutions. There are someinteresting challenges to be faced in modifying the fast pyrolysis technology, in upgradingthe liquids and adapting applications to accept the unusual behaviour and characteristics ofthe liquid product. International co-operation is one of the key routes to facilitate suchdevelopments and this needs to be encouraged as bioenergy is increasingly accepted as apotentially significant resource. Further research and development of the fundamentalscience which provides the tools for the design engineer to achieve the performanceimprovements is also required for successful exploitation.
1045
References
1 Bridgwater, A.V., Applied Catalysis A, 116, (1-2), pp 5-47, 19942 Radlein, D., Piskorz, J. and Scott, D.S., Proceedings 2nd EC-Canada Workshop,
Toronto, May 1995, Eds. Bridgwater, T. and Hogan, E., (Aston University 1995)3 Diebold, J.P., et al. pp 1325-1342, Advances in thermochemical biomass
conversion, Ed. Bridgwater, A.V., (Blackie, 1994).4 Diebold, J.P. et al., pp 90-108, Proc. workshop on biomass pyrolysis oil
properties and combustion, Estes Park, USA, September 1994 (NREL 1995).5 Bridgwater, A.V. pp 109-127, Proc. workshop on biomass pyrolysis oil properties
and combustion, Estes Park, USA, September 1994 (NREL 1995).6 Bridgwater, A.V. and Evans, G.D., Report to UK DTI, 254 pp (ETSU
BffllOO207IREP), 1993.7 Black, J.W. and Brown, D.B., in Biomass Thermal Processing, 23-25 October
1990, Ottawa, Canada, p 123-125.8 Black, J.W. and Brown, D.B., report of DSS Contract me No. 23440-9-9513/01
SZ. Alternate Energy Division: Energy, Mines and Resources Canada, Ottawa,Ontario, Canada, March 1993.
9 Samolada, E. and Vasalos, LA., pp 859-873 in Advances in thermochemicalbiomass conversion, Ed. Bridgwater, A.V., (Blackie 1993).
10 Boukis, I. et al. pp 1151 - 1164 in Advances in thermochemical biomassconversion, Ed. A V Bridgwater, A.V., (Blackie 1993).
11 Maniatis, K. et aI. pp 1257-1264 in Advances in thermochemical biomassconversion, Ed. Bridgwater, A.V., (Blackie 1994)..
12 Trebbi, G., ENEL, Private Communication, May 1994.13 Gulyurtlu, I., Final report ofEC JOULE contract JOUB-0053, July 1993.14 Czernik, S. et aI., pp 429-436, Proceedings of the 28th Intersociety Energy
Conversion Engineering Conference, (American Chemical Society, 1993)15 Pyrovac International Inc. trade literature. Sillery, Quebec, Canada.16 Cuevas, A., Proceedings ofEC JOULE Contractors Meeting, Athens, June 199317 Peacocke, G.V.c. and Bridgwater, A.V., pp 147-154, Biomass and Bioenergy
(1994), Vol. 7, nos. 1-6.18. Williams, P.T. et al., Fuel, 1990, 69, p 1474-1482.19 Conti, L., Scano, G. and Boufala, J., Proc. ACS Meeting Denver March 1993,
accepted for Biomass and Bioenergy, 1995.20 Wagenaar B.M. et aI., pp 1122-1133, in Advances in Thermochemical Biomass
Conversion, Ed. Bridgwater, A.V., (Blackie 1994)21 Baxter, L. And Jenkins, B., pp 270-280, Proc. workshop on biomass pyrolysis oil
properties and combustion, Estes Park, USA, September 1994 (NREL 1995).22 Gust, S., pp 316-320, Proc. workshop on biomass pyrolysis oil properties and
combustion, Estes Park, USA, September 1994 (NREL 1995).23 Rossi, C., pp 321-328, Proc. workshop on biomass pyrolysis oil properties and
combustion, Estes Park, USA, September 1994 (NREL 1995).24 Freel, B. And Huffman, D., 309-315, Proc. workshop on biomass pyrolysis oil
properties and combustion, Estes Park, USA, September 1994 (NREL 1995).25 Solantausta, Y. et al., pp 355-361, Proc. workshop on biomass pyrolysis oil
properties and combustion, Estes Park, USA, September 1994 (NREL 1995).26 Andrews, R., et al., pp 383-392, Proc. workshop on biomass pyrolysis oil
properties and combustion, Estes Park, USA, September 1994 (NREL 1995).27 Toft, A.J. and Bridgwater, A.V. These proceedings.
1046
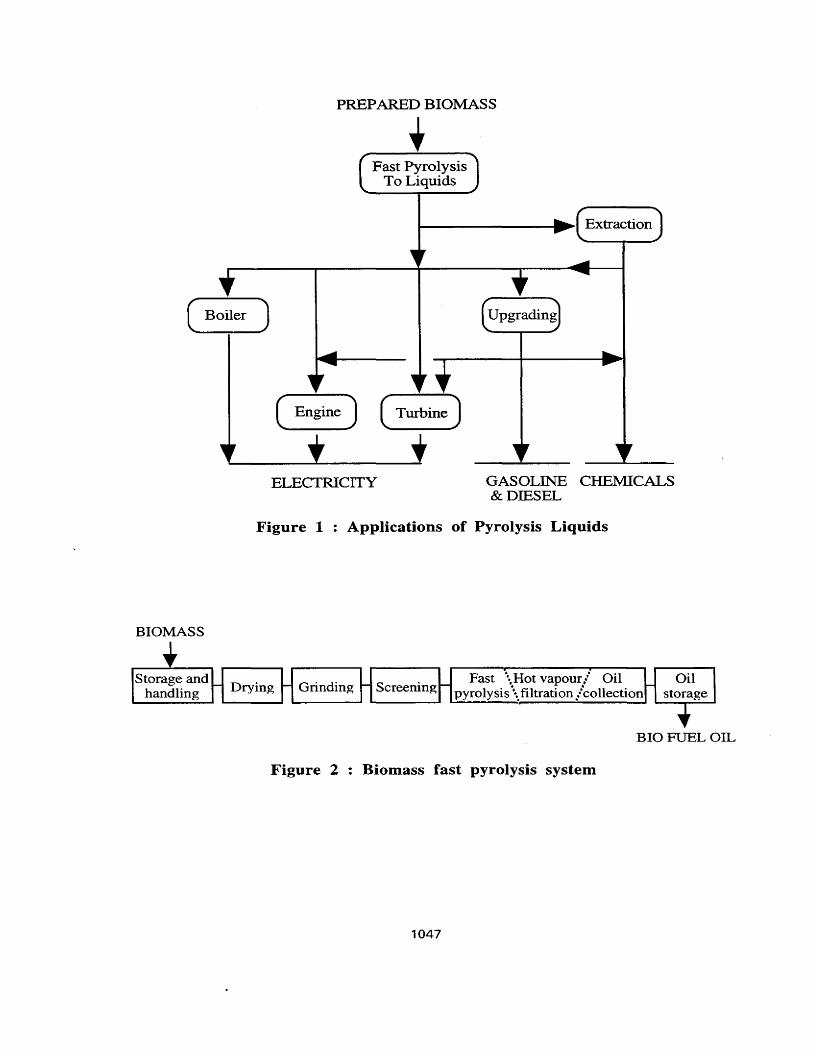
( BOiler)
PREPARED BIOMASS
Fast PyrolysisTo Liquids
......-------__~I Extraction
ELECTRICITY GASOLINE CHElVIICALS& DIESEL
Figure 1 : Applications of Pyrolysis Liquids
BIOMASS
Fast .... Hot vapourj' Oilpyrolysis\. filtration /collection
BIOFUELOIL
Figure 2 Biomass fast pyrolysis system
1047
ADVANCED LIQUID FUEL PRODUCTION FROM BIOMASSFOR POWER GENERATION
Dr. G. Grassi, Dr. M. Palmarocchi, European Bioenergy Industry Association, BrusselsDr. J. Koeler, Zentrum fur Sonnenenergie, Stuttgart
Dr. G. Trebbi, ENEL - CRT, PISA
Abstract
In the European Union, important political decisions recently adopted and concerning theevolution of the Common Agriculture Policy, the GATT trade liberalisation Agreement andnew measures actually under discussion (CARBON TAX, Financial support for ruraldevelopment...) will have significant impact, in a no distant future, on the bioenergy activity.Also the considerable energy import (:::; 55% of the consumption) is of increasing concerns.The biomass potential in the E.U. is large, but the availability of commercial technologiesfor processing and utilising this renewable energy resource is very modest.Thus, a strong effort for the development of new and efficient technologies (like the oneimplemented by ENEL / CRT) is essential, as well as the build-up of an efficient industry forthe commercialisation of reliable, low-cost biomass conversion / utilisation systems. Therecently founded "European Bioenergy Industry Association" will make an effort for thepromotion of this specific new industrial sector. In this framework, a new research effort (inGermany / Italy) for up-grading the bio-crude-oil by high energetic electrons. This process,if demonstrated feasible, could be of great interest for the production of new liquid fuels ofsufficient quality to be utilised in most types of modern power generator.
1048
Introduction
Interest in vegetal biomass production and utilisation as a regenerable renewable energyresource is growing, because of the increasing awareness of its benefits, such as: thediversification of energy supply, the creation of new jobs especially in rural areas, and theimprovement of environmental conditions (C02 neutral, no S02 emissions).
Although a considerable amount of information is available, commercial technologies lackthus preventing in practice the most effective use ofbiomass resources.There is general consensus that some energy processes and products are likely to becomeviable in a near future. Electricity is seen as the most valuable and economically attractivebiomass-derived product with considerable environmental advantage over the traditionalfossil fuels that dominate electricity production in the E.D. Also, the production ofoxygenated fuels (like ETBE, MTBE) as ingredients for reformulated gasoline seemseconomically feasible, once integrated with the power-heat production, especially if specificnew energy crops like sweet-sorghum (well suited for central-south Europe) could beutilised.The directive on the Carbon Tax recently adopted by the European Commission (May1995) and now under discussion for approval at the European Parliament and at the Councilof Ministers will be able to produce a strong promotion of renewable energy and inparticular of bioenergy. This Directive propose a transition period 1996-1999 of voluntarytaxation on all fuels except renewable energy resources. The amount of taxation will berelated for 50% to the CO2 emission and for 500/0 to the heat content of the energy productas shown in the following table:
Gasoline (1,000 1): 44,87 ECD
Diesel (1,000 Kg): 51,40 ECD
Coal (1,000 Kg): 57,37 ECU
GPL (1,000 Kg): 62,53 ECD3Natural gas (1,000 m ): 41,53 ECU
Electricity (lMWh): 7,00 ECU
The other energy products will be submitted to the taxation equal to:
19.37 ECU/ton CO2 produced + 0.70 ECU/G J IThe necessity to preserve the environment and the growing concern over the availability oftraditional energy sources have stimulated, the national, and the European Union policytowards an increased interest for renewable energy sources.In this context, beyond the energy from the sun, the wind and the water, also the concept tocultivate the land for energy production, with selected herbaceous and woody species(energy crops), is now consolidated.This concept grew stronger in the last years, following the compulsory introduction by theE.C. of the "set-a-side" land (land retired from food production) as a consequence of theevolution of the Common agricultural policy. In the E.U. this reaches now 6.4 millionhectares and is creating growing concern in the agricultural world.Therefore, the use of agricultural lands for the production of vegetal biomass for energeticpurposes can offer a real new opportunity for farms.
1049
ENEL Bioenergy Programme
As far as the actual biomass potential in Italy is concerned, the most significant amounts arethose related to:
the "set-a-side" area: about 1 million ha. able to produce 8 M. TOE/y (5% of the totalItaly energy needs);the marginal agricultural land (retired from the food production in the last 20 years):about 2 million ha;the biomass stock (::::: 70 dry ton/ha) on the 3 million ha of"bosco-ceduo" which had beenabandoned in the last 20-30 years and which should be harvested to re-establish again itsnormal rotation (20 years).
Once quantified the biomass resource potential, it appeared at the same time important todevelop suitable processes to convert biomass into gaseous and in particular liquid fuelswhich can be more easily handled and transported.
The penetration possibility of thermal power plants fed with biomass seems closely linked tothe industrial development of conversion technologies with high efficiency, such as thosebased on the Integrated Gasification Combined Cycle (IGCC), or on the use of bio-crudeoil in diesel or gas-turbine generators.
In fact, biomass can be converted into more valuable fuel, called bio-crude-oil, through aflash pyrolysis process with an energy efficiency up to 75%. This bio-fuel could be utiliseddirectly in conventional boilers of existing power plant and in furnaces, to produceelectricity/heat with some advantages in comparison with solid biomass, but also withcertain limits for its handling storage and transport in comparison with a conventional fueloil.The chemical and physical characteristics of bio-crude-oil are quite different from those ofconventional liquid fuels; thus its utilisation in gas turbines or in diesel engines requiressome important modifications. To avoid these problems, the bio-crude oil could suitably beupgraded through a process capable of improving its characteristics, especially in terms ofviscosity, stability and net heat value. In any case, in order to arrive at the commercialisationof the flash pyrolysis technology, a wide R&D activity is needed.
ENEL has launched several programmes aimed at the development and demonstration ofadvanced processes and technologies to asses the feasibility of biomass conversion intoelectricity.
In this context, beyond an important demonstration project named "IGCC Energy Farm" ofwhich the main characteristics are shown in the following table:
Gross Electric Power (MW) / Atm. gasifier 14.3Net Electric Power (MW) / Two gas-turbines + steam turbine 11.9Gas Cycle Gross Electric Power (MW) 9.4Steam Cycle Gross Electric Power (MW) 4.9Dry Biomass Hourly Consumption (kg) 7100Net Thermal Efficiency (on HHV of biomass) 0.33
much attention is given also to conversion systems based on flash pyrolysis and low-costup-grading.
1050
As far as this specific sector is concerned, the Italian Utility (ENEL) is implementing a wideexperimental programme, which comprises in particular:
General R&D activity on characterisation, handling, combustion and emission control ofbio-crude-oil in boilers and combustion chamber of gas-turbines.Development of large power generating system (> 1 MW) based on the utilisation of aflash-pyrolysis plant (the largest in the E.D.) which will be delivered by Ensyn-CanadaInc. on September 1995. Meanwhile, in Italy the works needed for the auxiliary facilitiesare in progress and the biomass required for the trials to be started at the end of 1995 isbeing produced.After a sufficient period of operation (one year), it will be possible to assess the reliabilityand flexibility of this process and to collect all the technical-economic information usefulfor potential application in different areas of the country.This plant is considered very useful because it will make available a large amount of biocrude-oil, which is necessary for extensive experimental research activities concerning itsapplication on furnaces, diesel engines and gas turbines. It will be also possible to adaptthe plant for upgrading of bio-crude-oil by hydrotreatment process, or other innovativeupgrading systems, such as electronic and zeolites up-grading now under development inEurope. These activities will be described in more details at this Conference by otherAuthors.Development of a new biomass flash-pyrolysis/gasification technology and of anadvanced small power generator (150 kWe) in collaboration with the Pasquali Co.(Italy), Energidalen (Sweden), and Stadtwerke Saarbrucken AG (Germany).
This very sophisticated ENEL facility (CIRO) in Livorno will be able to test:
- the new flash-pyrolysis reactor- - three types of generators (Diesel, gas-turbine, sterling)- a new process for bio-crude-oil up-grading (in vapour phase).
A sketch of this experimental facility is presented in Figure 1.
European Bioenergy Industry Association (EUBIA) Activity
The 6th February 1995, in Brussels, with the patronage of the European Commission and inthe headquarters of the European Parliament, the European Association of BioenergyIndustries was funded. As Chairman was elected Mr. M. Palmarocchi (Italy) of ECOFUEL /AGIP PETROLI, while Mr. T. Fiallstrom (Sweden) and Mr. T. Weber (GErmany) wereelected as vice chairmen.The objectives of the new Association are the following:
to contribute to solving problems concerning the production, treatment, processing,marketing, and use of biomass in terms of feasibility, quality control, environmentalprotection, health and safety;to supply information and consultance on norms and guidelines of the Commission of theEuropean Union as well as to express opinions and proposals on the initiatives of thenational, international and European authorities on the subject of biomass and ofscientific and technological research in the field of energy, as well as on international cooperation;to make authorities and public opinion aware of the positive contribution which biomasscan offer in economic and technological terms as well as those in relation to theagricultural diversification and social progress;
1051
to assist- the members of the Association in the exploitation of the resources,technologies and bioenergy products; in the definition of the company marketing andproduction strategies; in the promotion of international networks for the developmentand exploitation of resources and of technologies through joint ventures, transfers ortechnologies, data banks, seminars, publications and training activities.
The activity of the Association will be based on the three large areas of operation, i.e.,communication, advisory assistance and consulting, and project co-ordination.
E.U.B.I.A. has already started its promotion activity for future large-scale bioenergyschemes, taking in particular consideration the now arising interest of oil Companies foroxygenated fuels (ETBE) produced from agricultural crops and required for thereformulation ofgasolines.Such interest is motivated by the fact that at present a complete, efficient exploitation ofconventional crops (i.e. corn) and of promising sustainable new high yield crops (like sweetsorghum.... ) makes the production .of bio-ethanol feasible, if this can be combined andintegrated with power-heat production.Furthermore, the possibility to grow biomass resources on "set-a-side" land will make thisproduction particularly attractive from the economic point of view. In Italy, a productioncost for bio-ethanol of about 220 $/ton is anticipated.
As far as the technological aspects are concerned, E.U.B.I.A. is confident that beyond thefluidised bed steam raising cogeneration technology already established commercially, newprocesses and products which are likely to become viable in a no distant future are thefollowing:
Cogeneration IGCC systems;Cogeneration systems with engines / turbines fuelled by bio-crude-oil;Production ofbioethanol and ethers (ETBE) combined with cogeneration;Hydrogenation of CO2 and production of MTBE if integrated with the production ofETBE, power and heat.
For economic viability, large biomass schemes (thousands of ha) are more attractive,although the estimated potential market of small capacity (hundreds of kWe) cogenerationsystems is very high. The main technological problem is how to get efficient (~ 30%),reliable, low-cost (~ 1500 ECU/kW) generators. An important research effort is under waynow, in Europe, in this particular sector. Perspectives for success seems promising.
Innovative Research on "Bio-Crude-Oil Up-grading(Zentrum fur Sonnenenergie, Stuttgart)
The development of a new process for the improvement of the physical-chemical-functionalcharacteristics of bio-crude-oil, derived from biomass by flash-pyrolysis, was initiatedrecently in the frame of a collaboration programme between the Zentrum fur Sonnenenergie/ Institute fur physikalische Electronik (Stuttgart - Germany) and the CESVIT /Universityof Florence (Florence - Italy). This activity is financially supported by the Commission ofthe European Union (DG XII).Last year preliminary Lab. experiments were carried out by a device schematically shown inFigure 2 following a procedure based on an "electronic-up-grading" treatment of distilledbio-crude-oil vapours.
1052
This "electronic up-grading" or as better known from literature, the electronic stimulationof chemical reactions, has been successfully applied for flue gas cleaning, demolition oforganic compounds, polymerisation, and other similar applications, in which the electronenergy acts as a catalyst (Ref. 1-2-3). Therefore, it was considered interesting to test thistechnique for the upgrading of bio-crude-oil, as an alternative method to state-of-the-arttechniques like hydrotreatment or zeolite synthesis.The establisment of a "cold" plasma is necessary for the electronic stimulation of chemicalreactions. In such a "cold" plasma the electron temperatures are very high (several eV ortens of eV, corresponding to several tens or hundreds of thousands K), whereas the gasatoms and molecules remain near room temperature. Plasmas matching these conditions canbe produced either by electrical discharges or electron beams.The high energy electrons, produced in this plasma, create very reactive radicals like e.g. 0., H·, CH3 · , OH·. All other excitation states can also be found, from vibrational androtational excitation up to single or even multiple ionisation states.The silent discharge device used in preliminary tests consisted of a pulsed high voltagesupply and a fused silica tunnel with metal electrodes. Both discharge electrodes had adielectric layer deposition to avoid direct contact with corrosive vapours. The high voltagesupply delivered a peak to peak voltage up to 60 kV into a capacitive load. The frequencyrange reaches from 1 Hz to 1,5 kHz for continuos operation and up to 50 kHz in burstmode.
The fused silica plates each had a thickness of 2 mm and form a tunnel with 5 mm air gap,150 rnm height and 300 mm length. Fused silica has good dielectric properties and veryhomogeneous discharge can be obtained. Nevertheless, the main advantage is that the fusedsilica is not affected by thermal stress, that occurs inside the pyrolysis plant. Electrodes inpreliminary tests were up to an area of 100x200 mm 2
. For the test with temperature up to100 0 C copper foil was used. For higher temperature applications materials like stainlesssteel, molybdenum or wolfram have to be used.The isolation of the electrodes leads to a self-termination of the discharge by accumulationof electric charge on the surface of the dielectric. The accumulated surface charge reducesthe electric field strength until the discharge terminates. Thus, the electric discharge consistsonly of the so-called breakdown phase of a spark. During this first breakdown phase highenergy electrons with energies up to several tens of electron volts are generated. Themaximum is estimated from literature between 7 and 10 eV (10), possibly up to 16 eV (11).This energy levels indicate, that the formation of radicals is preferred against the formationof ions.Preliminary tests with some organic substances (hydrogen, methane acetaldehyde)performed in 1994 had shown that:
From methane and acetaldehyde the formation of significant amounts of hydrogen in theelectric discharge can be observed. Additionally traces of higher hydrocarbons werefound. With hydrogen alone only a shift from the mass peak m=2 to m=1 can beobserved. .The discharge chamber used on the preliminary tests achieves the demand to produceradicals within volatile organic compounds. The power supply need optimisation for abetter matching to the discharge impedance for the. improvement of the efficiency.
The electronic upgrading reactor has also the advantage that it can easily be integratedwithin a pyrolysis plant. So the expense for additional heating for after-treatment methods isomitted. This saving will be partially compensated by the electrical power consumption ofthe unit. Also the synthesis gas (H2, CO, Cf4), that originates from the pyrolysis process
1053
can directly be used in the upgrading reactions. Since the chemical reactions sequences arecomplex and not yet understood, a prognosis about the additional hydrogen of hydrogendonor consumption cannot be anticipated. Another advantage is the fact, that only very inertdielectric materials (glass, fused silica or ceramics) are in direct contact with the corrosiveoil. Therefore long term stability of the unit will be an attainable aim, in comparison with therelative fast poisoning of catalyst or zeolites cooking.
In 1995, a more sophisticated experimental facility had been designed and constructed at theZentrum fur Sonnenenergie (Stuttgart) in collaboration with U.E.F. (Spain) and thewaterloo University (Canada) always with the financial support of the DG XII E.C -Joule.This facility is just starting now its operation to implement the first planned trials. It ishoped that some experimental data and results will be illustrated and discussed at the timeof the Conference (end of August 1995).In Figure 3 the flow-sheet of this experimental facility is given.
Operation of the pyrolysis reactor
FeederThe biomass feedstock (for preliminary tests the use of wood sawdust with a particle sizeup to 1.5 mm is planned) is filled into the feeder tube. The feeding rate is influenced by thestirrer velocity and the nitrogen flow through the feeder tube. It should be adjusted in therange of 100 - 150 g/h.
Pyrolysis reactorThe whole pyrolysis reactor is build into a tubular furnace, which is regulated to atemperature of 500°C. The biomass is brought via a cooled tube into the pyrolysis zone,where the contact with the hot fluidized sand bed guarantees a very rapid heating of thefeedstock. The resulting vapours are separated from char residues in a cyclone.
Upgrading unitThe hot vapours flow from the cyclone to the upgrading unit, which is situated in an ovenwith separate heating, which will usually be held at a temperature a little lower than in thepyrolysis reactor. The option is given to improve the C -i- H ratio of the bio oil by addingmethane before the oil vapours pass through the electronic upgrading unit, which worksafter the principle of the dielectric barrier discharge. Two different geometries will betested - the construction with coaxial tubes and a stack with parallel plates. Both solutionsare under construction in the workshop of the university.
CoolingThe hot vapours pass through a two stage ice water cooler, where they condensate in aheavy fuel fraction with high boiling point and a volatile light fuel fraction. Remaininggaseous components could be sampled (e.g. in a gas mouse) for further analysis.
In autumn 1995, if the experimental results from Z.F. S. - Stuttgart will be consideredsatisfactory, an "electronic up-grading unit of about 50 kg (B.C.O. vapours/hr will beconstructed and assembled on the U.E.F. Galice flash-pyrolysis plant and/or on the CIROFacility (ENEL). The budget for the construction and short experimentation is alreadyprovided. This facility should be adequate for the assessment of the techno-economicfeasibility and potentialities of this innovative refining process for the bio-crude-oil.
1054
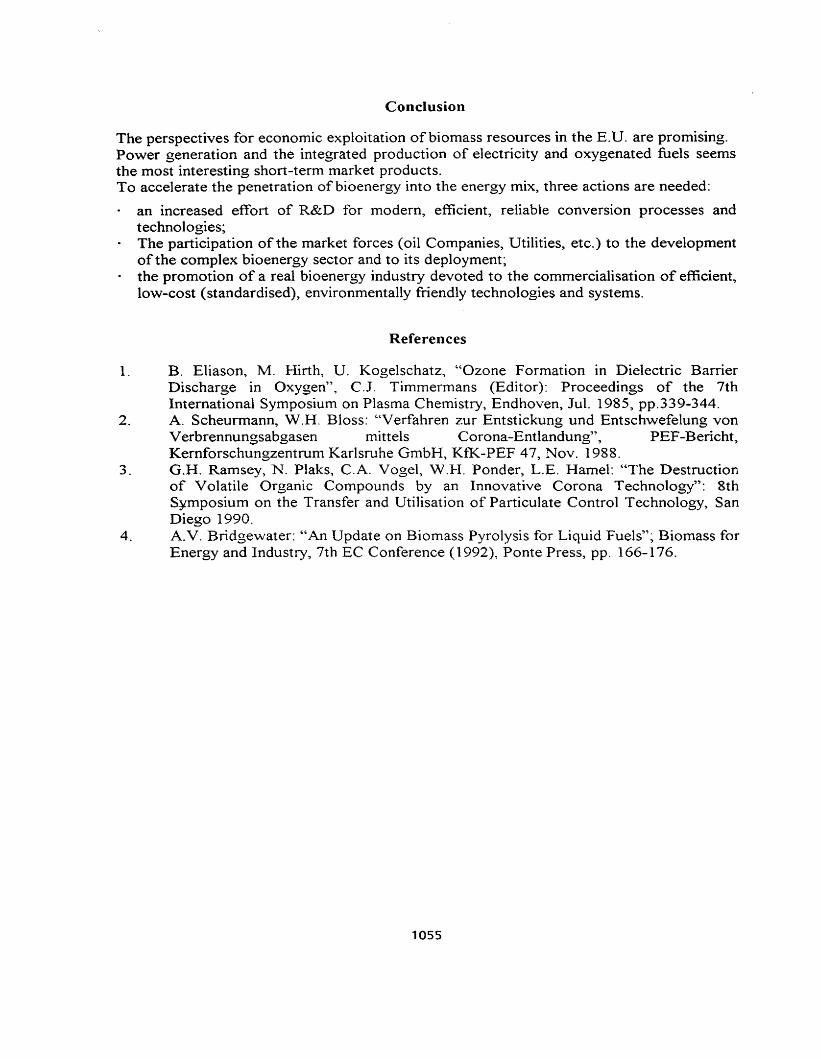
Conclusion
The perspectives for economic exploitation of biomass resources in the E.D. are promising.Power generation and the integrated production of electricity and oxygenated fuels seemsthe most interesting short-term market products.To accelerate the penetration ofbioenergy into the energy mix, three actions are needed:
an increased effort of R&D for modern, efficient, reliable conversion processes andtechnologies;The participation of the market forces (oil Companies, Utilities, etc.) to the developmentof the complex bioenergy sector and to its deployment;the promotion of a real bioenergy industry devoted to the commercialisation of efficient,low-cost (standardised), environmentally friendly technologies and systems.
References
1. B. Eliason, M. Hirth, U. Kogelschatz, "Ozone Formation in Dielectric BarrierDischarge in Oxygen", C.J. Timmermans (Editor): Proceedings of the 7thInternational Symposium on Plasma Chemistry, Endhoven, Jul. 1985, pp.339-344.
2. A. Scheunnann, W.H. Bloss: "Verfahren zur Entstickung und Entschwefelung vonVerbrennungsabgasen mittels Corona-Entlandung", PEF-Bericht,Kernforschungzentrum Karlsruhe GmbH, KtK-PEF 47, Nov. 1988.
3. G.H. Ramsey, N. Plaks, C.A. Vogel, W.H. Ponder, L.E. Hamel: "The Destructionof Volatile Organic Compounds by an Innovative Corona Technology": 8thSymposium on the Transfer and Utilisation of Particulate Control Technology, SanDiego 1990.
4. A.V. Bridgewater: "An Update on Biomass Pyrolysis for Liquid Fuels"; Biomass forEnergy and Industry, 7th EC Conference (1992), Ponte Press, pp. 166-176.
1055
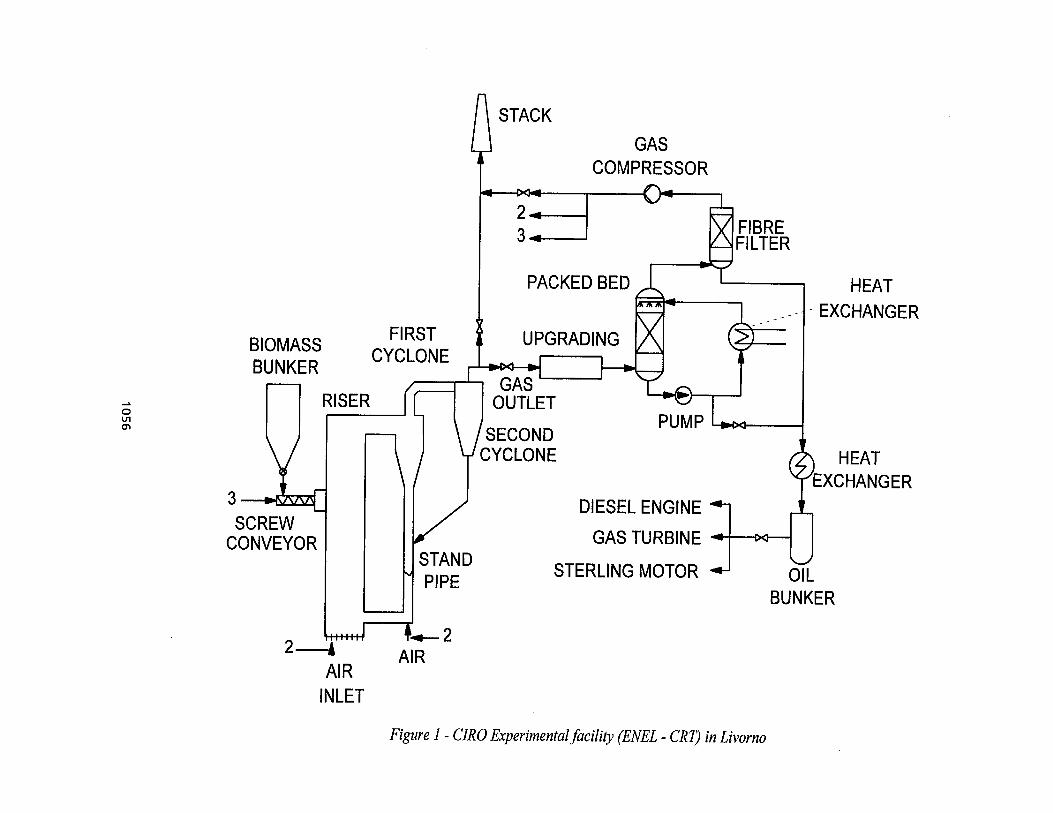
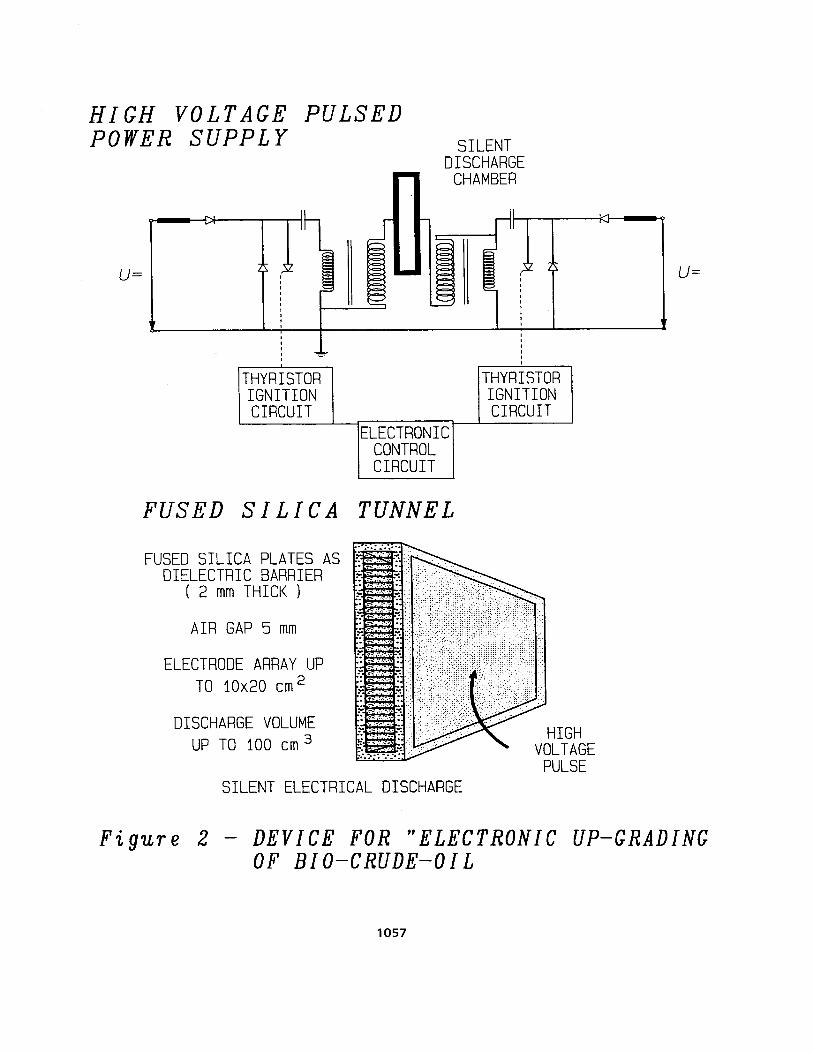
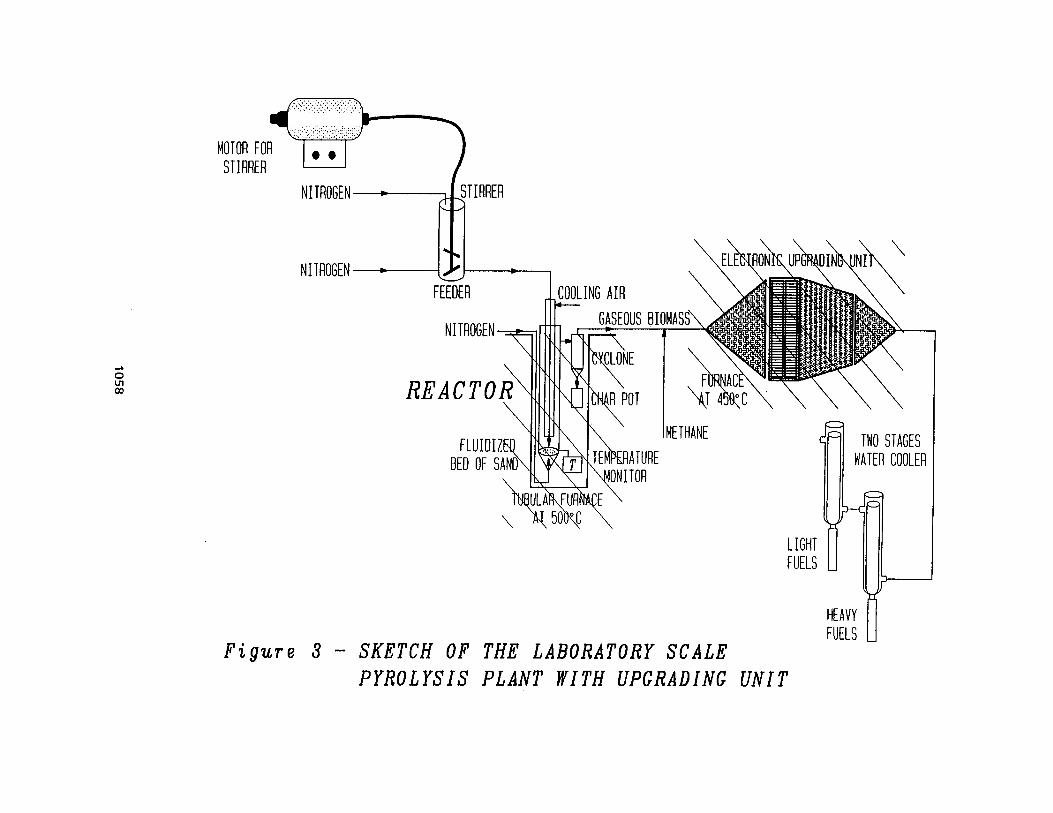
DEVELOPMENT OF END-MARKET USESFOR SLUDGE DERIVED OILS
Herb W. Campbell, M.A.Sc., Vice-President, Wastewater TechnologyCentre, 867 Lakeshore Rd., Burlington, Ontario, Canada, L7R 4L7
Jean Houde Jr, B.Sc., Chemist, Canada Centre for Mineral andEnergy Technology, 555 Booth St., Ottawa, Ontario, Canada, Kl A OG1
EI Hussein Hassan Mohamed, Ph.D., Research Associate, NationalResearch Council of Canada, Ottawa, Ontario, Canada, KIA OR6
Pierre Mourot, Ph.D, Process Development Engineer,SNC-Lavalin Inc., 2 Place Felix-Martin,
Montreal, Quebec, Canada, H2Z lZ3
Abstract
Pyrolytic processes can be utilized to convert organic materials into solid and liquid fuels.The economic viability of most of these processes will be greatly affected by the end-usemarket for the oil, in terms of both a guaranteed outlet for the product and the potentialrevenue. "Since these oils are not conventional products, significant effort may be requiredto establish firm markets.
The "Oil from Sludge" (OFS) technology developed by the Wastewater TechnologyCentre (WTC) has been shown to produce oil yields ranging from 10 to 30% (on a dryweight basis) from dried sewage sludge. Efforts over the last several years have focusedon developing high-value, non-combustion uses for the oil, primarily in the asphaltindustry. Two applications which have shown significant promise are as an asphaltantistripping agent and as an additive for recycling aged asphalt. This paper will focuson the antistripping application.
This research has been a joint effort of the WTC, the Canada Centre for Mineral andEnergy Technology, the National Research Council of Canada and SNC-Lavalin. Theprogram included preliminary characterization of the sludge derived oil (SDO), laboratorytests to evaluate its potential as an antistripping agent and to determine the effect of SDOon asphalt performance factors, field tests to evaluate engineering properties and ahighway test trial on an operating highway.
The study concluded that SDO is an effective antistripping agent and provides protectionagainst moisture induced damage comparable to that achieved with commercial additives.The addition of SDO did not adversely affect the performance of asphalt concrete but didresult in increased workability and compaction, and increased resistance to damage by lowtemperature, rutting and fatigue.
1059
Introduction
Environmental stewardship is based to a large extent, on the concepts of reduction, reuseand recycling. Pyrolysis is a technology which has the potential to recycle a wide varietyof materials ranging from waste plastics to biomass, into some form of liquid oil. Theimplicit assumption is that any oil produced will have some inherent market value andtherefore the process must be a positive one. This is not necessarily true. Oils producedby the pyrolysis of waste materials generally have unique properties and may not beacceptable for conventional end uses without some additional testing or modifications.If a practical outlet for the oil cannot be found, then the original waste disposal problemwill not be solved but simply transformed from one material to another. Similarly, thejustification for pyrolysis is often based on optimistic projections of the potential revenuefrom the use or sale of the oil. If either the projected revenues or the security of themarkets are not realistic, then the overall economics of the technology may need to becompletely re-evaluated. Assuming that the pyrolytic technology is technically sound, theestablishment of markets for the end products is one of the most important componentsto ..commercial success.
Oil from Sludge Technology
The treatment and disposal of sludge from wastewater treatment facilities is becoming amajor issue for large municipalities throughout the world. Costs are significant andacceptable alternatives are limited. Agricultural utilization of sludge or biosolids is beingheavily promoted by both public and government organizations. However, for somecities, this approach is not practical, either because of the quality of the sludge or the lackof a market for the large quantities of material that must be disposed of. Incineration canbe a technically attractive method for reducing the volume of material for ultimatedisposal but currently is not perceived, by either the public or the regulators, as anenvironmentally attractive technology. Pyrolysis of sewage sludge has the potential toaccomplish similar volume reduction and produce an end-product that can be recycled ina more efficient and flexible manner than waste heat from an incinerator.
The Wastewater Technology Centre (WTC) has developed a pyrolytic, low temperature,thermal conversion process known as the "Oil from Sludge" (OFS) technology thatproduces liquid and solid fuels from sewage sludge. A schematic of the process ispresented in Figure 1 and a comprehensive description of the technology is available inthe literature (Campbell and Martinoli, 1990). A bench-scale reactor (lkg/h capacity) anda pilot plant (40 kg/h capacity) have been used to develop the data base. Thefundamental components are similar for both systems and are outlined below. Driedsludge is heated, in the absence of oxygen, to a temperature of approximately 450°C ina reactor. The organic fraction of the sludge is volatilized into the gas phase leaving asolid residue or char. In the secondary portion of the reactor, the gas is brought intocontact with the char in a manner designed to maximize gas/solid contact. The char isdischarged to storage and the vapours are condensed and passed through a decanter orcentrifuge to separate the oil and water phases. Table 1 shows typical performance dataachieved with the bench and pilot scale systems when processing raw sludge. In anintegrated full-scale system, the conceptual design includes combusting the char, reactionwater and non-condensible gases in a fluid bed furnace to control environmental
1060
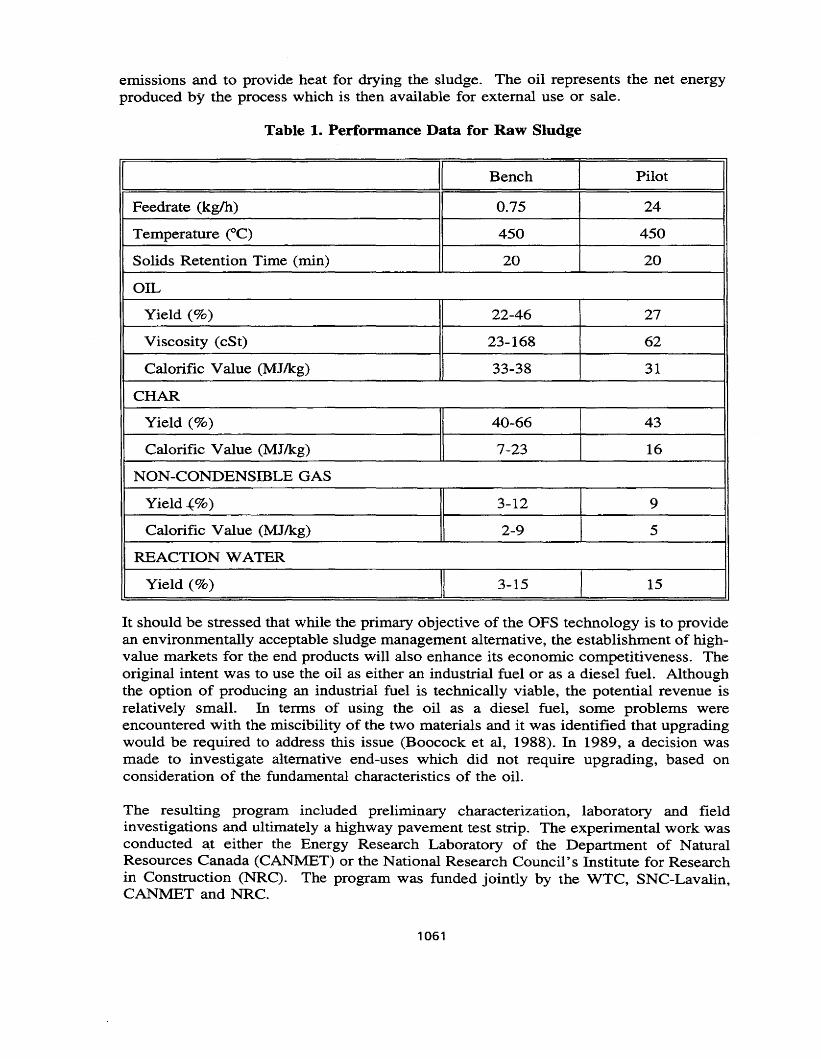
emissions and to provide heat for drying the sludge. The oil represents the net energyproduced by the process which is then available for external use or sale.
Table 1. Performance Data for Raw Sludge
I II Bench I Pilot IFeedrate (kg/h) 0.75 24
Temperature eC) 450 450
Solids Retention Time (min) 20 20
OIL
Yield (%) 22-46 27
Viscosity (cSt) 23-168 62
Calorific Value (MJlkg) 33-38 31
CHAR
Yield (%) 40-66 43
Calorific Value (MJlkg) 7-23 16
NON-CONDENSffiLE GAS
Yield-.(%) 3-12 9
Calorific Value (MJ/kg) 2-9 5
REACTION WATER
Yield (%) 3-15 15
It should be stressed that while the primary objective of the OFS technology is to providean environmentally acceptable sludge management alternative, the establishment of highvalue markets for the end products will also enhance its economic competitiveness. Theoriginal intent was to use the oil as either an industrial fuel or as a diesel fuel. Althoughthe option of producing an industrial fuel is technically viable, the potential revenue isrelatively small. In terms of using the oil as a diesel fuel, some problems wereencountered with the miscibility of the two materials and it was identified that upgradingwould be required to address this issue (Boocock et al, 1988). In 1989, a decision wasmade to investigate alternative end-uses which did not require upgrading, based onconsideration of the fundamental characteristics of the oil.
The resulting program included preliminary characterization, laboratory and fieldinvestigations and ultimately a highway pavement test strip. The experimental work wasconducted at either the Energy Research Laboratory of the Department of NaturalResources Canada (CANMET) or the National Research Council's Institute for Researchin Construction (NRC). The program was funded jointly by the WTC, SNC-Lavalin,CANMET and NRC.
1061
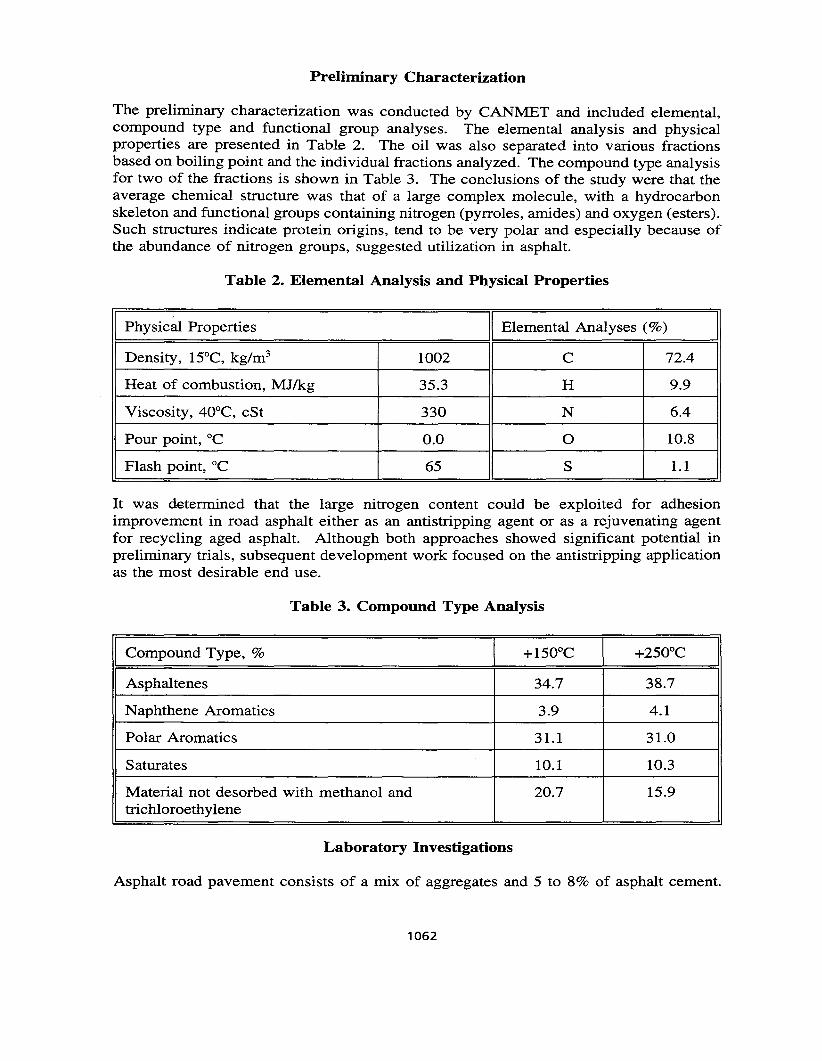
Preliminary Characterization
The preliminary characterization was conducted by CANMET and included elemental,compound type and functional group analyses. The elemental analysis and physicalproperties are presented in Table 2. The oil was also separated into various fractionsbased on boiling point and the individual fractions analyzed. The compound type analysisfor two of the fractions is shown in Table 3. The conclusions of the study were that theaverage chemical structure was that of a large complex molecule, with a hydrocarbonskeleton and functional groups containing nitrogen (pyrroles, amides) and oxygen (esters).Such structures indicate protein origins, tend to be very polar and especially because ofthe abundance of nitrogen groups, suggested utilization in asphalt.
Table 2. Elemental Analysis and Physical Properties
I Physical Properties II Elemental Analyses (%) IDensity, 15°C, kg/rrr' 1002 C 72.4
Heat of combustion, MJ/kg 35.3 H 9.9
Viscosity, 40°C, cSt 330 N 6.4
Pour point, "C 0.0 0 10.8
Flash point, °C 65 S 1.1
It was determined that the large nitrogen content could be exploited for adhesionimprovement in road asphalt either as an antistripping agent or as a rejuvenating agentfor recycling aged asphalt. Although both approaches showed significant potential inpreliminary trials, subsequent development work focused on the antistripping applicationas the most desirable end use.
Table 3. Compound Type Analysis
ICompound Type, % I +150°C I +250°C IAsphaltenes 34.7 38.7
N aphthene Aromatics 3.9 4.1
Polar Aromatics 31.1 31.0
Saturates 10.1 10.3
Material not desorbed with methanol and 20.7 15.9trichloroethylene
Laboratory Investigations
Asphalt road pavement consists of a mix of aggregates and 5 to 8% of asphalt cement.
1062
Asphalt cement does not adhere well to certain aggregates and the separation of these twomaterials is a major cause of pavement failure. In order to utilize aggregates of thisnature, transportation agencies specify the use of approved antistripping agents to improveadhesion. The high polar component of the sludge derived oil (SOO) suggested that SOOwould be an effective alternative to commercially available antistripping agents.
An extensive research program to evaluate the potential of SOO as an antistripping agentwas conducted by CANMET. A summary of the results of this study has been reportedin the literature (Clelland et al, 1993). The program included evaluation of thecompatibility of SDO with conventional asphalt cements, the resistance to stripping ofSOO amended asphalt and the impact of SDO on the performance properties of asphaltcement.
SDO was determined to be compatible with asphalt cement based on the high ductilityof SOO and commercial asphalt blends. Incompatibility in an asphalt blend causes adrastic decrease in ductility that is easily detected.
The resistance to stripping was measured using static immersion tests in which a 95%retained coating is normally required to meet specifications. Test variables included thetype of asphalt (hard or soft), the source of the SDO, the addition rate of SOO andcomparison to commercial antistripping agents. Typical results are shown in Figure 2where the retained coating increases from less than 60% without SOD to approximately95% for both the soft (150/200) and the relatively hard (85/100) penetration asphalt at anSDO concentration of 3%. The performance of SOO was comparable to commercialantistripping agents but slightly higher dosages were required.
The impact of SDO on other properties of asphalt cement was evaluated by measuringperformance parameters such as penetration, viscosity, ductility, etc. Thin film oven testsand Marshall testing were also conducted on the various samples of SDO amendedasphalt. In general, the addition of 3% SDO did not result in any significant deteriorationin asphalt performance and all applicable specifications could be achieved. The additionof 5% SDO did result in increased loss of volatiles in the thin film oven test and softenedthe resulting asphalt. The SOO Marshall stability (strength test) was found to becomparable to that of the commercial additive.
Subsequent to this phase of the study, a number of process changes were tested with theWTC pilot plant. The SDO samples from these trial runs were supplied to CAN:MET todetermine if the processing modifications had a measurable impact on the antistrippingproperties of the oils. A similar program to that described above was conducted on thesesamples. Figure 3 shows the antistripping performance of four of these samples whentested with two different asphalt cements. With the exception of one sample, acceptableperformance was achieved with the addition of 3% SDO. At 3% SOO concentration,modification of the asphalt cement's properties (penetration, viscosity and weight lossafter thin film oven test) was marginal.
In 1992 the National Research Council (NRC) of Canada's Institute for Research inConstruction became involved in the program. It was identified that, in order for SDOto be accepted for use in the asphalt pavement industry, highway authorities would require
1063
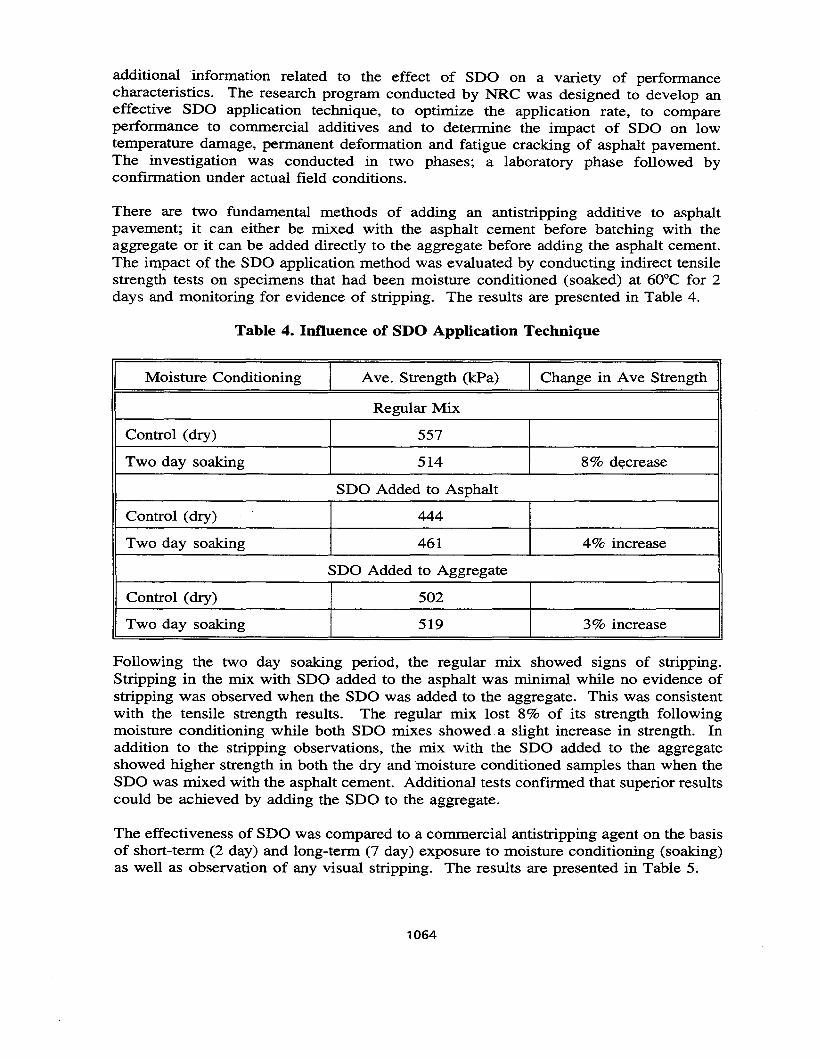
additional information related to the effect of SDO on a variety of performancecharacteristics. The research program conducted by NRC was designed to develop aneffective SDO application technique, to optimize the application rate, to compareperformance to commercial additives and to determine the impact of SDO on lowtemperature damage, permanent deformation and fatigue cracking of asphalt pavement.The investigation was conducted in two phases; a laboratory phase followed byconfirmation under actual field conditions.
There are two fundamental methods of adding an antistripping additive to asphaltpavement; it can either be mixed with the asphalt cement before batching with theaggregate or it can be added directly to the aggregate before adding the asphalt cement.The impact of the SDO application method was evaluated by conducting indirect tensilestrength tests on specimens that had been moisture conditioned (soaked) at 60°C for 2days and monitoring for evidence of stripping. The results are presented in Table 4.
Table 4. Influence of SDO Application Technique
Moisture Conditioning Ave. Strength (kPa) Change in Ave Strength
Regular Mix
Control (dry) 557
Two day soaking 514 8% decrease
SDO Added to Asphalt
Control (dry) 444
Two day soaking 461 4% increase
SDO Added to Aggregate
Control (dry) 502
Two day soaking 519 3% increase
Following the two day soaking period, the regular mix showed signs of stripping.Stripping in the mix with SDO added to the asphalt was minimal while no evidence ofstripping was observed when the SDO was added to the aggregate. This was consistentwith the tensile strength results. The regular mix lost 8% of its strength followingmoisture conditioning while both SDO mixes showed a slight increase in strength. Inaddition to the stripping observations, the mix with the SDO added to the aggregateshowed higher strength in both the dry and 'moisture conditioned samples than when theSDO was mixed with the asphalt cement. Additional tests confirmed that superior resultscould be achieved by adding the SDO to the aggregate.
The effectiveness of SDO was compared to a commercial antistripping agent on the basisof short-term (2 day) and long-term (7 day) exposure to moisture conditioning (soaking)as well as observation of any visual stripping. The results are presented in Table 5.
1064
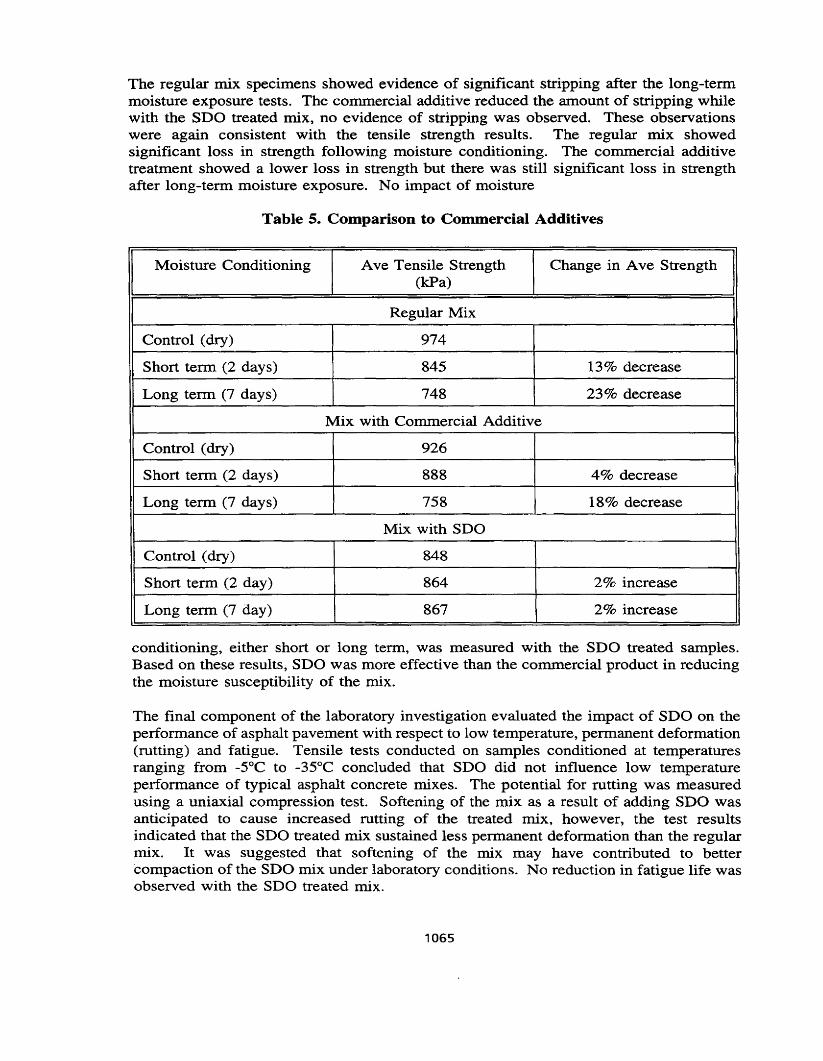
The regular mix specimens showed evidence of significant stripping after the long-termmoisture exposure tests. The commercial additive reduced the amount of stripping whilewith the SDO treated mix, no evidence of stripping was observed. These observationswere again consistent with the tensile strength results. The regular mix showedsignificant loss in strength following moisture conditioning. The commercial additivetreatment showed a lower loss in strength but there was still significant loss in strengthafter long-term moisture exposure. No impact of moisture
Table 5. Comparison to Commercial Additives
Moisture Conditioning Ave Tensile Strength Change in Ave Strength(kPa)
Regular Mix
Control (dry) 974
Short term (2 days) 845 13% decrease
Long term (7 days) 748 23% decrease
Mix with Commercial Additive
Control (dry) 926
Short term (2 days) 888 4% decrease
Long term (7 days) 758 18% decrease
Mix with SDO
Control (dry) 848
Short term (2 day) 864 2% increase
Long term (7 day) 867 2% increase
conditioning, either short or long term, was measured with the SDO treated samples.Based on these results, SDO was more effective than the commercial product in reducingthe moisture susceptibility of the mix.
The final component of the laboratory investigation evaluated the impact of SDO on theperformance of asphalt pavement with respect to low temperature, permanent deformation(rutting) and fatigue. Tensile tests conducted on samples conditioned at temperaturesranging from -Soc to -35°C concluded that SDO did not influence low temperatureperformance of typical asphalt concrete mixes. The potential for rutting was measuredusing a uniaxial compression test. Softening of the mix as a result of adding SDO wasanticipated to cause increased rutting of the treated mix, however, the test resultsindicated that the SDO treated mix sustained less permanent deformation than the regularmix. It was suggested that softening of the mix may have contributed to better'compaction of the SDO mix under laboratory conditions. No reduction in fatigue life wasobserved with the SDO treated mix.
1065
Field Investigations
Laboratory tests are a useful tool to evaluate the impact of changing variables undercontrolled conditions. However, the absolute value of measurements obtained on asphaltconcrete samples produced in the laboratory may not be representative of the performanceof pavements in the field. Factors which are difficult to evaluate in the lab include themethod of field placement, curing under ambient conditions, exposure to weather anduncontrolled loading conditions. In an attempt to address these issues, two sections ofexperimental road were constructed on NRC property in Ottawa. The 25 metre sectionswere laid side-by-side and consisted of a regular mix and an SOO modified mix. Coreswere taken at specific time intervals and tested in the laboratory.
The results from the field testing essentially confirmed the earlier findings in thelaboratory. Moisture damage analysis conducted on conventional and SOO-modifiedcores proved the effectiveness of SOO to provide long-term resistance to stripping. Theaddition of SOO to the mix led to improved resistance to permanent deformation, a higherresistance to low temperature induced stresses and improved resistance to fatigue. Theimproved resistance to permanent deformation was again somewhat surprising based onthe expectation that the SOO would soften the mix. The SOO appeared to provide alubricant effect which enhanced aggregate movement and reorientation during compactionproducing a favourable structure which proved to be denser and more stable than that ofthe regular mix.
Highway Test Strip
The final-step in receiving approval from transportation authorities for the use of newmaterials in the manufacture of asphalt pavement, is generally the construction of a teststrip of highway which will be subjected to ordinary traffic conditions. The Ministry ofTransportation of Quebec (MTQ) was approached with a request to construct a highwayfield test using SOO amended asphalt. Laboratory trials, conducted by the MTQ, toassess the performance of SOO with the proposed aggregate were positive and approvalwas given for the field test.
The field site was constructed in September 1994, in L'Annonciation, Quebec, onHighway 117. This road had a history of stripping problems and was noted forcontinuous heavy traffic, including logging trucks. During the trial, approximately 370tonnes of asphalt cement were utilized to construct almost one half a kilometre ofhighway surface. Samples of the mix were collected randomly by a third party undercontract to MTQ, for QAlQC purposes.
There were no visual differences between the completed section of SOO amendedpavement and the conventional pavement. Two observations were noted during theplacement of the SOO section. The asphalt concrete containing SOO showed a muchimproved workability for the roller operator (compaction) and other paving crewpersonnel (handling with rakes). The roller driver observed that the road with SOOasphalt did not "crack" while the conventional pavement did. As well, there weresignificant amounts of white smoke released by the paving machine during laying of theSOO asphalt. This smoke was attributed to the presence of water and low boiling
1066
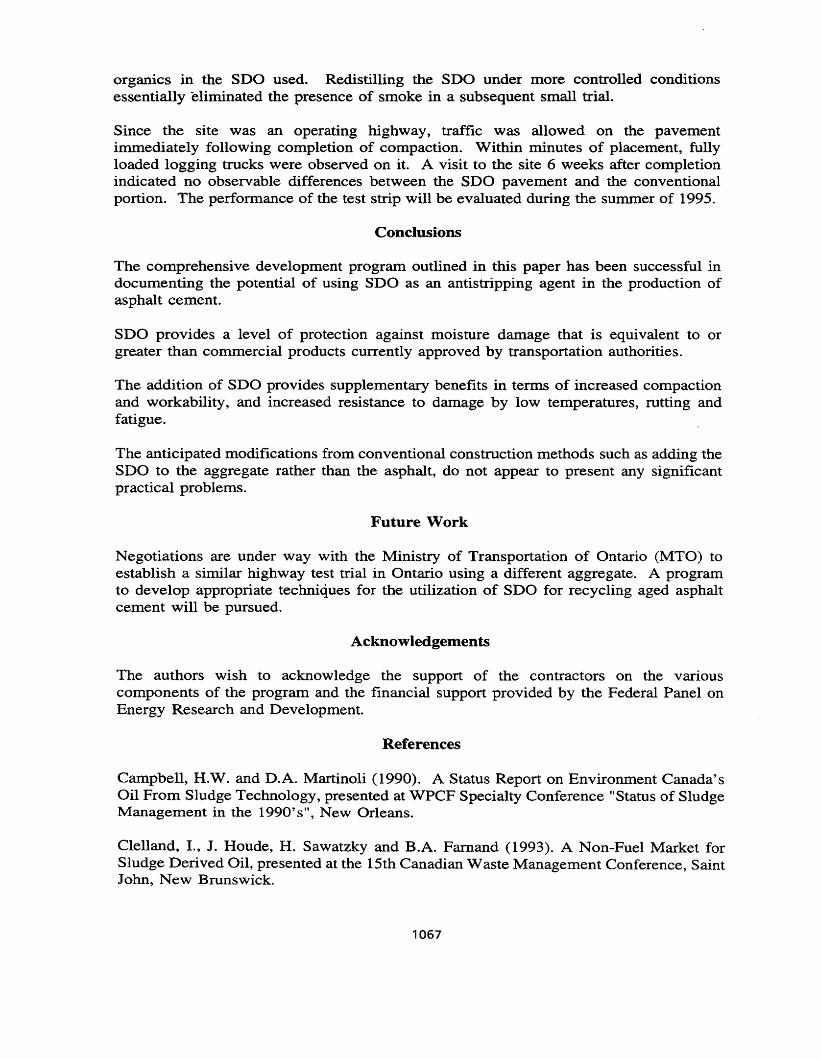
organics in the SDO used. Redistilling the SDO under more controlled conditionsessentially eliminated the presence of smoke in a subsequent small trial.
Since the site was an operating highway, traffic was allowed on the pavementimmediately following completion of compaction. Within minutes of placement, fullyloaded logging trucks were observed on it. A visit to the site 6 weeks after completionindicated no observable differences between the SDO pavement and the conventionalportion. The performance of the test strip will be evaluated during the summer of 1995.
Conclusions
The comprehensive development program outlined in this paper has been successful indocumenting the potential of using SDO as an antistripping agent in the production ofasphalt cement.
SDO provides a level of protection against moisture damage that is equivalent to orgreater than commercial products currently approved by transportation authorities.
The addition of SDO provides supplementary benefits in terms of increased compactionand workability, and increased resistance to damage by low temperatures, rutting andfatigue.
The anticipated modifications from conventional construction methods such as adding theSDO to the aggregate rather than the asphalt, do not appear to present any significantpractical problems.
Future Work
Negotiations are under way with the Ministry of Transportation of Ontario (MTO) toestablish a similar highway test trial in Ontario using a different aggregate. A programto develop appropriate techniques for the utilization of SDO for recycling aged asphaltcement will be pursued.
Acknowledgements
The authors wish to acknowledge the support of the contractors on the variouscomponents of the program and the financial support provided by the Federal Panel onEnergy Research and Development.
References
Campbell, H.W. and D.A. Martinoli (1990). A Status Report on Environment Canada'sOil From Sludge Technology, presented at WPCF Specialty Conference "Status of SludgeManagement in the 1990's", New Orleans.
Clelland, I., J. Houde, H. Sawatzky and B.A. Farnand (1993). A Non-Fuel Market forSludge Derived Oil, presented at the 15th Canadian Waste Management Conference, SaintJohn, New Brunswick.
1067
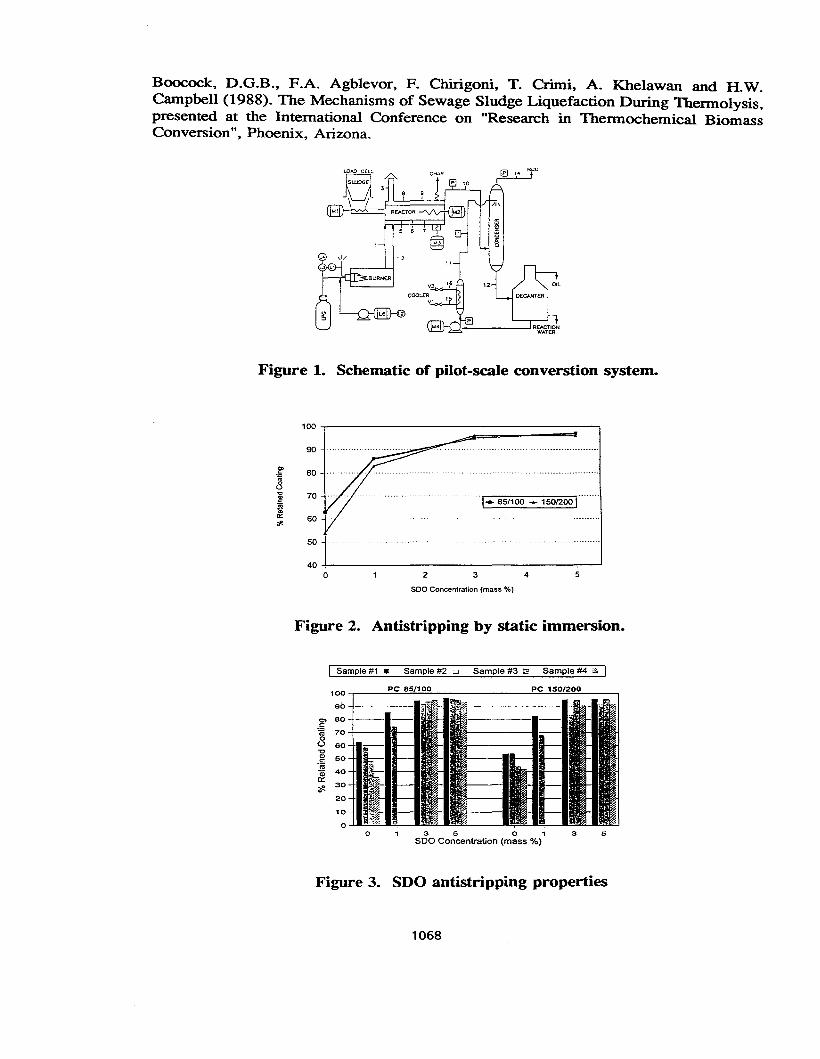
Boocock, D.G.B., EA. Agblevor, F. Chirigoni, T. Crimi, A. Khelawan and H.W.Campbell (1988). The Mechanisms of Sewage Sludge Liquefaction During Thermolysis,presented at the International Conference on "Research in Thermochemical BiomassConversion", Phoenix, Arizona.
Figure 1. Schematic of pilot-scale converstion system.
"",- 85/100 ... 15012001'...... ·
100
90
g- 80~u
~ 70
~'" 60#-
50
400 2 3 4 5
SOO Concentration (mass %)
Figure 2. Antistripping by static immersion.
Sample #1. Sample #2 -' Sample #3::B Sample #4 li;i
100 --.----~~=~~-------'-.:::.....:===----_,
0>c:~ 700(J 60"0
'" 50c:·iii
40a;a::
30:.!!0
20
10
0o 3 5 0 1
SOO Concentration (mass 'Yo)3 5
Figure 3. SDO antistripping properties
1068
RECYCLING OF TREATED WOOD POLES
Peter Fransham, Ph.D.President
TWT Wood Products Inc.537 Hamptons Mews N.W.Calgary, Alberta, T3A 5Bl
(403) 861-3424
Abstract
There are approximately 150 million utilities poles in service in North America. Of the 3million poles removed from service each year, many poles still contain a sound andstructurally intact core and only the outer layer has deteriorated. Since most of the oldpoles are treated with either pentachlorophenol or creosote there are limited disposaloptions available to pole users. The practice of giving old poles away to farmers orother interested parties is falling into disfavour since this practice does not absolve theutility of the environmental liability associated with the treated wood.
TWT has commercialised a thermolysis (Pyrolysis) based process capable of removingoil based preservatives from treated wood. The patented process involves: the shaving ofthe weathered pole exterior; the rapid distillation of oil based preservatives in an oxygendepleted environment; condensation of the vapours; and separation of liquids. TWT hasconstructed a 30,000 pole per year facility east of Calgary and has provided recycledpoles for the construction of two power lines now in use by TransAlta UtilitiesCorporation, Canada's largest investor owned electric utility.
TWT has tested two thermolysis (Pyrolysis) technologies and has determined that contactthermolysis using a heated auger design performed better and with less plugging than afast fluid bed reactor. The fluid bed reactor is prone to coke formation andcontamination of the oil by fine char particles.
Residual PCP concentration in the shavings was reduced from 9500 ppm to 10 ppm.Leachate testing on the char yielded a P~P concentration of 1.43 ppm in the Leachate,well below the EPA standard maximum of 100 ppm.
1069
Introduction
The recycle and reuse philosophy continues to gain acceptance in the industrialisedworld. New industries are finding profitable niches using wastes streams from otherindustries. TWT Wood Products was formed to take advantage of a pending disposalproblem in the treated wood industry. Treated wood has been used in construction formany years. Coal tar derivatives commonly referred to as creosote found widespreadapplications in the manufacturing of railway ties and bridge timbers and was thepreservative of choice for most utility poles put into service prior to 1960. Since 1960pentachlorophenol has replaced most of the creosote utility poles. Pressure fromenvironmental groups and more stringent government regulations limited the use ofcreosote and PCP to industrial applications only (i.e. ties and poles). Water based heavymetal preservatives have totally replaced the organic preservatives in consumer woodproducts. The familiar green wood found at most lumber years is pressure treated withwater based copper chromium arsenate (CCA). The only oil based treating solutionavailable in the domestic market is zinc or copper napthanate and is recommended totreat saw cuts and other non treated exposed surfaces.
All preservatives have one thing in common, that is how to dispose of treated wood onceit has been removed from service. Landfilling is the obvious choice in many jurisdictionsbut it is becoming more expensive and less acceptable politically. Wood is a low densitywaste anddoes not compact as readily as regular municipal waste and some landfills arelimiting the disposal of wood in landfills. Furthermore, the landfill operator normallyonly stores the waste and does not take title to the waste. If for some reason treated woodwas to be reclassified as a hazardous material, then the pole owner, in this case theutility, could be responsible for its removal from the landfill and subsequent disposal.The incineration of PCP and CCA treated wood is not recommended or permitted inmany jurisdictions because of the potential for formation of dioxins, furans, and freearsenic.
As utilities move towards deregulation and search for means to reduce capital andinventory costs, recycling of salvaged poles becomes more attractive. TWT hasdemonstrated that utility poles can be recycled and provided back to the utility for lessthan the cost of a new pole and thereby reduce the cost of line installations. For exampleon a line constructed in the fall of 1994 TransAlta Utilities Corporation savedapproximately $30,000 on the cost of 41 poles. In a competitive market, these savingsare passed onto the consumer resulting in equivalent service at a reduced cost.
TWT Wood Products Inc. was formed in 1993 specifically to develop disposal methodsfor treated wood. The initial partners in the venture were Worthing Industries Inc., afirm specialising in environmental technology and TransAlta Utilities Corporation,Canada's largest investor owned utility. Worthing has recently signed a letter of intent topurchase TransAlta's shares of TWT. Part of the sale/purchase agreement is a contractfor TWT to supply TransAlta with recycled poles.
1070
Age and Life Span of Utility Poles
The useful life of a treated wood pole can exceed 40 years, however relatively few polesare retired because they have reached their age limit. Bell Canada reported that poles arereplaced early because they are too small to carry the required equipment (Millette,1994). The average age of poles in service at Bell Canada was 23 years and in recentyears the average has dropped to about 12 years (Millette, 1994). TWT has notconducted a statistical analysis of poles delivered to its plant, but it is safe to say that maypoles. where the brand is still visible were manufactured in the late 1970 to early 1980.Poles recycled in 1976 by Bell Pole Company for TransAlta Utilities were removed fromservice in the fall of 1994. These poles have been refurbished and returned to service fora third time. Refurbishing reduces the size and class of a pole and hence it is returned toservice in lighter capacity than its first or second service period. Refurbishing ensuresthat the pole will reach its projected life span of fifty years. Furthermore the retreatmentof the pole should kill any incipient rot that may have gone undetected in the inspectionprocess and a recycled pole should last as long as a new pole. By extending the life of autility pole beyond its initial projected service life fewer trees will be cut for poles andthe forest will have sufficient time to grow new trees for poles.
Utility Pole Management
The management of poles arnvmg at TWT's yard is shown in Figure 1. Prior toinspection all poles are scanned for nails, staples, bolts and hardware. A standard metallocator is used to detect metal that could damage the peeler or saws. There is a completespectrum of pole quality arriving at the plant. Some poles can be returned to service afterinspection, while others are too rotten or damaged to warrant additional work. About35% of the salvaged poles are suitable for reuse as utility poles. Of the remaining 65%about 35% is being cut into lumber for exterior uses. The remaining 30% is peeled andsales are developing in the agricultural and off shore markets.
Poles that can be recycled are peeled to remove the weathered surface. Generally lessthan 1 cm is removed from the pole exterior and no attempt is made to remove all of thetreated layer. Thick sapwood species like pine have preservative penetrations in excessof 2.5 em, while thin sapwood species like western red cedar have penetrations in therange of 1 em. Only enough wood is removed from the pole to expose sound fibre andno attempt is made to remove all of the treated portion.
Shavings from the pole peeler are conveyed to the thermolysis plant were the treatingsolutions are distilled and condensed. The pole is then retreated and returned to service.Wood too small for utility poles is used in construction of pole barns, sheds, fence posts,and landscaping. The cleaned shavings are sold to a concrete additive finn for use in themanufacture of speciality concrete. Pildysh & Associates ( a local Calgary, Alberta firm)
1071
have developed a patented process whereby the additive can increase the percentage offlyash used in the manufacture of cement. Fly ash is a by-product of thermal powergeneration and its incorporation into cement reduces the cost of the cement and solves afly ash disposal problem.
TWT has succeeded in finding markets for all the by-products of pole recycling. Acontract has been signed with a pole treating company to purchase the recoveredpreservatives for reuse in the manufacture of treated wood. Wood has its highest valueas a pole and offsets the small margins available for the other products. With theexception of the wood for poles, any revenue generated by the char and the recovered oilcontributes positively to the bottom line and offsets what would otherwise be a disposalcost. TWT has completed a test program to saw non utility grade wood into dimensionedlumber. The quality of the wood exceeded expectations and there is a strong market fordimensioned lumber in the agricultural markets.
Thermolysis Process
Thermolysis is used as a synonym of Pyrolysis. For a number of reasons the termpyrolysis-has a somewhat tainted reputation in western Canada. For marketing reasons itwas decided to use a new term with a similar meaning.
Fast ThermolysisThe initial called for the conversion ofTWT's mobile fast thermolysis plant into a mobilepreservative recovery facility. The thermolysis process has been described in detailelsewhere (Fransham, 1992). The process uses a fluidized bed design with heated recyclegas as the fluidizing gas. The plant ~as designed to operate with a bed temperature of550 degrees C. PCP vaporises at 310 degrees C and the operating temperature wasreduced to 330 degrees C. Initial testing on western red cedar shavings were successfuland the PCP concentration in the char was reduced to 2 ppm from 10,000 ppm. Theshavings were slightly charred and chemical analyses indicated the presence of somepyrolysis products. Carry over of char from the cyclone into the captured oil resulted inthe sludge formation and pump blockages. The addition of filter elements eliminated allstoppages due to sludge for western red cedar. There were however blockages in therecycled gas lines due to coke formation. This aspect is discussed in detail in a followingsection.
In October 1994 TWT received a truckload of southern yellow pine poles fromTennessee. The poles were peeled and a test run was conducted. The test run was farfrom satisfactory. A viscous resinous sludge was formed that upon cooling became avitreous solid. Virtually all product recovery lines became totally blocked after one hourof running. It was clearlyevident that present design would not stay running on resinoussouthern yellow pine. Since southern yellow pine is the dominant species used for poles
1072
in the southern US. it was imperative that a method be located to treat salvaged yellowpine poles.
Contact ThermolysisBench scale testing during a preliminary feasibility study showed that a clean oil could beevaporated from shavings using heat and a nitrogen purge gas. While the amount ofsample tested was small (less than 50 grams) there was no evidence of sludge formationor coking. Based on these results, again with western red cedar, it was decided that acontact thermolysis design using a slow rotating auger could solve some of the sludgingand coking problems. Heated augers have been used in the agricultural industry formany years to prepare feed and auger pyrolysis of sewage sludge has been described byCampbell (1991). Since the auger system can operate without recycle gas, it was felt thatthe sludge problem could be eliminated if the gas velocity could be reduced. A recyclegas pump was added to the system to test the effects of gas velocity on performance. Therecycled gas was heated in the oven to 350 degrees prior to entering into the augersection.
A 2 kg/hr bench scale unit was designed and built during the winter of 1994-95. A flowsheet for the bench scale apparatus is shown in Figure 2. In simplistic terms a stainlesssteel auger is heated to 350 degrees C in a direct fired furnace. A blower removes thevapours from the auger section to a spray tower where first stage condensation occurs.The temperature in the spray tower is maintained at 120 degrees C to ensure that allwater remains in the vapour state. A second heat exchanger cools and condenses theaqueous phase. Excess gas is flared through the furnace and the standard volume of gasis moved through the system by a blower. The entire process is simpler than the fluidizedbed design used previously and given the relatively low volume of gas recycled throughthe system, there is less char carry over into the oil phase.
Results and Discussion
OperationsTWTfs fast fluid bed thermolysis unit was designed to operate at 550 degrees centigradewith a recycled gas flow of approximately 350 cubic metres per hour. The gas velocitygives a reactor residence time of under one second. Prior to entering the reactor therecycled gas is heated indirectly in a furnace to a temperature of 770 degrees centigrade.For operation as a preservative distillation unit the furnace parameters remain the samebut the quantity of feed is increased to reduce the reactor temperature to thepentachlorophenol distillation temperature of 350 degrees centigrade.
Given the above mentioned operating parameters, it was possible to reduce theconcentration of PCP in the wood shavings from lO~OOO ppm to under 3 ppm. However,
1073
continuous operation was not possible because of severe coking in the quench tower.The quench tower consists of a 25 em diameter by 50 em high cylinder packed with PallRings. Within eight hours ofoperation the top surface of the pall rings became encrustedwith a vitreous like, black, porous carbon material. Recycled gas flow was reduced andhot reactor gas was forced into the main feed hopper and resulted in combustion of thewood shavings in the hopper.
Furthermore, carry over of fine char into the oil resulted in the formation of a sludge atthe bottom of the product tanks. Since this sludge is rich in PCP, it required disposal at ahazardous waste processing facility at a cost of over $400. per barrel.
The bench scale unit performed satisfactorily only when recycled gas was not used topurge the auger section. When recycled gas was used, there was a rapid plugging of thetube between the auger and the spray tower. The conclusion drawn here is that the cokeformation is directly related to the flow of recycled gas in the auger section. Further testsif planned to confirm the relationship between coking and gas velocity.
ResultsThe results shown in Figure 3 are for southern yellow pine. The October tests were runon the larger fluid bed reactor and samples were obtained before the total blockage of allproduct collection pipes. The December and January tests were run on the bench scalecontact thermolysis unit. There are two interesting trends in the data. The first is theapparent loss of penta in the stored samples. Samples were stored in 20 litre plastic pailswith tight fitting lids. Between October and January the initial concentration of PCPdecreased from 9970 ppm to 1100 ppm. The pre-thermolysis wood was previouslyhammer milled to a size fraction approximately 1 mm in thickness and 10 mm in length.The PCP is: either evaporating during storage; photodegrading or bio-degrading.
The second trend is the reduction in PCP concentration in the char. The PCPconcentration in the post thermolysis char was systematically reduced from 1100 ppm to10.6 ppm through changes in residence time and temperature. A toxicity characteristicleaching procedure (TCLP) test was performed on the shavings and yielded a value of1.43 ppm, well below the EPA requirement of 100 ppm.
Conclusion
TWT technologies has demonstrated the technical feasibility of removing oil based woodpreservatives from salvaged utility poles. A demonstration facility has been constructednear Calgary, Alberta, Canada and has been recycling salvaged utility poles. Two powerlines have been constructed using recycled poles and the utility and field crews aresatisfied with their performance.
1074
Fast pyrolysis with high recycle gas velocities appears to cause coking and sludgeformation problems. The formation of theses unwanted materials has been solved byswitching the technology to a heated auger contact thermolysis process.
References
Campbell, H.W., Converting Sludge to Fuel - A Status Report, Biomass ThermalProcessing, Proceedings of the first CanadaJEuropean Community R&D ContractorsMeeting, Ottawa, 1990, pp78 - 85 ..
Fransham, Peter, Fast Pyrolysis Demonstration Plant, Biomass Thermal Processing,Proceedings of the first CanadalEuropean Community R&D Contractors Meeting,Ottawa, 1990, pp74 - 77.
Millette, Louise, Les Problematigues Associees au Bois Treaite Chez Bell Canada,Proceedings of a conferences sponsored by The Canadian Institue of Treated Wood,Ottawa, Ontario, June 20-21, 1994.
1075
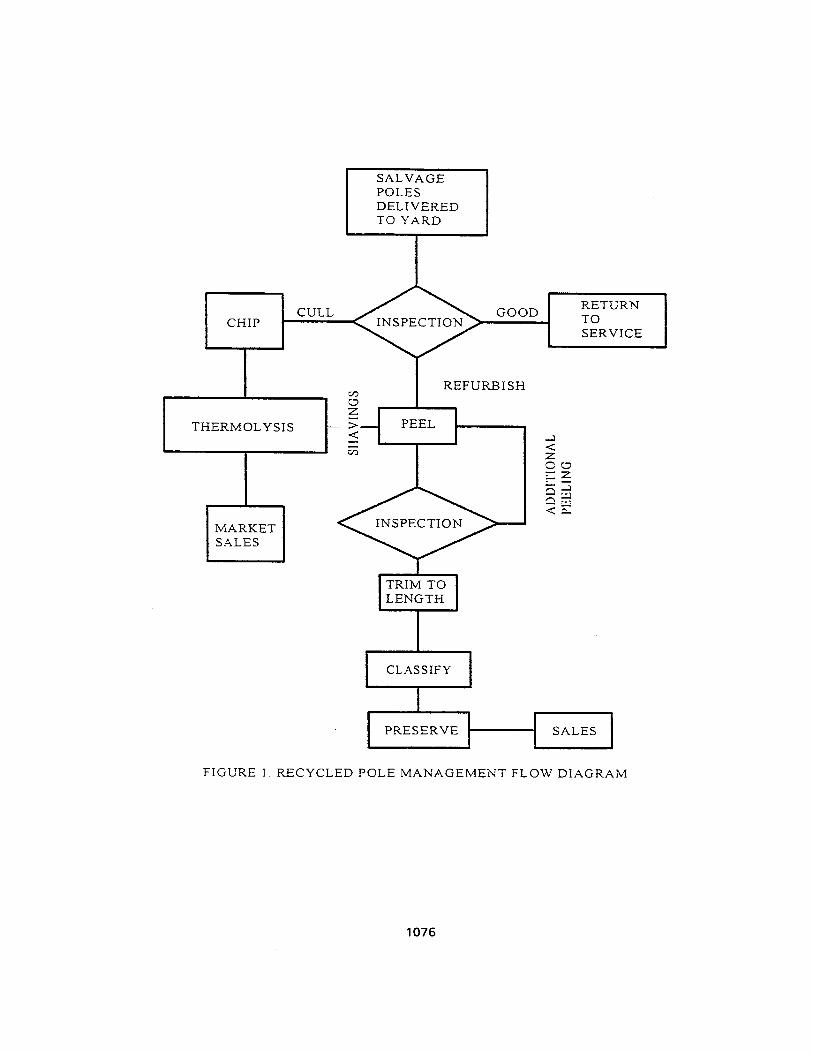
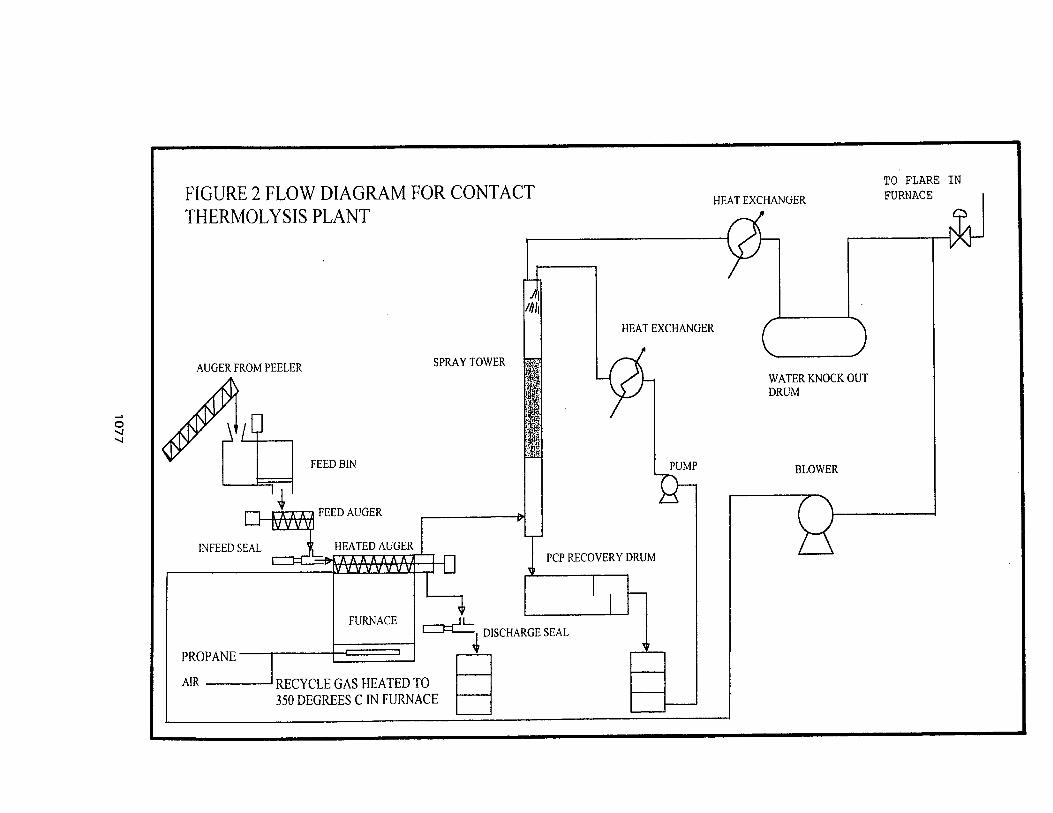
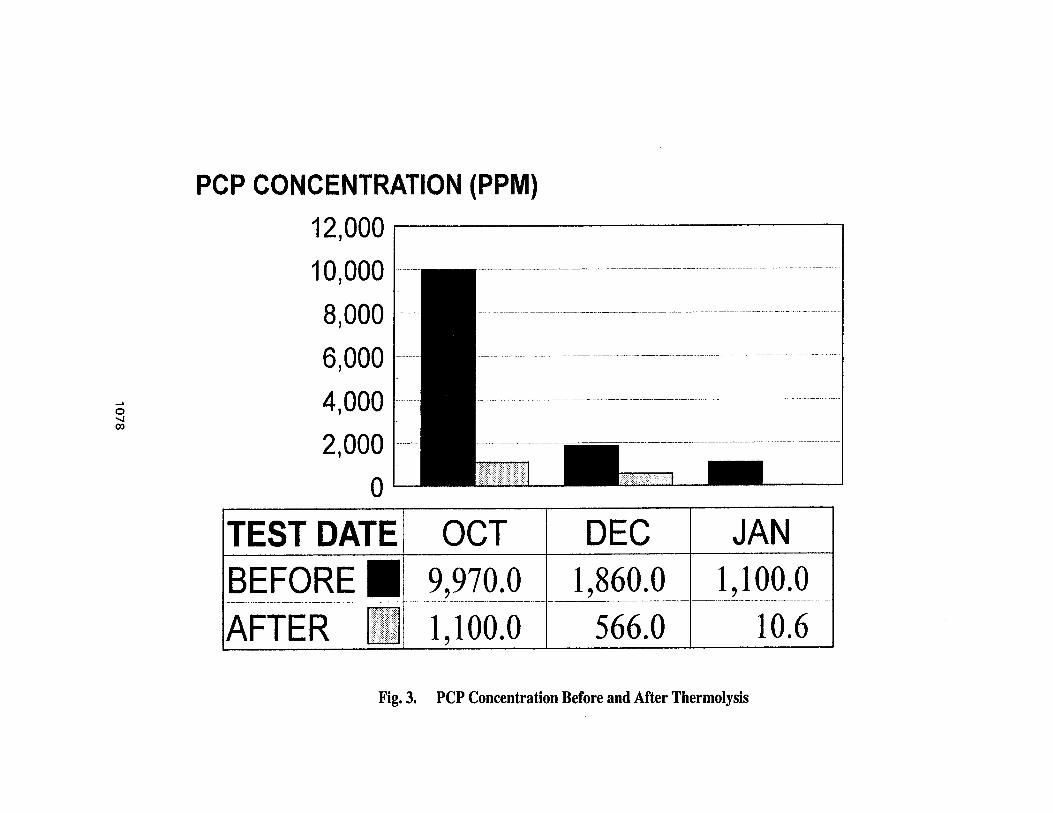
CHARACTERISTICS OF A FAST PYROLYSIS BIO-FUEL AND ITSMISCIBILITY WITH OXYGENATED AND CONVENTIONAL
FUELS
Narendra N. Bakhshi, Ph.D., Professor and John D. Adjaye, Ph.D., Postdoctoral FellowCatalysis & Chemical Reaction Engineering Laboratory, Department of Chemical
Engineering110 Science Place, University of Saskatchewan
Saskatoon, S7N OWO. Canada.
Abstract
A bio-fuel produced by ENSYN Technologies Inc. using the RTP method wasthoroughly characterized for its pH, specific gravity, viscosity, water content, ash content,alkali content, flash point, vapor pressure, elemental composition, heating value, stabilitybehavior, filterability as well as its distillation and separation characteristics. In addition,its miscibility characteristics with some oxygenated compounds and conventional fuelswere investigated. The objective was to determine the essential bio-fuel properties neededfor applications such as storage and combustion in turbines. The bio-fuel consisted of49.8 wt% C, 7.5 wt% H, and 42.7 wt% O. Its flash point was 7fPC and heating value was17.5 MJtK.g. About 58.0 wt% of Bio-fuel was low boiling fraction «2000C), 6.0 wt%high boiling fraction (200-4500C) and 36.0 wt% non-volatiles (>450 0C). The viscosityand heating value were significantly affected by its water content. The stability of thebio-fuel (studied by monitoring its pH, density, viscosity and distillation characteristicsover a 1 year period) changed with time. The bio-fuel was miscible with methanol,ethanol and acetone (oxygenated compounds (OC)). Addition of small amounts of OCdecreased its viscosity and density and increased its heating value. The miscibilitycharacteristics of Bio-fuel and Bio-fuel-i-OC (termed feeds) with Diesel and Bunker Cwere investigated. Based on 100g of feed, the optimum amount of Diesel required toobtain stable miscibility over a test period of 24h were: 16g in Bio-fuel, 2Ig in Biofuel-s-Methanol, 25g in Bio-fuel-t-Ethanol and 199 in Bio-fuel+Acetone. The bio-fuel wasmiscible with Bunker C in all proportions. Other miscibility studies involving mixtures ofWIF (water-insoluble fraction of Bio-fuel)+OC will be discussed. These studies showedthat there was a potential for utilizing Bio-fuel directly or indirectly with conventionalfuels.
1079
Introduction
The bio-oil produced by ENSYN uses the Rapid Thermal Processing (RTP) method'fwhich is one of the fast pyrolysis technologies. In order to use the bio-oil for anyapplication, it is necessary to characterize it thoroughly", Characterization normallyrequires measurement of the bio-oil properties such as density, viscosity, flash point,heating values, surface tension, volatility and its distillation characteristics. Monitoring ofthese properties over time is also important for identifying the bio-oil stabilitycharacteristics. In addition, bio-oils may contain particulate and mineral matter whichwould require their measurement andlor removal before being used.
Thus, the objective of this study was to determine the physical properties of some fastpyrolysis bio-oils, study their filtration, distillation, separation characteristics as well asstability behavior. Since bio-fuels are being considered as alternative sources of fuel, itwas of interest to investigate its miscibility characteristics with both oxygenated (such asethanol, methanol, acetone) and conventional fuels such as diesel and bunker C.
ExperimentalBio-oil Preparation
Three different types of bio-oils (designated as Bio-oil A, B and C) were investigated fortheir physical properties. Bio-oil A was produced from commercial hardwood sawdustwith the ENSYN RTP-3 Pilot Plant which was operated at approximately 525°C andresidence time of 450-500 ms. Bio-oil B was produced from birch wood flour with theENSYN Research Unit (using reactor configuration RTP-3A) which was operated atapproximately 515°C and residence time of 500 ms. The bio-oil vapors were hot filteredprior to condensation. Bio-oil C was a commercial bio-oil sample produced fromhardwood sawdust (Maple/Oak) with the ENSYN 25 TPD Plant. The plant was operatedat approximately 500°C and residence time of 700 ms. The bio-oil was wet scrubbed.
Methods for Measurement of Bio-oil PropertiesThe CHN content of the oils was determined with Perkin Elmer 2000 CHN Analyzer.The oxygen content of the bio-oil was obtained by difference. The total ash content of thebio-oil was determined following the procedure outlined in ASTM D 482-80 forpetroleum products". The alkali content was determined by thermal ashing of the bio-oilfollowed by ICP-AES (Le. Inductively Coupled Plasma-Atomic Emission Spectroscopy)method.
The water content was determined by Karl Fischer (KF) method. The procedure outlinedin ASTM E 203-75 was followed", With normal KF reagents, the presence of aldehydes,ketones and carboxylic acid" in the bio-oil react with the KF titrant to produce water,thus, the amount of water is usually over-estimated. Instead, Hydranal-compositereagents, AQUASTAR Comp 5K and Solvent K (ALDRICH, USA) were used for thetitration. These reagents limit the water formed during titration. The pH of the bio-oil wasdetermined with a Fischer Scientific Accumet Model 10 pH/mV meter equipped withcontrols and connections necessary to compensate automatically for effects of solutiontemperature and to standardize the meter with buffers. The flash point of the bio-oil wasdetermined following the procedure described in the ASTM D 93-80 method". Thedensity measurements were made with a 10 mL pycnometer and viscosity measurementswere performed with a cone/plate Brookfield Digital Viscometer (Model DV-II).
The surface tension (ST) of the oil was measured with a Fisher Surface Tensiomat Model21. The meter uses the Ring Method (platinum-iridium ring) to determine the surfacetension. The instrument was calibrated with ethanol (ST = 22.75 mN/m), acetone (ST =23.70 mN/m), and methanol (ST = 22.61 mN/m). Effect of water content on theproperties of Bio-oil A was also studied. By using a desiccator (drierite, Le., anhydrous
1080
calcium sulfate) the water content of Bio-oil A was varied and the heating value,viscosity, density and pH measured. Also, the stability behavior of Bio-oil A wasexamined by monitoring the changes in its properties over a 1 year period.
Bio-oils need to be dewatered in order to increase their heating values. Our observationsindicate that by adding extra water to bio-oil, it separated into a water soluble fraction(WSF) and an organic fraction (Water Insoluble Fraction, (WIF) which contained verylow water content). Thus, about 2 g of water was added to 109 bio-oil and the contentswere shaken vigorously and left for 24 hr. After 24 hr, WSF was separated from the WIF.The physical properties of the WIF and WSF products were determined. The effect oftemperature (between 23-80°C) on the yield of WIF was also investigated.
Filtration characteristics of the bio-oils were also studied. Pyrolytic bio-oils contain tarand particulates in the form of char. Thus, attempts were made to identify the mosteffective means of removing these particulates to determine the amount of tar usingfritted glass funnels, screens and centrifugation. Bio-oil A only was used for thesestudies. The distillation characteristics (studied (at atmospheric pressure) of the bio-oilalso was The objective was to investigate the extent of volatility of the bio-oil undernormal conditions of temperature and pressure as well as to determine the composition(by GC and GC-MS) of the volatile fractions. The distillation procedure described inStandard Method IP 24 for crude petroleum? was followed
Methods for Measurement of Bio-oil Miscibility CharacteristicsSince bio-oils are potential fuel alternatives, it would be worthwhile to utilize it withtraditional fuels such as diesel and bunker C. Hence, miscibility of bio-oil (and WIF) withoxyfuels (namely, methanol, ethanol and acetone) with Diesel and Bunker C wasexamined. Later, the miscibility of mixtures of Bio-oil and oxyfuels with diesel andbunker C were investigated.
ProcedureAbout 10 g of feed (bio-oil, WIF, bio-oil+Oxyfuel or WIF+Oxyfuel) was placed in a 50mL bottle. A pre-determined quantity of diesel was added. The proportion of feed toDiesel was varied from 9: 1 to 1:9 weight ratio. The mixture was stirred for 30 min at aspeed of 1500 rpm. The miscibility of the mixtures during stirring and the time taken forthe mixture to remain miscible were monitored. These observations were carried out atregular time intervals for about 4 h. After 24 h, the mixture was observed formiscibility/separation. Usually, some amount of diesel was found to separate from themixture forming a layer of diesel above the mixture. The quantity of this diesel wasdetermined by collecting it with a micro-pipette and weighing. The amount of diesel thatwas miscible with the feed material was determined by difference between the quantity ofdiesel added and the diesel separated from the mixture after 24 hr. This quantity of dieselwas designated as permanently "soluble" diesel. Changes in the miscibility associatedwith temperature was studied by conducting the experiments at room temperature (23°C)and at 45°C. The Bio-oil-Oxyfuel and WIF+Oxyfuel mixtures used were prepared in theweight ratios; 9: 1, 4: 1 and 1: 1. The properties of some of the feed material+dieselmixtures were also determined.
A similar procedure was followed with the Feed+Bunker C miscibility studies. In theseruns, it was observed that only acetone was miscible with Bunker C. Also, preliminaryresults showed that the miscibility of Bio-oil+Methanol and Bio-oil+Ethanol with Bunkerwas exceptionally poor. Hence, these tests were discontinued. Thus, only the Bio-oil andBio-oil-i-Acetone with Bunker C test was investigated-in detail.
1081
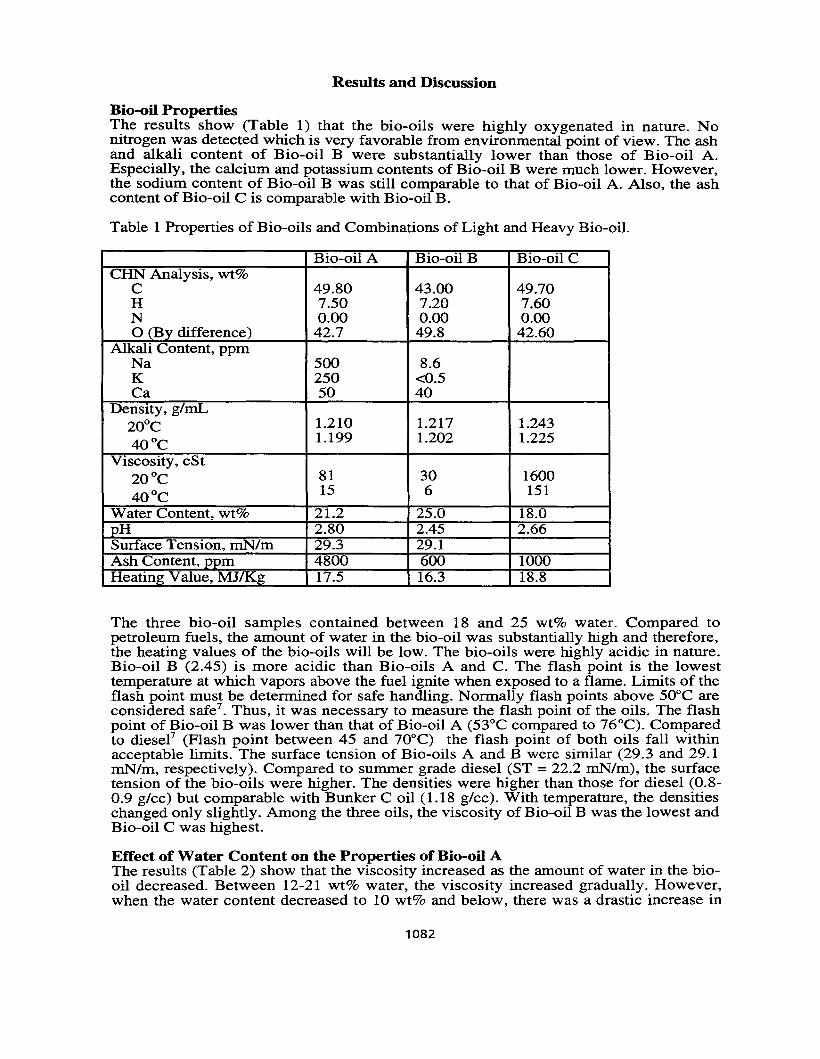
Results and Discussion
Bio-oil PropertiesThe results show (Table 1) that the bio-oils were highly oxygenated in nature. Nonitrogen was detected which is very favorable from environmental point of view. The ashand alkali content of Bio-oil B were substantially lower than those of Bio-oil A.Especially, the calcium and potassium contents of Bio-oil B were much lower. However,the sodium content of Bio-oil B was still comparable to that of Bio-oil A. Also, the ashcontent of Bio-oil C is comparable with Bio-oil B.
Table 1 Properties of Bio-oils and Combinations of Light and Heavy Bio-oil.
Bio-oil A Bio-oil B Bio-oil CCRN Analysis, wt%
C 49.80 43.00 49.70H 7.50 7.20 7.60N 0.00 0.00 0.00o (By difference) 42.7 49.8 42.60
Alkali Content, ppmNa 500 8.6K 250 <0.5Ca 50 40
Density, g/mL20°C 1.210 1.217 1.243
40°C 1.199 1.202 1.225
Viscosity, cSt20°C 81 30 1600
40°C 15 6 151
Water Content, wt% 21.2 25.0 18.0pH 2.80 2.45 2.66Surface Tension, mN/m 29.3 29.1Ash Content, ppm 4800 600 1000Heating Value, MJlKg 17.5 16.3 18.8
The three bio-oil samples contained between 18 and 25 wt% water. Compared topetroleum fuels, the amount of water in the bio-oil was substantially high and therefore,the heating values of the bio-oils will be low. The bio-oils were highly acidic in nature.Bio-oil B (2.45) is more acidic than Bio-oils A and C. The flash point is the lowesttemperature at which vapors above the fuel ignite when exposed to a flame. Limits of theflash point must be determined for safe handling. Normally flash points above 50°C areconsidered safe? Thus, it was necessary to measure the flash point of the oils. The flashpoint of Bio-oil B was lower than that of Bio-oil A (53°C compared to 76°C). Comparedto diesel? (Flash point between 45 and 70°C) the flash point of both oils fall withinacceptable limits. The surface tension of Bio-oils A and B were similar (29.3 and 29.1mN/m, respectively). Compared to summer grade diesel (ST = 22.2 mN/m), the surfacetension of the bio-oils were higher. The densities were higher than those for diesel (0.80.9 glee) but comparable with Bunker C oil (1.18 glee). With temperature, the densitieschanged only slightly. Among the three oils, the viscosity of Bio-oil B was the lowest andBio-oil C was highest.
Effect of Water Content on the Properties of Bio-oil AThe results (Table 2) show that the viscosity increased as the amount of water in the biooil decreased. Between 12-21 wt% water, the viscosity increased gradually. However,when the water content decreased to 10 wt% and below, there was a drastic increase in
1082
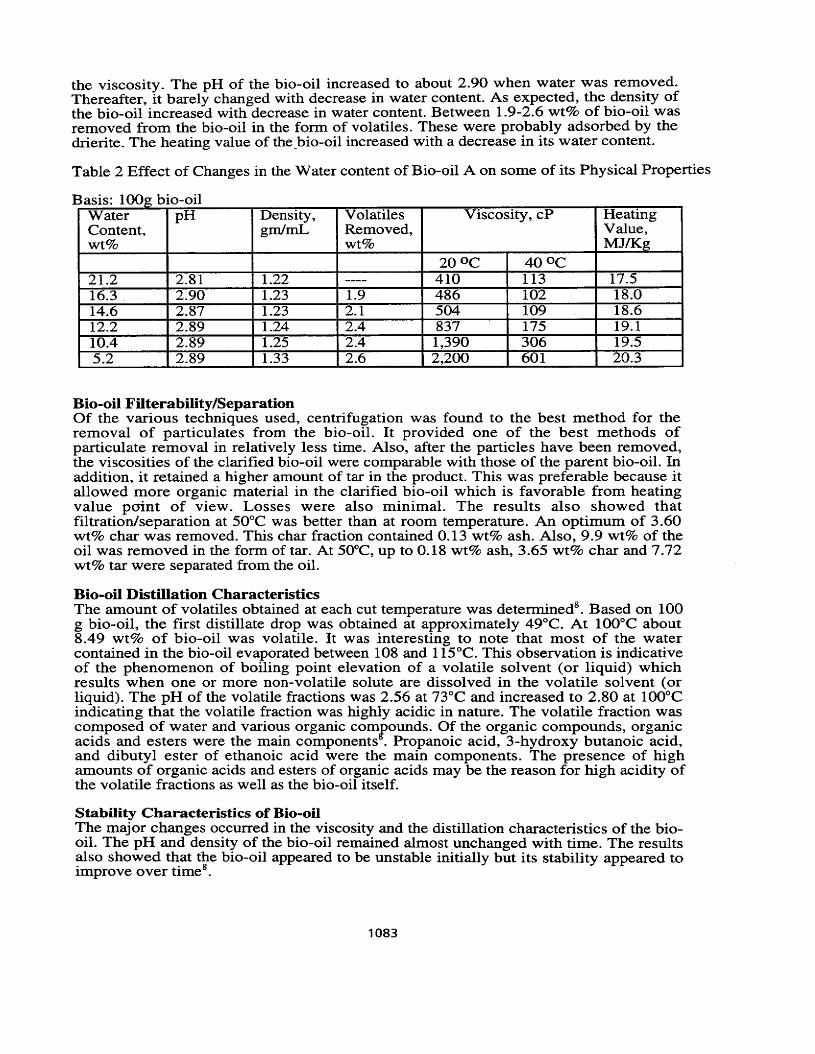
the viscosity. The pH of the bio-oil increased to about 2.90 when water was rem?ved.Thereafter, it barely changed with decrease in water content. As expected, the density ofthe bio-oil increased with decrease in water content. Between 1.9-2.6 wt% of bio-oil wasremoved from the bio-oil in the form of volatiles. These were probably adsorbed by thedrierite. The heating value of the_bio-oil increased with a decrease in its water content.
Table 2 Effect of Changes in the Water content of Bio-oil A on some of its Physical Properties
"1100 b'asis: ,~ 10-01
Water pH Density, Volatiles Viscosity, cP HeatingContent, gm/mL Removed, Value,wt% wt% MJlKg
20 0C 40 0C
21.2 2.81 1.22 ---- 410 113 17.516.3 2.90 1.23 1.9 486 102 18.014.6 2.87 1.23 2.1 504 109 18.612.2 2.89 1.24 2.4 837 175 19.110.4 2.89 1.25 2.4 1,390 306 19.55.2 2.89 1.33 2.6 2,200 601 20.3
B
Bio-oil Filterability/SeparationOf the various techniques used, centrifugation was found to the best method for theremoval of particulates from the bio-oil. It provided one of the best methods ofparticulate removal in relatively less time. Also, after the particles have been removed,the viscosities of the clarified bio-oil were comparable with those of the parent bio-oil. Inaddition, it retained a higher amount of tar in the product. This was preferable because itallowed more organic material in the clarified bio-oil which is favorable from heatingvalue point of view. Losses were also minimal. The results also showed thatfiltration/separation at 50°C was better than at room temperature. An optimum of 3.60wt% char was removed. This char fraction contained 0.13 wt% ash. Also, 9.9 wt% of theoil was removed in the form of tar. At 50°C, up to 0.18 wt% ash, 3.65 wt% char and 7.72wt% tar were separated from the oil.
Bio-oil Distillation CharacteristicsThe amount of volatiles obtained at each cut temperature was determined". Based on 100g bio-oil, the first distillate drop was obtained at approximately 49°C. At 100°C about8.49 wt% of bio-oil was volatile. It was interesting to note that most of the watercontained in the bio-oil evaporated between 108 and 115°C. This observation is indicativeof the phenomenon of boiling point elevation of a volatile solvent (or liquid) whichresults when one or more non-volatile solute are dissolved in the volatile solvent (orliquid). The pH of the volatile fractions was 2.56 at 73°C and increased to 2.80 at 100°Cindicating that the volatile fraction was highly acidic in nature. The volatile fraction wascomposed of water and various organic compounds. Of the organic compounds, organicacids and esters were the main components. Propanoic acid, 3-hydroxy butanoic acid,and dibutyl ester of ethanoic acid were the main components. The presence of highamounts of organic acids and esters of organic acids may be the reason for high acidity ofthe volatile fractions as well as the bio-oil itself.
Stability Characteristics of Bio-oilThe major changes occurred in the viscosity and the distillation characteristics of the biooil. The pH and density of the bio-oil remained almost unchanged with time. The resultsalso showed that the bio-oil appeared to be unstable initially but its stability appeared toimprove over time8
•
1083
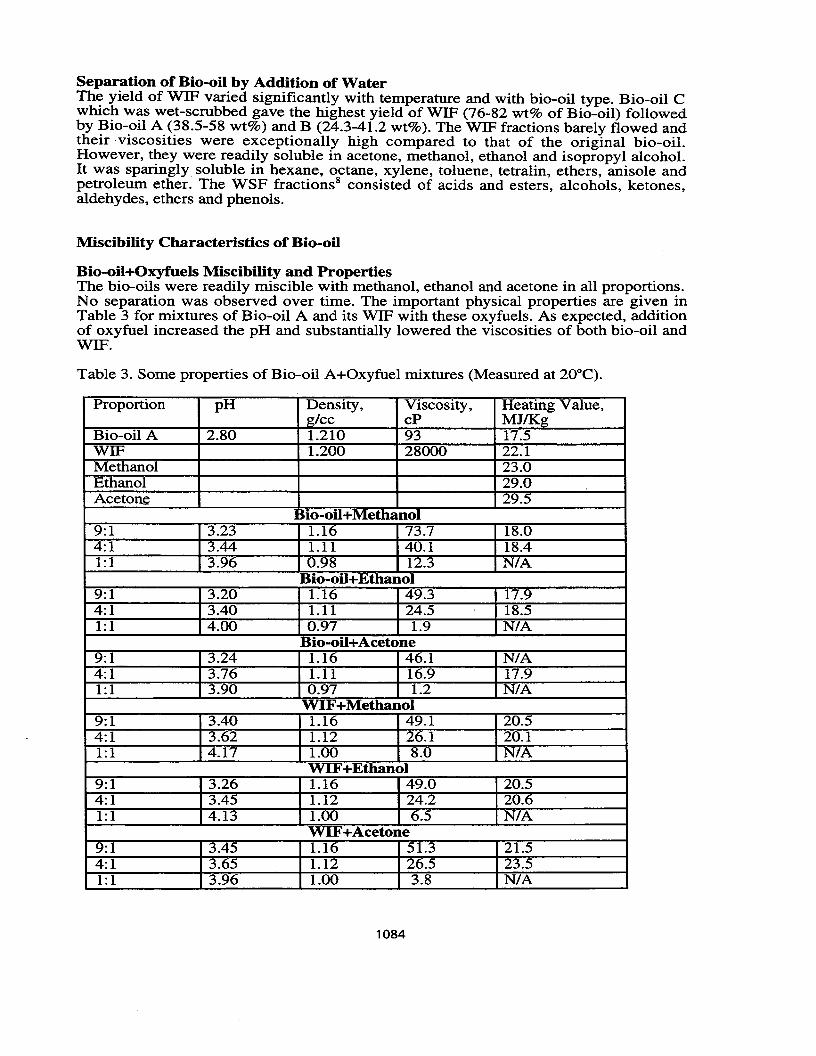
Separation of Bio-oil by Addition of WaterThe yield of WIF varied significantly with temperature and with bio-oil type. Bio-oil Cwhich was wet-scrubbed gave the highest yield of WIF (76-82 wt% of Bio-oil) followedby Bio-oil A (38.5-58 wt%) and B (24.3-41.2 wt%). The WIF fractions barely flowed andtheir viscosities were exceptionally high compared to that of the original bio-oil,However, they were readily soluble in acetone, methanol, ethanol and isopropyl alcohol.It was sparingly soluble in hexane, octane, xylene, toluene, tetralin, ethers, anisole andpetroleum ether. The WSF fractions" consisted of acids and esters, alcohols, ketones,aldehydes, ethers and phenols.
Miscibility Characteristics of Bio-oil
Bio-oil+Oxyfuels Miscibility and PropertiesThe bio-oils were readily miscible with methanol, ethanol and acetone in all proportions.No separation was observed over time. The important physical properties are given inTable 3 for mixtures of Bio-oil A and its WIF with these oxyfuels. As expected, additionof oxyfuel increased the pH and substantially lowered the viscosities of both bio-oil andWIF.
Table 3. Some properties of Bio-oil A+Oxyfuel mixtures (Measured at 20°C).
Proportion pH Density, Viscosity, Heating Value,glee cP MJlKg
Bio-oil A 2.80 1.210 93 17.5WIF 1.200 28000 22.1Methanol 23.0Ethanol 29.0Acetone 29.5
Bio-oil+Methanol9:1 3.23 1.16 73.7 18.04:1 3.44 1.11 40.1 18.41:1 3.96 0.98 12.3 N/A
Bio-oil+Ethanol9:1 3.20 1.16 49.3 17.94:1 3.40 1.11 24.5 18.51:1 4.00 0.97 1.9 N/A
Bio-oil+Acetone9:1 3.24 1.16 46.1 N/A4:1 3.76 1.11 16.9 17.91:1 3.90 0.97 1.2 N/A
WIF+Methanol9:1 3.40 1.16 49.1 20.54:1 3.62 1.12 26.1 20.11:1 4.17 1.00 8.0 N/A
WIF+Ethanol9:1 3.26 1.16 49.0 20.54:1 3.45 1.12 24.2 20.61:1 4.13 1.00 6.5 N/A
WIF+Acetone9:1 3.45 1.16 51.3 21.54:1 3.65 1.12 26.5 23.51:1 3.96 1.00 3.8 N/A
1084
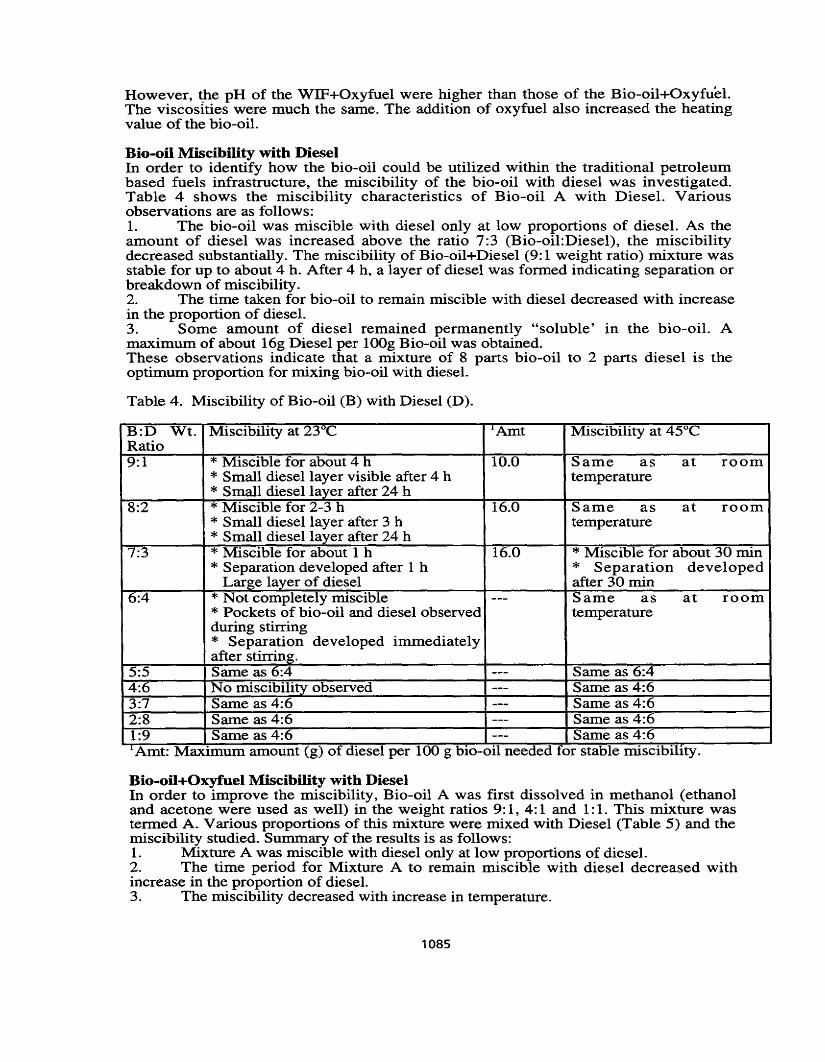
However, the pH of the WIF+Oxyfuel were higher than those of the Bio-oil-i-Oxyfuel,The viscosities were much the same. The addition of oxyfuel also increased the heatingvalue of the bio-oil.
Bio-oil Miscibility with DieselIn order to identify how the bio-oil could be utilized within the traditional petroleumbased fuels infrastructure, the miscibility of the bio-oil with diesel was investigated.Table 4 shows the miscibility characteristics of Bio-oil A with Diesel. Variousobservations are as follows:1. The bio-oil was miscible with diesel only at low proportions of diesel. As theamount of diesel was increased above the ratio 7:3 (Bio-oil.Diesel), the miscibilitydecreased substantially. The miscibility of Bio-oil+Diesel (9: 1 weight ratio) mixture wasstable for up to about 4 h. After 4 h, a layer of diesel was formed indicating separation orbreakdown of miscibility.2. The time taken for bio-oil to remain miscible with diesel decreased with increasein the proportion of diesel.3. Some amount of diesel remained permanently "soluble' in the bio-oil. Amaximum of about 16g Diesel per 100g Bio-oil was obtained.These observations indicate that a mixture of 8 parts bio-oil to 2 parts diesel is theoptimum proportion for mixing bio-oil with diesel.
Table 4. Miscibility of Bio-oil (B) with Diesel (D).
Amt. Maximum amount (g) of diesel per 100 g bio-oil needed for stable miscibility.
Bio-oil+Oxyfuel Miscibility with DieselIn order to improve the miscibility, Bio-oil A was first dissolved in methanol (ethanoland acetone were used as well) in the weight ratios 9: 1, 4: 1 and 1: 1. This mixture wastermed A. Various proportions of this mixture were mixed with Diesel (Table 5) and themiscibility studied. Summary of the results is as follows:1. Mixture A was miscible with diesel only at low proportions of diesel.2. The time period for Mixture A to remain miscible with diesel decreased withincrease in the proportion of diesel.3. The miscibility decreased with increase in temperature.
B:D Wt. Miscibility at 23°C 'Amt Miscibility at 45°CRatio9:1 * Miscible for about 4 h 10.0 Same as at room
* Small diesel layer visible after 4 h temperature* Small diesel layer after 24 h
8:2 * Miscible for 2-3 h 16.0 Same as at room* Small diesel layer after 3 h temperature* Small diesel layer after 24 h
7:3 * Miscible for about 1 h 16.0 * Miscible for about 30 min* Separation developed after 1 h * Separation developed
Large layer of diesel after 30 min6:4 * Not completely miscible --- Same as at room
* Pockets of bio-oil and diesel observed temperatureduring stirring* Separation developed immediatelyafter stirring.
5:5 Same as 6:4 --- Same as 6:44:6 No miscibility observed --- Same as 4:63:7 Same as 4:6 --- Same as 4:62:8 Same as 4:6 --- Same as 4:61:9 Same as 4:6 --- Same as 4:61
..
1085
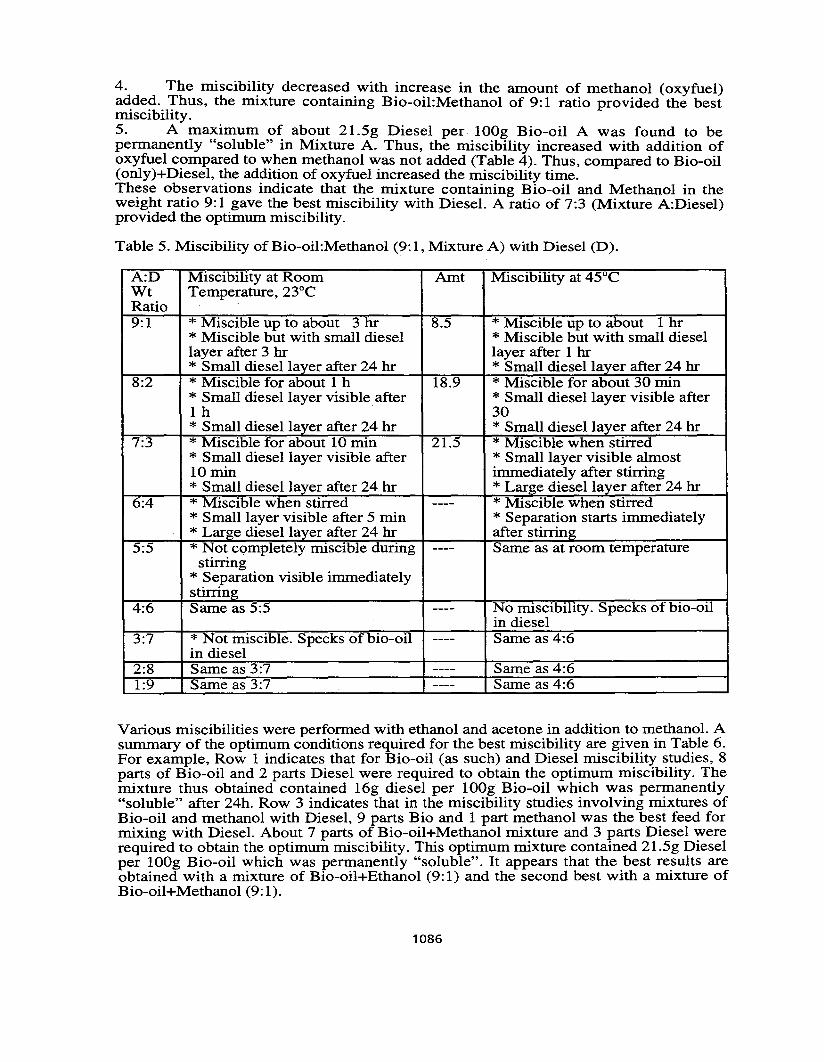
4. The miscibility decreased with increase in the amount of methanol (oxyfuel)added. Thus. the mixture containing Bio-oil.Methanol of 9: 1 ratio provided the bestmiscibility.5. A maximum of about 21.5g Diesel per 100g Bio-oil A was found to bepermanently "soluble" in Mixture A. Thus. the miscibility increased with addition ofoxyfuel compared to when methanol was not added (Table 4). Thus. compared to Bio-oil(onlyj--Diesel, the addition of oxyfuel increased the miscibility time.These observations indicate that the mixture containing Bio-oil and Methanol in theweight ratio 9: 1 gave the best miscibility with Diesel. A ratio of 7:3 (Mixture A:Diesel)provided the optimum miscibility.
Table 5. Miscibility of Bio-oil:Methano1 (9: 1, Mixture A) with Diesel (D).
A:D Miscibility at Room Amt Miscibility at 45°CWt Temperature, 23°CRatio9:1 * Miscible up to about 3hr 8.5 * Miscible up to about 1hr
* Miscible but with small diesel * Miscible but with small diesellayer after 3 hr layer after 1 hr* Small diesel layer after 24 hr * Small diesel layer after 24 hr
8:2 * Miscible for about 1 h 18.9 * Miscible for about 30 min* Small diesel layer visible after * Small diesel layer visible after1h 30* Small diesel layer after 24 hr * Small diesel layer after 24 hr
7:3 * Miscible for about 10 min 21.5 * Miscible when stirred* Small diesel layer visible after * Small layer visible almost10 min immediately after stirring* Small diesel layer after 24 hr * Large diesel layer after 24 hr
6:4 * Miscible when stirred ---- * Miscible when stirred* Small layer visible after 5 min * Separation starts immediately* Large diesel layer after 24 hr after stirring
5:5 * Not completely miscible during ---- Same as at room temperaturestirring
* Separation visible immediatelystirring
4:6 Same as 5:5 ---- No miscibility. Specks of bio-oilin diesel
3:7 * Not miscible. Specks of bio-oil ---- Same as 4:6in diesel
2:8 Same as 3:7 ---- Same as 4:61:9 Same as 3:7 ---- Same as 4:6
Various miscibilities were performed with ethanol and acetone in addition to methanol. Asummary of the optimum conditions required for the best miscibility are given in Table 6.For example, Row 1 indicates that for Bio-oil (as such) and Diesel miscibility studies, 8parts of Bio-oil and 2 parts Diesel were required to obtain the optimum miscibility. Themixture thus obtained contained 16g diesel per 100g Bio-oil which was permanently"soluble" after 24h. Row 3 indicates that in the miscibility studies involving mixtures ofBio-oil and methanol with Diesel, 9 parts Bio and 1 part methanol was the best feed formixing with Diesel. About 7 parts of Bio-oil--Methanol mixture and 3 parts Diesel wererequired to obtain the optimum miscibility. This optimum mixture contained 21.5g Dieselper 100g Bio-oil which was permanently "soluble". It appears that the best results areobtained with a mixture of Bio-oil-i-Ethanol (9: 1) and the second best with a mixture ofBio-oil+Methanol (9: 1).
1086
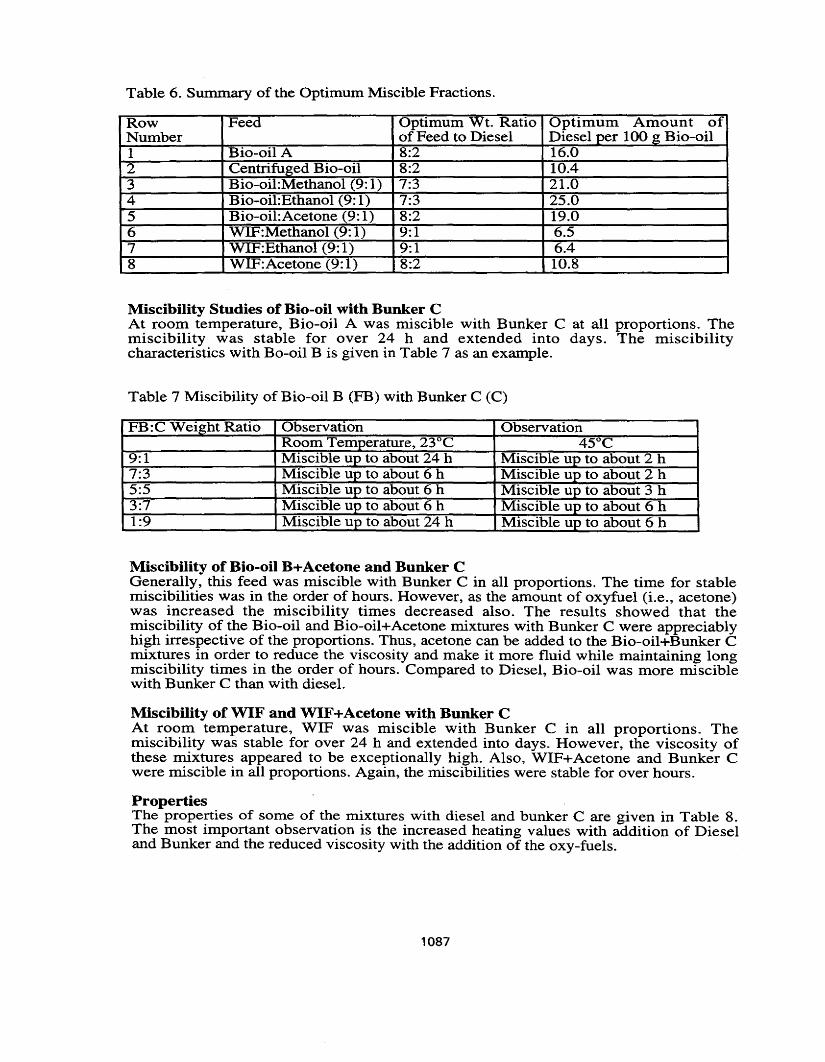
Table 6. Summary of the Optimum Miscible Fractions.
Row Feed Optimum Wt. Ratio Optimum Amount ofNumber of Feed to Diesel Diesel per 100 }?; Bio-oil1 Bio-oil A 8:2 16.02 Centrifuged Bio-oil 8:2 10.43 Bio-oil:Methanol (9: 1) 7:3 21.04 Bio-oil:Ethanol (9: 1) 7:3 25.05 Bio-oil:Acetone (9: 1) 8:2 19.06 WIF:Methanol (9: 1) 9:1 6.57 WIF:Ethanol (9: 1) 9:1 6.48 WIF:Acetone (9:1) 8:2 10.8
Miscibility Studies of Bio-oil with Bunker CAt room temperature, Bio-oil A was miscible with Bunker C at all proportions. Themiscibility was stable for over 24 h and extended into days. The miscibilitycharacteristics with Bo-oil B is given in Table 7 as an example.
Table 7 Miscibility of Bio-oil B (FB) with Bunker C (C)
FB:C Weight Ratio Observation ObservationRoom Temperature, 23°C 45°C
9:1 Miscible up to about 24 h Miscible up to about 2 h7:3 Miscible up to about 6 h Miscible up to about 2 h5:5 Miscible up to about 6 h Miscible up to about 3 h3:7 Miscible up to about 6 h Miscible up to about 6 h1:9 Miscible up to about 24 h Miscible up to about 6 h
Miscibility of Bio-oil Bs-Acetone and Bunker CGenerally, this feed was miscible with Bunker C in all proportions. The time for stablemiscibilities was in the order of hours. However, as the amount of oxyfuel (i.e., acetone)was increased the miscibility times decreased also. The results showed that themiscibility of the Bio-oil and Bio-oil-i-Acetone mixtures with Bunker C were appreciablyhigh irrespective of the proportions. Thus, acetone can be added to the Bio-oil-i-Bunker Cmixtures in order to reduce the viscosity and make it more fluid while maintaining longmiscibility times in the order of hours. Compared to Diesel, Bio-oil was more misciblewith Bunker C than with diesel.
Miscibility ofWIF and WIF+Acetone with Bunker CAt room temperature, WIF was miscible with Bunker C in all proportions. Themiscibility was stable for over 24 h and extended into days. However, the viscosity ofthese mixtures appeared to be exceptionally high. Also, WIF+Acetone and Bunker Cwere miscible in all proportions. Again, the miscibilities were stable for over hours.
PropertiesThe properties of some of the mixtures with diesel and bunker C are given in Table 8.The most important observation is the increased heating values with addition of Dieseland Bunker and the reduced viscosity with the addition of the oxy-fuels.
1087
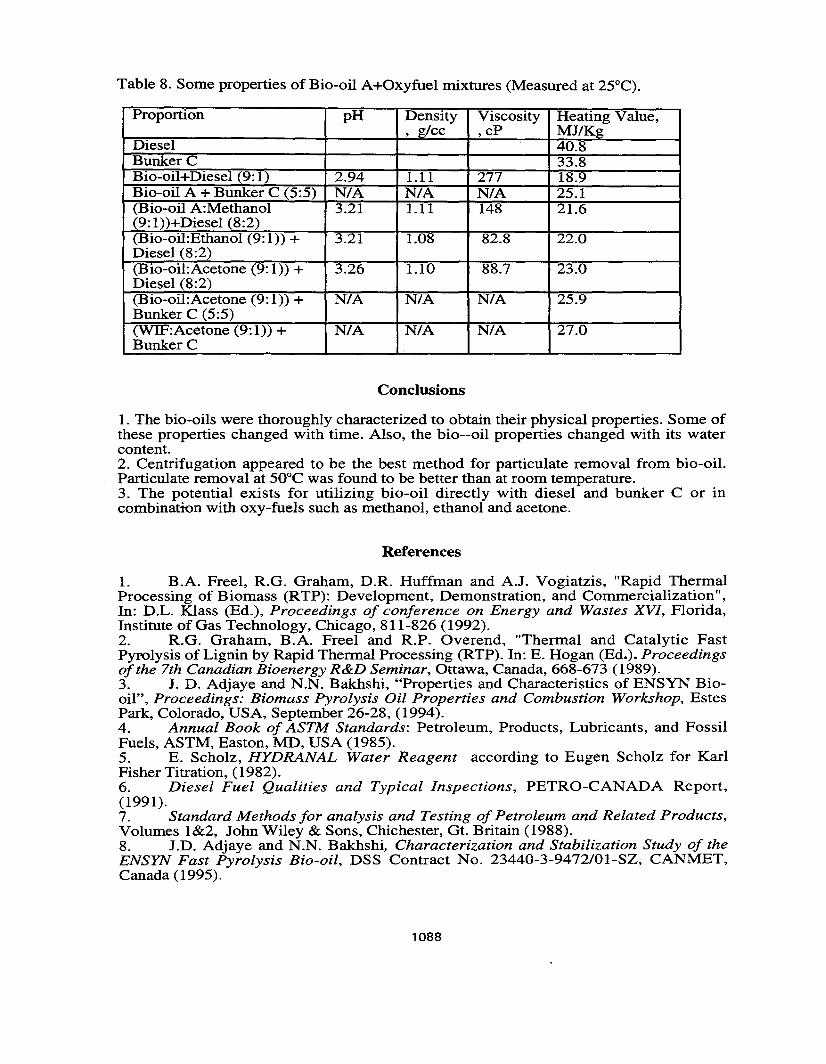
Table 8. Some properties of Bio-oil As-Oxyfuel mixtures (Measured at 25°C).
Proportion pH Density Viscosity Heating Value.• glee .cp MJlKg
Diesel 40.8BunkerC 33.8Bio-oil+Diesel (9: 1) 2.94 1.11 277 18.9Bio-oil A + Bunker C (5:5) N/A N/A N/A 25.1(Bio-oil A:Methanol 3.21 1.11 148 21.6(9: l»+Diesel (8:2)(Bio-oil:Ethanol (9: 1» + 3.21 1.08 82.8 22.0Diesel (8:2)(Bio-oil:Acetone (9: 1» + 3.26 1.10 88.7 23.0Diesel (8:2)(Bio-oil:Acetone (9:1» + N/A N/A N/A 25.9Bunker C (5:5)(WlF:Acetone (9: 1) + N/A N/A N/A 27.0BunkerC
Conclusions
1. The bio-oils were thoroughly characterized to obtain their physical properties. Some ofthese properties changed with time. Also. the bio--oil properties changed with its watercontent.2. Centrifugation appeared to be the best method for particulate removal from bio-oil.Particulate removal at 50°C was found to be better than at room temperature.3. The potential exists for utilizing bio-oil directly with diesel and bunker C or incombination with oxy-fuels such as methanol. ethanol and acetone.
References
1. B.A. Freel. R.G. Graham. D.R. Huffman and A.J. Vogiatzis, "Rapid ThermalProcessing of Biomass (RTP): Development, Demonstration, and Commercialization",In: D.L. Klass (Ed.), Proceedings of conference on Energy and Wastes XVI, Florida,Institute of Gas Technology, Chicago, 811-826 (1992).2. R.G. Graham, B.A. Freel and R.P. Overend, "Thermal and Catalytic FastPyrolysis of Lignin by Rapid Thermal Processing (RTP). In: E. Hogan (Ed.). Proceedingsofthe 7th Canadian Bioenergy R&D Seminar. Ottawa. Canada. 668-673 (1989).3. J. D. Adjaye and N.N. Bakhshi, "Properties and Characteristics of ENSYN Biooil", Proceedings: Biomass Pyrolysis Oil Properties and Combustion Workshop. EstesPark. Colorado. USA. September 26-28. (1994).4. Annual Book of ASTM Standards: Petroleum, Products. Lubricants, and FossilFuels. ASTM, Easton, MD, USA (1985).5. E. Scholz, HYDRANAL Water Reagent according to Eugen Scholz for KarlFisher Titration, (1982).6. Diesel Fuel Qualities and Typical Inspections. PETRO-CANADA Report.(1991).7. Standard Methods for analysis and Testing of Petroleum and Related Products.Volumes 1&2. John Wiley & Sons. Chichester. Gt. Britain (1988).8. J.D. Adjaye and N.N. Bakhshi, Characterization and Stabilization Study of theENSYN Fast Pyrolysis Bio-oil, DSS Contract No. 23440-3-9472/01-SZ, CANMET,Canada (1995).
1088
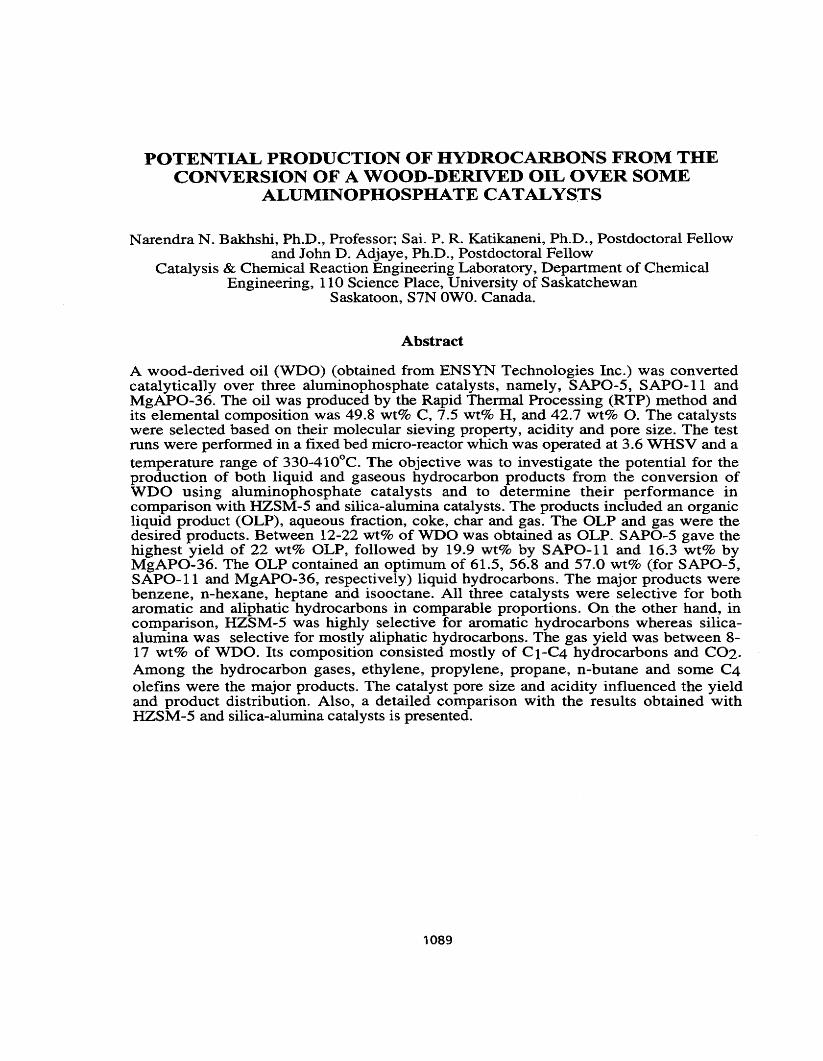
POTENTIAL PRODUCTION OF HYDROCARBONS FROM THECONVERSION OF A WOOD-DERIVED OIL OVER SOME
ALUNUNOPHOSPHATECATALYSTS
Narendra N. Bakhshi, Ph.D., Professor; Sai. P. R. Katikaneni, Ph.D., Postdoctoral Fellowand John D. Adjaye, Ph.D., Postdoctoral Fellow
Catalysis & Chemical Reaction Engineering Laboratory, Department of ChemicalEngineering, 110 Science Place, University of Saskatchewan
Saskatoon, S7N OWO. Canada.
Abstract
A wood-derived oil (WOO) (obtained from ENSYN Technologies Inc.) was convertedcatalytically over three aluminophosphate catalysts, namely, SAPO-5, SAPO-II andMgAPO-36. The oil was produced by the Rapid Thermal Processing (RTP) method andits elemental composition was 49.8 wt% C, 7.5 wt% H, and 42.7 wt% O. The catalystswere selected based on their molecular sieving property, acidity and pore size. The testruns were performed in a fixed bed micro-reactor which was operated at 3.6 WHSV and atemperature range of 330-410oC. The objective was to investigate the potential for theproduction of both liquid and gaseous hydrocarbon products from the conversion ofWDO using aluminophosphate catalysts and to determine their performance incomparison with HZSM-5 and silica-alumina catalysts. The products included an organicliquid product (OLP), aqueous fraction, coke, char and gas. The OLP and gas were thedesired products. Between 12-22 wt% of WOO was obtained as OLP. SAPO-5 gave thehighest yield of 22 wt% aLP, followed by 19.9 wt% by SAPO-II and 16.3 wt% byMgAPO-36. The OLP contained an optimum of 61.5, 56.8 and 57.0 wt% (for SAPO-5,SAPO-II and MgAPO-36, respectively) liquid hydrocarbons. The major products werebenzene, n-hexane, heptane and isooctane. All three catalysts were selective for botharomatic and aliphatic hydrocarbons in comparable proportions. On the other hand, incomparison, HZSM-5 was highly selective for aromatic hydrocarbons whereas silicaalumina was selective for mostly aliphatic hydrocarbons. The gas yield was between 817 wt% of WDO. Its composition consisted mostly of C l-C4 hydrocarbons and C02.Among the hydrocarbon gases, ethylene, propylene, propane, n-butane and some C4olefins were the major products. The catalyst pore size and acidity influenced the yieldand product distribution. Also, a detailed comparison with the results obtained withHZSM-5 and silica-alumina catalysts is presented.
1089
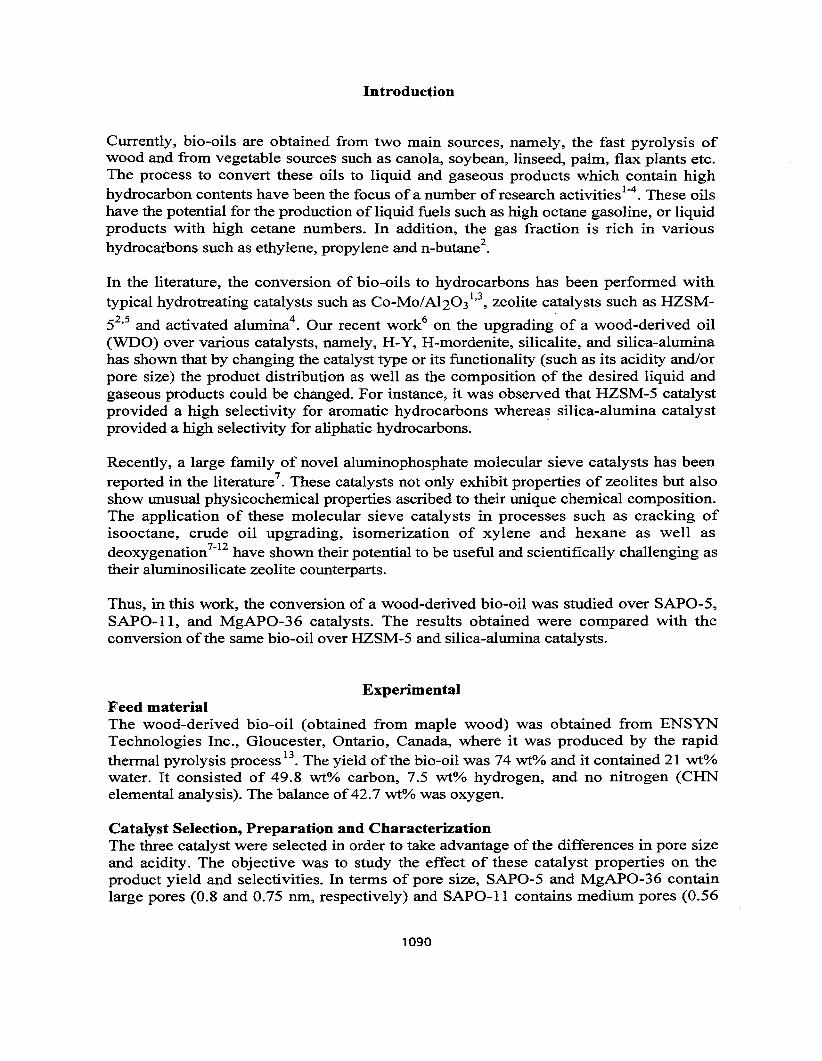
Introduction
Currently, bio-oils are obtained from two main sources, namely, the fast pyrolysis ofwood and from vegetable sources such as canola, soybean, linseed, palm, flax plants etc.The process to convert these oils to liquid and gaseous products which contain highhydrocarbon contents have been the focus of a number of research activities1-4. These oilshave the potential for the production of liquid fuels such as high octane gasoline, or liquidproducts with high cetane numbers. In addition, the gas fraction is rich in varioushydrocarbons such as ethylene, propylene and n-butane'.
In the literature, the conversion of bio-oils to hydrocarbons has been performed withtypical hydrotreating catalysts such as Co-Mo/AI20/,3, zeolite catalysts such as HZSM-
52,5 and activated alumina4
• Our recent work" on the upgrading' of a wood-derived oil(WDO) over various catalysts, namely, H-Y, H-mordenite, silicalite, and silica-aluminahas shown that by changing the catalyst type or its functionality (such as its acidity and/orpore size) the product distribution as well as the composition of the desired liquid andgaseous products could be changed. For instance, it was observed that HZSM-5 catalystprovided a high selectivity for aromatic hydrocarbons whereas silica-alumina catalystprovided a high selectivity for aliphatic hydrocarbons.
Recently, a large family of novel aluminophosphate molecular sieve catalysts has beenreported in the literature7
• These catalysts not only exhibit properties of zeolites but alsoshow unusual physicochemical properties ascribed to their unique chemical composition.The application of these molecular sieve catalysts in processes such as cracking ofisooctane, crude oil upgrading, isomerization of xylene and hexane as well asdeoxygenation7-12 have shown their potential to be useful and scientifically challenging astheir aluminosilicate zeolite counterparts.
Thus, in this work, the conversion of a wood-derived bio-oil was studied over SAPO-5,SAPO-II, and MgAPO-36 catalysts. The results obtained were compared with theconversion of the same bio-oil over HZSM-5 and silica-alumina catalysts.
ExperimentalFeed materialThe wood-derived bio-oil (obtained from maple wood) was obtained from ENSYNTechnologies Inc., Gloucester, Ontario, Canada, where it was produced by the rapidthermal pyrolysis process 13. The yield of the bio-oil was 74 wt% and it contained 21 wt%water. It consisted of 49.8 wt% carbon, 7.5 wt% hydrogen, and no nitrogen (CRNelemental analysis). The balance of42.7 wt% was oxygen.
Catalyst Selection, Preparation and CharacterizationThe three catalyst were selected in order to take advantage of the differences in pore sizeand acidity. The objective was to study the effect of these catalyst properties on theproduct yield and selectivities. In terms of pore size, SAPO-5 and MgAPO-36 containlarge pores (0.8 and 0.75 nm, respectively) and SAPO-ll contains medium pores (0.56
1090
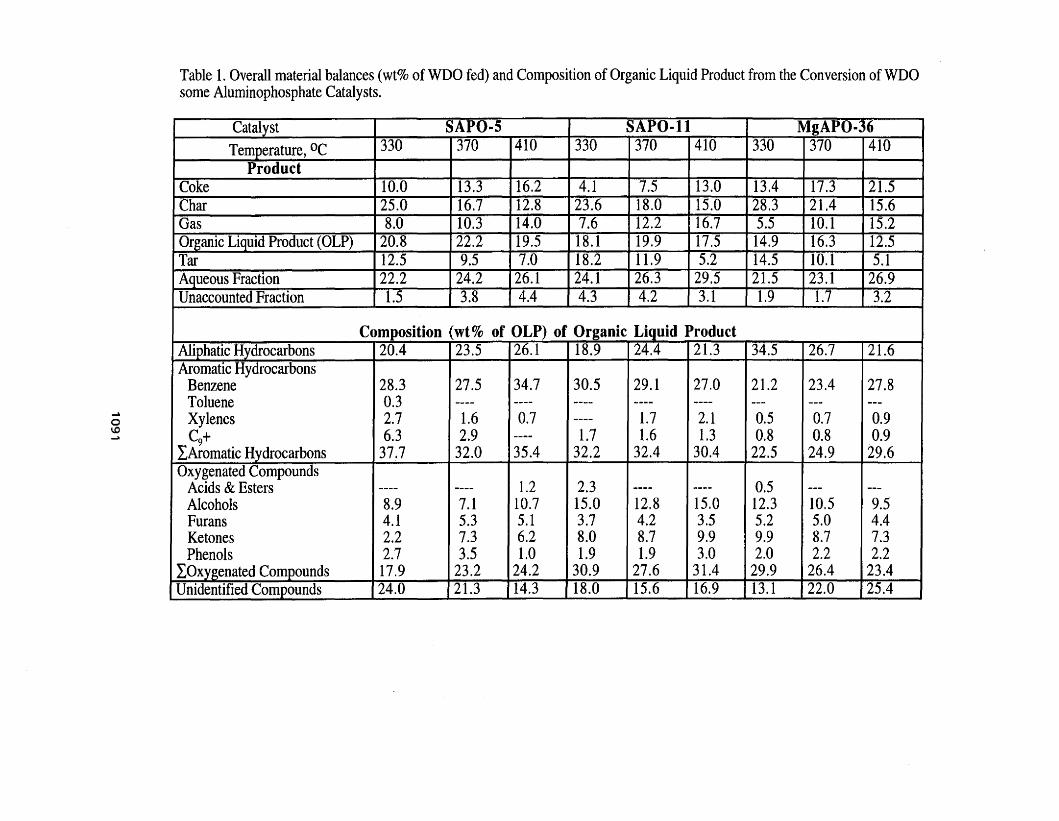
Table 1. Overall material balances (wt% ofWDO fed) and Composition ofOrganic Liquid Product from the Conversion ofWDOsome Aluminophosphate Catalysts.
Catalyst SAPO·5 SAPO·II MgAPO-36
Temperature.Pf 330 370 410 330 370 410 330 370 410Product
Coke 10.0 13.3 16.2 4.1 7.5 13.0 13.4 17.3 21.5Char 25.0 16.7 12.8 23.6 18.0 15.0 28.3 21.4 15.6Gas 8.0 10.3 14.0 7.6 12.2 16.7 5.5 10.1 15.2Organic Liquid Product (OLP) 20.8 22.2 19.5 18.1 19.9 17.5 14.9 16.3 12.5Tar 12.5 9.5 7.0 18.2 11.9 5.2 14.5 10.1 5.1Aqueous Fraction 22.2 24.2 26.1 24.1 26.3 29.5 21.5 23.1 26.9Unaccounted Fraction 1.5 3.8 4.4 4.3 4.2 3.1 1.9 1.7 3.2
Composition (wt% of OLP) of Organic Liquid ProductAliphatic Hydrocarbons 20.4 23.5 26.1 18.9 24.4 21.3 34.5 26.7 21.6Aromatic Hydrocarbons
Benzene 28.3 27.5 34.7 30.5 29.1 27.0 21.2 23.4 27.8Toluene 0.3 ---- ---- ---- ---- ---- --- --- ---Xylenes 2.7 1.6 0.7 ---- 1.7 2.1 0.5 0.7 0.9C9+ 6.3 2.9 ---- 1.7 1.6 1.3 0.8 0.8 0.9
I,Aromatic Hydrocarbons 37.7 32.0 35.4 32.2 32.4 30.4 22.5 24.9 29.6Oxygenated Compounds
Acids & Esters ---- ---- 1.2 2.3 ---- ---- 0.5 --- ---Alcohols 8.9 7.1 10.7 15.0 12.8 15.0 12.3 10.5 9.5Furans 4.1 5.3 5.1 3.7 4.2 3.5 5.2 5.0 4.4Ketones 2.2 7.3 6.2 8.0 8.7 9.9 9.9 8.7 7.3Phenols 2.7 3.5 1.0 1.9 1.9 3.0 2.0 2.2 2.2
LOxygenated Compounds 17.9 23.2 24.2 30.9 27.6 31.4 29.9 26.4 23.4Unidentified Compounds 24.0 21.3 14.3 18.0 15.6 16.9 13.1 22.0 25.4
nm). In addition, SAPO-5 and SAPO-II have relatively higher acidity compared to otheraluminophosphate-based molecular sieves. On the contrary, pure aluminophosphate(ALPO's) catalysts are primarily non-acidic in nature. Hence their direct use as crackingcatalysts is limited. However, incorporation of metals into ALPO's is known to increasetheir acidity as well as enhance their resistance to coke formation l 4
. The acidity indecreasing order is known to be as follows: Mg>Co>Zn>Si>Mn>Be>Fe7
, 15 . Thus,MgAPO-36 was selected for the present work.
SAPO-5 and SAPO-II catalysts were synthesized according to the method described byLok et a1.16 and MgAPO-36 catalyst was synthesized according to the procedure outlinedby Wilson et a1.l? The catalysts were characterized by the following techniques: x-raypowder diffraction (XRD), temperature programmed adsorption and desorption (TPD)with ammonia and measurement of their BET surface area and pore sizes. Elementalcompositions as well as the solid state MAS NMR spectra were also determined. Detailson the catalyst preparation and characterization can be found elsewherel 8
.
Equipment Set-up, Procedure and Product AnalysisCatalytic runs were carried out in a fixed bed micro-reactor made of 316 SS tubing, 380mm long and 12.5 mm ID. It was operated at atmospheric pressure, over a temperaturerange 330-550°C and at 3.6 WHSV. Details of the reactor setup, run procedure and
I · . I h 1920ana YSIS are gIven e sew ere ' .
Results and Discussion
Overall Product DistributionThe definitions of the terms yield and selectivity as used in this work are given inAppendix 1. In all the runs, the overall mass balances were better than 96%. In order tocheck for reproducibility, a number of runs were repeated. The experimental error wasfound to be less than ±4%. The overall material balances for the conversion runs and theOLP compositions are given in Tables 1.
Among the three catalysts, SAPO-5 gave the highest yield of OLP followed by SAPO-IIand MgAPO-36 in that order. As the BET surface area and catalyst acidity decreased'",the OLP yields also decreased indicating that these properties had a significant influenceon the yield of the OLP. For all the catalysts, conversion ofWDO to OLP increased withtemperature reaching maximum values at 370°C. These values were 22.2, 19.9, and 16.3wt% for SAPO-5, SAPO-II, and MgAPO-36, respectively. Thereafter, the yieldsdecreased with increase in temperature. The decrease in the yield of OLP at hightemperatures was due to the conversion of WDO to gaseous products and coke. A similarobservation was made during the upgrading of the same oil with HZSM-5 catalysr'".
Composition of Organic Liquid Product (OLP)The OLP consisted of aliphatic hydrocarbons, aromatic hydrocarbons and oxygenatedcompounds. The oxygenated compounds mostly consisted of acids and esters, alcohols,furans, ketones and phenols.
1092
The concentration of aromatic hydrocarbons varied with catalyst type and rangedbetween 22.5-37.7 wt% of OLP. SAPO-5 gave the highest yield of aromatichydrocarbons with a maximum value of 37.7 wt% at 330°C and MgAPO-36 gave thelowest yield with a maximum value of29.6 wt% at 410°C. It is interesting to note that theeffect of temperature on the three catalysts was significantly different. With SAPO-5, aminimum of 32.0 wt% aromatic hydrocarbons was obtained at 370°C, whereas withSAPO-II a slight decrease at high temperature (410°C) was observed. With MgAPO-36,the yield of aromatic hydrocarbons increased progressively with temperature. Theseobservations indicate that a complex combination of catalyst acidity, catalyst pore sizeand temperature influence the formation of aromatic hydrocarbons.
It was interesting to observe that, benzene was the single most abundant aromatichydrocarbon produced, (in most cases, over 90 %) in the aromatic hydrocarbon fraction.Toluene and xylenes were obtained in relatively small amounts. This observation is incomplete contrast to the results obtained from the conversion of the same oil over HZSM-
5 catalyst2o• With HZSM-5, the selectivity for toluene and xylenes was high. The high
yields of benzene with the aluminophosphate catalysts are probably due to a low rate ofalleylation reaction which is the consequence of their lower acidity compared to theHZSM-5 catalyst2 1
,22. The acid site density for HZSM-5 was high in comparison with allthree aluminophosphate catalyst18 and may have resulted in higher rates of alley lationreactions leading to higher selectivities for C 7 and Cs than C6 aromatic hydrocarbons with
HZSM-5 catalyst. Milne et al.23 also states that the amount of benzene relative to that ofxylene is an indication of the degree of methylation (or alkylation). The lower the ratio ofbenzene -10 xylene, the higher the extent of alkylation reactions.
The yield of aliphatic hydrocarbons in the OLP ranged between 20.4-34.5 wt% for thethree catalysts. It was made up mostly of C6-CS aliphatic hydrocarbons. Among the three
catalysts, MgAPO-36 gave the highest aliphatic yield of 34.5 wt% at 330°C. Among thealiphatics, the major compounds were n-hexane, heptane and 2,2,4-trimethyl pentane(isooctane - a fuel standard with an octane number of 100). Temperature had a significanteffect on the production of aliphatic hydrocarbons. For instance, there was an increase inthe concentration of aliphatic hydrocarbons for SAPO-5 and a decrease for MgAPO-36catalyst. On the other hand, with SAPO-II catalyst aliphatic hydrocarbon yield increasedwith temperature up to 410°C and then decreased. These results are in contrast to thoseobtained with HZSM-5 catalyst in which low yields of aliphatic hydrocarbons wereobserved. Again, these higher yields of aliphatic hydrocarbons with aluminophosphatecatalysts can be attributed to the lower acid strength possessed by these catalystscompared to HZSM-5 catalyst'".
In most cases, the results show that the aromatic hydrocarbon content of OLP increasedwith an increase in the acid density of catalyst. Consequently, SAPO-5 with its higheracid density gave high yields of aromatic hydrocarbons compared to MgAPO-36 whichwas low in acidity and strength. These observations are in agreement with the those
d · h I' 24reporte ill t e iterature .
1093
These observations indicate that the reaction temperatures needed for optimum yields ofaromatic hydrocarbons were: 330°C for SAPO-5, 370°C for SAPO-II and 410°C forMgAPO-36 catalyst. The relative performance based on the optimum yields for aromaticshydrocarbons was of the order: SAPO-5>SAPO-II> MgAPO-36. Similarly, the optimumaliphatic hydrocarbon yields were obtained at the following reaction temperatures: 410°Cfor SAPO-5, 370°C for SAPO-II and 330°C for MgAPO-36 catalyst and the catalystsperformance followed the order: MgAPO-36>SAPO-5>SAPO-II.
The amount of oxygenated compounds was significant in the OLP fractions indicatingthat further deoxygenation may be required in order to optimize the yield ofboth gaseousand liquid hydrocarbons. The maximum concentration of oxygenates for SAPO-5,SAPO-II and MgAPO-36 were 24.2, 31.4 and 29.9 wt%, respectively. Methanol andacetone were the main components among these oxygenated compounds. In comparison,the yields of oxygenated compounds with HZSM-5 catalyst were low. This result reemphasizes the role of catalyst acidity in the conversion of WDO. Since the rate ofdeoxygenation is a function of acid strength, it appears that the low extent ofdeoxygenation with aluminophosphate catalyst is a direct consequence oflow acidity. Forinstance, in our earlier work25 on the conversion of canola oil with a variety of catalysts,it was observed that catalysts with relatively low acidity such as aluminum-pillared clayand silica-alumina produced high amounts of oxygenated compounds in their OLPfractions compared with catalysts such as HZSM-5 and H-Y.
Gas Yield and CompositionAs expected, the amount of gas product increased monotonically with temperature (Table1). The major hydrocarbons present in the gas fraction were ethylene, propylene, butaneand C4 ole:fms. Of particular interest was the olefinic content of the gas phase. Plots(Figure 1) of olefin/paraffin ratio show a number of interesting observations. WithSAPO-5 and SAPO-ll, the hydrocarbon gas fraction was highly olefinic in nature. Onthe other hand, with MgAPO-36, the olefinic fraction was low especially at 330 and370°C. These observations imply that where high fractions of olefins (mostly ethyleneand propylene) in the gas product are desired SAPO-5 or SAPO-II should be used.Ethylene and propylene are well known as the primary building blocks for the productionofvarious plastics.
Proposed Reaction PathwayBased on the above results an attempt was made to suggest a reaction pathway (Figure 2)that describes the conversion of WDO over aluminophosphate catalysts.
The formation of the desired aromatic and aliphatic hydrocarbons in the liquid product aswell as gaseous hydrocarbons from WDO involves a complex reaction mechanism. Theprimary steps are the polymerization to form char (step 1), cracking and partialdeoxygenation to form an intermediate heavy volatile components and water (step 2).The char formation is the consequence of only thermal effects rather than catalytic effect.Further cracking and deoxygenation (step 3) of the heavy volatile components results inthe formation of various olefins and paraffms as well as CO, C02 and water. Some of theolefins and paraffins thus produced compose the observed aliphatic hydrocarbon fraction.In addition, some of the intermediate olefins aromatize to produce benzene (step 4). Theproduction of aromatic hydrocarbons from olefins has been well documented in the
1094
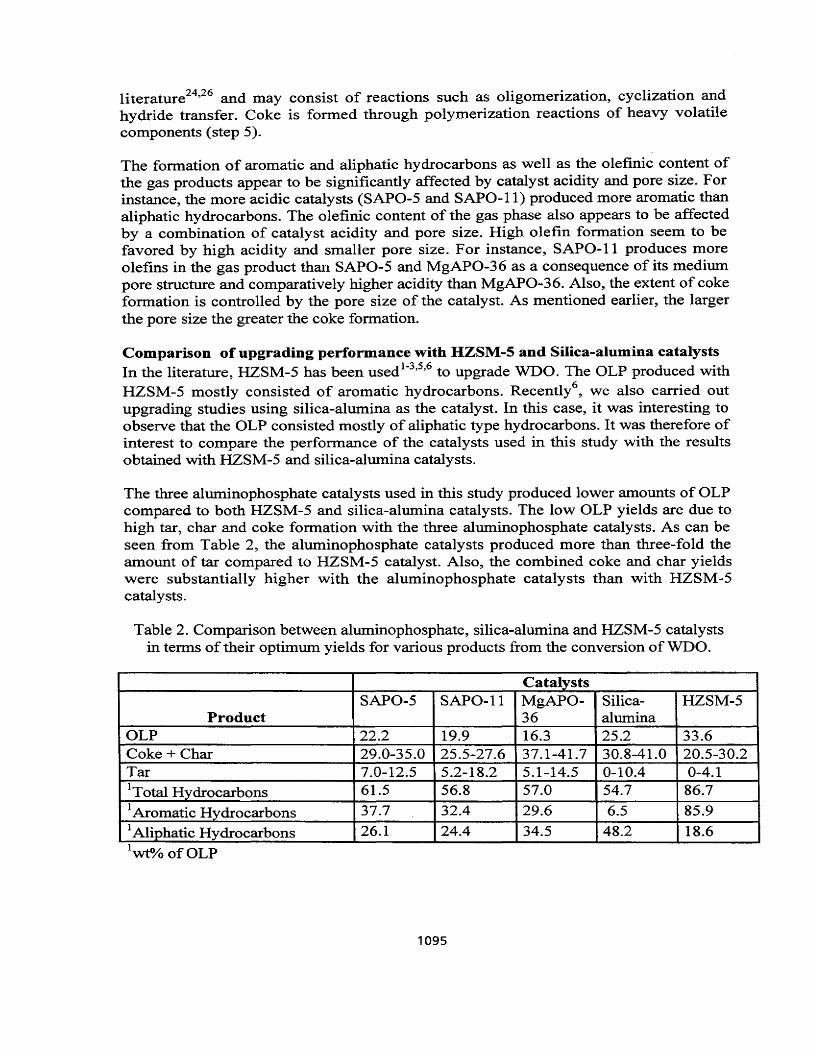
literature24•26 and may consist of reactions such as oligomerization, cyclization andhydride transfer. Coke is formed through polymerization reactions of heavy volatilecomponents (step 5).
The formation of aromatic and aliphatic hydrocarbons as well as the olefinic content ofthe gas products appear to be significantly affected by catalyst acidity and pore size. Forinstance, the more acidic catalysts (SAPO-5 and SAPO-II) produced more aromatic thanaliphatic hydrocarbons. The olefinic content of the gas phase also appears to be affectedby a combination of catalyst acidity and pore size. High olefin formation seem to befavored by high acidity and smaller pore size. For instance, SAPO-II produces moreolefins in the gas product than SAPO-5 and MgAPO-36 as a consequence of its mediumpore structure and comparatively higher acidity than MgAPO-36. Also, the extent of cokeformation is controlled by the pore size of the catalyst. As mentioned earlier, the largerthe pore size the greater the coke formation.
Comparison of upgrading performance with HZSM-5 and Silica-alumina catalystsIn the literature, HZSM-5 has been used l
-3
,5,6 to upgrade WDO. The OLP produced withHZSM-5 mostly consisted of aromatic hydrocarbons. Recently", we also carried outupgrading studies using silica-alumina as the catalyst. In this case, it was interesting toobserve that the OLP consisted mostly of aliphatic type hydrocarbons. It was therefore ofinterest to compare the performance of the catalysts used in this study with the resultsobtained with HZSM-5 and silica-alumina catalysts.
The three aluminophosphate catalysts used in this study produced lower amounts of OLPcompared to both HZSM-5 and silica-alumina catalysts. The low OLP yields are due tohigh tar, char and coke formation with the three aluminophosphate catalysts. As can beseen from Table 2, the aluminophosphate catalysts produced more than three-fold theamount of tar compared to HZSM-5 catalyst. Also, the combined coke and char yieldswere substantially higher with the aluminophosphate catalysts than with HZSM-5catalysts.
Table 2. Comparison between aluminophosphate, silica-alumina and HZSM-5 catalystsin terms of their optimum yields for various products from the conversion of WDO.
CatalystsSAPO-5 SAPO-II MgAPO- Silica- HZSM-5
Product 36 aluminaOLP 22.2 19.9 16.3 25.2 33.6Coke + Char 29.0-35.0 25.5-27.6 37.1-41.7 30.8-41.0 20.5-30.2Tar 7.0-12.5 5.2-18.2 5.1-14.5 0-10.4 0-4.11 61.5 56.8 57.0 54.7 86.7Total Hydrocarbons1Aromatic Hydrocarbons 37.7 32.4 29.6 6.5 85.9
1Aliphatic Hydrocarbons 26.1 24.4 34.5 48.2 18.6
Iwt%ofOLP
1095
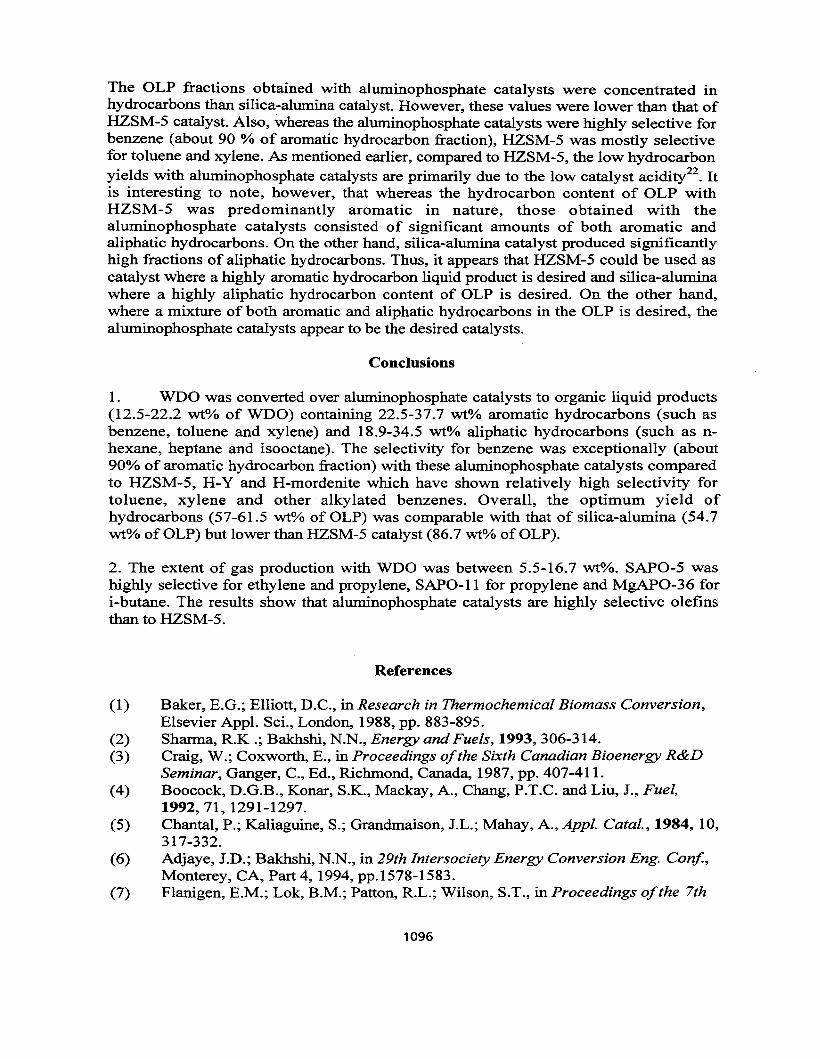
The OLP fractions obtained with aluminophosphate catalysts were concentrated inhydrocarbons than silica-alumina catalyst. However, these values were lower than that ofHZSM-5 catalyst. Also, whereas the aluminophosphate catalysts were highly selective forbenzene (about 90 % of aromatic hydrocarbon fraction), HZSM-5 was mostly selectivefor toluene and xylene. As mentioned earlier, compared to HZSM-5, the low hydrocarbonyields with aluminophosphate catalysts are primarily due to the low catalyst acidity22. Itis interesting to note, however, that whereas the hydrocarbon content of OLP withHZSM-5 was predominantly aromatic in nature, those obtained with thealuminophosphate catalysts consisted of significant amounts of both aromatic andaliphatic hydrocarbons. On the other hand, silica-alumina catalyst produced significantlyhigh fractions of aliphatic hydrocarbons. Thus, it appears that HZSM-5 could be used ascatalyst where a highly aromatic hydrocarbon liquid product is desired and silica-aluminawhere a highly aliphatic hydrocarbon content of OLP is desired. On the other hand,where a mixture of both aromatic and aliphatic hydrocarbons in the OLP is desired, thealuminophosphate catalysts appear to be the desired catalysts.
Conclusions
1. WDO was converted over aluminophosphate catalysts to organic liquid products(12.5-22.2 wt% of WDO) containing 22.5-37.7 wt% aromatic hydrocarbons (such asbenzene, toluene and xylene) and 18.9-34.5 wt% aliphatic hydrocarbons (such as nhexane, heptane and isooctane). The selectivity for benzene was exceptionally (about90% of aromatic hydrocarbon fraction) with these aluminophosphate catalysts comparedto HZSM-5, H-Y and H-mordenite which have shown relatively high selectivity fortoluene, xylene and other alkylated benzenes. Overall, the optimum yield ofhydrocarbons (57-61.5 wt% of OLP) was comparable with that of silica-alumina (54.7wt% of OLP) but lower than HZSM-5 catalyst (86.7 wt% of OLP).
2. The extent of gas production with WDO was between 5.5-16.7 wt%. SAPO-5 washighly selective for ethylene and propylene, SAPO-II for propylene and MgAPO-36 fori-butane. The results show that aluminophosphate catalysts are highly selective olefinsthan to HZSM-5.
References
(1) Baker, E.G.; Elliott, D.C., in Research in Thermochemical Biomass Conversion,Elsevier Appl. Sci., London, 1988, pp. 883-895.
(2) Sharma, R.K .; Bakhshi, N.N., Energy and Fuels, 1993, 306-314.(3) Craig, W.; Coxworth, E., in Proceedings ofthe Sixth Canadian Bioenergy R&D
Seminar, Ganger, c., Ed., Richmond, Canada, 1987, pp. 407-411.(4) Boocock, D.G.B., Konar, S.K., Mackay, A., Chang, P.T.C. and Liu, J., Fuel,
1992, 71, 1291-1297.(5) Chantal, P.; Kaliaguine, S.; Grandmaison, J.L.; Mahay, A., Appl. Catal., 1984, 10,
317-332.(6) Adjaye, J.D.; Bakhshi, N.N., in 29th Intersociety Energy Conversion Eng. Conf.,
Monterey, CA, Part 4, 1994, pp.1578-1583.(7) Flanigen, E.M.; Lok, B.M.; Patton, R.L.; Wilson, S.T., in Proceedings ofthe 7th
1096
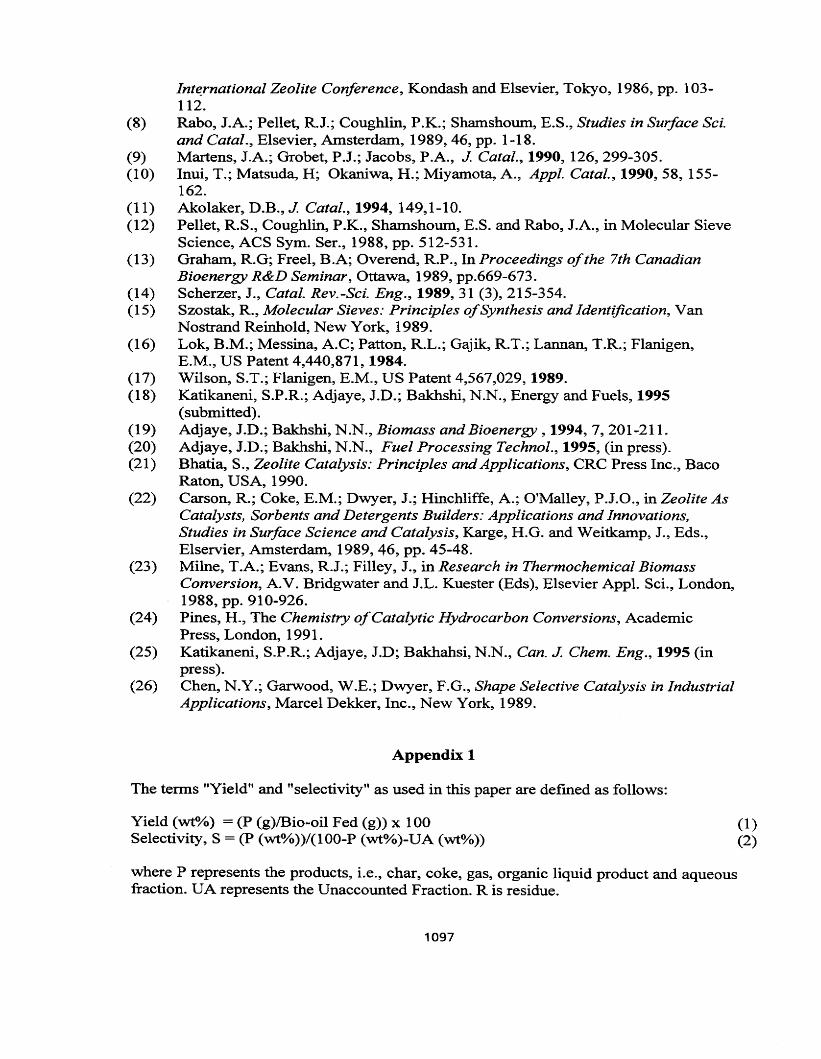
International Zeolite Conference, Kondash and Elsevier~ Tokyo~ 1986~ pp. 103112.
(8) Rabo, J.A.; Pellet, RJ.; Coughlin, P.K.; Shamshoum, E.S.~ Studies in Surface Sci.and Catal., Elsevier, Amsterdam, 1989~ 46~ pp. 1-18.
(9) Martens, J.A.; Grobet, P.J.; Jacobs, P.A., J. Catal., 1990~ 126~ 299-305.(10) Inui, T.; Matsuda, H; Okaniwa, H.; Miyamota, A., Appl. Catal., 1990, 58, 155
162.(11) Akolaker, D.B.~ J. Cata/., 1994~ 149~1-10.
(12) Pellet, R.S., Coughlin, P.K.~ Shamshoum, E.S. and Rabo, J.A., in Molecular SieveScience, ACS Sym. Ser., 1988~ pp. 512-531.
(13) Graham, R.G; Freel~ B.A; Overend, R.P., In Proceedings ofthe 7th CanadianBioenergy R&D Seminar, Ottawa, 1989, pp.669-673.
(14) Scherzer, J., Catal. Rev.-Sci. Eng., 1989, 31 (3), 215-354.(15) Szostak, R., Molecular Sieves: Principles ofSynthesis and Identification, Van
Nostrand Reinhold, New York, 1989.(16) Lok, H.M.; Messina, A.C; Patton, R.L.; Gajik, R.T.; Lannan, T.R.; Flanigen,
E.M., US Patent 4,440,871, 1984.(17) Wilson, S.T.; Flanigen, E.M., US Patent 4,567,029, 1989.(18) Katikaneni, S.P.R.; Adjaye, J.D.; Bakhshi, N.N., Energy and Fuels, 1995
(submitted).(19) Adjaye, J.D.; Bakhshi, N.N., Biomass and Bioenergy , 1994, 7,201-211.(20) Adjaye, J.D.; Bakhshi, N.N., Fuel Processing Technol., 1995, (in press).(21) Bhatia, S., Zeolite Catalysis: Principles and Applications, CRC Press Inc., Baco
Raton, USA, 1990.(22) Carson, R.; Coke, E.M.; Dwyer, J.; Hinchliffe, A.; O'Malley, P.J.D., in Zeolite As
Catalysts, Sorbents and Detergents Builders: Applications and Innovations,Studies in Surface Science and Catalysis, Karge, H.G. and Weitkamp, J., Eds.,Elservier, Amsterdam, 1989, 46, pp. 45-48.
(23) Milne, T.A.; Evans, R.J.; Filley, J., in Research in Thermochemical BiomassConversion, A.V. Bridgwater and J.L. Kuester (Eds), Elsevier Appl. Sci., London,1988, pp. 910-926.
(24) Pines, H., The Chemistry ofCatalytic Hydrocarbon Conversions, AcademicPress, London, 1991.
(25) Katikaneni, S.P.R.; Adjaye, J.D; Bakhahsi, N.N., Can. J. Chem. Eng., 1995 (inpress).
(26) Chen, N.Y.; Garwood, W.E.; Dwyer, F.G., Shape Selective Catalysis in IndustrialApplications, Marcel Dekker, Inc., New York, 1989.
Appendix 1
The terms "Yield" and "selectivity" as used in this paper are defmed as follows:
Yield (wt%) = (P (g)/Bio-oil Fed (g)) x 100Selectivity, S = (P (wt%))/(IOO-P (wt%)-UA (wt%))
(1)(2)
where P represents the products, i.e., char, coke, gas, organic liquid product and aqueousfraction. UA represents the Unaccounted Fraction. R is residue.
1097
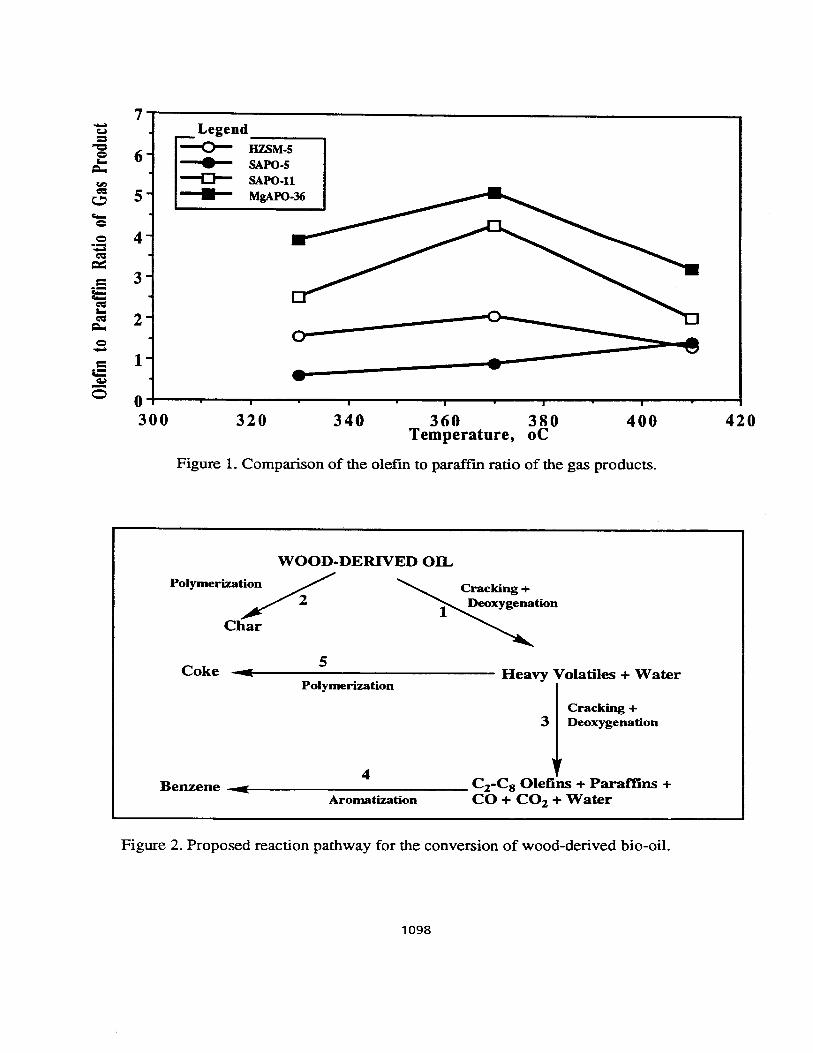
PLANT VARIABILITY AND BIO-OIL PROPERTIES
F.A. Agblevor, S. Besler-Guran, and A.E. WiselogelNational Renewable Energy Laboratory
1617 Cole Boulevard, Golden, CO 80401.
Abstract
Thennochemically converting biomass feedstocks to fuels is one of the major thrustsof renewable energy research at the National Renewable Energy Laboratory. Amongseveral thermochernical routes is the fast pyrolysis process which produces liquid fuelsfrom woody and herbaceous biomass feedstocks. Because of the large variability inthe composition of biomass feedstocks due to plant variety and environmental factors,it is important to assess how these variabilities affect the properties of thermochemicalliquid fuels (bio-oils) produced from these resources.
Similar varieties of switchgrass (Panicum virgatum L.) that were grown at threedifferent locations and three hybrid poplar clones that were grown at one location wereused in these studies. The feedstocks were pyrolyzed in a fluidized bed reactor at500°C. The gas products were analyzed on-line and the liquid products wereanalyzed for elemental composition and higher heating values.
Apart from small differences in the yield of char/ash, the yields of pyrolysis oils andgases were similar for switchgrass feedstocks grown at all three locations. Thechar/ash yields ranged from 21.1 to 22.9%; total liquids (organic liquids + water)yields ranged from 59%-60.5%; and the gas yields ranged from 11%-12% (wt). Thehigher heating values (HHVs) of the oils were similar (24.3-24.6 Ml/kg).
For the hybrid poplar feedstocks, total liquids (65%-69%), char/ash (10%-11 %), andgas yields (15.6%-17%) were similar for all three poplar clones; however, theelemental composition and the HHVs of the pyrolysis oils had statistically significantdifferences. The NC5260 pyrolysis oils had lower HHV ( 22.0±O.5 MJ/kg ) comparedto the DN clones (23.2±0.3 Ml/kg). The yields of total liquids and organics for thethree clones were higher than those for the switchgrass feedstocks. The gas yields forthe hybrid poplar clones were higher than those for the switchgrass, but hadcompositions similar to those of the switchgrass feedstocks. The char/ash yields of theswitchgrass were twofold those of the hybrid poplar clones.
1099
Introduction
Because of the large variability in the composition of biomass feedstocks caused byplant variety and environmental factors, it is important to assess how these variabilitiesaffect the properties of thermochemical liquid fuels (bio-oils) produced from theseresources.
Most published studies in literature [1,2,3] have not addressed these issues, therefore,we found it expedient to undertake the current studies. This work assesses theinfluence of plant location and plant variety on the thermochemical conversion processand on the properties of biomass pyrolysis oils.
Experimental
Biomass Feedstocks
For this study, hybrid poplar feedstocks were selected from the following clones: DNl7(deltoides x nigra), DN182 (deltoides x nigra), and NC5260 (tristis x balsamifera). Theselection was aided by summative analysis of the poplar clones which showed significantdifferences in the composition of the feedstocks [4]. The poplar clones were harvestedfrom sites in Ashland, Wisconsin, by the United States Department of Agriculture ForestService (USDA-FS), North Central Experiment Station, Rhinelander, Wisconsin.
Switchgrass (Panicum virgatum L.) samples were harvested from plots in Mead,Nebraska, West Lafayette, Indiana, and Ames, Iowa. The samples from each plotwere too small for triplicate runs to be conducted in the fluidized bed reactor,therefore, samples from several plots were combined to give enough sample fortriplicate runs. This approach was justified because the summative analysis studiesrevealed no significant difference in the composition of switchgrass from differentplots at the same location [5].
Switchgrass and hybrid poplar samples were prepared for pyrolysis by knife milling ina Wiley mill (model 4) until all the samples passed through a 2-mm screen. Themilled materials were then sieved to -20/+80 mesh size and dried at room temperatureto a moisture content of 4%-6% before pyrolyzing in the fluidized bed reactor. TheSauter mean diameter of the feedstocks was 345-400 urn.
Fluidized Bed Pyrolysis of Feedstocks
To assess the influence of plant location and plant variety on thermochemicalconversion products, the feedstocks (switchgrass and hybrid poplar) were pyrolyzed ina fluidized bed reactor.
1100
The reactor consisted of a 2-in. (50 mm) schedule 40 Inconel steel pipe, 20 in. (500mm) long -(including a 5.5 in. (140-mm) preheater zone below the gas distributionplate) and equipped with a 100-pm porous metal gas distributor. The fluidizingmedium was silica sand, and the bed was fluidized with nitrogen. The reactor wasexternally heated with a three-zone electric furnace. The reactor tube contained abubbling fluid bed with back-mixing of the feed and sand. The static sand bed heightwas 3.5 in. (90 mm), expanding to 4.7 in. (120 mm) when fully fluidized The silicasand particles had a Sauter mean diameter of 350 urn.
The biomass was loaded into a feed hopper (batch-wise) and conveyed by a twinscrew feeder into an entrainment compartment where high-velocity nitrogen gasentrained the feed and carried it through a jacketed air-cooled feeder tube into thefluidized bed.
The pyrolysis temperature was maintained at 500°C and the apparent pyrolysis vaporresidence time was about 0.4 s. The apparent vapor residence time in the reactor wasestimated by the Waterloo Fast Pyrolysis Process methodology [6]. In this approach,the apparent residence time of gases and vapors is defined as the free reactor volume(the empty reactor volume minus the volume of hot sand) divided by the entering gasflow rate expressed at reactor conditions. Runs lasted from 1.5-3.5 h, and the feedrate was 80-100 g/h. The feed rate, gas flow rate, and reactor temperature were keptconstant during each run. Feed gas flow rate was kept at 9 L/min (STP), and thefluidizing gas flow rate was kept at 16 L/min (STP). The feed hopper was slightlypressured with gas flowing at less than 1 L/min (STP).
Pyrolysis gases and vapors exiting the reactor passed through a heated cyclone toseparate char/ash and any entrained sand. The cyclone and char-pot temperatures weremaintained at 400°C to avoid condensation of the pyrolysis vapors. The pyrolysisgases and vapors were then passed through a condensation train consisting of a chilledwater condenser, an ice/salt mixture condenser, electrostatic precipitator, and acoalescence filter (all connected in series). The electrostatic precipitator wasmaintained at 18-20 kV throughout each run. The temperatures, gas flow rates,pressure drop across reactor, and electrostatic precipitator voltage were controlledand/or monitored by an MKS™ data acquisition unit.
The gaseous products were analyzed using an on-line HP 5890 Series II gaschromatograph (GC). The gaseous products were sampled and analyzed every twentyfive minutes during the run. In addition, gas samples were collected in syringesbetween GC runs and these were analyzed after the run. Total gas volume wasmeasured by a dry test meter. To ensure good mass closure, the entire setup(excluding the dry test meter) was weighed before and after each run.
Pyrolysis oils were recovered (after weighing the pyrolysis unit) by rinsing thecondensers with acetone. The oil-acetone mixture was filtered through a 40-60 urnfritted glass filter, and the moisture content of the filtrate was determined by KarlFischer analysis. The weight of the acetone-insoluble fraction of the filtrate was addedto the weight of the char/ash recovered from the char-pot and the fluidized bed reactor.
1101
These were recorded as total char/ash produced from each run. The acetone wasevaporated under vacuum (40°C and 61. 3 kPa), and the recovered oils were analyzedfor elemental composition and HHV. The char/ash samples were not analyzed further.
Elemental analysis and HHVs of the pyrolysis oils were determined in triplicate atHuffman Laboratories in Golden, Colorado.
Results
Switchgrass Feedstocks Pyrolysis Products
Assessing the influence of plant location on the pyrolysis products of the switchgrassfeedstocks was based on the following criteria: total liquids (organic liquids +pyrolysis water), gas, and char/ash yields, elemental composition, and HHV of thepyrolysis oils.
The yields of total pyrolysis liquids (organic liquids + water) from feedstocks grown atall three locations (Mead, Ames, and West Lafayette) were very similar and rangedfrom 59%-60% (see Table 1). However, there were significant differences betweenorganic liquid yields from the three sites. The West Lafayette sample had a slightlylower organic liquids yield (49.9±2.0%) than the other two sites, which had averageorganic liquid yields of 53.2%. The pyrolysis oils were dark brown, viscous, singlephase acidic liquids with a pH of 2.5-3.0. The char/ash content of the oils beforefiltration through 40-60 urn filter was 1%-2%.
The condensation train segregated the oils into a light fraction with high moisturecontent and a heavy fraction with low moisture content. The light fraction condensedin the chilled water condenser. The heavy fraction was mostly aerosols that formedduring the pyrolysis process and did not condense in the chilled water condenser.These were captured in the electrostatic precipitator. The heavy oil fraction containedvery little water and was extremely viscous and sticky. The sticky oils accumulatedon the electrostatic precipitator electrodes and often led to voltage leakage and arcing.The heavy oil fraction conducted electrical current probably because it containedchar/ash which had about 2% potassium. The oils stuck to the walls of the glasscontainers, and once they dried did not dissolve readily in acetone or methanol. Theglass equipment was usually cleaned with alcoholic potassium hydroxide, the onlysolvent that could dissolve these dry oils.
The char/ash was defined as the acetone-insoluble material recovered from the cycloneseparator, fluidized bed reactor, and 40-60 urn filter. About 90% of the char/ash wasrecovered from the cyclone separator, 1%-2% from the filtration of the oil, and therest from the reactor. The char is mostly carbonaceous material, with small amountsof oxygen and hydrogen. Most of the ash in the original feedstock is associated withthis carbonaceous material; hence, the material had a high ash content (unreporteddata).
1102
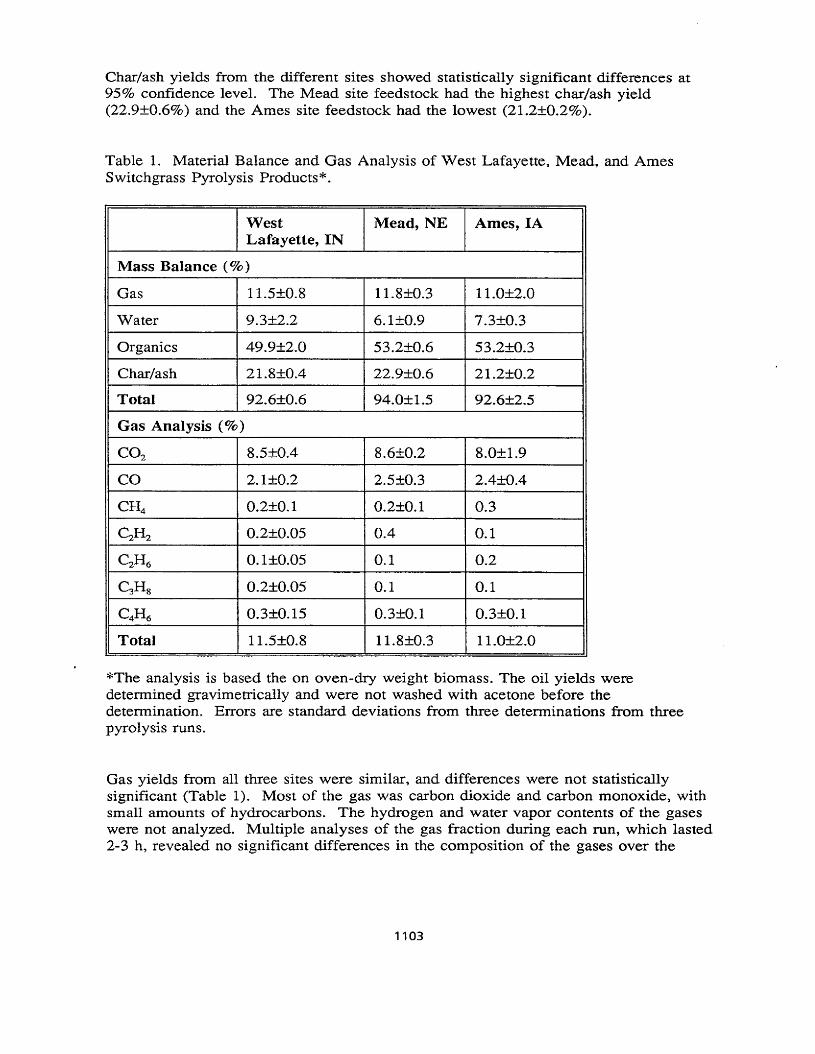
Char/ash yields from the different sites showed statistically significant differences at95% confidence level. The Mead site feedstock had the highest char/ash yield(22.9±O.6%) and the Ames site feedstock had the lowest (21.2±O.2%).
Table 1. Material Balance and Gas Analysis of West Lafayette, Mead, and AmesSwitchgrass Pyrolysis Products*.
West Mead, NE Ames,IALafayette, IN
Mass Balance (%)
Gas 11.5±O.8 l1.8±O.3 ri.o-z.oWater 9.3±2.2 6.1±a.9 7.3±O.3
Organics 49.9±2.a 53.2±O.6 53.2±O.3
Char/ash 21.8±OA 22.9±O.6 21.2±O.2
Total 92.6±O.6 94.0±1.5 92.6±2.5
Gas Analysis (%)
CO2 8.5±O.4 8.6±O.2 8.0±1.9
CO 2.1±O.2 2.5±a.3 2.4±0.4
CH4 a.2±O.1 O.2±a.1 a.3
~H2 a.2±O.OS 0.4 0.1
C2H6 a.l±O.OS o.i 0.2
C3Hs 0.2±0.OS o.i 0.1
C4H6 O.3±O.15 o.seo.i O.3±a.l
Total 11.5±a.8 l1.8±O.3 11.0±2.0
*The analysis is based the on oven-dry weight biomass. The oil yields weredetermined gravimetrically and were not washed with acetone before thedetermination, Errors are standard deviations from three determinations from threepyrolysis runs.
Gas yields from all three sites were similar, and differences were not statisticallysignificant (Table 1). Most of the gas was carbon dioxide and carbon monoxide, withsmall amounts of hydrocarbons. The hydrogen and water vapor contents of the gaseswere not analyzed. Multiple analyses of the gas fraction during each run, which lasted2-3 h, revealed no significant differences in the composition of the gases over the
1103
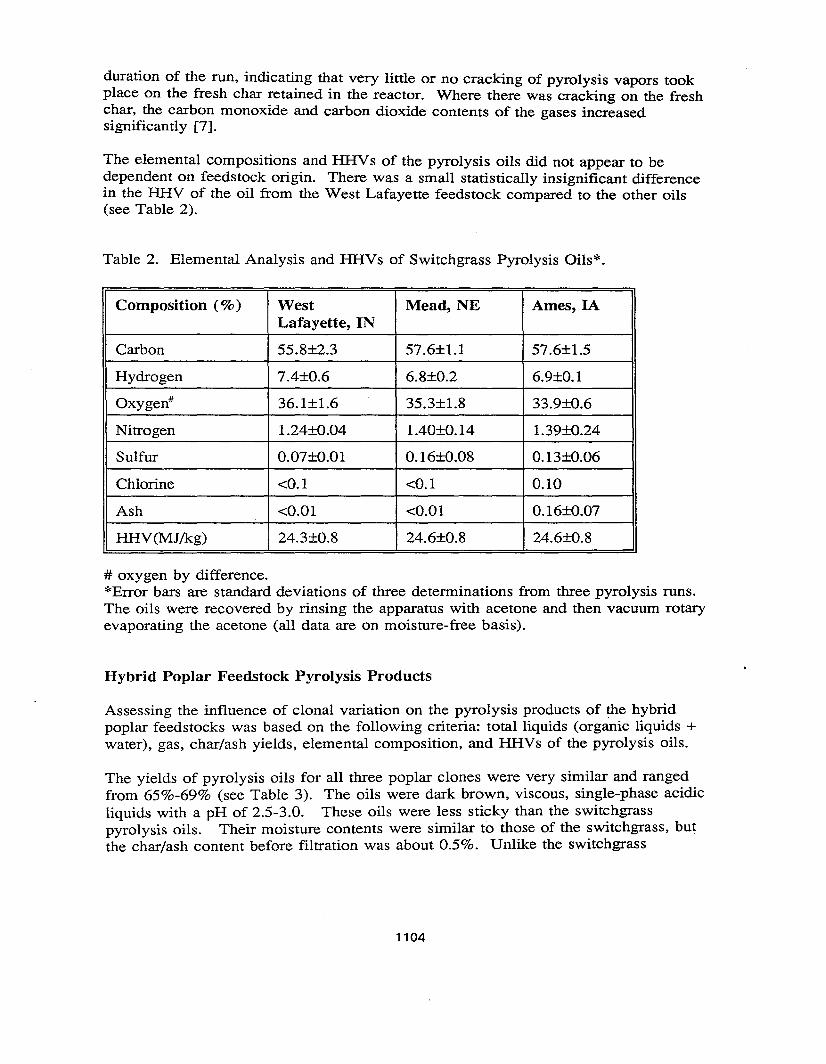
duration of the run, indicating that very little or no cracking of pyrolysis vapors tookplace on the fresh char retained in the reactor. Where there was cracking on the freshchar, the carbon monoxide and carbon dioxide contents of the gases increasedsignificantly [7].
The elemental compositions and HHVs of the pyrolysis oils did not appear to bedependent on feedstock origin. There was a small statistically insignificant differencein the HHV of the oil from the West Lafayette feedstock compared to the other oils(see Table 2).
Table 2. Elemental Analysis and HHVs of Switchgrass Pyrolysis Oils*.
Composition (%) West Mead, NE Ames, IALafayette, IN
Carbon 55.8±2.3 57.6±1.1 57.6±1.5
Hydrogen 7.4±0.6 6.8±0.2 6.9±0.1
Oxygen" 36.1±1.6 35.3±1.8 33.9±O.6
Nitrogen 1.24±0.04 1.40±0.14 1.39±0.24
Sulfur 0.07±0.01 0.16±0.08 0.13±O.06
Chlorine <0.1 <0.1 0.10
Ash <0.01 <0.01 0.16±0.07
HHV(MJ/kg) 24.3±0.8 24.6±0.8 24.6±O.8
# oxygen by difference.*Error bars are standard deviations of three determinations from three pyrolysis runs.The oils were recovered by rinsing the apparatus with acetone and then vacuum rotaryevaporating the acetone (all data are on moisture-free basis).
Hybrid Poplar Feedstock Pyrolysis Products
Assessing the influence of clonal variation on the pyrolysis products of the hybridpoplar feedstocks was based on the following criteria: total liquids (organic liquids +water), gas, char/ash yields, elemental composition, and HHVs of the pyrolysis oils.
The yields of pyrolysis oils for all three poplar clones were very similar and rangedfrom 65%-69% (see Table 3). The oils were dark brown, viscous, single-phase acidicliquids with a pH of 2.5-3.0. These oils were less sticky than the switchgrasspyrolysis oils. Their moisture contents were similar to those of the switchgrass, butthe char/ash content before filtration was about 0.5%. Unlike the switchgrass
1104
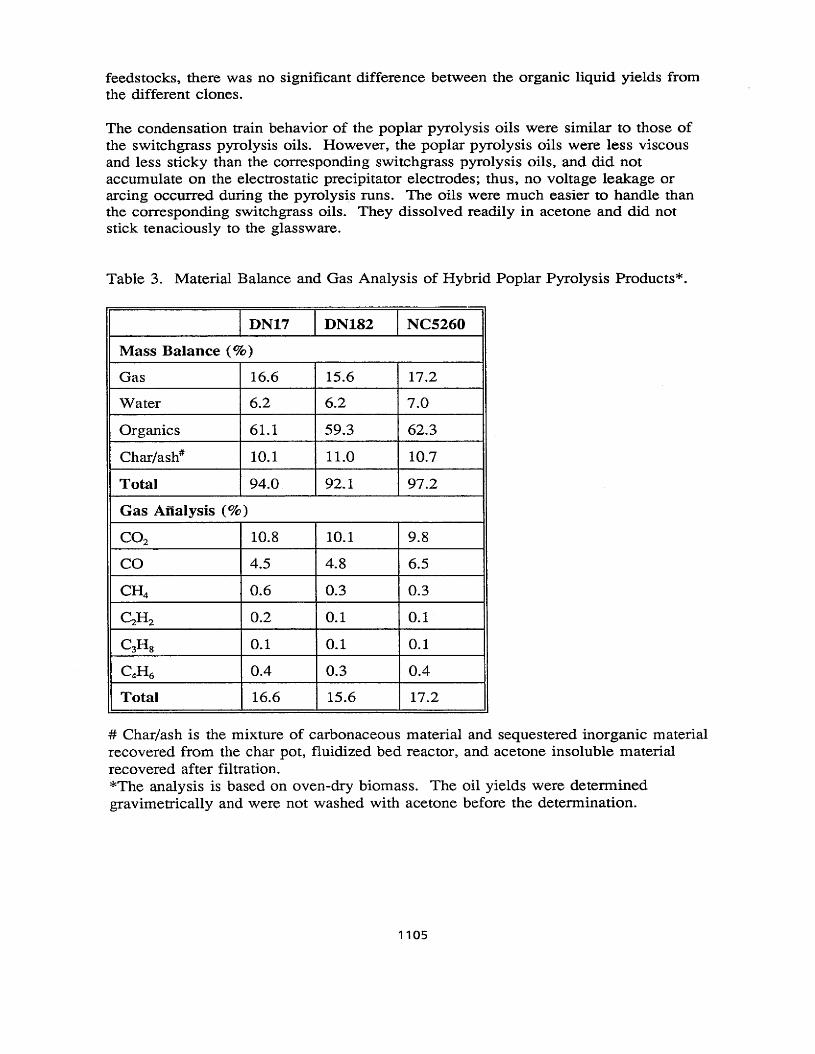
feedstocks, there was no significant difference between the organic liquid yields fromthe different clones.
The condensation train behavior of the poplar pyrolysis oils were similar to those ofthe switchgrass pyrolysis oils. However, the poplar pyrolysis oils were less viscousand less sticky than the corresponding switchgrass pyrolysis oils, and did notaccumulate on the electrostatic precipitator electrodes; thus, no voltage leakage orarcing occurred during the pyrolysis runs. The oils were much easier to handle thanthe corresponding switchgrass oils. They dissolved readily in acetone and did notstick tenaciously to the glassware.
Table 3. Material Balance and Gas Analysis of Hybrid Poplar Pyrolysis Products*.
DN17 DN182 NC5260
Mass Balance (%)
Gas 16.6 15.6 17.2
Water 6.2 6.2 7.0
Organics 61.1 59.3 62.3
Char/ash" 10.1 11.0 10.7
Total 94.0 92.1 97.2
Gas Analysis (%)
CO2 10.8 10.1 9.8
CO 4.5 4.8 6.5
CH4 0.6 0.3 0.3
~H2 0.2 0.1 0.1
C3Hg 0.1 0.1 0.1
C4H6 0.4 0.3 0.4
Total 16.6 15.6 17.2
# Char/ash is the mixture of carbonaceous material and sequestered inorganic materialrecovered from the char pot, fluidized bed reactor, and acetone insoluble materialrecovered after filtration.*The analysis is based on oven-dry biomass. The oil yields were determinedgravimetrically and were not washed with acetone before the determination.
1105
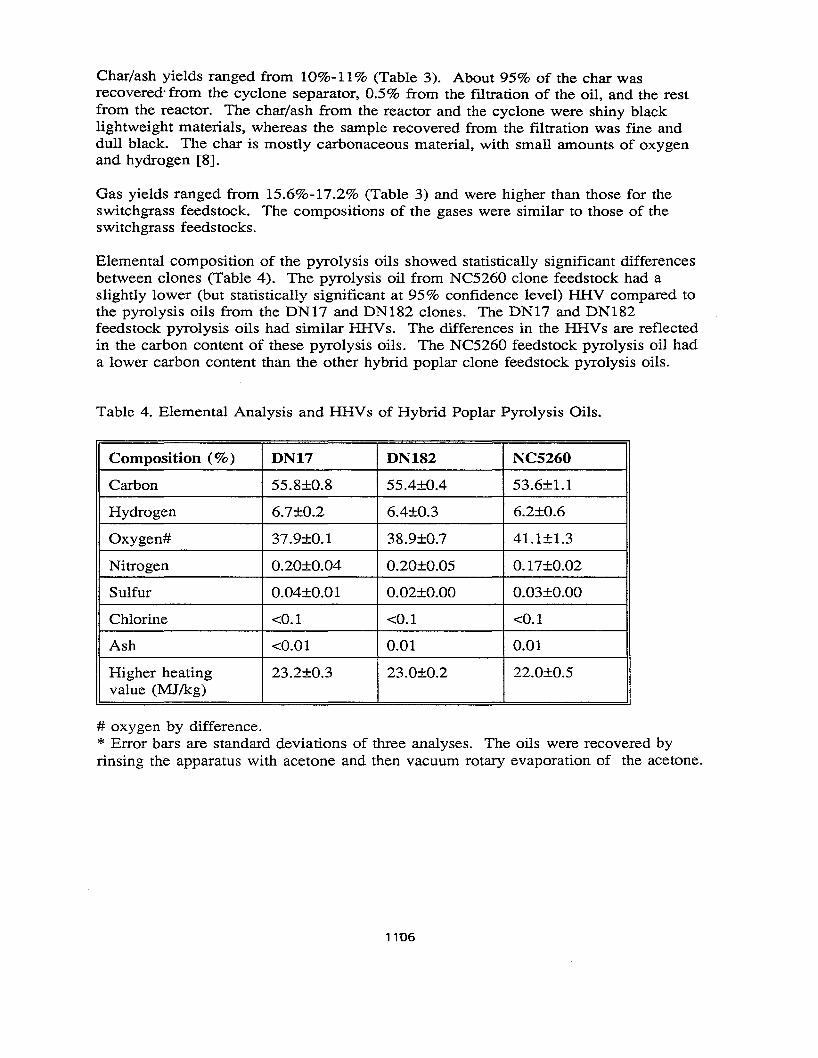
Char/ash yields ranged from 10%-11% (Table 3). About 95% of the char wasrecovered- from the cyclone separator, 0.5% from the filtration of the oil, and the restfrom the reactor. The char/ash from the reactor and the cyclone were shiny blacklightweight materials, whereas the sample recovered from the filtration was fine anddull black. The char is mostly carbonaceous material, with small amounts of oxygenand hydrogen [8].
Gas yields ranged from 15.6%-17.2% (Table 3) and were higher than those for theswitchgrass feedstock. The compositions of the gases were similar to those of theswitchgrass feedstocks.
Elemental composition of the pyrolysis oils showed statistically significant differencesbetween clones (Table 4). The pyrolysis oil from NC5260 clone feedstock had aslightly lower (but statistically significant at 95% confidence level) IlliV compared tothe pyrolysis oils from the DN17 and DN182 clones. The DN17 and DN182feedstock pyrolysis oils had similar IlliVs. The differences in the IlliVs are reflectedin the carbon content of these pyrolysis oils. The NC5260 feedstock pyrolysis oil hada lower carbon content than the other hybrid poplar clone feedstock pyrolysis oils.
Table 4. Elemental Analysis and IlliVs of Hybrid Poplar Pyrolysis Oils.
Composition (%) DN17 DN182 NC5260
Carbon 55.8±0.8 55.4±0.4 53.6±1.1
Hydrogen 6.7±0.2 6.4±0.3 6.2±0.6
Oxygen# 37.9±0.1 38.9±0.7 41.1±1.3
Nitrogen 0.20±0.04 0.20±0.05 0.17±0.02
Sulfur 0.04±0.01 0.02±0.00 0.03±0.00
Chlorine <0.1 <0.1 <0.1
Ash <0.01 0.01 0.01
Higher heating 23.2±0.3 23.0±0.2 22.0±0.5value (MJ/kg)
# oxygen by difference.* Error bars are standard deviations of three analyses. The oils were recovered byrinsing the apparatus with acetone and then vacuum rotary evaporation of the acetone.
1106
Discussion
Influence of Plant Location on the Pyrolysis Products of Switchgrass
The yield of pyrolysis products from switchgrass varieties grown at Ames, Mead, andWest Lafayette sites were similar except for the char/ash yields, which showedsignificant differences. The Mead site switchgrass gave the highest yield of char/ashcompared to the switchgrass from the other sites, and the Ames switchgrass gave thelowest char/ash yield. The differences in the yields were significant at the 95%confidence level.
The differences in the yields of char/ash were attributed to the protein and lignincontents of the feedstocks rather than the ash contents. Although the ash in biomassfeedstocks promotes char formation [9], the ash contents of the feedstocks from thethree sites were similar [5]. It is therefore unlikely that the ash caused the differencesin the char/ash yields. The lignin and nitrogen compounds (proteins) also promotechar formation [10], and are a probable cause of the observed differences in char/ashyields. The data show that the protein content of the Mead switchgrass ( 7%) washigher than that of the Ames and West Lafayette feedstocks (5%). Because proteinstend to denature and also react with carbohydrate decomposition products at hightemperatures [11], this is a likely source of the higher char/ash yield for thisswitchgrass
The small but statistically insignificant differences in the char/ash yields of the Amesand West Lafayette feedstocks were probably caused by the differences in their lignincontents, because the ash and protein contents of these feedstocks were similar.
Although the char/ash yields of the feedstocks differed significantly, the pyrolysis oilyields and lffiVs of the oils were similar for all switchgrass feedstocks (Tables 1 and2). This was probably because the nitrogen compounds (protein) formed mostlychar/ash during the pyrolysis process and did not form a significant component of theoils. Most of the oils originated from the lignocellulosic component of the feedstocks;and hence, the HHVs of the oils were similar.
The difference in the yield of char/ash from the different switchgrass feedstockssuggests that the time and frequency of fertilization may play some role in the qualityof the feedstock. A heavily fertilized field, may result in higher protein or nitrogencompound content in the feedstock, resulting in high char/ash yields and subsequentlylower the liquid and gaseous product yields. These data also suggest that perhaps lowprotein switchgrass varieties may be better feedstocks for thermochemical conversionprocess.
The time of harvest of the switchgrass may also be an important factor with respect tothe protein content of the feedstock. The crude protein content of grasses is lowestduring the winter and highest during spring [12]. Thus, if the switchgrass is harvestedin the fall when the plant is matured, the protein content will be low and the fiber
1107
content will be high and therefore this will make a better feedstock forthermochemical conversion.
Influence of Clonal Variation on Hybrid Poplar Pyrolysis Products
The hybrid poplar clones showed no significant differences in the yields of variousproducts from pyrolytic conversion; however, statistically significant differences wereobserved in the carbon contents (and consequently the HHVs) of the pyrolysis oils.The pyrolysis oil from the NC5260 poplar clones had a significantly lower HHVcompared to the DN poplar clones, which can be attributed to the differences observedin the summative composition of the feedstocks [4]. The NC5260 poplar clones weresignificantly lower in lignin (21 %) and higher in cellulose content (46%) compared tothe DN poplar clones (23% and 43% lignin and cellulose respectively). Thisdifference in composition implies lower carbon content and higher oxygen content.Since higher carbon and lower oxygen contents translate into high energy content, itfollows that the energy content of the pyrolysis products of the NC5260 clones will belower than that of the DN clones.
The extractives component of woody species tend to have higher energy content thanthe lignocellulosic component, but no statistically significant differences were detectedbetween the extractives component of the poplar clones [4]. Thus, the differences inthe HHVs of the pyrolysis oils were attributed solely to the differences in thelignin/cellulose content of the original feedstocks.
Conclusions
For all practical applications, it appears that plant location did not significantly affectthe properties of pyrolysis oils generated from the switchgrass used in this study.However, for the hybrid poplar studied here, clonal variation did have a significanteffect on the higher heating values (HHV) of the pyrolysis oils. Feedstocks with highcellulosellow lignin content (such as NC5260) had lower HHVs, but the overall oilyield was similar for all poplar clones.
Pyrolysis oil and gas yields were not significantly affected by plant location, but thesmall differences in the protein and lignin contents of the switchgrass occurringbecause of the different plant locations affected the char/ash yields. The protein andlignin appear to promote char formation reactions and increased char yields. Becausemost protein in the switchgrass appeared to be converted into char/ash, it had verylittle influence on the properties of the oils.
Plant cultural practices may be an important factor for the production of herbaceousthermochemical feedstocks. Low protein, high fiber switchgrass varieties may be themost suitable switchgrass for thermochemical conversion processes.
1108
References
1. Moser, L.E. "Quality of Forage as Affected by Post-Harvest Storage andProcessing." In Crop Quality, Storage, and Utilization. Hoveland, C.S. Ed.; ASACSSA, Madison, WI. 1980 p. 227.
2. Jirjis, R.; and Theander, O. "The Effect of Seasonal Storage on ChemicalComposition of Forest Residue Chips." Scan. J. For, Res. 1990, 5, 345-448.
3. White, M.S.; Curtis, M.L.; Sarles, R.L.; and Green, D.W. "Effects of OutsideStorage on the Energy Potential of Hardwood Particulate Fuels: Part 1. Higher andNet Heating Values. 1t For. Prod. J. 1983,33 (11/12),61-65.
4. Davis, M.F.; Johnson, D.K.; Deutch, S.; Agblevor, F.; Fennell, J.; and Ashley, P."Variability in the Composition of Short Rotation Woody Feedstocks." In thisproceeding.
5.- Johnson, D.K. et. al. In this proceeding.
6. Palm, M.; Piskorz, J.; Peacock, C.; Scott, D.S.; and Bridgewater, A. V. "FastPyrolysis of Sweet Sorghum Bagasse in a Fluidized Bed." In Proceedings of, FirstBiomass Conference of the Americas: Energy, Environment, Agriculture, and Industry.National Renewable Energy Laboratory, Golden, CO, 1993, p. 947.
7. Boronson, M.L.; Howard, J.B.; Longwell, J.P.; and Peters, W.A. "HeterogeneousCracking of Wood Pyrolysis Tars over Fresh Wood Char Surfaces." Energy andFuels, 1989, 3, 735-740.
8. Agblevor, F.A.; Besler, S.; and Wiselogel, A.E. "Fluidized Bed Pyrolysis of StoredBiomass." Energy and Fuels, 9(4), July/August, 1995, in press.
9. DeGroot, W.F.; and Shafizadeh, F. "Influence of Exchangeable Cations on theCarbonization of Biomass." J. Anal. Appl. Pyro. 1984; 6(3) 217-232.
10... Agblevor, F.A.; Rejai, B.; Evans, R.I.; and Johnson, K.D. "Pyrolytic Analysisand Catalytic Upgrading of Lignocellulosic Materials by Molecular Beam MassSpectrometry." In Energy from Biomass and Wastes XVI; Klass, D.L., Ed.; Institute ofGas Technology (lOT), Chicago, IL, 1993, pp. 767-795.
11. Theander, 0.; and Nelson, D.A., "Aqueous High Temperature Transformation ofCarbohydrates Relative to Utilization of Biomass," Adv. Carbohydrate Chern. Biochem.1989, 46, 273-326.
12. Waller, G.R.; Morrison, R.D.; and Nelson, A.B. "Chemical Composition ofNative Grasses in Central Oklahoma From 1947-1962." Oklahoma State University,Agricultural Experiment Station, Bulletin B-697, January 1972.
1109
BIO-FUEL OIL COMBUSTION IN A 0.5 MW FURNACE
Pietro Barbucci, Manager; Ferdinando Costanzi, Researcher;
Sergio Ligasacchi, Senior Researcher; Angelo Mosti, Researcher;
Carlo Rossi, Senior Researcher
ENEL S.p.A. - Thermal Research Center
Via Andrea Pisano 120
56122 Pisa (Italy)
Abstract
Within the framework of a research partially financed by ED, ENEL-CRT has carriedout combustion tests on two different kinds of bio-fuel oil derived from the fastpyrolysis ofvegetable biomass.The tests have been performed utilizing a multi-purpose test rig, that includes a vertical0.5 MWt furnace equipped with an industrial swirl-type design burner installed at thetop ofthe combustion chamber.The scope was to compare the behavior ofbio-fuel oil with a NO.6 fuel oil, in view ofinvestigating on the possible utilization in power systems of this new fuel, inreplacement of conventional mineral fuel oils.To that purpose some minor modifications of the existing experimental facility werenecessary, in order to adapt the rig to the specific research.The paper presents the encouraging results of the experiments, during which the stablecombustion that it was possible to achieve, allowed the monitoring of operatingconditions and of flame quality, with particular attention to the thermal furnace load,final O2, flow rates, pressures and temperatures.Flue gas sampling and analysis of NOx , CO, S02 and CO2 were also performed,together with solid particulate sampling.
1110
Introduction
Biomass fuels are attracting growing world-wide interest because of theirenvironmental benefits. Liquid fuels derived from biomass pyrolysis have a potentiallywide range of applications in industrial process heating, steam rising or powergeneration.The research, carried out by ENEL in this field, is essentially aimed at evaluating thepotentialities of using these bio-oils as a fuel to replace heavy oils in power plants,especially of small and medium size.
Aim of the test
The objective of this investigation, carried out with the partial financing support ofED,was to characterize the combustion behavior of two biomass derived pyrolysis oilssupplied by ENSYN (Canada), and Union Fenosa (Spain), respectively.The biomass fuels were compared with a NO.6 fuel oil.The experimental activity was performed at the ENEL CRT Experimental Area ofLivorno (Italy).The tests included flue gas analysis as regards the traditional pollutants, the samplingof solid particles and their chemical and physical characterization.Particular attention was devoted to handling, pumping and atomization problems.This study has not assessed the problems posed by the corrosive characteristics of biooils, due to their acidity. In fact a longer test period would be necessary for acomprehensive investigation on this subject.
Experimental apparatus
The 0.5 MWt furnace used for the tests is an experimental facility built up by ENEL toperform experiments on different types of fuel: indeed, this furnace may be fired withfuel oil, gas oil, L.P.G., pulverized coal and coal-water slurries.The plant consists of a O.8m x O.8m x 3.2m vertical furnace (see Fig. 1) fed by onesingle burner at the top. Water-cooled probes can be introduced into the furnace, inorder to control heat extraction and flue gas outlet temperature.The furnace is normally run under slight depression, using a suction fan.The burner, with radial blade layout, may burn fuel oil and pulverized coal. It is fedthrough two independent lines: the primary air line, used for conveying coal, and thesecondary air line. The secondary air swirl number is controlled by varying theinclination angle ofblades.Oil atomization is assisted by compressed air.All the main operating parameters are collected with a data acquisition and displaysystem installed in the control room.
Fuel characterization
The results of chemical-physical analysis of the bio-fuels are given in Table 1.
1111
The reference fuel used was a heavy oil commonly fired in ENEL thermoelectric powerplants with an average sulphur content of 0.95% and nitrogen content of 0.55%.The two bio-oils have similar chemical-physical characteristics, but are markedlydifferent as regards water content (19% for ENSYN vs 23% for Union Fenosa) andviscosity (ENSYN ehxibits a higher viscosity than Union Fenosa oil).The nitrogen content of both fuels is very low (approximately 0.05%).Sulphur is also present in small concentrations, however in lower concentrationscompared to heavy oil.A high content of water and oxygenated compounds is typical of bio-oils; the oxygencontent, calculated by difference, is therefore very high in both fuels (approximately50%). This value decreases to about 27% or O2 available for combustion, taking intoaccount the contribution ofwater present in the fuels.The heat value of both bio-oils is approximately 40% of heavy oil heat value. It wastherefore necessary to feed more then two times the amount of bio-oil to obtain thesame thermal input into the furnace.The carbon residue for the two bio-oils is approximately double compared to thatfound in heavy oils, indicating their trend to produce more unburnt material.
Plant modification
The use ofbio-fuels required the solution of some problems, especially in consequenceof their high acidity and viscosity.A stainless steel tank, equipped with a stirrer to prevent stratification phenomena, wastherefore provided for bio-oils storage. Bio-oil was not pre-heated, to prevent theseparation ofwater.The fuel was fed to the burner through an existing feeder line of stainless steel,designed for testing coal-water slurries (CWS) and a moyno pump was utilized. Thebio-oils flow rate was controlled by varying the pump's speed with a frequencyconverter. The line was equipped with an insulated heating system, in order to maintainproper viscosity levels of the fuel at the burner's inlet nozzle. Figure 2 shows theviscosity curve of the fuels as a function of temperature.Fluid mechanics of the burner was characterised prior to starting the tests; the resultsshowed that the pressure-flow characteristics, i.e. the flow rate at the outlet, met therequirements to run the furnace with bio-oils.The atomization of the fuels was made with air, on the basis of knowledge acquired onfuels with viscosity similar to that of bio-oils. A 5-hole Y-mixing atomizer wasmanufactured to be used both with fuel oil and bio-oils.The fuel's pressure at the inlet nozzle was fixed at lObar, whereas the pressure foratomization air was slightly higher.The presence of fine solid particles suspended in the bio-oils was not considered as adisturbing factor considering the type of atomizer that had been chosen. No filterswere therefore installed in the feeding system ofbio-oils.
Measurement methods
Measurements of gaseous and solid (soot) species concentrations were performed onlyat the exit of the furnace.In-flame temperature was measured by a shielded thermocouple of type S.
1112
Experimental procedure
The main target of this test campaign was to evaluate the possibility of running theplant with bio-oils, in conditions of stationary combustion, without aid auxiliary fuels,and providing a good combustion quality.During the first period of the campaign, the plant's best operation conditions for fueloil were established, considering flame quality and gas emissions. Table 1 shows thecharacteristics offuel oil.The following variables were considered: position ofthe oil inlet nozzle, position of theprimary pipe inside the burner's throat, blade angle, primary air flow rate and injectionangle of fuel spray.The best layout resulting from the tests was also characterized for solid particulate atthree oxygen levels in the flue gas (3%, 2%, 1%) and for three different loads: 100%,750/0, 50% of nominal load.Bio-oils were tested with this layout, sampling solid particulate under the sameoperation conditions used for oil, with a thermal load of 100%, 75% and 600/0. The testplanned at 50% of the load was not performed, since the feeding pump in this casecould not guarantee a stable flow rate as required.At the beginning of the tests with bio-oils, difficulties occurred as the atomizer holesclogged up; this problem was solved increasing the diameter of outlet and atomizingair holes.The CWS feed line has no heating; the system thermal coating could keep the linewarm, but could not guarantee sufficient heating and an accurate temperature control.The bio-oil temperature was therefore maintained within the range of40+55°C.The following main parameters were checked during the tests and used for analyzingthe behavior of'bio-fuels combustion process:
• gas emissions (02, CO, CO2, S02, NOx) ;
• combustion air flow rate, pressure and temperature;• oil and bio-oil flow rate, pressure and temperature;• flue gas temperature inside the combustion chamber.
Fuel oil tests
Fuel oil tests, carried out before characterizing the bio-fuels, allowed to find out a setof operating conditions, characterized by a stable flame and reduced pollutingemissions, to be used for testing the various fuels.This configuration was the following:
• standard position ofthe burner inlet nozzle;• standard position of the primary air pipe;• primary air flow rate 160/0 ofthe total flow rate;• secondary air flow rate 84% of the total flow rate;• blade angle of swirl 35° (=0 = closed);• V-mix atomizer T5-1.5-80°, CT 3.5-4-1.2.
1113
During the tests some problems occurred regarding the behavior of the flame, whichwas however stable in the various layouts tested, even with reduced loads. The graphsin Fig. 3 and 4 show the results obtained.
Union Fenosa bio-oil
As stated above, the main problems experienced during the test campaign on bio-oils,regarded atomization, in particular the obstruction of the atomizer head outlet holes.This problem appeared during the tests with Union Fenosa bio-oil and became moremarked as this bio-oil could not be heated up to a temperature higher than 40°C,.The outlet hole diameter was increased from 1.5 to 2 mm, in order to solve thisproblem; in addition, the diameter of the counter-head hole for fuel was increased from3.5 to 4 mm and that of the atomization air holes from 1.2 to 2 mm, thus obtaining ahigher air flow rate and preventing the hole's obstruction.In consequence of these modifications, the holes did not clog up and no adverse effecton the flame stability was observed.Fig. 5 and 6 show the most important results obtained during the tests.Combustion did not show any particular problems. The switching from gas, used in thefurnace pre-heating stage, to bio-oil operation was made gradually, and ignition did notshow any problems. However, the construction features of the combustion chamber,completely insulated with refractory, resulted to be a very favourable environment fora regular development of the combustion process.Visual control of the flame showed a combustion of essentially good quality. The flamewas never detached from the burner; indeed, no damages to the boiler were found afterthe tests. Marked improvements in atomization were obtained, even when bio-oil wasatomized at a temperature lower than design temperature. At the end of the tests onUnion Fenosa bio-oil, during which about 1500 kg bio-oil were burnt, the atomizeroutlet holes showed an oval shape and a larger section compared with the geometricconditions at the beginning of tests. It should however be stressed that the atomizer tipwas made of steel to be hardened, but that had not been actually hardened. A throughevaluation ofthese phenomena should require proper further tests.
EDSyD bio-oil
During the operation with Ensyn bio-oil, the bio-oil line was strengthened, thusincreasing temperature from 40°C to 50/55°C and obtaining a lower viscosity.Atomization was carried out with the modified atomizer used for the previous tests.Test results are given in Fig. 7 and 8.Combustion tests were performed without any particular difficulties during theswitching from gas to bio-oil and during bio-oil combustion under all test conditions.An increase of the atomizer hole diameters, similar to that experienced with UnionFenosa oil, was observed at the end of the tests, during which about 1500 kg ofbio-oilwere burnt.
1114
System cleanup
During operation no feed line cleaning was usually performed. At the end of each testthe fuel gun was cleaned with ethanol. Pipeline cleaning with ethanol was performedonly at the end ofeach campaign with bio-oil, by flushing with a 600/0 ethanol solution.
Data analysis
Figures 9 and 10 show the NOx emission and solid particulate curves as a function ofoxygen content in the combustion gas. The graphs refer to 1000/0 thermal load. NOx
values are normalized at 3% oxygen in the flue gas, whereas the values for solidparticulate are all normalized at the oxygen test value. CO concentrations during thetests were always very low, so that it was not possible to find an evident correlationwith other parameters.When observing the NOx curves, it appears that bio-oils, with a reduction ofapproximately 300 ppm, offer an advantage in comparison with fuel oil. This differenceof emissions at the same plant operating conditions can be explained considering thedifferent organic nitrogen content that is much lower in bio-oils (see Table 1), and thelower temperature ofbio-oil combustion.Figure 11 shows the temperature profiles inside the combustion' chamber at 100%thermal load. The different temperature profiles for the two bio-oils show a gap ofabout 100°C near to the burner, thus explaining the markedly different NOx emissionsfrom bio-oils with a similar organic nitrogen content.The difference of temperature is due to the bio-oils different water content: Ensyn biooil has a lower water content compared to Union Fenosa bio-oil (about 19% vs 23%).Flame temperatures are therefore higher, when thermal input is the same.Also the 'different atomization conditions playa role. Ensyn bio-oil was heated up to ahigher temperature and therefore was characterized by a lower viscosity in comparisionwith Union Fenosa bio-oil. In consequence of that an improved atomization, a bettermixing between air and fuel and higher NOx emissions were obtained. The aboveresults may at least partially explain the differences of NOx emissions at the sametemperature (see Fig. 12).The values for solid particulate reflect the ash content of the three fuels (see Table 1).In particular, Union Fenosa bio-oil showed higher particulate emissions compared withEnsyn fuel oil.
Conclusions
An experimental investigation was carrried out on the combustion characteristics oftwo biomass pyrolysis fuels prepared by ENSYN (Canada) and Union Fenosa (Spain)respectively. The experimental studies were performed at the ENEL CRTExperimental Area ofLivorno.The bio-fuels flame was compared with a NO.6 oil flame (ENEL).The peculiar chemical-physical characteristics of the two bio-oils required some careespecially as regards storage and feeding system.As regards Ensyn bio-oil, a preheating up to a temperature ranging between 50°C and60°C solved the problem of polymerization occuring at ambient temperature in thefeeder line and in the atomizer.
1115
Union Fenosa bio-oil did not cause problems after heating it up to 40°C.Gas emissions showed a difference of 120 ppm ofNOx between the two bio-oils duringthe tests carried out by ENEL, probably due to the fuel's different water content and,consequently, to the different temperature in the flame zone.ENEL tests proved that NOx emissions were significantly reduced because of the loworganic nitrogen content of bio-oils compared to oil No.6. Solid particulateconcentrations were higher for bio-oils compared to oil No.6, according to thedifferent ash content"A complete combustion ofboth bio-fuels was obtained in the burner used for the tests.In conclusion, the experimental capaign has proved that a high-quality stablecombustion ofliquid fuels obtained from biomass flash pyrolysis is possible.
References
P. Barbucci, G. Benelli, S. Ligasacchi, C. Rossi: "Bio-oil and bio-oil ethanol mixturescombustion tests"Presented at the Poster session of the 8th European Conference on Biomass forEnergy, Enviroment, Agriculture and Industry. Vienna, 3-5 october"1994.
1116
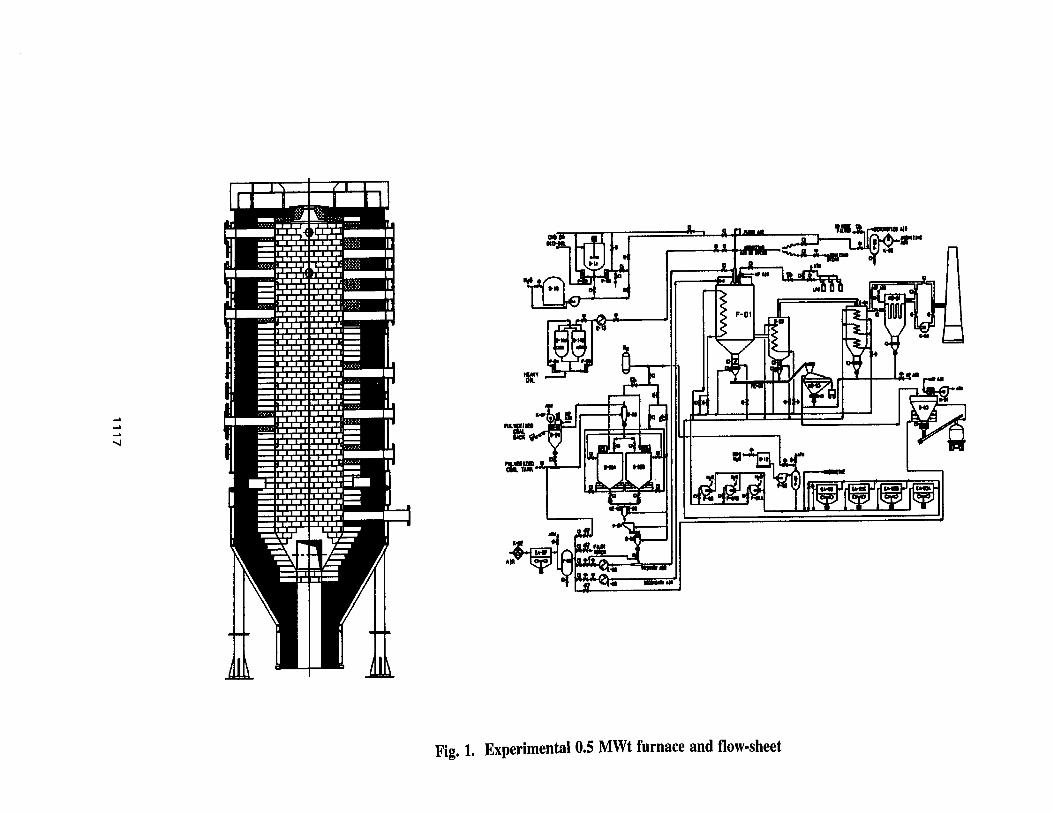
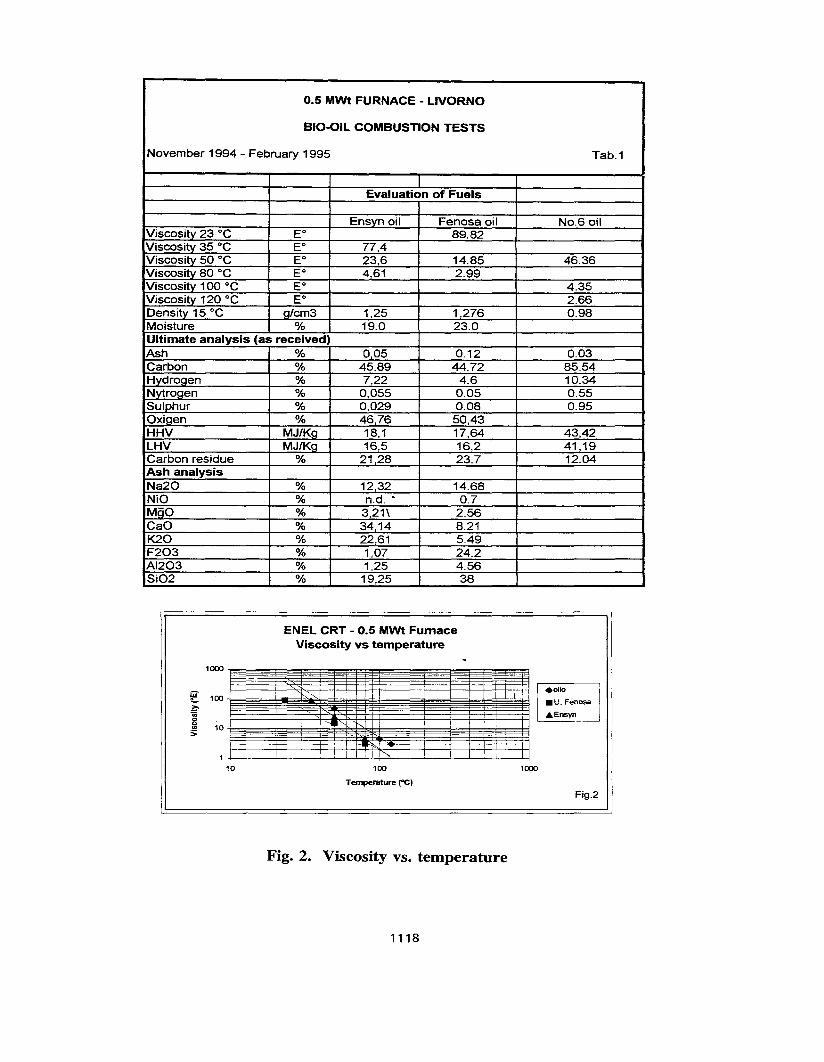
0.5 MWt FURNACE - L1VORNO
BIO-QIL COMBUSTION TESTS
November 1994 - February 1995 Tab.1
Evaluation of Fuels
Ensyn oil Fenosa oil No.6 oilViscosity 23°C EO 89.82Viscosity 35 °C EO 77,4Viscosity 50°C EO 23,6 14.85 46.36Viscosity 80 °C EO 4,61 2.99Viscositv 100°C EO 4.35Viscosity 120 °C EO 2.66Density 15°C a/cm3 1,25 1,276 0.98Moisture % 19.0 23.0Ultimate analysis (as received)Ash % 0,05 0.12 0.03Carbon % 45,89 44.72 85.54Hvdroaen % 7,22 4.6 10.34Nytrogen % 0,055 0.05 0.55Sulphur % 0,029 0.08 0.95Oxiaen % 46,76 50,43HHV MJ/Ka 18,1 17,64 43,42LHV MJ/Ka 16,5 16,2 41,19Carbon residue % 21,28 23.7 12.04Ash analysisNa20 % 12,32 14.68NiO % n.d.• 0.7MOO % 3,21\ 2.56CaO % 34,14 8.21K20 % 22,61 5.49F203 % 1,07 24.2AI203 % 1,25 4.56Si02 % 19,25 38
ENEL CRT - 0.5 MWt FurnaceViscosity vs temperature
Fig.2
1000100
Temperature (OC)
1+--__--"---_-'------L--L-.L.....L--'-'--+--'''--_---'-_+-----'------'----'--l---'---'-j10
II
Fig. 2. Viscosity vs. temperature
1118