Embed Size (px)
Citation preview

At the Intersection of Health, Health Care and Policy
(published online September 20, 2006; 10.1377/hlthaff.25.w457), 25, no.6 (2006):w457-w475Health Affairs
U.S. Health System Performance: A National ScorecardCathy Schoen, Karen Davis, Sabrina K.H. How and Stephen C. Schoenbaum
Cite this article as:
http://content.healthaffairs.org/content/25/6/w457.full.html
available at: The online version of this article, along with updated information and services, is
For Reprints, Links & Permissions: http://healthaffairs.org/1340_reprints.php
http://content.healthaffairs.org/subscriptions/etoc.dtlE-mail Alerts : http://content.healthaffairs.org/subscriptions/online.shtmlTo Subscribe:
from the Publisher. All rights reserved.including photocopying or by information storage or retrieval systems, without prior written permission may be reproduced, displayed, or transmitted in any form or by any means, electronic or mechanical,
Health Affairs Foundation. As provided by United States copyright law (Title 17, U.S. Code), no part of by Project HOPE - The People-to-People Health2006Bethesda, MD 20814-6133. Copyright ©
is published monthly by Project HOPE at 7500 Old Georgetown Road, Suite 600,Health Affairs
Not for commercial use or unauthorized distribution
by guest on May 15, 2011Health Affairs by content.healthaffairs.orgDownloaded from

U.S. Health SystemPerformance: A NationalScorecardThe United States would have to improve its performance on keyindicators by 50 percent or more to reach benchmark rates.
by Cathy Schoen, Karen Davis, Sabrina K.H. How, and Stephen C.Schoenbaum
ABSTRACT: This paper presents the findings of a new scorecard designed to assess andmonitor multiple domains of U.S. health system performance. The scorecard uses nationaland international data to identify performance benchmarks and calculates simple ratioscores comparing U.S averages to benchmarks. Average ratio scores range from 51 to 71across domains of health outcomes, quality, access, equity, and efficiency. The overall pic-ture that emerges from the scorecard is one of missed opportunities and room for improve-ment. The findings underscore the importance of policies that take a coherent, whole-system approach to change and address the interaction of access, quality, and cost.[Health Affairs 25 (2006): w457–w475; 10.1377/hlthaff.25.w457]
Th e u n i t e d s tat e s h a s m a n y of the world’s best-equipped hospitalsand most highly specialized physicians. At 16 percent of gross domesticproduct (GDP), U.S. health spending is double the median of industrialized
countries and since 2000 has been growing more rapidly than before.1 Yet theUnited States is the only major industrialized country that fails to guarantee uni-versal health insurance; coverage in this country is deteriorating, leaving millionswithout affordable access to care.2 The U.S. health system also is not the best onquality of care, nor is it a leader in health information technology (IT).3
To delineate the status of U.S. health care and opportunities to improve, wehave developed a national scorecard spanning health outcomes, quality, access, ef-ficiency, and equity in one report. Thus, the scorecard, which was designed to as-sess and monitor all key dimensions of performance in relationship to benchmarksand over time, provides a unique whole-system view. Benchmarks and targets forimprovement are based primarily on levels achieved internationally or within theUnited States.
S c o r e c a r d
H E A L T H A F F A I R S ~ W e b E x c l u s i v e w 4 5 7
DOI 10.1377/hlthaff.25.w457 ©2006 Project HOPE–The People-to-People Health Foundation, Inc.
Cathy Schoen ([email protected]) is senior vice president for research and evaluation at the Commonwealth Fund inNew York City. Karen Davis is president of the Commonwealth Fund. Sabrina How is a research associate, andStephen Schoenbaum is executive vice president for programs.
by guest on May 15, 2011Health Affairs by content.healthaffairs.orgDownloaded from

Study MethodsWith guidance from the Commonwealth Fund Commission on a High Perfor-
mance Health System and input from leading experts, the scorecard includes keyindicators drawn from efforts of public, professional, and other national entitiesplus new analyses. Criteria for indicator selection focused on sentinel or whole-system measures that capture key areas where improvement could make a majordifference for the public, where information is available from international or na-tional databases, and where the potential exists for time-trend analyses. In total,the scorecard includes thirty-seven scored indicators, many of which are compos-ites. The indicator set includes thirteen from new data analyses and compositesdeveloped for the scorecard; the remainder represent an array from past researchand ongoing efforts to track quality performance.
� Indicator domains. The analysis organizes indicators into five broad domains:health outcomes, quality, access, efficiency, and equity. Within the domain of qual-ity, there are four clusters of indicators: getting the right care (effective care); coordi-nated care; safe care; and patient-centered, timely care. Access includes two clus-ters: universal participation and affordability of coverage and care. We assignedindicators of overuse or waste to “efficiency.”
Except for coordinated care, quality follows the framework developed by theInstitute of Medicine (IOM).4 We broadened “quality” to include coordination, inlight of its critical link to effective, safe, and efficient care.5 To take a whole-systemview, the scorecard emphasizes composites and develops new indicators that ad-dress efficiency—that is, joint performance on quality and cost.6
� Benchmarks. The report scores U.S. national performance relative to bench-marks, with a maximum score of 100. In general, benchmarks reflect the perfor-mance achieved by top-performing groups, but not “perfection.” For each indicator,we identified the benchmark rate based on rates achieved by top countries or thetop 10 percent of U.S. states, hospitals, health plans, or other providers. The choice ofbenchmarks reflects the specific indicator and availability of data. For example, forhospital clinical care, the benchmark is the best hospitals, but for potentially pre-ventable admissions, the benchmark is the top 10 percent of states or regions. Wherepatient data were available only at the national level, we compared national rateswith the experiences of high-income, insured people, choosing the benchmarkgroup least likely to face barriers because of costs.
Four access benchmarks are targets that reflect logical policy goals, such asaiming for 100 percent of the population to be adequately insured.7 We also usedtargets for two quality indicators—adults getting all basic preventive care andmental health care—since national rates even for high-income groups came tobarely half receiving care according to guidelines. For these we set “stretch tar-gets” of 80 percent to allow for less-than-perfect scores and still aim for majorimprovement.
� Scoring. To score, we calculated simple ratios of U.S. national averages com-
S y s t e m P e r f o r m a n c e
w 4 5 8 2 0 S e p t e m b e r 2 0 0 6
by guest on May 15, 2011Health Affairs by content.healthaffairs.orgDownloaded from

pared to benchmarks. Where higher rates would indicate a move in a positive direc-tion, we divided the national average by the benchmark. Where lower rates wouldindicate a positive direction—such as lower mortality or error rates—we comparedthe benchmark (lower rate) to the U.S. average. To summarize scores by domain, weaveraged indicator ratios.
� Risk ratios. For equity, we used the percentage of the group at risk (for exam-ple, the percentage not receiving recommended care) to calculate risk ratios for se-lected indicators. The ratios compare rates for whites with those for blacks and His-panics; high income with low income; and insured with uninsured.
Outcomes: Long, Healthy, And Productive LivesAn overarching goal for the health care system is its capacity to contribute to
long, healthy, and productive lives. The scorecard includes five system-level indi-cators of health outcomes: two on potentially preventable mortality, one on lifeexpectancy, and two on the prevalence of health conditions that limit the capacityof adults to work or children to learn (Exhibit 1). The average ratio score for theUnited States is 69 out of a possible 100, which reflects the extent to which U.S.health outcomes differ from those in other countries or vary across states.
An indicator of mortality from conditions amenable to health care, widely usedin Europe, is deaths before age seventy-five from conditions that are at least par-tially preventable or modifiable with timely and effective health care. The UnitedStates ranked fifteenth out of nineteen countries on this indicator as of 1998, witha death rate more than 40 percent higher than the benchmark, which is the aver-age of the three best countries (France, Japan, and Spain).
The United States ranked last on infant mortality out of twenty-three industri-alized countries as of 2002, with rates more than double the average of the threeleading countries (Iceland, Japan, and Finland). The United States tied for lastwith Portugal, Ireland, Denmark, and the Czech Republic on healthy life expec-tancy at age sixty. The U.S. ranking reflects shorter life expectancy and more yearsof life with poor health and disability.
Within the United States, there is wide variation across states on the percent-age of working-age adults with health-related limits on their ability to work or doother activities and in the percentage of children missing eleven or more days fromschool because of illness or injury.
Quality Of CareHigh-quality care means care that is “right” (effective), well-coordinated, safe,
patient-centered, and timely. On multiple quality indicators there are substantialspreads between the top and bottom groups of hospitals, health plans, or states(Exhibits 2 and 3). Hence, even moving the bottom of the distribution up to thenational averages would yield substantial net gains.
� Getting the right care. Across five indicators for getting the right care, the
S c o r e c a r d
H E A L T H A F F A I R S ~ W e b E x c l u s i v e w 4 5 9
by guest on May 15, 2011Health Affairs by content.healthaffairs.orgDownloaded from

United States averages 71 percent of the benchmark rates, with ratio scores rangingfrom 39 to 89 (Exhibit 2). Based on patients’ reports, just about half of adults receiveall recommended clinical screening tests and preventive care according to U.S. na-tional guidelines.8 Only half of adults and 59 percent of children needing mentalhealth care receive treatment. Rates are only 15 percent better for high-incomeadults. In general, the scorecard results confirm those of a medical-record-reviewstudy that found low rates of receipt of recommended care for adults.9
For children, receipt of basic vaccines and annual preventive medical and dentalcare varies greatly across states. As a result, national averages are well below thebenchmark top 10 percent of states. National average rates of chronic disease con-trol—using diabetes and hypertension as key indicators—also fall well belowbenchmark rates achieved by the top decile of health plans. Even within managedcare plans, there is a wide spread in performance.
Hospitals vary in their provision of care according to basic clinical guidelinesfor heart attacks, congestive heart failure (CHF), and pneumonia. Although top-performing hospitals reached 100 percent adherence, hospitals delivered recom-mended care only 84 percent of the time on a composite measure of ten clinical
S y s t e m P e r f o r m a n c e
w 4 6 0 2 0 S e p t e m b e r 2 0 0 6
EXHIBIT 1Performance Indicators For The U.S. Health Care System: Long, Healthy, AndProductive Lives (Outcomes)
Range of performance
Dimension and indicator
U.S.nationalrate
Comparisongroup
(Bottomgroup–topgroup) Benchmark
Score: ratioof U.S. tobenchmark
Mortality amenable to health care(deaths per 100,000 population) 115 Countries (130–80)a 80 70
Infant mortality (deaths per 1,000live births) 7.0 Countries (6.0–2.7)b 2.7 39
Healthy life expectancy at age 60(years) (average of 2 ratios)
MenWomen
15.317.9
CountriesCountries
(14.4–17.4)b
(17.2–20.8)b17.420.8
878886
Adults (ages 19–64)—limited in anyactivities because of physical,mental, or emotional problems(percent) 14.9 States (20.1–11.5)c 11.5 77
Children—missed 11 or more schooldays due to illness or injury (percent) 5.2 States (8.1–3.8)c 3.8 73
Long, healthy, and productive lives(outcomes) dimension score 69
SOURCES: See the online technical appendix, http://content.healthaffairs.org/cgi/content/full/hlthaff.25.w457/DC2.
NOTES: Range of performance shows the rates for the bottom (worst) and top (best) group as footnoted. Benchmark is the topgroup rate. Underlined ratios were used to determine the dimension scores.a Average bottom or top three of nineteen countries.b Average bottom or top three of twenty-three countries.c Average bottom or top 10 percent of states.
by guest on May 15, 2011Health Affairs by content.healthaffairs.orgDownloaded from

processes that are reported to Medicare in exchange for full payment updates.10
� Coordinated care. Coordinating care over time and sites, especially for thosewith complex conditions, can help assure that patients receive appropriate follow-up treatment and minimize the risk of errors or complications. Having a doctor whois available and serves as a central source of primary care and referral facilitates carecontinuity and coordination. Yet nearly one-third of adults and more than half of allchildren do not have such a primary care “medical home” (Exhibit 2).
Coordination of care is particularly critical during transitions following hospi-tal discharge. Yet hospitalized patients in the United States are less likely to havemedications reviewed when discharged than is the case in several other countries.Across the United States, patients discharged from the hospital with CHF receivewritten discharge instructions only 50 percent of the time, on average, and there isan eighty-percentage-point spread between the top and bottom 10 percent of hos-pitals and a forty-percentage-point spread between the top and bottom 10 percentof states (64 percent versus 26 percent, data not shown). Patients hospitalized formental health conditions often do not receive follow-up care within thirty days of
S c o r e c a r d
H E A L T H A F F A I R S ~ W e b E x c l u s i v e w 4 6 1
EXHIBIT 2Performance Indicators For The U.S. Health Care System: Quality—Getting The RightCare And Coordinated Care
Range of performance
Dimension and indicator
U.S.nationalrate (%)
Comparisongroup
(Bottomgroup–topgroup) (%) Benchmark (%)
Score: ratioof U.S. tobenchmark
Adults—received recommendedscreening and preventive care 49 Insurance (31–52)a 80* 61
Children—received recommendedimmunizations and preventive care(average of 2 ratios)
Received all recommended doses offive key vaccines
Received both preventive medicaland dental care visits
79
59
States
States
(71–89)b
(48–73)b
89
73
85
89
81
Needed mental health care andreceived treatment (average of 2 ratios)
AdultsChildren
4759
IncomeStates
(42–54)c
(47–74)b80*80*
665973
Chronic disease under control (averageof 2 ratios)
Adults with diagnosed diabetes—HbA1c level <9%
Adults with hypertension—bloodpressure <140/90 mmHg
74
29
Health plans
Health plans
(23–89)d
(48–75)e
89
75
61
83
39
Hospitalized patients—receivedrecommended care for AMI, CHF, andpneumonia (composite) 84 Hospitals (75–91)f 100f 84
Getting the right care dimensionscore 71
by guest on May 15, 2011Health Affairs by content.healthaffairs.orgDownloaded from

discharge. On both CHF and mental illness indicators, there is a gap of twenty tothirty percentage points between national averages and rates achieved by the topgroup of hospitals or health plans. These shortcomings put patients at risk for
S y s t e m P e r f o r m a n c e
w 4 6 2 2 0 S e p t e m b e r 2 0 0 6
EXHIBIT 2Performance Indicators For The U.S. Health Care System: Quality—Getting The RightCare And Coordinated Care (cont.)
Range of performance
Dimension and indicator
U.S.nationalrate (%)
Comparisongroup
(Bottomgroup–topgroup) (%) Benchmark (%)
Score: ratioof U.S. tobenchmark
Adults (ages 19–64)—have accessibleprimary care provider 66
Age, income,and insurance (38–84)g 84 79
Children—have “medical home” 46 States (36–60)b 60 77
Care coordination at hospital discharge(average of 3 ratios)
Hospitalized patients with new Rx—medications were reviewed atdischarge
Heart failure patients—receivedwritten instructions at discharge
Follow-up within 30 days afterhospitalization for mental healthdisorder j (average of health plans)
Private plansMedicare plansMedicaid plans
67
50
766154
Countries
Hospitals
Health plansHealth plansHealth plans
(67–86)h
(9–87)i
(65–86)k
(39–80)l
(22–81)m
86
87
8686l
86m
70
78
58
74887063
Nursing homes: hospital admissionsand readmissions among residents(average of 2 ratios)
Hospital admissionsReadmissions
1612
StatesStates
(21–9)n
(16–8)n98
645772
Home health: hospital admissions 28 Agencies (47–17)o 17 62
Coordinated care dimension score 70
SOURCES: See the online technical appendix, http://content.healthaffairs.org/cgi/content/full/hlthaff.25.w457/DC2.
NOTES: All rates are rounded. Range of performance shows the rates for the bottom (worst) and top (best) group as footnoted.Benchmark is the top group rate unless marked with an asterisk to indicate target rate. Ratios use values to the nearestdecimal point. AMI is acute myocardial infarction. CHF is congestive heart failure. Underlined ratios were used to determine thedimension scores.a Uninsured or insured all year.b Average bottom or top 10 percent of states.c Less than 100 percent of the federal poverty level or 400% or more of the federal poverty level.d Tenth percentile Medicaid plans or ninetieth percentile Medicare plans.e Tenth percentile Medicaid plans or ninetieth percentile private plans.f Tenth or ninetieth percentile hospitals; benchmark is top hospitals.g Uninsured adults under age sixty-five or high-income elderly.h Worst or best of six countries.i Tenth or ninetieth percentile hospitals.j Average of National Committee for Quality Assurance (NCQA) health plans; no national data available.k Tenth or ninetieth percentile private plans.l Tenth or ninetieth percentile Medicare plans; benchmark is ninetieth percentile private plans.m Tenth or ninetieth percentile Medicaid plans; benchmark is ninetieth percentile private plans.n Ninetieth or tenth percentile states.o Average bottom or top 25 percent of agencies.
by guest on May 15, 2011Health Affairs by content.healthaffairs.orgDownloaded from

complications and readmissions and raise the cost of care.Carefully managed transitions between hospital and nursing homes or home
health settings combined with high-quality care in the latter two settings can pre-vent or minimize hospitalizations and rehospitalizations for long-term care pa-tients. Yet, on average, one in six nursing home residents are hospitalized eachyear, and of those discharged from hospitals to nursing homes, 12 percent are read-mitted within three months. These average rates are 50 percent higher than thoseachieved by the five best states, with a two- to nearly threefold variation acrossstates. National rates of home health patients admitted to the hospital are alsowell above the benchmark set by top-performing agencies.
An estimated 28 percent of readmissions from nursing homes and home healthcare agencies could be prevented.11 Reductions of this magnitude would bring na-tional rates nearer to rates achieved by the top-performing states, result in less dis-ruption for vulnerable patients, and save money.
� Safe care. Seven years after the publication of the IOM’s To Err Is Human, theUnited States still lacks a reporting system to assess safety or to target areas for im-provement.12 Safety risks cut across care both in and out of the hospital (Exhibit 3).
In a six-nation survey, one-third of U.S. patients reported a medical mistake,medication, or lab test error in the past two years. It would take a one-third reduc-tion in the U.S. rate to reach benchmark-country rates (Germany and the United
S c o r e c a r d
H E A L T H A F F A I R S ~ W e b E x c l u s i v e w 4 6 3
EXHIBIT 3Performance Indicators For The U.S. Health Care System: Quality—Safe Care AndPatient-Centered, Timely Care
Range of performance
Dimension and indicator
U.S.nationalrate
Comparisongroup
(Bottomgroup–topgroup) Benchmark
Score: ratioof U.S. tobenchmark
Patients reported medical, medication,or lab test error (percent) 34 Countries (34–22)a 22 65
Unsafe drug use (average of 3 ratios)Ambulatory care visits for treating
adverse drug effects (number per1,000 population per year)
Children—prescribed antibiotics forthroat infection without a “strep”test (percent)
Elderly—used 1 of 33 inappropriatedrugs (percent)
15
43
18
Regions
Health plans
Regions
(19–11)b
(75–12)c
(20–15)b
11
12
15
60
71
27
83
Nursing home residents with pressuresores (average of 2 ratios)
High-risk residents (percent)Short-stay residents (percent)
1319
StatesStates
(18–8)d
(23–14)d8
14
676073
Hospital-standardized mortality ratios(actual to expected deaths) 101 Hospitals (118–85)e 85 84
Safe care dimension score 69
by guest on May 15, 2011Health Affairs by content.healthaffairs.orgDownloaded from

Kingdom).Visits to doctors for adverse drug events vary greatly across regions and have in-
creased in the past five years. The percentage of elderly people prescribed one ofthirty-three drugs listed as inappropriate has edged up since 2000, as has the per-centage of children prescribed antibiotics for sore throats since 1998.
Among nursing home residents, inadequate care can result in pressure soreswith risks of serious complications. It would take a 33 percent reduction in na-tional pressure sore rates to reach the average level achieved by the top five states.
Hospital-standardized mortality ratios provide an overall indicator of hospitalsafety and quality used internationally and in the United States to target improve-
S y s t e m P e r f o r m a n c e
w 4 6 4 2 0 S e p t e m b e r 2 0 0 6
EXHIBIT 3Performance Indicators For The U.S. Health Care System: Quality—Safe Care AndPatient-Centered, Timely Care (cont.)
Range of performance
Dimension and indicator
U.S.nationalrate
Comparisongroup
(Bottomgroup–topgroup) Benchmark
Score: ratioof U.S. tobenchmark
Ability to see doctor when sick or needmedical attention on same or nextday (percent) 47 Countries (36–81)a 81 58
Very/somewhat easy to get care afterhours without going to the emergencyroom (percent) 38 Countries (38–72)a 72 53
Doctor-patient communication: alwayslistened, explained, showed respect, spentenough time (percent) 54 Health plans (55–74)f 74 74
Adults with chronic conditions—given self-management plan (percent) 58 Countries (37–65)a 65 89
Patient-centered hospital care (average of3 ratios)
Staff managed pain well (percent)Staff always responded when needed help
to get to the bathroom or pressed callbutton (percent)
Staff always explained medicines and sideeffects (percent)
70
63
60
Hospitals
Hospitals
Hospitals
(61–79)g
(52–74)g
(49–70)g
79
74
70
8789
86
86
Patient-centered, timely caredimension score 72
SOURCES: See the online technical appendix, http://content.healthaffairs.org/cgi/content/full/hlthaff.25.w457/DC2.
NOTES: All rates are rounded. Range of performance shows the rates for the bottom (worst) and top (best) group as footnoted.Benchmark is the top group rate. Ratios use values to the nearest decimal point. Underlined ratios were used to determine thedimension scores.a Worst or best of six countries.b Worst or best region.c Ninetieth percentile Medicaid plans or tenth percentile private plans.d Average bottom or top 10 percent of states.e Average bottom or top 10 percent of hospitals.f Tenth percentile Medicaid/private plans or ninetieth percentile Medicare plans.g Tenth or ninetieth percentile hospitals.
by guest on May 15, 2011Health Affairs by content.healthaffairs.orgDownloaded from

ment.13 Based on 2000–2002 mortality rates for Medicare beneficiaries, there is athirty-three-percentage-point spread between the risk-adjusted mortality ratiosachieved in the best 10 percent of hospitals (lowest rate) and the bottom 10 per-cent.14 If hospitals with observed mortality rates that are higher than expectedbrought deaths down to the levels that were expected given their patient mix, theimprovement would translate into an estimated 17,000–21,000 fewer deaths peryear. Reducing mortality rates to the level achieved by the top-performing groupof hospitals (lowest 10 percent) would more than triple the number of lives saved.
� Patient-centered, timely care. Patient-centered, timely care can increase ad-herence, improve care experiences, and promote more-efficient care. Compared torates achieved in several other countries, U.S. patients are notably less likely to haverapid (same- or next-day) access to physicians when sick or to find it easy to get careafter hours without going to the emergency room (ER) (Exhibit 3). These deficien-cies are in turn associated with higher rates of ER visits for conditions that couldhave been handled by a regular physician if he or she were available.
Also, the percentage of U.S. patients reporting that their doctor always listenscarefully, explains things clearly, shows respect, and spends enough time withthem varies greatly across the country and by source of coverage. There are sub-stantial differences between national rates and the level achieved by the top-per-forming group of health plans, based on data reported to the National Committeefor Quality Assurance (NCQA), Medicare, and Medicaid.
Providing a self-management plan to patients with chronic diseases encouragesthem to take steps to control their conditions. Only three in five U.S. adults withchronic conditions report having such a plan (Exhibit 3).
In a pilot study, experiences of patients in 254 hospitals have been reported tothe Agency for Healthcare Research and Quality’s (AHRQ’s) Consumers Assess-ment of Health Providers and Systems Hospital Survey (HCAHPS) benchmarkingdatabase. There is a spread of eighteen to twenty-two percentage points betweenthe top- and bottom-performing groups of hospitals (tenth and ninetieth percen-tiles) on how well hospitals manage pain, explain medications and possible sideeffects, or respond when patients press call buttons or need help going to thebathroom.15 Although patients’ experiences in nursing homes are of critical publicconcern, no indicator exists to assess resident-centered care.
Access And AffordabilityStudies repeatedly find that the single most important determinant of whether
patients obtain essential health care is having health insurance.16 With insurancepremiums rising at higher rates than wages and consumer cost sharing up sharply,the affordability of insurance and care is of increasing concern to middle- and low-income families and employers.17 In Exhibit 4, four of the five scorecard indicatorsof access and affordability are assessed against policy targets.
� Universal participation. The scorecard includes two indicators for universal
S c o r e c a r d
H E A L T H A F F A I R S ~ W e b E x c l u s i v e w 4 6 5
by guest on May 15, 2011Health Affairs by content.healthaffairs.orgDownloaded from

participation: adequate insurance and receipt of needed care. The insurance indica-tor tracks the percentage of adults who are adequately insured all year. Inadequateprotection or being underinsured is defined as having expenses that exceed 10 per-cent of family income (5 percent for those with incomes below 200 percent of thefederal poverty level) or being exposed to deductibles that alone constitute 5 per-cent of income. As of 2003, sixteen million U.S. adults (ages 19–64) were under-insured, and sixty-one million adults (35 percent) were either uninsured or under-insured. In 2004, 40 percent of U.S. adults reported that they went without carebecause of costs during the year, a rate four times higher than in the United King-dom, the benchmark country.
� Affordability. Only 58 percent of the nonelderly population lives in a statewhere employer insurance premiums average less than 15 percent of this popula-tion’s median household income. One-third of nonelderly adults report having prob-
S y s t e m P e r f o r m a n c e
w 4 6 6 2 0 S e p t e m b e r 2 0 0 6
EXHIBIT 4Performance Indicators For The U.S. Health Care System: Access
Range of performance
Dimension and indicator
U.S.nationalrate (%)
Comparisongroup
(Bottomgroup–topgroup) (%) Benchmark (%)
Score: ratioof U.S. tobenchmark
Adults (ages 19–64)—insured all year,not underinsured 65 Income (32–83)a 100* 65
Adults—no access problem due to costs 60 Countries (60–91)b 91 66
Universal participation dimension score 65
Families—spending <10% of income or <5%of income, if low income, on OOP medicalcosts and premiums 83 Income (54–96)c 100* 83
Population under age sixty-five—living instates where premiums for employer-sponsored health insurance are <15% ofnonelderly median household income 58 –d –d 100* 58
Adults (ages 19–64)—no medical billproblems or medical debt 66 Income (53–84)e 100* 66
Affordable care dimension scoref 69
Overall access score 67
SOURCES: See the online technical appendix, http://content.healthaffairs.org/cgi/content/full/hlthaff.25.w457/DC2.
NOTES: All rates are rounded. Range of performance shows the rates for the bottom (worst) and top (best) group as footnoted.Items marked with an asterisk are the target rate. For access problems due to costs, benchmark is best country rate. OOP isout-of-pocket. Underlined ratios were used to determine the dimension scores.a Less than 200 percent of the federal poverty level or 200 percent or more of poverty.b Worst or best of five countries.c Less than 100 percent of poverty or 400 percent or more of poverty.d Not applicable.e Less than 200 percent of poverty or 400 percent or more of poverty.f Affordable care indicator scores refer to percentage of U.S. population meeting each threshold.
by guest on May 15, 2011Health Affairs by content.healthaffairs.orgDownloaded from
lems with medical bills, collection agencies, or medical debt. High out-of-pocketand premium costs compared to income affect 17 percent of all nonelderly families.Time trends on all three indicators have been moving toward less affordability.18
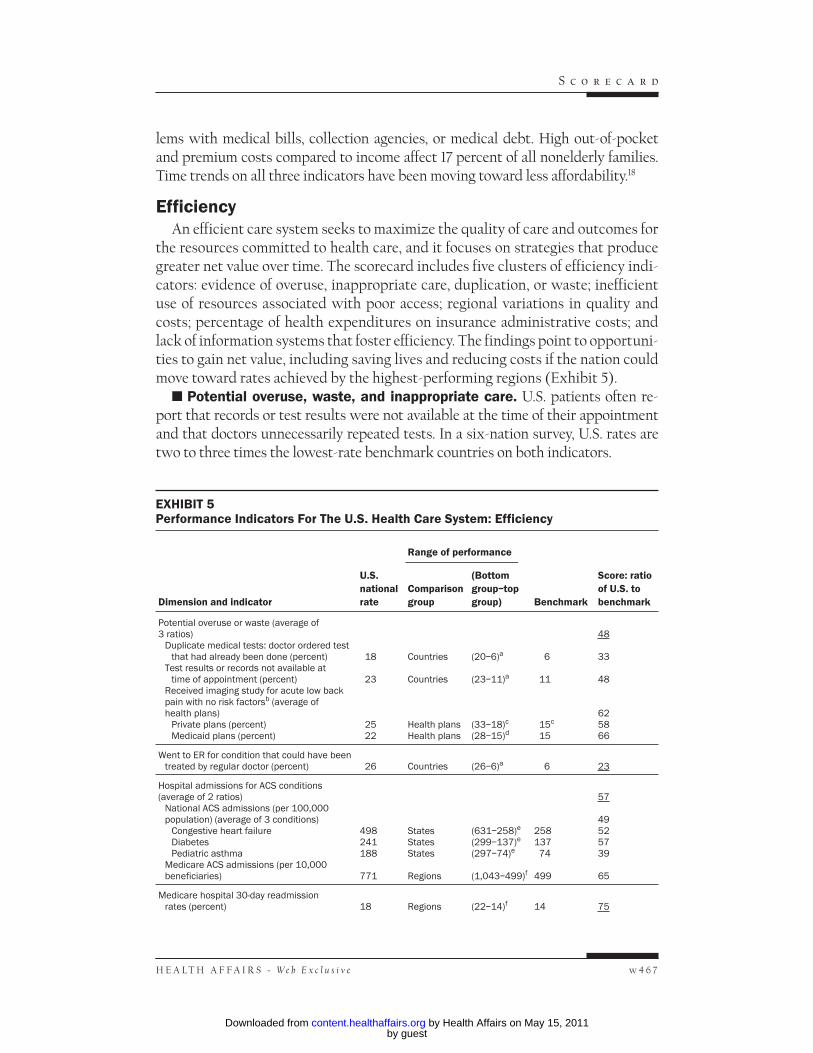
EfficiencyAn efficient care system seeks to maximize the quality of care and outcomes for
the resources committed to health care, and it focuses on strategies that producegreater net value over time. The scorecard includes five clusters of efficiency indi-cators: evidence of overuse, inappropriate care, duplication, or waste; inefficientuse of resources associated with poor access; regional variations in quality andcosts; percentage of health expenditures on insurance administrative costs; andlack of information systems that foster efficiency. The findings point to opportuni-ties to gain net value, including saving lives and reducing costs if the nation couldmove toward rates achieved by the highest-performing regions (Exhibit 5).
� Potential overuse, waste, and inappropriate care. U.S. patients often re-port that records or test results were not available at the time of their appointmentand that doctors unnecessarily repeated tests. In a six-nation survey, U.S. rates aretwo to three times the lowest-rate benchmark countries on both indicators.
S c o r e c a r d
H E A L T H A F F A I R S ~ W e b E x c l u s i v e w 4 6 7
EXHIBIT 5Performance Indicators For The U.S. Health Care System: Efficiency
Range of performance
Dimension and indicator
U.S.nationalrate
Comparisongroup
(Bottomgroup–topgroup) Benchmark
Score: ratioof U.S. tobenchmark
Potential overuse or waste (average of3 ratios)
Duplicate medical tests: doctor ordered testthat had already been done (percent)
Test results or records not available attime of appointment (percent)
Received imaging study for acute low backpain with no risk factorsb (average ofhealth plans)
Private plans (percent)Medicaid plans (percent)
18
23
2522
Countries
Countries
Health plansHealth plans
(20–6)a
(23–11)a
(33–18)c
(28–15)d
6
11
15c
15
48
33
48
625866
Went to ER for condition that could have beentreated by regular doctor (percent) 26 Countries (26–6)a 6 23
Hospital admissions for ACS conditions(average of 2 ratios)
National ACS admissions (per 100,000population) (average of 3 conditions)
Congestive heart failureDiabetesPediatric asthma
Medicare ACS admissions (per 10,000beneficiaries)
498241188
771
StatesStatesStates
Regions
(631–258)e
(299–137)e
(297–74)e
(1,043–499)f
258137
74
499
57
49525739
65
Medicare hospital 30-day readmissionrates (percent) 18 Regions (22–14)f 14 75
by guest on May 15, 2011Health Affairs by content.healthaffairs.orgDownloaded from

Within the United States, the NCQA has begun tracking potential overuse orinappropriate care by expanding Health Plan Employer Data and Information Set(HEDIS) measures to include ordering of imaging tests for patients with lowerback pain with no apparent risk factors. Among both private and Medicaid plans,the average rates of potentially inappropriate testing are 50 percent higher thanare those for the lowest 10 percent of health plans.
� Access and efficiency. Lack of availability of physicians when a patient issick or in need of after-hours care can result in a visit to a hospital ER. Based on across-national survey in six nations asking patients about ER use for conditions thatcould have been seen by a regular doctor if available, it would require nearly an 80percent reduction in U.S. rates to reach rates achieved by Germany and New Zea-
S y s t e m P e r f o r m a n c e
w 4 6 8 2 0 S e p t e m b e r 2 0 0 6
EXHIBIT 5Performance Indicators For The U.S. Health Care System: Efficiency (cont.)
Range of performance
Dimension and indicator
U.S.nationalrate
Comparisongroup
(Bottomgroup–topgroup) Benchmark
Score: ratioof U.S. tobenchmark
Medical annual costs of care andmortality for AMI, hip fracture, andcolon cancer (average of 2 ratios)
Resource costs (annual Part A andPart B $)
One-year mortality rate (percent)26,82930
RegionsRegions
(29,047–23,314)f
(32–27)f23,31427
88
8790
Medicare annual costs of care forchronic diseases: diabetes, CHF,COPD (Part A and Part B $) (average of4 ratios)
All three conditionsDiabetes + CHFDiabetes + COPDCHF + COPD
31,79218,46113,18822,415
RegionsRegionsRegionsRegions
(43,973–20,960)f
(27,310–12,747)f
(18,024–8,872)f
(32,732–15,355)f
20,96012,7478,87215,355
6866696769
Percent of national healthexpenditures spent on healthadministration and insurance 7.3 Countries (5.9–2.0)g 2.0 28
Physicians using EMRs (percent) 17 Countries (7–80)h 80 21
Efficiency dimension score 51
SOURCES: See the online technical appendix, http://content.healthaffairs.org/cgi/content/full/hlthaff.25.w457/DC2.
NOTES: All rates are rounded. Range of performance shows the rates for the bottom (worst) and top (best) group as footnoted.Benchmark is the top group rate. Ratios use values to the nearest decimal point. ER is emergency room. ACS is ambulatorycare–sensitive. AMI is acute myocardial infarction. CHF is congestive heart failure. COPD is chronic obstructive pulmonarydisease. EMR is electronic medical record. Underlined ratios were used to determine the dimension scores.a Worst or best of six countries.b Average of National Committee for Quality Assurance (NCQA) health plans; no national data available.c Ninetieth or tenth percentile private plans; benchmark is tenth percentile Medicaid plans.d Ninetieth or tenth percentile Medicaid plans.e Average bottom or top 10 percent of states.f Ninetieth or tenth percentile regions.g Average bottom or top three of eleven countries.h Average bottom or top three of nineteen countries.
by guest on May 15, 2011Health Affairs by content.healthaffairs.orgDownloaded from

land, the benchmark countries. Within the United States, ER use rates for condi-tions that could have been cared for by regular doctors were significantly higher foruninsured, low-income, and minority patients.
The substantial variation across the United States in admissions for ambulatorycare–sensitive (ACS) conditions points to hospitalization costs that are poten-tially preventable with improved primary or ambulatory care. There is a two- tothreefold spread between states with the lowest and highest rates of ACS admis-sions for asthma, diabetes, and CHF and among hospital regions for all ACS ad-missions for Medicare beneficiaries. Based on estimated national costs for all ACSadmissions, bringing rates down by 10–20 percent would amount to a savings of$4–$8 billion per year.19 These gains do not count the gains from reduced sickdays, improved school attendance, and productivity. For Medicare, bringing ACSadmission rates down to levels achieved by the top quartile or decile of hospital re-gions would save $2.4–$3.5 billion per year.20
� Variations in quality and costs. High-quality hospital care combined with ef-fective discharge planning and transition care can prevent readmissions. On average,18 percent of Medicare beneficiaries hospitalized with one of several specified con-ditions were readmitted to the hospital within thirty days of discharge, a rate 30 per-cent higher than in the lowest 10 percent of states.21 Readmission rates in the highest10 percent of hospital regions were more than 50 percent higher than those of thelowest regional group. Bringing all readmission rates down to levels achieved by thelowest-rate regions would amount to $1.9 billion in annual savings for Medicare.22
Analysis of Medicare data on quality and costs of care for acute myocardial in-farction (AMI), hip fracture, and colorectal cancer (with resection) reveals sub-stantial variations in one-year, risk-adjusted mortality rates following the initialhospital admission and in resource use over the course of a year. The analysis usedtwo indices to identify hospital regions in the top-performance quartile on bothquality (annual mortality) and costs. The high-performing regions have fewerphysicians involved in care, greater reliance on primary care, lower rates of hospi-tal readmissions, and less extensive use of hospital and intensive care services.23 Ifthe United States as a whole were able to reach the level of higher survival andlower cost achieved by regions in the top quartile for both indices, the nationcould save 8,400 lives and reduce annual Medicare spending by $900 million forthe three conditions.
Medicare annual payments for patients with three chronic conditions—diabe-tes, chronic obstructive pulmonary disease (COPD), and CHF—also vary widelyacross regions. Annual total Medicare costs for beneficiaries with at least two ofthese conditions in the lowest-cost regions (bottom 10 percent) are one-third lessthan the national average. As shown in Exhibit 5, for each of the chronic care com-binations, there is twofold or greater variation in cost between the lowest- andhighest-cost regional groups.
� Insurance administrative costs. U.S. private health insurance has complex
S c o r e c a r d
H E A L T H A F F A I R S ~ W e b E x c l u s i v e w 4 6 9
by guest on May 15, 2011Health Affairs by content.healthaffairs.orgDownloaded from

benefit and cost-sharing designs, and there is much churning in enrollment. As apercentage of national health spending, U.S. insurance administrative costs are morethan three times those of countries with the most integrated insurance systems. U.S.rates are also 20–30 percent higher than rates in Germany and Switzerland, twocountries with relatively complex public-private insurance systems (7.3 percent inthe United States versus 5.6 percent in Germany and 4.8 percent in Switzerland).24
� Information systems to support efficient care. Well-integrated electronicinformation systems have the capacity to improve the delivery of care, reduce errors,avoid duplication, and provide a mechanism to track and assess care. Fewer thanone-fifth of U.S. physicians report routine use of electronic medical records (EMRs),compared with 60–90 percent in leading countries. Although the share of U.S. doc-tors with full or partial EMR use increased to nearly one in four in 2005, U.S. ratesare still well below those of other industrialized nations.25 Spread of health IT tohospitals, such as EMRs and computerized physician order entry (CPOE) systems,has also been limited.26 Furthermore, recent studies find that most U.S. physicianscannot easily generate lists of patients by diagnoses or medications they are taking,nor do they have alert systems or prompts for drug interactions. Fewer than one-fifth have access to clinical outcomes data.27
EquityNational policy statements, including the Healthy People 2010 targets, have
made reducing and eliminating disparities in U.S. health care a top priority. Thescorecard documents major inequities in health, quality, access, and efficiency di-mensions (Exhibit 6). Disparities are widest in the paired contrasts by income orinsurance, with an average 34 percent gap between uninsured and insured popu-lations and a 38 percent gap between low-income and high-income populations.On multiple indicators, it would require a 50 percent or greater improvement inrates among the low-income or uninsured to equal the experience of high-incomeor insured groups. Living in low-income communities also is associated with dis-parities. Cancer statistics demonstrate systematically lower five-year survival forwhites, blacks, and Hispanics in high-poverty geographic areas.
Also on multiple indicators, rates for Hispanics and African Americans arehigher than rates for whites, with particularly wide disparities in getting the righttimely, patient-centered care and health insurance. On average, it would require a20 percent decrease in Hispanics’ risk rates to reach the levels of whites. Overall,gaps for African Americans tend to be equally wide or wider, including muchhigher mortality rates than for whites. These inequities in part reflect lower in-comes and less access to insurance. Insured higher-income populations are gener-ally at lower risk of poor access or quality, regardless of race and ethnicity.
Compared to benchmark populations, each of the vulnerable groups is lesslikely to receive preventive care according to clinical guidelines, more likely towait for care when sick, and more likely to report communication difficulties. Low
S y s t e m P e r f o r m a n c e
w 4 7 0 2 0 S e p t e m b e r 2 0 0 6
by guest on May 15, 2011Health Affairs by content.healthaffairs.orgDownloaded from

S c o r e c a r d
H E A L T H A F F A I R S ~ W e b E x c l u s i v e w 4 7 1
EXHIBIT 6Performance Indicators For The U.S. Health Care System: Equity
Dimension and indicator
Whitecompared toblack (%)
Whitecompared toHispanic (%)
High incomecompared tolow income (%)
Insuredcompared touninsured (%)
Infant mortalityAdults (ages 19–64)—limited in any activities
because of physical, mental, or emotionalproblems
42
100
100
100
63
46
–a
–a
Children—missed 11 or more school days dueto illness or injury
Cancer five-year survivalCoronary heart disease– and diabetes-related
deaths
10082
64
10097
86
5182
29
–a
–a
–a
Long, healthy, and productive lives score 77 97 54 –a
Older adults—did not receive recommendedscreening and preventive care
Children—did not receive recommendedimmunizations and preventive care
85
77
77
75
80
58
76
57
Needed mental health care and did not receivetreatment
Untreated dental caries7450
6450
8243
56–a
Chronic disease not under controlDiabetics—did not receive HbA1c, retinal, and
foot exams
97
98
92
72
93
72
66
60
Getting the right care score 80 72 71 63
Patients reported medical, medication, or labtest error
AHRQ patient safety indicatorsNursing home residents with pressure sores
677379
1009487
9496–a
10094
–a
Safe care score 73 94 95 97
6+ days to see doctor when sick or needmedical attention
Doctor-patient communication:sometimes/never listened, explained, showedrespect, spent enough time
69
86
65
63
52
63
47
55
Patient-centered, timely care score 78 64 57 51
Adults—without accessible primary careprovider
Children—without “medical home”Hospital admissions for ACS conditions
747833
636860
686552
4762
–a
Went to emergency room for condition thatcould have been treated by regular doctor
Duplicate medical tests: doctor ordered testthat had already been done
Tests results or records not available at timeof appointment
56
60
67
96
65
71
70
57
67
64
70
70
Coordinated and efficient care score 65 69 64 61
Adults (ages 19–64)—time uninsuredduring the year
Adults (ages 19–64)—access problemsbecause of costs
75
100
47
88
28
46
–a
47
by guest on May 15, 2011Health Affairs by content.healthaffairs.orgDownloaded from

scores on coordination and efficiency reveal the extent to which poor access un-dermines quality and increases costs. Black, Hispanic, low-income, and uninsuredpatients are less likely than white, higher-income, and insured patients to haveprimary care providers to coordinate care and are more likely to experience testresults/records delays and duplication, go to the ER when other care was not avail-able, and be admitted to the hospital for potentially preventable conditions.
The scorecard equity findings are consistent with recent reports showing sig-nificant and sometimes increasing disparities by income, insurance, and race/eth-nicity.28 These three risk factors often coexist: Minorities are more likely thanwhites to have low incomes, and those with low incomes are more likely thanthose with higher incomes to be uninsured or underinsured.
Summary And Implications� Overall picture. The overall picture that emerges from the scorecard is one of
missed opportunities and room for improvement. Despite high expenditures, theUnited States lags behind other countries on indicators of mortality and healthy lifeexpectancy. Within the United States, there is often a substantial spread betweenthe top and bottom groups of states, hospitals, or health plans as well as wide gapsbetween the national average and top rates. As a result, the U.S. performance relativeto benchmarks averages near 50 for efficiency to 70 for healthy lives, quality, access,and equity, for an overall average score of 66 across the main domains of performance(Exhibit 7). On multiple indicators, the United States would need to improve itsperformance by 50 percent or more to reach benchmark countries, regions, states,hospitals, health plans, or targets.
The indicators and benchmarks selected to span the domains of performancereflect the judgment of the Commission on a High Performance Health System
S y s t e m P e r f o r m a n c e
w 4 7 2 2 0 S e p t e m b e r 2 0 0 6
EXHIBIT 6Performance Indicators For The U.S. Health Care System: Equity (cont.)
Dimension and indicator
Whitecompared toblack (%)
Whitecompared toHispanic (%)
High incomecompared tolow income (%)
Insuredcompared touninsured (%)
Families—spent >10% of income or >5% ofincome, if low income, on OOP medical costsand premiums
Adults (ages 19–64)—medical billproblems or medical debt
–a
75
–a
100
9
34
91
50
Universal participation and affordablecare score 81 84 29 59
Overall equity dimension score 76 80 62 66
SOURCES: See the online technical appendix, http://content.healthaffairs.org/cgi/content/full/hlthaff.25.w457/DC2.
NOTES: AHRQ is Agency for Healthcare Research and Quality. ACS is ambulatory care–sensitive. OOP is out-of-pocket.a Data not available.
by guest on May 15, 2011Health Affairs by content.healthaffairs.orgDownloaded from

and the authors, informed by experts and tempered by data availability. Yet we be-lieve that substituting different indicators or weighting indicators in a differentfashion is unlikely to change the basic overall picture.
� Interrelatedness of deficits. This first edition of the scorecard offers a start-ing point for national discussion. In many cases, desired data to represent an impor-tant concept were not available. By necessity, the scorecard includes some indicatorsfor which data were available only with a time lag or for segments of the insuredpopulation. Indeed, the absence of good data on critical areas and fragmentedsources are symptomatic of lower-than-desirable system performance.
The results provide evidence of the potential net gain from strategies focused si-multaneously on improving access, quality, and efficiency. Policies are needed thataddress the interaction of access, quality, and cost and take a coherent, whole-system view rather than a fragmented approach to change. Universal coverage andparticipation are essential to improving health care quality and cost performance.High and rising rates of the population that is under- and uninsured destabilizethe delivery system, fuel inefficient use of resources, and put families and the na-tion at risk of losing ground on past gains in health and workforce productivity.
Fragmented and unstable coverage not only increases insurance overhead costs,it also undermines the nation’s ability to assess outcomes or costs over time. Medi-care is often the only national program with the stability to track outcomes andcosts over episodes of care and follow patients over multiple years.
Although the analysis divides performance into access, quality, and efficiency/cost, they are closely interconnected. Lack of access to primary care, poor qualityin hospitals and nursing homes or during transitions, and inadequate informationsystems contribute to duplicate efforts, inefficient use of specialized care, andhigher rates of hospital admission and readmission, which raise the costs of careand lead to poorer outcomes.
There is evidence that quality and efficiency can be improved together. Savingscan be generated from more efficient use of costly resources, producing the same
S c o r e c a r d
H E A L T H A F F A I R S ~ W e b E x c l u s i v e w 4 7 3
EXHIBIT 7Summary Of Scores: Dimensions Of A High-Performance Health Care System
SOURCE: Authors’ calculations based on scores in Exhibits 1–6. Quality: average of (1) right care, (2) coordinated care, (3) safecare, and (4) patient-centered, timely care. Equity: average of income, insurance, black, and Hispanic.
0 10 20 30 40Score
Long, healthy, and productive lives
Quality
Access
Equity
Efficiency
Overall score
50 60 70
69
71
67
71
51
66
by guest on May 15, 2011Health Affairs by content.healthaffairs.orgDownloaded from

or better quality at lower resource cost. The challenge is finding systematic waysto achieve net gains and rechannel the savings into investments to improve cover-age and the capacity to innovate. The critical importance of improving coordina-tion of care emerges across multiple indicators. Policies that facilitate and pro-mote more-connected care, linking medical care providers and information inmore integrated care systems, will be essential for productivity, efficiency, andquality gains.
� Research and data needs. Improving the yield for the nation’s investment inhealth care requires research and data capacity. The nation underinvests in researchon the cost-effectiveness or organization of care as well as information systems. In a$2 trillion health care sector, the federal government spends only an estimated $1.5billion on health systems research—less than $1 for every $1,000 of national healthspending.29 Even if private investments equal federal levels, spending on system re-search comes to only 0.14 percent of total spending. Furthermore, in an industrythat has usually been quick to adopt new technologies, the adoption of health IT(such as EMRs, CPOE, and computerized decision support) and an infrastructureto foster better communication and coordination between providers has been veryslow. Bringing in effective IT for maximum national gain likely requires a criticalmass and whole-system approach that spans ambulatory, diagnostic, pharmacy, andinpatient settings.
In s u m , t h e s c o r e c a r d i n d i c at e s that the United States has broad op-portunities to improve. It can do better, given the level of resources it has com-mitted to health care. There is also much risk in failing to act: Cost and cover-
age vital signs are moving in the wrong direction. To assure a healthy, productivenation, transformation of the health system is of great urgency.
The authors thank the editors and anonymous reviewers for thoughtful comments. The views are those of theauthors and should not be attributed to the Commonwealth Fund or its directors.
NOTES1. G.F. Anderson et al., “Health Care Spending and Use of Information Technology in OECD Countries,”
Health Affairs 25, no. 3 (2006): 819–831.
2. P. Fronstin, Workers’ Health Insurance: Trends, Issues, and Options to Expand Coverage, March 2006, http://www.cmwf.org/usr_doc/Fronstin_workershltins_908.pdf (accessed 13 September 2006).
3. P.S. Hussey et al., “How Does the Quality of Care Compare in Five Countries?” Health Affairs 23, no. 3(2004): 89–99.
4. Institute of Medicine, Crossing the Quality Chasm: A New Health System for the Twenty-first Century (Washington:National Academies Press, 2001).
5. Medicare Payment Advisory Commission, “Care Coordination,” Chap. 2 in Report to the Congress: Increasingthe Value of Medicare (Washington: MedPAC, June 2006), 31–56.
6. An online technical appendix lists experts contributing to the scorecard, details data sources, and de-scribes indicators and composites developed for the scorecard. Throughout the discussion of the scorecardresults in the text, many factual statements are made that are not directly attributed to specific sources us-ing traditional endnotes, because of space constraints. Unless otherwise specified, sources for these state-ments are included in the indicator source notes for each exhibit. The appendix is available online at
S y s t e m P e r f o r m a n c e
w 4 7 4 2 0 S e p t e m b e r 2 0 0 6
by guest on May 15, 2011Health Affairs by content.healthaffairs.orgDownloaded from

http://content.healthaffairs.org/cgi/content/full/hlthaff.25.w457/DC2. A chartpack is available from theCommonwealth Fund at http://www.cmwf.org/publications/publications_show.htm?doc_id=401577.
7. Indicators with 100 percent targets include adults with adequate coverage, adults with no medicalbills/debt, families spending no more than 10 percent of income on out-of-pocket medical costs and premi-ums, and population under age sixty-five in states where premiums are less than 15 percent of medianhousehold income.
8. Indicator includes seven key preventive care services: blood pressure check, cholesterol screening, papsmear, mammogram, fecal occult blood test or sigmoidoscopy/colonoscopy, and flu shot. See Note 6 for on-line technical appendix, p. 11.
9. E.A. McGlynn et al., “The Quality of Health Care Delivered to Adults in the United States,” New EnglandJournal of Medicine 348, no. 26 (2003): 2635–2645.
10. For the list of ten hospital clinical indicators, see the online technical appendix (Note 6), p. 11.
11. MedPAC, A Data Book: Health Care Spending and the Medicare Program (Washington: MedPAC, 2005).
12. R.M. Wachter, “The End of the Beginning: Patient Safety Five Years after ‘To Err Is Human’,” Health Affairs23 (2004): w534–w545 (published online 30 November 2004; 10.1377/hlthaff.w4.534).
13. B. Jarman et al., “Monitoring Changes in Hospital Standardised Mortality Ratios,” British Medical Journal330, no. 7487 (2005): 329; and Institute for Healthcare Improvement, Move Your Dot: Measuring, Evaluating,and Reducing Hospital Mortality Rates (Cambridge, Mass.: IHI, 2003).
14. Data analysis by Sir Brian Jarman, Imperial College, England. Jarman calculated ratios and potential reduc-tions in mortality. See online technical appendix (Note 6), pp. 12–13.
15. For hospitals providing 2005 data to HCAHPS benchmarking database. Data analysis provided by AHRQ.
16. IOM, Hidden Costs, Value Lost: Uninsurance in America (Washington: National Academies Press, 2003).
17. S.R. Collins et al., Gaps in Health Insurance: An All-American Problem, April 2006, http://www.cmwf.org/usr_doc/Collins_gapshltins_920.pdf (accessed 12 September 2006).
18. Ibid.; and M. Merlis, D. Gould, and B. Mahato, Rising Out-of-Pocket Spending for Medical Care: A Growing Strain onFamily Budgets, February 2006, http://www.cmwf.org/usr_doc/Merlis_risingoopspending_887.pdf (accessed13 September 2006).
19. Calculations by authors based on national costs are from D.T. Kruzikas et al., Preventable Hospitalizations: AWindow into Primary and Preventive Care (Rockville, Md.: AHRQ, 2004). Costs inflated to 2006.
20. Calculation by authors based on 2003 variations in Medicare ACS rates and reimbursement per discharge.
21. Data analysis by Gerard Anderson, Johns Hopkins University. See online technical appendix (Note 6), p.15.
22. Calculation by authors based on 2003 variations in Medicare readmission rates and costs per readmission.
23. Data analysis by Elliott Fisher, Dartmouth Medical School. See online technical appendix (Note 6), p. 16;and E. Fisher, “Improving the Efficiency of U.S. Healthcare: Can Pay-for-Performance Help?” (Presentationat the Thirteenth Princeton Conference: Reinventing Health Care Delivery in the Twenty-first Century, 25May 2006). See also E.S. Fisher et al., “Variations in the Longitudinal Efficiency of Academic Medical Cen-ters,” Health Affairs 23 (2004): VAR19–VAR32 (published online 7 October 2004; 10.1377/hlthaff.VAR.19).
24. Organization for Economic Cooperation and Development, OECD Health Data 2005: Statistics and Indicators forThirty Countries, CD Database, Version 10/12/2005 (Paris: OECD, 2005).
25. C.W. Burt, E. Hing, and D. Woodhall, “Electronic Medical Record Use by Office-based Physicians: UnitedStates, 2005,” 3 August 2006, http://www.cdc.gov/nchs/products/pubs/pubd/hestats/electronic/electronic.htm (accessed 29 August 2006).
26. American Hospital Association, Forward Momentum: Hospital Use of Information Technology (Chicago: AHA,2005).
27. A.M. Audet et al., “Measure, Learn, and Improve: Physicians’ Involvement in Quality Improvement,” HealthAffairs 24, no. 3 (2005): 843–853.
28. See, for example, AHRQ, National Healthcare Disparities Report, 2005 (Rockville, Md.: AHRQ, 2005).
29. Coalition for Health Services Research, “Unlocking Secrets to Better Health Care,” Testimony before theHouse Committee on Appropriations, 29 March 2006, http://www.chsr.org/testimony032906.pdf (ac-cessed 29 August 2006).
S c o r e c a r d
H E A L T H A F F A I R S ~ W e b E x c l u s i v e w 4 7 5
by guest on May 15, 2011Health Affairs by content.healthaffairs.orgDownloaded from


