Embed Size (px)
Citation preview

INTERBULL BULLETIN NO. 44. Stavanger, Norway, August 26 - 29, 2011
249
Use of Phenotypes from Research Herds to Develop Genomic Selection for Scarcely Recorded Traits
like Feed Efficiency
R.F. Veerkamp1, D.P. Berry2, E.Wall3,Y. de Haas1, S. McParland2, M. Coffey3, and M.P.L. Calus1
1Animal Breeding and Genomics Centre, Wageningen UR Livestock Research, Lelystad, The Netherlands; 2Animal & Grassland Research and Innovation Centre, Teagasc, Moorepark, Co. Cork,
Ireland; 3Sustainable Livestock Systems Group, Scottish Agricultural College, United Kingdom Keywords: Genomic selection, reference population, robustness, feed intake Introduction There has been long running interest in how feed intake and feed efficiency should be taken into account in breeding decisions (for review Veerkamp, 1998). Initially the interest in feed intake was based on trying to reduce the amount of feed required per unit of production, i.e. improving feed efficiency. However, in the past two decades, interest has shifted towards the role of feed intake and its relationship with energy balance (EB), health, and fertility. There is, as yet, no direct selection practiced for feed efficiency or EB using actual feed intake observations. This is primarily because the large resource demand of measuring, particularly, individual feed intake in dairy cows. This makes routine selection in breeding programs too difficult. Similar arguments hold for detailed fertility measures using progesterone (van der Lende et al., 2004), methane (Wall et al., 2010) and several disease traits.
An alternative might be to combine existing datasets from, for example, research herds in different countries and use these as a reference herd for calibrating a SNP key. In the RobustMilk database we combined data from research herds in four countries to generate sufficient data to achieve the research objectives of the project. Research was undertaken on how to combine the data (with different recording systems, feeding systems, and genetic groups), QTL detection, and statistical models. In this study the objective was to test the accuracy of the genomic breeding values
from the RobustMilk database in predicting the breeding values based on progeny information in the UK, The Netherlands and Ireland. Material & Methods Phenotypic data The data used in the present study originated from Teagasc, Moorepark, Ireland; the Langhill herd from the Scottish Agricultural College, United Kingdom; two herds of Wageningen UR Livestock Research, the Netherlands and the Jälla herd of the Swedish University of Agricultural Science. Phenotypic data were available on 2,031 Irish, 1,018 UK, 725 Dutch, and 225 Swedish Holstein-Friesian cows, but only the first lactation was selected. Phenotype handling Because the data came from different herds with different management and different frequencies of data recording, phenotypic data were pre-adjusted using a test-day model. The model included a random animal effect as a sixth order polynomial (no genetic relationships included), a fixed effect for the mean lactation curve (fourth order polynomial) and a deviation of this mean curve for ten management groups generated as the interaction between farm-nutritional treatment and milking frequency. Specific time dependent random effects were fitted for year-month of test by management

INTERBULL BULLETIN NO. 44. Stavanger, Norway, August 26 - 29, 2011
250
group (353 levels) and a specific treatment effect was fitted for experimental treatments during lactation for the cows in Ireland (81 levels). The model was fitted in ASReml (Gilmour et al., 2009) and used to predict a full lactation curve for each cow. The average live weight (LW), body condition score (BCS), dry matter intake (DMI) and milk, fat and protein yield of the predicted values for week 3 – 15 were subsequently used in the analysis. Only first lactation cows with at least ten observations in this period were retained (Table 1). This strict editing criteria resulted in many animals being discarded from the analysis, especially when no weekly recording system was practised, for example for BCS and DMI in Ireland. Genotyping Cows were genotyped with the Illumina BovineSNP50 BeadChip (Illumina Inc., San Diego, CA); genotypes of bulls were also available. After the quality control 37,590 SNPs remained. After removing animals with Mendelian inconsistencies between pedigree and SNP data (Calus et al., 2011) in total 1841 cows and 194 sires with genotypes remained. Table 1. Number of records for each trait and country involved. Trait UK SW IE NL N Yield x x x x 1629 DMI x x 970 BCS x 564 LW x x x 1416 Statistical analysis The BSSVS model described by Calus et al. (2008) and Verbyla et al. (2010) was performed using Gibbs sampling, run for 50,000 cycles with 10,000 cycles discarded for burn-in. Each trait was analysed with five different Gibbs chains of 50,000 cycles.
At the end of each chain the direct genomic value (DGV) of each sire was calculated as the sum of the allelic effects and the polygenic component. The average for each sire across the five chains was used in the further study. The prior QTL variance assumed the SNPs accounted for 80% of the genetic variance with the remaining 20% accounted for by the polygenic component. Progeny test proofs The cows with phenotypes included in the analysis were from 334 sires, and 194 sires had genotypes available. Thus, 44 of those sires had no daughters with phenotypes included, yet. For three countries (NL, UK, IE) progeny test breeding values were requested for the 194 sires. In NL 177 had breeding values available and 140 had a reliability of the breeding values above 90% for the milk yield traits. In the UK 189 bulls could be traced and 143 had a reliability above 90%. In IE 144 bulls were traced, and 110 had a reliability above 90%. Results Correlations between direct genomic values (DGV) estimated using the RobustMilk data and the progeny test evaluations approximate the accuracy of the DGV. In the three countries these correlations ranged from 0.46 to 0.57 in NL, 0.40 to 0.51 in IE, and 0.56 to 0.58 in the UK (Table 2). Correlations were stronger for fat yield, than for milk and protein yield. Prediction for the milk composition traits had even higher accuracy, between 0.70 and 0.78. There was little difference between the correlation across traits between the UK and NL.

INTERBULL BULLETIN NO. 44. Stavanger, Norway, August 26 - 29, 2011
251
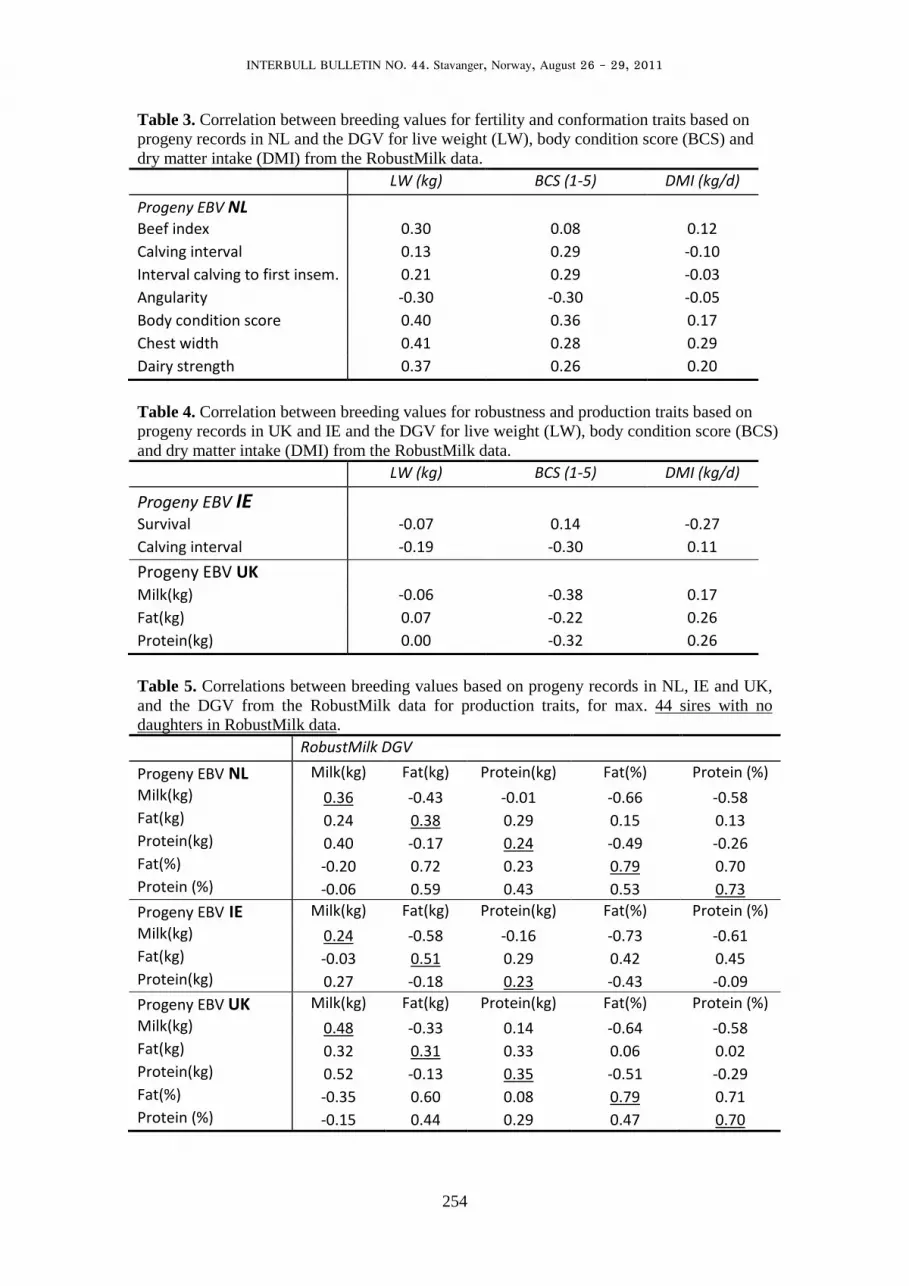
For the Netherlands where a larger set of breeding values was available, only traits with an absolute correlation above 0.25 are presented (Table 2). DGV for LW were correlated with progeny breeding values for dairy strength, chest width, body condition score and the beef index. The DGV for BCS (primarily on UK data) was associated with BCS in the Netherlands, but also several other body and fertility traits (Table 3). The DGV for DMI had a correlation of 0.29 with chest width.
Bulls with a high DGV for DMI had poorer survival in Ireland (-0.29), and bulls with a low DGV for BCS had a longer calving interval (-0.30). Lower DGV for BCS and a higher DGV for DMI were associated with higher milk production in the UK.
When only the bulls with no daughters in the RobustMilk dataset were taken, the accuracy of the DGV dropped as expected, except for the percentages (Table 5). For BCS the accuracy increased somewhat from 0.36 to 0.44, when taking the 44 bulls only. Discussion The objective of this study was to test the accuracy of the DGV generated from the RobustMilk data set on 4 research farms. The accuracy was validated by correlating the DGV with the breeding value based on progeny information from national genetic evaluations in the UK, The Netherlands and Ireland. The correlation between the DGV and the progeny breeding values is a measure of the accuracy of the DGV.
In all three countries higher accuracies were obtained than might be expected on the basis of heritability and number of records (Daetwyler et al., 2008), (Figure 2) despite the large differences in recording, population structures, and trait measurement. The likely reason is that most sires had daughters in the RobustMilk database, hence there was a very close relationship between the reference population and the bulls used for testing. The results for the 44 sires without daughters in the reference set are a more realistic estimation of the accuracy that can be obtained. These accuracies are close to the values expected (Daetwyler et al., 2008). Conclusions Data across research herds may be valuable to develop SNP keys for “difficult traits”. Despite differences in recording and management, reasonably accurate genomic predictions were obtained especially when there is a close relationship between bulls and the reference herd. Acknowledgments This study is part of the RobustMilk project (http://www.robustmilk.eu) which is financially supported by the European Commission under the Seventh Research Framework Programme, Grant Agreement KBBE-211708. The content of this paper is the sole responsibility of the authors, and it does not necessarily represent the views of the Commission or its services.

INTERBULL BULLETIN NO. 44. Stavanger, Norway, August 26 - 29, 2011
252
References
Calus, M.P.L., Meuwissen, T.H.E., de Roos, A.P.W. & Veerkamp, R.F. 2008. Accuracy of genomic selection using different methods to define haplotypes. Genetics 178, 553-561.
Calus, M.P.L., Mulder, H.A. & Bastiaansen, J.W.M. 2011. Identification of mendelian inconsistencies between snp and pedigree information of sibs. Submitted for publication.
Daetwyler, H.D., Villanueva, B. & Woolliams, J.A. 2008. Accuracy of Predicting the Genetic Risk of Disease Using a Genome-Wide Approach. PLoS One 3.
Gilmour, A.R., Cullis, B.R., Welham, S.J. & Thompson, R. 2009. ASREML. Program user manual. NSW Agriculture, Orange Agricultural Institute, Forest Road, Orange, NSW, 2800, Australia.
van der Lende, T., Kaal, L., Roelofs, R.M.G., Veerkamp, R.F., Schrooten, C. & Bovenhuis, H. 2004. Infrequent milk progesterone measurements in daughters enable bull selection for cow fertility. J. Dairy Sci. 87, 3953-3957.
Veerkamp, R.F. 1998. Selection for economic efficiency of dairy cattle using information on live weight and feed intake: a review. J. Dairy Sci. 81, 1109-1119.
Verbyla, K.L., Calus, M.P.L., Mulder, H.A., de Haas, Y. & Veerkamp, R.F. 2010. Predicting energy balance for dairy cows using high density SNP information. J. Dairy Sci. 93, 2757-2764.
Wall, E., Simm, G. & Moran, D. 2010. Developing breeding schemes to assist mitigation of greenhouse gas emissions. Animal 4, 366-376.
Figure 1. Frequency distribution of the number of daughters per genotyped sire.

INTERBULL BULLETIN NO. 44. Stavanger, Norway, August 26 - 29, 2011
253
Figure 2. Accuracy as a function of number of records, the solid line as predicted for DGV and h2=0.45, and as observed correlation between DGV and progeny EBV for yield traits in NL ▲, UK (◊) and IE (■) and BCS in NL (x), when using all bulls.
Table 2. Correlations between breeding values based on progeny records in NL, IE and UK, and the DGV from the RobustMilk data for production traits. RobustMilk DGV Progeny EBV NL Milk(kg) Fat(kg) Protein(kg) Fat(%) Protein (%) Milk(kg) 0.51 -0.01 0.29 -0.52 -0.44 Fat(kg) 0.16 0.57 0.32 0.40 0.28 Protein(kg) 0.41 0.23 0.46 -0.20 0.02 Fat(%) -0.33 0.45 0.00 0.78 0.63 Protein (%) -0.26 0.31 0.16 0.53 0.71 Progeny EBV IE Milk(kg) Fat(kg) Protein(kg) Fat(%) Protein (%) Milk(kg) 0.42 -0.13 0.15 -0.53 -0.49 Fat(kg) -0.02 0.51 0.21 0.53 0.38 Protein(kg) 0.30 0.15 0.40 -0.17 0.08 Progeny EBV UK Milk(kg) Fat(kg) Protein(kg) Fat(%) Protein (%) Milk(kg) 0.57 0.12 0.37 -0.45 -0.44 Fat(kg) 0.35 0.58 0.45 0.29 0.16 Protein(kg) 0.54 0.35 0.56 -0.19 -0.06 Fat(%) -0.30 0.40 0.02 0.76 0.64 Protein (%) -0.17 0.31 0.22 0.50 0.70
INTERBULL BULLETIN NO. 44. Stavanger, Norway, August 26 - 29, 2011
254
Table 3. Correlation between breeding values for fertility and conformation traits based on progeny records in NL and the DGV for live weight (LW), body condition score (BCS) and dry matter intake (DMI) from the RobustMilk data. LW (kg) BCS (1-5) DMI (kg/d) Progeny EBV NL Beef index 0.30 0.08 0.12 Calving interval 0.13 0.29 -0.10 Interval calving to first insem. 0.21 0.29 -0.03 Angularity -0.30 -0.30 -0.05 Body condition score 0.40 0.36 0.17 Chest width 0.41 0.28 0.29 Dairy strength 0.37 0.26 0.20 Table 4. Correlation between breeding values for robustness and production traits based on progeny records in UK and IE and the DGV for live weight (LW), body condition score (BCS) and dry matter intake (DMI) from the RobustMilk data. LW (kg) BCS (1-5) DMI (kg/d)
Progeny EBV IE Survival -0.07 0.14 -0.27 Calving interval -0.19 -0.30 0.11 Progeny EBV UK Milk(kg) -0.06 -0.38 0.17 Fat(kg) 0.07 -0.22 0.26 Protein(kg) 0.00 -0.32 0.26 Table 5. Correlations between breeding values based on progeny records in NL, IE and UK, and the DGV from the RobustMilk data for production traits, for max. 44 sires with no daughters in RobustMilk data. RobustMilk DGV Progeny EBV NL Milk(kg) Fat(kg) Protein(kg) Fat(%) Protein (%) Milk(kg) 0.36 -0.43 -0.01 -0.66 -0.58 Fat(kg) 0.24 0.38 0.29 0.15 0.13 Protein(kg) 0.40 -0.17 0.24 -0.49 -0.26 Fat(%) -0.20 0.72 0.23 0.79 0.70 Protein (%) -0.06 0.59 0.43 0.53 0.73 Progeny EBV IE Milk(kg) Fat(kg) Protein(kg) Fat(%) Protein (%) Milk(kg) 0.24 -0.58 -0.16 -0.73 -0.61 Fat(kg) -0.03 0.51 0.29 0.42 0.45 Protein(kg) 0.27 -0.18 0.23 -0.43 -0.09 Progeny EBV UK Milk(kg) Fat(kg) Protein(kg) Fat(%) Protein (%) Milk(kg) 0.48 -0.33 0.14 -0.64 -0.58 Fat(kg) 0.32 0.31 0.33 0.06 0.02 Protein(kg) 0.52 -0.13 0.35 -0.51 -0.29 Fat(%) -0.35 0.60 0.08 0.79 0.71 Protein (%) -0.15 0.44 0.29 0.47 0.70


