Embed Size (px)
Citation preview

www.ietdl.org
IE
d
Published in IET Science, Measurement and TechnologyReceived on 31st July 2013Revised on 24th January 2014Accepted on 12th February 2014doi: 10.1049/iet-smt.2013.0140
T Sci. Meas. Technol., pp. 1–6oi: 10.1049/iet-smt.2013.0140
ISSN 1751-8822
Use of proficiency testing schemes for motorcycleexhaust emissions laboratory: Brazilian experiencePaulo Roque Martins Silva1, Valnei Smarçaro da Cunha1, Werickson Fortunato de
Carvalho Rocha1, Gabriel Fonseca Sarmanho1, Joyce Costa Andrade2, Marcello Depieri3
1Chemical Metrology Division, Instituto Nacional de Metrologia Qualidade e Tecnologia – INMETRO, Avenida Nossa
Senhora das Graças, 50, Xerém, Duque de Caxias, Rio de Janeiro, 25250-020, Brazil2Interlaboratory Comparisons and Proficiency Division, Instituto Nacional de Metrologia Qualidade e Tecnologia –
INMETRO, Avenida Nossa Senhora das Graças, 50, Xerém, Duque de Caxias, Rio de Janeiro, 25250-020, Brazil3Associação de Engenharia Automotiva – AEA, R. Salvador Correia, 80, São Paulo, 04109-070, Brazil,
E-mail: [email protected]
Abstract: In this work, the Proficiency Testing Scheme (PTScheme) was used for evaluation of the motorcycle emissionslaboratories to measure the emission levels of this kind of vehicle, supplying subsidies to the laboratories to identify andsolve analytical problems and contributing for the measurement harmonisation in the country. The PTScheme of automotiveemissions is a type of study, provided only in Brazil, and it was the first time that this procedure was carried out formotorcycles. Such proficiency tests showed satisfactory results and shows the importance for the industry, society andenvironment.
1 Introduction
Air pollution constitutes a serious problem to human health,diminishing quality of life. Vehicles are a potential sourceof this pollution everywhere as automotive emissions ofgases contain diverse toxic substances that in contact withthe respiratory system can produce some negative effects onhealth. In the last 10 years the Brazilian automotive fleetdoubled and, during this period, the motorcycle fleetincreased four times [1]. Thus, the emission levels for thiskind of vehicle must be evaluated [2–5] as it is alreadycarried out for automobiles [6–8].Since 1980, proficiency testing has grown from a small
collection of schemes organised on a self-help basis to aminor industry, for the most part with third-partyaccreditation, in which nearly all analytical laboratoriesparticipate [9]. As a result, proficiency testing practice hasbeen subjected to a deep scrutiny, and procedures havebeen studied, refined and documented. Protocols relevant tothe conduct of schemes have been issued by ISO(International Organization for Standardization), IUPAC(International Union of Pure and Applied Chemistry), ILAC(International Laboratory Accreditation Cooperation) andAOAC International (Association of AnalyticalCommunities International). Regardless of all this activity,the basic plan for proficiency testing has remainedunchanged. Proficiency testing in analytical chemistrylaboratories comprises the regular distribution, by thescheme provider, of portions of an effectively homogeneousmaterial for analysis in the participating laboratories by anunspecified method. The concentration of the analyte is
unknown to the participant at the time of analysis. Theparticipant reports the result to the scheme provider by adeadline. The scheme provider then issues a reportcontaining the preferred value of the analyte concentration,a summary of the results of all the participants, and a scorethat gives an indication of the accuracy achieved by eachindividual result. This sequence of events, known as a‘round’, is repeated at regular intervals several times peryear. A round can comprise several test materials and callfor the determination of a number of analytes per material.A Proficiency Testing Scheme (PTScheme) has the
purpose of comparing measurement results from differentlaboratories, carried out under similar conditions, and tohave a continuous evaluation of the performance of theparticipating laboratories and it can be carried out in manyknowledge fields [10–16]. This evaluation is made throughthe results generated by interlaboratory comparisons thatconstitute an adjusted mechanism to evaluate anddemonstrate the quality/trueness in the measurementscarried out by the participants. This process is wellestablished in Brazil for automobiles, with fiveaccomplished rounds since 2004 [17–19] wheremanufacturers and accredited laboratories participate, butfor motorcycles it is the first time that such a PTScheme iscarried out. After the disclosure of the PTScheme,laboratories have the chance to review their analysisprocedures, as well to implement improvements in theirprocesses. Given the diverse purposes of PTSchemes, it isnot possible to define a single universal evaluation method.Therefore, a number of statistical designs used for theevaluation of performance are available [20]. Most schemes
1& The Institution of Engineering and Technology 2014

www.ietdl.org
convert a participant’s result x into a score reflecting itsaccuracy. In the determination of an assigned value,attention is usually focused on the exact meaning of‘consensus’ and how best to estimate it from theparticipants’ results. The usual estimates of central tendency(mean, median and mode) are all potential candidates forconsensus, but each presents some interesting problems.The arithmetic mean is clearly unsatisfactory because theresults of a round nearly always contain outliers, oftenextreme outliers. A robust mean (including the median) isoften suitable, but its utility depends on the distribution ofresults (outliers aside) being largely symmetric. Theharmonised protocol recommends the use of a robust meanas consensus when the results appear to be largelysymmetric, outliers aside. This is the most frequent outcomeof a round of a test.In this work, we report the first proficiency test formotorcycle exhaustion emissions laboratories where thefollowing parameters were determined: carbon monoxide(CO), carbon dioxide (CO2), nitrogen oxides (NOx), totalhydrocarbons (THC), total aldehydes and autonomy. Toverify if there was any difference in population distribution,the average results obtained by each laboratory werecompared using Kruskal–Wallis test and the outliers wereevaluated using box plot. The main purpose of this firstproficiency testing in motorcycles was to compare theanalysis results obtained by each laboratory, not to evaluatethe laboratory performance, as a consensus value for eachanalysed parameter was not used.
Fig. 1 Flowchart of the PTScheme for motorcycle exhaustemission laboratories
2 Methodology
The methodology for accomplishment of the PTScheme wasestablished in the protocol in [21], where the predeterminedcharacteristics of the test motorcycles, the logistics oftransportation, schedule of execution and the definition ofthe parameters to be analysed are defined. Fig. 1 shows aflowchart containing all steps of this PTScheme, from thedefinition of the procedures, tests, result reports by thelaboratories and the public result disclosure.Two different vehicles were used in this proficiency test: a
150 cc ethanol-fuelled motorcycle and a 250 ccgasoline-fuelled motorcycle. Seven different laboratoriesparticipated in this first round; each one received a code inorder to assure the confidentiality of the test. Theparameters under evaluation were CO, CO2, NOx, THC,urban autonomy and total aldehydes. For this lastparameter, participation was optional and the participatinglabs received a different codification. The laboratoriescarried out the tests in accordance with directive 97/24/ECand Brazilian standard methods: ABNT NBR 12026 foraldehyde determination and ABNT NBR 7024 forautonomy determination.The measurement results express the amount of pollutants
emitted for a light vehicle of the Otto cycle (CO, CO2, totalNOx, THC and aldehydes), expressed in g/km and urbanautonomy in km/l. The methodology of the testingdescribes situations, simulated in chassis dynamometer, ofdeparture (in cold state), situations in urban transit anddeparture in hot state one. Following those situations, thefunctioning of a vehicle can be reproduced with thedescription of repeatability proven in standardised situationsof transit.To compare the average results for all participants,
Kruskal–Wallis test was carried out for each analysed
2& The Institution of Engineering and Technology 2014
parameter. This test is based on the following hypothesis:H0 – there is no difference on the population distribution;Ha – there is difference on the distribution. Equation (1)shows the Kruskal–Wallis statistics.
H = 12
N (N + 1)
R21
n1+ R2
2
n2+ . . .+ R2
k
nk
( )− 3 N + 1( ) (1)
where ‘n’ is the number of replicates for each laboratory (inthis proficiency test three replicates), ‘N’ is the number ofparticipant laboratories (N = 7), ‘Ri’ is the rank sums ofeach sample and ‘H’ is the Kruskal–Wallis value.If any parameter shows difference on the distribution, the
pair of specific means of the participants which differssignificantly is identified as shown in (2)
Rj − Ri
∣∣∣ ∣∣∣ ≤ Z//k(k−1)
����������������������N (N + 1)
12
1
nj+ 1
ni
( )√√√√ (2)
where ‘R’ is the rank of j and i populations, ‘N’ is the totalresults number, ‘n’ is the replicate number for eachlaboratory, ‘k’ is the number of the participants in theproficiency test and ‘α’ is the confidence level. In thiswork, we used a 95% confidence level.
IET Sci. Meas. Technol., pp. 1–6doi: 10.1049/iet-smt.2013.0140

Fig. 2 Results distribution for proficiency emission test in gasoline-fuelled motorcycle
a CO b CO2 c THCd NOx e Autonomy f Total aldehydes
Fig. 3 Box plot for proficiency emission test in gasoline-fuelled motorcycle
a CO b CO2 c THCd NOx e Autonomy f Total aldehydes
www.ietdl.org
IET Sci. Meas. Technol., pp. 1–6doi: 10.1049/iet-smt.2013.0140
3& The Institution of Engineering and Technology 2014
www.ietdl.org
For outliers detection and evaluation, box plot was thenused. The box plot is a useful graphical display fordescribing the behaviour of the data in the middle as wellas at the ends of the distributions [22, 23]. The box plotuses the median and the lower and upper quartiles (definedas the 25th and 75th percentiles). If the lower quartile is Q1and the upper quartile is Q3, then the difference (Q3−Q1)is called the interquartile range or IQ. A box plotis constructed by drawing a box between the upper andlower quartiles with a solid line drawn across the box tolocate the median. The following quantities (called fences)are needed for identifying extreme values in the tails of thedistribution
1. lowerinnerfence: Q1− 1.5*IQ2. upperinnerfence: Q3 + 1.5*IQ3. lowerouterfence: Q1− 3*IQ4. upperouterfence: Q3 + 3*IQ
A point beyond an inner fence on either side is considered amild outlier. A point beyond an outer fence is considered anextreme outlier.
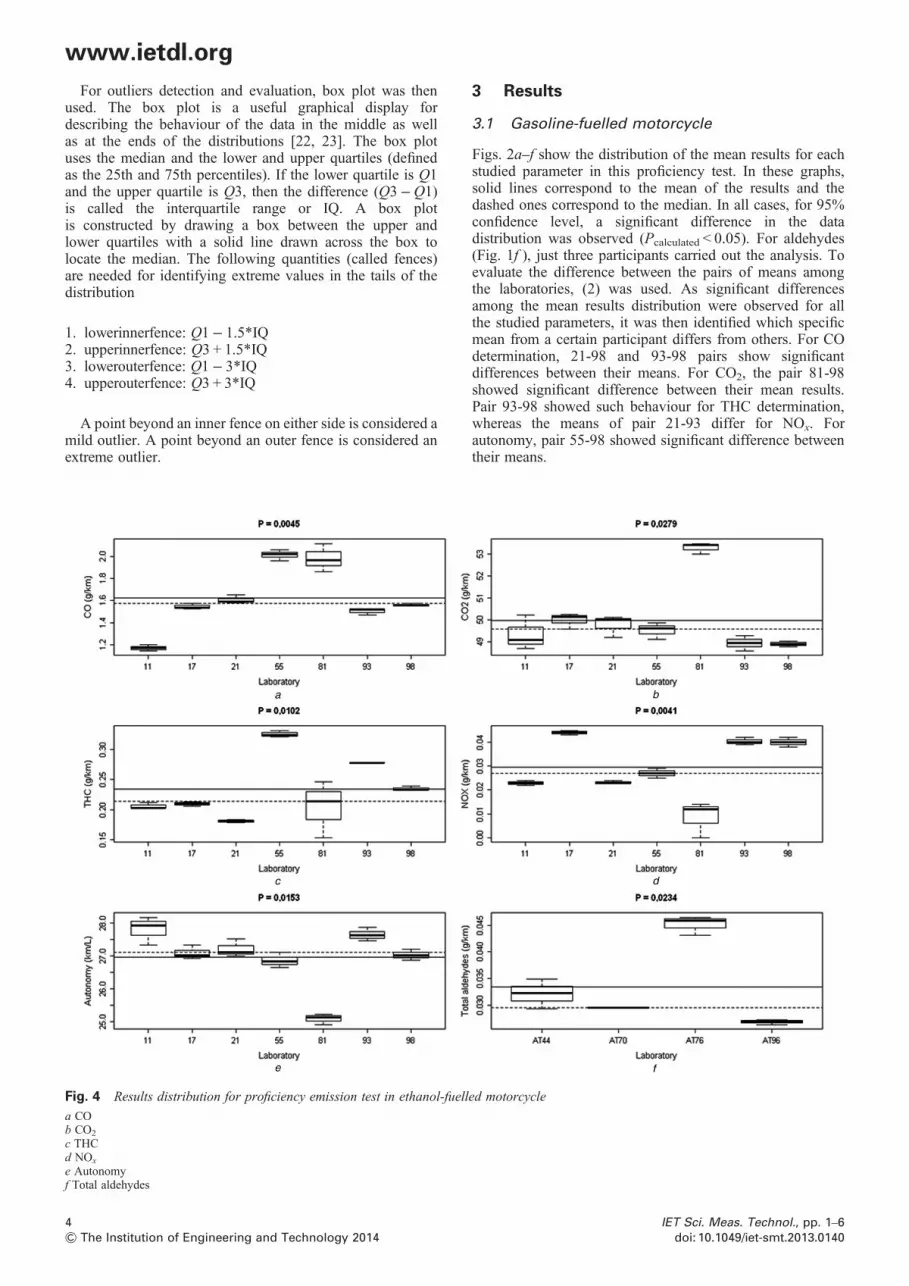
Fig. 4 Results distribution for proficiency emission test in ethanol-fuell
a COb CO2
c THCd NOx
e Autonomyf Total aldehydes
4& The Institution of Engineering and Technology 2014
3 Results
3.1 Gasoline-fuelled motorcycle
Figs. 2a–f show the distribution of the mean results for eachstudied parameter in this proficiency test. In these graphs,solid lines correspond to the mean of the results and thedashed ones correspond to the median. In all cases, for 95%confidence level, a significant difference in the datadistribution was observed (Pcalculated < 0.05). For aldehydes(Fig. 1f ), just three participants carried out the analysis. Toevaluate the difference between the pairs of means amongthe laboratories, (2) was used. As significant differencesamong the mean results distribution were observed for allthe studied parameters, it was then identified which specificmean from a certain participant differs from others. For COdetermination, 21-98 and 93-98 pairs show significantdifferences between their means. For CO2, the pair 81-98showed significant difference between their mean results.Pair 93-98 showed such behaviour for THC determination,whereas the means of pair 21-93 differ for NOx. Forautonomy, pair 55-98 showed significant difference betweentheir means.
ed motorcycle
IET Sci. Meas. Technol., pp. 1–6doi: 10.1049/iet-smt.2013.0140

Fig. 5 Box plot for proficiency emission test in ethanol-fuelled motorcycle
a COb CO2
c THCd NOx
e Autonomyf Total aldehydes
www.ietdl.org
For the total aldehydes parameter, the mean results forlaboratories AT-70 and AT-96 are statistically different.Finally, the outliers were evaluated for all the parameters,
as shown in Fig. 3. There are no outliers for almost all thestudied parameters, except for autonomy (Fig. 3e) wherelaboratory 98 showed results above the calculated upperlimits.
3.2 Ethanol-fuelled motorcycle
As shown in Figs. 4a–f, for ethanol-fuelled based motorcycle,a significant difference in the population distribution was alsoobserved. For CO determination, laboratories 11-55 and11-81 show significant statistical differences between theirmeans. For CO2, the pair 81-98 showed significantdifference between their mean results. Pair 21-55 showedsuch behaviour for THC determination, whereas for NOx,pair 17-81, their means are statistically different. Forautonomy, laboratories 11-81 and 81-93 showedsignificant difference between their means. For aldehydes,the mean results for laboratories AT-76 and AT96significantly differ.Laboratory 81 showed outlier results for two parameters, as
shown in Fig. 5: CO2 (Fig. 5b) and autonomy (Fig. 5e). Forthe first one, the values were above the upper calculatedlimits whereas for autonomy parameter, the results showedthe opposite behaviour.
IET Sci. Meas. Technol., pp. 1–6doi: 10.1049/iet-smt.2013.0140
4 Conclusions
PTSchemes in vehicle emission in Brazil have become animportant tool for the laboratory development in this field.As it is the first one carried out for motorcycles, the resultscan be considered satisfactory and the scheme must becontinued in order to improve the emissions laboratoryprocesses. The continuity of this program is very importantfor all players involved in the process: emission labs,automobile industry, government regulating agencies andthe wider society.The coefficient of variation for the gasoline-fuelled
motorcycle ranged from 4.2% for CO2 determination to36.6% for aldehyde determination, whereas for thealcohol-fuelled motorcycle this coefficient ranged from3.3% for autonomy to 42.9% for NOx. As the concentrationlevels of the analyte decrease, the variation among theresults clearly rises.The proficiency emission test has large variable numbers
that have direct impact on the obtained results. Although inthis first round the lab performances were not evaluated, asthere were no consensus values for all analysed parameters.It is worth noting that at this stage the uncertainties of themeasurements were not calculated as the statistical approachused in this round does not demand these values.The results of this proficiency testing can help motorcycle
exhaust emission laboratories to identify systematic errors,improve standard methods for automotive gas emission
5& The Institution of Engineering and Technology 2014

www.ietdl.org
determination and improve their measurement processes. Asecond round of this PTScheme was carried out in 2013.5 Acknowledgments
The authors would like to thank all members of ‘ComissãoTécnica de Acreditação de Laboratórios de Emissões deMotos’ from AEA (Associação Brasileira de EngenhariaAutomotiva) for the discussions and proficiency testparticipation.
6 References
1 Brazilian automotive fleet statistics: Retrieved 10 June 2013 from http://www.denatran.gov.br/frota.htm
2 Garcia, L.F.A., Correa, S.M., Penteado, R., Daemme, L.C., Gatti, L.V.,Alvim, D.S.: ‘Measurements of emissions from motorcycles andmodeling its impact on air quality’, J. Braz. Chem. Soc., 2013, 24,(3), pp. 375–384
3 Chen, K.S., Wang, W.C., Chen, H.M., et al.: ‘Motorcycle emissions andfuel consumption in urban and rural driving conditions’, Sci. TotalEnviron., 2003, 312, (1), pp. 113–122
4 Tsai, J.H., Chiang, H.L., Hsu, Y.C., Peng, B.J., Hung, R.F.:‘Development of a local real world driving cycle for motorcycles foremission factor measurements’, Atmos. Environ., 2005, 39, (35),pp. 6631–6641
5 Kumar, R., Durai, B.K., Saleh, W., Boswell, C.: ‘Comparison andevaluation of emissions for different driving cycles: a note’, Transp.Res. D, 2011, 16, (1), pp. 61–64
6 Souza, C.D.R., Silva, S.D., Silva, M.A.V., D´Agosto, M.A., Barboza, A.P.: ‘Inventory of conventional air pollutants emissions from roadtransportation for the state of Rio de Janeiro’, Energy Policy, 2013,53, pp. 125–135
7 Schnitzhofer, R., Beauchamp, J., Dunkl, J., Wisthaler, A., Weber, A.,Hansel, A.: ‘Long-term measurements of CO, NO, NO2, benzene,toluene and PM 10 at a motorway location in an Austrian valley’,Atmos. Environ., 2008, 42, (5), pp. 1012–1024
8 Nesamani, K.S.: ‘Estimation of automobile emissions and controlstrategies in India’, Sci. Total Environ., 2010, 408, (8), pp. 1800–1811
9 Thompson, M.: ‘Proficiency testing in analytical chemistry’, in Brown,S., Tauler, R., Walczak, B. (Eds.): ‘Comprehensive chemometrics,chemical and biochemical data analysis’ (Elsevier Science, 1st edn.),vol. 1, p. 78
6& The Institution of Engineering and Technology 2014
10 International Organization For Standardization: ISO/IEC 17043 –conformity assessment – General requirement for proficiency testing.Geneva, 2010
11 ISO 5725 (E): Accuracy (trueness and precision) of measurementmethods and results – Part 2: Basic method for the determination ofrepeatability and reproducibility of a standard measurement method,Geneva, 1994
12 Gonçalves, M., Gonzaga, F.B., Fraga, I.C.S., et al.: ‘Evaluation study ofdifferent glass electrodes by an interlaboratory comparison fordetermining the pH of fuel ethanol’, Sens. Actuators B, 2011, 158,pp. 327–332
13 Nogueira, J.M.F., Nieto de Castro, C.A., Cortez, L.: ‘EPTIS: the newEuropean database of proficiency testing schemes for analyticallaboratories’, Trends Anal. Chem., 2001, 20, (9), pp. 457–461
14 Camino-Sánchez, F., Zafra-Gómez, A., Ruiz-García, J., Vílchez, J.:‘Screening and quantification of 65 organic pollutants in drinkingwater by stir bar sorptive extraction-gas chromatography-triplequadrupole mass spectrometry’, Food Anal. Methods, 2013, 6, (3),pp. 854–867
15 Raposo, F., de la Rubia, M.A., Borja, R., et al.: ‘An interlaboratory studyas useful tool for proficiency testing of chemical oxygen demandmeasurements using solid substrates and liquid samples with highsuspended solid content’, Talanta, 2009, 80, (1), pp. 329–337
16 Heydorn, K.: ‘The quality of consensus values’, Accreditation Qual.Assurance, 2013, 18, (3), pp. 243–245
17 Relatório Final do Ensaio de Proficiência em Emissões Veiculares: 2ªrodada, retrieved 10 June 2013, from http://www.inmetro.gov.br/metcientifica/profiEmiVeicular.asp
18 Relatório Final do Ensaio de Proficiência em Emissões Veiculares: 3ªrodada. Retrieved 10 June 2013, from http://www.inmetro.gov.br/metcientifica/profiEmiVeicular.asp
19 Relatório Final do Ensaio de Proficiência em Emissões Veiculares: 4ªrodada. Retrieved 10 June 10 2013, from http://www.inmetro.gov.br/metcientifica/profiEmiVeicular.asp
20 Eurachem/Citac: ‘Guide CG4 in quantifying uncertainty in analyticalmeasurement’, in Ellison, S.L.R., Rosslein, M., Williams, A. (Eds.)(2000, 2nd edn.). Available from the Europchem Secretariat. (see http://www.eurochem.org)
21 Relatório Final do Ensaio de Proficiência em Emissões de motociclos: 1ªrodada. Retrieved 10 June 2013, from http://www.inmetro.gov.br/metcientifica/pdf/rf_emissoes_motociclos_1a_rodada.pdf
22 Nist/Sematech: e-Handbook of Statistical Methods, retrieved 29 April2013, from http://www.itl.nist.gov/div898/handbook/
23 Miller, J.C., Miller, J.N.: ‘Statitistics for analytical chemistry’ (EllisHorwood, Chichester, 1993, 3rd edn.)
IET Sci. Meas. Technol., pp. 1–6doi: 10.1049/iet-smt.2013.0140


