Embed Size (px)
Citation preview
Using No-Stakes Educational Testing toMitigate Summer Learning Loss:A Pilot Study
September 2014
Research ReportETS RR–14-21
Franklin Zaromb
Rachel M. Adler
Kelly Bruce
Yigal Attali
JoAnn Rock
ETS Research Report Series
EIGNOR EXECUTIVE EDITOR
James CarlsonPrincipal Psychometrician
ASSOCIATE EDITORS
Beata Beigman KlebanovResearch Scientist
Heather BuzickResearch Scientist
Brent BridgemanDistinguished Presidential Appointee
Keelan EvaniniManaging Research Scientist
Marna Golub-SmithPrincipal Psychometrician
Shelby HabermanDistinguished Presidential Appointee
Donald PowersManaging Principal Research Scientist
Gautam PuhanSenior Psychometrician
John SabatiniManaging Principal Research Scientist
Matthias von DavierDirector, Research
Rebecca ZwickDistinguished Presidential Appointee
PRODUCTION EDITORS
Kim FryerManager, Editing Services
Ayleen StellhornEditor
Since its 1947 founding, ETS has conducted and disseminated scientific research to support its products and services, andto advance the measurement and education fields. In keeping with these goals, ETS is committed to making its researchfreely available to the professional community and to the general public. Published accounts of ETS research, includingpapers in the ETS Research Report series, undergo a formal peer-review process by ETS staff to ensure that they meetestablished scientific and professional standards. All such ETS-conducted peer reviews are in addition to any reviews thatoutside organizations may provide as part of their own publication processes. Peer review notwithstanding, the positionsexpressed in the ETS Research Report series and other published accounts of ETS research are those of the authors andnot necessarily those of the Officers and Trustees of Educational Testing Service.
The Daniel Eignor Editorship is named in honor of Dr. Daniel R. Eignor, who from 2001 until 2011 served the Research andDevelopment division as Editor for the ETS Research Report series. The Eignor Editorship has been created to recognizethe pivotal leadership role that Dr. Eignor played in the research publication process at ETS.
ETS Research Report Series ISSN 2330-8516
R E S E A R C H R E P O R T
Using No-Stakes Educational Testing to Mitigate SummerLearning Loss: A Pilot Study
Franklin Zaromb, Rachel M. Adler, Kelly Bruce, Yigal Attali, & JoAnn Rock
Educational Testing Service, Princeton, NJ
This study investigates the benefits of no-stakes educational testing during students’ summer vacation as a strategy to mitigate summerlearning loss. Fifty-one students in Grades 3–8 from the Every Child Valued (ECV) and Lawrence Community Center (LCC) summerprograms in Lawrenceville, NJ, took short, online assessments throughout the summer, covering knowledge and procedural skills inboth mathematics and reading that they had previously learned. Students were randomly assigned to mathematics or reading conditions,whereby over the course of 5 weeks, students in the mathematics condition took online assessments in mathematics fluency two orthree times per week and students in the reading condition took online assessments in reading components skills (word recognitionand decoding, vocabulary, morphological awareness, and reading comprehension) two or three times per week. All students completedtests in both math and reading components at the beginning and end of the summer in order to compare baseline and final performance.Although students did not show significant summer learning loss in either reading components or mathematics fluency, students inthe reading condition scored significantly higher, on average, on standardized tests of reading components administered at the end ofthe study than students in the mathematics condition. Given the small sample size and variations in grade level, academic subjects,computer programs, and testing conditions, it is premature to draw any firm conclusions from these findings.
Keywords Summer learning loss; educational measurement; no-stakes testing; reading skills; mathematics skills; K-12 education
doi:10.1002/ets2.12021
Summer learning loss refers to the loss of knowledge and academic skills over summer months when students are out ofschool, and it is widely recognized as a pervasive and significant problem in United States education. Previous researchhas reported estimates of summer learning loss ranging from about 1–3 months of declines in measures of grade-levelequivalency, and these estimates vary with respect to grade level, subject matter, and socioeconomic status (Cooper, 2003;Cooper, Nye, Charlton, Lindsay, & Greathouse, 1996; Entwisle & Alexander, 1992, 1994).
For example, Cooper et al. (1996) conducted a meta-analysis and review of 39 studies examining the effects of summervacation on standardized test scores. They found that, on average, students’ scores on state standardized tests in the fallwere approximately one tenth of a standard deviation lower than they were in the preceding spring, which they inter-preted to mean that summer learning loss was the equivalent of at least 1 month of instruction. They also reported thatestimates of summer learning loss varied with respect to a number of factors. First of all, summer learning loss was morepronounced for subjects such as math computation and spelling than other subjects, such as problem solving and read-ing comprehension (see also, Cooper, 2003). Estimates of summer learning loss also varied by grade level, subject (e.g.,summer learning loss is greater in mathematics than in reading), and the intervening time interval between pre- and post-summer testing. With a longer interval between pre- and posttesting, lower measured learning loss was found, presumablybecause students had already received some instruction during the fall that reversed some of the summer learning loss.
In addition, estimates of summer learning loss vary among socioeconomic groups. For instance, Heyns (1978) con-ducted a longitudinal study of students in Grades 5–7 in 42 Atlanta schools in which she found that the differences inlearning rates for White, economically advantaged students and non-White, economically disadvantaged students signifi-cantly increased during the summer, and the differences were most pronounced in reading. Entwisle and Alexander (1992,1994) confirmed and extended these findings in a study that examined differences in Baltimore students’ spring and falltest scores in Grades 1–6. They found that during the school year, lower- and higher-income students learned at nearlythe same rate; however, during summer vacation, lower-income students’ scores fell much more rapidly than those ofhigher-income students. Presumably, higher-income students benefit from some forms of summer learning enrichment,
Corresponding author: F. Zaromb, E-mail: [email protected]
ETS Research Report No. RR-14-21. © 2014 Educational Testing Service 1
F. Zaromb et al. No-Stakes Educational Testing and Summer Learning Loss
particularly reading activities, which mitigate summer learning loss, most noticeably in reading skills (Cooper et al., 1996).Similarly, analyses of data from the Early Childhood Longitudinal Study, Kindergarten Class (ECLS-K) reveal that dif-ferent summer learning loss rates (again, especially in reading) account for a significant amount of the achievement gapbetween early elementary students from low- and high-income families (Benson & Borman, 2010; Burkam, Ready, Lee,& LoGerfo, 2004; Downey, von Hippel, & Broh, 2004).
Taken together, these findings are especially troubling, because research has further suggested that the detrimentaleffects of summer learning loss are cumulative, with lower-income students falling increasingly farther behind their moreaffluent peers as they advance to high school. In a longitudinal study that tracked Baltimore students’ academic progressand outcomes until the age of 22, Alexander, Entwisle, and Olson (2007) estimated that approximately two thirds of thereading achievement gap in the ninth grade was accounted for by summer learning loss during students’ first 5 years ofschooling. In addition, they reported that the ninth grade achievement gap was strongly correlated with later dropoutrates and whether a student took college preparatory courses.
In sum, considerable evidence shows that summer vacation has detrimental effects on learning for many students.While all students may show declines in some subjects, like mathematics, low-income students exhibit disproportionatedeclines in learning, especially in reading, which may contribute to long-term achievement gaps. Therefore, low-cost,widely accessible interventions that help students retain the knowledge and skills they acquired during the school yearcan potentially improve K-12 education by significantly reducing achievement gaps, enabling students to accelerate theirprogress in learning, and optimizing course instruction by allowing teachers to devote less class time and resources toreteaching the past year’s subject matter.
The purpose of our research was to investigate the benefits of no-stakes educational testing during students’ summervacation as a strategy to mitigate summer learning loss in Grades K-12. Testing has long been utilized by educators asa means to assess students’ learning and retention of instructed material. However, a growing body of research showstesting can also transform students’ knowledge of subject matter by rendering it more resistant to forgetting over thelong-term relative to restudying the subject matter for an equivalent amount of time. This finding, known as the testingeffect, has been demonstrated in educational settings using a wide range of subject materials among various test-takingpopulations (for reviews, see Roediger & Butler, 2011; Roediger & Karpicke, 2006). Surprisingly, testing effects are oftenrobust even under conditions in which correct answer feedback is not provided after testing (Butler & Roediger, 2008;Cull, 2000).
Despite the potential benefits of educational testing to enhance learning and instruction in the classroom, educationaltesting is seldom done outside of the school year, and frequent testing during the summer may help retain gains in thelearning and retention of knowledge and skills that were achieved during the school year. In 2011, Educational Testing Ser-vice (ETS®) conducted a pilot study at the Every Child Valued (ECV) and Lawrence Community Center (LCC) summerprograms in Lawrenceville, NJ, which focused on evaluating the effects of no-stakes testing on summer loss in mathemat-ics and reading components skills. The purpose of our pilot study was to explore the logistical feasibility, student reactions,and behavioral effects of using frequent, no-stakes educational testing as an intervention for reducing, if not eliminating,summer learning loss.
Specifically, throughout the summer, 51 students in Grades 3–8 took short, computer-based tests covering knowl-edge and procedural skills in both mathematics and reading components that they had previously learned. We focusedour efforts on mathematics and reading because acquiring fluency in these knowledge and skill domains (e.g., solvingarithmetic problems and decoding) in elementary and middle school grades is critical in laying the foundation for lateracademic success. In order to examine whether testing affects summer learning loss, we compared students’ performancein subject areas repeatedly tested throughout the summer with their performance in subject areas not tested repeatedlyduring the summer. All students completed tests in both math and reading at the beginning and end of the summer inorder to measure baseline and final performance. Students were then randomly assigned to mathematics or reading con-ditions, whereby students in the mathematics group took tests in mathematics fluency two or three times per week overthe course of 5 weeks, and students in the reading group took tests two or three times per week in fundamental readingcomponents skills (word recognition and decoding, vocabulary, morphological awareness, and reading comprehension).The effect of the intervention on summer loss was estimated as the difference in pre- and post-standardized test scores inboth subject areas, as well as the difference in posttest scores between students in the mathematics group and the readinggroup.
2 ETS Research Report No. RR-14-21. © 2014 Educational Testing Service
F. Zaromb et al. No-Stakes Educational Testing and Summer Learning Loss
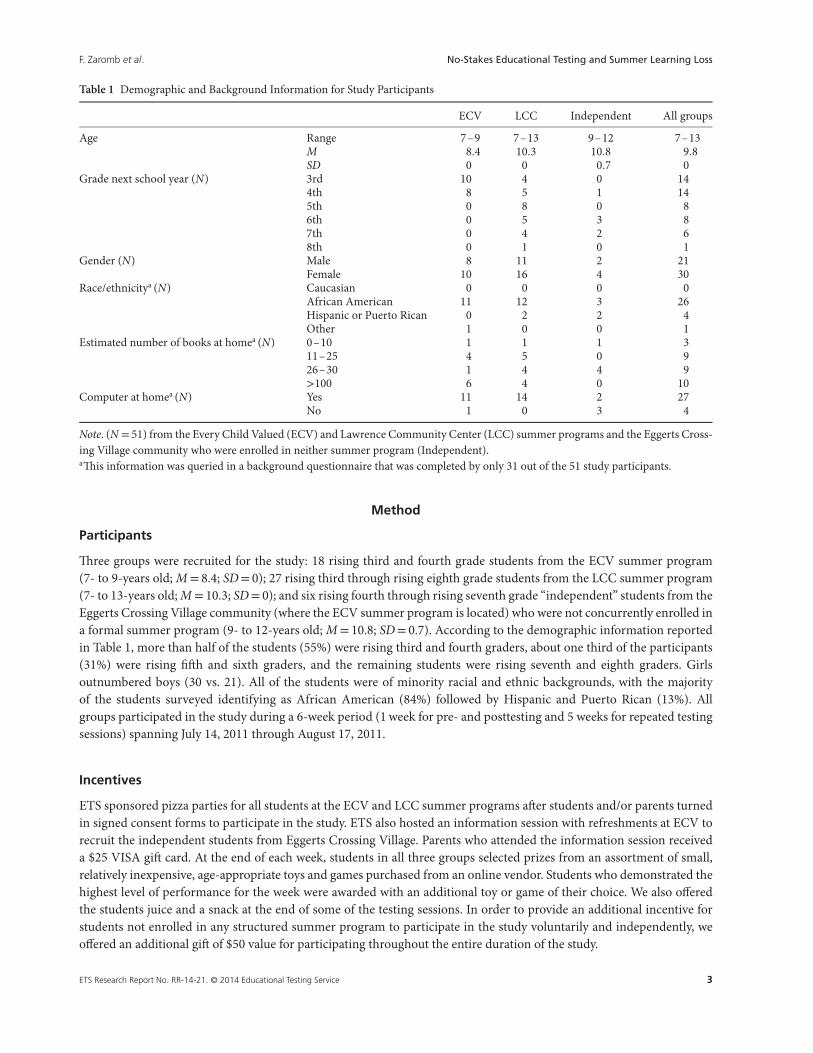
Table 1 Demographic and Background Information for Study Participants
ECV LCC Independent All groups
Age Range 7–9 7–13 9–12 7–13M 8.4 10.3 10.8 9.8SD 0 0 0.7 0
Grade next school year (N) 3rd 10 4 0 144th 8 5 1 145th 0 8 0 86th 0 5 3 87th 0 4 2 68th 0 1 0 1
Gender (N) Male 8 11 2 21Female 10 16 4 30
Race/ethnicitya (N) Caucasian 0 0 0 0African American 11 12 3 26Hispanic or Puerto Rican 0 2 2 4Other 1 0 0 1
Estimated number of books at homea (N) 0–10 1 1 1 311–25 4 5 0 926–30 1 4 4 9>100 6 4 0 10
Computer at homea (N) Yes 11 14 2 27No 1 0 3 4
Note. (N = 51) from the Every Child Valued (ECV) and Lawrence Community Center (LCC) summer programs and the Eggerts Cross-ing Village community who were enrolled in neither summer program (Independent).aThis information was queried in a background questionnaire that was completed by only 31 out of the 51 study participants.
Method
Participants
Three groups were recruited for the study: 18 rising third and fourth grade students from the ECV summer program(7- to 9-years old; M = 8.4; SD= 0); 27 rising third through rising eighth grade students from the LCC summer program(7- to 13-years old; M = 10.3; SD= 0); and six rising fourth through rising seventh grade “independent” students from theEggerts Crossing Village community (where the ECV summer program is located) who were not concurrently enrolled ina formal summer program (9- to 12-years old; M = 10.8; SD= 0.7). According to the demographic information reportedin Table 1, more than half of the students (55%) were rising third and fourth graders, about one third of the participants(31%) were rising fifth and sixth graders, and the remaining students were rising seventh and eighth graders. Girlsoutnumbered boys (30 vs. 21). All of the students were of minority racial and ethnic backgrounds, with the majorityof the students surveyed identifying as African American (84%) followed by Hispanic and Puerto Rican (13%). Allgroups participated in the study during a 6-week period (1 week for pre- and posttesting and 5 weeks for repeated testingsessions) spanning July 14, 2011 through August 17, 2011.
Incentives
ETS sponsored pizza parties for all students at the ECV and LCC summer programs after students and/or parents turnedin signed consent forms to participate in the study. ETS also hosted an information session with refreshments at ECV torecruit the independent students from Eggerts Crossing Village. Parents who attended the information session receiveda $25 VISA gift card. At the end of each week, students in all three groups selected prizes from an assortment of small,relatively inexpensive, age-appropriate toys and games purchased from an online vendor. Students who demonstrated thehighest level of performance for the week were awarded with an additional toy or game of their choice. We also offeredthe students juice and a snack at the end of some of the testing sessions. In order to provide an additional incentive forstudents not enrolled in any structured summer program to participate in the study voluntarily and independently, weoffered an additional gift of $50 value for participating throughout the entire duration of the study.
ETS Research Report No. RR-14-21. © 2014 Educational Testing Service 3
F. Zaromb et al. No-Stakes Educational Testing and Summer Learning Loss
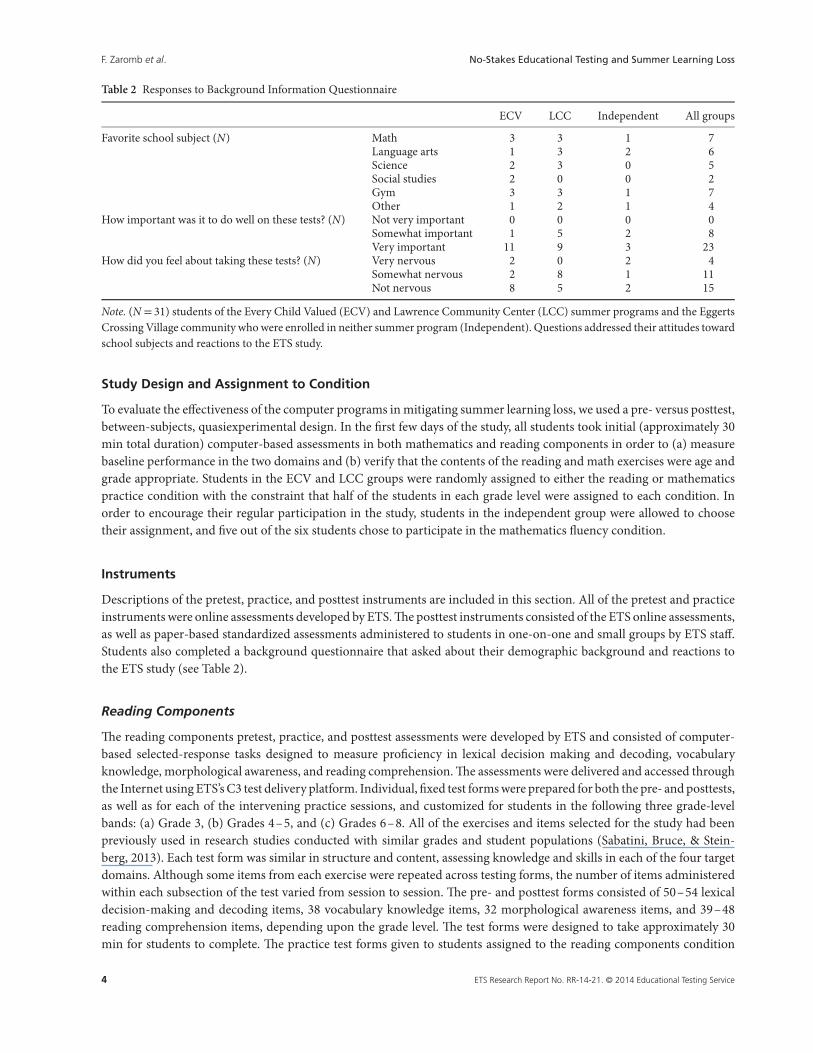
Table 2 Responses to Background Information Questionnaire
ECV LCC Independent All groups
Favorite school subject (N) Math 3 3 1 7Language arts 1 3 2 6Science 2 3 0 5Social studies 2 0 0 2Gym 3 3 1 7Other 1 2 1 4
How important was it to do well on these tests? (N) Not very important 0 0 0 0Somewhat important 1 5 2 8Very important 11 9 3 23
How did you feel about taking these tests? (N) Very nervous 2 0 2 4Somewhat nervous 2 8 1 11Not nervous 8 5 2 15
Note. (N = 31) students of the Every Child Valued (ECV) and Lawrence Community Center (LCC) summer programs and the EggertsCrossing Village community who were enrolled in neither summer program (Independent). Questions addressed their attitudes towardschool subjects and reactions to the ETS study.
Study Design and Assignment to Condition
To evaluate the effectiveness of the computer programs in mitigating summer learning loss, we used a pre- versus posttest,between-subjects, quasiexperimental design. In the first few days of the study, all students took initial (approximately 30min total duration) computer-based assessments in both mathematics and reading components in order to (a) measurebaseline performance in the two domains and (b) verify that the contents of the reading and math exercises were age andgrade appropriate. Students in the ECV and LCC groups were randomly assigned to either the reading or mathematicspractice condition with the constraint that half of the students in each grade level were assigned to each condition. Inorder to encourage their regular participation in the study, students in the independent group were allowed to choosetheir assignment, and five out of the six students chose to participate in the mathematics fluency condition.
Instruments
Descriptions of the pretest, practice, and posttest instruments are included in this section. All of the pretest and practiceinstruments were online assessments developed by ETS. The posttest instruments consisted of the ETS online assessments,as well as paper-based standardized assessments administered to students in one-on-one and small groups by ETS staff.Students also completed a background questionnaire that asked about their demographic background and reactions tothe ETS study (see Table 2).
Reading Components
The reading components pretest, practice, and posttest assessments were developed by ETS and consisted of computer-based selected-response tasks designed to measure proficiency in lexical decision making and decoding, vocabularyknowledge, morphological awareness, and reading comprehension. The assessments were delivered and accessed throughthe Internet using ETS’s C3 test delivery platform. Individual, fixed test forms were prepared for both the pre- and posttests,as well as for each of the intervening practice sessions, and customized for students in the following three grade-levelbands: (a) Grade 3, (b) Grades 4–5, and (c) Grades 6–8. All of the exercises and items selected for the study had beenpreviously used in research studies conducted with similar grades and student populations (Sabatini, Bruce, & Stein-berg, 2013). Each test form was similar in structure and content, assessing knowledge and skills in each of the four targetdomains. Although some items from each exercise were repeated across testing forms, the number of items administeredwithin each subsection of the test varied from session to session. The pre- and posttest forms consisted of 50–54 lexicaldecision-making and decoding items, 38 vocabulary knowledge items, 32 morphological awareness items, and 39–48reading comprehension items, depending upon the grade level. The test forms were designed to take approximately 30min for students to complete. The practice test forms given to students assigned to the reading components condition
4 ETS Research Report No. RR-14-21. © 2014 Educational Testing Service
F. Zaromb et al. No-Stakes Educational Testing and Summer Learning Loss
consisted of only about half as many test items in each subtest and were, therefore, designed to take approximately 15 minfor students to complete.
In addition to the ETS online reading assessments, students were given final paper-based tests of letter-word identi-fication, reading passage comprehension, and reading fluency from the Woodcock–Johnson III Tests of Achievement,Form B (Woodcock, McGrew, & Mather, 2001) as well as the Test of Silent Word Reading Fluency (TOSWRF) during thefinal week of the study. Whereas the Woodcock–Johnson tests were administered to individual students one-on-one, theTOSWRF was administered to individual students in small group settings.
Math Fluency
The math fluency computer-based assessments were also developed by ETS and consisted of short, 20-item online assess-ments based on 22 foundational tasks covering different areas of elementary and middle school mathematics instruction.In contrast to the reading components tests, which were fixed forms that did not provide students with immediate feed-back on their performance, each math test was modeled after a task (e.g., single-digit addition, two-digit subtraction,multiplication, adding negative numbers) that allowed for automatic generation of individual questions that were auto-matically scored. Students were presented with a menu of assessments from which to choose during each testing session,and students could attempt to complete the same or different assessments as many or as few times as they wished duringthe time allowed for each testing session. In addition, students received continuous feedback about their mastery of differ-ent areas (both accuracy and speed) as a way to guide and encourage frequent, regular use of the system. For example, aftersubmitting an answer to a question (e.g., 12+ 23= __), students were immediately informed if their answer was corrector incorrect.
After answering all 20 questions for a given assessment (e.g., two-digit addition), students were then told how manyquestions were answered correctly (e.g., 18 out of 20) and the average speed of their responses (e.g., 2.8 s). Each timestudents completed an assessment with at least 90% accuracy, they earned points—five points for the first successfulcompletion and one less point for each successive completion, at which point they would continue to accumulate onlyone point for each completion of that assessment. This system was meant to encourage students to branch out and com-plete assessments that they might otherwise not attempt. Students also earned different colored stars for completing theassessments quickly. When students mastered an assessment (scoring 90% or higher) by answering the questions with anaverage speed between 2 and 5 s, they earned a silver star; by answering the questions in under 2 s on average, they earneda gold star. Finally, whereas the reading assessments comprised selected-response items, the mathematics assessmentsincluded both selected- and constructed-response item types.
During the last week of the study, students completed a final 30-min session of math assessments that served as theposttest and were additionally given a paper-based test of math fluency from the Woodcock–Johnson III Tests of Achieve-ment, Form B (Woodcock et al., 2001). This test was administered to individual students one-on-one by ETS staff.
Procedure
Pretests
During the first few days of the study, all students completed the online ETS pretests for both reading components andmathematics fluency. Students in the ECV and independent groups took the assessments using laptops located in a com-puter lab set up in one of the ECV classrooms for the study. Students in the LCC group took the online tests using desktopcomputers located in the LCC’s two computer labs. ECV and LCC students arrived in the computer labs for each scheduledtesting session in groups of typically 5 to 10 students organized by grade level.
Students were introduced during one of the first two testing sessions to the reading components program and giventhe reading pretest, and on the second testing session, they were introduced to the mathematics fluency program andgiven the mathematics pretest. ETS staff first showed students PowerPoint presentations introducing them to the readingand mathematics computer programs and providing instructions for how to log in to each program and complete eachassessment. Each student was assigned a unique login identification code for accessing the computer programs and wasinstructed to memorize their identification code so that they could log in to the programs independently from any com-puter with Internet access. Assigning a unique computer login identification code ensured that each student would only
ETS Research Report No. RR-14-21. © 2014 Educational Testing Service 5
F. Zaromb et al. No-Stakes Educational Testing and Summer Learning Loss
work on the assessments to which he or she was assigned and that all data from each student were collected and monitoredwith efficiency, anonymity, and accuracy.
After students logged on to either the reading or mathematics programs, they were instructed to answer each questionas quickly and as accurately as possible by typing the appropriate number keys or using the mouse. We informed studentsthat they would be assigned to practice either reading or math and take similar assessments over the next few weeks andthat they should try their best to get better at answering the questions with accuracy and speed. In addition, students wereinformed that they would receive regular incentives (e.g., snacks and prizes) for their participation and effort.
For the reading assessments, students entered their responses using the number keys, which were associated withdifferent response options. For the mathematics assessments, students entered their answers to the constructed-responseitems using the keyboard and mouse. ETS, ECV, and/or LCC staff assisted students (especially the younger students)who had difficulty with logging in or entering their responses. During the math pretest (but not the reading pretest),students received immediate, continuous feedback on the accuracy of their answers and response timing. The readingpretest took about 30 min for students to complete, and for the mathematics pretest, students were instructed to workon as many mathematics assessments as they could complete within 30 min. Students who arrived late or could notcomplete the pretest within 30 min finished the assessment during the subsequent study session. We did not administerthe Woodcock–Johnson subtests and TOSWRF that were administered at the end of the study as additional pretests dueto the concern that additional testing at the very beginning of the study would discourage students and summer programstaff from participating further in the study and interfere too much with the ECV and LCC summer program schedules.
Practice Tests
Following the pretests, students took practice tests during testing sessions scheduled two or three times per week (onseparate days) over the course of the subsequent 5 weeks. The practice sessions were scheduled at days and times ofeach week in coordination with ECV and LCC staff so as not to replace or disrupt any of their planned summer programactivities. During each practice session, students in the reading components condition took the online reading assessmentsand students in the mathematics fluency condition took the online mathematics fluency assessments.
ETS staff set up the computers in each computer lab to run the ETS online reading and mathematics assessment pro-grams. Next, for each day and time that students were scheduled to participate in a practice session, students would arrivein the computer lab, sit at a computer that already had their assigned program (reading or mathematics) running, and thenlog in to the program using their assigned identification code. The computer presented the students with their assignedtest form for the reading condition or the menu of mathematics assessments and the cumulative number of points andstars they’d earned to date for the mathematics condition. The students were instructed to log in to their program andcomplete the assessments as accurately and as quickly as possible.
ETS, ECV, and/or LCC staff supervised and provided technical support to the students as they completed the onlineassessments, and they also occasionally provided additional verbal feedback to further encourage students to performwell and to discourage disruptive social behavior. Students in the mathematics fluency condition also received a penciland scratch paper to assist them with performing calculations. Each practice session lasted approximately 15–20 min, onaverage.
Posttests
During the last week of the study, all students took posttests for both reading and mathematics fluency using the onlineETS assessments, Woodcock–Johnson subtests, and the TOSWRF. Similar to the pretests, students devoted one session tocompleting a 30-min online reading assessment and a second session to completing as many online mathematics assess-ments as possible within the same time frame. After students logged on to either the reading or mathematics programs,they were instructed to answer questions as quickly and as accurately as possible. Students who arrived late or could notcomplete the posttest within 30 min finished the assessment during the subsequent study session. In addition, ETS staffadministered the Woodcock–Johnson reading and mathematics subtests and a background questionnaire to individualstudents one-on-one in a quiet classroom. Lastly, students took the paper-based TOSWRF in the computer labs undergroup administration. The Woodcock–Johnson subtests, background questionnaire, and TOSWRF took approximately45 min in total for students to complete, on average.
6 ETS Research Report No. RR-14-21. © 2014 Educational Testing Service
F. Zaromb et al. No-Stakes Educational Testing and Summer Learning Loss
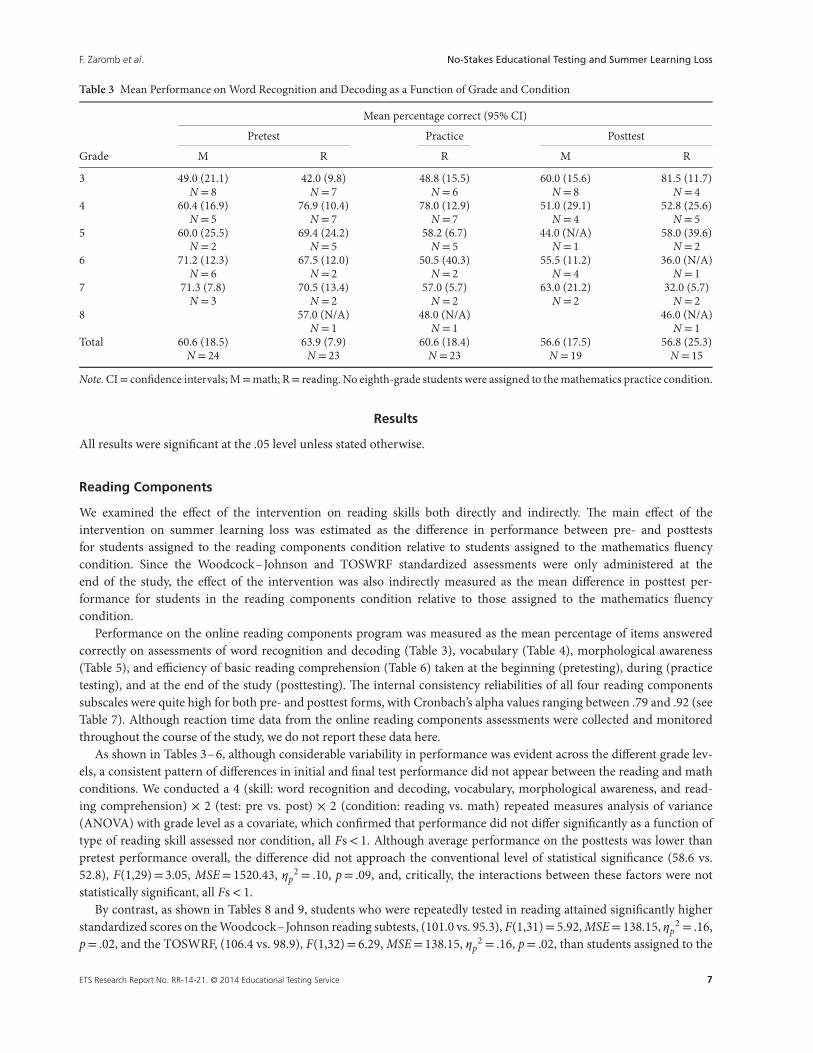
Table 3 Mean Performance on Word Recognition and Decoding as a Function of Grade and Condition
Mean percentage correct (95% CI)
Pretest Practice Posttest
Grade M R R M R
3 49.0 (21.1) 42.0 (9.8) 48.8 (15.5) 60.0 (15.6) 81.5 (11.7)N = 8 N = 7 N = 6 N = 8 N = 4
4 60.4 (16.9) 76.9 (10.4) 78.0 (12.9) 51.0 (29.1) 52.8 (25.6)N = 5 N = 7 N = 7 N = 4 N = 5
5 60.0 (25.5) 69.4 (24.2) 58.2 (6.7) 44.0 (N/A) 58.0 (39.6)N = 2 N = 5 N = 5 N = 1 N = 2
6 71.2 (12.3) 67.5 (12.0) 50.5 (40.3) 55.5 (11.2) 36.0 (N/A)N = 6 N = 2 N = 2 N = 4 N = 1
7 71.3 (7.8) 70.5 (13.4) 57.0 (5.7) 63.0 (21.2) 32.0 (5.7)N = 3 N = 2 N = 2 N = 2 N = 2
8 57.0 (N/A) 48.0 (N/A) 46.0 (N/A)N = 1 N = 1 N = 1
Total 60.6 (18.5) 63.9 (7.9) 60.6 (18.4) 56.6 (17.5) 56.8 (25.3)N = 24 N = 23 N = 23 N = 19 N = 15
Note. CI= confidence intervals; M=math; R= reading. No eighth-grade students were assigned to the mathematics practice condition.
Results
All results were significant at the .05 level unless stated otherwise.
Reading Components
We examined the effect of the intervention on reading skills both directly and indirectly. The main effect of theintervention on summer learning loss was estimated as the difference in performance between pre- and posttestsfor students assigned to the reading components condition relative to students assigned to the mathematics fluencycondition. Since the Woodcock–Johnson and TOSWRF standardized assessments were only administered at theend of the study, the effect of the intervention was also indirectly measured as the mean difference in posttest per-formance for students in the reading components condition relative to those assigned to the mathematics fluencycondition.
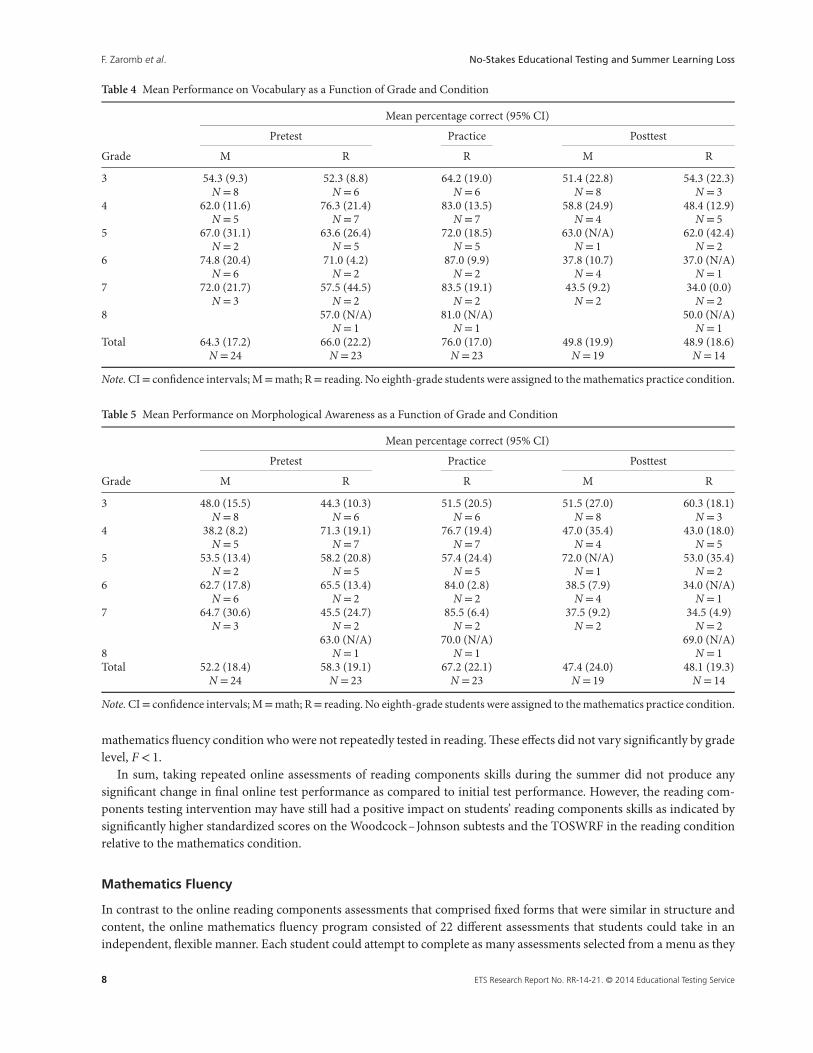
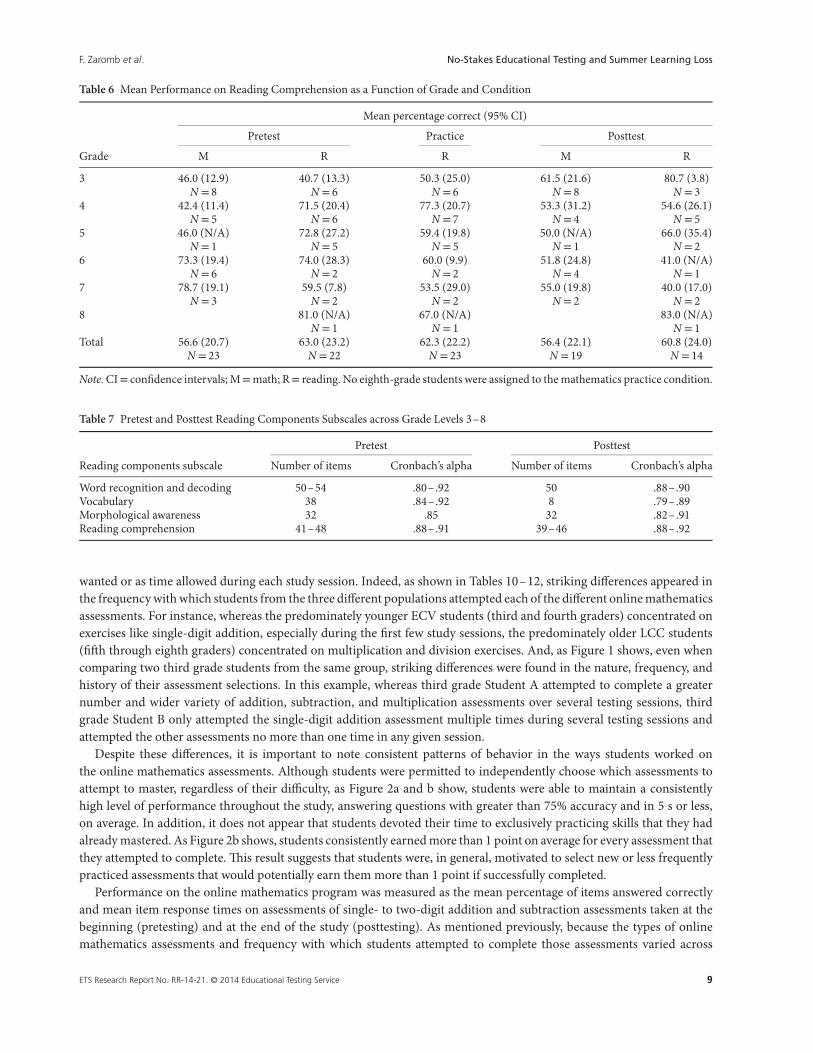
Performance on the online reading components program was measured as the mean percentage of items answeredcorrectly on assessments of word recognition and decoding (Table 3), vocabulary (Table 4), morphological awareness(Table 5), and efficiency of basic reading comprehension (Table 6) taken at the beginning (pretesting), during (practicetesting), and at the end of the study (posttesting). The internal consistency reliabilities of all four reading componentssubscales were quite high for both pre- and posttest forms, with Cronbach’s alpha values ranging between .79 and .92 (seeTable 7). Although reaction time data from the online reading components assessments were collected and monitoredthroughout the course of the study, we do not report these data here.
As shown in Tables 3–6, although considerable variability in performance was evident across the different grade lev-els, a consistent pattern of differences in initial and final test performance did not appear between the reading and mathconditions. We conducted a 4 (skill: word recognition and decoding, vocabulary, morphological awareness, and read-ing comprehension) × 2 (test: pre vs. post) × 2 (condition: reading vs. math) repeated measures analysis of variance(ANOVA) with grade level as a covariate, which confirmed that performance did not differ significantly as a function oftype of reading skill assessed nor condition, all Fs< 1. Although average performance on the posttests was lower thanpretest performance overall, the difference did not approach the conventional level of statistical significance (58.6 vs.52.8), F(1,29)= 3.05, MSE= 1520.43, 𝜂p
2 = .10, p= .09, and, critically, the interactions between these factors were notstatistically significant, all Fs< 1.
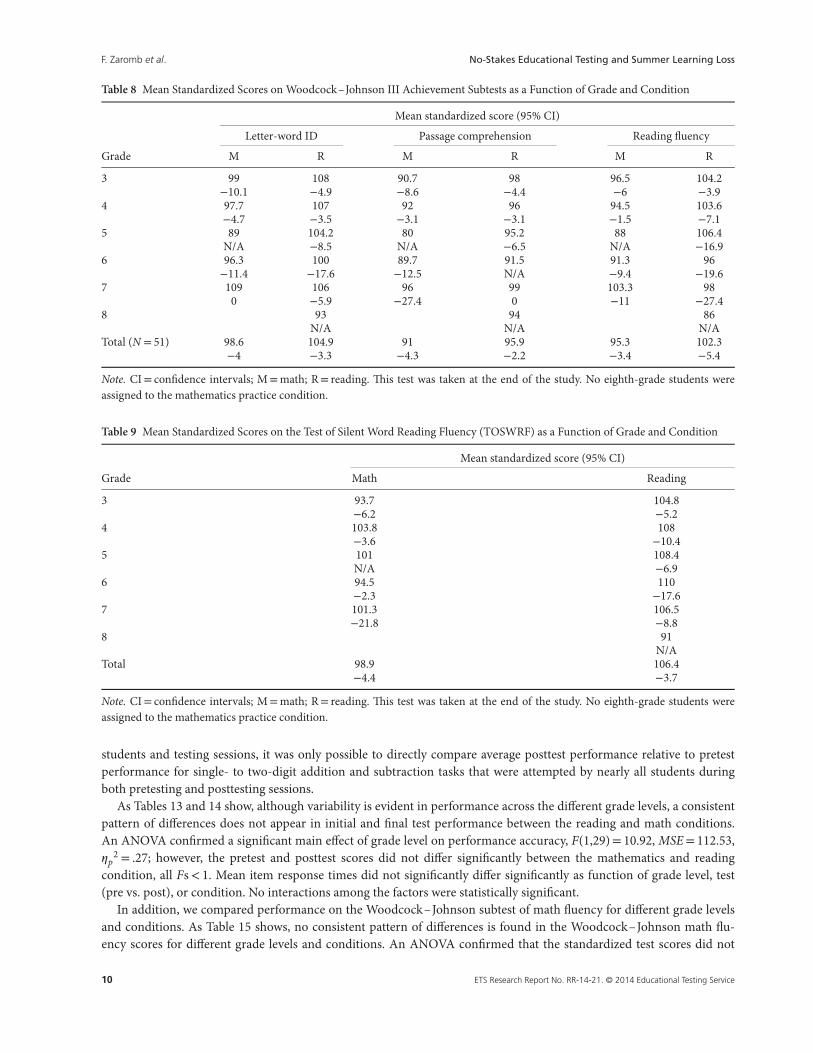
By contrast, as shown in Tables 8 and 9, students who were repeatedly tested in reading attained significantly higherstandardized scores on the Woodcock–Johnson reading subtests, (101.0 vs. 95.3), F(1,31)= 5.92, MSE= 138.15, 𝜂p
2 = .16,p= .02, and the TOSWRF, (106.4 vs. 98.9), F(1,32)= 6.29, MSE= 138.15, 𝜂p
2 = .16, p= .02, than students assigned to the
ETS Research Report No. RR-14-21. © 2014 Educational Testing Service 7
F. Zaromb et al. No-Stakes Educational Testing and Summer Learning Loss
Table 4 Mean Performance on Vocabulary as a Function of Grade and Condition
Mean percentage correct (95% CI)
Pretest Practice Posttest
Grade M R R M R
3 54.3 (9.3) 52.3 (8.8) 64.2 (19.0) 51.4 (22.8) 54.3 (22.3)N = 8 N = 6 N = 6 N = 8 N = 3
4 62.0 (11.6) 76.3 (21.4) 83.0 (13.5) 58.8 (24.9) 48.4 (12.9)N = 5 N = 7 N = 7 N = 4 N = 5
5 67.0 (31.1) 63.6 (26.4) 72.0 (18.5) 63.0 (N/A) 62.0 (42.4)N = 2 N = 5 N = 5 N = 1 N = 2
6 74.8 (20.4) 71.0 (4.2) 87.0 (9.9) 37.8 (10.7) 37.0 (N/A)N = 6 N = 2 N = 2 N = 4 N = 1
7 72.0 (21.7) 57.5 (44.5) 83.5 (19.1) 43.5 (9.2) 34.0 (0.0)N = 3 N = 2 N = 2 N = 2 N = 2
8 57.0 (N/A) 81.0 (N/A) 50.0 (N/A)N = 1 N = 1 N = 1
Total 64.3 (17.2) 66.0 (22.2) 76.0 (17.0) 49.8 (19.9) 48.9 (18.6)N = 24 N = 23 N = 23 N = 19 N = 14
Note. CI= confidence intervals; M=math; R= reading. No eighth-grade students were assigned to the mathematics practice condition.
Table 5 Mean Performance on Morphological Awareness as a Function of Grade and Condition
Mean percentage correct (95% CI)
Pretest Practice Posttest
Grade M R R M R
3 48.0 (15.5) 44.3 (10.3) 51.5 (20.5) 51.5 (27.0) 60.3 (18.1)N = 8 N = 6 N = 6 N = 8 N = 3
4 38.2 (8.2) 71.3 (19.1) 76.7 (19.4) 47.0 (35.4) 43.0 (18.0)N = 5 N = 7 N = 7 N = 4 N = 5
5 53.5 (13.4) 58.2 (20.8) 57.4 (24.4) 72.0 (N/A) 53.0 (35.4)N = 2 N = 5 N = 5 N = 1 N = 2
6 62.7 (17.8) 65.5 (13.4) 84.0 (2.8) 38.5 (7.9) 34.0 (N/A)N = 6 N = 2 N = 2 N = 4 N = 1
7 64.7 (30.6) 45.5 (24.7) 85.5 (6.4) 37.5 (9.2) 34.5 (4.9)N = 3 N = 2 N = 2 N = 2 N = 2
63.0 (N/A) 70.0 (N/A) 69.0 (N/A)8 N = 1 N = 1 N = 1Total 52.2 (18.4) 58.3 (19.1) 67.2 (22.1) 47.4 (24.0) 48.1 (19.3)
N = 24 N = 23 N = 23 N = 19 N = 14
Note. CI= confidence intervals; M=math; R= reading. No eighth-grade students were assigned to the mathematics practice condition.
mathematics fluency condition who were not repeatedly tested in reading. These effects did not vary significantly by gradelevel, F < 1.
In sum, taking repeated online assessments of reading components skills during the summer did not produce anysignificant change in final online test performance as compared to initial test performance. However, the reading com-ponents testing intervention may have still had a positive impact on students’ reading components skills as indicated bysignificantly higher standardized scores on the Woodcock–Johnson subtests and the TOSWRF in the reading conditionrelative to the mathematics condition.
Mathematics Fluency
In contrast to the online reading components assessments that comprised fixed forms that were similar in structure andcontent, the online mathematics fluency program consisted of 22 different assessments that students could take in anindependent, flexible manner. Each student could attempt to complete as many assessments selected from a menu as they
8 ETS Research Report No. RR-14-21. © 2014 Educational Testing Service
F. Zaromb et al. No-Stakes Educational Testing and Summer Learning Loss
Table 6 Mean Performance on Reading Comprehension as a Function of Grade and Condition
Mean percentage correct (95% CI)
Pretest Practice Posttest
Grade M R R M R
3 46.0 (12.9) 40.7 (13.3) 50.3 (25.0) 61.5 (21.6) 80.7 (3.8)N = 8 N = 6 N = 6 N = 8 N = 3
4 42.4 (11.4) 71.5 (20.4) 77.3 (20.7) 53.3 (31.2) 54.6 (26.1)N = 5 N = 6 N = 7 N = 4 N = 5
5 46.0 (N/A) 72.8 (27.2) 59.4 (19.8) 50.0 (N/A) 66.0 (35.4)N = 1 N = 5 N = 5 N = 1 N = 2
6 73.3 (19.4) 74.0 (28.3) 60.0 (9.9) 51.8 (24.8) 41.0 (N/A)N = 6 N = 2 N = 2 N = 4 N = 1
7 78.7 (19.1) 59.5 (7.8) 53.5 (29.0) 55.0 (19.8) 40.0 (17.0)N = 3 N = 2 N = 2 N = 2 N = 2
8 81.0 (N/A) 67.0 (N/A) 83.0 (N/A)N = 1 N = 1 N = 1
Total 56.6 (20.7) 63.0 (23.2) 62.3 (22.2) 56.4 (22.1) 60.8 (24.0)N = 23 N = 22 N = 23 N = 19 N = 14
Note. CI= confidence intervals; M=math; R= reading. No eighth-grade students were assigned to the mathematics practice condition.
Table 7 Pretest and Posttest Reading Components Subscales across Grade Levels 3–8
Pretest Posttest
Reading components subscale Number of items Cronbach’s alpha Number of items Cronbach’s alpha
Word recognition and decoding 50–54 .80–.92 50 .88–.90Vocabulary 38 .84–.92 8 .79–.89Morphological awareness 32 .85 32 .82–.91Reading comprehension 41–48 .88–.91 39–46 .88–.92
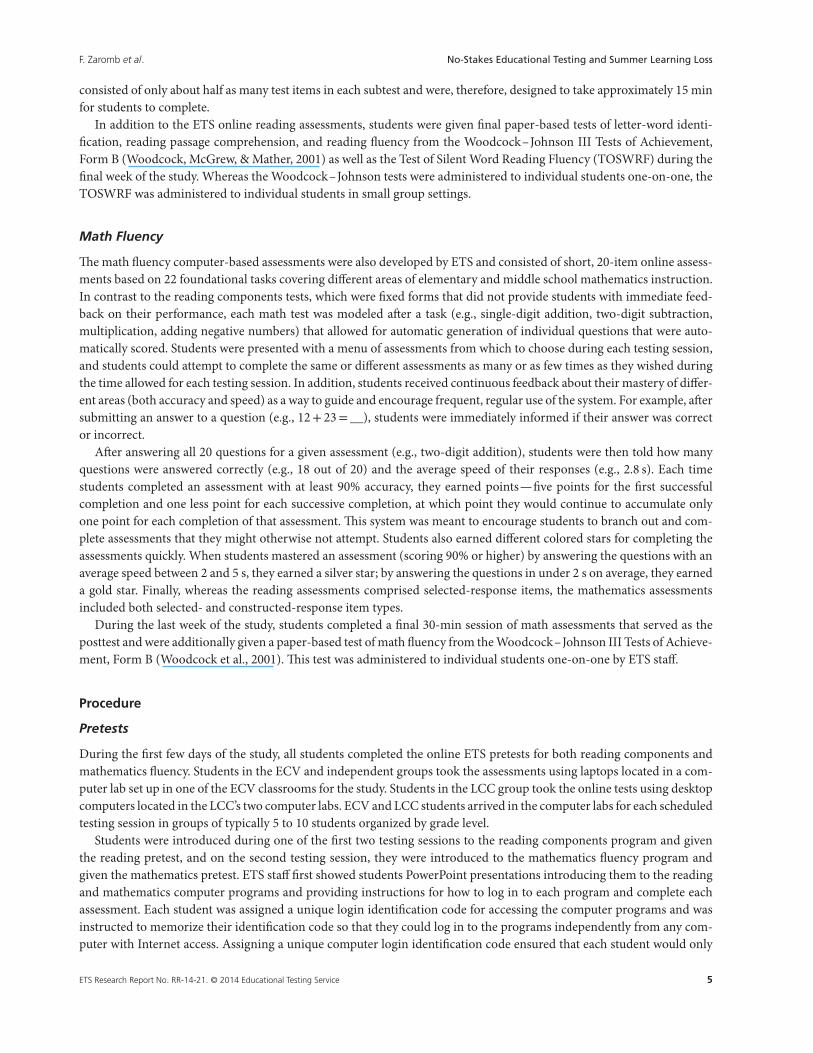
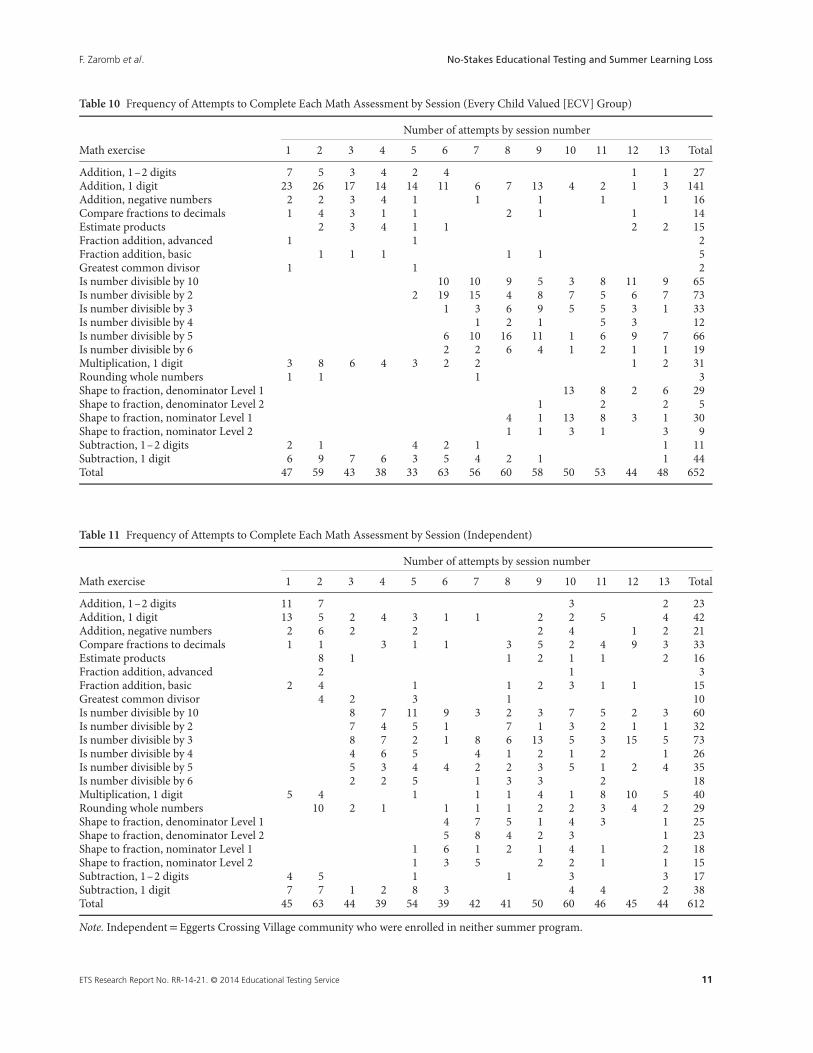
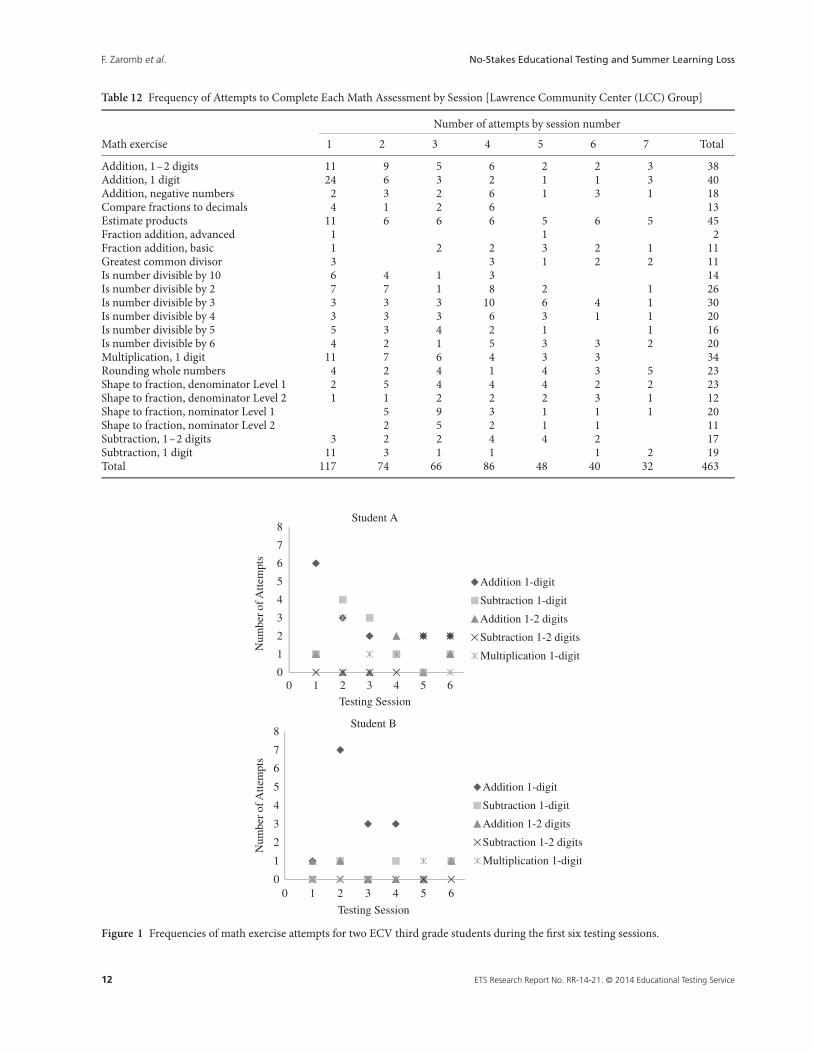
wanted or as time allowed during each study session. Indeed, as shown in Tables 10–12, striking differences appeared inthe frequency with which students from the three different populations attempted each of the different online mathematicsassessments. For instance, whereas the predominately younger ECV students (third and fourth graders) concentrated onexercises like single-digit addition, especially during the first few study sessions, the predominately older LCC students(fifth through eighth graders) concentrated on multiplication and division exercises. And, as Figure 1 shows, even whencomparing two third grade students from the same group, striking differences were found in the nature, frequency, andhistory of their assessment selections. In this example, whereas third grade Student A attempted to complete a greaternumber and wider variety of addition, subtraction, and multiplication assessments over several testing sessions, thirdgrade Student B only attempted the single-digit addition assessment multiple times during several testing sessions andattempted the other assessments no more than one time in any given session.
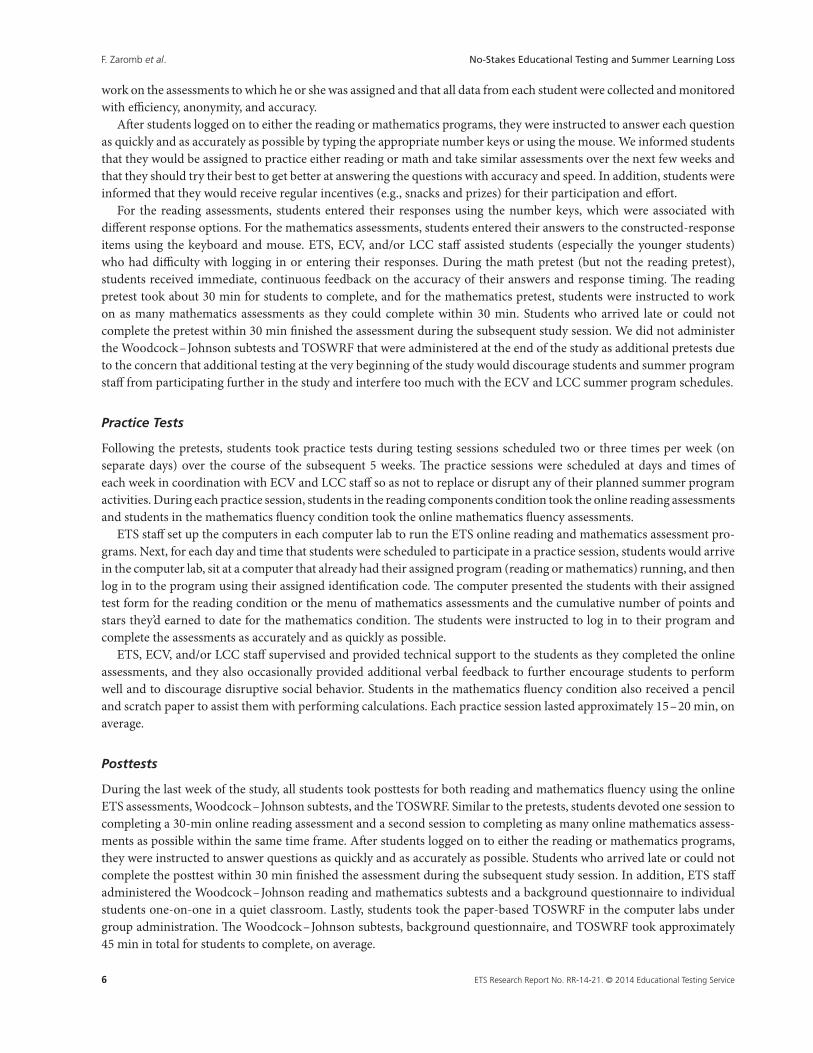
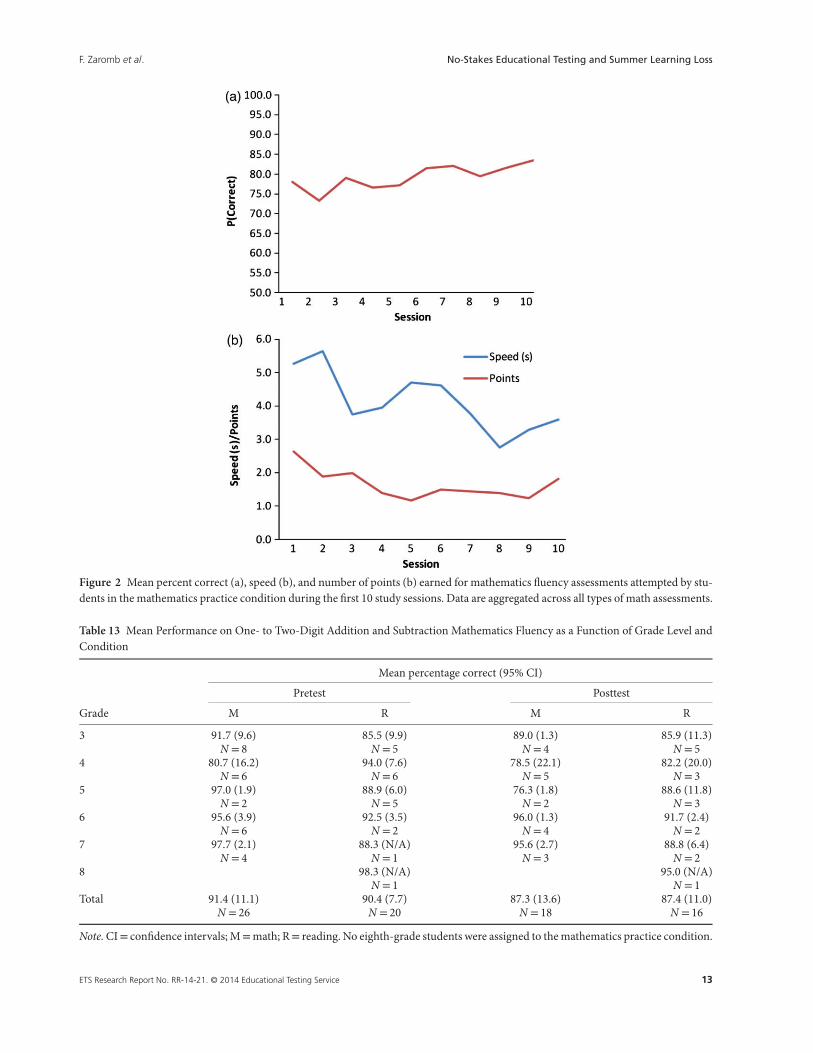
Despite these differences, it is important to note consistent patterns of behavior in the ways students worked onthe online mathematics assessments. Although students were permitted to independently choose which assessments toattempt to master, regardless of their difficulty, as Figure 2a and b show, students were able to maintain a consistentlyhigh level of performance throughout the study, answering questions with greater than 75% accuracy and in 5 s or less,on average. In addition, it does not appear that students devoted their time to exclusively practicing skills that they hadalready mastered. As Figure 2b shows, students consistently earned more than 1 point on average for every assessment thatthey attempted to complete. This result suggests that students were, in general, motivated to select new or less frequentlypracticed assessments that would potentially earn them more than 1 point if successfully completed.
Performance on the online mathematics program was measured as the mean percentage of items answered correctlyand mean item response times on assessments of single- to two-digit addition and subtraction assessments taken at thebeginning (pretesting) and at the end of the study (posttesting). As mentioned previously, because the types of onlinemathematics assessments and frequency with which students attempted to complete those assessments varied across
ETS Research Report No. RR-14-21. © 2014 Educational Testing Service 9
F. Zaromb et al. No-Stakes Educational Testing and Summer Learning Loss
Table 8 Mean Standardized Scores on Woodcock–Johnson III Achievement Subtests as a Function of Grade and Condition
Mean standardized score (95% CI)
Letter-word ID Passage comprehension Reading fluency
Grade M R M R M R
3 99 108 90.7 98 96.5 104.2−10.1 −4.9 −8.6 −4.4 −6 −3.9
4 97.7 107 92 96 94.5 103.6−4.7 −3.5 −3.1 −3.1 −1.5 −7.1
5 89 104.2 80 95.2 88 106.4N/A −8.5 N/A −6.5 N/A −16.9
6 96.3 100 89.7 91.5 91.3 96−11.4 −17.6 −12.5 N/A −9.4 −19.6
7 109 106 96 99 103.3 980 −5.9 −27.4 0 −11 −27.4
8 93 94 86N/A N/A N/A
Total (N = 51) 98.6 104.9 91 95.9 95.3 102.3−4 −3.3 −4.3 −2.2 −3.4 −5.4
Note. CI= confidence intervals; M=math; R= reading. This test was taken at the end of the study. No eighth-grade students wereassigned to the mathematics practice condition.
Table 9 Mean Standardized Scores on the Test of Silent Word Reading Fluency (TOSWRF) as a Function of Grade and Condition
Mean standardized score (95% CI)
Grade Math Reading
3 93.7 104.8−6.2 −5.2
4 103.8 108−3.6 −10.4
5 101 108.4N/A −6.9
6 94.5 110−2.3 −17.6
7 101.3 106.5−21.8 −8.8
8 91N/A
Total 98.9 106.4−4.4 −3.7
Note. CI= confidence intervals; M=math; R= reading. This test was taken at the end of the study. No eighth-grade students wereassigned to the mathematics practice condition.
students and testing sessions, it was only possible to directly compare average posttest performance relative to pretestperformance for single- to two-digit addition and subtraction tasks that were attempted by nearly all students duringboth pretesting and posttesting sessions.
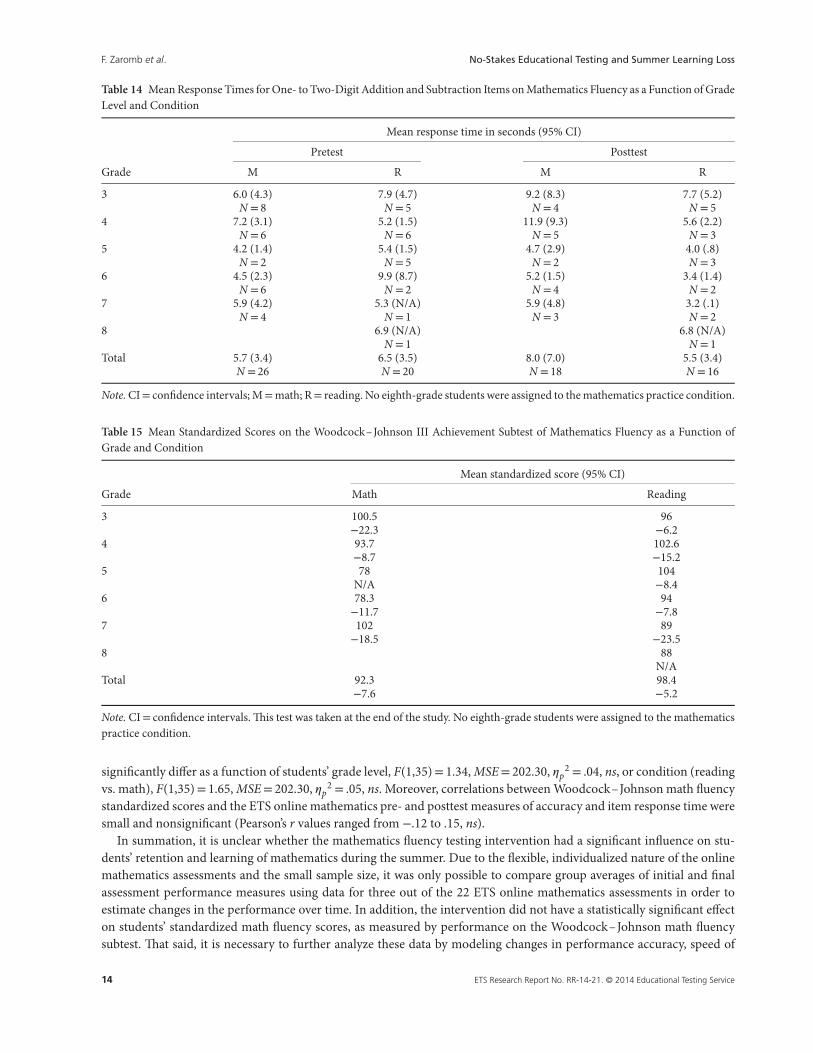
As Tables 13 and 14 show, although variability is evident in performance across the different grade levels, a consistentpattern of differences does not appear in initial and final test performance between the reading and math conditions.An ANOVA confirmed a significant main effect of grade level on performance accuracy, F(1,29)= 10.92, MSE= 112.53,𝜂p
2 = .27; however, the pretest and posttest scores did not differ significantly between the mathematics and readingcondition, all Fs< 1. Mean item response times did not significantly differ significantly as function of grade level, test(pre vs. post), or condition. No interactions among the factors were statistically significant.
In addition, we compared performance on the Woodcock–Johnson subtest of math fluency for different grade levelsand conditions. As Table 15 shows, no consistent pattern of differences is found in the Woodcock–Johnson math flu-ency scores for different grade levels and conditions. An ANOVA confirmed that the standardized test scores did not
10 ETS Research Report No. RR-14-21. © 2014 Educational Testing Service
F. Zaromb et al. No-Stakes Educational Testing and Summer Learning Loss
Table 10 Frequency of Attempts to Complete Each Math Assessment by Session (Every Child Valued [ECV] Group)
Number of attempts by session number
Math exercise 1 2 3 4 5 6 7 8 9 10 11 12 13 Total
Addition, 1–2 digits 7 5 3 4 2 4 1 1 27Addition, 1 digit 23 26 17 14 14 11 6 7 13 4 2 1 3 141Addition, negative numbers 2 2 3 4 1 1 1 1 1 16Compare fractions to decimals 1 4 3 1 1 2 1 1 14Estimate products 2 3 4 1 1 2 2 15Fraction addition, advanced 1 1 2Fraction addition, basic 1 1 1 1 1 5Greatest common divisor 1 1 2Is number divisible by 10 10 10 9 5 3 8 11 9 65Is number divisible by 2 2 19 15 4 8 7 5 6 7 73Is number divisible by 3 1 3 6 9 5 5 3 1 33Is number divisible by 4 1 2 1 5 3 12Is number divisible by 5 6 10 16 11 1 6 9 7 66Is number divisible by 6 2 2 6 4 1 2 1 1 19Multiplication, 1 digit 3 8 6 4 3 2 2 1 2 31Rounding whole numbers 1 1 1 3Shape to fraction, denominator Level 1 13 8 2 6 29Shape to fraction, denominator Level 2 1 2 2 5Shape to fraction, nominator Level 1 4 1 13 8 3 1 30Shape to fraction, nominator Level 2 1 1 3 1 3 9Subtraction, 1–2 digits 2 1 4 2 1 1 11Subtraction, 1 digit 6 9 7 6 3 5 4 2 1 1 44Total 47 59 43 38 33 63 56 60 58 50 53 44 48 652
Table 11 Frequency of Attempts to Complete Each Math Assessment by Session (Independent)
Number of attempts by session number
Math exercise 1 2 3 4 5 6 7 8 9 10 11 12 13 Total
Addition, 1–2 digits 11 7 3 2 23Addition, 1 digit 13 5 2 4 3 1 1 2 2 5 4 42Addition, negative numbers 2 6 2 2 2 4 1 2 21Compare fractions to decimals 1 1 3 1 1 3 5 2 4 9 3 33Estimate products 8 1 1 2 1 1 2 16Fraction addition, advanced 2 1 3Fraction addition, basic 2 4 1 1 2 3 1 1 15Greatest common divisor 4 2 3 1 10Is number divisible by 10 8 7 11 9 3 2 3 7 5 2 3 60Is number divisible by 2 7 4 5 1 7 1 3 2 1 1 32Is number divisible by 3 8 7 2 1 8 6 13 5 3 15 5 73Is number divisible by 4 4 6 5 4 1 2 1 2 1 26Is number divisible by 5 5 3 4 4 2 2 3 5 1 2 4 35Is number divisible by 6 2 2 5 1 3 3 2 18Multiplication, 1 digit 5 4 1 1 1 4 1 8 10 5 40Rounding whole numbers 10 2 1 1 1 1 2 2 3 4 2 29Shape to fraction, denominator Level 1 4 7 5 1 4 3 1 25Shape to fraction, denominator Level 2 5 8 4 2 3 1 23Shape to fraction, nominator Level 1 1 6 1 2 1 4 1 2 18Shape to fraction, nominator Level 2 1 3 5 2 2 1 1 15Subtraction, 1–2 digits 4 5 1 1 3 3 17Subtraction, 1 digit 7 7 1 2 8 3 4 4 2 38Total 45 63 44 39 54 39 42 41 50 60 46 45 44 612
Note. Independent=Eggerts Crossing Village community who were enrolled in neither summer program.
ETS Research Report No. RR-14-21. © 2014 Educational Testing Service 11
F. Zaromb et al. No-Stakes Educational Testing and Summer Learning Loss
Table 12 Frequency of Attempts to Complete Each Math Assessment by Session [Lawrence Community Center (LCC) Group]
Number of attempts by session number
Math exercise 1 2 3 4 5 6 7 Total
Addition, 1–2 digits 11 9 5 6 2 2 3 38Addition, 1 digit 24 6 3 2 1 1 3 40Addition, negative numbers 2 3 2 6 1 3 1 18Compare fractions to decimals 4 1 2 6 13Estimate products 11 6 6 6 5 6 5 45Fraction addition, advanced 1 1 2Fraction addition, basic 1 2 2 3 2 1 11Greatest common divisor 3 3 1 2 2 11Is number divisible by 10 6 4 1 3 14Is number divisible by 2 7 7 1 8 2 1 26Is number divisible by 3 3 3 3 10 6 4 1 30Is number divisible by 4 3 3 3 6 3 1 1 20Is number divisible by 5 5 3 4 2 1 1 16Is number divisible by 6 4 2 1 5 3 3 2 20Multiplication, 1 digit 11 7 6 4 3 3 34Rounding whole numbers 4 2 4 1 4 3 5 23Shape to fraction, denominator Level 1 2 5 4 4 4 2 2 23Shape to fraction, denominator Level 2 1 1 2 2 2 3 1 12Shape to fraction, nominator Level 1 5 9 3 1 1 1 20Shape to fraction, nominator Level 2 2 5 2 1 1 11Subtraction, 1–2 digits 3 2 2 4 4 2 17Subtraction, 1 digit 11 3 1 1 1 2 19Total 117 74 66 86 48 40 32 463
Student A
Student B
0
1
2
3
4
5
6
7
8
0 1 2 3 4 5 6
Nu
mb
er
of
Att
em
pts
Testing Session
Addition 1-digit
Subtraction 1-digit
Addition 1-2 digits
Subtraction 1-2 digits
Multiplication 1-digit
0
1
2
3
4
5
6
7
8
0 1 2 3 4 5 6
Nu
mb
er
of
Att
em
pts
Testing Session
Addition 1-digit
Subtraction 1-digit
Addition 1-2 digits
Subtraction 1-2 digits
Multiplication 1-digit
Figure 1 Frequencies of math exercise attempts for two ECV third grade students during the first six testing sessions.
12 ETS Research Report No. RR-14-21. © 2014 Educational Testing Service
F. Zaromb et al. No-Stakes Educational Testing and Summer Learning Loss
Figure 2 Mean percent correct (a), speed (b), and number of points (b) earned for mathematics fluency assessments attempted by stu-dents in the mathematics practice condition during the first 10 study sessions. Data are aggregated across all types of math assessments.
Table 13 Mean Performance on One- to Two-Digit Addition and Subtraction Mathematics Fluency as a Function of Grade Level andCondition
Mean percentage correct (95% CI)
Pretest Posttest
Grade M R M R
3 91.7 (9.6) 85.5 (9.9) 89.0 (1.3) 85.9 (11.3)N = 8 N = 5 N = 4 N = 5
4 80.7 (16.2) 94.0 (7.6) 78.5 (22.1) 82.2 (20.0)N = 6 N = 6 N = 5 N = 3
5 97.0 (1.9) 88.9 (6.0) 76.3 (1.8) 88.6 (11.8)N = 2 N = 5 N = 2 N = 3
6 95.6 (3.9) 92.5 (3.5) 96.0 (1.3) 91.7 (2.4)N = 6 N = 2 N = 4 N = 2
7 97.7 (2.1) 88.3 (N/A) 95.6 (2.7) 88.8 (6.4)N = 4 N = 1 N = 3 N = 2
8 98.3 (N/A) 95.0 (N/A)N = 1 N = 1
Total 91.4 (11.1) 90.4 (7.7) 87.3 (13.6) 87.4 (11.0)N = 26 N = 20 N = 18 N = 16
Note. CI= confidence intervals; M=math; R= reading. No eighth-grade students were assigned to the mathematics practice condition.
ETS Research Report No. RR-14-21. © 2014 Educational Testing Service 13
F. Zaromb et al. No-Stakes Educational Testing and Summer Learning Loss
Table 14 Mean Response Times for One- to Two-Digit Addition and Subtraction Items on Mathematics Fluency as a Function of GradeLevel and Condition
Mean response time in seconds (95% CI)
Pretest Posttest
Grade M R M R
3 6.0 (4.3) 7.9 (4.7) 9.2 (8.3) 7.7 (5.2)N = 8 N = 5 N = 4 N = 5
4 7.2 (3.1) 5.2 (1.5) 11.9 (9.3) 5.6 (2.2)N = 6 N = 6 N = 5 N = 3
5 4.2 (1.4) 5.4 (1.5) 4.7 (2.9) 4.0 (.8)N = 2 N = 5 N = 2 N = 3
6 4.5 (2.3) 9.9 (8.7) 5.2 (1.5) 3.4 (1.4)N = 6 N = 2 N = 4 N = 2
7 5.9 (4.2) 5.3 (N/A) 5.9 (4.8) 3.2 (.1)N = 4 N = 1 N = 3 N = 2
8 6.9 (N/A) 6.8 (N/A)N = 1 N = 1
Total 5.7 (3.4) 6.5 (3.5) 8.0 (7.0) 5.5 (3.4)N = 26 N = 20 N = 18 N = 16
Note. CI= confidence intervals; M=math; R= reading. No eighth-grade students were assigned to the mathematics practice condition.
Table 15 Mean Standardized Scores on the Woodcock–Johnson III Achievement Subtest of Mathematics Fluency as a Function ofGrade and Condition
Mean standardized score (95% CI)
Grade Math Reading
3 100.5 96−22.3 −6.2
4 93.7 102.6−8.7 −15.2
5 78 104N/A −8.4
6 78.3 94−11.7 −7.8
7 102 89−18.5 −23.5
8 88N/A
Total 92.3 98.4−7.6 −5.2
Note. CI= confidence intervals. This test was taken at the end of the study. No eighth-grade students were assigned to the mathematicspractice condition.
significantly differ as a function of students’ grade level, F(1,35)= 1.34, MSE= 202.30, 𝜂p2 = .04, ns, or condition (reading
vs. math), F(1,35)= 1.65, MSE= 202.30, 𝜂p2 = .05, ns. Moreover, correlations between Woodcock–Johnson math fluency
standardized scores and the ETS online mathematics pre- and posttest measures of accuracy and item response time weresmall and nonsignificant (Pearson’s r values ranged from −.12 to .15, ns).
In summation, it is unclear whether the mathematics fluency testing intervention had a significant influence on stu-dents’ retention and learning of mathematics during the summer. Due to the flexible, individualized nature of the onlinemathematics assessments and the small sample size, it was only possible to compare group averages of initial and finalassessment performance measures using data for three out of the 22 ETS online mathematics assessments in order toestimate changes in the performance over time. In addition, the intervention did not have a statistically significant effecton students’ standardized math fluency scores, as measured by performance on the Woodcock–Johnson math fluencysubtest. That said, it is necessary to further analyze these data by modeling changes in performance accuracy, speed of
14 ETS Research Report No. RR-14-21. © 2014 Educational Testing Service
F. Zaromb et al. No-Stakes Educational Testing and Summer Learning Loss
responding over time, and number of assessment attempts for each individual student and type of assessment in order toprovide more fine-grained measures of individual student performance.
Discussion
It would be premature to draw any firm conclusions from this exploratory study given the small sample size and variationsin grade level, academic subjects, computer programs, and testing conditions. However, the main findings and observa-tions of our study are nonetheless encouraging, albeit mixed. Taking repeated online assessments of mathematics fluencyand reading components skills during the summer did not reveal any significant decline in final online test performance ascompared to initial test performance, and furthermore, the reading components testing intervention appears to have pro-duced some improvement in students’ reading components skills, as indicated by significantly higher standardized scoreson the Woodcock–Johnson III achievement subtests and the TOSWRF in the reading condition relative to standardizedscores for students assigned to the mathematics condition. Nevertheless, average performance on the final online read-ing assessments was quite low, and yet, students performed at or above average for their grade level on the standardizedassessments.
One potential explanation for the discrepant findings among the reading posttests is that students may have felt lessmotivated to take the final online assessments after having taken multiple, similar assessments throughout the summer.As a result, their final performance on the online assessments may be a suboptimal measure of their reading knowledgeand skills at that time point than their final performance on the paper-based standardized tests, which were administeredunder more traditional standardized testing conditions, either one on one or in small groups. Another possibility is thatthe online pretest scores are not a reliable or valid measure of students’ baseline reading knowledge and skill level, anddifferences in the final standardized test scores may reflect pre-existing differences in the student groups. This explanationseems unlikely considering that the internal consistency reliabilities for the online reading components pre- and posttestswere consistently high, with Cronbach’s alpha values ranging from .79 to .92 across all subtests, grade levels, and forms.
The mathematics fluency testing intervention does not appear to have a significant impact on measures of students’retention and learning of mathematics during the summer. First, students who were assigned to the mathematics fluencypractice condition did not score higher on standardized tests of math fluency administered at the end of the study thanstudents who were assigned to the reading components practice condition. Second, due to the flexible, individualizednature of the online mathematics assessments and the small sample size, it was only possible to compare group averagesof initial and final assessment performance measures using data from a small subset of the ETS online mathematics assess-ments in order to estimate changes in the performance over time. Nevertheless, it would be premature to conclude thatthe mathematics testing intervention had absolutely no impact on learning and retention.
One aim of future research should be to conduct similar studies with larger samples of students and model longitudinalchanges in performance accuracy, speed of responding, and number of assessment attempts for each individual studentand type of assessment in order to provide more fine-grained measures of individual learning. Such analyses would permitthe identification of specific areas where students improved or showed little or no decline in mathematics learning overtime and show how particular test characteristics—spaced repetition and feedback—affect learning and guide studentsin their independent practice. Indeed, there is some indication that the continuous feedback of the online mathematicsassessment encourages students to independently choose appropriate exercises to practice. Including a system that rewardsstudents with points and stars for completing math tests with high accuracy and speed appears to further motivate studentsto voluntarily devote most of their time to practicing knowledge and skills that are neither too easy nor too difficult. Manystudents also appear to enjoy and feel motivated by the social competition of comparing how many points and stars theyearned with their peers. In a way, these various forms of feedback make the math assessments adaptive, in that studentscan take more difficult assessments as they become comfortable with the easier assessments (this is in contrast to thereading assessments, which remained the same difficulty level regardless of student performance).
Another purpose of this research was to evaluate the feasibility of using no-stakes educational testing as an interventionto mitigate summer learning loss. Responses from student background surveys, qualitative observations, and feedbackfrom ECV and LCC staff highlighted several advantages and positive outcomes of the intervention, along with somelogistical challenges that will need to be overcome in future research and test development. First, the no-stakes nature ofthe testing does not appear to have any significant negative effects on students’ interest in or willingness to participate inthe study. If anything, students had positive reactions to the study as a whole. Many of the students surveyed reported that
ETS Research Report No. RR-14-21. © 2014 Educational Testing Service 15
F. Zaromb et al. No-Stakes Educational Testing and Summer Learning Loss
they enjoyed and/or learned from participating in the ETS study. While many of the students reported feeling that it wasimportant to do well on the tests, they only felt at most somewhat nervous while taking the tests.
Despite the regularity and frequency of testing throughout the study, the intervention was incorporated into both theECV and LCC summer program schedules without replacing or disrupting other planned activities. ECV and LCC staffalso supported the pilot study and contributed to its successful implementation in a variety of ways. It should be noted,however, that logistical challenges that are typical of summer programs, such as offsite day trips, last minute changes to theprogram schedules, and students starting or ending their participation in the summer programs at different times, resultedin some students participating in fewer practice testing sessions or experiencing longer delays (and perhaps greater for-getting) between testing sessions.
In addition, students responded positively to receiving incentives of snacks, toys, games, and other prizes givenon a weekly basis, as well as at the end of the study. The incentives appeared to enhance students’ willingness andinterest participating in the study; however, it is impossible to determine the exact contribution of the incentives tostudent performance throughout the study. Another aim of future research should be to examine the effects of pro-viding such incentives on students’ motivation and effort to perform well on no-stakes assessments taken during thesummer. This is particularly important given the goal of developing interventions that are both low-cost and widelyaccessible.
Differences in the testing environments may have also had an impact on how students participated in the study andperformed on the tests. For example, during each testing session, ECV students were tested in a computer lab that wasset up specifically for the research study, and they were supervised by a teacher from the summer program who helped toensure that students were working quietly on the ETS computer programs and not distracting other students. By contrast,LCC students were tested in one of the LCC computer labs, and they were often distracted by the activities (e.g., musicclass) that were taking place in the neighboring rooms or by seeing other students not enrolled in the ETS study playingcomputer games on nearby computers. All of the ECV students participated in the ETS study. Perhaps most importantly,both the ECV and LCC summer programs provided students with academic enrichment, and some of the knowledgeand skills tested during the course of the study may have also been taught to or reviewed by students as part of theirrespective summer programs. In order to disentangle the influence of the summer programs themselves from this typetesting intervention, future studies should include a larger sample of “independent” students who are not concurrentlyenrolled in a formal summer program.
In summation, the findings and observations from this exploratory study highlight both the ease and potential benefitsof incorporating no-stakes educational testing into a summer program. The fact that we did not observe any significantsummer learning loss, particularly in tests of reading components skills, is encouraging news for students, parents, andeducators and suggests that this type of intervention may contribute to the academic enrichment of summer programsand have some potential to address summer learning loss in students in Grades 3–8. The fact that this intervention didnot require much time relative to the total time students spent in the ECV and LCC summer programs, or in comparisonto the amount of instruction time they experience in school, further underscores the ease with which such an interventioncould be implemented on a broader scale. For instance, students could complete the online assessments for free (excluding,of course, any additional material rewards or incentives) at home (or any suitable location with a computer and internetconnection) during the summer for only 30 min a day, two or three times per week. Understanding how such a low-coststrategy may decrease summer learning loss would make an important contribution to education throughout the UnitedStates.
Acknowledgments
Financial, technical, and logistical support for this research was provided by the Educational Testing Service (ETS®)and the Every Child Valued (ECV) and Lawrence Community Center summer programs. Special thanks to Lenovo andComputer Sciences Corporation for providing laptops and laptop security locks that allowed us to conduct the studyat ECV, and to Pavan Pillarisetti for setting up the wireless network for the ECV computer lab. Thanks also go to CaraLaitusis, Tenaha O’Reilly, and John Sabatini for their input in designing the study, as well as to Edith Aurora Graf andLaura Halderman for providing helpful comments and suggestions on earlier drafts of the manuscript. The views andconclusions contained in this document are those of the authors and not those of ETS.
16 ETS Research Report No. RR-14-21. © 2014 Educational Testing Service
F. Zaromb et al. No-Stakes Educational Testing and Summer Learning Loss
References
Alexander, K. L., Entwisle, D. R., & Olson, L. S. (2007). Lasting consequences of the summer learning gap. American Sociological Review,72, 167–180.
Benson, J., & Borman, G. D. (2010). Family, neighborhood, and school settings across seasons: When do socioeconomic context andracial composition matter for the reading achievement growth of young children? Teachers College Record, 112, 1338–1390.
Burkam, D. T., Ready, D. D., Lee, V. E., & LoGerfo, L. F. (2004). Social-class differences in summer learning between kindergarten andfirst grade: Model specification and estimation. Sociology of Education, 77, 1–31.
Butler, A. C., & Roediger, H. L. (2008). Feedback enhances the positive effects and reduces the negative effect of multiple-choice testing.Memory & Cognition, 36, 604–616.
Cooper, H. (2003). Summer learning loss: The problem and some solutions (ERIC Digest No. EDO-PS-03-5). Champaign, IL: ERICClearinghouse on Elementary and Early Childhood Education. Retrieved from ERIC database. (ED475391). Retrieved from ERICdatabase. (EDO-PS-03-5)
Cooper, H., Nye, B., Charlton, K., Lindsay, J., & Greathouse, S. (1996). The effects of summer vacation on achievement test scores: Anarrative and meta-analytic review. Review of Educational Research, 66(3), 227–268.
Cull, W. (2000). Untangling the benefits of multiple study opportunities and repeated testing for cued recall. Applied CognitivePsychology, 14, 439–477.
Downey, D. B., von Hippel, P. T., & Broh, B. A. (2004). Are schools the great equalizer? Cognitive inequality during the summer monthsand the school year. American Sociological Review, 69, 613–635.
Entwisle, D. R., & Alexander, K. L. (1992). Summer setback: Race, poverty, school composition, and mathematics achievement in thefirst two years of school. American Sociological Review, 57, 72–84.
Entwisle, D. R., & Alexander, K. L. (1994). Winter setback: School racial composition and learning to read. American SociologicalReview, 59, 446–460.
Heyns, B. (1978). Summer learning and the effects of schooling. New York, NY: Academic Press.Roediger, H. L., III, & Butler, A. C. (2011). The critical role of retrieval practice in long-term retention. Trends in Cognitive Science, 15,
20–27.Roediger, H. L., III, & Karpicke, J. D. (2006). The power of testing memory: Basic research and implications for educational practice.
Perspectives on Psychological Science, 1, 181–210.Sabatini, J., Bruce, K., & Steinberg, J. (2013). SARA reading components tests, RISE form: Test design and technical adequacy (Research
Report No. RR-13-08). Princeton, NJ: Educational Testing Service.Woodcock, R. W., McGrew, K. S., & Mather, N. (2001). Woodcock-Johnson III tests of achievement. Itasca, IL: Riverside.
Suggested citation:
Zaromb, F., Adler, R. M., Bruce, K., Attali, Y., & Rock, J. (2014). Using no-stakes educational testing to mitigate summer learning loss:A pilot study (Research Report No. RR-14-21). Princeton, NJ: Educational Testing Service. doi:10.1002/ets2.12021
Action Editor: John Sabatini
Reviewers: Laura Halderman and Edith Aurora Graf
ETS, the ETS logo, and LISTENING. LEARNING. LEADING. are registered trademarks of Educational Testing Service (ETS). All othertrademarks are property of their respective owners.
Find other ETS-published reports by searching the ETS ReSEARCHER database at http://search.ets.org/researcher/
ETS Research Report No. RR-14-21. © 2014 Educational Testing Service 17


